Embed Size (px)
Citation preview
STRONGERSMARTERSUSTAINABLE
VEDANTA RESOURCES PLCANNUAL REPORT FY2017
VEDANTA RESOURCES PLC ANNUAL REPORT FY2017
VEDANTA RESOURCES PLC IS A UK LISTED GLOBAL DIVERSIFIED NATURAL RESOURCES COMPANY.
OUR CORE PURPOSEVedanta is a globally diversified natural resources company with low-cost operations. We empower our people to drive excellence and innovation to create value for our stakeholders. We demonstrate world-class standards of governance, safety, sustainability and social responsibility.
At a Glance see pages 04–05
Jharsuguda smelter and power operations
01
Vedanta Resources plc | Annual Report FY2017www.vedantaresources.com
STRATEGIC REPORT DIRECTORS’ REPORT FINANCIAL STATEMENTS ADDITIONAL INFORMATION
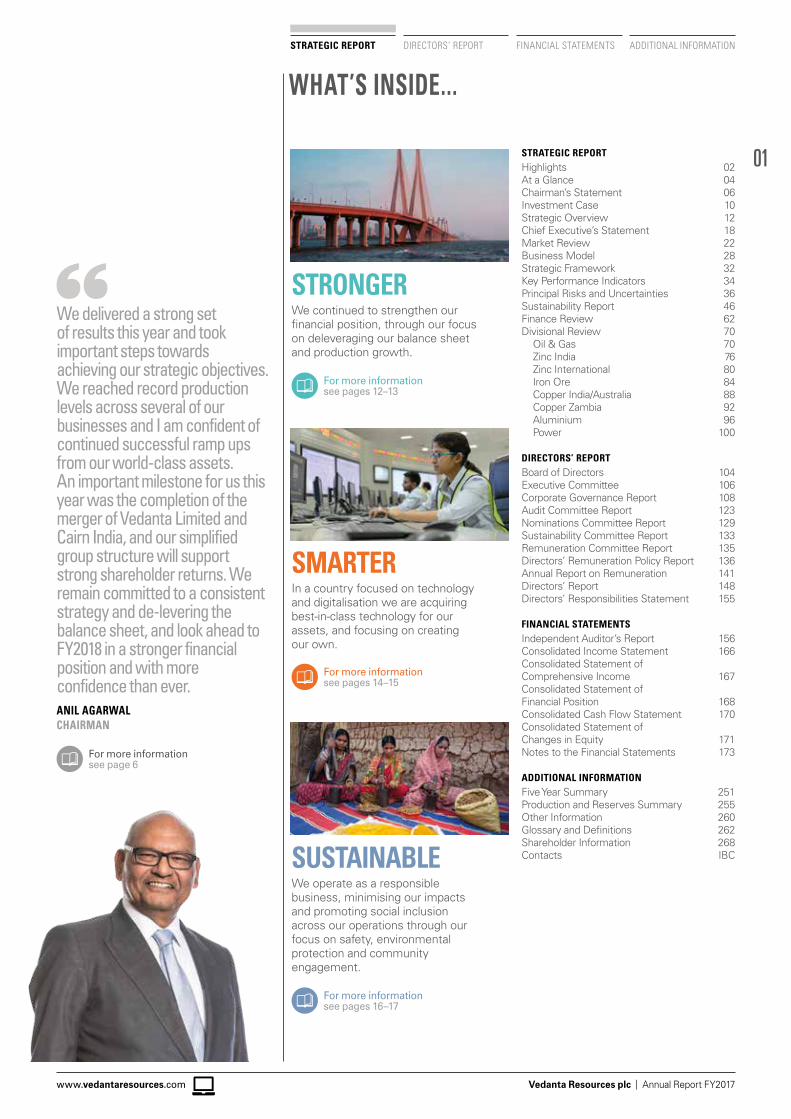
WHAT’S INSIDE...
STRONGERWe continued to strengthen our financial position, through our focus on deleveraging our balance sheet and production growth.
SMARTERIn a country focused on technology and digitalisation we are acquiring best-in-class technology for our assets, and focusing on creating our own.
SUSTAINABLEWe operate as a responsible business, minimising our impacts and promoting social inclusion across our operations through our focus on safety, environmental protection and community engagement.
For more informationsee pages 12–13
For more informationsee pages 14–15
For more informationsee pages 16–17
STRATEGIC REPORTHighlights 02At a Glance 04Chairman’s Statement 06Investment Case 10Strategic Overview 12Chief Executive’s Statement 18Market Review 22Business Model 28Strategic Framework 32Key Performance Indicators 34Principal Risks and Uncertainties 36Sustainability Report 46Finance Review 62Divisional Review 70 Oil & Gas 70 Zinc India 76 Zinc International 80 Iron Ore 84 Copper India/Australia 88 Copper Zambia 92 Aluminium 96 Power 100
DIRECTORS’ REPORT Board of Directors 104Executive Committee 106Corporate Governance Report 108Audit Committee Report 123Nominations Committee Report 129Sustainability Committee Report 133Remuneration Committee Report 135Directors’ Remuneration Policy Report 136Annual Report on Remuneration 141 Directors’ Report 148Directors’ Responsibilities Statement 155
FINANCIAL STATEMENTSIndependent Auditor’s Report 156Consolidated Income Statement 166Consolidated Statement of Comprehensive Income 167Consolidated Statement of Financial Position 168Consolidated Cash Flow Statement 170Consolidated Statement of Changes in Equity 171Notes to the Financial Statements 173
ADDITIONAL INFORMATIONFive Year Summary 251Production and Reserves Summary 255Other Information 260Glossary and Definitions 262Shareholder Information 268Contacts IBC
We delivered a strong set of results this year and took important steps towards achieving our strategic objectives. We reached record production levels across several of our businesses and I am confident of continued successful ramp ups from our world-class assets. An important milestone for us this year was the completion of the merger of Vedanta Limited and Cairn India, and our simplified group structure will support strong shareholder returns. We remain committed to a consistent strategy and de-levering the balance sheet, and look ahead to FY2018 in a stronger financial position and with more confidence than ever.ANIL AGARWALCHAIRMAN
For more information see page 6
02
Vedanta Resources plc | Annual Report FY2017
FINANCIAL HIGHLIGHTS ❯ Revenue increased by 7% to US$11.5 billion (FY2016:
US$10.7 billion) driven by firmer commodity prices and volume ramp up
❯ EBITDA increased by 37% to US$3.2 billion (FY2016: EBITDA: US$2.3 billion)
❯ Adjusted EBITDA margin of 36% (FY2016: 28%), driven by firmer commodity prices and operational efficiencies
❯ Free cash flow (FCF) post capex of US$1.5 billion (FY2016: US$1.8 billion). Excluding one-time working capital initiatives FCF at US$1.4 billion (FY2016: US$0.9 billion)
❯ Gross debt at US$18.2 billion (FY2016: US$16.3 billion), higher on account of temporary borrowings at HZL (US$1.2 billion) for special dividend payment
❯ Gross debt reduced by US$1.4 billion post 31 March 2017 ❯ Net debtat US$8.5 billion (FY2016: US$7.3 billion), higher,
driven by dividends paid to minorities and the associated dividend distribution tax
❯ Vedanta Limited and Cairn India merger completed ❯ Underlying profit per share of 1.1 US cents (FY2016: loss of
131.9 US cents) ❯ Positive credit rating movements
– S&P upgraded the issuer credit rating from B/Stable Outlook to B+/Stable Outlook
– Moody’s upgraded the Company’s Corporate Family Rating (CFR) by one notch from B2/Negative to B1/Stable
❯ Announced a final dividend of 35 US cents per share (total dividend 55 US cents per share), dividend yield of 6.5%
❯ Declaration of record interim dividend by subsidiaries in March 2017 – Hindustan Zinc Limited announced dividend of US$2.1
billion including dividend distribution tax – Vedanta Limited announced a dividend of US$1.0 billion,
of which US$500 million was received by Vedanta Resources plc
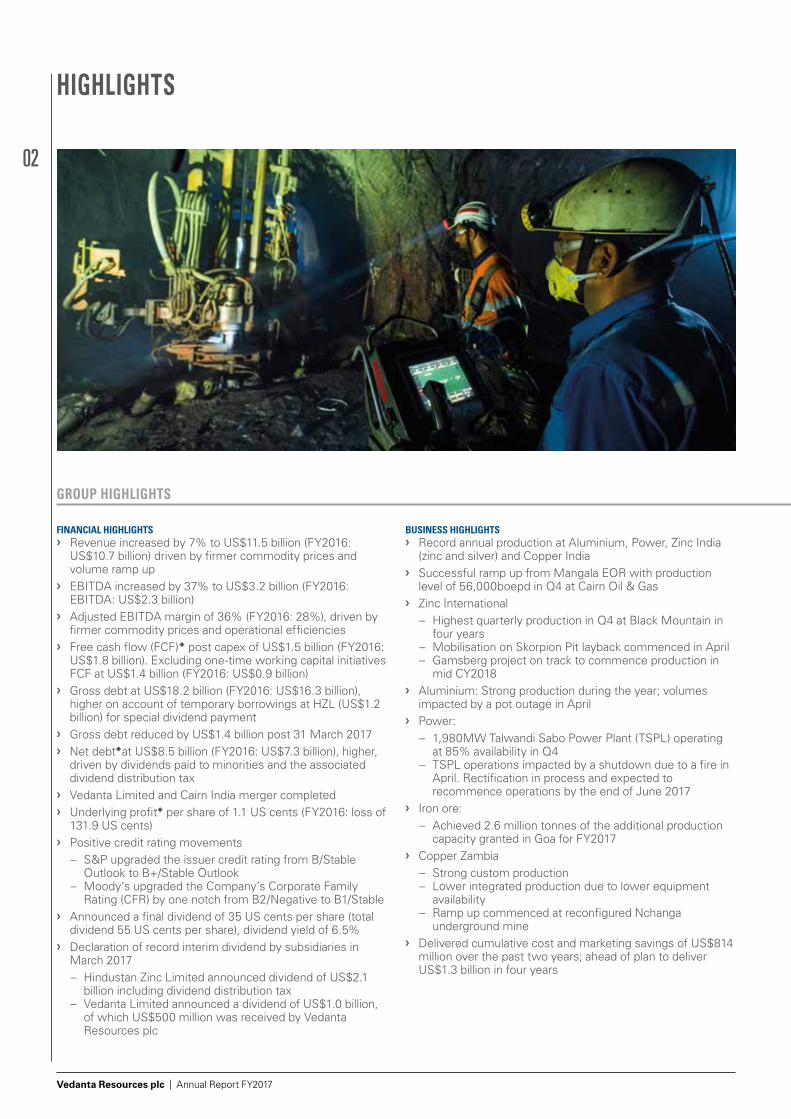
GROUP HIGHLIGHTS
BUSINESS HIGHLIGHTS ❯ Record annual production at Aluminium, Power, Zinc India
(zinc and silver) and Copper India ❯ Successful ramp up from Mangala EOR with production
level of 56,000boepd in Q4 at Cairn Oil & Gas ❯ Zinc International
– Highest quarterly production in Q4 at Black Mountain in four years
– Mobilisation on Skorpion Pit layback commenced in April – Gamsberg project on track to commence production in
mid CY2018 ❯ Aluminium: Strong production during the year; volumes
impacted by a pot outage in April ❯ Power:
– 1,980MW Talwandi Sabo Power Plant (TSPL) operating at 85% availability in Q4
– TSPL operations impacted by a shutdown due to a fire in April. Rectification in process and expected to recommence operations by the end of June 2017
❯ Iron ore: – Achieved 2.6 million tonnes of the additional production
capacity granted in Goa for FY2017 ❯ Copper Zambia
– Strong custom production – Lower integrated production due to lower equipment
availability – Ramp up commenced at reconfigured Nchanga
underground mine ❯ Delivered cumulative cost and marketing savings of US$814
million over the past two years; ahead of plan to deliver US$1.3 billion in four years
HIGHLIGHTS
03
STRATEGIC REPORT DIRECTORS’ REPORT FINANCIAL STATEMENTS ADDITIONAL INFORMATION
Vedanta Resources plc | Annual Report FY2017www.vedantaresources.com
REVENUE(US$ MILLION)
12,9
45
14,6
40
12,8
79
10,7
38
11,5
20
2014
2013
2015
2016
2017
EBITDA(US$ MILLION)
4,4
91
4,9
09
3,74
1
2,33
6
3,19
1
2014
2013
2015
2016
2017
FCF POST CAPEX(US$ MILLION)
1,27
0
1,51
6
1,04
7
1,77
3*
1,54
4
2014
2013
2015
2016
2017
DIVIDEND(US CENTS PER SHARE)
6158 63 30 55
2014
2013
2015
2016
2017
GROUP HIGHLIGHTS
Image opposite: Employees at Sindesar Khurd Mine, HZL
Image left: Employee at packing area of Jharsuguda aluminium cast house
Image right: Women empowerment through self-help groups
CONSOLIDATED GROUP RESULTS(US$ MILLIONS, EXCEPT AS STATED)
FY2017 FY2016
Revenue 11,520.1 10,737.9EBITDA 3,191.1 2,336.4 EBITDA margin (%) 27.7% 21.8% EBITDA margin excluding custom smelting (%) 36.5% 27.6%Operating profit before special items 2,160.6 881.2Loss attributable to equity holders (22.7) (1,837.4)Underlying attributable profit/(loss) 3.0 (364.1)Basic loss per share (US cents) (8.2) (665.8)Profit/(loss) per share on underlying profit (US cents) 1.1 (131.9)ROCE (%) 15.6% 6.2%*Total dividend (US cents per share) 55 30
* Before impairment Indicates alternate performance measures which are defined in detail in ‘Other information’
* Restated
04
Vedanta Resources plc | Annual Report FY2017
VEDANTA AT A GLANCE
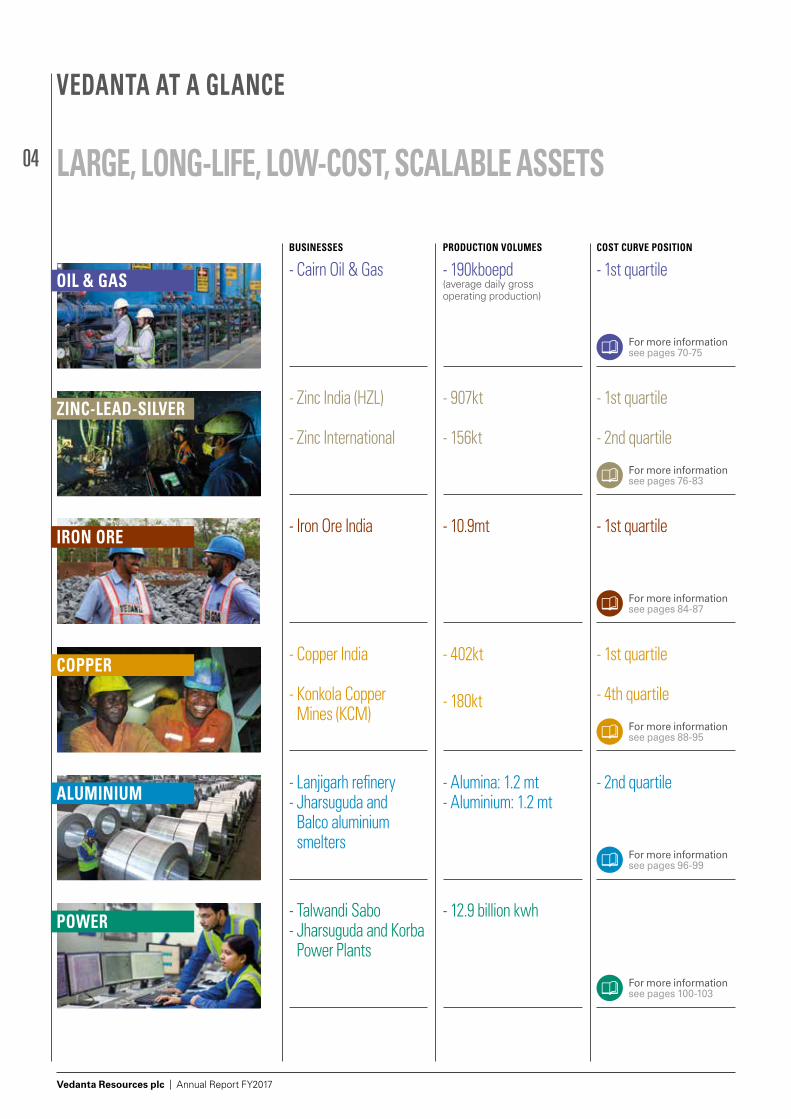
LARGE, LONG-LIFE, LOW-COST, SCALABLE ASSETS
OIL & GAS
ZINC-LEAD-SILVER
IRON ORE
COPPER
ALUMINIUM
POWER
- Cairn Oil & Gas - 190kboepd(average daily gross operating production)
- 1st quartileBUSINESSES PRODUCTION VOLUMES COST CURVE POSITION
- Zinc India (HZL)
- Zinc International
- 907kt
- 156kt
- 1st quartile
- 2nd quartile
- Iron Ore India - 10.9mt - 1st quartile
- Copper India
- Konkola Copper Mines (KCM)
- 402kt
- 180kt
- 1st quartile
- 4th quartile
- Lanjigarh refinery- Jharsuguda and
Balco aluminium smelters
- Alumina: 1.2 mt- Aluminium: 1.2 mt
- 2nd quartile
- Talwandi Sabo- Jharsuguda and Korba
Power Plants
- 12.9 billion kwh
For more information see pages 70-75
For more information see pages 76-83
For more information see pages 84-87
For more information see pages 88-95
For more information see pages 96-99
For more information see pages 100-103
05
Vedanta Resources plc | Annual Report FY2017www.vedantaresources.com
STRATEGIC REPORT DIRECTORS’ REPORT FINANCIAL STATEMENTS ADDITIONAL INFORMATION
710 9
8
22
1
3
2
45
6
23
25
20
17
19
12
13
14
15
2416
17
1818
27
28
11
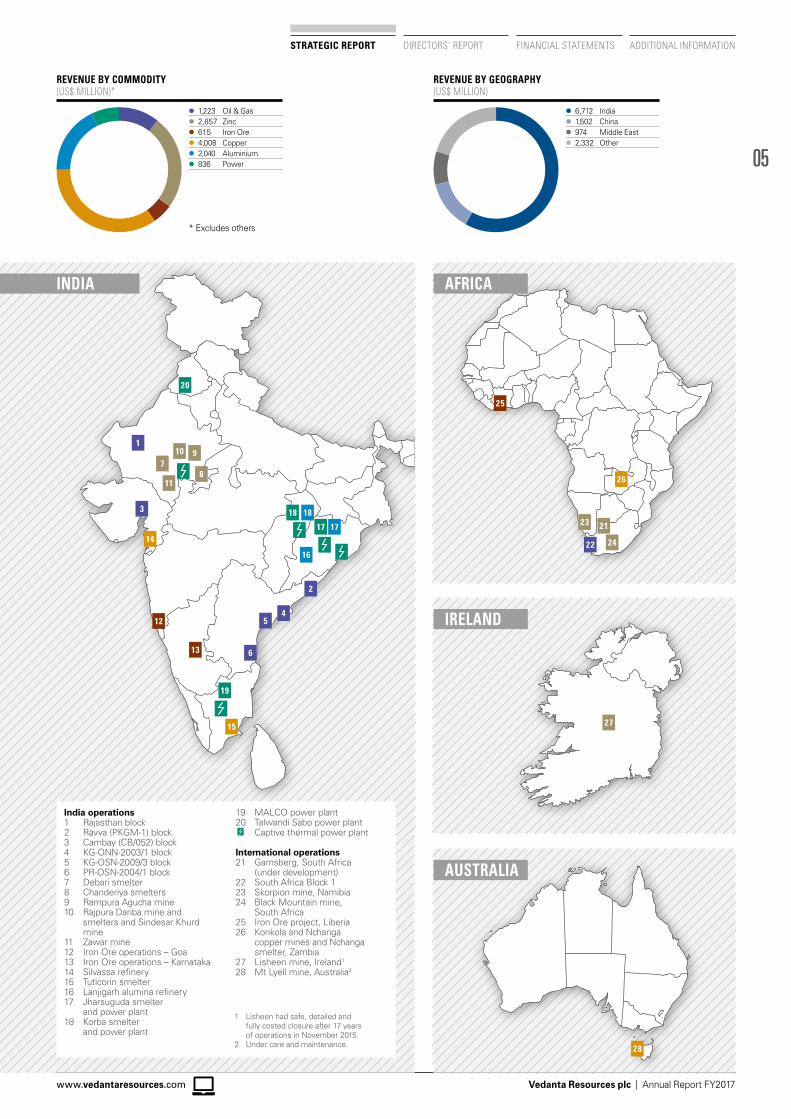
REVENUE BY COMMODITY (US$ MILLION)*
REVENUE BY GEOGRAPHY(US$ MILLION)
l 1,223 Oil & Gasl 2,857 Zincl 615 Iron Orel 4,008 Copperl 2,040 Aluminiuml 836 Power
l 6,712 Indial 1,502 Chinal 974 Middle Eastl 2,332 Other
* Excludes others
26
21
India operations1 Rajasthan block2 Ravva (PKGM-1) block3 Cambay (CB/052) block4 KG-ONN-2003/1 block5 KG-OSN-2009/3 block6 PR-OSN-2004/1 block7 Debari smelter8 Chanderiya smelters9 Rampura Agucha mine10 Rajpura Dariba mine and
smelters and Sindesar Khurd mine
11 Zawar mine12 Iron Ore operations – Goa13 Iron Ore operations – Karnataka14 Silvassa refinery15 Tuticorin smelter16 Lanjigarh alumina refinery17 Jharsuguda smelter
and power plant18 Korba smelter
and power plant
19 MALCO power plant20 Talwandi Sabo power plant Captive thermal power plant
International operations21 Gamsberg, South Africa
(under development)22 South Africa Block 123 Skorpion mine, Namibia24 Black Mountain mine,
South Africa25 Iron Ore project, Liberia26 Konkola and Nchanga
copper mines and Nchanga smelter, Zambia
27 Lisheen mine, Ireland1 28 Mt Lyell mine, Australia2
1 Lisheen had safe, detailed and fully costed closure after 17 years of operations in November 2015.
2 Under care and maintenance.
INDIA AFRICA
IRELAND
AUSTRALIA
06
Vedanta Resources plc | Annual Report FY2017
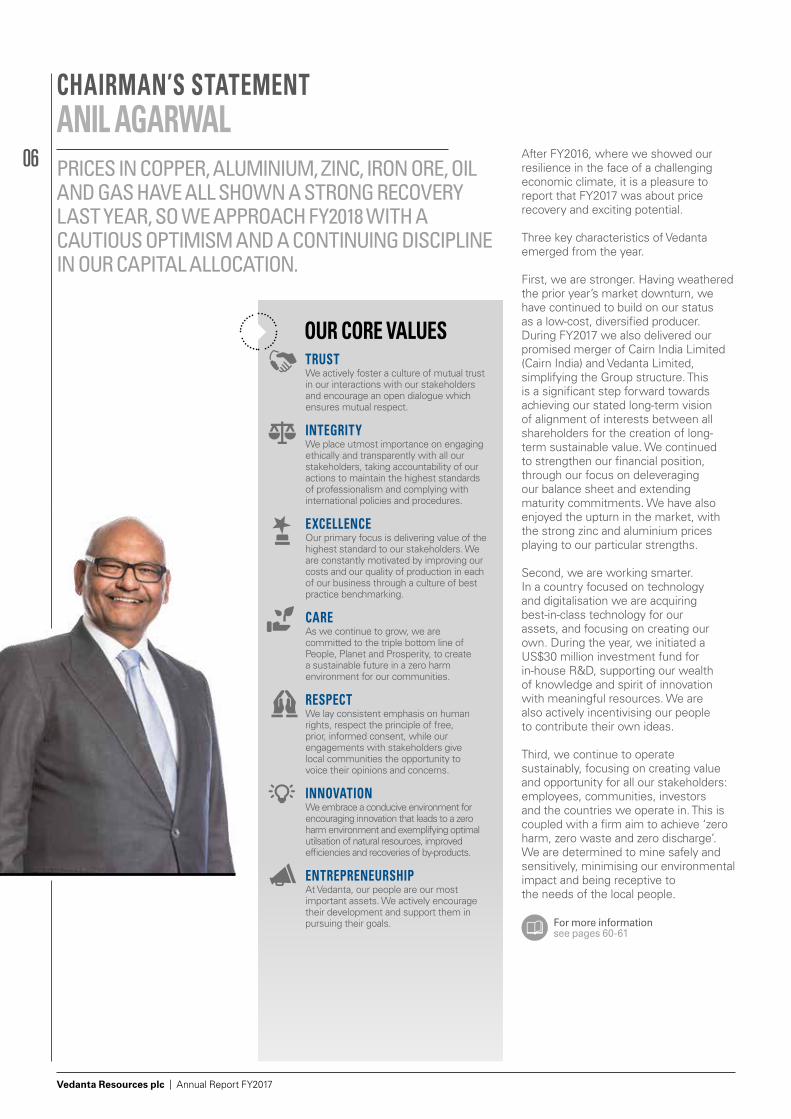
CHAIRMAN’S STATEMENTANIL AGARWALPRICES IN COPPER, ALUMINIUM, ZINC, IRON ORE, OIL AND GAS HAVE ALL SHOWN A STRONG RECOVERY LAST YEAR, SO WE APPROACH FY2018 WITH A CAUTIOUS OPTIMISM AND A CONTINUING DISCIPLINE IN OUR CAPITAL ALLOCATION.
TRUSTWe actively foster a culture of mutual trust in our interactions with our stakeholders and encourage an open dialogue which ensures mutual respect.
INTEGRITYWe place utmost importance on engaging ethically and transparently with all our stakeholders, taking accountability of our actions to maintain the highest standards of professionalism and complying with international policies and procedures.
EXCELLENCEOur primary focus is delivering value of the highest standard to our stakeholders. We are constantly motivated by improving our costs and our quality of production in each of our business through a culture of best practice benchmarking.
CAREAs we continue to grow, we are committed to the triple bottom line of People, Planet and Prosperity, to create a sustainable future in a zero harm environment for our communities.
RESPECTWe lay consistent emphasis on human rights, respect the principle of free, prior, informed consent, while our engagements with stakeholders give local communities the opportunity to voice their opinions and concerns.
INNOVATIONWe embrace a conducive environment for encouraging innovation that leads to a zero harm environment and exemplifying optimal utilsation of natural resources, improved efficiencies and recoveries of by-products.
ENTREPRENEURSHIPAt Vedanta, our people are our most important assets. We actively encourage their development and support them in pursuing their goals.
OUR CORE VALUES
For more information see pages 60-61
After FY2016, where we showed our resilience in the face of a challenging economic climate, it is a pleasure to report that FY2017 was about price recovery and exciting potential.
Three key characteristics of Vedanta emerged from the year.
First, we are stronger. Having weathered the prior year’s market downturn, we have continued to build on our status as a low-cost, diversified producer. During FY2017 we also delivered our promised merger of Cairn India Limited (Cairn India) and Vedanta Limited, simplifying the Group structure. This is a significant step forward towards achieving our stated long-term vision of alignment of interests between all shareholders for the creation of long-term sustainable value. We continued to strengthen our financial position, through our focus on deleveraging our balance sheet and extending maturity commitments. We have also enjoyed the upturn in the market, with the strong zinc and aluminium prices playing to our particular strengths.
Second, we are working smarter. In a country focused on technology and digitalisation we are acquiring best-in-class technology for our assets, and focusing on creating our own. During the year, we initiated a US$30 million investment fund for in-house R&D, supporting our wealth of knowledge and spirit of innovation with meaningful resources. We are also actively incentivising our people to contribute their own ideas.
Third, we continue to operate sustainably, focusing on creating value and opportunity for all our stakeholders: employees, communities, investors and the countries we operate in. This is coupled with a firm aim to achieve ‘zero harm, zero waste and zero discharge’. We are determined to mine safely and sensitively, minimising our environmental impact and being receptive to the needs of the local people.
07
Vedanta Resources plc | Annual Report FY2017www.vedantaresources.com
STRATEGIC REPORT DIRECTORS’ REPORT FINANCIAL STATEMENTS ADDITIONAL INFORMATION
We are in the business of producing commodities and supplying energy that make lives and economies better, from the essentials for creating infrastructure, to the basic needs of transportation and power and the material requirements of manufacturing consumer goods. We are also excellently located: Vedanta operates primarily in India and Africa, countries that are endowed with an abundant supply of natural resources, and have growing economies waiting to make good use of them.
As an efficient and experienced natural resources player, we offer investors an opportunity to take part in the extraordinary growth story of India as it seeks to improve its infrastructure, house its growing population and develop its manufacturing base.
HOW WE PERFORMED With a strong operational performance and a supportive market environment, we were able to deliver encouraging numbers for FY2017.
Revenues rose to US$11.5 billion with EBITDA at US$3.2 billion. EBITDA margin
(excluding custom smelting at Zinc India and Copper) was 36% and we delivered strong free cash flow of US$1.5 billion.
This led the Board to recommend a final dividend of 35 US cents per share.
I was pleased that we were able to ramp up our production, despite some operational issues at the Aluminium and Power businesses and the Konkola Copper Mines (KCM). We were also successful in controlling costs at the majority of our businesses.
I also deeply regret that the year saw seven fatalities in the course of our operations. There are no circumstances in which this is acceptable, and I am personally committed to eradicating such incidents.
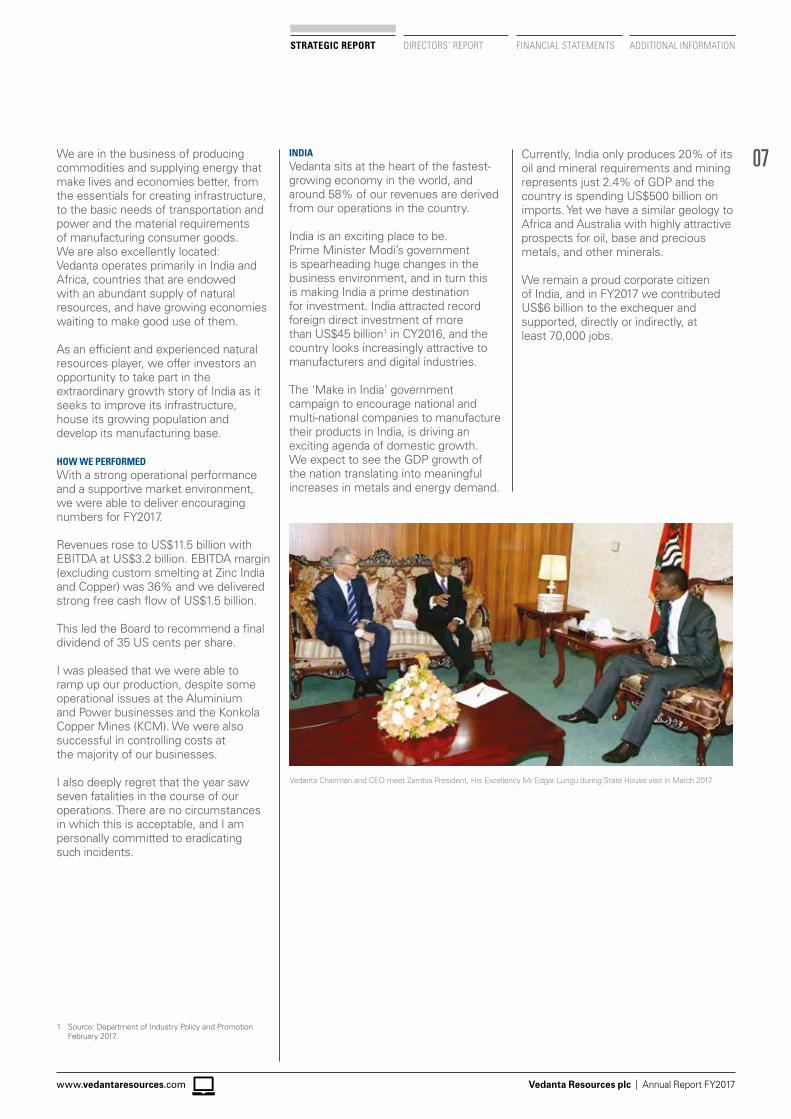
INDIA Vedanta sits at the heart of the fastest-growing economy in the world, and around 58% of our revenues are derived from our operations in the country.
India is an exciting place to be. Prime Minister Modi’s government is spearheading huge changes in the business environment, and in turn this is making India a prime destination for investment. India attracted record foreign direct investment of more than US$45 billion1 in CY2016, and the country looks increasingly attractive to manufacturers and digital industries.
The 'Make in India' government campaign to encourage national and multi-national companies to manufacture their products in India, is driving an exciting agenda of domestic growth. We expect to see the GDP growth of the nation translating into meaningful increases in metals and energy demand.
1 Source: Department of Industry Policy and Promotion February 2017.
Currently, India only produces 20% of its oil and mineral requirements and mining represents just 2.4% of GDP and the country is spending US$500 billion on imports. Yet we have a similar geology to Africa and Australia with highly attractive prospects for oil, base and precious metals, and other minerals.
We remain a proud corporate citizen of India, and in FY2017 we contributed US$6 billion to the exchequer and supported, directly or indirectly, at least 70,000 jobs.
Vedanta Chairman and CEO meet Zambia President, His Excellency Mr Edgar Lungu during State House visit in March 2017
08
Vedanta Resources plc | Annual Report FY2017
CHAIRMAN’S STATEMENTCONTINUED
AFRICAVedanta enjoys a productive and long-standing relationship with Africa, and during the year I was pleased to accompany India’s Prime Minister on a visit to South Africa, as part of his business delegation.
We continue to invest in projects and assets in both India and Africa. Our zinc project in Gamsberg, South Africa is under active construction as we prepare to mine one of the world’s largest deposits of zinc. Given strong zinc market fundamentals, this venture looks increasingly well-timed and we look forward to production going live in 2018. We are also looking at extending the life of the successful Black Mountain and Skorpion zinc mines. This is in sharp contrast to a few years ago, when Skorpion was being considered for closure.
In Zambia, although we experienced some operational challenges during the year, we continue to focus on being a leading player in copper. We have exciting technical projects planned, and are looking at initiatives both to ramp up volumes and develop captive power generation sources over the coming years.
A COMPANY FOR COMMUNITIES For two decades now, Vedanta has maintained that financial returns alone are not the mark of a good business. We also care passionately about the well-being of our employees and, equally, the local communities in which we operate.
I am therefore proud to say that during the year, we backed our commitment to the communities we operate in with an investment of US$18 million towards community initiatives.
A key part of our work in this area is to empower women and to give children the best possible start in life. As an example, Vedanta is participating in India’s ‘Nand Ghars’ (also known as Anganwadi) programme, helping to transform 4,000 state-run child welfare centres across the country to support women and children by providing the education, skills development and healthcare they need.
In total, we support projects focused on constructive welfare and sustainability, impacting the lives of around 2.2 million people.
OUR PEOPLEFollowing the difficult market environment of the prior year, I want to thank all of our employees whose energy, talents and commitment came to fruition in FY2017.
I would also like to thank my fellow Directors for their wise counsel and, in particular, our CEO Tom Albanese, who has been instrumental to Vedanta’s performance in his three years in the organisation. Tom’s contract came to its scheduled end in March, and he decided it was an appropriate juncture to make the personal decision to re-join his family in the US.
He leaves the Company having made a strong impact with his ideas and efficiencies starting to show positive results. I thank him warmly for the successful part he has played in our story and we wish him well. Tom remains in his position until August 2017 and the search for his successor is well underway.
As announced earlier in the year, Euan Macdonald, Non-Executive Director and Chairman of the Remuneration Committee and Sustainability Committee, retired from the Board. I would like to thank Euan for his huge contribution to sustainability at Vedanta, including improved safety standards and best practices in site closures. Katya Zotova, a member of our Sustainability Committee, will be leading its priorities in the coming year. Further, Edward Story has been appointed as a Non-Executive Director of the Company with effect from 1 June 2017. He will also be appointed as a member of the Company’s Audit Committee with effect from 1 June 2017. I am delighted to welcome him to our Board. His background and domain experience in the oil & gas industry will significantly enhance our ability to grow and develop Vedanta’s oil & gas business.
I also welcome Ravi Rajagopal to his new roles, both as a Non-Executive Director of Vedanta Resources and to the Audit and Sustainability Committees. He comes with a wealth of experience across finance and operational roles in a FTSE 100 company.
In line with regulatory guidance, Mr Aman Mehta will retire at the conclusion of this year’s AGM. Meanwhile, he has overseen the Company’s transition to a new auditor for the Group and I would like to thank him for his sound guidance and commitment over the years.
On behalf of the entire Board, I would also like to thank all our investors, communities and the governments of the countries in which we operate, for their constant support.
FY2018: OPTIMISM AND DISCIPLINEI am optimistic that the improvement in commodity markets we have experienced this year may be with us for the foreseeable future.
Prices in copper, aluminium, zinc, iron ore, oil and gas have all shown a strong recovery last year, so we approach FY2018 with a cautious optimism and a continuing discipline in our capital allocation.
Meanwhile, we will continue to contribute to India’s exciting growth trajectory, working with the Indian Government, our employees and communities to make a difference.
Anil AgarwalChairman24 May 2017
Main image: Employees at the control room at Goa iron ore operations
ADDITIONAL INFORMATIONFINANCIAL STATEMENTSDIRECTORS’ REPORTSTRATEGIC REPORT
Vedanta Resources plc | Annual Report FY2017www.vedantaresources.com
09
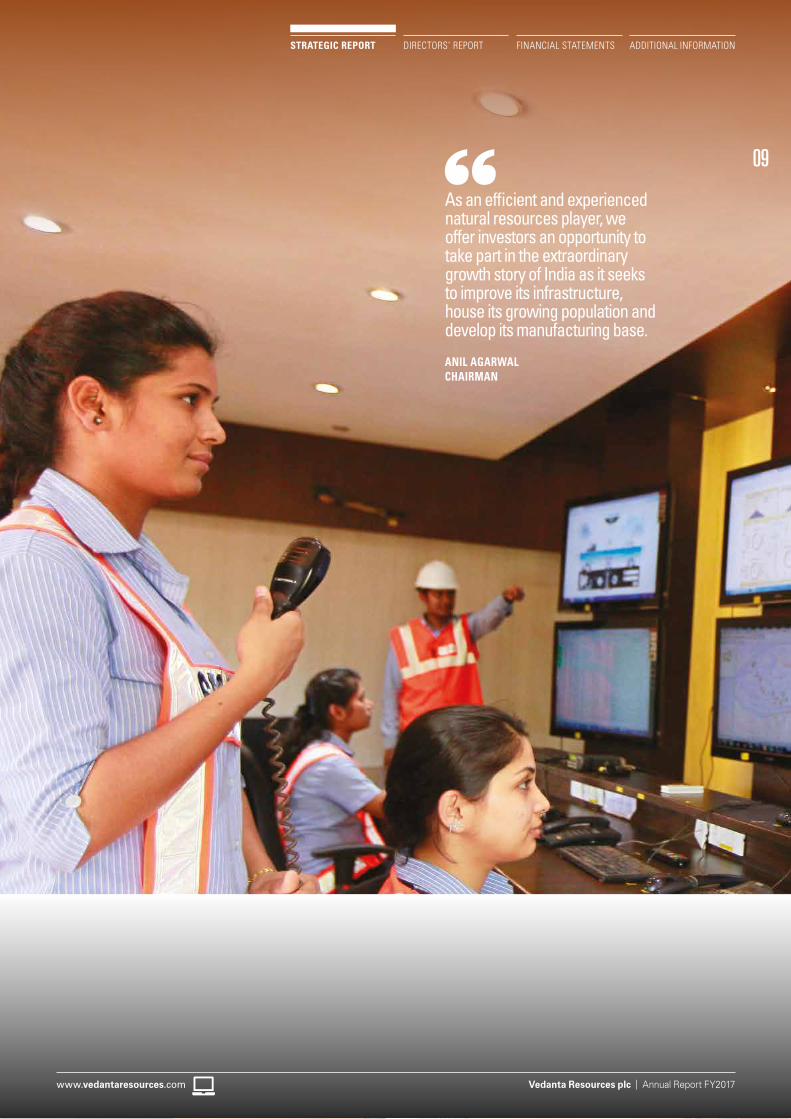
As an efficient and experienced natural resources player, we offer investors an opportunity to take part in the extraordinary growth story of India as it seeks to improve its infrastructure, house its growing population and develop its manufacturing base.
ANIL AGARWALCHAIRMAN
10
Vedanta Resources plc | Annual Report FY2017
COMMODITY DIVERSIFICATION (% REVENUE CY 2016)
Peers
Vedanta
COMMODITY DIVERSIFICATION(% REVENUE CY 2016)
ZincOil & Gas Aluminium PowerCopper Iron Ore Coal Precious Other
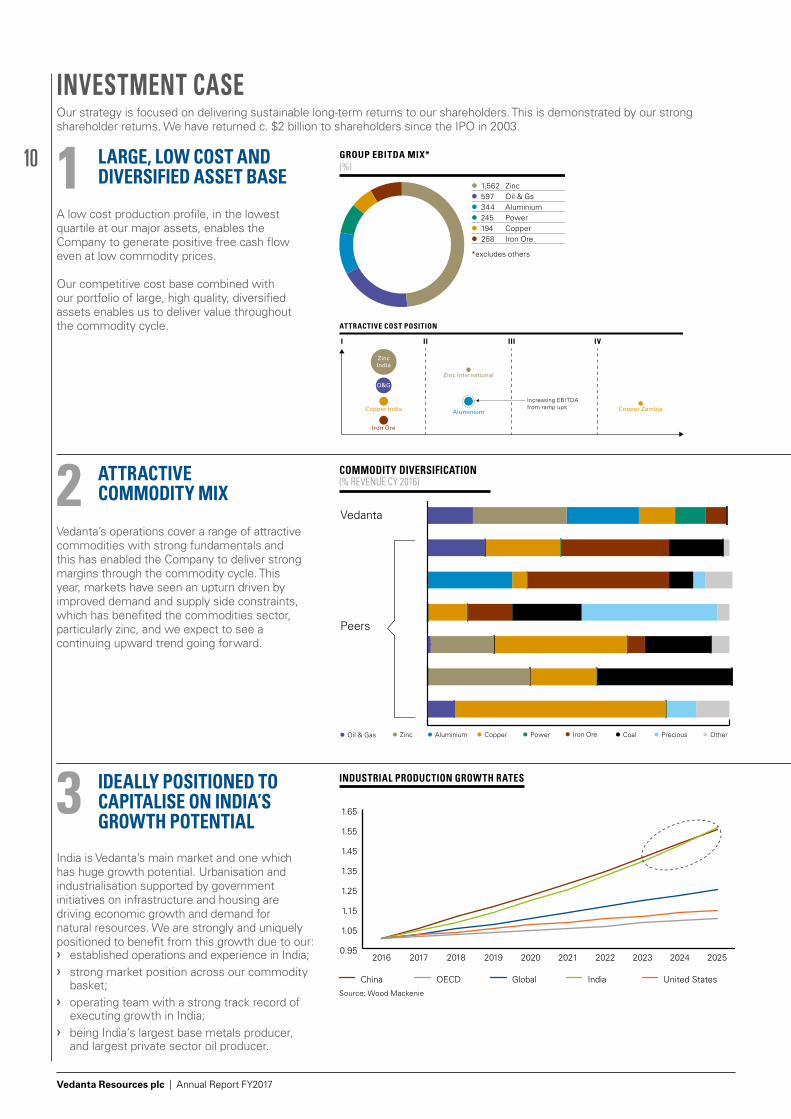
GROUP EBITDA MIX*(%)
l 1,562 Zincl 597 Oil & Gsl 344 Aluminiuml 245 Powerl 194 Copperl 258 Iron Ore
*excludes others
ATTRACTIVE COST POSITION
I II III IV
ZincIndia
O&G
Increasing EBITDAfrom ramp ups
Iron Ore
Copper India Copper ZambiaAluminium
Zinc International
0.95
1.05
1.15
1.25
1.35
1.45
1.55
1.65 China
India
Global
United States
OECD
2025202420232022202120202019201820172016
China IndiaGlobal United StatesOECD
Source: Wood Mackenie
INDUSTRIAL PRODUCTION GROWTH RATES
INVESTMENT CASEOur strategy is focused on delivering sustainable long-term returns to our shareholders. This is demonstrated by our strong shareholder returns. We have returned c. $2 billion to shareholders since the IPO in 2003.
LARGE, LOW COST AND DIVERSIFIED ASSET BASE
ATTRACTIVE COMMODITY MIX
IDEALLY POSITIONED TO CAPITALISE ON INDIA’S GROWTH POTENTIAL
A low cost production profile, in the lowest quartile at our major assets, enables the Company to generate positive free cash flow even at low commodity prices.
Our competitive cost base combined with our portfolio of large, high quality, diversified assets enables us to deliver value throughout the commodity cycle.
Vedanta’s operations cover a range of attractive commodities with strong fundamentals and this has enabled the Company to deliver strong margins through the commodity cycle. This year, markets have seen an upturn driven by improved demand and supply side constraints, which has benefited the commodities sector, particularly zinc, and we expect to see a continuing upward trend going forward.
India is Vedanta’s main market and one which has huge growth potential. Urbanisation and industrialisation supported by government initiatives on infrastructure and housing are driving economic growth and demand for natural resources. We are strongly and uniquely positioned to benefit from this growth due to our: ❯ established operations and experience in India; ❯ strong market position across our commodity
basket; ❯ operating team with a strong track record of
executing growth in India; ❯ being India’s largest base metals producer,
and largest private sector oil producer.
1
2
3
11
Vedanta Resources plc | Annual Report FY2017www.vedantaresources.com
STRATEGIC REPORT DIRECTORS’ REPORT FINANCIAL STATEMENTS ADDITIONAL INFORMATION
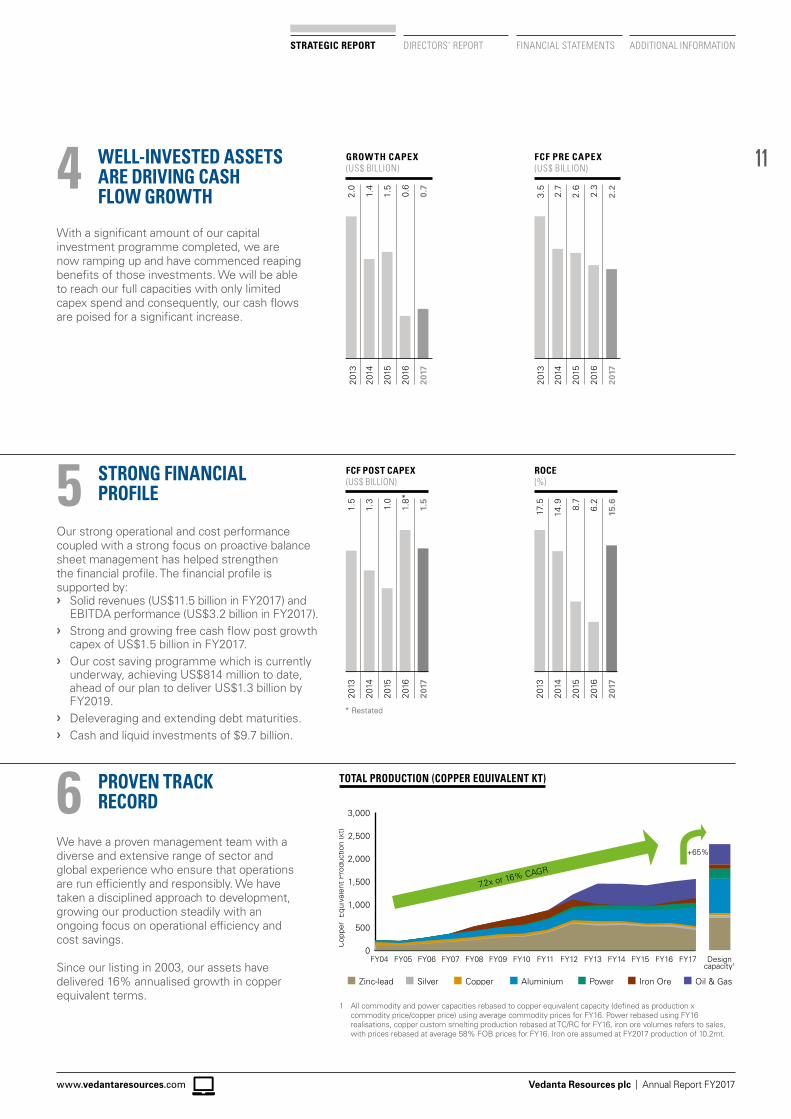
TOTAL PRODUCTION (COPPER EQUIVALENT KT)
Zinc-lead Silver
7.2x or 16% CAGR
Copper Aluminium Power Iron Ore Oil & Gas
FY17FY16FY15FY14FY13FY12FY11FY10FY09FY08FY07FY06FY05FY040
500
1,000
1,500
2,000
2,500
3,000
Designcapacity1
+65%
Cop
per
Equ
ival
ent
Prod
uctio
n (k
t)
GROWTH CAPEX(US$ BILLION)
1.5
1.4
0.6
0.7
2015
2014
2016
2017
2013
2.0
FCF PRE CAPEX(US$ BILLION)
2.6
2.7
2.3
2.2
2015
2014
2016
2017
2013
3.5
FCF POST CAPEX(US$ BILLION)
1.3
1.5
1.0
1.8*
1.5
2014
2013
2015
2016
2017
ROCE(%)
14.9
17.5 8.7
6.2
15.6
2014
2013
2015
2016
2017
WELL-INVESTED ASSETS ARE DRIVING CASH FLOW GROWTH
STRONG FINANCIAL PROFILE
PROVEN TRACK RECORD
With a significant amount of our capital investment programme completed, we are now ramping up and have commenced reaping benefits of those investments. We will be able to reach our full capacities with only limited capex spend and consequently, our cash flows are poised for a significant increase.
Our strong operational and cost performance coupled with a strong focus on proactive balance sheet management has helped strengthen the financial profile. The financial profile is supported by: ❯ Solid revenues (US$11.5 billion in FY2017) and
EBITDA performance (US$3.2 billion in FY2017). ❯ Strong and growing free cash flow post growth
capex of US$1.5 billion in FY2017. ❯ Our cost saving programme which is currently
underway, achieving US$814 million to date, ahead of our plan to deliver US$1.3 billion by FY2019.
❯ Deleveraging and extending debt maturities. ❯ Cash and liquid investments of $9.7 billion.
We have a proven management team with a diverse and extensive range of sector and global experience who ensure that operations are run efficiently and responsibly. We have taken a disciplined approach to development, growing our production steadily with an ongoing focus on operational efficiency and cost savings.
Since our listing in 2003, our assets have delivered 16% annualised growth in copper equivalent terms.
4
5
6
1 All commodity and power capacities rebased to copper equivalent capacity (defined as production x commodity price/copper price) using average commodity prices for FY16. Power rebased using FY16 realisations, copper custom smelting production rebased at TC/RC for FY16, iron ore volumes refers to sales, with prices rebased at average 58% FOB prices for FY16. Iron ore assumed at FY2017 production of 10.2mt.
* Restated
Vedanta Resources plc | Annual Report FY2017
12
During the year we announced a new 5.5-year USD fixed rate bond offering with a yield of 6.375%, the largest single-tranche G3 high yield bond issuance from Asia ex-Japan since 2015. This bond issue was well received by investors, and attracted strong demand from a range of high quality institutional shareholders across the US, Asia, Europe and the Middle East.
A simultaneous tender offer enabled us to refinance all of our existing 2018 and 2019 bonds using the proceeds from the new issue, as a result proactively extending our average debt maturity years and strengthening our balance sheet.
STRONGER: STRENGTHENING OUR BALANCE SHEETCASE STUDY
STRATEGIC REPORT DIRECTORS’ REPORT FINANCIAL STATEMENTS ADDITIONAL INFORMATION
Vedanta Resources plc | Annual Report FY2017www.vedantaresources.com
13
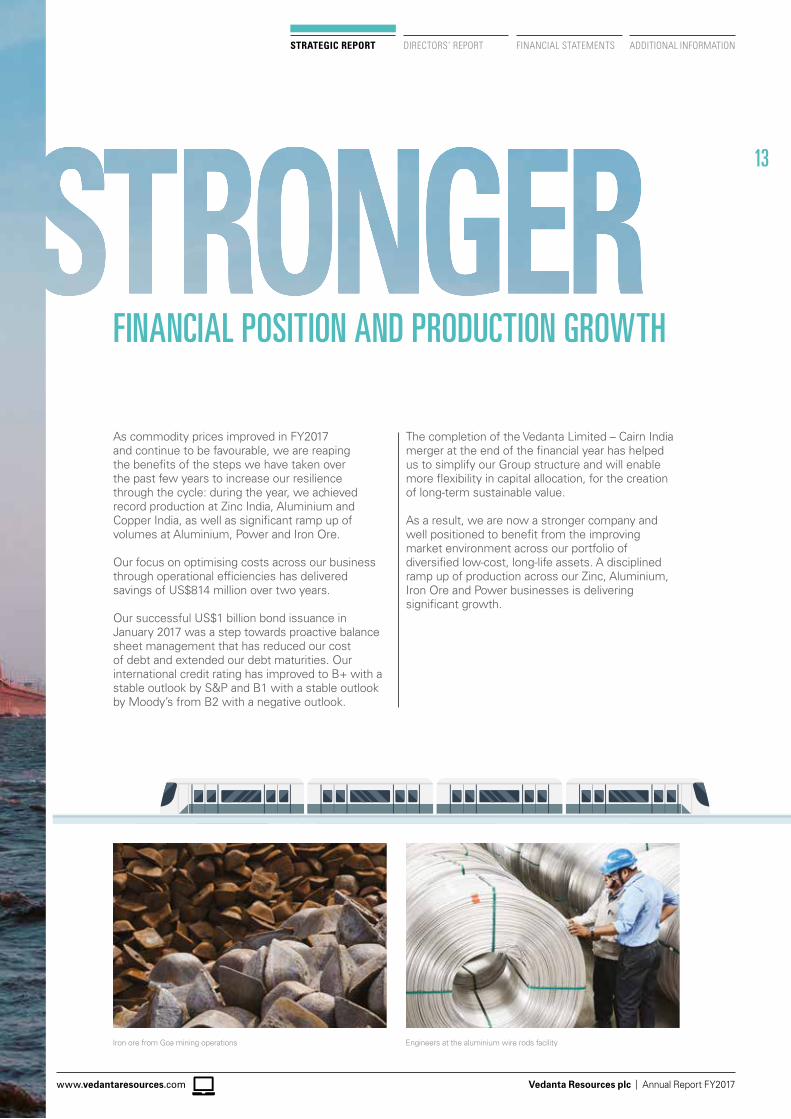
FINANCIAL POSITION AND PRODUCTION GROWTH
As commodity prices improved in FY2017 and continue to be favourable, we are reaping the benefits of the steps we have taken over the past few years to increase our resilience through the cycle: during the year, we achieved record production at Zinc India, Aluminium and Copper India, as well as significant ramp up of volumes at Aluminium, Power and Iron Ore.
Our focus on optimising costs across our business through operational efficiencies has delivered savings of US$814 million over two years.
Our successful US$1 billion bond issuance in January 2017 was a step towards proactive balance sheet management that has reduced our cost of debt and extended our debt maturities. Our international credit rating has improved to B+ with a stable outlook by S&P and B1 with a stable outlook by Moody’s from B2 with a negative outlook.
The completion of the Vedanta Limited – Cairn India merger at the end of the financial year has helped us to simplify our Group structure and will enable more flexibility in capital allocation, for the creation of long-term sustainable value.
As a result, we are now a stronger company and well positioned to benefit from the improving market environment across our portfolio of diversified low-cost, long-life assets. A disciplined ramp up of production across our Zinc, Aluminium, Iron Ore and Power businesses is delivering significant growth.
Iron ore from Goa mining operations Engineers at the aluminium wire rods facility
Vedanta Resources plc | Annual Report FY2017
14
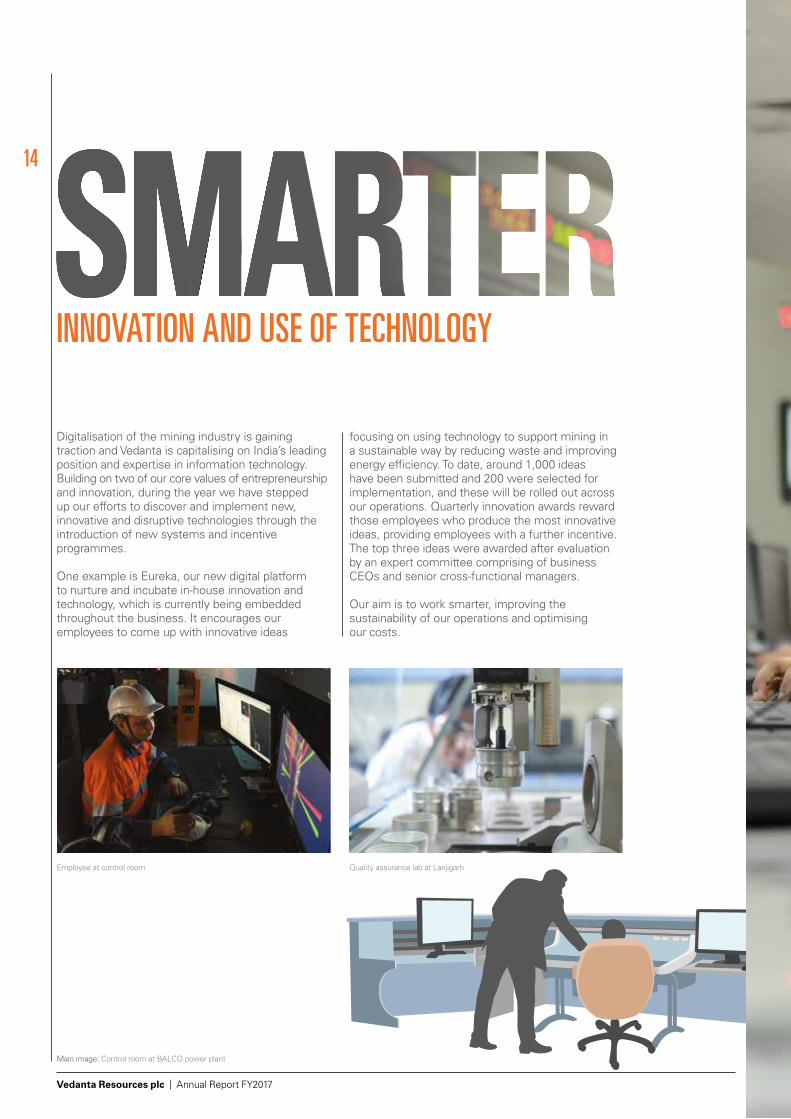
INNOVATION AND USE OF TECHNOLOGY
Digitalisation of the mining industry is gaining traction and Vedanta is capitalising on India’s leading position and expertise in information technology. Building on two of our core values of entrepreneurship and innovation, during the year we have stepped up our efforts to discover and implement new, innovative and disruptive technologies through the introduction of new systems and incentive programmes.
One example is Eureka, our new digital platform to nurture and incubate in-house innovation and technology, which is currently being embedded throughout the business. It encourages our employees to come up with innovative ideas
focusing on using technology to support mining in a sustainable way by reducing waste and improving energy efficiency. To date, around 1,000 ideas have been submitted and 200 were selected for implementation, and these will be rolled out across our operations. Quarterly innovation awards reward those employees who produce the most innovative ideas, providing employees with a further incentive. The top three ideas were awarded after evaluation by an expert committee comprising of business CEOs and senior cross-functional managers.
Our aim is to work smarter, improving the sustainability of our operations and optimising our costs.
Quality assurance lab at LanjigarhEmployee at control room
Main image: Control room at BALCO power plant
ADDITIONAL INFORMATIONFINANCIAL STATEMENTSDIRECTORS’ REPORTSTRATEGIC REPORT
Vedanta Resources plc | Annual Report FY2017www.vedantaresources.com
15
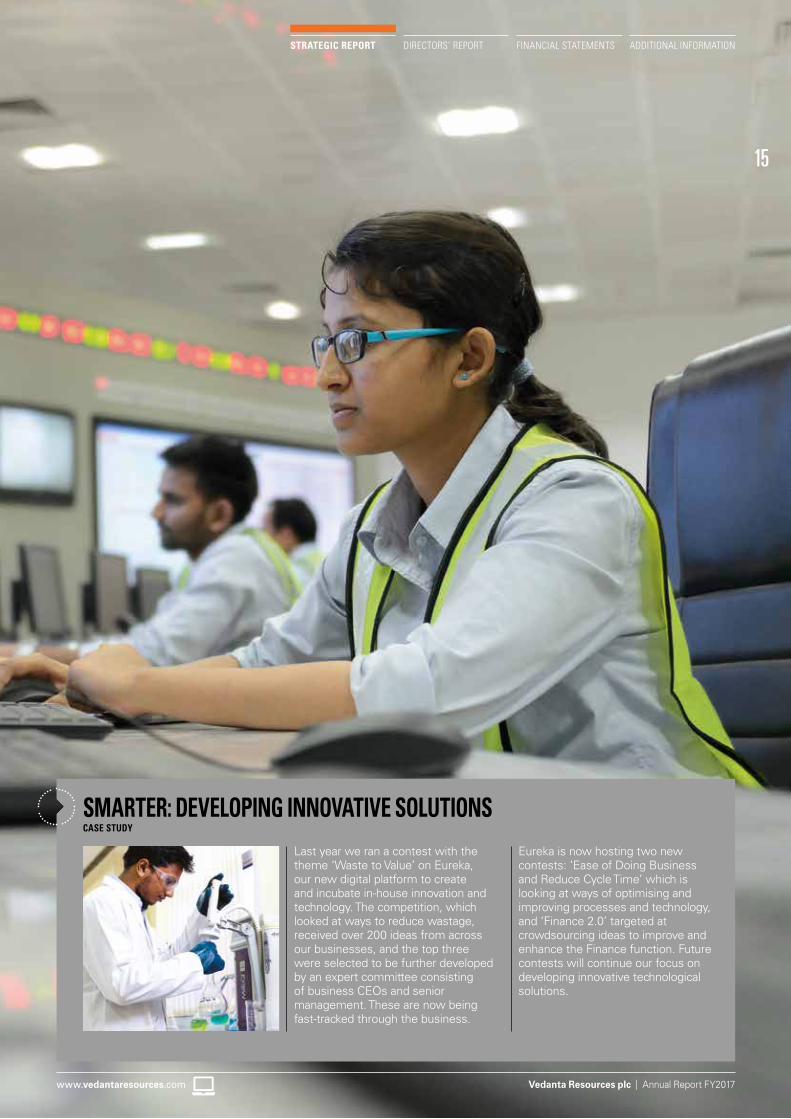
SMARTER: DEVELOPING INNOVATIVE SOLUTIONSCASE STUDY
Last year we ran a contest with the theme ‘Waste to Value’ on Eureka, our new digital platform to create and incubate in-house innovation and technology. The competition, which looked at ways to reduce wastage, received over 200 ideas from across our businesses, and the top three were selected to be further developed by an expert committee consisting of business CEOs and senior management. These are now being fast-tracked through the business.
Eureka is now hosting two new contests: ‘Ease of Doing Business and Reduce Cycle Time’ which is looking at ways of optimising and improving processes and technology, and ‘Finance 2.0’ targeted at crowdsourcing ideas to improve and enhance the Finance function. Future contests will continue our focus on developing innovative technological solutions.
Vedanta Resources plc | Annual Report FY2017
16
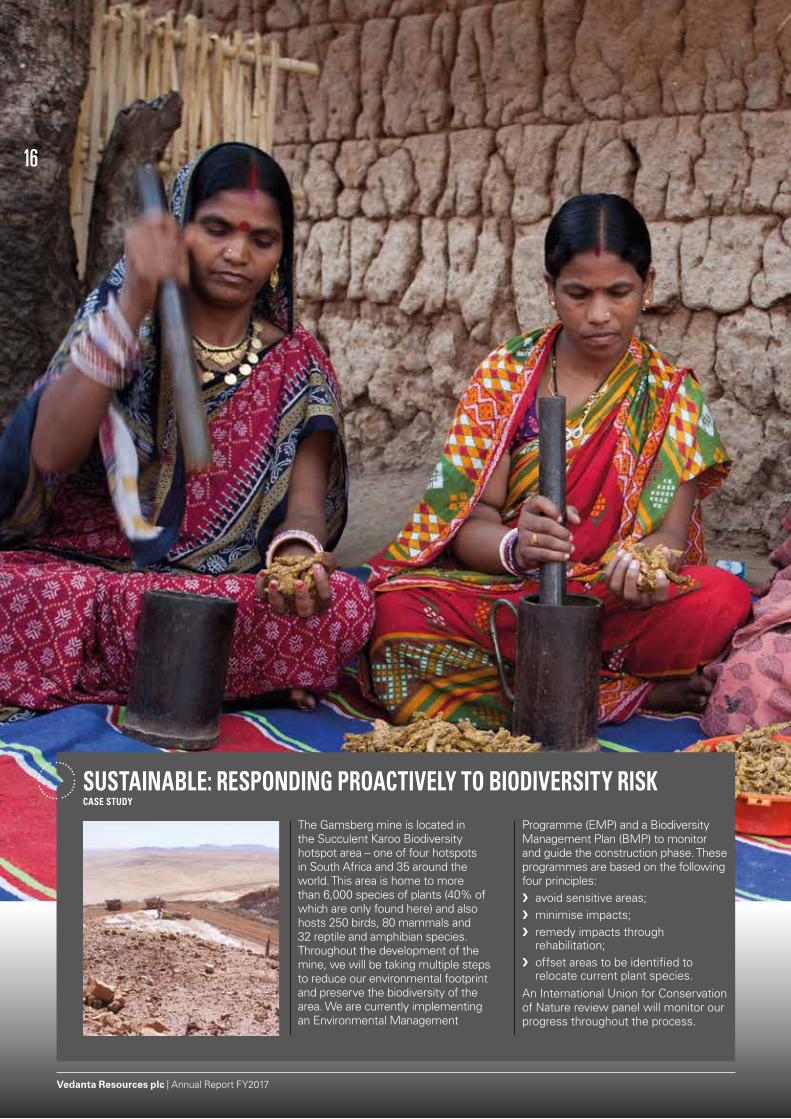
The Gamsberg mine is located in the Succulent Karoo Biodiversity hotspot area – one of four hotspots in South Africa and 35 around the world. This area is home to more than 6,000 species of plants (40% of which are only found here) and also hosts 250 birds, 80 mammals and 32 reptile and amphibian species. Throughout the development of the mine, we will be taking multiple steps to reduce our environmental footprint and preserve the biodiversity of the area. We are currently implementing an Environmental Management
Programme (EMP) and a Biodiversity Management Plan (BMP) to monitor and guide the construction phase. These programmes are based on the following four principles: ❯ avoid sensitive areas; ❯ minimise impacts; ❯ remedy impacts through
rehabilitation; ❯ offset areas to be identified to
relocate current plant species. An International Union for Conservation of Nature review panel will monitor our progress throughout the process.
SUSTAINABLE: RESPONDING PROACTIVELY TO BIODIVERSITY RISKCASE STUDY
Vedanta Resources plc | Annual Report FY2017www.vedantaresources.com
STRATEGIC REPORT DIRECTORS’ REPORT FINANCIAL STATEMENTS ADDITIONAL INFORMATION
17
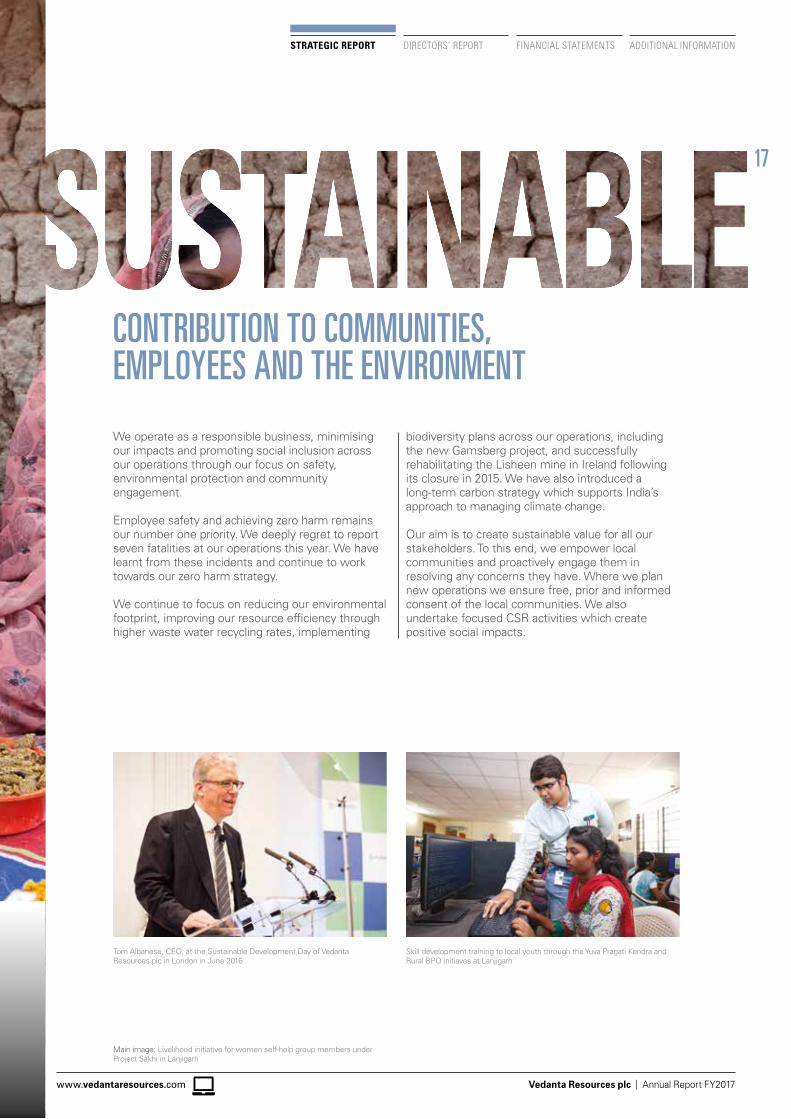
CONTRIBUTION TO COMMUNITIES,EMPLOYEES AND THE ENVIRONMENT
We operate as a responsible business, minimising our impacts and promoting social inclusion across our operations through our focus on safety, environmental protection and community engagement.
Employee safety and achieving zero harm remains our number one priority. We deeply regret to report seven fatalities at our operations this year. We have learnt from these incidents and continue to work towards our zero harm strategy.
We continue to focus on reducing our environmental footprint, improving our resource efficiency through higher waste water recycling rates, implementing
biodiversity plans across our operations, including the new Gamsberg project, and successfully rehabilitating the Lisheen mine in Ireland following its closure in 2015. We have also introduced a long-term carbon strategy which supports India’s approach to managing climate change.
Our aim is to create sustainable value for all our stakeholders. To this end, we empower local communities and proactively engage them in resolving any concerns they have. Where we plan new operations we ensure free, prior and informed consent of the local communities. We also undertake focused CSR activities which create positive social impacts.
Tom Albanese, CEO, at the Sustainable Development Day of Vedanta Resources plc in London in June 2016
Main image: Livelihood initiative for women self-help group members under Project Sakhi in Lanjigarh
Skill development training to local youth through the Yuva Pragati Kendra and Rural BPO initiaves at Lanjigarh
18
Vedanta Resources plc | Annual Report FY2017
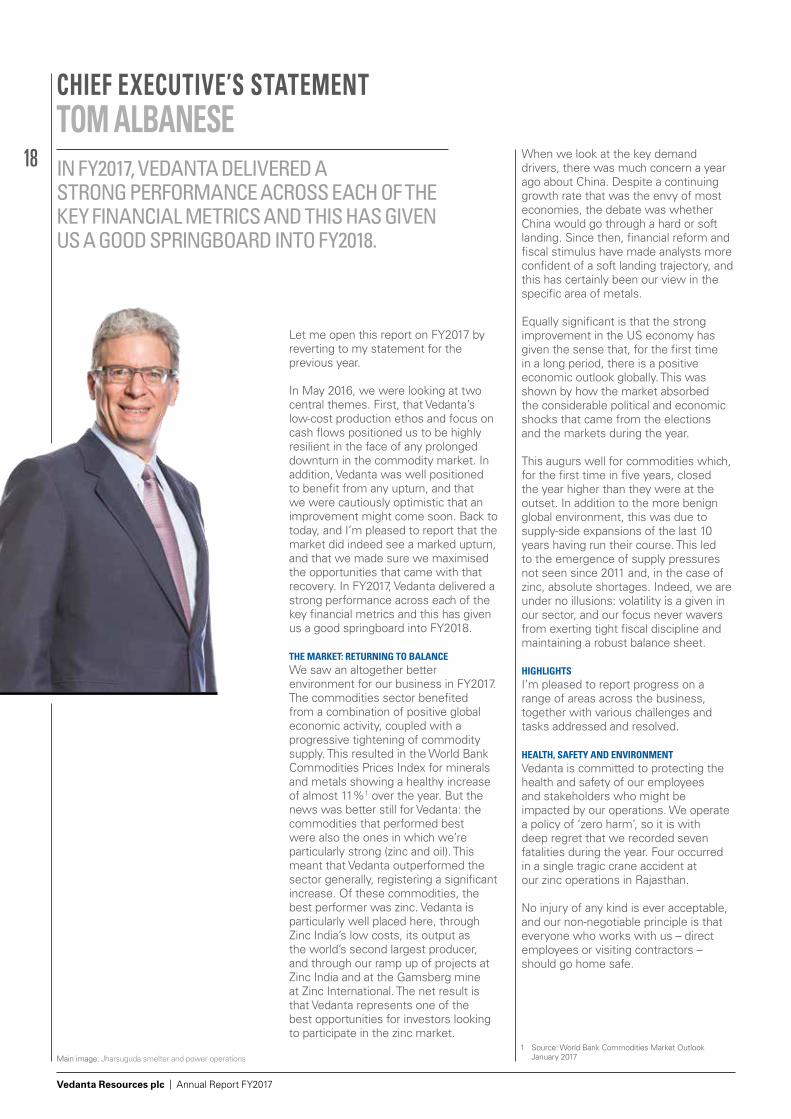
CHIEF EXECUTIVE’S STATEMENTTOM ALBANESEIN FY2017, VEDANTA DELIVERED ASTRONG PERFORMANCE ACROSS EACH OF THEKEY FINANCIAL METRICS AND THIS HAS GIVENUS A GOOD SPRINGBOARD INTO FY2018.
Let me open this report on FY2017 by reverting to my statement for the previous year.
In May 2016, we were looking at two central themes. First, that Vedanta’s low-cost production ethos and focus on cash flows positioned us to be highly resilient in the face of any prolonged downturn in the commodity market. In addition, Vedanta was well positioned to benefit from any upturn, and that we were cautiously optimistic that an improvement might come soon. Back to today, and I’m pleased to report that the market did indeed see a marked upturn, and that we made sure we maximised the opportunities that came with that recovery. In FY2017, Vedanta delivered a strong performance across each of the key financial metrics and this has given us a good springboard into FY2018.
THE MARKET: RETURNING TO BALANCE We saw an altogether better environment for our business in FY2017. The commodities sector benefited from a combination of positive global economic activity, coupled with a progressive tightening of commodity supply. This resulted in the World Bank Commodities Prices Index for minerals and metals showing a healthy increase of almost 11%1 over the year. But the news was better still for Vedanta: the commodities that performed best were also the ones in which we’re particularly strong (zinc and oil). This meant that Vedanta outperformed the sector generally, registering a significant increase. Of these commodities, the best performer was zinc. Vedanta is particularly well placed here, through Zinc India’s low costs, its output as the world’s second largest producer, and through our ramp up of projects at Zinc India and at the Gamsberg mine at Zinc International. The net result is that Vedanta represents one of the best opportunities for investors looking to participate in the zinc market.
When we look at the key demand drivers, there was much concern a year ago about China. Despite a continuing growth rate that was the envy of most economies, the debate was whether China would go through a hard or soft landing. Since then, financial reform and fiscal stimulus have made analysts more confident of a soft landing trajectory, and this has certainly been our view in the specific area of metals.
Equally significant is that the strong improvement in the US economy has given the sense that, for the first time in a long period, there is a positive economic outlook globally. This was shown by how the market absorbed the considerable political and economic shocks that came from the elections and the markets during the year.
This augurs well for commodities which, for the first time in five years, closed the year higher than they were at the outset. In addition to the more benign global environment, this was due to supply-side expansions of the last 10 years having run their course. This led to the emergence of supply pressures not seen since 2011 and, in the case of zinc, absolute shortages. Indeed, we are under no illusions: volatility is a given in our sector, and our focus never wavers from exerting tight fiscal discipline and maintaining a robust balance sheet.
HIGHLIGHTSI’m pleased to report progress on a range of areas across the business, together with various challenges and tasks addressed and resolved.
HEALTH, SAFETY AND ENVIRONMENT Vedanta is committed to protecting the health and safety of our employees and stakeholders who might be impacted by our operations. We operate a policy of ‘zero harm’, so it is with deep regret that we recorded seven fatalities during the year. Four occurred in a single tragic crane accident at our zinc operations in Rajasthan.
No injury of any kind is ever acceptable, and our non-negotiable principle is that everyone who works with us – direct employees or visiting contractors – should go home safe.
1 Source: World Bank Commodities Market Outlook January 2017Main image: Jharsuguda smelter and power operations
ADDITIONAL INFORMATIONFINANCIAL STATEMENTSDIRECTORS’ REPORT
Vedanta Resources plc | Annual Report FY2017www.vedantaresources.com
STRATEGIC REPORT
19
ADDITIONAL INFORMATIONFINANCIAL STATEMENTSDIRECTORS’ REPORT
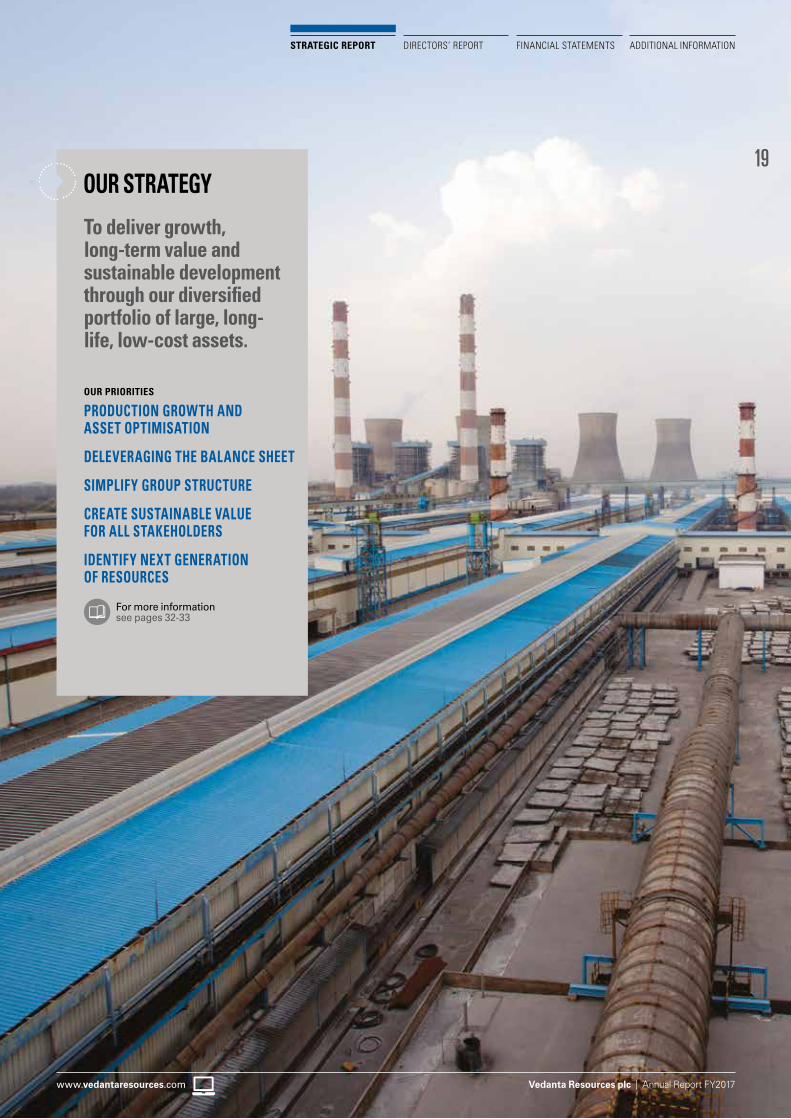
To deliver growth, long-term value and sustainable development through our diversified portfolio of large, long-life, low-cost assets.
OUR PRIORITIES
PRODUCTION GROWTH AND ASSET OPTIMISATION
DELEVERAGING THE BALANCE SHEET
SIMPLIFY GROUP STRUCTURE
CREATE SUSTAINABLE VALUE FOR ALL STAKEHOLDERS
IDENTIFY NEXT GENERATION OF RESOURCES
OUR STRATEGY
For more information see pages 32-33
20
Vedanta Resources plc | Annual Report FY2017
CHIEF EXECUTIVE’S STATEMENTCONTINUED
We continue to analyse every incident, and through acting on what we learn, our safety KPIs have showed measurable improvements, with LTIFR down to 0.39 (FY2016: 0.51). However, it is clear that more is needed.
Our sustainable development agenda is at the core of Vedanta’s strategic priorities and governs every business decision. During the year, our social investment stood at US$18 million and our efforts benefited 2.2 million people across 576 villages and 1,142 peripheral villages where we operate.
Vedanta is a strong advocate of child development and women empowerment. In India, we are transforming 4,000 state-run child welfare centres into pre-fabricated units with the latest technology and modern amenities known as ‘Nand Ghars’ (also known as Anganwadi). These centres will be the convergence point for a number of government programmes such as clean water, sanitation facilities and electricity, with additional services such as primary healthcare, women empowerment and entrepreneurship training.
In South Africa, we are supporting Pink Drive, a non-profit organisation to create awareness on breast cancer. Vedanta is also promoting skill development amongst youth in addition to agriculture, livestock and livelihood development programmes in India and Africa. In FY2017, for example, we assisted 90,000 farmers.
We are a signatory to the World Business Council for Sustainable Development ‘WASH’ (Water and Sanitation Hygiene) pledge. Under this we provide access to safe drinking water and promote best hygiene practices among employees and the community.
Our focus on sustainable development, inclusive growth and greater value creation for all our internal and external stakeholders is critical to ensure the future of our operations and helps us earn our social licence to operate.
Vedanta is also determined to minimise the impact of our operations on the environment. As a resources company, we appreciate the vital importance of using resources wisely, and one example is our water recycling programme that is now delivering water recycling rates of 24%.
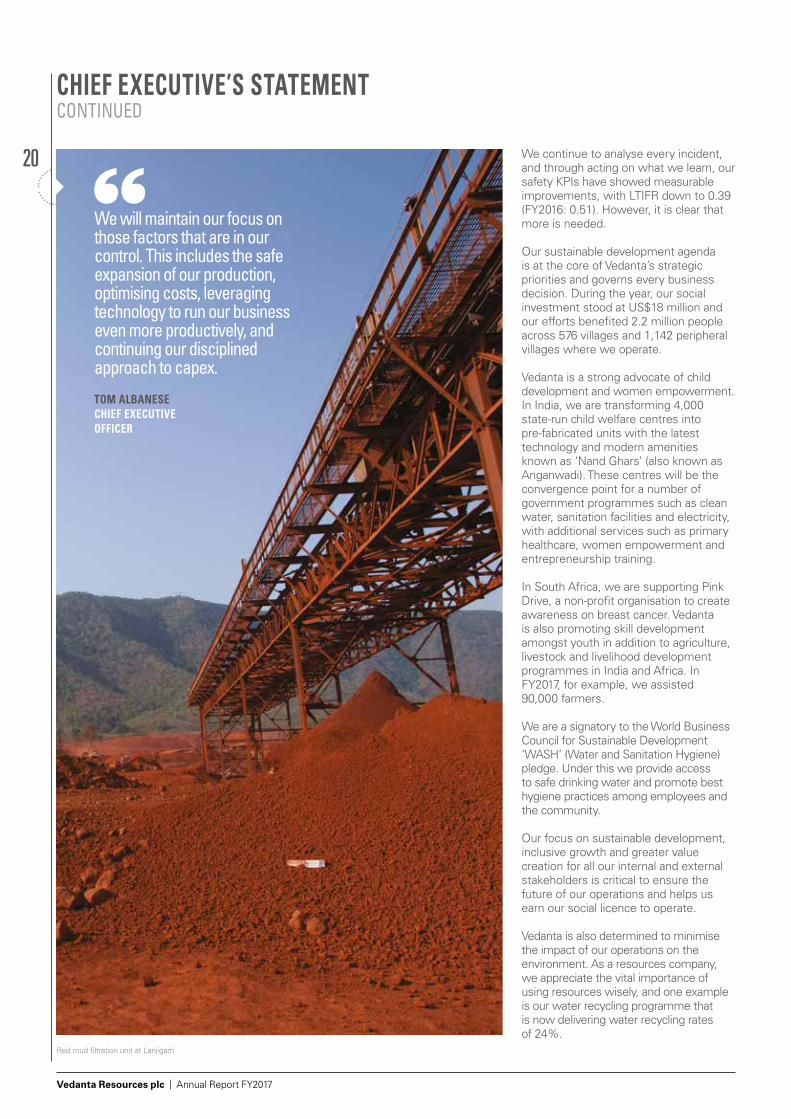
We will maintain our focus on those factors that are in our control. This includes the safe expansion of our production, optimising costs, leveraging technology to run our business even more productively, and continuing our disciplined approach to capex.
TOM ALBANESECHIEF EXECUTIVE OFFICER
Red mud filtration unit at Lanjigarh
21
Vedanta Resources plc | Annual Report FY2017www.vedantaresources.com
STRATEGIC REPORT DIRECTORS’ REPORT FINANCIAL STATEMENTS ADDITIONAL INFORMATION
We are also operating waste-to-revenue retrieval programmes, and during the year we will send about 50% of our fly ash waste for re-use in construction materials.
Our operations are mostly located in developing countries where growth of the country and human indices are dependent on reliable and affordable coal-based power. We are committed to the climate change agenda and set up a Carbon Forum anchored by our CEO, Power with representation from the businesses to guide the Group Executive Committee on our climate change mitigation programme. Practical examples of this include an investment in a 16MW solar power project by our Zinc business in India.
CAIRN INDIA AND VEDANTA LIMITED MERGER COMPLETEDI am pleased that we closed the year by completing the merger of Cairn India Limited into Vedanta Limited. The objective here is to simplify our Group structure, and the move followed the strong approval from all sets of shareholders and the necessary regulatory permissions.
We see synergies ahead, principally through a more efficient balance sheet and through being able to allocate capital with more flexibility. We continue to be committed to expand energy production through Cairn, one of the largest oil & gas private producers in India, focusing on the major discoveries at the Rajasthan block.
VOLUME RAMP UPWe achieved increased production across key commodities within our business. ❯ Aluminium. We began ramping up
on 1 April 2016. At that point our run rate was approximately 900ktpa and by the close of the year we saw over 30% increase to 1.2 million tonnes. This improvement was not as fast as we had hoped, stalled by a few operational outages. However, the ramp up in Q4 FY2017 saw production at a record level, up 56% year-on-year and marking strong progress towards our total production capacity of 2.3 million tonnes for aluminium.
❯ Power. The full 1,980MW Talwandi Sabo Power Limited (TSPL) in Punjab became operational this year, enabling the business to contribute improved earnings.
❯ Iron Ore. It is good to report that the mining ban in Goa is now in the past, and during the year we ramped up production within the mining cap limits. We have also been able to control costs, producing iron ore at a cash cost comparable with some of the world’s largest operations. India’s geology is similar to that of Western Australia, the world leader in iron ore mining, and a lot needs to be done to realise the resource potential of the country.
❯ Copper Zambia. We remained focused on improving volumes and cost at this asset but this was impacted by lower production due to low equipment availability. The custom production, however, was strong post the biennial shutdown at the smelter.
CONTINUING COST SAVINGSWe complemented the benefits of better market conditions by maintaining tight financial discipline. Despite many analysts saying that the industry appears to have reached ‘peak savings’, our programme continues to drive down costs intelligently and safely, through optimising our plant and through achieving material efficiencies across the supply chain. We have achieved US$814 million cost savings over the last two years since this cost savings programme was launched over the base of FY2015.
STRENGTHENING THE BALANCE SHEETThese successes play to our fiscal ethos: that we should be able to generate positive cash flows even in the most difficult passages of the market cycle. With this in mind, I also want to highlight the achievements on the balance sheet. Through tight cash flow control and capital discipline we have delivered on our promise to strengthen the balance sheet and extended our average debt maturities. This was also complemented by the success of our recent US$1 billion bond issuance, which was oversubscribed by three times. This bond issuance extended our 2018 and 2019 debt maturities to 2022. We also undertook several other liability management initiatives such as the bond buybacks and continue work in this direction to further strengthen the balance sheet.
FY2018 AND BEYONDWe approach the new financial year with optimism. I believe the progressive improvements in the markets that we saw last year will continue, driven largely by supply-side constraints.
At the same time, we bring a strong sense of realism and experience to our decision-making: our plans and investments do not rely on further help from market conditions, and we are prepared for volatility at any time.
We will maintain our focus on those factors that are in our control. This includes the safe expansion of our production, optimising costs, leveraging technology to run our business even more productively, and continuing our disciplined approach to capex.
On a personal note, I have elected to step down as CEO at the end of August 2017. I have spent a wonderful three-plus years in the role and leave the business in a strong position to contribute to, and benefit from, the future of India. I have always seen this extraordinary country as the next great growth vector, and my experiences here have only reinforced that view. I believe Vedanta will continue to be the premier opportunity for those investing in India, and I look forward to watching the Company’s progress in the exciting years ahead.
Tom AlbaneseChief Executive Officer24 May 2017
22
Vedanta Resources plc | Annual Report FY2017
MARKET REVIEW
INDIA IS A KEY MARKET FOR VEDANTA AND ONE WHICH WE BELIEVE HAS HUGE GROWTH POTENTIAL. SUSTAINED ECONOMIC GROWTH WILL LEAD TO DEVELOPMENT, GREATER PROSPERITY AND AN OVERALL INCREASE IN PER-CAPITA SPENDING.
GLOBAL ECONOMY AND COMMODITY MARKETSDespite a series of economic and political shocks during the year which resulted in volatility in global markets, the commodities index ended the fiscal year 25% higher as a result of a more positive macroeconomic environment. The global economy was boosted by an improvement in the US economy and a commitment to infrastructure spending by the new administration, financial reforms and the introduction of stimulus measures in China aimed at keeping its economy on track. This uplift in global economic activity has increased demand for commodities, in particular Iron Ore, Aluminium, Copper and Oil & Gas, leading to higher prices.
In addition, as a result of the negative environment over the past few years and limited investment by mining companies, a lack of new mining projects coming on stream is leading to supply pressures for some commodities, particularly zinc.
We therefore expect to see continued tightening in the markets over the next few years as demand starts to exceed supply.
OUTLOOKWhile there will be some volatility, we expect commodity markets to remain robust following last year’s rally and the recovery in the global economy in the fourth quarter of 2016 to continue to gain momentum, leading to higher levels of employment and rising incomes.
According to the IMF’s World Economic Outlook (WEO), global growth is projected to increase from an estimated 3.1% in 2016 to 3.5% in 2017 and 3.6% in 2018. This is an upward revision of 0.1 percentage point for 2017 relative to WEO October 2016.
In advanced economies this pick-up will largely be driven by the United States. Post the United States election, expectations of higher spending on critical infrastructure (US$1 trillion infrastructure plan over 10 years) and relaxed fiscal policy are fuelling expectations of higher growth.
Emerging market and developing economies are also set to experience a pick-up in activity on the back of the partial recovery in commodity prices and this will be a key factor in global growth. According to the IMF, emerging and developing economies now account for more than 75% of global growth in output and consumption, almost double the share of just two decades ago.
China’s growth trajectory, as has been the case for many years, also plays an important role. Chinese growth forecasts were revised upwards in October 2016 and the Chinese economy is now projected to grow at 6.6% in 2017 and 6.2% in 2018.
This growth will support commodity prices in the short-term. Vedanta’s diversified low-cost portfolio and attractive basket of commodities positions us well to take advantage of the recent economic uplift.
.
23
Vedanta Resources plc | Annual Report FY2017www.vedantaresources.com
STRATEGIC REPORT DIRECTORS’ REPORT FINANCIAL STATEMENTS ADDITIONAL INFORMATION
0
200
400
600
800
1000
1200
1400
1600
1800
2000
LME
Q1-2
015
Q2 Q3
Q4
Q1-2
016
Q2 Q3 Q4
Jan
17Fe
b 17
Mar
17
0
100
200
300
400
500
600
US MidwestDDUPMJP
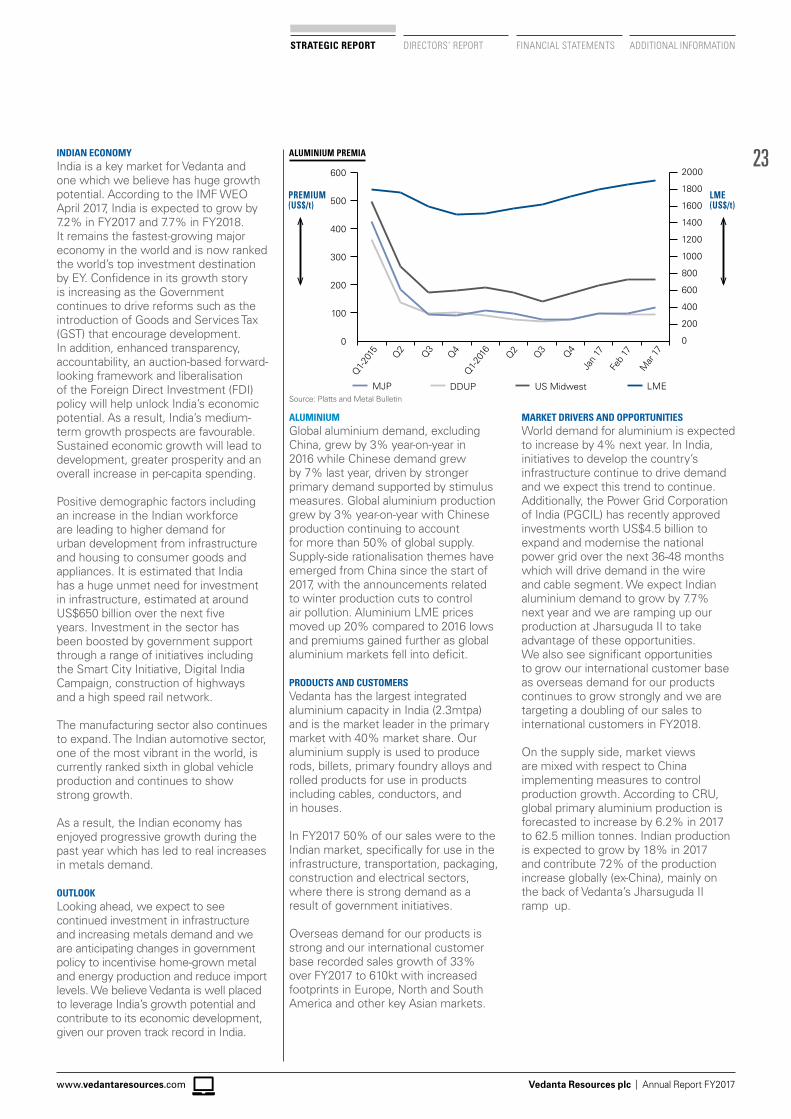
ALUMINIUM PREMIA
PREMIUM(US$/t)
LME(US$/t)
Source: Platts and Metal Bulletin
ALUMINIUMGlobal aluminium demand, excluding China, grew by 3% year-on-year in 2016 while Chinese demand grew by 7% last year, driven by stronger primary demand supported by stimulus measures. Global aluminium production grew by 3% year-on-year with Chinese production continuing to account for more than 50% of global supply. Supply-side rationalisation themes have emerged from China since the start of 2017, with the announcements related to winter production cuts to control air pollution. Aluminium LME prices moved up 20% compared to 2016 lows and premiums gained further as global aluminium markets fell into deficit.
PRODUCTS AND CUSTOMERSVedanta has the largest integrated aluminium capacity in India (2.3mtpa) and is the market leader in the primary market with 40% market share. Our aluminium supply is used to produce rods, billets, primary foundry alloys and rolled products for use in products including cables, conductors, and in houses.
In FY2017 50% of our sales were to the Indian market, specifically for use in the infrastructure, transportation, packaging, construction and electrical sectors, where there is strong demand as a result of government initiatives.
Overseas demand for our products is strong and our international customer base recorded sales growth of 33% over FY2017 to 610kt with increased footprints in Europe, North and South America and other key Asian markets.
INDIAN ECONOMYIndia is a key market for Vedanta and one which we believe has huge growth potential. According to the IMF WEO April 2017, India is expected to grow by 7.2% in FY2017 and 7.7% in FY2018. It remains the fastest-growing major economy in the world and is now ranked the world’s top investment destination by EY. Confidence in its growth story is increasing as the Government continues to drive reforms such as the introduction of Goods and Services Tax (GST) that encourage development. In addition, enhanced transparency, accountability, an auction-based forward-looking framework and liberalisation of the Foreign Direct Investment (FDI) policy will help unlock India’s economic potential. As a result, India’s medium-term growth prospects are favourable. Sustained economic growth will lead to development, greater prosperity and an overall increase in per-capita spending.
Positive demographic factors including an increase in the Indian workforce are leading to higher demand for urban development from infrastructure and housing to consumer goods and appliances. It is estimated that India has a huge unmet need for investment in infrastructure, estimated at around US$650 billion over the next five years. Investment in the sector has been boosted by government support through a range of initiatives including the Smart City Initiative, Digital India Campaign, construction of highways and a high speed rail network.
The manufacturing sector also continues to expand. The Indian automotive sector, one of the most vibrant in the world, is currently ranked sixth in global vehicle production and continues to show strong growth.
As a result, the Indian economy has enjoyed progressive growth during the past year which has led to real increases in metals demand.
OUTLOOKLooking ahead, we expect to see continued investment in infrastructure and increasing metals demand and we are anticipating changes in government policy to incentivise home-grown metal and energy production and reduce import levels. We believe Vedanta is well placed to leverage India’s growth potential and contribute to its economic development, given our proven track record in India.
MARKET DRIVERS AND OPPORTUNITIESWorld demand for aluminium is expected to increase by 4% next year. In India, initiatives to develop the country’s infrastructure continue to drive demand and we expect this trend to continue. Additionally, the Power Grid Corporation of India (PGCIL) has recently approved investments worth US$4.5 billion to expand and modernise the national power grid over the next 36-48 months which will drive demand in the wire and cable segment. We expect Indian aluminium demand to grow by 7.7% next year and we are ramping up our production at Jharsuguda II to take advantage of these opportunities. We also see significant opportunities to grow our international customer base as overseas demand for our products continues to grow strongly and we are targeting a doubling of our sales to international customers in FY2018.
On the supply side, market views are mixed with respect to China implementing measures to control production growth. According to CRU, global primary aluminium production is forecasted to increase by 6.2% in 2017 to 62.5 million tonnes. Indian production is expected to grow by 18% in 2017 and contribute 72% of the production increase globally (ex-China), mainly on the back of Vedanta’s Jharsuguda II ramp up.
Source: Platts and Metal Bulletin
24
Vedanta Resources plc | Annual Report FY2017
MARKET REVIEWCONTINUED
ZINC
COPPERWorld refined copper consumption grew by 2.2% in 2016 while consumption in China, the largest consumer of copper, grew by 4.9%. Copper prices also firmed up on the prospects of the US’s infrastructure plans and increased demand in China due to a greater government stimulus impact on the power grid investments and higher end-use demand, particularly for appliances and consumer goods.
In India, the refined copper market experienced 8% growth in H1 FY2017 but saw a slowdown in Q3 owing to demonetisation; however it started picking up in Q4 and is expected to continue growing on par with growth in the Indian economy.
On the supply side, after the fifth consecutive year of mine supply growth in 2016 (5%), 2017 started with production disruptions at some of the largest global copper mines such as Escondida, Grasberg and Cerro Verde, which supported copper prices.
The 2017 annual benchmark settlements for concentrate showed a 5% reduction over the previous year, mainly due to disruptions resulting in a decline in concentrate availability.
PRODUCTS AND CUSTOMERSRefined copper is predominantly used in manufacturing cables, transformers and motors as well as making castings and alloy-based products.
Vedanta, with its 400ktpa custom smelter in Southern India, is the market leader in India with a market share for refined copper of approximately 35%, and our major customers in India are cable manufacturers, winding wire units and transformer manufacturers. Our exports are mainly to China and South East Asia and these customers are largely served from India as well as our KCM business in Africa.
Exports contributed 41% of overall sales for FY2017.
MARKET DRIVERS AND OPPORTUNITIES FOR VEDANTAGlobally, higher end-use demand in China, particularly for appliances and consumer goods, is driving demand and we expect this trend to continue as Chinese stimulus measures continue.
In India, growth drivers include a range of infrastructure initiatives, including the Smart Cities project, ‘Housing for all Indians by 2022’ programme, industrial corridors, National Highways Development Project and a focus on building renewable energy projects under the National Electricity Policy.
We therefore expect to see demand growth in India and China in the coming years. We see opportunities to take advantage of this growth in demand to further grow our market share in India and potentially to expand our smelter capacity and to increase export sales.
ZINCZinc markets rallied in 2016 fuelled by improving market fundamentals. The zinc LME increased by c.50% fiscal year-on-year to end the year above US$2,700/t. Zinc consumption grew by 2.7% to 14.3 million tonnes, primarily due to rising demand from India and China, while a global zinc concentrate deficit supported zinc prices. Production cuts and mine closures led to a fall in the supply of concentrate by almost 700kt in 2016, the largest contribution coming from Glencore’s output curtailments of 500kt.
Since there is no indication yet that this capacity will be restarted in the coming months, the concentrate market is expected to remain tight for most of 2017. This concentrate tightness has yet to translate into refined market tightness due to the presence of refined zinc inventory. But as warehouse stocks are drawn down we will see a steady rise in premiums.
PRODUCTS AND CUSTOMERSVedanta’s zinc production primarily caters to Indian demand. Hence around 68-75% of the refined zinc produced is sold in the Indian market and the rest is exported.
Vedanta is the largest zinc producer in India, with 72% market share in FY2017. 70% of Indian zinc consumption is used in the galvanising sector, predominantly in the construction and infrastructure sectors. We also produce zinc for use in die-casting alloys, brass and oxides and
COPPER
25
Vedanta Resources plc | Annual Report FY2017www.vedantaresources.com
STRATEGIC REPORT DIRECTORS’ REPORT FINANCIAL STATEMENTS ADDITIONAL INFORMATION
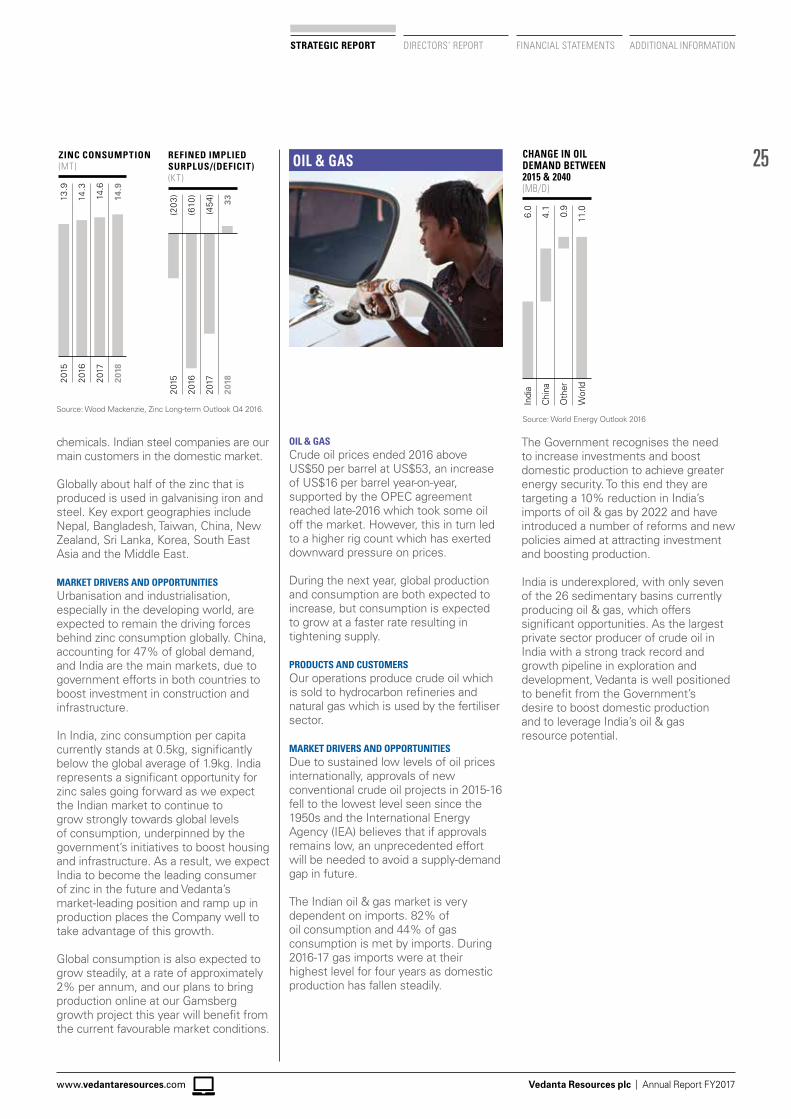
OIL & GASZINC CONSUMPTION(MT)
14.3
13.9
14.6
14.9
2016
2015
2017
2018
REFINED IMPLIEDSURPLUS/(DEFICIT)(KT)
(610
)
(20
3)
(454
)
33
2016
2015
2017
2018
chemicals. Indian steel companies are our main customers in the domestic market.
Globally about half of the zinc that is produced is used in galvanising iron and steel. Key export geographies include Nepal, Bangladesh, Taiwan, China, New Zealand, Sri Lanka, Korea, South East Asia and the Middle East.
MARKET DRIVERS AND OPPORTUNITIESUrbanisation and industrialisation, especially in the developing world, are expected to remain the driving forces behind zinc consumption globally. China, accounting for 47% of global demand, and India are the main markets, due to government efforts in both countries to boost investment in construction and infrastructure.
In India, zinc consumption per capita currently stands at 0.5kg, significantly below the global average of 1.9kg. India represents a significant opportunity for zinc sales going forward as we expect the Indian market to continue to grow strongly towards global levels of consumption, underpinned by the government’s initiatives to boost housing and infrastructure. As a result, we expect India to become the leading consumer of zinc in the future and Vedanta’s market-leading position and ramp up in production places the Company well to take advantage of this growth.
Global consumption is also expected to grow steadily, at a rate of approximately 2% per annum, and our plans to bring production online at our Gamsberg growth project this year will benefit from the current favourable market conditions.
OIL & GASCrude oil prices ended 2016 above US$50 per barrel at US$53, an increase of US$16 per barrel year-on-year, supported by the OPEC agreement reached late-2016 which took some oil off the market. However, this in turn led to a higher rig count which has exerted downward pressure on prices.
During the next year, global production and consumption are both expected to increase, but consumption is expected to grow at a faster rate resulting in tightening supply.
PRODUCTS AND CUSTOMERSOur operations produce crude oil which is sold to hydrocarbon refineries and natural gas which is used by the fertiliser sector.
MARKET DRIVERS AND OPPORTUNITIESDue to sustained low levels of oil prices internationally, approvals of new conventional crude oil projects in 2015-16 fell to the lowest level seen since the 1950s and the International Energy Agency (IEA) believes that if approvals remains low, an unprecedented effort will be needed to avoid a supply-demand gap in future.
The Indian oil & gas market is very dependent on imports. 82% of oil consumption and 44% of gas consumption is met by imports. During 2016-17 gas imports were at their highest level for four years as domestic production has fallen steadily.
The Government recognises the need to increase investments and boost domestic production to achieve greater energy security. To this end they are targeting a 10% reduction in India’s imports of oil & gas by 2022 and have introduced a number of reforms and new policies aimed at attracting investment and boosting production.
India is underexplored, with only seven of the 26 sedimentary basins currently producing oil & gas, which offers significant opportunities. As the largest private sector producer of crude oil in India with a strong track record and growth pipeline in exploration and development, Vedanta is well positioned to benefit from the Government’s desire to boost domestic production and to leverage India’s oil & gas resource potential.
CHANGE IN OILDEMAND BETWEEN2015 & 2040(MB/D)
4.1
6.0
0.9
11.0
Chi
na
Indi
a
Oth
er
Wor
ld
Source: Wood Mackenzie, Zinc Long-term Outlook Q4 2016.Source: World Energy Outlook 2016
26
Vedanta Resources plc | Annual Report FY2017
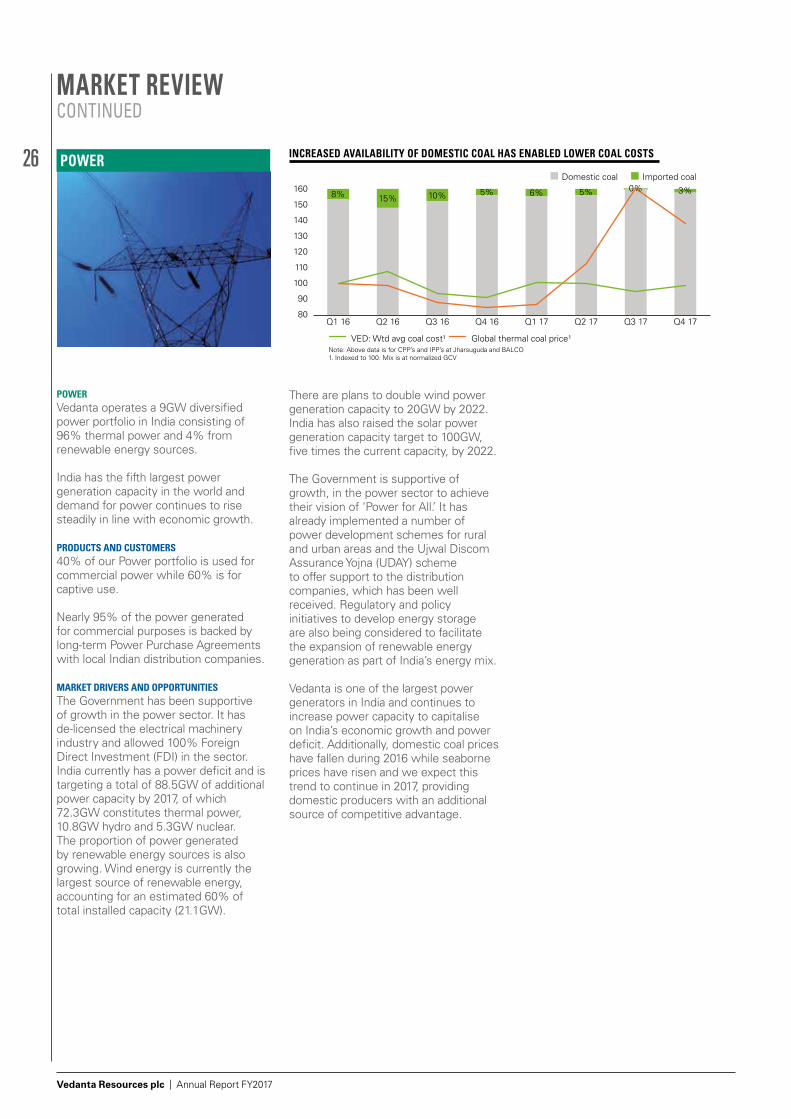
INCREASED AVAILABILITY OF DOMESTIC COAL HAS ENABLED LOWER COAL COSTS
Global thermal coal price¹VED: Wtd avg coal cost¹
80
90
100
110
120
130
140
150
1608% 3%0%5%6%5%10%15%
Q1 16 Q4 17Q3 17Q2 17Q1 17Q4 16Q3 16Q2 16
Domestic coal Imported coal
Note: Above data is for CPP’s and IPP’s at Jharsuguda and BALCO 1. Indexed to 100, Mix is at normalized GCV
MARKET REVIEWCONTINUED
POWERVedanta operates a 9GW diversified power portfolio in India consisting of 96% thermal power and 4% from renewable energy sources.
India has the fifth largest power generation capacity in the world and demand for power continues to rise steadily in line with economic growth.
PRODUCTS AND CUSTOMERS40% of our Power portfolio is used for commercial power while 60% is for captive use.
Nearly 95% of the power generated for commercial purposes is backed by long-term Power Purchase Agreements with local Indian distribution companies.
MARKET DRIVERS AND OPPORTUNITIESThe Government has been supportive of growth in the power sector. It has de-licensed the electrical machinery industry and allowed 100% Foreign Direct Investment (FDI) in the sector. India currently has a power deficit and is targeting a total of 88.5GW of additional power capacity by 2017, of which 72.3GW constitutes thermal power, 10.8GW hydro and 5.3GW nuclear. The proportion of power generated by renewable energy sources is also growing. Wind energy is currently the largest source of renewable energy, accounting for an estimated 60% of total installed capacity (21.1GW).
There are plans to double wind power generation capacity to 20GW by 2022. India has also raised the solar power generation capacity target to 100GW, five times the current capacity, by 2022.
The Government is supportive of growth, in the power sector to achieve their vision of ‘Power for All.’ It has already implemented a number of power development schemes for rural and urban areas and the Ujwal Discom Assurance Yojna (UDAY) scheme to offer support to the distribution companies, which has been well received. Regulatory and policy initiatives to develop energy storage are also being considered to facilitate the expansion of renewable energy generation as part of India’s energy mix.
Vedanta is one of the largest power generators in India and continues to increase power capacity to capitalise on India’s economic growth and power deficit. Additionally, domestic coal prices have fallen during 2016 while seaborne prices have risen and we expect this trend to continue in 2017, providing domestic producers with an additional source of competitive advantage.
POWER
IRON ORE 27
Vedanta Resources plc | Annual Report FY2017www.vedantaresources.com
STRATEGIC REPORT DIRECTORS’ REPORT FINANCIAL STATEMENTS ADDITIONAL INFORMATION
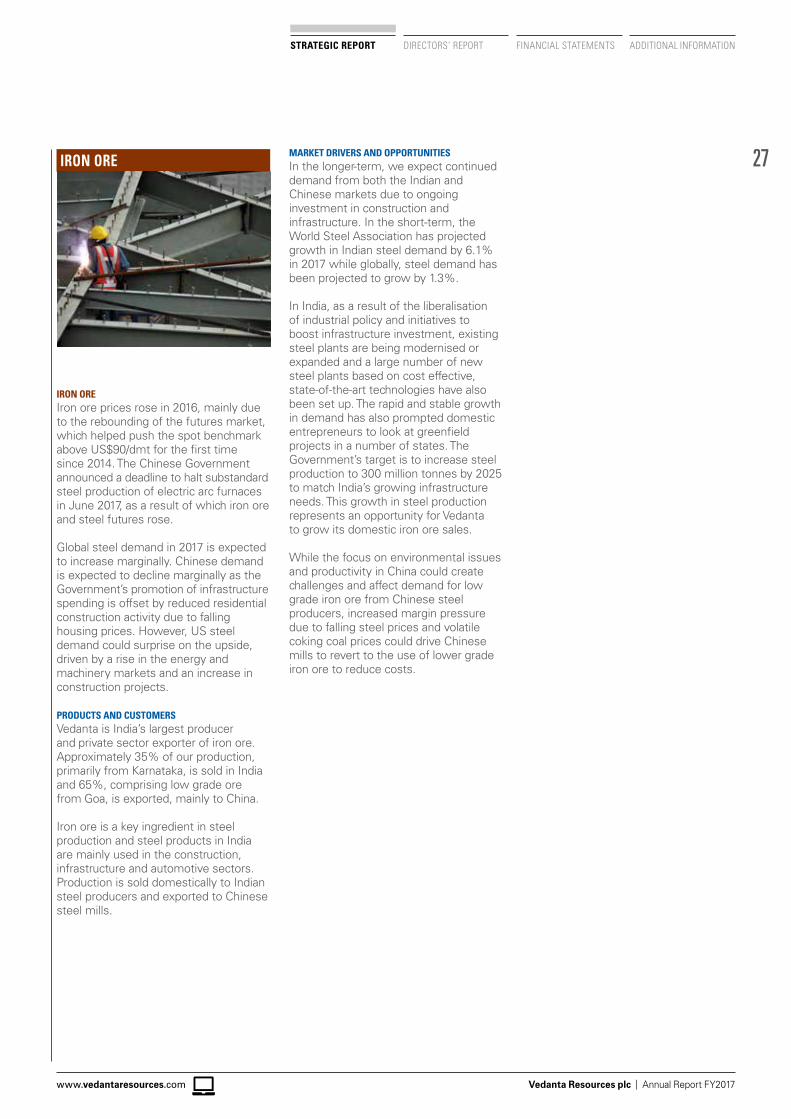
IRON OREIron ore prices rose in 2016, mainly due to the rebounding of the futures market, which helped push the spot benchmark above US$90/dmt for the first time since 2014. The Chinese Government announced a deadline to halt substandard steel production of electric arc furnaces in June 2017, as a result of which iron ore and steel futures rose.
Global steel demand in 2017 is expected to increase marginally. Chinese demand is expected to decline marginally as the Government’s promotion of infrastructure spending is offset by reduced residential construction activity due to falling housing prices. However, US steel demand could surprise on the upside, driven by a rise in the energy and machinery markets and an increase in construction projects.
PRODUCTS AND CUSTOMERSVedanta is India’s largest producer and private sector exporter of iron ore. Approximately 35% of our production, primarily from Karnataka, is sold in India and 65%, comprising low grade ore from Goa, is exported, mainly to China.
Iron ore is a key ingredient in steel production and steel products in India are mainly used in the construction, infrastructure and automotive sectors. Production is sold domestically to Indian steel producers and exported to Chinese steel mills.
MARKET DRIVERS AND OPPORTUNITIESIn the longer-term, we expect continued demand from both the Indian and Chinese markets due to ongoing investment in construction and infrastructure. In the short-term, the World Steel Association has projected growth in Indian steel demand by 6.1% in 2017 while globally, steel demand has been projected to grow by 1.3%.
In India, as a result of the liberalisation of industrial policy and initiatives to boost infrastructure investment, existing steel plants are being modernised or expanded and a large number of new steel plants based on cost effective, state-of-the-art technologies have also been set up. The rapid and stable growth in demand has also prompted domestic entrepreneurs to look at greenfield projects in a number of states. The Government’s target is to increase steel production to 300 million tonnes by 2025 to match India’s growing infrastructure needs. This growth in steel production represents an opportunity for Vedanta to grow its domestic iron ore sales.
While the focus on environmental issues and productivity in China could create challenges and affect demand for low grade iron ore from Chinese steel producers, increased margin pressure due to falling steel prices and volatile coking coal prices could drive Chinese mills to revert to the use of lower grade iron ore to reduce costs.
28
Vedanta Resources plc | Annual Report FY2017
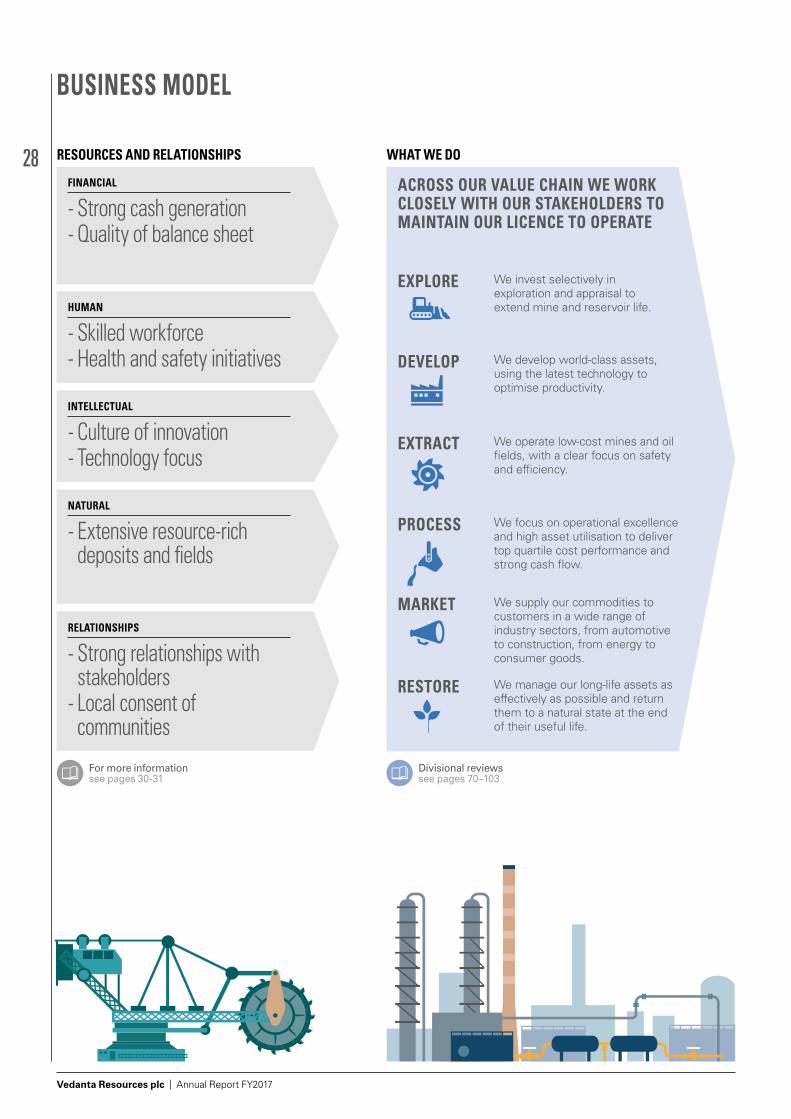
RESOURCES AND RELATIONSHIPS WHAT WE DO
FINANCIAL
- Strong cash generation - Quality of balance sheet
HUMAN
- Skilled workforce - Health and safety initiatives
INTELLECTUAL
- Culture of innovation - Technology focus
NATURAL
- Extensive resource-rich deposits and fields
RELATIONSHIPS
- Strong relationships with stakeholders - Local consent of communities
ACROSS OUR VALUE CHAIN WE WORK CLOSELY WITH OUR STAKEHOLDERS TO MAINTAIN OUR LICENCE TO OPERATE
EXPLORE We invest selectively in exploration and appraisal to extend mine and reservoir life.
DEVELOP We develop world-class assets, using the latest technology to optimise productivity.
EXTRACT We operate low-cost mines and oil fields, with a clear focus on safety and efficiency.
PROCESS We focus on operational excellence and high asset utilisation to deliver top quartile cost performance and strong cash flow.
MARKET We supply our commodities to customers in a wide range of industry sectors, from automotive to construction, from energy to consumer goods.
RESTORE We manage our long-life assets as effectively as possible and return them to a natural state at the end of their useful life.
Divisional reviews see pages 70–103
For more information see pages 30-31
BUSINESS MODEL
29
Vedanta Resources plc | Annual Report FY2017www.vedantaresources.com
STRATEGIC REPORT DIRECTORS’ REPORT FINANCIAL STATEMENTS ADDITIONAL INFORMATION
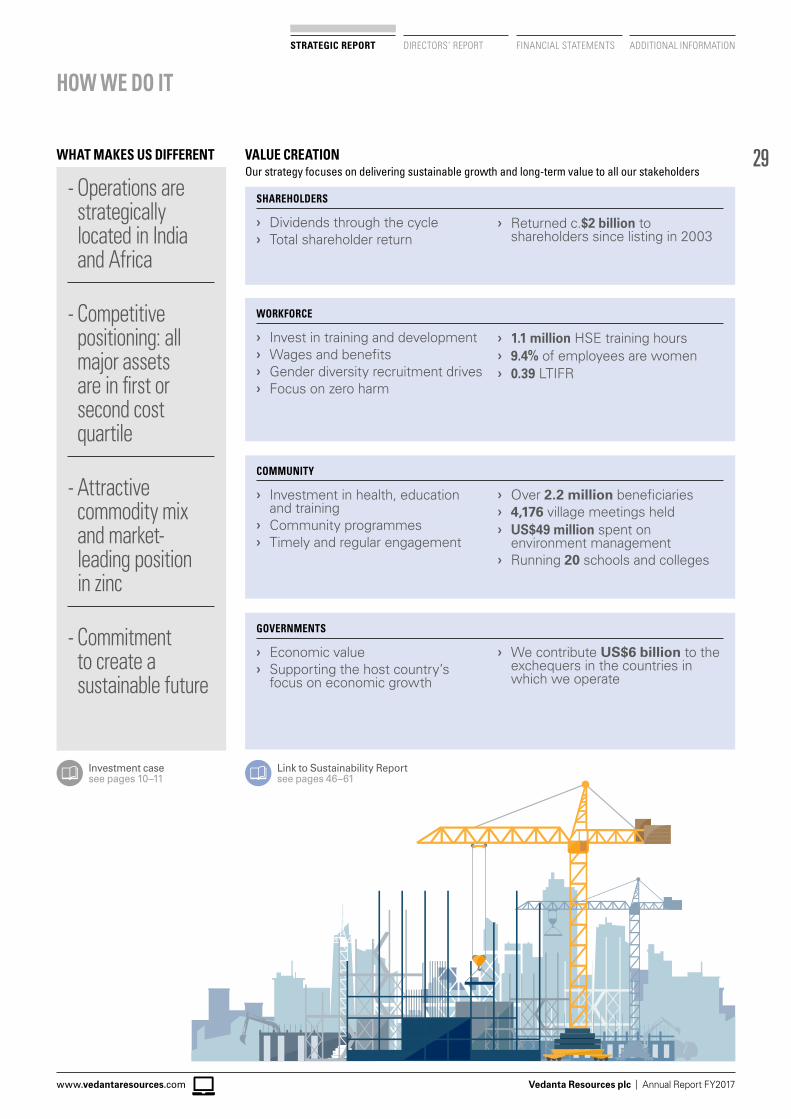
WHAT MAKES US DIFFERENT VALUE CREATION
- Operations are strategically located in India and Africa
- Competitive positioning: all major assets are in first or second cost quartile
- Attractive commodity mix and market-leading position in zinc
- Commitment to create a sustainable future
SHAREHOLDERS
❯ Dividends through the cycle ❯ Total shareholder return
❯ Returned c.$2 billion to shareholders since listing in 2003
WORKFORCE
❯ Invest in training and development ❯ Wages and benefits ❯ Gender diversity recruitment drives ❯ Focus on zero harm
❯ 1.1 million HSE training hours ❯ 9.4% of employees are women ❯ 0.39 LTIFR
COMMUNITY
❯ Investment in health, education and training
❯ Community programmes ❯ Timely and regular engagement
❯ Over 2.2 million beneficiaries ❯ 4,176 village meetings held ❯ US$49 million spent on
environment management ❯ Running 20 schools and colleges
GOVERNMENTS
❯ Economic value ❯ Supporting the host country’s
focus on economic growth
❯ We contribute US$6 billion to the exchequers in the countries in which we operate
Link to Sustainability Report see pages 46–61
Investment case see pages 10–11
HOW WE DO IT
Our strategy focuses on delivering sustainable growth and long-term value to all our stakeholders
30
Vedanta Resources plc | Annual Report FY2017
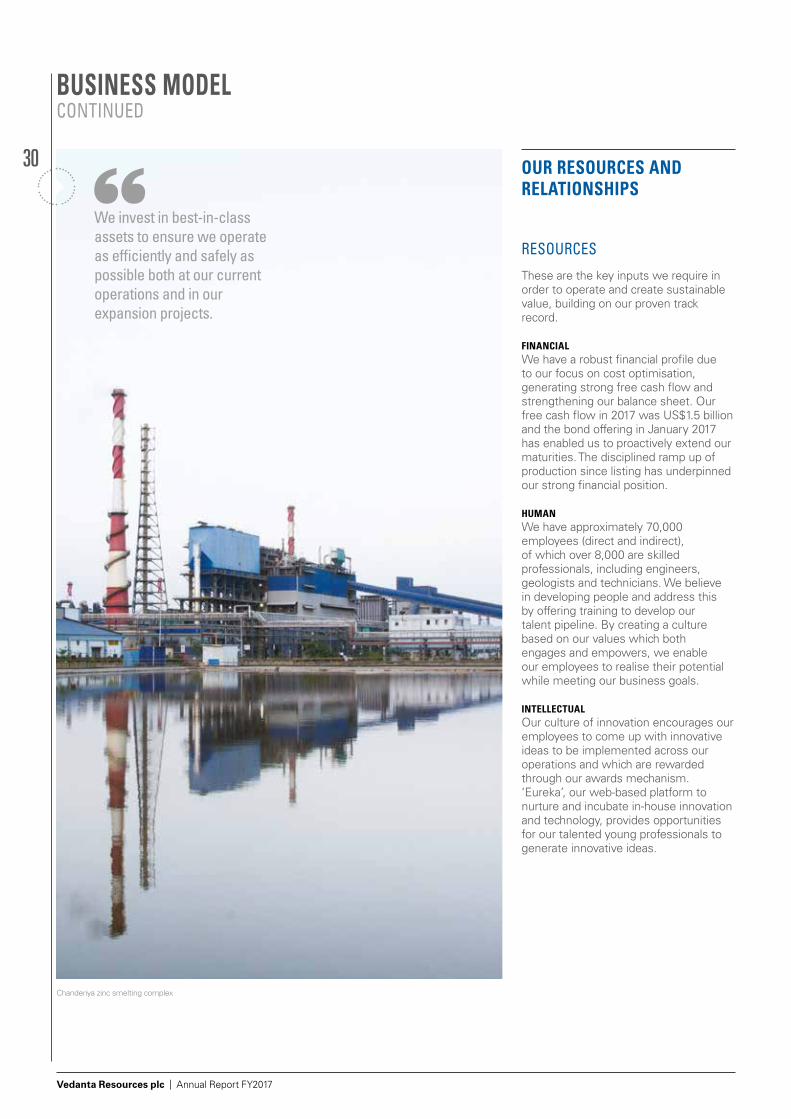
We invest in best-in-class assets to ensure we operate as efficiently and safely as possible both at our current operations and in our expansion projects.
OUR RESOURCES AND RELATIONSHIPS
RESOURCES
These are the key inputs we require in order to operate and create sustainable value, building on our proven track record.
FINANCIALWe have a robust financial profile due to our focus on cost optimisation, generating strong free cash flow and strengthening our balance sheet. Our free cash flow in 2017 was US$1.5 billion and the bond offering in January 2017 has enabled us to proactively extend our maturities. The disciplined ramp up of production since listing has underpinned our strong financial position.
HUMANWe have approximately 70,000 employees (direct and indirect), of which over 8,000 are skilled professionals, including engineers, geologists and technicians. We believe in developing people and address this by offering training to develop our talent pipeline. By creating a culture based on our values which both engages and empowers, we enable our employees to realise their potential while meeting our business goals.
INTELLECTUALOur culture of innovation encourages our employees to come up with innovative ideas to be implemented across our operations and which are rewarded through our awards mechanism. ‘Eureka’, our web-based platform to nurture and incubate in-house innovation and technology, provides opportunities for our talented young professionals to generate innovative ideas.
BUSINESS MODEL CONTINUED
Chanderiya zinc smelting complex
31
Vedanta Resources plc | Annual Report FY2017www.vedantaresources.com
STRATEGIC REPORT DIRECTORS’ REPORT FINANCIAL STATEMENTS ADDITIONAL INFORMATION
RESPONSIBLESTEWARDSHIP
ADDINGAND SHARING
VALUE
BUILDINGSTRONG
RELATIONSHIPS
STRATEGICCOMMUNICATIONS
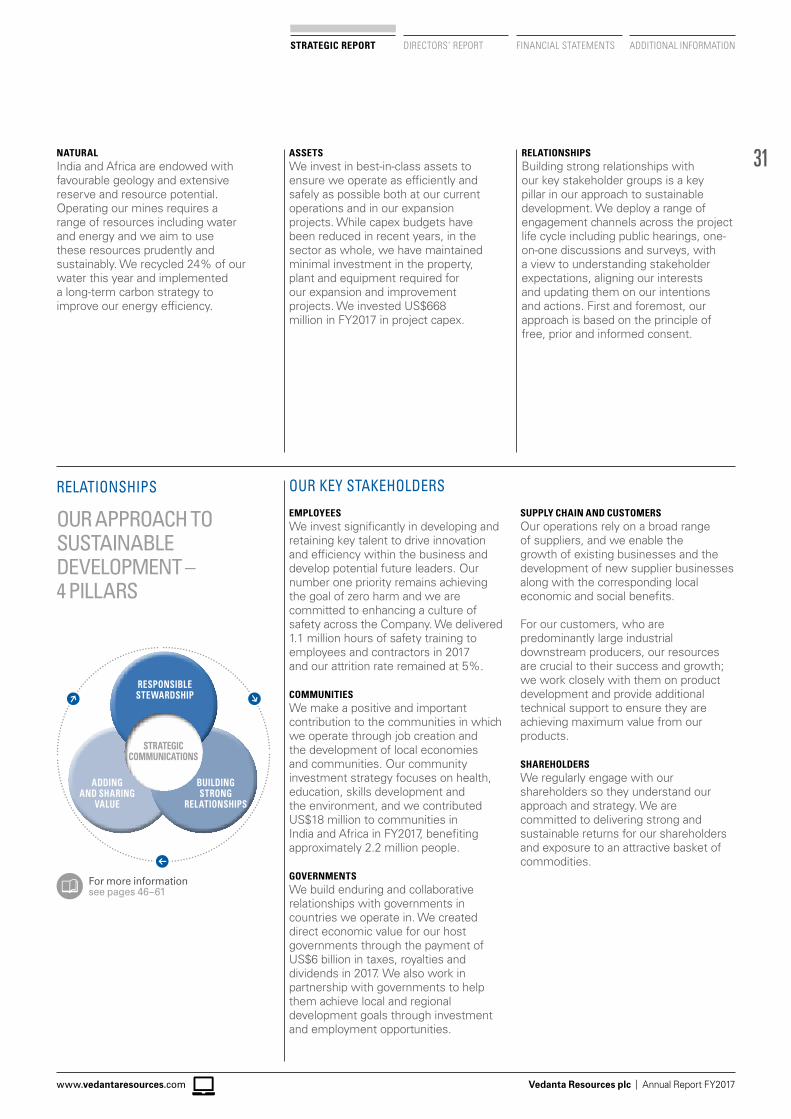
OUR APPROACH TO SUSTAINABLE DEVELOPMENT – 4 PILLARS
OUR KEY STAKEHOLDERS
EMPLOYEESWe invest significantly in developing and retaining key talent to drive innovation and efficiency within the business and develop potential future leaders. Our number one priority remains achieving the goal of zero harm and we are committed to enhancing a culture of safety across the Company. We delivered 1.1 million hours of safety training to employees and contractors in 2017 and our attrition rate remained at 5%.
COMMUNITIESWe make a positive and important contribution to the communities in which we operate through job creation and the development of local economies and communities. Our community investment strategy focuses on health, education, skills development and the environment, and we contributed US$18 million to communities in India and Africa in FY2017, benefiting approximately 2.2 million people.
GOVERNMENTSWe build enduring and collaborative relationships with governments in countries we operate in. We created direct economic value for our host governments through the payment of US$6 billion in taxes, royalties and dividends in 2017. We also work in partnership with governments to help them achieve local and regional development goals through investment and employment opportunities.
NATURALIndia and Africa are endowed with favourable geology and extensive reserve and resource potential. Operating our mines requires a range of resources including water and energy and we aim to use these resources prudently and sustainably. We recycled 24% of our water this year and implemented a long-term carbon strategy to improve our energy efficiency.
SUPPLY CHAIN AND CUSTOMERSOur operations rely on a broad range of suppliers, and we enable the growth of existing businesses and the development of new supplier businesses along with the corresponding local economic and social benefits.
For our customers, who are predominantly large industrial downstream producers, our resources are crucial to their success and growth; we work closely with them on product development and provide additional technical support to ensure they are achieving maximum value from our products.
SHAREHOLDERSWe regularly engage with our shareholders so they understand our approach and strategy. We are committed to delivering strong and sustainable returns for our shareholders and exposure to an attractive basket of commodities.
For more information see pages 46–61
ASSETSWe invest in best-in-class assets to ensure we operate as efficiently and safely as possible both at our current operations and in our expansion projects. While capex budgets have been reduced in recent years, in the sector as whole, we have maintained minimal investment in the property, plant and equipment required for our expansion and improvement projects. We invested US$668 million in FY2017 in project capex.
RELATIONSHIPSBuilding strong relationships with our key stakeholder groups is a key pillar in our approach to sustainable development. We deploy a range of engagement channels across the project life cycle including public hearings, one-on-one discussions and surveys, with a view to understanding stakeholder expectations, aligning our interests and updating them on our intentions and actions. First and foremost, our approach is based on the principle of free, prior and informed consent.
RELATIONSHIPS
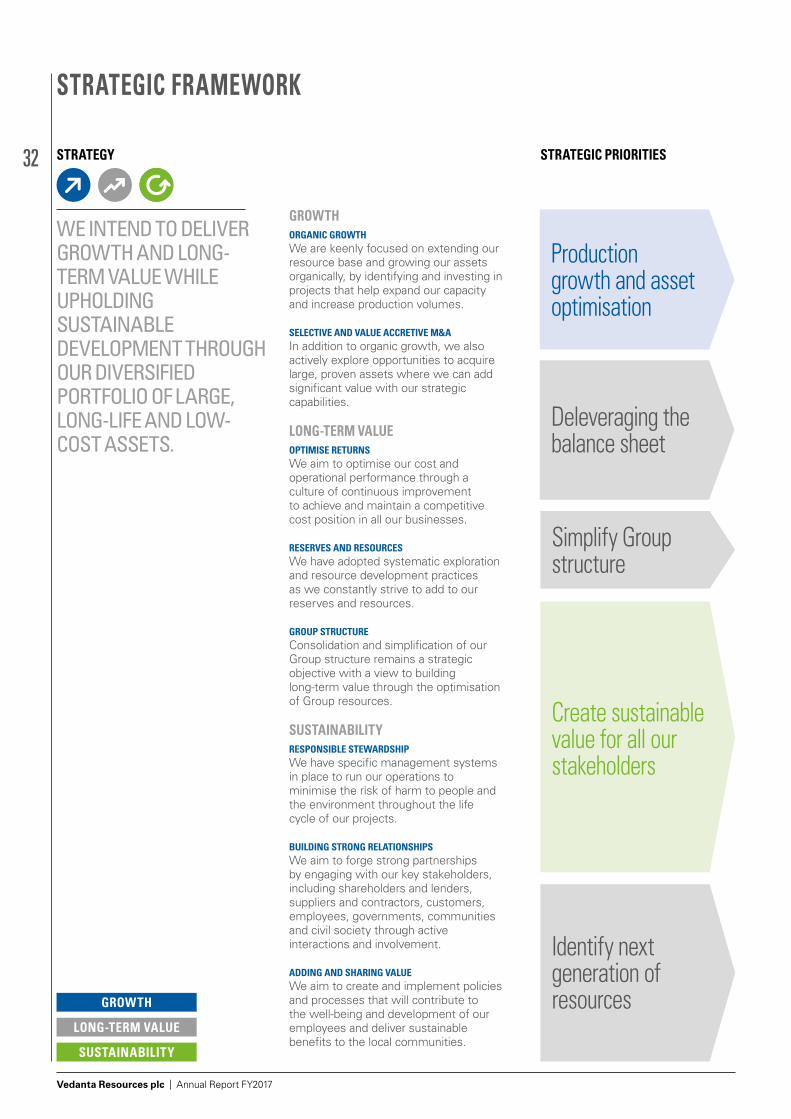
32
Vedanta Resources plc | Annual Report FY2017
STRATEGIC FRAMEWORK
STRATEGY STRATEGIC PRIORITIES
WE INTEND TO DELIVER GROWTH AND LONG-TERM VALUE WHILE UPHOLDING SUSTAINABLE DEVELOPMENT THROUGH OUR DIVERSIFIED PORTFOLIO OF LARGE, LONG-LIFE AND LOW-COST ASSETS.
Production growth and asset optimisation
Deleveraging the balance sheet
Identify next generation of resources
Simplify Group structure
Create sustainable value for all our stakeholders
GROWTHORGANIC GROWTHWe are keenly focused on extending our resource base and growing our assets organically, by identifying and investing in projects that help expand our capacity and increase production volumes.
SELECTIVE AND VALUE ACCRETIVE M&AIn addition to organic growth, we also actively explore opportunities to acquire large, proven assets where we can add significant value with our strategic capabilities.
LONG-TERM VALUEOPTIMISE RETURNSWe aim to optimise our cost and operational performance through a culture of continuous improvement to achieve and maintain a competitive cost position in all our businesses.
RESERVES AND RESOURCESWe have adopted systematic exploration and resource development practices as we constantly strive to add to our reserves and resources.
GROUP STRUCTUREConsolidation and simplification of our Group structure remains a strategic objective with a view to building long-term value through the optimisation of Group resources.
SUSTAINABILITYRESPONSIBLE STEWARDSHIPWe have specific management systems in place to run our operations to minimise the risk of harm to people and the environment throughout the life cycle of our projects.
BUILDING STRONG RELATIONSHIPSWe aim to forge strong partnerships by engaging with our key stakeholders, including shareholders and lenders, suppliers and contractors, customers, employees, governments, communities and civil society through active interactions and involvement.
ADDING AND SHARING VALUEWe aim to create and implement policies and processes that will contribute to the well-being and development of our employees and deliver sustainable benefits to the local communities.
GROWTH
SUSTAINABILITY
LONG-TERM VALUE
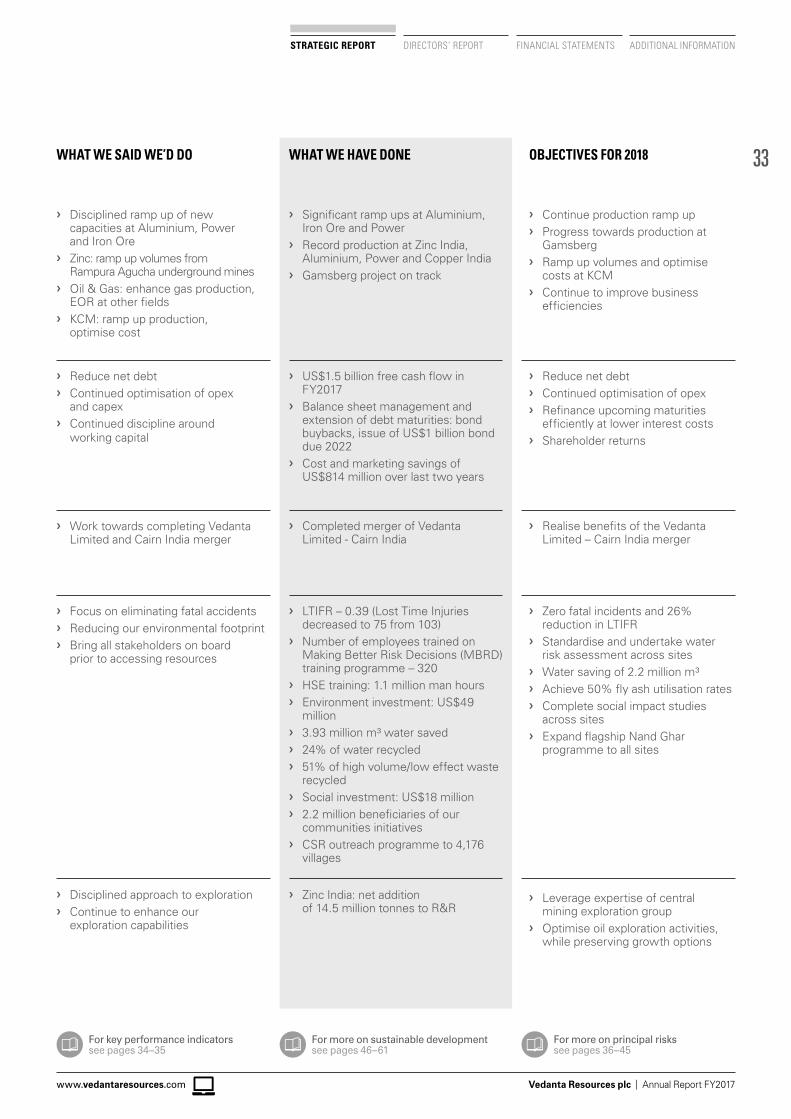
33
Vedanta Resources plc | Annual Report FY2017www.vedantaresources.com
STRATEGIC REPORT DIRECTORS’ REPORT FINANCIAL STATEMENTS ADDITIONAL INFORMATION
WHAT WE SAID WE’D DO WHAT WE HAVE DONE OBJECTIVES FOR 2018
❯ Disciplined ramp up of new capacities at Aluminium, Power and Iron Ore
❯ Zinc: ramp up volumes from Rampura Agucha underground mines
❯ Oil & Gas: enhance gas production, EOR at other fields
❯ KCM: ramp up production, optimise cost
❯ Reduce net debt ❯ Continued optimisation of opex
and capex ❯ Continued discipline around
working capital
❯ Work towards completing Vedanta Limited and Cairn India merger
❯ Focus on eliminating fatal accidents ❯ Reducing our environmental footprint ❯ Bring all stakeholders on board
prior to accessing resources
❯ Disciplined approach to exploration ❯ Continue to enhance our
exploration capabilities
❯ Significant ramp ups at Aluminium, Iron Ore and Power
❯ Record production at Zinc India, Aluminium, Power and Copper India
❯ Gamsberg project on track
❯ US$1.5 billion free cash flow in FY2017
❯ Balance sheet management and extension of debt maturities: bond buybacks, issue of US$1 billion bond due 2022
❯ Cost and marketing savings of US$814 million over last two years
❯ Completed merger of Vedanta Limited - Cairn India
❯ LTIFR – 0.39 (Lost Time Injuries decreased to 75 from 103)
❯ Number of employees trained on Making Better Risk Decisions (MBRD) training programme – 320
❯ HSE training: 1.1 million man hours ❯ Environment investment: US$49
million ❯ 3.93 million m³ water saved ❯ 24% of water recycled ❯ 51% of high volume/low effect waste
recycled ❯ Social investment: US$18 million ❯ 2.2 million beneficiaries of our
communities initiatives ❯ CSR outreach programme to 4,176
villages
❯ Zinc India: net addition of 14.5 million tonnes to R&R
❯ Continue production ramp up ❯ Progress towards production at
Gamsberg ❯ Ramp up volumes and optimise
costs at KCM ❯ Continue to improve business
efficiencies
❯ Reduce net debt ❯ Continued optimisation of opex ❯ Refinance upcoming maturities
efficiently at lower interest costs ❯ Shareholder returns
❯ Realise benefits of the Vedanta Limited – Cairn India merger
❯ Zero fatal incidents and 26% reduction in LTIFR
❯ Standardise and undertake water risk assessment across sites
❯ Water saving of 2.2 million m³ ❯ Achieve 50% fly ash utilisation rates ❯ Complete social impact studies
across sites ❯ Expand flagship Nand Ghar
programme to all sites
❯ Leverage expertise of central mining exploration group
❯ Optimise oil exploration activities, while preserving growth options
For key performance indicators see pages 34–35
For more on principal risks see pages 36–45
For more on sustainable development see pages 46–61
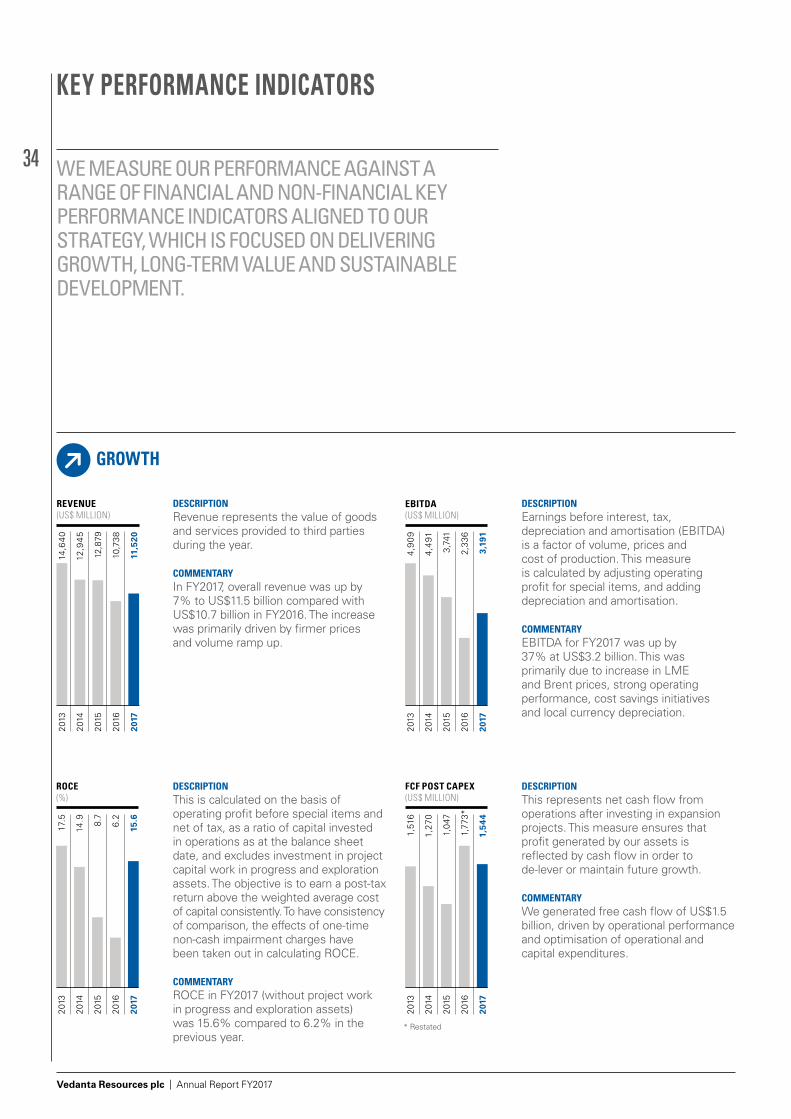
34
Vedanta Resources plc | Annual Report FY2017
* Restated
EBITDA(US$ MILLION)
4,4
91
4,9
09
3,74
1
2,33
6
3,19
1
2014
2013
2015
2016
2017
ROCE(%)
14.9
17.5 8.7
6.2
15.6
2014
2013
2015
2016
2017
FCF POST CAPEX(US$ MILLION)
1,27
0
1,51
6
1,04
7
1,77
3*
1,54
4
2014
2013
2015
2016
2017
KEY PERFORMANCE INDICATORS
WE MEASURE OUR PERFORMANCE AGAINST A RANGE OF FINANCIAL AND NON-FINANCIAL KEY PERFORMANCE INDICATORS ALIGNED TO OUR STRATEGY, WHICH IS FOCUSED ON DELIVERING GROWTH, LONG-TERM VALUE AND SUSTAINABLE DEVELOPMENT.
GROWTH
DESCRIPTIONRevenue represents the value of goods and services provided to third parties during the year.
COMMENTARYIn FY2017, overall revenue was up by 7% to US$11.5 billion compared with US$10.7 billion in FY2016. The increase was primarily driven by firmer prices and volume ramp up.
DESCRIPTIONEarnings before interest, tax, depreciation and amortisation (EBITDA) is a factor of volume, prices and cost of production. This measure is calculated by adjusting operating profit for special items, and adding depreciation and amortisation.
COMMENTARYEBITDA for FY2017 was up by 37% at US$3.2 billion. This was primarily due to increase in LME and Brent prices, strong operating performance, cost savings initiatives and local currency depreciation.
DESCRIPTIONThis is calculated on the basis of operating profit before special items and net of tax, as a ratio of capital invested in operations as at the balance sheet date, and excludes investment in project capital work in progress and exploration assets. The objective is to earn a post-tax return above the weighted average cost of capital consistently. To have consistency of comparison, the effects of one-time non-cash impairment charges have been taken out in calculating ROCE.
COMMENTARYROCE in FY2017 (without project work in progress and exploration assets) was 15.6% compared to 6.2% in the previous year.
DESCRIPTIONThis represents net cash flow from operations after investing in expansion projects. This measure ensures that profit generated by our assets is reflected by cash flow in order to de-lever or maintain future growth.
COMMENTARYWe generated free cash flow of US$1.5 billion, driven by operational performance and optimisation of operational and capital expenditures.
REVENUE(US$ MILLION)
12,9
45
14,6
40
12,8
79
10,7
38
11,5
20
2014
2013
2015
2016
2017
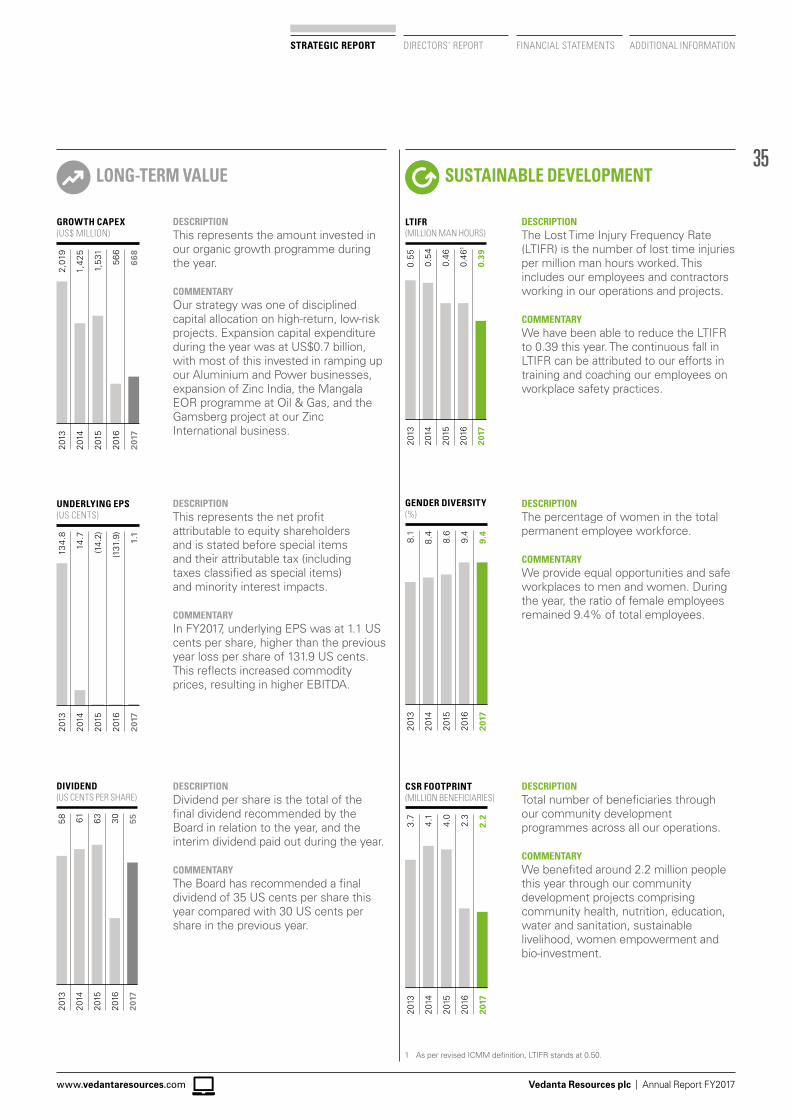
35
STRATEGIC REPORT DIRECTORS’ REPORT FINANCIAL STATEMENTS ADDITIONAL INFORMATION
Vedanta Resources plc | Annual Report FY2017www.vedantaresources.com
GROWTH CAPEX(US$ MILLION)
1,42
5
2,01
9
1,53
1
566
668
2014
2013
2015
2016
2017
UNDERLYING EPS(US CENTS)
14.7
134.
8
(14.
2)
(131
.9)
1.1
2014
2013
2015
2016
2017
DIVIDEND(US CENTS PER SHARE)
6158 63 30 55
2014
2013
2015
2016
2017
LTIFR(MILLION MAN HOURS)
0.5
4
0.55
0.46
0.46
1
0.39
2014
2013
2015
2016
2017
GENDER DIVERSITY(%)
8.48.1
8.6
9.4
9.4
2014
2013
2015
2016
2017
CSR FOOTPRINT(MILLION BENEFICIARIES)
4.1
3.7
4.0
2.3
2.2
2014
2013
2015
2016
2017
LONG-TERM VALUE SUSTAINABLE DEVELOPMENT
DESCRIPTIONThis represents the net profit attributable to equity shareholders and is stated before special items and their attributable tax (including taxes classified as special items) and minority interest impacts.
COMMENTARYIn FY2017, underlying EPS was at 1.1 US cents per share, higher than the previous year loss per share of 131.9 US cents. This reflects increased commodity prices, resulting in higher EBITDA.
DESCRIPTIONThe percentage of women in the total permanent employee workforce.
COMMENTARYWe provide equal opportunities and safe workplaces to men and women. During the year, the ratio of female employees remained 9.4% of total employees.
DESCRIPTIONDividend per share is the total of the final dividend recommended by the Board in relation to the year, and the interim dividend paid out during the year.
COMMENTARYThe Board has recommended a final dividend of 35 US cents per share this year compared with 30 US cents per share in the previous year.
DESCRIPTIONTotal number of beneficiaries through our community development programmes across all our operations.
COMMENTARYWe benefited around 2.2 million people this year through our community development projects comprising community health, nutrition, education, water and sanitation, sustainable livelihood, women empowerment and bio-investment.
DESCRIPTIONThis represents the amount invested in our organic growth programme during the year.
COMMENTARYOur strategy was one of disciplined capital allocation on high-return, low-risk projects. Expansion capital expenditure during the year was at US$0.7 billion, with most of this invested in ramping up our Aluminium and Power businesses, expansion of Zinc India, the Mangala EOR programme at Oil & Gas, and the Gamsberg project at our Zinc International business.
DESCRIPTIONThe Lost Time Injury Frequency Rate (LTIFR) is the number of lost time injuries per million man hours worked. This includes our employees and contractors working in our operations and projects.
COMMENTARYWe have been able to reduce the LTIFR to 0.39 this year. The continuous fall in LTIFR can be attributed to our efforts in training and coaching our employees on workplace safety practices.
1 As per revised ICMM definition, LTIFR stands at 0.50.
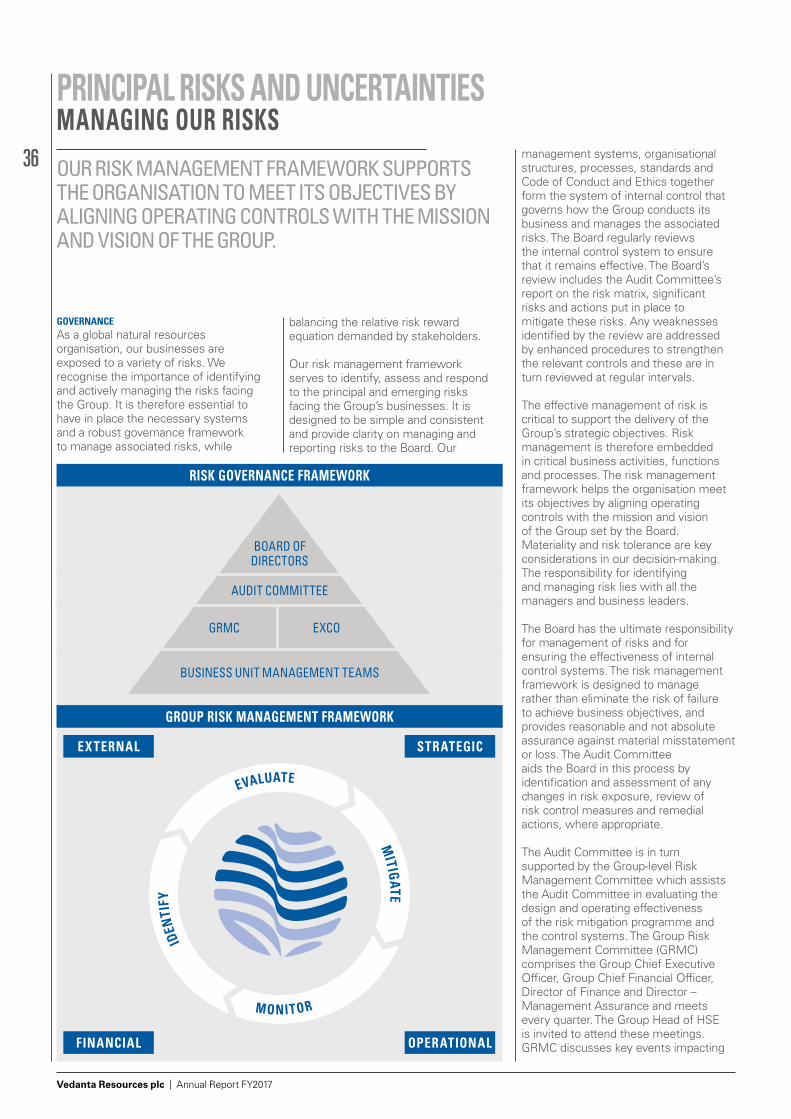
36
Vedanta Resources plc | Annual Report FY2017
PRINCIPAL RISKS AND UNCERTAINTIES MANAGING OUR RISKS
GOVERNANCEAs a global natural resources organisation, our businesses are exposed to a variety of risks. We recognise the importance of identifying and actively managing the risks facing the Group. It is therefore essential to have in place the necessary systems and a robust governance framework to manage associated risks, while
OUR RISK MANAGEMENT FRAMEWORK SUPPORTS THE ORGANISATION TO MEET ITS OBJECTIVES BY ALIGNING OPERATING CONTROLS WITH THE MISSION AND VISION OF THE GROUP.
balancing the relative risk reward equation demanded by stakeholders.
Our risk management framework serves to identify, assess and respond to the principal and emerging risks facing the Group’s businesses. It is designed to be simple and consistent and provide clarity on managing and reporting risks to the Board. Our
management systems, organisational structures, processes, standards and Code of Conduct and Ethics together form the system of internal control that governs how the Group conducts its business and manages the associated risks. The Board regularly reviews the internal control system to ensure that it remains effective. The Board’s review includes the Audit Committee’s report on the risk matrix, significant risks and actions put in place to mitigate these risks. Any weaknesses identified by the review are addressed by enhanced procedures to strengthen the relevant controls and these are in turn reviewed at regular intervals.
The effective management of risk is critical to support the delivery of the Group’s strategic objectives. Risk management is therefore embedded in critical business activities, functions and processes. The risk management framework helps the organisation meet its objectives by aligning operating controls with the mission and vision of the Group set by the Board. Materiality and risk tolerance are key considerations in our decision-making. The responsibility for identifying and managing risk lies with all the managers and business leaders.
The Board has the ultimate responsibility for management of risks and for ensuring the effectiveness of internal control systems. The risk management framework is designed to manage rather than eliminate the risk of failure to achieve business objectives, and provides reasonable and not absolute assurance against material misstatement or loss. The Audit Committee aids the Board in this process by identification and assessment of any changes in risk exposure, review of risk control measures and remedial actions, where appropriate.
The Audit Committee is in turn supported by the Group-level Risk Management Committee which assists the Audit Committee in evaluating the design and operating effectiveness of the risk mitigation programme and the control systems. The Group Risk Management Committee (GRMC) comprises the Group Chief Executive Officer, Group Chief Financial Officer, Director of Finance and Director – Management Assurance and meets every quarter. The Group Head of HSE is invited to attend these meetings. GRMC discusses key events impacting
RISK GOVERNANCE FRAMEWORK
GROUP RISK MANAGEMENT FRAMEWORK
IDEN
TIFY
EVALUATE
MONITOR
MITIGATE
BOARD OF DIRECTORS
AUDIT COMMITTEE
GRMC EXCO
BUSINESS UNIT MANAGEMENT TEAMS
EX TERNAL STRATEGIC
OPERATIONALFINANCIAL
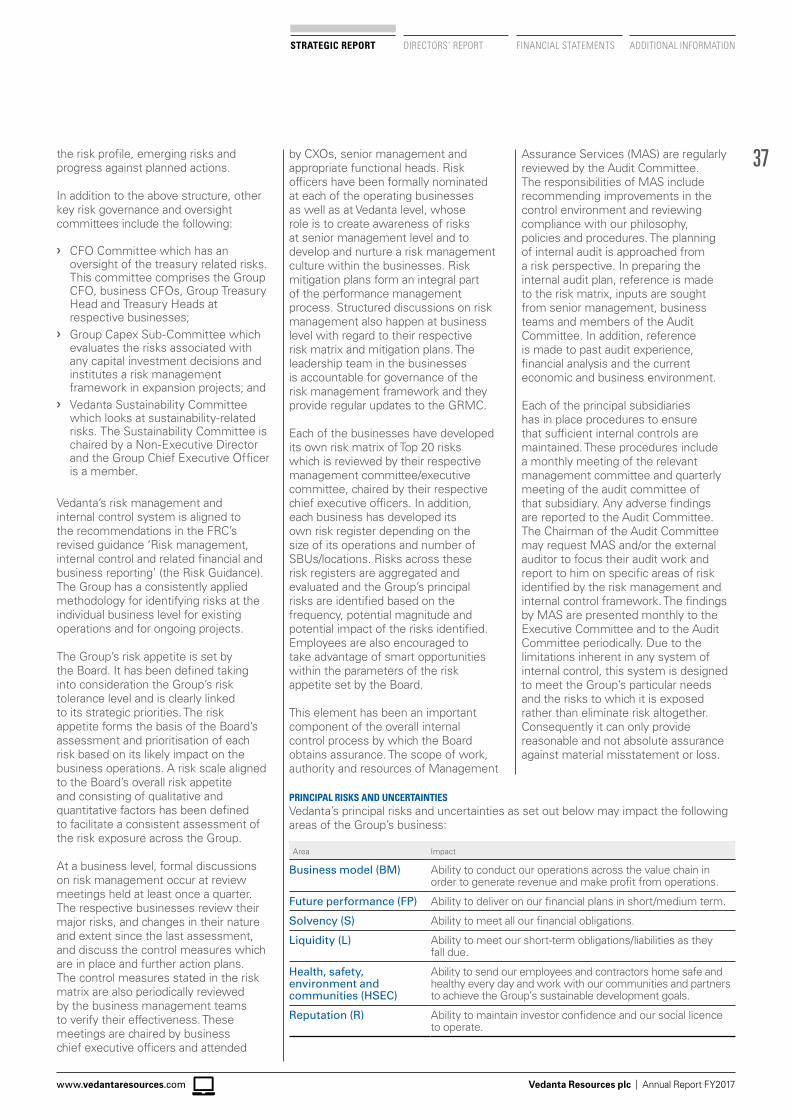
37
Vedanta Resources plc | Annual Report FY2017www.vedantaresources.com
STRATEGIC REPORT DIRECTORS’ REPORT FINANCIAL STATEMENTS ADDITIONAL INFORMATION
the risk profile, emerging risks and progress against planned actions.
In addition to the above structure, other key risk governance and oversight committees include the following:
❯ CFO Committee which has an oversight of the treasury related risks. This committee comprises the Group CFO, business CFOs, Group Treasury Head and Treasury Heads at respective businesses;
❯ Group Capex Sub-Committee which evaluates the risks associated with any capital investment decisions and institutes a risk management framework in expansion projects; and
❯ Vedanta Sustainability Committee which looks at sustainability-related risks. The Sustainability Committee is chaired by a Non-Executive Director and the Group Chief Executive Officer is a member.
Vedanta’s risk management and internal control system is aligned to the recommendations in the FRC’s revised guidance ‘Risk management, internal control and related financial and business reporting’ (the Risk Guidance). The Group has a consistently applied methodology for identifying risks at the individual business level for existing operations and for ongoing projects.
The Group’s risk appetite is set by the Board. It has been defined taking into consideration the Group’s risk tolerance level and is clearly linked to its strategic priorities. The risk appetite forms the basis of the Board’s assessment and prioritisation of each risk based on its likely impact on the business operations. A risk scale aligned to the Board’s overall risk appetite and consisting of qualitative and quantitative factors has been defined to facilitate a consistent assessment of the risk exposure across the Group.
At a business level, formal discussions on risk management occur at review meetings held at least once a quarter. The respective businesses review their major risks, and changes in their nature and extent since the last assessment, and discuss the control measures which are in place and further action plans. The control measures stated in the risk matrix are also periodically reviewed by the business management teams to verify their effectiveness. These meetings are chaired by business chief executive officers and attended
by CXOs, senior management and appropriate functional heads. Risk officers have been formally nominated at each of the operating businesses as well as at Vedanta level, whose role is to create awareness of risks at senior management level and to develop and nurture a risk management culture within the businesses. Risk mitigation plans form an integral part of the performance management process. Structured discussions on risk management also happen at business level with regard to their respective risk matrix and mitigation plans. The leadership team in the businesses is accountable for governance of the risk management framework and they provide regular updates to the GRMC.
Each of the businesses have developed its own risk matrix of Top 20 risks which is reviewed by their respective management committee/executive committee, chaired by their respective chief executive officers. In addition, each business has developed its own risk register depending on the size of its operations and number of SBUs/locations. Risks across these risk registers are aggregated and evaluated and the Group’s principal risks are identified based on the frequency, potential magnitude and potential impact of the risks identified. Employees are also encouraged to take advantage of smart opportunities within the parameters of the risk appetite set by the Board.
This element has been an important component of the overall internal control process by which the Board obtains assurance. The scope of work, authority and resources of Management
Assurance Services (MAS) are regularly reviewed by the Audit Committee. The responsibilities of MAS include recommending improvements in the control environment and reviewing compliance with our philosophy, policies and procedures. The planning of internal audit is approached from a risk perspective. In preparing the internal audit plan, reference is made to the risk matrix, inputs are sought from senior management, business teams and members of the Audit Committee. In addition, reference is made to past audit experience, financial analysis and the current economic and business environment.
Each of the principal subsidiaries has in place procedures to ensure that sufficient internal controls are maintained. These procedures include a monthly meeting of the relevant management committee and quarterly meeting of the audit committee of that subsidiary. Any adverse findings are reported to the Audit Committee. The Chairman of the Audit Committee may request MAS and/or the external auditor to focus their audit work and report to him on specific areas of risk identified by the risk management and internal control framework. The findings by MAS are presented monthly to the Executive Committee and to the Audit Committee periodically. Due to the limitations inherent in any system of internal control, this system is designed to meet the Group’s particular needs and the risks to which it is exposed rather than eliminate risk altogether. Consequently it can only provide reasonable and not absolute assurance against material misstatement or loss.
PRINCIPAL RISKS AND UNCERTAINTIESVedanta’s principal risks and uncertainties as set out below may impact the following areas of the Group’s business:
Area Impact
Business model (BM) Ability to conduct our operations across the value chain in order to generate revenue and make profit from operations.
Future performance (FP) Ability to deliver on our financial plans in short/medium term.
Solvency (S) Ability to meet all our financial obligations.
Liquidity (L) Ability to meet our short-term obligations/liabilities as they fall due.
Health, safety, environment and communities (HSEC)
Ability to send our employees and contractors home safe and healthy every day and work with our communities and partners to achieve the Group’s sustainable development goals.
Reputation (R) Ability to maintain investor confidence and our social licence to operate.
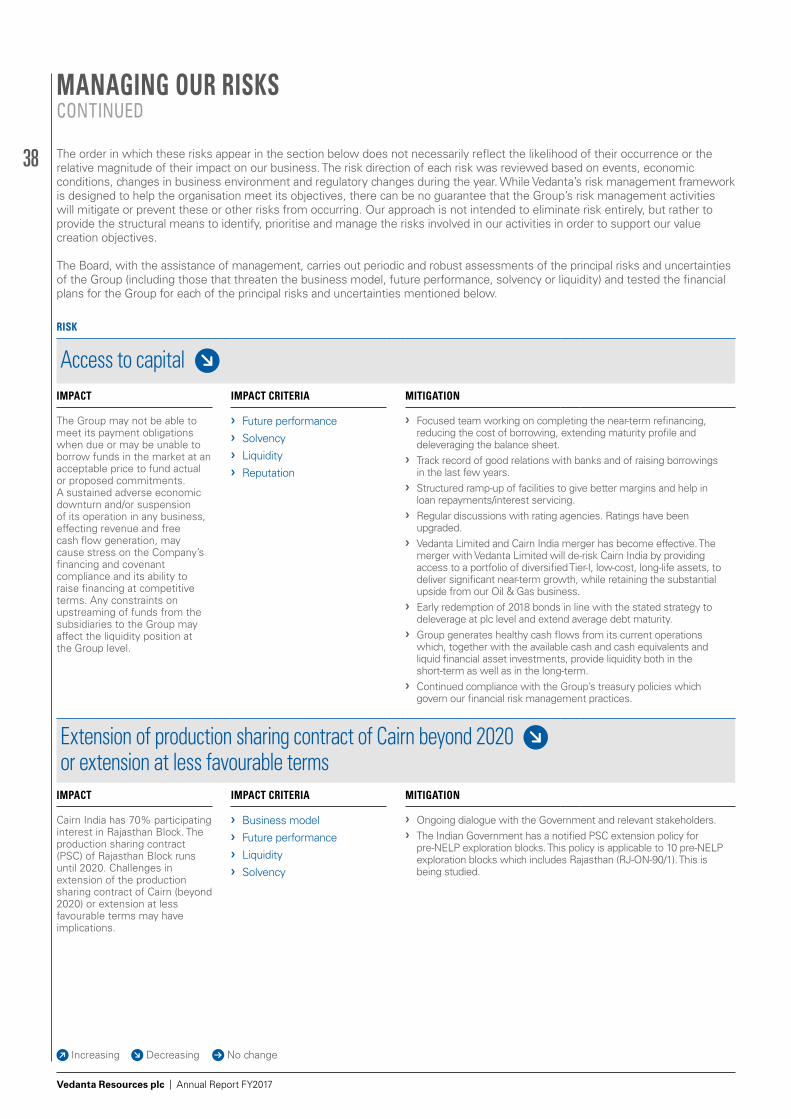
38
Vedanta Resources plc | Annual Report FY2017
RISK
Access to capital IMPACT IMPACT CRITERIA MITIGATION
The Group may not be able to meet its payment obligations when due or may be unable to borrow funds in the market at an acceptable price to fund actual or proposed commitments. A sustained adverse economic downturn and/or suspension of its operation in any business, effecting revenue and free cash flow generation, may cause stress on the Company’s financing and covenant compliance and its ability to raise financing at competitive terms. Any constraints on upstreaming of funds from the subsidiaries to the Group may affect the liquidity position at the Group level.
❯ Future performance ❯ Solvency ❯ Liquidity ❯ Reputation
❯ Focused team working on completing the near-term refinancing, reducing the cost of borrowing, extending maturity profile and deleveraging the balance sheet.
❯ Track record of good relations with banks and of raising borrowings in the last few years.
❯ Structured ramp-up of facilities to give better margins and help in loan repayments/interest servicing.
❯ Regular discussions with rating agencies. Ratings have been upgraded.
❯ Vedanta Limited and Cairn India merger has become effective. The merger with Vedanta Limited will de-risk Cairn India by providing access to a portfolio of diversified Tier-I, low-cost, long-life assets, to deliver significant near-term growth, while retaining the substantial upside from our Oil & Gas business.
❯ Early redemption of 2018 bonds in line with the stated strategy to deleverage at plc level and extend average debt maturity.
❯ Group generates healthy cash flows from its current operations which, together with the available cash and cash equivalents and liquid financial asset investments, provide liquidity both in the short-term as well as in the long-term.
❯ Continued compliance with the Group’s treasury policies which govern our financial risk management practices.
Extension of production sharing contract of Cairn beyond 2020 or extension at less favourable terms
IMPACT IMPACT CRITERIA MITIGATION
Cairn India has 70% participating interest in Rajasthan Block. The production sharing contract (PSC) of Rajasthan Block runs until 2020. Challenges in extension of the production sharing contract of Cairn (beyond 2020) or extension at less favourable terms may have implications.
❯ Business model ❯ Future performance ❯ Liquidity ❯ Solvency
❯ Ongoing dialogue with the Government and relevant stakeholders. ❯ The Indian Government has a notified PSC extension policy for
pre-NELP exploration blocks. This policy is applicable to 10 pre-NELP exploration blocks which includes Rajasthan (RJ-ON-90/1). This is being studied.
MANAGING OUR RISKSCONTINUED
The order in which these risks appear in the section below does not necessarily reflect the likelihood of their occurrence or the relative magnitude of their impact on our business. The risk direction of each risk was reviewed based on events, economic conditions, changes in business environment and regulatory changes during the year. While Vedanta’s risk management framework is designed to help the organisation meet its objectives, there can be no guarantee that the Group’s risk management activities will mitigate or prevent these or other risks from occurring. Our approach is not intended to eliminate risk entirely, but rather to provide the structural means to identify, prioritise and manage the risks involved in our activities in order to support our value creation objectives.
The Board, with the assistance of management, carries out periodic and robust assessments of the principal risks and uncertainties of the Group (including those that threaten the business model, future performance, solvency or liquidity) and tested the financial plans for the Group for each of the principal risks and uncertainties mentioned below.
Increasing Decreasing No change
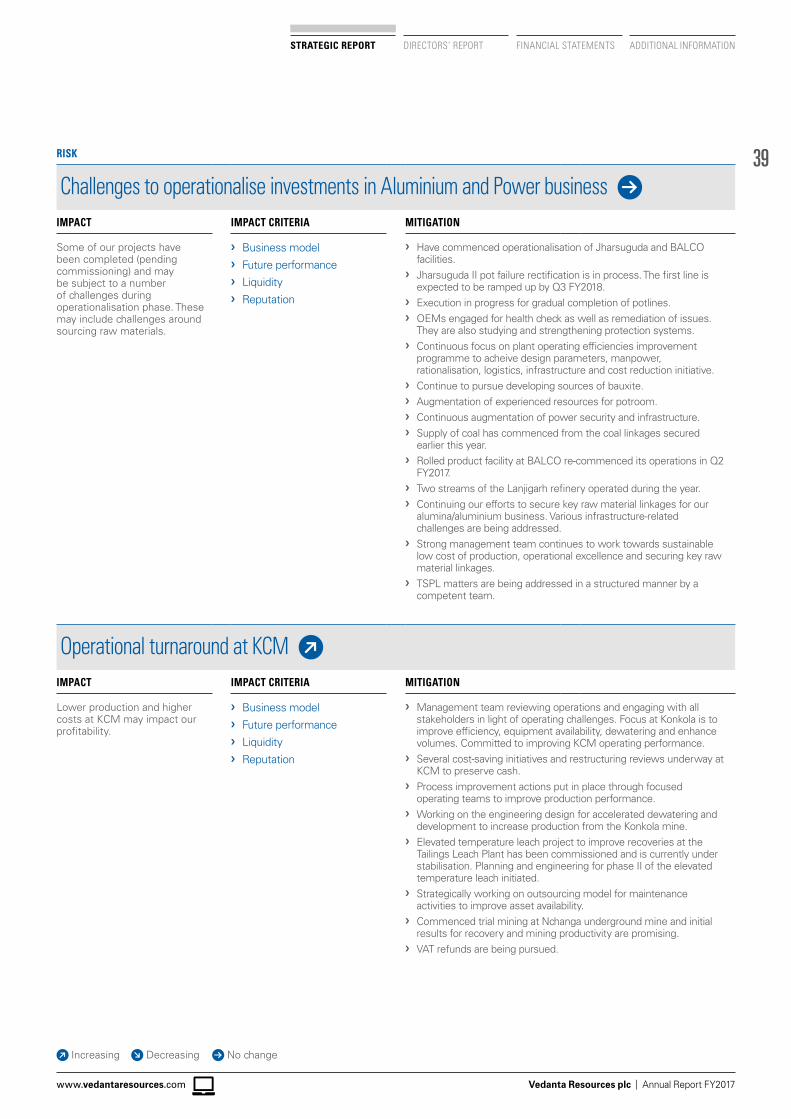
39
Vedanta Resources plc | Annual Report FY2017www.vedantaresources.com
STRATEGIC REPORT DIRECTORS’ REPORT FINANCIAL STATEMENTS ADDITIONAL INFORMATION
RISK
Challenges to operationalise investments in Aluminium and Power business IMPACT IMPACT CRITERIA MITIGATION
Some of our projects have been completed (pending commissioning) and may be subject to a number of challenges during operationalisation phase. These may include challenges around sourcing raw materials.
❯ Business model ❯ Future performance ❯ Liquidity ❯ Reputation
❯ Have commenced operationalisation of Jharsuguda and BALCO facilities.
❯ Jharsuguda II pot failure rectification is in process. The first line is expected to be ramped up by Q3 FY2018.
❯ Execution in progress for gradual completion of potlines. ❯ OEMs engaged for health check as well as remediation of issues.
They are also studying and strengthening protection systems. ❯ Continuous focus on plant operating efficiencies improvement
programme to acheive design parameters, manpower, rationalisation, logistics, infrastructure and cost reduction initiative.
❯ Continue to pursue developing sources of bauxite. ❯ Augmentation of experienced resources for potroom. ❯ Continuous augmentation of power security and infrastructure. ❯ Supply of coal has commenced from the coal linkages secured
earlier this year. ❯ Rolled product facility at BALCO re-commenced its operations in Q2
FY2017. ❯ Two streams of the Lanjigarh refinery operated during the year. ❯ Continuing our efforts to secure key raw material linkages for our
alumina/aluminium business. Various infrastructure-related challenges are being addressed.
❯ Strong management team continues to work towards sustainable low cost of production, operational excellence and securing key raw material linkages.
❯ TSPL matters are being addressed in a structured manner by a competent team.
Operational turnaround at KCM IMPACT IMPACT CRITERIA MITIGATION
Lower production and higher costs at KCM may impact our profitability.
❯ Business model ❯ Future performance ❯ Liquidity ❯ Reputation
❯ Management team reviewing operations and engaging with all stakeholders in light of operating challenges. Focus at Konkola is to improve efficiency, equipment availability, dewatering and enhance volumes. Committed to improving KCM operating performance.
❯ Several cost-saving initiatives and restructuring reviews underway at KCM to preserve cash.
❯ Process improvement actions put in place through focused operating teams to improve production performance.
❯ Working on the engineering design for accelerated dewatering and development to increase production from the Konkola mine.
❯ Elevated temperature leach project to improve recoveries at the Tailings Leach Plant has been commissioned and is currently under stabilisation. Planning and engineering for phase II of the elevated temperature leach initiated.
❯ Strategically working on outsourcing model for maintenance activities to improve asset availability.
❯ Commenced trial mining at Nchanga underground mine and initial results for recovery and mining productivity are promising.
❯ VAT refunds are being pursued.
Increasing Decreasing No change
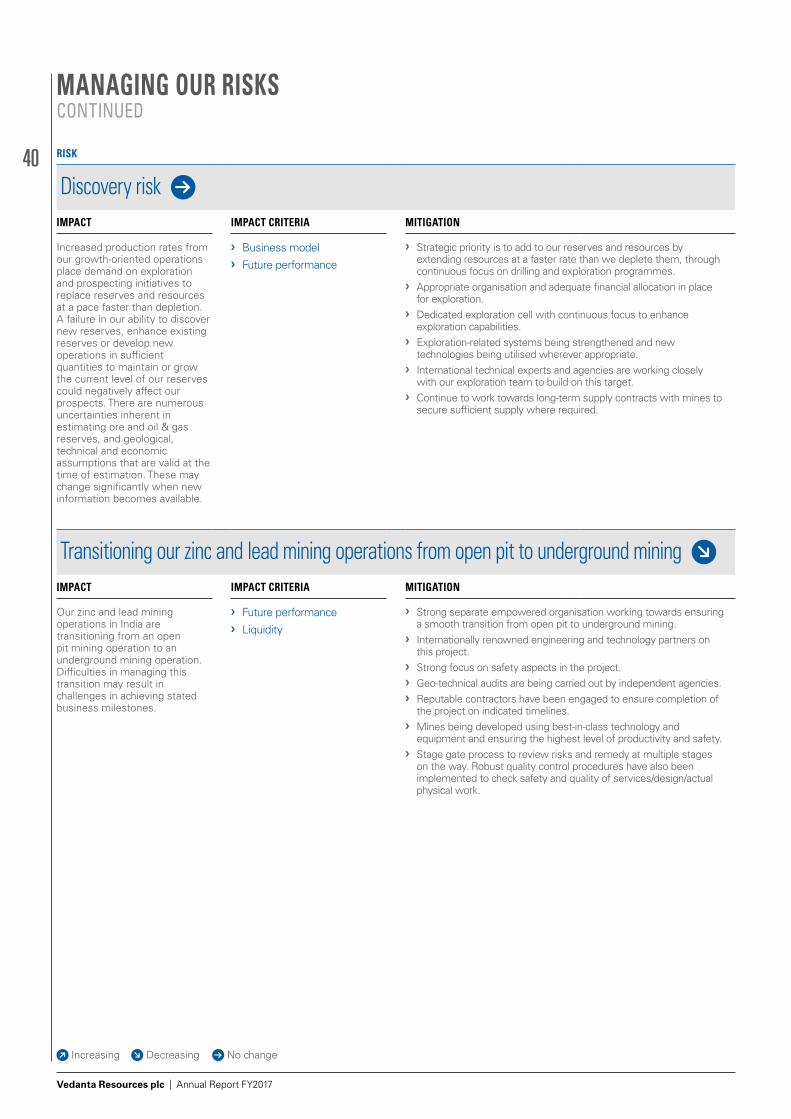
40
Vedanta Resources plc | Annual Report FY2017
Transitioning our zinc and lead mining operations from open pit to underground mining IMPACT IMPACT CRITERIA MITIGATION
Our zinc and lead mining operations in India are transitioning from an open pit mining operation to an underground mining operation. Difficulties in managing this transition may result in challenges in achieving stated business milestones.
❯ Future performance ❯ Liquidity
❯ Strong separate empowered organisation working towards ensuring a smooth transition from open pit to underground mining.
❯ Internationally renowned engineering and technology partners on this project.
❯ Strong focus on safety aspects in the project. ❯ Geo-technical audits are being carried out by independent agencies. ❯ Reputable contractors have been engaged to ensure completion of
the project on indicated timelines. ❯ Mines being developed using best-in-class technology and
equipment and ensuring the highest level of productivity and safety. ❯ Stage gate process to review risks and remedy at multiple stages
on the way. Robust quality control procedures have also been implemented to check safety and quality of services/design/actual physical work.
RISK
Discovery risk IMPACT IMPACT CRITERIA MITIGATION
Increased production rates from our growth-oriented operations place demand on exploration and prospecting initiatives to replace reserves and resources at a pace faster than depletion. A failure in our ability to discover new reserves, enhance existing reserves or develop new operations in sufficient quantities to maintain or grow the current level of our reserves could negatively affect our prospects. There are numerous uncertainties inherent in estimating ore and oil & gas reserves, and geological, technical and economic assumptions that are valid at the time of estimation. These may change significantly when new information becomes available.
❯ Business model ❯ Future performance
❯ Strategic priority is to add to our reserves and resources by extending resources at a faster rate than we deplete them, through continuous focus on drilling and exploration programmes.
❯ Appropriate organisation and adequate financial allocation in place for exploration.
❯ Dedicated exploration cell with continuous focus to enhance exploration capabilities.
❯ Exploration-related systems being strengthened and new technologies being utilised wherever appropriate.
❯ International technical experts and agencies are working closely with our exploration team to build on this target.
❯ Continue to work towards long-term supply contracts with mines to secure sufficient supply where required.
MANAGING OUR RISKSCONTINUED
Increasing Decreasing No change
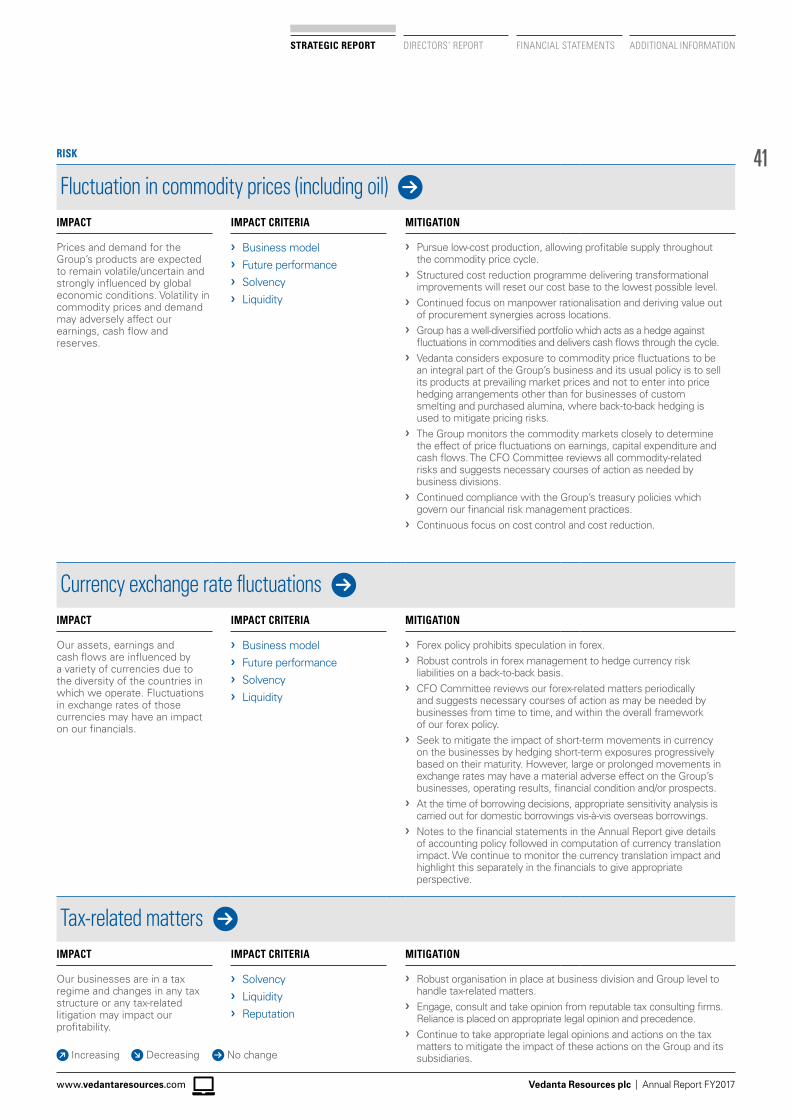
41
Vedanta Resources plc | Annual Report FY2017www.vedantaresources.com
STRATEGIC REPORT DIRECTORS’ REPORT FINANCIAL STATEMENTS ADDITIONAL INFORMATION
Tax-related matters IMPACT IMPACT CRITERIA MITIGATION
Our businesses are in a tax regime and changes in any tax structure or any tax-related litigation may impact our profitability.
❯ Solvency ❯ Liquidity ❯ Reputation
❯ Robust organisation in place at business division and Group level to handle tax-related matters.
❯ Engage, consult and take opinion from reputable tax consulting firms. Reliance is placed on appropriate legal opinion and precedence.
❯ Continue to take appropriate legal opinions and actions on the tax matters to mitigate the impact of these actions on the Group and its subsidiaries.
Currency exchange rate fluctuations IMPACT IMPACT CRITERIA MITIGATION
Our assets, earnings and cash flows are influenced by a variety of currencies due to the diversity of the countries in which we operate. Fluctuations in exchange rates of those currencies may have an impact on our financials.
❯ Business model ❯ Future performance ❯ Solvency ❯ Liquidity
❯ Forex policy prohibits speculation in forex. ❯ Robust controls in forex management to hedge currency risk
liabilities on a back-to-back basis. ❯ CFO Committee reviews our forex-related matters periodically
and suggests necessary courses of action as may be needed by businesses from time to time, and within the overall framework of our forex policy.
❯ Seek to mitigate the impact of short-term movements in currency on the businesses by hedging short-term exposures progressively based on their maturity. However, large or prolonged movements in exchange rates may have a material adverse effect on the Group’s businesses, operating results, financial condition and/or prospects.
❯ At the time of borrowing decisions, appropriate sensitivity analysis is carried out for domestic borrowings vis-à-vis overseas borrowings.
❯ Notes to the financial statements in the Annual Report give details of accounting policy followed in computation of currency translation impact. We continue to monitor the currency translation impact and highlight this separately in the financials to give appropriate perspective.
RISK
Fluctuation in commodity prices (including oil) IMPACT IMPACT CRITERIA MITIGATION
Prices and demand for the Group’s products are expected to remain volatile/uncertain and strongly influenced by global economic conditions. Volatility in commodity prices and demand may adversely affect our earnings, cash flow and reserves.
❯ Business model ❯ Future performance ❯ Solvency ❯ Liquidity
❯ Pursue low-cost production, allowing profitable supply throughout the commodity price cycle.
❯ Structured cost reduction programme delivering transformational improvements will reset our cost base to the lowest possible level.
❯ Continued focus on manpower rationalisation and deriving value out of procurement synergies across locations.
❯ Group has a well-diversified portfolio which acts as a hedge against fluctuations in commodities and delivers cash flows through the cycle.
❯ Vedanta considers exposure to commodity price fluctuations to be an integral part of the Group’s business and its usual policy is to sell its products at prevailing market prices and not to enter into price hedging arrangements other than for businesses of custom smelting and purchased alumina, where back-to-back hedging is used to mitigate pricing risks.
❯ The Group monitors the commodity markets closely to determine the effect of price fluctuations on earnings, capital expenditure and cash flows. The CFO Committee reviews all commodity-related risks and suggests necessary courses of action as needed by business divisions.
❯ Continued compliance with the Group’s treasury policies which govern our financial risk management practices.
❯ Continuous focus on cost control and cost reduction.
Increasing Decreasing No change
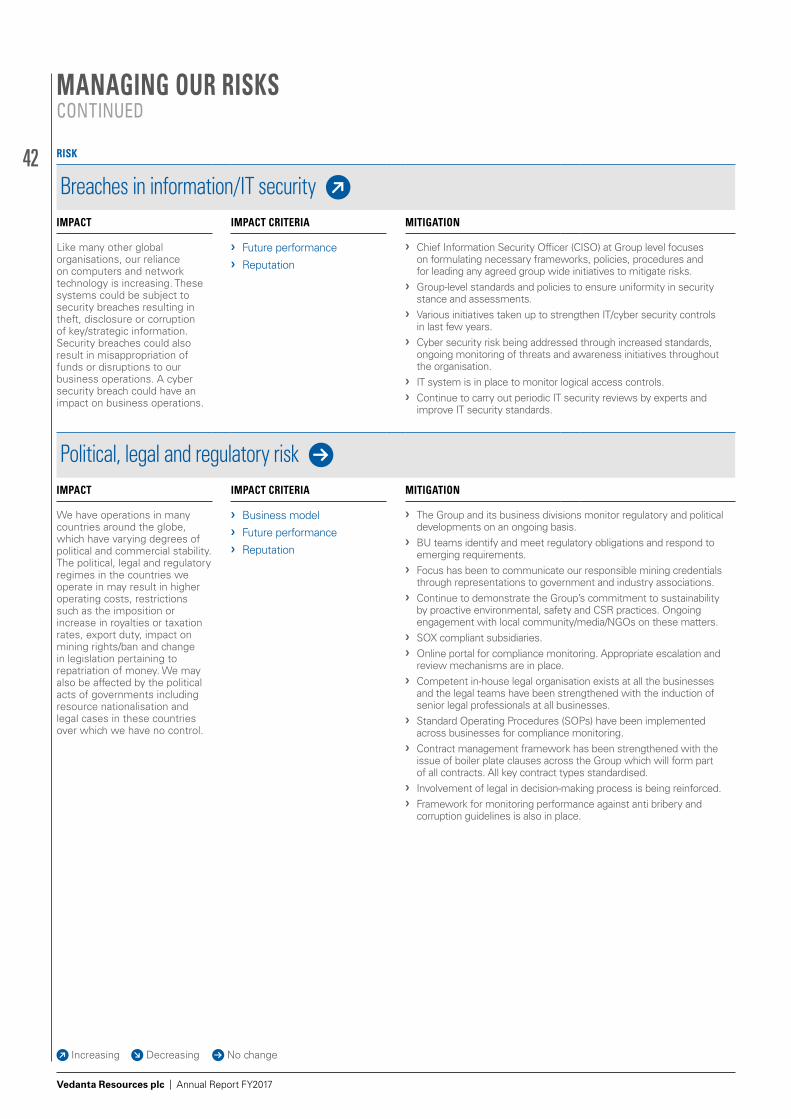
42
Vedanta Resources plc | Annual Report FY2017
Political, legal and regulatory risk IMPACT IMPACT CRITERIA MITIGATION
We have operations in many countries around the globe, which have varying degrees of political and commercial stability. The political, legal and regulatory regimes in the countries we operate in may result in higher operating costs, restrictions such as the imposition or increase in royalties or taxation rates, export duty, impact on mining rights/ban and change in legislation pertaining to repatriation of money. We may also be affected by the political acts of governments including resource nationalisation and legal cases in these countries over which we have no control.
❯ Business model ❯ Future performance ❯ Reputation
❯ The Group and its business divisions monitor regulatory and political developments on an ongoing basis.
❯ BU teams identify and meet regulatory obligations and respond to emerging requirements.
❯ Focus has been to communicate our responsible mining credentials through representations to government and industry associations.
❯ Continue to demonstrate the Group’s commitment to sustainability by proactive environmental, safety and CSR practices. Ongoing engagement with local community/media/NGOs on these matters.
❯ SOX compliant subsidiaries. ❯ Online portal for compliance monitoring. Appropriate escalation and
review mechanisms are in place. ❯ Competent in-house legal organisation exists at all the businesses
and the legal teams have been strengthened with the induction of senior legal professionals at all businesses.
❯ Standard Operating Procedures (SOPs) have been implemented across businesses for compliance monitoring.
❯ Contract management framework has been strengthened with the issue of boiler plate clauses across the Group which will form part of all contracts. All key contract types standardised.
❯ Involvement of legal in decision-making process is being reinforced. ❯ Framework for monitoring performance against anti bribery and
corruption guidelines is also in place.
RISK
Breaches in information/IT security IMPACT IMPACT CRITERIA MITIGATION
Like many other global organisations, our reliance on computers and network technology is increasing. These systems could be subject to security breaches resulting in theft, disclosure or corruption of key/strategic information. Security breaches could also result in misappropriation of funds or disruptions to our business operations. A cyber security breach could have an impact on business operations.
❯ Future performance ❯ Reputation
❯ Chief Information Security Officer (CISO) at Group level focuses on formulating necessary frameworks, policies, procedures and for leading any agreed group wide initiatives to mitigate risks.
❯ Group-level standards and policies to ensure uniformity in security stance and assessments.
❯ Various initiatives taken up to strengthen IT/cyber security controls in last few years.
❯ Cyber security risk being addressed through increased standards, ongoing monitoring of threats and awareness initiatives throughout the organisation.
❯ IT system is in place to monitor logical access controls. ❯ Continue to carry out periodic IT security reviews by experts and
improve IT security standards.
MANAGING OUR RISKSCONTINUED
Increasing Decreasing No change
43
Vedanta Resources plc | Annual Report FY2017www.vedantaresources.com
STRATEGIC REPORT DIRECTORS’ REPORT FINANCIAL STATEMENTS ADDITIONAL INFORMATION
RISK
Community relations IMPACT IMPACT CRITERIA MITIGATION
The continued success of our existing operations and future projects are in part dependent upon broad support and a healthy relationship with the respective local communities. Failure to identify and manage local concerns and expectations can have a negative impact on relations with local communities and therefore affect the organisation’s reputation and social licence to operate and grow.
❯ Business model ❯ Future performance ❯ HSEC ❯ Reputation
❯ CSR approach to community programmes is governed by the following key considerations: the needs of the local people and the development plan in line with the new Companies Act in India, CSR guidelines, UN Millennium Development Goals (UNMDG) and also CSR National Voluntary Guidelines of Ministry of Corporate Affairs, Government of India and the UN’s Sustainable Development Goals.
❯ Board-level CSR Committee comprising independent Directors, full-time Directors and CEO decides focus areas of CSR, budget and programmes of respective businesses.
❯ Sustainable development programmes are driven by stakeholder engagement and consultation along with baseline studies and needs-based assessments.
❯ Periodic meetings with existing and potential SRI investors, lenders and analysts and hosting of maiden Sustainable Development Day in London helps in two-way engagement and understanding the material issues for stakeholders.
❯ Every business has a dedicated CSR team. Key focus areas for CSR are health, nutrition, sanitation, education, sustainable livelihoods and female empowerment. Dedicated team of over 180 corporate social responsibility personnel.
❯ Help communities identify their priorities through participatory need assessment programmes and work closely with them to design programmes that seek to make progress towards improvements in quality of life of local communities.
❯ Our business leadership teams have periodic engagements with the local communities to build relations based on trust and mutual benefit. Our businesses seek to identify and minimise any potentially negative operational impacts and risks through responsible behaviour – acting transparently and ethically, promoting dialogue and complying with commitments to stakeholders.
❯ Integration of sustainability objectives into long-term plans.
Emissions and climate change IMPACT IMPACT CRITERIA MITIGATION
Our global presence exposes us to a number of jurisdictions in which regulations or laws have been or are being considered to limit or reduce emissions. The likely effect of these changes will be to increase the cost for fossil fuels, impose levies for emissions in excess of certain permitted levels and increased administrative costs for monitoring and reporting. Increasing regulation of greenhouse gas (GHG) emissions, including the progressive introduction of carbon emissions trading mechanisms and tighter emission reduction targets, is likely to raise costs and reduce demand growth.
❯ Business model ❯ Future performance ❯ HSEC ❯ Reputation
❯ Carbon Forum with business representation monitors developments and set out defensive policies, strategy and actions.
❯ Defining targets and implementing action plans to reduce the carbon intensity of our operations. This will include:
– reduce emission intensity through technology, energy conservation and efficiency;
– increase renewable mix to the extent feasible; and – increase green cover at our locations.
❯ Engaging with Government on carbon policies and innovation technologies.
❯ Facilitate development and implementation of the adaptive measures in the community around our operations.
❯ Institutionalise system to manage carbon risks and opportunities across the business over the life cycle of its products.
❯ Engage with stakeholders in creating awareness and developing climate change solutions.
❯ Monitor and report carbon emissions from the businesses in line with local standards as well as accepted international standards.
❯ Increasing focus on renewable power obligations.
Increasing Decreasing No change
44
Vedanta Resources plc | Annual Report FY2017
RISK
Health, safety and environment (HSE) IMPACT IMPACT CRITERIA MITIGATION
The resources sector is subject to extensive health, safety and environmental laws, regulations and standards. Evolving regulations, standards and stakeholder expectations could result in increased cost, litigation or threaten the viability of operations in extreme cases.
❯ HSEC ❯ Business model ❯ Reputation
❯ Health, safety and environment (HSE) is a high priority area for Vedanta. Compliance with international and local regulations and standards, protecting our people, communities and the environment from harm and our operations from business interruptions are our key focus areas.
❯ Vedanta has a Board level Sustainability Committee chaired by a non-executive director and of which the Group CEO is a member, which meets periodically to discuss HSE performance.
❯ Appropriate policies and standards are in place to mitigate and minimise any HSE-related occurrences. Structured monitoring and a review mechanism and system of positive compliance reporting are in place.
❯ The Company has implemented a set of standards to align its sustainability framework with international practice. A structured sustainability assurance programme continues to operate in the business divisions covering environment, health, safety, community relations and human rights aspects and to embed our commitment at operational level.
❯ HSE experts are also inducted from reputed Indian and global organisations to bring in best-in-class practices.
❯ All businesses have appropriate policies in place for occupational health-related matters supported by structured processes, controls and technology. Our operations ensure the issue of operational health and potential risk/ obligations are carefully handled. Depending on the nature of the exposure and surrounding risk, our operations have different levels of processes, controls and monitoring mechanisms.
❯ Strong focus on safety during project planning/execution with adequate oversight of contract workmen safety.
❯ Report, investigate and share learnings from HSE incidents. Fatal accidents and injury rates have declined.
❯ Building safety targets into performance management to incentivise safe behaviour and effective risk management.
❯ Leadership coaching being rolled out across businesses to make better risk decisions.
❯ High potential actions closure and standards implementation discussed at Executive Committee level.
❯ Critical environment controls being reviewed including measure, monitor and report requirements.
❯ Leadership remains focused on a zero-harm culture across the organisation. Consistent application of ‘life-saving’ performance standards, introduction of Making Better Risk Decisions concept, quantitative risk assessments for critical risks and the formal identification of process safety risks with the focus on the implementation of controls are central to our improvement programme. We continue to improve on our safety investigations and follow-up processes.
MANAGING OUR RISKSCONTINUED
Increasing Decreasing No change
45
Vedanta Resources plc | Annual Report FY2017www.vedantaresources.com
STRATEGIC REPORT DIRECTORS’ REPORT FINANCIAL STATEMENTS ADDITIONAL INFORMATION
RISK
Talent/skill shortage risk IMPACT IMPACT CRITERIA MITIGATION
The Company’s efforts to continue its growth and efficient operations will place significant demand on its management resources. Our highly skilled workforce and experienced management team is critical to maintaining its current operations, implementing its development projects and achieving longer-term growth. Any significant loss or diminution in the collective pool of Vedanta’s executive management or other key team members could have a material effect on its businesses, operating results and future prospects.
❯ Future performance ❯ Reputation
❯ Progressive HR policies and strong HR leadership have ensured that career progression, job rotation and job enrichment are focus areas for our businesses.
❯ Continue to invest in initiatives to widen our talent pool. This is a priority area for the Group.
❯ Senior leadership actively involved in development of talent pool. ❯ Talent management system in place to identify and develop internal
candidates for critical management positions and processes to identify suitable external candidates.
❯ Manpower optimisation across businesses ensuring proper skill development of employees.
❯ Our performance management system is designed to provide reward and remuneration structures and personal development opportunities to attract and retain key employees.
❯ Structured programme maps critical positions and ensures all such positions are filled with suitable candidates.
❯ Established the Mining Academy in Rajasthan to develop an employee pool with enhanced underground mining skills.
❯ Structured programme to develop a technically proficient employee pool.
❯ Continued focus on improving diversity at all levels.
Loss of assets or profit due to natural calamities IMPACT IMPACT CRITERIA MITIGATION
Our operations may be subject to a number of circumstances not wholly within the Group’s control. These include damage to or breakdown of equipment or infrastructure, unexpected geological variations or technical issues, extreme weather conditions and natural disasters, any of which could adversely affect production and/or costs.
❯ Future performance ❯ Reputation
❯ Vedanta has taken appropriate Group insurance cover to mitigate this risk.
❯ External agency reviews the risk portfolio and adequacy of this cover and assists us in our insurance portfolio.
❯ Our underwriters are reputed institutions and have capacity to underwrite our risk.
❯ Established mechanism of periodic insurance review in place at all entities. However, any occurrence not fully covered by insurance could have an adverse effect on the Group’s business.
❯ Continue to focus on capability building within the Group.
Tailings dam failure IMPACT IMPACT CRITERIA MITIGATION
A release of waste material leading to loss of life, injuries, environmental damage, reputational damage, financial costs and production impacts. Tailings dam failure is considered a catastrophic risk – i.e. a very high severity but very low frequency event that must be treated with the highest priority.
❯ Future performance ❯ Reputation ❯ HSEC ❯ Business model
❯ The Risk Management Committee included tailings dams on the Group Risk Register with a requirement for annual internal review and three-yearly external review.
❯ Operation of tailings dams by suitable experienced personnel within the businesses.
❯ Periodic audit of tailings dam facilities. ❯ Management standard developed with business involvement. ❯ Third-party expert assessment of the dams to identify tailings dams
related risks largely completed across the Group by reputable international firm and improvement opportunities/remedial work in line with best practice identified. ‘Dam Break’ analysis to be done, if needed, to determine the impact should a dam fail and indicate the action required to protect communities.
❯ Individuals responsible for dam management have received training from reputed agency.
Increasing Decreasing No change
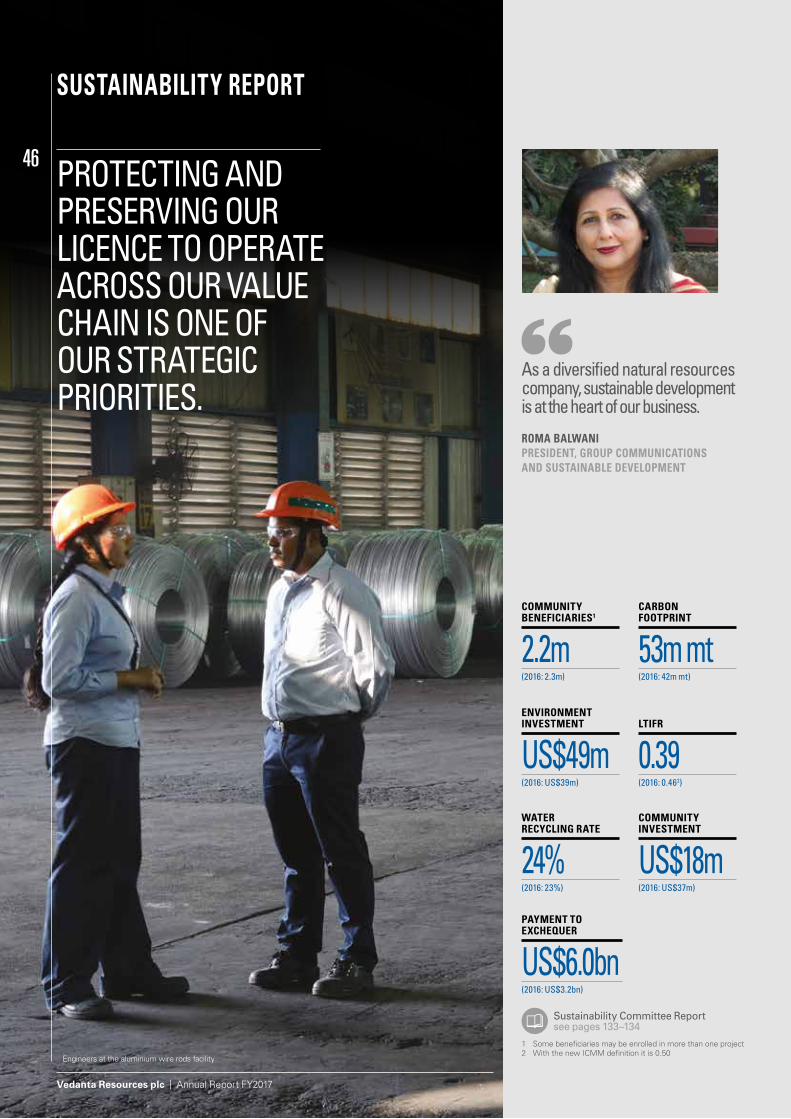
46
Vedanta Resources plc | Annual Report FY2017
SUSTAINABILITY REPORT
PROTECTING AND PRESERVING OUR LICENCE TO OPERATE ACROSS OUR VALUE CHAIN IS ONE OF OUR STRATEGIC PRIORITIES.
As a diversified natural resources company, sustainable development is at the heart of our business.
ROMA BALWANIPRESIDENT, GROUP COMMUNICATIONS AND SUSTAINABLE DEVELOPMENT
COMMUNITY BENEFICIARIES1
2.2m(2016: 2.3m)
ENVIRONMENT INVESTMENT
US$49m(2016: US$39m)
WATER RECYCLING RATE
24%(2016: 23%)
PAYMENT TO EXCHEQUER
US$6.0bn(2016: US$3.2bn)
CARBON FOOTPRINT
53m mt(2016: 42m mt)
LTIFR
0.39(2016: 0.462)
COMMUNITY INVESTMENT
US$18m(2016: US$37m)
Sustainability Committee Report see pages 133–134
Engineers at the aluminium wire rods facility
1 Some beneficiaries may be enrolled in more than one project2 With the new ICMM definition it is 0.50
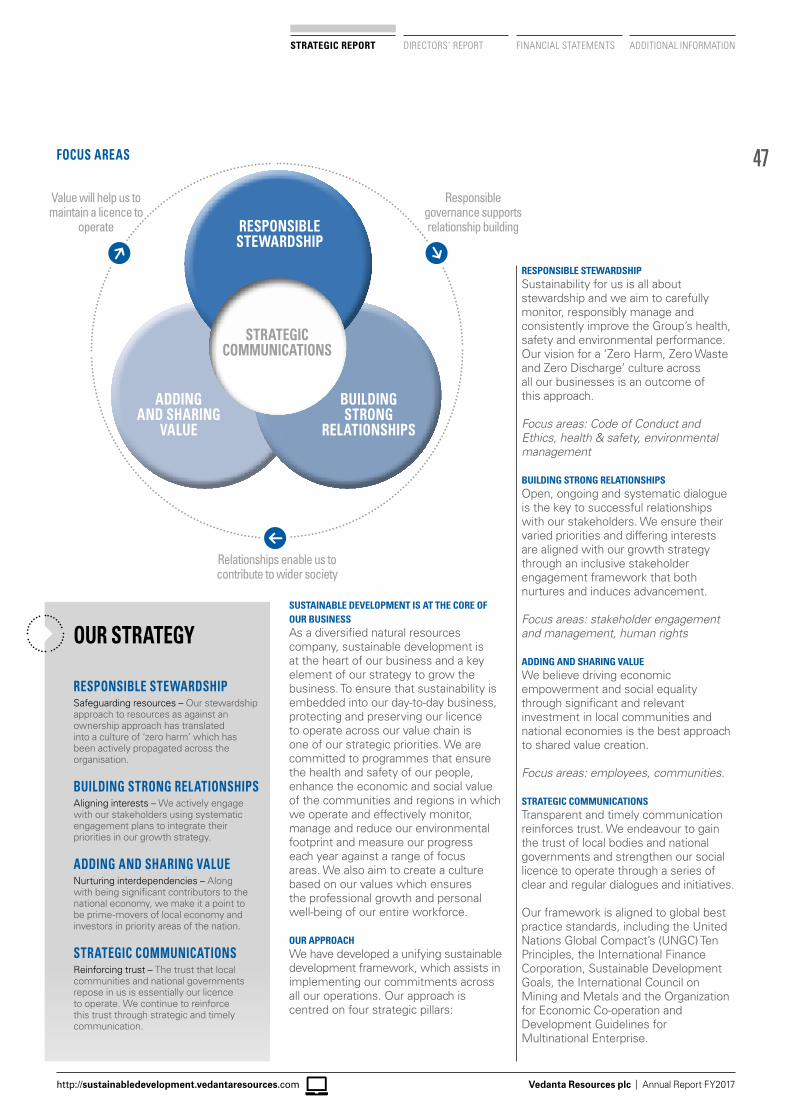
47
Vedanta Resources plc | Annual Report FY2017
STRATEGIC REPORT DIRECTORS’ REPORT FINANCIAL STATEMENTS ADDITIONAL INFORMATION
http://sustainabledevelopment.vedantaresources.com
RESPONSIBLESTEWARDSHIP
ADDINGAND SHARING
VALUE
BUILDINGSTRONG
RELATIONSHIPS
STRATEGICCOMMUNICATIONS
Responsible governance supports relationship building
Value will help us to maintain a licence to
operate
Relationships enable us to contribute to wider society
FOCUS AREAS
RESPONSIBLE STEWARDSHIPSafeguarding resources – Our stewardship approach to resources as against an ownership approach has translated into a culture of ‘zero harm’ which has been actively propagated across the organisation.
BUILDING STRONG RELATIONSHIPSAligning interests – We actively engage with our stakeholders using systematic engagement plans to integrate their priorities in our growth strategy.
ADDING AND SHARING VALUENurturing interdependencies – Along with being significant contributors to the national economy, we make it a point to be prime-movers of local economy and investors in priority areas of the nation.
STRATEGIC COMMUNICATIONSReinforcing trust – The trust that local communities and national governments repose in us is essentially our licence to operate. We continue to reinforce this trust through strategic and timely communication.
OUR STRATEGYSUSTAINABLE DEVELOPMENT IS AT THE CORE OF OUR BUSINESSAs a diversified natural resources company, sustainable development is at the heart of our business and a key element of our strategy to grow the business. To ensure that sustainability is embedded into our day-to-day business, protecting and preserving our licence to operate across our value chain is one of our strategic priorities. We are committed to programmes that ensure the health and safety of our people, enhance the economic and social value of the communities and regions in which we operate and effectively monitor, manage and reduce our environmental footprint and measure our progress each year against a range of focus areas. We also aim to create a culture based on our values which ensures the professional growth and personal well-being of our entire workforce.
OUR APPROACH We have developed a unifying sustainable development framework, which assists in implementing our commitments across all our operations. Our approach is centred on four strategic pillars:
RESPONSIBLE STEWARDSHIP Sustainability for us is all about stewardship and we aim to carefully monitor, responsibly manage and consistently improve the Group’s health, safety and environmental performance. Our vision for a ‘Zero Harm, Zero Waste and Zero Discharge’ culture across all our businesses is an outcome of this approach.
Focus areas: Code of Conduct and Ethics, health & safety, environmental management
BUILDING STRONG RELATIONSHIPS Open, ongoing and systematic dialogue is the key to successful relationships with our stakeholders. We ensure their varied priorities and differing interests are aligned with our growth strategy through an inclusive stakeholder engagement framework that both nurtures and induces advancement.
Focus areas: stakeholder engagement and management, human rights
ADDING AND SHARING VALUE We believe driving economic empowerment and social equality through significant and relevant investment in local communities and national economies is the best approach to shared value creation.
Focus areas: employees, communities.
STRATEGIC COMMUNICATIONS Transparent and timely communication reinforces trust. We endeavour to gain the trust of local bodies and national governments and strengthen our social licence to operate through a series of clear and regular dialogues and initiatives.
Our framework is aligned to global best practice standards, including the United Nations Global Compact’s (UNGC) Ten Principles, the International Finance Corporation, Sustainable Development Goals, the International Council on Mining and Metals and the Organization for Economic Co-operation and Development Guidelines for Multinational Enterprise.
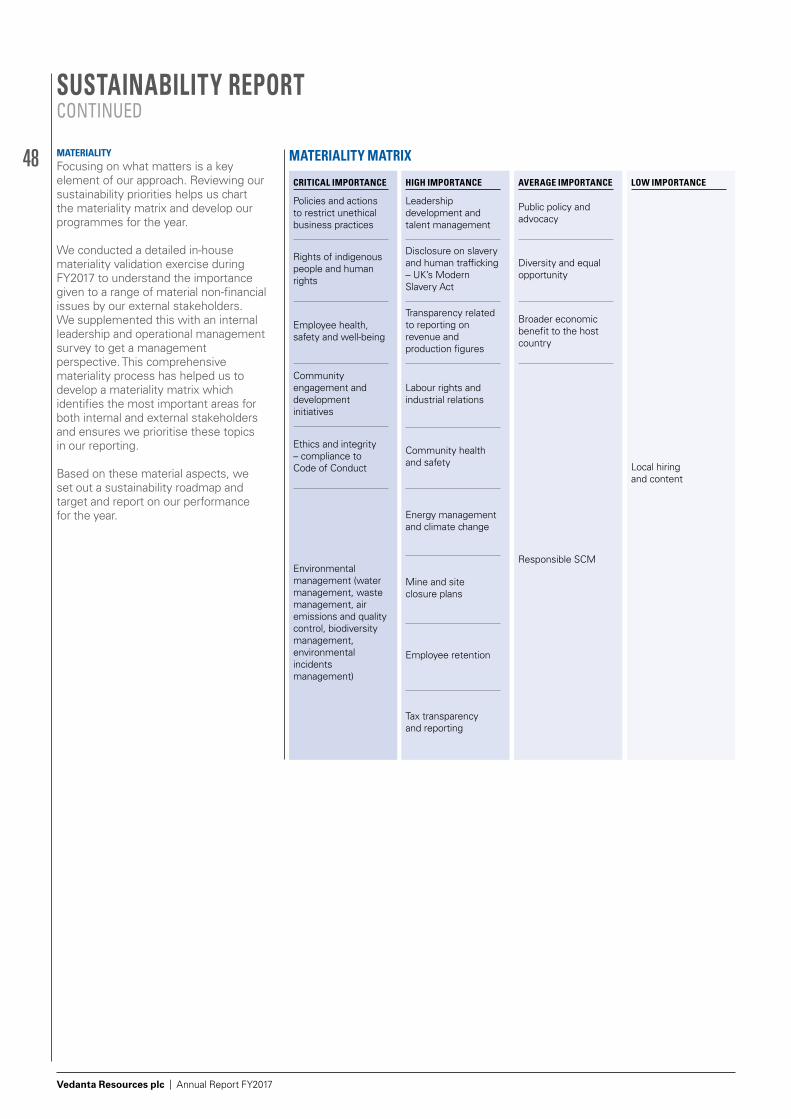
48
Vedanta Resources plc | Annual Report FY2017
SUSTAINABILITY REPORTCONTINUED
MATERIALITYFocusing on what matters is a key element of our approach. Reviewing our sustainability priorities helps us chart the materiality matrix and develop our programmes for the year.
We conducted a detailed in-house materiality validation exercise during FY2017 to understand the importance given to a range of material non-financial issues by our external stakeholders. We supplemented this with an internal leadership and operational management survey to get a management perspective. This comprehensive materiality process has helped us to develop a materiality matrix which identifies the most important areas for both internal and external stakeholders and ensures we prioritise these topics in our reporting.
Based on these material aspects, we set out a sustainability roadmap and target and report on our performance for the year.
MATERIALITY MATRIX
CRITICAL IMPORTANCE
Policies and actions to restrict unethical business practices
Rights of indigenous people and human rights
Employee health, safety and well-being
Community engagement and development initiatives
Ethics and integrity – compliance to Code of Conduct
Environmental management (water management, waste management, air emissions and quality control, biodiversity management, environmental incidents management)
HIGH IMPORTANCE
Leadership development and talent management
Disclosure on slavery and human trafficking – UK’s Modern Slavery Act
Transparency related to reporting on revenue and production figures
Labour rights and industrial relations
Community health and safety
Energy management and climate change
Mine and site closure plans
Employee retention
Tax transparency and reporting
AVERAGE IMPORTANCE
Public policy and advocacy
Diversity and equal opportunity
Broader economic benefit to the host country
Responsible SCM
LOW IMPORTANCE
Local hiring and content
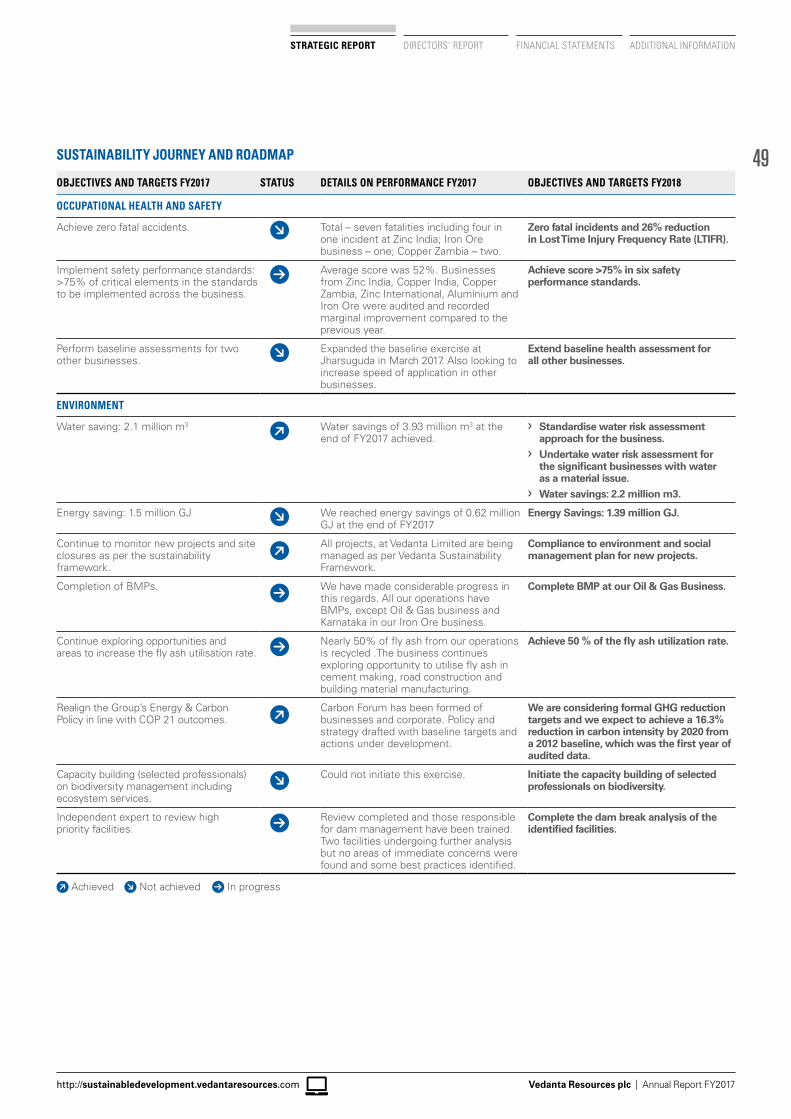
49
Vedanta Resources plc | Annual Report FY2017
STRATEGIC REPORT DIRECTORS’ REPORT FINANCIAL STATEMENTS ADDITIONAL INFORMATION
http://sustainabledevelopment.vedantaresources.com
SUSTAINABILITY JOURNEY AND ROADMAP
OBJECTIVES AND TARGETS FY2017 STATUS DETAILS ON PERFORMANCE FY2017 OBJECTIVES AND TARGETS FY2018
OCCUPATIONAL HEALTH AND SAFETY
Achieve zero fatal accidents. Total – seven fatalities including four in one incident at Zinc India; Iron Ore business – one; Copper Zambia – two.
Zero fatal incidents and 26% reduction in Lost Time Injury Frequency Rate (LTIFR).
Implement safety performance standards: >75% of critical elements in the standards to be implemented across the business.
Average score was 52%. Businesses from Zinc India, Copper India, Copper Zambia, Zinc International, Aluminium and Iron Ore were audited and recorded marginal improvement compared to the previous year.
Achieve score >75% in six safety performance standards.
Perform baseline assessments for twoother businesses.
Expanded the baseline exercise at Jharsuguda in March 2017. Also looking to increase speed of application in other businesses.
Extend baseline health assessment for all other businesses.
ENVIRONMENT
Water saving: 2.1 million m3 Water savings of 3.93 million m3 at the end of FY2017 achieved.
❯ Standardise water risk assessment approach for the business.
❯ Undertake water risk assessment for the significant businesses with water as a material issue.
❯ Water savings: 2.2 million m3.
Energy saving: 1.5 million GJ We reached energy savings of 0.62 million GJ at the end of FY2017
Energy Savings: 1.39 million GJ.
Continue to monitor new projects and siteclosures as per the sustainability framework.
All projects, at Vedanta Limited are being managed as per Vedanta Sustainability Framework.
Compliance to environment and social management plan for new projects.
Completion of BMPs. We have made considerable progress in this regards. All our operations have BMPs, except Oil & Gas business and Karnataka in our Iron Ore business.
Complete BMP at our Oil & Gas Business.
Continue exploring opportunities andareas to increase the fly ash utilisation rate.
Nearly 50% of fly ash from our operations is recycled .The business continues exploring opportunity to utilise fly ash in cement making, road construction and building material manufacturing.
Achieve 50 % of the fly ash utilization rate.
Realign the Group’s Energy & CarbonPolicy in line with COP 21 outcomes.
Carbon Forum has been formed of businesses and corporate. Policy and strategy drafted with baseline targets and actions under development.
We are considering formal GHG reduction targets and we expect to achieve a 16.3% reduction in carbon intensity by 2020 from a 2012 baseline, which was the first year of audited data.
Capacity building (selected professionals)on biodiversity management includingecosystem services.
Could not initiate this exercise. Initiate the capacity building of selected professionals on biodiversity.
Independent expert to review highpriority facilities.
Review completed and those responsible for dam management have been trained. Two facilities undergoing further analysis but no areas of immediate concerns were found and some best practices identified.
Complete the dam break analysis of the identified facilities.
Achieved Not achieved In progress
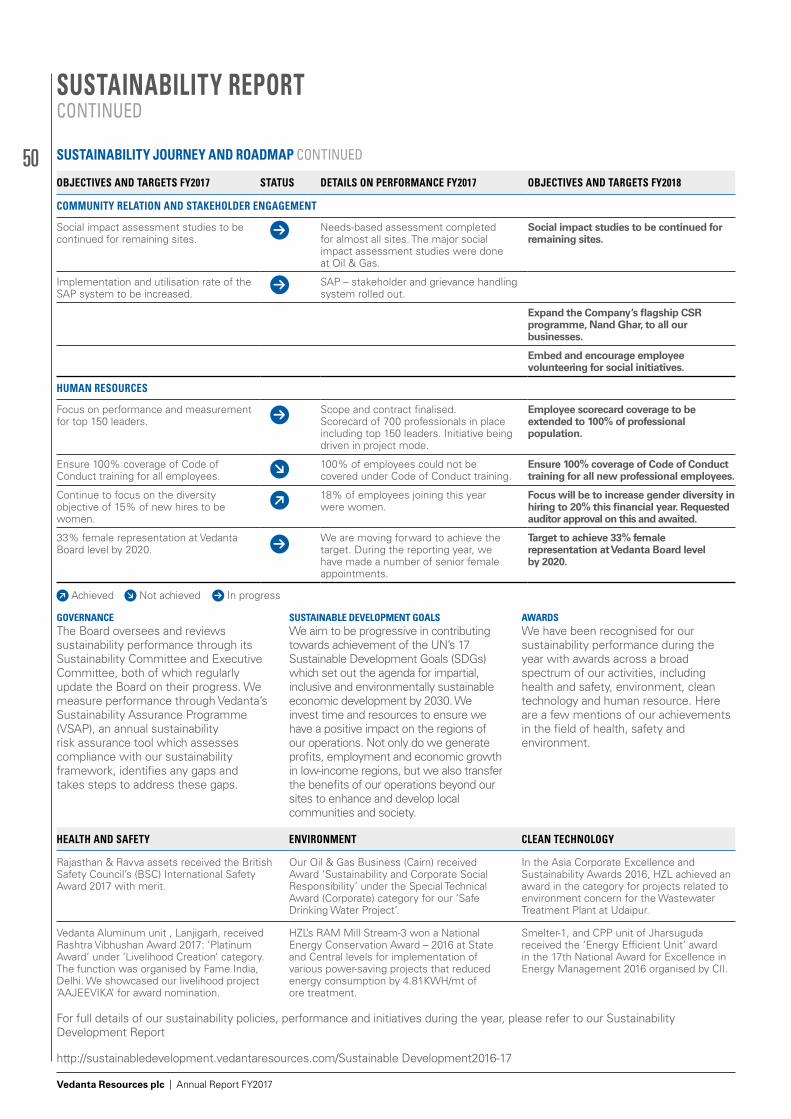
50
Vedanta Resources plc | Annual Report FY2017
SUSTAINABILITY JOURNEY AND ROADMAP CONTINUED
OBJECTIVES AND TARGETS FY2017 STATUS DETAILS ON PERFORMANCE FY2017 OBJECTIVES AND TARGETS FY2018
COMMUNITY RELATION AND STAKEHOLDER ENGAGEMENT
Social impact assessment studies to be continued for remaining sites.
Needs-based assessment completed for almost all sites. The major social impact assessment studies were done at Oil & Gas.
Social impact studies to be continued for remaining sites.
Implementation and utilisation rate of the SAP system to be increased.
SAP – stakeholder and grievance handling system rolled out.
Expand the Company’s flagship CSR programme, Nand Ghar, to all our businesses.
Embed and encourage employee volunteering for social initiatives.
HUMAN RESOURCES
Focus on performance and measurement for top 150 leaders.
Scope and contract finalised. Scorecard of 700 professionals in place including top 150 leaders. Initiative being driven in project mode.
Employee scorecard coverage to be extended to 100% of professional population.
Ensure 100% coverage of Code of Conduct training for all employees.
100% of employees could not be covered under Code of Conduct training.
Ensure 100% coverage of Code of Conduct training for all new professional employees.
Continue to focus on the diversityobjective of 15% of new hires to be women.
18% of employees joining this year were women.
Focus will be to increase gender diversity in hiring to 20% this financial year. Requested auditor approval on this and awaited.
33% female representation at Vedanta Board level by 2020.
We are moving forward to achieve the target. During the reporting year, we have made a number of senior female appointments.
Target to achieve 33% female representation at Vedanta Board level by 2020.
Achieved Not achieved In progress
SUSTAINABILITY REPORTCONTINUED
GOVERNANCEThe Board oversees and reviews sustainability performance through its Sustainability Committee and Executive Committee, both of which regularly update the Board on their progress. We measure performance through Vedanta’s Sustainability Assurance Programme (VSAP), an annual sustainability risk assurance tool which assesses compliance with our sustainability framework, identifies any gaps and takes steps to address these gaps.
SUSTAINABLE DEVELOPMENT GOALSWe aim to be progressive in contributing towards achievement of the UN’s 17 Sustainable Development Goals (SDGs) which set out the agenda for impartial, inclusive and environmentally sustainable economic development by 2030. We invest time and resources to ensure we have a positive impact on the regions of our operations. Not only do we generate profits, employment and economic growth in low-income regions, but we also transfer the benefits of our operations beyond our sites to enhance and develop local communities and society.
AWARDSWe have been recognised for our sustainability performance during the year with awards across a broad spectrum of our activities, including health and safety, environment, clean technology and human resource. Here are a few mentions of our achievements in the field of health, safety and environment.
HEALTH AND SAFETY ENVIRONMENT CLEAN TECHNOLOGY
Rajasthan & Ravva assets received the British Safety Council’s (BSC) International Safety Award 2017 with merit.
Our Oil & Gas Business (Cairn) received Award ‘Sustainability and Corporate Social Responsibility’ under the Special Technical Award (Corporate) category for our ‘Safe Drinking Water Project’.
In the Asia Corporate Excellence and Sustainability Awards 2016, HZL achieved an award in the category for projects related to environment concern for the Wastewater Treatment Plant at Udaipur.
Vedanta Aluminum unit , Lanjigarh, received Rashtra Vibhushan Award 2017: ’Platinum Award’ under ‘Livelihood Creation’ category. The function was organised by Fame India, Delhi. We showcased our livelihood project ‘AAJEEVIKA’ for award nomination.
HZL’s RAM Mill Stream-3 won a National Energy Conservation Award – 2016 at State and Central levels for implementation of various power-saving projects that reduced energy consumption by 4.81KWH/mt of ore treatment.
Smelter-1, and CPP unit of Jharsuguda received the ‘Energy Efficient Unit’ award in the 17th National Award for Excellence in Energy Management 2016 organised by CII.
For full details of our sustainability policies, performance and initiatives during the year, please refer to our Sustainability Development Report
http://sustainabledevelopment.vedantaresources.com/Sustainable Development2016-17
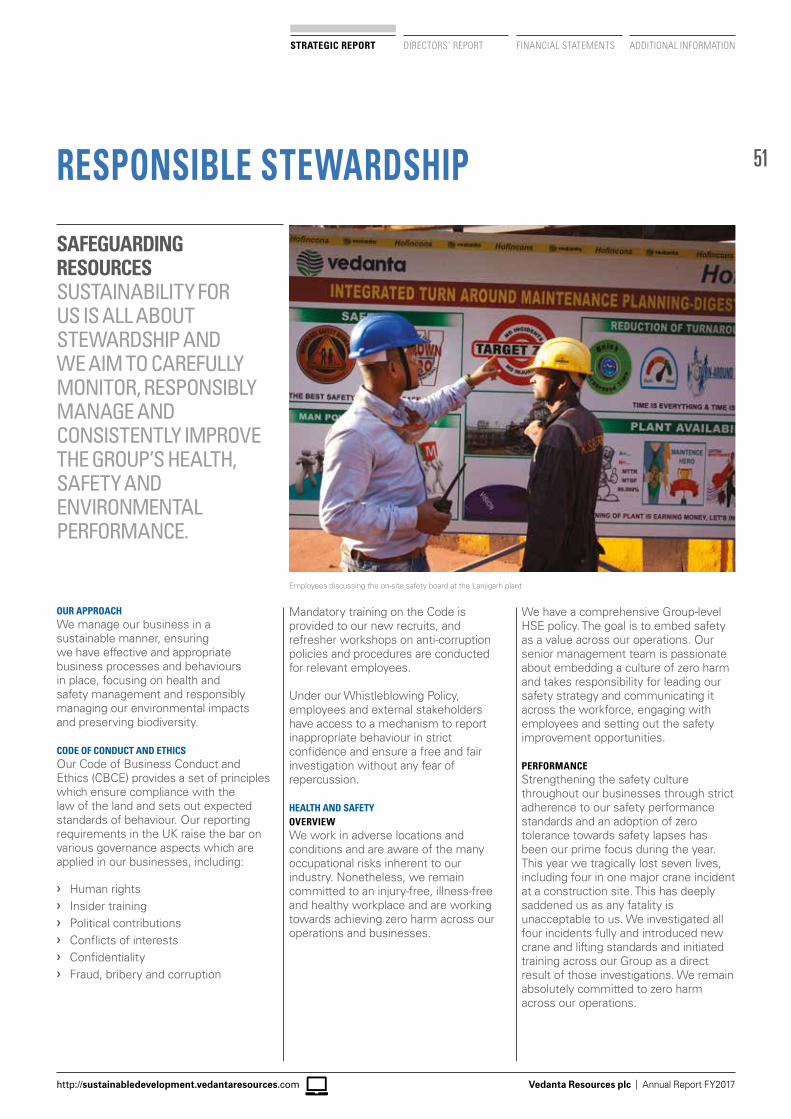
51
Vedanta Resources plc | Annual Report FY2017
STRATEGIC REPORT DIRECTORS’ REPORT FINANCIAL STATEMENTS ADDITIONAL INFORMATION
http://sustainabledevelopment.vedantaresources.com
RESPONSIBLE STEWARDSHIP
SAFEGUARDING RESOURCES SUSTAINABILITY FOR US IS ALL ABOUT STEWARDSHIP AND WE AIM TO CAREFULLY MONITOR, RESPONSIBLY MANAGE AND CONSISTENTLY IMPROVE THE GROUP’S HEALTH, SAFETY AND ENVIRONMENTAL PERFORMANCE.
OUR APPROACHWe manage our business in a sustainable manner, ensuring we have effective and appropriate business processes and behaviours in place, focusing on health and safety management and responsibly managing our environmental impacts and preserving biodiversity.
CODE OF CONDUCT AND ETHICSOur Code of Business Conduct and Ethics (CBCE) provides a set of principles which ensure compliance with the law of the land and sets out expected standards of behaviour. Our reporting requirements in the UK raise the bar on various governance aspects which are applied in our businesses, including:
❯❯ Human rights❯❯ Insider training❯❯ Political contributions❯❯ Conflicts of interests❯❯ Confidentiality❯❯ Fraud, bribery and corruption
Mandatory training on the Code is provided to our new recruits, and refresher workshops on anti-corruption policies and procedures are conducted for relevant employees.
Under our Whistleblowing Policy, employees and external stakeholders have access to a mechanism to report inappropriate behaviour in strict confidence and ensure a free and fair investigation without any fear of repercussion.
HEALTH AND SAFETY OVERVIEWWe work in adverse locations and conditions and are aware of the many occupational risks inherent to our industry. Nonetheless, we remain committed to an injury-free, illness-free and healthy workplace and are working towards achieving zero harm across our operations and businesses.
We have a comprehensive Group-level HSE policy. The goal is to embed safety as a value across our operations. Our senior management team is passionate about embedding a culture of zero harm and takes responsibility for leading our safety strategy and communicating it across the workforce, engaging with employees and setting out the safety improvement opportunities.
PERFORMANCEStrengthening the safety culture throughout our businesses through strict adherence to our safety performance standards and an adoption of zero tolerance towards safety lapses has been our prime focus during the year. This year we tragically lost seven lives, including four in one major crane incident at a construction site. This has deeply saddened us as any fatality is unacceptable to us. We investigated all four incidents fully and introduced new crane and lifting standards and initiated training across our Group as a direct result of those investigations. We remain absolutely committed to zero harm across our operations.
Employees discussing the on-site safety board at the Lanjigarh plant
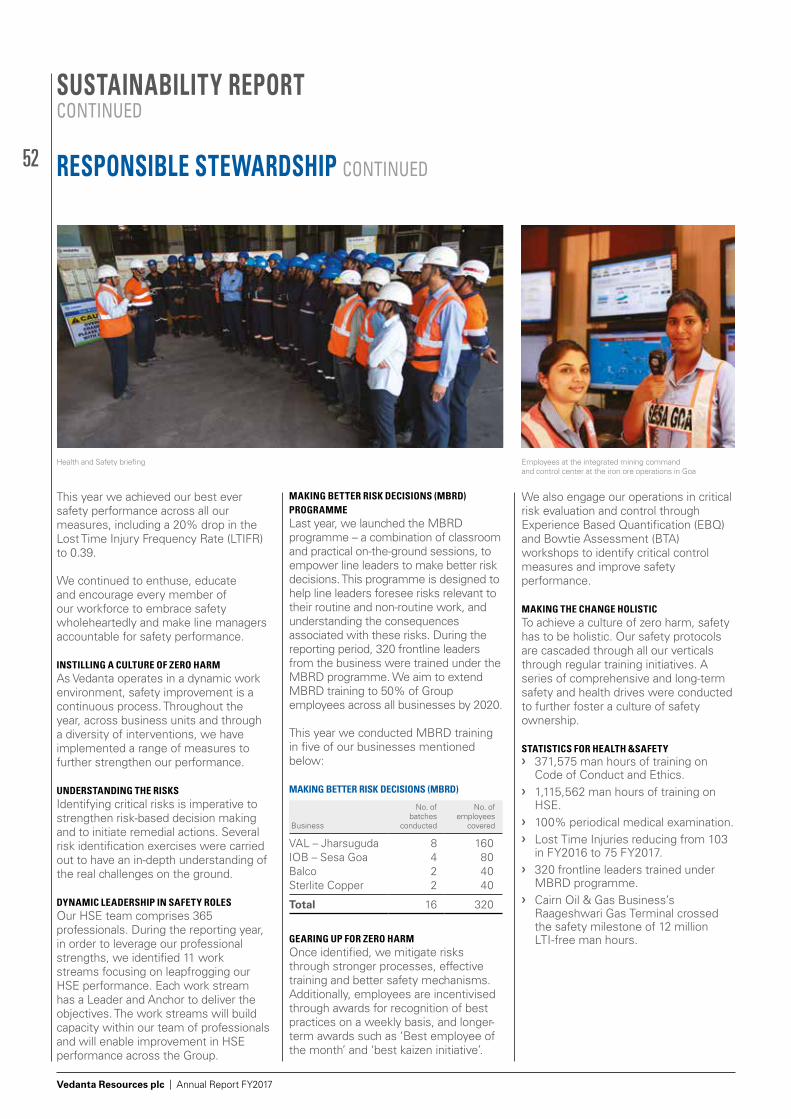
52
Vedanta Resources plc | Annual Report FY2017
This year we achieved our best ever safety performance across all our measures, including a 20% drop in the Lost Time Injury Frequency Rate (LTIFR) to 0.39.
We continued to enthuse, educate and encourage every member of our workforce to embrace safety wholeheartedly and make line managers accountable for safety performance.
INSTILLING A CULTURE OF ZERO HARMAs Vedanta operates in a dynamic work environment, safety improvement is a continuous process. Throughout the year, across business units and through a diversity of interventions, we have implemented a range of measures to further strengthen our performance.
UNDERSTANDING THE RISKSIdentifying critical risks is imperative to strengthen risk-based decision making and to initiate remedial actions. Several risk identification exercises were carried out to have an in-depth understanding of the real challenges on the ground.
DYNAMIC LEADERSHIP IN SAFETY ROLES Our HSE team comprises 365 professionals. During the reporting year, in order to leverage our professional strengths, we identified 11 work streams focusing on leapfrogging our HSE performance. Each work stream has a Leader and Anchor to deliver the objectives. The work streams will build capacity within our team of professionals and will enable improvement in HSE performance across the Group.
MAKING BETTER RISK DECISIONS (MBRD) PROGRAMME Last year, we launched the MBRD programme – a combination of classroom and practical on-the-ground sessions, to empower line leaders to make better risk decisions. This programme is designed to help line leaders foresee risks relevant to their routine and non-routine work, and understanding the consequences associated with these risks. During the reporting period, 320 frontline leaders from the business were trained under the MBRD programme. We aim to extend MBRD training to 50% of Group employees across all businesses by 2020.
This year we conducted MBRD training in five of our businesses mentioned below:
MAKING BETTER RISK DECISIONS (MBRD)
Business
No. of batches
conducted
No. of employees
covered
VAL – Jharsuguda 8 160IOB – Sesa Goa 4 80Balco 2 40Sterlite Copper 2 40
Total 16 320
GEARING UP FOR ZERO HARMOnce identified, we mitigate risks through stronger processes, effective training and better safety mechanisms. Additionally, employees are incentivised through awards for recognition of best practices on a weekly basis, and longer- term awards such as ‘Best employee of the month’ and ‘best kaizen initiative’.
SUSTAINABILITY REPORTCONTINUED
RESPONSIBLE STEWARDSHIP CONTINUED
We also engage our operations in critical risk evaluation and control through Experience Based Quantification (EBQ) and Bowtie Assessment (BTA) workshops to identify critical control measures and improve safety performance.
MAKING THE CHANGE HOLISTICTo achieve a culture of zero harm, safety has to be holistic. Our safety protocols are cascaded through all our verticals through regular training initiatives. A series of comprehensive and long-term safety and health drives were conducted to further foster a culture of safety ownership.
STATISTICS FOR HEALTH &SAFETY❯❯ 371,575 man hours of training on
Code of Conduct and Ethics.❯❯ 1,115,562 man hours of training on
HSE.❯❯ 100% periodical medical examination.❯❯ Lost Time Injuries reducing from 103
in FY2016 to 75 FY2017.❯❯ 320 frontline leaders trained under
MBRD programme.❯❯ Cairn Oil & Gas Business’s
Raageshwari Gas Terminal crossed the safety milestone of 12 million LTI-free man hours.
Health and Safety briefing Employees at the integrated mining command and control center at the iron ore operations in Goa
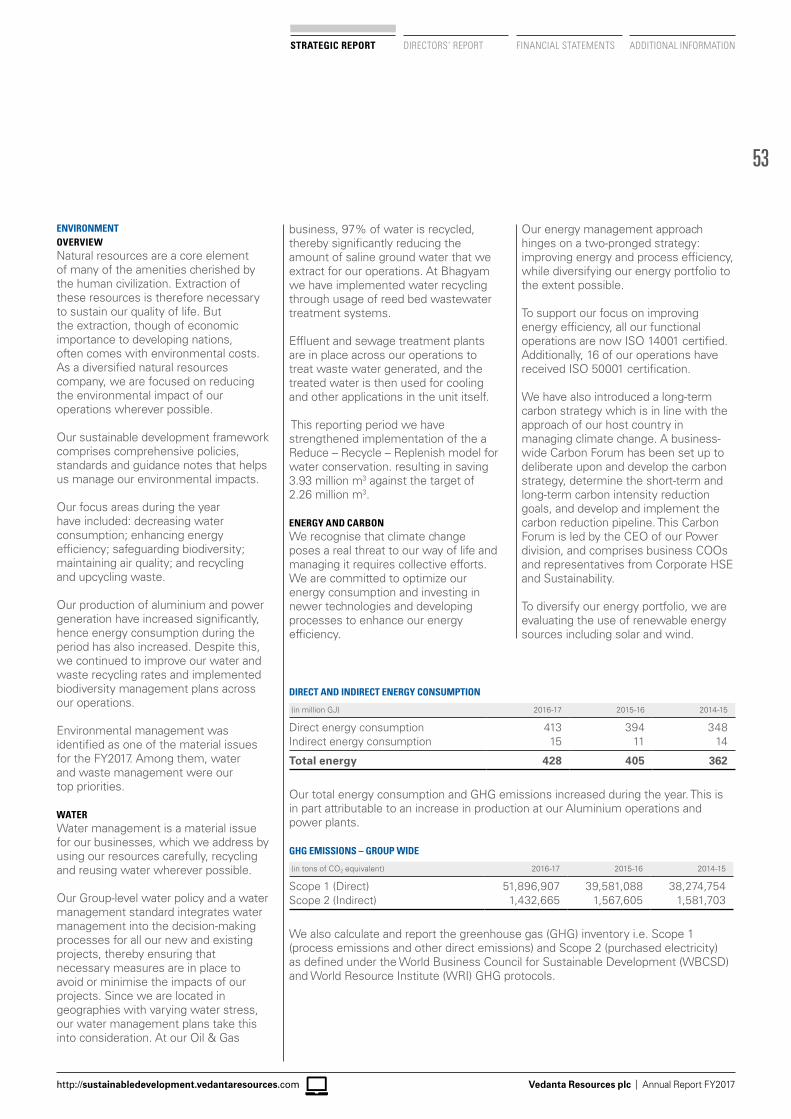
53
Vedanta Resources plc | Annual Report FY2017
STRATEGIC REPORT DIRECTORS’ REPORT FINANCIAL STATEMENTS ADDITIONAL INFORMATION
http://sustainabledevelopment.vedantaresources.com
ENVIRONMENTOVERVIEWNatural resources are a core element of many of the amenities cherished by the human civilization. Extraction of these resources is therefore necessary to sustain our quality of life. But the extraction, though of economic importance to developing nations, often comes with environmental costs. As a diversified natural resources company, we are focused on reducing the environmental impact of our operations wherever possible.
Our sustainable development framework comprises comprehensive policies, standards and guidance notes that helps us manage our environmental impacts.
Our focus areas during the year have included: decreasing water consumption; enhancing energy efficiency; safeguarding biodiversity; maintaining air quality; and recycling and upcycling waste.
Our production of aluminium and power generation have increased significantly, hence energy consumption during the period has also increased. Despite this, we continued to improve our water and waste recycling rates and implemented biodiversity management plans across our operations.
Environmental management was identified as one of the material issues for the FY2017. Among them, water and waste management were our top priorities.
WATERWater management is a material issue for our businesses, which we address by using our resources carefully, recycling and reusing water wherever possible.
Our Group-level water policy and a water management standard integrates water management into the decision-making processes for all our new and existing projects, thereby ensuring that necessary measures are in place to avoid or minimise the impacts of our projects. Since we are located in geographies with varying water stress, our water management plans take this into consideration. At our Oil & Gas
business, 97% of water is recycled, thereby significantly reducing the amount of saline ground water that we extract for our operations. At Bhagyam we have implemented water recycling through usage of reed bed wastewater treatment systems.
Effluent and sewage treatment plants are in place across our operations to treat waste water generated, and the treated water is then used for cooling and other applications in the unit itself.
This reporting period we have strengthened implementation of the a Reduce – Recycle – Replenish model for water conservation. resulting in saving 3.93 million m3 against the target of 2.26 million m3.
ENERGY AND CARBONWe recognise that climate change poses a real threat to our way of life and managing it requires collective efforts. We are committed to optimize our energy consumption and investing in newer technologies and developing processes to enhance our energy efficiency.
Our energy management approach hinges on a two-pronged strategy: improving energy and process efficiency, while diversifying our energy portfolio to the extent possible.
To support our focus on improving energy efficiency, all our functional operations are now ISO 14001 certified. Additionally, 16 of our operations have received ISO 50001 certification.
We have also introduced a long-term carbon strategy which is in line with the approach of our host country in managing climate change. A business-wide Carbon Forum has been set up to deliberate upon and develop the carbon strategy, determine the short-term and long-term carbon intensity reduction goals, and develop and implement the carbon reduction pipeline. This Carbon Forum is led by the CEO of our Power division, and comprises business COOs and representatives from Corporate HSE and Sustainability.
To diversify our energy portfolio, we are evaluating the use of renewable energy sources including solar and wind.
DIRECT AND INDIRECT ENERGY CONSUMPTION
(in million GJ) 2016-17 2015-16 2014-15
Direct energy consumption 413 394 348Indirect energy consumption 15 11 14
Total energy 428 405 362
Our total energy consumption and GHG emissions increased during the year. This is in part attributable to an increase in production at our Aluminium operations and power plants.
GHG EMISSIONS – GROUP WIDE
(in tons of CO2 equivalent) 2016-17 2015-16 2014-15
Scope 1 (Direct) 51,896,907 39,581,088 38,274,754Scope 2 (Indirect) 1,432,665 1,567,605 1,581,703
We also calculate and report the greenhouse gas (GHG) inventory i.e. Scope 1 (process emissions and other direct emissions) and Scope 2 (purchased electricity) as defined under the World Business Council for Sustainable Development (WBCSD) and World Resource Institute (WRI) GHG protocols.
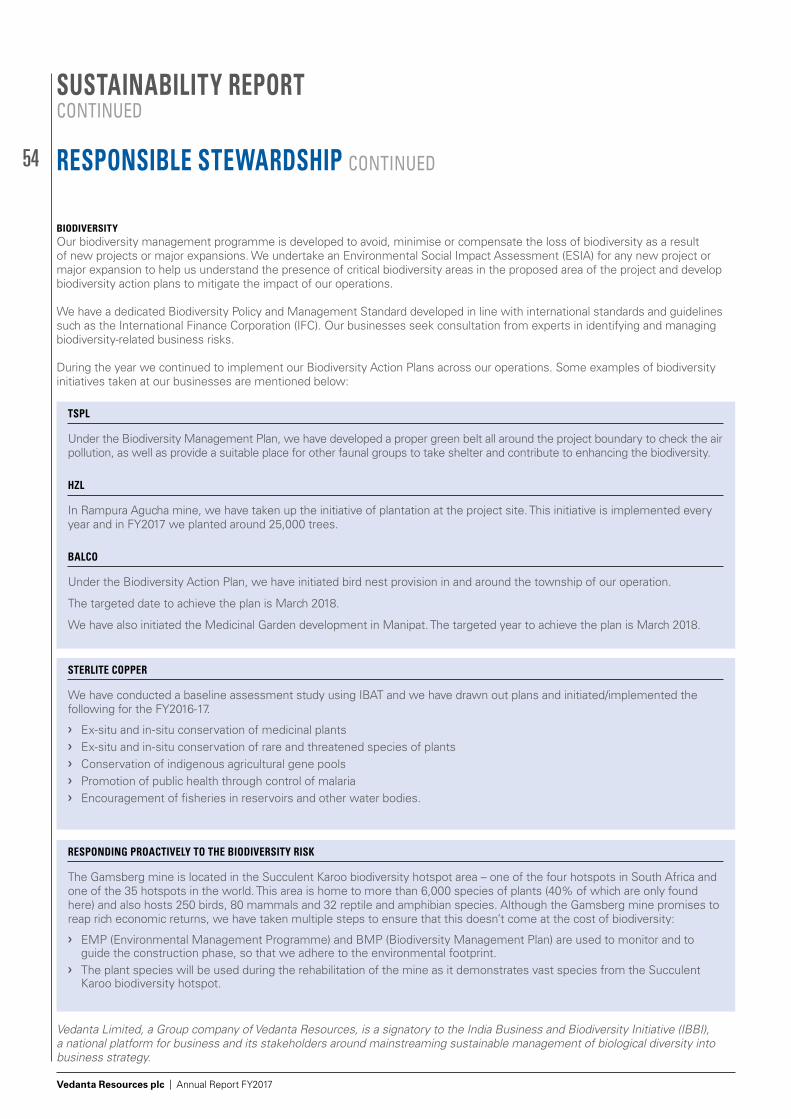
54
Vedanta Resources plc | Annual Report FY2017
BIODIVERSITYOur biodiversity management programme is developed to avoid, minimise or compensate the loss of biodiversity as a result of new projects or major expansions. We undertake an Environmental Social Impact Assessment (ESIA) for any new project or major expansion to help us understand the presence of critical biodiversity areas in the proposed area of the project and develop biodiversity action plans to mitigate the impact of our operations.
We have a dedicated Biodiversity Policy and Management Standard developed in line with international standards and guidelines such as the International Finance Corporation (IFC). Our businesses seek consultation from experts in identifying and managing biodiversity-related business risks.
During the year we continued to implement our Biodiversity Action Plans across our operations. Some examples of biodiversity initiatives taken at our businesses are mentioned below:
TSPL
Under the Biodiversity Management Plan, we have developed a proper green belt all around the project boundary to check the air pollution, as well as provide a suitable place for other faunal groups to take shelter and contribute to enhancing the biodiversity.
HZL
In Rampura Agucha mine, we have taken up the initiative of plantation at the project site. This initiative is implemented every year and in FY2017 we planted around 25,000 trees.
BALCO
Under the Biodiversity Action Plan, we have initiated bird nest provision in and around the township of our operation.
The targeted date to achieve the plan is March 2018.
We have also initiated the Medicinal Garden development in Manipat. The targeted year to achieve the plan is March 2018.
RESPONDING PROACTIVELY TO THE BIODIVERSITY RISK
The Gamsberg mine is located in the Succulent Karoo biodiversity hotspot area – one of the four hotspots in South Africa and one of the 35 hotspots in the world. This area is home to more than 6,000 species of plants (40% of which are only found here) and also hosts 250 birds, 80 mammals and 32 reptile and amphibian species. Although the Gamsberg mine promises to reap rich economic returns, we have taken multiple steps to ensure that this doesn’t come at the cost of biodiversity:
❯❯ EMP (Environmental Management Programme) and BMP (Biodiversity Management Plan) are used to monitor and to guide the construction phase, so that we adhere to the environmental footprint.
❯❯ The plant species will be used during the rehabilitation of the mine as it demonstrates vast species from the Succulent Karoo biodiversity hotspot.
STERLITE COPPER
We have conducted a baseline assessment study using IBAT and we have drawn out plans and initiated/implemented thefollowing for the FY2016-17.
❯❯ Ex-situ and in-situ conservation of medicinal plants❯❯ Ex-situ and in-situ conservation of rare and threatened species of plants❯❯ Conservation of indigenous agricultural gene pools❯❯ Promotion of public health through control of malaria❯❯ Encouragement of fisheries in reservoirs and other water bodies.
Vedanta Limited, a Group company of Vedanta Resources, is a signatory to the India Business and Biodiversity Initiative (IBBI), a national platform for business and its stakeholders around mainstreaming sustainable management of biological diversity into business strategy.
SUSTAINABILITY REPORTCONTINUED
RESPONSIBLE STEWARDSHIP CONTINUED
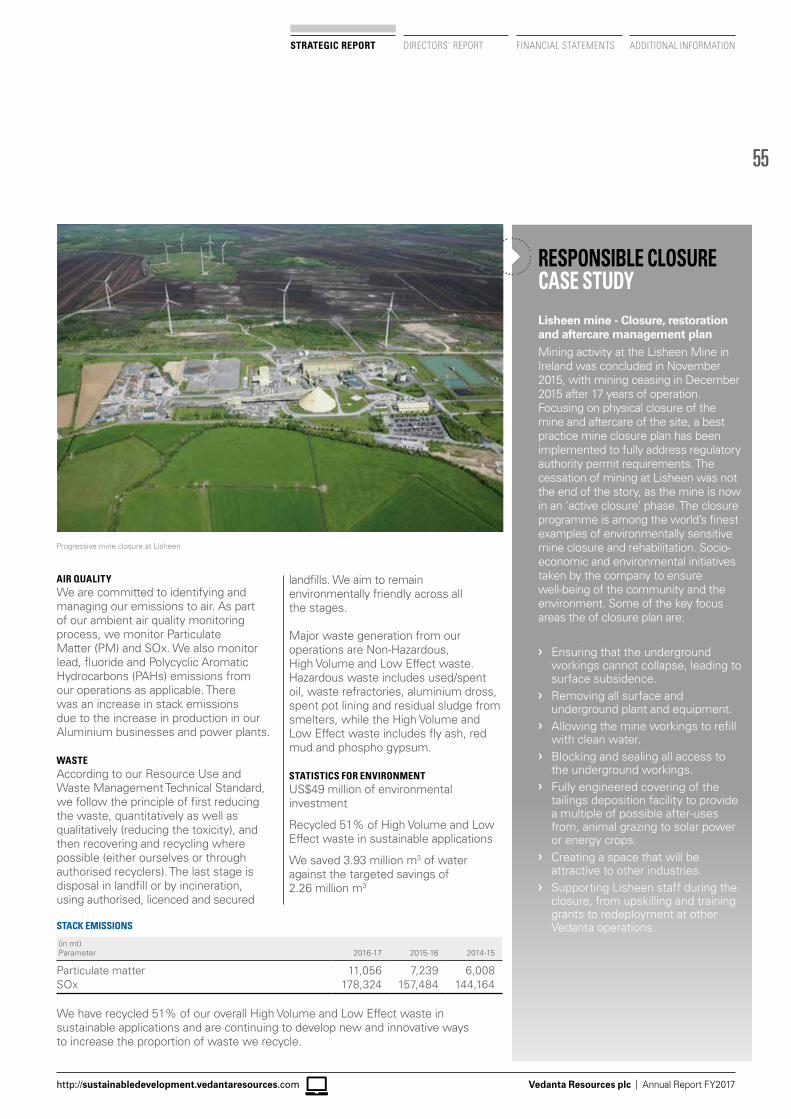
55
Vedanta Resources plc | Annual Report FY2017
STRATEGIC REPORT DIRECTORS’ REPORT FINANCIAL STATEMENTS ADDITIONAL INFORMATION
http://sustainabledevelopment.vedantaresources.com
AIR QUALITYWe are committed to identifying and managing our emissions to air. As part of our ambient air quality monitoring process, we monitor Particulate Matter (PM) and SOx. We also monitor lead, fluoride and Polycyclic Aromatic Hydrocarbons (PAHs) emissions from our operations as applicable. There was an increase in stack emissions due to the increase in production in our Aluminium businesses and power plants.
WASTEAccording to our Resource Use and Waste Management Technical Standard, we follow the principle of first reducing the waste, quantitatively as well as qualitatively (reducing the toxicity), and then recovering and recycling where possible (either ourselves or through authorised recyclers). The last stage is disposal in landfill or by incineration, using authorised, licenced and secured
landfills. We aim to remain environmentally friendly across all the stages.
Major waste generation from our operations are Non-Hazardous, High Volume and Low Effect waste. Hazardous waste includes used/spent oil, waste refractories, aluminium dross, spent pot lining and residual sludge from smelters, while the High Volume and Low Effect waste includes fly ash, red mud and phospho gypsum.
STATISTICS FOR ENVIRONMENTUS$49 million of environmental investment
Recycled 51% of High Volume and Low Effect waste in sustainable applications
We saved 3.93 million m3 of water against the targeted savings of 2.26 million m3
STACK EMISSIONS
(in mt) Parameter 2016-17 2015-16 2014-15
Particulate matter 11,056 7,239 6,008SOx 178,324 157,484 144,164
We have recycled 51% of our overall High Volume and Low Effect waste in sustainable applications and are continuing to develop new and innovative ways to increase the proportion of waste we recycle.
Lisheen mine - Closure, restoration and aftercare management plan Mining activity at the Lisheen Mine in Ireland was concluded in November 2015, with mining ceasing in December 2015 after 17 years of operation. Focusing on physical closure of the mine and aftercare of the site, a best practice mine closure plan has been implemented to fully address regulatory authority permit requirements. The cessation of mining at Lisheen was not the end of the story, as the mine is now in an ‘active closure’ phase. The closure programme is among the world’s finest examples of environmentally sensitive mine closure and rehabilitation. Socio-economic and environmental initiatives taken by the company to ensure well-being of the community and the environment. Some of the key focus areas the of closure plan are:
❯❯ Ensuring that the underground workings cannot collapse, leading to surface subsidence.
❯❯ Removing all surface and underground plant and equipment.
❯❯ Allowing the mine workings to refill with clean water.
❯❯ Blocking and sealing all access to the underground workings.
❯❯ Fully engineered covering of the tailings deposition facility to provide a multiple of possible after-uses from, animal grazing to solar power or energy crops.
❯❯ Creating a space that will be attractive to other industries.
❯❯ Supporting Lisheen staff during the closure, from upskilling and training grants to redeployment at other Vedanta operations.
RESPONSIBLE CLOSURE CASE STUDY
Progressive mine closure at Lisheen
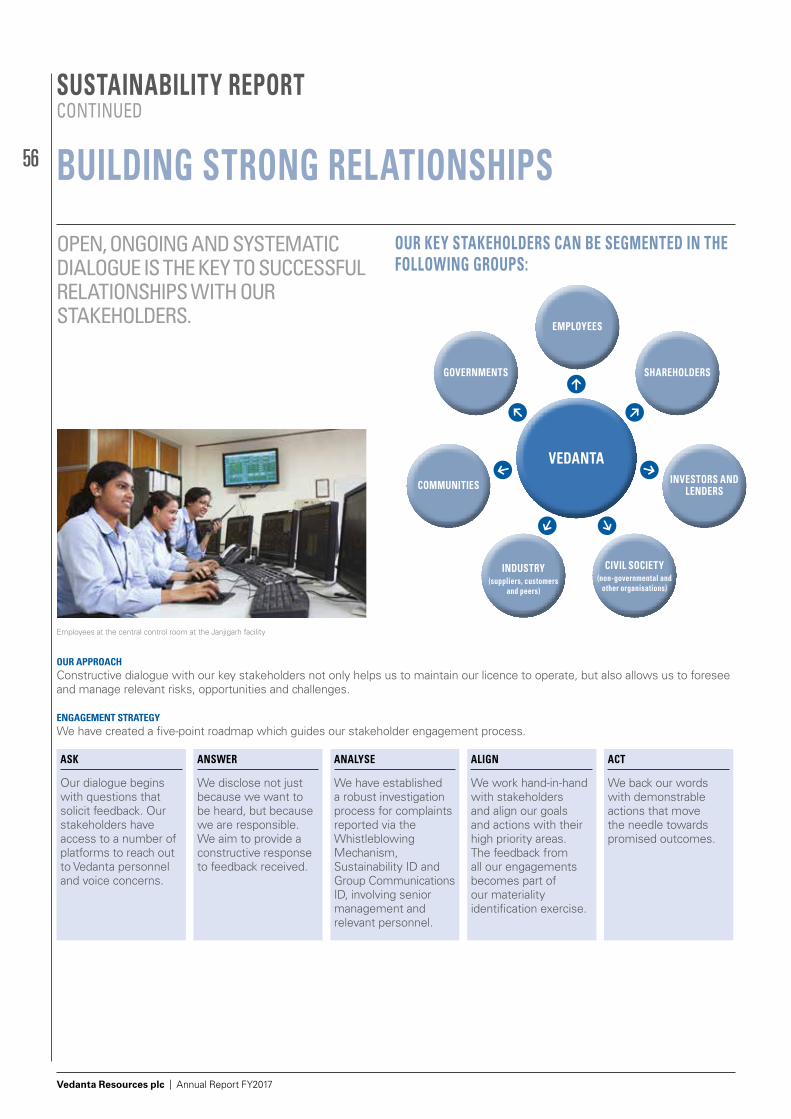
56
Vedanta Resources plc | Annual Report FY2017
VEDANTA
EMPLOYEES
GOVERNMENTS SHAREHOLDERS
INVESTORS AND LENDERSCOMMUNITIES
INDUSTRY (suppliers, customers
and peers)
CIVIL SOCIETY(non-governmental and
other organisations)
SUSTAINABILITY REPORTCONTINUED
BUILDING STRONG RELATIONSHIPS
OPEN, ONGOING AND SYSTEMATIC DIALOGUE IS THE KEY TO SUCCESSFUL RELATIONSHIPS WITH OUR STAKEHOLDERS.
OUR APPROACH Constructive dialogue with our key stakeholders not only helps us to maintain our licence to operate, but also allows us to foresee and manage relevant risks, opportunities and challenges.
ENGAGEMENT STRATEGYWe have created a five-point roadmap which guides our stakeholder engagement process.
ASK ANSWER ANALYSE ALIGN ACT
Our dialogue begins with questions that solicit feedback. Our stakeholders have access to a number of platforms to reach out to Vedanta personnel and voice concerns.
We disclose not just because we want to be heard, but because we are responsible. We aim to provide a constructive response to feedback received.
We have established a robust investigation process for complaints reported via the Whistleblowing Mechanism, Sustainability ID and Group Communications ID, involving senior management and relevant personnel.
We work hand-in-hand with stakeholders and align our goals and actions with their high priority areas. The feedback from all our engagements becomes part of our materiality identification exercise.
We back our words with demonstrable actions that move the needle towards promised outcomes.
OUR KEY STAKEHOLDERS CAN BE SEGMENTED IN THE FOLLOWING GROUPS:
Employees at the central control room at the Janjigarh facility
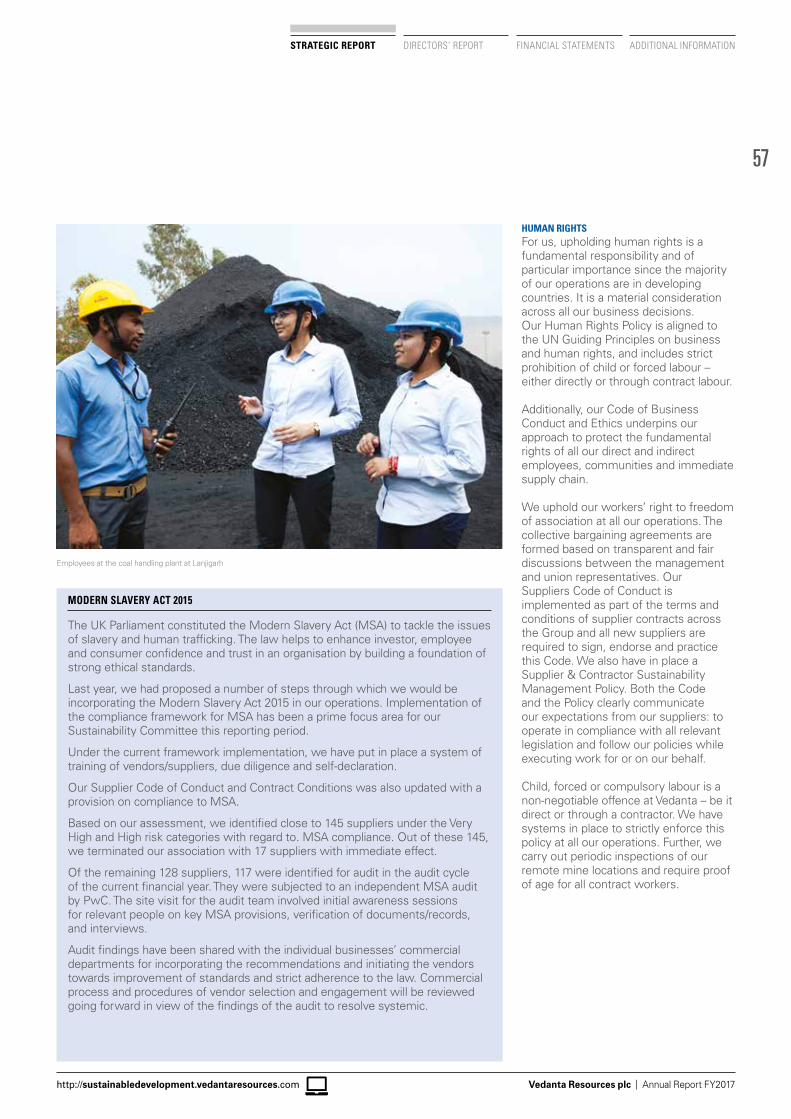
57
Vedanta Resources plc | Annual Report FY2017
STRATEGIC REPORT DIRECTORS’ REPORT FINANCIAL STATEMENTS ADDITIONAL INFORMATION
http://sustainabledevelopment.vedantaresources.com
HUMAN RIGHTSFor us, upholding human rights is a fundamental responsibility and of particular importance since the majority of our operations are in developing countries. It is a material consideration across all our business decisions.Our Human Rights Policy is aligned to the UN Guiding Principles on business and human rights, and includes strict prohibition of child or forced labour – either directly or through contract labour.
Additionally, our Code of Business Conduct and Ethics underpins our approach to protect the fundamental rights of all our direct and indirect employees, communities and immediate supply chain.
We uphold our workers’ right to freedom of association at all our operations. The collective bargaining agreements are formed based on transparent and fair discussions between the management and union representatives. Our Suppliers Code of Conduct is implemented as part of the terms and conditions of supplier contracts across the Group and all new suppliers are required to sign, endorse and practice this Code. We also have in place a Supplier & Contractor Sustainability Management Policy. Both the Code and the Policy clearly communicate our expectations from our suppliers: to operate in compliance with all relevant legislation and follow our policies while executing work for or on our behalf.
Child, forced or compulsory labour is a non-negotiable offence at Vedanta – be it direct or through a contractor. We have systems in place to strictly enforce this policy at all our operations. Further, we carry out periodic inspections of our remote mine locations and require proof of age for all contract workers.
MODERN SLAVERY ACT 2015
The UK Parliament constituted the Modern Slavery Act (MSA) to tackle the issues of slavery and human trafficking. The law helps to enhance investor, employee and consumer confidence and trust in an organisation by building a foundation of strong ethical standards.
Last year, we had proposed a number of steps through which we would be incorporating the Modern Slavery Act 2015 in our operations. Implementation of the compliance framework for MSA has been a prime focus area for our Sustainability Committee this reporting period.
Under the current framework implementation, we have put in place a system of training of vendors/suppliers, due diligence and self-declaration.
Our Supplier Code of Conduct and Contract Conditions was also updated with a provision on compliance to MSA.
Based on our assessment, we identified close to 145 suppliers under the Very High and High risk categories with regard to. MSA compliance. Out of these 145, we terminated our association with 17 suppliers with immediate effect.
Of the remaining 128 suppliers, 117 were identified for audit in the audit cycle of the current financial year. They were subjected to an independent MSA audit by PwC. The site visit for the audit team involved initial awareness sessions for relevant people on key MSA provisions, verification of documents/records, and interviews.
Audit findings have been shared with the individual businesses’ commercial departments for incorporating the recommendations and initiating the vendors towards improvement of standards and strict adherence to the law. Commercial process and procedures of vendor selection and engagement will be reviewed going forward in view of the findings of the audit to resolve systemic.
Employees at the coal handling plant at Lanjigarh
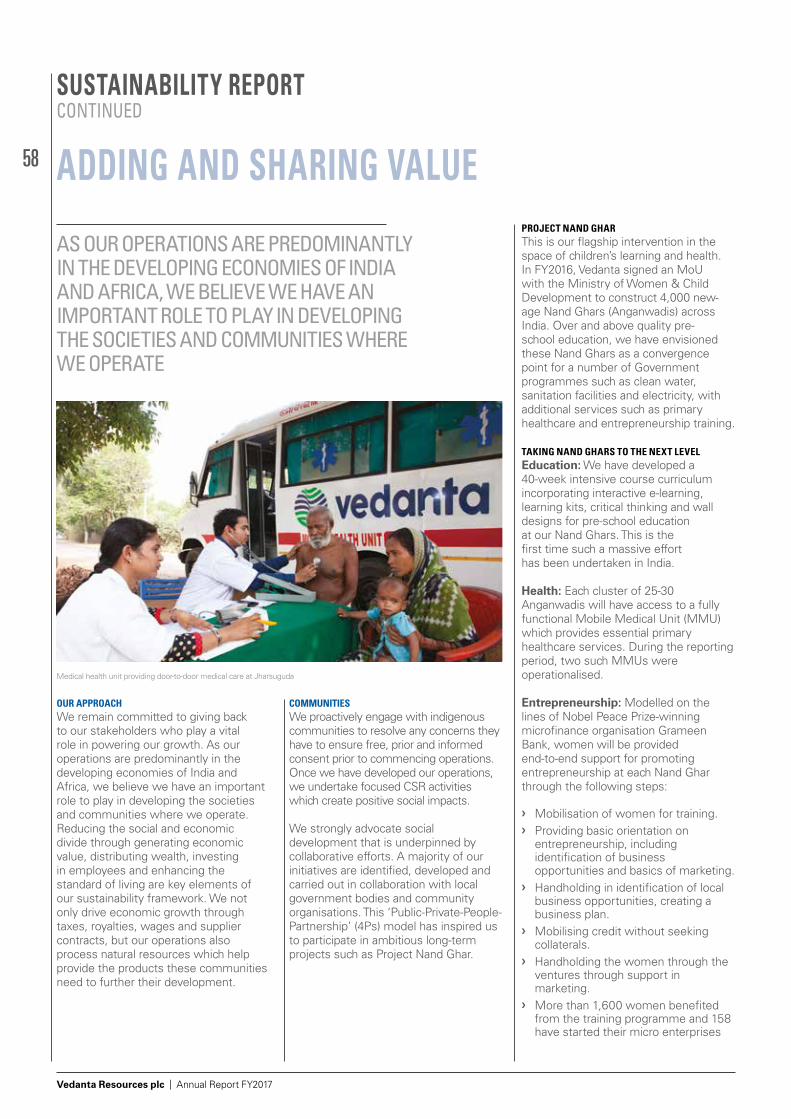
58
Vedanta Resources plc | Annual Report FY2017
ADDING AND SHARING VALUE
AS OUR OPERATIONS ARE PREDOMINANTLY IN THE DEVELOPING ECONOMIES OF INDIA AND AFRICA, WE BELIEVE WE HAVE AN IMPORTANT ROLE TO PLAY IN DEVELOPING THE SOCIETIES AND COMMUNITIES WHERE WE OPERATE
OUR APPROACHWe remain committed to giving back to our stakeholders who play a vital role in powering our growth. As our operations are predominantly in the developing economies of India and Africa, we believe we have an important role to play in developing the societies and communities where we operate. Reducing the social and economic divide through generating economic value, distributing wealth, investing in employees and enhancing the standard of living are key elements of our sustainability framework. We not only drive economic growth through taxes, royalties, wages and supplier contracts, but our operations also process natural resources which help provide the products these communities need to further their development.
COMMUNITIESWe proactively engage with indigenous communities to resolve any concerns they have to ensure free, prior and informed consent prior to commencing operations. Once we have developed our operations, we undertake focused CSR activities which create positive social impacts.
We strongly advocate social development that is underpinned by collaborative efforts. A majority of our initiatives are identified, developed and carried out in collaboration with local government bodies and community organisations. This ‘Public-Private-People-Partnership’ (4Ps) model has inspired us to participate in ambitious long-term projects such as Project Nand Ghar.
PROJECT NAND GHAR This is our flagship intervention in the space of children’s learning and health. In FY2016, Vedanta signed an MoU with the Ministry of Women & Child Development to construct 4,000 new-age Nand Ghars (Anganwadis) across India. Over and above quality pre-school education, we have envisioned these Nand Ghars as a convergence point for a number of Government programmes such as clean water, sanitation facilities and electricity, with additional services such as primary healthcare and entrepreneurship training.
TAKING NAND GHARS TO THE NEXT LEVELEducation: We have developed a 40-week intensive course curriculum incorporating interactive e-learning, learning kits, critical thinking and wall designs for pre-school education at our Nand Ghars. This is the first time such a massive effort has been undertaken in India.
Health: Each cluster of 25-30 Anganwadis will have access to a fully functional Mobile Medical Unit (MMU) which provides essential primary healthcare services. During the reporting period, two such MMUs were operationalised.
Entrepreneurship: Modelled on the lines of Nobel Peace Prize-winning microfinance organisation Grameen Bank, women will be provided end-to-end support for promoting entrepreneurship at each Nand Ghar through the following steps:
❯❯ Mobilisation of women for training.❯❯ Providing basic orientation on
entrepreneurship, including identification of business opportunities and basics of marketing.
❯❯ Handholding in identification of local business opportunities, creating a business plan.
❯❯ Mobilising credit without seeking collaterals.
❯❯ Handholding the women through the ventures through support in marketing.
❯❯ More than 1,600 women benefited from the training programme and 158 have started their micro enterprises
SUSTAINABILITY REPORTCONTINUED
Medical health unit providing door-to-door medical care at Jharsuguda
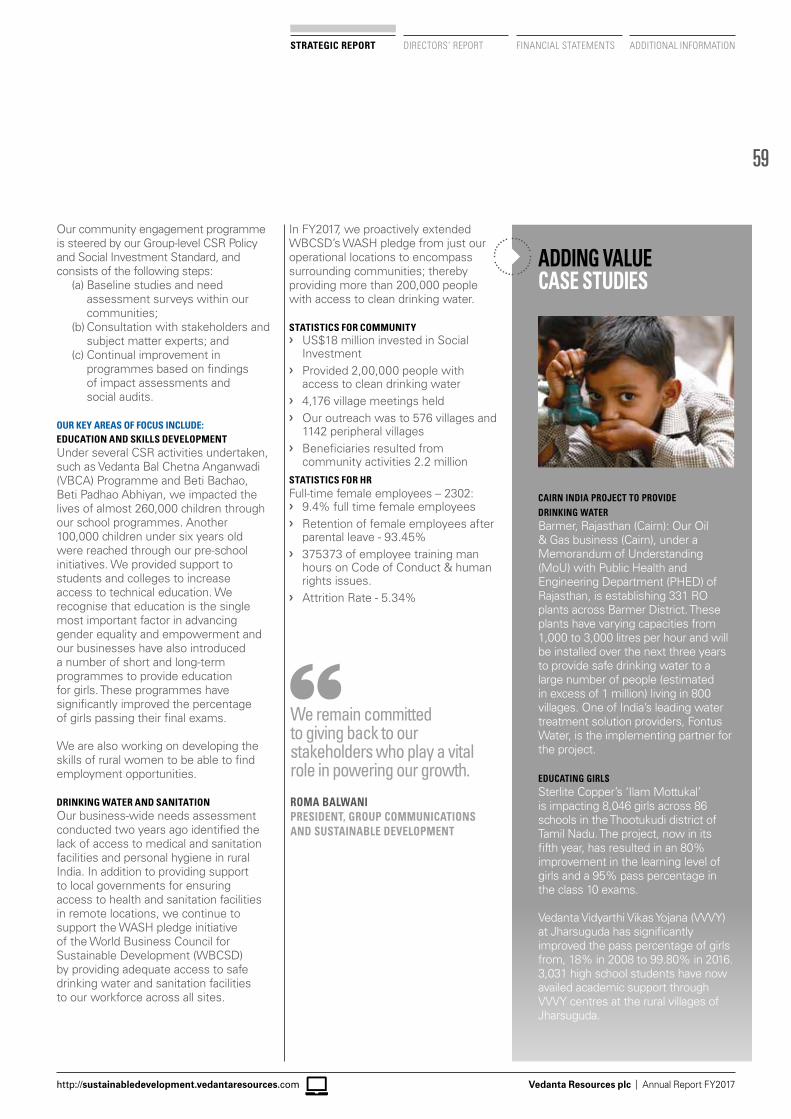
ADDING VALUE CASE STUDIES
59
Vedanta Resources plc | Annual Report FY2017
STRATEGIC REPORT DIRECTORS’ REPORT FINANCIAL STATEMENTS ADDITIONAL INFORMATION
http://sustainabledevelopment.vedantaresources.com
Our community engagement programme is steered by our Group-level CSR Policy and Social Investment Standard, and consists of the following steps:
(a) Baseline studies and need assessment surveys within our communities;
(b) Consultation with stakeholders and subject matter experts; and
(c) Continual improvement in programmes based on findings of impact assessments and social audits.
OUR KEY AREAS OF FOCUS INCLUDE: EDUCATION AND SKILLS DEVELOPMENTUnder several CSR activities undertaken, such as Vedanta Bal Chetna Anganwadi (VBCA) Programme and Beti Bachao, Beti Padhao Abhiyan, we impacted the lives of almost 260,000 children through our school programmes. Another 100,000 children under six years old were reached through our pre-school initiatives. We provided support to students and colleges to increase access to technical education. We recognise that education is the single most important factor in advancing gender equality and empowerment and our businesses have also introduced a number of short and long-term programmes to provide education for girls. These programmes have significantly improved the percentage of girls passing their final exams.
We are also working on developing the skills of rural women to be able to find employment opportunities.
DRINKING WATER AND SANITATIONOur business-wide needs assessment conducted two years ago identified the lack of access to medical and sanitation facilities and personal hygiene in rural India. In addition to providing support to local governments for ensuring access to health and sanitation facilities in remote locations, we continue to support the WASH pledge initiative of the World Business Council for Sustainable Development (WBCSD) by providing adequate access to safe drinking water and sanitation facilities to our workforce across all sites.
In FY2017, we proactively extended WBCSD’s WASH pledge from just our operational locations to encompass surrounding communities; thereby providing more than 200,000 people with access to clean drinking water.
STATISTICS FOR COMMUNITY❯❯ US$18 million invested in Social
Investment❯❯ Provided 2,00,000 people with
access to clean drinking water❯❯ 4,176 village meetings held❯❯ Our outreach was to 576 villages and
1142 peripheral villages❯❯ Beneficiaries resulted from
community activities 2.2 millionSTATISTICS FOR HRFull-time female employees – 2302:❯❯ 9.4% full time female employees ❯❯ Retention of female employees after
parental leave - 93.45%❯❯ 375373 of employee training man
hours on Code of Conduct & human rights issues.
❯❯ Attrition Rate - 5.34%
CAIRN INDIA PROJECT TO PROVIDE DRINKING WATERBarmer, Rajasthan (Cairn): Our Oil & Gas business (Cairn), under a Memorandum of Understanding (MoU) with Public Health and Engineering Department (PHED) of Rajasthan, is establishing 331 RO plants across Barmer District. These plants have varying capacities from 1,000 to 3,000 litres per hour and will be installed over the next three years to provide safe drinking water to a large number of people (estimated in excess of 1 million) living in 800 villages. One of India’s leading water treatment solution providers, Fontus Water, is the implementing partner for the project.
EDUCATING GIRLSSterlite Copper’s ‘Ilam Mottukal’ is impacting 8,046 girls across 86 schools in the Thootukudi district of Tamil Nadu. The project, now in its fifth year, has resulted in an 80% improvement in the learning level of girls and a 95% pass percentage in the class 10 exams.
Vedanta Vidyarthi Vikas Yojana (VVVY) at Jharsuguda has significantly improved the pass percentage of girls from, 18% in 2008 to 99.80% in 2016. 3,031 high school students have now availed academic support through VVVY centres at the rural villages of Jharsuguda.
We remain committed to giving back to our stakeholders who play a vital role in powering our growth.
ROMA BALWANIPRESIDENT, GROUP COMMUNICATIONS AND SUSTAINABLE DEVELOPMENT
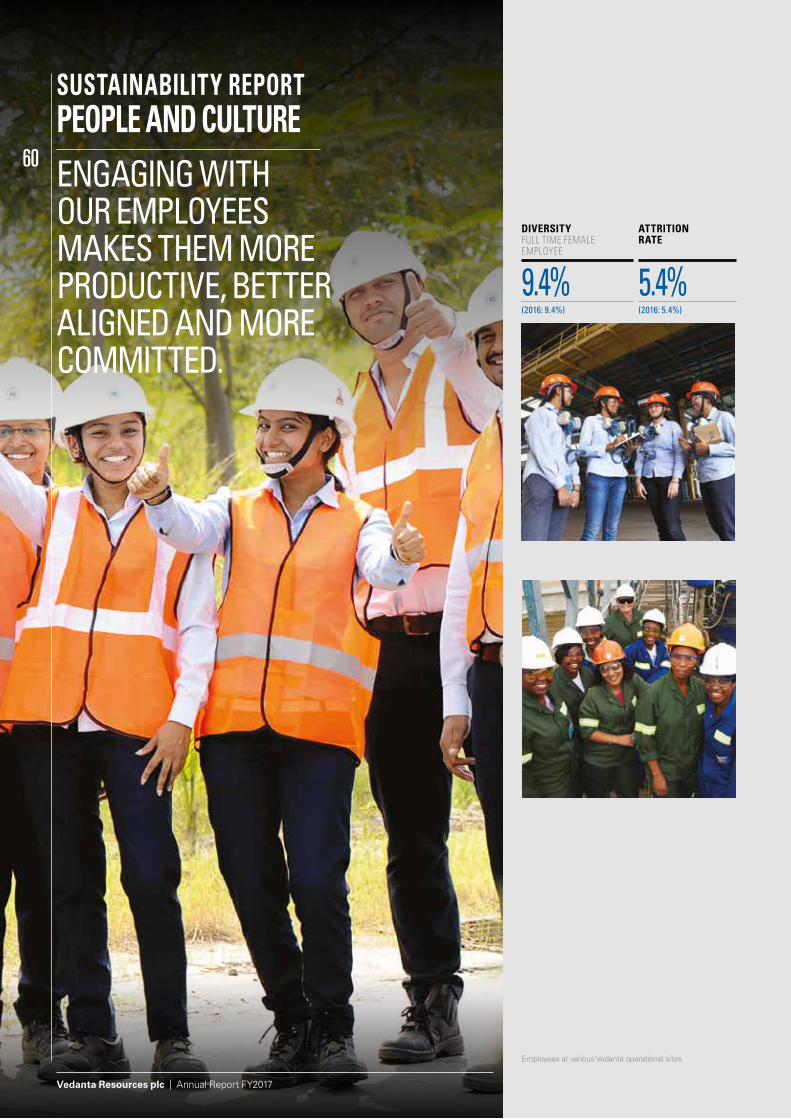
60
Vedanta Resources plc | Annual Report FY2017
SUSTAINABILITY REPORTPEOPLE AND CULTUREENGAGING WITHOUR EMPLOYEESMAKES THEM MOREPRODUCTIVE, BETTERALIGNED AND MORECOMMITTED.
DIVERSITY FULL TIME FEMALE EMPLOYEE
9.4%(2016: 9.4%)
ATTRITION RATE
5.4%(2016: 5.4%)
Employees at various Vedanta operational sites
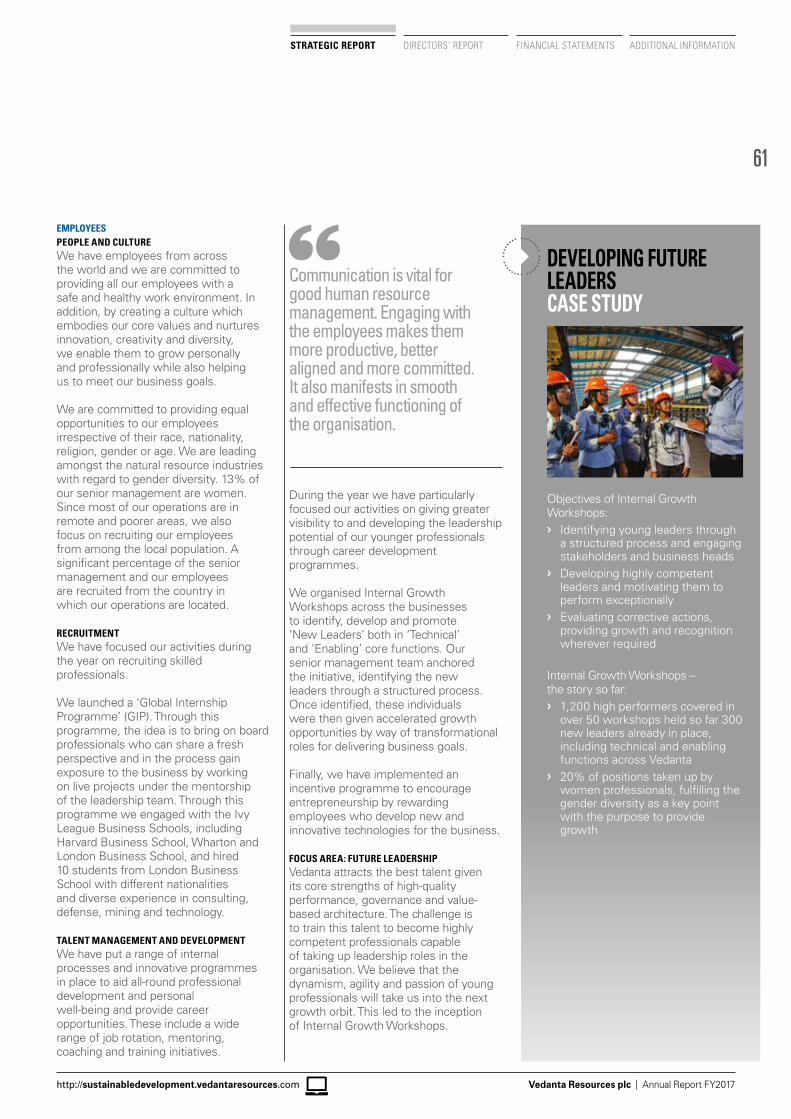
EMPLOYEESPEOPLE AND CULTUREWe have employees from across the world and we are committed to providing all our employees with a safe and healthy work environment. In addition, by creating a culture which embodies our core values and nurtures innovation, creativity and diversity, we enable them to grow personally and professionally while also helping us to meet our business goals.
We are committed to providing equal opportunities to our employees irrespective of their race, nationality, religion, gender or age. We are leading amongst the natural resource industries with regard to gender diversity. 13% of our senior management are women. Since most of our operations are in remote and poorer areas, we also focus on recruiting our employees from among the local population. A significant percentage of the senior management and our employees are recruited from the country in which our operations are located.
RECRUITMENT We have focused our activities during the year on recruiting skilled professionals.
We launched a ‘Global Internship Programme’ (GIP). Through this programme, the idea is to bring on board professionals who can share a fresh perspective and in the process gain exposure to the business by working on live projects under the mentorship of the leadership team. Through this programme we engaged with the Ivy League Business Schools, including Harvard Business School, Wharton and London Business School, and hired 10 students from London Business School with different nationalities and diverse experience in consulting, defense, mining and technology.
TALENT MANAGEMENT AND DEVELOPMENTWe have put a range of internal processes and innovative programmes in place to aid all-round professional development and personal well-being and provide career opportunities. These include a wide range of job rotation, mentoring, coaching and training initiatives.
During the year we have particularly focused our activities on giving greater visibility to and developing the leadership potential of our younger professionals through career development programmes.
We organised Internal Growth Workshops across the businesses to identify, develop and promote ‘New Leaders’ both in ‘Technical’ and ‘Enabling’ core functions. Our senior management team anchored the initiative, identifying the new leaders through a structured process. Once identified, these individuals were then given accelerated growth opportunities by way of transformational roles for delivering business goals.
Finally, we have implemented an incentive programme to encourage entrepreneurship by rewarding employees who develop new and innovative technologies for the business.
FOCUS AREA: FUTURE LEADERSHIPVedanta attracts the best talent given its core strengths of high-quality performance, governance and value-based architecture. The challenge is to train this talent to become highly competent professionals capable of taking up leadership roles in the organisation. We believe that the dynamism, agility and passion of young professionals will take us into the next growth orbit. This led to the inception of Internal Growth Workshops.
Objectives of Internal Growth Workshops:❯❯ Identifying young leaders through
a structured process and engaging stakeholders and business heads
❯❯ Developing highly competent leaders and motivating them to perform exceptionally
❯❯ Evaluating corrective actions, providing growth and recognition wherever required
Internal Growth Workshops – the story so far:❯❯ 1,200 high performers covered in
over 50 workshops held so far 300 new leaders already in place, including technical and enabling functions across Vedanta
❯❯ 20% of positions taken up by women professionals, fulfilling the gender diversity as a key point with the purpose to provide growth
DEVELOPING FUTURE LEADERS CASE STUDY
Communication is vital for good human resource management. Engaging with the employees makes them more productive, better aligned and more committed. It also manifests in smooth and effective functioning of the organisation.
61
Vedanta Resources plc | Annual Report FY2017
STRATEGIC REPORT DIRECTORS’ REPORT FINANCIAL STATEMENTS ADDITIONAL INFORMATION
http://sustainabledevelopment.vedantaresources.com
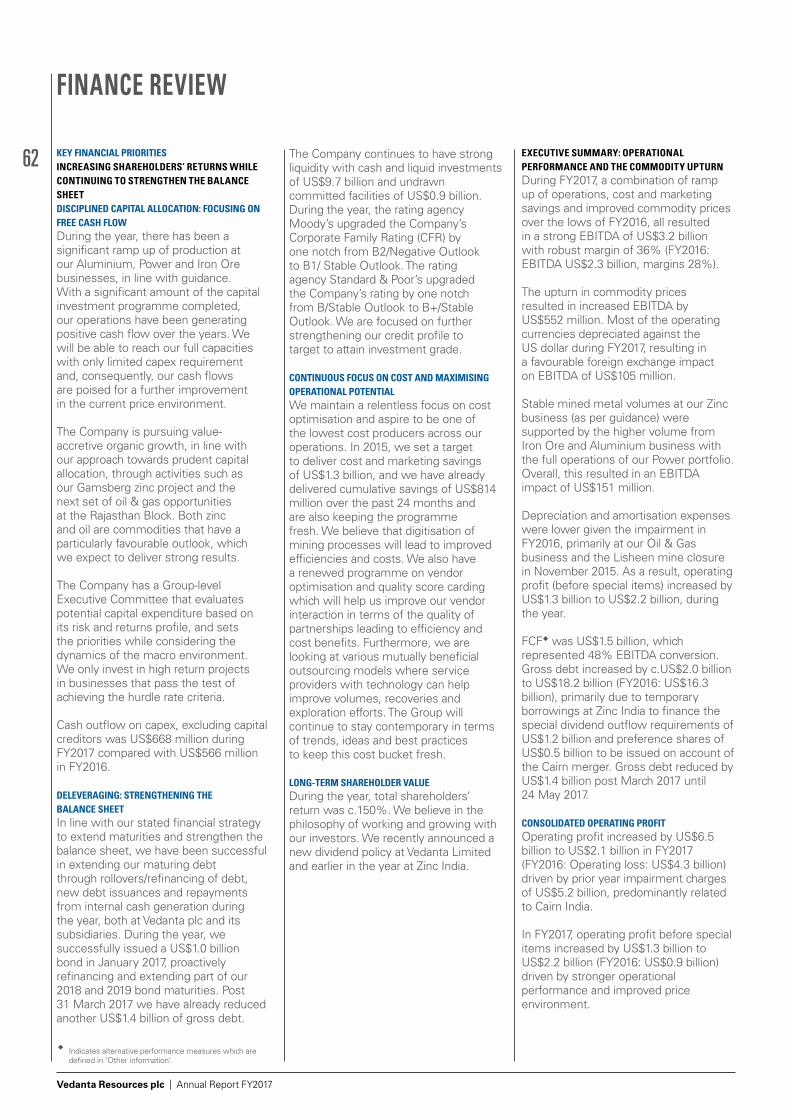
62
Vedanta Resources plc | Annual Report FY2017
FINANCE REVIEW
KEY FINANCIAL PRIORITIES INCREASING SHAREHOLDERS’ RETURNS WHILE CONTINUING TO STRENGTHEN THE BALANCE SHEET DISCIPLINED CAPITAL ALLOCATION: FOCUSING ON FREE CASH FLOWDuring the year, there has been a significant ramp up of production at our Aluminium, Power and Iron Ore businesses, in line with guidance. With a significant amount of the capital investment programme completed, our operations have been generating positive cash flow over the years. We will be able to reach our full capacities with only limited capex requirement and, consequently, our cash flows are poised for a further improvement in the current price environment.
The Company is pursuing value-accretive organic growth, in line with our approach towards prudent capital allocation, through activities such as our Gamsberg zinc project and the next set of oil & gas opportunities at the Rajasthan Block. Both zinc and oil are commodities that have a particularly favourable outlook, which we expect to deliver strong results.
The Company has a Group-level Executive Committee that evaluates potential capital expenditure based on its risk and returns profile, and sets the priorities while considering the dynamics of the macro environment. We only invest in high return projects in businesses that pass the test of achieving the hurdle rate criteria.
Cash outflow on capex, excluding capital creditors was US$668 million during FY2017 compared with US$566 million in FY2016.
DELEVERAGING: STRENGTHENING THE BALANCE SHEETIn line with our stated financial strategy to extend maturities and strengthen the balance sheet, we have been successful in extending our maturing debt through rollovers/refinancing of debt, new debt issuances and repayments from internal cash generation during the year, both at Vedanta plc and its subsidiaries. During the year, we successfully issued a US$1.0 billion bond in January 2017, proactively refinancing and extending part of our 2018 and 2019 bond maturities. Post 31 March 2017 we have already reduced another US$1.4 billion of gross debt.
The Company continues to have strong liquidity with cash and liquid investments of US$9.7 billion and undrawn committed facilities of US$0.9 billion.During the year, the rating agency Moody’s upgraded the Company’s Corporate Family Rating (CFR) by one notch from B2/Negative Outlook to B1/ Stable Outlook. The rating agency Standard & Poor’s upgraded the Company’s rating by one notch from B/Stable Outlook to B+/Stable Outlook. We are focused on further strengthening our credit profile to target to attain investment grade.
CONTINUOUS FOCUS ON COST AND MAXIMISING OPERATIONAL POTENTIALWe maintain a relentless focus on cost optimisation and aspire to be one of the lowest cost producers across our operations. In 2015, we set a target to deliver cost and marketing savings of US$1.3 billion, and we have already delivered cumulative savings of US$814 million over the past 24 months and are also keeping the programme fresh. We believe that digitisation of mining processes will lead to improved efficiencies and costs. We also have a renewed programme on vendor optimisation and quality score carding which will help us improve our vendor interaction in terms of the quality of partnerships leading to efficiency and cost benefits. Furthermore, we are looking at various mutually beneficial outsourcing models where service providers with technology can help improve volumes, recoveries and exploration efforts. The Group will continue to stay contemporary in terms of trends, ideas and best practices to keep this cost bucket fresh.
LONG-TERM SHAREHOLDER VALUE During the year, total shareholders’ return was c.150%. We believe in the philosophy of working and growing with our investors. We recently announced a new dividend policy at Vedanta Limited and earlier in the year at Zinc India.
EXECUTIVE SUMMARY: OPERATIONAL PERFORMANCE AND THE COMMODITY UPTURNDuring FY2017, a combination of ramp up of operations, cost and marketing savings and improved commodity prices over the lows of FY2016, all resulted in a strong EBITDA of US$3.2 billion with robust margin of 36% (FY2016: EBITDA US$2.3 billion, margins 28%).
The upturn in commodity prices resulted in increased EBITDA by US$552 million. Most of the operating currencies depreciated against the US dollar during FY2017, resulting in a favourable foreign exchange impact on EBITDA of US$105 million.
Stable mined metal volumes at our Zinc business (as per guidance) were supported by the higher volume from Iron Ore and Aluminium business with the full operations of our Power portfolio. Overall, this resulted in an EBITDA impact of US$151 million.
Depreciation and amortisation expenses were lower given the impairment in FY2016, primarily at our Oil & Gas business and the Lisheen mine closure in November 2015. As a result, operating profit (before special items) increased by US$1.3 billion to US$2.2 billion, during the year.
FCF was US$1.5 billion, which represented 48% EBITDA conversion. Gross debt increased by c.US$2.0 billion to US$18.2 billion (FY2016: US$16.3 billion), primarily due to temporary borrowings at Zinc India to finance the special dividend outflow requirements of US$1.2 billion and preference shares of US$0.5 billion to be issued on account of the Cairn merger. Gross debt reduced by US$1.4 billion post March 2017 until 24 May 2017.
CONSOLIDATED OPERATING PROFIT Operating profit increased by US$6.5 billion to US$2.1 billion in FY2017 (FY2016: Operating loss: US$4.3 billion) driven by prior year impairment charges of US$5.2 billion, predominantly related to Cairn India.
In FY2017, operating profit before special items increased by US$1.3 billion to US$2.2 billion (FY2016: US$0.9 billion) driven by stronger operational performance and improved price environment.
Indicates alternative performance measures which are defined in ‘Other information’.
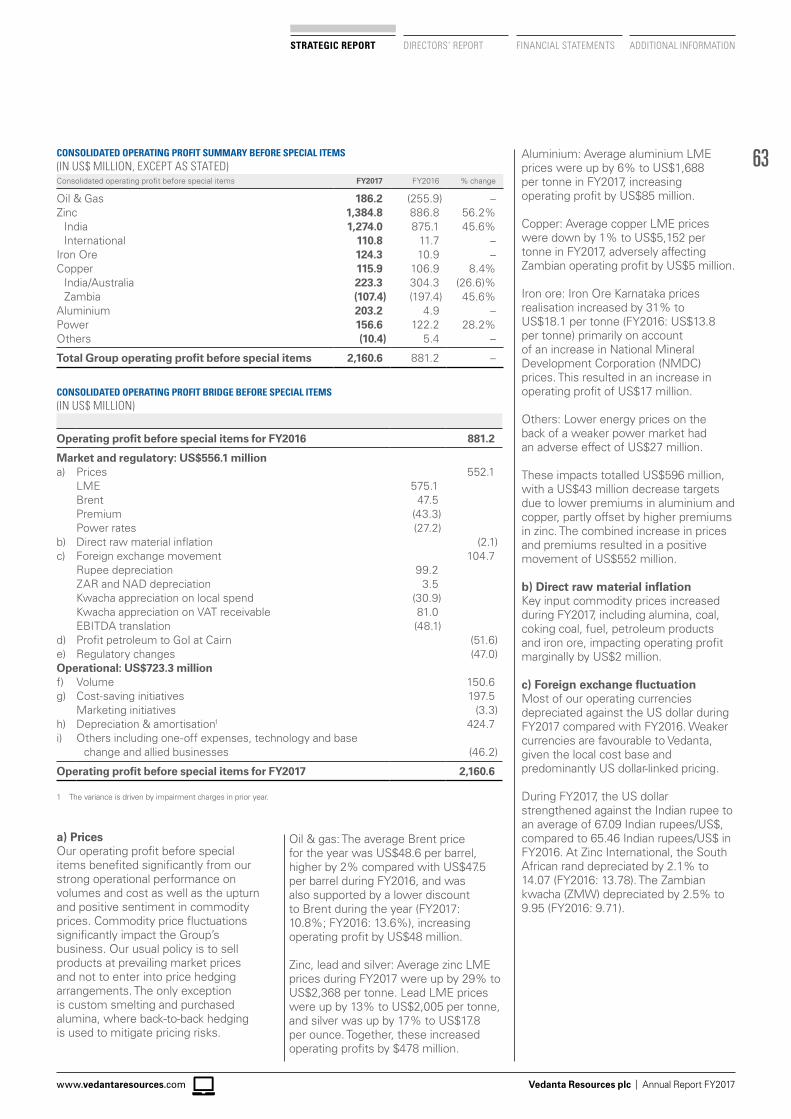
63
Vedanta Resources plc | Annual Report FY2017www.vedantaresources.com
STRATEGIC REPORT DIRECTORS’ REPORT FINANCIAL STATEMENTS ADDITIONAL INFORMATION
CONSOLIDATED OPERATING PROFIT SUMMARY BEFORE SPECIAL ITEMS(IN US$ MILLION, EXCEPT AS STATED)Consolidated operating profit before special items FY2017 FY2016 % change
Oil & Gas 186.2 (255.9) –Zinc 1,384.8 886.8 56.2%
India 1,274.0 875.1 45.6%International 110.8 11.7 –
Iron Ore 124.3 10.9 –Copper 115.9 106.9 8.4%
India/Australia 223.3 304.3 (26.6)%Zambia (107.4) (197.4) 45.6%
Aluminium 203.2 4.9 –Power 156.6 122.2 28.2%Others (10.4) 5.4 –
Total Group operating profit before special items 2,160.6 881.2 –
CONSOLIDATED OPERATING PROFIT BRIDGE BEFORE SPECIAL ITEMS(IN US$ MILLION)
Operating profit before special items for FY2016 881.2
Market and regulatory: US$556.1 milliona) Prices 552.1
LME 575.1 Brent 47.5 Premium (43.3)Power rates (27.2)
b) Direct raw material inflation (2.1)c) Foreign exchange movement 104.7
Rupee depreciation 99.2 ZAR and NAD depreciation 3.5 Kwacha appreciation on local spend (30.9)Kwacha appreciation on VAT receivable 81.0 EBITDA translation (48.1)
d) Profit petroleum to GoI at Cairn (51.6)e) Regulatory changes (47.0)Operational: US$723.3 millionf) Volume 150.6 g) Cost-saving initiatives 197.5
Marketing initiatives (3.3)h) Depreciation & amortisation1 424.7 i) Others including one-off expenses, technology and base
change and allied businesses (46.2)
Operating profit before special items for FY2017 2,160.6
1 The variance is driven by impairment charges in prior year.
a) Prices Our operating profit before special items benefited significantly from our strong operational performance on volumes and cost as well as the upturn and positive sentiment in commodity prices. Commodity price fluctuations significantly impact the Group’s business. Our usual policy is to sell products at prevailing market prices and not to enter into price hedging arrangements. The only exception is custom smelting and purchased alumina, where back-to-back hedging is used to mitigate pricing risks.
Oil & gas: The average Brent price for the year was US$48.6 per barrel, higher by 2% compared with US$47.5 per barrel during FY2016, and was also supported by a lower discount to Brent during the year (FY2017: 10.8%; FY2016: 13.6%), increasing operating profit by US$48 million.
Zinc, lead and silver: Average zinc LME prices during FY2017 were up by 29% to US$2,368 per tonne. Lead LME prices were up by 13% to US$2,005 per tonne, and silver was up by 17% to US$17.8 per ounce. Together, these increased operating profits by $478 million.
Aluminium: Average aluminium LME prices were up by 6% to US$1,688 per tonne in FY2017, increasing operating profit by US$85 million.
Copper: Average copper LME prices were down by 1% to US$5,152 per tonne in FY2017, adversely affecting Zambian operating profit by US$5 million.
Iron ore: Iron Ore Karnataka prices realisation increased by 31% to US$18.1 per tonne (FY2016: US$13.8 per tonne) primarily on account of an increase in National Mineral Development Corporation (NMDC) prices. This resulted in an increase in operating profit of US$17 million.
Others: Lower energy prices on the back of a weaker power market had an adverse effect of US$27 million.
These impacts totalled US$596 million, with a US$43 million decrease targets due to lower premiums in aluminium and copper, partly offset by higher premiums in zinc. The combined increase in prices and premiums resulted in a positive movement of US$552 million.
b) Direct raw material inflationKey input commodity prices increased during FY2017, including alumina, coal, coking coal, fuel, petroleum products and iron ore, impacting operating profit marginally by US$2 million.
c) Foreign exchange fluctuationMost of our operating currencies depreciated against the US dollar during FY2017 compared with FY2016. Weaker currencies are favourable to Vedanta, given the local cost base and predominantly US dollar-linked pricing.
During FY2017, the US dollar strengthened against the Indian rupee to an average of 67.09 Indian rupees/US$, compared to 65.46 Indian rupees/US$ in FY2016. At Zinc International, the South African rand depreciated by 2.1% to 14.07 (FY2016: 13.78). The Zambian kwacha (ZMW) depreciated by 2.5% to 9.95 (FY2016: 9.71).
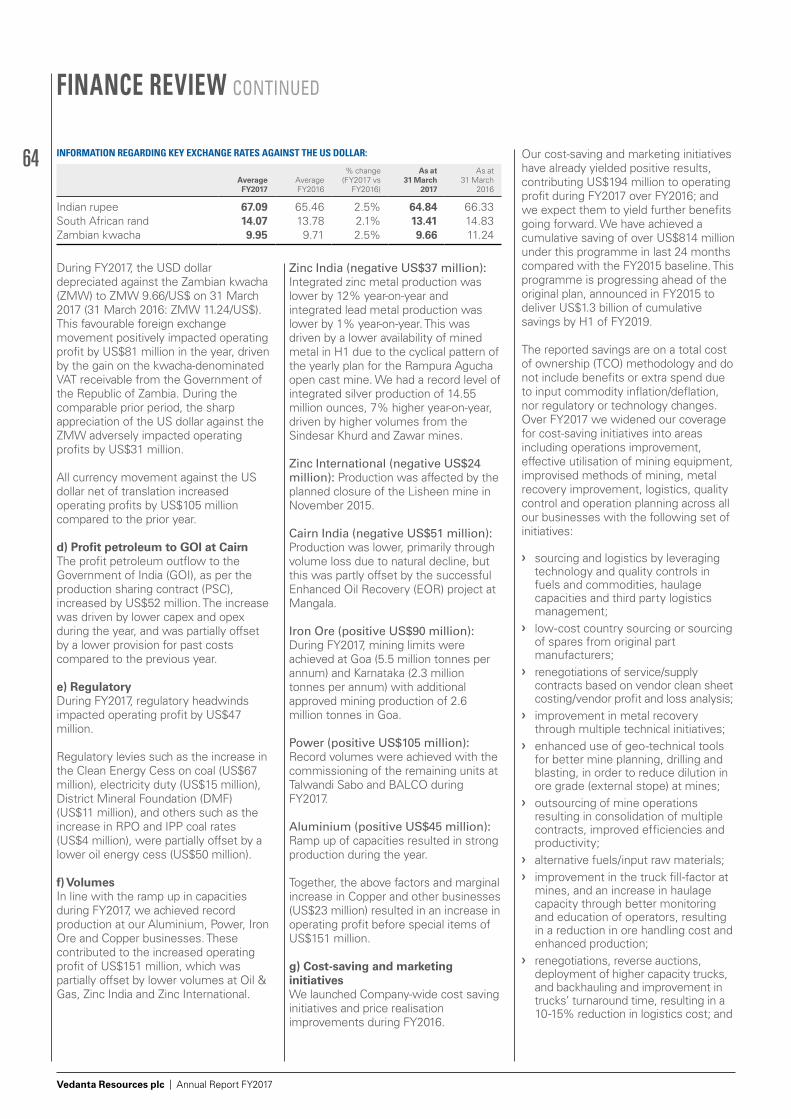
64
Vedanta Resources plc | Annual Report FY2017
FINANCE REVIEW CONTINUED
INFORMATION REGARDING KEY EXCHANGE RATES AGAINST THE US DOLLAR:
Average FY2017
Average FY2016
% change (FY2017 vs
FY2016)
As at 31 March
2017
As at 31 March
2016
Indian rupee 67.09 65.46 2.5% 64.84 66.33South African rand 14.07 13.78 2.1% 13.41 14.83Zambian kwacha 9.95 9.71 2.5% 9.66 11.24
During FY2017, the USD dollar depreciated against the Zambian kwacha (ZMW) to ZMW 9.66/US$ on 31 March 2017 (31 March 2016: ZMW 11.24/US$). This favourable foreign exchange movement positively impacted operating profit by US$81 million in the year, driven by the gain on the kwacha-denominated VAT receivable from the Government of the Republic of Zambia. During the comparable prior period, the sharp appreciation of the US dollar against the ZMW adversely impacted operating profits by US$31 million.
All currency movement against the US dollar net of translation increased operating profits by US$105 million compared to the prior year.
d) Profit petroleum to GOI at Cairn The profit petroleum outflow to the Government of India (GOI), as per the production sharing contract (PSC), increased by US$52 million. The increase was driven by lower capex and opex during the year, and was partially offset by a lower provision for past costs compared to the previous year.
e) RegulatoryDuring FY2017, regulatory headwinds impacted operating profit by US$47 million.
Regulatory levies such as the increase in the Clean Energy Cess on coal (US$67 million), electricity duty (US$15 million), District Mineral Foundation (DMF) (US$11 million), and others such as the increase in RPO and IPP coal rates (US$4 million), were partially offset by a lower oil energy cess (US$50 million).
f) VolumesIn line with the ramp up in capacities during FY2017, we achieved record production at our Aluminium, Power, Iron Ore and Copper businesses. These contributed to the increased operating profit of US$151 million, which was partially offset by lower volumes at Oil & Gas, Zinc India and Zinc International.
Zinc India (negative US$37 million): Integrated zinc metal production was lower by 12% year-on-year and integrated lead metal production was lower by 1% year-on-year. This was driven by a lower availability of mined metal in H1 due to the cyclical pattern of the yearly plan for the Rampura Agucha open cast mine. We had a record level of integrated silver production of 14.55 million ounces, 7% higher year-on-year, driven by higher volumes from the Sindesar Khurd and Zawar mines.
Zinc International (negative US$24 million): Production was affected by the planned closure of the Lisheen mine in November 2015.
Cairn India (negative US$51 million): Production was lower, primarily through volume loss due to natural decline, but this was partly offset by the successful Enhanced Oil Recovery (EOR) project at Mangala.
Iron Ore (positive US$90 million): During FY2017, mining limits were achieved at Goa (5.5 million tonnes per annum) and Karnataka (2.3 million tonnes per annum) with additional approved mining production of 2.6 million tonnes in Goa.
Power (positive US$105 million): Record volumes were achieved with the commissioning of the remaining units at Talwandi Sabo and BALCO during FY2017.
Aluminium (positive US$45 million): Ramp up of capacities resulted in strong production during the year.
Together, the above factors and marginal increase in Copper and other businesses (US$23 million) resulted in an increase in operating profit before special items of US$151 million.
g) Cost-saving and marketing initiativesWe launched Company-wide cost saving initiatives and price realisation improvements during FY2016.
Our cost-saving and marketing initiatives have already yielded positive results, contributing US$194 million to operating profit during FY2017 over FY2016; and we expect them to yield further benefits going forward. We have achieved a cumulative saving of over US$814 million under this programme in last 24 months compared with the FY2015 baseline. This programme is progressing ahead of the original plan, announced in FY2015 to deliver US$1.3 billion of cumulative savings by H1 of FY2019.
The reported savings are on a total cost of ownership (TCO) methodology and do not include benefits or extra spend due to input commodity inflation/deflation, nor regulatory or technology changes. Over FY2017 we widened our coverage for cost-saving initiatives into areas including operations improvement, effective utilisation of mining equipment, improvised methods of mining, metal recovery improvement, logistics, quality control and operation planning across all our businesses with the following set of initiatives:
❯ sourcing and logistics by leveraging technology and quality controls in fuels and commodities, haulage capacities and third party logistics management;
❯ low-cost country sourcing or sourcing of spares from original part manufacturers;
❯ renegotiations of service/supply contracts based on vendor clean sheet costing/vendor profit and loss analysis;
❯ improvement in metal recovery through multiple technical initiatives;
❯ enhanced use of geo-technical tools for better mine planning, drilling and blasting, in order to reduce dilution in ore grade (external stope) at mines;
❯ outsourcing of mine operations resulting in consolidation of multiple contracts, improved efficiencies and productivity;
❯ alternative fuels/input raw materials; ❯ improvement in the truck fill-factor at
mines, and an increase in haulage capacity through better monitoring and education of operators, resulting in a reduction in ore handling cost and enhanced production;
❯ renegotiations, reverse auctions, deployment of higher capacity trucks, and backhauling and improvement in trucks’ turnaround time, resulting in a 10-15% reduction in logistics cost; and
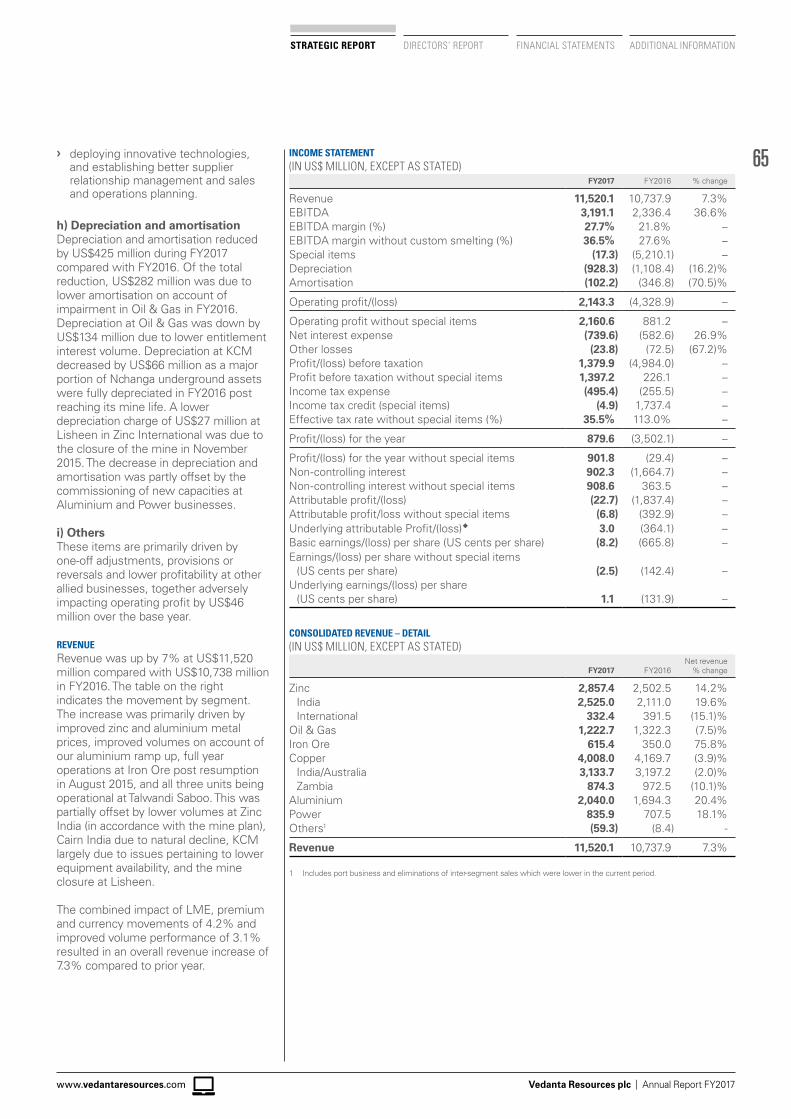
65
Vedanta Resources plc | Annual Report FY2017www.vedantaresources.com
STRATEGIC REPORT DIRECTORS’ REPORT FINANCIAL STATEMENTS ADDITIONAL INFORMATION
❯ deploying innovative technologies, and establishing better supplier relationship management and sales and operations planning.
h) Depreciation and amortisationDepreciation and amortisation reduced by US$425 million during FY2017 compared with FY2016. Of the total reduction, US$282 million was due to lower amortisation on account of impairment in Oil & Gas in FY2016. Depreciation at Oil & Gas was down by US$134 million due to lower entitlement interest volume. Depreciation at KCM decreased by US$66 million as a major portion of Nchanga underground assets were fully depreciated in FY2016 post reaching its mine life. A lower depreciation charge of US$27 million at Lisheen in Zinc International was due to the closure of the mine in November 2015. The decrease in depreciation and amortisation was partly offset by the commissioning of new capacities at Aluminium and Power businesses.
i) OthersThese items are primarily driven by one-off adjustments, provisions or reversals and lower profitability at other allied businesses, together adversely impacting operating profit by US$46 million over the base year.
REVENUERevenue was up by 7% at US$11,520 million compared with US$10,738 million in FY2016. The table on the right indicates the movement by segment. The increase was primarily driven by improved zinc and aluminium metal prices, improved volumes on account of our aluminium ramp up, full year operations at Iron Ore post resumption in August 2015, and all three units being operational at Talwandi Saboo. This was partially offset by lower volumes at Zinc India (in accordance with the mine plan), Cairn India due to natural decline, KCM largely due to issues pertaining to lower equipment availability, and the mine closure at Lisheen.
The combined impact of LME, premium and currency movements of 4.2% and improved volume performance of 3.1% resulted in an overall revenue increase of 7.3% compared to prior year.
INCOME STATEMENT(IN US$ MILLION, EXCEPT AS STATED)
FY2017 FY2016 % change
Revenue 11,520.1 10,737.9 7.3%EBITDA 3,191.1 2,336.4 36.6%EBITDA margin (%) 27.7% 21.8% –EBITDA margin without custom smelting (%) 36.5% 27.6% –Special items (17.3) (5,210.1) –Depreciation (928.3) (1,108.4) (16.2)%Amortisation (102.2) (346.8) (70.5)%
Operating profit/(loss) 2,143.3 (4,328.9) –
Operating profit without special items 2,160.6 881.2 –Net interest expense (739.6) (582.6) 26.9%Other losses (23.8) (72.5) (67.2)%Profit/(loss) before taxation 1,379.9 (4,984.0) –Profit before taxation without special items 1,397.2 226.1 –Income tax expense (495.4) (255.5) –Income tax credit (special items) (4.9) 1,737.4 –Effective tax rate without special items (%) 35.5% 113.0% –
Profit/(loss) for the year 879.6 (3,502.1) –
Profit/(loss) for the year without special items 901.8 (29.4) –Non-controlling interest 902.3 (1,664.7) –Non-controlling interest without special items 908.6 363.5 –Attributable profit/(loss) (22.7) (1,837.4) –Attributable profit/loss without special items (6.8) (392.9) –Underlying attributable Profit/(loss) 3.0 (364.1) –Basic earnings/(loss) per share (US cents per share) (8.2) (665.8) –Earnings/(loss) per share without special items
(US cents per share) (2.5) (142.4) –Underlying earnings/(loss) per share
(US cents per share) 1.1 (131.9) –
CONSOLIDATED REVENUE – DETAIL(IN US$ MILLION, EXCEPT AS STATED)
FY2017 FY2016Net revenue
% change
Zinc 2,857.4 2,502.5 14.2%India 2,525.0 2,111.0 19.6%International 332.4 391.5 (15.1)%
Oil & Gas 1,222.7 1,322.3 (7.5)%Iron Ore 615.4 350.0 75.8%Copper 4,008.0 4,169.7 (3.9)%
India/Australia 3,133.7 3,197.2 (2.0)%Zambia 874.3 972.5 (10.1)%
Aluminium 2,040.0 1,694.3 20.4%Power 835.9 707.5 18.1%Others1 (59.3) (8.4) -
Revenue 11,520.1 10,737.9 7.3%
1 Includes port business and eliminations of inter-segment sales which were lower in the current period.
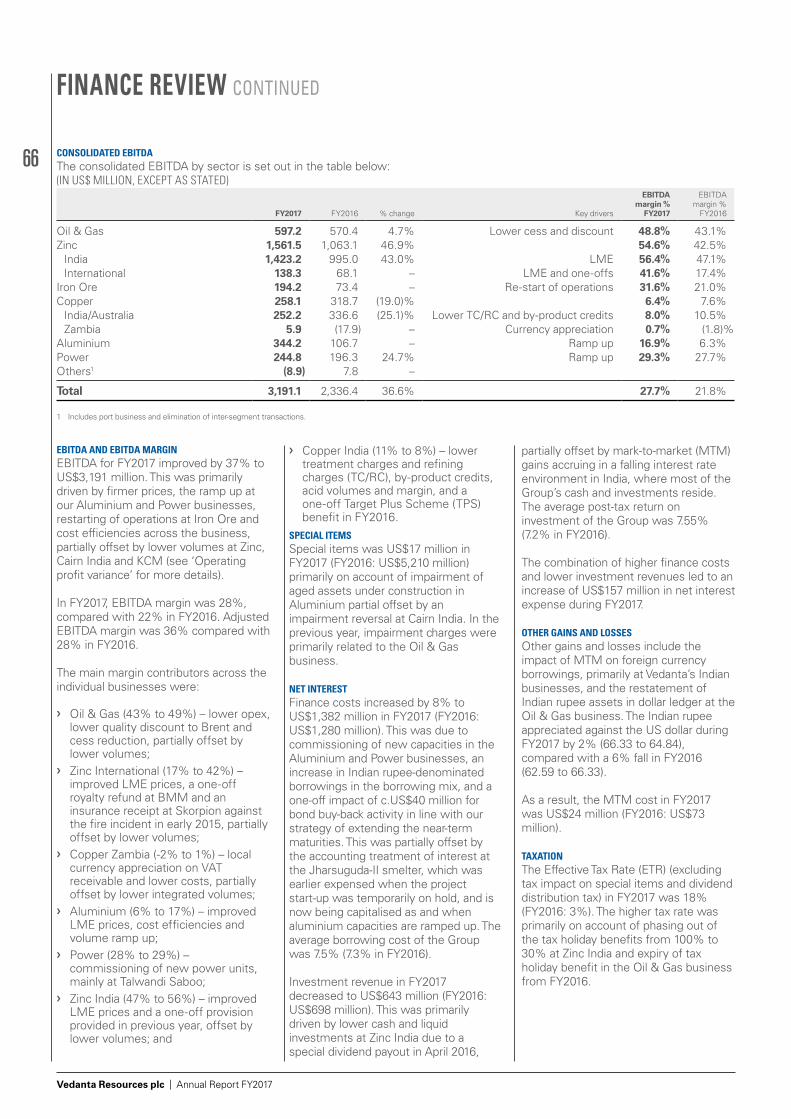
66
Vedanta Resources plc | Annual Report FY2017
CONSOLIDATED EBITDAThe consolidated EBITDA by sector is set out in the table below:(IN US$ MILLION, EXCEPT AS STATED)
FY2017 FY2016 % change Key drivers
EBITDA margin %
FY2017
EBITDA margin %
FY2016
Oil & Gas 597.2 570.4 4.7% Lower cess and discount 48.8% 43.1%Zinc 1,561.5 1,063.1 46.9% 54.6% 42.5%
India 1,423.2 995.0 43.0% LME 56.4% 47.1%International 138.3 68.1 – LME and one-offs 41.6% 17.4%
Iron Ore 194.2 73.4 – Re-start of operations 31.6% 21.0%Copper 258.1 318.7 (19.0)% 6.4% 7.6%
India/Australia 252.2 336.6 (25.1)% Lower TC/RC and by-product credits 8.0% 10.5%Zambia 5.9 (17.9) – Currency appreciation 0.7% (1.8)%
Aluminium 344.2 106.7 – Ramp up 16.9% 6.3%Power 244.8 196.3 24.7% Ramp up 29.3% 27.7%Others1 (8.9) 7.8 –
Total 3,191.1 2,336.4 36.6% 27.7% 21.8%
1 Includes port business and elimination of inter-segment transactions.
EBITDA AND EBITDA MARGINEBITDA for FY2017 improved by 37% to US$3,191 million. This was primarily driven by firmer prices, the ramp up at our Aluminium and Power businesses, restarting of operations at Iron Ore and cost efficiencies across the business, partially offset by lower volumes at Zinc, Cairn India and KCM (see ‘Operating profit variance’ for more details).
In FY2017, EBITDA margin was 28%, compared with 22% in FY2016. Adjusted EBITDA margin was 36% compared with 28% in FY2016.
The main margin contributors across the individual businesses were:
❯ Oil & Gas (43% to 49%) – lower opex, lower quality discount to Brent and cess reduction, partially offset by lower volumes;
❯ Zinc International (17% to 42%) – improved LME prices, a one-off royalty refund at BMM and an insurance receipt at Skorpion against the fire incident in early 2015, partially offset by lower volumes;
❯ Copper Zambia (-2% to 1%) – local currency appreciation on VAT receivable and lower costs, partially offset by lower integrated volumes;
❯ Aluminium (6% to 17%) – improved LME prices, cost efficiencies and volume ramp up;
❯ Power (28% to 29%) – commissioning of new power units, mainly at Talwandi Saboo;
❯ Zinc India (47% to 56%) – improved LME prices and a one-off provision provided in previous year, offset by lower volumes; and
❯ Copper India (11% to 8%) – lower treatment charges and refining charges (TC/RC), by-product credits, acid volumes and margin, and a one-off Target Plus Scheme (TPS) benefit in FY2016.
SPECIAL ITEMSSpecial items was US$17 million in FY2017 (FY2016: US$5,210 million) primarily on account of impairment of aged assets under construction in Aluminium partial offset by an impairment reversal at Cairn India. In the previous year, impairment charges were primarily related to the Oil & Gas business.
NET INTERESTFinance costs increased by 8% to US$1,382 million in FY2017 (FY2016: US$1,280 million). This was due to commissioning of new capacities in the Aluminium and Power businesses, an increase in Indian rupee-denominated borrowings in the borrowing mix, and a one-off impact of c.US$40 million for bond buy-back activity in line with our strategy of extending the near-term maturities. This was partially offset by the accounting treatment of interest at the Jharsuguda-II smelter, which was earlier expensed when the project start-up was temporarily on hold, and is now being capitalised as and when aluminium capacities are ramped up. The average borrowing cost of the Group was 7.5% (7.3% in FY2016).
Investment revenue in FY2017 decreased to US$643 million (FY2016: US$698 million). This was primarily driven by lower cash and liquid investments at Zinc India due to a special dividend payout in April 2016,
partially offset by mark-to-market (MTM) gains accruing in a falling interest rate environment in India, where most of the Group’s cash and investments reside. The average post-tax return on investment of the Group was 7.55% (7.2% in FY2016).
The combination of higher finance costs and lower investment revenues led to an increase of US$157 million in net interest expense during FY2017.
OTHER GAINS AND LOSSESOther gains and losses include the impact of MTM on foreign currency borrowings, primarily at Vedanta’s Indian businesses, and the restatement of Indian rupee assets in dollar ledger at the Oil & Gas business. The Indian rupee appreciated against the US dollar during FY2017 by 2% (66.33 to 64.84), compared with a 6% fall in FY2016 (62.59 to 66.33).
As a result, the MTM cost in FY2017 was US$24 million (FY2016: US$73 million).
TAXATIONThe Effective Tax Rate (ETR) (excluding tax impact on special items and dividend distribution tax) in FY2017 was 18% (FY2016: 3%). The higher tax rate was primarily on account of phasing out of the tax holiday benefits from 100% to 30% at Zinc India and expiry of tax holiday benefit in the Oil & Gas business from FY2016.
FINANCE REVIEW CONTINUED
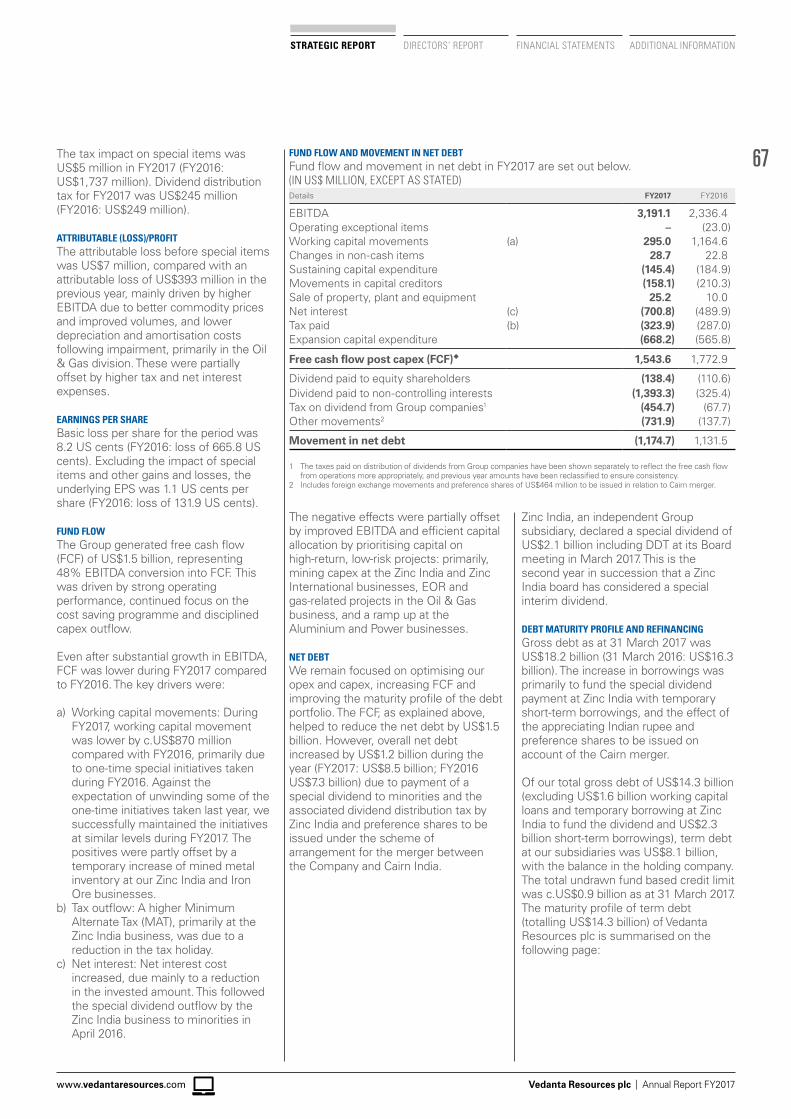
67
Vedanta Resources plc | Annual Report FY2017www.vedantaresources.com
STRATEGIC REPORT DIRECTORS’ REPORT FINANCIAL STATEMENTS ADDITIONAL INFORMATION
The tax impact on special items was US$5 million in FY2017 (FY2016: US$1,737 million). Dividend distribution tax for FY2017 was US$245 million (FY2016: US$249 million).
ATTRIBUTABLE (LOSS)/PROFITThe attributable loss before special items was US$7 million, compared with an attributable loss of US$393 million in the previous year, mainly driven by higher EBITDA due to better commodity prices and improved volumes, and lower depreciation and amortisation costs following impairment, primarily in the Oil & Gas division. These were partially offset by higher tax and net interest expenses.
EARNINGS PER SHAREBasic loss per share for the period was 8.2 US cents (FY2016: loss of 665.8 US cents). Excluding the impact of special items and other gains and losses, the underlying EPS was 1.1 US cents per share (FY2016: loss of 131.9 US cents).
FUND FLOWThe Group generated free cash flow (FCF) of US$1.5 billion, representing 48% EBITDA conversion into FCF. This was driven by strong operating performance, continued focus on the cost saving programme and disciplined capex outflow.
Even after substantial growth in EBITDA, FCF was lower during FY2017 compared to FY2016. The key drivers were:
a) Working capital movements: During FY2017, working capital movement was lower by c.US$870 million compared with FY2016, primarily due to one-time special initiatives taken during FY2016. Against the expectation of unwinding some of the one-time initiatives taken last year, we successfully maintained the initiatives at similar levels during FY2017. The positives were partly offset by a temporary increase of mined metal inventory at our Zinc India and Iron Ore businesses.
b) Tax outflow: A higher Minimum Alternate Tax (MAT), primarily at the Zinc India business, was due to a reduction in the tax holiday.
c) Net interest: Net interest cost increased, due mainly to a reduction in the invested amount. This followed the special dividend outflow by the Zinc India business to minorities in April 2016.
FUND FLOW AND MOVEMENT IN NET DEBTFund flow and movement in net debt in FY2017 are set out below.(IN US$ MILLION, EXCEPT AS STATED)Details FY2017 FY2016
EBITDA 3,191.1 2,336.4Operating exceptional items – (23.0)Working capital movements (a) 295.0 1,164.6Changes in non-cash items 28.7 22.8Sustaining capital expenditure (145.4) (184.9)Movements in capital creditors (158.1) (210.3)Sale of property, plant and equipment 25.2 10.0Net interest (c) (700.8) (489.9)Tax paid (b) (323.9) (287.0)Expansion capital expenditure (668.2) (565.8)
Free cash flow post capex (FCF) 1,543.6 1,772.9
Dividend paid to equity shareholders (138.4) (110.6)Dividend paid to non-controlling interests (1,393.3) (325.4)Tax on dividend from Group companies1 (454.7) (67.7)Other movements2 (731.9) (137.7)
Movement in net debt (1,174.7) 1,131.5
1 The taxes paid on distribution of dividends from Group companies have been shown separately to reflect the free cash flow from operations more appropriately, and previous year amounts have been reclassified to ensure consistency.
2 Includes foreign exchange movements and preference shares of US$464 million to be issued in relation to Cairn merger.
The negative effects were partially offset by improved EBITDA and efficient capital allocation by prioritising capital on high-return, low-risk projects: primarily, mining capex at the Zinc India and Zinc International businesses, EOR and gas-related projects in the Oil & Gas business, and a ramp up at the Aluminium and Power businesses.
NET DEBTWe remain focused on optimising our opex and capex, increasing FCF and improving the maturity profile of the debt portfolio. The FCF, as explained above, helped to reduce the net debt by US$1.5 billion. However, overall net debt increased by US$1.2 billion during the year (FY2017: US$8.5 billion; FY2016 US$7.3 billion) due to payment of a special dividend to minorities and the associated dividend distribution tax by Zinc India and preference shares to be issued under the scheme of arrangement for the merger between the Company and Cairn India.
Zinc India, an independent Group subsidiary, declared a special dividend of US$2.1 billion including DDT at its Board meeting in March 2017. This is the second year in succession that a Zinc India board has considered a special interim dividend.
DEBT MATURITY PROFILE AND REFINANCINGGross debt as at 31 March 2017 was US$18.2 billion (31 March 2016: US$16.3 billion). The increase in borrowings was primarily to fund the special dividend payment at Zinc India with temporary short-term borrowings, and the effect of the appreciating Indian rupee and preference shares to be issued on account of the Cairn merger.
Of our total gross debt of US$14.3 billion (excluding US$1.6 billion working capital loans and temporary borrowing at Zinc India to fund the dividend and US$2.3 billion short-term borrowings), term debt at our subsidiaries was US$8.1 billion, with the balance in the holding company. The total undrawn fund based credit limit was c.US$0.9 billion as at 31 March 2017. The maturity profile of term debt (totalling US$14.3 billion) of Vedanta Resources plc is summarised on the following page:
68
Vedanta Resources plc | Annual Report FY2017
Particulars
As at 31 March
2016
As at 31 March
2017 FY2018 FY2019 FY2020 FY2021 FY2022 Beyond FY2022
Debt at Vedanta Resources plc 7.5 6.2 1.0 1.8 0.4 0.1 1.1 1.8Debt at subsidiaries 7.3 8.1 1.9 2.4 1.2 1.2 0.6 0.8
Total term debt 14.8 14.3 2.9 4.3 1.6 1.3 1.7 2.6
We have been successful in extending our maturing debt through rollovers, new debt and repayments from internal accruals during the year, both at Vedanta plc and its subsidiaries. In line with our stated financial strategy to proactively refinance the debt and extend the near-term maturities, we successfully issued a US$1.0 billion bond in January 2017 to refinance proactively part of our 2018 and 2019 bond maturities.
Vedanta plc: The upcoming US$1.0 billion debt maturing at Vedanta plc comprises term loans out of which US$74 million has been repaid in April 2017 and the balance will be repaid or refinanced. Of the FY2019 term maturities, US$379 million has already been paid in April 2017 through an early redemption of the bond maturing in July 2018.
Subsidiary: Of the US$1.9 billion debt maturing during FY2018 (excluding US$1.6 billion working capital loans and the temporary borrowing at Zinc India to fund the dividend and US$2.3 billion short-term borrowings which, as previously, will be rolled over in the normal way), we have already repaid c.US$1.0 billion after 31 March, 2017. The balance will either be repaid from opening cash and liquid investment and cash generation from operations, or refinanced through other sources such as NCDs and term loans.
Cash and liquid investments stood at US$9,725 million at 31 March 2017 (31 March 2016: US$8,937 million). The portfolio continues to be conservatively invested in debt mutual funds, and in cash and fixed deposits with banks.
GOING CONCERNThe Directors have considered the Group’s cash flow forecasts for the next 12-month period, from the date of signing the financial statements ending 31 March 2017. Net debt has increased by US$1.2 billion in the financial year to US$8.5 billion, with US$0.9 billion of undrawn facilities at the balance sheet date. Further analysis of net debt is set out in Note 26 of the financial statements and details of borrowings and facilities are set out on page 203. The Board is satisfied that the Group’s forecasts and projections
show that the Group will be able to operate within the level of its current facilities for the foreseeable future. This takes into account reasonably possible changes in trading performance on cash flows and forecast covenant compliance; the transferability of cash within the Group; the flexibility that the Group has over the timings of its capital expenditure; and other uncertainties. For these reasons, the Group continues to adopt the going concern basis in preparing its financial statements.
LONGER-TERM VIABILITY STATEMENTIn accordance with provision C.2.1 of the UK Corporate Governance Code, the Directors have assessed the viability of the Group taking into account the Group’s current position and the potential impact of the principal risks which could threaten the business model, future performance, solvency or liquidity of the Group.
PERIOD OF VIABILITY STATEMENTAs per provision C.2.2 of the UK Corporate Governance Code, the Directors have reviewed the length of time to be covered by the viability statement, particularly given its primary purpose of providing investors with a view of financial viability that goes beyond the period of the going concern statement.
The Board of Directors have considered a three-year period appropriate for the longer-term viability testing on account of following key reasons:
❯ Commodity prices which are key to the Group’s viability are difficult to forecast beyond three years.
❯ Capital allocation and refinancing plans are prepared for a period of three years.
❯ Conversion of exploration projects to mining typically requires three to five years.
❯ Internal financial modelling is performed over a three-year period.
In assessing the Group’s longer-term viability, the going concern assumptions and financial model were used as the starting position. Severe but plausible risks were subsequently quantified both individually and in combination, to apply additional stress testing into the viability model.
Details of the Group’s principal risks are documented in the Principal Risks and Uncertainties part of this report. The Directors have considered the following risks as particularly relevant for assessing the longer-term viability:
❯ Decline in commodity prices. ❯ Delays in ramping up of aluminium
production. ❯ Operational turnaround at KCM
operations. ❯ Adverse outcomes of material legal
and tax cases.
The Group remains viable under these severe but plausible scenarios taking into consideration the specific mitigations highlighted above and the Group’s financing optionality. These include capital allocation and dividend policy flexibility and readily available access to lines of credit and alternative sources of finance.
CONCLUSIONWhile it is impossible to foresee all risks, and the combinations in which they could manifest, based on the results of this assessment and taking into account the Group’s current position and principal risks, the Directors have assessed the prospects of the Group, over the next three years, and have a reasonable expectation that the Group will be able to continue in operation and meet its liabilities as they fall due over a period of three years from 1 April 2017.
COVENANTSThe lending banks of Vedanta Resources plc have consented to certain changes to its covenants requested by the Company under the terms of the relevant debt facilities effective from 31 March 2017 until the period ending 30 September 2018. With this, the Company is in compliance with its covenants relating to all facilities for the testing period ending 31 March 2017.
CREDIT RATINGDuring FY2017, our Group simplification with the Cairn merger, upward movement on metal and oil prices, successful ramp up and volume growth have supported the Company’s improved credit rating.
FINANCE REVIEW CONTINUED
69
Vedanta Resources plc | Annual Report FY2017www.vedantaresources.com
STRATEGIC REPORT DIRECTORS’ REPORT FINANCIAL STATEMENTS ADDITIONAL INFORMATION
During the year, the rating agency Moody’s upgraded the Company’s Corporate Family Rating (CFR) by one notch from B2/Outlook Negative to B1/ Stable Outlook. The rating agency Standard & Poor’s upgraded the Company’s rating by one notch from B/Stable Outlook to B+/Stable Outlook.
We are focused on further strengthening our credit profile to attain investment grade ratings through ramp ups in our businesses which will deliver accelerated cash flows.
Shareholders’ (deficit)/equity was US$(409) million at 31 March 2017 compared with US$(713) million at 31 March 2016. This largely reflected the impact of the Cairn merger of US$817 million, currency appreciation US$87 million partly offset by preference share issuance of US$464 million, dividend payment of US$138 million by Vedanta plc and attributable loss of US$23 million.
Non-controlling interests decreased to US$6,423 million at 31 March 2017 (from US$7,565 million at 31 March 2016), mainly due to dividend payments to minorities of US$1,340 million, the impact of the Cairn merger of US$817 million partly offset by the attributable profit to minority shareholders during the year of US$902 million and the impact of rupee appreciation of US$129 million.
PROPERTY, PLANT AND EQUIPMENT During the year, we invested US$814 million in property, plant and equipment, comprising US$668 million on our expansion and improvement projects and US$145 million on sustaining capital expenditure. Expansion project expenses were US$56 million in our Oil & Gas business; US$238 million at Zinc India; US$60 million in the Power business (mainly at Talwandi Saboo); US$263 million in our Aluminium business; US$45 million at Zinc International and US$7 million at Copper India.
CONTRIBUTION TO EXCHEQUER: We contributed c.US$6.0 billion to the exchequer in FY2017 compared to US$3.2 billion in FY2016 through direct and indirect taxes, levies, royalties and dividend.
BALANCE SHEET(IN US$ MILLION, EXCEPT AS STATED)
31 March 2017
31 March 2016
Goodwill 16.6 16.6Intangible assets 95.6 92.2 Property, plant and equipment 16,806.1 16,647.8Other non-current assets 2,101.3 1,862.3Cash and liquid investments 9,725.2 8,936.5Other current assets 2,758.6 2,763.9Gross debt (18,228.7) (16,263.3)Other current and non-current liabilities (7,260.1) (7,203.6)Net assets 6,014.6 6,852.4Shareholders’ equity (408.5) (712.8)Non-controlling interests 6,423.1 7,565.2Total equity 6,014.6 6,852.4
PROJECT CAPEX:
Capex in progress Status
Total capex approved (US$mn)
Cumulative spend up to March 2017
Spend in FY2017
Unspent as at 31 March
20171
Cairn India RDG, Mangala Infill, EOR, Aishwariya Barmer Hill, Liquid handling & others)
306 56 56 250
Aluminium sector BALCO – Korba-II 325ktpa smelter and 1200MW power plant (4x300MW)1
Smelter: fully operational and to be capitalised in Q1, Power – All four units operational
1,872 1,965 76 (93)
Jharsuguda 1.25mtpa smelter Line 4: Fully Capitalised (316 pots operational) Line 3: two sections capitalised
2,920 2,746 178 174
Power sector Talwandi 1980MW IPP Completed 2,150 2,113 60 37Zinc sectorZinc India (Mines expansion) Phase-wise by FY2020 1,600 1,015 225 585Others 150 12 12 138Zinc InternationalGamsberg mining project First production by mid-2018 400 63 42 337Capex flexibility
Metals and Mining
Lanjigarh Refinery (Phase II) – 4mtpa Subject to Bauxite availability 1,570 822 10 748Tuticorin Smelter 400ktpa Under evaluation 367 139 7 228Skorpion Refinery conversion Currently deferred 156 14 3 142
1 Unspent capex represents difference between the total projected capex and the cumulative spend as at 31 March 2017.2 Cost over-run on account of changes in exchange rate. Total over-run expected to be US$120 million up to FY2019.
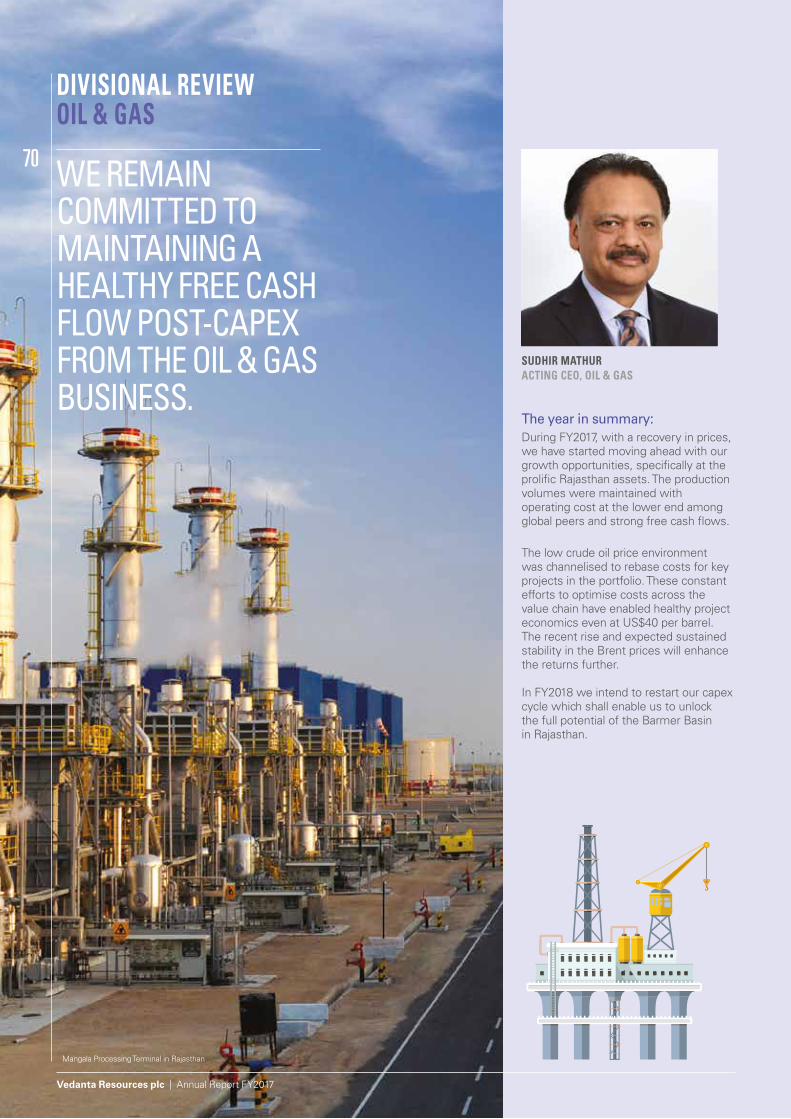
70
Vedanta Resources plc | Annual Report FY2017
DIVISIONAL REVIEWOIL & GAS
WE REMAIN COMMITTED TO MAINTAINING A HEALTHY FREE CASH FLOW POST-CAPEX FROM THE OIL & GAS BUSINESS.
The year in summary:During FY2017, with a recovery in prices, we have started moving ahead with our growth opportunities, specifically at the prolific Rajasthan assets. The production volumes were maintained with operating cost at the lower end among global peers and strong free cash flows.
The low crude oil price environment was channelised to rebase costs for key projects in the portfolio. These constant efforts to optimise costs across the value chain have enabled healthy project economics even at US$40 per barrel. The recent rise and expected sustained stability in the Brent prices will enhance the returns further.
In FY2018 we intend to restart our capex cycle which shall enable us to unlock the full potential of the Barmer Basin in Rajasthan.
Mangala Processing Terminal in Rajasthan
SUDHIR MATHURACTING CEO, OIL & GAS
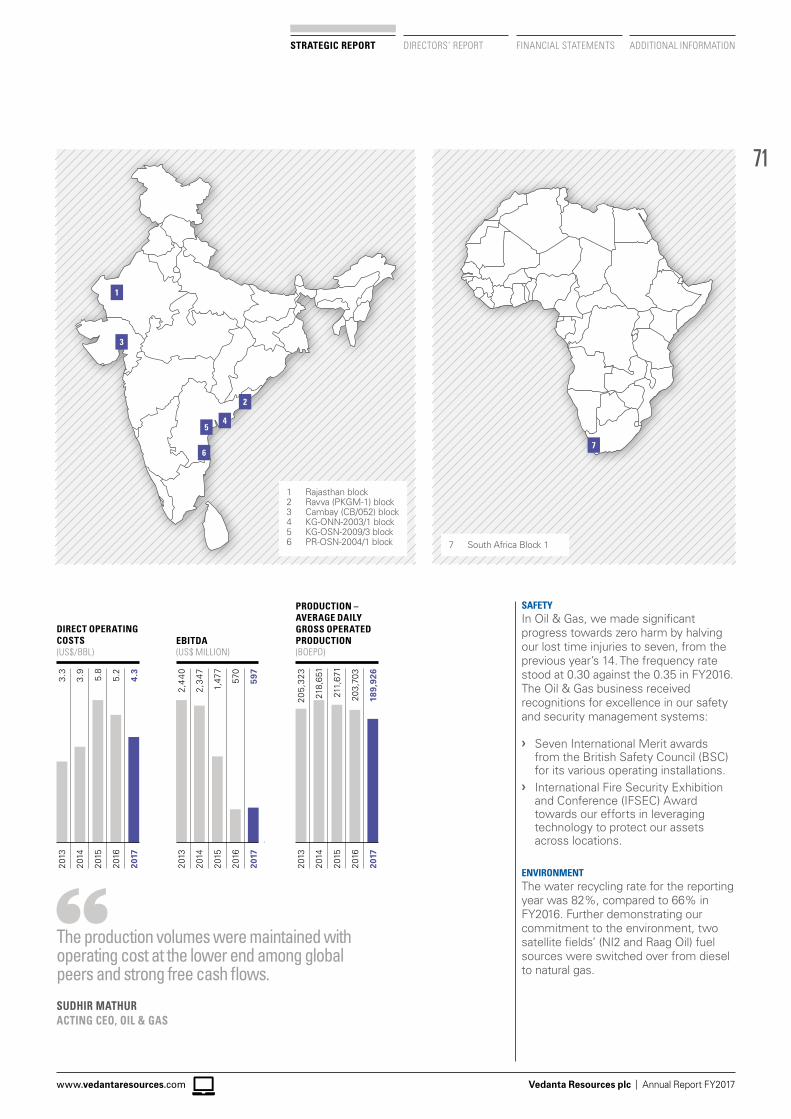
71
Vedanta Resources plc | Annual Report FY2017www.vedantaresources.com
STRATEGIC REPORT DIRECTORS’ REPORT FINANCIAL STATEMENTS ADDITIONAL INFORMATION
1
3
2
45
6
1 Rajasthan block2 Ravva (PKGM-1) block3 Cambay (CB/052) block4 KG-ONN-2003/1 block5 KG-OSN-2009/3 block6 PR-OSN-2004/1 block 7 South Africa Block 1
7
DIRECT OPERATINGCOSTS(US$/BBL)
3.9
3.3
5.8
5.2
4.3
2014
2013
2015
2016
2017
EBITDA(US$ MILLION)
2,3
47
2,4
40
1,47
7
570
597
2014
2013
2 015
2016
2017
PRODUCTION –AVERAGE DAILYGROSS OPERATEDPRODUCTION(BOEPD)
218,
651
205,
323
211,
671
203,
703
189,
926
2014
2013
2015
2016
2017
SAFETYIn Oil & Gas, we made significant progress towards zero harm by halving our lost time injuries to seven, from the previous year’s 14. The frequency rate stood at 0.30 against the 0.35 in FY2016.The Oil & Gas business received recognitions for excellence in our safety and security management systems:
❯ Seven International Merit awards from the British Safety Council (BSC) for its various operating installations.
❯ International Fire Security Exhibition and Conference (IFSEC) Award towards our efforts in leveraging technology to protect our assets across locations.
ENVIRONMENTThe water recycling rate for the reporting year was 82%, compared to 66% in FY2016. Further demonstrating our commitment to the environment, two satellite fields’ (NI2 and Raag Oil) fuel sources were switched over from diesel to natural gas.
The production volumes were maintained with operating cost at the lower end among global peers and strong free cash flows.
SUDHIR MATHURACTING CEO, OIL & GAS
72
Vedanta Resources plc | Annual Report FY2017
DIVISIONAL REVIEW CONTINUED OIL & GASPRODUCTION PERFORMANCE
Unit FY2017 FY2016 % change
Gross production boepd 189,926 203,703 (6.8)%Rajasthan boepd 161,571 169,609 (4.7)%Ravva boepd 18,602 23,845 (22.0)%Cambay boepd 9,753 10,249 (4.8)%
Oil bopd 184,734 196,955 (6.2)%Gas mmscfd 31.2 40.5 (23.0)%Net production – working interest boepd 121,186 128,191 (5.5)%
Oil bopd 118,976 125,314 (5.1)%Gas mmscfd 13.3 17.3 (23.1)%
Gross production mboe 69.3 74.6 (7.1)%Working interest production mboe 44.2 46.9 (5.7)%
PRICES
FY2017 FY2016 % change
Average Brent prices – US$/barrel 48.6 47.5 2.3%
FINANCIAL PERFORMANCE(IN US$ MILLION, UNLESS STATED)
FY2017 FY2016 % change
Revenue 1,222.7 1,322.3 (7.5)%EBITDA 597.2 570.4 4.7%EBITDA margin 48.8% 43.1% –Depreciation 411.0 544.6 (24.5)%Acquisition-related amortisation – 281.7 –Operating profit 186.2 (255.9) –Share in Group EBITDA % 18.7% 24.4% –Capital expenditure 62.2 214.2 (71.0)%Sustaining 6.2 15.8 (60.8)%Projects 56.0 198.4 (71.8)%
OPERATIONSAverage gross production for FY2017 was 189,926 barrels of oil equivalent per day (boepd), which was 6.8% lower than the previous year. Cairn India operates approximately 26% of India’s crude oil production. Rajasthan block production was 4.7% lower at 161,571boepd. The production was lower due to the reservoir underperformance at Bhagyam and Aishwariya fields and the planned maintenance shutdown at Mangala Processing Terminal in November 2016. However, the decline was partially offset by the successful execution of the polymer Enhanced Oil Recovery (EOR) project at Mangala, which enhanced production from the Mangala Field. Production from the Ravva and Cambay blocks was down by 22% and 5% respectively, due to natural decline.
The Mangala EOR, the world’s largest polymer flood project, continued to show its exemplary performance. The polymer injection was maintained at target levels of 400,000 barrels of liquid per day and resulted in a positive production impact of ~52,000 barrels of oil per day (bopd) in FY2017. The Rajasthan block recorded an excellent plant uptime of over 99% for the year.
In the Ravva block, the coil tubing and acid stimulation campaign was executed in Q4 FY2017 and this has helped to offset the natural decline. Well stimulation in a few of the water injector wells has also had a positive effect, helping to sustain the required water injection rates to support production from the oil wells. The Ravva block recorded an excellent uptime of over 99% for the year.
In the Cambay block, natural decline was restricted to 5%, supported by production optimisation activities. The Oil and Natural Gas Corporation (ONGC) Olpad gas tolling commenced to utilise surplus facilities at the onshore terminal. The Cambay block recorded an excellent uptime of over 99% for the year.
Gas production from Raageshwari Deep Gas (RDG) in Rajasthan was maintained at an average of 26mmscfd in FY2017, with average sales at 10mmscfd. The technical issue between the transporter and the gas buyers, which resulted in the temporary suspension of sales from October to mid-February, has now been resolved.
FY2017 saw a substantial recovery in crude oil prices compared with the record lows at the beginning of the calendar year (CY) 2016. The Brent crude oil price averaged US$48.6 per barrel, with a closing rate of US$51.9 per barrel on 31 March 2017. The year marked the landmark deal wherein the Organisation of the Petroleum Exporting Countries (OPEC) surprised the market by announcing a production cut agreement of 1.2 million barrels per day (mbpd), for the first time since 2008. The deal also called for an additional 0.6mbpd reduction from non-OPEC suppliers. This action by OPEC signalled a return to its focus on active market management in order to stabilise crude oil prices.
Ravva oil field
73
Vedanta Resources plc | Annual Report FY2017www.vedantaresources.com
STRATEGIC REPORT DIRECTORS’ REPORT FINANCIAL STATEMENTS ADDITIONAL INFORMATION
Market reports have indicated an impressive level of compliance by the producers from the effective date of January 2017, as well as growing support for an extension of the pact beyond the agreed six-month period to tackle the global supply glut. However, a sustained and rapid growth in the US oil rig count, indicating an increase in shale drilling activities, kept the price within the US$45 – US$55 range per barrel. Prices were also burdened by US Government data showing a sustained build-up of supplies to record levels since the beginning of the 2017 calendar year. The U.S. Energy Information Administration (EIA) reported that US crude oil inventories rose to 535.5 million barrels – the highest level ever.
In CY2017, global production and consumption are both expected to increase, with consumption expected to grow at a faster rate. However, due to the sustained low levels of oil prices internationally, approvals of new conventional crude oil projects in 2015-16 fell to the lowest level seen since the 1950s. The International Energy Agency (IEA) believes that if approvals continue to remain low, an unprecedented effort will be needed to avoid a supply-demand gap in the future.
FINANCIAL PERFORMANCERevenue for the year was lower at US$1,223 million (after profit and royalty sharing with the Government of India), impacted by lower production volumes. However, EBITDA for FY2017 was higher by 5% at US$597 million, due to cost optimisation initiatives and reduced cess on an ad-valorem basis. The Rajasthan water flood operating cost was further reduced by 17% to US$4.3 per barrel compared with US$5.2 per barrel in the previous year, through the continuous improvement in crude processing and well maintenance costs. Despite a ramp up of polymer injection volumes to 400,000 barrels of liquid per day, blended operating cost decreased to US$6.2 per barrel during FY2017 compared with US$6.5 per barrel in FY2016.
In FY2017 capital expenditure was US$62 million, which was primarily focused on the Mangala Polymer Project, the Raageshwari Deep Gas Project and the Palar drilling campaign.
RESERVESIn FY2017, the Oil & Gas division started the year with working interest (WI) 2P reserves of 175mmboe, and ended the period with 124mmboe. Excluding production, our working interest 2P reserves for the year declined by approximately 4.6mmboe, driven by the polymer flood project’s deferral in the Bhagyam field. However, reserves were added from certain new projects – Mangala Infill, Nagayalanka, Aishwariya BH Stage 1 – and from some satellite fields and better reservoir performance in offshore fields, mainly at Cambay. The 2P reserves would increase by approximately 175mmboe (WI) on the extension of Rajasthan production sharing contract (PSC) beyond 2020.
74
Vedanta Resources plc | Annual Report FY2017
EXPLORATION AND DEVELOPMENTDEVELOPMENTRAAGESHWARI DEEP GAS DEVELOPMENTGas development in the Raageshwari Deep Gas (RDG) field in Rajasthan continues to be a strategic priority. Capex investment in the phased development of the project is progressing well, with the aim of achieving a gradual ramp up in production. In FY2018, the completion of a low-cost expansion of the existing facility and the enhancement of current pipeline capacity are expected to lead to a ramp up of production to 40-45mmscfd. The team is also working to enhance the recovery estimates from the field by maintaining a technology-focused approach and gaining a better understanding of the reservoir, based on geological and geophysical studies carried out in FY2017. The capex investment programme in the project includes plans for a new well drilling programme in FY2018. A new gas processing infrastructure is also progressing well.
ENHANCED OIL RECOVERY IN BHAGYAM AND AISHWARIYAWe look to leverage the learnings from the excellent performance of Mangala EOR to enhance production from Bhagyam and Aishwariya through polymer injection. A multi-well polymer injectivity test for Bhagyam was successfully completed during the quarter and the results have been encouraging. The revised field development plan has been submitted to the JV partner. The injectivity test in Aishwariya has started in three polymer injector wells. The field development plan has been submitted to the JV partner.
AISHWARIYA BARMER HILLThe large hydrocarbons initially in place (HIIP) of 1.4 billion barrels of oil equivalent of Barmer Hill offers significant growth potential. Development cost for Aishwariya Barmer Hill has been reduced by over 30% to US$195 million from an initial estimate of US$300 million, for an estimated recovery of 32 million barrels. We have achieved commercial and technical alignment with our JV partner for Stage 1 and production from appraised wells would start in Q1 FY2018. Execution of Stage 2 is expected to begin in fiscal year 2018.
MANGALA INFILLMangala has been the most prolific field over the years. We are commencing a 15 -well infill drilling programme at Mangala to monetise the reserves early. The field development plan for this project has been approved and drilling of the wells is planned for Q2 FY2018.
SURFACE FACILITY UPGRADEIn order to maximise production, we are focusing on creating ullage at the Mangala Processing Plan (MPT) and debottlenecking surface network. A series of measures are being planned to increase the liquid handling and water injection capacities
KRISHNA-GODAVARI BASIN ONSHORE – (BLOCK KG-ONN-2003/1)Our joint venture partner and operator ONGC has submitted the field development plan (FDP), which has been approved by the Management Committee.
EXPLORATIONRAJASTHAN – (BLOCK RJ-ON-90/1)During FY2017, our focus was on identifying new plays, appraising new discoveries, and processing and interpreting the new 3D seismic data over high-priority areas. We have made significant progress in revamping the portfolio of prospects in the block to achieve an overall prospective resource base of more than 1 billion barrels of oil & gas by FY2018. New prospects based on both new-play concepts and proven-play extensions have added 436mmboe of prospective resources in FY2017. Exploration prospects have been firmed up for drilling in FY2018, based on the interpretations of newly acquired 3D seismic data.
KRISHNA-GODAVARI BASIN OFFSHORE – (BLOCK KG-OSN-2009/3)The initial exploration period in the block expired on 8 March 2016. We continue to engage with the Ministry of Petroleum & Natural Gas for an extension of the initial exploration period and defence clearance for drilling exploration wells. Interpretation of the new seismic volumes has resulted in the identification of robust drillable prospects and a number of leads over different play types. Prospects are now being firmed up for exploration drilling in fiscal year 2018.
PALAR-PENNAR BASIN OFFSHORE – (BLOCK PR-OSN-2004/1)An exploratory drilling campaign in the frontier block started on 10 February 2017. Three well-drilling campaigns were completed by April 2017 and the wells were subsequently abandoned.
ORANGE BASIN OFFSHORE, SOUTH AFRICA – (BLOCK-1, SOUTH AFRICA)The prospect inventory matured in the outboard plays. The assessment of exploration potential of inboard plays is ongoing, to provide other drilling options. Cairn, along with the Joint Venture (JV) partner Petro SA, have deferred entry into the second renewal phase (February 2015 – February 2017) in Block-1, South Africa, awaiting clarity on the changes in fiscal terms as proposed in the Mineral and Petroleum Resources Development (MPRD) Amendment Bill.
OUTLOOKWe remain committed to maintaining a healthy free cash flow post-capex from the Oil & Gas business. We expect Rajasthan production volumes to remain steady at 165,000boepd with potential upside from execution of growth projects in FY2018. The net capex is estimated at US$250 million with further optionality for growth projects. The key development projects being pursued in FY2018 are Mangala Infill, surface facility upgrade, Aishwariya EOR, Bhagyam EOR, RDG and Barmer Hill, with expected capex investment of US$250 million.
STRATEGIC PRIORITIES ❯ Generate free cash flow post growth
capex from the Oil & Gas business; ❯ Continue managing base production
with a focus on opex optimisation and efficient reservoir management;
❯ Activate growth capex plans to unlock the potential of the Barmer Basin. Key projects being planned are Mangala Infill, Surface facility upgrade, Aishwariya EOR, Bhagyam EOR, RDG and Barmer Hill; and
❯ Pursue an alternative strategy of executing projects through an integrated project development model in partnership with consortiums led by global oil field services majors. This shall help us drive incremental efficiencies and execute projects faster with the aim of increasing the production to 300,000boepd in foreseeable future.
DIVISIONAL REVIEW CONTINUED OIL & GAS
Main image: Employees at Raageshwari Gas Terminal in Rajasthan
75
STRATEGIC REPORT DIRECTORS’ REPORT FINANCIAL STATEMENTS ADDITIONAL INFORMATION
Vedanta Resources plc | Annual Report FY2017www.vedantaresources.com
In FY2018 we intend to restart our capex cycle which will enable us to unlock the full potential of the Barmer Basin in Rajasthan.
SUDHIR MATHURACTING CEO, OIL & GAS
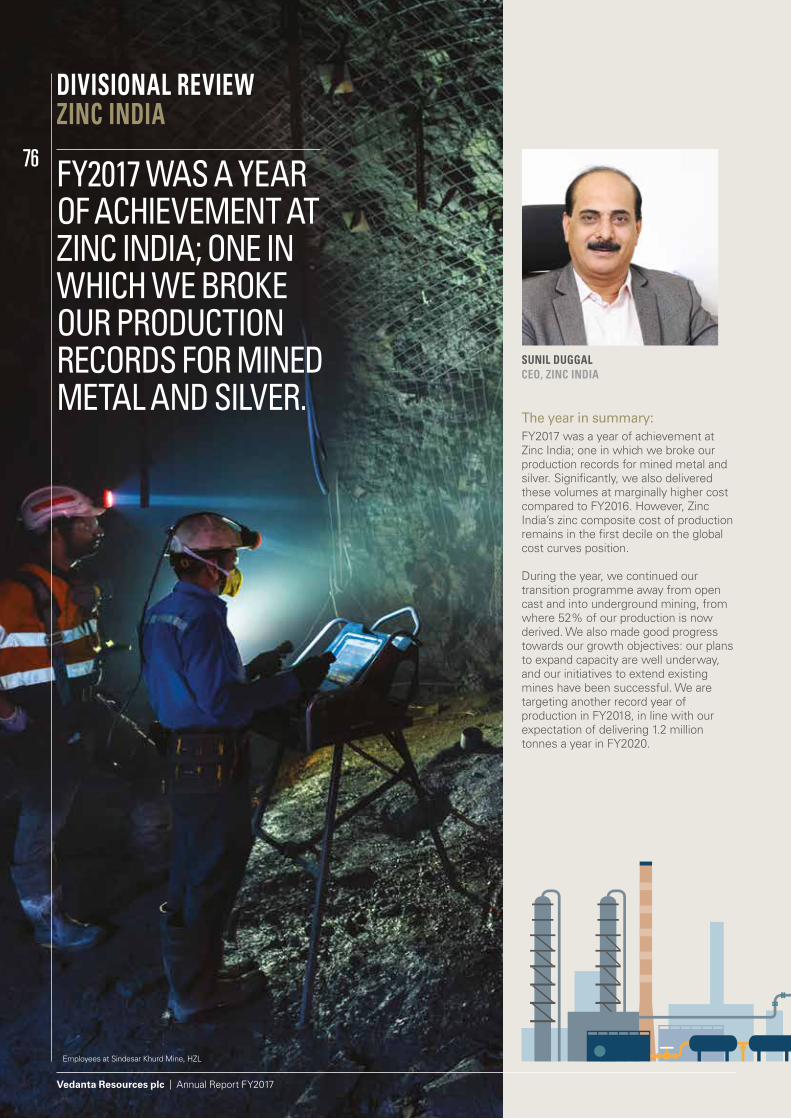
76
Vedanta Resources plc | Annual Report FY2017
DIVISIONAL REVIEWZINC INDIA
FY2017 WAS A YEAR OF ACHIEVEMENT AT ZINC INDIA; ONE IN WHICH WE BROKE OUR PRODUCTION RECORDS FOR MINED METAL AND SILVER.
The year in summary:FY2017 was a year of achievement at Zinc India; one in which we broke our production records for mined metal and silver. Significantly, we also delivered these volumes at marginally higher cost compared to FY2016. However, Zinc India’s zinc composite cost of production remains in the first decile on the global cost curves position.
During the year, we continued our transition programme away from open cast and into underground mining, from where 52% of our production is now derived. We also made good progress towards our growth objectives: our plans to expand capacity are well underway, and our initiatives to extend existing mines have been successful. We are targeting another record year of production in FY2018, in line with our expectation of delivering 1.2 million tonnes a year in FY2020.
Employees at Sindesar Khurd Mine, HZL
SUNIL DUGGALCEO, ZINC INDIA
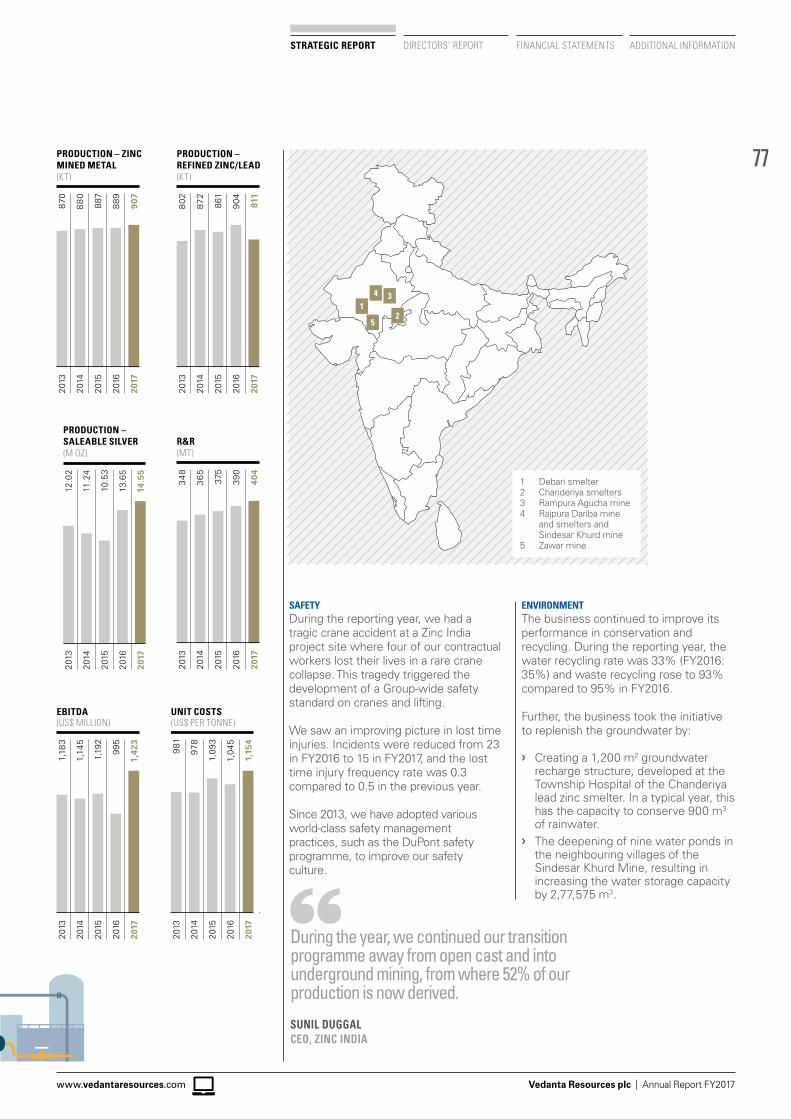
77
Vedanta Resources plc | Annual Report FY2017www.vedantaresources.com
STRATEGIC REPORT DIRECTORS’ REPORT FINANCIAL STATEMENTS ADDITIONAL INFORMATION
14 3
25
1 Debari smelter2 Chanderiya smelters3 Rampura Agucha mine4 Rajpura Dariba mine
and smelters and Sindesar Khurd mine
5 Zawar mine
PRODUCTION – SALEABLE SILVER(M OZ)
11.2
4
12.0
2
10.5
3
13.6
5
14.5
5
2014
2013
2015
2016
2017
PRODUCTION – ZINCMINED METAL(KT)
88
0
870
887
889
907
2014
2013
2015
2016
2017
R&R(MT)
36
5
34
8
375
390
404
2014
2013
2015
2016
2017
PRODUCTION – REFINED ZINC/LEAD(KT)
872
802 86
1
904
811
2014
2013
2015
2016
2017
EBITDA(US$ MILLION)
1,14
5
1,18
3
1,19
2
995
1,4
23
2014
2013
2015
2016
2017
UNIT COSTS(US$ PER TONNE)
978
981
1,09
3
1,04
5
1,15
4
2014
2013
2015
2016
2017
SAFETYDuring the reporting year, we had a tragic crane accident at a Zinc India project site where four of our contractual workers lost their lives in a rare crane collapse. This tragedy triggered the development of a Group-wide safety standard on cranes and lifting.
We saw an improving picture in lost time injuries. Incidents were reduced from 23 in FY2016 to 15 in FY2017, and the lost time injury frequency rate was 0.3 compared to 0.5 in the previous year.
Since 2013, we have adopted various world-class safety management practices, such as the DuPont safety programme, to improve our safety culture.
ENVIRONMENTThe business continued to improve its performance in conservation and recycling. During the reporting year, the water recycling rate was 33% (FY2016: 35%) and waste recycling rose to 93% compared to 95% in FY2016.
Further, the business took the initiative to replenish the groundwater by:
❯ Creating a 1,200 m2 groundwater recharge structure, developed at the Township Hospital of the Chanderiya lead zinc smelter. In a typical year, this has the capacity to conserve 900 m3 of rainwater.
❯ The deepening of nine water ponds in the neighbouring villages of the Sindesar Khurd Mine, resulting in increasing the water storage capacity by 2,77,575 m3.
During the year, we continued our transition programme away from open cast and into underground mining, from where 52% of our production is now derived.
SUNIL DUGGALCEO, ZINC INDIA
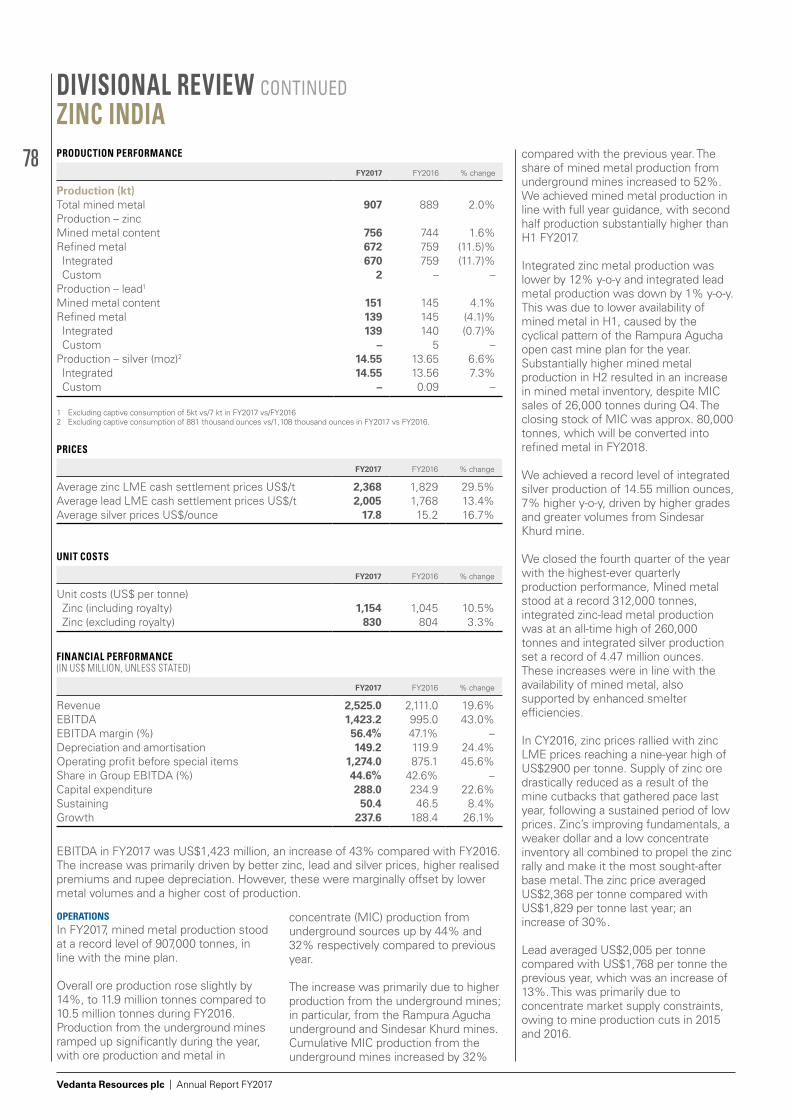
78
Vedanta Resources plc | Annual Report FY2017
DIVISIONAL REVIEW CONTINUED ZINC INDIA
OPERATIONSIn FY2017, mined metal production stood at a record level of 907,000 tonnes, in line with the mine plan.
Overall ore production rose slightly by 14%, to 11.9 million tonnes compared to 10.5 million tonnes during FY2016. Production from the underground mines ramped up significantly during the year, with ore production and metal in
concentrate (MIC) production from underground sources up by 44% and 32% respectively compared to previous year.
The increase was primarily due to higher production from the underground mines; in particular, from the Rampura Agucha underground and Sindesar Khurd mines.Cumulative MIC production from the underground mines increased by 32%
compared with the previous year. The share of mined metal production from underground mines increased to 52%. We achieved mined metal production in line with full year guidance, with second half production substantially higher than H1 FY2017.
Integrated zinc metal production was lower by 12% y-o-y and integrated lead metal production was down by 1% y-o-y. This was due to lower availability of mined metal in H1, caused by the cyclical pattern of the Rampura Agucha open cast mine plan for the year. Substantially higher mined metal production in H2 resulted in an increase in mined metal inventory, despite MIC sales of 26,000 tonnes during Q4. The closing stock of MIC was approx. 80,000 tonnes, which will be converted into refined metal in FY2018.
We achieved a record level of integrated silver production of 14.55 million ounces, 7% higher y-o-y, driven by higher grades and greater volumes from Sindesar Khurd mine.
We closed the fourth quarter of the year with the highest-ever quarterly production performance, Mined metal stood at a record 312,000 tonnes, integrated zinc-lead metal production was at an all-time high of 260,000 tonnes and integrated silver production set a record of 4.47 million ounces. These increases were in line with the availability of mined metal, also supported by enhanced smelter efficiencies.
In CY2016, zinc prices rallied with zinc LME prices reaching a nine-year high of US$2900 per tonne. Supply of zinc ore drastically reduced as a result of the mine cutbacks that gathered pace last year, following a sustained period of low prices. Zinc’s improving fundamentals, a weaker dollar and a low concentrate inventory all combined to propel the zinc rally and make it the most sought-after base metal. The zinc price averaged US$2,368 per tonne compared with US$1,829 per tonne last year; an increase of 30%.
Lead averaged US$2,005 per tonne compared with US$1,768 per tonne the previous year, which was an increase of 13%. This was primarily due to concentrate market supply constraints, owing to mine production cuts in 2015 and 2016.
UNIT COSTS
FY2017 FY2016 % change
Unit costs (US$ per tonne) Zinc (including royalty) 1,154 1,045 10.5% Zinc (excluding royalty) 830 804 3.3%
FINANCIAL PERFORMANCE(IN US$ MILLION, UNLESS STATED)
FY2017 FY2016 % change
Revenue 2,525.0 2,111.0 19.6%EBITDA 1,423.2 995.0 43.0%EBITDA margin (%) 56.4% 47.1% –Depreciation and amortisation 149.2 119.9 24.4%Operating profit before special items 1,274.0 875.1 45.6%Share in Group EBITDA (%) 44.6% 42.6% –Capital expenditure 288.0 234.9 22.6%Sustaining 50.4 46.5 8.4%Growth 237.6 188.4 26.1%
EBITDA in FY2017 was US$1,423 million, an increase of 43% compared with FY2016. The increase was primarily driven by better zinc, lead and silver prices, higher realised premiums and rupee depreciation. However, these were marginally offset by lower metal volumes and a higher cost of production.
PRODUCTION PERFORMANCE
FY2017 FY2016 % change
Production (kt)Total mined metal 907 889 2.0%Production – zincMined metal content 756 744 1.6%Refined metal 672 759 (11.5)% Integrated 670 759 (11.7)% Custom 2 – –Production – lead1
Mined metal content 151 145 4.1%Refined metal 139 145 (4.1)% Integrated 139 140 (0.7)% Custom – 5 –Production – silver (moz)2 14.55 13.65 6.6% Integrated 14.55 13.56 7.3% Custom – 0.09 –
1 Excluding captive consumption of 5kt vs/7 kt in FY2017 vs/FY20162 Excluding captive consumption of 881 thousand ounces vs/1,108 thousand ounces in FY2017 vs FY2016.
PRICES
FY2017 FY2016 % change
Average zinc LME cash settlement prices US$/t 2,368 1,829 29.5%Average lead LME cash settlement prices US$/t 2,005 1,768 13.4%Average silver prices US$/ounce 17.8 15.2 16.7%
79
Vedanta Resources plc | Annual Report FY2017www.vedantaresources.com
STRATEGIC REPORT DIRECTORS’ REPORT FINANCIAL STATEMENTS ADDITIONAL INFORMATION
Silver averaged US$17.8 per ounce compared with US$15.2 per ounce the previous year, rising by 17% y-o-y. According to the Silver Institute, silver will continue to benefit predominantly from higher industrial demand, notably in the solar sector.
The unit cost of zinc production increased by 11% to US$1,154 per tonne in FY2017 compared with US$1,045 per tonne in FY2016, due mainly to higher royalties driven by higher LME prices and Indian rupee depreciation.
Excluding royalties, the cost of zinc production increased from US$804 per tonne to US$830 per tonne. The increase was primarily driven by higher power costs, due to increased coal prices, metallurgical coke & commodity prices, mine development expenses and lower integrated production. This was partly offset by cost reduction initiatives for operational and commercial efficiencies.
According to the Wood Mackenzie report for CY2017, Zinc India’s zinc composite cost of production remains in the first decile on the global cost curves position.
Out of the total cost of production of US$1,154 per tonne, total government levies were US$339 per tonne (FY2016: US$277 per tonne), comprised mainly of royalty payments, the District Mineral Fund (DMF), the Clean Energy Cess, electricity duty and other taxes.
PROJECTSThe mining projects we have announced are progressing in line with the expectation of reaching 1.2 million tonnes per annum in FY2020.
Zinc India’s successful transition from open cast to underground mining continues. When the mining expansion projects were announced in early 2013, share of mined metal from underground mines was 15%. This increased to 52% in FY2017 and is expected to reach 80% in FY2018 and 100% in FY2019.
Total mine development during the year reached 66,545 metres, an increase of 15% on a year ago.
Mine development at the Rampura Agucha underground mine ranked at an all-time high of 5,309 metres in Q4, after consistently exceeding the 4,000 metres benchmark for the previous four quarters. During the year, it produced 1.4 million tonnes of ore, compared with 0.2 million tonnes a year ago.
The sinking of the south ventilation shaft was completed during the year, following the sinking of the main shaft that reached the ultimate depth of 955 metres. Further commissioning of both production and service winders was completed during the year as shaft equipping work continued to progress satisfactorily. The underground mine achieved a record ore production run-rate of over 2 million tonnes per annum (mtpa) at the end of the fourth quarter.
At the Sindesar Khurd mine, environmental clearance was received in December 2016 for the expansion from 3.75 to 4.5mtpa in ore production and beneficiation from 4.5mtpa to 5mtpa. The current mining run-rate is above 4mtpa and is ahead of schedule. The winder foundation work for the shaft was completed during the year and head gear erection is nearing completion. The new mill of 1.5mtpa capacity was completed in a record 14 months and was commissioned in January 2017.
At Zawar, environmental clearance of the 4mtpa ore production and beneficiation was received in January 2017, and this was followed by consent to establish and operate. The mill expansion to 2.5mtpa and the associated power upgrade project are at an advanced stage, with completion targeted at August 2017.
The Kayad project is now complete and the mine has attained its rated capacity of 1.0mtpa.
In addition to the ongoing mining expansion projects, we started the Fumer project during the second half of the year, with duration of 18-20 months. This project will further improve cost and metal recoveries from the Company’s hydro plant and could be replicated in other hydro plants in the coming years. The work is progressing well and anticipated to be completed in mid-FY2019.
In keeping with the Company’s commitment to green energy, we have successfully commissioned 16MW of captive solar farms during the year, adding to the existing 273MW Wind Power Plant (WPP). A unique feature of this project was that, it was set up on un-utilisable land such as tailing dam and jarofix pond.
EXPLORATIONDuring the year, gross additions of 26.4 million tonnes were made to reserves and resources (R&R), prior to depletion of 11.9 million tonnes. As at 31 March 2017, Zinc India’s combined mineral resources and ore reserves were estimated to be 404.4 million tonnes, containing 36.09 million tonnes of zinc-lead metal and 1,032 million ounces of silver. Overall mine life continues to be more than 25 years.
OUTLOOKIn FY2018, mined metal production is expected to be higher than in FY2017. Refined zinc-lead metal production will be around 950kt, which will be evenly spread through the year. Silver production will be over ~15.0 million ounces (or 500 metric tonnes). Both the Rampura Agucha and Sindesar Khurd shafts are on track for completion in FY2019.
Share of mined metal from underground mining, which was 52% of total production in FY2017, is expected to reach 80% in FY2018 and 100% by FY2019.
The cost of production excluding royalties is expected to be marginally higher based on current levels of coal and input commodity prices.
The capex on the ongoing mine expansion projects, the Fumer project and smelter debottlenecking will be around US$350 million in FY2018.
STRATEGIC PRIORITIES ❯ To progress the brownfield expansion
of underground mines to achieve 1.2mpta of mined zinc-lead, with mining projects completed in FY2020;
❯ Ramp up underground mining in Rampura Agucha, Zawar and SK mine cluster;
❯ Remain in the top cost decile with the focus on operational and commercial efficiencies;
❯ Ramp up production volumes of silver; and
❯ Continue our focus on adding more reserves and resources than we deplete, through exploration.
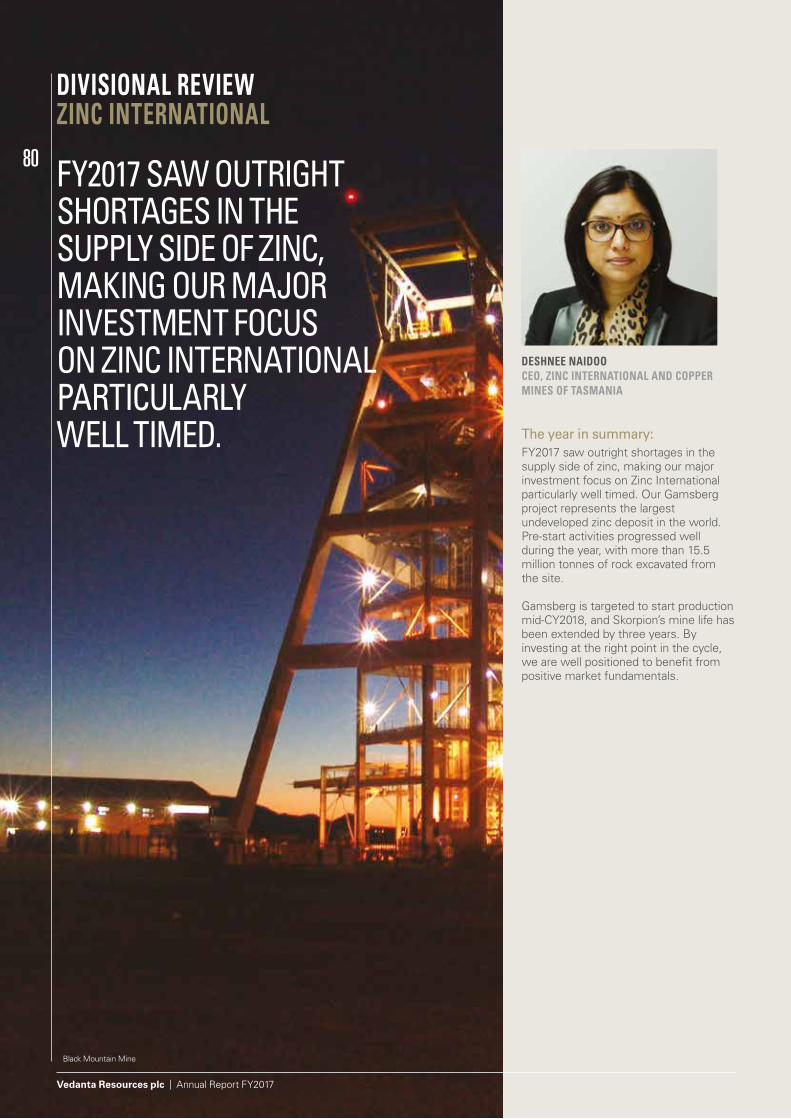
80
Vedanta Resources plc | Annual Report FY2017
DIVISIONAL REVIEWZINC INTERNATIONAL
FY2017 SAW OUTRIGHT SHORTAGES IN THE SUPPLY SIDE OF ZINC, MAKING OUR MAJOR INVESTMENT FOCUS ON ZINC INTERNATIONAL PARTICULARLY WELL TIMED. The year in summary:
FY2017 saw outright shortages in the supply side of zinc, making our major investment focus on Zinc International particularly well timed. Our Gamsberg project represents the largest undeveloped zinc deposit in the world. Pre-start activities progressed well during the year, with more than 15.5 million tonnes of rock excavated from the site.
Gamsberg is targeted to start production mid-CY2018, and Skorpion’s mine life has been extended by three years. By investing at the right point in the cycle, we are well positioned to benefit from positive market fundamentals.
Black Mountain Mine
DESHNEE NAIDOOCEO, ZINC INTERNATIONAL AND COPPER MINES OF TASMANIA
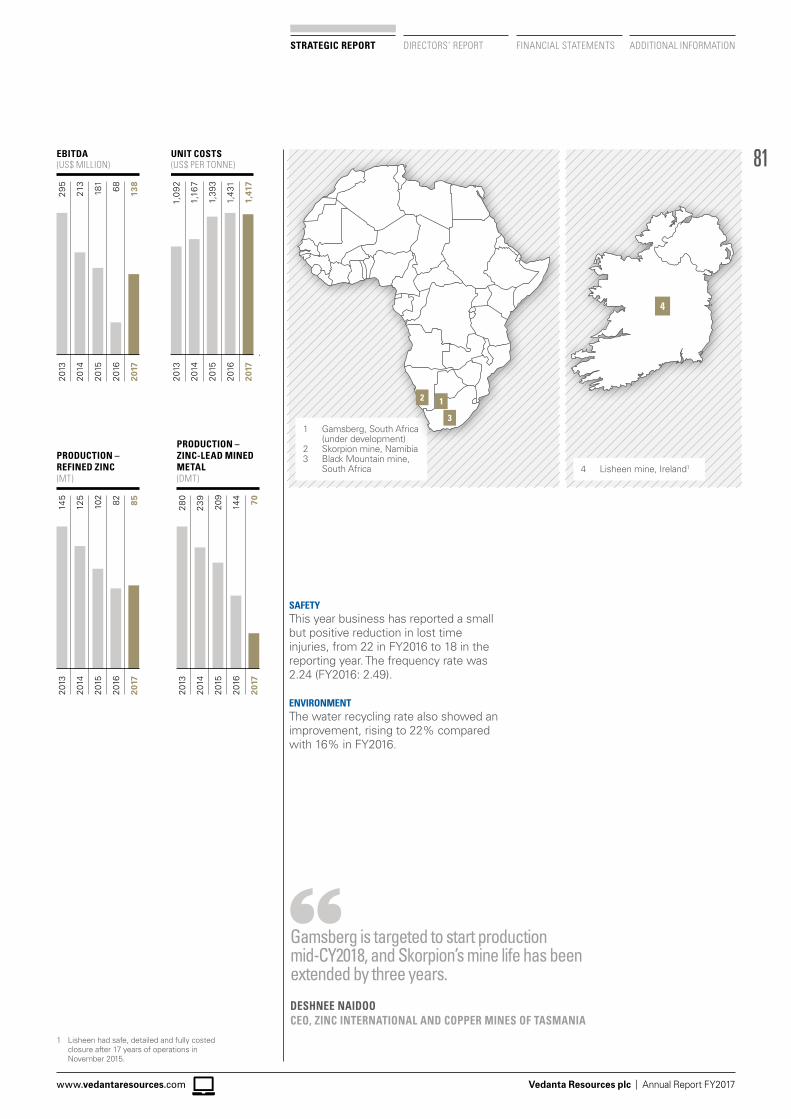
81
Vedanta Resources plc | Annual Report FY2017www.vedantaresources.com
STRATEGIC REPORT DIRECTORS’ REPORT FINANCIAL STATEMENTS ADDITIONAL INFORMATION
EBITDA(US$ MILLION)
213
295
181
68 138
2014
2013
2015
2016
2017
UNIT COSTS(US$ PER TONNE)
1,16
7
1,0
92
1,39
3
1,43
1
1,41
7
2014
2013
2015
2016
2017
PRODUCTION – ZINC-LEAD MINED METAL(DMT)
239
280
209
144 70
2014
2013
2015
2016
2017
PRODUCTION – REFINED ZINC(MT)
125
145
102
82 85
2014
2013
2015
2016
2017
4
4 Lisheen mine, Ireland1
1 Gamsberg, South Africa (under development)
2 Skorpion mine, Namibia3 Black Mountain mine, South Africa
2
3
1
Gamsberg is targeted to start production mid-CY2018, and Skorpion’s mine life has been extended by three years.
DESHNEE NAIDOOCEO, ZINC INTERNATIONAL AND COPPER MINES OF TASMANIA
SAFETYThis year business has reported a small but positive reduction in lost time injuries, from 22 in FY2016 to 18 in the reporting year. The frequency rate was 2.24 (FY2016: 2.49).
ENVIRONMENT The water recycling rate also showed an improvement, rising to 22% compared with 16% in FY2016.
1 Lisheen had safe, detailed and fully costed closure after 17 years of operations in November 2015.
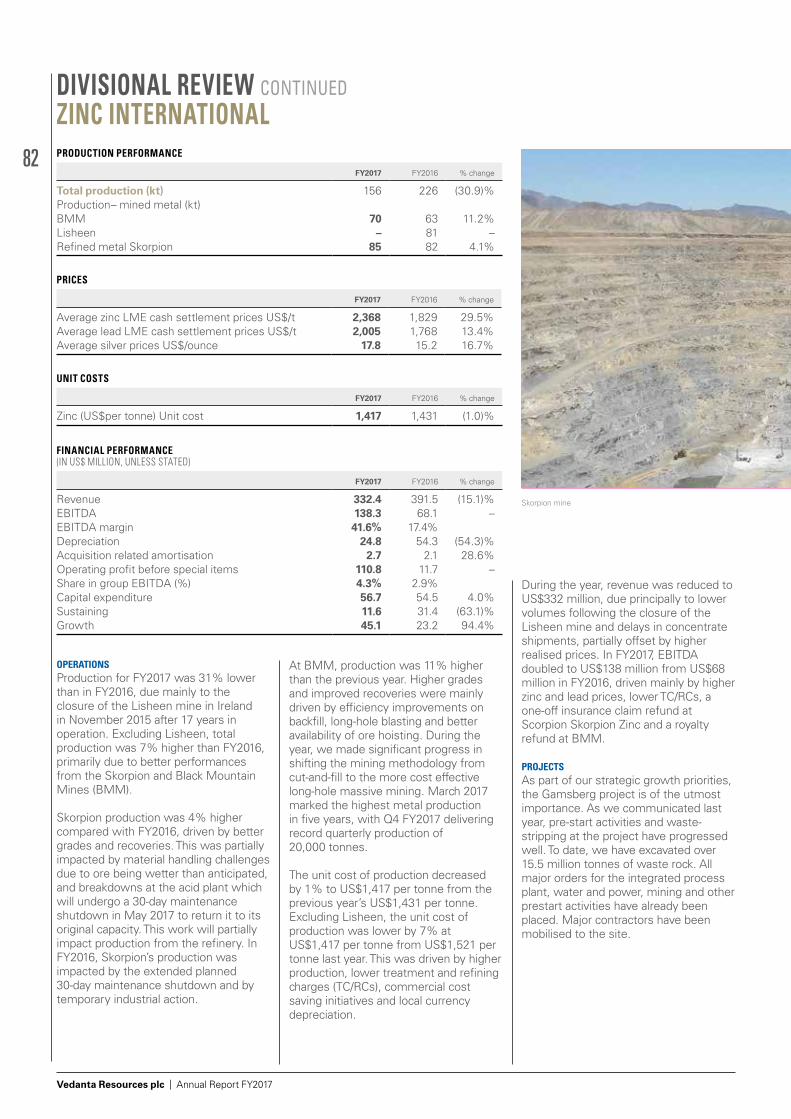
82
Vedanta Resources plc | Annual Report FY2017
PRODUCTION PERFORMANCE
FY2017 FY2016 % change
Total production (kt) 156 226 (30.9)%Production– mined metal (kt)BMM 70 63 11.2%Lisheen – 81 –Refined metal Skorpion 85 82 4.1%
PRICES
FY2017 FY2016 % change
Average zinc LME cash settlement prices US$/t 2,368 1,829 29.5%Average lead LME cash settlement prices US$/t 2,005 1,768 13.4%Average silver prices US$/ounce 17.8 15.2 16.7%
UNIT COSTS
FY2017 FY2016 % change
Zinc (US$per tonne) Unit cost 1,417 1,431 (1.0)%
FINANCIAL PERFORMANCE(IN US$ MILLION, UNLESS STATED)
FY2017 FY2016 % change
Revenue 332.4 391.5 (15.1)%EBITDA 138.3 68.1 –EBITDA margin 41.6% 17.4%Depreciation 24.8 54.3 (54.3)%Acquisition related amortisation 2.7 2.1 28.6%Operating profit before special items 110.8 11.7 –Share in group EBITDA (%) 4.3% 2.9%Capital expenditure 56.7 54.5 4.0%Sustaining 11.6 31.4 (63.1)%Growth 45.1 23.2 94.4%
DIVISIONAL REVIEW CONTINUED ZINC INTERNATIONAL
OPERATIONSProduction for FY2017 was 31% lower than in FY2016, due mainly to the closure of the Lisheen mine in Ireland in November 2015 after 17 years in operation. Excluding Lisheen, total production was 7% higher than FY2016, primarily due to better performances from the Skorpion and Black Mountain Mines (BMM).
Skorpion production was 4% higher compared with FY2016, driven by better grades and recoveries. This was partially impacted by material handling challenges due to ore being wetter than anticipated, and breakdowns at the acid plant which will undergo a 30-day maintenance shutdown in May 2017 to return it to its original capacity. This work will partially impact production from the refinery. In FY2016, Skorpion’s production was impacted by the extended planned 30-day maintenance shutdown and by temporary industrial action.
At BMM, production was 11% higher than the previous year. Higher grades and improved recoveries were mainly driven by efficiency improvements on backfill, long-hole blasting and better availability of ore hoisting. During the year, we made significant progress in shifting the mining methodology from cut-and-fill to the more cost effective long-hole massive mining. March 2017 marked the highest metal production in five years, with Q4 FY2017 delivering record quarterly production of 20,000 tonnes.
The unit cost of production decreased by 1% to US$1,417 per tonne from the previous year’s US$1,431 per tonne. Excluding Lisheen, the unit cost of production was lower by 7% at US$1,417 per tonne from US$1,521 per tonne last year. This was driven by higher production, lower treatment and refining charges (TC/RCs), commercial cost saving initiatives and local currency depreciation.
During the year, revenue was reduced to US$332 million, due principally to lower volumes following the closure of the Lisheen mine and delays in concentrate shipments, partially offset by higher realised prices. In FY2017, EBITDA doubled to US$138 million from US$68 million in FY2016, driven mainly by higher zinc and lead prices, lower TC/RCs, a one-off insurance claim refund at Scorpion Skorpion Zinc and a royalty refund at BMM.
PROJECTSAs part of our strategic growth priorities, the Gamsberg project is of the utmost importance. As we communicated last year, pre-start activities and waste-stripping at the project have progressed well. To date, we have excavated over 15.5 million tonnes of waste rock. All major orders for the integrated process plant, water and power, mining and other prestart activities have already been placed. Major contractors have been mobilised to the site.
Skorpion mine
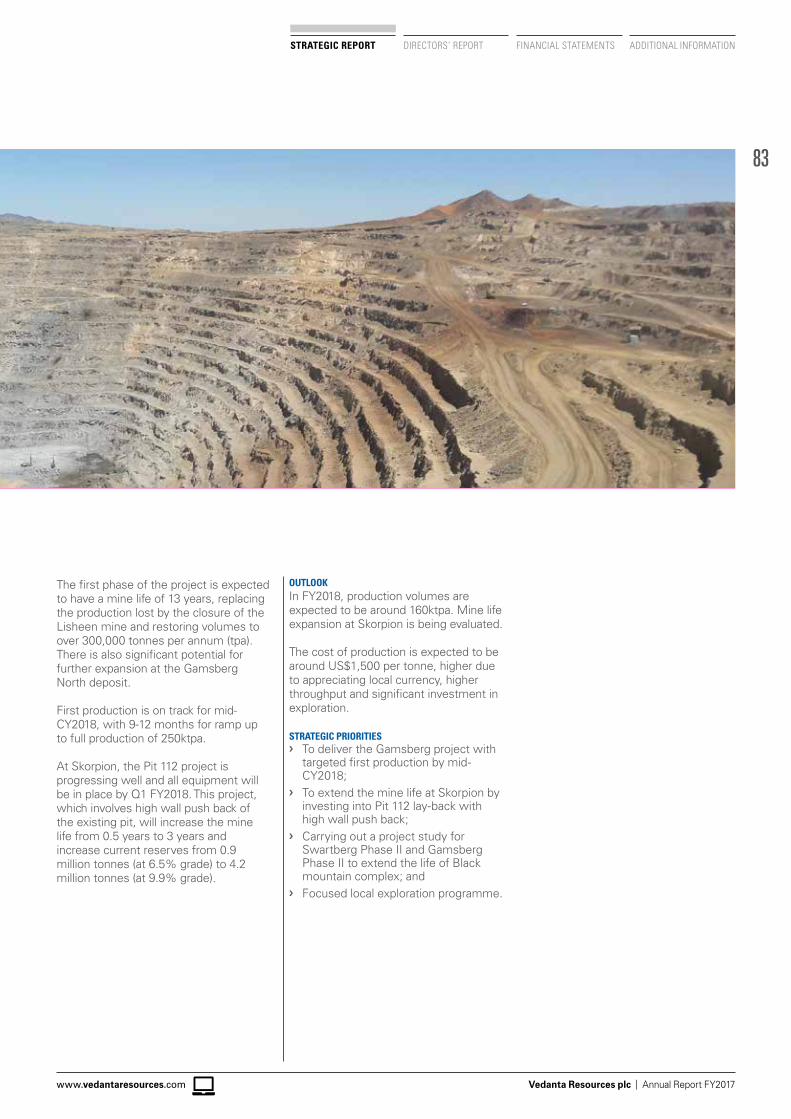
83
Vedanta Resources plc | Annual Report FY2017www.vedantaresources.com
STRATEGIC REPORT DIRECTORS’ REPORT FINANCIAL STATEMENTS ADDITIONAL INFORMATION
The first phase of the project is expected to have a mine life of 13 years, replacing the production lost by the closure of the Lisheen mine and restoring volumes to over 300,000 tonnes per annum (tpa). There is also significant potential for further expansion at the Gamsberg North deposit.
First production is on track for mid-CY2018, with 9-12 months for ramp up to full production of 250ktpa.
At Skorpion, the Pit 112 project is progressing well and all equipment will be in place by Q1 FY2018. This project, which involves high wall push back of the existing pit, will increase the mine life from 0.5 years to 3 years and increase current reserves from 0.9 million tonnes (at 6.5% grade) to 4.2 million tonnes (at 9.9% grade).
OUTLOOKIn FY2018, production volumes are expected to be around 160ktpa. Mine life expansion at Skorpion is being evaluated.
The cost of production is expected to be around US$1,500 per tonne, higher due to appreciating local currency, higher throughput and significant investment in exploration.
STRATEGIC PRIORITIES ❯ To deliver the Gamsberg project with
targeted first production by mid-CY2018;
❯ To extend the mine life at Skorpion by investing into Pit 112 lay-back with high wall push back;
❯ Carrying out a project study for Swartberg Phase II and Gamsberg Phase II to extend the life of Black mountain complex; and
❯ Focused local exploration programme.
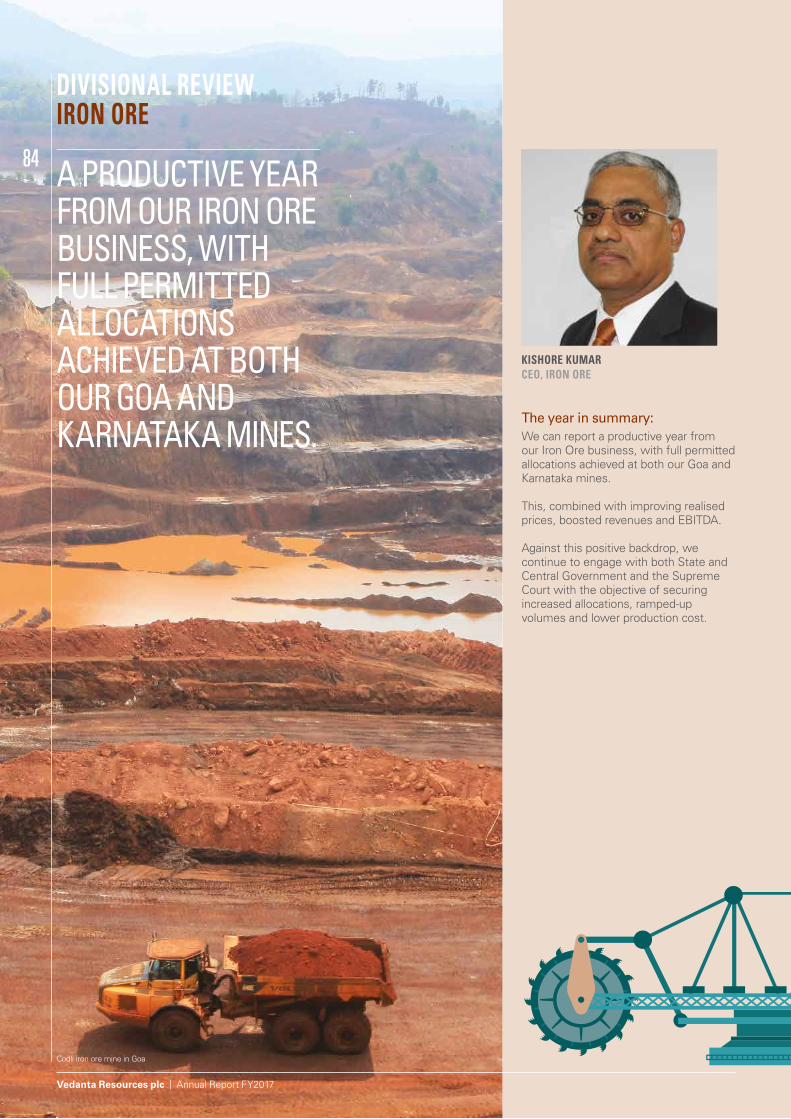
84
Vedanta Resources plc | Annual Report FY2017
DIVISIONAL REVIEWIRON ORE
A PRODUCTIVE YEAR FROM OUR IRON ORE BUSINESS, WITH FULL PERMITTEDALLOCATIONS ACHIEVED AT BOTH OUR GOA ANDKARNATAKA MINES.
The year in summary:We can report a productive year from our Iron Ore business, with full permitted allocations achieved at both our Goa and Karnataka mines.
This, combined with improving realised prices, boosted revenues and EBITDA.
Against this positive backdrop, we continue to engage with both State and Central Government and the Supreme Court with the objective of securing increased allocations, ramped-up volumes and lower production cost.
Codli iron ore mine in Goa
KISHORE KUMARCEO, IRON ORE
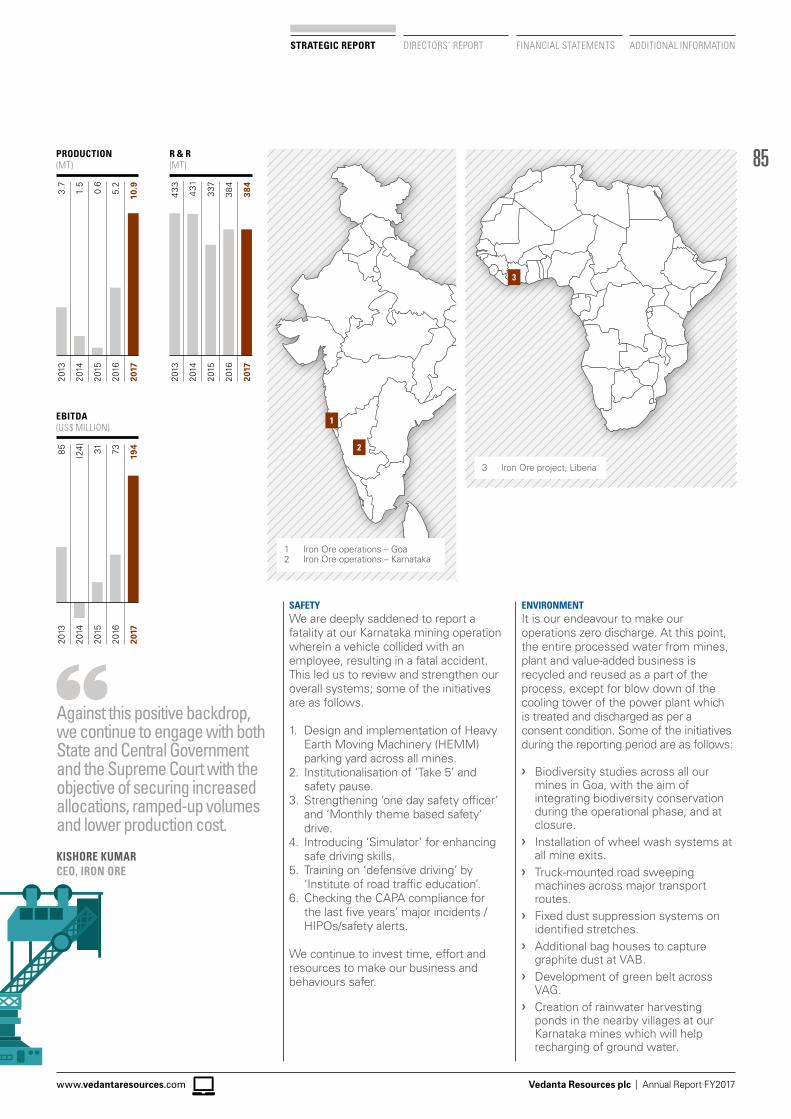
85
Vedanta Resources plc | Annual Report FY2017www.vedantaresources.com
STRATEGIC REPORT DIRECTORS’ REPORT FINANCIAL STATEMENTS ADDITIONAL INFORMATION
PRODUCTION(MT)
1.5
3.7
0.6
5.2
10.9
2014
2013
2015
2016
2017
R & R(MT)
431
43
3
337
384
384
2014
2013
2015
2016
2017
EBITDA(US$ MILLION)
(24)85 31 73 194
2014
2013
2015
2016
2017
1 Iron Ore operations – Goa2 Iron Ore operations – Karnataka
2
1
3 Iron Ore project, Liberia
3
SAFETYWe are deeply saddened to report a fatality at our Karnataka mining operation wherein a vehicle collided with an employee, resulting in a fatal accident. This led us to review and strengthen our overall systems; some of the initiatives are as follows.
1. Design and implementation of Heavy Earth Moving Machinery (HEMM) parking yard across all mines.
2. Institutionalisation of ‘Take 5’ and safety pause.
3. Strengthening ‘one day safety officer’ and ‘Monthly theme based safety’ drive.
4. Introducing ‘Simulator’ for enhancing safe driving skills.
5. Training on ‘defensive driving’ by ‘Institute of road traffic education’.
6. Checking the CAPA compliance for the last five years’ major incidents / HIPOs/safety alerts.
We continue to invest time, effort and resources to make our business and behaviours safer.
ENVIRONMENTIt is our endeavour to make our operations zero discharge. At this point, the entire processed water from mines, plant and value-added business is recycled and reused as a part of the process, except for blow down of the cooling tower of the power plant which is treated and discharged as per a consent condition. Some of the initiatives during the reporting period are as follows:
❯ Biodiversity studies across all our mines in Goa, with the aim of integrating biodiversity conservation during the operational phase, and at closure.
❯ Installation of wheel wash systems at all mine exits.
❯ Truck-mounted road sweeping machines across major transport routes.
❯ Fixed dust suppression systems on identified stretches.
❯ Additional bag houses to capture graphite dust at VAB.
❯ Development of green belt across VAG.
❯ Creation of rainwater harvesting ponds in the nearby villages at our Karnataka mines which will help recharging of ground water.
Against this positive backdrop, we continue to engage with both State and Central Government and the Supreme Court with the objective of securing increased allocations, ramped-up volumes and lower production cost.
KISHORE KUMARCEO, IRON ORE
86
Vedanta Resources plc | Annual Report FY2017
DIVISIONAL REVIEW CONTINUED IRON ORE
OPERATIONSAt Goa, production was 8.8 million tonnes and sales were 7.4 million tonnes during FY2017. We achieved our annual mining allocation of 5.5 million tonnes in January 2017. The Goa Government granted an additional allocation of 2.6 million tonnes in Q4 FY2017. Production in FY2016 was significantly lower as we were ramping up after the lifting of the mining ban in August 2015.
At Karnataka, production was 2.1 million tonnes with sales of 2.7 million tonnes during FY2017. Sales included 0.7 million tonnes of opening ore inventory. Environmental Clearance (EC) annual capacity of 2.29 million tonnes was achieved during the year and we continue to engage with the Government to enhance the mining capacity in Karnataka.
During the year, production of pig iron ramped up from the previous year’s 654,000 tonnes to a record 708,000 tonnes, with higher plant availability.
PRICESPrices for 62Fe grade averaged US$67.8 per tonne CFR basis, up by 30% in FY2017 compared to prior year. The net realisation after freight for 56Fe grade was around US$39 per tonne for FY2017. The realisation for Goa ore was also lower due to the 10% Goa Permanent Fund.
In FY2017, the price recovered, following lower production forecasts compared to the earlier guidance from the major iron ore mining companies, and an uptick in Chinese demand. The main driver of this price increase was a rebounding of the billet and futures market. Also, the Chinese Government announced deadlines to halt substandard steel production of induction furnaces; this resulted in incentives for blast furnaces to increase steel production to compensate for this loss. This resulted in an increase in demand for iron ore demand and a rise in iron ore and steel futures market.
Currently, the realisation for 56Fe has softened due to the surge in steel inventory and inventory of IO at steel mills and ports in China.
Because of its logistical proximity to the port and inland waterways, Vedanta’s iron ore business in Goa caters primarily for the global seaborne trade. Goa low-grade exports are primarily destined for Chinese steel mills that are able to blend the low grades with other high-grade expensive ores from Brazil, Australia or within China.
In contrast, the iron ore business in Karnataka caters primarily for the domestic steel industry in the state of Karnataka, within a 200km radius of the mine.
Karnataka ex-works realisation was US$18.1 per tonne for FY2017, as domestic prices are largely determined by government mining companies and local supply and demand factors.
FINANCIAL PERFORMANCE(IN US$ MILLION, UNLESS STATED)
FY2017 FY2016 % change
Revenue 615.4 350.0 75.8%EBITDA 194.2 73.4 –EBITDA margin 31.6% 21.0%Depreciation 25.7 26.8 4.2%Acquisition-related amortisation 44.2 35.7 23.9%Operating (loss) before special items 124.3 10.9 –Share in Group EBITDA % 6.1% 3.1%Capital expenditure 3.7 13.2 (71.9)%Sustaining 3.7 10.3 (64.2)%Growth 0.0 2.8 –
PRODUCTION PERFORMANCE
FY2017 FY2016 % change
Production (dmt)Saleable ore 10.9 5.2 – Goa 8.8 2.2 – Karnataka 2.1 3.0 (30.0)%Pig iron (kt) 708 654 8.2%Sales (dmt) –Iron ore 10.2 5.3 91.0% Goa1 7.4 2.2 – Karnataka 2.7 3.1 (12.9)%Pig iron (kt) 714 663 7.6%
Employees near an ore pile at Iron Ore operations
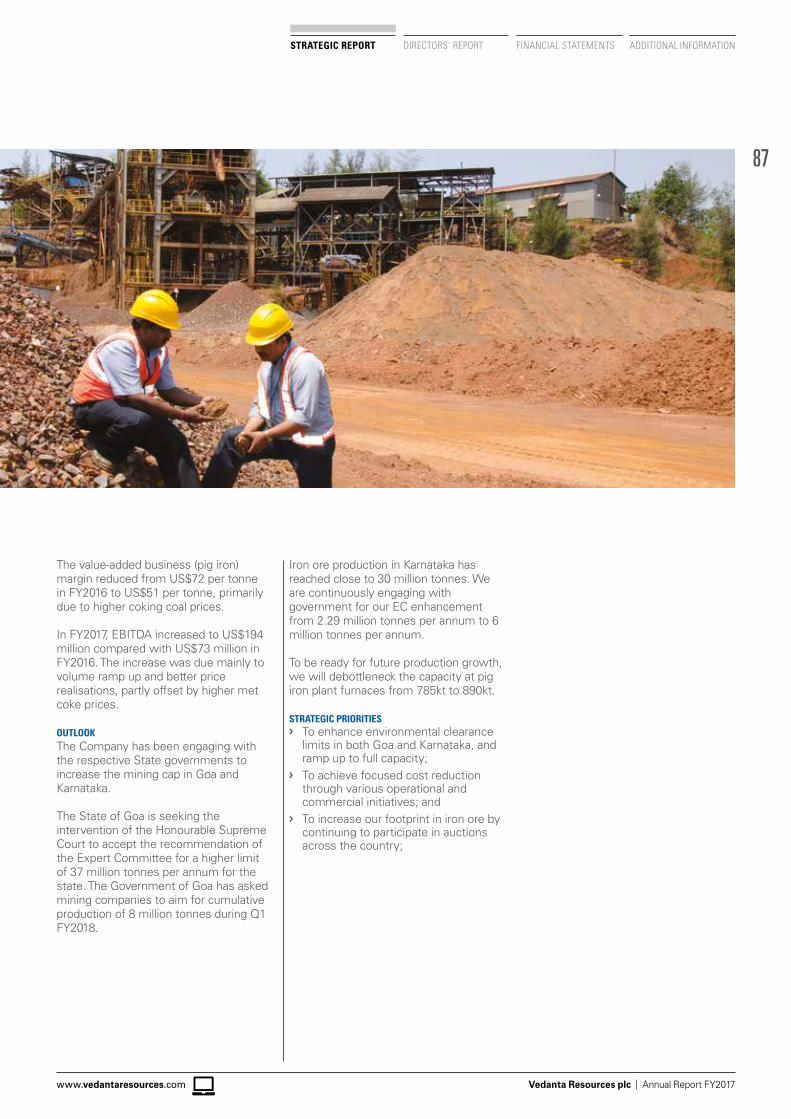
87
Vedanta Resources plc | Annual Report FY2017www.vedantaresources.com
STRATEGIC REPORT DIRECTORS’ REPORT FINANCIAL STATEMENTS ADDITIONAL INFORMATION
The value-added business (pig iron) margin reduced from US$72 per tonne in FY2016 to US$51 per tonne, primarily due to higher coking coal prices.
In FY2017, EBITDA increased to US$194 million compared with US$73 million in FY2016. The increase was due mainly to volume ramp up and better price realisations, partly offset by higher met coke prices.
OUTLOOKThe Company has been engaging with the respective State governments to increase the mining cap in Goa and Karnataka.
The State of Goa is seeking the intervention of the Honourable Supreme Court to accept the recommendation of the Expert Committee for a higher limit of 37 million tonnes per annum for the state. The Government of Goa has asked mining companies to aim for cumulative production of 8 million tonnes during Q1 FY2018.
Iron ore production in Karnataka has reached close to 30 million tonnes. We are continuously engaging with government for our EC enhancement from 2.29 million tonnes per annum to 6 million tonnes per annum.
To be ready for future production growth, we will debottleneck the capacity at pig iron plant furnaces from 785kt to 890kt.
STRATEGIC PRIORITIES ❯ To enhance environmental clearance
limits in both Goa and Karnataka, and ramp up to full capacity;
❯ To achieve focused cost reduction through various operational and commercial initiatives; and
❯ To increase our footprint in iron ore by continuing to participate in auctions across the country;
Vedanta Resources plc | Annual Report FY2017
88
DIVISIONAL REVIEWCOPPER – INDIA / AUSTRALIA
FY2017 WAS A STRONG YEAR FOR COPPERINDIA FROM A VOLUME PERSPECTIVE.
The year in summary:FY2017 was a strong year for Copper India from a volume perspective, where record delivery of copper cathodes and phosphoric acid were achieved.
Although the unit conversion costs were higher, these were partially offset by various operational efficiencies. The business was also successful in reducing environmental waste, and making measurable improvements in safety.
With positive fundamentals in place, we will now be exploring the feasibility of expanding our smelter capacity.
Copper smelter at Tuticorin
P RAMNATHCEO, COPPER INDIA
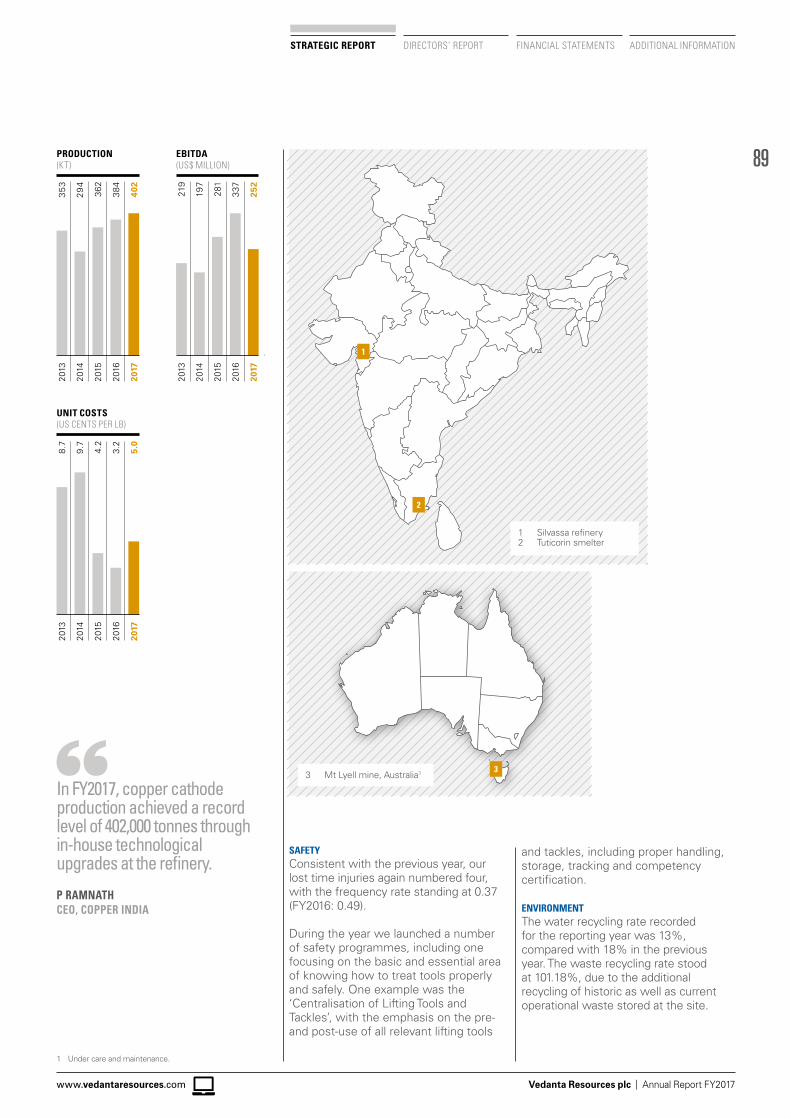
89
Vedanta Resources plc | Annual Report FY2017www.vedantaresources.com
STRATEGIC REPORT DIRECTORS’ REPORT FINANCIAL STATEMENTS ADDITIONAL INFORMATION
1 Silvassa refinery2 Tuticorin smelter
1
2
33 Mt Lyell mine, Australia1
PRODUCTION(KT)
294
353
362
384
402
2014
2013
2015
2016
2017
EBITDA(US$ MILLION)
197
219
281
337
252
2014
2013
2 015
2016
2017
UNIT COSTS(US CENTS PER LB)
9.7
8.7
4.2
3.2
5.0
2014
2013
2015
2016
2017
and tackles, including proper handling, storage, tracking and competency certification.
ENVIRONMENTThe water recycling rate recorded for the reporting year was 13%, compared with 18% in the previous year. The waste recycling rate stood at 101.18%, due to the additional recycling of historic as well as current operational waste stored at the site.
SAFETYConsistent with the previous year, our lost time injuries again numbered four, with the frequency rate standing at 0.37 (FY2016: 0.49).
During the year we launched a number of safety programmes, including one focusing on the basic and essential area of knowing how to treat tools properly and safely. One example was the ‘Centralisation of Lifting Tools and Tackles’, with the emphasis on the pre- and post-use of all relevant lifting tools
In FY2017, copper cathode production achieved a record level of 402,000 tonnes through in-house technological upgrades at the refinery.
P RAMNATHCEO, COPPER INDIA
1 Under care and maintenance.
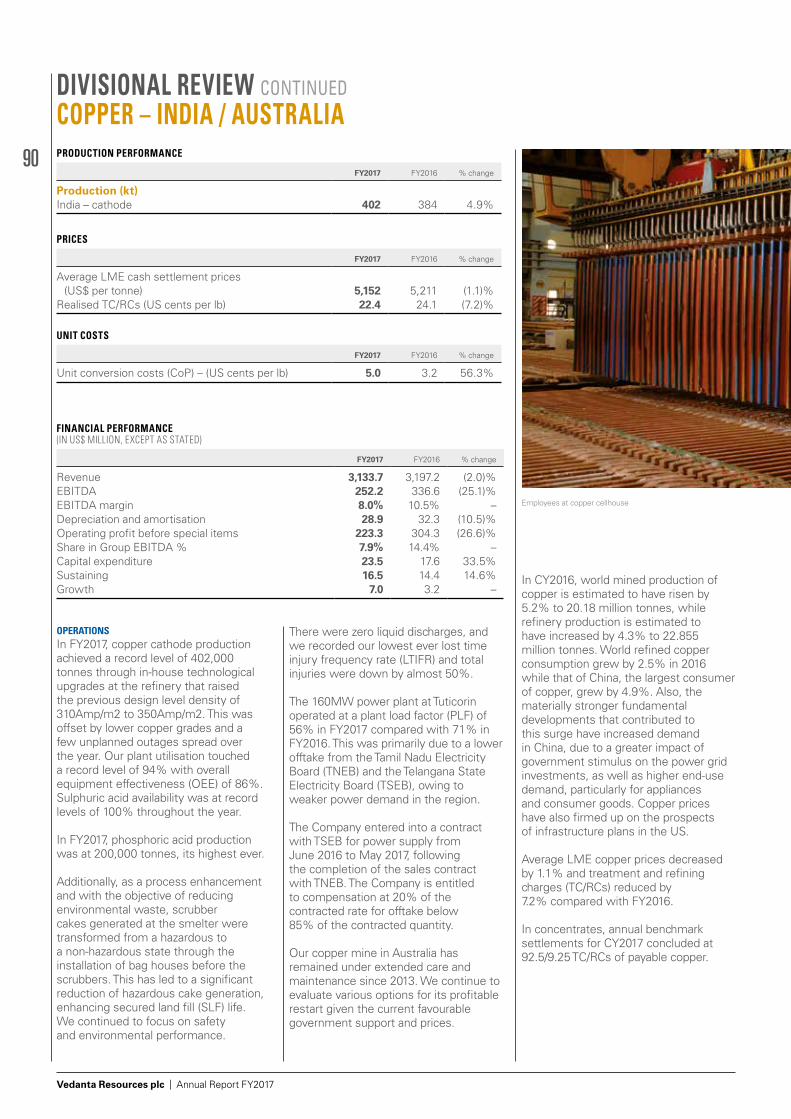
90
Vedanta Resources plc | Annual Report FY2017
DIVISIONAL REVIEW CONTINUED COPPER – INDIA / AUSTRALIA
OPERATIONSIn FY2017, copper cathode production achieved a record level of 402,000 tonnes through in-house technological upgrades at the refinery that raised the previous design level density of 310Amp/m2 to 350Amp/m2. This was offset by lower copper grades and a few unplanned outages spread over the year. Our plant utilisation touched a record level of 94% with overall equipment effectiveness (OEE) of 86%. Sulphuric acid availability was at record levels of 100% throughout the year.
In FY2017, phosphoric acid production was at 200,000 tonnes, its highest ever.
Additionally, as a process enhancement and with the objective of reducing environmental waste, scrubber cakes generated at the smelter were transformed from a hazardous to a non-hazardous state through the installation of bag houses before the scrubbers. This has led to a significant reduction of hazardous cake generation, enhancing secured land fill (SLF) life. We continued to focus on safety and environmental performance.
There were zero liquid discharges, and we recorded our lowest ever lost time injury frequency rate (LTIFR) and total injuries were down by almost 50%.
The 160MW power plant at Tuticorin operated at a plant load factor (PLF) of 56% in FY2017 compared with 71% in FY2016. This was primarily due to a lower offtake from the Tamil Nadu Electricity Board (TNEB) and the Telangana State Electricity Board (TSEB), owing to weaker power demand in the region.
The Company entered into a contract with TSEB for power supply from June 2016 to May 2017, following the completion of the sales contract with TNEB. The Company is entitled to compensation at 20% of the contracted rate for offtake below 85% of the contracted quantity.
Our copper mine in Australia has remained under extended care and maintenance since 2013. We continue to evaluate various options for its profitable restart given the current favourable government support and prices.
In CY2016, world mined production of copper is estimated to have risen by 5.2% to 20.18 million tonnes, while refinery production is estimated to have increased by 4.3% to 22.855 million tonnes. World refined copper consumption grew by 2.5% in 2016 while that of China, the largest consumer of copper, grew by 4.9%. Also, the materially stronger fundamental developments that contributed to this surge have increased demand in China, due to a greater impact of government stimulus on the power grid investments, as well as higher end-use demand, particularly for appliances and consumer goods. Copper prices have also firmed up on the prospects of infrastructure plans in the US.
Average LME copper prices decreased by 1.1% and treatment and refining charges (TC/RCs) reduced by 7.2% compared with FY2016.
In concentrates, annual benchmark settlements for CY2017 concluded at 92.5/9.25 TC/RCs of payable copper.
FINANCIAL PERFORMANCE(IN US$ MILLION, EXCEPT AS STATED)
FY2017 FY2016 % change
Revenue 3,133.7 3,197.2 (2.0)%EBITDA 252.2 336.6 (25.1)%EBITDA margin 8.0% 10.5% –Depreciation and amortisation 28.9 32.3 (10.5)%Operating profit before special items 223.3 304.3 (26.6)%Share in Group EBITDA % 7.9% 14.4% –Capital expenditure 23.5 17.6 33.5%Sustaining 16.5 14.4 14.6%Growth 7.0 3.2 –
PRODUCTION PERFORMANCE
FY2017 FY2016 % change
Production (kt)India – cathode 402 384 4.9%
PRICES
FY2017 FY2016 % change
Average LME cash settlement prices (US$ per tonne) 5,152 5,211 (1.1)%
Realised TC/RCs (US cents per lb) 22.4 24.1 (7.2)%
UNIT COSTS
FY2017 FY2016 % change
Unit conversion costs (CoP) – (US cents per lb) 5.0 3.2 56.3%
Employees at copper cellhouse
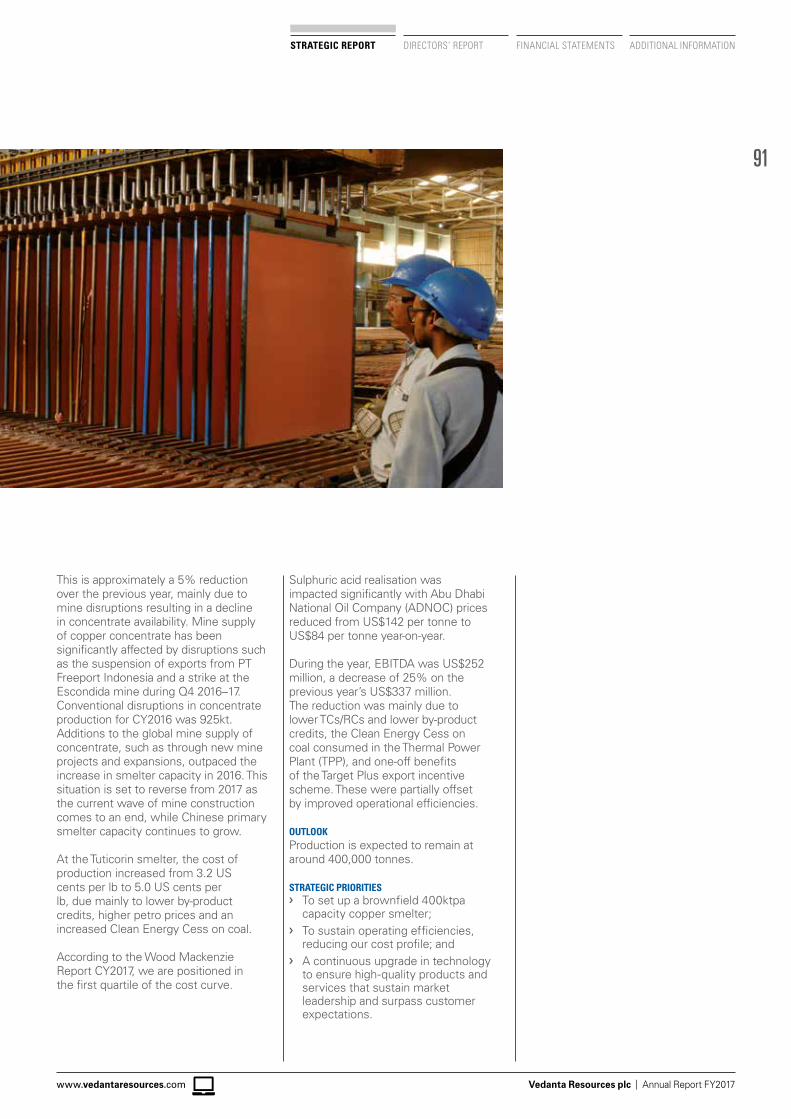
91
Vedanta Resources plc | Annual Report FY2017www.vedantaresources.com
STRATEGIC REPORT DIRECTORS’ REPORT FINANCIAL STATEMENTS ADDITIONAL INFORMATION
This is approximately a 5% reduction over the previous year, mainly due to mine disruptions resulting in a decline in concentrate availability. Mine supply of copper concentrate has been significantly affected by disruptions such as the suspension of exports from PT Freeport Indonesia and a strike at the Escondida mine during Q4 2016–17. Conventional disruptions in concentrate production for CY2016 was 925kt. Additions to the global mine supply of concentrate, such as through new mine projects and expansions, outpaced the increase in smelter capacity in 2016. This situation is set to reverse from 2017 as the current wave of mine construction comes to an end, while Chinese primary smelter capacity continues to grow.
At the Tuticorin smelter, the cost of production increased from 3.2 US cents per lb to 5.0 US cents per lb, due mainly to lower by-product credits, higher petro prices and an increased Clean Energy Cess on coal.
According to the Wood Mackenzie Report CY2017, we are positioned in the first quartile of the cost curve.
Sulphuric acid realisation was impacted significantly with Abu Dhabi National Oil Company (ADNOC) prices reduced from US$142 per tonne to US$84 per tonne year-on-year.
During the year, EBITDA was US$252 million, a decrease of 25% on the previous year’s US$337 million. The reduction was mainly due to lower TCs/RCs and lower by-product credits, the Clean Energy Cess on coal consumed in the Thermal Power Plant (TPP), and one-off benefits of the Target Plus export incentive scheme. These were partially offset by improved operational efficiencies.
OUTLOOKProduction is expected to remain at around 400,000 tonnes.
STRATEGIC PRIORITIES❯› To set up a brownfield 400ktpa
capacity copper smelter;❯› To sustain operating efficiencies,
reducing our cost profile; and❯› A continuous upgrade in technology
to ensure high-quality products and services that sustain market leadership and surpass customer expectations.
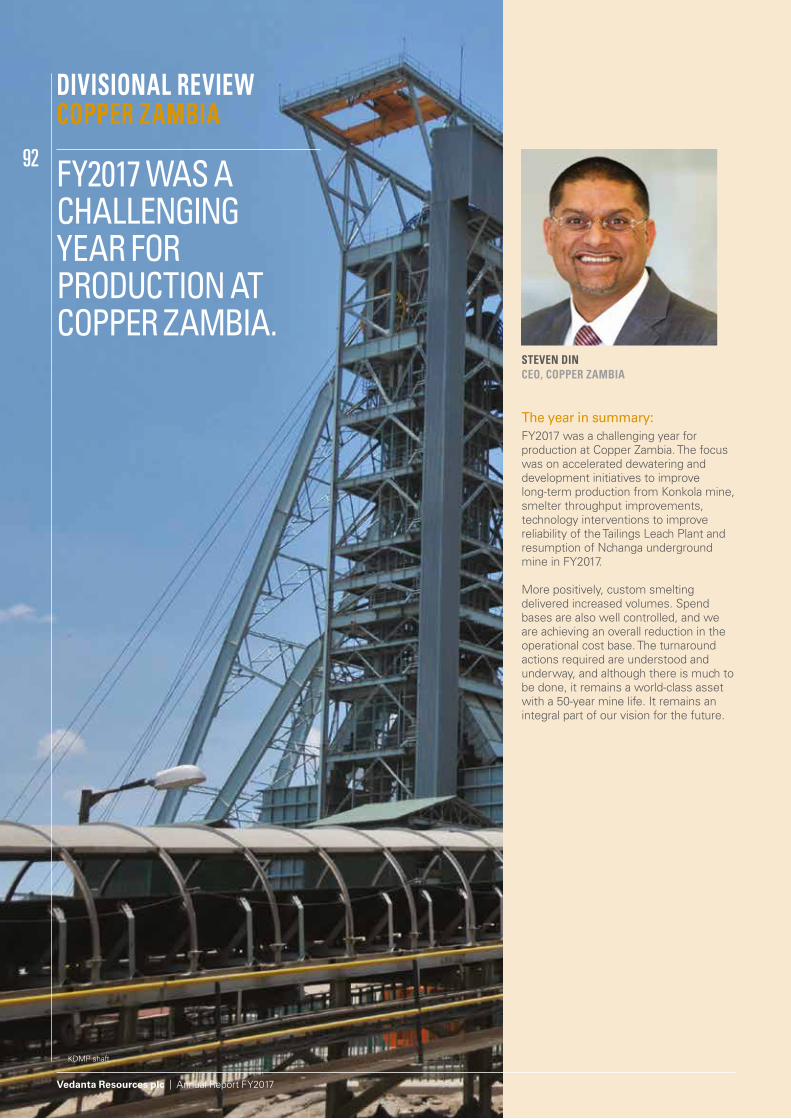
Vedanta Resources plc | Annual Report FY2017
92
DIVISIONAL REVIEWCOPPER ZAMBIA
FY2017 WAS A CHALLENGING YEAR FORPRODUCTION AT COPPER ZAMBIA.
The year in summary:FY2017 was a challenging year for production at Copper Zambia. The focus was on accelerated dewatering and development initiatives to improve long-term production from Konkola mine, smelter throughput improvements, technology interventions to improve reliability of the Tailings Leach Plant and resumption of Nchanga underground mine in FY2017.
More positively, custom smelting delivered increased volumes. Spend bases are also well controlled, and we are achieving an overall reduction in the operational cost base. The turnaround actions required are understood and underway, and although there is much to be done, it remains a world-class asset with a 50-year mine life. It remains an integral part of our vision for the future.
KDMP shaft
STEVEN DINCEO, COPPER ZAMBIA
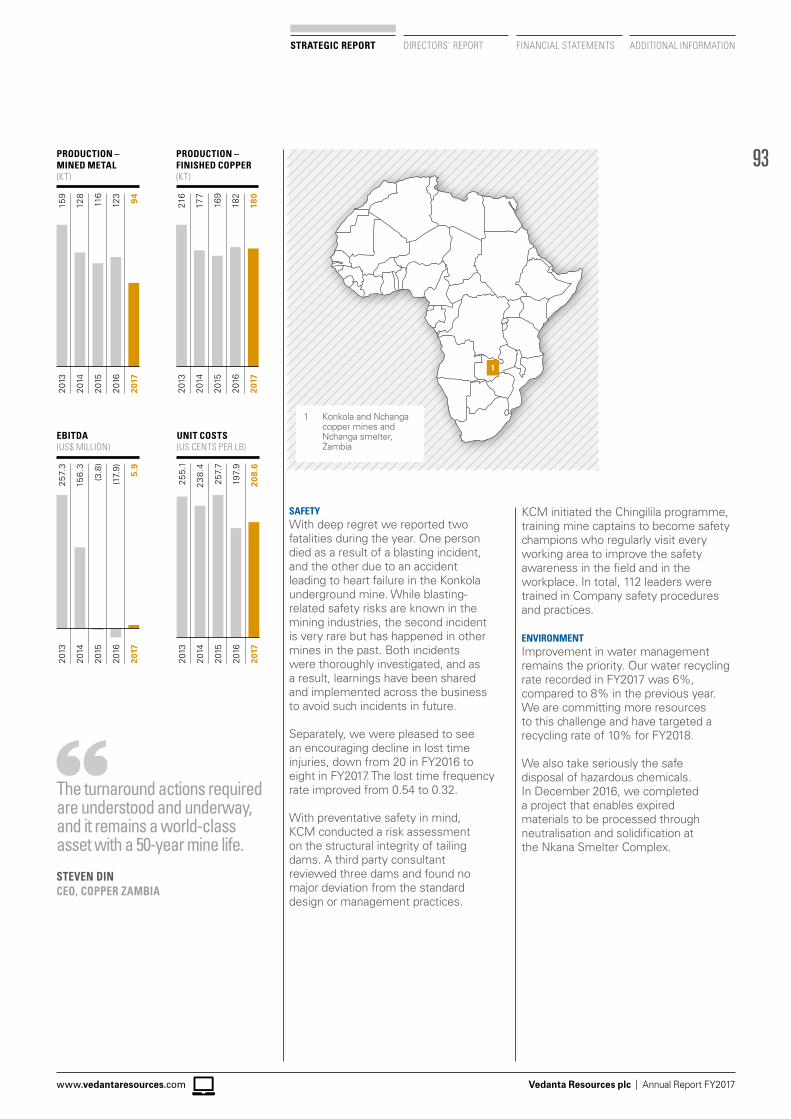
93
Vedanta Resources plc | Annual Report FY2017www.vedantaresources.com
STRATEGIC REPORT DIRECTORS’ REPORT FINANCIAL STATEMENTS ADDITIONAL INFORMATION
1
1 Konkola and Nchanga copper mines and Nchanga smelter, Zambia
PRODUCTION – MINED METAL(KT)
128
159
116
123 94
2014
2013
2015
2016
2017
PRODUCTION – FINISHED COPPER (KT)
177
216
169
182
180
2014
2013
2 015
2016
2017
EBITDA(US$ MILLION)
156.
3
257.
3
(3.8
)
(17.
9) 5.9
2014
2013
2015
2016
2017
UNIT COSTS(US CENTS PER LB)
238
.4
255.
1
257.
7
197.
9
208.
6
2014
2013
2015
2016
2017
SAFETYWith deep regret we reported two fatalities during the year. One person died as a result of a blasting incident, and the other due to an accident leading to heart failure in the Konkola underground mine. While blasting-related safety risks are known in the mining industries, the second incident is very rare but has happened in other mines in the past. Both incidents were thoroughly investigated, and as a result, learnings have been shared and implemented across the business to avoid such incidents in future.
Separately, we were pleased to see an encouraging decline in lost time injuries, down from 20 in FY2016 to eight in FY2017. The lost time frequency rate improved from 0.54 to 0.32.
With preventative safety in mind, KCM conducted a risk assessment on the structural integrity of tailing dams. A third party consultant reviewed three dams and found no major deviation from the standard design or management practices.
KCM initiated the Chingilila programme, training mine captains to become safety champions who regularly visit every working area to improve the safety awareness in the field and in the workplace. In total, 112 leaders were trained in Company safety procedures and practices.
ENVIRONMENTImprovement in water management remains the priority. Our water recycling rate recorded in FY2017 was 6%, compared to 8% in the previous year. We are committing more resources to this challenge and have targeted a recycling rate of 10% for FY2018.
We also take seriously the safe disposal of hazardous chemicals. In December 2016, we completed a project that enables expired materials to be processed through neutralisation and solidification at the Nkana Smelter Complex.
The turnaround actions required are understood and underway, and it remains a world-class asset with a 50-year mine life.
STEVEN DINCEO, COPPER ZAMBIA
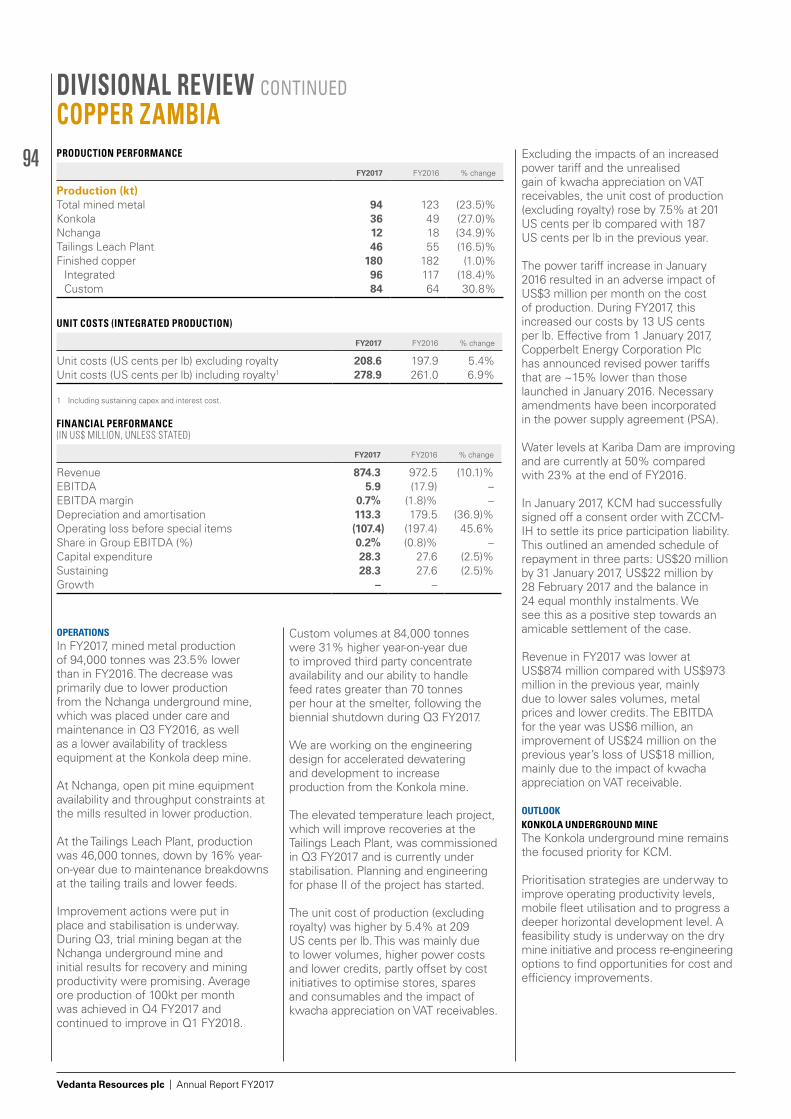
94
Vedanta Resources plc | Annual Report FY2017
DIVISIONAL REVIEW CONTINUED COPPER ZAMBIA
OPERATIONSIn FY2017, mined metal production of 94,000 tonnes was 23.5% lower than in FY2016. The decrease was primarily due to lower production from the Nchanga underground mine, which was placed under care and maintenance in Q3 FY2016, as well as a lower availability of trackless equipment at the Konkola deep mine.
At Nchanga, open pit mine equipment availability and throughput constraints at the mills resulted in lower production.
At the Tailings Leach Plant, production was 46,000 tonnes, down by 16% year-on-year due to maintenance breakdowns at the tailing trails and lower feeds.
Improvement actions were put in place and stabilisation is underway. During Q3, trial mining began at the Nchanga underground mine and initial results for recovery and mining productivity were promising. Average ore production of 100kt per month was achieved in Q4 FY2017 and continued to improve in Q1 FY2018.
Custom volumes at 84,000 tonnes were 31% higher year-on-year due to improved third party concentrate availability and our ability to handle feed rates greater than 70 tonnes per hour at the smelter, following the biennial shutdown during Q3 FY2017.
We are working on the engineering design for accelerated dewatering and development to increase production from the Konkola mine.
The elevated temperature leach project, which will improve recoveries at the Tailings Leach Plant, was commissioned in Q3 FY2017 and is currently under stabilisation. Planning and engineering for phase II of the project has started.
The unit cost of production (excluding royalty) was higher by 5.4% at 209 US cents per lb. This was mainly due to lower volumes, higher power costs and lower credits, partly offset by cost initiatives to optimise stores, spares and consumables and the impact of kwacha appreciation on VAT receivables.
Excluding the impacts of an increased power tariff and the unrealised gain of kwacha appreciation on VAT receivables, the unit cost of production (excluding royalty) rose by 7.5% at 201 US cents per lb compared with 187 US cents per lb in the previous year.
The power tariff increase in January 2016 resulted in an adverse impact of US$3 million per month on the cost of production. During FY2017, this increased our costs by 13 US cents per lb. Effective from 1 January 2017, Copperbelt Energy Corporation Plc has announced revised power tariffs that are ~15% lower than those launched in January 2016. Necessary amendments have been incorporated in the power supply agreement (PSA).
Water levels at Kariba Dam are improving and are currently at 50% compared with 23% at the end of FY2016.
In January 2017, KCM had successfully signed off a consent order with ZCCM-IH to settle its price participation liability. This outlined an amended schedule of repayment in three parts: US$20 million by 31 January 2017, US$22 million by 28 February 2017 and the balance in 24 equal monthly instalments. We see this as a positive step towards an amicable settlement of the case.
Revenue in FY2017 was lower at US$874 million compared with US$973 million in the previous year, mainly due to lower sales volumes, metal prices and lower credits. The EBITDA for the year was US$6 million, an improvement of US$24 million on the previous year’s loss of US$18 million, mainly due to the impact of kwacha appreciation on VAT receivable.
OUTLOOKKONKOLA UNDERGROUND MINEThe Konkola underground mine remains the focused priority for KCM.
Prioritisation strategies are underway to improve operating productivity levels, mobile fleet utilisation and to progress a deeper horizontal development level. A feasibility study is underway on the dry mine initiative and process re-engineering options to find opportunities for cost and efficiency improvements.
FINANCIAL PERFORMANCE(IN US$ MILLION, UNLESS STATED)
FY2017 FY2016 % change
Revenue 874.3 972.5 (10.1)%EBITDA 5.9 (17.9) –EBITDA margin 0.7% (1.8)% –Depreciation and amortisation 113.3 179.5 (36.9)%Operating loss before special items (107.4) (197.4) 45.6%Share in Group EBITDA (%) 0.2% (0.8)% –Capital expenditure 28.3 27.6 (2.5)%Sustaining 28.3 27.6 (2.5)%Growth – –
PRODUCTION PERFORMANCE
FY2017 FY2016 % change
Production (kt)Total mined metal 94 123 (23.5)%Konkola 36 49 (27.0)%Nchanga 12 18 (34.9)%Tailings Leach Plant 46 55 (16.5)%Finished copper 180 182 (1.0)%
Integrated 96 117 (18.4)%Custom 84 64 30.8%
UNIT COSTS (INTEGRATED PRODUCTION)
FY2017 FY2016 % change
Unit costs (US cents per lb) excluding royalty 208.6 197.9 5.4%Unit costs (US cents per lb) including royalty1 278.9 261.0 6.9%
1 Including sustaining capex and interest cost.
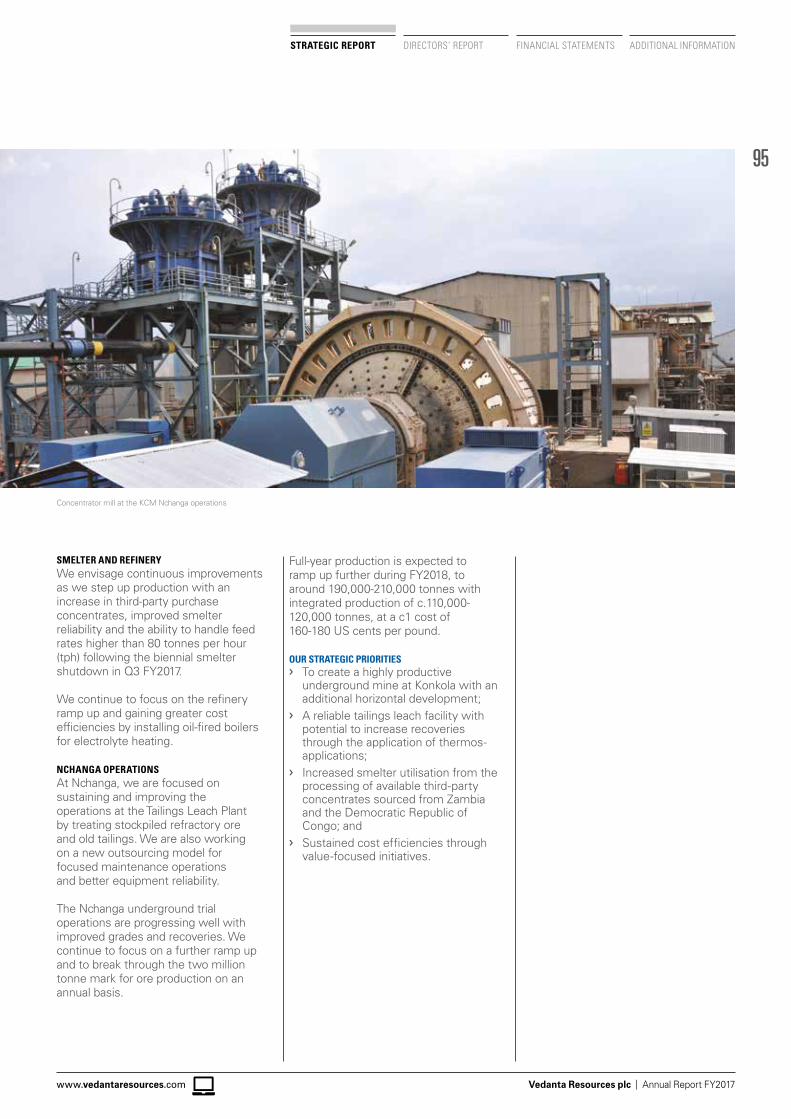
95
Vedanta Resources plc | Annual Report FY2017www.vedantaresources.com
STRATEGIC REPORT DIRECTORS’ REPORT FINANCIAL STATEMENTS ADDITIONAL INFORMATION
SMELTER AND REFINERYWe envisage continuous improvements as we step up production with an increase in third-party purchase concentrates, improved smelter reliability and the ability to handle feed rates higher than 80 tonnes per hour (tph) following the biennial smelter shutdown in Q3 FY2017.
We continue to focus on the refinery ramp up and gaining greater cost efficiencies by installing oil-fired boilers for electrolyte heating.
NCHANGA OPERATIONSAt Nchanga, we are focused on sustaining and improving the operations at the Tailings Leach Plant by treating stockpiled refractory ore and old tailings. We are also working on a new outsourcing model for focused maintenance operations and better equipment reliability.
The Nchanga underground trial operations are progressing well with improved grades and recoveries. We continue to focus on a further ramp up and to break through the two million tonne mark for ore production on an annual basis.
Full-year production is expected to ramp up further during FY2018, to around 190,000-210,000 tonnes with integrated production of c.110,000-120,000 tonnes, at a c1 cost of 160-180 US cents per pound.
OUR STRATEGIC PRIORITIES❯› To create a highly productive
underground mine at Konkola with an additional horizontal development;
❯› A reliable tailings leach facility with potential to increase recoveries through the application of thermos-applications;
❯› Increased smelter utilisation from the processing of available third-party concentrates sourced from Zambia and the Democratic Republic of Congo; and
❯› Sustained cost efficiencies through value-focused initiatives.
Concentrator mill at the KCM Nchanga operations
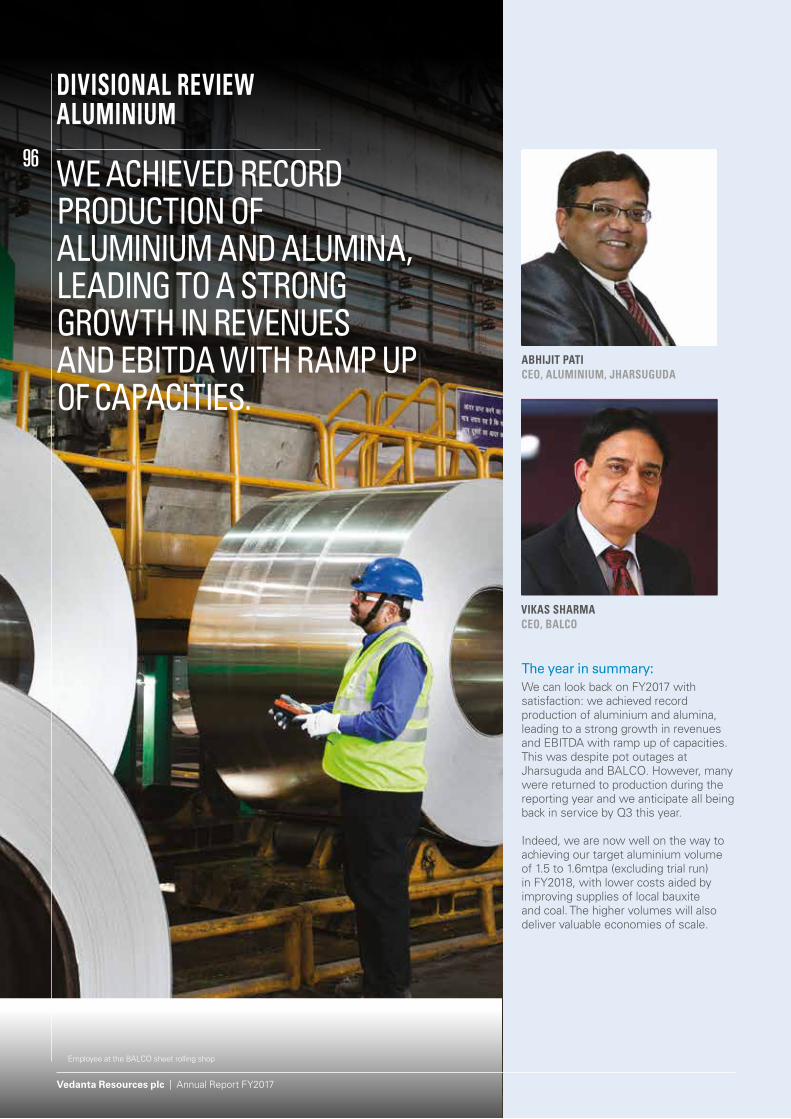
Vedanta Resources plc | Annual Report FY2017
96
DIVISIONAL REVIEWALUMINIUM
WE ACHIEVED RECORDPRODUCTION OF ALUMINIUM AND ALUMINA,LEADING TO A STRONG GROWTH IN REVENUESAND EBITDA WITH RAMP UP OF CAPACITIES.
The year in summary:We can look back on FY2017 with satisfaction: we achieved record production of aluminium and alumina, leading to a strong growth in revenues and EBITDA with ramp up of capacities. This was despite pot outages at Jharsuguda and BALCO. However, many were returned to production during the reporting year and we anticipate all being back in service by Q3 this year.
Indeed, we are now well on the way to achieving our target aluminium volume of 1.5 to 1.6mtpa (excluding trial run) in FY2018, with lower costs aided by improving supplies of local bauxite and coal. The higher volumes will also deliver valuable economies of scale.
Employee at the BALCO sheet rolling shop
ABHIJIT PATICEO, ALUMINIUM, JHARSUGUDA
VIKAS SHARMACEO, BALCO
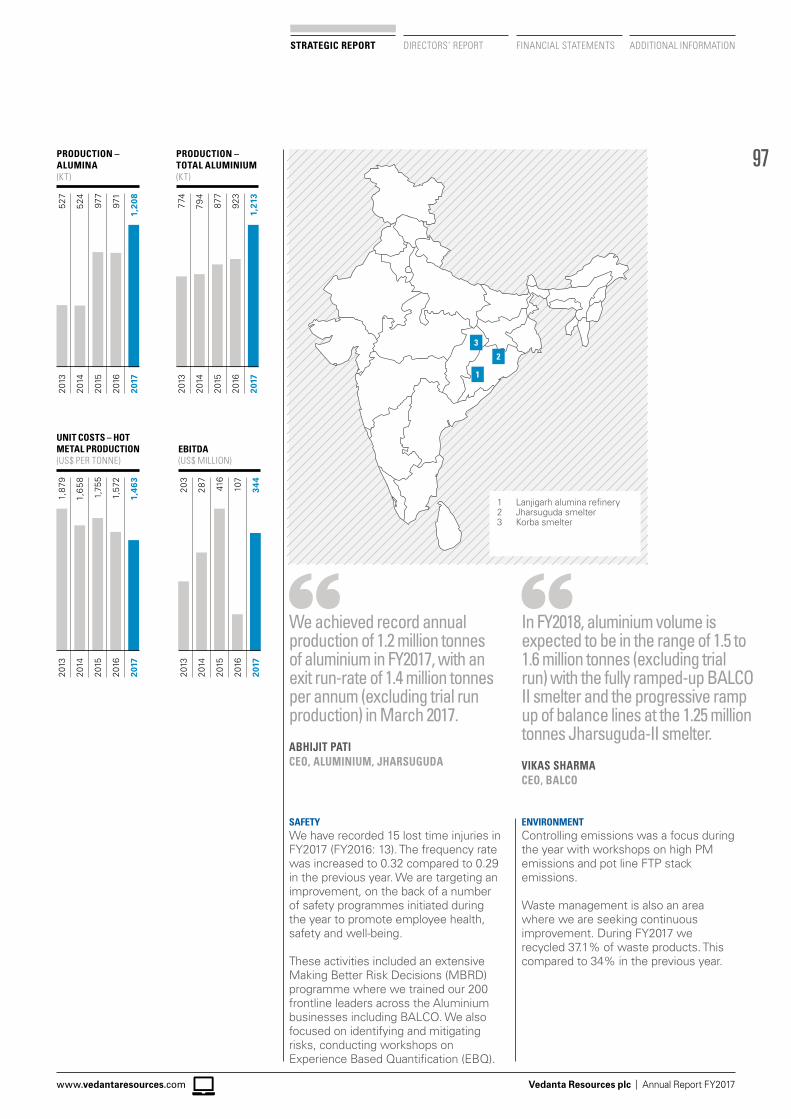
97
Vedanta Resources plc | Annual Report FY2017www.vedantaresources.com
STRATEGIC REPORT DIRECTORS’ REPORT FINANCIAL STATEMENTS ADDITIONAL INFORMATION
1 Lanjigarh alumina refinery2 Jharsuguda smelter3 Korba smelter
1
EBITDA(US$ MILLION)
287
203
416
107
344
2014
2013
2015
2016
2017
PRODUCTION – ALUMINA(KT)
524
527
977
971
1,20
8
2014
2013
2015
2016
2017
PRODUCTION – TOTAL ALUMINIUM(KT)
794
774
877
923
1,21
3
2014
2013
2 015
2016
2017
UNIT COSTS – HOT METAL PRODUCTION(US$ PER TONNE)
1,6
58
1,87
9
1,75
5
1,57
2
1,46
3
2014
2013
2 015
2016
2017
2
3
We achieved record annual production of 1.2 million tonnes of aluminium in FY2017, with an exit run-rate of 1.4 million tonnes per annum (excluding trial run production) in March 2017.
ABHIJIT PATICEO, ALUMINIUM, JHARSUGUDA
In FY2018, aluminium volume is expected to be in the range of 1.5 to 1.6 million tonnes (excluding trial run) with the fully ramped-up BALCO II smelter and the progressive ramp up of balance lines at the 1.25 million tonnes Jharsuguda-II smelter.
VIKAS SHARMACEO, BALCO
ENVIRONMENTControlling emissions was a focus during the year with workshops on high PM emissions and pot line FTP stack emissions.
Waste management is also an area where we are seeking continuous improvement. During FY2017 we recycled 37.1% of waste products. This compared to 34% in the previous year.
SAFETYWe have recorded 15 lost time injuries in FY2017 (FY2016: 13). The frequency rate was increased to 0.32 compared to 0.29 in the previous year. We are targeting an improvement, on the back of a number of safety programmes initiated during the year to promote employee health, safety and well-being.
These activities included an extensive Making Better Risk Decisions (MBRD) programme where we trained our 200 frontline leaders across the Aluminium businesses including BALCO. We also focused on identifying and mitigating risks, conducting workshops on Experience Based Quantification (EBQ).
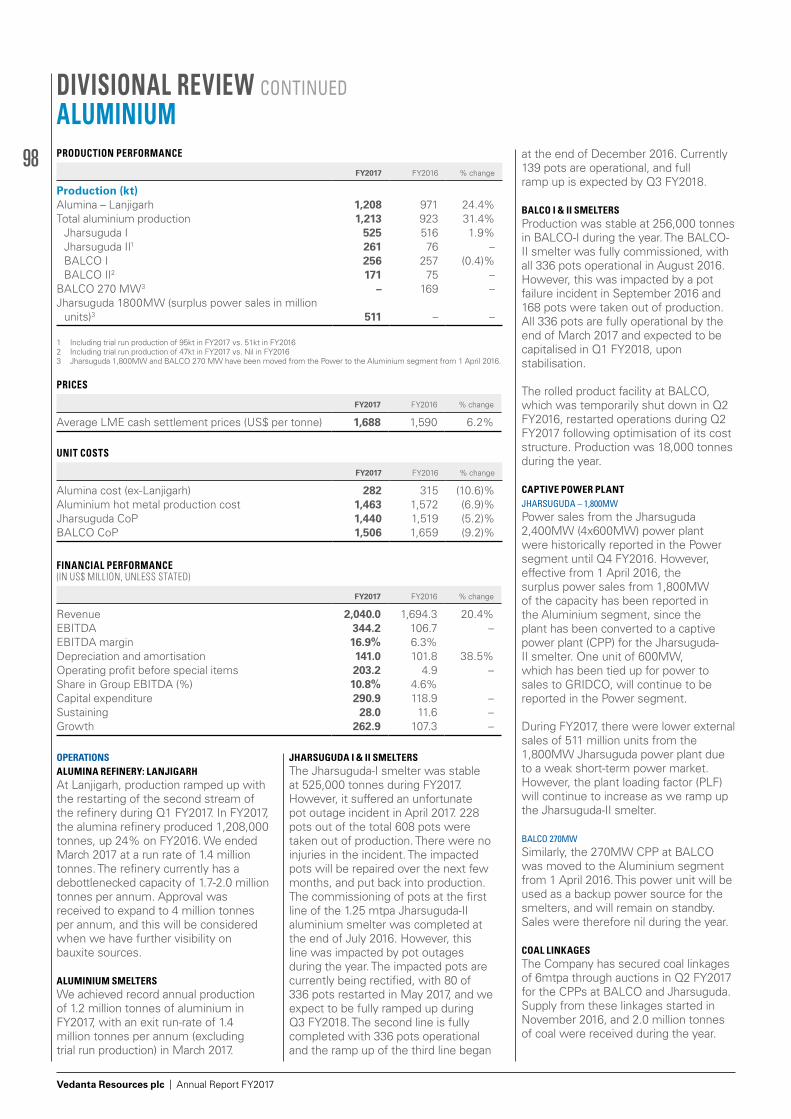
98
Vedanta Resources plc | Annual Report FY2017
DIVISIONAL REVIEW CONTINUED ALUMINIUM
OPERATIONSALUMINA REFINERY: LANJIGARHAt Lanjigarh, production ramped up with the restarting of the second stream of the refinery during Q1 FY2017. In FY2017, the alumina refinery produced 1,208,000 tonnes, up 24% on FY2016. We ended March 2017 at a run rate of 1.4 million tonnes. The refinery currently has a debottlenecked capacity of 1.7-2.0 million tonnes per annum. Approval was received to expand to 4 million tonnes per annum, and this will be considered when we have further visibility on bauxite sources.
ALUMINIUM SMELTERSWe achieved record annual production of 1.2 million tonnes of aluminium in FY2017, with an exit run-rate of 1.4 million tonnes per annum (excluding trial run production) in March 2017.
JHARSUGUDA I & II SMELTERSThe Jharsuguda-I smelter was stable at 525,000 tonnes during FY2017. However, it suffered an unfortunate pot outage incident in April 2017. 228 pots out of the total 608 pots were taken out of production. There were no injuries in the incident. The impacted pots will be repaired over the next few months, and put back into production. The commissioning of pots at the first line of the 1.25 mtpa Jharsuguda-II aluminium smelter was completed at the end of July 2016. However, this line was impacted by pot outages during the year. The impacted pots are currently being rectified, with 80 of 336 pots restarted in May 2017, and we expect to be fully ramped up during Q3 FY2018. The second line is fully completed with 336 pots operational and the ramp up of the third line began
at the end of December 2016. Currently 139 pots are operational, and full ramp up is expected by Q3 FY2018.
BALCO I & II SMELTERSProduction was stable at 256,000 tonnes in BALCO-I during the year. The BALCO-II smelter was fully commissioned, with all 336 pots operational in August 2016. However, this was impacted by a pot failure incident in September 2016 and 168 pots were taken out of production. All 336 pots are fully operational by the end of March 2017 and expected to be capitalised in Q1 FY2018, upon stabilisation.
The rolled product facility at BALCO, which was temporarily shut down in Q2 FY2016, restarted operations during Q2 FY2017 following optimisation of its cost structure. Production was 18,000 tonnes during the year.
CAPTIVE POWER PLANTJHARSUGUDA – 1,800MWPower sales from the Jharsuguda 2,400MW (4x600MW) power plant were historically reported in the Power segment until Q4 FY2016. However, effective from 1 April 2016, the surplus power sales from 1,800MW of the capacity has been reported in the Aluminium segment, since the plant has been converted to a captive power plant (CPP) for the Jharsuguda-II smelter. One unit of 600MW, which has been tied up for power to sales to GRIDCO, will continue to be reported in the Power segment.
During FY2017, there were lower external sales of 511 million units from the 1,800MW Jharsuguda power plant due to a weak short-term power market. However, the plant loading factor (PLF) will continue to increase as we ramp up the Jharsuguda-II smelter.
BALCO 270MWSimilarly, the 270MW CPP at BALCO was moved to the Aluminium segment from 1 April 2016. This power unit will be used as a backup power source for the smelters, and will remain on standby. Sales were therefore nil during the year.
COAL LINKAGESThe Company has secured coal linkages of 6mtpa through auctions in Q2 FY2017 for the CPPs at BALCO and Jharsuguda. Supply from these linkages started in November 2016, and 2.0 million tonnes of coal were received during the year.
FINANCIAL PERFORMANCE(IN US$ MILLION, UNLESS STATED)
FY2017 FY2016 % change
Revenue 2,040.0 1,694.3 20.4%EBITDA 344.2 106.7 –EBITDA margin 16.9% 6.3%Depreciation and amortisation 141.0 101.8 38.5%Operating profit before special items 203.2 4.9 –Share in Group EBITDA (%) 10.8% 4.6%Capital expenditure 290.9 118.9 –Sustaining 28.0 11.6 –Growth 262.9 107.3 –
PRODUCTION PERFORMANCE
FY2017 FY2016 % change
Production (kt)Alumina – Lanjigarh 1,208 971 24.4%Total aluminium production 1,213 923 31.4%
Jharsuguda I 525 516 1.9%Jharsuguda II1 261 76 –BALCO I 256 257 (0.4)%BALCO II2 171 75 –
BALCO 270 MW3 – 169 –Jharsuguda 1800MW (surplus power sales in million
units)3 511 – –
1 Including trial run production of 95kt in FY2017 vs. 51kt in FY20162 Including trial run production of 47kt in FY2017 vs. Nil in FY20163 Jharsuguda 1,800MW and BALCO 270 MW have been moved from the Power to the Aluminium segment from 1 April 2016.
PRICES
FY2017 FY2016 % change
Average LME cash settlement prices (US$ per tonne) 1,688 1,590 6.2%
UNIT COSTS
FY2017 FY2016 % change
Alumina cost (ex-Lanjigarh) 282 315 (10.6)%Aluminium hot metal production cost 1,463 1,572 (6.9)%Jharsuguda CoP 1,440 1,519 (5.2)%BALCO CoP 1,506 1,659 (9.2)%
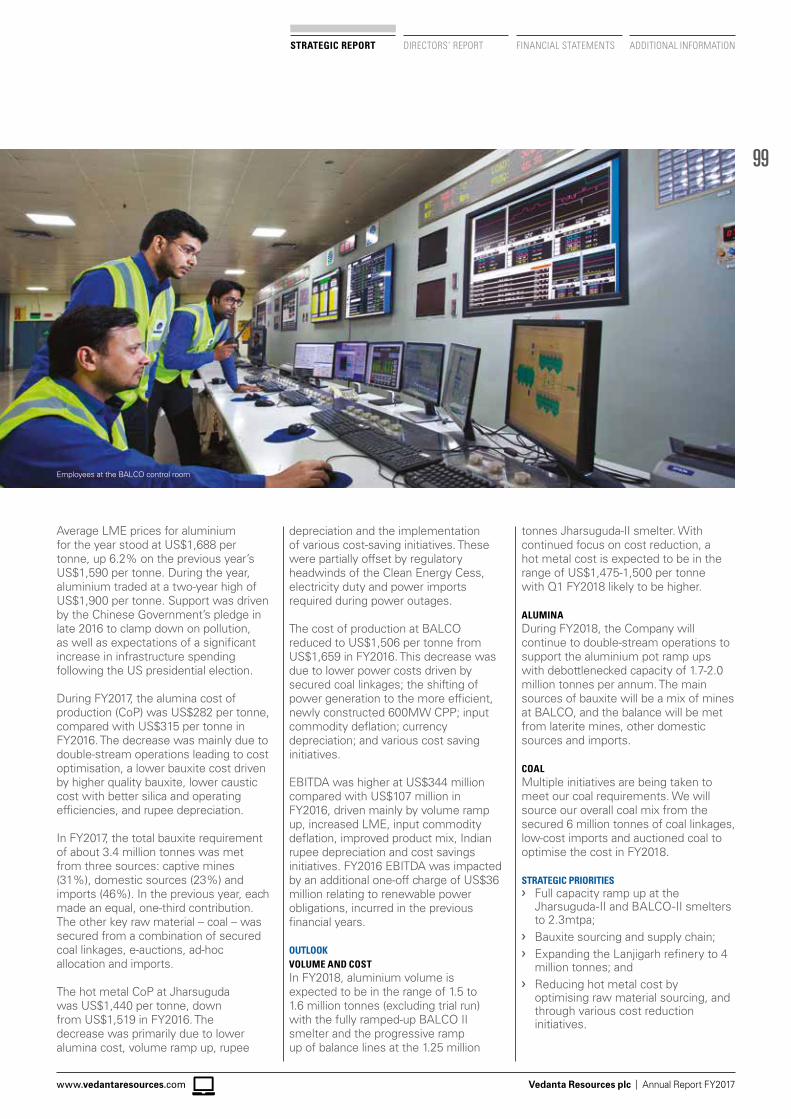
99
Vedanta Resources plc | Annual Report FY2017www.vedantaresources.com
STRATEGIC REPORT DIRECTORS’ REPORT FINANCIAL STATEMENTS ADDITIONAL INFORMATION
Average LME prices for aluminium for the year stood at US$1,688 per tonne, up 6.2% on the previous year’s US$1,590 per tonne. During the year, aluminium traded at a two-year high of US$1,900 per tonne. Support was driven by the Chinese Government’s pledge in late 2016 to clamp down on pollution, as well as expectations of a significant increase in infrastructure spending following the US presidential election.
During FY2017, the alumina cost of production (CoP) was US$282 per tonne, compared with US$315 per tonne in FY2016. The decrease was mainly due to double-stream operations leading to cost optimisation, a lower bauxite cost driven by higher quality bauxite, lower caustic cost with better silica and operating efficiencies, and rupee depreciation.
In FY2017, the total bauxite requirement of about 3.4 million tonnes was met from three sources: captive mines (31%), domestic sources (23%) and imports (46%). In the previous year, each made an equal, one-third contribution. The other key raw material – coal – was secured from a combination of secured coal linkages, e-auctions, ad-hoc allocation and imports.
The hot metal CoP at Jharsuguda was US$1,440 per tonne, down from US$1,519 in FY2016. The decrease was primarily due to lower alumina cost, volume ramp up, rupee
depreciation and the implementation of various cost-saving initiatives. These were partially offset by regulatory headwinds of the Clean Energy Cess, electricity duty and power imports required during power outages.
The cost of production at BALCO reduced to US$1,506 per tonne from US$1,659 in FY2016. This decrease was due to lower power costs driven by secured coal linkages; the shifting of power generation to the more efficient, newly constructed 600MW CPP; input commodity deflation; currency depreciation; and various cost saving initiatives.
EBITDA was higher at US$344 million compared with US$107 million in FY2016, driven mainly by volume ramp up, increased LME, input commodity deflation, improved product mix, Indian rupee depreciation and cost savings initiatives. FY2016 EBITDA was impacted by an additional one-off charge of US$36 million relating to renewable power obligations, incurred in the previous financial years.
OUTLOOKVOLUME AND COSTIn FY2018, aluminium volume is expected to be in the range of 1.5 to 1.6 million tonnes (excluding trial run) with the fully ramped-up BALCO II smelter and the progressive ramp up of balance lines at the 1.25 million
tonnes Jharsuguda-II smelter. With continued focus on cost reduction, a hot metal cost is expected to be in the range of US$1,475-1,500 per tonne with Q1 FY2018 likely to be higher.
ALUMINA During FY2018, the Company will continue to double-stream operations to support the aluminium pot ramp ups with debottlenecked capacity of 1.7-2.0 million tonnes per annum. The main sources of bauxite will be a mix of mines at BALCO, and the balance will be met from laterite mines, other domestic sources and imports.
COAL Multiple initiatives are being taken to meet our coal requirements. We will source our overall coal mix from the secured 6 million tonnes of coal linkages, low-cost imports and auctioned coal to optimise the cost in FY2018.
STRATEGIC PRIORITIES❯› Full capacity ramp up at the
Jharsuguda-II and BALCO-II smelters to 2.3mtpa;
❯› Bauxite sourcing and supply chain;❯› Expanding the Lanjigarh refinery to 4
million tonnes; and❯› Reducing hot metal cost by
optimising raw material sourcing, and through various cost reduction initiatives.
Employees at the BALCO control room
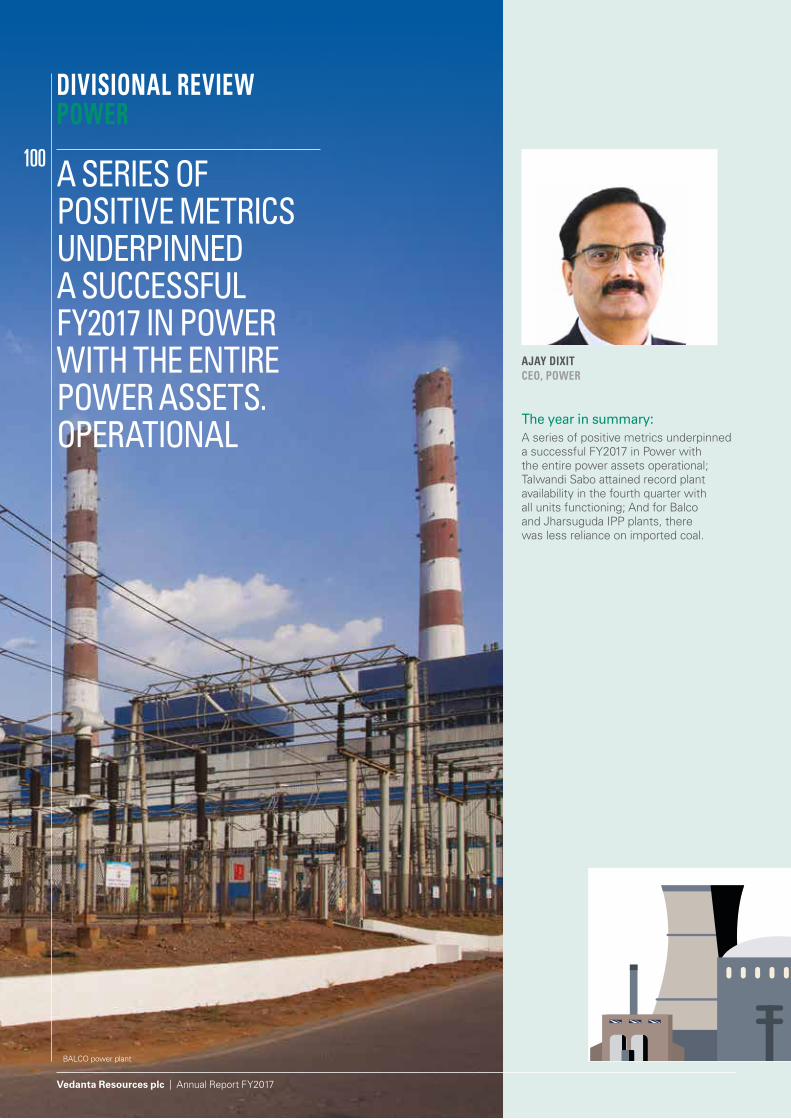
Vedanta Resources plc | Annual Report FY2017
100
DIVISIONAL REVIEWPOWER
A SERIES OF POSITIVE METRICS UNDERPINNEDA SUCCESSFUL FY2017 IN POWER WITH THE ENTIREPOWER ASSETS. OPERATIONAL
The year in summary:A series of positive metrics underpinned a successful FY2017 in Power with the entire power assets operational; Talwandi Sabo attained record plant availability in the fourth quarter with all units functioning; And for Balco and Jharsuguda IPP plants, there was less reliance on imported coal.
BALCO power plant
AJAY DIXITCEO, POWER
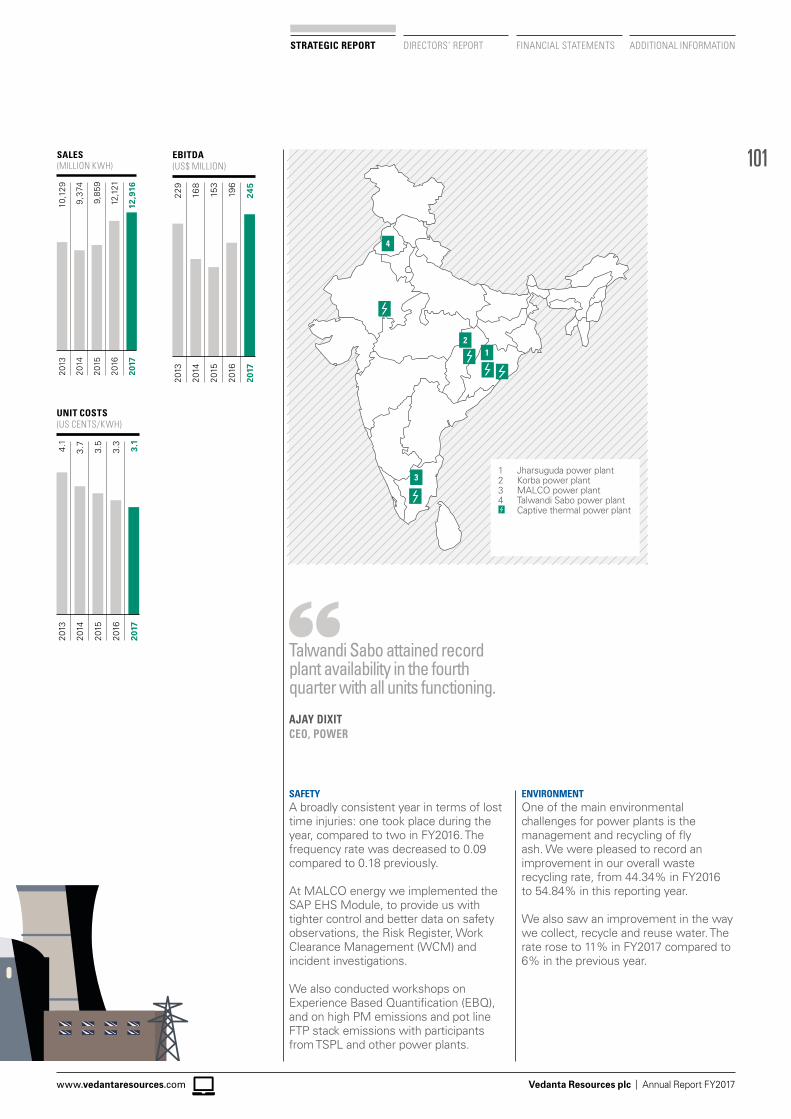
101
Vedanta Resources plc | Annual Report FY2017www.vedantaresources.com
STRATEGIC REPORT DIRECTORS’ REPORT FINANCIAL STATEMENTS ADDITIONAL INFORMATION
1 Jharsuguda power plant2 Korba power plant3 MALCO power plant4 Talwandi Sabo power plant Captive thermal power plant
SALES(MILLION KWH)
9,37
4
10,1
29
9,85
9
12,1
21
12,9
16
2014
2013
2015
2016
2017
EBITDA(US$ MILLION)
168
229
153
196
245
2014
2013
2015
2016
2017
UNIT COSTS(US CENTS/KWH)
3.7
4.1
3.5
3.3
3.1
2014
2013
2015
2016
2017
12
3
4
Talwandi Sabo attained record plant availability in the fourth quarter with all units functioning.
AJAY DIXITCEO, POWER
SAFETYA broadly consistent year in terms of lost time injuries: one took place during the year, compared to two in FY2016. The frequency rate was decreased to 0.09 compared to 0.18 previously.
At MALCO energy we implemented the SAP EHS Module, to provide us with tighter control and better data on safety observations, the Risk Register, Work Clearance Management (WCM) and incident investigations.
We also conducted workshops on Experience Based Quantification (EBQ), and on high PM emissions and pot line FTP stack emissions with participants from TSPL and other power plants.
ENVIRONMENTOne of the main environmental challenges for power plants is the management and recycling of fly ash. We were pleased to record an improvement in our overall waste recycling rate, from 44.34% in FY2016 to 54.84% in this reporting year.
We also saw an improvement in the way we collect, recycle and reuse water. The rate rose to 11% in FY2017 compared to 6% in the previous year.
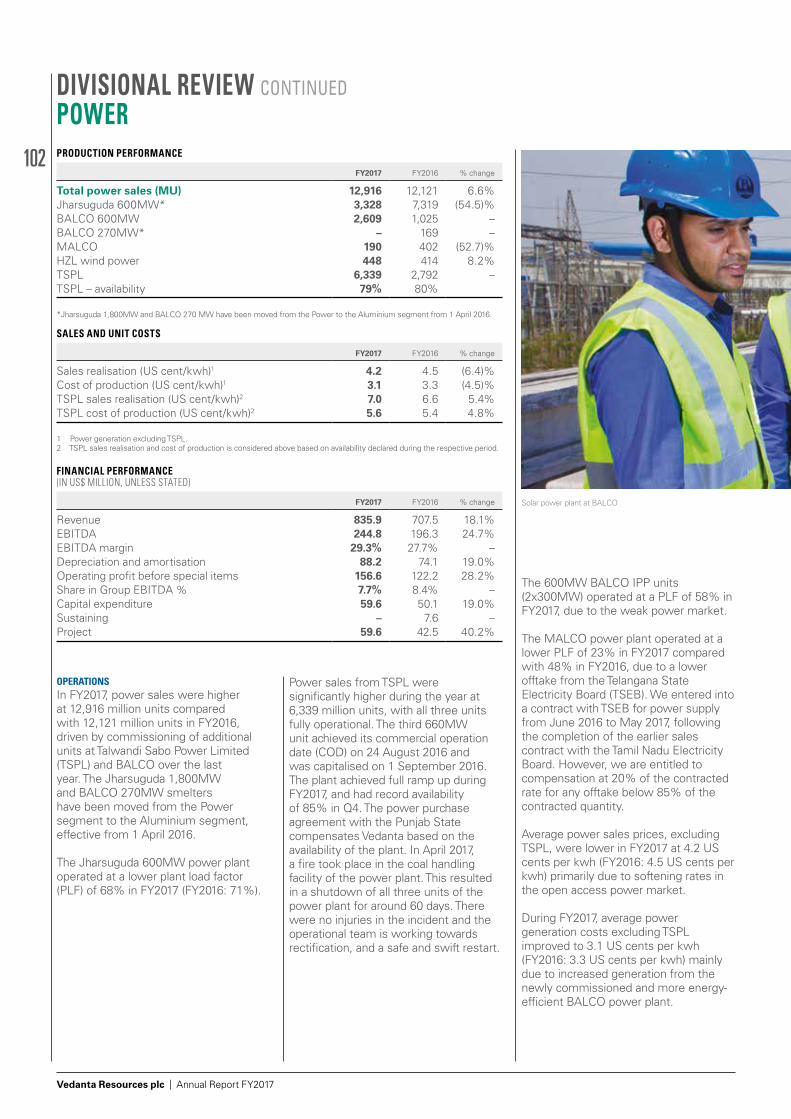
102
Vedanta Resources plc | Annual Report FY2017
DIVISIONAL REVIEW CONTINUED POWER
OPERATIONSIn FY2017, power sales were higher at 12,916 million units compared with 12,121 million units in FY2016, driven by commissioning of additional units at Talwandi Sabo Power Limited (TSPL) and BALCO over the last year. The Jharsuguda 1,800MW and BALCO 270MW smelters have been moved from the Power segment to the Aluminium segment, effective from 1 April 2016.
The Jharsuguda 600MW power plant operated at a lower plant load factor (PLF) of 68% in FY2017 (FY2016: 71%).
Power sales from TSPL were significantly higher during the year at 6,339 million units, with all three units fully operational. The third 660MW unit achieved its commercial operation date (COD) on 24 August 2016 and was capitalised on 1 September 2016. The plant achieved full ramp up during FY2017, and had record availability of 85% in Q4. The power purchase agreement with the Punjab State compensates Vedanta based on the availability of the plant. In April 2017, a fire took place in the coal handling facility of the power plant. This resulted in a shutdown of all three units of the power plant for around 60 days. There were no injuries in the incident and the operational team is working towards rectification, and a safe and swift restart.
The 600MW BALCO IPP units (2x300MW) operated at a PLF of 58% in FY2017, due to the weak power market.
The MALCO power plant operated at a lower PLF of 23% in FY2017 compared with 48% in FY2016, due to a lower offtake from the Telangana State Electricity Board (TSEB). We entered into a contract with TSEB for power supply from June 2016 to May 2017, following the completion of the earlier sales contract with the Tamil Nadu Electricity Board. However, we are entitled to compensation at 20% of the contracted rate for any offtake below 85% of the contracted quantity.
Average power sales prices, excluding TSPL, were lower in FY2017 at 4.2 US cents per kwh (FY2016: 4.5 US cents per kwh) primarily due to softening rates in the open access power market.
During FY2017, average power generation costs excluding TSPL improved to 3.1 US cents per kwh (FY2016: 3.3 US cents per kwh) mainly due to increased generation from the newly commissioned and more energy-efficient BALCO power plant.
FINANCIAL PERFORMANCE(IN US$ MILLION, UNLESS STATED)
FY2017 FY2016 % change
Revenue 835.9 707.5 18.1%EBITDA 244.8 196.3 24.7%EBITDA margin 29.3% 27.7% –Depreciation and amortisation 88.2 74.1 19.0%Operating profit before special items 156.6 122.2 28.2%Share in Group EBITDA % 7.7% 8.4% –Capital expenditure 59.6 50.1 19.0%Sustaining – 7.6 –Project 59.6 42.5 40.2%
PRODUCTION PERFORMANCE
FY2017 FY2016 % change
Total power sales (MU) 12,916 12,121 6.6%Jharsuguda 600MW* 3,328 7,319 (54.5)%BALCO 600MW 2,609 1,025 –BALCO 270MW* – 169 –MALCO 190 402 (52.7)%HZL wind power 448 414 8.2%TSPL 6,339 2,792 –TSPL – availability 79% 80%
*Jharsuguda 1,800MW and BALCO 270 MW have been moved from the Power to the Aluminium segment from 1 April 2016.
SALES AND UNIT COSTS
FY2017 FY2016 % change
Sales realisation (US cent/kwh)1 4.2 4.5 (6.4)%Cost of production (US cent/kwh)1 3.1 3.3 (4.5)%TSPL sales realisation (US cent/kwh)2 7.0 6.6 5.4%TSPL cost of production (US cent/kwh)2 5.6 5.4 4.8%
1 Power generation excluding TSPL.2 TSPL sales realisation and cost of production is considered above based on availability declared during the respective period.
Solar power plant at BALCO
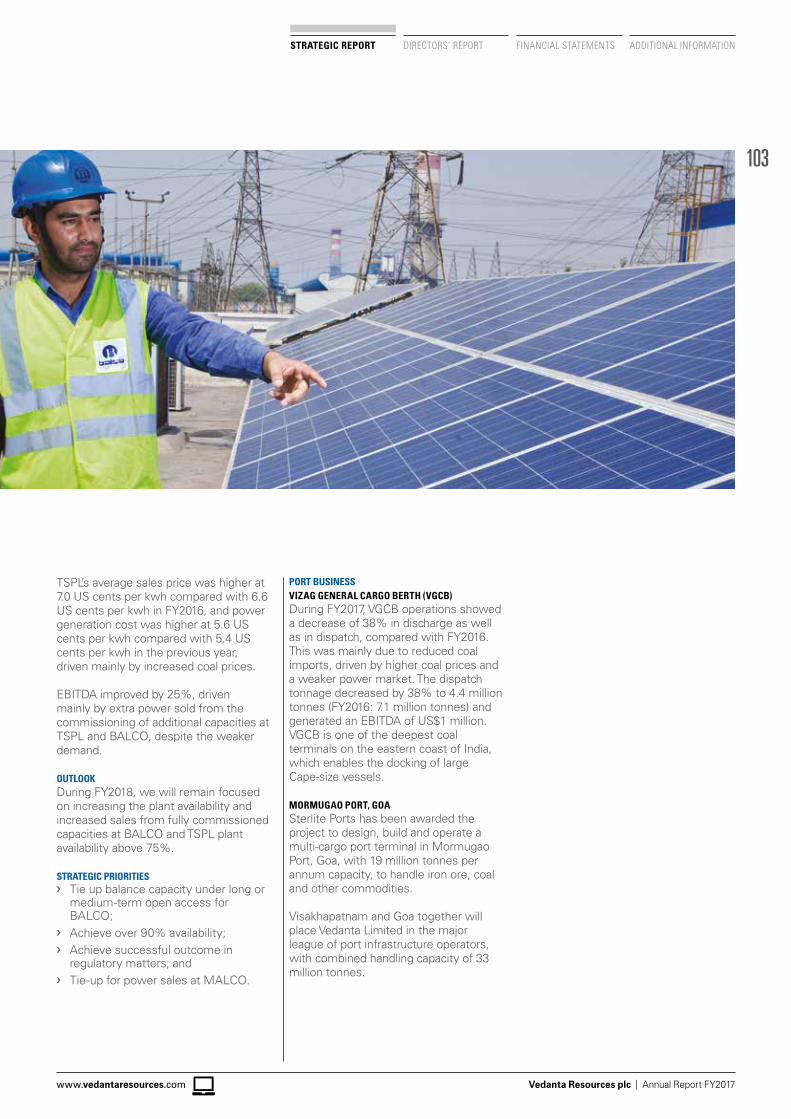
103
Vedanta Resources plc | Annual Report FY2017www.vedantaresources.com
STRATEGIC REPORT DIRECTORS’ REPORT FINANCIAL STATEMENTS ADDITIONAL INFORMATION
TSPL’s average sales price was higher at 7.0 US cents per kwh compared with 6.6 US cents per kwh in FY2016, and power generation cost was higher at 5.6 US cents per kwh compared with 5.4 US cents per kwh in the previous year, driven mainly by increased coal prices.
EBITDA improved by 25%, driven mainly by extra power sold from the commissioning of additional capacities at TSPL and BALCO, despite the weaker demand.
OUTLOOKDuring FY2018, we will remain focused on increasing the plant availability and increased sales from fully commissioned capacities at BALCO and TSPL plant availability above 75%.
STRATEGIC PRIORITIES❯› Tie up balance capacity under long or
medium-term open access for BALCO;
❯› Achieve over 90% availability;❯› Achieve successful outcome in
regulatory matters; and ❯› Tie-up for power sales at MALCO.
PORT BUSINESSVIZAG GENERAL CARGO BERTH (VGCB)During FY2017, VGCB operations showed a decrease of 38% in discharge as well as in dispatch, compared with FY2016. This was mainly due to reduced coal imports, driven by higher coal prices and a weaker power market. The dispatch tonnage decreased by 38% to 4.4 million tonnes (FY2016: 7.1 million tonnes) and generated an EBITDA of US$1 million. VGCB is one of the deepest coal terminals on the eastern coast of India, which enables the docking of large Cape-size vessels.
MORMUGAO PORT, GOA Sterlite Ports has been awarded the project to design, build and operate a multi-cargo port terminal in Mormugao Port, Goa, with 19 million tonnes per annum capacity, to handle iron ore, coal and other commodities.
Visakhapatnam and Goa together will place Vedanta Limited in the major league of port infrastructure operators, with combined handling capacity of 33 million tonnes.
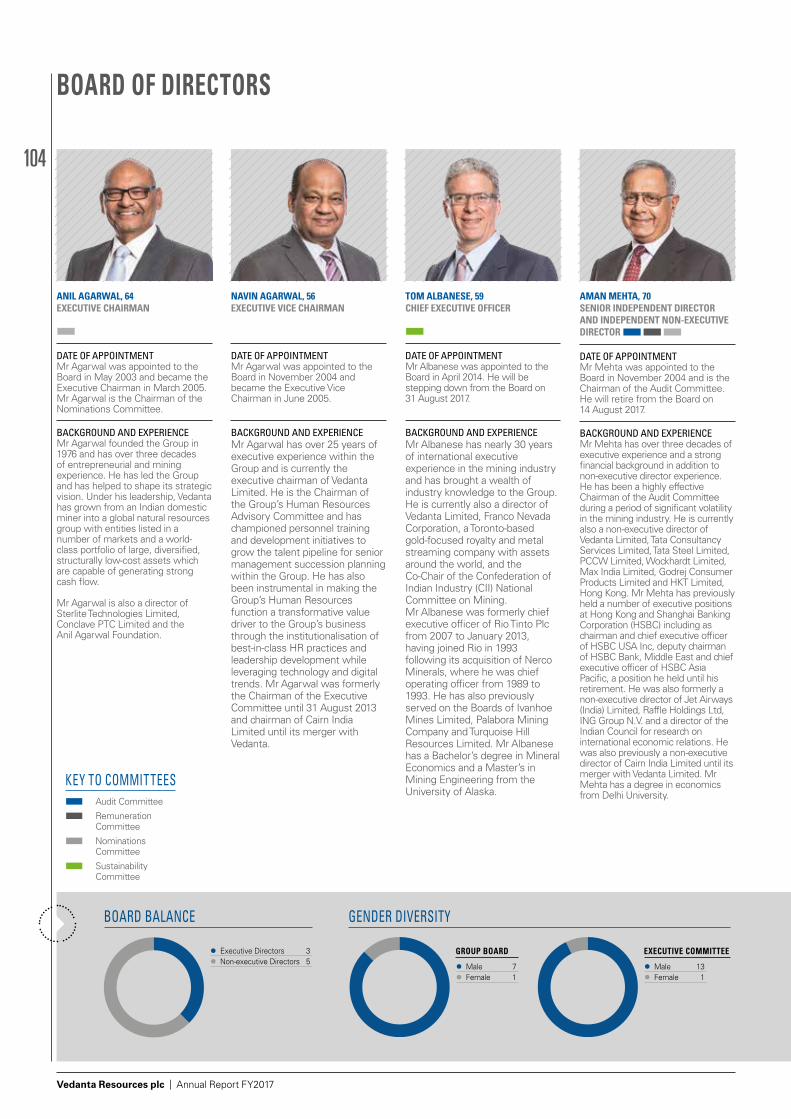
104
Vedanta Resources plc | Annual Report FY2017
Male 7 Female 1
GROUP BOARD
GENDER DIVERSITY
Male 13 Female 1
EXECUTIVE COMMITTEEl Executive Directors 3l Non-executive Directors 5
BOARD BALANCE
BOARD OF DIRECTORS
ANIL AGARWAL, 64EXECUTIVE CHAIRMAN
n
DATE OF APPOINTMENTMr Agarwal was appointed to the Board in May 2003 and became the Executive Chairman in March 2005. Mr Agarwal is the Chairman of the Nominations Committee.
BACKGROUND AND EXPERIENCEMr Agarwal founded the Group in 1976 and has over three decades of entrepreneurial and mining experience. He has led the Group and has helped to shape its strategic vision. Under his leadership, Vedanta has grown from an Indian domestic miner into a global natural resources group with entities listed in a number of markets and a world-class portfolio of large, diversified, structurally low-cost assets which are capable of generating strong cash flow.
Mr Agarwal is also a director of Sterlite Technologies Limited, Conclave PTC Limited and the Anil Agarwal Foundation.
NAVIN AGARWAL, 56EXECUTIVE VICE CHAIRMAN
DATE OF APPOINTMENTMr Agarwal was appointed to the Board in November 2004 and became the Executive Vice Chairman in June 2005.
BACKGROUND AND EXPERIENCEMr Agarwal has over 25 years of executive experience within the Group and is currently the executive chairman of Vedanta Limited. He is the Chairman of the Group’s Human Resources Advisory Committee and has championed personnel training and development initiatives to grow the talent pipeline for senior management succession planning within the Group. He has also been instrumental in making the Group’s Human Resources function a transformative value driver to the Group’s business through the institutionalisation of best-in-class HR practices and leadership development while leveraging technology and digital trends. Mr Agarwal was formerly the Chairman of the Executive Committee until 31 August 2013 and chairman of Cairn India Limited until its merger with Vedanta.
TOM ALBANESE, 59CHIEF EXECUTIVE OFFICER
n
DATE OF APPOINTMENTMr Albanese was appointed to the Board in April 2014. He will be stepping down from the Board on 31 August 2017.
BACKGROUND AND EXPERIENCEMr Albanese has nearly 30 years of international executive experience in the mining industry and has brought a wealth of industry knowledge to the Group. He is currently also a director of Vedanta Limited, Franco Nevada Corporation, a Toronto-based gold-focused royalty and metal streaming company with assets around the world, and the Co-Chair of the Confederation of Indian Industry (CII) National Committee on Mining. Mr Albanese was formerly chief executive officer of Rio Tinto Plc from 2007 to January 2013, having joined Rio in 1993 following its acquisition of Nerco Minerals, where he was chief operating officer from 1989 to 1993. He has also previously served on the Boards of Ivanhoe Mines Limited, Palabora Mining Company and Turquoise Hill Resources Limited. Mr Albanese has a Bachelor’s degree in Mineral Economics and a Master’s in Mining Engineering from the University of Alaska.
AMAN MEHTA, 70SENIOR INDEPENDENT DIRECTOR AND INDEPENDENT NON-EXECUTIVE DIRECTOR nnn
DATE OF APPOINTMENTMr Mehta was appointed to the Board in November 2004 and is the Chairman of the Audit Committee. He will retire from the Board on 14 August 2017.
BACKGROUND AND EXPERIENCEMr Mehta has over three decades of executive experience and a strong financial background in addition to non-executive director experience. He has been a highly effective Chairman of the Audit Committee during a period of significant volatility in the mining industry. He is currently also a non-executive director of Vedanta Limited, Tata Consultancy Services Limited, Tata Steel Limited, PCCW Limited, Wockhardt Limited, Max India Limited, Godrej Consumer Products Limited and HKT Limited, Hong Kong. Mr Mehta has previously held a number of executive positions at Hong Kong and Shanghai Banking Corporation (HSBC) including as chairman and chief executive officer of HSBC USA Inc, deputy chairman of HSBC Bank, Middle East and chief executive officer of HSBC Asia Pacific, a position he held until his retirement. He was also formerly a non-executive director of Jet Airways (India) Limited, Raffle Holdings Ltd, ING Group N.V. and a director of the Indian Council for research on international economic relations. He was also previously a non-executive director of Cairn India Limited until its merger with Vedanta Limited. Mr Mehta has a degree in economics from Delhi University.
KEY TO COMMITTEESn Audit Committee
n Remuneration Committee
n Nominations Committee
n Sustainability Committee
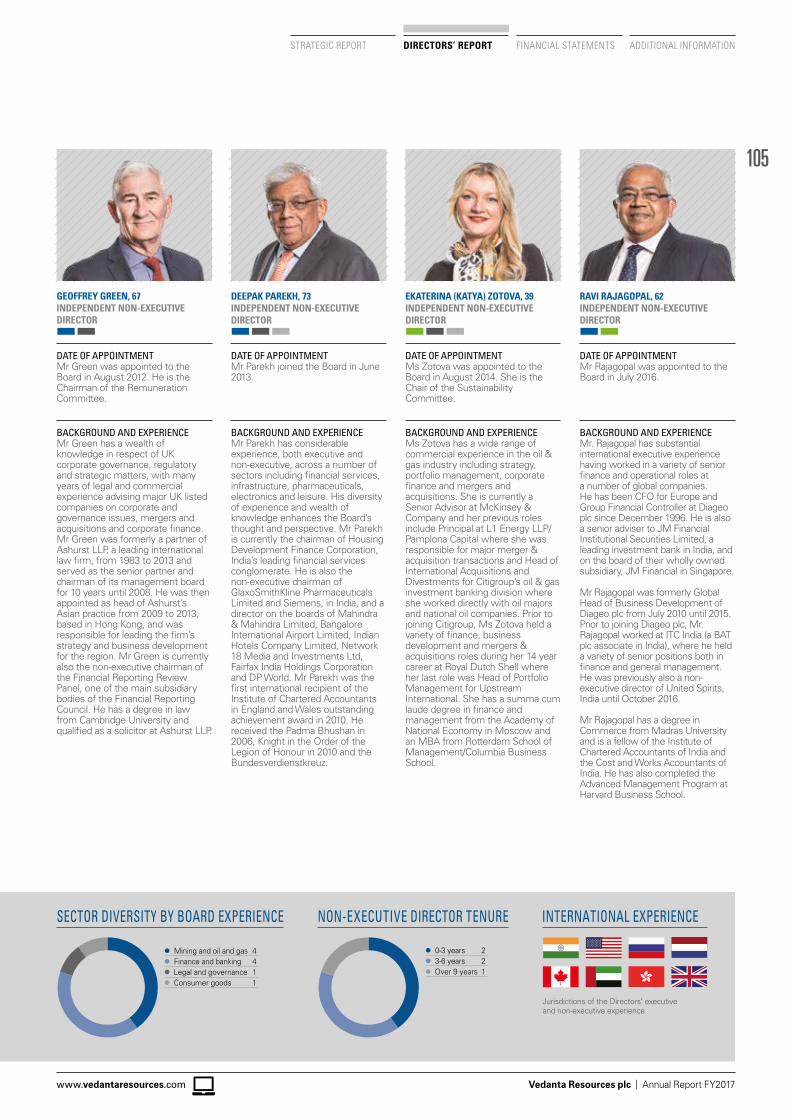
105
Vedanta Resources plc | Annual Report FY2017www.vedantaresources.com
FINANCIAL STATEMENTS ADDITIONAL INFORMATIONDIRECTORS’ REPORTSTRATEGIC REPORT
l Mining and oil and gas 4l Finance and banking 4l Legal and governance 1l Consumer goods 1
SECTOR DIVERSITY BY BOARD EXPERIENCE INTERNATIONAL EXPERIENCE
l 0-3 years 2l 3-6 years 2l Over 9 years 1
NON-EXECUTIVE DIRECTOR TENURE
GEOFFREY GREEN, 67 INDEPENDENT NON-EXECUTIVE DIRECTORnn
DATE OF APPOINTMENTMr Green was appointed to the Board in August 2012. He is the Chairman of the Remuneration Committee.
BACKGROUND AND EXPERIENCEMr Green has a wealth of knowledge in respect of UK corporate governance, regulatory and strategic matters, with many years of legal and commercial experience advising major UK listed companies on corporate and governance issues, mergers and acquisitions and corporate finance. Mr Green was formerly a partner of Ashurst LLP, a leading international law firm, from 1983 to 2013 and served as the senior partner and chairman of its management board for 10 years until 2008. He was then appointed as head of Ashurst’s Asian practice from 2009 to 2013, based in Hong Kong, and was responsible for leading the firm’s strategy and business development for the region. Mr Green is currently also the non-executive chairman of the Financial Reporting Review Panel, one of the main subsidiary bodies of the Financial Reporting Council. He has a degree in law from Cambridge University and qualified as a solicitor at Ashurst LLP.
DEEPAK PAREKH, 73INDEPENDENT NON-EXECUTIVE DIRECTORnnn
DATE OF APPOINTMENTMr Parekh joined the Board in June 2013.
BACKGROUND AND EXPERIENCEMr Parekh has considerable experience, both executive and non-executive, across a number of sectors including financial services, infrastructure, pharmaceuticals, electronics and leisure. His diversity of experience and wealth of knowledge enhances the Board’s thought and perspective. Mr Parekh is currently the chairman of Housing Development Finance Corporation, India’s leading financial services conglomerate. He is also the non-executive chairman of GlaxoSmithKline Pharmaceuticals Limited and Siemens, in India, and a director on the boards of Mahindra & Mahindra Limited, Bangalore International Airport Limited, Indian Hotels Company Limited, Network 18 Media and Investments Ltd, Fairfax India Holdings Corporation and DP World. Mr Parekh was the first international recipient of the Institute of Chartered Accountants in England and Wales outstanding achievement award in 2010. He received the Padma Bhushan in 2006, Knight in the Order of the Legion of Honour in 2010 and the Bundesverdienstkreuz.
EKATERINA (KATYA) ZOTOVA, 39INDEPENDENT NON-EXECUTIVE DIRECTORnnn
DATE OF APPOINTMENTMs Zotova was appointed to the Board in August 2014. She is the Chair of the Sustainability Committee.
BACKGROUND AND EXPERIENCEMs Zotova has a wide range of commercial experience in the oil & gas industry including strategy, portfolio management, corporate finance and mergers and acquisitions. She is currently a Senior Advisor at McKinsey & Company and her previous roles include Principal at L1 Energy LLP/ Pamplona Capital where she was responsible for major merger & acquisition transactions and Head of International Acquisitions and Divestments for Citigroup’s oil & gas investment banking division where she worked directly with oil majors and national oil companies. Prior to joining Citigroup, Ms Zotova held a variety of finance, business development and mergers & acquisitions roles during her 14 year career at Royal Dutch Shell where her last role was Head of Portfolio Management for Upstream International. She has a summa cum laude degree in finance and management from the Academy of National Economy in Moscow and an MBA from Rotterdam School of Management/Columbia Business School.
RAVI RAJAGOPAL, 62INDEPENDENT NON-EXECUTIVE DIRECTORnn
DATE OF APPOINTMENTMr Rajagopal was appointed to the Board in July 2016.
BACKGROUND AND EXPERIENCEMr. Rajagopal has substantial international executive experience having worked in a variety of senior finance and operational roles at a number of global companies. He has been CFO for Europe and Group Financial Controller at Diageo plc since December 1996. He is also a senior adviser to JM Financial Institutional Securities Limited, a leading investment bank in India, and on the board of their wholly owned subsidiary, JM Financial in Singapore.
Mr Rajagopal was formerly Global Head of Business Development of Diageo plc from July 2010 until 2015. Prior to joining Diageo plc, Mr. Rajagopal worked at ITC India (a BAT plc associate in India), where he held a variety of senior positions both in finance and general management. He was previously also a non-executive director of United Spirits, India until October 2016.
Mr Rajagopal has a degree in Commerce from Madras University and is a fellow of the Institute of Chartered Accountants of India and the Cost and Works Accountants of India. He has also completed the Advanced Management Program at Harvard Business School.
Jurisdictions of the Directors’ executive and non-executive experience
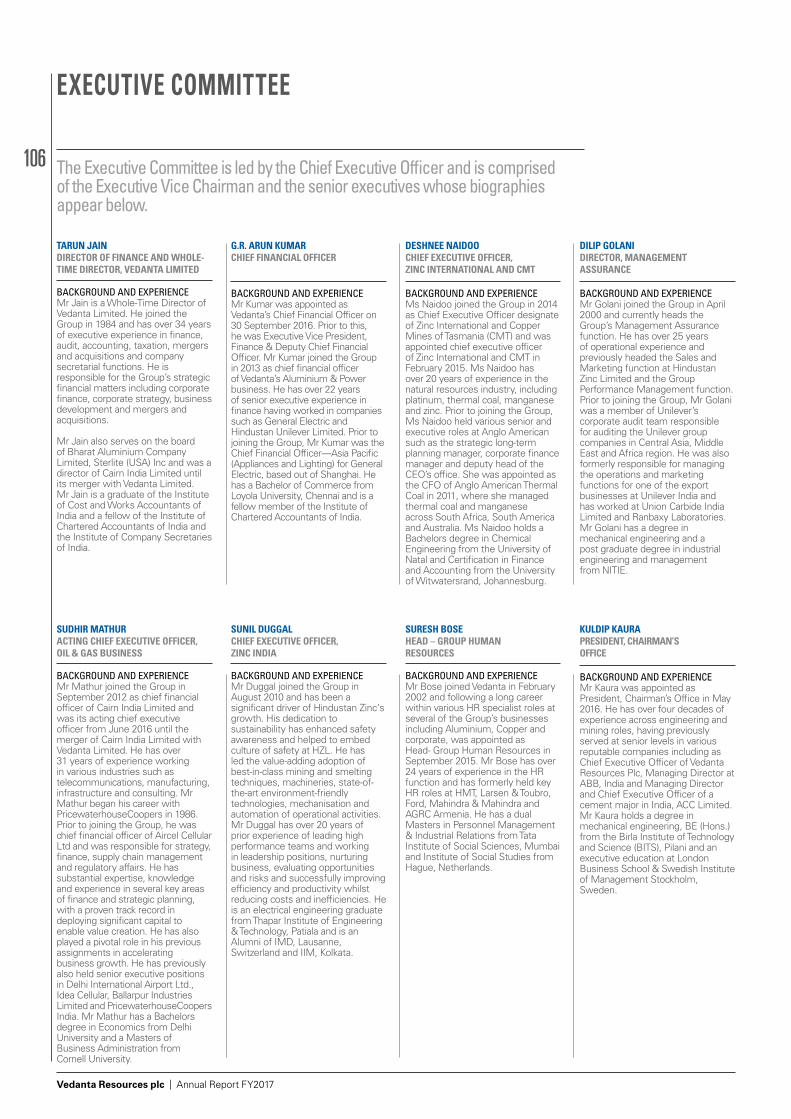
106
Vedanta Resources plc | Annual Report FY2017
SUDHIR MATHURACTING CHIEF EXECUTIVE OFFICER, OIL & GAS BUSINESS
BACKGROUND AND EXPERIENCEMr Mathur joined the Group in September 2012 as chief financial officer of Cairn India Limited and was its acting chief executive officer from June 2016 until the merger of Cairn India Limited with Vedanta Limited. He has over 31 years of experience working in various industries such as telecommunications, manufacturing, infrastructure and consulting. Mr Mathur began his career with PricewaterhouseCoopers in 1986. Prior to joining the Group, he was chief financial officer of Aircel Cellular Ltd and was responsible for strategy, finance, supply chain management and regulatory affairs. He has substantial expertise, knowledge and experience in several key areas of finance and strategic planning, with a proven track record in deploying significant capital to enable value creation. He has also played a pivotal role in his previous assignments in accelerating business growth. He has previously also held senior executive positions in Delhi International Airport Ltd., Idea Cellular, Ballarpur Industries Limited and PricewaterhouseCoopers India. Mr Mathur has a Bachelors degree in Economics from Delhi University and a Masters of Business Administration from Cornell University.
SUNIL DUGGALCHIEF EXECUTIVE OFFICER, ZINC INDIA
BACKGROUND AND EXPERIENCEMr Duggal joined the Group in August 2010 and has been a significant driver of Hindustan Zinc‘s growth. His dedication to sustainability has enhanced safety awareness and helped to embed culture of safety at HZL. He has led the value-adding adoption of best-in-class mining and smelting techniques, machineries, state-of-the-art environment-friendly technologies, mechanisation and automation of operational activities. Mr Duggal has over 20 years of prior experience of leading high performance teams and working in leadership positions, nurturing business, evaluating opportunities and risks and successfully improving efficiency and productivity whilst reducing costs and inefficiencies. He is an electrical engineering graduate from Thapar Institute of Engineering & Technology, Patiala and is an Alumni of IMD, Lausanne, Switzerland and IIM, Kolkata.
SURESH BOSEHEAD – GROUP HUMAN RESOURCES
BACKGROUND AND EXPERIENCEMr Bose joined Vedanta in February 2002 and following a long career within various HR specialist roles at several of the Group’s businesses including Aluminium, Copper and corporate, was appointed as Head- Group Human Resources in September 2015. Mr Bose has over 24 years of experience in the HR function and has formerly held key HR roles at HMT, Larsen & Toubro, Ford, Mahindra & Mahindra and AGRC Armenia. He has a dual Masters in Personnel Management & Industrial Relations from Tata Institute of Social Sciences, Mumbai and Institute of Social Studies from Hague, Netherlands.
KULDIP KAURAPRESIDENT, CHAIRMAN’S OFFICE
BACKGROUND AND EXPERIENCEMr Kaura was appointed as President, Chairman’s Office in May 2016. He has over four decades of experience across engineering and mining roles, having previously served at senior levels in various reputable companies including as Chief Executive Officer of Vedanta Resources Plc, Managing Director at ABB, India and Managing Director and Chief Executive Officer of a cement major in India, ACC Limited. Mr Kaura holds a degree in mechanical engineering, BE (Hons.) from the Birla Institute of Technology and Science (BITS), Pilani and an executive education at London Business School & Swedish Institute of Management Stockholm, Sweden.
TARUN JAIN DIRECTOR OF FINANCE AND WHOLE-TIME DIRECTOR, VEDANTA LIMITED
BACKGROUND AND EXPERIENCEMr Jain is a Whole-Time Director of Vedanta Limited. He joined the Group in 1984 and has over 34 years of executive experience in finance, audit, accounting, taxation, mergers and acquisitions and company secretarial functions. He is responsible for the Group’s strategic financial matters including corporate finance, corporate strategy, business development and mergers and acquisitions.
Mr Jain also serves on the board of Bharat Aluminium Company Limited, Sterlite (USA) Inc and was a director of Cairn India Limited until its merger with Vedanta Limited. Mr Jain is a graduate of the Institute of Cost and Works Accountants of India and a fellow of the Institute of Chartered Accountants of India and the Institute of Company Secretaries of India.
G.R. ARUN KUMARCHIEF FINANCIAL OFFICER
BACKGROUND AND EXPERIENCEMr Kumar was appointed as Vedanta’s Chief Financial Officer on 30 September 2016. Prior to this, he was Executive Vice President, Finance & Deputy Chief Financial Officer. Mr Kumar joined the Group in 2013 as chief financial officer of Vedanta’s Aluminium & Power business. He has over 22 years of senior executive experience in finance having worked in companies such as General Electric and Hindustan Unilever Limited. Prior to joining the Group, Mr Kumar was the Chief Financial Officer—Asia Pacific (Appliances and Lighting) for General Electric, based out of Shanghai. He has a Bachelor of Commerce from Loyola University, Chennai and is a fellow member of the Institute of Chartered Accountants of India.
DESHNEE NAIDOOCHIEF EXECUTIVE OFFICER, ZINC INTERNATIONAL AND CMT
BACKGROUND AND EXPERIENCEMs Naidoo joined the Group in 2014 as Chief Executive Officer designate of Zinc International and Copper Mines of Tasmania (CMT) and was appointed chief executive officer of Zinc International and CMT in February 2015. Ms Naidoo has over 20 years of experience in the natural resources industry, including platinum, thermal coal, manganese and zinc. Prior to joining the Group, Ms Naidoo held various senior and executive roles at Anglo American such as the strategic long-term planning manager, corporate finance manager and deputy head of the CEO’s office. She was appointed as the CFO of Anglo American Thermal Coal in 2011, where she managed thermal coal and manganese across South Africa, South America and Australia. Ms Naidoo holds a Bachelors degree in Chemical Engineering from the University of Natal and Certification in Finance and Accounting from the University of Witwatersrand, Johannesburg.
DILIP GOLANIDIRECTOR, MANAGEMENT ASSURANCE
BACKGROUND AND EXPERIENCEMr Golani joined the Group in April 2000 and currently heads the Group’s Management Assurance function. He has over 25 years of operational experience and previously headed the Sales and Marketing function at Hindustan Zinc Limited and the Group Performance Management function. Prior to joining the Group, Mr Golani was a member of Unilever’s corporate audit team responsible for auditing the Unilever group companies in Central Asia, Middle East and Africa region. He was also formerly responsible for managing the operations and marketing functions for one of the export businesses at Unilever India and has worked at Union Carbide India Limited and Ranbaxy Laboratories. Mr Golani has a degree in mechanical engineering and a post graduate degree in industrial engineering and management from NITIE.
EXECUTIVE COMMITTEE
The Executive Committee is led by the Chief Executive Officer and is comprised of the Executive Vice Chairman and the senior executives whose biographies appear below.
107
Vedanta Resources plc | Annual Report FY2017www.vedantaresources.com
FINANCIAL STATEMENTS ADDITIONAL INFORMATIONDIRECTORS’ REPORTSTRATEGIC REPORT
M SIDDIQIGROUP DIRECTOR, PROJECTS
BACKGROUND AND EXPERIENCEMr Siddiqi joined the Group in 1991 and having risen through various operational roles has 40 years of industry experience. He was formerly chief executive officer, Aluminium and led the setting up of the Group’s large aluminium and power projects including BALCO smelters and captive power plants. He also played a key role in setting up the Group’s copper smelter at Tuticorin and copper refinery at Silvassa. Prior to joining the Group, Mr Siddiqi held senior positions in Hindustan Copper Limited. Mr Siddiqi has a mechanical engineering degree from the Indian Institute of Technology, New Delhi and a PG Diploma in Management from AIMA, New Delhi.
PHILIP TURNERHEAD - GROUP HEALTH, SAFETY, ENVIRONMENT AND SUSTAINABILITY
BACKGROUND AND EXPERIENCEMr Turner joined the Group in September 2014 as Head of Group Health and Safety. He currently heads the Group HSE and Sustainability function. Mr Turner has over 35 years of experience within mining, heavy engineering and manufacturing organisations. He was previously General Manager Risk & Sustainability of JK Tech, a wholly-owned subsidiary of the University of Queensland. He has also previously held a number of senior corporate and operational roles at Rio Tinto in Australia, Canada and the UK including responsibility for HSE and sustainability assurance. Mr Turner has held senior roles at mining company, North Limited and at BHP Petroleum’s offshore operations. Mr Turner has a Master of Applied Science degree in Risk Engineering from Ballarat University; Bachelor of Science degree in Chemistry/Physics from Deakin University; Graduate Diploma in Occupational Hygiene from Deakin University; and Graduate Diploma in Occupational Hazard Management from Ballarat C.A.E.
RAJAGOPAL KISHORE KUMARCHIEF EXECUTIVE OFFICER, IRON ORE
BACKGROUND AND EXPERIENCEMr Kumar joined the Group in April 2003 and has over 32 years of experience covering accountancy, commerce, marketing, supply chain management, mergers and acquisitions, human capital development, business turnaround, and policy advocacy. Since his appointment as Chief Executive Officer, Iron Ore in February 2015, he has been leading the revival of the Group’s iron ore mining operations in Goa / Karnataka /Jharkhand and Liberia. He currently also leads the Group’s Port business. Mr Kumar has previously held various executive roles in the Group including Chief Executive Officer of Sterlite Copper from 2007 to 2008, Chief Executive Officer of KCM from 2008 to 2011, Chief Executive Officer of Zinc International from 2011 to 2013 and Chief Executive Officer, Africa (Base Metals) from 2013 to 2015. Prior to joining the Group, Mr Kumar worked at Hindustan Lever Limited for 12 years.
SAMIR CAIRAECHIEF EXECUTIVE OFFICER OF DIVERSIFIED METALS (INDIA)
BACKGROUND AND EXPERIENCEMr Cairae was appointed as CEO Diversified Metals in January 2016. He provides operational and strategic leadership for the Group’s Aluminium, Copper India, Power and Iron Ore divisions in addition to the commercial and asset optimization functions.
He has extensive and varied experience in a number of corporate roles in India, China, Philippines and France including strategy, M&A, industrial operations and managing industrial operations in both growth and turnaround situations. Prior to joining Vedanta, Mr Cairae headed the global industrial function for Lafarge’s 150 cement operations in over 45 countries. He has previously also held various senior leadership positions at Lafarge and Schlumberger. He holds a graduate degree in Electrical Engineering from Indian Institute of Technology (IIT), Kanpur, and a Masters in Management from the Hautes Etudes Commerciales (HEC) School of Management, Paris.
108
Vedanta Resources plc | Annual Report FY2017
CORPORATE GOVERNANCE REPORTINTRODUCTION FROM THE CHAIRMAN
Dear fellow shareholder,
I am pleased to introduce Vedanta’s Corporate Governance Report, which explains the Group’s governance during the year. It covers the principal activities of the Board and its Committees, major areas of the Board’s stewardship and governance actions and how we have complied with the principles of the September 2014 edition of the UK Corporate Governance Code which applied to the Company for the financial year ended 31 March 2017.
We have matched the format of this report to the sections of the Code namely Leadership, Effectiveness, Accountability and Relations with Shareholders, in order to provide a clear description of the work we have undertaken, our approach to ensuring good governance throughout the Group and compliance with the relevant provisions of the Code.
CULTUREThe Board’s position is that good corporate governance is essential for delivering sustainable growth and protecting shareholder value and it therefore underpins the delivery of our strategic objectives. Similarly, corporate culture and values of the Group are key. As a Board, we recognise that the correct tone needs to be set from the top to ensure that good standards of behaviour permeate across all levels within the Group. Our values of Trust, Entrepreneurship, Innovation, Excellence, Integrity, Respect and Care are becoming increasingly embedded across all our businesses and drive our business model and strategy.
The Board fosters an innovative culture and encourages all employees to embrace digital technology to drive innovation. During the year, we launched our Innovation and Technology online forum, ‘Eureka - Waste to Value’ to encourage an innovative culture and augment innovative practices and technology. The ‘Chairman’s Business Award’ further enhances the competitive motivational
culture in the Group and drives improved performance across sustainability, management practices, and quality improvement initiatives. We have also launched the ‘One Vedanta’ Group intranet. This enables effective engagement and communication with employees throughout the Group and provides a forum for management to share information, ideas and opportunities quickly.
Our entrepreneurial and innovative culture has helped Vedanta to emerge stronger and more resilient following a challenging period of volatile commodity markets and the Group is making progress on its strategic priorities to simplify the Group’s structure, deleverage the business and ramp up production in a sustainable manner.
Read more on pages 6–61.
TALENT DEVELOPMENT AND EMPLOYEE ENGAGEMENTOur people are our biggest asset and this is reflected in our values. We are committed to making Human Resources a transformative, value driver by capitalising the immense and diverse talent pool across our businesses. We continue to invest in the development of our employees through initiatives such as the Internal Growth Workshops across each of the Group’s business and functional pillars and the V-Connect mentorship programme. These initiatives provide a forum for identifying and developing leadership potential from within the Group and foster ideas generation, innovation and help to create an engaged workforce.
Vedanta strives to be an ‘employer of choice’ and has introduced a number of progressive employee policies across our businesses in India, which have been benchmarked with the best both within and outside our industry in India. Vedanta’s HR policies and practices have contributed to the Group receiving a number of commendations such as inclusion in the list of ‘Top companies to work for in Asia’ at the Asia Corporate Excellence and Sustainability Awards 2016 and ‘100 Best Companies for Women in India’.
STRATEGY AND GROWTHIn October 2016, the Company held a Leadership conference which was focused on the growth and evolution of Vedanta where each of the Group’s businesses presented blueprints for the growth of their world class assets in line with the Group’s strategy.
DIVERSITYWe remain committed to achieving the voluntary target of at least 33% female representation on the Board by 2020 while ensuring that all appointments are made on merit to achieve the appropriate balance of skills and experience on the Board. We are also focused on enhancing gender diversity in management by developing the female talent pipeline through inclusion of our high calibre female employees in the Internal Growth workshops. While the representation of women on the Board has not changed during the year, there were a number of appointments and progressions of women in senior management positions,
109
Vedanta Resources plc | Annual Report FY2017www.vedantaresources.com
FINANCIAL STATEMENTS ADDITIONAL INFORMATIONDIRECTORS’ REPORTSTRATEGIC REPORT
For more on Relations with Shareholders see page 122
Governance at Vedanta is an important element of our Board environment. It feeds into how we do business and how we serve our stakeholders. It therefore needs to be authentic and meaningful.
We have used the key themes of the UK Corporate Governance Code as the framework for articulating the Board’s activities during the year:
LEADERSHIP
EFFECTIVENESS
ACCOUNTABILITY
RELATIONS WITH SHAREHOLDERS
For more on leadership see pages 111–115
For more on accountability see pages 120–121
For more on effectiveness see pages 116–119
including Ms Deshnee Naidoo to the Executive Committee, appointment of the deputy chief financial officer of Hindustan Zinc Limited and the appointment of the company secretary of Vedanta Limited.
BOARD AND COMMITTEE COMPOSITIONAs Chairman, I am responsible for leading the Company’s Board of Directors and ensuring that it has the optimum balance of skills, experience and knowledge to operate effectively and deliver long-term value for shareholders. During the year, succession planning was a priority for both executive and non-executive positions on the Board. As the Chairman of the Company’s Nominations Committee, I am leading the search for suitable candidates to succeed Tom Albanese, who will be stepping down as the Company’s Chief Executive Officer on 31 August 2017. Details of a successor to the Chief Executive Officer will be announced in due course. In addition, the Company’s Senior Independent Director, Aman Mehta, will be retiring from the Board following the conclusion of the Company’s 2017 Annual General Meeting and we have been focused on refreshing the composition of the Board. I would like to thank both Tom and Aman for their significant contributions to the Board and the Company. Mr Ravi Rajagopal was appointed to the Board in July 2016 and will succeed Mr Mehta as the Chairman of the Audit Committee following Mr Mehta’s retirement from the Board. Mr Deepak Parekh will succeed Mr Mehta as the Company’s Senior Independent Director with effect from the conclusion of the 2017 Annual General Meeting.
The Nominations Committee has been mindful of the recent changes to the Code in respect of the requirement for audit committees as a whole to have competence relevant to the sector in which the Company operates in and accordingly this was a key criterion in the Board recruitment specification.
Following a comprehensive search facilitated by an independent board recruitment agency, RGF Executive Search, Mr Edward Story was appointed to the Board as a Non-Executive Director of the Company and a member of the Audit Committee with effect from 1 June 2017. Mr Story brings extensive strategic and operational expertise in the natural resources sector to the Board. He is currently the chief executive officer of SOCO International PLC, an oil & gas exploration and production company.
SENIOR MANAGEMENT SUCCESSION PLANNINGMr Akhilesh Joshi, our former President, Global Zinc business and director of Hindustan Zinc Limited retired from the Group on 30 September 2016 after 30 years of distinguished service. The senior management structure was reviewed in light of this to ensure ongoing stability of Vedanta’s zinc business. Mr Sunil Duggal is responsible for Hindustan Zinc Limited and Ms Deshnee Naidoo is responsible for Zinc International. On 1 October 2016, Mr Arun Kumar took over as the Group Chief Financial Officer from Mr DD Jalan following his retirement on 30 September 2016 after a long career at Vedanta. I would like to thank Mr Joshi and Mr Jalan for their dedicated service.
SUSTAINABILITY AND SAFETYSafety and the goal of zero harm remains a top priority for the Board and senior management. We have conducted a number of employee townhalls on safety and held ‘Being Safe’ safety interactive workshops to embed safety consciousness throughout the Group. While we have made progress and achieved our best safety performance to date, it is immensely regrettable that there were seven fatalities during the year. We are developing further safety protocols having learned from these incidents.
Read more on pages 16 to 103.
BOARD EFFECTIVENESS AND EVALUATIONThis year we conducted an external formal evaluation of the Board’s effectiveness facilitated by Prism Board Room and I am pleased to confirm that we have a capable and effective functioning Board.
Read more on pages 118–119.
Yours sincerely,
Anil AgarwalExecutive Chairman23 May 2017
110
Vedanta Resources plc | Annual Report FY2017
CORPORATE GOVERNANCE REPORT CONTINUED
STATEMENT OF COMPLIANCE WITH THE UK CORPORATE GOVERNANCE CODE
The Corporate Governance Report set out below describes Vedanta’s governance structure, policies and practices and highlights how the Company has applied the main principles of the September 2014 edition of the UK Corporate Governance Code (the Code) for the year ended 31 March 2017. Further details of how the Company has applied the provisions of the Code are also contained in the reports of each Board Committee and the Directors’ Remuneration Report. Disclosures on share capital and related matters as required by the Disclosure and Transparency Rules (DTR 7.2.6) may be found in the Directors’ Report on pages 148 to 154. A copy of the Code is available at www.frc.org.uk.
STATEMENT OF COMPLIANCE WITH THE CODEIt is the Board’s view that the Company has, throughout the financial year ended 31 March 2017, fully complied with all the provisions of the Code, with the exception of the following:
CODE PROVISION A.3.1Mr Anil Agarwal was appointed as Executive Chairman in 2005. Mr Agarwal is the founder of the Group and has steered its growth since its inception in 1976 including the flotation of Vedanta Resources plc on the London Stock Exchange. This meant that Mr Agarwal did not meet the independence criteria as defined in the Code on his appointment in 2005 because he was previously the Chief Executive and, through Volcan Investments Limited (Volcan), members of his family have a controlling interest in the Company. Mr Agarwal is pivotal in helping to achieve the strategic objectives of Vedanta through his skills in seeking out value creating acquisitions and projects. In addition, the fact that he dedicates himself full time to his role of Executive Chairman enables him to balance his executive duties with providing leadership to the Board. As Executive Chairman Mr Agarwal encourages debate and challenge and sets high ethical standards. For these reasons the Board is unanimously of the opinion that his continued involvement in an executive capacity is important to the success of the Group.
CODE PROVISION B.1.1Mr Aman Mehta, a Non-Executive Director, has served on the Company’s Board for over twelve years and was also a non-executive director of Cairn India Limited until its merger with Vedanta Limited. He was appointed as a non-executive director of Vedanta Limited on 17 May 2017. The Board was mindful of the potential for his independence to become compromised and carefully reviewed his independence and potential for conflicts of interest. Mr Mehta did not have any business relationship with the Group other than his directorship at Cairn India (until its merger with Vedanta Limited), Vedanta Limited and Vedanta Resources plc. As he absents himself from discussions in the event of any conflict of interest but otherwise continues to actively participate in Board discussions and provides robust challenge to management, the Board remains satisfied that his independent judgement was not compromised and determined him to be independent. Mr Mehta will be retiring from the Board following the conclusion of the Company’s 2017 Annual General Meeting.
CODE PROVISION B.2.1Volcan Investments Limited (Volcan) is a controlling shareholder as per the definition under the UK Listing Rules and has an agreement with the Company to safeguard the independence provisions as set out in the UK Listing Rules (Relationship Agreement). Under the terms of the Relationship Agreement, Volcan will be consulted on all appointments to the Board. The Nominations Committee therefore works collaboratively with Volcan when making appointments to the Board and, to this extent, differs from the process set out in Code Provision B.2.1 which stipulates that the Nominations Committee should lead the process for Board appointments.
CODE PROVISION E.2.4The Notice of General Meeting in respect of the all-share merger of Vedanta Limited and Cairn India Limited was posted to the Company’s shareholders on 19 August 2016 following the approval of the related Circular and Notice of General Meeting by the UK Listing Authority on 19 August 2016. Vedanta did not meet the requirement of the Code to send Notices of General Meetings to shareholders at least 14 working days in advance of the meeting because the Company required its shareholders to vote on the transaction prior to the Court convened meeting of the equity shareholders of Vedanta Limited on 8 September 2016 and Cairn India Limited on 12 September 2016. Notice of General Meeting was given to shareholders 14 clear days before the meeting in accordance with the provisions of the Companies Act 2006 and the resolution which was approved by shareholders at the Company’s 2016 Annual General Meeting permitting the calling of general meetings at short notice.
The Board is satisfied that the above deviations from the provisions of the Code are not detrimental to the Company’s governance for the reasons highlighted and that good governance remains an intrinsic part of the Group’s culture and operations.
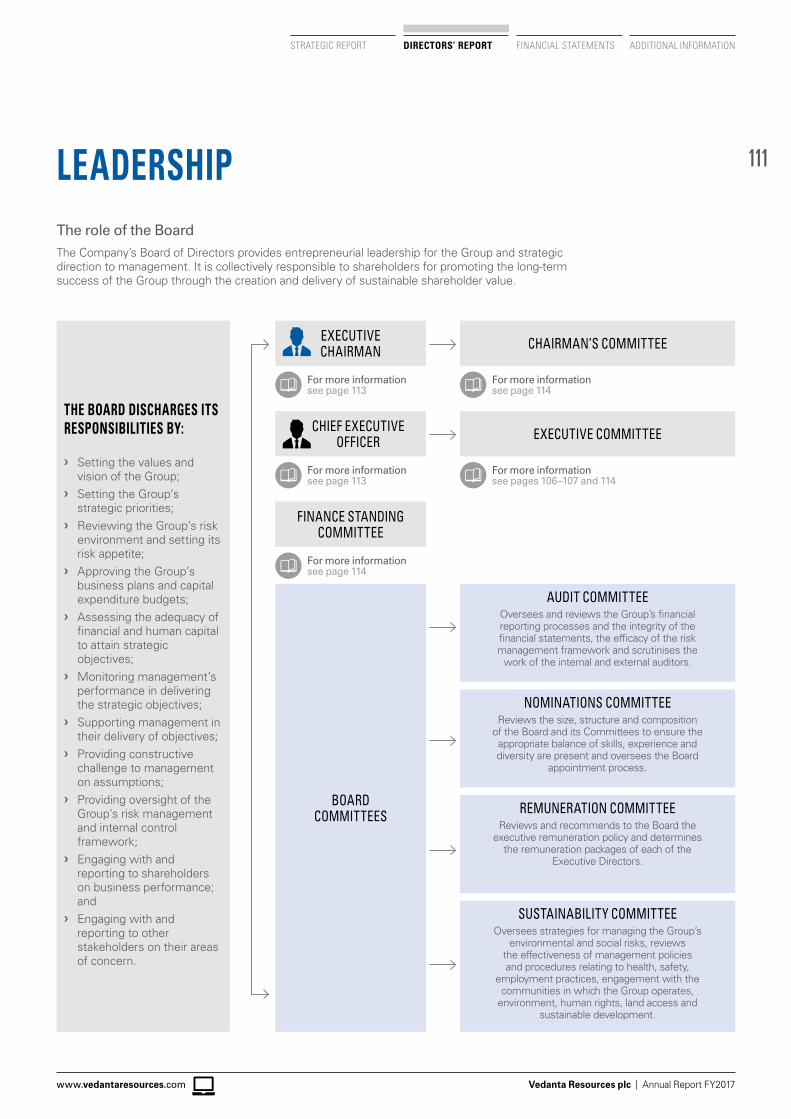
111
Vedanta Resources plc | Annual Report FY2017www.vedantaresources.com
FINANCIAL STATEMENTS ADDITIONAL INFORMATIONDIRECTORS’ REPORTSTRATEGIC REPORT
EXECUTIVE CHAIRMAN
AUDIT COMMITTEEOversees and reviews the Group’s financial reporting processes and the integrity of the financial statements, the efficacy of the risk management framework and scrutinises the
work of the internal and external auditors.
NOMINATIONS COMMITTEEReviews the size, structure and composition
of the Board and its Committees to ensure the appropriate balance of skills, experience and diversity are present and oversees the Board
appointment process.
REMUNERATION COMMITTEEReviews and recommends to the Board the
executive remuneration policy and determines the remuneration packages of each of the
Executive Directors.
SUSTAINABILITY COMMITTEEOversees strategies for managing the Group’s
environmental and social risks, reviews the effectiveness of management policies and procedures relating to health, safety,
employment practices, engagement with the communities in which the Group operates,
environment, human rights, land access and sustainable development.
CHAIRMAN’S COMMITTEE
EXECUTIVE COMMITTEECHIEF EXECUTIVE OFFICER
FINANCE STANDING COMMITTEE
BOARD COMMITTEES
For more information see page 113
For more information see page 114
For more information see pages 106–107 and 114
For more information see page 113
For more information see page 114
The role of the BoardThe Company’s Board of Directors provides entrepreneurial leadership for the Group and strategic direction to management. It is collectively responsible to shareholders for promoting the long-term success of the Group through the creation and delivery of sustainable shareholder value.
LEADERSHIP
THE BOARD DISCHARGES ITS RESPONSIBILITIES BY:
❯ Setting the values and vision of the Group;
❯ Setting the Group’s strategic priorities;
❯ Reviewing the Group’s risk environment and setting its risk appetite;
❯ Approving the Group’s business plans and capital expenditure budgets;
❯ Assessing the adequacy of financial and human capital to attain strategic objectives;
❯ Monitoring management’s performance in delivering the strategic objectives;
❯ Supporting management in their delivery of objectives;
❯ Providing constructive challenge to management on assumptions;
❯ Providing oversight of the Group’s risk management and internal control framework;
❯ Engaging with and reporting to shareholders on business performance; and
❯ Engaging with and reporting to other stakeholders on their areas of concern.
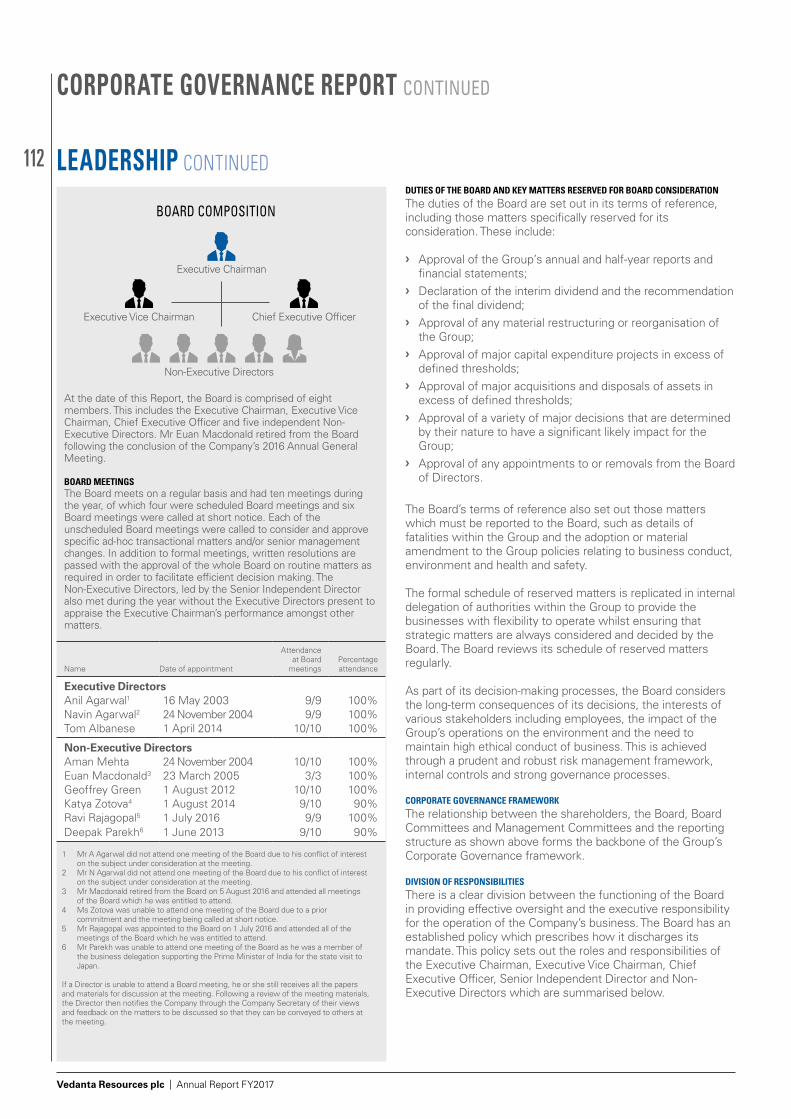
112
Vedanta Resources plc | Annual Report FY2017
Executive Chairman
Executive Vice Chairman Chief Executive Officer
Non-Executive Directors
BOARD COMPOSITION
DUTIES OF THE BOARD AND KEY MATTERS RESERVED FOR BOARD CONSIDERATIONThe duties of the Board are set out in its terms of reference, including those matters specifically reserved for its consideration. These include:
❯ Approval of the Group’s annual and half-year reports and financial statements;
❯ Declaration of the interim dividend and the recommendation of the final dividend;
❯ Approval of any material restructuring or reorganisation of the Group;
❯ Approval of major capital expenditure projects in excess of defined thresholds;
❯ Approval of major acquisitions and disposals of assets in excess of defined thresholds;
❯ Approval of a variety of major decisions that are determined by their nature to have a significant likely impact for the Group;
❯ Approval of any appointments to or removals from the Board of Directors.
The Board’s terms of reference also set out those matters which must be reported to the Board, such as details of fatalities within the Group and the adoption or material amendment to the Group policies relating to business conduct, environment and health and safety.
The formal schedule of reserved matters is replicated in internal delegation of authorities within the Group to provide the businesses with flexibility to operate whilst ensuring that strategic matters are always considered and decided by the Board. The Board reviews its schedule of reserved matters regularly.
As part of its decision-making processes, the Board considers the long-term consequences of its decisions, the interests of various stakeholders including employees, the impact of the Group’s operations on the environment and the need to maintain high ethical conduct of business. This is achieved through a prudent and robust risk management framework, internal controls and strong governance processes.
CORPORATE GOVERNANCE FRAMEWORKThe relationship between the shareholders, the Board, Board Committees and Management Committees and the reporting structure as shown above forms the backbone of the Group’s Corporate Governance framework.
DIVISION OF RESPONSIBILITIESThere is a clear division between the functioning of the Board in providing effective oversight and the executive responsibility for the operation of the Company’s business. The Board has an established policy which prescribes how it discharges its mandate. This policy sets out the roles and responsibilities of the Executive Chairman, Executive Vice Chairman, Chief Executive Officer, Senior Independent Director and Non-Executive Directors which are summarised below.
LEADERSHIP CONTINUED
At the date of this Report, the Board is comprised of eight members. This includes the Executive Chairman, Executive Vice Chairman, Chief Executive Officer and five independent Non-Executive Directors. Mr Euan Macdonald retired from the Board following the conclusion of the Company’s 2016 Annual General Meeting.
BOARD MEETINGSThe Board meets on a regular basis and had ten meetings during the year, of which four were scheduled Board meetings and six Board meetings were called at short notice. Each of the unscheduled Board meetings were called to consider and approve specific ad-hoc transactional matters and/or senior management changes. In addition to formal meetings, written resolutions are passed with the approval of the whole Board on routine matters as required in order to facilitate efficient decision making. The Non-Executive Directors, led by the Senior Independent Director also met during the year without the Executive Directors present to appraise the Executive Chairman’s performance amongst other matters.
Name Date of appointment
Attendance at Board
meetingsPercentage attendance
Executive DirectorsAnil Agarwal1 16 May 2003 9/9 100%Navin Agarwal2 24 November 2004 9/9 100%Tom Albanese 1 April 2014 10/10 100%
Non-Executive DirectorsAman Mehta 24 November 2004 10/10 100%Euan Macdonald3 23 March 2005 3/3 100%Geoffrey Green 1 August 2012 10/10 100%Katya Zotova4 1 August 2014 9/10 90%Ravi Rajagopal5 1 July 2016 9/9 100%Deepak Parekh6 1 June 2013 9/10 90%
1 Mr A Agarwal did not attend one meeting of the Board due to his conflict of interest on the subject under consideration at the meeting.
2 Mr N Agarwal did not attend one meeting of the Board due to his conflict of interest on the subject under consideration at the meeting.
3 Mr Macdonald retired from the Board on 5 August 2016 and attended all meetings of the Board which he was entitled to attend.
4 Ms Zotova was unable to attend one meeting of the Board due to a prior commitment and the meeting being called at short notice.
5 Mr Rajagopal was appointed to the Board on 1 July 2016 and attended all of the meetings of the Board which he was entitled to attend.
6 Mr Parekh was unable to attend one meeting of the Board as he was a member of the business delegation supporting the Prime Minister of India for the state visit to Japan.
If a Director is unable to attend a Board meeting, he or she still receives all the papers and materials for discussion at the meeting. Following a review of the meeting materials, the Director then notifies the Company through the Company Secretary of their views and feedback on the matters to be discussed so that they can be conveyed to others at the meeting.
CORPORATE GOVERNANCE REPORT CONTINUED
113
Vedanta Resources plc | Annual Report FY2017www.vedantaresources.com
FINANCIAL STATEMENTS ADDITIONAL INFORMATIONDIRECTORS’ REPORTSTRATEGIC REPORT
THE ROLE OF THE EXECUTIVE CHAIRMANThe Executive Chairman is responsible for:
❯ Leading the Board and ensuring that it has the resources required to function effectively;
❯ Developing succession plans for Board appointments for approval by the Board;
❯ Helping to identify strategic priorities to enhance shareholder value;
❯ Formulating strategic plans for the Board’s consideration and approval;
❯ Identifying new business opportunities in line with the strategic plans approved by the Board;
❯ Engaging with the Company’s shareholders and other stakeholders such as governments, communities and employees to ensure that an appropriate balance is maintained between the various interests;
❯ Providing leadership to the senior management team; ❯ Upholding the highest standards of integrity, probity and
governance at Board level and throughout the Group; ❯ Facilitating active engagement by all Directors and fostering
an environment in which Non-Executive Directors can freely provide constructive challenge;
❯ Evaluating the performance of the Board, Board Committees and individual Directors and acting on the results of such evaluation;
❯ Reviewing the training needs of the Directors for the fulfilment of their duties; and
❯ Ensuring that new Directors participate in a full, formal and tailored induction programme.
THE ROLE OF THE CHIEF EXECUTIVE OFFICER The Chief Executive Officer is responsible for:
❯ Ensuring effective implementation of Board decisions; ❯ Developing operational business plans for the Board’s
approval; ❯ Providing leadership to the senior management team for the
delivery of the Group’s operational business plans following Board approval;
❯ Providing oversight and management of all of the Group’s operations, business activities and performance including environmental, social, governance, health and safety, sustainability, investor relations and external communications;
❯ Managing the Group’s risk profile in line with the risk appetite set by the Board;
❯ Ensuring that prudent and robust risk management and internal control systems are in place throughout the Group;
❯ Recommending annual budgets to the Board for approval; ❯ Making recommendations to the Remuneration Committee
on remuneration policy and executive remuneration; ❯ Supporting the Executive Chairman in maintaining effective
communications with various stakeholders; ❯ Maintaining a close working relationship with the Chairman;
and ❯ Leading the Executive Committee.
THE ROLE OF THE EXECUTIVE VICE CHAIRMANThe Executive Vice Chairman is responsible for:
❯ Supporting the Executive Chairman in his leadership of the Board and ensuring that the Board functions effectively;
❯ Supporting the Executive Chairman in identifying new business opportunities;
❯ Supporting the development of the Group’s oil & gas strategy;
❯ Supporting the development of the Group’s corporate structure to greater align strategic priorities and enhance shareholder value;
❯ Strengthening the Group’s HR and internal talent development function as a driver to unlock and enhance shareholder value;
❯ Providing oversight of the development of top talent throughout the Group; and
❯ Strengthening the Group’s procurement capability and focusing management attention on critical areas.
THE ROLE OF THE SENIOR INDEPENDENT DIRECTOR The Senior Independent Director plays a key role on the Board. He is responsible for:
❯ Acting as a sounding board for the Executive Chairman; ❯ Serving as an intermediary between the Company’s
Executive and Non-Executive Directors; ❯ Acting as an intermediary for shareholders who wish to
raise concerns that they have been unable to resolve through the normal channels of communication;
❯ Acting as a sounding board for the Executive Chairman and serving as an intermediary for the Non-Executive Directors where necessary;
❯ Meeting with the Non-Executive Directors at least once a year to appraise the Executive Chairman’s performance and on such other occasions as are deemed appropriate; and
❯ Meeting with a range of shareholders when requested, to develop a better understanding of their issues and concerns and reporting the outcomes of such meetings at subsequent Board meetings.
NON-EXECUTIVE DIRECTORSThe Non-Executive Directors are responsible for helping to develop the Company’s strategy and providing rigorous, objective and constructive challenge to create accountability and drive performance. Collectively, the current Non-Executive Directors have the appropriate balance of expertise and independent judgement, together with a good understanding of the Group’s risk environment to enable them to provide effective oversight in the context of uncertainty and volatile markets.
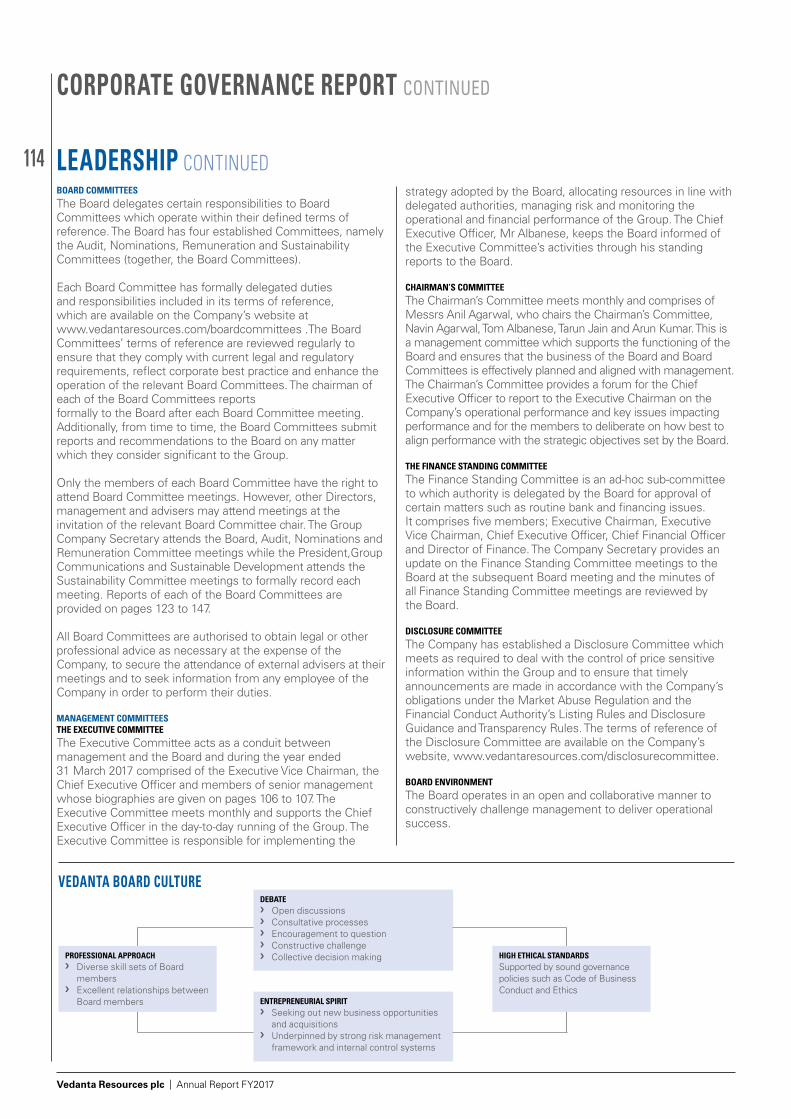
114
Vedanta Resources plc | Annual Report FY2017
LEADERSHIP CONTINUED
CORPORATE GOVERNANCE REPORT CONTINUED
BOARD COMMITTEESThe Board delegates certain responsibilities to Board Committees which operate within their defined terms of reference. The Board has four established Committees, namely the Audit, Nominations, Remuneration and Sustainability Committees (together, the Board Committees).
Each Board Committee has formally delegated duties and responsibilities included in its terms of reference, which are available on the Company’s website at www.vedantaresources.com/boardcommittees .The Board Committees’ terms of reference are reviewed regularly to ensure that they comply with current legal and regulatory requirements, reflect corporate best practice and enhance the operation of the relevant Board Committees. The chairman of each of the Board Committees reports formally to the Board after each Board Committee meeting. Additionally, from time to time, the Board Committees submit reports and recommendations to the Board on any matter which they consider significant to the Group.
Only the members of each Board Committee have the right to attend Board Committee meetings. However, other Directors, management and advisers may attend meetings at the invitation of the relevant Board Committee chair. The Group Company Secretary attends the Board, Audit, Nominations and Remuneration Committee meetings while the President,Group Communications and Sustainable Development attends the Sustainability Committee meetings to formally record each meeting. Reports of each of the Board Committees are provided on pages 123 to 147.
All Board Committees are authorised to obtain legal or other professional advice as necessary at the expense of the Company, to secure the attendance of external advisers at their meetings and to seek information from any employee of the Company in order to perform their duties.
MANAGEMENT COMMITTEESTHE EXECUTIVE COMMITTEEThe Executive Committee acts as a conduit between management and the Board and during the year ended 31 March 2017 comprised of the Executive Vice Chairman, the Chief Executive Officer and members of senior management whose biographies are given on pages 106 to 107. The Executive Committee meets monthly and supports the Chief Executive Officer in the day-to-day running of the Group. The Executive Committee is responsible for implementing the
strategy adopted by the Board, allocating resources in line with delegated authorities, managing risk and monitoring the operational and financial performance of the Group. The Chief Executive Officer, Mr Albanese, keeps the Board informed of the Executive Committee’s activities through his standing reports to the Board.
CHAIRMAN’S COMMITTEEThe Chairman’s Committee meets monthly and comprises of Messrs Anil Agarwal, who chairs the Chairman’s Committee, Navin Agarwal, Tom Albanese, Tarun Jain and Arun Kumar. This is a management committee which supports the functioning of the Board and ensures that the business of the Board and Board Committees is effectively planned and aligned with management. The Chairman’s Committee provides a forum for the Chief Executive Officer to report to the Executive Chairman on the Company’s operational performance and key issues impacting performance and for the members to deliberate on how best to align performance with the strategic objectives set by the Board.
THE FINANCE STANDING COMMITTEEThe Finance Standing Committee is an ad-hoc sub-committee to which authority is delegated by the Board for approval of certain matters such as routine bank and financing issues. It comprises five members; Executive Chairman, Executive Vice Chairman, Chief Executive Officer, Chief Financial Officer and Director of Finance. The Company Secretary provides an update on the Finance Standing Committee meetings to the Board at the subsequent Board meeting and the minutes of all Finance Standing Committee meetings are reviewed by the Board.
DISCLOSURE COMMITTEEThe Company has established a Disclosure Committee which meets as required to deal with the control of price sensitive information within the Group and to ensure that timely announcements are made in accordance with the Company’s obligations under the Market Abuse Regulation and the Financial Conduct Authority’s Listing Rules and Disclosure Guidance and Transparency Rules. The terms of reference of the Disclosure Committee are available on the Company’s website, www.vedantaresources.com/disclosurecommittee.
BOARD ENVIRONMENTThe Board operates in an open and collaborative manner to constructively challenge management to deliver operational success.
DEBATE ❯ Open discussions ❯ Consultative processes ❯ Encouragement to question ❯ Constructive challenge ❯ Collective decision making
ENTREPRENEURIAL SPIRIT ❯ Seeking out new business opportunities
and acquisitions ❯ Underpinned by strong risk management
framework and internal control systems
VEDANTA BOARD CULTURE
PROFESSIONAL APPROACH ❯ Diverse skill sets of Board
members ❯ Excellent relationships between
Board members
HIGH ETHICAL STANDARDSSupported by sound governance policies such as Code of Business Conduct and Ethics
115
Vedanta Resources plc | Annual Report FY2017www.vedantaresources.com
FINANCIAL STATEMENTS ADDITIONAL INFORMATIONDIRECTORS’ REPORTSTRATEGIC REPORT
SCHEDULED BOARD MEETINGS
MAY 2016 ❯ Review of the Group’s operational performance across
its businesses, including safety performance; ❯ Review of the financial performance of the Group; ❯ Review of the Business Plan 2017; ❯ Liability management update; ❯ Board Committee updates; ❯ Review of the Group’s internal risk management and
internal control framework; ❯ Approval of the Company’s Annual Report and Accounts
FY2016; ❯ Declaration of the Company’s 2016 final dividend; ❯ Review of regular feedback from investors and other
stakeholders through investor relations updates; ❯ Review of the Group’s progress on compliance with the
Modern Slavery Act; ❯ Convened the Company 2016 Annual General Meeting
and approved the business to be considered at the meeting;
❯ Review of the outcome of the Board evaluation and effectiveness review and agreed appropriate actions;
❯ Appointment of new Non-Executive Director; ❯ Approval of a Corporate Guarantee; and ❯ Received updates from each of the Board Committees;
AUGUST 2016 ❯ Review of the Group’s operational performance across its
businesses, including safety performance; ❯ Review of the financial performance of the Group; ❯ Approval of the updated Business Plan 2017; ❯ Annual General Meeting arrangements; ❯ Received updates from each of the Board Committees;
and ❯ Received updates on implementation of procedures for
compliance with the Modern Slavery Act.
NOVEMBER 2016 ❯ Review of the Group’s operational performance across its
businesses, including safety performance; ❯ Review of the financial performance of the Group; ❯ Approval of the Company’s Interim Report and Accounts
2017; ❯ Approval of the 2017 interim dividend; ❯ Review of Group Treasury management; ❯ Review of regular feedback from investors and other
stakeholders through investor relations updates;
❯ Received updates from each of the Board Committees; ❯ Received governance updates on regulatory matters such
as The UK Listing Authority Related Party rules and EU Market Abuse Regulation; and
❯ Review of recent tax litigation of significant impact to the Group.
MARCH 2017 ❯ Review of the Group’s operational performance across its
businesses, including safety performance; ❯ Review of the financial performance of the Group; ❯ Review of the Business Plan 2018; ❯ Received updates from each of the Board Committees; ❯ Refreshing the composition of the Company’s Finance
Standing Committee; ❯ Board and Committee performance evaluation; ❯ Review of draft Disclosure Policy and terms of reference;
and ❯ Board succession planning and extension of Chief
Executive Officer’s Management Service Agreement.
UNSCHEDULED BOARD MEETINGS HELD TO CONSIDER AD-HOC MATTERS
JULY 2016 ❯ Consideration of revised offer terms for the proposed
merger of Vedanta Limited and Cairn India Limited.
AUGUST 2016 ❯ Approval of shareholder circular in respect of the all- share
merger between Vedanta Limited and Cairn India Limited; and
❯ Approval of the Group’s Related Party Policy.
SEPTEMBER 2016 ❯ Senior management succession and restructuring.
JANUARY 2017 ❯ Approval of Bond offering and Bond buyback tender offer.
FEBRUARY 2017 ❯ Review and approval of a waiver of the non-compete
clause under the Relationship Agreement.
MARCH 2017 ❯ Review of Liability Management proposals and approval
of ‘Make Whole’ bond buyback.
BOARD PROGRAMME 2017The main items of business considered by the Board during the year are shown below:
116
Vedanta Resources plc | Annual Report FY2017
EFFECTIVENESSBOARD BALANCEThe Board has a rich diversity, with Directors having diverse backgrounds and a wide range of international, professional and sector-specific experience. As the majority of Directors are Non-Executive Directors, the Board has an appropriate balance between Executive and Non-Executive Directors and the right mix of skills and experience for effective decision making.
BOARD APPOINTMENTSAll Directors are subject to annual election or re-election by shareholders at the Company’s Annual General Meeting. The Board believes that annual re-election promotes accountability to shareholders as Directors are effectively subject to an annual appraisal. The Board, on the recommendation of the Nominations Committee, makes an informed decision as to whether it will endorse a Director for re-election.
Following changes to the UK Listing Rules in 2014, as the Company is Premium listed and has a controlling shareholder, the appointment of the independent Non-Executive Directors of the Company must be approved by a majority vote of not only all shareholders of the Company but also of the independent shareholders of the Company (that is, the shareholders of the Company entitled to vote on the election of Directors who are not controlling shareholders of the Company). If a resolution to elect or re-elect an independent Non-Executive Director is not approved by a majority vote of both the shareholders as a whole and the independent shareholders of the Company at the Annual General Meeting, a further resolution may be put forward to be approved by the shareholders as a whole at a meeting which must be held more than 90 days after, but within 120 days, of the Annual General Meeting when the first vote was held.
BOARD INDEPENDENCEIn accordance with the Code, it is the Company’s policy that at least half the Board, excluding the Executive Chairman, comprises of independent Non-Executive Directors to ensure that an appropriate balance is maintained between Executive and Non-Executive Directors for effective governance and so that no individual or small group of Directors can dominate the decision-making process. The Board undertakes an evaluation of each Director’s independence on appointment, annually prior to recommending their re-election by shareholders, as well as when any Director’s circumstances change and warrant a re-evaluation. The Board regards each of the five Non-Executive Directors as being fully independent in character and judgement (see the Nominations Committee Report on page 132. Mr Mehta will be retiring from the Board following the conclusion of the 2017 Annual General Meeting. The Board also reviewed the independence of Mr Story who joins the Board with effect from 1 June 2017, and determined him to be independent.
DIRECTORS’ CONFLICTS OF INTERESTThe Board has an established procedure for the disclosure of interests and other related matters in line with published guidance and the Companies Act 2006. Each Director must promptly disclose actual or potential conflicts and any changes, to the Board which are noted at each Board meeting. The Board considers and authorises potential or actual conflicts, as appropriate. Directors with a conflict do not participate in the discussion or vote on the matter in question. These procedures have proved to be effective during the year under review. Related party transactions, which include those in respect of any Director, are disclosed in Note 39 on pages 235 to 237.
TIME COMMITMENTThe Directors are all required to commit sufficient time to fulfil their responsibilities. Non-Executive Directors may serve on a number of other Boards provided they continue to demonstrate their commitment to their role as Directors of the Company. The Nominations Committee monitors the extent of Directors’ other interests to ensure that the effectiveness of the Directors and the Board as a whole is not compromised.
Prior to the appointment of new Non-Executive Directors to the Board, candidates are notified of the time commitment expected of them. The Company’s Non-Executive Directors are expected to spend a minimum of 20 days per annum on the Company’s business, with greater time commitment during periods of heightened strategic and commercial activity as set out in their letters of appointment. The Non-Executive Directors’ letters of appointment are available on request from the Company Secretary. Non-Executive Directors are also required to disclose their other time commitments and seek the agreement of the Executive Chairman prior to accepting any additional appointments in order to ensure that they have sufficient time to fulfil their role as a Director.
The Board is also supportive of the Executive Directors accepting non-executive directorships of other companies in order to widen their experience and knowledge for the benefit of the Company. Accordingly, subject to the agreement of the Board, Executive Directors are permitted to accept one external non-executive board appointment and to retain any fees paid to them in respect of such appointment. Details of Mr Albanese’s external appointment are in the Directors’ Remuneration Report on page 144.
The Board is satisfied that each of the Non-Executive Directors commits sufficient time to their duties in relation to the Company.
RELATIONSHIP AGREEMENT WITH CONTROLLING SHAREHOLDERThe Company has a written legally binding Relationship Agreement with its controlling shareholder, Mr Anil Agarwal, and his associate, Volcan Investments Limited (Volcan). The original Relationship Agreement entered into at the time of admission of the Company’s shares to the premium listing segment of the Official List of the Financial Conduct Authority (FCA) and to trading on the London Stock Exchange plc’s main market for listed securities (Listing) in 2003 and amended in December 2011 was further amended in November 2014 to comply with the revised Listing Rules for the protection for minority shareholders which came into force in May 2014.
The Relationship Agreement ensures that the Group is able to carry on business independently of Volcan, the Agarwal family and their associates and that the controlling shareholder complies with the independence provisions set out in Listing Rule 6.1.4D. Under the terms of the Relationship Agreement, the Board and Nominations Committee will at all times consist of a majority of Directors who are independent of Volcan and the Agarwal family, while the Remuneration and Audit Committees shall at all times comprise solely of Non-Executive Directors. However, Volcan is entitled to nominate for appointment as Director such number of persons as is one less than the number of Directors who are independent of Volcan, the Agarwal family and their associates. As the Board is comprised of a majority of independent Non-Executive Directors and Vedanta’s ability to operate independently of Volcan is protected by the Relationship Agreement, the Board
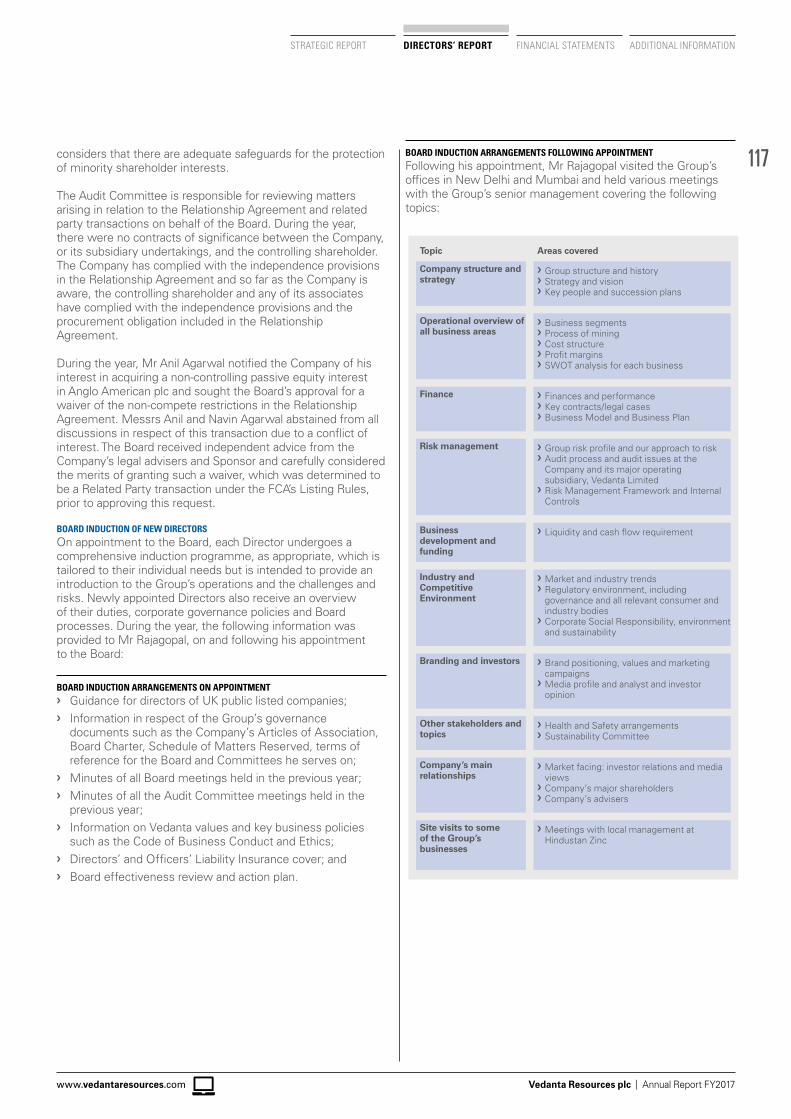
117
Vedanta Resources plc | Annual Report FY2017www.vedantaresources.com
FINANCIAL STATEMENTS ADDITIONAL INFORMATIONDIRECTORS’ REPORTSTRATEGIC REPORT
Topic Areas covered
Company structure and strategy
❯ Group structure and history ❯ Strategy and vision ❯ Key people and succession plans
Operational overview of all business areas
❯ Business segments ❯ Process of mining ❯ Cost structure ❯ Profit margins ❯ SWOT analysis for each business
Finance ❯ Finances and performance ❯ Key contracts/legal cases ❯ Business Model and Business Plan
Risk management ❯ Group risk profile and our approach to risk ❯ Audit process and audit issues at the Company and its major operating subsidiary, Vedanta Limited
❯ Risk Management Framework and Internal Controls
Business development and funding
❯ Liquidity and cash flow requirement
Industry and Competitive Environment
❯ Market and industry trends ❯ Regulatory environment, including governance and all relevant consumer and industry bodies
❯ Corporate Social Responsibility, environment and sustainability
Branding and investors ❯ Brand positioning, values and marketing campaigns
❯ Media profile and analyst and investor opinion
Other stakeholders and topics
❯ Health and Safety arrangements ❯ Sustainability Committee
Company’s main relationships
❯ Market facing: investor relations and media views
❯ Company’s major shareholders ❯ Company’s advisers
Site visits to some of the Group’s businesses
❯ Meetings with local management at Hindustan Zinc
considers that there are adequate safeguards for the protection of minority shareholder interests.
The Audit Committee is responsible for reviewing matters arising in relation to the Relationship Agreement and related party transactions on behalf of the Board. During the year, there were no contracts of significance between the Company, or its subsidiary undertakings, and the controlling shareholder. The Company has complied with the independence provisions in the Relationship Agreement and so far as the Company is aware, the controlling shareholder and any of its associates have complied with the independence provisions and the procurement obligation included in the Relationship Agreement.
During the year, Mr Anil Agarwal notified the Company of his interest in acquiring a non-controlling passive equity interest in Anglo American plc and sought the Board’s approval for a waiver of the non-compete restrictions in the Relationship Agreement. Messrs Anil and Navin Agarwal abstained from all discussions in respect of this transaction due to a conflict of interest. The Board received independent advice from the Company’s legal advisers and Sponsor and carefully considered the merits of granting such a waiver, which was determined to be a Related Party transaction under the FCA’s Listing Rules, prior to approving this request.
BOARD INDUCTION OF NEW DIRECTORSOn appointment to the Board, each Director undergoes a comprehensive induction programme, as appropriate, which is tailored to their individual needs but is intended to provide an introduction to the Group’s operations and the challenges and risks. Newly appointed Directors also receive an overview of their duties, corporate governance policies and Board processes. During the year, the following information was provided to Mr Rajagopal, on and following his appointment to the Board:
BOARD INDUCTION ARRANGEMENTS ON APPOINTMENT ❯ Guidance for directors of UK public listed companies; ❯ Information in respect of the Group’s governance
documents such as the Company’s Articles of Association, Board Charter, Schedule of Matters Reserved, terms of reference for the Board and Committees he serves on;
❯ Minutes of all Board meetings held in the previous year; ❯ Minutes of all the Audit Committee meetings held in the
previous year; ❯ Information on Vedanta values and key business policies
such as the Code of Business Conduct and Ethics; ❯ Directors’ and Officers’ Liability Insurance cover; and ❯ Board effectiveness review and action plan.
BOARD INDUCTION ARRANGEMENTS FOLLOWING APPOINTMENTFollowing his appointment, Mr Rajagopal visited the Group’s offices in New Delhi and Mumbai and held various meetings with the Group’s senior management covering the following topics:
118
Vedanta Resources plc | Annual Report FY2017
EFFECTIVENESS CONTINUED
CORPORATE GOVERNANCE REPORT CONTINUED
ONGOING BOARD TRAINING AND DEVELOPMENTThe Board is committed to the development of its employees and Directors and they are offered ongoing training as appropriate to assist them in the performance of their duties. There are also procedures in place to provide the Directors with appropriate and timely information, including receiving information between meetings regarding Group business development and financial performance. The Directors have access to the advice and services of the Company Secretary, who is responsible for ensuring that Board procedures are followed. The Company Secretary is also responsible for advising the Board through the Chairman on governance matters. The Company’s professional advisers are also available to the Directors for consultation, where necessary, for the discharge of their duties.
During the year, the Board and senior management received legal and regulatory updates on corporate governance developments. They also received training in respect of the UK Listing Rules on Related Party transactions and the EU Market Abuse Regulation. Detailed presentations from senior management were made to the Directors on the Group’s oil & gas, aluminium and Zinc India businesses. Some of the Company’s Executive and Non-Executive Directors also visited a number of the Group’s operations during the year, including KCM in Zambia, Hindustan Zinc Limited, Lanjigarh and the aluminium operations at BALCO and Jharsuguda in India.
BOARD EVALUATIONThe effectiveness of the Board is of paramount importance to the overall success of the Group and the Company undertakes a formal and rigorous annual review of the Board and its Committees. The evaluation is an important part of the Board’s corporate governance framework and both the process and outcome are taken seriously by the Board, each Board Committee and by each individual Director.
Pursuant to the Code, the Company carries out a comprehensive externally facilitated Board effectiveness review at least once every three years. Accordingly, the 2017 Board evaluation was externally facilitated by Prism Boardroom (Prism), a specialist Board advisory firm. Prism has no other connection with the Company. The Board effectiveness review was supplemented by an internal review of the Board Committees.
BOARD EVALUATION PROCESSCopies of agendas and minutes of all meetings of the Board and Board Committees were provided to Prism and a scope document covering the areas of enquiry and ground rules for the externally facilitated Board evaluation process were agreed with the Executive Vice Chairman and the Company Secretary. Detailed one-to-one interviews were conducted with each of the Company’s Directors, excluding the Executive Chairman.
The internal Board Committee review was facilitated by the Company Secretary through tailored questionnaires in respect of the performance of each of the Board Committees. The questionnaires were pragmatically structured to draw out significant issues that were relevant to each of the Board Committees and to assist in identifying any areas for improvement.
The 2017 Board Evaluation Report by Prism and the internal report on the effectiveness of each of the Board Committees were reviewed by the Executive Chairman and an action plan was formulated by management for presentation to the Board.
ACTIONS TAKEN DURING THE YEARThe main actions taken in respect of the Company’s 2016 evaluation include maintaining an ongoing focus on succession planning, improved reporting to the Board on certain key matters and initiatives to enhance diversity in the business.
BOARD AND BOARD COMMITTEE COMPOSITION ❯ The Company’s Nominations Committee reviewed
the Board’s succession planning arrangements and commenced the search for a new Chief Executive Officer to succeed Mr Tom Albanese, who will stepping down from the Board on 31 August 2017.
❯ The Board’s composition was refreshed through the appointment of Mr Ravi Rajagopal and Mr Edward Story. Mr Rajagopal has recent and relevant financial experience and qualifications and Mr Story has sector relevant experience, both of which were criteria determined to be of importance for the Audit Committee, in view of Mr Mehta’s impending retirement from the Board on 14 August 2017.
❯ The composition of the Board Committees was also refreshed during the year.
STRATEGIC DISCUSSIONThe Board held dedicated strategy sessions in respect of the Group’s aluminium, oil & gas and Hindustan Zinc businesses to consider, develop and test the Group’s strategy, particularly in light of the difficult operating environments and volatile markets.
119
Vedanta Resources plc | Annual Report FY2017www.vedantaresources.com
FINANCIAL STATEMENTS ADDITIONAL INFORMATIONDIRECTORS’ REPORTSTRATEGIC REPORT
OPERATIONALManagement actions to deliver stability to the Group in a difficult operating environment included capital rephrasing, cost management initiatives, exercising financial and fiscal prudence, continuing the simplification of the Group’s financial structure, deleveraging, focus on safety and linkage of corporate social responsibility initiatives to the Group’s licence to operate.
BOARD ORIENTATION AND INDUCTIONThe Board induction programme for new Directors was enhanced during the year to provide the Directors with a better understanding of their role and responsibilities, the Group’s businesses and the operational challenges faced.
BOARD ADMINISTRATIONThe Company implemented enhanced arrangements for the administration of the Board and its Committees.
2017 RECOMMENDATIONSThe Company’s 2017 Board effectiveness evaluation confirmed that the Board and Board Committees are functioning effectively. There is a good balance of skills and experience and a positive, collaborative atmosphere around the Board table providing constructive challenge to management.
The recommendations from the 2017 Board evaluation included: ❯ Considering the structure and role of the Company and
of its major subsidiary, Vedanta Limited, including a review of the schedules of matters reserved for the respective Boards and how these are aligned with each other;
❯ Reviewing the process for developing the Group’s long-term strategy;
❯ Ensuring that the successor to the Group Chief Executive Officer continues the focus on safety and the goal of zero harm across the Group;
❯ Reviewing how Health and Safety is managed throughout the Group; and
❯ Reviewing the time commitments expected of each of the Company’s Non-Executive Directors.
The findings and recommendations from the 2017 evaluation exercise were discussed with the Executive Chairman and reviewed by the whole Board before a set of actions were agreed. Each of these key areas will remain firmly on the Board’s agenda during the year ahead and will be reported on in the Company’s Annual Report and Accounts FY2018.
The actions which were agreed following the Board and Committee evaluations are as follows:
❯ Management will enhance the Board’s strategy development sessions by considering how the output from the strategy sessions at Vedanta Limited can be combined with the Company’s strategy discussions to avoid a duplication of effort;
❯ Management will progress the review of the role and structure of the Group and engage advisers to develop this further;
❯ Management will combine the annual strategy away sessions with a site visit to one of the Group’s businesses to enhance the Board’s understanding of the key challenges and progress of that business;
❯ The role profile for the successor to the Group Chief Executive Officer will include Health and Safety as a key responsibility of that role;
❯ The Company will review the Board recruitment process to identify ways to improve its effectiveness and ensure that the Board has the appropriate mix of skills, experience and diversity to deliver its objectives; and
❯ Management will review the ownership of Health and Safety across the Group and ensure that it is a key standing item on the Board’s agenda to enable the Board to regularly monitor the progress made.
EXECUTIVE CHAIRMAN’S PERFORMANCEThe Executive Chairman’s performance was evaluated by the Non-Executive Directors, led by the Senior Independent Director, and the conclusions of the evaluation were fed back to the Executive Chairman.
120
Vedanta Resources plc | Annual Report FY2017
CORPORATE GOVERNANCE REPORT CONTINUED
ACCOUNTABILITYFinancial and business reportingThe Directors present a fair, balanced and understandable assessment of the Company’s position and prospects.
The Group has a comprehensive financial reporting system, which is reviewed and modified in line with Accounting Standards to ensure that all published financial information is accurate. Vedanta’s financial reporting procedures are based on five main elements:
1) Financial information supplied by subsidiary companies and consolidated at central level: › Management accounts are prepared on a monthly basis
and reviewed by the Executive Committee; › Management accounts are reviewed by the Board at
least quarterly; › Performance is monitored against key performance
indicators throughout the financial year and forecasts are updated as appropriate; and
› Annual operational budgets are prepared by each operating subsidiary and consolidated into the Group budget which is reviewed and approved by the Board.
2) External auditor assurance: › Full year audit and interim reviews are carried out on the
published financial statements.
3) Review by the Audit Committee of: › Year-end reporting plans; › Legal, tax and accounting issues; › the financial statements and disclosures in accordance
with financial reporting standards; and › Going concern and viability statements with supporting
cash flow, liquidity and funding forecasts.
4) The Internal Audit function provides an independent assurance in respect of processes, physical verification and management information system accuracy for operating companies.
5) Review by the Audit Committee and the Board of the preliminary and half-year announcements, the Annual Report and Accounts and any other announcements including financial information.
RISK MANAGEMENT AND INTERNAL CONTROLThe responsibilities, processes and information flows for ensuring that significant risks are recognised and reported up to the Board are shown below:
The Board ❯ Sets ‘risk appetite’; ❯ Reviews significant reported risks.
The Audit Committee ❯ Reviews the effectiveness of internal control/risk
systems and reports to the Board; ❯ Reviews the risk matrix, significant risks, status of risks
and mitigating factors; ❯ Considers and approves remedial actions where
appropriate; ❯ Reviews action plans put in place to mitigate risks; ❯ Reviews significant findings reported by the Internal
Audit function, Management Assurance Services; ❯ Reviews internal audit plans; ❯ Assesses the effectiveness of the internal audit
function; ❯ Reviews whistleblower reports presented by MAS.
Management Assurance Services (‘MAS’) ❯ Plans and carries out internal audits through
arrangements with leading international accounting and audit firms;
❯ Recommends improvements to the Group’s internal control system;
❯ Reviews compliance with Group policies and procedures;
❯ Facilitates the update of the risk matrix; ❯ Reviews findings in respect of the risk management
and internal control framework with senior management and reports to the Audit Committee;
❯ Investigates whistleblower cases.
The Director, MAS attends all the Company’s Executive Committee and Audit Committee meetings. During the year, the MAS team supported the respective business teams at Vedanta Limited and its subsidiaries towards compliance with the US Sarbanes-Oxley Act 2002 requirements (the Act), including documenting internal controls as required by section 404 of the Act. KCM is excluded from the scope of the Act. The effectiveness of internal controls is assessed by Vedanta’s own administration and certified by independent auditors, as set forth in the Act.
121
Vedanta Resources plc | Annual Report FY2017www.vedantaresources.com
FINANCIAL STATEMENTS ADDITIONAL INFORMATIONDIRECTORS’ REPORTSTRATEGIC REPORT
RISK MANAGEMENT AND INTERNAL FRAMEWORKVedanta’s risk management framework serves to identify, assess and respond to the principal and emerging risks facing the Group’s business and is designed to be simple and consistent and provide clarity on managing and reporting risks to the Board. The Group’s management systems, organisational structures, processes, standards and Code of Conduct and Ethics together form the system of internal control that governs how the Group conducts its business and manages the associated risks.
The Board has reviewed the internal control system in place during the year and up to the date of the approval of this Report to ensure that it remains effective. The Board’s review included the Audit Committee’s report on the risk matrix, significant risks and actions put in place to mitigate these risks. Any weaknesses identified by the review are addressed by enhanced procedures to strengthen the relevant controls and these are in turn reviewed at regular intervals.
WHISTLEBLOWER PROCEDUREAll Vedanta employees are expected to observe high ethical standards which are enshrined in the Vedanta Code of Business Conduct and Ethics, and employees in key positions are required to complete the Annual Code of Conduct Certification form. The annual certification process reinforces our commitment to ethical practices and promoting an ethical culture across the Group.
The Group’s Whistleblower Policy forms part of the Code of Business Conduct and Ethics and supports the Group’s aim of working to the highest ethical standards. The policy allows employees of the Company, its subsidiaries and all external stakeholders to raise issues of concern in confidence. Under the Whistleblower Policy adopted by each of the businesses in the Group, all complaints are reported to the Director, MAS who is independent of operating management and businesses. Dedicated email addresses and a centralised database have been created to facilitate the receipt of complaints and for ease of reporting. The Company has a 24x7 ethics helpline where employees can place anonymous complaints in respect of violations of the Group’s Code of Business Conduct and Ethics. All employees and stakeholders can register their integrity-related concerns either by calling a freephone number or via a web based portal. The hotline also provides multiple local language options.
Following an investigation, established cases are brought to the Group Ethics Committee for decision making. The Group Ethics Committee is a management committee whose core purpose is to reinforce Vedanta’s commitment to zero tolerance of unethical behaviour. The Ethics Committee also ensures uniformity and consistency in the decision-making process following investigation of reported whistleblower incidents and other ethics violations. All cases are taken to their logical closure. A summary of cases along with outcome of the investigations and actions taken is presented periodically to the audit committees of the respective businesses as well as at Group level. During the year, the composition of the Group Ethics Committee was refreshed to encourage diversity of ideas and perspective.
FRAUD AND UK BRIBERY ACTThe Board has a zero tolerance policy for corruption and the Company is committed to the elimination of fraud, with each suspected case thoroughly investigated and concluded. The Audit Committee reviews the actions taken by management in the elimination of fraudulent practices and to promote ethical working practices.
122
Vedanta Resources plc | Annual Report FY2017
RELATIONS WITH SHAREHOLDERSThe Board recognises the value of maintaining an ongoing dialogue with the Company’s shareholders to ensure a mutual understanding of the Group’s strategy, performance and governance. Investors are kept informed of the Group’s performance and progress through regular corporate updates such as the preliminary results announcement, half-year results announcement, Annual Report and Accounts, Notice of Annual General Meeting and regulatory announcements in respect of significant developments in the Group. These communications are available on the Company’s website at www.vedantaresources.com/investorelations.
INSTITUTIONAL SHAREHOLDERSThe Group arranges regular meetings with institutional investors, analysts, brokers and fund managers which are attended by the Chief Executive Officer and managed by the Investor Relations team to keep investors informed and develop an understanding of the views of major shareholders. The Senior Independent Director and other Non-Executive Directors are available to meet with major investors to discuss any specific issues. During the year, the Board received feedback from some of its major shareholders in respect of the composition of the Board and the importance of new Non-Executive Directors having UK listed company experience. The Nominations Committee was mindful of these concerns and ensured that the Non-Executive Director recruitment search focused on candidates with sector-relevant experience in UK listed companies.
The Company arranges site visits to the Group’s major operations for institutional investors, analysts and brokers from time to time to provide them with a better understanding of the strengths and capabilities of the Group’s business operations.
The Board is kept informed of share price performance, shareholder sentiment and issues raised by the Company’s investors, brokers and analysts through regular updates from the Director, Investor Relations and the Company Secretary.
The Group held its second Sustainable Development Day in London on 24 June 2016 to engage with the Company’s stakeholders on sustainability and corporate responsibility matters and to reiterate the Group’s commitment to the zero harm philosophy. The event was attended by senior management and several members of the Board, including the Executive Chairman, Anil Agarwal, Chief Executive Officer, Tom Albanese and Chair of the Company’s Sustainability Committee, Katya Zotova, and enabled the Board to get a better understanding of stakeholders’ concerns on sustainability matters.
RETAIL SHAREHOLDERSThe Company is committed to ongoing engagement with its retail shareholders and we promptly respond to any queries. Shareholders are encouraged to access communications from the Company via the website at www.vedantaresources.com.
ANNUAL GENERAL MEETINGThe Board welcomes the opportunity to meet with the Company’s shareholders at the Annual General Meeting (AGM). All of the Company’s Directors attend the AGM in order to answer questions from shareholders.
The Company’s 2017 AGM will be held at 3.00pm on 14 August 2017 at The Lincoln Centre, 18 Lincoln’s Inn Fields, London WC2A 3ED. Further details, including the business to be considered at the meeting, are given in the Notice of 2017 Annual General Meeting accompanying this Annual Report and Accounts. The Notice of Annual General Meeting is sent to shareholders at least 20 working days before the AGM.
Voting at the AGM on all resolutions is by poll. The Board believes that voting by poll allows the views of all shareholders to be taken into account regardless of whether or not they are able to attend the AGM and shareholders are encouraged to register their votes electronically in advance of the meeting. The results of the voting are published on the Company’s website following the AGM.
INVESTOR RELATIONS PROGRAMME 2017
APRIL 2016 ❯ Q4 FY2016 production results
MAY 2016 ❯ FY2016 preliminary results presentation ❯ FY2016 preliminary results roadshow (London)
JUNE 2016 ❯ 2nd Vedanta Sustainable Development Day
JULY 2016 ❯ Q1 FY2017 production results ❯ Meetings with the Company’s credit investors
AUGUST 2016 ❯ 2016 Annual General Meeting ❯ Roadshows in respect of the all-share merger between
Vedanta Limited and Cairn India Limited (London)
SEPTEMBER 2016 ❯ Deutsche Access Metals & Mining Conference ❯ Standard Chartered Credit Conference
OCTOBER 2016 ❯ Q2 and H1 FY2017 production results
NOVEMBER 2016 ❯ H1 FY2017 interim results ❯ H1 FY2017 interim results roadshow (London) ❯ Goldman Sachs Conference ❯ Barclays Fixed Income Conference
FEBRUARY 2017 ❯ Q3 FY2017 production results ❯ BMO Metals and Mining Conference
CORPORATE GOVERNANCE REPORT CONTINUED
123
Vedanta Resources plc | Annual Report FY2017www.vedantaresources.com
FINANCIAL STATEMENTS ADDITIONAL INFORMATIONDIRECTORS’ REPORTSTRATEGIC REPORT
Dear shareholder,
I am pleased to introduce this report which sets out how the Audit Committee has discharged its responsibilities during the year.
The Audit Committee’s remit falls into four main areas: oversight of financial reporting, risk and the internal control environment, external audit and internal audit processes. The Committee is responsible for ensuring that sound risk management and internal control systems are in place throughout the Group.
FINANCIAL REPORTINGThe Audit Committee oversees the integrity of the Company’s financial reporting process in order to ensure that the information provided to the Company’s shareholders is fair, balanced and understandable and provides the information necessary for shareholders to assess the Company’s position and performance, business model and strategy. As detailed below, the Audit Committee addressed and challenged the key accounting and other judgements presented by management throughout the year and for the preparation of the Annual Report and Accounts FY2017. As a result and as supported by the high standard of reporting by management, the Audit Committee concluded that we have discharged our responsibilities effectively. I am pleased to confirm on behalf of the Audit Committee that the Annual Report and Accounts FY2017 including the financial statements are considered fair, balanced and understandable and provides the information necessary for shareholders to assess the Company’s position and performance, business model and strategy.
RISK AND INTERNAL CONTROL ASSESSMENTDuring the year, the Committee continued to monitor the market conditions, risks and uncertainties relevant to the Group, reviewed the risk management framework and reported to the Board on relevant risks affecting the Group. The Committee received regular updates from management confirming that risks relevant to the Group were appropriately categorised to ensure that the Committee understood the potential impact to the Group and adequate resources were allocated to manage the risks.
AUDIT COMMITTEE COMPOSITIONDuring the year, the Audit Committee’s composition was refreshed following the retirement of Mr Euan Macdonald from the Board in August 2016. I am pleased to confirm that the Audit Committee meets the requirement of the UK Corporate Governance Code to have at least one member with competence in accounting. Mr Edward Story will be appointed as a member of the Audit Committee to enhance its composition with natural resources sector experience and meet the enhanced requirements of the Code for the Audit Committee to have competence relevant to the sector as a whole.
UK TAX STATEMENTDuring the year, the Group Head of Taxation led the preparation of the Group’s Tax Strategy including the UK tax arrangements in accordance with the new tax governance measures in the UK Finance Bill 2016 which came into force on 15 September 2016. Vedanta’s UK tax strategy has been reviewed by the Audit Committee and will be published on the Company’s website following approval by the Board.
The Audit Committee’s remit falls into four main areas: financial reporting, risk and the internal control environment, and oversight of the external and internal audit processes.
AUDIT COMMITTEE REPORT
124
Vedanta Resources plc | Annual Report FY2017
AUDIT COMMITTEE REPORT CONTINUED
MEMBERSHIP AND ATTENDANCEThe Audit Committee comprises the following independent Non-Executive Directors who met on four occasions during the year based on appropriate times in the financial reporting calendar. The Group Company Secretary acts as Secretary to the Audit Committee and attends all meetings. The Executive Directors, Chief Financial Officer, Director, MAS, other members of the senior management team and the external auditor regularly attend meetings at the invitation of the Audit Committee to report on issues and facilitate discussions with the external auditor. The Audit Committee also meets with representatives from the external auditor without management being present bi-annually. The Chairman of the Audit Committee reports to the Board on the Audit Committee’s activities following each meeting. The external auditor attends meetings of the Audit Committee to ensure effective communication of matters relating to the external audit of the Group’s full year and interim financial statements.
Meetings are scheduled to allow sufficient time for discussions of key topics and to enable early identification and resolution of risks and issues.
Number of meetings attended
Percentage attendance
Aman Mehta, Chair 4/4 100%Euan Macdonald1 2/2 100%Deepak Parekh2 3/4 75% Geoffrey Green3 2/2 100%Ravi Rajagopal4 3/3 100%
1 Mr Macdonald retired from the Board on 5 August 2016 and attended all the meetings of the Audit Committee which he was entitled to attend while a member of it.
2 Mr Parekh was unable to attend one meeting of the Audit Committee as he was a member of the business delegation supporting the Prime Minister of India for the state visit to Japan.
3 Mr Green attended all the meetings of the Audit Committee which he was entitled to attend since his appointment as a member of it.
4 Mr Rajagopal attended all the meetings of the Audit Committee which he was entitled to attend since his appointment as a member of it.
Mr Mehta has been the Chairman of the Audit Committee since 24 November 2004. As shown in his biography on page 104, Mr Mehta has extensive executive and non-executive experience with a strong financial background in large listed companies. The Board is therefore satisfied that Mr Mehta has recent and relevant financial experience as is required by the UK Corporate Governance Code. Mr Mehta will be retiring from the Board and as Chairman of the Audit Committee with effect from the conclusion of the Company’s 2017 Annual General Meeting. Mr Ravi Rajagopal, who will succeed Mr Mehta as the Chairman of the Audit Committee with effect from the conclusion of the 2017 Annual General Meeting, also has recent and relevant financial experience as shown in his biography on page 105. The Directors who serve on the Audit Committee bring a wide range and depth of financial and commercial experience across various industries and their collective knowledge, skills, experience and objectivity enables the Audit Committee to work effectively and to probe and challenge management. With effect from 1 June 2017, Mr Edward Story will be appointed to the Audit Committee, thereby enhancing the Audit Committee’s competence relevant to the sector in which the Group operates.
The Audit Committee assists the Board in the discharge of its responsibility for maintaining and monitoring the integrity of the Group’s financial statements, assessing the effectiveness of the Group’s system of risk management and internal controls and the independence and objectivity of the external auditor. Whilst the Audit Committee has very specific responsibilities as set out in its terms of reference, it serves a much greater purpose in reassuring shareholders that their interests are properly protected in respect of the financial management and reporting, on which the Audit Committee regularly reports to the Board. The Audit Committee has delegated responsibility to oversee the Company’s procedures and systems in relation to risk management and internal control that is adopted by the Company. In order to carry out its duties effectively, the Audit Committee receives high quality and detailed information from management and the internal and external auditor which is reviewed regularly, discussed and challenged by the Audit Committee as required.
During the year, the Audit Committee reviewed the Group’s financial results, including significant financial reporting estimates and judgements, as well as the financial disclosures in the interim management statements, monitored the Group’s system of internal control and management of the Group’s risks and oversaw the relationship with the external auditor and with the internal audit function.
RESPONSIBILITIES OF THE AUDIT COMMITTEEThe Board has established formal and transparent arrangements for considering how they should apply the corporate reporting, risk management and internal control principles and for maintaining an appropriate relationship with the Company’s external auditor. The main responsibilities of the Audit Committee are included in its terms of reference which can be found on the Company’s website at www.vedantaresources.com/committees.
125
Vedanta Resources plc | Annual Report FY2017www.vedantaresources.com
FINANCIAL STATEMENTS ADDITIONAL INFORMATIONDIRECTORS’ REPORTSTRATEGIC REPORT
Area of responsibility Activities
Financial reportingIt is one of the Audit Committee’s key duties to monitor the integrity of the Company’s financial statements. As part of this process it reviews in detail the preliminary results statements, the Annual Report and Accounts and half-year report. The appropriateness of accounting polices used is considered, accounting judgements are reviewed and the external audit findings discussed. Details of financial reporting procedures in place are given on page 120 of the Corporate Governance Report.
❯ Review and approval of preliminary announcement, Annual Report and financial statements; ❯ Review of key significant issues for year-end audit (further detail on page 127; ❯ Six-monthly reviews of significant accounting issues and receipt of reports on key accounting issues;
❯ Review and approval of the half-year report; ❯ Discussions on impairment reviews; ❯ Review of pending tax issues; ❯ Review of Audit Committee Report for the Annual Report and Accounts FY2016; ❯ Review of legal cases to ensure appropriate provisions are made and disclosed; ❯ Review of the going concern basis for the preparation of the financial statements including working capital forecasts, monthly projections and funding requirements.
Internal controls, risk management and governanceDetails of the Company’s internal control and risk management processes are discussed on pages 36 to 37 The Audit Committee reviews these processes and output from the regular review of risks carried out during the year by the internal audit function.
❯ Internal audit review including reviews of the internal control framework, changes to the control gradings within the Group and whistleblower cases;
❯ Review of the Group’s risk management infrastructure, risk profile, significant risks, risk matrix and resulting action plans;
❯ Review of reports from subsidiary company audit committees; ❯ Review of feedback from the performance evaluation of the Audit Committee; ❯ Reviewing the Group’s cyber security controls; ❯ Receiving updates on the implementation of the Vedanta Code of Business Conduct and Ethics and UK Bribery Act training across the Group;
❯ Approving the updated terms of reference of the Audit Committee in respect of the requirements of the UK Corporate Governance Code 2016 and guidance for Audit Committees issued by the FRC.
The audit and external auditor ❯ Review of the significant audit risks with the external auditor during interim review and year-end audit;
❯ Consideration of external audit findings and review of significant issues raised; ❯ Review of key audit issues and management’s report; ❯ Review of the materiality figure for the external audit; ❯ Review of the independence of the external auditor and the provision of non-audit services; ❯ Approval of the revised Non-Audit Services Policy for the Group; ❯ Performance evaluation of the external auditor and recommendation for re-appointment of the external auditor;
❯ Consideration of the external audit fee; ❯ Review of the management representation letter; ❯ Review of the audit plan, scope of the 2017 external audit of the financial statements and key risk areas for the 2017 audit.
Internal audit ❯ Review of internal audit observations and monitoring of implementation of any corrective actions identified;
❯ Review of the performance of the internal audit function; ❯ Review of 2016-2017 internal audit plan; ❯ Review of the Group’s Anti-Bribery Policy and its implementation.
Fraud and Whistleblowing ❯ Receiving reports on fraud and monitoring the effectiveness of the whistleblower policy to ensure that it remains robust and fit for purpose;
❯ Review of whistleblower cases across the Group.
AUDIT COMMITTEE ACTIVITIES DURING THE YEARThe main areas covered by the Audit Committee during the year are summarised below:
126
Vedanta Resources plc | Annual Report FY2017
ANNUAL REPORT AND ACCOUNTS FY2017 REVIEWAt the request of the Board, the Audit Committee considered whether the Annual Report and Accounts FY2017 was fair, balanced and understandable and whether it provided the necessary information for shareholders and stakeholders to assess the Company’s performance, business model and strategy. Such assessments are provided in the Chairman’s and Chief Executive Officer’s statements and the Strategic Report of this Annual Report and Accounts FY2017. The Audit Committee and the Board are satisfied that the Annual Report and Accounts FY2017 meet this requirement as both positive and negative developments in the year were considered at length. In justifying this statement, the Audit Committee has considered the robust process which operates in creating the Annual Report and Accounts FY2017, including:
❯ Evaluation and verification of the inputs from the business functions, to include the well-established financial reporting system within Vedanta to ensure accuracy and consistency;
❯ Progress through various levels of review, including review by the Executive Committee and senior management across the Group;
❯ Consideration is given to the completeness of the information and to ensuring that there are no significant omissions to enable shareholders to assess the Company’s performance;
❯ Management Assurance Services conduct internal audit reviews with conclusions and recommendations presented to the Audit Committee;
❯ Revisions to regulatory requirements are considered and incorporated;
❯ Advice is also received by the Audit Committee from external advisers in order to make the recommendation to the Board that the Annual Report and Accounts FY2017 as a whole is fair, balanced and understandable;
❯ Members of the Audit Committee received an advance draft of the Annual Report and Accounts FY2017 enabling them to assess and challenge whether the various reports within the annual report are consistent and in line with their understanding of the business;
❯ A meeting of the Audit Committee is held to formally review and sign-off the draft Annual Report and Accounts FY2017; and
❯ A meeting of the Board is held to review and provide final sign-off.
WHISTLEBLOWER POLICY The Audit Committee is responsible for reviewing the adequacy of the Group’s whistleblower arrangements and ensuring that all reported whistleblower incidents are appropriately investigated and actioned.
The Group’s Whistleblower Policy forms part of the Vedanta Code of Business Conduct and Ethics and enables employees of the Company, its subsidiaries and all external stakeholders to raise concerns about suspected wrongdoing within the Group in confidence. The Whistleblower Policy has been extended to cover the requirements of the UK legislation covering slavery and human trafficking reporting. Further details of the Group’s whistleblower arrangements can be found on page 121.
The Audit Committee regularly reviews the Group’s whistleblower arrangements and monitors the outcome of investigations into whistleblower incidents received.
FRAUD AND UK BRIBERY ACTThe Company is committed to the elimination of fraud, with each suspected case thoroughly investigated and concluded. The Audit Committee reviews the actions taken by management in the elimination of fraudulent practices and to promote ethical working practices.
COMPETITION AND MARKETS AUTHORITY 2014 ORDERDuring the year ended 31 March 2017, the Company was compliant with the Competition and Markets Authority 2014 Order on mandatory tendering and audit committee responsibilities.
EXTERNAL AUDITORFollowing the competitive tender process for the provision of external audit services in 2015 and approval by shareholders at the Company’s 2016 Annual General Meeting, Ernst & Young LLP (E&Y) was appointed as the Group’s external auditor with effect from the financial year which commenced on 1 April 2016. A resolution to re-appoint E&Y as the Group’s external auditor will be proposed at the Company’s 2017 Annual General Meeting.
THE AUDIT PROCESSA detailed audit plan (the Audit Plan) is prepared by the external auditor, E&Y which is reviewed by the Audit Committee. The Audit Plan sets out the audit scope, key audit risks identified, materiality issues, the client team working on the audit and the audit timetable. The audit scope covers the significant components of the audit and audit plans for each component and geographical location. Each of the key audit risks and the external auditor’s response on how it will investigate these risks is considered by the Audit Committee.
SIGNIFICANT ISSUES CONSIDERED BY THE AUDIT COMMITTEEThe preparation of financial statements requires management to make judgements, estimates and assumptions, that affect the application of accounting policies and the reported amount of assets, liabilities, income, expenses and disclosures of contingent liabilities at the date of these financial statements and the reported amount of revenues and expenses for the years presented. The Audit Committee reviews whether the Group’s accounting policies are appropriate, and management’s estimate and judgements applied in the financial statements are reasonable. The Audit Committee also reviewed the disclosures made in the financial statements. The views of the statutory auditor on these significant issues were also considered by the Audit Committee.
AUDIT COMMITTEE REPORT CONTINUED
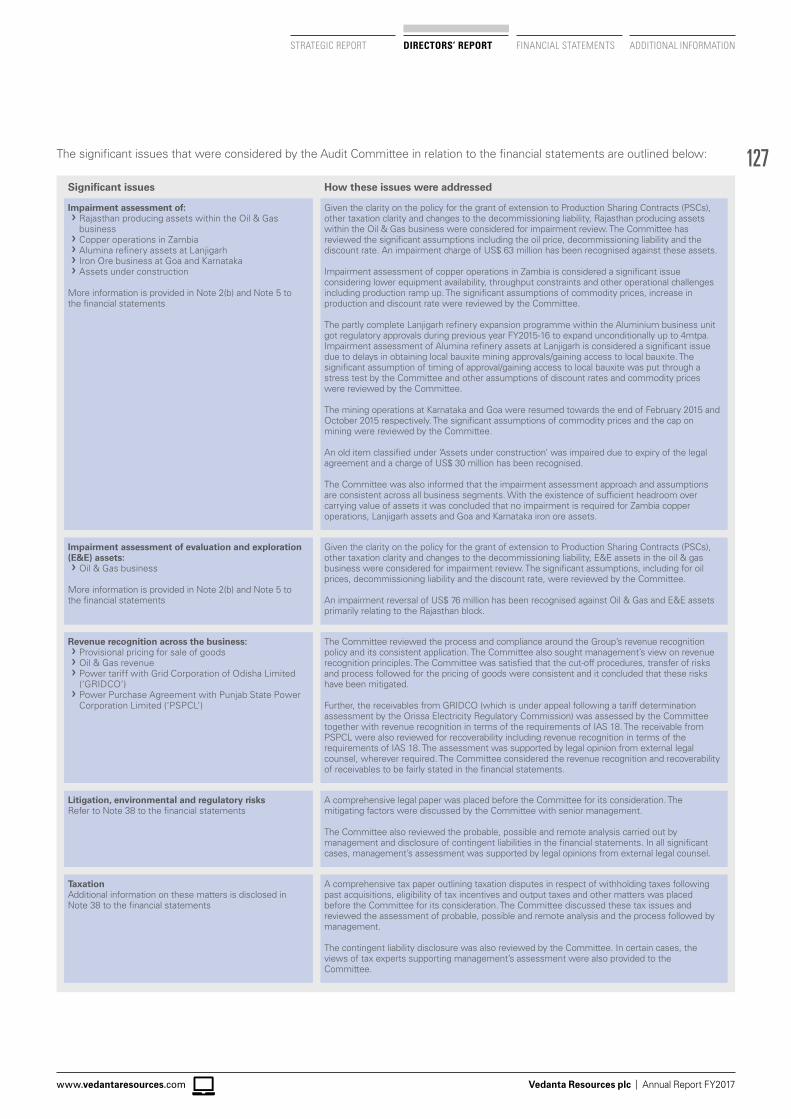
127
Vedanta Resources plc | Annual Report FY2017www.vedantaresources.com
FINANCIAL STATEMENTS ADDITIONAL INFORMATIONDIRECTORS’ REPORTSTRATEGIC REPORT
Significant issues How these issues were addressed
Impairment assessment of: ❯ Rajasthan producing assets within the Oil & Gas business
❯ Copper operations in Zambia ❯ Alumina refinery assets at Lanjigarh ❯ Iron Ore business at Goa and Karnataka ❯ Assets under construction
More information is provided in Note 2(b) and Note 5 to the financial statements
Given the clarity on the policy for the grant of extension to Production Sharing Contracts (PSCs), other taxation clarity and changes to the decommissioning liability, Rajasthan producing assets within the Oil & Gas business were considered for impairment review. The Committee has reviewed the significant assumptions including the oil price, decommissioning liability and the discount rate. An impairment charge of US$ 63 million has been recognised against these assets.
Impairment assessment of copper operations in Zambia is considered a significant issue considering lower equipment availability, throughput constraints and other operational challenges including production ramp up. The significant assumptions of commodity prices, increase in production and discount rate were reviewed by the Committee.
The partly complete Lanjigarh refinery expansion programme within the Aluminium business unit got regulatory approvals during previous year FY2015-16 to expand unconditionally up to 4mtpa. Impairment assessment of Alumina refinery assets at Lanjigarh is considered a significant issue due to delays in obtaining local bauxite mining approvals/gaining access to local bauxite. The significant assumption of timing of approval/gaining access to local bauxite was put through a stress test by the Committee and other assumptions of discount rates and commodity prices were reviewed by the Committee.
The mining operations at Karnataka and Goa were resumed towards the end of February 2015 and October 2015 respectively. The significant assumptions of commodity prices and the cap on mining were reviewed by the Committee.
An old item classified under ‘Assets under construction’ was impaired due to expiry of the legal agreement and a charge of US$ 30 million has been recognised.
The Committee was also informed that the impairment assessment approach and assumptions are consistent across all business segments. With the existence of sufficient headroom over carrying value of assets it was concluded that no impairment is required for Zambia copper operations, Lanjigarh assets and Goa and Karnataka iron ore assets.
Impairment assessment of evaluation and exploration(E&E) assets:
❯ Oil & Gas business
More information is provided in Note 2(b) and Note 5 to the financial statements
Given the clarity on the policy for the grant of extension to Production Sharing Contracts (PSCs), other taxation clarity and changes to the decommissioning liability, E&E assets in the oil & gas business were considered for impairment review. The significant assumptions, including for oil prices, decommissioning liability and the discount rate, were reviewed by the Committee.
An impairment reversal of US$ 76 million has been recognised against Oil & Gas and E&E assets primarily relating to the Rajasthan block.
Revenue recognition across the business: ❯ Provisional pricing for sale of goods ❯ Oil & Gas revenue ❯ Power tariff with Grid Corporation of Odisha Limited (‘GRIDCO’)
❯ Power Purchase Agreement with Punjab State Power Corporation Limited (‘PSPCL’)
The Committee reviewed the process and compliance around the Group’s revenue recognition policy and its consistent application. The Committee also sought management’s view on revenue recognition principles. The Committee was satisfied that the cut-off procedures, transfer of risks and process followed for the pricing of goods were consistent and it concluded that these risks have been mitigated.
Further, the receivables from GRIDCO (which is under appeal following a tariff determination assessment by the Orissa Electricity Regulatory Commission) was assessed by the Committee together with revenue recognition in terms of the requirements of IAS 18. The receivable from PSPCL were also reviewed for recoverability including revenue recognition in terms of the requirements of IAS 18. The assessment was supported by legal opinion from external legal counsel, wherever required. The Committee considered the revenue recognition and recoverability of receivables to be fairly stated in the financial statements.
Litigation, environmental and regulatory risksRefer to Note 38 to the financial statements
A comprehensive legal paper was placed before the Committee for its consideration. The mitigating factors were discussed by the Committee with senior management.
The Committee also reviewed the probable, possible and remote analysis carried out by management and disclosure of contingent liabilities in the financial statements. In all significant cases, management’s assessment was supported by legal opinions from external legal counsel.
TaxationAdditional information on these matters is disclosed in Note 38 to the financial statements
A comprehensive tax paper outlining taxation disputes in respect of withholding taxes following past acquisitions, eligibility of tax incentives and output taxes and other matters was placed before the Committee for its consideration. The Committee discussed these tax issues and reviewed the assessment of probable, possible and remote analysis and the process followed by management.
The contingent liability disclosure was also reviewed by the Committee. In certain cases, the views of tax experts supporting management’s assessment were also provided to the Committee.
The significant issues that were considered by the Audit Committee in relation to the financial statements are outlined below:
128
Vedanta Resources plc | Annual Report FY2017
EXTERNAL AUDITOR REMUNERATIONThe Audit Committee is responsible for determining the external auditor’s remuneration on behalf of the Board, subject to the approval by shareholders at the Company’s forthcoming Annual General Meeting.
EXTERNAL AUDITOR INDEPENDENCE AND PROVISION OF NON-AUDIT SERVICES BY THE EXTERNAL AUDITORThe Audit Committee is responsible for reviewing the external auditor’s independence and assessing their continued effectiveness. The Audit Committee and the Board place great emphasis on the objectivity of the external auditor. There are two aspects to the external auditor independence that the Audit Committee monitors:
Firstly, in accordance with the Auditing Practices Board Ethical Standards, E&Y has to implement rules and requirements such that none of its employees working on our audit can hold any shares in Vedanta Resources plc. E&Y is also required to inform the Company of any significant facts and matters that may reasonably be thought to bear on its independence or on the objectivity of the lead partner and the audit team. The lead partner must change every five years.
Secondly, the Audit Committee considers and approves all the fees that the Company pays for audit, audit-related and non-audit services performed by E&Y.
The Group’s policy on the provision of non-audit services by the external auditor specifies the services which the external auditor is permitted to and prohibited from undertaking in order to safeguard their objectivity and independence as such services present a high risk of conflict and could undermine the external auditor’s independence. The Company’s Non-Audit Services Policy was reviewed and updated in November 2016 to reflect the requirements of the FRC’s revised UK Corporate Governance Code 2016, guidance for Audit Committees and the EU Audit Directive. Prohibited non-audit services include work relating to the financial statements that will ultimately be subject to audit, certain tax, consultancy and advisory services and the provision of internal audit services amongst others. The policy also identifies those services which the external auditor is permitted to deliver to the Group. These include work on mergers and acquisitions, regulatory reviews, any certification required under loan agreements or bond covenants and assurance work in respect of compliance and corporate governance amongst others.
Furthermore, auditor independence is also safeguarded by limiting the value of non-audit services performed by the external auditor. In accordance with the FRC’s Ethical Standards 2016, a cap for non-audit services will be set at 70% of the average audit fees based on a three-year average and will first be applied from the fourth year commencing on 1 April 2020. The Audit Committee will monitor all non-audit services each year to ensure that they are in compliance with the requirements. Of the permitted services, any assignment in excess of US$30,000 may only be awarded to the external auditor with the prior approval of the Audit Committee.
All permitted non-audit services and the fees paid to the external auditor for non-audit work are reported to the Audit Committee. An analysis of non-audit fees can be found in Note 11 to the financial statements.
The Company also has a policy on employment of former employees of the external auditor to maintain the auditor’s independence.
PERFORMANCE OF THE EXTERNAL AUDITORThe Audit Committee is pivotal in monitoring the performance of the external auditor and the Group’s relationship with the external auditor. During the year, the Audit Committee reviewed the effectiveness of Ernst & Young LLP in its first year as the Group’s external auditor using a survey comprising a range of questions covering objectivity, quality and efficiency. The Audit Committee concluded that the results of the survey were positive and considered that they had provided a high quality audit.
FRC’S CORPORATE REPORTING REVIEWThe Company’s Annual Report and Accounts FY2016 has not been reviewed by the FRC’s Corporate Reporting Review team.
AUDIT COMMITTEE PERFORMANCE EVALUATIONAs part of the Board’s annual evaluation of its effectiveness and that of its Committees, described on page 118, the Audit Committee assessed its own effectiveness. The members of the Audit Committee agreed that its overall performance had been effective during the year.
THE YEAR AHEADThe Audit Committee’s objectives for the forthcoming year include: ❯ Working closely with E&Y to understand key areas for focus,
to streamline the audit process including its automation and to enhance the Group’s system of risk management and internal control; and
❯ Consideration and implementation of arrangements to enhance the Audit Committee’s effectiveness such as reconstitution of the composition of the Audit Committee, review of the Audit Committee calendar and agenda to enhance focus on risk and internal controls.
Aman MehtaChairman, Audit Committee23 May 2017
AUDIT COMMITTEE REPORT CONTINUED
129
Vedanta Resources plc | Annual Report FY2017www.vedantaresources.com
FINANCIAL STATEMENTS ADDITIONAL INFORMATIONDIRECTORS’ REPORTSTRATEGIC REPORT
NOMINATIONS COMMITTEE REPORT
Dear fellow shareholder,
I am pleased to present the Company’s 2017 Nominations Committee Report, which provides a summary of the Committee’s responsibilities and activities during the year.
MEMBERSHIP AND ATTENDANCEThe Nominations Committee is chaired by the Executive Chairman of the Company and is comprised of a majority of Non-Executive Directors in accordance with the Code. In the event of a conflict of interest, the Executive Chairman will abstain from the discussions and another member of the Nominations Committee will chair the meeting. The Group Company Secretary acts as Secretary to the Nominations Committee and attends all meetings. Any other Director, members of the senior management team and external advisers may attend meetings at the invitation of the Nominations Committee as appropriate. The chairman of the Nominations Committee provides an update to the Board in respect of the Nominations Committee’s activities during the year. The Nominations Committee met on four occasions during the year.
Number of meetings attended
Percentage attendance
Anil Agarwal, Chairman 4/4 100%Euan Macdonald1 2/2 100%Aman Mehta 4/4 100%Deepak Parekh2 3/4 75%Katya Zotova 4/4 100%
1 Mr Macdonald retired from the Board on 5 August 2016 and attended all of the Nominations Committee meetings which he was entitled to attend while he was a member of the Committee.
2 Mr Parekh was unable to attend one meeting of the Nominations Committee as he was a member of the business delegation supporting the Prime Minister of India for the state visit to Japan.
ROLE AND RESPONSIBILITIES OF THE NOMINATIONS COMMITTEEThe Nominations Committee is responsible for making recommendations to the Board on the structure, size and composition of the Board and Board Committees, ensuring that the appropriate mix of skills, experience, diversity and independence is present on the Board for it to function effectively. The Nominations Committee also leads the process for new Board appointments, advises the Board on succession planning arrangements and oversees the development of management talent within the Group. The Nominations Committee works collaboratively with Volcan Investments Limited on new Board appointments in accordance with the terms of the Relationship Agreement between the Company, Mr Anil Agarwal and Volcan Investments Limited.
The responsibilities of the Nominations Committee are set out in its terms of reference which can be found on the Company’s website at www.vedantaresources.com/committees.
BOARD DIVERSITYThe Board recognises the benefit that diversity of thought and representation can bring to Board debate and perspective. Board diversity has been considered from a number of aspects, including, but not limited to, age, gender, race and ethnic origin, cultural and educational background. The Board has a wide range of knowledge and expertise including mining, oil & gas, corporate finance, banking, diplomacy and governance.
The Board remains committed to achieving a minimum of 33% female representation on the Board by 2020, while maintaining diversity in its broadest sense. While all appointments are made on merit, measured against objective criteria and the skills and experience of the candidate, in order to achieve this target for women on the Board, the Nominations Committee ensures that female candidates are considered routinely as part of the recruitment process. The Nominations Committee acknowledges that there is further work to be done in respect of increasing gender diversity on the Board and this remains an ongoing priority for the Nominations Committee and the Board.
130
Vedanta Resources plc | Annual Report FY2017
The Group actively encourages and monitors the progress of female executives throughout the Group. Significant progress has been made to increase gender diversity across the Group’s workforce and senior management population and to develop the female pipeline of high calibre talent across the Group through various mentoring and leadership development programmes such as Internal Growth Workshops and V-Connect. Initiatives to enhance gender diversity across the Group also included implementing family-friendly HR policies to address the barriers for women with children in returning to work. By supporting equal opportunities we will ensure that the pool of women from which management can be drawn will increase. During the year, notable internal appointments and advances of women in senior management within the Group included Ms Deshnee Naidoo joining the Company’s Executive Committee, the appointment of the company secretary of Vedanta Limited and of the Deputy Chief Financial Officer of Hindustan Zinc Limited.
Women currently comprise 10% of the overall employee population within the Group, whereas the percentage of female representation across the Group’s professional population is 11%.
NOMINATIONS COMMITTEE ACTIVITIES DURING THE YEARThe focus this year has continued to be on succession planning for the role of Chief Executive Officer to succeed Mr Albanese and refreshing the Board’s and Board Committees’ composition through the appointment of new Non-Executive Directors, given Mr Mehta’s upcoming retirement, having served on the Board for over 12 years.
The main areas covered by the Nominations Committee during the year are summarised below:
Area of responsibility Item
Board composition and succession planning ❯ Review of skills, experience and diversity and approving key search criteria for recruitment of new Non-Executive Directors;
❯ Continued engagement of search consultancy to aid in recruitment process; ❯ Review of candidates and recommendation of the appointment of Mr Ravi Rajagopal as a new Non-Executive Director;
❯ Keeping under review potential candidates to address gender balance on the Board; ❯ Review of succession planning for executive management.
Governance ❯ Review of the feedback from the Nominations Committee’s annual effectiveness review; ❯ Approval of disclosures in the Nominations Committee report in the Company’s Annual Report FY2016.
Non-Executive Director review ❯ Review of the performance, external commitments and independence of each of the Non-Executive Directors prior to recommending their re-appointment by shareholders at the Annual General Meeting;
NOMINATIONS COMMITTEE REPORT CONTINUED
131
Vedanta Resources plc | Annual Report FY2017www.vedantaresources.com
FINANCIAL STATEMENTS ADDITIONAL INFORMATIONDIRECTORS’ REPORTSTRATEGIC REPORT
BOARD APPOINTMENTSWhen considering new appointments to the Board, the Nominations Committee reviews the balance of skills, experience and diversity on the Board to identify those criteria which are determined to be vital for enhancing the Board’s effectiveness. These criteria form the basis of the search for new appointments to the Board. During the year, the Nominations Committee appointed independent Board recruitment agency, RGF Executive Search (RGF) to conduct a global search for new Non-Executive Directors to refresh the composition of the Board. RGF has no other connection with the Group other than to provide recruitment consultancy services to the Nominations Committee.
Mr Ravi Rajagopal was appointed to the Board on 1 July 2016 and brings a wealth of experience across finance and operational roles in a FTSE100 company to the Board. In addition, he has recent and relevant financial experience and qualifications, which were criteria determined to be of importance for the Audit Committee, in view of Mr Mehta’s impending retirement from the Board on 14 August 2017.
RGF was also provided with a brief to identify candidates that had relevant UK listed company experience within the extractive industries. The brief also requested the inclusion of more female candidates on candidate shortlists to address the lack of gender diversity on the Board and meet the aspirational target of achieving 33% of women on the Board by 2020. While the Nominations Committee is committed to addressing the gender imbalance, it is of the view that any appointments to the Board should be based on merit rather than to fulfil targets. Mr Edward Story has been appointed as an independent Non-Executive Director with effect from 1 June 2017. Mr Story is the chief executive officer of SOCO International PLC and will bring a wealth of operational and strategic experience of the oil & gas industry to the Board. He will also become a member of the Audit Committee from 1 June 2017 to ensure that the Audit Committee as a whole has competence relevant to the sector.
BOARD INDUCTION OF NEW DIRECTORSOn appointment to the Board, each Director undergoes a comprehensive induction programme as appropriate which is tailored to their individual needs but is intended to provide an introduction to the Group’s operations, challenges and risks. Newly appointed Directors also receive an overview of their duties, corporate governance policies and Board processes. During the year, Mr Rajagopal received a comprehensive induction on and following his appointment to the Board. Further details are provided on page 117.
TIME COMMITMENTThe Directors are all required to commit sufficient time to fulfil their responsibilities. Further details are disclosed on page 116. The Nominations Committee monitors the extent of Directors’ other interests to ensure that the effectiveness of the Directors and the Board as a whole is not compromised. The Nominations Committee was mindful of shareholder concerns over Mr Parekh’s external appointments in light of the significant shareholder vote against his re-election as a Director of the Company and shareholder feedback in respect of this. Following careful consideration of Mr Parekh’s external appointments, none of which has any exceptional circumstances which would require additional time commitment, the Nominations Committee determined that the wealth of his expertise and experience across a diverse range of sectors was a huge benefit to the Board and the Group. Furthermore, Mr Parekh’s other appointments did not compromise his commitment to the Board as he was able to attend the majority of Board meetings held during the year, including those held on short notice, and participate fully in discussions.
The Nominations Committee is satisfied that each of the Non-Executive Directors commits sufficient time to their duties in relation to the Company.
SUCCESSION PLANNINGBoard succession planning was at the forefront of the Nominations Committee’s considerations during the year and the Nominations Committee was focused on the search for new Non-Executive Directors to refresh the composition of the Board and its Committees. As detailed above, following an evaluation of the skills and experience present on the Board and a thorough assessment of the skills that would enhance its effectiveness, Mr Rajagopal and Mr Story were appointed as independent Non-Executive Directors.
A key priority of the Nominations Committee is the search for a successor to the Group Chief Executive Officer, Mr Tom Albanese, who steps down from the Board on 31 August 2017. The Board recruitment process is underway and further details will be announced in due course.
132
Vedanta Resources plc | Annual Report FY2017
The Nominations Committee also reviewed the composition of the Board Committees and succession for the role of the Senior Independent Director in view of Mr Mehta’s impending retirement from the Board. Following the review, the Nominations Committee recommended to the Board that Mr Deepak Parekh be appointed as the Company’s Senior Independent Director and Mr Ravi Rajagopal be appointed as the Chairman of the Audit Committee with effect from the conclusion of the Company’s 2017 Annual General Meeting. The Nominations Committee will continue to keep the composition of the Board Committees under review.
TALENT DEVELOPMENT AND SENIOR MANAGEMENT SUCCESSION PLANNINGOur people are our biggest asset for the delivery of business results and long-term shareholder value and continued investment in our people is critical to our future success.
In line with our philosophy, the Group conducts ‘ Internal Growth Workshops’ which are focused on promoting internal talent across the Group’s businesses and functions into leadership roles. The Internal Growth Workshops have identified over 321 new leaders, including 72 female professionals, across the Group’s businesses to date who have taken up significantly elevated roles and responsibilities.
BOARD INDEPENDENCEDuring the year, the Board carefully considered the independence of Mr Mehta as he has served on the Company’s Board for over twelve years. As he also served as a non-executive director on the board of Cairn India Limited (until its merger with Vedanta Limited), and is a non-executive director of Vedanta Limited, the Nominations Committee reviewed the potential conflicts of interest arising from those appointments. Mr Mehta absents himself from discussions in the event of any conflict of interest and continues to actively participate in Board discussions and provide robust challenge to management. Accordingly, the Nominations Committee concluded that his independent judgement was not compromised and he remained impartial and able to act in the best interests of the Company. Mr Mehta will be retiring from the Board following the conclusion of the Company’s 2017 Annual General Meeting on 14 August 2017 and will not be standing for re-election by shareholders.
Mr Green’s independence was also subject to close scrutiny due to his current role as Chair of the Financial Reporting Review Panel. The Board determined that there were no conflicts of interest arising out of the appointment.
Following the review of the Non-Executive Directors’ independence, the Board has determined that all of the current Non-Executive Directors are independent and free from any relationship or circumstance that could affect or appear to affect their independent judgement.
CONFLICTS OF INTERESTAs part of our annual review process, the Nominations Committee reviewed and considered all situations entered in the Conflicts Register and remains satisfied that the independence of those Directors who have external board appointments has not been compromised.
NOMINATIONS COMMITTEE PERFORMANCE EVALUATIONAs part of the Board’s annual evaluation of its effectiveness and that of its Committees, described on page 118, the Nominations Committee assessed its own effectiveness. The members of the Nominations Committee agreed that its overall performance had been effective during the year.
THE YEAR AHEADThe Nominations Committee’s objectives for the coming year are:
❯ Board recruitment for the appointment of a successor to the Group Chief Executive Officer;
❯ Review of the Board recruitment process to identify ways to improve its effectiveness and ensure that the Board has the appropriate mix of skills, experience and diversity to deliver its objectives; and
❯ Review of the Board diversity goals and identify ways in which this could be progressed.
Anil AgarwalChairman, Nominations Committee23 May 2017
NOMINATIONS COMMITTEE REPORT CONTINUED
133
Vedanta Resources plc | Annual Report FY2017www.vedantaresources.com
FINANCIAL STATEMENTS ADDITIONAL INFORMATIONDIRECTORS’ REPORTSTRATEGIC REPORT
SUSTAINABILITY COMMITTEE REPORT
Dear shareholder,
I am pleased to introduce this Sustainability Committee Report which provides details of the role and responsibilities of the Sustainability Committee and the work it has undertaken during the year.
Vedanta’s business model is to deliver operational excellence while demonstrating world-class standards of governance, safety, environmental and social responsibility in the locations of each of the Group’s operations and projects. The Vedanta Sustainability Framework guides us to ensure a long-term, sustainable future for our business operations, meeting our growth aspirations, and creating long-term value for all our stakeholders.
The robust implementation of the Vedanta Sustainability Framework (VSF) has been a top priority for the Sustainability Committee and we’ve made significant improvements in the way we conduct our business since its launch in 2012. One of the significant sustainability objectives for our business has been our Group’s safety performance. Considerable efforts have been made in this sphere with involvement at all levels, however we still have a long journey ahead of us. I’m deeply saddened that seven people lost their lives while working for or with Vedanta during the financial year under review. One of these tragedies was an unfortunate crane accident at a project site in Rajasthan, which led to the loss of four invaluable lives. Our thoughts and prayers are with the families and loved ones of everyone involved. The accident highlighted a certain vulnerability across our contractor safety management system while working with cranes, even when they are well established and well known for their expertise and safety practices. Important lessons have been learned by both sides and Vedanta has decided to introduce a Crane Safety Performance Standard to ensure proper safety management during crane operations. As a Board Committee we have to ensure that such events do not shake our confidence in the journey of achieving ‘Zero Harm’. We have certainly made good progress over the years and will continue to make ourselves a safer and a better company.
Another important aspect is ensuring that lessons from incidents are institutionalised across the businesses and repeat incidents are eliminated. To this effect, we ensure that each subsidiary company’s chief executive presents a detailed appraisal of critical incidents along with root causes and action plans to the Committee. Through Corporate HSE, we’ve started tracking ‘sign off’ from Chief Operating Officers on lessons from High Potential Incidents (HIPOs).
We maintained our focus on containing impacts on air, water, waste and tailing related risks, to achieve our targets on water savings, energy savings and waste recycling during the year. Businesses have met many of their goals but a few remain where we fell short of targets and those businesses are working on the root causes.
During the Company’s 2016 Annual General Meeting, some contentious sustainability issues were raised by stakeholders, including the Niyamgiri Bauxite Deposit, Balco Chimney Collapse in 2009, Bodai Daldali and KCM pollution cases. As a Committee we took note of the issues and reviewed the current status, sought further details as required and asked for development of remedial measures to ensure that actions taken are in line with VSF requirements and commitments and that we can effectively address these at the 2017 Annual General Meeting. Stakeholder engagement is key in the entire process and the Group’s businesses are encouraged to maintain transparent and collaborative relationships with all stakeholders.
Post Paris Convention (COP 21), climate change has again emerged as a key global challenge of focus for the world. INDCs developed by signatory countries have become a guidance document and a road map for action. We are pleased to see India’s inclusion as a signatory, but as an Indian company, we do respect India’s unique issues in the carbon debate. As a Committee we’ve overseen the progress made by the business in developing the carbon policy/strategy and action plan through a formalized interdisciplinary forum, ‘Carbon Forum’ headed by the CEO, Power.
Businesses’ contribution on Sustainable Development Goals (SDGs) is another important dimension which has become a forefront issue of deliberation and action. The Sustainability Committee reviewed the preliminary assessment of priority SDGs and recommended detailed workings with appropriate action plan/road map for the priority SDGs at Group level.
We are using the Vedanta Sustainability Assurance Programme (VSAP) as our internal tool to monitor implementation of the VSF. As a result of follow-up audit processes, including review and implementation of action plans, each of the businesses, operational sites and mines have put in place objectives and programmes in line with our framework requirements and monitors performance at regular intervals, with emphasis on the completion of actions from past audits. I take this opportunity to thank the management across our businesses for their commitment to VSAP, which has been a demanding exercise.
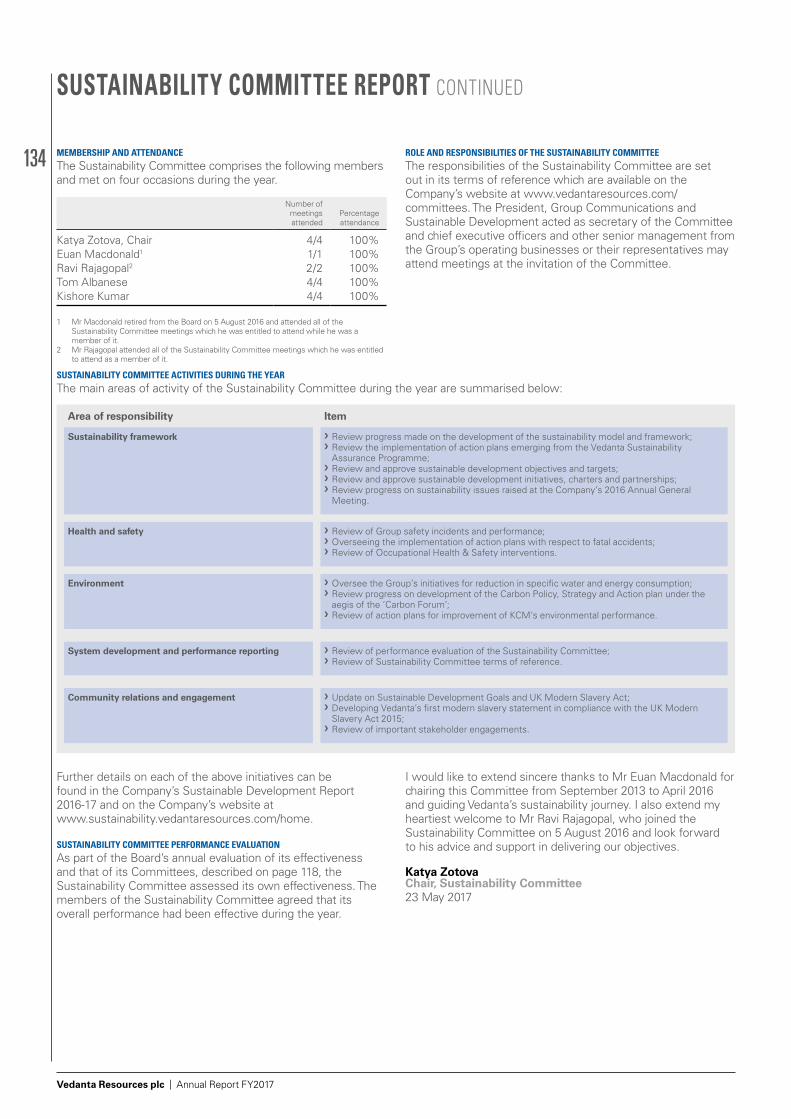
134
Vedanta Resources plc | Annual Report FY2017
MEMBERSHIP AND ATTENDANCEThe Sustainability Committee comprises the following members and met on four occasions during the year.
Number of meetings attended
Percentage attendance
Katya Zotova, Chair 4/4 100%Euan Macdonald1 1/1 100%Ravi Rajagopal2 2/2 100%Tom Albanese 4/4 100%Kishore Kumar 4/4 100%
1 Mr Macdonald retired from the Board on 5 August 2016 and attended all of the Sustainability Committee meetings which he was entitled to attend while he was a member of it.
2 Mr Rajagopal attended all of the Sustainability Committee meetings which he was entitled to attend as a member of it.
ROLE AND RESPONSIBILITIES OF THE SUSTAINABILITY COMMITTEEThe responsibilities of the Sustainability Committee are set out in its terms of reference which are available on the Company’s website at www.vedantaresources.com/committees. The President, Group Communications and Sustainable Development acted as secretary of the Committee and chief executive officers and other senior management from the Group’s operating businesses or their representatives may attend meetings at the invitation of the Committee.
Area of responsibility Item
Sustainability framework ❯ Review progress made on the development of the sustainability model and framework; ❯ Review the implementation of action plans emerging from the Vedanta Sustainability Assurance Programme;
❯ Review and approve sustainable development objectives and targets; ❯ Review and approve sustainable development initiatives, charters and partnerships; ❯ Review progress on sustainability issues raised at the Company’s 2016 Annual General Meeting.
Health and safety ❯ Review of Group safety incidents and performance; ❯ Overseeing the implementation of action plans with respect to fatal accidents; ❯ Review of Occupational Health & Safety interventions.
Environment ❯ Oversee the Group’s initiatives for reduction in specific water and energy consumption; ❯ Review progress on development of the Carbon Policy, Strategy and Action plan under the aegis of the ‘Carbon Forum’;
❯ Review of action plans for improvement of KCM’s environmental performance.
System development and performance reporting ❯ Review of performance evaluation of the Sustainability Committee; ❯ Review of Sustainability Committee terms of reference.
Community relations and engagement ❯ Update on Sustainable Development Goals and UK Modern Slavery Act; ❯ Developing Vedanta’s first modern slavery statement in compliance with the UK Modern Slavery Act 2015;
❯ Review of important stakeholder engagements.
SUSTAINABILITY COMMITTEE ACTIVITIES DURING THE YEARThe main areas of activity of the Sustainability Committee during the year are summarised below:
Further details on each of the above initiatives can be found in the Company’s Sustainable Development Report 2016-17 and on the Company’s website at www.sustainability.vedantaresources.com/home.
SUSTAINABILITY COMMITTEE PERFORMANCE EVALUATIONAs part of the Board’s annual evaluation of its effectiveness and that of its Committees, described on page 118, the Sustainability Committee assessed its own effectiveness. The members of the Sustainability Committee agreed that its overall performance had been effective during the year.
I would like to extend sincere thanks to Mr Euan Macdonald for chairing this Committee from September 2013 to April 2016 and guiding Vedanta’s sustainability journey. I also extend my heartiest welcome to Mr Ravi Rajagopal, who joined the Sustainability Committee on 5 August 2016 and look forward to his advice and support in delivering our objectives.
Katya ZotovaChair, Sustainability Committee23 May 2017
SUSTAINABILITY COMMITTEE REPORT CONTINUED
135
Vedanta Resources plc | Annual Report FY2017www.vedantaresources.com
FINANCIAL STATEMENTS ADDITIONAL INFORMATIONDIRECTORS’ REPORTSTRATEGIC REPORT
REMUNERATION COMMITTEE REPORT
Dear shareholder,
On behalf of the Board, I am pleased to present the Directors’ Remuneration Report for the year ended 31 March 2017. The report sets out disclosures in relation to Annual Report on Remuneration which details the remuneration paid to the Directors last year as per the policy, which received shareholder approval in 2014. The Remuneration of the Executive Directors continues to be linked with the overall Business Performance. The Regulations require that shareholders formally approve the Remuneration Policy every three years. It is intended that the Remuneration Policy will be put before shareholders for approval by way of a binding vote at the Company’s AGM on 14 August 2017. If approved by shareholders, the Remuneration Policy will have effect immediately thereafter. Prior to that date, the Company’s existing Remuneration Policy will continue to apply.
The Company reviewed the Remuneration Policy during the year and believes that it remains appropriate. As such, the 2017 Remuneration Policy will remain broadly unchanged from the Remuneration Policy approved by shareholders at the 2014 AGM.
BUSINESS PERFORMANCE AT A GLANCE Having weathered the prior year’s market downturn, we have continued to build on our status as a low-cost, diversified producer. During FY2017 we also delivered our promised merger of Cairn India Limited (Cairn India) and Vedanta Limited, simplifying the group structure. This is a significant step forward towards achieving our stated long-term vision of alignment of interests between all shareholders for the creation of long-term sustainable value.
The Business showed its resilience in the face of a tough market and a challenging economic climate. The group achieved significant milestones operationally, financially and strategically during the year. A synopsis of the Business Performance is outlined below:
❯ Financial & Operational Performance:During FY2017, a combination of a strong operating performance driven by ramping up capacity, cost efficiency and marketing initiatives and improved commodity prices from the lows of FY2016, resulted in an EBITDA of US$3.2 billion with robust margins of 36%. (FY2016: US$2.3 billion and 28%). Commodity prices improved during the year,
resulting in increased EBITDA by US$552 million. Most of the operating currencies depreciated against the US$ during FY2017, resulting in a favourable impact on EBITDA by US$105 million. We further strengthened our financial position, through our continued focus on deleveraging our balance sheet and extending maturity commitments. We have been well positioned during the recent upturn in the market, with the strong performance of zinc and aluminium in the commodities market playing to our particular strengths. The Company continued to remain focused on free cash, after project capital expenditure, from across its businesses by reinforcing discipline in working capital management, and operational and capital cost controls.
❯ Strategic Parameters: In addition to the financial performance the group also achieved significant strategic milestones during the financial year 2016-17 that will fuel the next level of stability and agility to catapult growth. To further enhance our effectiveness on Regulatory framework and create value to the organization, Board and the key executives led various key initiatives and achieved significant success and progress in following areas: Improvement in Group Balance Sheet; Simplification of Group Structure, PSC Extension, Ramping up of Assets etc.
❯ Sustainability and Safety Scorecard:The philosophy of a sustainable development agenda is at the core of Vedanta’s strategic priorities and governs every business decision. Employee safety and achieving zero harm remained our number one priority and we have made significant progress on all our safety measures during the year, but deeply regret the seven fatalities at our operations. So despite significantly improved performance in all metrics, fatality prevention remains the centre point of our focus. We continue to maintain our good track record in managing health and environment performance and focus on reducing our environmental footprint and improving our resource efficiency. There were no significant environmental incidents or health related observations during FY2016-17.
Business performance for the year was evaluated against the measures and targets set and resulted in a bonus of 42.68% of the maximum for the Executive Chairman, Executive Vice Chairman and Group CEO (details are provided in the relevant part of the Annual Report on Remuneration)
During the year, the Remuneration committee took up various matters pertaining to the Remuneration of the Directors of the company which included determining the Remuneration for the year 2016-17, approving the Annual Bonus to be paid to the executives and the Long Term Incentive design and grant of Options. The Committee also deliberated and finalized the new Remuneration policy which will be put to vote to the shareholders.
We hope that we will receive your support on the new remuneration policy and approval of the annual remuneration report at the forthcoming AGM.
Yours sincerely,
Geoffrey GreenChairman, Remuneration Committee
136
Vedanta Resources plc | Annual Report FY2017
DIRECTORS’ REMUNERATION POLICY REPORT
The Company’s Remuneration Policy will be put to a binding shareholder vote at the 2017 AGM and if approved will take effect immediately.
POLICY OVERVIEWThe key objective of the Group’s broad remuneration policy is to ensure that competitive and fair awards are linked to key deliverables and are also aligned with market practice and shareholders’ expectations.
The Committee ensures that remuneration policies and practices are designed to attract, retain and motivate the Executive Directors and the senior management group, while focusing on the delivery of the Group’s strategic and business objectives. The Committee is also focused on aligning the interests of the Executive Directors and the senior management group with those of shareholders, to build a sustainable performance culture.
When setting remuneration for the Executive Directors, the Committee takes into account the business performance, developments in the natural resources sector and, considering that the majority of the Group’s operations are based in India, similar information for high-performing Indian companies.
The Committee has set remuneration taking into consideration both UK and Indian market practice to ensure it is globally competitive as the Executive Directors are based in India (with the exception of Mr Anil Agarwal, who is UK-based), along with the majority of the Group’s professional management team. The Committee also considers the inflation rates prevalent in UK and India in the setting of remuneration.
The Committee recognises that the financial performance of the Company is heavily influenced by macro-economic considerations such as commodity prices and exchange rate movements. These factors are therefore taken into consideration when setting executive remuneration.
HOW THE VIEWS OF SHAREHOLDERS ARE TAKEN INTO ACCOUNTThe Committee considers the AGM to be an opportunity to meet and communicate with investors and considers shareholder feedback received in relation to the AGM each year and guidance from shareholder representative bodies more generally. This feedback, plus any additional feedback received during any meetings from time to time, is then considered as part of the Company’s annual review of remuneration policy.
In addition, the Committee will seek to engage directly with major shareholders and their representative bodies should any material changes be proposed to the remuneration policy. Details of votes cast for and against the resolution to approve last year’s remuneration report and any matters discussed with shareholders during the year are set out in the Annual Report on Remuneration.
HOW THE VIEWS OF EMPLOYEES ARE TAKEN INTO ACCOUNTIn setting the policy for Executive Directors’ remuneration, the Committee considers the pay and employment conditions across the Group, including annual base compensation increases across the general employee population and the overall spend on annual bonuses. Employees may be eligible to participate in the annual bonus arrangement and receive awards under the ESOP or LTIP. Opportunities and performance metrics may vary by employee level with specific business metrics incorporated where possible.
The Committee does not formally consult with employees in respect of the design of the Executive Directors’ remuneration policy, although the Committee will keep this under review.
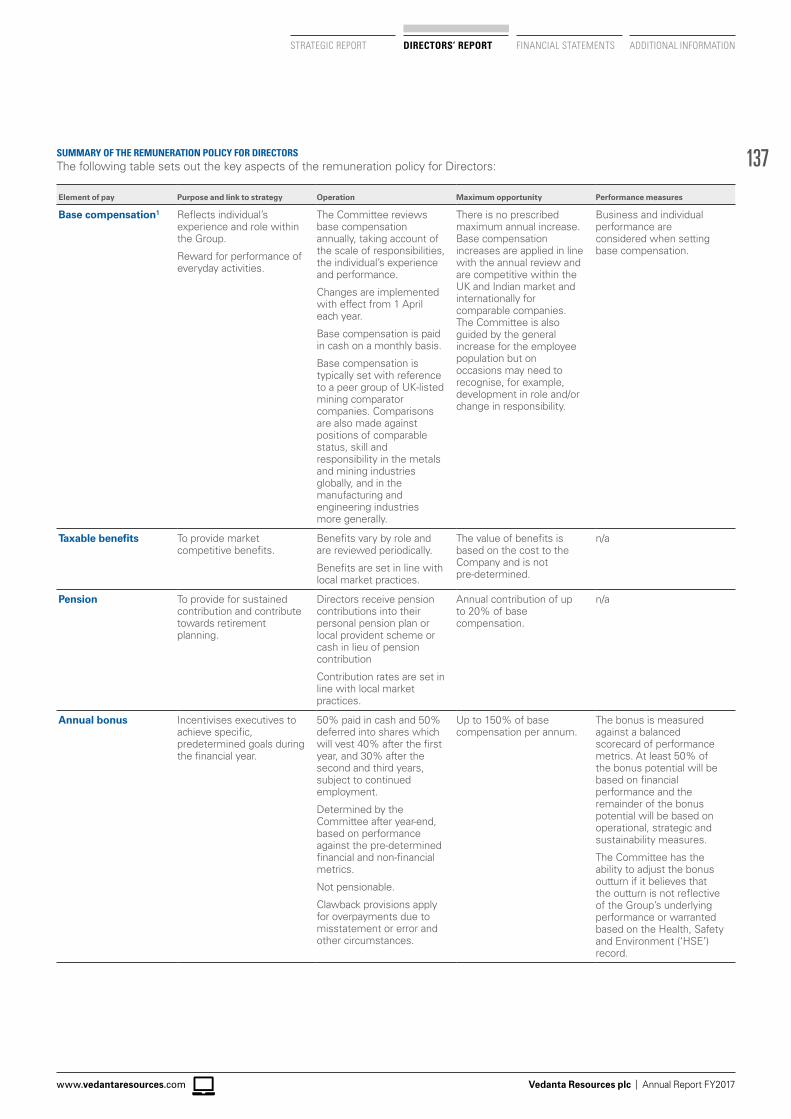
137
Vedanta Resources plc | Annual Report FY2017www.vedantaresources.com
STRATEGIC REPORT DIRECTORS’ REPORT FINANCIAL STATEMENTS ADDITIONAL INFORMATION
SUMMARY OF THE REMUNERATION POLICY FOR DIRECTORSThe following table sets out the key aspects of the remuneration policy for Directors:
Element of pay Purpose and link to strategy Operation Maximum opportunity Performance measures
Base compensation1 Reflects individual’s experience and role within the Group.
Reward for performance of everyday activities.
The Committee reviews base compensation annually, taking account of the scale of responsibilities, the individual’s experience and performance.
Changes are implemented with effect from 1 April each year.
Base compensation is paid in cash on a monthly basis.
Base compensation is typically set with reference to a peer group of UK-listed mining comparator companies. Comparisons are also made against positions of comparable status, skill and responsibility in the metals and mining industries globally, and in the manufacturing and engineering industries more generally.
There is no prescribed maximum annual increase. Base compensation increases are applied in line with the annual review and are competitive within the UK and Indian market and internationally for comparable companies. The Committee is also guided by the general increase for the employee population but on occasions may need to recognise, for example, development in role and/or change in responsibility.
Business and individual performance are considered when setting base compensation.
Taxable benefits To provide market competitive benefits.
Benefits vary by role and are reviewed periodically.
Benefits are set in line with local market practices.
The value of benefits is based on the cost to the Company and is not pre-determined.
n/a
Pension To provide for sustained contribution and contribute towards retirement planning.
Directors receive pension contributions into their personal pension plan or local provident scheme or cash in lieu of pension contribution
Contribution rates are set in line with local market practices.
Annual contribution of up to 20% of base compensation.
n/a
Annual bonus Incentivises executives to achieve specific, predetermined goals during the financial year.
50% paid in cash and 50% deferred into shares which will vest 40% after the first year, and 30% after the second and third years, subject to continued employment.
Determined by the Committee after year-end, based on performance against the pre-determined financial and non-financial metrics.
Not pensionable.
Clawback provisions apply for overpayments due to misstatement or error and other circumstances.
Up to 150% of base compensation per annum.
The bonus is measured against a balanced scorecard of performance metrics. At least 50% of the bonus potential will be based on financial performance and the remainder of the bonus potential will be based on operational, strategic and sustainability measures.
The Committee has the ability to adjust the bonus outturn if it believes that the outturn is not reflective of the Group’s underlying performance or warranted based on the Health, Safety and Environment (‘HSE’) record.
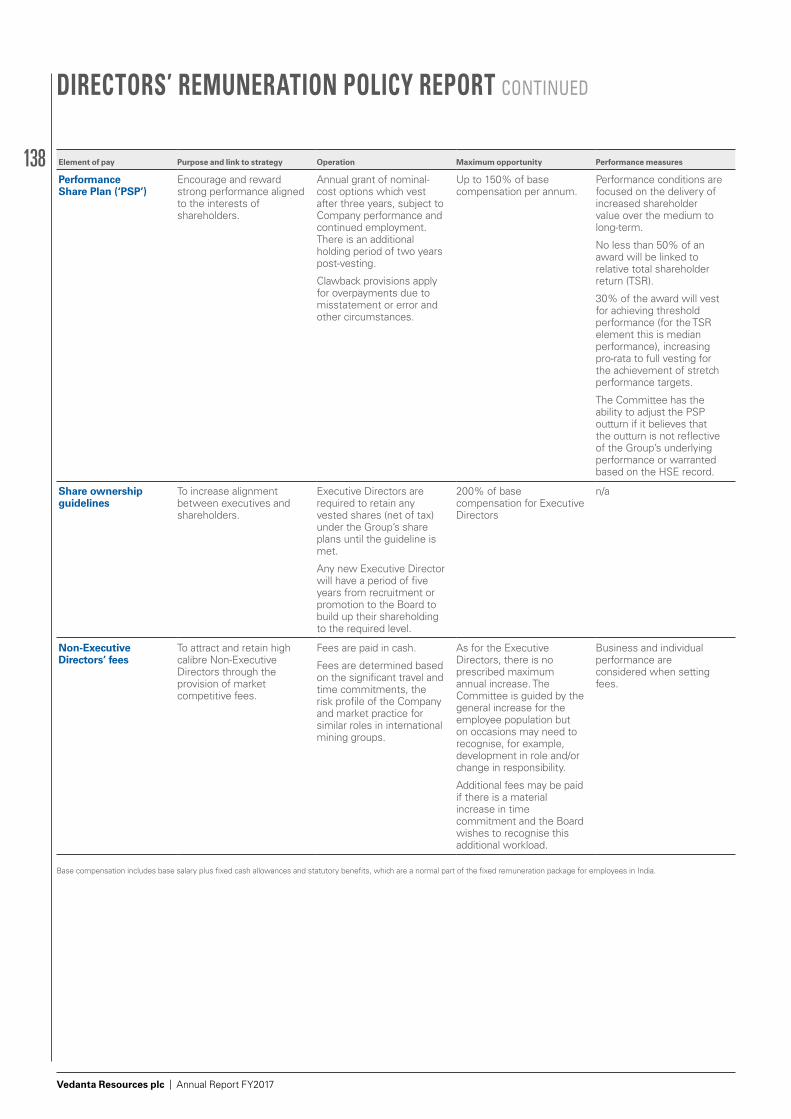
138
Vedanta Resources plc | Annual Report FY2017
DIRECTORS’ REMUNERATION POLICY REPORT CONTINUED
Element of pay Purpose and link to strategy Operation Maximum opportunity Performance measures
Performance Share Plan (‘PSP’)
Encourage and reward strong performance aligned to the interests of shareholders.
Annual grant of nominal-cost options which vest after three years, subject to Company performance and continued employment. There is an additional holding period of two years post-vesting.
Clawback provisions apply for overpayments due to misstatement or error and other circumstances.
Up to 150% of base compensation per annum.
Performance conditions are focused on the delivery of increased shareholder value over the medium to long-term.
No less than 50% of an award will be linked to relative total shareholder return (TSR).
30% of the award will vest for achieving threshold performance (for the TSR element this is median performance), increasing pro-rata to full vesting for the achievement of stretch performance targets.
The Committee has the ability to adjust the PSP outturn if it believes that the outturn is not reflective of the Group’s underlying performance or warranted based on the HSE record.
Share ownership guidelines
To increase alignment between executives and shareholders.
Executive Directors are required to retain any vested shares (net of tax) under the Group’s share plans until the guideline is met.
Any new Executive Director will have a period of five years from recruitment or promotion to the Board to build up their shareholding to the required level.
200% of base compensation for Executive Directors
n/a
Non-Executive Directors’ fees
To attract and retain high calibre Non-Executive Directors through the provision of market competitive fees.
Fees are paid in cash.
Fees are determined based on the significant travel and time commitments, the risk profile of the Company and market practice for similar roles in international mining groups.
As for the Executive Directors, there is no prescribed maximum annual increase. The Committee is guided by the general increase for the employee population but on occasions may need to recognise, for example, development in role and/or change in responsibility.
Additional fees may be paid if there is a material increase in time commitment and the Board wishes to recognise this additional workload.
Business and individual performance are considered when setting fees.
Base compensation includes base salary plus fixed cash allowances and statutory benefits, which are a normal part of the fixed remuneration package for employees in India.
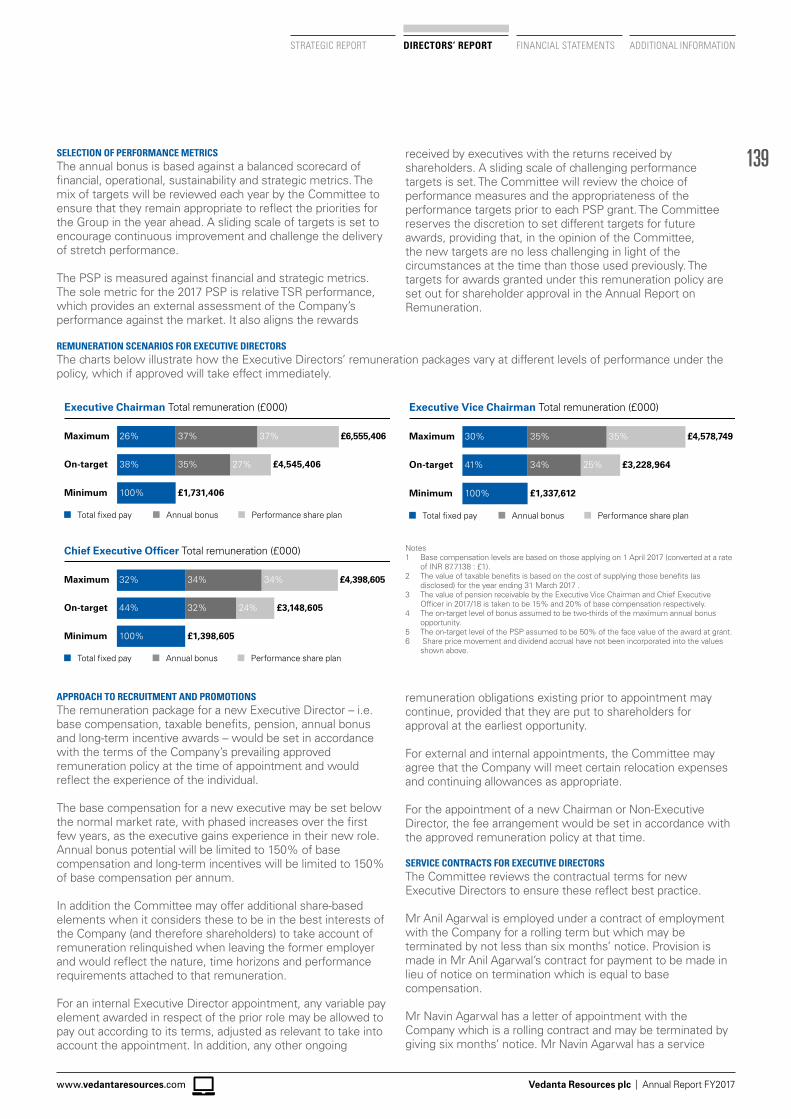
139
Vedanta Resources plc | Annual Report FY2017www.vedantaresources.com
FINANCIAL STATEMENTS ADDITIONAL INFORMATIONDIRECTORS’ REPORTSTRATEGIC REPORT
Maximum
On-target
Minimum
37%
35%
37%
27%
£6,555,406
£4,545,406
£1,731,406
26%
38%
100%
Executive Chairman Total remuneration (£000)
Total fixed pay Annual bonus Performance share plan
Maximum
On-target
Minimum
35%
34%
35%
25%
£4,578,749
£3,228,964
£1,337,612
30%
41%
100%
Executive Vice Chairman Total remuneration (£000)
Total fixed pay Annual bonus Performance share plan
Maximum
On-target
Minimum
34%
32%
34%
24%
£4,398,605
£3,148,605
£1,398,605
32%
44%
100%
Chief Executive Of�cer Total remuneration (£000)
Total fixed pay Annual bonus Performance share plan
Notes1 Base compensation levels are based on those applying on 1 April 2017 (converted at a rate
of INR 87.7138 : £1).2 The value of taxable benefits is based on the cost of supplying those benefits (as
disclosed) for the year ending 31 March 2017 .3 The value of pension receivable by the Executive Vice Chairman and Chief Executive
Officer in 2017/18 is taken to be 15% and 20% of base compensation respectively.4 The on-target level of bonus assumed to be two-thirds of the maximum annual bonus
opportunity.5 The on-target level of the PSP assumed to be 50% of the face value of the award at grant.6 Share price movement and dividend accrual have not been incorporated into the values
shown above.
SELECTION OF PERFORMANCE METRICSThe annual bonus is based against a balanced scorecard of financial, operational, sustainability and strategic metrics. The mix of targets will be reviewed each year by the Committee to ensure that they remain appropriate to reflect the priorities for the Group in the year ahead. A sliding scale of targets is set to encourage continuous improvement and challenge the delivery of stretch performance.
The PSP is measured against financial and strategic metrics. The sole metric for the 2017 PSP is relative TSR performance, which provides an external assessment of the Company’s performance against the market. It also aligns the rewards
received by executives with the returns received by shareholders. A sliding scale of challenging performance targets is set. The Committee will review the choice of performance measures and the appropriateness of the performance targets prior to each PSP grant. The Committee reserves the discretion to set different targets for future awards, providing that, in the opinion of the Committee, the new targets are no less challenging in light of the circumstances at the time than those used previously. The targets for awards granted under this remuneration policy are set out for shareholder approval in the Annual Report on Remuneration.
REMUNERATION SCENARIOS FOR EXECUTIVE DIRECTORS The charts below illustrate how the Executive Directors’ remuneration packages vary at different levels of performance under the policy, which if approved will take effect immediately.
APPROACH TO RECRUITMENT AND PROMOTIONSThe remuneration package for a new Executive Director – i.e. base compensation, taxable benefits, pension, annual bonus and long-term incentive awards – would be set in accordance with the terms of the Company’s prevailing approved remuneration policy at the time of appointment and would reflect the experience of the individual.
The base compensation for a new executive may be set below the normal market rate, with phased increases over the first few years, as the executive gains experience in their new role. Annual bonus potential will be limited to 150% of base compensation and long-term incentives will be limited to 150% of base compensation per annum.
In addition the Committee may offer additional share-based elements when it considers these to be in the best interests of the Company (and therefore shareholders) to take account of remuneration relinquished when leaving the former employer and would reflect the nature, time horizons and performance requirements attached to that remuneration.
For an internal Executive Director appointment, any variable pay element awarded in respect of the prior role may be allowed to pay out according to its terms, adjusted as relevant to take into account the appointment. In addition, any other ongoing
remuneration obligations existing prior to appointment may continue, provided that they are put to shareholders for approval at the earliest opportunity.
For external and internal appointments, the Committee may agree that the Company will meet certain relocation expenses and continuing allowances as appropriate.
For the appointment of a new Chairman or Non-Executive Director, the fee arrangement would be set in accordance with the approved remuneration policy at that time.
SERVICE CONTRACTS FOR EXECUTIVE DIRECTORSThe Committee reviews the contractual terms for new Executive Directors to ensure these reflect best practice.
Mr Anil Agarwal is employed under a contract of employment with the Company for a rolling term but which may be terminated by not less than six months’ notice. Provision is made in Mr Anil Agarwal’s contract for payment to be made in lieu of notice on termination which is equal to base compensation.
Mr Navin Agarwal has a letter of appointment with the Company which is a rolling contract and may be terminated by giving six months’ notice. Mr Navin Agarwal has a service
140
Vedanta Resources plc | Annual Report FY2017
agreement with Vedanta Limited which expires on 31 July 2018, with a notice period of three months or base compensation in lieu thereof.
Mr Tom Albanese had a separate letter of appointment with the Company and Vedanta Limited on a fixed Three Year Term which expired on 31 March, 2017. The service contracts of the executive with both the entities were extended for a five month term which expires on 31 August, 2017, but which may be terminated by not less than one month’s notice. Provision is made in Mr Tom Albanese’s contract for payment to be made in lieu of notice on termination which is equal to one month’s base compensation and benefits.
It is the Group’s policy that the notice period in the Directors’ service contracts does not exceed 12 months.
Copies of all Executive Directors’ service contracts and the letters of appointment of the Non-Executive Directors are available for inspection during normal business hours at the registered office of the Company, and available for inspection at the AGM.
PAYMENTS FOR LOSS OF OFFICEThe executive directors’ service contracts provide for pay in lieu of notice in respect of base compensation, as set out above.
The annual bonus may be payable with respect to the period of the financial year served although it will be pro-rated for time and paid at the normal payout date. Any share-based entitlements granted to an Executive Director under the Company’s share plans will be determined based on the relevant plan rules.
The default treatment under the PSP is that any outstanding awards lapse on cessation of employment. However, in certain prescribed circumstances, such as death, ill-health, disability, retirement or other circumstances at the discretion of the Committee, ‘good leaver’ status may be applied. For good leavers, awards will normally vest on the original vesting date, subject to the satisfaction of the relevant performance conditions at that time and reduced pro-rata to reflect the proportion of the performance period actually served. However, the Committee has discretion to determine that awards vest at an earlier date and/or to dis-apply time pro-rating, although it is envisaged that this would only be applied in exceptional circumstances. Any such incidents, where discretion is applied by the Committee, will be disclosed in the next year’s Annual Report on Remuneration.
The default treatment for deferred annual bonus awards is that any outstanding awards lapse on cessation of employment. However, in certain ‘good leaver’ circumstances (as described under the PSP above) awards will normally vest in full on the original vesting date.
In determining whether an executive should be treated as a good leaver or not, the Committee will take into account the performance of the individual and the reasons for their departure.
In the event of a change of control all unvested awards under the deferred annual bonus and long-term incentive arrangements would vest, to the extent that any performance conditions attached to the relevant awards have been achieved. The award will, be pro-rated for the period of the financial year served.
LETTERS OF APPOINTMENT FOR NON-EXECUTIVE DIRECTORSThe Non-Executive Directors have letters of appointment which may be terminated by either party by giving three months’ notice. The Non-Executive Directors’ letters of appointment set out the time requirements expected of them in the performance of their duties. Non-Executive Directors are normally expected to spend at least 20 days per year in the performance of their duties for the Company. There is no provision in the letters of appointment of the Non-Executive Directors for compensation to be paid in the event of early termination.
LEGACY ARRANGEMENTSFor avoidance of doubt, in approving this Directors’ Remuneration Policy Report, authority is given to the Company to honour any commitments entered into with current or former Directors (such as the vesting of past share awards) that have been disclosed to and approved by shareholders in this and previous Remuneration Reports. Details of any payments to former Directors will be set out in the Annual Report on Remuneration as they arise.
DIRECTORS’ REMUNERATION POLICY REPORT CONTINUED
141
Vedanta Resources plc | Annual Report FY2017www.vedantaresources.com
FINANCIAL STATEMENTS ADDITIONAL INFORMATIONDIRECTORS’ REPORTSTRATEGIC REPORT
This part of the report has been prepared in accordance with Schedule 8 of the Large and Medium-sized Companies and Groups (Accounts and Reports) (Amendment) Regulations 2013 and 9.8.6R of the UK’s Listing Rules. The Annual Report on Remuneration will be put to an advisory shareholder vote at the 2017 AGM. This report contains both auditable and non-auditable information. The information subject to audit by the Group’s auditors, Ernst & Young LLP, has been identified accordingly.
MEMBERSHIP OF THE REMUNERATION COMMITTEEThe members of the Remuneration Committee who served during the year, all of whom are independent Non-Executive Directors, are shown below together with their attendance at Remuneration Committee meetings:
NameMeetings attended
Percentage attendance
Euan Macdonald (Chairman up to 5 August, 2016)2 1/1 100%
Aman Mehta 3/3 100%Deepak Parekh1 1/2 50%Geoffrey Green (Chairman) 3/3 100%Katya Zotova 3/3 100%
1 Mr Deepak Parekh became a member on 5 August 20162 Mr Euan Macdonald retired from the board on 5 August, 2016
The Committee’s responsibilities are set out in its terms of reference, which are available on the Company’s website at www.vedantaresources.com or on request from the Company Secretary. The Committee’s terms of reference were reviewed during the year, and no further amendments have been made in the year ended 31 March 2017.
The Committee’s responsibilities primarily include: ❯ setting the Group’s overall policy on executive and senior
management remuneration; ❯ determining the remuneration packages for individual
Executive Directors, including base compensation, performance-based short- and long-term incentives, pensions and other benefits;
❯ approving the design and operation of the Company’s share incentive schemes; and
❯ reviewing and determining the terms of the service agreements of the Executive Directors.
ADVISERS TO THE COMMITTEEThe Committee retained New Bridge Street (‘NBS’), a trading name of Aon plc, to provide independent advice on remuneration matters. NBS is a signatory to the Remuneration Consultants Group’s Code of Conduct, which requires its advice to be objective and impartial. NBS does not provide any other services to the Company. Other pay information for employees below Board level is provided to the Company by Aon in India. The Committee considers that this enables a global perspective to be achieved. Where relevant, NBS reviews the work of Aon India to ensure that the advice is appropriate for a UK plc context and internally consistent. The Committee has reviewed the operating processes in place at NBS and is satisfied that the advice it receives is objective and independent. The Committee considers various external reports from NBS on remuneration in the UK as well as India to provide detailed insights that aid remuneration decisions. The fees paid to NBS in respect of work carried out in 2016/17 were £46,220. In addition, advisers to the Committee during the year and their roles are set out below. ❯ Mr Suresh Bose (Head of Group HR) and Manoj Kumar
Sharma (Group Head of Total Rewards) advise the Committee on general remuneration policies and practices followed in India and the global market, Executive Directors’ remuneration and benefits and remuneration policy applicable to the wider employee population within the Group.
❯ The Executive Directors provide input on remuneration packages for the senior management group to ensure parity amongst senior management in different businesses but at similar roles. Executive Directors may attend meetings at the invitation of the Committee but no Director is present during discussions of their own remuneration.
❯ New Bridge Street reviewed and confirmed the Company’s TSR performance in respect of the Long-Term Incentive Plan.
STATEMENT OF SHAREHOLDER VOTINGAt the 2016 Annual General Meeting, a resolution was proposed to shareholders to approve the Directors’ Remuneration report for the year ended 31 March 2016. This resolution was passed with the following votes from shareholders:
Annual Report on Remuneration
Votes cast in favour 226,297,422 (98.80%)Votes cast against 2,759,714 (1.2%)Total votes cast 229,057,136Abstentions 1
ANNUAL REPORT ON REMUNERATION
142
Vedanta Resources plc | Annual Report FY2017
ANNUAL REPORT ON REMUNERATION CONTINUED
SINGLE TOTAL FIGURE FOR REMUNERATION (AUDITED)The table below summarises Directors’ remuneration received during the year ended 31 March 2017 and the prior year for comparison.
Base compensation
including salary or fees
£000
Taxable Benefits
£000Pension
£000Annual bonus
£0008
Long-term incentives
£0009, 10 Total
£00011, 12
Executive DirectorsAnil Agarwal1 2016/17 1608 124 1029 35 2796
2015/16 1608 124 894 2625Navin Agarwal2,3,7 2016/17 1081 83 173 692 25 2054
2015/16 969 67 153 533 1723Tom Albanese4, 7 2016/17 1000 138 261 640 2039
2015/16 1000 90 251 556 1897
Non-Executive Directors6
Geoffrey Green 2016/17 108 1082015/16 95 95
Euan Macdonald 2016/17 49 492015/16 140 140
Aman Mehta5 2016/17 239 2392015/16 225 225
Deepak Parekh 2016/17 109 1092015/16 102 102
Katya Zotova 2016/17 119 1192015/16 112 112
Ravi RajaGopal 2016/17 77 77
NOTES 1 Mr Anil Agarwal’s taxable benefits in kind include provision of medical benefits; car and fuel in the UK for business purposes.2 There has been no increase in the base compensation of Mr Navin Agarwal and the change in compensation reflected in the table is purely on account of movement in currency exchange
(GBP vs INR) during the year FY2016-17. Furthermore, he is based out of India and is drawing the majority of his remuneration in INR. For the financial year ended 31 March 2017, Mr Navin Agarwal received a Vedanta Limited salary of INR85618845 excluding medical and leave travel allowances, Vedanta Resources Plc fees of £85,000, Hindustan Zinc Limited fees of INR 250,000 & Commission of INR 10,00,000 and Cairn India Limited fees of INR500,000.
3 Mr Navin Agarwal’s taxable benefits in kind include housing and related benefits, and use of a car and driver.4 Mr Tom Albanese’s taxable benefits in kind include housing and related benefits, and use of a car & driver (Grossed upto Tax) in India and Medical benefits in UK5 The fees paid to Mr Aman Mehta includes the fees of £98,616 paid by Cairn India Limited. The amount paid in FY2015-16 were shown exclusive of the fees of £85,204 paid by Cairn India
Limited, which are herewith reflected inclusive of such fees.6 Non-Executive Directors are reimbursed for expenses incurred while on Company business. No other benefits are provided to Non-Executive Directors.7 All of the Group’s pension schemes are based on cash contribution and do not confirm an entitlement to a defined benefit. Pension contributions are made into the Executive Vice Chairman
and Chief Executive Officer’s personal pension schemes (or local provident fund) and will become payable on the retirement, normally at age 58. The Executive Chairman does not receive pension benefits.
8 Amounts shown for 2016/17 relate to the payment of the annual bonus for the year ended 31 March 2017. 50% of the Annual Bonus figures shown in the table are paid in Cash and the balance 50% is paid in the form of Deferred shares to vest in the staggered manner in 3 years in the ratio 40:30:30 subject to continued employment. Further details of this payment are set out below.
9 The Performance Period for PSP 2014 came to a close on 31st March, 2017. Upon testing as per the scheme rules, Vedanta stood at 6th Position against its peers in the TSR Basket with a 28.6% TSR Achievement which made the potential EDs eligible for vesting of 60% against the grant made to them. However, this is not been made part of the Remuneration Table as the Vesting Period will conclude on 16 November, 2017.
10 Amount shown here pertains to the ESOP 2012 options that the Executive Directors exercised during the year FY2016-17.11 NIC Contribution as per the statutory requirement is made for all Executive and Non-Executive Directors12 The exchange rate applicable as at 31 March 2016 was INR 98.7645 to £1; and at 31 March 2017 was INR87.7138 to £1.
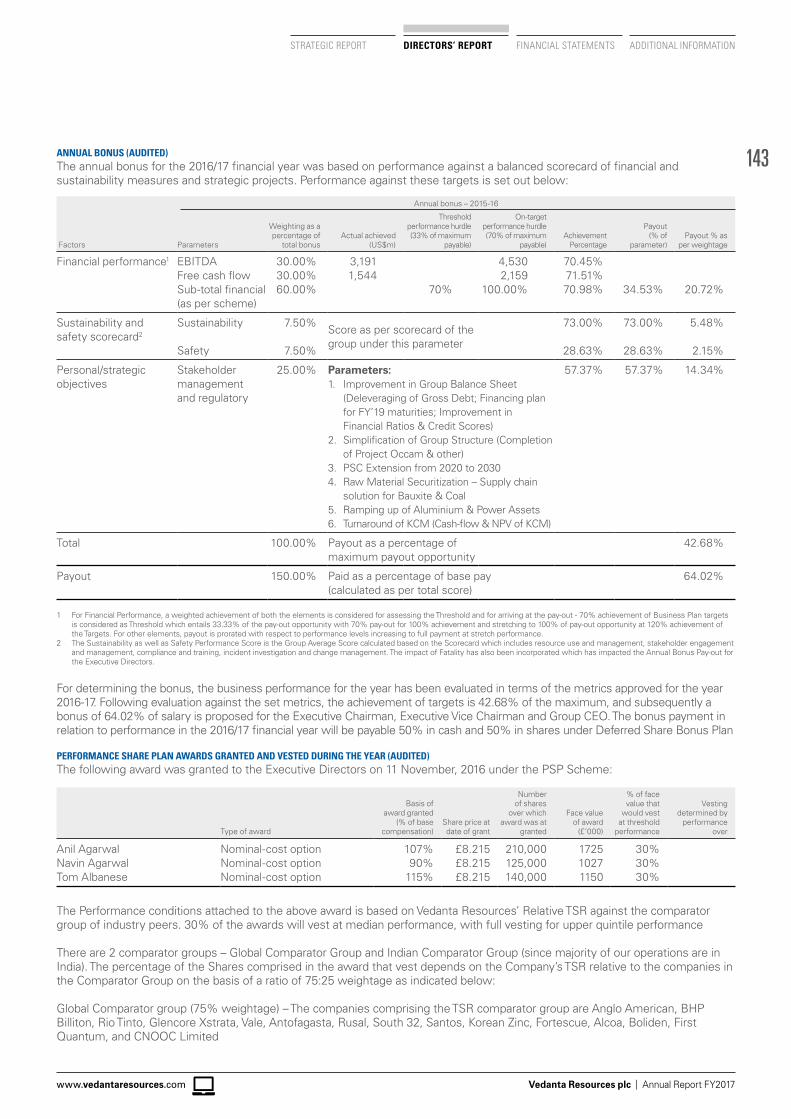
143
Vedanta Resources plc | Annual Report FY2017www.vedantaresources.com
STRATEGIC REPORT DIRECTORS’ REPORT FINANCIAL STATEMENTS ADDITIONAL INFORMATION
ANNUAL BONUS (AUDITED)The annual bonus for the 2016/17 financial year was based on performance against a balanced scorecard of financial and sustainability measures and strategic projects. Performance against these targets is set out below:
Annual bonus – 2015-16
Factors Parameters
Weighting as a percentage of
total bonusActual achieved
(US$m)
Threshold performance hurdle (33% of maximum
payable)
On-target performance hurdle (70% of maximum
payable)Achievement
Percentage
Payout (% of
parameter)Payout % as
per weightage
Financial performance1 EBITDA 30.00% 3,191 4,530 70.45%Free cash flow 30.00% 1,544 2,159 71.51%Sub-total financial (as per scheme)
60.00% 70% 100.00% 70.98% 34.53% 20.72%
Sustainability and safety scorecard2
Sustainability 7.50%Score as per scorecard of the group under this parameter
73.00% 73.00% 5.48%
Safety 7.50% 28.63% 28.63% 2.15%
Personal/strategicobjectives
Stakeholdermanagementand regulatory
25.00% Parameters:1. Improvement in Group Balance Sheet
(Deleveraging of Gross Debt; Financing plan for FY’19 maturities; Improvement in Financial Ratios & Credit Scores)
2. Simplification of Group Structure (Completion of Project Occam & other)
3. PSC Extension from 2020 to 20304. Raw Material Securitization – Supply chain
solution for Bauxite & Coal5. Ramping up of Aluminium & Power Assets6. Turnaround of KCM (Cash-flow & NPV of KCM)
57.37% 57.37% 14.34%
Total 100.00% Payout as a percentage of maximum payout opportunity
42.68%
Payout 150.00% Paid as a percentage of base pay (calculated as per total score)
64.02%
1 For Financial Performance, a weighted achievement of both the elements is considered for assessing the Threshold and for arriving at the pay-out - 70% achievement of Business Plan targets
is considered as Threshold which entails 33.33% of the pay-out opportunity with 70% pay-out for 100% achievement and stretching to 100% of pay-out opportunity at 120% achievement of the Targets. For other elements, payout is prorated with respect to performance levels increasing to full payment at stretch performance.
2 The Sustainability as well as Safety Performance Score is the Group Average Score calculated based on the Scorecard which includes resource use and management, stakeholder engagement and management, compliance and training, incident investigation and change management. The impact of Fatality has also been incorporated which has impacted the Annual Bonus Pay-out for the Executive Directors.
For determining the bonus, the business performance for the year has been evaluated in terms of the metrics approved for the year 2016-17. Following evaluation against the set metrics, the achievement of targets is 42.68% of the maximum, and subsequently a bonus of 64.02% of salary is proposed for the Executive Chairman, Executive Vice Chairman and Group CEO. The bonus payment in relation to performance in the 2016/17 financial year will be payable 50% in cash and 50% in shares under Deferred Share Bonus Plan
PERFORMANCE SHARE PLAN AWARDS GRANTED AND VESTED DURING THE YEAR (AUDITED)The following award was granted to the Executive Directors on 11 November, 2016 under the PSP Scheme:
Type of award
Basis of award granted
(% of base compensation)
Share price at date of grant
Number of shares
over which award was at
granted
Face value of award
(£’000)
% of face value that
would vest at threshold
performance
Vesting determined by
performance over
Anil Agarwal Nominal-cost option 107% £8.215 210,000 1725 30%Navin Agarwal Nominal-cost option 90% £8.215 125,000 1027 30%Tom Albanese Nominal-cost option 115% £8.215 140,000 1150 30%
The Performance conditions attached to the above award is based on Vedanta Resources’ Relative TSR against the comparator group of industry peers. 30% of the awards will vest at median performance, with full vesting for upper quintile performance
There are 2 comparator groups – Global Comparator Group and Indian Comparator Group (since majority of our operations are in India). The percentage of the Shares comprised in the award that vest depends on the Company’s TSR relative to the companies in the Comparator Group on the basis of a ratio of 75:25 weightage as indicated below:
Global Comparator group (75% weightage) – The companies comprising the TSR comparator group are Anglo American, BHP Billiton, Rio Tinto, Glencore Xstrata, Vale, Antofagasta, Rusal, South 32, Santos, Korean Zinc, Fortescue, Alcoa, Boliden, First Quantum, and CNOOC Limited
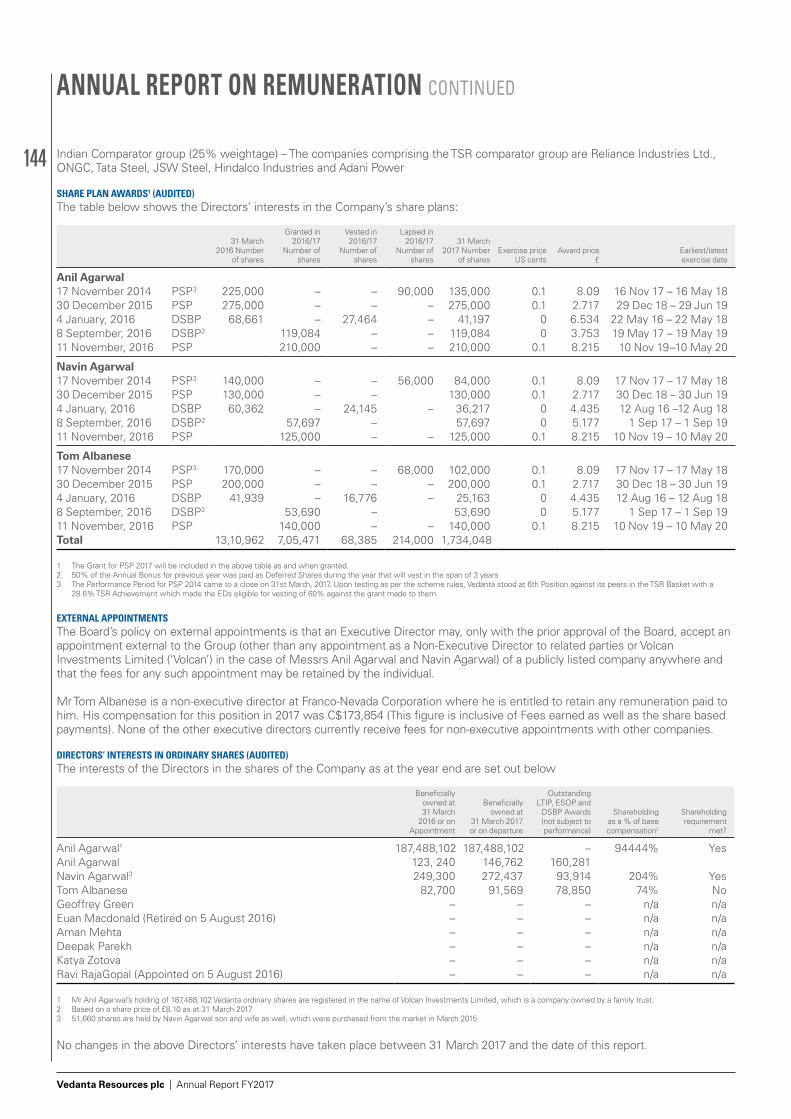
144
Vedanta Resources plc | Annual Report FY2017
ANNUAL REPORT ON REMUNERATION CONTINUED
Indian Comparator group (25% weightage) – The companies comprising the TSR comparator group are Reliance Industries Ltd., ONGC, Tata Steel, JSW Steel, Hindalco Industries and Adani Power
SHARE PLAN AWARDS1 (AUDITED)The table below shows the Directors’ interests in the Company’s share plans:
31 March 2016 Number
of shares
Granted in 2016/17
Number of shares
Vested in 2016/17
Number of shares
Lapsed in 2016/17
Number of shares
31 March 2017 Number
of sharesExercise price
US cents Award price
£Earliest/latest exercise date
Anil Agarwal17 November 2014 PSP3 225,000 – – 90,000 135,000 0.1 8.09 16 Nov 17 – 16 May 1830 December 2015 PSP 275,000 – – – 275,000 0.1 2.717 29 Dec 18 – 29 Jun 194 January, 2016 DSBP 68,661 – 27,464 – 41,197 0 6.534 22 May 16 – 22 May 188 September, 2016 DSBP2 119,084 – – 119,084 0 3.753 19 May 17 – 19 May 1911 November, 2016 PSP 210,000 – – 210,000 0.1 8.215 10 Nov 19–10 May 20
Navin Agarwal17 November 2014 PSP3 140,000 – – 56,000 84,000 0.1 8.09 17 Nov 17 – 17 May 1830 December 2015 PSP 130,000 – – 130,000 0.1 2.717 30 Dec 18 – 30 Jun 194 January, 2016 DSBP 60,362 – 24,145 – 36,217 0 4.435 12 Aug 16 –12 Aug 188 September, 2016 DSBP2 57,697 – 57,697 0 5.177 1 Sep 17 – 1 Sep 1911 November, 2016 PSP 125,000 – – 125,000 0.1 8.215 10 Nov 19 – 10 May 20
Tom Albanese 17 November 2014 PSP3 170,000 – – 68,000 102,000 0.1 8.09 17 Nov 17 – 17 May 1830 December 2015 PSP 200,000 – – – 200,000 0.1 2.717 30 Dec 18 – 30 Jun 194 January, 2016 DSBP 41,939 – 16,776 – 25,163 0 4.435 12 Aug 16 – 12 Aug 188 September, 2016 DSBP2 53,690 – 53,690 0 5.177 1 Sep 17 – 1 Sep 1911 November, 2016 PSP 140,000 – – 140,000 0.1 8.215 10 Nov 19 – 10 May 20Total 13,10,962 7,05,471 68,385 214,000 1,734,048
1 The Grant for PSP 2017 will be included in the above table as and when granted.2 50% of the Annual Bonus for previous year was paid as Deferred Shares during the year that will vest in the span of 3 years3 The Performance Period for PSP 2014 came to a close on 31st March, 2017. Upon testing as per the scheme rules, Vedanta stood at 6th Position against its peers in the TSR Basket with a
28.6% TSR Achievement which made the EDs eligible for vesting of 60% against the grant made to them.
EXTERNAL APPOINTMENTSThe Board’s policy on external appointments is that an Executive Director may, only with the prior approval of the Board, accept an appointment external to the Group (other than any appointment as a Non-Executive Director to related parties or Volcan Investments Limited (‘Volcan’) in the case of Messrs Anil Agarwal and Navin Agarwal) of a publicly listed company anywhere and that the fees for any such appointment may be retained by the individual.
Mr Tom Albanese is a non-executive director at Franco-Nevada Corporation where he is entitled to retain any remuneration paid to him. His compensation for this position in 2017 was C$173,854 (This figure is inclusive of Fees earned as well as the share based payments). None of the other executive directors currently receive fees for non-executive appointments with other companies.
DIRECTORS’ INTERESTS IN ORDINARY SHARES (AUDITED)The interests of the Directors in the shares of the Company as at the year end are set out below
Beneficially owned at 31 March
2016 or on Appointment
Beneficially owned at
31 March 2017 or on departure
Outstanding LTIP, ESOP and
DSBP Awards (not subject to performance)
Shareholding as a % of base compensation2
Shareholding requirement
met?
Anil Agarwal1 187,488,102 187,488,102 – 94444% YesAnil Agarwal 123, 240 146,762 160,281Navin Agarwal3 249,300 272,437 93,914 204% YesTom Albanese 82,700 91,569 78,850 74% NoGeoffrey Green – – – n/a n/aEuan Macdonald (Retired on 5 August 2016) – – – n/a n/aAman Mehta – – – n/a n/aDeepak Parekh – – – n/a n/aKatya Zotova – – – n/a n/aRavi RajaGopal (Appointed on 5 August 2016) – – – n/a n/a
1 Mr Anil Agarwal’s holding of 187,488,102 Vedanta ordinary shares are registered in the name of Volcan Investments Limited, which is a company owned by a family trust.2 Based on a share price of £8.10 as at 31 March 2017.3 51,660 shares are held by Navin Agarwal son and wife as well, which were purchased from the market in March 2015
No changes in the above Directors’ interests have taken place between 31 March 2017 and the date of this report.
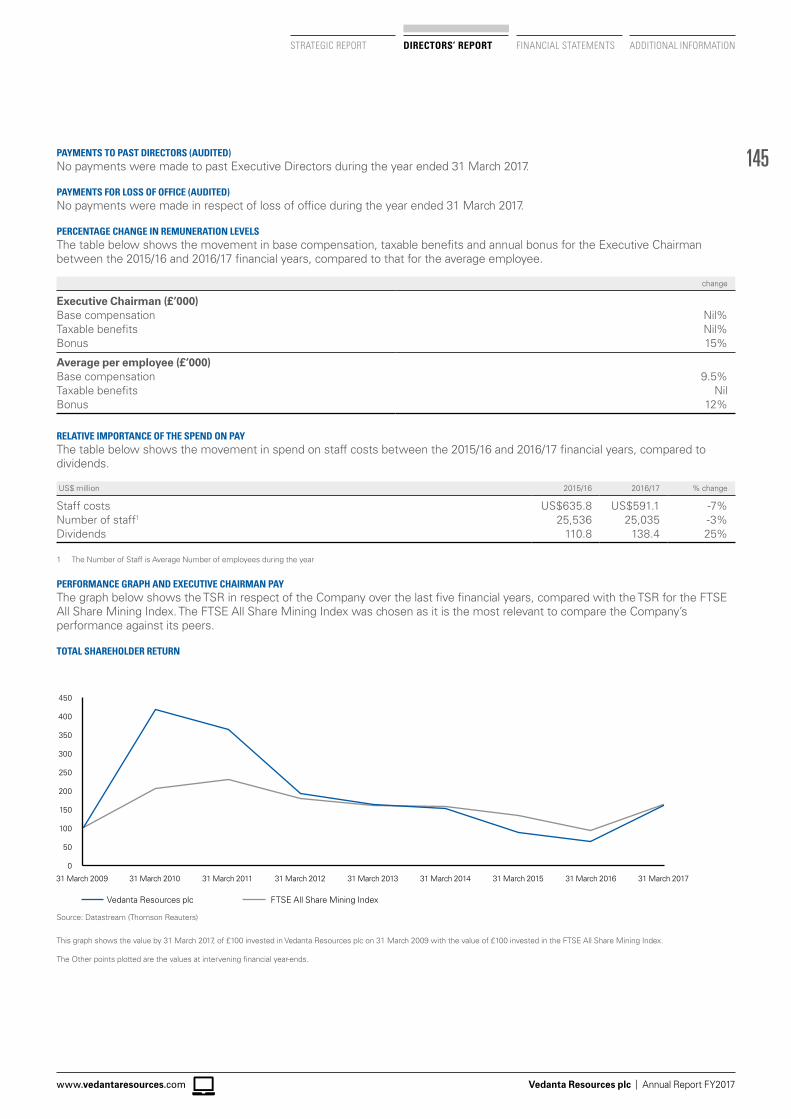
145
Vedanta Resources plc | Annual Report FY2017www.vedantaresources.com
STRATEGIC REPORT DIRECTORS’ REPORT FINANCIAL STATEMENTS ADDITIONAL INFORMATION
Vedanta Resources plc FTSE All Share Mining Index
0
50
100
150
200
250
300
350
400
450
31 March 2009 31 March 2010 31 March 2011 31 March 2012 31 March 2013 31 March 201531 March 2014 31 March 2016 31 March 2017
PAYMENTS TO PAST DIRECTORS (AUDITED)No payments were made to past Executive Directors during the year ended 31 March 2017.
PAYMENTS FOR LOSS OF OFFICE (AUDITED)No payments were made in respect of loss of office during the year ended 31 March 2017.
PERCENTAGE CHANGE IN REMUNERATION LEVELS The table below shows the movement in base compensation, taxable benefits and annual bonus for the Executive Chairman between the 2015/16 and 2016/17 financial years, compared to that for the average employee.
change
Executive Chairman (£’000)Base compensation Nil%Taxable benefits Nil%Bonus 15%
Average per employee (£’000)Base compensation 9.5%Taxable benefits NilBonus 12%
RELATIVE IMPORTANCE OF THE SPEND ON PAYThe table below shows the movement in spend on staff costs between the 2015/16 and 2016/17 financial years, compared to dividends.
US$ million 2015/16 2016/17 % change
Staff costs US$635.8 US$591.1 -7%Number of staff1 25,536 25,035 -3%Dividends 110.8 138.4 25%
1 The Number of Staff is Average Number of employees during the year
PERFORMANCE GRAPH AND EXECUTIVE CHAIRMAN PAYThe graph below shows the TSR in respect of the Company over the last five financial years, compared with the TSR for the FTSE All Share Mining Index. The FTSE All Share Mining Index was chosen as it is the most relevant to compare the Company’s performance against its peers.
TOTAL SHAREHOLDER RETURN
Source: Datastream (Thomson Reauters)
This graph shows the value by 31 March 2017, of £100 invested in Vedanta Resources plc on 31 March 2009 with the value of £100 invested in the FTSE All Share Mining Index.
The Other points plotted are the values at intervening financial year-ends.
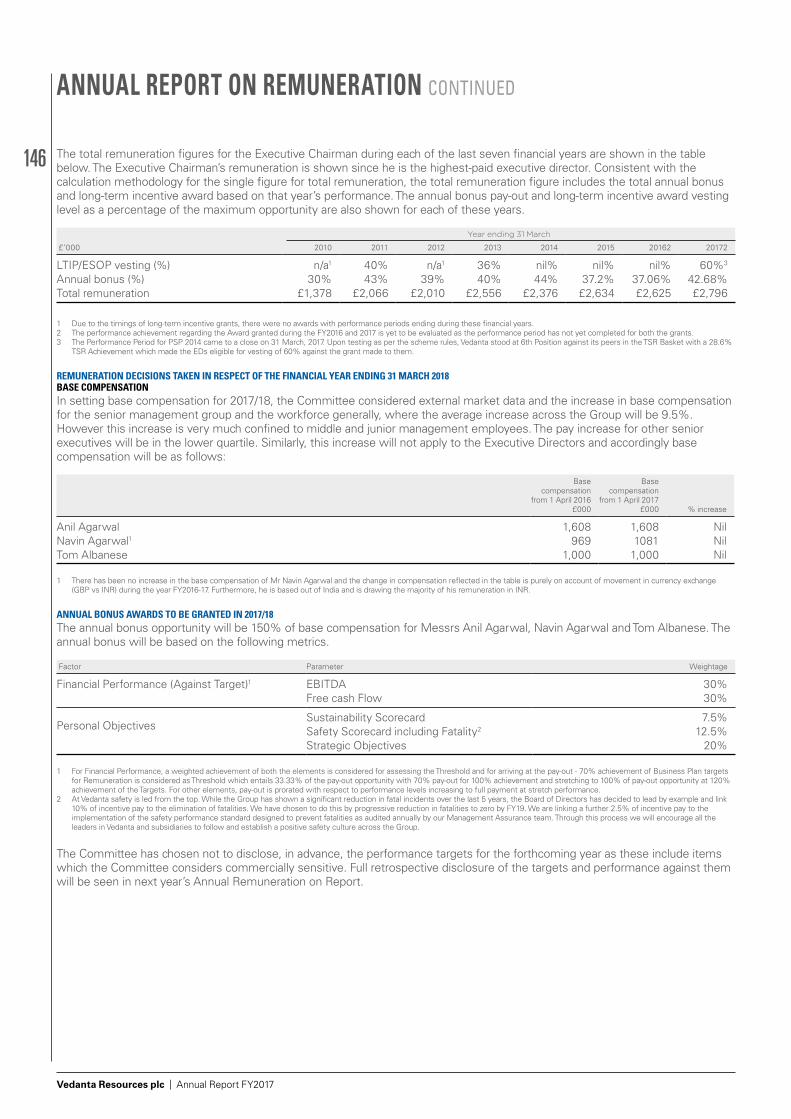
146
Vedanta Resources plc | Annual Report FY2017
ANNUAL REPORT ON REMUNERATION CONTINUED
The total remuneration figures for the Executive Chairman during each of the last seven financial years are shown in the table below. The Executive Chairman’s remuneration is shown since he is the highest-paid executive director. Consistent with the calculation methodology for the single figure for total remuneration, the total remuneration figure includes the total annual bonus and long-term incentive award based on that year’s performance. The annual bonus pay-out and long-term incentive award vesting level as a percentage of the maximum opportunity are also shown for each of these years.
£’000
Year ending 31 March
2010 2011 2012 2013 2014 2015 20162 20172
LTIP/ESOP vesting (%) n/a1 40% n/a1 36% nil% nil% nil% 60%3
Annual bonus (%) 30% 43% 39% 40% 44% 37.2% 37.06% 42.68%Total remuneration £1,378 £2,066 £2,010 £2,556 £2,376 £2,634 £2,625 £2,796
1 Due to the timings of long-term incentive grants, there were no awards with performance periods ending during these financial years.2 The performance achievement regarding the Award granted during the FY2016 and 2017 is yet to be evaluated as the performance period has not yet completed for both the grants.3 The Performance Period for PSP 2014 came to a close on 31 March, 2017. Upon testing as per the scheme rules, Vedanta stood at 6th Position against its peers in the TSR Basket with a 28.6%
TSR Achievement which made the EDs eligible for vesting of 60% against the grant made to them.
REMUNERATION DECISIONS TAKEN IN RESPECT OF THE FINANCIAL YEAR ENDING 31 MARCH 2018BASE COMPENSATIONIn setting base compensation for 2017/18, the Committee considered external market data and the increase in base compensation for the senior management group and the workforce generally, where the average increase across the Group will be 9.5%. However this increase is very much confined to middle and junior management employees. The pay increase for other senior executives will be in the lower quartile. Similarly, this increase will not apply to the Executive Directors and accordingly base compensation will be as follows:
Base compensation
from 1 April 2016 £000
Base compensation
from 1 April 2017 £000 % increase
Anil Agarwal 1,608 1,608 NilNavin Agarwal1 969 1081 NilTom Albanese 1,000 1,000 Nil
1 There has been no increase in the base compensation of Mr Navin Agarwal and the change in compensation reflected in the table is purely on account of movement in currency exchange (GBP vs INR) during the year FY2016-17. Furthermore, he is based out of India and is drawing the majority of his remuneration in INR.
ANNUAL BONUS AWARDS TO BE GRANTED IN 2017/18The annual bonus opportunity will be 150% of base compensation for Messrs Anil Agarwal, Navin Agarwal and Tom Albanese. The annual bonus will be based on the following metrics.
Factor Parameter Weightage
Financial Performance (Against Target)1 EBITDA 30%Free cash Flow 30%
Sustainability Scorecard 7.5%Personal Objectives Safety Scorecard including Fatality2 12.5%
Strategic Objectives 20%
1 For Financial Performance, a weighted achievement of both the elements is considered for assessing the Threshold and for arriving at the pay-out - 70% achievement of Business Plan targets for Remuneration is considered as Threshold which entails 33.33% of the pay-out opportunity with 70% pay-out for 100% achievement and stretching to 100% of pay-out opportunity at 120% achievement of the Targets. For other elements, pay-out is prorated with respect to performance levels increasing to full payment at stretch performance.
2 At Vedanta safety is led from the top. While the Group has shown a significant reduction in fatal incidents over the last 5 years, the Board of Directors has decided to lead by example and link 10% of incentive pay to the elimination of fatalities. We have chosen to do this by progressive reduction in fatalities to zero by FY19. We are linking a further 2.5% of incentive pay to the implementation of the safety performance standard designed to prevent fatalities as audited annually by our Management Assurance team. Through this process we will encourage all the leaders in Vedanta and subsidiaries to follow and establish a positive safety culture across the Group.
The Committee has chosen not to disclose, in advance, the performance targets for the forthcoming year as these include items which the Committee considers commercially sensitive. Full retrospective disclosure of the targets and performance against them will be seen in next year’s Annual Remuneration on Report.
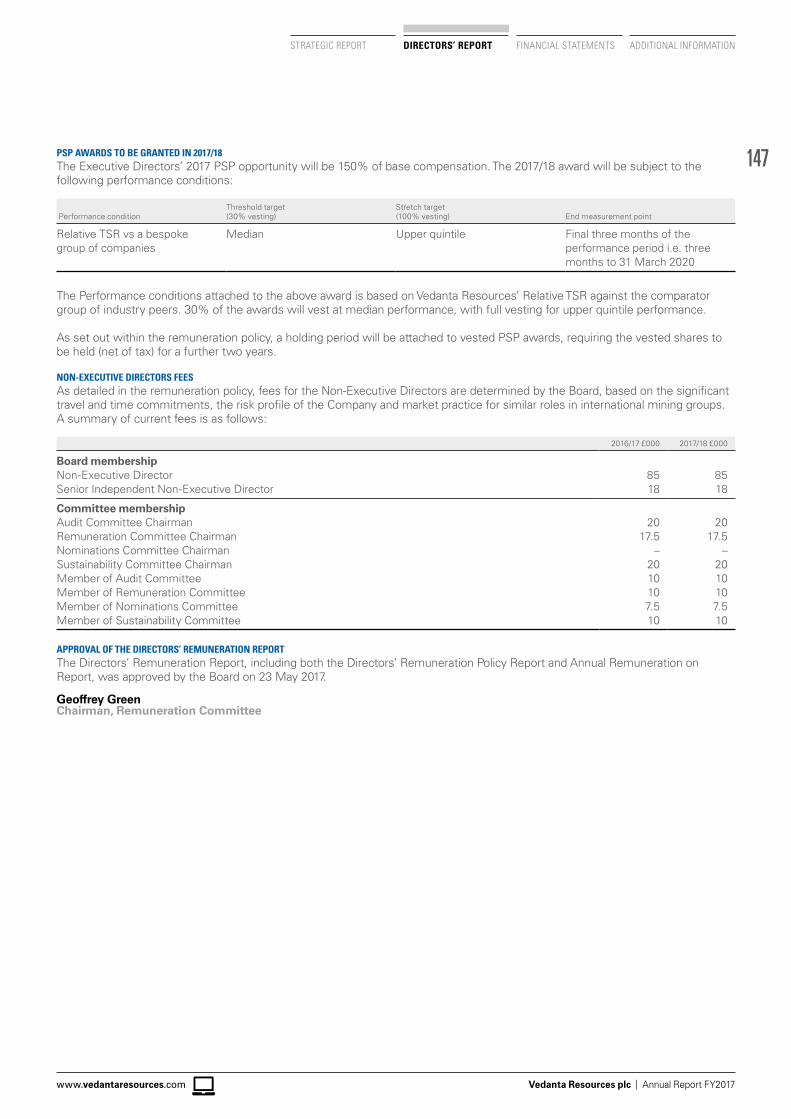
147
Vedanta Resources plc | Annual Report FY2017www.vedantaresources.com
STRATEGIC REPORT DIRECTORS’ REPORT FINANCIAL STATEMENTS ADDITIONAL INFORMATION
PSP AWARDS TO BE GRANTED IN 2017/18The Executive Directors’ 2017 PSP opportunity will be 150% of base compensation. The 2017/18 award will be subject to the following performance conditions:
Performance conditionThreshold target(30% vesting)
Stretch target(100% vesting) End measurement point
Relative TSR vs a bespoke group of companies
Median Upper quintile Final three months of theperformance period i.e. threemonths to 31 March 2020
The Performance conditions attached to the above award is based on Vedanta Resources’ Relative TSR against the comparator group of industry peers. 30% of the awards will vest at median performance, with full vesting for upper quintile performance.
As set out within the remuneration policy, a holding period will be attached to vested PSP awards, requiring the vested shares to be held (net of tax) for a further two years. NON-EXECUTIVE DIRECTORS FEESAs detailed in the remuneration policy, fees for the Non-Executive Directors are determined by the Board, based on the significant travel and time commitments, the risk profile of the Company and market practice for similar roles in international mining groups. A summary of current fees is as follows:
2016/17 £000 2017/18 £000
Board membershipNon-Executive Director 85 85Senior Independent Non-Executive Director 18 18
Committee membership Audit Committee Chairman 20 20Remuneration Committee Chairman 17.5 17.5Nominations Committee Chairman – –Sustainability Committee Chairman 20 20Member of Audit Committee 10 10Member of Remuneration Committee 10 10Member of Nominations Committee 7.5 7.5Member of Sustainability Committee 10 10
APPROVAL OF THE DIRECTORS’ REMUNERATION REPORTThe Directors’ Remuneration Report, including both the Directors’ Remuneration Policy Report and Annual Remuneration on Report, was approved by the Board on 23 May 2017.
Geoffrey GreenChairman, Remuneration Committee
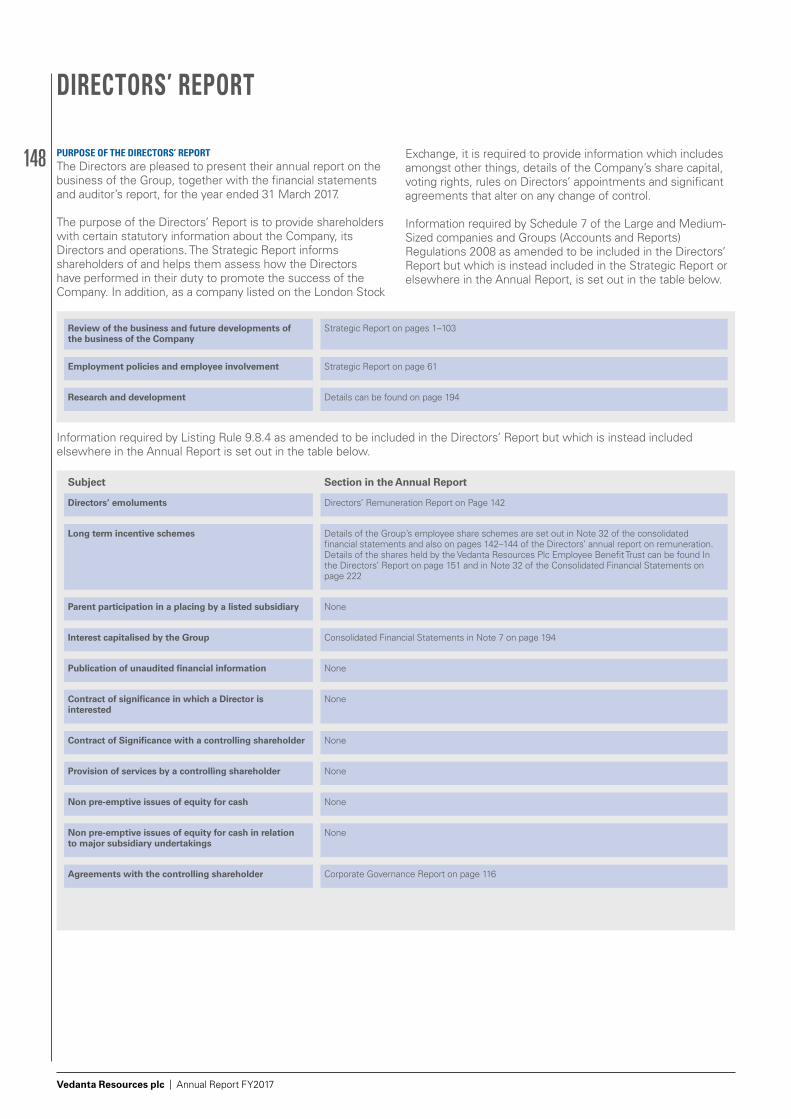
148
Vedanta Resources plc | Annual Report FY2017
DIRECTORS’ REPORT
PURPOSE OF THE DIRECTORS’ REPORTThe Directors are pleased to present their annual report on the business of the Group, together with the financial statements and auditor’s report, for the year ended 31 March 2017.
The purpose of the Directors’ Report is to provide shareholders with certain statutory information about the Company, its Directors and operations. The Strategic Report informs shareholders of and helps them assess how the Directors have performed in their duty to promote the success of the Company. In addition, as a company listed on the London Stock
Exchange, it is required to provide information which includes amongst other things, details of the Company’s share capital, voting rights, rules on Directors’ appointments and significant agreements that alter on any change of control.
Information required by Schedule 7 of the Large and Medium-Sized companies and Groups (Accounts and Reports) Regulations 2008 as amended to be included in the Directors’ Report but which is instead included in the Strategic Report or elsewhere in the Annual Report, is set out in the table below.
Review of the business and future developments of the business of the Company
Strategic Report on pages 1–103
Employment policies and employee involvement Strategic Report on page 61
Research and development Details can be found on page 194
Subject Section in the Annual Report
Directors’ emoluments Directors’ Remuneration Report on Page 142
Long term incentive schemes Details of the Group’s employee share schemes are set out in Note 32 of the consolidated financial statements and also on pages 142–144 of the Directors’ annual report on remuneration. Details of the shares held by the Vedanta Resources Plc Employee Benefit Trust can be found In the Directors’ Report on page 151 and in Note 32 of the Consolidated Financial Statements on page 222
Parent participation in a placing by a listed subsidiary None
Interest capitalised by the Group Consolidated Financial Statements in Note 7 on page 194
Publication of unaudited financial information None
Contract of significance in which a Director is interested
None
Contract of Significance with a controlling shareholder None
Provision of services by a controlling shareholder None
Non pre-emptive issues of equity for cash None
Non pre-emptive issues of equity for cash in relation to major subsidiary undertakings
None
Agreements with the controlling shareholder Corporate Governance Report on page 116
Information required by Listing Rule 9.8.4 as amended to be included in the Directors’ Report but which is instead included elsewhere in the Annual Report is set out in the table below.
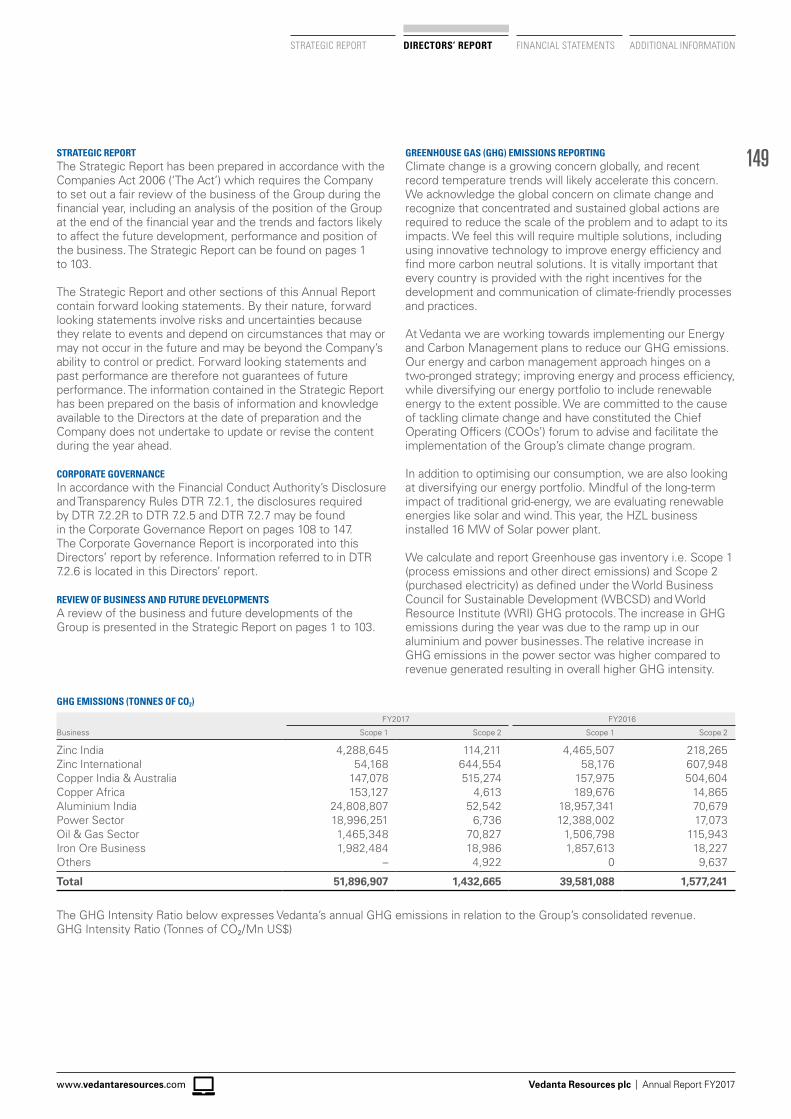
149
Vedanta Resources plc | Annual Report FY2017www.vedantaresources.com
FINANCIAL STATEMENTS ADDITIONAL INFORMATIONDIRECTORS’ REPORTSTRATEGIC REPORT
STRATEGIC REPORTThe Strategic Report has been prepared in accordance with the Companies Act 2006 (‘The Act’) which requires the Company to set out a fair review of the business of the Group during the financial year, including an analysis of the position of the Group at the end of the financial year and the trends and factors likely to affect the future development, performance and position of the business. The Strategic Report can be found on pages 1 to 103.
The Strategic Report and other sections of this Annual Report contain forward looking statements. By their nature, forward looking statements involve risks and uncertainties because they relate to events and depend on circumstances that may or may not occur in the future and may be beyond the Company’s ability to control or predict. Forward looking statements and past performance are therefore not guarantees of future performance. The information contained in the Strategic Report has been prepared on the basis of information and knowledge available to the Directors at the date of preparation and the Company does not undertake to update or revise the content during the year ahead.
CORPORATE GOVERNANCEIn accordance with the Financial Conduct Authority’s Disclosure and Transparency Rules DTR 7.2.1, the disclosures required by DTR 7.2.2R to DTR 7.2.5 and DTR 7.2.7 may be found in the Corporate Governance Report on pages 108 to 147. The Corporate Governance Report is incorporated into this Directors’ report by reference. Information referred to in DTR 7.2.6 is located in this Directors’ report.
REVIEW OF BUSINESS AND FUTURE DEVELOPMENTS A review of the business and future developments of the Group is presented in the Strategic Report on pages 1 to 103.
GREENHOUSE GAS (GHG) EMISSIONS REPORTINGClimate change is a growing concern globally, and recent record temperature trends will likely accelerate this concern. We acknowledge the global concern on climate change and recognize that concentrated and sustained global actions are required to reduce the scale of the problem and to adapt to its impacts. We feel this will require multiple solutions, including using innovative technology to improve energy efficiency and find more carbon neutral solutions. It is vitally important that every country is provided with the right incentives for the development and communication of climate-friendly processes and practices.
At Vedanta we are working towards implementing our Energy and Carbon Management plans to reduce our GHG emissions. Our energy and carbon management approach hinges on a two-pronged strategy; improving energy and process efficiency, while diversifying our energy portfolio to include renewable energy to the extent possible. We are committed to the cause of tackling climate change and have constituted the Chief Operating Officers (COOs’) forum to advise and facilitate the implementation of the Group’s climate change program.
In addition to optimising our consumption, we are also looking at diversifying our energy portfolio. Mindful of the long-term impact of traditional grid-energy, we are evaluating renewable energies like solar and wind. This year, the HZL business installed 16 MW of Solar power plant.
We calculate and report Greenhouse gas inventory i.e. Scope 1 (process emissions and other direct emissions) and Scope 2 (purchased electricity) as defined under the World Business Council for Sustainable Development (WBCSD) and World Resource Institute (WRI) GHG protocols. The increase in GHG emissions during the year was due to the ramp up in our aluminium and power businesses. The relative increase in GHG emissions in the power sector was higher compared to revenue generated resulting in overall higher GHG intensity.
GHG EMISSIONS (TONNES OF CO2)
Business
FY2017 FY2016
Scope 1 Scope 2 Scope 1 Scope 2
Zinc India 4,288,645 114,211 4,465,507 218,265Zinc International 54,168 644,554 58,176 607,948Copper India & Australia 147,078 515,274 157,975 504,604Copper Africa 153,127 4,613 189,676 14,865Aluminium India 24,808,807 52,542 18,957,341 70,679Power Sector 18,996,251 6,736 12,388,002 17,073Oil & Gas Sector 1,465,348 70,827 1,506,798 115,943Iron Ore Business 1,982,484 18,986 1,857,613 18,227Others – 4,922 0 9,637
Total 51,896,907 1,432,665 39,581,088 1,577,241
The GHG Intensity Ratio below expresses Vedanta’s annual GHG emissions in relation to the Group’s consolidated revenue.GHG Intensity Ratio (Tonnes of CO2/Mn US$)
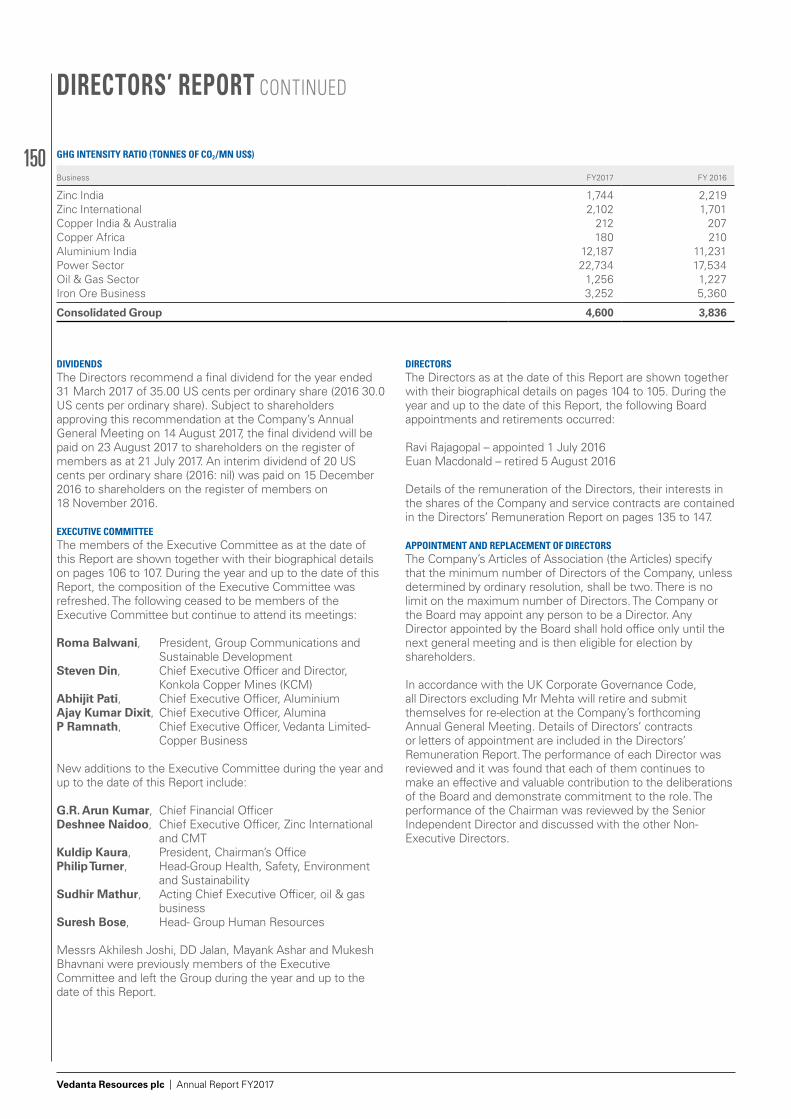
150
Vedanta Resources plc | Annual Report FY2017
GHG INTENSITY RATIO (TONNES OF CO2/MN US$)
Business FY2017 FY 2016
Zinc India 1,744 2,219Zinc International 2,102 1,701Copper India & Australia 212 207Copper Africa 180 210Aluminium India 12,187 11,231Power Sector 22,734 17,534Oil & Gas Sector 1,256 1,227Iron Ore Business 3,252 5,360
Consolidated Group 4,600 3,836
DIVIDENDSThe Directors recommend a final dividend for the year ended 31 March 2017 of 35.00 US cents per ordinary share (2016 30.0 US cents per ordinary share). Subject to shareholders approving this recommendation at the Company’s Annual General Meeting on 14 August 2017, the final dividend will be paid on 23 August 2017 to shareholders on the register of members as at 21 July 2017. An interim dividend of 20 US cents per ordinary share (2016: nil) was paid on 15 December 2016 to shareholders on the register of members on 18 November 2016.
EXECUTIVE COMMITTEE The members of the Executive Committee as at the date of this Report are shown together with their biographical details on pages 106 to 107. During the year and up to the date of this Report, the composition of the Executive Committee was refreshed. The following ceased to be members of the Executive Committee but continue to attend its meetings:
Roma Balwani, President, Group Communications and Sustainable Development
Steven Din, Chief Executive Officer and Director, Konkola Copper Mines (KCM)
Abhijit Pati, Chief Executive Officer, AluminiumAjay Kumar Dixit, Chief Executive Officer, Alumina P Ramnath, Chief Executive Officer, Vedanta Limited-
Copper Business
New additions to the Executive Committee during the year and up to the date of this Report include:
G.R. Arun Kumar, Chief Financial OfficerDeshnee Naidoo, Chief Executive Officer, Zinc International and CMTKuldip Kaura, President, Chairman’s OfficePhilip Turner, Head-Group Health, Safety, Environment
and SustainabilitySudhir Mathur, Acting Chief Executive Officer, oil & gas
businessSuresh Bose, Head- Group Human Resources
Messrs Akhilesh Joshi, DD Jalan, Mayank Ashar and Mukesh Bhavnani were previously members of the Executive Committee and left the Group during the year and up to the date of this Report.
DIRECTORS’ REPORT CONTINUED
DIRECTORSThe Directors as at the date of this Report are shown together with their biographical details on pages 104 to 105. During the year and up to the date of this Report, the following Board appointments and retirements occurred:
Ravi Rajagopal – appointed 1 July 2016Euan Macdonald – retired 5 August 2016
Details of the remuneration of the Directors, their interests in the shares of the Company and service contracts are contained in the Directors’ Remuneration Report on pages 135 to 147.
APPOINTMENT AND REPLACEMENT OF DIRECTORSThe Company’s Articles of Association (the Articles) specify that the minimum number of Directors of the Company, unless determined by ordinary resolution, shall be two. There is no limit on the maximum number of Directors. The Company or the Board may appoint any person to be a Director. Any Director appointed by the Board shall hold office only until the next general meeting and is then eligible for election by shareholders.
In accordance with the UK Corporate Governance Code, all Directors excluding Mr Mehta will retire and submit themselves for re-election at the Company’s forthcoming Annual General Meeting. Details of Directors’ contracts or letters of appointment are included in the Directors’ Remuneration Report. The performance of each Director was reviewed and it was found that each of them continues to make an effective and valuable contribution to the deliberations of the Board and demonstrate commitment to the role. The performance of the Chairman was reviewed by the Senior Independent Director and discussed with the other Non-Executive Directors.
151
Vedanta Resources plc | Annual Report FY2017www.vedantaresources.com
FINANCIAL STATEMENTS ADDITIONAL INFORMATIONDIRECTORS’ REPORTSTRATEGIC REPORT
POWERS OF THE DIRECTORSSubject to the provisions of the Companies Act and the Company’s Articles and to any directions given by special resolution, the business of the Company is to be managed by the Board which may exercise all the powers of the Company.
DIRECTORS’ EMOLUMENTSDetails of the Directors’ emoluments and any waiver are included in the Directors’ Remuneration Report on pages 142–144.
LONG TERM INCENTIVE SCHEMES Details of the long-term incentive schemes operated by the Company namely the Performance Share Plan (PSP) and the Deferred Share Bonus Plan (DSBP) are included in the Directors’ Remuneration Report on pages 143–144.
DIVIDEND WAIVERAs noted in the Remuneration Committee Report contained in pages 135 to 147 of this document, the Company operates a DSBP under which bonus payments to the Executive Chairman, Executive Vice Chairman and Group Chief Executive Officer are payable partly in cash and partly in deferred share awards which vest over a staggered period of two or three years subject to service conditions being met. Pending vesting, Sanne Fiduciary Services Limited (SFSL) holds any shares that are the subject of awards under the DSBP as nominee on behalf of the relevant executives. SFSL, on behalf of the relevant executives, has waived the right to receive dividends on these shares as well as any voting rights attaching to these shares pending vesting of these awards in accordance with the rules of the DSBP. As at 31 March 2017, there were 163,250 shares in respect of the DSBP and 254,195 shares in respect of Forfeitable Share Awards granted under the DSBP to Anil Agarwal and Navin Agarwal. Other than the waiver of dividends by SFSL as described above, there have been no arrangements under which a shareholder has waived or agreed to waive dividends or future dividends during the year ended 31 March 2017.
DIRECTORS’ AND OFFICERS’ LIABILITY INSURANCE AND INDEMNITIESThe Company purchases and maintains liability insurance for its Directors and Officers and those of the subsidiaries of the Group, as permitted by the Act. The insurance policy does not provide cover where the Director has acted fraudulently or dishonestly. The Company believes that it is appropriate to provide such cover to protect Directors from innocent error as the Directors carry significant liability under criminal and civil law and under the UK Listing, Prospectus and Disclosure and Transparency Rules, and face a range of penalties.
In addition, the Company’s Articles contain an indemnity provision in favour of the Directors against proceedings brought by third parties, subject to the Act, to allow the Company to pay legal defence costs for the Director where the Director is exonerated.
EMPLOYEESInformation on the Group’s employees and its policies with respect to employees can be found in the Sustainability Report section of the Strategic Report on page 61. In summary, the Group’s commitment to communication and dialogue with employees continues. The existence of a Group-wide intranet enables engagement and communication with employees throughout the Group. It also helps management to share information, ideas and opportunities quickly and to achieve a common awareness on the part of all employees of the financial and economic factors affecting the performance of the Company. Employees have opportunities to voice their opinions and ask questions through the Group intranet and engage in question and answer sessions with the Executive Chairman.
POLITICAL DONATIONSIt is the Board’s policy that neither Vedanta nor any of its subsidiary companies outside India may, under any circumstances, make donations or contributions to political organisations. Subsidiaries in India may make political donations or contributions as this is customary in India and permitted under local legislation. In exceptional circumstances, if political donations or contributions are deemed necessary in the United Kingdom and European Union for legitimate business reasons, they will not be made without the approval of the Board and shareholders at a general meeting. Any political donations made in India will be disclosed in the Company’s Annual Report and Accounts. The Company and its subsidiaries did not make any political donations during the financial year ended 31 March 2017 (2016: Nil).
RESEARCH AND DEVELOPMENTThe Group’s business units carry out research and development activities necessary to further their operations.
POST BALANCE SHEET EVENTSPost balance Sheet events have been disclosed in Note 43 to the financial statements.
MATERIAL SHAREHOLDINGSAs at 31 March 2017 and 14 June 2017, the Company had received notifications of control of 3% or more over the Company’s total voting rights and capital in issue as set out below:
Name of shareholderNature of holding
Number of ordinary shares
of US$0.10 each
Percentage of total voting
rights
Volcan Investments Limited Indirect 187,488,102 69.39% Standard Life Investment (Holdings Limited) Indirect – Below 5%Viktor Falk Direct 8,340,408 3.10%
1 The voting rights at 31 March 2017 were 270,189,014 ordinary shares (net of treasury shares and shares held in Global Depositary Receipt.)
152
Vedanta Resources plc | Annual Report FY2017
ARTICLES OF ASSOCIATION, SHARE CAPITAL AND VOTING RIGHTSThe following description summarises certain provisions in the Company’s Articles and applicable English law concerning companies. This is a summary only and the relevant provisions of the Act, or the Articles should be consulted if further information is required. Copies of the Company’s current Articles are available for inspection at the Company’s registered office during normal business hours. They are also available from Companies House and the Company’s website at www.vedantaresources.com.
AMENDMENTS TO THE ARTICLESThe Company’s Articles may be amended only by special resolution passed by the Company’s shareholders.
SHARE CAPITALAs at 31 March 2017 the issued share capital of the Company was comprised of 301,300,825 ordinary shares of US$0.10 each and 50,000 deferred shares of £1 each.
RIGHTS AND OBLIGATIONS ATTACHING TO SHARESThe rights and obligations attaching to the ordinary and deferred shares are set out in the Articles. Details of the issued share capital together with movements in the Company’s issued share capital during the year are shown in Note 35 of the financial statements.
Vedanta currently holds 22,502,483 ordinary shares in treasury. A further 1,704,333 shares, which had previously been purchased under Vedanta’s Buyback Programme, were held by an independent company, Gorey Investments Limited (Gorey) and this company will not vote on these shares. These shares purchased by Gorey will be treated in the consolidated accounts of Vedanta as treasury shares.
6,904,995 ordinary shares of 10 US cents each were issued on the conversion of certain convertible bonds issued by one of the Company’s subsidiaries. These 6,904,995 ordinary shares are held through a global depository receipt and carry no voting rights. Apart from the above, each ordinary share carries the right to one vote at general meetings of the Company. Holders of deferred shares are not entitled to attend, speak or vote at any general meeting of the Company, nor are they entitled to the payment of any dividend or to receive notice of general meetings.
Further details of the rights attaching to the deferred shares are set out in the Articles and summarised in Note 35 of the financial statements.
DIRECTORS’ REPORT CONTINUED
VARIATION OF RIGHTSSubject to the provisions of the Act, the rights attached to any class may be varied with the consent of the holders of three-quarters in nominal value of the issued shares of the class or with the sanction of an extraordinary resolution passed at a separate general meeting of the holders of the shares of the class.
DEADLINES FOR EXERCISING VOTING RIGHTSVotes may be exercised at general meetings in relation to the business being transacted either in person, by proxy or, in relation to corporate members, by corporate representatives. The Articles provide that forms of proxy shall be submitted not less than 48 hours before the time appointed for holding the meeting or adjourned meeting.
RESTRICTIONS ON VOTING AND THE TRANSFER OF SHARESNo member shall be entitled to vote at a general meeting or at a separate meeting of the holders of any class of shares in the capital of the Company, either in person or by proxy, in respect of any share held by him unless all monies payable by him in respect of that share have been fully paid. Furthermore, no shareholder shall be entitled to attend or vote either personally or by proxy at a general meeting or at a separate meeting of the holders of that class of shares or on a poll if he has been served with a notice after failing to provide the Company with information concerning interests in his shares that is required to be provided under the Act.
With the exception of restrictions on the transfer of unpaid shares and ordinary shares held under the Company’s employee share incentive plans whilst the shares are subject to the rules of the plans, there are no restrictions on the transfer rights attaching to the Company’s ordinary shares or the transfer of securities in the Company.
No person holds securities in the Company carrying special rights with regard to control of the Company. The Company is not aware of any agreements between holders of securities that may result in restrictions in the transfer of securities or voting rights.
153
Vedanta Resources plc | Annual Report FY2017www.vedantaresources.com
FINANCIAL STATEMENTS ADDITIONAL INFORMATIONDIRECTORS’ REPORTSTRATEGIC REPORT
ISSUE OF SHARESThe powers of the Company’s Directors are subject to relevant legislation and, in certain circumstances (including in relation to the issue or buying back by the Company of its shares), are subject to authority being given to the Directors by shareholders in general meeting. At the Company’s 2017 Annual General Meeting, shareholders will be asked to renew the Directors’ authority to allot new securities. Details are contained in the 2017 Notice of Annual General Meeting (Notice of AGM).
Subject to the provisions of the Act, the Company has authority under its Articles to allot new shares in the Company. Such authority would be exercised having regard to the Statement of Principles published by the Pre-emption Group.
SHARES HELD IN UNCERTIFICATED FORMSubject to the provisions of the Uncertificated Securities Regulations 2001, the Board may permit the holding of shares in any class of shares in uncertificated form and the transfer of title to shares in that class by means of a relevant system and may determine that any class of shares shall cease to be a participating security.
DIVIDENDS AND DISTRIBUTIONSSubject to the provisions of the Act, the Company may by ordinary resolution declare dividends in accordance with the respective rights of the members, but no dividend shall exceed the amount recommended by the Board. The Board may pay interim dividends if it appears to the Board that they are justified by the profits of the Company available for distribution. The treasury shares directly held by the Company are not entitled to receive a dividend.
Dividends may be declared and paid in any currency or currencies that the Board shall determine. The Board may also determine the exchange rate and the relevant date for determining the value of the dividend in any currency.
PURCHASE OF THE COMPANY’S OWN SHARESThe Directors had authority, under a shareholders’ resolution dated 5 August 2016, to make market purchases of up to approximately 10% of the Company’s ordinary shares. The authority expires at the conclusion of the Company’s 2017 Annual General Meeting or on 1 October 2017, whichever is the earlier. A resolution to obtain a further authority will be proposed at the 2017 Annual General Meeting. During the year the Company did not purchase any shares under its previously announced share buyback programme.
As at 31 March 2017, the Company held a total of 24,206,816 ordinary shares in treasury equivalent to 8.03% (2016: 8.05%) of the issued share capital.
AGREEMENTS: CHANGE OF CONTROLThere are a number of agreements that take effect, alter or terminate upon a change of control of the Company such as commercial contracts, bank loan agreements, and capital market borrowing. The following are considered to be significant in terms of their likely impact on the business of the Group as a whole:
1 The US$1,200 million 6% bonds due in 2019 (of which approximately US$775 million is outstanding, US$900 million 8.25% bonds due in 2021, US$1000 million 6.375% bonds due in 2022 and US$500 million 7.125% bonds due in 2023 where a change of control together with a rating decline requires the Company to make an offer to purchase all of the outstanding bonds at 101% of the principal amount together with any accrued and unpaid interest.
2 Under various other financing facilities entered into by the Group where a change of control gives the majority lenders the right to declare the loans immediately payable.
All of the Company’s employee share incentive plans contain provisions relating to a change of control. Outstanding awards and options would normally vest and become exercisable on a change of control, subject to the satisfaction of any performance conditions and pro-rata reduction as may be applicable under the rules of the employee share incentive plans.
There are no agreements between the Company and any of its Directors or employees that provide for compensation for loss of office or employment that occurs because of a takeover bid.
DISCLOSURE OF INFORMATION TO AUDITORSIn accordance with section 418 of the Act, each Director who held office at the date of approval of this Directors’ Report confirms that:
❯ so far as he/she is aware, there is no relevant audit information of which the Company’s auditor is unaware; and
❯ he/she has taken all the steps that he/she ought to have taken as a Director to make himself/herself aware of any relevant audit information and to establish that the Company’s auditor is aware of that information.
APPOINTMENT OF EXTERNAL AUDITORFollowing a competitive tender process held by the Company in 2015 and approval by shareholders at the Company’s 2016 Annual General Meeting, Ernst & Young LLP was appointed as the Company’s external auditor for the year ending 31 March 2017. A resolution to reappoint Ernst & Young LLP as the Group’s external auditor will be proposed at Company’s the forthcoming Annual General Meeting.
154
Vedanta Resources plc | Annual Report FY2017
POLICY ON DERIVATIVES AND FINANCIAL INSTRUMENTSAn explanation of the Group’s financial management objectives and policies together with details of the Group’s exposure to price risk, credit risk, liquidity and cash flow risk and foreign currency risk appears in Note 29 to the financial statements.
SHARE ALLOTMENTS During the year, there has been not been any allotment, for cash, of equity securities otherwise than to holders of the Company’s equity shares authorised by the Company’s shareholders.
SHARE PLACINGThe Company has not participated in any share placing during the year ended 31 March 2017.
RELATIONSHIP AGREEMENT WITH THE COMPANY’S CONTROLLING SHAREHOLDERDetails of the Relationship Agreement between the Company and its controlling shareholder, Volcan Investments Limited, are provided in the Corporate Governance Report on pages 116–117.
GOING CONCERNThe Directors have considered the Group’s cash flow forecasts for the next twelve month period, from the date of signing the financial statements ending 31 March 2017. Net debt has increased by US$1.2 billion in the financial year to US$8.5 billion, with US$0.9 billion of undrawn facilities at the balance sheet date. Further analysis of net debt is set out in Note 26 of the financial statements and details of borrowings and facilities are set out on page 207. The Board is satisfied that the Group’s forecasts and projections show that the Group will be able to operate within the level of its current facilities for the foreseeable future. This takes into account reasonably possible changes in trading performance on cash flows and forecast covenant compliance; the transferability of cash within the Group; the flexibility that the Group has over the timings of its capital expenditure; and other uncertainties. For these reasons, the Group continues to adopt the ‘going concern’ basis in preparing its financial statements.
LONGER TERM VIABILITY STATEMENTIn accordance with paragraph C2.2 of the UK Corporate Governance Code, the Directors have assessed the prospects of the Group’s viability over a longer period than the 12 months required by the going concern assessment. Details of this assessment are included in the Strategic Report on page 68.
DIRECTORS’ REPORT CONTINUED
ANNUAL GENERAL MEETINGThe 2017 Annual General Meeting of the Company will be held on 14 August 2017 at 3:00pm at The Lincoln Centre, Lincoln’s Inn Fields, London WC2A 3ED. The Notice convening the 2017 Annual General Meeting accompanies this Annual Report and Accounts FY2017 and sets out details of the business to be considered thereof.
The Strategic Report as set out on pages 1 to 103 and the Directors’ Report as set out on pages 148 to 154 were prepared in accordance with the applicable UK company law and was approved by the Board on 23 May 2017.
By order of the Board
Signed on behalf of the Board
Deepak KumarCompany Secretary23 May 2017 Vedanta Resources plc5th Floor, 6 St Andrew Street, London, EC4A 3AE
Registered in England Number 4740415

155
Vedanta Resources plc | Annual Report FY2017www.vedantaresources.com
FINANCIAL STATEMENTS ADDITIONAL INFORMATIONDIRECTORS’ REPORTSTRATEGIC REPORT
DIRECTORS’ RESPONSIBILITIES STATEMENT
The Directors are responsible for preparing the Annual Report and the financial statements in accordance with applicable law and regulations.
Company law requires the Directors to prepare financial statements for each financial year. Under that law the Directors are required to prepare the group financial statements in accordance with International Financial Reporting Standards (IFRSs) as adopted by the European Union and Article 4 of the IAS Regulation and have elected to prepare the parent company financial statements in accordance with United Kingdom Generally Accepted Accounting Practice (United Kingdom Accounting Standards and applicable law), including FRS 101 “Reduced Disclosure Framework”. Under company law, the Directors must not approve the accounts unless they are satisfied that they give a true and fair view of the state of affairs of the Company and of the profit or loss of the Company for that period.
In preparing the parent company financial statements, the Directors are required to:
❯ select suitable accounting policies and then apply them consistently;
❯ make judgments and accounting estimates that are reasonable and prudent;
❯ state whether applicable UK Accounting Standards have been followed, subject to any material departures disclosed and explained in the financial statements; and
❯ prepare the financial statements on the going concern basis unless it is inappropriate to presume that the Company will continue in business.
In preparing the group financial statements, International Accounting Standard 1 requires that Directors:
❯ properly select and apply accounting policies; ❯ present information, including accounting policies, in a
manner that provides relevant, reliable, comparable and understandable information;
❯ provide additional disclosures when compliance with the specific requirements in IFRSs are insufficient to enable users to understand the impact of particular transactions, other events and conditions on the entity’s financial position and financial performance; and
❯ make an assessment of the Company’s ability to continue as a going concern.
The Directors are responsible for keeping adequate accounting records that are sufficient to show and explain the Group and parent company’s transactions and disclose with reasonable accuracy at any time the financial position of the Group and parent company and enable them to ensure that the financial statements comply with the Companies Act 2006. They are also responsible for safeguarding the assets of the Company and hence for taking reasonable steps for the prevention and detection of fraud and other irregularities.
The Directors are also responsible for preparing a Directors’ Report, Directors’ Remuneration Report and Corporate Governance Statement that comply with that law and those regulations. The Directors are responsible for the maintenance and integrity of the corporate and financial information included on the Company’s website. Legislation in the United Kingdom governing the preparation and dissemination of financial statements may differ from legislation in other jurisdictions.
RESPONSIBILITY STATEMENT Each of the Directors confirms that to the best of his/her knowledge:
❯ the financial statements, prepared in accordance with the relevant financial reporting framework, give a true and fair view of the assets, liabilities, financial position and profit or loss of the Company and the undertakings included in the consolidation taken as a whole;
❯ the Strategic Report includes a fair review of the development and performance of the business and the position of the Company and the undertakings included in the consolidation taken as a whole, together with a description of the principal risks and uncertainties that they face; and
❯ the annual report and financial statements, taken as a whole, are fair, balanced and understandable and provide the information necessary for shareholders to assess the Company’s performance, business model and strategy.
This responsibility statement was approved by the Board of Directors on 23 May 2017 and is signed on its behalf by:
Tom Albanese G.R. Arun KumarChief Executive Officer Chief Financial Officer23 May 2017 23 May 2017
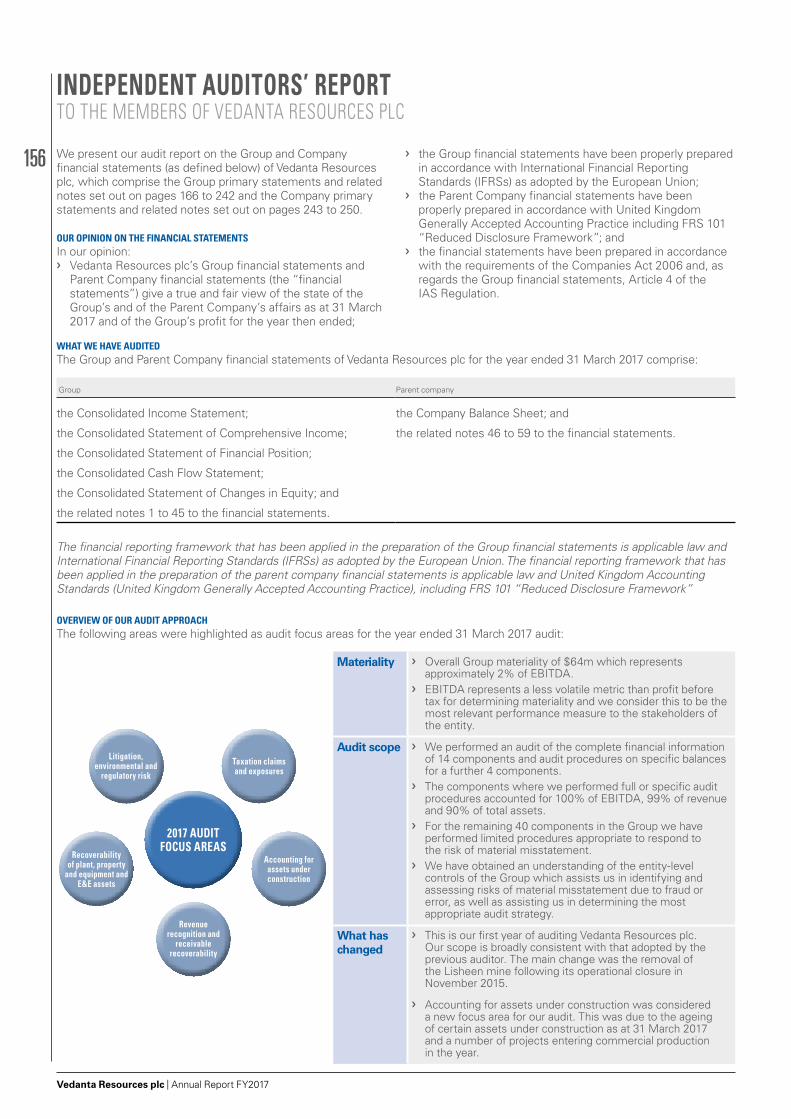
156
Vedanta Resources plc | Annual Report FY2017
INDEPENDENT AUDITORS’ REPORTTO THE MEMBERS OF VEDANTA RESOURCES PLC
We present our audit report on the Group and Company financial statements (as defined below) of Vedanta Resources plc, which comprise the Group primary statements and related notes set out on pages 166 to 242 and the Company primary statements and related notes set out on pages 243 to 250.
OUR OPINION ON THE FINANCIAL STATEMENTSIn our opinion: › Vedanta Resources plc’s Group financial statements and
Parent Company financial statements (the “financial statements”) give a true and fair view of the state of the Group’s and of the Parent Company’s affairs as at 31 March 2017 and of the Group’s profit for the year then ended;
› the Group financial statements have been properly prepared in accordance with International Financial Reporting Standards (IFRSs) as adopted by the European Union;
› the Parent Company financial statements have been properly prepared in accordance with United Kingdom Generally Accepted Accounting Practice including FRS 101 “Reduced Disclosure Framework”; and
› the financial statements have been prepared in accordance with the requirements of the Companies Act 2006 and, as regards the Group financial statements, Article 4 of the IAS Regulation.
WHAT WE HAVE AUDITEDThe Group and Parent Company financial statements of Vedanta Resources plc for the year ended 31 March 2017 comprise:
Group Parent company
the Consolidated Income Statement; the Company Balance Sheet; and
the Consolidated Statement of Comprehensive Income; the related notes 46 to 59 to the financial statements.
the Consolidated Statement of Financial Position;
the Consolidated Cash Flow Statement;
the Consolidated Statement of Changes in Equity; and
the related notes 1 to 45 to the financial statements.
The financial reporting framework that has been applied in the preparation of the Group financial statements is applicable law and International Financial Reporting Standards (IFRSs) as adopted by the European Union. The financial reporting framework that has been applied in the preparation of the parent company financial statements is applicable law and United Kingdom Accounting Standards (United Kingdom Generally Accepted Accounting Practice), including FRS 101 “Reduced Disclosure Framework”
2017 AUDIT FOCUS AREAS
Taxation claims and exposures
Accounting for assets under construction
Revenue recognition and
receivable recoverability
Recoverability of plant, property
and equipment and E&E assets
Litigation, environmental and
regulatory risk
OVERVIEW OF OUR AUDIT APPROACHThe following areas were highlighted as audit focus areas for the year ended 31 March 2017 audit:
Materiality › Overall Group materiality of $64m which represents approximately 2% of EBITDA.
› EBITDA represents a less volatile metric than profit before tax for determining materiality and we consider this to be the most relevant performance measure to the stakeholders of the entity.
Audit scope › We performed an audit of the complete financial information of 14 components and audit procedures on specific balances for a further 4 components.
› The components where we performed full or specific audit procedures accounted for 100% of EBITDA, 99% of revenue and 90% of total assets.
› For the remaining 40 components in the Group we have performed limited procedures appropriate to respond to the risk of material misstatement.
› We have obtained an understanding of the entity-level controls of the Group which assists us in identifying and assessing risks of material misstatement due to fraud or error, as well as assisting us in determining the most appropriate audit strategy.
What has changed
› This is our first year of auditing Vedanta Resources plc. Our scope is broadly consistent with that adopted by the previous auditor. The main change was the removal of the Lisheen mine following its operational closure in November 2015.
› Accounting for assets under construction was considered a new focus area for our audit. This was due to the ageing of certain assets under construction as at 31 March 2017 and a number of projects entering commercial production in the year.
157
Vedanta Resources plc | Annual Report FY2017www.vedantaresources.com
STRATEGIC REPORT DIRECTORS’ REPORT FINANCIAL STATEMENTS ADDITIONAL INFORMATION
OUR ASSESSMENT OF FOCUS AREASWe identified the risk areas to be included with our audit opinion based on issues that had the greatest impact on the financial statements and which involved the most of senior team member involvement. Further details of why we identified issues as areas of focus and our audit response are set out in the table below. This is not a complete list of all the procedures we performed in respect of these areas nor is it a complete list of all the risks identified in our audit.
We identified the risk and focus areas described below as those that had the greatest effect on our overall audit strategy, the allocation of resources in the audit and the direction of the efforts of the audit team. In addressing these risks, we have performed the procedures below which were designed in the context of the financial statements as a whole and, consequently, we do not express any opinion on these individual areas.
CHANGES FROM THE PRIOR YEARAs this is our first year as external auditors of the Group, the starting point for our audit focus areas were the same as those identified by Deloitte for the year ended 31 March 2016. The audit focus areas have since been amended following our experience gained from the understanding of developments in the business, and time spent during the year end audit.
Audit focus area Our audit approach What we reported to the Audit Committee
Revenue recognition and receivable recoverability Refer to the Audit Committee Report on pages 123 to 128 and the disclosures in notes 2b and 4 of the Group financial statements on pages 185 to 189 and 192.
Group revenue: $11,520m (2016: $10,738m)
Revenue recognition and receivable recoverability has been identified as an audit focus area due to the diverse and complex revenue streams across the Group.
We have identified the following key areas for consideration:
› complex calculation of power tariff agreements and associated disputed receivables outstanding with Grid Corporation of Odisha Limited (“GRIDCO”) and Punjab State Power Corporation Limited (“PSPCL”).
› calculation of revenue due to complexity associated with the calculation of profit petroleum at the Cairn India oil and gas joint ventures.
› determination of when risks and rewards have transferred, especially in relation to determining to which accounting period sales relate.
› correct accounting treatment of differing shipping terms across the Group.
› measurement of revenue due to provisional pricing agreements where prices are only finalised after the balance sheet date.
The risk has increased in the current year due to increased disputed receivable balances across the Group, particularly in the power division.
We performed our audit procedures across the Group’s revenue streams considering the revenue recognition policies and receivable recoverability. Our procedures were performed mainly by the component teams under the direction and supervision of the UK Group engagement team.
To address this focus area we have:
› performed walkthroughs of the revenue recognition processes at each full scope component and assessed the design effectiveness of key controls.
› assessed the recoverability of the GRIDCO and PSPCL trade receivables by:
– inspecting the state regulatory commission and appellate tribunal rulings.
– examining the underlying power purchase agreements.
– Inspecting external legal opinions in respect of the merits of the cases.
› reviewed the terms of Cairn’s profit sharing agreements and tested the underlying cost recovery and profit petroleum calculations. This included challenging the aging profile of current unapproved cost receivables to test recoverability.
› selected a sample of sales across the Group made pre and post year end, agreeing the date of revenue recognition to third party support, such as bills of lading, to confirm sales are recognised in the correct period.
› examined invoice samples with complex shipping terms to ensure that revenue has been recognised appropriately.
› re-calculated the value of provisional pricing adjustments and validated the prices used to third party data.
Based on the procedures performed we consider revenue recognition and the recoverability of receivables to be fairly stated in the financial statements.
158
Vedanta Resources plc | Annual Report FY2017
Audit focus area Our audit approach What we reported to the Audit Committee
Accounting for assets under construction Refer to the Audit Committee Report on pages 123 to 128 and the disclosures in note 17 of the Group financial statements on page 201
Group Assets under construction: $2,366m (2016: $3,363m)
Accounting for assets under construction has been identified as an audit focus area due to:
› the significant judgment involved in assessing when an asset is available for use as intended by management. At this point, revenue and operating costs associated to the asset cease to be capitalised to the statement of financial position and depreciation should commence.
› Multiple construction projects across the Group that have been placed on hold. There is therefore a risk relating to the viability of these projects and thus the recoverability of the balance.
Additionally we considered recent impairment charges recognised in respect of assets under construction where licences have expired or projects have ceased.
The risk has increased in the current year due to some significant projects being commissioned in the current year as well as the increased ageing of projects on hold and awaiting approval.
We performed our audit procedures across the asset under construction balances across the Group. Due to the local considerations impacting our assessments our procedures were performed predominantly by the component teams under the direction and supervision of the UK Group engagement team.
To address this focus area we have:
› considered the stage of completion of ongoing projects specifically in relation to ascertaining when the assets will be available for use as intended by management.
› assessed project timelines by tracking project progress against forecast spend and management budgets.
› assessed the accounting treatment of testing revenue and associated costs during the testing phase where applicable.
› ensured costs associated to assets which came into production in the year cease to be capitalised and depreciation charges commenced.
› assessed the viability and recoverability of long outstanding projects and performed inspections to confirm that the machinery and material related to these projects is not obsolete.
Based on our evaluation of the asset under construction projects and other procedures performed, we are comfortable that projects completed in the current year have been treated in accordance with IAS 16 and that long outstanding balances are recoverable.
INDEPENDENT AUDITORS’ REPORTTO THE MEMBERS OF VEDANTA RESOURCES PLC CONTINUED
159
Vedanta Resources plc | Annual Report FY2017www.vedantaresources.com
STRATEGIC REPORT DIRECTORS’ REPORT FINANCIAL STATEMENTS ADDITIONAL INFORMATION
Audit focus area Our audit approach What we reported to the Audit Committee
Litigation, environmental and regulatory risk Refer to the Audit Committee Report on pages 123 to 128 and the disclosures in note 38 of the Group financial statements on pages 231 to 234
The Group has disclosed in note 38 contingent liabilities of $1,361m for litigation, environmental and regulatory matters excluding income tax figures.
Litigation, environmental and regulatory risk has been identified as an area of audit focus due to the large number of complex legal claims across the Group and impact to the Group’s operations of potential non-compliance with environmental and regulatory requirements.
There is significant judgment required by management in classifying each case as probable, possible or remote as per IAS 37 and thus a risk that such cases may not be adequately provided for or disclosed.
It is not unusual in the jurisdictions in which the company operates for claims to remain outstanding for a number of years, with the complex regulatory environment and regulators focusing on the environmental and social impacts of the operations.
Any adverse litigation may have a material impact on both the solvency and liquidity as well as the reputation of the Group.
The risk has not increased or decreased in the current year.
At both a component team and group level, we have understood and tested management’s process for identifying and assessing litigation, environmental and regulatory risk.
To address this focus area we have:
› obtained the Group legal summary and critically assessed management’s position through discussions with the head of legal and operational management, on both the probability of success in significant cases, and the magnitude of any potential loss.
› inspected external legal opinions (where considered necessary) and other evidence to corroborate management’s assessment of the risk profile in respect of legal claims.
› considered the terms and conditions of applicable licences, environmental exposures and regulatory requirements and performed procedures to gain assurance over compliance with these terms.
› assessed the appropriateness of legal provisions and disclosures included in the Group financial statements and thus ensured adequate disclosure in accordance with IAS 37.
We are satisfied the accounting treatment in respect of legal cases is appropriate based on our procedures performed.
160
Vedanta Resources plc | Annual Report FY2017
Audit focus area Our audit approach What we reported to the Audit Committee
Taxation claims and exposures Refer to the Audit Committee Report on pages 123 to 128 and the disclosures in note 38 of the Group financial statements on pages 231 to 234
The Group has disclosed contingent liabilities of $4,352m for income tax claims and exposures.
Taxation claims and exposures have been identified as an audit focus area due to the large number of tax claims across the Group, particularly in relation to the operations located in India.
There is significant judgment required by management in assessing the exposure of each tax case and thus a risk that such cases may not be adequately provided for or disclosed.
Recent material tax cases have included:
› In the current year, the Supreme Court in India upheld the constitutional validity for each state to levy an entry tax. The Groups potential exposure in respect of this matter is $165 million.
› In 2015 a demand was received by Cairn India Limited (CIL) ordering payment to the Tax Authority of withholding taxes not paid on the acquisition of Cairn India.
Management judgment is also required in assessing the recoverability of the Minimum Alternative Tax (MAT) asset, which is based on forecasted future profits.
We focused on this area because of the potential financial impact on the Consolidated financial statements and the judgements involved. We consider the risk to have remained high in the current year.
Our procedures were performed centrally where tax cases impacted a number of components. For location specific issues component teams undertook the majority of the procedures under the direction and supervision of the Group audit team.
To address this focus area we have:
› obtained the Group tax summary and challenged management through discussions with the head of tax and operational management, on both the probability of success in significant cases, and the magnitude of any potential loss.
› inspected external legal opinions and correspondence with tax authorities (where applicable) to corroborate management’s risk classification.
› engaged internal tax specialists to technically appraise the tax positions taken by management with respect to local tax issues.
› reviewed and challenged the assumptions used in the model by management in justifying the recoverability of deferred tax and MAT assets. In challenging these assumptions we took account of actual results, external data and market conditions.
› ensured that the management assessment of similar cases is aligned across the Group or that differences in positions are adequately justified.
› assessed the appropriateness of tax provisions and disclosures made in the Group financial statements in respect of tax claims and exposures.
We are satisfied the accounting treatment in respect of potential tax exposures is appropriate based on our procedures performed.
INDEPENDENT AUDITORS’ REPORTTO THE MEMBERS OF VEDANTA RESOURCES PLC CONTINUED
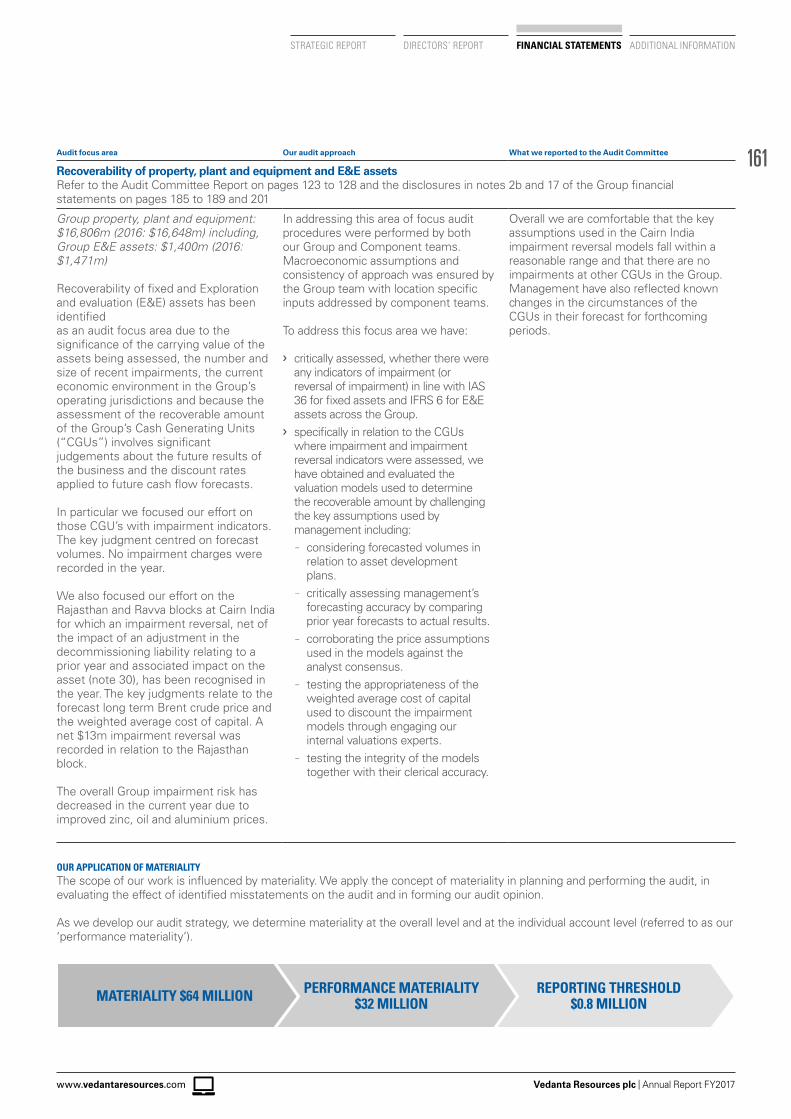
161
Vedanta Resources plc | Annual Report FY2017www.vedantaresources.com
STRATEGIC REPORT DIRECTORS’ REPORT FINANCIAL STATEMENTS ADDITIONAL INFORMATION
Audit focus area Our audit approach What we reported to the Audit Committee
Recoverability of property, plant and equipment and E&E assets Refer to the Audit Committee Report on pages 123 to 128 and the disclosures in notes 2b and 17 of the Group financial statements on pages 185 to 189 and 201
Group property, plant and equipment: $16,806m (2016: $16,648m) including, Group E&E assets: $1,400m (2016: $1,471m)
Recoverability of fixed and Exploration and evaluation (E&E) assets has been identified as an audit focus area due to the significance of the carrying value of the assets being assessed, the number and size of recent impairments, the current economic environment in the Group’s operating jurisdictions and because the assessment of the recoverable amount of the Group’s Cash Generating Units (“CGUs”) involves significant judgements about the future results of the business and the discount rates applied to future cash flow forecasts.
In particular we focused our effort on those CGU’s with impairment indicators. The key judgment centred on forecast volumes. No impairment charges were recorded in the year.
We also focused our effort on the Rajasthan and Ravva blocks at Cairn India for which an impairment reversal, net of the impact of an adjustment in the decommissioning liability relating to a prior year and associated impact on the asset (note 30), has been recognised in the year. The key judgments relate to the forecast long term Brent crude price and the weighted average cost of capital. A net $13m impairment reversal was recorded in relation to the Rajasthan block.
The overall Group impairment risk has decreased in the current year due to improved zinc, oil and aluminium prices.
In addressing this area of focus audit procedures were performed by both our Group and Component teams. Macroeconomic assumptions and consistency of approach was ensured by the Group team with location specific inputs addressed by component teams.
To address this focus area we have:
› critically assessed, whether there were any indicators of impairment (or reversal of impairment) in line with IAS 36 for fixed assets and IFRS 6 for E&E assets across the Group.
› specifically in relation to the CGUs where impairment and impairment reversal indicators were assessed, we have obtained and evaluated the valuation models used to determine the recoverable amount by challenging the key assumptions used by management including:
– considering forecasted volumes in relation to asset development plans.
– critically assessing management’s forecasting accuracy by comparing prior year forecasts to actual results.
– corroborating the price assumptions used in the models against the analyst consensus.
– testing the appropriateness of the weighted average cost of capital used to discount the impairment models through engaging our internal valuations experts.
– testing the integrity of the models together with their clerical accuracy.
Overall we are comfortable that the key assumptions used in the Cairn India impairment reversal models fall within a reasonable range and that there are no impairments at other CGUs in the Group. Management have also reflected known changes in the circumstances of the CGUs in their forecast for forthcoming periods.
OUR APPLICATION OF MATERIALITYThe scope of our work is influenced by materiality. We apply the concept of materiality in planning and performing the audit, in evaluating the effect of identified misstatements on the audit and in forming our audit opinion.
As we develop our audit strategy, we determine materiality at the overall level and at the individual account level (referred to as our ‘performance materiality’).
REPORTING THRESHOLD$0.8 MILLION
PERFORMANCE MATERIALITY$32 MILLIONMATERIALITY $64 MILLION
162
Vedanta Resources plc | Annual Report FY2017
MATERIALITYThe magnitude of an omission or misstatement that, individually or in the aggregate, could reasonably be expected to influence the economic decisions of the users of the financial statements. Materiality provides a basis for determining the nature and extent of our audit procedures.
We determined materiality for the Group to be $64 million (Deloitte 2016: $40 million), which is 2% of EBITDA. The higher materiality threshold was due to an increase in Group EBITDA to $3,191m (2016: $2,336m) driven by higher commodity prices and increased volumes in certain components compared to the prior year. Our materiality amount provides a basis for determining the nature and extent of risk assessment procedures, identifying and assessing the risk of material misstatement and determining the nature and extent of further audit procedures. Materiality is assessed on both quantitative and qualitative grounds. With respect to disclosure and presentational matters, amounts in excess of the quantitative thresholds above may not be adjusted if their effect is not considered to be material on a qualitative basis.
RATIONALE FOR BASISWe have used an earnings based measure as our basis of materiality. It was considered inappropriate to calculate materiality using Group profit or loss before tax due to the historic volatility of this metric. EBITDA is a key performance indicator for the Group and is also a key metric used by the Group in the assessment of the performance of management. We also noted that market and analyst commentary on the performance of the Group uses EBITDA as a key metric. We therefore, considered EBITDA, to be the most appropriate performance metric on which to base our materiality calculation as we considered that to be the most relevant performance measure to the stakeholders of the entity.
PERFORMANCE MATERIALITYThe application of materiality at the individual account or balance level. It is set at an amount to reduce to an appropriately low level the probability that the aggregate of uncorrected and undetected misstatements exceeds materiality.
We set our performance materiality at 50% of planning materiality calculated as $32 million. This was based upon our overall risk analysis, our assessment of the Group’s control environment, the short reporting cycle, potential for misstatements and the fact this is a first year audit engagement.
Audit work at component locations for the purpose of obtaining audit coverage over significant financial statement accounts is undertaken based on a percentage of total performance materiality. The performance materiality set for each component is based on the relative scale and risk of the component to the Group as a whole and our assessment of the risk of misstatement at that component. In the current year, the range of performance materiality allocated to components was $5 million to $19 million.
REPORTING THRESHOLDAn amount below which identified misstatements are considered as being clearly trivial.
We agreed with the Audit Committee that we would report to them all uncorrected audit differences in excess of $0.8 million
(Deloitte 2016 $0.8 million) in line with the prior year threshold as requested by the Audit Committee. In addition, we have reported any difference below that threshold that, in our view, warranted reporting on qualitative grounds.
We evaluate any uncorrected misstatements against both the quantitative measures of materiality discussed above and in light of other relevant qualitative considerations in forming our opinion.
SCOPE OF THE AUDIT OF THE FINANCIAL STATEMENTSAn audit involves obtaining evidence about the amounts and disclosures in the financial statements sufficient to give reasonable assurance that the financial statements are free from material misstatement, whether caused by fraud or error. This includes an assessment of whether the accounting policies are appropriate to the Group’s and the parent company’s circumstances and have been consistently applied and adequately disclosed; the reasonableness of significant accounting estimates made by the directors; and the overall presentation of the financial statements. In addition, we read all the financial and non-financial information in the Vedanta Resources plc Annual Report to identify material inconsistencies with the audited financial statements and to identify any information that is apparently materially incorrect based on, or materially inconsistent with, the knowledge acquired by us in the course of performing the audit. If we become aware of any apparent material misstatements or inconsistencies we consider the implications for our report.
TAILORING THE SCOPEOur assessment of audit risk, our evaluation of materiality and our allocation of performance materiality determine our audit scope for each entity within the Group. Taken together, this enables us to form an opinion on the consolidated financial statements. We take into account size, risk profile, the organisation of the Group and effectiveness of Group-wide controls, changes in the business environment and other factors such as recent internal audit results when assessing the level of work to be performed at each entity.
In assessing the risk of material misstatement to the Group financial statements and to ensure we had adequate quantitative coverage of significant accounts in the financial statements, we focused our Group audit scope on 18 out of the 58 Group components. Of these selected components 14 were subject to a full audit, in India, Namibia, Zambia, South Africa and the UAE. The remaining 4 components were subject to an audit of specified account balances that we considered had the potential for the greatest impact on the Group financial statements. We have also considered requirements for certain local statutory audits to be finalised before our audit report date in determining our audit scope which increased the total coverage.
For the current year, the full scope components contributed 99% of the Group’s EBITDA, 99% of the Group’s Revenue and 85% of the Group’s Total assets. The specific scope components contributed 1% of the Group’s EBITDA, 0% of the Group’s Revenue and 5% of the Group’s Total assets. The audit scope of these components may not have included testing of all significant accounts of the component but will have contributed to the coverage of significant accounts tested for the Group.
INDEPENDENT AUDITORS’ REPORTTO THE MEMBERS OF VEDANTA RESOURCES PLC CONTINUED
163
Vedanta Resources plc | Annual Report FY2017www.vedantaresources.com
STRATEGIC REPORT DIRECTORS’ REPORT FINANCIAL STATEMENTS ADDITIONAL INFORMATION
EBITDA
Full 99% Specific 1% Other 0%
REVENUE
Full 99% Specific 0% Other 1%
TOTAL ASSETS
Full 85% Specific 5% Other 10%
For the remaining 40 components that together represent 0% of the Group’s EBITDA we performed other procedures, including analytical reviews, reviews of internal audit reports, consolidation adjustment audit procedures and statutory financial statement audits. This ensured we responded appropriately to any potential risks of material misstatement to the Group financial statements.
We have obtained an understanding of the entity-level controls of the Group as a whole which assisted us in identifying and assessing risks of material misstatement due to fraud or error, as well as assisting us in determining the most appropriate audit strategy.
CHANGES FROM THE PRIOR YEARThis is our first year of auditing Vedanta Resources plc. Our scope is broadly consistent with that adopted by the previous auditor. The main change was the removal of the Lisheen mine following its operational closure in November 2015.
INTEGRATED TEAM STRUCTUREThe overall audit strategy is determined by the senior statutory auditor, Mirco Bardella. The senior statutory auditor is based in the UK however, since Group management and many operations reside in India, the Group audit team includes members from both the UK and India. The senior statutory auditor visited India four times during the current year’s audit and members of the Group audit team in both jurisdictions work together as an integrated team throughout the audit process. Whilst in India, he focused his time on the audit focus areas, interactions with management and Group and component teams. During the current year’s audit he reviewed key working papers and met with key representatives of the integrated and Indian component audit teams for all full scope components to discuss the audit approach and issues arising from their work.
INVOLVEMENT WITH COMPONENT TEAMS In establishing our overall approach to the Group audit, we determined the split of work that needed to be undertaken at each of the components by the Group audit engagement team, or by component auditors from other EY global network firms operating under the Group team instruction.
It was concluded that audit procedures on all of the 14 full scope components would be performed directly by the component audit team. The Group team reviewed this work and ensured sufficient audit evidence had been obtained as a basis to form part of our opinion on the Group as a whole. In addition the integrated Group team also included key members of certain full scope components ensuring knowledge was transferred effectively through the team. The work on all of the specific scope components was performed by the Group audit team directly.
The Group audit team established a programme of planned visits. During the current year’s audit cycle, visits were undertaken by senior members of the Group audit team to
certain component teams in India together with teams in Zambia, Namibia and South Africa. These visits involved key members of the Group audit team meeting with local management and discussing the audit approach with the Component teams together with any issues arising from their work. In addition members from all of the Indian based component teams physically attended a global planning event with the Group team. Additionally the Group audit team participated in key discussions, via conference calls with all full scope entities.
RESPECTIVE RESPONSIBILITIES OF DIRECTORS AND AUDITORAs explained more fully in the Directors’ Responsibilities Statement set out on page 155, the directors are responsible for the preparation of the financial statements and for being satisfied that they give a true and fair view. Our responsibility is to audit and express an opinion on the financial statements in accordance with applicable law and International Standards on Auditing (UK and Ireland). Those standards require us to comply with the Auditing Practices Board’s Ethical Standards for Auditors.
This report is made solely to the company’s members, as a body, in accordance with Chapter 3 of Part 16 of the Companies Act 2006. Our audit work has been undertaken so that we might state to the company’s members those matters we are required to state to them in an auditor’s report and for no other purpose. To the fullest extent permitted by law, we do not accept or assume responsibility to anyone other than the company and the company’s members as a body, for our audit work, for this report, or for the opinions we have formed.
OPINION ON OTHER MATTERS PRESCRIBED BY THE COMPANIES ACT 2006In our opinion: › the part of the Directors’ Remuneration Report to be audited
has been properly prepared in accordance with the Companies Act 2006; and
› based on the work undertaken in the course of the audit: – the information given in the Strategic Report and the
Directors’ Report for the financial year for which the financial statements are prepared is consistent with the financial statements.
– the Strategic Report and the Directors’ Report have been prepared in accordance with applicable legal requirements.
The charts below illustrate the coverage obtained from the work performed by our audit teams.
164
Vedanta Resources plc | Annual Report FY2017
MATTERS ON WHICH WE ARE REQUIRED TO REPORT BY EXCEPTION
ISAs (UK and Ireland) reporting
We are required to report to you if, in our opinion, financial and non-financial information in the annual report is: › materially inconsistent with the information in the audited financial
statements; or
› apparently materially incorrect based on, or materially inconsistent with, our knowledge of the Group acquired in the course of performing our audit; or
› otherwise misleading.
In particular, we are required to report whether we have identified any inconsistencies between our knowledge acquired in the course of performing the audit and the directors’ statement (included on page 155 of the Annual Report) that they consider the annual report and accounts taken as a whole is fair, balanced and understandable and provides the information necessary for shareholders to assess the entity’s performance, business model and strategy; and whether the annual report appropriately addresses those matters that we communicated to the audit committee that we consider should have been disclosed.
We have no exceptions to report.
Companies Act 2006 reporting
In light of the knowledge and understanding of the Company and its environment obtained in the course of the audit, we have identified no material misstatements in the Strategic Report or the Directors’ Report set out on pages 02–155 of the Annual Report.
We are required to report to you if, in our opinion: › adequate accounting records have not been kept by the parent company,
or returns adequate for our audit have not been received from branches not visited by us; or
› the parent company financial statements and the part of the Directors’ Remuneration Report to be audited are not in agreement with the accounting records and returns; or
› certain disclosures of directors’ remuneration specified by law are not made; or
› we have not received all the information and explanations we require for our audit.
We have no exceptions to report.
Listing Rules review requirements
We are required to review: › the directors’ statement in relation to going concern, set out on page 154,
and longer-term viability, set out on page 68;
› the part of the Corporate Governance Statement relating to the company’s compliance with the provisions of the UK Corporate Governance Code specified for our review.
We have no exceptions to report.
INDEPENDENT AUDITORS’ REPORTTO THE MEMBERS OF VEDANTA RESOURCES PLC CONTINUED
165
Vedanta Resources plc | Annual Report FY2017www.vedantaresources.com
STRATEGIC REPORT DIRECTORS’ REPORT FINANCIAL STATEMENTS ADDITIONAL INFORMATION
STATEMENT ON THE DIRECTORS’ ASSESSMENT OF THE PRINCIPAL RISKS THAT WOULD THREATEN THE SOLVENCY OR LIQUIDITY OF THE ENTITY
ISAs (UK and Ireland) reporting
We are required to give a statement as to whether we have anything material to add or to draw attention to in relation to: › the directors’ confirmation in the annual report that they have carried out a
robust assessment of the principal risks facing the entity, including those that would threaten its business model, future performance, solvency or liquidity;
› the disclosures in the annual report that describe those risks and explain how they are being managed or mitigated;
› the directors’ statement in the financial statements about whether they considered it appropriate to adopt the going concern basis of accounting in preparing them, and their identification of any material uncertainties to the entity’s ability to continue to do so over a period of at least twelve months from the date of approval of the financial statements; and
› the directors’ explanation in the annual report as to how they have assessed the prospects of the entity, over what period they have done so and why they consider that period to be appropriate, and their statement as to whether they have a reasonable expectation that the entity will be able to continue in operation and meet its liabilities as they fall due over the period of their assessment, including any related disclosures drawing attention to any necessary qualifications or assumptions.
We have nothing material to add or to draw attention to.
Mirco Bardella (senior statutory auditor)
for and on behalf of Ernst & Young LLP, Statutory AuditorLondon23 May 2017
Notes:• The maintenance and integrity of the Vedanta Resources plc web site is the responsibility of the directors; the work carried out by the auditors does not involve consideration of these matters
and, accordingly, the auditors accept no responsibility for any changes that may have occurred to the financial statements since they were initially presented on the web site.• Legislation in the United Kingdom governing the preparation and dissemination of financial statements may differ from legislation in other jurisdictions.
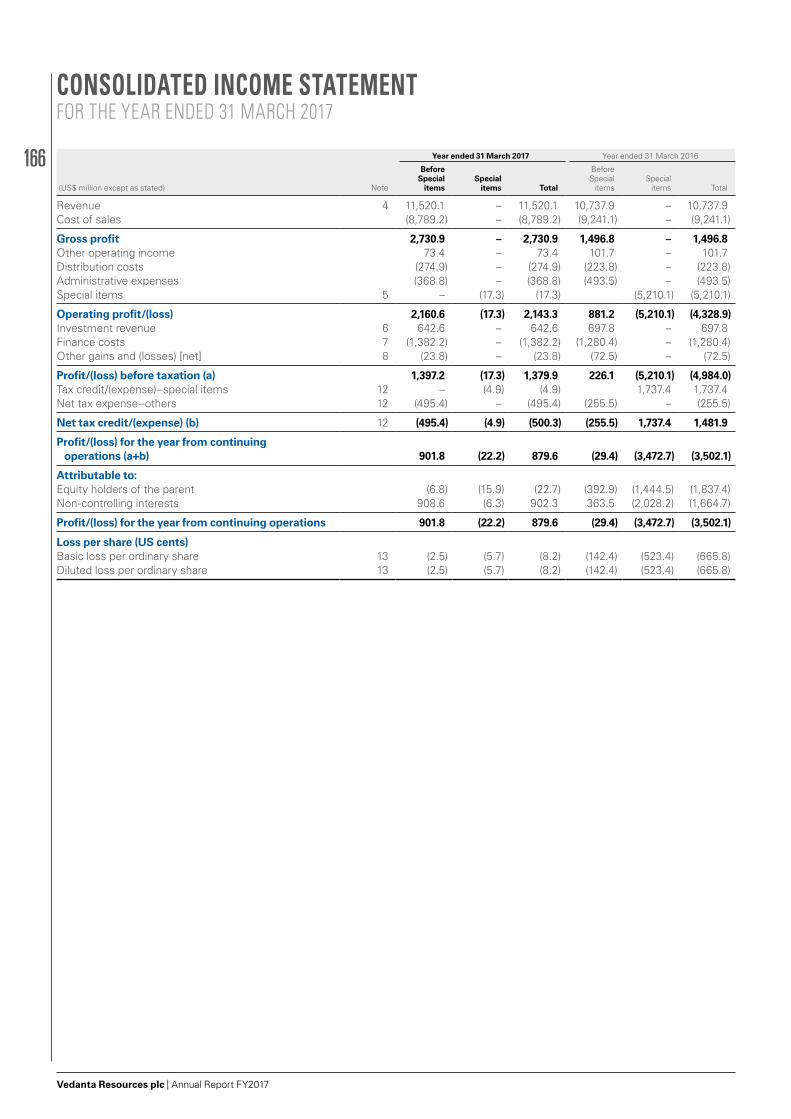
166
Vedanta Resources plc | Annual Report FY2017
Year ended 31 March 2017 Year ended 31 March 2016
(US$ million except as stated) Note
Before Special
items Special
items Total
Before Special
itemsSpecial
items Total
Revenue 4 11,520.1 – 11,520.1 10,737.9 – 10,737.9Cost of sales (8,789.2) – (8,789.2) (9,241.1) – (9,241.1)
Gross profit 2,730.9 – 2,730.9 1,496.8 – 1,496.8Other operating income 73.4 – 73.4 101.7 – 101.7Distribution costs (274.9) – (274.9) (223.8) – (223.8)Administrative expenses (368.8) – (368.8) (493.5) – (493.5)Special items 5 – (17.3) (17.3) (5,210.1) (5,210.1)
Operating profit/(loss) 2,160.6 (17.3) 2,143.3 881.2 (5,210.1) (4,328.9)Investment revenue 6 642.6 – 642.6 697.8 – 697.8Finance costs 7 (1,382.2) – (1,382.2) (1,280.4) – (1,280.4)Other gains and (losses) [net] 8 (23.8) – (23.8) (72.5) – (72.5)
Profit/(loss) before taxation (a) 1,397.2 (17.3) 1,379.9 226.1 (5,210.1) (4,984.0)Tax credit/(expense)–special items 12 – (4.9) (4.9) 1,737.4 1,737.4Net tax expense–others 12 (495.4) – (495.4) (255.5) – (255.5)
Net tax credit/(expense) (b) 12 (495.4) (4.9) (500.3) (255.5) 1,737.4 1,481.9
Profit/(loss) for the year from continuing operations (a+b) 901.8 (22.2) 879.6 (29.4) (3,472.7) (3,502.1)
Attributable to:Equity holders of the parent (6.8) (15.9) (22.7) (392.9) (1,444.5) (1,837.4)Non-controlling interests 908.6 (6.3) 902.3 363.5 (2,028.2) (1,664.7)
Profit/(loss) for the year from continuing operations 901.8 (22.2) 879.6 (29.4) (3,472.7) (3,502.1)
Loss per share (US cents)Basic loss per ordinary share 13 (2.5) (5.7) (8.2) (142.4) (523.4) (665.8)Diluted loss per ordinary share 13 (2.5) (5.7) (8.2) (142.4) (523.4) (665.8)
CONSOLIDATED INCOME STATEMENTFOR THE YEAR ENDED 31 MARCH 2017
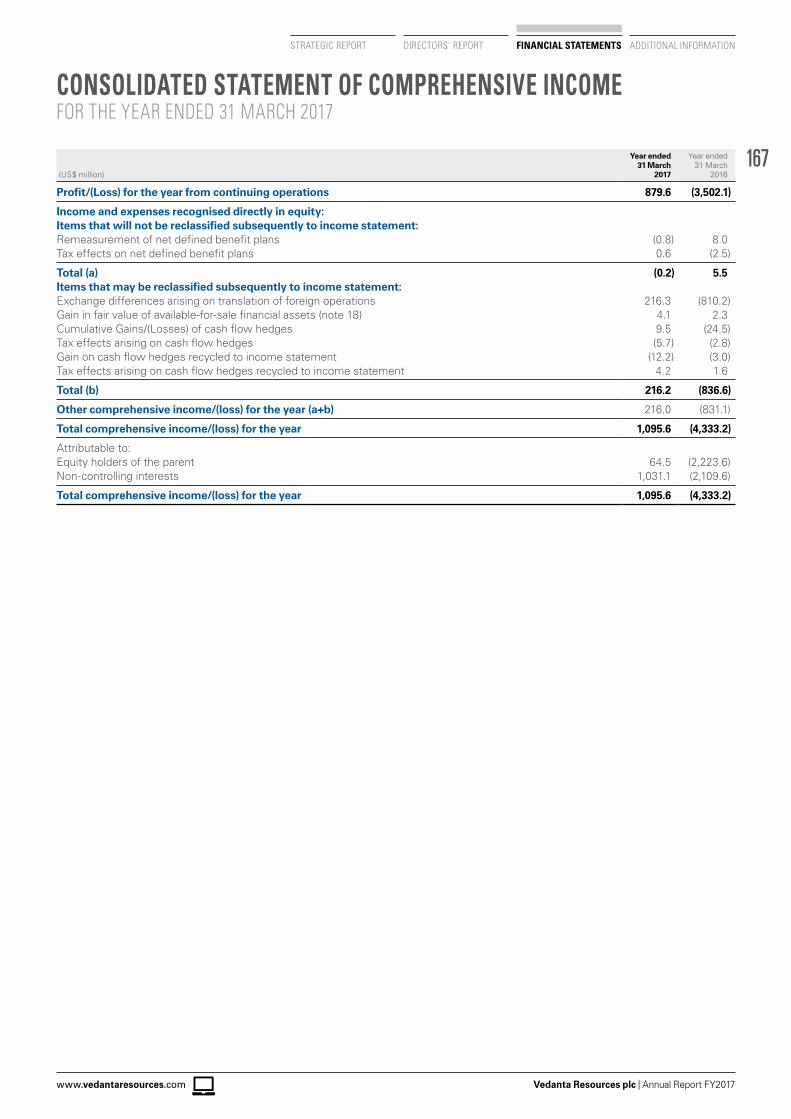
167
Vedanta Resources plc | Annual Report FY2017www.vedantaresources.com
STRATEGIC REPORT DIRECTORS’ REPORT FINANCIAL STATEMENTS ADDITIONAL INFORMATION
CONSOLIDATED STATEMENT OF COMPREHENSIVE INCOMEFOR THE YEAR ENDED 31 MARCH 2017
(US$ million)
Year ended 31 March
2017
Year ended 31 March
2016
Profit/(Loss) for the year from continuing operations 879.6 (3,502.1)
Income and expenses recognised directly in equity:Items that will not be reclassified subsequently to income statement:Remeasurement of net defined benefit plans (0.8) 8.0Tax effects on net defined benefit plans 0.6 (2.5)
Total (a) (0.2) 5.5Items that may be reclassified subsequently to income statement:Exchange differences arising on translation of foreign operations 216.3 (810.2)Gain in fair value of available-for-sale financial assets (note 18) 4.1 2.3Cumulative Gains/(Losses) of cash flow hedges 9.5 (24.5)Tax effects arising on cash flow hedges (5.7) (2.8)Gain on cash flow hedges recycled to income statement (12.2) (3.0)Tax effects arising on cash flow hedges recycled to income statement 4.2 1.6
Total (b) 216.2 (836.6)
Other comprehensive income/(loss) for the year (a+b) 216.0 (831.1)
Total comprehensive income/(loss) for the year 1,095.6 (4,333.2)
Attributable to:Equity holders of the parent 64.5 (2,223.6)Non-controlling interests 1,031.1 (2,109.6)
Total comprehensive income/(loss) for the year 1,095.6 (4,333.2)
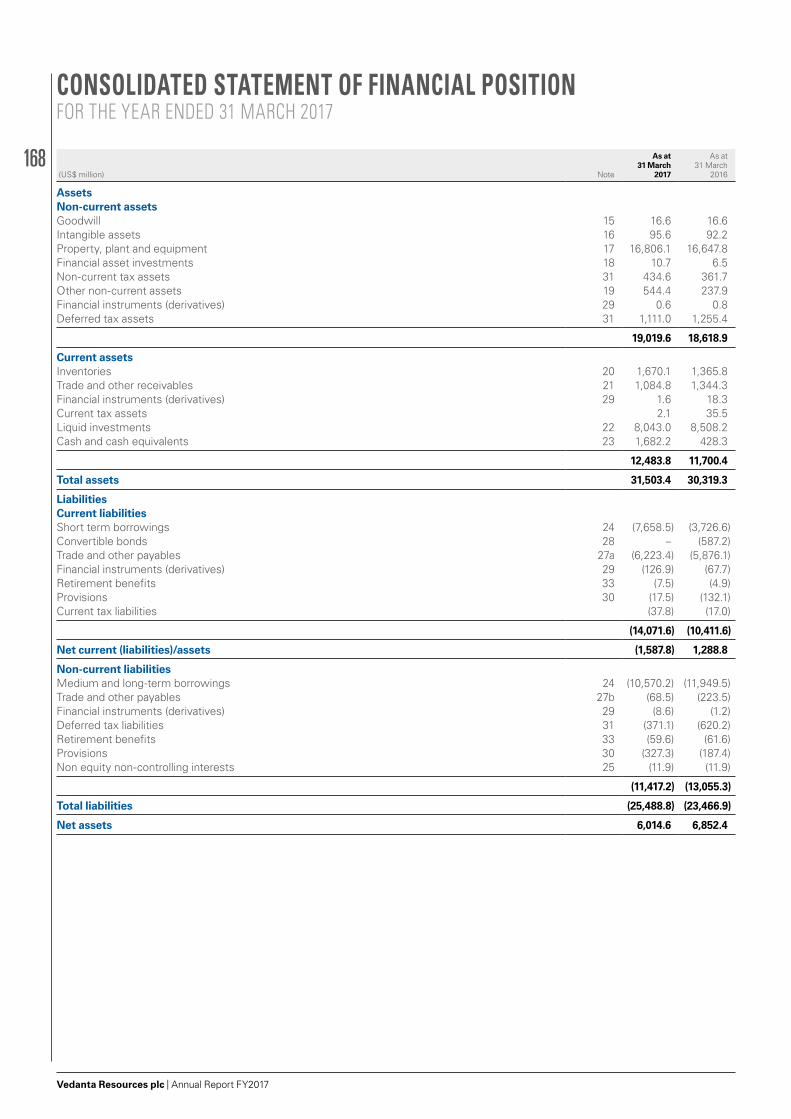
168
Vedanta Resources plc | Annual Report FY2017
CONSOLIDATED STATEMENT OF FINANCIAL POSITIONFOR THE YEAR ENDED 31 MARCH 2017
(US$ million) Note
As at 31 March
2017
As at 31 March
2016
AssetsNon-current assetsGoodwill 15 16.6 16.6Intangible assets 16 95.6 92.2Property, plant and equipment 17 16,806.1 16,647.8Financial asset investments 18 10.7 6.5Non-current tax assets 31 434.6 361.7Other non-current assets 19 544.4 237.9Financial instruments (derivatives) 29 0.6 0.8Deferred tax assets 31 1,111.0 1,255.4
19,019.6 18,618.9
Current assetsInventories 20 1,670.1 1,365.8Trade and other receivables 21 1,084.8 1,344.3Financial instruments (derivatives) 29 1.6 18.3Current tax assets 2.1 35.5Liquid investments 22 8,043.0 8,508.2Cash and cash equivalents 23 1,682.2 428.3
12,483.8 11,700.4
Total assets 31,503.4 30,319.3
LiabilitiesCurrent liabilitiesShort term borrowings 24 (7,658.5) (3,726.6)Convertible bonds 28 – (587.2)Trade and other payables 27a (6,223.4) (5,876.1)Financial instruments (derivatives) 29 (126.9) (67.7)Retirement benefits 33 (7.5) (4.9)Provisions 30 (17.5) (132.1)Current tax liabilities (37.8) (17.0)
(14,071.6) (10,411.6)
Net current (liabilities)/assets (1,587.8) 1,288.8
Non-current liabilitiesMedium and long-term borrowings 24 (10,570.2) (11,949.5)Trade and other payables 27b (68.5) (223.5)Financial instruments (derivatives) 29 (8.6) (1.2)Deferred tax liabilities 31 (371.1) (620.2)Retirement benefits 33 (59.6) (61.6)Provisions 30 (327.3) (187.4)Non equity non-controlling interests 25 (11.9) (11.9)
(11,417.2) (13,055.3)
Total liabilities (25,488.8) (23,466.9)
Net assets 6,014.6 6,852.4
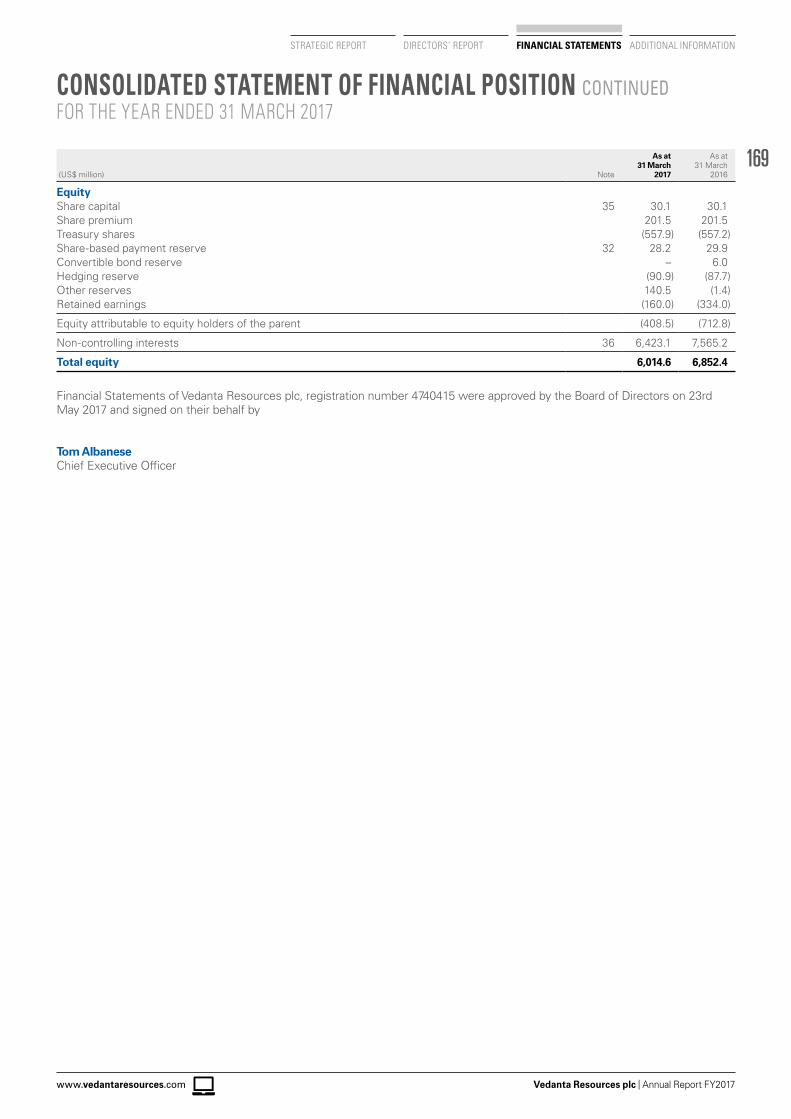
169
Vedanta Resources plc | Annual Report FY2017www.vedantaresources.com
STRATEGIC REPORT DIRECTORS’ REPORT FINANCIAL STATEMENTS ADDITIONAL INFORMATION
CONSOLIDATED STATEMENT OF FINANCIAL POSITION CONTINUEDFOR THE YEAR ENDED 31 MARCH 2017
(US$ million) Note
As at 31 March
2017
As at 31 March
2016
EquityShare capital 35 30.1 30.1Share premium 201.5 201.5Treasury shares (557.9) (557.2)Share-based payment reserve 32 28.2 29.9Convertible bond reserve – 6.0Hedging reserve (90.9) (87.7)Other reserves 140.5 (1.4)Retained earnings (160.0) (334.0)
Equity attributable to equity holders of the parent (408.5) (712.8)
Non-controlling interests 36 6,423.1 7,565.2
Total equity 6,014.6 6,852.4
Financial Statements of Vedanta Resources plc, registration number 4740415 were approved by the Board of Directors on 23rd May 2017 and signed on their behalf by
Tom Albanese Chief Executive Officer
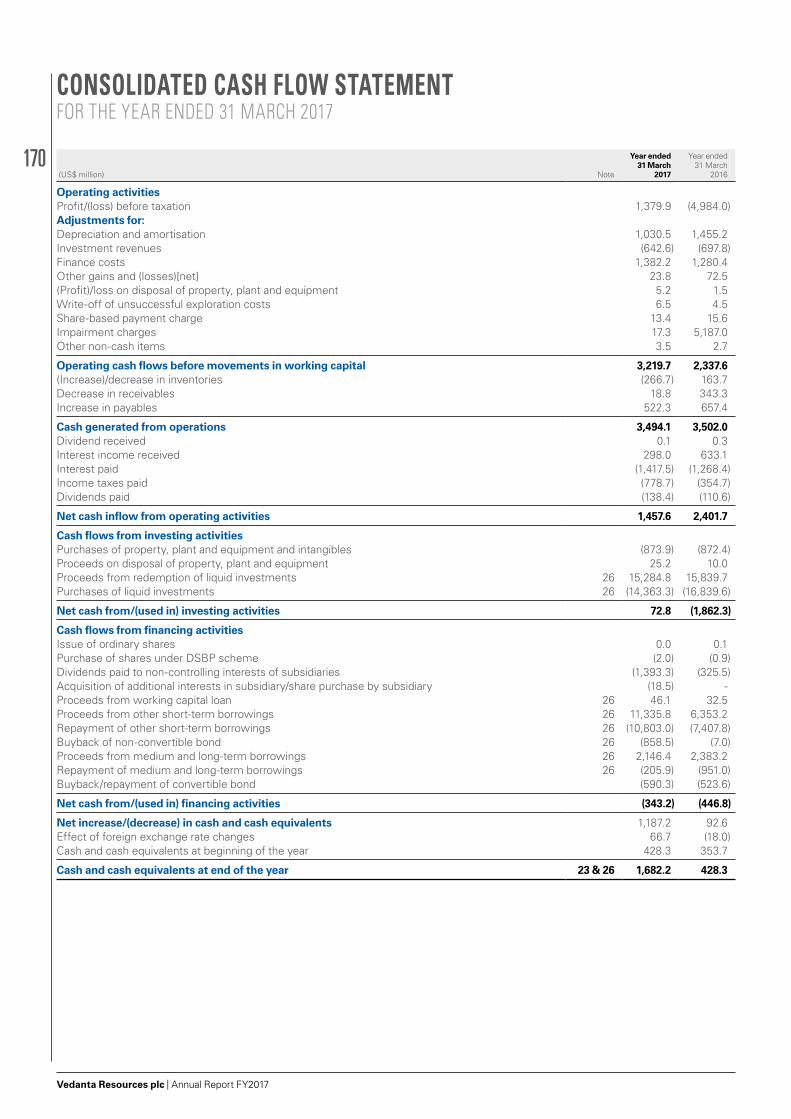
170
Vedanta Resources plc | Annual Report FY2017
CONSOLIDATED CASH FLOW STATEMENTFOR THE YEAR ENDED 31 MARCH 2017
(US$ million) Note
Year ended 31 March
2017
Year ended 31 March
2016
Operating activitiesProfit/(loss) before taxation 1,379.9 (4,984.0)Adjustments for:Depreciation and amortisation 1,030.5 1,455.2Investment revenues (642.6) (697.8)Finance costs 1,382.2 1,280.4Other gains and (losses)[net] 23.8 72.5(Profit)/loss on disposal of property, plant and equipment 5.2 1.5Write-off of unsuccessful exploration costs 6.5 4.5Share-based payment charge 13.4 15.6Impairment charges 17.3 5,187.0Other non-cash items 3.5 2.7
Operating cash flows before movements in working capital 3,219.7 2,337.6(Increase)/decrease in inventories (266.7) 163.7Decrease in receivables 18.8 343.3Increase in payables 522.3 657.4
Cash generated from operations 3,494.1 3,502.0Dividend received 0.1 0.3Interest income received 298.0 633.1Interest paid (1,417.5) (1,268.4)Income taxes paid (778.7) (354.7)Dividends paid (138.4) (110.6)
Net cash inflow from operating activities 1,457.6 2,401.7
Cash flows from investing activitiesPurchases of property, plant and equipment and intangibles (873.9) (872.4)Proceeds on disposal of property, plant and equipment 25.2 10.0Proceeds from redemption of liquid investments 26 15,284.8 15,839.7Purchases of liquid investments 26 (14,363.3) (16,839.6)
Net cash from/(used in) investing activities 72.8 (1,862.3)
Cash flows from financing activitiesIssue of ordinary shares 0.0 0.1Purchase of shares under DSBP scheme (2.0) (0.9)Dividends paid to non-controlling interests of subsidiaries (1,393.3) (325.5) Acquisition of additional interests in subsidiary/share purchase by subsidiary (18.5) -Proceeds from working capital loan 26 46.1 32.5Proceeds from other short-term borrowings 26 11,335.8 6,353.2Repayment of other short-term borrowings 26 (10,803.0) (7,407.8)Buyback of non-convertible bond 26 (858.5) (7.0)Proceeds from medium and long-term borrowings 26 2,146.4 2,383.2 Repayment of medium and long-term borrowings 26 (205.9) (951.0)Buyback/repayment of convertible bond (590.3) (523.6)
Net cash from/(used in) financing activities (343.2) (446.8)
Net increase/(decrease) in cash and cash equivalents 1,187.2 92.6Effect of foreign exchange rate changes 66.7 (18.0)Cash and cash equivalents at beginning of the year 428.3 353.7
Cash and cash equivalents at end of the year 23 & 26 1,682.2 428.3
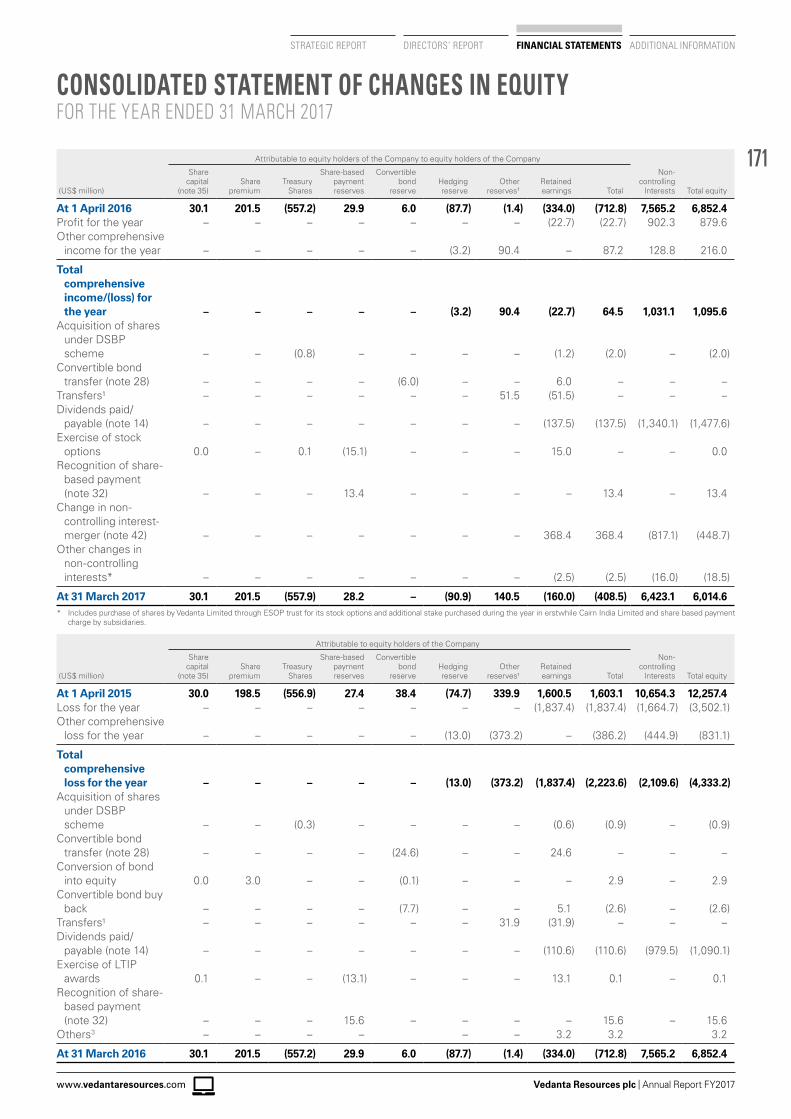
171
Vedanta Resources plc | Annual Report FY2017www.vedantaresources.com
STRATEGIC REPORT DIRECTORS’ REPORT FINANCIAL STATEMENTS ADDITIONAL INFORMATION
CONSOLIDATED STATEMENT OF CHANGES IN EQUITYFOR THE YEAR ENDED 31 MARCH 2017
Attributable to equity holders of the Company to equity holders of the Company
(US$ million)
Share capital
(note 35)Share
premiumTreasury
Shares
Share-based payment reserves
Convertible bond
reserveHedging reserve
Other reserves1
Retained earnings Total
Non-controlling
Interests Total equity
At 1 April 2016 30.1 201.5 (557.2) 29.9 6.0 (87.7) (1.4) (334.0) (712.8) 7,565.2 6,852.4Profit for the year – – – – – – – (22.7) (22.7) 902.3 879.6 Other comprehensive
income for the year – – – – – (3.2) 90.4 – 87.2 128.8 216.0
Total comprehensive income/(loss) for the year – – – – – (3.2) 90.4 (22.7) 64.5 1,031.1 1,095.6
Acquisition of shares under DSBP scheme – – (0.8) – – – – (1.2) (2.0) – (2.0)
Convertible bond transfer (note 28) – – – – (6.0) – – 6.0 – – –
Transfers1 – – – – – – 51.5 (51.5) – – –Dividends paid/
payable (note 14) – – – – – – – (137.5) (137.5) (1,340.1) (1,477.6)Exercise of stock
options 0.0 – 0.1 (15.1) – – – 15.0 – – 0.0 Recognition of share-
based payment (note 32) – – – 13.4 – – – – 13.4 – 13.4
Change in non-controlling interest- merger (note 42) – – – – – – – 368.4 368.4 (817.1) (448.7)
Other changes in non-controlling interests* – – – – – – – (2.5) (2.5) (16.0) (18.5)
At 31 March 2017 30.1 201.5 (557.9) 28.2 – (90.9) 140.5 (160.0) (408.5) 6,423.1 6,014.6 * Includes purchase of shares by Vedanta Limited through ESOP trust for its stock options and additional stake purchased during the year in erstwhile Cairn India Limited and share based payment
charge by subsidiaries.
Attributable to equity holders of the Company
(US$ million)
Share capital
(note 35)Share
premiumTreasury
Shares
Share-based payment reserves
Convertible bond
reserveHedging reserve
Other reserves1
Retained earnings Total
Non-controlling
Interests Total equity
At 1 April 2015 30.0 198.5 (556.9) 27.4 38.4 (74.7) 339.9 1,600.5 1,603.1 10,654.3 12,257.4Loss for the year – – – – – – – (1,837.4) (1,837.4) (1,664.7) (3,502.1)Other comprehensive
loss for the year – – – – – (13.0) (373.2) – (386.2) (444.9) (831.1)
Total comprehensive loss for the year – – – – – (13.0) (373.2) (1,837.4) (2,223.6) (2,109.6) (4,333.2)
Acquisition of shares under DSBP scheme – – (0.3) – – – – (0.6) (0.9) – (0.9)
Convertible bond transfer (note 28) – – – – (24.6) – – 24.6 – – –
Conversion of bond into equity 0.0 3.0 – – (0.1) – – – 2.9 – 2.9
Convertible bond buy back – – – – (7.7) – – 5.1 (2.6) – (2.6)
Transfers1 – – – – – – 31.9 (31.9) – – –Dividends paid/
payable (note 14) – – – – – – – (110.6) (110.6) (979.5) (1,090.1)Exercise of LTIP
awards 0.1 – – (13.1) – – – 13.1 0.1 – 0.1Recognition of share-
based payment (note 32) – – – 15.6 – – – – 15.6 – 15.6
Others3 – – – – – – 3.2 3.2 3.2
At 31 March 2016 30.1 201.5 (557.2) 29.9 6.0 (87.7) (1.4) (334.0) (712.8) 7,565.2 6,852.4
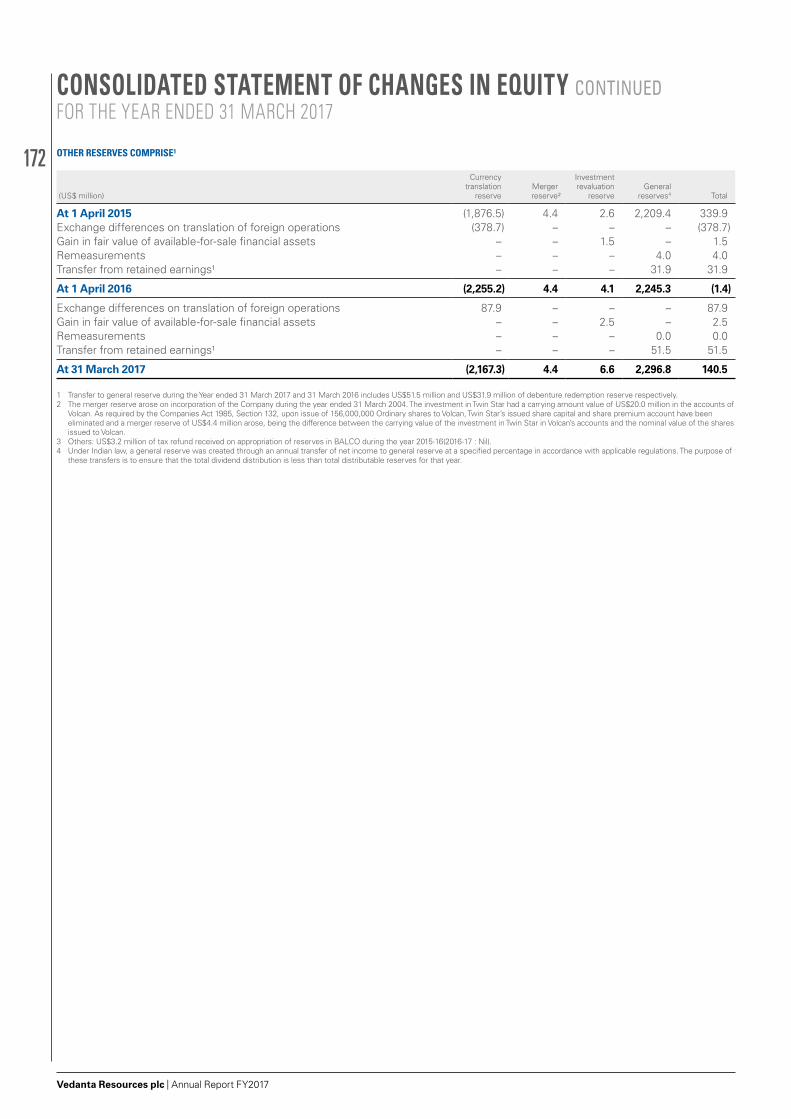
172
Vedanta Resources plc | Annual Report FY2017
OTHER RESERVES COMPRISE1
(US$ million)
Currency translation
reserveMergerreserve2
Investment revaluation
reserveGeneral
reserves4 Total
At 1 April 2015 (1,876.5) 4.4 2.6 2,209.4 339.9Exchange differences on translation of foreign operations (378.7) – – – (378.7)Gain in fair value of available-for-sale financial assets – – 1.5 – 1.5Remeasurements – – – 4.0 4.0Transfer from retained earnings1 – – – 31.9 31.9
At 1 April 2016 (2,255.2) 4.4 4.1 2,245.3 (1.4)
Exchange differences on translation of foreign operations 87.9 – – – 87.9Gain in fair value of available-for-sale financial assets – – 2.5 – 2.5Remeasurements – – – 0.0 0.0Transfer from retained earnings1 – – – 51.5 51.5
At 31 March 2017 (2,167.3) 4.4 6.6 2,296.8 140.5
1 Transfer to general reserve during the Year ended 31 March 2017 and 31 March 2016 includes US$51.5 million and US$31.9 million of debenture redemption reserve respectively.2 The merger reserve arose on incorporation of the Company during the year ended 31 March 2004. The investment in Twin Star had a carrying amount value of US$20.0 million in the accounts of
Volcan. As required by the Companies Act 1985, Section 132, upon issue of 156,000,000 Ordinary shares to Volcan, Twin Star’s issued share capital and share premium account have been eliminated and a merger reserve of US$4.4 million arose, being the difference between the carrying value of the investment in Twin Star in Volcan’s accounts and the nominal value of the shares issued to Volcan.
3 Others: US$3.2 million of tax refund received on appropriation of reserves in BALCO during the year 2015-16(2016-17 : Nil).4 Under Indian law, a general reserve was created through an annual transfer of net income to general reserve at a specified percentage in accordance with applicable regulations. The purpose of
these transfers is to ensure that the total dividend distribution is less than total distributable reserves for that year.
CONSOLIDATED STATEMENT OF CHANGES IN EQUITY CONTINUEDFOR THE YEAR ENDED 31 MARCH 2017
173
Vedanta Resources plc | Annual Report FY2017www.vedantaresources.com
STRATEGIC REPORT DIRECTORS’ REPORT FINANCIAL STATEMENTS ADDITIONAL INFORMATION
NOTES TO THE FINANCIAL STATEMENTSFOR THE YEAR ENDED 31 MARCH 2017
1. PRESENTATION OF FINANCIAL STATEMENTSGENERAL INFORMATIONVedanta Resources plc (‘Company’ or ‘VRplc’) is a company incorporated and domiciled in the United Kingdom and is a London listed diversified global natural resources major. The group produces aluminium, copper, zinc, lead, silver, iron ore, oil & gas and commercial energy. Vedanta has operations in India, Zambia, Namibia, South Africa, Ireland, Liberia, UAE and Australia. These financial statements are presented in US dollars being the functional currency of the Company and all values are rounded to one decimal of the nearest million except where otherwise indicated.
COMPLIANCE WITH APPLICABLE LAW AND IFRSThe financial statements have been prepared in accordance with those parts of the Companies Act 2006 applicable to companies reporting under International Financial Reporting Standards (IFRS), Article 4 of the IAS Regulation and IFRS as adopted by the European Union and related interpretations.
BASIS OF PREPARATIONThe financial statements have been prepared on a historical cost basis, except for derivative financial instruments, available-for-sale financial assets, liquid investments and defined benefit pension obligations that have been measured at fair value as per the principles of Fair value measurement under IFRS 13 or IAS 19, as applicable. The following Standards have been issued but are not yet effective up to the date of authorisation of these financial statements (and in some cases had not yet been adopted by EU):
Amendments resulting from Annual Improvements 2014-2016 Cycle: The amendments are effective for annual periods beginning on or after 1 January 2018, although entities are permitted to apply them earlier. IAS 7 Statement of Cash Flows: Narrow-scope amendments: The amendments introduce an additional disclosure that will enable users of financial statements to evaluate changes in liabilities arising from financing activities. The Group will be required to provide information on movements in gross liabilities arising from financing activities in addition to the net debt reconciliation currently provided. The amendments are effective for annual periods beginning on or after 1 January 2017, although entities are permitted to apply them earlier.
Amendments to IAS 12: Recognition of Deferred Tax Assets for Unrealised Losses. These amendments on the recognition of deferred tax assets for unrealised losses clarify how to account for deferred tax assets related to debt instruments measured at fair value. The amendments are effective for annual periods beginning on or after 1 January 2017, although entities are permitted to apply them earlier.
IFRIC 22: Foreign Currency Transactions and Advance Consideration: not yet endorsed by the EU : The Interpretation, which was issued on 8 December 2016, addresses how to determine the date of a transaction for the purpose of determining the exchange rate to use on initial recognition of an asset, expense or income (or part of it) when a related non-monetary asset or non-monetary liability arising from the payment or receipt of advance consideration in a foreign currency is derecognised. The amendments are effective for annual periods beginning on or after 1 January 2018, although entities are permitted to apply them earlier.
IAS 40 Investment Property: Paragraph 57 has been amended to state that an entity shall transfer a property to, or from, investment property when, and only when, there is evidence of a change in use. A change of use occurs if property meets, or ceases to meet, the definition of investment property. A change in management’s intentions for the use of a property by itself does not constitute evidence of a change in use. The list of evidence in paragraph 57(a) – (d) was designated as non-exhaustive list of examples instead of the previous exhaustive list. The amendments are effective for periods beginning on or after 1 January 2018. Earlier application is permitted.
IFRS 2 Share-based Payment: Few amendments to clarify the classification and measurement of share-based payment transactions have been issued. The amendments are effective for annual periods beginning on or after 1 January 2018. Earlier application is permitted. The amendments are to be applied prospectively. However, retrospective application is allowed if this is possible without the use of hindsight.
IFRS 4 Insurance Contracts: Amendments regarding the interaction of IFRS 4 and IFRS 9 has been issued. An entity choosing to apply the overlay approach retrospectively to qualifying financial assets does so when it first applies IFRS 9. An entity choosing to apply the deferral approach does so for annual periods beginning on or after 1 January 2018.
IFRS 9 – FINANCIAL INSTRUMENTSIn July 2014,the International Accounting Standards Board issued the final version of IFRS 9, Financial Instruments. The standard reduces the complexity of the current rules on financial instruments as mandated in IAS 39. IFRS 9 has fewer classification and measurement categories as compared to IAS 39 and has eliminated the categories of held to maturity, available for sale and loans and receivables. Further it eliminates the rule based requirement of segregating embedded derivatives and tainting rules pertaining to held to maturity investments. For an investment in an equity instrument which is not held for trading, IFRS 9 permits an
174
Vedanta Resources plc | Annual Report FY2017
irrevocable election, on initial recognition, on an individual share-by- share basis,to present all fair value changes from the investment in other comprehensive income. No amount recognized in other comprehensive income would ever be reclassified to profit or loss. It requires the entity, which chooses to measure a liability at fair value,to present the portion of the fair value change attributable to the entity’s own credit risk in the other comprehensive income. IFRS 9 replaces the ‘incurred loss model’ in IAS 39 with an ‘expected credit loss’ model. The measurement uses a dual measurement approach, under which the loss allowance is measured as either 12 month expected credit losses or lifetime expected credit losses. The standard also introduces new presentation and disclosure requirements. The effective date for adoption of IFRS 9 is annual periods beginning on or after 1 January 2018,though early adoption is permitted.
The indicative impacts of adopting IFRS 9 on the Group are as follows. The work is ongoing and additional impacts may be identified later in the implemenatation process. › Classification and measurement: IFRS 9 establishes a principle based approach for classification of financial assets based on
cash flow characteristics of the asset and the business model in which an asset is held. The Group anticipates no significant changes in the classification of financial assets and liabilities under this model.
› Impairment: Based on Group’s initial assessment, the impairment of financial assets held at amortised cost is not expected to have material impact on the Group’s results, given the low exposure to counterparty default risk as a result of the credit risk management processes that are in place.
› Hedge accounting: The adoption of the new standard would not materially change the amounts recognised in relation to existing hedging arrangements.
IFRS 15 – REVENUE FROM CONTRACTS WITH CUSTOMERSIFRS 15 – Revenue from contracts with Customers outlines a single comprehensive model for entities to use in accounting for revenue arising from contracts with customers. The standard replaces most current revenue recognition guidance. The core principle of the new standard is for companies to recognize revenue to depict the transfer of goods or services to customers in amounts that reflect the consideration to which the company expects to be entitled in exchange for those goods or services. The new standard also will result in enhanced disclosures about revenue, provide guidance for transactions that were not previously addressed comprehensively including service revenues and contract modifications and improve guidance for multiple-element arrangements. The new Standard will come into effect for the annual reporting periods beginning on or after 1 January 2018 with early application permitted.
The indicative impacts of implementing IFRS 15 on the Group results are detailed below. The work is ongoing and additional impacts may be identified later in the implementation process. › The timing of the recognition of revenue- The new standard introduces the concept of ‘control’ for revenue recognition, in
contrast to the “risk and rewards” approach in IAS 18. Accordingly, the revenue recognition model will change from one based on the transfer of risk and reward of ownership to the transfer of control of ownership. The Group’s revenue is predominantly derived from commodity sales, where the point of recognition is dependent on the contract sales terms, known as the International Commercial terms (Incoterms). As the transfer of risks and rewards generally coincides with the transfer of control at a point in time for the Incoterms as part of the Group’s commodity sales arrangements, the timing and amount of revenue recognised for the sale of commodities is unlikely to be materially affected for the majority of sales.
IFRS 16 – LEASESIFRS 16- Leases, specifies recognition, measurement and disclosure criteria for leases. The standard provides a single lessee accounting model, requiring lessees to recognise assets and liabilities for all leases unless the lease term is 12 months or less or the underlying asset has a low value. Lessors continue to classify leases as operating or finance, with IFRS 16’s approach to lessor accounting substantially unchanged from its predecessor, IAS 17. The new Standard will come into effect for annual reporting periods beginning on or after 1 January 2019. Earlier application is permitted if IFRS 15 Revenue from Contracts with Customers has also been applied.
The Group is currently in the process of determining the potential impact of adopting the above standard.
ADOPTION OF NEW AND REVISED STANDARDS AND PRONOUNCEMENTS:The Group has adopted with effect from 1 April 2016, the following new amendment and pronouncements. Their adoption has not had any significant impact on the amounts reported in the financial statements. › Amendments to IAS 1: Disclosure Initiative › Annual Improvements to IFRSs: 2012-2014 Cycle › Amendments to IAS 27: Equity method in separate financial statements › Amendments to IAS 16 and IAS 38: Clarification of Acceptable Methods of Depreciation and Amortisation › Amendments to IFRS 11: Accounting for Acquisitions of Interests in Joint Operations › Amendment to IFRS 10, IFRS 12 and IAS 28: Sale or Contribution of Assets between an Investor and its Associate or Joint
Venture. › Amendments to IFRS 10, IFRS 12 and IAS 28: Investment entities : Applying the Consolidation Exemption
The Group has not early adopted any other amendments, standards or interpretations that have been issued but are not yet effective.
1. PRESENTATION OF FINANCIAL STATEMENTS (CONTINUED)
NOTES TO THE FINANCIAL STATEMENTS CONTINUEDFOR THE YEAR ENDED 31 MARCH 2017
175
Vedanta Resources plc | Annual Report FY2017www.vedantaresources.com
STRATEGIC REPORT DIRECTORS’ REPORT FINANCIAL STATEMENTS ADDITIONAL INFORMATION
PARENT COMPANY FINANCIAL STATEMENTSThe financial statements of the parent company, Vedanta Resources plc, incorporated in the United Kingdom, have been prepared in accordance with FRS 101 and UK company law. The Company financial statements and associated notes are presented in note 46 to 59.
2 (A) ACCOUNTING POLICIES(I) BASIS OF CONSOLIDATIONSUBSIDIARIES:The consolidated financial information incorporates the results of the Company and all its subsidiaries (the “Group”), being the companies that it controls. Control is evidenced where the Company has power over the investee, is exposed, or has rights, to variable returns from its involvement with the investee and has the ability to affect those returns through its power over the investee. Power is demonstrated through existing rights that give the ability to direct relevant activities, which significantly affect the entity returns.
The financial statements of subsidiaries are prepared for the same reporting year as the parent Company. Where necessary, adjustments are made to the financial statements of subsidiaries to bring the accounting policies used into line with accounting policies used by the Group.
For non-wholly owned subsidiaries, a share of the profit for the financial year and net assets is attributed to the non-controlling interests as shown in the consolidated income statement, consolidated statement of comprehensive income and consolidated balance sheet.
For acquisitions of additional interests in subsidiaries, where there is no change in control, the Group recognises a reduction to the non-controlling interest of the respective subsidiary with the difference between this figure and the cash paid, inclusive of transaction fees, being recognised in equity. In addition, upon dilution of controlling interests the difference between the cash received from sale or listing of the subsidiary shares and the increase to non-controlling interest is also recognised in equity. The results of subsidiaries acquired or disposed of during the year are included in the consolidated income statement from the effective date of acquisition or up to the effective date of disposal, as appropriate.
All intercompany balances and transactions, including unrealised profits arising from intra-Group transactions, have been eliminated in full. Unrealised losses are eliminated unless costs cannot be recovered.
JOINT ARRANGEMENTSA Joint arrangement is an arrangement of which two or more parties have joint control. Joint control is considered when there is contractually agreed sharing of control of an arrangement, which exists only when decisions about the relevant activities require the unanimous consent of the parties sharing control. › The Group has Joint operations within its Oil & Gas segment, the Group participates in several unincorporated joint operations
which involve the joint control of assets used in oil and gas exploration and producing activities. The Group accounts for its share of assets, liabilities, income and expenditure of joint ventures in which the Group holds an interest, classified in the appropriate balance sheet and income statement headings. In addition, where the Group acts as operator to the joint venture, the gross liabilities and receivables (including amounts due to or from non-operating partners) of the joint operations are included in the Group balance sheet.
(II) REVENUE RECOGNITIONRevenues are measured at the fair value of the consideration received or receivable , net of discounts, volume rebates, outgoing sales taxes excise duty and other indirect taxes. Revenues from sales are recognised when all significant risks and rewards of ownership of the commodity sold are transferred to the customer and the commodity has been delivered to the shipping agent. Revenues from sale of by-products are included in revenue.
Certain of the Group’s sales contracts provide for provisional pricing based on the price on The London Metal Exchange (“LME”), as specified in the contract, when shipped. Final settlement of the price is based on the applicable price for a specified future period. The Group’s provisionally priced sales are marked to market using the relevant forward prices for the future period specified in the contract and is adjusted in revenue. › Revenue from oil, gas and condensate sales represent the Group’s share of oil, gas and condensate production, recognised on
a direct entitlement basis, and tolling income received for third party use of operating facilities and pipelines in accordance with agreements.
› Revenue from sale of power is recognised when delivered and measured based on rates as per bilateral contractual agreements with buyers and at rate arrived at based on the principles laid down under the relevant Tariff Regulations as notified by the regulatory bodies, as applicable.
› Where the Group acts as a port operator, revenues and costs relating to each construction contract of service concession arrangements are recognised over the period of each arrangement only to the extent of costs incurred that are probable of recovery. Revenues and costs relating to operating phase of the port contract are measured at the fair value of the consideration received or receivable for the services provided.
› Revenue from rendering of services is recognised on the basis of work performed.
1. PRESENTATION OF FINANCIAL STATEMENTS (CONTINUED)
176
Vedanta Resources plc | Annual Report FY2017
› Dividend income recognised when the right to receive payment is established is accounted for as investment income in consolidated income statement.
› Interest income is recognised using the effective interest rate method, accounted for as investment income in consolidated income statement.
› The fair value gain/(loss) in relation to financial assets held for trading is accounted for as investment income in consolidated income statement.
(III) SPECIAL ITEMSSpecial items are those items that management considers, by virtue of their size or incidence (including but not limited Impairment charges and acquisition and restructuring related costs), should be disclosed separately to ensure that the financial information allows an understanding of the underlying performance of the business in the year, so as to facilitate comparison with prior periods. Also tax charges related to Special items and certain one-time tax effects are considered Special. Such items are material by nature or amount to the year’s result and require separate disclosure in accordance with IFRS. The determination as to which items should be disclosed separately requires a degree of judgement.
(IV) BUSINESS COMBINATIONSThe results of subsidiaries acquired or sold during the year are consolidated for the periods from, or to, the date on which control passed. Acquisitions are accounted for under the acquisition method. The acquiree’s identifiable assets, liabilities and contingent liabilities that meet the conditions for recognition are recognised at their fair value at the acquisition date, except certain assets and liabilities required to be measured as per the applicable standards.
The identifiable assets, liabilities and contingent liabilities of a subsidiary, which can be measured reliably, are recorded at their provisional fair values at the date of acquisition. The difference between the fair value of the consideration transferred (including contingent consideration and previously held non-controlling interests) and Group’s share of the fair value of the identifiable net assets on acquisition is recognised as Goodwill. Goodwill arising on acquisitions is reviewed for impairment at least annually.
Where the fair values of the identifiable assets and liabilities exceed the cost of acquisition, the surplus is credited to the income statement in the Year of acquisition. If the fair value of the identifiable net assets acquired is in excess of the aggregate consideration transferred, the Group reassesses whether it has correctly identified all of the assets acquired and all of the liabilities assumed and reviews the procedures used to measure the amounts to be recognised at the acquisition date. If the reassessment still results in an excess of the fair value of net assets acquired over the aggregate consideration transferred, then the gain is recognised in statement of profit or loss and other comprehensive income.
Where it is not possible to complete the determination of fair values by the date on which the first post-acquisition financial statements are approved, a provisional assessment of fair values is made and any adjustments required to those provisional fair values, and the corresponding adjustments to purchased goodwill, are finalised within 12 months of the acquisition date.
Any non-controlling interest in an acquiree is measured at fair value or as the non-controlling interest’s proportionate share of the acquiree’s identifiable net assets, excluding goodwill. This accounting choice is made on a transaction-by-transaction basis.
Acquisition expenses are charged to the income statement.
If the Group acquires a group of assets or equity in a company that does not constitute a business combination in accordance with IFRS 3 Business Combinations (2008 revised), the cost of the acquired group of assets or equity is allocated to the individual identifiable assets acquired based on their relative fair value.
COMMON CONTROL TRANSACTIONS A business combination involving entities or businesses under common control is a business combination in which all of the combining entities or businesses are ultimately controlled by the same party or parties both before and after the business combination and the control is not transitory. The transactions between entities under common control are scoped out of IFRS 3 and there is no authoritative literature for these transactions under IFRS. As a result, the Group adopted accounting principles similar to the pooling-of-interest method based on the predecessor values. The assets and liabilities of the acquired entity are recognised at the book values recorded in the ultimate parent entity’s consolidated financial statements with the exception of certain income tax and deferred tax benefits arising on account of the common control transaction but relating to previous years, which are recognised retrospectively. The components of equity of the acquired companies are added to the same components within Group equity except that any share capital and investments in the books of the acquiring entity is cancelled and the differences, if any, is adjusted in the opening retained earnings. The Company’s shares issued in consideration for the acquired companies are recognized from the moment the acquired companies are included in these financial statements and the financial statements of the commonly controlled entities would be combined, retrospectively, as if the transaction had occurred at the beginning of the earliest reporting period presented. However, the prior years’ comparative information is only adjusted for periods during which the entities were under common control.
2 (A) ACCOUNTING POLICIES (CONTINUED)
NOTES TO THE FINANCIAL STATEMENTS CONTINUEDFOR THE YEAR ENDED 31 MARCH 2017
177
Vedanta Resources plc | Annual Report FY2017www.vedantaresources.com
STRATEGIC REPORT DIRECTORS’ REPORT FINANCIAL STATEMENTS ADDITIONAL INFORMATION
(V) INTANGIBLE ASSETSIntangibles assets are measured at cost less accumulated amortisation and accumulated impairment losses, if any. The Group determines the amortisation period as the period over which the future economic benefits will flow to the Group after taking into account all relevant facts and circumstances. Amortisation method, residual values and estimated useful life of intangible assets are reviewed annually or more frequently if events or changes in circumstances indicate a potential impairment.
Intangible assets arising out of service concession arrangements are accounted for as intangible assets where the Company has a contractual right to charge users of services when the projects are completed and is measured at the cost of such construction services completed. Such assets are amortised on straight line basis over the balance of license period, usually between 3 to 30 years.
Gains or losses arising from derecognition of an intangible asset are measured as the difference between the net disposal proceeds and the carrying amount of the asset are recognised in the consolidated income statement when the asset is derecognised.
(VI) PROPERTY, PLANT AND EQUIPMENTRELATING TO MINERAL ASSETS- MINING PROPERTIES AND LEASESThe costs of mining properties and leases, which include the costs of acquiring and developing mining properties and mineral rights, are capitalised as property, plant and equipment under the heading ‘Mining properties and leases’ in the year in which they are incurred.
When a decision is taken that a mining property is viable for commercial production (i.e. when the Group determines that the mining property will provide sufficient and sustainable returns relative to the risk and decides to proceed with the development), all further pre-production primary development expenditure other than land, buildings, plant and equipment is capitalised as part of the cost of the mining property until the mining property is capable of commercial production. From that point, capitalised mining properties and lease costs are amortised on a unit-of-production basis over the total estimated remaining commercial reserves of each property or group of properties.
Exploration and evaluation assets acquired are recognised as assets at their cost of acquisition subject to meeting the commercial production criteria mentioned above and are subject to impairment review on an event of indication for impairment.
Exploration and evaluation expenditure incurred after obtaining the right to mine or the legal right to explore, is capitalised as property, plant and equipment and stated at cost less any impairment. Exploration and evaluation assets are transferred to the appropriate category of property, plant and equipment when the technical feasibility and commercial viability has been determined. Exploration and evaluation assets are assessed for impairment and impairment loss, if any, is recognised prior to reclassification. Exploration and evaluation expenditure incurred prior to obtaining the mining right or the legal right to explore are expensed as incurred.
Exploration expenditure includes all direct and allocated indirect expenditure associated with finding specific mineral resources which includes depreciation and applicable operating costs of related support equipment and facilities and other costs of exploration activities: › Acquisition costs – costs associated with acquisition of licences and rights to explore, including related professional fees. › General exploration costs – costs of surveys and studies, rights of access to properties to conduct those studies (e.g., costs
incurred for environment clearance, defence clearance, etc.), and salaries and other expenses of geologists, geophysical crews and other personnel conducting those studies.
› Costs of exploratory drilling and equipping exploratory and appraisal wells.
The stripping cost incurred during the production phase of a surface mine are deferred to the extent the current period stripping cost exceeds the average period stripping cost over the life of mine and recognised as an asset if such cost provides a benefit in terms of improved access to ore in future periods and certain criteria are met. Deferred stripping costs are included in mining properties within Property, plant and equipment and disclosed as a part of mining properties. After initial recognition, the stripping activity asset is depreciated on a unit of production method over the expected useful life of the identified component of the ore body.
In circumstances where a mining property is abandoned, the cumulative capitalised costs relating to the property are written off in the period in which it occurs i.e. when the group determines that the mining property will not provide sufficient and sustainable returns relative to the risks and the group decides not to proceed with the mine development.
Commercial reserves are proved and probable reserves as defined by the ‘JORC’ Code and ‘SAMREC’ Code. Changes in the commercial reserves affecting unit of production calculations are dealt with prospectively over the revised remaining reserves.
RELATING TO OIL AND GAS ASSETS- EXPLORATION & EVALUATION ASSETS AND DEVELOPING/PRODUCING ASSETSFor oil and gas assets a successful efforts based accounting policy is followed. Costs incurred prior to obtaining the legal rights to explore an area are expensed immediately to the income statement. Expenditure incurred on the acquisition of a licence interest is
2 (A) ACCOUNTING POLICIES (CONTINUED)
178
Vedanta Resources plc | Annual Report FY2017
initially capitalised on a licence-by-licence basis. Costs are held, are not amortised or depreciated, within exploration and evaluation assets until such time as the exploration phase on the licence area is complete or commercial reserves have been discovered.
Exploration expenditure incurred in the process of determining oil and gas exploration targets is capitalised initially within property, plant and equipment- exploration and evaluation assets and subsequently allocated to drilling activities (under oil and gas properties and/or exploration and evaluation assets as appropriate). Exploration drilling costs are initially capitalised on a well-by-well basis until the success or otherwise of the well has been established. The success or failure of each exploration effort is judged on a well-by-well basis. Drilling costs are written off on completion of a well unless the results indicate that hydrocarbon reserves exist and there is a reasonable prospect that these reserves are commercial.
Following appraisal of successful exploration wells, if commercial reserves are established and technical feasibility for extraction demonstrated, then the related capitalised exploration costs are transferred into a single field cost centre within property, plant & equipment - development/producing assets (oil and gas properties) after testing for impairment. Where results of exploration drilling indicate the presence of hydrocarbons which are ultimately not considered commercially viable, all related costs are written off to the income statement.
All costs incurred after the technical feasibility and commercial viability of producing hydrocarbons has been demonstrated are capitalised within property, plant & equipment - development/producing assets (oil and gas properties) on a field-by-field basis. Subsequent expenditure is capitalised only where it either enhances the economic benefits of the development/producing asset or replaces part of the existing development/producing asset. Any remaining costs associated with the part replaced are expensed.
Net proceeds from any disposal of an exploration asset are initially credited against the previously capitalised costs. Any surplus proceeds are credited to the income statement. Net proceeds from any disposal of development/producing assets are credited against the previously capitalised cost. A gain or loss on disposal of a development/producing asset is recognised in the income statement to the extent that the net proceeds exceed or are less than the appropriate portion of the net capitalised costs of the asset.
OTHER PROPERTY, PLANT AND EQUIPMENTThe initial cost of property, plant and equipment comprises its purchase price, including import duties and non-refundable purchase taxes, and any directly attributable costs of bringing an asset to working condition and location for its intended use, including relevant borrowing costs and any expected costs of decommissioning. This policy is set out under ‘Borrowings Costs’. Expenditure incurred after the property, plant and equipment have been put into operation, such as repairs and maintenance, are charged to the income statement in the period in which the costs are incurred. Major shut-down and overhaul expenditure is capitalised as the activities undertaken improve the economic benefits expected to arise from the asset.
(VII) ASSETS UNDER CONSTRUCTIONAssets under construction are capitalised in the assets under construction account. At the point when an asset is operating at management’s intended use, the cost of construction is transferred to the appropriate category of property, plant and equipment and depreciation commences (see below). Costs associated with the commissioning of an asset and any obligatory decommissioning costs are capitalised where the asset is available for use but incapable of operating at normal levels until a period of commissioning has been completed. Revenue generated from production during the trial period is capitalised. Borrowing costs and certain foreign exchange gains or losses are in certain circumstances capitalised in the cost of the asset under construction. This policy is set out under ‘Borrowing Costs’.
(VIII) DEPRECIATION AND AMORTISATIONRELATING TO MINING PROPERTIESMining properties and other assets in the course of development or construction, freehold land and goodwill are not depreciated or amortised. Capitalised mining properties are depreciated and lease costs are amortised once commercial production commences, as described in “Property, plant and equipment – mining properties and leases”. Leasehold land and buildings are depreciated on a straight-line basis over the period of the lease or, if shorter, their useful economic life.
RELATING TO OIL AND GAS ASSETSAll expenditure carried within each field is depreciated from the commencement of production on a unit of production basis, which is the ratio of oil and gas production in the period to the estimated quantities of commercial reserves at the end of the period plus the production in the period, generally on a field-by-field basis or group of fields which are reliant on common infrastructure.
Commercial reserves are proven and probable oil and gas reserves, which are defined as the estimated quantities of crude oil, natural gas and natural gas liquids which geological, geophysical and engineering data demonstrate with a specified degree of certainty to be recoverable in future years from known reservoirs and which are considered commercially producible. There should be a 50 per cent statistical probability that the actual quantity of recoverable reserves will be more than the amount estimated as proven and probable reserves and a 50 per cent statistical probability that it will be less.
Costs used in the unit of production calculation comprise the net book value of capitalised costs plus the estimated future field development costs required to access commercial reserves. Changes in the estimates of commercial reserves or future field development costs are dealt with prospectively.
2 (A) ACCOUNTING POLICIES (CONTINUED
NOTES TO THE FINANCIAL STATEMENTS CONTINUEDFOR THE YEAR ENDED 31 MARCH 2017
179
Vedanta Resources plc | Annual Report FY2017www.vedantaresources.com
STRATEGIC REPORT DIRECTORS’ REPORT FINANCIAL STATEMENTS ADDITIONAL INFORMATION
OTHERSOther buildings, plant and equipment, office equipment and fixtures, and motor vehicles are stated at cost less accumulated depreciation and any provision for impairment. Depreciation commences when the assets are ready for their intended use. Depreciation is provided at rates calculated to write off the cost, less estimated residual value, of each asset on a straight-line basis over its expected useful life, as follows:
Buildings operations and administration 30-60 yearsPlant and machinery 15-40 yearsOffice equipment and fixtures 5–10 yearsMotor vehicles 8-10 years
The Group reviews the residual value and useful life of an asset annually and, if expectations differ from previous estimates, the change is accounted for as a change in accounting estimate.
Major overhaul costs are depreciated over the estimated life of the economic benefit to be derived from the overhaul. The carrying amount of the remaining previous overhaul cost is charged to the income statement if the next overhaul is undertaken earlier than the previously estimated life of the economic benefit.
Property, plant and equipment held for sale or which is part of a disposal Group held for sale is not depreciated. Property, plant and equipment held for sale is carried at the lower of its carrying value and fair value less disposal cost and is presented separately on the face of the balance sheet.
(IX) IMPAIRMENTFINANCIAL ASSETSA financial asset is assessed at each reporting date to determine whether there is any objective evidence that it is impaired. A financial asset is considered to be impaired if objective evidence indicates that one or more events have had a negative effect on the estimated future cash flows of that asset.
An impairment loss in respect of a financial asset measured at amortised cost is calculated as the difference between its carrying amount, and the present value of the estimated future cash flows discounted at the original effective interest rate. An impairment loss in respect of an available-for-sale financial asset is calculated by reference to its fair value.
Significant financial assets are tested for impairment on an individual basis. The remaining financial assets are assessed collectively in groups that share similar credit risk characteristics. All impairment losses are recognized in the consolidated statements of income. Any cumulative loss in respect of an available-for-sale financial asset recognized previously in the consolidated statements of comprehensive income is transferred to the consolidated statements of income on recognition of impairment. An impairment loss is reversed if the reversal can be related objectively to an event occurring after the impairment loss was recognized. For financial assets measured at amortised cost and available-for-sale financial assets that are debt securities, the reversal is recognized in the consolidated statements of income. For available-for-sale financial assets that are equity securities, the change in fair value is recognized directly in the consolidated income statement.
In respect of trade and other receivables, the Group would provide for impairment losses unless the Company is satisfied that no recovery of the amount owing is possible; at that point the amounts are considered irrecoverable and are written off against the financial asset directly.
NON-FINANCIAL ASSETSImpairment charges and reversals are assessed at the level of cash-generating units. A cash-generating unit (CGU) is the smallest identifiable group of assets that generate cash inflows that are largely independent of the cash inflows from other assets or group of assets.
Formal impairment tests are carried out annually for goodwill. In addition, formal impairment tests for all assets are performed when there is an indication of impairment. The Group conducts an internal review of asset values annually, which is used as a source of information to assess for any indications of impairment or reversal of previously recognised impairment losses. Internal and external factors, such as worse economic performance than expected, changes in expected future prices, costs and other market factors are also monitored to assess for indications of impairment or reversal of previously recognised impairment losses.
If any such indication exists then an impairment review is undertaken, the recoverable amount is calculated, as the higher of fair value less costs of disposal and the asset’s value in use.
Fair value less costs of disposal is the price that would be received to sell the asset in an orderly transaction between market participants less costs of disposal and does not reflect the effects of factors that may be specific to the entity and not applicable to entities in general. Fair value for mineral and oil and gas assets is generally determined as the present value of the estimated future cash flows expected to arise from the continued use of the asset, including any expansion prospects, and its eventual disposal, using assumptions that an independent market participant may take into account. These cash flows are discounted at an appropriate post-tax discount rate to arrive at the net present value.
2 (A) ACCOUNTING POLICIES (CONTINUED)
180
Vedanta Resources plc | Annual Report FY2017
Value in use is determined as the present value of the estimated future cash flows expected to arise from the continued use of the asset in its present form and its eventual disposal. The cash flows are discounted using a pre-tax discount rate that reflects current market assessments of the time value of money and the risks specific to the asset for which estimates of future cash flows have not been adjusted. Value in use is determined by applying assumptions specific to the Group’s continued use and cannot take into account future development. These assumptions are different to those used in calculating fair value and consequently the value in use calculation is likely to give a different result to a fair value calculation.
The carrying amount of the CGU is determined on a basis consistent with the way the recoverable amount of the CGU is determined. The carrying amount is net of deferred tax liability recognised in the fair value of the assets acquired in a business combination.
If the recoverable amount of an asset or CGU is estimated to be less than its carrying amount, the carrying amount of the asset or CGU is reduced to its recoverable amount. An impairment loss is recognised in the consolidated income statement.
Any reversal of the previously recognised impairment loss is limited to the extent that the asset’s carrying amount does not exceed the carrying amount that would have been determined if no impairment loss had previously been recognised except if initially attributed to goodwill.
EXPLORATION & EVALUATION ASSETS:In assessing whether there is any indication that an exploration and evaluation asset may be impaired, the company considers, as a minimum, the following indicators: › the period for which the entity has the right to explore in the specific area has expired during the period or will expire in the
near future, and is not expected to be renewed; › substantive expenditure on further exploration for and evaluation of mineral resources in the specific area is neither budgeted
nor planned; › exploration for and evaluation of mineral resources in the specific area have not led to the discovery of commercially viable
quantities of mineral resources and the entity has decided to discontinue such activities in the specific area; › sufficient data exist to indicate that, although a development in the specific area is likely to proceed, the carrying amount of the
exploration and evaluation asset is unlikely to be recovered in full from successful development or by sale; and › reserve information prepared annually by external experts.
When a potential impairment is identified, an assessment is performed for each area of interest in conjunction with the group of operating assets (representing a cash-generating unit) to which the exploration and evaluation assets is attributed. Exploration areas in which reserves have been discovered but require major capital expenditure before production can begin, are continually evaluated to ensure that commercial quantities of reserves exist or to ensure that additional exploration work is under way or planned. To the extent that capitalised expenditure is no longer expected to be recovered, it is charged to the income statement.
(X) NON-CURRENT ASSETS HELD FOR SALE AND DISCONTINUED OPERATIONSNon-current assets are classified as held for sale if their carrying amount will be recovered principally through a sale transaction rather than through continuing use. This condition is regarded as met only when a sale is highly probable from the date of classification, management are committed to the sale and the asset is available for immediate sale in its present condition. Non-current assets are classified as held for sale from the date these conditions are met and are measured at the lower of carrying amount and fair value (less costs to sell). Any resulting impairment loss that is material is recognised in the income statement as a special item. On classification as held for sale the assets are no longer depreciated and moved to current assets.
(XI) GOVERNMENT GRANTSGovernment grants related to assets, including non monetary grants at fair value, have been deducted in arriving at the carrying amount of the asset.
(XII) INVENTORIESInventories and work-in-progress are stated at the lower of cost and net realisable value.
COST IS DETERMINED ON THE FOLLOWING BASIS: › Purchased copper concentrate is recorded at cost on a first-in, first-out (“FIFO”) basis; all other materials including stores and
spares are valued on weighted average basis; except in Oil and Gas business where stores and spares are valued on a FIFO basis.
› Finished products are valued at raw material cost plus costs of conversion, comprising labour costs and an attributable proportion of manufacturing overheads based on normal levels of activity; and by-products and scrap are valued at net realisable value.
› Net realisable value is determined based on estimated selling price, less further costs expected to be incurred to completion and disposal.
2 (A) ACCOUNTING POLICIES (CONTINUED)
NOTES TO THE FINANCIAL STATEMENTS CONTINUEDFOR THE YEAR ENDED 31 MARCH 2017
181
Vedanta Resources plc | Annual Report FY2017www.vedantaresources.com
STRATEGIC REPORT DIRECTORS’ REPORT FINANCIAL STATEMENTS ADDITIONAL INFORMATION
(XIII) TAXATIONTax expense represents the sum of tax currently payable and deferred tax.
Current tax is provided at amounts expected to be paid (or recovered) using the tax rates and laws that have been enacted or substantively enacted by the balance sheet date.
Deferred tax is provided, using the balance sheet method, on all temporary differences at the balance sheet date between the tax bases of assets and liabilities and their carrying amounts for financial reporting purposes. Exceptions to this principle are:
Tax payable on the future remittance of the past earnings of subsidiaries where the timing of the reversal of the temporary differences can be controlled and it is probable that the temporary differences will not reverse in the foreseeable future;
Deferred income tax is not recognised on the impairment of goodwill which is not deductible for tax purposes or on the initial recognition of an asset or liability in a transaction that is not a business combination, which at the time of the transaction, affects neither the accounting profit nor taxable profit or loss; and
Deferred tax assets are recognised only to the extent that it is more likely than not that they will be recovered.
Deferred tax assets and liabilities are measured at the tax rates that are expected to apply to the year when the asset is realised or the liability is settled, based on tax rates (and tax laws) that have been enacted or substantively enacted at the balance sheet date. Tax relating to items recognised directly in other comprehensive income is recognised in the consolidated statements of comprehensive income and not in the income statement.
The carrying amount of deferred tax assets is reviewed at each balance sheet date and is adjusted to the extent that it is no longer probable that sufficient taxable profit will be available to allow all or part of the asset to be recovered.
Deferred tax assets and deferred tax liabilities are offset, if a legally enforceable right exists to set off current income tax assets against current income tax liabilities and the deferred taxes relate to the same taxable entity and the same taxation authority.
Deferred tax is provided on temporary differences arising on acquisitions that are categorised as Business Combinations. Deferred tax is recognised at acquisition as part of the assessment of the fair value of assets and liabilities acquired. Any deferred tax is charged or credited in the income statement/other comprehensive income as the underlying temporary difference is reversed.
(XIV) RETIREMENT BENEFIT SCHEMESThe Group operates or participates in a number of defined benefits and contribution schemes, the assets of which are (where funded) held in separately administered funds.
For defined benefit schemes the cost of providing benefits under the plans is determined each year separately for each plan using the projected unit credit method by independent qualified actuaries.
Re-measurement gains and losses arising in the year are recognised in Other Comprehensive Income and are not recycled to the income statement.
Net interest is calculated by applying a discount rate to the net defined benefit liability or asset. Defined benefit costs are split into current service cost, past service cost, net interest expense or income and remeasurement.
Current service cost and past service costs is recognised within cost of sales and administrative expenses. Net interest expense or income is recognised within finance costs.
For defined contribution schemes, the amount charged to the income statement in respect of pension costs and other post-retirement benefits is the contributions payable in the year.
(XV) SHARE-BASED PAYMENTSCertain employees (including executive directors) of the Group receive part of their remuneration in the form of share-based payment transactions, whereby employees render services in exchange for shares or rights over shares (‘equity-settled transactions’).
The resultant increase in equity is recorded in share based payment reserve.
The cost of equity-settled transactions with employees is measured at fair value at the date at which they are granted. The fair value of share awards with market-related vesting conditions are determined with the assistance of an external valuer and the fair value at the grant date is expensed on a proportionate basis over the vesting period based on the Group’s estimate of shares that will eventually vest. The estimate of the number of awards likely to vest is reviewed at each balance sheet date up to the vesting date at which point the estimate is adjusted to reflect the current expectations.
2 (A) ACCOUNTING POLICIES (CONTINUED)
182
Vedanta Resources plc | Annual Report FY2017
In case of cash-settled transactions, a liability is recognised for the fair value of cash-settled transactions. The fair value is measured initially and at each reporting date up to and including the settlement date, with changes in fair value recognised in employee benefits expense. The fair value is expensed over the period until the vesting date with recognition of a corresponding liability. The fair value is determined with the assistance of an external valuer.
(XVI) PROVISIONS FOR LIABILITIES AND CHARGESProvisions are recognised when the Group has a present obligation (legal or constructive), as a result of past events, and it is probable that an outflow of resources, that can be reliably estimated, will be required to settle such an obligation. If the effect of the time value of money is material, provisions are determined by discounting the expected future cash flows to net present value using an appropriate pre-tax discount rate that reflects current market assessments of the time value of money and, where appropriate, the risks specific to the liability. Unwinding of the discount is recognised in the income statement as a finance cost. Provisions are reviewed at each balance sheet date and are adjusted to reflect the current best estimate.
(XVII) RESTORATION, REHABILITATION AND ENVIRONMENTAL COSTSAn obligation to incur restoration, rehabilitation and environmental costs arises when environmental disturbance is caused by the development or ongoing production of a mine or oil fields. Costs arising from the decommissioning of plant and other site preparation work are provided for based on their discounted net present value, with a corresponding amount being capitalised at the start of each project. The amount provided for is recognised, as soon as the obligation to incur such costs arises. These costs are charged to the income statement over the life of the operation through the depreciation of the asset and the unwinding of the discount on the provision. The cost estimates are reviewed periodically and are adjusted to reflect known developments which may have an impact on the cost estimates or life of operations. The cost of the related asset is adjusted for changes in the provision due to factors such as updated cost estimates, new disturbance and revisions to discount rates. The adjusted cost of the asset is depreciated prospectively over the lives of the assets to which they relate. The unwinding of the discount is shown as a finance cost in the income statement.
Costs for restoration of subsequent site damage which is caused on an ongoing basis during production are provided for at their net present values and charged to the income statement as extraction progresses. Where the costs of site restoration are not anticipated to be significant, they are expensed as incurred.
(XVIII) OPERATING LEASESGROUP AS A LESSEERentals under operating leases are charged on a straight-line basis over the lease term, even if the payments are not made on such a basis.
GROUP AS A LESSORLeases in which the Group does not transfer substantially all the risks and rewards of ownership of an asset are classified as operating leases. Initial direct costs incurred in negotiating and arranging an operating lease are added to the carrying amount of the leased asset and recognised over the lease term on the same basis as rental income. Contingent rents are recognised as revenue in the period in which they are earned.
(XIX) FINANCE LEASESAssets held under finance leases are recognised as assets of the Group at their fair value at the inception of the lease or, if lower, at the present value of the minimum lease payments. The corresponding liability to the lessor is included in the Balance Sheet as a finance lease obligation. Lease payments are apportioned between finance charges and reduction of the lease obligation so as to achieve a constant rate of interest on the remaining balance of the liability. Finance charges are charged to the Income Statement, unless they are directly attributable to qualifying assets, in which case they are capitalised in accordance with the Group’s policy on borrowing costs.
(XX) FOREIGN CURRENCY TRANSLATIONThe functional currency for each entity in the Group is determined as the currency of the primary economic environment in which it operates. For all principal operating subsidiaries, the functional currency is the local currency of the country in which it operates with the exception of KCM and Oil and gas business which has a US Dollar functional currency as that is the currency of primary economic environment in which it operates. In the financial statements of individual Group companies, transactions in currencies other than the functional currency are translated into the functional currency at the exchange rates ruling at the date of transaction. Monetary assets and liabilities denominated in other currencies are translated into the functional currency at exchange rates prevailing on the balance sheet date. Non-monetary assets and liabilities denominated in other currencies and measured at historical cost or fair value are translated at the exchange rates prevailing on the dates on which such values were determined.
All exchange differences are included in the income statement, except, where the monetary item is designated as an effective hedging instrument of the currency risk of designated forecast sales. These include the exchange differences recognised in equity and exchange differences on foreign currency borrowings relating to asset under construction, and for future productive use, and are included in the cost of those assets when they are regarded as an adjustment to interest costs on those foreign currency borrowings.
2 (A) ACCOUNTING POLICIES (CONTINUED)
NOTES TO THE FINANCIAL STATEMENTS CONTINUEDFOR THE YEAR ENDED 31 MARCH 2017
183
Vedanta Resources plc | Annual Report FY2017www.vedantaresources.com
STRATEGIC REPORT DIRECTORS’ REPORT FINANCIAL STATEMENTS ADDITIONAL INFORMATION
For the purposes of consolidation, the income statement items of those entities for which the US dollar is not the functional currency are translated into US dollars at the average rates of exchange during the period. The related consolidated statements of financial position are translated at the rates as at the reporting date. Exchange differences arising on translation are recognised in the consolidated statements of comprehensive income. On disposal of such entities the deferred cumulative exchange differences recognised in equity relating to that particular foreign operation are recognised in the consolidated statements of profit or loss.
(XXI) FINANCIAL ASSET INVESTMENTSFinancial asset investments are classified as available for sale under IAS 39 and are initially recorded at fair value plus transaction costs that are directly attributable to the acquisition of financial asset investments and then remeasured at subsequent reporting dates to fair value. Unrealised gains and losses on financial asset investments are recognised directly in equity. On disposal or impairment of the investments, the gains and losses in equity are recycled to the income statement.
Investments in equity instruments are recorded in non-current assets unless they are expected to be sold within one year.
Investments in unquoted equity instruments that do not have a market price and whose fair value cannot be reliably measured are measured at cost.
The Group assesses at each reporting date whether there is objective evidence that a financial asset or a group of financial assets is impaired. An impairment exists if one or more events that has occurred since the initial recognition of the asset (an incurred ‘loss event’) has an impact on the estimated future cash flows of the financial asset or the group of financial assets that can be reliably estimated.
(XXII) LIQUID INVESTMENTSLiquid investments represent short-term investments that do not meet the definition of cash and cash equivalents for one or more of the following reasons: › They have a maturity profile greater than 90 days; › They may be subject to a greater risk of changes in value than cash; › They are held for investment purposes.
These include Short-term marketable securities and other Bank Deposits.
Short-term marketable securities are categorized as held for trading and are initially recognised at fair value with any gains or losses arising on remeasurement recognised in the consolidated statements of profit or loss.
Other bank deposits are subsequently measured at amortised cost using the effective interest method.
The value of trading investments incorporates any dividend and interest earned on the held for trading investments.
(XXIII) CASH AND CASH EQUIVALENTSCash and cash equivalents in the balance sheet comprise cash at bank and in hand, short-term deposits with banks and short-term highly liquid investments that are readily convertible into cash which are subject to insignificant risk of changes in value and are held for the purpose of meeting short-term cash commitments.
(XXIV) TRADE RECEIVABLESTrade receivables are stated at their transaction value as reduced by appropriate allowances for estimated irrecoverable amounts. An allowance for impairment of trade receivables is made where there is an event, which based on previous experience, is an indication of a reduction in the recoverability of the carrying value of the trade receivables.
Trade receivables are subsequently measured at amortised cost using the effective interest method, less any impairment. Interest income is recognised on non-current receivables on specific items by applying the effective interest rate method.
(XXV) TRADE PAYABLESTrade and other payables are recognised at their transaction cost, which is its fair value, and subsequently measured at amortised cost.
(XXVI) BILLS OF EXCHANGE PAYABLEThe Group enters into arrangements whereby financial institutions make direct payments to suppliers for raw materials and project materials. The financial institutions are subsequently repaid by the company at a later date providing working capital timing benefits. These are normally settled up to twelve months (for raw materials) and up to 36 months (for project materials). Where these arrangements are for raw materials with a maturity of up to twelve months, the economic substance of the transaction is determined to be operating in nature and these are recognised as Bills of exchange (under Trade and other payables). Where these arrangements are for project materials with a maturity up to thirty six months, the economic substance of the transaction is determined to be financing in nature, and these are classified as projects buyers’ credit within borrowings in the statement of financial position.
2 (A) ACCOUNTING POLICIES (CONTINUED)
184
Vedanta Resources plc | Annual Report FY2017
(XXVII) EQUITY INSTRUMENTSEquity instruments issued by the Company are recorded at the proceeds received, net of direct issue costs.
(XXVIII) BORROWINGSInterest bearing loans and overdrafts are recorded at the fair value. Finance charges, including premiums payable on settlement or redemption and direct issue costs, are accounted for on an accruals basis and charged to the income statement using the effective interest method. They are netted against the carrying amount of the instrument to the extent that they are not settled in the period in which they arise.
(XXIX)CONVERTIBLE BONDSConvertible bonds denominated in the functional currency of the issuing entity are accounted for as compound instruments. The equity components and the liability components are separated out on the date of the issue. The equity component is recognised in a separate reserve and is not subsequently remeasured. The liability component (net of transaction cost) is held at amortised cost. The interest expense on the liability component is calculated by applying the effective interest rate, being the prevailing market interest rate at the date of issuance for similar non-convertible debt. The difference between this amount and interest paid is added to the carrying amount of the liability component.
Convertible bonds not denominated in the functional currency of the issuing entity or where a cash conversion option exists, are split into two components: a debt component and a component representing the embedded derivative in the convertible bond. The debt component represents a liability for future coupon payments and the redemption of the principal amount. The embedded derivative, a financial liability, represents the value of the option that bondholders have to convert into ordinary shares. At inception the embedded derivative is recorded at fair value and the remaining balance, after deducting a share of issue costs, is recorded as the debt component. Subsequently, the debt component is measured at amortised cost and the embedded derivative is measured at fair value at each balance sheet date with the change in the fair value recognised in the income statement. The embedded derivative and the debt component are disclosed together and the current/non-current classification follows the classification of the debt component which is the host contract.
(XXX) BORROWING COSTSBorrowing costs directly relating to the acquisition, construction or production of a qualifying capital project under construction are capitalised and added to the project cost during construction until such time that the assets are substantially ready for their intended use in accordance with the Group policy which is when they are capable of commercial production. Where funds are borrowed specifically to finance a qualifying capital project, the amount capitalised represents the actual borrowing costs incurred. Where surplus funds are available out of money borrowed specifically to finance a project, the income generated from such short-term investments is also capitalised to reduce the total capitalised borrowing cost. Where the funds used to finance a project form part of general borrowings, the amount capitalised is calculated using a weighted average of rates applicable to relevant general borrowings of the Group during the year.
All other borrowing costs are recognised in the income statement in the period in which they are incurred.
Capitalisation of interest on borrowings related to construction or development projects is ceased when substantially all the activities that are necessary to make the assets ready for their intended use are complete or when delays occur outside of the normal course of business.
(XXXI) AVAILABLE FOR SALE FINANCIAL ASSETSEquity shares held by the Group that are traded in an active market are classified as being available for sale (AFS) financial assets and are stated at fair value. Unrealised gains and losses on financial asset investments are recognised directly in equity. On disposal or impairment of the investments, the gains and losses in equity are recycled to the income statement. Dividends received from investees accounted for as equity instruments are recognised in income statement when the right to receive the payment is established.
(XXXII) FINANCIAL INSTRUMENTS FAIR VALUED THROUGH PROFIT AND LOSSHELD FOR TRADING FINANCIAL ASSETSFinancial assets are classified as held for trading if they have been acquired principally for the purpose of selling in the near term. The change in fair value of trading investments incorporates any dividend and interest earned on the held for trading investments and is accounted for in the income statement.
DERIVATIVE FINANCIAL INSTRUMENTSIn order to hedge its exposure to foreign exchange, interest rate and commodity price risks, the Group enters into forward contracts, option contracts, swap contracts and other derivative financial instruments. The Group does not hold derivative financial instruments for speculative purposes.
Derivative financial instruments are initially recorded at their fair value on the date of the derivative transaction and are re-measured at their fair value at subsequent balance sheet dates. The resultant gains or losses are recognised in the income statement unless these are designated as effective hedging instruments.
2 (A) ACCOUNTING POLICIES (CONTINUED)
NOTES TO THE FINANCIAL STATEMENTS CONTINUEDFOR THE YEAR ENDED 31 MARCH 2017
185
Vedanta Resources plc | Annual Report FY2017www.vedantaresources.com
STRATEGIC REPORT DIRECTORS’ REPORT FINANCIAL STATEMENTS ADDITIONAL INFORMATION
(XXXIII) HEDGE ACCOUNTINGThe Group designates certain hedging instruments, which include derivatives and non-derivatives in respect of foreign currency risk, as either fair value hedges or cash flow hedges. Changes in the fair value of derivatives that are designated and qualify as fair value hedges are recorded in the income statement. The hedged item is recorded at fair value and any gain or loss is recorded in the income statement and is offset by the gain or loss from the change in the fair value of the derivative.
Changes in the fair value of derivatives that are designated and qualify as cash flow hedges are recorded in equity. This includes certain non-derivative liabilities that are designated as hedge of the foreign currency risk on future, highly probable, forecast sales. Amounts deferred in equity are recycled to the income statement in the periods when the hedged item is recognised in the income statement.
The gain or loss on hedging instruments relating to the effective portion of a net investment hedge is recognised in equity. The ineffective portion is recognised immediately in the income statement. Gains or losses accumulated in equity are reclassified to the income statement on disposal of the foreign operations to which they relate.
Hedge accounting is discontinued when the hedging instrument expires or is sold, terminated or exercised, or no longer qualifies for hedge accounting. Any cumulative gain or loss on the hedging instrument recognised in equity is kept in equity until the forecast transaction occurs. If a hedged transaction is no longer expected to occur, the net cumulative gain or loss recognised in equity is transferred to the income statement.
Derivatives embedded in other financial instruments or other host contracts are treated as separate derivatives when their risks and characteristics are not closely related to those of the host contracts and the host contracts are not carried at fair value with unrealised gains or losses recognised in the income statement.
For derivative instruments that are designated and qualify as a hedge of a net investment in a foreign operations, the gain or loss is reported in the consolidated statements of comprehensive income as part of the exchange difference on translation of foreign operations to the extent it is effective. Any ineffective portions of net investment hedges are recognized in other income/expense in the consolidated statement of profit or loss immediately. Under a hedge of a net investment, the cumulative gain or loss remains in the consolidated statements of comprehensive income when the hedging instrument expires or is sold, terminated or exercised, or when the hedge no longer qualifies for hedge accounting or the Group revokes designation of the hedge relationship. The cumulative gain or loss is recognised in the consolidated income statement as part of the gain/loss on disposal when the net investment in the foreign operation is disposed.
Derivative financial instruments that do not qualify for hedge accounting are marked to market at the financial position date and gains or losses are recognised in the consolidated income statement immediately.
2(B) CRITICAL ACCOUNTING JUDGMENT AND ESTIMATION UNCERTAINTYThe preparation of financial statements in conformity with IFRS requires management to make judgments, estimates and assumptions, that affect the application of accounting policies and the reported amounts of assets, liabilities, income, expenses and disclosures of contingent assets and liabilities at the date of these consolidated financial statements and the reported amounts of revenues and expenses for the years presented. Actual results may differ from these estimates under different assumptions and conditions.
Estimates and underlying assumptions are reviewed on an ongoing basis. Revisions to accounting estimates are recognised in the period in which the estimate is revised and future periods affected. The Group considers the following areas as the key sources of estimation uncertainty:
(I) OIL & GAS RESERVESOil & Gas reserves are estimated on a proved and probable entitlement interest basis. Proven and probable reserves are estimated using standard recognised evaluation techniques. The estimate is reviewed annually. Future development costs are estimated taking into account the level of development required to produce the reserves by reference to operators, where applicable, and internal engineers.
Net entitlement reserves estimates are subsequently calculated using the Group’s current oil price and cost recovery assumptions, in line with the relevant agreements.
Changes in reserves as a result of factors such as production cost, recovery rates, grade of reserves or commodity prices could impact the depreciation rates, carrying value of assets and environmental and restoration provisions.
(II) CARRYING VALUE OF EXPLORATION AND EVALUATION OIL AND GAS ASSETSThe recoverability of a project is assessed under IFRS 6. Exploration assets are assessed by comparing the carrying value to higher of fair value less cost of disposal or value in use. Change to the valuation of exploration assets is an area of judgement. Further details on the Group’s accounting policies on this are set out in accounting policy above. The amounts for exploration and evaluation assets represent active exploration projects. These amounts will be written off to the income statement as exploration costs unless commercial reserves are established or the determination process is not completed and there are no indications of
2 (A) ACCOUNTING POLICIES (CONTINUED)
186
Vedanta Resources plc | Annual Report FY2017
impairment. The outcome of ongoing exploration, and therefore whether the carrying value of exploration and evaluation assets will ultimately be recovered, is inherently uncertain.
Details of impairment charge/reversal impact and the assumptions used are disclosed in note 5.
(III) CARRYING VALUE OF DEVELOPING/PRODUCING OIL AND GAS ASSETSManagement perform impairment tests on the Group’s developing/producing oil and gas assets where indicators of impairment are identified in accordance with IAS 36.
The impairment assessments are based on a range of estimates and assumptions, including:
Estimates/assumptions Basis
Future production proved and probable reserves, resource estimates and, in certain cases, expansion projects
Commodity pricesmanagement’s best estimate benchmarked with external sources of information, to ensure they are within the range of available analyst forecast
Discount to price management’s best estimate based on historical prevailing discount
Extension of PSC assumed that PSC for Rajasthan block would be extended till 2030 on the expected commercial terms
Discount rates cost of capital risk-adjusted for the risk specific to the asset/CGU
Any subsequent changes to cash flows due to changes in the above mentioned factors could impact the carrying value of the assets.
Details of impairment charge and the assumptions used are disclosed in note 5.
(IV) MINING PROPERTIES AND LEASESThe carrying value of mining property and leases is arrived at by depreciating the assets over the life of the mine using the unit of production method based on proved and probable reserves. The estimate of reserves is subject to assumptions relating to life of the mine and may change when new information becomes available. Changes in reserves as a result of factors such as production cost, recovery rates, grade of reserves or commodity prices could thus impact the carrying values of mining properties and leases and environmental and restoration provisions.
Management performs impairment tests when there is an indication of impairment. The impairment assessments are based on a range of estimates and assumptions, including:
Estimates/assumptions Basis
Future productionproved and probable reserves, resource estimates (with an appropriate conversion factor) considering the expected permitted mining volumes and, in certain cases, expansion projects
Commodity pricesmanagement’s best estimate benchmarked with external sources of information, to ensure they are within the range of available analyst forecast
Exchange rates management best estimate benchmarked with external sources of information
Discount rates cost of capital risk-adjusted for the risk specific to the asset/CGU
Details of impairment charge are disclosed in note 5.
(V) USEFUL ECONOMIC LIVES AND IMPAIRMENT OF OTHER ASSETSProperty, plant and equipment other than mining properties, oil and gas properties, and leases are depreciated over their useful economic lives. Management reviews the useful economic lives at least once a year and any changes could affect the depreciation rates prospectively and hence the asset carrying values. The Group also reviews its property, plant and equipment, including mining properties and leases, for possible impairment if there are events or changes in circumstances that indicate that carrying values of the assets may not be recoverable. In assessing the property, plant and equipment for impairment, factors leading to significant reduction in profits such as changes in commodity prices, the Group’s business plans and changes in regulatory environment are taken into consideration. The carrying value of the assets of a cash generating unit (CGU) is compared with the recoverable amount of those assets, that is, the higher of fair value less costs of disposal and value in use. Recoverable value is based on the management estimates of commodity prices, market demand and supply, economic and regulatory climates, long-term plan, discount rates and other factors. Any subsequent changes to cash flow due to changes in the abovementioned factors could impact the carrying value of the assets.
(VI) ASSESSMENT OF IMPAIRMENT AT LANJIGARH REFINERYDuring the previous year, the Group has received the necessary approvals for expansion of the Lanjigarh refinery to 4 million tonnes per annum (MTPA). Approval for expansion from 4 MTPA to 6 MTPA is dependent upon certain conditions.
2(B) CRITICAL ACCOUNTING JUDGMENT AND ESTIMATION UNCERTAINTY (CONTINUED)
NOTES TO THE FINANCIAL STATEMENTS CONTINUEDFOR THE YEAR ENDED 31 MARCH 2017
187
Vedanta Resources plc | Annual Report FY2017www.vedantaresources.com
STRATEGIC REPORT DIRECTORS’ REPORT FINANCIAL STATEMENTS ADDITIONAL INFORMATION
Accordingly, second stream operation has commenced in Alumina refinery from April 2016 thus, taking it to the debottlenecked capacity of 1.7 - 2.0 MTPA (contingent on bauxite quality). Further ramp up to 4 MTPA will be considered after tying up the local bauxite sources. The Group has considered the delay in tying up local bauxite sources as an indication of impairment. Hence, the Group has reviewed the carrying value of its property, plant and equipments at Lanjigarh as at balance sheet date, estimated the recoverable amounts of these assets and concluded that there was no impairment because the recoverable amount (estimated based on fair value less cost of disposal) exceeded the carrying amounts.
The key assumptions and estimates used in determining the fair value less cost of disposal of these assets were: › The State of Odisha has abundant bauxite resources and given the initiatives by the Government of Odisha, management is
confident that bauxite will be made available in the short to medium term. The company has entered into agreements with various suppliers internationally and domestically to ensure the availability of bauxite to run its refinery. In the initial years, the Company has assumed that bauxite will be purchased from third party suppliers in India and other countries, till the bauxite is sourced from own mines.
› The State of Odisha has taken certain measures including reservation of areas for mining operations or undertaking prospecting and constitution of Ministerial Committee for formulation of policy for supply of ores to Odisha based industries on long term basis. GOI has amended the existing MMDR Act. The major change is in the process of grant of concessions i.e. from First come First serve basis to more transparent process of auction and to expedite the grant process.
› Management expects that the conditions for construction of the alumina refinery beyond 4 MTPA will be fulfilled and it is assumed that the final unconditional approval for the expansion of the refinery would be received for commencement of production by fiscal 2020.
The government of Odisha has cancelled all the old reservations for mine allotment and has formed a more transparent process of auction of mines under the MMDR Act, which will improve the chances of local bauxite availability.
Management expects that the mining approvals for various local bauxite mines will be received.
The Group has carried out a sensitivity analysis on the key variables including delay in obtaining bauxite mining approval, depreciation of US dollar against Rupee, discount rate and London Metal Exchange aluminium prices. The most significant variable is the estimated timeframe for obtaining regulatory approval for the mining and/or gaining access to local bauxite. The sensitivity analysis indicates that even if regulatory approvals for mines/access to local bauxite are delayed by a year, the recoverable amount is still expected to exceed the carrying value and costs. As at March 31, 2017 the carrying amount of property plant and equipment related to alumina refinery operations at Lanjigarh and related mining assets is US$1,099.4 million (31 March 2016 : US$1,079.0 million).
(VII) ASSESSMENT OF IMPAIRMENT OF KARNATAKA AND GOA IRON ORE MINES:KARNATAKA MININGThe mining ban in Karnataka was lifted on 17 April 2013 and the mining operations resumed in December 2013. The mining operations were suspended since August 2014 pending environment clearances. On execution of Mining Lease Deed and final forest clearance, the operations were resumed towards the end of February 2015. Currently the permissible extraction capacity is fixed at 2.29 MTPA which is based on lowest of Reserves and Resources (R & R) capacity, dumping capacity and road capacity as assessed by Indian Council of Forestry Research and Education. Subsequently, based on reassessment of R & R and other factors, the modified mining plan has been submitted to Indian Bureau of Mines in March 2016 for enhancement of production to 6 MTPA. Management has estimated the recoverable amounts of these assets considering the increase in the extraction capacity in FY2018.
A delay of one year in increase in the allocated capacity would result in reduction in the recoverable amount by approximately 1% and the recoverable amount would continue to be sufficiently in excess of the carrying value.
The carrying value of assets as at 31 March 2017 is US$140.2 million (31 March 2016: US$145.6 million).
GOA MININGThe Ministry of Environment and Forest revoked its earlier order which had kept the environment clearances for iron ore mines in Goa in abeyance. The State Government has issued a mining policy and has lifted the ban on Iron ore mining in Goa. The Group has been allocated with an interim annual mining quantity of 6.9 million tonnes per annum (MTPA) (out of the total interim mining cap of 20 MTPA for FY 2016) of saleable ore.
The Expert Committee, constituted by the Supreme Court of India for conducting the Macro-Environmental Impact Assessment study on the ceiling of annual extraction of iron ore mining in Goa has recommended the enhancement of mining cap to 30 MTPA. This has been recommended to be further enhanced to 37 MTPA after the review of Macro Environment Impact Assessment and augmenting the carrying capacity. The report is pending for consideration of Supreme Court. Post the Supreme Court clearance, the State Government will allocate the limits. It has been assumed that the allocation will be made based on the proportionate share of the current EC limits.
The mining operations resumed in October, 2015. Management has estimated the recoverable amounts of these assets considering the mining cap of 30 MTPA in FY 2018 and 37 MTPA from FY 2019 and onwards.
2(B) CRITICAL ACCOUNTING JUDGMENT AND ESTIMATION UNCERTAINTY (CONTINUED)
188
Vedanta Resources plc | Annual Report FY2017
A delay of one year in increase in the mining cap to 30 MTPA and 37 MTPA would result in a reduction in the recoverable amount by approximately 4% and the recoverable amount would continue to be sufficiently in excess of the carrying value.
The carrying value of assets as at 31 March 2017 is US$635.2 million (31 March 2016: US$643.9 million).
Management has reviewed the carrying value of Karnataka and Goa mining assets as at the balance sheet date, estimated the recoverable amounts of these assets and concluded that there was no impairment as the recoverable amount (estimated based on fair value less costs of disposal) exceeded the carrying amounts.
The Group has also carried out a sensitivity analysis on key variables including delay in increase in the mining cap, movement in iron ore prices, discount rate and appreciation of rupee against US dollar. Based on the sensitivity analysis, the recoverable amount is still expected to exceed the carrying value.
Details of impairment charge are disclosed in note 5.
(VIII) ASSESSMENT OF IMPAIRMENT AT KONKOLA COPPER MINES (KCM)The KCM operations in Zambia have experienced, lower equipment availability, throughput constraints, and other operational challenges including production ramp up. Due to these factors, the Group has reviewed the carrying value of its property, plant and equipments at KCM as at balance sheet date, estimated the recoverable amounts of the assets and concluded that there was no impairment because the recoverable amount (estimated based on fair value less costs of disposal) exceeded the carrying amounts.
The Group has also carried out a sensitivity analysis on key variables like movement in copper prices, discount rate and production. Based on the sensitivity analysis, the recoverable amount is still expected to exceed the carrying value.
The carrying value of assets as at 31 March 2017 is US$1,663.6 million (31 March 2016: US$1,744.9 million).
(IX) RESTORATION, REHABILITATION AND ENVIRONMENTAL COSTSProvision is made for costs associated with restoration and rehabilitation of mining sites as soon as the obligation to incur such costs arises. Such restoration and closure costs are typical of extractive industries and they are normally incurred at the end of the life of the mine or oil fields. The costs are estimated on an annual basis on the basis of mine closure plans and the estimated discounted costs of dismantling and removing these facilities and the costs of restoration are capitalised as soon as the obligation to incur such costs arises. The critical accounting judgement is associated with calculating the provision for decommissioning oil and gas assets is based on the current estimate of the costs for removing and decommissioning producing facilities, the forecast timing and currency of settlement of decommissioning liabilities and the appropriate discount rate.
A corresponding provision is created on the liability side. The capitalised asset is charged to the income statement over the life of the operation through the depreciation of the asset and the provision is increased each period via unwinding the discount on the provision. Management estimates are based on local legislation and/or other agreements. The actual costs and cash outflows may differ from estimates because of changes in laws and regulations, changes in prices, analysis of site conditions and changes in restoration technology.
(X) PROVISIONS AND LIABILITIESProvisions and liabilities are recognised in the period when it becomes probable that there will be a future outflow of funds resulting from past operations or events that can be reasonably estimated. The timing of recognition requires the application of judgement to existing facts and circumstances which may be subject to change especially when taken in the context of the legal environment in India. The actual cash outflows may take place over many years in the future and hence the carrying amounts of provisions and liabilities are regularly reviewed and adjusted to take into account the changing circumstances and other factors that influence the provisions and liabilities. This is set out in note 30.
(XI) CONTINGENCIES AND COMMITMENTSIn the normal course of business, contingent liabilities may arise from litigation, taxation and other claims against the Group. A tax provision is recognised when the group has a present obligation as a result of a past event, it is probable that the group will be required to settle that obligation.
Where it is management’s assessment that the outcome cannot be reliably quantified or is uncertain the claims are disclosed as contingent liabilities unless the likelihood of an adverse outcome is remote. Such liabilities are disclosed in the notes but are not provided for in the financial statements.
When considering the classification of a legal or tax cases as probable, possible or remote there is judgement involved. This pertains to the application of the legislation, which in certain cases is based upon management’s interpretation of country specific tax law, in particular India, and the likelihood of settlement. Management uses in-house and external legal professionals to inform their decision.
2(B) CRITICAL ACCOUNTING JUDGMENT AND ESTIMATION UNCERTAINTY (CONTINUED)
NOTES TO THE FINANCIAL STATEMENTS CONTINUEDFOR THE YEAR ENDED 31 MARCH 2017
189
Vedanta Resources plc | Annual Report FY2017www.vedantaresources.com
STRATEGIC REPORT DIRECTORS’ REPORT FINANCIAL STATEMENTS ADDITIONAL INFORMATION
Although there can be no assurance regarding the final outcome of the legal proceedings, the Group does not expect them to have a materially adverse impact on the Group’s financial position or profitability. These are set out in note 38.
(XII) THE HZL AND BALCO CALL OPTIONSThe Group had exercised its call option to acquire the remaining 49% interest in BALCO and 29.5% interest in HZL. The Government of India has however, contested the validity of the options and disputed their valuation performed in terms of the relevant agreements the details of which are set out in note 40. In view of the lack of resolution on the options, the non-response to the exercise and valuation request from the Government of India, the resultant uncertainty surrounding the potential transaction and the valuation of the consideration payable, the Group considers the strike price of the options to be at fair value, accordingly, the value of the option would be nil, and hence, the call options have not been recognised in the financial statements.
(XIII) ASSESSMENT OF IFRIC 4 – DETERMINING WHETHER AN ARRANGEMENT CONTAINS A LEASEThe Group has ascertained that the Power Purchase Agreement (PPA) entered into between one of the Subsidiary and a State Grid qualifies to be an operating lease under IAS 17 “Leases”. Accordingly, the consideration receivable under the PPA relating to recovery of capacity charges towards capital cost have been recognised as operating lease rentals and in respect of variable cost that includes fuel costs, operations and maintenance etc. is considered as revenue from sale of products/services.
Significant judgement is required in segregating the capacity charges due from State Grid, between fixed and contingent payments. The Group has determined that since the capacity charges under the PPA are based on the number of units of electricity made available by its Subsidiary which would be subject to variation on account of various factors like availability of coal and water for the plant, there are no fixed minimum payments under the PPA, which requires it to be accounted for on a straight line basis.
(XIV) REVENUE RECOGNITION AND RECEIVABLE RECOVERY IN RELATION TO THE POWER DIVISIONIn certain cases, the Group’s power customers are disputing various contractual provisions of Power Purchase Agreements (PPA). Significant judgement is required in both assessing the tariff to be charged under the PPA in accordance with IAS 18 and to assess the recoverability of withheld revenue currently accounted for as receivables.
In assessing this critical judgment management considered favorable legal opinions the Group has obtained in relation to the claims and favorable court judgements in the related matter. In addition the fact that the contracts are with government owned companies implies the credit risk is low.
3. SEGMENT INFORMATIONThe Group is diversified natural resources group engaged in exploring, extractive and processing minerals and oil and gas. We produce Zinc, Lead, Silver, Copper, Aluminium, Iron ore, Oil and gas and commercial power and have presence across India, Zambia, South Africa, Namibia, UAE, Ireland, Australia and Liberia. The Group is also in the business of port operations in India.
The Group’s reportable segments defined in accordance with IFRS 8 are as follows: › Zinc- India › Zinc-International › Oil & Gas › Iron Ore › Copper-India/Australia › Copper-Zambia › Aluminium › Power
The components not meeting the quantitative threshold for reporting are being reported as ‘Others’.
Management monitors the operating results of reportable segments for the purpose of making decisions about resources to be allocated and for assessing performance. Segment performance is evaluated based on the EBITDA of each segment. Business segment financial data includes certain corporate costs, which have been allocated on an appropriate basis. Intersegment sales are charged based on prevailing market prices.
The following tables present revenue and profit information and certain asset and liability information regarding the Group’s reportable segments for the years ended 31 March 2017 and 31 March 2016. Items after operating profit are not allocated by segment.
2(B) CRITICAL ACCOUNTING JUDGMENT AND ESTIMATION UNCERTAINTY (CONTINUED)
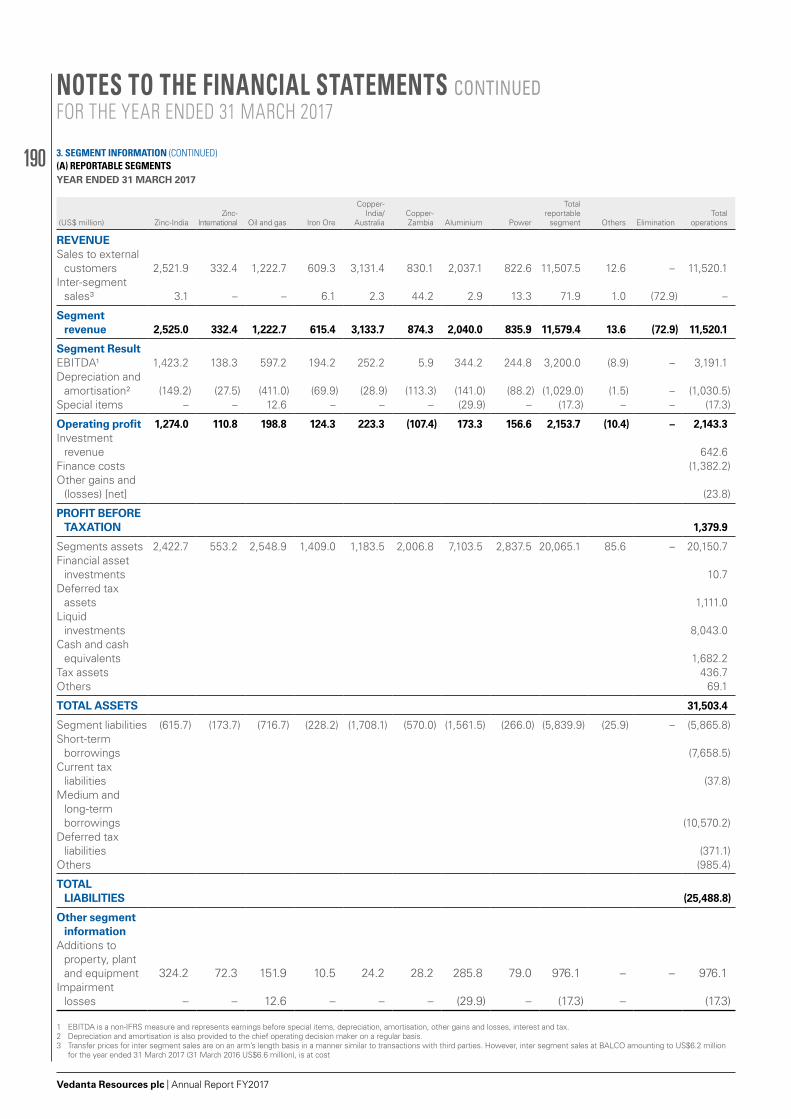
190
Vedanta Resources plc | Annual Report FY2017
(A) REPORTABLE SEGMENTSYEAR ENDED 31 MARCH 2017
(US$ million) Zinc-IndiaZinc-
International Oil and gas Iron Ore
Copper-India/
AustraliaCopper-Zambia Aluminium Power
Total reportable
segment Others EliminationTotal
operations
REVENUESales to external
customers 2,521.9 332.4 1,222.7 609.3 3,131.4 830.1 2,037.1 822.6 11,507.5 12.6 – 11,520.1Inter-segment
sales3 3.1 – – 6.1 2.3 44.2 2.9 13.3 71.9 1.0 (72.9) –
Segment revenue 2,525.0 332.4 1,222.7 615.4 3,133.7 874.3 2,040.0 835.9 11,579.4 13.6 (72.9) 11,520.1
Segment ResultEBITDA1 1,423.2 138.3 597.2 194.2 252.2 5.9 344.2 244.8 3,200.0 (8.9) – 3,191.1 Depreciation and
amortisation2 (149.2) (27.5) (411.0) (69.9) (28.9) (113.3) (141.0) (88.2) (1,029.0) (1.5) – (1,030.5)Special items – – 12.6 – – – (29.9) – (17.3) – – (17.3)
Operating profit 1,274.0 110.8 198.8 124.3 223.3 (107.4) 173.3 156.6 2,153.7 (10.4) – 2,143.3 Investment
revenue 642.6Finance costs (1,382.2)Other gains and
(losses) [net] (23.8)
PROFIT BEFORE TAXATION 1,379.9
Segments assets 2,422.7 553.2 2,548.9 1,409.0 1,183.5 2,006.8 7,103.5 2,837.5 20,065.1 85.6 – 20,150.7 Financial asset
investments 10.7Deferred tax
assets 1,111.0Liquid
investments 8,043.0Cash and cash
equivalents 1,682.2Tax assets 436.7Others 69.1
TOTAL ASSETS 31,503.4
Segment liabilities (615.7) (173.7) (716.7) (228.2) (1,708.1) (570.0) (1,561.5) (266.0) (5,839.9) (25.9) – (5,865.8)Short-term
borrowings (7,658.5)Current tax
liabilities (37.8)Medium and
long-term borrowings (10,570.2)
Deferred tax liabilities (371.1)
Others (985.4)
TOTAL LIABILITIES (25,488.8)
Other segment information
Additions to property, plant and equipment 324.2 72.3 151.9 10.5 24.2 28.2 285.8 79.0 976.1 – – 976.1
Impairment losses – – 12.6 – – – (29.9) – (17.3) – (17.3)
1 EBITDA is a non-IFRS measure and represents earnings before special items, depreciation, amortisation, other gains and losses, interest and tax.2 Depreciation and amortisation is also provided to the chief operating decision maker on a regular basis.3 Transfer prices for inter segment sales are on an arm’s length basis in a manner similar to transactions with third parties. However, inter segment sales at BALCO amounting to US$6.2 million
for the year ended 31 March 2017 (31 March 2016 US$6.6 million), is at cost
3. SEGMENT INFORMATION (CONTINUED)
NOTES TO THE FINANCIAL STATEMENTS CONTINUEDFOR THE YEAR ENDED 31 MARCH 2017
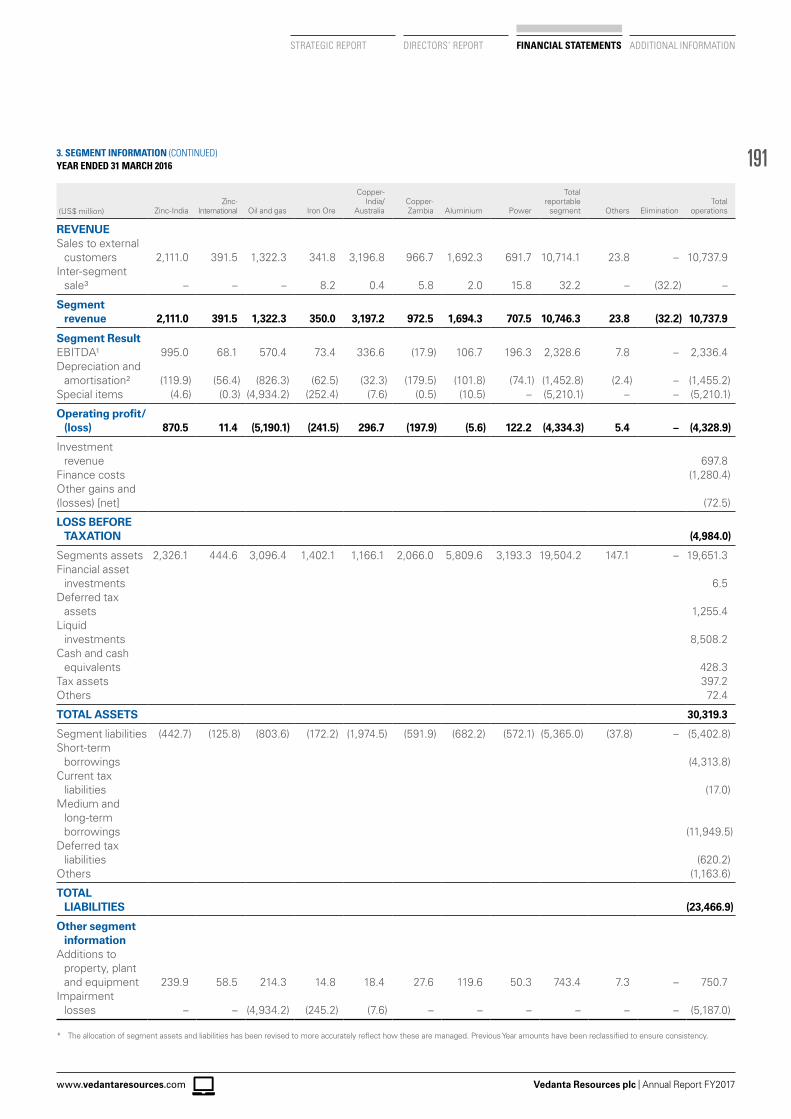
191
Vedanta Resources plc | Annual Report FY2017www.vedantaresources.com
STRATEGIC REPORT DIRECTORS’ REPORT FINANCIAL STATEMENTS ADDITIONAL INFORMATION
YEAR ENDED 31 MARCH 2016
(US$ million) Zinc-IndiaZinc-
International Oil and gas Iron Ore
Copper-India/
AustraliaCopper-Zambia Aluminium Power
Total reportable
segment Others EliminationTotal
operations
REVENUESales to external
customers 2,111.0 391.5 1,322.3 341.8 3,196.8 966.7 1,692.3 691.7 10,714.1 23.8 – 10,737.9Inter-segment
sale3 – – – 8.2 0.4 5.8 2.0 15.8 32.2 – (32.2) –
Segment revenue 2,111.0 391.5 1,322.3 350.0 3,197.2 972.5 1,694.3 707.5 10,746.3 23.8 (32.2) 10,737.9
Segment ResultEBITDA1 995.0 68.1 570.4 73.4 336.6 (17.9) 106.7 196.3 2,328.6 7.8 – 2,336.4Depreciation and
amortisation2 (119.9) (56.4) (826.3) (62.5) (32.3) (179.5) (101.8) (74.1) (1,452.8) (2.4) – (1,455.2)Special items (4.6) (0.3) (4,934.2) (252.4) (7.6) (0.5) (10.5) – (5,210.1) – – (5,210.1)
Operating profit/(loss) 870.5 11.4 (5,190.1) (241.5) 296.7 (197.9) (5.6) 122.2 (4,334.3) 5.4 – (4,328.9)
Investment revenue 697.8
Finance costs (1,280.4)Other gains and (losses) [net] (72.5)
LOSS BEFORE TAXATION (4,984.0)
Segments assets 2,326.1 444.6 3,096.4 1,402.1 1,166.1 2,066.0 5,809.6 3,193.3 19,504.2 147.1 – 19,651.3Financial asset
investments 6.5Deferred tax
assets 1,255.4Liquid
investments 8,508.2Cash and cash
equivalents 428.3Tax assets 397.2Others 72.4
TOTAL ASSETS 30,319.3
Segment liabilities (442.7) (125.8) (803.6) (172.2) (1,974.5) (591.9) (682.2) (572.1) (5,365.0) (37.8) – (5,402.8)Short-term
borrowings (4,313.8)Current tax
liabilities (17.0)Medium and
long-term borrowings (11,949.5)
Deferred tax liabilities (620.2)
Others (1,163.6)
TOTAL LIABILITIES (23,466.9)
Other segment information
Additions to property, plant and equipment 239.9 58.5 214.3 14.8 18.4 27.6 119.6 50.3 743.4 7.3 – 750.7
Impairment losses – – (4,934.2) (245.2) (7.6) – – – – – – (5,187.0)
* The allocation of segment assets and liabilities has been revised to more accurately reflect how these are managed. Previous Year amounts have been reclassified to ensure consistency.
3. SEGMENT INFORMATION (CONTINUED)
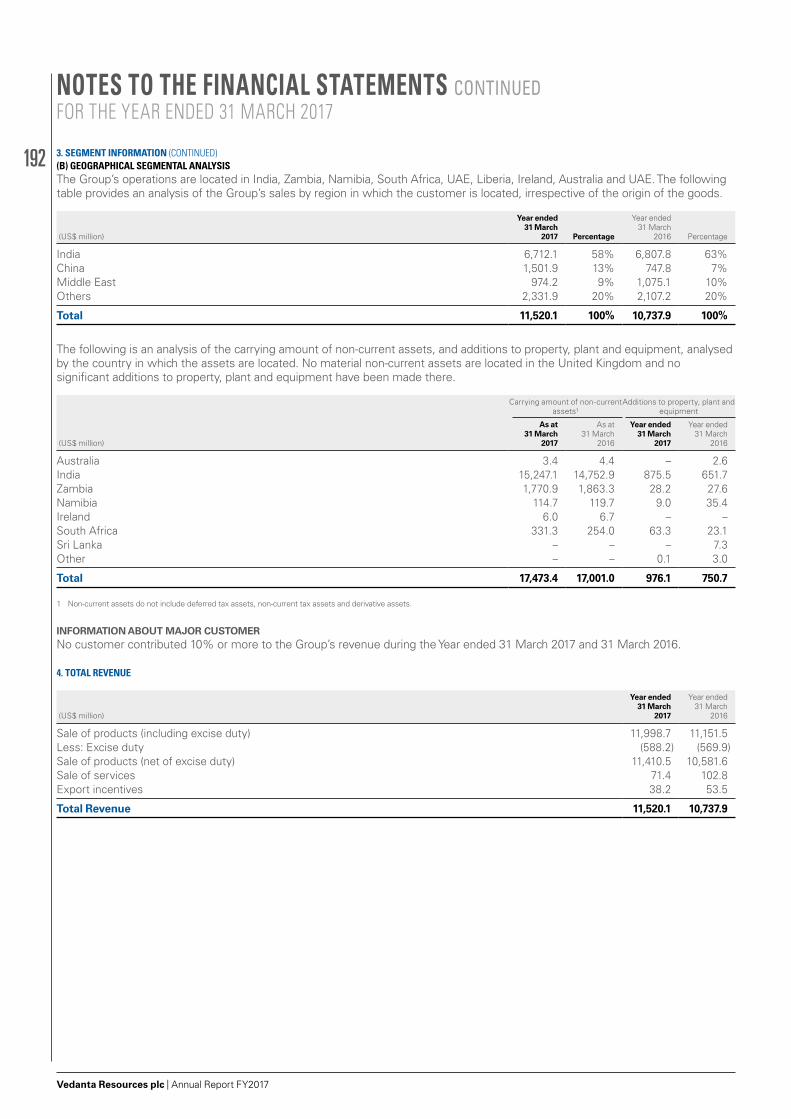
192
Vedanta Resources plc | Annual Report FY2017
(B) GEOGRAPHICAL SEGMENTAL ANALYSISThe Group’s operations are located in India, Zambia, Namibia, South Africa, UAE, Liberia, Ireland, Australia and UAE. The following table provides an analysis of the Group’s sales by region in which the customer is located, irrespective of the origin of the goods.
(US$ million)
Year ended 31 March
2017 Percentage
Year ended 31 March
2016 Percentage
India 6,712.1 58% 6,807.8 63%China 1,501.9 13% 747.8 7%Middle East 974.2 9% 1,075.1 10%Others 2,331.9 20% 2,107.2 20%
Total 11,520.1 100% 10,737.9 100%
The following is an analysis of the carrying amount of non-current assets, and additions to property, plant and equipment, analysed by the country in which the assets are located. No material non-current assets are located in the United Kingdom and no significant additions to property, plant and equipment have been made there.
Carrying amount of non-current assets1
Additions to property, plant and equipment
(US$ million)
As at 31 March
2017
As at 31 March
2016
Year ended 31 March
2017
Year ended 31 March
2016
Australia 3.4 4.4 – 2.6India 15,247.1 14,752.9 875.5 651.7Zambia 1,770.9 1,863.3 28.2 27.6Namibia 114.7 119.7 9.0 35.4Ireland 6.0 6.7 – – South Africa 331.3 254.0 63.3 23.1Sri Lanka – – – 7.3 Other – – 0.1 3.0
Total 17,473.4 17,001.0 976.1 750.7
1 Non-current assets do not include deferred tax assets, non-current tax assets and derivative assets.
INFORMATION ABOUT MAJOR CUSTOMERNo customer contributed 10% or more to the Group’s revenue during the Year ended 31 March 2017 and 31 March 2016.
4. TOTAL REVENUE
(US$ million)
Year ended 31 March
2017
Year ended 31 March
2016
Sale of products (including excise duty) 11,998.7 11,151.5Less: Excise duty (588.2) (569.9)Sale of products (net of excise duty) 11,410.5 10,581.6Sale of services 71.4 102.8Export incentives 38.2 53.5
Total Revenue 11,520.1 10,737.9
3. SEGMENT INFORMATION (CONTINUED)
NOTES TO THE FINANCIAL STATEMENTS CONTINUEDFOR THE YEAR ENDED 31 MARCH 2017
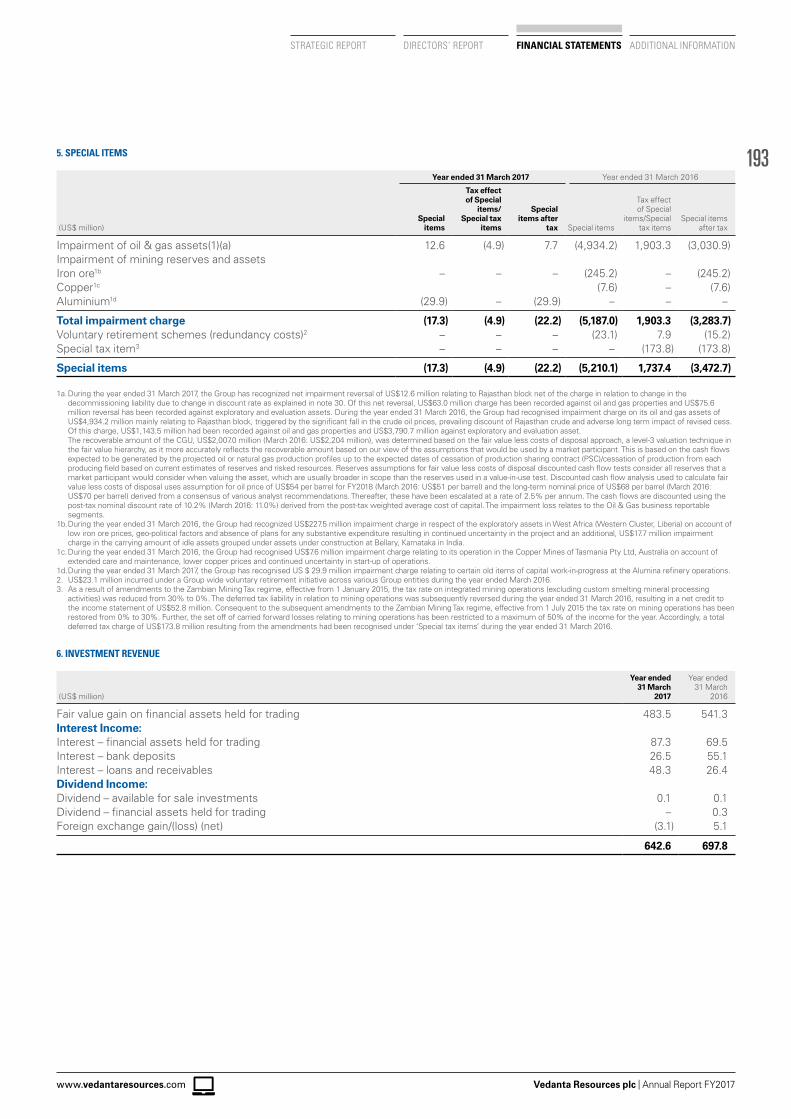
193
Vedanta Resources plc | Annual Report FY2017www.vedantaresources.com
STRATEGIC REPORT DIRECTORS’ REPORT FINANCIAL STATEMENTS ADDITIONAL INFORMATION
5. SPECIAL ITEMS
Year ended 31 March 2017 Year ended 31 March 2016
(US$ million)Special
items
Tax effect of Special
items/Special tax
items
Special items after
tax Special items
Tax effect of Special
items/Special tax items
Special items after tax
Impairment of oil & gas assets(1)(a) 12.6 (4.9) 7.7 (4,934.2) 1,903.3 (3,030.9)Impairment of mining reserves and assetsIron ore1b – – – (245.2) – (245.2)Copper1c (7.6) – (7.6)Aluminium1d (29.9) – (29.9) – – –
Total impairment charge (17.3) (4.9) (22.2) (5,187.0) 1,903.3 (3,283.7)Voluntary retirement schemes (redundancy costs)2 – – – (23.1) 7.9 (15.2)Special tax item3 – – – – (173.8) (173.8)
Special items (17.3) (4.9) (22.2) (5,210.1) 1,737.4 (3,472.7)
1a. During the year ended 31 March 2017, the Group has recognized net impairment reversal of US$12.6 million relating to Rajasthan block net of the charge in relation to change in the decommissioning liability due to change in discount rate as explained in note 30. Of this net reversal, US$63.0 million charge has been recorded against oil and gas properties and US$75.6 million reversal has been recorded against exploratory and evaluation assets. During the year ended 31 March 2016, the Group had recognised impairment charge on its oil and gas assets of US$4,934.2 million mainly relating to Rajasthan block, triggered by the significant fall in the crude oil prices, prevailing discount of Rajasthan crude and adverse long term impact of revised cess. Of this charge, US$1,143.5 million had been recorded against oil and gas properties and US$3,790.7 million against exploratory and evaluation asset.
The recoverable amount of the CGU, US$2,007.0 million (March 2016: US$2,204 million), was determined based on the fair value less costs of disposal approach, a level-3 valuation technique in the fair value hierarchy, as it more accurately reflects the recoverable amount based on our view of the assumptions that would be used by a market participant. This is based on the cash flows expected to be generated by the projected oil or natural gas production profiles up to the expected dates of cessation of production sharing contract (PSC)/cessation of production from each producing field based on current estimates of reserves and risked resources. Reserves assumptions for fair value less costs of disposal discounted cash flow tests consider all reserves that a market participant would consider when valuing the asset, which are usually broader in scope than the reserves used in a value-in-use test. Discounted cash flow analysis used to calculate fair value less costs of disposal uses assumption for oil price of US$54 per barrel for FY2018 (March 2016: US$51 per barrel) and the long-term nominal price of US$68 per barrel (March 2016: US$70 per barrel) derived from a consensus of various analyst recommendations. Thereafter, these have been escalated at a rate of 2.5% per annum. The cash flows are discounted using the post-tax nominal discount rate of 10.2% (March 2016: 11.0%) derived from the post-tax weighted average cost of capital. The impairment loss relates to the Oil & Gas business reportable segments.
1b. During the year ended 31 March 2016, the Group had recognized US$227.5 million impairment charge in respect of the exploratory assets in West Africa (Western Cluster, Liberia) on account of low iron ore prices, geo-political factors and absence of plans for any substantive expenditure resulting in continued uncertainty in the project and an additional, US$17.7 million impairment charge in the carrying amount of idle assets grouped under assets under construction at Bellary, Karnataka in India.
1c. During the year ended 31 March 2016, the Group had recognised US$7.6 million impairment charge relating to its operation in the Copper Mines of Tasmania Pty Ltd, Australia on account of extended care and maintenance, lower copper prices and continued uncertainty in start-up of operations.
1d. During the year ended 31 March 2017, the Group has recognised US $ 29.9 million impairment charge relating to certain old items of capital work-in-progress at the Alumina refinery operations.2. US$23.1 million incurred under a Group wide voluntary retirement initiative across various Group entities during the year ended March 2016.3. As a result of amendments to the Zambian Mining Tax regime, effective from 1 January 2015, the tax rate on integrated mining operations (excluding custom smelting mineral processing
activities) was reduced from 30% to 0%. The deferred tax liability in relation to mining operations was subsequently reversed during the year ended 31 March 2016, resulting in a net credit to the income statement of US$52.8 million. Consequent to the subsequent amendments to the Zambian Mining Tax regime, effective from 1 July 2015 the tax rate on mining operations has been restored from 0% to 30%. Further, the set off of carried forward losses relating to mining operations has been restricted to a maximum of 50% of the income for the year. Accordingly, a total deferred tax charge of US$173.8 million resulting from the amendments had been recognised under ‘Special tax items’ during the year ended 31 March 2016.
6. INVESTMENT REVENUE
(US$ million)
Year ended 31 March
2017
Year ended 31 March
2016
Fair value gain on financial assets held for trading 483.5 541.3Interest Income:Interest – financial assets held for trading 87.3 69.5Interest – bank deposits 26.5 55.1Interest – loans and receivables 48.3 26.4Dividend Income:Dividend – available for sale investments 0.1 0.1Dividend – financial assets held for trading – 0.3Foreign exchange gain/(loss) (net) (3.1) 5.1
642.6 697.8
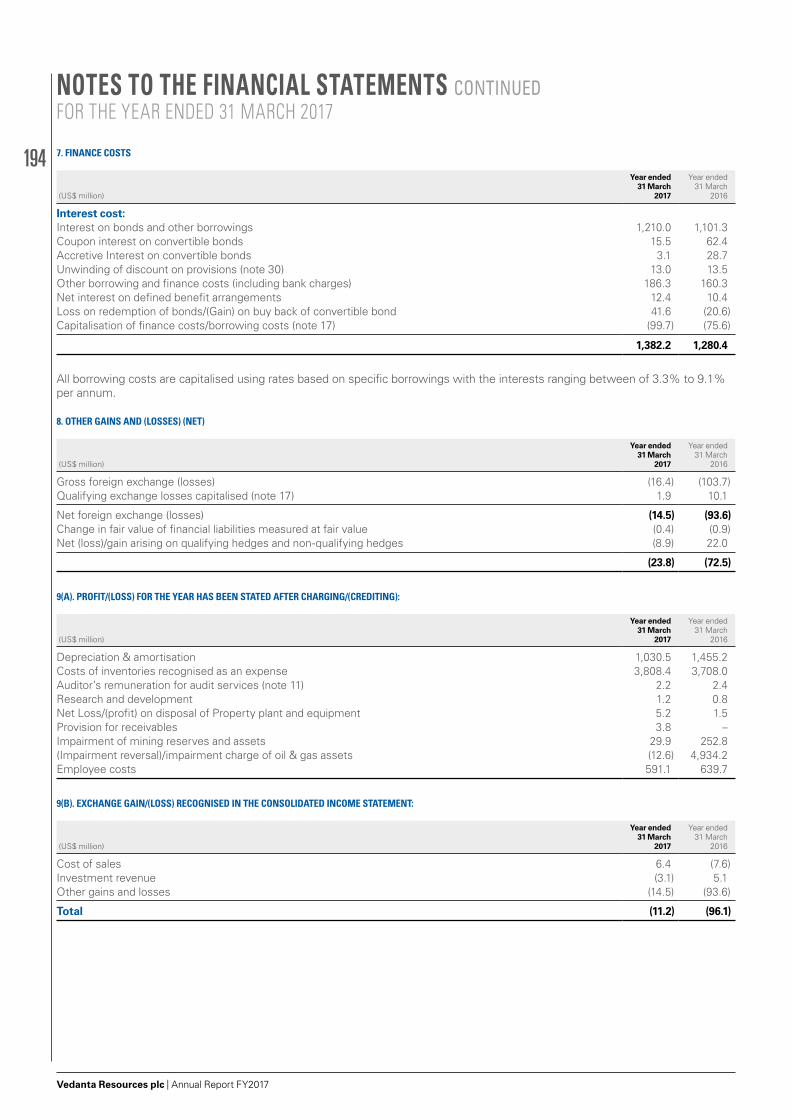
194
Vedanta Resources plc | Annual Report FY2017
7. FINANCE COSTS
(US$ million)
Year ended 31 March
2017
Year ended 31 March
2016
Interest cost:Interest on bonds and other borrowings 1,210.0 1,101.3Coupon interest on convertible bonds 15.5 62.4Accretive Interest on convertible bonds 3.1 28.7Unwinding of discount on provisions (note 30) 13.0 13.5Other borrowing and finance costs (including bank charges) 186.3 160.3Net interest on defined benefit arrangements 12.4 10.4Loss on redemption of bonds/(Gain) on buy back of convertible bond 41.6 (20.6)Capitalisation of finance costs/borrowing costs (note 17) (99.7) (75.6)
1,382.2 1,280.4
All borrowing costs are capitalised using rates based on specific borrowings with the interests ranging between of 3.3% to 9.1% per annum.
8. OTHER GAINS AND (LOSSES) (NET)
(US$ million)
Year ended 31 March
2017
Year ended 31 March
2016
Gross foreign exchange (losses) (16.4) (103.7)Qualifying exchange losses capitalised (note 17) 1.9 10.1
Net foreign exchange (losses) (14.5) (93.6)Change in fair value of financial liabilities measured at fair value (0.4) (0.9)Net (loss)/gain arising on qualifying hedges and non-qualifying hedges (8.9) 22.0
(23.8) (72.5)
9(A). PROFIT/(LOSS) FOR THE YEAR HAS BEEN STATED AFTER CHARGING/(CREDITING):
(US$ million)
Year ended 31 March
2017
Year ended 31 March
2016
Depreciation & amortisation 1,030.5 1,455.2Costs of inventories recognised as an expense 3,808.4 3,708.0Auditor’s remuneration for audit services (note 11) 2.2 2.4Research and development 1.2 0.8Net Loss/(profit) on disposal of Property plant and equipment 5.2 1.5Provision for receivables 3.8 – Impairment of mining reserves and assets 29.9 252.8(Impairment reversal)/impairment charge of oil & gas assets (12.6) 4,934.2Employee costs 591.1 639.7
9(B). EXCHANGE GAIN/(LOSS) RECOGNISED IN THE CONSOLIDATED INCOME STATEMENT:
(US$ million)
Year ended 31 March
2017
Year ended 31 March
2016
Cost of sales 6.4 (7.6)Investment revenue (3.1) 5.1Other gains and losses (14.5) (93.6)
Total (11.2) (96.1)
NOTES TO THE FINANCIAL STATEMENTS CONTINUEDFOR THE YEAR ENDED 31 MARCH 2017
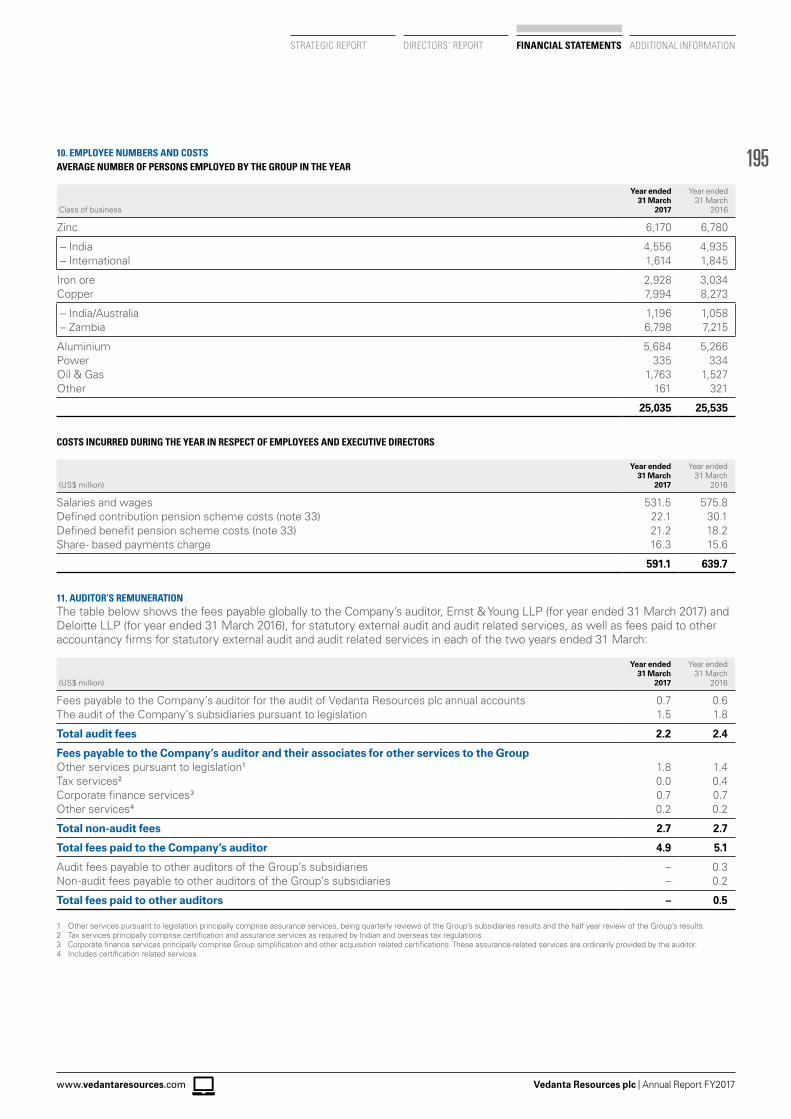
195
Vedanta Resources plc | Annual Report FY2017www.vedantaresources.com
STRATEGIC REPORT DIRECTORS’ REPORT FINANCIAL STATEMENTS ADDITIONAL INFORMATION
10. EMPLOYEE NUMBERS AND COSTSAVERAGE NUMBER OF PERSONS EMPLOYED BY THE GROUP IN THE YEAR
Class of business
Year ended 31 March
2017
Year ended 31 March
2016
Zinc 6,170 6,780
– India 4,556 4,935 – International 1,614 1,845
Iron ore 2,928 3,034Copper 7,994 8,273
– India/Australia 1,196 1,058 – Zambia 6,798 7,215
Aluminium 5,684 5,266Power 335 334Oil & Gas 1,763 1,527Other 161 321
25,035 25,535
COSTS INCURRED DURING THE YEAR IN RESPECT OF EMPLOYEES AND EXECUTIVE DIRECTORS
(US$ million)
Year ended 31 March
2017
Year ended 31 March
2016
Salaries and wages 531.5 575.8Defined contribution pension scheme costs (note 33) 22.1 30.1Defined benefit pension scheme costs (note 33) 21.2 18.2Share- based payments charge 16.3 15.6
591.1 639.7
11. AUDITOR’S REMUNERATIONThe table below shows the fees payable globally to the Company’s auditor, Ernst & Young LLP (for year ended 31 March 2017) and Deloitte LLP (for year ended 31 March 2016), for statutory external audit and audit related services, as well as fees paid to other accountancy firms for statutory external audit and audit related services in each of the two years ended 31 March:
(US$ million)
Year ended 31 March
2017
Year ended 31 March
2016
Fees payable to the Company’s auditor for the audit of Vedanta Resources plc annual accounts 0.7 0.6The audit of the Company’s subsidiaries pursuant to legislation 1.5 1.8
Total audit fees 2.2 2.4
Fees payable to the Company’s auditor and their associates for other services to the GroupOther services pursuant to legislation1 1.8 1.4Tax services2 0.0 0.4Corporate finance services3 0.7 0.7Other services4 0.2 0.2
Total non-audit fees 2.7 2.7
Total fees paid to the Company’s auditor 4.9 5.1
Audit fees payable to other auditors of the Group’s subsidiaries – 0.3Non-audit fees payable to other auditors of the Group’s subsidiaries – 0.2
Total fees paid to other auditors – 0.5
1 Other services pursuant to legislation principally comprise assurance services, being quarterly reviews of the Group’s subsidiaries results and the half year review of the Group’s results.2 Tax services principally comprise certification and assurance services as required by Indian and overseas tax regulations.3 Corporate finance services principally comprise Group simplification and other acquisition related certifications. These assurance-related services are ordinarily provided by the auditor.4 Includes certification related services.
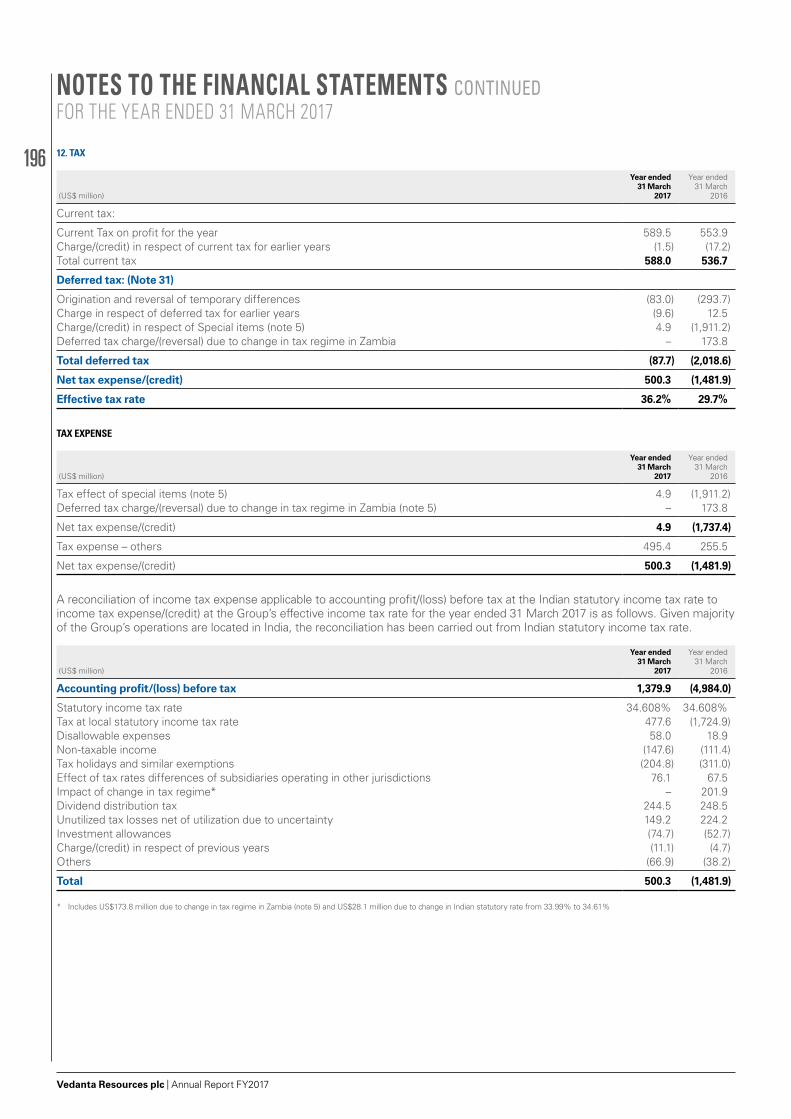
196
Vedanta Resources plc | Annual Report FY2017
12. TAX
(US$ million)
Year ended 31 March
2017
Year ended 31 March
2016
Current tax:
Current Tax on profit for the year 589.5 553.9Charge/(credit) in respect of current tax for earlier years (1.5) (17.2)Total current tax 588.0 536.7
Deferred tax: (Note 31)
Origination and reversal of temporary differences (83.0) (293.7)Charge in respect of deferred tax for earlier years (9.6) 12.5Charge/(credit) in respect of Special items (note 5) 4.9 (1,911.2)Deferred tax charge/(reversal) due to change in tax regime in Zambia – 173.8
Total deferred tax (87.7) (2,018.6)
Net tax expense/(credit) 500.3 (1,481.9)
Effective tax rate 36.2% 29.7%
TAX EXPENSE
(US$ million)
Year ended 31 March
2017
Year ended 31 March
2016
Tax effect of special items (note 5) 4.9 (1,911.2)Deferred tax charge/(reversal) due to change in tax regime in Zambia (note 5) – 173.8
Net tax expense/(credit) 4.9 (1,737.4)
Tax expense – others 495.4 255.5
Net tax expense/(credit) 500.3 (1,481.9)
A reconciliation of income tax expense applicable to accounting profit/(loss) before tax at the Indian statutory income tax rate to income tax expense/(credit) at the Group’s effective income tax rate for the year ended 31 March 2017 is as follows. Given majority of the Group’s operations are located in India, the reconciliation has been carried out from Indian statutory income tax rate.
(US$ million)
Year ended 31 March
2017
Year ended 31 March
2016
Accounting profit/(loss) before tax 1,379.9 (4,984.0)
Statutory income tax rate 34.608% 34.608% Tax at local statutory income tax rate 477.6 (1,724.9)Disallowable expenses 58.0 18.9 Non-taxable income (147.6) (111.4)Tax holidays and similar exemptions (204.8) (311.0) Effect of tax rates differences of subsidiaries operating in other jurisdictions 76.1 67.5Impact of change in tax regime* – 201.9Dividend distribution tax 244.5 248.5Unutilized tax losses net of utilization due to uncertainty 149.2 224.2Investment allowances (74.7) (52.7)Charge/(credit) in respect of previous years (11.1) (4.7)Others (66.9) (38.2)
Total 500.3 (1,481.9)
* Includes US$173.8 million due to change in tax regime in Zambia (note 5) and US$28.1 million due to change in Indian statutory rate from 33.99% to 34.61%
NOTES TO THE FINANCIAL STATEMENTS CONTINUEDFOR THE YEAR ENDED 31 MARCH 2017
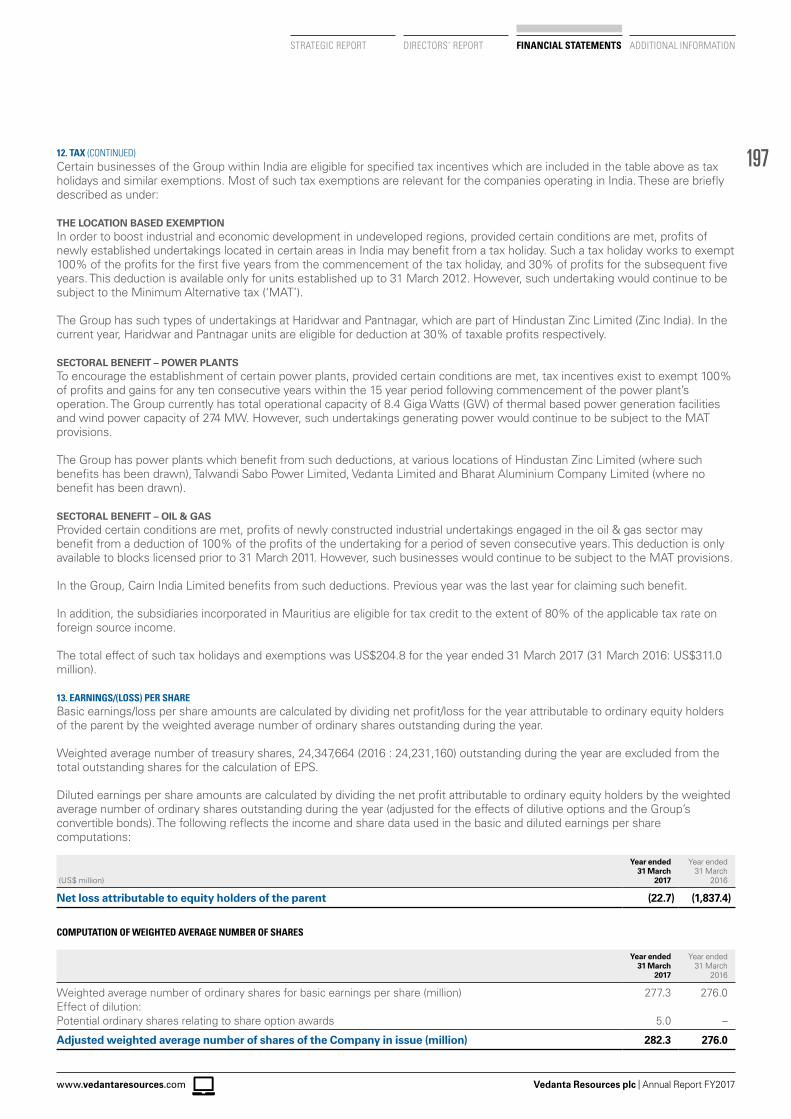
197
Vedanta Resources plc | Annual Report FY2017www.vedantaresources.com
STRATEGIC REPORT DIRECTORS’ REPORT FINANCIAL STATEMENTS ADDITIONAL INFORMATION
Certain businesses of the Group within India are eligible for specified tax incentives which are included in the table above as tax holidays and similar exemptions. Most of such tax exemptions are relevant for the companies operating in India. These are briefly described as under:
THE LOCATION BASED EXEMPTIONIn order to boost industrial and economic development in undeveloped regions, provided certain conditions are met, profits of newly established undertakings located in certain areas in India may benefit from a tax holiday. Such a tax holiday works to exempt 100% of the profits for the first five years from the commencement of the tax holiday, and 30% of profits for the subsequent five years. This deduction is available only for units established up to 31 March 2012. However, such undertaking would continue to be subject to the Minimum Alternative tax (‘MAT’).
The Group has such types of undertakings at Haridwar and Pantnagar, which are part of Hindustan Zinc Limited (Zinc India). In the current year, Haridwar and Pantnagar units are eligible for deduction at 30% of taxable profits respectively. SECTORAL BENEFIT – POWER PLANTSTo encourage the establishment of certain power plants, provided certain conditions are met, tax incentives exist to exempt 100% of profits and gains for any ten consecutive years within the 15 year period following commencement of the power plant’s operation. The Group currently has total operational capacity of 8.4 Giga Watts (GW) of thermal based power generation facilities and wind power capacity of 274 MW. However, such undertakings generating power would continue to be subject to the MAT provisions.
The Group has power plants which benefit from such deductions, at various locations of Hindustan Zinc Limited (where such benefits has been drawn), Talwandi Sabo Power Limited, Vedanta Limited and Bharat Aluminium Company Limited (where no benefit has been drawn).
SECTORAL BENEFIT – OIL & GASProvided certain conditions are met, profits of newly constructed industrial undertakings engaged in the oil & gas sector may benefit from a deduction of 100% of the profits of the undertaking for a period of seven consecutive years. This deduction is only available to blocks licensed prior to 31 March 2011. However, such businesses would continue to be subject to the MAT provisions.
In the Group, Cairn India Limited benefits from such deductions. Previous year was the last year for claiming such benefit.
In addition, the subsidiaries incorporated in Mauritius are eligible for tax credit to the extent of 80% of the applicable tax rate on foreign source income.
The total effect of such tax holidays and exemptions was US$204.8 for the year ended 31 March 2017 (31 March 2016: US$311.0 million).
13. EARNINGS/(LOSS) PER SHAREBasic earnings/loss per share amounts are calculated by dividing net profit/loss for the year attributable to ordinary equity holders of the parent by the weighted average number of ordinary shares outstanding during the year.
Weighted average number of treasury shares, 24,347,664 (2016 : 24,231,160) outstanding during the year are excluded from the total outstanding shares for the calculation of EPS.
Diluted earnings per share amounts are calculated by dividing the net profit attributable to ordinary equity holders by the weighted average number of ordinary shares outstanding during the year (adjusted for the effects of dilutive options and the Group’s convertible bonds). The following reflects the income and share data used in the basic and diluted earnings per share computations:
(US$ million)
Year ended 31 March
2017
Year ended 31 March
2016
Net loss attributable to equity holders of the parent (22.7) (1,837.4)
COMPUTATION OF WEIGHTED AVERAGE NUMBER OF SHARES
Year ended 31 March
2017
Year ended 31 March
2016
Weighted average number of ordinary shares for basic earnings per share (million) 277.3 276.0Effect of dilution:Potential ordinary shares relating to share option awards 5.0 –
Adjusted weighted average number of shares of the Company in issue (million) 282.3 276.0
12. TAX (CONTINUED)
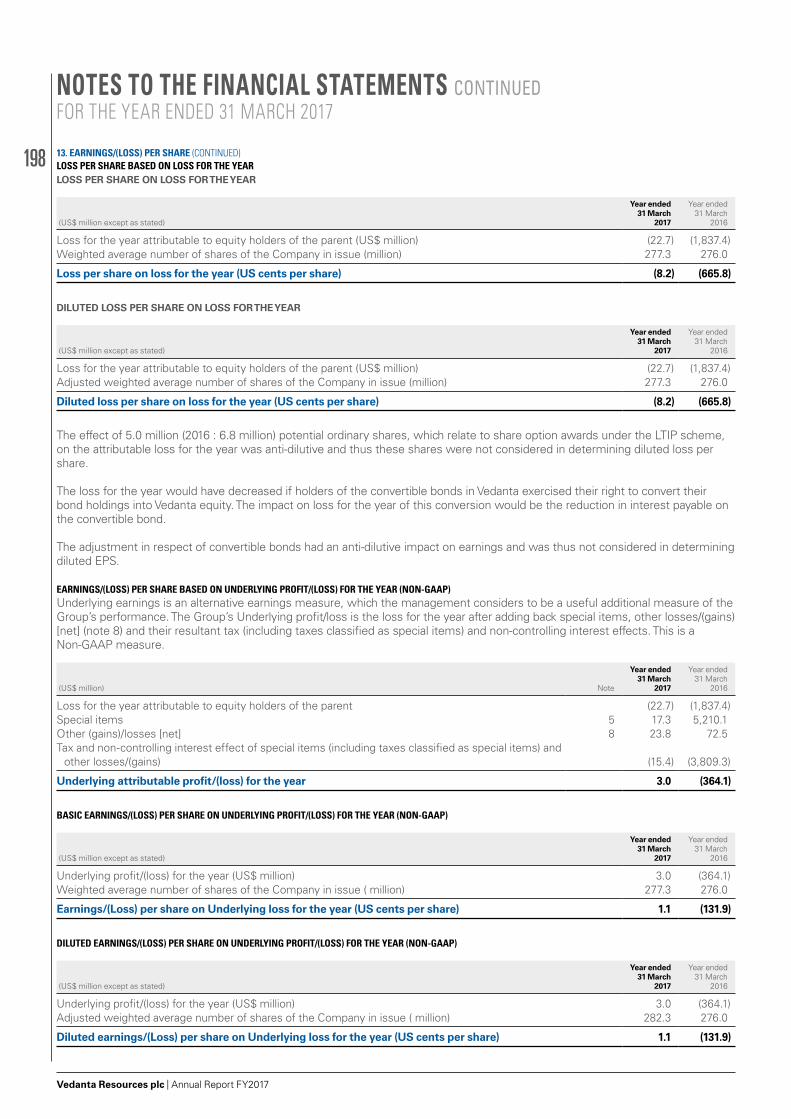
198
Vedanta Resources plc | Annual Report FY2017
LOSS PER SHARE BASED ON LOSS FOR THE YEARLOSS PER SHARE ON LOSS FOR THE YEAR
(US$ million except as stated)
Year ended 31 March
2017
Year ended 31 March
2016
Loss for the year attributable to equity holders of the parent (US$ million) (22.7) (1,837.4)Weighted average number of shares of the Company in issue (million) 277.3 276.0
Loss per share on loss for the year (US cents per share) (8.2) (665.8)
DILUTED LOSS PER SHARE ON LOSS FOR THE YEAR
(US$ million except as stated)
Year ended 31 March
2017
Year ended 31 March
2016
Loss for the year attributable to equity holders of the parent (US$ million) (22.7) (1,837.4)Adjusted weighted average number of shares of the Company in issue (million) 277.3 276.0
Diluted loss per share on loss for the year (US cents per share) (8.2) (665.8)
The effect of 5.0 million (2016 : 6.8 million) potential ordinary shares, which relate to share option awards under the LTIP scheme, on the attributable loss for the year was anti-dilutive and thus these shares were not considered in determining diluted loss per share.
The loss for the year would have decreased if holders of the convertible bonds in Vedanta exercised their right to convert their bond holdings into Vedanta equity. The impact on loss for the year of this conversion would be the reduction in interest payable on the convertible bond.
The adjustment in respect of convertible bonds had an anti-dilutive impact on earnings and was thus not considered in determining diluted EPS.
EARNINGS/(LOSS) PER SHARE BASED ON UNDERLYING PROFIT/(LOSS) FOR THE YEAR (NON-GAAP)Underlying earnings is an alternative earnings measure, which the management considers to be a useful additional measure of the Group’s performance. The Group’s Underlying profit/loss is the loss for the year after adding back special items, other losses/(gains) [net] (note 8) and their resultant tax (including taxes classified as special items) and non-controlling interest effects. This is a Non-GAAP measure.
(US$ million) Note
Year ended 31 March
2017
Year ended 31 March
2016
Loss for the year attributable to equity holders of the parent (22.7) (1,837.4)Special items 5 17.3 5,210.1Other (gains)/losses [net] 8 23.8 72.5Tax and non-controlling interest effect of special items (including taxes classified as special items) and
other losses/(gains) (15.4) (3,809.3)
Underlying attributable profit/(loss) for the year 3.0 (364.1)
BASIC EARNINGS/(LOSS) PER SHARE ON UNDERLYING PROFIT/(LOSS) FOR THE YEAR (NON-GAAP)
(US$ million except as stated)
Year ended 31 March
2017
Year ended 31 March
2016
Underlying profit/(loss) for the year (US$ million) 3.0 (364.1)Weighted average number of shares of the Company in issue ( million) 277.3 276.0
Earnings/(Loss) per share on Underlying loss for the year (US cents per share) 1.1 (131.9)
DILUTED EARNINGS/(LOSS) PER SHARE ON UNDERLYING PROFIT/(LOSS) FOR THE YEAR (NON-GAAP)
(US$ million except as stated)
Year ended 31 March
2017
Year ended 31 March
2016
Underlying profit/(loss) for the year (US$ million) 3.0 (364.1)Adjusted weighted average number of shares of the Company in issue ( million) 282.3 276.0
Diluted earnings/(Loss) per share on Underlying loss for the year (US cents per share) 1.1 (131.9)
13. EARNINGS/(LOSS) PER SHARE (CONTINUED)
NOTES TO THE FINANCIAL STATEMENTS CONTINUEDFOR THE YEAR ENDED 31 MARCH 2017
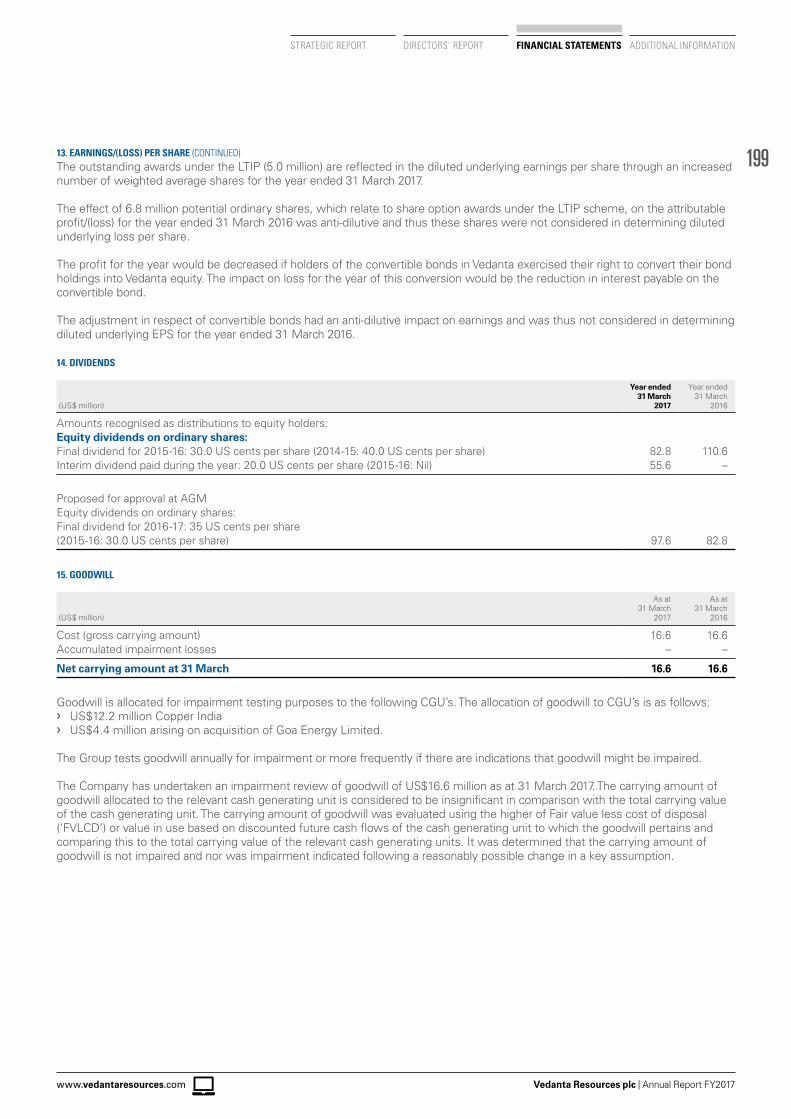
199
Vedanta Resources plc | Annual Report FY2017www.vedantaresources.com
STRATEGIC REPORT DIRECTORS’ REPORT FINANCIAL STATEMENTS ADDITIONAL INFORMATION
The outstanding awards under the LTIP (5.0 million) are reflected in the diluted underlying earnings per share through an increased number of weighted average shares for the year ended 31 March 2017.
The effect of 6.8 million potential ordinary shares, which relate to share option awards under the LTIP scheme, on the attributable profit/(loss) for the year ended 31 March 2016 was anti-dilutive and thus these shares were not considered in determining diluted underlying loss per share.
The profit for the year would be decreased if holders of the convertible bonds in Vedanta exercised their right to convert their bond holdings into Vedanta equity. The impact on loss for the year of this conversion would be the reduction in interest payable on the convertible bond.
The adjustment in respect of convertible bonds had an anti-dilutive impact on earnings and was thus not considered in determining diluted underlying EPS for the year ended 31 March 2016.
14. DIVIDENDS
(US$ million)
Year ended 31 March
2017
Year ended 31 March
2016
Amounts recognised as distributions to equity holders:Equity dividends on ordinary shares:Final dividend for 2015-16: 30.0 US cents per share (2014-15: 40.0 US cents per share) 82.8 110.6Interim dividend paid during the year: 20.0 US cents per share (2015-16: Nil) 55.6 –
Proposed for approval at AGMEquity dividends on ordinary shares:Final dividend for 2016-17: 35 US cents per share(2015-16: 30.0 US cents per share) 97.6 82.8
15. GOODWILL
(US$ million)
As at 31 March
2017
As at 31 March
2016
Cost (gross carrying amount) 16.6 16.6Accumulated impairment losses – –
Net carrying amount at 31 March 16.6 16.6
Goodwill is allocated for impairment testing purposes to the following CGU’s. The allocation of goodwill to CGU’s is as follows: › US$12.2 million Copper India › US$4.4 million arising on acquisition of Goa Energy Limited.
The Group tests goodwill annually for impairment or more frequently if there are indications that goodwill might be impaired.
The Company has undertaken an impairment review of goodwill of US$16.6 million as at 31 March 2017. The carrying amount of goodwill allocated to the relevant cash generating unit is considered to be insignificant in comparison with the total carrying value of the cash generating unit. The carrying amount of goodwill was evaluated using the higher of Fair value less cost of disposal (‘FVLCD’) or value in use based on discounted future cash flows of the cash generating unit to which the goodwill pertains and comparing this to the total carrying value of the relevant cash generating units. It was determined that the carrying amount of goodwill is not impaired and nor was impairment indicated following a reasonably possible change in a key assumption.
13. EARNINGS/(LOSS) PER SHARE (CONTINUED)
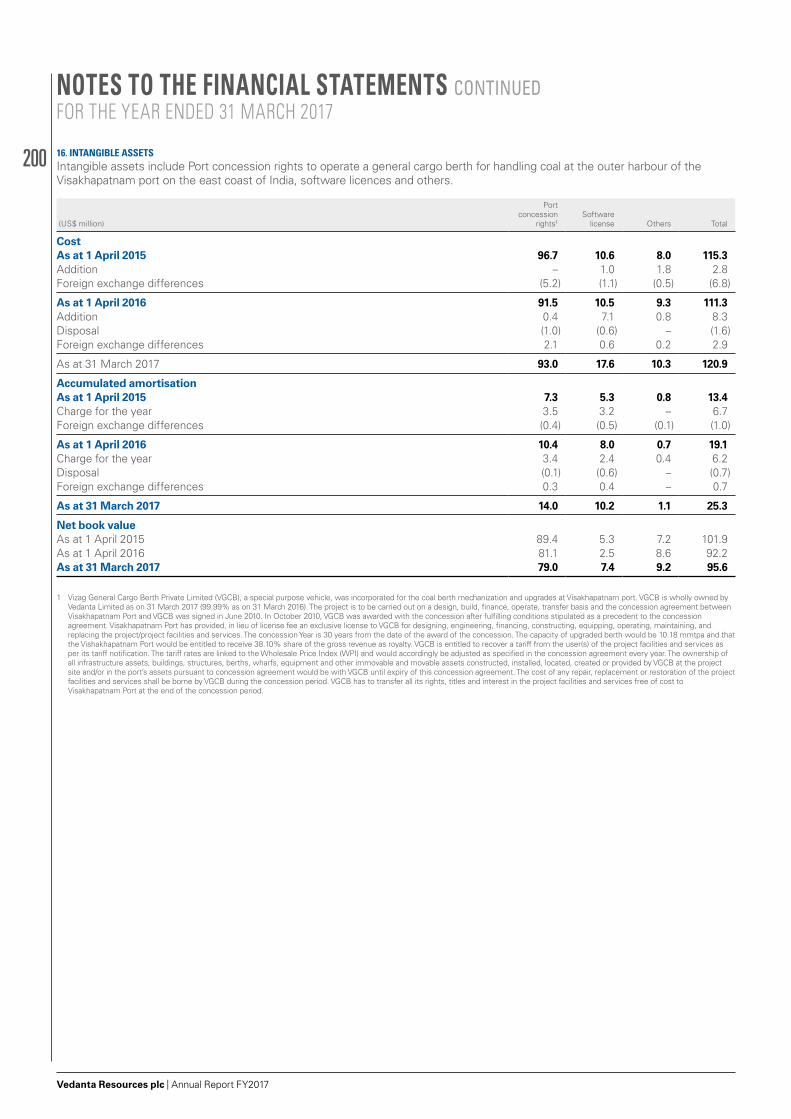
200
Vedanta Resources plc | Annual Report FY2017
16. INTANGIBLE ASSETSIntangible assets include Port concession rights to operate a general cargo berth for handling coal at the outer harbour of the Visakhapatnam port on the east coast of India, software licences and others.
(US$ million)
Port concession
rights1Software
license Others Total
CostAs at 1 April 2015 96.7 10.6 8.0 115.3Addition – 1.0 1.8 2.8Foreign exchange differences (5.2) (1.1) (0.5) (6.8)
As at 1 April 2016 91.5 10.5 9.3 111.3Addition 0.4 7.1 0.8 8.3 Disposal (1.0) (0.6) – (1.6)Foreign exchange differences 2.1 0.6 0.2 2.9
As at 31 March 2017 93.0 17.6 10.3 120.9
Accumulated amortisationAs at 1 April 2015 7.3 5.3 0.8 13.4Charge for the year 3.5 3.2 – 6.7Foreign exchange differences (0.4) (0.5) (0.1) (1.0)
As at 1 April 2016 10.4 8.0 0.7 19.1Charge for the year 3.4 2.4 0.4 6.2 Disposal (0.1) (0.6) – (0.7)Foreign exchange differences 0.3 0.4 – 0.7
As at 31 March 2017 14.0 10.2 1.1 25.3
Net book valueAs at 1 April 2015 89.4 5.3 7.2 101.9As at 1 April 2016 81.1 2.5 8.6 92.2 As at 31 March 2017 79.0 7.4 9.2 95.6
1 Vizag General Cargo Berth Private Limited (VGCB), a special purpose vehicle, was incorporated for the coal berth mechanization and upgrades at Visakhapatnam port. VGCB is wholly owned by
Vedanta Limited as on 31 March 2017 (99.99% as on 31 March 2016). The project is to be carried out on a design, build, finance, operate, transfer basis and the concession agreement between Visakhapatnam Port and VGCB was signed in June 2010. In October 2010, VGCB was awarded with the concession after fulfilling conditions stipulated as a precedent to the concession agreement. Visakhapatnam Port has provided, in lieu of license fee an exclusive license to VGCB for designing, engineering, financing, constructing, equipping, operating, maintaining, and replacing the project/project facilities and services. The concession Year is 30 years from the date of the award of the concession. The capacity of upgraded berth would be 10.18 mmtpa and that the Vishakhapatnam Port would be entitled to receive 38.10% share of the gross revenue as royalty. VGCB is entitled to recover a tariff from the user(s) of the project facilities and services as per its tariff notification. The tariff rates are linked to the Wholesale Price Index (WPI) and would accordingly be adjusted as specified in the concession agreement every year. The ownership of all infrastructure assets, buildings, structures, berths, wharfs, equipment and other immovable and movable assets constructed, installed, located, created or provided by VGCB at the project site and/or in the port’s assets pursuant to concession agreement would be with VGCB until expiry of this concession agreement. The cost of any repair, replacement or restoration of the project facilities and services shall be borne by VGCB during the concession period. VGCB has to transfer all its rights, titles and interest in the project facilities and services free of cost to Visakhapatnam Port at the end of the concession period.
NOTES TO THE FINANCIAL STATEMENTS CONTINUEDFOR THE YEAR ENDED 31 MARCH 2017
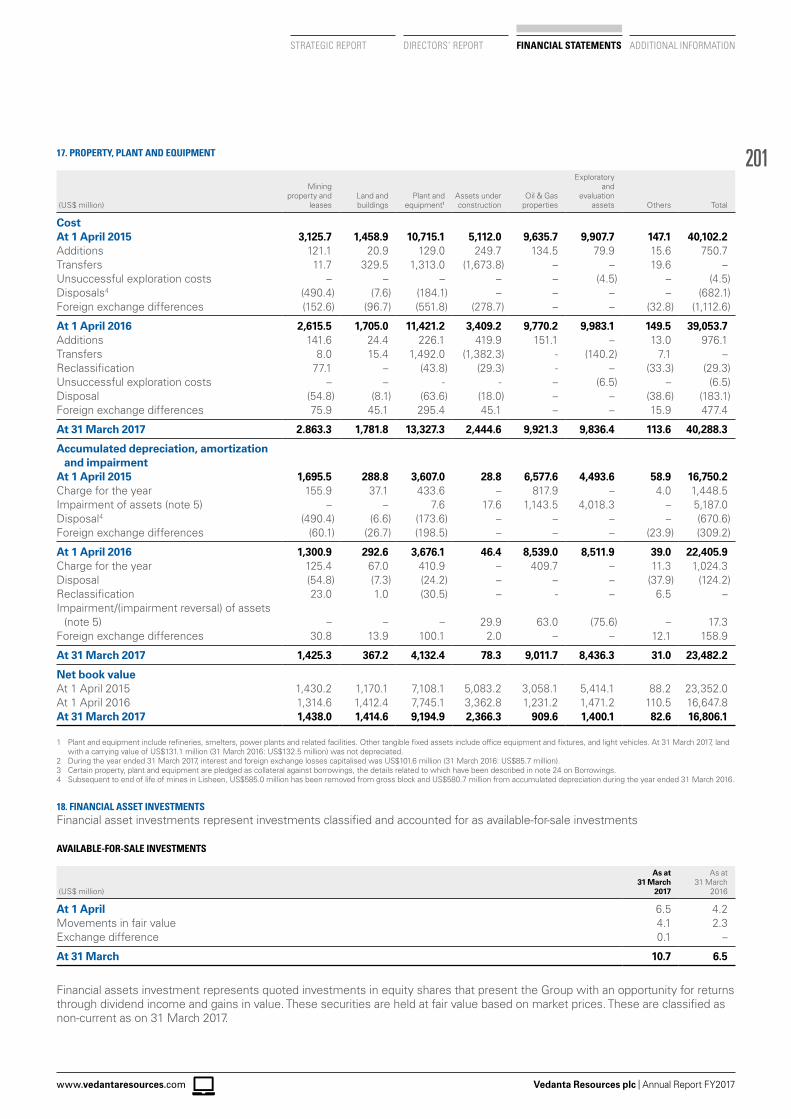
201
Vedanta Resources plc | Annual Report FY2017www.vedantaresources.com
STRATEGIC REPORT DIRECTORS’ REPORT FINANCIAL STATEMENTS ADDITIONAL INFORMATION
17. PROPERTY, PLANT AND EQUIPMENT
(US$ million)
Mining property and
leasesLand and buildings
Plant and equipment1
Assets under construction
Oil & Gas properties
Exploratory and
evaluation assets Others Total
CostAt 1 April 2015 3,125.7 1,458.9 10,715.1 5,112.0 9,635.7 9,907.7 147.1 40,102.2Additions 121.1 20.9 129.0 249.7 134.5 79.9 15.6 750.7Transfers 11.7 329.5 1,313.0 (1,673.8) – – 19.6 –Unsuccessful exploration costs – – – – – (4.5) – (4.5)Disposals4 (490.4) (7.6) (184.1) – – – – (682.1)Foreign exchange differences (152.6) (96.7) (551.8) (278.7) – – (32.8) (1,112.6)
At 1 April 2016 2,615.5 1,705.0 11,421.2 3,409.2 9,770.2 9,983.1 149.5 39,053.7 Additions 141.6 24.4 226.1 419.9 151.1 – 13.0 976.1 Transfers 8.0 15.4 1,492.0 (1,382.3) - (140.2) 7.1 –Reclassification 77.1 – (43.8) (29.3) - – (33.3) (29.3)Unsuccessful exploration costs – – - - – (6.5) – (6.5)Disposal (54.8) (8.1) (63.6) (18.0) – – (38.6) (183.1)Foreign exchange differences 75.9 45.1 295.4 45.1 – – 15.9 477.4
At 31 March 2017 2.863.3 1,781.8 13,327.3 2,444.6 9,921.3 9,836.4 113.6 40,288.3
Accumulated depreciation, amortization and impairment
At 1 April 2015 1,695.5 288.8 3,607.0 28.8 6,577.6 4,493.6 58.9 16,750.2Charge for the year 155.9 37.1 433.6 – 817.9 – 4.0 1,448.5Impairment of assets (note 5) – – 7.6 17.6 1,143.5 4,018.3 – 5,187.0Disposal4 (490.4) (6.6) (173.6) – – – – (670.6)Foreign exchange differences (60.1) (26.7) (198.5) – – – (23.9) (309.2)
At 1 April 2016 1,300.9 292.6 3,676.1 46.4 8,539.0 8,511.9 39.0 22,405.9 Charge for the year 125.4 67.0 410.9 – 409.7 – 11.3 1,024.3 Disposal (54.8) (7.3) (24.2) – – – (37.9) (124.2)Reclassification 23.0 1.0 (30.5) – - – 6.5 –Impairment/(impairment reversal) of assets
(note 5) – – – 29.9 63.0 (75.6) – 17.3 Foreign exchange differences 30.8 13.9 100.1 2.0 – – 12.1 158.9
At 31 March 2017 1,425.3 367.2 4,132.4 78.3 9,011.7 8,436.3 31.0 23,482.2
Net book valueAt 1 April 2015 1,430.2 1,170.1 7,108.1 5,083.2 3,058.1 5,414.1 88.2 23,352.0 At 1 April 2016 1,314.6 1,412.4 7,745.1 3,362.8 1,231.2 1,471.2 110.5 16,647.8 At 31 March 2017 1,438.0 1,414.6 9,194.9 2,366.3 909.6 1,400.1 82.6 16,806.1
1 Plant and equipment include refineries, smelters, power plants and related facilities. Other tangible fixed assets include office equipment and fixtures, and light vehicles. At 31 March 2017, land with a carrying value of US$131.1 million (31 March 2016: US$132.5 million) was not depreciated.
2 During the year ended 31 March 2017, interest and foreign exchange losses capitalised was US$101.6 million (31 March 2016: US$85.7 million).3 Certain property, plant and equipment are pledged as collateral against borrowings, the details related to which have been described in note 24 on Borrowings.4 Subsequent to end of life of mines in Lisheen, US$585.0 million has been removed from gross block and US$580.7 million from accumulated depreciation during the year ended 31 March 2016.
18. FINANCIAL ASSET INVESTMENTSFinancial asset investments represent investments classified and accounted for as available-for-sale investments
AVAILABLE-FOR-SALE INVESTMENTS
(US$ million)
As at 31 March
2017
As at 31 March
2016
At 1 April 6.5 4.2Movements in fair value 4.1 2.3Exchange difference 0.1 –
At 31 March 10.7 6.5
Financial assets investment represents quoted investments in equity shares that present the Group with an opportunity for returns through dividend income and gains in value. These securities are held at fair value based on market prices. These are classified as non-current as on 31 March 2017.
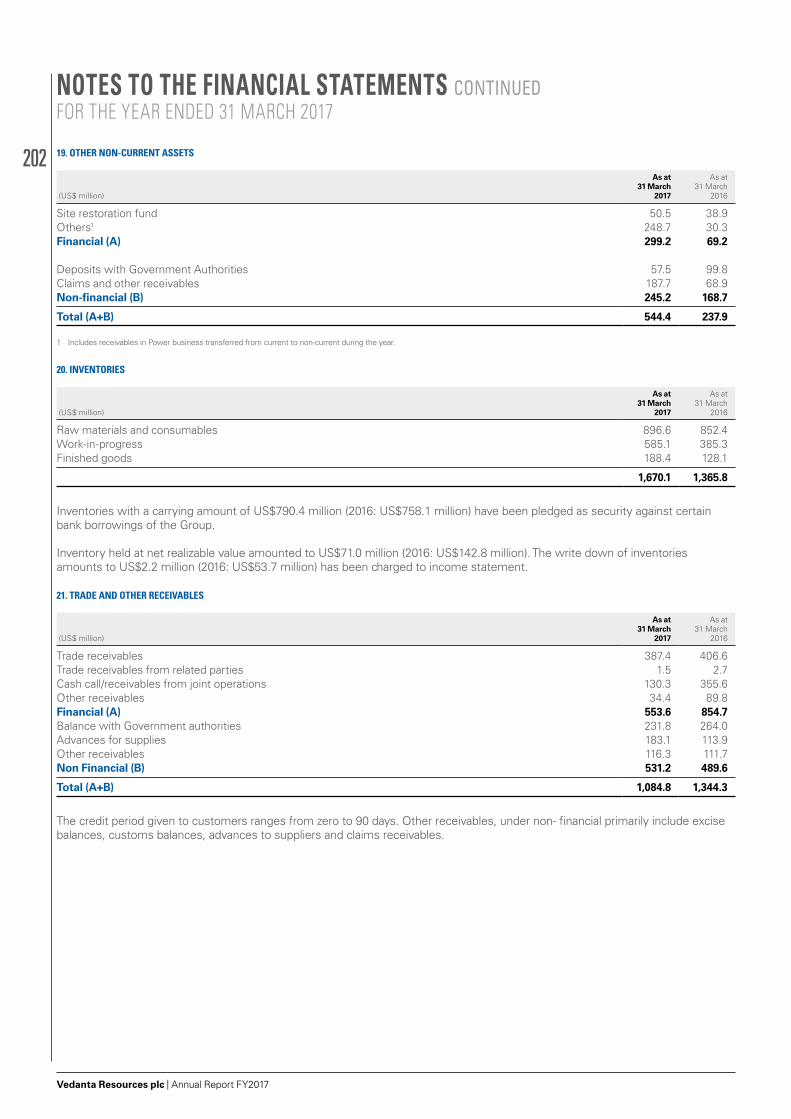
202
Vedanta Resources plc | Annual Report FY2017
19. OTHER NON-CURRENT ASSETS
(US$ million)
As at 31 March
2017
As at 31 March
2016
Site restoration fund 50.5 38.9Others1 248.7 30.3Financial (A) 299.2 69.2
Deposits with Government Authorities 57.5 99.8Claims and other receivables 187.7 68.9Non-financial (B) 245.2 168.7
Total (A+B) 544.4 237.9
1 Includes receivables in Power business transferred from current to non-current during the year.
20. INVENTORIES
(US$ million)
As at 31 March
2017
As at 31 March
2016
Raw materials and consumables 896.6 852.4Work-in-progress 585.1 385.3Finished goods 188.4 128.1
1,670.1 1,365.8
Inventories with a carrying amount of US$790.4 million (2016: US$758.1 million) have been pledged as security against certain bank borrowings of the Group.
Inventory held at net realizable value amounted to US$71.0 million (2016: US$142.8 million). The write down of inventories amounts to US$2.2 million (2016: US$53.7 million) has been charged to income statement.
21. TRADE AND OTHER RECEIVABLES
(US$ million)
As at 31 March
2017
As at 31 March
2016
Trade receivables 387.4 406.6Trade receivables from related parties 1.5 2.7Cash call/receivables from joint operations 130.3 355.6Other receivables 34.4 89.8Financial (A) 553.6 854.7Balance with Government authorities 231.8 264.0Advances for supplies 183.1 113.9Other receivables 116.3 111.7Non Financial (B) 531.2 489.6
Total (A+B) 1,084.8 1,344.3
The credit period given to customers ranges from zero to 90 days. Other receivables, under non- financial primarily include excise balances, customs balances, advances to suppliers and claims receivables.
NOTES TO THE FINANCIAL STATEMENTS CONTINUEDFOR THE YEAR ENDED 31 MARCH 2017
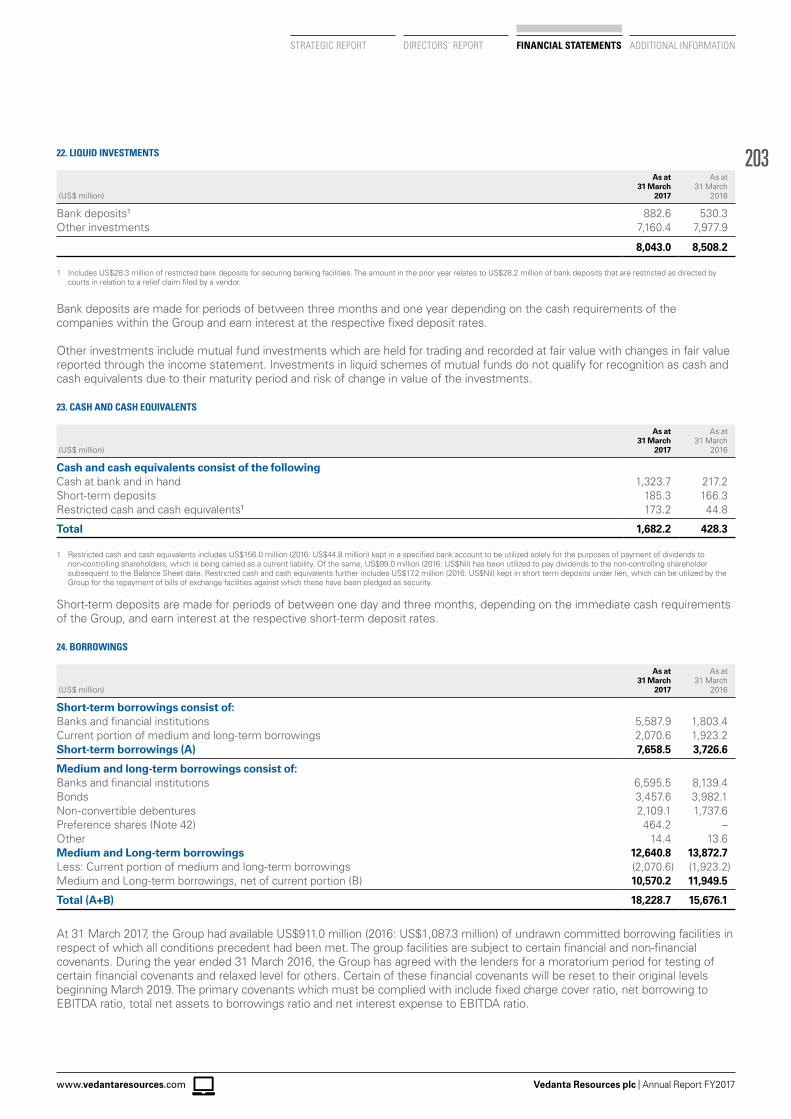
203
Vedanta Resources plc | Annual Report FY2017www.vedantaresources.com
STRATEGIC REPORT DIRECTORS’ REPORT FINANCIAL STATEMENTS ADDITIONAL INFORMATION
22. LIQUID INVESTMENTS
(US$ million)
As at 31 March
2017
As at 31 March
2016
Bank deposits1 882.6 530.3Other investments 7,160.4 7,977.9
8,043.0 8,508.2
1 Includes US$28.3 million of restricted bank deposits for securing banking facilities. The amount in the prior year relates to US$28.2 million of bank deposits that are restricted as directed by courts in relation to a relief claim filed by a vendor.
Bank deposits are made for periods of between three months and one year depending on the cash requirements of the companies within the Group and earn interest at the respective fixed deposit rates.
Other investments include mutual fund investments which are held for trading and recorded at fair value with changes in fair value reported through the income statement. Investments in liquid schemes of mutual funds do not qualify for recognition as cash and cash equivalents due to their maturity period and risk of change in value of the investments.
23. CASH AND CASH EQUIVALENTS
(US$ million)
As at 31 March
2017
As at 31 March
2016
Cash and cash equivalents consist of the followingCash at bank and in hand 1,323.7 217.2Short-term deposits 185.3 166.3Restricted cash and cash equivalents1 173.2 44.8
Total 1,682.2 428.3
1 Restricted cash and cash equivalents includes US$156.0 million (2016: US$44.8 million) kept in a specified bank account to be utilized solely for the purposes of payment of dividends to non-controlling shareholders, which is being carried as a current liability. Of the same, US$99.0 million (2016: US$Nil) has been utilized to pay dividends to the non-controlling shareholder subsequent to the Balance Sheet date. Restricted cash and cash equivalents further includes US$17.2 million (2016: US$Nil) kept in short term deposits under lien, which can be utilized by the Group for the repayment of bills of exchange facilities against which these have been pledged as security.
Short-term deposits are made for periods of between one day and three months, depending on the immediate cash requirements of the Group, and earn interest at the respective short-term deposit rates.
24. BORROWINGS
(US$ million)
As at 31 March
2017
As at 31 March
2016
Short-term borrowings consist of:Banks and financial institutions 5,587.9 1,803.4Current portion of medium and long-term borrowings 2,070.6 1,923.2Short-term borrowings (A) 7,658.5 3,726.6
Medium and long-term borrowings consist of:Banks and financial institutions 6,595.5 8,139.4Bonds 3,457.6 3,982.1Non-convertible debentures 2,109.1 1,737.6Preference shares (Note 42) 464.2 –Other 14.4 13.6Medium and Long-term borrowings 12,640.8 13,872.7Less: Current portion of medium and long-term borrowings (2,070.6) (1,923.2)Medium and Long-term borrowings, net of current portion (B) 10,570.2 11,949.5
Total (A+B) 18,228.7 15,676.1
At 31 March 2017, the Group had available US$911.0 million (2016: US$1,087.3 million) of undrawn committed borrowing facilities in respect of which all conditions precedent had been met. The group facilities are subject to certain financial and non-financial covenants. During the year ended 31 March 2016, the Group has agreed with the lenders for a moratorium period for testing of certain financial covenants and relaxed level for others. Certain of these financial covenants will be reset to their original levels beginning March 2019. The primary covenants which must be complied with include fixed charge cover ratio, net borrowing to EBITDA ratio, total net assets to borrowings ratio and net interest expense to EBITDA ratio.
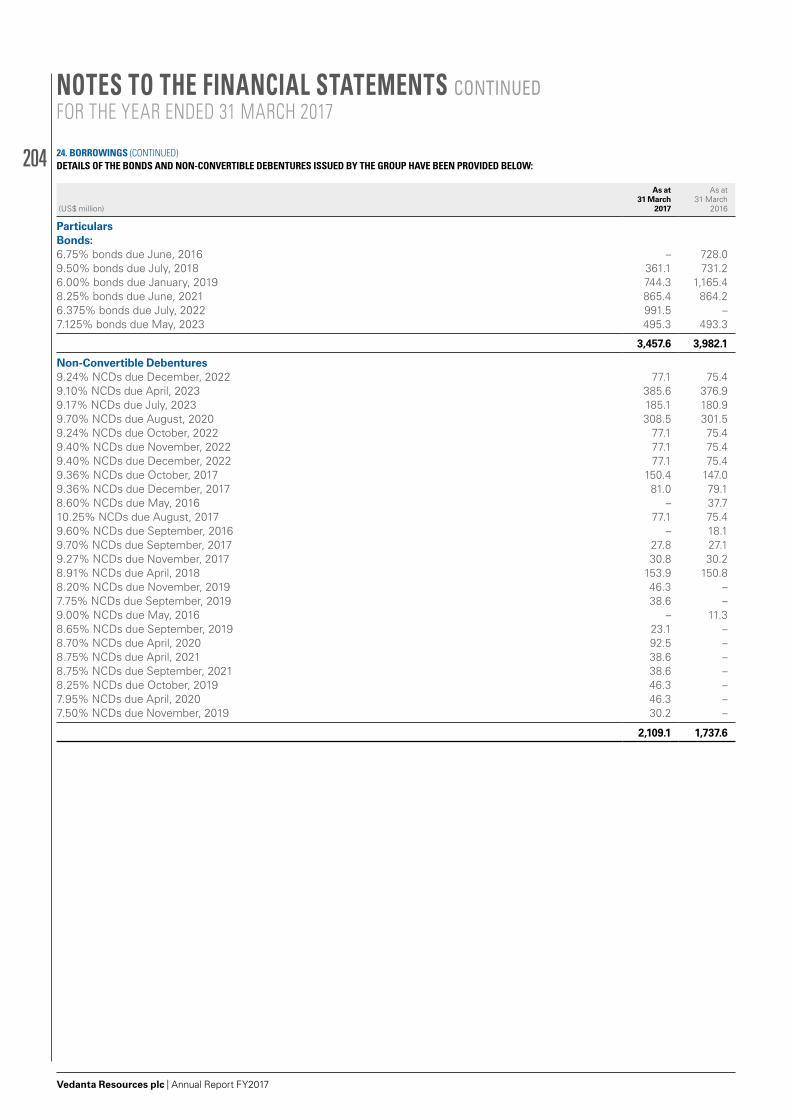
204
Vedanta Resources plc | Annual Report FY2017
DETAILS OF THE BONDS AND NON-CONVERTIBLE DEBENTURES ISSUED BY THE GROUP HAVE BEEN PROVIDED BELOW:
(US$ million)
As at 31 March
2017
As at 31 March
2016
ParticularsBonds:6.75% bonds due June, 2016 – 728.09.50% bonds due July, 2018 361.1 731.26.00% bonds due January, 2019 744.3 1,165.48.25% bonds due June, 2021 865.4 864.26.375% bonds due July, 2022 991.5 –7.125% bonds due May, 2023 495.3 493.3
3,457.6 3,982.1
Non-Convertible Debentures9.24% NCDs due December, 2022 77.1 75.49.10% NCDs due April, 2023 385.6 376.99.17% NCDs due July, 2023 185.1 180.99.70% NCDs due August, 2020 308.5 301.59.24% NCDs due October, 2022 77.1 75.49.40% NCDs due November, 2022 77.1 75.49.40% NCDs due December, 2022 77.1 75.49.36% NCDs due October, 2017 150.4 147.09.36% NCDs due December, 2017 81.0 79.18.60% NCDs due May, 2016 – 37.710.25% NCDs due August, 2017 77.1 75.49.60% NCDs due September, 2016 – 18.19.70% NCDs due September, 2017 27.8 27.19.27% NCDs due November, 2017 30.8 30.28.91% NCDs due April, 2018 153.9 150.88.20% NCDs due November, 2019 46.3 –7.75% NCDs due September, 2019 38.6 –9.00% NCDs due May, 2016 – 11.38.65% NCDs due September, 2019 23.1 –8.70% NCDs due April, 2020 92.5 –8.75% NCDs due April, 2021 38.6 –8.75% NCDs due September, 2021 38.6 –8.25% NCDs due October, 2019 46.3 –7.95% NCDs due April, 2020 46.3 –7.50% NCDs due November, 2019 30.2 –
2,109.1 1,737.6
24. BORROWINGS (CONTINUED)
NOTES TO THE FINANCIAL STATEMENTS CONTINUEDFOR THE YEAR ENDED 31 MARCH 2017
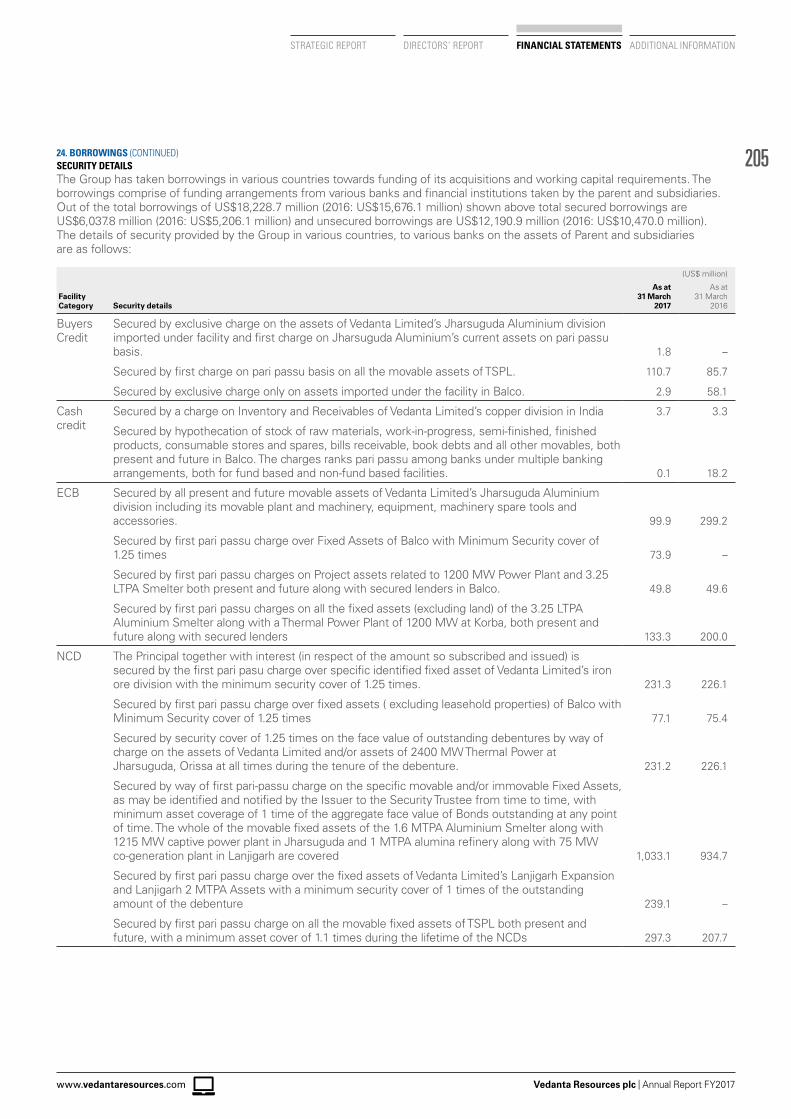
205
Vedanta Resources plc | Annual Report FY2017www.vedantaresources.com
STRATEGIC REPORT DIRECTORS’ REPORT FINANCIAL STATEMENTS ADDITIONAL INFORMATION
SECURITY DETAILSThe Group has taken borrowings in various countries towards funding of its acquisitions and working capital requirements. The borrowings comprise of funding arrangements from various banks and financial institutions taken by the parent and subsidiaries. Out of the total borrowings of US$18,228.7 million (2016: US$15,676.1 million) shown above total secured borrowings are US$6,037.8 million (2016: US$5,206.1 million) and unsecured borrowings are US$12,190.9 million (2016: US$10,470.0 million). The details of security provided by the Group in various countries, to various banks on the assets of Parent and subsidiaries are as follows:
(US$ million)
Facility Category Security details
As at 31 March
2017
As at 31 March
2016
Buyers Credit
Secured by exclusive charge on the assets of Vedanta Limited’s Jharsuguda Aluminium division imported under facility and first charge on Jharsuguda Aluminium’s current assets on pari passu basis. 1.8 –
Secured by first charge on pari passu basis on all the movable assets of TSPL. 110.7 85.7
Secured by exclusive charge only on assets imported under the facility in Balco. 2.9 58.1
Cash credit
Secured by a charge on Inventory and Receivables of Vedanta Limited’s copper division in India 3.7 3.3
Secured by hypothecation of stock of raw materials, work-in-progress, semi-finished, finished products, consumable stores and spares, bills receivable, book debts and all other movables, both present and future in Balco. The charges ranks pari passu among banks under multiple banking arrangements, both for fund based and non-fund based facilities. 0.1 18.2
ECB Secured by all present and future movable assets of Vedanta Limited’s Jharsuguda Aluminium division including its movable plant and machinery, equipment, machinery spare tools and accessories. 99.9 299.2
Secured by first pari passu charge over Fixed Assets of Balco with Minimum Security cover of 1.25 times 73.9 –
Secured by first pari passu charges on Project assets related to 1200 MW Power Plant and 3.25 LTPA Smelter both present and future along with secured lenders in Balco. 49.8 49.6
Secured by first pari passu charges on all the fixed assets (excluding land) of the 3.25 LTPA Aluminium Smelter along with a Thermal Power Plant of 1200 MW at Korba, both present and future along with secured lenders 133.3 200.0
NCD The Principal together with interest (in respect of the amount so subscribed and issued) is secured by the first pari pasu charge over specific identified fixed asset of Vedanta Limited’s iron ore division with the minimum security cover of 1.25 times. 231.3 226.1
Secured by first pari passu charge over fixed assets ( excluding leasehold properties) of Balco with Minimum Security cover of 1.25 times 77.1 75.4
Secured by security cover of 1.25 times on the face value of outstanding debentures by way of charge on the assets of Vedanta Limited and/or assets of 2400 MW Thermal Power at Jharsuguda, Orissa at all times during the tenure of the debenture. 231.2 226.1
Secured by way of first pari-passu charge on the specific movable and/or immovable Fixed Assets, as may be identified and notified by the Issuer to the Security Trustee from time to time, with minimum asset coverage of 1 time of the aggregate face value of Bonds outstanding at any point of time. The whole of the movable fixed assets of the 1.6 MTPA Aluminium Smelter along with 1215 MW captive power plant in Jharsuguda and 1 MTPA alumina refinery along with 75 MW co-generation plant in Lanjigarh are covered 1,033.1 934.7
Secured by first pari passu charge over the fixed assets of Vedanta Limited’s Lanjigarh Expansion and Lanjigarh 2 MTPA Assets with a minimum security cover of 1 times of the outstanding amount of the debenture 239.1 –
Secured by first pari passu charge on all the movable fixed assets of TSPL both present and future, with a minimum asset cover of 1.1 times during the lifetime of the NCDs 297.3 207.7
24. BORROWINGS (CONTINUED)
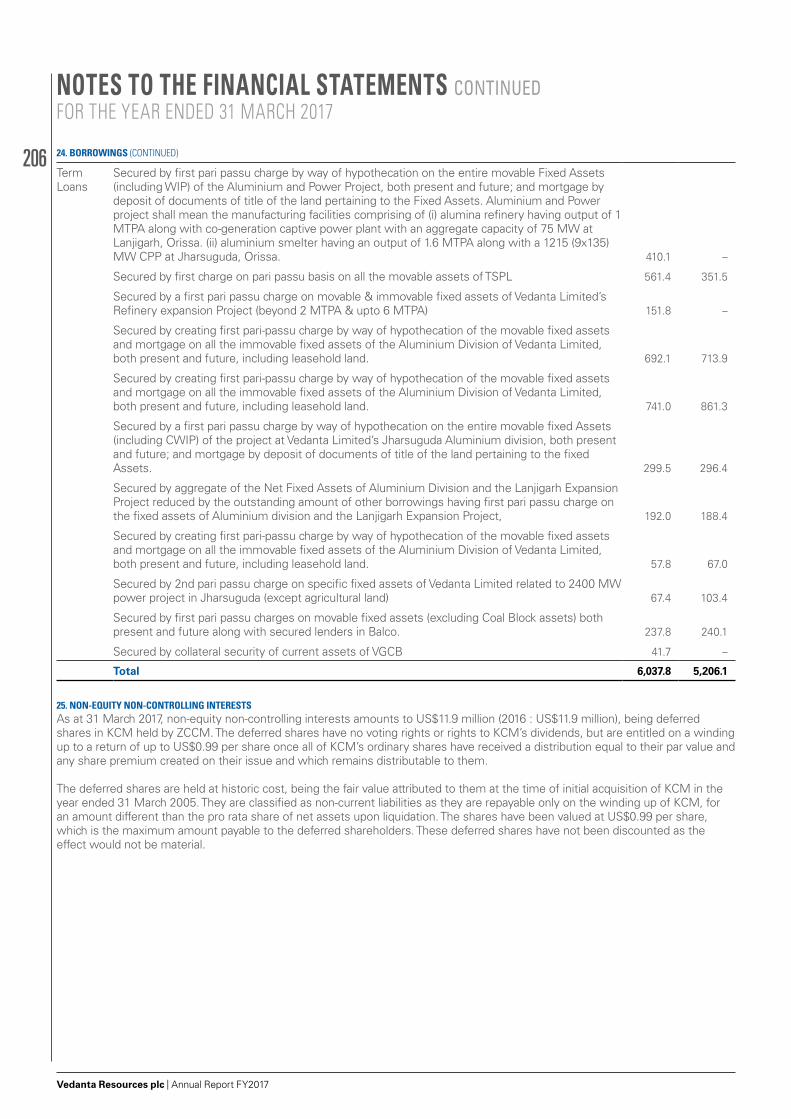
206
Vedanta Resources plc | Annual Report FY2017
Term Loans
Secured by first pari passu charge by way of hypothecation on the entire movable Fixed Assets (including WIP) of the Aluminium and Power Project, both present and future; and mortgage by deposit of documents of title of the land pertaining to the Fixed Assets. Aluminium and Power project shall mean the manufacturing facilities comprising of (i) alumina refinery having output of 1 MTPA along with co-generation captive power plant with an aggregate capacity of 75 MW at Lanjigarh, Orissa. (ii) aluminium smelter having an output of 1.6 MTPA along with a 1215 (9x135) MW CPP at Jharsuguda, Orissa. 410.1 –
Secured by first charge on pari passu basis on all the movable assets of TSPL 561.4 351.5
Secured by a first pari passu charge on movable & immovable fixed assets of Vedanta Limited’s Refinery expansion Project (beyond 2 MTPA & upto 6 MTPA) 151.8 –
Secured by creating first pari-passu charge by way of hypothecation of the movable fixed assets and mortgage on all the immovable fixed assets of the Aluminium Division of Vedanta Limited, both present and future, including leasehold land. 692.1 713.9
Secured by creating first pari-passu charge by way of hypothecation of the movable fixed assets and mortgage on all the immovable fixed assets of the Aluminium Division of Vedanta Limited, both present and future, including leasehold land. 741.0 861.3
Secured by a first pari passu charge by way of hypothecation on the entire movable fixed Assets (including CWIP) of the project at Vedanta Limited’s Jharsuguda Aluminium division, both present and future; and mortgage by deposit of documents of title of the land pertaining to the fixed Assets. 299.5 296.4
Secured by aggregate of the Net Fixed Assets of Aluminium Division and the Lanjigarh Expansion Project reduced by the outstanding amount of other borrowings having first pari passu charge on the fixed assets of Aluminium division and the Lanjigarh Expansion Project, 192.0 188.4
Secured by creating first pari-passu charge by way of hypothecation of the movable fixed assets and mortgage on all the immovable fixed assets of the Aluminium Division of Vedanta Limited, both present and future, including leasehold land. 57.8 67.0
Secured by 2nd pari passu charge on specific fixed assets of Vedanta Limited related to 2400 MW power project in Jharsuguda (except agricultural land) 67.4 103.4
Secured by first pari passu charges on movable fixed assets (excluding Coal Block assets) both present and future along with secured lenders in Balco. 237.8 240.1
Secured by collateral security of current assets of VGCB 41.7 –
Total 6,037.8 5,206.1
25. NON-EQUITY NON-CONTROLLING INTERESTSAs at 31 March 2017, non-equity non-controlling interests amounts to US$11.9 million (2016 : US$11.9 million), being deferred shares in KCM held by ZCCM. The deferred shares have no voting rights or rights to KCM’s dividends, but are entitled on a winding up to a return of up to US$0.99 per share once all of KCM’s ordinary shares have received a distribution equal to their par value and any share premium created on their issue and which remains distributable to them.
The deferred shares are held at historic cost, being the fair value attributed to them at the time of initial acquisition of KCM in the year ended 31 March 2005. They are classified as non-current liabilities as they are repayable only on the winding up of KCM, for an amount different than the pro rata share of net assets upon liquidation. The shares have been valued at US$0.99 per share, which is the maximum amount payable to the deferred shareholders. These deferred shares have not been discounted as the effect would not be material.
24. BORROWINGS (CONTINUED)
NOTES TO THE FINANCIAL STATEMENTS CONTINUEDFOR THE YEAR ENDED 31 MARCH 2017
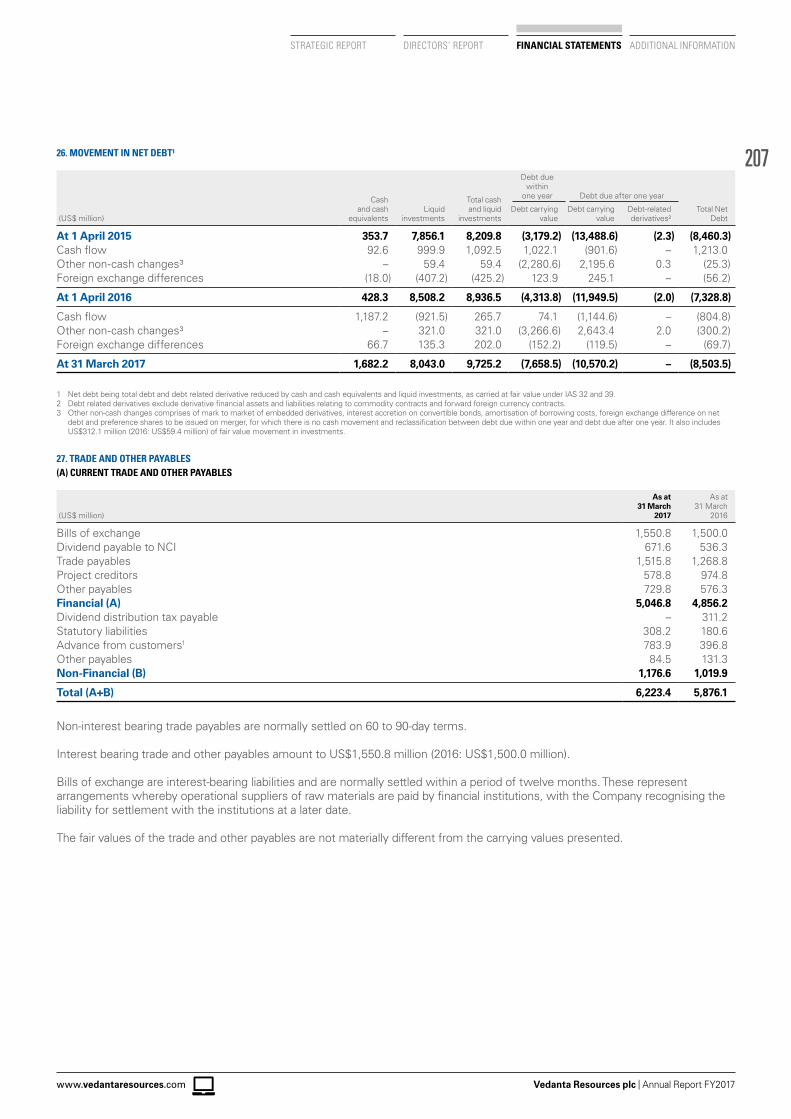
207
Vedanta Resources plc | Annual Report FY2017www.vedantaresources.com
STRATEGIC REPORT DIRECTORS’ REPORT FINANCIAL STATEMENTS ADDITIONAL INFORMATION
26. MOVEMENT IN NET DEBT1
(US$ million)
Cash and cash
equivalentsLiquid
investments
Total cash and liquid
investments
Debt due within
one year Debt due after one year
Debt carrying value
Debt carrying value
Debt-related derivatives2
Total Net Debt
At 1 April 2015 353.7 7,856.1 8,209.8 (3,179.2) (13,488.6) (2.3) (8,460.3)Cash flow 92.6 999.9 1,092.5 1,022.1 (901.6) – 1,213.0Other non-cash changes3 – 59.4 59.4 (2,280.6) 2,195.6 0.3 (25.3)Foreign exchange differences (18.0) (407.2) (425.2) 123.9 245.1 – (56.2)
At 1 April 2016 428.3 8,508.2 8,936.5 (4,313.8) (11,949.5) (2.0) (7,328.8)
Cash flow 1,187.2 (921.5) 265.7 74.1 (1,144.6) – (804.8)Other non-cash changes3 – 321.0 321.0 (3,266.6) 2,643.4 2.0 (300.2)Foreign exchange differences 66.7 135.3 202.0 (152.2) (119.5) – (69.7)
At 31 March 2017 1,682.2 8,043.0 9,725.2 (7,658.5) (10,570.2) – (8,503.5)
1 Net debt being total debt and debt related derivative reduced by cash and cash equivalents and liquid investments, as carried at fair value under IAS 32 and 39.2 Debt related derivatives exclude derivative financial assets and liabilities relating to commodity contracts and forward foreign currency contracts.3 Other non-cash changes comprises of mark to market of embedded derivatives, interest accretion on convertible bonds, amortisation of borrowing costs, foreign exchange difference on net
debt and preference shares to be issued on merger, for which there is no cash movement and reclassification between debt due within one year and debt due after one year. It also includes US$312.1 million (2016: US$59.4 million) of fair value movement in investments.
27. TRADE AND OTHER PAYABLES(A) CURRENT TRADE AND OTHER PAYABLES
(US$ million)
As at 31 March
2017
As at 31 March
2016
Bills of exchange 1,550.8 1,500.0Dividend payable to NCI 671.6 536.3Trade payables 1,515.8 1,268.8Project creditors 578.8 974.8Other payables 729.8 576.3Financial (A) 5,046.8 4,856.2Dividend distribution tax payable – 311.2Statutory liabilities 308.2 180.6Advance from customers1 783.9 396.8Other payables 84.5 131.3Non-Financial (B) 1,176.6 1,019.9
Total (A+B) 6,223.4 5,876.1
Non-interest bearing trade payables are normally settled on 60 to 90-day terms.
Interest bearing trade and other payables amount to US$1,550.8 million (2016: US$1,500.0 million).
Bills of exchange are interest-bearing liabilities and are normally settled within a period of twelve months. These represent arrangements whereby operational suppliers of raw materials are paid by financial institutions, with the Company recognising the liability for settlement with the institutions at a later date.
The fair values of the trade and other payables are not materially different from the carrying values presented.
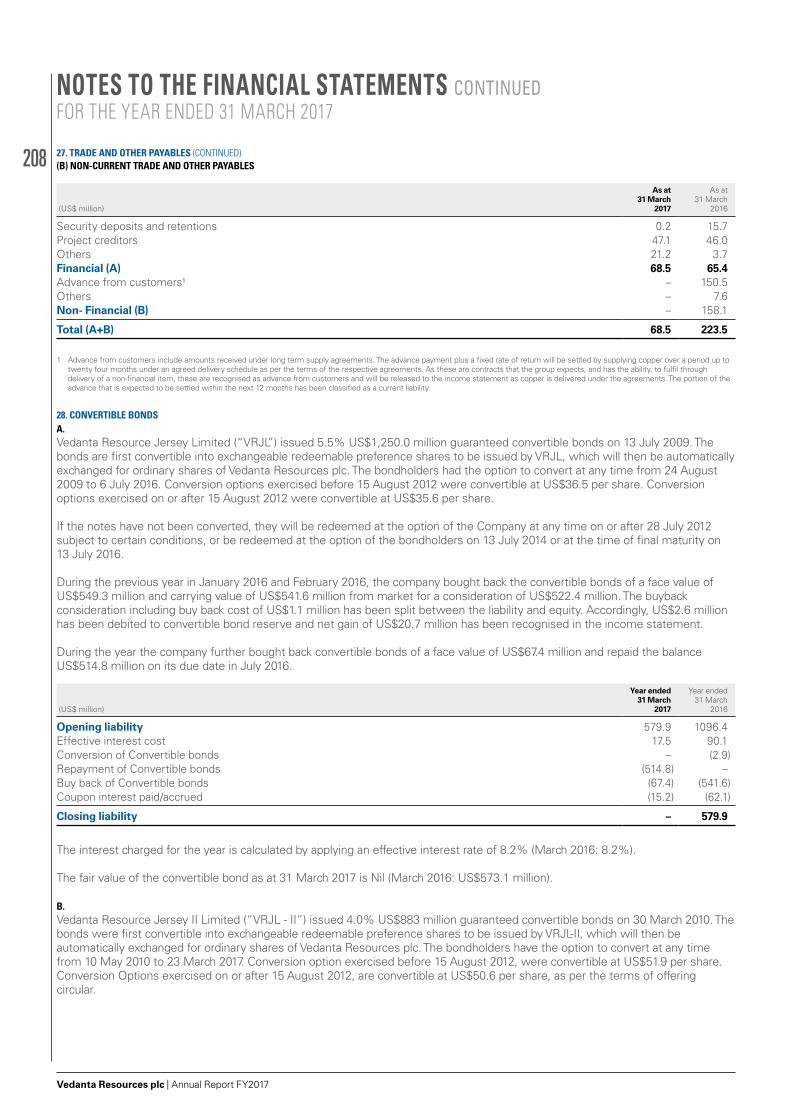
208
Vedanta Resources plc | Annual Report FY2017
(B) NON-CURRENT TRADE AND OTHER PAYABLES
(US$ million)
As at 31 March
2017
As at 31 March
2016
Security deposits and retentions 0.2 15.7Project creditors 47.1 46.0Others 21.2 3.7Financial (A) 68.5 65.4Advance from customers1 – 150.5Others – 7.6Non- Financial (B) – 158.1
Total (A+B) 68.5 223.5
1 Advance from customers include amounts received under long term supply agreements. The advance payment plus a fixed rate of return will be settled by supplying copper over a period up to twenty four months under an agreed delivery schedule as per the terms of the respective agreements. As these are contracts that the group expects, and has the ability, to fulfil through delivery of a non-financial item, these are recognised as advance from customers and will be released to the income statement as copper is delivered under the agreements. The portion of the advance that is expected to be settled within the next 12 months has been classified as a current liability.
28. CONVERTIBLE BONDSA.Vedanta Resource Jersey Limited (“VRJL”) issued 5.5% US$1,250.0 million guaranteed convertible bonds on 13 July 2009. The bonds are first convertible into exchangeable redeemable preference shares to be issued by VRJL, which will then be automatically exchanged for ordinary shares of Vedanta Resources plc. The bondholders had the option to convert at any time from 24 August 2009 to 6 July 2016. Conversion options exercised before 15 August 2012 were convertible at US$36.5 per share. Conversion options exercised on or after 15 August 2012 were convertible at US$35.6 per share.
If the notes have not been converted, they will be redeemed at the option of the Company at any time on or after 28 July 2012 subject to certain conditions, or be redeemed at the option of the bondholders on 13 July 2014 or at the time of final maturity on 13 July 2016.
During the previous year in January 2016 and February 2016, the company bought back the convertible bonds of a face value of US$549.3 million and carrying value of US$541.6 million from market for a consideration of US$522.4 million. The buyback consideration including buy back cost of US$1.1 million has been split between the liability and equity. Accordingly, US$2.6 million has been debited to convertible bond reserve and net gain of US$20.7 million has been recognised in the income statement.
During the year the company further bought back convertible bonds of a face value of US$67.4 million and repaid the balance US$514.8 million on its due date in July 2016.
(US$ million)
Year ended 31 March
2017
Year ended 31 March
2016
Opening liability 579.9 1096.4Effective interest cost 17.5 90.1Conversion of Convertible bonds – (2.9)Repayment of Convertible bonds (514.8) –Buy back of Convertible bonds (67.4) (541.6)Coupon interest paid/accrued (15.2) (62.1)
Closing liability – 579.9
The interest charged for the year is calculated by applying an effective interest rate of 8.2% (March 2016: 8.2%).
The fair value of the convertible bond as at 31 March 2017 is Nil (March 2016: US$573.1 million).
B.Vedanta Resource Jersey II Limited (“VRJL - II”) issued 4.0% US$883 million guaranteed convertible bonds on 30 March 2010. The bonds were first convertible into exchangeable redeemable preference shares to be issued by VRJL-II, which will then be automatically exchanged for ordinary shares of Vedanta Resources plc. The bondholders have the option to convert at any time from 10 May 2010 to 23 March 2017. Conversion option exercised before 15 August 2012, were convertible at US$51.9 per share. Conversion Options exercised on or after 15 August 2012, are convertible at US$50.6 per share, as per the terms of offering circular.
27. TRADE AND OTHER PAYABLES (CONTINUED)
NOTES TO THE FINANCIAL STATEMENTS CONTINUEDFOR THE YEAR ENDED 31 MARCH 2017
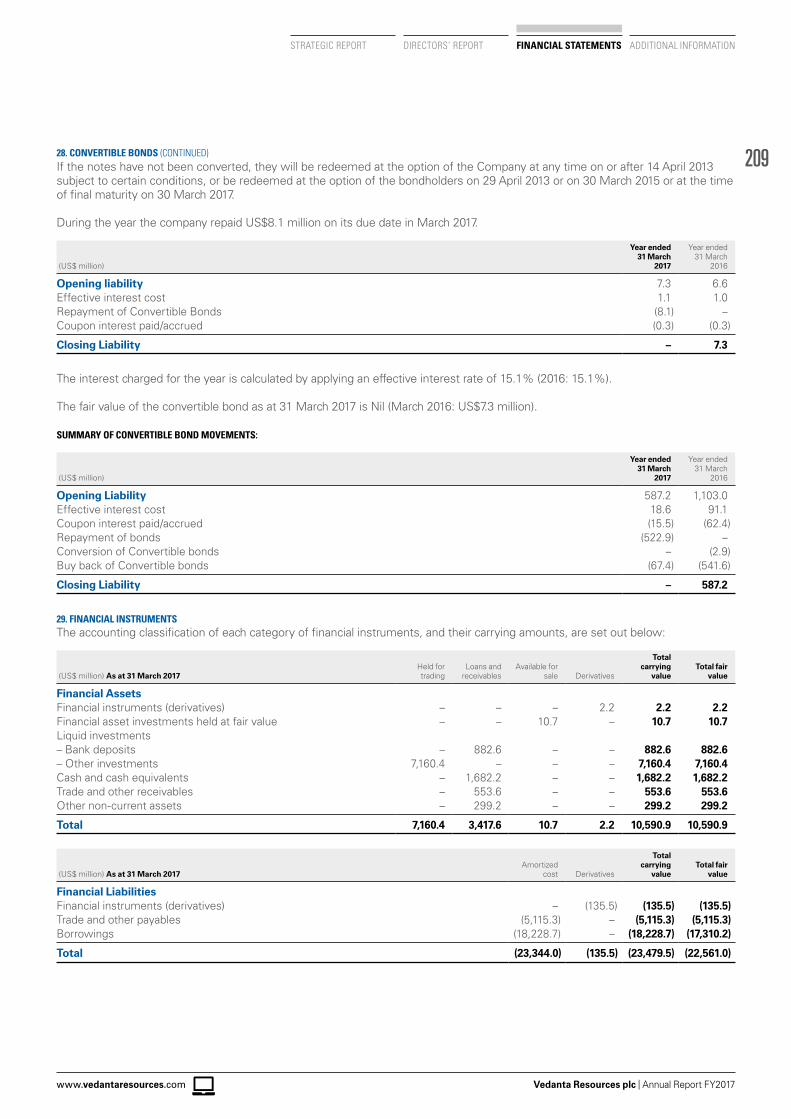
209
Vedanta Resources plc | Annual Report FY2017www.vedantaresources.com
STRATEGIC REPORT DIRECTORS’ REPORT FINANCIAL STATEMENTS ADDITIONAL INFORMATION
If the notes have not been converted, they will be redeemed at the option of the Company at any time on or after 14 April 2013 subject to certain conditions, or be redeemed at the option of the bondholders on 29 April 2013 or on 30 March 2015 or at the time of final maturity on 30 March 2017.
During the year the company repaid US$8.1 million on its due date in March 2017.
(US$ million)
Year ended 31 March
2017
Year ended 31 March
2016
Opening liability 7.3 6.6 Effective interest cost 1.1 1.0 Repayment of Convertible Bonds (8.1) –Coupon interest paid/accrued (0.3) (0.3)
Closing Liability – 7.3
The interest charged for the year is calculated by applying an effective interest rate of 15.1% (2016: 15.1%).
The fair value of the convertible bond as at 31 March 2017 is Nil (March 2016: US$7.3 million).
SUMMARY OF CONVERTIBLE BOND MOVEMENTS:
(US$ million)
Year ended 31 March
2017
Year ended 31 March
2016
Opening Liability 587.2 1,103.0Effective interest cost 18.6 91.1Coupon interest paid/accrued (15.5) (62.4)Repayment of bonds (522.9) –Conversion of Convertible bonds – (2.9)Buy back of Convertible bonds (67.4) (541.6)
Closing Liability – 587.2
29. FINANCIAL INSTRUMENTSThe accounting classification of each category of financial instruments, and their carrying amounts, are set out below:
(US$ million) As at 31 March 2017Held for trading
Loans and receivables
Available for sale Derivatives
Total carrying
valueTotal fair
value
Financial AssetsFinancial instruments (derivatives) – – – 2.2 2.2 2.2Financial asset investments held at fair value – – 10.7 – 10.7 10.7Liquid investments– Bank deposits – 882.6 – – 882.6 882.6 – Other investments 7,160.4 – – – 7,160.4 7,160.4 Cash and cash equivalents – 1,682.2 – – 1,682.2 1,682.2 Trade and other receivables – 553.6 – – 553.6 553.6Other non-current assets – 299.2 – – 299.2 299.2
Total 7,160.4 3,417.6 10.7 2.2 10,590.9 10,590.9
(US$ million) As at 31 March 2017Amortized
cost Derivatives
Total carrying
valueTotal fair
value
Financial LiabilitiesFinancial instruments (derivatives) – (135.5) (135.5) (135.5)Trade and other payables (5,115.3) – (5,115.3) (5,115.3) Borrowings (18,228.7) – (18,228.7) (17,310.2)
Total (23,344.0) (135.5) (23,479.5) (22,561.0)
28. CONVERTIBLE BONDS (CONTINUED)
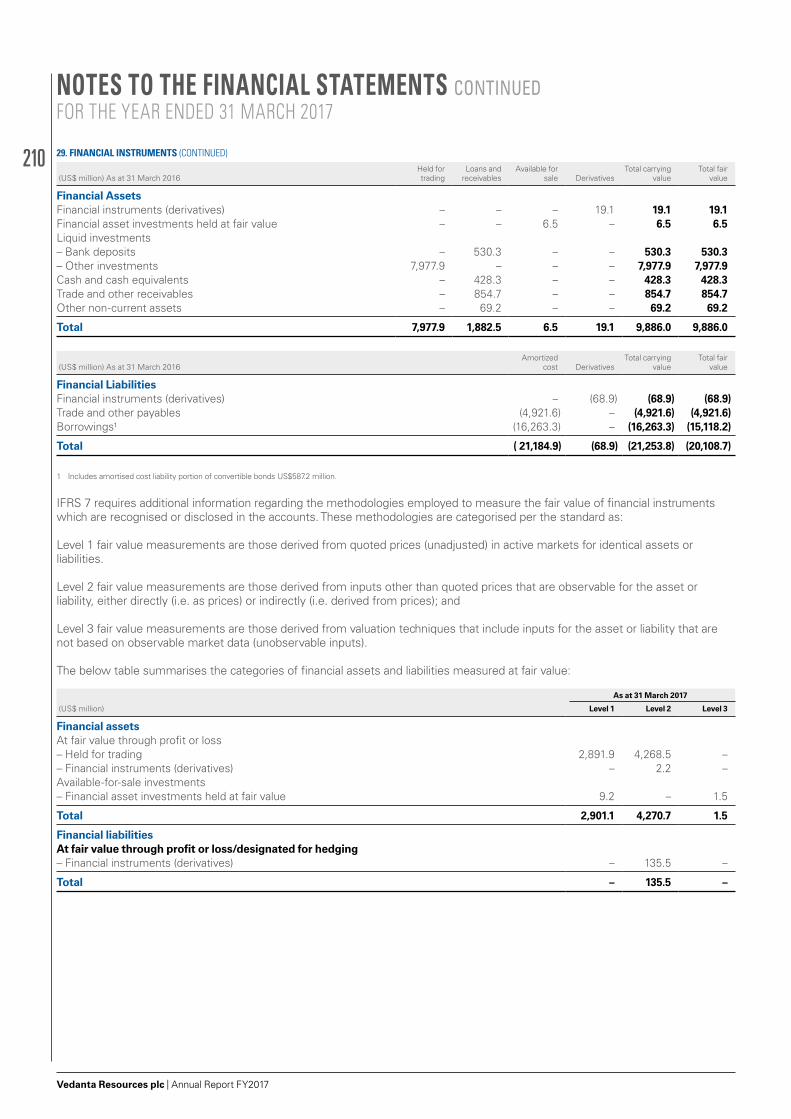
210
Vedanta Resources plc | Annual Report FY2017
(US$ million) As at 31 March 2016Held for trading
Loans and receivables
Available for sale Derivatives
Total carrying value
Total fair value
Financial AssetsFinancial instruments (derivatives) – – – 19.1 19.1 19.1Financial asset investments held at fair value – – 6.5 – 6.5 6.5Liquid investments– Bank deposits – 530.3 – – 530.3 530.3– Other investments 7,977.9 – – – 7,977.9 7,977.9Cash and cash equivalents – 428.3 – – 428.3 428.3Trade and other receivables – 854.7 – – 854.7 854.7Other non-current assets – 69.2 – – 69.2 69.2
Total 7,977.9 1,882.5 6.5 19.1 9,886.0 9,886.0
(US$ million) As at 31 March 2016Amortized
cost DerivativesTotal carrying
valueTotal fair
value
Financial LiabilitiesFinancial instruments (derivatives) – (68.9) (68.9) (68.9)Trade and other payables (4,921.6) – (4,921.6) (4,921.6)Borrowings1 (16,263.3) – (16,263.3) (15,118.2)
Total ( 21,184.9) (68.9) (21,253.8) (20,108.7)
1 Includes amortised cost liability portion of convertible bonds US$587.2 million.
IFRS 7 requires additional information regarding the methodologies employed to measure the fair value of financial instruments which are recognised or disclosed in the accounts. These methodologies are categorised per the standard as:
Level 1 fair value measurements are those derived from quoted prices (unadjusted) in active markets for identical assets or liabilities.
Level 2 fair value measurements are those derived from inputs other than quoted prices that are observable for the asset or liability, either directly (i.e. as prices) or indirectly (i.e. derived from prices); and
Level 3 fair value measurements are those derived from valuation techniques that include inputs for the asset or liability that are not based on observable market data (unobservable inputs). The below table summarises the categories of financial assets and liabilities measured at fair value:
As at 31 March 2017
(US$ million) Level 1 Level 2 Level 3
Financial assetsAt fair value through profit or loss– Held for trading 2,891.9 4,268.5 –– Financial instruments (derivatives) – 2.2 –Available-for-sale investments– Financial asset investments held at fair value 9.2 – 1.5
Total 2,901.1 4,270.7 1.5
Financial liabilitiesAt fair value through profit or loss/designated for hedging– Financial instruments (derivatives) – 135.5 –
Total – 135.5 –
29. FINANCIAL INSTRUMENTS (CONTINUED)
NOTES TO THE FINANCIAL STATEMENTS CONTINUEDFOR THE YEAR ENDED 31 MARCH 2017
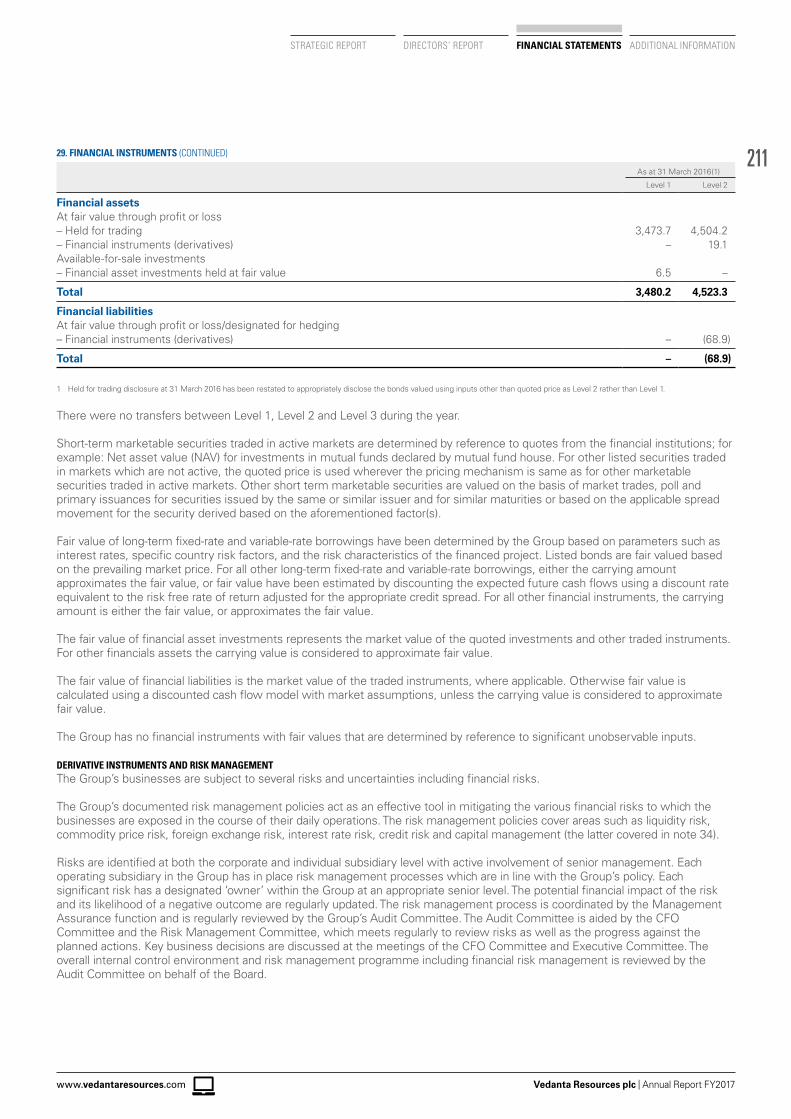
211
Vedanta Resources plc | Annual Report FY2017www.vedantaresources.com
STRATEGIC REPORT DIRECTORS’ REPORT FINANCIAL STATEMENTS ADDITIONAL INFORMATION
As at 31 March 2016(1)
Level 1 Level 2
Financial assetsAt fair value through profit or loss– Held for trading 3,473.7 4,504.2– Financial instruments (derivatives) – 19.1Available-for-sale investments– Financial asset investments held at fair value 6.5 –
Total 3,480.2 4,523.3
Financial liabilitiesAt fair value through profit or loss/designated for hedging– Financial instruments (derivatives) – (68.9)
Total – (68.9)
1 Held for trading disclosure at 31 March 2016 has been restated to appropriately disclose the bonds valued using inputs other than quoted price as Level 2 rather than Level 1.
There were no transfers between Level 1, Level 2 and Level 3 during the year.
Short-term marketable securities traded in active markets are determined by reference to quotes from the financial institutions; for example: Net asset value (NAV) for investments in mutual funds declared by mutual fund house. For other listed securities traded in markets which are not active, the quoted price is used wherever the pricing mechanism is same as for other marketable securities traded in active markets. Other short term marketable securities are valued on the basis of market trades, poll and primary issuances for securities issued by the same or similar issuer and for similar maturities or based on the applicable spread movement for the security derived based on the aforementioned factor(s).
Fair value of long-term fixed-rate and variable-rate borrowings have been determined by the Group based on parameters such as interest rates, specific country risk factors, and the risk characteristics of the financed project. Listed bonds are fair valued based on the prevailing market price. For all other long-term fixed-rate and variable-rate borrowings, either the carrying amount approximates the fair value, or fair value have been estimated by discounting the expected future cash flows using a discount rate equivalent to the risk free rate of return adjusted for the appropriate credit spread. For all other financial instruments, the carrying amount is either the fair value, or approximates the fair value.
The fair value of financial asset investments represents the market value of the quoted investments and other traded instruments. For other financials assets the carrying value is considered to approximate fair value.
The fair value of financial liabilities is the market value of the traded instruments, where applicable. Otherwise fair value is calculated using a discounted cash flow model with market assumptions, unless the carrying value is considered to approximate fair value.
The Group has no financial instruments with fair values that are determined by reference to significant unobservable inputs.
DERIVATIVE INSTRUMENTS AND RISK MANAGEMENTThe Group’s businesses are subject to several risks and uncertainties including financial risks.
The Group’s documented risk management policies act as an effective tool in mitigating the various financial risks to which the businesses are exposed in the course of their daily operations. The risk management policies cover areas such as liquidity risk, commodity price risk, foreign exchange risk, interest rate risk, credit risk and capital management (the latter covered in note 34).
Risks are identified at both the corporate and individual subsidiary level with active involvement of senior management. Each operating subsidiary in the Group has in place risk management processes which are in line with the Group’s policy. Each significant risk has a designated ‘owner’ within the Group at an appropriate senior level. The potential financial impact of the risk and its likelihood of a negative outcome are regularly updated. The risk management process is coordinated by the Management Assurance function and is regularly reviewed by the Group’s Audit Committee. The Audit Committee is aided by the CFO Committee and the Risk Management Committee, which meets regularly to review risks as well as the progress against the planned actions. Key business decisions are discussed at the meetings of the CFO Committee and Executive Committee. The overall internal control environment and risk management programme including financial risk management is reviewed by the Audit Committee on behalf of the Board.
29. FINANCIAL INSTRUMENTS (CONTINUED)
212
Vedanta Resources plc | Annual Report FY2017
TREASURY MANAGEMENTTreasury management focuses on liability management, capital protection, liquidity maintenance and yield maximisation. The treasury policies are approved by the Committee of the Board. Daily treasury operations of the subsidiary companies are managed by their respective finance teams within the framework of the overall Group treasury policies. Long-term fund raising including strategic treasury initiatives are handled by a central team while short-term funding for routine working capital requirements is delegated to subsidiary companies. A monthly reporting system exists to inform senior management of investments, debt, currency, commodity and interest rate derivatives. The Group has a strong system of internal control which enables effective monitoring of adherence to Group policies. The internal control measures are supplemented by regular internal audits.
The investment portfolio is independently reviewed by CRISIL Limited and our portfolio has been rated as “Very Good” meaning highest safety. The investments are made keeping in mind safety, liquidity and yield maximisation.
The Group uses derivative instruments to manage the exposure in foreign currency exchange rates, interest rates and commodity prices. The Group does not acquire or issue derivative financial instruments for trading or speculative purposes. The Group does not enter into complex derivative transactions to manage the treasury and commodity risks. Both treasury and commodities derivative transactions are normally in the form of forward contracts and interest rate and currency swaps and these are in line with the Group policies.
COMMODITY RISKThe Group is exposed to the movement of base metal commodity prices on the London Metal Exchange. Any decline in the prices of the base metals that the Group produces and sells will have an immediate and direct impact on the profitability of the businesses. As a general policy, the Group aims to sell the products at prevailing market prices. The commodity price risk in import of Copper Concentrate & Alumina is hedged on back-to back basis ensuring no price risk for the business. Entities with integrated operations aim to achieve the monthly average of the commodity prices for sales realization. Hedging is used primarily as a risk management tool to secure future cash flows in cases of high volatility by entering into forward contracts or similar instruments. The hedging activities are subject to strict limits set out by the Board and to a strictly defined internal control and monitoring mechanism. Decisions relating to hedging of commodities are taken at the Executive Committee level and with clearly laid down guidelines for their implementation by the subsidiaries.
Whilst the Group aims to achieve average LME prices for a month or a year, average realised prices may not necessarily reflect the LME price movements due to a variety of reasons such as uneven sales during the year and timing of shipments.
The Group is also exposed to the movement of international crude oil price and the discount in the price of Rajasthan crude oil to Brent price.
COPPERThe Group’s custom smelting copper operations at Tuticorin is benefited by a natural hedge except to the extent of a possible mismatch in quotational periods between the purchase of concentrate and the sale of finished copper. The Group’s policy on custom smelting is to generate margins from Treatment charges/Refining charges, improving operational efficiencies, minimising conversion cost, generating a premium over LME on sale of finished copper, sale of by-products and from achieving import parity on domestic sales. Hence, mismatches in quotational periods are managed to ensure that the gains or losses are minimised. The Group hedges this variability of LME prices through forward contracts and tries to make the LME price a pass-through cost between purchases of copper concentrate and sales of finished products, both of which are linked to the LME price.
TC/RCs are a major source of income for the Indian copper smelting operations. Fluctuations in TC/RCs are influenced by factors including demand and supply conditions prevailing in the market for mine output. The Group’s copper business has a strategy of securing a majority of its concentrate feed requirement under long-term contracts with mines.
KCM is largely an integrated copper producer and whenever hedging is done it is with an intention to protect the Group from price fluctuations in copper. KCM also engages in hedging for its custom smelting operations in line with the Group’s policy on custom smelting at Tuticorin, as explained above.
ALUMINIUMThe requirement of the primary raw material, alumina, is partly met from own sources and the rest is purchased primarily on negotiated price terms. Sales prices are linked to the LME prices. At present the Group on selective basis hedges the aluminium content in imported alumina to protect its margins.
The Group also enters into hedging arrangements for its aluminium sales to realise month of sale LME prices.
ZINC AND LEADThe sales prices are linked to the LME prices. The Group also enters into hedging arrangements for its Zinc and Lead sales to realise month of sale LME prices.
29. FINANCIAL INSTRUMENTS (CONTINUED)
NOTES TO THE FINANCIAL STATEMENTS CONTINUEDFOR THE YEAR ENDED 31 MARCH 2017
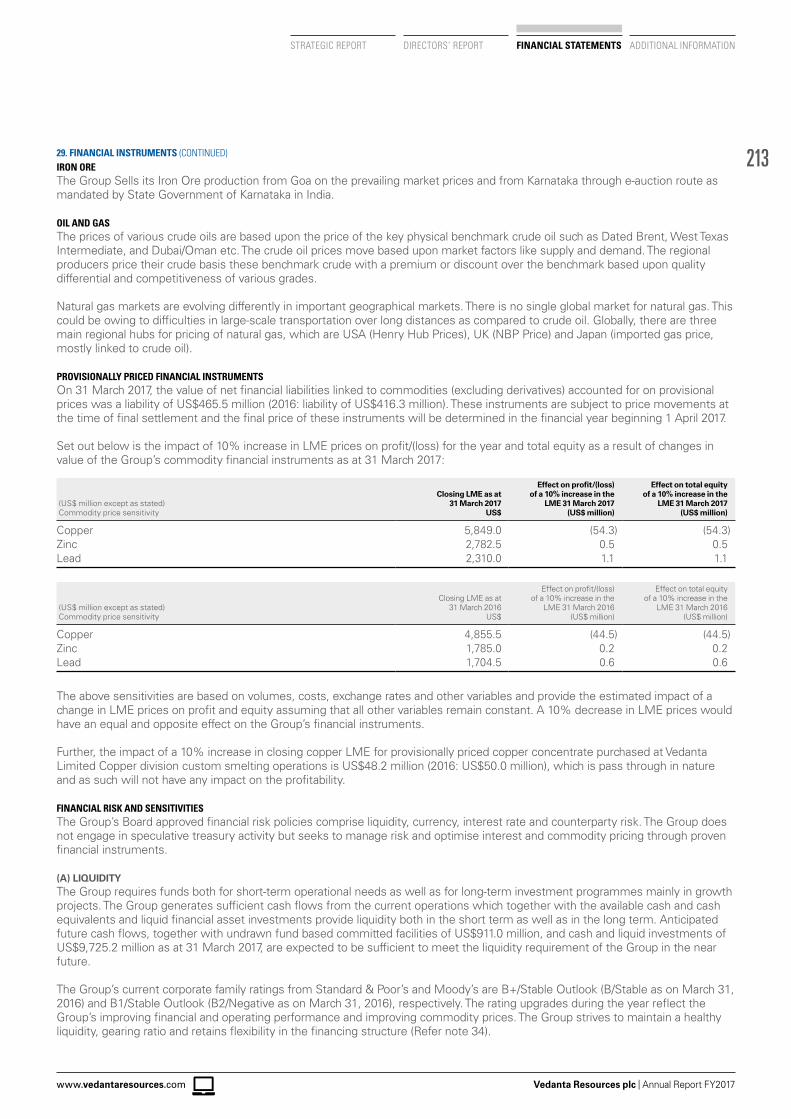
213
Vedanta Resources plc | Annual Report FY2017www.vedantaresources.com
STRATEGIC REPORT DIRECTORS’ REPORT FINANCIAL STATEMENTS ADDITIONAL INFORMATION
IRON OREThe Group Sells its Iron Ore production from Goa on the prevailing market prices and from Karnataka through e-auction route as mandated by State Government of Karnataka in India.
OIL AND GASThe prices of various crude oils are based upon the price of the key physical benchmark crude oil such as Dated Brent, West Texas Intermediate, and Dubai/Oman etc. The crude oil prices move based upon market factors like supply and demand. The regional producers price their crude basis these benchmark crude with a premium or discount over the benchmark based upon quality differential and competitiveness of various grades.
Natural gas markets are evolving differently in important geographical markets. There is no single global market for natural gas. This could be owing to difficulties in large-scale transportation over long distances as compared to crude oil. Globally, there are three main regional hubs for pricing of natural gas, which are USA (Henry Hub Prices), UK (NBP Price) and Japan (imported gas price, mostly linked to crude oil).
PROVISIONALLY PRICED FINANCIAL INSTRUMENTSOn 31 March 2017, the value of net financial liabilities linked to commodities (excluding derivatives) accounted for on provisional prices was a liability of US$465.5 million (2016: liability of US$416.3 million). These instruments are subject to price movements at the time of final settlement and the final price of these instruments will be determined in the financial year beginning 1 April 2017.
Set out below is the impact of 10% increase in LME prices on profit/(loss) for the year and total equity as a result of changes in value of the Group’s commodity financial instruments as at 31 March 2017:
(US$ million except as stated) Commodity price sensitivity
Closing LME as at 31 March 2017
US$
Effect on profit/(loss) of a 10% increase in the
LME 31 March 2017 (US$ million)
Effect on total equity of a 10% increase in the
LME 31 March 2017 (US$ million)
Copper 5,849.0 (54.3) (54.3)Zinc 2,782.5 0.5 0.5Lead 2,310.0 1.1 1.1
(US$ million except as stated) Commodity price sensitivity
Closing LME as at 31 March 2016
US$
Effect on profit/(loss) of a 10% increase in the
LME 31 March 2016 (US$ million)
Effect on total equity of a 10% increase in the
LME 31 March 2016 (US$ million)
Copper 4,855.5 (44.5) (44.5)Zinc 1,785.0 0.2 0.2 Lead 1,704.5 0.6 0.6
The above sensitivities are based on volumes, costs, exchange rates and other variables and provide the estimated impact of a change in LME prices on profit and equity assuming that all other variables remain constant. A 10% decrease in LME prices would have an equal and opposite effect on the Group’s financial instruments.
Further, the impact of a 10% increase in closing copper LME for provisionally priced copper concentrate purchased at Vedanta Limited Copper division custom smelting operations is US$48.2 million (2016: US$50.0 million), which is pass through in nature and as such will not have any impact on the profitability.
FINANCIAL RISK AND SENSITIVITIESThe Group’s Board approved financial risk policies comprise liquidity, currency, interest rate and counterparty risk. The Group does not engage in speculative treasury activity but seeks to manage risk and optimise interest and commodity pricing through proven financial instruments.
(A) LIQUIDITYThe Group requires funds both for short-term operational needs as well as for long-term investment programmes mainly in growth projects. The Group generates sufficient cash flows from the current operations which together with the available cash and cash equivalents and liquid financial asset investments provide liquidity both in the short term as well as in the long term. Anticipated future cash flows, together with undrawn fund based committed facilities of US$911.0 million, and cash and liquid investments of US$9,725.2 million as at 31 March 2017, are expected to be sufficient to meet the liquidity requirement of the Group in the near future.
The Group’s current corporate family ratings from Standard & Poor’s and Moody’s are B+/Stable Outlook (B/Stable as on March 31, 2016) and B1/Stable Outlook (B2/Negative as on March 31, 2016), respectively. The rating upgrades during the year reflect the Group’s improving financial and operating performance and improving commodity prices. The Group strives to maintain a healthy liquidity, gearing ratio and retains flexibility in the financing structure (Refer note 34).
29. FINANCIAL INSTRUMENTS (CONTINUED)
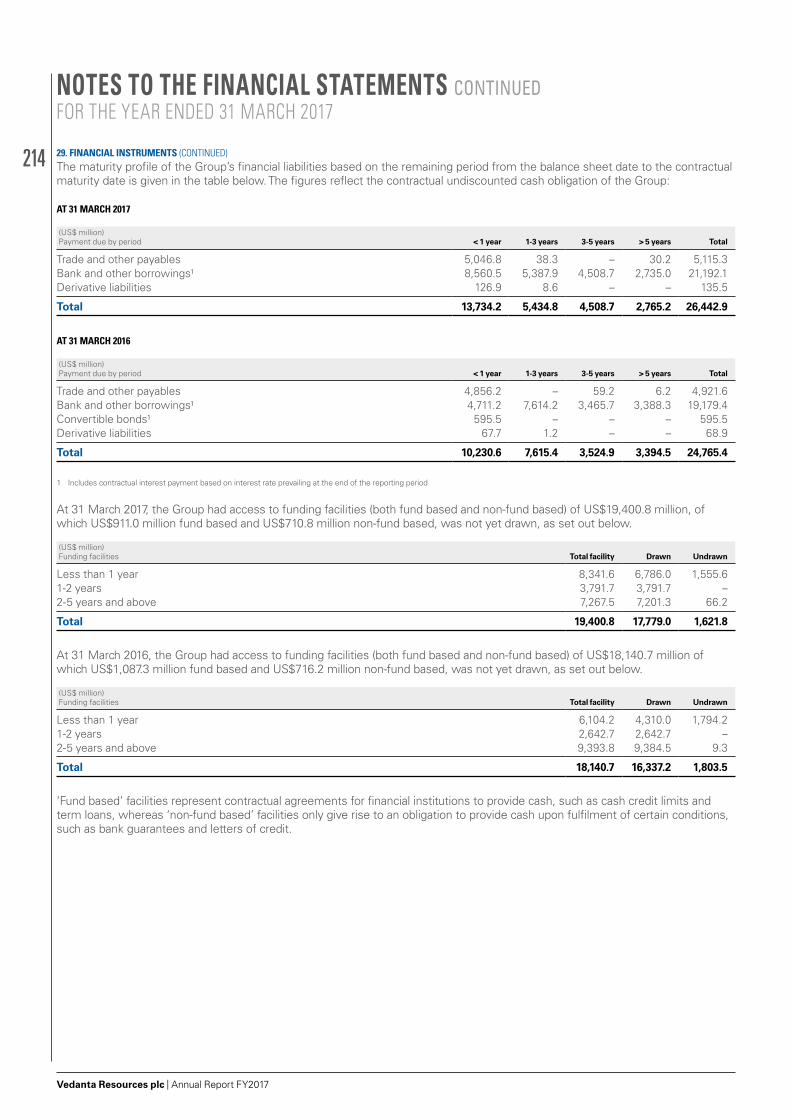
214
Vedanta Resources plc | Annual Report FY2017
The maturity profile of the Group’s financial liabilities based on the remaining period from the balance sheet date to the contractual maturity date is given in the table below. The figures reflect the contractual undiscounted cash obligation of the Group:
AT 31 MARCH 2017
(US$ million) Payment due by period < 1 year 1-3 years 3-5 years > 5 years Total
Trade and other payables 5,046.8 38.3 – 30.2 5,115.3Bank and other borrowings1 8,560.5 5,387.9 4,508.7 2,735.0 21,192.1 Derivative liabilities 126.9 8.6 – – 135.5
Total 13,734.2 5,434.8 4,508.7 2,765.2 26,442.9
AT 31 MARCH 2016
(US$ million) Payment due by period < 1 year 1-3 years 3-5 years > 5 years Total
Trade and other payables 4,856.2 – 59.2 6.2 4,921.6Bank and other borrowings1 4,711.2 7,614.2 3,465.7 3,388.3 19,179.4Convertible bonds1 595.5 – – – 595.5Derivative liabilities 67.7 1.2 – – 68.9
Total 10,230.6 7,615.4 3,524.9 3,394.5 24,765.4
1 Includes contractual interest payment based on interest rate prevailing at the end of the reporting period
At 31 March 2017, the Group had access to funding facilities (both fund based and non-fund based) of US$19,400.8 million, of which US$911.0 million fund based and US$710.8 million non-fund based, was not yet drawn, as set out below.
(US$ million) Funding facilities Total facility Drawn Undrawn
Less than 1 year 8,341.6 6,786.0 1,555.61-2 years 3,791.7 3,791.7 –2-5 years and above 7,267.5 7,201.3 66.2
Total 19,400.8 17,779.0 1,621.8
At 31 March 2016, the Group had access to funding facilities (both fund based and non-fund based) of US$18,140.7 million of which US$1,087.3 million fund based and US$716.2 million non-fund based, was not yet drawn, as set out below.
(US$ million) Funding facilities Total facility Drawn Undrawn
Less than 1 year 6,104.2 4,310.0 1,794.2 1-2 years 2,642.7 2,642.7 – 2-5 years and above 9,393.8 9,384.5 9.3
Total 18,140.7 16,337.2 1,803.5
‘Fund based’ facilities represent contractual agreements for financial institutions to provide cash, such as cash credit limits and term loans, whereas ‘non-fund based’ facilities only give rise to an obligation to provide cash upon fulfilment of certain conditions, such as bank guarantees and letters of credit.
29. FINANCIAL INSTRUMENTS (CONTINUED)
NOTES TO THE FINANCIAL STATEMENTS CONTINUEDFOR THE YEAR ENDED 31 MARCH 2017
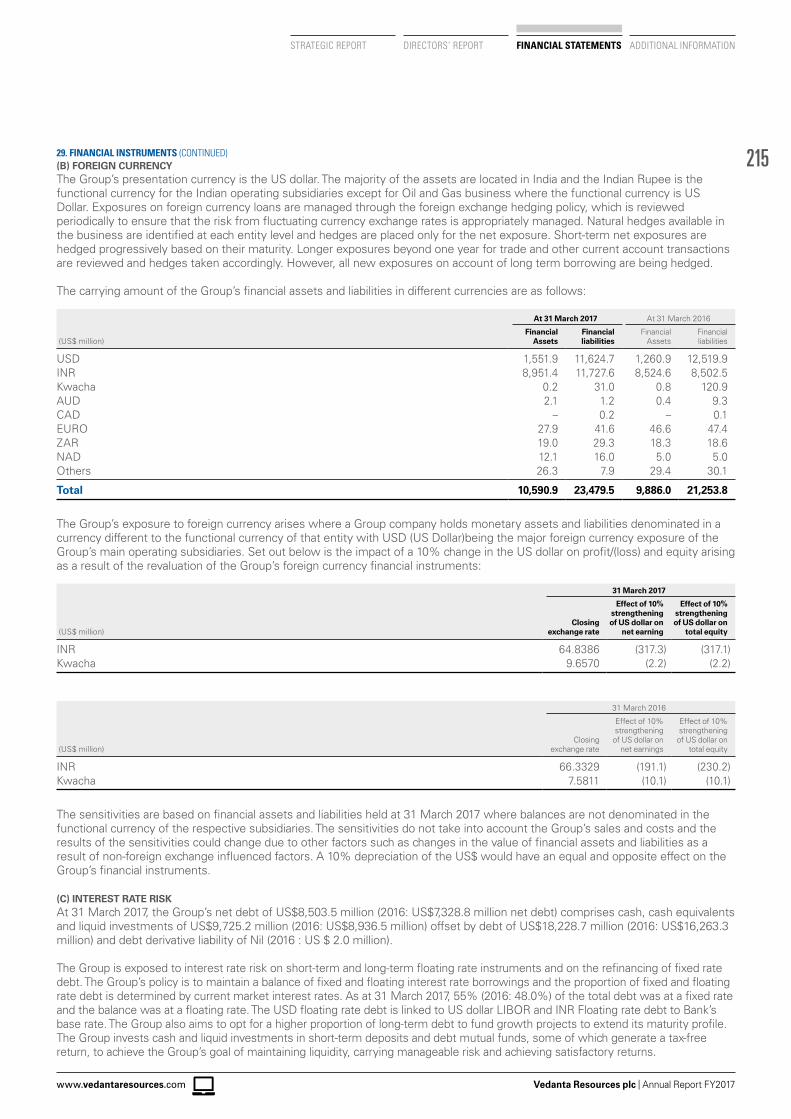
215
Vedanta Resources plc | Annual Report FY2017www.vedantaresources.com
STRATEGIC REPORT DIRECTORS’ REPORT FINANCIAL STATEMENTS ADDITIONAL INFORMATION
(B) FOREIGN CURRENCYThe Group’s presentation currency is the US dollar. The majority of the assets are located in India and the Indian Rupee is the functional currency for the Indian operating subsidiaries except for Oil and Gas business where the functional currency is US Dollar. Exposures on foreign currency loans are managed through the foreign exchange hedging policy, which is reviewed periodically to ensure that the risk from fluctuating currency exchange rates is appropriately managed. Natural hedges available in the business are identified at each entity level and hedges are placed only for the net exposure. Short-term net exposures are hedged progressively based on their maturity. Longer exposures beyond one year for trade and other current account transactions are reviewed and hedges taken accordingly. However, all new exposures on account of long term borrowing are being hedged.
The carrying amount of the Group’s financial assets and liabilities in different currencies are as follows:
At 31 March 2017 At 31 March 2016
(US$ million)Financial
AssetsFinancial liabilities
Financial Assets
Financial liabilities
USD 1,551.9 11,624.7 1,260.9 12,519.9INR 8,951.4 11,727.6 8,524.6 8,502.5Kwacha 0.2 31.0 0.8 120.9AUD 2.1 1.2 0.4 9.3 CAD – 0.2 – 0.1EURO 27.9 41.6 46.6 47.4ZAR 19.0 29.3 18.3 18.6NAD 12.1 16.0 5.0 5.0Others 26.3 7.9 29.4 30.1
Total 10,590.9 23,479.5 9,886.0 21,253.8
The Group’s exposure to foreign currency arises where a Group company holds monetary assets and liabilities denominated in a currency different to the functional currency of that entity with USD (US Dollar)being the major foreign currency exposure of the Group’s main operating subsidiaries. Set out below is the impact of a 10% change in the US dollar on profit/(loss) and equity arising as a result of the revaluation of the Group’s foreign currency financial instruments:
31 March 2017
(US$ million)Closing
exchange rate
Effect of 10% strengthening of US dollar on
net earning
Effect of 10% strengthening of US dollar on
total equity
INR 64.8386 (317.3) (317.1)Kwacha 9.6570 (2.2) (2.2)
31 March 2016
(US$ million)Closing
exchange rate
Effect of 10% strengthening
of US dollar on net earnings
Effect of 10% strengthening
of US dollar on total equity
INR 66.3329 (191.1) (230.2)Kwacha 7.5811 (10.1) (10.1)
The sensitivities are based on financial assets and liabilities held at 31 March 2017 where balances are not denominated in the functional currency of the respective subsidiaries. The sensitivities do not take into account the Group’s sales and costs and the results of the sensitivities could change due to other factors such as changes in the value of financial assets and liabilities as a result of non-foreign exchange influenced factors. A 10% depreciation of the US$ would have an equal and opposite effect on the Group’s financial instruments.
(C) INTEREST RATE RISKAt 31 March 2017, the Group’s net debt of US$8,503.5 million (2016: US$7,328.8 million net debt) comprises cash, cash equivalents and liquid investments of US$9,725.2 million (2016: US$8,936.5 million) offset by debt of US$18,228.7 million (2016: US$16,263.3 million) and debt derivative liability of Nil (2016 : US $ 2.0 million).
The Group is exposed to interest rate risk on short-term and long-term floating rate instruments and on the refinancing of fixed rate debt. The Group’s policy is to maintain a balance of fixed and floating interest rate borrowings and the proportion of fixed and floating rate debt is determined by current market interest rates. As at 31 March 2017, 55% (2016: 48.0%) of the total debt was at a fixed rate and the balance was at a floating rate. The USD floating rate debt is linked to US dollar LIBOR and INR Floating rate debt to Bank’s base rate. The Group also aims to opt for a higher proportion of long-term debt to fund growth projects to extend its maturity profile. The Group invests cash and liquid investments in short-term deposits and debt mutual funds, some of which generate a tax-free return, to achieve the Group’s goal of maintaining liquidity, carrying manageable risk and achieving satisfactory returns.
29. FINANCIAL INSTRUMENTS (CONTINUED)
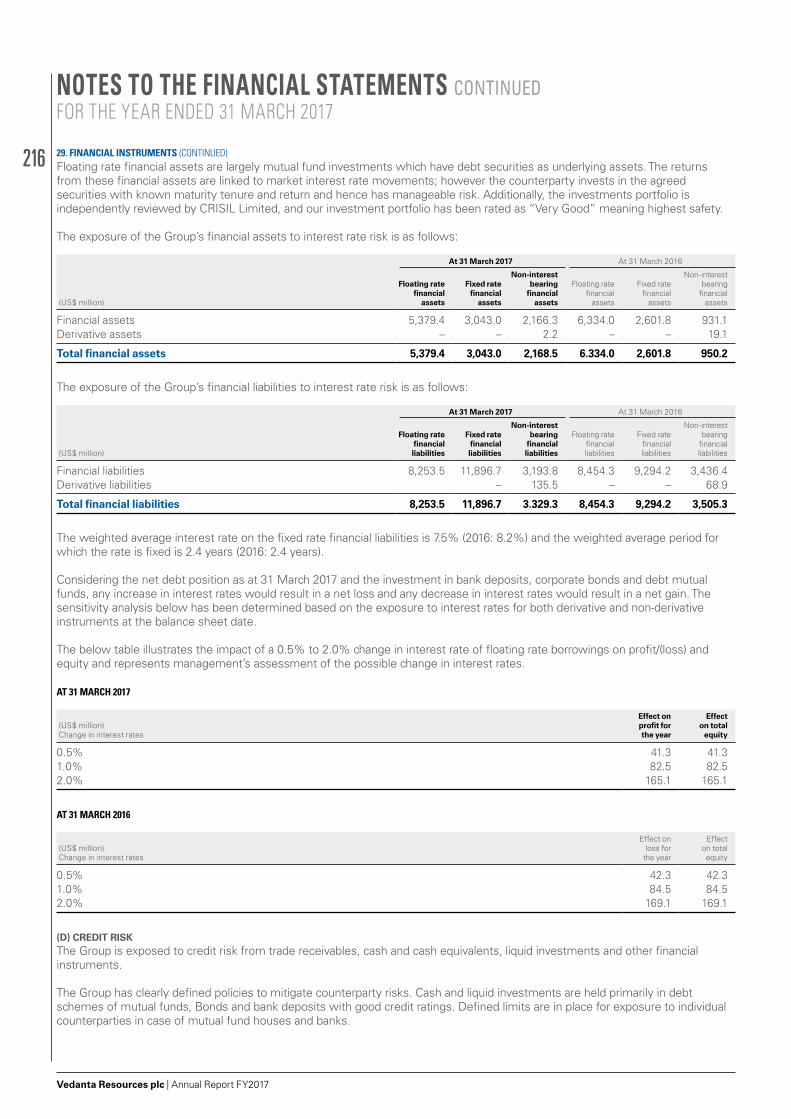
216
Vedanta Resources plc | Annual Report FY2017
Floating rate financial assets are largely mutual fund investments which have debt securities as underlying assets. The returns from these financial assets are linked to market interest rate movements; however the counterparty invests in the agreed securities with known maturity tenure and return and hence has manageable risk. Additionally, the investments portfolio is independently reviewed by CRISIL Limited, and our investment portfolio has been rated as “Very Good” meaning highest safety.
The exposure of the Group’s financial assets to interest rate risk is as follows:
At 31 March 2017 At 31 March 2016
(US$ million)
Floating rate financial
assets
Fixed rate financial
assets
Non-interest bearing
financial assets
Floating rate financial
assets
Fixed rate financial
assets
Non-interest bearing
financial assets
Financial assets 5,379.4 3,043.0 2,166.3 6,334.0 2,601.8 931.1Derivative assets – – 2.2 – – 19.1
Total financial assets 5,379.4 3,043.0 2,168.5 6.334.0 2,601.8 950.2
The exposure of the Group’s financial liabilities to interest rate risk is as follows:
At 31 March 2017 At 31 March 2016
(US$ million)
Floating rate financial liabilities
Fixed rate financial liabilities
Non-interest bearing
financial liabilities
Floating rate financial liabilities
Fixed rate financial liabilities
Non-interest bearing
financial liabilities
Financial liabilities 8,253.5 11,896.7 3,193.8 8,454.3 9,294.2 3,436.4Derivative liabilities – 135.5 – – 68.9
Total financial liabilities 8,253.5 11,896.7 3.329.3 8,454.3 9,294.2 3,505.3
The weighted average interest rate on the fixed rate financial liabilities is 7.5% (2016: 8.2%) and the weighted average period for which the rate is fixed is 2.4 years (2016: 2.4 years).
Considering the net debt position as at 31 March 2017 and the investment in bank deposits, corporate bonds and debt mutual funds, any increase in interest rates would result in a net loss and any decrease in interest rates would result in a net gain. The sensitivity analysis below has been determined based on the exposure to interest rates for both derivative and non-derivative instruments at the balance sheet date.
The below table illustrates the impact of a 0.5% to 2.0% change in interest rate of floating rate borrowings on profit/(loss) and equity and represents management’s assessment of the possible change in interest rates.
AT 31 MARCH 2017
(US$ million) Change in interest rates
Effect on profit for the year
Effect on total
equity
0.5% 41.3 41.31.0% 82.5 82.52.0% 165.1 165.1
AT 31 MARCH 2016
(US$ million) Change in interest rates
Effect on loss for
the year
Effect on total equity
0.5% 42.3 42.31.0% 84.5 84.52.0% 169.1 169.1
(D) CREDIT RISKThe Group is exposed to credit risk from trade receivables, cash and cash equivalents, liquid investments and other financial instruments.
The Group has clearly defined policies to mitigate counterparty risks. Cash and liquid investments are held primarily in debt schemes of mutual funds, Bonds and bank deposits with good credit ratings. Defined limits are in place for exposure to individual counterparties in case of mutual fund houses and banks.
29. FINANCIAL INSTRUMENTS (CONTINUED)
NOTES TO THE FINANCIAL STATEMENTS CONTINUEDFOR THE YEAR ENDED 31 MARCH 2017
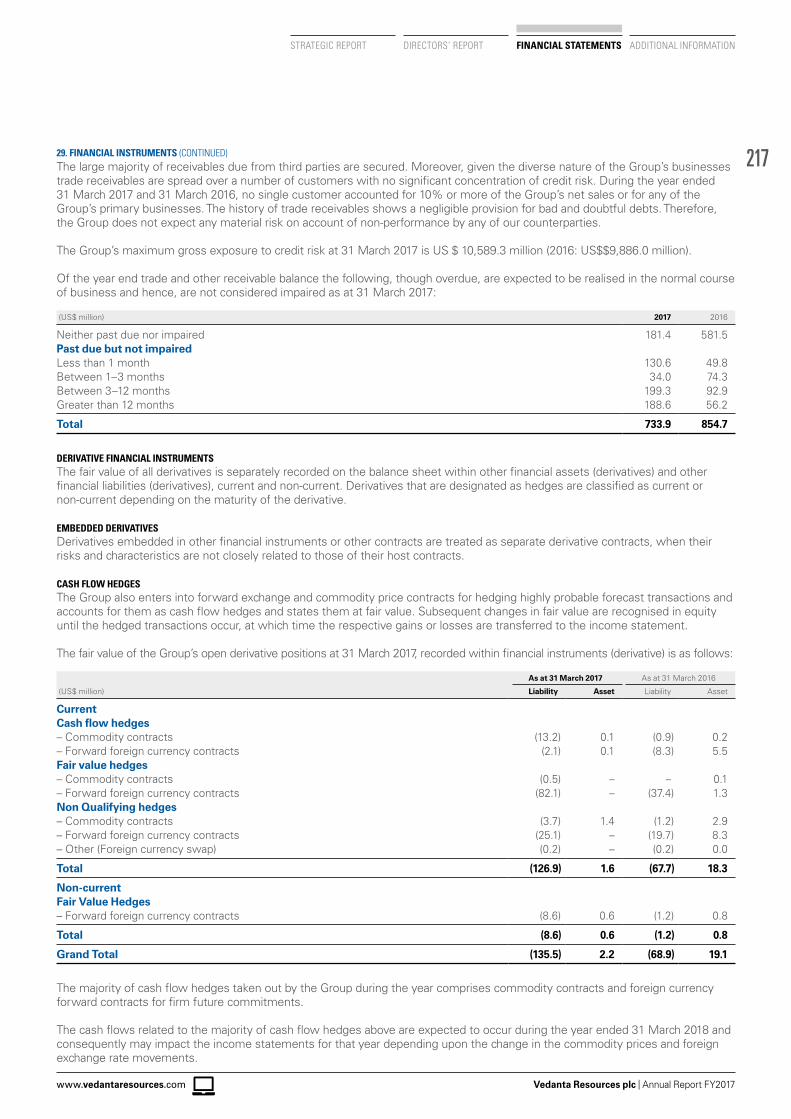
217
Vedanta Resources plc | Annual Report FY2017www.vedantaresources.com
STRATEGIC REPORT DIRECTORS’ REPORT FINANCIAL STATEMENTS ADDITIONAL INFORMATION
The large majority of receivables due from third parties are secured. Moreover, given the diverse nature of the Group’s businesses trade receivables are spread over a number of customers with no significant concentration of credit risk. During the year ended 31 March 2017 and 31 March 2016, no single customer accounted for 10% or more of the Group’s net sales or for any of the Group’s primary businesses. The history of trade receivables shows a negligible provision for bad and doubtful debts. Therefore, the Group does not expect any material risk on account of non-performance by any of our counterparties.
The Group’s maximum gross exposure to credit risk at 31 March 2017 is US $ 10,589.3 million (2016: US$$9,886.0 million).
Of the year end trade and other receivable balance the following, though overdue, are expected to be realised in the normal course of business and hence, are not considered impaired as at 31 March 2017:
(US$ million) 2017 2016
Neither past due nor impaired 181.4 581.5Past due but not impairedLess than 1 month 130.6 49.8Between 1–3 months 34.0 74.3Between 3–12 months 199.3 92.9Greater than 12 months 188.6 56.2
Total 733.9 854.7
DERIVATIVE FINANCIAL INSTRUMENTSThe fair value of all derivatives is separately recorded on the balance sheet within other financial assets (derivatives) and other financial liabilities (derivatives), current and non-current. Derivatives that are designated as hedges are classified as current or non-current depending on the maturity of the derivative.
EMBEDDED DERIVATIVESDerivatives embedded in other financial instruments or other contracts are treated as separate derivative contracts, when their risks and characteristics are not closely related to those of their host contracts.
CASH FLOW HEDGESThe Group also enters into forward exchange and commodity price contracts for hedging highly probable forecast transactions and accounts for them as cash flow hedges and states them at fair value. Subsequent changes in fair value are recognised in equity until the hedged transactions occur, at which time the respective gains or losses are transferred to the income statement.
The fair value of the Group’s open derivative positions at 31 March 2017, recorded within financial instruments (derivative) is as follows:
As at 31 March 2017 As at 31 March 2016
(US$ million) Liability Asset Liability Asset
CurrentCash flow hedges– Commodity contracts (13.2) 0.1 (0.9) 0.2– Forward foreign currency contracts (2.1) 0.1 (8.3) 5.5Fair value hedges– Commodity contracts (0.5) – – 0.1– Forward foreign currency contracts (82.1) – (37.4) 1.3Non Qualifying hedges– Commodity contracts (3.7) 1.4 (1.2) 2.9– Forward foreign currency contracts (25.1) – (19.7) 8.3– Other (Foreign currency swap) (0.2) – (0.2) 0.0
Total (126.9) 1.6 (67.7) 18.3
Non-currentFair Value Hedges– Forward foreign currency contracts (8.6) 0.6 (1.2) 0.8
Total (8.6) 0.6 (1.2) 0.8
Grand Total (135.5) 2.2 (68.9) 19.1
The majority of cash flow hedges taken out by the Group during the year comprises commodity contracts and foreign currency forward contracts for firm future commitments.
The cash flows related to the majority of cash flow hedges above are expected to occur during the year ended 31 March 2018 and consequently may impact the income statements for that year depending upon the change in the commodity prices and foreign exchange rate movements.
29. FINANCIAL INSTRUMENTS (CONTINUED)
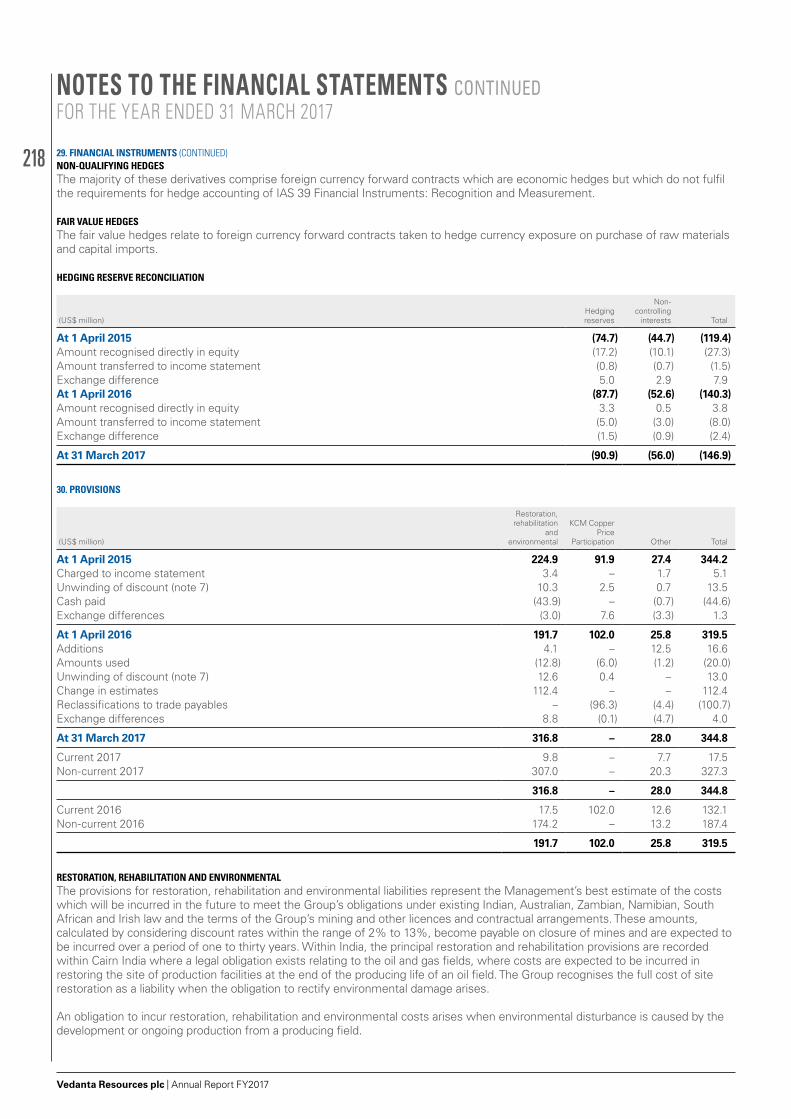
218
Vedanta Resources plc | Annual Report FY2017
NON-QUALIFYING HEDGESThe majority of these derivatives comprise foreign currency forward contracts which are economic hedges but which do not fulfil the requirements for hedge accounting of IAS 39 Financial Instruments: Recognition and Measurement.
FAIR VALUE HEDGESThe fair value hedges relate to foreign currency forward contracts taken to hedge currency exposure on purchase of raw materials and capital imports.
HEDGING RESERVE RECONCILIATION
(US$ million)Hedging reserves
Non-controlling
interests Total
At 1 April 2015 (74.7) (44.7) (119.4)Amount recognised directly in equity (17.2) (10.1) (27.3)Amount transferred to income statement (0.8) (0.7) (1.5)Exchange difference 5.0 2.9 7.9At 1 April 2016 (87.7) (52.6) (140.3)Amount recognised directly in equity 3.3 0.5 3.8 Amount transferred to income statement (5.0) (3.0) (8.0)Exchange difference (1.5) (0.9) (2.4)
At 31 March 2017 (90.9) (56.0) (146.9)
30. PROVISIONS
(US$ million)
Restoration, rehabilitation
and environmental
KCM Copper Price
Participation Other Total
At 1 April 2015 224.9 91.9 27.4 344.2Charged to income statement 3.4 – 1.7 5.1Unwinding of discount (note 7) 10.3 2.5 0.7 13.5Cash paid (43.9) – (0.7) (44.6)Exchange differences (3.0) 7.6 (3.3) 1.3
At 1 April 2016 191.7 102.0 25.8 319.5Additions 4.1 – 12.5 16.6 Amounts used (12.8) (6.0) (1.2) (20.0)Unwinding of discount (note 7) 12.6 0.4 – 13.0 Change in estimates 112.4 – – 112.4 Reclassifications to trade payables – (96.3) (4.4) (100.7)Exchange differences 8.8 (0.1) (4.7) 4.0
At 31 March 2017 316.8 – 28.0 344.8
Current 2017 9.8 – 7.7 17.5 Non-current 2017 307.0 – 20.3 327.3
316.8 – 28.0 344.8
Current 2016 17.5 102.0 12.6 132.1Non-current 2016 174.2 – 13.2 187.4
191.7 102.0 25.8 319.5
RESTORATION, REHABILITATION AND ENVIRONMENTALThe provisions for restoration, rehabilitation and environmental liabilities represent the Management’s best estimate of the costs which will be incurred in the future to meet the Group’s obligations under existing Indian, Australian, Zambian, Namibian, South African and Irish law and the terms of the Group’s mining and other licences and contractual arrangements. These amounts, calculated by considering discount rates within the range of 2% to 13%, become payable on closure of mines and are expected to be incurred over a period of one to thirty years. Within India, the principal restoration and rehabilitation provisions are recorded within Cairn India where a legal obligation exists relating to the oil and gas fields, where costs are expected to be incurred in restoring the site of production facilities at the end of the producing life of an oil field. The Group recognises the full cost of site restoration as a liability when the obligation to rectify environmental damage arises.
An obligation to incur restoration, rehabilitation and environmental costs arises when environmental disturbance is caused by the development or ongoing production from a producing field.
29. FINANCIAL INSTRUMENTS (CONTINUED)
NOTES TO THE FINANCIAL STATEMENTS CONTINUEDFOR THE YEAR ENDED 31 MARCH 2017
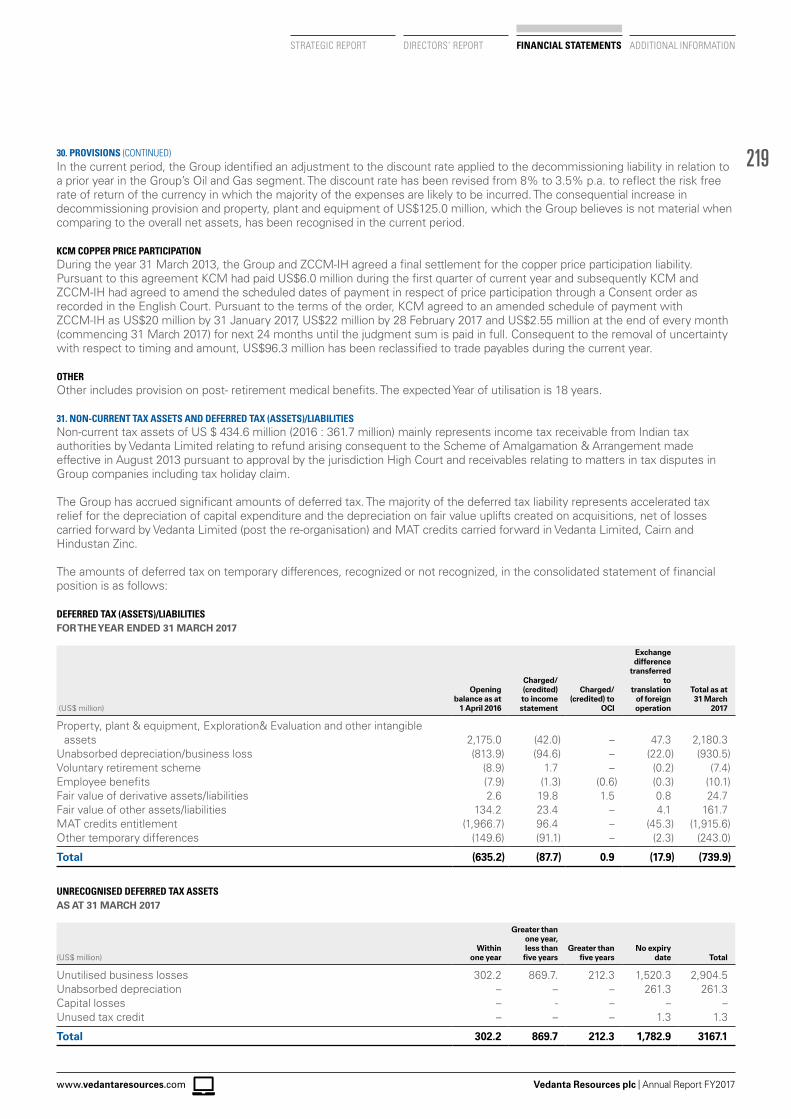
219
Vedanta Resources plc | Annual Report FY2017www.vedantaresources.com
STRATEGIC REPORT DIRECTORS’ REPORT FINANCIAL STATEMENTS ADDITIONAL INFORMATION
In the current period, the Group identified an adjustment to the discount rate applied to the decommissioning liability in relation to a prior year in the Group’s Oil and Gas segment. The discount rate has been revised from 8% to 3.5% p.a. to reflect the risk free rate of return of the currency in which the majority of the expenses are likely to be incurred. The consequential increase in decommissioning provision and property, plant and equipment of US$125.0 million, which the Group believes is not material when comparing to the overall net assets, has been recognised in the current period.
KCM COPPER PRICE PARTICIPATIONDuring the year 31 March 2013, the Group and ZCCM-IH agreed a final settlement for the copper price participation liability. Pursuant to this agreement KCM had paid US$6.0 million during the first quarter of current year and subsequently KCM and ZCCM-IH had agreed to amend the scheduled dates of payment in respect of price participation through a Consent order as recorded in the English Court. Pursuant to the terms of the order, KCM agreed to an amended schedule of payment with ZCCM-IH as US$20 million by 31 January 2017, US$22 million by 28 February 2017 and US$2.55 million at the end of every month (commencing 31 March 2017) for next 24 months until the judgment sum is paid in full. Consequent to the removal of uncertainty with respect to timing and amount, US$96.3 million has been reclassified to trade payables during the current year.
OTHEROther includes provision on post- retirement medical benefits. The expected Year of utilisation is 18 years.
31. NON-CURRENT TAX ASSETS AND DEFERRED TAX (ASSETS)/LIABILITIESNon-current tax assets of US $ 434.6 million (2016 : 361.7 million) mainly represents income tax receivable from Indian tax authorities by Vedanta Limited relating to refund arising consequent to the Scheme of Amalgamation & Arrangement made effective in August 2013 pursuant to approval by the jurisdiction High Court and receivables relating to matters in tax disputes in Group companies including tax holiday claim.
The Group has accrued significant amounts of deferred tax. The majority of the deferred tax liability represents accelerated tax relief for the depreciation of capital expenditure and the depreciation on fair value uplifts created on acquisitions, net of losses carried forward by Vedanta Limited (post the re-organisation) and MAT credits carried forward in Vedanta Limited, Cairn and Hindustan Zinc.
The amounts of deferred tax on temporary differences, recognized or not recognized, in the consolidated statement of financial position is as follows:
DEFERRED TAX (ASSETS)/LIABILITIESFOR THE YEAR ENDED 31 MARCH 2017
(US$ million)
Opening balance as at
1 April 2016
Charged/(credited) to income statement
Charged/(credited) to
OCI
Exchange difference
transferred to
translation of foreign operation
Total as at 31 March
2017
Property, plant & equipment, Exploration& Evaluation and other intangible assets 2,175.0 (42.0) – 47.3 2,180.3
Unabsorbed depreciation/business loss (813.9) (94.6) – (22.0) (930.5)Voluntary retirement scheme (8.9) 1.7 – (0.2) (7.4)Employee benefits (7.9) (1.3) (0.6) (0.3) (10.1)Fair value of derivative assets/liabilities 2.6 19.8 1.5 0.8 24.7 Fair value of other assets/liabilities 134.2 23.4 – 4.1 161.7 MAT credits entitlement (1,966.7) 96.4 – (45.3) (1,915.6) Other temporary differences (149.6) (91.1) – (2.3) (243.0)
Total (635.2) (87.7) 0.9 (17.9) (739.9)
UNRECOGNISED DEFERRED TAX ASSETSAS AT 31 MARCH 2017
(US$ million)Within
one year
Greater than one year, less than five years
Greater than five years
No expiry date Total
Unutilised business losses 302.2 869.7. 212.3 1,520.3 2,904.5Unabsorbed depreciation – – – 261.3 261.3Capital losses – - – – –Unused tax credit – – – 1.3 1.3
Total 302.2 869.7 212.3 1,782.9 3167.1
30. PROVISIONS (CONTINUED)
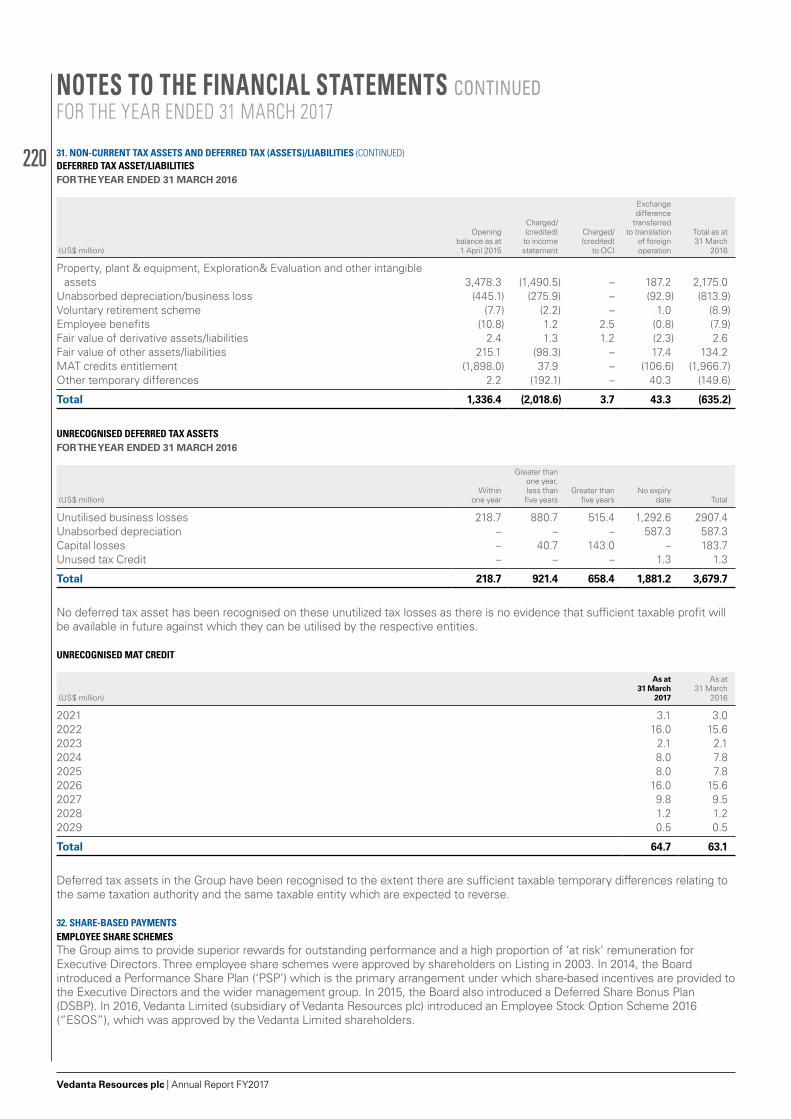
220
Vedanta Resources plc | Annual Report FY2017
DEFERRED TAX ASSET/LIABILITIES FOR THE YEAR ENDED 31 MARCH 2016
(US$ million)
Opening balance as at 1 April 2015
Charged/(credited) to income statement
Charged/(credited)
to OCI
Exchange difference
transferred to translation
of foreign operation
Total as at 31 March
2016
Property, plant & equipment, Exploration& Evaluation and other intangible assets 3,478.3 (1,490.5) – 187.2 2,175.0
Unabsorbed depreciation/business loss (445.1) (275.9) – (92.9) (813.9)Voluntary retirement scheme (7.7) (2.2) – 1.0 (8.9)Employee benefits (10.8) 1.2 2.5 (0.8) (7.9)Fair value of derivative assets/liabilities 2.4 1.3 1.2 (2.3) 2.6 Fair value of other assets/liabilities 215.1 (98.3) – 17.4 134.2 MAT credits entitlement (1,898.0) 37.9 – (106.6) (1,966.7)Other temporary differences 2.2 (192.1) – 40.3 (149.6)
Total 1,336.4 (2,018.6) 3.7 43.3 (635.2)
UNRECOGNISED DEFERRED TAX ASSETSFOR THE YEAR ENDED 31 MARCH 2016
(US$ million)Within
one year
Greater than one year, less than five years
Greater than five years
No expiry date Total
Unutilised business losses 218.7 880.7 515.4 1,292.6 2907.4Unabsorbed depreciation – – – 587.3 587.3Capital losses – 40.7 143.0 – 183.7Unused tax Credit – – – 1.3 1.3
Total 218.7 921.4 658.4 1,881.2 3,679.7
No deferred tax asset has been recognised on these unutilized tax losses as there is no evidence that sufficient taxable profit will be available in future against which they can be utilised by the respective entities.
UNRECOGNISED MAT CREDIT
(US$ million)
As at 31 March
2017
As at 31 March
2016
2021 3.1 3.02022 16.0 15.62023 2.1 2.12024 8.0 7.82025 8.0 7.82026 16.0 15.62027 9.8 9.52028 1.2 1.22029 0.5 0.5
Total 64.7 63.1
Deferred tax assets in the Group have been recognised to the extent there are sufficient taxable temporary differences relating to the same taxation authority and the same taxable entity which are expected to reverse.
32. SHARE-BASED PAYMENTSEMPLOYEE SHARE SCHEMESThe Group aims to provide superior rewards for outstanding performance and a high proportion of ‘at risk’ remuneration for Executive Directors. Three employee share schemes were approved by shareholders on Listing in 2003. In 2014, the Board introduced a Performance Share Plan (‘PSP’) which is the primary arrangement under which share-based incentives are provided to the Executive Directors and the wider management group. In 2015, the Board also introduced a Deferred Share Bonus Plan (DSBP). In 2016, Vedanta Limited (subsidiary of Vedanta Resources plc) introduced an Employee Stock Option Scheme 2016 (“ESOS”), which was approved by the Vedanta Limited shareholders.
31. NON-CURRENT TAX ASSETS AND DEFERRED TAX (ASSETS)/LIABILITIES (CONTINUED)
NOTES TO THE FINANCIAL STATEMENTS CONTINUEDFOR THE YEAR ENDED 31 MARCH 2017
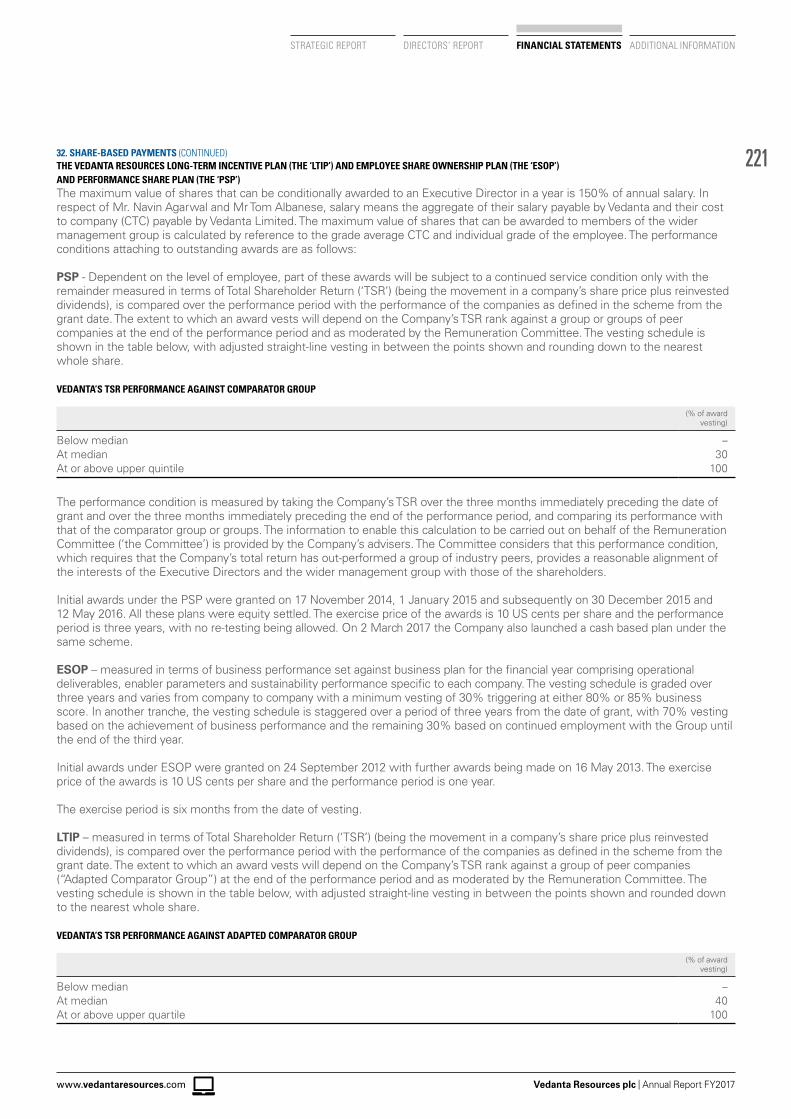
221
Vedanta Resources plc | Annual Report FY2017www.vedantaresources.com
STRATEGIC REPORT DIRECTORS’ REPORT FINANCIAL STATEMENTS ADDITIONAL INFORMATION
THE VEDANTA RESOURCES LONG-TERM INCENTIVE PLAN (THE ‘LTIP’) AND EMPLOYEE SHARE OWNERSHIP PLAN (THE ‘ESOP’) AND PERFORMANCE SHARE PLAN (THE ‘PSP’)The maximum value of shares that can be conditionally awarded to an Executive Director in a year is 150% of annual salary. In respect of Mr. Navin Agarwal and Mr Tom Albanese, salary means the aggregate of their salary payable by Vedanta and their cost to company (CTC) payable by Vedanta Limited. The maximum value of shares that can be awarded to members of the wider management group is calculated by reference to the grade average CTC and individual grade of the employee. The performance conditions attaching to outstanding awards are as follows:
PSP - Dependent on the level of employee, part of these awards will be subject to a continued service condition only with the remainder measured in terms of Total Shareholder Return (‘TSR’) (being the movement in a company’s share price plus reinvested dividends), is compared over the performance period with the performance of the companies as defined in the scheme from the grant date. The extent to which an award vests will depend on the Company’s TSR rank against a group or groups of peer companies at the end of the performance period and as moderated by the Remuneration Committee. The vesting schedule is shown in the table below, with adjusted straight-line vesting in between the points shown and rounding down to the nearest whole share.
VEDANTA’S TSR PERFORMANCE AGAINST COMPARATOR GROUP
(% of award vesting)
Below median –At median 30At or above upper quintile 100
The performance condition is measured by taking the Company’s TSR over the three months immediately preceding the date of grant and over the three months immediately preceding the end of the performance period, and comparing its performance with that of the comparator group or groups. The information to enable this calculation to be carried out on behalf of the Remuneration Committee (‘the Committee’) is provided by the Company’s advisers. The Committee considers that this performance condition, which requires that the Company’s total return has out-performed a group of industry peers, provides a reasonable alignment of the interests of the Executive Directors and the wider management group with those of the shareholders.
Initial awards under the PSP were granted on 17 November 2014, 1 January 2015 and subsequently on 30 December 2015 and 12 May 2016. All these plans were equity settled. The exercise price of the awards is 10 US cents per share and the performance period is three years, with no re-testing being allowed. On 2 March 2017 the Company also launched a cash based plan under the same scheme.
ESOP – measured in terms of business performance set against business plan for the financial year comprising operational deliverables, enabler parameters and sustainability performance specific to each company. The vesting schedule is graded over three years and varies from company to company with a minimum vesting of 30% triggering at either 80% or 85% business score. In another tranche, the vesting schedule is staggered over a period of three years from the date of grant, with 70% vesting based on the achievement of business performance and the remaining 30% based on continued employment with the Group until the end of the third year.
Initial awards under ESOP were granted on 24 September 2012 with further awards being made on 16 May 2013. The exercise price of the awards is 10 US cents per share and the performance period is one year.
The exercise period is six months from the date of vesting.
LTIP – measured in terms of Total Shareholder Return (‘TSR’) (being the movement in a company’s share price plus reinvested dividends), is compared over the performance period with the performance of the companies as defined in the scheme from the grant date. The extent to which an award vests will depend on the Company’s TSR rank against a group of peer companies (“Adapted Comparator Group”) at the end of the performance period and as moderated by the Remuneration Committee. The vesting schedule is shown in the table below, with adjusted straight-line vesting in between the points shown and rounded down to the nearest whole share.
VEDANTA’S TSR PERFORMANCE AGAINST ADAPTED COMPARATOR GROUP
(% of award vesting)
Below median –At median 40At or above upper quartile 100
32. SHARE-BASED PAYMENTS (CONTINUED)
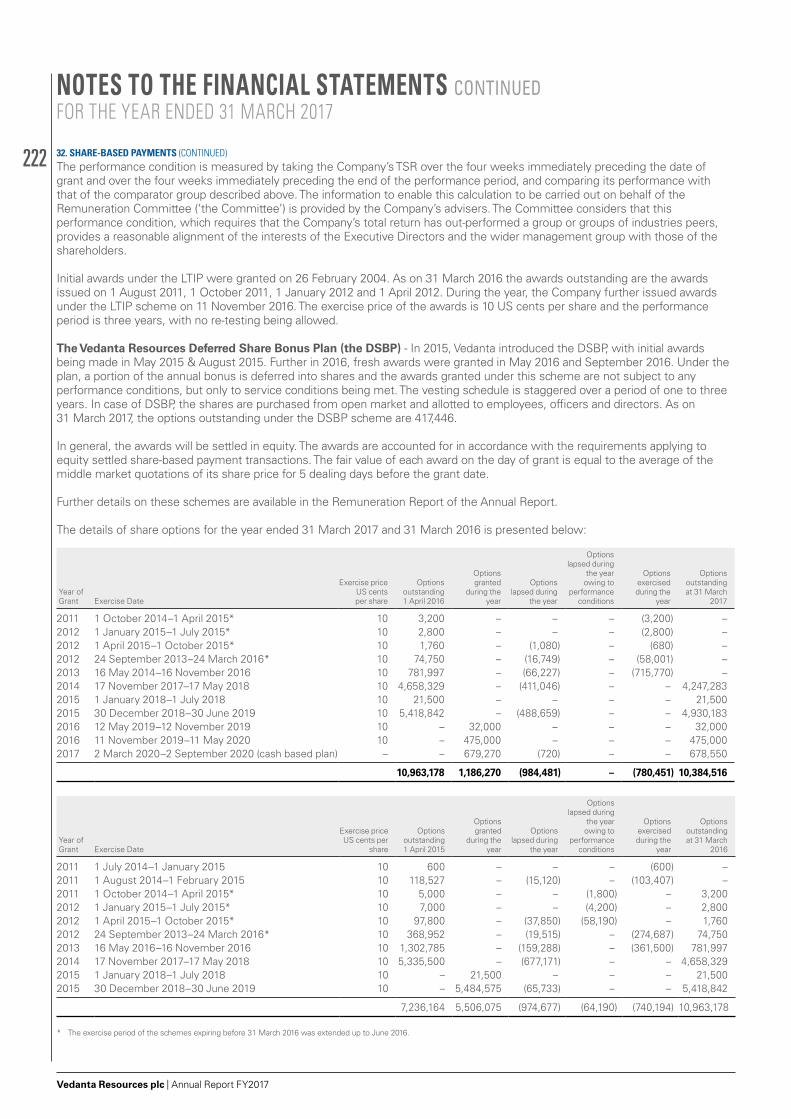
222
Vedanta Resources plc | Annual Report FY2017
The performance condition is measured by taking the Company’s TSR over the four weeks immediately preceding the date of grant and over the four weeks immediately preceding the end of the performance period, and comparing its performance with that of the comparator group described above. The information to enable this calculation to be carried out on behalf of the Remuneration Committee (‘the Committee’) is provided by the Company’s advisers. The Committee considers that this performance condition, which requires that the Company’s total return has out-performed a group or groups of industries peers, provides a reasonable alignment of the interests of the Executive Directors and the wider management group with those of the shareholders.
Initial awards under the LTIP were granted on 26 February 2004. As on 31 March 2016 the awards outstanding are the awards issued on 1 August 2011, 1 October 2011, 1 January 2012 and 1 April 2012. During the year, the Company further issued awards under the LTIP scheme on 11 November 2016. The exercise price of the awards is 10 US cents per share and the performance period is three years, with no re-testing being allowed.
The Vedanta Resources Deferred Share Bonus Plan (the DSBP) - In 2015, Vedanta introduced the DSBP, with initial awards being made in May 2015 & August 2015. Further in 2016, fresh awards were granted in May 2016 and September 2016. Under the plan, a portion of the annual bonus is deferred into shares and the awards granted under this scheme are not subject to any performance conditions, but only to service conditions being met. The vesting schedule is staggered over a period of one to three years. In case of DSBP, the shares are purchased from open market and allotted to employees, officers and directors. As on 31 March 2017, the options outstanding under the DSBP scheme are 417,446.
In general, the awards will be settled in equity. The awards are accounted for in accordance with the requirements applying to equity settled share-based payment transactions. The fair value of each award on the day of grant is equal to the average of the middle market quotations of its share price for 5 dealing days before the grant date.
Further details on these schemes are available in the Remuneration Report of the Annual Report. The details of share options for the year ended 31 March 2017 and 31 March 2016 is presented below:
Year of Grant Exercise Date
Exercise price US cents per share
Options outstanding 1 April 2016
Options granted
during the year
Options lapsed during
the year
Options lapsed during
the year owing to
performance conditions
Options exercised during the
year
Options outstanding at 31 March
2017
2011 1 October 2014–1 April 2015* 10 3,200 – – – (3,200) –2012 1 January 2015–1 July 2015* 10 2,800 – – – (2,800) –2012 1 April 2015–1 October 2015* 10 1,760 – (1,080) – (680) –2012 24 September 2013–24 March 2016* 10 74,750 – (16,749) – (58,001) –2013 16 May 2014–16 November 2016 10 781,997 – (66,227) – (715,770) –2014 17 November 2017–17 May 2018 10 4,658,329 – (411,046) – – 4,247,2832015 1 January 2018–1 July 2018 10 21,500 – – – – 21,5002015 30 December 2018–30 June 2019 10 5,418,842 – (488,659) – – 4,930,1832016 12 May 2019–12 November 2019 10 – 32,000 – – – 32,0002016 11 November 2019–11 May 2020 10 – 475,000 – – – 475,0002017 2 March 2020–2 September 2020 (cash based plan) – – 679,270 (720) – – 678,550
10,963,178 1,186,270 (984,481) – (780,451) 10,384,516
Year of Grant Exercise Date
Exercise price US cents per
share
Options outstanding 1 April 2015
Options granted
during the year
Options lapsed during
the year
Options lapsed during
the year owing to
performance conditions
Options exercised during the
year
Options outstanding at 31 March
2016
2011 1 July 2014–1 January 2015 10 600 – – – (600) –2011 1 August 2014–1 February 2015 10 118,527 – (15,120) – (103,407) –2011 1 October 2014–1 April 2015* 10 5,000 – – (1,800) – 3,2002012 1 January 2015–1 July 2015* 10 7,000 – – (4,200) – 2,8002012 1 April 2015–1 October 2015* 10 97,800 – (37,850) (58,190) – 1,7602012 24 September 2013–24 March 2016* 10 368,952 – (19,515) – (274,687) 74,7502013 16 May 2016–16 November 2016 10 1,302,785 – (159,288) – (361,500) 781,9972014 17 November 2017–17 May 2018 10 5,335,500 – (677,171) – – 4,658,3292015 1 January 2018–1 July 2018 10 – 21,500 – – – 21,5002015 30 December 2018–30 June 2019 10 – 5,484,575 (65,733) – – 5,418,842
7,236,164 5,506,075 (974,677) (64,190) (740,194) 10,963,178
* The exercise period of the schemes expiring before 31 March 2016 was extended up to June 2016.
32. SHARE-BASED PAYMENTS (CONTINUED)
NOTES TO THE FINANCIAL STATEMENTS CONTINUEDFOR THE YEAR ENDED 31 MARCH 2017
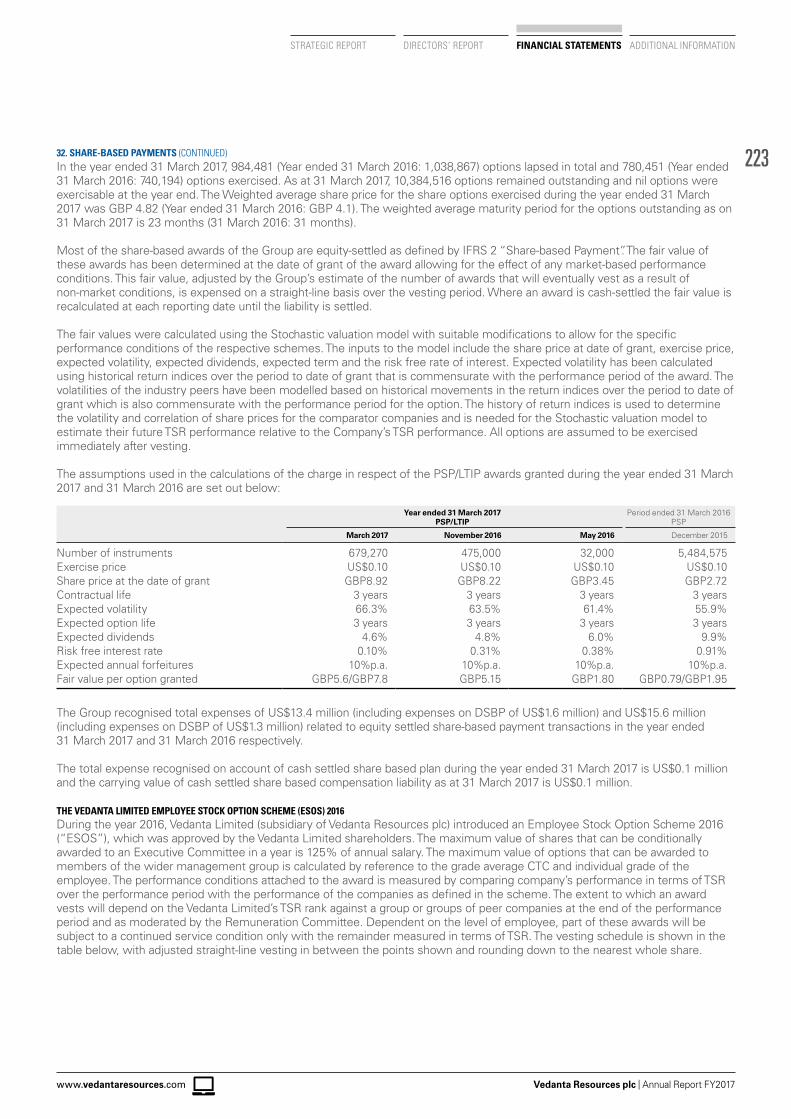
223
Vedanta Resources plc | Annual Report FY2017www.vedantaresources.com
STRATEGIC REPORT DIRECTORS’ REPORT FINANCIAL STATEMENTS ADDITIONAL INFORMATION
In the year ended 31 March 2017, 984,481 (Year ended 31 March 2016: 1,038,867) options lapsed in total and 780,451 (Year ended 31 March 2016: 740,194) options exercised. As at 31 March 2017, 10,384,516 options remained outstanding and nil options were exercisable at the year end. The Weighted average share price for the share options exercised during the year ended 31 March 2017 was GBP 4.82 (Year ended 31 March 2016: GBP 4.1). The weighted average maturity period for the options outstanding as on 31 March 2017 is 23 months (31 March 2016: 31 months).
Most of the share-based awards of the Group are equity-settled as defined by IFRS 2 “Share-based Payment”. The fair value of these awards has been determined at the date of grant of the award allowing for the effect of any market-based performance conditions. This fair value, adjusted by the Group’s estimate of the number of awards that will eventually vest as a result of non-market conditions, is expensed on a straight-line basis over the vesting period. Where an award is cash-settled the fair value is recalculated at each reporting date until the liability is settled.
The fair values were calculated using the Stochastic valuation model with suitable modifications to allow for the specific performance conditions of the respective schemes. The inputs to the model include the share price at date of grant, exercise price, expected volatility, expected dividends, expected term and the risk free rate of interest. Expected volatility has been calculated using historical return indices over the period to date of grant that is commensurate with the performance period of the award. The volatilities of the industry peers have been modelled based on historical movements in the return indices over the period to date of grant which is also commensurate with the performance period for the option. The history of return indices is used to determine the volatility and correlation of share prices for the comparator companies and is needed for the Stochastic valuation model to estimate their future TSR performance relative to the Company’s TSR performance. All options are assumed to be exercised immediately after vesting.
The assumptions used in the calculations of the charge in respect of the PSP/LTIP awards granted during the year ended 31 March 2017 and 31 March 2016 are set out below:
Year ended 31 March 2017 PSP/LTIP
Period ended 31 March 2016 PSP
March 2017 November 2016 May 2016 December 2015
Number of instruments 679,270 475,000 32,000 5,484,575Exercise price US$0.10 US$0.10 US$0.10 US$0.10Share price at the date of grant GBP8.92 GBP8.22 GBP3.45 GBP2.72Contractual life 3 years 3 years 3 years 3 yearsExpected volatility 66.3% 63.5% 61.4% 55.9%Expected option life 3 years 3 years 3 years 3 yearsExpected dividends 4.6% 4.8% 6.0% 9.9%Risk free interest rate 0.10% 0.31% 0.38% 0.91%Expected annual forfeitures 10%p.a. 10%p.a. 10%p.a. 10%p.a.Fair value per option granted GBP5.6/GBP7.8 GBP5.15 GBP1.80 GBP0.79/GBP1.95
The Group recognised total expenses of US$13.4 million (including expenses on DSBP of US$1.6 million) and US$15.6 million (including expenses on DSBP of US$1.3 million) related to equity settled share-based payment transactions in the year ended 31 March 2017 and 31 March 2016 respectively.
The total expense recognised on account of cash settled share based plan during the year ended 31 March 2017 is US$0.1 million and the carrying value of cash settled share based compensation liability as at 31 March 2017 is US$0.1 million.
THE VEDANTA LIMITED EMPLOYEE STOCK OPTION SCHEME (ESOS) 2016During the year 2016, Vedanta Limited (subsidiary of Vedanta Resources plc) introduced an Employee Stock Option Scheme 2016 (“ESOS”), which was approved by the Vedanta Limited shareholders. The maximum value of shares that can be conditionally awarded to an Executive Committee in a year is 125% of annual salary. The maximum value of options that can be awarded to members of the wider management group is calculated by reference to the grade average CTC and individual grade of the employee. The performance conditions attached to the award is measured by comparing company’s performance in terms of TSR over the performance period with the performance of the companies as defined in the scheme. The extent to which an award vests will depend on the Vedanta Limited’s TSR rank against a group or groups of peer companies at the end of the performance period and as moderated by the Remuneration Committee. Dependent on the level of employee, part of these awards will be subject to a continued service condition only with the remainder measured in terms of TSR. The vesting schedule is shown in the table below, with adjusted straight-line vesting in between the points shown and rounding down to the nearest whole share.
32. SHARE-BASED PAYMENTS (CONTINUED)
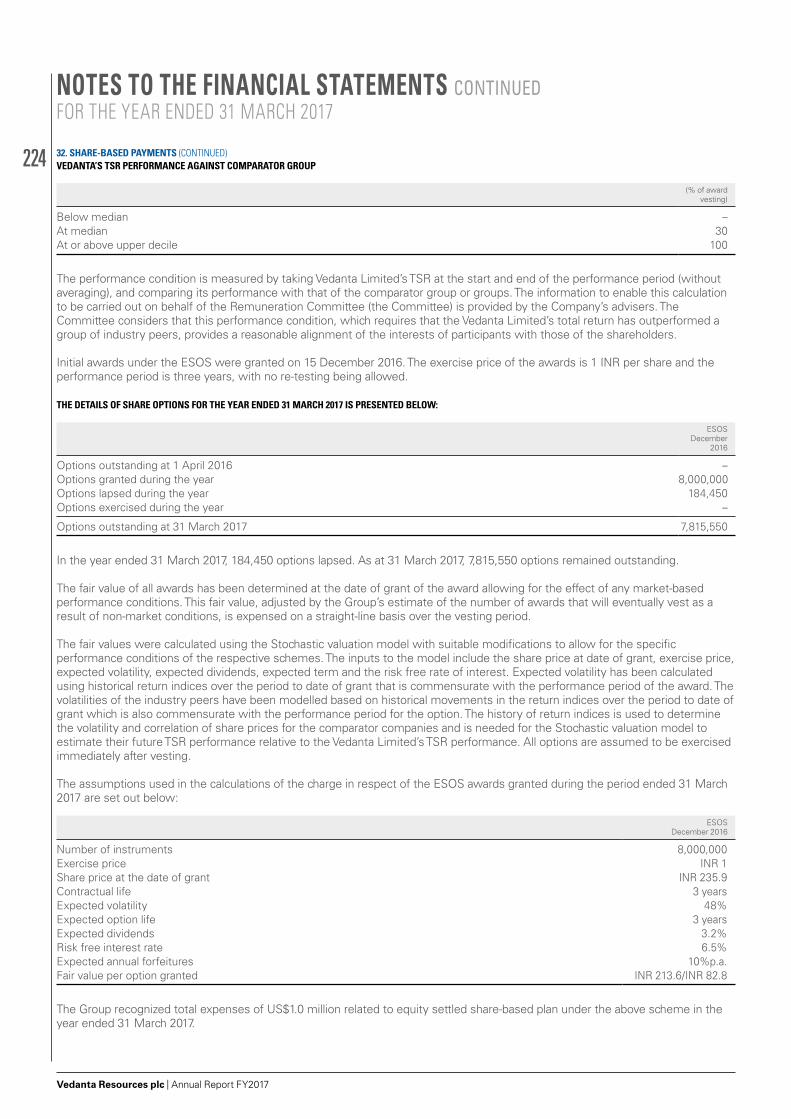
224
Vedanta Resources plc | Annual Report FY2017
VEDANTA’S TSR PERFORMANCE AGAINST COMPARATOR GROUP
(% of award vesting)
Below median –At median 30At or above upper decile 100
The performance condition is measured by taking Vedanta Limited’s TSR at the start and end of the performance period (without averaging), and comparing its performance with that of the comparator group or groups. The information to enable this calculation to be carried out on behalf of the Remuneration Committee (the Committee) is provided by the Company’s advisers. The Committee considers that this performance condition, which requires that the Vedanta Limited’s total return has outperformed a group of industry peers, provides a reasonable alignment of the interests of participants with those of the shareholders.
Initial awards under the ESOS were granted on 15 December 2016. The exercise price of the awards is 1 INR per share and the performance period is three years, with no re-testing being allowed. THE DETAILS OF SHARE OPTIONS FOR THE YEAR ENDED 31 MARCH 2017 IS PRESENTED BELOW:
ESOS December
2016
Options outstanding at 1 April 2016 –Options granted during the year 8,000,000Options lapsed during the year 184,450Options exercised during the year –
Options outstanding at 31 March 2017 7,815,550
In the year ended 31 March 2017, 184,450 options lapsed. As at 31 March 2017, 7,815,550 options remained outstanding.
The fair value of all awards has been determined at the date of grant of the award allowing for the effect of any market-based performance conditions. This fair value, adjusted by the Group’s estimate of the number of awards that will eventually vest as a result of non-market conditions, is expensed on a straight-line basis over the vesting period.
The fair values were calculated using the Stochastic valuation model with suitable modifications to allow for the specific performance conditions of the respective schemes. The inputs to the model include the share price at date of grant, exercise price, expected volatility, expected dividends, expected term and the risk free rate of interest. Expected volatility has been calculated using historical return indices over the period to date of grant that is commensurate with the performance period of the award. The volatilities of the industry peers have been modelled based on historical movements in the return indices over the period to date of grant which is also commensurate with the performance period for the option. The history of return indices is used to determine the volatility and correlation of share prices for the comparator companies and is needed for the Stochastic valuation model to estimate their future TSR performance relative to the Vedanta Limited’s TSR performance. All options are assumed to be exercised immediately after vesting.
The assumptions used in the calculations of the charge in respect of the ESOS awards granted during the period ended 31 March 2017 are set out below:
ESOS December 2016
Number of instruments 8,000,000Exercise price INR 1Share price at the date of grant INR 235.9Contractual life 3 yearsExpected volatility 48%Expected option life 3 yearsExpected dividends 3.2%Risk free interest rate 6.5%Expected annual forfeitures 10%p.a.Fair value per option granted INR 213.6/INR 82.8
The Group recognized total expenses of US$1.0 million related to equity settled share-based plan under the above scheme in the year ended 31 March 2017.
32. SHARE-BASED PAYMENTS (CONTINUED)
NOTES TO THE FINANCIAL STATEMENTS CONTINUEDFOR THE YEAR ENDED 31 MARCH 2017
225
Vedanta Resources plc | Annual Report FY2017www.vedantaresources.com
STRATEGIC REPORT DIRECTORS’ REPORT FINANCIAL STATEMENTS ADDITIONAL INFORMATION
33. RETIREMENT BENEFITSThe Group operates pension schemes for the majority of its employees in India, Australia, Africa and Ireland.
(A) DEFINED CONTRIBUTION SCHEMESINDIAN PENSION SCHEMESCentral Recognised Provident FundThe Central Recognised Provident Fund relates to all full-time Indian employees of the Group. The amount contributed by the Group is a designated percentage of 12% of basic salary less contributions made as part of the Pension Fund (see below), together with an additional contribution of 12% (limited to a maximum contribution of 30% in case of Iron Ore Segment) of the salary of the employee.
The benefit is paid to the employee on their retirement or resignation from the Group.
SuperannuationSuperannuation, another pension scheme applicable in India, is applicable only to executives in grade M4 and above. However, in case of the Cairn India Group and Iron Ore Segment, the benefit is applicable to all executives. In Cairn India, it is applicable from the second year of employment. Certain companies hold policies with the Life Insurance Corporation of India (“LIC”), to which they contribute a fixed amount relating to superannuation, and the pension annuity is met by the LIC as required, taking into consideration the contributions made. Accordingly, this scheme has been accounted for on a defined contribution basis and contributions are charged directly to the income statement.
Pension FundThe Pension Fund was established in 1995 and is managed by the Government of India. The employee makes no contribution to this fund but the employer makes a contribution of 8.33% of salary each month subject to a specified ceiling per employee. This must be provided for every permanent employee on the payroll.
At the age of superannuation, contributions cease and the individual receives a monthly payment based on the level of contributions through the years, and on their salary scale at the time they retire, subject to a maximum ceiling of salary level. The Government funds these payments, thus the Group has no additional liability beyond the contributions that it makes, regardless of whether the central fund is in surplus or deficit.
AUSTRALIAN PENSION SCHEMEThe Group also operates defined contribution pension schemes in Australia. The contribution of a proportion of an employee’s salary into a superannuation fund is a compulsory legal requirement in Australia. The employer contributes 9.5% of the employee’s gross remuneration where the employee is covered by the industrial agreement and 12.5% of the basic remuneration for all other employees, into the employee’s fund of choice. All employees have the option to make additional voluntary contributions.
ZAMBIAN PENSION SCHEMEThe KCM Pension Scheme is applicable to full-time permanent employees of KCM (subject to the fulfilment of certain eligibility criteria). The management of the scheme is vested in the trustees consisting of representatives of the employer and the members. The employer makes a monthly contribution of 5% to the KCM Pension Scheme and the member makes monthly contribution of 5%.
All contributions to the KCM Pension Scheme in respect of a member cease to be payable when the member attains normal retirement age of 55 years, or upon leaving the service of the employer, or when the member is permanently medically incapable of performing duties in the service of the employer. Upon such cessation of contribution on the grounds of normal retirement, or being rendered medically incapable of performing duties, or early voluntary retirement, the member is entitled to receive his accrued pension. The member is allowed to commute his/her accrued pension subject to certain rules and regulations.
The Group has no additional liability beyond the contributions that it makes. Accordingly, this scheme has been accounted for on a defined contribution basis and contributions are charged directly to the income statement.
SKORPION ZINC PROVIDENT FUND, NAMIBIAThe Skorpion Zinc Provident Fund is a defined contribution fund and is compulsory to all full time employees under the age of 60. Company contribution to the fund is a fixed percentage of 9% per month of pensionable salary, whilst the employee contributes 7% with the option of making additional contributions, over and above the normal contribution, up to a maximum of 12%.
Normal retirement age is 60 years and benefit payable is the member’s fund credit which is equal to all employer and employee contributions plus interest. The same applies when an employee resigns from Skorpion Zinc. The Fund provides disability cover which is equal to the member’s fund credit and a death cover of 2 times annual salary in the event of death before retirement. Current membership total is 908.
The Group has no additional liability beyond the contributions that it makes. Accordingly, this scheme has been accounted for on a defined contribution basis and contributions are charged directly to the income statement.
226
Vedanta Resources plc | Annual Report FY2017
BLACK MOUNTAIN (PTY) LIMITED, SOUTH AFRICA PENSION & PROVIDENT FUNDSBlack Mountain Mining (Pty) Ltd has two retirement funds, both administered by Alexander Forbes, a registered financial service provider. Both funds form part of the Alexander Forbes umbrella fund and are defined contribution funds.
Membership of both funds is compulsory for all permanent employees under the age of 60.
LISHEEN MINE, IRELAND PENSION FUNDSLisheen Pension Plan is for all employees. Lisheen pays 5% and employees pays 5% with the option to make Additional Voluntary Contributions (‘AVC’s’) if desired. Executive contributions are 15% by Lisheen and a minimum of 5% by the employee with the option to make AVC’s if desired. Death benefit is three times salary for employees and four times salary for executives. Pension and Life Cover ceases at 65. On wind up of the pension schemes, the benefits will be paid out to the remaining members in accordance with the scheme rules and Irish Revenue tax regulations.
The Group has no additional liability beyond the contributions that it makes. Accordingly, this scheme has been accounted for on a defined contribution basis and contributions are charged directly to the income statement.
(B) DEFINED BENEFIT SCHEMESINDIAThe Gratuity schemes are defined benefit schemes which are open to all Group employees in India who have a minimum of five years of service with their employing company. These schemes are funded in some subsidiaries. Based on actuarial valuation, a provision is recognised in full for the projected obligation over and above the funds held in scheme. In case where there is no funding held by the scheme, full provision is recognised in the balance sheet. Under these schemes, benefits are provided based on final pensionable pay.
The assets of the schemes are held in separate funds and a full actuarial valuation of the schemes is carried out on an annual basis.
VEDANTA LIMITEDThe Iron ore, Aluminium and Copper division of Vedanta Limited contributed to the LIC Fund based on an actuarial valuation every year. Vedanta Limited’s Gratuity scheme is accounted for on a defined benefit basis. The latest actuarial valuation was performed as at 31 March 2017 using the projected unit credit actuarial method.
BALCOAll employees who are scheduled to retire on or before 31 March 2017 are being paid by BALCO. The Gratuity scheme is accounted for as a defined benefit scheme for all employees scheduled to retire after 31 March 2017. A provision is recognised based on the latest actuarial valuation which was performed as at 31 March 2017 using the projected unit actuarial method. At that date the fund was in deficit.
HZLHZL contributes to the LIC fund based on an actuarial valuation every year. HZL’s Gratuity scheme is accounted for on a defined benefit basis. The latest actuarial valuation was performed as at 31 March 2017 using the projected unit actuarial method. At that date the fund was in deficit.
MELThe MEL contributed to the LIC fund based on an actuarial valuation every year. MEL Gratuity scheme is accounted for on a defined benefit basis. The latest actuarial valuation was performed as at 31 March 2017 using the projected unit credit actuarial method.
TSPLTSPL contributes to the LIC based on an actuarial valuation. Liabilities with regard to the Gratuity scheme are fully provided in the Balance Sheet and are determined by actuarial valuation as at the balance sheet date and as per gratuity regulations for TSPL. The latest actuarial valuation was performed as at 31 March 2017 using the projected unit actuarial method.
CAIRNCairn contributes to the LIC fund based on an actuarial valuation every year. Cairn India Group’s Gratuity scheme is accounted for on a defined benefit basis. The latest actuarial valuation was performed as at 31 March 2017 using the projected unit actuarial method. At that date the fund was in deficit.
ZAMBIASpecified permanent employees of KCM are entitled to receive medical and retirement severance benefits. This comprises two months’ basic pay for every completed year of service with an earliest service start date of 1 July 2004. Under this scheme, benefits are provided based on final pensionable pay and a full actuarial valuation of the scheme is carried out on an annual basis. The accruals are not contributed to any fund and are in the form of provisions in KCM’s accounts.
On the death of an employee during service, a lump sum amount is paid to his or her dependants. This amount is equal to sixty months’ basic pay for employees who joined before 1 April 2000 and thirty months’ basic pay for employees who joined on or after 1 April 2000. For fixed term contract employees, the benefit payable on death is thirty months’ basic pay.
33. RETIREMENT BENEFITS (CONTINUED)
NOTES TO THE FINANCIAL STATEMENTS CONTINUEDFOR THE YEAR ENDED 31 MARCH 2017
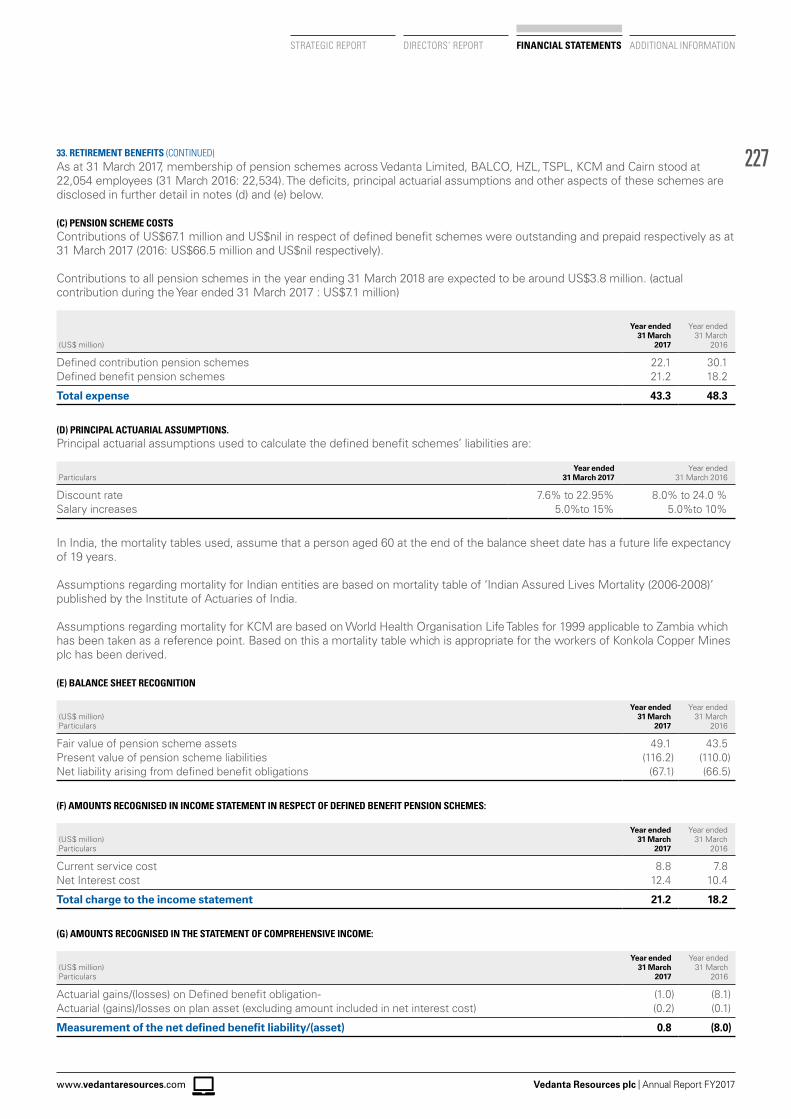
227
Vedanta Resources plc | Annual Report FY2017www.vedantaresources.com
STRATEGIC REPORT DIRECTORS’ REPORT FINANCIAL STATEMENTS ADDITIONAL INFORMATION
As at 31 March 2017, membership of pension schemes across Vedanta Limited, BALCO, HZL, TSPL, KCM and Cairn stood at 22,054 employees (31 March 2016: 22,534). The deficits, principal actuarial assumptions and other aspects of these schemes are disclosed in further detail in notes (d) and (e) below.
(C) PENSION SCHEME COSTSContributions of US$67.1 million and US$nil in respect of defined benefit schemes were outstanding and prepaid respectively as at 31 March 2017 (2016: US$66.5 million and US$nil respectively).
Contributions to all pension schemes in the year ending 31 March 2018 are expected to be around US$3.8 million. (actual contribution during the Year ended 31 March 2017 : US$7.1 million)
(US$ million)
Year ended 31 March
2017
Year ended 31 March
2016
Defined contribution pension schemes 22.1 30.1Defined benefit pension schemes 21.2 18.2
Total expense 43.3 48.3
(D) PRINCIPAL ACTUARIAL ASSUMPTIONS.Principal actuarial assumptions used to calculate the defined benefit schemes’ liabilities are:
ParticularsYear ended
31 March 2017Year ended
31 March 2016
Discount rate 7.6% to 22.95% 8.0% to 24.0 %Salary increases 5.0%to 15% 5.0%to 10%
In India, the mortality tables used, assume that a person aged 60 at the end of the balance sheet date has a future life expectancy of 19 years.
Assumptions regarding mortality for Indian entities are based on mortality table of ‘Indian Assured Lives Mortality (2006-2008)’ published by the Institute of Actuaries of India.
Assumptions regarding mortality for KCM are based on World Health Organisation Life Tables for 1999 applicable to Zambia which has been taken as a reference point. Based on this a mortality table which is appropriate for the workers of Konkola Copper Mines plc has been derived.
(E) BALANCE SHEET RECOGNITION
(US$ million) Particulars
Year ended 31 March
2017
Year ended 31 March
2016
Fair value of pension scheme assets 49.1 43.5Present value of pension scheme liabilities (116.2) (110.0)Net liability arising from defined benefit obligations (67.1) (66.5)
(F) AMOUNTS RECOGNISED IN INCOME STATEMENT IN RESPECT OF DEFINED BENEFIT PENSION SCHEMES:
(US$ million) Particulars
Year ended 31 March
2017
Year ended 31 March
2016
Current service cost 8.8 7.8Net Interest cost 12.4 10.4
Total charge to the income statement 21.2 18.2
(G) AMOUNTS RECOGNISED IN THE STATEMENT OF COMPREHENSIVE INCOME:
(US$ million) Particulars
Year ended 31 March
2017
Year ended 31 March
2016
Actuarial gains/(losses) on Defined benefit obligation- (1.0) (8.1)Actuarial (gains)/losses on plan asset (excluding amount included in net interest cost) (0.2) (0.1)
Measurement of the net defined benefit liability/(asset) 0.8 (8.0)
33. RETIREMENT BENEFITS (CONTINUED)
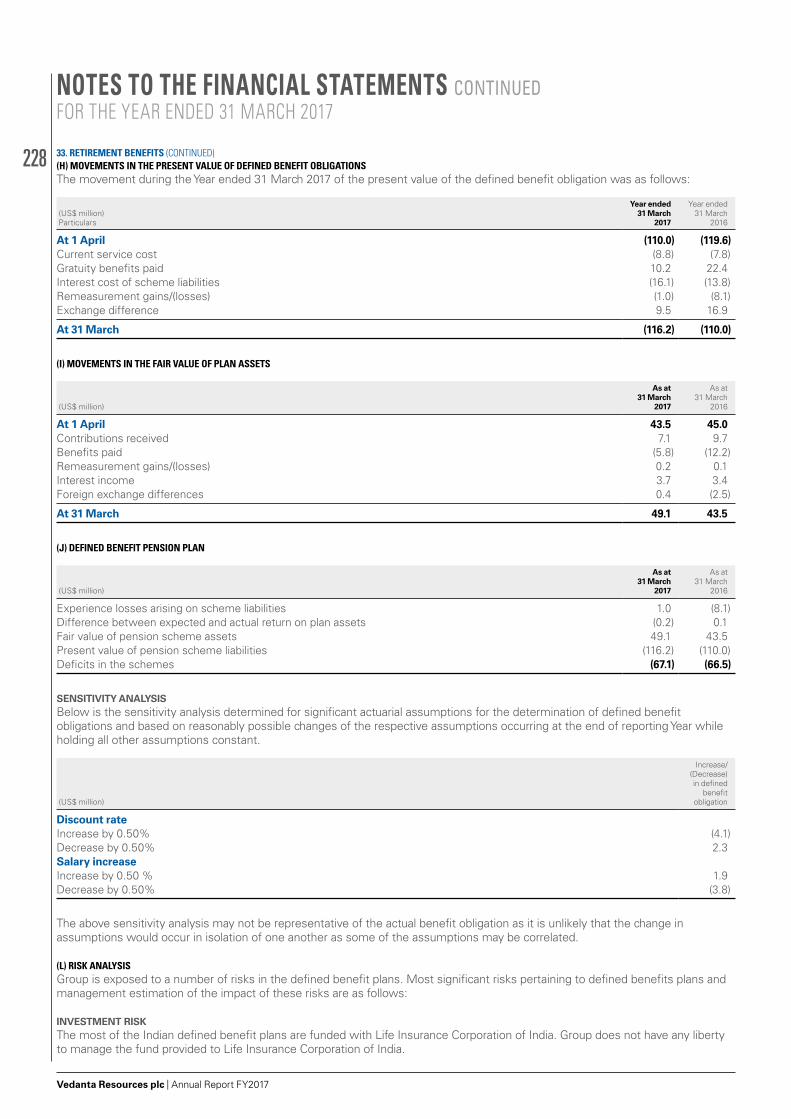
228
Vedanta Resources plc | Annual Report FY2017
(H) MOVEMENTS IN THE PRESENT VALUE OF DEFINED BENEFIT OBLIGATIONSThe movement during the Year ended 31 March 2017 of the present value of the defined benefit obligation was as follows:
(US$ million) Particulars
Year ended 31 March
2017
Year ended 31 March
2016
At 1 April (110.0) (119.6)Current service cost (8.8) (7.8)Gratuity benefits paid 10.2 22.4Interest cost of scheme liabilities (16.1) (13.8)Remeasurement gains/(losses) (1.0) (8.1)Exchange difference 9.5 16.9
At 31 March (116.2) (110.0)
(I) MOVEMENTS IN THE FAIR VALUE OF PLAN ASSETS
(US$ million)
As at 31 March
2017
As at 31 March
2016
At 1 April 43.5 45.0Contributions received 7.1 9.7Benefits paid (5.8) (12.2)Remeasurement gains/(losses) 0.2 0.1Interest income 3.7 3.4Foreign exchange differences 0.4 (2.5)
At 31 March 49.1 43.5
(J) DEFINED BENEFIT PENSION PLAN
(US$ million)
As at 31 March
2017
As at 31 March
2016
Experience losses arising on scheme liabilities 1.0 (8.1)Difference between expected and actual return on plan assets (0.2) 0.1Fair value of pension scheme assets 49.1 43.5Present value of pension scheme liabilities (116.2) (110.0)Deficits in the schemes (67.1) (66.5)
SENSITIVITY ANALYSISBelow is the sensitivity analysis determined for significant actuarial assumptions for the determination of defined benefit obligations and based on reasonably possible changes of the respective assumptions occurring at the end of reporting Year while holding all other assumptions constant.
(US$ million)
Increase/(Decrease) in defined
benefit obligation
Discount rateIncrease by 0.50% (4.1)Decrease by 0.50% 2.3Salary increaseIncrease by 0.50 % 1.9Decrease by 0.50% (3.8)
The above sensitivity analysis may not be representative of the actual benefit obligation as it is unlikely that the change in assumptions would occur in isolation of one another as some of the assumptions may be correlated.
(L) RISK ANALYSISGroup is exposed to a number of risks in the defined benefit plans. Most significant risks pertaining to defined benefits plans and management estimation of the impact of these risks are as follows:
INVESTMENT RISKThe most of the Indian defined benefit plans are funded with Life Insurance Corporation of India. Group does not have any liberty to manage the fund provided to Life Insurance Corporation of India.
33. RETIREMENT BENEFITS (CONTINUED)
NOTES TO THE FINANCIAL STATEMENTS CONTINUEDFOR THE YEAR ENDED 31 MARCH 2017
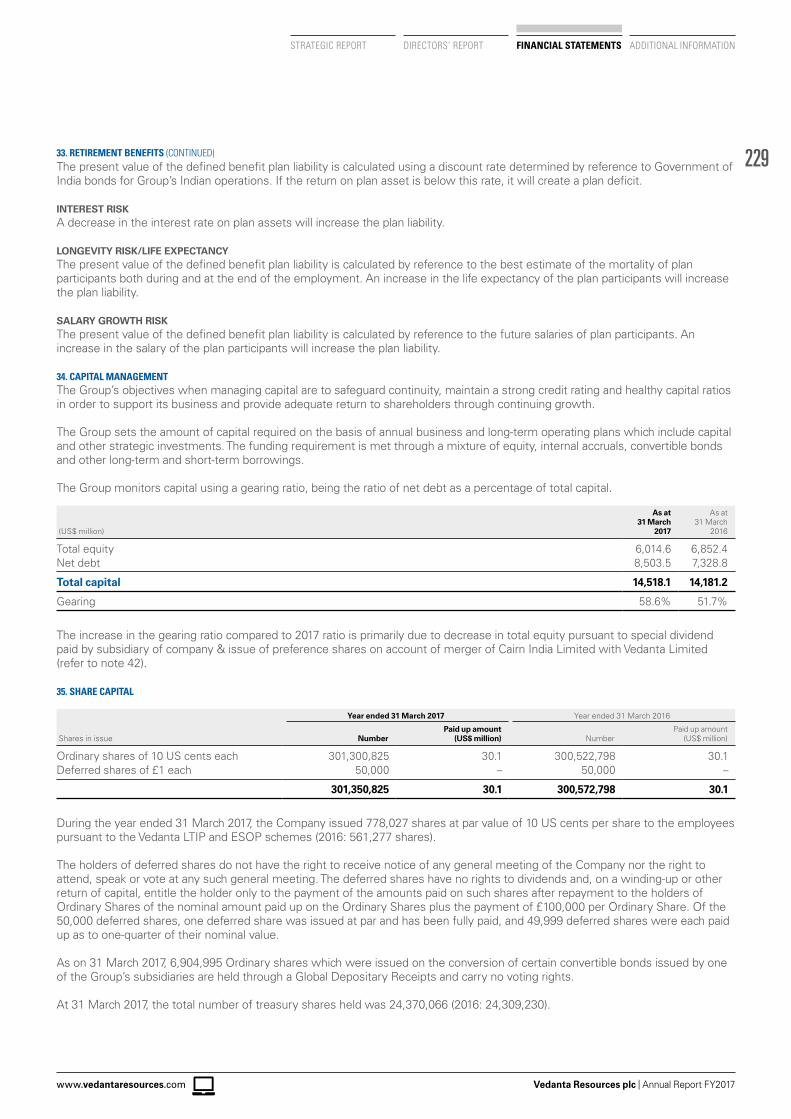
229
Vedanta Resources plc | Annual Report FY2017www.vedantaresources.com
STRATEGIC REPORT DIRECTORS’ REPORT FINANCIAL STATEMENTS ADDITIONAL INFORMATION
The present value of the defined benefit plan liability is calculated using a discount rate determined by reference to Government of India bonds for Group’s Indian operations. If the return on plan asset is below this rate, it will create a plan deficit.
INTEREST RISKA decrease in the interest rate on plan assets will increase the plan liability.
LONGEVITY RISK/LIFE EXPECTANCYThe present value of the defined benefit plan liability is calculated by reference to the best estimate of the mortality of plan participants both during and at the end of the employment. An increase in the life expectancy of the plan participants will increase the plan liability.
SALARY GROWTH RISKThe present value of the defined benefit plan liability is calculated by reference to the future salaries of plan participants. An increase in the salary of the plan participants will increase the plan liability.
34. CAPITAL MANAGEMENTThe Group’s objectives when managing capital are to safeguard continuity, maintain a strong credit rating and healthy capital ratios in order to support its business and provide adequate return to shareholders through continuing growth.
The Group sets the amount of capital required on the basis of annual business and long-term operating plans which include capital and other strategic investments. The funding requirement is met through a mixture of equity, internal accruals, convertible bonds and other long-term and short-term borrowings.
The Group monitors capital using a gearing ratio, being the ratio of net debt as a percentage of total capital.
(US$ million)
As at 31 March
2017
As at 31 March
2016
Total equity 6,014.6 6,852.4Net debt 8,503.5 7,328.8
Total capital 14,518.1 14,181.2
Gearing 58.6% 51.7%
The increase in the gearing ratio compared to 2017 ratio is primarily due to decrease in total equity pursuant to special dividend paid by subsidiary of company & issue of preference shares on account of merger of Cairn India Limited with Vedanta Limited (refer to note 42).
35. SHARE CAPITAL
Year ended 31 March 2017 Year ended 31 March 2016
Shares in issue NumberPaid up amount
(US$ million) NumberPaid up amount
(US$ million)
Ordinary shares of 10 US cents each 301,300,825 30.1 300,522,798 30.1Deferred shares of £1 each 50,000 – 50,000 –
301,350,825 30.1 300,572,798 30.1
During the year ended 31 March 2017, the Company issued 778,027 shares at par value of 10 US cents per share to the employees pursuant to the Vedanta LTIP and ESOP schemes (2016: 561,277 shares).
The holders of deferred shares do not have the right to receive notice of any general meeting of the Company nor the right to attend, speak or vote at any such general meeting. The deferred shares have no rights to dividends and, on a winding-up or other return of capital, entitle the holder only to the payment of the amounts paid on such shares after repayment to the holders of Ordinary Shares of the nominal amount paid up on the Ordinary Shares plus the payment of £100,000 per Ordinary Share. Of the 50,000 deferred shares, one deferred share was issued at par and has been fully paid, and 49,999 deferred shares were each paid up as to one-quarter of their nominal value.
As on 31 March 2017, 6,904,995 Ordinary shares which were issued on the conversion of certain convertible bonds issued by one of the Group’s subsidiaries are held through a Global Depositary Receipts and carry no voting rights.
At 31 March 2017, the total number of treasury shares held was 24,370,066 (2016: 24,309,230).
33. RETIREMENT BENEFITS (CONTINUED)
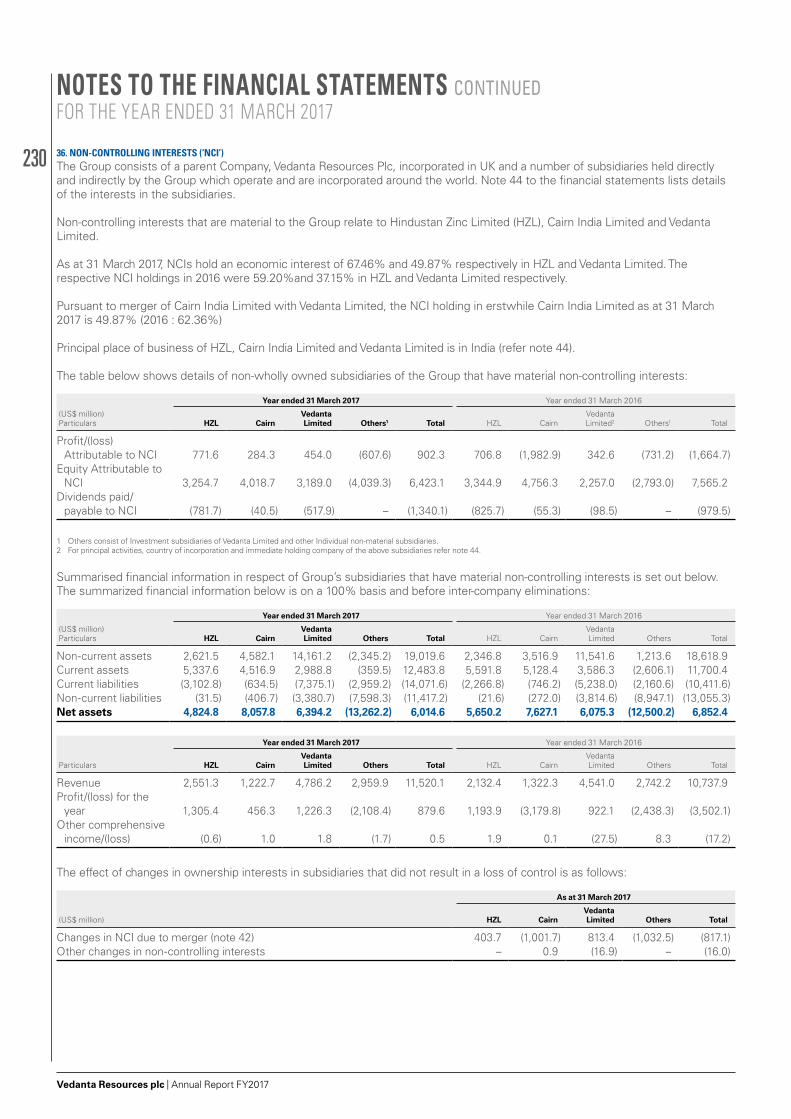
230
Vedanta Resources plc | Annual Report FY2017
36. NON-CONTROLLING INTERESTS (‘NCI’)The Group consists of a parent Company, Vedanta Resources Plc, incorporated in UK and a number of subsidiaries held directly and indirectly by the Group which operate and are incorporated around the world. Note 44 to the financial statements lists details of the interests in the subsidiaries.
Non-controlling interests that are material to the Group relate to Hindustan Zinc Limited (HZL), Cairn India Limited and Vedanta Limited.
As at 31 March 2017, NCIs hold an economic interest of 67.46% and 49.87% respectively in HZL and Vedanta Limited. The respective NCI holdings in 2016 were 59.20%and 37.15% in HZL and Vedanta Limited respectively.
Pursuant to merger of Cairn India Limited with Vedanta Limited, the NCI holding in erstwhile Cairn India Limited as at 31 March 2017 is 49.87% (2016 : 62.36%)
Principal place of business of HZL, Cairn India Limited and Vedanta Limited is in India (refer note 44). The table below shows details of non-wholly owned subsidiaries of the Group that have material non-controlling interests:
Year ended 31 March 2017 Year ended 31 March 2016
(US$ million) Particulars HZL Cairn
Vedanta Limited Others1 Total HZL Cairn
Vedanta Limited2 Others1 Total
Profit/(loss) Attributable to NCI 771.6 284.3 454.0 (607.6) 902.3 706.8 (1,982.9) 342.6 (731.2) (1,664.7)
Equity Attributable to NCI 3,254.7 4,018.7 3,189.0 (4,039.3) 6,423.1 3,344.9 4,756.3 2,257.0 (2,793.0) 7,565.2
Dividends paid/payable to NCI (781.7) (40.5) (517.9) – (1,340.1) (825.7) (55.3) (98.5) – (979.5)
1 Others consist of Investment subsidiaries of Vedanta Limited and other Individual non-material subsidiaries.2 For principal activities, country of incorporation and immediate holding company of the above subsidiaries refer note 44.
Summarised financial information in respect of Group’s subsidiaries that have material non-controlling interests is set out below.The summarized financial information below is on a 100% basis and before inter-company eliminations:
Year ended 31 March 2017 Year ended 31 March 2016
(US$ million) Particulars HZL Cairn
Vedanta Limited Others Total HZL Cairn
Vedanta Limited Others Total
Non-current assets 2,621.5 4,582.1 14,161.2 (2,345.2) 19,019.6 2,346.8 3,516.9 11,541.6 1,213.6 18,618.9Current assets 5,337.6 4,516.9 2,988.8 (359.5) 12,483.8 5,591.8 5,128.4 3,586.3 (2,606.1) 11,700.4 Current liabilities (3,102.8) (634.5) (7,375.1) (2,959.2) (14,071.6) (2,266.8) (746.2) (5,238.0) (2,160.6) (10,411.6)Non-current liabilities (31.5) (406.7) (3,380.7) (7,598.3) (11,417.2) (21.6) (272.0) (3,814.6) (8,947.1) (13,055.3)Net assets 4,824.8 8,057.8 6,394.2 (13,262.2) 6,014.6 5,650.2 7,627.1 6,075.3 (12,500.2) 6,852.4
Year ended 31 March 2017 Year ended 31 March 2016
Particulars HZL CairnVedanta Limited Others Total HZL Cairn
Vedanta Limited Others Total
Revenue 2,551.3 1,222.7 4,786.2 2,959.9 11,520.1 2,132.4 1,322.3 4,541.0 2,742.2 10,737.9 Profit/(loss) for the
year 1,305.4 456.3 1,226.3 (2,108.4) 879.6 1,193.9 (3,179.8) 922.1 (2,438.3) (3,502.1)Other comprehensive
income/(loss) (0.6) 1.0 1.8 (1.7) 0.5 1.9 0.1 (27.5) 8.3 (17.2)
The effect of changes in ownership interests in subsidiaries that did not result in a loss of control is as follows:
As at 31 March 2017
(US$ million) HZL CairnVedanta Limited Others Total
Changes in NCI due to merger (note 42) 403.7 (1,001.7) 813.4 (1,032.5) (817.1)Other changes in non-controlling interests – 0.9 (16.9) – (16.0)
NOTES TO THE FINANCIAL STATEMENTS CONTINUEDFOR THE YEAR ENDED 31 MARCH 2017
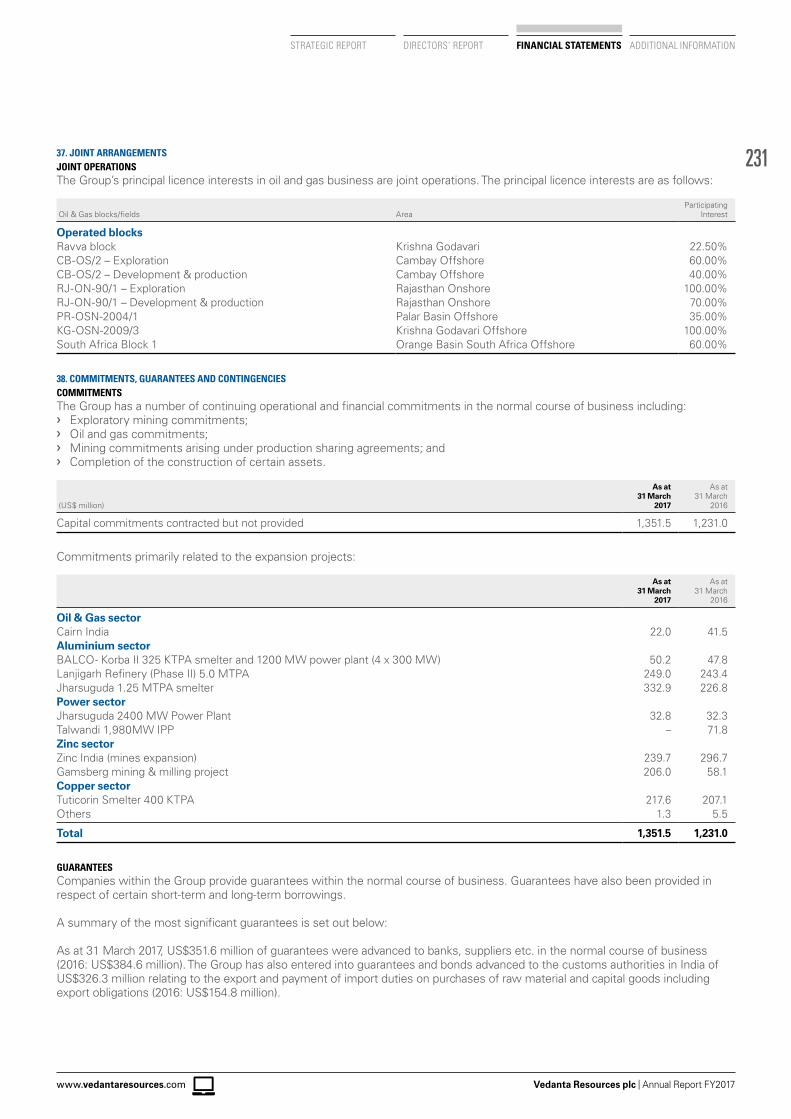
231
Vedanta Resources plc | Annual Report FY2017www.vedantaresources.com
STRATEGIC REPORT DIRECTORS’ REPORT FINANCIAL STATEMENTS ADDITIONAL INFORMATION
37. JOINT ARRANGEMENTSJOINT OPERATIONSThe Group’s principal licence interests in oil and gas business are joint operations. The principal licence interests are as follows:
Oil & Gas blocks/fields AreaParticipating
Interest
Operated blocksRavva block Krishna Godavari 22.50%CB-OS/2 – Exploration Cambay Offshore 60.00%CB-OS/2 – Development & production Cambay Offshore 40.00%RJ-ON-90/1 – Exploration Rajasthan Onshore 100.00%RJ-ON-90/1 – Development & production Rajasthan Onshore 70.00%PR-OSN-2004/1 Palar Basin Offshore 35.00%KG-OSN-2009/3 Krishna Godavari Offshore 100.00%South Africa Block 1 Orange Basin South Africa Offshore 60.00%
38. COMMITMENTS, GUARANTEES AND CONTINGENCIESCOMMITMENTSThe Group has a number of continuing operational and financial commitments in the normal course of business including: › Exploratory mining commitments; › Oil and gas commitments; › Mining commitments arising under production sharing agreements; and › Completion of the construction of certain assets.
(US$ million)
As at 31 March
2017
As at 31 March
2016
Capital commitments contracted but not provided 1,351.5 1,231.0
Commitments primarily related to the expansion projects:
As at 31 March
2017
As at 31 March
2016
Oil & Gas sectorCairn India 22.0 41.5Aluminium sectorBALCO- Korba II 325 KTPA smelter and 1200 MW power plant (4 x 300 MW) 50.2 47.8Lanjigarh Refinery (Phase II) 5.0 MTPA 249.0 243.4Jharsuguda 1.25 MTPA smelter 332.9 226.8Power sectorJharsuguda 2400 MW Power Plant 32.8 32.3Talwandi 1,980MW IPP – 71.8Zinc sectorZinc India (mines expansion) 239.7 296.7Gamsberg mining & milling project 206.0 58.1Copper sectorTuticorin Smelter 400 KTPA 217.6 207.1Others 1.3 5.5
Total 1,351.5 1,231.0
GUARANTEESCompanies within the Group provide guarantees within the normal course of business. Guarantees have also been provided in respect of certain short-term and long-term borrowings.
A summary of the most significant guarantees is set out below:
As at 31 March 2017, US$351.6 million of guarantees were advanced to banks, suppliers etc. in the normal course of business (2016: US$384.6 million). The Group has also entered into guarantees and bonds advanced to the customs authorities in India of US$326.3 million relating to the export and payment of import duties on purchases of raw material and capital goods including export obligations (2016: US$154.8 million).
232
Vedanta Resources plc | Annual Report FY2017
38. COMMITMENTS, GUARANTEES AND CONTINGENCIES (CONTINUED)CAIRN PSC GUARANTEE TO GOVERNMENTThe Group has provided Parent company guarantee for the Cairn India Group’s obligation under the Production Sharing Contract (‘PSC’).
Cairn India have provided various other guarantees under the Cairn India Group’s bank facilities for the Cairn India Group’s share of minimum work programme commitments of US$19.9 million outstanding as of 31 March 2017 (2016: US$13.1 million).
EXPORT OBLIGATIONSThe Indian entities of the Group have export obligations of US$2,016.7 million (2016: US$2,200.5 million) on account of concessional rates of import duty paid on capital goods under the Export Promotion Capital Goods Scheme and under the Advance Licence Scheme for import of raw material laid down by the Government of India.
In the event of the Group’s inability to meet its obligations, the Group’s liability would be US$261.7 million (2016: US$349.1 million), reduced in proportion to actual exports, plus applicable interest.
CONTINGENCIESThe Group discloses the following legal and tax cases as contingent liabilities.
HZL: DEPARTMENT OF MINES AND GEOLOGYThe Department of Mines and Geology of the State of Rajasthan issued several show cause notices in August, September and October 2006 to HZL, totalling US$51.5 million. These notices alleged unlawful occupation and unauthorised mining of associated minerals other than zinc and lead at HZL’s Rampura Agucha, Rajpura Dariba and Zawar mines in Rajasthan during the period from July 1968 to March 2006.
HZL believes it is unlikely the claim will lead to a future obligation to the company and therefore no provision has been made in the financial statements. HZL has filed appeals (writ petitions) in the High Court of Rajasthan in Jodhpur and has obtained a stay in respect of these demands.
RICHTER AND WESTGLOBE : INCOME TAXThe Group through its subsidiaries Richter Holdings Limited and Westglobe Limited in 2007 acquired the entire stake in Finsider International Company Limited (FICL) based in the United Kingdom which was holding 51 percent shares of Sesa Goa Ltd, an Indian Company. In October 2013, the Indian Tax Authorities (Tax Authorities) have served an order on Richter and Westglobe for alleged failure to deduct withholding tax on capital gain on the indirect acquisition of shares in April 2007.
The Tax Authorities determined the liability for such non-deduction of tax as US$135.0 million in the case of Richter and US$90.0 million in the case of Westglobe, comprising tax and interest. Richter and Westglobe filed appeals before the first appellate authority. Appeals (writ petitions) were filed in the High Court of Karnataka challenging the constitutional validity of retrospective amendments made by the Finance Act 2012 and in particular the imposition of obligations to deduct tax on payments made against an already concluded transaction. The Karnataka High Court passed interim orders and directed that the adjudication of liability (TDS quantum and interest) shall no more remain in force since tax department passed the orders on merits travelling beyond the limited issue of jurisdiction. The high court will hear on jurisdiction issue. The next hearing date is awaited.
CAIRN INDIA: INCOME TAXIn March 2014, Cairn India received a show cause notice from the Indian Tax Authorities (“Tax Authorities”) for not deducting withholding tax on the payments made to Cairn UK Holdings Limited (“CUHL”) UK, for acquiring shares of Cairn India Holdings Limited (“CIHL”), as part of their internal reorganisation. Tax Authorities have stated in the notice that a short-term capital gain has accrued to CUHL on transfer of the shares of CIHL to Cairn India, in financial year 2006-2007, on which tax should have been withheld by the Company. Pursuant to this various replies were filed with the tax authorities.
After hearings, the Income Tax Authority, during March 2015, have issued an order by holding Cairn India as ‘assessee in default’ and asked to pay such demand totalling US$3,161 million (including interest of US$1,581 million). Cairn India has filed its appeal before the Appellate Authority CIT (Appeals) and filed a fresh Appeal (Writ petition) before Delhi High Court wherein it raised several points for assailing the aforementioned order. The hearing of the Appeal is due on 17 August 2017.
The Company has issued a Notice of arbitration to Government of India by invoking Bilateral Investment Promotion Treaty between the UK and India.
VEDANTA LIMITED: CONTRACTOR CLAIMShenzhen Shandong Nuclear Power Construction Co. Limited (‘SSNP’) subsequent to terminating the EPC contract invoked arbitration as per the contract alleging non-payment of their dues towards construction of a 210 MW co-generation power plant for 6 MTPA expansion project, and filed a claim of US$243.7 million. SSNP also filed a petition under Section 9 of the Arbitration and Conciliation Act, 1996 before the Bombay High Court praying for interim relief. The Bombay High Court initially dismissed their petition, but on a further appeal by SSNP, the Division Bench of the Bombay High Court directed Jharsuguda Aluminium to deposit a bank guarantee for an amount of US$27.6 million as a security, being a prima facie representation of the claim, until arbitration
NOTES TO THE FINANCIAL STATEMENTS CONTINUEDFOR THE YEAR ENDED 31 MARCH 2017
233
Vedanta Resources plc | Annual Report FY2017www.vedantaresources.com
STRATEGIC REPORT DIRECTORS’ REPORT FINANCIAL STATEMENTS ADDITIONAL INFORMATION
proceedings are completed. Jharsuguda Aluminium has deposited a bank guarantee of equivalent amount. Management is of the opinion that this claim is not valid under the terms of the contract with SSNP and it is unlikely that SSNP can legally sustain the claim and accordingly, no provision is considered necessary. The arbitration proceedings have concluded and the Tribunal may hold a clarificatory hearing before passing the final award.
RAVVA JOINT VENTURE ARBITRATION PROCEEDINGS: ONGC CARRYCairn is involved in a dispute against GOI relating to the recovery of contractual costs in terms of calculation of payments that contractor party were required to make in connection with the Ravva field.
The Ravva production sharing contract obliges the contractor party to pay proportionate share of ONGC’s exploration, development, production and contract costs in consideration for ONGC’s payment of costs related to construction and other activities it conducted in Ravva prior to the effective date of the Ravva production sharing contract (the ‘‘ONGC Carry’’). The question as to how the ONGC Carry is to be recovered and calculated, along with other issues, was submitted to an international arbitration Tribunal in August 2002 which rendered a decision on the ONGC Carry in favor of the contractor party whereas four other issues were decided in favor of GOI in October 2004 (“Partial Award”).
The GOI then proceeded to challenge the ONGC Carry decision before the Malaysian courts, as Kuala Lumpur was the seat of the arbitration. The Federal Court of Malaysia which adjudicated the matter on October 11, 2011, upheld the partial award. Per the decision of the Arbitral Tribunal in the partial award, the contractor party and GOI were required to arrive at a quantification of the sums relatable to each of the issues under the Partial Award. Also, the arbitral Tribunal retained the jurisdiction for determination of any remaining issues in the matter.
Pursuant to the decision of the Federal Court, the contractor party approached the Ministry of Petroleum and Natural Gas (“MoPNG”) to implement the partial award while reconciling the statement of accounts as outlined in partial award in 2004. GOI failed to implement the partial award by way of reconciling accounts as provided in the partial award ever since the Federal Court of Malaysia adjudicated in Cairn and other joint operator partners’ favor.
However, the MoPNG on July 10, 2014 proceeded to issue a show cause notice alleging that since the partial award has not been enforced profit petroleum share of GOI has been short-paid. MoPNG threatened to recover that amount from the sale proceeds payable by the oil marketing companies to the contractor party. The contractor party replied to the show cause notice taking various legal contentions. On March 9, 2015 personal hearing took place between MoPNG and contractor party whereby, the contractor party expressed their concerns against such alleged unilateral recoveries and filed further written submissions on March 12, 2015.
As partial award did not quantify the sums, therefore, contractor party approached the same arbitral Tribunal to pass a final award in the subject matter since it had retained the jurisdiction to do so. The Arbitral Tribunal was reconstituted and the final award has been passed in Cairn’s favour. While the Cairn does not believe the GOI will be successful in its challenge, if the arbitral award is reversed and such reversal is binding, Cairn could be liable for approximately US$116.7 million including interest thereon. Cairn has secured a final award in its favour in October, 2016. Parallely, GOI has challenged the final award in the Malaysian courts.
PROCEEDINGS RELATED TO THE IMPOSITION OF ENTRY TAX Vedanta Limited and other group companies i.e. Balco, HZL and Cairn (now merged with Vedanta Limited) challenged the constitutional validity of the local statutes and related notifications in the states of Chhattisgarh, Odisha and Rajasthan pertaining to the levy of entry tax on the entry of goods brought into the states from outside. Post some contradictory orders of High Courts across India adjudicating on similar challenges, the Supreme Court referred the matters to a nine judge bench. Post a detailed hearing, although the bench rejected the compensatory nature of tax as a ground of challenge, it maintained status quo with respect to all other issues which have been left open for adjudication by regular benches hearing the matters. The total claims from Vedanta Limited and its subsidiaries is US$165.0 million (2016: US$151.3 million).
Post the order of the nine judge bench, the regular bench of the Supreme Court proceeded with hearing the matters. The regular bench remanded the entry tax matters relating to the issue of discrimination against domestic goods from other States to the respective High Courts for final determination but retained the issue of jurisdiction on levy on imported goods, for determination by Supreme Court.
The argument pertaining to imported goods are currently pending before a regular bench of the Supreme Court. The issue of discrimination has been remanded back to the High Courts for final adjudication. Vedanta has filed an Appeal (Writ petition) before the Odisha High Court and is also looking to Appeals (Writ petitions) before the Rajasthan and Chhattisgarh High Courts.
Whereas, the issue pertaining to levy of entry tax on movement of goods into a Special Economic Zone (SEZ) remains pending before the Odisha High Court. We have challenged the levy of entry tax on any movement of goods into an SEZ basis the definition of local area under the Odisha Entry Tax Act which is very clear and does not include an SEZ. In addition, the Govt of Odisha further through its SEZ Policy 2015 and the operational guidelines for administration of this policy dated 22.08.2016, exempted entry tax levy on SEZ operations.
38. COMMITMENTS, GUARANTEES AND CONTINGENCIES (CONTINUED)
234
Vedanta Resources plc | Annual Report FY2017
38. COMMITMENTS, GUARANTEES AND CONTINGENCIES (CONTINUED)TSPL: PROCEEDINGS RELATED TO CLAIM FOR LIQUIDATED DAMAGESTSPL has entered into a long term Power Purchase Agreement (PPA) with Punjab State Power Corporation Limited (PSPCL) for supply of power. Due to delay in fulfilment of certain obligations by PSPCL as per the PPA, other related reasons and force majeure events, there has been a delay in implementation/completion of the project as compared to the PPA timelines. TSPL has received notices of claims from PSPCL seeking payment of Liquidated Damages (LD) maximum of US$50.9 million each for delay in commissioning of Unit I, II and III totalling to US$147.0 million.
PSPCL invoked the Performance Bank Guarantee of US$24.1 million to recover the LD on account of delay in COD of 1st Unit. TSPL filed a petition at Punjab State Electricity Regulatory Commission (PSERC) for adjudication of above dispute. TSPL had also filed an Appeal (Civil Writ petition) before the High Court of Punjab and Haryana against the bank guarantee invocation, which was disposed with a direction to refer the matter to PSERC for adjudication while granting stay. Further, the PSERC order dated October 22, 2014 directed the matter to be settled through arbitration and allowed the stay on encashment of the bank guarantee until further orders. PSPCL has preferred an appeal in Appellate Tribunal for Electricity (APTEL) against the PSERC order and APTEL had on May 12, 2015, disposed the matter with a direction that the matter will be heard by way of arbitration. The arbitration proceedings have concluded and the order has been reserved. The Group has been legally advised by its advisors who have opined that such claims for LD from PSPCL are unsustainable. Recently, Appellate Tribunal for Electricity has, in a separate petition, before it by TSPL has adjudicated that coal is an absolute obligation of PSPCL and it needs to enter into a Fuel Supply Agreement and assign to TSPL. In light of the delay by PSPCL in entering into the Fuel Supply Agreement, the claims of PSPCL are further unsustainable.
BALCO: CHALLENGE AGAINST IMPOSITION OF ENERGY DEVELOPMENT CESSBalco challenged the imposition of Energy Development Cess levied on generators and distributors of electrical energy @ 10 paise per unit on the electrical energy sold or supplied before the High Court on the grounds that the Cess is effectively on production and not on consumption or sale since the figures of consumption are not taken into account and the Cess is discriminatory since CPPs are required to pay @ 10 paise while the State Electricity Board is required to pay @ 5 paise. The High Court of Chhattisgarh by order dated December 15, 2006 declared the provisions imposing ED Cess on CPPs as discriminatory and therefore ultra vires the Constitution. The Company has sought refund of ED Cess paid till March 2006 amounting to US$5.3 mn.
The State of Chhattisgarh moved an SLP in the Supreme Court and whilst issuing notice has stayed the refund of the Cess already deposited. The matter is to be heard by a larger bench of the Supreme Court and will be listed in due course for final hearing. In case the Supreme Court overturns the decision of the High Court, Balco would be liable to pay an amount of US$88.8 mn.
MISCELLANEOUS DISPUTES – VEDANTA LIMITED, HZL, MEL, BALCO, CAIRN, LISHEEN, VRJL AND VRJIIThe Group is subject to various claims and exposures which arise in the ordinary course of conducting and financing its business from the income tax, excise, indirect tax authorities and others. These claims and exposures mostly relate to the assessable values of sales and purchases or to incomplete documentation supporting the companies’ returns or other claims.
The approximate value of claims against the Group companies excluding claims shown above total US$1,738.4 million (2016: US$1,182.3 million), of which US$148.7 million (2016: US$14.9 million) is included as a provision in the Balance Sheet as at 31 March 2017 (including claims of US$989.6 million in respect of Income tax assessments out of which US$23.3 million is included as a provision in the Balance sheet as at 31 March 2017).
The Group considers that it can take steps such that the risks can be mitigated and that there are no significant unprovided liabilities arising.
OPERATING LEASE COMMITMENTS: AS LESSEEOperating leases are in relation to the office premises, office equipment and other assets, some of which are cancellable and some are non-cancellable. There is an escalation clause in the lease agreements during the primary lease period. There are no restrictions imposed by lease arrangements and there are no sub leases. There are no contingent rents. The total of the future minimum lease payments under non cancellable leases are as under:
(US$ million) Particulars
As at 31 March
2017
As at 31 March
2016
Within one year of the balance sheet date 0.4 3.9Within two to five years from the balance sheet date 0.4 0.4
Total 0.8 4.3
Lease payments recognised as expenses during the year ended 31 March 2017, on non cancellable leases, is US$1.1 million (31 March 2016: US$8.1 million).
NOTES TO THE FINANCIAL STATEMENTS CONTINUEDFOR THE YEAR ENDED 31 MARCH 2017
235
Vedanta Resources plc | Annual Report FY2017www.vedantaresources.com
STRATEGIC REPORT DIRECTORS’ REPORT FINANCIAL STATEMENTS ADDITIONAL INFORMATION
39. RELATED PARTY TRANSACTIONSThe information below sets out transactions and balances between the Group and various related parties in the normal course of business for the year ended 31 March 2017.
STERLITE TECHNOLOGIES LIMITED (‘STL’)
(US$ million)
Year ended 31 March
2017
Year ended 31 March
2016
Sales to STL 127.8 140.4Recovery of expenses 0.0 0.2Purchases 2.6 1.1Net Interest Income 1.3 0.2Net amounts receivable at year end 4.0 0.2Net amounts payable at year end 0.2 1.4Outstanding advance received at year end 2.1 0.0Dividend Income 0.1 0.0Investment in Equity Share 9.2 6.5
Sterlite Technologies Limited is related by virtue of having the same controlling party as the Group, namely Volcan. Pursuant to the terms of the Shared Services Agreement dated 5 December 2003 entered into by the Company and STL, the Company provides various commercial services in relation to STL’s businesses on an arm’s length basis and at normal commercial terms. For the year ended 31 March 2017, the commercial services provided to STL were performed by certain senior employees of the Group on terms set out in the Shared Services Agreement. The services provided to STL in this year amounted to US$0.03 million (2016: US$0.02 million).
STERLITE POWER TRANSMISSION LIMITED (‘SPTL’).
(US$ million)
Year ended 31 March
2017
Year ended 31 March
2016
Sales to SPTL 2.6 –Purchases 0.4 –Investment in Equity Share 1.5 –
Sterlite Power Transmission limited (‘SPTL’) is related by virtue of having the same controlling party as the Group, namely Volcan.
VEDANTA FOUNDATIONDuring the year US$10.2 million was paid to the Vedanta Foundation including the value of land and a flat given as donation. (2016: US$0.5 million).
The Vedanta Foundation is a registered not-for-profit entity with a broad focus mainly on education, nutrition and livelihood. The Vedanta Foundation is a related party as it is controlled by members of the Agarwal family who control Volcan. Volcan is also the majority shareholder of Vedanta Resources plc.
SESA GOA COMMUNITY FOUNDATION LIMITEDFollowing the acquisition of erstwhile Sea Goa Limited, the Sesa Goa Community Foundation Limited, a charitable institution, became a related party of the Group on the basis that key management personnel of the Group have significant influence on the Sesa Goa Community Foundation Limited. During the year ended 31 March 2017, US$0.3 million (2016: US$0.4 million) was paid to the Sesa Goa Community Foundation Limited.
STERLITE IRON AND STEEL LIMITED
(US$ million)
Year ended 31 March
2017
Year ended 31 March
2016
Loan balance receivable 0.7 0.7Net amount receivable at year end (including interest) 1.9 1.8Net Interest Income 0.1 0.1
Sterlite Iron and Steel Limited is a related party by virtue of having the same controlling party as the Group, namely Volcan.
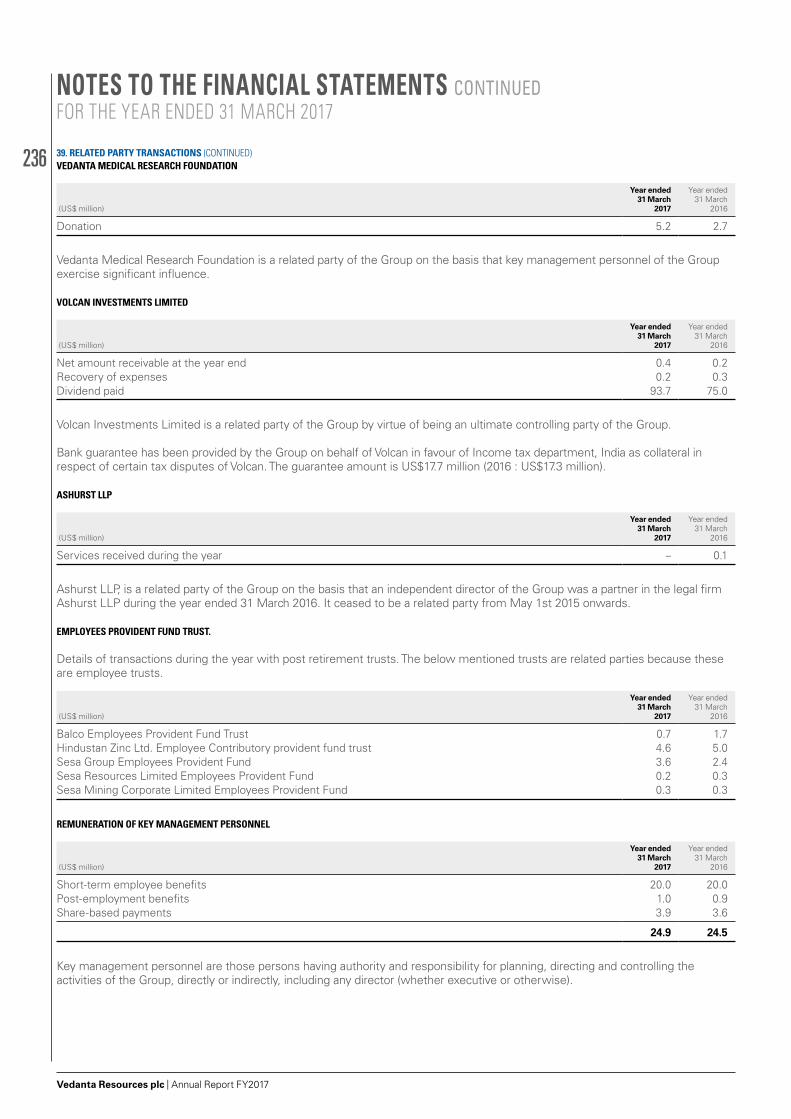
236
Vedanta Resources plc | Annual Report FY2017
VEDANTA MEDICAL RESEARCH FOUNDATION
(US$ million)
Year ended 31 March
2017
Year ended 31 March
2016
Donation 5.2 2.7
Vedanta Medical Research Foundation is a related party of the Group on the basis that key management personnel of the Group exercise significant influence.
VOLCAN INVESTMENTS LIMITED
(US$ million)
Year ended 31 March
2017
Year ended 31 March
2016
Net amount receivable at the year end 0.4 0.2Recovery of expenses 0.2 0.3Dividend paid 93.7 75.0
Volcan Investments Limited is a related party of the Group by virtue of being an ultimate controlling party of the Group.
Bank guarantee has been provided by the Group on behalf of Volcan in favour of Income tax department, India as collateral in respect of certain tax disputes of Volcan. The guarantee amount is US$17.7 million (2016 : US$17.3 million).
ASHURST LLP
(US$ million)
Year ended 31 March
2017
Year ended 31 March
2016
Services received during the year – 0.1
Ashurst LLP, is a related party of the Group on the basis that an independent director of the Group was a partner in the legal firm Ashurst LLP during the year ended 31 March 2016. It ceased to be a related party from May 1st 2015 onwards.
EMPLOYEES PROVIDENT FUND TRUST. Details of transactions during the year with post retirement trusts. The below mentioned trusts are related parties because these are employee trusts.
(US$ million)
Year ended 31 March
2017
Year ended 31 March
2016
Balco Employees Provident Fund Trust 0.7 1.7Hindustan Zinc Ltd. Employee Contributory provident fund trust 4.6 5.0Sesa Group Employees Provident Fund 3.6 2.4Sesa Resources Limited Employees Provident Fund 0.2 0.3Sesa Mining Corporate Limited Employees Provident Fund 0.3 0.3
REMUNERATION OF KEY MANAGEMENT PERSONNEL
(US$ million)
Year ended 31 March
2017
Year ended 31 March
2016
Short-term employee benefits 20.0 20.0Post-employment benefits 1.0 0.9Share-based payments 3.9 3.6
24.9 24.5
Key management personnel are those persons having authority and responsibility for planning, directing and controlling the activities of the Group, directly or indirectly, including any director (whether executive or otherwise).
39. RELATED PARTY TRANSACTIONS (CONTINUED)
NOTES TO THE FINANCIAL STATEMENTS CONTINUEDFOR THE YEAR ENDED 31 MARCH 2017
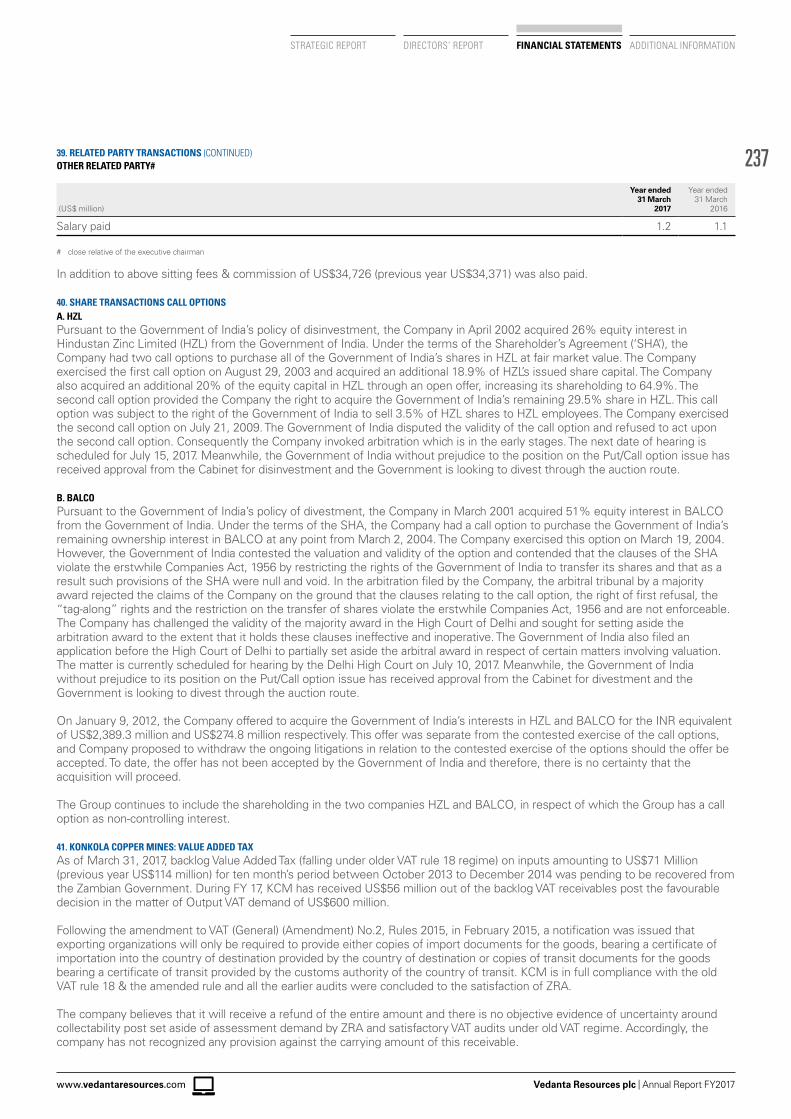
237
Vedanta Resources plc | Annual Report FY2017www.vedantaresources.com
STRATEGIC REPORT DIRECTORS’ REPORT FINANCIAL STATEMENTS ADDITIONAL INFORMATION
OTHER RELATED PARTY#
(US$ million)
Year ended 31 March
2017
Year ended 31 March
2016
Salary paid 1.2 1.1
# close relative of the executive chairman
In addition to above sitting fees & commission of US$34,726 (previous year US$34,371) was also paid.
40. SHARE TRANSACTIONS CALL OPTIONS A. HZLPursuant to the Government of India’s policy of disinvestment, the Company in April 2002 acquired 26% equity interest in Hindustan Zinc Limited (HZL) from the Government of India. Under the terms of the Shareholder’s Agreement (‘SHA’), the Company had two call options to purchase all of the Government of India’s shares in HZL at fair market value. The Company exercised the first call option on August 29, 2003 and acquired an additional 18.9% of HZL’s issued share capital. The Company also acquired an additional 20% of the equity capital in HZL through an open offer, increasing its shareholding to 64.9%. The second call option provided the Company the right to acquire the Government of India’s remaining 29.5% share in HZL. This call option was subject to the right of the Government of India to sell 3.5% of HZL shares to HZL employees. The Company exercised the second call option on July 21, 2009. The Government of India disputed the validity of the call option and refused to act upon the second call option. Consequently the Company invoked arbitration which is in the early stages. The next date of hearing is scheduled for July 15, 2017. Meanwhile, the Government of India without prejudice to the position on the Put/Call option issue has received approval from the Cabinet for disinvestment and the Government is looking to divest through the auction route.
B. BALCOPursuant to the Government of India’s policy of divestment, the Company in March 2001 acquired 51% equity interest in BALCO from the Government of India. Under the terms of the SHA, the Company had a call option to purchase the Government of India’s remaining ownership interest in BALCO at any point from March 2, 2004. The Company exercised this option on March 19, 2004. However, the Government of India contested the valuation and validity of the option and contended that the clauses of the SHA violate the erstwhile Companies Act, 1956 by restricting the rights of the Government of India to transfer its shares and that as a result such provisions of the SHA were null and void. In the arbitration filed by the Company, the arbitral tribunal by a majority award rejected the claims of the Company on the ground that the clauses relating to the call option, the right of first refusal, the “tag-along” rights and the restriction on the transfer of shares violate the erstwhile Companies Act, 1956 and are not enforceable. The Company has challenged the validity of the majority award in the High Court of Delhi and sought for setting aside the arbitration award to the extent that it holds these clauses ineffective and inoperative. The Government of India also filed an application before the High Court of Delhi to partially set aside the arbitral award in respect of certain matters involving valuation. The matter is currently scheduled for hearing by the Delhi High Court on July 10, 2017. Meanwhile, the Government of India without prejudice to its position on the Put/Call option issue has received approval from the Cabinet for divestment and the Government is looking to divest through the auction route.
On January 9, 2012, the Company offered to acquire the Government of India’s interests in HZL and BALCO for the INR equivalent of US$2,389.3 million and US$274.8 million respectively. This offer was separate from the contested exercise of the call options, and Company proposed to withdraw the ongoing litigations in relation to the contested exercise of the options should the offer be accepted. To date, the offer has not been accepted by the Government of India and therefore, there is no certainty that the acquisition will proceed.
The Group continues to include the shareholding in the two companies HZL and BALCO, in respect of which the Group has a call option as non-controlling interest.
41. KONKOLA COPPER MINES: VALUE ADDED TAXAs of March 31, 2017, backlog Value Added Tax (falling under older VAT rule 18 regime) on inputs amounting to US$71 Million (previous year US$114 million) for ten month’s period between October 2013 to December 2014 was pending to be recovered from the Zambian Government. During FY 17, KCM has received US$56 million out of the backlog VAT receivables post the favourable decision in the matter of Output VAT demand of US$600 million.
Following the amendment to VAT (General) (Amendment) No.2, Rules 2015, in February 2015, a notification was issued that exporting organizations will only be required to provide either copies of import documents for the goods, bearing a certificate of importation into the country of destination provided by the country of destination or copies of transit documents for the goods bearing a certificate of transit provided by the customs authority of the country of transit. KCM is in full compliance with the old VAT rule 18 & the amended rule and all the earlier audits were concluded to the satisfaction of ZRA.
The company believes that it will receive a refund of the entire amount and there is no objective evidence of uncertainty around collectability post set aside of assessment demand by ZRA and satisfactory VAT audits under old VAT regime. Accordingly, the company has not recognized any provision against the carrying amount of this receivable.
39. RELATED PARTY TRANSACTIONS (CONTINUED)
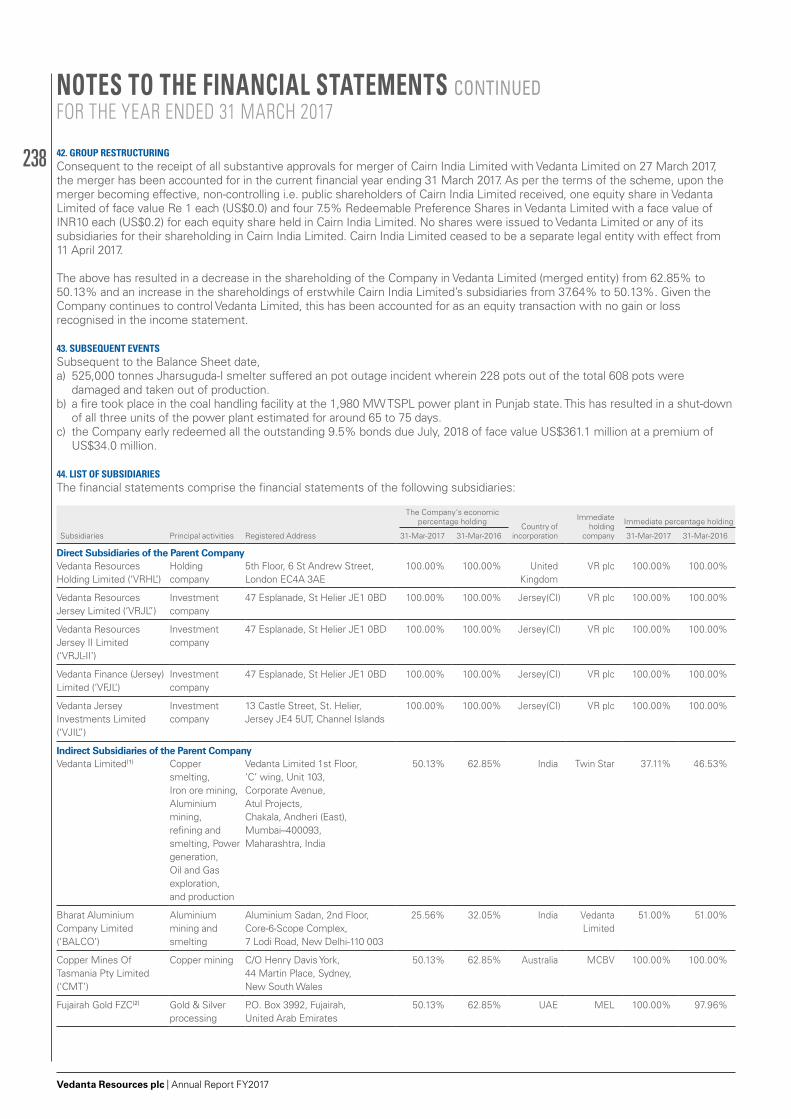
238
Vedanta Resources plc | Annual Report FY2017
42. GROUP RESTRUCTURINGConsequent to the receipt of all substantive approvals for merger of Cairn India Limited with Vedanta Limited on 27 March 2017, the merger has been accounted for in the current financial year ending 31 March 2017. As per the terms of the scheme, upon the merger becoming effective, non-controlling i.e. public shareholders of Cairn India Limited received, one equity share in Vedanta Limited of face value Re 1 each (US$0.0) and four 7.5% Redeemable Preference Shares in Vedanta Limited with a face value of INR10 each (US$0.2) for each equity share held in Cairn India Limited. No shares were issued to Vedanta Limited or any of its subsidiaries for their shareholding in Cairn India Limited. Cairn India Limited ceased to be a separate legal entity with effect from 11 April 2017.
The above has resulted in a decrease in the shareholding of the Company in Vedanta Limited (merged entity) from 62.85% to 50.13% and an increase in the shareholdings of erstwhile Cairn India Limited’s subsidiaries from 37.64% to 50.13%. Given the Company continues to control Vedanta Limited, this has been accounted for as an equity transaction with no gain or loss recognised in the income statement.
43. SUBSEQUENT EVENTSSubsequent to the Balance Sheet date, a) 525,000 tonnes Jharsuguda-I smelter suffered an pot outage incident wherein 228 pots out of the total 608 pots were
damaged and taken out of production.b) a fire took place in the coal handling facility at the 1,980 MW TSPL power plant in Punjab state. This has resulted in a shut-down
of all three units of the power plant estimated for around 65 to 75 days.c) the Company early redeemed all the outstanding 9.5% bonds due July, 2018 of face value US$361.1 million at a premium of
US$34.0 million. 44. LIST OF SUBSIDIARIESThe financial statements comprise the financial statements of the following subsidiaries:
Subsidiaries Principal activities Registered Address
The Company’s economic percentage holding
Country of incorporation
Immediate holding
company
Immediate percentage holding
31-Mar-2017 31-Mar-2016 31-Mar-2017 31-Mar-2016
Direct Subsidiaries of the Parent CompanyVedanta Resources Holding Limited (‘VRHL’)
Holding company
5th Floor, 6 St Andrew Street, London EC4A 3AE
100.00% 100.00% UnitedKingdom
VR plc 100.00% 100.00%
Vedanta Resources Jersey Limited (‘VRJL”)
Investment company
47 Esplanade, St Helier JE1 0BD 100.00% 100.00% Jersey(CI) VR plc 100.00% 100.00%
Vedanta Resources Jersey II Limited (‘VRJL-II’)
Investment company
47 Esplanade, St Helier JE1 0BD 100.00% 100.00% Jersey(CI) VR plc 100.00% 100.00%
Vedanta Finance (Jersey) Limited (‘VFJL’)
Investment company
47 Esplanade, St Helier JE1 0BD 100.00% 100.00% Jersey(CI) VR plc 100.00% 100.00%
Vedanta Jersey Investments Limited (‘VJIL”)
Investment company
13 Castle Street, St. Helier, Jersey JE4 5UT, Channel Islands
100.00% 100.00% Jersey(CI) VR plc 100.00% 100.00%
Indirect Subsidiaries of the Parent CompanyVedanta Limited(1) Copper
smelting, Iron ore mining, Aluminium mining, refining and smelting, Power generation, Oil and Gas exploration, and production
Vedanta Limited 1st Floor, ‘C’ wing, Unit 103, Corporate Avenue, Atul Projects, Chakala, Andheri (East), Mumbai–400093, Maharashtra, India
50.13% 62.85% India Twin Star 37.11% 46.53%
Bharat Aluminium Company Limited (‘BALCO’)
Aluminium mining and smelting
Aluminium Sadan, 2nd Floor, Core-6-Scope Complex, 7 Lodi Road, New Delhi-110 003
25.56% 32.05% India VedantaLimited
51.00% 51.00%
Copper Mines Of Tasmania Pty Limited (‘CMT’)
Copper mining C/O Henry Davis York, 44 Martin Place, Sydney, New South Wales
50.13% 62.85% Australia MCBV 100.00% 100.00%
Fujairah Gold FZC(2) Gold & Silver processing
P.O. Box 3992, Fujairah, United Arab Emirates
50.13% 62.85% UAE MEL 100.00% 97.96%
NOTES TO THE FINANCIAL STATEMENTS CONTINUEDFOR THE YEAR ENDED 31 MARCH 2017
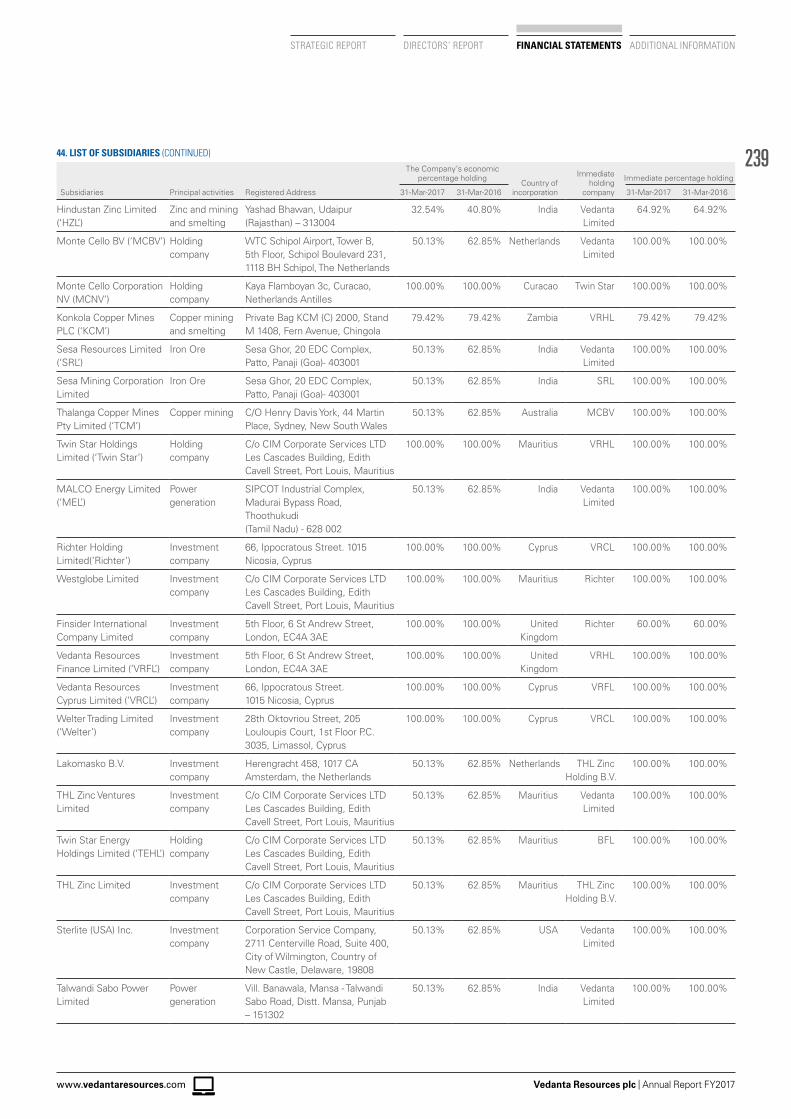
239
Vedanta Resources plc | Annual Report FY2017www.vedantaresources.com
STRATEGIC REPORT DIRECTORS’ REPORT FINANCIAL STATEMENTS ADDITIONAL INFORMATION
Subsidiaries Principal activities Registered Address
The Company’s economic percentage holding
Country of incorporation
Immediate holding
company
Immediate percentage holding
31-Mar-2017 31-Mar-2016 31-Mar-2017 31-Mar-2016
Hindustan Zinc Limited (‘HZL’)
Zinc and mining and smelting
Yashad Bhawan, Udaipur (Rajasthan) – 313004
32.54% 40.80% India VedantaLimited
64.92% 64.92%
Monte Cello BV (‘MCBV’) Holding company
WTC Schipol Airport, Tower B, 5th Floor, Schipol Boulevard 231, 1118 BH Schipol, The Netherlands
50.13% 62.85% Netherlands VedantaLimited
100.00% 100.00%
Monte Cello Corporation NV (MCNV’)
Holding company
Kaya Flamboyan 3c, Curacao, Netherlands Antilles
100.00% 100.00% Curacao Twin Star 100.00% 100.00%
Konkola Copper Mines PLC (‘KCM’)
Copper mining and smelting
Private Bag KCM (C) 2000, Stand M 1408, Fern Avenue, Chingola
79.42% 79.42% Zambia VRHL 79.42% 79.42%
Sesa Resources Limited (‘SRL’)
Iron Ore Sesa Ghor, 20 EDC Complex, Patto, Panaji (Goa)- 403001
50.13% 62.85% India Vedanta Limited
100.00% 100.00%
Sesa Mining Corporation Limited
Iron Ore Sesa Ghor, 20 EDC Complex, Patto, Panaji (Goa)- 403001
50.13% 62.85% India SRL 100.00% 100.00%
Thalanga Copper Mines Pty Limited (‘TCM’)
Copper mining C/O Henry Davis York, 44 Martin Place, Sydney, New South Wales
50.13% 62.85% Australia MCBV 100.00% 100.00%
Twin Star Holdings Limited (‘Twin Star’)
Holding company
C/o CIM Corporate Services LTD Les Cascades Building, Edith Cavell Street, Port Louis, Mauritius
100.00% 100.00% Mauritius VRHL 100.00% 100.00%
MALCO Energy Limited (‘MEL’)
Power generation
SIPCOT Industrial Complex, Madurai Bypass Road, Thoothukudi (Tamil Nadu) - 628 002
50.13% 62.85% India Vedanta Limited
100.00% 100.00%
Richter Holding Limited(‘Richter’)
Investment company
66, Ippocratous Street. 1015 Nicosia, Cyprus
100.00% 100.00% Cyprus VRCL 100.00% 100.00%
Westglobe Limited Investment company
C/o CIM Corporate Services LTD Les Cascades Building, Edith Cavell Street, Port Louis, Mauritius
100.00% 100.00% Mauritius Richter 100.00% 100.00%
Finsider International Company Limited
Investment company
5th Floor, 6 St Andrew Street, London, EC4A 3AE
100.00% 100.00% United Kingdom
Richter 60.00% 60.00%
Vedanta Resources Finance Limited (‘VRFL’)
Investment company
5th Floor, 6 St Andrew Street, London, EC4A 3AE
100.00% 100.00% United Kingdom
VRHL 100.00% 100.00%
Vedanta Resources Cyprus Limited (‘VRCL’)
Investment company
66, Ippocratous Street. 1015 Nicosia, Cyprus
100.00% 100.00% Cyprus VRFL 100.00% 100.00%
Welter Trading Limited (‘Welter’)
Investment company
28th Oktovriou Street, 205 Louloupis Court, 1st Floor P.C. 3035, Limassol, Cyprus
100.00% 100.00% Cyprus VRCL 100.00% 100.00%
Lakomasko B.V. Investment company
Herengracht 458, 1017 CA Amsterdam, the Netherlands
50.13% 62.85% Netherlands THL Zinc Holding B.V.
100.00% 100.00%
THL Zinc Ventures Limited
Investment company
C/o CIM Corporate Services LTD Les Cascades Building, Edith Cavell Street, Port Louis, Mauritius
50.13% 62.85% Mauritius Vedanta Limited
100.00% 100.00%
Twin Star Energy Holdings Limited (‘TEHL’)
Holding company
C/o CIM Corporate Services LTD Les Cascades Building, Edith Cavell Street, Port Louis, Mauritius
50.13% 62.85% Mauritius BFL 100.00% 100.00%
THL Zinc Limited Investment company
C/o CIM Corporate Services LTD Les Cascades Building, Edith Cavell Street, Port Louis, Mauritius
50.13% 62.85% Mauritius THL Zinc Holding B.V.
100.00% 100.00%
Sterlite (USA) Inc. Investment company
Corporation Service Company, 2711 Centerville Road, Suite 400, City of Wilmington, Country of New Castle, Delaware, 19808
50.13% 62.85% USA VedantaLimited
100.00% 100.00%
Talwandi Sabo Power Limited
Power generation
Vill. Banawala, Mansa - Talwandi Sabo Road, Distt. Mansa, Punjab – 151302
50.13% 62.85% India VedantaLimited
100.00% 100.00%
44. LIST OF SUBSIDIARIES (CONTINUED)
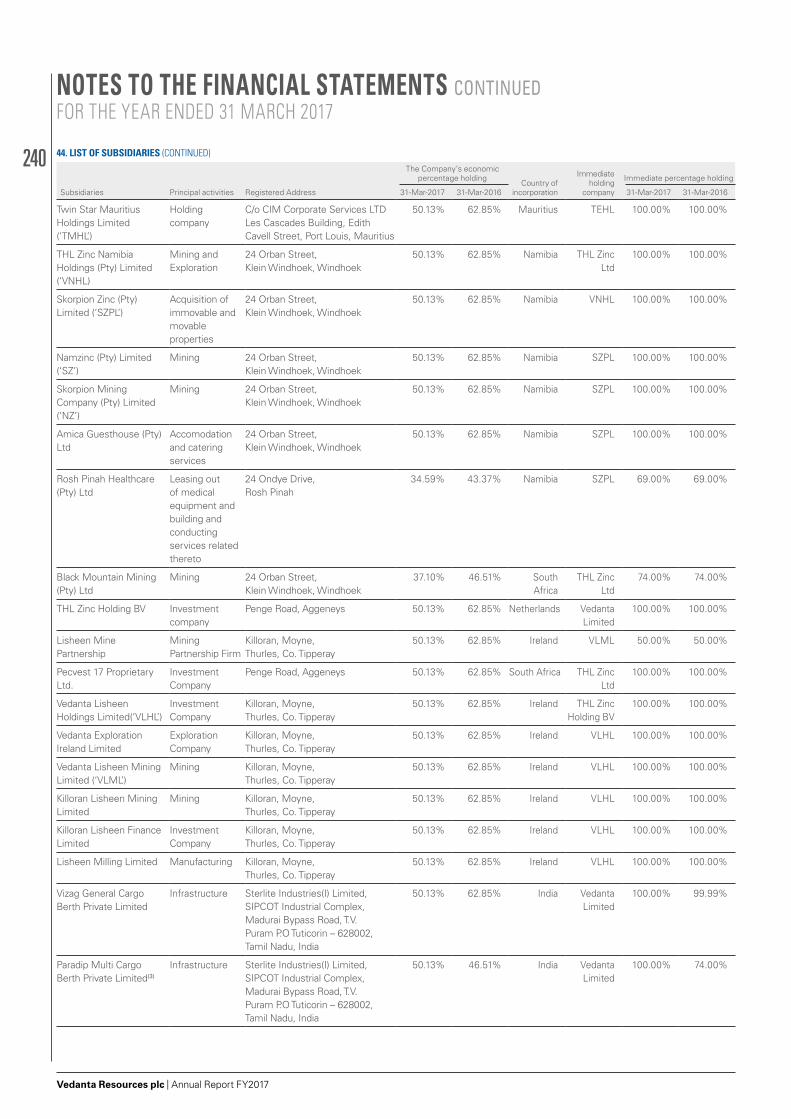
240
Vedanta Resources plc | Annual Report FY2017
Subsidiaries Principal activities Registered Address
The Company’s economic percentage holding
Country of incorporation
Immediate holding
company
Immediate percentage holding
31-Mar-2017 31-Mar-2016 31-Mar-2017 31-Mar-2016
Twin Star Mauritius Holdings Limited (‘TMHL’)
Holding company
C/o CIM Corporate Services LTD Les Cascades Building, Edith Cavell Street, Port Louis, Mauritius
50.13% 62.85% Mauritius TEHL 100.00% 100.00%
THL Zinc Namibia Holdings (Pty) Limited (‘VNHL)
Mining and Exploration
24 Orban Street, Klein Windhoek, Windhoek
50.13% 62.85% Namibia THL Zinc Ltd
100.00% 100.00%
Skorpion Zinc (Pty) Limited (‘SZPL’)
Acquisition of immovable and movable properties
24 Orban Street, Klein Windhoek, Windhoek
50.13% 62.85% Namibia VNHL 100.00% 100.00%
Namzinc (Pty) Limited (‘SZ’)
Mining 24 Orban Street, Klein Windhoek, Windhoek
50.13% 62.85% Namibia SZPL 100.00% 100.00%
Skorpion Mining Company (Pty) Limited (‘NZ’)
Mining 24 Orban Street, Klein Windhoek, Windhoek
50.13% 62.85% Namibia SZPL 100.00% 100.00%
Amica Guesthouse (Pty) Ltd
Accomodation and catering services
24 Orban Street, Klein Windhoek, Windhoek
50.13% 62.85% Namibia SZPL 100.00% 100.00%
Rosh Pinah Healthcare (Pty) Ltd
Leasing out of medical equipment and building and conducting services related thereto
24 Ondye Drive, Rosh Pinah
34.59% 43.37% Namibia SZPL 69.00% 69.00%
Black Mountain Mining (Pty) Ltd
Mining 24 Orban Street, Klein Windhoek, Windhoek
37.10% 46.51% South Africa
THL Zinc Ltd
74.00% 74.00%
THL Zinc Holding BV Investment company
Penge Road, Aggeneys 50.13% 62.85% Netherlands VedantaLimited
100.00% 100.00%
Lisheen Mine Partnership
Mining Partnership Firm
Killoran, Moyne, Thurles, Co. Tipperay
50.13% 62.85% Ireland VLML 50.00% 50.00%
Pecvest 17 Proprietary Ltd.
Investment Company
Penge Road, Aggeneys 50.13% 62.85% South Africa THL Zinc Ltd
100.00% 100.00%
Vedanta Lisheen Holdings Limited(‘VLHL’)
Investment Company
Killoran, Moyne, Thurles, Co. Tipperay
50.13% 62.85% Ireland THL ZincHolding BV
100.00% 100.00%
Vedanta Exploration Ireland Limited
Exploration Company
Killoran, Moyne, Thurles, Co. Tipperay
50.13% 62.85% Ireland VLHL 100.00% 100.00%
Vedanta Lisheen Mining Limited (‘VLML’)
Mining Killoran, Moyne, Thurles, Co. Tipperay
50.13% 62.85% Ireland VLHL 100.00% 100.00%
Killoran Lisheen Mining Limited
Mining Killoran, Moyne, Thurles, Co. Tipperay
50.13% 62.85% Ireland VLHL 100.00% 100.00%
Killoran Lisheen Finance Limited
Investment Company
Killoran, Moyne, Thurles, Co. Tipperay
50.13% 62.85% Ireland VLHL 100.00% 100.00%
Lisheen Milling Limited Manufacturing Killoran, Moyne, Thurles, Co. Tipperay
50.13% 62.85% Ireland VLHL 100.00% 100.00%
Vizag General Cargo Berth Private Limited
Infrastructure Sterlite Industries(I) Limited, SIPCOT Industrial Complex, Madurai Bypass Road, T.V. Puram P.O Tuticorin – 628002, Tamil Nadu, India
50.13% 62.85% India VedantaLimited
100.00% 99.99%
Paradip Multi Cargo Berth Private Limited(3)
Infrastructure Sterlite Industries(I) Limited, SIPCOT Industrial Complex, Madurai Bypass Road, T.V. Puram P.O Tuticorin – 628002, Tamil Nadu, India
50.13% 46.51% India VedantaLimited
100.00% 74.00%
44. LIST OF SUBSIDIARIES (CONTINUED)
NOTES TO THE FINANCIAL STATEMENTS CONTINUEDFOR THE YEAR ENDED 31 MARCH 2017
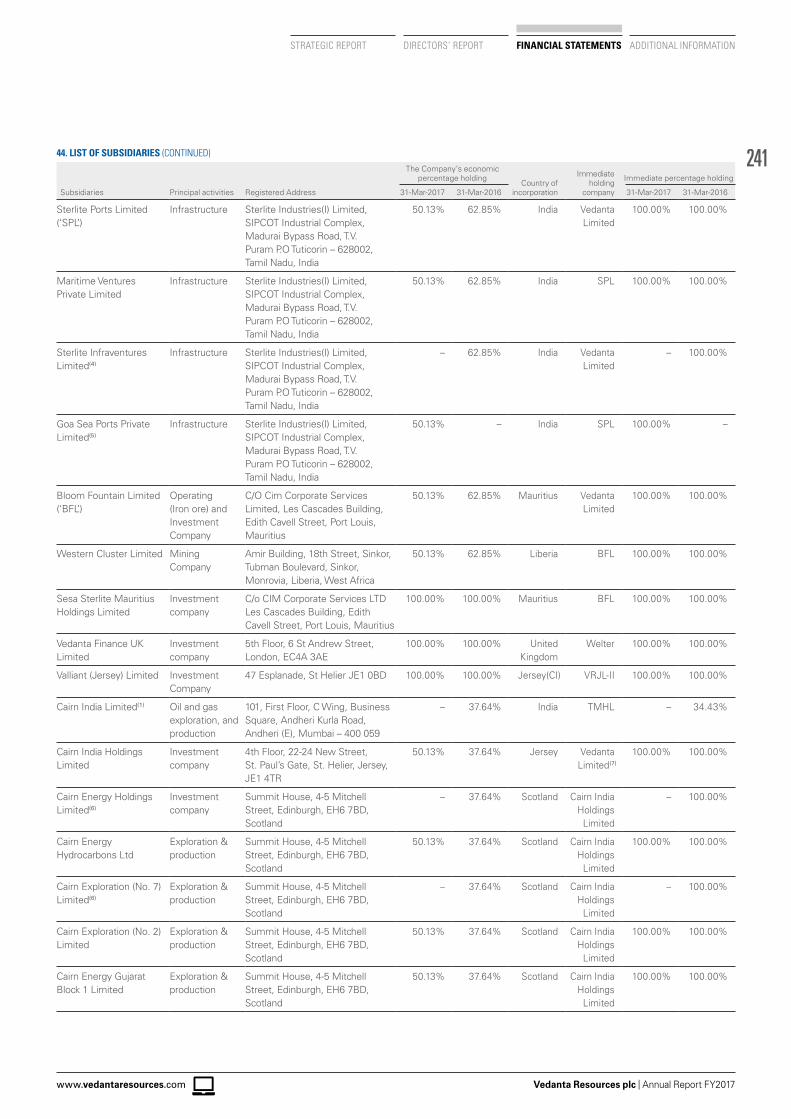
241
Vedanta Resources plc | Annual Report FY2017www.vedantaresources.com
STRATEGIC REPORT DIRECTORS’ REPORT FINANCIAL STATEMENTS ADDITIONAL INFORMATION
Subsidiaries Principal activities Registered Address
The Company’s economic percentage holding
Country of incorporation
Immediate holding
company
Immediate percentage holding
31-Mar-2017 31-Mar-2016 31-Mar-2017 31-Mar-2016
Sterlite Ports Limited (‘SPL’)
Infrastructure Sterlite Industries(I) Limited, SIPCOT Industrial Complex, Madurai Bypass Road, T.V. Puram P.O Tuticorin – 628002, Tamil Nadu, India
50.13% 62.85% India VedantaLimited
100.00% 100.00%
Maritime Ventures Private Limited
Infrastructure Sterlite Industries(I) Limited, SIPCOT Industrial Complex, Madurai Bypass Road, T.V. Puram P.O Tuticorin – 628002, Tamil Nadu, India
50.13% 62.85% India SPL 100.00% 100.00%
Sterlite Infraventures Limited(4)
Infrastructure Sterlite Industries(I) Limited, SIPCOT Industrial Complex, Madurai Bypass Road, T.V. Puram P.O Tuticorin – 628002, Tamil Nadu, India
– 62.85% India VedantaLimited
– 100.00%
Goa Sea Ports Private Limited(5)
Infrastructure Sterlite Industries(I) Limited, SIPCOT Industrial Complex, Madurai Bypass Road, T.V. Puram P.O Tuticorin – 628002, Tamil Nadu, India
50.13% – India SPL 100.00% –
Bloom Fountain Limited (‘BFL’)
Operating (Iron ore) and Investment Company
C/O Cim Corporate Services Limited, Les Cascades Building, Edith Cavell Street, Port Louis, Mauritius
50.13% 62.85% Mauritius VedantaLimited
100.00% 100.00%
Western Cluster Limited Mining Company
Amir Building, 18th Street, Sinkor, Tubman Boulevard, Sinkor, Monrovia, Liberia, West Africa
50.13% 62.85% Liberia BFL 100.00% 100.00%
Sesa Sterlite Mauritius Holdings Limited
Investment company
C/o CIM Corporate Services LTD Les Cascades Building, Edith Cavell Street, Port Louis, Mauritius
100.00% 100.00% Mauritius BFL 100.00% 100.00%
Vedanta Finance UK Limited
Investment company
5th Floor, 6 St Andrew Street, London, EC4A 3AE
100.00% 100.00% UnitedKingdom
Welter 100.00% 100.00%
Valliant (Jersey) Limited Investment Company
47 Esplanade, St Helier JE1 0BD 100.00% 100.00% Jersey(CI) VRJL-II 100.00% 100.00%
Cairn India Limited(1) Oil and gas exploration, and production
101, First Floor, C Wing, Business Square, Andheri Kurla Road, Andheri (E), Mumbai – 400 059
– 37.64% India TMHL – 34.43%
Cairn India Holdings Limited
Investment company
4th Floor, 22-24 New Street, St. Paul’s Gate, St. Helier, Jersey, JE1 4TR
50.13% 37.64% Jersey VedantaLimited(7)
100.00% 100.00%
Cairn Energy Holdings Limited(6)
Investment company
Summit House, 4-5 Mitchell Street, Edinburgh, EH6 7BD, Scotland
– 37.64% Scotland Cairn IndiaHoldings
Limited
– 100.00%
Cairn Energy Hydrocarbons Ltd
Exploration & production
Summit House, 4-5 Mitchell Street, Edinburgh, EH6 7BD, Scotland
50.13% 37.64% Scotland Cairn IndiaHoldings
Limited
100.00% 100.00%
Cairn Exploration (No. 7) Limited(6)
Exploration & production
Summit House, 4-5 Mitchell Street, Edinburgh, EH6 7BD, Scotland
– 37.64% Scotland Cairn IndiaHoldings
Limited
– 100.00%
Cairn Exploration (No. 2) Limited
Exploration & production
Summit House, 4-5 Mitchell Street, Edinburgh, EH6 7BD, Scotland
50.13% 37.64% Scotland Cairn IndiaHoldings
Limited
100.00% 100.00%
Cairn Energy Gujarat Block 1 Limited
Exploration & production
Summit House, 4-5 Mitchell Street, Edinburgh, EH6 7BD, Scotland
50.13% 37.64% Scotland Cairn IndiaHoldings
Limited
100.00% 100.00%
44. LIST OF SUBSIDIARIES (CONTINUED)
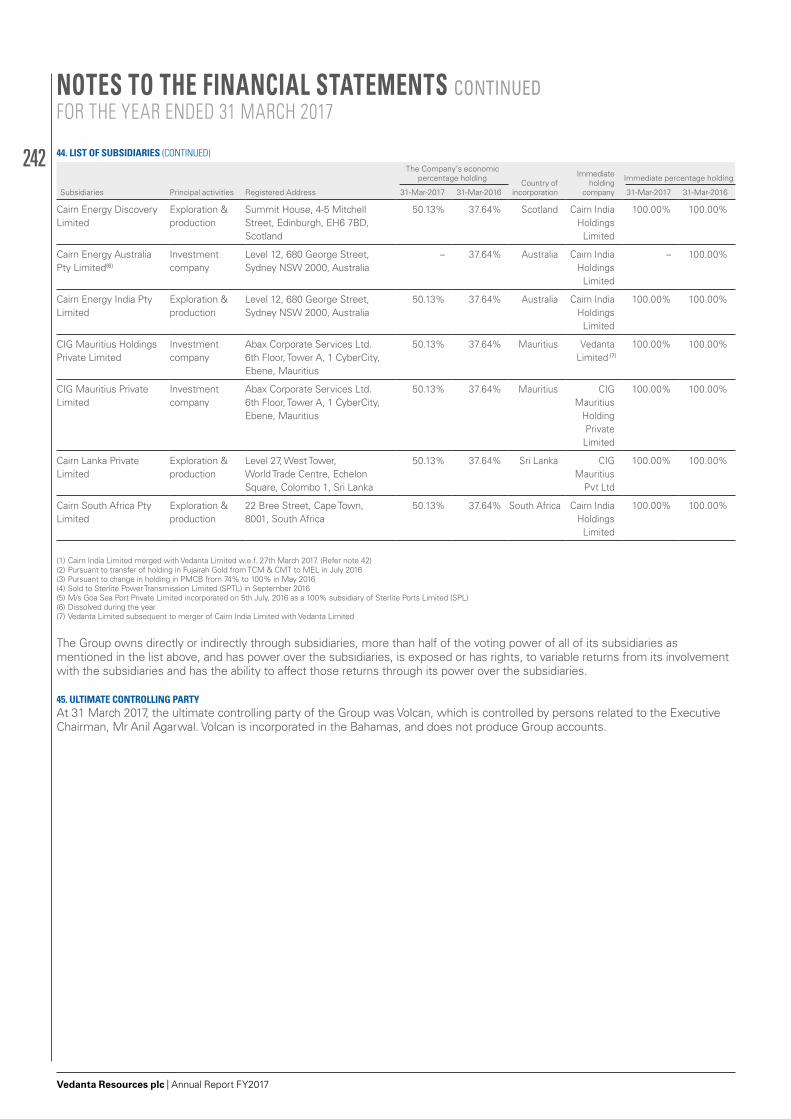
242
Vedanta Resources plc | Annual Report FY2017
Subsidiaries Principal activities Registered Address
The Company’s economic percentage holding
Country of incorporation
Immediate holding
company
Immediate percentage holding
31-Mar-2017 31-Mar-2016 31-Mar-2017 31-Mar-2016
Cairn Energy Discovery Limited
Exploration & production
Summit House, 4-5 Mitchell Street, Edinburgh, EH6 7BD, Scotland
50.13% 37.64% Scotland Cairn IndiaHoldings
Limited
100.00% 100.00%
Cairn Energy Australia Pty Limited(6)
Investment company
Level 12, 680 George Street, Sydney NSW 2000, Australia
– 37.64% Australia Cairn IndiaHoldings
Limited
– 100.00%
Cairn Energy India Pty Limited
Exploration & production
Level 12, 680 George Street, Sydney NSW 2000, Australia
50.13% 37.64% Australia Cairn IndiaHoldings
Limited
100.00% 100.00%
CIG Mauritius Holdings Private Limited
Investment company
Abax Corporate Services Ltd. 6th Floor, Tower A, 1 CyberCity, Ebene, Mauritius
50.13% 37.64% Mauritius VedantaLimited (7)
100.00% 100.00%
CIG Mauritius Private Limited
Investment company
Abax Corporate Services Ltd. 6th Floor, Tower A, 1 CyberCity, Ebene, Mauritius
50.13% 37.64% Mauritius CIGMauritius
HoldingPrivateLimited
100.00% 100.00%
Cairn Lanka Private Limited
Exploration & production
Level 27, West Tower, World Trade Centre, Echelon Square, Colombo 1, Sri Lanka
50.13% 37.64% Sri Lanka CIGMauritius
Pvt Ltd
100.00% 100.00%
Cairn South Africa Pty Limited
Exploration & production
22 Bree Street, Cape Town, 8001, South Africa
50.13% 37.64% South Africa Cairn IndiaHoldings
Limited
100.00% 100.00%
(1) Cairn India Limited merged with Vedanta Limited w.e.f. 27th March 2017. (Refer note 42)(2) Pursuant to transfer of holding in Fujairah Gold from TCM & CMT to MEL in July 2016(3) Pursuant to change in holding in PMCB from 74% to 100% in May 2016 (4) Sold to Sterlite Power Transmission Limited (SPTL) in September 2016(5) M/s Goa Sea Port Private Limited incorporated on 5th July, 2016 as a 100% subsidiary of Sterlite Ports Limited (SPL)(6) Dissolved during the year(7) Vedanta Limited subsequent to merger of Cairn India Limited with Vedanta Limited
The Group owns directly or indirectly through subsidiaries, more than half of the voting power of all of its subsidiaries as mentioned in the list above, and has power over the subsidiaries, is exposed or has rights, to variable returns from its involvement with the subsidiaries and has the ability to affect those returns through its power over the subsidiaries.
45. ULTIMATE CONTROLLING PARTYAt 31 March 2017, the ultimate controlling party of the Group was Volcan, which is controlled by persons related to the Executive Chairman, Mr Anil Agarwal. Volcan is incorporated in the Bahamas, and does not produce Group accounts.
44. LIST OF SUBSIDIARIES (CONTINUED)
NOTES TO THE FINANCIAL STATEMENTS CONTINUEDFOR THE YEAR ENDED 31 MARCH 2017
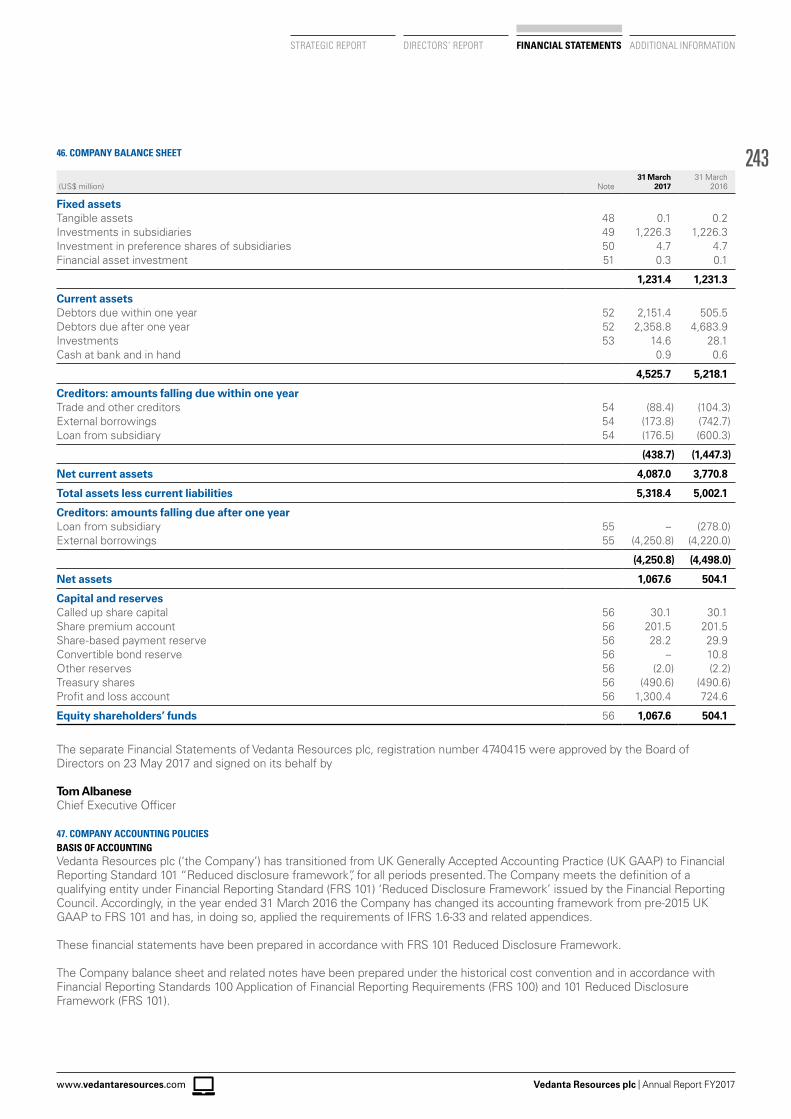
243
Vedanta Resources plc | Annual Report FY2017www.vedantaresources.com
STRATEGIC REPORT DIRECTORS’ REPORT FINANCIAL STATEMENTS ADDITIONAL INFORMATION
46. COMPANY BALANCE SHEET
(US$ million) Note31 March
201731 March
2016
Fixed assetsTangible assets 48 0.1 0.2Investments in subsidiaries 49 1,226.3 1,226.3Investment in preference shares of subsidiaries 50 4.7 4.7Financial asset investment 51 0.3 0.1
1,231.4 1,231.3
Current assetsDebtors due within one year 52 2,151.4 505.5Debtors due after one year 52 2,358.8 4,683.9Investments 53 14.6 28.1Cash at bank and in hand 0.9 0.6
4,525.7 5,218.1
Creditors: amounts falling due within one yearTrade and other creditors 54 (88.4) (104.3)External borrowings 54 (173.8) (742.7)Loan from subsidiary 54 (176.5) (600.3)
(438.7) (1,447.3)
Net current assets 4,087.0 3,770.8
Total assets less current liabilities 5,318.4 5,002.1
Creditors: amounts falling due after one yearLoan from subsidiary 55 – (278.0)External borrowings 55 (4,250.8) (4,220.0)
(4,250.8) (4,498.0)
Net assets 1,067.6 504.1
Capital and reservesCalled up share capital 56 30.1 30.1Share premium account 56 201.5 201.5Share-based payment reserve 56 28.2 29.9Convertible bond reserve 56 – 10.8Other reserves 56 (2.0) (2.2)Treasury shares 56 (490.6) (490.6)Profit and loss account 56 1,300.4 724.6
Equity shareholders’ funds 56 1,067.6 504.1
The separate Financial Statements of Vedanta Resources plc, registration number 4740415 were approved by the Board of Directors on 23 May 2017 and signed on its behalf by
Tom Albanese Chief Executive Officer
47. COMPANY ACCOUNTING POLICIESBASIS OF ACCOUNTINGVedanta Resources plc (‘the Company’) has transitioned from UK Generally Accepted Accounting Practice (UK GAAP) to Financial Reporting Standard 101 “Reduced disclosure framework”, for all periods presented. The Company meets the definition of a qualifying entity under Financial Reporting Standard (FRS 101) ‘Reduced Disclosure Framework’ issued by the Financial Reporting Council. Accordingly, in the year ended 31 March 2016 the Company has changed its accounting framework from pre-2015 UK GAAP to FRS 101 and has, in doing so, applied the requirements of IFRS 1.6-33 and related appendices.
These financial statements have been prepared in accordance with FRS 101 Reduced Disclosure Framework.
The Company balance sheet and related notes have been prepared under the historical cost convention and in accordance with Financial Reporting Standards 100 Application of Financial Reporting Requirements (FRS 100) and 101 Reduced Disclosure Framework (FRS 101).
244
Vedanta Resources plc | Annual Report FY2017
As permitted by section 408 of the Companies Act 2006, the profit and loss account of the Company is not presented as part of these financial statements. The profit after tax for the year of the Company amounted to US$690.2 million (2016: Loss US$8.0 million).
These financial statements are presented in US dollars being the functional currency of the Company.
SIGNIFICANT ACCOUNTING POLICIESINVESTMENTS IN SUBSIDIARIESInvestments in subsidiaries represent equity holdings in subsidiaries except preference shares, valued at cost less any provision for impairment. Investments are reviewed for impairment if events or changes in circumstances indicate that the carrying amount may not be recoverable.
INVESTMENT IN PREFERENCE SHARES OF SUBSIDIARIESInvestments in preference shares of subsidiaries are stated at fair value. The fair value is represented by the face value of the preference shares as the investments are redeemable at any time for their face value at the option of the Company.
CASH AND CASH EQUIVALENTSCash in the balance sheet comprise of cash at bank and cash in hand.
FINANCIAL ASSET INVESTMENTSFinancial asset investments are classified as available for sale under IAS 39 and are initially recorded at cost and then remeasured at subsequent reporting dates to fair value. Unrealized gains and losses on financial asset investments are recognized directly in equity. On disposal or impairment of the investments, the gains and losses in equity are recycled to the income statement.
CURRENCY TRANSLATIONTransactions in currencies other than the functional currency of the Company, being US dollars, are translated into US Dollars at the spot exchange rates ruling at the date of transaction. Monetary assets and liabilities denominated in other currencies at the balance sheet date are translated into US dollars at year end exchange rates, or at a contractual rate if applicable.
TANGIBLE FIXED ASSETSTangible fixed assets are stated at cost less accumulated depreciation and provision for impairment.
DEFERRED TAXATIONDeferred taxation is provided in full on all timing differences that result in an obligation at the balance sheet date to pay more tax, or a right to pay less tax, at a future date, subject to the recoverability of deferred tax assets. Deferred tax assets and liabilities are not discounted.
SHARE-BASED PAYMENTSThe cost of equity-settled transactions with employees is measured at fair value at the date at which they are granted. The fair value of share awards with market-related vesting conditions are determined by an external valuer and the fair value at the grant date is expensed on a straight-line basis over the vesting period based on the Company’s estimate of shares that will eventually vest. The estimate of the number of awards likely to vest is reviewed at each balance sheet date up to the vesting date at which point the estimate is adjusted to reflect the current expectations. No adjustment is made to the fair value after the vesting date even if the awards are forfeited or not exercised. Amounts recharged to subsidiaries in respect of awards granted to employees of subsidiaries are recognised as intercompany debtors until repaid.
In case of cash-settled transactions, a liability is recognised for the fair value of cash-settled transactions. The fair value is measured initially and at each reporting date up to and including the settlement date, with changes in fair value recognised in employee benefits expense. The fair value is expensed over the period until the vesting date with recognition of a corresponding liability. The fair value is determined with the assistance of an external valuer.
BORROWINGSInterest bearing loans are recorded at the net proceeds received i.e. net of direct transaction costs. Finance charges, including premiums payable on settlement or redemption and direct issue costs, are accounted for on accruals basis and charged to the profit and loss account using the effective interest method and are added to the carrying amount of the instrument to the extent that they are not settled in the period in which they arise.
CONVERTIBLE BONDSThe Convertible bond issued by VRJL and VRJL-II (note 54) are accounted for as a compound instrument. The gross proceeds (net of issue costs) were lent to the Company by VRJL and VRJL-II. The equity component has been recognised in a separate reserve of the company and is not subsequently re measured. The recognition of the equity component by the company acts to reduce the payable to VRJL and VRJL-II which arises once the gross proceeds are borrowed. The liability component is held at amortised cost. The interest expensed on the liability component is calculated by applying an effective interest rate. The difference between interest expensed and interest paid is added to the carrying amount of the liability component.
47. COMPANY ACCOUNTING POLICIES (CONTINUED)
NOTES TO THE FINANCIAL STATEMENTS CONTINUEDFOR THE YEAR ENDED 31 MARCH 2017
245
Vedanta Resources plc | Annual Report FY2017www.vedantaresources.com
STRATEGIC REPORT DIRECTORS’ REPORT FINANCIAL STATEMENTS ADDITIONAL INFORMATION
The bonds are first convertible into preference shares of the issuer having a principal value of $100,000 per Preference share, which are exchanged immediately for ordinary shares of the Company.
FINANCIAL INSTRUMENTSThe Company has elected to take the exemption provided in paragraph 8 of FRS 101 in respect of these parent company financial statements. Full disclosures are provided in note 29 to the financial statements of the Group for the year ended 31 March 2017.
DERIVATIVE FINANCIAL INSTRUMENTSDerivative financial instruments are initially recorded at their fair value on the date of the derivative transaction and are re-measured at their fair value at subsequent balance sheet dates.
Changes in the fair value of derivatives that are designated and qualify as fair value hedges are recorded in the profit and loss account. The hedged item is recorded at fair value and any gain or loss is recorded in the profit and loss account and is offset by the gain or loss from the change in the fair value of the derivative.
Derivative financial instruments that do not qualify for hedge accounting are marked to market at the balance sheet date and gains or losses are recognised in the profit and loss account immediately.
Hedge accounting is discontinued when the hedging instrument expires or is sold, terminated or exercised, or no longer qualifies for hedge accounting.
CASH FLOW STATEMENTThe company financial statements are prepared under FRS 101, which does not require application of IAS 7. Accordingly, the Company does not present the individual company cash flow statement.
FINANCIAL GUARANTEESGuarantees issued by the Company on behalf of other Group companies are designated as ‘Insurance Contracts’. Accordingly these are shown as contingent liabilities. (note 57)
DEBTORSDebtors are stated at their nominal value as reduced by appropriate allowance for estimated irrecoverable amounts. An allowance for impairment for debtors is made where there is an indication of a reduction in the recoverability of the carrying value of the debtor.
CREDITORSCreditors are stated at their nominal value.
48. COMPANY TANGIBLE FIXED ASSETS
(US$ million)
CostAt 1 April 2015 2.3Additions 0.0
At 31 March 2016 2.3Additions 0.0
At 31 March 2017 2.3
Accumulated depreciationAt 1 April 2015 2.0Charge for the period 0.1
At 31 March 2016 2.1Charge for the period 0.1At 31 March 2017 2.2
Net book valueAt 1 April 2015 0.3
At 31 March 2016 0.2
At 31 March 2017 0.1
47. COMPANY ACCOUNTING POLICIES (CONTINUED)
246
Vedanta Resources plc | Annual Report FY2017
49. INVESTMENTS IN SUBSIDIARIES
(US$ million)
CostAt 1 April 2015 1,226.3At 1 April 2016 1,226.3
At 31 March 2017 1,226.3
At 31 March 2017, the Company held 157,538,524 shares in Vedanta Resources Holdings Limited (‘VRHL’) (March 2016: 157,538,524 shares), being 100% of VRHL’s issued equity share capital. The Company also held one deferred share in VRHL (March 2016: one). At 31 March 2017, the Company held two shares in Vedanta Finance Jersey Limited (‘VFJL’) (March 2016: two), two shares in Vedanta Resources Jersey Limited (‘VRJL’) (March 2016: two), two shares in Vedanta Resources Jersey II Limited (‘VRJL-II’) (March 2016: two), two shares in Vedanta Jersey Investment Limited (‘VJIL’) (March 2016: two), being 100% of its issued equity share capital.
VRHL is an intermediary holding company incorporated in the United Kingdom (note 44) and registered in England and Wales. VFJL, VRJL, VJIL and VRJL-II are companies, registered and incorporated in Jersey, established to raise funds for the Vedanta Group.
50. INVESTMENT IN PREFERENCE SHARES OF SUBSIDIARIES
(US$ million)
Fair valueAt 1 April 2016 4.7Additions –Disposal –
At 31 March 2017 4.7
At 1 April 2015 1.7Additions 3.0Disposal –
At 31 March 2016 4.7
As at 31 March 2017, the Company held 47 preference shares in Vedanta Resources Jersey Limited (“VRJL”) (31 March 2016: 47 preference shares).
During the previous year, VRJL received notice from the bondholders to exercise the option to convert US$3,000,000 bonds into equity shares of the Company in accordance with the provisions of the Offer circular and accordingly 30 preference shares with a nominal value of US$100,000 each were issued by VRJL to the Company.
51. FINANCIAL ASSET INVESTMENT
(US$ million)
Fair valueAt 1 April 2016 0.1Fair value movement 0.2
At 31 March 2017 0.3
At 1 April 2015 0.1Fair value movement –
At 31 March 2016 0.1
The investment relates to an equity investment in the shares of Victoria Gold Corporation. At 31 March 2017, the investment in Victoria Gold Corporation was revalued and gain of US$0.2 million (2016: no gain/loss) was recognised in equity.
NOTES TO THE FINANCIAL STATEMENTS CONTINUEDFOR THE YEAR ENDED 31 MARCH 2017
247
Vedanta Resources plc | Annual Report FY2017www.vedantaresources.com
STRATEGIC REPORT DIRECTORS’ REPORT FINANCIAL STATEMENTS ADDITIONAL INFORMATION
52. COMPANY DEBTORS
(US$ million)31 March
201731 March
2016
Amounts due from subsidiary undertakings 4,509.4 5,188.4Prepayments and accrued income 0.5 0.5Other taxes 0.3 0.5
Total 4,510.2 5,189.4
Debtors due within one year 2,151.4 505.5Debtors due after one year 2,358.8 4,683.9
Total 4,510.2 5,189.4
AMOUNTS DUE FROM SUBSIDIARY UNDERTAKINGSAt 31 March 2017, the Company had loans due from VRHL of US$1,790.3 million (2016: US$1,737.4 million) which represented the funds being loaned to other group companies for funding the subsidiaries. Out of the total loan, US$579.3 million bears interest at six month US$LIBOR plus 350 basis points, US$500.0 million at 5.8%, US$31.2 million at 5.9%, US$47.0 million at 9.7%, and US$632.8 million at US$LIBOR plus 367 basis points.
At 31 March 2017, the Company had loan of US$1,757.1 million (2016: US$3,069.6 million) due from Vedanta Resources Jersey II Limited. Out of the total loan US$41.4 million bears interest at US$LIBOR plus 357 basis points, US$1,200.0 million at 6.50%, US$121.4 million at LIBOR plus 300 basis points US$60.0 million at 3.15%, US$68.4 million at 6.75% and US$265.8 million at six month US$LIBOR plus 430 basis points.
The Company was owed US$344.9 million (2016: US$372.1 million) of accrued interest from VRHL and Vedanta Resources Jersey II Limited.
During the year, the company gave a loan to Vedanta Resources Jersey Limited of facility amount US$400.0 million at an interest rate of 6.75%. The outstanding amount as at 31 March 2017 was US$125.0 million and accrued interest thereon US$0.1 million.
As at 31 March 2017, the company was owed dividend receivable from Vedanta Resources Holdings limited of US$475.0 million. In addition to the loans, the company was also owed US$17.0 million (2016: US$9.3 million) other receivables from Group companies.
53. COMPANY CURRENT ASSET INVESTMENTS
(US$ million)31 March
201731 March
2016
Bank term deposits 14.6 28.1
Total 14.6 28.1
54. COMPANY CREDITORS: AMOUNTS FALLING DUE WITHIN ONE YEAR
(US$ million)31 March
201731 March
2016
Accruals (88.4) (104.3)External borrowings (173.8) (742.7)Loan from Subsidiary (176.5) (600.3)
Total (438.7) (1,447.3)
In April 2013, the Company entered into a Standby Letter of Credit agreement arranged by Axis Bank for an amount of US$150.0 million at a commission of 1% per annum payable quarterly. The facility is funded by Bank of India to the extent of US$148.5 million and bears interest rate at three month US$LIBOR plus 290 basis points. The facility is repayable in two equal annual instalments starting April 2017. As at 31 March 2017, the outstanding amount under this facility amounting to US$74.2 million has been shown under creditors falling due within one year and balance US$74.3 million in creditors falling due after one year.
In December 2013, the Company entered into a facility agreement with Bank of India for borrowing up to US$100.0 million at an interest rate of US$LIBOR plus 357 basis points repayable to the extent of 50% in October 2017 and balance in January 2018. As at 31 March 2017, the outstanding amount under this facility is US$100.0 million.
As at 31 March 2016, loans from subsidiaries included a loan of US$1,140.3 million from VRJL relating to its issue of US$1,250.0 million convertible bonds (bond issued in July 2009). During the previous year, the Company bought from the market the bonds of face value of US$549.3 million for a consideration of US$522.4 million. Accordingly, the carrying value of the bond bought along with accrued interest i.e. US$540.0 million had been reduced from the inter-co loan outstanding amount of US$1,140.3 million from the subsidiary, VRJL.
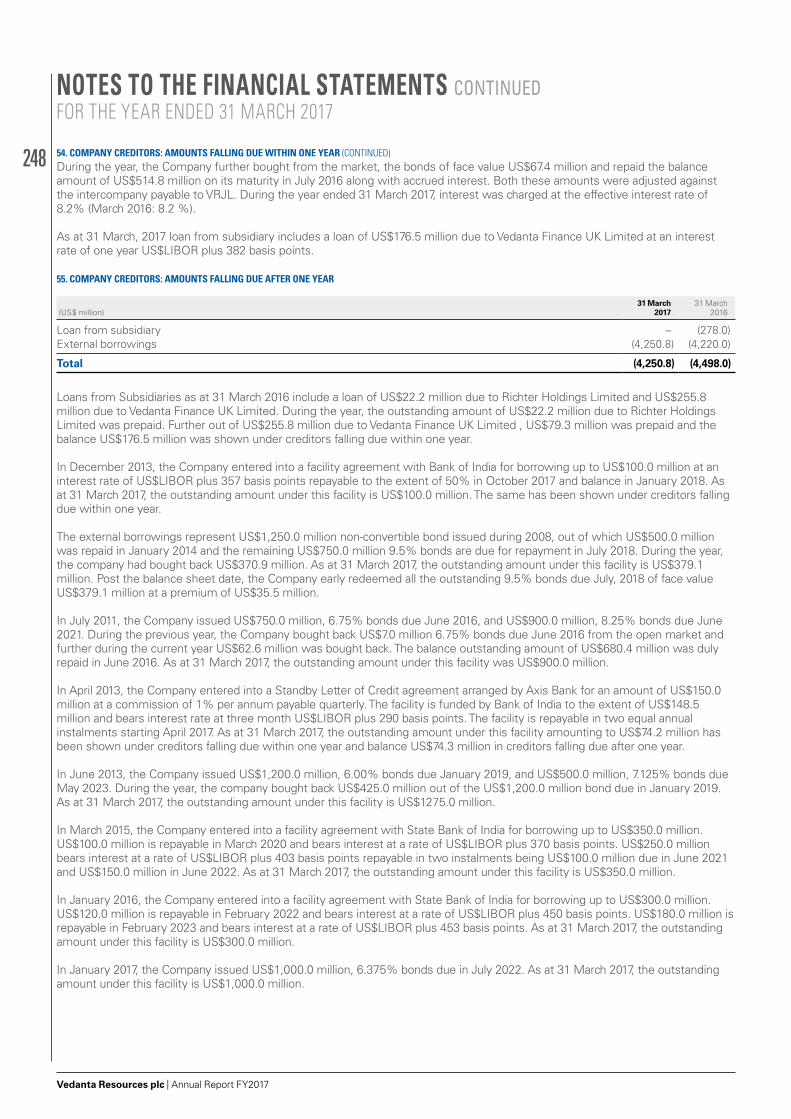
248
Vedanta Resources plc | Annual Report FY2017
During the year, the Company further bought from the market, the bonds of face value US$67.4 million and repaid the balance amount of US$514.8 million on its maturity in July 2016 along with accrued interest. Both these amounts were adjusted against the intercompany payable to VRJL. During the year ended 31 March 2017, interest was charged at the effective interest rate of 8.2% (March 2016: 8.2 %).
As at 31 March, 2017 loan from subsidiary includes a loan of US$176.5 million due to Vedanta Finance UK Limited at an interest rate of one year US$LIBOR plus 382 basis points.
55. COMPANY CREDITORS: AMOUNTS FALLING DUE AFTER ONE YEAR
(US$ million)31 March
201731 March
2016
Loan from subsidiary – (278.0)External borrowings (4,250.8) (4,220.0)
Total (4,250.8) (4,498.0)
Loans from Subsidiaries as at 31 March 2016 include a loan of US$22.2 million due to Richter Holdings Limited and US$255.8 million due to Vedanta Finance UK Limited. During the year, the outstanding amount of US$22.2 million due to Richter Holdings Limited was prepaid. Further out of US$255.8 million due to Vedanta Finance UK Limited , US$79.3 million was prepaid and the balance US$176.5 million was shown under creditors falling due within one year.
In December 2013, the Company entered into a facility agreement with Bank of India for borrowing up to US$100.0 million at an interest rate of US$LIBOR plus 357 basis points repayable to the extent of 50% in October 2017 and balance in January 2018. As at 31 March 2017, the outstanding amount under this facility is US$100.0 million. The same has been shown under creditors falling due within one year.
The external borrowings represent US$1,250.0 million non-convertible bond issued during 2008, out of which US$500.0 million was repaid in January 2014 and the remaining US$750.0 million 9.5% bonds are due for repayment in July 2018. During the year, the company had bought back US$370.9 million. As at 31 March 2017, the outstanding amount under this facility is US$379.1 million. Post the balance sheet date, the Company early redeemed all the outstanding 9.5% bonds due July, 2018 of face value US$379.1 million at a premium of US$35.5 million.
In July 2011, the Company issued US$750.0 million, 6.75% bonds due June 2016, and US$900.0 million, 8.25% bonds due June 2021. During the previous year, the Company bought back US$7.0 million 6.75% bonds due June 2016 from the open market and further during the current year US$62.6 million was bought back. The balance outstanding amount of US$680.4 million was duly repaid in June 2016. As at 31 March 2017, the outstanding amount under this facility was US$900.0 million.
In April 2013, the Company entered into a Standby Letter of Credit agreement arranged by Axis Bank for an amount of US$150.0 million at a commission of 1% per annum payable quarterly. The facility is funded by Bank of India to the extent of US$148.5 million and bears interest rate at three month US$LIBOR plus 290 basis points. The facility is repayable in two equal annual instalments starting April 2017. As at 31 March 2017, the outstanding amount under this facility amounting to US$74.2 million has been shown under creditors falling due within one year and balance US$74.3 million in creditors falling due after one year.
In June 2013, the Company issued US$1,200.0 million, 6.00% bonds due January 2019, and US$500.0 million, 7.125% bonds due May 2023. During the year, the company bought back US$425.0 million out of the US$1,200.0 million bond due in January 2019. As at 31 March 2017, the outstanding amount under this facility is US$1275.0 million.
In March 2015, the Company entered into a facility agreement with State Bank of India for borrowing up to US$350.0 million. US$100.0 million is repayable in March 2020 and bears interest at a rate of US$LIBOR plus 370 basis points. US$250.0 million bears interest at a rate of US$LIBOR plus 403 basis points repayable in two instalments being US$100.0 million due in June 2021 and US$150.0 million in June 2022. As at 31 March 2017, the outstanding amount under this facility is US$350.0 million.
In January 2016, the Company entered into a facility agreement with State Bank of India for borrowing up to US$300.0 million. US$120.0 million is repayable in February 2022 and bears interest at a rate of US$LIBOR plus 450 basis points. US$180.0 million is repayable in February 2023 and bears interest at a rate of US$LIBOR plus 453 basis points. As at 31 March 2017, the outstanding amount under this facility is US$300.0 million.
In January 2017, the Company issued US$1,000.0 million, 6.375% bonds due in July 2022. As at 31 March 2017, the outstanding amount under this facility is US$1,000.0 million.
54. COMPANY CREDITORS: AMOUNTS FALLING DUE WITHIN ONE YEAR (CONTINUED)
NOTES TO THE FINANCIAL STATEMENTS CONTINUEDFOR THE YEAR ENDED 31 MARCH 2017
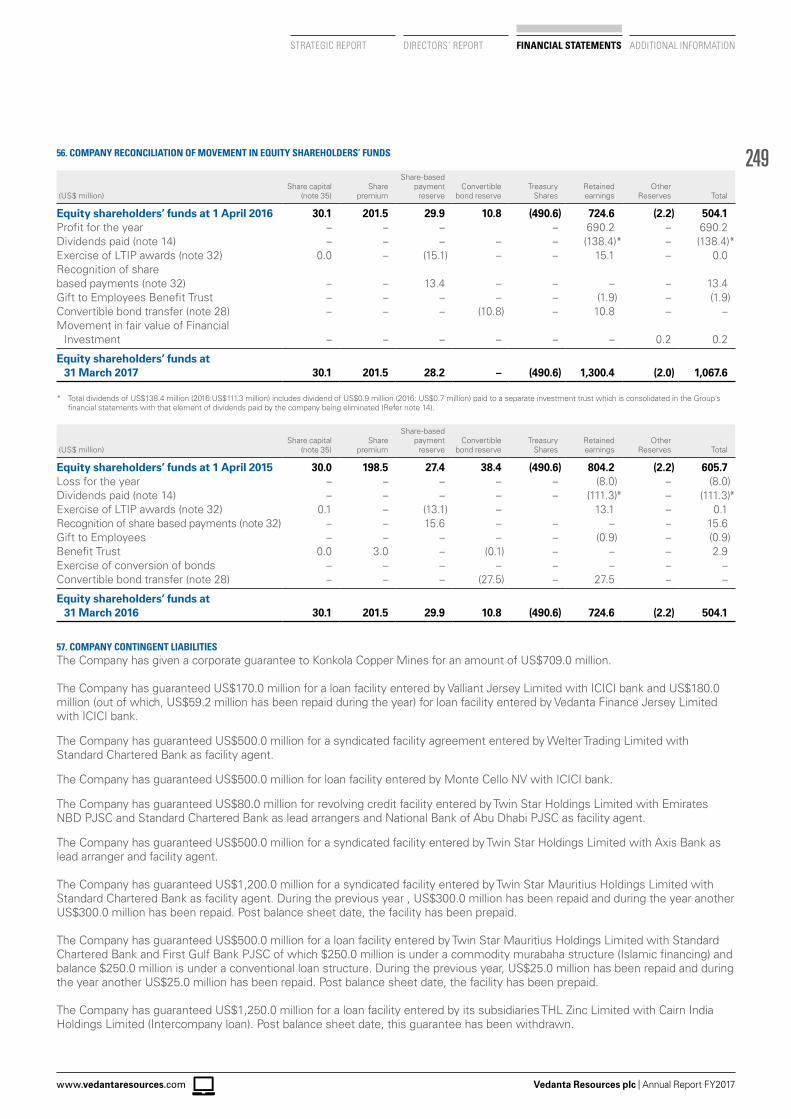
249
Vedanta Resources plc | Annual Report FY2017www.vedantaresources.com
STRATEGIC REPORT DIRECTORS’ REPORT FINANCIAL STATEMENTS ADDITIONAL INFORMATION
56. COMPANY RECONCILIATION OF MOVEMENT IN EQUITY SHAREHOLDERS’ FUNDS
(US$ million)Share capital
(note 35)Share
premium
Share-based payment reserve
Convertible bond reserve
Treasury Shares
Retained earnings
Other Reserves Total
Equity shareholders’ funds at 1 April 2016 30.1 201.5 29.9 10.8 (490.6) 724.6 (2.2) 504.1Profit for the year – – – – 690.2 – 690.2Dividends paid (note 14) – – – – – (138.4)* – (138.4)*Exercise of LTIP awards (note 32) 0.0 – (15.1) – – 15.1 – 0.0Recognition of sharebased payments (note 32) – – 13.4 – – – – 13.4Gift to Employees Benefit Trust – – – – – (1.9) – (1.9)Convertible bond transfer (note 28) – – – (10.8) – 10.8 – –Movement in fair value of Financial
Investment – – – – – – 0.2 0.2
Equity shareholders’ funds at 31 March 2017 30.1 201.5 28.2 – (490.6) 1,300.4 (2.0) 1,067.6
* Total dividends of US$138.4 million (2016:US$111.3 million) includes dividend of US$0.9 million (2016: US$0.7 million) paid to a separate investment trust which is consolidated in the Group’s financial statements with that element of dividends paid by the company being eliminated (Refer note 14).
(US$ million)Share capital
(note 35)Share
premium
Share-based payment reserve
Convertible bond reserve
Treasury Shares
Retained earnings
Other Reserves Total
Equity shareholders’ funds at 1 April 2015 30.0 198.5 27.4 38.4 (490.6) 804.2 (2.2) 605.7Loss for the year – – – – – (8.0) – (8.0)Dividends paid (note 14) – – – – – (111.3)* – (111.3)*Exercise of LTIP awards (note 32) 0.1 – (13.1) – 13.1 – 0.1Recognition of share based payments (note 32) – – 15.6 – – – – 15.6Gift to Employees – – – – – (0.9) – (0.9)Benefit Trust 0.0 3.0 – (0.1) – – – 2.9Exercise of conversion of bonds – – – – – – – –Convertible bond transfer (note 28) – – – (27.5) – 27.5 – –
Equity shareholders’ funds at 31 March 2016 30.1 201.5 29.9 10.8 (490.6) 724.6 (2.2) 504.1
57. COMPANY CONTINGENT LIABILITIESThe Company has given a corporate guarantee to Konkola Copper Mines for an amount of US$709.0 million.
The Company has guaranteed US$170.0 million for a loan facility entered by Valliant Jersey Limited with ICICI bank and US$180.0 million (out of which, US$59.2 million has been repaid during the year) for loan facility entered by Vedanta Finance Jersey Limited with ICICI bank.
The Company has guaranteed US$500.0 million for a syndicated facility agreement entered by Welter Trading Limited with Standard Chartered Bank as facility agent.
The Company has guaranteed US$500.0 million for loan facility entered by Monte Cello NV with ICICI bank.
The Company has guaranteed US$80.0 million for revolving credit facility entered by Twin Star Holdings Limited with Emirates NBD PJSC and Standard Chartered Bank as lead arrangers and National Bank of Abu Dhabi PJSC as facility agent.
The Company has guaranteed US$500.0 million for a syndicated facility entered by Twin Star Holdings Limited with Axis Bank as lead arranger and facility agent.
The Company has guaranteed US$1,200.0 million for a syndicated facility entered by Twin Star Mauritius Holdings Limited with Standard Chartered Bank as facility agent. During the previous year , US$300.0 million has been repaid and during the year another US$300.0 million has been repaid. Post balance sheet date, the facility has been prepaid.
The Company has guaranteed US$500.0 million for a loan facility entered by Twin Star Mauritius Holdings Limited with Standard Chartered Bank and First Gulf Bank PJSC of which $250.0 million is under a commodity murabaha structure (Islamic financing) and balance $250.0 million is under a conventional loan structure. During the previous year, US$25.0 million has been repaid and during the year another US$25.0 million has been repaid. Post balance sheet date, the facility has been prepaid.
The Company has guaranteed US$1,250.0 million for a loan facility entered by its subsidiaries THL Zinc Limited with Cairn India Holdings Limited (Intercompany loan). Post balance sheet date, this guarantee has been withdrawn.
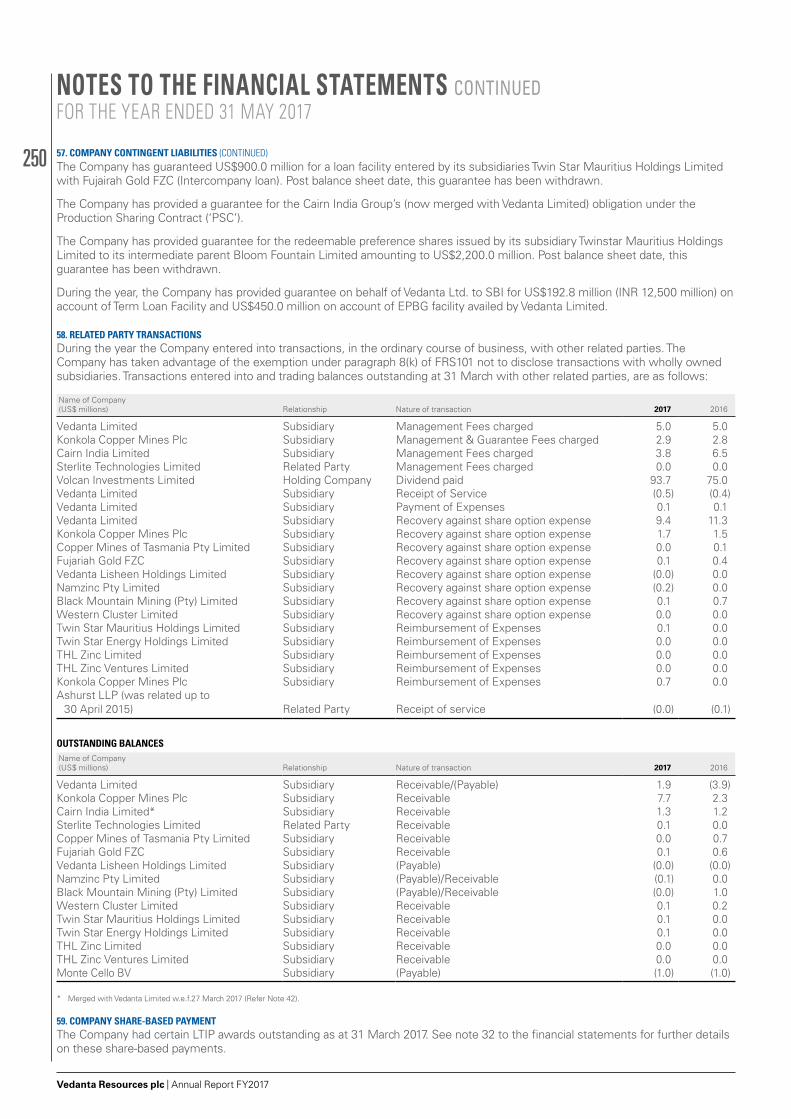
250
Vedanta Resources plc | Annual Report FY2017
The Company has guaranteed US$900.0 million for a loan facility entered by its subsidiaries Twin Star Mauritius Holdings Limited with Fujairah Gold FZC (Intercompany loan). Post balance sheet date, this guarantee has been withdrawn.
The Company has provided a guarantee for the Cairn India Group’s (now merged with Vedanta Limited) obligation under the Production Sharing Contract (‘PSC’).
The Company has provided guarantee for the redeemable preference shares issued by its subsidiary Twinstar Mauritius Holdings Limited to its intermediate parent Bloom Fountain Limited amounting to US$2,200.0 million. Post balance sheet date, this guarantee has been withdrawn.
During the year, the Company has provided guarantee on behalf of Vedanta Ltd. to SBI for US$192.8 million (INR 12,500 million) on account of Term Loan Facility and US$450.0 million on account of EPBG facility availed by Vedanta Limited.
58. RELATED PARTY TRANSACTIONSDuring the year the Company entered into transactions, in the ordinary course of business, with other related parties. The Company has taken advantage of the exemption under paragraph 8(k) of FRS101 not to disclose transactions with wholly owned subsidiaries. Transactions entered into and trading balances outstanding at 31 March with other related parties, are as follows:
Name of Company (US$ millions) Relationship Nature of transaction 2017 2016
Vedanta Limited Subsidiary Management Fees charged 5.0 5.0Konkola Copper Mines Plc Subsidiary Management & Guarantee Fees charged 2.9 2.8Cairn India Limited Subsidiary Management Fees charged 3.8 6.5Sterlite Technologies Limited Related Party Management Fees charged 0.0 0.0Volcan Investments Limited Holding Company Dividend paid 93.7 75.0Vedanta Limited Subsidiary Receipt of Service (0.5) (0.4)Vedanta Limited Subsidiary Payment of Expenses 0.1 0.1Vedanta Limited Subsidiary Recovery against share option expense 9.4 11.3Konkola Copper Mines Plc Subsidiary Recovery against share option expense 1.7 1.5Copper Mines of Tasmania Pty Limited Subsidiary Recovery against share option expense 0.0 0.1Fujariah Gold FZC Subsidiary Recovery against share option expense 0.1 0.4Vedanta Lisheen Holdings Limited Subsidiary Recovery against share option expense (0.0) 0.0Namzinc Pty Limited Subsidiary Recovery against share option expense (0.2) 0.0Black Mountain Mining (Pty) Limited Subsidiary Recovery against share option expense 0.1 0.7Western Cluster Limited Subsidiary Recovery against share option expense 0.0 0.0Twin Star Mauritius Holdings Limited Subsidiary Reimbursement of Expenses 0.1 0.0Twin Star Energy Holdings Limited Subsidiary Reimbursement of Expenses 0.0 0.0THL Zinc Limited Subsidiary Reimbursement of Expenses 0.0 0.0THL Zinc Ventures Limited Subsidiary Reimbursement of Expenses 0.0 0.0Konkola Copper Mines Plc Subsidiary Reimbursement of Expenses 0.7 0.0Ashurst LLP (was related up to
30 April 2015) Related Party Receipt of service (0.0) (0.1)
OUTSTANDING BALANCES Name of Company (US$ millions) Relationship Nature of transaction 2017 2016
Vedanta Limited Subsidiary Receivable/(Payable) 1.9 (3.9)Konkola Copper Mines Plc Subsidiary Receivable 7.7 2.3Cairn India Limited* Subsidiary Receivable 1.3 1.2Sterlite Technologies Limited Related Party Receivable 0.1 0.0Copper Mines of Tasmania Pty Limited Subsidiary Receivable 0.0 0.7Fujariah Gold FZC Subsidiary Receivable 0.1 0.6Vedanta Lisheen Holdings Limited Subsidiary (Payable) (0.0) (0.0)Namzinc Pty Limited Subsidiary (Payable)/Receivable (0.1) 0.0Black Mountain Mining (Pty) Limited Subsidiary (Payable)/Receivable (0.0) 1.0Western Cluster Limited Subsidiary Receivable 0.1 0.2Twin Star Mauritius Holdings Limited Subsidiary Receivable 0.1 0.0Twin Star Energy Holdings Limited Subsidiary Receivable 0.1 0.0THL Zinc Limited Subsidiary Receivable 0.0 0.0THL Zinc Ventures Limited Subsidiary Receivable 0.0 0.0Monte Cello BV Subsidiary (Payable) (1.0) (1.0)
* Merged with Vedanta Limited w.e.f.27 March 2017 (Refer Note 42).
59. COMPANY SHARE-BASED PAYMENTThe Company had certain LTIP awards outstanding as at 31 March 2017. See note 32 to the financial statements for further details on these share-based payments.
57. COMPANY CONTINGENT LIABILITIES (CONTINUED)
NOTES TO THE FINANCIAL STATEMENTS CONTINUEDFOR THE YEAR ENDED 31 MAY 2017
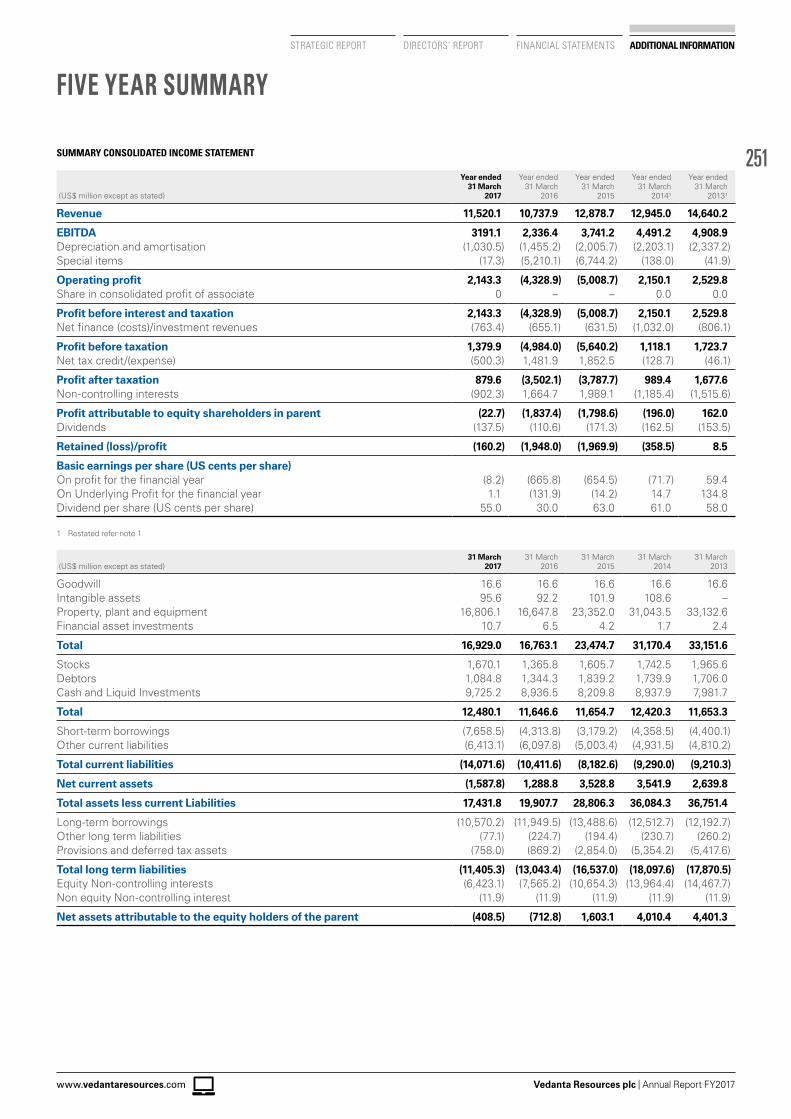
251
Vedanta Resources plc | Annual Report FY2017www.vedantaresources.com
STRATEGIC REPORT DIRECTORS’ REPORT FINANCIAL STATEMENTS ADDITIONAL INFORMATION
FIVE YEAR SUMMARY
SUMMARY CONSOLIDATED INCOME STATEMENT
(US$ million except as stated)
Year ended 31 March
2017
Year ended 31 March
2016
Year ended 31 March
2015
Year ended 31 March
20141
Year ended 31 March
20131
Revenue 11,520.1 10,737.9 12,878.7 12,945.0 14,640.2
EBITDA 3191.1 2,336.4 3,741.2 4,491.2 4,908.9Depreciation and amortisation (1,030.5) (1,455.2) (2,005.7) (2,203.1) (2,337.2)Special items (17.3) (5,210.1) (6,744.2) (138.0) (41.9)
Operating profit 2,143.3 (4,328.9) (5,008.7) 2,150.1 2,529.8Share in consolidated profit of associate 0 – – 0.0 0.0
Profit before interest and taxation 2,143.3 (4,328.9) (5,008.7) 2,150.1 2,529.8Net finance (costs)/investment revenues (763.4) (655.1) (631.5) (1,032.0) (806.1)
Profit before taxation 1,379.9 (4,984.0) (5,640.2) 1,118.1 1,723.7Net tax credit/(expense) (500.3) 1,481.9 1,852.5 (128.7) (46.1)
Profit after taxation 879.6 (3,502.1) (3,787.7) 989.4 1,677.6Non-controlling interests (902.3) 1,664.7 1,989.1 (1,185.4) (1,515.6)
Profit attributable to equity shareholders in parent (22.7) (1,837.4) (1,798.6) (196.0) 162.0Dividends (137.5) (110.6) (171.3) (162.5) (153.5)
Retained (loss)/profit (160.2) (1,948.0) (1,969.9) (358.5) 8.5
Basic earnings per share (US cents per share)On profit for the financial year (8.2) (665.8) (654.5) (71.7) 59.4On Underlying Profit for the financial year 1.1 (131.9) (14.2) 14.7 134.8Dividend per share (US cents per share) 55.0 30.0 63.0 61.0 58.0
1 Restated refer note 1
(US$ million except as stated)31 March
201731 March
201631 March
201531 March
201431 March
2013
Goodwill 16.6 16.6 16.6 16.6 16.6 Intangible assets 95.6 92.2 101.9 108.6 – Property, plant and equipment 16,806.1 16,647.8 23,352.0 31,043.5 33,132.6 Financial asset investments 10.7 6.5 4.2 1.7 2.4
Total 16,929.0 16,763.1 23,474.7 31,170.4 33,151.6
Stocks 1,670.1 1,365.8 1,605.7 1,742.5 1,965.6 Debtors 1,084.8 1,344.3 1,839.2 1,739.9 1,706.0 Cash and Liquid Investments 9,725.2 8,936.5 8,209.8 8,937.9 7,981.7
Total 12,480.1 11,646.6 11,654.7 12,420.3 11,653.3
Short-term borrowings (7,658.5) (4,313.8) (3,179.2) (4,358.5) (4,400.1)Other current liabilities (6,413.1) (6,097.8) (5,003.4) (4,931.5) (4,810.2)
Total current liabilities (14,071.6) (10,411.6) (8,182.6) (9,290.0) (9,210.3)
Net current assets (1,587.8) 1,288.8 3,528.8 3,541.9 2,639.8
Total assets less current Liabilities 17,431.8 19,907.7 28,806.3 36,084.3 36,751.4
Long-term borrowings (10,570.2) (11,949.5) (13,488.6) (12,512.7) (12,192.7)Other long term liabilities (77.1) (224.7) (194.4) (230.7) (260.2)Provisions and deferred tax assets (758.0) (869.2) (2,854.0) (5,354.2) (5,417.6)
Total long term liabilities (11,405.3) (13,043.4) (16,537.0) (18,097.6) (17,870.5)Equity Non-controlling interests (6,423.1) (7,565.2) (10,654.3) (13,964.4) (14,467.7)Non equity Non-controlling interest (11.9) (11.9) (11.9) (11.9) (11.9)
Net assets attributable to the equity holders of the parent (408.5) (712.8) 1,603.1 4,010.4 4,401.3
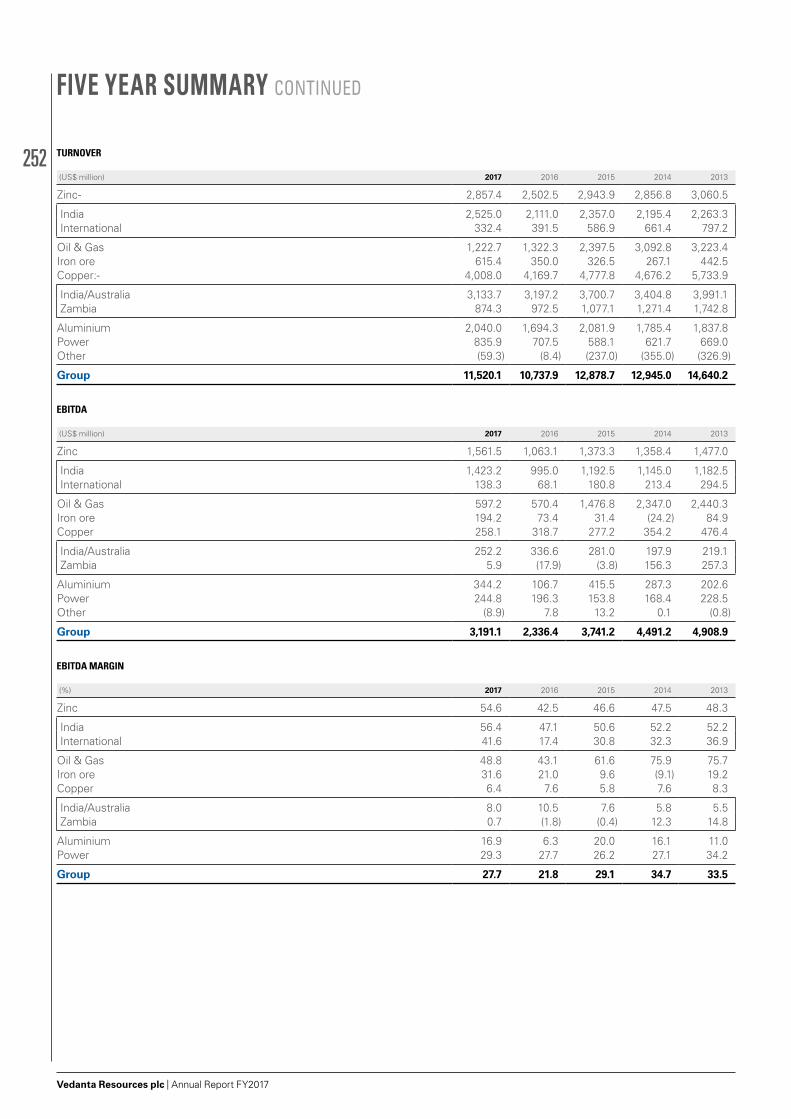
252
Vedanta Resources plc | Annual Report FY2017
TURNOVER
(US$ million) 2017 2016 2015 2014 2013
Zinc- 2,857.4 2,502.5 2,943.9 2,856.8 3,060.5
India 2,525.0 2,111.0 2,357.0 2,195.4 2,263.3 International 332.4 391.5 586.9 661.4 797.2
Oil & Gas 1,222.7 1,322.3 2,397.5 3,092.8 3,223.4 Iron ore 615.4 350.0 326.5 267.1 442.5 Copper:- 4,008.0 4,169.7 4,777.8 4,676.2 5,733.9
India/Australia 3,133.7 3,197.2 3,700.7 3,404.8 3,991.1 Zambia 874.3 972.5 1,077.1 1,271.4 1,742.8
Aluminium 2,040.0 1,694.3 2,081.9 1,785.4 1,837.8 Power 835.9 707.5 588.1 621.7 669.0 Other (59.3) (8.4) (237.0) (355.0) (326.9)
Group 11,520.1 10,737.9 12,878.7 12,945.0 14,640.2
EBITDA
(US$ million) 2017 2016 2015 2014 2013
Zinc 1,561.5 1,063.1 1,373.3 1,358.4 1,477.0
India 1,423.2 995.0 1,192.5 1,145.0 1,182.5 International 138.3 68.1 180.8 213.4 294.5
Oil & Gas 597.2 570.4 1,476.8 2,347.0 2,440.3 Iron ore 194.2 73.4 31.4 (24.2) 84.9 Copper 258.1 318.7 277.2 354.2 476.4
India/Australia 252.2 336.6 281.0 197.9 219.1 Zambia 5.9 (17.9) (3.8) 156.3 257.3
Aluminium 344.2 106.7 415.5 287.3 202.6 Power 244.8 196.3 153.8 168.4 228.5 Other (8.9) 7.8 13.2 0.1 (0.8)
Group 3,191.1 2,336.4 3,741.2 4,491.2 4,908.9
EBITDA MARGIN
(%) 2017 2016 2015 2014 2013
Zinc 54.6 42.5 46.6 47.5 48.3
India 56.4 47.1 50.6 52.2 52.2 International 41.6 17.4 30.8 32.3 36.9
Oil & Gas 48.8 43.1 61.6 75.9 75.7 Iron ore 31.6 21.0 9.6 (9.1) 19.2 Copper 6.4 7.6 5.8 7.6 8.3
India/Australia 8.0 10.5 7.6 5.8 5.5 Zambia 0.7 (1.8) (0.4) 12.3 14.8
Aluminium 16.9 6.3 20.0 16.1 11.0 Power 29.3 27.7 26.2 27.1 34.2
Group 27.7 21.8 29.1 34.7 33.5
FIVE YEAR SUMMARY CONTINUED
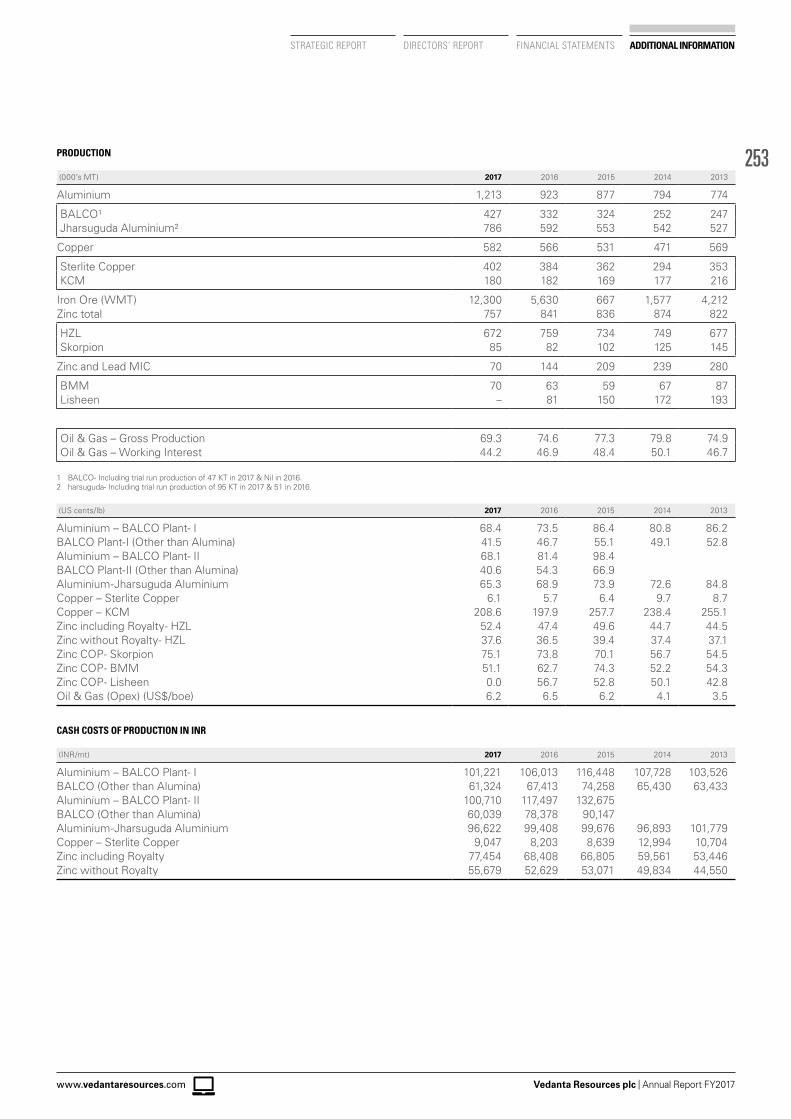
253
Vedanta Resources plc | Annual Report FY2017www.vedantaresources.com
STRATEGIC REPORT DIRECTORS’ REPORT FINANCIAL STATEMENTS ADDITIONAL INFORMATION
PRODUCTION
(000’s MT) 2017 2016 2015 2014 2013
Aluminium 1,213 923 877 794 774
BALCO1 427 332 324 252 247 Jharsuguda Aluminium2 786 592 553 542 527
Copper 582 566 531 471 569
Sterlite Copper 402 384 362 294 353 KCM 180 182 169 177 216
Iron Ore (WMT) 12,300 5,630 667 1,577 4,212 Zinc total 757 841 836 874 822
HZL 672 759 734 749 677 Skorpion 85 82 102 125 145
Zinc and Lead MIC 70 144 209 239 280
BMM 70 63 59 67 87 Lisheen – 81 150 172 193
Oil & Gas – Gross Production 69.3 74.6 77.3 79.8 74.9 Oil & Gas – Working Interest 44.2 46.9 48.4 50.1 46.7 1 BALCO- Including trial run production of 47 KT in 2017 & Nil in 2016.2 harsuguda- Including trial run production of 95 KT in 2017 & 51 in 2016.
(US cents/lb) 2017 2016 2015 2014 2013
Aluminium – BALCO Plant- I 68.4 73.5 86.4 80.8 86.2 BALCO Plant-I (Other than Alumina) 41.5 46.7 55.1 49.1 52.8 Aluminium – BALCO Plant- II 68.1 81.4 98.4 BALCO Plant-II (Other than Alumina) 40.6 54.3 66.9 Aluminium-Jharsuguda Aluminium 65.3 68.9 73.9 72.6 84.8 Copper – Sterlite Copper 6.1 5.7 6.4 9.7 8.7 Copper – KCM 208.6 197.9 257.7 238.4 255.1 Zinc including Royalty- HZL 52.4 47.4 49.6 44.7 44.5 Zinc without Royalty- HZL 37.6 36.5 39.4 37.4 37.1 Zinc COP- Skorpion 75.1 73.8 70.1 56.7 54.5 Zinc COP- BMM 51.1 62.7 74.3 52.2 54.3 Zinc COP- Lisheen 0.0 56.7 52.8 50.1 42.8 Oil & Gas (Opex) (US$/boe) 6.2 6.5 6.2 4.1 3.5
CASH COSTS OF PRODUCTION IN INR
(INR/mt) 2017 2016 2015 2014 2013
Aluminium – BALCO Plant- I 101,221 106,013 116,448 107,728 103,526 BALCO (Other than Alumina) 61,324 67,413 74,258 65,430 63,433 Aluminium – BALCO Plant- II 100,710 117,497 132,675 BALCO (Other than Alumina) 60,039 78,378 90,147 Aluminium-Jharsuguda Aluminium 96,622 99,408 99,676 96,893 101,779 Copper – Sterlite Copper 9,047 8,203 8,639 12,994 10,704 Zinc including Royalty 77,454 68,408 66,805 59,561 53,446 Zinc without Royalty 55,679 52,629 53,071 49,834 44,550
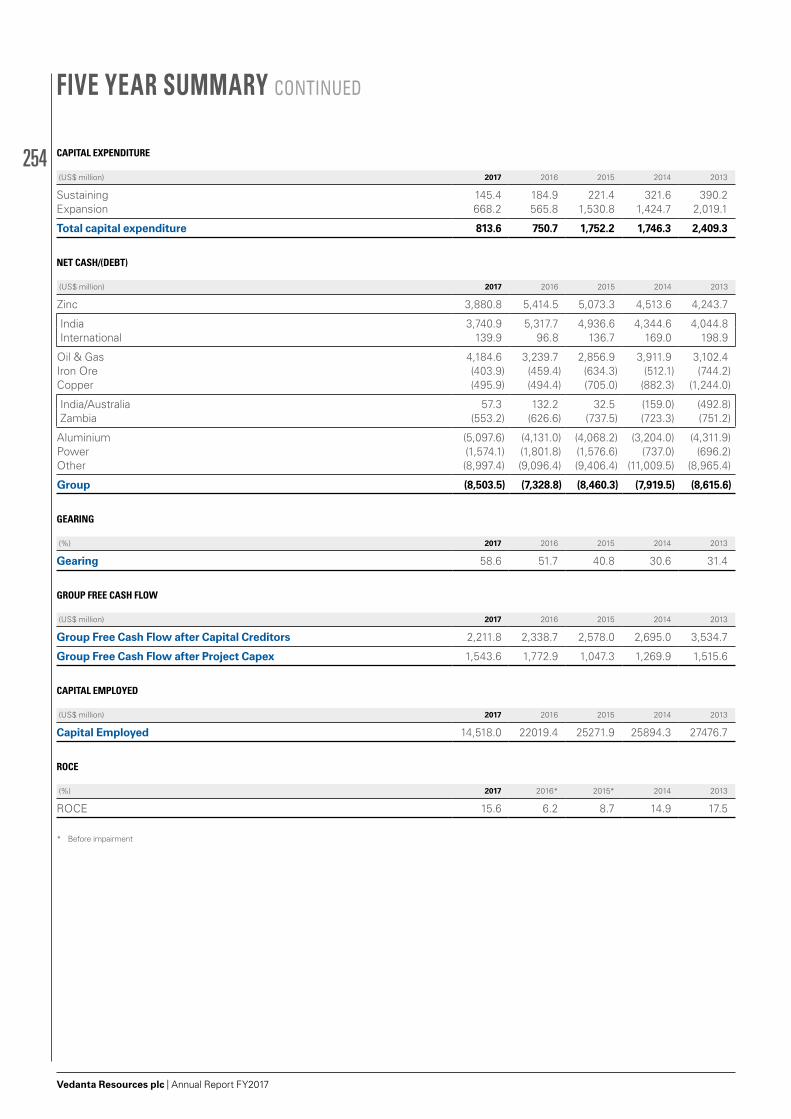
254
Vedanta Resources plc | Annual Report FY2017
CAPITAL EXPENDITURE
(US$ million) 2017 2016 2015 2014 2013
Sustaining 145.4 184.9 221.4 321.6 390.2 Expansion 668.2 565.8 1,530.8 1,424.7 2,019.1
Total capital expenditure 813.6 750.7 1,752.2 1,746.3 2,409.3
NET CASH/(DEBT)
(US$ million) 2017 2016 2015 2014 2013
Zinc 3,880.8 5,414.5 5,073.3 4,513.6 4,243.7
India 3,740.9 5,317.7 4,936.6 4,344.6 4,044.8 International 139.9 96.8 136.7 169.0 198.9
Oil & Gas 4,184.6 3,239.7 2,856.9 3,911.9 3,102.4 Iron Ore (403.9) (459.4) (634.3) (512.1) (744.2)Copper (495.9) (494.4) (705.0) (882.3) (1,244.0)
India/Australia 57.3 132.2 32.5 (159.0) (492.8) Zambia (553.2) (626.6) (737.5) (723.3) (751.2)
Aluminium (5,097.6) (4,131.0) (4,068.2) (3,204.0) (4,311.9)Power (1,574.1) (1,801.8) (1,576.6) (737.0) (696.2)Other (8,997.4) (9,096.4) (9,406.4) (11,009.5) (8,965.4)
Group (8,503.5) (7,328.8) (8,460.3) (7,919.5) (8,615.6)
GEARING
(%) 2017 2016 2015 2014 2013
Gearing 58.6 51.7 40.8 30.6 31.4
GROUP FREE CASH FLOW
(US$ million) 2017 2016 2015 2014 2013
Group Free Cash Flow after Capital Creditors 2,211.8 2,338.7 2,578.0 2,695.0 3,534.7
Group Free Cash Flow after Project Capex 1,543.6 1,772.9 1,047.3 1,269.9 1,515.6
CAPITAL EMPLOYED
(US$ million) 2017 2016 2015 2014 2013
Capital Employed 14,518.0 22019.4 25271.9 25894.3 27476.7
ROCE
(%) 2017 2016* 2015* 2014 2013
ROCE 15.6 6.2 8.7 14.9 17.5
* Before impairment
FIVE YEAR SUMMARY CONTINUED
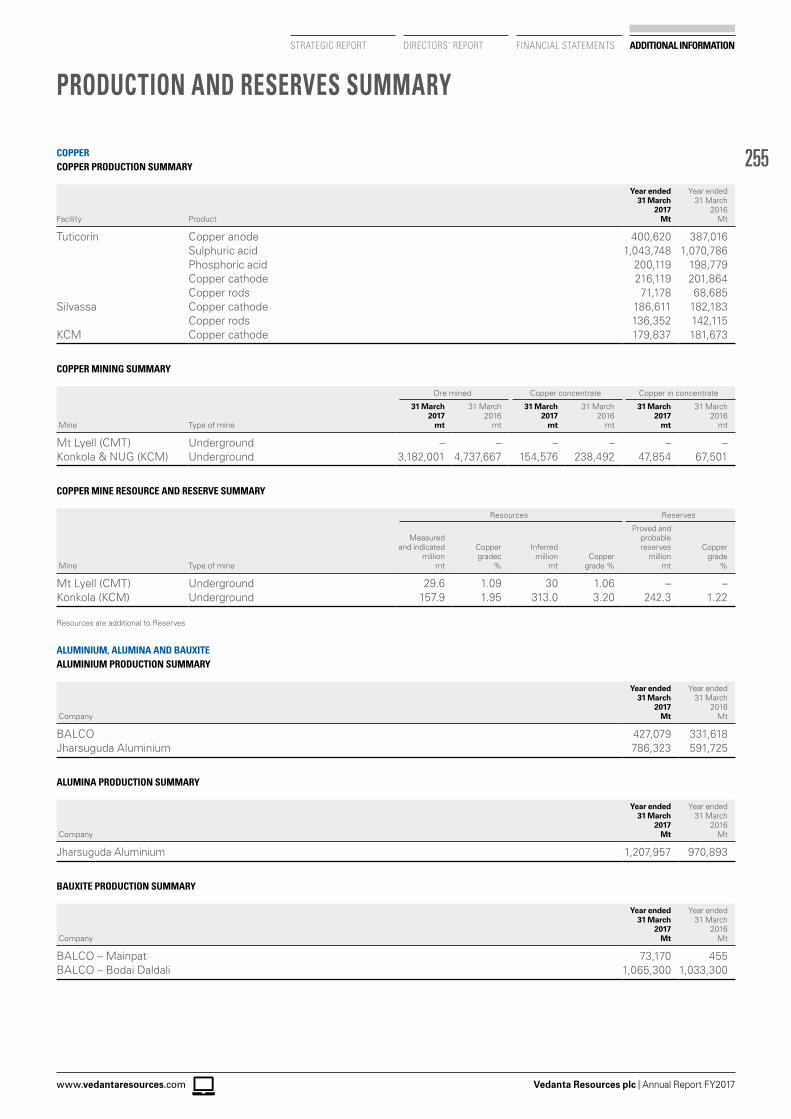
255
Vedanta Resources plc | Annual Report FY2017www.vedantaresources.com
STRATEGIC REPORT DIRECTORS’ REPORT FINANCIAL STATEMENTS ADDITIONAL INFORMATION
COPPERCOPPER PRODUCTION SUMMARY
Facility Product
Year ended 31 March
2017Mt
Year ended 31 March
2016 Mt
Tuticorin Copper anode 400,620 387,016Sulphuric acid 1,043,748 1,070,786Phosphoric acid 200,119 198,779Copper cathode 216,119 201,864Copper rods 71,178 68,685
Silvassa Copper cathode 186,611 182,183Copper rods 136,352 142,115
KCM Copper cathode 179,837 181,673
COPPER MINING SUMMARY
Ore mined Copper concentrate Copper in concentrate
Mine Type of mine
31 March 2017
mt
31 March 2016
mt
31 March 2017
mt
31 March 2016
mt
31 March 2017
mt
31 March 2016
mt
Mt Lyell (CMT) Underground – – – – – –Konkola & NUG (KCM) Underground 3,182,001 4,737,667 154,576 238,492 47,854 67,501
COPPER MINE RESOURCE AND RESERVE SUMMARY
Resources Reserves
Mine Type of mine
Measured and indicated
million mt
Copper gradec
%
Inferred million
mtCopper
grade %
Proved and probable reserves
million mt
Copper grade
%
Mt Lyell (CMT) Underground 29.6 1.09 30 1.06 – –Konkola (KCM) Underground 157.9 1.95 313.0 3.20 242.3 1.22
Resources are additional to Reserves
ALUMINIUM, ALUMINA AND BAUXITEALUMINIUM PRODUCTION SUMMARY
Company
Year ended 31 March
2017 Mt
Year ended 31 March
2016 Mt
BALCO 427,079 331,618Jharsuguda Aluminium 786,323 591,725
ALUMINA PRODUCTION SUMMARY
Company
Year ended 31 March
2017 Mt
Year ended 31 March
2016 Mt
Jharsuguda Aluminium 1,207,957 970,893
BAUXITE PRODUCTION SUMMARY
Company
Year ended 31 March
2017 Mt
Year ended 31 March
2016 Mt
BALCO – Mainpat 73,170 455BALCO – Bodai Daldali 1,065,300 1,033,300
PRODUCTION AND RESERVES SUMMARY
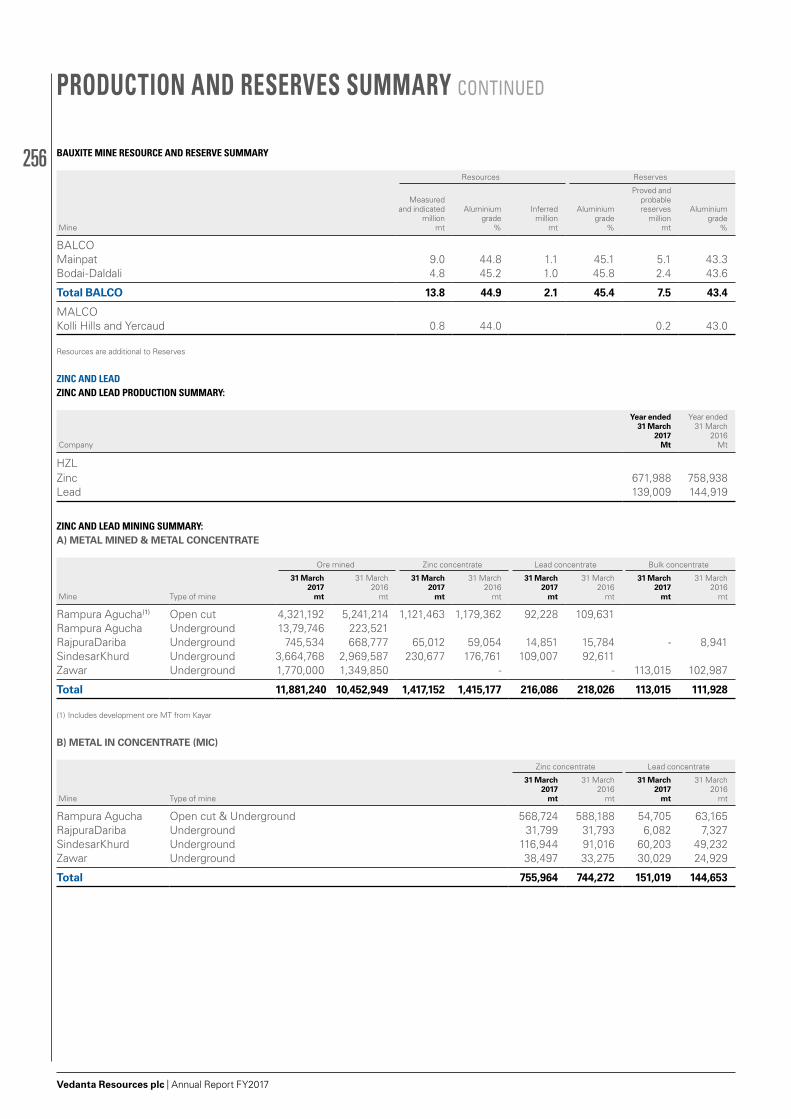
256
Vedanta Resources plc | Annual Report FY2017
BAUXITE MINE RESOURCE AND RESERVE SUMMARY
Resources Reserves
Mine
Measured and indicated
million mt
Aluminium grade
%
Inferred million
mt
Aluminium grade
%
Proved and probable reserves
million mt
Aluminium grade
%
BALCOMainpat 9.0 44.8 1.1 45.1 5.1 43.3Bodai-Daldali 4.8 45.2 1.0 45.8 2.4 43.6
Total BALCO 13.8 44.9 2.1 45.4 7.5 43.4
MALCOKolli Hills and Yercaud 0.8 44.0 0.2 43.0
Resources are additional to Reserves
ZINC AND LEADZINC AND LEAD PRODUCTION SUMMARY:
Company
Year ended 31 March
2017 Mt
Year ended 31 March
2016 Mt
HZLZinc 671,988 758,938Lead 139,009 144,919
ZINC AND LEAD MINING SUMMARY:A) METAL MINED & METAL CONCENTRATE
Ore mined Zinc concentrate Lead concentrate Bulk concentrate
Mine Type of mine
31 March 2017
mt
31 March 2016
mt
31 March 2017
mt
31 March 2016
mt
31 March 2017
mt
31 March 2016
mt
31 March 2017
mt
31 March 2016
mt
Rampura Agucha(1) Open cut 4,321,192 5,241,214 1,121,463 1,179,362 92,228 109,631Rampura Agucha Underground 13,79,746 223,521RajpuraDariba Underground 745,534 668,777 65,012 59,054 14,851 15,784 - 8,941SindesarKhurd Underground 3,664,768 2,969,587 230,677 176,761 109,007 92,611Zawar Underground 1,770,000 1,349,850 - - 113,015 102,987
Total 11,881,240 10,452,949 1,417,152 1,415,177 216,086 218,026 113,015 111,928
(1) Includes development ore MT from Kayar
B) METAL IN CONCENTRATE (MIC)
Zinc concentrate Lead concentrate
Mine Type of mine
31 March 2017
mt
31 March 2016
mt
31 March 2017
mt
31 March 2016
mt
Rampura Agucha Open cut & Underground 568,724 588,188 54,705 63,165RajpuraDariba Underground 31,799 31,793 6,082 7,327SindesarKhurd Underground 116,944 91,016 60,203 49,232Zawar Underground 38,497 33,275 30,029 24,929
Total 755,964 744,272 151,019 144,653
PRODUCTION AND RESERVES SUMMARY CONTINUED
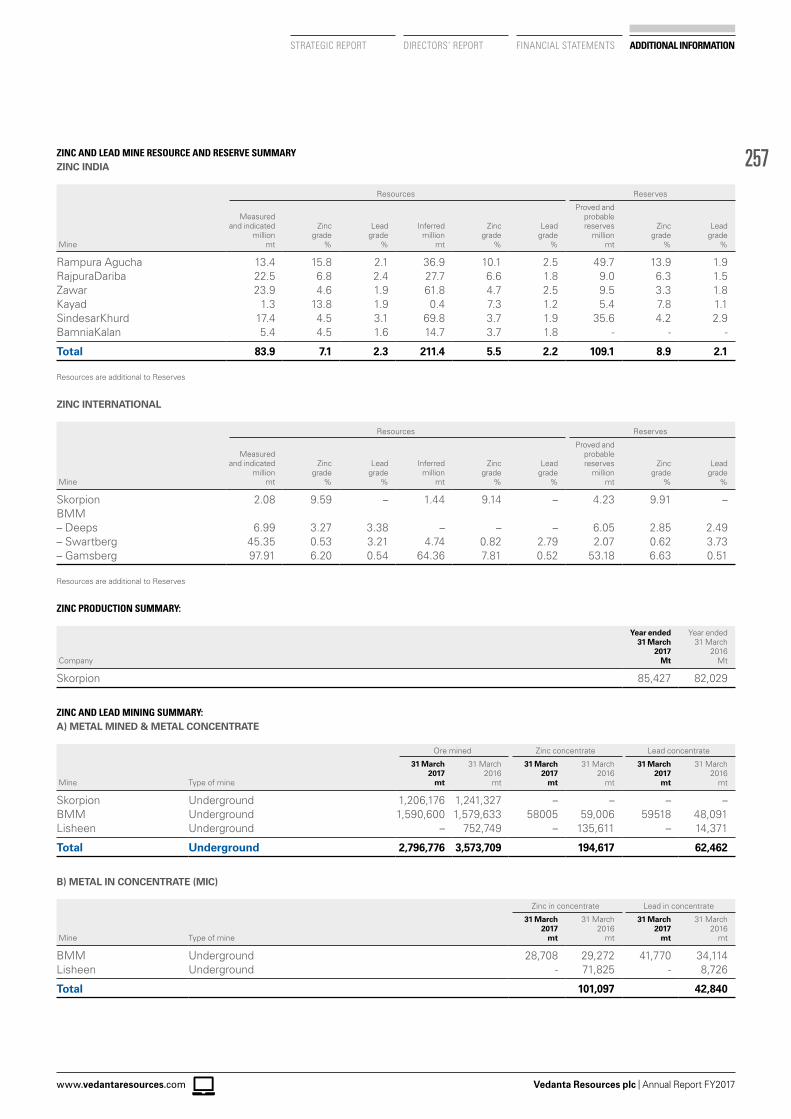
257
Vedanta Resources plc | Annual Report FY2017www.vedantaresources.com
STRATEGIC REPORT DIRECTORS’ REPORT FINANCIAL STATEMENTS ADDITIONAL INFORMATION
ZINC AND LEAD MINE RESOURCE AND RESERVE SUMMARYZINC INDIA
Resources Reserves
Mine
Measured and indicated
million mt
Zinc grade
%
Lead grade
%
Inferred million
mt
Zinc grade
%
Lead grade
%
Proved and probable reserves
million mt
Zinc grade
%
Lead grade
%
Rampura Agucha 13.4 15.8 2.1 36.9 10.1 2.5 49.7 13.9 1.9RajpuraDariba 22.5 6.8 2.4 27.7 6.6 1.8 9.0 6.3 1.5Zawar 23.9 4.6 1.9 61.8 4.7 2.5 9.5 3.3 1.8Kayad 1.3 13.8 1.9 0.4 7.3 1.2 5.4 7.8 1.1SindesarKhurd 17.4 4.5 3.1 69.8 3.7 1.9 35.6 4.2 2.9BamniaKalan 5.4 4.5 1.6 14.7 3.7 1.8 - - -
Total 83.9 7.1 2.3 211.4 5.5 2.2 109.1 8.9 2.1
Resources are additional to Reserves
ZINC INTERNATIONAL
Resources Reserves
Mine
Measured and indicated
million mt
Zinc grade
%
Lead grade
%
Inferred million
mt
Zinc grade
%
Lead grade
%
Proved and probable reserves
million mt
Zinc grade
%
Lead grade
%
Skorpion 2.08 9.59 – 1.44 9.14 – 4.23 9.91 –BMM– Deeps 6.99 3.27 3.38 – – – 6.05 2.85 2.49– Swartberg 45.35 0.53 3.21 4.74 0.82 2.79 2.07 0.62 3.73– Gamsberg 97.91 6.20 0.54 64.36 7.81 0.52 53.18 6.63 0.51
Resources are additional to Reserves
ZINC PRODUCTION SUMMARY:
Company
Year ended 31 March
2017 Mt
Year ended 31 March
2016 Mt
Skorpion 85,427 82,029
ZINC AND LEAD MINING SUMMARY:A) METAL MINED & METAL CONCENTRATE
Ore mined Zinc concentrate Lead concentrate
Mine Type of mine
31 March 2017
mt
31 March 2016
mt
31 March 2017
mt
31 March 2016
mt
31 March 2017
mt
31 March 2016
mt
Skorpion Underground 1,206,176 1,241,327 – – – –BMM Underground 1,590,600 1,579,633 58005 59,006 59518 48,091Lisheen Underground – 752,749 – 135,611 – 14,371
Total Underground 2,796,776 3,573,709 194,617 62,462
B) METAL IN CONCENTRATE (MIC)
Zinc in concentrate Lead in concentrate
Mine Type of mine
31 March 2017
mt
31 March 2016
mt
31 March 2017
mt
31 March 2016
mt
BMM Underground 28,708 29,272 41,770 34,114Lisheen Underground - 71,825 - 8,726
Total 101,097 42,840
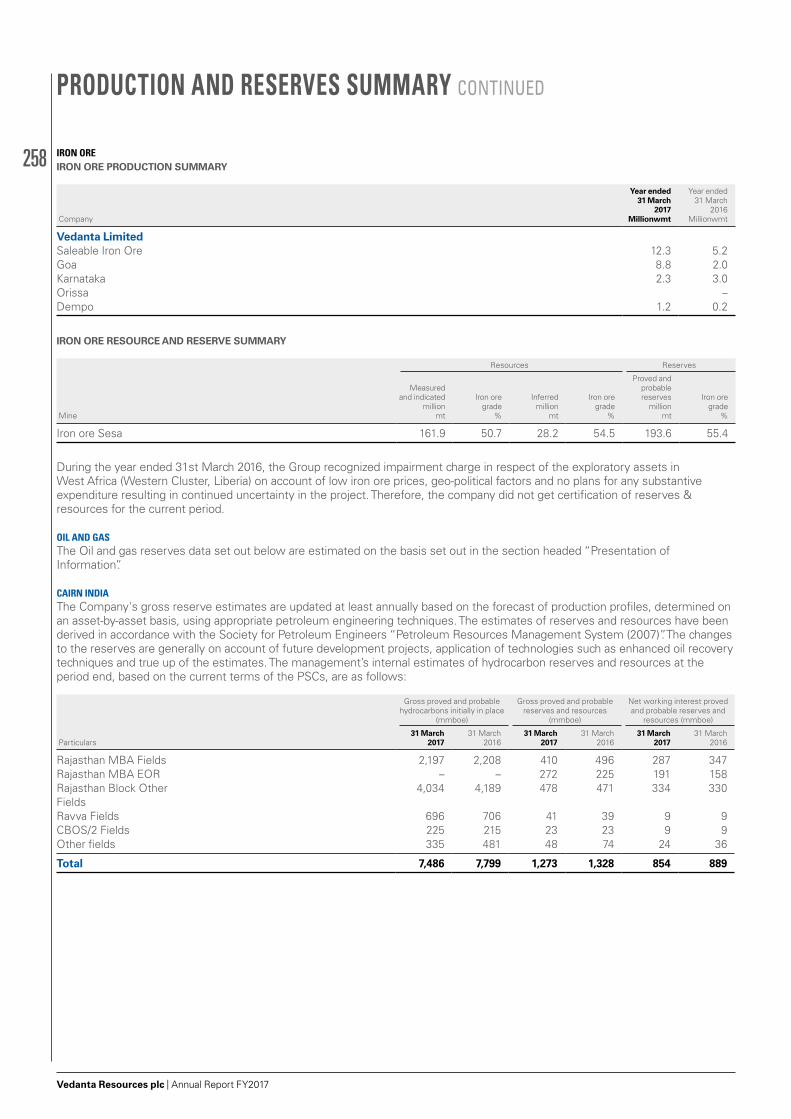
258
Vedanta Resources plc | Annual Report FY2017
IRON OREIRON ORE PRODUCTION SUMMARY
Company
Year ended 31 March
2017 Millionwmt
Year ended 31 March
2016 Millionwmt
Vedanta LimitedSaleable Iron Ore 12.3 5.2Goa 8.8 2.0Karnataka 2.3 3.0Orissa –Dempo 1.2 0.2
IRON ORE RESOURCE AND RESERVE SUMMARY
Resources Reserves
Mine
Measured and indicated
million mt
Iron ore grade
%
Inferred million
mt
Iron ore grade
%
Proved and probable reserves
million mt
Iron ore grade
%
Iron ore Sesa 161.9 50.7 28.2 54.5 193.6 55.4
During the year ended 31st March 2016, the Group recognized impairment charge in respect of the exploratory assets in West Africa (Western Cluster, Liberia) on account of low iron ore prices, geo-political factors and no plans for any substantive expenditure resulting in continued uncertainty in the project. Therefore, the company did not get certification of reserves & resources for the current period.
OIL AND GASThe Oil and gas reserves data set out below are estimated on the basis set out in the section headed “Presentation of Information”.
CAIRN INDIAThe Company's gross reserve estimates are updated at least annually based on the forecast of production profiles, determined on an asset-by-asset basis, using appropriate petroleum engineering techniques. The estimates of reserves and resources have been derived in accordance with the Society for Petroleum Engineers “Petroleum Resources Management System (2007)”. The changes to the reserves are generally on account of future development projects, application of technologies such as enhanced oil recovery techniques and true up of the estimates. The management’s internal estimates of hydrocarbon reserves and resources at the period end, based on the current terms of the PSCs, are as follows:
Gross proved and probable hydrocarbons initially in place
(mmboe)
Gross proved and probable reserves and resources
(mmboe)
Net working interest proved and probable reserves and
resources (mmboe)
Particulars31 March
201731 March
201631 March
201731 March
201631 March
201731 March
2016
Rajasthan MBA Fields 2,197 2,208 410 496 287 347Rajasthan MBA EOR – – 272 225 191 158Rajasthan Block Other 4,034 4,189 478 471 334 330FieldsRavva Fields 696 706 41 39 9 9CBOS/2 Fields 225 215 23 23 9 9Other fields 335 481 48 74 24 36
Total 7,486 7,799 1,273 1,328 854 889
PRODUCTION AND RESERVES SUMMARY CONTINUED
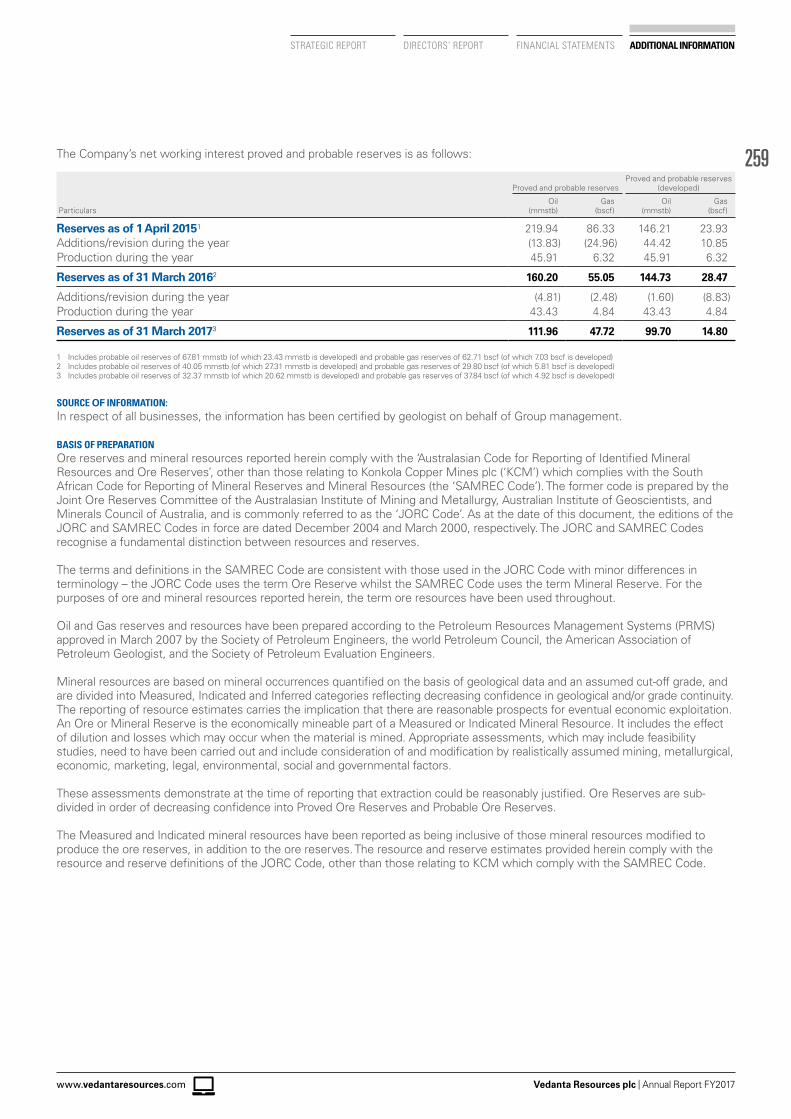
259
Vedanta Resources plc | Annual Report FY2017www.vedantaresources.com
STRATEGIC REPORT DIRECTORS’ REPORT FINANCIAL STATEMENTS ADDITIONAL INFORMATION
The Company’s net working interest proved and probable reserves is as follows:
Proved and probable reservesProved and probable reserves
(developed)
ParticularsOil
(mmstb)Gas
(bscf)Oil
(mmstb)Gas
(bscf)
Reserves as of 1 April 20151 219.94 86.33 146.21 23.93Additions/revision during the year (13.83) (24.96) 44.42 10.85Production during the year 45.91 6.32 45.91 6.32
Reserves as of 31 March 20162 160.20 55.05 144.73 28.47
Additions/revision during the year (4.81) (2.48) (1.60) (8.83)Production during the year 43.43 4.84 43.43 4.84
Reserves as of 31 March 20173 111.96 47.72 99.70 14.80
1 Includes probable oil reserves of 67.81 mmstb (of which 23.43 mmstb is developed) and probable gas reserves of 62.71 bscf (of which 7.03 bscf is developed)2 Includes probable oil reserves of 40.05 mmstb (of which 27.31 mmstb is developed) and probable gas reserves of 29.80 bscf (of which 5.81 bscf is developed)3 Includes probable oil reserves of 32.37 mmstb (of which 20.62 mmstb is developed) and probable gas reserves of 37.84 bscf (of which 4.92 bscf is developed)
SOURCE OF INFORMATION:In respect of all businesses, the information has been certified by geologist on behalf of Group management.
BASIS OF PREPARATIONOre reserves and mineral resources reported herein comply with the ‘Australasian Code for Reporting of Identified Mineral Resources and Ore Reserves’, other than those relating to Konkola Copper Mines plc (‘KCM’) which complies with the South African Code for Reporting of Mineral Reserves and Mineral Resources (the ‘SAMREC Code’). The former code is prepared by the Joint Ore Reserves Committee of the Australasian Institute of Mining and Metallurgy, Australian Institute of Geoscientists, and Minerals Council of Australia, and is commonly referred to as the ‘JORC Code’. As at the date of this document, the editions of the JORC and SAMREC Codes in force are dated December 2004 and March 2000, respectively. The JORC and SAMREC Codes recognise a fundamental distinction between resources and reserves.
The terms and definitions in the SAMREC Code are consistent with those used in the JORC Code with minor differences in terminology – the JORC Code uses the term Ore Reserve whilst the SAMREC Code uses the term Mineral Reserve. For the purposes of ore and mineral resources reported herein, the term ore resources have been used throughout.
Oil and Gas reserves and resources have been prepared according to the Petroleum Resources Management Systems (PRMS) approved in March 2007 by the Society of Petroleum Engineers, the world Petroleum Council, the American Association of Petroleum Geologist, and the Society of Petroleum Evaluation Engineers.
Mineral resources are based on mineral occurrences quantified on the basis of geological data and an assumed cut-off grade, and are divided into Measured, Indicated and Inferred categories reflecting decreasing confidence in geological and/or grade continuity. The reporting of resource estimates carries the implication that there are reasonable prospects for eventual economic exploitation. An Ore or Mineral Reserve is the economically mineable part of a Measured or Indicated Mineral Resource. It includes the effect of dilution and losses which may occur when the material is mined. Appropriate assessments, which may include feasibility studies, need to have been carried out and include consideration of and modification by realistically assumed mining, metallurgical, economic, marketing, legal, environmental, social and governmental factors.
These assessments demonstrate at the time of reporting that extraction could be reasonably justified. Ore Reserves are sub-divided in order of decreasing confidence into Proved Ore Reserves and Probable Ore Reserves.
The Measured and Indicated mineral resources have been reported as being inclusive of those mineral resources modified to produce the ore reserves, in addition to the ore reserves. The resource and reserve estimates provided herein comply with the resource and reserve definitions of the JORC Code, other than those relating to KCM which comply with the SAMREC Code.
260
Vedanta Resources plc | Annual Report FY2017
OTHER INFORMATION:
ALTERNATIVE PERFORMANCE MEASURES INTRODUCTIONVedanta Group is committed to providing timely and clear information on financial and operational performance to investors, lenders and other external parties, in the form of annual reports, disclosures, RNS feeds and other communications. We regard high standards of disclosure as critical to business success.
Alternative Performance Measure (APM) is an evaluation metric of financial performance, financial position or cash flows that is not defined or specified under International Financial Reporting Standards (IFRS).
The APMs used by the group fall under two categories:
› Financial APMs: These financial metrics are usually derived from financial statements, prepared in accordance with IFRS. Certain financials metrics cannot be directly derived from the financial statements as they contain additional information such as profit estimates or projections, impact of macro-economic factors and changes in regulatory environment on financial performance.
› Non-Financial APMs: These metrics incorporate non – financial information that management believes is useful in assessing the performance of the group.
APMs are not uniformly defined by all the companies, including those in the Group’s industry. APM’s should be considered in addition to, and not a substitute for or as superior to, measures of financial performance, financial position or cash flows reported in accordance with IFRS.
PURPOSEThe Group uses APMs to improve comparability of information between reporting periods and business units, either by adjusting for uncontrollable or one-off factors which impacts upon IFRS measures or, by aggregating measures, to aid the user of the Annual Report in understanding the activity taking place across the Group’s portfolio.
APMs are used to provide valuable insight to analysts and investors along with Generally Accepted Accounting Practices (GAAP). We believe these measures assist in providing a holistic view of the company’s performance.
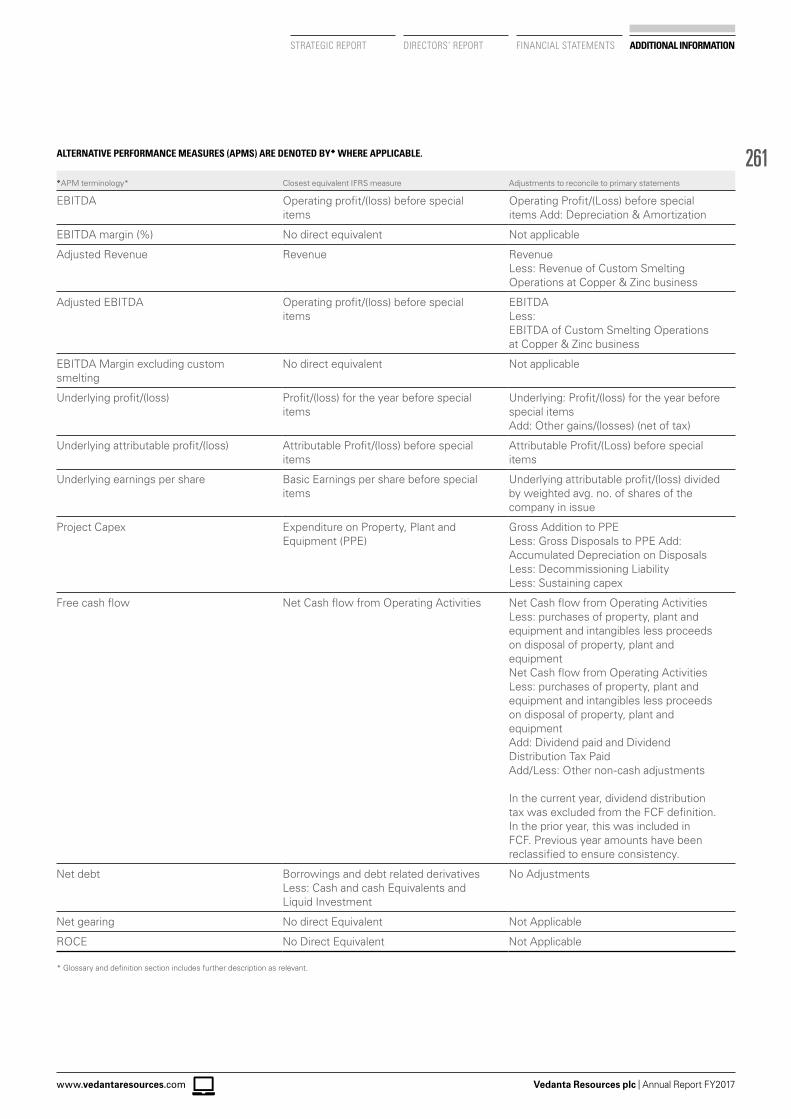
261
Vedanta Resources plc | Annual Report FY2017www.vedantaresources.com
STRATEGIC REPORT DIRECTORS’ REPORT FINANCIAL STATEMENTS ADDITIONAL INFORMATION
ALTERNATIVE PERFORMANCE MEASURES (APMS) ARE DENOTED BY WHERE APPLICABLE.
APM terminology* Closest equivalent IFRS measure Adjustments to reconcile to primary statements
EBITDA Operating profit/(loss) before special items
Operating Profit/(Loss) before special items Add: Depreciation & Amortization
EBITDA margin (%) No direct equivalent Not applicable
Adjusted Revenue Revenue RevenueLess: Revenue of Custom Smelting Operations at Copper & Zinc business
Adjusted EBITDA Operating profit/(loss) before special items
EBITDALess:EBITDA of Custom Smelting Operations at Copper & Zinc business
EBITDA Margin excluding custom smelting
No direct equivalent Not applicable
Underlying profit/(loss) Profit/(loss) for the year before special items
Underlying: Profit/(loss) for the year before special itemsAdd: Other gains/(losses) (net of tax)
Underlying attributable profit/(loss) Attributable Profit/(loss) before special items
Attributable Profit/(Loss) before special items
Underlying earnings per share Basic Earnings per share before special items
Underlying attributable profit/(loss) divided by weighted avg. no. of shares of the company in issue
Project Capex Expenditure on Property, Plant and Equipment (PPE)
Gross Addition to PPE Less: Gross Disposals to PPE Add: Accumulated Depreciation on DisposalsLess: Decommissioning Liability Less: Sustaining capex
Free cash flow Net Cash flow from Operating Activities Net Cash flow from Operating Activities Less: purchases of property, plant and equipment and intangibles less proceeds on disposal of property, plant and equipmentNet Cash flow from Operating Activities Less: purchases of property, plant and equipment and intangibles less proceeds on disposal of property, plant and equipmentAdd: Dividend paid and Dividend Distribution Tax PaidAdd/Less: Other non-cash adjustments
In the current year, dividend distribution tax was excluded from the FCF definition. In the prior year, this was included in FCF. Previous year amounts have been reclassified to ensure consistency.
Net debt Borrowings and debt related derivativesLess: Cash and cash Equivalents and Liquid Investment
No Adjustments
Net gearing No direct Equivalent Not Applicable
ROCE No Direct Equivalent Not Applicable * Glossary and definition section includes further description as relevant.
262
Vedanta Resources plc | Annual Report FY2017
GLOSSARY AND DEFINITIONS
5SA Japanese concept laying emphasis on housekeeping and occupational safety in a sequential series of steps as Sort (Seiri); Set in Order (Seiton); Shine (Selso); Standardise (Seiketsu); and Sustain (Shitsuke)
ADAPTED COMPARATOR GROUPThe new comparator group of companies used for the purpose of comparing TSR performance in relation to the LTIP, adopted by the Remuneration Committee on 1 February 2006 and replacing the previous comparator group comprising companies constituting the FTSE Worldwide Mining Index (excluding precious metals)
AGM OR ANNUAL GENERAL MEETINGThe annual general meeting of the Company which is scheduled to be held at 3.00pm, UK time, on 14 August 2017
AEAnode effects
ALUMINIUM BUSINESSThe aluminium business of the Group, comprising of its fully-integrated bauxite mining, alumina refining and aluminium smelting operations in India, and trading through the Bharat Aluminium Company Limited and Jharsuguda Aluminium (a division of Vedanta Limited), in India
ARTICLES OF ASSOCIATIONThe articles of association of Vedanta Resources plc
ATTRIBUTABLE PROFITProfit for the financial year before dividends attributable to the equity shareholders of Vedanta Resources plc
BALCOBharat Aluminium Company Limited, a company incorporated in India.
BMMBlack Mountain Mining Pty
BOARD OR VEDANTA BOARDThe board of directors of the Company
BOARD COMMITTEESThe committees reporting to the Board: Audit, Remuneration, Nominations, and Sustainability, each with its own terms of reference
BUSINESSESThe Aluminium Business, the Copper Business, the Zinc, lead, silver, Iron ore, Power and Oil & Gas Business together
CAIRN INDIAErstwhile Cairn India Limited and its subsidiaries
CAPITAL EMPLOYEDNet assets before Net (Debt)/Cash
CAPEXCapital expenditure
CASH TAX RATECurrent taxation as a percentage of profit before taxation
CEOChief executive officer
CFOChief Financial Officer
CIIConfederation of Indian Industries
CLZSChanderiya lead and zinc smelter
CO2
Carbon dioxide
CMTCopper Mines of Tasmania Pty Limited, a company incorporated in Australia
COMPANY OR VEDANTAVedanta Resources plc
COMPANY FINANCIAL STATEMENTSThe audited financial statements for the Company for the year ended 31 March 2017 as defined in the Independent Auditors’ Report on the individual Company Financial Statements to the members of Vedanta Resources plc
CONVERTIBLE BONDS$1,250 million 5.5% guaranteed convertible bonds due 2016, issued by a wholly owned subsidiary of the Company, Vedanta Resource Jersey Limited (‘VRJL’) and guaranteed by the Company, the proceeds of which are to be applied for to support its organic growth pipeline, to increase its ownership interest in its subsidiaries and for general corporate purposes.
$883 million 4.0% guaranteed convertible bonds due 2017, issued by a wholly owned subsidiary of the Company, Vedanta Resource Jersey II Limited (‘VRJL-II’) and guaranteed by the Company, the proceeds of which are to be applied for to refinance debt redemptions and for general corporate purposes.
COPPER BUSINESSThe copper business of the Group, comprising: › A copper smelter, two refineries and two copper rod plants
in India, trading through Vedanta Limited, a company incorporated in India;
› One copper mine in Australia, trading through Copper Mines of Tasmania Pty Limited, a company incorporated in Australia; and
› An integrated operation in Zambia consisting of three mines, a leaching plant and a smelter, trading through Konkola Copper Mines PLC, a company incorporated in Zambia
CREPCorporate responsibility for environmental protection
CENTS/LBUS cents per pound
CRRICentral Road Research Institute
263
Vedanta Resources plc | Annual Report FY2017www.vedantaresources.com
STRATEGIC REPORT DIRECTORS’ REPORT FINANCIAL STATEMENTS ADDITIONAL INFORMATION
CRISILCRISIL Limited is a rating agency incorporated in India
CSRCorporate social responsibility
CTCCost to company, the basic remuneration of executives in India, which represents an aggregate figure encompassing basic pay, pension contributions and allowances
CYCalendar year
DDTDividend distribution tax
DEFERRED SHARESDeferred shares of £1.00 each in the Company
DFSDetailed feasibility study
DGMSDirector General of Mine Safety in the Government of India
DIRECTORSThe Directors of the Company
DMFDistrict Mineral Fund
DMTDry metric tonne
DOLLAR OR $United States Dollars, the currency of the United States of America
EACExpert advisory committee
EBITDAEBITDA is a non-IFRS measure and represents earnings before special items, depreciation, amortisation, other gains and losses, interest and tax.
EBITDA MARGINEBITDA as a percentage of turnover
EBITDA INTEREST COVEREBITDA divided by gross finance costs excluding accretive interest on convertible bonds, unwinding of discount on provisions, interest on defined benefit arrangements less investment revenue
EBITDA MARGIN EXCLUDING CUSTOM SMELTINGEBITDA Margin excluding EBITDA and turnover from custom smelting of Copper India, Copper Zambia and Zinc India businesses
ECONOMIC HOLDINGS OR ECONOMIC INTERESTThe economic holdings/interest are derived by combining the Group’s direct and indirect shareholdings in the operating companies. The Group’s Economic Holdings/Interest is the basis on which the Attributable Profit and net assets are determined in the consolidated accounts
E&OHSASEnvironment and occupational health and safety assessment standards
E&OHSEnvironment and occupational health and safety management system
EPSEarnings per ordinary share
ESOPEmployee share option plan
ESPElectrostatic precipitator
EXECUTIVE COMMITTEEThe Executive Committee to whom the Board has delegated operational management. It comprises of the Executive Vice Chairman, Chief Executive Officer and the senior management of the Group
EXECUTIVE DIRECTORSThe Executive Directors of the Company
EXPANSION CAPITAL EXPENDITURECapital expenditure that increases the Group’s operating capacity
FINANCIAL STATEMENTS OR GROUP FINANCIAL STATEMENTSThe consolidated financial statements for the Company and the Group for the year ended 31 March 2017 as defined in the Independent Auditor’s Report to the members of Vedanta Resources plc
FYFinancial year i.e. April to March.
GAAP, INCLUDING UK GAAP AND INDIAN GAAPGenerally Accepted Accounting Principles, the common set of accounting principles, standards and procedures that companies use to compile their financial statements in their respective local territories
GDPGross domestic product
GEARINGNet Debt as a percentage of Capital Employed
GJGiga joule
GOVERNMENT OR INDIAN GOVERNMENTThe Government of the Republic of India
264
Vedanta Resources plc | Annual Report FY2017
GLOSSARY AND DEFINITIONS CONTINUED
GRATUITYA defined contribution pension arrangement providing pension benefits consistent with Indian market practices
GROUPThe Company and its subsidiary undertakings and, where appropriate, its associate undertaking
GROSS FINANCE COSTSFinance costs before capitalisation of borrowing costs
HIIPHydrocarbons initially-in place
HSEHealth, safety and environment
HZLHindustan Zinc Limited, a company incorporated in India
IASInternational Accounting Standards
ICMMInternational Council on Mining and Metals
IFRICIFRS Interpretations Committee
IFRSInternational Financial Reporting Standards
INRIndian Rupees
INTEREST COVEREBITDA divided by finance costs
IPPIndependent Power Plant
ISO 9001An international quality management system standard published by the International Organisation for Standardisation
ISO 14001An international environmental management system standard published by the International Organisation for Standardisation
IRON ORE SESAIron ore Division of Vedanta Limited, comprising of a Iron ore mines in Goa and Karnataka in India.
JHARSUGUDA ALUMINIUMAluminium Division of Vedanta Limited, comprising of an aluminium refining and smelting facilities at Jharsuguda and Lanjigarh in Odisha in India.
KCM OR KONKOLA COPPER MINESKonkola Copper Mines PLC, a company incorporated in Zambia
KDMPKonkola deep mining project
KEY RESULT AREAS OR KRA SFor the purpose of the remuneration report, specific personal targets set as an incentive to achieve short-term goals for the purpose of awarding bonuses, thereby linking individual performance to corporate performance
KLDKilo litres per day
KPIsKey performance indicators
KTPAThousand Tonne Per Annum
KwHKilo-watt hour
KwH/DKilo-watt hour per day
LIBORLondon inter bank offered rate
LICLife Insurance Corporation
LISTING OR IPO (INITIAL PUBLIC OFFERING)The listing of the Company’s ordinary shares on the London Stock Exchange on 10 December 2003
LISTING PARTICULARSThe listing particulars dated 5 December 2003 issued by the Company in connection with its Listing or revised listing filled in 2011.
LISTING RULESThe listing rules of the Financial Services Authority, with which companies with securities that are listed in the UK must comply
LMELondon Metals Exchange
LONDON STOCK EXCHANGELondon Stock Exchange plc
LOST TIME INJURYAn accident/injury forcing the employee/contractor to remain away from his/her work beyond the day of the accident
LTIFRLost time injury frequency rate: the number of lost time injuries per million man hours worked
LTIPThe Vedanta Resources Long-Term Incentive Plan or Long-Term Incentive Plan
MALCOThe Madras Aluminium Company Limited, a company incorporated in India
MANAGEMENT ASSURANCE SERVICES (MAS)The function through which the Group’s internal audit activities are managed
265
Vedanta Resources plc | Annual Report FY2017www.vedantaresources.com
STRATEGIC REPORT DIRECTORS’ REPORT FINANCIAL STATEMENTS ADDITIONAL INFORMATION
MATMinimum alternative tax
MBAMangala, Bhagyam, Aishwarya
MICMetal in concentrate
MISManagement information system
MOEFThe Ministry of Environment & Forests of the Government of the Republic of India
MT OR TONNESMetric tonnes
MUmillion Units
MWMegawatts of electrical power
NCCBMNational Council of Cement and Building Materials
NET (DEBT)/CASHTotal debt after fair value adjustments under IAS 32 and 39, cash and cash equivalents, liquid investments and debt related derivative
NGONon-governmental organisation
NIHLNoise induced hearing loss
NON-EXECUTIVE DIRECTORSThe Non-Executive Directors of the Company
NMETNational Mineral Exploration Trust
OECDOrganisation for Economic Co-operation and Development
OHSAS 18001Occupational Health and Safety Assessment Series (standards for occupational health and safety management systems)
OIL & GAS BUSINESSOil & Gas Division of Vedanta Limited, is involved in the business of exploration, development and production of Oil & Gas.
ORDINARY SHARESOrdinary shares of 10 US cents each in the Company
ONGCOil and Natural Gas Corporation Limited, a company incorporated in India
OPECOrganisation of the Petroleum Exporting Countries
PBTProfit before tax
PFCPer fluorocarbons
PHCPrimary health centre
PPEPersonal protective equipment
PROVIDENT FUNDA defined contribution pension arrangement providing pension benefits consistent with Indian market practices
PSCA “production sharing contract” by which the Government of India grants a license to a company or consortium of companies (the ‘Contractor”) to explore for and produce any hydrocarbons found within a specified area and for a specified period, incorporating specified obligations in respect of such activities and a mechanism to ensure an appropriate sharing of the profits arising there from (if any) between the Government and the Contractor.
PSPThe Vedanta Resources Performance Share Plan
RECYCLED WATERWater released during mining or processing and then used in operational activities
RELATIONSHIP AGREEMENTThe agreement between the Company, Volcan Investments Limited and members of the Agarwal family which had originally been entered into at the time of the Company’s listing in 2003 and was subsequently amended in 2011 and 2014 to regulate the ongoing relationship between them, the principal purpose of which is to ensure that the Group is capable of carrying on business independently of Volcan, the Agarwal family and their associates.
RETURN ON CAPITAL EMPLOYED OR ROCEOperating profit after tax as a ratio of capital invested in operations as at the balance sheet date and excludes investments in Project capital work in progress and exploration assets.
ROReverse osmosis
SA 8000Standard for Social Accountability based on international workplace norms in the International Labour Organisation (‘ILO’) conventions and the UN’s Universal Declaration of Human Rights and the Convention on Rights of the Child
SENIOR MANAGEMENT GROUPFor the purpose of the remuneration report, the key operational and functional heads within the Group
266
Vedanta Resources plc | Annual Report FY2017
GLOSSARY AND DEFINITIONS CONTINUED
SEWTSterlite Employee Welfare Trust, a long-term investment plan for Sterlite senior management
STERLITE COPPERCopper Division of Vedanta Limited comprising of a copper smelter, two refineries and two copper rod plants in India.
SHGSSelf help groups
SIDSenior Independent Director
SO2
Sulphur dioxide
SBUStrategic Business Unit
STLSterlite Technologies Limited, a company incorporated in India
SPECIAL ITEMSItems which derive from events and transactions that need to be disclosed separately by virtue of their size or nature (refer Note 2(A) (III) special items of accounting policies)
SPMSuspended particulate matter. Fine dust particles suspended in air
STERLING, GBP OR £The currency of the United Kingdom
SUPERANNUATION FUNDA defined contribution pension arrangement providing pension benefits consistent with Indian market practices
SUSTAINING CAPITAL EXPENDITURECapital expenditure to maintain the Group’s operating capacity
TCMThalanga Copper Mines Pty Limited, a company incorporated in Australia
TC/RCTreatment charge/refining charge being the terms used to set the smelting and refining costs
TGSTail gas scrubber
TGTTail gas treatment
TLPTail Leaching Plan
TPAMetric tonnes per annum
TPMTonne per month
TSPLTalwandi Sabo Power Limited, a company incorporated in India
TSRTotal shareholder return, being the movement in the Company’s share price plus reinvested dividends
TWIN STARTwin Star Holdings Limited, a company incorporated in Mauritius
TWIN STAR HOLDINGS GROUPTwin Star and its subsidiaries and associated undertaking
UNDERLYING EPSUnderlying earnings per ordinary share
UNDERLYING PROFITProfit for the year after adding back special items and other gains and losses and their resultant tax and Non-controlling interest effects
US CENTSUnited States cents
UK CORPORATE GOVERNANCE CODE OR THE CODEThe UK Corporate Governance Code 2014 issued by the Financial Reporting Council
VEDANTA LIMITEDVedanta Limited, a company incorporated in India engaged in the business of Copper smelting, Iron Ore mining, Aluminium mining, refining and smelting, Energy generation and in Oil & Gas
VFDVariable frequency drive
VFJLVedanta Finance (Jersey) Limited, a company incorporated in Jersey
VGCBVizag General Cargo Berth Private Limited, a company incorporated in India
VOLCANVolcan Investments Limited, a company incorporated in the Bahamas
VRCLVedanta Resources Cyprus Limited, a company incorporated in Cyprus
VRFLVedanta Resources Finance Limited, a company incorporated in the United Kingdom
267
Vedanta Resources plc | Annual Report FY2017www.vedantaresources.com
STRATEGIC REPORT DIRECTORS’ REPORT FINANCIAL STATEMENTS ADDITIONAL INFORMATION
VRHLVedanta Resources Holdings Limited, a company incorporated in the United Kingdom
VSSVertical Stud Söderberg
WATER USED FOR PRIMARY ACTIVITIESTotal new or make-up water entering the operation and used for the operation’s primary activities; primary activities are those in which the operation engages to produce its product
WBCSDWorld Business Council for Sustainable Development
ZCIZambia Copper Investment Limited, a company incorporated in Bermuda
ZCCMZCCM Investments Holdings plc, a company incorporated in Zambia
ZRAZambia Revenue Authority
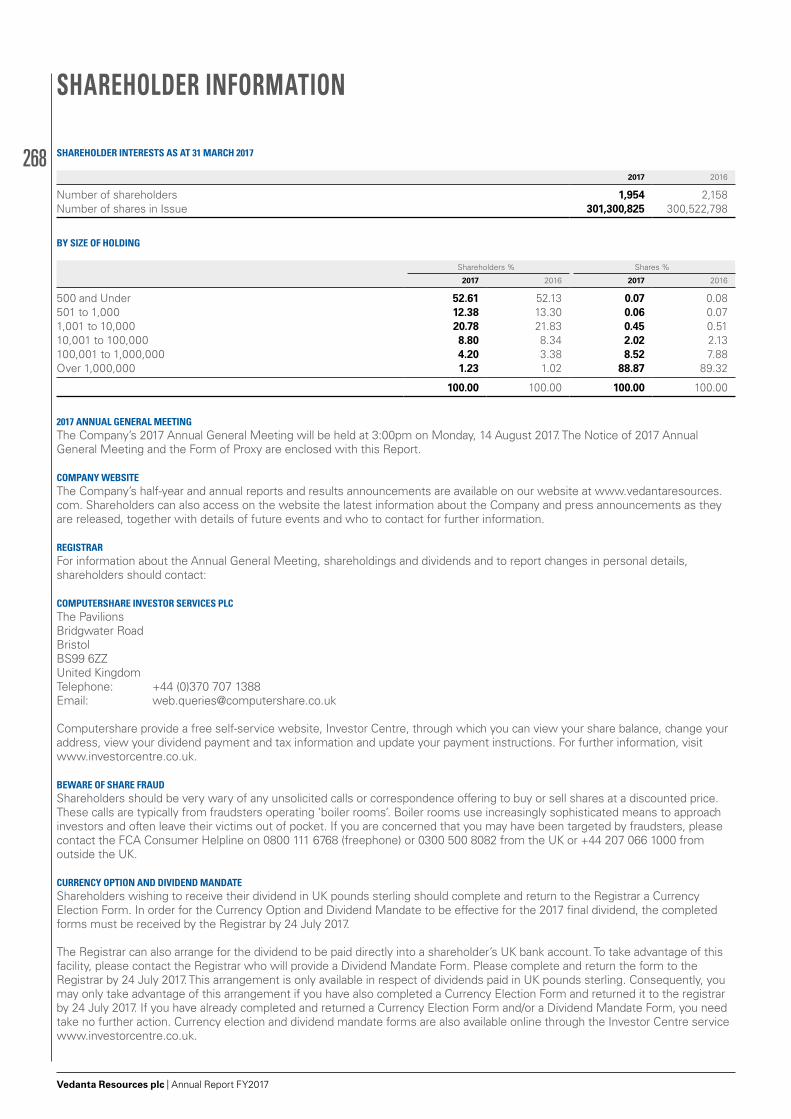
268
Vedanta Resources plc | Annual Report FY2017
SHAREHOLDER INTERESTS AS AT 31 MARCH 2017
2017 2016
Number of shareholders 1,954 2,158Number of shares in Issue 301,300,825 300,522,798
BY SIZE OF HOLDING
Shareholders % Shares %
2017 2016 2017 2016
500 and Under 52.61 52.13 0.07 0.08501 to 1,000 12.38 13.30 0.06 0.071,001 to 10,000 20.78 21.83 0.45 0.5110,001 to 100,000 8.80 8.34 2.02 2.13100,001 to 1,000,000 4.20 3.38 8.52 7.88Over 1,000,000 1.23 1.02 88.87 89.32
100.00 100.00 100.00 100.00
2017 ANNUAL GENERAL MEETINGThe Company’s 2017 Annual General Meeting will be held at 3:00pm on Monday, 14 August 2017. The Notice of 2017 Annual General Meeting and the Form of Proxy are enclosed with this Report.
COMPANY WEBSITEThe Company’s half-year and annual reports and results announcements are available on our website at www.vedantaresources.com. Shareholders can also access on the website the latest information about the Company and press announcements as they are released, together with details of future events and who to contact for further information.
REGISTRARFor information about the Annual General Meeting, shareholdings and dividends and to report changes in personal details, shareholders should contact:
COMPUTERSHARE INVESTOR SERVICES PLCThe PavilionsBridgwater RoadBristol BS99 6ZZUnited KingdomTelephone: +44 (0)370 707 1388Email: [email protected]
Computershare provide a free self-service website, Investor Centre, through which you can view your share balance, change your address, view your dividend payment and tax information and update your payment instructions. For further information, visit www.investorcentre.co.uk.
BEWARE OF SHARE FRAUDShareholders should be very wary of any unsolicited calls or correspondence offering to buy or sell shares at a discounted price. These calls are typically from fraudsters operating ‘boiler rooms’. Boiler rooms use increasingly sophisticated means to approach investors and often leave their victims out of pocket. If you are concerned that you may have been targeted by fraudsters, please contact the FCA Consumer Helpline on 0800 111 6768 (freephone) or 0300 500 8082 from the UK or +44 207 066 1000 from outside the UK.
CURRENCY OPTION AND DIVIDEND MANDATEShareholders wishing to receive their dividend in UK pounds sterling should complete and return to the Registrar a Currency Election Form. In order for the Currency Option and Dividend Mandate to be effective for the 2017 final dividend, the completed forms must be received by the Registrar by 24 July 2017.
The Registrar can also arrange for the dividend to be paid directly into a shareholder’s UK bank account. To take advantage of this facility, please contact the Registrar who will provide a Dividend Mandate Form. Please complete and return the form to the Registrar by 24 July 2017. This arrangement is only available in respect of dividends paid in UK pounds sterling. Consequently, you may only take advantage of this arrangement if you have also completed a Currency Election Form and returned it to the registrar by 24 July 2017. If you have already completed and returned a Currency Election Form and/or a Dividend Mandate Form, you need take no further action. Currency election and dividend mandate forms are also available online through the Investor Centre service www.investorcentre.co.uk.
SHAREHOLDER INFORMATION
INVESTOR RELATIONSFor investor enquiries, please contact:Mr Ashwin BajajPresident, Investor RelationsVedanta Resources plc16 Berkeley StreetLondon W1J 8DZTelephone: +44 (0)20 7659 4732 (London) +91 22 6646 1531 (Mumbai)Email: [email protected]
DIVIDEND CALENDAREx-dividend date – 20 July 2017Record date – 21 July 20172017 final ordinary dividend payable – 23 August 2017
OTHER DATES2017 Annual General Meeting – 14 August 2017
REGISTERED NUMBER4740415
REGISTERED OFFICEVedanta Resources plc5th Floor, 6 St Andrew StreetLondonEC4A 3AE
COMPANY SECRETARYDeepak Kumar
HEAD OFFICE16 Berkeley StreetLondon W1J 8DZ Telephone: +44 (0)20 7499 5900Fax: +44 (0)20 7491 8440
AUDITORErnst & Young LLP1 More London PlaceLondon SE1 2AF
SOLICITORSAshurst LLPBroadwalk House5 Appold StreetLondon EC2A 2HA
Latham & Watkins LLP99 BishopsgateLondon EC2M 3XF
CONTACTS

VEDANTA RESOURCES PLC5TH FLOOR 16 BERKELEY STREET LONDON W1J 8DZ T +44 (0) 20 7499 5900F +44 (0) 20 7491 8440
VEDANTARESOURCES.COM
VEDANTA RESOURCES PLC ANNUAL REPORT FY2017