Embed Size (px)
Citation preview
EVA Dimensions 15 Watersedge Court Locust Valley, NY 11560 516.759.3711 www.evaDimensions.com
Copyright © 2017 EVA Dimensions LLC. All rights reserved.
STOP Using ROI (and Use EVA Instead) By Bennett Stewart, CEO, EVA Dimensions
EVA versus ROI. Which is better? ROI is profit divided by capital, and EVA is profit less the full cost of
the capital. ROI is a ratio, and EVA is a fully-loaded measure of profit. Both use the same ingredients
and there is no more work to get to EVA than ROI—but in practice EVA is far better and much easier, so
much so that you should stop using ROI and use EVA instead. Let’s walk through the reasons.
EVA provides more obvious and more accurate incentives to manage assets
EVA turns balance sheet assets into a charge to profit, a cost of doing business like any other
operating expense. There no longer are separate P&L statements and balance sheets to confuse
people. There’s a single consolidated schedule of economic profit (or loss).
EVA plainly motivates managers to turn assets faster and develop leaner business models to
reduce the capital charge. The incentive is obvious and the same as if superfluous overhead
costs were cut.
ROI also motivates managers to cut capital, but does so as a function of reducing the
denominator in the ratio; the incentive is not as obvious, simple, or precise as when it’s
expressed as a P&L benefit.
Consider, too, that ROI overstates the value of asset management, because it expands at an
exponential rate as more and more capital is withdrawn from a business. Take $200 of capital
out of a $1,000 capital base, and ROI increases by 20%; then take an additional $200 out of the
remaining $800 capital base, and ROI increases by 25%. Yet, the impact on value is the same,
$200 in both cases, and the impact on EVA is the same too. It increases by the cost of the
capital saved.
ROI is thus a deeply flawed metric. It complicates and overstates the value of asset
management. ROI overstates the added value because where ROI is higher, it is earned on less
“I.” There’s less capital going along for the return ride, much like a basketball player who
improves his shooting percentage by taking fewer shots. Actual scoring doesn’t improve as
much as the shooting percentage suggests.
EVA, on the other hand, and ratios derived from it, avoid that distortion. In fact, EVA works
quite successfully even when capital is near zero or negative, whereas ROI completely blows up.
EVA puts decisions in big picture perspective
EVA puts the incentive to manage assets in the context of the greater good. A manager, for
example, can appreciate the merits of holding more working capital and incurring a greater
capital charge if that supports additional sales that generate added profits that increase EVA
overall.
It is impossible to evaluate opportunities like that with ROI because it offers an incomplete
picture. ROI myopically focuses on efficiency and ignores the potential value of growth or
increasing the scale of an investment, a point that deserves elaboration.
EVA Dimensions 15 Watersedge Court Locust Valley, NY 11560 516.759.3711 www.evaDimensions.com
Copyright © 2017 EVA Dimensions LLC. All rights reserved.
ROI ignores the value of growth, where EVA incorporates it
As was suggested, ROI is like rewarding a basketball player for shooting percentage. The
incentive is to take a sure layup and shoot no more. In business, a goal to increase ROI or just
maintain a high one encourages managers to pass up worthwhile opportunities, to under-invest,
under-innovate, and under-scale, and to leave valuable growth on the table.
But that does not happen with EVA. So long as an investment covers the cost of capital, which
means it adds to NPV, it adds to EVA, and will do so even if a business unit’s existing margins or
returns come down. Add a 15% ROI investment to a 20% ROI business, and the blended ROI
comes down. But EVA goes up and value goes up so long as the hurdle rate is less than 15%.
ROI also is a very poor measure to evaluate the optimal scale or pacing of individual projects
The same deficiency applies to specific investment proposals shaped by field operating teams,
which means ROI-minded companies can never optimally allocate capital.
Suppose a new plant, product line, marketing campaign or R&D program is forecast to generate
a 20% return. Suppose increasing the size of the investment—with a larger plant, or more
product lines, or a stepped-up ad or innovation budget—would incrementally return 15%.
Managers that look to maximize IRR or ROI will reject the bigger scale, the larger plant, the extra
products, and the added marketing or research oomph.
But again, so long as the cost of capital is less than 15%—say it is 10%—they should eagerly
embrace the more ambitious proposals. They should seek the additional funding, drive for the
bigger scale, and punch harder, because that will add EVA and that will add value.
EVA is value additive
EVA gets the incentives right incrementally and at the margin. Add something good enough to
something that’s great, and EVA is greater still. The value adds up, whether for a whole business
division or for sizing up an individual investment decision.
But that’s not true of ROI. ROI increases only when the returns from new investments or new
decisions exceed the existing return or some arbitrary target return, which are completely
irrelevant considerations.
EVA harmonizes corporate and line-of-business perspectives
EVA is additive in another way: When a business unit initiates a positive EVA decision, its EVA
increases by the EVA of the decision, and the parent’s EVA goes up, too, in exactly the same
amount. EVA adds up, from bottom to top, so that managers at all levels reach the same
conclusion about a given decision and its significance.
ROI does not possess this important attribute (neither does margin, or growth, nor any other
conventional ratio statistic for that matter—they’re all biased by the beginning point). The ROI
impact of a given decision will look different depending on which unit sponsors it, and will have
a different impact on corporate ROI than by line of business. It is an incredibly clumsy and
confusing metric, when you think about it.
EVA Dimensions 15 Watersedge Court Locust Valley, NY 11560 516.759.3711 www.evaDimensions.com
Copyright © 2017 EVA Dimensions LLC. All rights reserved.
ROI is a legacy metric that makes irrelevant sunk costs seem relevant
The ROI a business reports is an agglomeration of the returns earned on all prior investments in
the business, including acquisition premiums. The value of any new decision, therefore, is
distorted because it is overlaid on top of an arbitrary and irrelevant capital base.
But when managers focus on increasing EVA, which is the goal we advocate, then all prior
investments, all legacy capital, all “sunk” costs, are effectively wiped out, as they should be. EVA
brings the performance in the period into sharp relief. It is always forward looking and aimed at
adding incremental value, whereas ROI always drags a heavy anchor from the past.
This also simplifies asset allocation. Since existing assets are just a fixed charge to EVA, the
initial allocation has no bearing on a manager’s ability to drive improvements in EVA. Existing
assets are seen for what they are—irrelevant sunk costs. It’s only new investments, and new
decisions, that count. With ROI, by contrast, the allocation of existing assets to individual
divisions matters greatly, which always makes the allocation a bitter political battle. There’s no
need for it.
In sum, the right goal, and the simple message, is to zero in on the news and not the nostalgia
by focusing on the increase in EVA.
Even if a growth factor is added, ROI is still handicapped
There is no need to add a growth goal or growth metric to EVA since the value of growth is
already correctly factored into it. To increase EVA managers must devise and exploit profitable
growth opportunities. Stand still, and EVA stands still, too.
But for ROI to work at all, some measure of growth must be added to it. But how, and in what
proportions? With ROI hovering near the cost of capital, growth doesn’t count, but at any other
ROI, it does. Combining a growth goal with ROI is thus very complicated, ambiguous, hard to
target, non-linear, and dependent on the situation.
Also, it can never be as simple or as effective as asking managers to increase EVA (and then,
showing them how to do that with a companion ratio analysis framework, which is discussed
later). Two wrong measures don’t add up to a single right one.
EVA discounts to value where ROI does not
Here is the real clincher in the case for EVA: it turns out that, for any given forecast or business
plan, the present value of the projected EVA always equals the net present value of the forecast
cash flows. Said simply the PV of EVA = NPV.
That’s mathematically true, because EVA sets aside the profit that must be earned in each
period to recover the value of the capital that has been or will be invested, and thus it always
discounts to the value added to, or deducted from, the invested capital base.
If EVA is zero, NPV is zero. If that’s a project, or line of business or company, it is worth just the
book capital put into it, and not more. If there’s no economic value added, there is no market
value added to the capital. But if EVA is positive, and better, growing, then NPV is too.
To maximize EVA is to maximize NPV, share price, and TSR – by definition!
EVA Dimensions 15 Watersedge Court Locust Valley, NY 11560 516.759.3711 www.evaDimensions.com
Copyright © 2017 EVA Dimensions LLC. All rights reserved.
The implications are profound
For one, the change in EVA measured by period or over a multi-period trajectory must be and in
fact is the single best and most reliable indicator of whether value is being added or lost, clearly
superseding ROI, or ROI with an added growth metric (which is then no longer a single metric).
Second, managers can forecast and discount EVA to measure the value of plans, projects,
acquisitions and decisions, and they can use EVA and a set of EVA ratios that are discussed later
to explore alternatives and discover ways to increase value with insights they otherwise would
not see or see so easily. And they can do that instead of discounting cash flow.
Third, one measure, EVA, can be used to make decisions, check results, even meter incentive
pay, as discussed below. Using EVA for all those things is what makes it so simple—there’s just
one technique to learn--and what also makes managers feel so accountable—the same metric
that guides their decisions is used to measure their performance, even reward them, after the
fact. There’s a natural post audit built in.
ROI can’t do any of this, of course, because ROI (or ROI plus growth) does not discount to
anything. ROI forces companies to use discounted cash flow analysis. But that multiplies the
metrics, adds complexity, and voids accountability.
In sum, EVA is not just a measure, and not just an interesting performance indicator to sit beside
others. It is a score, really, the score, which means it is the one measure to maximize. It ought to sit
at the pinnacle of any scorecard that purports to be value based.
ROI, or ROI in tandem with a growth goal, doesn’t do the trick. There is no objective function.
There’s nothing to maximize. There’s only complexity, ambiguity, impracticality.
EVA can be used in bonus plans that are extraordinarily powerful.
A classic EVA bonus plan consists of a competitive base bonus plus a percent of the change in
EVA. It’s not tied to beating negotiated budget or plan goals. It’s a profit sharing formula.
With that, there’s no incentive for managers to lobby for lower budget or plan goals because
they are not paid for beating their plans. Quite the contrary: There is every incentive for them
to develop and execute the stretch plans that are they believe will create the most value by
creating the most EVA over time, for that is how they are paid.
Managers also can simulate the bonuses they will receive if they achieve their long-range plans
by running them through the EVA profit sharing formula. What looks like an annual bonus plan
is in fact a very long term incentive plan, the longest of all in fact because it is a never-ending
share of the added value. With this, managers are inclined to approach planning much more
seriously, strategically and collaboratively. They are motivated to think and act like long term
owners because they are paid like long term owners.
Under the EVA regime, the bigger the EVA is, the bigger the bonus is, and the greater the
company’s value and TSR will be. The line of sight is clear, and everyone wins. The alignment
between pay and performance that boards seek but seldom achieve is there. Bonuses are no
longer a cost to be controlled or minimized; they are a share of added value to be maximized.
ROI, or ROI in combination with a growth metric, can’t do this. It takes a score, a single
measure to maximize, to end up with a bonus plan that is this simple, yet so effective.
EVA Dimensions 15 Watersedge Court Locust Valley, NY 11560 516.759.3711 www.evaDimensions.com
Copyright © 2017 EVA Dimensions LLC. All rights reserved.
EVA is now a ratio, and a ratio analysis framework
ROI’s one traditional advantage over EVA was that it is a ratio. It provides a convenient statistic
that can be compared over time and across business lines, and a companion analysis model,
breaking ROI into profit margin and asset turns.
But those advantages over EVA no longer exist. Advances pioneered by EVA Dimensions
converted EVA into a set of headline ratio statistics and a structured format to trace them to all
the levers and ratio drivers that managers can manage.
We believe, and our clients tell us, that the new EVA ratios and ratio analysis format are far
better than what ROI offers.
The most important new ratio is EVA Momentum
That’s defined as the change in EVA, divided by prior period sales. It measures an EVA growth
rate, scaled to the sales size of the business.
Unlike ROI, EVA Momentum is a ratio measure to maximize. It’s literally the only corporate
performance ratio where bigger is always better, because more Momentum is more EVA, which
means even more value is being created.
In fact, the EVA Momentum a business plan generates over the life of the plan is always 100%
perfectly correlated with the quality and intrinsic value of a plan, which makes EVA Momentum
a perfect partner in the planning process.
EVA Momentum also can be traced to all the levers managers have at their disposal to increase
the value of their business, as will be shown. It conveniently provides the score and the insights
needed to improve the score.
Which is what led Dow Chemical’s CEO Andrew Liveris to call EVA Momentum a “game-
changer.” It gave him what he wanted—an overarching goal and common scorecard to apply
across all the company’s lines of business—while freeing each line team to discover the specific
strategies most suited to create value and add EVA given the unique opportunities they faced.
Call it, “freedom within a framework.” True empowerment is possible because the requisite
accountability for managing capital and delivering value clearly exists.
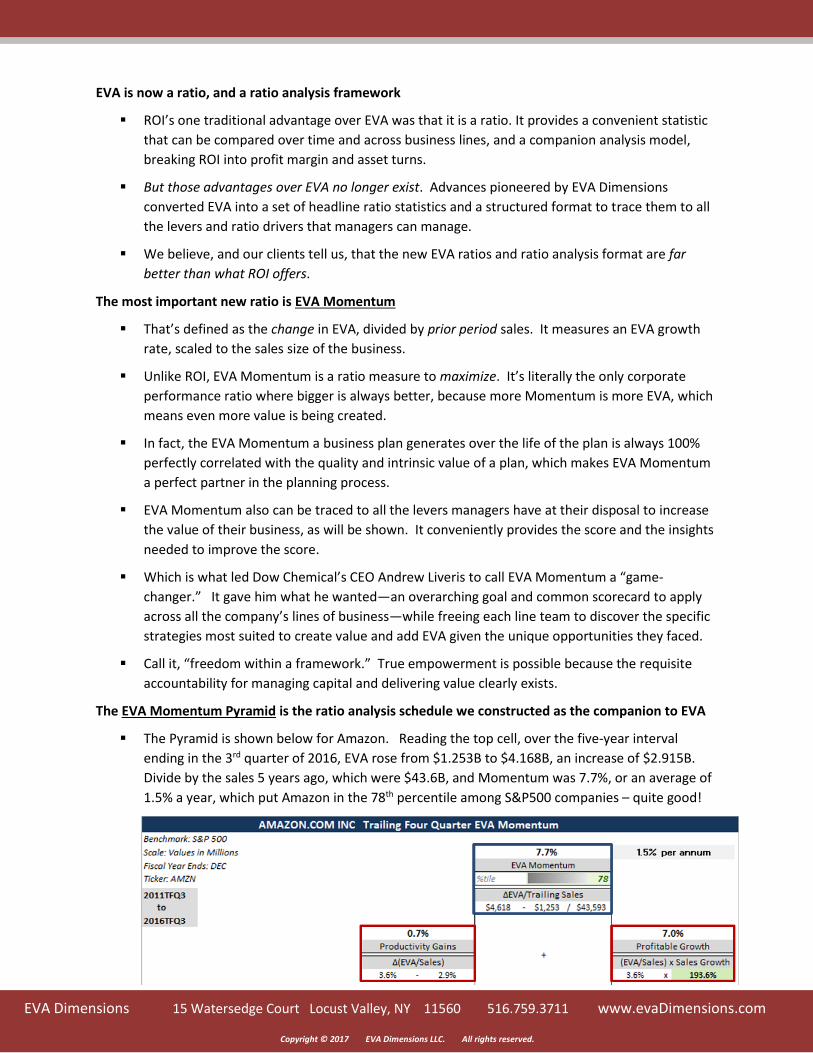
The EVA Momentum Pyramid is the ratio analysis schedule we constructed as the companion to EVA
The Pyramid is shown below for Amazon. Reading the top cell, over the five-year interval
ending in the 3rd quarter of 2016, EVA rose from $1.253B to $4.168B, an increase of $2.915B.
Divide by the sales 5 years ago, which were $43.6B, and Momentum was 7.7%, or an average of
1.5% a year, which put Amazon in the 78th percentile among S&P500 companies – quite good!
EVA Dimensions 15 Watersedge Court Locust Valley, NY 11560 516.759.3711 www.evaDimensions.com
Copyright © 2017 EVA Dimensions LLC. All rights reserved.
What accounts for the 7.7% Momentum? What are the sources, the insights? How can it be
managed? The Pyramid starts to answer the question by revealing two main drivers.
The first, Productivity Gains, is the added value that comes from an increase in the ratio of EVA
to sales, which we call the EVA Margin. Assuming sales are flat, EVA still can increase if
management finds ways to drop more EVA to the bottom line out of its top line, which Amazon
did to a modest degree. Its EVA increased from 2.9% of sales to 3.6%, which contributed 0.7%
to Momentum, or .14% a year, as reported in the lower-left cell above.
Productivity gains emerge from many different sources. For convenience of exposition, we
divide them into 3 categories – price, product and process—covering actions and strategies that
enable a company to earn premium prices, to field an outstanding, EVA-attuned product
portfolio and bench the losers, and to extend operational excellence by trimming the total sum
of operating costs and capital costs. Do those, and EVA Margin expands, and Momentum too.
A second source of Momentum and value creation, labelled Profitable Growth, comes from
adding sales at positive EVA profit margins. Note that this score is multiplicative: what counts is
the sales growth rate times the EVA Margin. Only profitable sales are valuable.
As is shown in the lower-right cell above, Amazon was a real winner in this category. Its sales
grew by 191.6% over the five years, basically tripling. Combine that with a solidly-profitable
3.6% EVA Margin, and significant value was created. To put a precise figure on it, Profitable
Growth contributed 7% to EVA Momentum, or 1.4% a year, which is 10 times the productivity
gains. Obviously, pure productivity measures like ROI miss a big part of the performance story.
Add the two sources— 0.7% from Productivity Gains and 7% from Profitable Growth. The 7.7%
sum ties to the 5-year change in EVA divided by sales five years ago. The math works.
Managers indeed can use the schedule to dissect performance and analyze decisions and set
targets with full confidence it ties back to growing EVA and growing value.
Momentum tells us, for example, that no amount of sales growth or EPS or EBITDA growth adds
any value if the EVA Margin is zero or close to it. It also shows that 5% sales growth at a 5% EVA
Margin is more valuable than 10% growth at a 2% EVA Margin. The tradeoff of growth and
profitability is naturally built in.
Unlike ROI, or even ROI in tandem with sales growth, EVA Momentum helps managers instantly
see where there is and isn’t value to growth, and it shows the precise value of the growth
compared to productivity gains, or really any driver, which improves resource allocation.
EVA Margin is simpler and analytically superior to the ROI analysis model
While EVA Momentum is the ultimate ratio score, reflecting the growth pace in EVA, managers
also need a measure and technique to help them assess and improve productivity.
The reigning champ in this is the co-called “DuPont” ROI formula, which divides ROI into
operating margin times asset turns. It’s a longstanding technique, but rather clumsy.
The ROI impact of improving operating margins depends on the existing turnover ratio, and the
value of improving asset turns depends on the current profit margin. The one is the derivative
of the other. The multiplicative dependency is complicated. A margin is not a margin if it
depends on the turns.
EVA Dimensions 15 Watersedge Court Locust Valley, NY 11560 516.759.3711 www.evaDimensions.com
Copyright © 2017 EVA Dimensions LLC. All rights reserved.
Isolating the impact of managing any individual asset also is hard to discern. Suppose a supply
chain initiative to cut working capital by a third is being considered. How much does that
increase ROI? It’s not immediately obvious, is it? It depends on the overall asset turnover ratio,
of which working capital is a component. If working capital is small compared to fixed assets,
the ROI benefit will be small, and it will be larger for working capital intense businesses. It’s just
not easy to appreciate the value of managing specific assets.
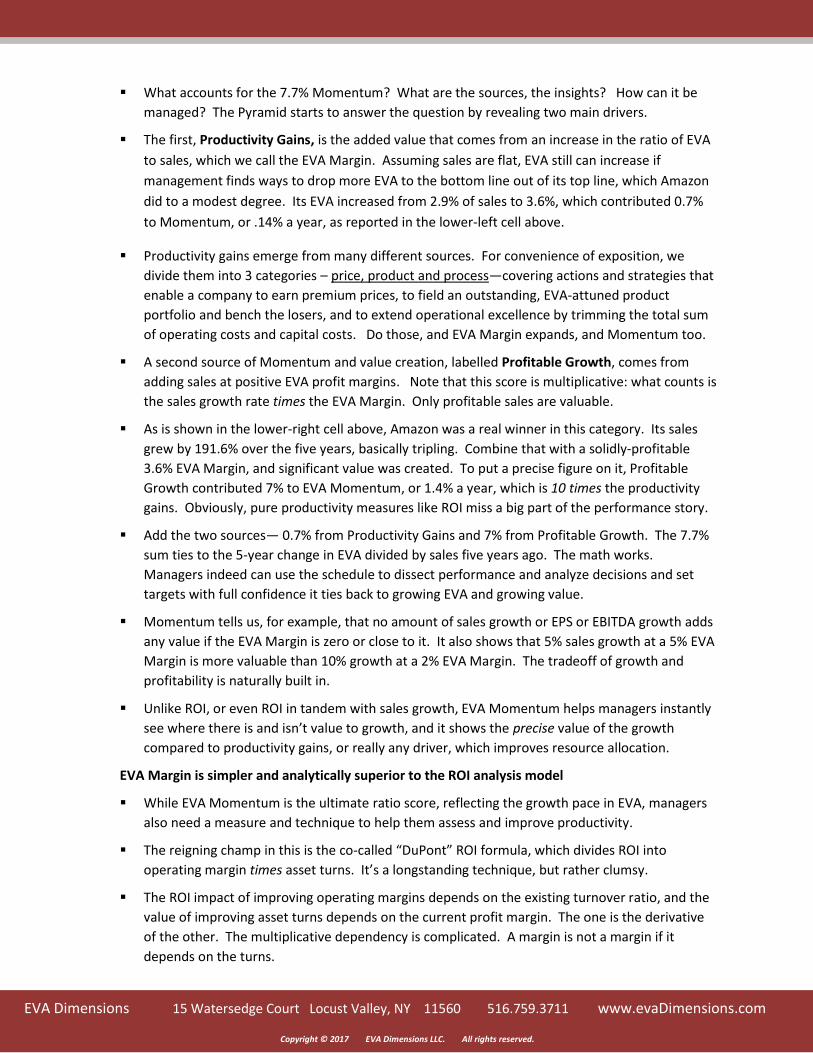
In the EVA model, productivity performance is represented by the EVA profit margin, by the
ratio of EVA-to-sales. Like ROI, it can be taken apart to reveal the underlying operating and
capital levers, but in a simpler and more practical format.
Consider the schedule at left, which
breaks out the components of Amazon’s
EVA Margin for the most recent period and
five years back. Remember, it’s the change
in the Margin that creates Momentum, so
contrasting the two helps.
Note that each driver on the schedule is
expressed as a percent of sales. P&L and
balance sheet, gross margin and capital
costs, are directly comparable, for example.
All the drivers are on the same scale.
Each component of capital has its own
line item charge. Unlike ROI, the decision
impact on specific capital items is easily
assessed.
For example, the annual charge Amazon
incurred to cover the cost of capital and
depreciation of its gross property plant and
equipment assets, including leased assets,
featured in the blue bordered box above, increased significantly, from 3.8% of sales to 9.3%.
That figure tells management exactly how much its PPE assets are costing as an annual profit
charge, and the increase tells them exactly how much compensation they must obtain
elsewhere in their business model if they are to preserve EVA and grow it.
The EVA Margin schedule also makes the working capital question that stumped ROI a snap.
Suppose a company has $1,000 in sales and carries $300 in working capital, which is equivalent
to about 110 days on hand. If the firm’s cost of capital is 10%, the working capital investment
translates into a $30 charge to EVA, or 3% of sales. A manager can easily see that cutting
working capital by a third, reducing days on hand from 110 to 73, say, cuts the charge a third—
its linear—from 3% of sales to 2%. The 1% benefit is the same as if gross margin increased 1% or
sales grew 20% at a 5% EVA Margin. Everything is on the same scale, even growth, and all
tradeoffs are comparable with simple plus and minus math. There’s no multiplication involved.
By comparing the two columns, which could be separated by years, or quarters, or the span of a
five-year business plan, managers can easily pinpoint the key trends and key drivers, and
accurately size up the significance, and assess tradeoffs that otherwise might not be so obvious.
EVA Dimensions 15 Watersedge Court Locust Valley, NY 11560 516.759.3711 www.evaDimensions.com
Copyright © 2017 EVA Dimensions LLC. All rights reserved.
The EVA ratios also reflect the true value of asset management, and do not exaggerate it as ROI
does. Turn assets faster and withdraw capital from a business, and EVA, and the EVA ratios
related to sales, get steadily bigger, not exponentially larger.
Summing Up – EVA Wins, Hands Down. Stop Using ROI, and Use EVA Instead.
The EVA Momentum and the EVA Margin schedules are unquestionably far easier to understand
and far more effective to use in analysis of business plans and business performance than any
other technique. They are based on sales, and express all productivity drivers as ratios to sales,
which is a familiar and comfortable construct, much more so than looking at ROI.
Face it, managers don’t naturally think in terms of investing capital and earning returns on
capital. That’s a financial model, jury rigged for operating people.
Real world business managers naturally think in terms of sales—of driving sales growth, serving
customers, entering markets, expanding share, innovating products, and the like—and earning a
profitable margin on the sales. That’s what the EVA Momentum model does—it transforms the
financial complexities of cash flow and IRR and ROI and NPV into a simple and intuitive sales-
based, margin-driven management model.
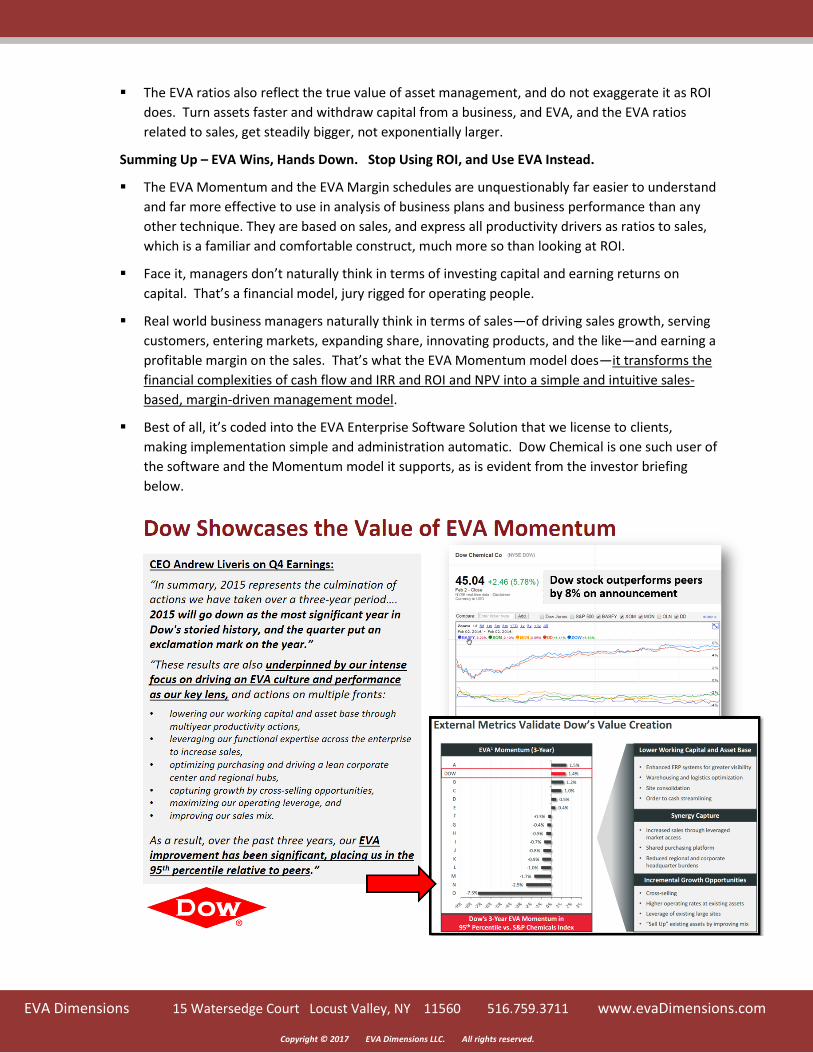
Best of all, it’s coded into the EVA Enterprise Software Solution that we license to clients,
making implementation simple and administration automatic. Dow Chemical is one such user of
the software and the Momentum model it supports, as is evident from the investor briefing
below.


