Embed Size (px)
Citation preview

Atacicept Atacicept in IgA NephropathyMS700461-0035 Final V2.0
1/67
Statistical Analysis Plan
Clinical Trial Protocol Identification No.
MS700461 – 0035
Title: A Phase II, Randomized, Double-blind, Placebo-Controlled Study to Evaluate the Efficacy and Safety of Atacicept in IgA Nephropathy
Trial Phase Phase II
Investigational Medicinal Product(s)
Atacicept 25 mg, 75 mg or 150 mg or Placebo
Clinical Trial Protocol Version
27 November 2018 / Version 5.0
Statistical Analysis Plan Author
Statistical Analysis PlanDate and Version
15 February 2019 / Final 2.0
Statistical Analysis Plan Reviewers
– Medical Responsible
, EMD Serono –
, EMD Serono –
, EMD Serono –
, EMD Serono – Medical Responsible
This document is the property of Merck KGaA, Darmstadt, Germany, or one of its affiliated companies.It is intended for restricted use only and may not - in full or part - be passed on, reproduced, published or used without express
permission of Merck KGaA, Darmstadt, Germany or its affiliate. Copyright ©2017 by Merck KGaA, Darmstadt, Germany or its affiliate. All rights reserved.
CCICCI
PPD
PPD
PPD
PPD
PPD
PPD
PPD
PPD PPD
PPD
PPD
PPD

Atacicept Atacicept in IgA NephropathyMS700461-0035 Final V2.0
2/67
1 Signature Page
Statistical Analysis Plan: MS700461 – 0035
A Phase II, Randomized, Double-blind, Placebo-Controlled Study to Evaluate the Efficacy and Safety of Atacicept in IgA Nephropathy
Anne Le Hénanff
Trial Biostatistician
Medical Responsible
Medical Responsible EMD Serono
CCICCI
PPDPPD
PPD
PPD
PPD
PPD
PPD
PPD

Atacicept Atacicept in IgA NephropathyMS700461-0035 Final V2.0
3/67
2 Table of Contents1 Signature Page ......................................................................................22 Table of Contents..................................................................................33 List of Abbreviations and Definition of Terms ....................................64 Modification History ............................................................................95 Purpose of the Statistical Analysis Plan ...............................................96 Summary of Clinical Trial Features .....................................................97 Sample Size/Randomization...............................................................197.1 Sample Size ........................................................................................197.2 Randomization....................................................................................218 Overview of Planned Analyses...........................................................228.1 Interim analysis for Part A..................................................................228.2 Primary and Final analysis for Part A.................................................239 Changes to the Planned Analyses in the Clinical Trial Protocol for
Part A ..................................................................................................2410 Protocol Deviations and Analysis Sets ...............................................2610.1 Definition of Protocol Deviations and Analysis Sets .........................2610.2 Definition of Analysis Sets and Subgroups for Part A .......................2611 General Specifications for Statistical Analyses ..................................2912 Study Subjects ....................................................................................3212.1 Disposition of Subjects and Discontinuations ....................................3212.2 Protocol Deviations ............................................................................3312.2.1 Important Protocol Deviations............................................................3412.2.2 Reasons Leading to the Exclusion from an Analysis Set ...................34
13 Demographics and Other Baseline Characteristics.............................3413.1 Demographics .....................................................................................3413.2 Medical History ..................................................................................3513.2.1 Medical History ..................................................................................3513.2.2 IgA Nephropathy Characteristics at Baseline.....................................35
13.3 Other Baseline Characteristics............................................................3614 Prior or Concomitant Medications/Procedures...................................3615 Treatment Compliance and Exposure.................................................38
CCICCI

Atacicept Atacicept in IgA NephropathyMS700461-0035 Final V2.0
4/67
15.1 Treatment Exposure............................................................................3815.2 Dose Frequency Reduction.................................................................4016 Endpoint Evaluation ...........................................................................4116.1 Primary Endpoint Analyses ................................................................4116.2 Secondary Endpoint Analyses ............................................................4116.3 Other Endpoint Analyses ....................................................................4216.4 Exploratory Endpoint Analyses ..........................................................4416.4.1 Biomarkers..........................................................................................4416.4.2 Renal biopsy .......................................................................................4616.5 Analysis of PK Endpoints and Population PK/PD Modeling.............4616.5.1 PK Evaluation.....................................................................................4616.5.2 Population PK/PD Modeling ..............................................................4716.5.2.1 PK Modeling.......................................................................................4816.5.2.2 IgA, IgG, IgM Modeling ....................................................................4816.5.2.3 Proteinuria Modeling ..........................................................................4916.5.2.4 Data Specifications for PK/PD Modeling...........................................4917 Safety Evaluation................................................................................4917.1 Adverse Events ...................................................................................4917.1.1 Adverse Events Leading to Treatment Discontinuation.....................5217.1.2 Exposure Adjusted Incidence Rate .....................................................5217.1.3 Serious Adverse Events ......................................................................5317.1.4 Deaths .................................................................................................5317.1.5 Other Adverse Event Assessments .....................................................5317.2 Clinical Laboratory Evaluations .........................................................54
17.2.1 Summary tables over-time..................................................................5617.2.2 Shift tables ..........................................................................................5617.2.3 Immunoglobulin .................................................................................5717.2.4 Proteinuria...........................................................................................5817.2.5 Anti-drug antibody..............................................................................58
17.2.6 Vital Signs ..........................................................................................5817.3 Other Safety or Tolerability Evaluations............................................5918 Benefit Risk Assessment ....................................................................60
CCICCI

Atacicept Atacicept in IgA NephropathyMS700461-0035 Final V2.0
5/67
19 References...........................................................................................6020 Appendices .........................................................................................6020.1 Appendix 1: Important protocol deviations........................................6120.2 Appendix 2: Firewall Team Charter ...................................................6120.3 Appendix 3: Important protocol deviations........................................6120.4 Appendix 4: Reference SAS code used for EAIR 95% confidence
interval calculation by Poisson model ................................................6120.5 Appendix 5: Details on Pharmacometry Evaluation ..........................6220.5.1 Software..............................................................................................6220.5.2 Modeling Methodology ......................................................................6220.2.2.1 Population PK/PD Modeling ..............................................................6320.2.2.1.1 Exploratory Data Analysis..................................................................6420.2.2.1.2 Structural Model Development...........................................................6420.2.2.1.3 Statistical Model Development...........................................................6420.2.2.1.4 Covariate Analysis..............................................................................6520.2.2.1.5 Final Model Refinement .....................................................................6620.2.2.1.6 Sensitivity Analysis of Fixed Parameter Values ................................6620.2.2.1.7 Model Evaluation................................................................................66
CCICCI

Atacicept Atacicept in IgA NephropathyMS700461-0035 Final V2.0
6/67
3 List of Abbreviations and Definition of Terms
ACEi Angiotensin converting enzyme inhibitorAE Adverse eventAESI Adverse event of special interestAIC Akaike information criterionAPRIL A proliferation-inducing ligandAPRIL-SLE Clinical trial 27646 in systemic lupus erythematosusARB Angiotensin receptor blockersAUC Area Under the CurveBLyS B lymphocyte stimulator (also called B-cell activating factor or BAFF)BMI Body Mass IndexBP Blood pressureCDISC Clinical Data Interchange Standards ConsortiumCI Coordinating InvestigatorCIC Circulating immune complexesCKD-EPI Chronic Kidney Disease Epidemiology CollaborationCPU Central Processing UnitCRCL Creatinine clearanceCRO Contract Research OrganizationCS Corticosteroid(s)CTP Clinical trial protocolDBPC Double-blind placebo-controlledDFR Dose frequency reduction
ECG ElectrocardiogrameCRF Electronic case report formeGFR Estimated glomerular filtration rateEOW Every other weekESRD End-stage renal disease
ET Early TerminationFOCE First-order conditionalFOCEI First-order conditional with interaction
CCICCI
Atacicept Atacicept in IgA NephropathyMS700461-0035 Final V2.0
7/67
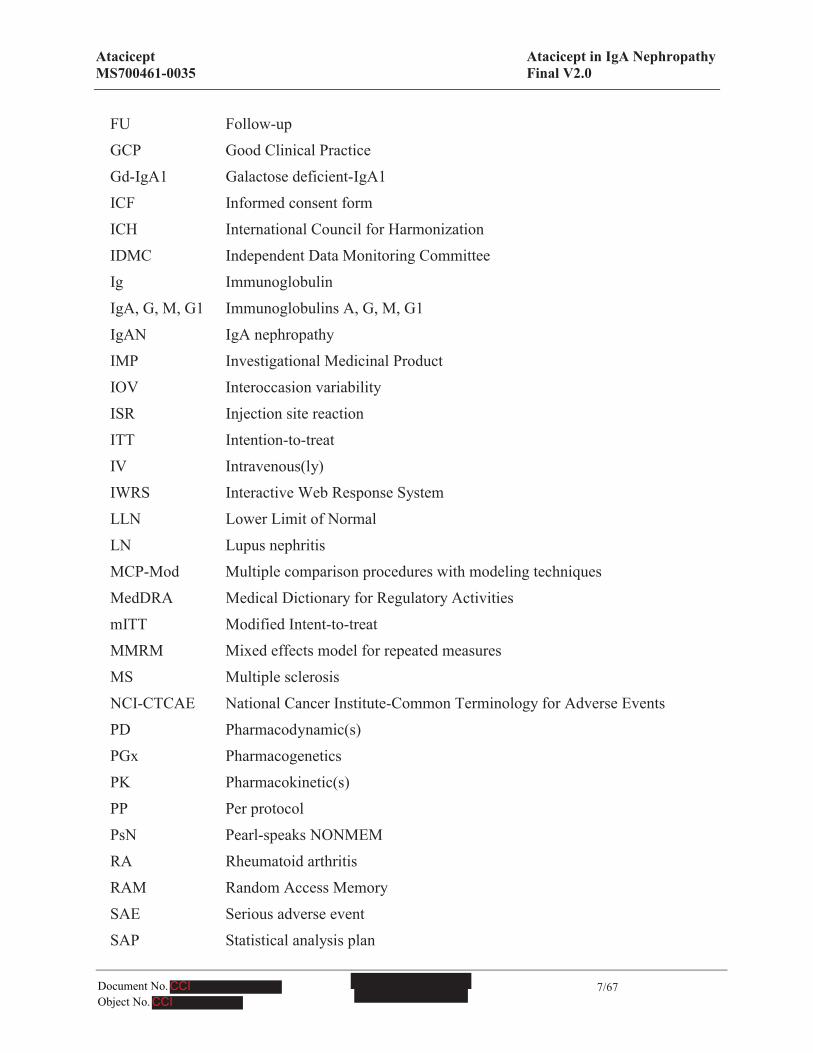
FU Follow-upGCP Good Clinical PracticeGd-IgA1 Galactose deficient-IgA1ICF Informed consent formICH International Council for HarmonizationIDMC Independent Data Monitoring CommitteeIg ImmunoglobulinIgA, G, M, G1 Immunoglobulins A, G, M, G1IgAN IgA nephropathyIMP Investigational Medicinal ProductIOV Interoccasion variabilityISR Injection site reactionITT Intention-to-treatIV Intravenous(ly)IWRS Interactive Web Response SystemLLN Lower Limit of NormalLN Lupus nephritisMCP-Mod Multiple comparison procedures with modeling techniquesMedDRA Medical Dictionary for Regulatory ActivitiesmITT Modified Intent-to-treatMMRM Mixed effects model for repeated measuresMS Multiple sclerosisNCI-CTCAE National Cancer Institute-Common Terminology for Adverse EventsPD Pharmacodynamic(s)
PGx PharmacogeneticsPK Pharmacokinetic(s)PP Per protocolPsN Pearl-speaks NONMEMRA Rheumatoid arthritis
RAM Random Access MemorySAE Serious adverse eventSAP Statistical analysis plan
CCICCI

Atacicept Atacicept in IgA NephropathyMS700461-0035 Final V2.0
8/67
SC SubcutaneousSCM Stepwise covariate modelSD Standard DeviationSLE Systemic lupus erythematosusSOP(s) Standard operating procedure(s)Subject ID Subject Identification NumberTB TuberculosisTEAE Treatment-emergent adverse eventTLF Tables, Listings, and FiguresTNF Tumor necrosis factorUACR Urine albumin: creatinine ratioULN Upper Limit of Normal UPCR Urine protein: creatinine ratio UPEP Urine protein electrophoresisVPC Virtual predictive checkWOCBP Women of childbearing potential
CCICCI

Atacicept Atacicept in IgA NephropathyMS700461-0035 Final V2.0
9/67
4 Modification History
UniqueIdentifier forSAP Version
Date ofSAP Version
Author Changes from the Previous Version
Version 1.0 8AUG2017Version 2.0 30JAN2019 To include amendments 3 and 4 of the protocol
5 Purpose of the Statistical Analysis Plan
The purpose of this Statistical Analysis Plan (SAP) is to document technical and detailed specifications for the analyses of data collected for protocol MS700461-0035.
This study is divided into two parts, Part A and Part B. The Summary of Clinical Trial Features in this SAP will describe both Part A and Part B, however, the analysis and outputs described in this SAP for the primary and final analyses are only for Part A (including description of interim analysis included in protocol amendment 4). If Part B of the study is activated, this SAP will be amended to include the analysis and outputs for Part B.
Results of the analyses described in this SAP will be included in the Clinical Study Report (CSR). Additionally, the planned analyses identified in this SAP may be included in regulatory submissions or future manuscripts. Any post-hoc, or unplanned analyses performed to provide results for inclusion in the CSR but not identified in this prospective SAP will be clearly identified in the CSR.
The SAP is based upon the Statistics section of the study protocol and is prepared in compliance with ICH E9.
6 Summary of Clinical Trial Features
Objectives:
Part A (if Part B is not activated)
Primary Objective
! Evaluate the safety and tolerability profiles of atacicept in subjects with IgA Nephropathy (IgAN) and persistent proteinuria (i.e., urine protein to creatinine ratio [UPCR] ≥ 1 mg/mg) through Week 48, while on a stable dose of Angiotensin Converting Enzyme Inhibitor (ACEi) and/or Angiotensin Receptor Blockers (ARB), considered optimal by the Investigator.
Secondary Objectives
! Evaluate the pharmacodynamic (PD) effect of atacicept
! Evaluate the serum atacicept concentrations (pharmacokinetic [PK])
CCICCI
PPDPPD

Atacicept Atacicept in IgA NephropathyMS700461-0035 Final V2.0
10/67
! Evaluate the safety and tolerability profiles of atacicept
! Evaluate the immunogenicity profile of atacicept.
Other Objectives
! Evaluate the effect of atacicept compared to placebo in reducing proteinuria
! Evaluate the effect of atacicept compared to placebo on achieving complete clinical remission and other measures of renal response
! Evaluate the effect of atacicept compared to placebo on renal function (i.e., estimated glomerular filtration rate [eGFR])
! Evaluate the effect of atacicept compared to placebo on titers of antibodies to pneumococcal antigens, tetanus toxoid, and diphtheria toxoid.
Exploratory Objectives
! Evaluate the association of baseline serum levels of B Lymphocyte Stimulator (also called B-cell activating factor or BAFF) (BLyS) and A Proliferation-Inducing Ligand (APRIL) with clinical response and/or safety
! Evaluate the association of exploratory markers (e.g., genetic variations, gene expression, immune cell subsets by flow cytometry, and circulating protein profiles) with clinical response (i.e., proteinuria, eGFR) and/or safety
! Evaluate the association of renal histopathology at baseline (archival kidney biopsies if available) with clinical response and/or safety
! Evaluate the effect of atacicept compared to placebo on renal histopathology after treatment (optional repeat kidney biopsy).
Part B
Primary Objective
! Evaluate the efficacy and dose-response of atacicept compared to placebo in reducing proteinuria in subjects with IgAN and persistent proteinuria (i.e., UPCR ≥ 1 mg/mg) while on a stable dose of ACEi and/or ARB, considered optimal by the Investigator, through Week 48.
Secondary Objectives
! Evaluate the effect of atacicept compared to placebo on proteinuria (i.e., UPCR < 1 mg/mg) at Week 48
! Evaluate the effect of atacicept compared to placebo on renal function (i.e., eGFR) at Week 156
! Evaluate the safety and tolerability profiles of atacicept.
CCICCI

Atacicept Atacicept in IgA NephropathyMS700461-0035 Final V2.0
11/67
Other Objectives
! Evaluate the effect of atacicept compared to placebo on proteinuria over 156 weeks
! Evaluate the effect of atacicept compared to placebo on achieving complete clinical remission and other measures of renal response
! Evaluate the effect of atacicept compared to placebo on renal function over 156 weeks
! Evaluate the serum atacicept concentrations (PK)
! Evaluate the PD effect of atacicept
! Evaluate the effect of atacicept compared to placebo on titers of antibodies to pneumococcal antigens, tetanus toxoid and diphtheria toxoid
! Evaluate the immunogenicity profile of atacicept.
Exploratory Objectives
! Evaluate the association of baseline serum levels of BLyS and APRIL with clinical response and/or safety
! Evaluate the association of exploratory markers (e.g., genetic variations, gene expression, immune cell subsets by flow cytometry, and circulating protein profiles) with clinical response and/or safety
! Evaluate the association of renal histopathology at baseline (archival kidney biopsies if available) with clinical response and/or safety
! Evaluate the effect of atacicept compared to placebo on renal histopathology after treatment (optional repeat kidney biopsy).
Methodology: This Phase II, multicenter, double-blind, placebo-controlled (DBPC), parallel arm study has 2 parts. The study will begin with 3 treatment arms in Part A; subjects will be randomized in a ratio of 1:1:1 to receive placebo, atacicept 25 mg, or atacicept 75 mg, given by subcutaneous (SC) injection once weekly. After at least 5 subjects per arm have had at least 12 weeks of treatment with Investigational Medicinal Product (IMP), assessments of the cumulative available safety data will be conducted, taking into account recommendations by an Independent Data Monitoring Committee (IDMC). After IDMC recommendation, an interim analysis (Part A) may be performed, after approximately 15 randomized subjects have completed 24 weeks of treatment, to inform the Sponsor decision. Proteinuria and other biomarkers (e.g., IgA and Gd-IgA1) may be evaluated by the Sponsor’s internal Unblinded Firewall team. Following recommendation by the IDMC and decision by the Sponsor, enrollment may be opened for Part B, wherein the atacicept 150 mg arm, given by SC injection once weekly for 156 weeks, will begin enrollment and the study will proceed with 4 treatment arms. The randomization ratio will be adjusted such that the 4 treatment arms will be approximately balanced when a total of 60 subjects are randomized, with ~15 subjects per arm at the time of interim futility analysis (when at least 60 subjects have completed 24 weeks of treatment), and so that the final sample size is ~25 subjects per arm (total n=100 subjects) to
CCICCI

Atacicept Atacicept in IgA NephropathyMS700461-0035 Final V2.0
12/67
receive placebo, atacicept 25 mg, 75 mg or 150 mg. If Part B is not activated, only Part A will be completed with ~10 subjects per arm treated up to 72 weeks; if Part B is activated, all subjects from Part A will roll into Part B and only Part B will be completed.
For each subject, the study is composed of a Screening Period, a DBPC treatment Period, and a Safety follow-up (FU) Period.
Screening Period: The first visit will be a Screening Visit and include review of the inclusion/exclusion criteria. The Day 1 Visit is the baseline visit. For all assessments except UPCR from 24-hour urine and total protein from 24-hour urine, the last non-missing value prior to randomization on Day 1 will be considered as the baseline value. Duration of the Screening Period will be up to 4 weeks, during which all screening assessments must be completed and reviewed to determine the subject’s eligibility. Importantly, subjects should undergo the Day 1 Visit as soon as possible after all assessments for eligibility of the study have been confirmed. Archival renal tissues from previous kidney biopsies, if available, will be requested for central pathology review.
DBPC Treatment Period: For each subject, duration of the treatment period from randomization will be 72 weeks for Part A if Part B is not activated, or extended to a total of 156 weeks if Part B is activated. Subject eligibility (based on screening assessments of the inclusion and exclusion criteria) must be reviewed again on Day 1 prior to randomization. The Day 1 procedures will be performed up to, at most, 4 weeks after the Screening Visit if the subject is found to be eligible. The first dose of the IMP (atacicept or placebo) will be given while the subject is still on site for the Day 1 Visit. Subjects will be monitored at study visits at Weeks 1, 2 and 4, and every 4 weeks thereafter through Week 24, then every 8 weeks through Week 48, and then every 12 weeks.
Part A may continue or Part B may be activated.
Decision to Activate/Not to Activate Part B: After review of the cumulative safety data and recommendation by the IDMC, a decision will be made by the Sponsor to either initiate Part B or complete only the ongoing Part A study without initiating Part B. The 2 possible scenarios are as follows:
! Begin Part B: If Part B is activated, the atacicept 150 mg arm will be opened for enrollment and only Part B will be completed. All subjects will be scheduled to receive IMP treatment for 156 weeks. Subjects who are receiving IMP in Part A will roll over to the DBPC treatment period of Part B and complete 156 weeks of IMP treatment. Additional subjects will be enrolled into all 4 treatment arms. The Week 156 Visit is the end of IMP treatment for the study.
! Complete only Part A: If the decision is made not to proceed to Part B, then enrolment will continue into Part A until approximately 30 subjects have been enrolled (~ 10 subjects per arm). The study enrollment for the placebo and atacicept 25 mg and 75 mg arms will continue uninterrupted and subjects will receive IMP treatment until Week 72.
CCICCI

Atacicept Atacicept in IgA NephropathyMS700461-0035 Final V2.0
13/67
Complete Clinical Remission: After Week 48, subjects who are considered to have achieved complete clinical remission may have discontinuation of IMP dosing, at the discretion of the investigator, after discussion with the medical monitor.
Complete clinical remission is defined as having at least 3 consecutive negative results (defined as urinary sediment red blood cell count of <5/high-power field and UPCR of <0.3 mg/mg from spot urine) over, at minimum a 24- week period (adapted from Suzuki 2013).
Subjects meeting criteria for complete clinical remission and having discontinuation of IMP will complete an Early Termination (ET) visit and Safety Follow-up (FU) visits until the end of the DBPC treatment period. IMP will not be restarted.
Safety FU Period:
After the last dose of the IMP, all subjects are required to enter a Safety FU period. For subjects who completed the treatment (72 weeks for Part A if Part B is not activated, or 156 weeks for Part B if Part B is activated), the Safety FU period is 24 weeks, with visits at Weeks 4, 12 and 24.
Part B: Alternatively, if Part B is activated, the study is composed of an up-to-4 week Screening Period, a 156-week DBPC treatment Period, and a 24-week Safety FU period for all subjects. If early discontinuation occurs, subjects will complete an ET Visit, and a Safety FU period, with visits at 4, 12, 24 weeks and every 12 weeks thereafter, until the end of the planned DBPC treatment period (Week 72 for Part A if Part B is not activated, or Week 156 for Part B if Part B is activated). All visits will be conducted on an outpatient basis.
Planned number of subjects: Approximately 30 subjects (~10 per arm) for Part A if Part B is not activated, or a total of 100 subjects (~25 per arm) if Part B is activated, are planned to be enrolled.
Part A (if Part B is not activated)Primary endpoint:
! Adverse Events (AEs), AEs of special interest (AESI), AEs leading to discontinuation, Serious AEs (SAE), AEs leading to death.
Secondary endpoints:
! Serum atacicept concentrations at pre-specified time points (additional PK sampling will be done on Days 2 and/or 3 in a subgroup of study subjects [~6 subjects per treatment group])
! Change from baseline levels in serum immunoglobulin (Ig) classes (IgG, IgA, and IgM) (g/L) at pre-specified time points
CCICCI
Atacicept Atacicept in IgA NephropathyMS700461-0035 Final V2.0
14/67
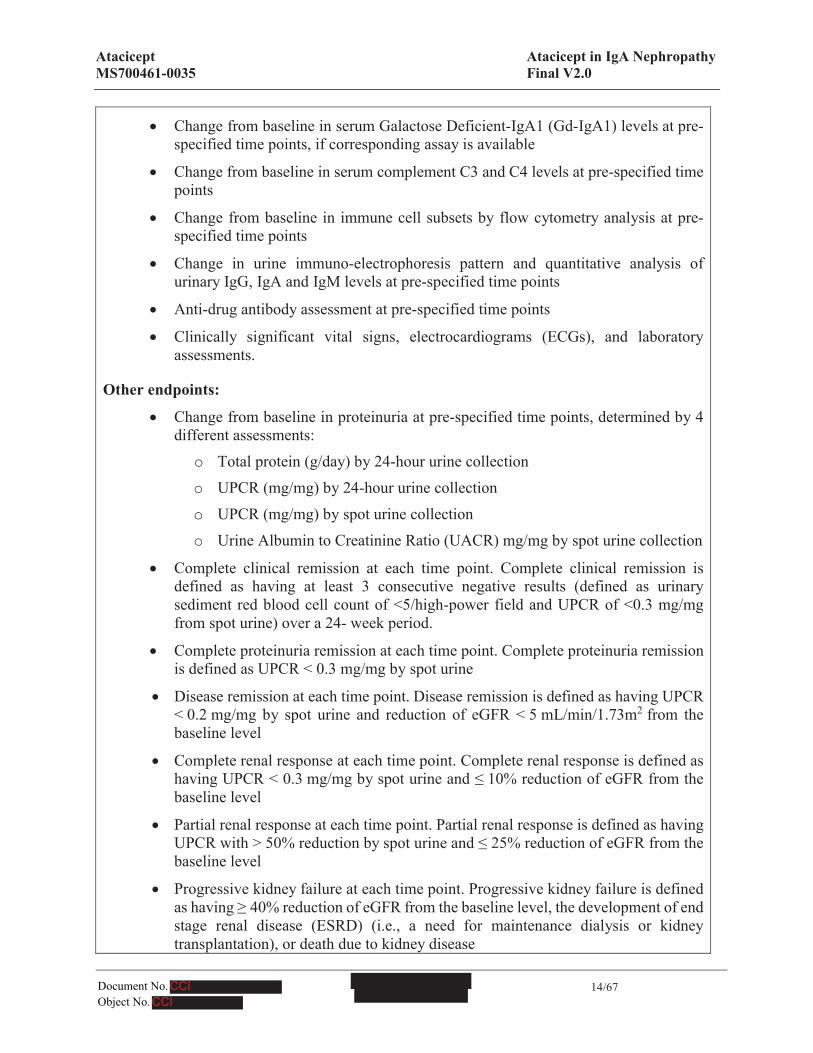
! Change from baseline in serum Galactose Deficient-IgA1 (Gd-IgA1) levels at pre-specified time points, if corresponding assay is available
! Change from baseline in serum complement C3 and C4 levels at pre-specified time points
! Change from baseline in immune cell subsets by flow cytometry analysis at pre-specified time points
! Change in urine immuno-electrophoresis pattern and quantitative analysis of urinary IgG, IgA and IgM levels at pre-specified time points
! Anti-drug antibody assessment at pre-specified time points
! Clinically significant vital signs, electrocardiograms (ECGs), and laboratory assessments.
Other endpoints:
! Change from baseline in proteinuria at pre-specified time points, determined by 4 different assessments:
o Total protein (g/day) by 24-hour urine collection o UPCR (mg/mg) by 24-hour urine collectiono UPCR (mg/mg) by spot urine collectiono Urine Albumin to Creatinine Ratio (UACR) mg/mg by spot urine collection
! Complete clinical remission at each time point. Complete clinical remission is defined as having at least 3 consecutive negative results (defined as urinary sediment red blood cell count of <5/high-power field and UPCR of <0.3 mg/mg from spot urine) over a 24- week period.
! Complete proteinuria remission at each time point. Complete proteinuria remission is defined as UPCR < 0.3 mg/mg by spot urine
! Disease remission at each time point. Disease remission is defined as having UPCR < 0.2 mg/mg by spot urine and reduction of eGFR < 5 mL/min/1.73m2 from the baseline level
! Complete renal response at each time point. Complete renal response is defined as having UPCR < 0.3 mg/mg by spot urine and ≤ 10% reduction of eGFR from the baseline level
! Partial renal response at each time point. Partial renal response is defined as having UPCR with > 50% reduction by spot urine and ≤ 25% reduction of eGFR from the baseline level
! Progressive kidney failure at each time point. Progressive kidney failure is defined as having ≥ 40% reduction of eGFR from the baseline level, the development of end stage renal disease (ESRD) (i.e., a need for maintenance dialysis or kidney transplantation), or death due to kidney disease
CCICCI

Atacicept Atacicept in IgA NephropathyMS700461-0035 Final V2.0
15/67
! Change from baseline in eGFR at pre-specified time points through Week 72
! Change from baseline in titers of antibodies to pneumococcal antigens, tetanus toxoid and diphtheria toxoid at pre-specified time points.
Exploratory Endpoints:
! Correlation of serum BLyS and APRIL baseline and change from baseline (if assay is available), with clinical response and/or safety
! Correlation of exploratory markers (e.g., genetic variants [gene expression profiles, immune cell subsets by flow cytometry, and circulating protein profiles) with clinical response (i.e., proteinuria, eGFR) and/or safety
! Scoring of renal tissues by immunohistochemistry using the Oxford-MEST classification of IgAN: mesangial hypercellularity (M), endocapillary proliferation (E), segmental glomerulosclerosis (S), and tubular atrophy/interstitial fibrosis (T)
! Glomerular IgG, IgA, Gd-IgA1, C3 and C4 deposition; measured by immunohistochemistry and/or immunofluorescence. BLyS and APRIL, expression in renal tissues
! Correlation of above histopathology parameters with clinical response (i.e., proteinuria, eGFR) and/or safety
Part BPrimary endpoint:
! Percent change in proteinuria from baseline at Week 48 (based on UPCR derived from 24-hour urine collections). The baseline value will be determined by the average of the values at Screening and Day 1 for UPCR.
Secondary endpoints:
! Proportion of subjects with UPCR < 1 mg/mg and ≥ 25% decrease from baseline (taken from the 24-hour urine collection) with stable eGFR (with <15% reduction from the baseline level) at Week 48
! Change from baseline in eGFR at Week 156
! AEs, AESI, AEs leading to discontinuation, SAE, AEs leading to death
! Clinically significant vital signs, ECGs and laboratory assessments.
Other endpoints:
! For each of the following endpoints, proteinuria will be determined by 4 different assessments:1. Total protein (g/day) by 24-hour urine collection 2. UPCR (mg/mg) by 24-hour urine collection
CCICCI

Atacicept Atacicept in IgA NephropathyMS700461-0035 Final V2.0
16/67
3. UPCR (mg/mg) by spot urine collection4. UACR (mg/mg) by spot urine collection
o Proportion of subjects with ≥25% decrease from baseline in proteinuria and to less than 1 (g/day for total protein or mg/mg for UPCR) with stable eGFR (with <15% reduction compared to baseline level) at pre-specified time points
o Proportion of subjects with ≥50% decrease in proteinuria with stable eGFR (with <15% reduction compared to baseline level) at pre-specified time points
o Proportion of subjects with proteinuria <0.5 (g/day for total protein or mg/mg for UPCR) at pre-specified time points
o Proportion of subjects with time-averaged proteinuria <1 (g/day for total protein or mg/mg for UPCR) at pre-specified time points. Time averaged proteinuria is defined as the average proteinuria over a 24-week time window. At Week 156, time averaged proteinuria will also be computed as the average proteinuria over the 156-week treatment period
o Change from baseline in proteinuria at pre-specified time points
! Complete clinical remission at each time point. Complete clinical remission is defined as having at least 3 consecutive negative results (defined as urinary sediment red blood cell count of <5/high-power field and UPCR of <0.3 mg/mg from spot urine) over a 24- week period
! Complete proteinuria remission at each time point. Complete proteinuria remission is defined as UPCR < 0.3 mg/mg by spot urine
! Disease remission at each time point. Disease remission is defined as having UPCR < 0.2 mg/mg by spot urine and reduction of eGFR < 5 mL/min/1.73m2 from the baseline level
! Complete renal response at each time point. Complete renal response is defined as having UPCR < 0.3 mg/mg by spot urine and ≤ 10% reduction of eGFR from the baseline level
! Partial renal response at each time point. Partial renal response is defined as having UPCR with > 50% reduction by spot urine and ≤ 25% reduction of eGFR from the baseline level
! Progressive kidney failure at each time point. Progressive kidney failure is defined as having ≥ 40% reduction of eGFR from the baseline level, the development of ESRD (i.e., a need for maintenance dialysis or kidney transplantation), or death due to kidney disease
! Poor renal outcome, defined as at least one of the following criteria: ≥30% decrease in eGFR (sustained for at least 4 weeks), ESRD (eGFR ≤15 mL/min/1.73m², dialysis, or renal transplant), or who died from renal or cardiovascular causes up to
CCICCI

Atacicept Atacicept in IgA NephropathyMS700461-0035 Final V2.0
17/67
and including Week 156; in addition, the proportion of subjects with individual components of this composite endpoint
! Change from baseline in eGFR at pre-specified time points
! Serum atacicept concentrations at pre-specified time points (additional PK sampling will be done on Days 2 and/or 3 in a subgroup of study subjects [approximately 6subjects per treatment group])
! Change from baseline levels in serum Ig classes (IgG, IgA, and IgM) (g/L) at pre-specified time points
! Change from baseline in serum galactose deficient IgA1 (Gd-IgA1) levels at pre-specified time points, if corresponding assay is available
! Change from baseline in serum complement C3 and C4 levels at pre-specified time points
! Change from baseline in immune cell subsets by flow cytometry analysis at pre-specified time points
! Change in urine immuno-electrophoresis pattern and quantitative analysis of urinary IgG, IgA and IgM levels at pre-specified time points
! Change from baseline in titers of antibodies to pneumococcal antigens, tetanus toxoid and diphtheria toxoid at pre-specified time points
! Anti-drug antibody assessment at pre-specified time points.
Exploratory Endpoints
! Correlation of serum BLyS and APRIL (Day 1 as baseline and change from baseline, if assay is available) with clinical response and/or safety
! Correlation of exploratory markers (e.g., genetic variants [gene expression profiles, immune cell subsets by flow cytometry, and circulating protein profiles) with clinical response (i.e., proteinuria, eGFR) and/or safety
! Scoring of renal tissues by immunohistochemistry using the Oxford-MEST classification of IgAN: mesangial hypercellularity (M), endocapillary proliferation (E), segmental glomerulosclerosis (S), and tubular atrophy/interstitial fibrosis (T)
! Glomerular IgG, IgA, Gd-IgA1, C3 and C4 deposition; measured by immunohistochemistry and/or immunofluorescence. BLyS and APRIL (if an assay is available) expression in renal tissues
! Correlation of above histopathology parameters with clinical response (i.e., proteinuria, eGFR) and/or safety.
CCICCI

Atacicept Atacicept in IgA NephropathyMS700461-0035 Final V2.0
18/67
Diagnosis and key inclusion and exclusion criteria: Eligible male and female subjects, 18 years of age or older who provide written informed consent, with IgAN as demonstrated by renal biopsy done within 60 months of the Screening Visit, with UPCR ≥0.75 and ≤6 mg/mg during screening, and on a stable, optimized ACEi and/or ARB for at least 8 weeks prior to the Screening Visit. Subjects are not eligible for this study if they have concomitant renal disease other than IgAN, severe renal impairment, history of tuberculosis (TB) or active or untreated latent TB, or positive hepatitis B or C serology, or concomitant immunosuppressant use.
Investigational Medicinal Product: dose/mode of administration/ dosing schedule: Atacicept 25 mg, 75 mg or 150 mg in pre-filled 1 mL syringes, administered as once weekly SC injection.
Reference therapy: dose/mode of administration/dosing schedule: Matching placebo in pre-filled 1 mL syringes, administered as once weekly SC injection.
Planned study and treatment duration per subject: A total of 72 weeks for Part A (if Part B is not activated) or 156 weeks if Part B is activated followed by a 24-week Safety FU Period.
Statistical methods:
Part A for this Phase II study is designed to evaluate safety, PK, and PD during the 72-week treatment period with atacicept compared to placebo in subjects with IgAN with persistent proteinuria ≥ 1 mg/mg by UPCR at Screening or within 12 months prior to the Screening Visit, or ≥ 0.75 mg/mg during Screening, while on a stable dose of ACEi and/or ARB (considered optimal by the Investigator). There is no hypothesis tested in the Safety analyses (sample size in Part A is not based on statistical power).
The sample size in Part B is planned to primarily support the dose-response testing. The randomization ratio will be adjusted such that the 4 treatment arms will be approximately balanced when a total of 60 subjects are randomized with ~15 subjects per arm at the time of interim futility analysis (when at least 60 subjects have completed 24 weeks of treatment); the final sample size is ~25 subjects per arm (total n=100 subjects). Given a maximum effect size assumption of 40% on proteinuria reduction over placebo, a standard deviation (SD)assumption of 40% for proteinuria change from baseline at Week 48, and 20% non-evaluable subjects by Week 156, it is estimated that 20 evaluable subjects per arm for an equal randomization ratio will provide at least 80% power to demonstrate a statistically significant dose-response at the 2-sided 5% alpha level. Randomization will be stratified according to the following stratification factors: baseline proteinuria (UPCR < 2 mg/mg vs ≥ 2 mg/mg, based on the Screening 24-hour urine collection) and race (Asian vs non-Asian).
Planned analyses:
Analyses, as indicated below, will be performed depending on whether or not Part B of the study is activated. For either Part A or Part B, the primary analysis will be performed when all subjects have completed the scheduled Week 48 Visit or have discontinued from study. Analyses at Weeks 96 and 156 of Part B will support long-term treatment evidence for safety and efficacy.
CCICCI

Atacicept Atacicept in IgA NephropathyMS700461-0035 Final V2.0
19/67
! Interim analysis (Part A): may be performed after approximately 15 randomized subjects have completed 24 weeks of treatment to inform the Sponsor decision. Proteinuria and other biomarkers (e.g., IgA and Gd-IgA1) may be evaluated by the Sponsor’s internal Unblinded Firewall team.
! Interim futility analysis (if Part B is activated): performed by an independent statistical center after 60 randomized subjects (60% of total subjects) have completed 24 weeks of treatment. Proteinuria and other biomarker changes from baseline at Week 24 will be evaluated for futility by the IDMC and the Sponsor's internal unblinded Firewall team.
! Week 48 analysis (primary analysis, Part A or Part B): performed after all randomized subjects have completed the scheduled Week 48 Visit or have discontinued from study. After the Week 48 analysis, the sites and subjects will remain blinded while the trial is ongoing.
! Week 96 analysis (if Part B is activated): performed after all randomized subjects have completed the scheduled Week 96 Visit or have discontinued from study.
! Week 156 analysis (if Part B is activated): performed after all randomized subjects have completed the scheduled Week 156 Visit or have discontinued from study.
! Final analysis (Part A or Part B): will be performed after all randomized subjects have completed the Safety FU Period or have discontinued from study.
7 Sample Size/Randomization
7.1 Sample Size
Sample size justification for Part A
Part A for this Phase II study is designed to evaluate safety, PK, and PD during the 72-week treatment period with atacicept compared to placebo in subjects with IgAN with persistent proteinuria ≥ 1 mg/mg by UPCR at Screening or within 12 months prior to the Screening Visit, or ≥ 0.75 mg/mg during Screening, while on a stable dose of ACEi and/or ARB (considered optimal by the Investigator). While the sample size of 10 subjects per arm in Part A is deemed sufficient to capture a treatment effect in terms of safety, PK and PD, it is not based on statistical power since no hypotheses will be tested. Particularly, based on observations of Week 24 data for the 75mg atacicept arm in the ADDRESS II study (EMR700461-023), this sample size will support the detection of a treatment effect in IgA (40% with SD 20%) with 98% power, or a treatment effect in IgG (25% with SD 20%) with 75% power, both for a two-sided t-test with 5% type 1 error. The PK-PD relationship will be explored as data permit.
Sample size justification for Part B
The primary endpoint of Part B is the percent change from baseline in proteinuria at Week 48 (based on UPCR from 24-hour urine collection). The dose-response of the primary endpoint will be analyzed using the dose-finding method Multiple Comparison Procedures with Modeling
CCICCI

Atacicept Atacicept in IgA NephropathyMS700461-0035 Final V2.0
20/67
Techniques (MCP-Mod) (see ref 2). The advantage of MCP-Mod is to combine multiple comparison and modeling techniques in choosing the appropriate dose response curve from several pre-defined candidate parametric models while preserving the family-wise error rate for the study.
Additionally for a chosen dose-response curve, MCP-Mod allows to estimate the minimum effective dose (MED) and the target dose (TD) based on pre-defined criteria. In this study, the MED is the smallest dose demonstrating a proteinuria decrease of at least 20% from baseline over placebo; the TD is the closest dose demonstrating a proteinuria decrease of at least 40% from baseline over placebo.
The sample size is planned to primarily support the dose-response testing via MCP-Mod method and calculated using the R package Dose Finding (Version 0.9-11, Date: 2014-02-11).
The following 4 parametric models are considered for dose-response: Emax, Linear, Logistic, and Quadratic. “Figure a” in Figure 1 shows the pre-specified dose-response curve of each model. The pre-specified dose-response models are chosen based on the prior dose-response information obtained from previous studies of atacicept in other immunology indications, e.g., Rheumatoid Arthritis (RA) and Systemic Lupus Erythematosus (SLE), where Emax or Linear dose-response were suggested. Logistic and Quadratic models are added to account for model uncertainty.
In the dose-response models, the maximum effect size assumption of 40% on proteinuria reduction over placebo is based indirectly from the observed significant PD effect of atacicept on IgG and IgA in the clinical studies conducted of other indications such as SLE and RA, and expecting the strong PD effect would translate into the treatment effect on proteinuria. The assumption is also indirectly supported by external evidence of another anti-BLyS agent (blisibimod) from a 24-week treatment study for SLE patients which showed blisibimod significantly reduced proteinuria in a subgroup of SLE patients whose baseline proteinuria was >1-6 g/day (baseline mean 1.8-2.0 g/day) (see ref 3). In a post-hoc analysis it showed that at Week 24, the pooled blisibimod doses (3 dosing regimens) resulted in a mean reduction in proteinuria of 0.73 g/day (-35.0%) compared to 0.24g/day (-5.1%) in the pooled placebo group (p=0.045, n=21-22 per group); and the reduction in proteinuria in the highest dose (200 mg QW) was 0.96 g/day (-50.1%) compared with an increase of 0.16g/day (+17.7%) in the matched placebo group (n=5-8 per group).
The SD for proteinuria percent change from baseline is indirectly estimated based on the blisibimod data. The SD of 40% is assumed for sample size planning.
Given the effect size and SD assumptions, it is estimated that 20 evaluable subjects per arm for an equal randomization ratio will provide at least 80% power to demonstrate a statistically significant dose-response at the 2-sided 5% alpha level. Evaluable subjects in Part B are define as subjects who have proteinuria values (based on UPCR from 24-hour urine collection) for both baseline and Week 48. Taking into account 20% non-evaluable subjects by Week 156, the planned total sample size is thus 100 subjects (~25 subjects per arm) randomized to placebo, atacicept 25 mg, atacicept 75 mg, and atacicept 150 mg.
The loss in power associated with misspecification of the parameters in the dose-response model is often found to be negligible for reasonable candidate models (see ref 1). “Figure b” in Figure 1displays a relationship between power and sample size for the dose-response models used in this
CCICCI

Atacicept Atacicept in IgA NephropathyMS700461-0035 Final V2.0
21/67
study. For a given sample size per dose, it shows the minimum, average, and maximum power achieved from the 4 dose-response models.
Figure 1 Dose-response Models and Sample Size and Power Calculations
Figure a. Dose-response models Figure b. Sample size and Power
7.2 Randomization
Subjects will be randomized by a central Interactive Web Response System (IWRS) randomization provider.
At the beginning of the study (Part A), eligible subjects will be randomized in a ratio of 1:1:1 to receive placebo, atacicept 25 mg, or atacicept 75 mg by the IWRS. After at least 5 subjects per arm have received at least 12 weeks of study drug, the IDMC will convene to review the cumulative safety data. Taking into account IDMC recommendation, the Sponsor will determine whether or not the study may then proceed to Part B, with 4 treatment arms, i.e., placebo or atacicept 25 mg, 75 mg, or 150 mg. The randomization ratio will be adjusted such that the 4 treatment arms will be approximately balanced when a total of 60 subjects are randomized with ~15 subjects per arm at the time of futility analysis, and that the final sample size will be approximately 25 subjects per arm (across all 4 arms), i.e. with a final ratio of 1:1:1:1.
Randomization will be stratified according to the following stratification factors: baseline proteinuria (UPCR <2 mg/mg vs. ≥2 mg/mg, based on the Screening 24-hour urine collection) and race (Asian vs. non-Asian). Randomization will be conducted in permuted blocks.
Dose
Mod
el m
eans
0
10
20
30
40
0 50 100 150
linear emax quadratic logistic
Sample size per dose (balanced)
Pow
er
0.5
0.6
0.7
0.8
0.9
1.0
10 15 20 25 30 35
min mean max
CCICCI

Atacicept Atacicept in IgA NephropathyMS700461-0035 Final V2.0
22/67
8 Overview of Planned Analyses
This SAP covers the interim, primary and final analyses and outputs for Part A only. If Part B of the study is activated, this SAP will be amended to include the analyses and outputs for Part B. The Statistical Analysis Plan for the IDMC reports is developed separately.
8.1 Interim analysis for Part A
An interim analysis may be performed after approximately 15 randomized subjects have completed 24 weeks of treatment.
The following analyses will be performed (mITT Set is defined in section 10.2, baseline, treatment period and imputation of laboratory data in case of modifiers are defined in Section 11):
Treatment receivedA listing presenting subjects who are randomized to a treatment but received a different treatment or did not receive any treatment will be produced using the mITT set.
Serum IgG, IgA, IgM
Serum IgG, IgA and IgM will be summarized using descriptive statistics of absolute values, changes and percent changes from baseline for each visit during treatment period and by treatment group.
Absolute value and percent change from baseline in Serum IgG at each time point during the treatment period will be displayed using line plots of mean and SD bars.
Percent change from baseline in Serum IgA and IgM at each time point during the treatment period will be displayed using line plots of mean and SD bars. A listing presenting data for which an imputation has been applied in case of modifiers in raw data, will be produced (see Section 11).
These analyses will be performed using the mITT Set.
Serum Gd-IgA1
Serum Gd-IgA1 will be summarized using descriptive statistics of absolute values, changes and percent changes from baseline for each visit during treatment period and by treatment group.
Individual absolute values of Serum Gd-IgA1 at each time point during the treatment period will be displayed using a spaghetti plot.
Absolute value and percent change from baseline in Serum Gd-IgA1 at each time point during the treatment period will be displayed using line plots of mean and SD bars.
A listing presenting data for which an imputation has been applied in case of modifiers in raw data, will be produced (see Section 11).
CCICCI

Atacicept Atacicept in IgA NephropathyMS700461-0035 Final V2.0
23/67
These analyses will be performed using the mITT Set.
eGFR
eGFR (calculated per the CKD-EPI equation for all subjects, see section 13.2.2) will be summarized using descriptive statistics of absolute values, changes and percent changes from baseline for each visit during treatment period and by treatment group.
Individual absolute values of eGFR at each time point during the treatment period will be displayed using a spaghetti plot.
Absolute value, absolute change, and percent change from baseline in eGFR at each time point during the treatment period will be displayed using line plots of mean and SD bars.A listing presenting data for which an imputation has been applied in case of modifiers in raw data, will be produced (see Section 11).
These analyses will be performed using the mITT Set.
Proteinuria
Total protein (g/day) by 24-hour urine, UACR (mg/mg) by spot urine, UPCR (mg/mg) by 24-hour urine and UPCR (mg/mg) by spot urine will be summarized using descriptive statistics of absolutevalues, changes and percent changes from baseline for each visit during treatment period and by treatment group.
Individual absolute values of total protein (g/day) by 24-hour urine, UACR (mg/mg) by spot urine, UPCR (mg/mg) by 24-hour urine and UPCR (mg/mg) by spot urine at each time point during the treatment period will be displayed using spaghetti plots.Absolute value and percent change from baseline in Total protein (g/day) by 24-hour urine, UPCR (mg/mg) by 24-hour urine and UPCR (mg/mg) by spot urine at each time point during the treatment period will be displayed using line plots of mean and SD bars.
A listing presenting data for which an imputation has been applied in case of modifiers in raw data, will be produced (see Section 11).
These analyses will be performed using the mITT Set.
8.2 Primary and Final analysis for Part A
A Week 48 analysis (primary analysis) will be performed after all randomized subjects have completed the scheduled Week 48 visit or have discontinued from study. After the Week 48 analysis, the sites and subjects remain blinded while the trial is ongoing.
A final analysis will be performed after all randomized subjects have completed the Safety FU Period or have discontinued the study.
CCICCI

Atacicept Atacicept in IgA NephropathyMS700461-0035 Final V2.0
24/67
A Data Review Meeting will be held prior to database lock for the Week 48 analysis and for the final analysis. In addition, no randomization code should be unblinded until this SAP has been approved, the database is locked, and the analysis datasets are approved.
The subsequent sections of this SAP detail these analyses.
9 Changes to the Planned Analyses in the Clinical Trial Protocolfor Part A
! Clarification: the protocol specifies slightly different criteria in the objective for Part A that is not completely aligned with inclusion criteria # 3: the objective specifies persistent proteinuria as urine protein to creatinine ratio [UPCR] ≥ 1 mg/mg. However, the inclusion criteria indicates “UPCR ≥0.75 mg/mg by 24-hour urine collection during the Screening Period with at least one documented historical UPCR ≥1 mg/mg within 12 months prior to the Screening visit or UPCR ≥1 mg/mg by 24-hour urine collection during the Screening Period. The objective of assessing safety and tolerability will still be tested in the subjects included per inclusion criteria 3, regardless of the wording used in the objective.
! Correction: The sample size calculation for the IgG and IgA endpoints is not based on a two-sided Fisher’s exact test (typo in the protocol) but on a two-sided t-test as this is a continous variable.
! Correction: The following seconday endpoint is specified in the protocol: Clinically significant laboratory assessments. This analysis will be performed considering the normal ranges since the information regarding clinical significance is not available.
! Removal of analysis: There will be no analysis of the following seconday endpoint:Clinically significant vital signs, since this information is not available.
! Removal of analysis: There will be no analysis of the following secondary endpoint: Quantitative analysis of urinary IgG, IgA, IgM and Gd-IgA1 levels at pre-specified time pointssince measurements are not available for these parameters.
! Removal of analysis: There will be no analysis of the following other endpoint: Correlation of change from baseline in serum BLyS and APRIL with clinical response and/or safety, since serum BLyS or APRIL level cannot be measured after baseline and with the presence of atacicept.
! Removal of analysis: There will be no analysis of the following exploratory endpoints:BLyS and APRIL (if an assay is available) expression in renal tissues since such assays will not be available.
CCICCI

Atacicept Atacicept in IgA NephropathyMS700461-0035 Final V2.0
25/67
! Removal of analysis: There will be no analysis of the following exploratory endpoints:Correlation of above histopathology parameters (archival and post-treatment biopsies if available) with clinical response (ie, proteinuria, eGFR) and/or safety)due to small number of kidney biopsies.
! Addition compared to the protocol: Definition of FC Set, KB Set and PGx Set have been specified in the IAP.
! Addition of “Demyelinating disorders” as AESI (not in the protocol): “Demyelinating disorders” was identified as AE of special interest based on completed Atacicept studies and as summarized in the IB version 14.0.
! Removal compared to the protocol: The Intent-to-treat (ITT) population consists of all randomized subjects”, but it will not be removed from the IAP since there will be no analysis in this Analysis Set in Part A or Part B. mITT Analysis set will be used as primary analysis set for Efficacy.
! Change from the protocol: Definition of the PK population is modified compared to the protocol.Original definition: the PK population consists of all randomized subjects without protocoldeviations affecting PK who were administered at least 1 dose of the IMP and have at least one evaluable PK sample. All. Updated definition: The PK population defined in this SAP consists of all randomized subjects without clinically-important protocol deviations affecting PK who were administered at least 1 dose of the IMP and have at least one evaluable PK sample.
! Change from the protocol: Definition of concomitant medications is modified compared to the protocol. Original definition: concomitant medications are medications which are taken on or after the date of informed consent. Updated definition: Concomitant medications defined in this SAP will include medications taken on or after the date of the first IMP dose. Therefore, prior medications are those taken before the date of the first IMP dose.
! Change from the protocol: Definition of complete clinical remission is modified compared to the protocol.Original definition: complete clinical remission is defined as having UPCR < 0.3 mg/mg and urine Red Blood Cells < 5/high power field by spot urine over, at minimum, a 24-week period or is defined as having at least 3 consecutive negative results (defined as urinary sediment red blood cell count of < 5/high-power field and UPCR of < 0.3 mg/mg from spot urine) over, at minimum, a 24-week period (adapted from Suzuki 2013).Updated definition: Complete clinical remission is defined in this SAP as having at least 3 consecutive negative results (defined as urinary sediment red blood cell count of <5/high-power field and UPCR of <0.3 mg/mg from spot urine) over a 24- week period. “At minimum” is removed to allow 3 consecutive results within any period of time.
CCICCI
Atacicept Atacicept in IgA NephropathyMS700461-0035 Final V2.0
26/67
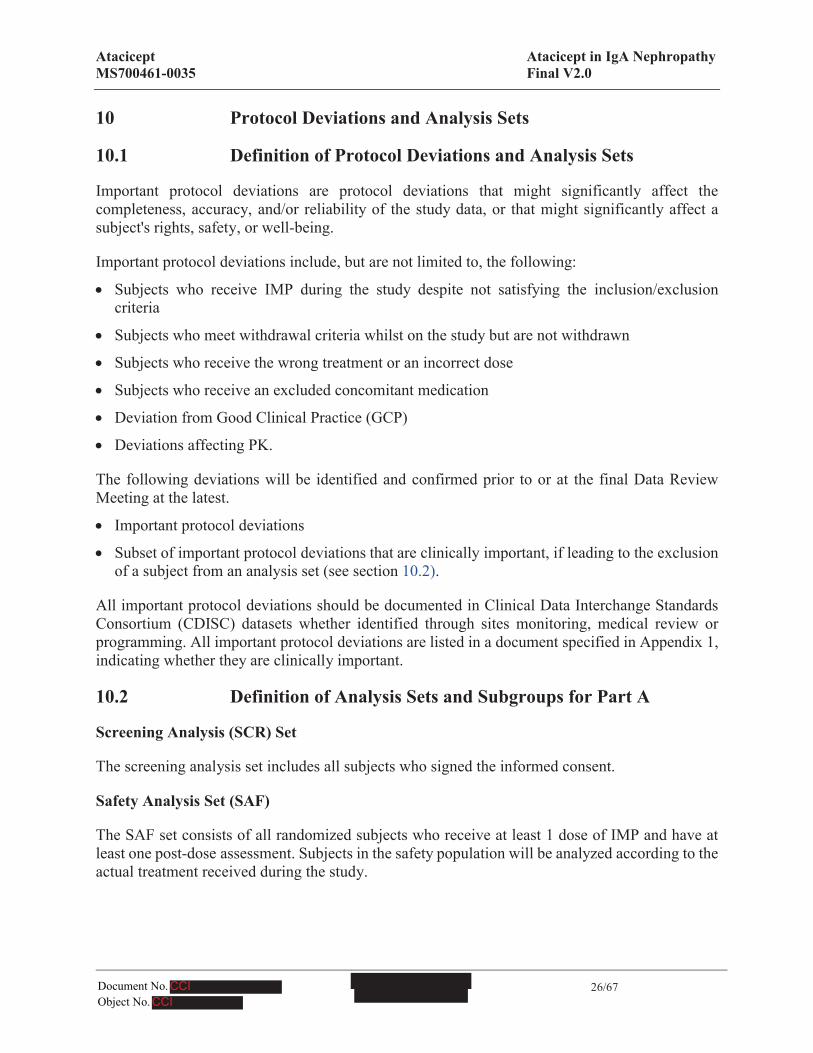
10 Protocol Deviations and Analysis Sets
10.1 Definition of Protocol Deviations and Analysis Sets
Important protocol deviations are protocol deviations that might significantly affect the completeness, accuracy, and/or reliability of the study data, or that might significantly affect a subject's rights, safety, or well-being.
Important protocol deviations include, but are not limited to, the following:
! Subjects who receive IMP during the study despite not satisfying the inclusion/exclusioncriteria
! Subjects who meet withdrawal criteria whilst on the study but are not withdrawn
! Subjects who receive the wrong treatment or an incorrect dose
! Subjects who receive an excluded concomitant medication
! Deviation from Good Clinical Practice (GCP)
! Deviations affecting PK.
The following deviations will be identified and confirmed prior to or at the final Data Review Meeting at the latest.
! Important protocol deviations
! Subset of important protocol deviations that are clinically important, if leading to the exclusion of a subject from an analysis set (see section 10.2).
All important protocol deviations should be documented in Clinical Data Interchange Standards Consortium (CDISC) datasets whether identified through sites monitoring, medical review or programming. All important protocol deviations are listed in a document specified in Appendix 1, indicating whether they are clinically important.
10.2 Definition of Analysis Sets and Subgroups for Part A
Screening Analysis (SCR) Set
The screening analysis set includes all subjects who signed the informed consent.
Safety Analysis Set (SAF)
The SAF set consists of all randomized subjects who receive at least 1 dose of IMP and have at least one post-dose assessment. Subjects in the safety population will be analyzed according to the actual treatment received during the study.
CCICCI

Atacicept Atacicept in IgA NephropathyMS700461-0035 Final V2.0
27/67
Modified Intention-to-Treat Set (mITT)
The mITT set is defined as all randomized subjects who have received at least 1 dose of the IMP.Analyses performed on the mITT set will allocate subjects’ treatment groups as randomized.
The mITT set is the primary analysis set for key endpoints (ie, proteinuria and eGFR endpoints).
Per-Protocol Set (PP)
The PP set consists of all patients in the mITT set who do not have any clinically important protocol deviations. Analyses of PP will be performed if more than 20% of the mITT (ie, proteinuria and eGFR endpoints) have clinically important protocol deviations. Analyses performed on the PP set will allocate subjects’ treatment groups as randomized. All clinically important protocol deviations specifying those leading to the exclusion from the PP set are defined in the document specified in Appendix 1. Additional criteria leading to exclusion from the PP set may also be defined.
Pharmacokinetic Set (PK)
The PK set consists of all randomized subjects without clinically important protocol deviations affecting PK who were administered at least 1 dose of the IMP and have at least one evaluable PK sample. Subjects in the PK set will be analyzed according to the actual treatment received during the study. Additional PK sampling will be done on Days 2 and/or 3 in a subgroup of study subjects (approximately 6 subjects per treatment group). All clinically important protocol deviations specifying those leading to the exclusion from the PK Set are defined in the document specified in Appendix 1.
Flow Cytometry Set (FC)
The FC set consists of all subjects in the SAF set who are part of the selected sites for Flow cytometry analysis and who had at least one sample taken for flow cytometry analysis. Subjects in the Flow cytometry analysis set will be analyzed according to the actual treatment received during the study.
Kidney Biopsy Set (KB)
The KB set consists of all subjects in the SAF set who have an archival kidney biopsy before treatment, or who consented to be part of the kidney biopsy analysis and had a post treatment kidney biopsy (up to a maximum of 4 weeks after 48 weeks of IMP treatment or a maximum of 4 weeks after at least 24 weeks of IMP treatment for ET). Subjects in the Kidney biopsy analysis set will be analyzed according to the actual treatment received during the study.
Pharmacogenetics Set (PGx)
The PGx set consists of all subjects in SAF set who consented to be part of the pharmacogenetics (PGx) analysis. Subjects in the PGx set will be analyzed according to the actual treatment received during the study.
CCICCI
Atacicept Atacicept in IgA NephropathyMS700461-0035 Final V2.0
28/67
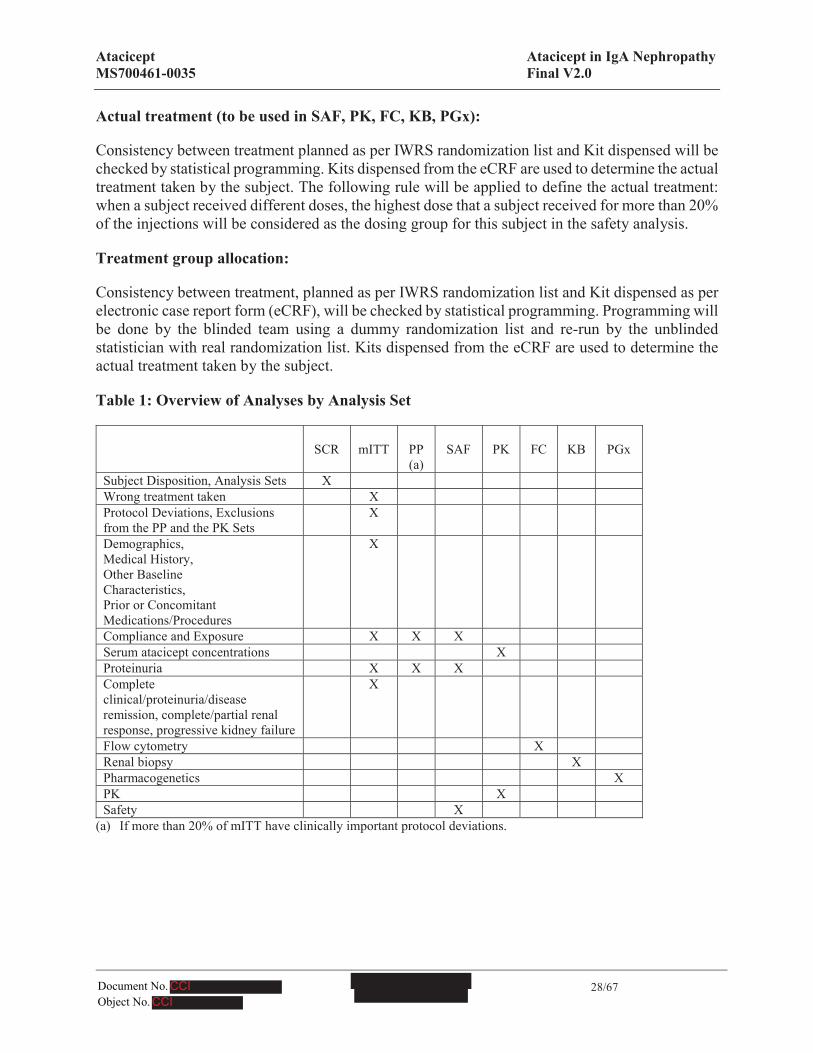
Actual treatment (to be used in SAF, PK, FC, KB, PGx):
Consistency between treatment planned as per IWRS randomization list and Kit dispensed will be checked by statistical programming. Kits dispensed from the eCRF are used to determine the actual treatment taken by the subject. The following rule will be applied to define the actual treatment: when a subject received different doses, the highest dose that a subject received for more than 20% of the injections will be considered as the dosing group for this subject in the safety analysis.
Treatment group allocation:
Consistency between treatment, planned as per IWRS randomization list and Kit dispensed as per electronic case report form (eCRF), will be checked by statistical programming. Programming will be done by the blinded team using a dummy randomization list and re-run by the unblinded statistician with real randomization list. Kits dispensed from the eCRF are used to determine the actual treatment taken by the subject.
Table 1: Overview of Analyses by Analysis Set
SCR mITT PP (a)
SAF PK FC KB PGx
Subject Disposition, Analysis Sets XWrong treatment taken XProtocol Deviations, Exclusions from the PP and the PK Sets
X
Demographics, Medical History, Other Baseline Characteristics, Prior or Concomitant Medications/Procedures
X
Compliance and Exposure X X XSerum atacicept concentrations XProteinuria X X XComplete clinical/proteinuria/disease remission, complete/partial renal response, progressive kidney failure
X
Flow cytometry XRenal biopsy XPharmacogenetics XPK XSafety X
(a) If more than 20% of mITT have clinically important protocol deviations.
CCICCI

Atacicept Atacicept in IgA NephropathyMS700461-0035 Final V2.0
29/67
11 General Specifications for Statistical Analyses
Listings will be provided for all data displayed in tables.
All analyses will be performed using SAS® Software version 9.2 or higher.
Pooling of centers:
Data from all investigative sites will be pooled for all planned analyses.
Presentation of continuous and qualitative variables:
For continuous parameters, descriptive statistics will include: Number (n) of subjects with non-missing values, number of subjects with missing values, mean, standard deviation (SD), median, Q1, Q3, minimum and maximum.
For categorical parameters, descriptive statistics will include the number and percentage of subjects in each category (including missing data). For the percentages, the denominator will be the total number of subjects in the treatment group and analysis set being presented, unless otherwise specified.
Significance level:
P-values and the 95% confidence intervals will be presented where applicable. As Part A was not powered for hypothesis testing, all statistical tests in Part A are to be regarded as exploratory.
Baseline evaluation:
The Day 1 Visit is the baseline visit. The baseline value will be the last non-missing value prior to first dosing for all assessments except UPCR from 24-hour urine and total protein from 24-hour urine, which will be obtained by averaging the value of the parameter at Screening and Day 1 Visits. If Day 1 value is missing, Screening value will be used as Baseline.
For assessment where time of assessment is available it will be compared to time of first dosing. For vital signs, data collected at Week 0 Day 1 post-dose will not be taken into account for the baseline.
Treatment period:
Treatment period is defined as the period between the date of first dose and the date of last dose plus 7 days, inclusive:
The Treatment period (weeks) duration = [(last dose date + 7 – first dose date) + 1]/7.
First dose date is defined as the first injection date from the “Atacicept/Placebo Administration”panel of the eCRF.
CCICCI

Atacicept Atacicept in IgA NephropathyMS700461-0035 Final V2.0
30/67
Last dose date is defined as the last study Atacicept/placebo administration date from the “treatment termination” page of the eCRF (or the cutoff date in case of an end of treatment status equal to “Ongoing” at the Week 48 analysis).
Study day
If date of assessment is prior to date of first dose: Study day = Date of assessment – Date of first dose
If date of assessment is on or after date of first dose: Study day = Date of assessment – Date of first dose + 1
Week 72 Visit and ET Visit:
According to the protocol, Week 72 is defined as the End of Treatment visit for Part A of the trial if Part B is not activated.
Subjects who discontinued prematurely (i.e. earlier than Week 72) from treatment will have an Early Termination (ET) visit.
Safety FU period:
After the last dose of the IMP, all subjects are required to enter a Safety FU period. For subjects who completed the 72 weeks of Part A treatment, the Safety FU period is 24 weeks, with visits at Weeks 4, 12 and 24.
If early discontinuation occurs, subjects will complete an ET Visit, and a Safety FU period, with visits at Weeks 4, 12, 24 and then every 12 weeks thereafter, until the end of the planned DBPC treatment period (Week 72 for Part A).
The by-visit summary tables for Safety FU Period will include Week 4, 12 and 24 for all subjects and every 12 weeks thereafter for early discontinued subjects.
Unscheduled visits:
As per database definition, the safety unscheduled assessments are always linked to a scheduled time point (each unscheduled assessment is linked to the previous scheduled time point). Safety data retrieved from an unscheduled time point (Vital Signs, Electrocardiogram (ECG) and Laboratory data) will be analyzed according to the following scenario:
! For Anti-Drug Antibody (see section 17.2.5)
! For Hypogammaglobulinaemia (see section 17.2.3)
! For complete clinical remission, complete proteinuria remission, disease remission , complete renal response, partial renal response , progressive kidney failure at each time point (see section 16.3)
CCICCI
Atacicept Atacicept in IgA NephropathyMS700461-0035 Final V2.0
31/67
! For shift table, they will be taken into account in the definition of the worst assessment during study
! For description at each time point, the first available result (in chronological order) will be taken into account in the analysis in case of multiple values.
Blinding/unblinding:
For Part A, the Week 48 analysis is the primary analysis of the study to be performed. The Week 48 analysis (primary analysis) for Part A will only be performed if Part B is not activated and after all randomized subjects have completed the scheduled Week 48 visit of Part A or have discontinued from the study. After the primary analysis, study subjects and sites will remain blinded until the end of the study. The primary analysis results will be generated on the aggregate group level and reviewed by a restricted team to limit initial dissemination. Subject level listings will not be automatically generated, in order to restrict the access to individual treatment information. In particular situations, individual listings may be generated for regulatory interactions. Such listings will be restricted from access by the clinical trial operation team. It is acknowledged that in special cases, such as the safety analysis involving rare events, it is possible that the treatment code for an individual subject may be revealed during the review of aggregate output. It is considered as a small and acceptable risk. The key endpoints of proteinuria, eGFR, and PD parameters are objective laboratory measures thus least affected by any subjective bias.
More details about the process to preserve the integrity of the study will be detailed in the FirewallTeam Charter for the Interim Analysis and in the Unblinding Plan (see appendix 2 and 3).
Calculation and conversions of dates and durations:
The following conversion factors will be used to convert dates:
! 1 week = 7 days
! 1 month = 30.4375 days
! 1 year = 365.25 days
! Duration (in days) = [end date] – [start date] + 1 day.
Conversion values
The following conversion factor will be used to convert UPCR from SI unit to mg/mg:
! 1 mg/mg = 113 mg/mmol.
The following conversion factor will be used to convert temperature measured in Fahrenheit to Celsius:
! X° C = (X°F – 32) * 5/9.
CCICCI

Atacicept Atacicept in IgA NephropathyMS700461-0035 Final V2.0
32/67
Imputation of laboratory data in case of modifiers
The following rules has to be applied for all the laboratory parameters (including biomarkers), except 24-hour Total Urine Protein and Spot Urine-protein Creatinine ratio.
! If the format reported in the results in raw data is ‘no decimals’ then apply “-1” (if the modifier is “<”) or “+1” (if the modifier is “>”) to the numerical value that is after the modifier, unless the original result is “<1”. In this case, use the numerical value “0.9”.
! If the format reported in the results in raw data is ‘one decimal’ then apply “-0.1” (if the modifier is “<”) or “+0.1” (if the modifier is “>”) to the numerical value that is after the modifier, unless the original result is “<0.1”. In this case, use the numerical value “0.09”.
! If the format reported in the results in raw data is ‘two decimals’ then apply “-0.01” (if the modifier is “<”) or “+0.01” (if the modifier is “>”) to the numerical value that is after the modifier, unless the original result is “<0.01”. In this case, use the numerical value “0.009”.
Handling of missing values
Missing statistics, e.g. when they cannot be calculated, should be presented as “nd”. For example, if n=1, the measure of variability (SD) cannot be computed and should be presented as “nd”.
Missing data will not be imputed except for missing and partially missing dates in medications and AEs and birthdate (see below the calculation of Age), and for the definitions of prior/concomitant medications and treatment-emergent AEs, as detailed in Sections 14 and 17.1, respectively. Imputed dates will be used for analysis and summary purposes only, original partial/missing dates will be displayed in listings and partial dates will be presented in the format ”__MMMYYYY” or “_____YYYY”.
Calculation of Age
! AGE = Written IC signature date (ICDT) - Birth date (DBIRDT) + 1)/ 365.25.
! In case of missing day only: Age [years]: (year/month of given informed consent -year/month of birth)
12 Study Subjects
The subsections in this section include specifications for reporting subject disposition and treatment/trial discontinuations. Additionally, procedures for reporting protocol deviations are provided.
12.1 Disposition of Subjects and Discontinuations
All subjects who provide informed consent will be accounted for in this study. Subject disposition and withdrawals will be presented for the screening analysis set.
Descriptive statistics will be used to summarize Subject Disposition.
CCICCI

Atacicept Atacicept in IgA NephropathyMS700461-0035 Final V2.0
33/67
The following information will be reported:
! Subjects screened (n) and reason for discontinuation prior to randomization (did not meet all eligibility criteria, withdrawal informed consent, progressive disease, adverse event, lost to follow-up, death, other)
! Subjects randomized (n), randomized without receiving treatment, treatment ongoing, treatment completed (indicating whether they completed or discontinued safety follow-up), treatment discontinued (indicating whether they completed or discontinued safety follow-up)
! Subjects randomized and received study drug (n) (mITT population)
! Subjects’ status at end of treatment and reasons for treatment discontinuation (adverse event, lost to follow-up, protocol non-compliance, lack of efficacy, death, withdrew consent, complete clinical remission, other)
! Subjects’ status at end of study and reasons for study discontinuation (adverse event, lost to follow-up, protocol non-compliance, lack of efficacy, death, withdrew consent, study reached its predefined end, participation in another clinical study, other). The Subject disposition will also be summarized by site: subjects screened, s treated, s in follow-up, subjects who completed treatment (indicating whether they completed or discontinued safety follow-up) and subjects who discontinued treatment (indicating whether they completed or discontinued follow-up).
A subjects will be considered as having completed the safety follow-up period if he has performed the Week 24 Follow-up visit.A subjects will be considered as having completed treatment if the status at end of treatment is “Completed” according to “Atacicept/Placebo termination” page of the eCRF.A subjects will be considered as having completed the study if the status at end of study is “Completed” according to “Study termination” page of the eCRF.These analyses will be performed using the Screening set.The number of subjects in each analysis set will also be summarized using the Screening set.A listing presenting subjects who are randomized to a treatment but received a different treatment or did not receive any treatment will be produced using the mITT set.
CCICCI

Atacicept Atacicept in IgA NephropathyMS700461-0035 Final V2.0
34/67
12.2 Protocol Deviations
12.2.1 Important Protocol Deviations
Important protocol deviations, as defined in Section 10.1, will be identified through sites monitoring, medical review or programming.
Regular cross-functional data review meetings will be held to discuss and update the definition of important protocol deviations. The identification of important protocol deviations and clinically important protocol deviations will be finalized for all subjects at the last Data Review Meeting before the Week-48 database lock.
All the important protocol deviations and clinically important protocol deviations will be included in Study Data Tabulation Model (SDTM) datasets and the Analysis Data Model (ADaM) datasets. The clinically-important protocol deviations leading to the exclusion of a subject from the PP setand the clinically important protocol deviations leading to the exclusion of a subject from the PK set will be summarized in the mITT Set.
All important Protocol Deviations are listed in a document specified in Appendix 1.
12.2.2 Reasons Leading to the Exclusion from an Analysis Set
Based on medical review, subjects who meet any of the clinically important protocol deviationswill be excluded from the PP set and/or PK set. For these subjects, the reasons for exclusion will be summarized and listed;
! Frequency table per reason of exclusion from the PP population
! Frequency table per reason of exclusion from the PK population
These analyses will be performed using the mITT Set.
13 Demographics and Other Baseline Characteristics
Demographic and baseline characteristics will be presented using summary statistics for continuous variables and frequency tables for categorical variables.
13.1 Demographics
The following demographic characteristics will be reported:
! Age (years)
! Sex (male/female)
! Race:
! White
CCICCI

Atacicept Atacicept in IgA NephropathyMS700461-0035 Final V2.0
35/67
! Black or African American
! Asian
! American Indian or Alaska Native
! Native Hawaiian or other Pacific Islander
! Not collected at this site
! Other
! Ethnicity:
! Hispanic or Latino/Not Hispanic or Latino
! Japanese/Not Japanese.
This analysis will be performed using the mITT Set.
13.2 Medical History
13.2.1 Medical History
Medical history and medical history related to the primary disease condition ongoing at screeningwill be summarized by MedDRA (version 20.0 or above) System Organ Class (SOC) and Preferred Term (PT); each subject will be counted only once within each PT or SOC. SOC and PT will be presented by overall descending frequency of SOC and PT within SOC within the 3 treatment arms. This analysis will be performed using the mITT Set.
13.2.2 IgA Nephropathy Characteristics at Baseline
Following disease characteristics at baseline will be summarized by descriptive statistics:
! Value of proteinuria by spot UPCR
! Value of proteinuria by spot UACR
! Total protein and UPCR by 24-hour urine collection
! Active urinary sediments: urine RBC/high power field, WBC/high power field, casts
! eGFR
! Screening Visit: eGFR will be calculated per the Chronic Kidney Disease Epidemiology Collaboration (CKD-EPI) equation for subjects in regions except in Japan, and as per the Japan Association of Chronic Kidney Disease formula 2008 for subjects in Japan (Matsuo 2009). However, only eGFR values calculated from the CKD-EPI will be used in summary tables and figures, including subjects in Japan.
CCICCI

Atacicept Atacicept in IgA NephropathyMS700461-0035 Final V2.0
36/67
For all regions except Japan:CKD-EPI: eGFR = 141 × min (Scr /κ, 1)α × max (Scr /κ, 1)-1.209 × 0.993Age × 1.018 (if female) × 1.159 (if black)
Scr is serum creatinine in mg/dL; κ is 0.7 for females and 0.9 for males, α is -0.329 for females and -0.411 for males, min indicated the minimum of Scr/κ or 1, and max indicates the maximum of Scr /κ or 1)
For Japan only (will only be used for screening and presented in subject listing):
Japan Association of Chronic Kidney Disease: eGFR = 194 × Scr-1.094 × age-0.287 (if male), or 194 × Scr-1.094 × age- 0.287 × 0.739 (if female)
! Other visits: eGFR will be calculated per the CKD-EPI equation for every subject regardless of ethnicity and region.
This analysis will be performed using the mITT Set.
13.3 Other Baseline Characteristics
The following characteristics at baseline will be described:
! Serum BLys and APRIL values
! Number of subjects with ACEi and/or ARB at screening
! Number of subjects with both ACEi and ARB at screening
! Number of subjects with ACEi without ARB at screening
! Number of subjects with ARB without ACEi at screening
! Number of subjects with Diuretics at screening
! Number of subjects with history of tonsillectomy.
This analysis will be performed using the mITT Set.
14 Prior or Concomitant Medications/Procedures
Data concerning concomitant medications, procedures and vaccinations will be collected throughout the trial. These data will be obtained at scheduled or unscheduled trial visits, based on information spontaneously provided by the subject and through questioning of the subject.
Procedures
Past or concomitant procedures are not coded so they will only be presented in subject level listings. Prior procedures are any procedures which stopped before the date of first IMP dose.
CCICCI

Atacicept Atacicept in IgA NephropathyMS700461-0035 Final V2.0
37/67
Medications
All medications will be coded using the latest version of the WHO Drug Dictionary (WHO Drug Dictionary Enhanced [DDE] Enhanced in B3 format). Medications will be classified into 1) prior medication, 2) concomitant medication, 3) concomitant medication during treatment period 4) concomitant medication ongoing at Day 1 and 5) concomitant medication post-treatment period.
Prior medications are medications taken before the date of first IMP dose.
Concomitant medications are any medications other than study medication taken at least once on or after the date of first IMP dose (start date on/after the date of first IMP dose, and/or end date on/after the date of first IMP dose).
Concomitant medications during treatment period are those concomitant medications taken at least once (i.e. with a start date and/or end date) in the treatment period as defined in Section 11.Concomitant medications ongoing at Day 1 includes those with a start date equal to or less than the date of Day 1 and an end date equal to or greater than the date of Day 1.Concomitant medications during the post-treatment period are those concomitant medications taken at least once (i.e. with a start date and/or end date) after the defined treatment period.
In the event of missing or partial start and/or end dates for medication, dates will be imputed in order to determine whether medications are prior, concomitant or concomitant during/post-treatment period. The following algorithm will be used:
! Missing parts of medication start date will be imputed to the earliest possible date (first of the month if the day is missing, January if the month is missing, year 2010 if the year is missing)
! Missing parts of medication end date will be imputed to the latest possible date (last of the month if the day is missing, December if the month is missing, year 2030 if the year is missing), if not resulting in a date later than the date of subject’s death. In the latter case the date of death will be used to impute the incomplete stop date.
The prior medications, all concomitant medications, concomitant medications taken in the treatment period, those ongoing at Day 1, and those taken post-treatment period will be presented by tables displaying the number and percentage of subjects by drug class (ATC level 2) and preferred term. A subject will be counted only once within a given drug class and within a given drug name, even if he received the same medication at different times in the same period.
In the subject level listing of medications, a flag will be added to identify each medication as Prior, Concomitant during treatment period, Concomitant ongoing at Day 1, or Post-treatment period.
The following concomitant medications during treatment period with potential confounding effectwill be described:
! Number of subjects with ACEi and/or ARB
! Number of subjects with both ACEi and ARB
! Number of subjects with ACEi without ARB
CCICCI

Atacicept Atacicept in IgA NephropathyMS700461-0035 Final V2.0
38/67
! Number of subjects with ARB without ACEi
! Number of subjects with Diuretics.
These analyses will be performed using the mITT Set.
Depending of the numbers of subjects concerned, this could be graphically checked.
Vaccinations
Vaccinations against S. pneumoniae (PCV13 or PPSV23) and influenza virus (as seasonally required) will be listed. Prior vaccinations are vaccinations which stopped before the date of first IMP dose. A flag will be added to identify each vaccination as Prior or Concomitant. This analysis will be performed using the mITT Set.
15 Treatment Compliance and Exposure
15.1 Treatment Exposure
During Part A, atacicept will be supplied as a sterilized solution in a ready-to-use pre-filled type 1 glass syringe at a concentration of 25 mg/mL (25 mg dose group) or 75 mg/mL (75 mg dose group. The 25 mg and 75 mg doses are supplied as single injections of 1 mL each. Placebo will be supplied as a sterilized solution for injection in pre-filled syringes matching the atacicept pre-filled syringes, each containing 1 mL.
The IMP will be administered at the site during scheduled visits. All other dosing will be done by the subject or subject’s caregiver at home throughout the rest of the study. Prior to discharge from each scheduled site visit, subjects will be given sufficient IMP for at-home dosing until the next scheduled visit. Subjects will be instructed to return all unused IMP including the boxes at each clinic visit, in order to allow to assess compliance with study treatment.
Exposure to study treatment will be evaluated based on the following endpoints, for which summary statistics will be presented by treatment group:
! Duration of treatment period (weeks) as defined in Section 11: to be summarized both as a continuous endpoint and by category as follows:! <2 weeks! 2 - <4 weeks! 4 - <8 weeks! 8 - <12 weeks! 12 - <16 weeks! 16 - <20 weeks! 20 - <24 weeks! 24 - <32 weeks! 32 - <40 weeks! 40 - <48 weeks! 48 - <60 weeks
CCICCI

Atacicept Atacicept in IgA NephropathyMS700461-0035 Final V2.0
39/67
! ≥60 weeks And then as follows:! <2 weeks! ≥2 weeks! ≥4 weeks! ≥8 weeks! ≥12 weeks! ≥16 weeks! ≥20 weeks! ≥24 weeks! ≥32 weeks! ≥40 weeks! ≥48 weeks! ≥60 weeksThese analyses will be performed using the SAF Set, the mITT Set and the PP Set.
! Number of injections received defined as the number of non-zero doses received (i.e. full dose or partial dose administered, derived from the number of kits received and the number of unused syringes): to be summarized both as continuous endpoint and by category as follows:! 1 - <4 ! 4 - <8 ! 8 - <12 ! 12 - <16 ! 16 - <20 ! 20 - <24 ! 24 - <32 ! 32 - <40 ! 40 - <48 ! 48 - <60 ! ≥ 60.This analysis will be performed using the SAF Set, the mITT Set and the PP Set.
! Relative Dose Intensity (%): define as[(sum of numerical doses) / (theoretical (planned) number of injections)] x 100.
The change of dose administration is recorded on the eCRF as being either i) no change, ii) no dose, or iii) partial dose with the reason for the two last cases. For analysis purposes these categories will be assigned the following numeric values for each study treatment administration time point, and referred to as the numerical dose:
! no change in dose is attributed a value of 1,
! a partial dose a value of 0.5,
CCICCI

Atacicept Atacicept in IgA NephropathyMS700461-0035 Final V2.0
40/67
! no dose a value of 0.For injections at home, it will not be possible to determine which injections and how many injections are with a partial dose. A value of 1 will be attributed to each injection received at home (even if it can be a partial dose).The theoretical number of injections will be derived as follows:Integer part of ((Date of last IMP administration - Date of first IMP administration)/7) +1Date of last IMP administration is defined as the last study Atacicept/placebo administration date from the “treatment termination” page of the eCRF (or the date of the last injection on site, for patients who have an end of treatment status equal to “Ongoing” for the Week 48 analysis).A subject will be considered compliant if he/she has received his/her study treatment with a Relative Dose Intensity equal to or higher than 80%. The number and percentage of subjects with Relative Dose Intensity ≥ 80% will be presented by treatment group.This analysis will be performed using the SAF Set, the mITT Set and the PP Set.
15.2 Dose Frequency Reduction
During the treatment period, subjects with large decreases in levels of serum IgG and who are at risk to develop severe hypogammaglobulinemia (serum IgG <3g/L) will have dose frequency reductions (DFRs) or discontinuations according to the criteria specified below (i.e., reduced from once weekly to once every other week [EOW]). The central lab will notify the IWRS, in a blinded manner, that a subject will require DFR. Once DFR is activated the subject will maintain IMP administration at a frequency of every other week until the end of the study.
Week Criteria ReductionWeek 1 >20% decrease in serum IgG from baseline (Day 1) and serum IgG < 5 g/L
Every other weekWeek 2 >25% decrease in serum IgG from baseline (Day 1) and serum IgG < 5 g/LWeek 4 >40% decrease in serum IgG from baseline (Day 1) or serum IgG < 4 g/LAfter Week 4 Serum IgG < 3.5 g/L
For subjects taking EOW dosing, serum IgG will be retested after 4 weeks at a scheduled or unscheduled visit.
If serum IgG is <3 g/L, and this value represents the second consecutive finding of severe hypogammaglobulinemia (at least 4 weeks apart), the study drug will be discontinued. Criteria for IMP discontinuation are based on Suzuki 2013.
Similarly, if serum IgG < 3 g/L results are observed during the Safety FU period, the site will be asked to confirm IMP discontinuation and retest serum IgG in 4 weeks (in case of first serum IgG < 3 g/L findings) and to strictly monitor for any signs or symptoms of infections (in case of a second consecutive serum IgG < 3 g/L at least 4 weeks apart).
A listing of subjects with DFR and the criteria met will be provided by planned treatment group.
These analyses will be performed using the SAF Set.
CCICCI

Atacicept Atacicept in IgA NephropathyMS700461-0035 Final V2.0
41/67
16 Endpoint Evaluation
For the analysis of Part A, the analysis of all endpoints will be descriptive in nature. Summary tables with descriptive statistics will be presented for all endpoints. Box plots, spaghetti plots, and scatter plots may also be created to present the data over time and to explore correlation between endpoints. P-values may be presented as nominal. Particularly, continuous variables may be compared between treatment groups by the Wilcoxon-Mann-Whitney test, categorical variables may be compared between treatment groups by Fisher's test or the Wilcoxon-Mann-Whitney test. The Pearson or Spearman correlation coefficient may be presented in scatter plots.
16.1 Primary Endpoint Analyses
The primary endpoints for Part A of this study are safety endpoints.
! AEs, related AEs, adverse events of special interest (AESI), AEs leading to discontinuation, SAEs, AEs leading to death.
Details of analyses and definitions can be found in Section 17.1.
16.2 Secondary Endpoint Analyses
The secondary endpoints for Part A of this study and their analyses are listed below.
! Serum atacicept concentrations at pre-specified time points (Week 0 Day 1 (pre-dose), Weeks 1, 2, 4, 8, 12, 16, 24, 40, 48, 72, ET visit and at the follow-up visits (FU Weeks 4, 12 and 24)and additional PK sampling will be done on Days 2 and/or 3 in a subgroup of study subjects [~6 subjects per treatment group]).
Serum atacicept concentrations will be summarized descriptively with actual values and change from baseline by treatment group. Box plots of atacicept serum concentration at each time point will be displayed by treatment group. Details of analyses can be found in Section 16.5.1. These analyses will be perfomed in the PK Set.
! Change from baseline levels in serum Ig classes (IgG, IgA, and IgM) (g/L) at pre-specified time points (Weeks 1, 2, 4, every 4 week until Week 24, every 8 weeks until Week 48, every 12 weeks until Week 72, ET visit, and at the follow-up visits (FU Weeks 4, 12 and 24)).
Details of analyses and definitions can be found in Section 17.2.
! Change from baseline in serum Gd-IgA1 levels at pre-specified time points (Weeks 4, 12, 24, 48, 72, ET visit, and at the follow-up visits (FU Weeks 12 and 24)), if corresponding assay is available.
Details of analyses and definitions can be found in Section 17.2.
! Change from baseline in serum complement C3 and C4 levels at pre-specified time points(Weeks 12, 24, 48, 72, ET visit, and at the follow-up visits (FU Weeks 12 and 24)).
CCICCI

Atacicept Atacicept in IgA NephropathyMS700461-0035 Final V2.0
42/67
Details of analyses and definitions can be found in Section 17.2.
! Change from baseline in immune cell subsets by flow cytometry analysis at pre-specified time points (Weeks 4, 12, 24, 48, 72, ET visit, and at the follow-up visit (FU Week 24)).
Details of analyses and definitions can be found in Section 17.2.
! Change in urine protein immuno-electrophoresis (UPEP) pattern at pre-specified time points(Baseline, Week 24 and Week 48 and ET visit).
Details of analyses and definitions can be found in Section 17.2.
! Anti-drug antibody assessment at pre-specified time points (Baseline, Weeks 4, 12, 24, 48, 72, ET visit, and at the follow-up visits (FU Week 12 and 24)).
Details of analyses and definitions can be found in Section 17.2.
! Clinically significant ECGs and laboratory assessments.
Details of analyses and definitions can be found in Sections 17.2 and 17.3.
16.3 Other Endpoint Analyses
Other endpoints for Part A of this study and their analyses are listed below.
! Change from baseline in proteinuria at pre-specified time points (Weeks 2, 4, every 4 week until Week 24, every 8 weeks until Week 48, every 12 weeks until Week 72, ET visit, and at the follow-up visits (FU Weeks 4, 12 and 24) for spot urine sample / Weeks 24, 48, 72, ET visitfor 24-hour urine collection), determined by 4 different assessments:
Details of analyses and definitions can be found in Section 17.2.
! Complete clinical remission at each time point.
After Week 48, subjects who are considered to have achieved complete clinical remission may have discontinuation of IMP dosing. Subjects meeting criteria for complete clinical remission and having discontinuation of IMP will complete an ET visit and have Safety Follow-up (FU) visits until the end of the DBPC treatment period. IMP will not be restarted. Complete clinical remission will be defined as having at least 3 consecutive negative results (defined as urinary sediment red blood cell count of <5/high-power field and UPCR of <0.3 mg/mg from spot urine) over a 24- week period (defined according to visit names); unscheduled measurements will also be taken into account. For an assessment “No complete clinical remission” and another “Complete clinical remission” linked to the same scheduled time point, the “Complete clinical remission” one will be considered.
CCICCI

Atacicept Atacicept in IgA NephropathyMS700461-0035 Final V2.0
43/67
Complete clinical remission will be presented by tables displaying the number and percentageof subjects who meet the complete clinical remission criteria, for each time point and overall, by treatment group. This analysis will be performed using the mITT Set.
! Complete proteinuria remission at each time point. Complete proteinuria remission is defined as UPCR < 0.3 mg/mg by spot urine
Complete proteinuria remission will be presented by tables displaying the number and percentage of subjects who meet the complete proteinuria remission criteria, for each time point and overall, by treatment group. Unscheduled measurements will also be taken into account.For an assessment “No complete proteinuria remission” and another “Complete proteinuria remission” linked to the same scheduled time point, the “Complete proteinuria remission” one will be considered. This analysis will be performed using the mITT Set.
! Disease remission at each time point. Disease remission is defined as having UPCR < 0.2 mg/mg by spot urine and reduction of eGFR < 5 mL/min/1.73m2 from the baseline level
The following derivation will be used: UPCR < 0.2 mg/mg by spot urine and absolute change from Baseline in eGFR>-5 mL/min/1.73m2.
Disease remission will be presented by tables displaying the number and percentage of subjects who meet the disease remission criteria, for each time point and overall, by treatment group.Unscheduled measurements will also be taken into account. For an assessment “No disease remission” and another “Disease remission” linked to the same scheduled time point, the “Disease remission” one will be considered. This analysis will be performed using the mITT Set.
! Complete renal response at each time point. Complete renal response is defined as having UPCR < 0.3 mg/mg by spot urine and ≤ 10% reduction of eGFR from the baseline level
The following derivation will be used: UPCR < 0.3 mg/mg by spot urine and relative change from Baseline in eGFR≥-10%.
Complete renal response will be presented by tables displaying the number and percentage of subjects who meet the complete renal response criteria, for each time point and overall, by treatment group. Unscheduled measurements will also be taken into account. For an assessment “No complete renal response” and another “Complete renal response” linked to the samescheduled time point, the “Complete renal response” one will be considered. This analysis will be performed using the mITT Set.
! Partial renal response at each time point. Partial renal response is defined as having UPCR with > 50% reduction by spot urine and ≤ 25% reduction of eGFR from the baseline level
The following derivation will be used: Relative change from Baseline in UPCR by spot urine < -50% and and relative change from Baseline in eGFR>= -25%.
Partial renal response will be presented by tables displaying the number and percentage of subjects who meet the partial renal response criteria, for each time point and overall, by
CCICCI
Atacicept Atacicept in IgA NephropathyMS700461-0035 Final V2.0
44/67
treatment group. Unscheduled measurements will also be taken into account. For an assessment “No partial renal response” and another “Partial renal response” linked to the same scheduled time point, the “Partial renal response” one will be considered. This analysis will be performed using the mITT Set.
! Progressive kidney failure at each time point. Progressive kidney failure is defined as having ≥ 40% reduction of eGFR from the baseline level, the development of end stage renal disease (ESRD) (i.e., a need for maintenance dialysis or kidney transplantation), or death due to kidney disease
Unscheduled measurements of eGFR will also be taken into account. For a measurement corresponding to a relative change from Baseline in eGFR <= -40% and another corresponding to a relative change from Baseline in eGFR > -40% linked to the same scheduled time point, the one with a relative change from Baseline in eGFR <= -40% will be considered. The development of end stage renal disease (ESRD) will be defined from the serious Adverse Events since patient would be hospitalized initially to get dialysis or go to kidney transplantation. Progressive kidney failure will be presented by tables displaying the number and percentage of subjects who meet the progressive kidney failure criteria, for each time point and overall, by treatment group. This analysis will be performed using the mITT Set.
! Change from baseline in eGFR at pre-specified time points through Week 72 (Weeks 2, 4, every 4 week until Week 24, every 8 weeks until Week 48, every 12 weeks until Week 72, ET visit, and at the follow-up visits (FU Weeks 4, 12 and 24)).
Details of analyses and definitions can be found in Section 17.2.
! Correlation of serum BLyS and APRIL baseline with clinical response.
Details of analysis and definitions can be found in Section 16.4.1.
! Change from baseline in titers of antibodies to pneumococcal antigens, tetanus toxoid and diphtheria toxoid at pre-specified time points (Week 48, Week 72 and ET visit).
Details of analyses and definitions can be found in Section 17.2.
16.4 Exploratory Endpoint Analyses
16.4.1 Biomarkers
! Correlation of exploratory markers (e.g., genetic variants [gene expression profiles], immune cell subsets by flow cytometry, and circulating protein profiles) with clinical response (i.e., proteinuria, eGFR) and/or safety.
Blood samples for pharmacogenetics (PGx), gene expression, and circulating proteins (e.g.cytokines etc.) will be acquired at pre-specified timepoints and may be processed and evaluated
CCICCI

Atacicept Atacicept in IgA NephropathyMS700461-0035 Final V2.0
45/67
after the primary results of the study are available. Analysis plan for these endpoints will be specified in a separate document near the completion of the primary analysis. This analysis will be performed using the PGx Set.
Blood samples for immune cell subsets by flow cytometry will be collected at pre-specified timepoints at selected sites. Total T, helper T, cytotoxic T, total B, mature naïve B, memory B, and PCs, PBs, and NK cells may be measured. For Part A of the study, summary statistics will be presented for the measured parameters. This analysis will be performed using the FC Set.
! Correlation between biomarkers and clinical response and safety will be explored. (BLyS and APRIL refer to free BLyS and APRIL in this SAP). The biomarker endpoints, the clinical response and the safety will be defined below.
The biomarker endpoints to be used in the analyses are:
! Serum BLyS, APRIL: baseline values
! Gd-IgA1: baseline values and the maximum decrease from baseline over 48 weeks (72 weeks for the final analysis).
The clinical response endpoints are:
! Change from baseline at Week 48 (Week 72 for the final analysis) in total protein (g/day) by 24-hour urine, UPCR (mg/mg) by 24-hour urine, UPCR (mg/mg) by spot urine, UACR (mg/mg) by spot urine
! Change from baseline at Week 48 in eGFR (Week 72 for the final analysis).
The safety enpoint considered is:
! The development of end stage renal disease (ESRD): defined from the serious Adverse Events since patient would be hospitalized initially to get dialysis or go to kidney transplantation.
To assess the correlation between each of the biomarker endpoints and each of the clinical response endpoints, scatter plots with the Spearman correlation coefficient will be presented by treatment group.To assess the association between each of the biomarker endpoints and the safety endpoint, the p-value of the Wilcoxon-Mann-Whitney test (in addition to t-test) will be presented to compare the distribution of the biomarker endpoint in subjects having developed End Stage Renal Disease (ESRD) and in subjects not having developed End Stage Renal Disease (ESRD) during the study, for each treatment group. The biomarker endpoints will also be described by treatment group, in subjects with ESRD during the study and in subjects without ESRD during the study in summary tables. If distribution of the biomarker is not normal, both t-test and Wilcoxon-Mann-Whitney will be considered.These analyses will be performed using the SAF Set.
CCICCI

Atacicept Atacicept in IgA NephropathyMS700461-0035 Final V2.0
46/67
16.4.2 Renal biopsy
Renal biopsy will be: 1) archival kidney biopsy to evaluate the prognostic risk of renal progression (ie, loss of function), and 2) optional post-treatment kidney biopsy to evaluate the renal status at Week 48 and categorize the risk for progression to end-stage renal disease.
Analysis of renal biopsy results are outlined as follows:
! Scoring of renal tissues by immunohistochemistry using the Oxford-MEST classification of IgAN: mesangial hypercellularity (M), endocapillary proliferation (E), segmental glomerulosclerosis (S), tubular atrophy/interstitial fibrosis (T), and crescent formation (C).
Mesangial hypercellularity (M) will be categorized as ≤0.5 or >0.5 based on the average from the mesangial proliferation score for each glomerulus in the section.
Segmental glomerulosclerosis (S) and endocapillary hypercellularity (E) will be categorized as either present or absent.
Tubular atrophy/interstitial fibrosis (T) will be categorized as 0–25%, 26–50% or > 50% of cortical area.
Crescent formation (C) will be categorized as no crescents, crescents in < 25% of glomeruli, and crescents in ≥25% of glomeruli.
The MEST results will be presented by summary tables displaying the number and percentage of subjects for each category by treatment group. This analysis will be performed using the KB Set.
! Glomerular IgG, IgA, Gd-IgA1, C3 and C4 deposition measured by immunohistochemistry and/or immunofluorescence.
The degree of glomerular intensity (IgG, IgA, Gd-IgA1, C3, C4) will be represented categorically with grade 0 (no or trace); grade 1 (mild); grade 2 (moderate); grade 3 (marked) respectively. Glomerular pattern will be categorized as mesangial, glomerular basement membrane (GBM), and both.
Results will be presented by summary tables displaying the number and percentage of subjects for each category by treatment group. This analysis will be performed using the KB Set.
16.5 Analysis of PK Endpoints and Population PK/PD Modeling
16.5.1 PK Evaluation
Blood samples for PK analysis will be collected from all subjects. Serum atacicept levels will be assessed at trough (within 25 hours before dosing) at the following visits:
! For all subjects: Week 0 Day 1 (pre-dose), Weeks 1, 2, 4, 8, 12, 16, 24, 40, 48, 72, and at the follow-up visits (FU Weeks 4, 12 and 24)
CCICCI

Atacicept Atacicept in IgA NephropathyMS700461-0035 Final V2.0
47/67
! For discontinued subjects: every assessment before discontinuation/ET Visit, and at the follow-up visits (FU Weeks 4, 12 and 24).
In a subset (PK Set) of subjects (approximately 6 subjects per treatment group), additional blood samples for PK will be collected at the following time points: Day 2 and/or Day 3 (i.e., 24 hours post-first dose on Day 2 and 48 hours post-first dose on Day 3).
Measured atacicept concentrations will be summarized by treatment group at scheduled time-pointusing descriptive statistics for the PK analysis set (defined in Section 10.2). Values below the lower limit of quantification will be taken as zero in the analysis. All individual concentration data will be listed by visit even if they do not qualify for the analysis population.
Box plots of atacicept serum concentration at each time point will be displayed by treatment group.
These analyses will be performed using the PK Set.
16.5.2 Population PK/PD Modeling
The primary objective of this population PK/PD Modeling & Simulation (M&S) analysis is to assess the dose- exposure-response relationship after subcutaneous administration of atacicept in subjects with IgA Nephropathy.
The full results of the PK/PD modeling analysis will be included in a, separate to the CSR, M&S report.
Analysis aims:
! To describe the atacicept concentration time profile in the current study population
! To describe the IgX (IgA, IgG, IgM) concentration time profile in the current study population
! To estimate the magnitude of the inter- and intra-individual variability in atacicept PK/PD
! To identify factors/covariates which account for variability in response under placebo and atacicept treatment.
The data set of Part A of the current study is limited (approximately) 10 subjects in each of the 25 and 75 mg QW cohorts and 30 subjects total, including placebos), and the sampling primarily concerns troughs in all subjects apart from approximately 6 per dose for which two non-trough samples will be available.
As a result, there is limited opportunity for population PK/PD model development. Rather, the existing population PK and IgA, IgG, IgM models (and data in subjects with SLE these models have been developed on) will be used. These models will potentially be adapted to describe the relevant data of the current study. This way, the entire PK and IgX time profiles for the subjects of study MS700461-0035 will be estimated and will be possible to obtain relevant summaries of their profiles, e.g. weekly steady state Area under the Curve (AUC) for PK). In case further
CCICCI

Atacicept Atacicept in IgA NephropathyMS700461-0035 Final V2.0
48/67
development of already existing models is possible (see sections 16.5.2.1 and 16.5.2.2), then this will follow the principles described in Appendix 5.
The population PK/PD modeling for the current clinical trial will be performed on the mITT population and relates to the primary analysis (Week 48) of the study only. It will be performed for the following endpoints:
! Atacicept concentrations
! Serum IgG, IgM, IgA concentrations.
Exposure response models for additional endpoints, e.g. proteinuria levels or other, may also be developed depending on the signals that will be detected based on the exploratory/inferential statistical analysis of the study data.
These analyses will be performed using the PK Set.
16.5.2.1 PK Modeling
A Quasi-Steady-State (QSS) approximation of the target-mediated drug disposition (TMDD) model was used and adequately described (total, i.e. free and bound) atacicept concentrations in three previous studies: a) the Phase I study in Caucasian and Japanese healthy volunteers (EMR700461-022) where single doses of 25, 75 or 150 mg were administered, b) the Phase II APRIL-SLE study (27646) where 75 or 150 mg doses of atacicept where administered weekly for 52 weeks (bi-weekly during the first four weeks of treatment) to subjects with active SLE, and c) a further Phase II study in SLE (EMR700461-023), where 75 or 150 mg doses of atacicept where administered weekly for 24 weeks to subjects with active SLE.
The concentrations of the current study will be appended to the PK data of the three studies above and the population PK model will be amended as necessary to describe the current data. This will involve in the first instance a refit of the current model. Subsequently, the IgA Nephropathyindication binary covariates will be incorporated to the model, based on relevant diagnostic plots, and their significance will be assessed (see Appendix 5). Further model development may be conducted as deemed necessary and the data allows. These analyses will be performed using the PK Set.
16.5.2.2 IgA, IgG, IgM Modeling
The pharmacodynamics of IgG/IgM/IgA have been described in the past (data from studies EMR700461-022, 27646 and EMR700461-023) by indirect response models with inhibition of production, where the fractional decrease in immunoglobulin synthesis was modeled as a Hill function. In these models, total atacicept concentration (as predicted by the population PK model) has been used as the driver of the pharmacological effect. Similarly to the population PK model, the IgX concentrations of study MS700461-0035 will be appended to previous study data. Then, the three IgX models will be updated, first by refitting the current models to the expanded data set, subsequently by adding IgA Nephropathy indication binary covariates to relevant model parameters (having initially investigated their relevance by diagnostic plots) and assessing their
CCICCI

Atacicept Atacicept in IgA NephropathyMS700461-0035 Final V2.0
49/67
significance. Further model development may be conducted as deemed necessary and the data allows. These analyses will be performed using the PK Set.
16.5.2.3 Proteinuria Modeling
Assuming there is enough information in the proteinuria data of study MS700461-0035, it will be attempted to build a PK/PD model on relating its time profiles to total atacicept concentration, using either direct or indirect response models, similarly to models on IgX. If this is not possible, a cross-sectional model relating exposure (possibly population PK model based steady state AUC over one week) to the proteinuria levels at Week 48 (percent change in proteinuria from baseline) will be attempted. Various functional forms of exposure response relationship, among which straight line (2 parameter), quadratic (3 parameter), Emax function (3 or 4 parameters) and step functions, will be investigated. These analyses will be performed using the PK Set.
16.5.2.4 Data Specifications for PK/PD Modeling
Actual observation times for the PK/PD variables will be used. Wherever actual time of observation is missing, it will be replaced by the respective nominal time if appropriate. No imputation of missing covariates is expected.
Prior to the population PK/PD analysis, the relevant NONMEM input files will be created according to specifications provided by the responsible analyst to the Merck-Serono Pharmacometry responsible.
Technical details on the M&S analysis to be undertaken are described in Appendix 5.
These analyses will be performed using the PK Set.
17 Safety Evaluation
The subsections in this section include specifications for summarizing safety endpoints that are common across clinical trials such as adverse events, laboratory tests and vital signs.
17.1 Adverse Events
TEAEs are defined as AEs that started at or after the first IMP dose to the end of the 24-weekSafety FU period. TEAEs are further divided into TEAEs during or after the treatment period, depending on whether the start date is within or after the treatment period as defined in Section11. Prior AEs are defined as AEs that started before the first IMP dose.
If the onset date is the same day as the first IMP dose, then variable “Timing related to Atacicept/placebo” will be checked and used to determine whether the event is treatment-emergent. If this variable is missing then the worst-case scenario is applied: adverse event will be considered as TEAE and TEAE during treatment period.
CCICCI

Atacicept Atacicept in IgA NephropathyMS700461-0035 Final V2.0
50/67
If a subject is treated but his first IMP dose date is missing or if a subject is no longer treated but his last IMP dose is missing, then the worst-case scenario is applied: the adverse event will be considered as a TEAE and a TEAE during treatment period.
In cases of missing or partial AE start/end dates, the following algorithm will be used to determine whether an AE is a TEAE, a TEAE during the treatment period, a TEAE after the treatment period, or a prior AE.
! Incomplete or missing start date: In case the start date is completely missing or it is partially missing but in the same year (when day and month are missing) or in the same month and year (if the day is missing) as 1st day of treatment, then the start date will be replaced by the minimum between 1st day of treatment and AE resolution date. In all other cases the missing onset day or onset month will be replaced by 01*.
! Incomplete stop dates (Month and year available or only year available): these dates will be imputed to the last day of the corresponding month, or the last day of the corresponding year if not resulting in a date later than the date of subject's death. In the latter case the date of death will be used to impute the incomplete stop date. In all other cases the incomplete stop date will not be imputed.
* Complete missing onset dates for AEs will be imputed by the first treatment day and the AE will be considered as treatment emergent during treatment period, unless the end date of the AE (imputed if needed) is entered and is clearly before the first treatment day. Otherwise they will remain missing.
AEs will be coded using the MedDRA version 21.0 or above. Frequency counts and percentages will be presented for subjects with at least one TEAE within each SOC and preferred term (PT) by descending overall frequency of SOC and PT within SOC within the 3 treatment arms. For uncoded AEs, SOC will be set by programming to “UNCODED SOC” and preferred term will be set to “UNCODED PT” (reported term).
Related Adverse Events are those AEs with relationship to study treatment reported by the investigator as related or those of unknown relationship. If relationship is missing then the worst-case scenario is applied and the adverse event will be set to “Related”.
Serious Adverse Events are those events reported on the AE eCRF form with the serious field ticked “Yes”.
Adverse Events leading to study treatment discontinuation are those AEs with action taken regarding with Atacicept/placebo as “Drug withdrawn” (as recorded on the AEs eCRF page).
Adverse Events of Special Interest (AESI) are TEAEs considered of clinical interest, regardless of the relationship to the study therapy.
! cardiac failure
! ischaemic heart disease
! cardiac arrhythmia
CCICCI

Atacicept Atacicept in IgA NephropathyMS700461-0035 Final V2.0
51/67
! hypersensitivity reactions (including anaphylactic/anaphylactoid shock conditions, asthma/bronchospasm, and angioedema)
! demyelinating disorders
! injection site reactions (ISRs) and by severity
! infections (and by severity):
! serious infections
! opportunistic infections
! non-opportunistic infections.
The AESIs cardiac failure, ischaemic heart disease, cardiac arrhythmia and hypersensitivity reactions will be programmatically determined from a predefined list of MedDRA preferred terms according to the Standardized MedDRA Query (SMQ) or Customized MedDRA Query (CMQ) classification of the corresponding MedDRA version. Injection Site Reactions (ISRs) are identified by the investigator on the AE eCRF page, and are defined using terms from the ISRs High Level Term per MedDRA. The overall infections are defined using the MedDRA SOC term “infections and infestations”.
Adverse Events with fatal outcome are those events reported on the AE eCRF form with the outcome equal “Fatal”.
TEAEs will be summarized by number and percentage of subjects using the MedDRA primary SOC and PT. Subjects experiencing multiple events of the same SOC or PT will be counted once within the SOC or PT.
Summary tables will be presented for the following:
! AEs prior to treatment
! TEAEs
! TEAEs during treatment period
! TEAEs post-treatment period
! TEAEs by severity
! Related TEAEs
! Serious TEAEs
! Serious TEAEs during treatment period
! Serious TEAEs post-treatment period
! Non Serious TEAEs
! TEAEs leading to treatment discontinuation
! TEAEs with fatal outcome
CCICCI

Atacicept Atacicept in IgA NephropathyMS700461-0035 Final V2.0
52/67
! TEAEs by PT only in descending order of frequency.Number of events will also be presented in the tables about Related TEAEs, Serious TEAEs and Non Serious TEAEs. These analyses will be performed using the SAF Set.
17.1.1 Adverse Events Leading to Treatment Discontinuation
A summary table of TEAEs leading to treatment discontinuation will present the number and percentage of subjects by MedDRA primary SOC and PT, and by treatment group. This analysis will be performed using the SAF Set.
17.1.2 Exposure Adjusted Incidence Rate
The observation period will be the treatment period, i.e. between the first drug intake and the last drug intake + 7 days.
Exposure Adjusted Incidence Rates (EAIR) will be calculated as the number of subjects experiencing the event (n) divided by the sum of the exposure time (year) of all subjects in the analysis prior to the event, expressed in 100 subject.
x 100
An event is taken into account if it occurs during the treatment period (i.e. date of first drug intake <= start date of the event <= date of last drug intake + 7 days).
The denominator is the total exposure adjusted subject-years by summing all , i.e. individual treatment duration (year) from the first dose of study medication until either the occurrence of the first onset of the event in the observation period or the end of treatment period, whichever occurs first.
The calculation of exposure time (treatment duration) is defined as follows:
! For a subject who had the event, and the earliest event date is within <= (last dose date + 7), the exposure time is [ first event date – first dose date + 1 ].
! For a subject who had the event, and the earliest event date is after > (last dose date + 7), the exposure time is [ (last dose date + 7) – first dose date + 1 ].
For a subject who had no event, the exposure time is [ (last dose date + 7) – first dose date + 1].
The denominator for subject years is 365.25 days.
∀#
itnEAIR
it
CCICCI

Atacicept Atacicept in IgA NephropathyMS700461-0035 Final V2.0
53/67
The number of subjects experiencing the event will be reported together with the exposure time, the EAIR and the associated 95% confidence interval ((estimated using Poisson model; see Reference SAS code in Appendix 3).
The EAIR analysis will be performed to study Adverse Events of Special Interest (AESI):
! Cardiac failure
! Ischemic heart disease
! Cardiac arrhythmia
! Infections,
! Serious infections,
! Injection site reactions (ISRs),
! Hypersensitivity reactions (including anaphylactic/anaphylactoid shock conditions, asthma/bronchospasm, and angioedema),
! Demyelinating disorders.
These analyses will be performed using the SAF Set.
17.1.3 Serious Adverse Events
Summary tables of serious TEAEs, serious TEAEs during treatment period and serious TEAEs post treatment period will present the number and percentage of subjects by MedDRA primary SOC and PT, and by treatment group. These analyses will be performed using the SAF Set.
17.1.4 DeathsThe number of subjects who died (as reported on the “Death” eCRF) and primary reason for death will be tabulated.
17.1.5 Other Adverse Event Assessments
AESIs (as defined above) will be summarized by number and percentage of subjects using the MedDRA primary SOC and PT. A subject experiencing similar events will be counted only once within a given SOC and within a PT.
The number and percentage of subjects with ISRs will be summarized by severity and by treatment group, using the MedDRA primary SOC and PT. A subject experiencing similar events will be counted only once within a given SOC and within a PT; the worst severity will be considered.For final analysis, a summary table of non-serious TEAEs (excluding SAEs) by treatment group applying frequency threshold of ≥ 5% in any treatment group will be provided using MedDRA primary SOC and PT (threshold to be applied for SOC and PT). Number of subjects and number of events will be presented in this table. These analyses will be performed using the SAF Set.
CCICCI

Atacicept Atacicept in IgA NephropathyMS700461-0035 Final V2.0
54/67
17.2 Clinical Laboratory Evaluations
Tables and figures on laboratory values from the central laboratory during the whole study period including 72 weeks for treatment and 24 weeks for Safety FU period will be produced as listed in the table 2, with the following abbreviations:
! “OT” = summary tables over-time by visit.
! “Shift” = shift tables, in which categories to be used are indicated as:
! NCI: the National Cancer Institute-Common Terminology Criteria (NCI-CTC) toxicity grades will be used for categorization
! Study: study-specific categorization as defined in Section 17.2.2
! NR: the normal ranges will be used for categorization
! Max: a shift table will be created for the shift from the baseline to the maximum post-baseline value
! Min: a shift table will be created for the shift from the baseline to the minimum post-baseline value.
! “(+ Infections)”: additional shift tables from baseline to the post-baseline value on treatment closest to the starting date of an infection will be created, as detailed in Section 16.2.
! “(Max)” or “(Min)”: maximum or minimum value will be used
! “Box ∃”: box plots of changes from baseline.
! “Box Pct ∃”: box plots of percent changes from baseline.
! “Line“: line plots of mean value (+/-SD) and line plots of median value.
! “Line ∃“: line plots of mean absolute change from Baseline (+/-SD) and line plots of median absolute change from Baseline.
! “Line Pct ∃”: line plots of mean relative change from Baseline (+/-SD) and line plots of median relative change from Baseline.
Table 2 Tables and figures on laboratory values
Parameter Tables FiguresOT Shift Box
∃Box Pct ∃
Line Line ∃
Line Pct ∃
HematologyHematocrit X NRHemoglobin X NCI MCH X NRMCHC X NRMCV X NRPlatelet X NCIRBC X NRWBC and differential in absolute values (neutrophils, lymphocytes,
X NCI
CCICCI

Atacicept Atacicept in IgA NephropathyMS700461-0035 Final V2.0
55/67
monocytes, eosinophils, basophils)
for WBC, lymphocytes,neutrophils
NR for eosinophils,
basophils, monocytes, basophils/leukocytes,
eosinophils/leukocytes,lymphocytes/leukocytes,monocytes/ leukocytes,neutrophils/leukocytes
BiochemistryAlbumin X NCIAlkaline Phosphatase X NCIAlanine Aminotransferase X NCIAspartate Aminotransferase X NCIBilirubin, total X NCIBilirubin, direct X NR (Max)Calcium X NCI Creatinine X NCIeGFR (a) X NR (Min) X X X X XGlucose X NCI Potassium X NCI Sodium X NCITotal protein X NRUric Acid X NCIImmunologySerum IgA X Study
(+ Infection) X X X X
Serum IgG X Study(+ Infection)
X X X
Serum IgM X Study(+ Infection)
X X
UrinalysispH XLeukocytes XNitrite XGlucose XKetones XProtein XBlood XUrine sediment analysisRBC/hpf and WBC/hpf X NRCasts XOrganisms Xcrystals XAdditional urinalysisTotal protein (g/day) by 24-hour urine
X Study X X X X
UPCR (mg/mg) by 24-hour urine X Study X X X XUPCR (mg/mg) by spot urine X Study X X X XUACR (mg/mg) by spot urine X X X X X
CCICCI

Atacicept Atacicept in IgA NephropathyMS700461-0035 Final V2.0
56/67
UPEP by spot urine (b) XOther PK/PD parametersSerum atacicept XAnti-drug antibodies (c) XSerum and urine BLyS & APRIL levelVaccine immunization titers (d) X StudySerum Gd-IgA1 X X X X X Serum complement (C3, C4) X NR X XFlow Cytometry of immune cell subsets (selected sites) (e)
X
(a) eGFR: calculated per the CKD-EPI equation for all subjects (see section 13.2.2).(b) UPEP: Urinary Albumin, Alpha-1 Globulin, Alpha-2 Globulin, Beta Globulin and Gamma Globulin levels.(c) Vaccine immunization titers: pneumococcal antigens, tetanus toxoid and diphtheria toxoid. (d) A non-protective level for tetanus and diphtheria is defined as a value < 0.1 IU/mL.(e) Flow cytometry: Total T, helper T, cytotoxic T, total B, mature naïve B, memory B, plasma cells, plasma blasts,
and NK cells.
Spaghetti plots may be created for some parameters.
By-subject listings of clinical laboratory data will include indications of values that are outside the normal ranges.
17.2.1 Summary tables over-time
Summary tables over time will present summary statistics for continuous and categorical variables by study visit. Both actual values, changes and percent changes from the baseline will be presented. These analyses will be performed using the SAF Set.
17.2.2 Shift tables
Number and subject counts will be presented in shift tables from the baseline to the worst on-treatment value, unless otherwise specified. For a given parameter, categories in the shift tables will be defined as follows. Note that “[a, b)” represents the interval ≥a and <b.
! For total protein (g/day) by 24-hour urine, UPCR (mg/mg) by 24-hour urine, UPCR (mg/mg) by spot urine, UACR (mg/mg) by spot urine, the following categories will be used: <0.5, [0.5, 1), [1, 1.5), [1.5, 2), [2, 3), [3, 6), ≥6. Two shift tables for each parameter will be created based on the highest and lowest post-baseline values.
! For serum IgA, IgG and IgM, the following categories will be used:
! IgA (g/L): Grade 0: ≥Lower Limit of Normal (LLN); Grade 1: [0.5, LLN); Grade 2: [0.3,0.5); Grade 3: [0.1, 0.3); Grade 4: [0, 0.1); with LLN=0.7 g/L and ULN=4 g/L
! IgG (g/L): Grade 0: ≥LLN; Grade 1: [5, LLN); Grade 2: [4, 5); Grade 3: [3, 4); Grade 4: [0, 3); with LLN=7 g/L and ULN=16 g/L
! IgM (g/L): Grade 0: ≥LLN; Grade 1: [0.3, LLN); Grade 2: [0.2, 0.3); Grade 3: [0.1, 0.2); Grade 4: [0, 0.1); with LLN=0.4 g/L and ULN=2.3 g/L.
! For vaccine immunization titers, the following categories will be used (see also Section 16.3):
CCICCICCI

Atacicept Atacicept in IgA NephropathyMS700461-0035 Final V2.0
57/67
! A non-protective level for tetanus and diphtheria is defined as a value < 0.1 IU/mL.
! For other parameters, the NCI-CTC toxicity grading version 4.03 (also named National Cancer Institute-Common Terminology Criteria of Adverse Events (NCI-CTCAE)) will be used if available. The post-baseline value on treatment with the highest toxicity grade will be used.
! Otherwise, the normal range will be used to create the categories below normal, normal, and above normal. The maximal and/or minimal post-baseline values on treatment will be used.
These analyses will be performed using the SAF Set.
17.2.3 Immunoglobulin
Only the unblinded team will have access to post-screening immunoglobulin data before unblinding of the study, since such data is potentially unblinding.
! Hypogammaglobulinaemia and severe Hypogammaglobulinaemia
A subject is defined as having hypogammaglobulinemia if the IgG level is below 6 g/L or severe hypogammaglobulinemia if the IgG level is below 3 g/L. A summary table will present the frequency and percentage of subjects with hypogammaglobulinemia and severe hypogammaglobulinemia at each visit and overall. The subject listing for immunoglobulin will include a column to flag records with IgG < 6 g/L or IgG < 3 g/L. Unscheduled measurements will also be taken into account. If 2 IgG values are linked to the same scheduled time point, the lowest one will be considered. These analyses will be performed using the SAF Set.
! Shift from Baseline to Worst On-treatment Value based on Toxicity Grading
A shift table from baseline to the post-baseline value on treatment with the worst grade, as described in “Shift tables” in section 17.2, will be created for immunoglobulin data.Unscheduled measurements will also be taken into account. If 2 assessments are linked to the same scheduled time point, the one with the worst grade will be considered. These analyses will be performed using the SAF Set.
! Shift in Toxicity Grading from Baseline to Closest Grade Compare to Infection Date
For immunoglobulin data, shift tables from baseline to the post-baseline value on treatment closest to the starting date of an infection, for 2 subgroups listed below, will be created. Such values will be identified by comparing the start date of the specified infection with dates of immunoglobulin assessments. Assessment dates before and after the infections will be taken into account. For two assessments equidistant to an infection, the one with the worst grade will be used. In case of multiple infections, the worst grade, among closest grades identified for each infection, will be used. In case of two equidistant assessments with the same grade, we will take the first one into account.
! Subjects including in the SAF Set having at least one infection during study
! Subjects in the SAF Set having at least one serious infection during study
CCICCI

Atacicept Atacicept in IgA NephropathyMS700461-0035 Final V2.0
58/67
Missing start date of an infection will be imputed using the imputation method for missing or partial AE start date as described in section 17.1.
Unscheduled measurements will also be taken into account.
17.2.4 Proteinuria
For Total protein by 24-hour urine, UPCR by 24-hour urine, UPCR by spot urine, the 12-week time-averaged value will be summarized for Week 12 and Week 24, and the 24-week time-averaged value will be summarized for Week 48, W72, and safety follow-up Week 24, etc., by treatment group. Time-averaged value is the mean of all UPCR values (scheduled or unscheduled) falling in the interval excluding value of first time point and including value of the end of the interval. For example, for Week 12, all values after the first IMP injection and until the date of the visit at Week 12 (included) will be taken into account. This analysis will be performed using the SAF Set, the mITT Set and the PP Set.
Summary tables may also be presented for the subgroup of the SAF Set excluding subjects with increased dose or addition of anti-hypertensive medications (e.g. diuretics, aldosterone antagonists, calcium-channel blockers and ß-blockers). (Angiotensin-converting enzyme inhibitors [ACEi] and angiotensin II receptor blockers [ARBs] are standard of care that should remain stable throughout the study, so they will not be considered in the definition of this subgroup.)
17.2.5 Anti-drug antibody
If baseline data is missing, assessment of treatment induced vs. pre-existing antibodies can not be made.
Antidrug antibody results will be reported as treatment-induced incidence and titers as well as increase in the titer of pre-existing antibodies.
Anti-drug antibody assessment over time will be summarized as detailed in table 2.
If data exist over time, data will also indicate persistence or not of the antidrug antibody response. The impact of ADAs on PK, PD, efficacy and safety will be analyzed if sufficient data is available. Similarly the presence and impact of pre-existing antibodies on PK, PD, efficacy and safety will also be evaluated (see European Medicines Agency Guideline in ref 4).
Unscheduled measurements will also be taken into account. For an assessment ‘Positive” and another “Negative” linked to the same scheduled time point, the “Positive” one will be considered.
This analysis will be performed using the SAF Set.
CCICCI

Atacicept Atacicept in IgA NephropathyMS700461-0035 Final V2.0
59/67
17.2.6 Vital Signs
Vital sign measurements, weight and height will be measured prior to any other study-related procedures, at the visits specified in the protocol. Vital signs parameters are listed below:
! Blood Pressure (BP) (systolic and diastolic) (mmHg)
! Pulse rate (beats/min)
! Oral body temperature (°C)
! Weight (kg)
! Height (cm) (available only at baseline)
! Body Mass Index (BMI) (kg/m2) (as recorded in the eCRF / available only at baseline).
All vital sign parameters will be summarized using descriptive statistics of actual values, changesand percent changes from baseline for each visit over time and by treatment group.
The changes of post-baseline vital sign value from baseline will be grouped as in table 3:
Table 3 Vital signs categories
Parameter Baseline categories Post-baseline categories (a)
Systolic blood pressure <140 / ≥140 mmHg
<90 / ≥90 mmHg
Change of: No change / ≤20 / >20 - ≤40 / >40 mmHg
Diastolic blood pressure <90 / ≥90 mmHg
<60 / ≥60 mmHg
Change of: No change / ≤ 20 / >20 - ≤40 / >40 mmHg
(a) Applied separately for increases and decreases.
These analyses will be performed using the SAF Set.
17.3 Other Safety or Tolerability Evaluations
ECG data will be evaluated by the investigator and by central interpretation as normal or abnormal. If abnormal, it will be reported if the abnormality is clinically significant or not clinically significant and the reason for the abnormality will be recorded on the eCRF. These data will be summarized using shift tables to show the baseline and worst on-study (ie, post baseline) category by number and percentage of subjects.
All ECG parameters will be summarized using descriptive statistics of actual values, changes and percent changes from baseline for each visit over time. End of treatment visit will be summarizedseparately. The changes computed will be the differences from baseline.
By-subject listings of ECG data will include indications of values that are clinically significant.
CCICCI

Atacicept Atacicept in IgA NephropathyMS700461-0035 Final V2.0
60/67
These analyses will be performed using the SAF Set.
18 Benefit Risk Assessment
Not applicable.
19 References
1. Bornkamp B, Pinheiro J, Bretz F. MCPMod: An R package for the design and analysis of dose-finding studies. Journal of Statistical Software 2009; 29(7): 1-23.
2. Bretz F, Pinheiro J, Branson M. Combining multiple comparisons and modeling techniques in dose-response studies. Biometrics 2005; 61:738–48.
3. Petri MA, Furie RA, Ramiterre E et al. The subcutaneous BAFF inhibitor, blisibimod, significantly reduces proteinuria in subjects with moderate-to-severe systemic lupus erythematosus. Poster presented at the Asian Lupus Summit. November 23-29 2012, Manila, Philippines.
4. European Medicines Agency. Guideline on Immunogenicity assessment of therapeutic proteins. EMEA/CHMP/BMWP/14327/2006 Rev 1. 18 May 2017.
CCICCI

Atacicept Atacicept in IgA NephropathyMS700461-0035 Final V2.0
61/67
20 Appendices
20.1 Appendix 1: Important protocol deviations
See document: ctp-ms700461-0035-sap-appendix-20-1-pds.doc
20.2 Appendix 2: Firewall Team Charter
See document: Firewall Team Charter for the Interim Analysis.doc
20.3 Appendix 3: Important protocol deviations
See document: MS700461-0035_Unblinding_Draft_V2_1.doc
20.4 Appendix 4: Reference SAS code used for EAIR 95% confidence interval calculation by Poisson model
data test;input n c arm;ln = log(n);ObsRate=c/n;datalines;100.6 3 1200.5 6 2;
proc genmod data=test;class arm;model c = arm / dist=poisson link=log offset=ln;lsmeans arm / ilink cl;run;
CCICCI

Atacicept Atacicept in IgA NephropathyMS700461-0035 Final V2.0
62/67
20.5 Appendix 5: Details on Pharmacometry Evaluation
This appendix contains technical details that are related to the population PK/PD analysis of clinical trial MS700461-0035.
20.5.1 Software
The software package NONMEM (version 7.3.0) will be used in the analysis, installed on six HP BL 460 C Servers with two Intel® Xeon® E5-2650 v2 octacore processors (speed 2.60 GHz) and with 64 Gb Random Access Memory (RAM) each and the LINUX (Novell SLES11 (64-bit) SP3) operating system, with Central Processing Unit (CPU) allocation controlled by a Univa Grid Engine (version 8.2). The NONMEM runs on the servers will be organized by Perl-speaks-NONMEM (PsN, version 4.4.8, http://psn.sourceforge.net/index.php), that will be used also to aid the development of the non-linear mixed effect models using NONMEM. The used Fortran compiler will be GNU Fortran (gcc version 4.7.2, http://gcc.gnu.org/fortran). Pirana software (http://www.pirana-software.com/ version 2.9.2) will be used to organize the runs and produce runs summary. The statistical software R (http://www.r-project.org/ version 3.2.2), as well as the R package Xpose 4.5.3 (http://xpose.sourceforge.net/) will be used for the exploratory analysis and post-processing of NONMEM output, for example to assess goodness-of-fit. The integrated development environment RStudio Server version 0.99.486 will also be used. All preceding software are installed in a validated GxP environment. R and SAS (The SAS System for Windows, version 9.3, SAS Institute Inc, Cary NC, USA) will be used for any other analyses not performed with NONMEM. Simulx (mlxR v. 2.1.1 R package) as well as NONMEM will be used to simulate PK/PD profiles.
20.5.2 Modeling Methodology
Estimation methods in NONMEM will be first-order conditional (FOCE) with additive or log-additive models for residual variability and first-order conditional with interaction (FOCEI) with proportional and additive + proportional models for residual variability (2) and (3) and if supported by the data. In case of prohibitive computer intensive runs with FOCE, the first-order estimation method may be used during model development. In such a case, critical modeling steps will be reassessed using FOCE (with or without interaction). Precision of parameter estimates will be assessed by the covariance matrix, derived from the Fisher information matrix obtained in the covariance step. In case of numerical difficulty to estimate this matrix, confidence intervals of parameter estimates will be obtained by a bootstrap analysis.
Additional methods including stochastic approximation expectation maximization and important sampling approach will be applied to overcome numerical difficulties in model convergence, if necessary. For non-continuous type data, the Laplacian method will be used.
CCICCI

Atacicept Atacicept in IgA NephropathyMS700461-0035 Final V2.0
63/67
Stability of NONMEM models will be assessed on the basis of:
! Acceptable basic goodness of fit plots
! Number of significant digits ≥ 3 for all estimated parameters
! Successful covariance step
! Model parameter estimates not close to a boundary
! Condition number (ratio of largest to smallest eigenvalue) < 1000
! Correlation less than 0.95 between any two parameters
! Stability of final solution for base model to perturbations of the initial values
Model selection will be based on:
! The comparison of full vs. reduced models is based on the Log-Likelihood Criterion: the difference in the minimum value of the objective function between hierarchical models is asymptotically chi-square distributed with degrees of freedom equal to the difference in number of parameters between the full and reduced models. Non-nested models will be compared using standard likelihood-based methods, e.g. -2 times the maximized log likelihood or Akaike Information Criterion (AIC).
! Decrease in unexplained variability. Extension of a model by adding independent variables should usually be accompanied by a decrease in random inter- and/or intra individual variability.
! Goodness of fit plots, e.g. relevant residuals against time randomly distributed around zero.
! Scientific/(patho)physiologic plausibility of the model.
20.2.2.1 Population PK/PD Modeling
The general procedure that will be followed for the development of the population PK/PD models is outlined below:
! Exploratory Data Analysis
! Structural Model Development
! Statistical model development
! Final Model Refinement
! Sensitivity Analysis of Fixed Parameter Values
! Model Evaluation
A tree diagram of relevant modeling steps may be included in the modeling report for each of the models developed.
CCICCI

Atacicept Atacicept in IgA NephropathyMS700461-0035 Final V2.0
64/67
20.2.2.1.1 Exploratory Data Analysis
Prior to the population PK/PD analyses, the following outputs will be produced as part of the exploratory data analyses for each of the parameters to be modeled:
! scatterplots of dependent variables versus time (linear axes for PD and both linear and semi-log axes for PK), split by dose; one plot per dose;
! summary statistics regarding the distribution of dependent variables by dose and scheduled timepoint;
! descriptive statistics and distribution of covariates;
! scatterplot matrices of covariates of interest and calculation of correlation measures for each pair of covariates;
Further exploratory analyses may be performed. These will be fully described in the M&S analysis report.
20.2.2.1.2 Structural Model Development
Different structural PK/PD models will be evaluated as necessary and if the data set allows.
Goodness-of-fit of the structural model will be assessed by diagnostic plots:
! Observations versus population and individual predictions and/or log-log plots
! Population, individual and conditional weighted residuals versus time
! Above plots stratified by dose, if necessary
! Above plots stratified by significant covariates, if necessary
! Visual Predictive Check (VPC)
20.2.2.1.3 Statistical Model Development
Additive, log-additive, proportional and additive + proportional error models will be explored for residual variability. Between subjects variability in residual error will be evaluated. Additive and/or exponential error models will be explored for between subject variability in the model parameters. As a start diagonal Ω-structure (variance-covariance matrix of the deviation of individual values from population means for the various model parameters) will be employed, the inclusion of off-diagonal elements will be investigated.
If required, interoccasion variability (IOV) will be modeled as described by Karlsson and Sheiner (4).
CCICCI

Atacicept Atacicept in IgA NephropathyMS700461-0035 Final V2.0
65/67
The goodness of fit and appropriateness of the random effects models will be assessed by means of diagnostic plots as mentioned in the previous section as well as:
! Plots of observations versus time with population and individual fits
! Histogram of ETA estimates
! Co-plots of individual ETA estimates
! (Absolute) individual weighted residuals versus individual predictions
! (Conditional) weighted residuals versus time
! Histogram of population and individual weighted residuals
20.2.2.1.4 Covariate Analysis
Identification of covariates will be implemented by the Stepwise Covariate Model (SCM) building tool of PsN (5).
Linear and power relationships will be tested in a stepwise fashion for forward inclusion (ΔOFV of 6.64, p < 0.01 for 1 DF) and backward elimination (ΔOFV of 10.83, p < 0.001 for 1 DF). Those p-values have been established by simulations to avoid false positive covariates due to approximation of the likelihood with FOCE methods. In case of categorical covariates, ΔOFV at the respective p-values may be different depending on the degrees of freedom and equal to the number of categories of the covariate minus one.
The resultant final model will only contain covariates that meet the pre-defined statistical inclusion and exclusion criteria. In addition, covariates will only be retained on basis of their relevance in view of the purpose of the model.
The covariates to be tested with the PPK model are: demography (Age (years), gender (male/female), Weight (kg), BMI (kg/m2), ethnicity (white/black/Asian /other)), baseline free BLyS and APRIL, baseline creatinine clearance (CRCL) patient population (IgA Nephropathy vs. not), as well as atacicept dose.
Creatinine clearance will be calculated as follows according to Cockcroft-Gault:
% &% &male
1.23× 140-Age(years) ×Weight(kilograms)CRCL
serum creatinine μmol/L#
% &% &female
1.04× 140-Age(years) ×Weight(kilograms)CRCL =
serum creatinine μmol/L
where, % & % &serum creatinine:1 mg/100mL =88.4 μmol/L
The covariates to be tested in the IgG, IgM, and IgA models are the same as the above, as well as the corresponding immunoglobulin baseline concentration.
CCICCI

Atacicept Atacicept in IgA NephropathyMS700461-0035 Final V2.0
66/67
The covariates to be tested with all models are: demography (gender (male/female), weight (kg), BMI (kg/m2), body surface area (m2), age (years), and descent (Japanese vs. non-Japanese).M2951 dose and food state (fed/fasted) will also be tested as covariates.
The goodness of fit and appropriateness of the covariate model will be assessed by means of diagnostic plots as mentioned in the previous two sections as well as plots of ETA estimates versus covariates.
20.2.2.1.5 Final Model Refinement
The final model including all significant covariates will be evaluated for any remaining inadequacies in the random effect and residual error structures. The model will also be checked for possible simplifications, such as power functions that can be reduced to linear functions (power approximately 1.0) or significant discrete group covariates that could be re-defined using fewer groups or parameters. In an attempt to further improve the precision of the parameter estimates, the final model will be re-estimated using the FOCE method and the FOCE method with interaction if the first-order method had been used previously.
20.2.2.1.6 Sensitivity Analysis of Fixed Parameter Values
In the event that a parameter is fixed to a constant value, the sensitivity of the remaining PK/PD parameters to that value will be evaluated. This analysis will be performed by altering the value of the fixed parameter over a range of the fixed value and recording the resulting estimates of all remaining PK/PD parameters and the OFV.
20.2.2.1.7 Model Evaluation
The models developed during this analysis will be validated internally. The following validation method(s) will be used:
! Numerical and visual predictive checks
! Plots of residuals against covariates
Confidence intervals of model parameters may also be derived by non-parametric bootstrapping of the final models, typically for 1000 resamples. If the bootstrap requires excessive CPU time, the number of resamples will be reduced.
For all covariates included in the final PK/PD models, simulated typical profiles of PK and/or PD at values of covariates corresponding to the minimum, 25th, 50th and 75th percentile as well as maximum observed in the analysis population distribution will also be presented. For categorical covariates included in the model, profiles will be simulated for each level of the covariate.
CCICCI

Atacicept Atacicept in IgA NephropathyMS700461-0035 Final V2.0
67/67
References
1. Beal SL, Sheiner LB. NONMEM Users Guides. NONMEM project group, University of California, San Francisco, CA, 1992.
2. Wahlby U, Bouw MR, Jonsson EN, Karlsson MO. Assessment of type I error rates for the statistical sub-model in NONMEM. J Pharmacokinet Pharmacodyn 2002;29:251-69
3. Wahlby U, Jonsson EN, Karlsson MO. Assessment of actual significance levels for covariate effects in NONMEM. J Pharmacokinet Pharmacodyn 2001;28:231-52
4. Karlsson MO, Sheiner LB. The importance of modeling inter-occasion variability in population pharmacokinetic analyses. J Pharmacokinet Biopharm 1993;21(6):735-50.
5. Jonsson EN, Karlsson MO. Automated covariate model building within NONMEM. Pharm Res 1998;15(9):1463-8.
CCICCI

CCICCI
PPD
PPD


