Embed Size (px)
Citation preview
STATISTICAL ABSTRACTOF
A N D H R A P R A D E S H 19 6 2
I ssu e d B y
BUREAU OF ECONOMICS AND STATISTICS GOVERNMENT OF ANDHRA PRADESH
HYDERABAD
P R E F A C E
The present issue o f the Statistical Abstract o f Andhra Pradesh is the
seventh o f its kind in the series and contains latest available data on various
item s o f im portance which have a bearing on the Econom ic D evelopm ent o f
the S tate. I am sure that this publication will serve as a useful reference book
in general and will be o f im m ense use particularly to the Administrators and
those engaged in Econom ic Planning and Developm ent.
One table on H ouseless and Institutional Population and four tables
relating to the results o f the 15th Round, Socio Econom ic Survey, 1959-60 have
been newly added to this issue.
I thank the various H eads o f Departm ents, both o f the State and
Central G overnm ents, for their kind Co-operation in furnishing the data promptly.
Any suggestions for the im provem ent o f this Publication are m ost welcom e.
D. R A N G A R A M A N U JA M , D I R E C T O R .
Bureau o f Economics and S t a t i s t i c s ,
Hyderabad.
14th November, 1963
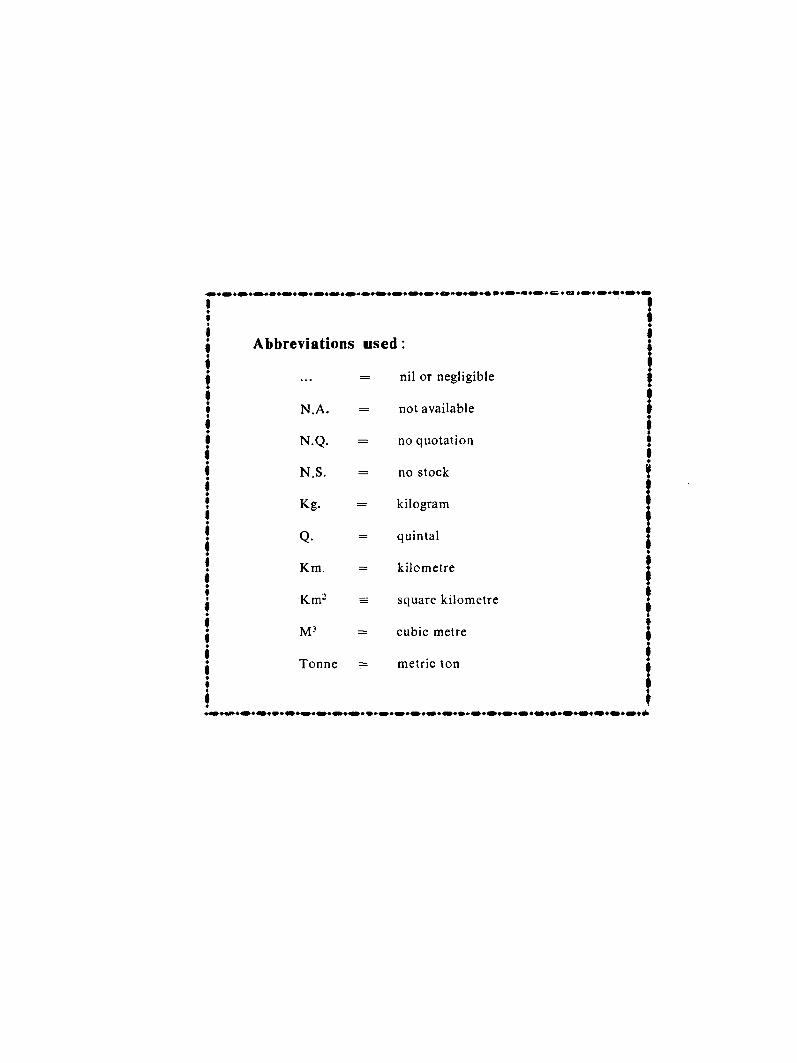
Abbreviations u sed :
... = nil or negligible
N .A . = not available
N.Q . = no quotation
N .S. = no stock
Kg. kilogram
Q. quintal
Km. = kilom etre
Km2 = square kilom etre
M-’ = cubic metre
Tonne metric ton
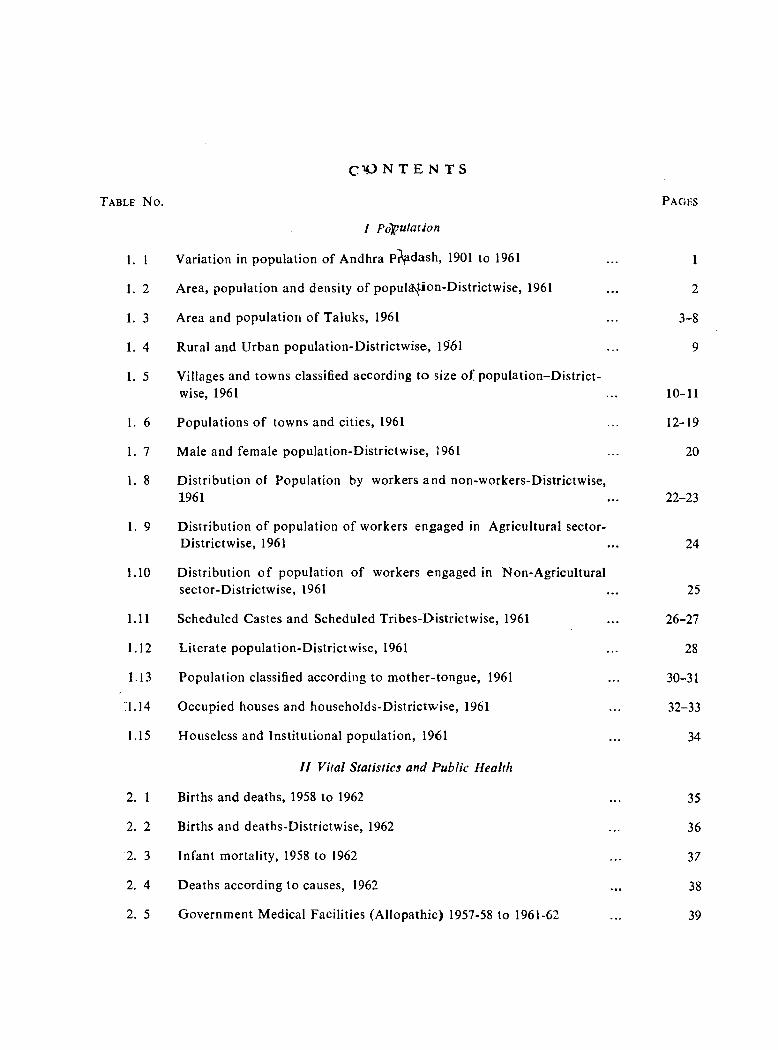
N T E N T S
I Population
1. 1 Variation in population o f Andhra Pr^dash, 1901 to 1961 ... l
1 . 2 Area, population and density o f popul^tion-D istrictw ise, 1961 .. . 2
1. 3 Area and population o f Taluks, 1961 ... 3-8
1. 4 Rural and Urban population-D istrictw ise, 1961 ... 9
1. 5 V illages and tow ns classified according to size o f population-D istrictwise, 1961 ... 10-11
1. 6 Populations o f towns and cities, 1961 ... 12-19
1. 7 M ale and fem ale population-D istrictw ise, 1961 ... 20
1. 8 D istribution of Population by workers and non-workers-Districtwise,1961 ... 22-23
1. 9 D istribution o f population o f workers engaged in Agricultural sector-Districtw ise, 1961 ... 24
1.10 D istribution o f population o f workers engaged in Non-Agriculturalsector-D istrictw ise, 1961 ... 25
1.11 Scheduled Castes and Scheduled Tribes-D istrictw ise, 1961 ... 26-27
1.12 Literate population-D istrictw ise, 1961 ... 28
1.13 Population classified according to m other-tongue, 1961 ... 30-31
1.14 O ccupied houses and households-Districtw/ise, 1961 ... 32-33
1.15 H ouseless and Institutional population, 1961 ... 34
/ / Vital Statistics and Public Health
2. 1 Births and deaths, 1958 to 1962 ... 35
2. 2 Births and deaths-Districtwise, 1962 ... 36
2. 3 Infant mortality, 1958 to 1962 ... 37
2, 4 Deaths according to causes, 1962 ... 38
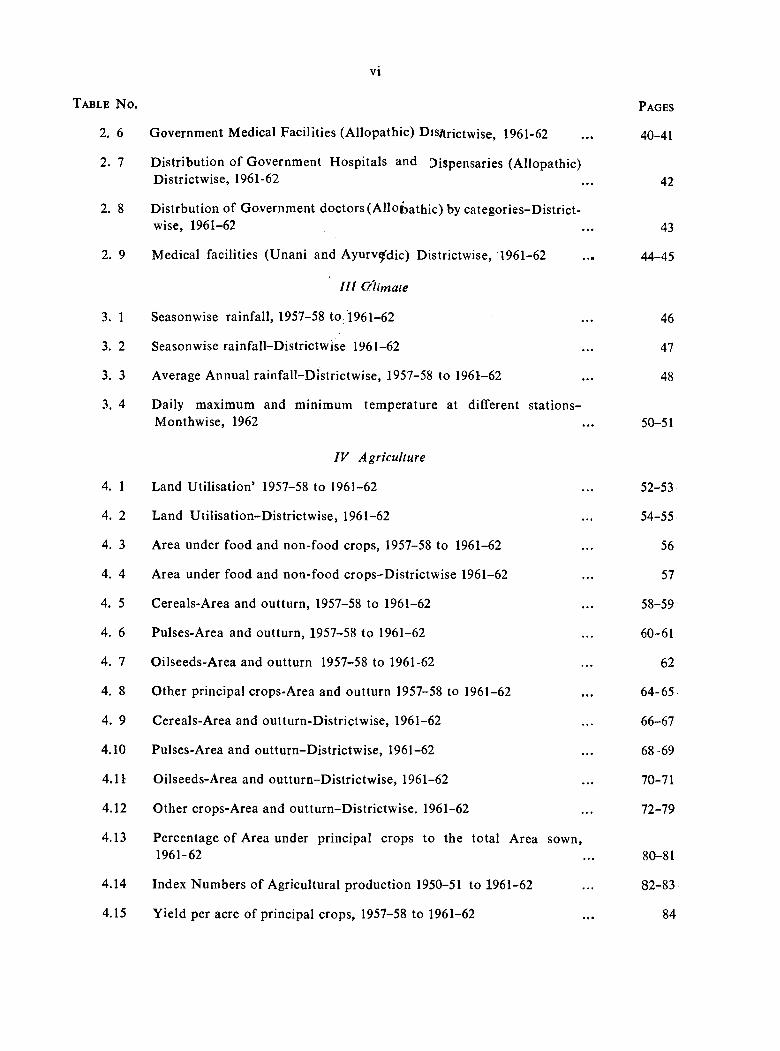
2. 5 Governm ent M edical Facilities (A llopathic) 1957-58 to 1961-62 ... 39
T able N o , P ag es
VI
T a b l e N o .
2. 6 Government M edical Facilities (A llopath ic) Disftrictwise, 1961-62
2. 7 D istribution o f Governm ent H ospitals and Dispensaries (A llopathic)D istrictw ise, 1961-62
2. 8 D istrbution o f G overnm ent doctors (Allof^athic) by categories-D istrict- wise, 1961-62
2. 9 M edical facilities (U nani and Ayurv^^dic) D istrictwise, 1961-62
III Q'limate
3. 1 Seasonwise rainfall, 1957-58 to 1961-62
3. 2 Seasonwise rainfall-D istrictw ise 1961-62
3. 3 Average Annual rainfall-D istrictw ise, 1957-58 to 1961-62
3. 4 D aily maximum and minimum temperature at different stations-M onthwise, 1962
IV Agriculture
4. 1 Land U tilisation’ 1957-58 to 1961-62
4. 2 Land U tilisation-D istrictw ise, 1961-62
4. 3 Area under food and non-food crops, 1957-58 to 1961-62
4. 4 Area under food and non-food crops-D istrictw ise 1961-62
4. 5 Cereals-Area and outturn, 1957-58 to 1961-62
4. 6 Pulses-Area and outturn, 1957-58 to 1961-62
4. 7 O ilseeds-A rea and outturn 1957-58 to 1961-62
4. 8 Other principal crops-Area and outturn 1957-58 to 1961-62
4. 9 Cereals-Area and outturn-D istrictw ise, 1961-62
4.10 Pulses-Area and outturn-D istrictw ise, 1961-62
4.11 O ilseeds-Area and outturn-D istrictw ise, 1961-62
4.12 Other crops-Area and outturn-D istrictw ise. 1961-62
4.13 Percentage o f Area under principal crops to the total Area sown,1961-62
4.14 Index Num bers o f Agricultural production 1950-51 to 1961-62
4.15 Y ield per acre o f principal crops, 1957-58 to 1961-62
40-41
42
43
44-45
46
47
48
50-51
52-53
54-55
56
57
58-59
60-61
62
64-65
66-67
68-69
70-71
72-79
80-81
82-83
P ag es
84
V ll
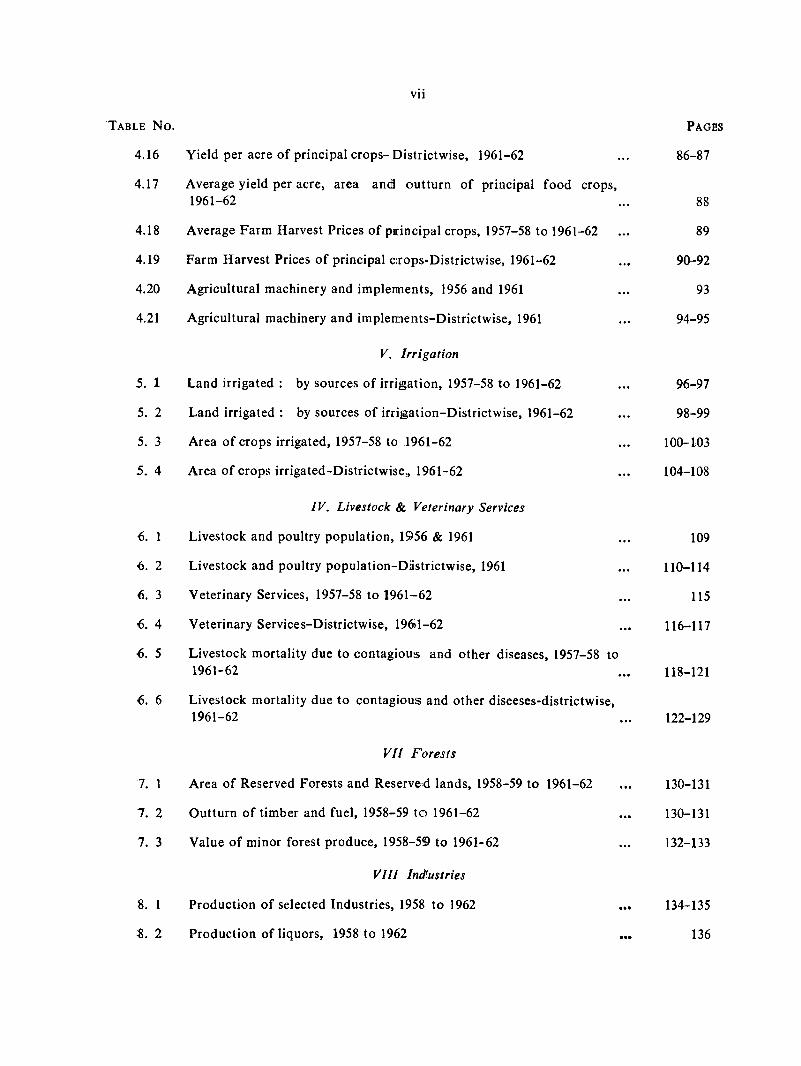
4.16 Y ield per acre o f principal crops-D istrictw ise, 1961-62
4.17 Average yield per acre, area and outturn o f principal food crops, 1961-62
4.18 Average Farm Harvest Prices o f pjrincipal crops, 1957-58 to 1961-62
4.19 Farm Harvest Prices o f principal c;rops-Districtwise, 1961-62
4.20 Agricultural machinery and implennents, 1956 and 1961
4.21 Agricultural machinery and im plem ents-D istrictw ise, 1961
V. Irrigation
5. 1 Land irrigated : by sources o f irrigation, 1957-58 to 1961-62
5. 2 Land irrigated : by sources o f irrigation-D istrictw ise, 1961-62
5. 3 Area o f crops irrigated, 1957-58 to 1961-62
5. 4 Area o f crops irrigated'Districtwise., 1961-62
IV. Livestock & Veterinary Services
6. 1 L ivestock and poultry population, 1956 & 1961
€. 2 L ivestock and poultry popuIation-Diistrictw ise, 1961
6 . 3 Veterinary Services, 1957-58 to 1961-62
€. 4 Veterinary Services-D istrictw ise, 196)1-62
■6 . 5 L ivestock mortality due to contagious and other diseases, 1957-58 to 1961-62
-6 . 6 L ivestock mortality due to contagious and other d iseeses-districtw ise,1961-62
VII Forests
7. 1 Area o f Reserved Forests and Reserve d lands, 1958-59 to 1961-62
7. 2 Outturn o f timber and fuel, 1958-59 to 1961-62
7. 3 Value o f minor forest produce, 1958-59 to 1961-62
VIII Ind’ustries
8 . 1 Production o f selected Industries, 1958 to 1962
2 Production o f liquors, 1958 to 1962
T a b le N o .
86-87
P a g es
89
90-92
93
94-95
96-97
98-99
100-103
104-108
109
110-114
115
116-117
118-121
122-129
130-131
130-131
132-133
134-135
136
Vlll.
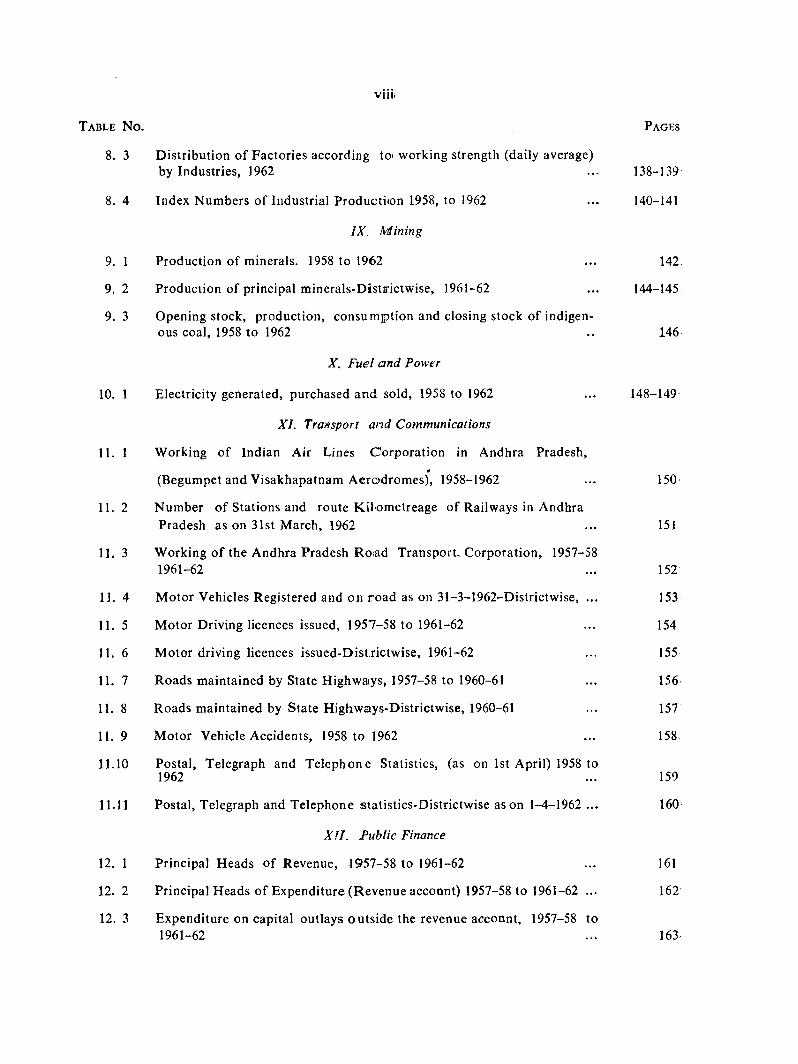
8. 3 D istribution o f Factories according to> working strengtli (daily average)by Industries, 1962 ... 138-139
8 . 4 Index Num bers o f Industrial Producti<on 1958, to 1962 ... 140-141
IX. Mining
9. 1 Production o f minerals. 1958 to 1962 ... 142
9. 2 Production o f principal m inerals-Distirictwise, 1961-62 ... 14 4 -14 5
9. 3 Opening stock, production, consum ption and closing stock o f indigenous coal, 1958 to 1962 .. 146
X, Fuel an d Power
10. 1 Electricity generated, purchased and sold, 1958 to 1962 ... 148-149
XI. Transport and Communications
11. 1 W orking o f Indian Air Lines Corporation in Andhra Pradesh,
(Begumpet and Visakhapatnam A erodrom es), 1958-1962 ... 150
11. 2 Number o f Stations and route K ilom etreage o f Railways in AndhraPradesh as on 31st March, 1962 ... 151
1 1 , 3 W orking o f the Andhra Pradesh R oad Transport. Corporation, 1957-581961-62 ... 152
11. 4 M otor Vehicles Registered and on road as on 31-3-1962-D istrictw ise, ... 153
11. 5 M otor Driving licences issued, 1957-58 to 1961-62 ... 154
11. 6 M otor driving licences issued-D istrictw ise, 1961-62 ... 155
11. 7 Roads maintained by State H ighw ays, 1957-58 to 1960-61 ... 156
11. 8 Roads maintained by State H ighw ays-D istrictw ise, 1960-61 ... 157
1 1 . 9 M otor Vehicle A ccidents, 1958 to 1962 ... 158
11.10 Postal, Telegraph and T elep h on e Statistics, (as on 1st April) 1958 to1962 ... 159
11.11 Postal, Telegraph and T elephone statistics-D istrictw ise as on 1-4-1962 ... 160
X!T. Fublic Finance
12. 1 Principal Heads o f Revenue, 1957-58 to 1961-62 ... 161
12. 2 Principal Heads o f Expenditure (R evenue account) 1957-58 to 1961-62 ... 162
1 2 , 3 Expenditure on capital outlays outside the revenue account, 1957-58 to1961-62 ... 163
T a ble N o . P ag es
IX
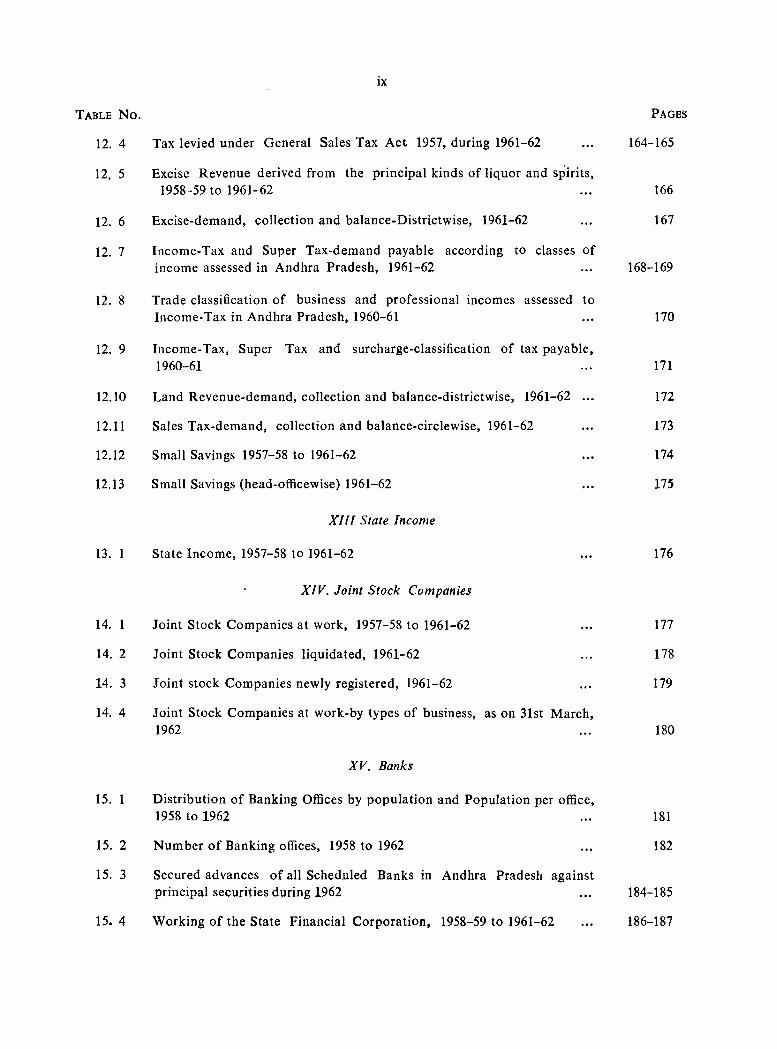
12. 4 Tax levied under General Sales Tax A ct 1957, during 1961-62
12. 5 Excise Revenue derived from the principal kinds o f liquor and spirits,1958-59 to 1961-62
12. 6 Excise-dem and, collection and balance-D istrictw ise, 1961-62
12. 7 Incom e-Tax and Super Tax-dem and payable according to classes o fincom e assessed in Andhra Pradesh, 1961-62
12. 8 Trade classification o f business and professional incom es assessed toIncom e-Tax in Andhra Pradesh, 1960-61
12. 9 Incom e-Tax, Super Tax and surcharge-classification o f tax payable,1960-61
12.10 Land Revenue-dem and, collection and balance-districtwise, 1961-62 ...
12.11 Sales Tax-dem and, collection and balance-circlew ise, 1961-62
12.12 Small Savings 1957-58 to 1961-62
12.13 Small Savings (head-officewise) 1961-62
X III State Income
13. 1 State Incom e, 1957-58 to 1961-62
XIV. Joint Stock Companies
14. 1 Joint Stock Com panies at work, 1957-58 to 1961-62
14. 2 Joint Stock Com panies liquidated, 1961-62
14. 3 Joint stock Com panies newly registered, 1961-62
14. 4 Joint Stock Com panies at work-by types o f business, as on 31st March,1962
XV. Banks
15. 1 D istribution o f Banking Offices by population and Population per office,1958 to 1962
15. 2 Num ber o f Banking offices, 1958 to 1962
15. 3 Secured advances o f all Scheduled Banks in Andhra Pradesh againstprincipal securities during 1962
15. 4 W orking o f the State Financial Corporation, 1958-59 to 1961-62
T able N o .
164-165
166
167
168-169
170
171
172
173
174
175
176
177
178
179
180
P ag es
181
182
184-185
186-187
T able N o . Pages
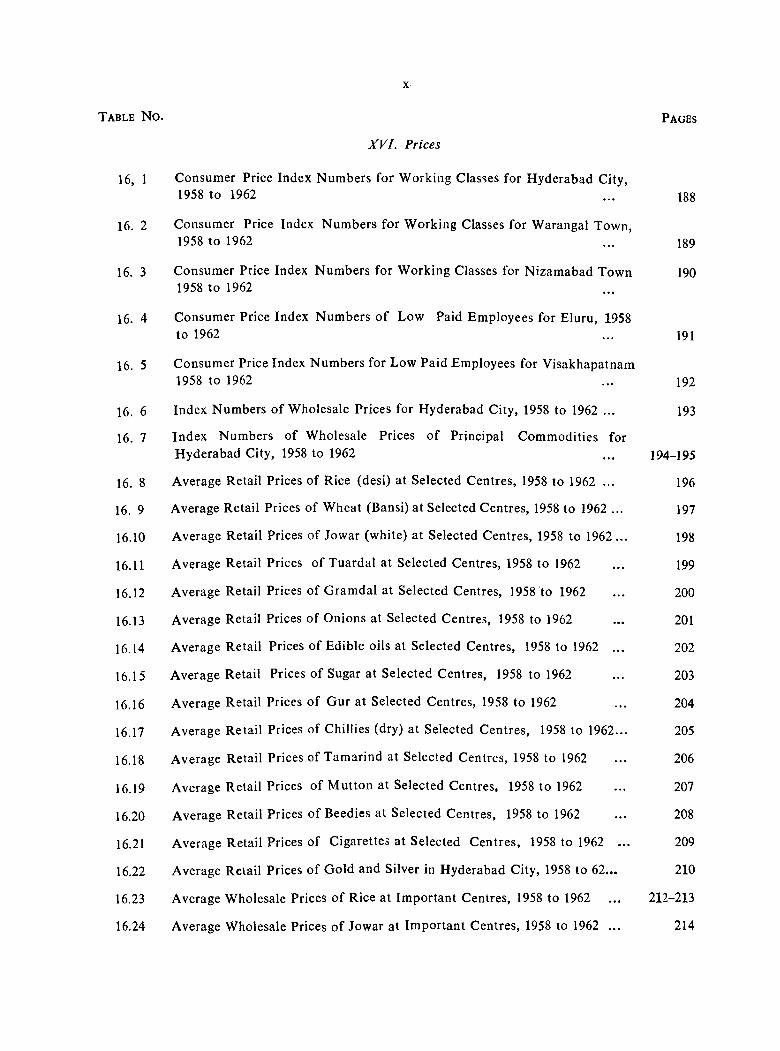
XVI. Prices
16, 1 Consumer Price Index Num bers for W orking Classes for Hyderabad City,1958 to 1962 ... 188
16. 2 Consumer Price Index Num bers for W orking Classes for Warangal Town,1958 to 1962 ... 189
16. 3 Consumer Price Index Num bers for W orking Classes for Nizam abad Town 1901958 to 1962
16. 4 Consumer Price Index Num bers o f Low Paid Em ployees for Eluru, 1958to 1962 ... 191
16. 5 Consumer Price Index Num bers for Low Paid Em ployees for Visakhapatnam1958 to 1962 ... 192
16, 6 Index Numbers o f W holesale Prices for Hyderabad City, 1958 to 1962 ... 193
16. 7 Index Num bers o f W holesale Prices o f Principal Com m odities forHyderabad City, 1958 to 1962 ... 194-195
16. 8 Average Retail Prices o f Rice (desi) at Selected Centres, 1958 to 1962 ... 196
16, 9 Average Retail Prices o f W heat (Bansi) at Selected Centres, 1958 to 1962 ... 197
16.10 Average Retail Prices o f Jowar (w hite) at Selected Centres, 1958 to 1962 ... 198
16.11 Average Retail Prices o f Tuardal at Selected Centres, 1958 to 1962 ... 199
16.12 Average Retail Prices o f Gramdal at Selected Centres, 1958 to 1962 ... 200
16.13 Average Retail Prices o f Onions at Selected Centres, 1958 to 1962 ... 201
16.14 Average Retail Prices o f Edible oils at Selected Centres, 1958 to 1962 ... 202
16.15 Average Retail Prices o f Sugar at Selected Centres, 1958 to 1962 ... 203
16.16 Average Retail Prices o f Gur at Selected Centres, 1958 to 1962 ... 204
16.17 Average Retail Prices o f C hillies (dry) at Selected Centres, 1958 to 1962... 205
16.18 Average Retail Prices o f Tamarind at Selected Centres, 1958 to 1962 ... 206
16.19 Average Retail Prices o f M utton at Selected Centres, 1958 to 1962 ... 207
16.20 Average Retail Prices o f Beedies at Selected Centres, 1958 to 1962 ... 208
16.21 Average Retail Prices o f Cigarettes at Selected Centres, 1958 to 1962 ... 209
16.22 Average Retail Prices o f G old and Silver in Hyderabad City, 1958 to 62... 210
16.23 Average W holesale Prices o f R ice at Important Centres, 1958 to 1962 ... 212-213
16.24 Average W holesale Prices o f Jowar at Important Centres, 1958 to 1962 ... 214

16.25 Average W holesale Prices o f wheat (B ansi) at Hyderabad, 1958 to 1962... 215
16.26 Average W holesale Prices o f Tuar (R edgram ) at Important Centres,1958 to 1962 ... 216
16.27 Average W holesale Prices o f Gram (Bengal) at Important Centres,1958 to 1962 ... 217
16.28 Average W holesale Prices o f Mung (Gireengram) at Important Centres,1958 to 1962 ... 218
16.29 Average W holesale Prices o f Chilli*es (dry) at Important Centres,1958 to 1962 ... 219
16.30 Average W holesale Prices o f Cane Jaggery (Gur) 1st. sort at ImportantCentres, 1958 to 1962 ... 220
16.31 Average W holesale Prices o f Onions at Im portant Centres, 1958 to 1962... 221
16.32 Average W holesale Prices o f G roundnut (Pods) at Important Centres,1958 to 1962 ... 222
16.33 Average W holesale Prices o f Til (Gingelily) at Important Centres, 1958to 1962 ... 223
16.34 Average W holesale Prices o f Karad and linseed at Hyderabad Centre,1958 to 1962 ' ... 224
16.35 Average W holesale Prices o f Castor (see<d) at Important Centres, 1958 to1962 ... 225
16.36 Average W holesale Prices o f Cotton (K apas) at Important Centres, 1958to 1962 ... 226
XVII Waiges
17. 1 Average D aily Earnings o f Labour at Koithagudem Coal M ines, 1958 to 62 227
17. 2 Average D aily Earnings o f Labour at YeDlandu Coal Fields, 1958 to 1962 227
17, 3 Average Daily Earnings o f Labour at Tandur and Ramagundam CoalFields, 1958 to 1962 ... 228
XVIII. Labour and Labour Welfare
18. 1 Average Num ber o f Daily Workers in C oal M ines, 1958 to 1962 ... 228
18. 2 Daily average number o f v/orkers em ploy ed in coal mines-by categorieso f em ploym ent, 1962 ... 229
18. 3 Number o f applicants on the live register classified by broad occupationalgroups, 1962 ... 230
18. 4 Registrations and placem ents by the Em ploym ent Exchanges, 1958to 1962 ... 232-233
XI
T able N o . P a g e s
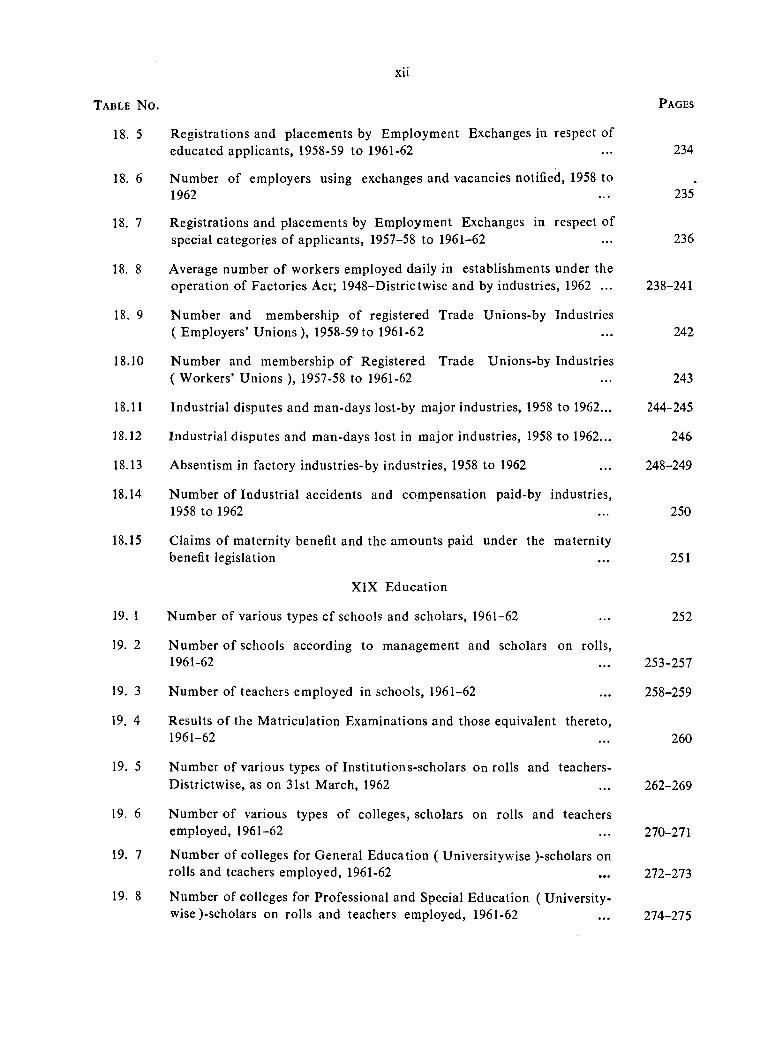
18. 5 Registrations and placem ents by E m ploym ent Exchanges in respect o feducated applicants, 1958-59 to 1961-62 ... 234
18. 6 Num ber o f em ployers using exchanges and vacancies notified, 1958 to1962 ... 235
18, 7 Registrations and placem ents by Em ploym ent Exchanges in respect o fspecial categories o f applicants, 1957-58 to 1961-62 ... 236
18. 8 Average number o f workers em ployed daily in establishm ents under theoperation o f Factories Act; 1948-D istrictw ise and by industries, 1962 ... 238-241
18. 9 Num ber and membership o f registered Trade U nions-by Industries( Em ployers’ U n io n s), 1958-59to 1961-62 ... 242
18.10 Num ber and membership o f Registered Trade U nions-by Industries( W orkers’ U n io n s ), 1957-58 to 1961-62 ... 243
18.11 Industrial disputes and man-days lost-by major industries, 1958 to 1962... 244-245
18.12 Industrial disputes and man-days lost in major industries, 1958 to 1962... 246
18.13 Absentism in factory industries-by industries, 1958 to 1962 ... 248-249
18.14 Num ber o f Industrial accidents and com pensation paid-by industries,1958 to 1962 ... 250
18.15 Claims o f maternity benefit and the am ounts paid under the maternitybenefit legislation ... 251
X IX Education
19. 1 Num ber o f various types c f schools and scholars, 1961-62 ... 252
19. 2 Num ber o f schools according to m anagem ent and scholars on rolls,1961-62 ... 253-257
19. 3 Num ber o f teachers em ployed in schools, 1961-62 ... 258-259
19. 4 Results o f the M atriculation Exam inations and those equivalent thereto,1961-62 ... 260
19. 5 Num ber o f various types o f Institutions-scholars e n r o lls and teachers-D istrictw ise, as on 31st M arch, 1962 ... 262-269
19. 6 Num ber o f various types o f colleges, scholars on rolls and teachersem ployed, 1961-62 ... 270-271
19. 7 Num ber o f colleges for General Education ( Universitywise )-scholars onrolls and teachers em ployed, 1961-62 ... 272-273
19. 8 Number o f colleges for Professional and Special Education ( University-wise )-scholars on rolls and teachers em ployed, 1961-62 ... 274-275
XII
T able N o . P ages
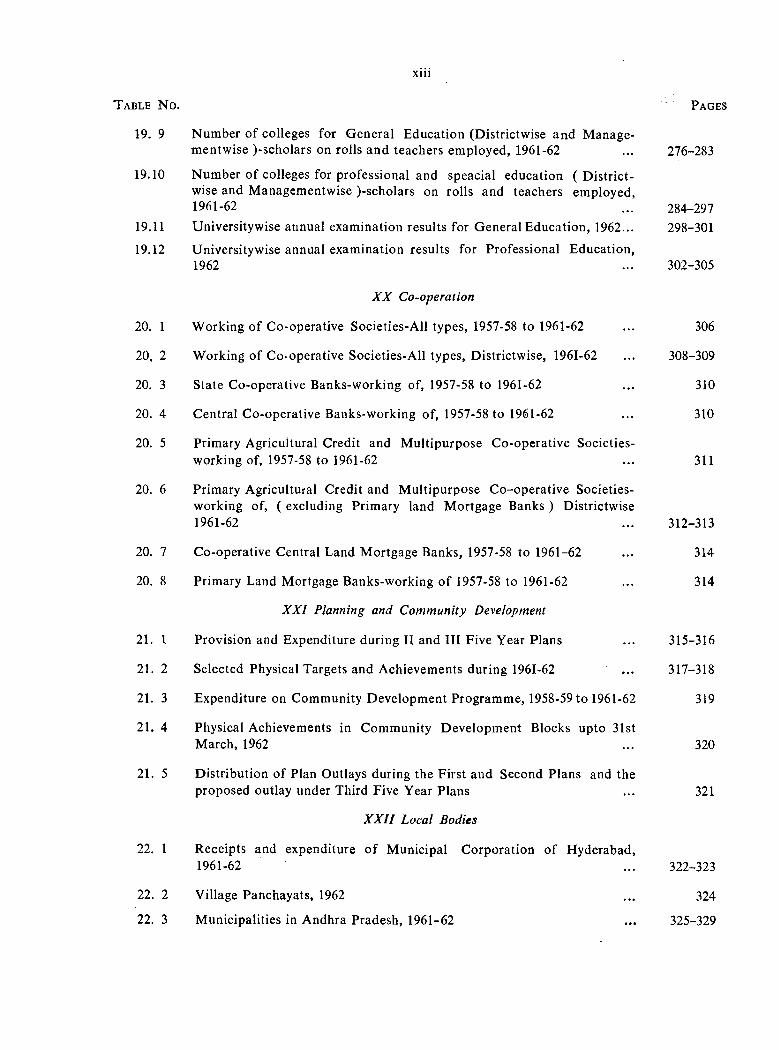
Xlll
19. 9 Number o f colleges for General Education (D istrictw ise and Manage-m entw ise )-scholars on rolls and teachers em ployed, 1961-62 ... 276-283
19.10 Number o f colleges for professional and speacial education (D is tr ic t- wise and M anagem entwise )-scholars on rolls and teachers em ployed,1961-62 ... 284-297
19.11 University wise annual examination results for General Education, 1962... 298-301
19.12 University wise annual exam ination results for Professional Education,1962 ... 302-305
X X Co-operation
20. 1 W orking o f Co-operative Societies-A ll types, 1957-58 to 1961-62 ... 306
20. 2 W orking o f Co-operative Societies-A ll types, D istrictw ise, 1961-62 ... 308-309
20. 3 State Co-operative Banks-working of, 1957-58 to 1961-62 ... 310
20. 4 Central Co-operative Banks-working of, 1957-58 to 1961-62 ... 310
20. 5 Primary Agricultural Credit and M ultipurpose Co-operative Societies-working of, 1957-58 to 1961-62 ... 311
20. 6 Primary Agricultural Credit and M ultipurpose C o-operative Societies-working of, ( excluding Primary land M ortgage Banks ) D istrictwise 1961-62 ... 312-313
20. 7 Co-operative Central Land M ortgage Banks, 1957-58 to 1961-62 ... 314
20, 8 Primary Land Mortgage Banks-working o f 1957-58 to 1961-62 314
X X I Planning and Community Development
21. \ Provision and Expenditure during II and III Five Year Plans ... 315-316
21. 2 Selected Physical Targets and A chievem ents during 1961-62 ... 317-318
21. 3 Expenditure on Community D evelopm ent Programme, 1958-59 to 1961-62 319
21, 4 Physical Achievem ents in Community D evelopm ent Blocks upto 31stMarch, 1962 ... 320
21. 5 D istribution o f Plan Outlays during the First and Second Plans and theproposed outlay under Third Five Year Plans ... 321
X X II Local Bodies
22. 1 R eceipts and expenditure o f M unicipal Corporation o f Hyderabad,1961-62 ... 322-323
22. 2 V illage Panchayats, 1962 ... 324
22. 3 M unicipalities in Andhra Pradesh, 1961-62 ... 325-329
T able N o . P a g es
XIV
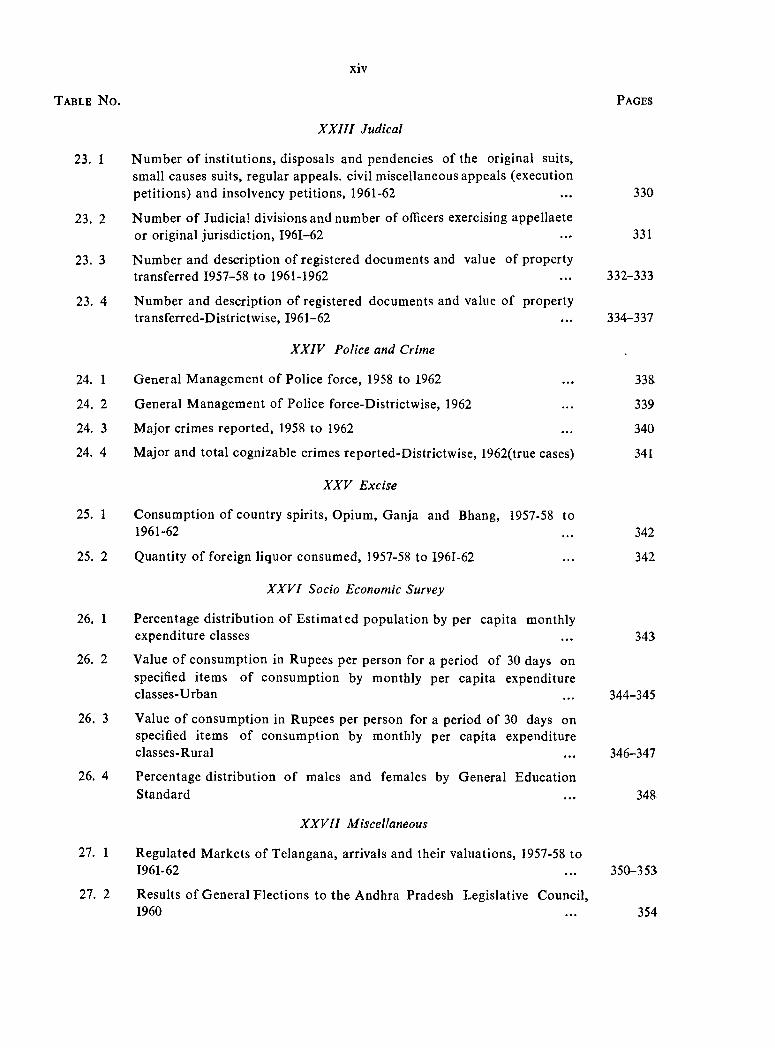
23. 1
23. 2
23. 3
23. 4
T a b le N o . P ag es
24. 1
24. 2
24. 3
24. 4
25. 1
25. 2
26. 1
26. 2
26. 3
26. 4
27. 1
27. 2
N um ber o f institutions, disposals and pendencies o f the original suits, small causes suits, regular appeals, civil m iscellaneous appeals (execution petitions) and insolvency petitions, 1961-62
Num ber o f Judicial divisions and number o f officers exercising appellaete or original jurisdiction, 1961-62
Num ber and description o f registered docum ents and value o f property transferred 1957-58 to 1961-1962
Num ber and description o f registered docum ents and value o f property transferred-Districtwise, 1961-62
X X IV Police and Crime
General M anagement o f Police force, 1958 to 1962
General M anagem ent o f Police force-D istrictw ise, 1962
Major crimes reported, 1958 to 1962
Major and total cognizable crimes reported-D istrictw ise, 1962(true cases)
X X V Excise
Consum ption o f country spirits, Opium, Ganja and Bhang, 1957-58 to 1961-62
Quantity o f foreign liquor consum ed, 1957-58 to 1961-62
X X V I Socio Economic Survey
Percentage distribution o f E stim ated population by per capita monthly expenditure classes
Value o f consum ption in Rupees per person for a period o f 30 days on specified item s o f consum ption by monthly per capita expenditure classes-Urban
Value o f consum ption in Rupees per person for a period o f 30 days on specified item s o f consum ption by m onthly per capita expenditure classes-Rural
Percentage distribution o f m ales and fem ales by General Education Standard
X X V II Miscellaneous
Regulated Markets o f Telangana, arrivals and their valuations, 1957-58 to 1961-62
Results o f General F lections to the Andhra Pradesh Legislative Council, I960
X X I I I Judical
330
331
332-333
334-337
338
339
340
341
342
342
343
344-345
346-347
348
350-353
354
XV
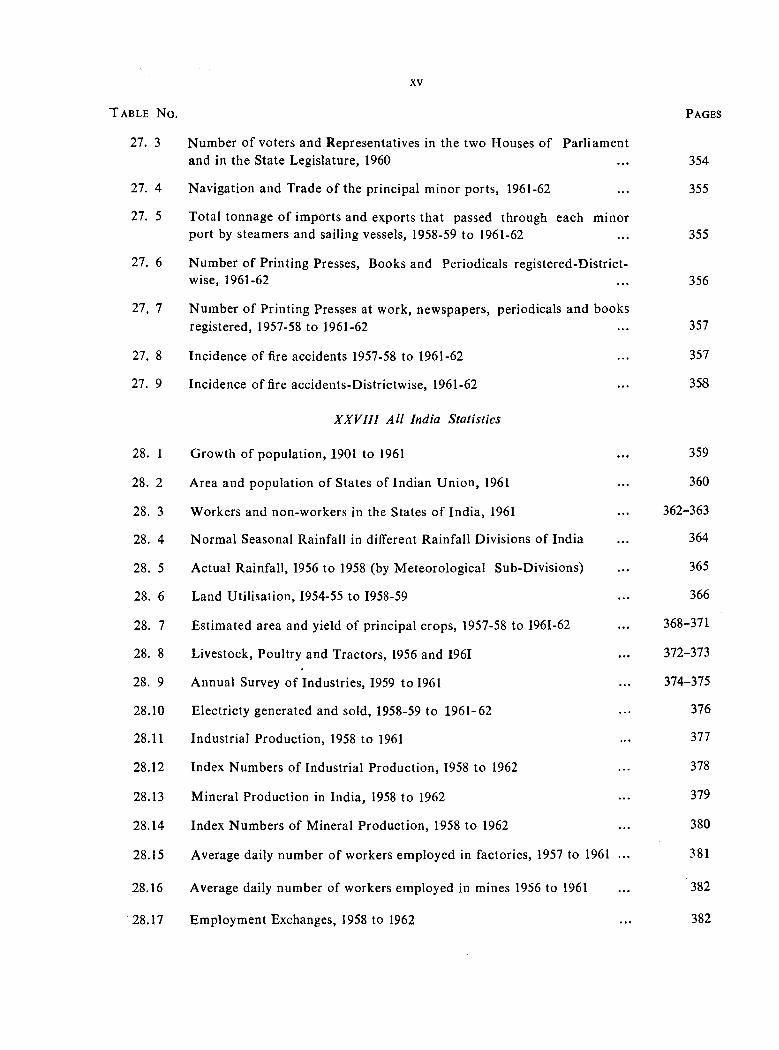
27. 3 Number o f voters and Representatives in the two Houses o f Parliam entand in the State Legislature, 1960 ... 354
27. 4 N avigation and Trade o f the principal minor ports, 1961-62 ... 355
27. 5 Total tonnage o f imports and exports that passed through each minorport by steamers and sailing vessels, 1958-59 to 1961-62 ... 355
27. 6 Num ber o f Printing Presses, Books and Periodicals registered-District-w ise, 1961-62 ... 356
27. 7 Num ber o f Printing Presses at work, newspapers, periodicals and booksregistered, 1957-58 to 1961-62 ... 357
27. 8 Incidence o f fire accidents 1957-58 to 1961-62 ... 357
2 7 . 9 Incidence o f fire accidents-D istrictw ise, 1961-62 ... 358
XXVIII A ll India Statistics
28. 1 Growth o f population, 1901 to 1961 ... 359
28. 2 Area and population o f States o f Indian U n ion , 1961 ... 360
28. 3 Workers and non-workers in the States o f India, 1961 ... 362-363
2 8 . 4 Norm al Seasonal Rainfall in different Rainfall D ivisions o f India ... 364
28. 5 Actual Rainfall, 1956 to 1958 (by M eteorological Sub-D ivisions) ... 365
28. 6 Land U tilisation, 1954-55 to 1958-59 ... 366
28. 7 Estim ated area and yield o f principal crops, 1957-58 to 1961-62 ... 368-371
28. 8 Livestock, Poultry and Tractors, 1956 and I96I ••• 372-373
2 8 . 9 Annual Survey o f Industries, 1959 to 1961 ... 374-375
28.10 Electricty generated and sold, 1958-59 to 1961-62 ... 376
28.11 Industrial Production, 1958 to 1961 ... 377
28.12 Index Numbers o f Industrial Production, 1958 to 1962 ... 378
28.13 Mineral Production in India, 1958 to 1962 ... 379
28.14 Index Num bers o f Mineral Production, 1958 to 1962 ... 380
28.15 Average daily number o f workers em ployed in factories, 1957 to 1961 ... 381
28.16 Average daily number o f workers em ployed in mines 1956 to 1961 ... 382
28.17 Em ploym ent Exchanges, 1958 to 1962 ... 382
T a b le N o . P ag es
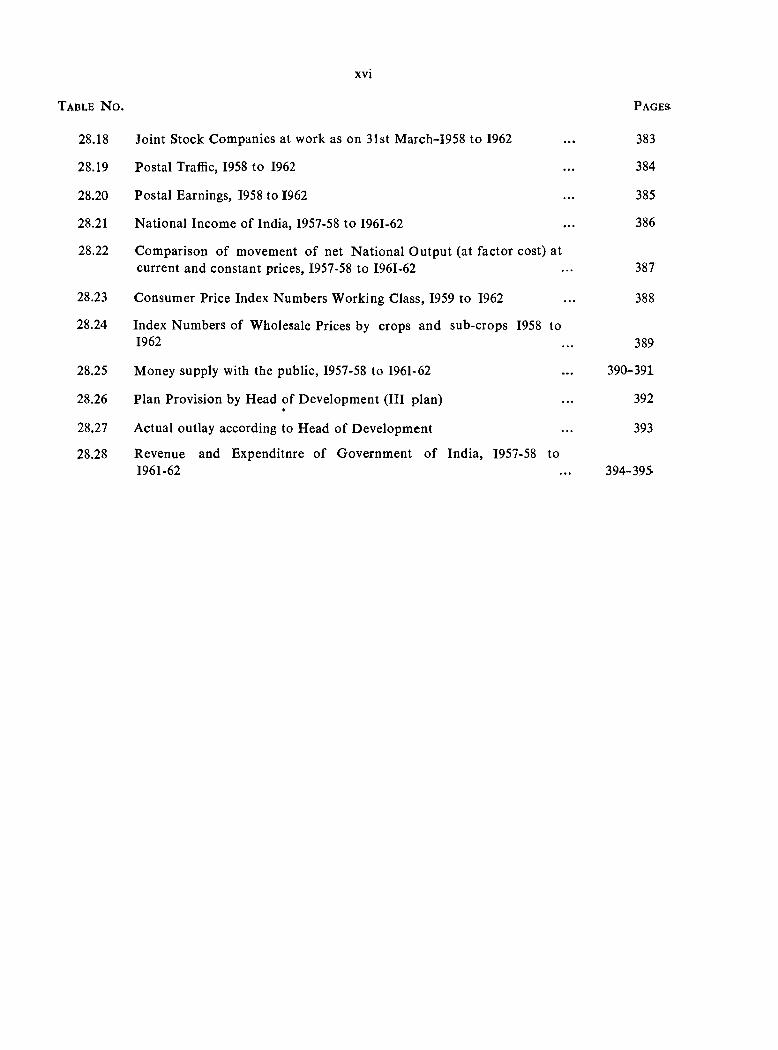
28.18 Joint Stock Com panies at work as on 31st M arch-1958 to 1962 ... 383
28.19 Postal Traffic, 1958 to 1962 ... 384
28.20 Postal Earnings, 1958 to 1962 ... 385
28.21 N ational Incom e o f India, 1957-58 to 1961-62 ... 386
28.22 Comparison o f movement o f net N ational Output (at factor cost) atcurrent and constant prices, 1957-58 to 1961-62 ... 387
28.23 Consumer Price Index Numbers W orking Class, 1959 to 1962 ... 388
28.24 Index Numbers o f W holesale Prices by crops and sub-crops 1958 to1962 ... 389
28.25 M oney supply with the public, 1957-58 to 1961-62 ... 390-391
28.26 Plan Provision by Head o f D evelopm ent (III plan) ... 392
28.27 Actual outlay according to Head o f D evelopm ent ... 393
28.28 Revenue and Expenditure o f Governm ent o f India, 1957-58 to1961-62 ... 394-395
XVI
T able N o . P a g e s
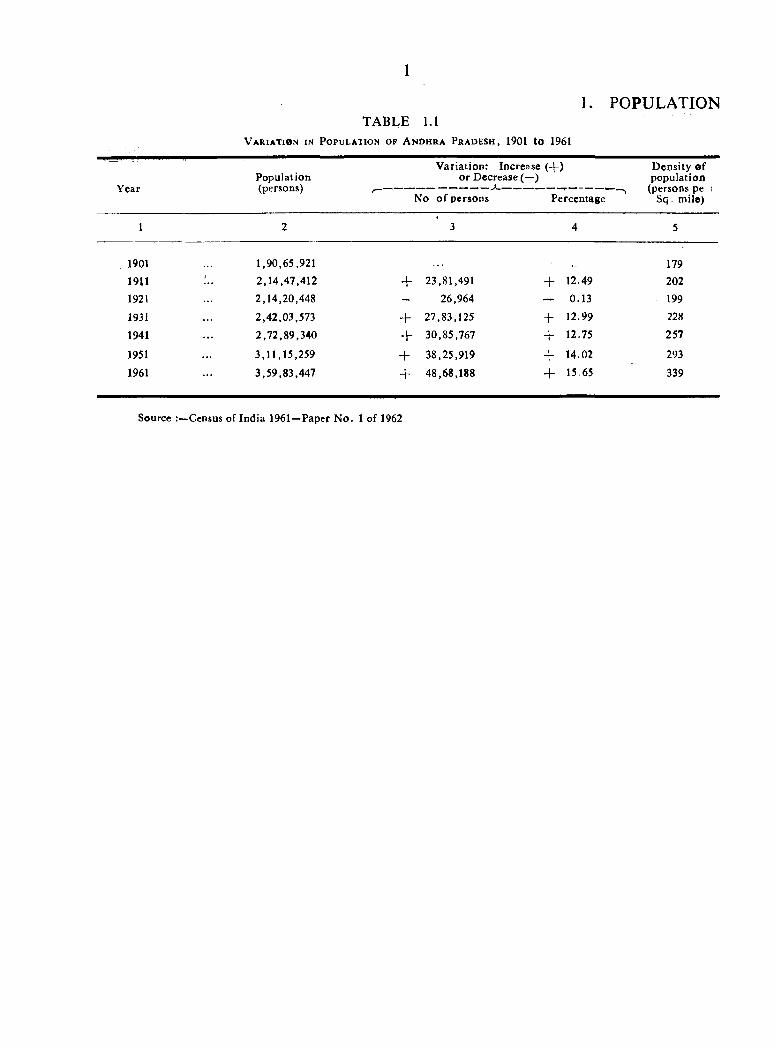
1. POPULATIONTABLE 1.1
V a r ia t io n in P o p u l a iio n o f A n d h r a P r a d e s h , 1901 to 1961
YearP o p u la t io n(p e rso n s)
V ariation; Increase (-]-) o r Decrease (—)
No o f persons Percentage
D ensity of population
(persons pe 3 Sq. mile)
1901
1911
1921
1931
1941
1951
1961
1,90,65,921
2,14,47,412
2,14,20,448
2,42,03,573
2,72,89,340
3,11,15,259
3,59,83,447
+
+
+
+
+
23,81,491
26,964
27,83,125
30,85,767
38,25,919
48,68,188
+
++
+
+
12.49
0.13
12.99
12.75
14.02
15.65
179202
199228
257
293
339
Source Census of India 1961—Paper N o. 1 of 1962
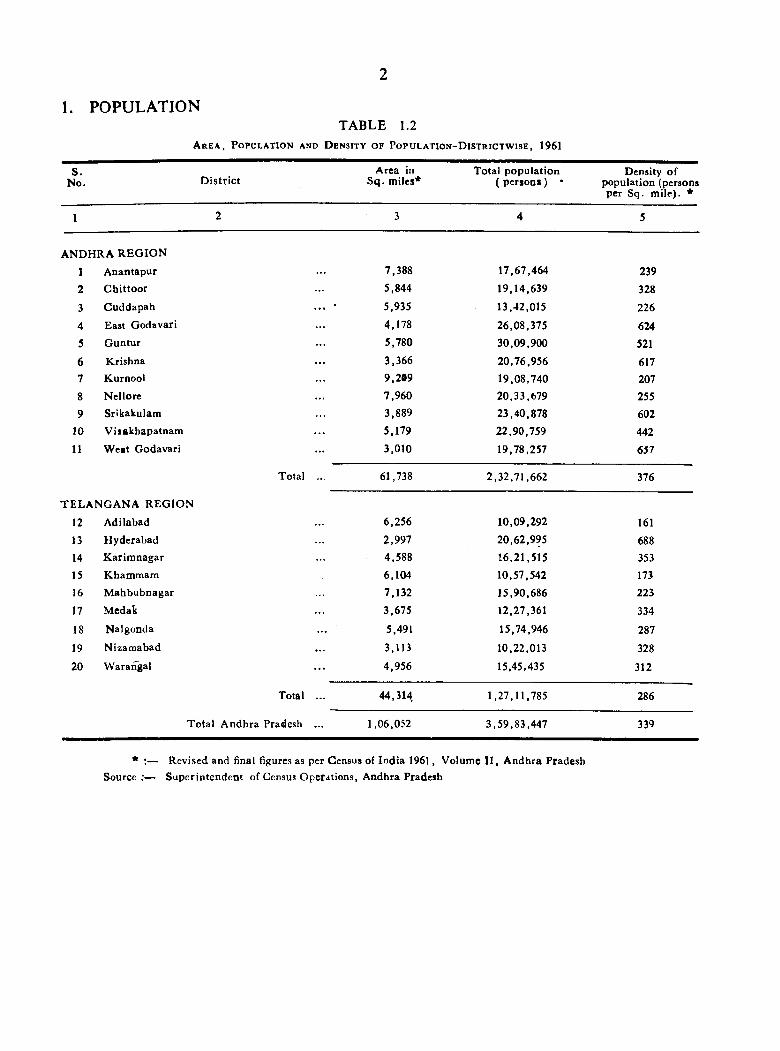
1. POPULATIONTABLE 1.2
A r e a , P o p u l a t i o n a n d D e n s i t y o f P o p u l a t i o n - D i s t r i c t w i s e , 1961
S.No. D istric t
Area in Sq. miles*
Total population ( per SODS ) •
Density o f population (persons per Sq. m ile). *
ANDHRA R EG IO N
123
45
67
8
910
11
A nantapurC hittoor
Cuddapah
East GodavariG untur
KrishnaKurnool
NellorcSrikakulamV isakhapatnam
W ett Godavari
T EL A N G A N A R EG IO N
12 Adilabad
Hyderabad K ariranagar
Khammam
M ahbubnagar
Medal;
Nalgonda
Nlzamabad
W arangal
131415
16
17
18
19
20
Total
Total
7,3885,844
5,935
4.178
5,780
3,366 9,209
7,960 3,889
5.179
3,010
61,738
6,256
2,997
4,588
6,104
7,132
3,675
5,491
3,113
4,956
44,314,
17,67,464
19,14,639
13,42,015
26,08,375
30,09,900
20,76,95619,08,74020,33,67923,40,878
22,90,759
19,78,257
2,32.71,662
10,09,292
20,62,995
16,21,51510,57,542
15,90,68612,27,361
15,74,946
10,22,013
15,45,435
1,27,11,785
239
328
226
624521
617207255
602
442657
376
161
688
353
173223
334
287
328
312
286
T otal A ndhra Pradesh 1,06,052 3,59,83,447 339
* :— Revised and final figures as per Census of India 1961, Volume I I , A ndhra Pradesh S ou rce :— Superintendent of Census Operations, Andhra Pradesh
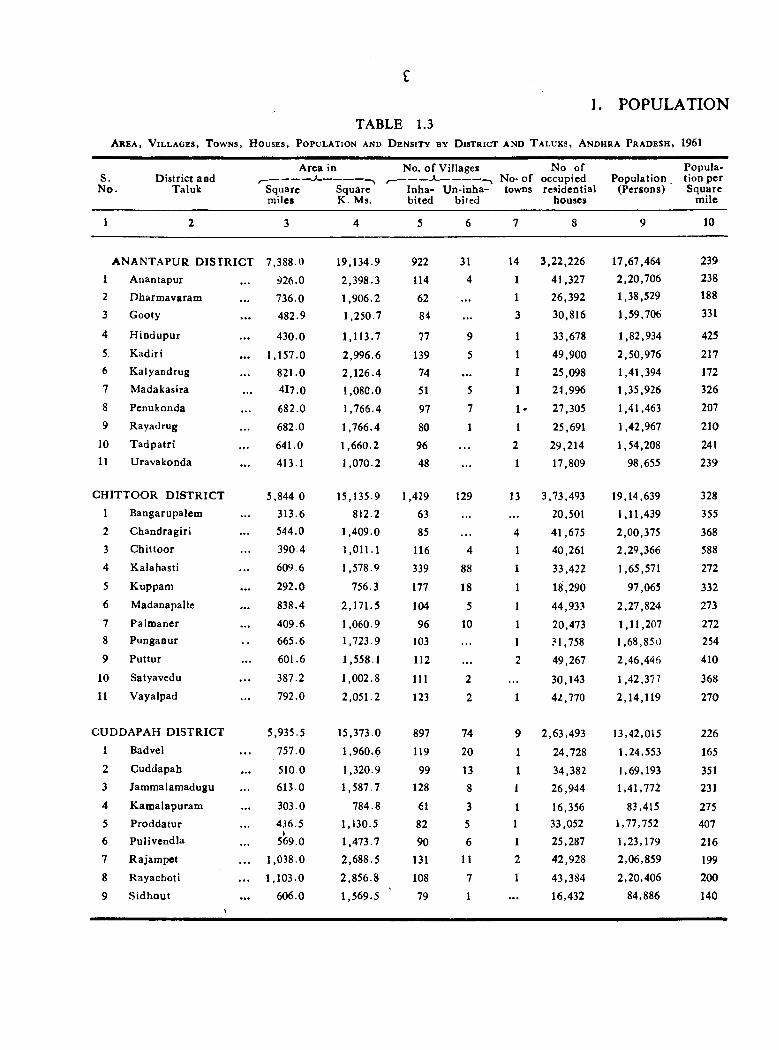
TABLE 1.3A r e a , V il l a g e s , T o w n s , H o u ses , P o p u l a t io n an d D e n s it y by D is t r ic t a n d T a l u k s , A n d h r a P r a d e s h , 1961
1. POPULATION
S.N o .
D istrict and T a lu k
Area in
Square Squaremiles K-. Ms.
No. o f Villages No of-----------*--------------- No* o f occupied
Inha- U n-inha- towns residential b ited bited houses
Popula- Population tion per
(Persons) Square m ile
ANA NTAPU R D IST R IC T 7,388.0 19,134.9 922 31 14 3,22,226 17,67,464 239
1 Anantapur 926.0 2,398.3 114 4 1 41,327 2,20,706 238
2 D barm avaram 736.0 1,906.2 62 ... 1 26,392 1,38,529 188
3 Gooty 482.9 1,250.7 84 ... 3 30,816 1,59,706 331
4 H indupur 430.0 1,113.7 77 9 1 33,678 1,82,934 425
5, K adiri 1,157.0 2,996.6 139 5 1 49,900 2,50,976 2176 K alyandrug 821.0 2,126.4 74 ... I 25,098 1,41,394 1727 M adakasira 417.0 1,080.0 51 5 1 24,996 1,35,926 3268 Penukonda 682.0 1,766.4 97 7 1- 27,305 1,41,463 207
9 Rayadrug 682.0 1,766.4 80 1 1 25,691 1,42,967 210
10 T adpatri 641.0 1,660.2 96 ... 2 29,214 1,54,208 24111 U ravakonda 413.1 1,070.2 48 ... 1 17,809 98,655 239
C H IT T O O R D IS T R IC T 5,844 0 15,135.9 1,429 129 13 3,73,493 19,14,639 3281 Bangarupalem 313.6 812.2 63 ... 20,501 1,11,439 3552 C handragiri 544.0 1,409.0 85 ... 4 41,675 2,00,375 3683 C hittoor 390.4 1,011.1 116 4 1 40,261 2,29,366 588
4 K alahasti 609.6 1,578.9 339 88 1 33,422 1,65,571 272
5 K uppam 292.0 756.3 177 18 1 18,290 97,065 3326 M adanapalle 838.4 2,171.5 104 5 1 44,933 2,27,824 273
7 Palm aner 409.6 1,060.9 96 10 1 20,473 1,11,207 2728 Punganur 665.6 1,723.9 103 ... 1 .M,758 1,68,850 254
9 Puttur 601.6 1,558.1 112 ... 2 49,267 2,46,446 410
10 Satyavedu 387.2 1,002.8 111 2 30,143 1,42,377 368
11 V ayalpad 792.0 2,051.2 123 2 1 42,770 2,14,119 270
CUD DA PAH D IST R IC T 5,935.5 15,373.0 897 74 9 2,63,493 13,42,015 2261 Badvel 757.0 1,960.6 119 20 1 24,728 1,24,553 1652 C uddapah 510 0 1,320.9 99 13 1 34,382 1,69,193 3513 Jam m alam adugu 613.0 1,587.7 128 8 1 26,944 1,41,772 231
4 K am alapuram 303.0 784.8 61 3 1 16,356 83,415 2755 Proddatur A i6 .5 1,130.5 82 5 1 33,052 1,77,752 4076 PuHvendla 569.0 1,473.7 90 6 1 25,287 1,23,179 2167 R ajam pet 1,038.0 2,688.5 131 11 2 42.928 2,06,859 199
8 Rayachoti 1,103.0 2,856.8 108 7 1 43,384 2,20,406 200
9 S idhou t 606.0 1,569.5 79 1 16,432 84,886 140
10
1. POPULATION
A r e a , V il l a g e s , T o w n s , H o u ses ,
TABLEP o p u l a t io n a n d
1.3-—(contd.)D en s it y BY D is t r ic t , T a l u k s , A n d h r a P r a d e s h , 1961
s .N o .
Area inD is tr ic t a n d ^ ------------------------------------------ r-
T a lu k S q u a re S q u a re m ile s K . M s.
N o . o f Villages
Inha- U n-inha- b ite d b ite d
No. o f to w n s
N o . o f o c c u p ie d re s id e n tia l
h o u s e s
Population(Persons)
Populat io n p e r Square
mile
1 2 3 4 5 6 7 8 9 10
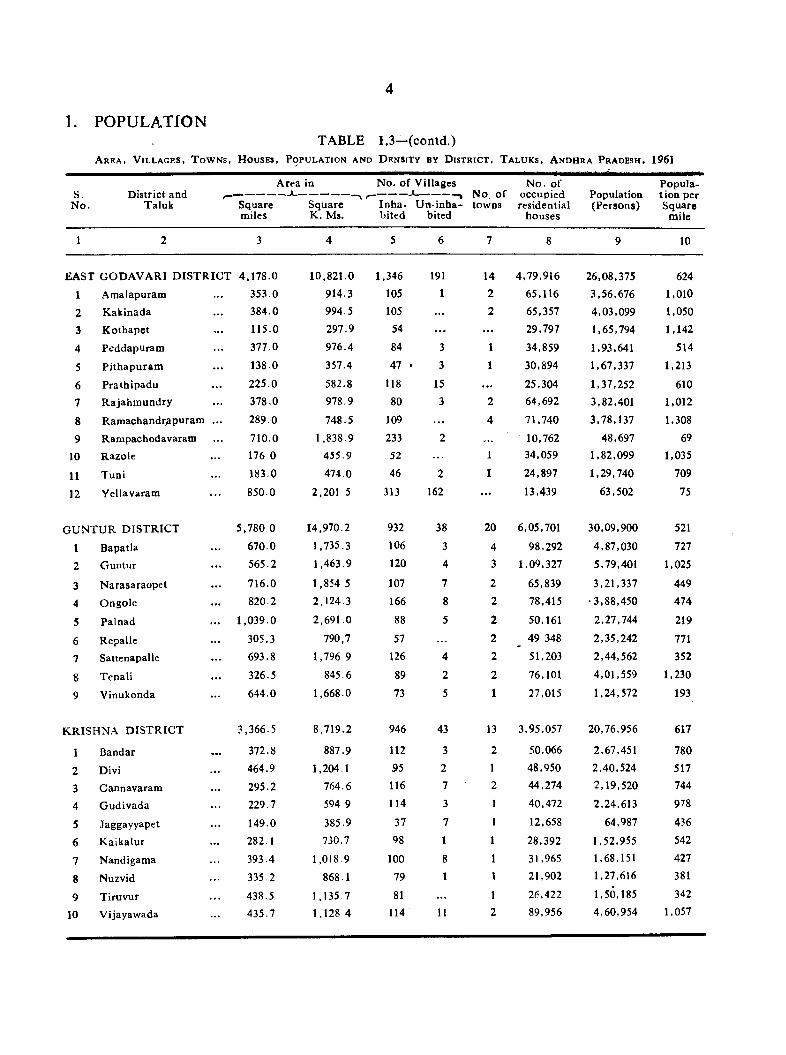
E A S T G O D A V A R I D I S T R I C T 4,178.0 10,821.0 1,346 191 14 4,79,916 26,08,375 624
1 A cn a la p u ra m 353.0 914.3 105 1 2 65,116 3,56,676 1,010
2 K akinada 384.0 994.5 105 . . . 2 65,357 4,03,099 1,050
3 K othapet 115.0 297.9 54 . . . . . . 29,797 1,65,794 1,142
4 P e d d a p u ra m 377.0 976.4 84 3 1 34,859 1,93,641 514
5 P i th a p u ra m 138.0 357.4 47 3 1 30,894 1,67,337 1,213
6 Prath ipadu 225.0 582.8 118 15 . . . 25,304 1,37,252 610
7 R a ja h m u n d r y 378.0 978.9 80 3 2 64,692 3,82,401 1,012
8 R a m a c h a n d r^ p u ra m .. . 289.0 748.5 109 . . . 4 71,740 3,78,137 1,308
9 R a m p a c h o d a v a ra m 710.0 1,838.9 233 2 10,762 48,697 69
10 R a z o le 176 0 455.9 52 1 34,059 1,82,099 1,035
11 Tuni 183.0 474.0 46 2 1 24,897 1,29,740 709
12 Y ellavaram 850.0 2.201 5 313 162 . . . 13,439 63,502 75
G U N TU R D ISTRICT 5,780 0 14,970.2 932 38 20 6,05,701 30,09,900 521
1 Bapatla 670.0 1,735.3 106 3 4 98,292 4,87,030 727
2 G untur 565.2 1,463.9 120 4 3 1,09,327 5,79,401 1,025
3 N arasaraopet 716.0 1,854 5 107 7 2 65,839 3.21,337 449
4 Ongole 820.2 2,124.3 166 2 78,415 •3,88,450 474
5 Palnad ... 1 ,039.0 2,691.0 88 5 2 50,161 2,27,744 219
6 Repalle 305.3 790,7 57 2 49 348 2,35,242 771
7 Sattenapalle 693.8 1,796 9 126 4 2 51,203 2,44,562 352
8 Tenali 326.5 845.6 89 2 2 76,101 4,01,559 1,230
9 Vinukonda 644.0 1,668.0 73 5 1 27,015 1,24,572 193
K RISHN A D IST R IC T 3,366.5 8,719.2 946
1 Bandar ... 372.8 887.9 112
2 Divi 464.9 1,204.1 95
3 Cannavaram 295.2 764.6 116
4 G udivada 229.7 594 9 114
5 Jaggayyapet 149.0 385.9 37
6 K aikalur 282.1 730.7 98
7 Nandigama 393.4 1,0)8 9 100
8 Nuzvid 335.2 868.1 79
9 Tiruvur 438.5 1,135.7 81
10 Vijayawada 435.7 1,128 4 114
13 3,95,057 20,76,956 617
2 50,066 2,67,451 7801 48,950 2,40,524 5172 44,274 2,19,520 744
1 40,472 2,24,613 978
1 12,658 64,987 436
1 28,392 1,52,955 542
1 31,965 1,68,151 427
I 21,902 1,27,616 381
1 26,422 1,50,185 342
2 89,956 4,60,954 1,057
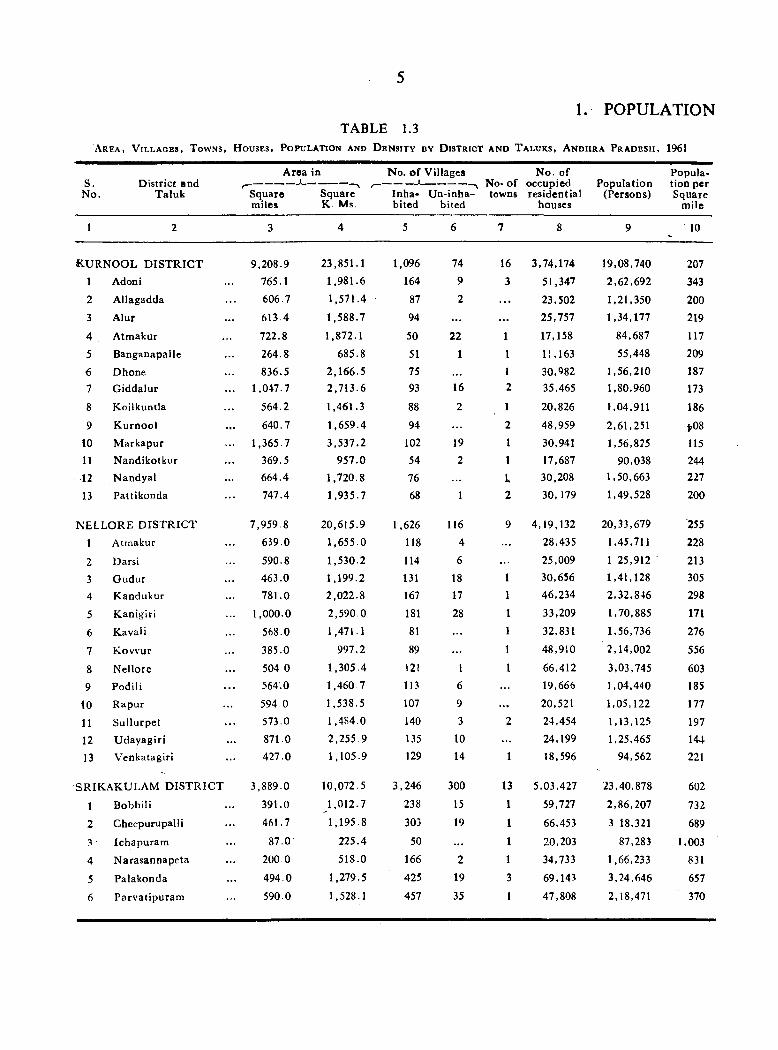
1. POPULATIONTABLE 1.3
A r e a , V i l l a g e s , T o w n s , H o u s e s , P o p u l a t i o n a n d D e n s i t y b y D i s t r i c t a n d T a l u k s , A n d h r a P r a d e s h , 1961
S.N o.
District and Taluk Square Square
miles K. Ms.
A rea in No. o f Villages N o. of----------- *--------------- No- o f occupied
Inha- U n-inha- towns residential bited bited houses
Popula- Population tion per
(Persons) Square mile
10
KURNO OL D IST R IC T1
23
4
5
67
8
9
1011
12
13
Adoni
Allagadda
Alur
Atm akur
Banganapalle
DhoneG iddalur
K oilkuntia
K urnool
M arkapurN andikotkurN andyal
Pattikonda
9,208.9765.1606.7
61J.4
722.8
264.8
836.51.047.7
564.2
640.7
1.365.7
369.5664.4
747.4
23.851.11.981.6
1.571.4
1.588.7
1.872.1
685.82.166.52.713.6
1.461.3
1.659.43.537.2
957.01.720.8
1.935.7
1,096164
87
94
50
51
7593
88
94 102
54
76 68
749
2
221
16
2
19
2
16
3
3,74,174 51,347
23,502 25,757
17,158
11,163 30,982 35,465
20,826
48,959 30,941
17,687 30,208
30,179
19,08,740 2,62,692
1,21,350 1,34,177
84,687
55,448
1,56,210 1,80,960
t , 04,911
2,61,251
1,56,825 90,038
1,50,663
1,49,528
207
343
200
219
117
209
187173
186
1;08
115
244227
200
N ELLO R E D IST R IC T 7,959,8 20,615.9 1,626 116 9 4,19,132 20,33,679 255
1 Atrnakur 639.0 1,655.0 118 4 28,435 1,45,711 228
2 Darsi 590.8 1,530.2 114 6 25,009 1.25,912 ' 213
3 G udur 463.0 1,199.2 131 18 1 30,656 1,41,128 305
4 K andukur 781.0 2,022.8 167 17 1 46,234 2,32,846 298
5 K anigiri 1,000.0 2,590 0 181 28 1 33,209 1,70,885 171
6 Kavali 568.0 1,471.1 81 ... 1 32,831 1,56,736 276
7 K ovvur 385.0 997.2 89 ... 1 48,910 2,14,002 556
8 N ellore 504 0 1,305.4 121 1 1 66,412 3,03,745 603
9 Podili 564.0 1,460 7 113 6 19,666 1,04,440 185
10 R apur 594 0 1,538.5 107 9 20,521 1,05,122 177
11 Sullurpet 573.0 1,484.0 140 3 24,454 1,13,125 197
12 U dayagiri 871.0 2,255.9 135 10 24,199 1,25,465 144
13 V enkatagiri 427.0 1,105.9 129 14 1 18,596 94,562 221
SR IK A K U LA M D IST R IC T 3,889.0 10,072.5 3,246 300 13 5,03,427 23,40,878 602
1 Bobbin 391.0 1,012.7 238 15 1 59,727 2,86,207 732
2 Cheepurupalli 461.7 1,195.8 303 19 1 66,453 3 18,321 6893 • Ichapuram 87.0 225.4 50 ... 1 20,203 87,283 1,003
4 N arasannapeta 200.0 518.0 166 2 1 34,733 1,66,233 831
5 Palakonda 494.0 1,279.5 425 19 3 69,143 3,24,646 657
6 Parvatipuram 590.0 1,528.1 457 35 1 47,808 2,18,471 370

TABLE 1.3—(contd.)A r e a , V il l a g e s , T o w n s , H o u s e s , P o p u l a t io n s a n d D e n s it y b y D it r ic t a n d T a l u k s , A n d h r a P r a d e s h , 1961
1. POPULATION
S.No.
D istrict and Taluk Square Square
miles K . Ms.
A rea in------- 1—-*------- No. o f occupiedInha* IJn-inha- towns residential bited bited houses
No. o f Villages N o. of Popula- P opulation tion per
(Persons) Square mile
8 10
SR IK A K U LA M D IS T R IC T -(co n td )7 Pathapatnam ... 463.0
8 Salur ... 491.09 Som peta ... 212.0
10 Srikakulam ... 227.3
11 Tekkali ... 272.0
VISAK HA PA TN AM D IS T R IC T 5,!79 01 A nakapalle ... 304.0
2 Bheemunipatnam ... 337.0
3 G hintapalii . . . 920.0
4 Chodavaram . . . 594.0
5 Narsapatnam ... 516.06 Paderu ... 1,199.07 Srungavarapukota ... 407.0
8 V isakhapatnam ... 196.0
9 V izianagaram ... 359 0
10 Y ellam anchili . . . 347.0
W EST G O D A V A R I D IS T R IC T 3,009.8Bheemavaram
C hin ta lapud i
EluruKovvur
N arsapur
Polavaram
Tadepalligudem
T anuku
ADILABAD D IS T R IC T123
4
5
678 9
10
A dilabad
Asifabad
Boath
C hinour
K hanapur
Luxettipet
M udholeN irm al
Sirpur
U tnoor
290.1418.3
509.9390.6
278.9548.7
359.0
214.3
6,256.3580.5
833.9
554.9
688.6
313.0
734.1
402.8566.4 855.7
726 4
1 .199.2 1,271.6
549.1
588.6
704.5
n ,4 I 3 .6787.4
872.8
2.382.8
1.538.5
1.336.4
3,10541.054.1
507.7
929 8
899.8
7.795.3751.3
1.083.4
1.320.61.011.6
722.41.421.2
929.8
555.0
16.203.81.503.5
2,159.81.437.2
1.783.4
810.7
1.901.3
1.043.2 1,467.02.216.3
1.881.4
445345290
190
337
3,504136
166
317
366
180
1,621337
58
197
146
82686
91135102
87128
10097
1,543187
223
142
151
73
121135167
186
158
4650
49
23
42
11784
42
9
14
223
12
3
571
10
9
15
10 12
17826
18
31
22
3
121523
17
11
1211
1011
21
1
21
1
101
122
13
1012
11
1211
50,36735,667
32.768
45,703
40,855
4.87,32554.101
49,735
9,485
68,434
52,185
29,262
43,540
61,074
63,007
56,502
3,54,86048,68122,86159,030
41,450
62,25022,338
42,52955,721
2,02,43023,410
25,499
12,837
19.383
11.768
25,367
19.101 25,542
29,033
10,490
2,26,674
1,64,125
1,40,941
2,17,993
1,89.984
22,90,7592,44,481
2,43,766
43,929
2,98,6192,41,375
1,32,1452,08,418
3,06,971
3.11,320
2,59,735
19,78,2572,76,221
1,21,8313,12,636
2,47,089
3,36,5481,18,2312,49,6623,16,039
10,09,2921,17,330
1,19,570
69,881
95,800
55,710
1.23,397
1,00,4971,37,3601,34,6^8
55,099
490334
665
959698
442804
723
4a
503468
110512
1,566
867
749
657952
291613
633
1,207
215695
1,475
161202
143-
126
139
178
168
249243
157
76
1. POPULATIONTABLE 1.3—(contd.)
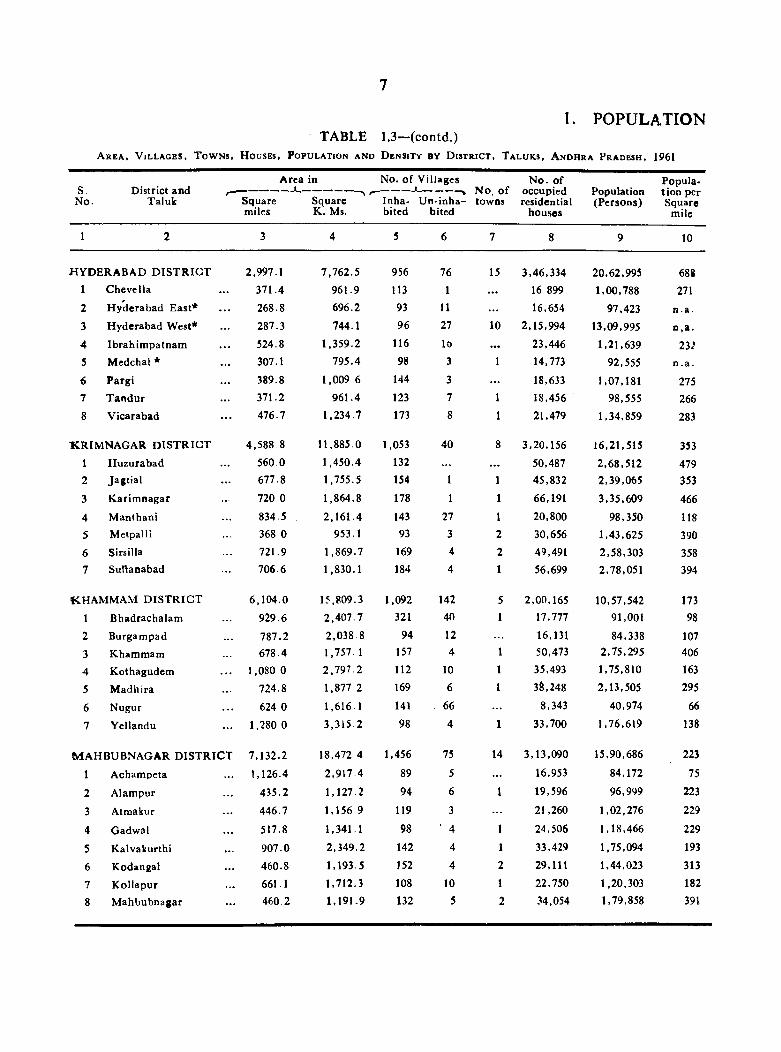
A r e a , V i l l a g e s , T o w n s , H o u s e s , P o p u l a t i o n a n d D e n s i t y b y D i s t r i c t , T a l u k s , A n d h r a P r a d e s h , 1961
S.No.
District and Taluk Square Square
miles K. Ms.
Area in No. o f V illages N o. of--------- -*-—% No. o f occupied
Inha- U n-inha- towns residential bited bited houses
PopuJa- Population tion per (Persons) Square
mile
10
HYDERABAD D IS T R IC T 2,997.1 7,762.5 956 76 15 3,46,334 20,62,995 688
1 C hevella ... 371.4 961.9 113 1 ... 16 899 1,00,788 271
2 H yderabad East* . . . 268.8 696.2 93 11 ... 16,654 97,423 n .a .
3 H yderabad West* ... 287.3 744.1 96 27 10 2,15,994 13,09,995 n ,a .
4 Ib rah im patnam .. . 524.8 1,359.2 116 lb ... 23,446 1,21,639 2325 M edchal* ... 307.1 795.4 98 3 1 14,773 92,555 n .a .
6 Pargi ... 389.8 1,009 6 144 3 ... 18,633 1,07,181 275
7 T andu r ... 371.2 961.4 123 7 1 18.456 98,555 266
8 V icarabad . . . 476.7 1,234.7 173 8 1 21,479 1,34,859 283
K RIM NA GA R D IST R IC T
H uzurabadJagtia l
K arim nagar
4,588.8
560 0 677.8
720 0
11,885 0
1.450.4
1.755.5
1,864.8
1,053
132
154
178
40 3,20,156
50,48745,832
66,191
16,21,515
2,68,5122,39,065
3,35.609
353
479353
466
4 M anthani 834.5 2,161.4 143 27 1 20,800 98,350 1185 MetpalU 368 0 953.1 93 3 2 30,656 1,43,625 3906 Sirsilla 721.9 1,869.7 169 4 2 49,491 2,58,303 3587 Surianabad 706.6 1,830.1 184 4 1 56,699 2,78,051 394
KHAMMAM D IST R IC T 6,104.0 15,809.3 1,092 142 5 2,00,165 10,57,542 173
1 Bhadrachalam 929.6 2,407.7 321 40 1 17,777 91,001 98
2 Burgam pad 787.2 2,038.8 94 12 16,131 84,338 107
3 Khammam 678.4 1,757. 1 157 4 1 50,473 2,75,295 406
4 Kothagudem 1,080 0 2,797.2 112 10 1 35,493 1,75,810 163
5 M adhira 724.8 1,877 2 169 6 1 38,248 2,13,505 295
6 Nugur 624 0 1,616.1 141 66 8,343 40,974 66
7 Yellandu 1,280 0 3,315.2 98 4 1 33,700 1,76,619 138
M AHBUBNAGAR D IST R IC T 7,132.2 18,472 4 1,456 75 14 3,13,090 15,90,686 223
1 Achampeta 1,126.4 2,917.4 89 5 ... 16,953 84,172 75
2 A lam pur 435.2 1,127.2 94 6 1 19,596 96,999 223
3 Atmakur 446.7 1,156 9 119 3 ... 21,260 1,02,276 229
4 Gadwal 517.8 1,341.1 98 ■ 4 1 24,506 1,18,466 229
5 K alvakurthi 907.0 2,349.2 142 4 1 33,429 1,75,094 193
6 Kodangal 460.8 1,193.5 152 4 2 29,111 1,44.023 313
7 K ollapur 661.1 1,712.3 108 10 1 22,750 1,20,303 182
8 M ahbubnagar 460.2 1,191.9 132 5 2 34,054 1,79,858 391
8
1. POPULATIONTABLE 1.3—(concld.)
A r e a , V i l l a g e s , T o w n s , H o u s e s , P o p u l a t i o n a n d D e n s i t y b y D i s t r i c t T a l u k s , A n d h r a P r a d e s h , 1961.
S.N o.
D is tric t and T aluk
Area in
Square Square miles K . M
No. of Villages
Inha- lln -in h a - b ited bited
N o. oftowns
No. of occupied
residential houses
Population(Persons)
Population per Square mile
1 2 3 4 5 6 7 8 9 10
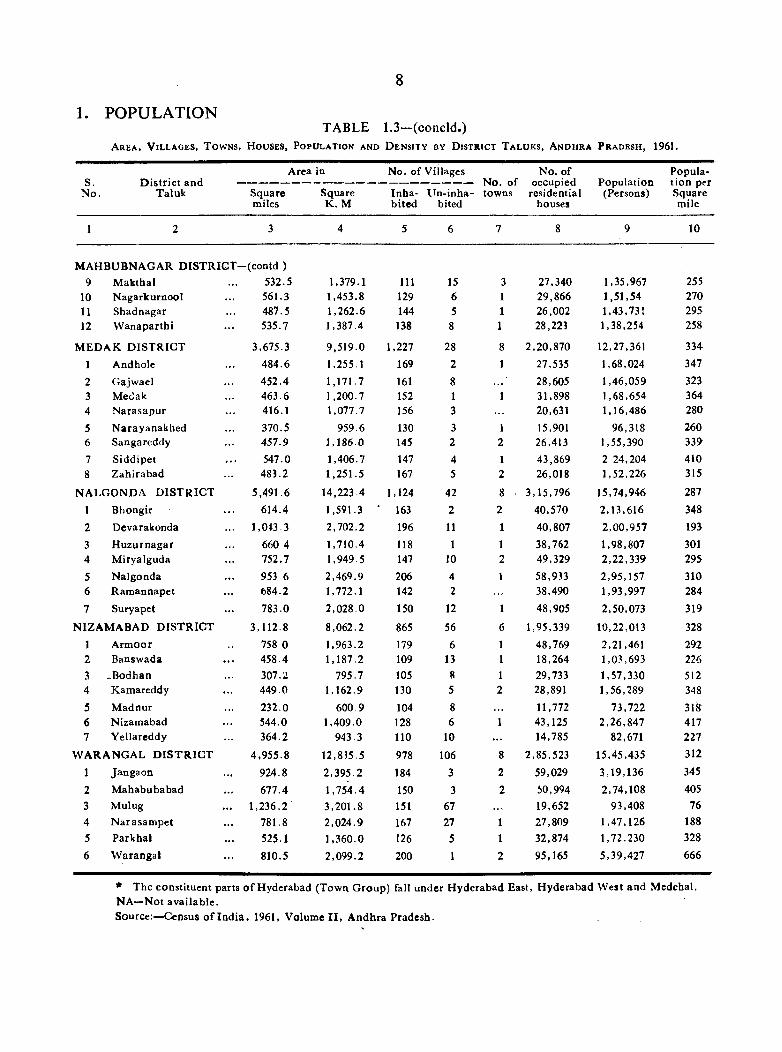
M AHBUBNAGAR D IS T R IG T -(co n td )9 M akthal 532.5 1,379.1 111 15 27,340 1,35,967 255
10 N agarkurnool 561.3 1,453.8 129 6 1 29,866 1,51,54 27011 Shadnagar 487.5 1,262.6 144 5 1 26,002 1,43,73! 29512 W anaparthi 535.7 1,387.4 138 8 1 28,223 1,38,254 258
M ED A K D IST R IC T 3,675.3 9,519.0 1,227 28 2,20,870 12,27,361 334
1 Andhole 484.6 1,255.1 169 2 1 27,535 1,68,024 347
2 Gajwael 452.4 1,171.7 161 8 28,605 1,46,059 3233 M edak 463.6 1,200.7 152 1 1 31,898 1,68,654 3644 N arasapur 416.1 1,077.7 156 3 20,631 1,16,486 280
5 N arayanakhed 370.5 959.6 130 3 1 15,901 96,318 2606 Sangarcddy 457.9 1,186.0 145 2 26,413 1,55,390 339
7 S iddipet 547.0 1,406.7 147 4 1 43,869 2 24,204 4108 Z ahirabad 483.2 1,251.5 167 5 2 26,018 1,52,226 315
N ALGONDA D IST R IC T 5,491.6 14,223 4 1,124 42 3,15,796 15,74,946 287
1 Bhongir 614.4 1,591.3 * 163 2 40,570 2,13,616 348
2 Devarakonda ... 1,043.3 2,702.2 196 11 1 40,807 2,00,957 193
3 H uzurnagar 660 4 1,710.4 118 1 1 38,762 1,98,807 3014 M iryalguda 752.7 1,949.5 147 10 49,329 2,22,339 295
5 N algonda 953 6 2,469.9 206 4 1 58,933 2,95,157 3106 R am annapet 684.2 1,772.1 142 2 38,490 1,93,997 2847 Suryapet 783.0 2,028.0 150 12 1 48,905 2,50,073 319
NIZAM ABAD D IST R IC T 3,112.8 8,062.2 865 56 1,95,339 10,22,013 3281 A rm oor 758 0 1,963.2 179 6 1 48,769 2,21,461 2922 Banswada 458.4 1,187.2 109 13 18,264 1,03,693 2263 -B odhan 307.2 795.7 105 8 1 29,733 1,57,330 5124 Kamareddy 449.0 1,162.9 130 5 28,891 1,56,289 3485 M adnur 232.0 600 9 104 8 11,772 73,722 3186 Nizamabad 544.0 1,409.0 128 6 1 43,125 2,26,847 4177 Y ellareddy 364.2 943.3 110 10 . . . 14,785 82,671 227
W A RA NG AL D IS T R IC T 4,955.8 12,835.5 978 106 8 2,85,523 15,45,435 312
1 Jangaon 924.8 2,395.2 184 3 2 59,029 3,19,136 345
2 M ahabubabad 677.4 1,754.4 150 3 2 50,994 2,74,108 4053 Mulug ... 1,236.2 3,201.8 151 67 . . . 19,652 93,408 764 N arasam pet 781.8 2,024.9 167 27 1 27,809 1,47,126 1885 Parkhal 525.1 1,360.0 126 5 1 32,874 1,72,230 328
6 W arangal 810.5 2,099.2 200 1 2 95,165 5,39,427 666
* The constituent parts o f Hyderabad (Tow n G roup) fall under H yderabad East, H yderabad W est and Medcbal. NA—N ot availab le .Source:—Census o f In d ia , 1961, Volume I I , A ndhra Pradesh.
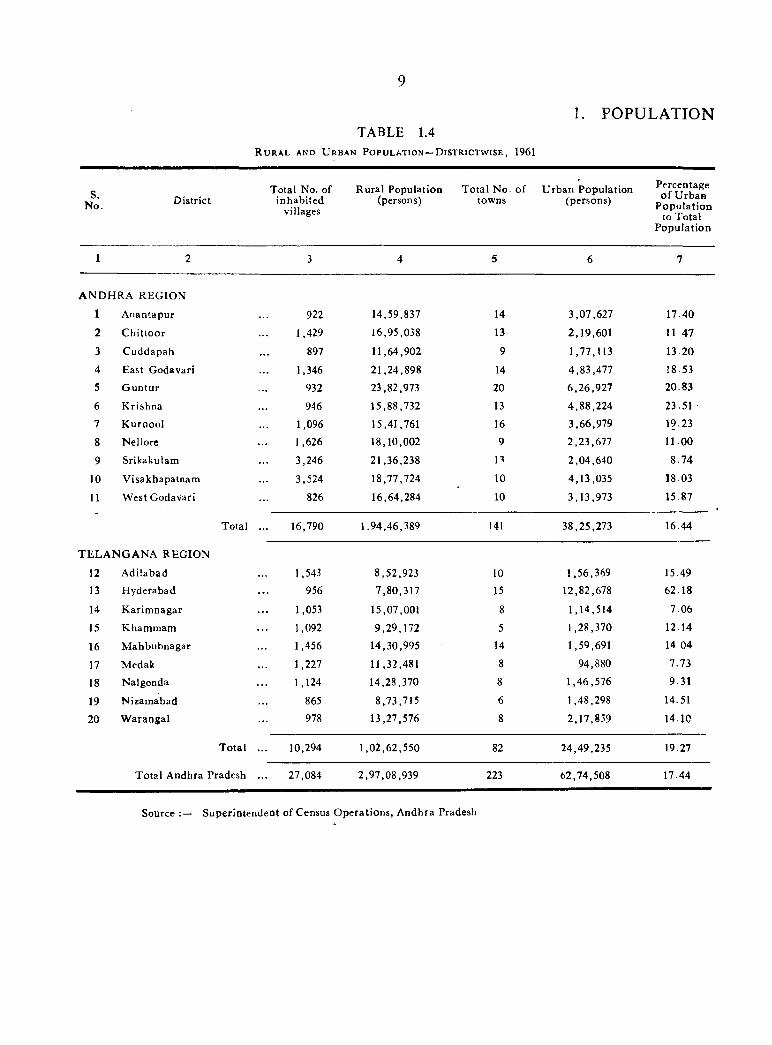
I. POPULATIONTABLE 1.4
R u r a l a n d U r ba n P o p u l a t io n — D is t r ic t w is e , 1961
S.No. District
Total No. of inhabited
villages
R ural Population (persons)
T otal No. towns
o f U rban Population (persons)
P e rc e n ta g e o f U rb a n
P o p u la t io n to T o ta l
P o p u la t io n
1 2 3 4 5 6 7
A N D H R A REGION
1 Anantapur 922 14,59,837 14 3,07,627 17 40
2 C hittoor 1,429 16,95,038 13 2,19,601 11 47
3 Cuddapah 897 11,64,902 9 1 ,77 ,U 3 13.20
4 East Godavari 1,346 21,24,898 14 4,83,477 18.53
5 G untu r 932 23,82,973 20 6,26,927 20.83
6 K rishna 946 15,88,732 13 4,88,224 23.51
7 K urnool 1,096 15,41,761 16 3,66,979 19.23
8 Nellore 1,626 18,10,002 9 2,23,677 11.00
9 Srikakulam 3,246 21,36,238 13 2,04,640 8.74
10 Visakhapatnam 3,524 18,77,724 10 4,13,035 18.03
11 West Godavari 826 16,64,284 10 3,13,973 15.87
Total 16,790 1,94,46,389 141 38,25,273 16.44
TEL A N G A N A REGION
12 A dilabad 1,543 8,52,923 10 1,56,369 15.49
13 Hyderabad 956 7,80,317 15 12,82,678 62.18
14 K arim nagar 1,053 15,07,001 8 1,14,514 7.06
15 Khammam 1,092 9,29,172 5 1,28,370 12.14
16 M ahbubnagar 1,456 14,30,995 14 1,59,691 14 04
17 Medak 1,227 11,32,481 8 94,880 7.73
18 Nalgonda 1,124 14,28,370 8 1,46,576 9.31
19 Nizamabad 865 8,73,715 6 1,48,298 14.51
20 W arangal 978 13,27,576 8 2,17,859 14.10
Total 10,294 1,02,62,550 82 24,49,235 19 27
T o ta l A n d h ra P ra d e sh 27,084 2,97,08,939 223 62,74,508 17.44
Source Superintendent of Census O perations, Andhra Pradesh
1. POPULATION
1 0
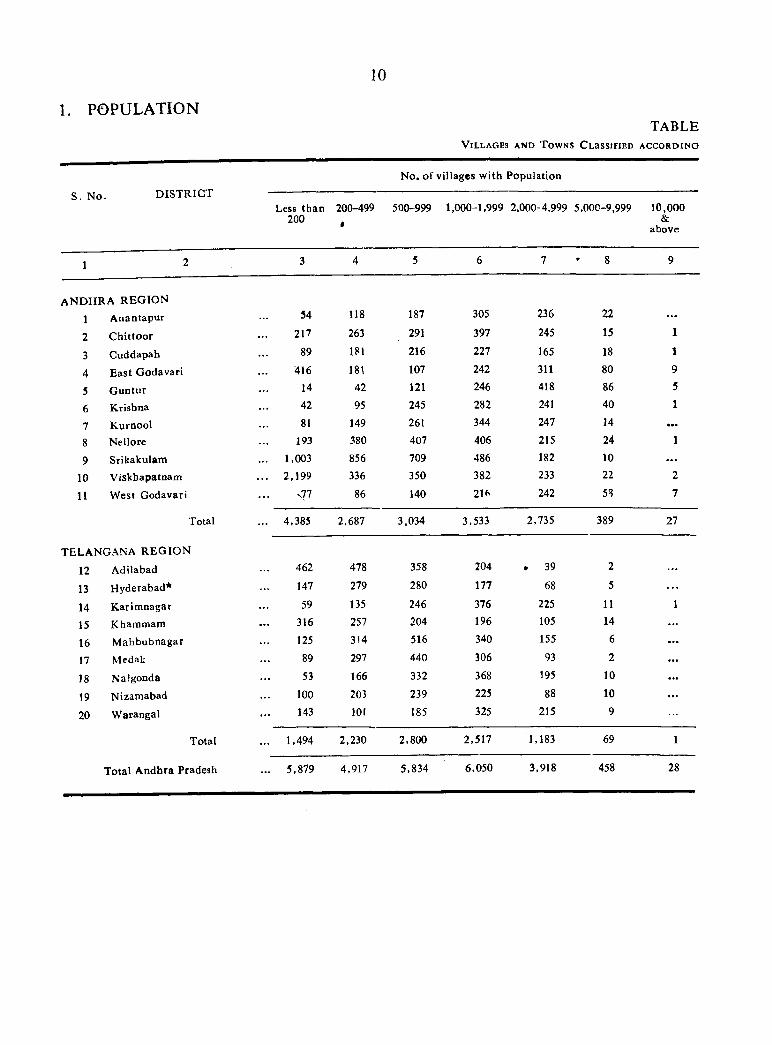
T A BLEV il l a g e s a n d T ow ns CLassiFiED a c c o r d in g
S. N o. D IST R IC TN o. o f villages w ith Population
Less than 200-499 500-999 1,000-1,999 2.000-4,999 5.000-9,999 10,000200 &
ab o v e
1 2 3 4 5 6 7 8 9
a n d h r a r e g i o n
1 A nantapur 54 118 187 305 236 22
2 C hittoor 217 263 291 397 245 15 1
3 Cuddapah 89 181 216 227 165 18 1
4 E ast G odavari 416 181 107 242 311 80 9
5 G untur 14 42 121 246 418 86 5
6 Krishna 42 95 245 282 241 40 1
7 K urnool 81 149 261 344 247 14 • • •
8 Nellore 193 380 407 406 215 24 1
9 Srikakulam ... 1,003 856 709 486 182 10 . . .
10 Viskhapatnam ... 2,199 336 350 382 233 22 2
11 W est Godavari 86 140 21^ 242 7
Total ... 4,385 2.687 3,034 3,533 2,735 389 27
TELANGANA R E G IO N
12 Adilabad 462 478 358 204 • 39 2
13 Hyderabad* 147 279 280 177 68 5
14 K arim nagar 59 135 246 376 225 11 1
15 Khammatn 316 257 204 196 105 14 • • •
16 M ahbubnagar 125 314 516 340 155 6 • r*
17 Medak 89 297 440 306 93 2 • • •
18 Nalgonda 53 166 332 368 195 10 • • •
19 Nizamabad 100 203 239 225 88 10 • • •
20 W arangal 143 101 185 325 215 9 • » •
Total ... 1,494 2,230 2,800 2,517 1,183 69 1
T otal A ndhra Pradesh ... 5,879 4,917 5,834 6,050 3,918 458 28
TO S iz e o f P o p u l a t io n — D is t r ic t w is e , 1961
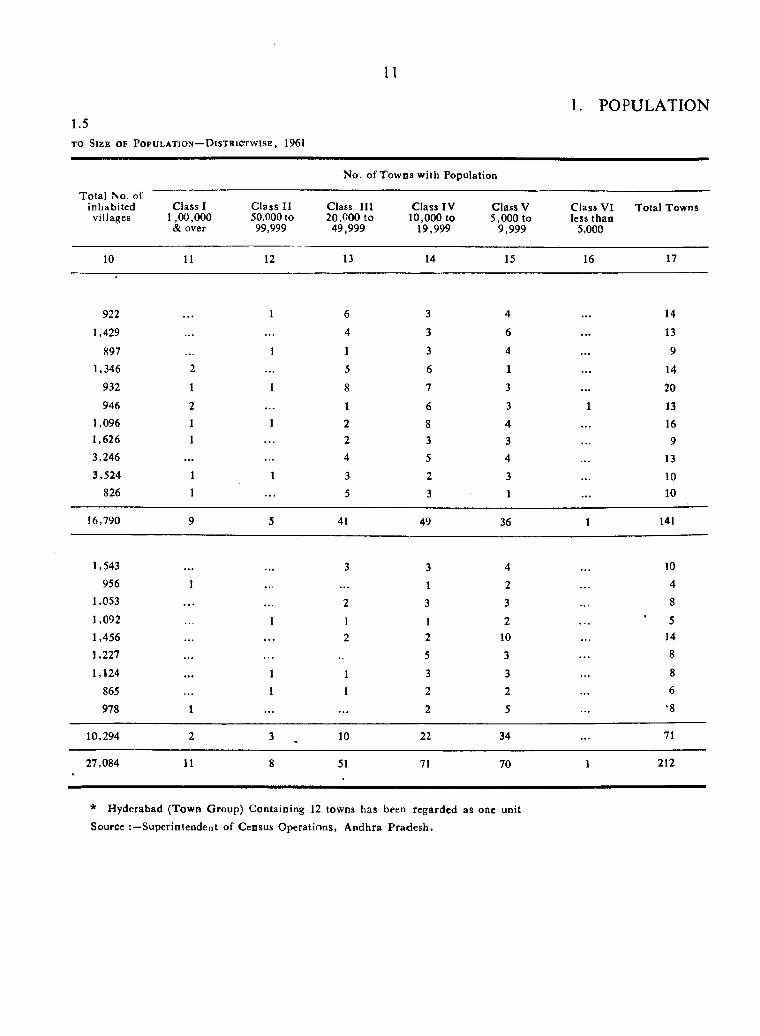
1.5
II
1. POPULATION
No. of Towns w ith Population
T otal No. of inhabited villages
Class I 1,00,000 & over
Class II 50,000 to 99,999
Class III 20,000 to
49,999
Class IV 10,000 to
19,999
Class V 5,000 to
9,999
Class VI less than
5,000
Total Towns
10 11 12 13 14 15 16 17
922 1 6 3 4 14
1,429 ... 4 3 6 ... 13
897 1 1 3 4 ... 9
1,346 2 5 6 1 ... 14
932 1 1 8 7 3 ... 20
946 2 1 6 3 1 131,096 1 1 2 8 4 ... 161,626 1 2 3 3 93,246 ... ... 4 5 4 133,524 1 1 3 2 3 10
826 1 5 3 1 ... 10
16,790 9 5 41 49 36 1 141
1,543 3 3 4 10956 1 1 2 4
1,053 ... 2 3 3 8
1,092 I 1 1 2 51,456 ... 2 2 10 ... 14
1,227 ... ... 5 3 8
1,124 ... 1 1 3 3 8
865 1 1 2 2 6
978 1 ... ... 2 5 •8
10,294 2 3 10 22 34 71
27,084 11 8 51 71 70 1 212
* H yderabad (Tow n Group) ContaiDing 12 towns has been regarded as one unit
Source Superintendent of Census O perations, A ndhra P radesh .
12
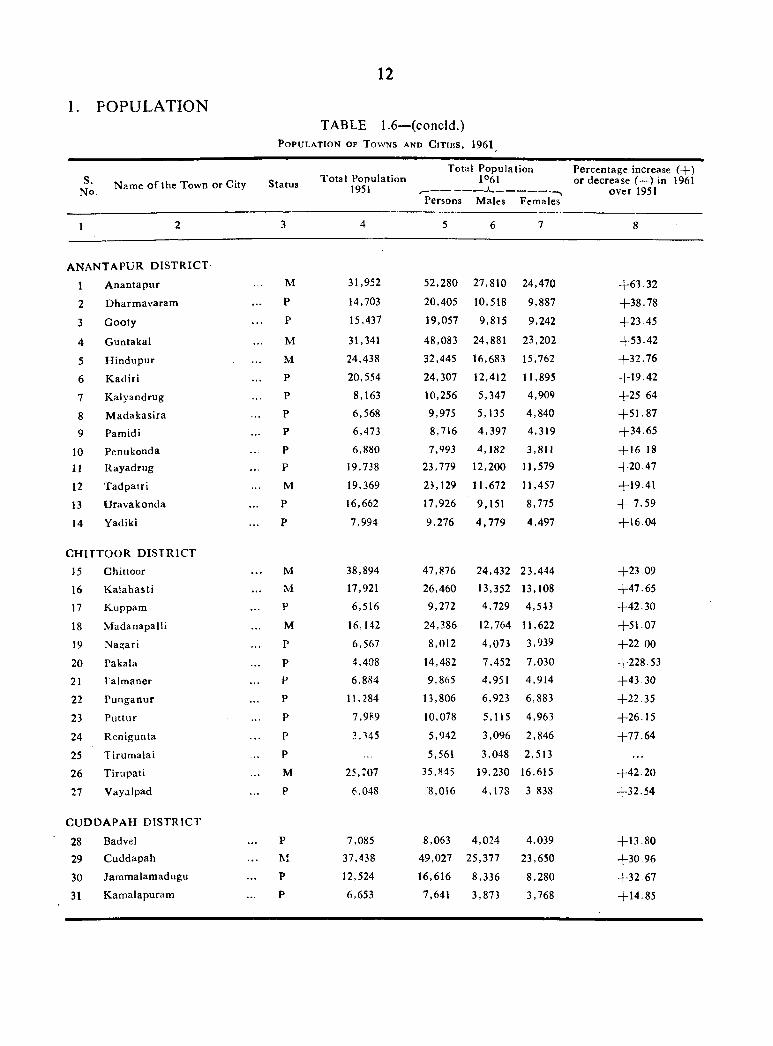
1. POPULATIONTABLE 1.6—(concld.)
Population of Towns and C ities , 1961^
S.No. Name o f the Town Or City Status T otal Population
1951
Total Populat 1061
Persons Males
ion
Females
Percentage increase (-f-) or decrease (—) in 1961
over 1951
1 2 3 4 5 6 7 8
A NA NTAPU R D IST R IC T'
1 A nantapur M 31,952 52,280 27,810 24,470 + 6 3 .3 2
2 D harm avaram P 14,703 20,405 10,518 9,887 + 3 8 .7 8
3 G ooty P 15,437 19,057 9,815 9,242 + 23 .45
4 G untakal M 31,341 48,083 24,881 23,202 + 53 .42
5 H indupur M 24,438 32,445 16,683 15,762 + 3 2 .7 6
6 K ad iri P 20,554 24,307 12,412 11,895 + 1 9 .42
7 K aiyandrug P 8,163 10,256 5,347 4,909 + 2 5 .6 4
8 M adakasira P 6,568 9,975 5,135 4,840 + 5 1 .8 7
9 Pamidi P 6,473 8,716 4,397 4,319 + 3 4 .6 5
10 Penukonda P 6,880 7,993 4,182 3,811 + 16.18
11 Rayadrijg P 19,738 23,779 12,200 11,579 + 2 0 .4 7
12 T adpatri M 19,369 23,129 11,672 11,457 + 19.41
13 U ravakonda P 16,662 17,926 9,151 8,775 + 7.59
14 Yadiki P 7,994 9,276 4,779 4,497 + 16.04
C H IT T O O R D IS T R IC T
15 Chittoor M 38,894 47,876 24,432 23,444 + 23 .09
16 K alahasti M 17,921 26,460 13,352 13,108 + 4 7 .6 5
17 Kuppam P 6,516 9,272 4,729 4,543 + 4 2 .3 0
18 M adanapalli M 16,142 24,386 12,764 11,622 + 51 .07
19 N agari P 6,567 8,012 4,073 3,939 + 2 2 00
20 Pakala P 4,408 14,482 7,452 7,030 +228.53
21 r alm aner P 6,884 9,865 4,951 4,914 + 4 3 .3 0
22 Punganur P 11,284 13,806 6,923 6,883 + 22 .35
23 P uttu r P 7,989 10,078 5,115 4,963 + 26 .15
24 Renigunta P 3,345 5,942 3,096 2,846 + 7 7 .6 4
25 Tirum alai P 5,561 3,048 2,513
26 Tiriipati M 25,:07 35,845 19,230 16,615 + 4 2 .2 0
27 Vayalpad P 6,048 8,016 4,178 3 838 + 3 2 .5 4
C U D D A PA H D IST R IC T
28 Badvel P 7,085 8,063 4,024 4,039 + 1 3 .8 0
29 C uddapah M 37,438 49,027 25,377 23,650 + 3 0 .9 6
30 Jam m alam adugu P 12,524 16,616 8,336 8,280 + 3 2 .6 7
31 K am alapuram P 6,653 7,641 3,873 3,768 + 14 .85
13
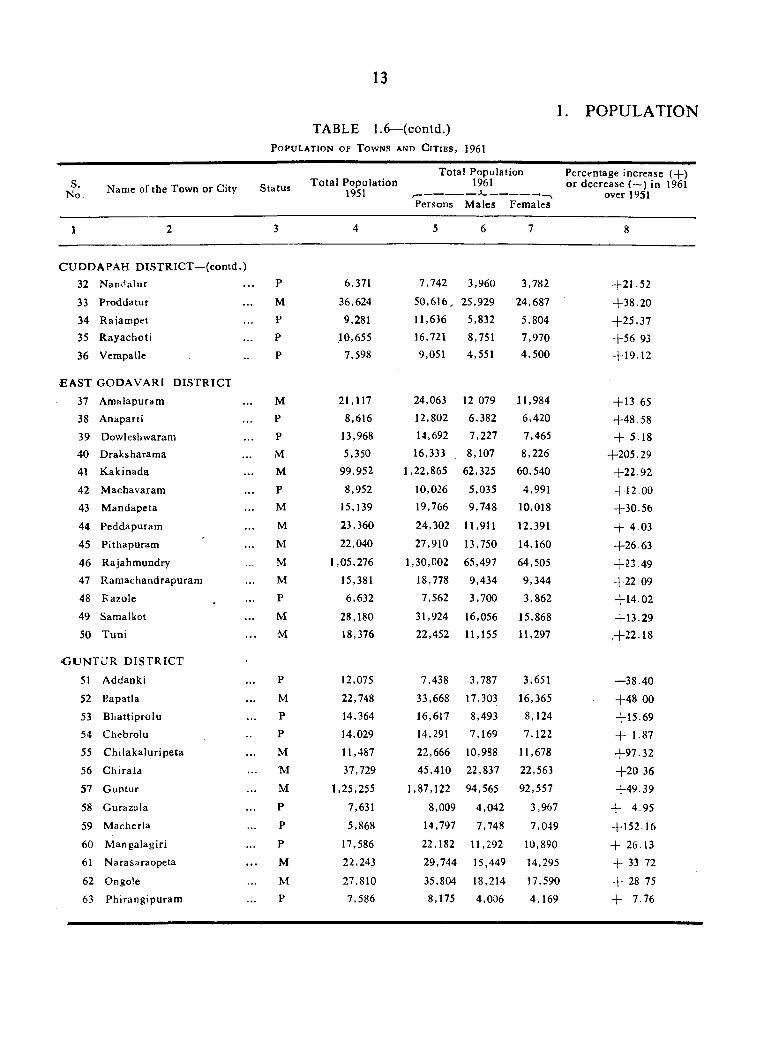
1. POPULATIONTABLE 1.6— (contd.)
P o p u la t io n o f Towns an d C i t i e s , 1961
s.No. Name of the Town or City Status T o ta l Population
1951
Total Population19611
Percentage increase (-{-) o r decrease ( ~ ) In 1961
over 1951Persons M ales Females
1 2 3 4 5 6 7 8
C U D D A PA H D IST R IC T —(contd.) 32 N am ialur P 6,371 7,742 3,960 3,782 •+21.52
33 Proddatur M 36,624 50,616, 25,929 24,687 + 3 8 .2 034 R ajam pet P 9,281 11,636 5,832 5,804 + 2 5 .3 735 R ayachoti P ,10,655 16,721 8,751 7,970 + 5 6 9336 Vempalle P 7,598 9,051 4,551 4,500 + 1 9 .1 2
E A ST
37
G O D A V A R I D IST R IC T
Amalapuram M 21,117 24,063 12 079 11,984 + 1 3 .6538 Anaparti P 8,616 12,802 6,382 6,420 + 4 8 .5 839 Dowleshwaram P 13,968 14,692 7,227 7,465 + 5.1840 Draksharam a iM 5,350 16,333 8,107 8,226 + 205 .2941 K akinada M 99.952 1,22,865 62,325 60,540 + 2 2 .9 242 Machavaram P 8,952 10,026 5,035 4,991 + 1 2 .0 0
43 M andapeta M 15,139 19,766 9,748 10,018 + 3 0 .5 6
44 Peddapuram M 23,360 24,302 11,911 12,391 + 4.03
45 Pithapuram M 22,040 27,910 13,750 14,160 + 26 .6346 R ajahm undry M 1,05,276 1,30,002 65,497 64,505 + 2 3 .4 947 Ram achandrapuram M 15,381 18,778 9,434 9,344 + 2 2 .0 948 Kazole P 6,632 7,562 3,700 3,862 + 1 4 .0 249 Samalkot M 28,180 31,924 16,056 15,868 + 13.2950 T uni M 18,376 22,452 11,155 11,297 ,+ 22 .18
<j U n t u r d i s t r i c t
51 A ddanki P 12,075 7,438 3,787 3,651 —38.40
52 Bapatia M 22,748 33,668 17,303 16,365 + 4 8 0053 B hattiprolu P 14,364 16,617 8,493 8,124 + 1 5 .6954 Chebrolu P 14,029 14,291 7,169 7,122 + 1.87
55 C hilakaluripeta M 11,487 22,666 10,988 11,678 + 9 7 .3 2
56 C hirald M 37,729 45,410 22,837 22,563 + 2 0 36
57 G untur M 1,25,255 1,87,122 94,565 92,557 + 4 9 .3 9
58 Gurazala P 7,631 8,009 4,042 3,967 + 4.95
59 M acherla P 5,868 14,797 7,748 7,049 + 152.16
60 M angalagiri P 17,586 22,182 11,292 10,890 + 26.1361 N arasaraopeta M 22,243 29,744 15,449 14,295 + 33 72
62 Ongole M 27,810 35,804 18,214 17,590 + 28.75
63 Phirangipuram P 7,586 8,175 4,006 4,169 + 7.76
14
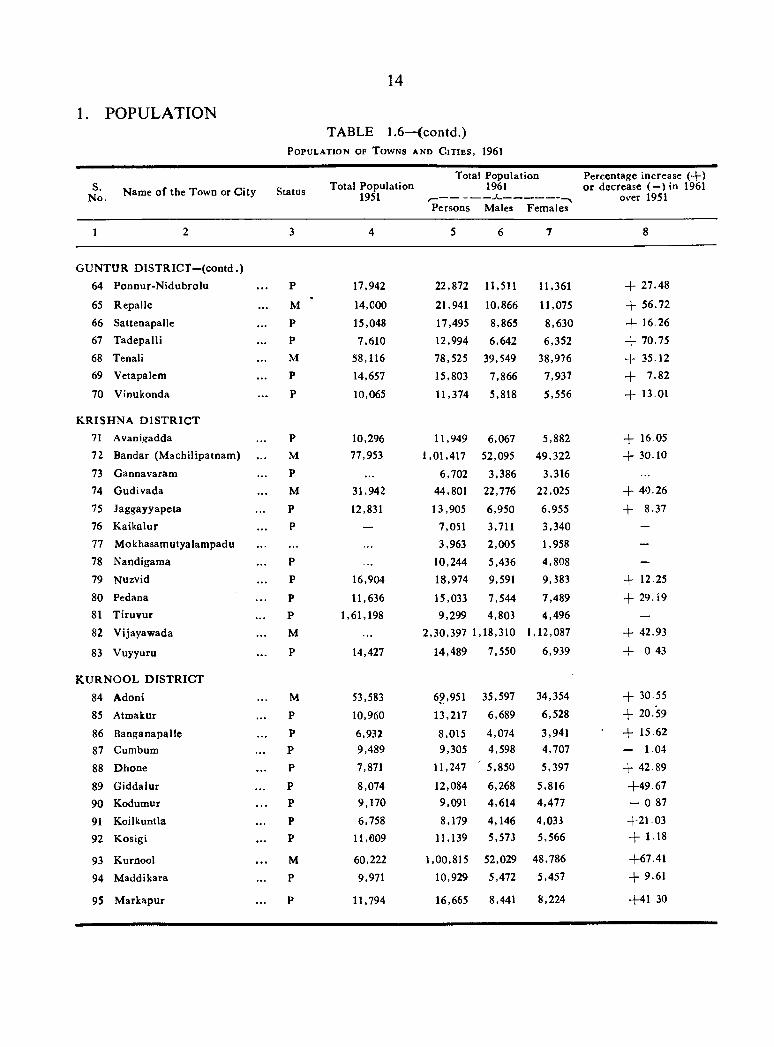
1. POPULATIONTABLE 1.6—(contd .)
Population of T owns and C it ie s , 1961
s.N o. Name o f the Town or City Status Total Population
1951
Total
Persons
1 Population 1961
Males Females
Percentage increase (-f-) o r decrease (—) in 1961
over 1951
1 2 3 4 5 6 7 8
G U N TU R D IS T R IC r- (c o n td .)
64 Ponnur-N idubrolu P 17,942 22,872 11,511 11,361 + 27.48
65 Repalle M 14,COO 21,941 10,866 11,075 + 56.72
66 Sattenapallc P 15,048 17,495 8,865 8,630 + 16.2667 Tadepalli P 7,610 12,994 6,642 6,352 + 70.75
68 Tenali M 58,116 78,525 39,549 38,976 + 35.1269 Vetapalem P 14,657 15,803 7,866 7,937 + 7.82
70 V inukonda P 10,065 11,374 5,818 5,556 + 13.01
K R ISH N A D IS T R IC T71 Avanigadda P 10,296 11,949 6,067 5,882 + 16 0572 Bandar (M achilipatnam ) M 77,953 1,01,417 52,095 49,322 - f 30.10
73 Ganna varam P 6,702 3,386 3,31674 G udivada M 31,942 44,801 22,776 22,025 + 40.26
75 Jaggayyapeta P 12,831 13,905 6,950 6,955 + 8.3776 K aikalur P — 7,051 3,711 3,340 -
77 M okhasam utyalam padu 3,963 2,005 1,958 -
78 Nandigama P 10,244 5,436 4,808 -
79 Nuzvid P 16,904 18,974 9,591 9,383 4- 12.25
80 Pedana P 11,636 15,033 7,544 7,489 + 2 9 .1 981 T iruvur P 1,61,198 9,299 4,803 4,496 —
82 Vijayawada M 2,30,397 1,18,310 1,12,087 4- 42.93
83 Vuyyuru P 14,427 14,489 7,550 6,939 - f 0 43
K U R N O O L D rST R IC T
84 Adoni M 53,583 69,951 35,597 34,354 + 30.55
85 Atmakur P 10,960 13,217 6,689 6,528 + 20.59
86 Banganapalle P 6,932 8,015 4,074 3,941 • + 15.62
87 Cumbum P 9,489 9,305 4,598 4,707 - 1.04
88 Dhone P i , m 11,247 5,850 5,397 + 42.89
89 G iddalur P 8,074 12,084 6,268 5,816 + 4 9 .6 7
90 Kodumur P 9,170 9,091 4,614 4,477 - 0 87
91 Koilkuntla P 6,758 8,179 4,146 4,033 + 2 1 .0 3
92 K osigi P 11,009 11,139 5,573 5,566 + 1.18
93 Kurnool M 60,222 1,00,815 52,029 48,786 +67.41
94 M addikara P 9,971 10,929 5,472 5,457 + 9.61
95 M arkapur P 11,794 16,665 8,441 8,224 + 4 1 30
15
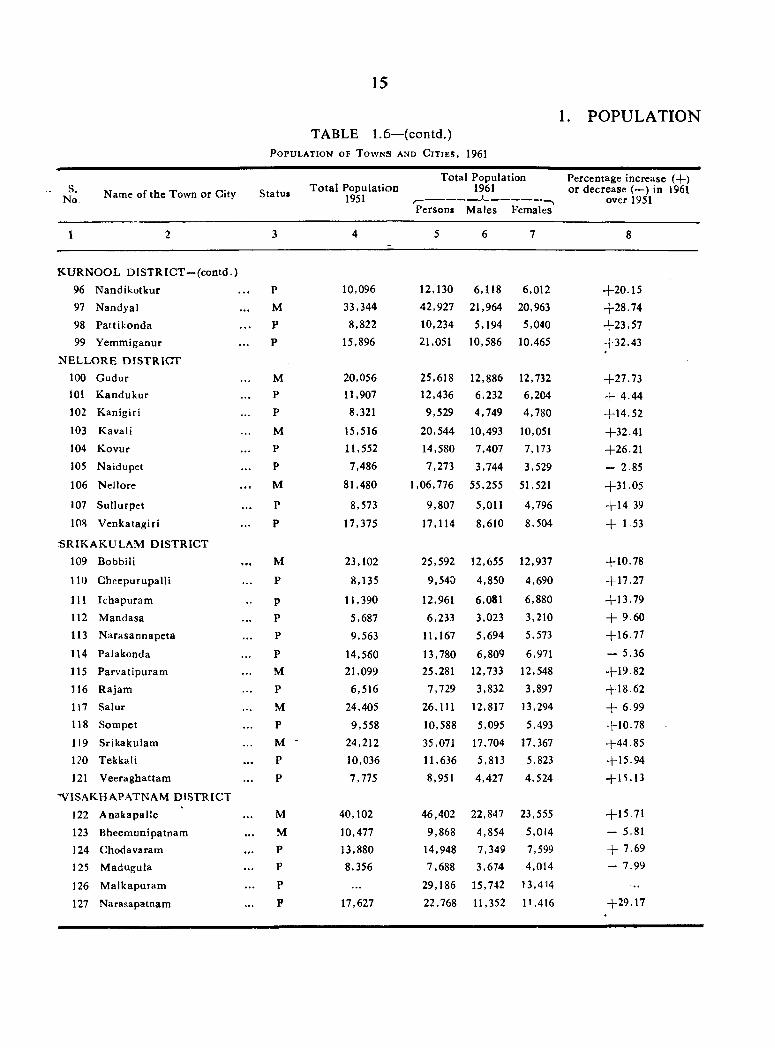
1. POPULATIONTABLE 1.6—(contd.)
P o p u l a t i o n o f T o w n s a n d C i t i e s , 1961
S.No. Name of the Town or City Status T o ta l Population
1951
Total Population 1961
Persons M ales Females
Percentage increase (+ ) o r decrease (—) in 1961
over 1951
1 2 3 4 5 6 7 8
K U R N O O L D IS T R IG T --(con td .)
96 N andikotkur P 10,096 12,130 6,118 6,012 + 2 0 .1 597 N andyal M 33,344 42,927 21,964 20,963 + 2 8 .7 498 Pattikonda P 8,822 10,234 5,194 5,040 + 2 3 ,5 799 Y emmiganur P 15,896 21,051 10,586 10,465 + 32 .43
N EL L O R E D IST R IC T100 G udur M 20,056 25,618 12,886 12,732 + 2 7 .73101 K andukur P 11,907 12,436 6,232 6,204 + 4.44102 K anigiri P 8,321 9,529 4,749 4,780 + 1 4 .5 2103 Kavali M 15,516 20,544 10,493 10,051 + 32.41104 K ovur P 11,552 14,580 7,407 7,173 + 26 .21105 N aidupet P 7,486 7,273 3,744 3,529 - 2 85
106 Nellore M 81,480 1,06,776 55,255 51,521 + 3 1 .0 5
107 Sullurpet P 8,573 9,807 5,011 4,796 + 1 4 39
108 V enkatagiri P 17,375 17,114 8,610 8,504 + 1.53
SR IK A K U L A M D IST R IC T109 Bobbin M 23,102 25,592 12,655 12,937 + 1 0 .78
111) CheepurupalU P 8,135 9,540 4,850 4,690 + 1 7 .27
111 Ichapuram P 11,390 12,961 6,081 6,880 + 1 3 .7 9
112 M andasa P 5,687 6,233 3,023 3,210 + 9.60
113 N arasannapeta P 9,563 11,167 5,694 5,573 + 1 6 .7 7
114 Palakonda P 14,560 13,780 6,809 6,971 - 5.36
115 Parvatipuram M 21,099 25,281 12,733 12,548 + 1 9 .8 2
116 R ajam P 6,516 7,729 3,832 3,897 + 1 8 .6 2
117 Salur M 24,405 26,111 12,817 13,294 + 6.99118 Som pet P 9,558 10,588 5,095 5,493 + 1 0 .7 8
119 Srikakulam M - 24,212 35,071 17,704 17,367 + 4 4 .8 5120 Tekkali P 10,036 11,636 5,813 5,823 + 1 5 .9 4
121 V eeraghattam P 7,775 8,951 4,427 4,524 + 1 5 .1 3
"VISAKHAPATNAM D ISTRICT
122 A nakapalle M 40,102 46,402 22,847 23,555 + 1 5 .7 1
123 Bheem unipatnam M 10,477 9,868 4,854 5,014 - 5.81
124 Chodavaram P 13,880 14,948 7,349 7,599 -4- 7.69
125 M adugula P 8,356 7,688 3,674 4,014 - 7.99
126 M alkapuram P ... 29,186 15,742 )3,414
127 Narasapatnam F 17,627 22,768 11,352 11,416 + 29 .17

1 6
1. POPULATIONTABLE 1.6— (contd.)
P o p u l a t i o n o f T o w n s a^ n d C i t i e s , 1961
cName o f the Town or City Status Total Population
1951
Total
Persons
Population1961
Males Females
Percentage increase (-}-) o r decrease ( —) in 1961
over 1951
1 2 3 4 5 6 7 8
V ISAK HA PA TN AM D IS T R IC T - (contd.)128 Srungavarapukota P 8,723 9,807 4,687 5,120 + 12.43
129 Visakhapatnam M 108,042 1,82,004 94,803 87,201 + 68.46
130 V izianagaram M 67,104 76,808 38,806 38,002 + 14.46
131 Y ellam anchili P 12,037 13,556 6,650 6,906 + 12.62
W EST G OD AV ARI D IST R IC T
132 Bheemavaram M 30,928 43,821 22,585 21,236 + 41.69
133 Eluru M 87,213 1,08,321 54,049 54,272 + 24.20134 Kovvur P 12,307 15,427 7,563 7,864 + 25.35135 M aruteru P 7,129 5,296 2,732 2,564 — 25.71136 N arasapur M 20,999 30,064 14,779 15,285 + 41.17137 N idadavolc P 11,628 16,842 8,438 8,404 J - 44 84138 Palacole M 23,037 28,481 14,085 14,396 + 23.63139 Penugorida P 12,200 13,978 6,875 7,103 + 14.57140 Tadepalligudem M 13,543 27,086 13,798 13,288 + 100 00
141 Tanuku P 16,906 24,657 12,551 12,106 + 45.85
A D ILA BA D D IST R IC T
142 A dilabad C.M . 17,196 20,970 10,777 10,193 + 21.95
143 A sifabad T.M , 5,584 6,190 3,162 3,028 + 10.85
144 B ellam palli 15,874 29,101 15,392 13,709 + 83.32
145 Bhainsa T.M . 11,200 12,346 6,203 6,143 + 10.23
146 C hinnuru T.M 8,976 9,645 4 821 4,824 - f 7.45147 K adam dam site 6,235 3,62) 2,612148 K agaznagar 14,265 30,604 16,735 13,869 + 114 .53
149 M ancherial C.M . 8,997 13,822 7,308 6,§14 + 53.63150 M udhole T .M . 7,459 7,560 3,666 3,894 + 1.35151 Nirmal C.M . 17,947 19,896 10,139 9,757 + 10 86
HYDERABAD D IST R IC T
152 H yderabad Town group 11,25,578 12,51,119 6,48,575 6,02,544 + 11.15(a) Alwal ... 7,909 9,886 5,081 4,805 + 25.00
(b) A ttapur 1,642 1,968 968 1,000 + 19.85(c) Bowenpalle 1,523 1,696 861 835 + 11.36(d) Fatehnagar ... 4,418 11,813 6,262 5,551 + 167.38
-(e) H yderabad(H yderabad division) ... M .C 9,31,082 4,79,319 4,51,763 ...
17
1. POPULATIONTABLE 1.6—(contd.)
P o p u l a t io n o f T o w n s an d C it ie s , 1961
s.N o. Name of the Town o r City Status Total Population
1951
T o ta l Population 1961
Persons Males Females
Percentage increase (+) or decrease (—) in 1961
over 1951
1 2 3 4 5 6 7 8
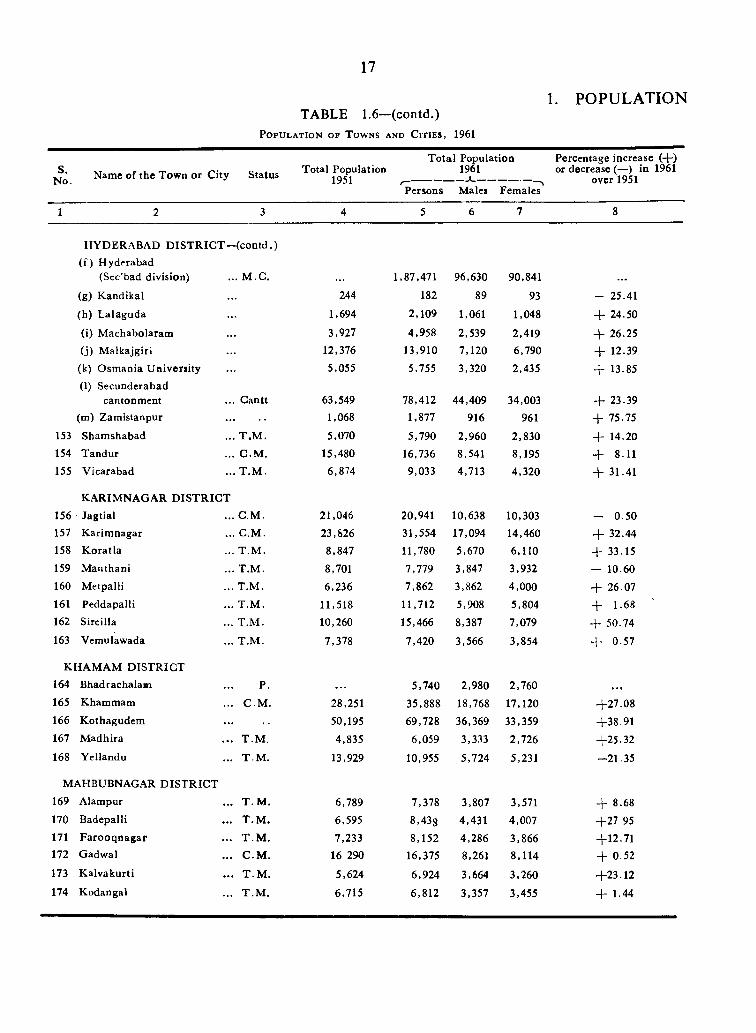
HYDERABAD D IS T R IC T -(c o n td .)(f) Hyderabad
(Sec’bad division) ... M .C . 1,87,471 96,630 90,841
(g) K andikal 244 182 89 93 - 25.41
(h) L alaguda 1,694 2,109 1,061 1,048 + 24.50
(i) M achabolaram 3,927 4,958 2,539 2,419 + 26.25(j) M alkajgiri 12,376 13,910 7,120 6,790 + 12.39(k) O sm ania U niversity 5,055 5,755 3,320 2,435 + 13.85(1) Secunderabad
cantonm ent ... C antt 63,549 78,412 44,409 34,003 + 23.39(m) Zam istanpur ............... 1,068 1,877 916 961 + 75.75
153 Sham shabad ... T .M . 5,070 5,790 2,960 2,830 + 14.20154 T andur ... C .M . 15,480 16,736 8,541 8,195 + 8.11155 V icarabad . . .T .M .
KARIM N AG A R D IS T R IC T
6,874 9,033 4,713 4,320 + 31.41
156 Jagtial ... C .M . 21,046 20,941 10,638 10,303 -■ 0.50157 K arim nagar ... C .M . 23,826 31,554 17,094 14,460 + 32.44158 K oratla ... T .M . 8,847 11,780 5,670 6,110 + 33.15159 M anthani ... T .M . 8,701 7,779 3,847 3,932 - 10.60160 M etpalli ... T .M . 6,236 7,862 3,862 4,000 + 26.07161 Peddapalli ... T .M . 11,518 11,712 5,908 5,804 + 1.68162 Sircilla ... T .M . 10,260 15,466 8,387 7,079 + 50.74163 Vcmulawada ... T .M . 7,378 7,420 3,566 3,854 + 0.57
K HA M AM D ISTRICT164 B hadrachalan ... P. 5,740 2,980 2,760 . . .165 Khammam ... C M . 28,251 35,888 18,768 17,120 H-27.08166 K othagudem 50,195 69,728 36,369 33,359 +38 .91167 M adhira . . . T .M . 4,835 6,059 3,333 2,726 4-25.32
168 Y eliandu ... T .M . 13,929 10,955 5,724 5,231 -2 1 .3 5
MAHBUBNAGAR D IST R IC T169 Alampur ... T .M . 6,789 7,378 3,807 3,571 + 8.68170 Badepalli ... T .M . 6,595 8,438 4,431 4,007 + 2 7 .9 5171 F arooqoagar ... T .M . 7,233 8,152 4,286 3,866 + 12 .71172 Gadwal ... C .M . 16 290 16,375 8,261 8,114 + 0.52
173 K alvakurti ... T .M . 5,624 6,924 3,664 3,260 + 2 3 .1 2174 Kodangal ... T .M . 6,715 6,812 3,357 3,455 + 1.44
1. POPULATION
18
TABLE 1.6—(contd.)P o p u l a t i o n o f T o w n s a n d C i t i e s , 1961
Name o f the Town or City StatusTotal Population
1951
Total Population 1961
Persons Males Females
Percentage increase (-j-) or decrease (—) in 1961
ov er 1951
1 2 3 4 5 6 7 8
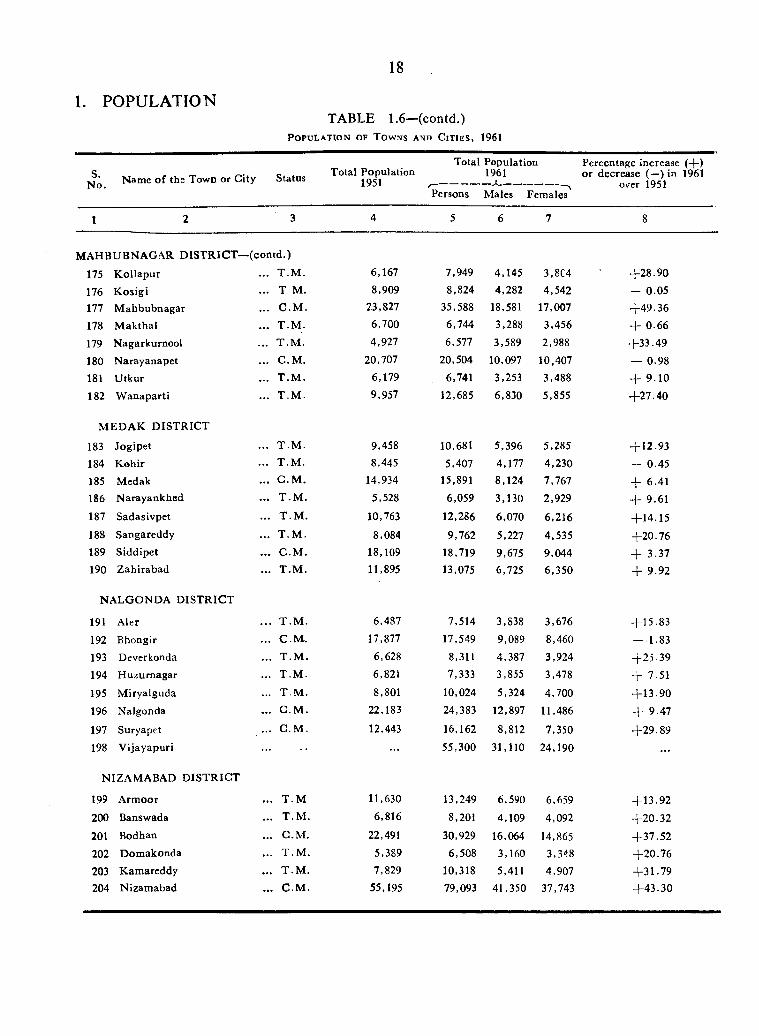
M AHBUBNAGAR D IS T R IC T -
175 K ollapur
•(contd.)
... T .M . 6.167 7,949 4,145 3,8C4 + 2 8 .9 0
176 K osigi ... T M. 8,909 8,824 4,282 4,542 - 0.05
177 M ahbubnagar ... C .M . 23,827 35,588 18,581 17,007 + 4 9 .3 6
178 M akthal ... T .M . 6,700 6,744 3,288 3,456 + 0.66
179 Nagarkurnool ... T .M . 4,927 6,577 3,589 2,988 + 3 3 .4 9180 N arayanapet ... C .M . 20,707 20,504 10,097 10,407 — 0.98181 U tkur ... T .M . 6,179 6,741 3,253 3,488 + 9.10
182 W anaparti ... T .M . 9,957 12,685 6,830 5,855 + 2 7 .4 0
M E D A K D IST R IC T
183 Jogipet ... T .M . 9,458 10,681 5,396 5,285 + 12.93
184 K ohir ... T .M . 8,445 5,407 4,177 4,230 ~ 0.45185 Medak ... C .M . 14,934 15,891 8,124 7,767 + 6.41186 N arayankhed ... T .M . 5,528 6,059 3,130 2,929 + 9.61187 Sadasivpet ... T .M . 10,763 12,286 6,070 6,216 + 1 4 .1 5188 Sangareddy ... T .M . 8,084 9,762 5,227 4,535 + 2 0 .7 6189 Siddipet ... C .M . 18,109 18,719 9,675 9,044 + 3.37190 Z ahirabad ... T .M . 11,895 13,075 6,725 6,350 + 9.92
N ALGONDA D IST R IC T
191 Aler .. . T .M . 6,487 7,514 3,838 3,676 + 1 5 .8 3
192 Bhongir ... C M. 17,877 17,549 9,089 8,460 - 1.83193 Devcrkonda ... T .M . 6,628 8,311 4,387 3,924 + 2 5 .3 9194 H uzurnagar ... T .M . 6,821 7,333 3,855 3,478 + 7.51
195 M iryalguda ... T .M . 8,801 10,024 5,324 4,700 + 1 3 .9 0196 Nalgonda ... C .M . 22,183 24,383 12,897 11,486 + 9.47
197 Suryapet ... C M. 12,443 16,162 8,812 7,350 + 2 9 .8 9198 V ijayapuri . . . 55,300 31,110 24,190 . . .
NIZAMABAD D ISTR IC T
199 A rm oor ... T .M 11,630 13,249 6,590 6,659 + 1 3 .9 2200 Banswada ... T .M . 6,816 8,201 4,109 4,092 + 2 0 .3 2201 Bodhan ... C .M . 22,491 30,929 16,064 14,865 + 3 7 .5 2202 D om akonda ... T .M . 5,389 6,508 3,160 3,348 + 2 0 .7 6203 K am arcddy ... T .M . 7,829 10,318 5,411 4,907 + 3 1 .7 9204 Nizam abad ... C M . 55,195 79,093 41,350 37,743 + 4 3 .3 0
19
1. POPULATIONTABLE 1.6—(concld.)
P o p u l a t i o n o f T o w n s a n d C i t i e s , 1961
Name o f the Town or City Status T otal Pop^ulationTotal Population
1961
Persons Males Females
Percentage increase (+ ) or decrease (—) in 1961
over 1951
1 2 3 4 5 6 7 8
W ARANGAL D IST R IC T
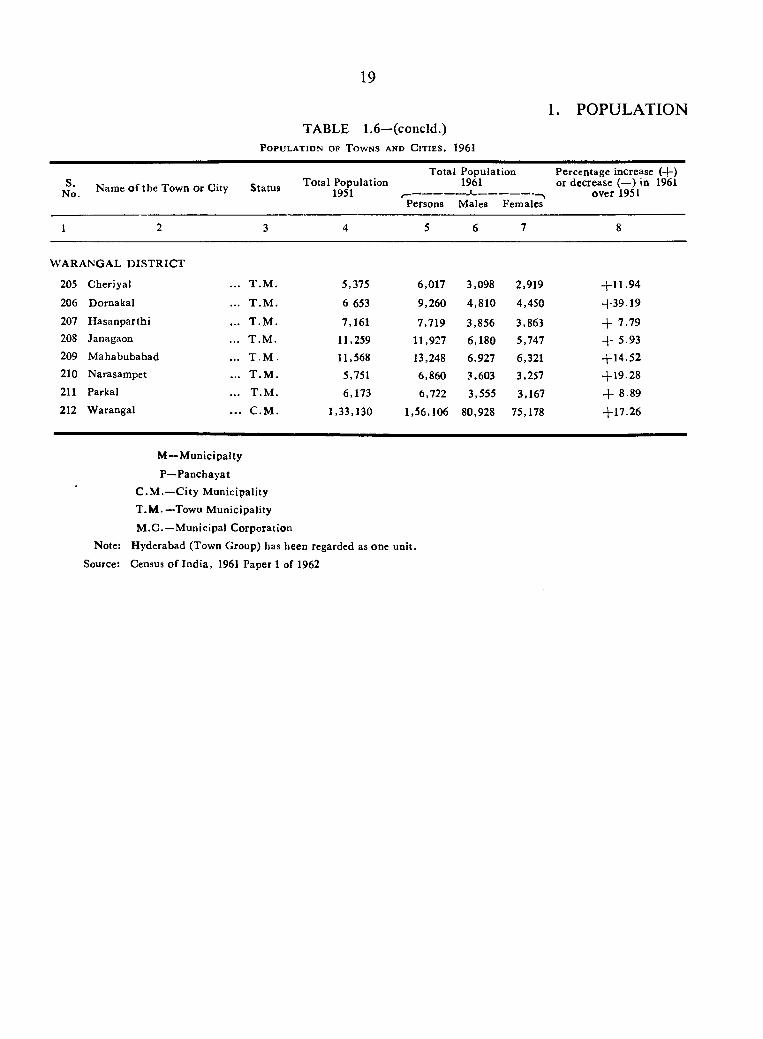
205 Cheriyal ... T .M . 5,375 6,017 3,098 2,919 + 1 1 .9 4
206 Dornakal ... T .M . 6 653 9,260 4,810 4,450 + 3 9 .1 9
207 H asanparthi ... T .M . 7,161 7,719 3,856 3,863 + 7.79208 Janagaon ... T .M . 11,259 11,927 6,180 5,747 + 5.93209 M ahabubabad ... T .M 11,568 13,248 6,927 6,321 + 1 4 .5 2210 Narasampet ... T .M . 5,751 6,860 3.603 3,257 + 1 9 .2 8211 Parkal ... T .M . 6,173 6,722 3,555 3.167 + 8.89212 W arangal .. . C .M . 1,33,130 1,56,106 80,928 75,178 + 1 7 .2 6
M —M unicipally
P—Panchayat C .M .—C ity M unicipality T .M .—Towu M unicipality
M .C .—M unicipal C orporation
Note: Hyderabad (Town Group) has heen regarded as one unit.
Source: Census o f Ind ia , 1961 Paper 1 of 1962
20
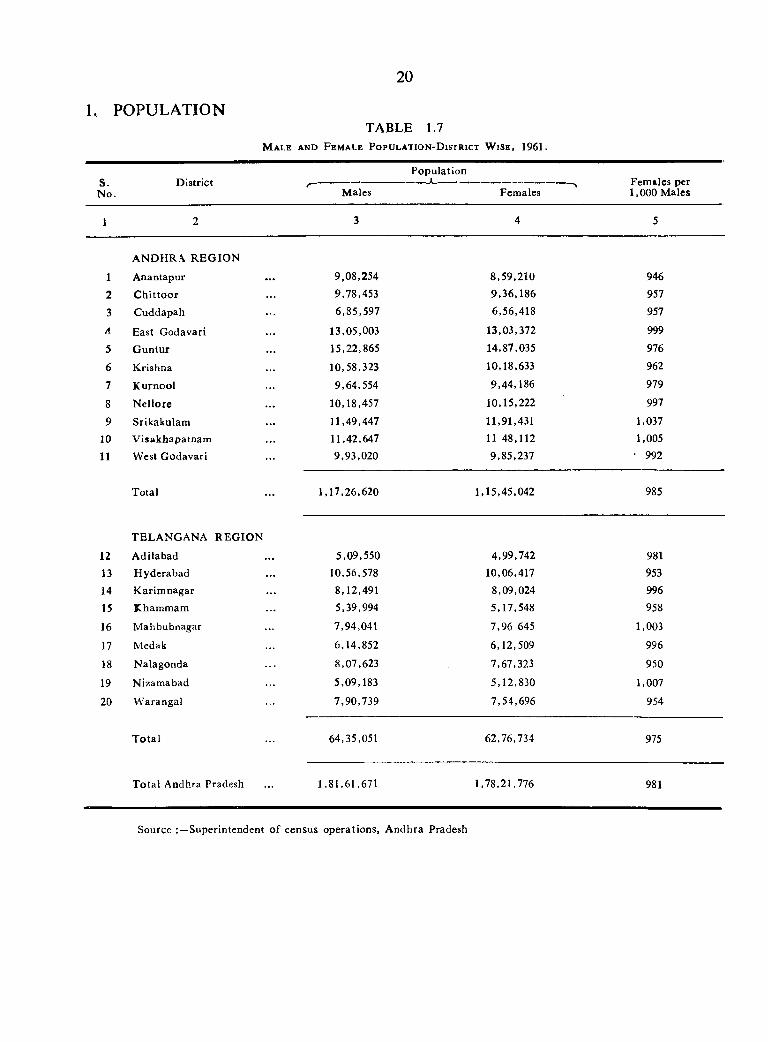
1. POPULATIONTABLE 1.7
M a l e a n d F e m a l e P o p u l a t io n -D is t r ic t W is e , 1961
S.No.
D istrictPopulation
Females per 1,000 M alesMales Females
1 2 3 4 5
A NDHRA R E G IO N
1 Anantapur 9,08,254 8,59,210 946
2 C h itto o r 9,78,453 9,36,186 957
3 Cuddapah 6,85,597 6,56,418 957
4 East Godavari 13,05,003 13,03,372 999
5 G untur 15,22,865 14,87,035 976
6 Krishna 10,58,323 10,18,633 962
7 K urnool 9,64,554 9,44,186 979
8 N ellore 10,18,457 10,15,222 997
9 Srikakulam 11,49,447 11,91,431 1,037
10 V isakhapatnam 11,42,647 11 48,112 1,005
11 West Godavari 9,93,020 9,85,237 • 992
Total 1,17,26,620 1,15,45,042 985
TELANGANA R EG IO N
12 A dilabad 5,09,550 4,99,742 981
13 H yderabad 10,56,578 10,06,417 953
14 K arim nagar 8,12,491 8,09,024 996
15 Kharnmam 5,39,994 5,17,548 958
16 M ahbubnagar 7,94,041 7,96 645 1,003
17 Medak 6,14,852 6,12,509 996
18 Nalagonda 8,07,623 7,67,323 950
19 Nizamabad 5,09,183 5,12,830 1,007
20 W arangal 7,90,739 7,54,696 954
T o ta l 64,35,051 62,76,734 975
T otal Andhra Pradesh 1,81,61,671 1,78,21,776 981
Source Superintendent o f census operations, A ndhra Pradesh

1. POPULATION
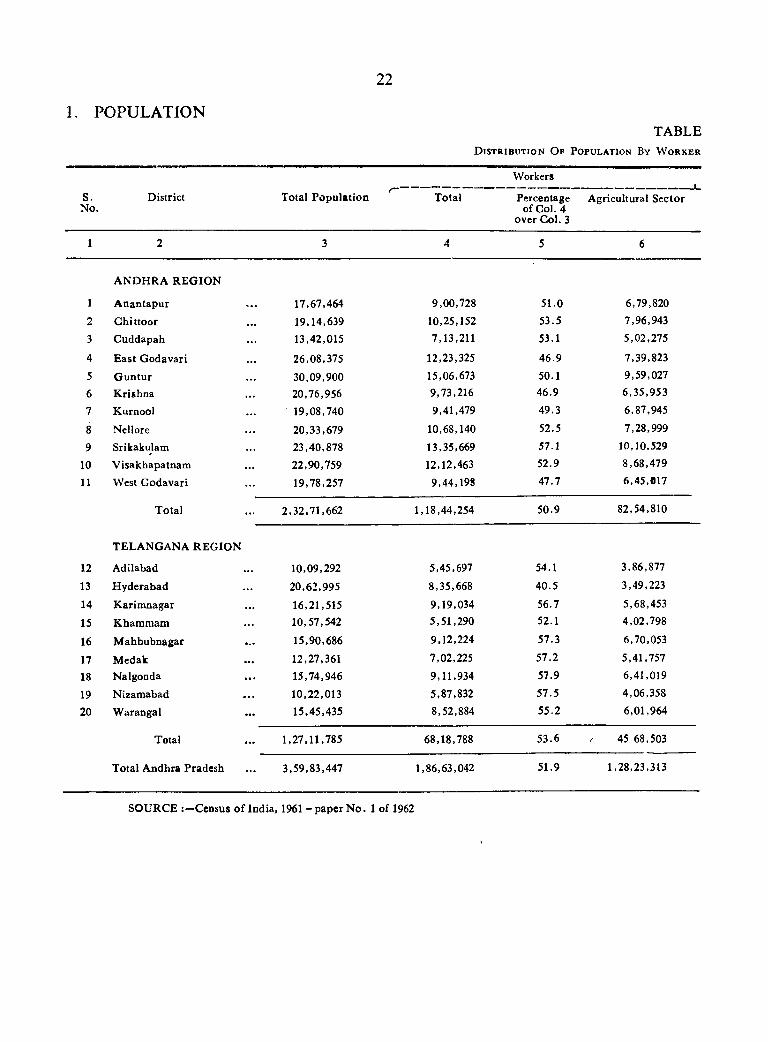
2 2
TABLED i s t r i b u t i o n O f P o p u l a t io n By W o r k e r
S.No.
District Total P opulation Total
W o rk ers
Percentage Agricultural Sector of Col. 4
over Col. 3
1
A N D H R A R EG IO N
A nantapur 17,67,464 9,00,728 51.0 6,79,820
2 C hittoor 19,14,639 10,25,152 53.5 7,96,943
3 C uddapah 13,42,015 7,13,211 53.1 5,02,275
4 E ast G odavari 26,08,375 12,23,325 46.9 7,39,823
5 G untu r 30,09,900 15,06,673 50.1 9,59,027
6 K rishna 20,76,956 9,73,216 46.9 6,35,953
7 Kurnool 19,08,740 9,41,479 49.3 6,87,945
8 Nellore 20,33,679 10,68,140 52.5 7,28,999
9 Srikakulam 23,40,878 13,35,669 57.1 10,10,529
10 V isakhapatnam 22,90,759 12,12,463 52.9 8,68,479
11 West G odavari 19,78,257 9,44,198 47.7 6,45,017
T otal 2,32.71,662 1,18,44,254 50.9 82,54,810
12
TELANGANA R EG IO N
Adilabad 10,09,292 5,45,697 54.1 3,86,877
13 H yderabad 20,62,995 8,35,668 40.5 3,49,223
14 K arim nagar 16,21,515 9,19,034 56.7 5,68,453
15 K ham m am 10,57,542 5,51,290 52.1 4,02,798
16 M ahbubnagar 15,90,686 9,12,224 57.3 6,70,053
17 M edak 12,27,361 7,02,225 57.2 5,41,757
18 Nalgonda 15,74,946 9,11,934 57.9 6,41,019
19 Nizamabad 10,22,013 5,87,832 57.5 4,06,358
20 W arangal 15,45,435 8,52,884 55.2 6,01,964
Total 1,27,11,785 68,18,788 53.6 45 68.503
Total A ndhra Pradesh 3.59,83,447 1,86,63,042 51.9 1,28,23,313
SOURCE Census o f India, 1961 - paper N o . 1 of 1962
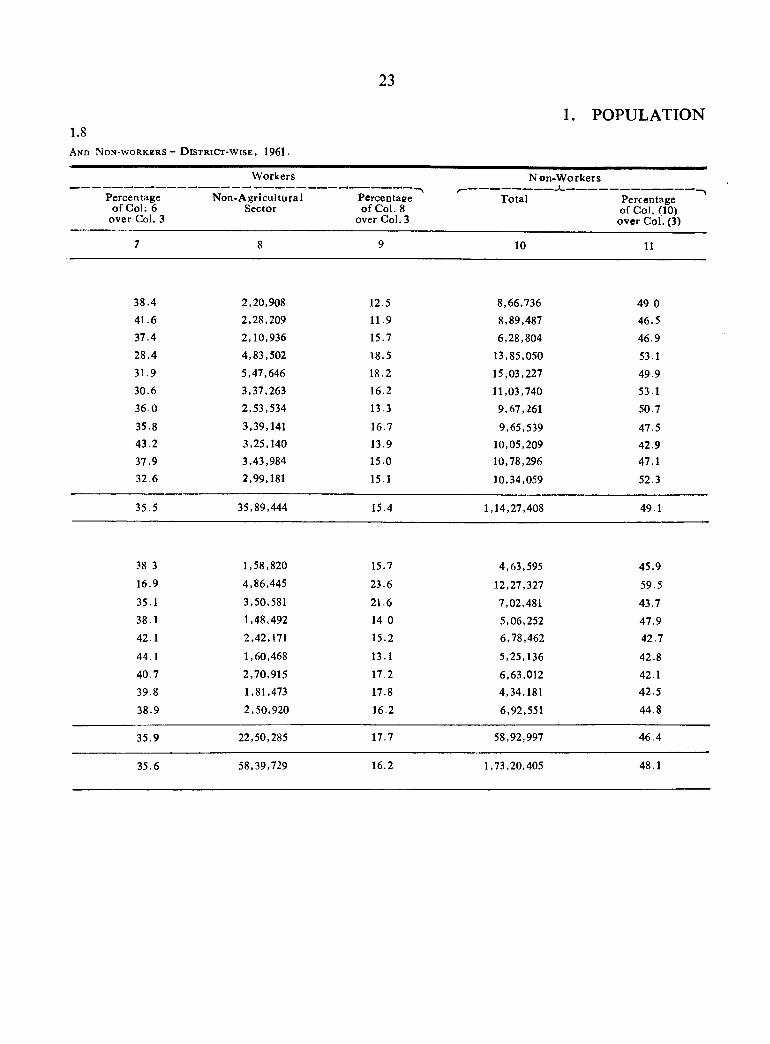
23
1. POPULATION1.8
A nd N o n -w o r k e r s - D is t r ic t -w is e , 1961
W orkers
Percentage o fC o l; 6
over Col. 3
N on-A gricu ltu ralSector
Percentage o f Col. 8
over Col. 3
N on-W orkers --------- «________
T otal Percentage of Col. (10)
over Col. (3)
9 10 11
38.4
41.637.4
28.4
31.9
30.6
36.0
35.8 43.2
37.932.6
2,20.908
2,28,2092,10,936
4,83,502
5,47,6463,37,2632,53,534
3,39,1413,25,1403,43,984
2,99,181
12.511.915.7
18.5
18.2 16.2
13.3
16.7
13.915.0
15.1
8,66,7368,89,487
6,28,804
13,85,05015,03,227
11,03,7409,67,261
9,65,53910,05,20910,78,296
10,34,059
49 046.5
46.9
53.1
49.9
53.1
50.7
47.542.947.1
52.3
35.5 35,89,444 15.4 1,14,27,408 49.1
38.3 1,58,820 15.7 4,63,595 45.916.9 4,86,445 23.6 12,27,327 59.5
35.1 3,50,581 21.6 7,02,481 43.738.1 1,48,492 14 0 5,06,252 47.942.1 2,42,171 15.2 6,78,462 42.7
44.1 1,60,468 13.1 5,25,136 42.840.7 2,70.915 17.2 6,63,012 42.139.8 1,81,473 17.8 4,34.181 42.5
38.9 2,50,920 16.2 6.92,551 44.8
35.9 22,50,285 17.7 58,92,997 46.4
35.6 58.39,729 16.2 1,73,20,405 48.1
24
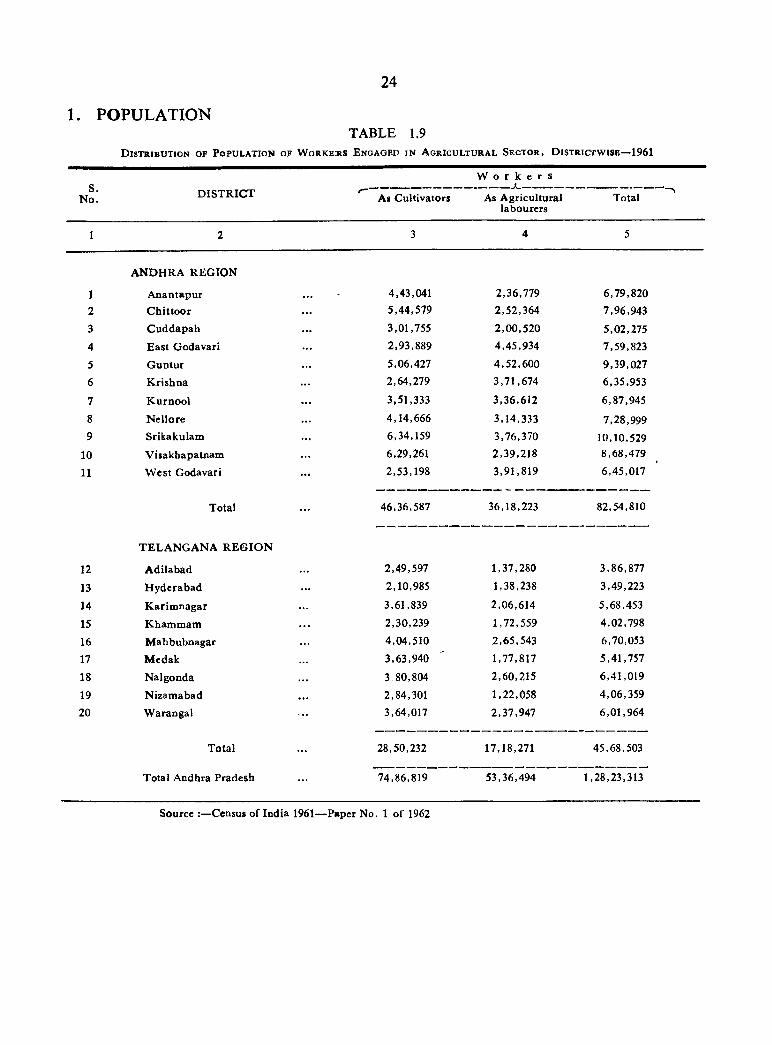
1. POPULATIONTABLE 1.9
D i s t r i b u t i o n o f P o p u l a t i o n o f W o r k e r s E n g a g e d i n A g r i c u l t u r a l S e c t o r , D i s t r i c t w i s e - - 1 9 6 1
S.N o. D IST R IC T As C ultivators
W o r k e r s
As A gricultural labourers
Total
1
ANDHRA REG IO N
A nantapur 4,43,041 2,36,779 6,79,820
2 C h ittoo r ... 5,44,579 2,52,364 7,96,943
3 C uddapah ... 3,01,755 2,00,520 5,02,275
4 East G odavari ... 2,93,889 4,45,934 7,59,823
5 G untur 5,06,427 4 ,52,600 9,39,027
6 K rishna ... 2,64,279 3,71,674 6,35,953
7 K urnool ... 3,51,333 3,36,612 6,87,945
8 N ellore ... 4,14,666 3,14,333 7,28,9999 Srikakulam ... 6,34,159 3,76,370 10,10,529
10 V isakhapatnam ... 6,29,261 2,39,218 8,68,479
11 W est Godavari ... 2,53,198 3,91,819 6,45,017
Total ... 46,36,587 36,18,223 82,54,810
12
T EL A N G A N A R E G IO N
A dilabad 2,49,597 1,37,280 3,86,877
13 H yderabad ... 2,10,985 1,38,238 3,49,223
14 K arim nagar ... 3,61,839 2,06,614 5,68,453
15 K ham m am ... 2,30,239 1,72,559 4,02,798
16 M ahbubnagar 4,04,510 2,65,543 6,70,053
17 M edak 3,63,940 1,77,817 5,41,757
18 N algonda ... 3.80,804 2,60,215 6,41,019
19 N izam abad ... 2,84,301 1,22,058 4,06,359
20 W arangal ... 3,64,017 2,37,947 6,01,964
T otal ... 28,50,232 17,18,271 45,68,503
T otal Andhra Pradesh ... 74,86,819 53,36,494 1,28,23,313
Source ;—Census of India 1961— Paper No. 1 of 1962
s.No.
25
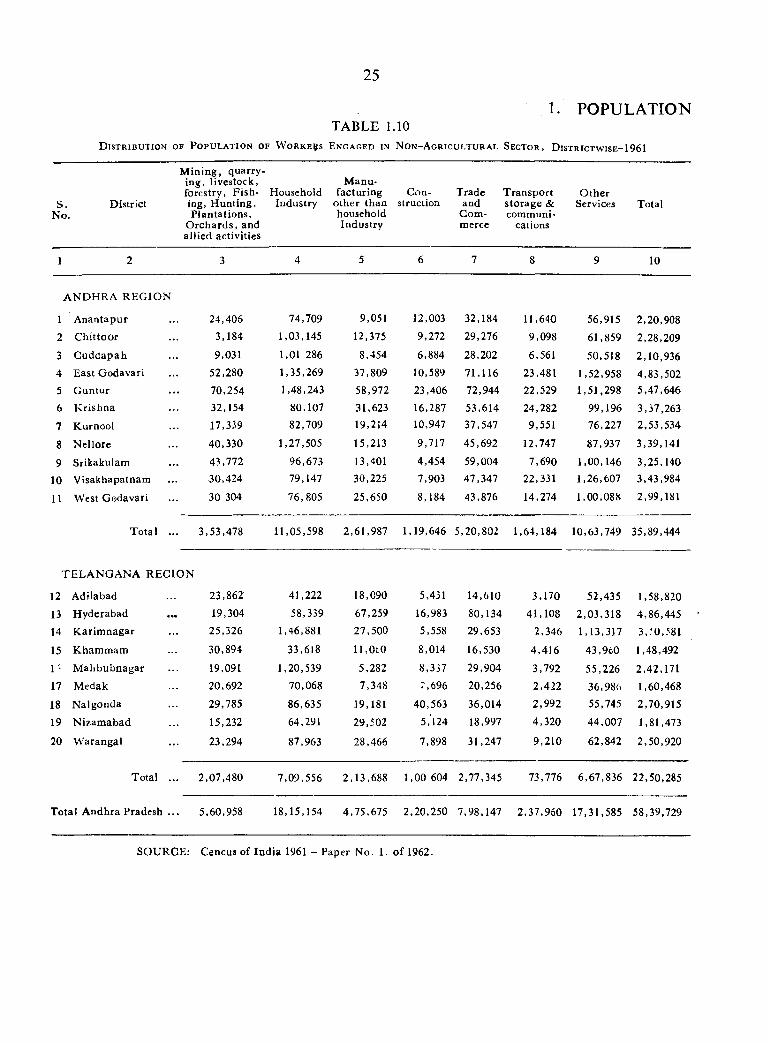
1. POPULATIONTABLE 1.10
D i s t r ib u t io n o f P o p u l a t i o n o f W o r k e r s E n g a g e d in N o n - A g r i c u l t u r a l S e c t o r , D i s t r ic t w is e - 1 9 6 1
District
M ining, quarrying, livestock, forestry. F ish ing, H unting, P lantations,
O rchards, and allied activities
M anu-Household facturing Con- Trade T ransport
Industry o ther than struction and storage &household Com- communi-Industry merce cations
O therServices Total
10
A N D H R A R EG IO N
1 A nantapur
2 C h ittoor
3 C uddapah
4 East Godavari5 G untur6 K rishna
7 Kurnool
8 Nellore
9 Srikakulam10 V isakhapatnam
11 West Godavari
24,406 3,184
9,031
52,280
70,254 32,154
17,339
40,330
43,772 30,424
30 304
74.709 1,03,145
1,01 286
1,35,269 1,48,243
80,10782.709
1,27,505
96,67379,147
76,805
9,051
12,375
8,454
37,809
58,972
31,62319,214
15,213
13,40130,225
25,650
12,003
9,272
6,88410,589
23,40616,28710,947
9,717
4,4547,903
8,184
32,184
29,276
28,202
71,11672,944
53,61437,547
45,692
59,00447,347
43,876
11,640
9,098
6,561
23,48122,529
24,2829,551
12,747
7,69022,331
14,274
56,915
61,859
50,518
1,52,9581,51,298
99,19676,227
87,937
1.00.146 1,26,607
1.00.088
2,20,908
2,28,209
2,10,936
4,83,5025,47,646
3,37,2632,53,534
3,39,141
3,25,1403,43,984
2,99,181
T otal ... 3,53,478 11,05,598 2,61,987 1,19,646 5,20,802 1,64,184 10,63,749 35,89,444
T EL A N G A N A R EG IO N
12 Adilabad 23,862 41,222 18,090 5,431 14,610 3,170 52,435 1,58,82013 Hyderabad 19,304 58,339 67,259 16,983 80,134 41,108 2,03,318 4,86,44514 K arim nagar 25,326 1,46,881 27,500 5,558 29,653 2,346 1,13,317 3, .‘0,581
15 Khammam 30,894 33,618 ll,O tO 8,014 16,530 4,416 43,960 1,48,492
1 ' M ahbubnagar 19,091 1,20,539 5,282 8,337 29,904 3,792 55,226 2,42,17117 M edak 20,692 70,068 7,348 :,696 20,256 2,422 36,986 1,60,46818 N algonda 29,785 86,635 19,181 40,563 36,014 2,992 55,745 2,70,915
19 N izam abad 15,232 64,291 29,502 5,124 18,997 4,320 44,007 1,81,473
20 W arangal 23,294 87,963 28,466 7,898 31,247 9,210 62,842 2,50,920
Total ... 2,07,480 7,09,556 2,13,688 1,00 604 2,77,345 73,776 6,67,836 22,50,285
Total A ndhra Pradesh ... 5,60,958 18,15,154 4,75,675 2,20,250 7,98,147 2,37,960 17,31,585 58,39,729
SOURCE: Cencus of Ind ia 1961 - Pap er No. 1. o f 1962.
1. POPULATION
2 6
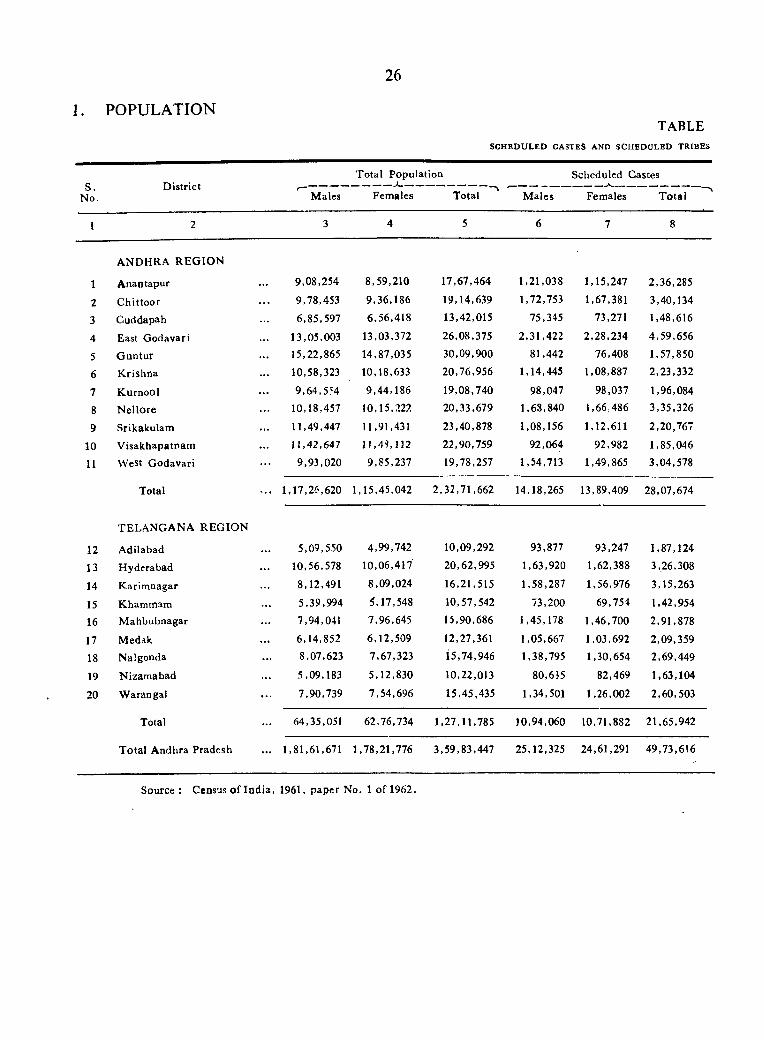
TABLESC H ED U LED CASTES AND SCH ED U LED TRIBES
S.No.
D istrictT otal Population
-- -- ----- ------------J____________ ____M ales Females Total
Scheduled Castes
M ales Females T o ta l
1
ANDHRA R EG IO N
Anantapur 9,08,254 8,59,210 17,67,464 1,21,038 1,15,247 2,36,285
2 C hittoor 9,78,453 9,36,186 19,14,639 1,72,753 1,67,381 3,40,134
3 Cuddapah 6,85,597 6,56,418 13,42,015 75,345 73,271 1,48,616
4 East Godavari 13,05,003 13,03,372 26,08,375 2,31,422 2,28,234 4,59,656
5 G untur 15,22,865 14,87,035 30,09,900 81,442 76,408 1,57,850
6 K rishna 10,58,323 10,18,633 20,76,956 1,14,445 1,08,887 2,23,332
7 KurnoOl 9,64,554 9,44,186 19,08,740 98,047 98,037 1,96,084
8 N ellore 10,18,457 10,15,222 20,33,679 1,63,840 1,66,486 3,35,326
9 Srikakulam 11,49,447 11,91,431 23,40,878 1,08,156 1,12,611 2,20,767
10 V isakhapatoam 11,42,647 11,49,112 22,90,759 92,064 92.982 1,85,046
11 W e s t G odavari 9,93,020 9,85,237 19,78,257 1,54,713 1,49,865 3,04,578
Total 1,17,26,620 1,15,45,042 2,32,71,662 14,18,265 13,89,409 28,07,674
12
TELANGANA R EG IO N
Adilabad 5,09,550 4,99,742 10,09,292 93,877 93,247 1,87,124
13 Hyderabad 10,56,578 10,06,417 20,62,995 1,63,920 1,62,388 3,26,308
14 Karim nagar 8,12,491 8,09,024 16,21,515 1,58,287 1,56,976 3,15,263
15 Khamrnam 5,39,994 5,17,548 10,57,542 73,200 69,754 1,42,954
16 M ahbubnagar 7,94,041 7,96,645 15,90,686 1,45,178 1,46,700 2,91,878
17 Medak 6,14,852 6,12,509 12,27,361 1,05,667 1,03,692 2,09,359
18 Nalgonda 8,07,623 7,67,323 15,74,946 1,38,795 1,30,654 2,69,449
19 Nizam abad 5,09,183 5,12,830 10,22,0)3 80,635 82,469 1,63,104
20 W arangal 7,90,739 7,54,696 15,45,435 1,34,501 1,26,002 2,60,503
Total 64,35,051 62,76,734 1.27,11,785 10,94,060 10,71,882 21,65,942
T otal Andhra Pradesh 1,81,61,671 1,78,21,776 3,59,83,447 25,12,325 24,61,291 49,73,616
Source : Census o f Ind ia , 1961, paper No. 1 of 1962.
27
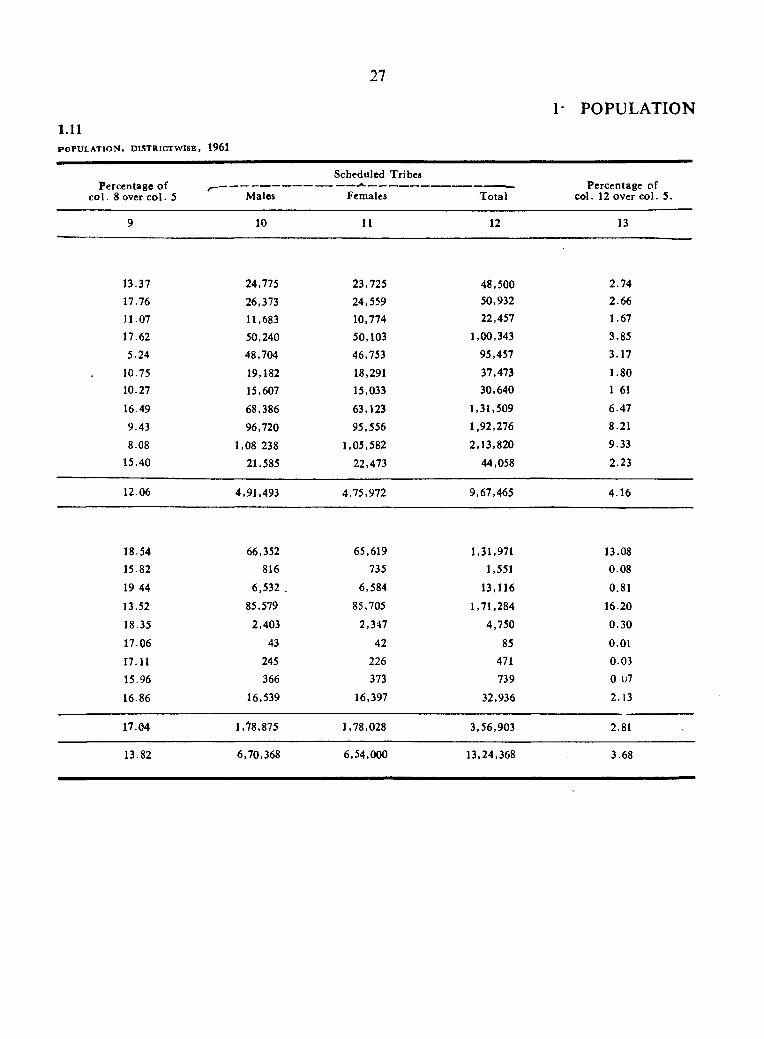
1.11P O P U L A T IO N , D IST R IC T W ISE , 1961
1* POPULATION
Percentage o fc o l . 8 over c o l . 5 Males
Scheduled Tribes
Females T otalPercentage of
col. 12 over col. 5.
10 11 12 13
13.37
17.7611.0717.62
5.24
10.7510.27
16.49
9.43
8.08
15.40
24,775
26,373 11,683
50,240
48,704
19,182
15,607
68,386
96,720
1,08 238
21.585
23,725
24,55910,774
50,103
46,753
18,29115,033
63,123
95,556
1,05,582
22,473
48,50050,93222.457
1,00,343
95.457
37,473 30,640
1,31,509
1,92,276
2,13,820
44,058
2.74 2.66 1.67
3.85
3.17
1.80 1 61
6.47
8.21 9.33
2.23
12.06 4,91,493 4,75,972 9,67,465 4.16
18.54 66,352 65,619 1,31,971 13.0815.82 816 735 1,551 0.08
19 44 6,532 . 6,584 13,116 0.81
13.52 85,579 85,705 1,71,284 16.20
18.35 2,403 2,347 4,750 0.30
17.06 43 42 85 0.01
17.11 245 226 471 0.03
15.96 366 373 739 0 07
16.86 16,539 16,397 32,936 2.13
17.04 1,'^8,875 1,78,028 3.56,903 2.81
13.82 6,70,368 6,54,000 13,24,368 3.68
28
1. POPULATIONT A B L E 1.12
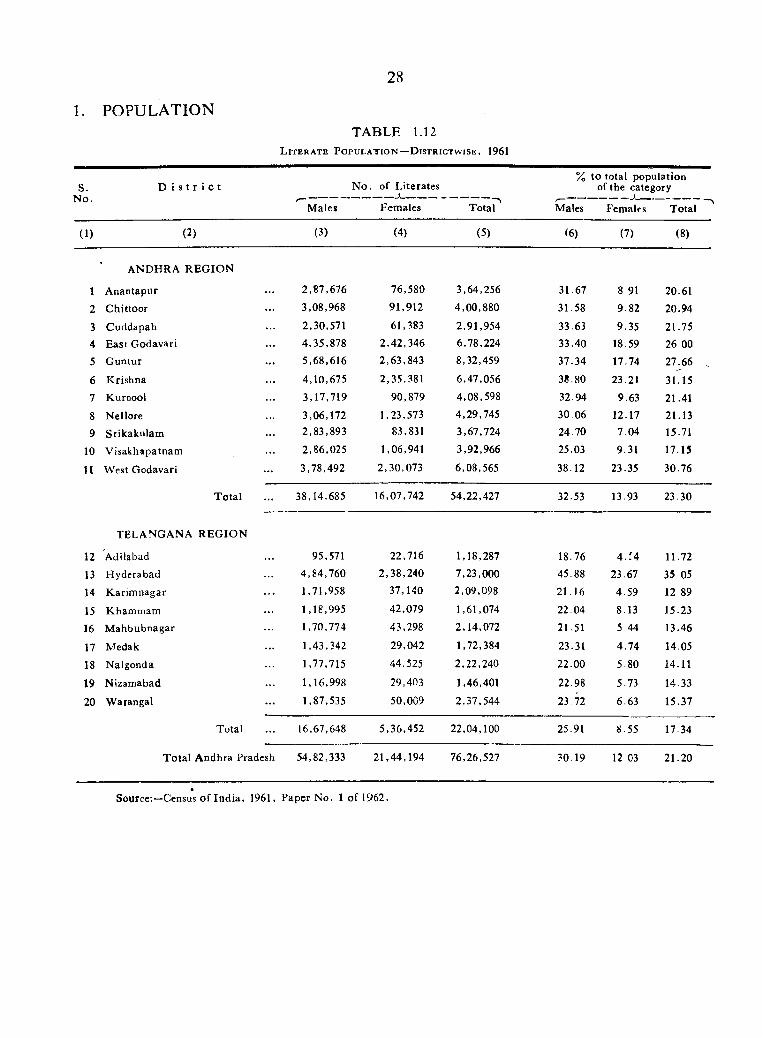
L i t e r a t e P o p u l a t i o n — D i s t r i c t w i s e , 1961
S.N o.
D i s t r i c t N o. of Literates
M ales Females Total
% to total population of the category
Males Females Total
( 1) ( 2) (3) (4) (5) (6) (7) ( 8)
ANDHRA R E G IO N
1 Anantapur
2 Chittoor
3 Cuddapah4 East Godavari
5 G untur
6 K rishna7 Kurnool
8 Nellore9 Srikakulam
10 V is a k h a p a tn a m
11 West Godavari
2,87,676 76,580 3,64,256 31.67 8.91 20.613,08,968 91,912 4,00,880 31.58 9.82 20.942,30,571 61,383 2,91,954 33.63 9.35 21.754,35,878 2,42,346 6,78,224 33.40 18.59 26 005,68,616 2,63,843 8,32,459 37.34 17.74 27.66 .4,10,675 2,35,381 6,47,056 38.80 23.21 31.153,17,719 90,879 4,08,598 32.94 9.63 21.413,06,172 1,23,573 4,29,745 30 06 12.17 21.132,83,893 83,831 3,67,724 24 70 7 04 15.71
2,86,025 1,06,941 3,92,966 25.03 9.31 17.15
3,78,492 2,30,073 6,08,565 38.12 23.35 30.76
T otal 38,14,685 16,07,742 54,22,427 32.53 13.93 23.30
TELANGANA R EG IO N
12 Adilabad 95,571 22,716 1,18,287 18.76 4 .M 11.72
13 H yderabad 4 ,84,760 2,38,240 7,23,000 45.88 23.67 35 05
14 K arim nagar 1,71,958 37,140 2,09,098 21.16 4.59 12 89
15 K hammam 1,18,995 42,079 1,61,074 22.04 8.13 15.23
16 M ahbubnagar 1,70,774 43,298 2,14,072 21.51 5.44 13.46
17 Medak 1,43,342 29,042 1,72,384 23.31 4.74 14.05
18 Nalgonda 1,77,715 44.525 2,22,240 22.00 5.80 14.11
19 Nizamabad 1,16,998 29,403 1,46,401 22.98 5.73 14 33
20 W arangal 1,87,535 50,009 2,37,544 23.72 6.63 15.37
Total 16,67,648 5,36,452 22,04,100 25.91 8.55 17.34
T o ta l A ndhra Pradesh 54,82,333 21,44,194 76,26,527 ?0.19 12 03 21.20
Source;—Census o f Ind ia , 1961, Paper No. 1 of 1962.

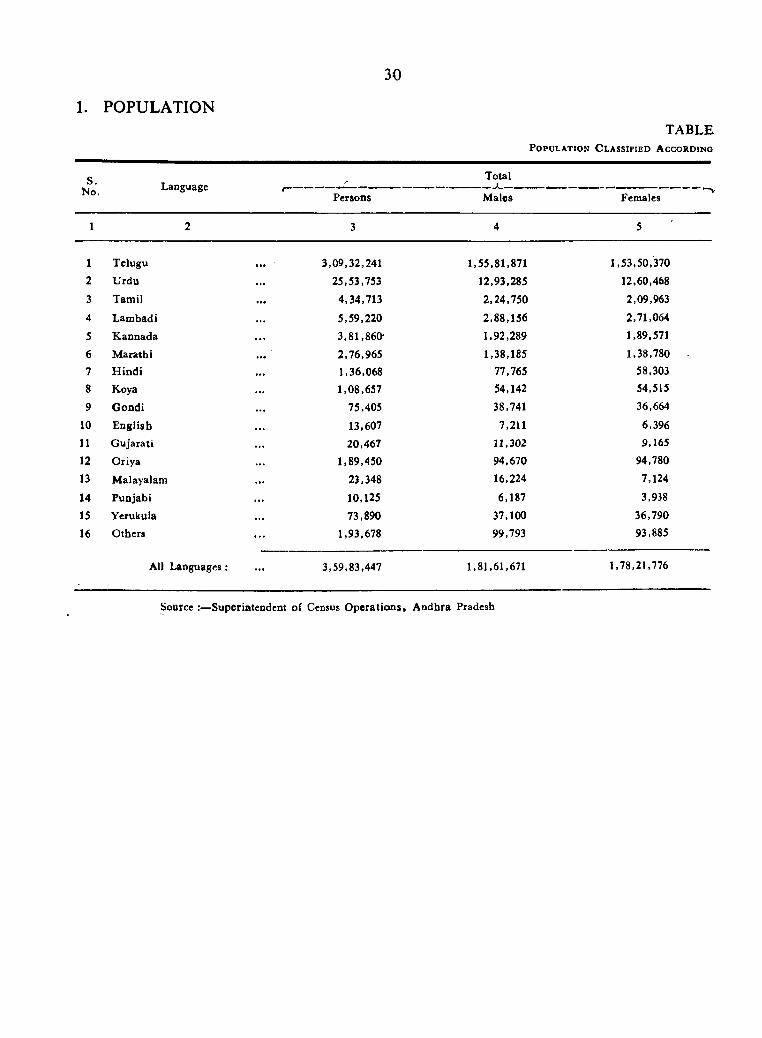
30
1. POPULATIONT A BLE
P o p u l a t io n C l a s s if ie d A c c o r d in g
S.No. Language
Persons
Total---- *___M ales Females
1
23
4
5
67
8 9
10111213
14
15
16
Telugu
U rdu
Tam il
Lam badiK annada
M arathi
H ind i
Koya
G ondi
E nglish
G ujarati
O riya
M alayalam
Punjabi
Yerukula
O thers
All Languages
3,09,32.241
25,53,753
4,34,713
5,59,220
3,81,860-
2,76,965
1,36,0681,08,657
75,405
13,607
20,467
1,89,450
23,348
10,125
73,890
1,93,678
1,55,81,871
12,93,285
2,24,750
2,88,156
1,92,289
1,38,185 77.765 54,142
38,741
7,211 11,302
94,670
16,224
6,187
37,100
9 9 ,m
1,53,50,370
12,60,468
2,09,963
2,71,064
1,89,571
1,38,78058,30354,515
36,664
6,3969,165
94,780
7,124
3,938
36,79093,885
3,59,83,447 1,81,61,671 1,78,21,776
Source :—Superintendent of Census O pera tions, A ndhra Pradesh
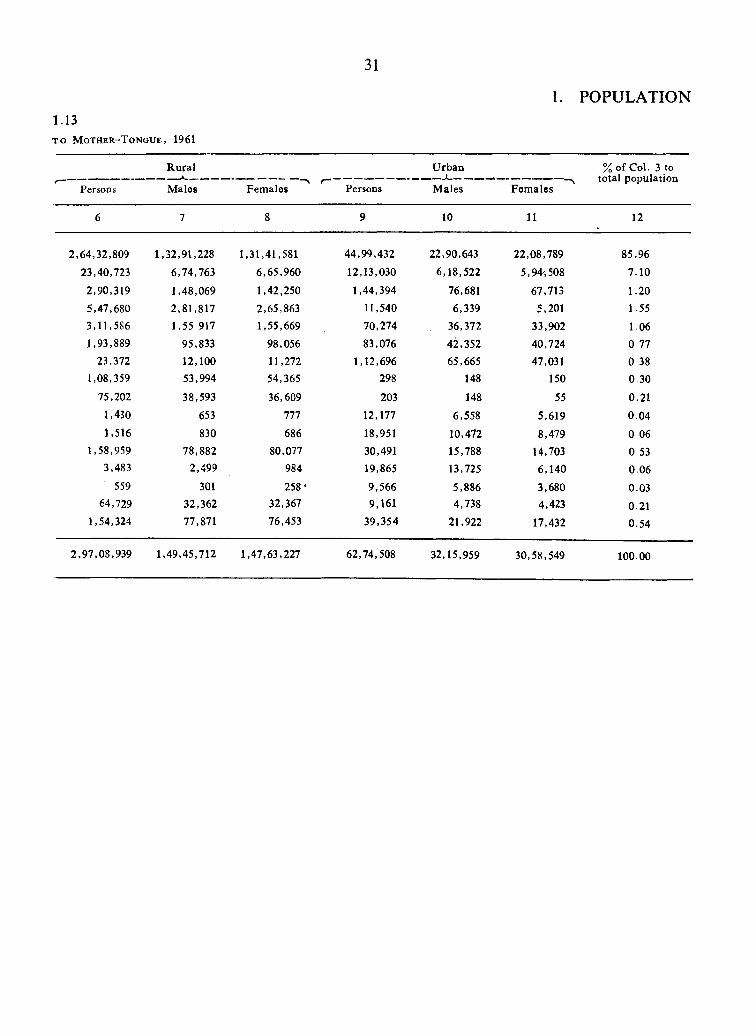
31
1. POPULATION1.13T O M o t h e r - T o n g u e , 1961
Persons
R ural
Males Fem ales P ersons
U rban ___i___M ales Fem ales
% of Col. 3 to total population
10 11 1 2
2,64,32,809
23,40,723
2,90,319
5,47,680
3 , 11 ,586
1,93,889
23,3721,08,359
75,202
1,430
1,516
1,58,9593,483
559
64,7291,54,324
1,32,91,228
6,74,763
1,48,069
2,81,817 1,55 917
95,833
12,100 53,994
38,593
653
830 78,882
2,499
301 32,362 77,871
1,31,41,581
6,65,960
1,42,250
2,65,8631,55,669
98,056
11,27254,365
36,609777
686
80,077
984
258*32,367
76,453
44,99,432
12,13,030
1,44,394
11,540
70,274
83,076
1,12,696298
20312,177
18,95130,491
19,865
9,5669,161
39,354
22,90,643
6,18,522
76,681
6,33936,372
4 l3 5 2
65,665148
148
6,558
10,47215,788
13,725
5,8864,738
21,922
22,08,789
5,94,508
67,7135,201
33,902
40,724
47,031150
55
5,619
8,479
14,7036,140
3,6804,423
17,432
85.96
7.10
1.20 1.55
1.06 0 77
0 38 0.30
0.21 0.04
0 06
0 53
0.06
0.03
0.21 0.54
2,97,08,939 1,49,45,712 1,47,63,227 62,74,508 32,15,959 30,58,549 100.00
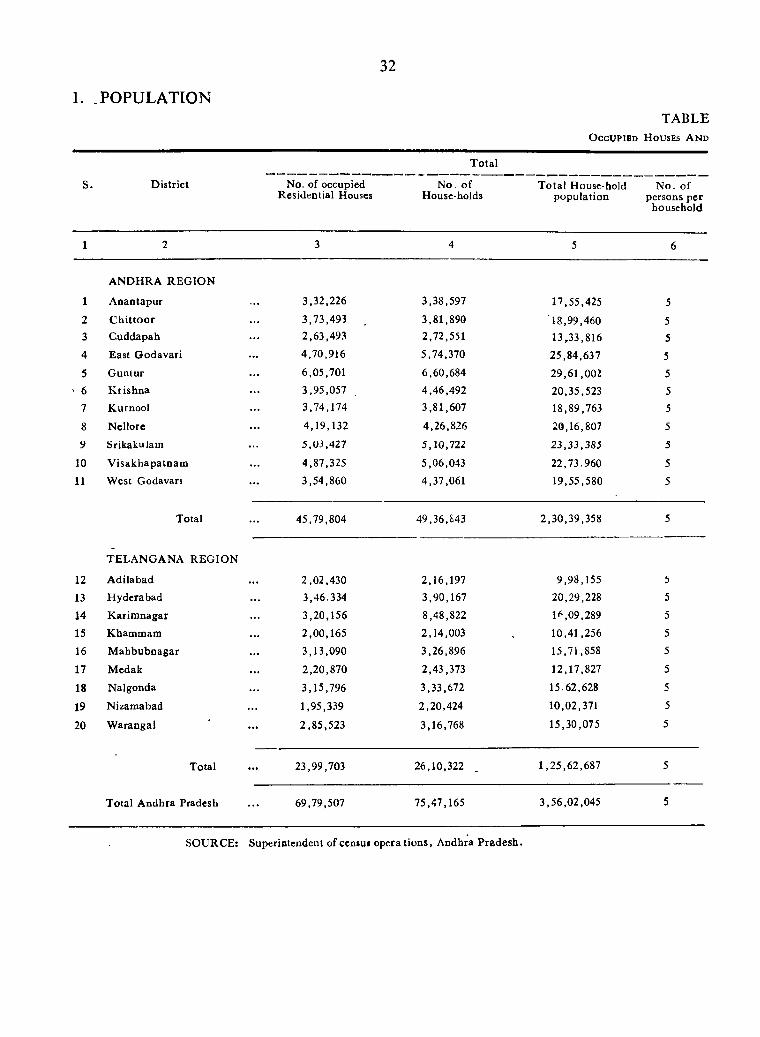
32
1. POPULATIONTABLE
O c c u p ie d H ouses A n d
S. D istrict No. of occupied Residential Houses
T otal
No. of House-holds
T o ta l House-hold population
N o. o f persons per
household
1 2 3 4 5 6
ANDHRA R EG IO N
1 A nantapur . . . 3,32,226 3,38,597 17,55,425 52 C h itto o r . . . 3.73,493 3,81,890 18,99,460 53 C uddapah . . . 2,63,493 2,72,551 13,33,816 54 East G odavari . . . 4,70,916 5,74,370 25,84,637 55 G untur . . . 6,05,701 6,60,684 29,61,002 5
' 6 K rishna . . . 3,95,057 4,46,492 20,35,523 57 K urnool . . . 3,74,174 3,81,607 18,89,763 5
8 Ncllorc . . . 4,19,132 4,26,826 20,16,807 5
9 Srikakulam . . . 5,03,427 5,10,722 23 ,33 ,385 5
10 V isaichapatnam . . . 4,87,325 5,06,043 22,73.960 5
11 W est Godavari . . . 3,54,860 4,37,061 19,55,580 5
Total . . . 45,79,804 49,36,843 2,30,39,358 5
TELA N G A N A REG IO N
12 A dilabad . . . 2,02,430 2,16,197 9,98,155 5
13 H yderabad . . . 3,46.334 3,90,167 20,29,228 5
14 K arim nagar 3,20,156 8,48,822 1^^,09,289 5
15 Kbammani . . . 2,00,165 2,14,003 10,41,256 5
16 M ahbuboagar 3,13,090 3,26,896 15,71,858 5
17 M edak . . . 2,20,870 2,43,373 12,17,827 5
18 Nalgonda . . . 3,15,796 3,33,672 15.62,628 5
19 Nizamabad . . . 1,95,339 2,20,424 10,02,371 5
20 W arangal . . . 2,85,523 3,16,768 15,30,075 5
Total . . . 23,99,703 26,10,322 1,25,62,687 5
T otal A ndhra Pradesh . . . 69,79,507 75,47,165 3,56,02,045 5
SOURCE; Superintendent of ccnsui opera tions, Andhra P radesh .
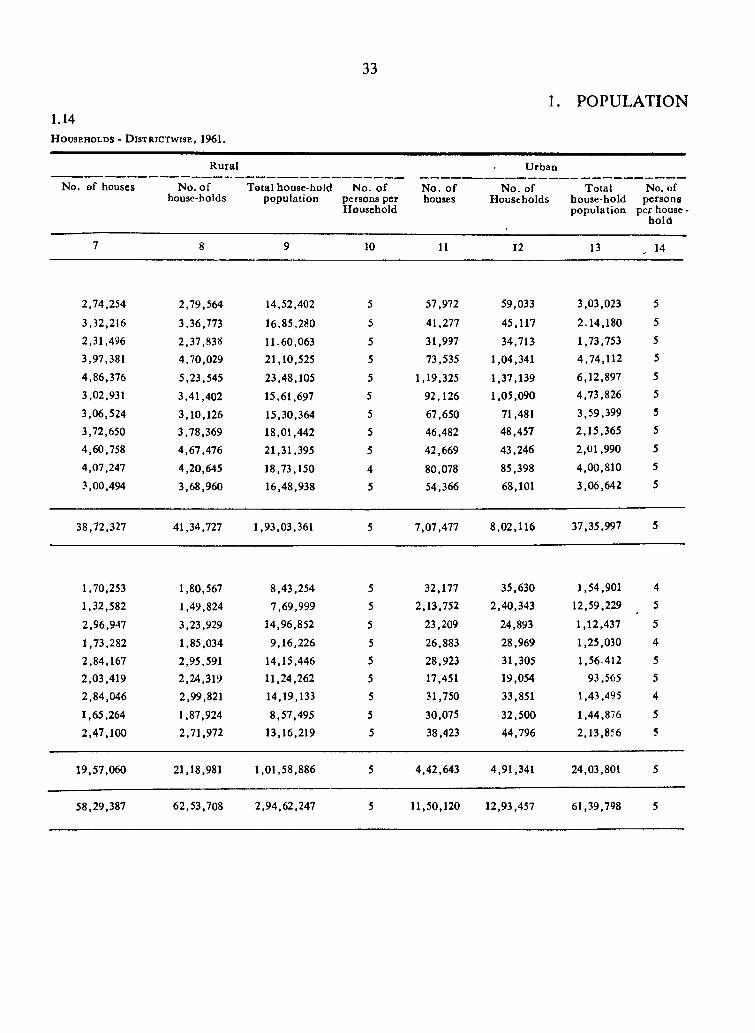
33
1. POPULATION1.14H o u seh o l d s - D is t r ic t w is e , 1961.
R ural U rban
No. of houses No. o f Total house-hold No. o f N o. o fhouse-holds population persons per houses
Household
N o. of Households
T otal No. of house-hold persons population per house •
ho ld
10 11 12 13 14
2,74,254
3,32,216
2,31,496
3,97,381
4,86,376
3,02,931
3,06,524
3,72,6504,60,758
4,07,247
3,00,494
2,79,564
3,36,773
2,37,83S
4,70,029
5,23,545
3,41,402
3,10,126
3,78,369
4,67,476
4,20,645
3,68,960
14,52,402
16,85.280
11.60,06321,10,525
23,48,105
15,61,697
15,30,36418.01,442
21,31,395
18,73,150
16,48,938
5 57,972 59,033 3.03,023 5
5 41,277 45,117 2.14,180 5
5 31,997 34,713 1,73,753 5
5 73,535 1,04,341 4,74,112 5
5 1,19,325 1.37,139 6,12,897 5
5 92,126 1,05,090 4,73,826 5
5 67,650 71,481 3,59,399 5
5 46,482 48,457 2,15,365 5
5 42,669 43,246 2,01,990 5
4 80,078 85,398 4,00,810 5
5 54,366 68,101 3,06,642 5
38,72,327 41,34,727 1,93,03,361 5 7.07,477 8,02.116 37.35,997 5
1,70,253 1,80,567 8,43,254 5 32,177 35,630 1,54.901 4
1,32,582 1,49,824 7,69,999 5 2,13,752 2,40,343 12.59,229 5
2,96,947 3,23,929 14,96,852 5 23,209 24,893 1,12,437 5
1,73,282 1,85,034 9,16,226 5 26,883 28,969 1,25,030 4
2,84,167 2,95,591 14,15,446 5 28,923 31,305 1,56.412 5
2,03,419 2,24,319 11,24,262 5 17,451 19,054 93,565 5
2,84,046 2,99,821 14,19,133 5 31,750 33,851 1,43,495 4
1,65,264 1,87,924 8,57,495 5 30,075 32,500 1,44,876 5
2,47,100 2,71,972 13,16,219 5 38,423 44,796 2,13,856 5
19,57,060 21,18,981 1.01,58,886 5 4,42,643 4,91,341 24,03,801 5
58,29,387 62,53,708 2,94,62,247 5 11,50,120 12,93,457 61,39,798 5
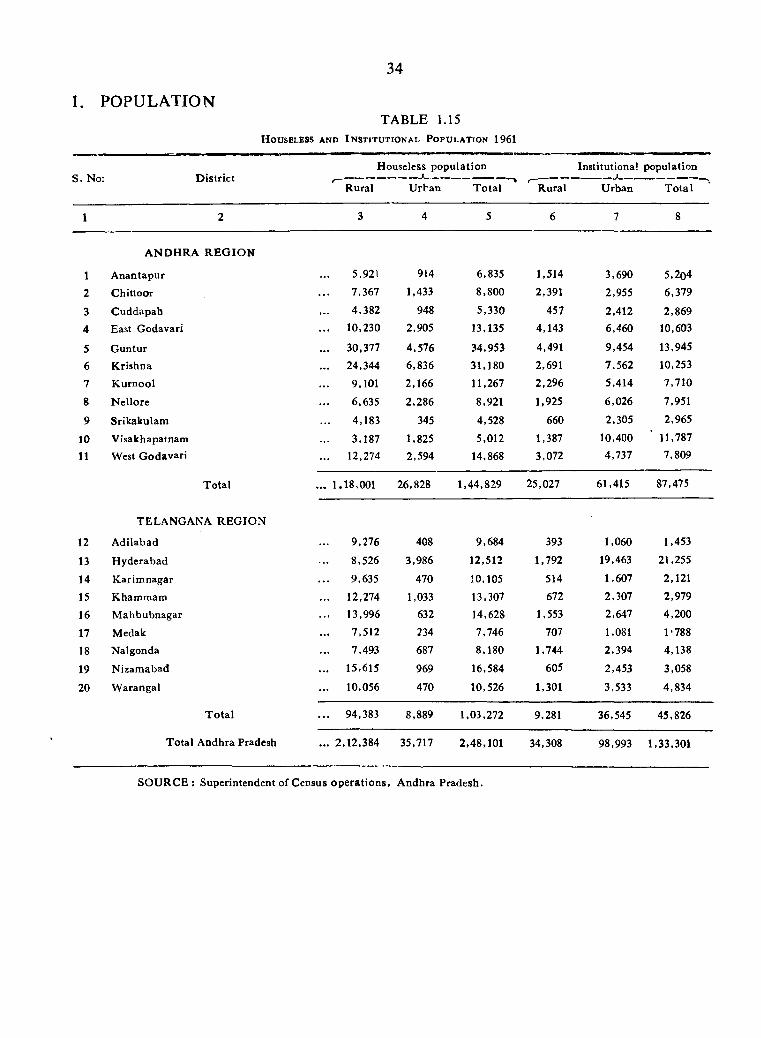
34
1. POPULATIONTABLE 1.15
H ouseless a n d I n s t it u t io n a l P o p u l a t io n 1961
S. No: D istric tHouseless population Institutional population
Rural U rban T o ta l R ural U rban T o ta l
1 2 3 4 5 6 7 8
A N D H R A R E G IO N
1 A nantapur 5,921 914 6,835 1,514 3,690 5,2o4
2 Chittoor 7,367 1,433 8,800 2,391 2,955 6,379
3 C uddapah 4,382 948 5,330 457 2,412 2,869
4 East Godavari .. . 10,230 2,905 13,135 4,143 6,460 10,603
5 G untur ... 30,377 4,576 34,953 4,491 9,454 13,945
6 K rishna ... 24,344 6,836 31,180 2,691 7.562 10,253
7 K urnool 9,101 2,166 11,267 2,296 5,414 7,710
8 N ellore 6,635 2,286 8,921 1,925 6,026 7,951
9 Srikakulam 4,183 345 4,528 660 2,305 2,965
10 V isakhapatnam 3,187 1,825 5,012 1,387 10,400 ■ 11,787
11 West G odavari ... 12,274 2,594 14,868 3,072 4,737 7,809
T otal ... 1.18,001 26,828 1,44,829 25,027 61,415 87,475
TELANGANA R EG IO N
12 A dilabad 9,276 408 9,684 393 1,060 1,453
13 H yderabad 8,526 3,986 12,512 1,792 19,463 21,255
14 K arim nagar 9,635 470 10,105 514 1,607 2,121
15 K ham m am ... 12,274 1,033 13,307 672 2,307 2,979
16 M ahbubnagar ... 13,996 632 14,628 1,553 2,647 4,200
17 Medak 7,512 234 7,746 707 1,081 1‘788
18 Nalgonda 7,493 687 8,180 1,744 2,394 4,138
19 N izam abad ... 15,615 969 16,584 605 2,453 3,058
20 W arangal ... 10,056 470 10,526 1,301 3,533 4,834
T o ta l . . . 94,383 8,889 1,03,272 9,281 36,545 45,826
T otal Andhra Pradesh ... 2,12,384 35,717 2,48,101 34,308 98,993 1,33,301
SO U R C E : Superintendent of Census o p era tions, A ndhra Pradesh.
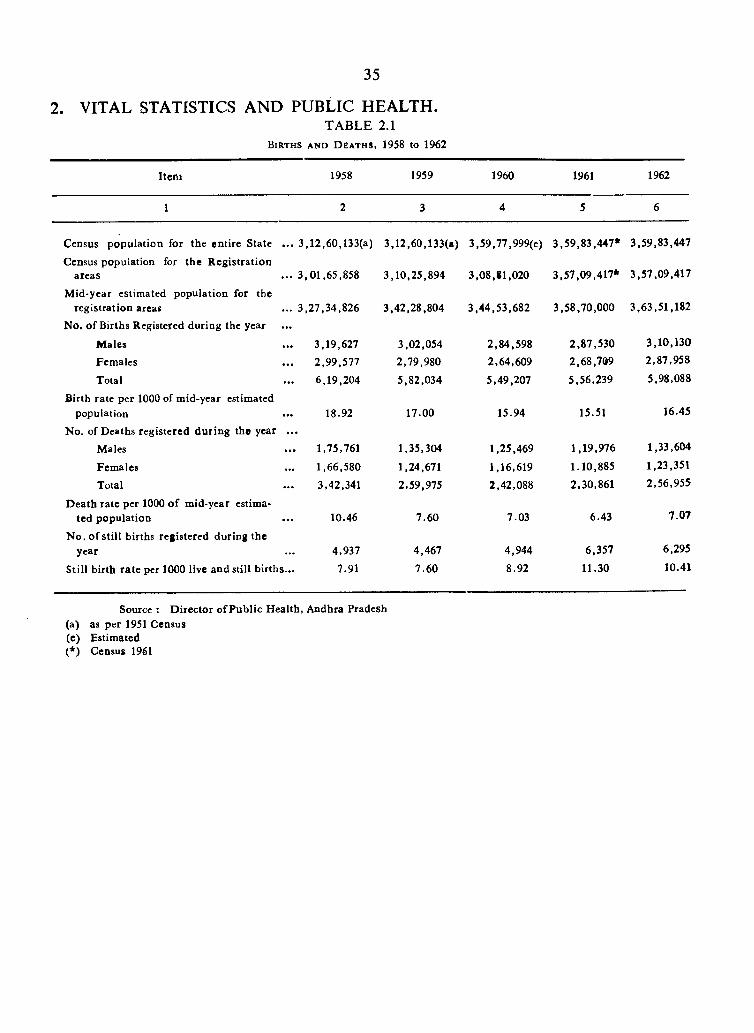
2. VITAL STATISTICS AND PUBLIC HEALTH.TABLE 2.1
B i r t h s a n d D e a t h s , 1958 t o 1962
35
Item 1958 1959 1960 1961 1962
1 2 3 4 5 6
Census population for the entire State • •• 3 ,1 2 .6 0 ,133(a) 3,12,60,133(8) 3 ,5 9 .7 7 ,999(e) 3.59,83.447* 3.59.83,447
Census population for the R egistration areas . . . 3,01,65,858 3,10,25,894 3,08,81,020 3.57,09,417* 3.57.09.417
M id-year estim ated population for the registration areas 3 ,27,34,826 3,42,28,804 3 .44.53,682 3,58,70,000 3,63,51.182
No. o f Births Registered during the year • ••Males 3,19,627 3,02,054 2,84.598 2,87,530 3,10.130
Females . . . 2,99,577 2,79,980 2,64,609 2.68.709 2,87,958
Total • •• 6,19,204 5,82,034 5,49,207 5,56.239 5,98,088
Birth rate per 1000 of mid-year estimated population 18.92 17.00 15.94 15.51 16.45
No. of Deaths registered du rin g the year . . .Males . . . 1,75,761 1,35,304 1,25,469 1.19.976 1,33,604
Females . . . 1,66,580 1,24,671 1,16,619 1.10.885 1,23,351
Total . . . 3,42,341 2,59,975 2,42,088 2,30,861 2,56,955
D eath rate per 1000 o f m id-year estimated population • • • 10.46 7.60 7.03 6.43 7.07
N o, o f still births registered during the year 4,937 4,467 4.944 6.357 6.295
Still b irth ra te per 1000 live and still b irths... 7.91 7.60 8.92 11.30 10.41
Source : D irector o f Public H ealth, Andhra Pradesh (a) as per 1951 Census (e) Estimated (*) Census 1961
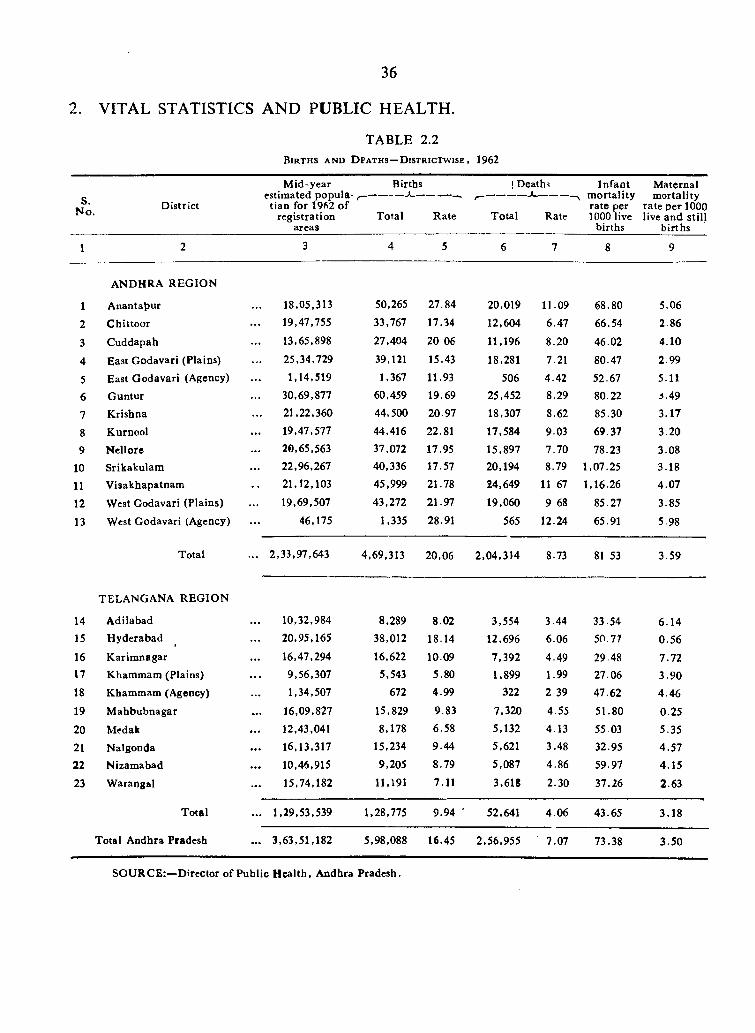
36
TABLE 2.2B i r t h s a n d D e a t h s — D i s t r i c t w i s e , 1962
2. VITAL STATISTICS AND PUBLIC HEALTH.
S.N o. D istrict
M id-year estimated popula-
tian for 1962 o f registration
areas
Births ! Deaths
Total Rate T otal Rate
In fao t m ortality rate per 1000 live
births
M aternal m ortality
rate per 1000 live and still
b irths
8
ANDHRA R EG IO N
1 Anantat)ur 18.05,313 50,265 27.84 20,019 11.09 68.80 5.06
2 C hittoor 19,47,755 33,767 17.34 12,604 6.47 66.54 2.86
3 Cuddapah 13,65,898 27,404 20 06 11,196 8.20 46.02 4.10
4 East G odavari (Plains) 25,34,729 39,121 15.43 18,281 7.21 80.47 2.99
5 East G odavari (Agency) 1,14,519 1,367 11.93 506 4.42 52.67 5.11
6 G untur 30,69,877 60,459 19.69 25,452 8.29 80.22 3.49
7 Krishna 21,22,360 44,500 20.97 18,307 8.62 85.30 3.17
8 Kurnool 19,47,577 44,416 22.81 17,584 9.03 69.37 3.20
9 N ellore 20,65,563 37,072 17.95 15,897 7.70 78.23 3.08
10 Srikakulam 22,96,267 40,336 17.57 20,194 8.79 1,07.25 3.18
11 Visakhapatnam 21,12,103 45,999 21.78 24,649 11 67 1,16.26 4.07
12 West Godavari (P lains) 19,69,507 43,272 21.97 19,060 9 68 85.27 3.85
13 West G odavari (Agency) 46,175 1,335 28.91 565 12.24 65.91 5.98
Total ... 2,33,97,643 4,69,313 20,06 2,04,314 8.73 81 53 3.59
TELANGANA R EG IO N
14 A diiabad 10,32,984 8,289 8.02 3,554 3.44 33.54 6.1415 H yderabad 20,95,165 38,012 18.14 12,696 6.06 50.77 0.56
16 K arim nagar 16,47,294 16,622 10.09 7,392 4.49 29.48 7.7217 Khammam (Plains) 9,56,307 5,543 5.80 1,899 1.99 27.06 3.9018 Khammam (Agency) 1,34,507 672 4.99 322 2 39 47.62 4.4619 M ahbubnagar 16,09,827 15,829 9.83 7,320 4.55 51.80 0.25
20 Medak 12,43,041 8,178 6.58 5,132 4.13 55.03 5.35
21 N algonda 16,13,317 15,234 9.44 5,621 3.48 32.95 4.57
22 Nizamabad 10,46,915 9,205 8.79 5,087 4.86 59.97 4.15
23 W arangal 15,74,182 11,191 7.11 3,618 2.30 37.26 2.63
T otal 1,29,53,539 1,28,775 9.94 • 52,641 4.06 43.65 3.18
Total Andhra Pradesh 3,63,51,182 5,98,088 16.45 2,56,955 ■ 7.07 73.38 3.50
SO U R C E:—Director of Public H ealth , A ndhra Pradesh.
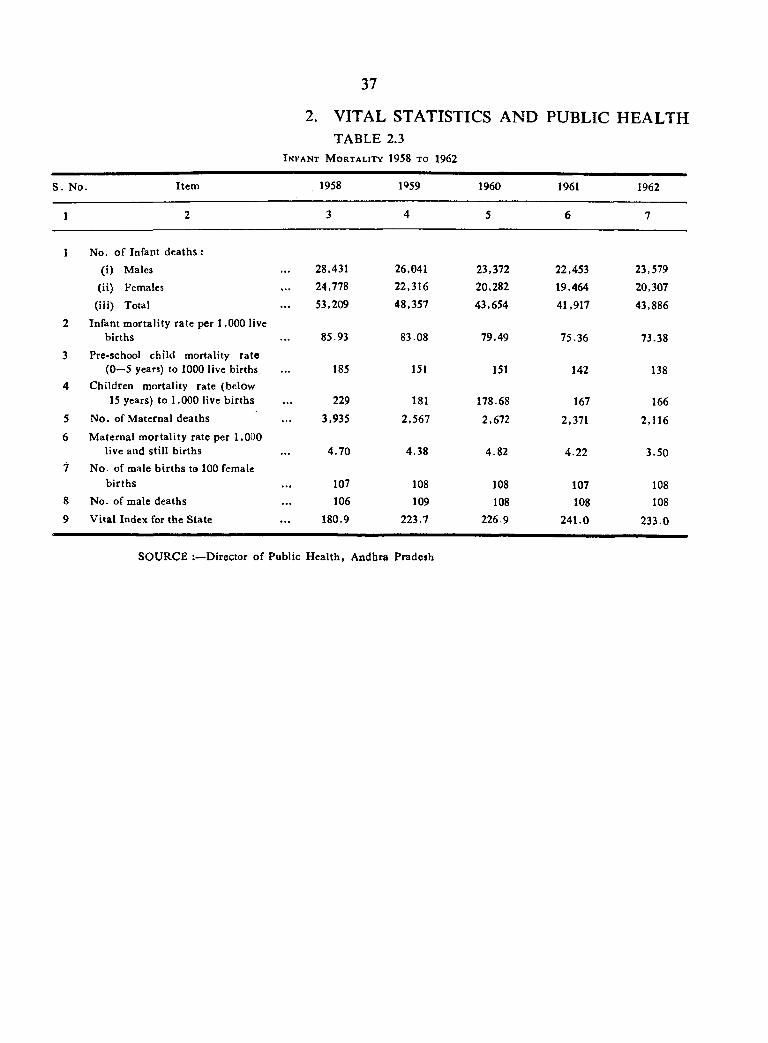
37
2. VITAL STATISTICS AND PUBLIC HEALTHTABLE 2.3
I n f a n t M o r t a l i t y 1958 t o 1962
S . No Item 1958 1059 1960 1961 1962
1 2 3 4 5 6 7
1 No. o f Infant deaths :
(i) Males 28,431 26,041 23,372 22,453 23,579
(ii) Females 24,778 22,316 20.282 19,464 20,307
(iii) Total 53,209 48,357 43,654 41,917 43.886
2 Infant m ortality rate per 1,000 live births 85.93 83.08 79.49 75.36 73.38
3 Pre-school child mortality ra te (0—5 years) to 1000 live births 185 151 151 142 138
4 Children mortality rate (below 15 years) to 1,000 live b irths 229 181 178.68 167 166
5 N o. of M aternal deaths 3,935 2,567 2,672 2,371 2,1166 M aternal m ortality rate per 1,000
live and still births 4.70 4.38 4.82 4.22 3.507 N o. of male b irth s te 100 female
b irths 107 108 108 107 1088 N o. of male deaths 106 109 108 108 1089 V ital Index for the State 180.9 223.7 226-9 241.0 233.0
SO URCE :—D irector o f Public H ealth , A ndhra P radeih
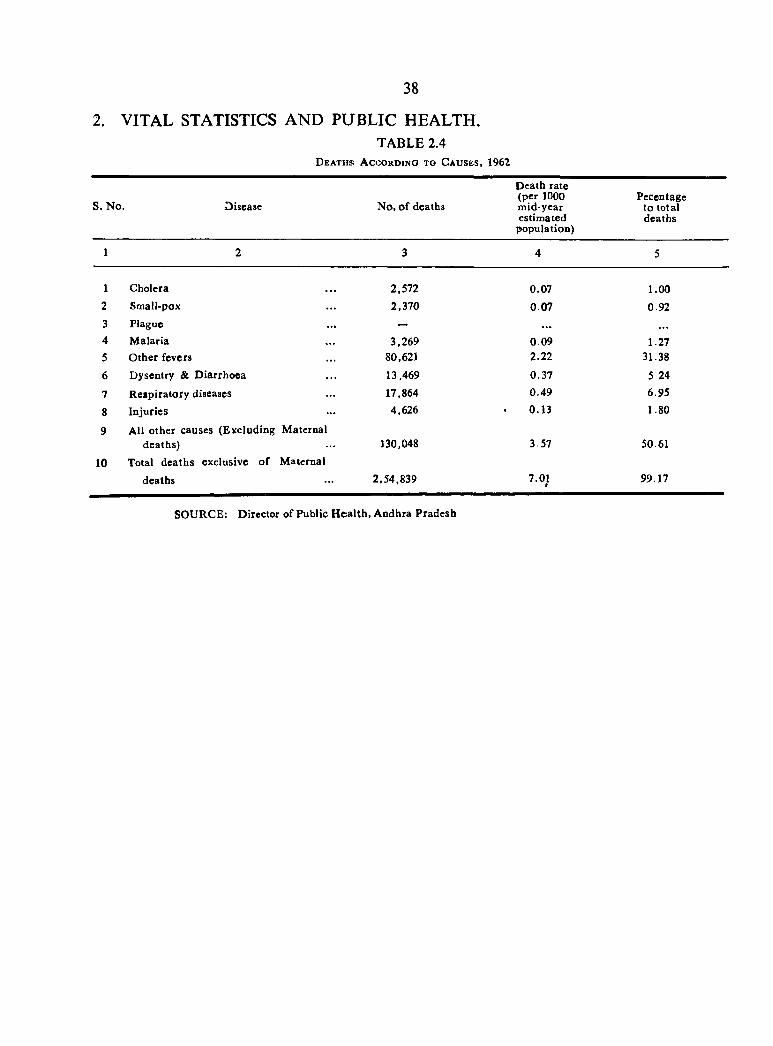
38
2. VITAL STATISTICS AND PUBLIC HEALTH.TABLE 2.4
D ea th s; A c c o r d in g to C a u s e s , 1962
S. No. Disease No, o f deaths
D eath rate (per 1000 m id-year estim ated
population)
Pecentage to total deaths
1 2 3 4 5
1 Cholera 2,572 0.07 1.002 Small-pox ... 2,370 0.07 0.923 Plague ... — ...4 M alaria ... 3,269 0.09 1.275 O ther fevers ... 80,621 2.22 31.38
6 Dysentry & D iarrhoea 13,469 0.37 5 24
7 R espiratory diseases ... 17,864 0.49 6.95
8 Injuries 4,626 0.13 1.80
9 All other causes (Excluding M aternal deaths) 130,048 3.57 50.61
10 Total deaths exclusive o f
deaths
M aternal
2,54.839 7.019 99.17
SO URCE; Director of Public H ea lth , A ndbra Pradesh
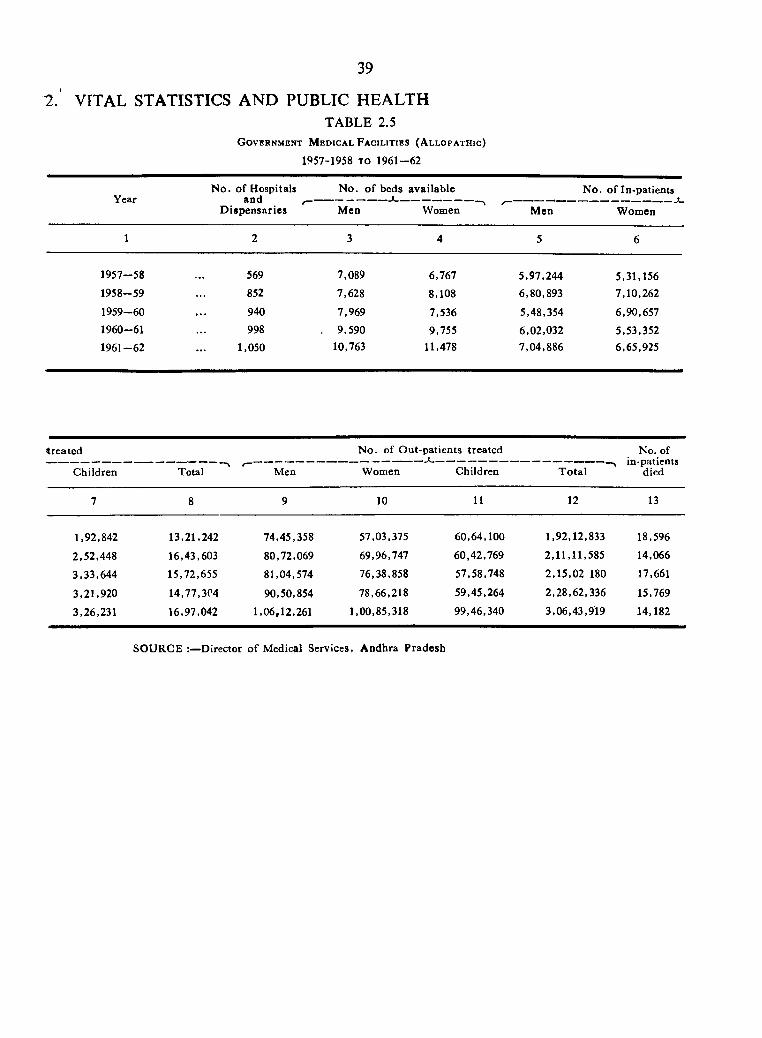
39
TABLE 2.5G o v e r n m e n t M e d i c a l F a c i l i t i e s ( A l l o p a t h i c )
1957-1958 TO 1961-62
2. VITAL STATISTICS A N D PUBLIC HEALTH
YearN o . o f Hospitals
3odN o . o f beds available N o. o f In-patients
D ispensaries Men—\
Women M en Women
1 2 3 4 5 6
1957-58 569 7,089 6,767 5,97,244 5,31,1561958-59 852 7,628 8,108 6,80,893 7,10,262
1959-60 940 7,969 7,536 5,48,354 6,90,657
1960-61 998 9,590 9,755 6,02,032 5,53,3521961-62 1,050 10,763 11,478 7,04,886 6,65,925
trea ted
Children Total Men
N o. of O ut-patients treated
Women Children T o ta l
No. of in-patients
died
7 8 9 10 11 12 13
1,92,842 13,21,242 74,45,358 57,03,375 60,64,100 1,92,12,833 18,596
2,52,448 16,43,603 80,72,069 69,96,747 60,42,769 2,11,11,585 14,066
3,33,644 15,72,655 81,04,574 76,38,858 57,58,748 2,15,02 180 17,661
3,21,920 14,77,304 90,50,854 78,66,218 59,45,264 2,28,62,336 15,769
3,26,231 16,97,042 1,06,12,261 1,00,85,318 99,46,340 3,06,43,919 14,182
SOURCE :—Director o f Medical Services, A ndhra Pradesh
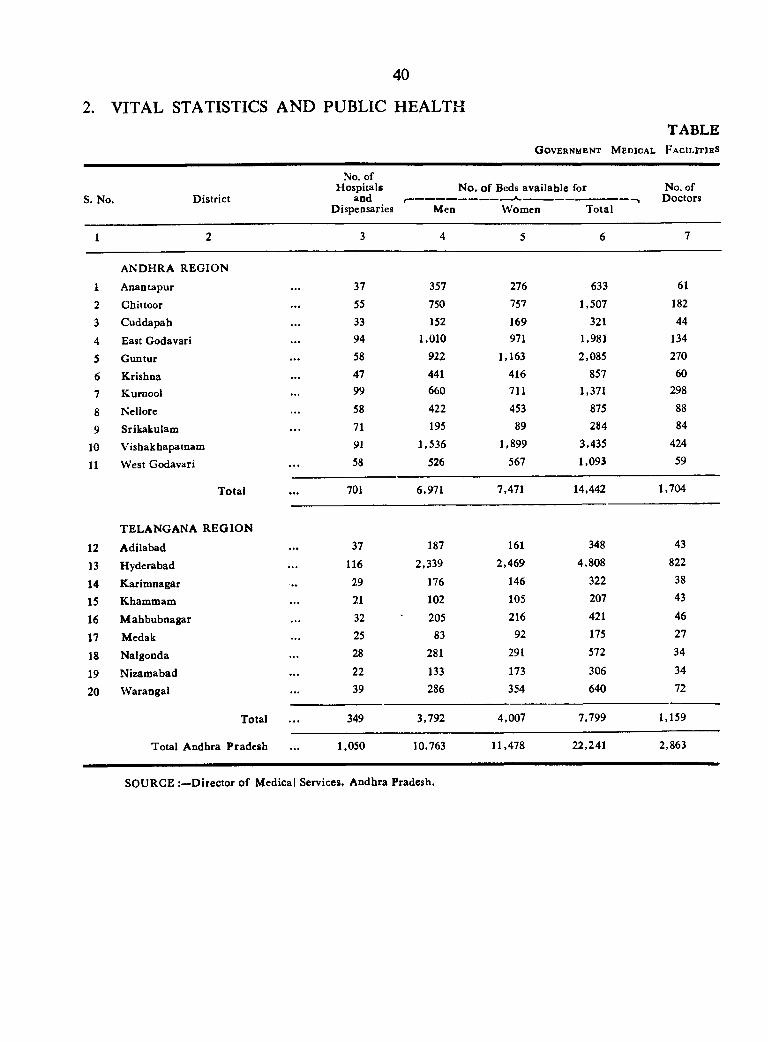
40
2 . VITAL STATISTICS AND PUBLIC HEALTH
G o v e r n m e n t M e d i c a l
T A B L E
F a c i l i t i e s
s. No. D istrict
No. of Hospitals
and Dispensaries
N o. o f Beds available for No. of Doctors
Men W omen Total
1 2 3 4 5 6 7
AND HRA R EG IO N
1 A nantapur . . . 37 357 276 633 61
2 Chittoor . . . 55 750 757 1,507 182
3 C uddapah . . . 33 152 169 321 44
4 East Godavari . . . 94 1,010 971 1,981 134
5 G untur . . . 58 922 1,163 2,085 270
6 K rishna . . . 47 441 416 857 60
7 Kurnool . . . 99 660 711 1,371 298
8 Nellore . . . 58 422 453 875 88
9 Srikakulam . . . 71 195 89 284 84
10 Visbakbapatnam 91 1,536 1,899 3,435 424
11 W est Godavari . . . 58 526 567 1,093 59
T otal 701 6,971 7,471 14,442 1,704
TELA NG AN A R E G IO N
12 A dilabad . . . 37 187 161 348 43
13 Hyderabad . . . 116 2,339 2,469 4,808 822
14 K arim nagar 29 176 146 322 38
15 Kham tnam . . . 21 102 105 207 43
16 M ahbubnagar . . . 32 205 216 421 46
17 Medak . . . 25 83 92 175 27
18 Nalgonda . . . 28 281 291 572 34
19 N izam abad . . . 22 133 173 306 34
20 W arangal . . . 39 286 354 640 72
Total . . . 349 3,792 4,007 7,799 1,159
Total A ndhra Pradesh . . . 1,050 10,763 11,478 22,241 2,863
SO URCE D irector o f M edical Services, A ndhra Pradesh.
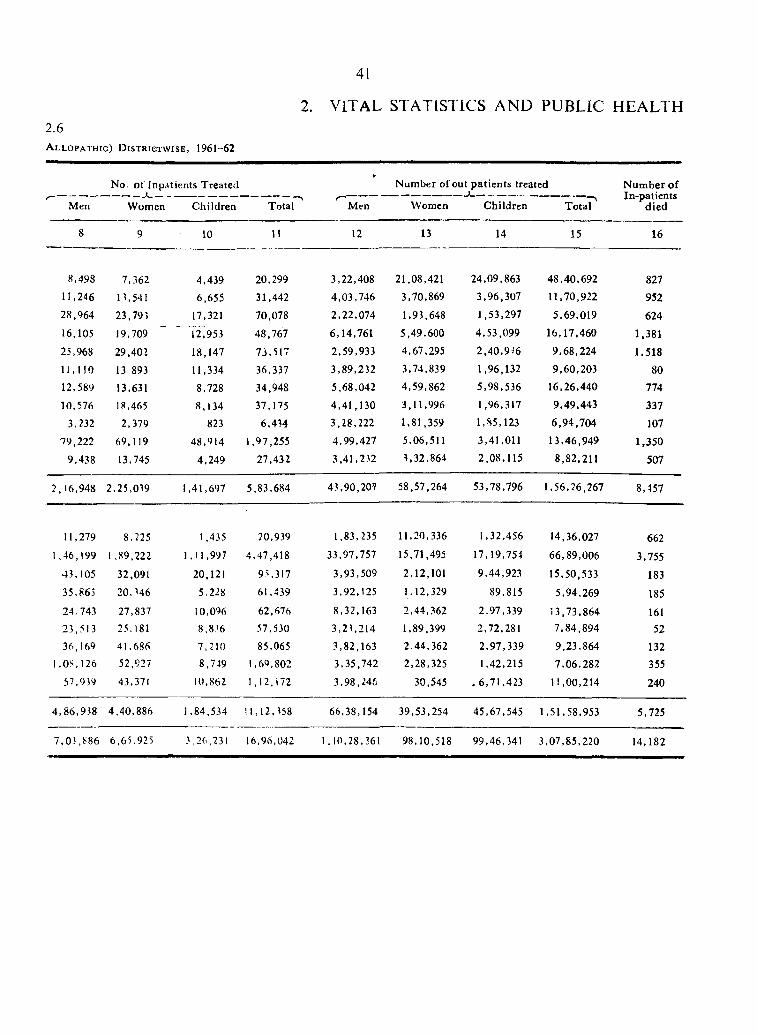
2.6
A l l o p a t h i c ) D i s t r i g t w i s e , 1961-62
41
2. VITAL STATISTICS AND PUBLIC HEALTH
No. o f Inpatients Treated
Men Women Children Total
N um ber of out patients treated
Men Women Children Total
10 n 12 13 14 15
N um ber o f In-patients
d ied
16
8,498
11,246
28,964
16,105
25,968
1 1 , 1 1 0
12,589
10,576
3,23279,222
9,438
7,362
n ,5 4 1
23,791
19,709
29,402
13 893
13,631
18,465
2,379
69,119
13,745
4,439
6,655
17,321
r2~95318,147
11,334
8,728
8,134
823
48,914
4,249
20,299
31,442
70,078
48,767
73,517
36,337
34,948
37,175
6,434
1,97,255
27,432
3,22,4084,03,746
2,22,074
6,14,761
2,59,933
3.89.232
5,68,042
4,41,130
3,28,222
4,99,427
3.41.232
21,08,421
3,70,869
1,93,648
5,49,600
4,67,295
3,74,839
4,59,862
3,11,996
1,81,359
5,06,511
3,32,864
24,09,8633,96,307
1,53,297
4,53,099
2,40,9^’6
1,96,132
5,98,536
1,96,317
1,85,123
3,41,0112,08,115
48,40,692
11,70,922
5,69,019
16,17,460
9.68,224
9,60,203
16,26,440
9,49,443
6,94.70413,46,949
8,82,211
827
952
624
1 ,381
1 .5 1 8
80
774
337
107
1 ,3 5 0
507
2.16,948 2,25,039 1,41,697 5,83,684 43,90,207 58,57,264 53,78,796 1,56,26.267 8,457
11,279 8,225 1 ,435 20,939 1,83,235 11,20,336 1,32,456 14,36,027 6621.46,199 1.89,222 1,11,997 4,47,418 33,97,757 15.71,495 17,19,754 66,89,006 3,755
43,105 32.091 20,121 95,317 3,93,509 2,12,101 9,44,923 15,50,533 18335,865 20. M6 5,228 61.439 3,92,125 1.12,329 89,815 5,94,269 18524,743 27,837 10,0% 62.676 8,32,163 2,44,362 2,97,339 13,73,864 16123,513 25.181 8.8:<6 57,530 3,23,214 1,89,399 2,72,281 7,84,894 5236,169 41,686 7,210 85,065 3,82,163 2,44,362 2,97,339 9,23,864 132
1,08,126 52.927 8,749 l,6Q,802 3,35,742 2,28,325 1,42,215 7,06,282 35557,939 43,371 10,862 1,12,172 3.98.246 30,545 . 6,71,423 11,00,214 240
4,86,938 4,40,886 1,84.534 11,12.358 66,38,154 39.53,254 45,67,545 1,51,58,953 5,725
7 ,03.886 6.65,925 3,26,231 16,96,042 1.10,28,361 98,10,518 99,46,341 3,07,85,220 14,182
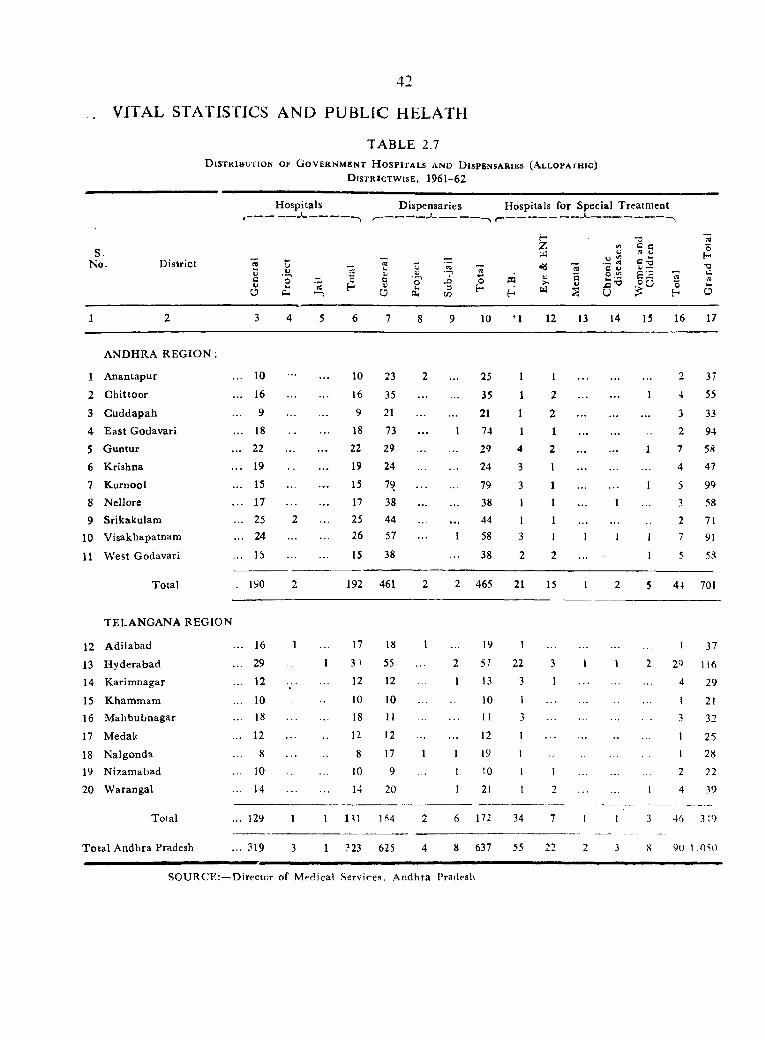
T A B L E 2.7
D i s t r i b u t i o n Of G o v e r n m e n t H o s p i t a l s a n d D i s p e n s a r i e s ( A l l o p a i h i c )
D i s t r i c t w i s e , 1961-62
42
. VITAL STATISTICS AND PUBLIC HELATH
H o s p ita ls Dispensaries Hospitals for Special Treatm ent _______________ «______________ _
S.No. District
ou0,
HZ
•aV>■
W
• Z <9c uo ^
U
T3 C flLIc -5V —a ic = a
o
1 2 3 4 5 6 7 8 9 10 ’ 1 12 13 14 15 16 17
A NDHRA R E G IO N ;
1 A nantapur 10 10 23 2 25 1 1 2 37
2 G hittoor 16 16 35 35 1 2 1 4 55
3 C uddapah 9 9 21 21 1 2 ... ... 3 33
4 E ast Godavari 18 18 73 I 74 1 1 ... ... 2 945 G untur 22 22 29 29 4 2 ... 1 7 58
6 Krishna 19 19 24 24 3 I ... 4 47
7 K urnool 15 15 7^ 79 3 1 1 5 99
8 Nellore 17 17 38 38 1 1 1 3 589 Srikakulana 25 2 25 44 ... 44 1 1 2 71
10 Visakhapatnam 24 26 57 1 58 3 1 I I 1 7 91
11 W est Godavari 15 15 38 38 2 2 1 5 5S
Total 190 2 192 461 2 2 465 21 15 I 2 5 44 701
TELANGANA REG IO N
12 A dilabad 16 1 17 18 1 19 1 1 37
13 H yderabad 29 I 3 > 55 2 51 22 3 I 1 2 20 1 16
14 K arim nagar 12 *•* * 12 12 1 13 3 1 4 29
15 K ham m am 10 10 10 10 1 1 2116 M ahbubnagar 18 18 n 1 ! 3 3 32
17 Medak 12 12 12 12 1 • - 1 2518 N algonda 8 8 17 1 1 19 1 1 28
19 Nizam abad 10 10 9 1 10 1 1 2 22
20 W arangal 14 14 20 1 21 1 2 1 4 39
Total 129 1 1 131 IM 6 172 34 7 I 1 3 46 319
T o ta l Andhra Pradesh 319 3 1 ?23 625 4 8 637 55 22 2 3 8 90 1.OSO
SO U RCE:—Director of Medical Services, Andhra I’radesh
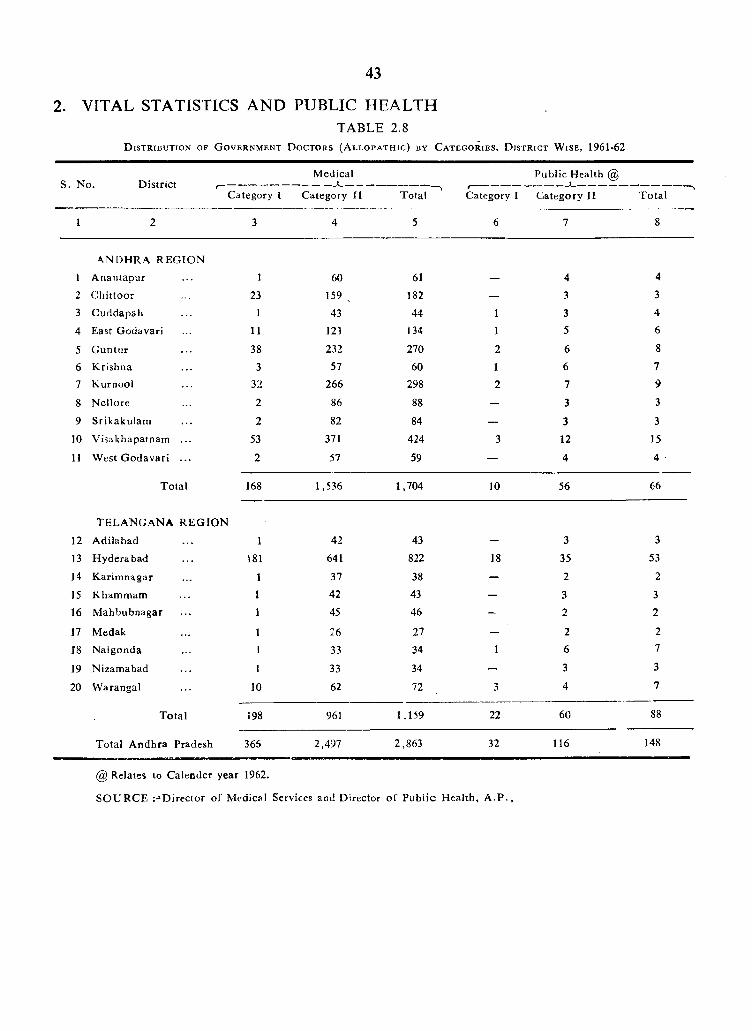
43
2. VITAL STATISTICS AND PUBLIC HEALTHT A B L E 2 .8
D is t r ib u t io n of G o v e r n m e n t D o c t o r s (A l l o p a t h ic ) by C a t e g o r i e s , D i s t r i c t W ise , 1961-62
S . N o . D is t r ic tC a te g o ry I
M e d ic a l
C a te g o ry II T o ta l C a te g o ry I
P u b lic H e a lth @
C a te g o ry II T o ta l
I 2 3 4 5 6 7 8
A N D H R A R E G IO N
1 A n a n ta p u r 1 60 61 — 4 4
2 C h it to o r 23 159 ^ 182 _ 3 3
3 C u d d a p a li ] 43 44 1 3 4
4 E ast G o d a v a r i 11 12i 134 1 5 6
5 G u n tu r 38 232 270 2 6 8
6 K r is h n a 3 57 60 1 6 7
7 K u rn o o l 32 266 298 2 7 9
8 N e llo re 2 86 88 — 3 39 S r ik a k u la m 2 82 84 — 3 3
10 V isa k h a p a tn a m . . . 53 371 424 3 12 15
11 W est Godavari . . . 2 57 59 — 4 4 '
Total 168 1,536 1,704 10 56 66
t e l a n g a n a r e g i o n
12 A d ila b a d 1 42 43 — 3 3
13 H y d e ra b a d 181 641 822 18 35 53
14 K a r im n a g a r 1 37 38 — 2 2
15 K h a m m a m 1 42 43 — 3 3
16 M a h b u b n a g a r 1 45 46 - 2 2
17 M e d a k 1 26 27 - 2 2
18 N a lg o n d a 1 33 34 1 6 7
19 N iz a m a b a d 1 33 34 - 3 3
20 W a ra n g a l 10 62 72 3 4 7
T o ta l 198 961 1,159 22 60 88
T o ta l A n d h r a P ra d e sh 366 2,497 2,863 32 116 148
@ Relates to Calender year 1962.
SO U R C E :-D irec to r of M edical Services and Director o f P ub lic H ealth , A .P .
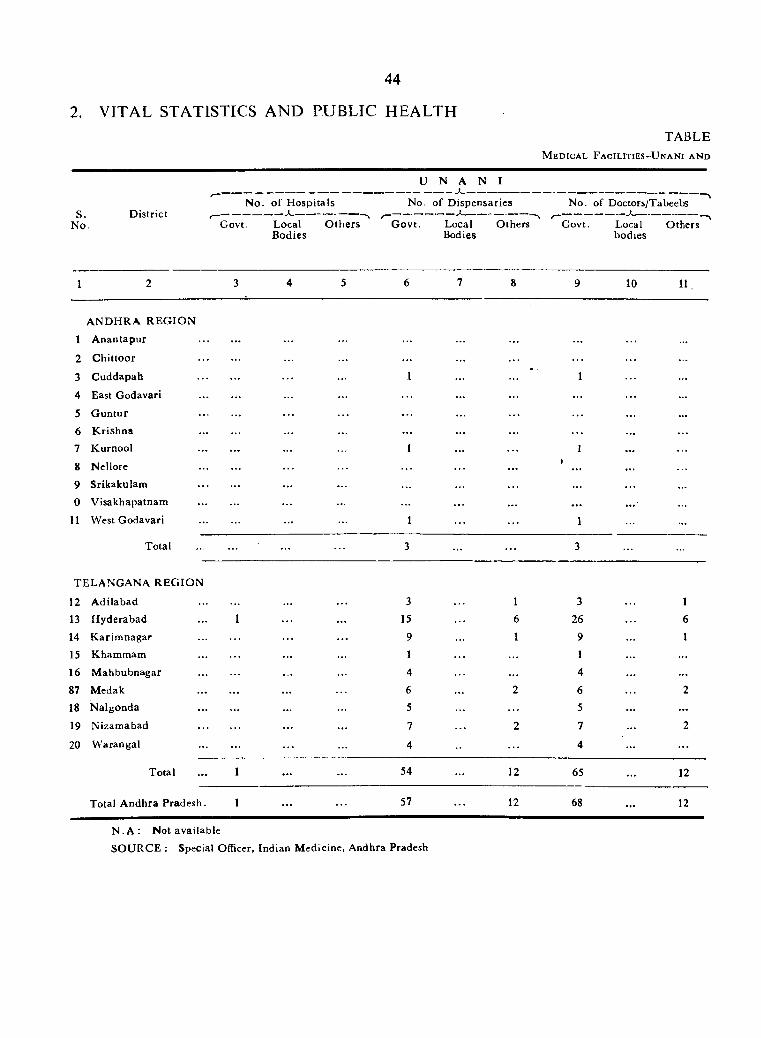
44
2. VITAL STATISTICS AND PUBLIC HEALTHTABLE
M e d i c a l F a c i l i t i e s - U n a n i a n d
U N A N1
[ I
N o. o f H ospitalsS. D istrict ^ -------------------*---------------------
N o. Govt. Local O thersBodies
No.
G ovt.
of D ispensaries
Local O thers Bodies
No. of Doctors/Tabeebs
Govt. Local Others bodies
1 2 3 4 5 6 7 8 9 10 11,
A N D H R A R E G IO N
1 A nantapur ...............
2 C hittoor ...............
3 C uddapah ............... 1 1
4 East Godavari ...............
5 G untur
6 K rishna ............... ...
7 Kurnool ............... 1 1
8 Nellore ............... ... 1
9 Srikakulam ............... ... . . .0 Visakhapatnam ............... .. .
11 West Godavari ............... 1 1
Total ............... 3 3
TELANGANA R E G IO N
12 A dilabad ............... 3 1 3 113 H yderabad ... 1 15 . . . 6 26 614 K arim nagar ............... 9 1 9 115 Khammam ............... 1 1 ...
16 M ahbubnagar ............... 4 4 ...
87 M edak ............... 6 2 6 2
18 N algonda ............... 5 5 ...
19 N izam abad ................. 7 2 7 2
20 W arangal ................ 4 4 ...
T o ta l . .. 1 54 12 65 12
Total A ndhra Pradesh. 1 57 12 68 12
N .A : Not availableSO U R C E : Special Officcr, Indian M edicine, Andhra Pradesh
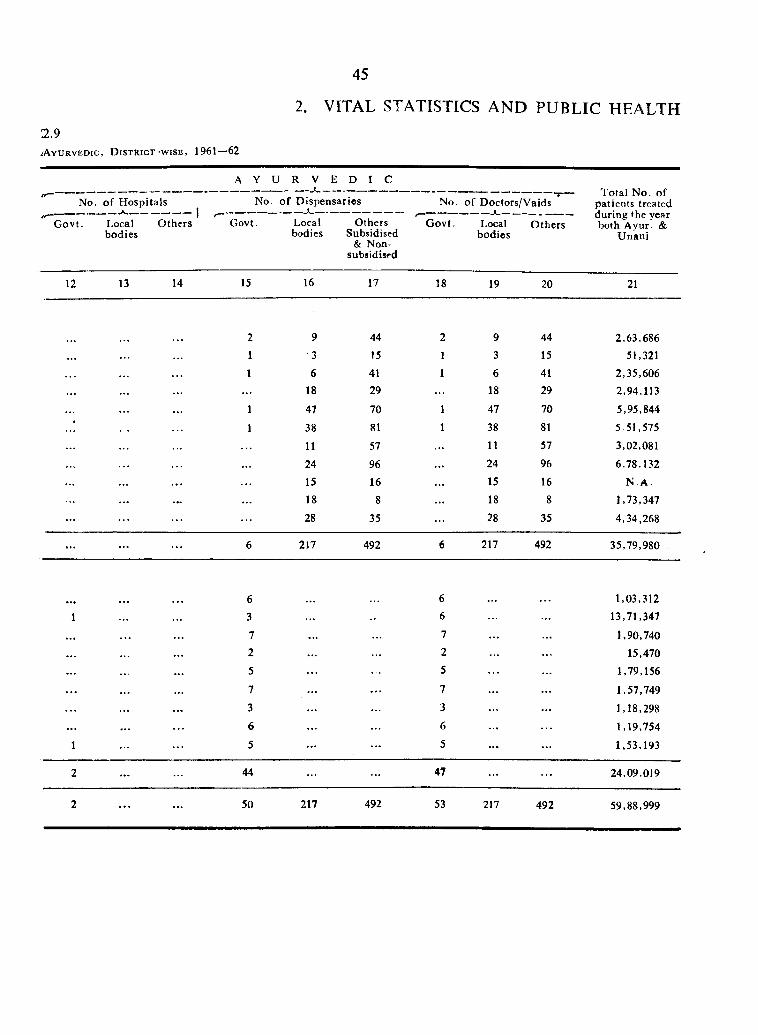
45
2. VITAL STATISTICS AND PUBLIC HEALTH
A y u r v e d i c , D i s t r i c t - w i s e , 1961—622 . 9
A Y U R V E D I C
No. o f H ospitals
G ovt. Localbodies
O thers
No. o f D ispensaries
Govt. Local Othersbodies Subsidised
& Non- subsidiscd
No. o f Doctors/Vaids
G ovt. Local O thers bodies
T otal N o. o f patients treated during the year both Ayur. &
U nani
12 13 14 15 16 17 18 19 20 21
2 9 44 2 9 44 2,63,686
. . . 1 3 15 1 3 15 51,321
1 6 41 1 6 41 2,35,606
. . . 18 29 18 29 2,94,113
... 1 47 70 1 47 70 5,95,844* 1 38 81 1 38 81 5.51,575
11 57 11 57 3,02,081
24 96 . . . 24 96 6,78,132. . . 15 16 . . . 15 16 N .A .
. . . 18 8 . . . 18 8 1,73,347. . . 28 35 28 35 4,34,268
• • • 6 217 492 6 217 492 35,79,980
1
o3
D
61 9 U J t J
13,71,347
. . . 7 . . . 7 . . . 1,90,740
. . . . . . 2 . . . 2 15,470
. . . 5 . . . 5 . . . 1,79,156
. . . 7 . . . 7 . . . 1,57,749. . . . . . 3 3 1,18,298
. . . . . . 6 6 1,19,754
1 . . . 5 . . . . . . 5 . . . 1,53,193
2 44 47 . . . 24,09,019
2 . . . 50 217 492 53 217 492 59,88,999
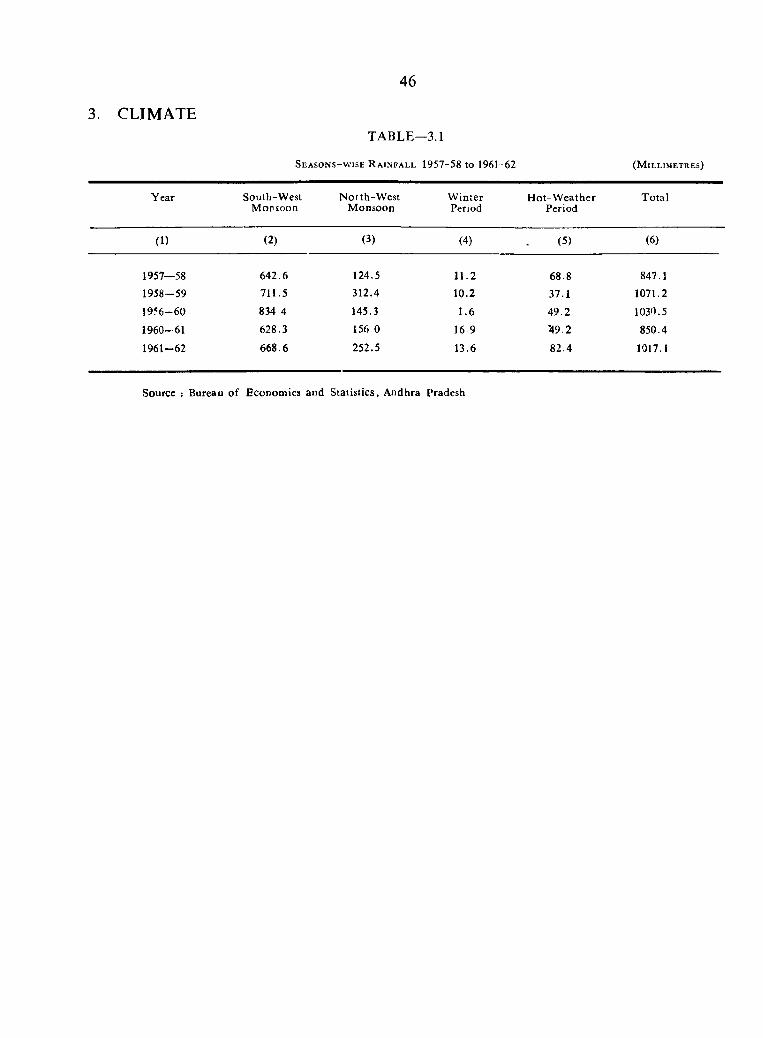
3. CLIMATET A B L E -3 .1
S e a s o n s - w i s e R a i n f a l l 1957-58 t o 1961-62
46
( M i l l i m e t r e s )
Year South-W estM o n i E o o n
N orth-W estMonsoon
W interPeriod
H ot-W eatherPeriod
Total
(1) (2) (3) (4) (5) (6)
1957—58 642.6 124.5 11.2 68.8 847.1
1958-59 711.5 312.4 10.2 37.1 1071.2
1956-60 834 4 145.3 1.6 49.2 1030.5
1960-61 628.3 156.0 16-9 *49.2 850.4
1961-62 668.6 252.5 13.6 82.4 1017.1
Source : Bureau of Economics and Statistics, Andhra Pradesh
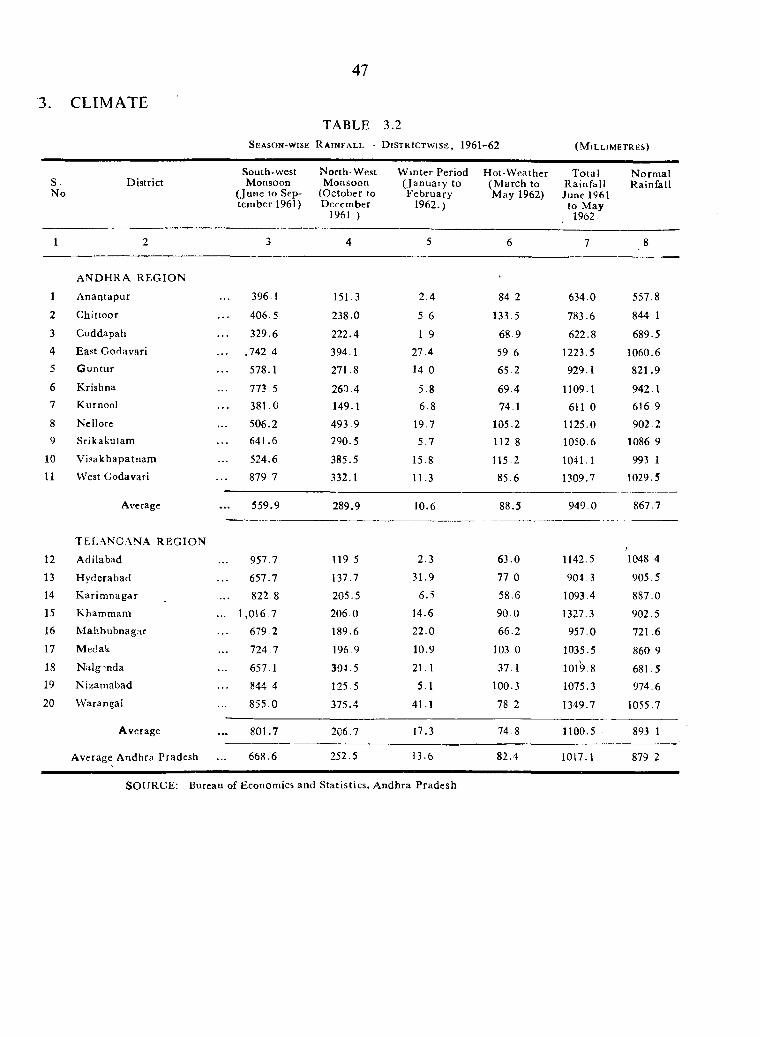
47
3. CLIMATETABLE 3,2
S e a s o n - w i s e R a i n f a l l - D iS T R lC T W lS E , 1961 -62 ( M i l l i m e t r e s )
S.No
DistrictSouth-west Monsoon
(June to Septem ber 1961)
North-West Monsoon
(October to December
1961 )
W inter Period (January to February
1962.)
H ot-W eather (M arch to May 1962)
T otal R ainfall June 1961
to May1962.
N orm alR ainfall
1 2 3 4 5 6 7 8
A N D H R A R EG IO N
1 Anaritapur 396.1 151.3 2.4 84 2 634.0 557.8
2 Chittoor 406.5 238.0 5 6 133.5 783.6 844.1
3 Cuddapah 329.6 222.4 1 9 68.9 622.8 689.54 East Godavari .. . .742 4 394.1 27.4 59.6 1223.5 1060.65 G untur 578.1 271.8 14 0 65.2 929.1 821.96 Krishna 773.5 260.4 5 8 69.4 1109.1 942.17 Kurnool 381.0 149.1 6.8 74.1 611 0 616.98 Nellore 506.2 493.9 19.7 105.2 1125.0 902.29 Srikakulam 641.6 290.5 5.7 112 8 1050 6 1086 9
10 V isakhapatnam 524.6 385.5 15.8 115.2 1041.1 993 111 West Godavari 879.7 332.1 11.3 85.6 1309.7 1029.5
Average 559.9 289.9 10.6 88.5 949.0 867.7
TELANGANA R EG IO N /12 Adilabad 957.7 119 5 2.3 63.0 1142.5 1048 4
13 H yderabad 657.7 137.7 31.9 77 0 904.3 905.514 K arim nagar 822.8 205.5 6.5 58.6 1093.4 887.015 Khammarn ... 1,016.7 206.0 14.6 90.0 1327.3 902.516 M ahbubnagar 679.2 189.6 22.0 66.2 957.0 721.617 Medak 724.7 196.9 10.9 103.0 1035.5 860 918 N alg 'nda 657.1 304.5 21.1 37.1 1019.8 681.519 Nizamabad 844 4 125.5 5.1 100.3 1075.3 974.620 W arangal 855.0 375.4 41.1 78.2 1349.7 1055.7
Average 801.7 206.7 17.3 74.8 1100.5 893.1
Average A ndhra Pradesh 668.6 252.5 13.6 82.4 1017.1 879 2
SOURCE; Bureau of Econom ics and Statistics, Andhra Pradesh
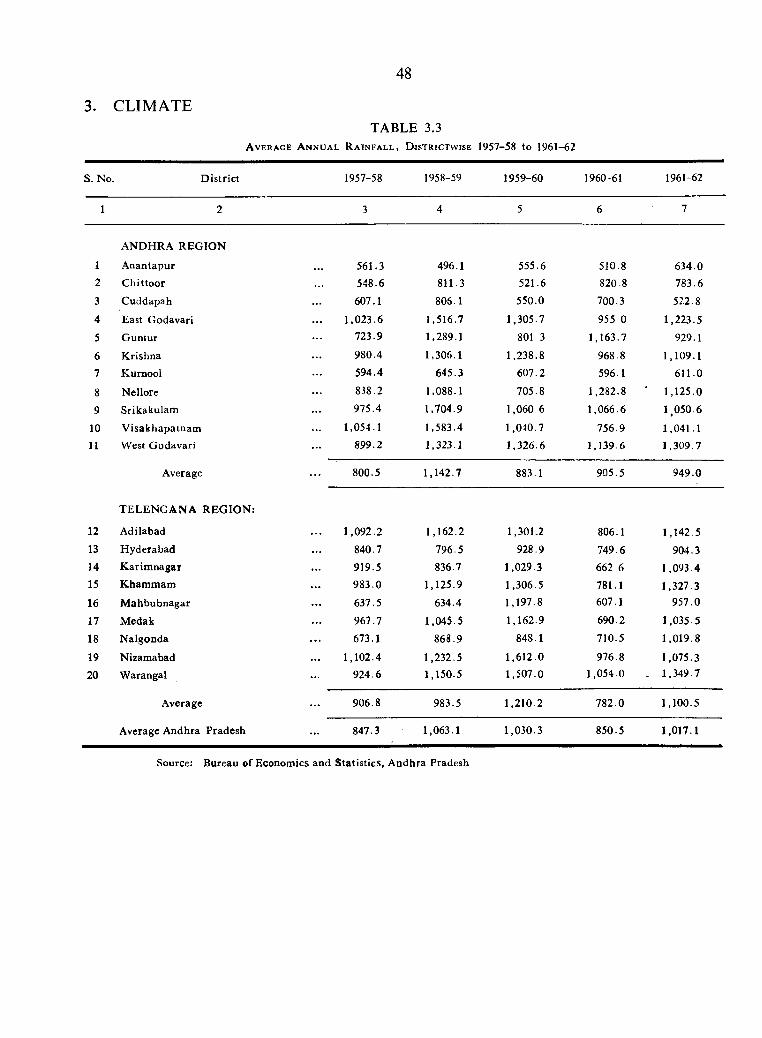
48
3. CLIMATETABLE 3.3
A v e r a g e A n n u a l R a i n f a l l , D i s t r i c t w i s e 1957-58 to 1961-62
S. No. D istrict 1957-58 1958-59 1959-60 1960-61 1961-62
1 2 3 4 5 6 7
ANDHRA REG IO N
1 A nantapur . . . 561.3 496.1 555.6 510.8 634.02 C hittoor 548.6 811.3 521.6 820.8 783.6
3 Cuddapah 607.1 806.1 550.0 700.3 522.8
4 East Godavari 1,023.6 1,516.7 1,305.7 955 0 1,223.5
5 G untur . . . 723.9 1,289.1 801 3 1,163.7 929.1
6 K rishna 980.4 1,306.1 1,238.8 968.8 1,109.17 Kurnool 594.4 645.3 607.2 596.1 611.0
8 Nellore 838.2 1,088.1 705.8 1,282.8 ' 1,125.0
9 Srikakulam 975.4 1,704.9 1,060 6 1,066.6 1,050.6
10 V isakhapatnam 1,054.1 1,583.4 1,040.7 756.9 1,041.1
11 West G odavari . . . 899.2 1,323.1 1,326.6 1,139.6 1,309.7
Average 800.5 1,142.7 883.1 905.5 949.0
TELEN G A N A R EG IO N :
12 Adilabad . . . 1,092.2 1,162.2 1,301.2 806.1 1,142.513 H yderabad . . . 840.7 796.5 928.9 749.6 904.314 K arim nagar . . . 919.5 836.7 1,029.3 662.6 1,093.415 K ham m am . . . 983.0 1,125.9 1,306.5 781.1 1,327.316 M ahbubnagar . . . 637.5 634.4 1,197.8 607.1 957.0
17 M edak . . . 967.7 1,045.5 1,162.9 690.2 1,035.5
18 N algonda . . . 673.1 868.9 848.1 710.5 1,019.8
19 Nizamabad . . . 1,102.4 1,232.5 1,612.0 976.8 1,075.3
20 W arangal . . . 924.6 1,150.5 1,507.0 1,054.0 - 1,349.7
Average . . . 906.8 983.5 1,210.2 782.0 1,100.5
Average Andhra Pradesh . . . 847.3 1,063.1 1,030.3 850.5 1,017.1
Source: Bureau of Economics and Statistics, A ndhra Pradesh

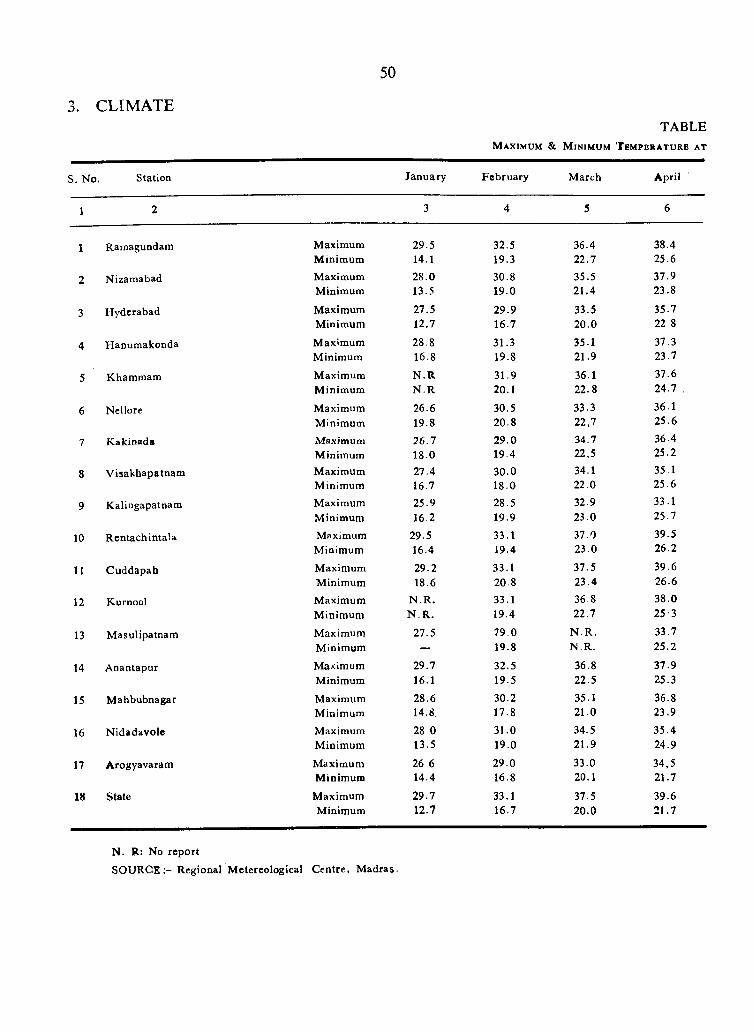
50
3. CLIMATETABLE
M a x i m u m & M i n i m u m T e m p e r a t u r e a t
S. No. Station
1
1 Ramagundam
2 N izam abad
3 H yderabad
4 H anum akonda
5 Khammam
6 Nellore
7 K akinada
8 V isakbapatnam
9 Kalingapatnam
10 R entachintala
11 C uddapah
12 Kurnool
13 M asulipatnam
14 A nantapur
15 M ahbubnagar
16 N idadavole
17 Arogyavaram
18 State
January February M arch April
MaximumM inim umM aximumM inimum
M aximumM inimum
M aximumM inimum
M aximumM inim um
M aximumM inim um
MaximumM inimumM aximumM inim um
M aximumM inim um
M a x i m u m
M inim um
M aximumM inim umM aximumM inim um
M aximumM inim um
M aximumMinimum
M aximumM inim um
M aximumM inim um
M aximumM inimum
M aximumM inimum
29.514.1
28.013.5
27.512.7
28.8 16.8
N .R N .R
26.619.826.7 18.027.416.725.9 16 2
29.516.4
29.2 18.6
N .R .N .R .
27.5
29.7 16.1
28.6 14.8.
28 0 13.5
26 6 14.4
29.712.7
32.519.3
30.819.0
29.916.7
31.319.8
31.920.130.5 20.829.019.430.018.028.519.9
33.119.4
33.1 20.833.119.4
29.019.8
32.519.5
30.217.8
31.019.0
29.016.8
33.1 16.7
36.422.735.521.4
33.5 20.0
35.121.9
36.122.8
33.322.1
34.722.5 34.1 22.0
32.923.0
37.023.0
37.523.436.822.7
N .R .N .R .
36.822.5
35.1 21.0
34.521.9
33.020.1
37.5 20.0
38.425.6 37.923.8
35.7 22 8
37.323.7
37.624.7
36.125.6
36.425.235.1 25 6
33.125.7
39.526.2
39.626.6 38.0 25-3
33.725.2
37.925.3
36.823.9
35.424.9
34.5 21.7
39.621.7
N . R: No report
SO U R C E :- Regional M etcreological C entre, M adras.
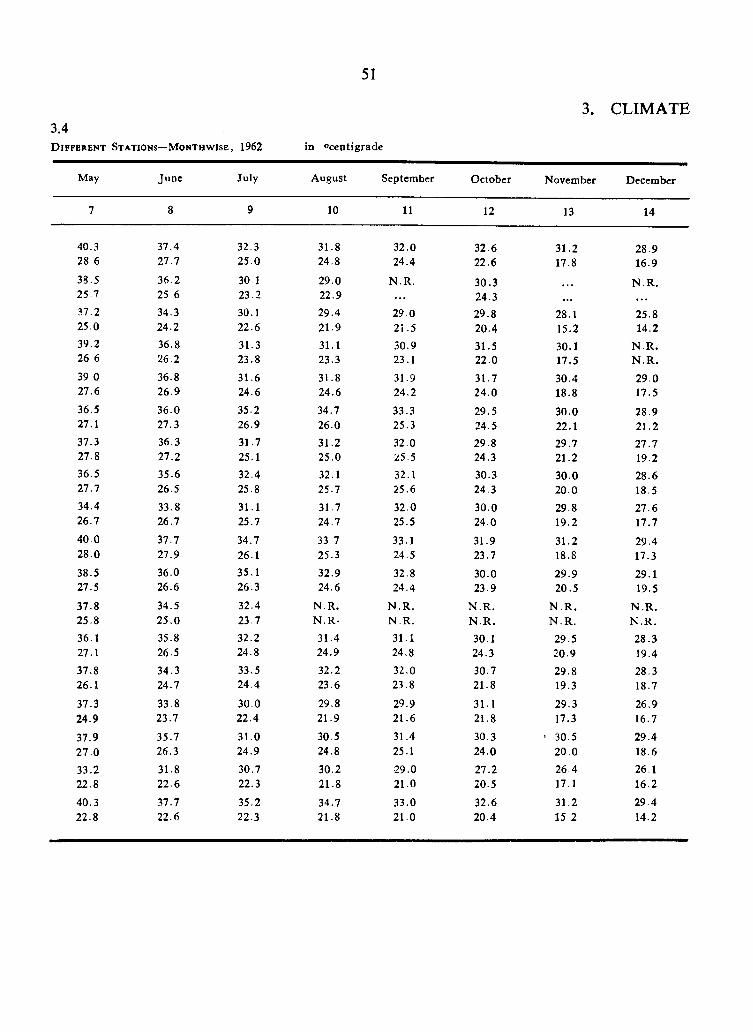
51
3.4D i f f e r e n t S t a t i o n s — M o n t h w i s e , 1962 in ocentigrade
3. CLIMATE
May June July August September O ctober November December
10 11 12 13 14
40.3 28 6
38.525.7
37.225.039.2 26 6
39.027.6
36.527.1
37.327.836.527.7
34.426.7
40 0 28.0
38.527.5
37.825.8
36.127.1
37.826.1
37.324.9
37.9 27 .0
33.222.8
40.3 22.8
37.427.7
36.225.6
34.324.2
36.826.2
36.826.9
36.027.3
36.327.235.626.5
33.826.7
37.727.936.026.6
34.525.035.826.5
34.324.7
33.823.7
35.726.3
31.822.637.722.6
32.325.0
30 123.2
30.1 22.6
31.323.8
31.624.6
35.226.931.725.132.425.8
31.125.7
34.726.135.126.3
32.423.732.224.8
33.524.4
30.022.4
31.024.9
30.722.3
35.222.3
31.824.8
29.022.9
29.421.9
31.1 23.3
31.824.6
34.7 26.0
31.225.032.125.7
31.724.7
33.725.3
32.924.6
N .R .N .R -
31.424.9
32.223.6
29.821.9
30.524.8
30.221.8
34.721.8
32.024.4
N .R .
29.021.530.923.1
31.924.2
33.325.3
32.025.532.125.6
32.025.5
33.124.5
32.824.4
N .R .N .R .
31.124.8
32.023.8
29.921.6
31.425.1
29.021.0
33.021.0
32.622.6
30.324.3 29.820.4
31.5 22.0
31.724.0
29.524.529.824.330.324.3
30.024.0
31.923.7
30.023.9
N .R .N .R .
30.124.330.721.8
31.1 21.8
30.3 24.0
27.220.5
32.620.4
31.217.8
28.115.2
30.117.5
30.4 18.8
30.022.129.7 21.2
30.020.0
29.819.2
31.218.8
29.920.5
N .R .N .R .29.520.9
29.819.3
29.317.3
30.5 20.026.417.1
31.2 15 2
28.916.9
N .R .
25.814.2
N .R . N .R .
29.017.5
28.921.2
27.719.228.618.5
27.617.7
29.417.3
29.119.5
N .R . N .R .
28.319.4
28.318.7
26.916.7
29.418.626.1 16.2
29.4 14.2
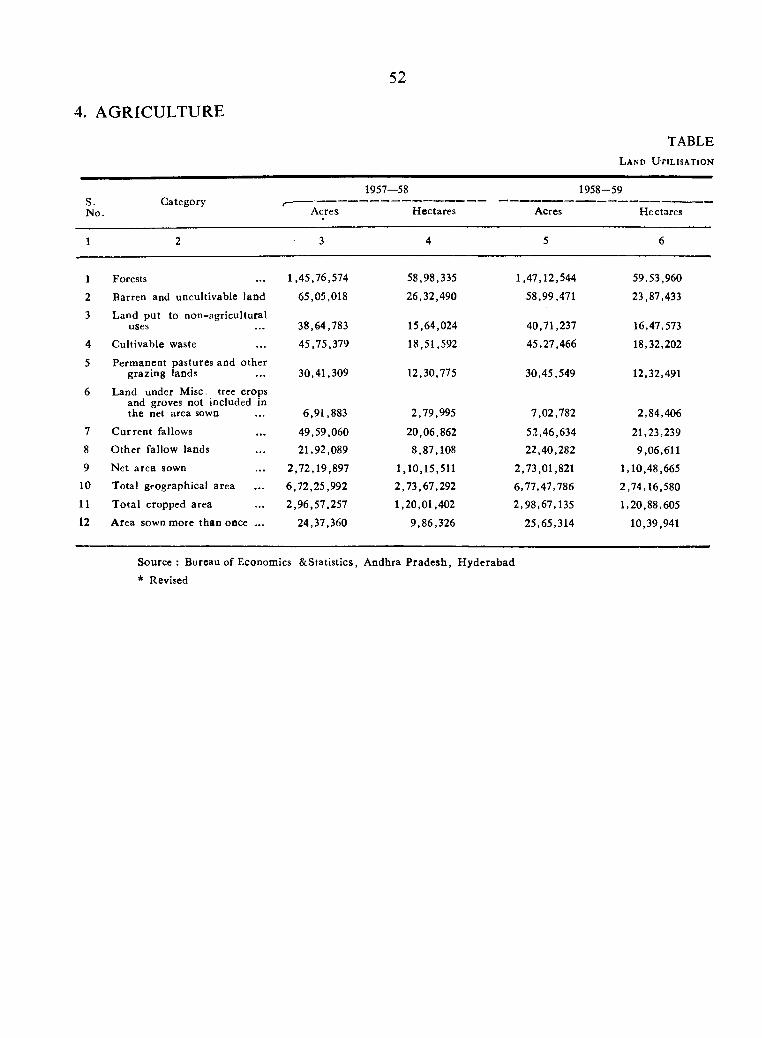
52
4. AGRICULTURE
TABLEL a n d U t i l i s a t i o n
S.No.
Category1957—58 1958--59
Acres Hectares Acres Hectares
1 2 3 4 5 6
1 Forests 1,45,76,574 58,98,335 1,47,12,544 59,53,960
2 Barren and uncultivable land 65,05,018 26,32,490 58,99,471 23,87,433
3 Land pu t to non-agricultural uses 38,64,783 15,64,024 40,71,237 16,47,573
4 Cultivable waste 45,75,379 18,51,592 45,27,466 18,32,202
5 Perm anent pastures and other grazing lands 30,41,309 12,30,775 30,45,549 12,32,491
6 Land under Misc. tree crops and groves not included in the net area sown 6,91,883 2,79,995 7,02,782 2,84,406
7 C urren t fallows 49,59,060 20,06,862 52,46,634 21,23,2398 O ther fallow lands 21,92,089 8,87,108 22,40,282 9,06,611
9 Net area sown 2,72,19,897 1,10,15,511 2,73,01,821 1,10,48,66510 Total geographical area 6,72,25,992 2,73,67,292 6,77,47,786 2,74,16,58011 T ota l cropped area 2,96,57.257 1,20,01,402 2,98,67,135 1,20,88,60512 Area sown more than once ... 24,37,360 9,86,326 25,65,314 10,39,941
S ource : Bureau of Economics & Statistics, Andhra P radesh , H yderabad
* Revised
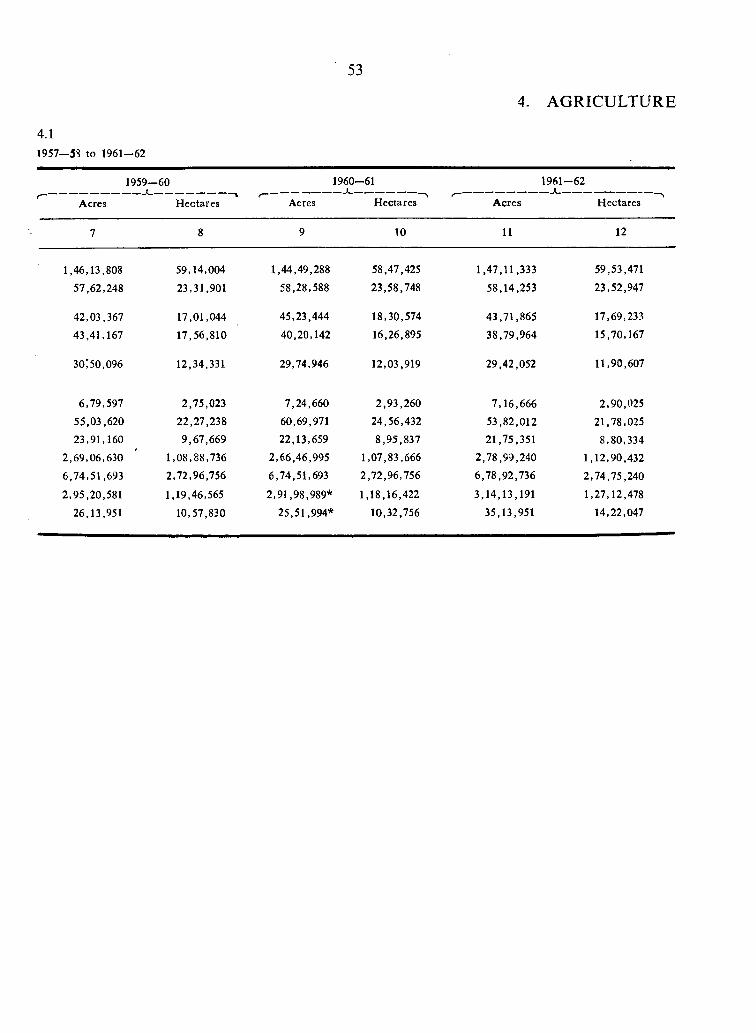
53
4. AGRICULTURE
4.11957—58 to 1961-62
1959-■60 1960--61 1961—. ——* JL,
- 6 2
Acres H ectares Acres Hectares Acres Hectares
7 8 9 10 11 12
1,46,13,808 59,14,004 1,44,49,288 58,47,425 1,47,11,333 59,53,471
57,62,248 23,31,901 58,28,588 23,58,748 58,14,253 23,52,947
42,03,367 17,01,044 45,23,444 18,30,574 43,71,865 17,69,233
43,41,167 17,56,810 40,20,142 16,26,895 38,79,964 15,70,167
30:50,096 12,34,331 29,74,946 12,03,919 29,42,052 11,90,607
6,79,597 2,75,023 7,24,660 2,93,260 7,16,666 2,90,025
55.03,620 22,27,238 60,69,971 24,56,432 53,82,012 21,78,025
23,91,160 9,67,669 22.13,659 8,95,837 21,75,351 8,80,334
2,69,06,630 1,08,88,736 2,66,46,995 1,07,83,666 2,78,99.240 1,12,90,432
6,74,51,693 2,72,96,756 6,74,51,693 2,72,96,756 6.78,92,736 2,74,75,240
2,95,20,581 1,19,46,565 2,91,98.989* 1,18,16,422 3.14,13,191 1,27,12,478
26,13,951 10,57,830 25,51,994* 10,32,756 35,13,951 14,22,047
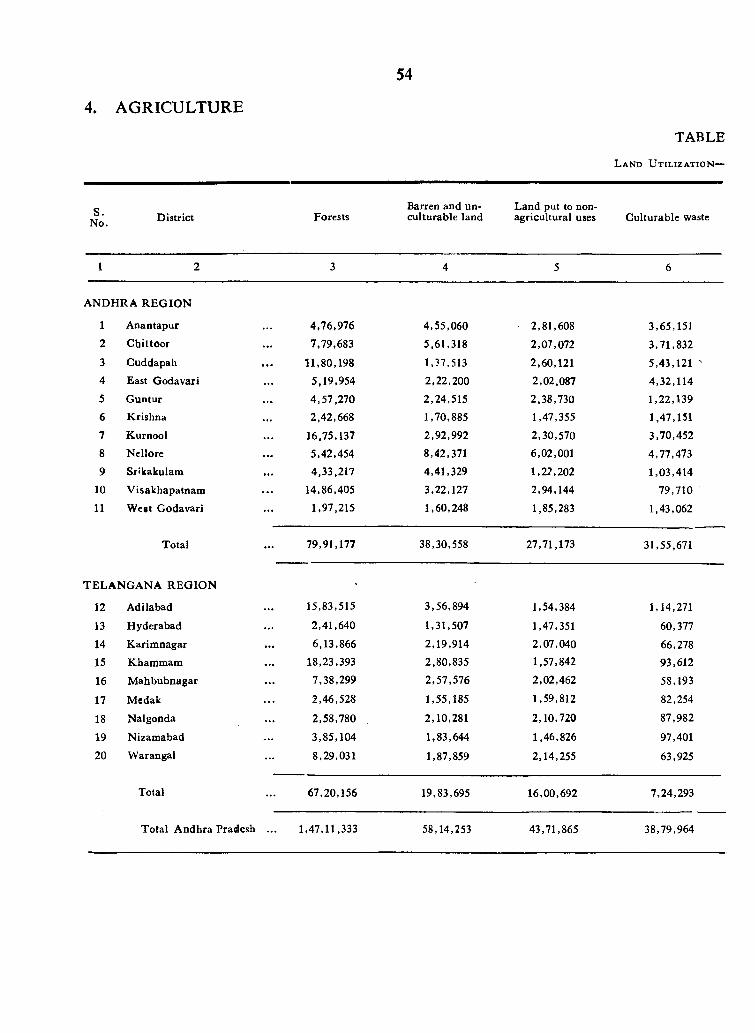
54
4. AGRICULTURE
T A B L E
L a n d U t i l i z a t i o n —
s.No. D istrict Forests
Barren and un- culturable land
Land put to non- agricultural uses C ulturable waste
1 2 3 4 5 6
ANDHRA R E G IO N
1 A nantapur 4,76,976 4,55,060 2,81,608 3,65,151
2 C hittoor 7,79,683 5,61,318 2,07,072 3,71,832
3 Cuddapah 11,80,198 1,37,513 2,60,121 5,43,121 '
4 East Godavari 5,19,954 2,22,200 2,02,087 4,32,114
5 G untur 4,57,270 2,24,515 2,38,730 1,22,139
6 Krishna 2,42,668 1,70,885 1,47,355 1,47,151
7 Kurnool 16,75,137 2,92,992 2,30,570 3,70,452
8 Ncllore 5,42,454 8,42,371 6,02,001 4,77,473
9 Srikakulam 4,33,217 4,41,329 1,22,202 1,03,414
10 V isakhapatnam 14,86,405 3,22,127 2,94,144 79,710
11 W est Godavari 1,97,215 1,60,248 1,85,283 1,43,062
Total 79,91,177 38,30,558 27,71,173 31,55,671
TELA N G A N A R E G IO N '
12 Adilabad 15,83,515 3,56,894 1,54,384 1,14,271
13 Hyderabad 2,41,640 1,31,507 1,47,351 60,377
14 K arim nagar 6,13,866 2,19,914 2,07,040 66,27815 Kham m am 18,23,393 2,80,835 1,57,842 93,612
16 M ahbubnagar 7,38,299 2,57,576 2,02,462 58,193
17 M edak 2,46,528 1,55,185 1,59,812 82,254
18 Nalgonda 2,58,780 2,10,281 2,10,720 87,982
19 Nizamabad 3,85,104 1,83,644 1,46,826 97,401
20 W arangal 8,29,031 1,87,859 2,14,255 63,925
Total 67,20,156 19,83,695 16,00,692 7,24,293
T otal A ndhra Pradesh ... 1,47,11,333 58,14,253 43,71,865 38,79,964
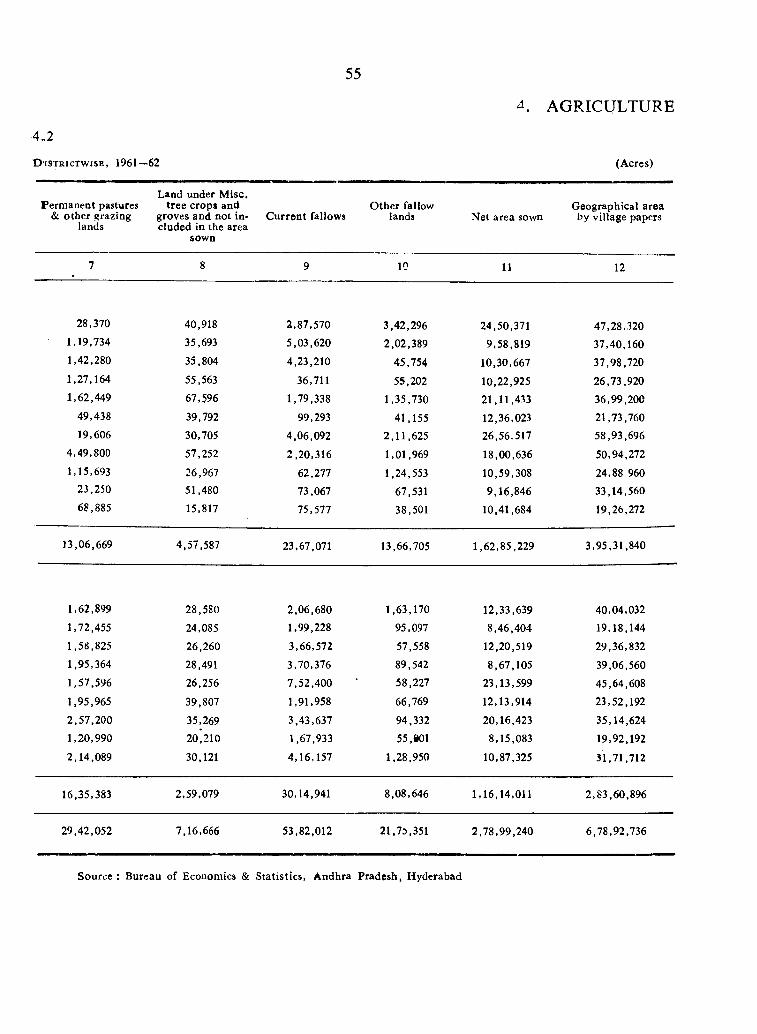
55
AGRICULTURE
D ’iSTRicTWiSE, 1961—62
4 - 2
(Acres)
Perm anent pastures & o ther grazing
lands
Land under M isc.tree crops and
groves and not included in the area
sown
C urren t fallowsO ther fallow
lands Net area sownGeographical area by village papers
7 8 9 10 11 12
28,370 40,918 2,87,570 3,42,296 24,50,371 47,28,3201,19,734 35,693 5,03,620 2,02,389 9,58,819 37,40,1601,42,280 35,804 4,23,210 45,754 10,30,667 37,98,7201,27,164 55,563 36,711 55,202 10,22,925 26,73,9201,62,449 67,596 1,79,338 1,35,730 21,11,433 36,99,200
49,438 39,792 99,293 41,155 12,36,023 21,73,76019,606 30,705 4,06,092 2,11,625 26,56,517 58,93,696
4,49,800 57,252 2,20,316 1,01,969 18,00,636 50,94,272
1,15,693 26,967 62,277 1,24,553 10,59,308 24,88 96023,250 51,480 73,067 67.531 9,16,846 33,14,56068,885 15,817 75,577 38,501 10,41,684 19,26,272
13,06,669 4,57,587 23,67.071 13,66,705 1,62,85,229 3,95,31,840
1,62,899 28,580 2,06,680 1,63,170 12,33,639 40,04,032
1,72,455 24,085 1,99,228 95,097 8,46,404 19,18,144
1,58,825 26,260 3,66,572 57,558 12,20,519 29,36,832
1,95,364 28,491 3,70,376 89,542 8,67,105 39,06,560
1,57,596 26.256 7,52,400 58,227 23,13,599 45,64,608
1,95,965 39,807 1,91,958 66,769 12,13,914 23,52,192
2,57,200 35,269 3,43,637 94,332 20,16,423 35,14,624
1,20,990 20,210 1,67,933 55,801 8,15,083 19,92,192
2,14,089 30,121 4,16,157 1,28,950 10,87,325 31,71,712
16,35,383 2,59,079 30,14,941 8,08,646 1,16,14,011 2,83,60,896
29,42,052 7,16,666 53,82,012 21,73.351 2,78,99,240 6,78,92,736
Source : Bureau of Economics & Statistics, A ndhra Pradesh, H yderabad
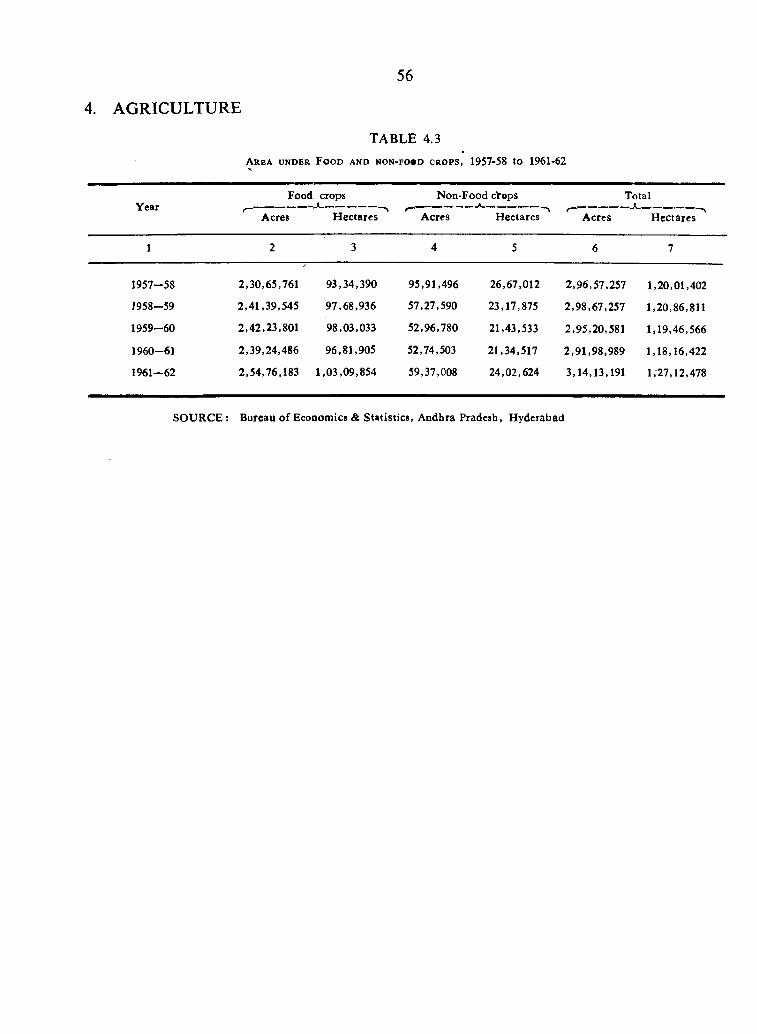
56
4. AGRICULTURE
TABLE 4.3
A r e a u n d e r F o o d a n d n o n - f o * d c r o p s , 1957-58 t o 1961-62
YearFood crops
Acres H ectares
Non-Food ctops
Acres Hectares
Total
Acres H ectares
1957-58
1958-59
1959-60
1960-61
1961-62
2,30,65,761 93,34,390 95,91,496 26,67,012
2,41,39,545 97,68,936 57,27,590 23,17,875
2,42,23,801 98,03,033 52,96,780 21,43,533
2,39,24,486 96.81,905 52,74,503 21,34,517
2,54,76,183 1,03,09,854 59,37,008 24,02,624
2.96.57.257 1,20,01,402
2.98.67.257 1,20,86,811
2,95,20,581 1,19,46,566
2,91,98,989 1,18,16,422
3,14,13,191 1,27,12,478
SO URCE : Bureau o f Economics & Statistics, A ndhra Pradesh, H yderabad
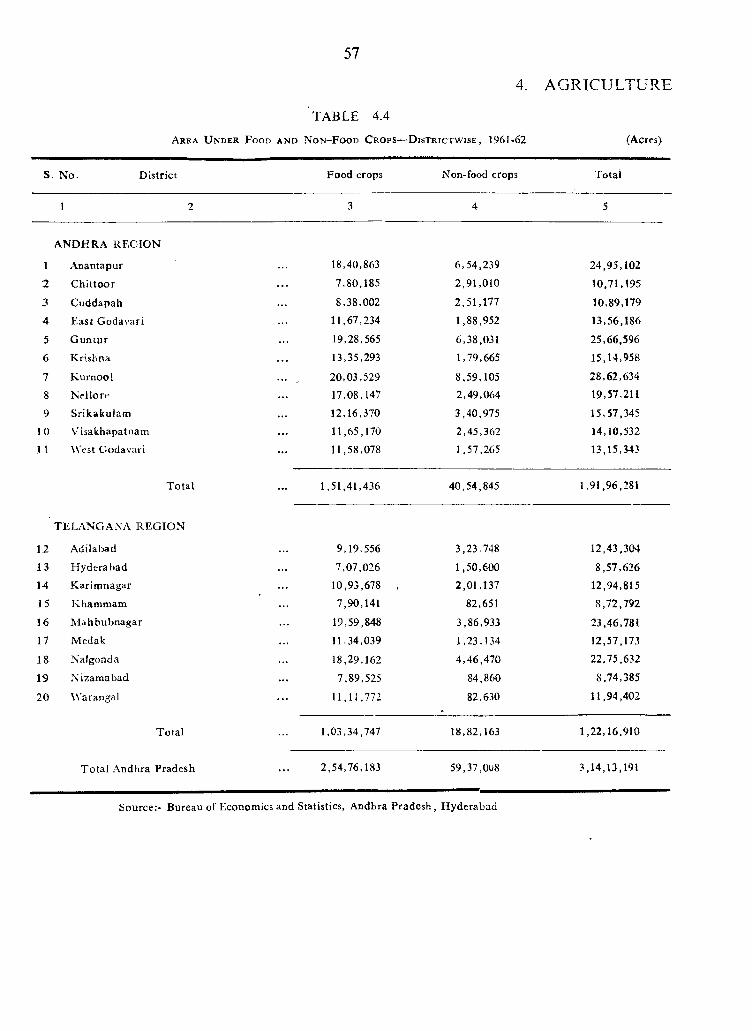
57
4. AGRICULTURE
A rea U n d e r F o o d a n d N o n - F o o d C r o p s —D istric tw ise , 1961-62
TABLE 4.4
(A.cres)
S. N o. District Food crops Non-food crops Totai
A N D H R A REG IO N
1 Anantapur
.2 C hittoor
3 Cuddapah
4 East Godavari
5 Guntur
6 K rishna
7 Kurnoo!
8 N e i l c r e
9 Srikakulam
10 Visakhapatnam
1 1 W est Godavari
T otal
T E L A N G A X A R E G IO N
12 Adilabad
13 H yderabad
14 Karimnagar
] 5 Khammam
16 M ahbubnagar
17 Medak
18 Nalgonda
15 N izam abad
20 W arangal
Total
T ota l Andhra Pradesh
18,40,863
7,80,185
8,38,002
11,67,234
19,28,565
13,35,293
20.03,529
17,08,147
12,16,370
11,65,170
11,58,078
1,51,41.436
9,19,556
7,07,026
10,93,678
7,90,141
19,59,848
11,34,039
18,29,162
7,89,525
11,11,772
1,03,34,747
6,54,239
2,91,010
2,51,177
1,88,952
6,38,031
1,79,665
8,59,105
2,49.064
3,40,975
2,45,362
1,57,265
40,54,845
3,23.748
1,50,600
2,01,137
82,651
3,86,933
1,23,134
4,46,470
84,860
82,630
18,82,163
24,95,102
10,71,195
10,89,179
13,56,186
25,66,596
15,14,958
28,62,634
19.57,211
15,57,345
14,10,532
13,15,343
1,91,96,281
12,43,304
8,57,626
12,94,815
8,72,792
23,46.781
12,57,173
22,75,632
8,74,385
11,94,402
1,22,16,910
2,54,76.183 59,37,0U8 3,14,13,191
Source :- B ureau of E conom ics and Statistics, A ndhra P ra d e sh , H y d e rab ad
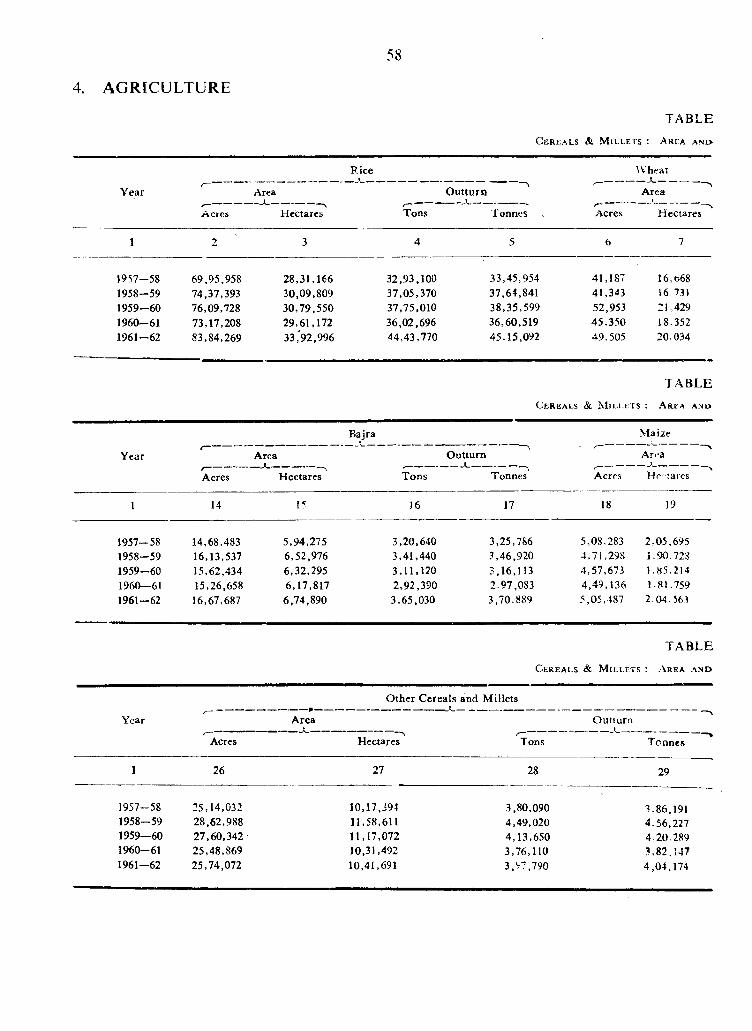
4. AGRICULTURE
58
C e r e a ls & M i l l e t s : A r la a n o
TABLE
Rice \Vheal
Y ear Area O utturnt
Area
Acres Hectares Tons lonncs/—--------Acres
___\______ ^Hectares
1 2 3 4 5 6 7
1957-58 69,95,958 28,31,166 32,93,100 33,45.954 41,187 16,b681958-59 74,37,393 30,09,809 37,05,370 37,64,841 41,343 16,7311959-60 76,09,728 30,79,550 37,75,010 38,35,599 52,953 21,4291960-61 73,17,208 29,61,172 36,02,696 36,60,519 45,350 18-3521961-62 83,84,269 33,92,996 44,43,770 45.15,092 49,505 20.034
TABLE
Cereals &. M u - i . e t s : A rka ane»
Bajra Maize
Yeart—
Area1
O utturn Area
Acres Hectares Tons T onnes Acres Ho laics
1 14 15 16 17 18 19
1957—58 14,68,483 5,94,275 3,20,640 3,25,786 5,08.283 2:05.6951958-59 16,13,537 6,52,976 3,41,440 ?,46,920 4,71,298 1.90.7281959-60 15,62,434 6,32,295 3,11,120 3,16,113 4,57,673 1.85.2141960—61 15,26,658 6,17,817 2,92,390 2.97,083 4,49,136 1-81.7591961-62 16,67,687 6,74,890 3,65,030 3,70.889 5,05,487 2.04.563
TA BLE
C ereals & M il i.f.ts : A rea a n d
O ther Cereals and M illets t
Year A rea O utturnI
Acres Hectares Tons Tonnes
1 26 27 28 29
1957-58 25,14,032 10,17,391 3,80,090 3.86,1911958-59 28,62,988 11,58,611 4,49,020 4-56,2271959—60 27,60,342 11,17,072 4,13,650 4.20.2891960-61 25,48,869 10,31,492 3,76,110 3,82,1471961-62 25,74,072 10,41,691 3,V7,790 4,04,174
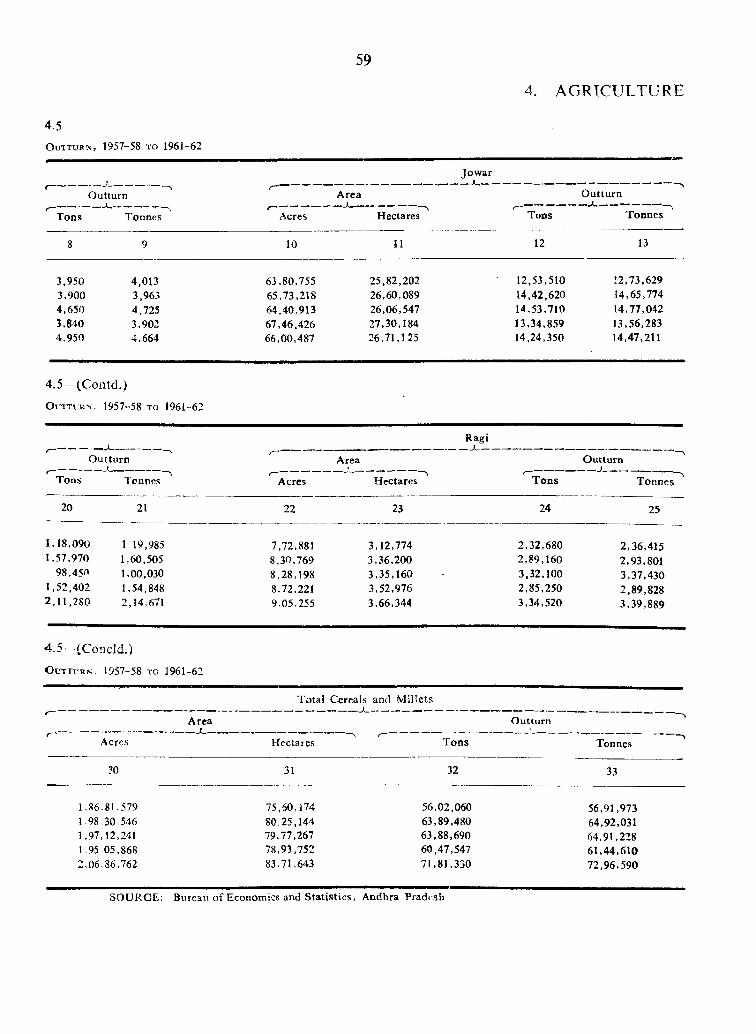
4.5O i n T U R N , 1957-58 t o 1961-62
59
4. AGRICULTURE
O utturn
Tons Tonnes
Jow ar ----«-----
Area
Acres Hectares
O utturn
Tons Tonnes
8 9 10 11 12 13
3.950 4,013 3,900 3,963 4.650 4,725 3,840 3.9024.950 4,664
63,80,75565,73,21864,40,91367,46,42666,00,487
25,82,20226,60,08926,06,54727,30,18426,71,125
12,53.51014,42,62014.53.71013,34.85914,24,350
12,73,62914,65,77414,77,04213,56.28314,47,211
4.5— (CoJltd.)
O m T t RN , 1957-58 t o 1961-62
Ragi
O uttu rn Area O utturn
TonnesTons Tonnes Acres Hectares Tons
20 21 22 23 24 25
1,18.090 1 19,985 1,57.970 1,60,505
98.45<T 1,00.030 1,52,402 1,54,848 2 .11 .280 2,14,671
7,72,8818,30,7698.28.1988.72,2219.05.255
3,12,7743,36,2003.35.1603,52.9763,66,344
2,32.6802,89,1603,32,1002,85,2503,34,520
2.36.4152.93.8013,37.4302,89,8283,39,889
4 .5—(C ondd.)
O u t t u r n . 1957-58 t o 1961-62
Area
T otal Cereals and M illets
O utturn
Acres Hectare.s T ons Tonnes
30 31 32 33
1.86.81.5791.98.30,5461,97,12,2411.95.05,8682,06.86,762
75.60,17480,25,14479.77,26778,93.75283,71.643
56,02,06063,89.48063.88,69060,47,54771,81.330
56,91,97364,92,03164,91,22861,44,61072,96,590
SOURCE: Bureau o f Economics and S tatistics, Andhra Pradesh
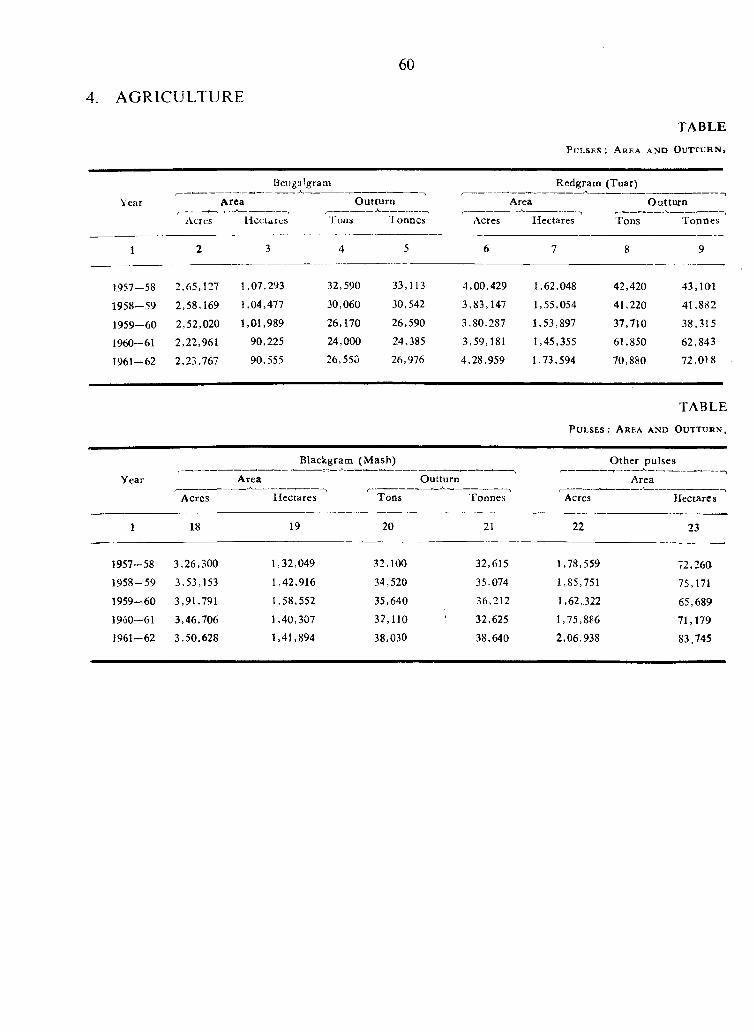
60
4. AGRICULTURE
P u l s e s : A r e a a n d O u t t u r n ,
TABLE
Year
1
Beiigalgram
Area
Acres H c c u ic s
1957__58 2,65,127 1,07,293
1958-59 2,58,169 1,04,477
1959-60 2,52,020 1,01,989
1960-61 2,22,961 90,225
1961-62 2,23,767 90,555
O utturn
I'oiis
32,590
30,060
26,170
24,000
26,550
Tonnes
33,113
30,542
26,590
24,385
26,976
Rcdgram (Tuar)
Area O utturn
Acres Hectares
4,00,429
3,83,147
3,80,287
3.59,181
4,28,959
1,62,048
1,55,054
1,53,897
1,45,355
1,73,594
Tons
42,420
41,220
37,710
61,850
70,880
T onnes
43,101
41,882
38,315
62,843
72,018
TABLE
P u l s e s ; A r e a a n d O u t t u r n ,
Year
Blackgram (M ash) O ther pulses
A r e a Outturn
Acres
18
Hectares
19
T o d s T onnes
20 21
Area
Acres
22
Hectares
23
1957-58 3,26,300
1958-59 3,53,153
1959-60 3,91,791
1960-61 3,46,706
1961-62 3,50.628
1,32,049
1,42,916
1,58,552
1,40,307
1,41,894
32.100
34,520
35,640
3 2 , 1 1 0
38,030
32,615
35,074
36,212
32,625
38,640
1,78,559
1,85,751
1,62,322
1,75,886
2,06,938
72,260
75,171
65,689
71,179
83,745
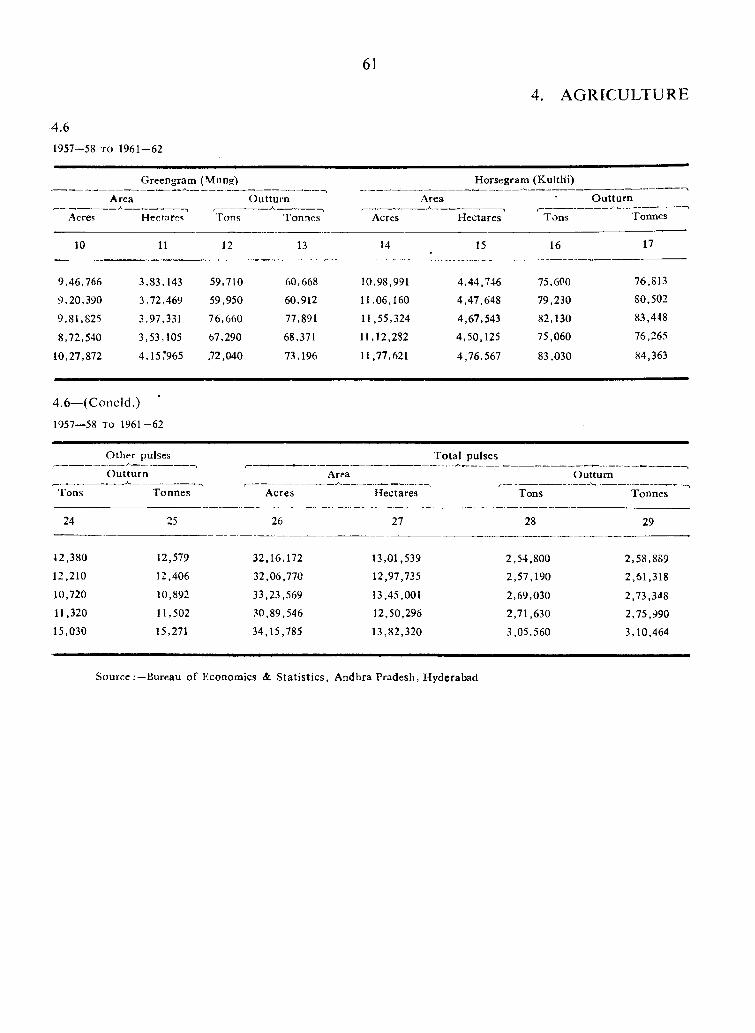
61
4. AGRICULTURE
1957-58 TO 1961-62
4.6
Acres
Greengram (Mimg)
Area O uttu rn
Hectarrs Tons
Horsegram (KultHi)
Area O utturn
Tonnes Acrcs H ectares Tons Tonnes
10 11 12 13 14 15 16 17
9,46,766 3,83,143 59,710 60,668 10,98,991 4,44,746 75,600 76,813
9,20,390 3,72,469 59,950 60,912 11,06,160 4,47,648 79,230 80,502
9,81,825 3,97,331 76,660 77,891 11,55,324 4,67,543 82,130 83,448
8,72,540 3,53,105 b7,290 68,371 11,12,282 4,50,125 75,060 76,265
10,27,872 4,15,*965 .72,040 73,196 11,77,621 4,76,567 83,030 84,363
4 .6 — (C o n o id .)
1957—58 TO 1961-62
Tons
24
12,380
12,210
10,720
11,320
15,030
O ther pulses
O uttu rn
Tonnes
12,579
12,406
10,892
11,502
15,271
Area
Acres
26
32,16,172
32,06,770
33,23,569
.^0,89,546
34,15,785
T otal pulses
Hectares
27
13,01,539
12,97,735
13,45,001
12,50,296
13,82,320
O utturn
Tons
28
2,54,800
2,57,190
2,69,030
2,71,630
3,05,560
Tonnes
29
2,58,889
2,61,318
2,73,348
2,75,990
3,10,464
S o u r c e B u r e a u o f Economics &. S ta tis tics , Andhra Pradesh, Hyderabad
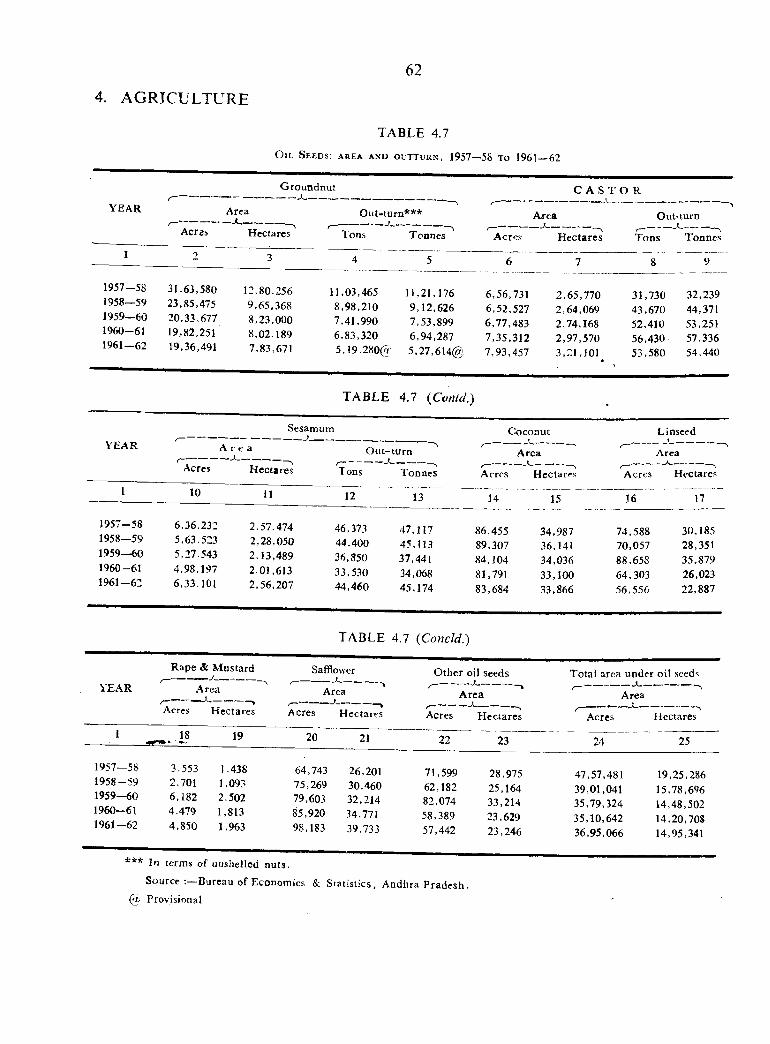
62
4. AGRICULTURE
TABLE 4.7
O i l S e e d s ; a r e a a n d o u t t u r n , 1957—58 t o 1961—62
G roundnut C A S T O R
YEAR
Acres
Area
Hectares
O ut-turn***
Tons Tonnes Acres
Area Out-turn
H ectares Tons Tonnes1 'J 3 4 5 6 7 8 9
1957—581958—591959—601960—611961—62
31.63,58023,85,47520,33,67719,82,25119,36,491
12,80.2569,65.3688,23,0008,02.1897,83,671
11,03,4658,98,2107,41,9906,83,3205,19,280^/
11,21,1769,12,6267,53,8996,94,2875,27,614@
6,56,7316,52,5276,77,4837,35,3127,93,457
2,65,770 31,730 32,239 2,64,069 43,670 44,371 2,74,168 52,410 53,251 2,97,370 56,430 57,336 3,7.1,101 53,580 54,440
TABLE 4 .7 {Contd.)
YEAR
Acres
Sesamum
' ^ ^ O u t -
Hectares Tons
turn
Tonnes
Coconut Linseed
A rea Area
Acres Hectares Acres Hectares
1 10 11 12 13 14 15 16 17
1957-581958-591959 -601960-611961-62
6,36,2325,63.5235.27.5434,98,1976,33.101
2.57,4742,28,0502.13,4892,01.6132,56,207
46,37344,40036,85033,53044,460
4 i , n i45,11337,44134,06845,174
86,455 89,307 84,104 81,791 83,684
34,987 74,588 30,185 36,141 70,057 28,351 34,036 88,658 35,879 33,100 64,303 26,023 33,866 56,556 22,887
TABLE 4 .7 {Concld.)
YEAR
Rape & M ustard Safflowcr
Area Area
Acres H ectares Acres Hectares
O ther oil seeds
Area
Acres H ectares
T otal area under oil seeds
Area
Acres Hectares
1 18 19 20 21 22 23 24 25
1957-581958-591959-601960-611961-62
3-553 1.438 64,743 2,701 1,093 75,269 6,182 2.502 79,603 4.479 1,813 85,920 4,850 1,963 98,183
26,20130,46032,21434,77139,733
71,59962,18282,07458,38957,442
28,97525,16433,21423,62923,246
47,57,481 19,25,286 39,01,041 15,78,696 35,79,324 14,48,502 35,10,642 14,20,708 36,95,066 14,95,341
S o u rce:— Bureau o f Econom ics & Statistics, Andhra Pradesh. (5; Provisional
TABLE 4.8
O t h e r P r i n c i p a l C r o p s : A r e a
A ND O u t t u r n , 1957-58 t o 1961-62
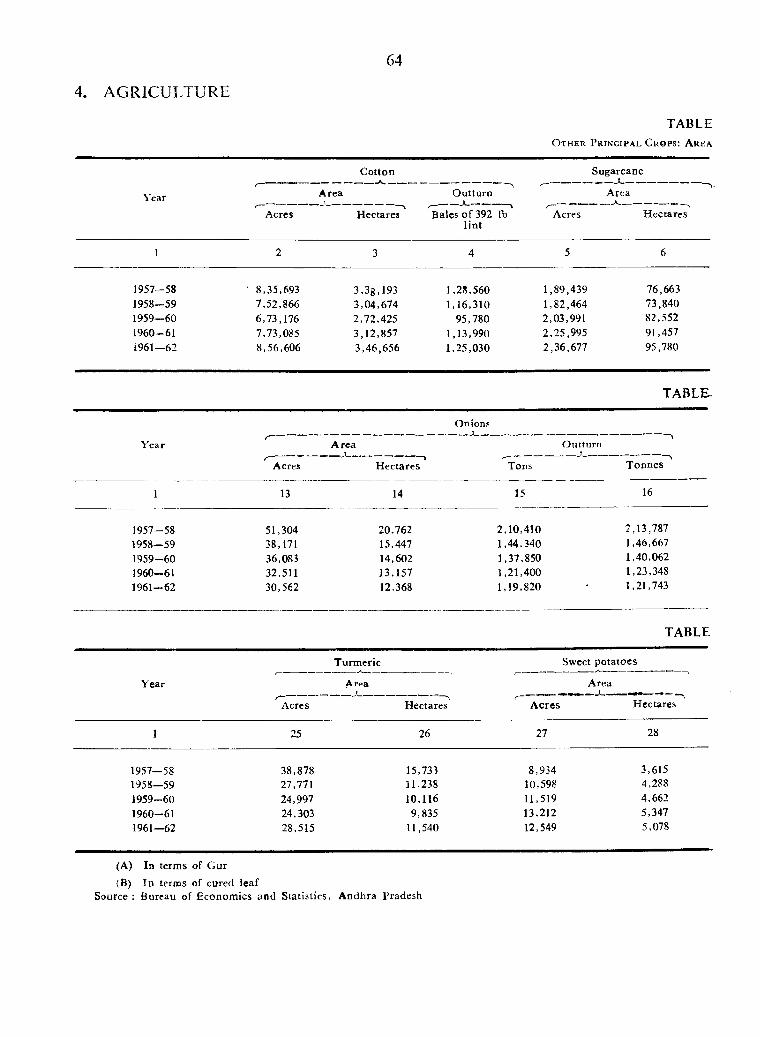
4. AGRICULTURE
64
TABLEO t h e r P r i n c i p a l C r o p s : A r e a .
Cotton Sugarcane
Year A rea
Acres Hectares
O utturn
's a le s o f 392 ItT* lin t
Acres
A rea
H ectares
1 2 3 4 5 6
1957-58 ' 8,35,693 3,38,193 1,28,560 1,89,439 76,6631958-59 7,52,866 3,04,674 1,16,310 1,82,464 73,8401959—60 6,73,176 2,72,425 95,780 2,03,991 82,5521960-61 7,73,085 3,12,857 1,13,990 2,25,995 91,4571961—62 8,56,606 3,46,656 1,25,030 2,36,677 95,780
TABLE.
Onions
Year
Acres
A rea
H ectares
O utturn!
Tons Tonnes
1 13 14 15 16
1957-58 51,304 20,762 2,10,410 2,13,7871958-59 38,171 15,447 1,44,340 1,46,6671959-60 36,083 14,602 1,37,850 1,40,0621960-61 32,511 13,157 1,21,400 1,23,3481961-62 30,562 12,368 1,19,820 1,21,743
TABLE
Year
Turm eric
Ar»‘a
Sweet potatoes
Area
Acres Hectares A cres Hectares
1 25 26 27 28
1957—58 38,878 15,733 8,934 3,6151958—59 27,771 11,238 10,598 4,2881959-60 24,997 10,116 11,519 4,6621960-61 24,303 9,835 13,212 5,3471961—62 28,515 11,540 12,549 5,078
(A) In term s of G ur(B) In terms of cured leaf
Source : Bureau of Economics and Statistics, A ndhra Pradesh
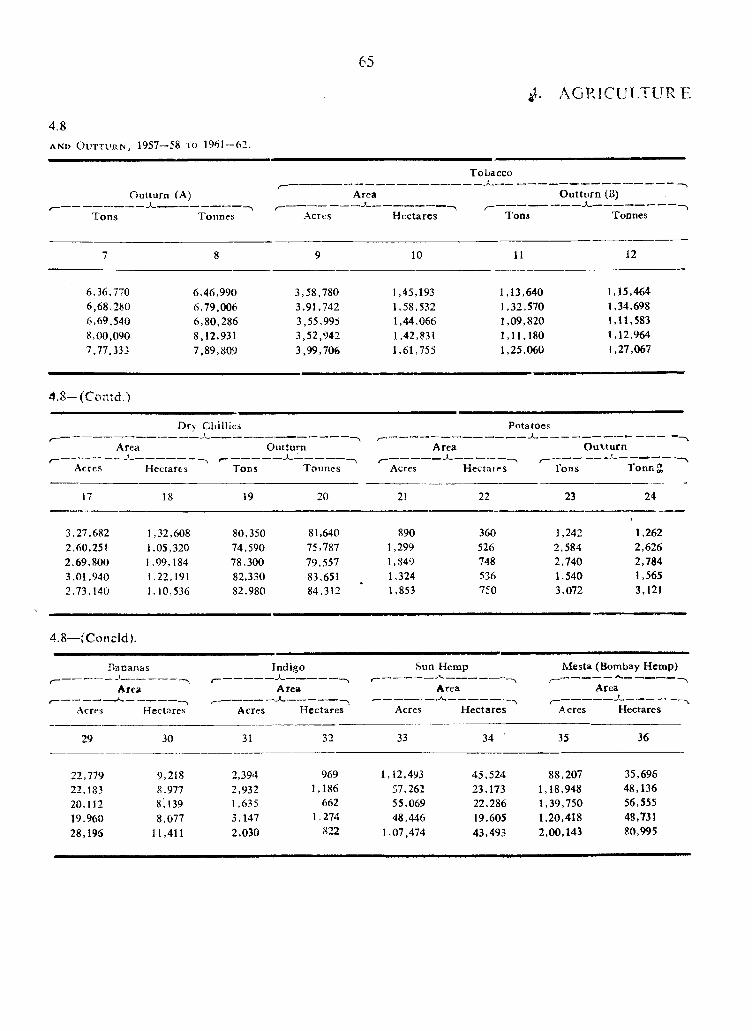
A N D O u t t u r n , 1957—58 t o 1961—62.
4.8
65
AGRICULTURE
O utturn (A) ------ ________
Tons Tonnes
Tobacco
Area
Acres H ectares Tons
O uttu rn (B)
Tonnes
7 8 9 10 11 12
6.36,770 6,46,990 3,58,780 1,45,193 1,13,640 1,15,4646,68,280 6,79,006 3,91,742 1,58,532 1,32,570 1,34,6986,69.540 6,80,286 3,55,995 1,44,066 1,09,820 1,11,5838,00,090 8,12,931 3,52,942 1,42,831 1,11,180 1.12.9647,77.333 7,89,809 3,99,706 1,61,755 1,25,060 1,27,067
4.8—(Contd.)
Drv Chillies Potatoes
Area
Acres Hectares
(
Tons
Outturn
Tonnes
A rea
Acres H ectaies
O u ttu rn
Tons TonnX
17 18 19 20 21 22 23 24
3.27,682 1,32,608 80,350 81,640 890 360 1,242 1,2622,60.25! 1,05,320 74,590 75,787 1,299 526 2,584 2,6262.69,800 1,09,184 78,300 79,557 1,849 748 2,740 2,7843.01,940 1,22,191 82,330 83,651 1,324 536 1,540 1,5652,73.140 1,10,536 82,980 84,312 1,853 750 3,072 3,121
4 .8 — ^(C oncld ).
Bananas Indigo Sun Hemp Mesta (Bombay Hemp)____________ 1____
AreaX.A rea Area Area
---- ------------------ _ ^ — 11 • II _ j -------------------------------------- ^ y—— — -- — — — ---— ■■ II ' ' ■ --- ------------------ -----— ------- —— — —,—Acres Hectares Acres H ectares Acres H ectares Acres Hectares
29 30 31 32 33 34 ■ 35 36
22.779 9,218 2,394 969 1,12,493 45,524 88,207 35,69622.183 8,977 2,932 1,186 57,262 23,173 1,18,948 48,13620.112 8,139 1,635 662 55,069 22,286 1,39.750 56,55519.960 8,077 3,147 1,274 48,446 19,605 1,20.418 48,73128,196 11,411 2,030 822 1.07,474 43,493 2.00,143 80,995
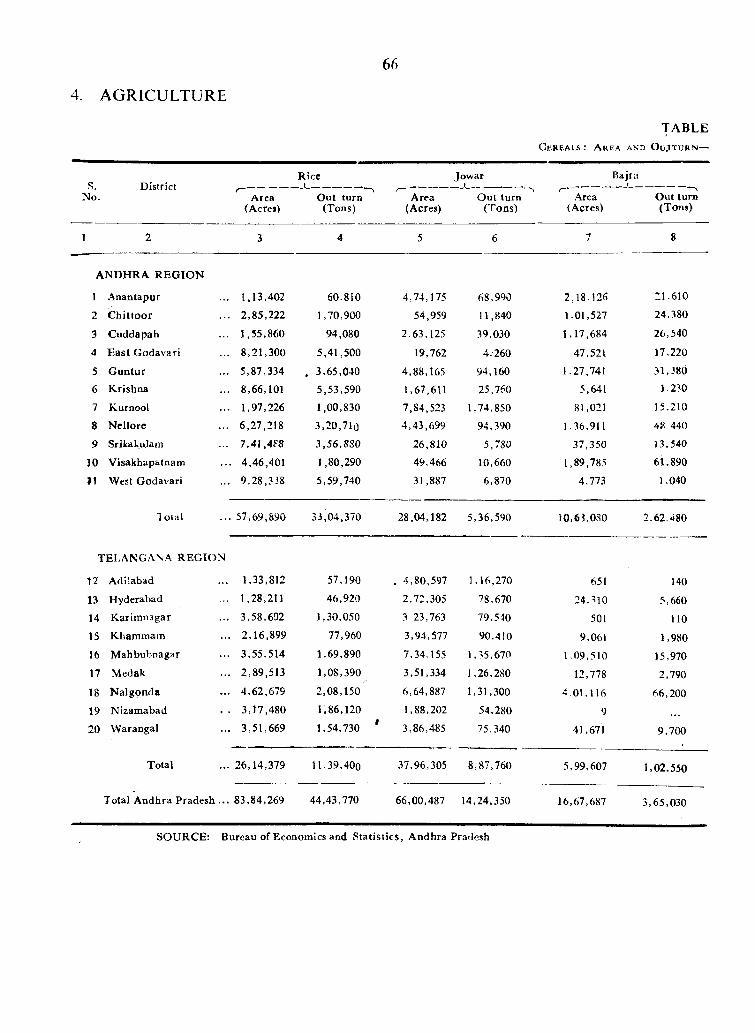
6 6
4. AGRICULTURE
T A B L EC e r e a l s : A r e a a n d O u J t u b n —'
S.No.
DistrictA r e a
(Acres)
Rice_ _ i -------------- ------------------ .
O ut turn (Tons)
Jow ar
Area O ut turn(Acres) (Tons)
Bajra
Area Out turn(Acres) (Tons)
ANDHRA R E G IO N
1 Anantapur
C h itto o r
Cuddapah
E ast G odavari
G un tu r K rishna
Kurnool
8 N ellorc
9 Srifcakulam
10 V isakhapatnam
11 West Godavari
1,13,402
2,85,222
1,55,860
8,21,300
5,87,334
8,66,1011,97,226
6,27,218
7 ,4I,4F 8
4,46,401
9,28,338
60-810
1,70,900
94,080
5,41,500
3,65,040
5,53,590
1,00,830
3,20,710
3 ,5 6 ,8 S 0
1,80,290
5,59,740
4,74,175
54,959
2.63,125
19,762
4,88,165
1,67,611
7,84,523
4,43,699
26,810
49,466
31,887
68,990
11,840
39,030
4.260
94,160
25,760
1,74,850
94,390
5,780
10,660
6,870
2,18 126
1,01,527
1,17,684
47,521
1.27,741
5,641
8J.021
1.36,911
37,350
1,89,785
4,773
21.610
24,380
26.540
17,220
31,38()1 , 2^0
15,210
48.440
13.540
61,890
1.040
Total 57,69,890 33,04,370 28,04,182 5,36,590 10,6?,080 2.62.480
TELANGANA R EG IO N
12 Adilabad 1,33,812 57,190 , 4,80,597 1,16,270 651 14013 Hyderabad 1,28,211 46,920 2,72,305 78,670 24,310 5,66014 K arim nagar 3,58,692 1,30,050 3 23,763 79,540 501 11015 Khammam 2,16,899 77,960 3,94,577 90,410 9,061 1,98016 M ahbubnagar 3,55,514 1,69,890 7,34.155 1,55,670 1.09,510 15,97017 Medak 2,89,513 1,08,390 3,51,334 1,26,280 12,778 2,79018 N algonda 4,62,679 2,08,150 6,64,887 1,31,300 4.01,116 66,20019 Nizamabad . • 3,17,480 1,86,120 1,88,202 54,280 920 W arangal 3,51,669 1,54,730 * 3,86,485 75.340 41,671 9,700
Total 26,14,379 11.39,400 37,96,305 8,87,760 5,99,607 1,02,550
Total A ndhra Pradesh ... 83,84,269 44,43,770 66,00,487 14,24,350 16,67,687 3,65,030
S O U R C E : B ureau of Econom ics and S ta tis tic s , A n d h ra P radesh
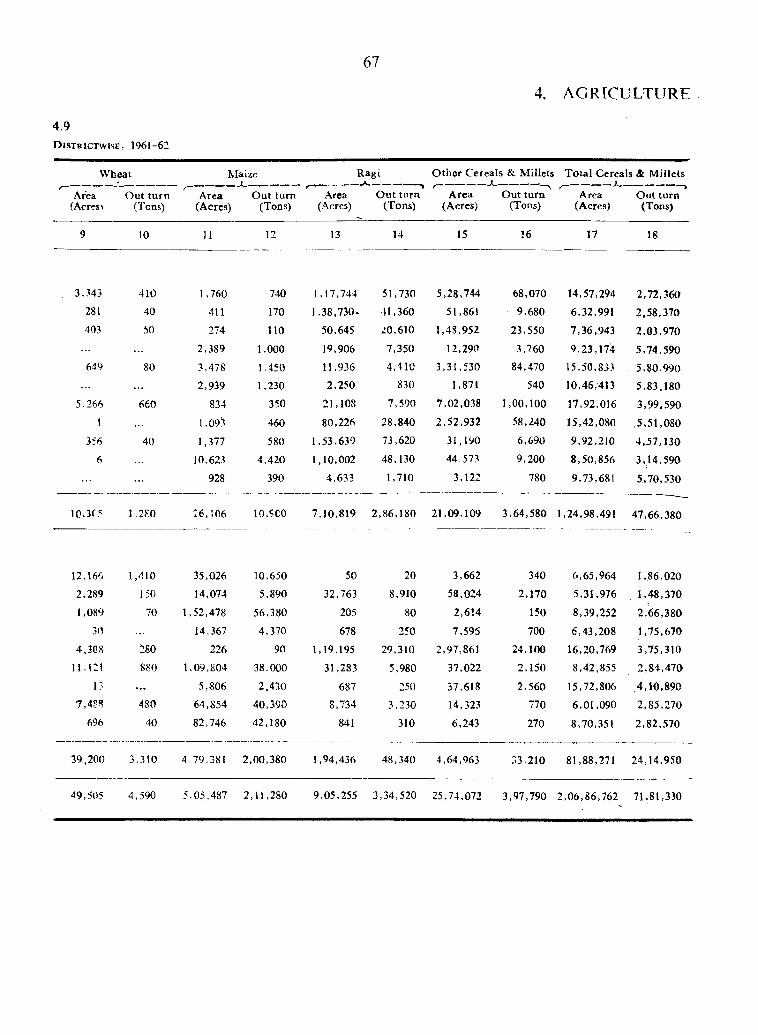
67
4. AGRICULTURE
4.9D i s t r i c t w j s e , 1961-62
Wheat Maize
Area O ut tu rn Area O ut turn (Acres') (Tons) (Acres) (Tons)
Ragi
Area O ut turn (Acres) (Tons)
O ther Cereals & Millets T otal Cereals & M illets
Area O ut turn A rea O ut turn(Acres) (Tons) (Acres) (Tons)
10 n 12 13 14 15 16 17 18
3,?43
281
403
649
5,266
1
356
6
410
40
50
80
660
40
1,760
411
274
2,389
3,478
2,939
834
1,093
1,377
10,623
928
740
170
110
1,000
1,450
1,230
350
460
580
4,420
390
1,17.744
1,38,730.
50,645
19,906
11.936
2,250
21,108
80.226
1,53,639
1 , 10,002
4,633
51.730
41,360
^0,610
7,350
4.410
830
7,590
28,840
73,620
48,130
1,710
5,28,744
51,861
1,48.952
12.290
3,31,530
1,871
7,02,038
2,52.932
31,190
44.573
3,122
68,070
9,680
23,550
3,'?60
84,470
540
1,00,100
58,240
6,690
9,200
780
14,57,294
6,32,991
7,36.943
9,23,174
15,50,833
10,46,413
17,92,016
15,42,080
9,92,210
8,50,856
9,73,681
2.72,360
2,58.370
2,03,970
5.74.590
5,80,990
5,83.180
3.99.590
.5,51,080
4.57,130
3.14.590
5,70,530
10.3f5 1,2?0 26,306 10,SCO 7,10,819 2,86,180 21,09,109 3,64,580 1,24,98,491 47,66,380
12.166 1,410 35,026 10,650 50 20 3,662 340 6,65,964 1,86,0202.289 150 14,074 5,890 32,763 8,910 58,024 2,170 5,31,976 1,48,370
1,089 70 1,52,478 56,380 205 80 2,6!4 150 8,39,252 2,66,380
30 14,367 4,370 678 250 7,595 700 6,43,208 1,75,670
4.308 280 226 90 1,19,195 29,310 2,97,861 24,100 16,20,769 3,75,310
11.121 880 1.09,804 38.000 31,283 5,980 37,022 2,150 8,42,855 2 ,84,470
13 . . . 5,806 2.430 687 250 37,618 2.560 15,72,806 4,10,8907,48!? 480 64,854 40,390 8,734 3,230 14,323 770 6,01,090 2,85,270
696 40 82,746 42,180 841 310 6,243 270 8,70,351 2,82,570
39.200 3,310 4.79.381 2,00,380 1,94.436 48,340 4.64,963 33.210 81,88,271 24,14,950
49,505 4,590 5.05,487 2 ,n ,2 8 0 9,05,255 3,34,520 25,74,072 3,97,790 2,06,86,762 71,81,330
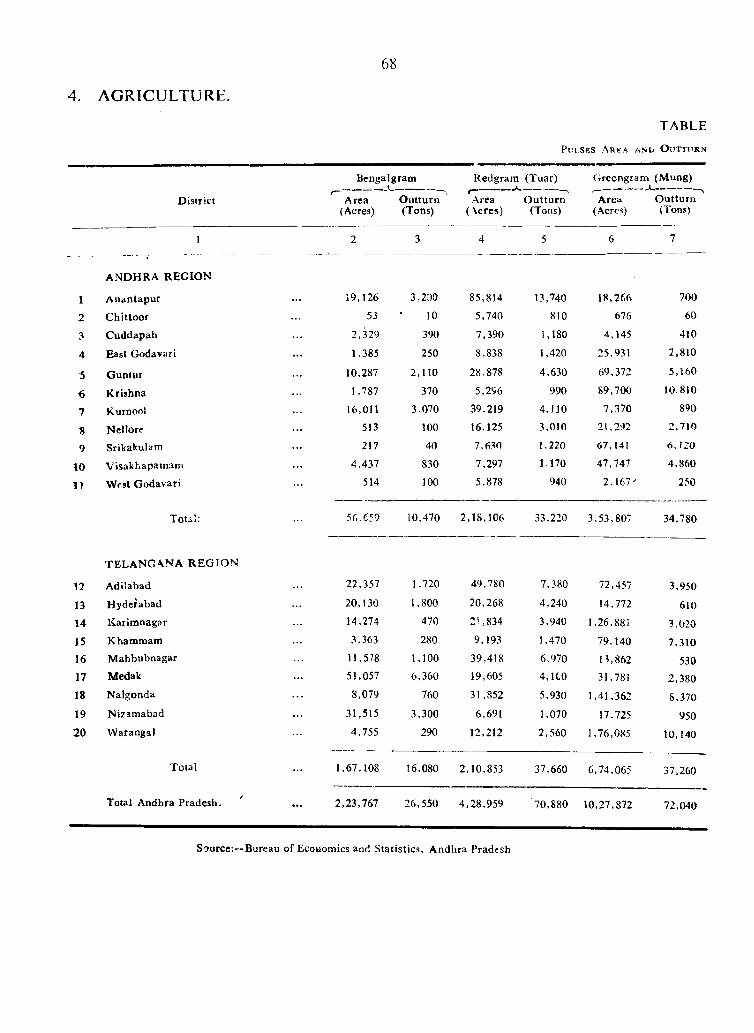
4. AGRICULTURE.
6 8
TABLE
Pni.SE S A rea an d O u ttv ’r n
Bengal gram__ _1 ________Redgram (Tuar)
A. .Greengram (M ung)
District Area (Acres)
O utturn(Tons)
Area(Acres)
O u ttu rn(Tons)
Area(Acrcs)
O uttu rn(Tons)
1 2 3 4 5 6 7
A NDHRA REG IO N
1 A u a n t a p u r 19,126 3,200 85,814 13,740 18,266 700
2 C hittoor 53 10 5,740 810 676 60
3 C uddapah 2,329 390 7,390 1,180 4,145 410
4 East Godavari 1,385 250 8,838 1,420 25,931 2,810
5 G untur 10,287 2,110 28,878 4,630 69,372 5,160
6 K rishna 1,787 370 5,296 990 89,700 10.810
7 Kurnool 16,011 3.070 39,219 4,110 7,370 890
« Nellorc 513 100 16,125 3,010 21,292 2,710
9 Srikakulam 217 40 7,630 1,220 67,141 6. 120
10 V isakhapainarn 4,437 830 7,297 1.170 47,747 4,860
11 West Godavari 514 100 5,878 940 2 .167 ' 250
Total: 56.659 10,470 2,18,106 33,220 3,53,807 34,780
TELA N G A N A R E G IO N
12 Aditabad 22,357 1,720 49,780 7,380 72,457 3,950
13 H yderabad 20,130 1,800 20,268 4,240 14,772 610
14 Karim nagar 14,274 470 2!,834 3,940 1,26,881 3,020
15 Khammam 3,363 280 9,193 1,470 79,140 7,31016 M ahbubnagar 11,578 1,100 39,418 6,970 13,862 53017 M e d a k 51,057 6,360 19,605 4, ICO 31,781 2,38018 Nalgonda 8,079 760 31,852 5,930 1,41,362 8,37019 Nizamabad 31,515 3,300 6,691 1,070 17.725 95020 W arangal 4,755 290 12,212 2,560 1,76,085 10,140
Total
Total Andhra Pradesh.
1,67,108 16,080 2,10,853 37,660 6,74,065 37,260
2,23,767 26,550 4.28,959 70,880 10,27,872 72,040
S ource :—B ureau of Ecouom ics and S ta tis tics , A n d h ra P radesh
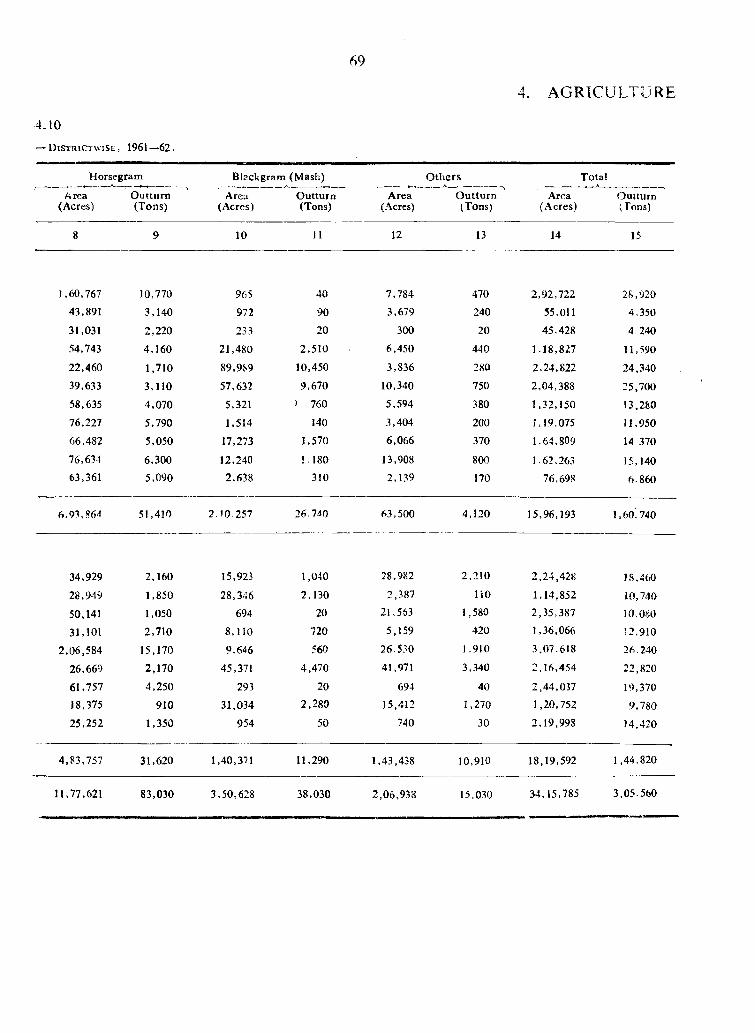
69
4. AGRICULTURE
— D iS T R i C T w i S E , 1961—62.
4.10
Horsegram
Area(Acres)
O utturn(Tons)
Blackgram (Mash) O thers Total
Area(Acres)
O utturn(Tons)
Area(Acres)
O utturn(Tons)
10 11 12 13
Area(Acres)
14
O utturn(Tons)
15
1,60,767
43,891
31,031
54,743
22,460
39.633
58,635
76,227
66,482
76.634
63,361
10,770
3,140
2,220
4,160
1,710
3,110
4,070
5,790
5,050
6,300
5,090
965
972
233
21,480
89,989
57,632
5,321
1,514
17,273
12,240
2,638
40
90
20
2,510
10,450
9,670
> 760
140
1,570
1.180 310
7,784
3,679
300
6,450
3,836
10,340
5,594
3,404
6,066
13,9082,139
470
240
20
440
280
750
380
200
370
800
170
2,92,722
55,011
45.428
1.18,827
2.24,822
2,04,388
1,32,150
1,19,075
1.6^,809
1.62.263
76.698
2S.920
4,350
4.240
11,590
24,340
25,700
13,280
11,950
14.370
15,140
6,860
6.91,864 51,410 2-10-257 26.740 63,500 4,120 15,96,193 1,60.740
34,929 2,160 15,923 1,040 28,982 2,210 2,24,428 18,460
28,949 1,850 28,346 2,130 2,387 liO 1,14,852 10,74050,141 1,050 694 20 21,563 1,580 2,35,387 10,080
31,101 2,710 8,110 720 5,159 420 1,36,066 12,910
2,06.584 15,170 9.646 560 26.530 1,910 3,07.618 26,240
26,669 2,170 45,371 4,470 41,971 3,340 2,16,454 22,820
61,757 4,250 293 20 694 40 2,44,037 19,370
18,375 910 31,034 2,280 15,412 1,270 1,20,752 9,780
25,252 1,350 954 50 740 30 2,19,998 14,420
4,83,757 31,620 1,40,371 11,290 1,43,438 10,910 18,19,592 1,44,820
11,77,621 83,030 3,50,628 38,030 2,06,938 15,030 34,15,785 3,05,560
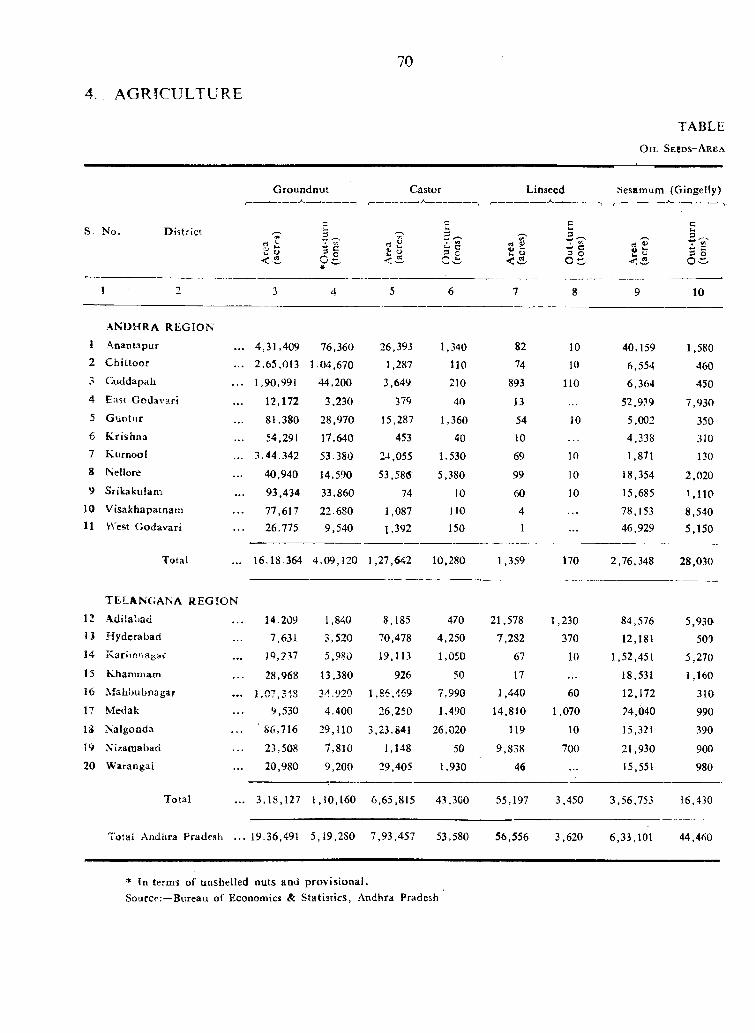
4. AGRICULTURE
JO
O i l S e b d s - A r e a
TABLE
S. No, D istrict
G roundnut Castor. A
LinseedA
Sesamum (Gingelly)
cU,3 ^
IIt o II*
y. rt t i o <
3 ^
if rf V^ 9 I ,
rt ? < 3
1 2 3 4 5 6 7 8 9 10
ANDHRA R EG IO N1 A-nantapur 4,31,409 76,360 26,393 1,340 82 10 40,159 1,5802 C h iitoo r 2,65,013 1.04,670 1,287 110 74 10 6,554 460
Cuddapah 1,90,991 44,200 3,649 210 893 110 6,364 4504 East G odavari 12,172 3,230 379 40 13 52,9.-'9 7,9305 G untu r 81,380 28,970 15,287 1,360 54 10 5,002 3506 K rishna 54,291 17.640 453 40 10 4,338 3107 K urnool 3.44.342 53.380 24,055 1,530 69 10 1,871 1308 Nellore 40,940 14,590 53,586- 5,380 99 10 18,354 2,0209 Srikakulam 93,434 33,860 74 10 60 10 15,685 M IO
10 Visakhapatnam 77,617 22.680 1,087 n o 4 78,153 8,54011 West G odavari 26,775 9,540 1,392 150 1 46,929 5,150
Total 16,18.364 4,09,120 1,27,642 10,280 1,359 170 2,76,348 28,030
TELA NG AN A R E G IO N12 Adi la bad 14.209 1,840 8,185 470 21,578 1,230 84,576 5,93013 H yderabad 7,631 3,520 70,478 4,250 7,282 370 12,181 50014 Karljnt'.ay?*f 39,237 5,980 19,113 1,050 67 10 1,52,451 5,27015 Khaminam 28,968 13,380 926 50 17 . . . 18,531 1,16016 M ahbubnagar J ,07 348 3/] ,920 1 S6 169 7,990 1,440 60 12,172 310IT Medak 9.530 4,400 26,250 1,490 14,810 1,070 24,040 990
IS N algonda 86,716 29,110 3,23.841 26,020 119 10 15,321 390
19 Xizamabad 23,508 7,810 1,148 50 9,838 700 21,930 90020 W arangai 20,980 9,200 29,405 1,930 46 15,551 980
Total 3,18,127 1,10,160 6,65,815 43,300 55,197 3,450 3,56,753 16,430
Total Andhra Pradesh .. . 19.36,491 5,19,280 7,93,457 53,580 56,556 3,620 6,33,101 44,460
* In terms of unshelled nuts and p rov isional.Source: —Bureau of Economics & S tatistics, Andhra Pradesh
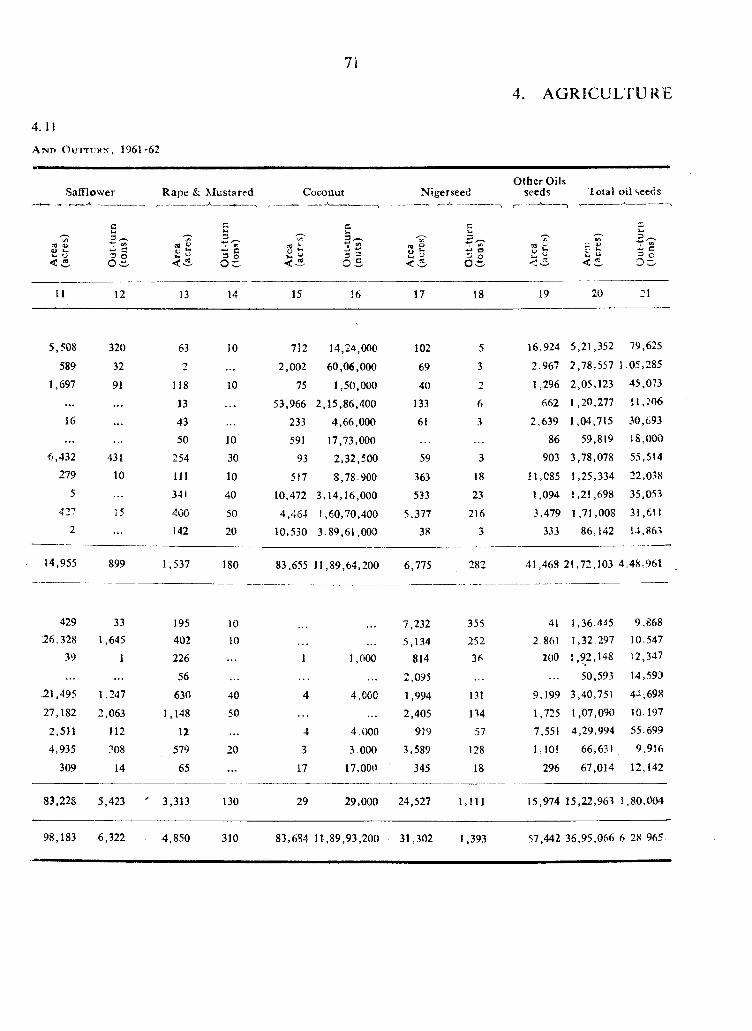
71
4. AGRICULTURE
4 .11
A mo OuTTi'HN, 1961-62
Safflower R ape & M ustarcd
s| il
C
s i
oconut N igerseed
< S
O ther Oilsseeds Total oil seeds
I ' - '
itw O
cW3 ^
■*7* C/5
II 0 5a ^< w
v>l i u
< t
11 12 13 14 15 16 17 18 19 20 21
5,508 320 63 10 712 14,24,000 102 5 16,924 5,21,352 79,625
589 32 2 2,002 60,06,000 69 3 2.967 2,78,557 1.05,285
1,697 91 118 10 75 1,50,000 40 1,296 2,05,123 45,073
. . . 13 53,966 2,15,86,400 133 6 662 1,20,277 u , : o 6
16 43 233 4,66,000 61 3 2,639 1,04,715 30,693
. . . 50 10 591 17,73,000 86 59,819 18,000
^,432 431 254 30 93 2,32,500 59 3 903 3,78,078 55,514
279 10 111 10 517 8,78.900 363 18 I1,C85 1,25,334 22,038
5 341 40 10,472 3,14,16,000 533 23 1,094 1,2!,698 35,055
427 15 400 50 4,464 1,60,70,400 5.377 216 3,479 1,71,008 31,61{2 142 20 10,530 3,89,61,000 38 3 333 86,142 14.863
14,955 899 1,537 180 83,655 11,89,64,200 6,775 282 41,468 21,72,103 4.48,961
429 33 195 10 7,232 355 41 1,36,445 9.86826,328 1,645 402 10 5,134 252 2.861 1,32,297 10,547
39 1 226 1 1,000 814 36 200 1,92,148 )2,347
. . . 56 2,095 50,593 14,.59J
:21,495 1,247 630 40 4 4,000 1,994 131 9,199 3,40,751 4-i,698
27,182 2,063 1,148 50 2,405 134 1,725 1,07,090 10.197
2,511 112 12 4 4.000 919 57 7,551 4,29,994 55.699
4,935 ?08 579 20 3 3.000 3,589 128 1,101 66,631 9,916
309 14 65 . . . 17 17,000 345 18 296 67,014 12,142
83,228 5,423 " 3,313 130 29 29,000 24,527 1,111 15,974 15,22,963 1,80,004
98,183 6,322 4,850 310 83,684 11,89,93,200 31,302 1,393 57,442 36,95,066 6,28 965
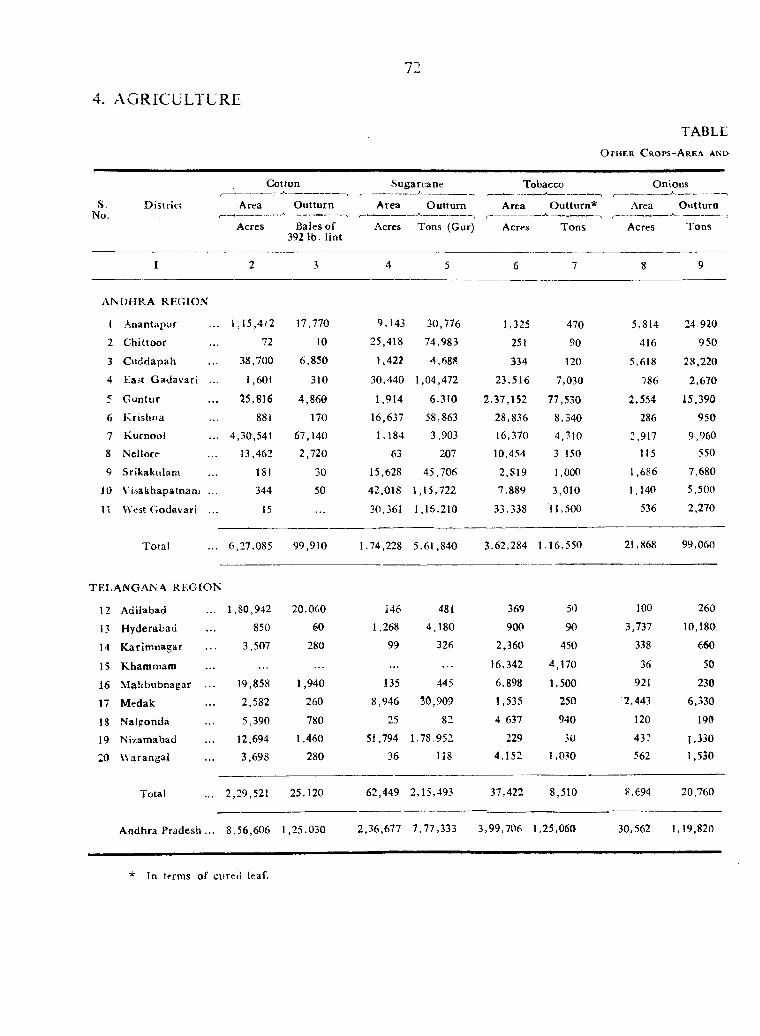
4. AGRICULTURE
72
TABLE
O t h e r C r o p s - A r e a a n d -
Cotton Sugarcane Tobacco
S.No.
D istrict Area
Acres
O utturn
Bales of 392 1b. lin t
Area O utturn Area O utturn*
Onions
Area O utturn
Acres Tons (Gur) Acres Tons Acres Tons
I 2 3 4 5 6 7 8 9
ANDHRA REGION
1 Anantapur 1,15,4/2 17,770 9,143 30,776 1,325 470 5,814 24 920
2 C hittoor 72 10 25,418 74,983 251 90 416 950
3 C uddapah 38,700 6,850 1.422 4,688 334 120 5,618 28.220
4 East G adavari ... 1,601 310 30,440 1,04,472 23,516 7,030 786 2,670
5 G untur 25,816 4,860 1,914 6,310 2,37,152 77,530 2.554 15.390
6 K rishna 881 170 16,637 58,863 28,836 8,340 286 950
7 Kurnool 4,30,541 67,140 1,184 3,903 16,370 4 ,? !0 2,917 9,960
8 Nellore 13,462 2,720 63 207 10,454 3.150 115 550
9 Srikakulam 181 30 15,628 45,706 2,819 1,000 1,686 7,680
10 Vl-sakhapatnanj ... 344 50 42.018 1,15,722 7,889 3,010 1,140 5,500
11 West G odavari ... 15 30,361 1,16,210 33,338 11,500 536 2,270
Total 6,27,085 99,910 1,74,228 5.61,840 3.62,284 1.16,550 21,868 99,060
rELA N G A N A R EG IO N
12 Adilabad 1,80,942 20,060 146 481 369 50 100 260
13 H yderabad 850 60 1,268 4,180 900 90 3,737 10,180
14 K arim nagar 3,507 280 99 326 2,360 450 338 660
15 Kham m am 16,342 4,170 36 50
16 M ahbubnagar ... 19,858 1,940 135 445 6,898 1,500 921 230
17 M edak 2,582 260 8,946 30,909 1,535 250 2,443 6,330
18 Nalieonda 5,390 780 25 82 4 637 940 120 190
19 Nizamabad 12,694 1,460 51,794 1,78,952 229 30 4 3 :’ 1,330
20 W arangai 3,698 280 36 118 4,152 1,030 562 1,530
Total 2,29,521 25,120 62,449 2,15,493 37,422 8,510 8,694 20,760
A ndhra Pradesh ... 8,56,606 1,25.030 2,36,677 7,77,333 3,99,706 1,25,060 30,562 1,19,820
* In terms of cured leaf.
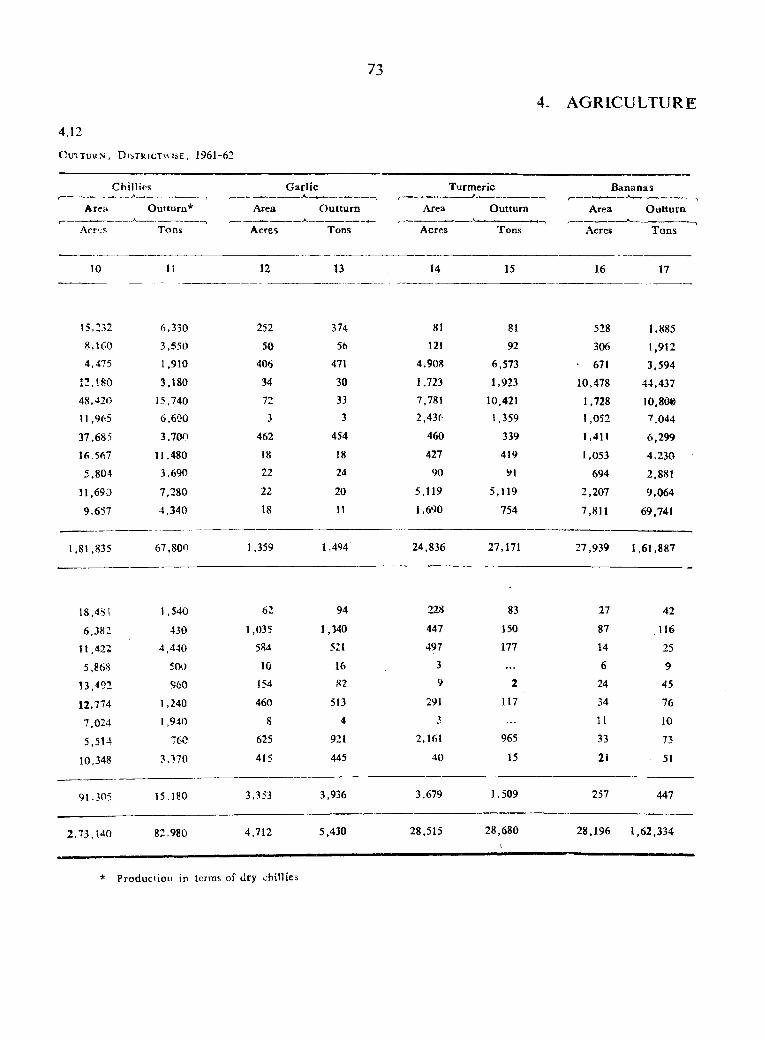
O u t t u r n , D i s t r i c t w i s e , 1961-62
4 . 1 2
73
4. AGRICULTURE
Chillies
Area
Acr-;S
O utturn*
Tons
Area
G arlic
Acres
O utturn
Tons
Turmeric
Area
Acres
Outturn
Tons
Bananas
Area
Acrcs
O utturn
Tons
10 11 12 13 14 15 16 17
15,252 6,330 252 374 81 81 528 1,8858,160 3,550 50 56 121 92 306 1,9124,475 1,910 406 471 4,908 6,573 • 671 3,594
n . i s o 3,180 34 30 1,723 1,923 10,478 44,43748,420 15,740 72 33 7,781 10.421 1,728 lo .so e11,965 6,600 3 3 2,436 1,359 1,052 7,044
37,685 3,70f.) 462 454 460 339 1,411 6,299
16,567 11,480 18 18 427 419 1,053 4,2305.804 3,690 Z.2 24 90 91 694 2.881
11,690 7,280 22 20 5,119 5,119 2,207 9,064
9,657 4,340 18 11 1,690 754 7,811 69,741
1,81,835 67,800 1,359 1,494 24,836 27,171 27,939 1,61,887
18,481 1 ,540 62 94 228 83 27 42
6.382 430 1,035 1,340 447 150 87 116
11,422 4,440 584 521 497 177 14 25
5 , m 500 10 16 3 . . . 6 9
13,492 960 154 S2 9 2 24 45
12,774 1,240 460 513 291 117 34 76
1,024 1,940 8 4 3 11 10
5,514 760 625 921 2,161 965 33 73
10,348 3,370 415 445 40 15 21 51
91.305 15,180 3,353 3,936 3,679 1,509 257 447
2,73,140 82,980 4,712 5,430 28,515 28,680 28,196 1,62,334
* Productioti in terms of dry chillies
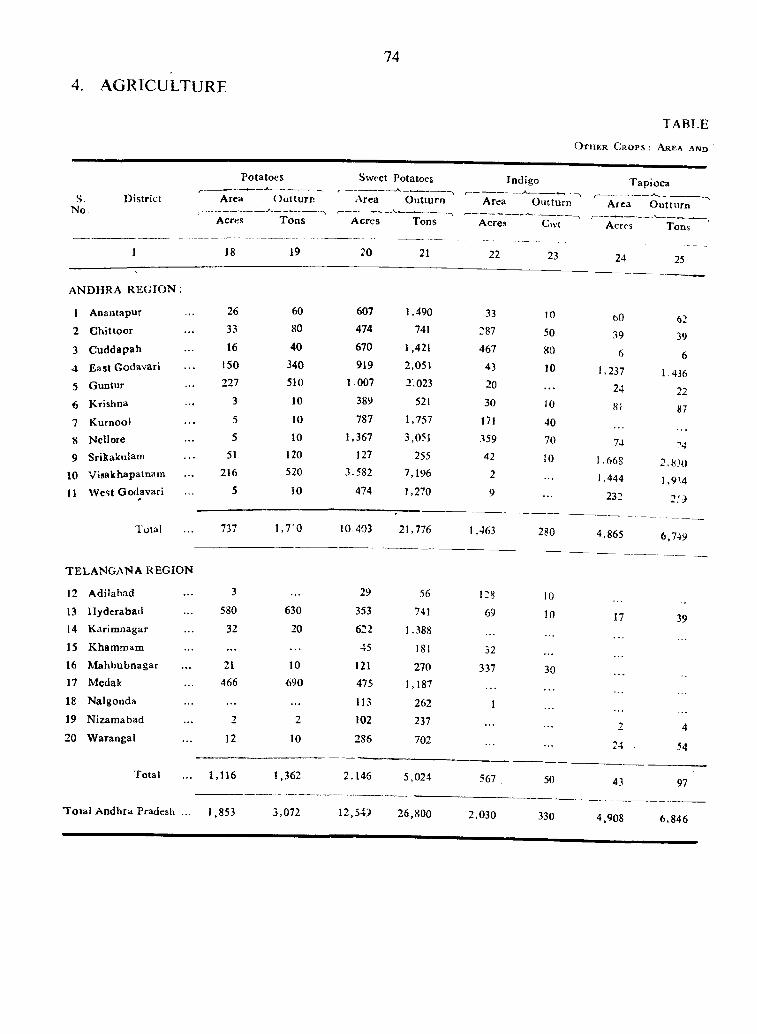
4. AGRICULTURE
74
O t h e r C r o p s : A r e a a n d
TABLE
Potatoes
S.No
District Area O uttu rn
Acres T ons
Sweet Potatoes
Area O utturn
Indigo
Acres Tons
Area O utturn
Acres C^vt
T o ta l A ndhra Pradesh ... 1,853 3,072 12,549 26,800
Tapioca
Area O utturn
Tons
1 18 19 20 21 22 23
ANDHRA R EG IO N ;
1 Anantapur 26 60 607 1,490 33 102 C hittoor 33 80 474 741 287 503 C uddapah 16 40 670 1,421 467 804 E ast Godavari 150 340 919 2,051 43 105 Guntur 227 510 1007 2,023 20
6 Krishna 3 10 389 521 30 10
7 Kurnoot 5 10 787 1,757 171 408 Nellore 5 10 1,367 3,051 359 709 Srikakulam 51 120 127 255 42 10
10 V isakhapatnam 216 520 3.582 7,196 211 W est Godavari 5 10 474 1,270 9
Total 737 1 ,7 '0 10.403 21,776 1,463 280
TELA N G A N A REGION
12 A dilabad 3 29 56 128 1013 H yderabad 580 630 353 741 69 1014 K arim nagar 32 20 622 1,38815 Kharnmam . . . 45 181 3216 M ahbubnagar 21 10 121 270 337 3017 Medak 466 -690 475 1,18718 N algonda 113 262 119 Nizam abad 2 2 102 23720 W arangal 12 10 286 702
Total 1,116 1,362 2,146 5,024 567 50
Acrcs
24
bO
39
6
1,237
24
81
74
1 . 6 6 S
J,444
232
4,865
24
25
62
39
6
1.436
2287
"4
2 , 8 3 0
],9>4
2 fJ
6,749
39
4
54
43
2,030 330 4,908
97
6,846
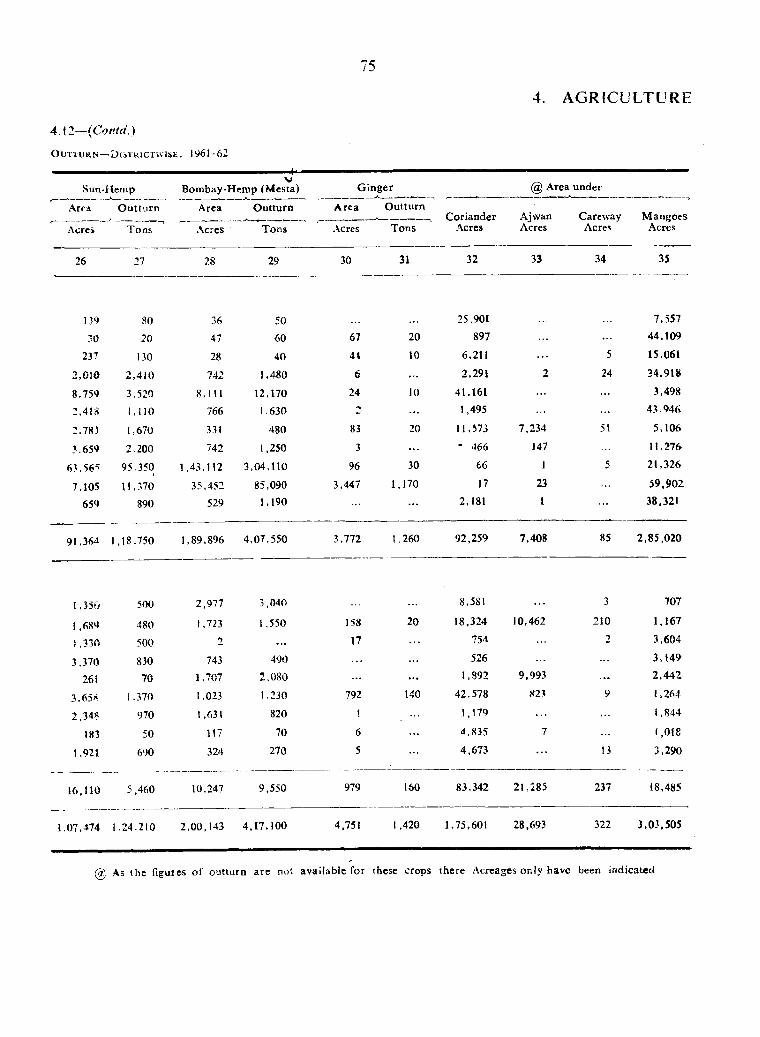
4.12— (Coritci.)
O u t t u r n —' D t j T R i c r u i S E , 1961-62
75
4. AGRICULTURE
Sun-Hemp
Area O uttu rn
TonsAcres
26 27
Bombay-Hemp (M esta)
Area O utturn
Acres
28
Tons
29
G inger @ Area under
A rea O utturn------------ ^ --------------, Coriander Ajwan Careway M angoesAcres Tons Acres Acres Acres Acres
30 31 32 33 34 35
30237
2,0108.759
2,418
2.78J
3.659
63.565
7.105
65‘)
80
20
130
2 ,4 J0
3.520
l . I IO
1,670
2.200
95.350
1\ .370 890
36
47
28
742
8. I l l 766
331
742
1 ,43 .U 2
35,452 529
50
60
40
1,480
12.170J.630
480
1,250
3,04.110
85,0901,190
67
4 t
6
24
83
3
96
3,447
20
10
10
20
30
1,170
25,901
897
6.211
2.291
41,161 1,495
11,573
- 466
66
17
2,181
7,234
147
1
23
1
5
24
51
7,55744.109
15,061
34.918
3,498
43.946
5 , 1 0 6
1 1 . 2 7 6
21,326
59.902
38,321
91.364 1,18,750 1,89,896 4,07,550 3,772 1,260 92,259 7.408 85 2,85,020
1.350
1 .689
1,330
3,370 26 i
3,65< 2,348
183
1.921
500
480
500
83070
1,370
970
50
690
16,110 5,460
2,977
1,723 2
743 1.707
1,023
! ,631
117
324
10,247
3,040
1,550
490
2.080
1.230
820
70
270
9,550
158
17
792
!
6
5
979
20
140
160
8.581
18,324
75.i
526
1,892
42,578
1,179
4,835
4,673
10,462
9,993
823
83,342 21,285
3
210
13
237
707
1,167
3,604
3 , 1 4 9
2,442
t,264
1,844
t,0 l8
3,290
18,485
1.07,474 1.24.210 2,00,143 4,17,100 4,751 1,420 1,75,601 28,693 322 3,03,505
@ As the figures o f outturn are not available for these crops there Acreages only have been indicated

76
4. AGRICULTURE
TABLE
O t h e r C r o p s ; A r e a a n d
@ A R E A U N D E R
S.N o .
District C itrus fruits oranges, M ossam bi
Lem on & o thersGrapes
Pome fru its apples, pears
etc .Guava Papaya
1 36 37 38 39 40
ANDHRA R E G IO N
1 Anantapur 10,495 36 412 99 17
2 C bittoo l 1 ,524 10 25 33 90
3 Guddapah 1 ,8 3 8 14 507 1 129
4 East Godavari 7 ,6 9 6 32 471 903 6
5 G untur 3 ,0 3 8 4 286 1 ,5 9 6 3
6 Krishna 1,341 . . . 291 350
7 K urnocl 4 ,2 9 9 10 208 32 5
S Nellore 8 ,1 6 6 31 300 162
9 Srikakulam 201 72 8 25 31
10 V isakhapatnam 533 60 228 231 10
11 W e s t Godavari 3 ,7 9 6 263 425 18
T o ta l 4 2 ,9 2 7 269 2 ,9 9 9 3 ,8 5 7 309
T EL A N G A N A R EG IO N
12 A dilabad 74 . . . 4 11 2
13 H yderabad 70 21 55 56
14 K arim nagar 523 8 16
15 K hammam 288 . . .
16 M ahbubnagar 132 3 16 5
17 M edak 139 28 19 357 5
18 Nalgonda 54 160 3
19 Nizam abad 206 . . . 9 30
2 0 W arangal 742 2 . . . 45 5
Total 2,228 51 98 691 20
Total A ndhra Pradesh ... 45 ,155 320 3 ,0 9 7 4 ,5 4 8 329
@ As the figures o f ou ttu rn a re not available for these Crops their acreages only have been indicated.
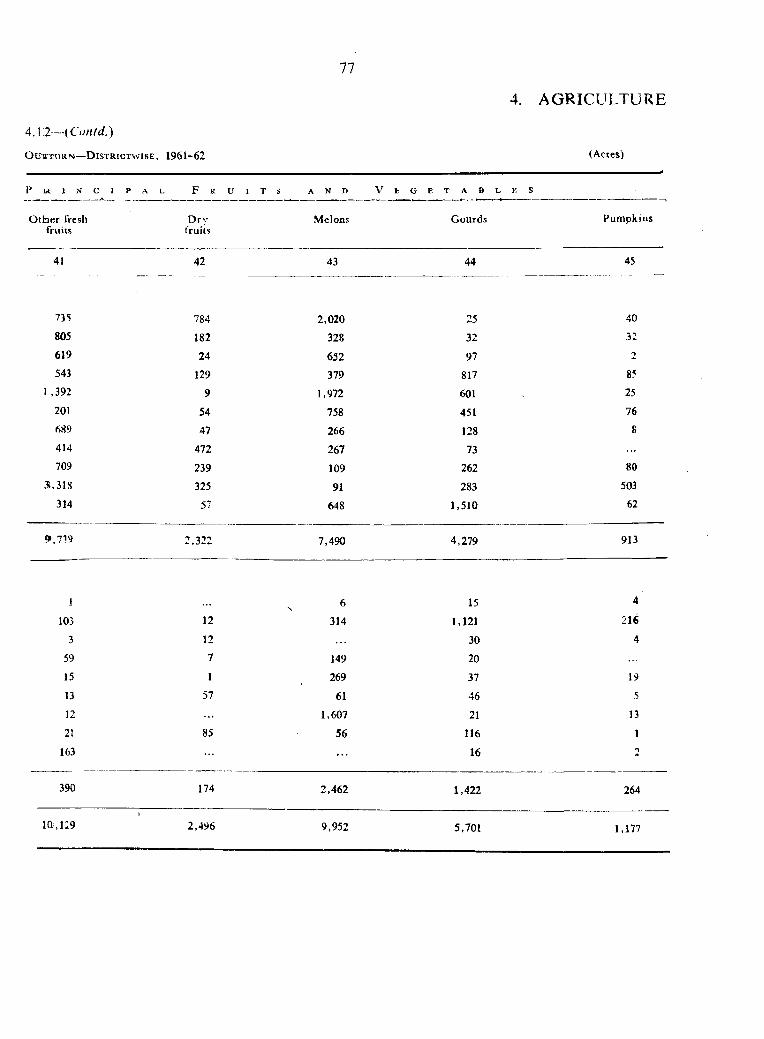
77
4. AGRICULTURE
A . \ l— {Contd.)
O u t T U R N — D iS T R lG T W lS E , 1961-62 (Acres)
P IR i N C I P A L F r u i t s A N D V E G E T A B L F. S
O th e r fresh D rv Melons Gourds Pumpkinsfruits fruits
41 42 43 44 45
735 784 2,020 25 40
805 182 328 32 32
619 24 632 97543 129 379 817 85
1 ,392 9 1,972 601 25
201 54 758 451 76
689 47 266 128 S
414 472 267 73709 239 109 262 80
31,318 325 91 283 503
314 57 648 1,510 62
9,719 2,322 7,490 4,279 913
1 N 6 15 4
103 12 314 1,121 216
3 12 30 4
59 7 149 20
15 1 269 37 19
13 57 61 46 5
12 1,607 21 13
21 85 56 116 1
163 . . . 16 2
390 174 2,462 1,422 264
110i,119 2,496 9,952 5,701 1,177

4. AGR [CULTURE
78
TABLEO t h e r c r o p s : A r e a a j \m>
S.No
D istric t
A r f - a u n d e r P r i n c i p a l F r u i t s a n d - -------------------------------------------------------- 1________________________________
Bhencii Brinjal G reens Spinach Cauliflower Peas
46 47 48 49 50 51
ANDHRA REG IO N
1 Anantapur
2 C h itto o r
3 Cudclapalx
4 East Godavari
5 G untu f
6 Krishna
7 Kurnool
3 Nellore
9 Srikakulam
10 V'isakhapatnam
11 West Godavari
Total
TELENG A NA REG IO N
1 Adilabad
2 Hyderabad
3 K arim nagar
4 KhacRmam
5 M ahbubnagar
6 Medak ..
7 Nalgonda
8 N izam abad
9 Warangal
T otal
Total A ndhra Pradesh ...
37
69
14
367
237
506
1,399
112
91
271
305
3,410
28
835
13
2
7957
7
72
49
1,142
757
828
234
1,983
2,169
566
788
648
1,454
2,520
2,620
14,567
241
1,550
217
67
414
8?
41
116
115
?,844
92
80
70
469
178
88
300
39
197
294
171
1 ,9 7 8
112
586
297
27
7
61
75
1,173
2
7
1
5
15
23
39
94
14
20
2
9
1
7
186
13
25
37
131
23
175
14
1
41
28
80
568
4,552 17.411 3,151 280
289
15
20
115
64
2
181
201
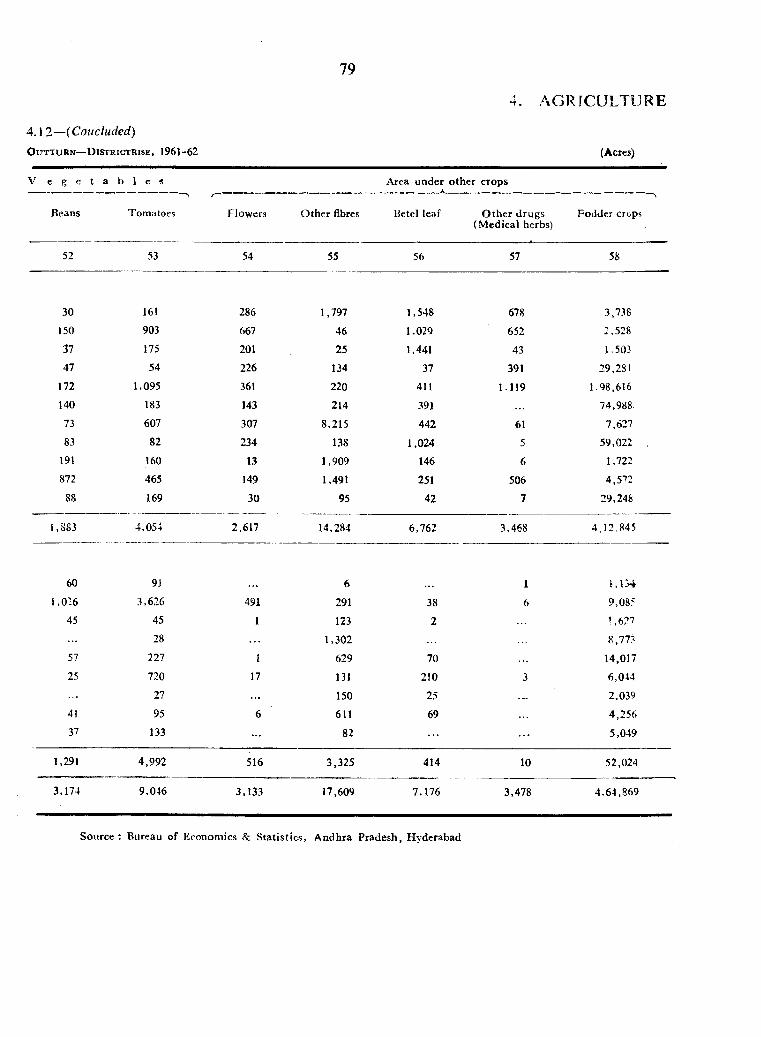
79
4 .12— {Concluded)O u t t u r n — D i s t r i c t r i s e , 1961-62
AGRICULTURE
(Acres)
V e g e t a b l c s
Beans Tomatoes Flowers
Area under o ther crops
O ther fibres Betel leaf O ther drugs (M edical herbs)
Fodder crops
52
30
150
37
47
172
140
73
83
191
872
1,883
53
161
903
175
54
1,095
183
607
82
160
465
169
4 ,0 5 ;
54
286
667
201226
361
143
307
234
1.3
149
30
2,617
55
1,797
46
25
134
220
214
8,215
138
1,909
1,491
95
14,284
56 57 58
1,548 678 3,738
1,029 652 2,528
1,441 43 1-503
37 391 29,281
411 1.119 1.98,616
391 74,988.
442 61 7,627
1,024 5 59,022
146 6 1,722
251 506 4,572
42 7 29,248
6,762 3,468 4,12,845
60 91 . . . 6 . . . 1
1,016 3,626 491 291 38 6 9,085
45 45 1 123 2 ?,6?7
28 1,302 8,77-'
57 227 I 629 70 14,017
25 720 17 131 210 6,044
. . . 27 150 25 2,039
41 95 6 611 69 4,25637 133 . . . 82 5,049
1,291 4.992 516 3,325 414 10 52,024
3,174 9,046 3,133 17,609 7,176 3,478 4,64.869
Source : Bureau of Economics & Statistics, A ndhra Pradesh, Hyderabad
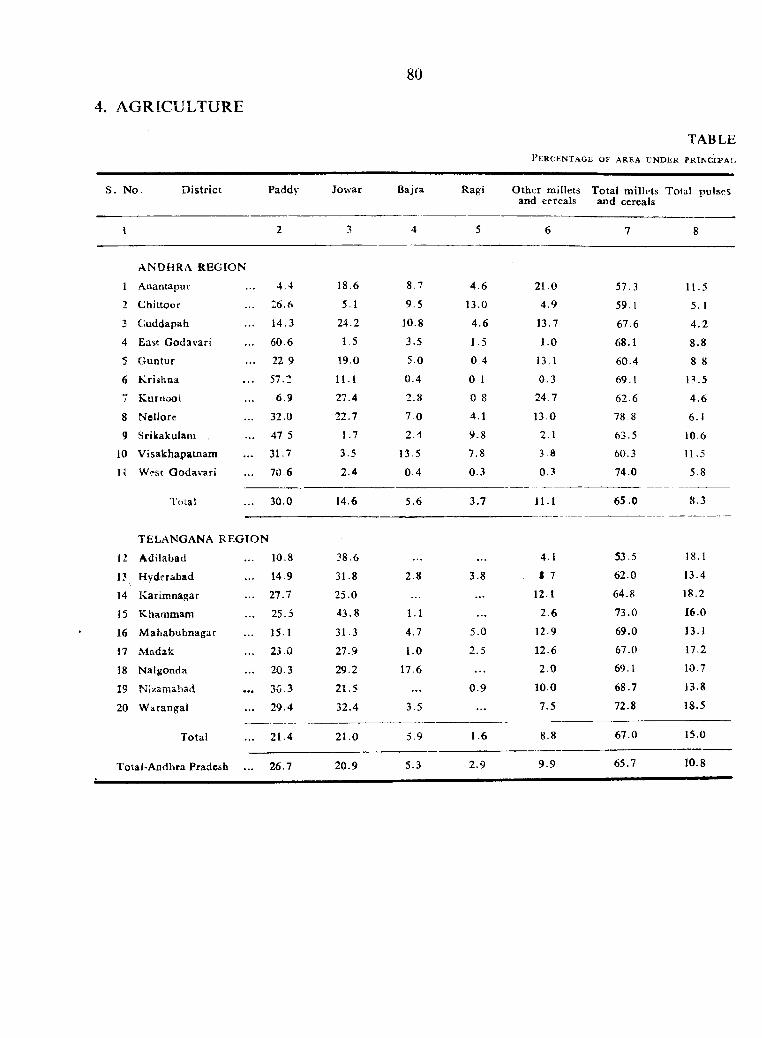
4, AGRICULTURE
80
TABLEP e r c e n t a g e o f a r e a u n d e r p r i n c i p a i .
S. N o. D istric t Paddy Jow ar Bajra Ragi O ther millets Total m illets Total pulses and eercals and cereals
A ND HRA R EG IO N
1 Anantapur 4.4 18.6 8.7 4 .6 21.0 57.3 11.52 C hittoor 26.6 5.1 9.5 13.0 4.9 59.1 5.1
3 Cluddapah 14.3 24.2 10.8 4.6 13.7 67.6 4 .2
4 East G odavari 60.6 1.5 3.5 1.5 1.0 68.1 8.8
5 G untur 22.9 19.0 5.0 0.4 13 1 60.4 8.8
6 K rishna 57.2 11.1 0 .4 0 1 0 .3 69.1 13.5
7 K-urnool 6 9 27.4 2 .8 0 8 24.7 62.6 4 .6
8 N ellore 32.0 22.7 7 .0 4.1 13.0 78-8 6.1
9 Srikakulam 47 5 1.7 2.4 9.8 2.1 63.5 10.6
10 V isakhapainam 31.7 3.5 13.5 7.8 3.8 60.3 11.5
11 West G odavari 70-6 2.4 0 .4 0.3 0.3 74.0 5.8
Total 30.0 14.6 5.6 3.7 11.1 65 .0 8.3
TELANGANA R E G IO N
12 A dilabad 10.8 38.6 . . . 4.1 53.5 18.1
13 H yderabad 14.9 31.8 2.8 3.8 1.7 62.0 13.4
14 K arim nagar 27.7 25.0 . . . 12.1 64.8 18.2
15 Kharnmam 25.5 43.8 1.1 . . . 2.6 73.0 16.0
16 iM ahabubnagar 15.1 31.3 4.7 5.0 12.9 69.0 13.1
17 xMadak 23.0 27.9 1.0 2.5 12.6 67.0 17.2
18 Nalgonda 20.3 29.2 17.6 2 .0 69.1 10.7
19 N i'/am ahad 3C.3 21.5 . . . 0 .9 10.0 68.7 13.8
20 W arangai 29.4 32.4 3.5 . . . 7.5 72.8 18.5
Total 21.4 21.0 5.9 1.6 8.8 67.0 15.0
TotaJ-Andhra Pradesh 26.7 20.9 5.3 2.9 9 .9 65.7 10.8
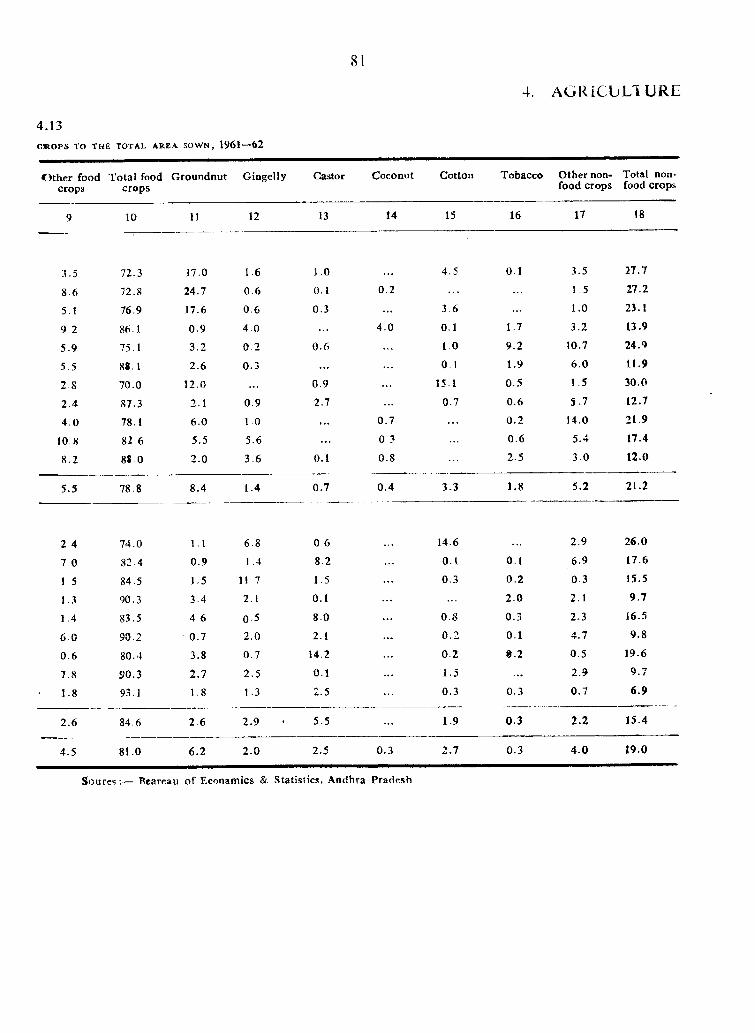
81
4.13GJROPS TO TH E TOTAL AREA S O W N , 1961 — 62
4. A G R I C U L T U R E
O th e r food crops
T o ta l food crops
G roundnut Gingelly Castor Coconut Cotton Tobacco other nonfood crops
Total nonfood crops
9 10 11 12 13 14 15 16 17 18
3.5 72.3 17.0 1.6 1.0 4.5 0.1 3.5 27.7
8.6 72.8 24.7 0 6 0.1 0.2 1.5 27.2
5.1 76.9 17.6 0.6 0.3 . . . 3 6 1.0 23.1
9.2 86.1 0 .9 4 .0 4 .0 0.1 1.7 3.2 13.9
5.9 75.1 3.2 0 2 0 .6 1 0 9.2 10.7 24.9
5.5 88.1 2.6 0.3 0 . 1 1.9 6 .0 11.9
2.S 70.0 12.0 . . . 0.9 15.1 0 .5 1 5 30.0
2.4 87.3 2.1 0.9 2.7 0.7 0 .6 S .7 12.7
4 .0 78.1 6 .0 1.0 0 .7 0.2 14.0 21.9
1 0 8 82 6 5.5 5.6 0 3 0 .6 5.4 17.4
8.2 88.0 2.0 3 6 0.1 0.8 2.5 3 .0 12.0
5.5 78.8 8.4 1.4 0.7 0 .4 3.3 1.8 5.2 21.2
2.4 74.0 1.1 6.8 0 6 14.6 2.9 26.0
7 0 82.4 0.9 1.4 8.2 O.l 0.1 6.9 17.6
1 5 84.5 1-5 11 7 1.5 0.3 0.2 0 3 15.5
1.3 90.3 3.4 2 1 0.1 2 .0 2.1 9.7
1.4 83.5 4 6 0-5 8.0 0 .8 0.3 2.3 16.5
6 .0 90.2 0.7 2 .0 2.1 0 .2 0.1 4.7 9.8
0 .6 80.4 3.8 0.7 14.2 0 .2 0.2 0,5 19.6
7.8 50.3 2 .7 2 .5 0.1 1.5 . . . 2.9 9.7
1.8 93.1 1.8 1 .3 2.5 0.3 0.3 0.7 6 .9
2.6 84.6 2.6 2.9 5.5 1.9 0.3 2.2 15.4
4.5 81.0 6.2 2 .0 2.5 0.3 2.7 0.3 4 .0 19.0
Soures :— Beareau o f Econamics & Statistics, A ndhra Pradesh
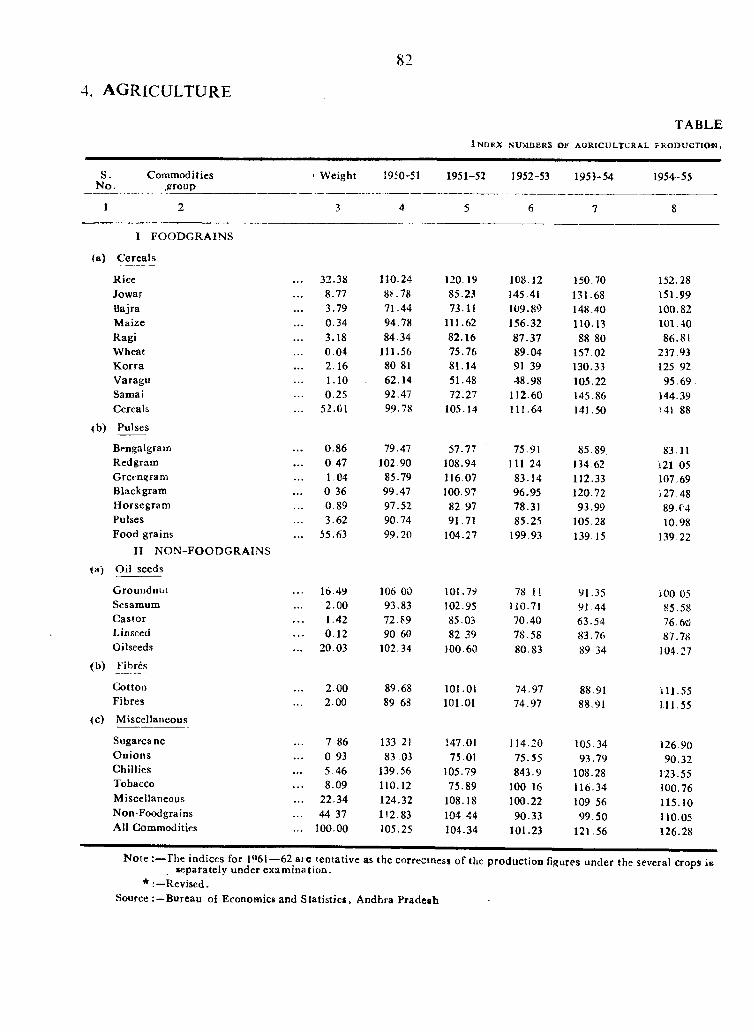
4. AGRICULTURE
TABLEI n d e x n u m b e r s o f a g r i c u l t u r a l p r o d u c t i o n .
S.N o.
Commodities ,group
W eight 1950-51 1951-52 1952-53 1953-54 1954-55
I FO O D G R A IN S
(a) C ereals
Rice .. 32.38 110.24 120.19 1C8.12 150.70 152.28Jowar 8.77 8>.78 85.23 145.41 131.68 151.99Bajra 3.79 71.44 73.11 109.89 148.40 100.82M aize 0.34 94.78 111.62 156.32 110.13 101.40Ragi 3.18 84.34 82.16 87.37 88 80 86.81W heat 0.04 111.56 75.76 89.04 157 02 237.93K orra 2.16 80 81 81.14 91 39 130.33 125 92Varagu 1.10 62.14 51.48 48.98 105.22 95.69Samat 0.25 92.47 72.27 112.60 145.86 144.39Cereals .. 52.01 99.78 105.14 111.64 141.50 H I 88
<b) Pulses
Bengal gram 0.86 79.47 57.77 75.91 85.89 83-11Redgram 0 4 7 102 90 108.94 111 24 134.62 i21 05G reengram 1.04 85.79 116 07 83.14 112.33 107.69Black gram 0 36 99.47 100.97 96.95 120.72 i27.48H orsegram 0.89 97.52 82 97 78.31 93.99 89.04Pulses 3.62 90.74 91.71 85.25 105.23 10.98Food grains .. 55.63 99.20 104.27 199.93 139.15 139.22
II N O N -FO O D G R A IN S
(a) O il seeds
G roundnut .. 16.49 106 00 101.79 78 i t 91.35 iOO 05Scsamum 2.00 93.83 102.95 110.71 91 44 85.58C astor 1.42 72.89 85.03 70.40 63.54 76.60Linseed 0.12 90 60 82 39 78.58 83.76 87.78Oilseeds .. 20.03 102.34 100.60 80.83 89 34 104.27
{b) Fibres
Cotton 2 00 89.68 101.01 74.97 88.91 111.55Fibres 2.00 89 68 101.01 74.97 88.91 111.55
<c) M iscellaneous
Sugarcane 7 86 133 21 147.01 114.20 105.34 126.90O nions 0 93 83.03 75.01 75.55 93.79 90.32Chillies 5.46 139.56 105.79 843.9 108.28 123.55Tobacco 8.09 110.12 75.89 100 16 116.34 100.76M iscellaneous .. 22.34 124.32 108.18 100.22 109 56 115.10Non-Foodgrains 44 37 112.83 104 44 90.33 99.50 110.05Ail Commodities .. 100.00 105.25 104.34 101.23 121.56 126.28
N ote rh e indices for 1%1—62 are tentative as the correctness o f the production figures under the several crops is _ leparately under exam ination .
* Revised.Source Bureau of Economics and S tatistics, Andhra Pradesh
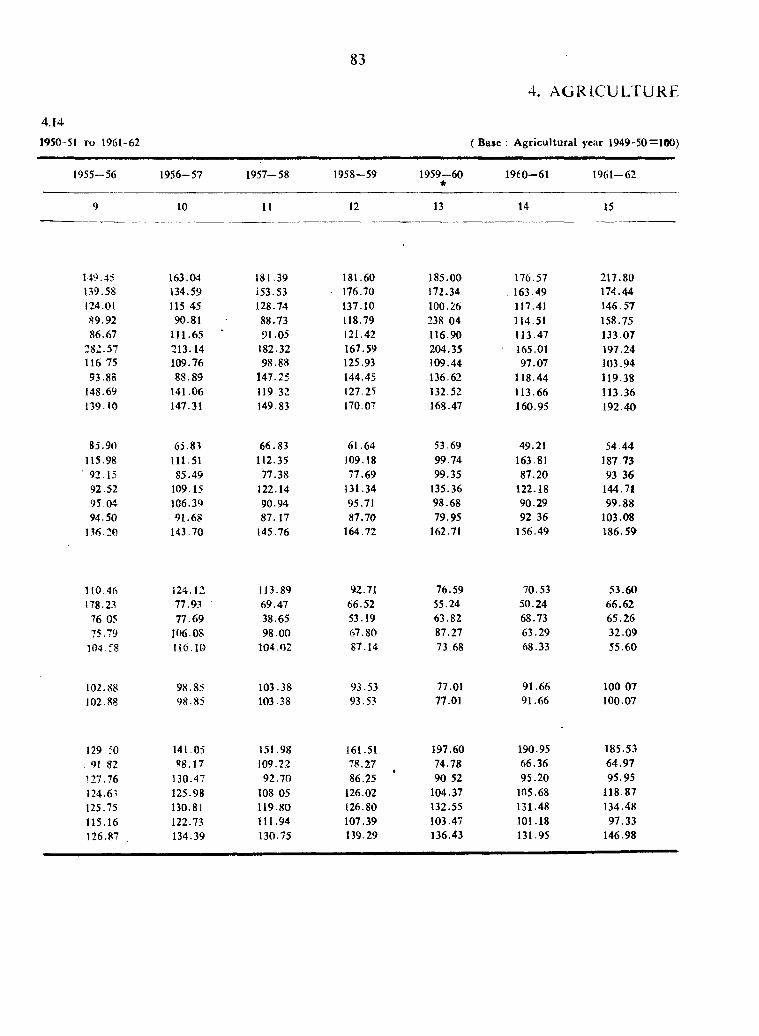
4.14
1950-51 TO 1961-62
83
4. A G R I C U L T U R E
(B ase : A gricultural year 1949-50=100)
1955-56 1956-57 1957-58 1958-59 1959-60*
1960-61 1961-62
9 10 11 12 13 14 15
149.45 163.04 181.39 181.60 185.00 176.57 217.80139.58 134.59 153.53 176.70 172.34 163.49 174.44124.01 115 45 128.74 137.10 100.26 117.41 146.5789.92 90.81 88.73 118.79 238 04 114.51 158.7586.67 111.65 * 91.05 121.42 116.90 113.47 133.07
282.57 213.14 182.32 167.59 204.35 165.01 197.24116.75 109.76 98.88 125.93 109.44 97.07 103.9493.88 88.89 147.25 144.45 136.62 118.44 119.38
148.69 141.06 119 32 127.25 132.52 113.66 113.36159.JO 147.31 149.83 170.07 168.47 160.95 192.40
85.90 65.83 66.83 61.64 53.69 49.21 54 44115.98 111.51 112.35 109.18 99.74 163.81 187 7592.15 85.49 77.38 77.69 99.35 87.20 93 3692.52 109 15 122.14 131.34 135.36 122.18 144.7195.04 106.30 90.94 95.71 98.68 90.29 99.8894.50 91.68 87.17 87.70 79.95 92 36 103.08
1?6 20 143.70 145.76 164.72 162.71 156.49 186.59
110.46 124.12 1J3.89 92.71 76.59 70.53 53.60178.23 77.93 69.47 66.52 55.24 50.24 66.62
76 05 77.69 38.65 53.19 63.82 68.73 65.2675.79 106-08 98.00 67.80 87.27 63.29 32.09
104 58 116.10 104.02 87.14 73.68 68.33 55.60
102.88 98.85 103.38 93.53 77.01 91.66 100 07102.88 98.85 103.38 93.5? 77.01 91.66 100.07
129 50 141.05 151.98 161.51 197.60 190.95 185.5391.82 f»8.17 109.22 78.27 74.78 66.36 64.97
127.76 130.47 92.70 86.25 90 52 95.20 95.95124.63 125.98 108 05 126.02 104.37 105.68 118.87125.75 130.81 119.80 126.80 132.55 131.48 134.48115.16 122.73 111.94 107.39 103.47 101.18 97.33126.87 134.39 130.75 139.29 136.43 131.95 146.98
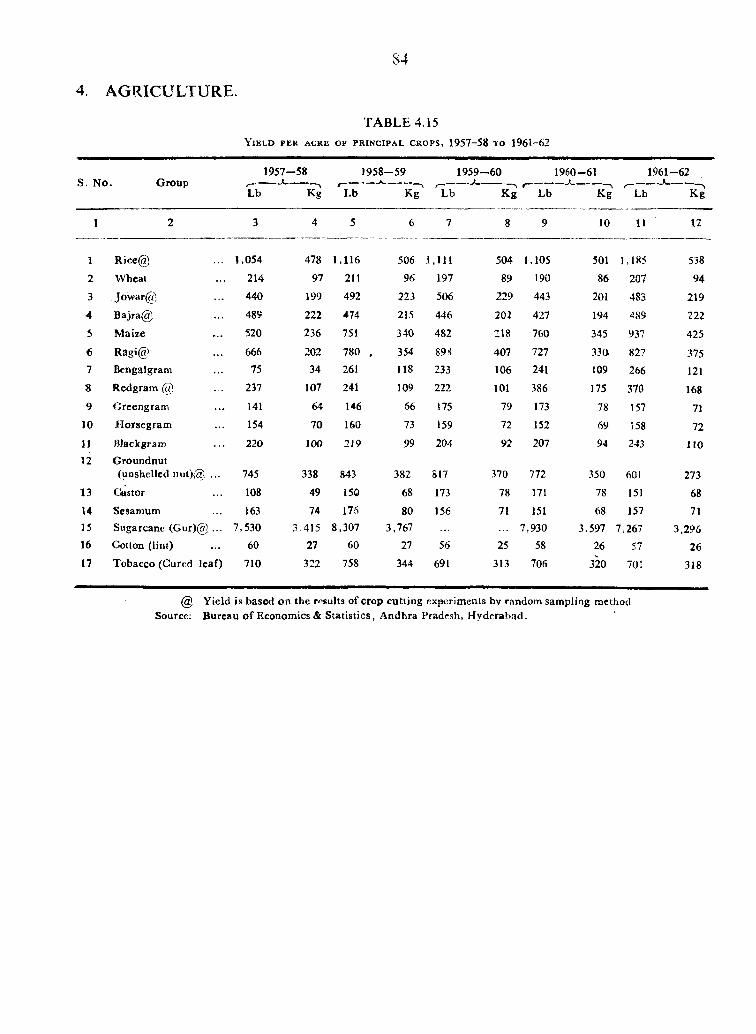
4. AGRICULTURE.
84
TABLE 4.15Y i e l d p e r a c r e o f p r i n c i p a l C r o p s , 1957-58 t o 1961-62
S. N o. G roup1957-58
----------*----------> t-----Lb Kg Lb
1958-59 1959-60
k J ' 'T b K g ' Lb
1960-61 1961-62
k J ^ L b K i
10 11 12
1 Rice@ 1,054 478 1.116 506 1,111 504 1,105 501 1,185 538
2 Wheat 214 97 211 96 197 89 190 86 207 94
3 Jow ar@ 440 199 492 223 506 229 443 201 483 219
4 Bajra@ 489 222 474 215 446 202 427 194 489 222
5 M aize S20 236 751 340 482 218 760 345 937 425
6 Ragi@ 666 202 780 . 354 89 S 407 727 330 827 3757 Bengal gram 75 34 261 118 233 106 241 109 266 1218 Redgram @ 237 107 241 109 222 101 386 175 37G 1689 G rcengram 141 64 146 66 175 79 173 78 157 71
10 H orsegram 154 70 160 73 159 72 152 69 158 72IJ >31ackgran3 220 100 219 99 204 92 207 94 243 11012 G roundnut
(unshelled nut)(®. ... 745 338 843 382 S17 370 772 350 601 27313 Castor 108 49 150 68 173 78 171 78 151 68
14 Sesanium 163 74 176 80 156 71 151 68 157 7115 Sugarcane (G ur)@ ... 7,530 3.415 8,307 3,767 7,930 3,597 7,267 3.29616 Cotton (lint) 60 27 60 27 56 25 58 26 57 2617 Tobacco (Cured leaf) 710 322 758 344 691 313 706 320 701 318
@ Yield is based on the results of crop cutting experiments by random sampling method Source: Bureau o f Economics & Statistics, A ndhra Pradesh, H yderabad.

TABLE 4.16
Y i e l d P e r A c r e ( i N l b s ) o f P r i n c i p a l C r o p s :
D i s t r i c t w i s e , 1961-62
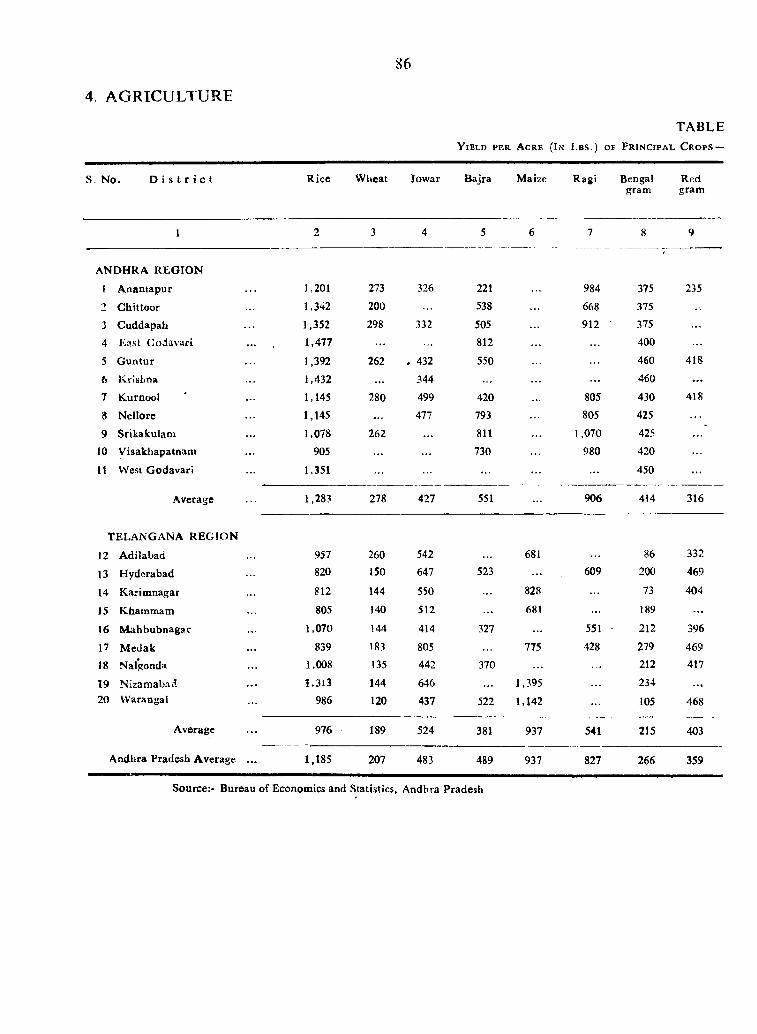
4 AGRICULTURE
8 6
TABLEY i e l d p e r A c r e ( I n L b s . ) o f P r i n c i p a l C r o p s —
S . N o. D i s t r i c t R ice W heat Jowar Bajra Maize Ragi Bengal Redgram gram
1 2 3 4 5 6 7 8 9
ANDHRA R EG IO N
1 A nantapur 1,201 273 326 221 984 375 235
2 C hittoor 1,342 200 538 668 375 ..
3 Cuddapah 1,352 298 332 505 912 375 . . .
4 East Godavari 1,477 812 400 ...
5 G un tu r 1,392 262 . 432 550 460 418
6 Krishna 1,432 . . . 344 460 . . .
7 K urnool 1,145 280 499 420 805 430 418
8 N d lo re 1,145 . . . 477 793 805 425
9 Srikakulam 1,078 262 . . . 811 1,070 425
10 V isakhapatnam 905 . . . 730 980 420
11 West G odavari 1,351 450 . . .
Average 1,283 278 427 551 . . . 906 414 316
TELANGANA R EG IO N
12 A dilabad 957 260 542 681 86 332
13 Hyderabad 820 150 647 523 609 200 469
14 K arim nagar 812 144 550 828 73 404
IS Kharamatn 805 140 512 681 . . . 189 . . .
16 M ahbubnagar 1,070 144 414 327 . . . 551 212 396
17 M cdak 839 183 805 775 428 279 469
18 Nalgonda 1,008 135 442 370 . . . 212 417
19 N izam abad l,3 i3 144 646 . . . 1,395 . . . 234 . . .
20 VVarangal 986 120 437 522 1,142 105 468
Average 976 189 524 381 937 541 215 403
A ndhra Pradesh Average ... 1,185 207 483 489 937 827 266 359
Source:- Bureau of Economics and Statistics, Andhra Pradesh
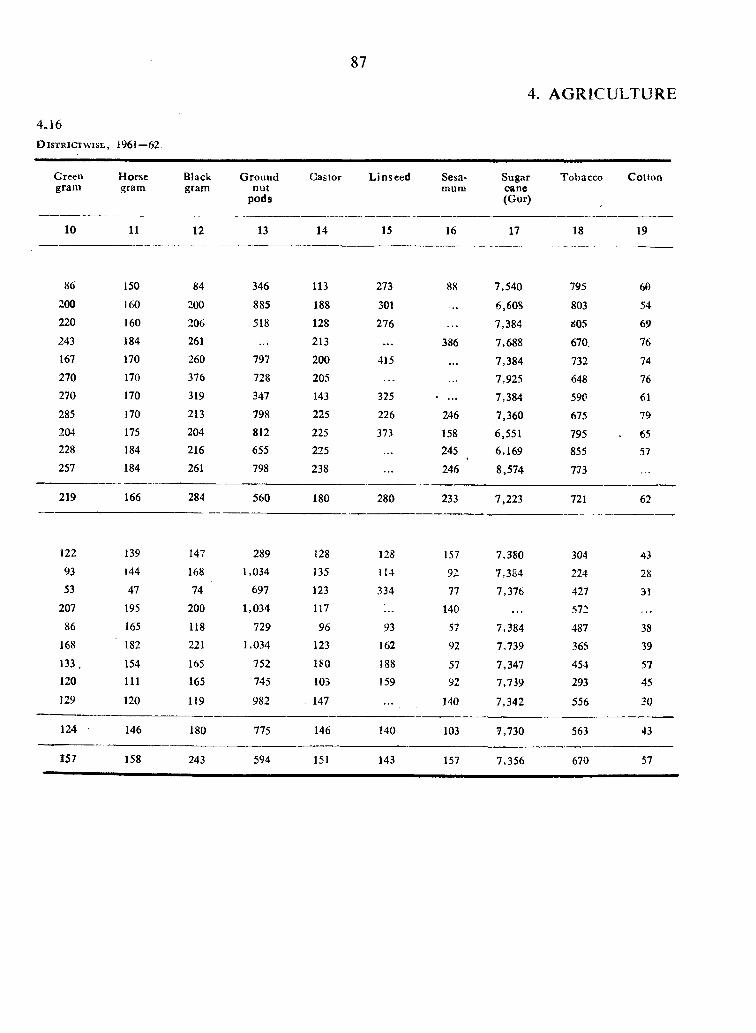
87
4. AGRICULTURE
4.16D IS TR ICTW ISE, 1961-62
Greengram
Horsegram
11
Blackgram
12
G roundnut
pods
Castor L inseed Sesa-mura
Sugarcane(Gur)
Tobacco C otton
10 13 14 15 16 17 18 19
86 150 84 346 113 273 88 7,540 795 66200 160 200 885 188 301 . . . 6,608 803 54220 160 206 518 128 276 7,384 805 69243 184 261 . . . 213 . . . 386 7,688 670. 76167 170 260 797 200 415 . . . 7,384 732 74270 170 376 728 205 7,925 648 76270 170 319 347 143 325 • . . . 7,384 590 61285 170 213 798 225 226 246 7,360 675 79204 175 204 812 225 373 158 6,551 795 . 65228 184 216 655 225 245 6,169 855 57257 184 261 798 238 . . . 246 8,574 773
219 166 284 560 180 280 233 7,223 721 62
122 139 147 289 128 128 157 7,3S0 304 4393 144 168 1,034 135 114 92 7,384 224 2853 47 74 697 123 334 77 7,376 427 31
207 195 200 1,034 117 140 57286 165 118 729 96 93 57 7,384 487 38
168 182 221 1,034 123 162 92 7,739 365 39133, 154 165 752 180 188 57 7,347 454 57120 111 165 745 103 159 92 7,739 293 45129 120 119 982 147 140 7,342 556 30
124 146 180 775 146 140 103 7,730 563 43
157 158 243 594 151 143 157 7,356 670 57
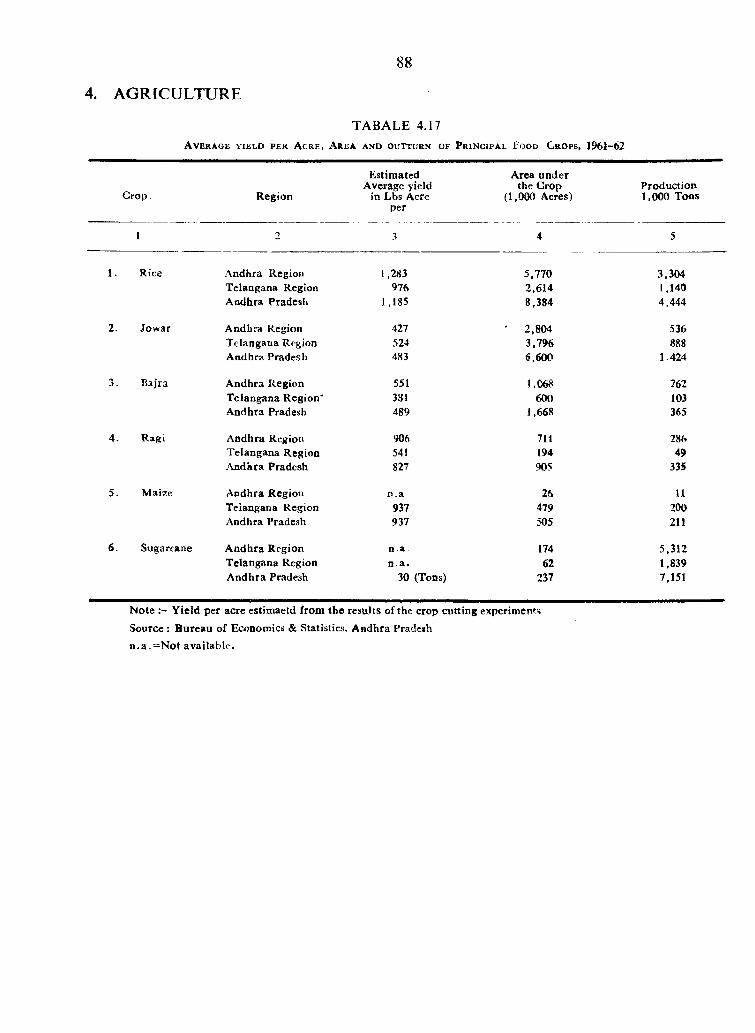
8 8
4. AGRICULTURE
TABALE 4.17A v e r a g e y i e l d p e r A c r e , A r e a a n d o u t t u r n o f P r i n c i p a l F o o d C r o p s , 1961-62
C rop. Region
Estim ated Average yield
in Lbs Acre per
Area under the Crop
(1,000 Acres)Production 1,000 Tons
1 2 3 4 5
1. Rice A ndhra Region 1,283 5,770 3,304Telangana Region 976 2,614 1,140A ndhra Pradesh 1,185 8,384 4,444
2. Jow ar A ndhra Region 427 • 2,804 536T elangana Region 524 3,796 888A ndhra Pradesh 483 6.600 1.424
3. Bajra A ndhra Region 551 1,068 262Telangana Region* 381 600 103A ndhra Pradesh 489 1,668 365
4. Ragi A ndhra Region 906 71i 286Telangana Region 541 194 49A adkra Pradesh 827 905 335
5. Maize Andhra Region n . a . 26 MTelangana Region 937 479 200Andhra Pradesh 937 505 211
6. Sugarcane A ndhra Region n a 174 5,312T elangana Region n .a . 62 1,839A ndhra Pradesh 30 (Tons) 237 7,151
N ote Y ield per acre estim aetd from the results of the crop cutting experimem s
Source ; B ureau o f Economics & Statistics, A odhra Pradeah
n .a .= N o t availab le .
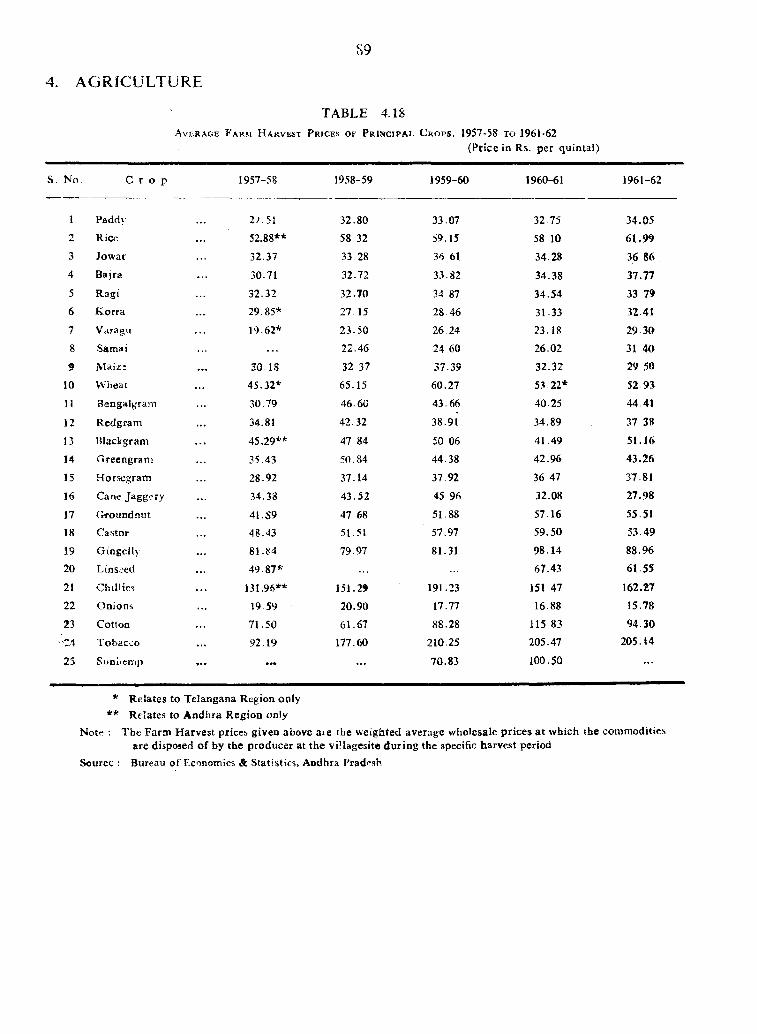
S9
4. AGRfCULTURE
A v e r a g e F a r m H a r v e s t P r i c e s o f P r i n c i p a l C r o p s , 1957-58 t o 1961-62(Price in Rs. per quintal)
TABLE 4.18
S. No. C r o p 1957-58 1958-59 1959-60 1960-61 1961-62
1 Paddy2 RiCe
3 Jow ar
4 Bajra
5 Ragi
6 K orra
7 Varagu
8 Samai
9 M aiz:
10 W heat
11 Bengalgram
12 Redgram
13 Blackgram
14 Cireengram
15 Horsegram
16 Cane Jagg-ry
17 (Jroundnut
18 Castor
19 Gingeily
20 Linseed
21 Chillies
22 Onions
23 Cotton
'C4 Tobacco
25 Sunliemp
2>.51
52.88**
32.37
30.71
32.32
29.85*
19.62*
30 18
45.32*
30.79
34.81
45,29**
35.43
28-92
34.38
41.59
48-43 81.84
49-87*
131.96**
19.59
71.50
92.19
32.80
58 32
33 28
32.72
32.70
27.15
23.50
22.46
32 37
65.15
46.60
42.32
47 84
50.84
37.14
43.52
47 6851.51
79.97
151.29
20.90
61.67
177.60
33.07 32.75 34.05
59.15 58 10 61,99
36 61 34.28 36 86
33.82 34.38 37.77
34 87 34.54 33 79
28.46 31.33 32.41
26.24 23.18 29 30
24 60 26.02 31 40
37.39 32.32 29 50
60.27 5. . 22* 52 93
43.66 40.25 44.41
38.91 34.89 37 38
50 06 41.49 51.16
44.38 42.96 43.26
37.92 36 47 37.81
45 96 32.08 27.98
51.88 57.16 55.51
57.97 59.50 53.49
81.31 98.14 88.96
67.43 61 55
191.23 151 47 162.27
17.77 16.88 15.78
88.28 115 83 94.30
210.25 205.47 205.14
70.83 100.50 . . .
* R elates to Telangana Region only** Relates to A ndhra R egion only
Note : The Farm H arvest prices given above a ie the w eighted average wholesale p rices a t which the commodities s re disposed o f by the producer at the v i’lagesite du ring the specific harvest period
Sourec : Bureau o f F.eonomics & Statistics, Andhra Pradesh
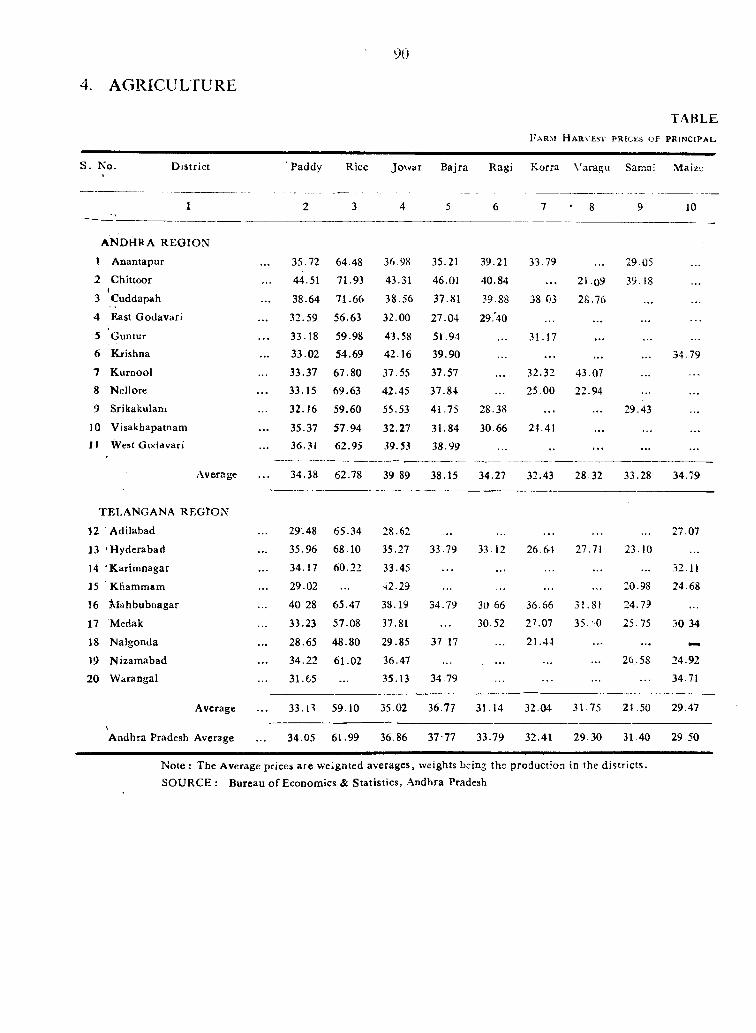
90
4. AGRICULTURE
F arm H arvest PRICES OF
TABLEPRINCIPAL
S . No. D istrict Paddy Rice Jow ar Bajra Ragi Korra \ ’aragu Samai Maize
1 2 3 4 5 6 7 • 8 9 10
A N D HRA R E G IO N
1 A nantapur 35.72 64.48 36.98 35.21 39.21 33.79 29.05
2 Chittoor 44.51 71.93 43.31 46.01 40.84 21.09 39.183 Cuddapah 38.64 71.66 38.56 37.81 39.88 38 03 28.76 . . . . . .
4 East G odavari 32.59 56.63 32.00 27.04 29.40 . . .
5 Guntur 33.18 59.98 43.58 51.94 31.17 * . * . . .
6 Krishna 33.02 54.69 42.16 39.90 . . . 34.79
7 K urnool 33.37 67.80 37.55 37.57 . . . 32.32 43.078 Ncilore 33.15 69.63 42.45 37.84 25.00 22.94 . . .
9 Srikakulam 32.16 59.60 55.53 41.75 28.38 . . . . . . 29.43
10 Visakhapatnam 35.37 57.94 32.27 31.84 30.66 24.41 . . . . . .
11 West Godavari 36.31 62.95 39.53 38.99 •• . . . . . .
Average 34.38 62.78 39 89 38.15 34.27 32.43 28.32 33.28 34.79
TELANGANA R EG IO N
12 Adilabad 29.48 65.34 28.62 . . . 27.07
J3 'H yderabad 35.96 68.10 35.27 33.79 33.12 26.64 27.71 23 10
]4 'K arim nagar 34.17 60.22 33.45 . . . . . . . . . . . . 32.11
J5 K ham m am 29.02 -i2.29 20.98 24.68
!6 M ahbubnagar 40 28 65.47 38.19 34.79 30 66 36.66 3!.81 24.79
17 Medak 33.23 57.08 37.81 30.52 27.07 35 .' 0 25.75 30 34
18 Nalgonda 28.65 48.80 29.85 37.17 21.44 . . .
19 N izam abad 34.22 61.02 36.47 . . . 26,58 24.92
20 VVarangal 31.65 . . . 35.13 34.79 34.71
Average 3 3 .n 59.10 35.02 36.77 31.14 32.04 31.75 24.50 29.47
A ndhra Pradesh Average 34.05 61.99 36.86 37-77 33.79 32.41 29.30 31 40 29.50
N ote : The Average prices a re w eighted averages, weights being the production in the d is tric ts . SO URCE : Bureau o f Economics & Statistics, Andhra Pradesh
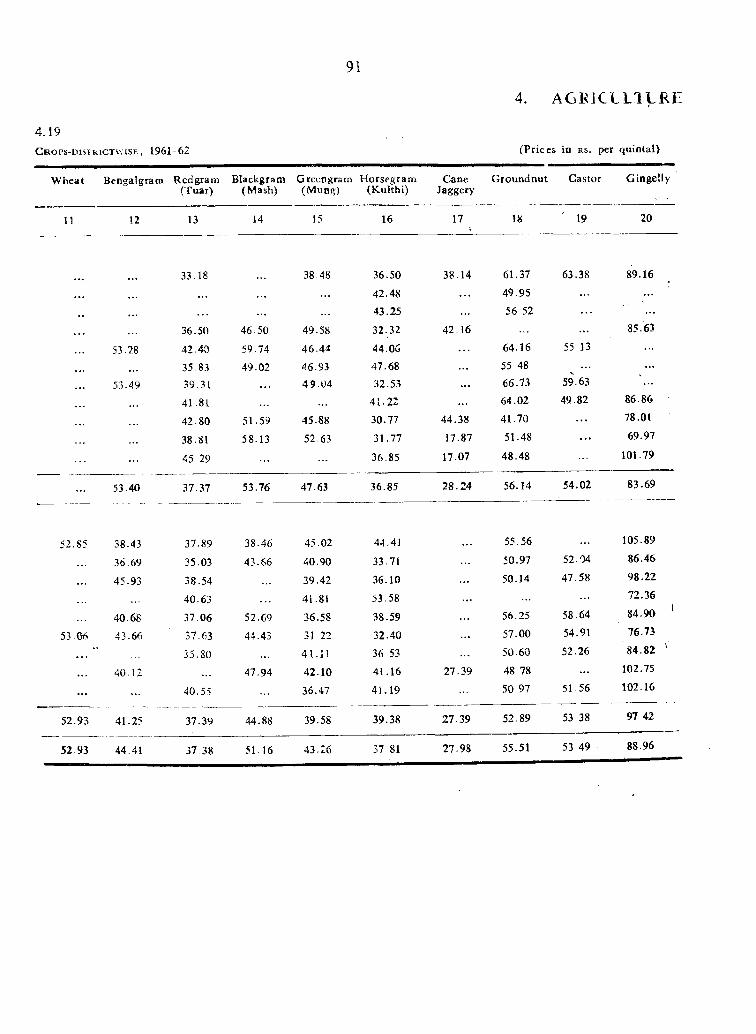
91
4. AGBiCLLlLRE
4 .1 9
C r o i»s-d ist r !CTw ise , 1961 -6 2 (P rices in R s . per quintal)
W heat Bengalgrani R edgram Blackgratn Green gram H orsegram Cane G roundnut Castor G ingelly(Tuar) (M ash) (M ung) (K ulthi) Jaggery
11 12 13 14 15 16 17\
18 19 20
33.18 38.48 36.50 38.14 61.37 63.38 89.16
• • • . . . 42.48 . . . 49.95
43.25 56. 52 • • •
36.50 46.50 49.58 32.32 42.16 85.63
53.28 42.40 59.74 46.44 44.06 64.16 55.13
35.83 49.02 4 6 .9 3 47.68 . . . 55 48 . . .
53.49 39.31 49 .04 32.53 . . . 66.73 59 .63
41.81 41.22 64.02 49.82 86 86
42.80 51.59 45.88 30.77 44.38 41.70 . . . 78.01
38.81 58.13 52.63 31.77 17.87 51.48 . . . 69.97
45.29 36.85 1 7 .0 7 48.48 101 79
53.40 37.37 53.76 47 .6 3 36.85 28.24 56.14 5 4 .0 2 8 3 .6 9
52.85 38.43 37.89 38.46 45.02 44.41 55.56 105.89
36.69 35.03 43.56 40.90 33.71 50.97 52.04 8 6 .4 6
45.93 38.54 39.42 36.10 50.14 47.58 9 8 .2 2
40.63 41.81 53.58 . . . . . . 72.36
40.68 37.06 52.69 36.58 38.59 56.25 58.64 8 4 .9 0 ‘
53 43.66 37.63 44.43 31 22 32.40 . . . 57.00 54.91 76.73
• • . 35.80 41.11 36 53 . . . 50.60 52.26 8 4 .8 2 ^
40.12 47.94 42.10 41.16 27.39 48 78 102.75
. . . 40.55 36.47 41.19 50 97 51.56 102.16
52.93 41.25 37.39 44.88 39.58 3 9 .3 8 27.39 52.89 53 38 97 42
5 2 .9 3 44.41 37.38 51.16 43.26 37 81 27.98 5 5 .5 1 5 3 .4 9 8 8 .9 6
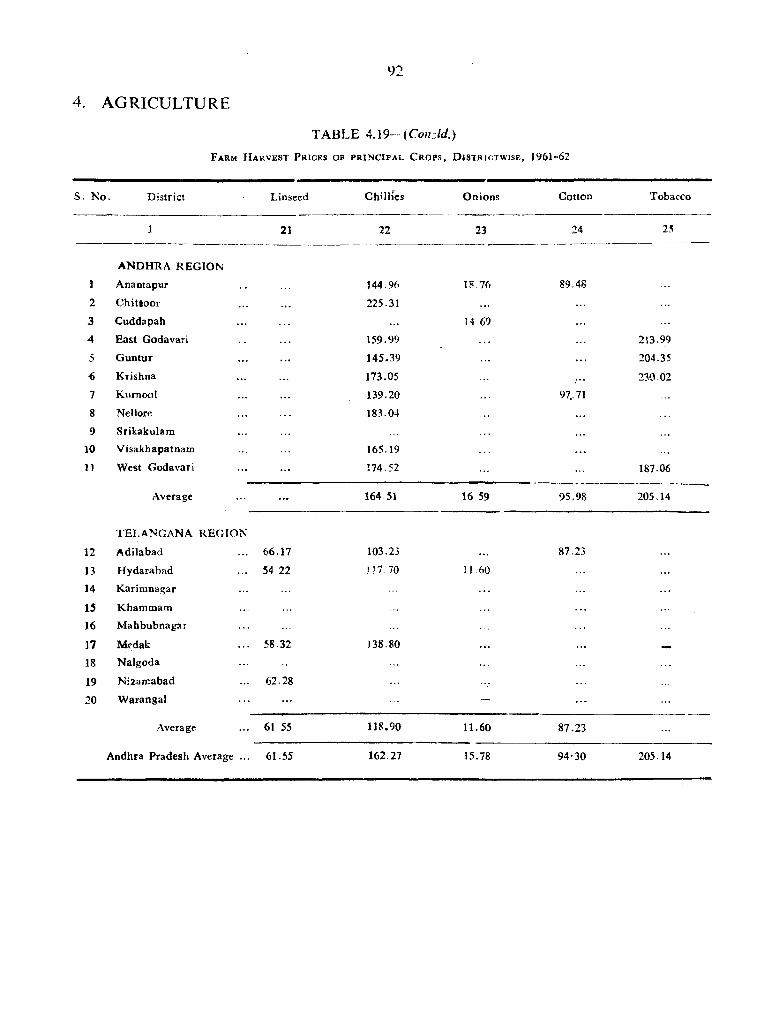
4. AGRICULTURE
TABLE 4.19—(Co«;W.)
F a r m H a r v e s t P r i c e s o f p r i n c i p a l C r o p s , D j s t r i c t w i s e , 1 9 6 1 -6 2
S. No District Linseed C h’llies O nions G otten Tobacco
1 21 22 23 24 25
ANDHRA REGION
1 Anantapuf 144.96 18.76 89.48
2 C hittoo r 225.31 . . .
3 Cuddapah 14.69
4 E ast Godavari 159.99 213.99
5 G untur 145.39 . . . 204.35
€ K rishna 173.05 230 02
7 K um ool 139.20 97,71
8 Nellore 183.04 . . .
9 Srikakularn
10 V isakhapatnam 165.19 . . .
11 W est Godavari 174.52 187.06
Average . . . 164 51 16 59 95.98 205.14
TELANGANA R EG IO N
12 A dilabad 66.17 103.23 87.23
13 H ydarabad 54 22 n 7 .7 0 11.60
14 K arim nagar
15 Khammam . . .
16 M ahbubnagar
17 Mcdak 58.32 138.80 ___
18 Nalgoda
19 N izaroabad 62.28
20 W arangal - . . .
Average 61 55 11P.90 11.60 87.23
Andhra Pradesh Average ... 61.55 162.27 15.78 94-30 205.14
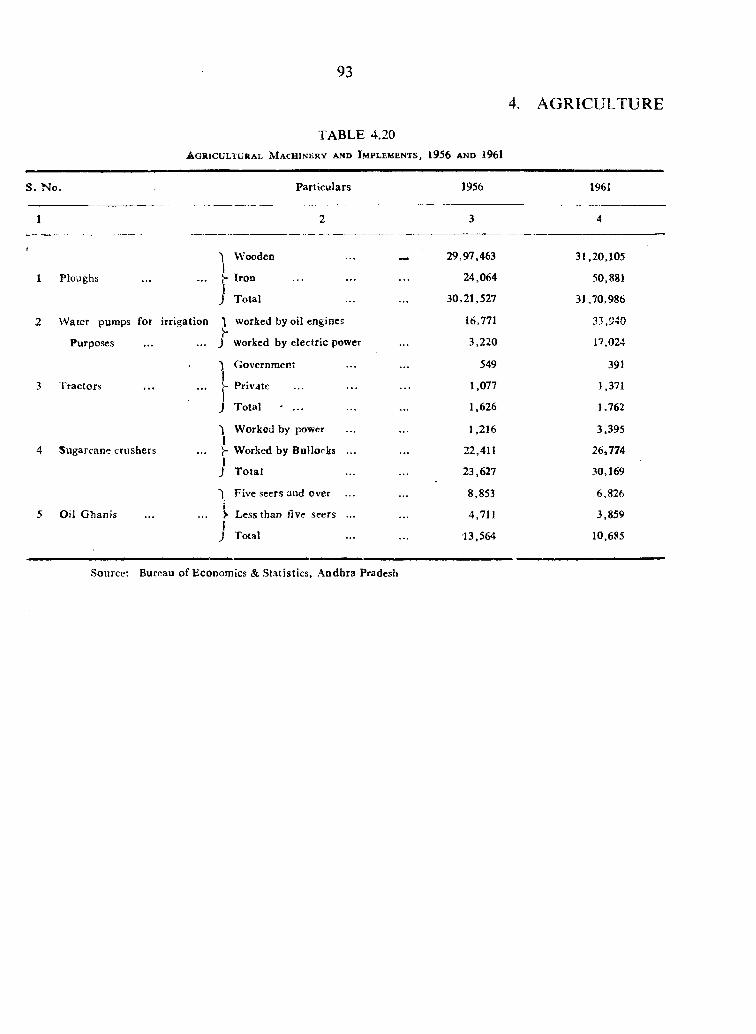
93
4. AGRICULTURE
TABLE 4.20A g r i c u l t u r a l M a c h i n e r y a n d I m p l e m e n t s , 1956 a n d 1961
S. N o . Particulars 1956 1961
1 2 3 4
■ 'j Wooden 29,97,463 31,20,105
1 Ploughs Iron 24,064 50,881j
) Total 30,21,527 31,70,986
2 W ater pumps for irrigation worked by oil engines 16,771 33,940
Purposes J worked by electric power 3,220 17,024
') Governraent 549 391
3 Tractors1
Private \ , o n 1,371
j Total ' ... 1,626 1,762
W orked by power1
1,216 3,395
4 Sugarcane crushers1^ Worked by Bullocks ... 22,411 26,774j
J T o ta l 23,627 30,169
'1 Five seers and O v e r 8,853 6,826
5 Oil G hanisi>• Less than tive seers ... 4,711 3,8591
J Total 13,564 10,685
Source: Bureau o f Economics & Statistics, A ndhra Pradesh
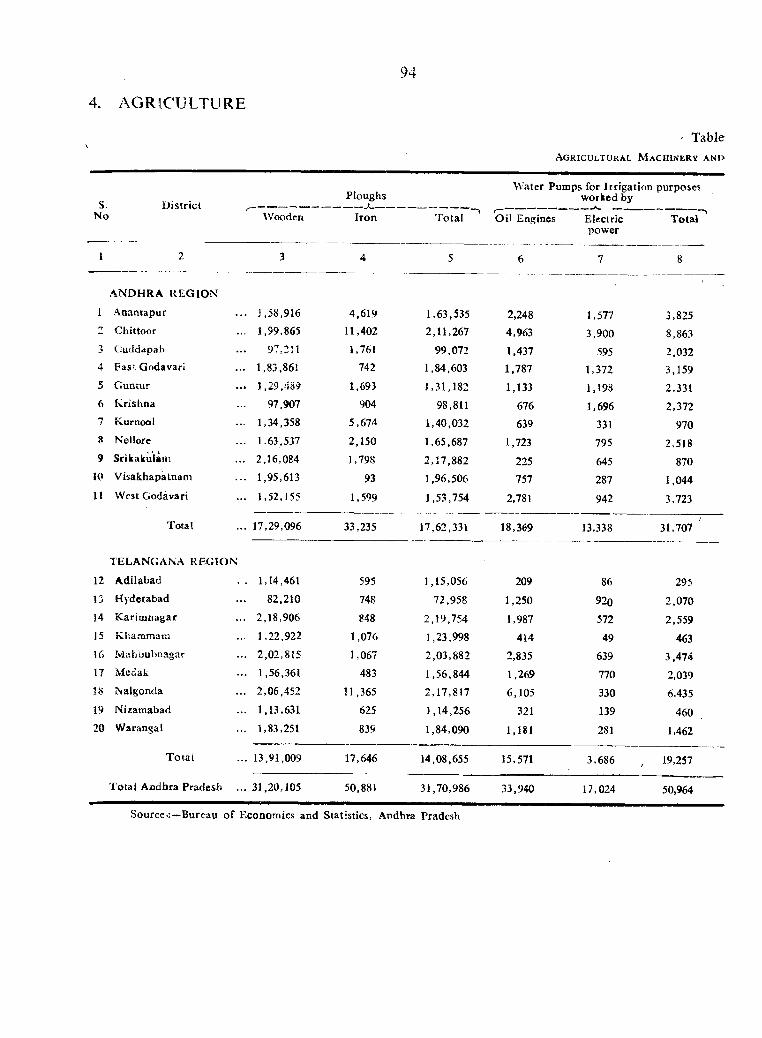
4. AGRICULTURE
94
' TableA g r i c u l t u r a l M a c h i n e r y a n d
S.No
D istric tWooden
Ploughs
Iron
W ater Pumps for Irrigation purposes worked by
T ota l O il Engines Electricpower
TELANGANA REGION
Total
1 2 3 4 5 6 7 8
A NDHRA R EG IO N
1 Aoantapur .. 1,58,916 4,619 1,63,535 2,248 1,577 3,8252 Chittoor .. 1,99,865 11,402 2,11,267 4,963 3,900 8,8633 Cuddapah 97,31i l,7 6 t 99,072 1,437 595 2,0324 Has'; Godavari .. 1,83,861 742 1,84,603 1,787 1,372 3,1595 G untur •. 1,29,489 1,69) 1,31,182 1,133 1.19S 2,3316 K rishna 97,907 904 98,811 676 1,696 2,3727 Kurnool .. 1,34,358 5,674 1,40,032 639 331 9708 Nellore .. 1.63,537 2,150 1,65,687 1,723 795 2,5189 Srikakulam .. 2,16,084 1,798 2,17,882 225 645 870
JO Visakhapatnam .. 1,95,613 93 1,96,506 757 287 1,04411 West Godavari .. 1,52,155 1,599 1,53,754 2,781 942 3,723
Total .. 17,29,096 33,235 17,62,331 18,369 13,338 31,707 '
12 A dilabad . 1,14,461 595 1,15,056 209 86 29513 Hyderabad 82,210 748 72,958 1,250 920 2,07014 K arim nagac .. 2,18,906 848 2,19,754 1,987 572 2,55915 Khammaia .. 1,22,922 1,076 1,23,998 414 49 46316 Zviiihbubnagar .. 2,02,815 1,067 2,03,882 2,835 639 3,47417 Mcdak .. 1,56,361 483 1,56,844 1,269 770 2,039
INalgonda .. 2,06,452 11,365 2,17,817 6,105 330 6.43519 Nizamabad .. 1,13,631 625 1,14,256 321 139 46020 W arangai .. 1,83,251 839 1,84,090 1,181 281 1.462
T otal .. 13,91,009 17,646 14,08,655 15,571 3,686 , 19,257
T o u l A cdbra Pradesh 31.20,105 50,881 31,70,986 33,940 17,024 50,964
Source.:—Bureau o f Economics and Statistics, Andhra Pradesh
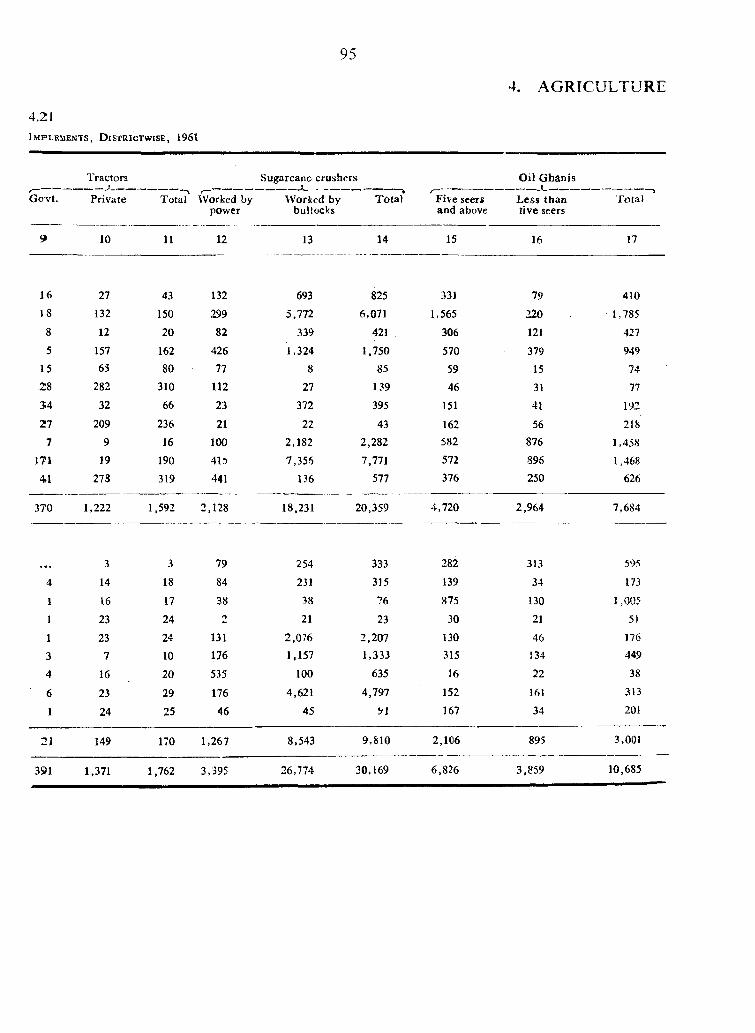
95
4:21I m p l e m e n t s , D is t r ic t w is e , i 9 6 l
4. A G R I C U L T U R E
Tractors Sugarcane crushers O il G hanis
GOTi't.-j r—» j
Private Total Worked by power
W orked by bullocks
T otal Five seers and above
Less than five seers
Tota}
9 10 11 12 13 14 15 16 17
16 27 43 132 693 825 331 79 410
18 132 150 299 5 ,7 7 2 6 ,071 1 ,565 220 1 ,785
8 12 20 82 339 421 306 121 427
5 157 162 426 1 ,3 2 4 1 ,7 5 0 570 379 949
15 65 80 77 8 85 59 15 74
2 8 282 310 112 27 139 46 31 77
5 4 32 66 23 372 395 151 41 192
2 7 209 236 21 22 43 162 56 218
7 9 16 100 2 ,1 8 2 2 ,2 8 2 582 876 1 ,458
171 19 190 41.T 7 ,3 5 6 7,771 572 896 1,468
41 278 319 441 136 577 376 250 626
3 7 0 1 ,2 2 2 1 ,592 2 ,1 2 8 18 ,231 2 0 ,3 5 9 4 ,7 2 0 2 ,9 6 4 7 ,6 8 4
3 3 79 254 333 282 313 595
4 14 18 84 231 315 139 34 173
1 16 17 38 38 76 875 130 1 ,0 0 5
1 23 24 2 21 23 30 21 5)
1 23 24 131 2 ,0 7 6 2 ,2 0 7 130 46 176
3 7 10 176 1 ,157 1 ,3 3 3 315 134 449
4 16 20 535 100 635 16 22 38
6 23 29 176 4 ,6 2 1 4 ,7 9 7 152 161 313
1 24 25 46 45 b l 167 34 201
21 149 170 1 ,2 6 7 8 ,5 4 3 9 ,8 1 0 2 ,1 0 6 895 3,001
391 1,371 1 ,762 3 ,395 2 6 ,7 7 4 3 0 ,1 6 9 6 ,8 2 6 3 ,8 5 9 10 ,6 8 5
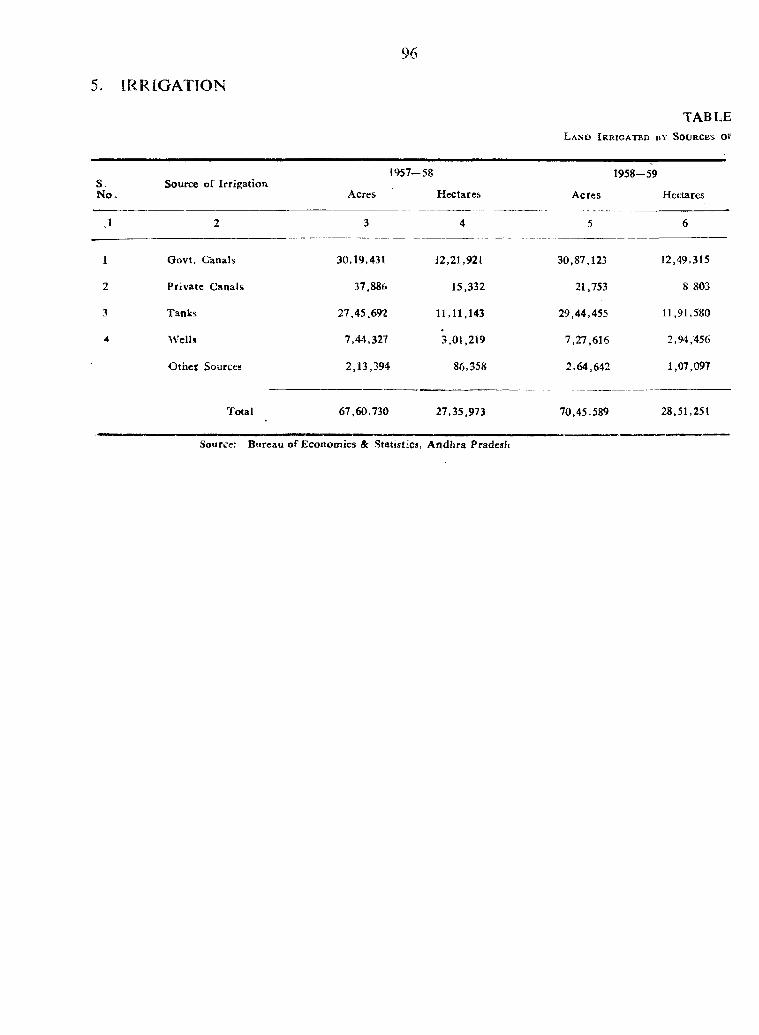
96
5. IRRiGATION
TABLEL a n d I r r i g a t e d b y S o u r c e s o i
SN o.
Source of Irrigation
Govt. Canals
Private Canals
Tanks
Wells
O tiie t Sources
Total
1957-58
Acres H ectares
30,19,431
37,886
27,45,692
7,44,327
2,13,394
12,21,921
15,332
11,11,143
3,01,219
86,358
1958-59
Acres Hectares
30,87,123
21,753
29,44,455
7,27,616
2,64,642
12,49,315
8 803
11,91,580
2,94,456
1,07,097
67,60,730 27,35,973 70,45,589 28,51,251
Source: Bureau o f Economics & Statistics, A ndhra Pradesh
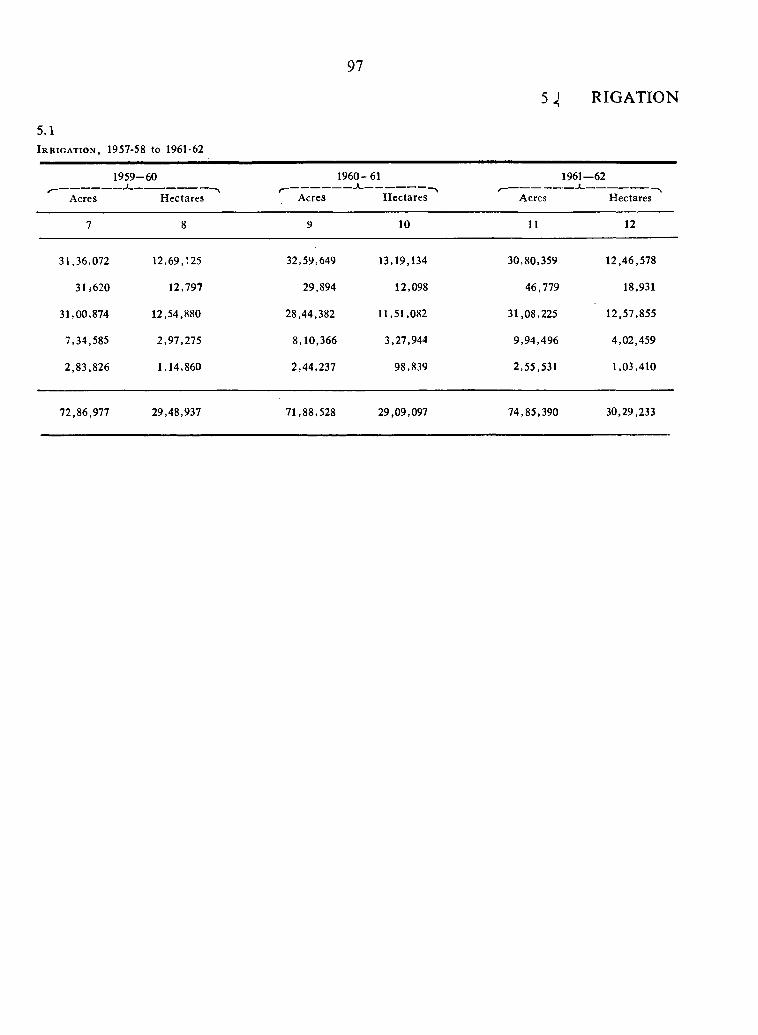
97
5^ RIGATION
5.1I r r i g a t i o n , 1957-58 t o 1961-62
1959-•60 1960-611 _ _ 1961-
1-62
Acres■ 'N
Hectares Acres—
H ectares Acres.. ™
Hectares
7 8 9 10 11 12
31,36,072 12,69,125 32,59,649 13,19,134 30,80,359 12,46,578
31f620 12,797 29,894 12,098 46,779 18,931
31,00,874 12,54,880 28,44,382 11,51,082 31,08,225 12,57,855
7,34,585 2,97,275 8,10,366 3,27,944 9,94,496 4,02,459
2,83,826 1,14,860 2,44,237 98,839 2,55,531 1,03,410
72,86,977 29,48,937 71,88,528 29,09,097 74,85,390 30,29,233
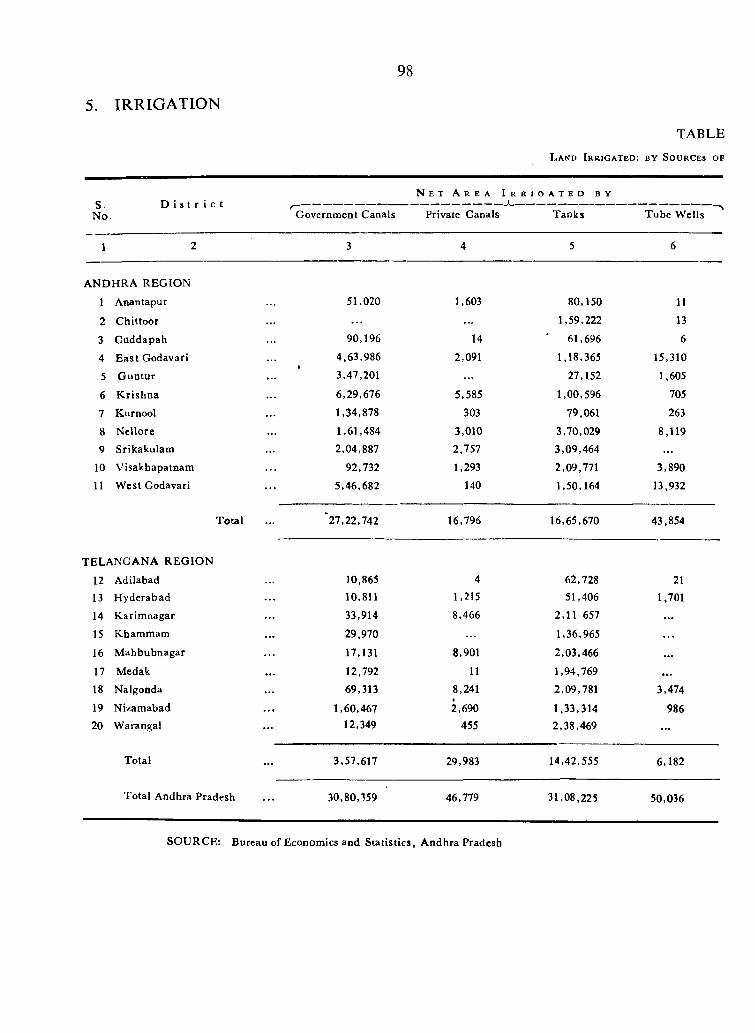
5. IRRIGATION
98
TABLE
L a n d I r r i g a t e d : BY S o u r c e s o f
S. D i s t r i c t No. G overnm ent Canals
N e t A r e a I r
Private Canals
R I O A T E D B Y
Tanks Tube W ells
1 2 3 4 5 6
A NDHRA R EG IO N
1 Anantapur 51,020 1,603 80,150 11
2 C hittoor ... 1,59,222 13
3 C uddapah 90,196 14 ' 61,696 6
4 E ast Godavari 4,63,986 2,091 1,18,365 15,310
5 G un tu r 3,47,201 27,152 1,605
6 K rishna 6,29,676 5,585 1,00,596 705
7 Kiirnool 1,34,878 303 79,061 263
8 N ellore 1,61,484 3,010 3,70,029 8,1199 Srikakulam 2,04,887 2,757 3,09,464
10 V isakhapatnam 92,732 1,293 2,09,771 3,89011 W est Godavari 5,46,682 140 1,50,164 13,932
Total '27 ,22,742 16,796 16,65,670 43,854
TELANGANA R EG IO N
12 Adilabad 10,865 4 62,728 21
13 H yderabad 10,811 1,215 51,406 1,701
14 K arim nagar 33,914 8,466 2,11 657 ...15 Kbammam 29,970 1,36,965
16 M ahbubnagar 17,131 8,901 2,03,466 ...17 M edak 12,792 11 1,94,769 ...18 Nalgonda 69,313 8,241 2,09,781 3,474
19 N izam abad 1,60,467 2,690 1,33,314 98620 W arangal 12,349 455 2,38,469 ...
Total 3,57,617 29,983 14,42,555 6,182
Total Andhra Pradesh 30,80,359 46,779 31,08,225 50,036
SO U RCE: Bureau of Economics and S tatistics, A ndhra Pradesh
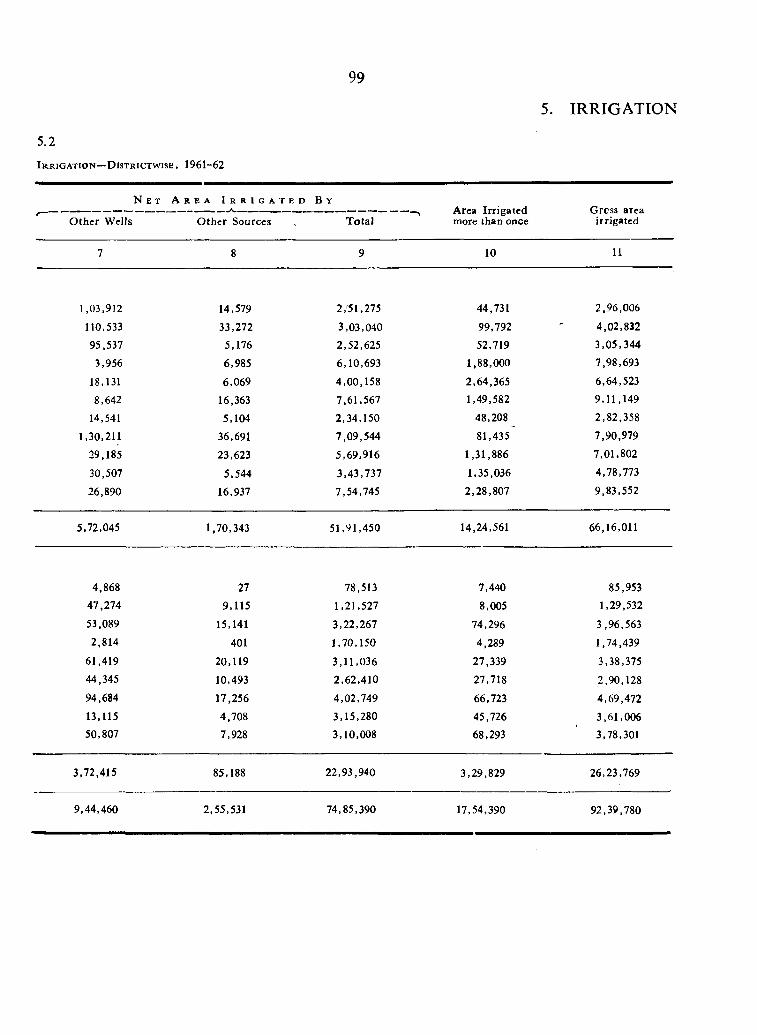
5.2
I r r i g a t i o n — D i s T R i C T w i s E , 1961-62
99
5. IRRIGATION
N e t A r e a I r r i g a t e d
O ther Wells O ther Sources
B Y
T otalArea Irrigated more than once
Grcss area irrigated
7 8 9 10 11
1,03,912 14,579 2,'51,275 44,731 2.96,006
110,533 33,272 3,03,040 99,792 4,02,832
95,537 5,176 2,52,625 52,719 3 ,05,344
3,956 6,985 6,10,693 1,88,000 7,98,693
18,131 6,069 4,00,158 2,64,365 6,64,523
8,642 16,363 7,61,567 1,49,582 9,11,149
14,541 5,104 2,34,150 48,208 2,82,358
1,30,211 36,691 7,09,544 81,435 7,90,979
29,185 23,623 5,69.916 1,31,886 7,01,802
30,507 5,544 3,43,737 1,35,036 4,78,773
26,890 16,937 7,54,745 2,28,807 9,83,552
5,72,045 1,70,343 51,91,450 14,24,561 66,16,011
4,868 27 78,513 7,440 85,953
47,274 9,115 1,21,527 8,005 1,29,532
53,089 15,141 3,22,267 74,296 3,96,5632,814 401 1,70,150 4,289 1,74,439
61,419 20,119 3,11,036 27,339 3,38,375
44,345 10,493 2,62,410 27,718 2,90,12894,684 17,256 4,02,749 66,723 4,69,472
13,115 4,708 3,15,280 45,726 3,61,00650,807 7,928 3,10,008 68,293 3,78,301
3,72,415 85,188 22,93,940 3,29,829 26,23,769
9,44,460 2,55,531 74,85,390 17,54,390 92,39,780
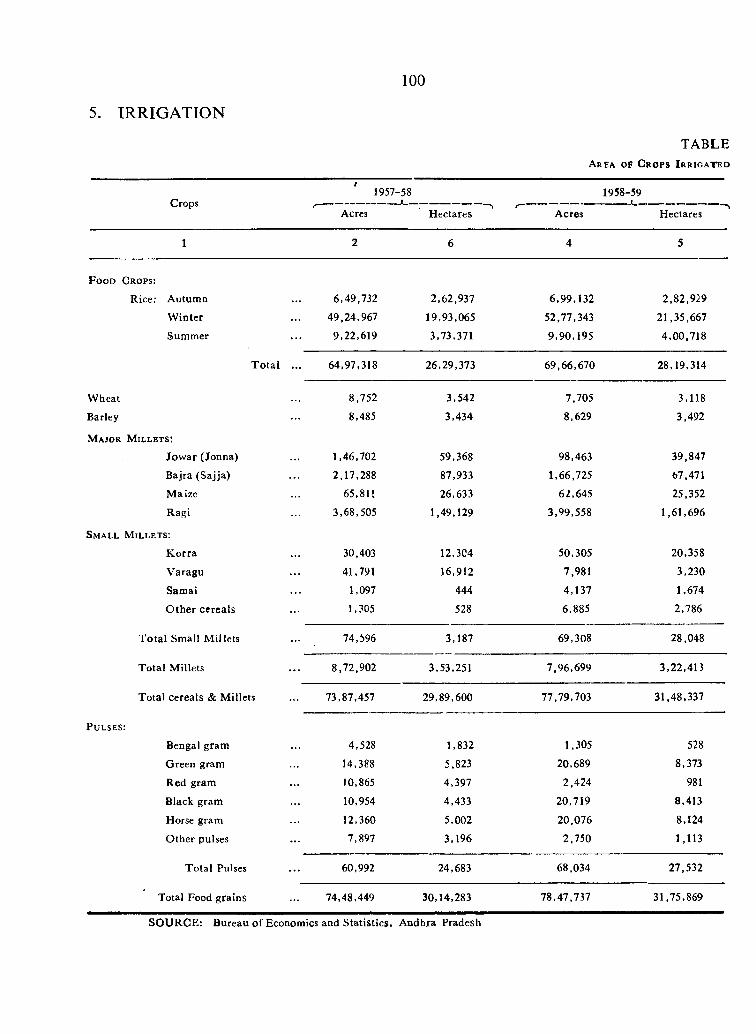
5. IRRIGATION
100
TABLEA r e a o f C r o p s I r r i g a t e d
Crops* 1957-58
Acres
1958-59
Hectares Acires Hectares
1 2 6 4 5
F o o d C r o p s :
Rice: Autumn 6,49,732 2,62,937 6,99,132 2,82,929
W inter 49,24,967 19,93,065 52,77,343 21,35,667
Summer 9,22,619 3,73,371 9,90,195 4,00,718
T o ta l ... 64,97,318 26,29,373 69,66,670 28,19,314
W heat 8,752 3,542 7,705 3,118
Barley 8,485 3,434 8,629 3,492
M a j o r M i l l e t s :
Jow ar (Jonna) 1,46,702 59,368 98,463 39,847
Bajra (Sajja) 2,17,288 87,933 1,66,725 67,471
Maize 65,811 26,633 62,645 25,352
Ragi 3,68,505 1,49,129 3,99,558 1,61,696
S m a l l M i l l e t s :
K orra 30,403 12,304 50,305 20,358
V aragu 41,791 16,912 7,981 3,230
Samai 1,097 444 4,137 1,674
O ther cereals 1,305 528 6,885 2,786
T o ta l Small M illets 74,596 3,187 69,308 28,048
Total Millets 8,72,902 3,53,251 7,96,699 3,22,413
Total cereals & M illets 73,87,457 29,89,600 77,79,703 31,48,337
P u l s e s :
Bengal gram 4,528 1,832 1,305 528
Green gram 14,388 5,823 20,689 8,373
Red gram 10,865 4,397 2,424 981
Black gram 10,954 4,433 20,719 8,413
Horse gram 12,360 5,002 20.076 8,124
O ther pulses 7,897 3,196 2.750 1,113
T otal Pulses 60,992 24,683 68,034 27,532
Total Food grains 74,48,449 30,14,283 78,47,737 31,75,869
SO URCE: Bureau o f Economics and S tatistics, Andhra Pradesh
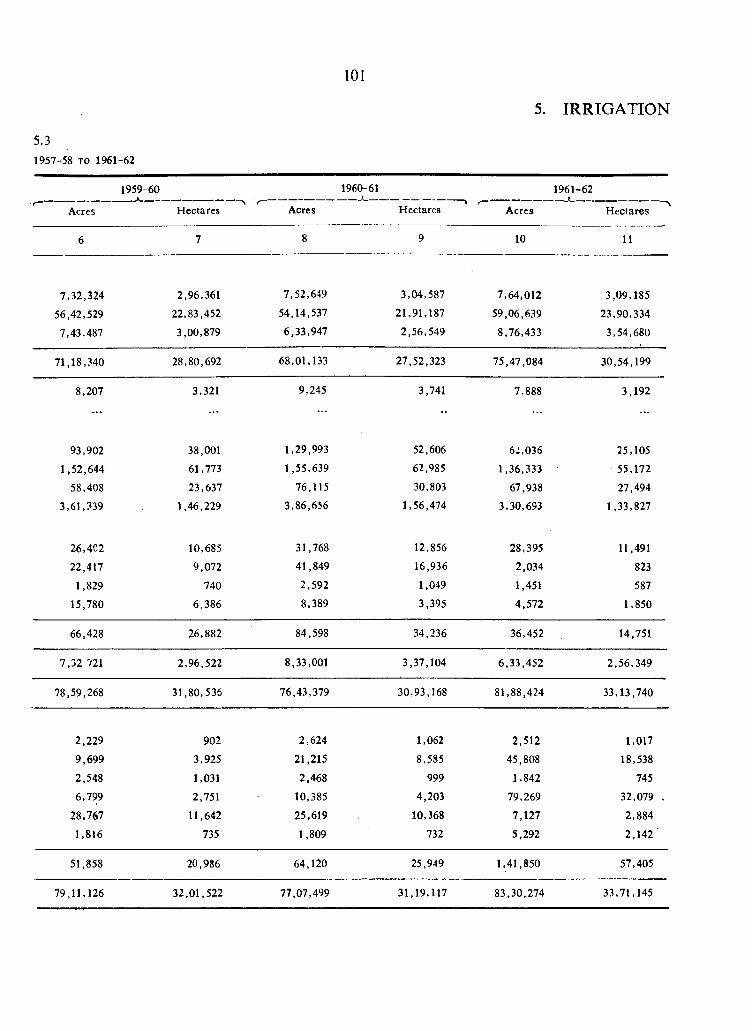
101
5.31957-58 TO 1961-62
5. IRRIGATION
1959-60
Acres Hectares■ — —
Acres
1960-61
Hectares Acres
1961-62
Hectares
6 7 8 9 10 11
7,32,324 2,96,361 1 , 5 1 M 9 3,04,587 7,64,012 3,09,185
56,42,529 22,83,452 54,14,537 21,91,187 59,06,639 23,90,334
7,43,487 3,00,879 6,33,947 2,56,549 8,76,433 3,54,680
71,18,340 28,80,692 68,01,133 27,52,323 75,47,084 30,54,199
8,207 3,321 9,245 3,741 7,888 3,192
93,902 38,001 1,29,993 52,606 6:,036 25,105
1,52,644 61,773 1,55,639 62,985 1,36,333 55,172
58,408 23,637 76,115 30,803 67,938 27,494
3,61,339 1,46,229 3,86,656 1,56,474 3,30,693 1,33,827
26,402 10,685 31,768 12,856 28,395 11,491
22,417 9,072 41,849 16,936 2,034 823
1,829 740 2,592 1,049 1,451 587
15,780 6,386 8,389 3,395 4,572 1,850
66,428 26,882 84,598 34,236 36,452 14,751
7,32 721 2,96,522 8,33,001 3,37,104 6,33,452 2,56,349
78,59,268 31,80,536 76,43,379 30,93,168 81,88,424 33,13,740
2,229 902 2,624 1,062 2,512 1,017
9,699 3,925 21,215 8,585 45,808 18,538
2,548 1,031 2,468 999 1,842 745
6,799 2,751 10,385 4,203 79,269 32,079 .
28,767 11,642 25,619 10,368 7,127 2,884
1,816 735 1,809 732 5,292 2 ,142 '
51,858 20,986 64,120 25,949 1,41,850 57,405
79,11,126 32,01,522 77,07,499 31,19,117 83,30,274 33,71,145
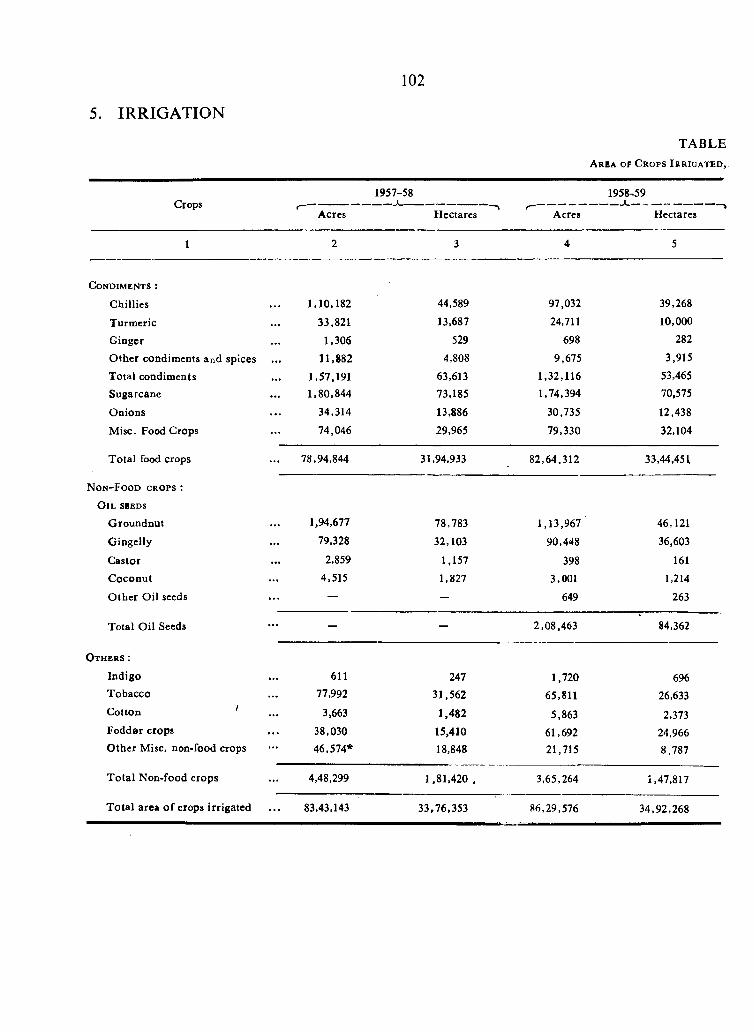
102
5. IRRIGATION
TABLEA r e a o f C r o p s I r r i g a t e d ,
CropsAcres
1957-58
Hectares
1958--59
Acres Hectares
C o n d i m e n t s :
Chillies
Turm eric
Ginger
O ther condim ents and spices
Total condiments Sugarcane
O nions
Misc. Food Crops
T otal food crops
N o n - F o o d c r o p s :
O i l s e e d s
G roundnut
G iogelly
Castor
C oconut
O ther O il seeds
Total O il Seeds
O t h e r s :
Indigo
Tobacco
C otton '
Fodder crops
O ther Misc. non-food crops
T o ta l Non-food erops
T o ta l area o f crops irrigated
1,10,182
33,821
1,306
11,882
1,57,1911,80,844
34,314
74,046
78,94,844
1,94,677
79,328
2,859
4,515
611
77,992
3,663
38,03046,574*
4,48,299
44,589
13,687
529
4,808
63,613
73,185
13,886
29,965
31,94,933
78,783
32,103
1,157
1,827
247
31,562
1,482
15,41018,848
97,032
24,711
698
9,675
1,32,1161,74,394
30,735
79,330
82,64,312
1,13,967
90,448
398
3,001
649
2,08,463
1,720
65,811
5,863
61,69221,715
1,81,420 3,65,264
39,268
10,000282
3,915
53,46570,575
12,438
32,104
33,44,451
46,121
36,603
161
1,214
263
84,362
696
26,633
2,373
24,9668,787
1,47,817
83,43,143 33,76,353 86,29.576 34,92,268
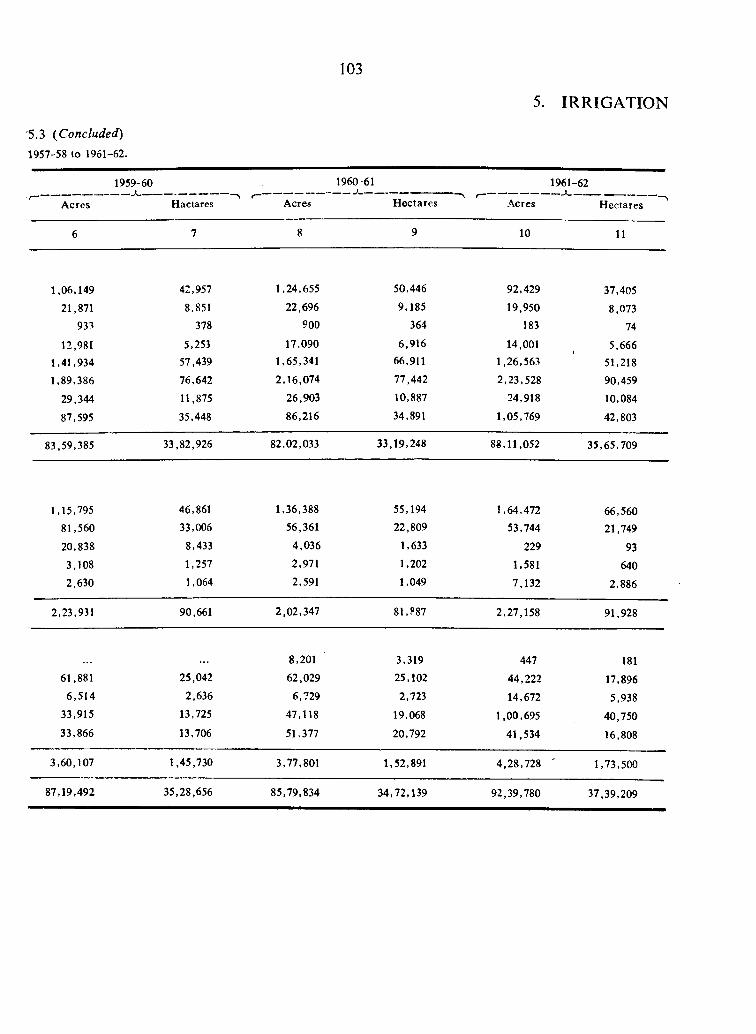
5.3 {Concluded)
1957-58 to 1961-62.
103
5. IRRIGATION
195^60
Acres Hactares
1960-61
Acres H ectares
1961-62-----------------f____________Acres Hectares
6 7 8 9 10 11
1,06,149 42,957 1,24,655 50,446 92,429 37,405
21,871 8,851 22,696 9,185 19,950 8,07393? 378 900 364 183 74
12,981 5,253 17,090 6,916 14,001 5,6661,41,934 57,439 1,65,341 66,911 1,26,563 51,218
1,89,386 76,642 2,16,074 77,442 2,23,528 90,459
29,344 11,875 26,903 10,887 24,918 10,084
87,595 35,448 86,216 34,891 1.05,769 42,803
83,59,385 33,82,926 82,02,033 33,19,248 88,11,052 35,65,709
1,15,795 46,861 1,36,388 55,194 1,64,472 66,56081,560 33,006 56,361 22,809 53,744 21,74920,838 8,433 4,036 1,633 229 933,108 1,257 2,971 1,202 1,581 6402,630 1,064 2,591 1,049 7,132 2,886
2,23,931 90,661 2,02,347 81,?87 2,27,158 91,928
8,201 3,319 447 18161,881 25,042 62,029 25,102 44,222 17,896
6,514 2,636 6,729 2,723 14,672 5,93833,915 13,725 47,118 19,068 1,00,695 40,75033,866 13,706 51,377 20,792 41,534 16,808
3,60,107 1,45,730 3,77,801 1,52,891 4,28,728 ' 1,73,500
87,19,492 35,28,656 85,79,834 34,72,139 92,39,780 37,39,209
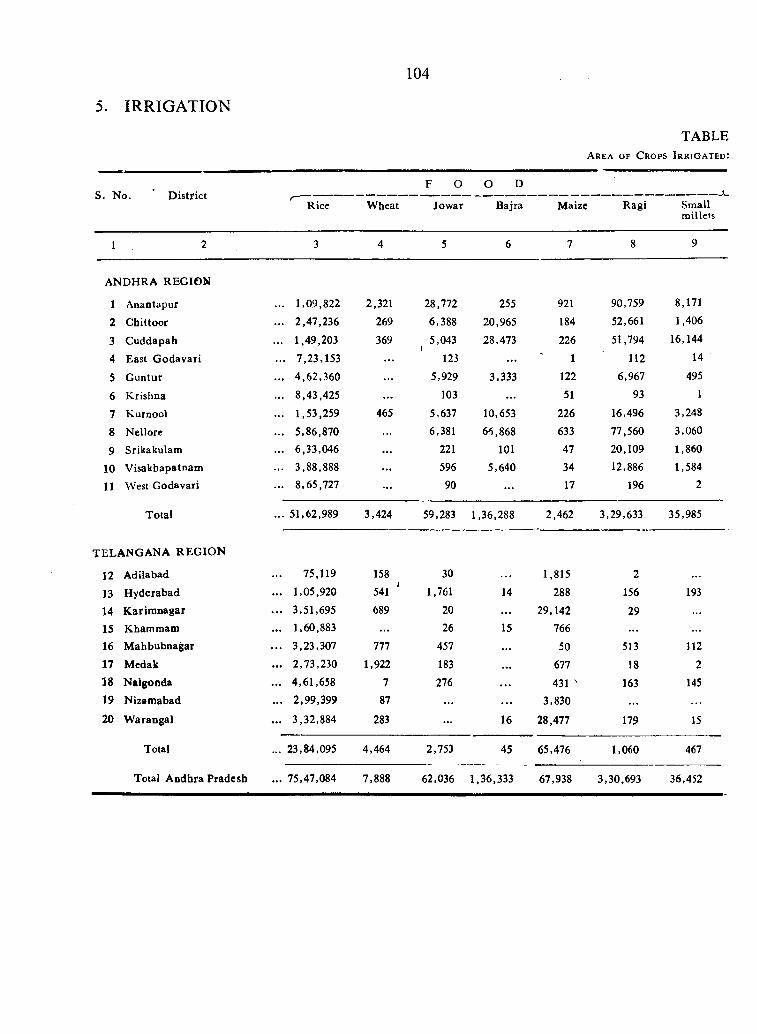
5. IRRIGATION
104
s. No. D istrict
TABLEA r e a o f C r o p s I r r i g a t e d :
Rice W heat
F O O D
Jow ar Bajra Maize Ragi Small millets
ANDHRA REG IO N
1 Anantapur ... 1,09,822 2,321 28,772 255 921 90,759 8,171
2 Chittoor ... 2,47,236 269 6,388 20,965 184 52,661 1,406
3 C uddapab ... 1,49,203 369 5,043 28,473 226 51,794 16,144
4 East G odavari ... 7,23,153 . . . 123 . . . 1 112 14
5 G untur ... 4 ,62 ,360 ... 5,929 3,333 122 6,967 495
6 K rishna ... 8,43,425 . . . 103 . . . 51 93 1
7 Kurnool ... 1,53,259 465 5,637 10,653 226 16,496 3,248
8 Nellorc ... 5,86,870 6,381 66,868 633 77,560 3,060
9 Srikakulam ... 6,33,046 . . . 221 101 47 20,109 1,860
10 V isakbapatnam ... 3,88,888 . . . 596 5,640 34 12,886 1,584
11 West Godavari ... 8,65,727 . . . 90 . . . 17 196 2
Total ... 51,62,989 3,424 59,283 1,36,288 2,462 3,29,633 35,985
TELA N G A N A R EG IO N
12 Adilabad 75,119 158 30 1,815 2
13 H yderabad ... 1,05,920 541 1,761 14 288 156 193
14 K ariinnagar . . . 3,51,695 689 20 . . . 29,142 29
15 Khammam ... 1,60,883 . . . 26 15 766 ...
16 M abbubnagar .. . 3,23,307 777 457 ... 50 513 112
17 M edak ... 2,73,230 1,922 183 ... 677 18 2
18 N algonda ... 4,61,658 7 27 6 431 ^ 163 14519 Nizamabad . . . 2 ,9 9 ,3 9 9 87 . . . . . . 3,830
20 W arangal ... 3,32,884 283 . . . 16 28,477 179 15
Total ... 23,84,095 4 ,4 6 4 2,753 45 65,476 1,060 467
Total A ndhra Pradesh ... 75,47,084 7,888 62,036 1,36,333 67,938 3,30,693 36,452
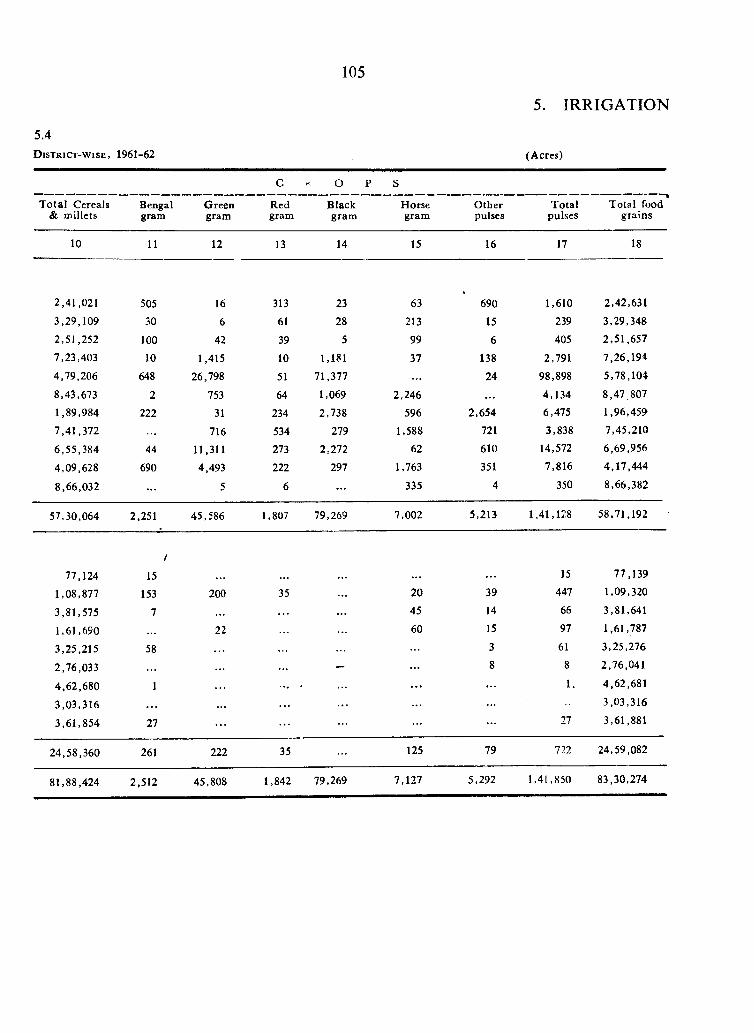
105
5. IRRIGATION
5.4
D is t r ic t -w i s e , 1961-62 (Acres)
G K o P S
T o ta l Cereals & miUets
Bengalg ra m
Greengram
Redgram
Blackgram
Horsegram
O therpulses
T otalpulses
Total food grains
10 11 12 13 14 15 16 17 18
2,41,021 505 16 313 23 63 690 1,610 2,42,631
3,29,109 30 6 61 28 213 15 239 3,29,348
2,51,252 100 42 39 5 99 6 405 2,51,657
7,23,403 10 1,415 10 1,181 37 138 2,791 7,26,194
4,79,206 648 26,798 51 71,377 . . . 24 98,898 5,78,104
8,43,673 2 753 64 1,069 2,246 . . . 4,134 8 , 4 7 .8 0 7
1,89,984 222 31 234 2,738 596 2,654 6,475 1,96,459
7,41,372 716 534 279 1,588 721 3,838 7,45,210
6,55,384 44 11,311 273 2,272 62 610 14,572 6,69,956
4,09,628 690 4,493 222 297 1,763 351 7,816 4,17,444
8,66,032 5 6 . . . 335 4 350 8,66,382
57,30,064 2,251 45,586 1,807 79,269 7,002 5,213 1 ,4 1 ,1 2 8 5 8 ,7 1 ,1 9 2
77,124 15 . . . . . . . . . 15 77,139
1,08,877 153 200 20 39 447 1,09,320
3,81,575 7 . . . 45 14 66 3,81,641
1,61,690 22 60 15 97 1,61,787
3,25,215 58 3 61 3,25,276
2,76,033 - 8 8 2,76,041
4,62,680 1 . . . 1. 4,62,681
3,03,316 . . . . . . 3,03,316
3,61,854 27 . . . 27 3,61,881
24,58,360 261 222 35 125 79 722 24,59,082
81,88,424 2,512 45,808 1,842 79,269 7,127 5,292 1,41,850 83,30,274
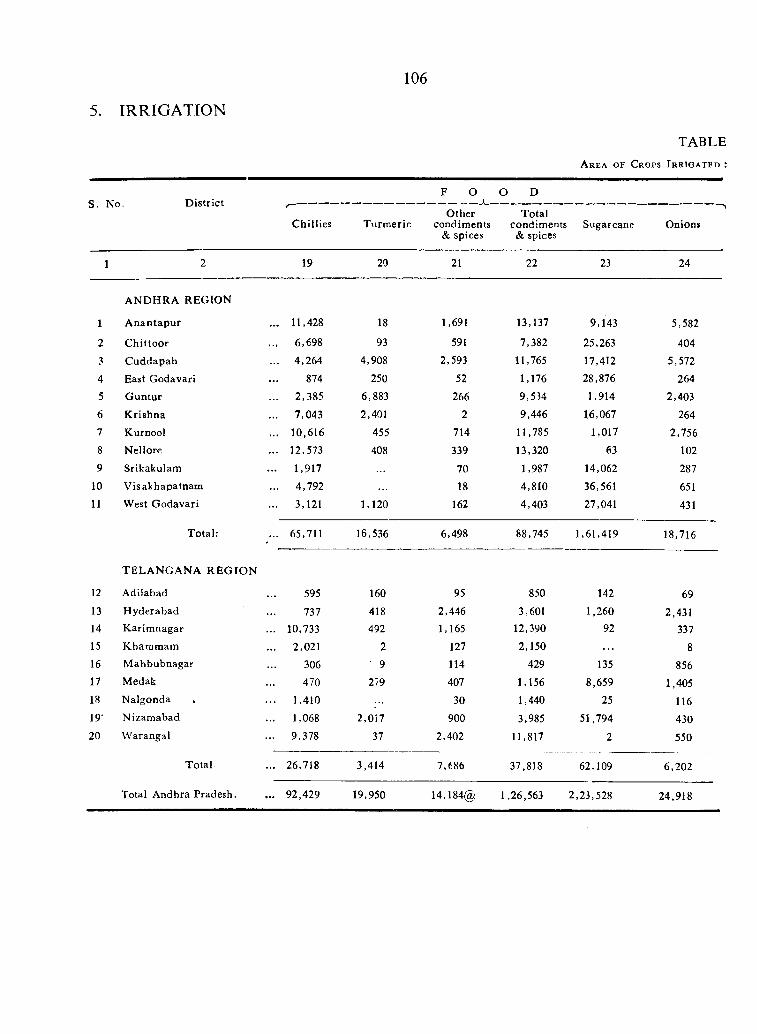
5. IRRIGATION
106
A r e a o f C r o p s I r r i g a t f d :
TABLE
S. No. D istrict
Chillies
D
Turm eric
F O O------------------------------*_____________________________________________I-----------------
O ther Totalcondiments condiments Sugarcane
& spices & spicesOnions
19 20 21 22 23 24
1
A N D H R A REGION
A naotapur 11,428 18 1,691 13,137 9,143 5,582
2 C hittoor 6,698 93 591 7,382 25,263 4043 C uddapah 4,264 4,908 2,593 11,765 17,412 5,572
4 East Godavari 874 250 52 1,176 28,876 264
5 G untur 2,385 6,883 266 9 ,5 H 1,914 2,403
6 K rishna 7,043 2,401 2 9,446 16,067 2647 Kurnool 10,616 455 714 11,785 1,017 2,7568 Nellore 12,573 408 339 13,320 63 1029 Srikakulam 1,917 70 1,987 14,062 287
10 V isakhapatnam 4,792 18 4,810 36,561 65111 West G odavari 3,121 1,120 162 4,403 27,041 431
Total: 65,711 16,536 6,498 88,745 1,61,419 18,716
12
T EL A N G A N A R E G IO N
Adilabad 595 160 95 850 142 6913 H yderabad 737 418 2,446 3,601 1,260 2,43114 K arim nagar 10,733 492 1,165 12,390 92 33715 K ham m am 2,021 2 127 2,150 816 M ahbubnagar 306 9 114 429 135 85617 Medak 470 279 407 1,156 8,659 1,40518 Nalgonda 1,410 30 1,440 25 11619- N izam abad 1,068 2,017 900 3,985 51,794 43020 W arangal 9,378 37 2,402 11,817 2 550
Total 26,718 3,414 7,686 37.818 62,109 6,202
Total Andhra Pradesh. 92,429 19,950 14,184@ 1,26,563 2,23,528 24,918
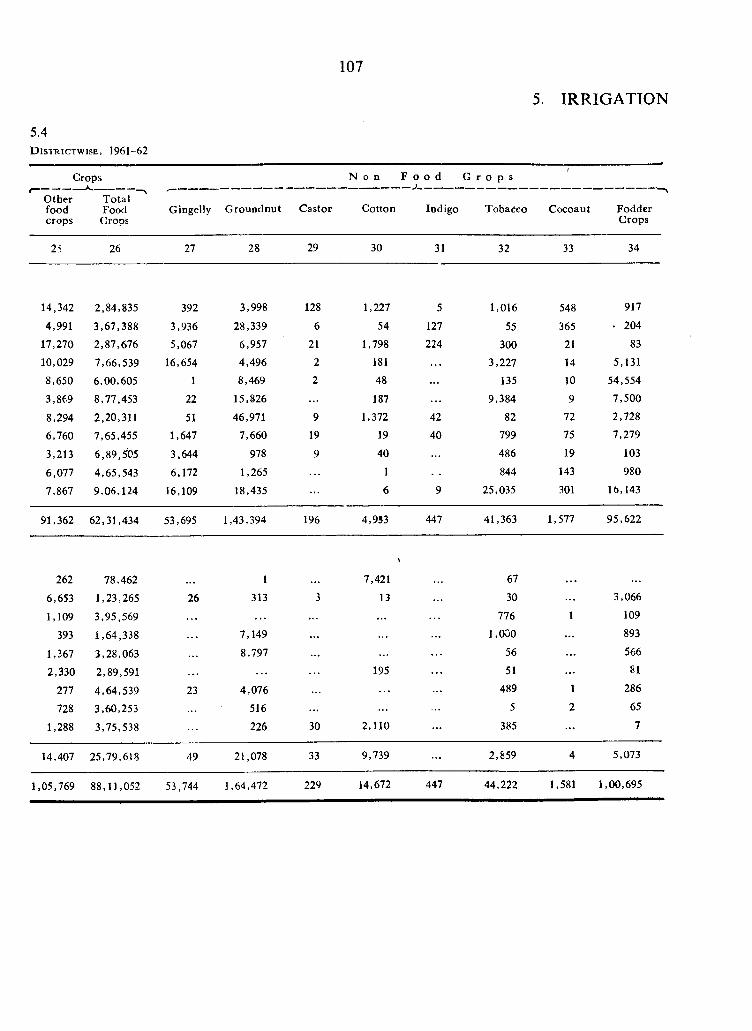
107
5. IRRIGATION
5.4
D i s t r i c t w i s e , 1961-62
Crops
25
N o n F o o d C r o p s ------------------- A----------------------------
O ther T otalfood Food Gingelly G roundnut Castor Cotton Indigo Tobacco Cocoaut Foddercrops Crops Crops
26 27 28 29 30 31 32 33 34
14,342
4,991
17,27010,029
8,650
3,869
8,294
6,760
3,213
6,077
7,867
2,84,835
3,67,388
2,87,676
7,66,539
6,00,605
8,77,453
2,20,311
7,65,455
6,89,505
4,65,543
9,06,124
392
3,936
5,067
16,654
1
22
51
1,647
3,644
6,172
16,109
3,998
28,339
6,957
4,496
8,469
15,826
46,971
7,660
978
1,265
18,435
128
621
22
9
19
9
1,227
54
1,798
181
48
187
1,372
19
40
16
5
127
224
42
40
1,016
55
300
3,227
135
9,384
82
799
486
844
25,035
548
365
21
14
109
72
75
19
143
301
917
• 204
83
5,131
54,554
7,500
2,728
7,279
103
980
16,143
91,362 62,31,434 53,695 1,43,394 196 4,953 447 41,363 1,577 95,622
262
6,653
1,109
393
1,367
2,330
277
728
1,288
78,462
1,23,265
3,95,569
1,64,338
3,28,063
2,89,591
4,64,539
3,60,253
3,75,538
26
23
1313
7,149
8,797
4,076
516
226 30
7,421
13
195
2,110
67
30
776
1,000
56
51
489
5
385
3,066
109
893
566
81
286
65
7
14,407 25,79,618 49 21,078 33 9,739 2,859 5,073
1,05,769 88,11,052 53,744 1,64,472 229 14,672 447 44,222 1,581 1,00,695
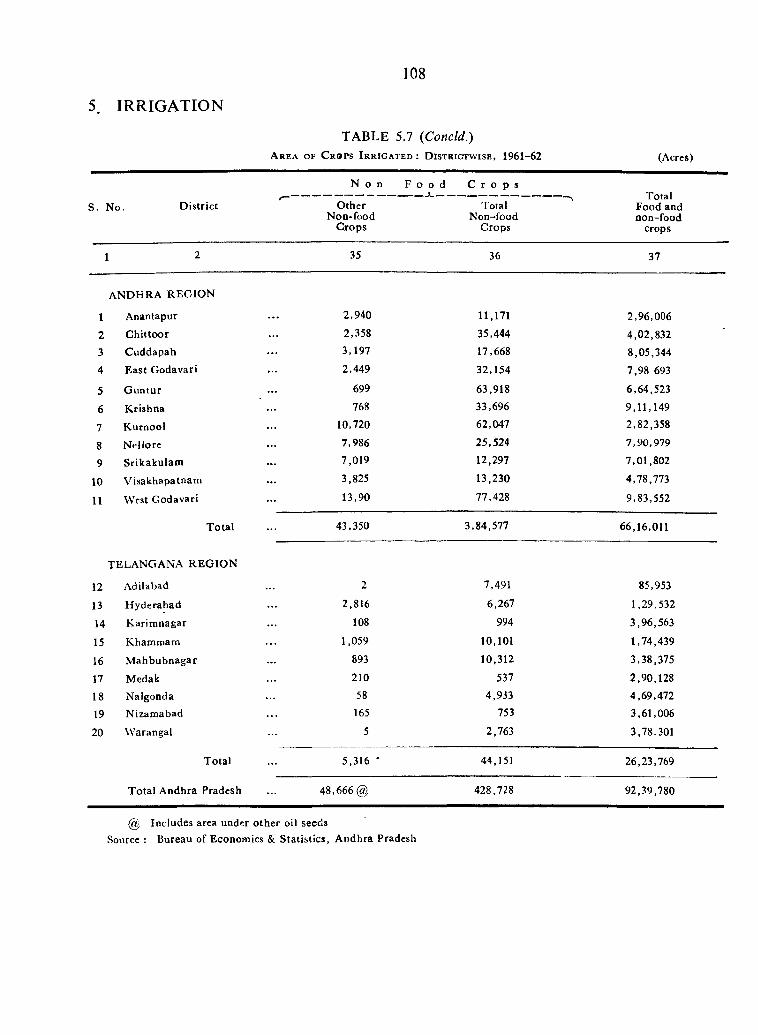
5 IRRIGATION
108
T A B L E 5.7 (C o n c ld .)
A r e a o f C r o p s I r r i g a t e d : D i s t r i c t w ^ i s e , 1961-62 (Acres)
N o n F o o d C r o p sr— Total
S. No. D istrict Otiier Total Food andNon-food Non-food non-food
C rops Crops crops
1 2 35 36 37
ANDHRA R EG IO N
1 Anantapur 2 ,940 11,171 2,96,006
2 C hittoor 2,358 35,444 4 ,02,832
3 Cuddapah 3,197 17,668 8 ,05,344
4 East Godavari 2,449 32,154 7,98 693
5 G untur 699 63,918 6,64,523
6 K rishna 768 33,696 9,11 ,149
7 K urnool 10,720 62,047 2,82,358
8 NcHore . . . 7,986 25,524 7 ,90 ,979
9 Srikakulatn 7,019 12,297 7 ,01,802
10 V isakhapatnam . . . 3,825 13,230 4,78,773
11 West Godavari 13,90 77,428 9,83,552
T otal 43,350 3 ,84,577 66,16,011
TELANGANA R EG IO N
12 Adilabad 2 7,491 85,953
13 H yderabad 2,816 6,267 1 ,29,532
14 Karironagar 108 994 3,96 ,563
15 Khammam 1,059 10,101 1,74,439
16 M ahbubnagar 893 10,312 3,38,375
17 Medak 210 537 2 ,90,128
18 Nalgonda 58 4,933 4,69,472
19 N izam abad 165 753 3,61,006
20 VVarangal 5 2,763 3,78.301
T otal 5,316 ‘ 44,151 26,23,769
T otal A ndhra Pradesh 4 8 ,6 6 6 @ 428,728 92 ,39,780
(ca Includes area under o ther oil seedsSource : Bureau of Economics & Statistics, A ndhra Pradesh
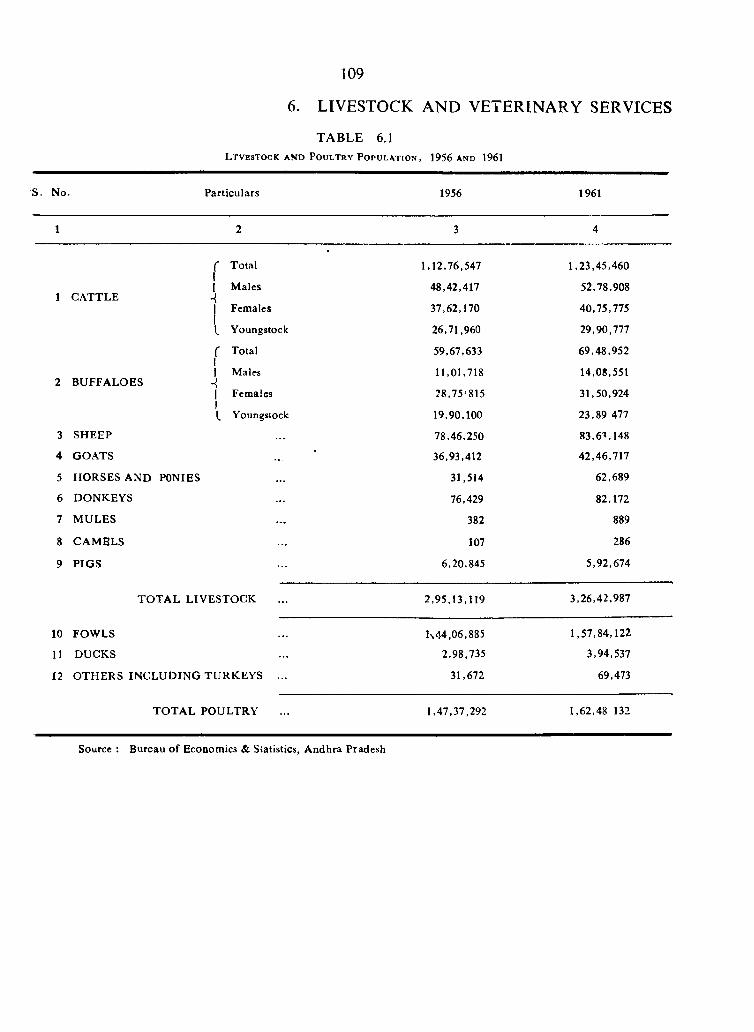
109
6. LIVESTOCK AND VETERINARY SERVICES
TABLE 6.1L t v e s t o c k a n d P o u l t r y P o p u l a t i o n , 1956 a n d 1961
S. No Particulars 1956 1961
1 2 3 4
f Total 1,12 ,76 ,547 1 ,23 ,4 5 ,4 6 0
M ales 48,42,417 52,78,9081 CATTLE
Females 37,62,170 40,75,775
Youngstock 26,71,960 29.90,777
r Total 59,67,633 6 9 ,48 ,952
1 Males 11,01,718 14,08,5512 BUFFALOES
1 Females 1
?8 ,7 5 ‘815 31.50,924I
Youngstock 19,90,100 23,89 477
3 SHEEP 78.46,250 83,63,148
4 GOATS • 36,93,412 42 ,46 ,717
5 HORSES AND PONIES . . . 31,514 62,689
6 DONKEYS 76,429 82,172
7 M U LES . . . 382 889
8 CAM ELS 107 286
9 PIG S 6,20,845 5 ,92 ,674
T O T A L LIV ESTO CK 2 ,95 ,13 ,119 3 ,26 ,42 ,987
10 FOW LS . . . 1x44,06,885 1 ,57 ,84 ,122
11 DUCKS 2,98,735 3 ,94,537
12 O TH ERS IN C L U D IN G TU RK EY S ... 31,672 69,473
T O T A L POULTRY 1 ,47,37,292 1 ,62,48 132
Source : Bureau of Economics & Statistics, A ndhra Pradesh
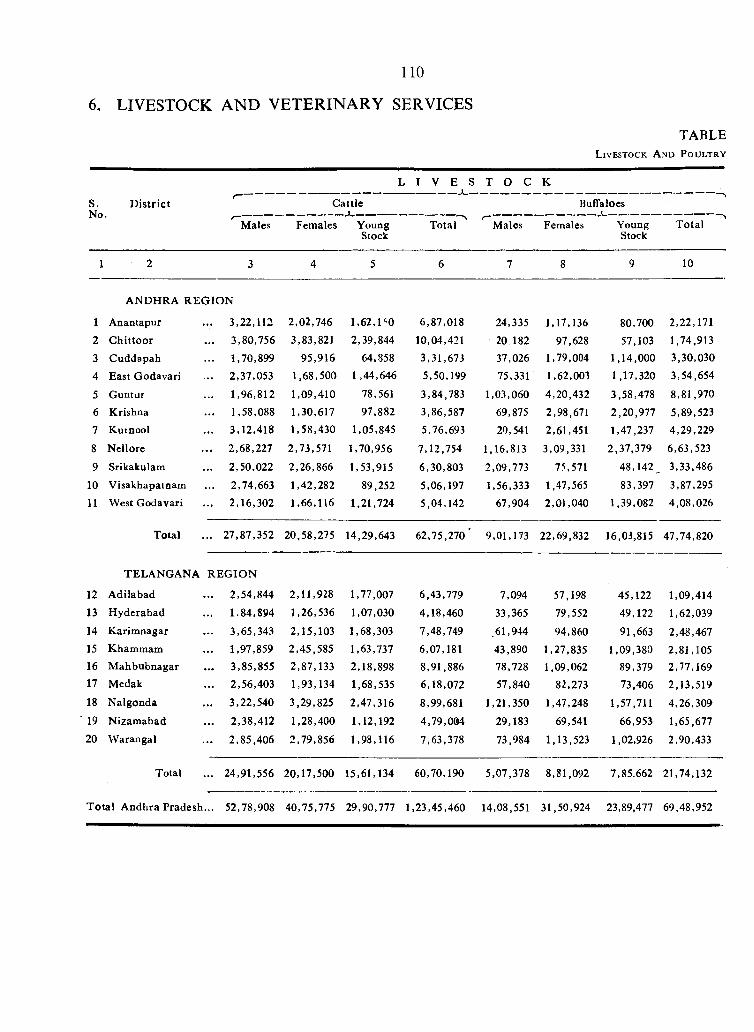
110
6, LIVESTOCK AND VETERINARY SERVICES
TABLEL iv e s t o c k A n d P o u l t r y
L I V E S T O C K -------------------«_________________
S.No.
D istric t Cattle Buffaloes
Males Females Young Stock
ANDHRA R EG IO N
... 31 Anantapur
2 C hittoor
Cuddapah
East G odavari
Guntur
Krishna Kuinool
8 Nellore
9 Srikakulam
10 Visakhapatnam11 West Godavari
22,112
,80,756
70,899
37,053
96,812
,58,088
12,418
68,227
50,022
,74,663
16,302
2,02,7463,83,821
95,916
1,68,500
1,09,410
1,30,6171,58,430
2,73,571
2,26,866
1,42,2821,66,116
1 ,6 2 ,1' O
2.39.844
64,8581,44,646
78,561
97,882
1.05.845
1,70,956
1,53,915
89,252
1,21,724
Totalr -
Males Females YoungStock
Total
6 7 8 9 10
6,87,018 24,335 1,17,136 80,700 2,22,171
10,04,421 20 182 97,628 57,103 1,74,913
3,31,67J 37,026 1,79,004 1,14,000 3,30,030
5,50,199 75,331’ 1,62,003 1 ,17,320 3,54,654
3,84,783 1,03,060 4,20,432 3,58,478 8,81,970
3,86,587 69,875 2,98,671 2,20,977 5,89,523
5,76,693 20,541 2,61,451 1,47,237 4,29,229
7,12,754 1,16,813 3,09,331 2,37,379 6,63,523
6,30,803 2 , ^ 9 , i n 75,571 48,142^ 3,33,486
5,06,197 1,56,333 1,47,565 83,397 3,87,295
5,04,142 67,904 2,01,040 1,39,082 4,08,026
Total ... 27,87,352 20,58,275 14,29,643 62,75,270 ' 9,01,173 22,69,832 16,0J,815 47,74,820
TELANGANA R EG IO N
12 A dilabad ... 2,54,844 2,11,928 1,77,007 6,43,779 7,094 57,198 45,122 1,09,41413 H yderabad ... 1.84,894 1,26,536 1,07,030 4,18,460 33,365 79,552 49,122 1,62,039
14 Karim nagar ... 3,65,343 2,15,103 1,68,303 7,48,749 .61,944 94,860 91,663 2,48,46715 Khammam ... 1,97,859 2,45,585 1,63,737 6,07,181 43,890 1,27,835 1,09,380 2,81,10516 M ahbubnagar ... 3,85,855 2,87,133 2,18,898 8,91,886 78,728 1,09,062 89,379 2,77,16917 Medak ... 2,56,403 1,93,134 1,68,535 6,18,072 57,840 82,273 73.406 2,13,519
18 N algonda ... 3,22,540 3,29,825 2,47,316 8,99,681 1,21,350 1,47,248 1,57,711 4,26,309
19 N izam abad ... 2,38,412 1,28,400 1,12,192 4,79,004 29,183 69,541 66,953 1,65,677
20 W arangal ... 2,85,406 2,79,856 1,98,116 7,63,378 73,984 1,13,523 1,02,926 2,90,433
Total ... 24,91,556 20,17,500 15,61,134 60,70,190 5,07,378 8,81,092 7,85.662 21,74,132
T otal A ndhra Pradesh ... 52,78,908 40,75,775 29,90,777 1,23,45,460 14,08,551 31,50,924 23,89,477 69,48,952
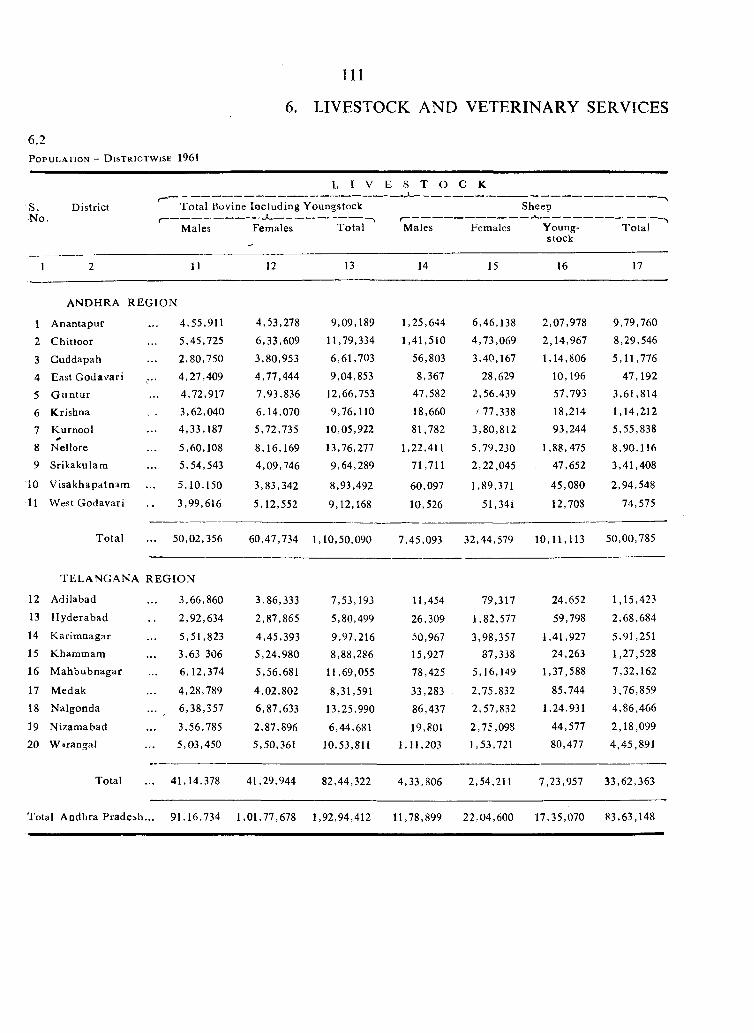
I l l
6. LIVESTOCK AND VETERINARY SERVICES
6 .2
P o p u l a t i o n - D i s t r I c t w i s e 1961
L I V E S T O C K
S. D istrict T o ta l Bovine Including Youngstock Sheet)^No.
M ales Females T otal Males Females Young- T otalstock
1 2 11 12 13 14 15 16 17
ANDHRA R E G IO N
1 A nantapur 4,55,911 4,53,278 9,09,189 1,25,644 6,46,138 2,07,978 9,79,760
2 Chittoor 5,45,725 6,33,609 11,79,334 1,41,510 4,73,069 2,14,967 8,29,546
3 Cuddapah 2,80,750 3,80,953 6,61,703 56,803 3,40,167 1,14,806 5,11,776
4 East G odavari 4,27,409 4,77,444 9,04,853 8,367 28,629 10,196 47,192
5 G u n tu r 4,72,917 7,93,836 12,66,753 47,582 2,56,439 57,793 3,61,814
6 Krishna 3,62,040 6,14,070 9,76,110 18,660 / 77,338 18,214 1,14,212
7 K urnool 4,33,187 5,72,735 10,05,922 81,782 3,80,812 93,244 5,55,838
8 Nellore 5,60,108 8,16,169 13,76,277 1,22,411 5,79,230 1,88,475 8,90,1169 Srikakulara 5,54,543 4,09,746 9,64.289 71,711 2,22,045 47,652 3,41,408
10 V isakhapatnam ... 5,10,150 3,83,342 8,93,492 60,097 1,89,371 45,080 2,94,548
11 West G odavari 3,99,616 5,12,552 9,12,168 10,526 51,34i 12,708 74,575
T otal ... 50,02,356 60,47,734 1,10,50,090 7,45,093 32,44,579 10,11,113 50,00,785
t e l a n g a n a R E G IO N
12 Adilabad 3,66,860 3,86,333 7,53,193 11,454 79,317 24,652 1,15,423
13 H yderabad 2,92,634 2,87,865 5,80,499 26,309 1,82,577 59,798 2,68,68414 K arim nagar 5,51,823 4,45,393 9,97,216 50,967 3,98,357 1,41,927 5,91,25115 Khamrnam 3,63 306 5,24,980 8,88,286 15,927 87,338 24,263 1,27,528
16 M ahbubnagar 6,12,374 5,56,681 11,69,055 78,425 5,16,149 1,37,588 7,32,162
17 M edak 4,28,789 4,02,802 8,31,591 33,283 , 2,75,832 85,744 3,76,859
18 N algonda 6,38,357 6,87,633 13,25,990 86,437 2,57,832 1,24,931 4,86,466
19 N izam abad 3,56,785 2,87,896 6,44,681 19,801 2,75,098 44,577 2,18,099
20 Warangal 5,03,450 5,50,361 10,53,811 1,11,203 1,53,721 80,477 4,45,891
Total ... 41,14,378 41,29,944 82,44,322 4,33,806 2,54,211 7,23,957 33,62,363
Total A ndhra Pradeah... 91,16,734 1,01,77,678 1,92,94,412 11,78,899 22,04,600 17,35,070 83,63,148
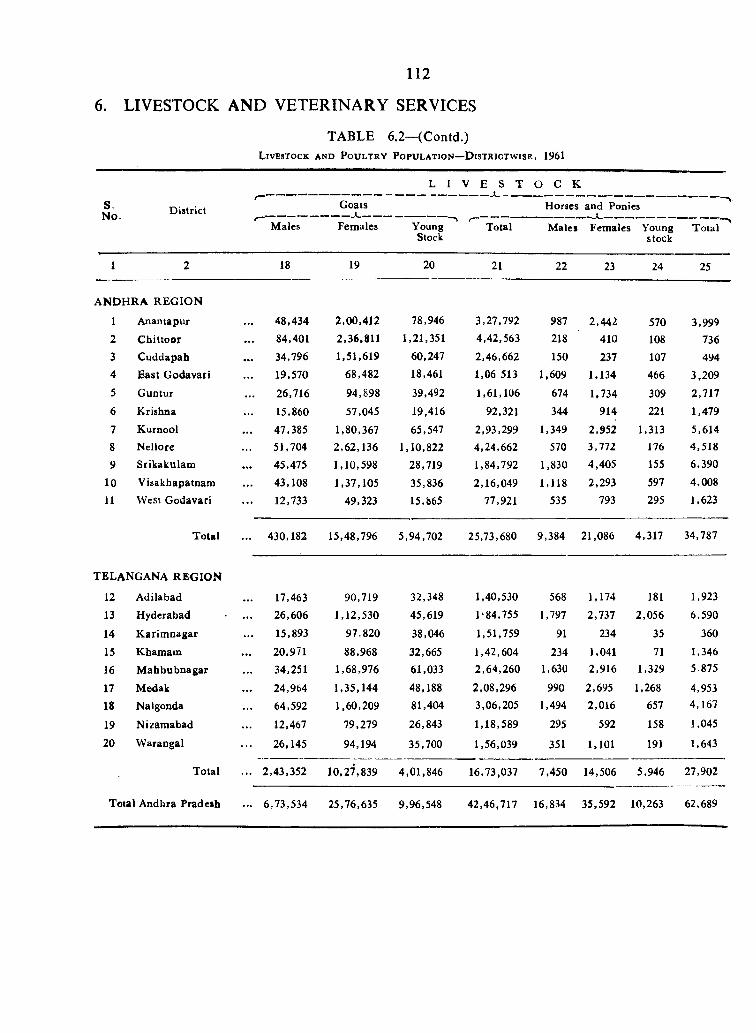
112
TABLE 6.2—(Contd.)
6. LIVESTOCK AND VETERINARY SERVICES
L i v e s t o c k a n d P o u l t r y P o p u l a t i o n - - D lS T R l C T W l S E , 1961
L I V E S T O C K
S.No. D istrict
f—'..........Goats Horses and Ponies
t ...........Males Females Young
StockTotal Males Females Young
stockTotal
1 2 18 19 20 21 22 23 24 25
A ND HRA R EG IO N
1 Anantapur 48,434 2,00,412 78,946 3,27,792 987 2,442 570 3,9992 C bittoor 84,401 2,36,811 1,21,351 4,42,563 218 410 108 7363 C uddapah 34,796 1,51,619 60,247 2,46,662 150 237 107 4944 East G odavari 19,570 68,482 18,461 1,06 513 1,609 1,134 466 3,209
5 G untur 26,716 94,898 39,492 1,61,106 674 1,734 309 2,717
6 Krishna 15,860 57,045 19,416 92,321 344 914 221 1,479
7 Kurnool 47,385 1,80,367 65,547 2,93,299 1,349 2,952 1,313 5,6148 Nellore 51,704 2,62,136 1,10,822 4,24,662 570 3 , n z 176 4,518
9 Srikakulam 45,475 1,10,598 28,719 1,84,792 1,830 4,405 155 6,390
10 Visakhapatnam 43,108 1,37,105 35,836 2,16,049 1,118 2,293 597 4,008
11 West G odavari 12,733 49,323 15,lk65 77,921 535 793 295 1,623
Total ... 430,182 15,48,796 5,94,702 25,73,680 9,384 21,086 4,317 34,787
TELANGANA R EG IO N
12 Adilabad 17,463 90,719 32,348 1,40,530 568 1,174 181 1,923
13 Hyderabad 26,606 1,12,530 45,619 1*84,755 1,797 2,737 2,056 6,590
14 K aritnuagar 15,893 97.820 38,046 1,51,759 91 234 35 360
15 Khamam 20,971 88,968 32,665 1,42,604 234 1,041 71 1,346
16 M ahbubnagar 34,251 1,68,976 61,033 2,64,260 1,630 2,916 1,329 5.875
17 Medak 24,964 1,35,144 48,188 2,08,296 990 2,695 1,268 4,953
18 Nalgonda 64,592 1,60,209 81,404 3,06,205 1,494 2,016 657 4,167
19 N izam abad 12,467 79,279 26,843 1,18,589 295 592 158 1,045
20 W arangal 26,145 94,194 35,700 1,56,039 351 1,101 191 1,643
Total ... 2,43,352 10,27,839 4,01,846 16,73,037 7,450 14,506 5,946 27,902
Total Andhra Pradesh ... 6,73,534 25,76,635 9,96,548 42,46,717 16,834 35,592 10,263 62,689
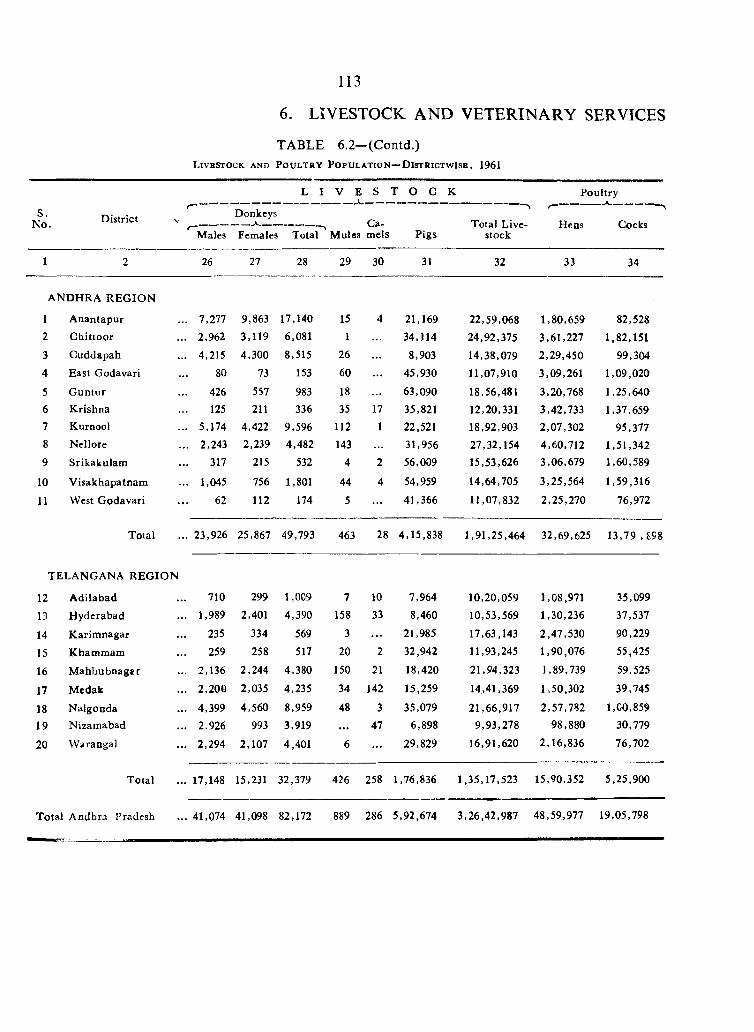
113
s.N o. D istrict
6. LIVESTOCK AND VETERINARY SERVICES
TABLE 6 .2 -(C on td .)L i v e s t o c k a n d P o u l t r y P o p u l a t i o n — D i s t r i c t w i s e , 1961
L I V E S T O C K -----------------«----------------------------
Donkeys
Males Females Total M ules mels PigsTotal Live
stock
Poultry
Hens Cocks
26 27 28 29 30 31 32 33 34
A ND HRA R EG IO N
1 A nantapur2 C hittoor
3 C uddapah
4 East Godavari
5 G untur6 K rishna7 Kurnool
8 Nellore
9 Srikakulam
10 V isakhapatnam
11 West G odavari
7,277
2,962
4,215
80
426125
5,1742,243
317
1,045
62
9,863 17,140 3,119 6,081
4,300
73
557211
4,4222,239
215
756
112
8,515
153
983336
9,596
4,482
532
1,801
174
15
126
60
18
35
112143
4
44
5
17
1
2
4
21,169
34,114
8,903
45,930
63,090
35,82122,521
31,956
56,009
54,959
41,366
22,59,068
24,92,375
14,38,079
11,07,910
18,56,481
12,20,33118,92,903
27,32,15415,53,626
14,64,705
11,07,832
1,80,659
3,61,227
2,29,4503,09,261
3,20,768
3,42,7332,07,302
4,60,712
3,06,679
3,25,564
2,25,270
82,528
1,82,151
99,304
1,09,020
1,25,640
1,37,659
95,377
1,51,3421,60,589
1,59,316
76,972
Total 23,926 25,867 49,793 463 28 4,15,838 1,91,25,464 32,69,625 13,79 ,898
TELANGANA R E G IO N
12 A dilabad 710 299 1,009 7 10 7,964 10,20,059 1,08,971 35,099
13 Hyderabad 1,989 2,401 4,390 158 33 8,460 10,53,569 1,30,236 37,537
14 K arim nagar 235 334 569 3 . . . 21,985 17,63,143 2,47,530 90,229
15 K bam m am 259 258 517 20 2 32,942 11,93,245 1,90,076 55,425
16 M ahbubnagar 2,136 2,244 4,380 150 21 18,420 21,94,323 1,89,739 59,525
17 M edak 2,20§ 2,035 4,235 34 142 15,259 14,41,369 1,50,302 39,745
18 N algonda 4,399 4,560 8,959 48 3 35,079 21,66,917 2,57,782 1,00,859
19 Nizam abad 2.926 993 3,919 . . . 47 6,898 9,93,278 98,880 30,779
20 VVarangal 2,294 2,107 4,401 6 29,829 16,91,620 2,16,836 76,702
T otal 17,148 15,231 32,379 426 258 1,76,836 1,35,17,523 15,90,352 5,25,900
T otal A ndhra Pradesh 41,074 41,098 82,172 889 286 5,92,674 3,26,42,987 48,59,977 19,05,798
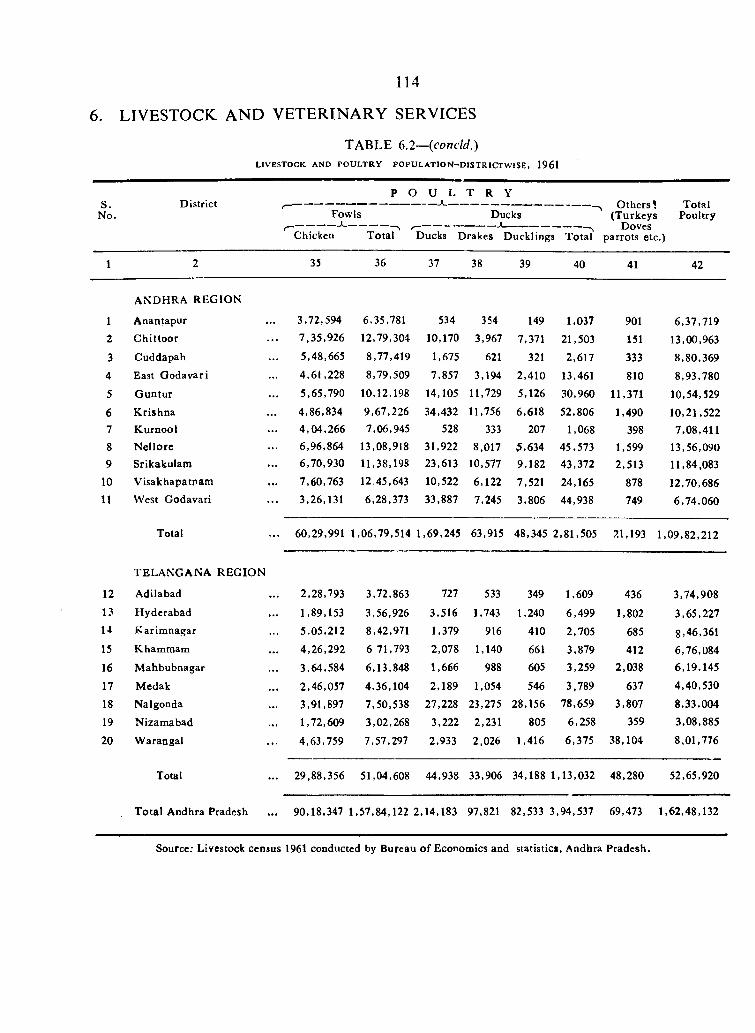
6. l i v e s t o c k : a n d v e t e r i n a r y s e r v i c e s
TABLE 6.2—(concld.)LIVESTOCK AND PO U LT R Y P O P U L A T IO N -D IS T R IC T W IS E , 1961
114
s.No.
DistrictP O U L T R Y
DucksFowls
Chicken T otal Ducks Drakes D ucklings Total' parrots etc.)
O thers! Total(T urkeys Poultry
Doves
1 2 35 36 37 38 39 40 41 42
1
ANDHRA REG IO N
A nantapur 3,72,594 6,35,781 534 354 149 1,037 901 6,37,7192 C h ittoo r 7 ,35,926 12,79,304 10,170 3,967 7,371 21,503 151 13,00,963
3 Cuddapah 5,48,665 8,77,419 1,675 621 321 2,617 333 8,80,369
4 East G odavari 4,61,228 8,79,509 7,857 3,194 2,410 13,461 810 8,93,780
5 G untu r 5,65,790 10,12,198 14,105 11,729 5,126 30,960 11,371 10,54,529
6 K rishna 4,86,834 9,67,226 34,432 11,756 6,618 52,806 1,490 10,21,5227 K urnool 4 ,04,266 7,06,945 528 333 207 1,068 398 7,08,4118 N ello re 6,96,864 13,08,918 31,922 8,017 ^,634 45,573 1,599 13,56,0909 Srikakulam 6,70,930 11,38,198 23,613 10,577 9,182 43,372 2,513 11,84,083
10 V isakhapatnam 7,60,763 12,45,643 10,522 6,122 7,521 24,165 878 12,70,68611 W est Godavari 3,26,131 6,28,373 33,887 7,245 3,806 44,938 749 6,74,060
Total 60,29,991 1,06,79,514 1,69,245 63,915 48,345 2,81,505 21,193 1,09,82,212
12
TELA N G A N A R EG IO N
Adilabad 2,28,793 3,72,863 727 533 349 1,609 436 3,74,908
13 H yderabad 1,89,153 3,56,926 3,516 1,743 1,240 6,499 1,802 3,65,22714 K arim nagar 5,05,212 8,42,971 1,379 916 410 2,705 685 8,46,36115 Khamrnam 4,26,292 6 71,793 2,078 1,140 661 3,879 412 6,76,084
16 M ahbubnagar 3,64,584 6,13,848 1,666 988 605 3,259 2,038 6,19,145
17 Medak 2,46,057 4,36,104 2,189 1,054 546 3,789 637 4,40,530
18 Nalgonda 3,91,897 7,50,538 27,228 23,275 28,156 78,659 3,807 8,33,004
19 N izam abad 1,72,609 3,02,268 3,222 2,231 805 6,258 359 3,08,885
20 W arangal 4,63,759 7,57,297 2,933 2,026 1,416 6,375 38,104 8,01,776
Total 29,88,356 51,04,608 44,938 33,906 34,188 1,13,032 48,280 52,65,920
T o ta l Andhra Pradesh 90,18,347 1,57,84,122 2,14,183 97,821 82,533 3,94,537 69,473 1,62,48,132
Source: Livestock census 1961 conducted by Bureau o f Economics and statistic*, Andhra Pradesh.
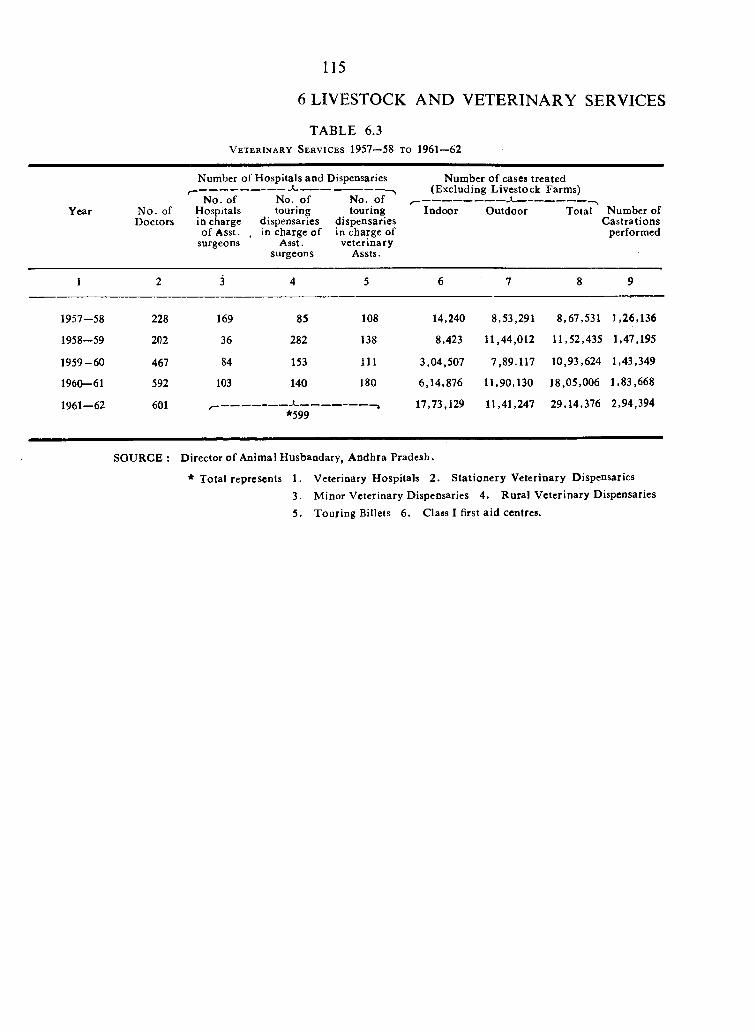
TABLE 6.3V e t e r i n a r y S e r v i c e s 1957—58 t o 1961—62
115
6 LIVESTOCK AND VETERINARY SERVICES
Year
Number o f H ospitals and Dispensaries
N o. of No. o f No. o fN o. of Hospitals touring touringDoctors in charge dispensaries dispensaries
o f Asst. , in charge o f in charge of
N um ber o f cases treated (Excluding Livestock Farms)
Indoor O utdoor Total Number ofC astrations
performedsurgeons Asst.
surgeonsveterinary
Assts.
1 2 3 4 5 6 7 8 9
1957-58 228 169 85 108 14,240 8,53,291 8,67,531 1,26,136
1958-59 202 36 282 138 8,423 11,44,012 11,52,435 1,47,195
1959-60 467 84 153 111 3,04,507 7,89.117 10,93,624 1,43,349
1960-61 592 103 140 180 6,14,876 11,90,130 18,05,006 1,83,668
1961—62 601 r~ 17,73,129 11,41,247 29,14,376 2,94,394*599
SOURCE : D irector o f Animal H usbandary, A ndhra Pradesh.
* Total represents 1. Veterinary H ospitals 2 . S ta tionery V eterinary Dispensaries3. M inor V eterinary Dispensaries 4. R ural V eterinary Dispensaries
5. T ouring Billets 6. Class I first a id centres.
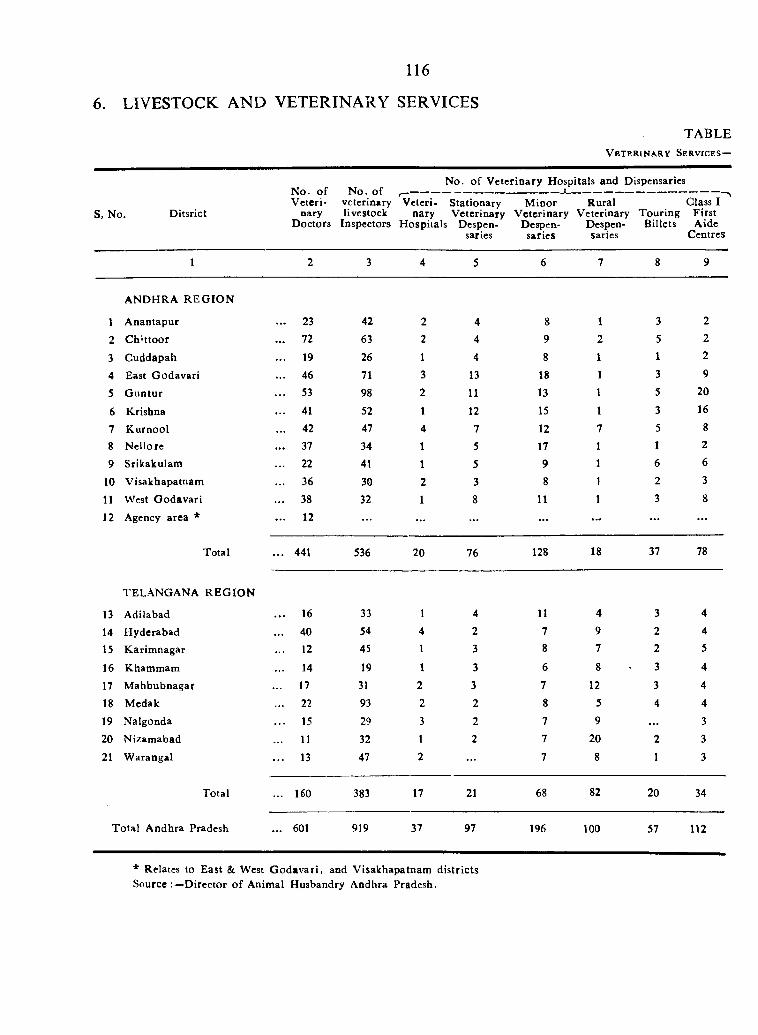
116
6. LIVESTOCK AND VETERINARY SERVICES
TABLE V e t e r i n a r y S e r v i c e s —
No. o f V eterinary Hospitals and Dispensaries
Veteri- veterinary Vcteri- Stationary M inor R ural Class ID itsrict nary livestock nary V eterinary V eterinary Veterinary T ouring F irst
D octors Inspectors H ospitals Despen- Despcn- Despen- Billets Aidesaries saries saries Centres
S, No.
1 2 3 4 5 6 7 8 9
ANDHRA R E G IO N
1 A nantapur ... 23 42 2 4 8 1 3 2
2 C hUtoor ... 72 63 2 4 9 2 5 2
3 C uddapah ... 19 26 1 4 8 1 1 2
4 East G odavari ... 46 71 3 13 18 1 3 9
5 G untu r .. . 53 98 2 11 13 1 5 20
6 Krishna ... 41 52 1 12 15 1 3 16
7 K urnool ... 42 47 4 7 12 7 5 8
8 N ellore ... 37 34 1 5 17 1 1 2
9 Srikakulam ... 22 41 1 5 9 1 6 6
10 V isakhapatnam ... 36 30 2 3 8 1 2 3
11 West G odavari ... 38 32 1 8 11 1 3 8
12 Agency area * ... 12 . . . . . . . . . . . . . . . . . . . . .
Total . . . 441 536 20 76 128 18 37 78
TELANGANA R E G IO N
13 Adilabad ... 16 33 1 4 11 4 3 4
14 H yderabad ... 40 54 4 2 7 9 2 4
15 K arim nagar ... 12 45 1 3 8 7 2 5
16 Khammam ... 14 19 1 3 6 8 3 4
17 M ahbubnagar ... 17 31 2 3 7 12 3 4
18 M edak ... 22 93 2 2 8 5 4 4
19 Nalgonda .. . 15 29 3 2 7 9 . . . 3
20 N izam abad ... 11 32 1 2 7 20 2 3
21 W arangal . . . 13 47 2 . . . 7 8 1 3
Total ... 160 383 17 21 68 82 20 34
T otal A ndhra Pradesh ... 601 919 37 97 196 100 57 112
* Relates to East & West G o davari, and V isakhapatnam districts Source D irector o f Animal Husbandry Andhra Pradesh.
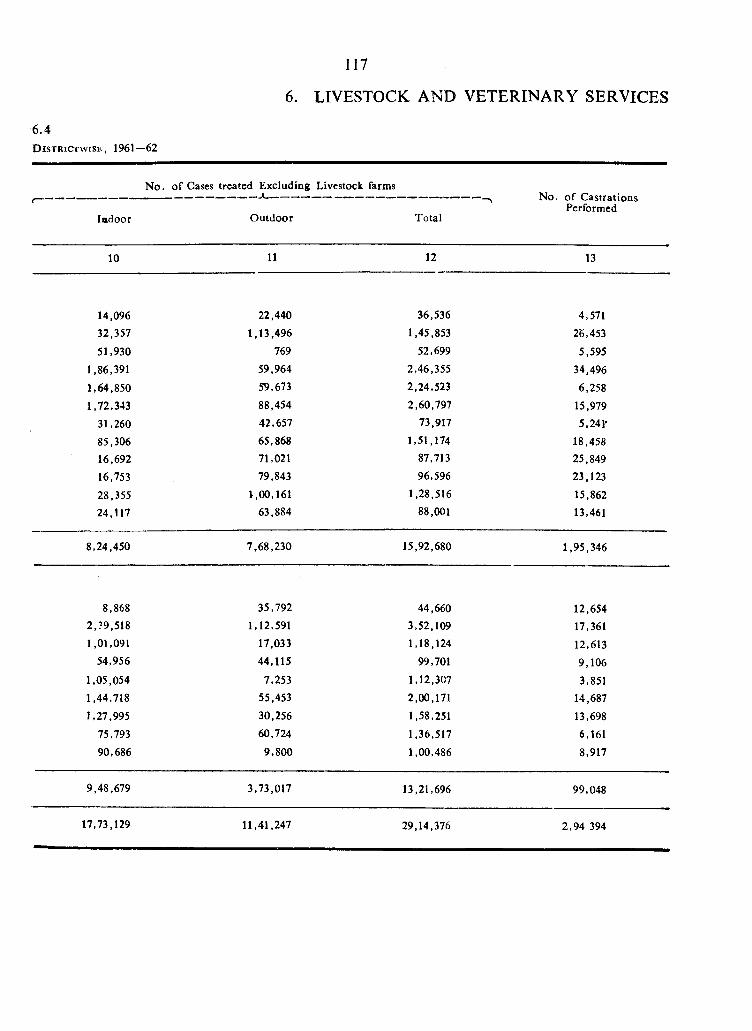
117
6.4D i s t r i c t w i s e , 1961—62
6 . LIVESTOCK AND VETERINARY SERVICES
N o.
Indoor
o f Cases treated Excluding Livestock farms
O utdoor Total
— No. o f C astrations Performed
10 11 12 13
14,096 22,440 36,536 4,571
32,357 1,13,496 1,45,853 25,453
51,930 769 52,699 5,595
1,86,391 59,964 2,46,355 34,496
1,64,850 59,673 2,24,523 6,258
1,72,343 88,454 2,60,797 15,979
31,260 42,657 73,917 5,241'
85,306 65,868 1,51,174 18,45816,692 71,021 87,713 25,849
16,753 79,843 96,596 23,123
28,355 1,00,161 1,28.516 15,862
24,117 63,884 88,001 13,461
8,24,450 7,68,230 15,92,680 1,95,346
8,868 35,792 44,660 12,6542,?9,518 1,12,591 3,52,109 17,3611,01,091 17,033 1,18,124 12,613
54,956 44,115 99,701 9,1061,05,054 7,253 1,12,307 3,8511,44,718 55,453 2,00,171 14,687
1,27,995 30,256 1,58,251 13,69875,793 60,724 1,36,517 6,161
90,686 9,800 1,00,486 8,917
9,48,679 3,73,017 13,21,696 99,048
17,73,129 11,41,247 29,14,376 2,94.394
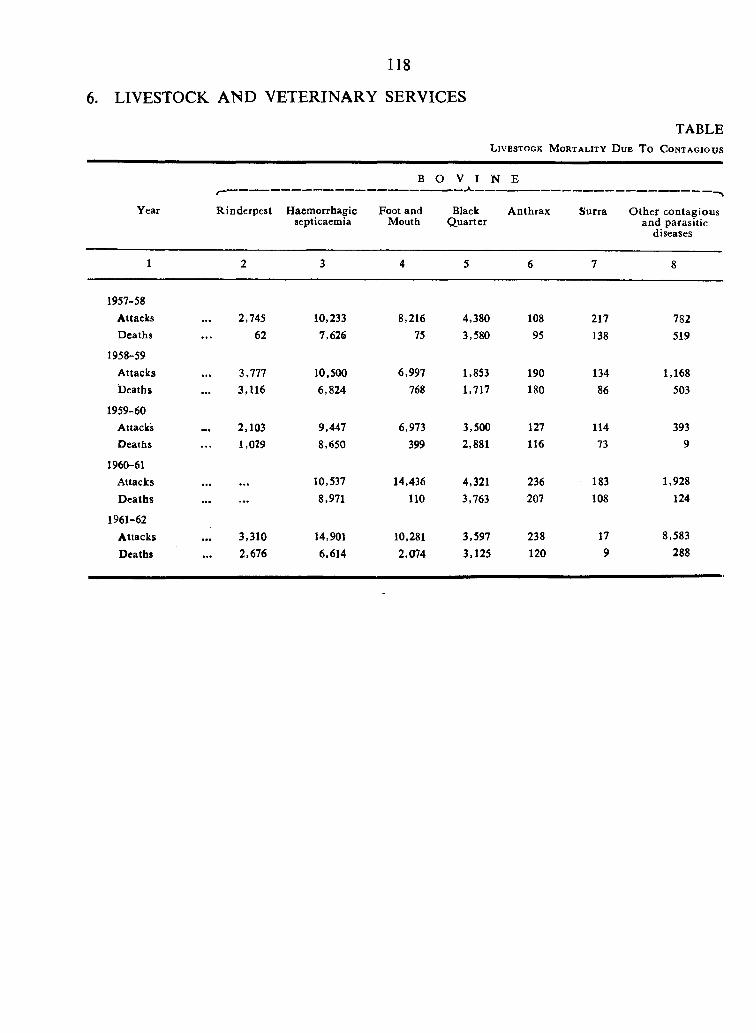
118
6. LIVESTOCK A ND VETERINARY SERVICES
TABLEL i v e s t o c k M o r t a l i t y D u e T o C o n t a g i o u s
B O V I N E
Year R inderpest Haemorrhagicsepticaemia
Foot and Mouth
BlackQ uarter
A nthrax Surra O ther contagious and parasitic
diseases
1 2 3 4 5 6 7 8
1957-58Attacks 2,745 10,233 8,216 4,380 108 217 782D eaths 62 7,626 75 3,580 95 138 519
1958-59Attacks 3,777 10,500 6,997 1,853 190 134 1,168Deaths 3,116 6,824 768 1,717 180 86 503
1959-60Attackis 2.103 9,447 6,973 3,500 127 114 393Deaths 1,029 8,650 399 2,881 116 73 9
1960-61Attacks . . . 10,537 14,436 4,321 236 183 1,928
D eaths ................. 8,971 110 3,763 207 108 124
1961-62Attacks 3,310 14,901 10,281 3,597 238 17 8,583
Deaths 2,676 6,614 2,074 3,125 120 9 288
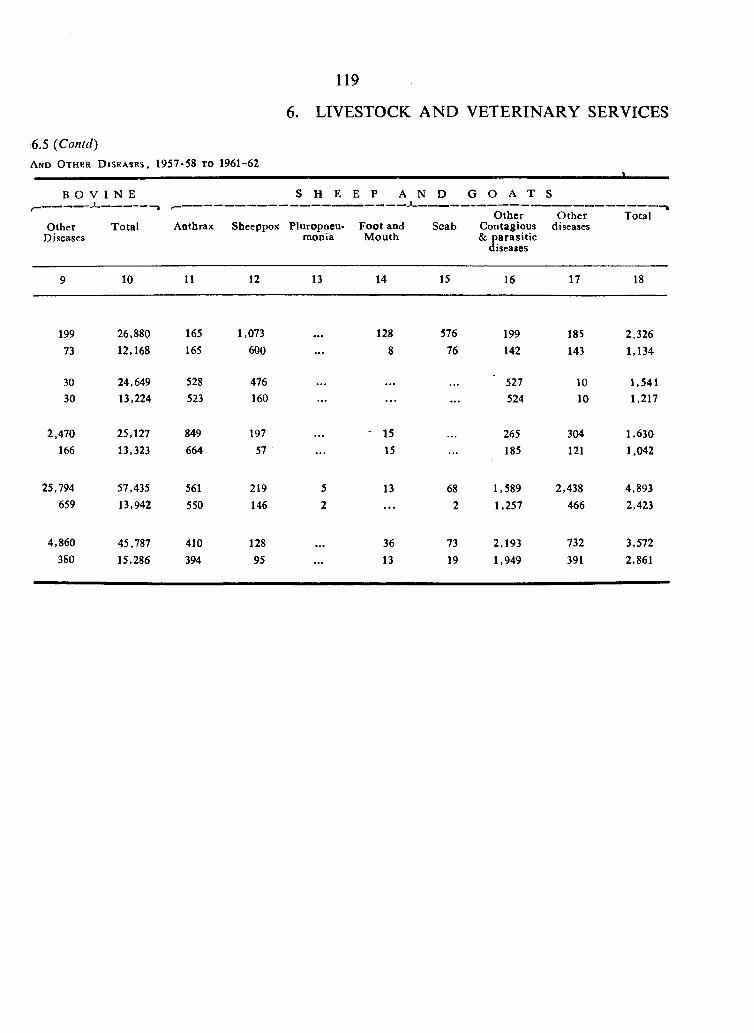
119
6. LIVESTOCK A N D VETERINARY SERVICES
6,5 {Contd)A n d O t h e r D i s e a s e s , 1957-58 t o 1961-62
B O V I N E S H E E P A N D G O A T S
O therDiseases
--------------)
T otal
f—
Anthrax Sheeppox Pluropneu-monia
F oot and M outh
ScabO ther
Contagious & paras itic
diseases
O therdiseases
Total
9 10 11 12 13 14 15 16 17 18
199 26.880 165 1,073 128 576 199 185 2,32673 12,168 165 600 8 76 142 143 1,134
30 24,649 528 476 527 10 1,54130 13,224 523 160 . . . . . . 524 10 1,217
2,470 25,127 849 197 - 15 265 304 1,630166 13,323 664 57 15 185 121 1,042
25,794 57,435 561 219 5 13 68 1,589 2,438 4,893659 13,942 550 146 2 . . . 2 1,257 466 2,423
4,860 45,787 410 128 36 73 2,193 732 3,572380 15,286 394 95 . . . 13 19 1,949 391 2,861
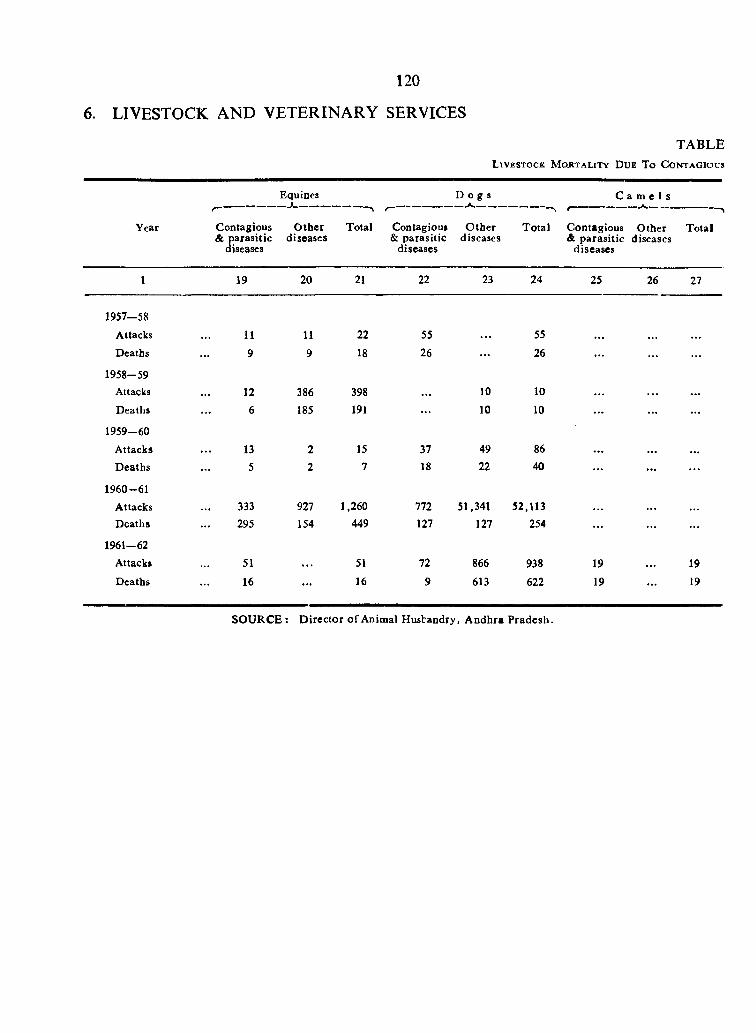
120
6. LIVESTOCK AND VETERINARY SERVICES
TABLEL iv e s t o c k M o j it a l i t y D u e T o C o n t a g i o u s
Equines D o g s C a m e l s
Year
r~
Contagious & parasitic
diseases
O therdiseases
Total Contagious & parasitic
diseases
O therdiseases
T otal Contagious O ther & parasitic diseases
diseases
T otal
I 19 20 21 22 23 24 25 26 27
1957—58
Attacks 11 11 22 55 . . . 55 . . . . . .
Deaths 9 9 18 26 . . . 26
1958-59Attacks 12 386 398 . . . 10 10
Deaths 6 185 191 . . . 10 10 . . .
1959-60
Attacks 13 2 15 37 49 86 . . .
D eaths 5 2 7 18 22 40
1960-61
Attacks 333 927 1,260 772 51,341 52,113Deaths 295 154 449 127 127 254 . . .
1961-62
Attacks 51 . . . 51 72 866 938 19 19
Deaths 16 . . . 16 9 613 622 19 . . . 19
SO U R C E ; D irec to r o f Animal H usbandry, A ndhra P radesh .
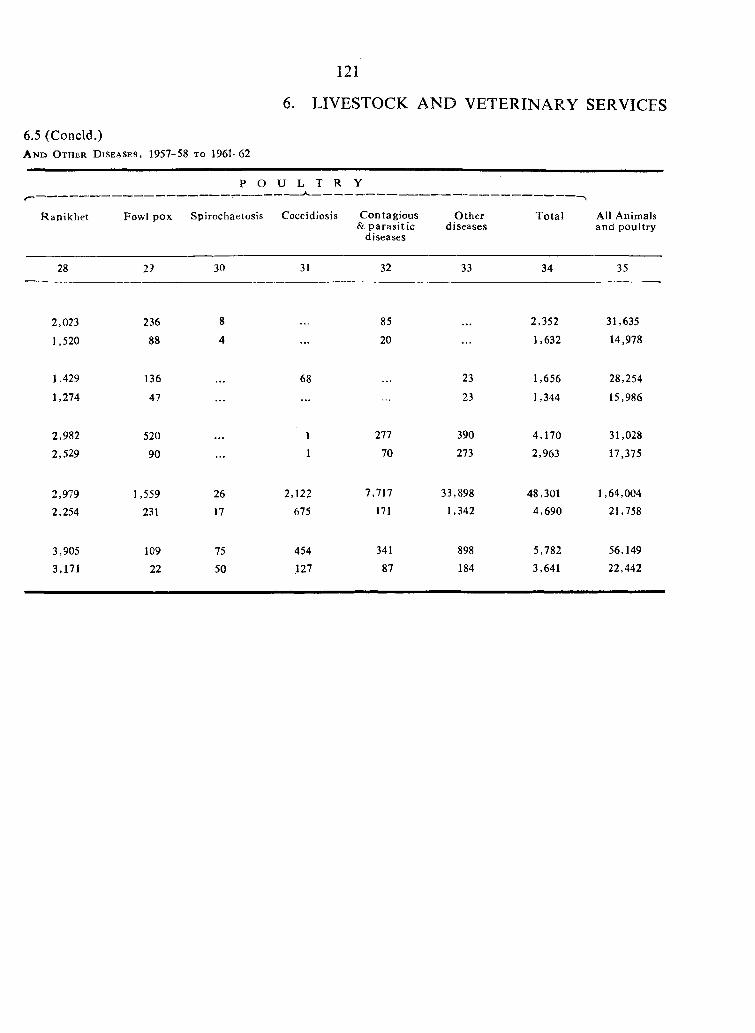
121
6. LIVESTOCK A N D VETERINARY SERVICES
6.5 (Concld.)A n e » O t h e r D i s e a s e s , 1957-58 t o 1961-62
P O U L T R Y
R an ikhe t Fowl pox Spirochaetosis Coccidiosis C ontagious & p a ra s itic
diseases
O therdiseases
T o ta l All Animals and poultry
28 29 30 31 32 33 34 35
2,023 236 8 85 2,352 31,635
1,520 88 4 . . . 20 1,632 14,978
1.429 136 68 . . . 23 1,656 28,254
1,274 47 . . . 23 1,344 15,986
2,982 520 . . . 1 277 390 4,170 31,028
2,529 90 1 70 273 2,963 17,375
2,979 1,559 26 2,122 7,717 33,898 48,301 1,64,004
2,254 231 17 675 171 1,342 4,690 21,758
3,905 109 75 454 341 898 5,782 56,149
3,171 22 50 .127 87 184 3,641 22,442
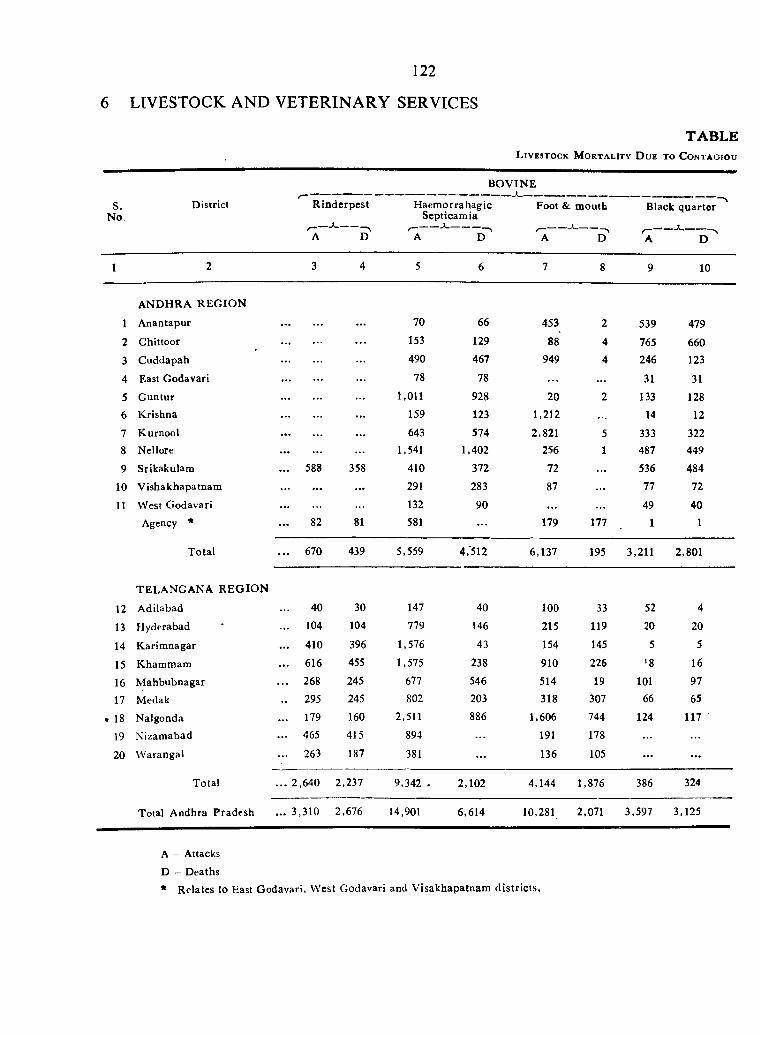
1 2 2
6 LIVESTOCK AND VETERINARY SERVICES
TABLEL iv e s t o c k M o r t a l it y D u e t o C o n t a o i o u
S.No.
District
B O V IN E
R inderpest
_____ I--------- ^A D
H aem orrahagicSepticamia
A i T
Foot & m outh
' a o '
Black quarter
^ ------«-------A D
1 2 3 4 5 6 7 8 9 10
1
A NDHRA R EG IO N
Anantapur 70 66 453 2 539 479
2 Chittoor .............................. . . . 153 129 88 4 765 660
3 Cuddapah ............... ... 490 467 949 4 246 123
4 East Godavari ............... . . . 78 78 ... 31 31
5 G untur ............... 1,011 928 20 2 133 128
6 Krishna ............... ... 159 123 1,212 ... 14 12
7 Kurnool ............... ... 643 574 2,821 5 333 3228 Nellore ............... 1,541 1,402 256 1 487 449
9 Srikakulam ... 588 358 410 372 72 ... 536 484
10 V ishakhapatnam ............... ... 291 283 87 ... 77 72
11 West G odavari ............... 132 90 . . . 49 40
Agency * 82 81 581 179 177 1 1
Total . . . 670 439 5,559 4,512 6,137 195 3,211 2,801
12
TELA NG AN A R E G IO N
A dilabad 40 30 147 40 100 33 52 4
13 Hyderabad ... 104 104 779 146 215 119 20 20
14 Karim nagar ... 410 396 1,576 43 154 145 5 5
15 Khammam ... 616 455 1,575 238 910 226 '8 16
16 M ahbubnagar . . . 268 245 677 546 514 19 101 97
17 Medak . . 295 245 802 203 318 307 66 65
• 18 Nalgonda . . . 179 160 2,511 886 1,606 744 124 117
19 Nizam abad . . . 465 415 894 191 178
20 Warangal .. . 263 187 381 . . . 136 105 . . . . . .
Total . . . 2 ,6 4 0 2 ,2 3 7 9 ,342 > 2 ,1 0 2 4,144 1,876 386 324
Total A ndhra Pradesh ... 3,310 2,676 14,901 6,614 10,281 2,071 3,597 3,125
A = Attacks
D = Deaths* Relates to East Godavari, W est Godavari and V isakhapatnam d is tric ts .
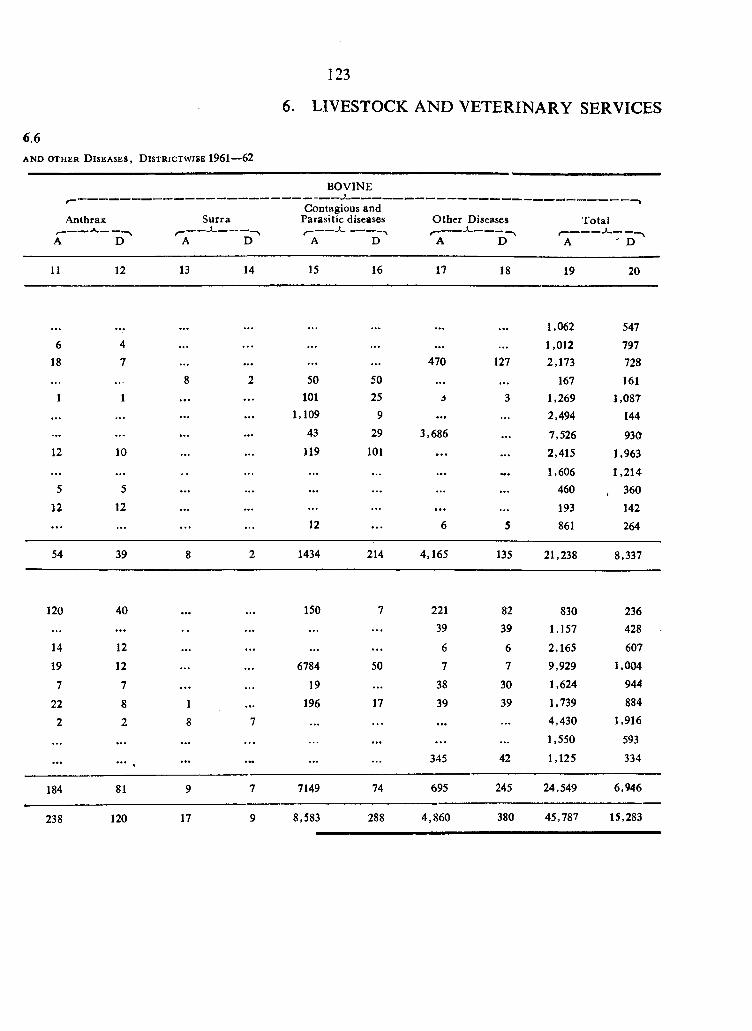
6.6A N D O TH ER D i s e a s e s , D i s t r i c t w i s b 1961—62
123
6. LIVESTOCK AND VETERINARY SERVICES
Anthrax
A D~
Surra
”a D~
BOVINE------------- >________
Contagious and Parasitic diseases O ther Diseases
D~
T otal
A " D
11 12 13 14 15 16 17 18 19 20
• • • 1,062 547
6 4 . . . . . . . . . . . . . . . . . . 1,012 79718 7 . . . . . . . . . 470 127 2,173 728
. . . 8 2 50 50 . . . . . . 167 1611 1 . . . . . . 101 25 3 3 1,269 1,087
. . . . . . . . . . . . 1,109 9 . . . 2,494 144. . . . . . . . . 43 29 3.686 . . . 7,526 930
12 10 . . . . . . 119 101 . . . . . . 2,415 1,963
. . . . . . . . . . . . . . . 1,606 1,2145 5 . . . . . . . . . . . . . . . . . . 460 , 360
12 12 . . . . . . . . . . . . . . . . . . 193 142. . . . . . . . . . . . 12 . . . 6 5 861 264
54 39 8 2 1434 214 4,165 135 21,238 8,337
120 40 150 7 221 82 830 236. . . . . . . . . . . . . . . 39 39 1,157 428
14 12 . . . . . . . . . 6 6 2,165 607
19 12 . . . 6784 50 7 7 9,929 1,004
7 7 . . . 19 . . . 38 30 1,624 944
22 8 1 . . . 196 17 39 39 1,739 884
2 2 8 7 . . . . . . . . . 4,430 1,916
. . . . . . . . . . . . . . . 1,550 593
. . . . . . . . . . . . . . . 345 42 1,125 334
184 81 9 7 7149 74 695 245 24,549 6,946
238 120 17 9 8,583 288 4,860 380 45,787 15,283
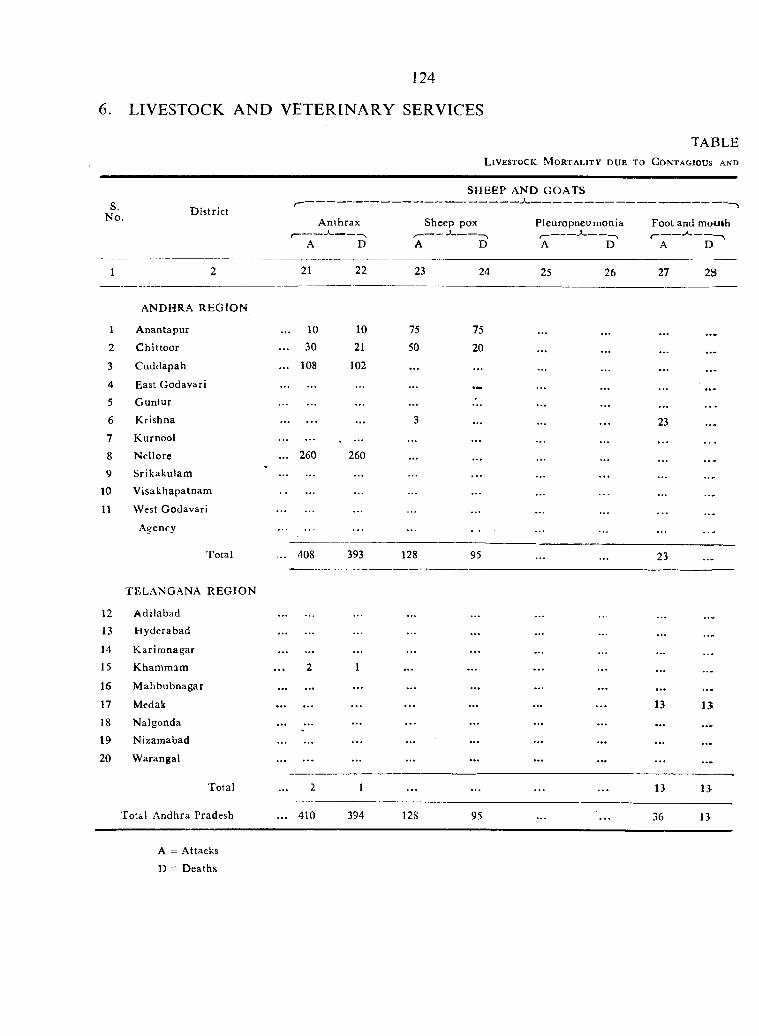
124
6. LIVESTOCK AND VETERINARY SERVICES
t a b l e
L i v e s t o c k M o r t a l i t y d u e t o C o n t a g i o u s a n d
S.N o D istrict
A nthrax1--------- *--------- \
A D
SH EEP
Sheep pox
A D
AND GOATS
Pleuropneu monia r - ------------------ ^A D
Foott------
A
and moMth--A------ --^
D
1 2 21 22 23 24 25 26 27 28
ANDHRA R EG IO N
1 A nantapur ... 10 10 75 75 ... • ••2 C hittoor ... 30 21 50 20
3 Cuddapah ... 108 102 ... ... ...4 East G odavari ... .M5 G untur ... ... ... ... ... ...6 Krishna ............. ... 3 ... 237 Kurnool ............. . ... ... • • •8 Nellore ... 260 260 ... • •• ... ...9 Srikakulam ......... ... ... • ••
10 V isakhapatnam ...
I t West Godavari
Agency ... ... ... ... , ...
Total ... 408 393 128 95 23
TELANGANA R EG IO N
12 A dilabad .............
13 H yderabad ............. ... ... ...14 K arim nagar ............. ... ...
15 Khamraam 2 1 ... ... . . . ... ... ...16 M ahbubnagar ............. ... ... ... ... ... . . .17 Medak ............. . . . ... .. . 13 1318 Nalgonda ............. ... ... ... ... ..i.19 Nizamabad ............. ... ... ... ... ... ...
20 W arangal ............. ... ... ... ...
Total 2 1 ... ... 13 13
Total Andhra Pradesh ... 410 394 128 95 ... 36 13
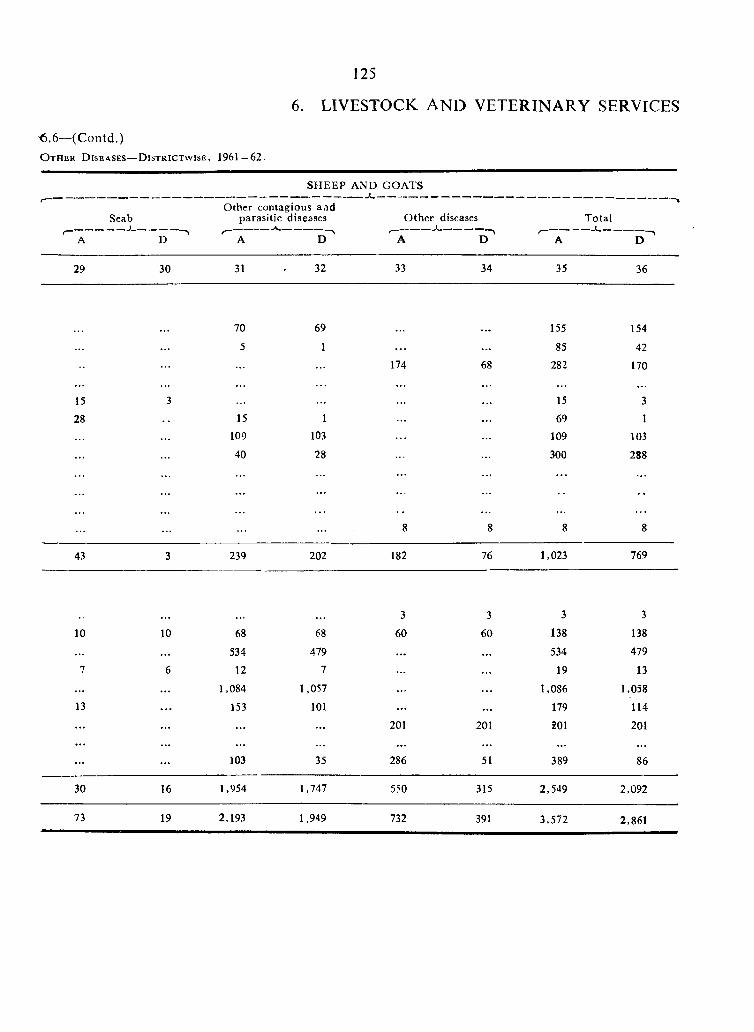
125
6. LIVESTOCK AND VETERINARY SERVICES
'€ .6— (Contd.)O t h e r D i s e a s e s — D i s t r I C T w i s e , 1961—62.
O ther conta parasitic
---------------A
SH EEP AND GOATS 1
A
Scab
D
gious and diseases
D
O ther diseases
A D A
— ■—»
Total
D -
29 30 31 32 33 34 35 36
70 69 155 154
5 1 . . . 85 42
174 68 282 170
15 3 15 3
28 15 1 . . . 69 1
109 103 . . . 109 103
40 28. . .
300 288
. . .
8 8 8 8
43 3 239 202 182 76 1,023 769
3 3 3 3
10 10 68 68 60 60 138 138
. . . . . . 534 479 . . . . . . 534 479
7 6 12 7 19 13
. . . . . . 1,084 1,057 . . . 1,086 1,05813 153 101 . . . . . . 179 114
. . . . . . 201 201 201 201
. . . . . . 103 35 286 51 389 86
30 16 1,954 1,747 550 315 2,549 2,092
73 19 2,193 1,949 732 39) 3,572 2,861
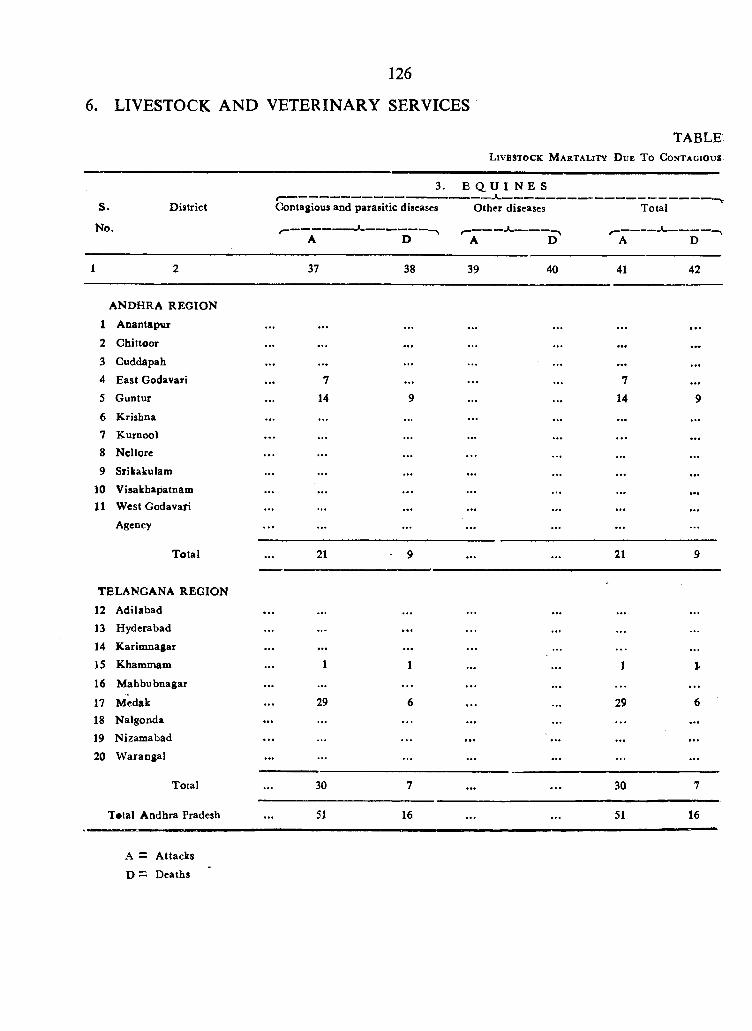
126
6. LIVESTOCK A N D VETERINARY SERVICES
TABLEL i v e s t o c k M a r t a l it y D u e T o C o n t a g io u s
S. D istrict
No.
Co
3.
ntagious and parasitic diseases
E Q .U I N E S
O ther diseases
. . 1
Total -
A—\
Dr~
A o 'r -
A—N.
D
I 2 37 38 39 40 41 42
A N D HRA R EG IO N
1 A nantapvr ... ... ... ... ... . . .2 Chittoor ... ...
3 Cuddapah ... ... ...4 E ast Godavari 7 ... 7 ...
5 G untur 14 9 ... 14 96 K rishna ... ... ... ...7 Kurnool ... ... • ••8 Nellorc ...9 Srikakulam ... • ••
10 V isakbapatnam ... ... •••n W est Godavari ... ...
Agcncy ... ... ...
T otal ... 21 • 9 ... 21 9
TELANGANA R EG IO N'
12 A dilabad . . . ... ... ... ... ... ...
13 H yderabad ... . . . .. . ... ... ...
14 K arim nagar ... ... ... . . . . . . ...15 Kham m am ... 1 1 ... ... 116 M ahbubnagar ... ... . . . . . . ... . . . . . .
17 M cdak ... 29 6 ... ... 29 618 N algonda • •• ... . . . ... ... . . . ...
19 N izam abad .. . .. . . . . ... ... ...
20 W arangal ... ... ... ... ... ...
Total ... 30 7 ... . . . 30 7
T etal A ndhra Pradesh ... 51 16 ... ... 51 16
A — A ttacks
D — D eaths
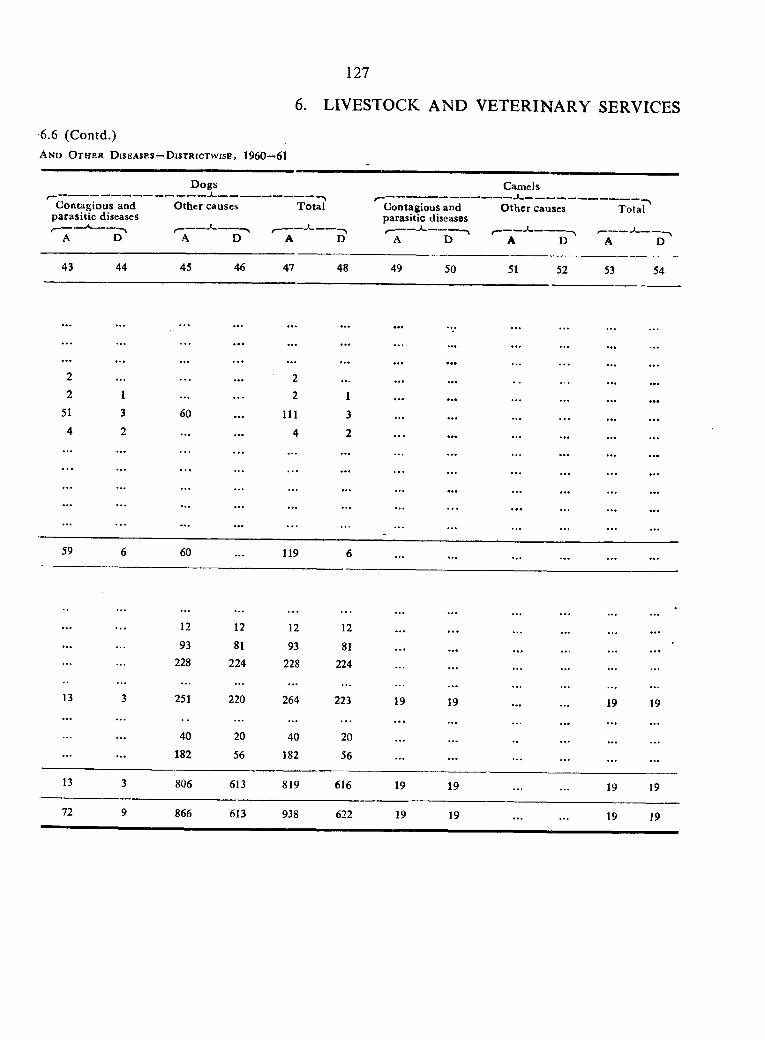
127
6. LIVESTOCK A ND VETERINARY SERVICES
D ogs
O ther causes
6.6 (Contd.)A n d O t h e r D i s e a s e s — D i s t r i c t w i s e , 1960—61
C ontagious and parasitic diseases
' " a D^
T otal
D A D
Camels
Contagious and O ther causes Totalparasitic diseases
'" a D ' ^ A ^D D
43 44 45 46 47 48 49 50 51 52 53 54
• • •
. . . • • • . . . • • • . . . • • •
. . . . . . . . . • • • . . . • • • • • • • • •
2 . . . . . . 2 • • • • • • • • •
2 1 . . . 2 1 • • • • • • • • •
51 3 60 • • • 111 3 • • • • • • • • •
4 2 . . . 4 2» • • . . . . . . . . . • • •
. . . . . . . . . • • « • • «
. . .
• • •
• • •
. . . . . . « • •
• • •
• • •
• • •
59 6 60 119 6 . . . • * • • • •
. . . . . . 12 12 12 12 . . . • • • . . . • • •
. . . 93 81 93 81 . . . • •> • • • • • t
228 224 228 224 . . . . . . . . . . . .
13 3 251 220 264 223 19 19 • • • 19 19. . . . . . . . . . . . . . . . . . . . .
. . . . . . 40 20 40 20 . . . . . . • • . . .
. . . . . . 182 56 182 56 . . . . . . . . . . . .
13 3 806 613 819 616 19 19 19 19
72 9 866 613 938 622 19 19 . . . 19 19
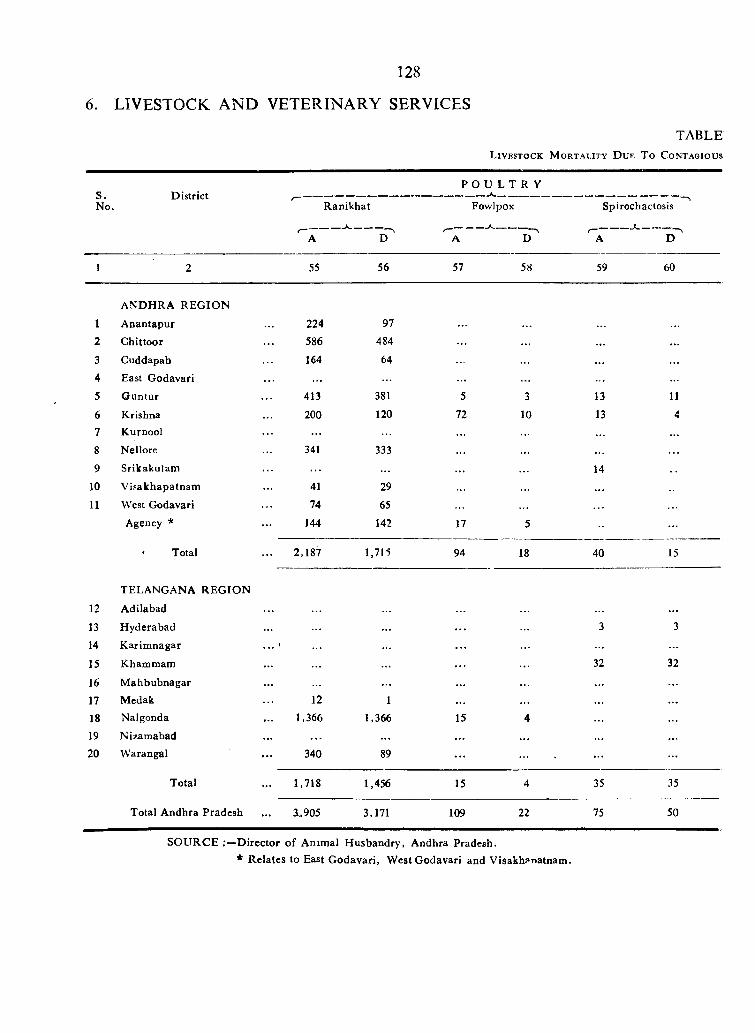
128
6. LIVESTOCK A N D VETERINARY SERVICES
TABLEL iv e s t o c k M o r t a l it y D u e T o C o n t a g io u s
S.No.
DistrictR anikhat
P O U L T R Y
Fowlpox Spirochactosis
"~A-----
D ^ A-----^D ^A ^ D ^
1 2 55 56 57 58 59 60
A N D H R A R E G IO N
1 A nantapur 224 97 . . .
2 Chittoor 586 484 . . .
3 Cuddapab 164 64 . . .
4 East G odavari . . . . . .
5 G untur 413 381 5 3 13 11
6 Krishna 200 120 72 10 13 47 Kurnool . . . . . .
8 Nellore 341 333
9 Srikakulam . . . 14
10 V isakhapatnam 41 29 . . .
11 West Godavari 74 65
Agency * 144 142 17 5 -
• Total 2,187 1,715 94 18 40 15
TELANGANA R EG IO N
12 Adilabad
13 H yderabad . . . 3 3
14 K arim nagar ' . . . . . .
15 Khammain . . . . . . 32 32
16 M ahbubnagar . . . . . . . . .
17 Medak 12 1 . . . . . .
18 Nalgonda 1,366 1,366 15 4
19 Nizamabad . . . . . . . . . . . . . . .
20 Warangal 340 89 . . . . . .
Total 1,718 1,456 15 4 35 35
Total A ndhra Pradesh 1.905 3,171 109 22 75 50
SO U R C E .‘—D irector o f A m m al H usbandry, Andhra Pradesh.* R elates to East G odavari, W est G odavari and V isakh?natnam .
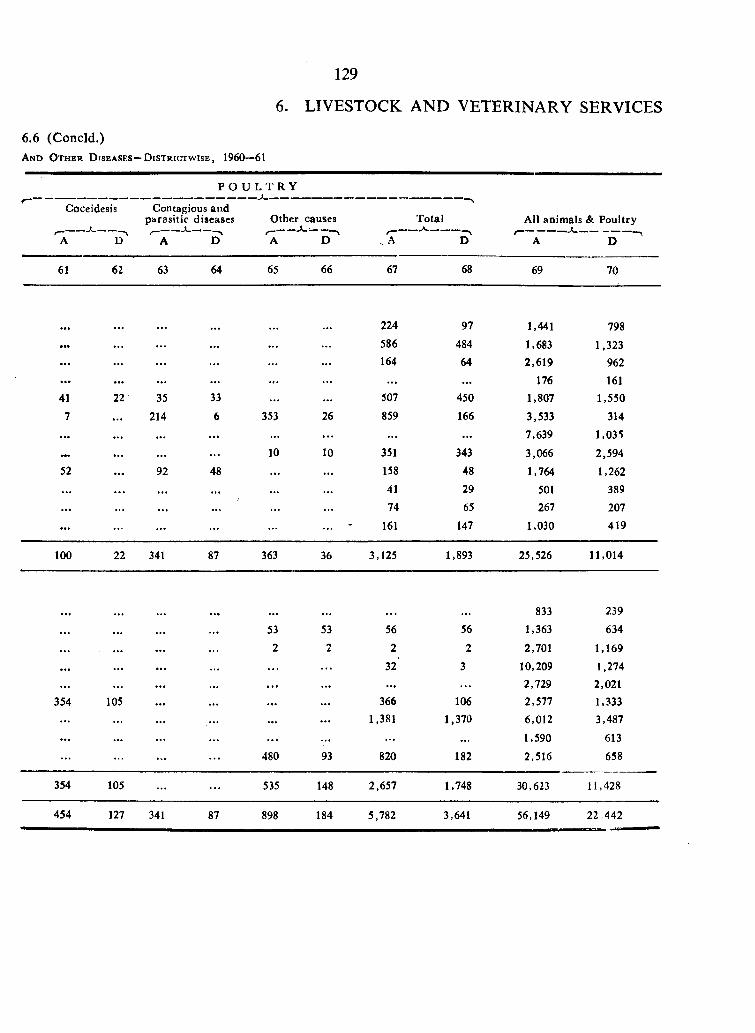
129
6. LIVESTOCK A ND VETERINARY SERVICES
6.6 (Concld.)A n d O t h e r D i s e a s e s - D i STr i c t w i s e , 1960-■61
Coceidesis
P O U L T R Y
C o n t a g i o u s a n d p a r a s i t i c d i s e a s e s O t h e r c a u s e s
D ' a/ —
. A
T o t a l
D
A l l a n i m a l s & P o u l t r y
A D
61 62 63 64 65 66 67 68 69 70
224 97 1,441 798• •• . . . . . . 586 484 1,683 1,323• • • . . . . . . . . . 164 64 2,619 962• •• . . . . . . . . . . . . . . . . . . 176 161
41 22 35 33 . . . . . . 507 450 1,807 1,550
7 . . . 214 6 353 26 859 166 3,533 314
. . . . . . . . . . . . . . . . . . . . . . . . 7,639 1,035
. . . . . . . . . 10 10 351 343 3,066 2,59452 . . . 92 48 . . . . . . 158 48 1,764 1,262
. . . . . . . . . . . . . . . . . . 41 29 501 389
. . . . . . . . . . . . . . . 74 65 267 207
. . . . . . . . . . . . . . . 161 147 1,030 419
100 22 341 87 363 36 3,125 1,893 25,526 11,014
833 239
. . . . . . 53 53 56 56 1,363 634
. . . . . . 2 2 2 2,701 1,169
. . . . . . . . . . . . 32 3 10,209 1,274
. . . . . . . . . . . . . . . 2,729 2,021
354 105 . . . 366 106 2,577 1,333. . . . . . . . . 1,381 1,370 6,012 3,487
. . . . . . . . . . . . . . . . . . 1,590 613
. . . 480 93 820 182 2,516 658
354 105 535 148 2,657 1,748 30,623 11,428
454 127 341 87 898 184 5,782 3,641 56,149 22.442
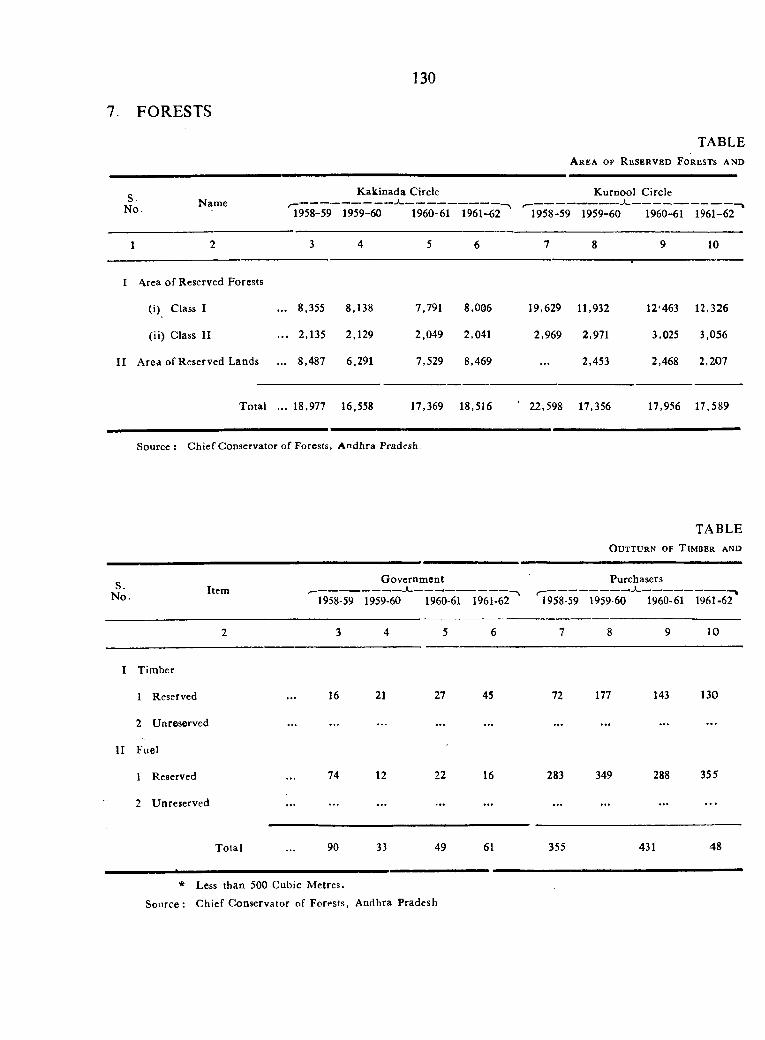
130
7. FORESTS
TABLEA r e a o f R e s e r v e d F o r e s t s a n d
S.No. Name
K akinada Circle
7958-59 1959-60 1960-61 1961-^62
K urnool Circle
1958-59 1959-60 1960-61 1961-62
1 2 3 4 5 6 7 8 9 10
I Area o f Reserved Forests
(i) Class I .. 8,355 8,138 7,791 8,006 19,629 11,932 12‘463 12,326
(ii) Class II .. 2,135 2,129 2,049 2,041 2,969 2,971 3,025 3,056
II Area of Reserved Lands .. 8,487 6,291 7,529 8,469 . . . 2,453 2,468 2,207
T otal . .. 18,977 16,558 17,369 18,516 ‘ 22,598 17,356 17,956 17,589
Source : C hief Conservator of Forests, A ndhra Pradesh.
TABLEO u t t u r n o f T i m b e r a n d
S. ItemG overnm ent
1Purchasers
N o. '^1958-59 1959-60 1960-61 1961-62 ^958-59 1959-60 1960-61 196!-62
2 3 4 5 6 7 8 9 10
I Timber
1 Reserved 16 21 27 45 72 177 143 130
2 Unreserved ................... . . . . . . . . . . . . . . .
II Fuel
1 Reserved 74 12 22 16 283 349 288 355
2 Unreserved ................... . . . . . . . . . . . . . . . . . .
Total 90 33 49 61 355 431 48
* Less than 500 Cubic M etres.
Source: C hief Conservator of Forests, Andhra Pradesh
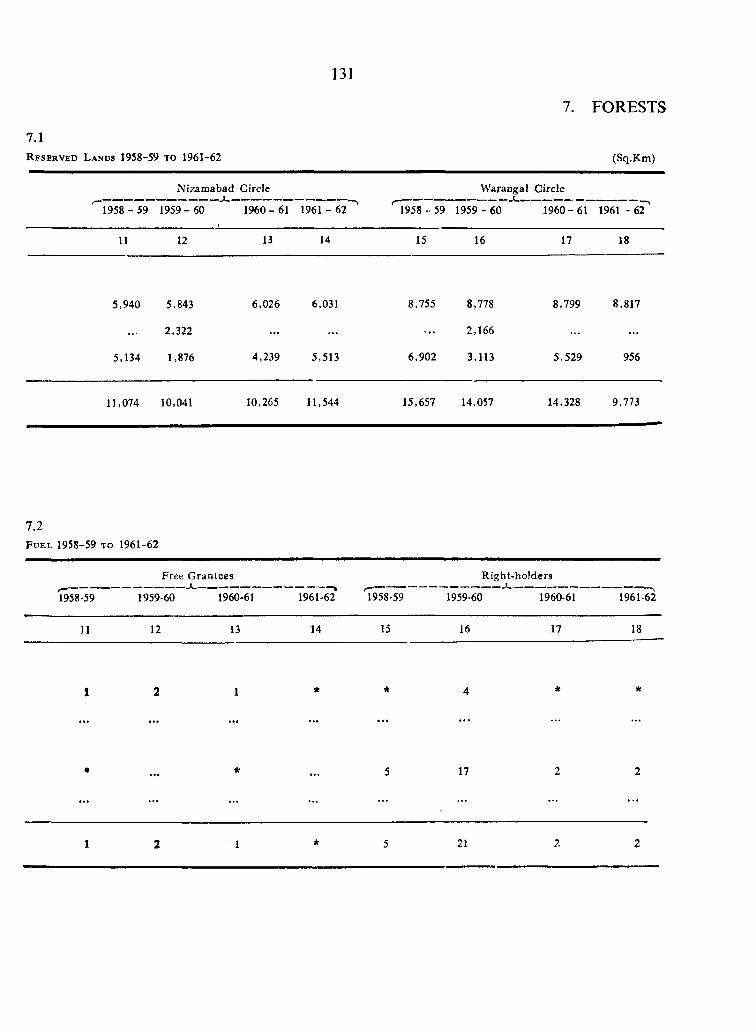
131
7. FORESTS
l A
R e s e r v e d L a n d s 1958-59 t o 1961-62 (Sq.Km)
N izam abad Circle W arangal Circle
1958 - 59 1959 - 60 1960 - 61 1961 - 62 1958 - 59 1959 - 60 1960 - 61 1961 - 62r - ■.
11 12 13 14 15 16 17 18
5,940 5,843 6,026 6,031 8,755 8,778 8,799 8,817
2,322 ... ... 2,166
5,134 1,876 4,239 5,513 6,902 3,113 5,529 956
11,074 10,041 10,265 11,544 15,657 14,057 14,328 9,773
7.2F u e l 1958-59 TO 1961-62
'1958-59
Free G rantees
1959-60 1960-61 1 9 6 1 -^ 1958-59
R ight-holders
1959-60 1960-61 1961-62
11 12 13 14 15 16 17 18
1 2 1
••• • • •
* * 4 * *
* *• • • . . . 5 17 2 2
1 2 I * 5 21 2 2
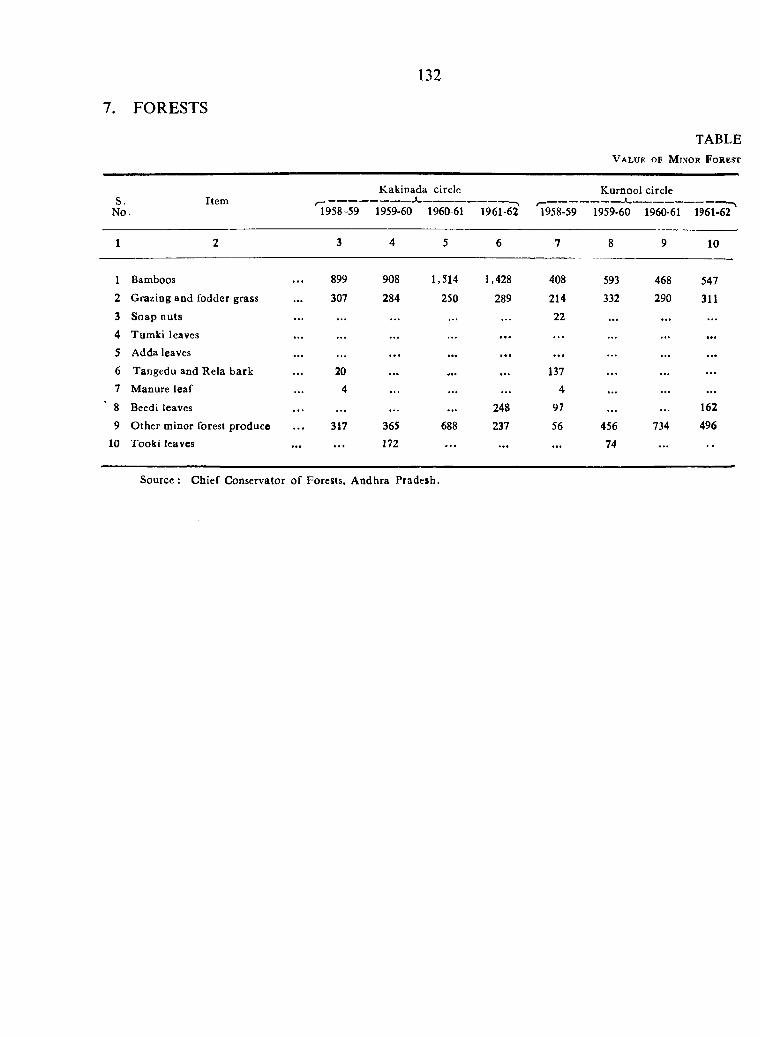
132
7. FORESTS
TABLEV a l u e o f Mimor F o r e s t
K akinada circle Kurnool circleS.
N o.Item
1958-59 1959-60 1960 61 1961-62 T958-59 1959-60 1960-61 1 9 6 1 ^
1 2 3 4 5 6 7 8 9 10
1 Bamboos
2 Grazing and fodder grass
3 Soap nuts
4 Tum ki leaves
5 Adda leaves
6 Tangedu and Rela bark
7 M anure leaf
8 Beedi leaves
9 O ther minor forest produce
10 Tooki leaves
899
307
20
4
317
908
284
1,514
250
1,428
289
365
172
688248
237
408
214
22
137
4
97
56
593
332
456
74
468
290
734
547
311
162
496
Source: C hief Conservator o f Forests. A ndhra Pradesh.
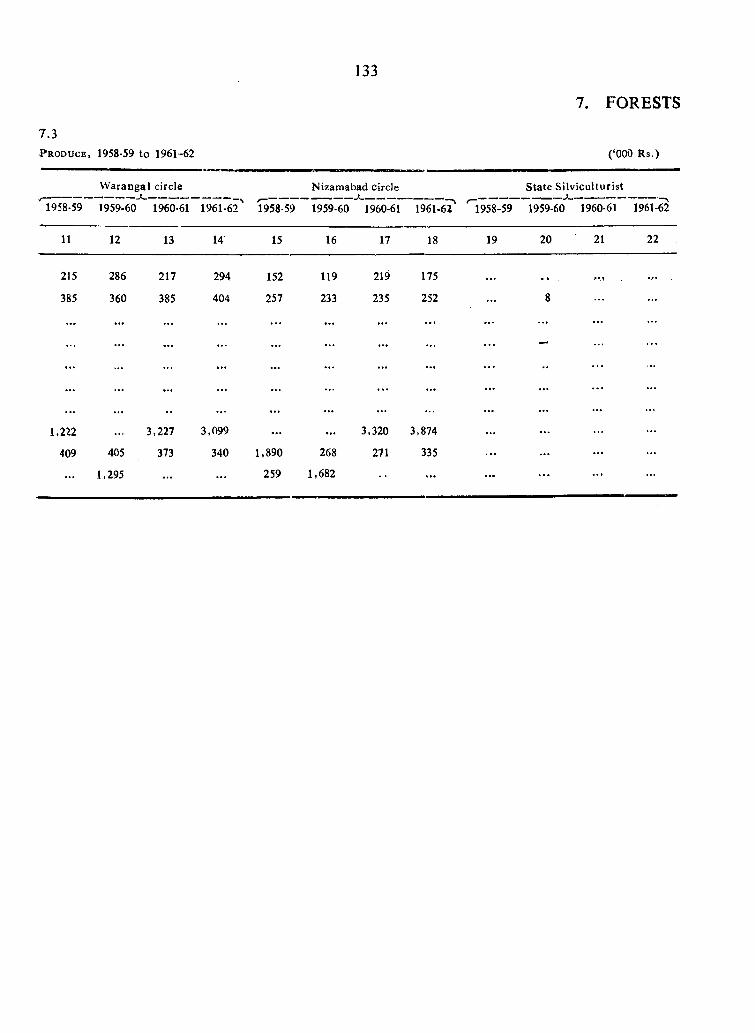
133
7. FORESTS
7.3P r o d u c e , 1958-59 to 1961-62 (‘000 R s.)
1958-59
W arangal circle
1959-60 1960-61 1961-6p 1958-59
N izamabad circle
1959-60 1960-61 1961-62 ^1958-59
State S ilv icu ltu rist
1959-60 1960-61 1961-62
11 12 13 14 15 16 17 18 19 20 21 22
215 286 217 294 152 119 219 175 • • •
385 360 385 404 257 233 235 252 8
. . . . . . . . . . . . . . .
. . . . . . . . .
. . . . . . . . .
. . . . . . . . . . . . . . .
. . . . . . . . . . . . . . . . . .
1,222 3,227 3,099 . . . . . . 3,320 3,874 . . .
409 405 373 340 1,890 268 271 335 . . .
. . . 1,295 . . . . . . 259 1,682 . . . . . . . . .
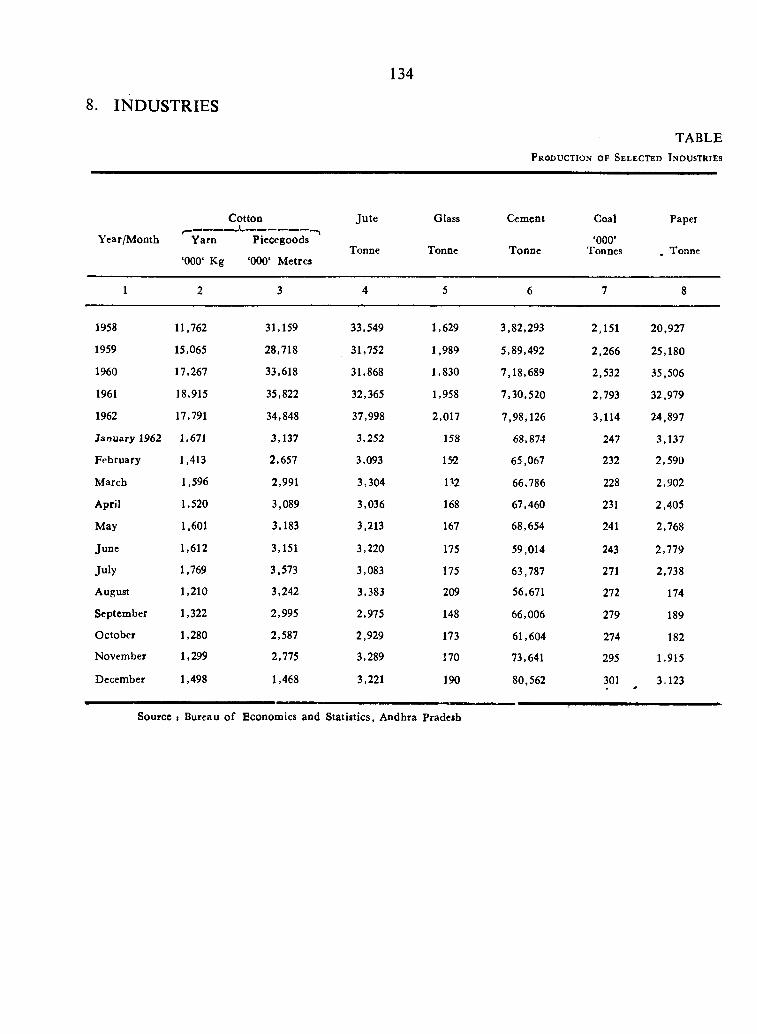
8. INDUSTRIES
134
TABLEP r o d u c t io n o f S e l e c t e d I n d u s t r ie s
Year/M onth
Cotton
Yarn
‘000‘ Kg
Piecegoods
‘000‘ Metres
Ju te
Tonne
Glass
Tonne
Cement
Tonne
Coal
‘ 000 ’
Tonnes
Paper
. Tonne
1 8
1958
1959
1960
1961
1962
January 1962
February
M arch
April
May
June
July
August
September
O ctober
November
December
11,762
15,065
17,267
18,915
17,791
1,671
1,413
1,596
1,520
1,601
1,612
1,769
1,210
1,322
1,280
1,299
1,498
31,159
28,718
33,618
35,822
34,848
3,137
2,657
2,991
3,089
3,183
3,151
3,573
3,242
2,995
2,587
2,775
1,468
33,549 1,629 3,82,293 2,151 20,927
31,752 1,989 5,89,492 2,266 25,180
31,868 1,830 7,18,689 2,532 35,506
32,365 1,958 7,30,520 2,793 32,979
37,998 2,017 7,98,126 3,114 24,897
3,252 158 68,874 247 3,137
3,093 152 65,067 232 2,590
3,304 132 66,786 228 2,902
3,036 168 67,460 231 2,405
3,213 167 68,654 241 2,768
3,220 175 59,014 243 2,779
3,083 175 63,787 271 2,738
3,383 209 56,671 272 174
2,975 148 66,006 279 189
2,929 173 61,604 274 182
3,289 J70 73,641 295 1.915
3,221 190 80,562 301 3.123
Source s Bureau o f Economics and Statistics, Andhra Pradesh
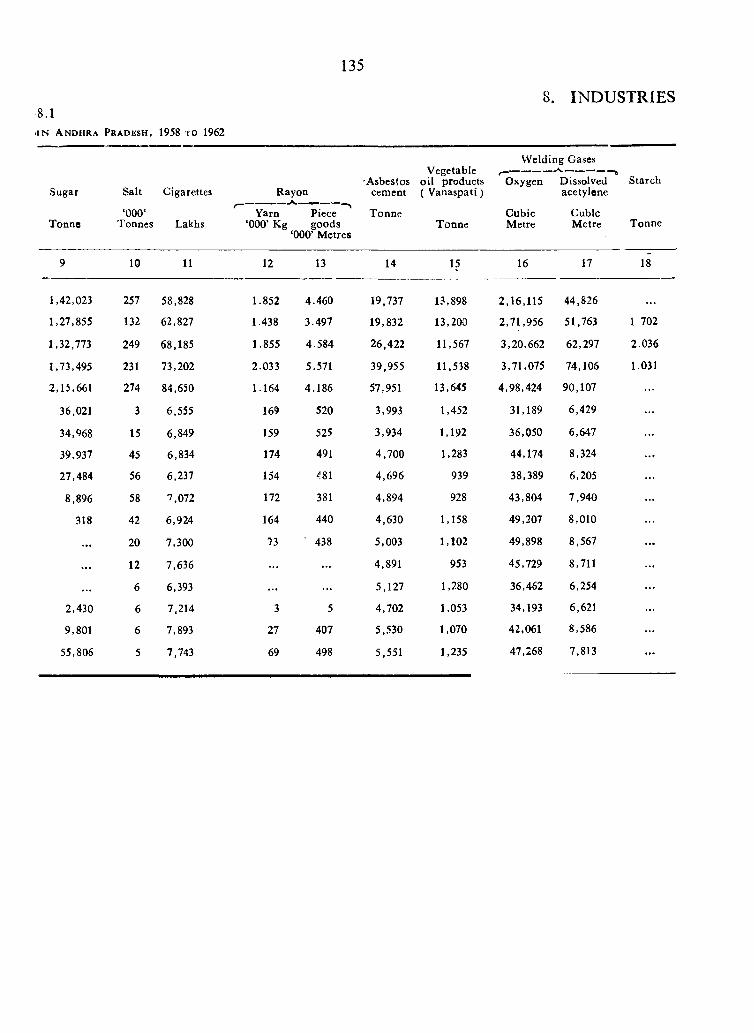
135
8. INDUSTRIES
I N A n d h r a P r a d e s h , 1958 t o 19628 . 1
Sugar Salt Cigarettes RayonA.
'Asbestoscemcnt
Vegetable oil products ( V anaspati)
W elding Gases
Oxygen Dissolved acetylene
Starch
Tonne‘000‘
Tonnes LakhsYarn
‘000’ KgPiece goods
‘000’ Metres
TonneTonne
CubicMetre
CubicMetre Tonne
9 10 11 12 13 14 15 16 17 18
1,42,023 257 58,828 1.852 4.460 19,737 13,898 2,16,115 44,826
1,27,855 132 62,827 1.438 3.497 19,832 13,200 2,71,956 51,763 1.702
1,32,773 249 68,185 1.855 4.584 26,422 11,567 3,20,662 62,297 2.036
1,73,495 231 73,202 2.033 5.571 39,955 11,538 3,71,075 74,106 1.031
2,15,661 274 84,650 1.164 4.186 57,951 13,645 4,98,424 90,107
36,021 3 6,555 169 520 3,993 1,452 31,189 6,429
34, %8 15 6,849 159 525 3,934 1,192 36,050 6,647
39,937 45 6,834 174 491 4,700 1,283 44,174 8,324
27,484 56 6,237 154 ^81 4,696 939 38,389 6,205
8,896 58 7,072 172 381 4,894 928 43,804 7,940
318 42 6,924 164 440 4,630 1,158 49,207 8,010
. . . 20 7,300 73 ' 438 5,003 1,102 49,898 8,567
. . . 12 7,636 . . . . . . 4,891 953 45,729 8,711
. . . 6 6,393 . . . 5,127 1,280 36,462 6,254
2,430 6 7,214 3 5 4,702 1,053 34,193 6,621
9,801 6 7,893 27 407 5,530 1,070 42,061 8,586
55,806 5 7,743 69 498 5,551 1,235 47,268 7,813
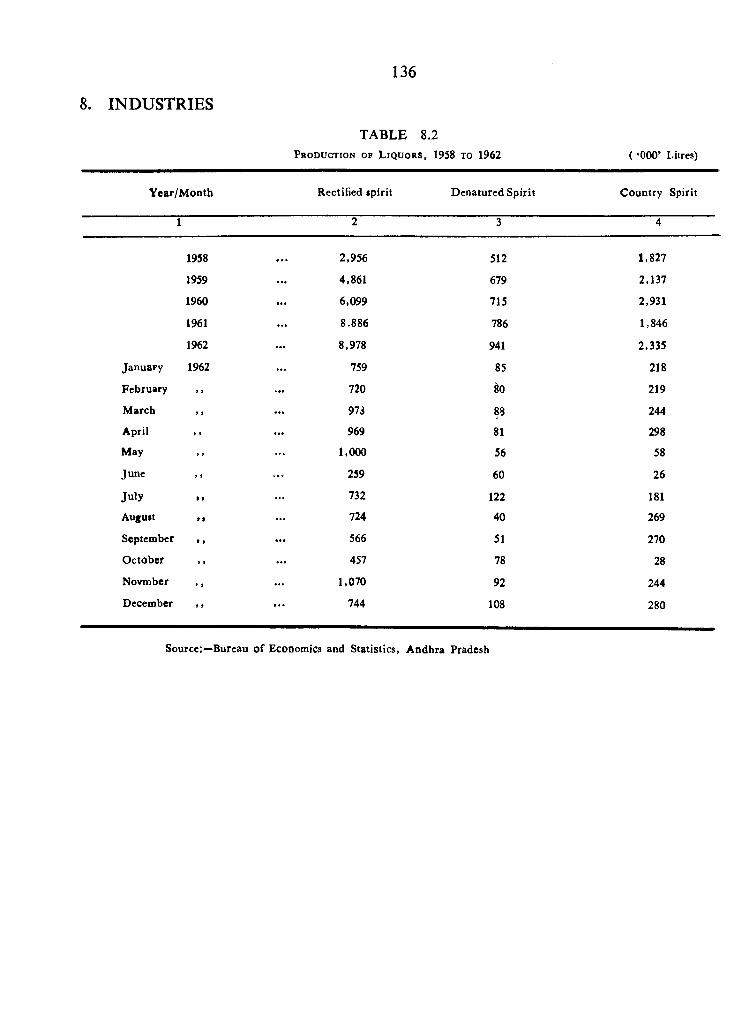
8. INDUSTRIES
136
TABLE 8.2P r o d u c t i o n o f L i q u o r s , 1958 t o 1962 ( ‘000’ Litres)
Y ear/M onth Rectified spirit D enatured Spirit C ountry Spirit
1 2 3 4
1958 2,956 512 1,827
1959 4,861 679 2,137
1960 6,099 715 2,931
1961 8.886 786 1,846
1962 8,978 941 2,335
January 1962 759 85 218
February .. 720 t o 219
M arch t 9 973 88 244
April 9 9 969 81 298
May 9 9 1,000 56 58
June 9 9 259 60 26
Ju ly > * 732 122 181
August » » 724 40 269
September t t 566 51 270
O ctober 457 78 28
Novmber 1,070 92 244
December 9 » 744 108 280
Source:—Bureau o f Economics and Statistics, A ndhra Pradesh
TABLE 8.3
D i s t r i b u t i o n o f W o r k i n g F a c t o r i e s A c c o r d i n g t o
W o r k i n g S t r e n g t h ( D a i l y A v e r a g e ) b y I n d u s t r i e s , 1962
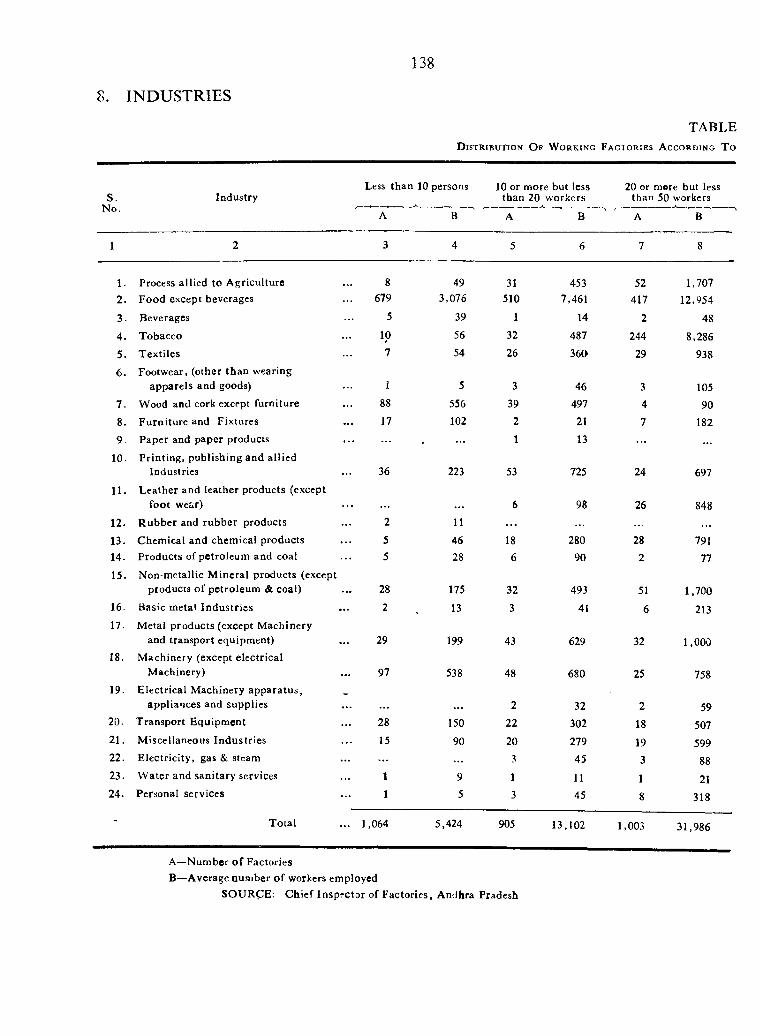
8. INDUSTRIES
138
TABLED is t r ib u t io n O f W o r k in g F a c t o r ie s A c c o r d in g T o
S. IndustryLess than 10 persons 10 or more but less
than 20 w orkers20 or more but less
than 50 workersINC. A B A B A B
1 2 3 4 5 6 7 8
1. Process allied to A griculture 8 49 31 453 52 1,7072. Food except beverages 679 3,076 510 7,461 417 12,954
3. Beverages 5 39 1 14 2 48
4. Tobacco 10 56 32 487 244 8,286
5. T extiles 7 54 26 360 29 938
6. Footwear, (other than wearing apparels and goods) }. 5 3 46 3 105
7. Wood and cork except furniture 8 8 556 39 497 4 908 . F urn itu re and Fixtures 17 102 2 21 7 1829 Paper and paper products / 1 13 . . . . . .
10. Printing, publishing and allied Industries 36 223 53 725 24 697
11. L eather and leather products (except foot wear) 6 98 26 848
12. R ubber and rubber products 2 11 . . . . . .
13. Chem ical and chemical products 5 46 18 280 28 79114. Products of petroleum and coal 5 28 6 90 2 7715. Non-metallic M ineral products (except
products o f petro leum & coal) 28 175 32 493 51 1,70016. Basic metal Industries 2 13 3 41 6 21317. M etal products (except M achinery
and transport equipment) 29 199 43 629 32 1,00018. M achinery (except electrical
M achinery) 97 538 48 680 25 75819. E lectrical M achinery apparatus,
appliances and supplies 2 32 2 5920. Transport Equipm ent 28 150 22 302 18 50721. M iscellaneous Industries 15 90 20 279 19 59922. E lectricity , gas & steam . . . 3 45 3 8 8
23. W ater and sanitary services 1 9 1 11 1 2124. Personal services 1 5 3 45 8 318
■* T otal 1,064 5,424 905 13,102 1,003 31,986
A—N um ber o f Factories B—Average num ber o f workers employed
SOURCE: C hief Inspector of Factories, Andhra Pradesh
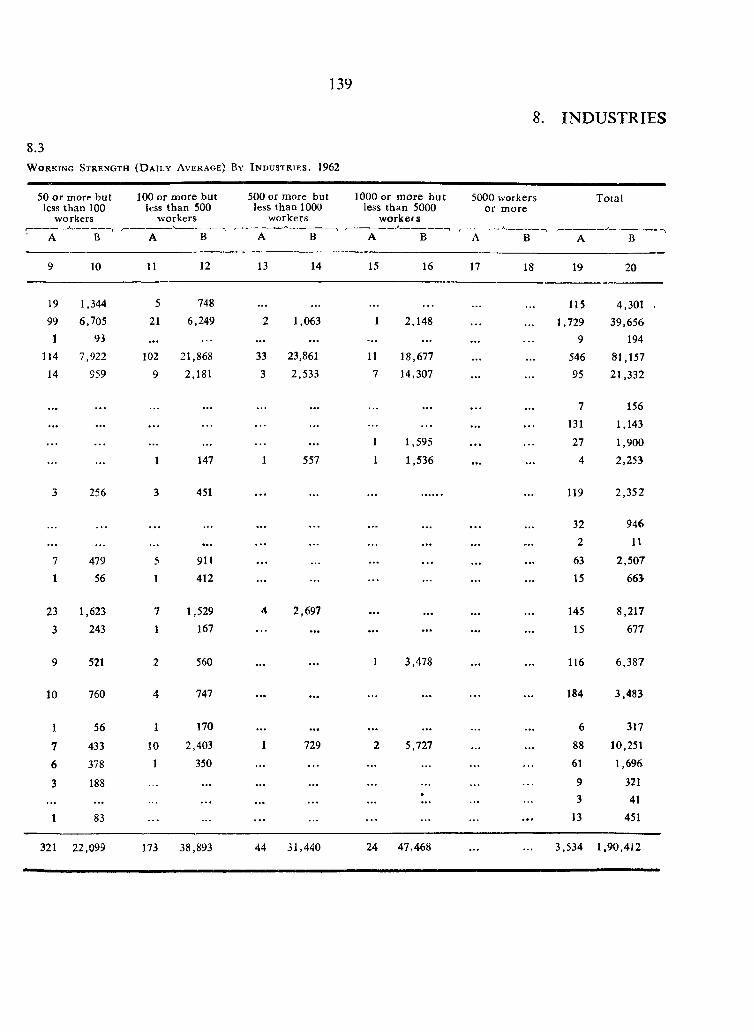
139
W o r k i n g S t r e n g t h ( D a i l y A v e r a g e ) B y I n d u s t r i e s , 1962
8 .3
8. INDUSTRIES
50 o r more but less than 100
workers
B
100 or more but less than 500
workers
B ~
500 or more but less than 1000
workers
B
1000 or m ore bu t less than 5000
w orkers
5000 workers or more
B
Total
10 11 1 2 13 14 15 16 17 18 19 20
19
991
114
14
1,344
6.70593
7,922
959
5 748
21 6,249
102
9
21,8682,181
2 1,063
33 23,861
3 2,533
1 2,148
11 18,677
7 14,307
115
1,7299
54695
4,301
39,656194
81,157
21,332
256
147
451
557
1,595
1,536
7
131
27
4
119
156
1,143
1,900
2,253
2,352
479
56911412
322
63
15
946
11
2,507
663
23 1,623
3
9
10
243
521
760
1,529167
560
747
2,697
3,478
145
15
116
184
8,217
677
6,387
3.483
56
433
378
188
83
1
101
170
2,403
350
729 5,727
688
61
93
13
317
10,251
1,696
321
41
451
321 22.099 173 38,893 44 31,440 24 47,468 3,534 1,90,412
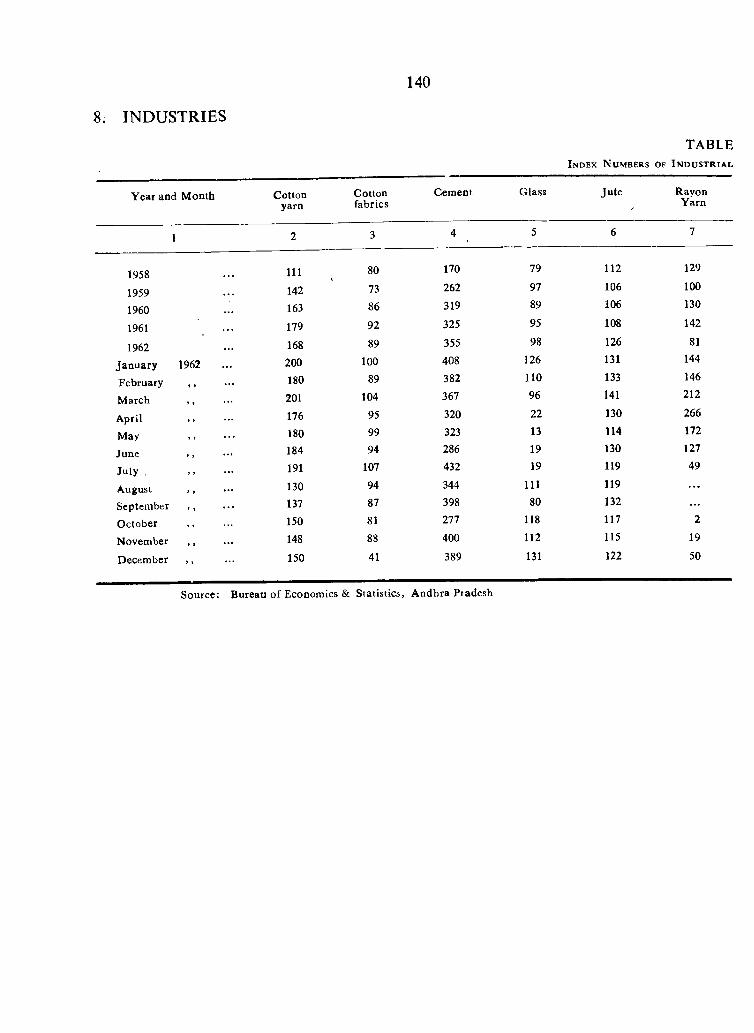
140
8. INDUSTRIES
Year and M onth Cottonyarn
Cottonfabrics
Cement
TABLEI n d e x N u m b e r s o f I n d u s t r i a l
Glass Ju te RayonYarn
1958195919601961
1962 January February M arch
April May June July ,
August September O ctober November
December
1962
111 80 170 79 112 129
142 73 262 97 106 100
163 86 319 89 106 130
179 92 325 95 108 142
168 89 355 98 126 81
200 100 408 126 131 144
180 89 382 110 133 146
201 104 367 96 141 212
176 95 320 22 130 266
180 99 323 13 114 172
184 94 286 19 130 127
191 107 432 19 119 49
130 94 344 111 119 . . .
137 87 398 80 132 . . .
150 81 277 118 117 2
148 88 400 112 115 19
150 41 389 131 122 50
Source: Bureau of Economics & Statistics, A ndhra Pradesh
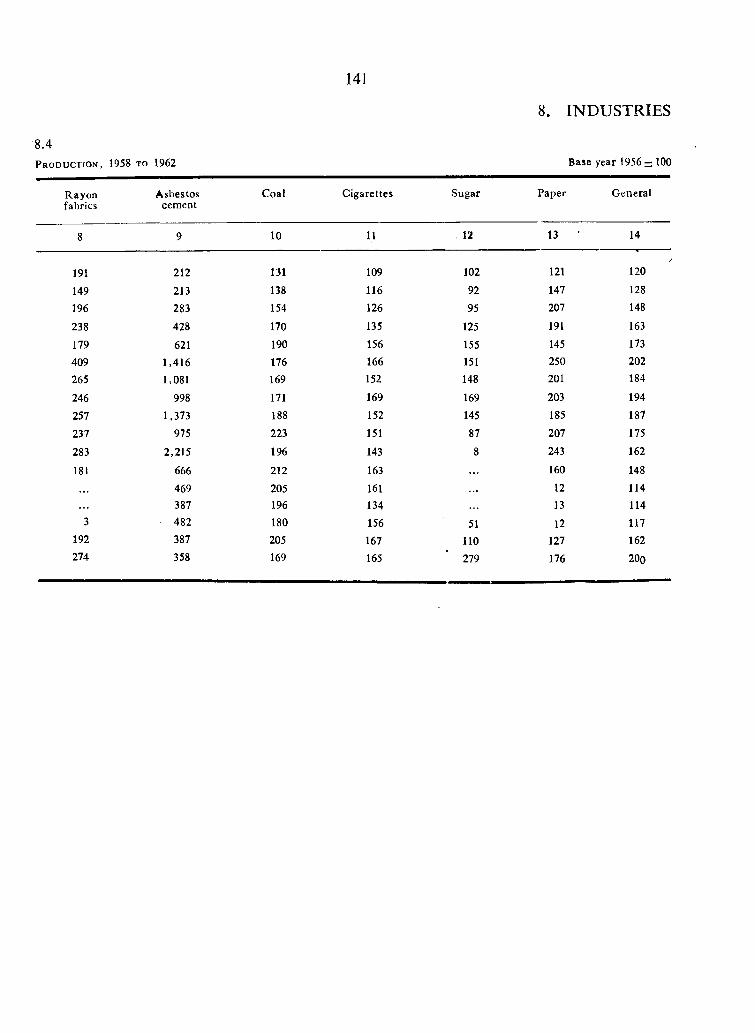
141
8. INDUSTRIES
8.4P r o d u c t i o n , 1958 t o 1962 Base year 1956 — 100
Rayonfabrics
Asbestoscement
Coal Cigarettes Sugar Paper G eneral
10 11 12 13 14
191149196238179409265
246257237
283
181
3192274
2 1 2
213283428621
1.4161,081
9981,373
9752,215
666469387482387358
131138154
170 190 176 169171 188 223
196
212
205 196 180 205 169
109116126135156166152169152151
143
163161134156167165
102 121 120
92 147 12895 207 148
125 191 163
155 145 173151 250 202148 201 184
169 203 194145 185 187
87 207 1758 243 162
. . . 160 14812 11413 114
51 12 117110 127 162279 176 200
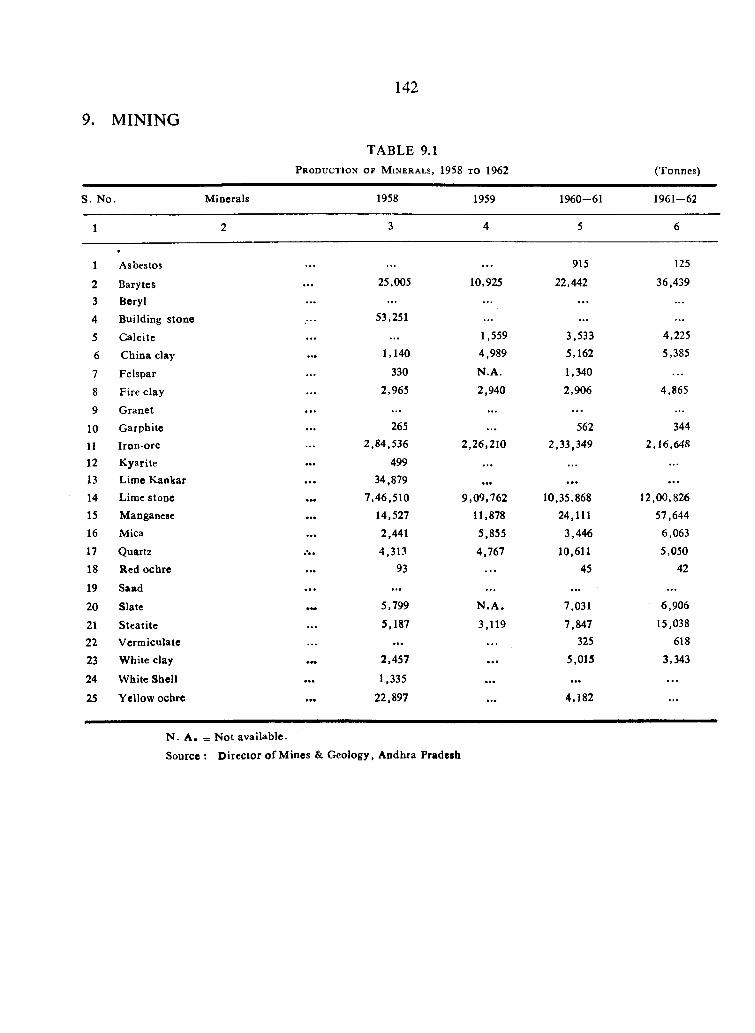
142
9. MINING
TABLE 9.1P r o d u c t i o n o f M i n e r a l s , 19 5 8 t o 1 9 6 2 (Tonnes)
S. No M inerals 1958 1959 1960-61 1961-62
1 2 3 4 5 6
1 Asbestos . . . • • • 915 125
2 Barytes . . . 25,005 10,925 22,442 36,439
3 Beryl . . . . . . . . . . . .
4 Building stone 53,251 . . . . . .
5 Calcite . . . . . . 1,559 3,533 4,225
6 China clay • •• 1,140 4,989 5,162 5,385
7 Felspar 330 N.A. 1,340
8 Fire clay . . . 2,965 2,940 2,906 4,865
9 G ranet ... . . . . . . . . .
10 Garphite . . . 265 . . . 562 344
11 Iron-ore 2,84,536 2,26,210 2,33,349 2,16,648
12 K yarite • •• 499 . . . . . . . . .
13 Lime K ankar . . . 34,879 . . . . . . . . .
14 Lime stone 7,46,510 9,09,762 10,35,868 12,00,82615 Manganese 14,527 11,878 24,111 57,64416 Mica . . . 2,441 5,855 3,446 6,06317 Quartz 4,313 4,767 10,611 5,05018 Red ochre . . . 93 . . . 45 42
19 Sand . . . . . . . . . . . .
20 Slate 5,799 N .A . 7,031 6,906
21 Steatite . . . 5,187 3,119 7,847 15,038
22 V erm iculate . . . . . . 325 618
23 W hite clay » » • 2,457 . . . 5,015 3,343
24 W hite Shell • • • 1,335 • • • • • • . . .
25 Yellow ochre 22,897 . . . 4,182 . . .
N . A . — N ot available.
Source : D irector o f M ines & G eology, A ndhra Pradesh
TABLE 9.2
P r o d u c t i o n o f P r i n c i p a l M i n e r a l s , D i s t r i c t w i s e ,
196J-62
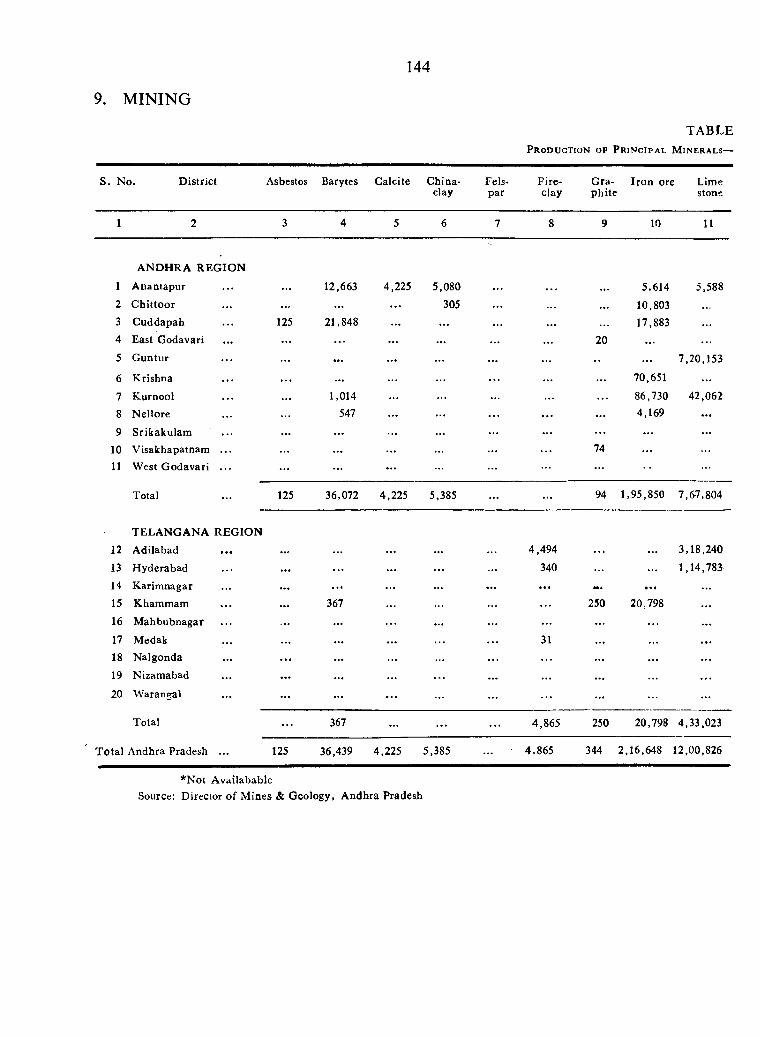
9. MINING
144
TABLEP r o d u c t io n o f P r i n c i p a l M i n e r a l s —
S. N o. D istrict Asbestos Barytes Calcite China-clay
Felspar
F ireclay
G raphite
Iro n ore Lime stone
1 2 3 4 5 6 7 8 9 10 11
1
A ND HRA R EG IO N
A nantapur 12,663 4,225 5,080 5,614 5,5882 C hittoor . . . . . . . . . 305 . . . . . . 10,8033 C uddapah 125 21,848 ... ... . . . 17,8834 East Godavari ... .. . . . . 20 . . .
5 G untur ... . . . . . . . . . .. . . . 7,20,153
6 K rishna ... ... 70,651 ...
7 Kurnool ... 1,014 ... 86,730 42,062
8 N ellore 547 ... ... 4,169 ...
9 Srikakulam ' . . . ... ... .. . ... ...
10 V isakhapatnam .. . ... ... 74
11 West G odavari . . . ... ... ... ...
Total 125 36,072 4,225 5,385 ... ... 94 1,95,850 7,67,804
12
TELA NG AN A R EG IO N
A dilabad . . . 4,494 3,18,240
13 Hyderabad ... ... ... 340 1,14,78S
14 Karim nagar ... .. . ... ... . . . . . . ...
15 Khammam 367 ... 250 20,798
16 M ahbubnagar . . . . . . ... .. . ...
17 Medak ... ... .. . 31 ...
18 Nalgonda .. . ... ... ... ... ...
19 Nizamabad ... ... ... . . .
20 W arangal ... ...
Total 367 ... ... . . . 4,865 250 20,798 4,33,023
T o ta l Andhra Pradesh ... 125 36,439 4,225 5,385 . . . ■ 4.865 344 2,16,648 12,00,826
*N ot A vailabable Source: Director o f M ines & Geology, A ndhra Pradesh
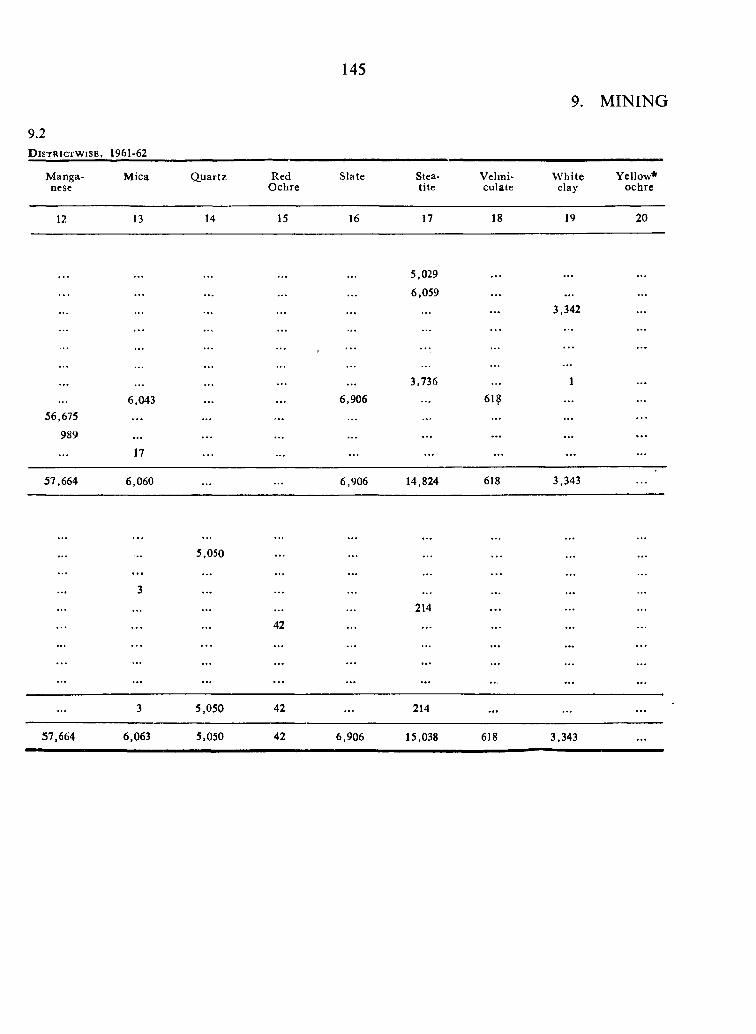
145
9. MINING
9.2D isT R ic T W iS E , 1961-62
M anganese
Mica Q uartz RedO chre
Slate Steatite
Veimi-culate
W hiteclay
Yellow*ochre
12 13 14 15 16 17 18 19 20
5,029
6,059 . . . . . .
••• 3,342
3,736 1
6,043 6,906 61^
56,675 . . . . . .
989 . . . . . . . . . . . . . . .
17 . . . . . .
57,664 6,060 6,906 14,824 618 3,343
5,050 . . . . . .
3
214 . . .
. . .
. . . . . .
42
. . .
. . .
. . .
3 5,050 42 214 . . .
57,664 6,063 5,050 42 6,906 15,038 618 3,343
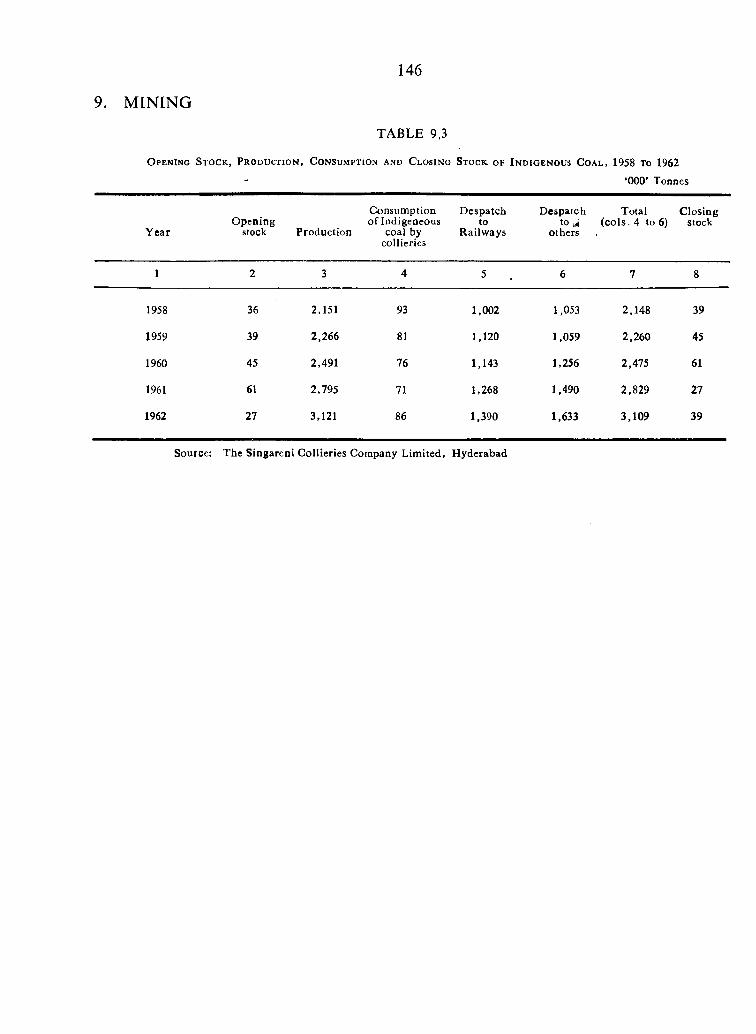
9. MINING
146
TABLE 9.3
O p e n i n g S t o c k , P r o d u c t i o n , C o n s u m p t i o n a n d C l o s i n g S t o c k , o f I n d i g e n o u s C o a l , 1958 t o 1962
‘000’ Tonnes
Consumption D espatch D espatch Total ClosingO pening o f Indigeneous to to-a (co ls. 4 to 6) stock
Y ear stock Production coal by Railways otherscollicries
1 2 3 4 5 6 7 8
1958 36 2,151 93 1,002 1,053 2,148 39
1959 39 2,266 81 1,120 1,059 2,260 45
1960 45 2,491 76 1,143 1,256 2,475 61
1961 61 2,795 71 1,268 1,490 2,829 27
1962 27 3,121 86 1,390 1,633 3,109 39
Source; The Singareni Collieries Company L im ited, H yderabad
TABLE 10.1
E l e c t r i c i t y G e n e r a t e d , P u r c h a s e d a n d S o l d ,
1958 TO 1962
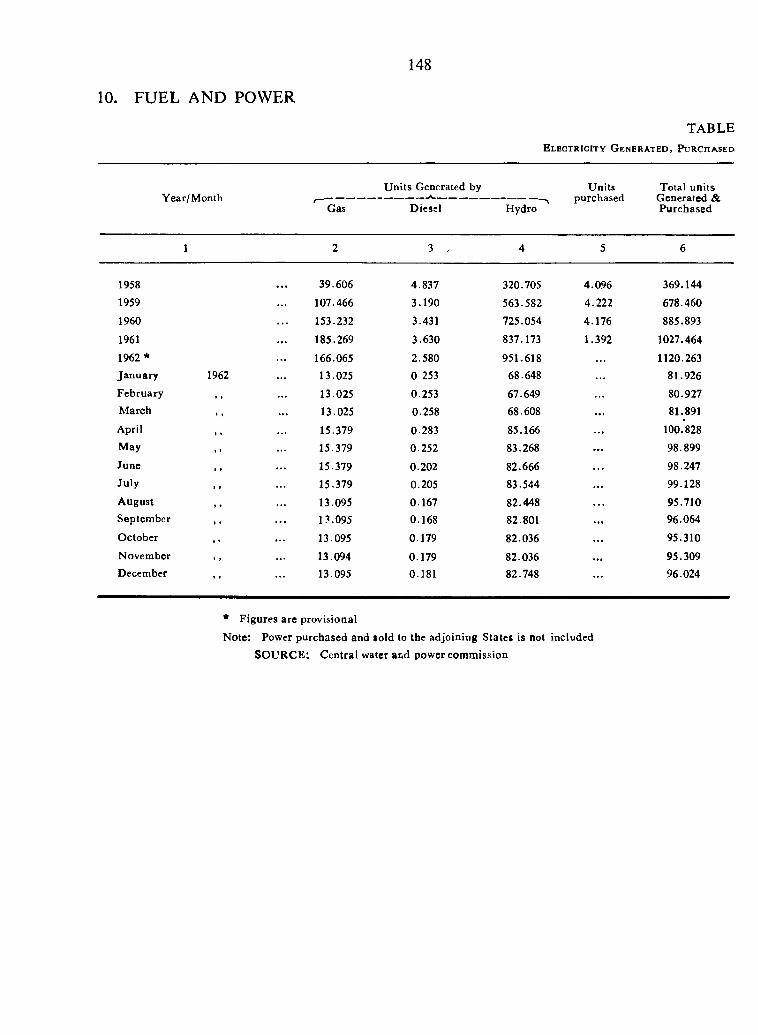
10. FUEL AND POWER
148
TABLEE l e c t r i c i t y G e n e r a t e d , P u r c h a s e d
Year/M onthGas
U nits Generated by
Diesel Hydro
Unitspurchased
Total units Generated & Purchased
19581959
1960
19611962 * January
February March
April
May
June July
August Septem ber
October
November
December
1962
39.606107.466153.232185.269
166.06513.02513.02513.02515.37915.379
15.37915.37913.095 1?.09513.095
13.09413.095
4.837 3.190 3.431
3.630 2.580 0 253 0.253 0.258
0 283 0.252 0.202
0.205 0.167 0.168 0.179
0.179 0.181
320.705563.582725.054
837.173
951.61868.648
67.649 68.608 85.166 83.268 82.666 83.544 82.448 82.80182.03682.036 82.748
6
22
62
369.144678.460885.893
1027.4641120.263
81.92680.927 81.891
100.82898.899
98.24799.12895.71096.06495.310
95.30996.024
* Figures are provisional
Note: Power purchased and sold to the adjoining States is not included SO U R C E: C entral water and power comm ission
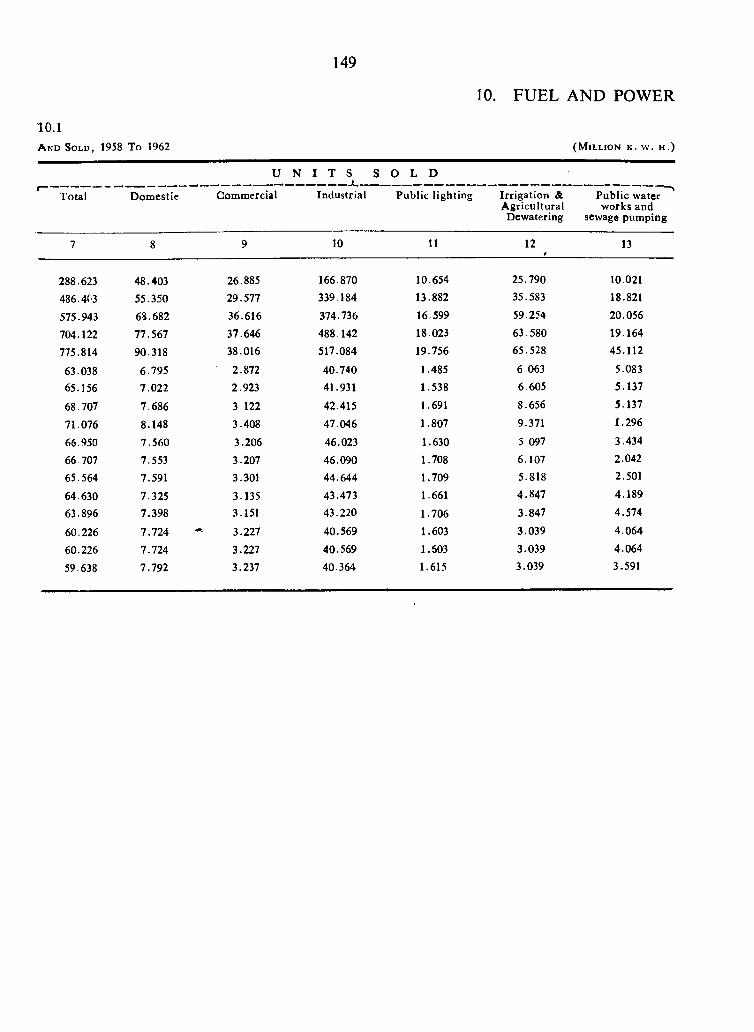
149
10.1A n d S o l d , 1958 To 1962
10. FUEL AND POWER
( M i l l i o n k . w . h . )
Total D om estie
U N I T ^
Commercial Industrial
S O L D
Public lighting Irriga tion & Public waterA gricultural works andDcwatering sewage pumping
10 11 12 13
288.623
486.403
575.943
704.122
775.814
63.03865.156
68.707
71.076
66.950
66.707
65.564
64.630 63.896
60.226 60.226
59.638
48.40355.350
68.682
77.567
90.318
6.7957.022
7.686
8.148
7.560
7.553
7.591
7.3257.398
7.724
7.724
7.792
26.885 166.870 10.654 25.790 10.021
29.577 339.184 13.882 35.583 18.821
36.616 374.736 16.599 59.254 20.056
37.646 488.142 18.023 63.580 19.164
38.016 517.084 19.756 65.528 45.112
2.872 40.740 1.485 6 063 5.083
2.923 41.931 1.538 6.605 5.137
3.122 42.415 1.691 8.656 5.137
3.408 47.046 1.807 9.371 1.296
3.206 46.023 1.630 5 097 3.434
3.207 46.090 1.708 6.107 2.042
3.301 44.644 1.709 5.818 2.501
3.135 43.473 1.661 4.847 4.189
3.151 43.220 1.706 3.847 4.574
3.227 40.569 1.603 3.039 4.064
3.227 40.569 1.603 3.039 4.064
3.237 40.364 1.615 3.039 3.591
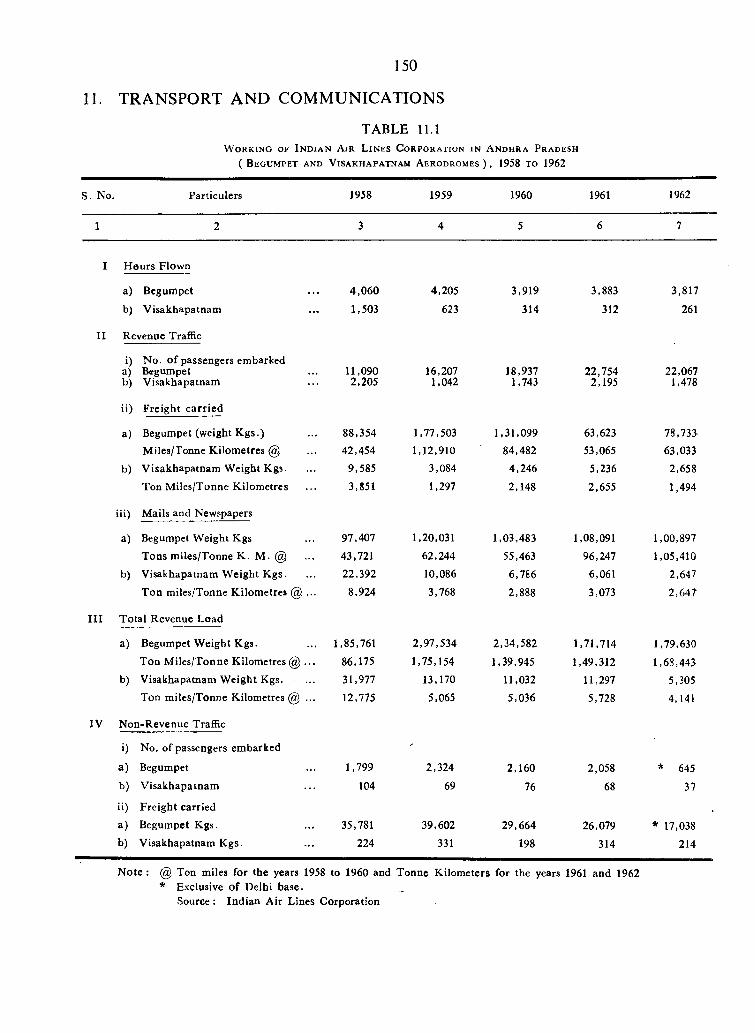
150
11. TRANSPORT A N D COMMUNICATIONS
TABLE 11.1W o r k i n g o f I n d i a n A i r L i n e s C o r p o r a t i o n i n A n d h r a P r a d e s h
( B e g u m p e t a n d V i Sa k h a p a t n a m A e r o d r o m e s ) , 1958 t o 1962
S. No Particulers 1958 1959 1960 1961 1962
1 2 3 4 5 6 7
I H ours Flown
a) Begumpet 4,060 4,205 3,919 3,883 3,817
b) V isakhapatnam 1,503 623 314 312 261
II Revenue Traffic
i) N o . o f passengers embarked a) Begumpet 11,090 16,207 18,937 22,754 22,067b) V isakhapatnam 2,205 1,042 1,743 2,195 1,478
ii) Freight ca rried
a) Begumpet (weight K gs.) 88,354 1,77,503 1,31,099 63,623 78,733M iles/Tonne K ilom etres @ 42,454 1,12,910 84,482 53,065 63,033
b) V isakhapatnam W eight Kgs. 9,585 3,084 4,246 5,236 2,658
Ton M iles/Tonne K ilom etres 3,851 1,297 2,148 2,655 1,494
iii) Mails and Newspapers
a) Begumpet W eight Kgs 97,407 1,20,031 1,03,483 1,08,091 1,00,897
Tons miles/Tonne K . M . @ 43,721 62,244 55,463 96,247 1,05,410
b) Visakhapatnam W eight K gs. 22,392 10,086 6,786 6,061 2,647
Ton miles/Tonne K ilom etres @ ... 8,924 3,768 2,888 3,073 2,647
II I T otal Revenue Load
a) Begumpet W eight Kgs. 1,85,761 2,97,534 2,34,582 1,71,714 1,79,630Ton M iles/Tonne K ilom etres@ ... 86,175 1,75,154 1,39,945 1,49,312 1,6S,443
b) Visakhapatnam W eight Kgs. 31,977 13,170 11,032 11,297 5,305Ton miles/Tonne Kilometres @ ... 12,775 5,065 5,036 5,728 4,141
IV N on-Revenue Traffic
i) No. of passengers embarked
a) Begumpet 1,799 2,324 2,160 2,058 * 645b) V isakhapatnam 104 69 76 68 37
ii) Freight carried
a) Begumpet Kgs. 35,781 39,602 29,664 26,079 * 17,038b) Visakhapatnam Kgs. 224 331 198 314 214
N ote : @ Ton miles for the years 1958 to 1960 and Tonne Kilom eters for the years 1961 and 1962* Exclusive o f Delhi base.
Source : Ind ian Air Lines Corporation
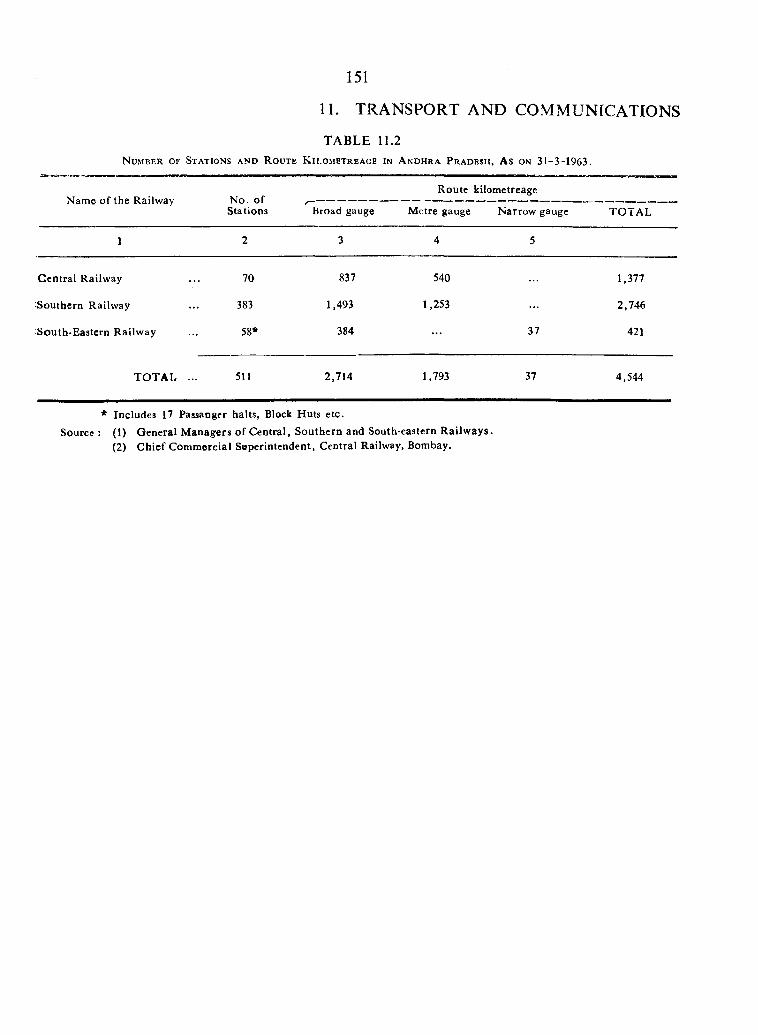
151
11. TRANSPORT AND COMMUNICATIONS
TABLE 11.2N u m b e r o f S t a t i o n s a n d R o u t e K i i , o m e t r e a g e I n A n d h r a P r a d e s h , A s o n 31-3-1963.
* Includes 17 Passaoger halts, Block Huts etc.Source : (1) G eneral M anagers o f C entral, Southern and South-eastern R ailw ays.
(2) C hief C om m ercial Superintendent, Central Railway, Bombay.
N ame o f the Railway N o. o f Stations
R oute kilometreage
broad gauge Metre gauge N arrow gauge T O T A L
1 2 3 4 5
C entral Railway 70 837 540 1,377
S o u th ern Railway 383 1,493 1,253 2,746
South-E astern Railway 58* 384 37 421
T O T A L ... 511 2,714 1,793 37 4,544
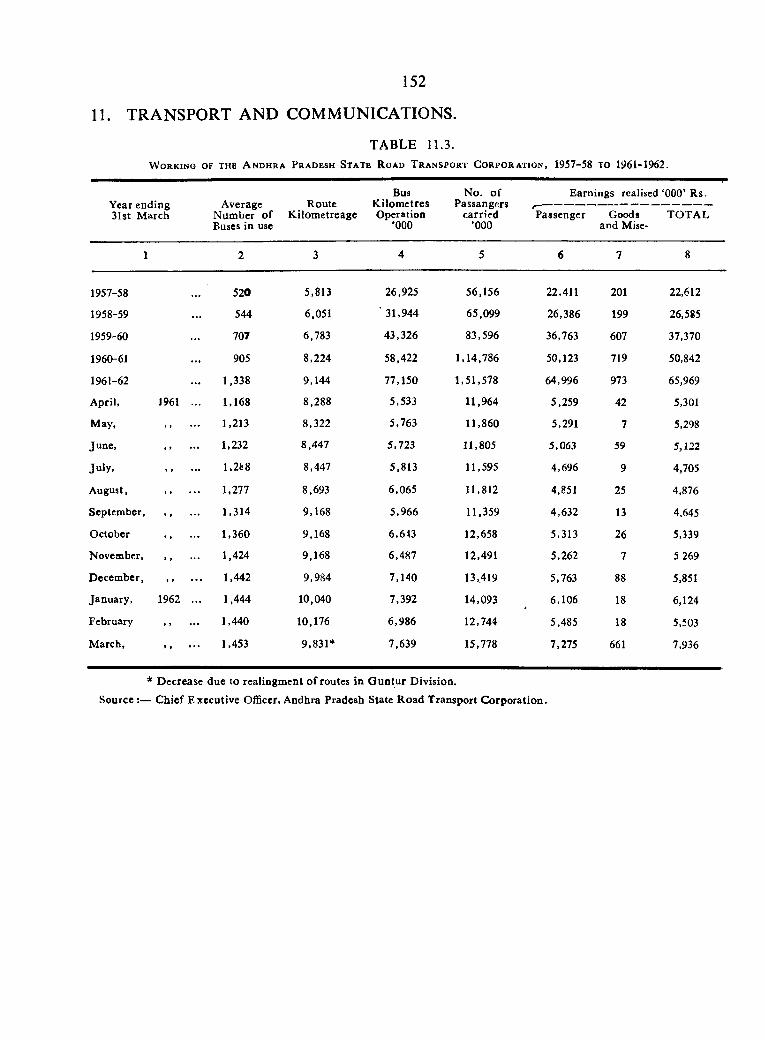
11. TRANSPORT AND COMMUNICATIONS.
TABLE 11.3.W o r k i n g o f t h e A n d h r a P r a d e s h S t a t e R o a d T r a n s p o r t C o r p o r a t i o n , 1957-58 t o 1961-1962.
152
Year ending Average Route31st M arch N um ber o f K ilom etreage
Buses in use
BusK ilom etresOperation
'000
N o . o f Passangers
carried '000
Earnings realised ‘000’ Rs.
TO TA LPassenger Goods and Mise-
I
1957-58
1958-59
1959-60
1960-61
1961-62
April,
May,
June,
July.
August,
September,
October
November,
Decem ber,
January ,
February
M arch,
1961
1962
520
544
707
905
1,338
1,168
1,213
1,232
1,288
1,277
1,314
1,360
1,424
1,442
1,444
1,440
1,453
5,813
6,051
6,783
8,224
9,144
8,288
8,322
8.447
8.447
8,693
9.168
9.168
9.168
9,984
10,040
10,176
9,831*
26,925
' 31,944
43,326
58,422
77,150
5,533
5,763
5,723
5,813
6,065
5,966
6,643
6,487
7,140
7,392
6,986
7,639
56,156
65,099
83,596
1,14,786
1,51,578
11,964
11,860
11,805
11,595
11,812
11,359
12,658
12,491
13,419
14,093
12,744
15,778
22,411
26,386
36,763
50,123
64,996
5,259
5,291
5,063
4,696
4,851
4,632
5,313
5,262
5,763
6,106
5,485
7,275
201
199
607
719
973
42
7
59
9
25
13
26
7
88
18
18
661
22,612
26,585
37,370
50,842
65,969
5,301
5,298
5,122
4,705
4,876
4.645
5,339
5 269
5,851
6,124
5,503
7,936
* D ecrease due to realingm ent o f routes in G un tu r Division.
Source ;— C hief E xecutive Officer, Andhra Pradesh State R oad Transport C orporation .
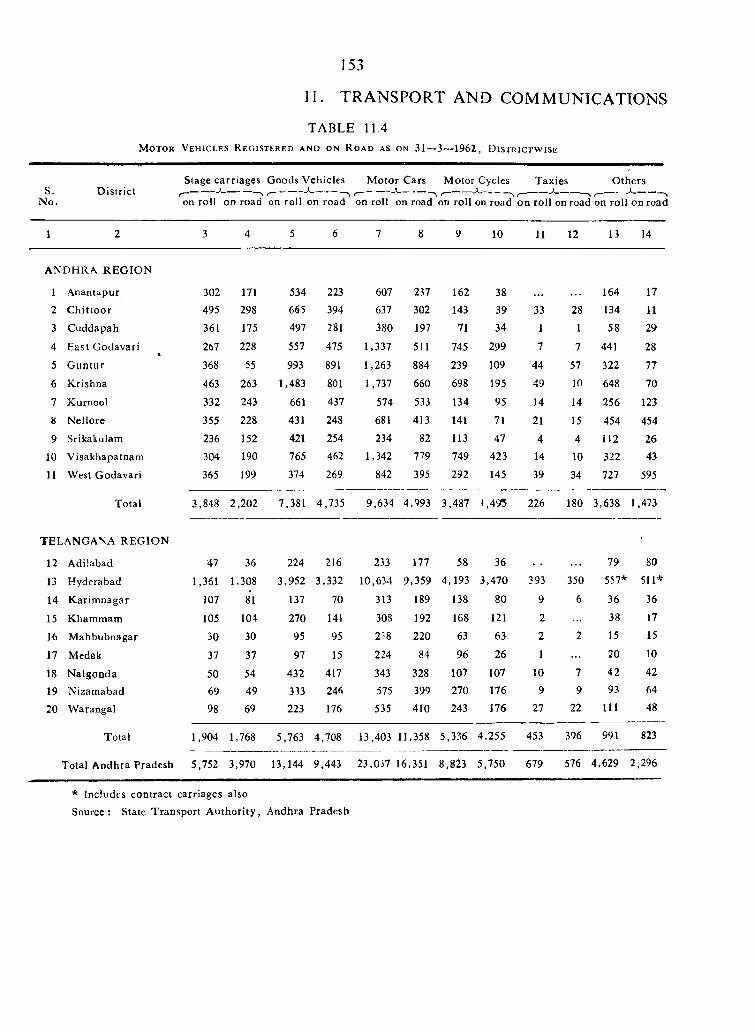
TABLE 11.4M o t o r V e h i c l e s R e g i s t e r e d a n d o n R o a d as on 31— 3— 1962, D i s t r i c t w i s e
Stage carriages Goods Vehicles M otor Cars M otor Cycles Taxies O thersS. D istrict ^ ------- -*-------- — --------- ------------ ,----------- ------------ ^ -------- *--------- ----------- '--------- — -*--------- ,
N o. on roll on road on roll on road on roll on road on roll on road on roll on road on roll on road
153
11. TRANSPORT AND COMMUNICATIONS
10 11 12 n 14
ANDHRA R EG IO N
1 Anantapur 302 171 534 223 607 237 162 38 164 17
2 C h ittoo r 495 298 665 394 637 302 143 39 33 28 134 113 Cuddapah 361 175 497 281 380 197 71 34 1 1 58 29
4 E ast G odavari 267 228 557 475 1,337 511 745 299 7 7 441 28
5 G untur 368 55 993 891 1,263 884 239 109 44 57 322 77
6 Krishna 463 263 1,483 801 1,737 660 698 195 49 10 648 70
7 Kurnool 332 243 661 437 574 533 134 95 14 14 256 123
8 Nellore 355 228 431 248 681 413 141 71 21 15 454 454
9 Srikakulam 236 152 421 254 234 82 113 47 4 4 112 26
10 Visakhapatnam 304 190 765 462 1,342 779 749 423 14 10 322 43
11 West Godavari 365 199 374 269 842 395 292 145 39 34 111 595
Total 3,848 2,202 7,381 4,735 9,634 4,993 3,487 1,49? 226 180 3,638 1,473
TELANGANA R EG IO N
12 Adiiabad 47 36 224 216 233 177 58 36 79 80
13 Hyderabad 1,361 1,308 3,952 3,332 10,634 9,359 4,193 3,470 393 350 557* 511*
14 K arim nagar 107 81 137 70 313 189 138 80 9 6 36 36
15 Kharnmam 105 104 270 141 308 192 168 121 2 38 17
16 M ahbubnagar 30 30 95 95 2^8 220 63 63 2 2 15 15
17 Medak 37 37 97 15 224 84 96 26 1 ... 20 10
18 N algonda 50 54 432 417 343 328 107 107 10 7 42 42
19 Nizamabad 69 49 333 246 575 399 270 176 9 9 93 64
20 W arangal 98 69 223 176 535 410 243 176 27 22 111 48
Total 1,904 1,768 5,763 4,708 13,403 11,358 5,336 4,255 453 396 991 823
Total A ndhra Pradesh 5,752 3,970 13,144 9,443 23,037 16,351 8,823 5,750 679 576 4,629 2.296
* Includes contract carriages alsoSource: State T ransport A u thority , Andhra Pradesh
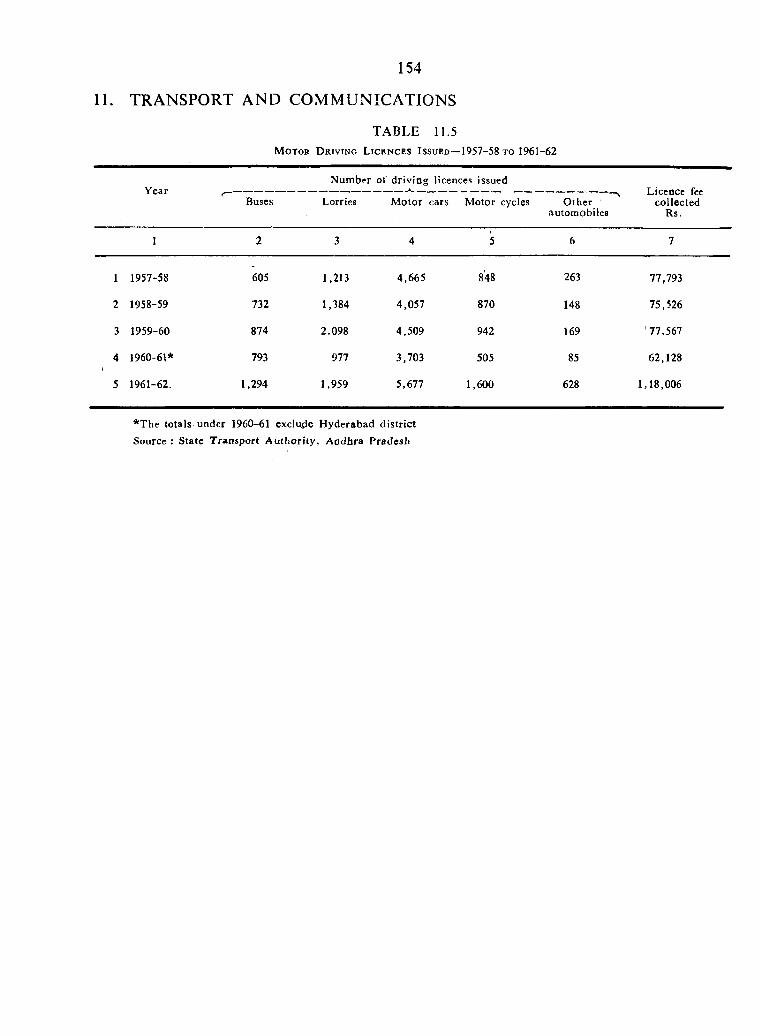
154
11. TRANSPORT AND COMMUNICATIONS
TABLE 11.5M o t o r D r i v i n g L i c e n c e s I s s u e d — 1957-58 TO 1961--62
YearBuses
N um ber-of driv ing licences issued
Lorries M otor cars M otor cycles O therautomobiles
Licence fee collected
Rs.
1 2 3 4 5 6 7
1 1957-58 605 1,213 4,665 848 263 77,793
2 1958-59 732 1,384 4,057 870 148 75,526
3 1959-60 874 2,098 4,509 942 169 '77,567
4 1960-61* 793 977 3,703 505 85 62,128
5 1961-62. 1,294 1,959 5,677 1,600 628 1,18,006
*The totals under 1960-61 exclu^le H yderabad district Source : State Transport A u th o r i t y , A ndhra Pradesh
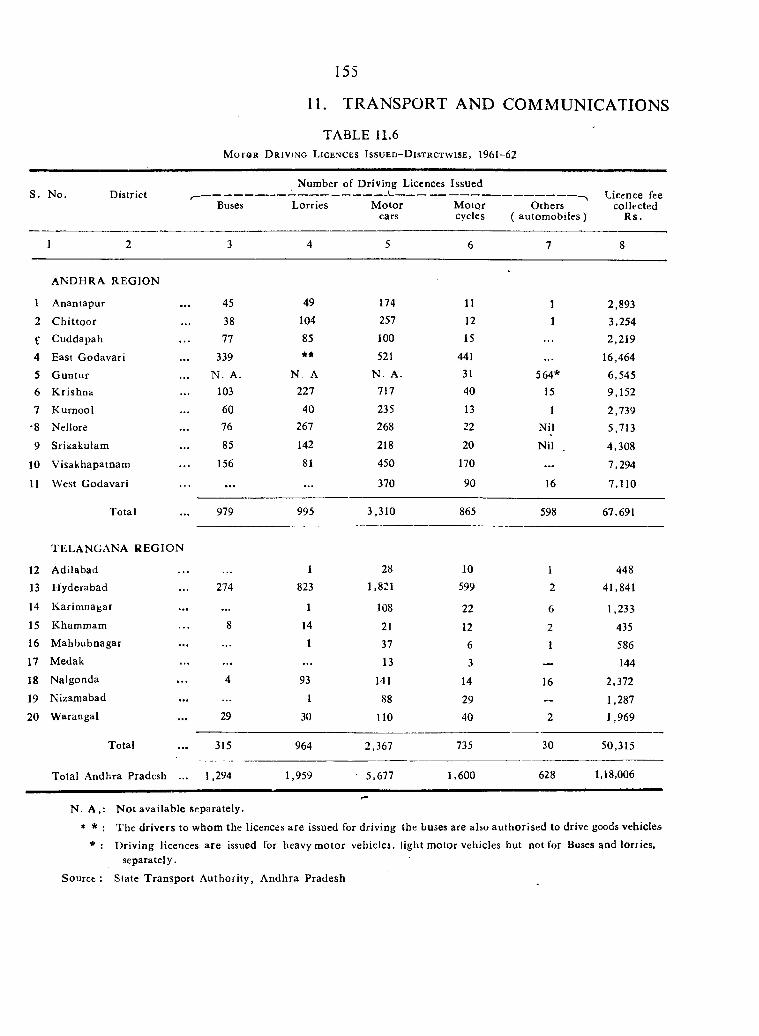
155
11. TRANSPORT AND COMMUNICATIONS
TABLE 11.6M o t o r D r i v i n g L i c e n c e s I s s u e d - D i s t r c t w i s e , 1961--62
S. N o. D istrict ,,—Buses
Number of D riving Liccnces Issued
Lorries M otor M otor cars cycles
Others ( autom obiles )
Licence fee collected
R s.
1 2 3 4 5 6 7 8
A N D HRA REG IO N
1 A nantapur 45 49 174 11 1 2,8932 C h ittoo r 38 104 257 12 1 3,254£ Cuddapah 77 85 100 15 2,219
4 East G odavari 339 ** 521 441 . . . 16,4645 G untur N . A. N . A N . A. 31 564* 6,5456 K rishna 103 227 717 40 15 9,152
7 Kurnool 60 40 235 13 1 2,739'8 Nellore 76 267 268 22 Nil 5,7139 Srikakulam 85 142 218 20 Nil 4,308
10 V isakhapatnam 156 81 450 170 . . . 7,294
11 West G odavari . . . . . . 370 90 16 7,110
Total 979 995 3,310 865 598 67,691
TELA NG AN A R EG IO N
12 A dilabad 1 28 10 1 448
13 H yderabad 274 823 1,821 599 2 41,841
14 K arim nagar . . . 1 108 22 6 1,23315 Khammam 8 14 21 12 2 43516 M ahbubnagar 1 37 6 1 58617 Medak . . . 13 3 — 14418 N algonda 4 93 141 14 16 2,37219 Nizamabad 1 88 29 — 1,28720 W arangal 29 30 110 40 2 1,969
Total 315 964 2,367 735 30 50,315
Total Andhra Pradesh ... 1,294 1,959 5,677 1,600 628 1,18,006
N. A , * *
*
Source :
N ot available separately.
T he drivers to whom the licences are issued for driving the buses are also au thorised to drive goods vehicles
D riving licences are issued for heavy m otor vehicles, light m otor vehicles but not for Buses and lorries, separately.
State T ransport A uthority , A ndhra Pradesh
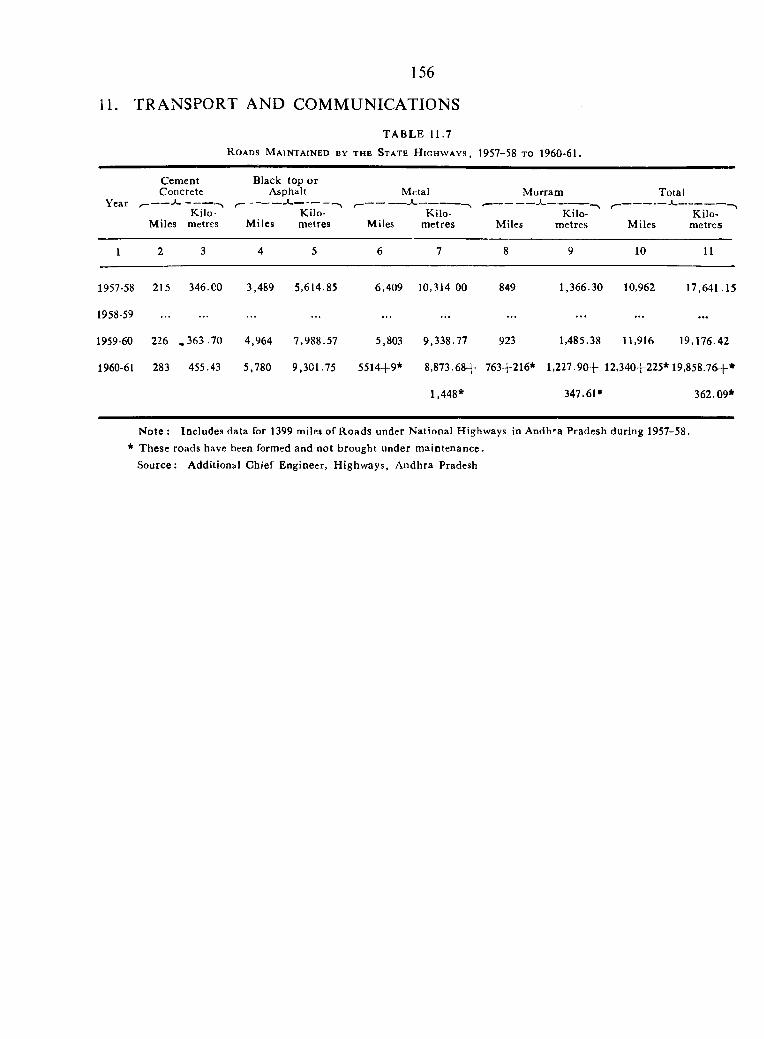
156
11. TRANSPORT AND COMMUNICATIONS
TA B LE 11.7
R o a d s M a i n t a i n e d b y t h e S t a t e H i g h w a y s , 1957-58 t o 1960-61,
Year
Cement Concrete
1 —
Black top orAsphalt Metal M urram
. 1Total.. 1
MilesKilo
metres M ilesK ilometres Miles
K ilom etres Miles
K ilo - ^metres Miles
K ilometres
1 2 3 4 5 6 7 8 9 10 11
1957-58 215 346.CO 3,489 5,614.85 6,409 10,314.00 849 1,366.30 10,962 17,641.15
1958-59 ... ... ... .. . ... ...
1959-60 226 , 363 .70 4,964 7,988.57 5,803 9,338.77 923 1,485.38 11,916 19,176.42
1960-61 283 455.43 5,780 9,301.75 5514+9* 8,873.68+ 763+216* 1,227.90+ 12,340+225*19,858.76+*
1,448* 347.61* 362.09*
N ote : Includes data for 1399 miles of R oads under N ational Highways in Andh'-a Pradesh during 1957-58.* These roads have been formed and not brought under m aintenance.
Source: Addition&i Ch/ef Engineer, H ighw ays, A ndhra Pradesh
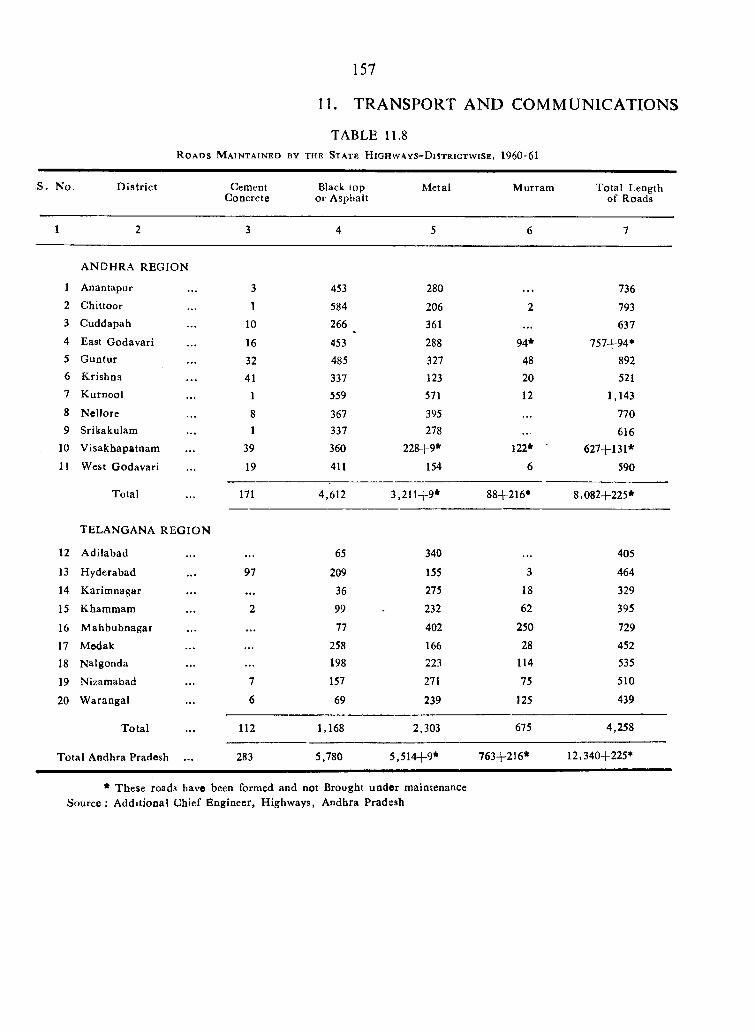
157
11. TRANSPORT A N D COMMUNICATIONS
TABLE 11.8R o a d s M a i n t a i n e d b y t h e S t a t e H i g h w a y s - D i s t r i c t w i s e , 1960-61
S . N o. D istric t CementConcrete
Black top or Asphalt
M etal M urram Total Length of Roads
1 2 3 4 5 6 7
A NDHRA R EG IO N
1 Anantapur 3 453 280 . . . 7362 Chittoor 1 584 206 2 7933 Cuddapah 10 266 ^ 361 . . . 6374 East G odavari 16 453 288 94* 757+94*5 G untur 32 485 327 48 8926 K rishna 41 337 123 20 5217 K urnool 1 559 571 12 1,1438 N ellore 8 367 395 . . . 7709 Srikakulam 1 337 278 616
10 V isakhapatnam 39 360 228+9* 122* • 627+131*11 West G odavari 19 411 154 6 590
Total 171 4,612 3,2!l-i-9* 88+216* 8,082+225*
TELANGANA R E G IO N
12 A dilabad . . . 65 340 405
13 H yderabad 97 209 155 3 464
14 K arim nagar . . . 36 275 18 329
15 Khammam 2 99 232 62 395
16 M ahbubnagar 77 402 250 729
17 Modak . . . 258 166 28 452
18 Nalgonda 198 223 114 535
19 Nizamabad 7 157 271 75 510
20 W arangal 6 69 239 125 439
T otal 112 1,168 2,303 675 4,258
T otal Andhra Pradesh 283 5,780 5,514+9* 763+216* 12,340+225*
* These roads have been formed and not Brought u ad e r maintenance S ource: A dditional Chief Engineer, H ighways, Andhra Pradssh
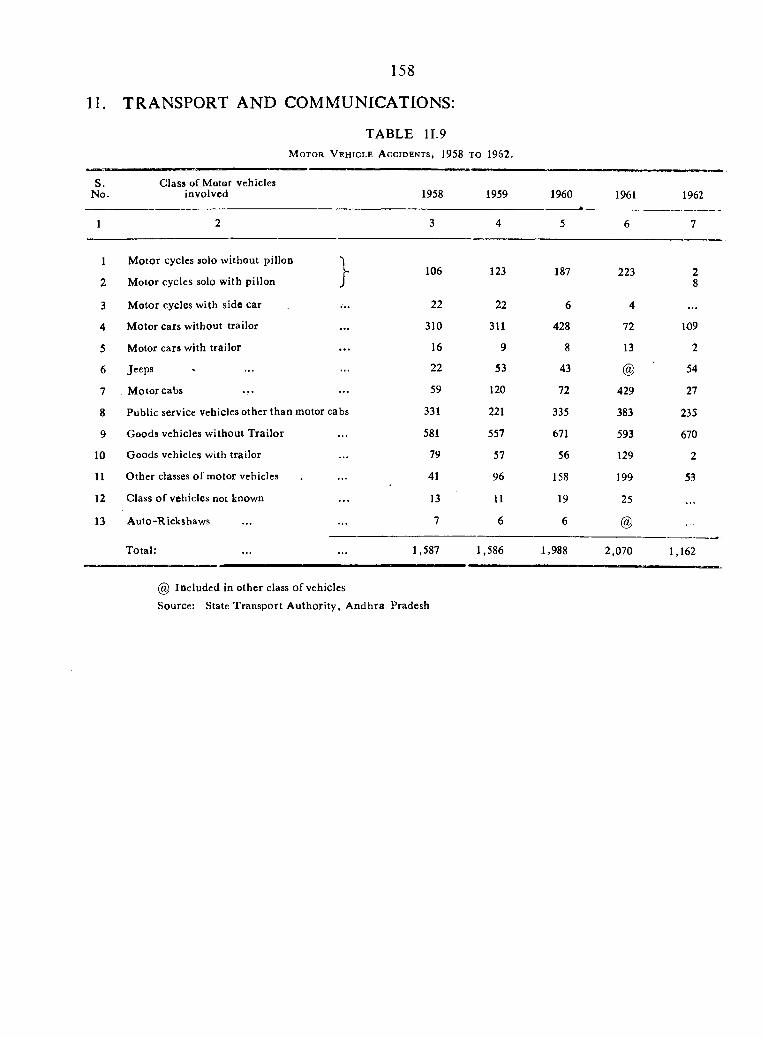
TABLE 11.9
158
11. TRANSPORT A N D COMMUNICATIONS:
M o t o r V e h i c l e A c c i d e n t s , 1958 TO 1962.
S. Class of Motor vehiclesNo. involved 1958 1959 1960
*1961 1962
1 2 3 4 5 6 7
1 M otor cycles solo w ithout pillon106 123 187 i223 2
2 M otor cycles solo with pillon J 8
3 M otor cycles w ith side car 22 22 6 4 ...4 M otor cars w ithout trailor 310 311 428 72 109
5 Motor cars with trailor 16 9 8 13 2
6 Jeeps 22 53 43 @ 54
7 M otor cabs 59 120 72 429 27
8 Public service vehicles other than motor cabs 331 221 335 383 235
9 Goods vehicles w ithout T railor 581 557 671 593 670
10 Goods vehicles with trailor 79 57 56 129 2
11 O ther classes o f motor vehicles 41 96 158 199 53
12 Class o f vehicles not known 13 11 19 25
13 Auto-Rickshaws 7 6 6 @
Total; 1,587 1,586 1,988 2,070 1,162
@ Included in other class o f vehicles
Source: State T ransport A uthority , A ndhra Pradesh
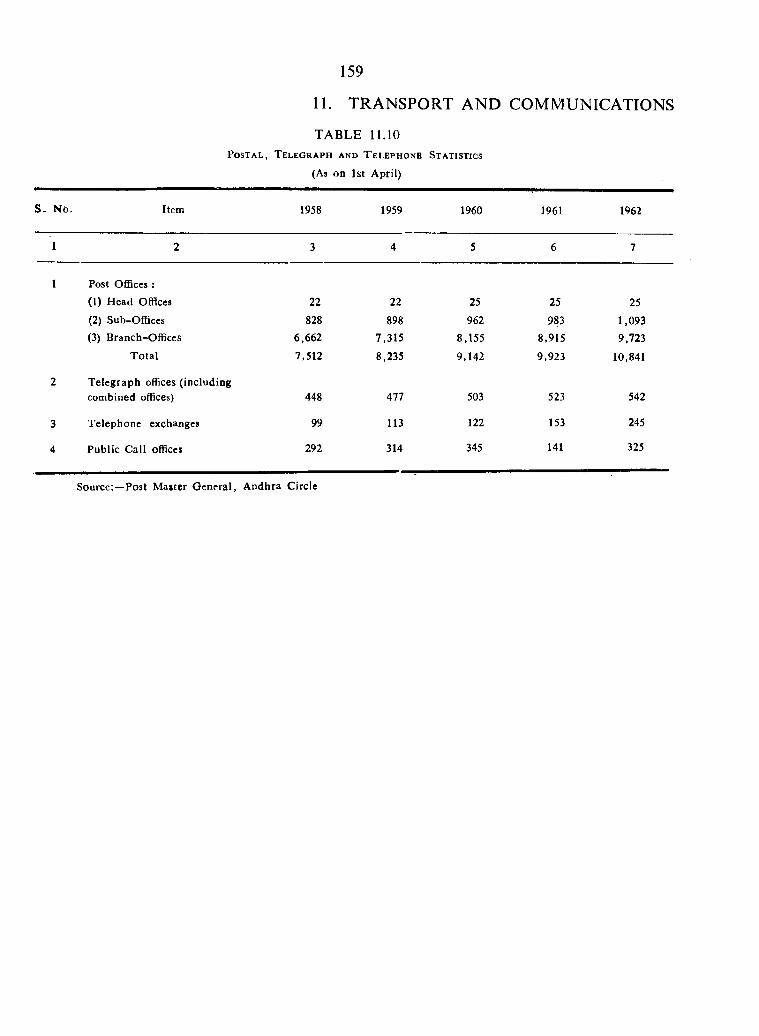
159
11. TRANSPORT AND COMMUNICATIONS
TABLE 11.10 P o s t a l , T e l e g r a p h a n d T e l e p h o n e S t a t i s t i c s
(As on 1st April)
S- N b. Item 1958 1959 1960 1961 1962
1 2 3 4 5 6 7
1 Post OflBces ;
(1) Head Offices 22 22 25 25 25(2) Sub-Offices 828 898 962 983 1,093(3) Branch-Offices 6,662 7,315 8,155 8,915 9,723
T ota l 7,512 8,235 9,142 9,923 10,841
2 T elegraph offices (including combined offices) 448 477 503 523 542
3 Telephone exchanges 99 113 122 153 245
4 Public Call offices 292 314 345 141 325
Source:—Post M atter G eneral, A ndhra Circle
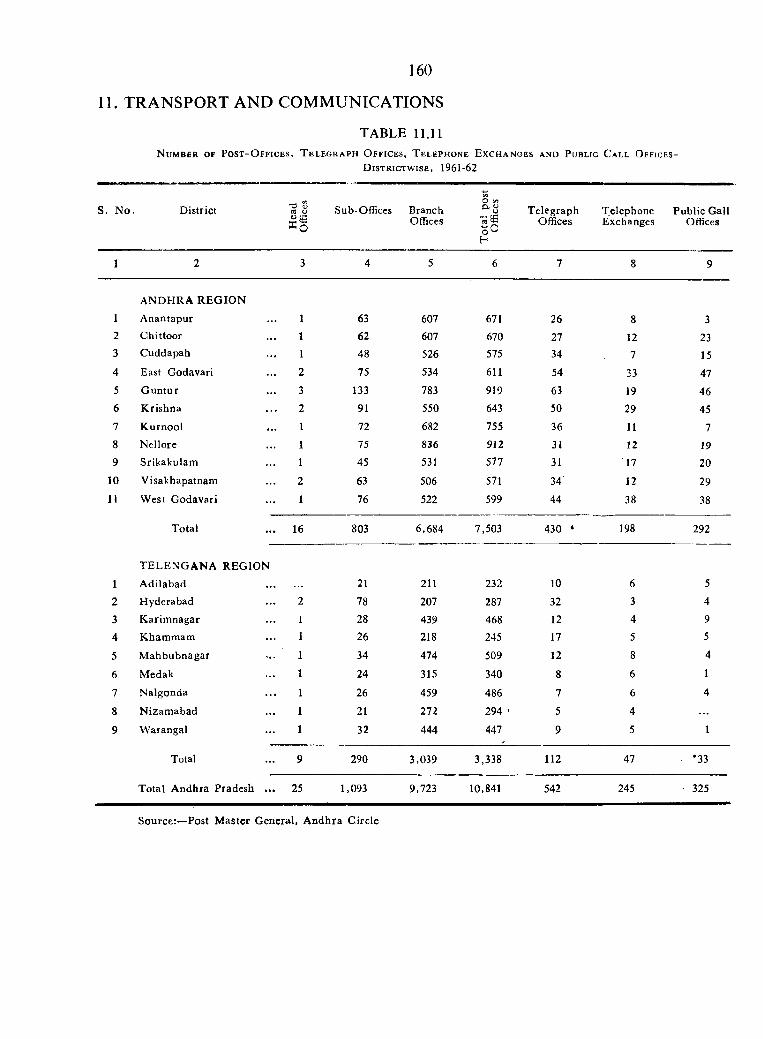
TABLE 11.11N u m b e r o f P o s t - O f f i c e s , T e l e g r a p h O f f i c e s , T e l e p h o n e E x c h a n g e s a n d P u b l i c C a l l O f f i c e s -
D i s t r i c t w i s e , 1961-62
160
11. TRANSPORT AND COMMUNICATIONS
S. N o. DistrictX q
Sub-Offices BranchOffices
Oa w
oOH
TelegraphOffices
TelephoneExchanges
Public Gall Offices
1 2 3 4 5 6 7 8 9
1
ANDHRA R EG IO N
A nantapur 1 63 607 671 26 8 32 Ghittoor 1 62 607 670 27 12 233 Cuddapah 1 48 526 575 34 7 154 East Godavari 2 75 534 611 54 33 475 G untur 3 133 783 919 63 19 466 K rishna 2 91 550 643 50 29 457 K urnool 1 72 682 755 36 11 78 Nellore 1 75 836 912 31 12 19
9 Srikakulam 1 45 531 577 31 17 20
10 Visakhapatnam 2 63 506 571 34' 12 29
11 W est Godavari 1 76 522 599 44 38 38
Total 16 803 6,684 7,503 430 • 198 292
1
T ELEX G A N A REGION
A dilabad 21 211 232 10 6 5
2 Hyderabad 2 78 207 287 32 3 4
3 Karim nagar 1 28 439 468 12 4 9
4 Kham m am 1 26 218 245 17 5 5
5 M ahbubnagar 1 34 474 509 12 8 4
6 Medak 1 24 315 340 8 6 1
7 Nalgonda 1 26 459 486 7 6 4
8 N izam abad 1 21 272 294 ' 5 4
9 W'arangal 1 32 444 447 9 5 1
Total 9 290 3,039 3,338 112 47 *33
Total A ndhra Pradesh ... 25 1,093 9,723 10,841 542 245 ’ 325
Source:—Post M aster G eneral, A ndhra Circle
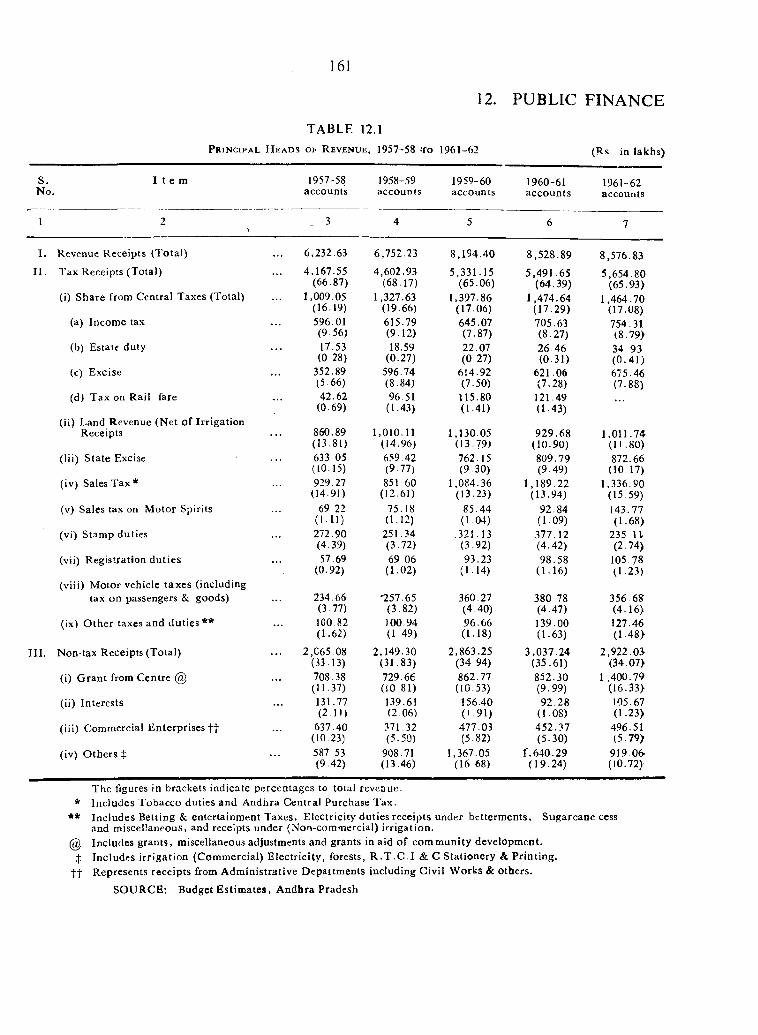
161
12. PUBLIC FINANCE
TABLE 12.1P r i n c i p a l H e a d s o f R e v e n u e , 1957-58 -t o 1961-62 (Rs i n lakhs)
S, I t e m No.
1957-58accounts
1958-59accounts
1959-60accounts
1960-61accounts
1961-62accounts
1 2>
3 4 5 6 7
I. Revenue Receipts (T otal) 6,232.63 6,752.23 8,194.40 8,528.89 8.576.83I I . Tax Receipts (Total) 4,167.55 4,602.93 5,331.15 5,491.65 5,654.80
(66.87) (68.17) (65.06) (64.39) (65.93)( i ) Share from Central Taxes (Total) 1,009.05 1,327.63 1,397.86 1,474.64 1,464.70
(16.19) (19.66) (17.06) (17.29) (17.08)(a) Income tax 596.01 615.79 645.07 705.63 754.31
(9.56) (9.12) (7.87) (8.27) (8.79)(b) Estate duty 17.53 18.59 22.07 26 46 34 93
(0 28) (0.27) (0.27) (0.31) (0 .41 )(c) Excise 352.89 596.74 614.92 621.06 675.46
(5 66) (8.84) (7.50) (7.28) (7.88)(d) Tax o n Rail fare 42.62 96.51 115.80 121.49
(0.69) (1-43) (1-41) (1.43)(ii) Land Revenue (N et of Irrigation
Receipts 860.89 1,010.11 1,130 05 929.68 1,011.74(13.81) (14.96) (13.79) (10.90) (11.80)
(lii) S tate Excise 633 05 659.42 762.15 809.79 872.66(10.15) (9.77) (9.30) (9.49) (10.17)
( i v ) Sales T ax* 929.27 851.60 1,084.36 1,189.22 1,336.90(14.91) (12.61) (13.23) (13.94) (15.59)
(v) Sales tax on M otor Spirits 69.22 75.18 85.44 92.84 143.77(1 .11) (1.12) (1 04) (1.09) (1.68)
(vi) Stamp duties 272.90 251.34 .321.13 377.12 2 3 5 .l t(4.39) (3.72) (3.92) (4.42) (2.74)
(vii) Registration du ties 57.69 69 06 93.23 98.58 105.78(0.92) (1.02) (1.14) (1-16) (1.23)
(viii) M otor vehicle taxes (includingtax on passengers & goods) 234.66 *257.65 360.27 380 78 356.68
(3.77) (3.82) (4.40) (4.47) (4.16)(ix) O ther taxes and duties ** 100.82 100.94 96.66 139.00 127.46
(1.62) (1.49) (1.18) (1.63) (1 48)
II I . Non tax Receipts (Total) 2,C65.08 2,149.30 2,863.25 3,037.24 2,922.03-(33.13) (31.83) (34 94) (35.61) (34.07)
(i) G ran t from Centre @ 708.38 729.66 862.77 852.30 1 ,400.79(11.37) (iO 81) (10.53) (9.99) (16.33)
(ii) Interests 131.77 139.61 156.40 92.28 105.67(2 H) (2.06) (1.91) (1.08) (1.23)
(iii) Commercial Enterprises f t 637 40 371.32 477.03 452.37 496.51(10.23) (5.50) (5.82) (5.30) (5.79)
( i v ) O thers t 587 53 908.71 1,367.05 f , 640.29 919 06(9.42) (13.46) (16 68) (19.24) (10.72)
The figures in brackets indicate percentages to total revenue. * Includes Tobacco duties and Andhra C entral Purchase Tax.
** Includes Betting & entertainm ent Taxes, Electricity duties receipts under betterm ents. Sugarcane cess and raisceHaneouS, and receipts under (Noa-comrncrcial) irrigation .
@ Includes grants, miscellaneous adjustments and grants in aid o f com m unity developm ent.X Includes irrigation (Com m ercial) E lectricity , forests, R .T .C .I & C Stationery & Printing,
t t R epresents receipts from A dm inistrative Departm ents including Civil W orks & others.
SO U R C E: Budget E stim ates, A ndhra Pradesh
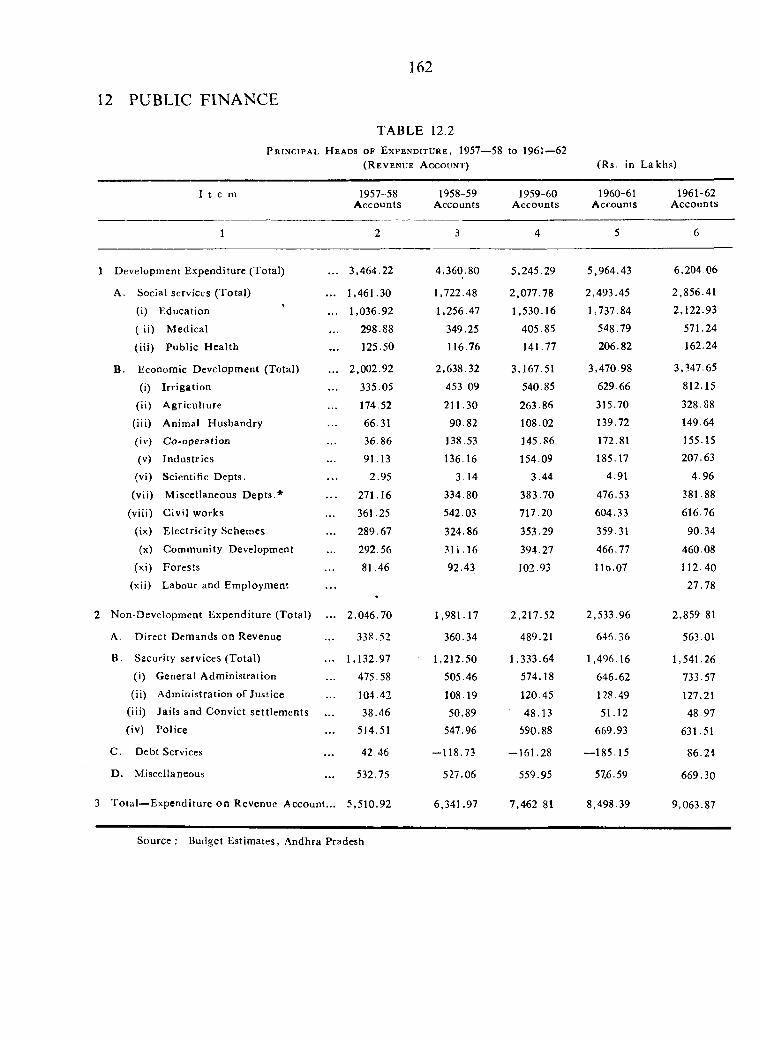
162
12 PUBLIC FINANCE
TABLE 12.2P r i n c i p a l H e a d s o f E x p e n d i t u r e , 1957—58 to 1961—62
( R e v e n u e A c c o u n t ) (Rs. in L akhs)
I t e m 1957-58A ccounts
1958-59Accounts
1959-60Accounts
1960-61Accounts
1961-62A ccounts
1 Development Expenditure (Total)
A. Social services (T otal)
(i) Education
( ii) M edical
(iii) Public H ealth
B. Economic Development (Total)(I) Irrigation
(ii) A griculture
(iii) Animal H usbandry
(iv') C o-opera t ion
(v) Industries
(vi) Scientific Depts.
(vii) M iscellaneous D ep ts.*
(viii) C ivil works
(ix) E lectricity Schemes
(x) Community Development
(xi) Forests
(xii) Labour and Employment
2 Non-Development E xpenditure (Total)
A. D irect Demands on Revenue
B. Security services (Total)
(i) G eneral Adm inistration
(ii) Administration of Justice
(iii) Jails and Convict settlem ents
(iv) Police
C . Debt Services
D. Miscellaneous
3 T o ta l—Expenditure on Revenue Account
3,464.22
1,461.30
1.036.92
298.88
125.50
2.002.92
335.05
174.52
66.31
36 86
91 13
2.95
271.16
361.25
289.67
292.5681.46
2,046.70
33P.52
1,132.97
475.58
104.4238.46
514.51
42.46
532.75
5.510.92
4,360.80
1,722.48
1,256.47
349.25
116.76
2,638.32
453 09
211.30 90.82
138.53
136.16
3 14
334.80
542.03
324.86
-M l.16
92.43
1,981.17
360.34
1,212.50
505.46
108.1950.89
547.96
-1 1 8 .7 3
527.06
6,341.97
5,245.29
2,077.78
1,530.16
405.85
141.77
3,167.51
540.85
263.86
108.02145.86
154.09
3.44
383.70
717.20
353.29
394.27
102.93
2,217.52
489.21
1,333.64
574.18
120.45
48.13590.88
-1 6 1 .2 8
559.95
7,462.81
5,964.43
2,493.45
1,737.84
548.79206.82
3,470.98
629.66
315.70
139.72
172.81
185.17
4.91
476.53
604.33
359.31
466.77
l i t ) .07
2,533.96
646.36
1,496.16
646.62
128.4951.12
669.93
— 185.15
57,6.59
8,498.39
6,204 06
2,856.41
2,122.93
571.24
162.24
3,347.65
812.15
328.88
149.64
155.15 207.63
4.96
381.88
616.76
90.34
460.08
112.40
27.78
2,859 81
563.01
1,541.26
733.57
127.2148.97
631.51
86.24
669.30
9,063.87
Source ; Budget Estimates, .Andhra Pradesh
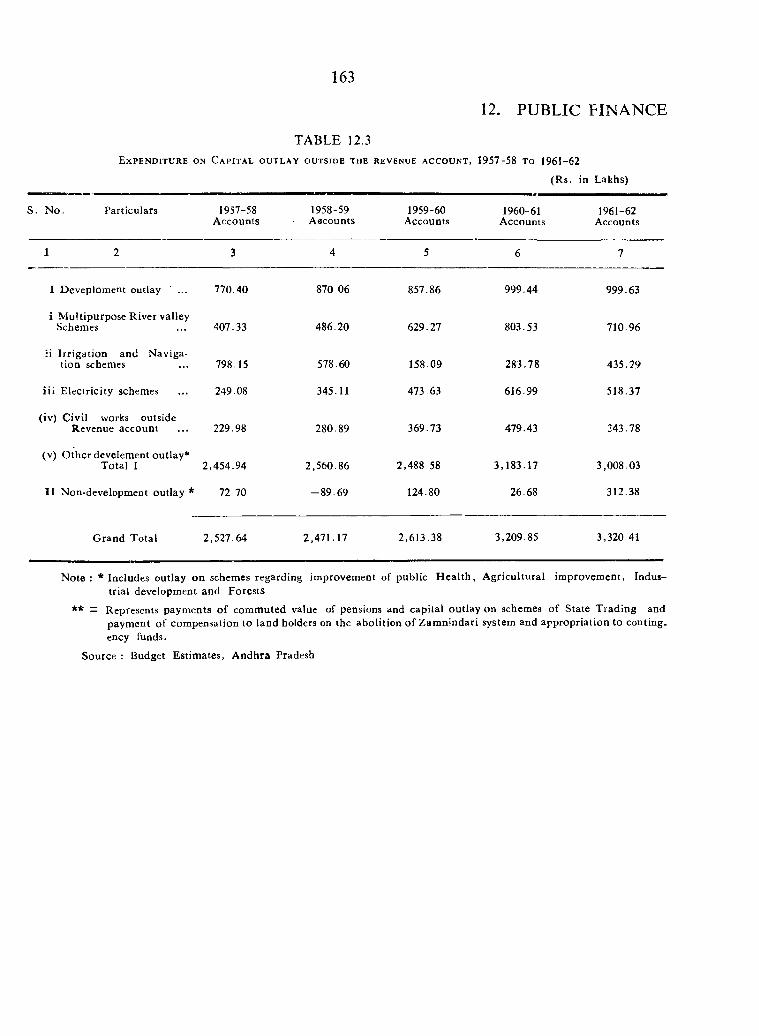
163
12. PUBLIC FINANCE
TABLE 12.3E x p e n d i t u r e o n C a p i t a l o u t l a y OUTSIDE THE REVENUE A C C O U N T, 1957-58 TO 1961-62
(Rs. in Lakhs)
S. N o. Particulars 1957-58Accounts
1958-59Aecounts
1959-60Accounts
1960-61Accounts
1961-62Accounts
1 2 3 4 5 6 7
I Deveploment outlay ' ... 770.40 870 06 857.86 999.44 999.63
i M ultipurpose River valley Schemes 407.33 486.20 629.27 803.53 710.96
ii Irrigation and N avigation schemes 798.15 578.60 158.09 283.78 435.29
ii i Electricity schemes 249.08 345.11 473.63 616.99 518.37
(iv) Civil works outside Revenue account 229.98 280.89 369.73 479.43 343.78
(v) O ther develement outlay*Total I 2,454.94 2,560.86 2,488.58 3,183.17 3,008.03
I I Non-development outlay * 72.70 -8 9 .6 9 124.80 26.68 312.38
G rand Total 2,527.64 2,471.17 2,613.38 3,209.85 3,320.41
N o te : * Includes outlay on schemes regarding improvement of public H ea lth , A gricultural iraprovem ent, Industrial development and Forests
** — Represents payments o f comm uted value of pensions and capital outlay on schemes o f State T rading and paym ent o f compensation to land holders on the abolition of Zam nindari system and appropriation to conting. ency funds.
Source : Budget Estimates, A ndhra Pradesh
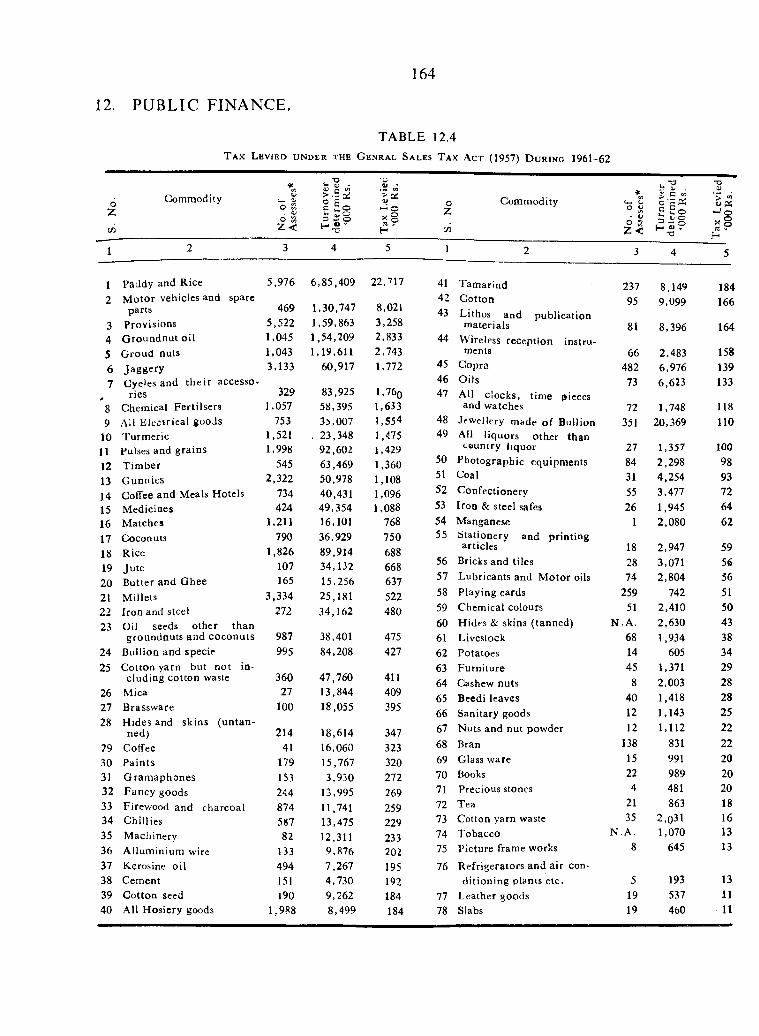
164
12. PUBLIC FINANCE.
TABLE 12.4T a x L e v i e d u n d e r t h e G e n r a l S a l e s T a x A c t (1957) D u r i n g 1961-62
oZ
Commodity*u
o 52 . w o 2? Z <
.>-S;2
3 “ O H
i tn■> a:<u1 - 1 o ^ o
-
oZC/D
Commodity*
<— 4j O• V
►5 " Z <
c pK
T3lUo «
1 2 3 4 5 1 2 3 4 5
1 Paddy and Rice 5,976 6,85,409 22,717 41 Tam arind 237 8,149 1842 M otor vehicles and spare
1,30,747 8,02142 Cotton 95 9,099 166parts 469 43 Lithos and publication
3 Provisions 5,522 1,59,863 3,258 materials 81 8,396 1644 G roundnut oil 1,045 1,54,209 2,833 44 Wireless reception instru5 G roud nuts 1,043 1,19,611 2,743 ments 66 2,483 1586 Jaggery 3,133 60,917 1,772 45 Copra 482 6,976 1397 Cycles and th e ir accesso 46 Oils 73 6,623 133
# ries 329 83,925 l,76o 47 All clocks, time pieces8 Chemical Fertilsers 1,057 58,395 1,633 and watches 72 1,748 1189 All E lectrical goods 753 33,007 1,554 48 Jewellery made o f Bullion 351 20,369 110
10 Turm eric 1,521 . 23,348 1.475 49 All liquors other than11 Pulses and grains 1,998 92,602 1,429
50country liquor 27 1,357 100
12 Tim ber 545 63,469 1,360 Photographic equipments 84 2,298 98
13 G unnies 2,322 50,978 1,108 51 Coal 31 4,254 93
14 Coffee and Meals Hotels 734 40,431 1,096 52 Confectionery 55 3,477 72
15 Medicines 424 49,354 1,088 53 Iron & steel safes 26 1,945 64
16 M atches 1,211 16,101 768 54 Manganese 1 2,080 6217 Coconuts 790 36,929 750 55 Stationery and printing
18 2,947 5918 Rice 1,826 89,914 68856
articles
19 Ju te 107 34,132 668 Bricks and tiles 28 3,071 56
20 Butter and Ghee 165 15.256 637 57 Lubricants and M otor oils 74 2,804 56
21 Millets 3,334 25,181 522 58 Playing cards 259 742 51
22 Iron and steel 272 34,162 480 59 Chemical colours 51 2,410 50
23 Oil seeds other than 60 Hides & skins (tanned) N .A . 2,630 43groundnuts and coconuts 987 38,401 475 61 Livestock 68 1,934 38
24 Bullion and specie 995 84,208 427 62 Potatoes 14 605 3425 Colton yarn but not in 63 Furniture 45 1,371 29
cluding cotton waste 360 47,760 411 64 Cashew nuts 8 2,003 2826 Mica 27 13,844 409 65 Becdileaves 40 1,418 2827 Brassware 100 18,055 395 66 Sanitary goods 12 1,143 2528 Hides and skins (un tan
ned) 214 18,614 347 67 Nuts and nut powder 12 1,112 22
29 Coffee 41 16,060 323 68 Bran 138 831 22
30 Paints 179 15,767 320 69 Glass ware 15 991 20
31 G ram aphones 153 3,930 272 70 Books 22 989 2032 Fancy goods 244 13,995 269 71 Precious stones 4 481 20
33 Firew'ood and charcoal 874 11,741 259 72 Tea 21 863 1834 Chillies 587 13,475 229 73 Cotton yarn waste 35 2,031 16
35 Machinery 82 12,311 233 74 Tobacco N .A . 1,070 13
36 A ilum inium wire 133 9,876 202 75 Picture frame works 8 645 13
37 Kerosine oil 494 7,267 195 76 Refrigerators and air con38 Cement 151 4,730 192 ditioning plants etc. 5 193 1339 Cotton seed 190 9,262 184 77 Leather goods 19 537 1140 All Hosiery goods 1,988 8,499 184 78 Slabs 19 4b0 11
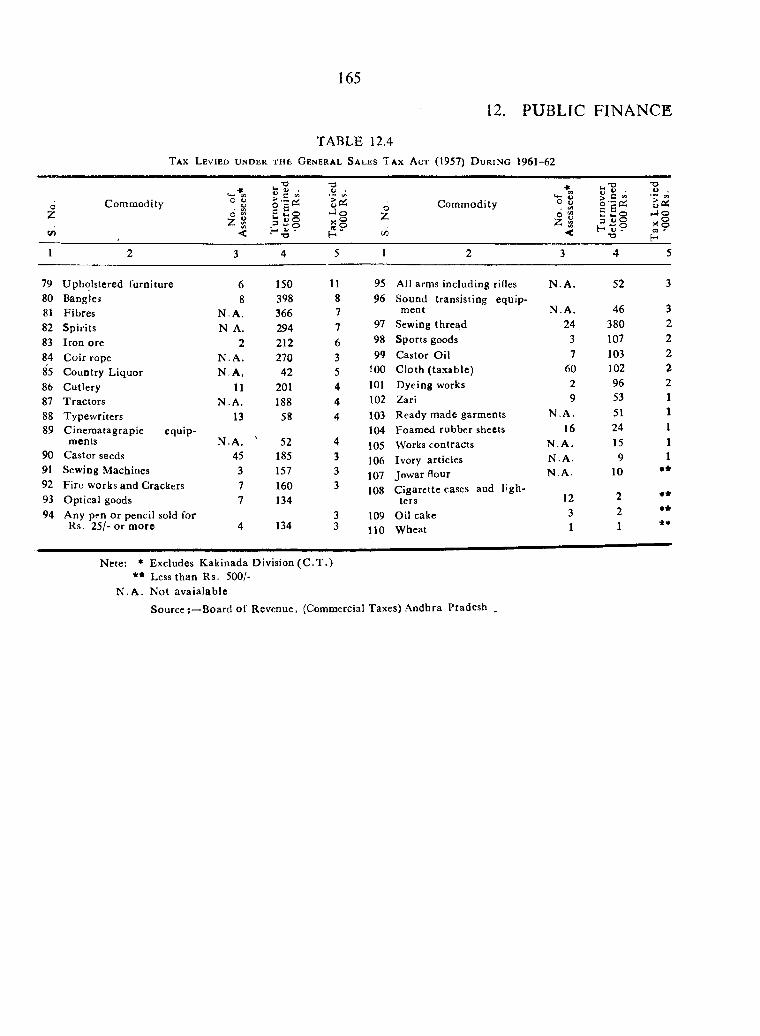
165
12. PUBLIC FINANCE
TABLE 12.4T a x L e v i e d u n d e r t h e G e n e r a l S a l e s T a x A c t (1957) D u r i n g 1961-62
CommodityC cn
O g « £o B S
Spi1-1 O^ ok 9H
Comm odity l l f Ih W O3 2
13
^05►JO><8COH
1 2 3 4 5 1 2 3 4 5
79 Upholstered furniture 6 150 11 95 All arms including rifles N .A . 52 380 Bangles 8 398 8 96 Sound transisting equip
4681 Fibres N .A . 366 7 ment N .A . 3
82 Spirits N A. 294 7 97 Sewing thread 24 380 2
83 Iron ore 2 212 6 98 Sports goods 3 107 2
84 C oir rope N .A . 270 3 99 Castor O il 7 103 2
85 Country Liquor N .A . 42 5 !00 C loth (taxable) 60 102 2
86 Cutlery 11 201 4 101 Dyeing works 2 96 2
87 Tractors N .A . 188 4 102 Zari 9 53 1
88 Typewriters 13 58 4 103 Ready m ade garments N .A . 51 1
89 C inem atagrapic equip 104 Foamed rubber sheets 16 24 1ments N .A . 52 4 105 Works contracts N .A . 15 1
90 Castor seeds 45 185 3 106 Ivory articles N .A . 9 191 Sewing Machines 3 157 3 107 Jowar flour N .A . 10 **92 Fire works and Crackers 7 160 3 108 C igarette cases and ligh
1293 O ptical goods 7 134 ters 2
94 Any pen O r pencil sold for 3 109 Oil cake 3 2 vw
Rs. 2 5 /-o r m ore 4 134 3 110 Wheat 1 1
Nfcte: * Excludes K akinada Division (C .T .)** Less than Rs. 500/-
N .A . N ot avaia lableSource'.—Board o f Revenue, (Commercial Taxes) Andhra Pradesh .
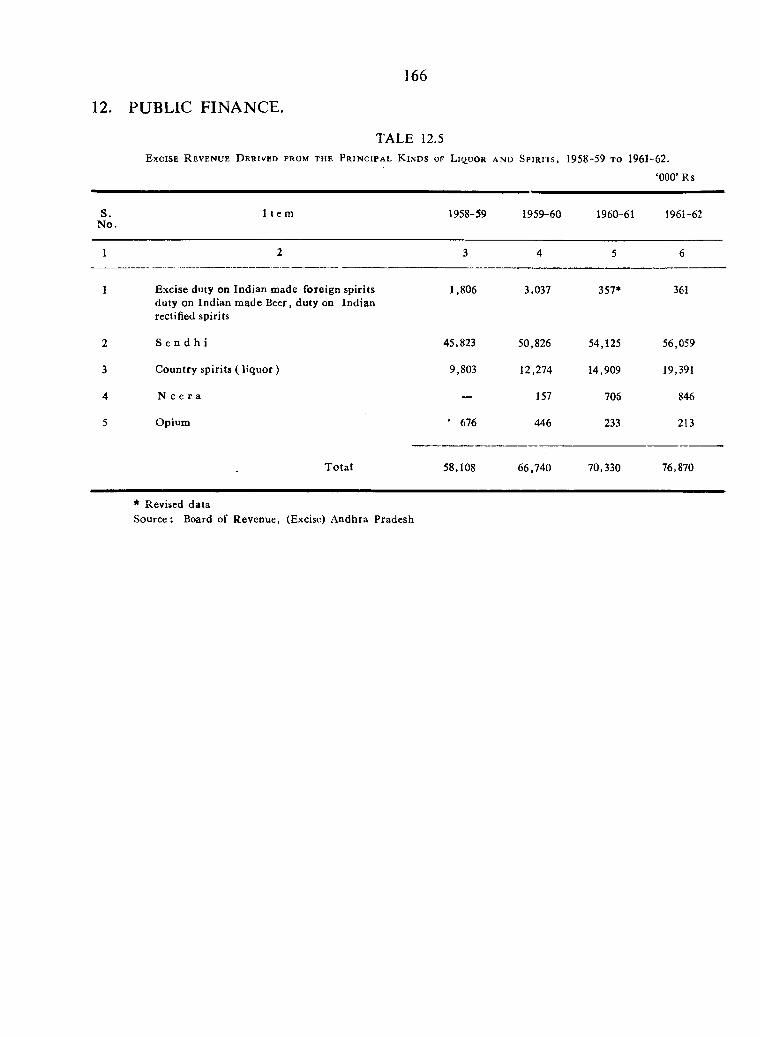
166
12. PUBLIC FINANCE.
TALE 12.5E x c i s e R e v e n u e D e r i v e d f r o m t h e P r i n c i p a l K i n d s OF L i q u o r A N D S p i r i t s , 1958-59 TO 1961--62.
‘000’ Rs
S.N o.
I t e m 1958-59 1959-60 1960-61 1961-62
1 2 3 4 5 6
1 Excise duty on Ind ian made foreign spirits duty on Indian made Beer, duty on Indian rectified spirits
1,806 3,037 357* 361
2 S e n d h i 45,823 50,826 54,125 56,059
3 C ountry spirits ( liq u o r) 9,803 12,274 14,909 19,391
4 N e e r a — 157 706 846
5 Opium • 676 446 233 213
T o ta l 58,108 66,740 70,330 76,870
* Revised dataSource : Board of Revenue, (Excise) A ndhra Pradesh
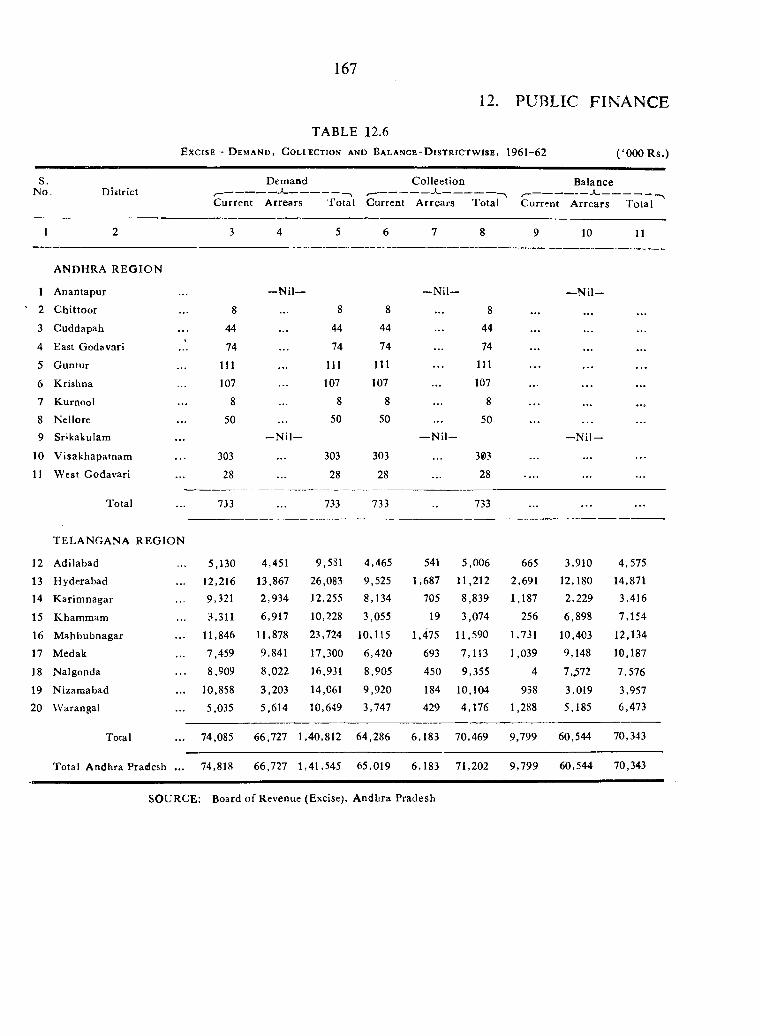
167
12. PUBLIC FINANCE
TABLE 12.6E x c i s e - D e m a n d , C o l i e c t i o n a n d B a l a n c e - D i s t r i c t w i s e , 1 9 6 1 -6 2 ( ‘000 Rs.)
S.ISfo District
C urrent
Demandj _
A rrears T otal Current
C ollection
A rrears Total C urr'
Balance
?nt A rrears T otal"^
1 2 3 4 5 6 7 8 9 10 11
ANDHRA R E G IO N
1 Anantapur - N i l — —Nil- —N i l -2 C hittoor 8 . . . 8 8 . . . 8 . . . . . . . . .
3 Cuddapah 44 . . . 44 44 . . . 44 . . .
4 East Godavari 74 ... 74 74 ... 74 ... ...
5 G untur 111 111 111 111 ... ... . . .
6 Krishna 107 107 107 ... 107 ... .. . ...
7 Kurnool 8 8 8 8
8 Nellore 50 ... 50 50 50 ... . . .
9 Srikakuiam - N i l - — N il- - N i l -
10 Visakhapatnam 303 303 303 303 ...
11 W est Godavari 28 28 28 28 ... .
Total 733 733 733 733 ...
TELA NG AN A R E G IO N
12 Adilabad 5,130 4,451 9,531 4,465 541 5,006 665 3,910 4,575
13 Hyderabad 12,216 13,867 26,083 9,525 1,687 11,212 2,691 12,180 14,871
14 K arim nagar 9,321 2,934 12,255 8,134 705 8,839 1,187 2,229 3,416
15 Khammam 3,311 6,917 10,228 3,055 19 3,074 256 6,898 7,154
16 M ahbubnagar 11,846 11,878 23,724 10,115 1,475 11,590 1,731 10,403 12,134
17 M e d a k 7,459 9,841 17,300 6,420 693 7,113 1,039 9,148 10,187
18 Nalgonda 8,909 8,022 16,931 8,905 450 9,355 4 7,.572 7,576
19 Nizamabad 10,858 3,203 14,061 9,920 184 10,104 938 3,019 3,957
20 Warangal 5,035 5,614 10,649 3,747 429 4,176 1,288 5,185 6,473
Total 74,085 66,727 1,40,812 64,286 6,183 70,469 9,799 60,544 70,343
Total Andhra Pradesh ... 74,818 66,727 1,41,545 65,019 6,183 71,202 9,799 60,544 70,343
SOURCE: Board o f Revenue (Excise), A ndhra Pradesh
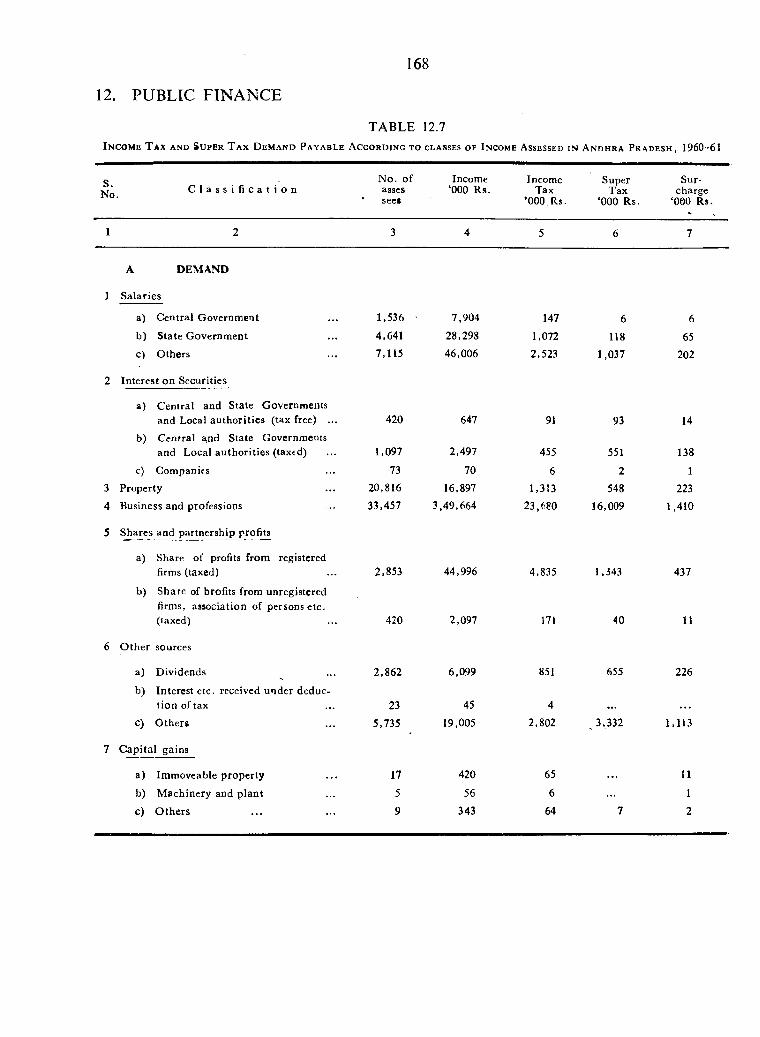
168
12. PUBLIC FINANCE
T A B L E 12.7
I n c o m e T a x a n d S u p e r T a x D e m a n d P a y a b l e A c c o r d i n g t o c l a s s e s o f I n c o m e A s s e s s e d i n A n d h r a P r a d e s h , 1960-61
S.No C l a s s i f i c a t i o n
N o. ofassesseel
Income ‘000 Rs.
Income Tax
’000 Rs.
Super Tax
‘000 Rs.
Surcharge
‘000 Rs.
1 2 3 4 5 6 7
1
A DEMAND
Salaries
a) Central Government 1,536 7,904 147 6 6b) State Government 4,641 28,298 1,072 118 65c) Others 7,115 46,006 2,523 1,037 202
2 Interest on Securities
a) Central and State Governments and Local authorities (tax free) ... 420 647 91 93 14
b) Central a,nd State Governments and Local authorities (taxed) 1,097 2,497 455 551 138
c) Companies 73 70 6 2 13 Property 20,816 16,897 1,313 548 2234 Business and professions 33,457 3,49,664 23,680 16,009 1,410
5 Shares and partnership profits
a) Share of profits from registered firms (taxed) 2,853 44,996 4,835 1,343 437
b) Share of brofits from unregistered firms, association of persons etc. (taxed) 420 2,097 171 40 11
6 O ther sources
a) Dividends 2,862 6,099 851 655 226
b) Interest etc. received under deduction of tax 23 45 4
c) O thers 5,735 19,005 2,802 ^3,332 1,113
7 C apital gains
a) Immoveable property 17 420 65 11
b) M achinery and plant 5 56 6 1
c) O thers 9 343 64 7 2
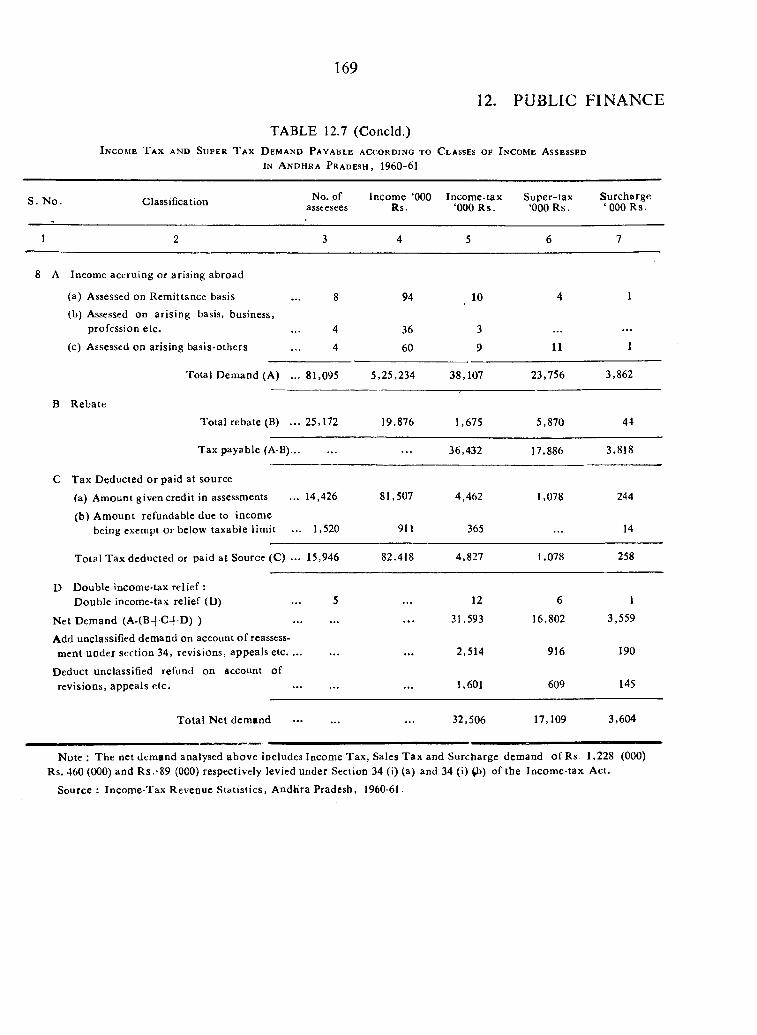
169
12. PUBLIC FINANCE
I n c o m e T a x a n d S u p e r T a x D e m a n d P a y a b l e a c c o r d i n g t o C l a s s e s o f I n c o m e A s s e s s e d
IN A n d h r a P r a d e s h , 1960-61
TABLE 12.7 (Concld.)
S. N o . Classification No. ofasscesees
Income ‘000 Rs.
Income-tax ‘000 Rs.
Super-tax ‘000 R s.
Surcharge ‘ 000 R s.
1 2 3 4 5 6 7
8 A Income accruing or arising abroad
(a) Assessed on Rem ittance basis 8 94 10 4 1
(b) Assessed on arising basis, business, profession etc. 4 36 3 • • •
(c) Assessed on arising basis-others 4 60 9 11 I
Total Demand (A) ... 81,095 5,25,234 38,107 23,756 3,862
B Rebate
Total rebate (B) ... 25,172 19,876 1,675 5,870 44
Tax payable (A-B)... . . . . . . 36,432 17,886 3,818
C Tax Deducted or paid at source(a) Amount given credit in assessments 14,426 81,507 4,462 1,078 2A4
(b) A m ount refundable due to income being exempt O r below taxable lim it 1,520 911 365 . . . 14
Total Tax deducted or paid at Source (C) ... 15,946 82,418 4,827 1,078 258
D Double income-tax relief : Double income-tax relief (D) 5 12 6 i
N et Demand (A -(B -fC + D ) ) . . . . . . 31,593 16,802 3,559
Add unclassified demand on account o f reassessment under section 34, revisions, appeals e tc . ... • • • 2,514 916 190
Deduct unclassified refund on account o f revisions, appeals etc. . . . 1,601 609 145
T ota l N et dem and . . . . . . 32,506 17,109 3,604
Note ; T he net dem and analysed above includes Income Tax, Sales T ax and Surcharge demand o f Rs 1,228 (000) Rs. 460 (000) and R s.'89 (000) respectively levied under Section 34 (i) (a) and 34 (i) ^ ) of the Incom e-tax Act.
Source : Incom e-Tax Revenue S tatistics, A ndhra Pradesh, 1960-61.
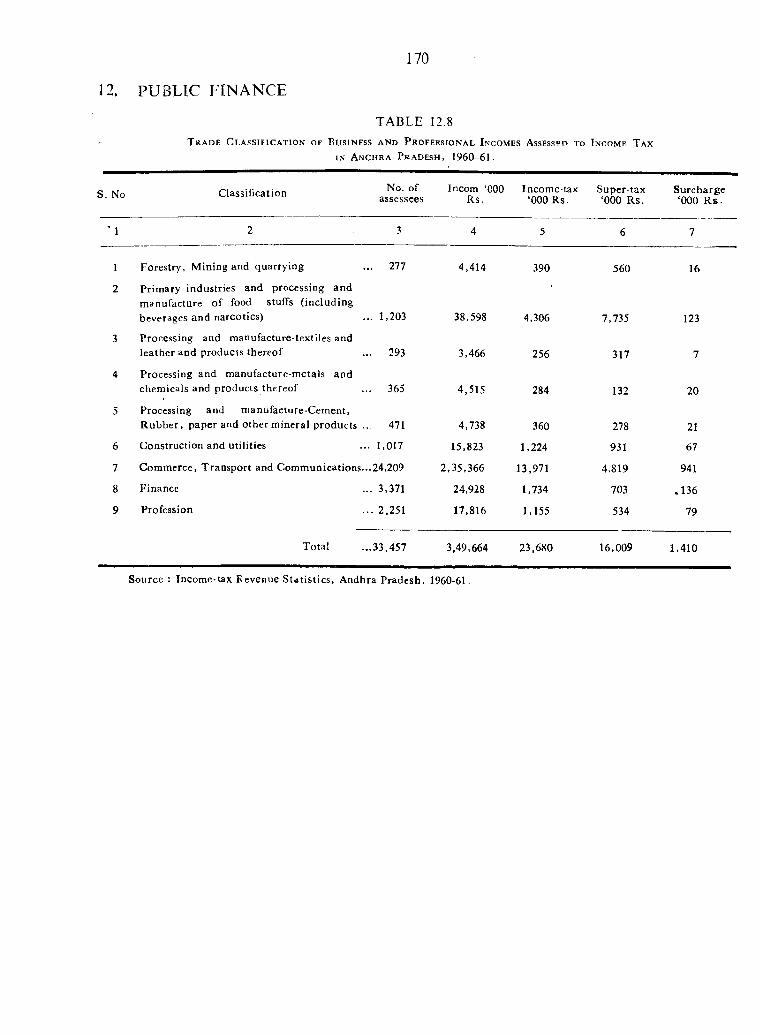
170
12. PUBLIC FINANCE
T r a d e C l a s s i f i c a t i o n o f B u s i n e s s a n d P r o f e f .s i o n a l I n c o m e s A s s e s s e d t o I n c o m e T a x
IN A n C h r a P r a d e s h , 1960-61.
TABLE 12.8
S. No. Classification No. of assessces
Incom ‘000 R s.
Income-tax ‘000 R s .
S u p ertax ‘000 R s.
Surcharge ‘000 R8 .
’ 1 2 3 4 5 6 7
1 Forestry, Mining and quarrying ... 277 4,414 390 560 16
2 Prim ary industries and processing and m anufacture o f food stuffs (including beverages and narcotics) ... 1,203 38,598 4,306 7,735 123
3 Processing and manufacture-textiles and leather and products thereof ... 293 3,466 256 317 7
4 Processing and manufacture-m ctals and chemicals and products thereof .. 365 4,515 284 132 20
5 Processing and manufacture-Cem ent, R ubber, paper and other m ineral products . 471 4,738 360 278 21
6 Construction and utilities .. 1,017 15,823 1,224 931 67
7 Commerce, T ransport and Com m unications...24,209 2,35,366 13,971 4,819 941
8 Finance ... 3,371 24,928 1,734 703 .136
9 Profession .. 2,251 17,816 1,155 534 79
Total ..33,457 3,49,664 23,680 16,009 1,410
Source : Income-tax Revenue S tdtistics, Andhra Pradesh, 1960-61.
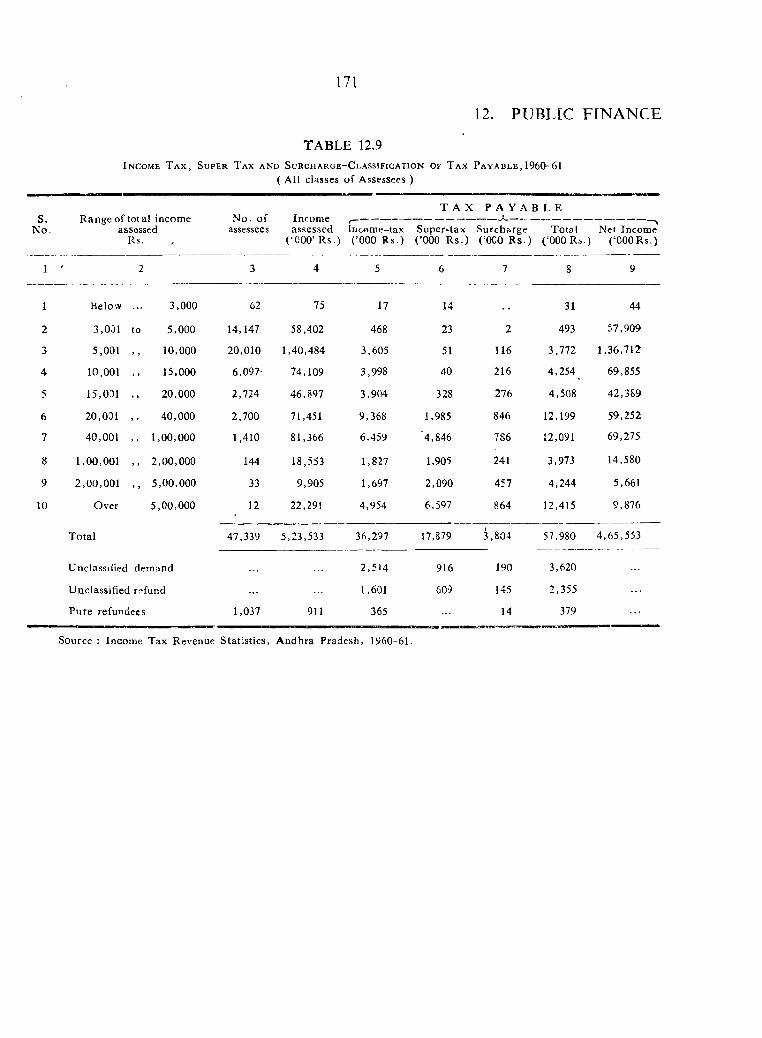
171
12. PUBLIC FINANCE
I n c o m e T a x , S u p e r T a x a n d S u r c h a r g e - C l a s s i f i c a t i o n o f T a x P a y a b l e , 1960-61( All classes of Assessees )
TABLE 12.9
S. Range of total income N o. assessed
Rs.
T A X P A Y A B L ENo. o f Income r - ---------------------------------------- ----------------------------------------
assessees assessed Income-tax Super-tax Surcharge Total Net Incomc (•OOO’ R s.) (’000 R s.) ( ’000 R s .) (‘OCO R s .) (‘OCORs.) (‘OOORs.)
1 2 3 4 5 6 7 8 9
1 Below ... 3,000 62 75 17 14 , , 31 44
2 3,001 to 5,000 14,147 58,402 468 23 2 493 57,909
3 5,001 , . 10,000 20,010 1,40,484 3,605 51 116 3,772 1,36,712
4 10,001 , , 15,000 6,097' 74,109 3,998 40 216 4,254^ 69,855
5 15,031 ,, 20,000 2,724 46,897 3,904 328 276 4,508 42,389
6 20,001 , , 40,000 2,700 71,451 9,368 1,985 846 12,199 59,252
7 40,001 , , 1,00,000 1,410 81,366 6,459 4,846 786 12,091 69,275
8 1,00,001 , , 2,00,000 144 18,553 1,827 1,905 241 3,973 14,580
9 2,00,001 , , 5,00,000 33 9,905 1,697 2,090 457 4,244 5,661
10 Over 5,00,000 12 22,291 4,954 6,597 864 12,415 9,876
Total 47,339 5,23,533 36,297 17,879 3,804 57,980 4,65,553
Unclassified demand 2,514 916 190 3,620
Unclassified rf*fund 1,601 609 145 2,355 . . .
Pure refundees 1,037 911 365 14 379
Source : Incom e Tax Revenue Statistics, Andhra Pradesh, 1960-61
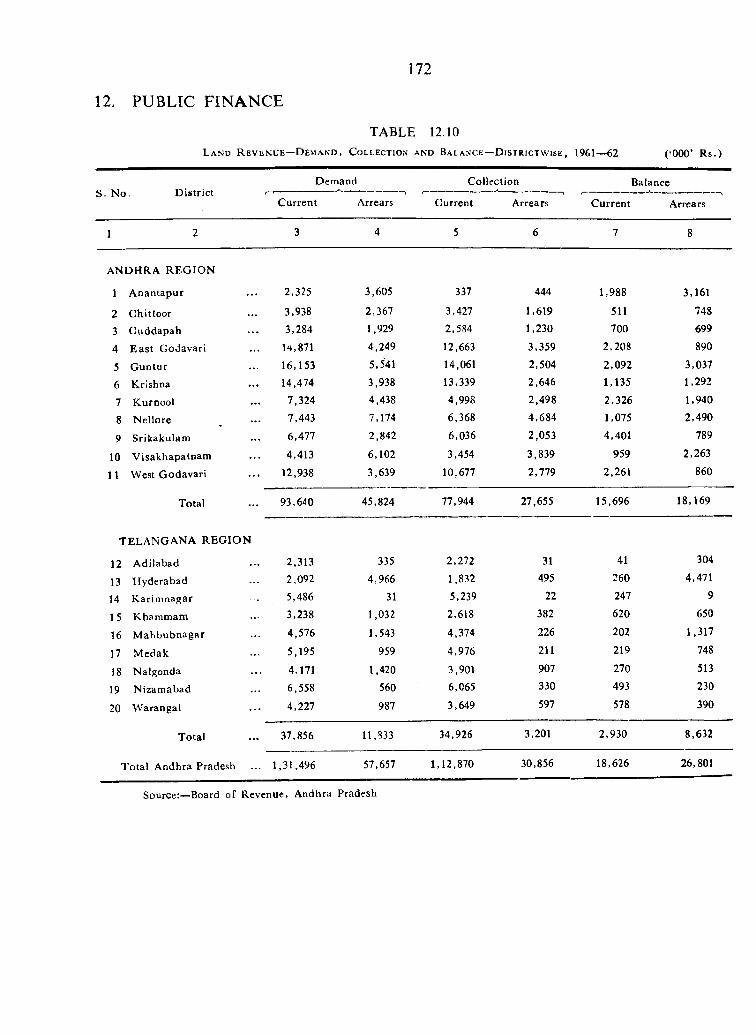
172
12. PUBLIC FINANCE
L a n d R e v e n u e — D e m a n d ,
TABLE 12.10C o l l e c t i o n a n d B a l a n c e — D i s t r i c t w i s e , 1961—62 (‘000’ R s.)
S . No D istrictDemand Collection Balance
C urrent Arrears Current Arrears C urrent- --,
Arrears
1 2 3 4 5 6 7 8
ANDHRA R EG IO N
1 A nantapur 2,325 3,605 337 444 1,988 3,161
2 C hittoor 3,938 2,367 3,427 1,619 511 748
3 C uddapah 3,284 1,929 2,584 1,230 700 699
4 E ast Godavari 14,871 4,249 12,663 3,359 2,208 890
5 G untur 16,153 5,541 14,061 2,504 2,092 3,037
6 Krishna 14,474 3,938 13,339 2,646 1,135 1,292
7 K urnool 7,324 4,438 4,998 2,498 2,326 1,940
8 N ellore 7,443 7,174 6,368 4,684 1,075 2,490
9 Srikakulam 6.477 2,842 6,036 2,053 4,401 789
10 V isakhapatnam 4,413 6,102 3,454 3,839 959 2,263
11 West G odavari 12,938 3,639 10,677 2,779 2,261 860
Total 93,640 45,824 77,944 27,655 15,696 18,169
TELA NG AN A R E G IO N
12 A dilabad 2,313 335 2,272 31 41 304
13 H yderabad 2,092 4,966 1,832 495 260 4,471
14 K arim nagar 5,486 31 5,239 22 247 9
15 K haramam 3,238 1,032 2,618 382 620 650
16 M ahbubnagar 4,576 1,543 4,374 226 202 1.317
17 M cdak 5,195 959 4,976 211 219 748
18 Nalgonda 4,171 1.420 3,901 907 270 513
19 N izam abad 6,558 560 6,065 330 493 230
20 W arangal 4,227 987 3,649 597 578 390
Total 37,856 11,833 34,926 3,201 2,930 8,632
T otal A ndhra Pradesh 1,31,496 57,657 1,12,870 30,856 18,626 26,801
Source:—Board of Revenue, Andhra Pradesh
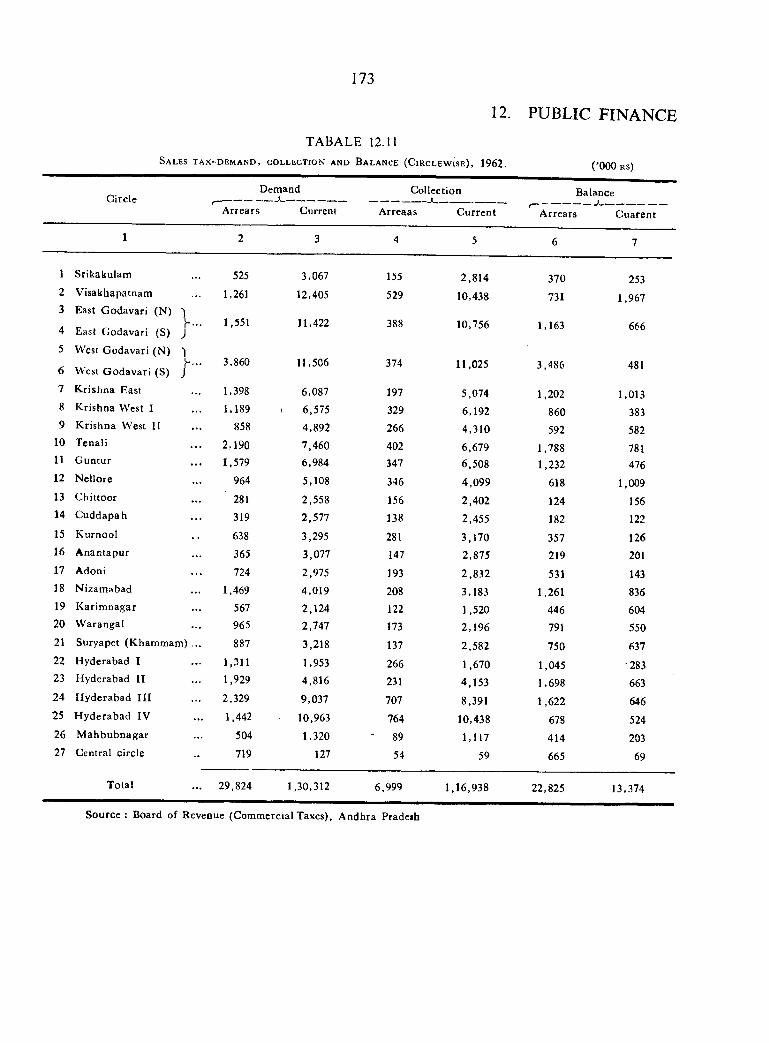
173
12. PUBLIC FINANCE
TABALE 12.11S a l e s t a x - d e m a n d , c o l l e c t i o n a n d B a l a n c e ( C i r c l e w i s e ) , 1962. (’000 RS)
CircleDemand Collection Balance_______ ____ 1 ,-----------------
ArrearsA rrears Current Arreaas C urrent C uarent
1 2 3 4 5 6 7
1 Srikakulam 525 3,067 155 2,814 370 2532 Visakhapatnam 1,261 12,405 529 10,438 731 1,9673 East G odavari (N) 'I
East Godavari (S)h ... 1,551 11,422 388 10,756 1,163 6664 J
5 West Godavari (N) 'I3,860 11,506 374 11,025 3,486 4816 West G odavari (S) J
7 K rishna East ... 1,398 6,087 197 5.074 1,202 1,0138 Krishna West I ... 1,189 1 6,575 329 6,192 860 3839 K rishna W'est U ... 858 4,892 266 4,310 592 582
10 Tenali ... 2:190 7,460 402 6,679 1,788 78111 G untur ... 1,579 6,984 347 6,508 1,232 47612 Nellore ... 964 5,108 346 4,099 618 1,00913 Chittoor ... ' 281 2,558 156 2,402 124 15614 C uddapah ... 319 2,577 138 2,455 182 12215 Kurnool 638 3,295 281 3,170 357 12616 A nantapur ... 365 3,077 147 2,875 219 20117 Adoni 724 2,975 193 2,832 531 14318 Nizam abad ... 1,469 4,019 208 3,183 1,261 83619 K arim nagar ... 567 2,124 122 1,520 446 60420 W arangal ... 965 2,747 173 2,196 791 55021 Suryapet (Khammam) ... 887 3,218 137 2.582 750 63722 Hyderabad I 1,311 1,953 266 1,670 1,045 ■28323 Hyderabad II 1,929 4,816 231 4,153 1,698 66324 H yderabad H I 2,329 9,037 707 8,391 1,622 64625 H yderabad IV ... 1,442 10,963 764 10,438 678 52426 M ahbubnagar 504 1,320 - 89 1,117 414 20327 Central circle - 719 127 54 59 665 69
Total ... 29,824 1,30,312 6,999 1,16,938 22,825 13,374
Source : Board of Revenue (Commercial Taxes), A ndhra Pradeih
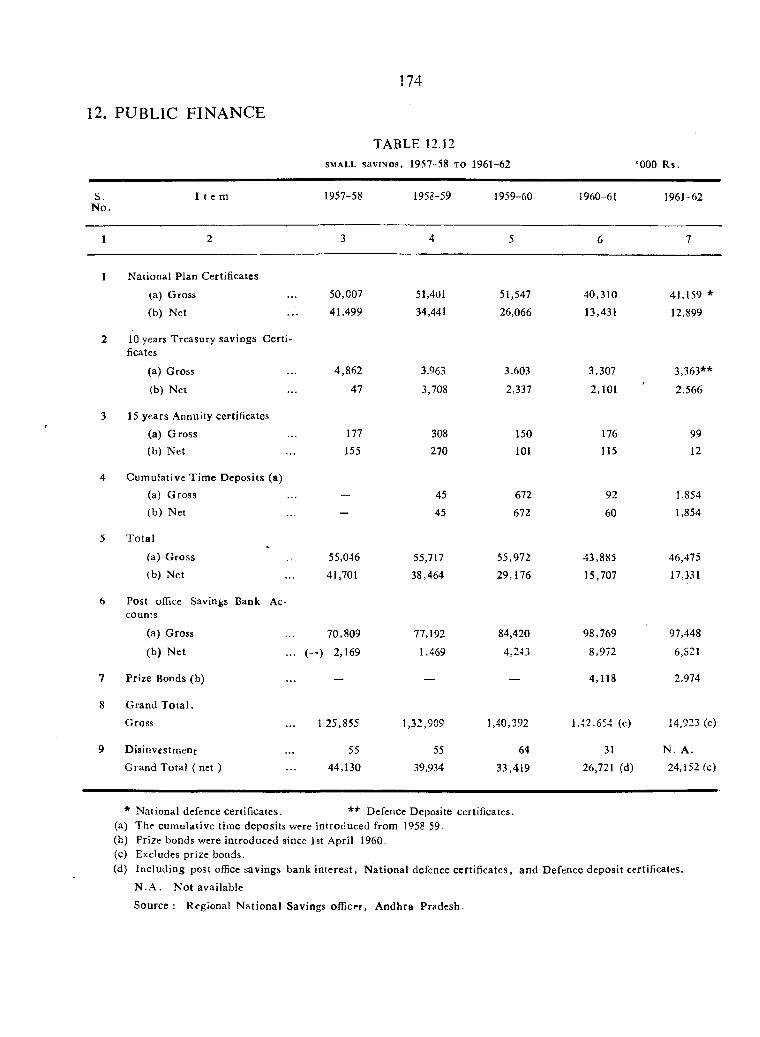
12. PUBLIC FINANCE
174
TABLE 12.12SMALL SaviN OS , 1957-58 TO 1961-62 ‘000 R s.
S.N o.
I t e m 1957-58 195S-59 1959-60 1960-61 1961-62
1 2 3 4 5 6 7
1 N ational Plan Certificates
(a) Gross 50,007 51,401 51,547 40,310 41,159 *(b) N et 41,499 34,441 26,066 13,431 12,899
2 10 years Treasury savings C ertificates
(a) Gross 4,862 3,963 3.603 3,307 3,363**
(b) N et 47 3,708 2,337 2,101 2.566
3 15 years Annuity certificates
(a) G ross 177 308 150 176 99(b) Net 155 270 101 115 12
4 C um ulative Tim e D eposits (a) (a) Gross 45 672 92 1,854(b) Net - 45 672 60 1,854
5 T o ta l
(a) G ross 55,046 55,717 55,972 43,885 46,475(b) Net 41,701 38,464 29,176 15,707 17,331
6 Post office Savings Bank Accounts
(a) Gross 70,809 77,192 84,420 98,769 97,448
(b) N et ( - ) 2,169 1,469 4,243 8,972 6,S21
7 Prize Bonds (b) - — — 4,118 2.974
8 Grand T o ta l .
Gross I 25,855 1,32,909 1,40,392 1,42,654 (c) 14,923 (c)
9 Disinvestm ent 55 55 64 31 N . A.G rand Total ( net ) 44,130 39,934 33,419 26,721 (d) 24,152 (c).
* N ational defence certificates. ** Defence Deposite certificates.(a) The cum ulative time deposits were introduced from 1958-59.(b) Prize bonds were introduced since 1st April 1960.(c) Excludes prize bonds.(d) Including post officc savings bank in terest, N ational defence certificates, and D efence deposit certificates,
N .A . N ot available
S ou rce; Regional N ational Savings officer, A ndhra Pradesh.
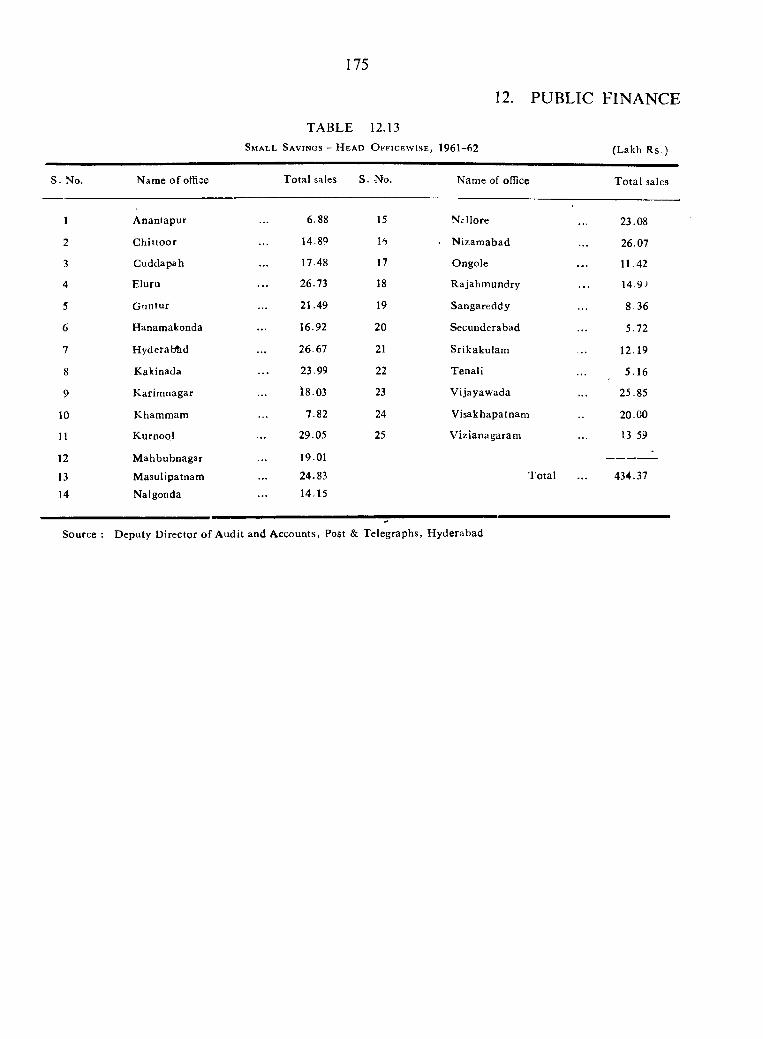
175
TABLE 12.13 S m a l l S a v i n g s - H e a d O f f i c e w i s e , 1961-62
12. PUBLIC FINANCE
(Lakh Rs.
S. No. Name o f office Total sales S. No. Name of office T o ta l sales
1
2
3
4
5
6
7
8
9
10
11
12
1314
A nantapur
C hittoor
Cuddapah
Eluru
G untur
Hanamakonda
H yderabad
Kakinada
K arim nagar
Khammam
Kurnool
M ahbubnagar
M asulipatnam
Nalgonda
6.88
14.89
17.48
26.73
21.49
16.92
26.67
23.99
18.03
7.82
29.05
19.01
24.83
14.15
15
17
18
19
20
21
22
23
24
25
NcUore
N izam abad
Ongole
R ajahm undry
Sangareddy
Secunderabad
Srikakulam
Tenali
V ijayaw ada
V isakhapatnam
V izianagaram
T otal
23.08
26.07
11.42
14.9J
8.36
5.72
12.19
5.16
25.85
20.00
13.59
434.37
Source : Deputy D irector o f A udit and Accounts, Post & Telegraphs, H yderabad
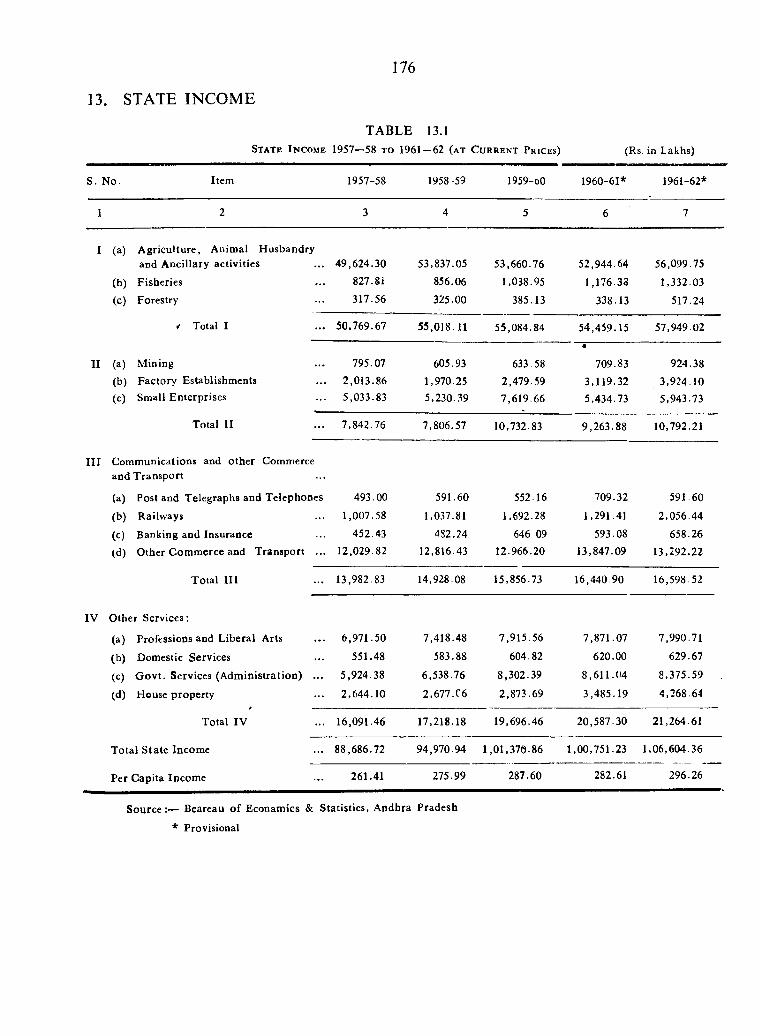
176
13. STATE INCOME
TABLE 13.1S t a t e I n c o m e 1957—58 TO 1961 — 62 ( a t C u r r e n t P r i c e s ) (Rs in Lakhs)
S. ]No. I t e m 1957-58 1958-59 1959-00 1960-61* 1961-62*
1 2 3 4 5 6 7
I (a) A griculture , Animal Husbandryand A ncillary activities ... 49,624.30 53,837.05 53,660.76 52,944.64 56,099.75
(b) Fisheries . . . 827.81 856.06 1,038.95 1,176.33 1,332.03
(c) Forestry . . . 317.56 325.00 385.13 338.13 517.24
i Total 1 . . . 50,769.67 55,018.11 55,084.84 54,459.15 57,949.02
II (a) M ining . . . 795.07 605.93 633.58
•
709.83 924.38
(b) Factory Establishments ... 2,013.86 1,970.25 2,479.59 3,119.32 3,924.10
(c) Small Enterprises 5,033.83 5,230..39 7,619.66 5,434.73 5,943.73
Total II ... 7,842.76 7,806.57 10,732.83 9,263.88 10,792.21
I I I Comm unications and other Commerceand T ransport
(a) Post and Telegraphs and Telephones 493.00 591.60 552.16 709.32 591.60
(b) Railways 1,007.58 1,037.81 1,692.28 1,291.41 2,056.44
(c) Banking and Insurance 452.43 482.24 646 09 593.08 658.26
(d) Other Com m erce and Transport ... 12,029.82 12,816.43 12.966.20 13,847.09 13,292.22
Total III ... 13,982.83 14,928.08 15,856.73 16,440.90 16,598.52
IV Other Services:
(a) Professions and Liberal Arts 6,971.50 7,418.48 7,915.56 7,871.07 7,990.71
(b) Domestic Services ... 551.48 583.88 604.82 620.00 629.67
(c) G ov t. Services (A dm inistration) ... 5,924.38 6,538.76 8,302.39 8,611.04 8,375.59
(d) House property ... 2,644.10 2,677.06 2,873.69 3,485.19 4,268.64
Total IV ... 16,091.46 17,218.18 19,696.46 20,587.30 21,264.61
Total S ta te Incom e 88,686.72 94,970.94 1,01,370.86 1,00,751.23 1,06,604.36
Per Capita Incom e ... 261.41 275.99 287.60 282.61 296.26
Source :— Beareau o f Econamics & Statistics, A ndbra Pradesh
* Provisional
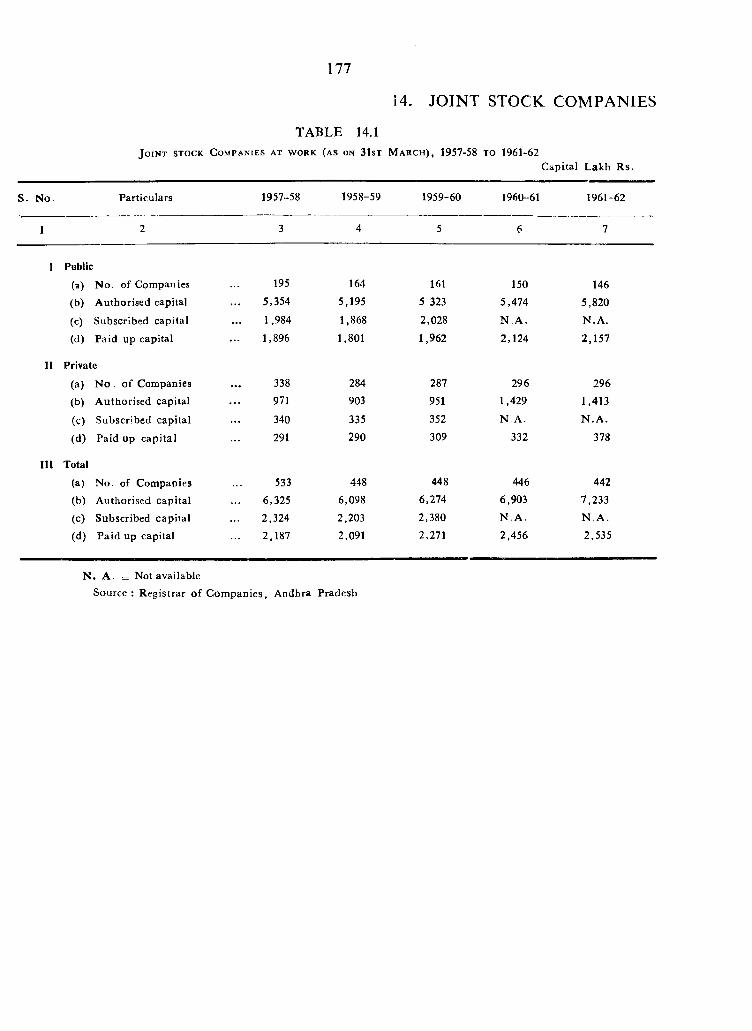
177
14. JOINT STOCK COMPANIES
TABLE 14.1J o in t stock C o m p a n i e s a t w o r k ( a s o n 31st M a r c h ) , 1957-58 to 1961-62
Capital Lakh R s.
S . N o. Particulars 1957-58 1958-59 1959-60 1960-61 1961-62
1 2 3 4 5 6 7
I Public
(a) No. of Companies 195 164 161 150 146(b) Authorised capital 5,354 5,195 5 323 5,474 5,820
(c) Subscribed capital 1,984 1,868 2,028 N .A . N .A .
(d) Paid up capital 1,896 1,801 1,962 2,124 2,157
11 Private
(a) No . of Companies 338 284 287 296 296
(b) A uthorised capital 971 903 951 1,429 1,413
(c) Subscribed capital 340 335 352 N .A . N .A .
(d) Paid up cap ita l 291 290 309 332 378
III Total
(a) No. of Companies 533 448 448 446 442
(b) Authorised capital 6,325 6,098 6,274 6,903 7,233
(c) Subscribed capital 2,324 2,203 2,380 N .A . N .A .
(d) Paid up capital 2,187 2,091 2,271 2,456 2,535
N . A . = Not availableSource : R egistrar o f C om panies, Andhra Pradesh
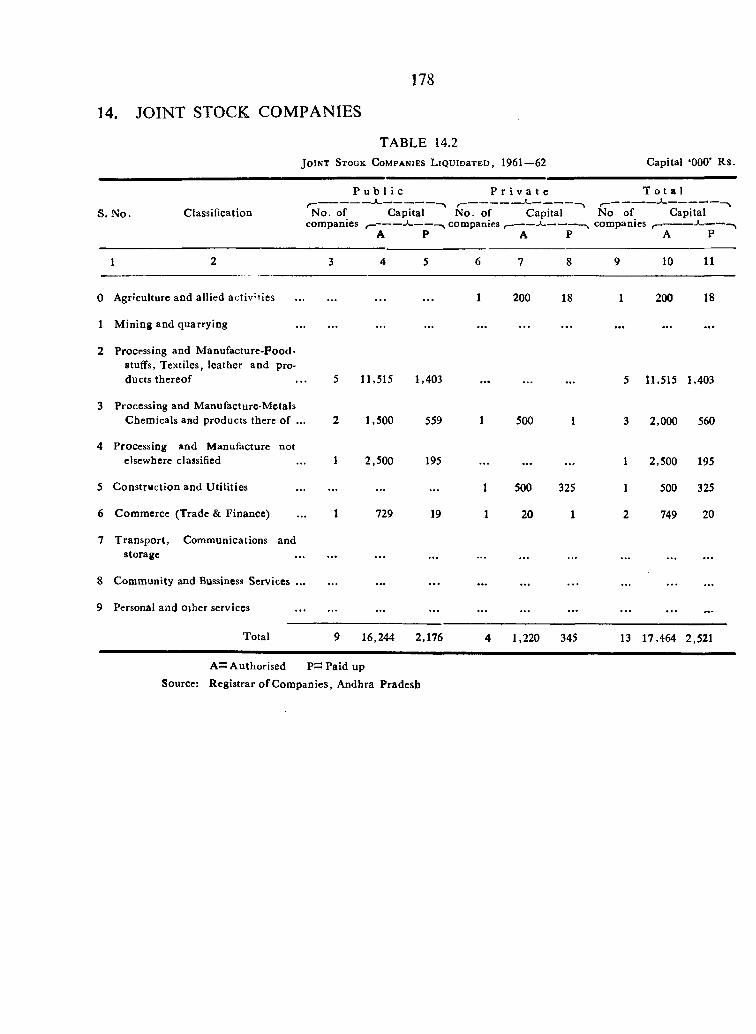
178
14. JOINT STOCK COMPANIES
TABLE 14.2 J o i n t S t o g k C o m p a n i e s L i Q U l o a T E O , 1961—62 Capital ‘000’ R s.
S. N o. Classification
P u b l i c P r i v a t e
N o. of C apital N o . of Capitalcompanies f—-------- *-------companies ^ ----------- *------ -—
A P A P
T o t a l
No of Capital companies ------------*------
1
0 Agriculture and allied activ ’ties
1 M ining and quarrying
2 Processing and M anufacture-Pood-stuffs. Textiles, leather and pro-
1 200 18
7 T ransport, Communications andstorage
8 Com m unity and Bussiness Services ...
9 Personal and ojher services
Total 9 16,244 2,176 4 1,220 345
10 11
1 200 18
ducts thereo f 5 11.515 1,403 . . . . . . . . . 5 11,515 1,403
3 Processing and M anufacture-M etals Chemicals and products there o f ... 2 1,500 559 1 500 1 3 2,000 560
4 Processing and M anufacture not elsewhere classified 1 2,500 195 . . . • • • • • • 1 2,500 195
5 C onstruction and U tilities . . . . . . . . . 1 500 325 1 500 325
6 Com m erce (Trade & Finance) 1 729 19 1 20 1 2 749 20
13 17,464 2,5
A— A uthorised P— Paid up
Source: Registrar o f C om panies, Andhra Pradesh
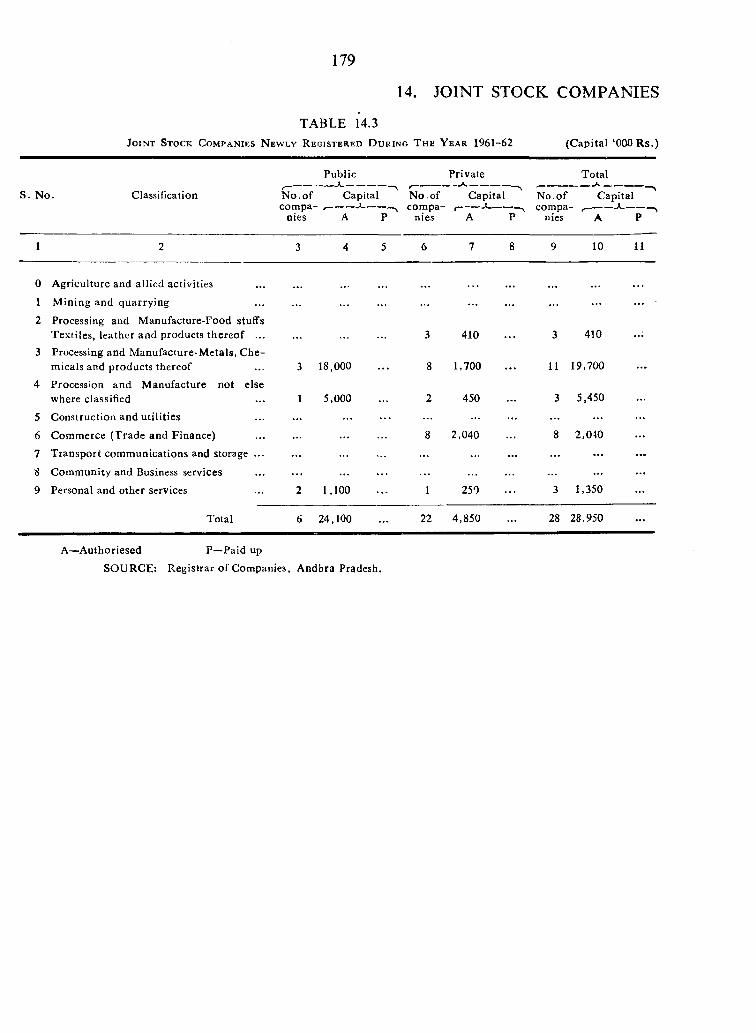
179
14. JOINT STOCK COMPANIES
TABLE 14.3J o i n t S t o c k C o m p a n i e s N e w l y R e g i s t e r e d D u r i n g T h e Y e a r 1961-62 (C apital ‘000 R s.)
Public Private TotalJL
S. N o. Classification N o. of com pa
nies
Capital
A P~^
N o. of compa
nies
Capital---------*-------
A P
No. o f compa
nies
Capital- ,-------- ------------,
A P
1 2 3 4 5 6 7 8 9 10 11
0 A griculture and allied activities
1 M ining and quarrying . . . . . . . . .
2 Processing and M anufacture-Food stuffs Textiles, leather and products thereo f ... 3 410 3 410
3 Processing and M anufacture-M etals, Chemicals and products thereof 3 18,000 8 1,700 11 19,700
4 Procession and M anufacture not else where classified 1 5,000 2 450 3 5,450
5 C onstruction and u tilities . . . ................. ................. . . . . . .
6 Comm erce (T rade and Finance) . . . 8 2,040 8 2,040
7 T ransport com m unications and storage ... . . . ................. ...................
8 C om m unity and Business services . . . ................. . . .
9 Personal and other services 2 1,100 1 250 3 1,350
Total 6 24,100 22 4,850 28 28,950
A—A uthoriesed P—Paid up
SO URCE: R egistrar o f Companies, Andhra Pradesh.
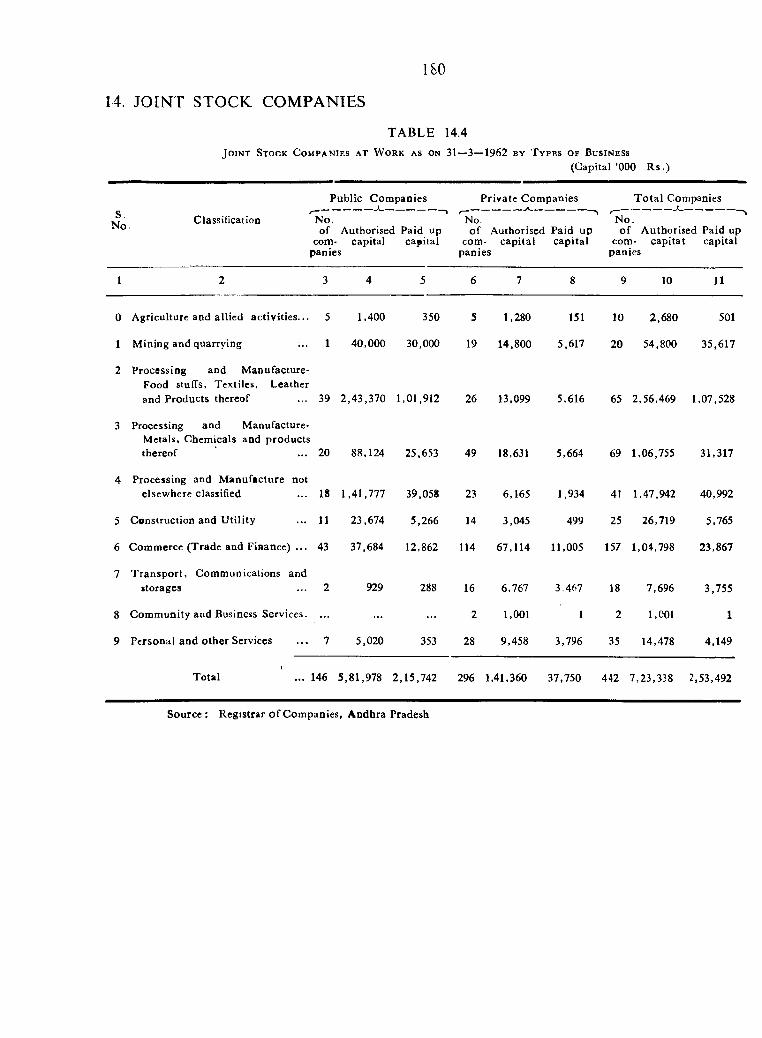
TABLE 14.4J o i n t S t o c k C o m p a n i e s a t W o r k a s o n 31—3—1962 b y T y p e s o f B u s i n e s s
(Capital ’000 R s.)
180
14. JOINT STOCK COMPANIES
S.No Classification
1
Public C om panies
"n o .of Authorised Paid up
com- capital capital panies
Private C om panies
'N o. ^ o f Authorised Paid up
com- cap ita l cap ita l panies
T o ta l Companies
N o.o f A uthorised Paid up
com- cap ita l capital panies
1 2 3 4 5 6 7 8 9 10 11
0 Agriculture and allied ac tiv ities... 5 1,400 350 5 1,280 151 10 2,680 501
1 M ining and quarrying 1 40,000 30,000 19 14,800 5,617 20 54,800 35,617
2 Processing and M anufacture- Food Stuffs, Textiles, Leather and Products thereof 39 2,43,370 1,01,912 26 13,099 5,616 65 2,56,469 1,07,528
3 Processing and M anufacture- Metals, Chemicals and products thereof 20 88,124 25,653 49 18,631 5,664 69 1,06,755 31,317
4 Processing and M anufacture not elsewhere classified 18 1,41,777 39,058 23 6,165 1,934 41 1,47,942 40,992
5 Construction and U tility 11 23,674 5,266 14 3,045 499 25 26,719 5,765
6 Commerce (T rade and Finance) . . . 43 37,684 12,862 114 67,114 11,005 157 1,04,798 23,867
7 T ran sp o rt, Comm unications and storages 2 929 288 16 6,767 3.467 18 7,696 3,755
8 Com m unity and Business Services. ... 2 1,001 1 2 1,001 1
9 Personal and o ther Services 7 5,020 353 28 9,458 3,796 35 14,478 4,149
\T otal 146 5,81,978 2,15,742 296 1,41,360 37,750 442 7,23,338 2,53,492
Source : R egistrar o f Companies, A ndhra Pradesh
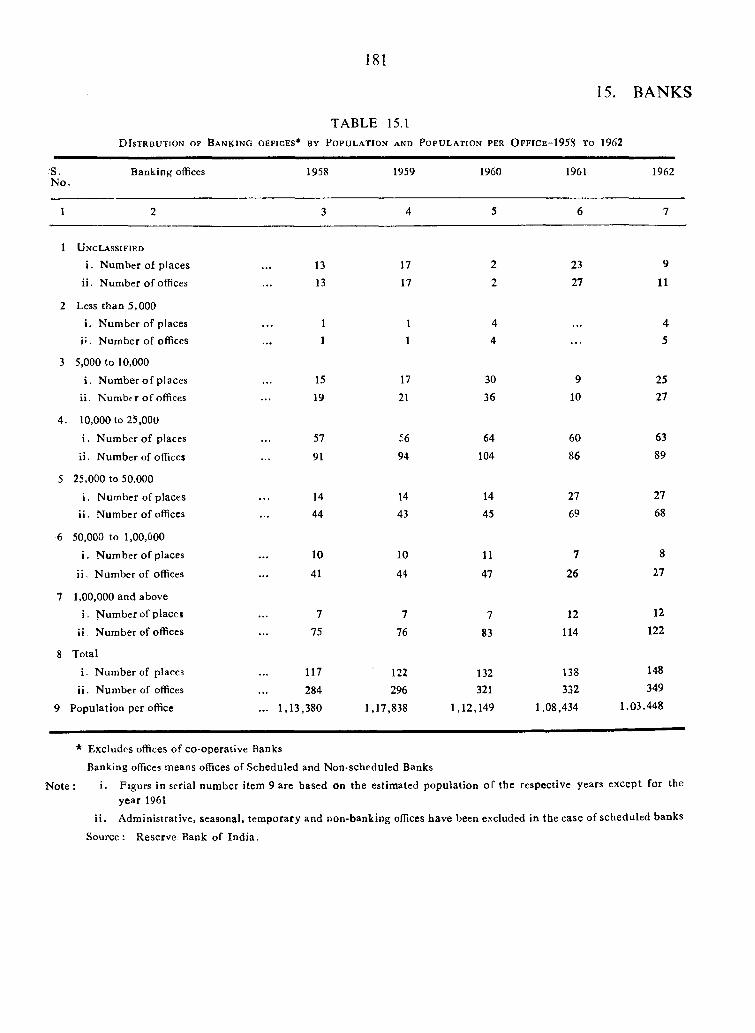
181
15. BANKS
TABLE 15.1D I s t r b u t i o n o f B a n k i n g o e f i c e s * b y P o p u l a t i o n a n d P o p u l a t i o n p e r O f f i c e -1 9 5 8 t o 1962
S.No
Banking offices 1958 1959 1960 1961 1962
1 2 3 4 5 6 7
1 U n c l a s s i f i e d
i. N um ber of places 13 17 2 23 9
ii. Number o f offices 13 17 2 27 11
2 Less than 5,000
i. N um ber of places 1 1 4 4i ' . N um ber of offices 1 1 4 5
3 5,000 to 10,000
i. Number o f places 15 17 30 9 25
ii. N um ber o f offices 19 21 36 10 27
4. 10,000 to 25,000
i. N um ber o f places 57 56 €4 60 63
ii. N um ber of offices 91 94 104 86 89
5 25,000 to 50.000
i, Number of places 14 14 14 27 27
ii. Number of offices 44 43 45 69 68
6 50,000 to 1,00,000
i . N um ber o f places 10 10 11 7 8
ii. N um ber of offices 41 44 47 26 27
7 1,00,000 and above i . N um ber of places 7 7 7 12 12
ii. N um ber of offices 75 76 83 114 122
8 Total
i. N um ber of places 117 122 132 138 148
ii. N um ber of offices 284 296 321 332 349
9 Population per office ... 1,13,380 1,17,838 1,12,149 1,08,434 1,03,448
* Excludes offices of co-operative Banks
Banking offices means offices of Scheduled and Non-scheduled Banks
N o te : i- Figurs in serial num ber item 9 are based on the estimated population o f the respective years except for theyear 1961
ii . Administrative, seasonal, tem porary and non-banking offices have been excluded in the case of scheduled banks
Source: Reserve Bank of Ind ia .
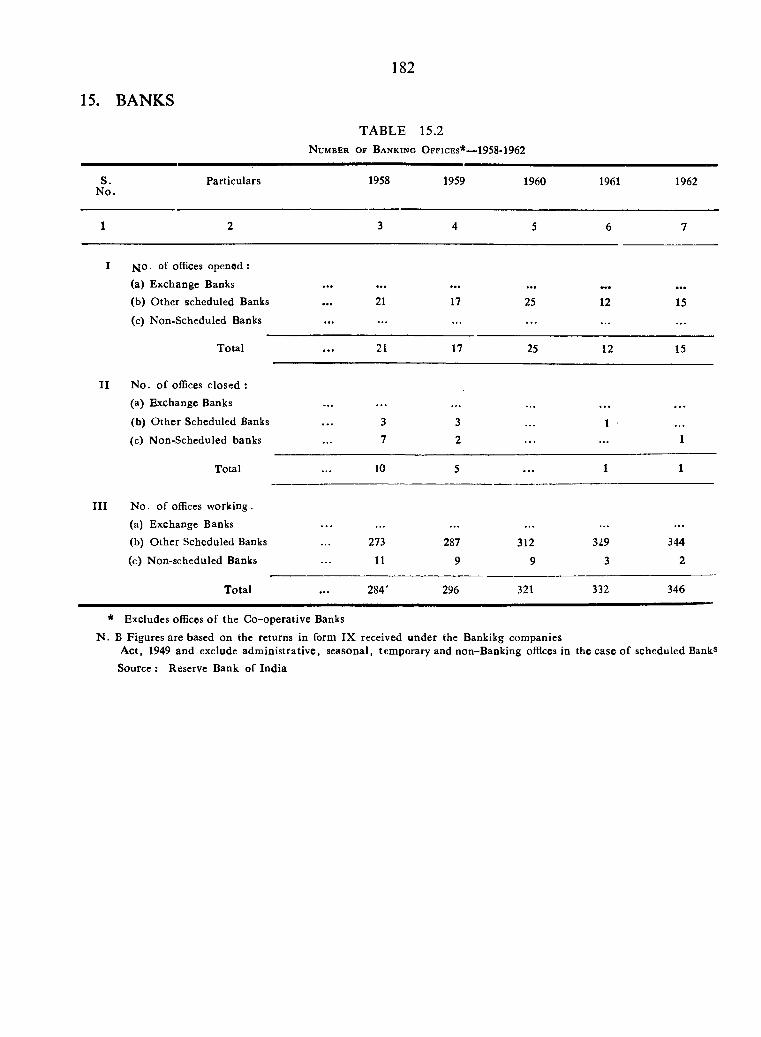
15. BANKS
182
TABLE 15.2N u m b e r o f B a n k i n g O f f i c e s * — 1958-1962
S.N o.
Particulars 1958 1959 1960 1961 1962
1 2 3 4 5 6 7
I fi^o. of offices opened :
(a) Exchange Banks(b) O ther scheduled Banks . . . 21 17 25 12 15(c) Non-Scheduled Banks . . . . . . . . .
T otal . . . 21 17 25 12 15
I I N o. o f offices closed :
(a) Exchange Banks
(b) O ther Scheduled Banks . . . 3 3 . . . 1(c) N on-Scheduled banks 7 2 1
Total 10 5 . . . 1 1
I I I N o. o f offices w^orking .
(a) Exchange Banks
(b) O ther Scheduled Banks 273 287 312 329 344
(c) Non-scheduled Banks 11 9 9 3 2
T otal . . . 284' 296 321 332 346
* Excludes offices o f the C o-operative Banks
N . B Figures are based on the returns in form IX received under the Bankikg companiesA ct, 1949 and exclude adm inistrative, seasonal, tem porary and non-Banking offices in the case o f scheduled Banks
Source : Reserve Bank of India
TABLE 15.3
S e c u r e d A d v a n c e s o f A l l S c h e d u l e d B a n k s i n
A n d h r a P r a d e s h
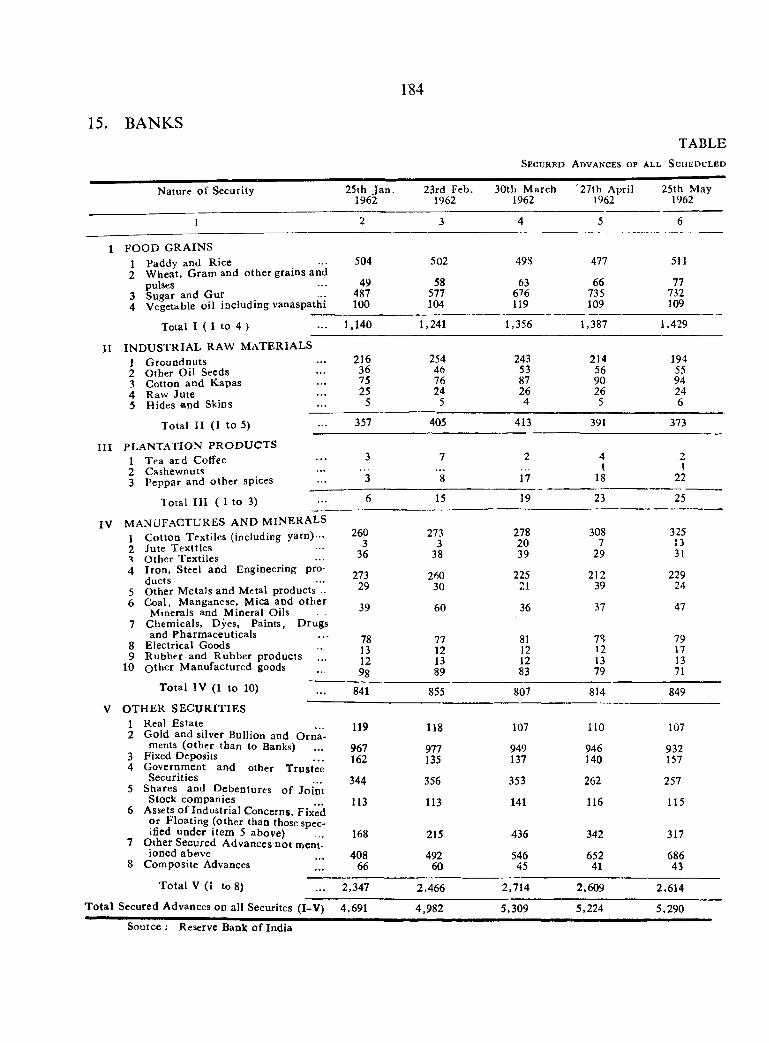
1'84
15. BANKSTABLE
S e c u r e d A d v a n c e s o f a l l S c h e d u l e d
N ature o f Security 25th Ja n . 1962
23rd Feb. 1962
30th M arch 1962
'27th April 1962
25th May 1962
1 2 3 4 5 6
1 FO O D G RA IN S 1 Paddy and Rice 504 502 498 477 5112 W heat, G ram and other grains and
pulses 49 58 63 66 773 Sugar and G ur 487 577 676 735 7324 Vegetable o il including vanaspathi 100 104 119 109 109
Total I ( 1 to 4 ) 1,140 1,241 1,356 1,387 1,429
11 IN D U ST R IA L RAW M ATERIALS 1 G roundnuts 216 254 243 214 1942 Other O il Seeds 36 46 53 56 553 Cotton and Kapas 75 76 87 90 944 Raw Jute 25 24 26 26 245 Hides and Skins 5 5 4 5 6
Total I I (1 to 5) 357 405 413 391 373
I I I PLANTA TIO N P R O D U C T S 1 Tea acd Coffee 3 7 2 4
I18
21
222 Cashewnuts3 Peppar and o ther spices *3 8 17
T otal I I I ( 1 to 3) 6 15 19 23 25
IV M ANUFACTURES AND M INERALS1 C otton Textiles (including yarn)...2 Jute T extiles
O ther Textiles4 Iron , Steel and Engineering pro
ducts5 O ther M etals and Metal products ..6 Coal, M anganese, Mica and o th e r
M inerals and M ineral Oils7 Chem icals, Dyes, Paints, Drugs
and Pharm aceuticals8 E lectrical Goods9 R ubber and R ubber products
10 o th e r M anufactured goods
T otal IV (1 to 10) 841 855V O TH E R SE C U R IT IE S
1 Real Estate2 Gold and silver Bullion and O rn a
ments (o ther than to Banks)Fixed DepositsG overnm ent and other T rustee Securities
Shares and D ebentures o f Jo in t Stock com panies
Assets o f Industrial Concerns, Fixed or F loating (o ther than those specified under item 5 above)
O ther Secured A dvances n o t naent- ioned above
C om posite Advances
260 273 278 308 3253 3 20 7 13
36 38 39 29 31
273 260 225 212 22929 30 21 39 24
39 60 36 37 47
78 77 81 7S 7913 12 12 12 1712 13 12 13 1398 89 83 79 71
807 814
T ota l V (i to 8) 2,347 2,466 2,714 2,609
T o ta l Secured Advances on all Securites (I-V ) 4,691 4,982 5,309 5,224
849
119 118 107 110 107
967 977 949 946 932162 135 137 140 157
344 356 353 262 257
113 113 141 116 115
168 215 436 342 317
408 492 546 652 68666 60 45 41 43
2,614
5,290
Source ; Reserve Bank o f India
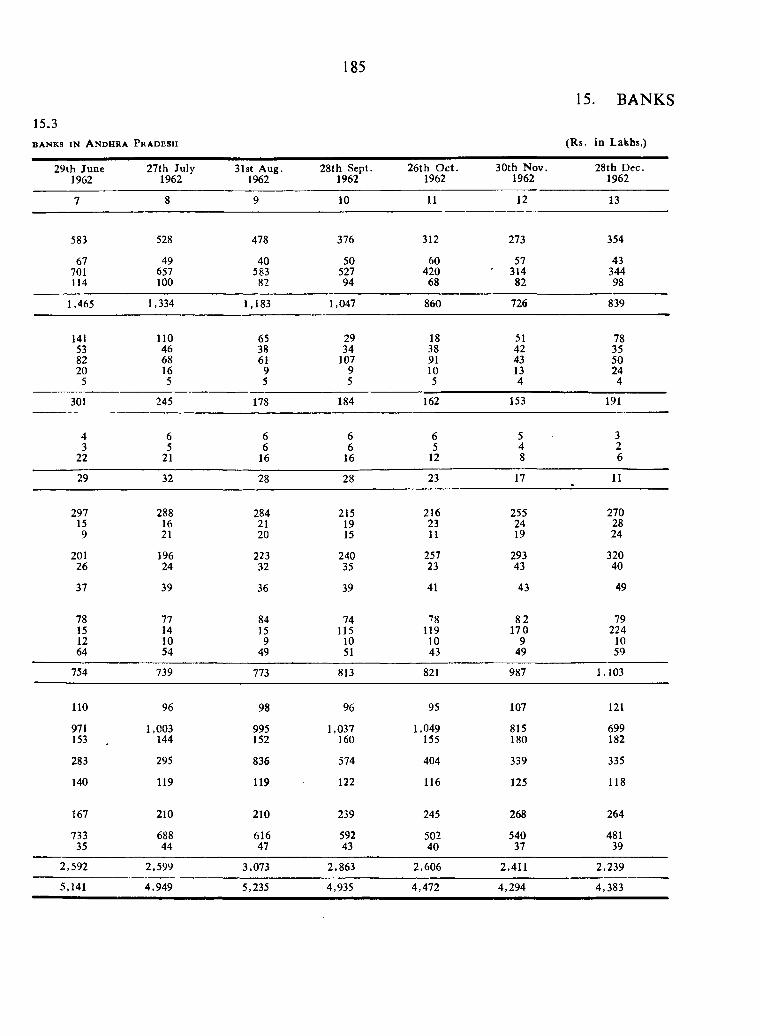
185
15.3
BANKS IN A n d h r a P r a d e s h
15. BANKS
(R s. in Lakhs,)
29th June 27th July 31st Aug. 28th Sept. 26th O ct. 30th Nov. 28th Dcc.1962 1962 1962 1962 1962 1962 1962
7 8 9 10 11 12 13
583 528 478 376 312 273 354
67 49 40 50 60 57 43701 657 583 527 420 ' 314 344114 100 82 94 68 82 98
1,465 1,334 1,183 1,047 860 726 839
141 110 65 29 18 51 7853 46 38 34 38 42 3582 68 61 107 91 43 5020 16 9 9 10 13 24
5 5 5 5 5 4 4
301 245 178 184 162 153 191
4 6 6 6 6 5 33 5 6 6 5 4 2
22 21 16 16 12 8 6
29 32 28 28 23 17 11
297 288 284 215 216 255 27015 16 21 19 23 24 289 21 20 15 11 19 24
201 196 223 240 257 293 32026 24 32 35 23 43 40
37 39 36 39 41 43 49
78 77 84 74 78 82 7915 14 15 115 119 170 22412 10 9 10 10 9 1064 54 49 51 43 49 59
754 739 773 813 821 987 1,103
110 96 98 96 95 107 121
971 1,003 995 1,037 1,049 815 699153 . 144 152 160 155 180 182
283 295 836 574 404 339 335
140 119 119 122 116 125 118
167 210 210 239 245 268 264
733 688 616 592 502 540 48135 44 47 43 40 37 39
2,592 2,599 3,073 2,863 2,606 2,411 2,239
5,141 4,949 5,235 4,935 4,472 4,294 4,383
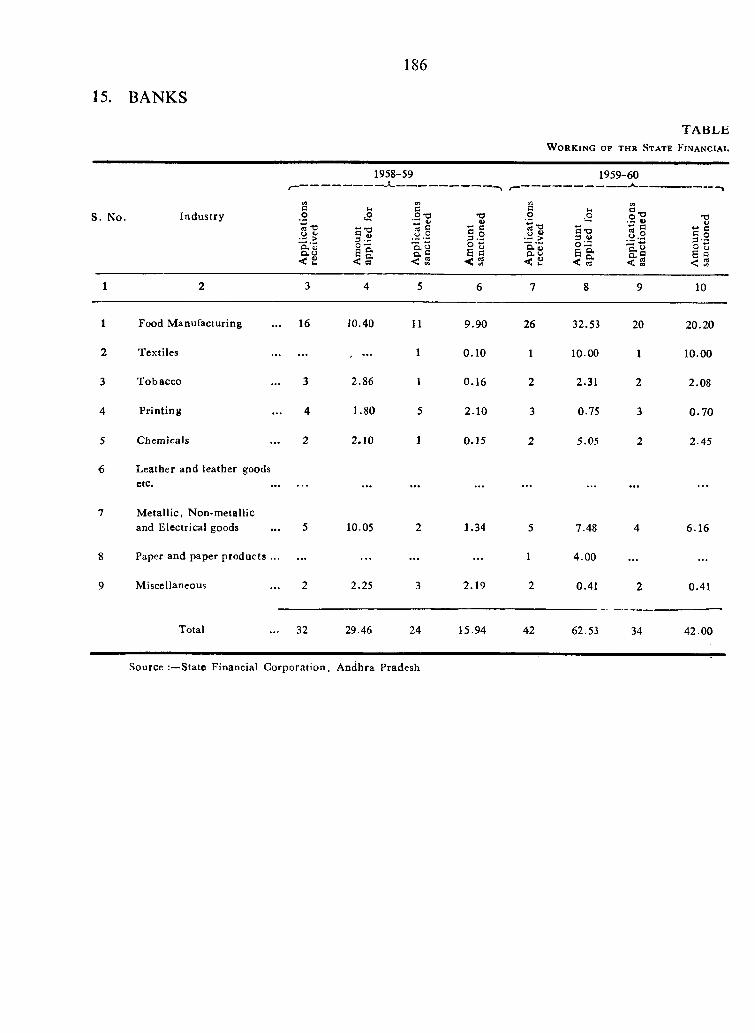
15. BANKS
186
W o r k i n g o f t h e S t a t e F i n a n c i a l
1958--59 1959-60
S. No. Industry09ao« T5
& V
< 2
Uac "O
g o ,K O. < «
c2nj C
_o _2
o. S < S
X)V
i |s 1 < s
wC_ou u O.VO. u < 2
a-v3 Wo —S< C3
hSI1:1< s
-----1
■ou
IIi g < 5
1 2 3 4 5 6 7 8 9 10
1 Food M anufacturing 16 JO.40 11 9.90 26 32.53 20 20.20
2 Textiles . . . , — 1 0.10 1 10.00 1 10.00
3 T obacco 3 2.86 1 0.16 2 2.31 2 2.08
4 Prin ting 4 1.80 5 2.10 3 0.75 3 0 .7 0
5 Chemicals 2 2.10 1 0.15 2 5.05 2 2.45
6 L eather and leather goods etc. . . . . . . . . . . . . . . . . . .
7 M etallic, N on-m etallic and Electrical goods ... 5 10.05 2 1.34 5 7.48 4 6.16
8 Paper and paper products ... . . . . . . . . . . . . 1 4.00 . . . . . .
9 Miscellaneous 2 2.25 3 2.19 2 0.41 2 0.41
Total 32 29.46 24 15.94 42 62.53 34 42.00
Source State Financial Corporation, Andhra Pradesh
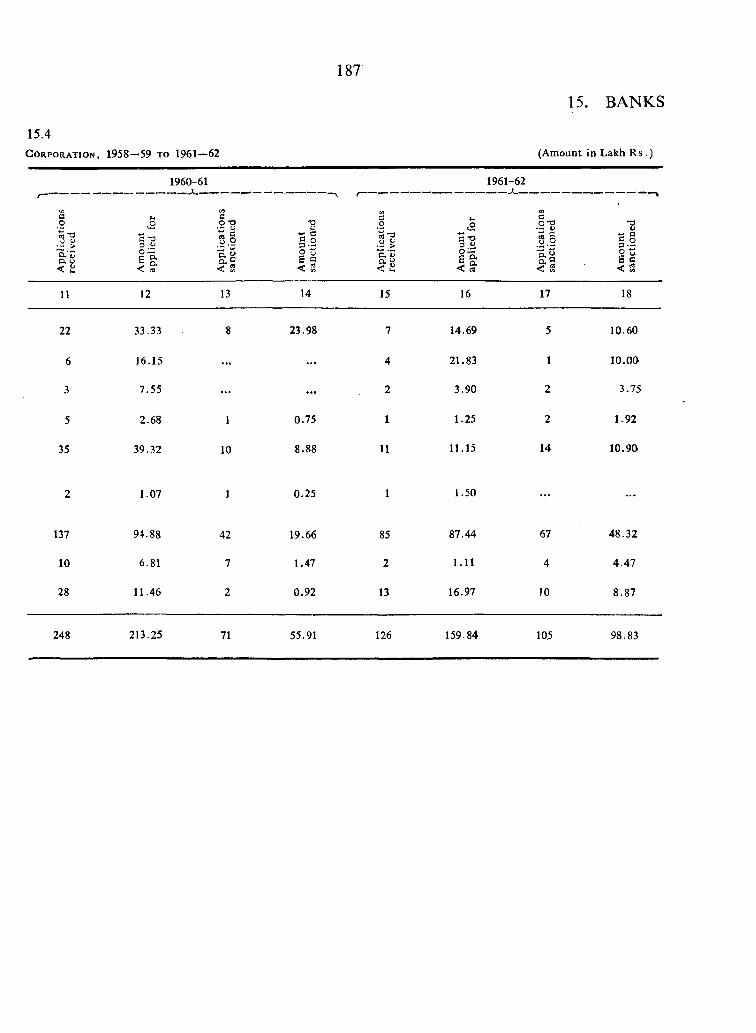
187
15. BANKS
15.4C o r p o r a t io n , 1 9 5 8 - 5 9 TO 1961— 62 (A m o u n t in L a k h R s .)
a■ o
Q.'U a tj< ii
1960-61
C/f
c -a g o
s i &I< 5' < S
-0 ^ c
§-B 2 « s S < 5
ao
.O W'o.’SD. W
1961-62
C "O 3.1i
P<I c3
c0-0
S .I
< S
T3t>
i o< s
11 12 13 14 15 16 17 18
22 3 3 .3 3 8 2 3 .9 8 7 1 4 .6 9 5 1 0 .6 0
6 1 6 .1 5 . . . . . . 4 2 1 .8 3 1 1 0 .0 0
3 7 .5 5 . . . . . . 2 3 .9 0 2 3 .7 5
5 2 .6 8 1 0 .7 5 1 1 .2 5 2 1 .9 2
35 3 9 .3 2 10 8 .8 8 11 1 1 .15 14 1 0 .9 0
2 1 .0 7 1 0 .2 5 1 1 .5 0 . . . . . .
137 9 4 .8 8 42 19 .66 85 8 7 .4 4 67 4 8 .3 2
10 6 .81 7 1 .47 2 1 .11 4 4 .4 7
28 1 1 .4 6 2 0 .9 2 13 16 .97 10 8 .8 7
248 2 1 3 .2 5 71 55 .91 126 1 5 9 .8 4 105 9 8 .8 3
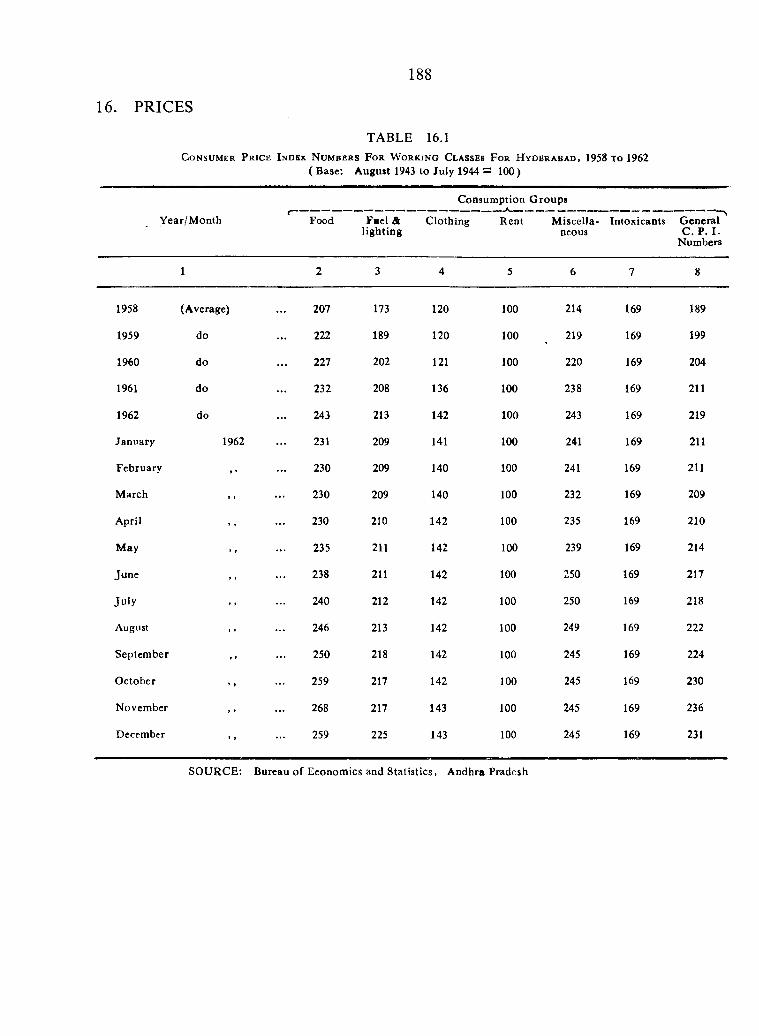
16. PRICES
188
TABLE 16.1C o n s u m e r P r i c e I n d e x N u m b e r s F o r W o r k i n g C l a s s e s F o r H y d e r a b a d , 1958 t o 1962
( Base: August 1943 to July 1944 = 100)
Year/M onth Food Fuel & lighting
Consum ption G roups
Clothing Rent M iscella- Intoxicants G eneral neous C . P . I .
Numbers
1
1958
1959
1960
1961
1962
January
February
M arch
April
M ay
Jiinc
Ju ly
August
Septem ber
O ctober
November
December
(Average)
do
do
do
do
1962
207 173 120 100 214 169 189
222 189 120 100 219 169 199
227 202 121 100 220 169 204
232 208 136 100 238 169 211
243 213 142 100 243 169 219
231 209 141 100 241 169 211
230 209 140 100 241 169 211
230 209 140 100 232 169 209
230 210 142 ICO 235 169 210
235 211 142 100 239 169 214
238 211 142 100 250 169 217
240 212 142 100 250 169 218
246 213 142 100 249 169 222
250 218 142 100 245 169 224
259 217 142 100 245 169 230
268 217 143 100 245 169 236
259 225 143 100 245 169 231
SOURCE; Bureau o f Eeonomics and Statistics, Andhra Pradesh
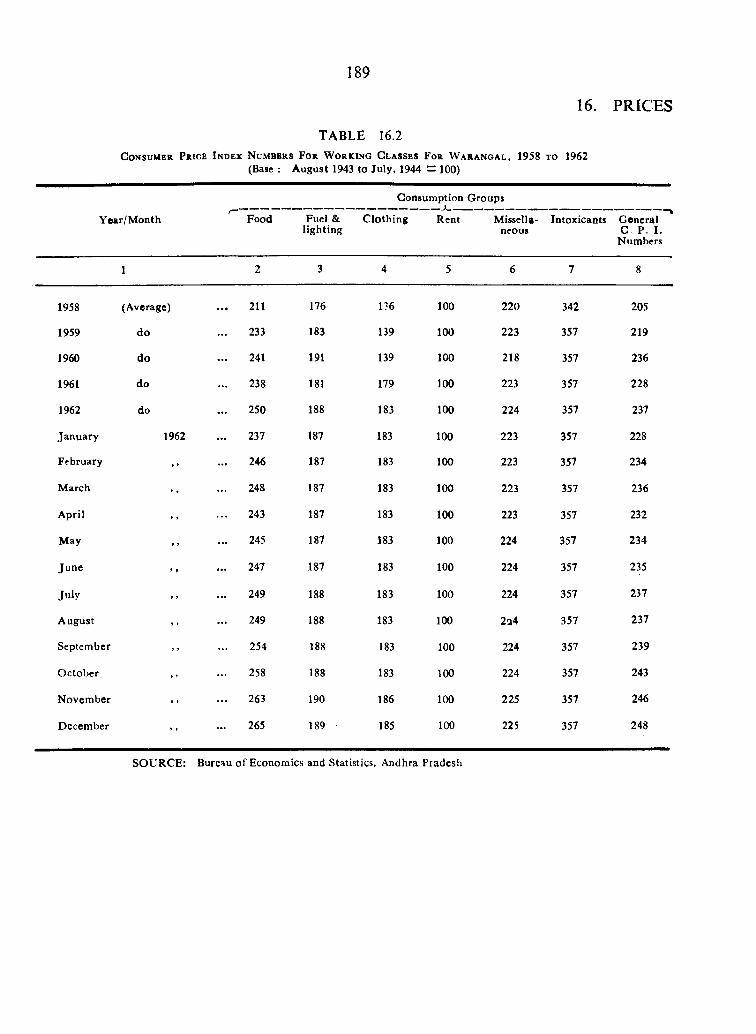
189
16. PRICES
TABLE 16.2C o n s u m e r P r i c e I n d e x N u m b e r s F o r W o r k i n g C l a s s e s F o r W a r a n g a l , 1958 t o 1962
(Base : A ugust 1943 to July, 1944 = 100)
Y ear/M onth Food Fuel & lighting
Consumption Groups
C lothing Rent Missella- Intoxicants General ncous C. P . I .
Numbers
1 8
1958
1959
1960
1961
1962
January
February
M arch
A pril
May
Ju n e
Ju ly
A ugust
September
O ctober
N ovem ber
D ecember
(Average)
do
do
do
do
1962
211
233
241
238
250
237
246
248
243
245
247
249
249
254
258
263
265
176
183
191
181
188
187
187
187
187
187
187
188
188
188
188
190
189
1?6
139
139
179
183
183
183
183
183
183
183
183
183
183
183
186
185
100
100
100
100
100
100
100
100
100
100
100
100
100
100
100
100
100
220
223
218
223
224
223
223
223
223
224
224
224
224
224
224
225
225
342
357
357
357
357
357
357
357
357
357
357
357
357
357
357
357
357
205
219
236
228
237
228
234
236
232
234
235
237
237
239
243
246
248
SO U RCE: Bureau o f Economics and Statistics, Andhra Pradesh
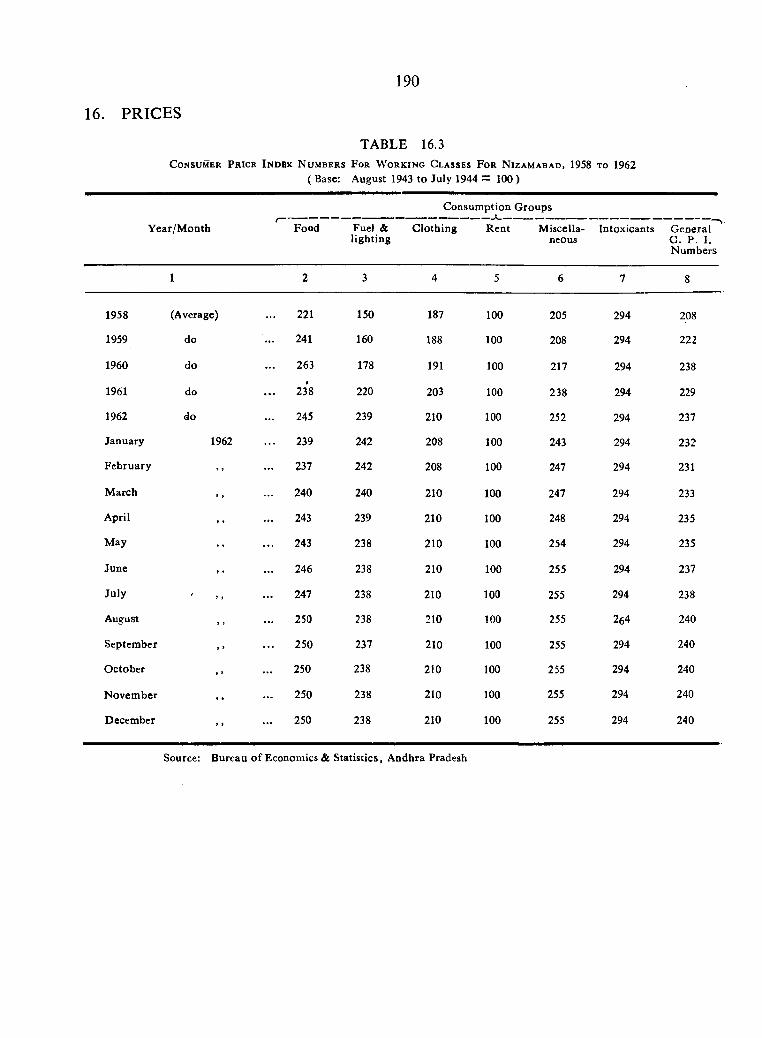
190
16. PRICES
TABLE 16.3C o n s u m e r P r i c e I n d e x N u m b e r s F o r W o r k i n g C l a s s e s F o r N i z a m a b a d , 1958 t o 1962
( Base: August 1943 to July 1944 — 100 )
Y ear/M onth Food Fuel & lighting
C lothing
Consum ption G roups
R ent Miscella- Intoxicantsneous
G eneral C . P. I.N um bers
1
1958
1959
1960
1961
1962
January
February
M arch
April
May
June
July
August
Septem ber
O ctober
N ovem ber
December
(Average)
do
do
do
do
1962
221 150 187 100 205 294 208
241 160 188 100 208 294 222
263 178 191 100 217 294 238
238 220 203 100 238 294 229
245 239 210 100 252 294 237
239 242 208 100 243 294 232
?37 242 208 100 247 294 231
240 240 210 100 247 294 233
243 239 210 100 248 294 235
243 238 210 100 254 294 235
246 238 210 100 255 294 237
247 238 210 100 255 294 238
250 238 210 100 255 264 240
250 237 210 100 255 294 240
250 238 210 100 255 294 240
250 238 210 100 255 294 240
250 238 210 100 255 294 240
Source: Bureau o f Economics & Statistics, Andhra Pradesh
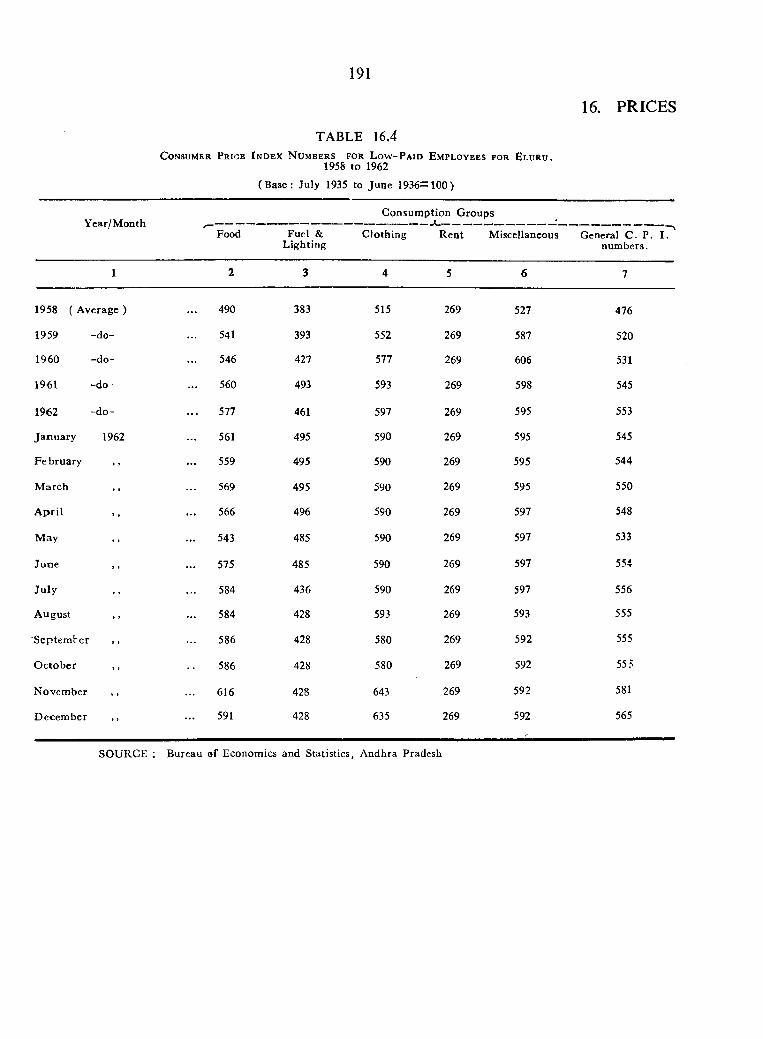
191
16. PRICES
TABLE 16.4C o n s u m e r P r i c e I n d e x N u m b e r s f o r L o w - P a i d E m p lo y e e s
1958 to 1962
( B a s e : J u ly 1935 to J u n e 1 9 3 6 = 1 0 0 )
FOR E l u r u ,
Y e a r /M o n thF oo d
C onsum ption G roups1 '
F u e l & L ig h t in g
C lo th in g R e n t M isc e lla n e o u s G e n e ra l C . P . I . n u m b e rs .
1 2 3 4 5 6 7
1958 ( A v e ra g e ) 490 383 515 269 527 476
1959 - d o - 541 393 552 269 587 520
1 960 - d o - 546 427 577 269 606 531
1961 - d o - . . . 560 493 593 269 598 545
1962 - d o - 577 461 597 269 595 553
J a n u a r y 1962 . . . 561 495 590 269 595 545
F e b r u a r y , , 559 495 590 269 595 544
M a rc h , , 569 495 590 269 595 550
A p r i l . . . 566 496 590 269 597 548
M a y 543 485 590 269 597 533
J u n e , , 575 485 590 269 597 554
J u l y . . . 584 436 590 269 597 556
A u g u s t . . . 584 428 593 269 593 555
S e p te m b e r , , 586 428 580 269 592 555
O c to b e r 586 428 580 269 592 555
N o v e m b e r , , 616 428 643 269 592 581
D e c e n n b e r , , . . . 591 428 635 269 592 565
SOURCE ; Bureau of Economics and Statistics, Andhra Pradesh
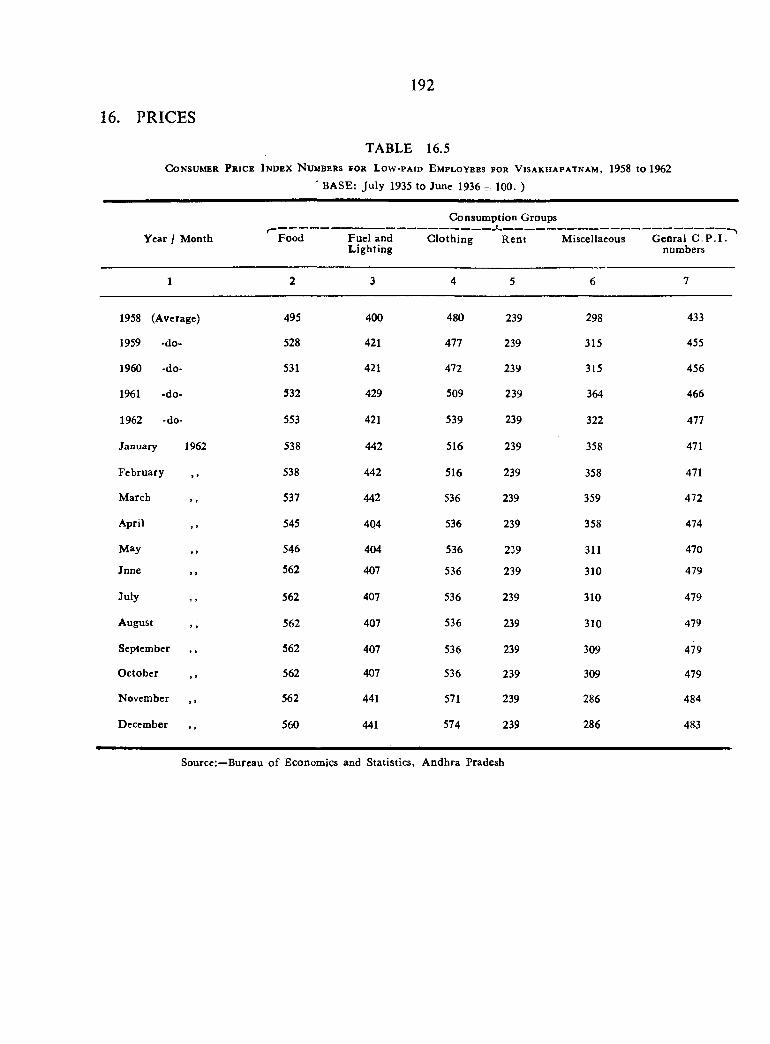
192
16. PRICES
TABLE 16.5C o n s u m e r P r i c e I n d e x N u m b e r s f o r L o w -p a i d E m p l o y e e s f o r V i s a k h a p a t n a m , 1958 to 1962
' BASE: Ju ly 1935 to June 1936 =. 100. )
Consum ption Groups
Year / Month Food Fuel and L ighting
C lothing R ent Miscellaeous G enral C . P . I . numbers
1 2 3 4 5 6 7
1958 (Average) 495 400 480 239 298 433
1959 -do- 528 421 477 239 315 455
1960 -do- 531 421 472 239 315 456
1961 -do- 332 429 509 239 364 466
1962 -do- 553 421 539 239 322 477
January 1962 538 442 516 239 358 471
February , , 538 442 516 239 358 471
M arch , , 537 442 536 239 359 472
April 545 404 536 239 358 474
May 546 404 536 239 311 470
Jnne , , 562 407 536 239 310 479
July 562 407 536 239 310 479
August 562 407 536 239 310 479
Seplcmber , , 562 407 536 239 309 479
O ctober 562 407 536 239 309 479
November ,, 562 441 571 239 286 484
December , , 560 441 574 239 286 483
Source;—Bureau o f Economics and Statistics, A ndhra Pradesh
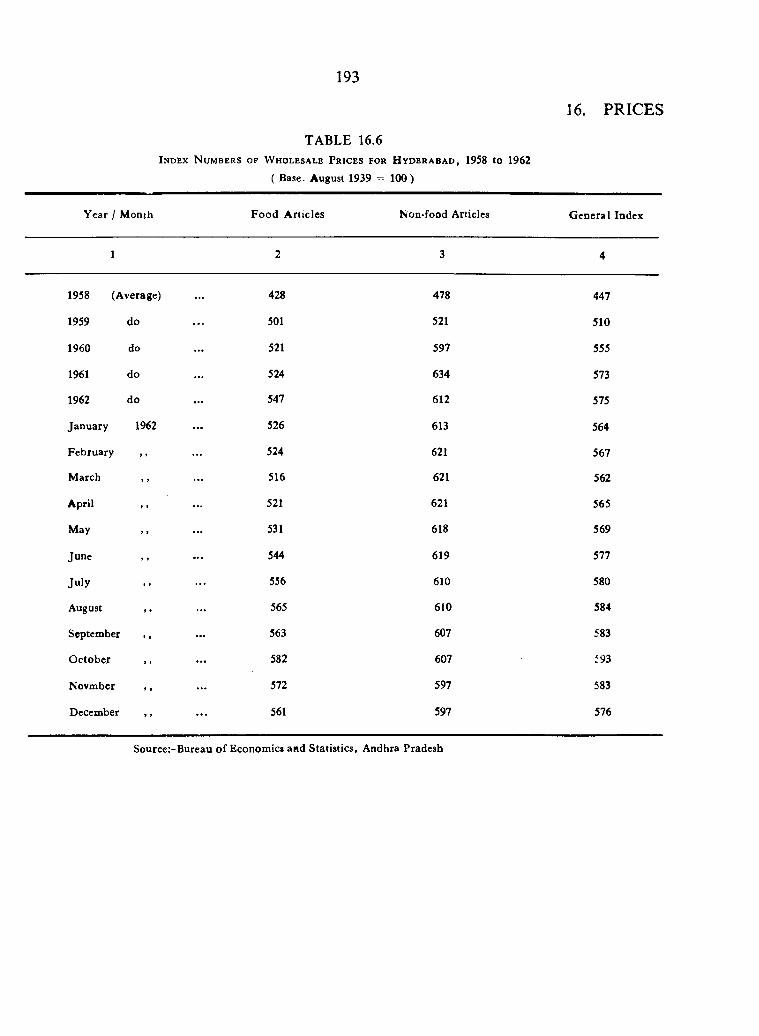
193
16. PRICES
TABLE 16.6I n d e x N u m b e r s o f W h o l e s a l e P r i c e s f o r H y d e r a b a d , 1958 to 1962
( Base. August 1939 = 100)
Y ear / M onth Food A rticles Non-food Articles G eneral Index
1 2 3 4
1958 (Average) 428 478 447
1959 do 501 521 510
1960 do 521 597 555
1961 do 524 634 573
1962 do 547 612 575
January 1962 526 613 564
February , , 524 621 567
M arch , , 516 621 562
April , , 521 621 565
May , , 531 618 569
June 544 619 577
Ju ly 556 610 580
August 565 610 584
September , , ... 563 607 583
O ctober , , 582 607 693
Novmber , , 572 597 583
December , , 561 597 576
Source:-Bureau o f Economics aad Statistics, Andhra Pradesh
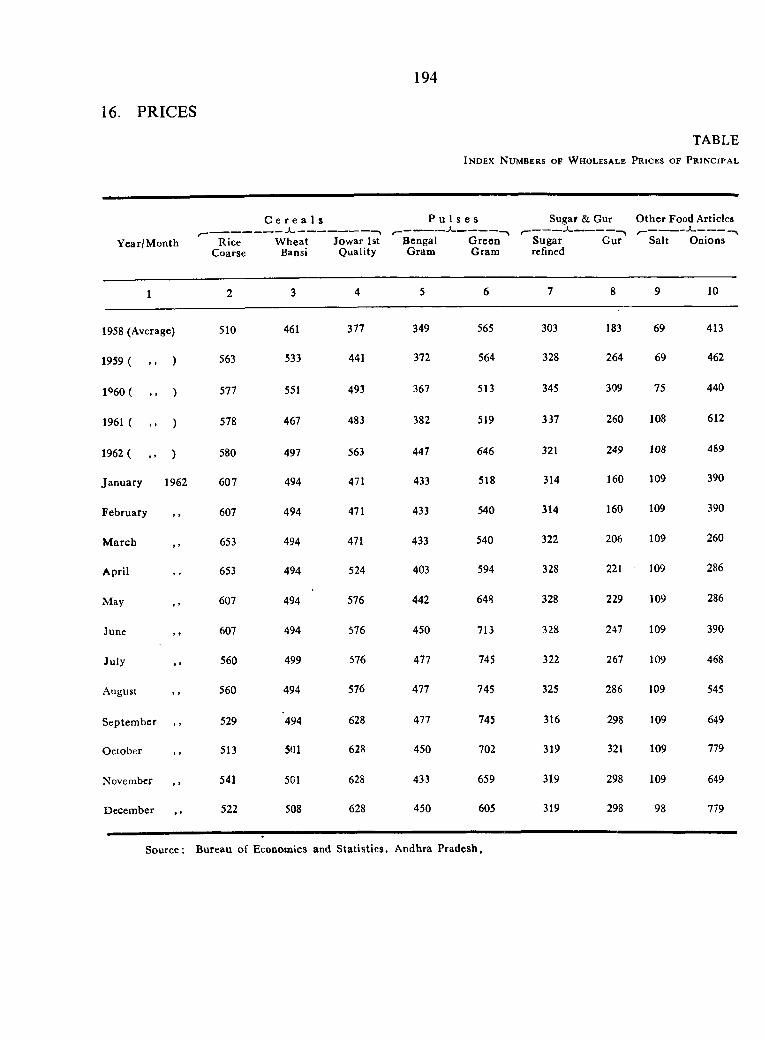
194
16. PRICES
TABLEI n d e x N u m b e r s o f W h o l e s a l e P r ic e s o f P r i n c i p a l
C e r e a l s P u l s e s
Y ear/M onth
1
RiceCoarse
W heat Jow ar 1st Bengal Bansi Q uality Gram
G reenGram
Sugar & Gur O ther Food Articles
Sugar G \iP Salt Onionsrefined
1958 (Average)
1959 ( , . )
1960 ( , , )
196K .. )
1962 ( )
Jan u ary 1962
February
M arch
April
May
June
July
August
Septem ber
October
November
December
510
563
577
578
580
607
607
653
653
607
607
560
560
529
513
541
522
461
533
551
467
497
494
494
494
494
494
494
499
494
494
501
501
508
377
441
493
483
563
471
471
471
524
576
576
576
576
628
628
628
628
349
372
367
382
447
433
433
433
403
442
450
477
477
477
450
433
450
565
564
513
519
646
518
540
540
594
648
713
745
745
745
702
659
605
303
328
345
337
321
314
314
322
328
328
328
322
325
316
319
319
319
10
183 69 413
264 69 462
309 75 440
260 108 612
249 108 489
160 109 390
160 109 390
206 109 260
221 109 286
229 109 286
247 109 390
267 109 468
286 109 545
298 109 649
321 109 779
298 109 649
298 98 779
Source: Bureau o f Economics and S ta tis tics, A ndhra P radesh,
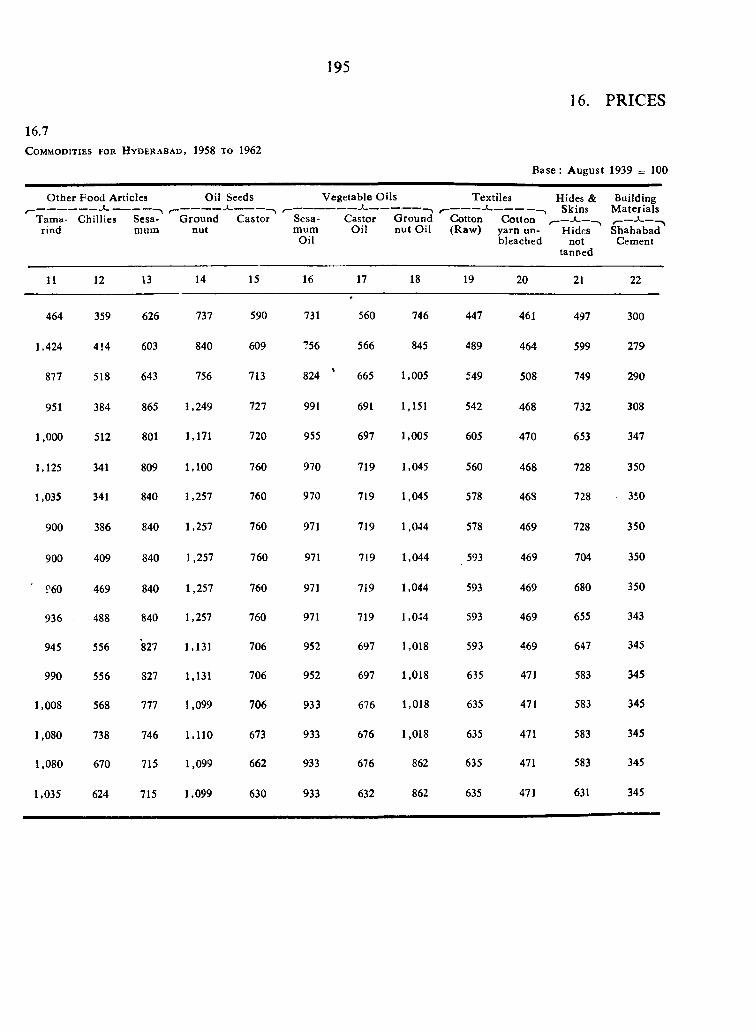
195
C o m m o d i t i e s f o r H y d e r a b a d , 1958 t o 1962
16.7
16. PRICES
B a s e : A u g u s t 1939 = 100
O ther Food Articles Oil Seeds Vegetable O ils Textiles Hides & Building
Tama- Chillies Sesa- G round C astor Sesa- Castor G round Cotton C otton”^,._____ >— — ^rind mum nut mum Oil nu t O il (Raw) yarn un- Hides Shahabad
Oil bleached not Cementtanned
11 12 13 14 15 16 17 18 19 20 21 22
464
1 ,424
877
951
1,000
1,125
1.035
900
900
?60
936
945
990
1 ,0 0 8
1 ,0 8 0
1 ,0 8 0
1 .035
359
414
518
384
512
341
341
386
409
469
488
556
556
568
738
670
624
626
603
643
865
801
809
840
840
840
840
840
827
827
777
746
715
715
737
840
756
1 ,2 4 9
1 ,171
1,100
1 .2 5 7
1 .257
1 .2 5 7
1 .2 5 7
1.257
1 .131
1.131
1 .0 9 9
1,110
1 .0 9 9
1 .0 9 9
590
609
713
727
720
760
760
760
760
760
760
706
706
706
673
662
630
731
756
824
991
955
970
970
971
971
971
971
952
952
933
933
933
933
560
566
665
691
697
719
719
719
719
7J9
719
697
697
676
676
676
632
746
845
1 .005
1 ,151
1 .005
1.045
1 .045
1 .0 4 4
1 .0 4 4
1 .0 4 4
1 .0 4 4
1 ,018
1 ,0 1 8
1 ,0 1 8
1 ,0 1 8
862
862
447
489
549
542
605
560
578
578
593
593
593
593
635
635
635
635
635
461
464
508
468
470
468
468
469
469
469
469
469
471
471
471
471
471
497
599
749
732
653
728
728
728
704
680
655
647
583
583
583
583
631
300
279
2 90
308
347
350
350
350
350
350
343
345
345
345
345
345
345
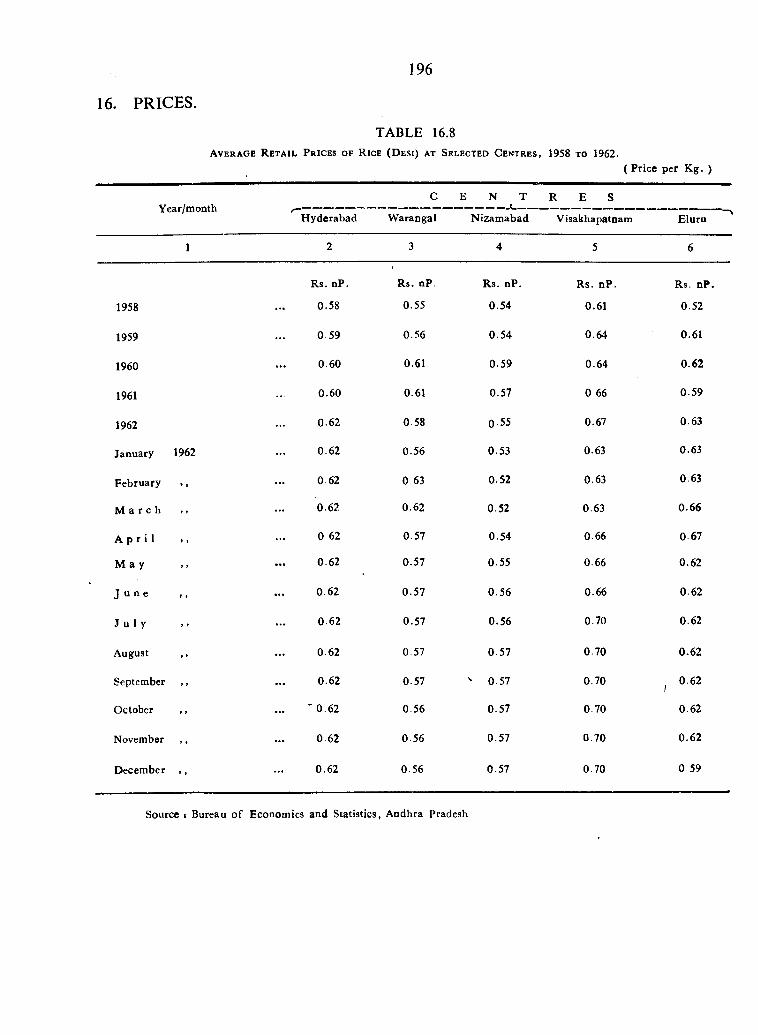
196
16, PRICES.
TABLE 16.8Av e r a g e R e t a il P r ic e s o f R ice ( D e s i) a t S e l e c t e d C e n t r e s , 1958 to 1962.
( P r ic e p e r K g . )
Y e a r /m o n thH y d e ra b a d
C
W a ra n g a l
E N T
N iz a m a b a d
R E S
V isa k b a p a tn a m E lu ru
1 2 3 4 5 6
R s . n P . R s . n P . R s . n P . R s . n P . R s . n P .
1958 . . . 0 .5 8 0 .5 5 0 .5 4 0 .6 1 0 .5 2
1959 0 59 0 .5 6 0 .5 4 0 .6 4 0 .6 1
1960 0 .6 0 0 .61 0 .5 9 0 .6 4 0 .6 2
1961 . . . 0 .6 0 0 .6 1 0 .5 7 0 66 0 .5 9
1962 0 .6 2 0 .5 8 0 -5 5 0 .6 7 0 .6 3
J a n u a ry 1962 . . . 0 .6 2 0 .5 6 0 .5 3 0 .6 3 0 .6 3
F e b ru a ry » >0 .6 2 0 63 0 .5 2 0 .6 3 0 .6 3
M a r c h 9 >0 .6 2 0 .6 2 0 .5 2 0 .6 3 0 .6 6
A p r i l * >0 62 0 .5 7 0 .5 4 0 .6 6 0 .6 7
M a y » 9 . . . 0 .6 2 0 .5 7 0 .5 5 0 .6 6 0 .6 2
J u n e > *0 .6 2 0 .5 7 0 .5 6 0 .6 6 0 .6 2
J u l y 9 9 . . . 0 .6 2 0 .5 7 0 .5 6 0 .7 0 0 .6 2
A u g u s t 9 > 0 .6 2 0 5 7 0 .5 7 0 .7 0 0 .6 2
S ep tem b er 9 9 0 .6 2 0 .5 7 ^ 0 .5 7 0 .7 0 0 .6 2/
O c to b e r 9 9 ■ 0 .6 2 0 .5 6 0 .5 7 0 .7 0 0 .6 2
N o v em b er » 9 0 .6 2 0 .5 6 0 .5 7 0 .7 0 0 .6 2
D e c e m b e r 9 9 • • • 0 .6 2 0 .5 6 0 .5 7 0 .7 0 0 .5 9
Source : Bureau o f Economics and Statistics, Andhra Pradesh
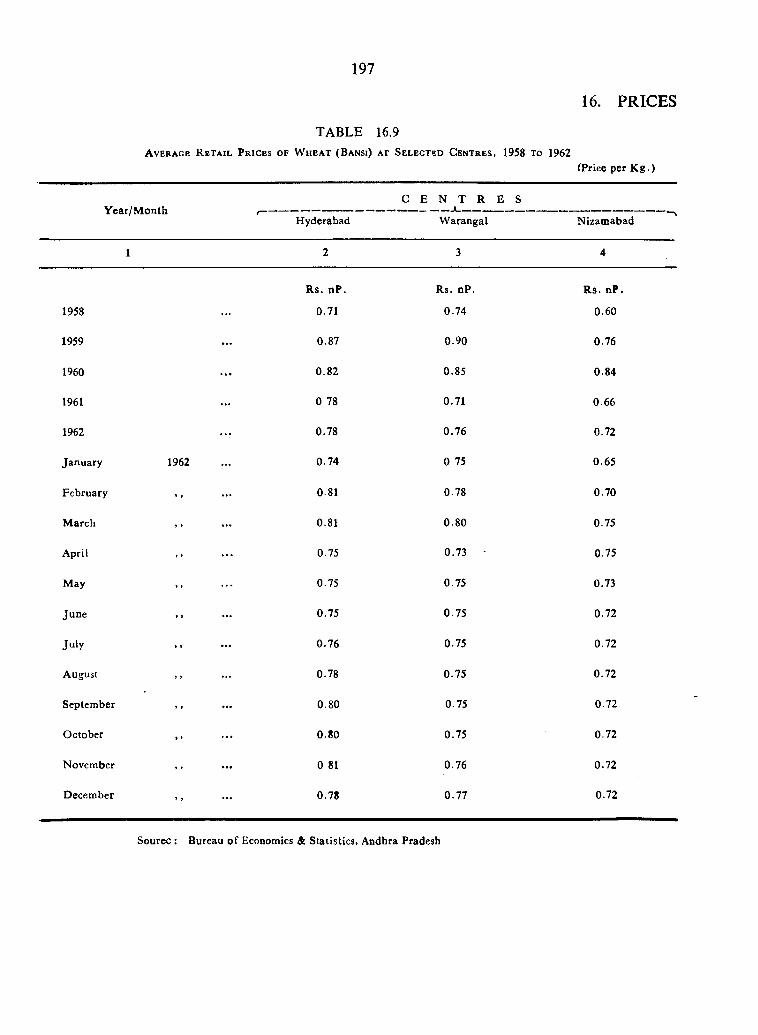
197
16. PRICES
TABLE 16.9A v e r a g e R e t a i l P r i c e s o f W h e a t ( B a n s i ) a t S e l e c t e d C e n t r e s , 1958 t o 1962
rPriee per K g .)
Y ear/M onthC E N T R E S
Hyderabad W arangal Nizam abad
1 2 3 4
1958
R s. nP .
0.71
Rs. nP.
0.74
R s. nP .
0.60
1959 0.87 0.90 0.76
1960 0.82 0.85 0.84
1961 0.78 0.71 0.66
1962 0.78 0.76 0.72
January 1962 . . . 0.74 0.75 0.65
February > » 0 8 1 0.78 0.70
M arch 9 9 0.81 0.80 0.75
April 9 9 . . . 0.75 0.73 - 0.75
May * 9 0.75 0.75 0.73
June 9 t 0.75 0 75 0.72
July 9 9 0.76 0.75 0.72
August 9 9 . . . 0.78 0.75 0.72
September 9 1 . . . 0.80 0.75 0.72
October » » 0.80 0.75 0.72
November 9 > 0 81 0.76 0.72
December » 9 . . . 0.78 0.77 0.72
Sourec : Bureau o f Economics & Statistics, Andhra Pradesh
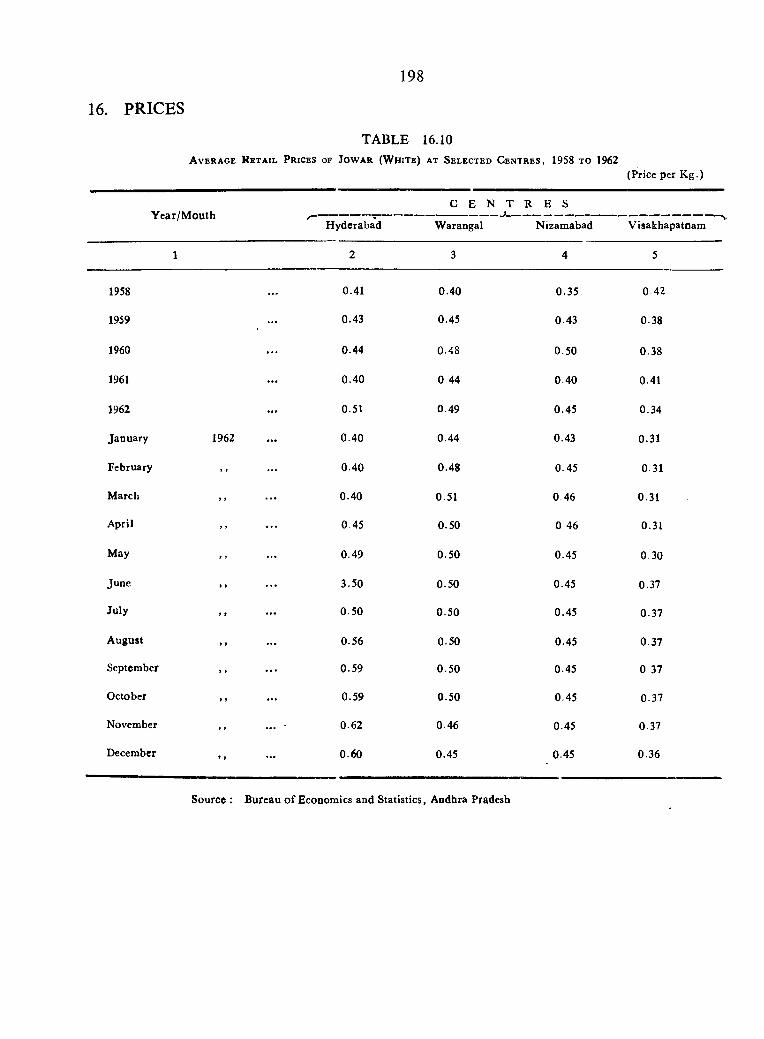
198
16. PRICES
TABLE 16.10A v e r a g e R e t a i l P r i c e s o f J o w a r ( W h i t e ) a t S e l e c t e d C e n t r e s , 1958 t o 1962
(Price per K g.)
C E N T R E S1, .............
M, c a i / i v i u u i i i ^ ^ --------- -- , ,
H yderabad W arangal Nizam abad Visakhapatnam
1 2 3 4 5
1958 . . . 0.41 0.40 0.35 0 42
1959 0.43 0.45 0.43 0.38
1960 0.44 0.48 0.50 0.38
1961 . . . 0.40 0 44 0.40 0.41
1962 0.51 0.49 0.45 0.34
January 1962 . . . 0.40 0.44 0.43 0.31
February * 9 0.40 0.48 0.45 0 31
M arch f t 0.40 0.51 0 46 0.31
April i > 0.45 0.50 0 46 0.31
M a y f J 0.49 0.50 0.45 0.30
June » » 3.50 0.50 0.45 0.37
J u ly » 9 0.50 0.50 0.45 0.37
A ugust 7 i 0.56 0.50 0.45 0.37
September > » . . . 0.59 0.50 0.45 0 37
October 1 9 . . . 0.59 0.50 0.45 0.37
November 9 » 0.62 0.46 0.45 0.37
December» » . . . 0.60 0.45 0.45 0.36
Source : Bureau o f Economics and Statistics, Andhra Pradesh
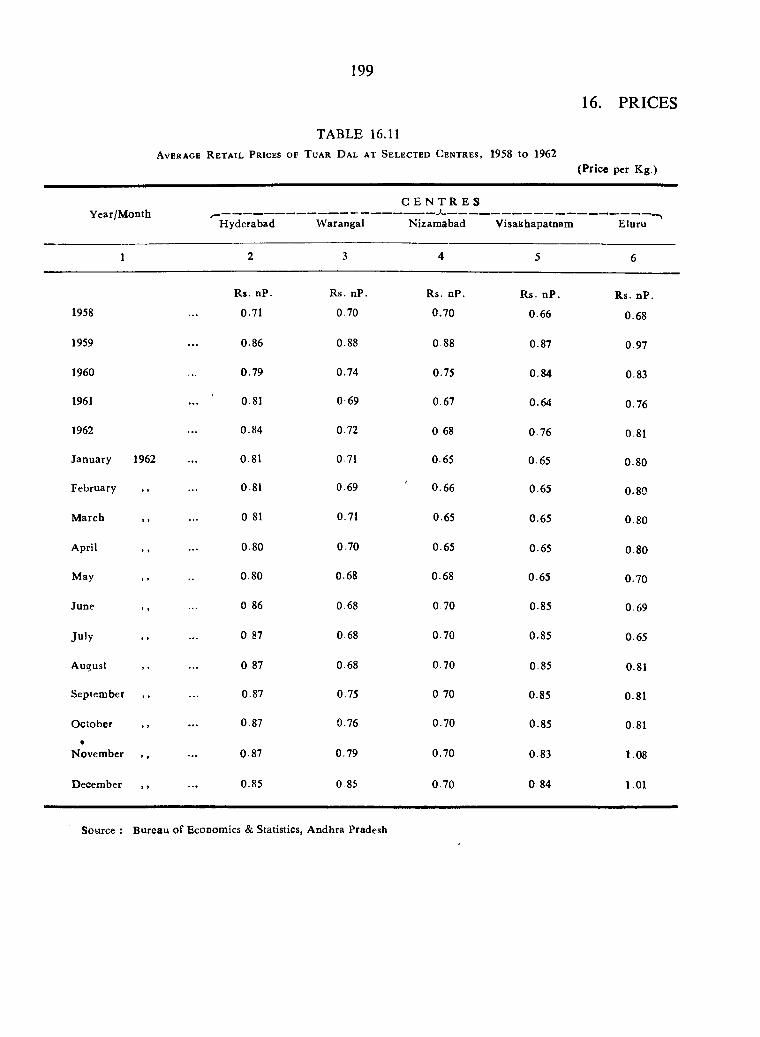
199
16. PRICES
TABLE 16.11Av er a g e R e t a il P r ices o f T u a r D al a t S e l e c t e d C e n t r e s , 1958 to 1962
(Price per Kg.)
Y ear/M onthH yderabad W arangal
C E N T R E S
N izam abad Visakhapatnam Eluru
1 2 3 4 5 6
Rs. nP. R s . nP. R s. nP. R s . n P . R s . nP.1958 0.71 0.70 0.70 0.66 0.68
1959 0.86 0.88 0 88 0.87 0.97
1960 0.79 0.74 0.75 0.84 0.83
1961 0.81 0 69 0.67 0.64 0.76
1962 0.84 0.72 0 68 0.76 0.81
January 1962 0.81 0 71 0.65 0.65 0.80
February ,, 0 8 1 0.69 0.66 0.65 0.80
M arch , , 0 81 0.71 0.65 0.65 0.80
April 0.80 0.70 0.65 0.65 0.80
May , , 0.80 0.68 0.68 0.65 0.70
June , , 0.86 0.68 0.70 0.85 0.69
Ju ly 0.87 0.68 0.70 0.85 0.65
A u g u s t 0 87 0 6 8 0.70 0.85 0.81
Septem ber , , 0.87 0.75 0 70 0 8 5 0.81
O ctober 0.87 0.76 0.70 0.85 0.81•
November , , 0.87 0.79 0.70 0 8 3 1.08
December , , 0.85 0 85 0.70 0 84 1.01
Source ; Bureau of Economics & Statistics, Andhra Pradesh
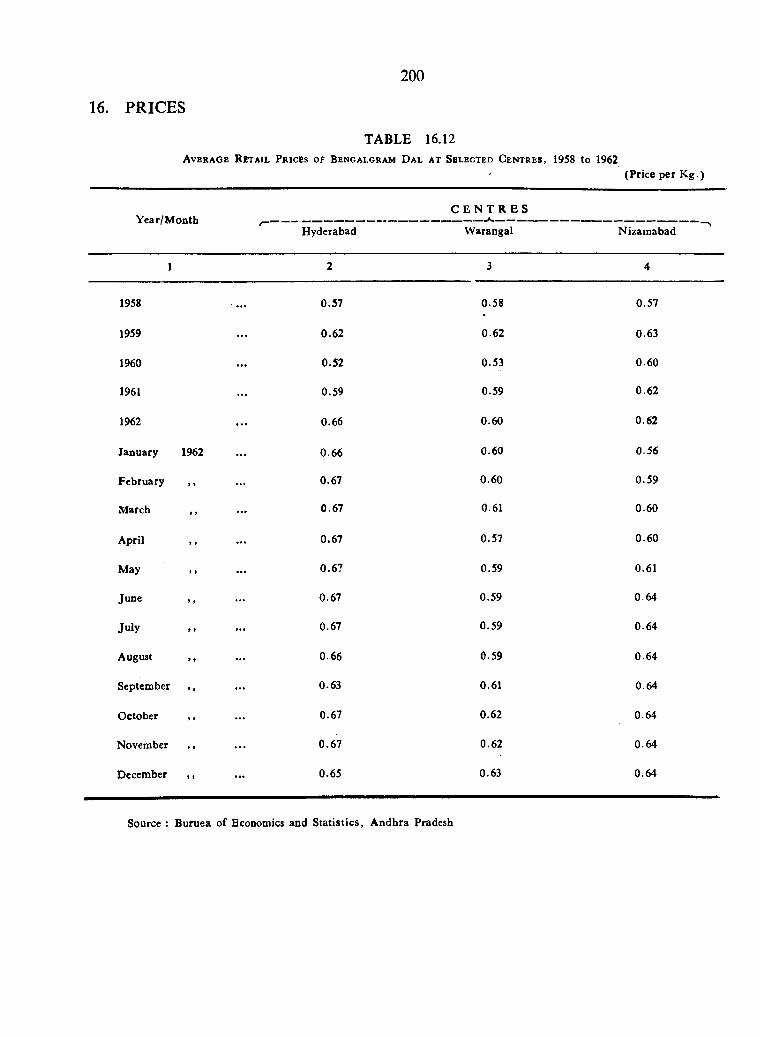
200
16. PRICES
TABLE 16.12Av e r a g e R e t a il P r ic e s o f B e n g a lo r a m D a l a t S e l e c t e d C e n t r e s , 1958 to 1962
( P r ic e p e r K g . )
Y e a r /M o n th r - " - "H y d e ra b a d
C E N T R E S
W a ra n g a l N iz a m a b a d
1 2 3 4
1958 0 .5 7 0 .5 8 0 .5 7
1959 0 .6 2 0 .6 2 0 .6 3
1960 . . . 0 .5 2 0 .5 3 0 .6 0
1961 . . . 0 .5 9 0 .5 9 0 .6 2
1962 0 .6 6 0 .6 0 0 .6 2
J a n u a ry 1962 . . . 0 6 6 0 .6 0 0 .5 6
F e b ru a ry > r 0 .6 7 0 .6 0 0 .5 9
M a rc h * f0 .6 7 0 .61 0 .6 0
A p ril 9 9 0 .6 7 0 .5 7 0 .6 0
M a y 9 9 0 .6 7 0 .5 9 0 .6 1
J u n e 9 9 0 .6 7 0 .5 9 0 .6 4
J u ly t t . . . 0 .6 7 0 .5 9 0 .6 4
A u g u s t » > 0 .6 6 0 .5 9 0 .6 4
S e p te m b e r 9 9 0 .6 3 0 .6 1 0 .6 4
O c to b e r 9 9 0 .6 7 0 .6 2 0 .6 4
N o v e m b e r 9 9 0 .6 7 0 .6 2 0 .6 4
D e c e m b e r 9 9 . . . 0 .6 5 0 .6 3 0 .6 4
Source : B uruea of Economics and S tatistics, A ndhra Pradesh
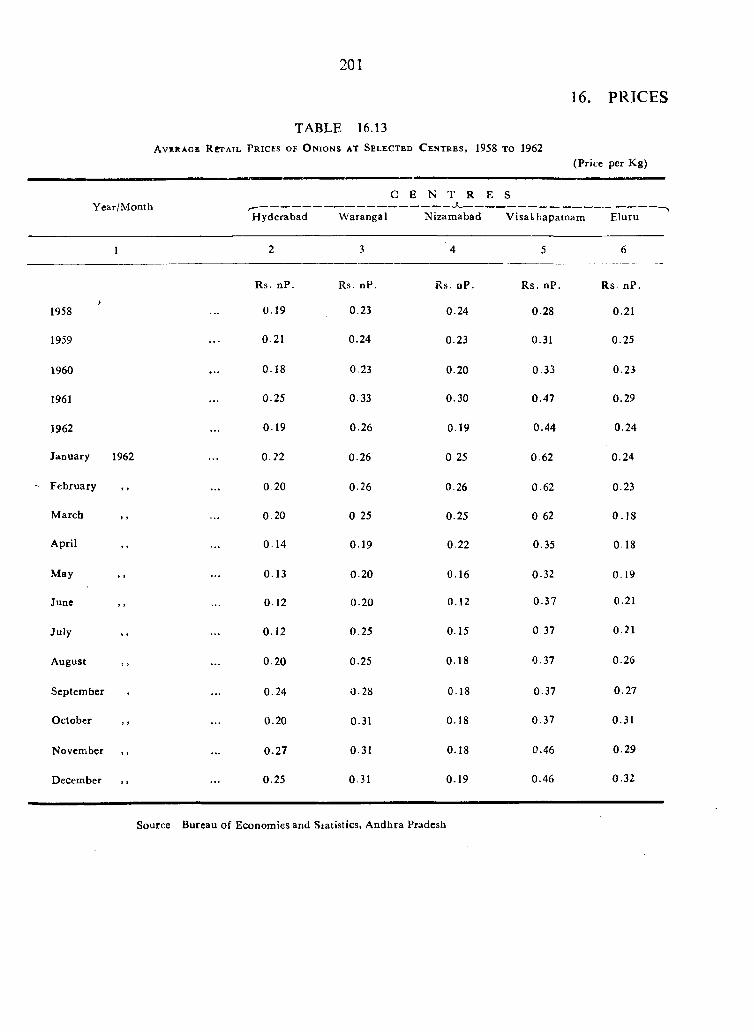
2 0 1
TABLE 16.13A v i r a g k R e t a i l P r i c e s o f O n i o n s a t S e l e c t e d C e n t r e s , 1958 t o 1962
16. PRICES
(Price per Kg)
Year/M onthC E N T R E S
------------------- <---------------H yderabad W arangal N izam abad V isakhapatnam E luru
1958
1959
1960
1961
1962
January 1962
February , ,
M arch , ,
April ,,
M ay , ,
June ,,
July
August
Septem ber
October
November
December
3
Rs. nP.
0.19
0.21
0.18
0.25
0.19
0.22
0 20
0.20
0.14
0.13
0-12
0.12
0.20
0.24
0.20
0.27
0.25
Rs. nP.
0.23
0.24
0.23
0.33
0.26
0.26
0.26
0 25
0.19
0.20
0.20
0.25
0.25
0 2 8
0.31
0.31
0.31
Rs. nP.
0.24
0.23
0.20
0.30
0.19
0 25
0.26
0.25
0.22
0.16
0.12
0.15
0.18
0.18
0.18
0.18
0.19
R s. nP.
0.28
0.31
0.33
0.47
0.44
0-62
0.62
0 62
0.35
0.32
0 .37
0.37
0.37
0.37
0.37
0.46
0.46
Rs. nP .
0.21
0.25
0.23
0.29
0.24
0.24
0.23
0 .18
0 1 8
0.19
0.21
0.21
0.26
0.27
0.31
0.29
0.32
Source Bureau of Economies and Statistics, A ndhra Pradesh
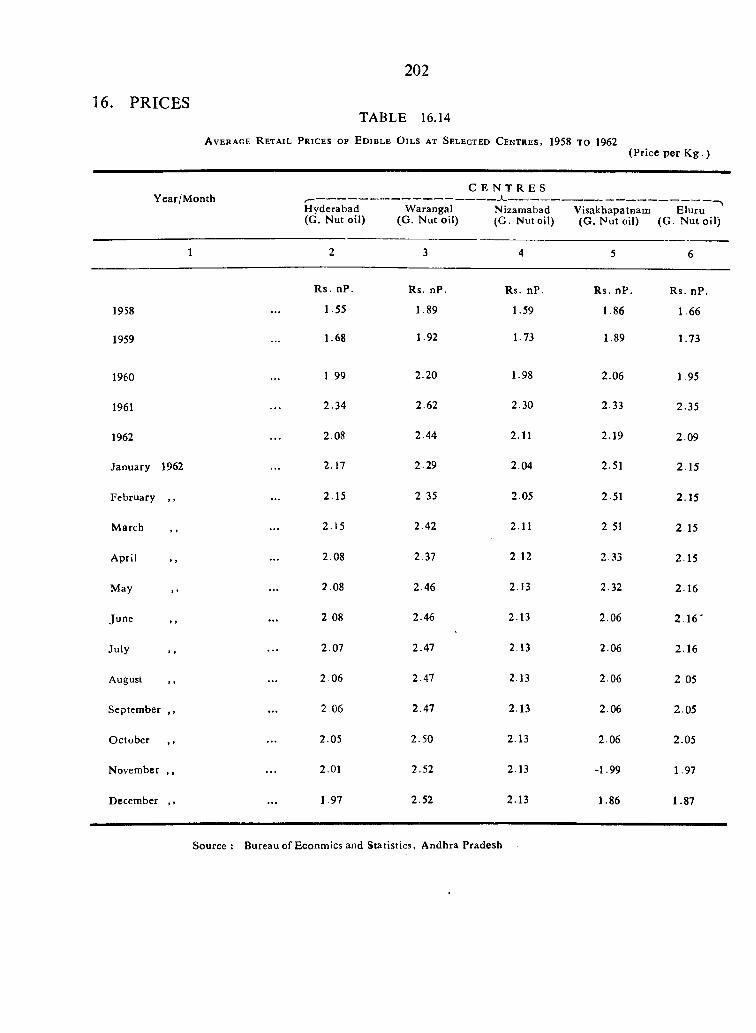
202
16. PRICESTABLE 16.14
A v e r a g e R e t a i l P r i c e s o f E d i b l e O i l s a t S e l e c t e d C e n t r e s , 1958 t o 1962(Price per K g .)
Year/M onthC E N T R E S
H yderabad (G. Nut oil)
W arangal (G . Nut oil)
Nizamabad (G. Nut oil)
Visakhapatnam (G. N ut oil)
Eluru (G . N ut oil)
1 2 3 4 5 6
R s. nP. Rs. nP. Rs. nP. Rs. nP. Rs. nP.
1958 ... 1.55 1.89 1.59 1.86 1.66
1959 1.68 1.92 1.73 1.89 1.73
1960 1 99 2.20 1.98 2.06 1.95
1961 2.34 2.62 2.30 2.33 2.35
1962 2.08 2.44 2.11 2.19 2.09
January 1962 2.17 2.29 2.04 2.51 2.15
February , , . . . 2.15 2 35 2.05 2.51 2.15
M arch , , 2.15 2.42 2.11 2 51 2 15
April , , 2.08 2.37 2.12 2.33 2.15
May ,, 2.08 2.46 2.13 2.32 2.16
June 2 08 2.46 2.13 2.06 2 .1 6 '
July ... 2.07 2.47 2.13 2.06 2.16
August , , 2 06 2.47 2.13 2.06 2 05
September ,, 2.06 2.47 2.13 2.06 2.05
O ctober ,, . . . 2.05 2.50 2.13 2.06 2.05
November , , . . . 2.01 2.52 2.13 -1.99 1.97
December ,, . . . 1.97 2.52 2.13 1.86 1.87
Source: Bureau of Econmics and Statistics, Andhra Pradesh
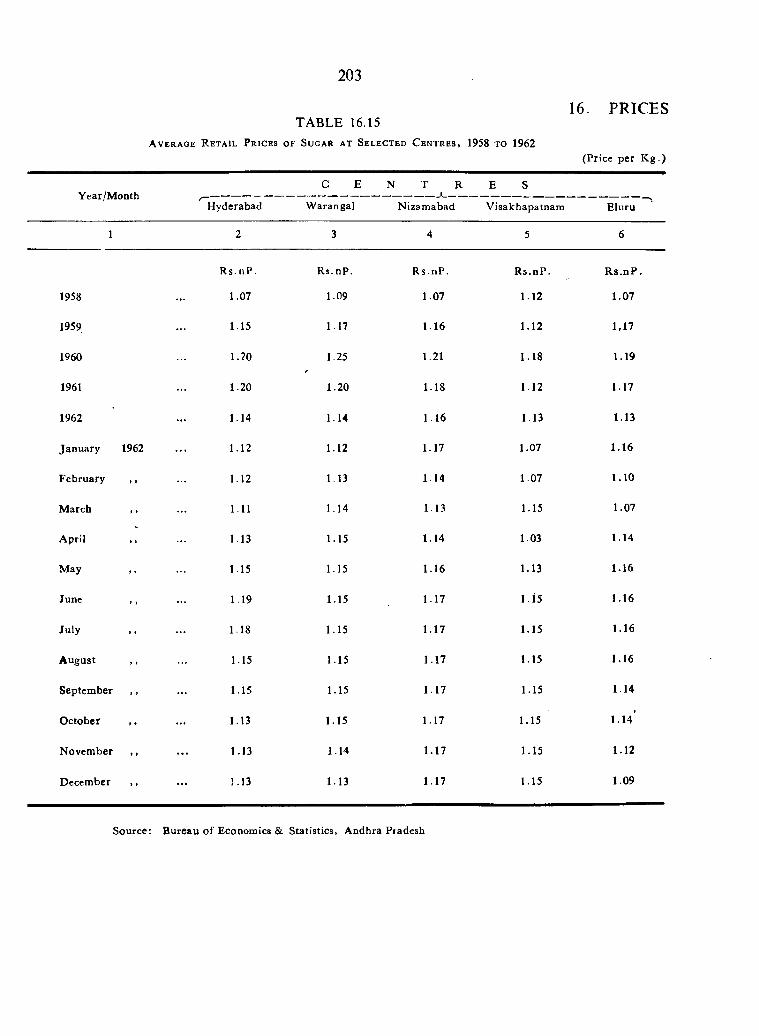
203
TABLE 16.1516 PRICES
A v e r a g e R e t a i l P r i c e s o f S u g a r a t S e l e c t e d C e n t r e s , 1958 TO 1962(Price per K g .)
Y ear/M onthHyderabad
C E
W arangal
N T R
Nizam abad
E S
V isakhapatnam Eluru
1 2 3 4 5 6
R s .n P . Rs. nP. R s .n P . R s.n P . R s .n P .
1958 1.07 1.09 1.07 1.12 1.07
1959 1.15 1.17 1.16 1.12 1.17
1960 1.20 1.25 1.21 1.18 1.19
1961 1.20 1.20 1.18 1.12 1.17
1962 1.14 1.14 1.16 1.13 1.13
January 1962 1.12 1.12 1.17 1.07 1.16
February , , 1.12 1.13 1.14 1.07 1.10
M a r c h , , 111 1.14 1.13 1.15 1.07
A p r i l 1.13 1.15 1.14 1.03 1.14
M ay 1.15 1.15 1.16 1.13 1.16
June , , 1.19 1.15 1.17 1.15 1.16
July 1.18 1.15 1.17 1.15 1.16
A ugust 1.15 1.15 1.17 1.15 1.16
Septem ber , , 1.15 1.15 1.17 1.15 1.14
O ctober 1.13 1.15 1.17 1.15 1.14*
N ovem ber 1.13 1.14 1.17 1.15 1.12
Decem ber , , !.13 1.13 1.17 1.15 1.09
Source: B ureau o f Economics & Statistics, Andhra Pradesh
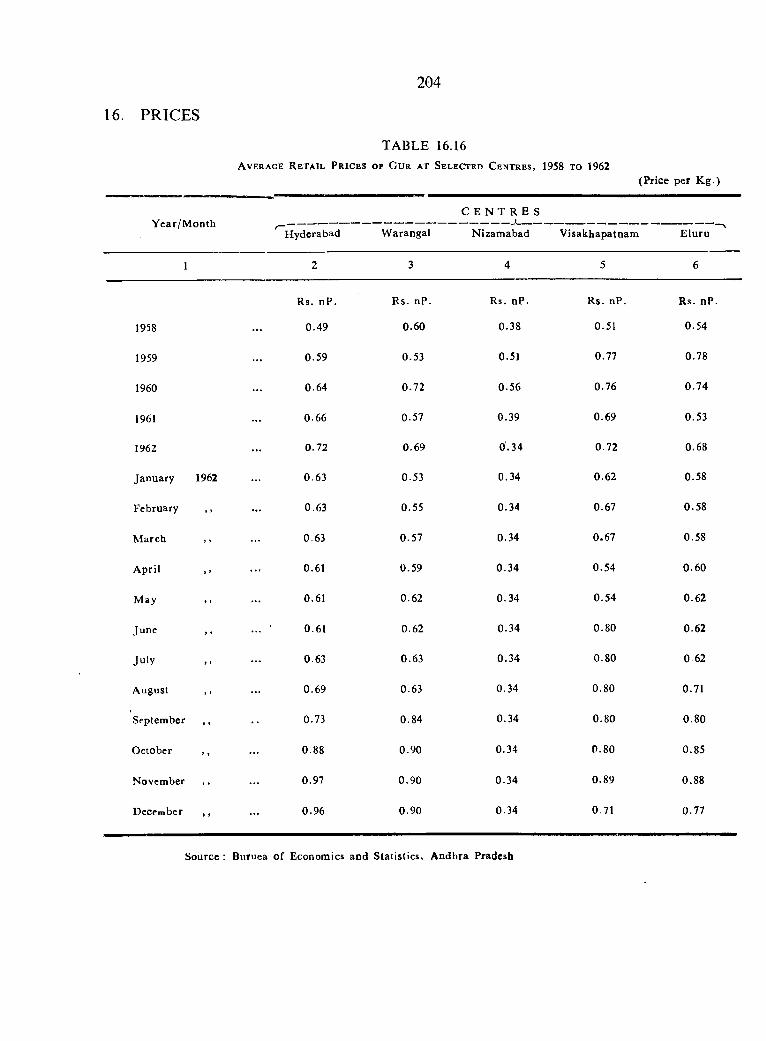
204
16. PRICES
TABLE 16.16A v e r a g e R e t a i l P r i c e s o f G ur a t S e l e c t e d C e n t r e s , 1958 t o 1962
(Price per K g .)
Y ear/M onthC E N T R E S -------------- j ____
H yderabad W arangal N izam abad V isakhapatnam E luru
1958
1959
1960
1961
1962
January 1962
February
M arch ,,
A pril
M ay ,,
June
July
August
September , ,
October , ,
November , ,
December , ,
Rs. nP .
0.49
0.59
0.64
0.66
0.72
0.63
0.63
0.63
0.61
0.61
0.61
0.63
0.69
0.73
0.88
0.97
0.96
R s. nP.
0.60
0.53
0.72
0.57
0.69
0.53
0.55
0.57
0.59
0.62
0.62
0.63
0.63
0.84
0.90
0.90
0.90
Rs. nP.
0.38
0.51
0.56
0.39
0 .34
0.34
0.34
0.34
0.34
0.34
0.34
0.34
0.34
0.34
0.34
0.34
0.34
R s. nP.
0.51
0.77
0.76
0.69
0.72
0.62
0.67
0.67
0.54
0.54
0.80
0.80
0.80
0.80
0.80
0.89
0.71
Rs. nP .
0.54
0.78
0 .74
0.53
0.68
0.58
0.58
0.58
0.60
0.62
0.62
0.62
0.71
0.80
0.85
0.88
0.77
Source : Buruea o f Economics and S tatistics, A ndhra Pradesh
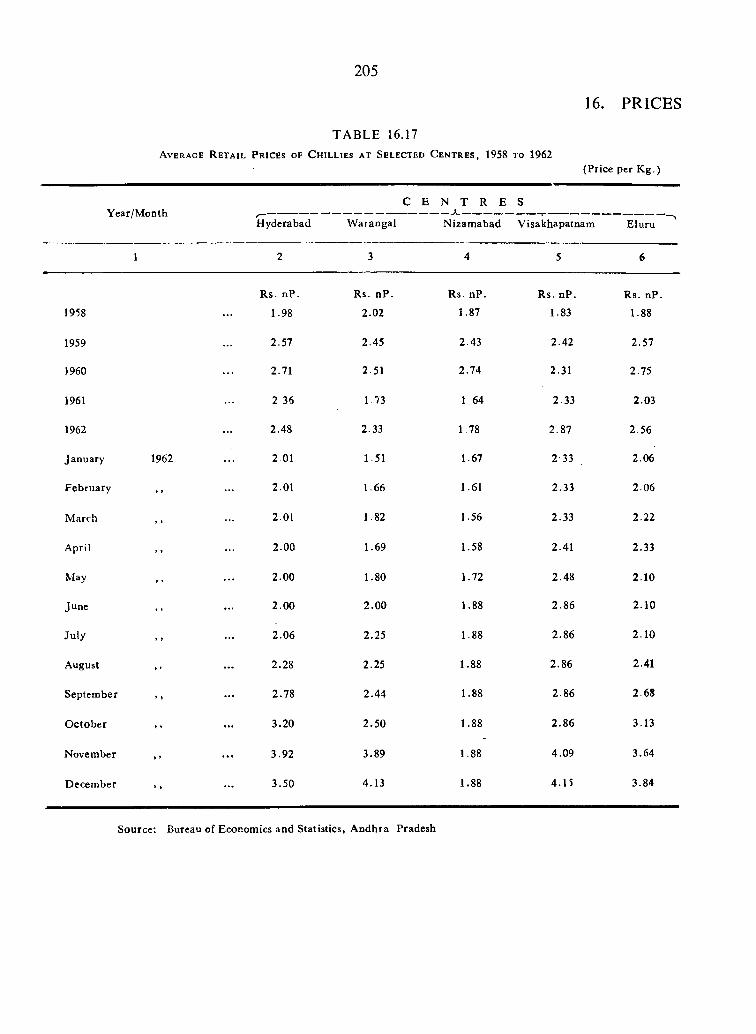
205
16. PRICES
TABLE 16.17A v e r a g e R e t a i l P r i c e s o f C h i l l i e s a t S e l e c t e d C e n t r e s , 1958 TO 1962
(Price per K g.)
Y ear/M onthHyderabad
C
W arangal
E N T R E
N izam abad
S
V isakhapatnam E luru
1 2 3 4 5 6
R s. nP. Rs. nP . Rs. nP. R s. nP . Rs. nP.
1958 1.98 2.02 1.87 1.83 1.88
1959 2.57 2.45 2.43 2.42 2.57
1960 2.71 2.51 2.74 2.31 2.75
1961 2 36 1.73 1 64 2.33 2.03
1962 2.48 2.33 1.78 2.87 2.56
January 1962 2.01 1.51 1.67 2 33 2.06
February » > 2.01 1.66 1.61 2.33 2.06
M a r c h > f 2.01 1.82 1.56 2.33 2.22
A p r i l 9 > 2.00 1.69 1.58 2.41 2.33
May * » 2.00 1.80 1.72 2.48 2.10
June * t 2.00 2.00 1.88 2.86 2.10
July » 9 2.06 2.25 1.88 2,86 2.10
August f » 2.28 2.25 1.88 2.86 2.41
Septem ber > > 2.78 2.44 1.88 2.86 2.68
O ctober ) 9 3.20 2.50 1.88 2.86 3.13
November > * 3.92 3.89 1.88 4.09 3.64
D ecember > t 3.50 4.13 1.88 4.15 3.84
Source: Bureau of Economics and Statistics, A ndhra Pradesh
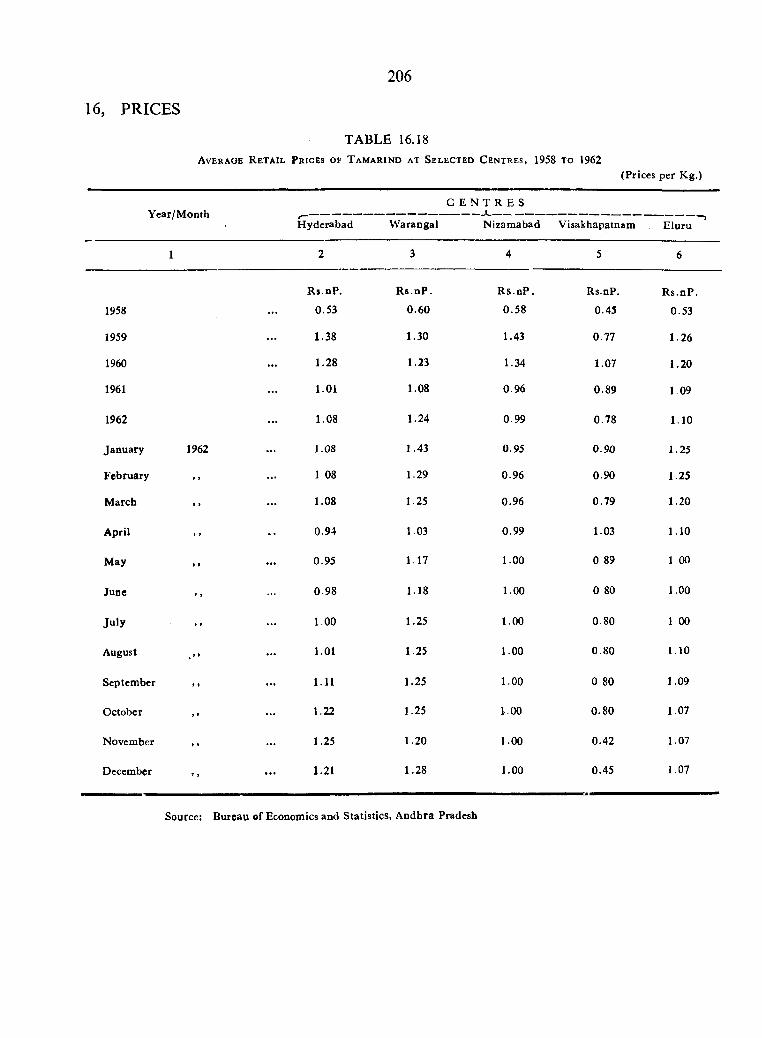
206
16, PRICES
TABLE 16.18Av e r a g e R e t a il P r ic e s o f T a m a r in d a t S e l e c t e d C e n t r e s , 1958 to 1962
(P r ic e s p e r K g .)
Y ear/M onthH yderabad
C E N T R E S
W arangal N izam abad Visakhapatnam E lu ru
1 2 3 4 5 6
R s .n P . R s .n P . R s .n P . R s .n P . R s .n P .
1958 0.53 0.60 0.58 0.45 0.53
1959 1.38 1.30 1.43 0.77 1.26
1960 1.28 1.23 1.34 1.07 1.20
1961 1.01 1.08 0.96 0.89 1 0 9
1962 1.08 1.24 0 99 0.78 1.10
January 1962 1.08 1.43 0.95 0.90 1.25
February 1 08 1.29 0.96 0.90 1.25
M arch , , 1.08 1 25 0.96 0.79 1.20
A pril ,, 0.94 1.03 0.99 1.03 1.10
May 0.95 1.17 1.00 0 89 1.00
June 0.98 1.18 1.00 0 80 1.00
Ju ly , , 1.00 1.25 1.00 0 80 1.00
A u g u s t , , 1.01 1.25 1.00 0.80 1.10
Septem ber , , 1.11 1.25 1.00 0 80 1.09
October , , 1.22 1.25 1.00 0.80 1.07
November , , 1.25 1.20 1.00 0.42 1.07
D e c e m b e r , , 1.21 1.28 1.00 0.45 1.07
Source Bureau of Economics and Statistics, A ndhra Pradesh
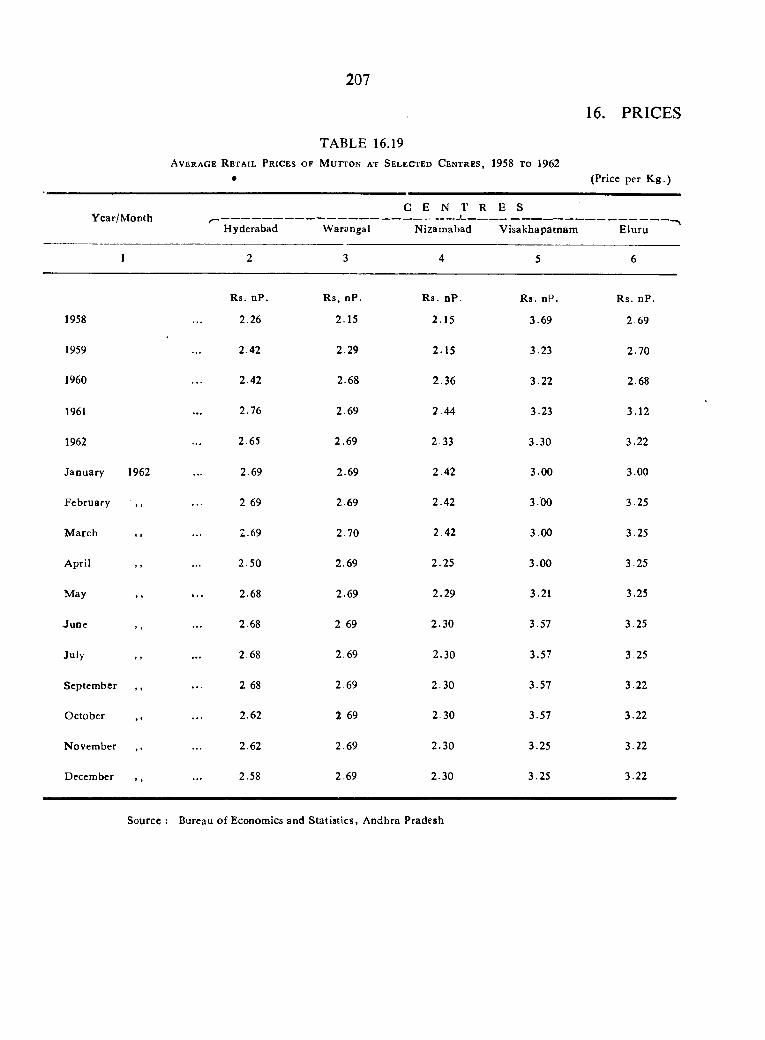
207
16. PRICES
TABLE 16.19A v e r a g e R e t a il P r ic e s o f
•M u t t o n at S e l ec te d C e n t r e s , 1958 TO 1962
(Price per K g .)
Year/M onth r—Hyderabad W a ra n g a l
C E N T R
Nizamabad
E S
V isakhapatnam E luru
1 2 3 4 5 6
Rs. nP. R s, nP. R s. n P . R s . nP. Rs. nP.
1958 2.26 2.15 2.15 3.69 2.69
1959 2.42 2.29 2.15 3.23 2.70
1960 2.42 2.68 2.36 3.22 2.68
1961 2.76 2.69 2.44 3.23 3.12
1962 2.65 2.69 2.33 3.30 3.22
January 1962 2.69 2.69 2.42 3.00 3.00
February 2 69 2.69 2.42 3.00 3.25
M arch , , 2.69 2.70 2.42 3.00 3.25
April 2.50 2.69 2.25 3.00 3.25
May 2.68 2.69 2.29 3.21 3.25
June , , 2.68 2 69 2.30 3.57 3.25
Ju ly 2.68 2.69 2.30 3.57 3.25
Septem ber , , 2 68 2.69 2.30 3.57 3.22
O ctober ,, 2.62 2 69 2.30 3.57 3.22
November 2.62 2.69 2.30 3.25 3.22
December , , 2.58 2.69 2.30 3.25 3.22
Source : Bureau of Economics and Statistics, Andhra Pradesh
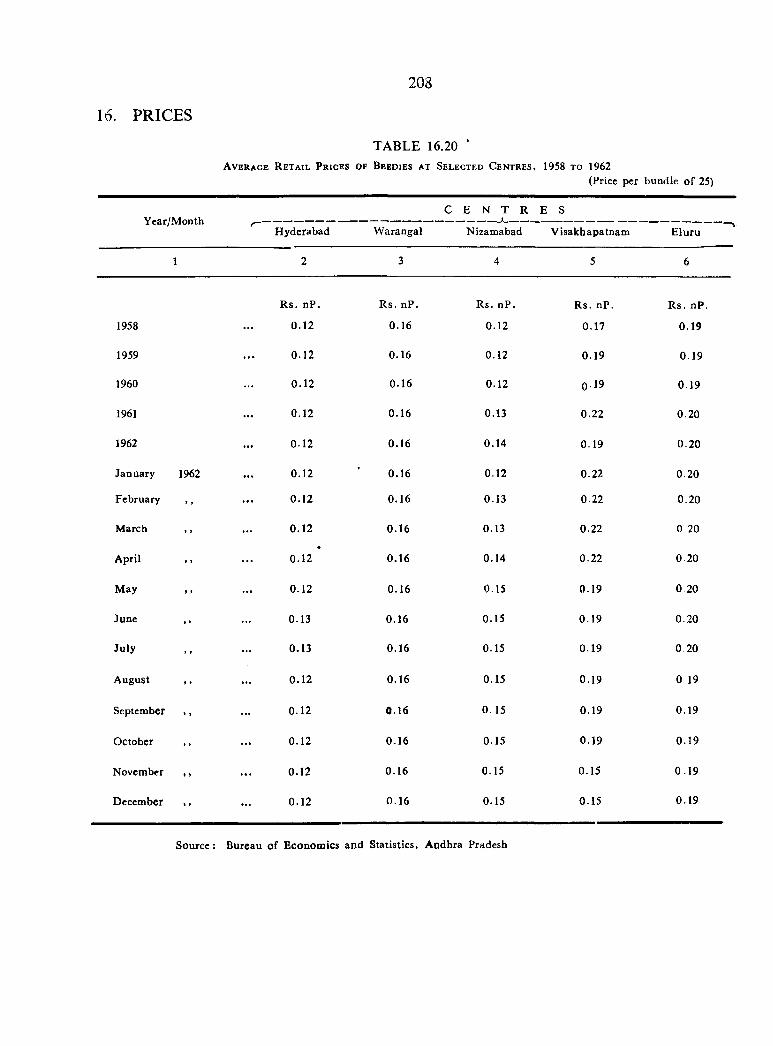
208
16. PRICES
TABLE 16.20 *A v e r a g e R e t a il P r ic e s o f B e e d ie s a t S e l ec te d C e n t r e s , 1958 TO 1962
(Price per bundle o f 25)
C E N T R E SjiX car/xvioni.ix r~— ••Hyderabad W arangal Nizamabad V isakhapatnam E luru
1 2 3 4 5 6
R s . n P . R s. nP . Rs. n P . R s . nP. R s . nP.
1958 ... 0.12 0.16 0.12 0.17 0.19
1959 . . . 0.12 0.16 0.12 0.19 0.19
1960 ... 0.12 0.16 0.12 0-19 0.19
1961 ... 0.12 0.16 0.13 0.22 0.20
1962 ... 0-12 0.16 0.14 0.19 0.20
January 1962 ... 0.12 0.16 0.12 0.22 0.20
February , , .. . 0.12 0.16 0.13 0.22 0.20
March , , ... 0.12 0.16 0.13 0.22 0 20
April , , . . . 0.12 0.16 0.14 0.22 0.20
May ... 0.12 0.16 0.15 0.19 0 20
June , , ... 0.13 0.16 0.15 0.19 0.20
July ... 0.13 0.16 0.15 0.19 0.20
A u g u s t , , ... 0.12 0.16 0.15 0.19 0 19
September , , ... 0.12 0.16 0.15 0.19 0.19
October ... 0.12 0.16 0.15 0.19 0.19
November , , .. . 0.12 0.16 0.15 0.15 0 .19
December , , ... 0.12 0.16 0.15 0.15 0.19
Source: Bureau of Econom ics and Statistics, A ndhra Pradesh
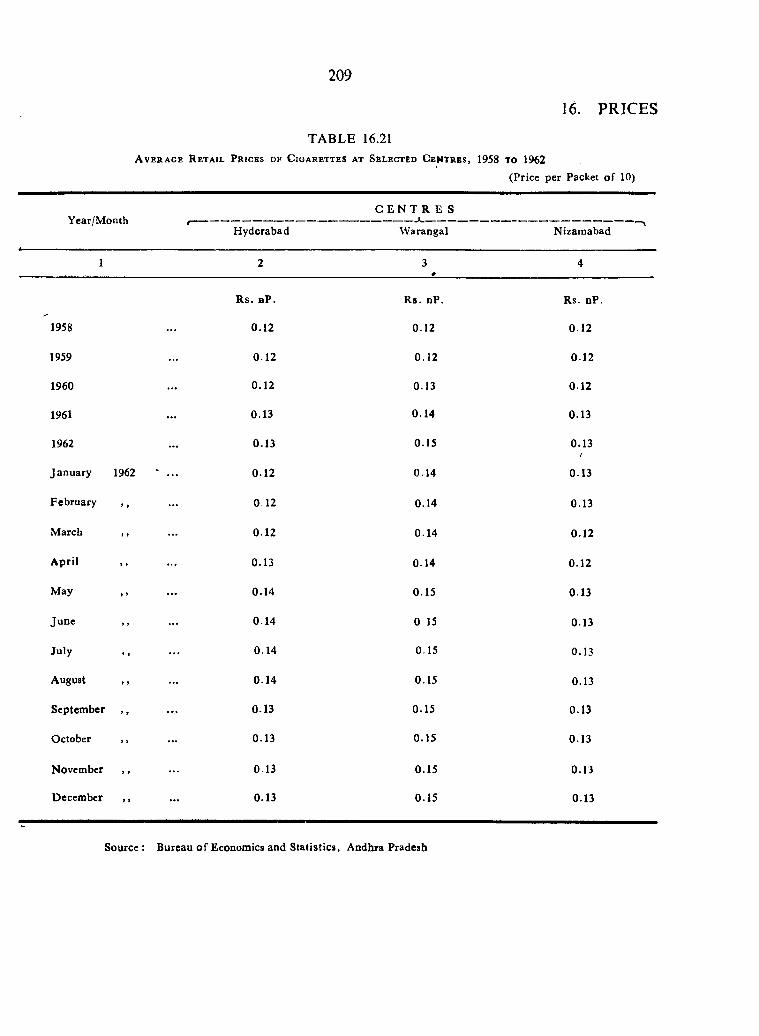
209
16. PRICES
TABLE 16.21A v e r a g e R e t a i l P r i c e s o f C i g a r e t t e s a t S s l e c t E d C e n t r e s , 1958 t o 1962
(Price per Packet o f 10)
Year/M onthC E N T R E S
«H yderabad W arangal Nizam abad
1 2 3#
4
R s. bP. R s. nP . Rs. nP.
1958 0.12 0.12 0.12
1959 . . . 0.12 0.12 0.12
1960 0.12 0.13 0.12
1961 . . . 0.13 0.14 0.13
1962 0.13 0.15 0.13/
Jan u ary 1962 ' 0.12 0.14 0.13
February , , 0.12 0.14 0.13
M arch , , 0.12 0.14 0.12
A pril 0.13 0.14 0.12
May 0.14 0.15 0.13
Ju n e 0.14 0 15 0.13
July . . . 0.14 0.15 0.13
August . . . 0.14 0.15 0.13
Septem ber , , 0.13 0.15 0.13
October , , 0.13 0.15 0.13
November , , 0.13 0.15 0.13
December , , . . . 0.13 0.15 0.13
Source : Bureau o f Economics and S tatistics, Andhra Pradesh
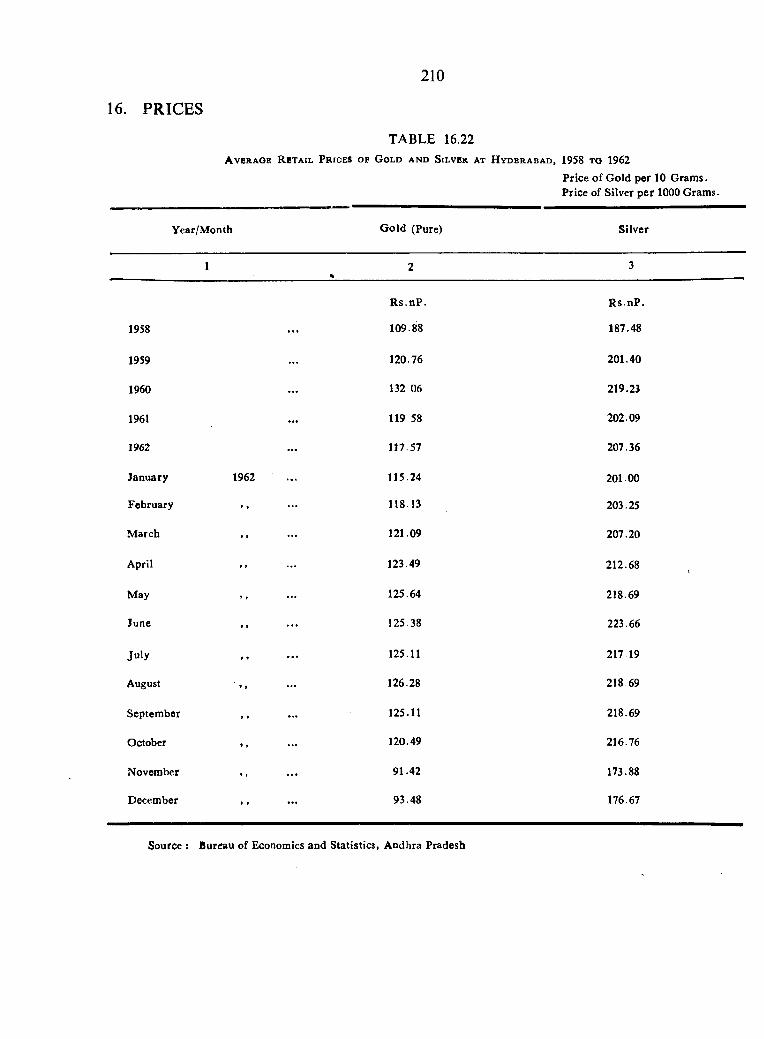
210
16. PRICES
A v b r a o b R e t a il P r ic e s o f G o l d a n d S il v er a t H y d e r a b a d , 1958 t o 1962
Price o f Gold per 10 G ram s. Price of Silver per 1000 Grams.
TABLE 16.22
Year/M onth G old (Pure) Silver
1%
2 3
R s.n P . R s .n P .
1958 . . . 109.88 187.48
1959 120-76 201.40
1960 132.06 219.23
1961 . . . 119 58 202.09
1962 . . . 117.57 207.36
January 1962 115.24 201.00
February , , 118.13 203.25
M arch , , . . . 121.09 207.20
April , 1 123.49 212.68
M ay , , 125.64 218.69
June , , 125.38 223.66
Ju ly 125.11 217.19
August , , . . . 126.28 218 69
Septem ber 125.11 218.69
October , , 120.49 216.76
November 91.42 173.88
December , , . . . 93.48 176.67
Source : Bureau of Economics and Statistics, A ndhra Pradesh
TABLE 16.23
A v e r a g e W h o l e s a l e P r ic e s o f R ic e AT I m p o r t a n t C e n t r e s , 1958 to 1962
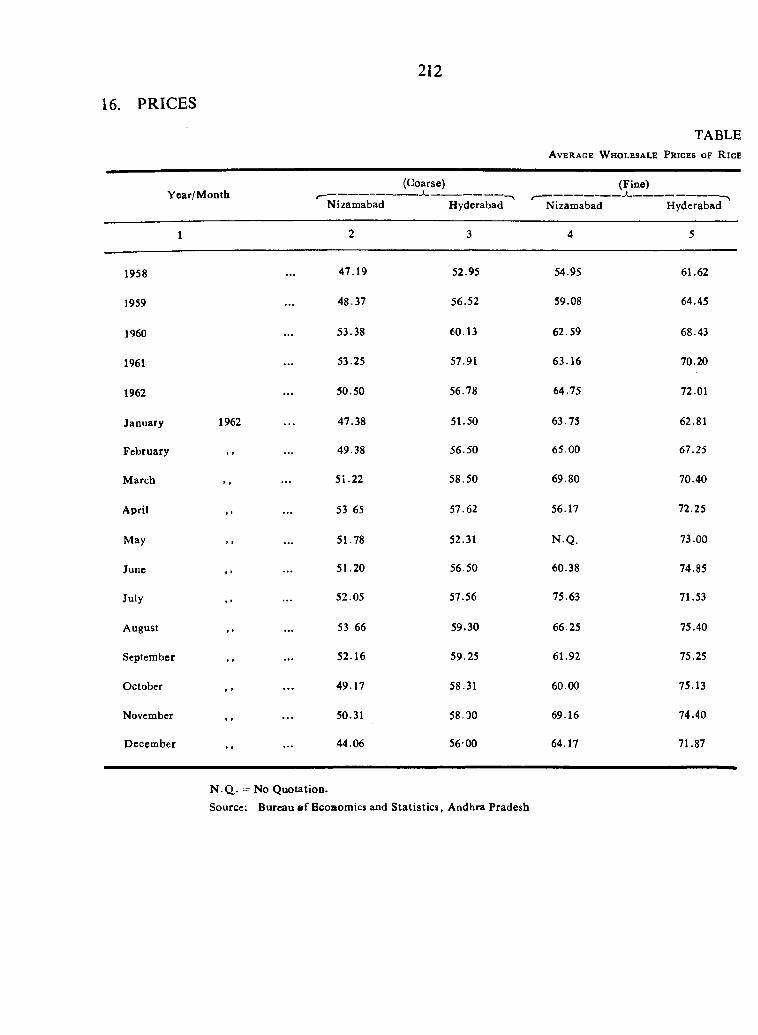
212
16. PRICES
TABLEA v e r a g e W h o l e s a l e P r i c e s o f R i c e
Y e a r /M o n th(Coarse)
------ 1------Nizamabad Hyderabad
(Fine)
Nizamabad H yderabad
1958
1959
1960
1961
1962
January
February
M arch
April
May
June
July
August
September
October
November
Decem ber
1962
47.19
48.37
53.38
53.25
50.50
47.38
49.38
5 i.2 2
53 65
51.78
51.20
52.05
53 66
52.16
49.17
50.31
44.06
52.95
56.52
60.13
57.91
56.78
51.50
56.50
58.50
57.62
52.31
56.50
57.56
59.30
59.25
58.31
58.30
56-00
54.95
59.08
62.59
63.16
64.75
63.75
65.00
69.80
56.17
N .Q .
60.38
75.63
66.25
61.92
60.00
69.16
64.17
61.62
64.45
68.43
70.20
72.01
62.81
67.25
70.40
72.25
73.00
74.85
71.53
75.40
75.25
75.13
74.40
71.87
N .Q . = No Q uotation .
Source: Bureau e f Economics and S ta tis tics, Andhra Pradesh
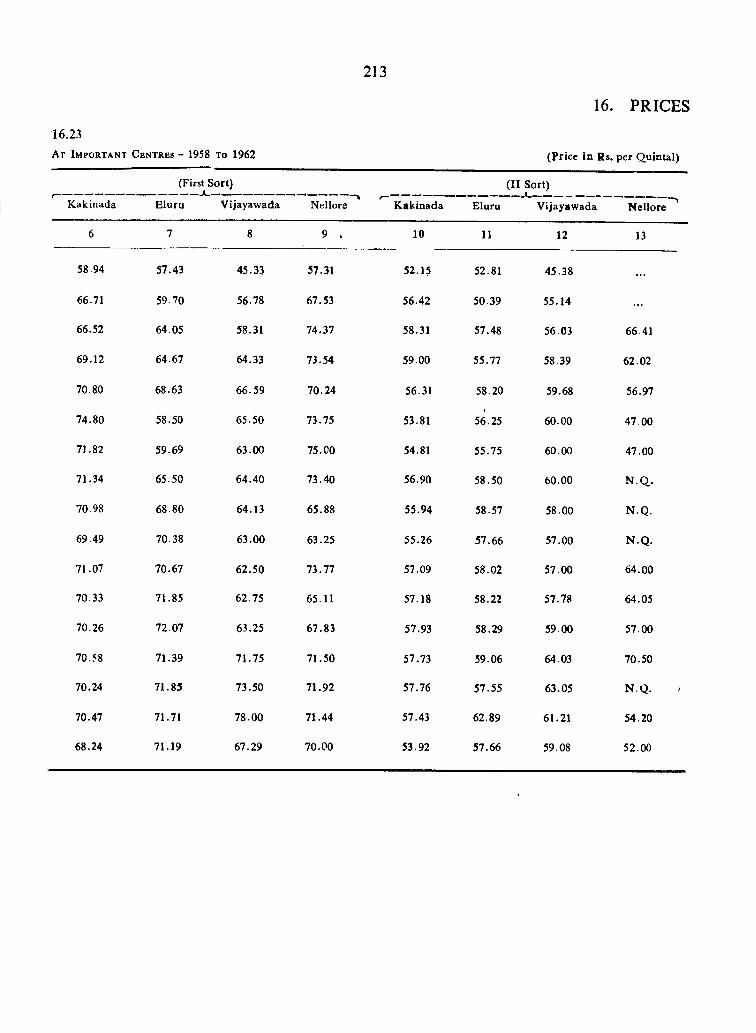
213
16.23At I m p o r t a n t C e n t r e s - 1958 To 1962 (Price in Rs. per Q uintal)
16. PRICES
(First Sort) (II Sort)
K akinada E luru Vijayawada Nellore
58.94
66.71
66.52
69.12
70.80
74.80
71.82
71.34
70.98
69.49
71.07
70.33
70.26
70.58
70.24
70.47
68.24
57.43
59.70
64.05
64.67
68.63
58.50
59.69
65.50
68.80
70.38
70.67
71.85
72.07
71.39
71.85
71.71
71.19
9 .
45.33
56.78
58.31
64.33
66.59
65.50
63.00
64.40
64.13
63.00
62.50
62.75
63.25
71.75
73.50
78.00
67.29
57.31
67.53
74.37
73.54
70.24
73.75
75.00
73.40
65.88
63.25
73.77
65.11
67.83
71.50
71.92
71.44
70.00
vakinada Eluru V ijayaw ada N ellore"^
10 11 12 13
52.15 52.81 45.38 . . .
56.42 50.39 55.14 . . .
58.31 57.48 56.03 66.41
59.00 55.77 58.39 62.02
56.31 58.20 59.68 56.97
53.81 56.25 60.00 47.00
54.81 55.75 60.00 47.00
56.90 58.50 60.00 N .Q ..
55.94 58.57 58.00 N .Q .
55.26 57.66 57.00 N .Q .
57.09 58.02 57.00 64.00
57.18 58.22 57.78 64.05
57.93 58.29 59.00 57.00
57.73 59.06 64.03 70.50
57.76 57.55 63.05 N .Q .
57.43 62.89 61.21 54.20
53.92 57.66 59.08 52.00
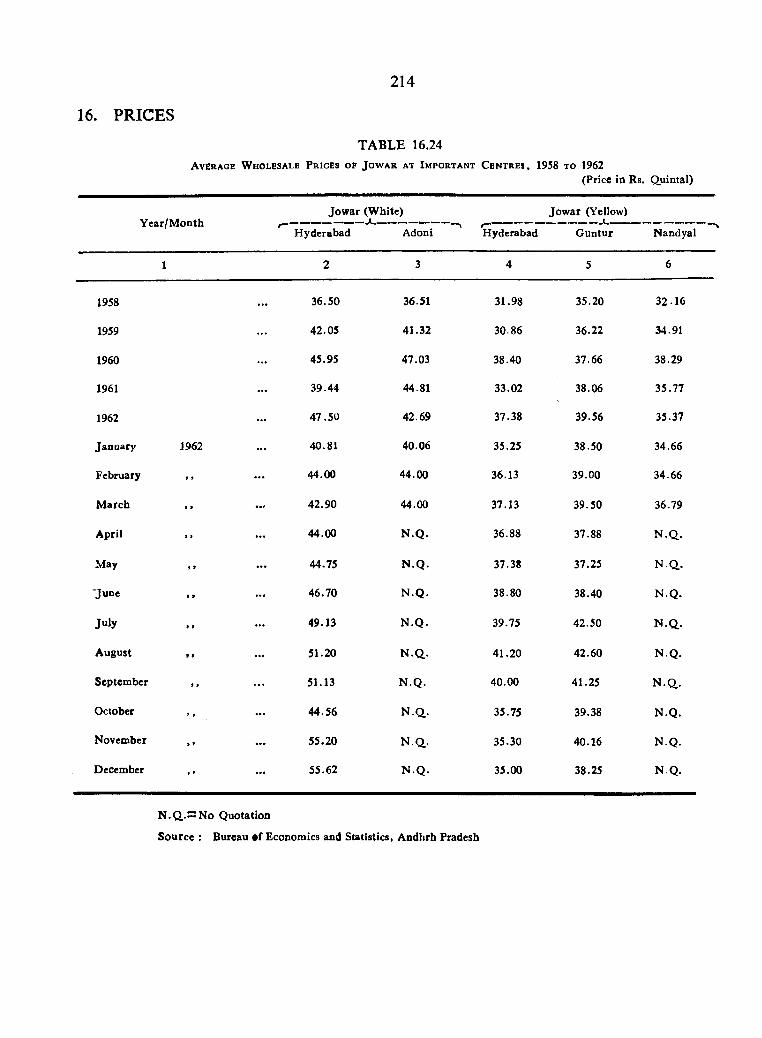
214
16. PRICES
TABLE 16.24A v e r a g e W h o l e s a l e P r i c e s o f J o w a r a t I m p o r t a n t C e n t r e s , 1958 t o 1962
(Price in Rs. Q uintal)
Y ear/M onthJow ar (W hite)
H yderabad Adoni
Jow ar (Yellow)
H yderabad G untur N andyal
1958
1959
1960
1961
1962
January
February
M arch
A pril
May
■June
Ju ly
August
Septem ber
October
November
December
1962
3 6 .5 0
4 2 .0 5
4 5 .9 5
3 9 .4 4
4 7 .5 0
4 0 .8 1
4 4 .0 0
4 2 .9 0
4 4 .0 0
4 4 .7 5
4 6 .7 0
4 9 .1 3
5 1 .2 0
5 1 .1 3
4 4 .5 6
5 5 .2 0
5 5 .6 2
3 6 .5 1
4 1 .3 2
4 7 .0 3
4 4 .8 1
4 2 .6 9
4 0 .0 6
4 4 .0 0
4 4 .0 0
N .Q .
N .Q .
N .Q .
N .Q .
N .Q .
N .Q .
N .Q .
N .Q .
N .Q .
3 1 .9 8
3 0 .8 6
3 8 .4 0
3 3 .0 2
3 7 .3 8
3 5 .2 5
3 6 .1 3
3 7 .1 3
3 6 .8 8
3 7 .3 8
3 8 .8 0
3 9 .7 5
4 1 .2 0
4 0 .0 0
3 5 .7 5
3 5 .3 0
3 5 .0 0
3 5 .2 0
3 6 .2 2
3 7 .6 6
3 8 .0 6
3 9 .5 6
3 8 .5 0
3 9 .0 0
3 9 .5 0
3 7 .8 8
3 7 .2 5
3 8 .4 0
4 2 .5 0
4 2 .6 0
4 1 .2 5
3 9 .3 8
4 0 .1 6
3 8 .2 5
3 2 .1 6
3 4 .9 1
3 8 .2 9
3 5 .7 7
3 5 .3 7
3 4 .6 6
3 4 .6 6
3 6 .7 9
N .Q .
N .Q ..
N .Q .
N .Q .
N .Q .
N .Q ..
N .Q .
N .Q .
N Q.
N .Q ,.S N o Q uotation
Source : Bureau «f Economics and Statistics, Andhrh Pradesh
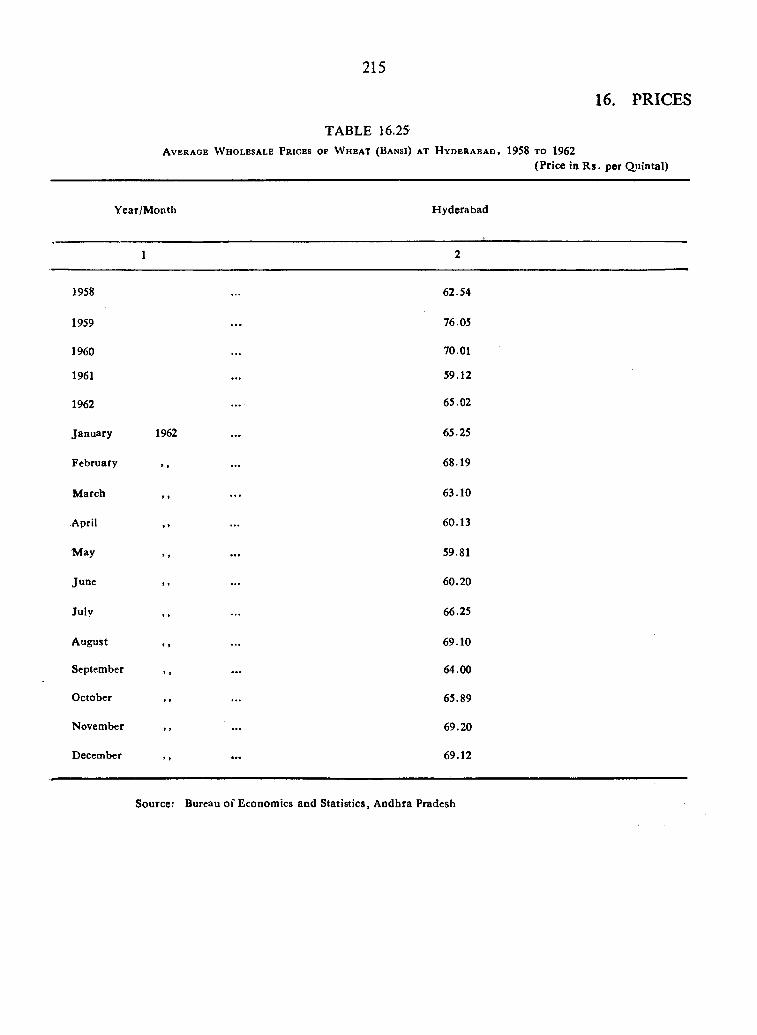
215
16. PRICES
TABLE 16.25A v e r a g e W h o l e s a l e P r i c e s o f W h e a t ( B a n s i ) a t H y d e r a b a d , 1958 t o 1962
(Price in R s. per Quintal)
Y ear/M onth H yderabad
1 2
1958 ... 62.54
1959 76.05
1960 70.01
1961 . . . 59.12
1962 65.02
January 1962 . . . 65.25
February , , 68.19
M arch , , . . . 63.10
April , , 60.13
M ay 59.81
June , , 60.20
July 66.25
August . . . 69.10
September , , . . . 64.00
O ctober , , 65.89
November , , 69.20
December , , . . . 69.12
Source: Bureau o f Economics and S tatistics, A ndhra Pradesh
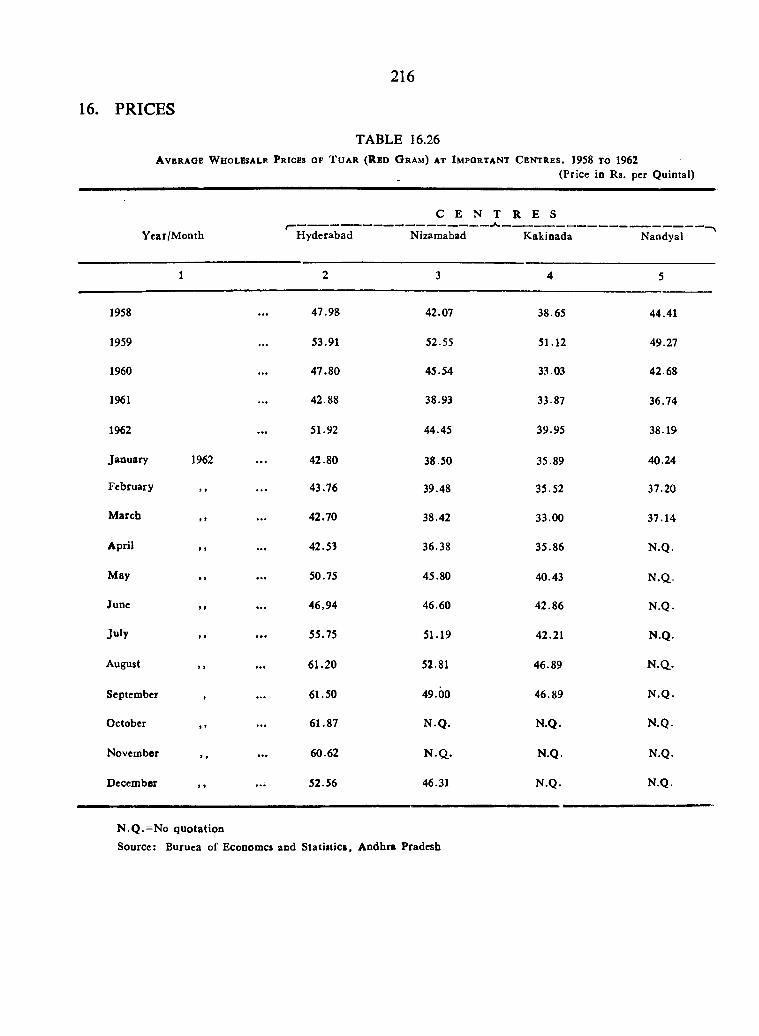
216
16. PRICES
TABLE 16.26A v e r a g e W h o l e s a l e P r i c e s o f T u a r ( R e d G r a m ) a t I m p o r t a n t C e n t r e s , 1958 t o 1962
(Price in Rs. per Quintal)
Y ear/M onth H yderabad
C E N T R E S
Nizamabad K akinada N a n d y a l
1958
1959
1960
1961
1962
January
February
M arch
April
May
June
Ju ly
August
September
October
November
December
1962
47.98
53.91
47.80
42.88
51.92
42.80
43.76
42.70
42.53
50.75
46,94
55.75
61.20
61.50
61.87
60.62
52.56
42.07
52.55
45.54
38.93
44.45
38.50
39.48
38.42
36.38
45.80
46.60
51.19
52.81
49.00
N .Q .
N .Q ..
46.31
38.65
51.12
33.03
33.87
39.95
35.89
35.52
33.00
35.86
40.43
42.86
42.21
46.89
46.89
N .Q .
N .Q .
N .Q .
44.41
49.27
42.68
36.74
38.19
40.24
37.2a
37. 14
N .Q .
N .a -
N .Q .
N .Q .
N .a -
N .Q .
N .Q .
N .Q.
N .Q .
N .Q .= N o q uo ta tion
Source: Buruea of Economcs and S ta tiitics, A ndhra Pradesh
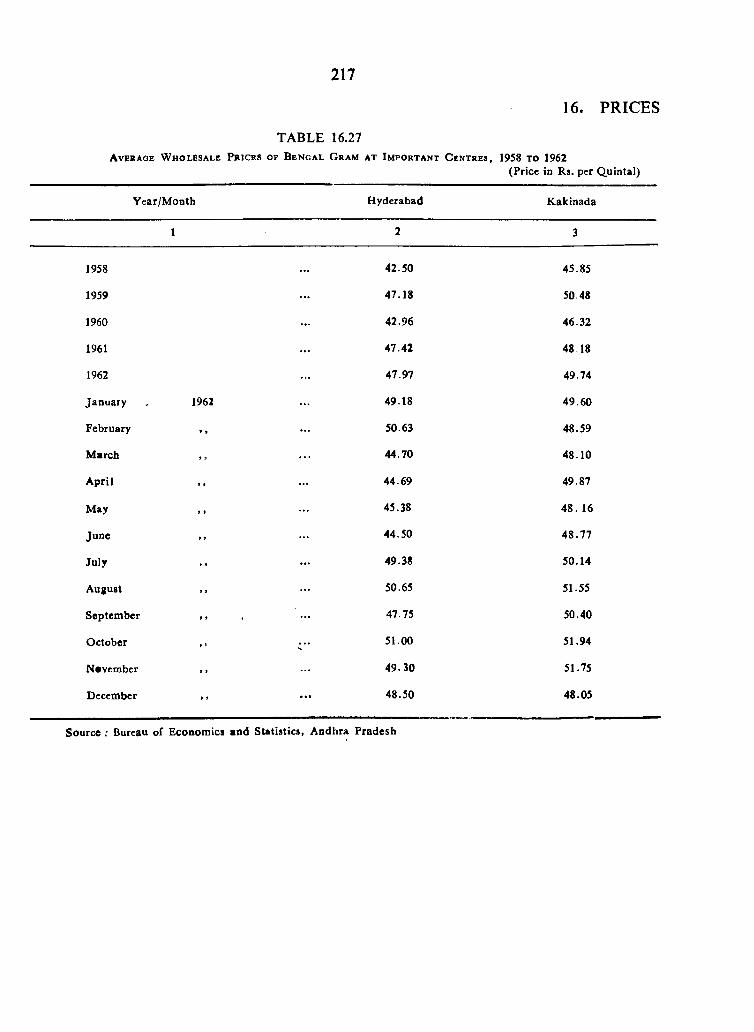
217
16. PRICES
TABLE 16.27A v er a g e W h o l e s a l e P r ic e s o f B e n g a l G r a m a t I m p o r t a n t C e n t r e s , 1958 TO 1962
(Price in Rs. per Q uintal)
Year/M oDth H yderabad K akinada
1 2 3
1958 . . . 42.50 45.85
1959 . . . 47.18 50.48
1960 . . . 42.96 46.32
1961 . . . 47.42 48.18
1962 . . . 47.97 49.74
January 1962 . . . 49.18 49.60
February » » . . . 50.63 48.59
M arch 9 9 . . . 44.70 48.10
A pril 9 * . . . 44.69 49.87
M ay * 9 45.38 48 . 16
June 9 9 . . . 44.50 48.77
July 9 9 . . . 49.38 50.14
August 9 9 . . . 50.65 51.55
Septem ber 9 9 47.75 50.40
O ctober 9 5 ■1’ * 51.00 51.94
N*ven»bcr 9 9 . . . 49.30 51.75
December . . . 48.50 48.05
Source : Bureau of Economics and Statistics, Andhra Pradesh
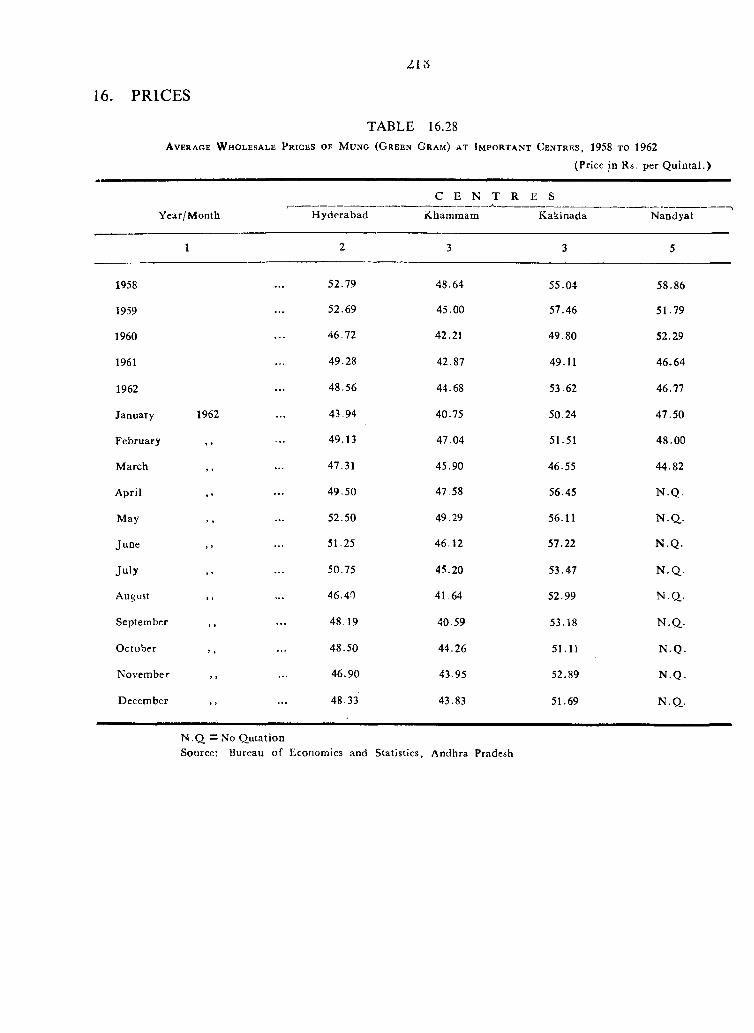
216
16. PRICES
TABLE 16.28A v e r a g e W h o l e s a l e P r i c e s o f M u n g ( G r e e n G r a m ) a t I m p o r t a n t C e n t r e s , 1958 t o 1962
(Price in Rs. per Q u in ta l.)
Y ear/M onth
C E N T R E S
H yderabad Khammam K akinada N andyal
1 2 3 3 5
1958 52.79 48.64 55.04 58.86
1959 52.69 45.00 57.46 51.79
1960 46.72 42.21 49.80 52.29
1961 49.28 42.87 49.11 46.64
1962 48.56 44.68 53.62 46.77
January 1962 43.94 40.75 50.24 47.50
February , , 49.13 47.04 51.51 48.00
M arch , , 47.31 45.90 46.55 44.82
A pril 49.50 47.58 56.45 N .Q .
May 52.50 49.29 56.11 n . q .
June 51.25 46.12 57.22 N .Q .
Ju ly 50.75 45.20 53.47 N .Q ..
August ,, 46.40 41 64 52.99 N . q ..
September , , 48.19 40.59 53.18 n .q ..
O ctober , , 48.50 44.26 51.11 N .Q .
N ovem ber ,, 46.90 43.95 52.89 N .Q .
December ,, 48.33 43.83 51.69 N .Q .
N .Q =! No Q utationSource; Bureau o f Economics and Statistics, Andhra Pradesh
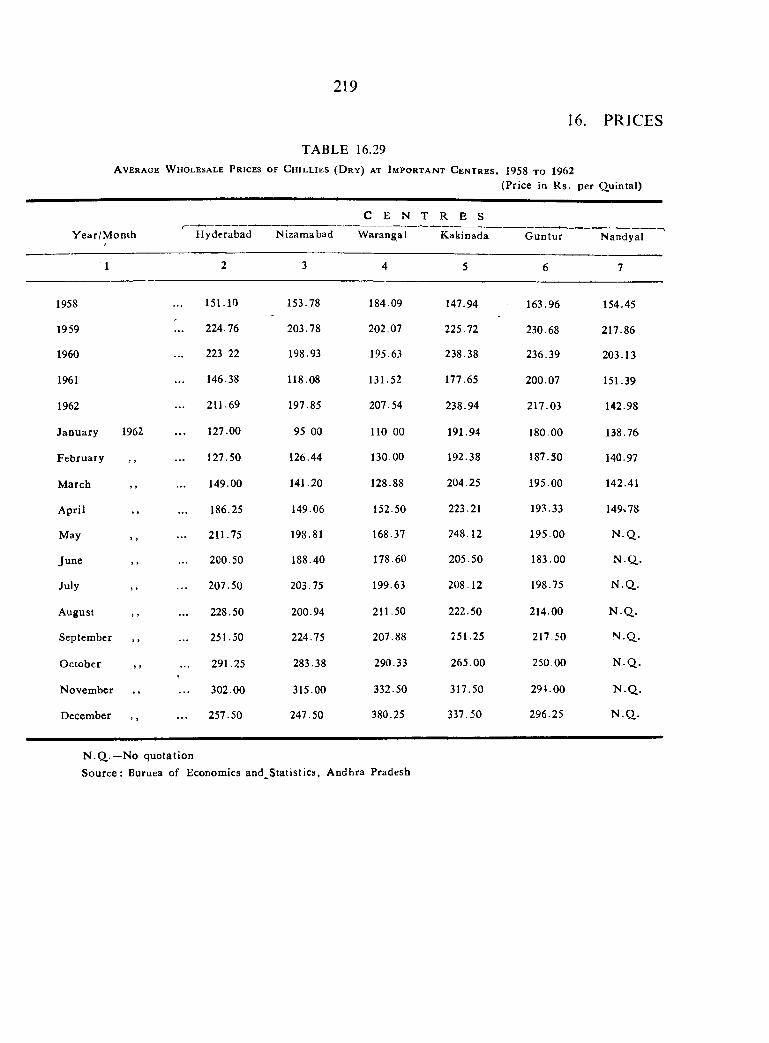
219
16. PRICES
TABLE 16.29A v e r a g e W h o l e s a l e P r i c e s o f C h i l l i e s ( D r y ) a t I m p o r t a n t C e n t r e s , 1958 t o 1962
(Price in R s. per Q uintal)
Y ear/M onth
C E N 1' R E SH yderabad N izam abad W arangai K akinada G untu r N andyal
1 2 3 4 5 6 7
1958 151.10 153.78 184.09 147.94 163.96 154.45
1959 1 224.76 203.78 202.07 225.72 230.68 217.86
1960 223.22 198.93 195.63 238.38 236.39 203.13
1961 146.38 118.08 131.52 177.65 200.07 151.39
1962 211.69 197.85 207.54 238.94 217.03 142.98
January 1962 127.00 95.00 110 00 191.94 180.00 138.76
February , , 127.50 126.44 130 00 192.38 187.50 140.97
M arch ,, 149.00 141.20 128.88 204.25 195.00 142.41
A pril ,, 186.25 149.06 152.50 223.21 193.33 149v78
May , , 211.75 198.81 168.37 248.12 195.00 N .Q .
June 200.50 188.40 178.60 205.50 183.00 N .Q .
July 207.50 203.75 199.63 208.12 198.75 N .Q .
August , , 228.50 200.94 211.50 222.50 214.00 N .Q .
Septem ber ,, 251.50 224.75 207.88 251.25 217.50 N .Q .
O ctober , , 291.25 283.38 290.33 265.00 250.00 N .Q .
N ovem ber ,, 302.00 315.00 332.50 317.50 294.00 N .Q .
December , , 257.50 247.50 380.25 337.50 296.25 N .Q .
N .Q ..—No quo ta tionS ource: Buruea of Economics and S tatistics, A ndhra Pradesh
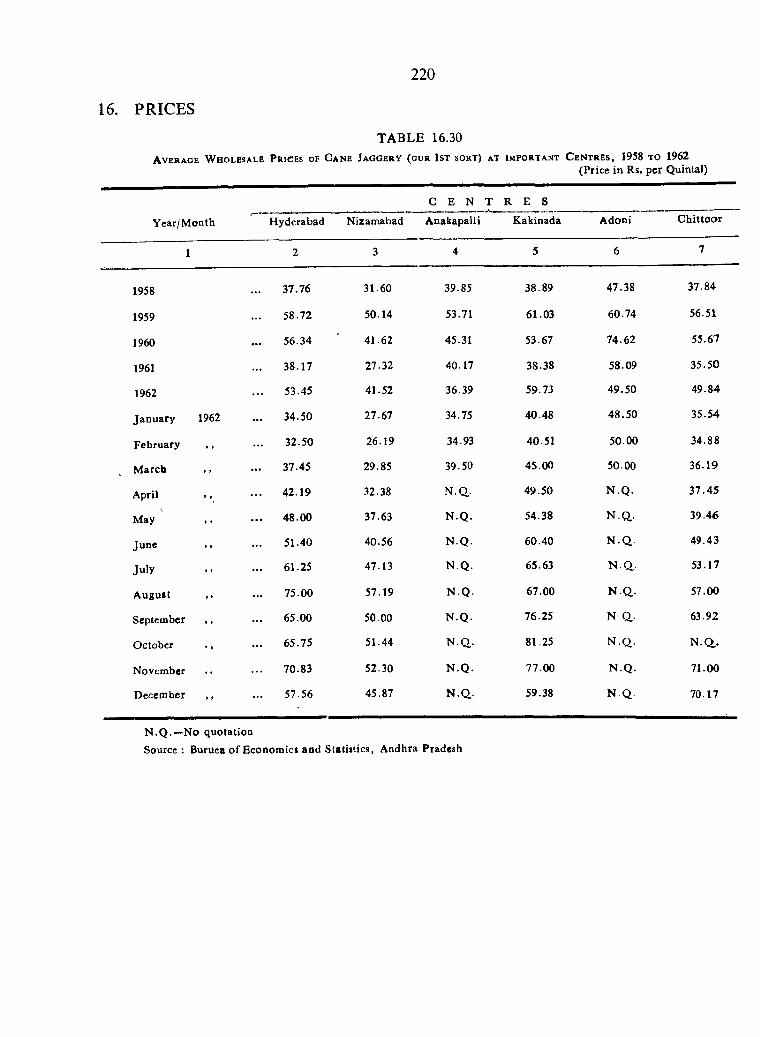
2 2 0
16. PRICES
TABLE 16.30A v e r a g e W h o l e s a l e P r i c e s o f C a ne J a g g e r y ( g u r 1 s t s o r t ) a t IMPORTANT C e n t r e s , 1958 t o 1962
(Price in Rs. per Quintal)
Y ear/M onth
G E N T R E SH yderabad N izam abad Anakapalli K akinada Adoni C h ittoo r
1 2 3 4 5 6 7
1958 37.76 31.60 39.85 38.89 47.38 37.84
1959 58.72 50.14 53.71 61.03 60.74 56.51
1960 56.34 41.62 45.31 53.67 74.62 55.67
1961 38.17 27.32 40.17 38.38 58.09 35.50
1962 53.45 41.52 36.39 59.73 49.50 49.84
Jan u ary 1962 34.50 27.67 34.75 40.48 48.50 35.54
February 32.50 26.19 34.93 40.51 50.00 34.8S
M arch > • 37.45 29.85 39.50 45.00 50.00 36.19
April . . 42.19 32.38 N .Q . 49.50 N .Q . 37.45
May , , . . . 48.00 37.63 N .Q . 54.38 N .Q .. 39.46
June . . 51.40 40.56 N .Q . 60.40 N .Q . 49.43
Ju ly 61.25 47.13 N .Q . 65.63 N .Q ,. 53.17
A ugust 75.00 57.19 N .Q . 67.00 N .Q . 57.00
September , , 65.00 50.00 N .Q . 76.25 N a - 63.92
O ctober 65.75 51.44 N.Q.. 81.25 N .Q . N .Q .
November 70.83 52.30 N .Q . 77.00 N .Q . 71.00
D ecember 57.56 45.87 N .Q . 59.38 N .Q . 70.17
N .Q .—No quotationSource : Buruea o f Econom ics and Statistics, Andhra Pradesh
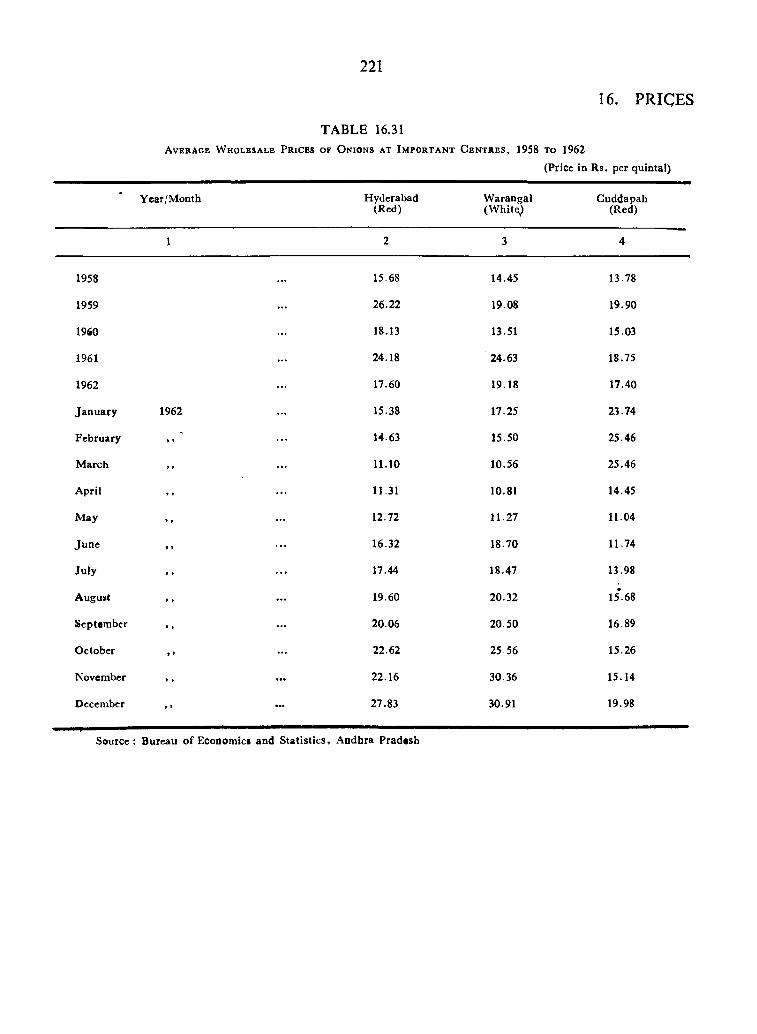
221
TABLE 16.31A v e r a g e W h o l e s a l e P r i c e s o f O n i o n s a t I m p o r t a n t C e n t r e s , 1958 t o 1962
(Price in R s. per quintal)
16. PRICES
Y ear/M onth Hyderabad(Red)
W arangal(W h it^
Cuddapah(Red)
1958
1959
1960
1961
1962
Jan u ary
February
M arch
A pril
M ay
Ju n e
July
August
Septem ber
October
November
December
1962
15.68
26.22
18.13
24.18
17.60
15.38
14.63
11.10
11.31
12.72
16.32
17.44
19.60
20.06
22.62
22.16
27.83
14.45
19.08
13.51
24.63
19.18
17.25
15.50
10.56
10.81
11.27
18.70
18.47
20.32
20.50
25.56
30.36
30.91
13.78
19.90
15.03
18.75
17.40
23.74
25.46
25.46
14.45
11.04
11.74
13.98
15*68
16.89
15.26
15.14
19.98
Source : Bureau o f Economics and S tatistics, A ndhra Pradesh
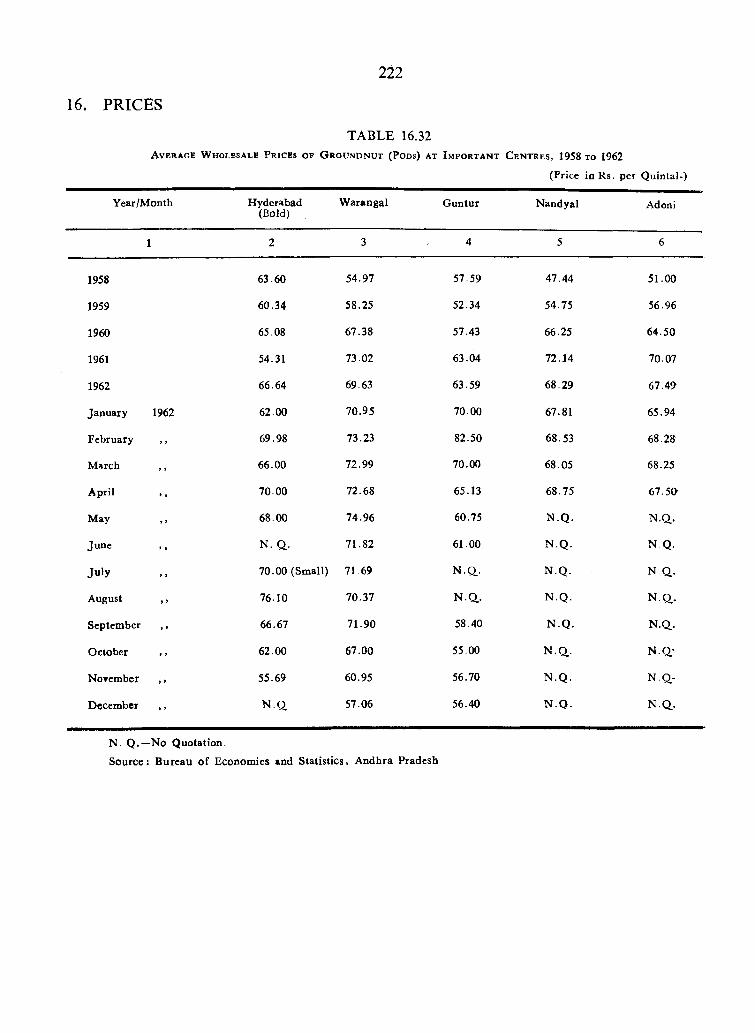
222
16. PRICES
TABLE 16.32A v e r a g e W h o l e s a l e P r i c e s o f G r o u n d n u t ( P o d s ) a t I m p o r t a n t C e n t r e s , 1958 t o 1962
(Price in Rs. per Q uintal-)
Year/M onth Hyderabad(Bold)
W arangal G untur N andyal Adoni
1958
1959
1960
1961
1962
January
February
M arch
April
May
June
Ju ly
August
September
October
NoTember
December
1962
63.60
60.34
65.08
54.31
66.64
62.00
69.98
66.00
70.00
68.00
N . Q .
70.00 (Small)
76.10
66.67
62.00
55.69
N .Q .
54.97
58.25
67.38
73.02
69.63
70.95
73.23
72.99
72.68
74.96
71.82
71 69
70.37
71.90
67.00
60.95
57.06
57.59
52.34
57.43
63.04
63.59
70.00
82.50
70.00
65.13
60.75
61.00
N .Q ..
N .Q .
58.40
55.00
56.70
56.40
47.44
54.75
66.25
72.14
68.29
67.81
68.53
68 05
68.75
N .Q .
N .Q .
N .Q .
N .Q .
N .Q .
N .Q ,.
N .Q .
N .Q .
51.00
56.96
64.50
70.07
67.49
65.94
68.28
68.25
67 .5a
N .Q .
N Q.
N Q .
N .Q .
N .Q .
N .Q
N Q-
N .Q .
N . Q .—No Q uotation.
S ource: B ureau o f Economics and Statistics, A ndhra Pradesh
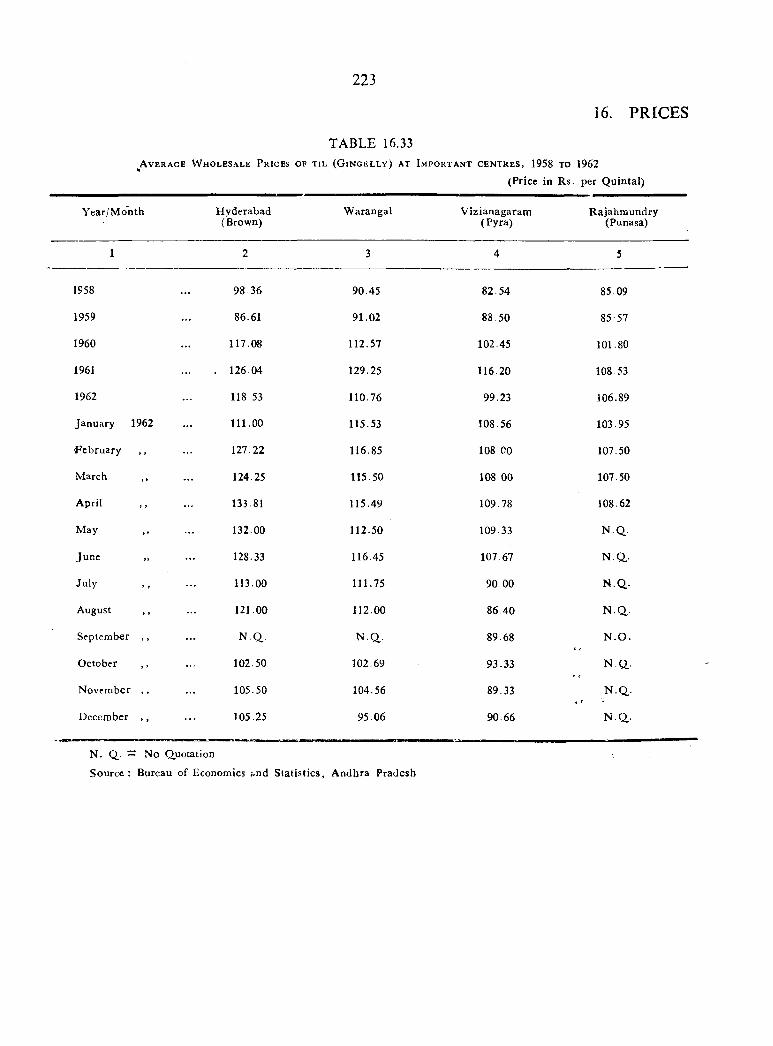
223
16. PRICES
TABLE 16.33^ A v e r a g e W h o l e s a l e P r i c e s O f t i l ( G i n g e l l y ) a t I m p o r t a n t c e n t r e s , 1958 t o 1962
(Pricc in Rs. per Q uintal)
Year/Month H yderabad(Brown)
W arangal V izianagaram(Pyra)
R ajahraundry(Punasa)
1958
1959
1960
1961
1962
January 1962
F ebruary , ,
March ,,
April ,,
May ,,
June
July
August , ,
September , ,
October ,,
N ovem ber , ,
December , ,
98 36
86.61
117.08
. 126.04
118 53
111.00
127.22
124.25
133.81
132.00
128.33
113.00
121.00
N.Q..
102.50
105.50
105.25
90.45
91.02
112.57
129.25
110.76
115.53
116.85
115.50
115.49
112.50
116.45
111.75
112.00
N.Q,.
102.69
104.56
95.06
82.54
88.50
102.45
116.20
99.23
108.56
108 00
108 00
109.78
109.33
107.67
90 00
86.40
89.68
93.33
89.33
90.66
85.09
85-57
101.80
108.53
106.89
103.95
107.50
107.50
108.62
N .Q .
N .Q..
N .Q .
N .Q .
N .O .
N .Q .
N .Q .
N .Q .
N . Q — No Quotation
S ourct : Bureau of Economics &nd S tatistics, A ndhra Pradesh
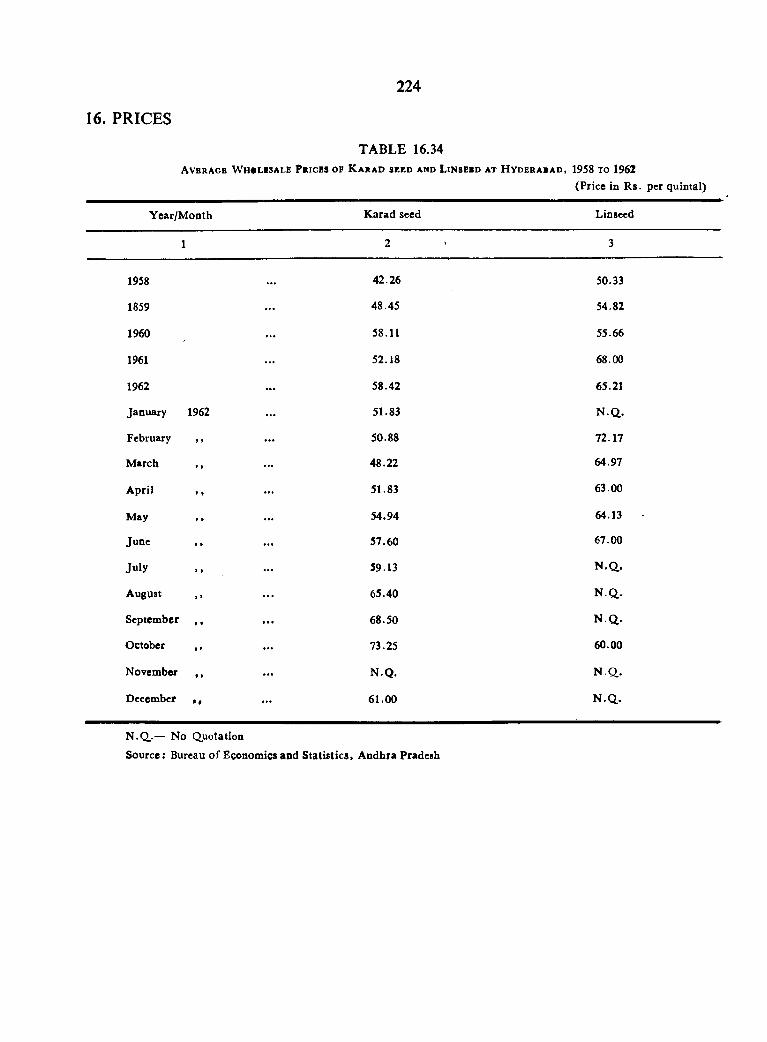
16. PRICES
A v e r a g e W h » l i s a l e P r i c e s o f
224
TABLE 16.34 K a r a d s e e d a n d L i n s e b d a t H y d e r a b a d , 1958 t o 1962
(Price in R s. per quintal)
Y ear/M onth K arad seed Linseed
1 2 3
1958 . . . 42.26 50.33
1859 48.45 54.82
1960 58.11 55.66
1961 52.18 68.00
1962 . . . 58.42 65.21
Janxiary 1962 51.83 n .q .
February , , 50.88 72.17
M arch , , 48.22 64.97
A pril , , 51.83 63.00
May , , 54.94 64.13 ‘
June , , 57.60 67.00
Ju ly ... 59.13 N .q .
August 65.40 N .Q ..
Septem ber , , 68.50 N .q .
October , , . . . 73.25 60.00
Novem ber , , N .Q . N .Q .
December • , . . . 61.00 N .Q .
N.Q..— No Quotation
Source: Bureau of Economics and Statistics, Andhra Pradesh
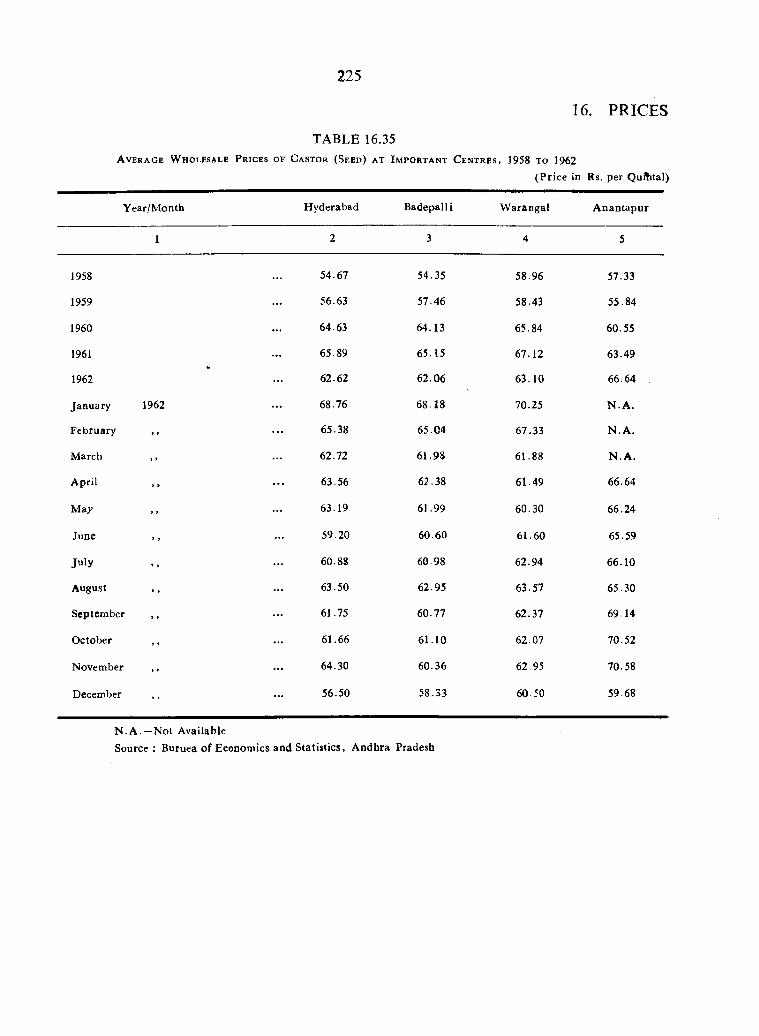
225
16. PRICES
TABLE 16.35A v e r a g e W h o l e s a l e P r i c e s o f C a s t o r ( S e e d ) a t I m p o r t a n t C e n t r e s , 1958 t o 1962
(P rice in Rs. per Quftital)
Year/M onth H yderabad B adepalli W arangal A nan tapur
1958
1959
1960
1961
1962
January
February
M arch
April
Ma;'
June
July
August
Septem ber
O ctober
November
December
1962
54.67 54.35 58.96 57.33
56.63 57.46 58.43 55.84
64.63 64.13 65.84 60.55
65.89 65.15 67.12 63.49
62.62 62.06 63.10 66.64
68.76 68.18 70.25 N .A .
65.38 65.04 67.33 N .A .
62.72 61.98 61.88 N .A .
63.56 62.38 61.49 66.64
63.19 61.99 60.30 66.24
59.20 60.60 61.60 65.59
60.88 60.98 62.94 66.10
63.50 62.95 63.57 65.30
61.75 60.77 62.37 69.14
61.66 61.10 62.07 70.52
64.30 60.36 62.95 70.58
56.50 58.33 60.50 59.68
N .A .—N ot AvailableS ource; Buruea of Economics and Statistics, A ndhra Pradesh
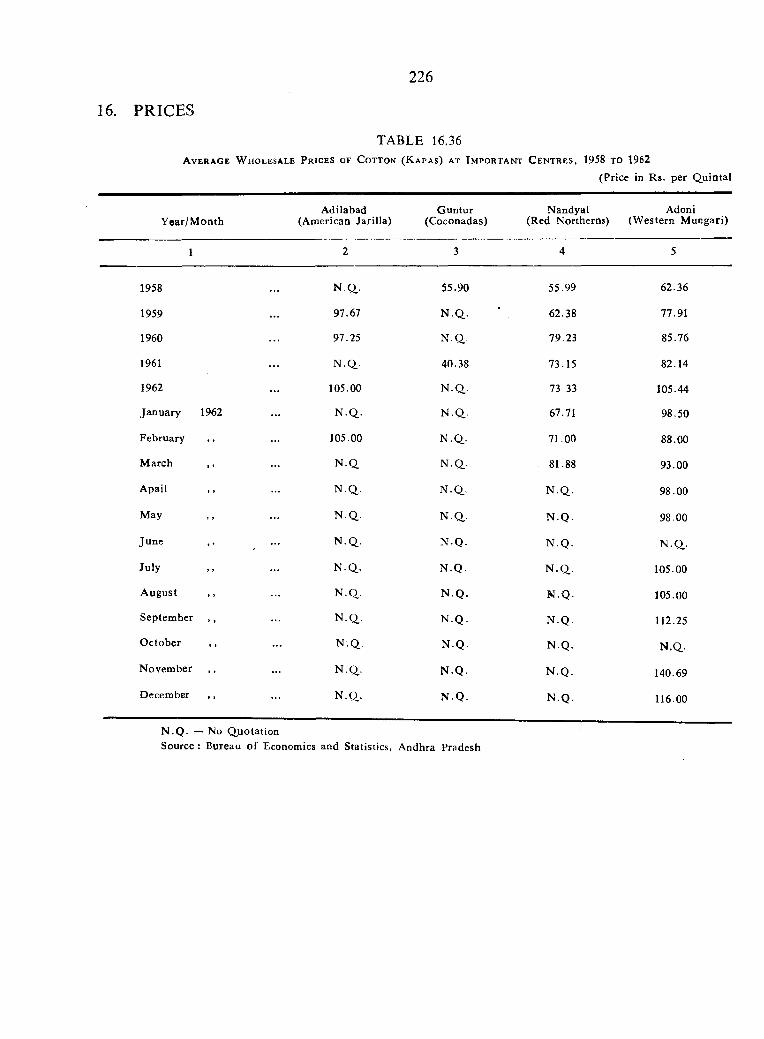
226
16. PRICES
TABLE 16.36A v e r a g e W h o l e s a l e P r i c e s o f C o t t o n ( K a p a s ) a t I m p o r t a n t C e n t r e s , 1958 t o 1962
(Price in Rs. per Q.uiotal
Y ear/M onthAdilabad
(American Jarilla)G untur Nandyal Adoni
(Coconadas) (Red Northerns) (W estern M ungari)
1 4
1958
1959
1960
1961
1962
January 1962
February
M arch
Apail
May
June
July
A ugust
Septem ber
O ctober
N ovem ber
December
N.Q..
97.67
97.25
N .Q
105.00
N.Q,.
105.00
N.Q..
N.Q..
N.Q..
N .Q .
N .Q .
N .Q .
N .Q .
N .Q .
N .Q .
N .Q .
55.90
N .Q .
N .Q .
40.38
N .Q .
N .Q .
N .Q .
N .Q .
N .Q .
N .Q .
N .Q .
N .Q .
N .Q .
N .Q .
N .Q .
N .Q .
N .Q .
55.99
62.38
79.23
73.15
73 33
67.71
71.00
81.88
N .Q .
N .Q .
N .Q .
N .Q .
N .Q .
N .Q .
N .Q .
N .Q .
N .Q .
62.36
77.91
85.76
82.14
105.44
98.50
88.00
93.00
98.00
98.00
N .Q .
105.00
105.00
112.25
N .Q .
140.69
116.00
N .Q . — No Q uotationSource : Bureau o f Economics and Statistics, Andhra Pradesh
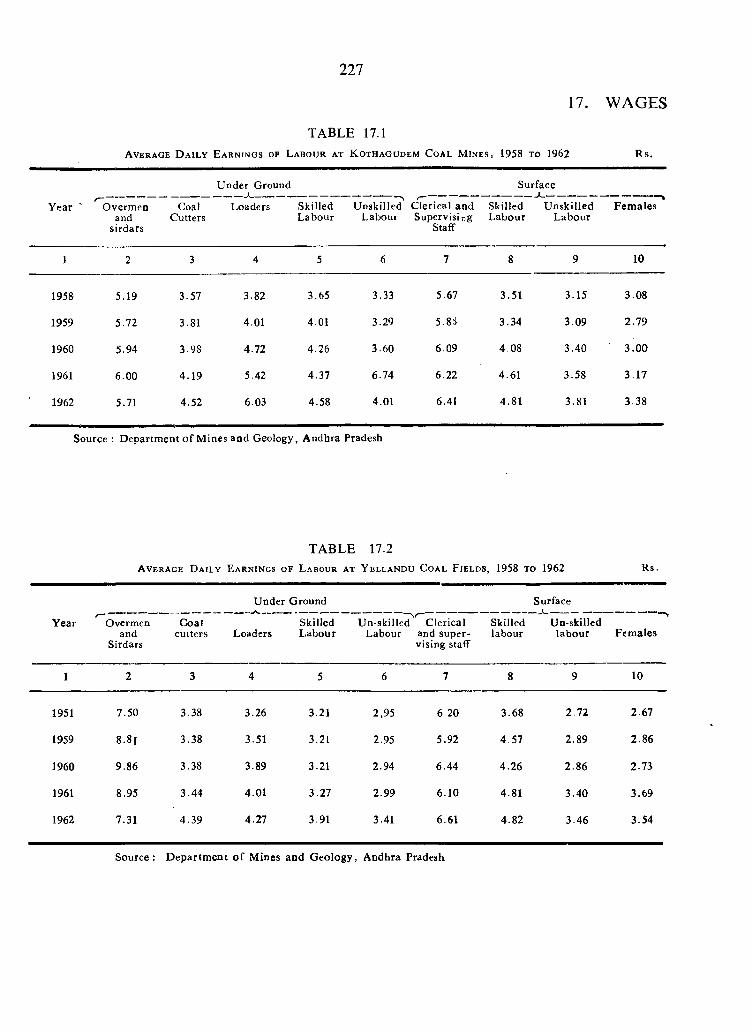
227
17. WAGES
TABLE 17.1A v e r a g e D a i l y E a r n i n g s o f L a b o u r a t K o t h a g o d e m C o a l M i n e s , 1958 t o 1962 R s.
SurfaceU n d e r G round
Y ear ' Overmen Coal Loaders Skilled U nskilled C lerical and Skilled U nskilled Fem ales and Cutters Labour Labour Supervising Labour L abour
sirdars Staff
1 2 3 4 5 6 7 8 9 10
1958 5.19 3.57 3.82 3.65 3.33 5.67 3.51 3.15 3.08
1959 5.72 3.81 4.01 4.01 3.29 5.8S 3.34 3.09 2.79
1960 5.94 3.98 4.72 4.26 3.60 6.09 4.08 3.40 3 .00
1961 6.00 4.19 5.42 4.37 6.74 6.22 4.61 3.58 3.17
1962 5.71 4.52 6.03 4.58 4.01 6.41 4.81 3.81 3.38
Source : D epartm ent o f M ines and Geology, A ndhra Pradesh
TABLE 17.2A v e r a g e D a i l y E a r n i n g s o f L a b o u r a t Y e l l a n d u C o a l F i e l d s , 1958 t o 1962 R s.
Year Overmenand
Sirdars
Coalcutters
U nder Ground
Skilled Loaders L abour
Un-skilledLabour
Clerical and supervising staff
Skilledlabour
Surface
Un-skilledlabour Fem ales
1 2 3 4 5 6 7 8 9 10
1951 7.50 3.38 3.26 3.21 2,95 6 20 3.68 2.72 2.67
1959 8 .8 i 3.38 3.51 3.21 2.95 5.92 4.57 2.89 2.86
I960 9.86 3.38 3.89 3.21 2.94 6.44 4.26 2.86 2.73
1961 8.95 3.44 4.01 3.27 2.99 6.10 4.81 3.40 3.69
1962 7.31 4.39 4.27 3.91 3.41 6.61 4.82 3.46 3.54
Source: D epartm ent o f M ines and G eology, Andhra Pradesh
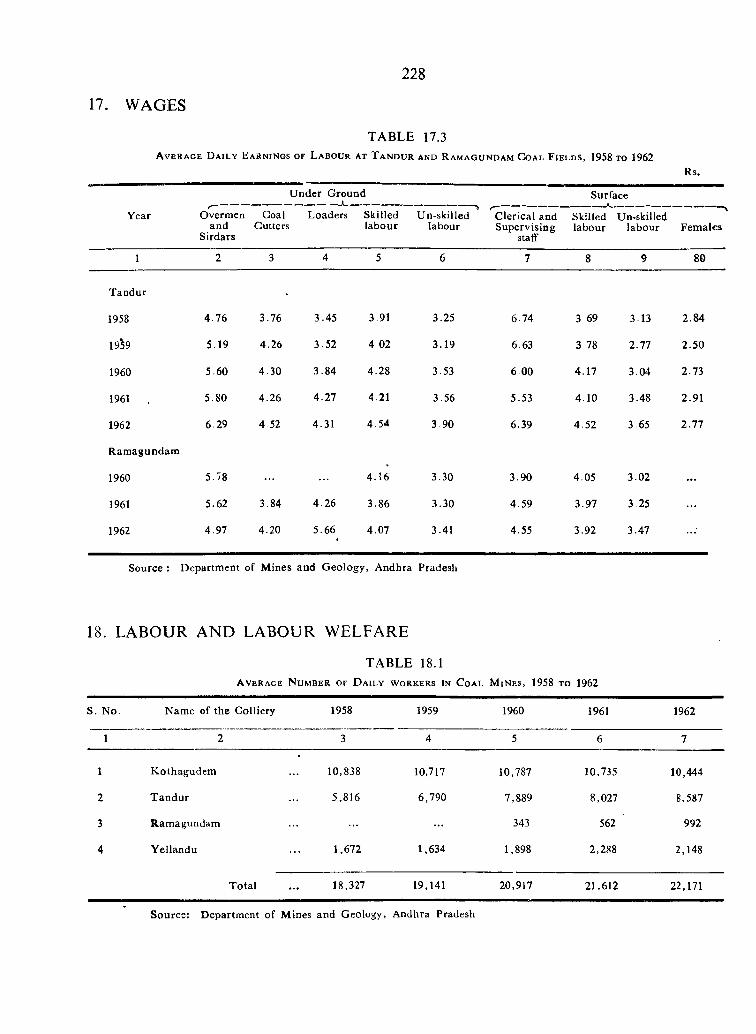
228
17. WAGES
TABLE 17.3A v e r a g e D a i l y E a r n i n g s o f L a b o u r a t T a n d u r a n d R a m a g u n d a m C o a l F i e l d s , 1958 t o 1962
Rs.
Year
U nder Ground
Overmen Coal Loaders Skilled Un-skilledand Gutters labour labour
Sirdars
Surface
C lerical and Skilled Un-skilled Supervising labour labour Females
staff
1 2 3 4 5 6 7 8 9 80
T andur
1958 4.76 3.76 3.45 3.91 3.25 6.74 3 69 3.13 2.84
19^9 5.19 4.26 3.52 4 02 3.19 6.63 3 78 2.77 2.50
1960 5.60 4.30 3.84 4.28 3.53 6.00 4.17 3.04 2.73
1961 5.80 4.26 4.27 4.21 3.56 5.53 4.10 3.48 2.91
1962 6.29 4.52 4-31 4.54 3.90 6.39 4.52 3.65 2.77
R am agundam
1960 5.78 4.16 3.30 3.90 4.05 3.02
1961 5.62 3.84 4.26 3.86 3.30 4.59 3.97 3.25
1962 4.97 4.20 5.66 4.07 3.41 4.55 3.92 3.47
Source : D epartm ent of M ines and G eology, Andhra Pradesh
18. LABOUR AND LABOUR WELFARE
TABLE 18.1A v e r a g e N u m b e r o f D a i l y w o r k e r s i n C o a l M i n e s , 1958 t o 1962
S. N o. Name of the Colliery 1958 1959 1960 1961 1962
1 2 3 4 5 6 7
1 K othagudem 10,838 10,717 10,787 10,735 10,444
2 T andu r 5,816 6,790 7,889 8,027 8,587
3 Ram agundam 343 562 992
4 Y ellandu 1,672 1,634 1,898 2,288 2,148
T otal 18,327 19,141 20,917 21,612 22,171
Source: Departm ent of Mines and Geology, Andhra Pradesh
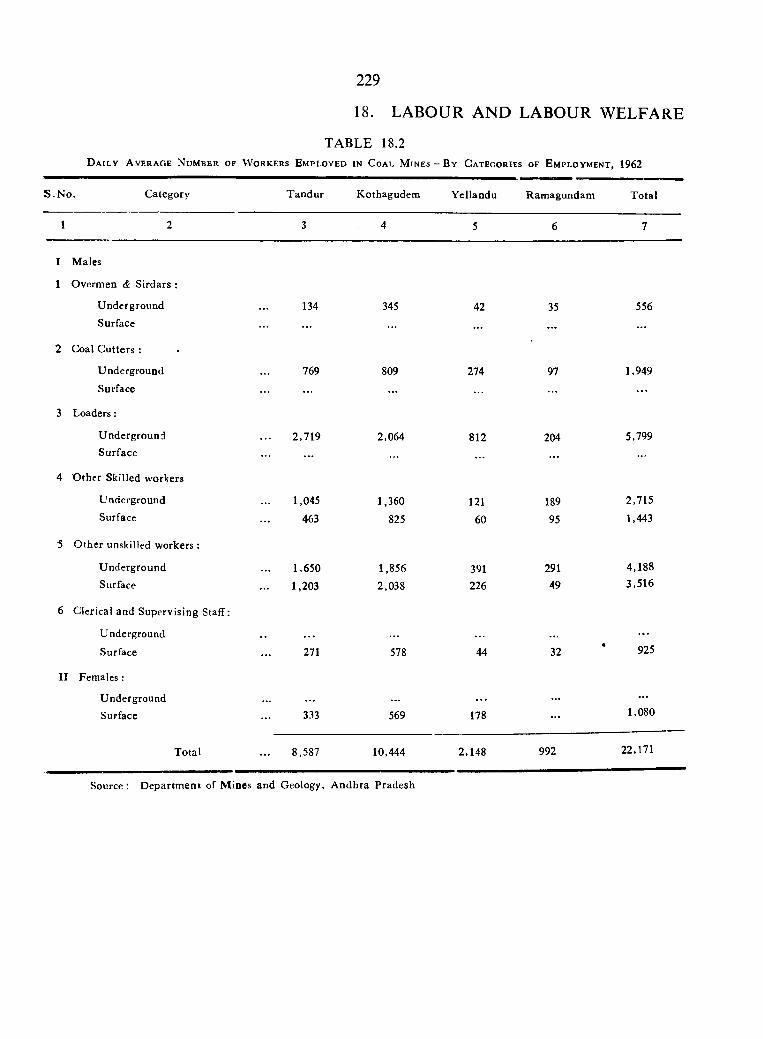
229
18. LABOUR A ND LABOUR WELFARE
TABLE 18.2D a i l y A v e r a g e N u m b e r o f W o r k e r s E m p l o y e d i n C o a l M i n e s - B y C a t e g o r i e s o f E m p l o y m e n t , 1962
S . No. Category T andur Kothagudem Y eilandu Ramagundam Total
1 2 3 4 5 6 7
I Males
1 Overmen & Sirdars :
U nderground 134 345 42 35 556Surface . . . . . . . . .
2 Coal C utters :
Underground 769 809 274 97 1,949
Surface ................... . . .
3 L oaders:
U nderground 2,719 2,064 812 204 5,799Surface ................... . . . . . .
4 O ther Skilled workers
Underground 1,045 1,360 121 189 2,715
Surface 463 825 60 95 1,443
5 O ther unskilled workers :
U nderground 1,650 1,856 391 291 4,188
Surface 1,203 2,038 226 49 3,516
6 Clerical and Supervising Staff:
Underground . . . . . . . .
Surface 271 578 44•
32 925
II Fem ales:
Underground . . . . . . . . . . . . . . .
Surface 333 569 178 . . . 1,080
Total 8,587 10,444 2,148 992 22,171
Source; D epartm ent of M ines and Geology, A ndhra Pradesh

TABLE 18.3N u m b e r o f A p p l i c a n t s o n t h e L i v e R e g i s t e r C l a s s i f i e d b y b r o a d O c c u p a t i 0 n a l G r o u p s , 1962.
230
18 LABOUR AN D LABOUR WELFARE
S. N o . Item N o o f applicants
1 2 3
1 Professional, Technical and related W orkers 9,137
2 A dm inistrative, executive and m anagerial workers 187
3 Clerical, sales and related workers 4,714
4 Agriculture, dairy and related workers 577
5 M iners, quarrym en and related workers 19
6 Workers in transport and comm unication occupations 2,676
7 Craftsmen and production process W orkers 9,182
8 Service, Sports and recreation workers 3,849
9 W orkers not classified by occupations 88,236
Total11,18,577
Source:—D irectorate o f Employment, Andhra Pradesh
TABLE 18.4 R e g i s t r a t i o n a n d P l a c e m e n t s b y t h e
E m p l o y m e n t E x c h a n g e s , 1958 t o 1962
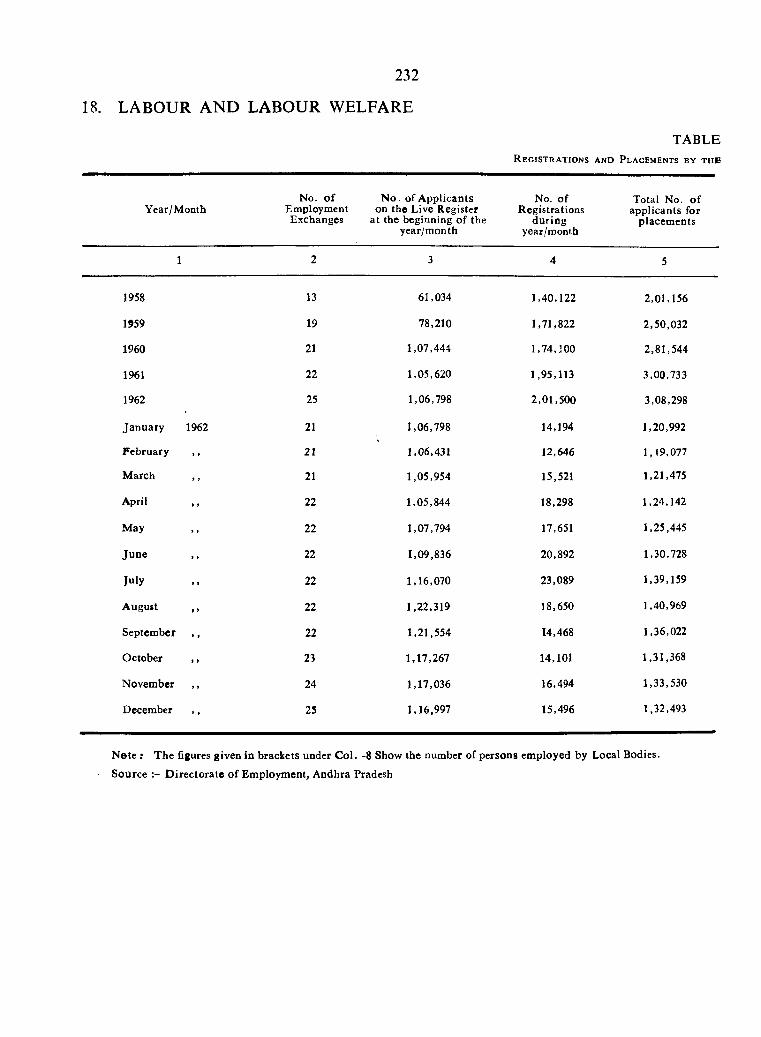
232
18. LABOUR AND LABOUR WELFARE
T A B L E
R e g i s t r a t i o n s a n d P l a c e m e n t s b y t h e
Year/M onthNo. o f
Employment Exchanges
N o. of A pplicants on the Live Register
a t the beginning of the year/m onth
No. of Registrations
during year/month
Total No. o f applicants for
placem ents
1 2 3 4 5
1958 13 61,034 1,40,122 2,01,156
1959 19 78,210 1,71,822 2,50,032
1960 21 1,07,444 1,74,100 2,81,544
1961 22 1,05,620 1,95,113 3,00,733
1962 25 1,06,798 2,01,500 3,08,298
Jan u ary 1962 21 1,06,798 14,194 1,20,992
F ebruary , , 21 1,06,431 12,646 1,119,077
M arch , , 21 1,05,954 15,521 1,21,475
April 22 1,05,844 18,298 1,24,142
May 22 1,07,794 17,651 1,25,445
Ju n e 22 1,09,836 20,892 1,30,728
July 22 1,16,070 23,089 1,39,159
August 22 1,22,319 18,650 1,40,969
Septem ber , , 22 1,21,554 14,468 1,36,022
O ctober , , 23 1,17,267 14,101 1,31,368
November 24 1,17,036 16,494 1,33,530
December , , 25 1,16,997 15,496 1,32,493
N ete ; T he figures given in brackets under C ol. -8 Show the number of persons em ployed by Local Bodies.
Source D irectorate o f Em ploym ent, Andhra Pradesh
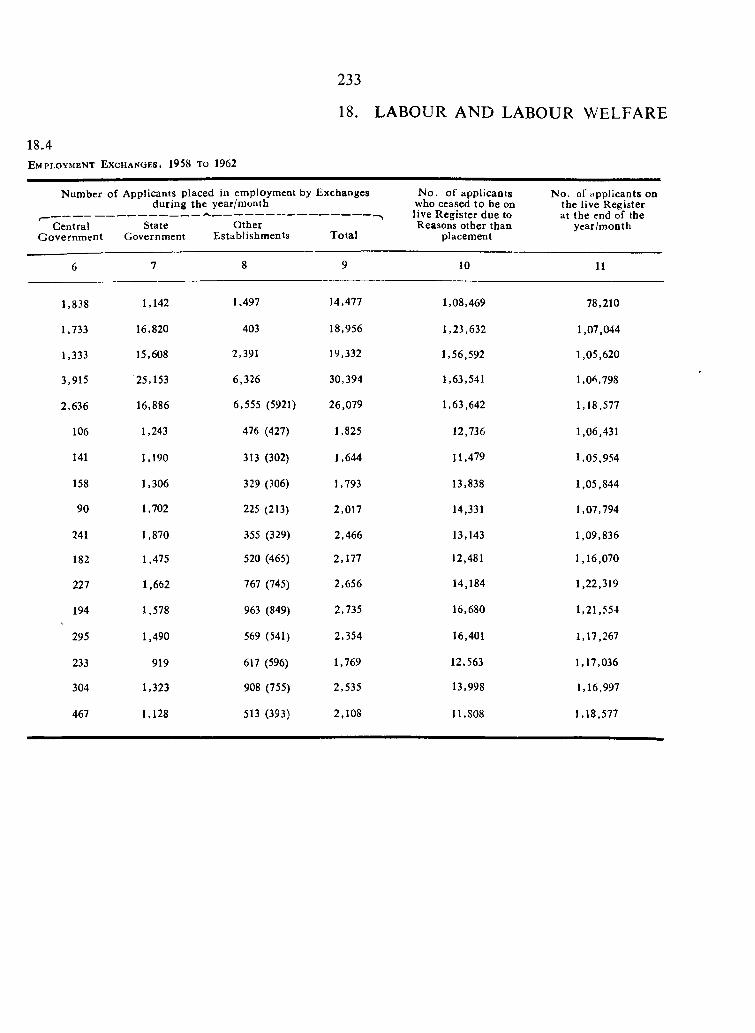
233
18. LABOUR A ND LABOUR WELFARE
18.4E m p l o y m e n t E x c h a n g e s , 1958 t o 1962
N um ber of Applicants placed in employment by Exchanges during the year/month
Central StateG overnm ent Government
O therEstablishm ents Total
N o . o f applicants who ceased to be on live R egister due to Reasons other than
placement
N o. of applicants on the live Register at the end of the
year/m onth
10 11
1,838
1,733
1,333
3,915
2,636
106
141
158
90
241
182
227
194
295
233
304
467
1,142
16,820
15,608
25,153
16,886
1,243
1,190
1,306
1,702
1,870
1,475
1,662
1,578
1,490
919
1,323
1,128
1,497
403
2,391
6,326
6,555 (5921)
476 (427)
313 (302)
329 (306)
225 (213)
355 (329)
520 (465)
767 (745)
963 (849)
569 (541)
617 (596)
908 (755)
513 (393)
14,477
18,956
19,332
30,394
26,079
1,825
1,644
1,793
2,017
2,466
2,177
2,656
2,735
2,354
1,769
2,535
2,108
1,08,469
1,23,632
1,56,592
1,63,541
1,63,642
12,736
11,479
13,838
14,331
13,143
12,481
14,184
16,680
16,401
12,563
13,998
11,808
78,210
1,07,044
1,05,620
l,0 'i,798
1.18.577
1,06,431
1,05,954
1,05,844
1,07,794
1,09,836
1,16,070
1,22,319
1,21,554
1,17,267
1,17,036
1,16,997
1.18.577
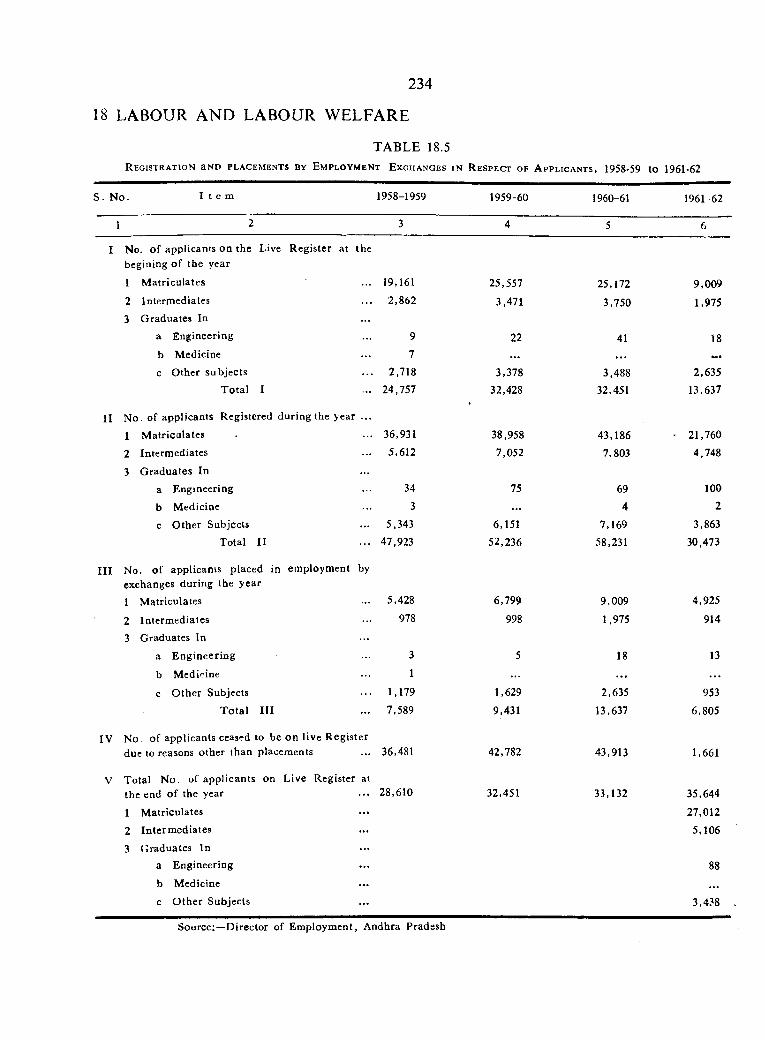
234
18 LABOUR AND LABOUR WELFARE
TABLE 18.5R e g i s t r a t i o n e n d p l a c e m e n t s b y E m p l o y m e n t E x c h a n g e s i n R e s p e c t o f A p p l i c a n t s , 1958-59 to 1961-62
S . N o. I t e m 1958-1959 1959-60 1960-61 1961-62
I 2 3 4 5 6
I No. o f applicants on the Live Register a t the bcgining of the year
1 M atriculates 19,161 25,557 25,172 9,0092 Interm ediates 2,862 3,471 3,750 1,9753 G raduates In
a Engineering 9 22 41 18b Medicine 7 . . . . . .
c O ther subjects 2,718 3,378 3,488 2,635T ota l I 24,757 32,428 32,451 13,637
11 No. of applicants Registered d u ring the year . . .
1 M atriculates 36,931 38,958 43,186 • 21,7602 Intermediates 5,612 7,052 7,803 4,748
3 G raduates In
a Engineering 34 75 69 100
b Medicine 3 . . . 4 2
c O ther Subjects 5,343 6,151 7,169 3,863Total II 47,923 52,236 58,231 30,473
II I No. o f applicants placed in employment by exchanges during the year
1 M atriculates 5,428 6,799 9,009 4,925
2 Interm ediates 978 998 1,975 914
3 Graduates In
a Engineering 3 5 18 13
b Medicine 1 . . . . . .
c O ther Subjects 1,179 1,629 2,635 953
T o ta l I I I 7,589 9,431 13,637 6,805
IV No- o f applicants ccased to be on live R egisterdue to reasons other than placements 36,481 42,782 43,913 1,661
V Total N o. of applicants on Live Register atthe end o f the year
1 M atriculates2 Interm ediates
28,610 32,451 33,132 35,644
27,012
5,1063 G raduates In
a Engineering
b Medicine
c O ther Subjects
88
3,438
Source:—D irector of Em ploym ent, Andhra Pradesh
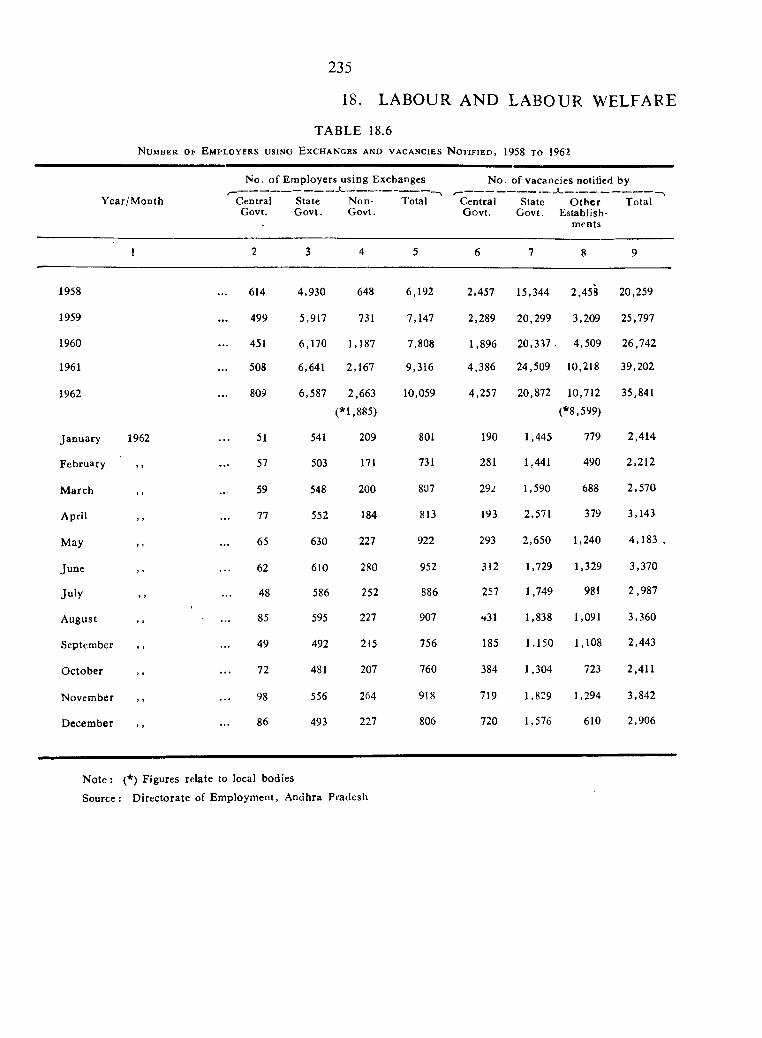
235
18. L A B O U R A N D L A B O U R W E L F A R E
TABLE 18.6
N u m b e r o f E m p l o y e r s u s i n g E x c h a n g e s a n d v a c a n c i e s N o t i f i e d , 1958 t o 1962
Y ear/M onth
No. o f Employers using Exchanges
Central State Non- TotalGovt. Govt. Govt.
N o. of vacancies notified by
Central State O th e r TotalGovt. Govt. Establish
ments
1958
1959
1960
1961
1962
January
February
M arch
April
May
June
July
August
September
O ctober
N ovem ber
D ecem ber
1962
614
499
451
508
809
51
57
59
77
65
62
48
85
49
72
98
86
4,930 648
5,917 731
6,170 1,187
6,641 2,167
6,587 2,663
(*1,885)
541
503
548
552
630
610
586
595
492
481
556
493
209
171
200
184
227
280
252
227
215
207
264
227
6,192
7,147
7,808
9,316
10,059
801
731
807
813
922
952
886
907
756
760
918
806
2,457
2,289
1,896
4,386
4,257
190
281
1^1
193
293
312
257
‘*31
185
384
719
720
15,344
20,299
20,337
24,509
20,872
1,445
1,441
1,590
2,571
2,650
1,729
1,749
1,838
1,150
1,304
1,829
1,576
2,458
3,209
4,509
10,218
10,712
(*8,599)
779
490
688
379
1,240
1,329
981
1,091
1,108
723
1,294
610
20,259
25,797
26,742
39,202
35,841
2,414
2,212
2,570
3,143
4,183
3,370
2,987
3,360
2,443
2,411
3,842
2,906
N o te : (*) Figures relate to local bodies
Source: D irectorate of Em ploym ent, Andhra Pradesh
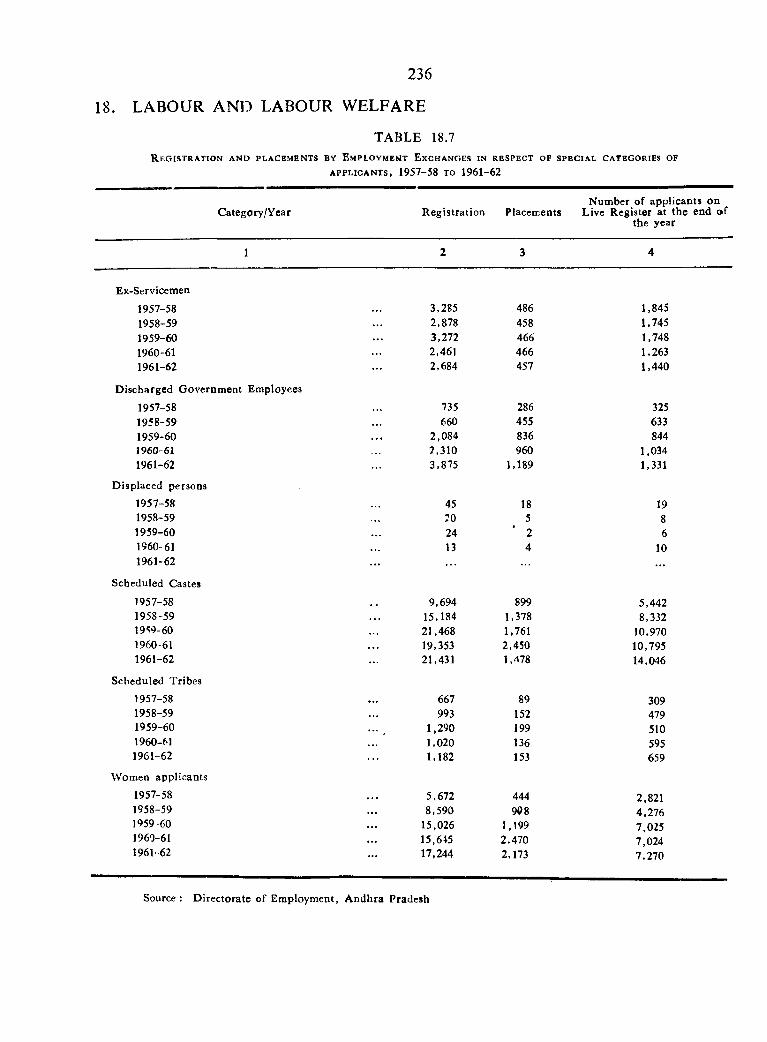
236
18. LABOUR A N D LABOUR WELFARE
TABLE 18.7R e g i s t r a t i o n a n d p l a c e m e n t s b y E m p l o y m e n t E x c h a n g e s i n r e s p e c t o f s p e c i a l c a t e g o r i e s o f
A PP L IC A N T S , 1957-58 t o 1961-62
Category/Year R egistration PlacementsN um ber of applicants on
Live Register at the end o f the year
1 2 3 4
Ex-Servicemen
1957-58 . . . 3,285 486 1,8451958-59 2,878 458 1,7451959-60 3,272 466 1,7481960-61 2,461 466 1,2631961-62 2,684 457 1,440
D ischarged G overnm ent Employees
1957-58 735 286 3251958-59 660 455 6331959-60 . . . 2,084 836 8441960-61 . . . 2,310 960 1,0341961-62 3,875 1,189 1,331
Displaced persons
1957-58 45 18 191958-59 20 5 81959-60 24 2 61960-61 13 4 101961-62 . . . . . .
Scheduled Castes
1957-58 ,, 9,694 899 5,4421958-59 15,184 1,378 8,33219^9-60 21,468 1,761 10,9701960-61 . . . 19,353 2,450 10,7951961-62 21,431 1,478 14,046
Scheduled Tribes
1957-58 . . . 667 89 3091958-59 993 152 4791959-60 . . . 1,290 199 5101960-61 1,020 136 5951961-62 1,182 153 659
W omen applicants
1957-58 5,672 444 2,8211958-59 . . . 8,590 908 4,2761959-60 . . . 15,026 1,199 7,0251960-61 . . . 15,645 2,470 7,0241961-62 . . . 17,244 2,173 7,270
Source: D irectorate of Employment, A ndhra Pradesh
TABLE 18.8
A v e r a g e N u m b e r OF W o r k e r s E m p l o y e d D a i l y i n
E s t a b l i s h m e n t s U n d e r T h e O p e r a t i o n o f F a c t o r i e s A c t ,
1948 D i s t r i c t w i s e a n d b y I n d u s t r i e s , 1962
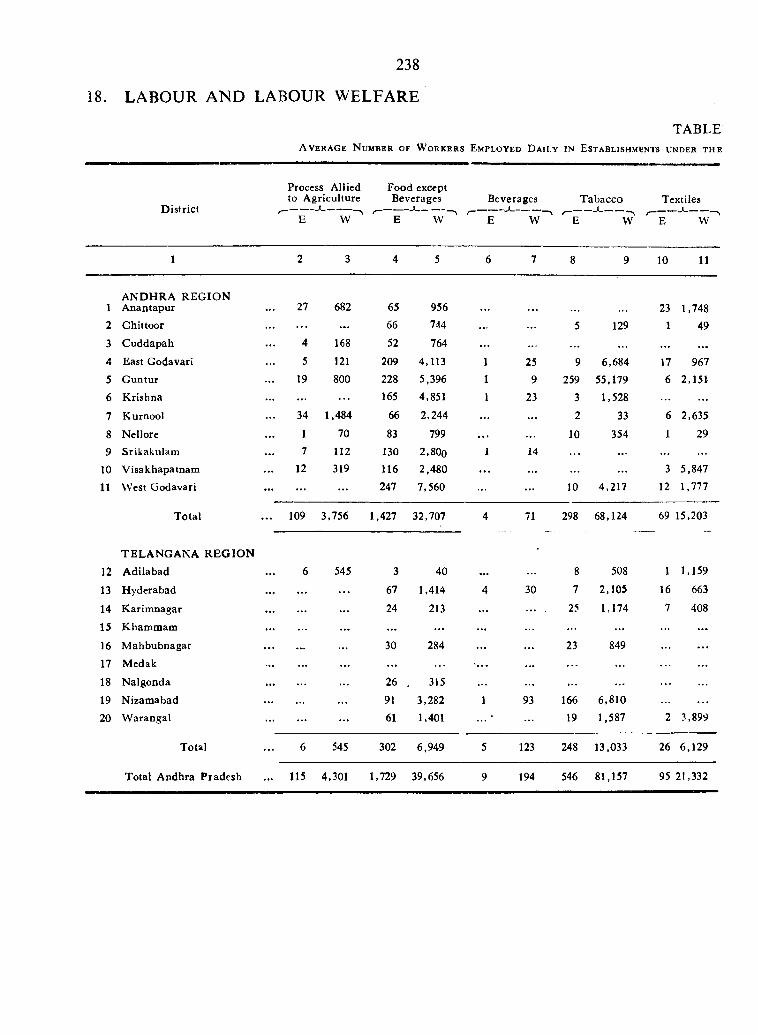
238
18. LABOUR A ND LABOUR WELFARE
TABLEA v e r a g e N u m b e r o f W o r k e r s E m p l o y e d D a i l y i n E s t a b l i s h m e n t s u n d e r t h e
D istrict
Process Allied to Agriculture
r -E W
Food except Beverages
^ E
Beverages r -— ^
E W
Tabacco
' " e W
Textiles
^ E
1 2 3 4 5 6 7 8 9 10 11
1A N D H R A R EG IO N A nantapur 27 682 65 956 23 1,748
2 Chittoor ... 66 744 ... ... 5 129 1 49
3 C uddapah 4 168 52 764 ... ... ...4 East Godavari 5 121 209 4,113 1 25 9 6,684 17 967
5 G untur 19 800 228 5,396 1 9 259 55,179 6 2,151
6 K rishna ............... 165 4,851 1 23 3 1,528 ...
7 Kurnool 34 1.484 66 2,244 ... ... 2 33 6 2,635
8 Nellore 1 70 83 799 10 354 1 29
9 Srikakulam 7 112 130 2,80o I 14 ... ...
10 V isakhapatnam 12 319 116 2.480 ... ... 3 5,847
11 West Godavari ... ... 247 7,560 ... 10 4,217 12 1,777
Total . . . 109 3,756 1,427 32,707 4 71 298 68,124 69 15,203
TELA N G A N A R E G IO N
12 A dilabad 6 545 3 40 ... ... 8 508 1 1,159
13 Hyderabad ............... . . . 67 1,414 4 30 7 2,105 16 663
14 K arim nagar ............... 24 213 ... ... , 25 1,174 7 408
15 K ham m am ............... ... ... ... ...
16 M ahbubnagar ... 30 284 ... ... 23 849
17 Medak ............... ... ...
18 N algonda ............... 26 315 ... ... ...
19 N izamabad ............... 91 3,282 1 93 166 6,810
20 W arangal ............... 61 1,401 19 1,587 2 3,899
Total 6 545 302 6,949 5 123 248 13,033 26 6,129
Total A ndhra Pradesh ... 115 4,301 1,729 39,656 9 194 546 81,157 95 21,332
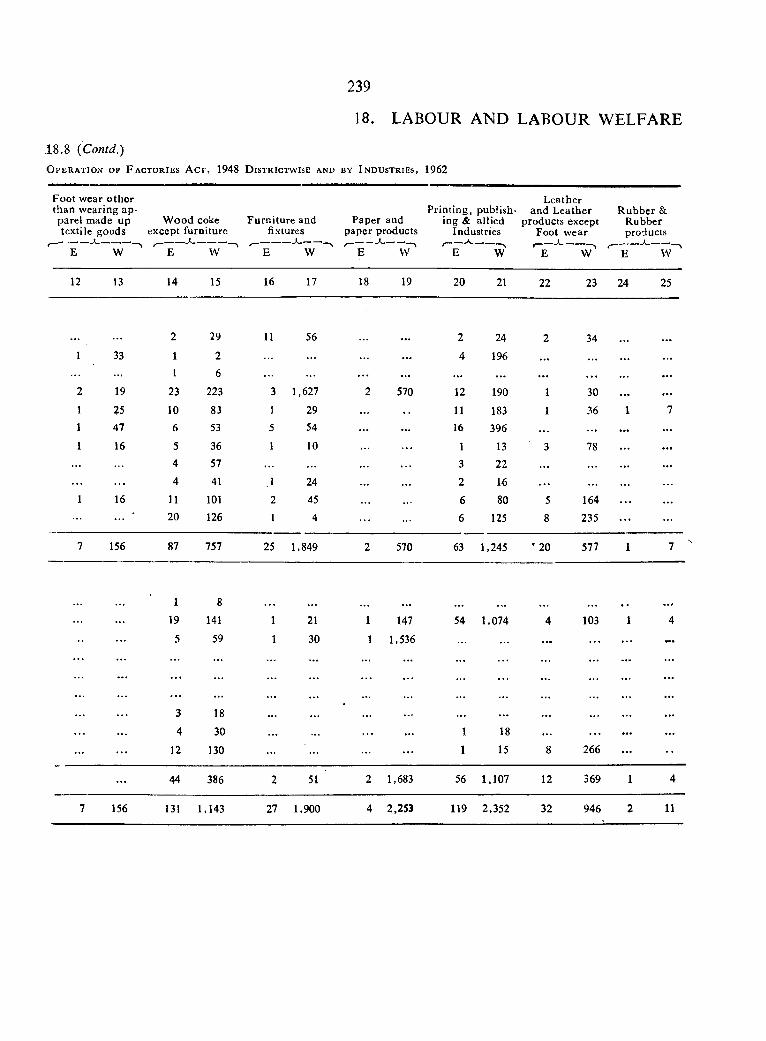
239
18. LABOUR AND LABOUR WELFARE
18.8 {Contd.)O p e r a t i o n o f F a c t o r i e s A c t , 1948 D i s t r i c t w i s e a n d b y I n d u s t r i e s , 1962
Foot wear o ther than wearing ap parel made up W ood coke Furniture and textile goods except furniture fixtures
E W ^ ' " e W W
LeatherPrinting, publish- and L eather R ubber &
Paper and ing & allied products except Rubberpaper products Industries Foot w ear products
W '~E ' " e W
12 13 14 15 16 17 18 19 20 21 22 23 24 25
2 29 11 56 2 24 2 341 33 1
1
23
2 . . . 4 196 . . . . . . . . .
2 19 223 3 1,627 2 570 12 190 1 30 • • •
1 25 10 83 1 29 . . . 11 183 1 . 6 1 71 47 6 53 5 54 . . . . . . 16 396 . . . . . . . . . . . .
1 16 54
4
3657
41
1
.1
10
24
. . . . . .
13
2
1322
16
78. . . . . .
16 11 101 2 45 6 80 5 164 . . . . . .
20 126 1 4 6 125 8 235 . . .
7 156 87 757 25 1,849 2 570 63 1,245 * 20 577 1 7
1
19
8
141 1 21 1 147 54 1,074 4 103 1 4
5 59 1 30 1 1,536 . . .
::—
3 18
. . .
.
. . . . . .
4 30 . . . 1 18 . . . . . . . . . . . .
. . . 12 130 . . . 1 15 8 266 . . . ••
. . . 44 386 2 51 2 1,683 56 1,107 12 369 1 4
7 156 131 1,143 27 1,900 4 2,253 119 2,352 32 946 2 11
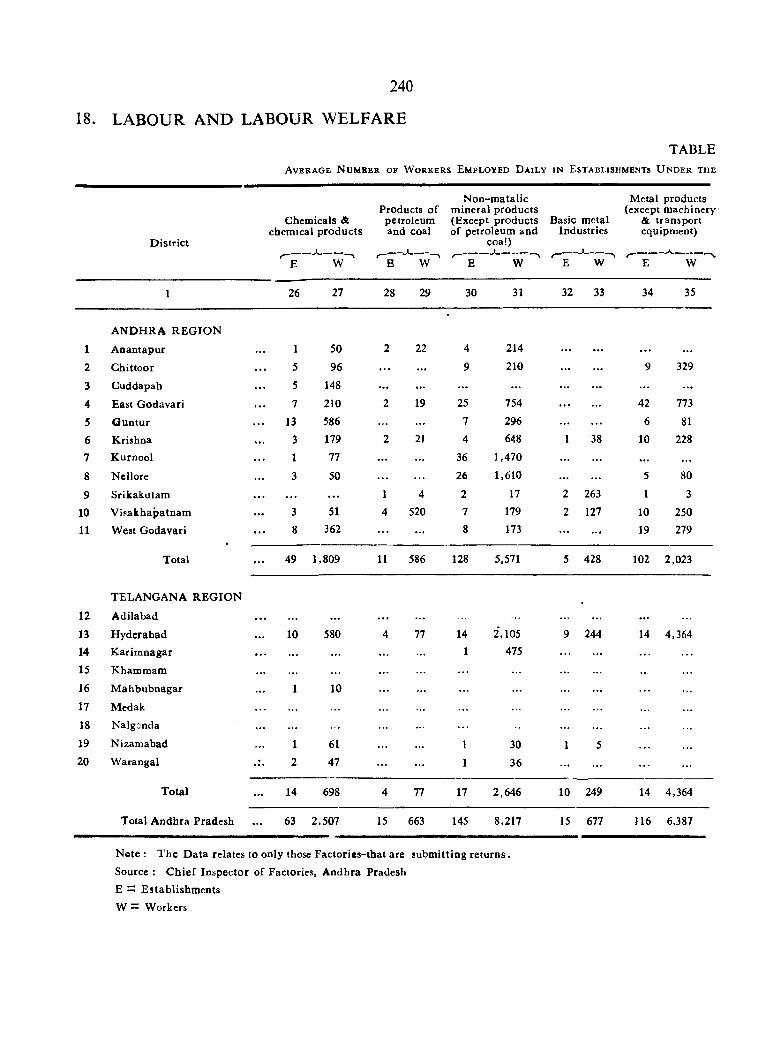
240
18. LABOUR AND LABOUR WELFARE
TABLEA v e r a g e N u m b e r o f W o r k e r s E m p l o y e d D a i l y i n E s t a b l i s h m e n t s U n d e r t h e
D istrict
Chemicals & chemical products
N on-m atalic Products o f m ineral products
petroleum (Except products Basic m etaland coal of petroleum and Industries
coa!)
Metal products (except m achinery
& transport equipment)
r~—E
— *-------W W ^ E W E
-j----- ^W E
—W
1 26 27 28 29 30 31 32 33 34 35
A N D H R A R E G IO N ■
1 A nantapur 1 50 2 22 4 214 . . . . . . . . . . . .
2 C hittoor 5 96 . . . . . . 9 210 . . . ... 9 329
3 C uddapah 5 148 . . . ... ... ... ... . . . ...
4 East G odavari 7 210 2 19 25 754 . . . ... 42 773
5 O un tu r 13 586 ... 7 296 . . . 6 81
6 Krishna 3 179 2 21 4 648 1 38 10 228
7 Kurnool 1 77 . . . . . . 36 1,470 . . . . . . . . . . . .
8 Ncllore 3 50 . . . . . . 26 1,610 . . . 5 80
9 Srikakulam . . . . . . 1 4 2 17 2 263 1 3
10 V isakhapatnam 3 51 4 520 7 179 2 127 10 250
11 West Godavari 8 362 . . . . . . 8 173 . . . 19 279
Total 49 1,809 11 586 128 5,571 5 428 102 2,023
TELANGANA R E G IO N
12 A dilabad . . . . . . . . . . . . . . .
13 H yderabad 10 580 4 77 14 2,105 9 244 14 4,36414 K ariranagar . . . . . . . . . . . . 1 475 . . .
15 K ham m am . . . . . .
16 M ahbubnagar 1 10 . . . . . . . . . . . .
17 Medak . . .
18 Nalgonda . . . . . .
19 Nizam abad 1 61 . . . 1 30 1 520 W arangal 2 47 . . . 1 36 . . . . . . . . .
T otal 14 698 4 77 17 2,646 10 249 14 4,364
Total A ndhra Pradesh 63 2.507 15 663 145 8,217 15 677 116 6,387
N ote : T h e D ata relates to only those Factories-that are subm itting re tu rn s .
Source ; C h ie f Inspector of Factories, A ndhra Pradesh E — E stablishm ents
W ~ W orkers
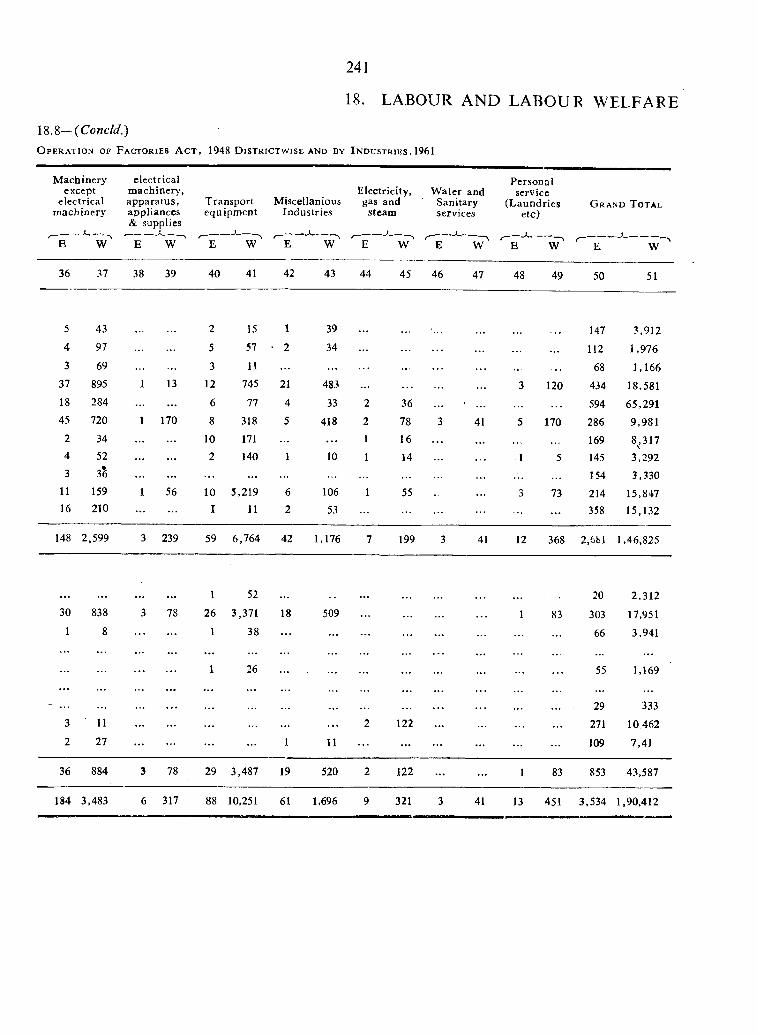
241
18. LABOUR AND LABOUR WELFARE
18.8— (ConcW.)
O p e r a t i o n o f F a c t o r i e s A c t , 1948 D i s t r i c t w i s e a n d b y I n d u s t r i e s , 1961
M achineryexcept
electrical
electricalmachinery,apparatus,
m achinery appliances & supplies
Electricity, Transport Miscellanious gas and equipm ent Industries steam
W ater and Sanitary services
Personalservice
(Laundriesetc)
G r a n d T o t a l
- j__W E
-j.__W
—<— W ^ E
- j___W E
- j____ ^W
^ -----E W E W
*----------—W
36 37 38 39 40 41 42 43 44 45 46 47 48 49 50 51
5 43 2 15 1 39 147 3,9124 97 5 57 ‘ 2 34 112 1,9763 69 3 11 68 1,166
37 895 1 13 12 745 21 483 ... 3 120 434 18,58118 284 ... 6 77 4 33 2 36 594 65,29145 720 1 170 8 318 5 418 2 78 3 41 5 170 286 9,981
2 34 ... 10 171 ... ... I 16 169 8^,3174 52 2 140 1 10 1 14 1 5 145 3,2923 ... ... ... 154 3,330
11 159 1 56 10 5,219 6 106 1 55 3 73 214 15,84716 210 I 11 2 53 358 15,132
148 2.599 3 239 59 6,764 42 1,176 7 199 3 41 12 368 2,681 1,46,825
1 52 20 2,31230 838 3 78 26 3,371 18 509 ... 1 83 303 17,951
1 8 1 38 ... ... 66 3,941
... 1 26 ... ... 55 1,169
- ... • . • 29 3333 11 ... 2 122 ... 271 10 462
2 27 ... 1 11 .. . ... ... 109 7,41
36 884 3 78 29 3,487 19 520 2 122 ... 1 83 853 43,587
184 3,483 6 317 88 10,251 61 1,696 9 321 3 41 13 451 3,534 1,90,412
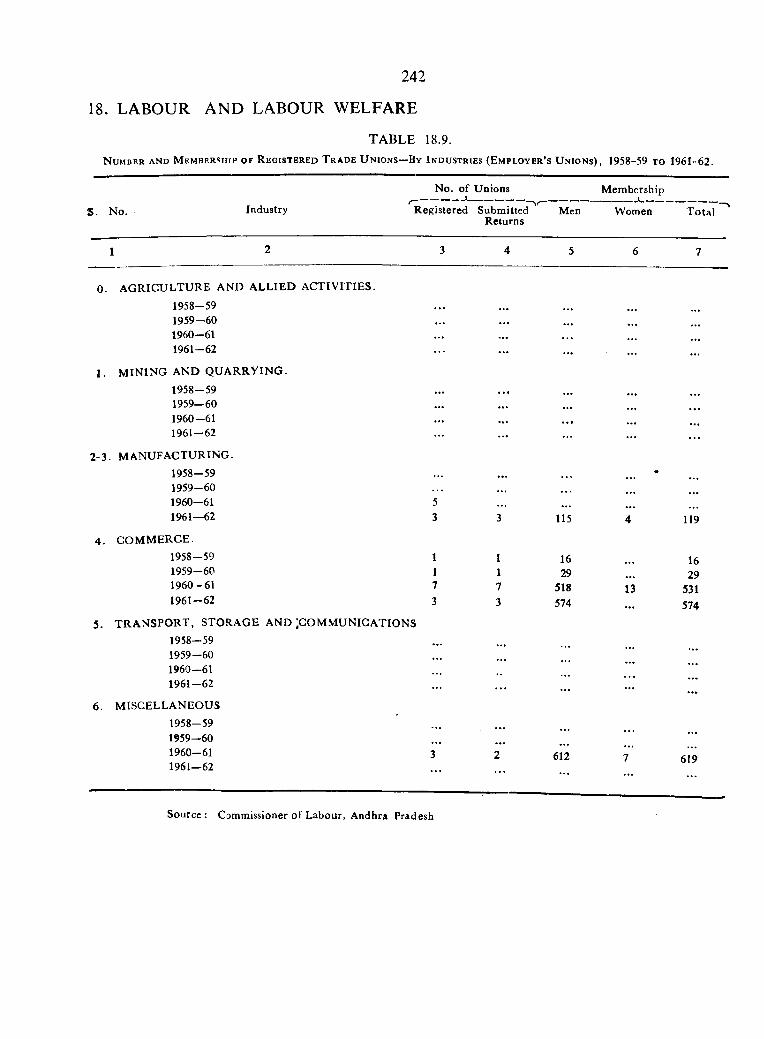
242
TABLE 18.9.
18. LABOUR AND LABOUR WELFARE
N u m b e r an d M e m b e r s h i p o f R e g is te re d T ra d e U n io n s—By In d u s tr ie s (E m p lo y er’s U n ions), 1958-59 t o 1961-62.
No. of Unions M em bership1
S. N o. Industry Registered SubmittedReturns
Men Women T o ta l
1 2 3 4 5 6 7
0 . A G R IC U L T U R E AND A LL IE D A C TIV ITIES.
1958-59 • • • • • .
1959-60 . . .
1960-61 • • • • . • . . .
1961-62 . . . . . . . . .
1. M IN IN G AND Q U A R R Y IN G .
1958-59 • • • . . .
1959—60 • • • . . .
1960-61 • • • . . •
1961-62 . . . . . . . . . . . .
2-3 . M A N U FA C TU R IN G .1958-59 • • •
1959-60 • • • • • •
1960-61 5 . . .
1961—62 3 3 115 4 119
4 . C O M M E R C E .1958—59 1 1 16 161959-60 1 1 29 291960-61 7 7 518 13 5311961 -62 3 3 574 . . . 574
5. T R A N SPO R T , STORA GE AND ;CO M M U NICA TION S1958-591959-60
. . .. . . . . .
1960-61. . .
1961-62 . . . . . . . . .
6. M ISCELLA N EO US1958-591959-60
. — . . . . . . . . .
1960-61 3 2 612 7 6191961—62
. . . . . .
Source : Commissioner o f Labour, A adhra Pradesh
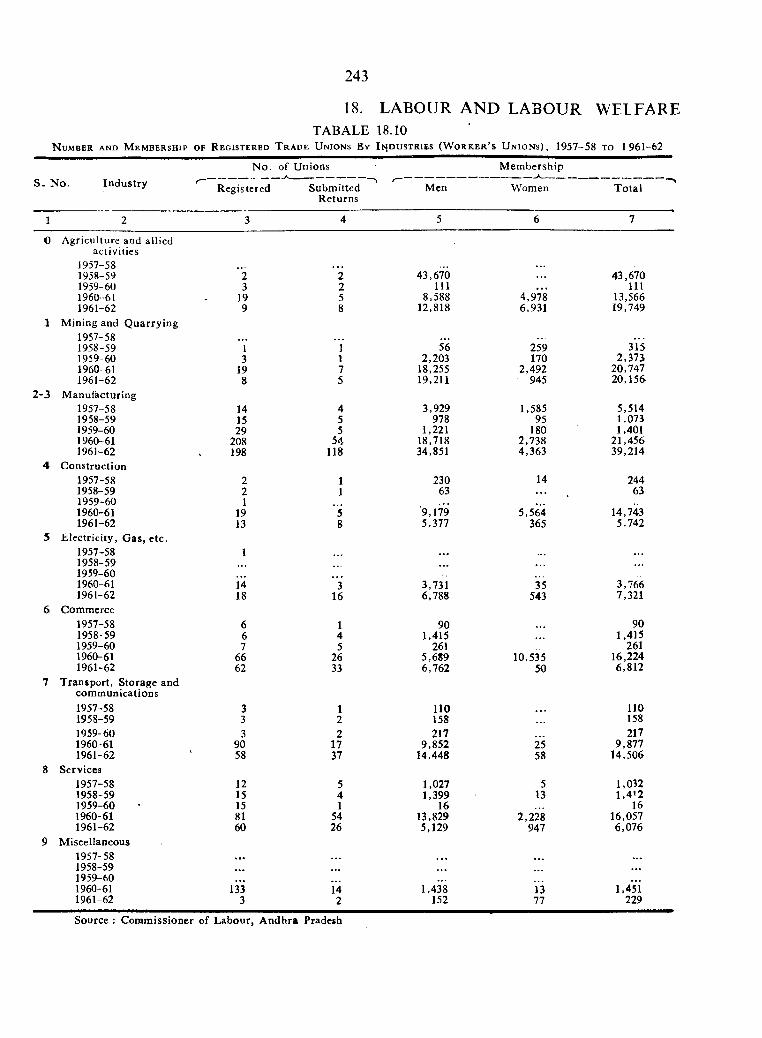
243
TABALE 18.10N u m b e r a n d M e m b e r s h i p o f R e g i s t e r e d T r a d e U n i o n s B y I i<j d u s t r i e s ( W o r k e r ' s U n i o n s ) , 1957-58 t o 1961-62
18. LABOUR A N D LABOUR WELFARE
S . N o. IndustryN o. of Unions
Registered
M em bership
SubmittedReturns
Men Women T otal
0 A griculture and alliedactivities
1957-581958-591959-601960-611961-62
1 M ining and Q uarry ing1957-581958-591959-601960-611961-62
2 -3 M anufacturing1957-581958-591959-601960-611961-62
4 C onstruction1957-581958-591959-601960-611961-62
5 E lectricity, G as, etc.1957-581958-591959-601960-611961-62
6 Commerce1957-581958-591959-601960-611961-62
7 Transport, Storage andcom m unications1957-581958-591959-601960-611961-62
8 Services1957-581958-591959-601960-611961-62
9 M iscellaneous1957-581958-591959-601960-611961-62
23
199
13
198
1415 29
208198
221
1913
1418
667
6662
333
9058
1215158160
1333
45 5
54118
316
145
26 33
122
1737
541
5426
142
43,670111
8,58812,818
562,203
18,25519,211
3,929978
1,22118,71834,851
23063
9,1795,377
3,7316,788
901,415
2615,6896,762
110158217
9,85214,448
1,0271,399
1613,8295.129
1,438152
4,9786,931
259170
2,492945
1,58595
1802,7384,363
14
5,564365
35543
10,53550
2558
513
2,228947
1377
43,670111
13,56619,749
3152,373
20,74720,156
5,5141,0731,401
21,45639,214
24463
14,7435,742
3,7667,321
901,415
26116,2246,812
110158217
9,87714,506
1,0321,412
1616,0576,076
1,451229
Source : Com m issioner of Labour, A ndhra Pradesh
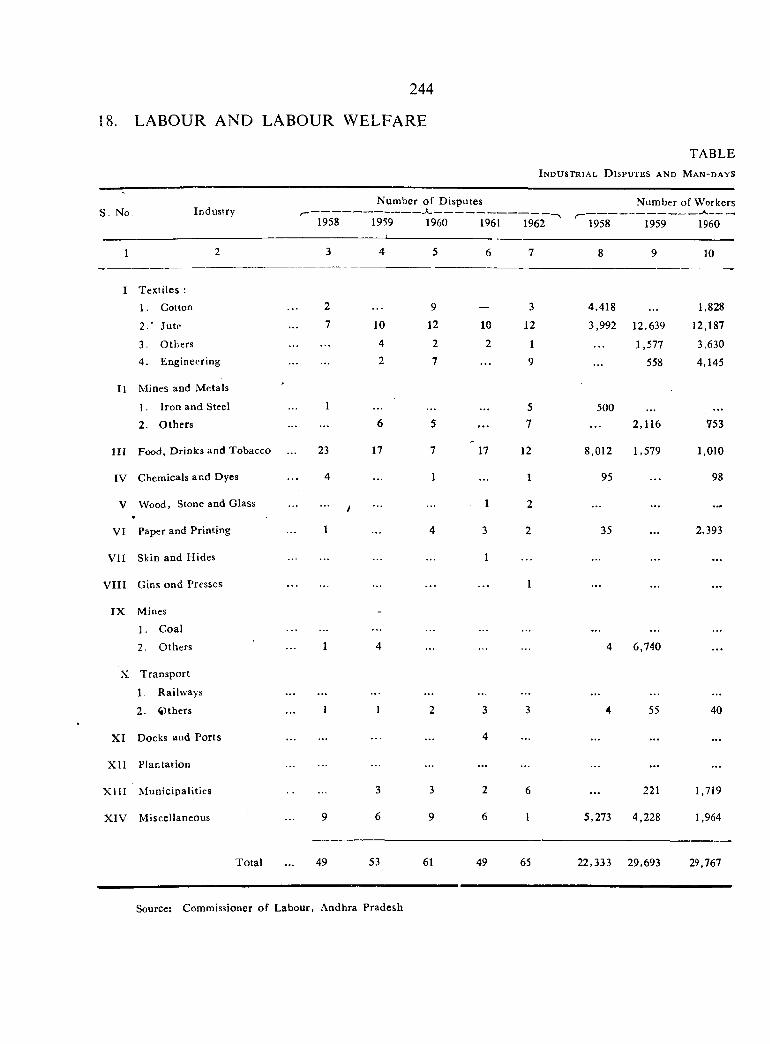
244
18. LABOUR AND LABOUR WELFARE
TABLEI n d u s t r i a l D i s p u t e s a n d M a n - d a y s
S. No Industry1958
N um ber o f Disputes
1959 1960 1961- 1
1962 ^ 1 9 5 8
Number of Workers
1959 1960
1 2 3 4 5 6 7 8 9 10
I Textiles :1. Cotton 2 9 3 4,418 1,828
i : Jute 7 10 12 10 12 3,992 12,639 12,187
3. Others ................ 4 2 2 1 1,577 3,6304. Engineering 2 7 9 558 4,145
11 Mines and M etals
1. Iron and Steel 1 5 5002. O thers ..... 6 5 7 ... 2,116 753
I I I Food, D rinks and Tobacco 23 17 7 17 12 8,012 1,579 1,010
IV Chemicals and Dyes 4 1 ... 1 95 98
V Wood, Stone and Glass ................ / 1 2 ... —
VI Paper and Printing 1 4 3 2 35 ... 2,393
V II Skin and Hides 1 . ..
V III Gins ond Presses ... 1 ... ...
IX Mines
1. Coal-
2. O thers 1 4 ... 4 6,740 . . .
X T ransport
1. Railways
2. (*)thers 1 1 2 3 3 4 55 40
XI Docks and Ports 4 ... ...
X II P lantation ................ ... ... ... ...
X III M unicipalities 3 3 2 6 . .. 221 1,719
X IV M iscellaneous 9 6 9 6 1 5,273 4,228 1,964
Total 49 53 61 49 65 22,333 29,693 29,767
Source; Commissioner o f Labour, Andhra Pradesh
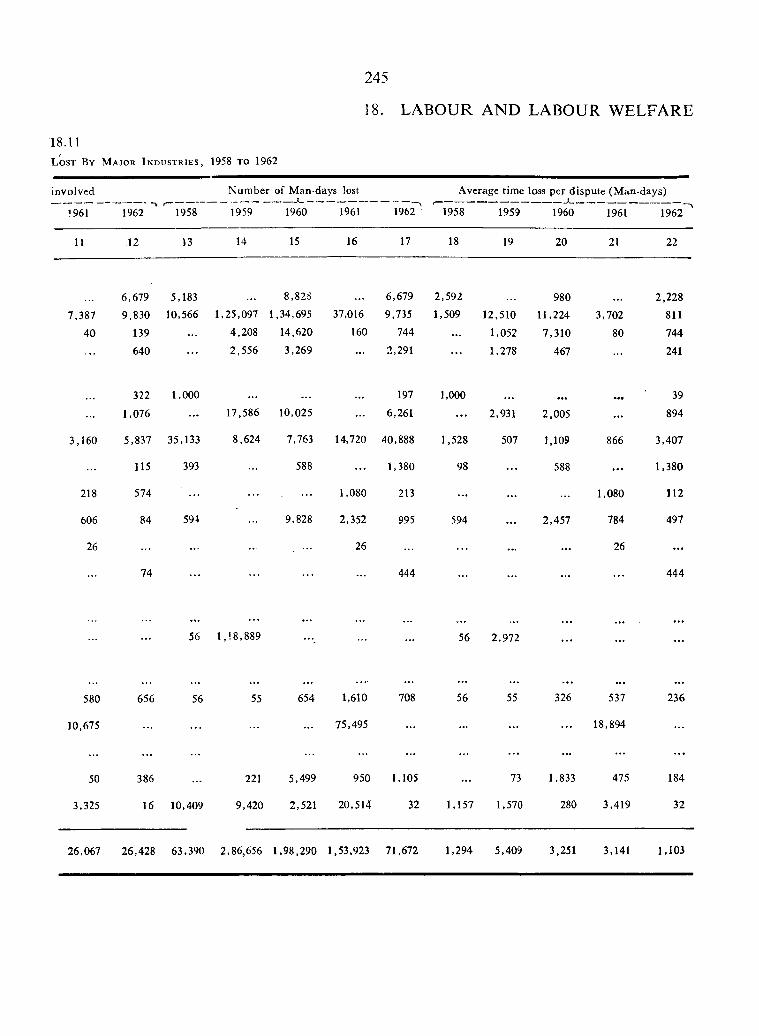
245
18. LABOUR A ND LABOUR WELFARE
1 8 .1 1
L o s t B y M a j o r I n d u s t r i e s , 1958 t o 1962
involved
1961 1962 "~1958
N um ber of Man-days lost
1959 1960 1961 1 9 6 ^
Average time loss per dispute (M an-days)
"~1958 1959 1960 1961 1962~^
11 12 13 14 15 16 17 18 19 20 21 22
6,679 5,183 8,82S 6,679 2,592 980 2,228
7,387 9,830 10,566 1,25,097 1,34,695 37,016 9,735 1,509 12,510 11,224 3,702 811
40 139 4,208 14,620 160 744 . . . 1,052 7,310 80 744
640 2,556 3,269 . . . 2,291 . . . 1,278 467 241
322 1,000 197 1,000 • • • 39
1,076 . . . 17,586 10,025 . . . 6,261 . . . 2,931 2,005 . . . 894
3,160 5,837 35,133 8,624 7,763 14,720 40,888 1,528 507 1,109 866 3,407
115 393 588 . . . 1,380 98 . . . 588 . . . 1,380
218 574 • • • 1,080 213 . . . 1,080 112
606 84 594 9,828 2,352 995 594 . . . 2,457 784 497
26 26 . . . . . . 26 . . .
74 . . . 444 . . . 444
• • • • • • . . .
56 1,18,889 . . . 56 2,972 . . . . . .
580 656 56 55 654 1,610 708 56 55 326 537 236
10,675 . . . . . . 75,495 . . . . . . . . . . . . 18,894
50 386 221 5,499 950 1,105 73 1,833 475 184
3,325 16 10,409 9,420 2,521 20,514 32 1,157 1,570 280 3,419 32
26,067 26,428 63,390 2,86,656 1,98,290 1,53,923 71,672 1,294 5,409 3,251 3,141 1.103
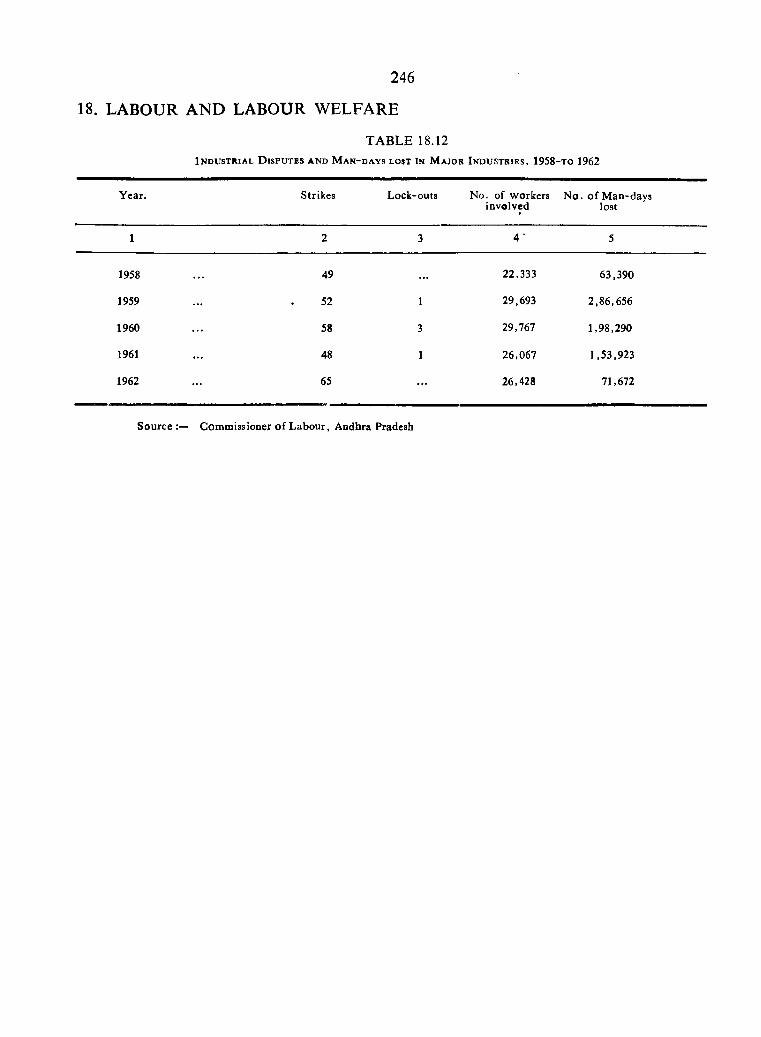
246
18. LABOUR AND LABOUR WELFARE
TABLE 18.12I n d u s t r i a l D i s p u t e s a n d M a n - d a y s l o s t i n M a j o r I n d u s t r i e s , 1958-to 1962
Y ear. Strikes Lock-outs No. of workers involved
N o. o f M an-days lost
1 2 3 4 ‘ 5
1958 . . . 49 . . . 22,333 63,390
1959 . . . 52 1 29,693 2,86,656
1960 . . . 58 3 29,767 1,98,290
1961 . . . 48 1 26,067 1,53,923
1962 . . . 65 . . . 26,428 71,672
Source • Commissioner o f L abour, Andhra Pradesh
TABLE 18.13
A b s e n t e e i s m i n F a c t o r y I n d u s t r i e s - b y I n d u s t r i e s ,
1958—1962
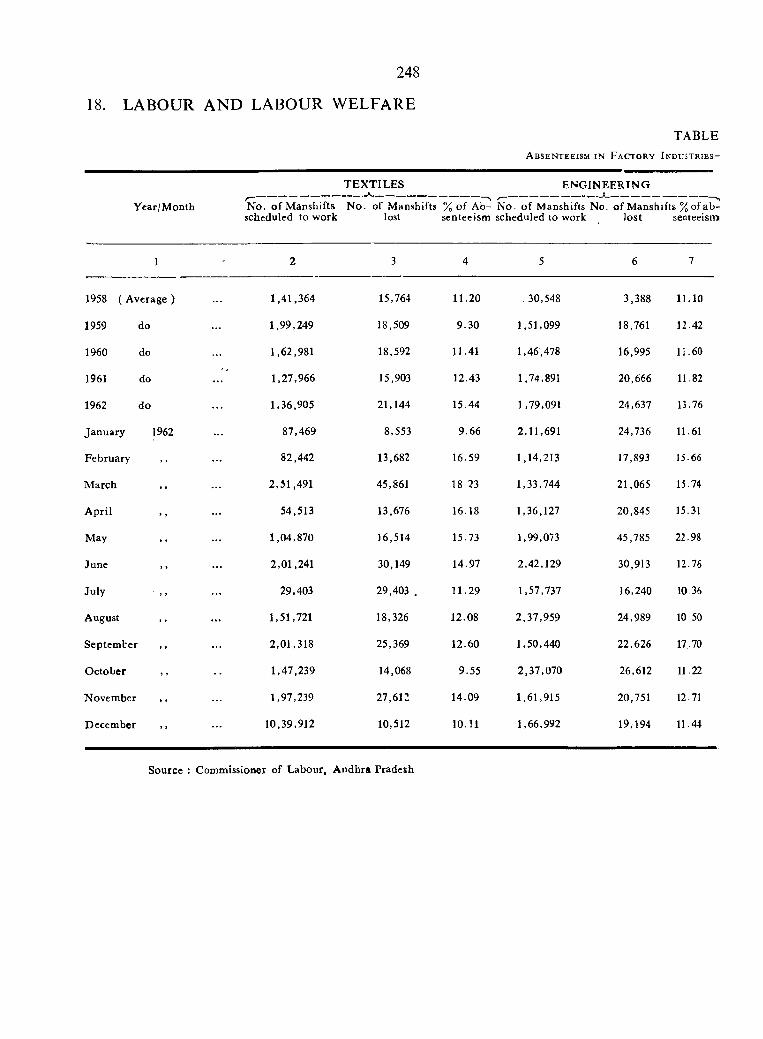
248
18. LABOUR AND LABOUR WELFARE
Year/M onth
TABLEA b s e n t e e i s m i n F a c t o r y I n d u s t r i e s -
T E X T IL E S EN G IN EE R IN G
N o. o f M anshifts N o. of Manshifts % o f A b- N o. o f Manshifts No. of M anshifts % of ab - schedulcd to work lost scntecism scheduled to work lost senteeismi
1
1958 ( Average )
1959 do
1960 do
1961 do
1962 do
January 1962
February
M arch
A pril
May
June
July
August
Sep tem ter
O ctober
November
Decem ber
1,41,364
1,99,249
1,62,981
1,27,966
1,36,905
87,469
82,442
2,51,491
54,513
1,04,870
2,01,241
29,403
1,51,721
2,01,318
1.47.239
1.97.239
10,39,912
15,764
18,509
18,592
15,903
21,144
8,553
13,682
45,861
13,676
16,514
30,149
29,403 .
18,326
25,369
14,068
27,612
10,512
11.20
9.30
11.41
12.43
15.44
9.66
16.59
18 23
16.18
15.73
14.97
11.29
12.08
12.60
9.55
14.09
10.11
30,548
1,51,099
1,46,478
1,74,891
1,79,091
2,11,691
1,14,213
1,33,744
1,36,127
1,99,073
2,42,129
1,57,737
2,37,959
1,50,440
2,37,070
1,61,915
1,66,992
3,388
18,761
16.995
20,666
24,637
24,736
17,893
21,065
20,845
45,785
30,913
16,240
24,989
22,626
26,612
20,751
19,194
11.10
12.42
11 . 6a
11.82
13.76
11.61
15.66
15.74
15.31
22.98
12.76
10.36
10 50
17.70
11.22
12.71
11.44
Source : Commissioner of Labour, A ndhra Pradesh
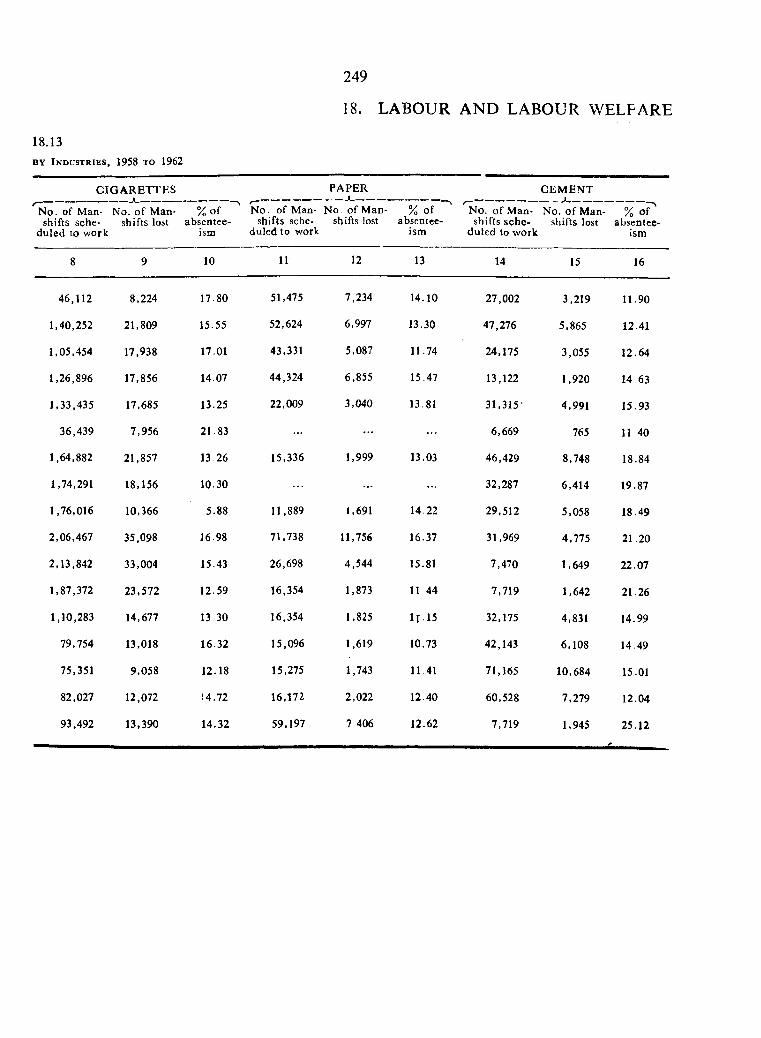
18.13BY I n d u s t r i e s , 1958 TO 1962
249
18. LABOUR AND LABOUR WELFARE
C IG A R E T T E S
N o. of Man- No. o f M anshifts sche- shifts lost
duled to work
% o fabsentee
ism
No. of M anshifts sche
duled to work
PAPER
No of M anshifts lost
% of absentee
ism
No. of M anshifts sche
duled to work
C EM EN T
No. o f M anshifts lost
% o P absentee
ism
8 9 10 11 12 13 14 15 16
46,112 8,224 17.80 51,475 7,234 14.10 27,002 3,219 11.90
1,40,252 21,809 15.55 52,624 6.997 13.30 47,276 5,865 12.41
1,05,454 17,938 17.01 43,331 5,087 11-74 24,175 3,055 12.64
1,26,896 17,856 14.07 44,324 6,855 15.47 13,122 1,920 14-63
1,33,435 17,685 13.25 22,009 3,040 13.81 31,315' 4,991 15.93
36,439 7,956 21.83 ... ... 6,669 765 11 40
1,64,882 21,857 13 26 15,336 1,999 13.03 46,429 8,748 18.84
1,74,291 18,156 10.30 ... ... 32,287 6,414 19.87
1,76,016 10,366 5.88 11,889 1,691 14.22 29,512 5,058 18.49
2,06,467 35,098 16.98 71,738 11,756 16.37 31,969 4,775 21.20
2,13,842 33,004 15.43 26,698 4,544 15.81 7,470 1,649 22.07
1,87,372 23,572 12.59 16,354 1,873 11-44 7,719 1,642 21.26
1,10,283 14,677 13 30 16,354 1,825 1 M 5 32,175 4,831 14.99
79,754 13,018 16.32 15,096 1,619 10.73 42,143 6,108 14.49
75,351 9,058 12.18 15,275 1,743 11-41 71,165 10,684 15.01
82,027 12,072 !4.72 16,172 2,022 12-40 60,528 7,279 12.04
93,492 13,390 14.32 59,197 7 406 12.62 7,719 1.945 25.12

250
18. LABOUR AND LABOUR WELFARE
TABLE 18.14N u m b e r o f I n d u s t r i a l A c c i d e n t s a n d C o m p e n s a t i o n P a i d By I n d u s t r i e s , 1958 t o 1962
S. N o. Industry1958 1959
Fatal (N o .)
1960 1961 1 9 6 ? ^1958
Non-Fatal (No )
1959 1960 1961 1962~^
1 2 3 4 5 6 7 8 9 10 11 12
1 Sugar 3 2 9 1 3 3 . . . 50 . . .
2 Cement . . . . . . . . . 1 1 4 . . . . . . . . . 24 1
3 Textiles 1 2 . . . . . . . . . 1 1
4 Paper 2 3 2 . . . 4 . . . . . .
5 Others . . . . . . 14 10 53 177 5 7 1,451 26
Total . . . 6 21 22 55 188 4 5 7 1,526 27
1958
Amount paid for fatal cases (R s.)
1959 1960 1961 1 9 6 2 ^ ^ 1958
Amount paid for N on-fatal cases R s .)
1959 1960 1961 1962 ^
13 14 15 )6 17 18 19 20 21 22
4,088 1,800 18,562
3,000
1,200 8,300
10.104
744 1,083
426 9
1,200 2,917 . . . . . . . . . 24
1,500 3,750 1,800 11.7C0 . . . . . .
33,412 29,292 14,906 1,12,286 3,44,199 5,111 7,333 2,667 1,05,353 23,611
40,200 37,759 38,268 1,13,486 3,74,303 5,855 7,333 2,667 1,06,888 23,625
Source : Commissioner o f Labour, A ndhra Pradesh
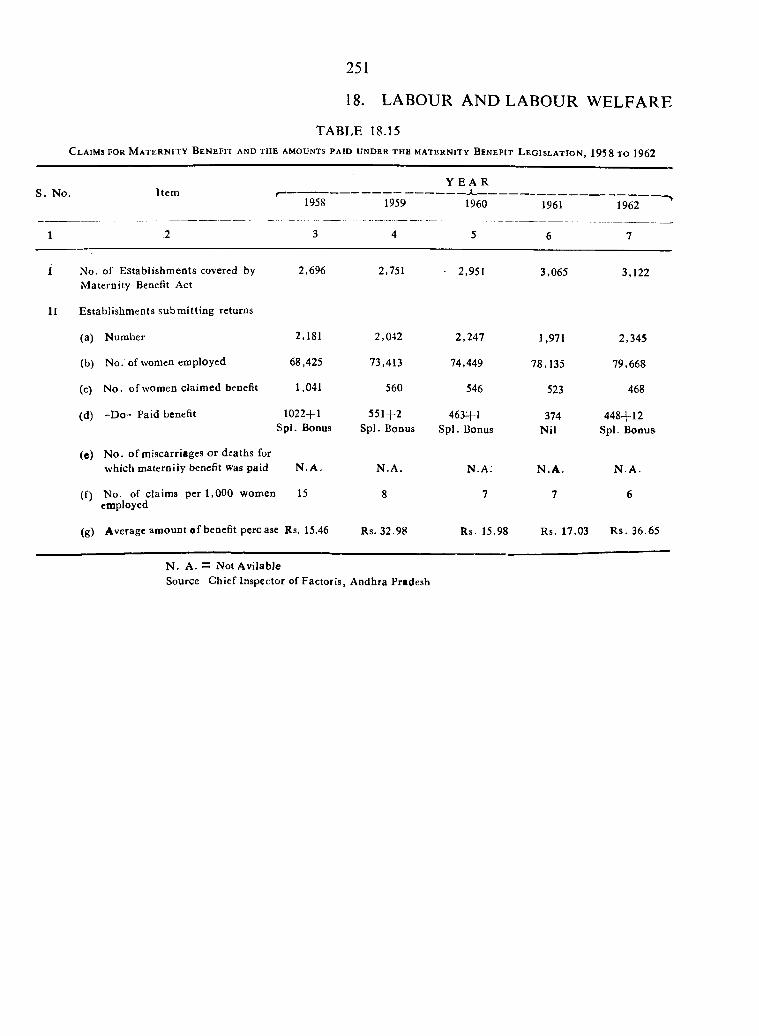
18. LABOUR AND LABOUR WELFARE
TABLE 18.15C l a i m s f o r M a t e r n i t y B e n e f i t a n d t h e a m o u n t s p a i d u n d e r t h e m a t e r n i t y B e n e f i t L e g i s l a t i o n , 1958 t o 1962
251
S . N o,Y E A R
1958 1959 1960 1961 1962
1 2 3 4 5 6 7
I No. of E stablishm ents covered by M aternity Benefit Act
2,696 2,751 ■ 2,951 3,065 3,122
II Establishm ents subm itting returns
(a) Number 2,181 2,042 2,247 1,971 2,345
(b) No. of women employed 68,425 73,413 74,449 78,135 79,668
(c) N o. of women claim ed benefit 1,041 560 546 523 468
(d) -D o - Paid benefit 10224-1Spl. Bonus
551+2 Spl. Bonus
463+1 Spl. Bonus
374N il
448+12 Spl. Bonus
(e) N o . o f miscarriages or deaths for which materniiy benefit was paid N .A , N .A . N .A; N .A . N .A .
(f) No. of claims per 1,000 women employed
15 8 7 7 6
(g) Average am ount o f benefit percase Rs. 15.46 Rs. 32 .98 Rs. 15.98 Rs. 17.03 R s. 36.65
N . A. = Not AvilabJeSource C hief Inspector of Factoris, Andhra Pradesh
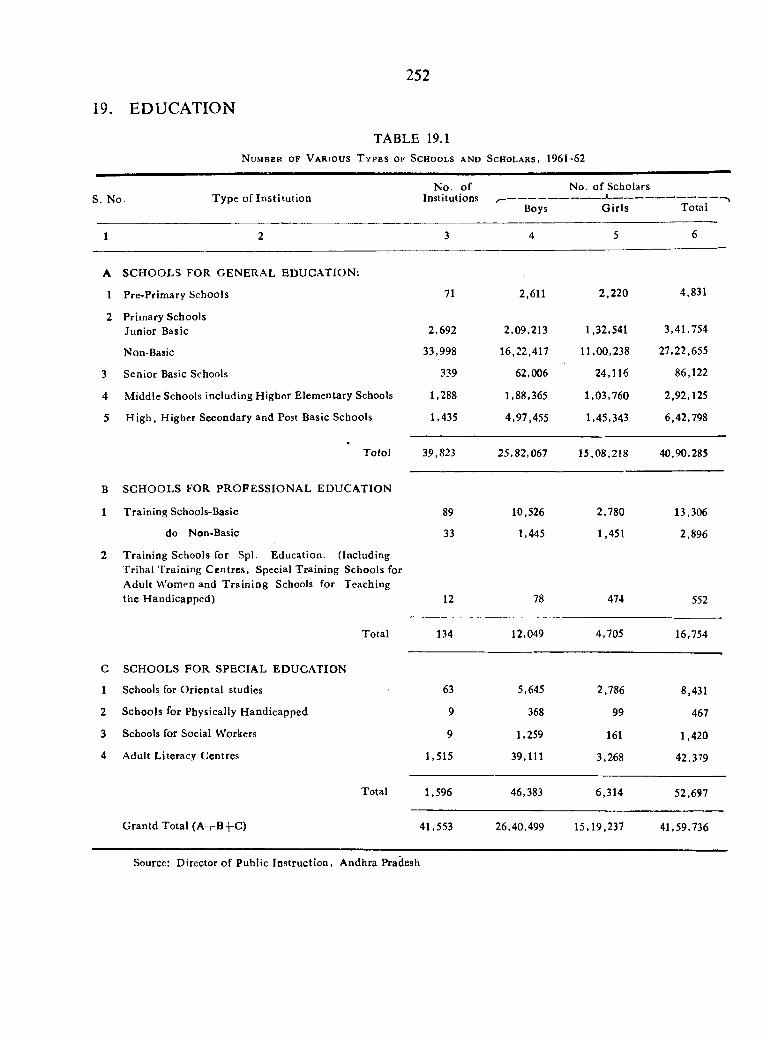
252
19. ED U C A TIO N
TABLE 19.1N u m b e r o f V a r i o u s T y p e s o f S c h o o l s a n d S c h o l a r s , 1961-62
s. N o. Type of In s titu tionN o. o f
InstitutionsBoys
No. o f Scholars
G irls Total
1 2 3 4 5 6
A SC H O O LS FO R GEN ERA L ED U C A TIO N :
1 Pre-Prim ary Schools 71 2,611 2,220 4,831
2 Prim ary Schools Junior Basic 2,692 2,09,213 1,32,541 3,41,754
Non-Basic 33,998 16,22,417 11,00,238 27,22,655
3 Senior Basic Schools 339 62,006 24,116 86,122
4 M iddle Schools including H igher Elem entary Schools 1,288 1,88,365 1,03,760 2,92,125
5 H ig h , H igher Secondary and Post Basic Schools 1,435 4,97,455 1,45,343 6,42,798
Totol 39,823 25,82,067 15,08,218 40,90,285
B SC H O O LS FOR PR O FE SSIO N A L ED U C A TIO N
1 T raining Schools-Basic 89 10,526 2,780 13,306
do Non-Basic 33 1,445 1,451 2,896
2 T raining Schools for S p l . E ducation. (Including T ribal T r a i n i n g C entres, Special Training Schools for A dult W omen and T ra in ing Schools for Teaching the H andicapped) 12 78 474 552
Total 134 12,049 4,705 16,754
C SCHOOLS FO R SPECIAL EDU CA TIO N
1 Schools for O rien tal studies 63 5,645 2,786 8,431
2 Schools for Physically H andicapped 9 368 99 467
3 Schools for Social Workers 9 1,259 161 1,420
4 Adult Literacy Centres 1,515 39,111 3,268 42,379
Total 1,596 46,383 6,314 52,697
G rantd Total (A -j-B +C ) 41,553 26,40,499 15,19,237 41,59,736
Source: Director o f Public Instruction , A ndhra Pradesh
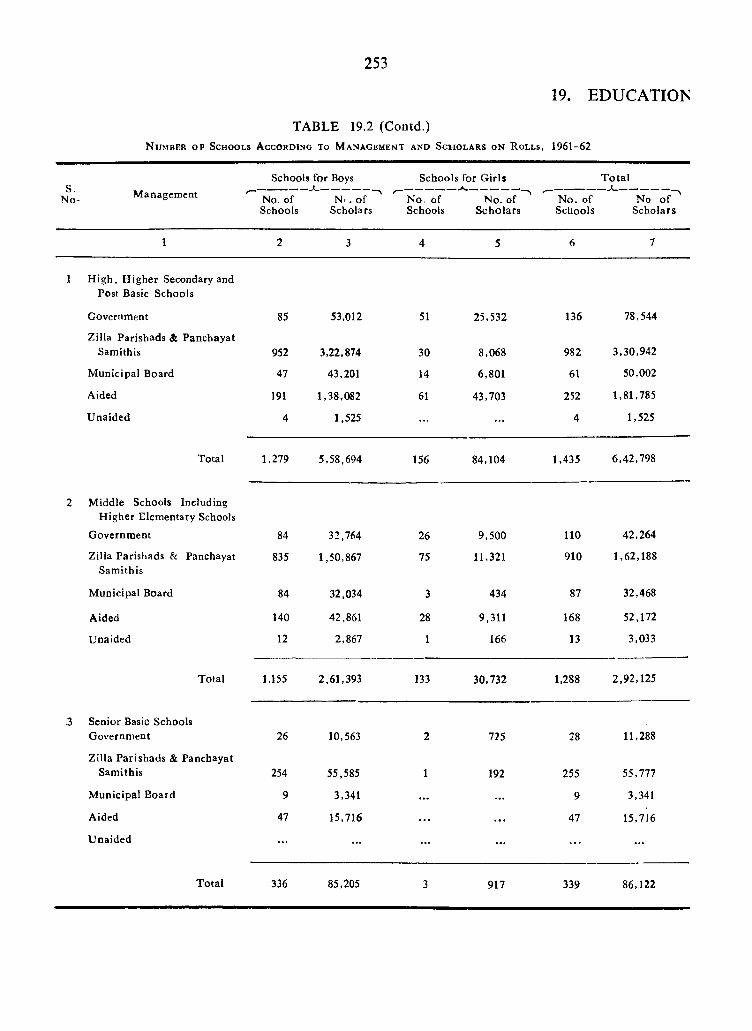
253
19. EDUCATION
TABLE 19.2 (Contd.)N u m b e r o f S c h o o l s A c c o r d i n g t o M a n a g e m e n t a n d S c h o l a r s o n R o l l s , 1961-62
Schools for Boys
No. of N i . of Schools Scholars
Schoccls for G irls T o ta l
No o f ^ Scholars
M anagement ^ N o. of Schools
No. of Scholars
N o. of Schools
1 2 3 4 5 6 7
1 H igh , H igher Secondary and Post Basic Schools
Government 85 53,012 51 25,532 136 78,544
Zilla Parishads & Panchayat Samithis 952 3,22,874 30 8,068 982 3,30,942
M unicipal Board 47 43,201 14 6,801 61 50,002
Aided 191 1,38,082 61 43,703 252 1,81,785
U naided 4 1,525 . . . . . . 4 1,525
Total 1,279 5,58,694 156 84,104 1,435 6,42,798
2 M iddle Schools Including H igher Elementary Schools
Governm ent 84 32,764 26 9,500 110 42,264
Zilla Parishads & Panchayat Samithis
835 1,50,867 75 11,321 910 1,62,188
M unicipal Board 84 32,034 3 434 87 32,468
Aided 140 42,861 28 9,311 168 52,172
U naided 12 2,867 1 166 13 3,033
Total 1,155 2,61,393 133 30,732 1,288 2,92,125
3 Senior Basic Schools Government 26 10,563 2 725 28 11,288
Zilla Parishads & Panchayat Samithis 254 55,585 1 192 255 55,777
M unicipal Board 9 3,341 . . . . . . 9 3,341
Aided 47 15,716 . . . . . . 47 15,716
U naided . . . . . . . . . . . . . . .
T otal 336 85,205 3 917 339 86,122
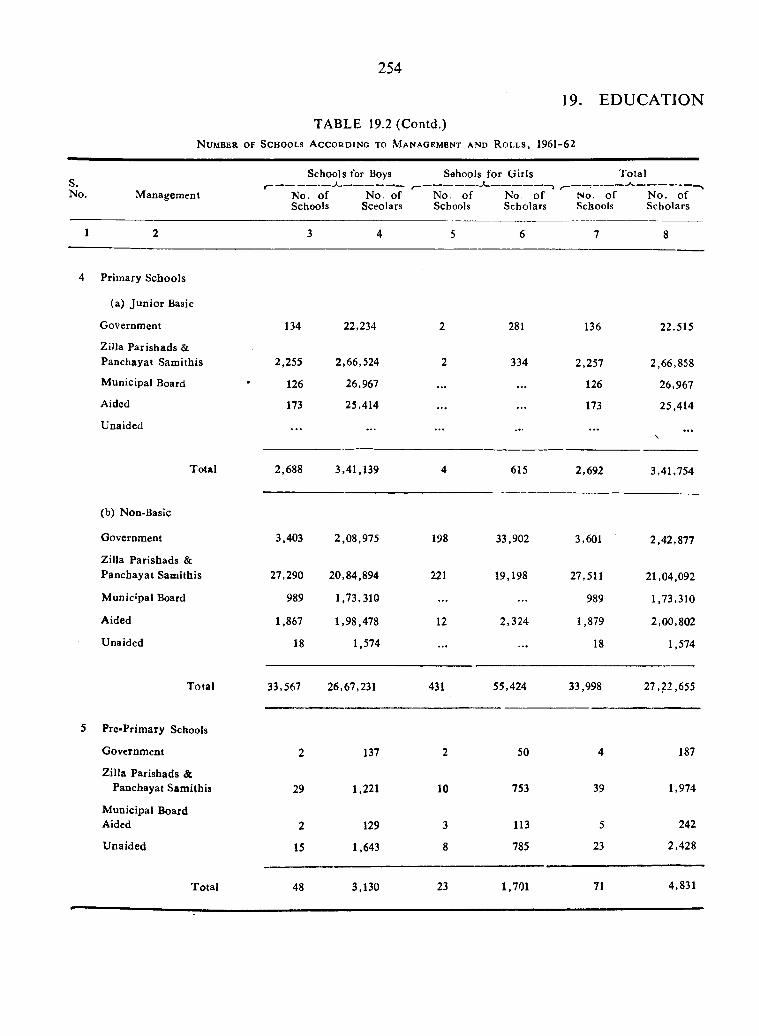
254
19. EDUCATIONTABLE 19.2(Contd.)
N u m b e r o f S c h o o l s A c c o r d i n g t o M a n a g e m e n t a n d R o l l s , 1961-62
S.Schools for Boys
. o f N o. of lools Sceolars
Sehools fo r G irls 1
Total
No. M anagem ent NoScl
N o. o f Schools
No. o f Scholars
No. o f Schools
N o . o f ^Scholars
1 2 3 4 5 6 7 8
4 Prim ary Schools
(a) Ju n io r Basic
Government 134 22,234 2 281 136 22,515
Zilla Parishads & Panchayat Sam ithis 2.255 2,66,524 2 334 2,257 2,66,858
M unicipal Board 126 26,967 . . . . . . 126 26,967
Aided 173 25,414 . . . . . . 173 25,414
U naided . . . . . . . . . . . . . . .
\
Total 2,688 3,41,139 4 615 2,692 3,41,754
(b) Non-Basic
Government 3,403 2,08,975 198 33,902 3,601 2,42,877
Zilla Parishads & Panchayat Samithis 27,290 20,84,894 221 19,198 27,511 21,04,092
M unicipal Board 989 1,73,310 . . . 989 1,73,310
Aided 1,867 1,98,478 12 2,324 1,879 2,00,802
U naided 18 1,574 . . . . . . 18 1,574
T otal 33,567 26,67,231 431 55,424 33,998 27,22,655
5 Pre-Prim ary Schools
Government 2 137 2 50 4 187
Z illa Parishads & Panchayat Sam ithis 29 1,221 10 753 39 1,974
M unicipal Board Aided 2 129 3 113 5 242
U naided 15 1,643 8 785 23 2,428
T otal 48 3,130 23 1,701 71 4,831
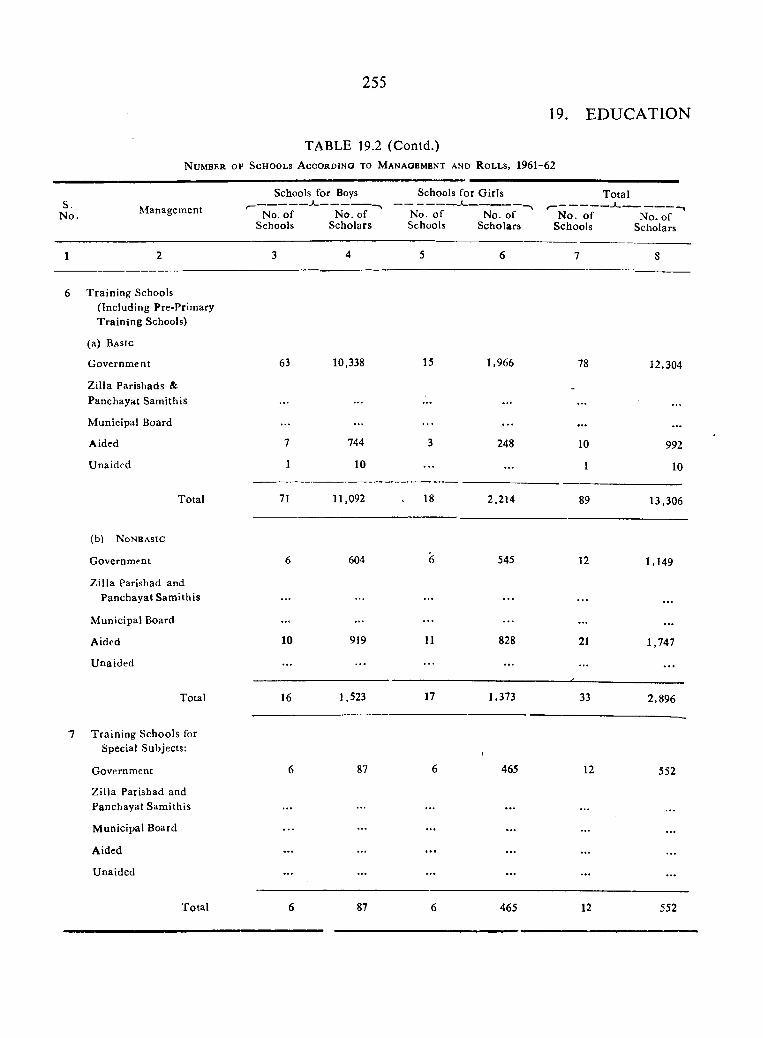
255
19. EDUCATION
TABLE 19.2 (Contd.)N u m b e r o f S c h o o l s A c c o r d i n g t o M a n a g e m e n t a n d R o l l s , 1961-62
cSchools for Boys Schools for G irls Total
N o . Management No. of No. of Schools Scholars
No. o f Schools
No. of Scholars
N o. o f Schools
N o. of Scholars
1 2 3 4 5 6 7 8
6 T rain ing Schools(Including Pre-Primary T rain ing Schools)
(a) Basic
G overnm ent 63 10,338 15 1.966 78 12.304
Z ilia Parishads & Panchayat Sam ithis • • • . . .
-
M unicipal Board . . . . . . . . . . . .
Aided 7 744 3 248 10 992
Unaided 1 10 . . . 1 10
Total 71 11,092 18 2,214 89 13,306
(b) Nonbasic
Government 6 604 6 545 12 1,149
Z illa Parishad and Panchayat Sam ithis . . . . . . . . . • • •
M unicipal Board . . . . . . . . .. . .
Aided 10 919 11 828 21 1.747
U naided . . . . . . . . .
Total 16 1.523 17 1,373 33 2.896
7 T rain ing Schools for Special Subjects:
Government 6 87 6(
465 12 552
Z illa Parishad and Panchayat Sam ithis . . .
M unicipal Board . . . . . .
Aided
U naided . . . . . . . . .
Total 6 87 6 465 12 552
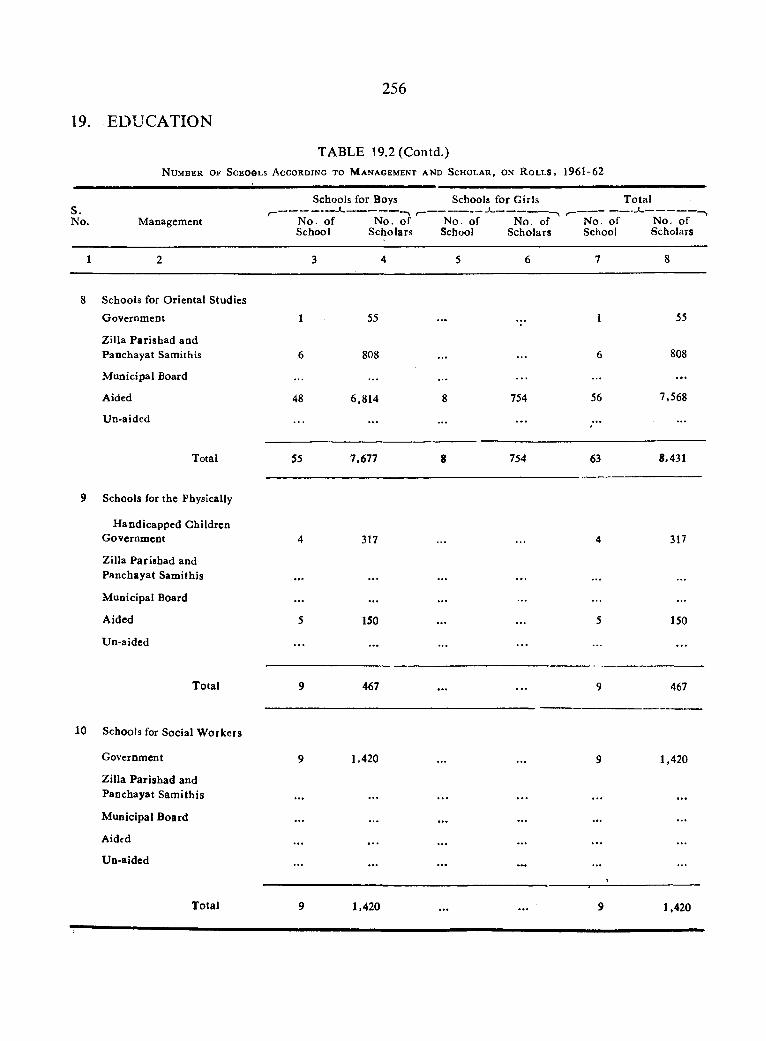
256
19. EDUCATION
TABLE 19.2(Contd.)N u m b e r o f S c e o o l s A c c o r d i n g t o M a n a g e m e n t a n d S c h o l a r , o n R o l l s , 1961-62
S.No. M anagement
Schools for Boys
N o. o f N o. ^ ^ School Scholars
Schools for G irls
N o. of N o. of School Scholars
^ N o. of School
T otal
N o. o f ^ Scholars
1 2 3 4 5 6 7 8
8 Schools for O riental Studies
G overnm ent 1 55 . . . 1 55
Z illa Parisbad andPanchayat Samithis 6 808 . . . . . . 6 808
M unicipal Board . . . . . . . . . . . . . . . . . .
Aided 48 6,814 8 754 56 7.568
U n-aided . . . . . . . . . . . .
Total 55 7,677 8 754 63 8.431
9 Schools for the Physically
H andicapped C hildrenGovernmcDt 4 317 4 317
Zilla Parisbad andPanchayat Sam ithis . . . . . . . . . . . . . . .
M unicipal Board . . . . . . . . . . . . . . .
Aided 5 150 . . . . . . 5 150
U n-aided . . . . . . . . . . . . . . . . . .
Total 9 467 . . . . . . 9 467
10 Schools for Social W orkers
Government 9 1,420 . . . . . . 9 1,420
Z illa Parishad andPanchayat Sam ith is . . . . . . . . . . . . . . . . . .
M unicipal B oard . . . . . . . . . . . . . . . . . .
Aided . . . . . . . . . . . . . . . . . .
U n-aided . . . . . . . . . . . . . . .
T otal 9 1,420 . . . . . . 9 1,420
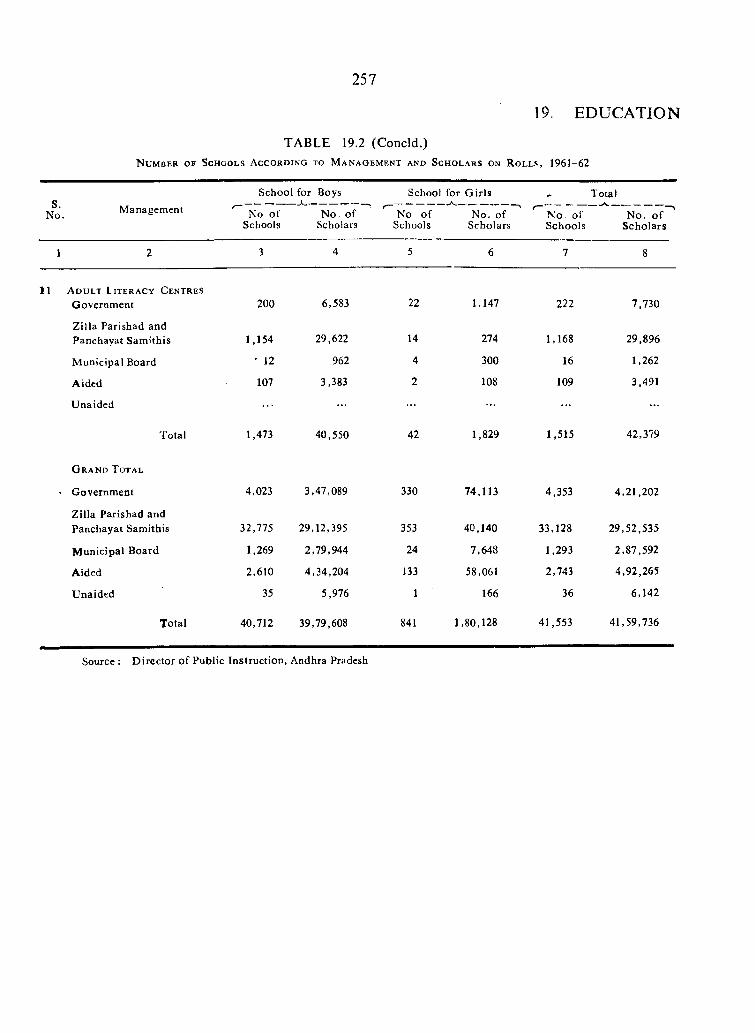
257
19. EDUCATION
TABLE 19.2 (Concld.)N u m b e r o f S c h o o l s A c c o r d i n g t o M a n a g e m e n t a n d S c h o l a r s o n R o l l s , 1961-62
cM anagement
School for Boys
No o f N o. of Schools Scholars
School for G irls
No o f No. of Schools Scholars
^ N o of Schools
Total
N o. of~^ Scholars
1 2 3 4 5 6 7 8
11 A d u l t L i t e r a c y C e n t r e s
Government 200 6,583 22 1,147 222 7,730
Zilla Parishad and Panchayat Samithis 1,154 29,622 14 274 1,168 29,896
M unicipal Board ' 12 962 4 300 16 1,262
Aided 107 3,383 2 108 109 3,491
U naided . . . . . . . . .
Total 1,473 40,550 42 1,829 1,515 42,379
G r a n d T o t a l
• Government 4,023 3,47,089 330 74,113 4,353 4,21,202
Zilla Parishad and Panchayat Samithis 32,775 29,12,395 353 40,140 33,128 29,52,535
M unicipal Board 1,269 2,79,944 24 7,648 1,293 2,87,592
Aided 2,610 4,34,204 133 58,061 2,743 4,92,265
U naided 35 5,976 1 166 36 6,142
Total 40,712 39,79,608 841 1,80,128 41,553 41,59,736
Source : D irector o f Public Instruction, Andhra Pradesh
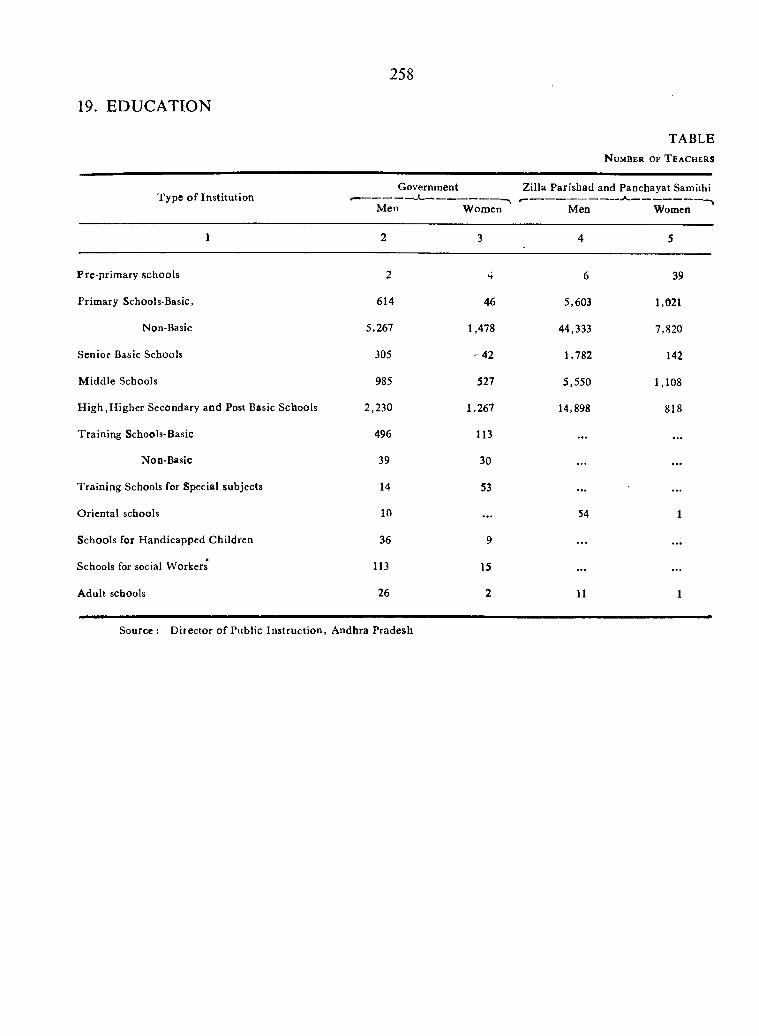
258
19. EDUCATION
TABLEN u m b e r o f T e a c h e r s
Type o f InstitutionGovernment
M en W omen
Zilla Parishad and Panchayat Samithi
Men Women
1 2 3 4 5
Pre-prim ary schools 2 •4 6 39
Prim ary Schools-Basic, 614 46 5,603 1,021
Non-Basic 5,267 1,478 44,333 7,820
Senior Basic Schools 305 '4 2 1,782 142
M iddle Schools 985 527 5,550 1,108
H igh ,H igher Secondary and Post Basic Schools 2,230 1,267 14,898 818
Training Schools-Basic 496 113 ... ...
Non-Basic 39 30 ... ...
T raining Schools for Special subjects 14 53 ... ...
O riental schools 10 ... 54 1
Schools for H andicapped Children 36 9 ... ...m
Schools for social Workers 113 15 ...
A dult schools 26 2 11 1
Source : D irector o f Public Instruction , Andhra Pradesh
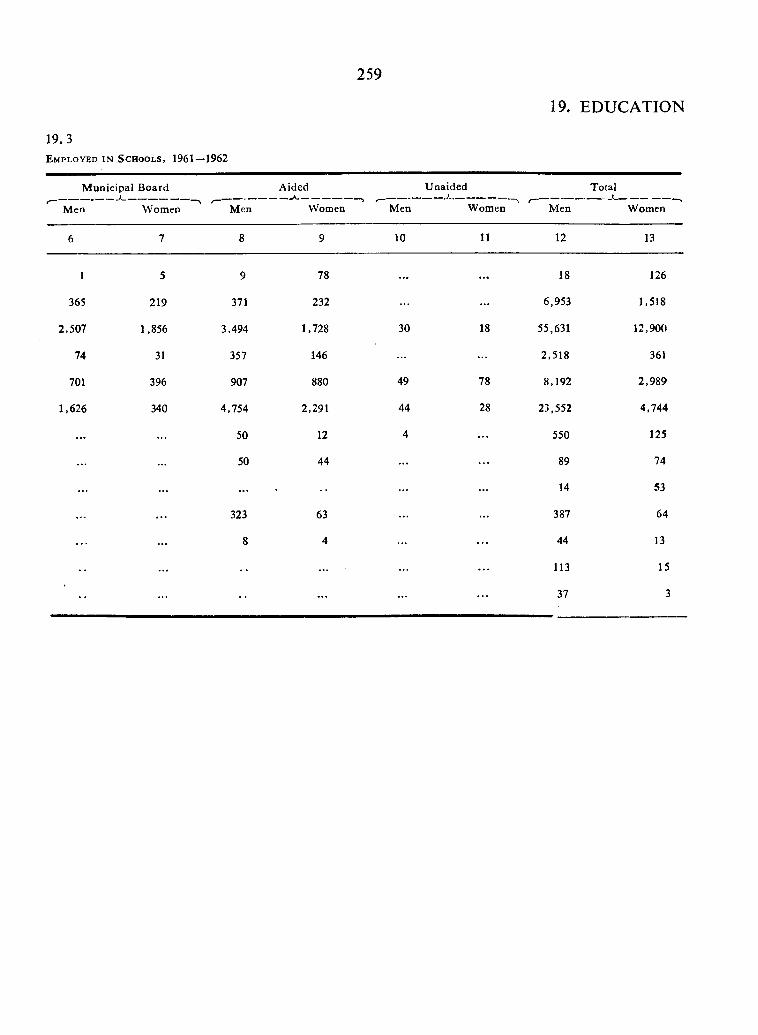
259
19.3E m p l o y e d i n S c h o o l s , 1961—1962
19. EDUCATION
M unicipal B oard
Men Women Men
Aided
Women
U naided
Men Women
Total
Men Women
10 11 12 13
1 5 9 78 . . . . . . 18 126
365 219 371 232 . . . . . . 6,953 1,518
2,507 1,856 3,494 1,728 30 18 55,631 12,900
74 31 357 146 . . . . . . 2,518 361
701 396 907 880 49 78 8,192 2,989
1,626 340 4,754 2,291 44 28 23,552 4,744
. . . 50 12 4 550 125
50 44 . . . 89 74
. . . . . . 14 53
323 63 . . . 387 64
8 4 . . . 44 13
. . . . . . 113 15
37 3
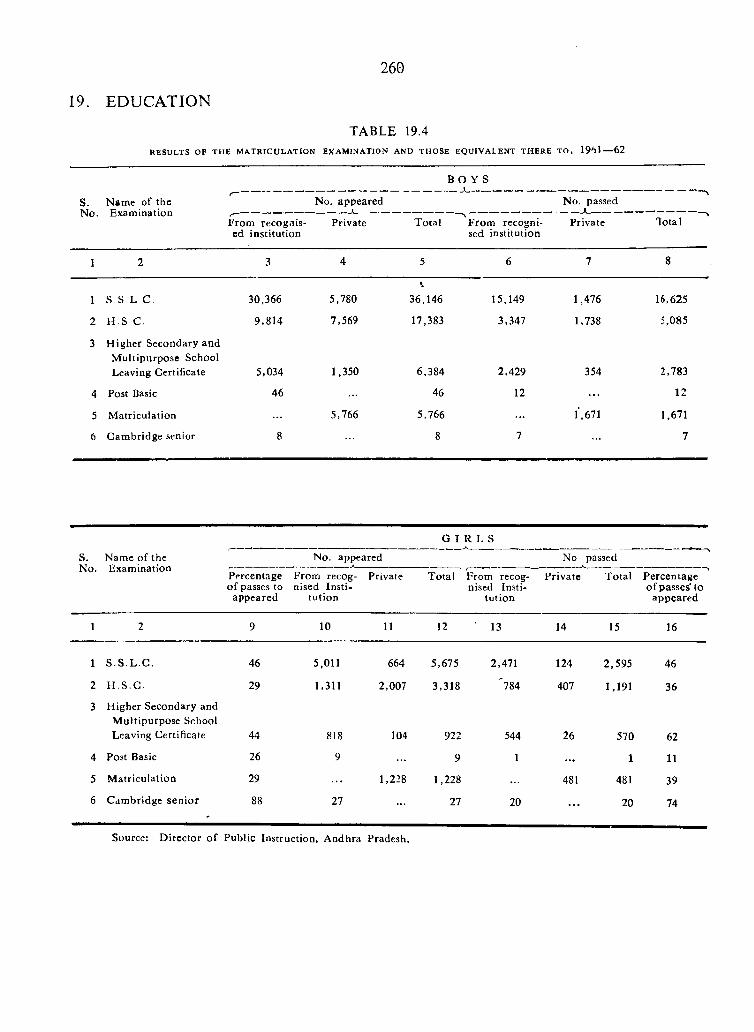
260
19. EDUCATION
TABLE 19.4RESULTS OF TH E M ATRICULATION EXAMINATION AND THOSE EQUIVALENT TH ERE T O , 1961— €2
S.No.
Name of the Examination
From recognised institution
No. appeared
Private Total
B O Y S
From recognised institution
No. passed
Private Total
1 2 3 4 5 6 7 8
1 S .S .L .C . 30,366 5,780 36,146 15,149 1,476 16,625
2 H .S C. 9,814 7,569 17,383 3,347 1,738 5,085
3 H igher Secondary and M ultipurpose School Leaving Certificate 5,034 1,350 6,384 2,429 354 2,783
4 Post Basic 46 46 12 . . . 12
5 M atriculation . . . 5,766 5,766 l‘,671 1,671
6 Cam bridge senior 8 8 7 7
G I R L S
S.No.
Name o f the Examination
No. appearedA
No passed
Percentage o f passes to
appeared
From recognised Insti
tution
Private T otal From recognised Insti
tution
Private Total Percentage o f passes’ to
appeared
I 2 9 10 11 12 ■ 13 14 15 16
1 S .S .L .C . 46 5,011 664 5,675 2,471 124 2,595 46
2 H .S .C . 29 1,311 2,007 3,318 '784 407 1,191 36
3 H igher Secondary and M ultipurpose SchoolLeaving Certificate 44 818 104 922 544 26 570 62
4 Post Basic 26 9 9 1 . . . 1 11
5 M atriculation 29 . . . 1,228 1,228 481 481 39
6 Cambridge senior 88 27 . . . 27 20 . . . 20 74
Source: D irector o f Public Instruction, Andhra Pradesh.
TABLE 19.5
N u m b e r o f V a r i o u s T y p e s o f . I n s t i t u t i o n s , S c h o l a r s o n
R o l l s a n d T e a c h e r s . D i s t r i c t w i s e , 1961-62
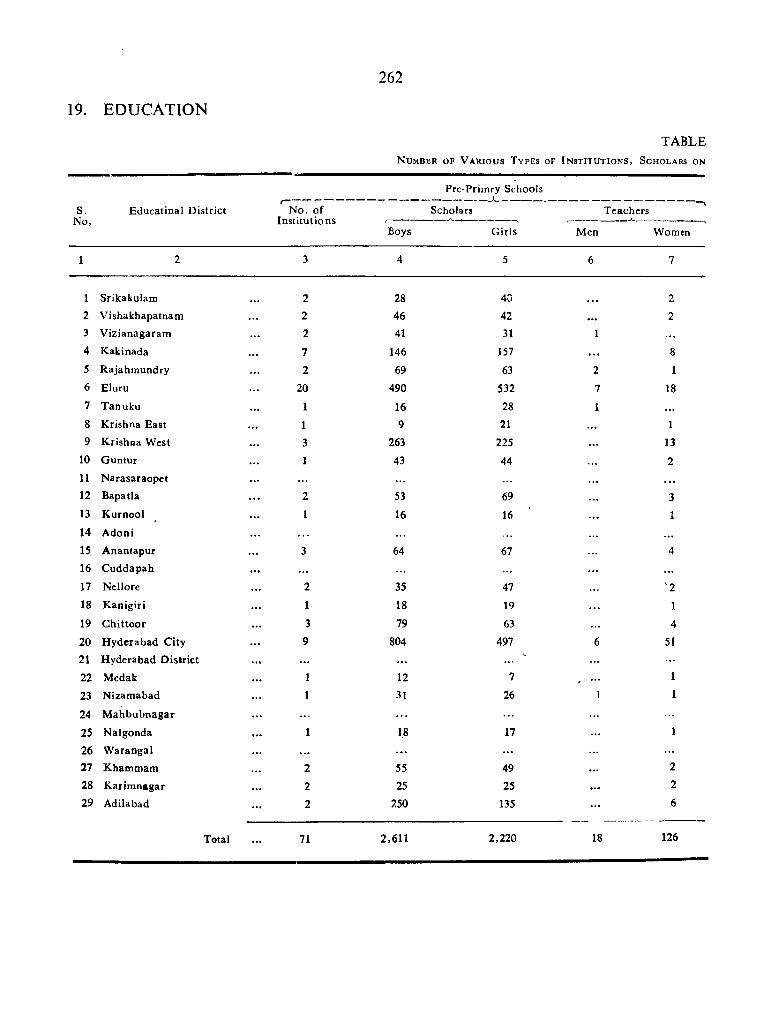
262
19. EDUCATION
TABLEN u m b e r o f V a r i o u s T y p e s of I n s t i t u t i o n s , S c h o l a r s o n
S.No ,
E ducatinal D istrict N o. of Institu tions
Pre-Primry Schools------------------ *_________Scholars
Boys G irls
Teachers
Men Women
1 Srikakulam
2 Vishakhapatnam
3 V izianagaram
4 K akinada
5 R ajahm undry
6 Eluru
7 T anuku
8 Krishna East
9 K rishoa West
10 G untur
11 N arasaraopet
12 Bapatla
13 K urnool
14 Adoni
15 A nantapur
16 C uddapah
17 Nellore
18 K anigiri
19 C hittoor
20 H yderabad City
21 Hyderabad D istrict
22 Medak
23 N izam abad
24 M ahbubnagar
25 N algonda
26 W arangal27 Khammam
28 K arim nagar
29 Adilabad
T otal
22
2
7
2
20
2
2
2
71
28
46
41
146
69
490
169
263
43
53
16
64
35
18
79
804
12
31
18
55
25
250
2,611
40
4231
157
63
532
28
21
225
44
69
16
67
47
19
63
497
7
26
17
49
25
135
2,220
1
18
1
13
2
'2
14
51
18
226
126
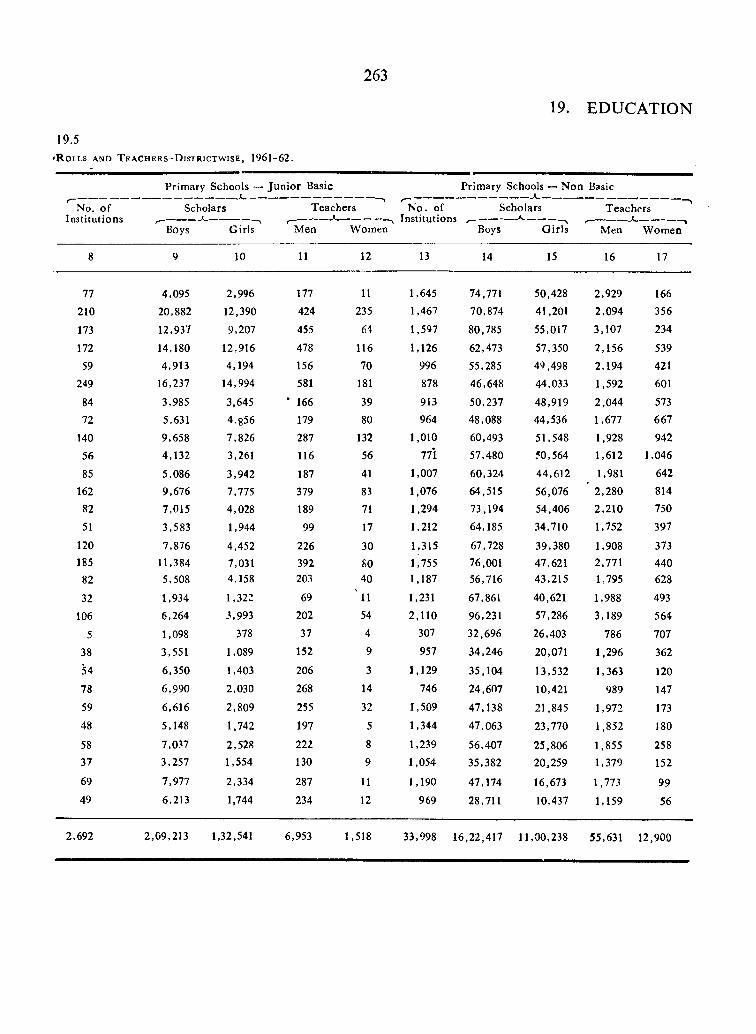
263
19. EDUCATION
' R o l l s a n d T e a c h e r s - D i s t r i c t w i s e , 1961-62.19.5
Prim ary Schools — Ju n io r Basic
No. o f Institutions
Scholars
Boys G irls
Prim ary Schools — N on Basic—\ r - “ ' *------------- ----------- —-------------
Teachers N o. of Scholars Teachers
Men Women Boys G irls Men W omen
10 11 12 13 14 15 16 17
77
210
173
172
59
249
84
72
14056
85
16282
51
12018582
32106
5
38
54
78
59
48
58 37
69
49
4,095
20,882
12,937
14,180 4,913
16,237
3,985
5,631
9,658 4,132
5,086 9,676
7,015
3,583
7,876 11,384 5,508
1,934 6,264
1,098 3,551
6,350
6,990
6,616
5,148
7,0.^7
3,257
7,977
6,213
2,996
12,390
9,207
12,9164,194
14,994
3,645
4,856
7,826
3,261
3,942
7,7754,028
1,944
4,4527,0314,158
1,322
3,993
378
1,089
1,403
2,030
2,809
1,742
2,5281,554
2,334
1,744
177
424
455
478
156 581
* 166
179
287
116
187
379
189
99
226 392 203
69
202
37
152
206
268
255
197
222
130
287
234
11
235
64
116
70 181
39
80
132
56
41
8371
17
30
8040
1154
4
9
3
14
32
5
8
9
1112
1,6451,467
1,597
1,126
996
878
913
9641,010
77*1
1,007
1,076
1,294
1,212
1,315
l ’7551,187
1,231
2,110307
957
1,129
746
1,509
1,344
1,239
1,054
1,190
969
74,771
70,874
80,785
62,473
55,28546,648
50,23748,088
60,49357,480
60,32464,51573,194
64,185
67,72876,00156,716
67,861
96,231
32,696
34,246
35,104
24,607
47,138
47,063
56,407
35,382
47,174
28,711
50,428
41,201
55,017
57,350
49,49844,033
48,91944,536
51,54850,564
44,612
56,07654,406
34,710
39,38047.621 43,215
40.621
57,286
26,403 20,071
13,532
10,421
21,845
23,770
25,806 20,259
16,673
10,437
2,929
2,094
3,107
2,156
2,194
1,592
2,044
1,677
1,9281,612
1,9812,280
2,2101,752
1,9082,7711,795
1,9883,189
786
1,296
1,363
989
1,972
1,852
1,8551,379
1,773
1,159
166
356
234
539
421
601
573667
942
1,046
642
814
750
397
373440628
493564
707
362
120
147
173
180
258152
99
56
2,692 2,09,213 1,32,541 6,953 1,518 33,998 16,22,417 11,00,238 55,631 12,900
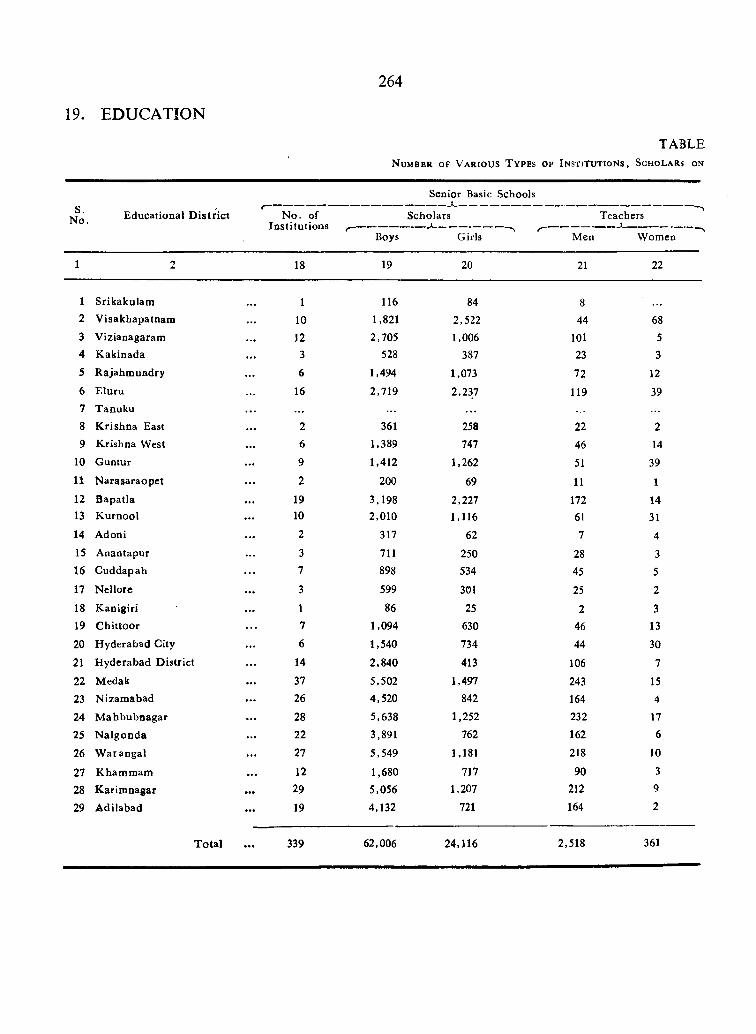
19. EDUCATION
264
TABLEN u m b e r o f V a r i o u s T y p e s o f I n s t i t u t i o n s , S c h o l a r s on
S.N o. Educational D is tr ic t N o. of
Institu tions
Senior Basic Schools---------------------- «________________
Scholars
Boys Girls
Teachers
Men W omen
18 19 20 21 22
1 Srikakulam2 V isakhapatnam
3 Vizianagaram4 K akinada
5 R ajahm undry
6 E luru
7 T anuku
8 K rishna East9 K rishna West
10 G untur
11 N arasaraopet
12 B apatla13 K urnool
14 Adoni
15 A nantapur16 C uddapah
17 Nellore
18 K anigiri19 C h ittoo r
20 H yderabad City
21 H yderabad D istrict
22 Medak
23 N izam abad
24 M ahbubnagar
25 N algonda
26 W arangal
27 K ham m am28 K arim nagar
29 A dilabad
T ota l
110
123
6
16
26
9
2
19102
37
3
17
6
14
37
26
28
2227
12
29
19
339
116
1,821
2,705528
1,494
2,719
361
1.389
1,412
200
3.1982,010
317
711
898
599
86
1,094
1,540
2,840
5,5024,520
5,638
3,891
5,549
1,680
5,056
4,132
62,006
84
2,522
1,006387
1,073
2,237
258
747
1,262
69
2,2271,116
62
250534
30!
25
630
734
413
1,497
842
1,252
762
1,181
717
1,207
721
24,116
44
10123
72
119
22
46
51
1117261
7
28
45
25
246
44
106
243
164232
162
218
90212
164
2,518
68
53
12
39
2
14
39
1
14 31
4
3
5
2
313
30
7
154
176
10
39
2
361
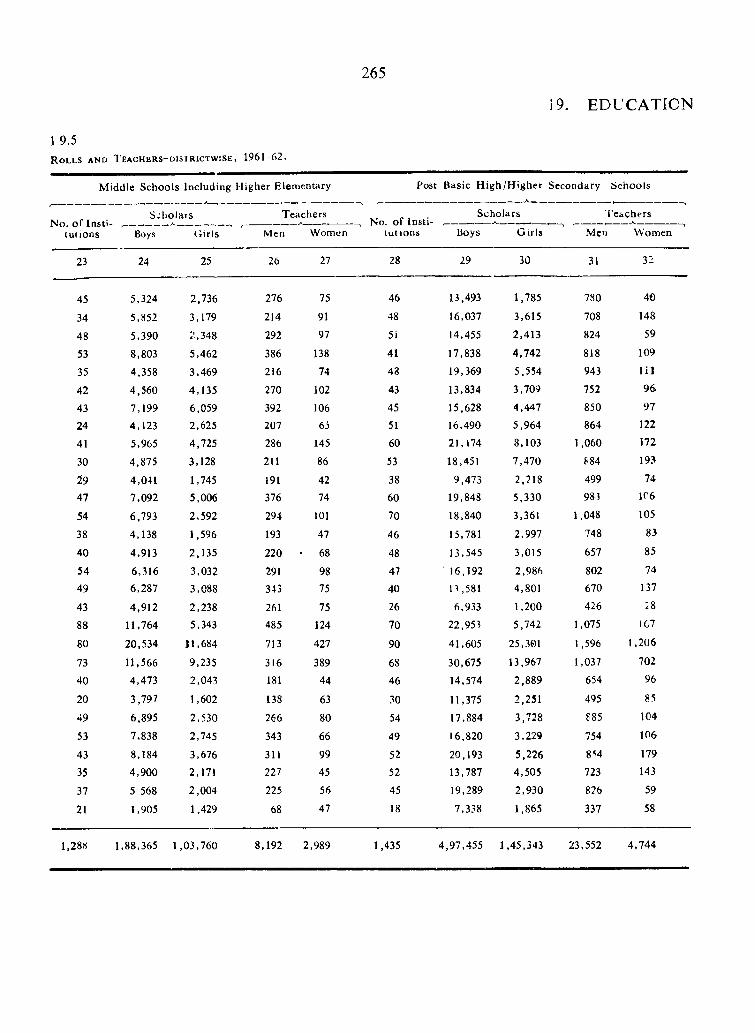
265
19. EDUCATION
19.5R o l l s a n d T e a c h e r s - d i s t r i c t w i s e , 1961-62.
M iddle Schools Including Higher Elementary Post Basic H igh/H igher Secondary Schools
ScholarsNo. o f ln s ti- ,----------------------------
lutions Boys Girls
Teachers
Men WomenNo. of in sti
tutions
Scholars Teachers
Boys G iris Men Women
23 24 25 26 27 28 29 30 31 32
75 46 13,493 1,785 780 40
91 48 16,037 3,615 708 148
97 51 14,455 2,413 824 59
138 41 17,838 4,742 818 109
74 48 19,369 5,554 943 111
102 43 13,834 3,709 752 96
106 45 15,628 4,447 850 97
65 51 16,490 5,964 864 122
145 60 21,174 8,103 1,060 172
86 53 18,451 7,470 884 193
42 38 9,473 2,218 499 74
74 60 19,848 5,330 98? 106
101 70 18,840 3,361 1,048 105
47 46 15,781 2,997 748 83
68 48 13,545 3,015 657 85
98 47 16,192 2,986 802 74
75 40 n ,5 8 1 4,801 670 137
75 26 6,933 1,200 426 28
124 70 22,953 5,742 1,075 167
427 90 41,605 25,-301 1,596 1,206
389 68 30,675 13,967 1,037 702
44 46 14,574 2,889 654 96
63 .10 11,375 2,251 495 85
80 54 17,884 3,728 885 104
66 49 16,820 3,229 754 106
99 52 20,193 5,226 8M 179
45 52 13,787 4,505 723 143
56 45 19,289 2,930 826 59
47 18 7,338 1,865 337 58
45
34
48
53
35
42
43 24
41
30
19 47
54
38
40
54
49
43
88
80
73
40
20 49
53
43
35
37
21
5,324
5,852
5,390
8,803
4,358
4,560
7,199
4,123
5,965
4,875
4,041 7,092
6,793
4,138
4,913
6,316 6,287
4,912
11,764
20,534
11,566
4,473
3,797
6,895
7,838
8,184
4,900
5 568
1,905
2,736
3,179
2,348
5,462
3,469
4.135
6,059 2,625
4,725
3,128
1.745
5,006
2,592
1,596
2.135
3,032 3,088
2,238
5,343
11,684
9,235
2,043
1,602
2,530
2.745
3,676 2,171
2,004
1,429
276
214
292
386
216
270
392
207
286
211
191376
294
193
220
291343
261485
713
316
181
138
266
343
311227
225
68
1,28« 1,88,365 1,03,760 8,192 2,989 1,435 4,97,455 1,45,343 23,552 4,744
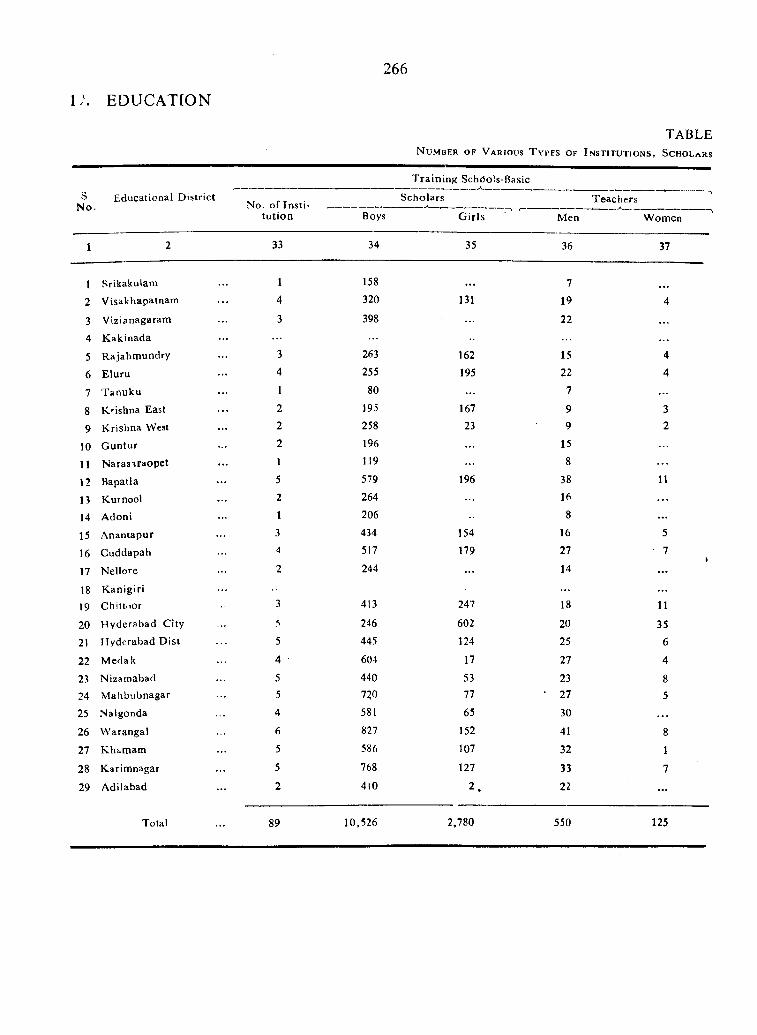
i ; . EDUCATION
266
TABLEN umber op Various T ypes of I nstitutions, Scholars
T rain ing Schdols-Basics
NoEducational District
No. o fln s ti-Scholars Teachers
tu tion Boys G irls Men— 1— -A.
Women
1 2 33 34 35 36 37
1 Srikakulam 1 158 7
2 Visakhapatnam 4 320 131 19 4
3 Vizianagaram 3 398 22 ...
4 K akinada
5 Rajahm undry 3 263 162 15 4
6 Eluru 4 255 195 22 4
7 T anuku 1 80 7
8 K<-ishna East 2 195 167 9 3
9 Krishna West 2 258 23 9 2
10 G untur 2 196 15
11 N arasiraopet 1 119 8
12 Bapatla 5 579 196 38 11
13 Kurnool 2 264 ... 16
14 Adoni 1 206 8 ...
15 A nantapur 3 434 154 16
16 Cuddapah 4 517 .179 271
17 Nellore 2 244 ... 14
18 K anigiri ...
19 Chittnor 3 413 247 18 11
20 H yderabad City 5 246 602 20 35
21 Hyderabad D ist 5 445 124 25 6
22 M edak 4 • 604 17 27 4
23 Nizamabad 5 440 53 23 824 M ahbubnagar 5 720 77 27 5
25 Nalgonda 4 581 65 30 ...
26 VVarangal 6 827 152 41 8
27 Khi.mam 5 586 107 32 1
28 Karimnagar 5 768 127 33 7
29 Adilabad 2 410 2 . 22 ...
Total 89 10,526 2.780 550 125
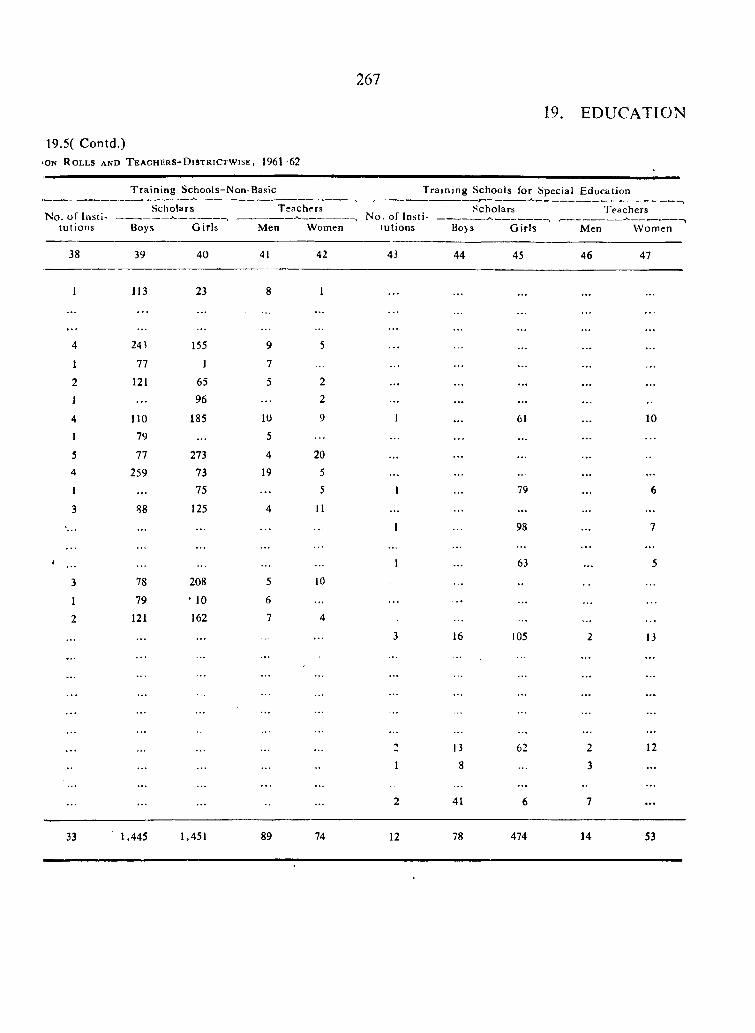
267
19. EDUCATION
19.5( Contd.)«ON R o l l s a n d T e a c h e r S - D i s t r i c t w i s e , 1 9 6 1 -6 2
T rain ing Schools-Non-Basic T rain ing Schools for Special Education
Scholars Teachers Scholars Teachersnf fncti. _tutions Boys G irls Men Women tutions Bo>s G irls Men W omen
38 39 40 41 42 43 44 45 46 47
1 113 23 8 1 . . .
4 241 155 9 5
1 77 1 7
2 121 65 5 2 . . . . . . . . .
1 . . . 96 2 . . . . . .
4 110 185 10 9 1 61 10
1 79 5 . . .
5 77 273 4 20 . . . . . .
4 259 73 19 5 . . .
1 . . . 75 . . . 5 1 79 6
3 88 125 4 11 . . .
. . . 1 98 7
1 1 63 5
3 78 208 5 10
1 79 • 10 6 . . . . . .
2 121 162 7 4
■
3 16 105 2 13
2 13 62 2 12
1 8 3
2 41 6 7
33 1,445 1,451 89 74 12 78 474 14 53
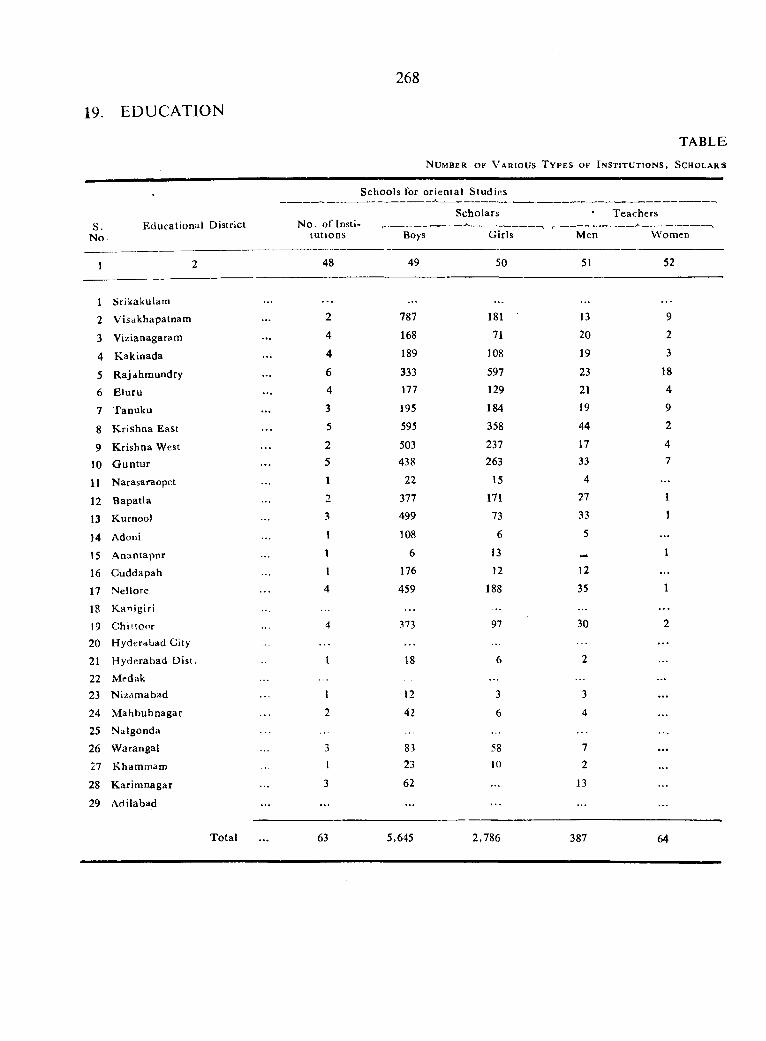
268
19. EDUCATION
N u m b e r o f V ' a r i o u s T y p e s o f I n s t i t u t i o n s , S c h o l a r .s
TABLE
S.No
Educational District
Schools for o rien ta l S tudies
N o . of Institu tions
Scholars Teachers
Boys Girls Men W omen
1
1 S r i k a k u l a m
2 V isakhapatnani
3 Vizianagaram
4 K akinada
5 R ajdhm undry
6 E luru7 T anuku
8 K rishna East
9 K rishna West10 G un tu r
11 Narasaraopet
12 Bapatla
13 Kurnool
14 Adoni
15 A nantapnr
16 Cuddapah17 Neliore
18 K anigiri
19 C hittoor20 Hyderabad City
21 H yderabad D ist.
22 Medak23 N izam abad
24 M ahbubnagar25 N algonda
26 W arangal
27 Khammam
28 K arim nagar
29 Ariilabad
48
T otal 63
49 50
787
168
189
333177
195
595
503438
22
377
499
108
6
176
459
373
18
12
42
8323
62
5,645
181
71
108
597
129
184
358
237263
15
171
73
6
13
12
188
97
3
6
5810
51
2,786
13
20
19
23
21
19
44
1733
4
27
33
5
12
35
30
2
3
4
72
13
387
52
9
2
3
18
4
9
2
4 7
64
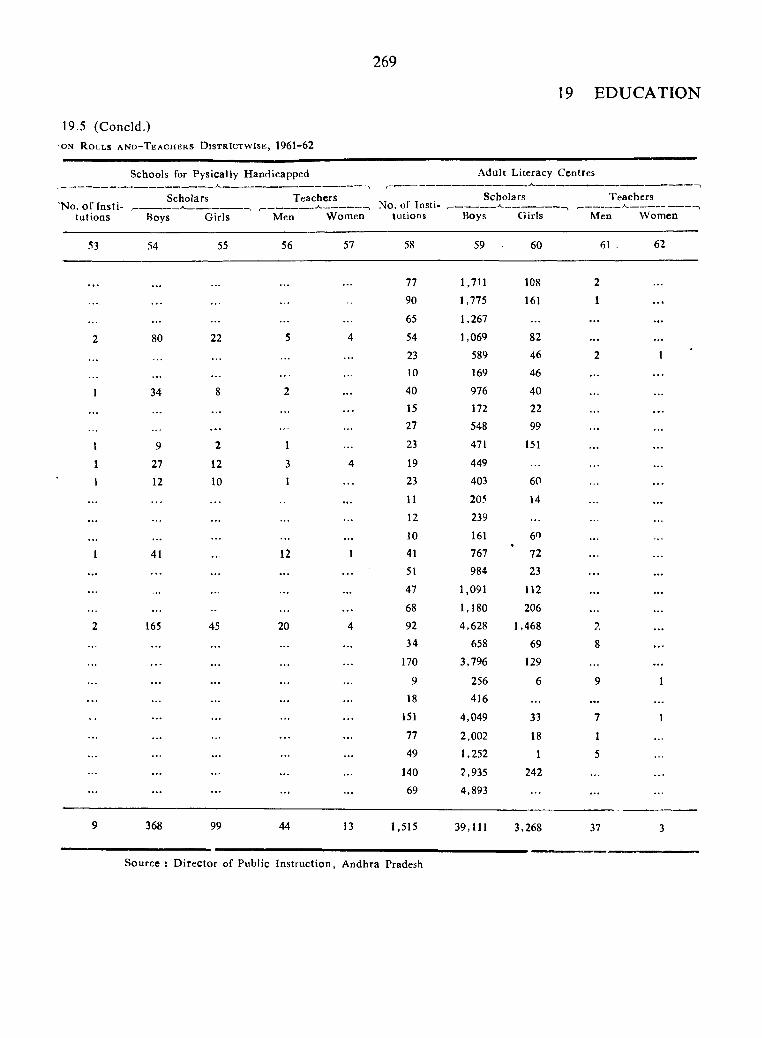
269
19 EDUCATION
19.5 (Concld.)ON R o l l s a n d - T e a c h e r s D i s t r I c t w i s e , 1 9 6 1 -6 2
Schools for Pysically Handicapped A dult Literacy Centres
No. o f In s titutions
Scholars Teachersk No. of Institutions
Scholars Teachers
Men W omenBoys Girls Men Women Boys Girls
53 54 55 56 57 58 59 60 61 . 62
77 1,711 108 2
90 1,775 161 1
65 1,267 ...
2 80 22 5 4 54 1,069 82 ...
23 589 46 2 1
... 10 169 46 ...
1 34 8 2 ... 40 976 40
... 15 172 22 ...
.. . 27 548 99 ...
1 9 2 1 23 471 151 ...
1 27 12 3 4 19 449 ...
1 12 10 1 ... 23 403 60 ...
... ... 11 205 14 ...
... ... 12 239
... ... 10 161 60
1 12 1 41 767 72 ...
... ... ... 51 984 23 ...
... 47 1,091 112 ...
68 1,180 206 ...2 165 45 20 4 92 4,628 1,468 2
... 34 658 69 8
... 170 3,796 129 ...
... 9 256 6 9 1... ... ... 18 416 ...
... 151 4,049 33 7 1... ... 77 2,002 18 1
... ... 49 1,252 1 5... 140 2,935 242 ...
... 69 4,893 ...
9 368 99 44 13 1,515 39,111 3,268 37 3
Source ; D irector of Public Instruction , Andhra Pradesh
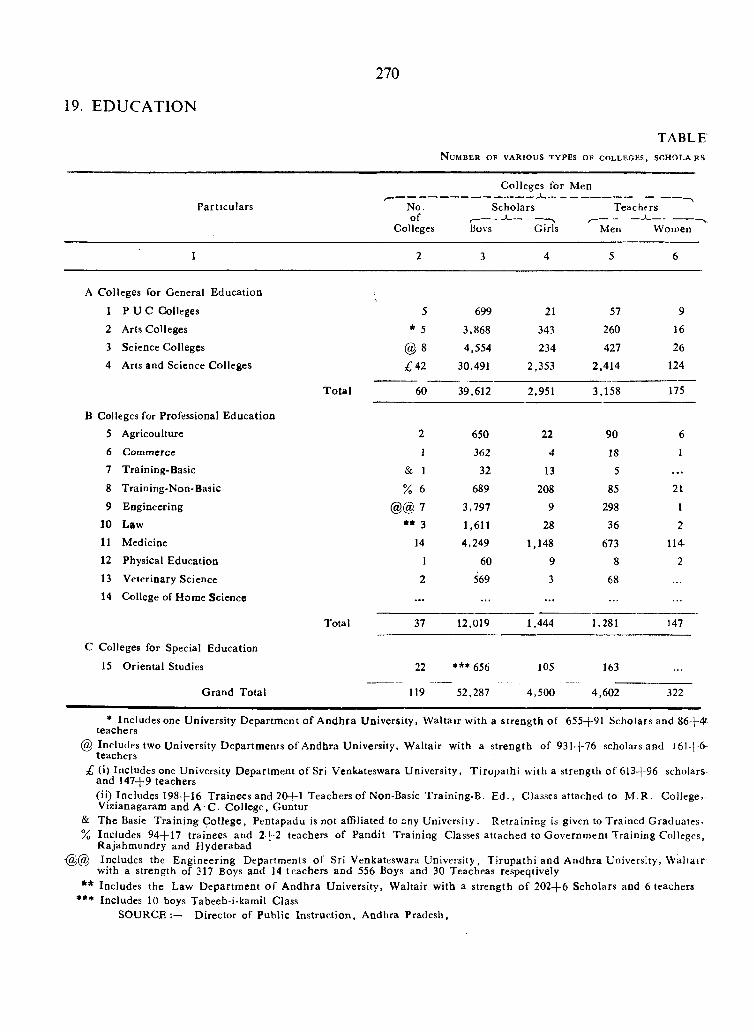
19. EDUCATION
270
TABLEN u m b e r o f v a r i o u s t y p e s o f c o l l e g e s , s c h o l a r s
Particulars ^ No. of
Colleges
Colleges for Men
Scholars Teachers
Boys Girls Men Women
1 2 3 4 5 6
A Colleges for General Education
1 P U C Colleges 5 699 21 57 9
2 Arts Colleges * 5 3,868 343 260 16
3 Science Colleges @ 8 4,554 234 427 264 Arts and Science Colleges ;C42 30.491 2,353 2,414 124
T ota l 60 39,612 2,951 3,158 175
B Colleges for Professional E ducation
5 Agricoulture 2 650 22 90 6
6 C om m erce 1 362 4 18 11 Training-Basic & 1 32 13 5 . . .
8 Training-Non-Basic % 6 689 208 85 21
9 Engineering @ @ 7 3,797 9 298 110 Law ** 3 1,611 28 36 211 Medicine 14 4,249 1,148 673 114
12 Physical Education 1 60 9 8 2
13 Veterinary Science 2 569 3 68
14 College of Home Science . . . . . . . . . . . .
Total 37 12,019 1,444 1,281 147
C Colleges for Special Education
15 O riental Studies 22 *** 656 105 163
G rand Total 119 52,287 4,500 4,602 322
* Includes one University D epartm ent o f A ndhra U niversity, W altair w ith a strength o f 655-f-91 Scholars and 86-1-'^ teachers
@ Includes two University Departm ents o f Andhra University, W altair with a strength of 931+76 scholars and teachers
£ (i) Includes one University D epartm ent o f Sri Vcnkateswara U niversity , T irupath i w ith a strength o f 6l3-f-96 scholars and 1474-9 teachers(ii) Includes 198-|-16 Trainees and 20+1 Teachers o f Non-Basic Training-B . E d ., Classes attached to M R . College. Vizianagaram and A C . C ollege, G untur
& The Basie T rain ing C ollege, Pentapadu is not affiliated to any U niversity. R etraining is given to Trained Graduates- % Includes 94-1-17 trainees and 2-j-2 teachers of Pandit T rain ing Classes attached to G overnm ent Training Colleges,
Rajahm undry and H yderabadIncludes the Engineering Departments o f Sri Venkateswara U niversity, T irupath i and A ndhra University, W altair
with a strength of 317 Boys and 14 teachers and 556 Boys and 30 Teacheas respeqtively** Includes the Law D epartm ent o f A ndhra University, W altair with a strength o f 202-|-6 Scholars and 6 teachers
*** Includes 10 boys Tabeeb-i-kamil ClassSO U R C E ;— D irector of Public Instruction , Andhra Pradesh,
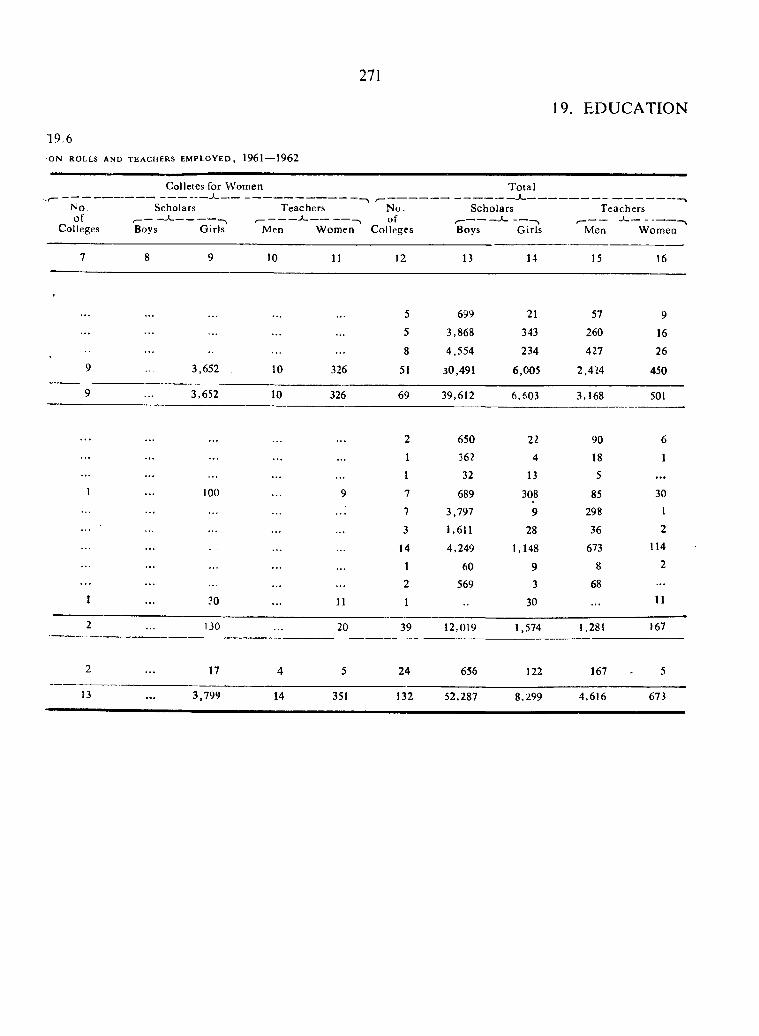
271
19. EDUCATION
O N ROLLS AND t e a c h e r s EM P L O Y E D , 1961—1962
19.6
No.of
Colleges
Colletes for Women
Scholars Teachers
Boys G irls Men Women
No.of
Colleges
T otal
Scholars
Boys Girls
Teachers----- --------------------- N
Men Women
7 8 9 10 11 12 13 14 15 16
•
5 699 21 57 9... 5 3,868 343 260 16
8 4,554 234 427 269 3,652 10 326 51 30,491 6,005 2 ,4 i4 450
9 3,652 10 326 69 39,612 6,603 3,168 501
2 650 22 90 6... ... 1 362 4 18 1
... 1 32 13 5 ...1 100 9 7 689 308 85 30
7 3,797 9 298 I
3 1,611 28 36 2
14 4,249 1,148 673 114
1 60 9 8 2
2 569 3 68 ...
1 30 11 1 30 11
2 130 20 39 12,019 1,574 1,281 167
2 17 4 5 24 656 122 167 5
13 ... 3,799 14 351 132 52,287 8,299 4,616 673
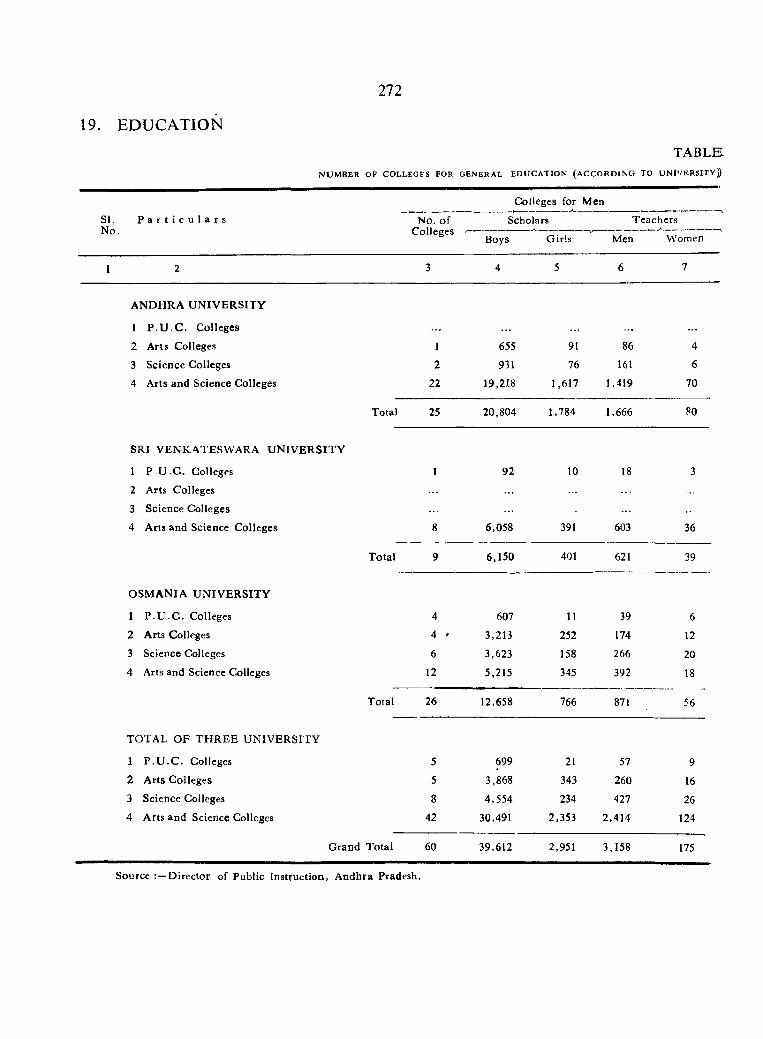
19. EDUCATION
272
T A B L EN U M B E R OF COLLEGES FOR GENERAL ED U C A T IO N ( A C C O R D I N G TO UNIVERSITY))
Colleges for Men
SI.No.
P a r t i c u l a r s No. o f Colleges
Scholars Teachers
Boys Girls Men Women
1 2 3 4 5 6 7
A NDHRA U N IV E R SITY
1 P .U .C . Colleges
2 Arls Colleges 1 655 91 86 4
3 Science Colleges 2 931 76 161 6
4 Arts and Science Colleges 22 19,218 1,617 1,419 70
Total 25 20,804 1,784 1,666 80
SRI VENKATESW ARA U N IV E R SIT Y
1 P .U .C . Colleges I 92 10 18 3
2 Arts Colleges
3 Science Colleges
4 Arts and Science Colleges 8 6,058 391 603 36
Total 9 6,150 401 621 39
O SM A N IA U N IV E R SITY
1 P .U .C . Colleges 4 607 11 39 6
2 Arts Colleges 4 • 3,213 252 174 12
3 Science Colleges 6 3,623 158 266 20
4 Arts and Science Colleges 12 5,215 345 392 18
Total 26 12,658 766 871 56
TOTAL O F T H R E E U N IV ERSITY
1 P .U .C . Colleges 5 699 21 57 9
2 Arts Colleges 5 3,868 343 260 163 Science Colleges 8 4,554 234 427 264 Arts and Science Colleges 42 30,491 2,353 2,414 124
G rand T otal 60 39,612 2,951 3,158 175
Source D irector of Public Instruction, A ndhra Pradesh,
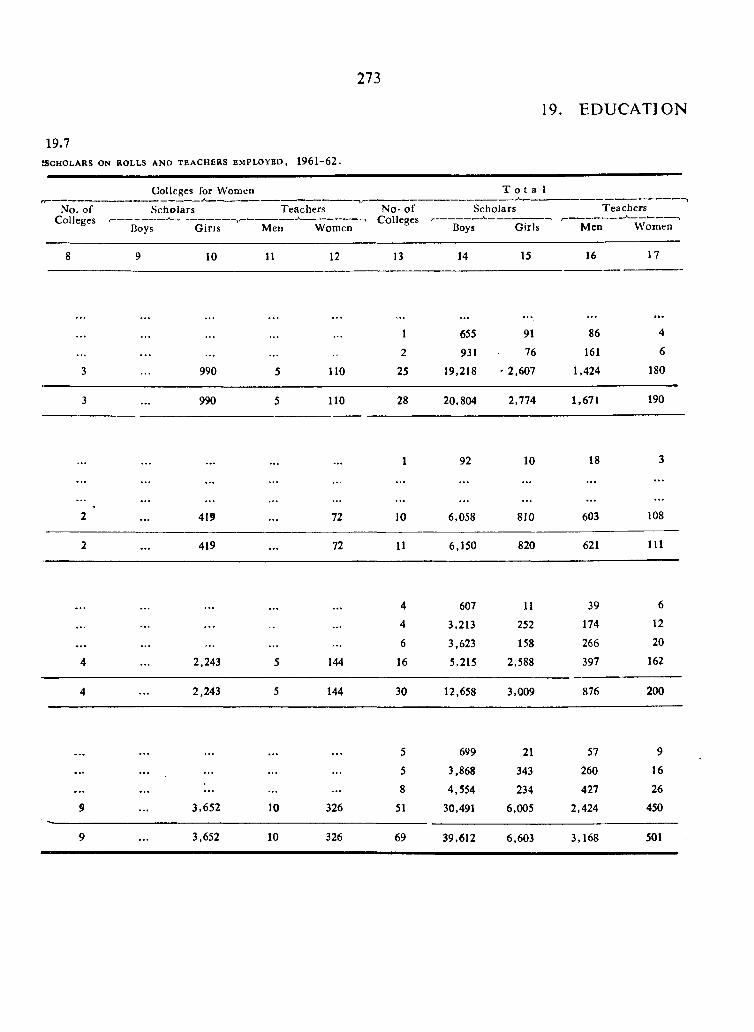
273
JSCHOLARS ON RO LLS AND T E A C H ER S EM PLO Y E D , 1961-62.
19.7
19. EDUCATION
Colleges for Women
No. of ScholarsColleges <--------------- ^---------------
Boys G ins
Teachers
Men Women
No- o f Colleges
T o t a l
Scholars
Boys Girls
Teachers
M en W omen
8 9 10 11 12 13 14 15 16 17
. . . . . . . . .
1 655 91 86 4
. . . . . . 2 931 76 161 6
3 990 5 110 25 19,218 - 2,607 1,424 180
3 . . . 990 5 110 28 20,804 2,774 1,671 190
1 92 10 18 3
. . . . . . . . . . . . . . . . . . . . . . . .
2 . . . 419 . . . 72 10 6,058 810 603 108
2 . . . 419 . . . 72 11 6,150 820 621 111
4 607 11 39 6
. . . . . . . . . . . . 4 3,213 252 ,174 12
. . . 6 3,623 158 266 20
4 2,243 5 144 16 5,215 2,588 397 162
4 2,243 5 144 30 12,658 3,009 876 200
5 699 21 57 9
. . . ••• . . . . . . . . . 5 3,868 343 260 16
. . . . . . 1.. . . . 8 4,554 234 427 26
9 . . . 3,652 10 326 51 30,491 6,005 2,424 450
9 3,652 10 326 69 39,612 6,603 3,168 501
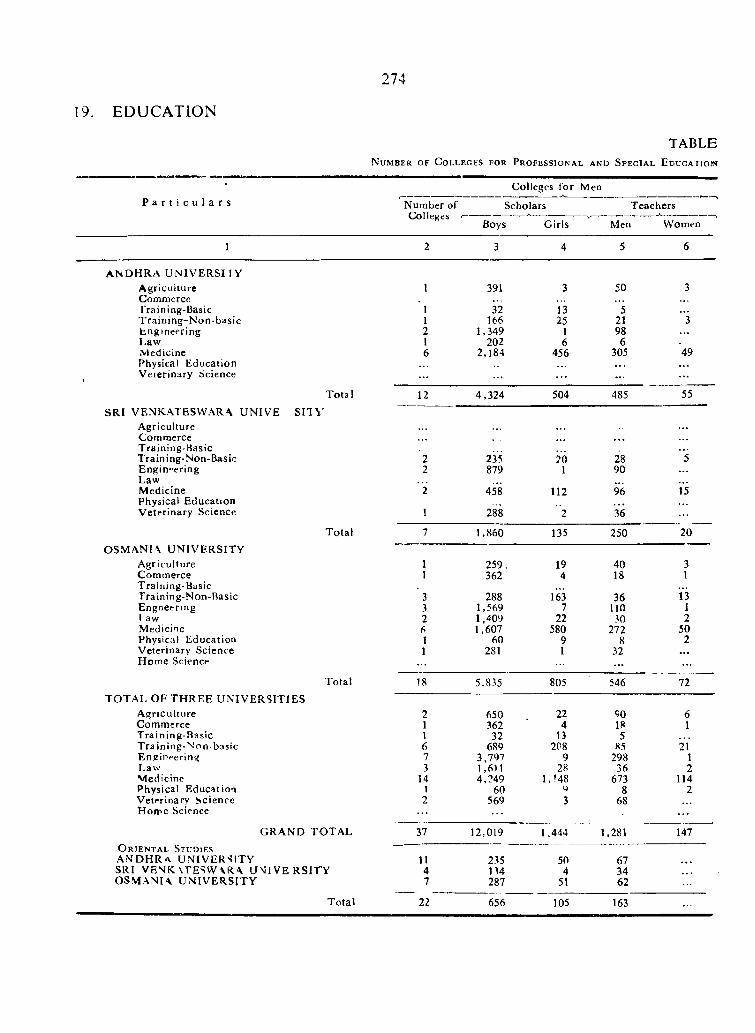
19. EDUCATION
274
TA B L EN u m b e r o f C o l l e g e s f o r P r o f e s s i o n a l a n d S p e c i a l E d u c a t i o n
Colleges tor MenP a r t i c u l a r s Number of
Colleges
--------------- - 1 ----------A---Scholars Teachers
Boys Girls Men Women
1 2 3 4 5 6
A N D H R A U N IV E R S IIYAgriculture 1 391 3 50 3CommerceTraining-Basic T rain ing-N on-basic
11
32166
1325
521
Engineering 2 1,349 1 98Law 1 202 6 6Medicine 6 2,184 456 305 49Physical EducationV eterinary Scicnce . . .
Tota 1
SR I V EN K A T ESW A R \ U N IV E S I I V Agriculture
12 4,324 504 485 55
CommerceTraining-Basic
. . .
Train ing-Non-Basic 2 235 ?6 28 " 5
Engin'*eringLaw
2 879 1 90 . . .
M edicinePhysical Education
"i 458 112 96 15
V eterinary Science 1 288 2 36
T otal 7 1,860 135 250 20O S M A N I\ U N IV ER SITY
Agriculture 1 259. 19 40 3CommerceTraining-Basic
1 362 4 18 I
Training-Non-Rasic 3 288 163 36 i ' 3
Engneering 3 1,569 7 110 11 aw 2 1,409 22 30 2Medicine 6 1,607 580 272 50Physical Education 1 60 9 8 2Veterinary Science Home Science
1 281 1 32 . . .
T otal 18 5,835 805 546 72TO T A L OF T H R E E U N IV E R S IT IE S
A griculture 2 650 22 90 6Commerce 1 362 4 18 1Training-Basic 1 32 13 5Training-N on-basic 6 689 2P8 X5 ’2 1
Enjzineering 7 3,797 9 298 1Law 3 1,611 28 36 2M edicine 14 4,249 1,148 673 114Physical Education 1 60 g 8 2Veterinary Science Hont'e Science
2 569 3 68
GRA ND TO TA L 37 12,019 1,444 1,281 147O r i e n t a l SrtJOiESANDHR-v U N IV ER'?ITY 11 235 50 67 . • •SRI V R N fC \rE SW \R .A U N IV E R S IT Y 4 134 4 34OSMANIA U N IV E R SIT Y 7 287 51 62
T otal 22 656 105 163

275
19. EDUCATION
19.8T U n i v e r s i t y w i s e ) S c h o l a r s o n R o l l s a n d T e a c h e r s E m p l o y e d , 1961-62.
N um ber of Colleges <
Colleges for Women
Scholars Teachers
Bovs Girls Men
N umber of ---------- ' Colleges
Tota l
Scholars
Women Boys Girls
Teachers
Men Women
10 11 12 13 14 15 16
100
391
32166
1,?49202
2,184
13125
16
456
50
5 21986
305
3
’i
49
100 13 4,324 604 485 64
235879
458
288
201
i i ’2
”2
2890
96
36
5
15
1,860 135 250 20
30 It
259362
288 1,569 1,409 1.607
60 281
194
1637
22580
91
?0
4018
36noM)
2728
32
31
\'i1
2502
11
30 11 19 5,835 835 546 83
loo
30
130
11
20
3
11773
1 4
121
39
650 362
32 689
3,797 1,611 4,249
60 569
12,019
224
1 3
3089
281,148
93
30
1,574
9080
585
29836
6738
1,281
61
30\2
1142
11
167
17 1347
235134287
674
51
71. 461
16 24 656 122 167
Source: D irector of Public In s truc tion , A ndhra Pradesh
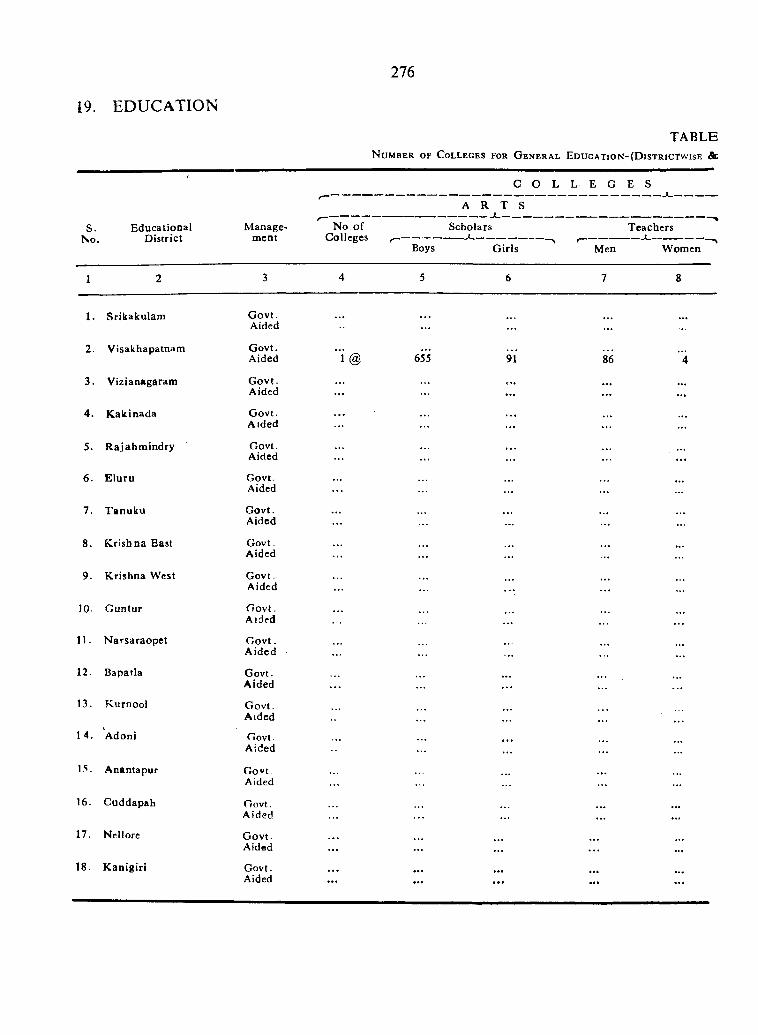
19. EDUCATION
276
TABLEN u m b e r o f C o l l e g e s f o r G e n e r a l E d u c a t i o n - ( D i s t r i c t w i s e Ac
!--C O L
A R T S
L E G E S
S.No.
EducationalD istrict
M anagem ent
No o f Colleges
Boys
Scholars
G irls Men
Teachers
W omen
1 2 3 4 5 6 7 8
1. Srikakulam G ovt.Aided
...
2. V isakhapatnam Govt.Aided ‘ l @ 655 91 86 " 4
3. V izianagaram G ovt.Aided ... • •• • •• ;;;
4. K akinada G ovt.A ided
. . .
. . .
. . .
• • .
5. R ajahm indry Govt.Aided • ••
. . .
6. E luru Govt.Aided
. . . ... ... ...
7. T anuku G ovt.Aided
... ...
8. K rishna East G ov t. Aided
.... . •
... ... ...
9. K rishna W est G o v t. Aided
10. G untur G o v t. Aided
. . . . . .
11. N arsaraopct G o v t. A ided ;;;
. . . . . .
12. Bapatla G ovt.Aided
. . . ...
13. K urnool G o v t. Aided
. . . ...
1 4. Adoni Govt.Aided
... .. .
15. A nantapur GovtAided
...
16. C uddapah G ovt. A ided
. . . ...
17. N rllorc G ovt.Aided ;;;
... ... . . .
18. K anigiri G ovt. Aided . . . . . . . . .
...
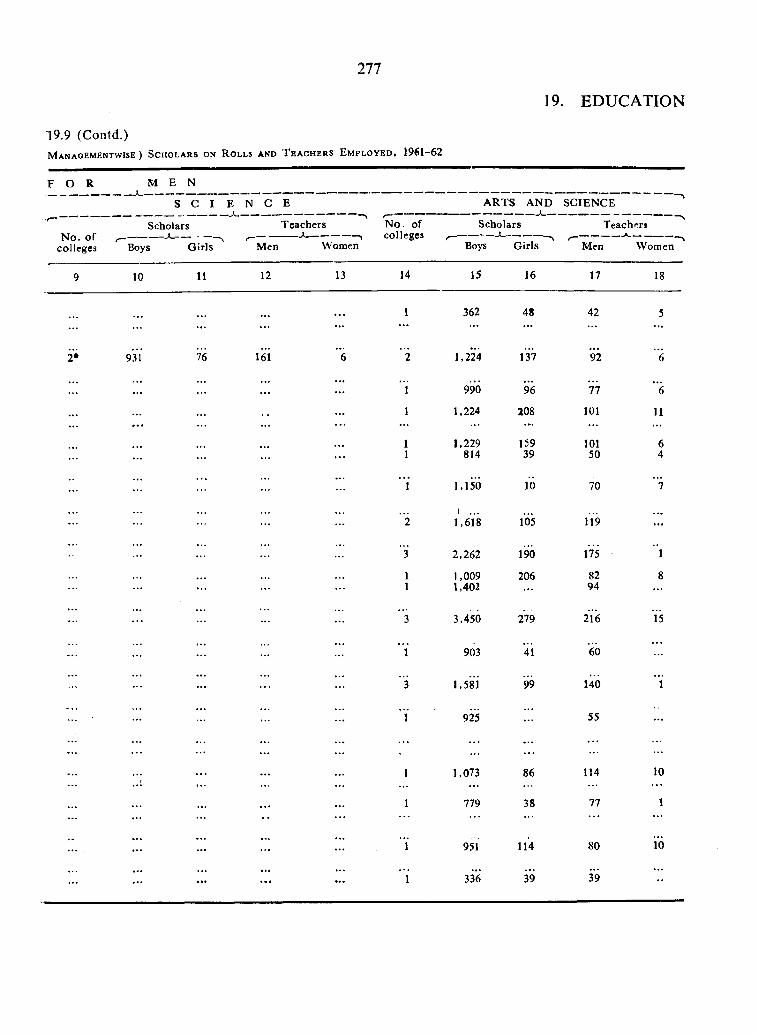
277
19. EDUCATION
19.9 (Contd.)M a n a o e m e n t w i s e ) S c h o l a r s o n R o l l s a n d T e a c h e r s E m p l o y e d , 1961-62
F O R M E N
S G I E N C E ARTS AND SCIENCE■<— ---- -
N o . o f colleges
Scholars Teachers N o. of colleges
Scholars1 _ Teach f'rs
Men WomenBoys G irls Men Womenr— —
Boys G irls
9 1 0 1 1 12 13 14 15 16 17 18
1 362 48 42 5
931 76 161 ’ 6 2 1,2*24 137 *92 *6
1 990 *96 77 * 6
1 1,224 208 1 0 1 1 1
1 1,229 159 1 0 1 6
1 814 39 50 4
1 1,150 1 6 70 * ’7
" l1 . . .
1,618 1*05 119 . ..
i 2,262 190 175 1
1 1,009 206 82 81 1,402 . . . 94
*3 3,450 279 216 *15
1 903 *41 60• • •
" 3 1,581 99 140 *1
1 925 55 . . .
1 1,073 86 114 10
1 779 38 77 1
1 951 114 80 i‘6
1 336 3*9 39
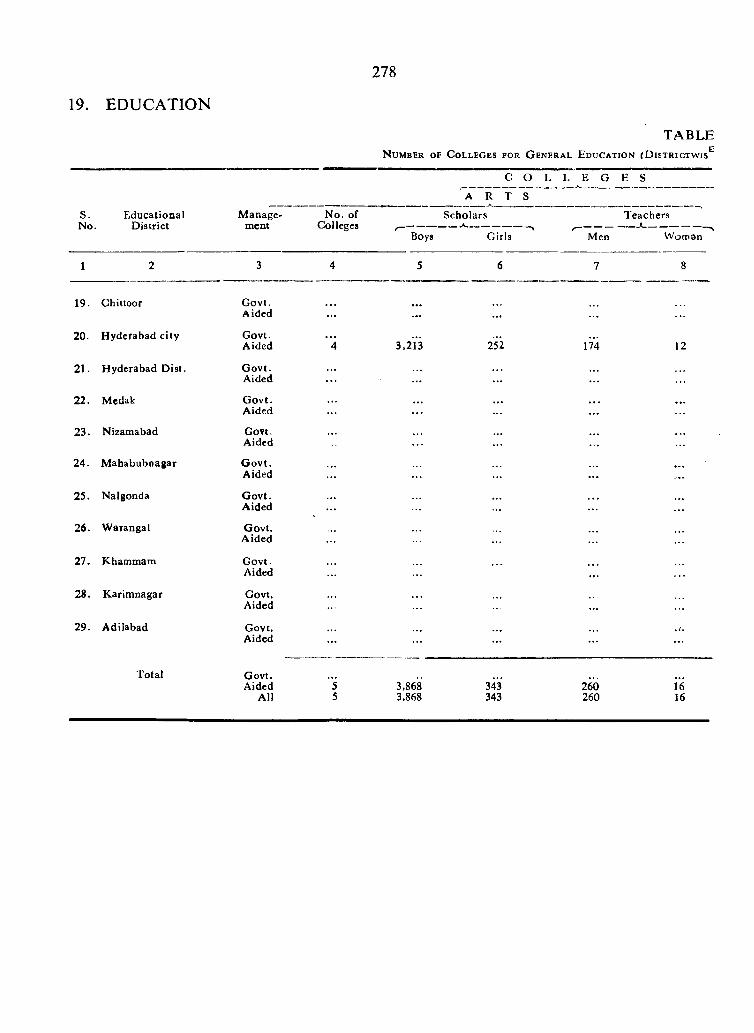
19. EDUCATION
278
T A B L EN u m b e r o f C o l l e g e s f o r G e n e r a l E d u c a t i o n r D i s T R i c x w i s ' ^
S.No.
EducationalDistrict
C
^ /T ~ r ~ T
0 L L E G
S
E S
M anagement
No. of Colleges
Boys
Scholars
Girls Men
Teachers
Woman
1 2 3 4 5 6 7 8
19. Ghittoor G ovt.Aided
20. H yderabad city Govt. . . .
Aided 3,213 252 174 12
21. H yderabad Dist. G ovt.Aided . . .
22. Medak G ovt. . . .
Aided . . .
23. Nizamabad Govt.Aided
24. M ahabubnagar G o v t.Aided . . .
25. Nalgonda G ovt.Aided
26. W arangal Govt.A ided
27. Khammam Govt.Aided . . . . . .
28. K arim nagar Govt.Aided
29. Adilabad Govt.Aided . . .
Total Govt.Aided '5 3.868 343 2 m 16
All 5 3,868 343 260 16
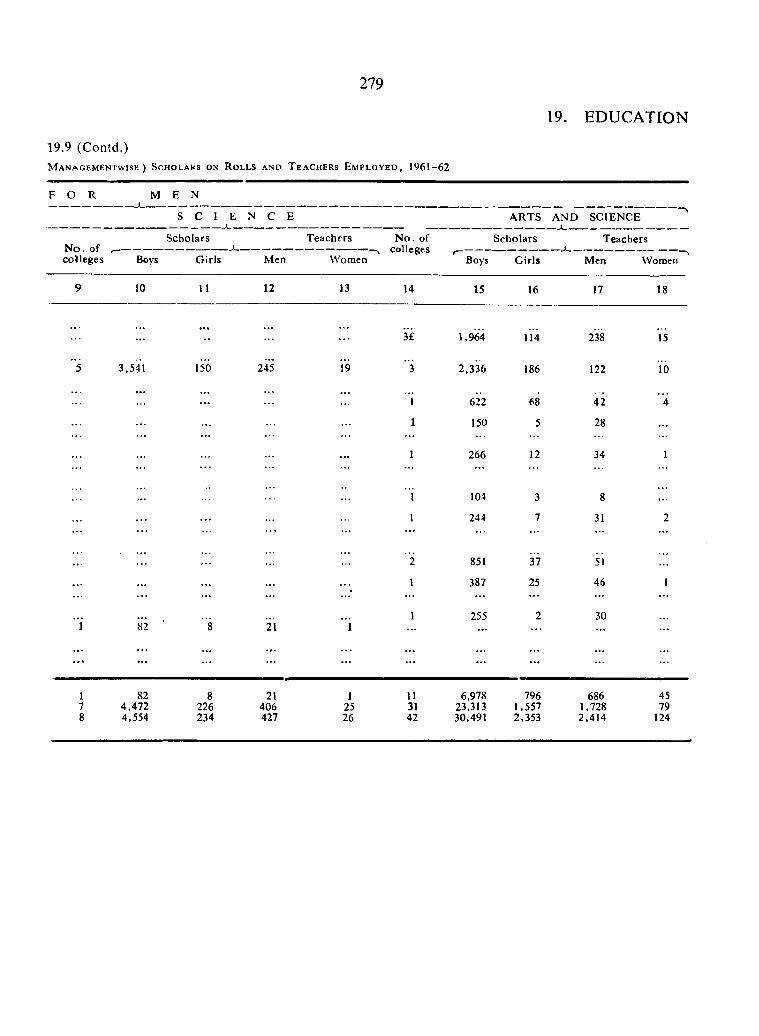
279
19. EDUCATION
19.9 (Contd.)M a n a g e m e n t w i s e ) S c h o l a r s o n R o l l s a n d T e a c h e r s E m p l o y e d , 1 9 6 1 -6 2
F O R M.. 1E N
N o. of colleges Boys
S C 1 E
Scholars
G irls
N C E
Men
Teachers
Women
N o. of colleges
Boys
ARTS
Scholars
G irls
AND SCIENCE
Teachers
Men Women
9 10 11 12 13 14 15 16 17 18
... ...3£ 1,964 114 238 15
" 5 3,541 150 245 19 " 3 2,336 186 122 10
......
...’ i 622 68 42 " 4
... ... 1 150 5 28 ...
... ... 1 266 12 34 1
f* "i 104 3 8
... 1 244 7 31 2
• • . , . . "2 851 37 51
... ... ... ... 1 387 25 46 1
1 255 2 30'i 82 ’ 8 21 " i
... ......
...
1 82 8 21 1 1 1 6,978 796 686 457 4,472 226 406 25 31 23,313 1 , 5 5 7 1,728 798 4,554 234 427 26 42 30,491 2,353 2,414 124
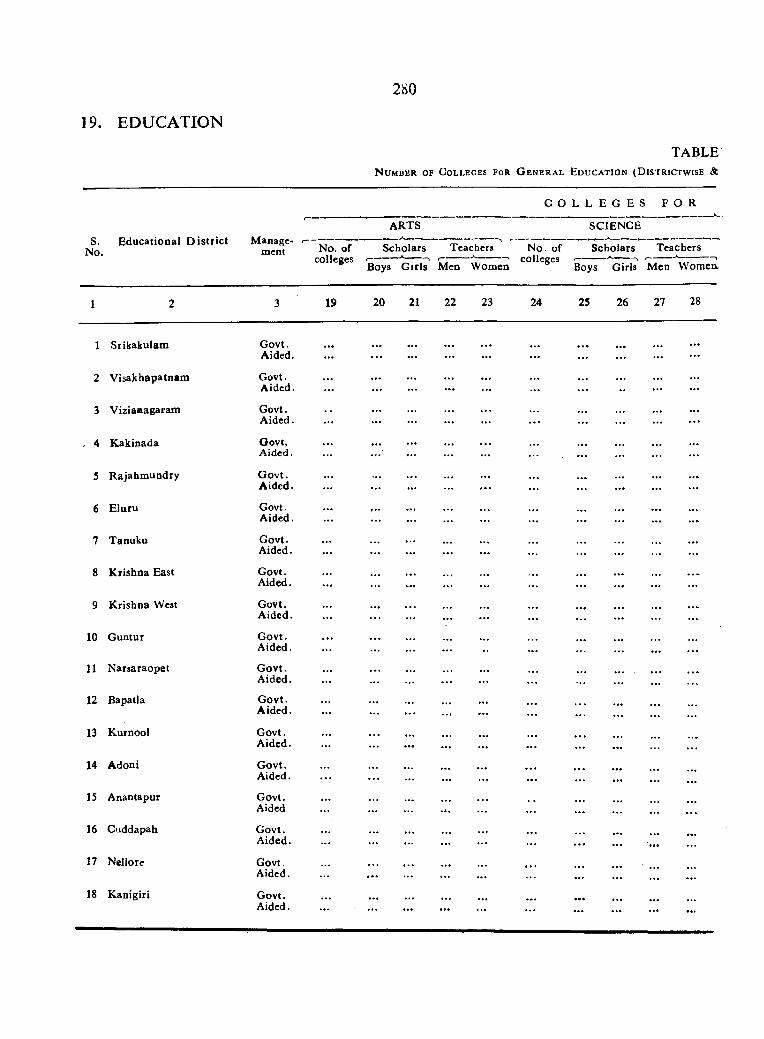
19. EDUCATION
280
TABLEN u m b e r o f C o l l e g e s f o r G e n e r a l E d u c a t i o n ( D i s t r i c t w i s e &
C O L L E G E S F O R
ARTS SCIENCES. E ducatioaal D is tr ic t Managc-
No. mcnt No. of colleges
Scholars Teachers
Boys G irls Men Women
No of colleges
Scholars Teachers
Boys Girls M en Women.
1 2 3 19 20 21 22 23 24 25 26 27 28
1 Srikakulam G ovt.Aided.
... ................. ...... ... ... ... ... ...
2 V isakhapatnam Govt.A ided. ... ... . . .
......
3 V izianagaram Govt.A ided. ... . . .
. 4 K akinada Govt,A ided.
................. ...• ••
...
5 R ajahm undry G ovt.A ided.
...••• ••• ••• •••
...• ••
6 E luru Govt.A ided.
... ... ...
7 T anuku G ovt. A ided. • •• • * • •••
...
8 K rishna East Govt. A ided. • •• ••• • ••
9 K rishna West Govt.A ided.
10 G untur G ovt.A ided.
.................
11 N arsaraopet G ovt.A ided.
...... ...
12 Bapatla G ovt.A ided. • •• •••
.................
13 Kurnool G ovt.A ided.
................. ................. ...
14 Adoni G ovt.Aided.
................ ................. ...
15 A nantapur Govt.Aided ;;; ;;; •• ...
16 Cuddapah G ovt.A ided.
17 Nellore Govt.Aided.
.................
18 Kanigiri Govt.Aided. ... ..................... ................. ...
...... ... ...
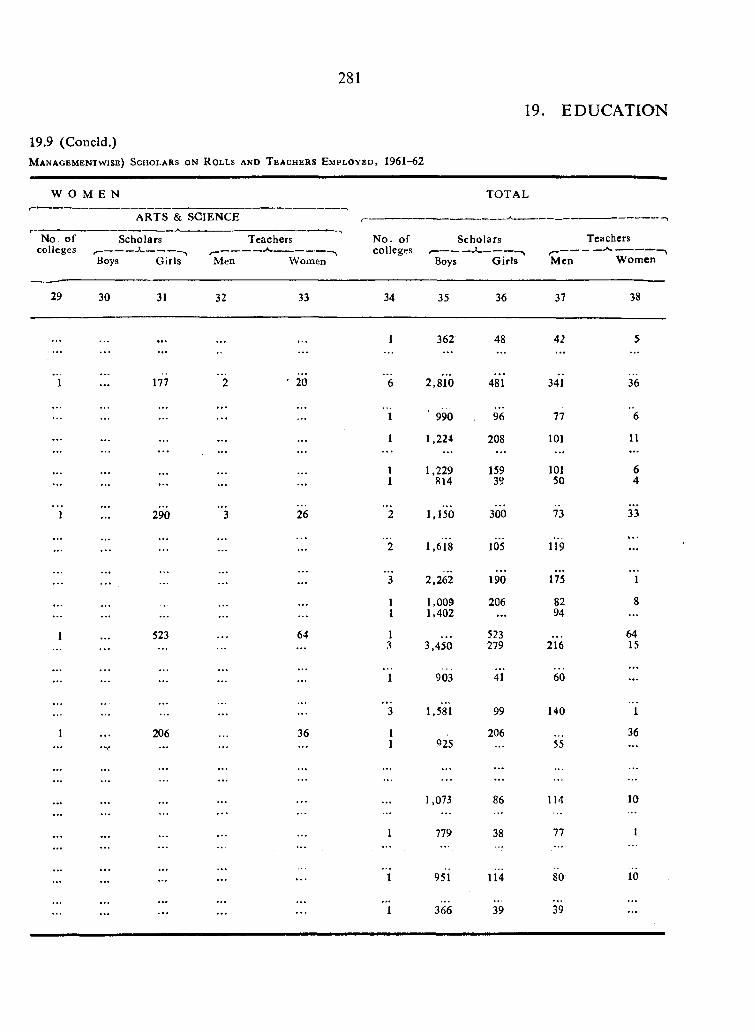
281
19.9 (Concld.)M a n a g e m e n t w i s e ) S c h o l a r s o n R o l l s a n d T e a c h e r s E m p l o y e d , 1961-62
19. EDUCATION
W O M E N T O T A L
No o f
ARTS & SCIENCE
Scholars Teachers N o. o f Scholars Teachcrscolleges r-------
Boys G ir lP Men Womencolleges ,-----------
BoysJ ------------ ,
G irls M en W om en"^
29 30 31 32 33 34 3 5 36 37 38
. . . . . . 1 362 48 42 5
i 177 "2 ■ 2 6 "6 2,810 481 341 36
. . . . . . . . .
i ' 990 9(5 77 "6
. . . . . . . . . 1 1,224 208 101 11
t 1,229 159 101 6. . . . . . . . . . . . 1 814 39 50 4
1 290 “ 3 ’2 6 "2 i . i i o 300 73 33
. . . . . .
. . . ” 2 1,618 105 1 V9 . . .
• . . . . . ‘ 3 2,262 190 175 ” 1
1 1,009 206 82 8. . . 1 1,402 . . . 94 . . .
1 523 64 1 523 . . . 64. . . . . . 3 3,450 279 216 15
. . .
. . .
. . . • • .
1 903 41 60 . . .
. . .
. . . . . .
« • •
3 1,5‘ 1 99 140 i
1 206 36 1 206 36. . . . . . 1 n s 55 . . .
. . . . . . . . . . . . 1,073 86 114 10
. . . . . . . . . 1 779 38 77 1
. . . . . .
. . . . . . i 951 114 80 1 6
• • •
. . . . . . . . . 1 366 39 39 . . .
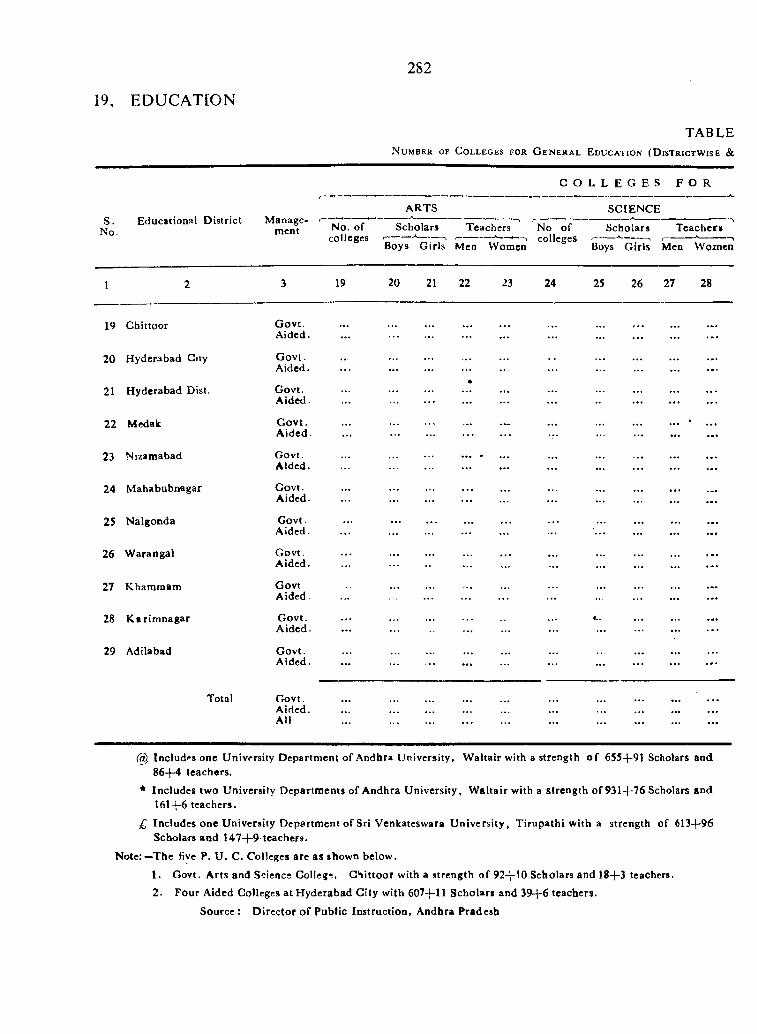
19, EDUCATION
282
TABLEN u m b e r of C o l l e g e s f o r G e n e r a l E d u c a t i o n ( D i s t r i c t w i s e &
C O L L E G E S F O R
Educational D istrict M anagement
ARTS SCIENCES.
No. No. of colleges
Scholars Teachcrs, A , e
No o f colleges
Scholars*•
T eachers
Boys Girls Men Women Boys G irls Men W om en
1 2 3 19 20 21 22 23 24 25 26 27 28
19 Ghittoor G ovt.A ided.
... ................. ................. .................
20 H yderabad City G ovt.Aided.
...... ...
................. ..................
21 H yderabad Dist. G ovt.Aided.
... ................ .................. . .
22 Medak G o v t. A id ed . . . . ••• •••
23 Nizamabad G ovt.A ided.
••• •... ••• •••
24 M ahabubnagar Govt.A ided.
......
25 N algonda G ovt. A ided .
... ................. ....................
26 W arangal G ovt.A ided.
... ................•••
.................
27 K ham raam Govt A ided .
................. .................
28 K i rim nagar G ovt.A ided. ...
.................
29 Adilabad G ovt. A ided . ... ................. ................. ................. .................
Total Govt.A ided.All
...
................ ................. •••
(d), Includrs one University D epartm ent of Andhra U niversity , W altair with a strength o f 655-}-91 Scholars and 86-f-4 teachers.
* Includes two University D epartm ents of A ndhra U niversity, W altair with a strength of 9314-76 Scholars and 161-|-6 teachers.
£ Includes one U niversity D epartm ent of Sri Venkateswara U niversity , T irupath i w ith a strength of 6134-96 Scholars and 1474-9 teachers.
N ote:—-The five P. U . C. Colleges are as shown below.
1. Govt. A rts and Science Colleg*;, G hittoor with a strength o f 924-tO Scholars and 184*3 teachers.
2. Four Aided Colleges at H yderabad C ity w ith 6074-11 Scholars and 394-6 teachers.
Source : Director of Public Instruction, Andhra Pradesh
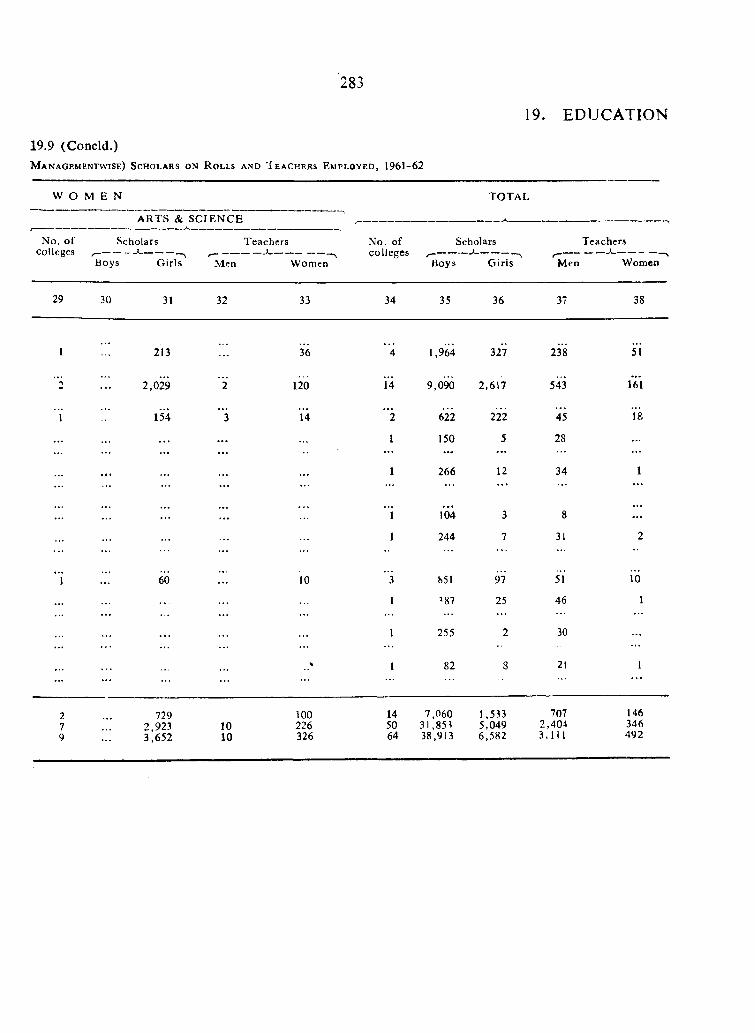
283
19.9 (Concld.)M a n a g e m e n t w i s e ) S c h o l a r s o n R o l l s a n d T e a c h e r s E m p l o y e d , 1961-62
19. EDUCATION
W O M E N TOTAL
No. of
ARTS & SC IE N C E
Scholars Teachers N o. of Scholars Teacherscolleges
Hoys--------
Girls Men Womencolleges
Boys_ j----------
G irls Men Women
29 30 31 32 33 34 35 36 37 38
1 213 36 ” 4 1,964 327 238 51
2,029 2 120 i ’4 9,090 2,617 543 161
1 154 ” 3 14 ” 2 622 2'22 45 18
... ... 1 150 5 28
1 266 12 34 1
... ..."i 1*04 3 8
...
... 1 244 7 31 2
i...
10 " 3 851 97 51 ib
... 1 ’ 87 25 46 1
. . . 1 255 2 30
%1 82 8 21 1
2 729 100 14 7,060 1,533 707 1467 2,923 10 226 50 31,85^ 5,049 2,404 3469 ... 3,652 10 326 64 38,913 6,582 3,111 492
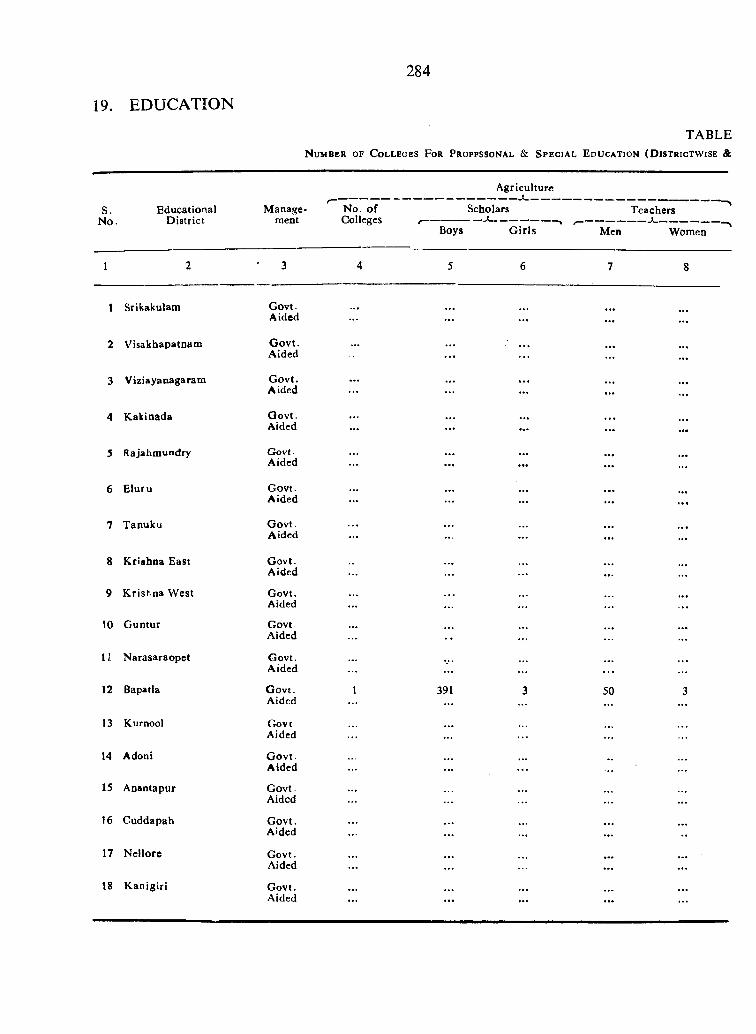
19. EDUCATION
284
TABLEN u m b e r o f C o l l e g e s F o r P r o f f s s o n a l & S p e c i a l E d u c a t i o n ( D i s t r i c t w i s e &
A griculture
S.N o.
EducationalD istrict
M anagement
No. o f Colleges
Scholars
Boys G irls
Teachers
Men Women
1 2 3 4 5 6 7 8
1 Srikakulam Govt.Aided
. . . ...
2 Visakbapatnam G ovt.Aided . . .
3 Viziayanagaram G ovt.Aided
. . . . . .
. . .
4 K akinada G ovt.Aided ...
5 Rajahm undry Govt.Aided . . . . . .
6 E luru G ovt.Aided
. . . . . .
7 Tanuku G ovt.Aided . . . . . . ...
8 K rishna East Govt.Aided
. . .
9 K rishna W est G ovt.Aided
. . .
10 G untur GovtAided • •
\ l N arasaraopet G ovt.Aided
. . . .
12 Bapatia G ovt.Aided
391 3 50 3
13 Kurnool GovtAided
. . .
14 Adoni G ov t.Aided • •• • • •
15 Anantapur G ovt.Aided :::
16 Cuddapah G ovt.A-’dcd
. . .
17 Nellore G ovt.Aided
. . .
18 K anigiri G ovt.Aided . . . . . . . . .
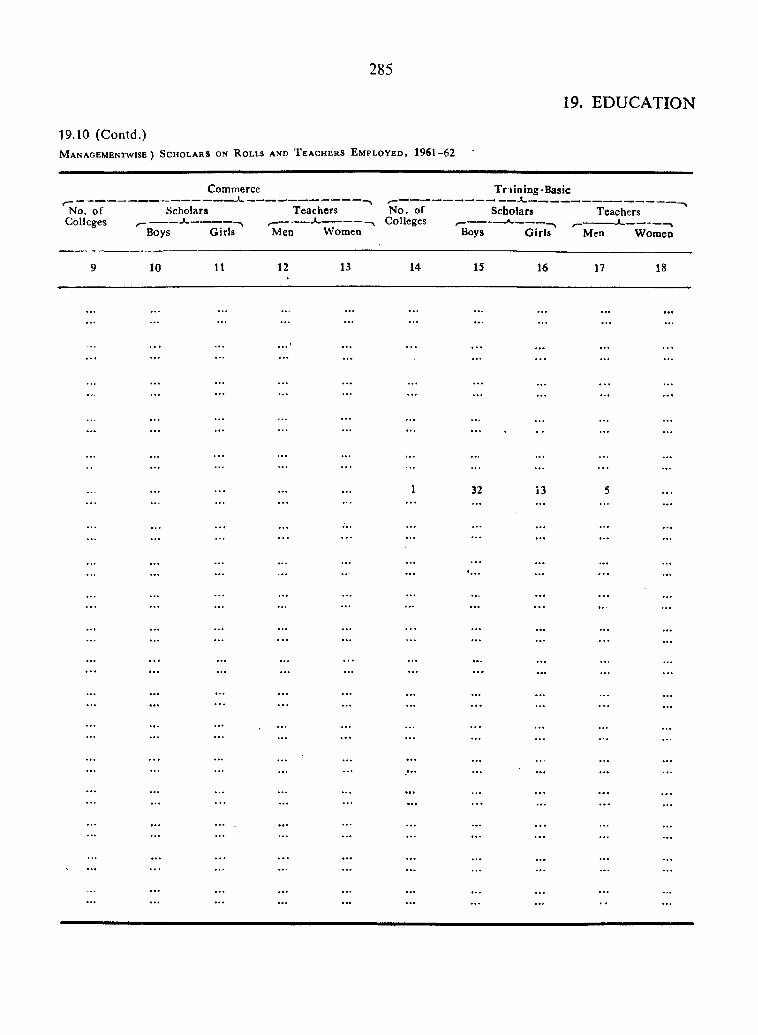
285
19.10 (Contd.)M a n a g e m e n t w I s e ) S c h o l a r s o n R o l l s a n d T e a c h e r s E m p l o y e d , 1961-62
19. EDUCATION
Commerce
No. o f Scholars Teachers N o. ofColleges ,------------ *--------------- X ---------- •-------------Colleges
Boys Girls Men Women
T r lining-Basic
Scholars-------------- *------------\Boys G irls Men
Teachers
Women
10 n 12 13 14 15 16 17 18
32
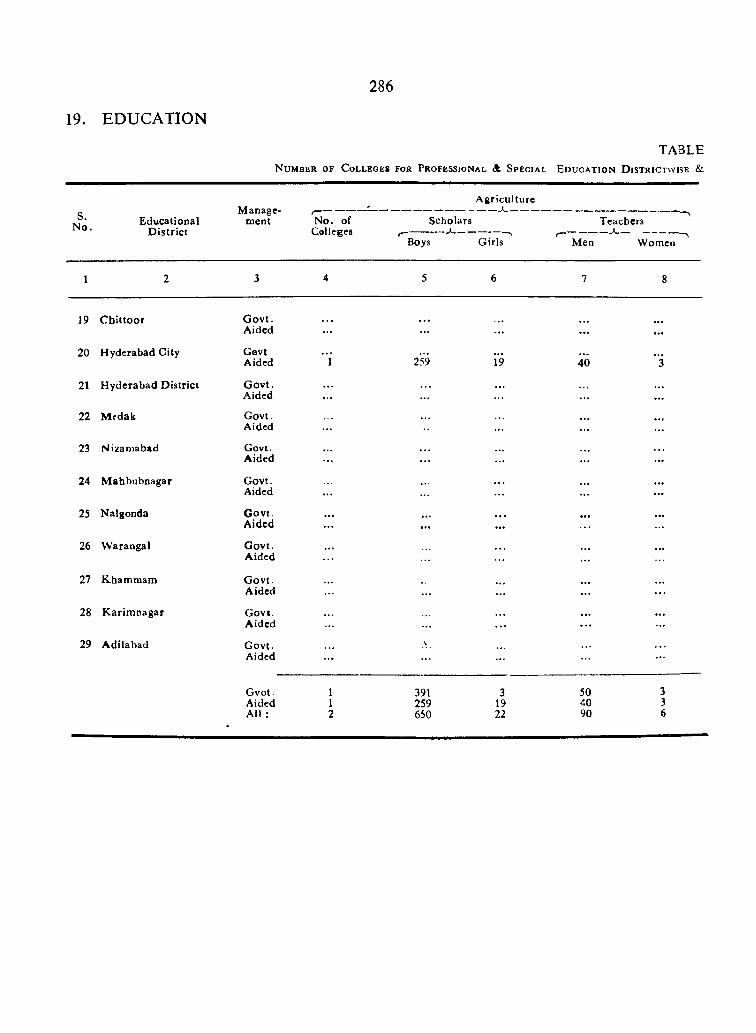
19. EDUCATION
286
TABLEN u m b e r o f C o l l e g e s f o r P r o f e s s i o n a l A S p e c i a l E d u c a t i o n D i s t r I C t v v i s e &
cVI * Educational
D istric t
M anagement N o. of
CollegesScholars
^ -X.Boys
A griculture
Girlsr—
Men
Teachers
Womeo
1 2 3 4 5 6 7 8
19 C h ittoo r G ovt.Aided ... ... ... ...
20 H yderabad City Gevt. . . . • •• • •• ...Aided 1 259 19 40 3
21 H yderabad D istrict G ov t. ... • ••Aided ... ...
22 M fdak Govt.Aided ... ... ...
23 N izaniabad Govt. • « •Aided ... ... ...
24 M ahbubnagar Govt. . . . ...Aided ... ...
25 Nalgonda G ovt ... . . . • •• ...A ided ... ...
26 W arangal G ovt. ...Aided ...
27 K bam m am G ovt.Aided ... ... .. .
28 K arim tiagar G ovt. • •• • ••A ided ... ... . . . ...
29 A dilabad G ovt. . • ♦Aided ... ... ...
Gvot. 1 391 3 50 3Aided 1 259 19 40 3All : 2 650 22 90 6
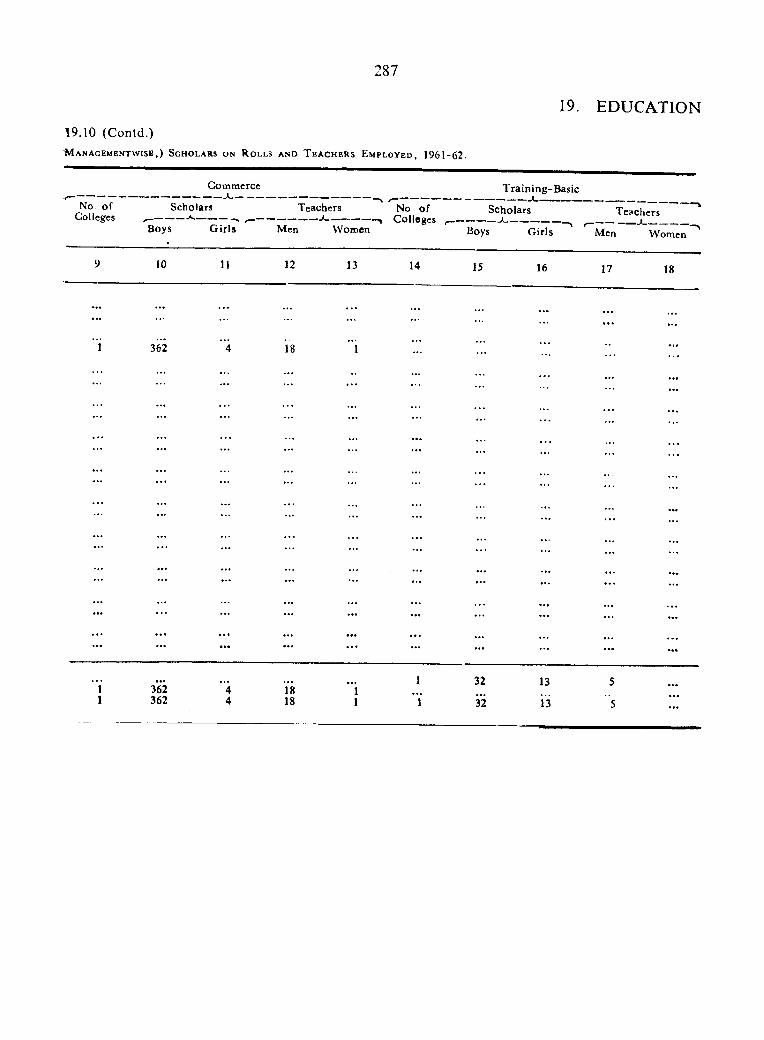
287
19.10 (Contd.)■ M a n a g e m e n t w i s e . ) S c h o l a r s o n R o l l s a n d T e a c h e r s E m p l o y e d , 1 9 6 1 -6 2 .
19. EDUCATION
No. o f Colleges
Commerce-----------------------«________________________ .
Scholars Teachers
Boys G irls Men Women
Training-Basic
No of ScholarsColleges ,---- —------ -A____ ____
Boys G irls
Teachers
Men Women
9 10 11 1 2 13 14 15 16 17 18
• • • . . . • • « • • •
. . .
1 362 4 18 1
. . .
• * • . . . • • •. . .
. . . . . . . . .
. . .
. . .
. . . . . . . . . . . . . . .
r . I '. . . • • •
. . .
. . . . . . . . . . . . . • •
. . .
. . .
• • •
. . .
. . .
. . .
• • •
'l 362 ‘ 4 18 " i1 32 13 5 . . .
1 362 4 18 1 "l 32 13 " 5 . . .
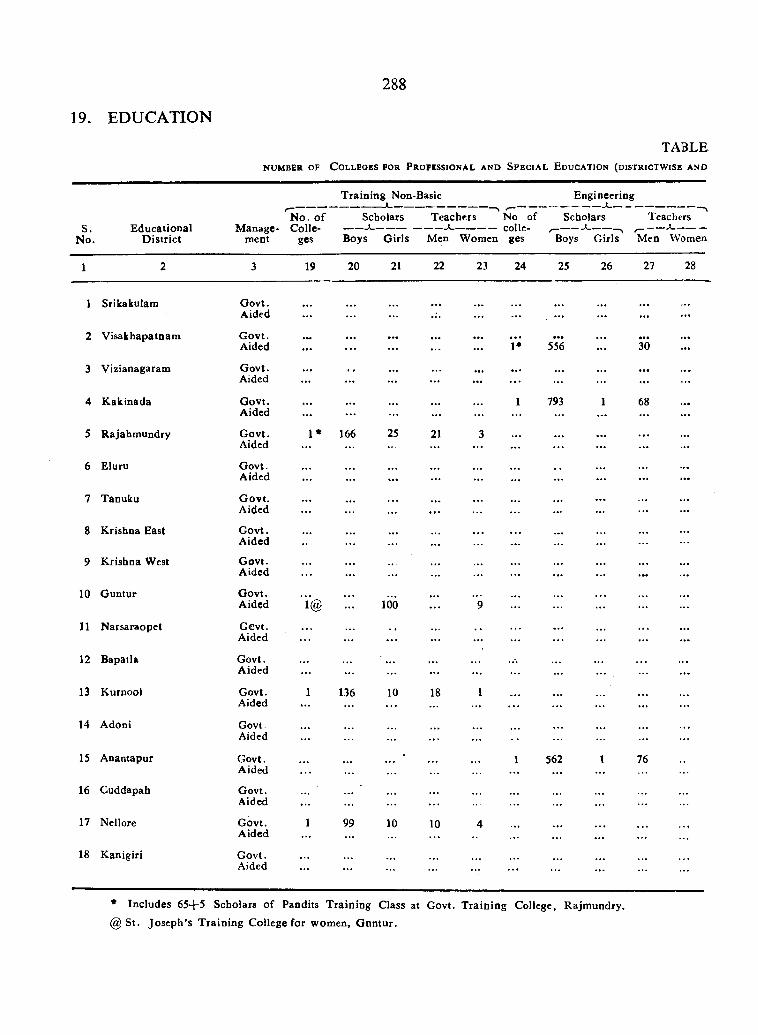
288
19. EDUCATION
TABLENUMBER OF C o l l e g e s f o r P r o f i s s i o n a l a n d S p e c i a l E d u c a t i o n ( d i s t r i c t w i s e a n d
S. E ducational N o. D istrict
M anagement
N o. o f Colle
ges
T rain ing Non-Basic— *_ _
Scholars Teachers
Boys G irls Men Women
No of colle
ges
Engineering
Scholars
Boys G irls
Teachers
Men Women
1 2 3 19 20 21 22 23 24 25 26 27 28
1 Srikakulam G ovt.Aided ... ... ... ... ... ...................
2 V isakhapatnam G ovt. ... • •• • •• • •• • •• •••Aided ... . . . ... ... ... 1* 556 ... 30
3 Vizianagaram G ovt. • •• ... • •• • •• f• •Aided ... ... ... ... ... . . . ... ...................
4 K akinada G ovt. 1 793 1 68Aided ... ... ... ... ... ..................
5 R ajahm undry G ovt. 1* 166 25 21 3 ... ... • •• • •• .«•Aided ... ... ... ... ..................
6 Eluru Govt.Aided ... ... ... ... ... ... ... ...................
7 Tanuku G ovt. ... • •• « • • • ••Aided ... . . . ... ... ...
8 Krishna East G ovt. ......Aided ... ... ... ...
9 K rishna West G ovt. ... ... ... ... ...................Aided ... ... ... ... ... ... ... ... ...................
10 G untur G ovt. .. . ... .. .A ided 'i @ ... 100 ... 9
11 N arsaraopet G evt. ... .. ... .. • ••Aided ... . . . ... ... ... .. . ... ...................
12 Bapatla Govt. ...A ided ... ... ... ... ... ... ••• .
13 KurnooJ Govt. 1 136 10 18 1Aided ... . . . ... . . . ...
14 Adoni GovtAided ... ... ... ...
15 A nantapur G ovt. • 1 562 1 76Aided ... ... ...
16 Cuddapah Govt. ...Aided ... ... ...
17 Nellore G ovt, 1 99 10 10 4Aided ... ... ... ...
18 K anigiri G ovt. ...Aided ... ... . . . ... ...
* Includes 65+5 Scholars o f Pandits T ra in ing Class at Govt. T ra in ing College, R ajm undry.
@ S t. Jo sep h ’s T rain ing College for women, G nn tu r.
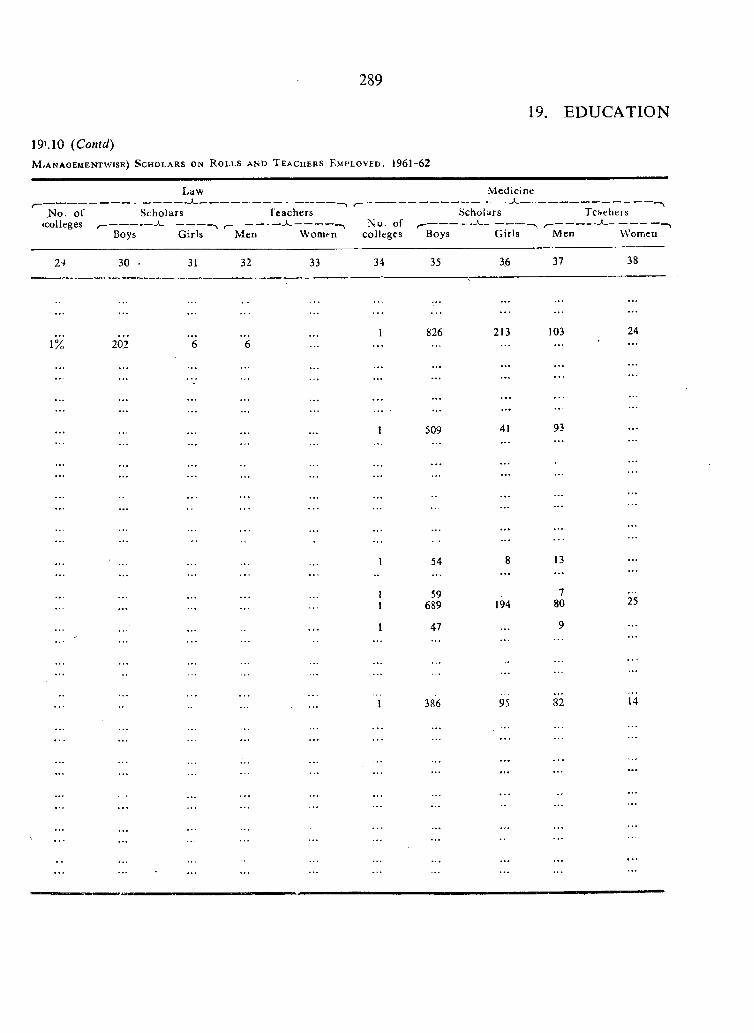
289
19'. 10 {Contd)M v A n a g e m e n t w i s e ) S c h o l a r s o n R o l l s a n d T e a c h e r s E m p l o y e d , 1961-62
19. EDUCATION
Law - . j —
.No. of Scholars(Colleges r~ ---------------^ ------------^
Boys Girls
Teachers
M en Women
Medicine
Scholars Teachers
colleges Boys Girls M en W omen
30 . 31 32 33 34 35 3,6 37 38
2032 6 61 826 213 103 24
. . . . . . . . .
. . . ••• • « •
• • •
::: . .
1 509 41 93
I 54 8 13. . . . . . . . .
1 59 71 689 194 80 25
1 47 9
386 95
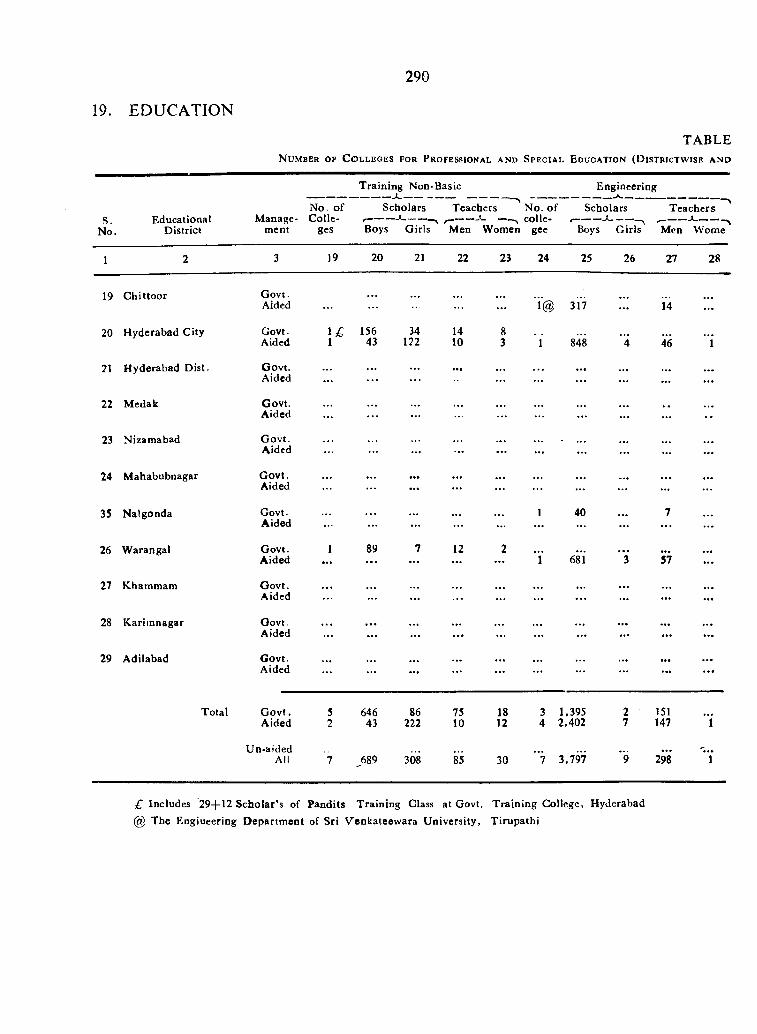
19. EDUCATION
290
TABLEN u m b e r o f C o l l e g e s f o r P r o f e s s i o n a l a n d S p e c i a l E d u c a t i o n ( D i s t r i c t w i s e a n d
T raining Non-Basic_______ 1 __________
Engineering
N o. of Scholars Teachers No. o f Scholars TeachersS. Educational M anage Colle !------- -----^ ,------- colle- ,----- _ J ------- _____.j --------- -
No. District ment ges Boys Girls Men Women gce Boys Girls Men Wome
1 2 3 19 20 21 22 23 24 25 26 27 28
19 C hittoor G ovt.Aided ... ... i@ 3l'7 ... 14 ...
20 H yderabad City Govt. 156 34 14 8Aided 1 43 122 10 3 1 848 ' 4 46 "i
21 H yderabad Dist. G ovt. • •• ... ... • •• ... • •« • •• ... ...Aided ... ... ... ... .. . ... ... ...
22 Medak Govt.Aided ... . . . ... ... ... ... ... ... • •
23 Nizamabad G ovt.Aided ... ••• ... ... ... ... ... ...
24 M ahabubnagar G ovt. ... ... ... ... ... ...Aided ... ... ... ... ... ... ... ... ... ...
35 N aigonda Govt. . . . ... ... ... 1 40 ... 7Aided ... ... ... ... ... ... ... ... ... ...
26 W arangal Govt. 1 89 7 12 2 ««• .. ...A ided ... . . . ... ... ... 1 681 3 57 ...
27 Khammam G ovt. ...Aided ... ... ... ... ... .. . ... ... ...
28 K ariinnagar Govt .. . t • • ... ... ... ... ... • •• • •• ...Aided ... ... ... . . . ... ... ... ... ... ...
29 Adilabad G ovt. • •• ...Aided ... ... ... ... ... ... ... ... ... . . .
Total G o v t. 5 646 86 75 18 3 1,395 2 151Aided 2 43 222 10 12 4 2,402 7 147 "i
U n-aidedAll 1 ^689 308 85 30 " l 3,797 ” 9 298 1
£ Includes 29-\-l2 Scholar's of Pandits T raining Class at Govt. T rain ing College, Hyderabad @ The Engiueering D epartm ent of Sri V enkateew ara U niversity, T irupathi
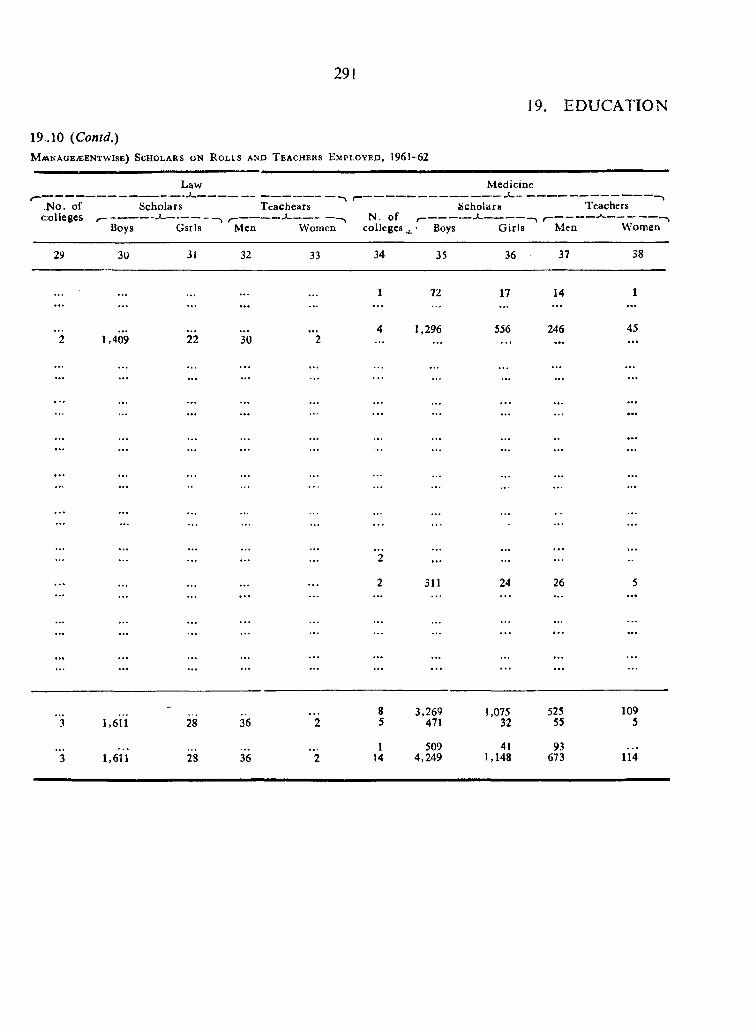
291
19. EDUCATION
19 .10 (Contd.)M M N A G E iE E N T W lS E ) SCHOLARS O N R O L I S AND T E A C H E R S E M P L O Y E D , 1961-62
;n o . of colleges
Law
Scholarsr - • ---- ^
Boys Gsrls/—
Men
Tcachears
WomenN . of
colleges ^t----------
Boys
Medicine
Scholarit— ^ -------------- ,
G irlst----------
Men
Teachers
W omen
29 30 31 32 33 34 35 36 37 38
1 72 17 14 1... .. . ... ... ...
1,409 ' 2 2 *304 1,296 556 246 45
• • » • • • ... • *. ... ... ...• •• •• • ... ... ... ...
• • • « • « ... ... . . . ... ...... .. . ... • ••
• • • ... ... ...• •• ... ... ... ... ...
• • • ... ... ...« • • • • ... ...
••• ... ... ...• • • • • » .. . ... ...
... « . • ...” 2 ...
• •• 2 311 24 26 5... . . . ... • ••
.... . . .. . ...
• • • • t • ... ... .. .... .. . ...
- 8 3,269 1,075 525 109” 3 1,611 28 36 2 5 471 32 55 5
1 509 41 93 .. .” 3 1,611 28 36 " 2 14 4,249 1,148 673 114
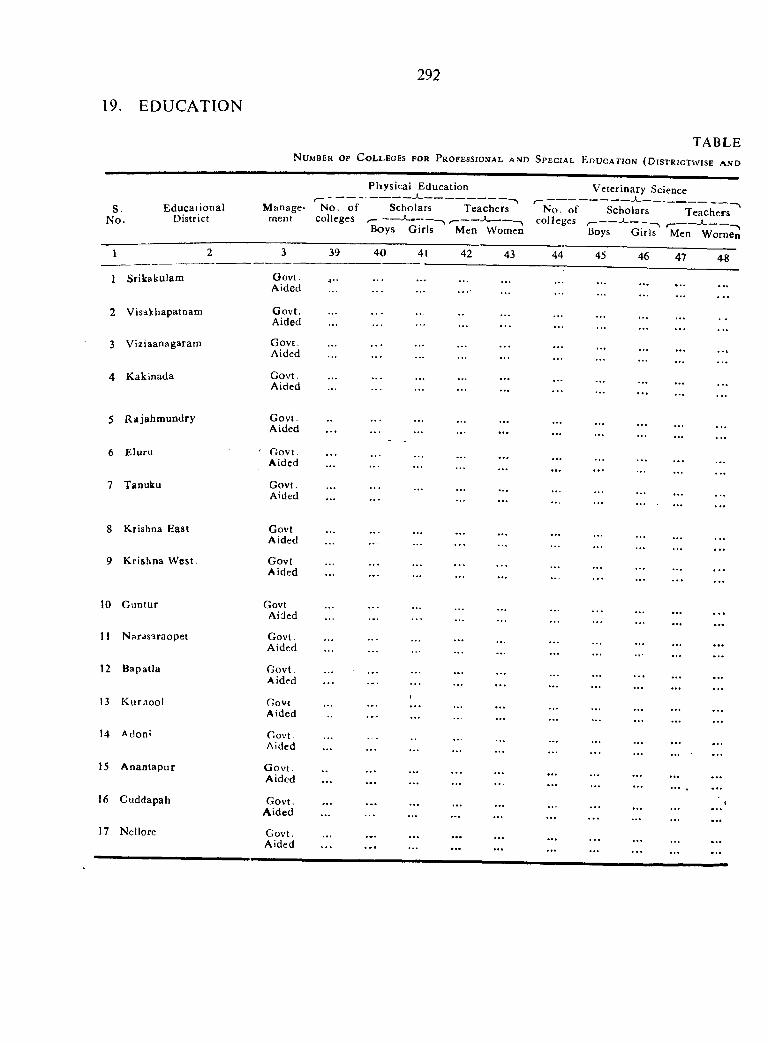
19. EDUCATION
292
TABLEN u m b e r o f C o l l e g e s f o r P r o f e s s i o n a l a n d S p e c i a l E d u c a t j o n ( D i s t r i c t w i s e a n d
Physical Education
S. E ducaiional Manage- N o. o f Scholars TeachersN o. District rnent colleges ^ ------ --------- — ,--------- *--------- ^
Boys Girls Men Women
V eterinary Science
No. of Scholars Teacherscolleges ^ ------ --------- r~------ *--------- n
Boys Girls Men W omen
1 2 3 39 40 41 42 43 44 45 46 47 48
1 Srikakulam G ovt. Aided
... ...• • •
...
2 Visakhapatnam Govt.Aided ...
3 V iziaanagaram G ovt.Aided
...
4 Kakinada G ovt. Aided ... ...
... ...
5 R ajahm undry Govt.Aided
... ... ...
6 Eluru ' G ovt. Aided
... ... ... ...
7 Tanuku Govt.Aided ... ...
...
8 Krishna East GovtAided
... ................... ...
9 K rishna W est. GovtAided
.... . .
. . .
10 G untur GovtAided ...
11 Naras^raopet Govt.Aided
12 Bapatla G o v t. Aided ... ...
13 K urnool GovtAided ...
14 Adoni G ovt. Aided
... ...
15 A nantapur G o v t. Aided ................... ... ...
16 Cuddapah Govt.A ided
... ... ...
17 Nellore G ovt. Aided
...................... ... ...
.... . . ... . . .
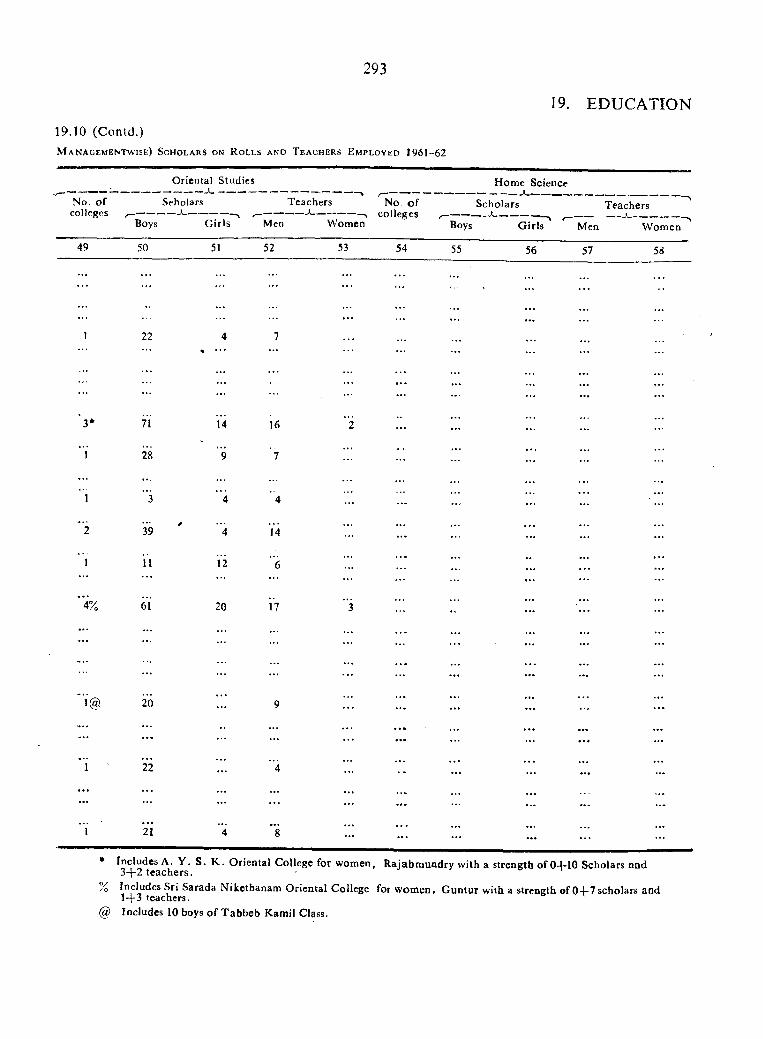
293
19.10 (Contd.)M a n a g e m e n t w i s e ) S c h o l a r s o n R o l l s a n d T e a c h e r s E m p l o y e d 1961-62
19. EDUCATION
Oriental Studies—■——--------—------------------- *-------------------------------------------1 ,-----------
No. o f Seholars Teachers No o fcolleges ^ ------------ *-------------— ^ ------------ *------------ colleges
Boys G irls Men Women
Home Science
Scholars
Boys G irls
Teachers
Men W omen
49 50 51 52 53 54 55 56 57 58
.... . .
. . . . . .
. . .
1 22 4 7
"■
. . .
. . .
. . .
’3* 71 i*4 16 "2 . . .
’ i 28 '9 ’ 7. . . . . .
. . .
•..1 3 4 '4 . . . . . .
. . .
' 1 39 4 14 . . .
1 n 12 ”6. . . . . .
‘ 4% 61 20 17 "3 . . .
. . .
. . .
. . . . . .
26 9 . . . . . . . . .
. . . . . . . . . . . . .
. . . . . . . . . . . .
. . .
" i 22 *'4 •• . . . . . .
. . . . . . . . . . . . . . . . . .
. . . . . .
"1 ‘21 ”4 *8 . . . . . . . . . . . .
* Includes A. Y. S. K . O riental College for women, R ajabm uodry w ith a strength o f 0+ 10 Scholars nnd 3 + 2 teachers.
% Includes Sri Sarada N ikethanam O riental College for w om en, G untur with a strength of 0 4 -7 scholars and l- f3 teachers.
(a) Includes 10 boys o f T abbeb Kamil Class.
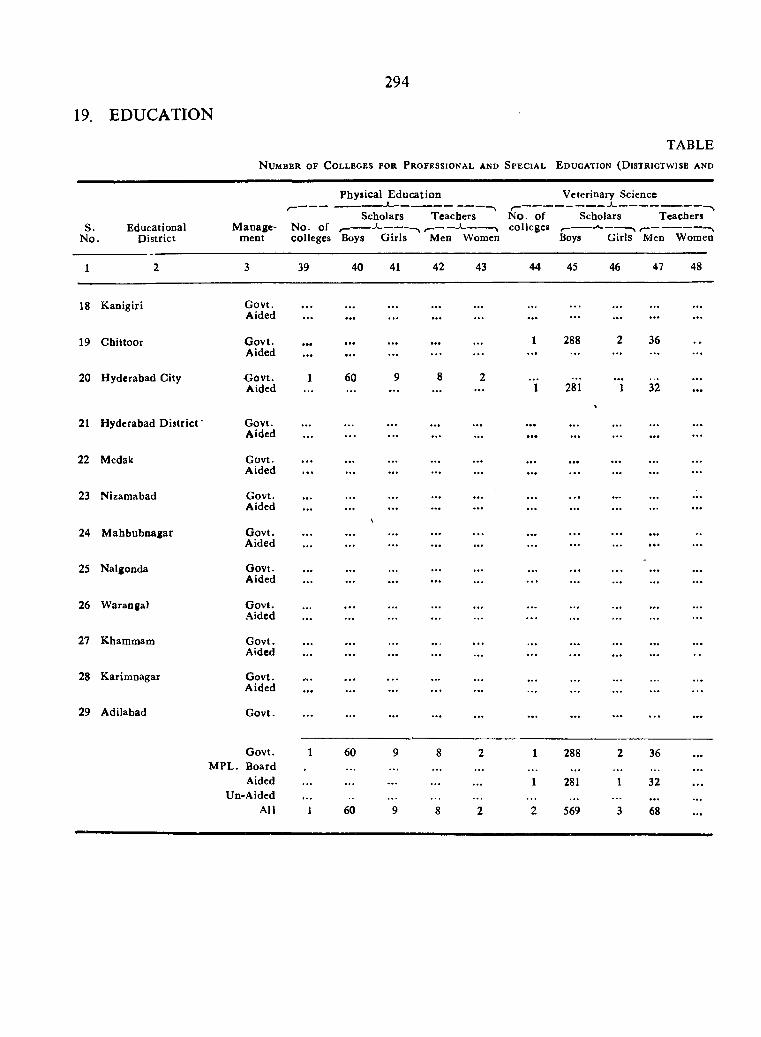
294
19. EDUCATION
s.N o.
EducationalD istrict
1
TABLEN u m b e r o f C o l l e g e s f o r P r o f e s s i o n a l a n d S p e c i a l E d u c a t i o n ( D i s t r i c t w i s e a n d
Physical E ducation
M anage- N o. of m eat
Veterinary Science
N o. of Scholars Teachers
colleges Boys G irls Men Women Boys Girls Men Women
Scholars Teachers
39 40 41 42 43 44 45 46 47 48
18 K anigiri
19 C hittoor
20 H yderabad City
G ovt.Aided
G ovt.Aided
G ov t.Aided
60
288
281
36
32
21 Hyderabad D istrict
22 Medak
23 Nizamabad
24 M ahbubnagar
25 Nalgonda
26 W arangal
27 Khammam
28 K arim nagar
29 Adilabad
Govt.Aided
Govt.A ided
Govt,Aided
G ovt.Aided
G ovt.Aided
G ovt.Aided
G ovt.Aided
G ovt.A ided
G ovt.
G ovt. M PL. Board
Aided Un-Aided
All
60
60
288
281
569
36
32
68
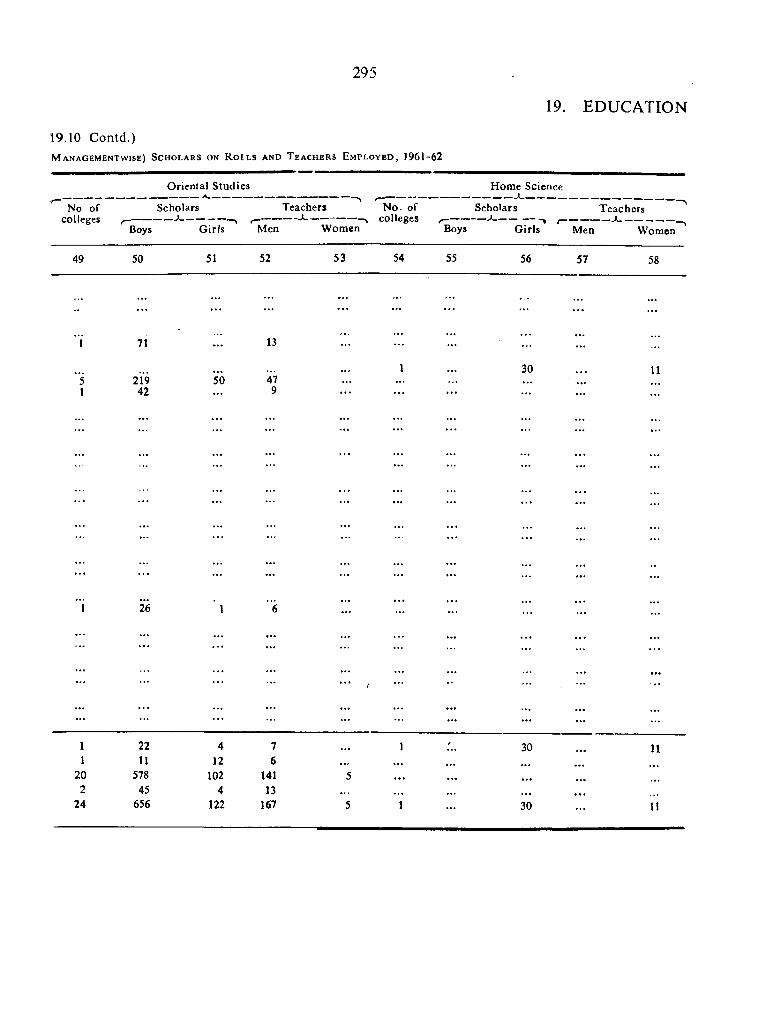
295
19.10 Contd.)M a n a g e m e n t w i s e ) S c h o l a r s o n R o i l s a n d T e a c h e r s E m p l o y e d , 1961-62
19. EDUCATION
O riental Studies
No of Scholarscolleges ------------ *-------------
Boys G ir/s
H om e Science-------------«-------------ScholarsTeachers N o. of Scholars Teachers
Men W om en"' ^ o y s Girls'* Men Women
49 50 51 52 53 54 55 56 57 58
11
202
24
71
21942
26
2211
57845
656
50
412
1024
122
13
479
76
14113
167
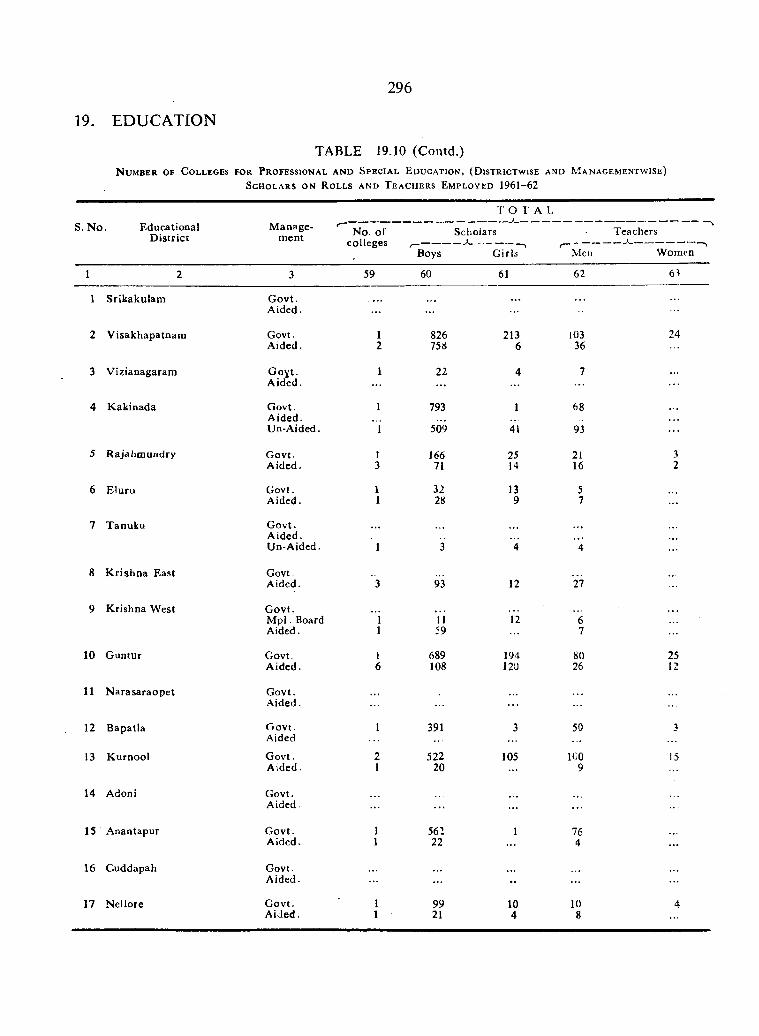
296
19. EDUCATION
N u m b e r o f C o l l e g e s f o r P r o f e s s i o n a l a n d S p e c i a l E d u c a t i o n , ( D i s t r i c t w i s e a n d M a n a g e m e n t w i s e )
S c h o l a r s o n R o l l s a n d T e a c h e r s E m p l o y e d 1961-62
TABLE 19.10 (Contd.)
S. N o . Educational D istrict
M anagem ent No. of
collegesBoys
i O T
Scholars
G ir ls ''
A L
r ~ -------Meti
Teachers
Women
1 2 3 59 60 61 62 63
1 Srikakulam G ovt.A ided . . . . . . .
2 V isakhapatnam Govt. 1 826 213 103 24A ided. 2 75« 6 36
3 V izianagaram OcYt. 1 22 4 7A ided. ...
4 K akinada G o v t. A ided.
1 793 1 68
Un-Aided. 1 509 41 93 . . .
5 Rajahcn undry G ovt. 1 166 25 21 3A ided. 3 71 14 16 2
6 E luru Govt. 1 32 13 5A ided■ 1 28 9 7 . . .
7 T anuku G ovt.A ided . • • »Un-Aided. 1 3 4 4
8 K rishna East Govt.A ided. 3 93 12 27
9 K rishna West G ovt.M p l. Board ” i Vi 12 6Aided. 1 59 7
10 G untur Govt. I 689 194 80 25A ided. 6 108 120 26 12
11 N arasaraopet G ovt.A ided.
12 Bapatla G o v t. 1 391 3 50 3Aided
13 K urnool G o v t. 2 522 105 ICO !5A ided . 1 20 9
14 Adoni Govt.A ided• . . .
15 A nantapur G ovt. 1 562 1 76Aided. 1 22 4 . . .
16 Cuddapah Govt. . . .
A ided. . . . •• . . .
17 N ellore G ovt. 1 99 10 10 4A ided . 1 21 4 8 . . .
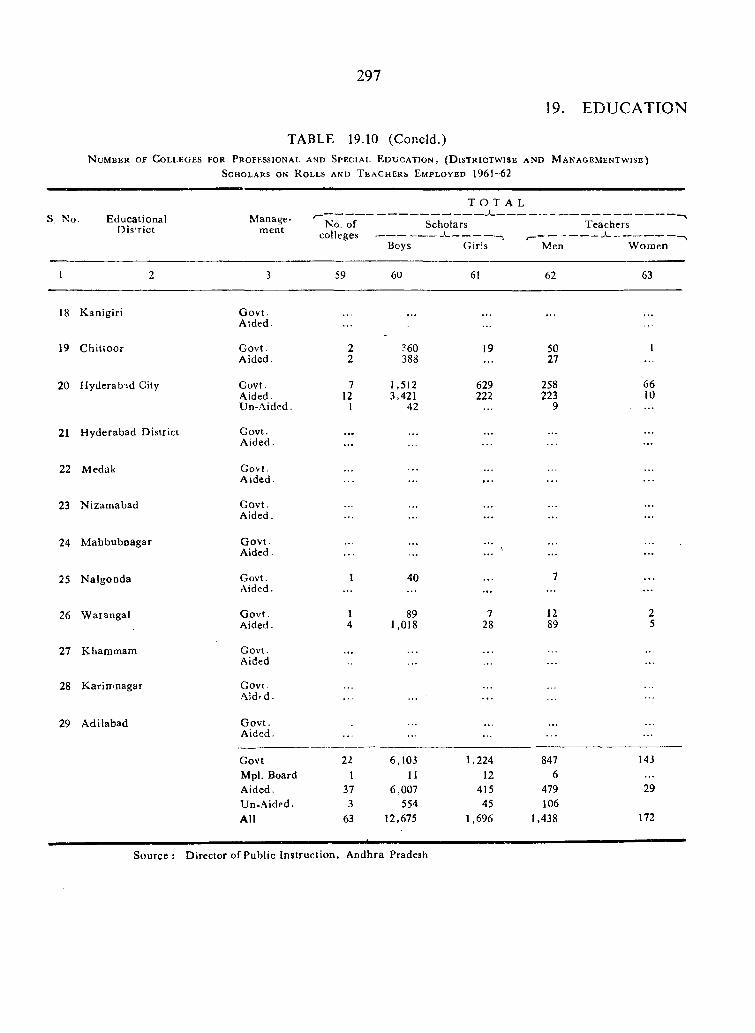
297
19. EDUCATION
N u m b e r o f C o l l e g e s f o r P r o f e s s i o n a l a n d S p e c i a l E o L i C A T i o N , ( D i s t r i c t w i s e a n d M a n a g e m e n t w i s e )
S c h o l a r s o n R o l l s a n d T e a c h e r s E m p l o y e d 1961-62
TABLE 19.10 (Concld.)
T O T A LS, No. Educational
DisTictManage
ment No. ofcolleges
Boys
Scholars
Girls Men
Teachers
W omen
1 2 3 59 60 61 62 63
18 Kanigiri G ovt.Aided.
. . .
19 Chittoor Govt. A id e d .
22
760388
19 5027
1
20 Hyderabad City G ovt. Aided. U n-A ided .
712
I
1,5123,421
42
629222
258223
9
6610
21 Hyderabad District Govt.Aided.
22 Medak Govt. A id e d . . . .
23 Nizamabad Govt.Aided. . . . . . .
24 Mahbuboagar G ovt. Aided .
25 N algonda Govt.Aided.
1 40. . .
7
26 Waiangal G o v t . A ided .
14
891,018
728
1289
25
27 Khammam GovtAided
28 Karitrnagar Govt. Aidt d .
29 Adilabad G o v t . A ided .
Govt. 22 6,103 1,224 847 143Mpl. Board I 11 12 6Aided. 37 6,007 415 479 29Un-Aided. 3 554 45 106All 63 12,675 1,696 1,438 172
S ource : D irector of Public Instruction , A ndhra Pradesh
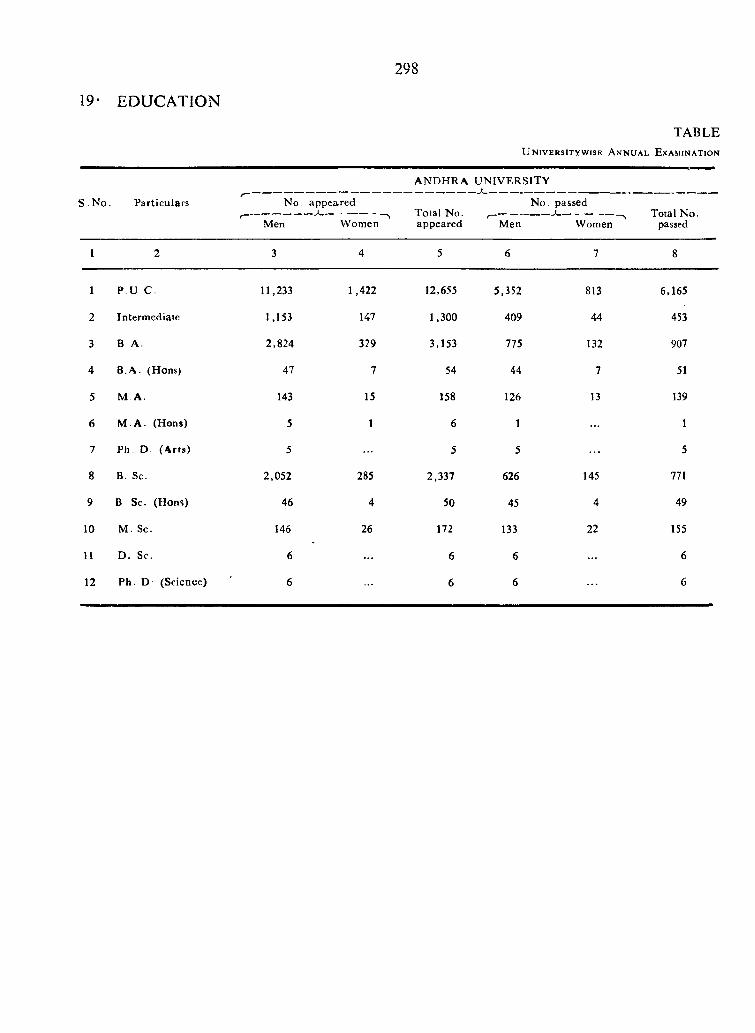
298
19- EDUCATION
TABLEU n i v e r s i t y w i s e A n n u a l E x a m i n a t i o n
S N o. Particulars
A N D HRA UNIVERSITY
No. appeared---------------- »------------------- Total No.
Men Women appeared
N o. passed
Men WomenTotal No.
passed
1
1 P U C
2 Intermediate
3 B A
4 8 .A. (Hons)
5 M A.
6 M .A . (Hons)
7 Ph . D. (A rts)
8 B. Sc.
9 B Sc. (Hons)
10 M .S c .
11 D. Sc.
12 Ph. D (Science)
11,233 1,422 12,655 5,352 813 6,165
1,153 147 1,300 409 44 453
2,824 329 3.153 775 132 907
47 7 54 44 7 51
143 15 158 126 13 139
5 1 6 1 1
5 5 5 5
2,052 285 2,337 626 145 771
46 4 50 45 4 49
146 26 172 133 22 155
6 . . . 6 6 6
6 6 6 6
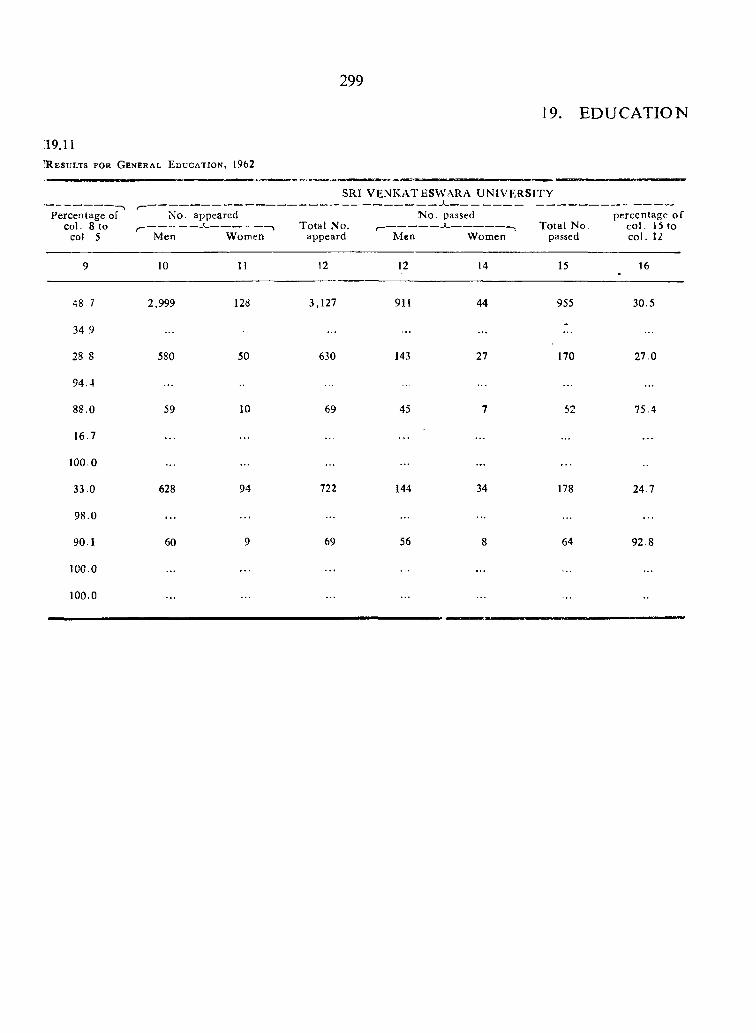
299
19. EDUCATION
19.11’R e s u l t s f o r G e n e r a l E d u c a t i o n , 1 9 6 2
SRI VEN KA TESW A RA U N IV E R SITY
Percentage of col. 8 to
col 5
No.
Men
appeared
WomenTotal No.
appeard
No
Men
. passed
WomenTotal No.
passed
percentage o f c o l. 15 to col. 12
9 10 11 12 12 14 15 16
48 , 7 2,999 128 3,127 911 44 955 30.5
34 9 . . .
28 8 580 50 630 143 27 170 27.0
94.4
88.0 59 10 69 45 7 52 75.4
16.7 . . .
100.0 . . .
33.0 628 94 722 144 34 178 24.7
98.0 . . .
90.1 60 9 69 56 8 64 92.8
100.0 . . . . . .
100.0
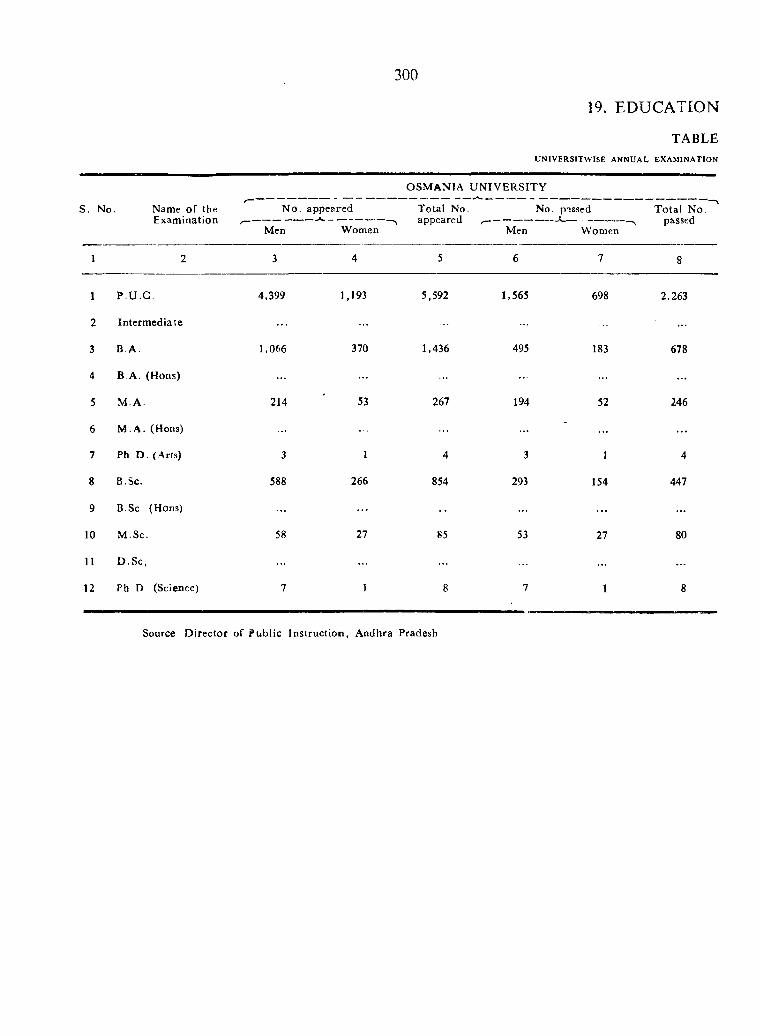
300
19, EDUCATION
TABLEUNIVERSITWISE a n n u a l EXAMINATION
S. No. Name o f the Exam ination
N o.
Men
appeared
Women
OSM ANIA
Total No > appeared
U N IV E R SITY
No. pissed
Men Women
T otal N o. passed
1 2 3 4 5 6 7 8
1 P .U .C . 4,399 1,193 5,592 1,565 698 2,263
2 Interm ediate
3 B A . 1,066 370 1,436 495 183 678
4 B A. (Hons)
5 M .A . 214 53 267 194 52 246
6 M . A . (Hons) -. . .
7 Ph D. ( Arfs) 3 1 4 3 1 4
8 B.Sc. 588 266 854 293 154 447
9 B Sc (Hons) . . .
10 M .Sc. 58 27 85 53 27 80
11 D .S c,
12 Ph D (Science) 7 1 8 7 1 8
Source D irector of Public Instructiom , Andhra Pradesh
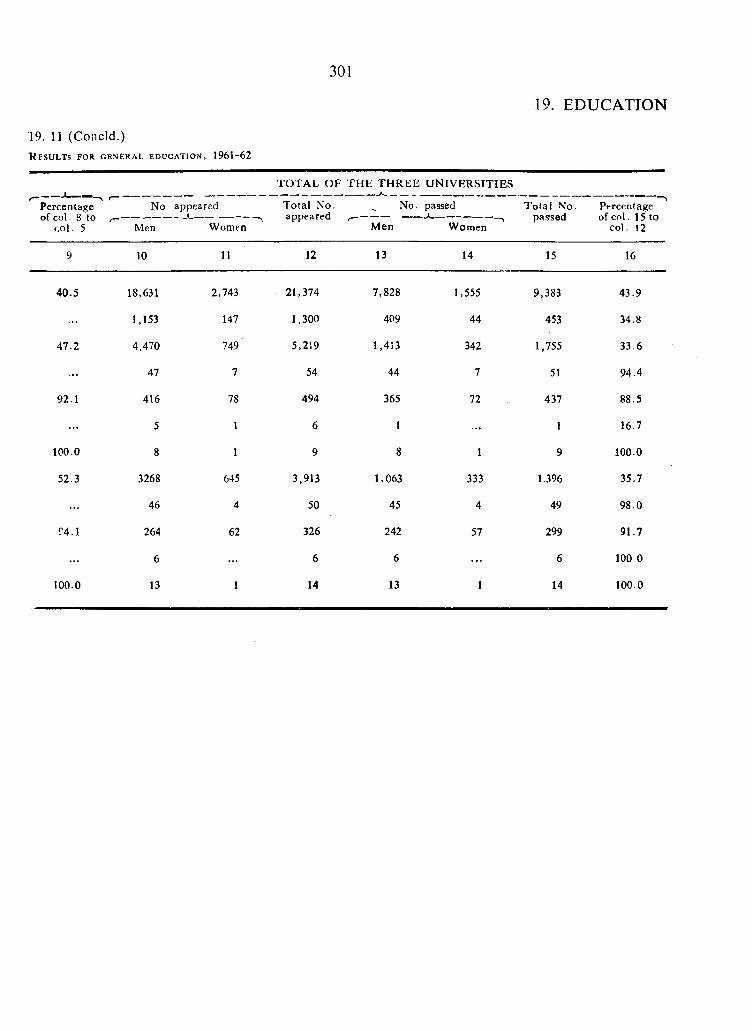
301
19. EDUCATION
19. 11 (Concld.)K f s u l t s f o r g e n e r a l e d u c a t i o n , 1961-62
_____«--------Percentage of co l. 8 to
col. 5
No appeared
Men Women
T O T A L O F T H E T H R E E U N IV E R SITIES-------------- A---------------------------
Total N o. No. passed T otal No.appeared ^ -------- ---------- *------------------passed
Men Women
Percentage of co l. 15 to
col. 12
10 11 12 13 14 15 16
40.5
47
92
100
52
T4
100.0
18,631
1,153
4,470
47
416
5
8
3268
46
264
6
13
2,743
147
749'
7
78
1
1
645
4
62
21,374 7,828 1,555 9,383 43.9
1,300 409 44 453 34.8
5,219 1,413 342 1,755 33 6
54 44 7 51 94.4
494 365 72 437 88.5
6 1 . . . 1 16.7
9 8 1 9 100.0
3,913 1,063 333 1.396 35.7
50 45 4 49 98.0
326 242 57 299 91.7
6 6 . . . 6 100 0
14 13 1 14 100.0
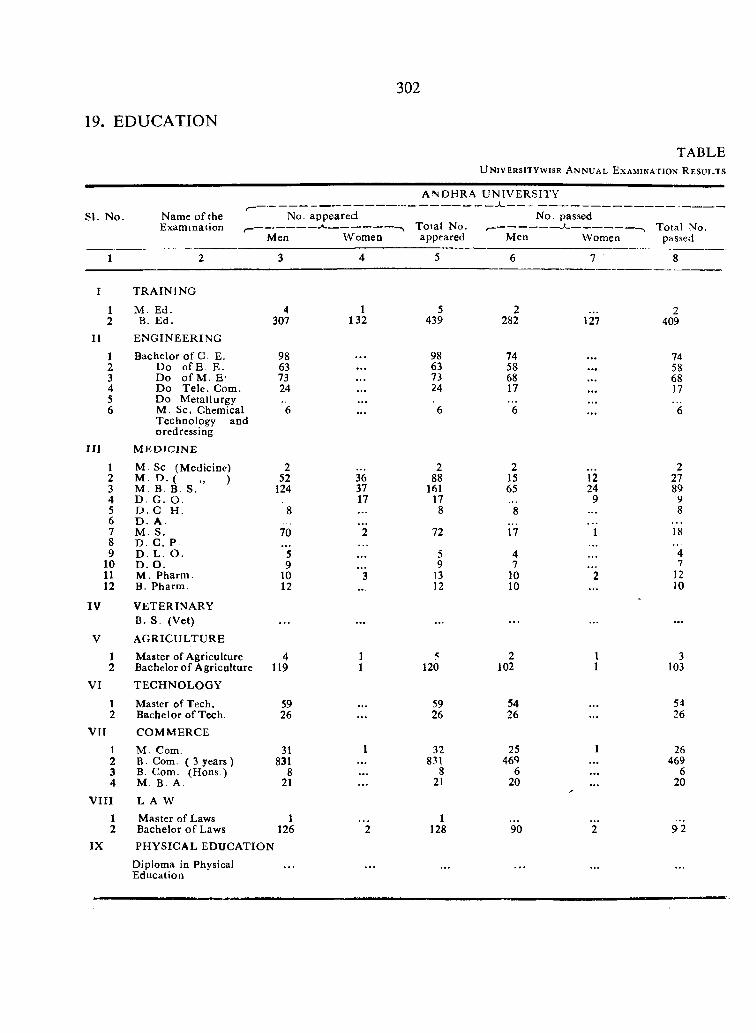
19. EDUCATION
302
T A B L EU n i v e r s i t y w i s e A n n u a l E x a m i n a t i o n R e s u l t s
SI. N o.f—
Name o f the Exam ination f - —
No.
Men
appeared
W omen
A ND HRA
Total No.appeared
U N IV ERSITY
No.
Men
passed
Women-V, Total No.
passed
1 2 3 4 5 6 7 8
I T R A IN IN G
1 M . Ed. 4 1 5 2 22 B. E d. 307 132 439 282 127 409
II E N G IN E E R IN G
1 B achelor o f C. E. 98 98 74 . . . 742 Do o fE E. 63 63 58 • •• 583 D o o fM . E- 73 73 68 • ■ • 684 D o T ele. Com. 24 • •• 24 17 • •• 175 D o M etallurgy . . .
6 M . Sc, Chemical 6 • •• 6 6 . . . ”6Technology andoredressing
II I M E D IC IN E
1 M Sc (M edicine) 2 2 2 22 M . D. ( „ ) 52 36 88 15 12 273 M B B S. 124 37 161 65 24 894 D. G . O . 17 17 9 95 D . G H . 8 8 8 • •• 86 D . A . • • •7 M . S. 70 2 72 i ' 7 1 188 D . C. P . . . . . .
9 D . L . O . 5 • •• 5 4 . • • " 4
10 D . O . 9 9 7 711 M . Pharm . 10 “ 3 13 10 "2 1212 B. Pharm . 12 12 10 10
IV VETERINARYB. S. (Vet) .. . ... ... . . . . . .
V A G R IC U L T U R E
1 Master of Agriculture 4 1 2 \ 32 Bachelor o f A griculture 119 1 120 102 1 103
V I T E C H N O L O G Y
1 Master of Tech. 59 59 54 . . . 5 i2 Bachelor of Tech. 26 . . . 26 26 . . . 26
V II C O M M ERC E1 M . Com. 31 1 32 25 1 262 B. Com. ( 3 years ) 831 . . . 831 469 . . . 4693 B. Com. (H ons.) 8 . . . 8 6 . . . 64 M. B. A. 21 . . . 21 20 . . . 20
V III L A W
1 M aster of Laws 1 12 Bachelor o f Laws 126 " 2 128 90 2 " 9 2
IX PH Y SICA L EDU CATIONDiploma in Physical • • • . . . • « •
Education
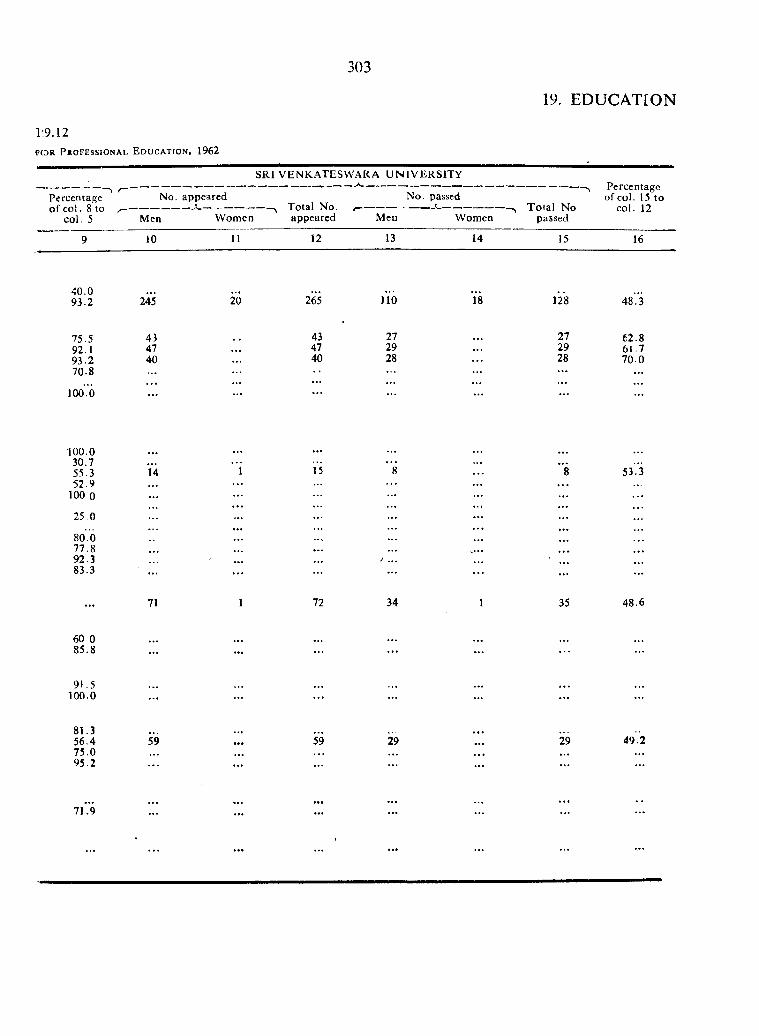
303
19. EDUCATION
V9A2F O R P r o f e s s i o n a l E d u c a t i o n , 1962
Percentage o f co l. 8 to
col. 5
SRI VENKATESVVARA U N IV ERSITY
No. appeared No. passed
Men W omen appeared Men WomenT o ta l No
passed
Percentage of col. 15 to
col. 12
9 10 11 12 13 14 15 16
40.093.2 245 20 265 JIO 18 128 48.3
75.5 43 43 27 27 62.892.1 47 47 29 29 61.793.2 40 40 28 28 70.070.8 . . . . . .
100.6 . . . . . . . . . . . .
100.030.7 . . .
55.3 14 ’ i 15 8 8 53.352.9 . . . . . . . . . . . .
100 0 . . . . . . . . . . . .
25.0 . . . . . . . . . . . .
80.077.8 . . . . . . • . .
92.3 J ,,, •83.3 . . . . . . . . . . . . . . .
. . . 71 1 72 34 1 35 48.6
60 085.8 . . . . . . . . . . . . . . .
9 \ .5100.0 . . . . . . . . . . . . . . . . . . . . .
81.356.4 59 ••• 59 29 . . . 29 49.275.0 • • • . . . , , , . . . . . .
95.2 . . . . . . . . . . . . . . .
7 l‘.9 . . . . . .
. . . . . .
. . .
. . .
. . . . . . . . . . . . . . . . . .
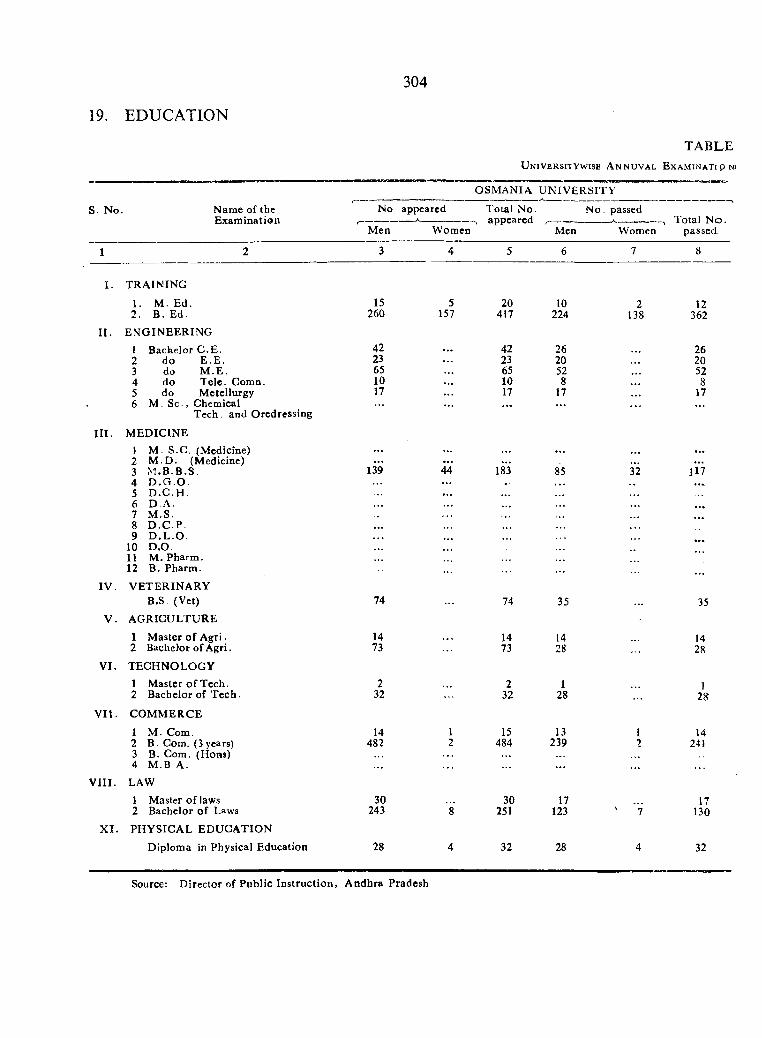
304
19. EDUCATION
T A B L EU n i v e r s i t y w i s e A n n u v a l E x a m i n a t i p n j
OSM ANIA U N IV E R SITY
S. N o. Name of the Exam ination
No appeared
Men W omen
T otal No. -----, appeared
N o. passed--------- , T otal N o .
Men Women passed
I . TRA IN IN G
1. M. E d .2. B. Ed.
I I . E N G IN EE R IN G
Bachelor C .E . do E .E .do M .E .do Tele. Comn.do M etellurgy
M. Sc . , ChemicalTech. and O redressing
I I I . M ED IC IN E1 M. S .C . (M edicine)2 M .D . (Medicine)3 M .B .B .S .4 D .G .O .5 D .C .H .6 D A .7 M .S .8 D .C .P9 D .L .O .
10 D.O.11 M .P harm .12 B. Pharm .
IV .
V .
V ETERIN A R Y B.S. (Vet)
A G RICULTURE
1 M aster o f Agri.2 Bachelor of A gri.
V I. TEC H N O LO G YM aster o f Tech. Bachelor of T e c h .
V II . CO M M ERCE
1 M . C om .2 B. Com. (3 years)3 B. Com. ( H o q s )4 M .B A.
V III . LAW1 Master o f laws2 Bachelor o f Laws
X I . PH Y SIC A L ED U C A TIO N
Diplom a in Physical Education
15260
4223651017
139
74
1473
232
14482
30243
28
5157
44
20417
4223651017
183
74
1473
232
15484
30251
32
10224
2620528
17
85
35
14
128
13239
17123
28
2138
32
12362
2620528
17
117
35
1428
128
14241
17130
32
Source: D irector of Public Ins truc tion , A ndhra Pradesh
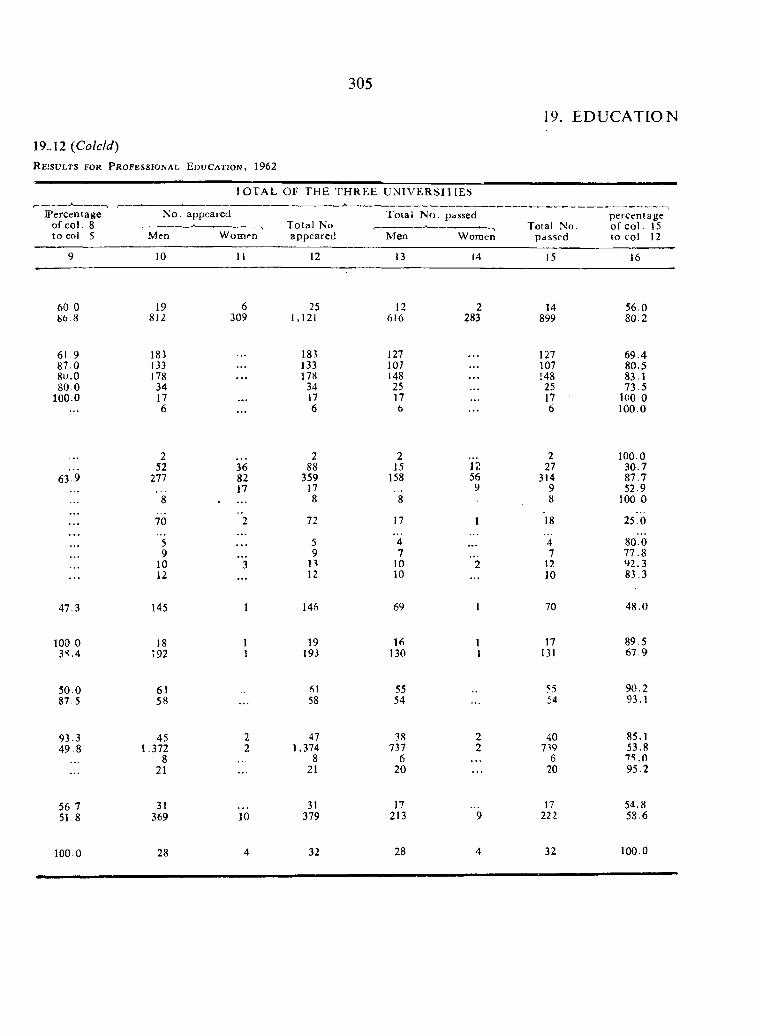
305
19. EDUCATION
19.. 12 {Colcid)R e i s u l t s f o r P r o f e s s i o n a l E d u c a t i o n , 1962
i o t a l o f t h e t h r e e u n i v e r s i t i e s
Percen tage of c o l. 8 to col 5
N o. appeared-A Total No
appeared
Total N o. passedTotal No.
passed
percentage of c o l . 15 to col 12Men Women Men Women
9 10 11 12 13 14 15 16
60 0 19 6 25 12 2 14 56.08(5 8 812 309 1,121 616 283 899 80.2
61 9 183 183 127 127 69.487.0 133 133 107 . . . 107 80.58U.0 178 . . . 178 148 . . . 148 83.180 0 34 34 25 25 73.5
100.0 17 17 17 17 100 06 . . . 6 t» . . . 6 100.0
2 2 2 2 100.052 36 88 15 12 27 30.7
63 9 277 82 359 158 56 314 87.717 17 9 9 52.9
'8 . . . . 8 ”8 8 100 0
::: 70 72 17 1 18 25^0
5 5 4 "4 80 69 . . . 9 7 7 77.8
10 3 n 10 ” 2 12 92.312 . . . 12 10 10 83.3
47.3 145 1 146 69 1 70 48.0
100 0 18 1 19 16 1 17 89.53'«.4 192 1 193 130 1 131 67.9
50.0 61 61 55 55 90.287.5 58 58 54 54 93.1
93.3 45 2 47 38 2 40 85.149.8 1.372 2 1,374 737 2 7?9 53.8
8 8 6 • • . 6 75.021 21 20 20 95.2
56 7 31 31 17 17 5 4 . 8
51-8 369 V6 379 213 "9 22 > 58.6
100.0 28 4 32 28 4 32 100.0
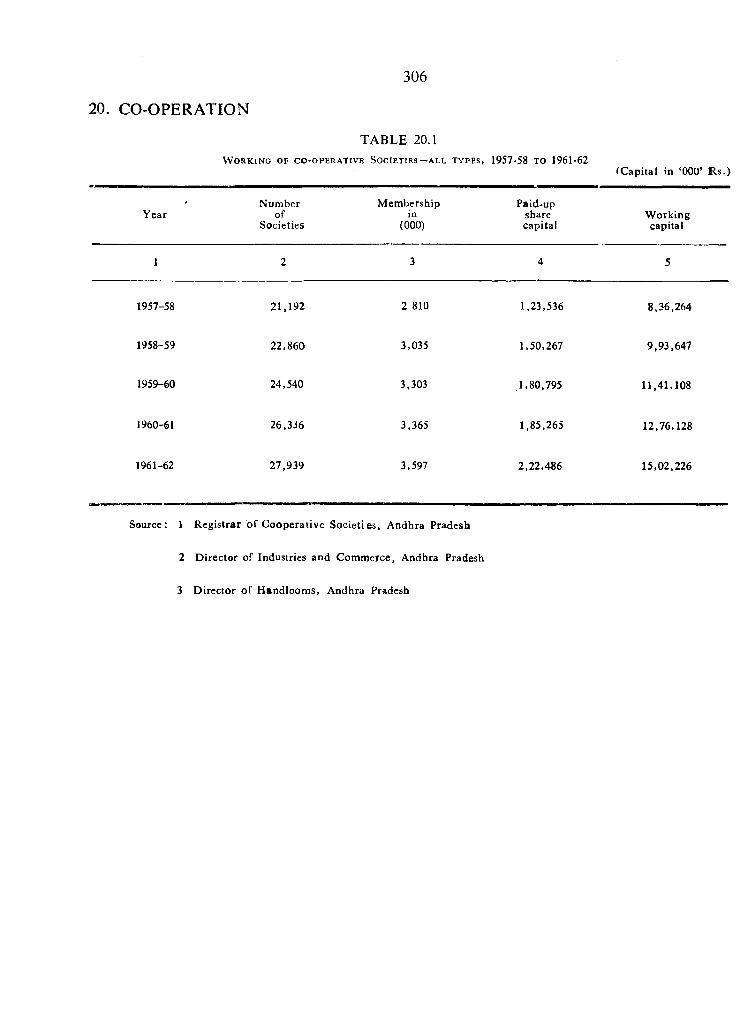
306
20. CO-OPERATION
TABLE 20.1W o r k i n g o f c o - o p e r a t i v e S o c i e t i e s — a l l t y p e s , 1957-58 t o 1961-62
rC apital in ‘000’ R s .)
YearNumber
ofSocieties
M embershipin
(000)
Paid-upsharecapital
W orkingcapital
1 2 3 4 5
1957-58 21,192 2 810 1,23,536 8,36,264
1958-59 22,860 3,035 1,50,267 9,93,647
1959-60 24,540 3,303 .1,80,795 11,41,108
1960-61 26,336 3,365 1,85,265 12,76,128
1961-62 27,939 3,597 2,22,486 15,02,226
Source: 1 R egistrar o f C ooperative Societies, A ndhra Pradesh
2 D irector of Industries and Com m erce, Andhra Pradesh
3 D irector o f H andloom s, Andhra Pradesh
TABLE 20.2
W o r k i n g o f C o -o p r a t i v e S o c i e t i e s A l l T y p e s
D i s t r i c t w i s e , 1961-62
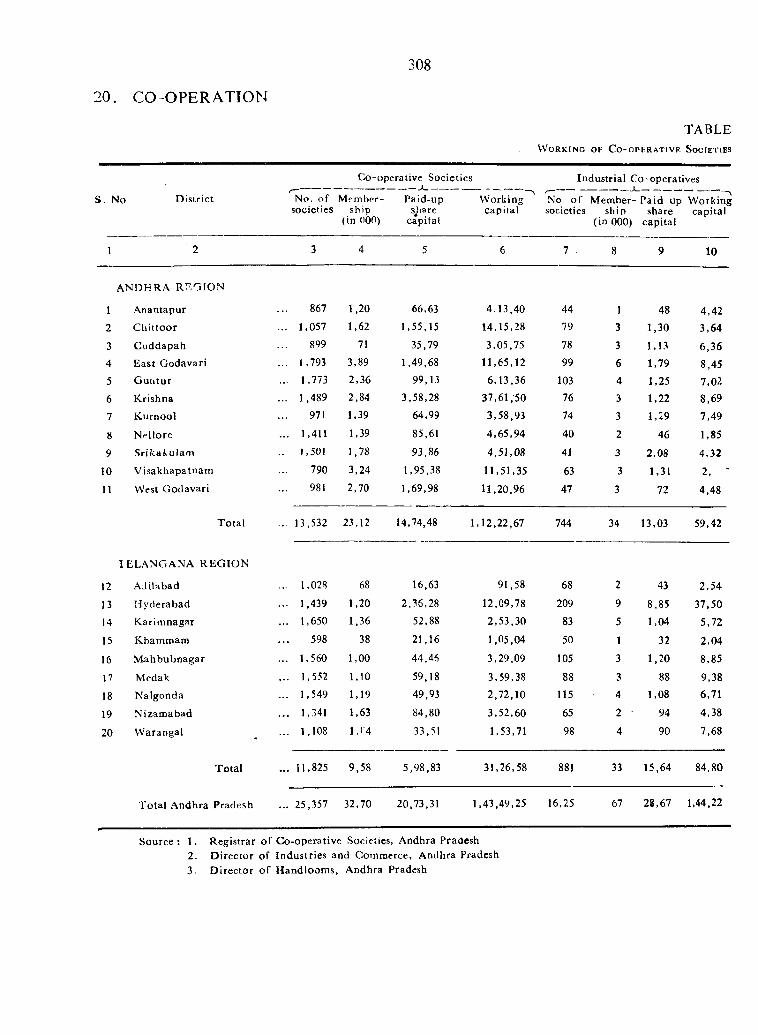
20. CO-OPERATION
308
TABLEW o r k i n g o f C o - o p e r a t i v e S o c i e t i e s
S. No. District
Co-operative Societies
N o. o f M ember- Paid-upsocieties ship s hare
(in (100) capital
Industrial Co-operatives
W orking No o f Member- P aid -up W orkingcapital societies ship share capital
(in 000) capital
10
ANDHRA RF.GION
1 Anantapur
2 C h ittoo r
3 C uddapah4 East G odavari
5 G un tu r
6 K rishna
7 K urnool
8 Nf'llore
9 S rika tu Jam
10 V isakhapatnam
11 West Godavari
867 1,20 66,63 4.13,40 44 1 48 4,421,057 1,62 1,55,15 14,15,28 79 3 1,30 3,64
899 71 35,79 3,05,75 78 3 1,13 6,361,793 3,89 1,49,68 11,65,12 99 6 1,79 8,451,773 2,36 99,13 6,13,36 103 4 1.25 7,021,489 2,84 3,58,28 37,61,50 76 3 1,22 8,69
971 1,39 64,99 3,58,93 74 3 1,29 7,491,411 1.39 85,61 4,65,94 40 2 46 1,851,501 1,78 93,86 4 ,5 1 ,0 8 41 3 2,08 4,32
790 3,24 1,95,38 11.51,35 63 3 1,31 2,981 2,70 1,69,98 11,20,96 47 3 72 4,48
Total ... 13,532 23,12 14,74,48 1,12,22,67 744 34 13,03 59,42
TELANGANA R EG IO N
12 A Jilabad ... 1,028 68 16,63 91,58 68 2 43 2,54
13 H yderabad ... 1,439 1,20 2,36,28 12,09,78 209 9 8,85 37,50
14 K arim nagar ... 1,650 1,36 52,88 2,53,30 83 5 1,04 5,72
15 Khammam 598 38 21,16 1,05,04 50 1 32 2,04
16 M ahbubnagar ... 1,560 1,00 44,46 3,29.09 105 3 1,20 8,85
17 Medak ... 1,552 1,10 59,18 3,59,38 88 3 88 9,38
18 Nalgonda ... 1,549 1,19 49,93 2,72,10 115 4 1,08 6,71
19 N izam abad ... 1,341 1,63 84,80 3,52,60 65 2 94 4,38
20 W arangal ... 1,108 1,T4 33,51 1,53,71 98 4 90 7,68
Total ... 11,825 9,58 5,98,83 31,26,58 881 33 15,64 84,80
T otal A ndhra Pradesh ... 25,357 32,70 20,73,31 1,43,49,25 16,25 67 28,67 1,44,22
Source : 1. Registrar o f Co-operative Societies, Andhra Pradesh2. D irector of Industries and Commerce, Andhra Pradesh3. D irector o f H andloom s, Andhra Pradesh
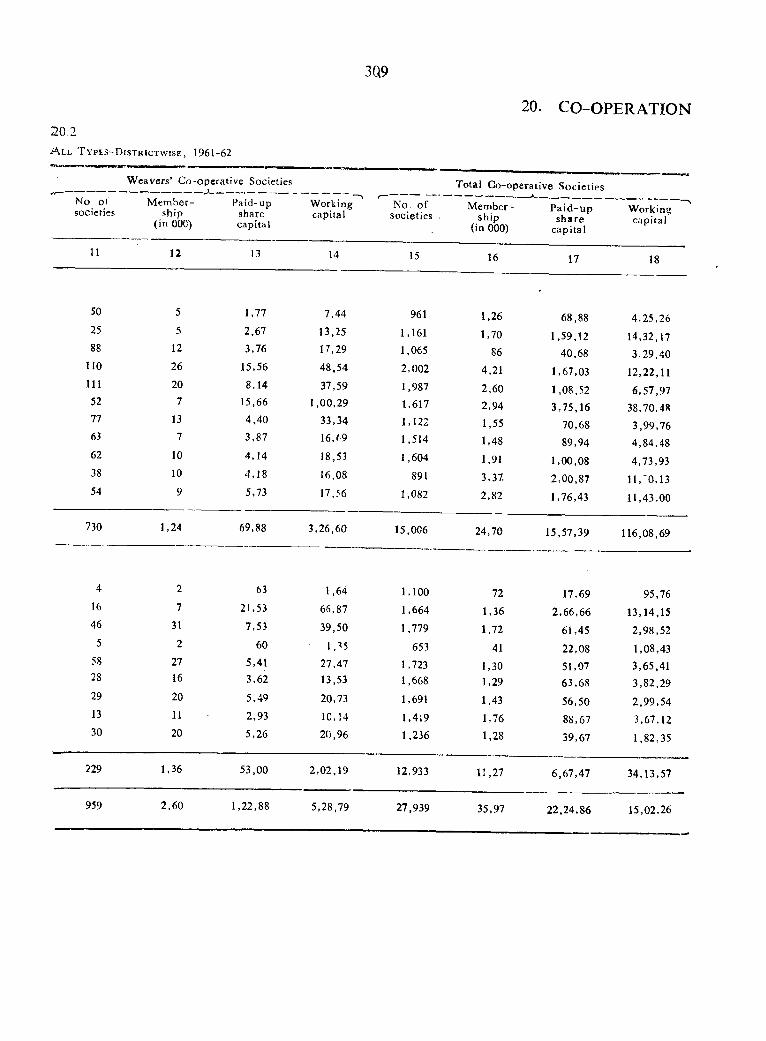
3Q9
20 2A l l T y p e s - D i s t r i c t w i s e , 1 9 6 1 -6 2
No of societies
11
W eavers’ Co-operative Societies
M em ber- Paid-up Workingship share capital
(in 000) capital
20. CO-OPERATION
12 13
N o. o f societies
14 15 16
Total Co-operative Societies
M em ber' P a id -u pship share
(in 000) capital
17
Workingcapital
18
50
25
88
110
1115277
6.3
62
38
54
5
51 2
26
20
7
137
10109
1,77
2,67
3,76
15,56
8.14 15,664,403,87
4.14
4,18
5,73
7,44
13,25
17,29
48,54
37,591,00,29
33,3416,69
18,53
J6.08
17,56
961
1,161
1,065
2,002
1,987
1.617
1,122
1,514
1 , 6 0 4
891
1,082
1,26
1,7086
4.21
2,602,94
1,551,48
1,91
3,37
2,82
68,88
1.59,1240.68
1,67,03
1,08,52 3,75,16
70.68
89,94
1,00,08
2,00,87
1,76,43
4,25,26
14.32,17 3.29,40
1 2 , 2 2 . 1 1
6,57,97 38,70,48
3,99,76 4,84.48
4,73,93
11 ,'0 ,13
11,43,00
730 1,24 69,88 3,26,60 15,006 24,70 15,57.39 116,08,69
4 2 63 1,64 1,100 72 17,69 95,7616 7 21,53 66,87 1,664 1,36 2,66,66 13,14,1546 31 7,53 39,50 1,779 1,72 61,45 2,98,52
5 2 60 1,35 653 41 22,08 1,08,4358 27 5,41 27,47 1,723 1,30 51,07 3,65,4128 16 3.62 13,53 1,668 1,29 63,68 3,82,2929 20 5,49 20,73 1,691 1,43 56,50 2,99,5413 11 2,93 10,14 1,419 1,76 88,67 3,67,1230 20 5,26 20,96 1,236 1,28 39,67 1,82,35
229 1,36 53,00 2,02,19 12,933 11,27 6.67,47 34,13,57
959 2,60 1,22,88 5,28,79 27,939 35,97 22.24,86 15,02,26
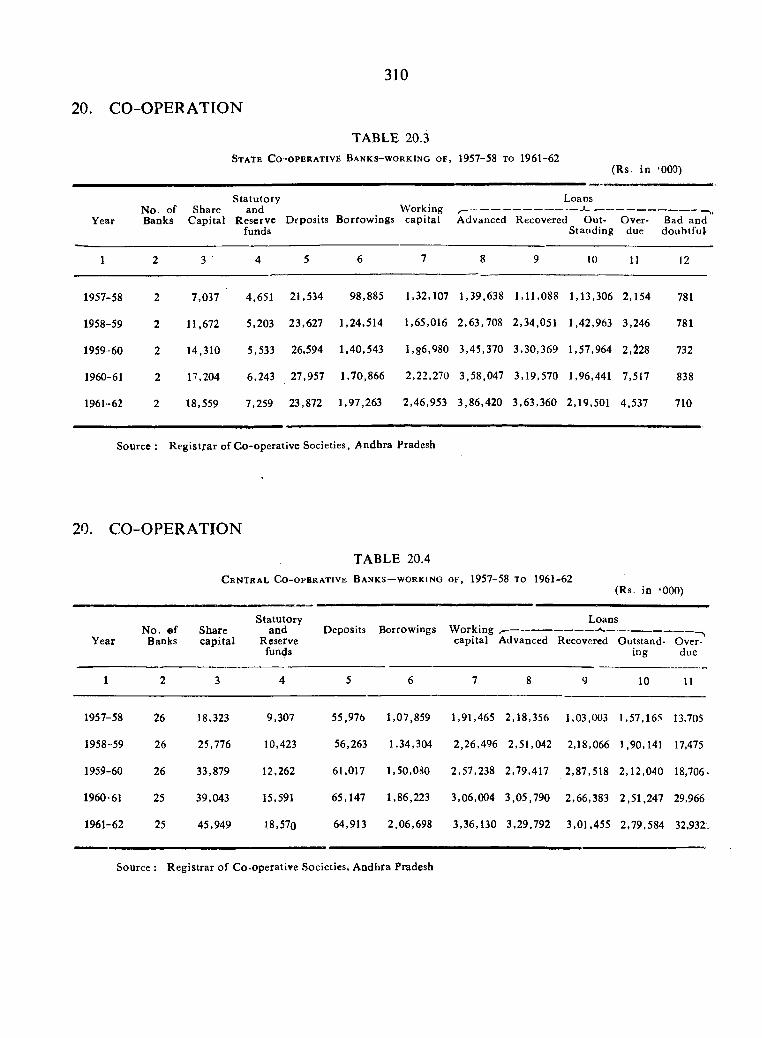
310
20. CO-OPERATION
Year
TABLE 20.3S t a t e C o - o p e r a t i v e B a n k s - w o r k i n g o f , 1957-58 t o 1961-62
(R s. in ‘000)
S tatu tory LoansNo- of Share and W orking ,-------------------------------------------------------------------------,Banks C apital Reserve Deposits Borrowings cap ita l Advanced Recovered Out- Over- Bad and
funds Standing due doubtful*
10 11 12
1957-58 2 7,037 4,651 21,534 98,885 1,32,107 1,39,638 1,11,088 1,13,306 2,154 781
1958-59 2 11,672 5,203 23,627 1,24,514 1,65,016 2,63,708 2,34,051 1,42,963 3,246 781
1959-60 2 14,310 5,533 26,594 1,40,543 1,86,980 3,45,370 3,30,369 1,57,964 2,228 732
1960-61 2 17,204 6,243 27,957 1,70,866 2,22,270 3,58,047 3,19,570 1,96,441 7,517 838
1961-62 2 18,559 7,259 23,872 1,97,263 2,46,953 3,86,420 3,63,360 2,19,501 4,537 710
Source : R egistrar of Co-operative Societies, Andhra Pradesh
20. CO-OPERATION
TABLE 20.4C e n t r a l C o - o p b r a t i v e B a n k s — w o r k i n g o f , 1957-58 t o 1961-62
(Rs. in ‘000)
No. ®f Banks
Sharecapital
S tatutoryand
Reservefunds
Deposits Borrowings W orkingcapital
Loans______ _ Jl__
Year Advanced Recovered Outstanding
O vei^due
1 2 3 4 5 6 7 8 9 10 11
1957-58 26 18,323 9,307 55,976 1,07,859 1,91,465 2,18,356 1,03,003 1,57,165 13.705
1958-59 26 25,776 10,423 56,263 1,34,304 2,26,496 2,51,042 2,18,066 1,90,141 17,475
1959-60 26 33,879 12,262 61,017 1,50,080 2,57,238 2,79,417 2,87,518 2,12,040 18,706.
1960-61 25 39,043 15,591 65,147 1,86,223 3,06,004 3,05,790 2,66,383 2,51,247 29,966
1961-62 25 45,949 )8,57o 64,913 2,06,698 3,36,130 3,29,792 3,01,455 2,79,584 32,932.
Source : R egistrar o f Co-operative Societies, A ndhra Pradesh
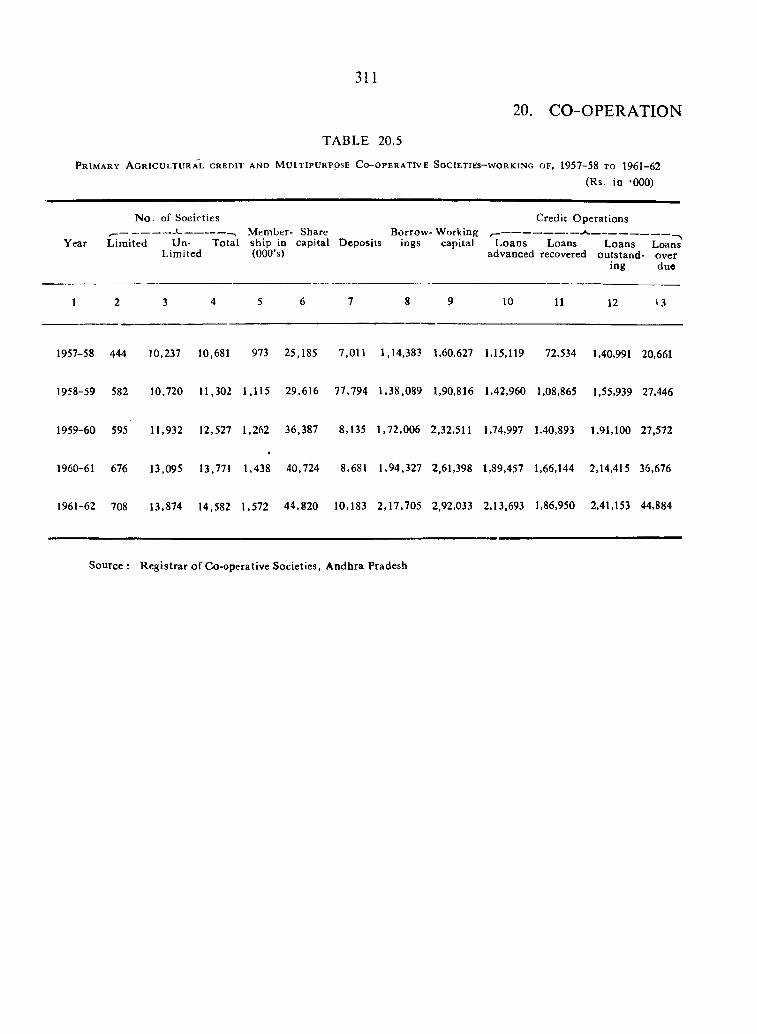
TABLE 20.5
P r i m a r y A g r i c u l t u r a l c r e d i t a n d M u i t i p u r p o s e C o- o p e r a t i v e S o c i e t i e s - w o r k i n g o f , 1957-58 t o 1961-62(Rs. in ‘000)
311
20. CO-OPERATION
Year
N o. of Soeieties^ --------------- «------------- Member- Share Borrow- WorkingLim ited Un- Total ship in capital Deposits ings capital
Lim ited (OOO’s)
Credit O perations
L oans Loans Loans L o a ^ advanced recovered outstand- over
ing due
1 2 3 4 5 6 7 8 9 10 11 12 13
1957-58 444 10,237 10,681 973 25,185 7,011 1,14,383 1,60,627 1,15,119 72,534 1.40,991 20,661
1958-59 582 10,720 11,302 1,115 29,616 77,794 1,38,089 1,90,816 1,42,960 1,08,865 1,55,939 27,446
1959-60 595 11,932 12,527 1,262 36,387 8,135 1,72,006 2,32,511 1,74,997 1,40,893 1.91,100 27,572
1960-61 676 13,095 13,771 1,438 40,724 8,681 1,94,327 2,61,398 1,89,457 1,66,144 2,14,415 36,676
1961-62 708 13,874 14,582 1,572 44,820 10,183 2,17,705 2,92,033 2,13,693 1,86.950 2,41,153 44,884
Source: R egistrar o f Co-operative Societies, A ndhra Pradesh
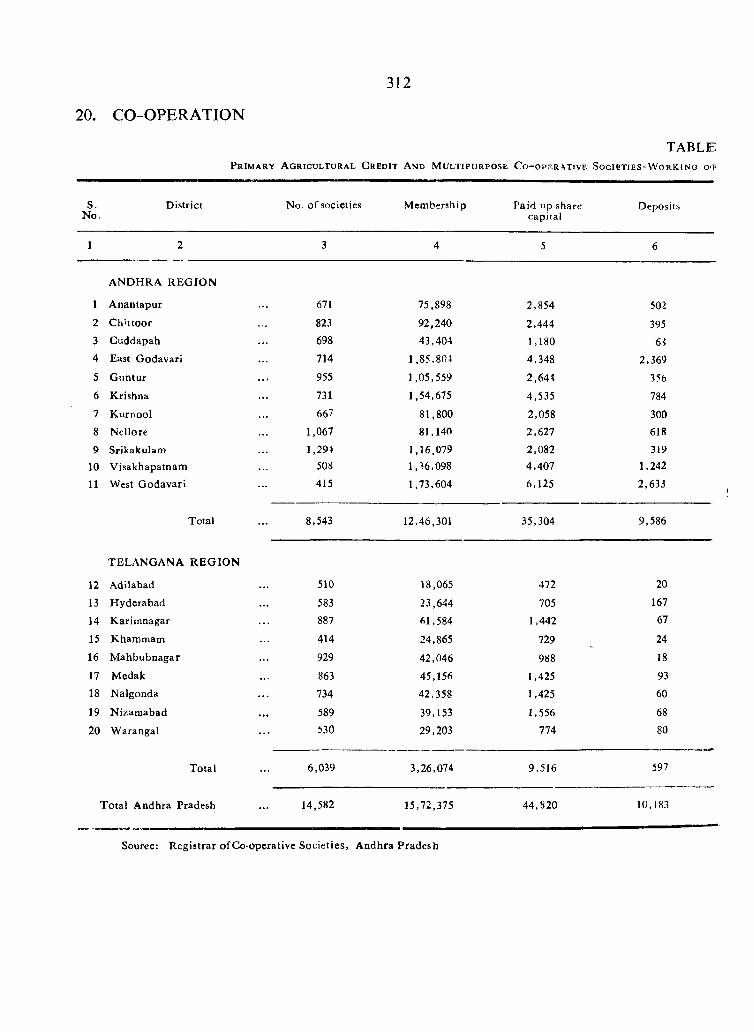
312
20. CO-OPERATION
P r i m a r y A g r i c u l t u r a l C r e d i t A n d M u l t i p u r p o s e C o - O P E R A T r V E
T A B L ES O C I E T I E S - W O R K J N G O'F
S. District No.
No. of societies M embership Paid up share capital
Deposits
1 2 3 4 5 6
ANDHRA R EG IO N
1 A nantapur 671 75,898 2,854 5022 C hutoor 823 92,240 2,444 3953 Cuddapah 698 43,404 1,180 6 i4 East G odavari 714 1,85,804 4,348 2,369
5 G nntur 955 1,05,559 2,644 356
6 Krishna 731 1,54,675 4,535 784
7 K urnool 667 81,800 2,058 3008 Nellore 1,067 81,140 2,627 618
9 Srikakulam 1,294 1,16,079 2,082 31910 Visakhapatnam 508 1,36,098 4,407 1,242
11 West G odavari 415 1,73,604 6,125 2,633
Total 8,543 12,46,301 35,304 9,586
TELANGANA R EG IO N
12 Adilabad 510 18,065 472 20
13 H yderabad 583 23,644 705 167
14 K arim nagar 887 61,584 1,442 67
15 Khammam 414 24,865 729 24
16 M ahbubnagar 929 42,046 988 18
17 M edak 863 45,156 1,425 9318 Nalgonda 734 42,358 1,425 60
19 N izam abad 589 39,153 1,556 68
20 W arangal 530 29,203 774 80
Total 6,039 3,26,074 9,516 597
Total A ndhra Pradesh 14,582 15,72,375 44,S20 10,183
Source: R egistrar ofCo-operative Societies, A ndhra Pradesh
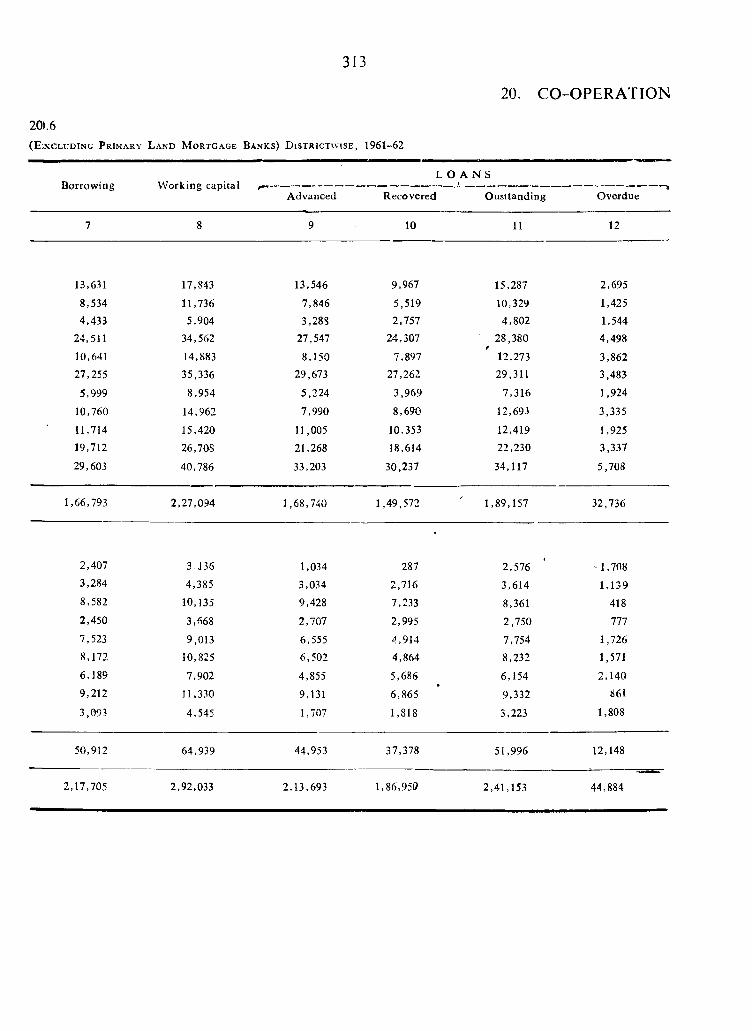
20).6( E : x c l u d i n g P r i m a r y
313
L a n d M o r t g a g e B a n k s ) D i s t r i c t v v i s e , 1961-62
20. CO-OPERATION
Borrowing W orking capitalAdvanced
L O A N S
Recovered Ousttanding Overdue
7 8 9 10 11 12
13,631 17,843 13,546 9,967 15,287 2,695
8,534 11,736 7,846 5,519 10,329 1,425
4.433 5,904 3,288 2,757 4,802 1,544
24,511 34,562 27,547 24,307 28,380 4,498
10,641 14,883 8,150 7,897 12,273 3,862
27,255 35,336 29,673 27,262 29,311 3,483
5,999 8,954 5,224 3,969 7,316 1,924
10,760 14,962 7,990 8,690 12,693 3,335
11,714 15,420 11,005 10,353 12,419 1,92519,712 26,708 21.268 18,614 22,230 3,337
29,603 40,786 33,203 30.237 34,117 5,708
1,66,793 2,27,094 1,68,740 1,49,572 1,89,157 32,736
2,407 3,136 1,034 287 2,576 -1 ,7083,284 4,385 3,034 2,716 3,614 1,1398,582 10,135 9,428 7,233 8,361 4182,450 3,668 2,707 2,995 2,750 777
7,523 9,013 6,555 4,914 7,754 1,7268,172 10,825 6,502 4,864 8,232 1,571
6,189 7,902 4,855 5,686 6,154 2,1409,212 11,330 9,131 6,865 9,332 861
3,093 4,545 1,707 1,818 3,223 1,808
50,912 64,939 44,953 37,378 51,996 12,148
2,17,705 2,92,033 2,13,693 1,86,950 2,41,153 44,884
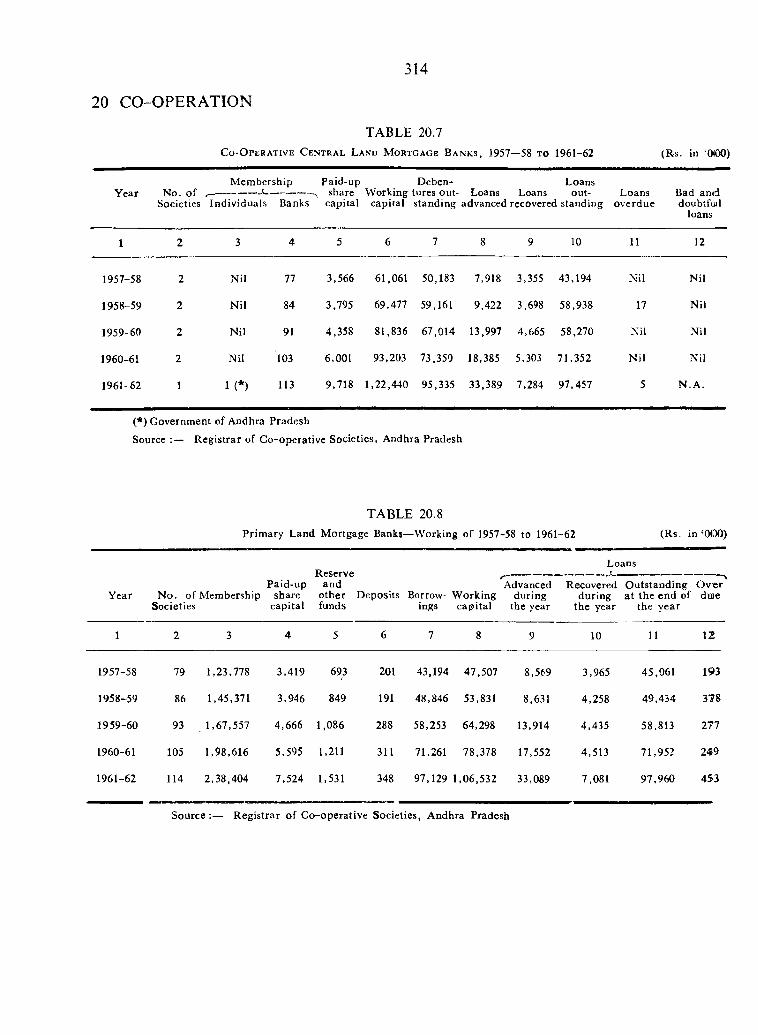
314
20 CO-OPERATION
TABLE 20.7C o - O p e r a t i v e C e n t r a l L a n d M o r t g a g e B a n k s , 1957—58 t o 1961-62 (R-s. in ‘0(00)
YearM embership
No. of ,-------------------------Paid-up Deben- Loans
share Working tures out- Loans Loans out- Loans B a d a n dSocieties Individuals Banks capital capital standing advanced recovered standing overdue doubtfuil
loans
1 2 3 4 5 6 7 8 9 10 11 12
1957-58 2 Nil 77 3,566 61,061 50,183 7,918 3,355 43,194 Nil Nil
1958-59 2 Nil 84 3,795 69,477 59,161 9,422 3,698 58,938 17 Nil
1959-60 2 N il 91 4,358 81,836 67,014 13,997 4,665 58,270 Nil Nil
1960-61 2 Nil 103 6,001 93,203 73,350 18,385 5,303 71,352 N il Nil
1961-62 1 1 (*) 113 9,718 1,22,440 95,335 33,389 7,284 97,457 5 N .A .
(*) Government of Andhra Pradesh
Source R egistrar of Co-operative Societies, Andhra Pradesh
TABLE 20.8Prim ary Land Mortgage Banks—Working of 1957-58 to 1961-62 (Rs. in ‘OOO)
Year N o. of Membership Societies
Paid-upshare
capital
Reserveand
otherfunds
Deposits Borrowings
W orkingcapital
Loans
Advanced during
the year
Recovered during
the year
O utstanding a t the end of
the year
Ovierdme
1 2 3 4 5 6 7 8 9 10 11 12
1957-58 79 1,23,778 3,419 693 201 43,194 47,507 8,569 3,965 45,061 193
1958-59 86 1,45,371 3,946 849 191 48,846 53,831 8,631 4,258 49,434 378
1959-60 93 1,67,557 4,666 1,086 288 58,253 64,298 13,914 4,435 58,813 277
1960-61 105 1,98,616 5,595 1,211 311 71,261 78,378 17,552 4,513 71,952 249
1961-62 114 2,38,404 7,524 1,531 348 97,129 1,06,532 33,089 7,081 97,960 453
Source :— R egistrar o f C o-operative Societies, Andhra Pradesh

315
21. PLANNING AND COMMUNITY DEVELOPMENT
TABLE 21.1P r o v i s i o n a n d E x p e n d i t u r e D u r i n g I I a n d I I I F i v e Y e a r P l a n s
(Rs. in Lakhs)
.‘S.M o.
H ead of DevelopmentI I Plan II Plan total I I I P lan total III Planrevised expenditure provision expenditure
p r o v i s i o n 1 9 5 6 - 5 7 t o 1 9 6 1 - 6 11 9 6 0 - 6 1
I Agricultural Programmes :
1 A gricultural production
2 M inor Irrigation
3 Land development
4 A nim al Husbandry
5 D airy in g and M ilk supply
6 Forests
7 Soil conservation
8 Fisheries
9 Co-operation, warehousing and M arketing
10 Panchayats
11 M iscellaneous
12 Com m unity Developm ent
II Irrigation and Power :
1 M ultipurpose projects
2 M ajor and M edium irrigation
3 Power
n i l Industries '
1 Large and M edium Industries
2 V illage and Sm all Scale Industries
HV Transport and Communications ;
1 Roads
2 T ourism
3,924.76
472.33
886.14
36.54
242.68
54.82
102.40
76.28
70.28
320.89
24.63
16.23
1,621.54
9,092.35
3,810.00
2,021.63
3,260.72
1,061.56
165.99
895.57
569.22
561.34
7.88
3.736.63
444.6J
811.47
30.97
235.82
34.42
97.13
63.48
61.99
310.04
22.20
15.13
1,609.35
9,596.33
3,809.39
1,9:.3.66
3 ,853 .28+
1,012.15
1 5 0 . 5 0
861.65
593.20
586.96
6.24
7,097.01
872.27
2,126.00
(a)
260.96
285.00
145.36
196.00
106.00
400.02
132.00
123.40
2.450.00
14,327.44
4.500.00
2,963.44
6.864.00
1.893.00
694.00(b)
1,199.00(c)
1.165.00
1,159.00(d)
6.00
939.50
110.09
220.83
(a)
34.15
28.15
15.30
11.97
16.11
55.04
5.15
29.81
412.90
2,742.97
999.37
496.10
1,247.50
254.58
51.31(b)
203.27(c)
298.48
298.48(d)
a) Included under A gricultural productionb) Includes m ineral developmentc) Includes H and loom sd) Includes R oad Transport+ Includes the expenditure included by the Electricity Board from its own resources
Source : 1. Statistical A bstract 19612. T hird Five Year Plan - AnnualPlan 1963-64
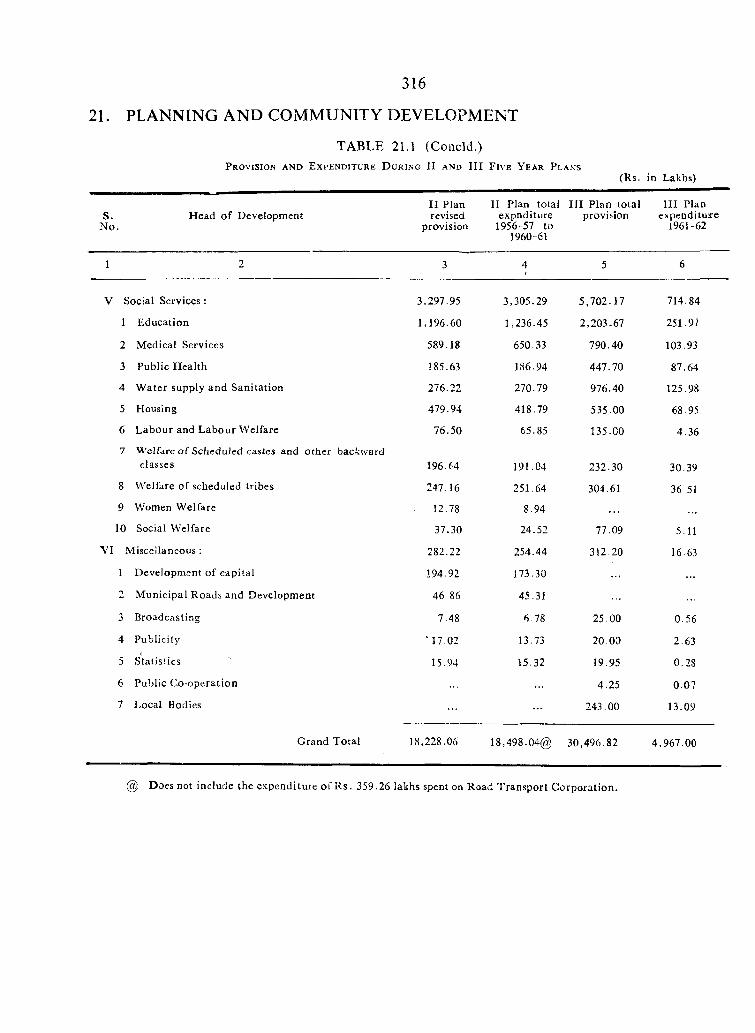
TABLE 21.1 (C oncld.)P r o v i s i o n a n d E x p e n d i t u r e D u r i n g II a n d I I I F i v e Y e a r P l a k s
316
21. PLANNING AND COMMUNITY DEVELOPMENT
S.N o.
H ead o f Development
(Rs. in Lakhs)
I I Plan II Plan total I I I Plan to tal I I I Plan revised expnditure provision cxpeodituire
provision 1956-57 to 1961-621960-61
1
V Social S erv ices:
1 E ducation
2 M edical Services
3 Public H ealth
4 W ater supply and Sanitation
5 Housing
6 Labour and Labour W elfare
7 W elfare o f ScheduJcd castcs and other backwardclasses
8 Welfare o f scheduled tribes
9 Women W elfare
1 0 Social W elfare
\ ’I M isce llan eou s:
1 D evelopm ent o f capital
2 M unicipal Roads and D evelopm ent
3 Broadcasting
4 Publicity
5 Statistics
6 Public C o-operation
7 Local Bodies
Grand T otal
3,297.95
1,196.60
589.18
185.63
276.22
479.94
76.50
196.64
247.16
12.78
37.30
282.22
194.92
46 86
7.48
“ 17.02
15.94
3,305.29
1,236.45
650.33
186.94
270.79
418.79
65.85
191.04
251.64
8.94
24.52
254.44
173.30
45.31
6.78
13.73
35.32
5,702.17
2,203.67
790.40
447.70
976.40
535.00
135.00
232.30
304.61
77.09
312.20
25.00
20 00
19.95
4.25
243.00
714.84
251.97
103.93
87.64
125.98
68 95
4.36
30.39
36 51
5.11
16.63
0.56
2.63
0.28
0.07
13.09
18,228.06 18,498.04@ 30,496.82 4,967.00
Does not include the expenditure o f R s. 359.26 lakhs spent on Road T ransport C orporation .
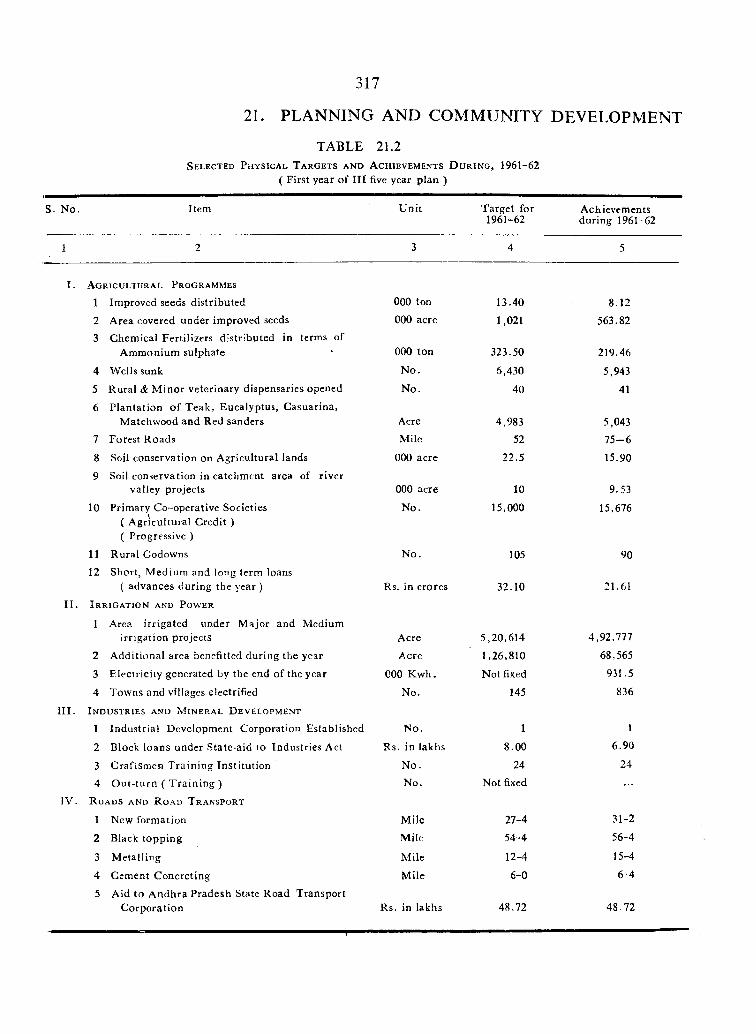
317
21. PLANNING AND COMMUNITY DEVELOPMENT
TABLE 21.2S e l e c t e d P h y s i c a l T a r g e t s a n d A c h i e v e m e n t s D u r i n g , 1961-62
( First year of III five year p lan )
S. N o. Item U nit Target for 1961-62
Achievements during 1961-62
1 2 3 4 5
I . Agricultural P rogrammes
1 Improved seeds distributed 000 ton 13.40 8.12
2 Area covered under improved seeds 000 acre 1,021 563.82
3 Chem ical Fertilizers d istributed in terms of A m monium sulphate 000 ton 323.50 219.46
4 Wells sunk N o. 6,430 5,943
5 Rural & M inor veterinary dispensaries opened No. 40 41
6 Plan tation o f T eak, Eucalyptus, Casuarina, Matchwood and Red sanders Acre 4,983 5,043
7 Forest Roads Mile 52 7 5 -6
8 Soil conservation on A gricultural lands 000 acre 22.5 15.90
9 Soil conservation in catchment area of river valley projects 000 acre 10 9.53
10 Primary Co-operative Societies ( A gricultural Credit )( Progressive )
N o. 15,000 15,676
11 R ural Godowns N o. 105 9012 Short, M edium and l o n g term loans
( advances during the year ) Rs. in crores 32.10 21.61
I I . I r r i g a t i o n a n d P o w e r
1 Area irrigated under M ajor and Medium irrigation projects Acre 5,20,614 4,92,777
2 A dditional area benefitted during the ye.-ar Acre 1,26,810 68,565
3 Electricity generated by the end of the year 000 K w h. Not fixed 931.5
4 Towns and villages electrified No. 145 836
III . I n d u s t r i e s a n d M i n e r a l D e v e l o p m e n t
1 Industrial Development Corporation Established No. 1 \
2 Block loans under Statc-aid to Industries Act Rs. in lakhs 8.00 6.90
3 Craftsm en T rain ing Institu tion N o. 24 24
4 O ut-tu rn ( T ra in in g ) No. Not fixed
IV . R o a d s a n d R o a d T r a n s p o r t
1 New form ation M ile 27-4 31-2
2 Black topping Mile 54-4 56-4
3 M etalling Mile 12-4 15-4
4 Cement C oncreting M ile 6-0 6-4
5 Aid to A ndhra Pradesh State Road Transport C orporation Rs. in lakhs 48.72 48.72
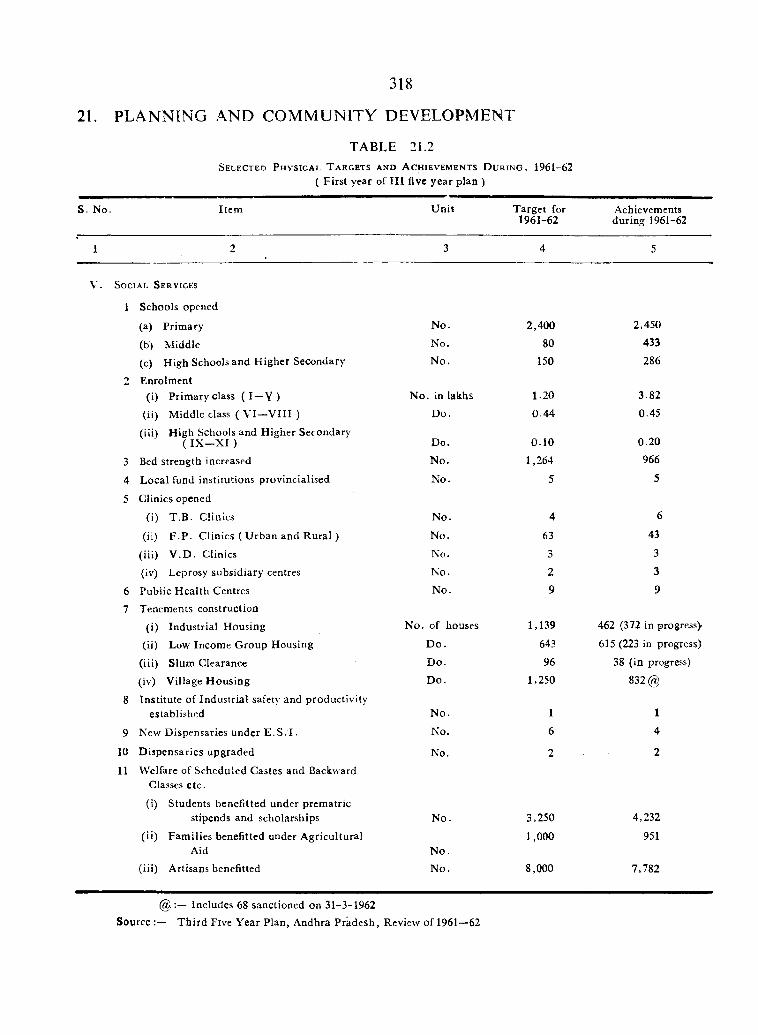
TABLE 21.2S e l e c t e d P h y s i c a l T a r g e t s a n d A c h i e v e m e n t s D u r i n g , 1961-62
( F irst year of I I I five year plan )
318
21. PLANNING AND COMMUNITY DEVELOPMENT
S. No. Item U nit T arget for 1961-62
Achievements during 1961-62
1 2 3 4 5
V . S o c i a l S e r v i c e s
1 Schools opened
(a) Prim ary N o. 2,400 2,450
(b) Middle No. 80 433
(c) High Schools and H igher Secondary N o. 150 286
2 Enrolment (i) Prim ary class ( I —Y ) N o. in lakhs 1.20 3.82
(ii) Middle class ( V I—V III ) Do. 0.44 0.45
(iii) High Schools and Higher Secondary ( IX —X I ) Do. 0.10 0.20
3 Bed strength increased N o. 1,264 966
4 Local fund institutions provincialised N o. 5 5
5 Clinics opened
(i) T .B . Clinics N o. 4 6
(ii) F .P . Clinics ( U rban and R ural ) N o. 63 43
(iii) V .D . Clinics No. 3 3
(iv) Leprosy subsidiary centres N o. 2 3
6 Public H ealth Centres No. 9 9
7 Tenements construction
(i) Industrial Housing N o. of houses 1,139 462 (372 in progress)
(ii) Low Income Group Housing D o . 643 615 (223 in progress)
(iii) Slum Clearance D o. 96 38 (in progress)
(iv) Village H ousing D o. 1,250 832 (^
8 Institute o f Industrial safety and productivity established N o. 1 1
9 New Dispensaries under E .S .I . No. 6 4
10 D ispensaries upgraded No. 2 2
11 Welfare of Scheduled Castes and Backward Classes etc.
(i) Students benefitted under prem atric stipends and scholarships N o. 3,250 4,232
(ii) Fam ilies b e n e f i t t e d u n d e r A g r i c u l t u r a l
Aid(iii) Artisans benefitted
N o.N o.
1,000
8,000
951
7,782
@ Includes 68 sanctioned on 31-3-1962 Source T h ird Five Y ear Plan, Andhra P radesh, Review of 1961—62
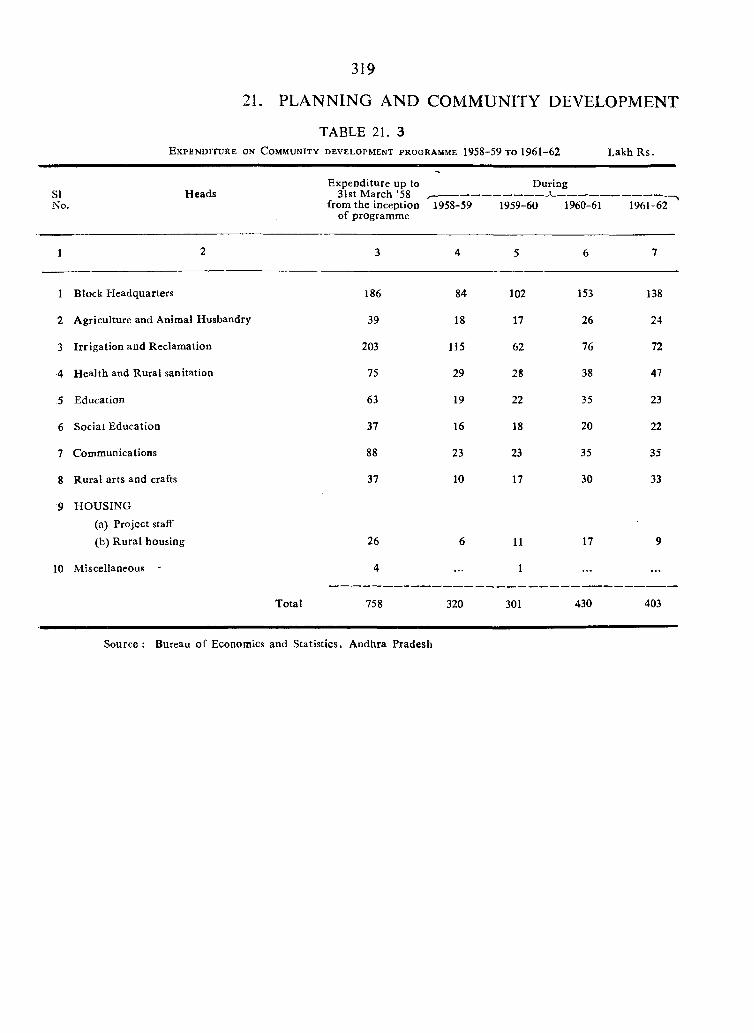
319
2L PLANNING AND COMMUNITY DEVELOPMENT
TABLE 21. 3E x p e n d i t u r e o n C o m m u n i t y d e v e l o p m e n t p r o g r a m m e 1958-59 t o 1961-62 Lakh R s.
SINo.
H eadsE xpenditure up to During
31st M arch ’58 ,--------------------------------- *---------------from the inception 1958-59 1959-60 1960-61
of programme1961-62
1
1 Block H eadquarters
2 A griculture and Animal Husbandry
3 Irriga tion and Reclam ation
4 H ealth and Rural sanitation
5 Education
6 Social E ducation
7 Communications
8 R ural arts and crafts
9 H O U SIN G
(a) Project staff
(b) R ural housing
10 Miscellaneous -
Total
186 84 102 153 138
39 18 17 26 24
203 115 62 76 72
75 29 28 38 47
63 19 22 35 23
37 16 18 20 22
88 23 23 35 35
37 10 17 30 33
26 6 11 17 9
4 — 1 . . . . . .
758 320 301 430 403
Source : Bureau o f Economics and Statistics, Andhra Pradesh
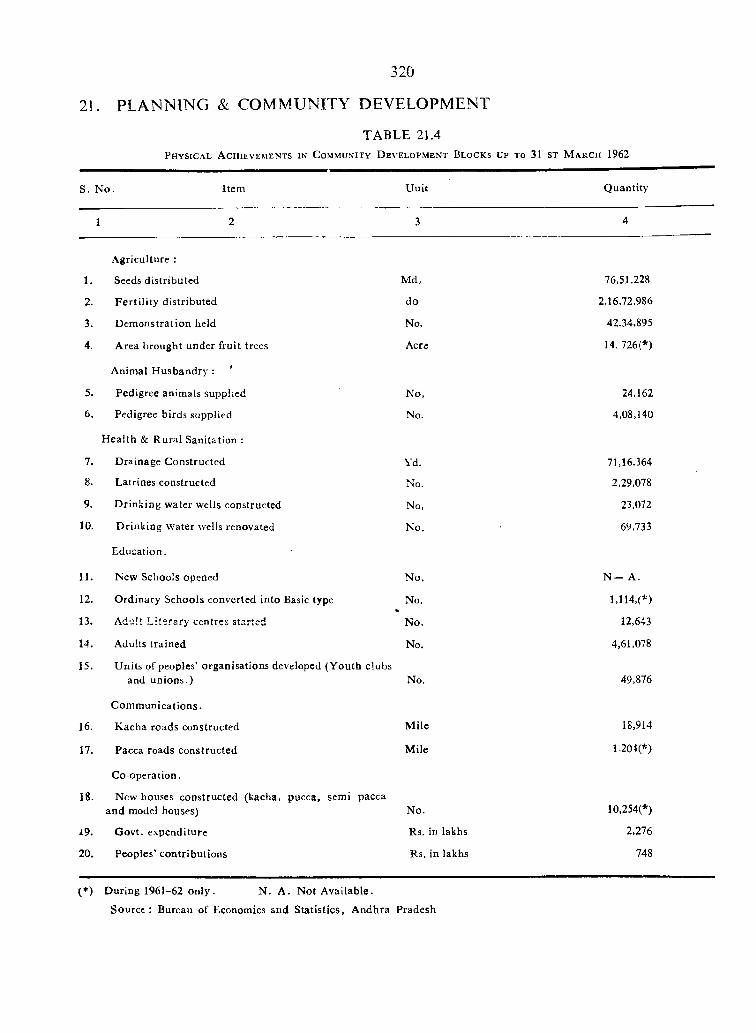
21. PLANNING & COMMUNITY DEVFXOPMENT
320
TABLE 21.4P h y s i c a l A c h i e v e m e n t s i n C o m m u n i t y D e v e l o p m e n t B l o c k s u p t o 31 ST M a r c h 1962
S. N o. Item U uit Q uantity
1 2 3 4
A griculture :
1. Seeds distributed Md, 76,51,228
2. F e rtility distributed do 2,16,72,986
3. D em onstration held No, 42,34,895
4. Area brought under fru it trees
Animal H usbandry : ’
Acre 14 ,726(*)
5. Pedigree animals supplied No, 24,162
6. Pedigree birds supplied
H ealth & R ural Sanitation :
No. 4,08,140
7. D rainage Constructed Yd. 71,16,364
8. Latrines constructed No. 2,29,078
9. D rinking water wells constructed No, 23,072
10, D rinking v»'ater wells renovated
Education.
No. 69,733
11. New Schools opened No. N — A.
12. O rdinary Schools converted into Basic type No. 1,114,(*)
13. Adult L iterary centres started No. 12,643
14. Adults trained No. 4,61,078
15. U nits of peoples’ organisations developed (Y outh clubs and un ions.)
C om m unications.
No. 49,876
16. K acha roads constructed M ile 18,914
17. Pacca roads constructed
Co-operation.
Mile 1,20 4 (*)
18. New houses constructed (kacha, pucca, semi pacca and model houses) No. 10,254(*)
19. G ovt, expenditure Rs. in lakhs 2,276
20. Peoples’ contributions Rs. in lakhs 748
(*) D uring 1961-62 only . N . A . Not A vailable.
S ou rce: Bureau of Economics snd Statistics, A ndhra Pradesh
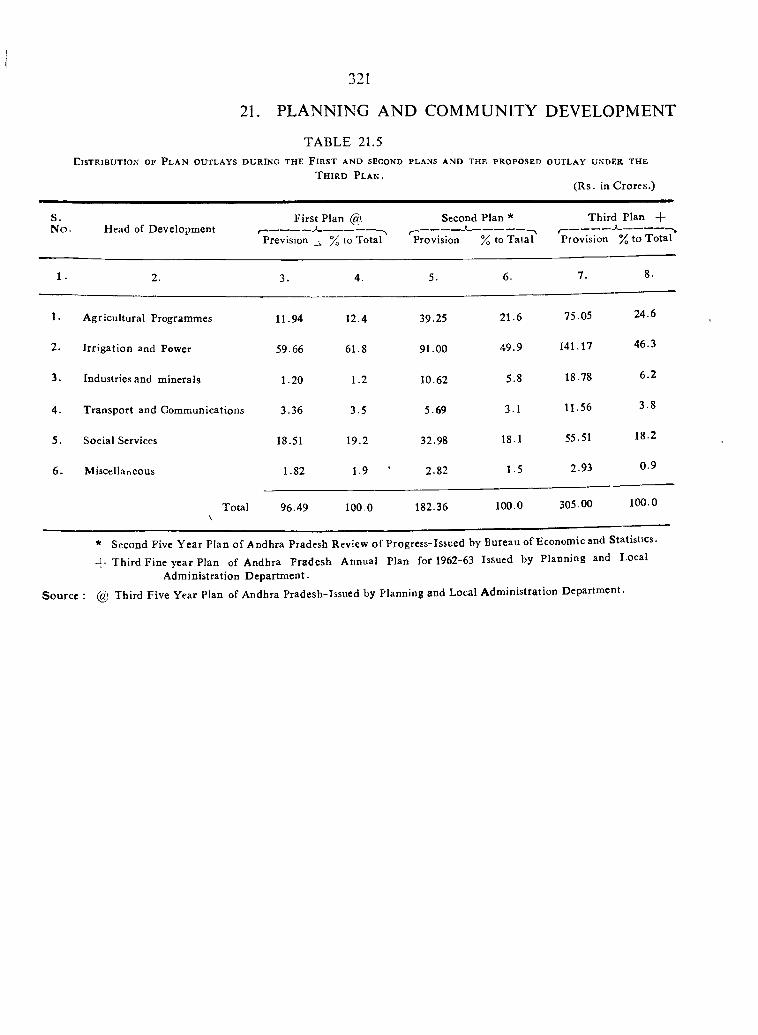
21. PLANNING AND COMMUNITY DEVELOPMENT
TABLE 21.5E i s t r i b u t i o n o f P l a n o u t l a y s d u r i n g t h e F i r s t a n d s e c o n d p l a n s a n d t h e p r o p o s e d o u t l a y u n d e r t h e
T h i r d P l a n .(R s. in C rores.)
321
S.N o . Head of Developm ent
F irst Plan @ Second Plan * T hird Plan +
Prevision % to Total Provision % to T atal Provision % to Total
1. 2. 3. 4. 5. 6. 7. 8.
1. A gricultural Programmes 11.94 12.4 39.25 21.6 75.05 24.6
2. Irriga tion and Power 59.66 61.8 91.00 49.9 141.17 46.3
3. Industries and minerals 1.20 1.2 10.62 5.8 18.78 6 .2
4. Transport and Communications 3.36 3.5 5.69 3.1 11.56 3.8
5. Social Services 18.51 19.2 32.98 18.1 55.51 18.2
6 . Miscellaneous 1.82 1.9 ' 2.82 1.5 2.93 0.9
Total 96.49 100.0 182.36 100.0 305.00 100.0
* Second Five Y ear Plan o f Andhra Pradesh Review o f Progress-Issued by Bureau of Economic and Statistics.
+ T h ird Fine year Plan of Andhra P radesh Annual Plan for 1962-63 Issued by P lanning and Local Adm inistration D epartm ent.
Source : @ Third Five Year Plan of Andhra Pradesh-Issued by Planning and Local A dm inistration D epartm ent,
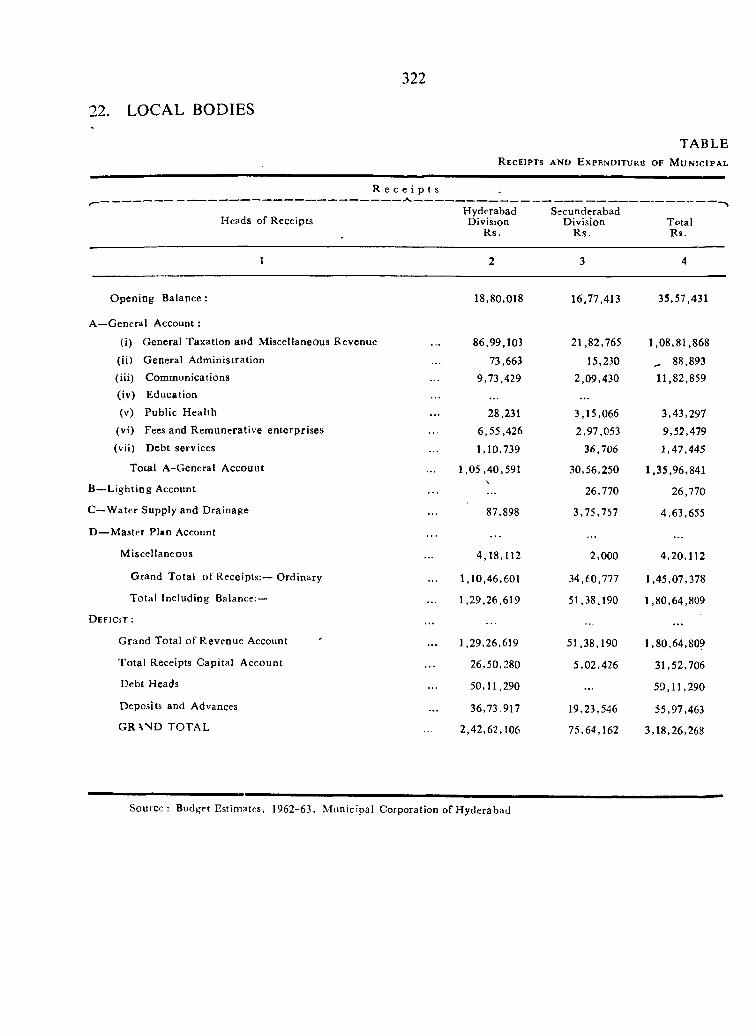
322
22. LOCAL BODIES
T A BLER e c e i p t s a n d E x p e n d i t u r e o f M u n i c i p a l
<—
Heads of Receipts
R e c e i p t s
HyderabadDivision
R s.
SecunderabadDivision
R s.TotalRs.
1 2 3 4
O pening Balance : 18,80,018 16,77,413 35,57,431
A—General Account :
(i) General Taxation and M iscellaneous Revenue 86.99,103 21,82,765 1,08,81,868(ii) General A dm inistration 73,663 15,230 ^ 88,893(iii) Communications 9,73,429 2,09,430 11,82,859(iv) Education
(v) Public H ealth 28,231 3,15,066 3,43,297(vi) Fees and R em unerative enterprises 6,55,426 2,97,053 9,52,479(vii) Debt services 1,10,739 36,706 1,47,445
Total A -General A ccount 1 ,05,40,591 30,56,250 1,35,96,841
B—L ighting Account\
26,770 26,770
C —W ater Supply and D rainage 87,898 3,75,757 4,63,655
D — Master Plan Account
M iscellaneous 4,18,112 2,000 4,20,112
G rand T otal o f Receipts:— Ordinary 1,10,46,601 34,60,777 1,45,07,378
Total Including Balance:— 1,29,26,619 51,38,190 1,80,64,809
D eficit : . . . • • •
G rand Total o f Revenue Account 1,29,26,619 51,38,190 1,80,64,809
T otal Receipts C apital Account . . . 26,50,280 5,02,426 31,52,706
Debt Heads 50,11,290 . . . 50,11,290
Deposits and Advances 36,73.917 19,23,546 55,97,463G R \N D TOTA L 2,42,62,106 75,64,162 3,18,26,268
Source: Budget Estimates, 1962-63, M unicipal Corporation of H yderabad

22.1CoiRPORATiON OF H y d e r a b a d , 1961-62
323
22. LOCAL BODIES
E x p e n d i t u r er -
Hyderabad SecunderabadHeads o f Expenditure Division
Rs.Division
Rs.T otal
Rs.
5 6 7 8
*A — G eoeja l A ccount:
(i) G eneral Taxation and M iscellaneous Revenue ... 13,90,424 77,450 14,67,874
(ii) G eneral Adm inistration 16,05,064 2,61,452 18,66,516
(iii) Communications 27,67,715 5,41,386 33,09,101
(iv) Education 23,695 7,338 3!,033(V) Public Health 27,97,591 6,69,368 34.66,959
(vi) Fees and R em unerative enterprises 3,20,367 69,255 3,89,622
(vii) D ebt services 23,004 39,158 62,162
T o ta l A—General A ccount 89,27,860 16,65,407 1,05,93.267
B—Lighting Account 3,33,975 1.27,042 4,61.017
C —W ater Supply and D rainage Account 6,31,353 4,32,045 10,63,398
D— M aster Plan Account . . . . . . . . .
Miscellaneous 4,42,879 . . . . . .
G rand total of Expenditure;— ordinary 1,03,36,067 22,24,494 . . .
SUIRPLUS . . . . . .
Closing Balance
(i) S tatutory 8,57,500 8,57,500
(ii) Utilisable 17,47,579 35,73,373 53,20,952
Total including Balance 1,29,41,146 57,97,867 1.82,96,134
T otal Expenditure (C apital) 26,36.770 2,586 26,38,355
D ebt Heads 50,11,290 50,11,290
Deposits and Advances 36,73,919 17,63,709 54,37,628
G R A N D TOTAL 2,42,62,125 75,64,162 3.18,26,286
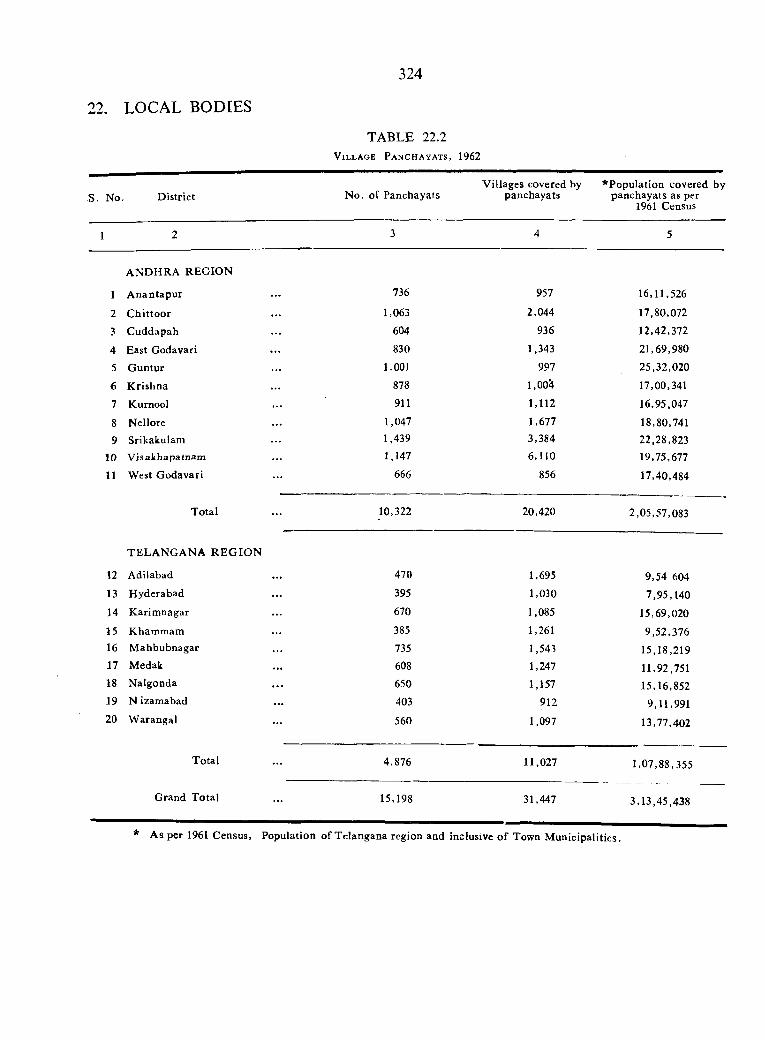
22. LOCAL BODIES
324
TABLE 22.2V i l l a g e P a n c h a y a t s , 1962
S. No. D istrict N o. of PanchayatsV illages covered by
panchayats*Population covered by
panchayats as per 1961 Census
1 2 3 4 5
A ND HRA REG IO N
1 A n a n t a p u r 736 957 16,11,526
2 C h ittoo r 1,063 2,044 17,80,072
3 C uddapah 604 936 12,42,372
4 East Godavari 830 1,343 21,69,980
5 G untur 1,001 997 25,32,020
6 K rishna 878 i ,o o i 17,00,341
7 Kurnool 911 1,112 16,95.047
8 Nellore 1,047 1,677 18,80,7419 Srikakulam 1,439 3,384 22.28,823
10 V i s a k h a p a t n a m 1,147 6,110 19,75,67711 West G odavari 666 856 17,40,484
Total 10,322 20,420 2,05,57,083
TELA N G A N A R E G IO N
12 Adilabad 470 1,695 9,54 60413 H yderabad 395 1,030 7.95,14014 K arim nagar 670 1,085 15,69,02015 Kham m am 385 1,261 9,52,37616 M ahbubnagar 735 1,54? 15,18,21917 Medak 608 1,247 11,92,75118 N algonda 650 1,157 15,16,85219 N izamabad 403 912 9,11,99120 W arangal 560 1,097 13,77,402
Total 4,876 11,027 1,07,88,355
G rand Total 15,198 31,447 3,13,45,438
* As per 1961 Census, Population of T riangana region and inclusive o f Town M unicipalities.
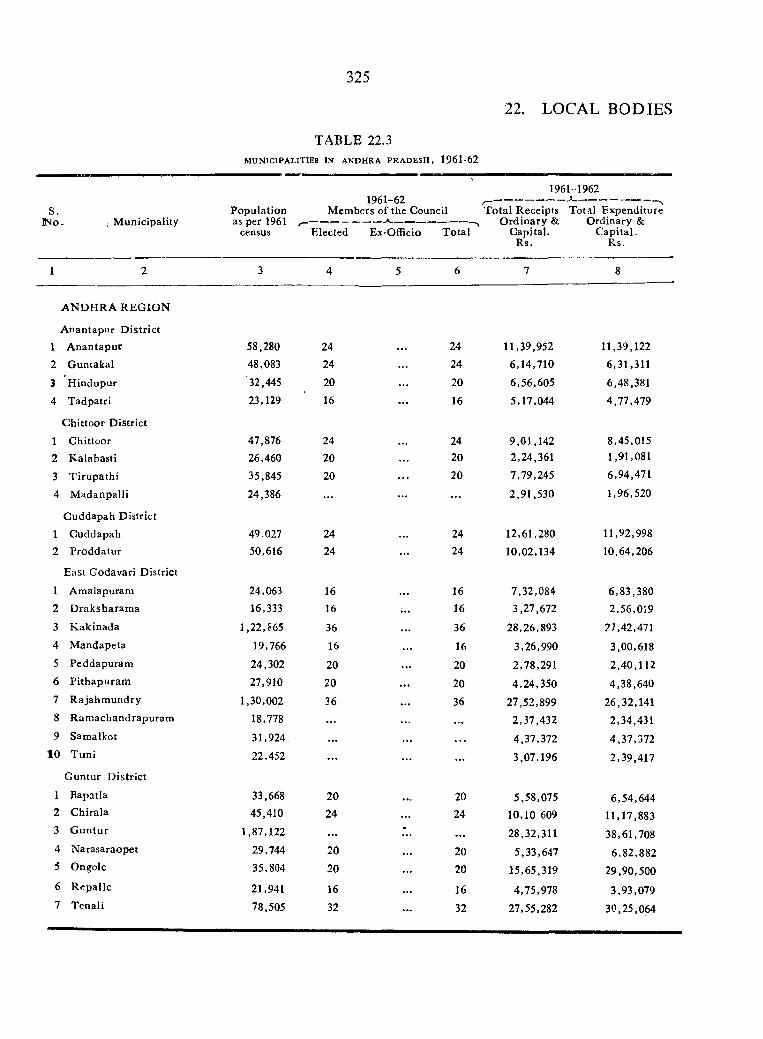
325
22. LOCAL BODIES
TABLE 22.3MUNICIPALITIES IN ANDHRA PRADESH, 1961-62
S.INo. , M unicipality
Population as per 1961
census
1961-62 M embers of the Council
Elected Ex-Officio T otal
1961-1962
T o ta l Receipts Total Expenditure O rd inary & Ordinary &
C apital, C apita l.Rs. Rs.
1 2 3 4 5 6 7 8
A N D H R A R E G IO N
A nantapur D istrict1 A nantapur 58,280 24 24 11,39,952 11,39,122
2 G untakal 48,083 24 24 6,14,710 6,31,311
3 H indupur 32,445 20 20 6,56,605 6,48,381
4 T adpatri 23,129 16 . . . 16 5,17,044 4,77,479
C hittoor D istrict
1 C hittoor 47,876 24 24 9,01,142 8,45,0!52 K alahasti 26,460 20 20 2,24,361 1,91,081
3 T irupa th i 35,845 20 . . . 20 7,79,245 6,94,471
4 M adanpalli 24,386 . . . . . . 2,91,530 1,96,520
C uddapah D istrict
1 C uddapah 49,027 24 . . . 24 12,61,280 11,92,998
2 P roddatur 50,616 24 . . . 24 10,02,134 10,64,206
E ast G odavari D istrict
1 Amalapuram 24,063 16 . . . 16 7,32,084 6,83,3802 D raksharam a 16,333 16 . . . 16 3,27,672 2,56,0193 K akinada 1,22,865 36 . . . 36 28,26,893 77,42,4714 M andapeta 19,766 16 . . . 16 3,26,990 3,00,6185 Peddapuram 24.302 20 . . . 20 2,78,291 2,40,1126 P ithapuram 27,910 20 . . . 20 4,24,350 4,38,6407 R ajahm undry 1,30,002 36 . . . 36 27,52,899 26,32,1418 R am achandrapuram 18,778 . . . . . . . . . 2,37,432 2,34,4319 Samalkot 31,924 . . . . . . . . . 4,37,372 4,37,372
10 T uni 22,452 . . . . . . 3,07,196 2,39,417
G untur D istric t
1 Bapatia 33,668 20 . . . 20 5,58,075 6,54,6442 C hirala 45,410 24 24 10,10 609 11,17,8833 G u n tu r 1,87,122 . . .
•. . . 28,32,311 38,61,708
4 N arasaraopet 29,744 20 . . . 20 5,33,647 6,82,8825 Ongole 35,804 20 . . . 20 15,65,319 29,90,5006 R«;palle 21,941 16 . . . 16 4,75,978 3,93,0797 Tenali 78,505 32 . . . 32 27,55,282 30,25,064
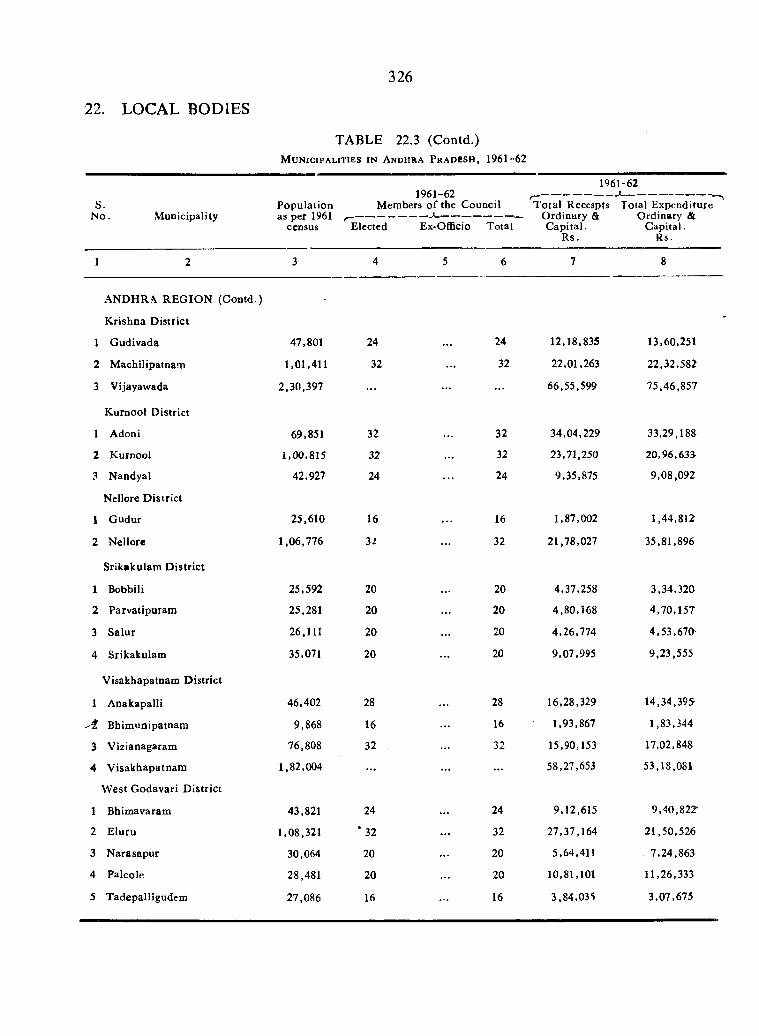
22. LOCAL BODIES
326
TABLE 22.3 (Contd.)M u n i c i p a l i t i e s i n A n d h r a P r a d e s h , 1 9 6 1 -6 2
S.N o. Municipality
Population as per 1961
census
1961-62 Members o f the Council
Elected Ex-Officio Total
1961-62
T ota l Recespts Total Expenditure O rdinary & Ordinary & C apital. C apital.
R s. Rs.
1 2 3 4 5 6 7 8
ANDHRA R E G IO N (C ontd .)
K rishna D istrict
1 G udivada 47,801 24 24 12,18,835 13,60,251
2 M achilipatnam 1,01,411 32 . . . 32 22,01,263 22,32,582
3 Vijayawada 2,30,397 . . . . . . . . . 66.55,599 75,46,857
K urnool D istrict
1 Adoni 69,851 32 . . . 32 34,04,229 33,29,188.
2 Kurnool 1,00,815 32 . . . 32 23,71,250 20 ,96 ,63J
3 Nandyal 42,927 24 24 9,35,875 9,08,092
Neilore D istric t
1 G udur 25,610 16 . . . 16 1,87,002 1,44,812
2 Neilore 1,06,776 32 . . . 32 21,78,027 35,81,896
Srikakulam D istrict
1 Bobbin 25,592 20 . . . 20 4,37,258 3,34,320
2 Parvatipuram 25,281 20 . . . 20 4,80,168 4,70,157
3 Salur 26,111 20 . . . 20 4,26,774 4,53,670
4 Srikakulam 35,071 20 . . . 20 9,07,995 9,23,555
Visakhapatnam D istrict
1 A nakapalli 46.402 28 28 16,28,329 14,34,395
^ Bhim unipatnam 9,868 16 . . . 16 1,93,867 1,83,344
3 Vizianagaram 76,808 32 . . . 32 15,90,153 17,02,848
4 V isakhapatnam 1,82,004 . . . . . . . . . 58,27,653 53,18,081
W est G odavari D istrict
1 Bhimavaram 43,821 24 . . . 24 9,12,615 9,40 ,822
2 E luru 1,08,321 '3 2 32 27,37,164 21,50,526
3 N arasapur 30,064 20 . . . 20 5,64,411 7,24,863
4 Palcole 28,481 20 . . . 20 10,81,101 11,26,333
5 TadepalHgudem 27,086 16 . . . 16 3,84,035 3,07,675
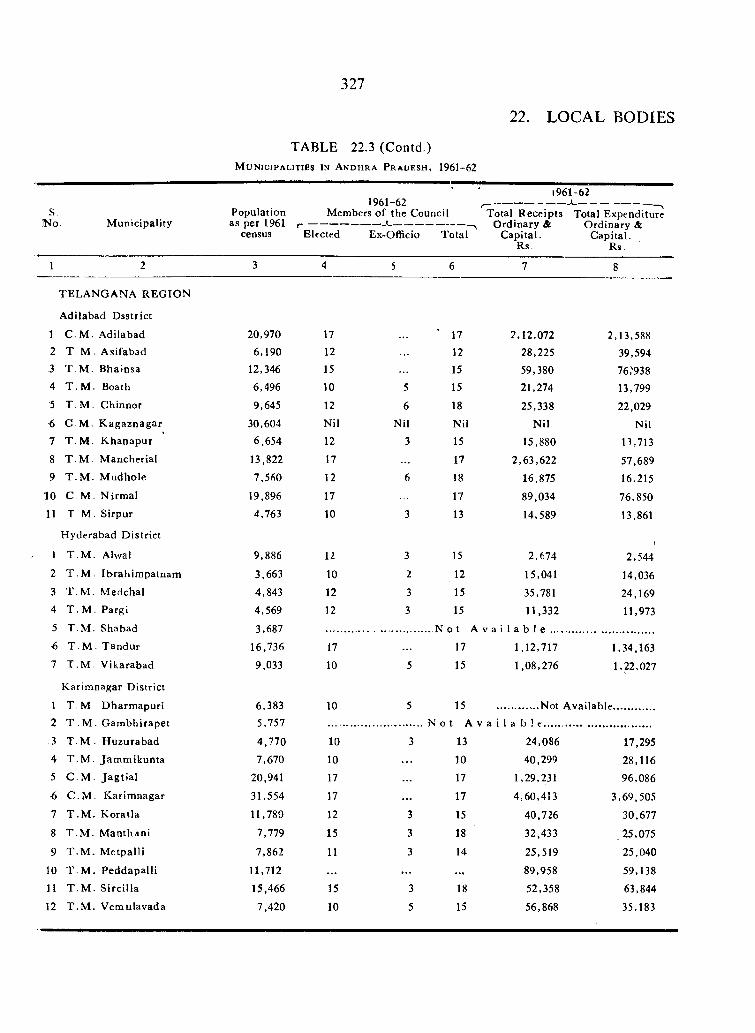
327
T A B L E 22.3 (C on td .)
M u n i c i p a l i t i e s in A n d h r a P r a d e s h , 1961-62
22. LOCAL BODIES
s .INo. M unicipality
1 9 6 1 - 6 2Population Members o f the Councilas per 1961 ,------------------------*-----------------------
census Elccted Ex-Officio Total
1961-62
Total R eceipts Total Expenditure O rdinary & O rdinary &
C apital. C apital.Rs. Rs
1 2 3 4 5 6 7 8
TELA N G A N A R EG IO N
Adilabad D sstrict
1 C M . Adilabad 20,970 17 ■ 17 2,12,072 2,13,5882 T .M . A sifabad 6,190 12 12 28,225 39,5943 T .M . Bhainsa 12,346 15 15 59,380 76,^9384 T .M . Boath 6,496 10 5 15 21,274 13,7995 T M. Chinnor 9,645 12 6 18 25,338 22,0296 C M. K agaznagar 30,604 Nil Nil Nil N il N il7 T .M . K hanapur 6,654 12 3 15 15,880 13,7138 T .M M ancherial 13,822 17 17 2,63,622 57,6899 T .M . M udhole 7,560 12 6 18 16,875 16,215
10 C .M .N irm a l 19,896 17 17 89,034 76,85011 T M . S irpur
H yderabad D istrict
4,763 10 3 13 14,589 13,861
) T .M . Alwal 9,886 12 3 15 2,674 2,5442 T .M . Ibrahim patnam 3,663 10 2 12 15,041 14,0363 T .M . M edchal 4,843 12 3 15 35,781 24,1694 T .M . Pargi
5 T .M . Shabad
4,569
3,687
16,736
12 3 15 11,332
1 a b 1 e
11,973
^ T .M . T andur 17 17 1,12,717 1,34,1637 T .M V ikarabad 9,033 10 5 15 1,08,276 1,22,027
K arim nagar D istrict
1 T .M . D harm apuri 6,383 10 5 15 ............ Not A vailable................2 T . M . G am bhirapet 5,757 ■ N o t A v a i l
3 T .M . H uzurabad 4,770 10 3 13 24,086 17,2954 T .M . Jam m ikun ta 7,670 10 10 40,299 28,1165 C M . Jag tia l 20,941 17 17 1,29,231 96,086S C .M . K arim nagar 31,554 17 . . . 17 4,60,413 3,69,5057 T .M . K oralla 11,780 12 3 15 40,726 30,677
8 T .M . M anthani 7,779 15 3 18 32,433 .25,075
9 T .M . M etpalli 7,862 11 3 14 25,519 25,040
10 T .M . Peddapalli 11,712 . . . . . . . . . 89,958 59,13811 T .M . S ircilla 15,466 15 3 18 52,358 63,844
12 T .M . V em ulavada 7,420 10 5 15 56,868 35,183
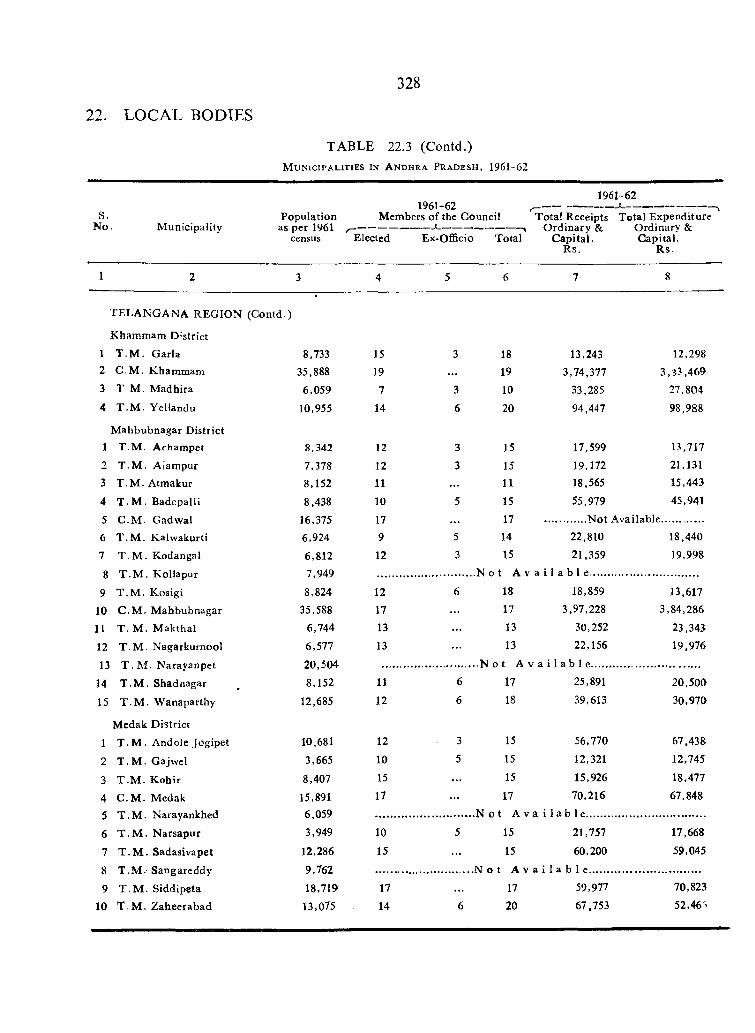
22. LOCAL BODIES
328
TABLE 22.3 (Contd.)M u n i c i p a l i t i e s i n A n d h r a P r a d e s h , 1961-62
S.N o . M unicipality
Population as per 1961
census
1961-62 Members o f the Council
f _
1961-62
T otal Receipts T otal E xpenditure O rd inary & O rdinary &
C ap ita l. C apital.R s. R s.
Elected Ex-Officio T otal
1 2 3 4 5 6 7 8
TELA N G A N A R EG IO N (C ontd .)
Kham m am D 'stric t1 T .M . G arla 8,733 15 3 18 13,243 12,2982 C .M . Kham m am 35,888 19 . . . 19 3,74,377 3 ,3?,4693 T M . M adhira 6,059 7 3 10 33,285 27,804
4 T .M . Y ellandu 10,955 14 6 20 94,447 98,988
M ahbubnagar D istrict1 T .M . A cham pet 8,342 12 3 15 17,599 13,717
2 T .M . A lam pur 7,378 12 3 15 19,172 21,131
3 T .M . Atmakur 8,152 11 11 18,565 15,443
4 T .M . B adepalli 8,438 10 5 15 55,979 45,941
5 C .M . G adw al 16,375 17 . . . 17
6 T .M . K alw akurti 6,924 9 5 14 22,810 18,440
7 T .M . Kodangal 6,812 12 3 15 21,359 19,998
8 T .M . K ollapur 7,949 N o t A V a i 1 a b 1 e .......
9 T .M . Kosigi 8,824 12 6 18 18,859 13,617
10 C .M . M ahbubnagar 35,588 17 17 3,97,228 3,84,286
11 T .M . M akthal 6,744 13 13 30,252 23,343
12 T .M . N agarkurnool 6,577 13 . . . 13 22,156 19,976
13 T . M . N arayanpet 20,504
14 T .M . Shadnagar 8,152 11 6 17 25,891 20,500
15 T .M . W anaparthy 12,685 12 6 18 39,613 30,970
M edak D istrict
1 T .M . Andole Jogipet 10,681 12 3 15 56.770 67,438
2 T .M . Gajwel 3,665 10 5 15 12,321 12,745
3 T .M . K ohir 8,407 15 . . . 15 15,926 18,477
4 C .M . M edak 15,891 17 . . . 17 70,216 67,848
5 T .M . Narayankhed 6,059
6 T .M . N arsapur 3,949 10 5 15 21,757 17,668
7 T .M . Sadasivapet 12,286 15 . . . 15 60,200 59,045
fi TT ■ Sfl^riffsrpHriv 9,762 N o t A V a i I a b 1 e .......o Ji • x v x • ci j . y
9 T .M . S iddipeta 18,7!9 17 . . . 17 59,977 70,823
10 T .M . Z aheerabad 13,075 14 6 20 67.753 52,46^^
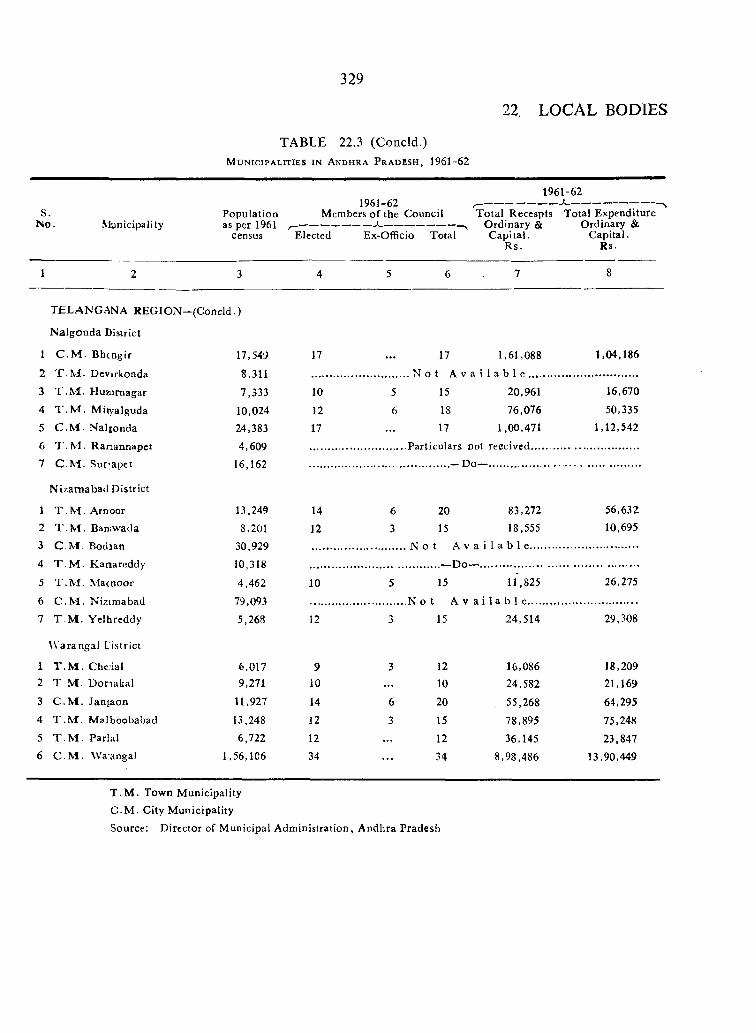
329
22. LOCAL BODIES
TABLE 22.3 (Concld.)M u n i c i p a l i t i e s i n A n d h r a P r a d e s h , 1961-62
S.N o . Municipality
Population as per 1961
census
1961-62 Members o f the Council
Elected Ex-OflBcio Total
1961-62
T ota l Recespts Total Expenditure O rdinary & Ordinary & C apital. C apital.
R s. Rs.
1 2 3 4 5 6 7 8
TELANGANA REGION--(C o n c ld .)
N algonda District
1 C .M . Bhcngir 17,549 17 ... 17 1,61,088 1,04,186
8 311
3 T .M . Huzurnagar 7,333 10 5 15 20,961 16,670
4 T .M . Mirv'alguda 10,024 12 6 18 76,076 50,335
5 C .M . N aljonda 24,383 17 ... 17 1,00,471 1,12,542
6 T .M . R anannapet 4,6097 C.N^. Sur^apct 16,162 ___ _ r > n _ ....... ...... .. .
N izam abad D istrict
1 T .M . Arnoor 13.249 14 6 20 83,272 56,632
2 T .M . Baniwada 8,201 12 3 15 18,555 10,695
3 C M Bodian 30,929
4 T .M . K anareddy 10,318 ....... —Do
5 T .M . M acnoor 4,462 10 5 15 11,825 26,275
6 C .M . N izim abad 79,093 . N o t A V a i 1 a b 1 R..........
7 T .M . Y elhreddy 5,268 12 3 15 24,514 29,308
W arangal Cistrict
1 T .M .C h e ia l 6,017 9 3 12 16,086 18,2092 T M . D o n ak a l 9,271 10 ... 10 24,582 21,169
3 C .M . Janjaon 11,927 14 6 20 55,268 64,295
4 T .M . M alboobabad 13,248 12 3 15 78,895 75,2485 T .M . Parlal 6,722 12 ... 12 36,145 23,8476 C M . \Va:anga] 1,56,106 34 ... 34 8,98,486 13,90,449
T .M . Town M unicipality
C .M . City M unicipality
Source: D irector of M unicipal Adm inistration, A ndhra Pradesh
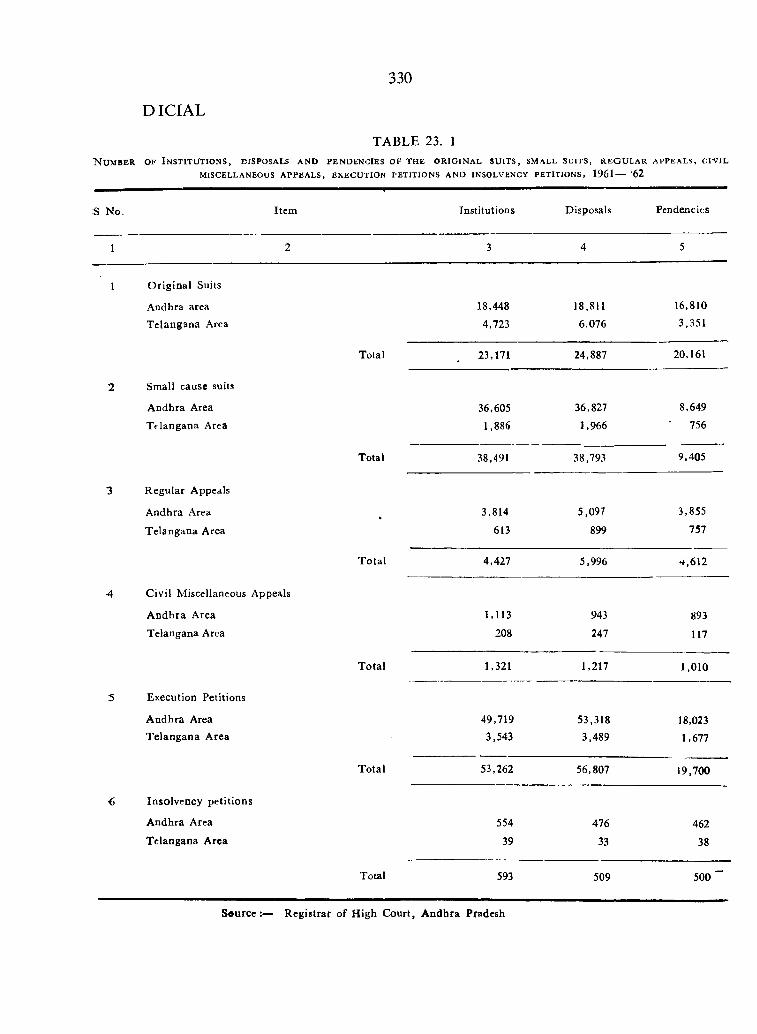
330
DICIAL
N u m b e r o f I n s t i t u t i o n s , d i s p o s a l s a n d p e n d e n c i e s o f t h e o r i g i n a l s u i t s , s m a l l s u i t s , r e g u l a r a p p e a l s , c i v i l
MISCELLANEOUS A PPEA LS, EX ECU TIO N PETITIONS A ND INSOLVENCY PETITIONS, 1961— '62
TABLE 23. 1
S No. Item Institutions Disposals Pendencies
1 2 3 4 5
1 O rig inal Suits
Andhra area T elangana Area
18,448
4,723
18,811
6,076
16,8103,351
Total 23,171 24,887 20,161
2 Small cause suits
A ndhra Area
T tlangana Area36,605
1,886
36,827
1,966
8,649
• 756
Total 38,491 38,793 9,405
3 R egular Appeals
A ndhra Area
T elangana Area•
3,814
613
5,097
899
3,855
757
T otal 4,427 5,996 4,612
4 Civil Miscellaneous Appeals
A ndhra Area
Telangana Area
1,113
208
943
247
893
117
T otal 1,321 1,217 1.010
5 Execution Petitions
A ndhra Area T elangana Area
49,7193,543
53,3183,489
18,023
1,677
Total 53,262 56,807 19,700
Insolvency petitions
A ndhra Area
Telangana Area
554
39
476
33
462
38
Total 593 509 5 0 0 '“
S ou rce :— R egistrar of H igh C ourt, A ndbra Pradesh
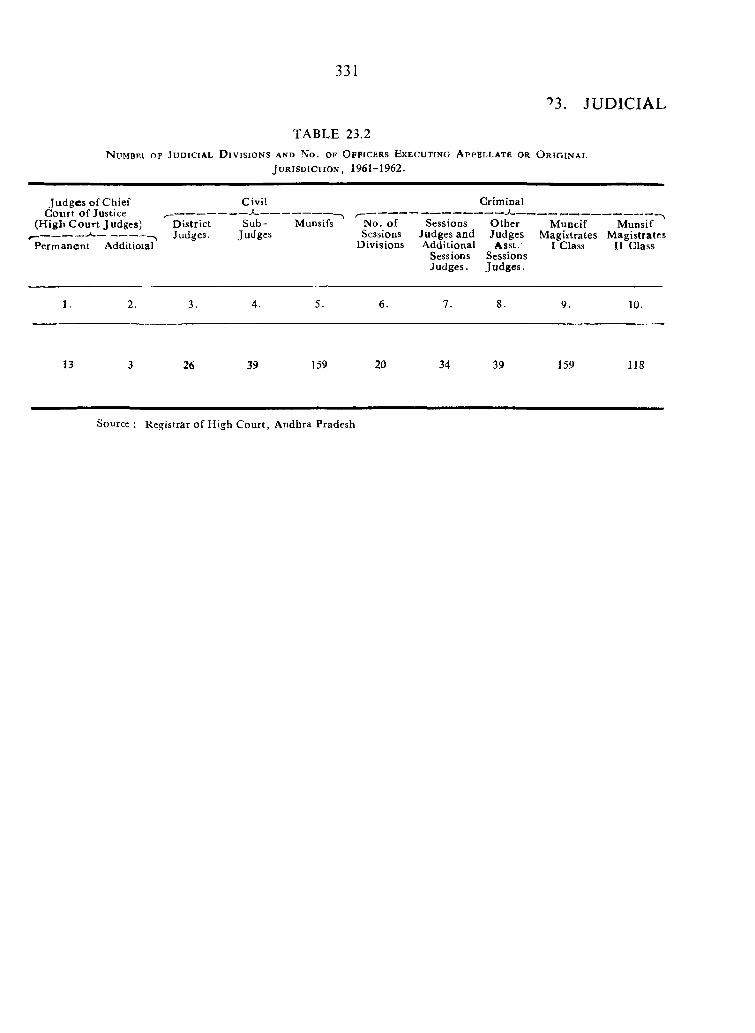
331
?3. JUDICIAL
TABLE 23.2N u m b e i o f J u d i c i a l D i v i s i o n s a n d N o . o f O f f i c e r s E x e c u t i n g A p p e l l a t e o r O r i g i n a l
J u r i s d i c t i o n , 1961-1962.
Ju d g es o f C hief C ourt o f Justice
(H igh C o u rt J udges)
Perm anent Additioiai
D istrictJudges.
C ivil
Sub-Judges
Munsifs No. o f Sessions
D ivisions
Sessions Judges and Additional
Sessions Judges.
Crim inal
O therJudgesA sst.'
SessionsJudges.
M uncif M agistrates
I Class
M unsif M agistrates
II Class
1. 2. 3. 4. 5. 6. 7. 8. 9. 10.
13 3 26 39 159 20 34 39 J59 118
Source ; Registrar o f High C ourt, Andhra Pradesh
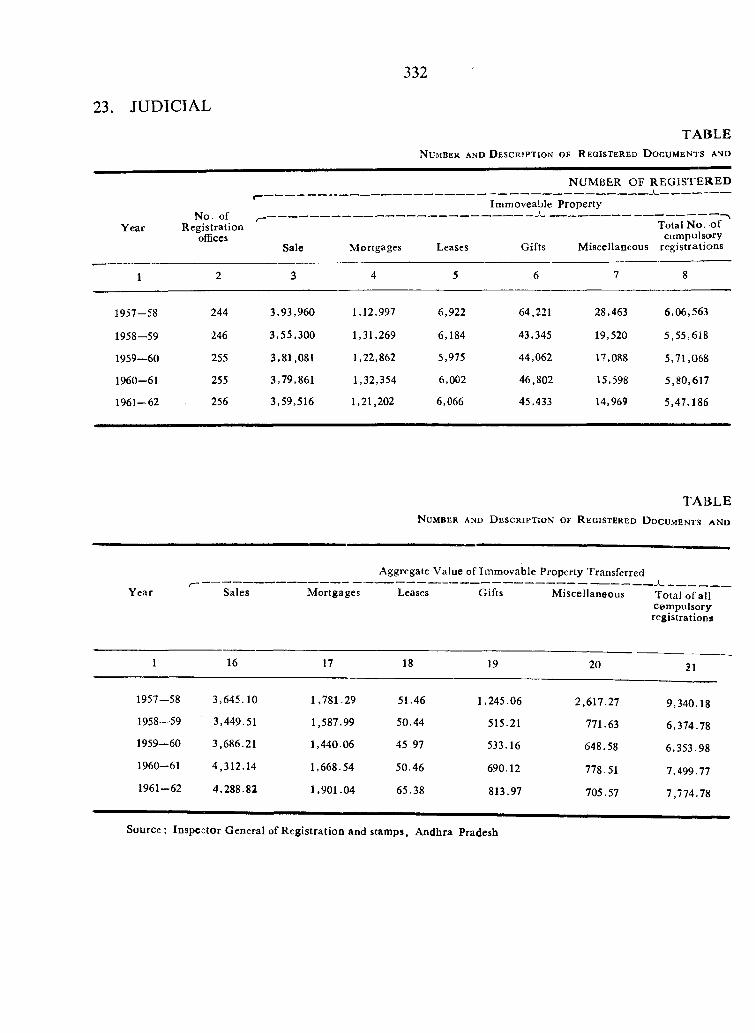
332
23. JUDICIAL
TABLEN u m b e r a n d D e s c r i p t i o n o f R e g i s t e r e d D o c u m e n t s a n d
NUM BER OF R E G IS T E R E D
Im moveable Property
YearN o. of
Registration ofRces
r~
Sale Mortgages Leases Gifts M iscellaneous
Total N o. of cumpulsary
registrations
1 2 3 4 5 6 7 8
1957-58 244 3,93,960 1,12,997 6,922 64,221 28,463 6,06,563
1958-59 246 3,55,300 1,31,269 6,184 43,345 19,520 5,55,618
1959—60 255 3,81,081 1,22,862 5,975 44,062 17,088 5,71,068
1960-61 255 3,79,861 1,32,354 6,002 46,802 15,598 5,80,617
1961-62 256 3,59,516 1,21,202 6,066 45,433 14,969 5,47,186
TA BLEN u m b e r a n d D e s c r i p t i o n o f R e g i s t e r e d D o c u m e n t s a n d
Year Sales
Aggregate V alue of Im m ovable Property Transferred
M ortgages Leases Gifts M iscellaneous Total of all cem pulsory registrations
1
1957—58
1958—59
1959—60
1960—61
1961—62
16
3,645.10
3,449.51
3.686.21
4,312.14
4.288.82
17 18
1,781.29
1,587.99
1,440.06
1,668.54
1,901.04
51.46
50.44
45.97
50.46
65.38
19
1,245.06
515.21
533.16
690.12
813.97
20
2,617.27
771.63
648.58
778.51
705.57
21
9,340.18
6,374.78
6,353.98
7.499.77
7.774.78
Source ; Inspector G eneral of R egistration and stam ps, Andhra Pradesh
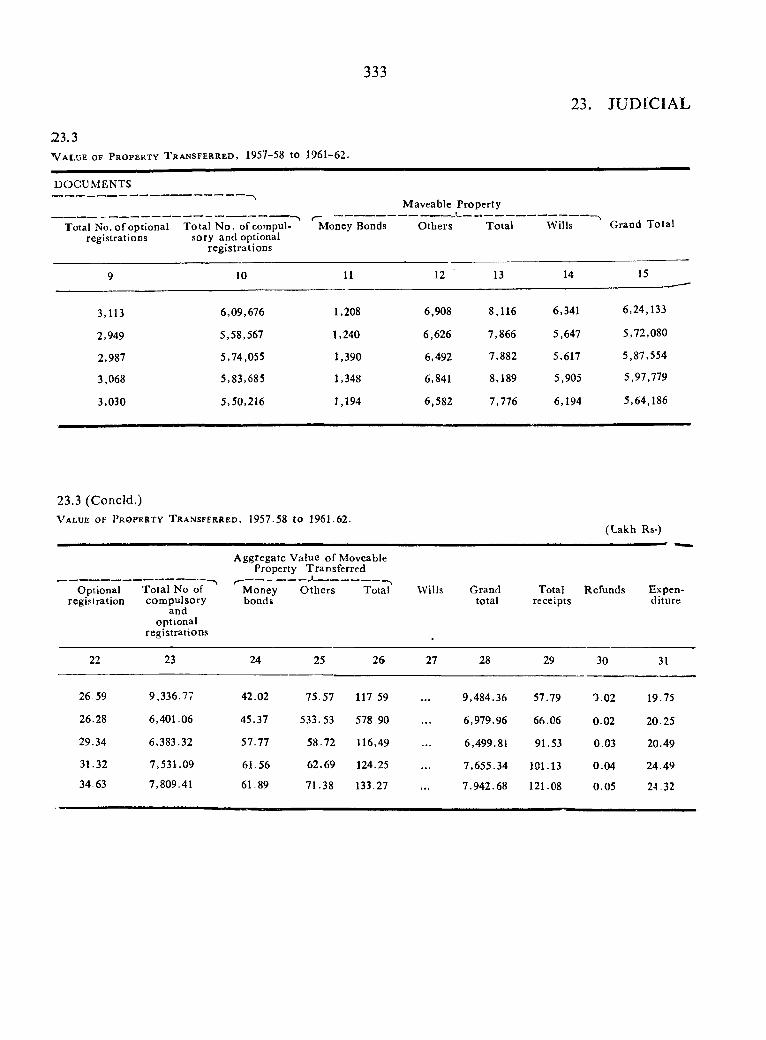
333
23. JUDICIAL
V a l u e o f P r o p e r t y T r a n s f e r r e d , 1957-58 to 1961-62.23 .3
DOCUM ENTS
Total No. o f optional T otal N o . of compul- registrations sory and optional
registrations
Maveablc Property
Money Bonds O thers T otal Wills Grand T otal
9 10 11 12 13 14 15
3,113 6,09,676 1,208 6,908 8,116 6,341 6,24,133
2,949 5,58,567 1,240 6,626 7,866 5,647 5,72,080
2,987 5,74,055 1,390 6,492 7,882 5,617 5,87,554
3,068 5,83,685 1,348 6,841 8,189 5,905 5,97,779
3,030 5,50,216 1,194 6,582 7,776 6,194 5,64,186
23.3 (Concld.)V a l u e o f P r o p e r t v T r a n s f e r r e d , 1957.58 to 1961.62.
(Lakh Rs-)
A ggregate V alue o f Moveable Property Transferred
Optionalregistration
T otal No of com pulsory
andoptional
registrations
Moneybonds
O thers Total Wills G randtotal
Totalreceipts
Refunds Expenditure
22 23 24 25 26 27 28 29 30 31
26.59 9,336.77 42.02 75.57 117 59 . . . 9,484.36 57.79 0.02 19.75
26.28 6,401.06 45.37 533.53 578.90 . . . 6,979.96 66.06 0.02 20.25
29.34 6,383.32 57.77 58.72 116,49 6,499.81 91.53 0.03 20.49
31.32 7,531.09 61.56 62.69 124.25 7,655.34 101.13 0.04 24 49
34 63 7,809.41 61.89 71.38 133.27 7.942.68 121.08 0.05 24.32
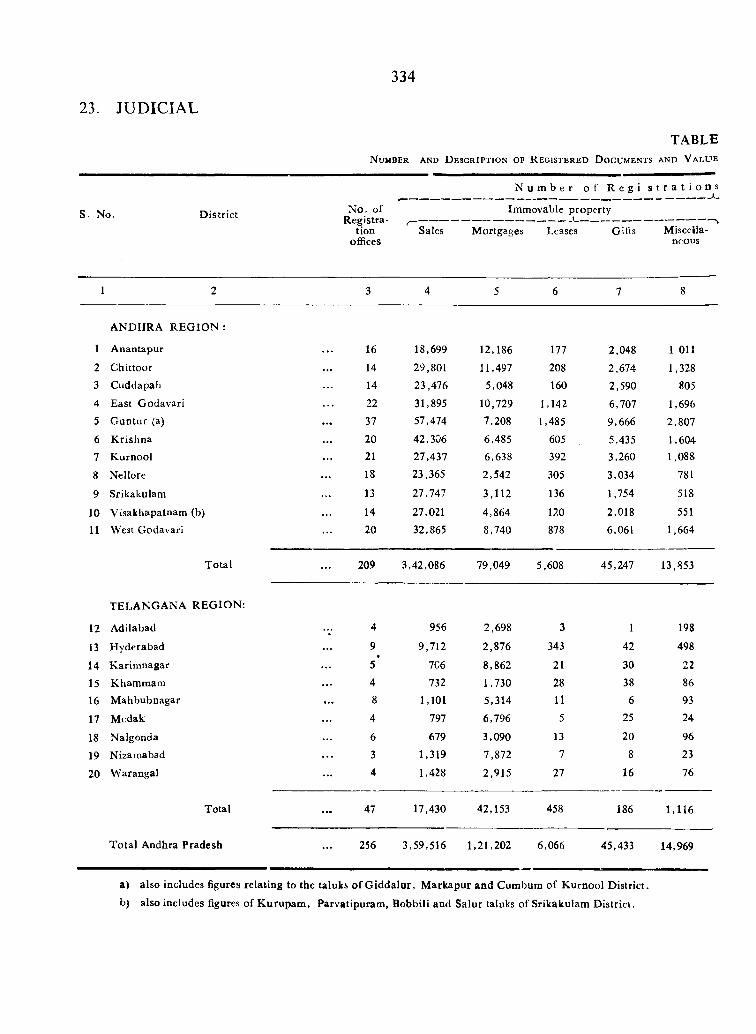
23. JUDICIAL
334
T A B L BN u m b e r a n d D e s c r i p t i o n o f R e g i s t e r e d D o c u m e n t s a n d V a l u e
S. No. D istrict N o. of R egistra
tion offices
Sales
N u m b e r o f R e g i
Immovable property
Mortgages Leases Gifts
s t r a t i o n s
Miscellaneous
1 2 3 4 5 6 7 8
ANDHRA R E G IO N ;
1 A nantapur . . . 16 18,699 12,186 177 2,048 1 Oil2 Chittoor 14 29,801 11,497 208 2,674 1,3283 Cuddapah 14 23,476 5,048 160 2,590 8054 East G odavari 22 31,895 10,729 1,142 6,707 1,6965 G untur (a) . . . 37 57,474 7,208 1,485 9,666 2,8076 K rishna 20 42,306 6,485 605 5,435 1,6047 Kurnool 21 27,437 6,638 392 3,260 1,088
8 Nellore . . . 18 23,365 2,542 305 3,034 781
9 Srikakulam • . • 13 27,747 3,112 136 1,754 518
10 V isakhapatnam (b) . . . 14 27,021 4,864 120 2,018 55111 West Godavari 20 32,865 8,740 878 6,061 1,664
Total . . . 209 3,42,086 79,049 5,608 45,247 13,853
TELA NG AN A R EG IO N :
12 Adilabad 4 956 2,698 3 1 198
13 Hyderabad 9 9,712 2,876 343 42 498
14 K arim nagar . . .f
5 7C6 8,862 21 30 22
15 Khammam . . . 4 732 1,730 28 38 86
16 M ahbubnagar . . . 8 1,101 5,314 11 6 93
17 Medak 4 797 6,796 5 25 24
18 Nalgonda 6 679 3,090 13 20 96
19 Nizamabad . . . 3 1,319 7,872 7 8 23
20 VVarangal 4 1,428 2,915 27 16 76
Total . . . 47 17,430 42,153 458 186 1,116
T otal Andhra Pradesh . . . 256 3,59,516 1,21,202 6,066 45,433 14,969
a) also includes figures relating to the taluks o f G iddalur, M arkapur and Cumbum of K urnool D istrict.
b) also includes figures o f K urupam , Parvatipuram , Bobbili and Salur taluks of Srikakulam D istrict.
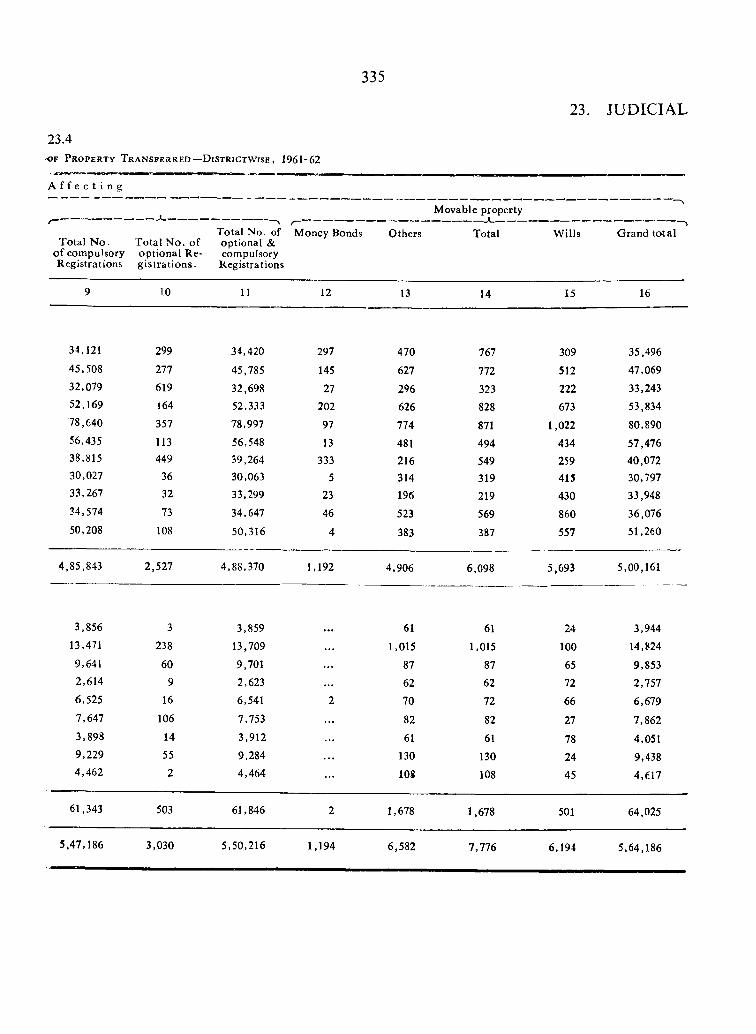
335
23. JUDICIAL
OF P r o p e r t y T r a n s f e r r e d — D i s t r i c t w i s e , 1961-62
23.4
A f f e c t i n g
Total N o. o f compulsory Registrations
T otal N o . of optional R eg is tra tions.
Total No. of optional & compulsory
Registrations
Money Bonds Others
Movable property
Total W ills Grand tot al
9 10 11 12 13 14 15 16
34,121 299 34,420 297 470 767 309 35,49645,508 277 45,785 145 627 772 512 47,06932,079 619 32,698 27 296 323 222 33,24352.169 164 52,333 202 626 828 673 53,83478,640 357 78,997 97 774 871 1,022 80,89056,435 113 56,548 13 481 494 434 57,47638,815 449 39,264 333 216 549 259 40,07230,027 36 30,063 5 314 319 415 30,79733,267 32 33,299 23 196 219 430 33,94834,574 73 34,647 46 523 569 860 36,07650,208 108 50,316 4 383 387 557 51,260
4,85,843 2,527 4,88,370 1,192 4,906 6.098 5,693 5,00,161
3,856 3 3,859 61 61 24 3,94413,471 238 13,709 1,015 1,015 100 14,8249,641 60 9,701 . . . 87 87 65 9,8532,614 9 2,623 . . . 62 62 72 2,7576,525 16 6,541 2 70 72 66 6,6797,647 106 7,753 . . . 82 82 27 7,8623,898 14 3,912 61 61 78 4,0519,229 55 9,284 . . . 130 130 24 9,4384,462 2 4,464 108 108 45 4,617
61,343 503 61,846 2 1,678 1,678 501 64,025
5,47,186 3,030 5,50,216 1,194 6,582 7,776 6.194 5,64,186
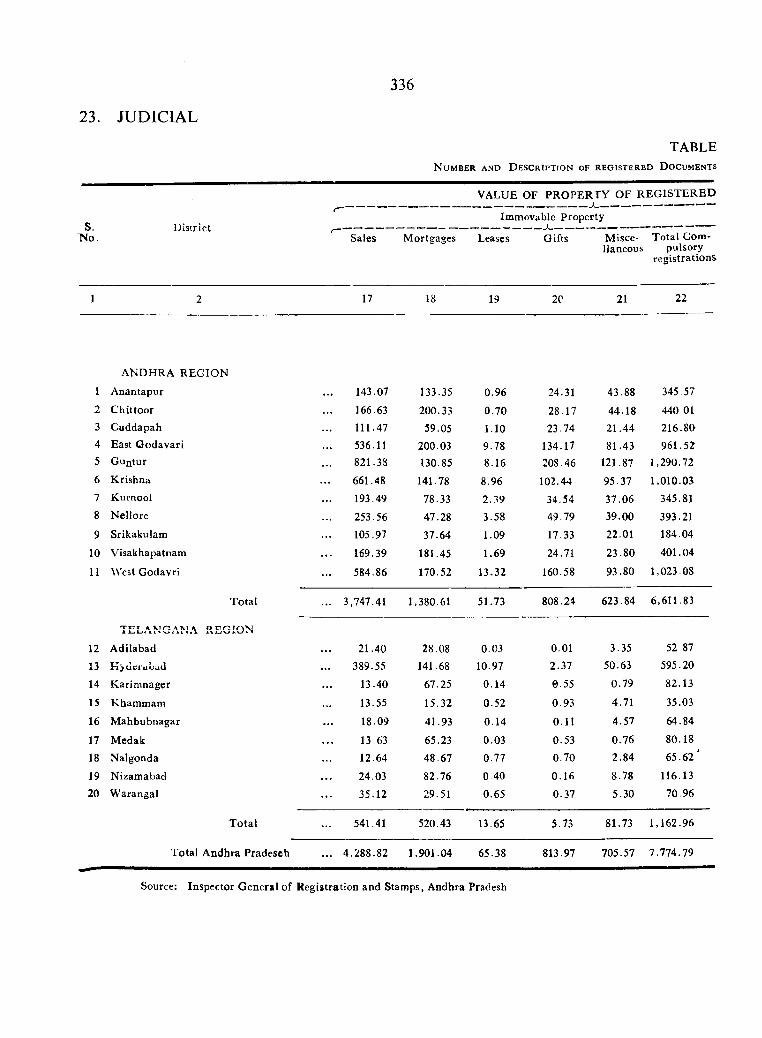
23. JUDICIAL
336
TABLEN u m b e r a n d D e s c r i p t i o n o f r e g i s t e r e d D o c u m e n t s
S.TNo.
DistrictSales Mortgages
VALUE OF PRO PERTY O F R E G IST E R E D
Immovable Property
Leases Gifts Misce- Total Gom- llaneous pulsory
registrations^
1 2 17 18 19 20 21 22
A NDHRA R EG IO N
1 Anantapur 143.07 133.35 0.96 24.31 43.88 345.57
2 C hittoor 166.63 200.33 0.70 28.17 44.18 440 013 Cuddapah 111.47 59.05 1.10 23.74 21.44 216.804 East G odavari 536.11 200.03 9.78 134.17 81.43 961.525 Gu0tur 821.38 130.85 8.16 208.46 121.87 1,290.726 K rishna 661.48 141.78 8.96 102.44 95.37 1,010.037 Kurnool 193.49 78.33 2.39 34.54 37.06 345.818 Nellore 253.56 47.28 3.58 49.79 39.00 393.21
9 Srikakulam 105.97 37.64 1.09 17.33 22.01 184.04
10 Visakhapatnam 169.39 181.45 1.69 24.71 23.80 401.04
11 West G odavri 584.86 170.52 13.32 160.58 93.80 1,023.08
T otal ... 3,747.41 1,380.61 51.73 808.24 623.84 6,611.83
TELA N G A N A REG IO N
12 A dilabad 21.40 28.08 0.03 0.01 3.35 52.87
13 H'y uci'auud 389.55 141.68 10.97 2.37 50.63 595.20
14 K arim nager 13.40 67.25 0.14 0.55 0.79 82.13
15 Khammam 13.55 15.32 0.52 0.93 4.71 35.03
16 M ahbubnagar 18.09 41.93 0.14 0.11 4.57 64.84
17 Medak 13.63 65.23 0.03 0.53 0.76 80.18
18 Nalgonda 12.64 48.67 0.77 0.70 2.84 6 5 .6 2 '
19 Nizamabad 24.03 82.76 0.40 0.16 8.78 116.13
20 W arangal 35.12 29.51 0.65 0.37 5.30 70.96
T otal 541.41 520.43 13.65 5.73 81.73 1,162.96
T otal A ndhra Pradesch ... 4,288.82 1,901.04 65.38 813.97 705.57 7.774.79
Source: Inspector G eneral of R egistration and Stamps, Andhra Pradesh
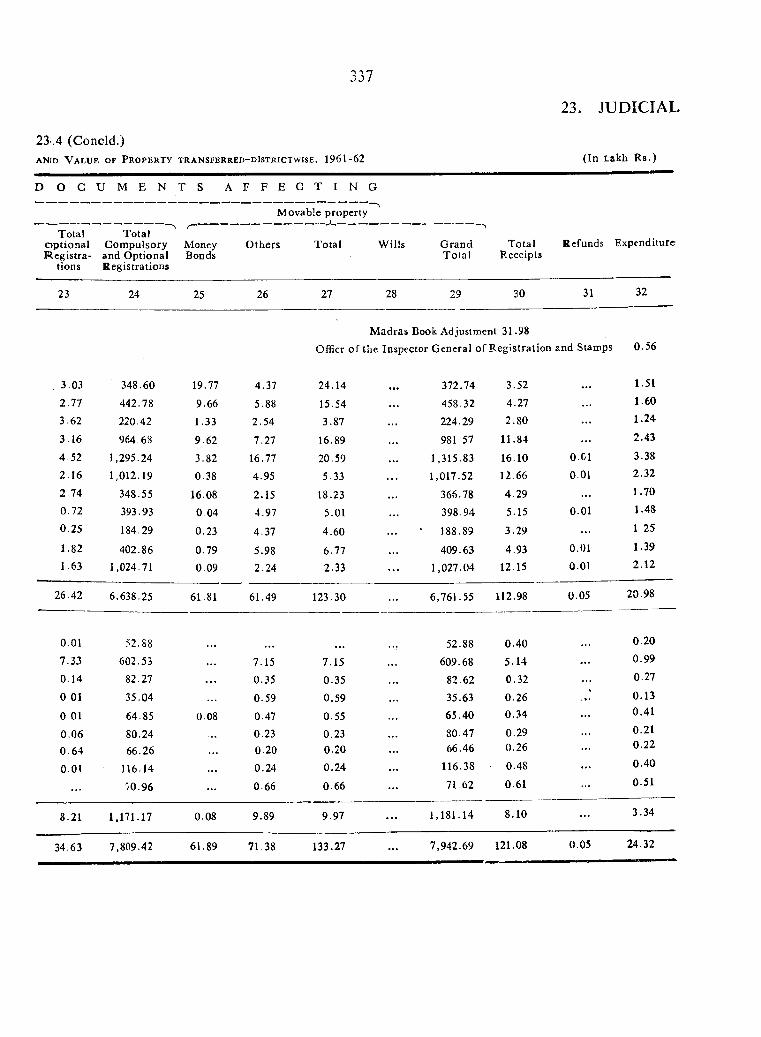
23. JUDICIAL
23..4 (Condd.)ANiD V a l u e o f P r o p e r t y t r a n s f e r r e d - d i s t r i c t w i s e , 1961-62 (In Lakh R s.)
D O C U M E N T S A F F E C T I N G
Total Totalo p tio n a l C om pulsory MoneyR egistra- and O ptional Bonds
tions Registrations
M ovable property
O thers T otal W ills G rand T otal Refunds ExpenditureT o ta l Receipts
23
3.03
2.77
3.62
3.16
4.52
2.16
2.74
0.72
0.25
1.82
1.63
24
348.60
442.78
220.42
964.68
1,295.24
1,012.19
348.55
393.93
184.29
402.861,024.71
25 26 27 28 29 30 31 32
M adras Book Adjustment 31.98 Officr o f the Inspector G eneral o f R egistration and Stamps 0.56
19.77
9.66
1.33
9.62
3.82
0 38
16.08
0.04
0.23
0.79
0.09
4.37
5.88
2.54
7.27
16.77
4.95
2.154.97
4.37
5.98 2.24
24.14
15.543.87
16.89
20.59
5.33
18.23
5.01
4.60
6.772.33
372.74
458.32
224.29
981 57
1,315.83
1,017.52
366.78
398.94
188.89
409.63 1,027.04
3.52
4.272.80
11.84
16.1012.66
4.29
5.15
3.29
4.9312.15
0.010.01
0.01
0.01Q.Ol
1.51
1.601.24
2.43
3.38 2.32
1.70
1.48
1 25
1.39 2.12
26.42 6,638.25 61.81 61.49 123.30 6,761.55 112.98 0.05 20.98
0.01 52.88 52.88 0.40 0.20
7.33 602.53 7.15 7.15 . . . 609.68 5.14 . . . 0.99
0.14 82.27 . . . 0.35 0.35 82.62 0.32 . . . 0.27
0 01 35.04 0.59 0,59 . . . 35.63 0.26 . . . 0.13
0 01 64.85 0.08 0.47 0.55 65.40 0.34 0.41
0.06 80.24 . • • 0.23 0.23 . . . 80.47 0.29 0.21
0.64 66.26 0.20 0.20 . . . 66.46 0.26 0.22
0.01 116.14 f • • 0.24 0.24 . . . 116.38 0.48 . . . 0.40
. . . '/0.96 . . . 0.66 0.66 71.62 0.61 . . . 0.51
8.21 1.171.17 0.08 9.89 9.97 . . . 1,181.14 8.10 . . . 3.34
34.63 7,809.42 61.89 71.38 133.27 . . . 7,942.69 121.08 0.05 24.32
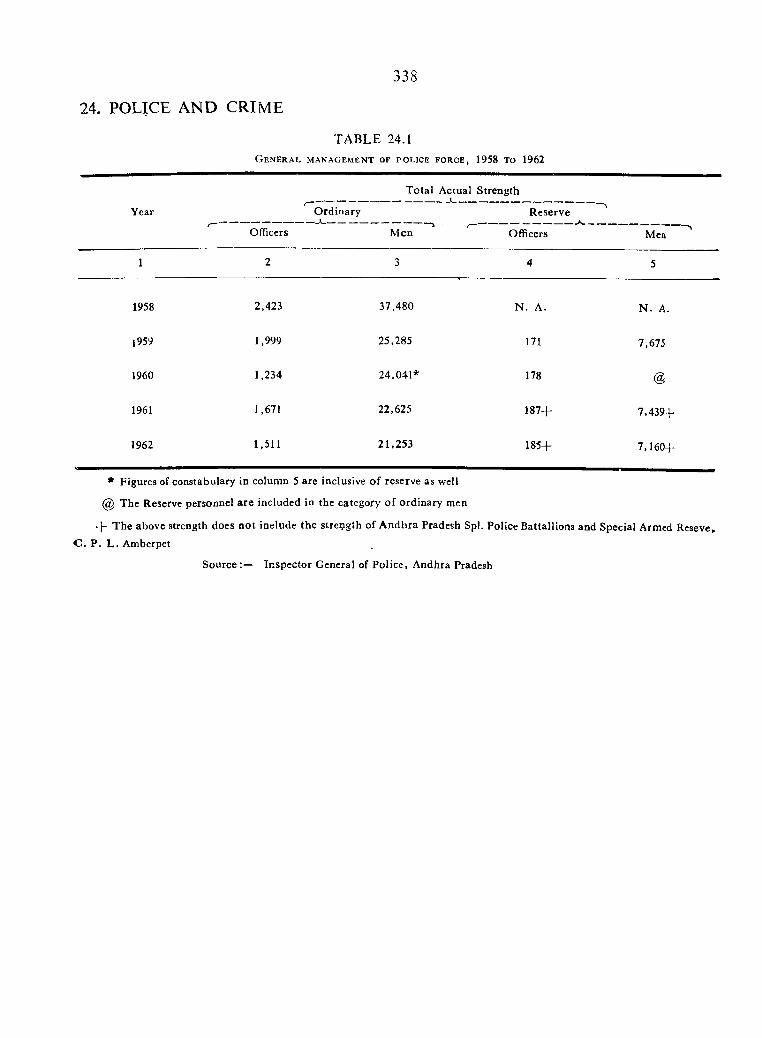
338
24. POLICE AND CRIME
TABLE 24.1G e n e r a l m a n a g e m e n t o f p o l i c e f o r c e , 1958 t o 1962
Year
Officers
T otal Actual Strength
O rdinary Reserve
M en Officers Men
1 2 3 4 5
1958 2,423 37,480 N . A. N . A.
]959 1,999 25,285 171 7,675
1960 1,234 24,041* 178 @
1961 1,671 22,625 187+ 7,439+
1962 1,511 21,253 185+ 7,160+
* Figures of constabulary in column 5 are inclusive o f reserve as well
@ The Reserve personnel a re included in the category o f ordinary men
T he above strength does n o t include the strength of A ndhra Pradesh Spl. Police Battallions and Special Armed Reseve, C . P . L . Amberpet
Source Inspector General of Police, Andhra Pradesh
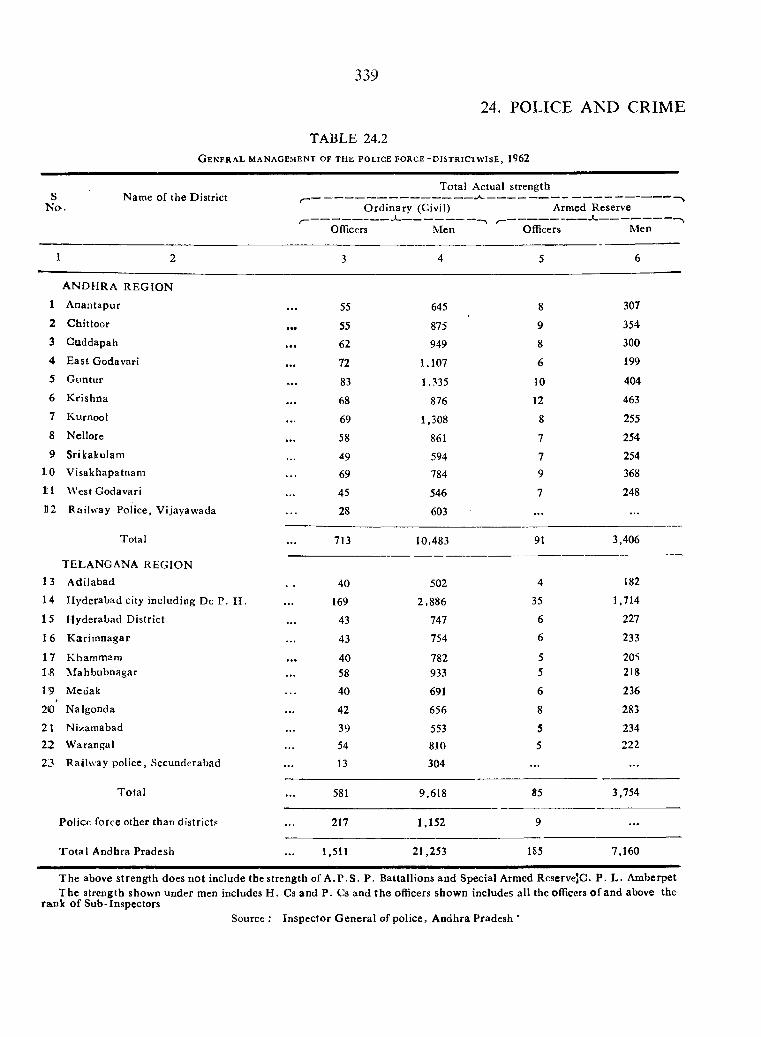
339
24. POLICE AND CRIME
T A B L E 24.2
G e n e r a l m a n a g e m e n t o f t h e p o l i c e f o r c e - d i s t r i c t w i s e , 1962
S Name of the D istrict N o .
t----Total Actual strength
O rd inary (Civil) Armed Reserve
Officers M en Officers Men
1 2 3 4 5 6
A N D H R A R E G IO N
1 A naiitapur ... 55 645 8 307
2 C hittoor 55 875 9 354
3 Guddapah ... 62 949 8 300
4 E ast Godavari ... 72 1.107 6 199
5 G untur ... 83 1,335 10 404
6 K rishna ... 68 876 12 4637 Kurnool 69 1,308 8 2558 Nellorc ... 58 861 7 2549 Srikakulam 49 594 7 254
10 V isakhapatnam 69 784 9 368
ill West Godavari ... 45 546 7 248
112 Railway Police, V ijayaw ada 28 603 ...
Total ... 713 10,483 91 3,406
TELANGANA R EG IO N 13 A dilabad 40 502 4 182
14 H yderabad city including Dc P. H . ... 169 2,886 35 1,714
1 5 H yderabad D istrict ... 43 747 6 227
16 K arim nagar 43 754 6 233
17 K ham m am ... 40 782 5 20*!18 M ahbubnagar ... 58 933 5 218
1 '9 M edak 40 691 6 236
2(0 N algonda ... 42 656 8 283
2 1 N izam abad ... 39 553 5 23422 W arangal 54 810 5 222
23 Railway po lice , Secunderabad ... 13 304 ...
T ota l ... 581 9,618 85 3,754
Police force other than districts 217 1,152 9 ...
T o ta l Andhra Pradesh ... 1,511 21,253 1S5 7,160
T he above strength does no t include the strength of A .P . S. P . Battallions and Special Armed RescrveJC. P . L . AmberpetT he strength shown under men includes H . Cs and P. Cs and th e officers show n includes all the officers o f and above the
rank o f Sub-InspectorsSource : Inspector G eneral of police, A ndhra Pradesh *
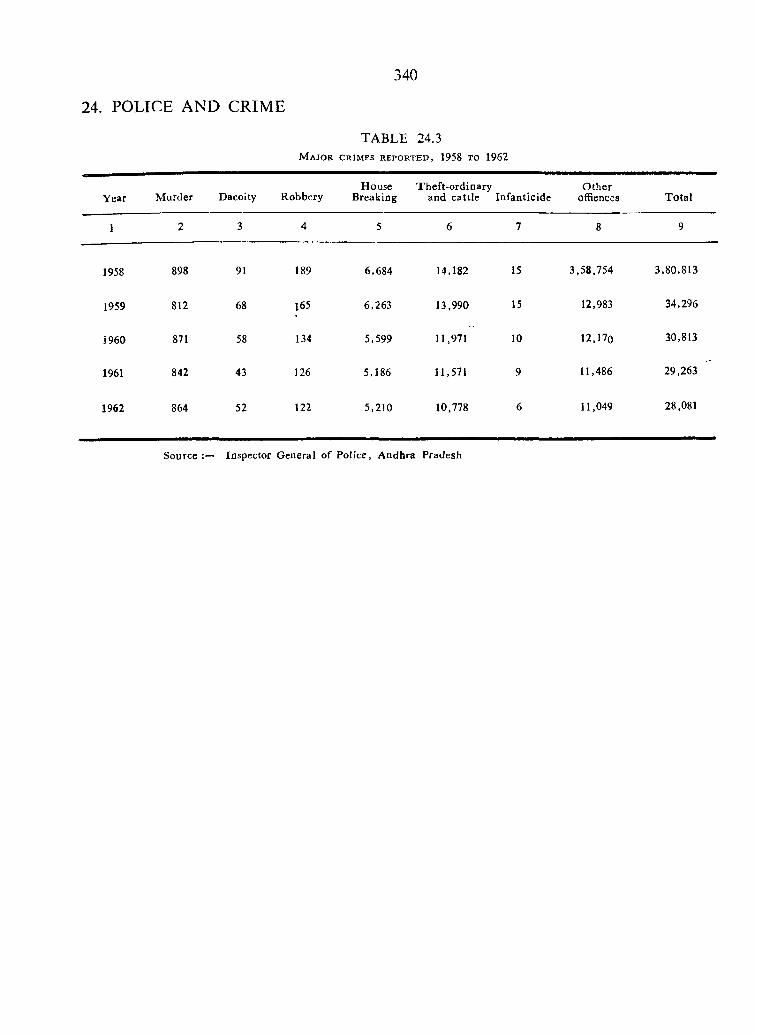
340
24. POLICE AND CRIME
T A B L E 24.3 M a j o r c r i m e s r e p o r t e d , 1958 t o 1962
House Theft-ordinary O therYear M urder Dacoity Robbery Breaking and cattle Infanticide offiences T otal
1958 898 91 189 6,684 14,182 15 3,58,754 3,80,813
1959 812 68 I65 6,263 13,990 15 12,983 34,296
i960 871 58 134 5,599 11,971 10 12,170 30,813
1961 842 43 126 5,186 11,571 9 11,486 29,263
1962 864 52 122 5,210 10,778 6 11,049 28,081
Source * Inspector General of Police, Andhra Pradesh

341
24. POLICE AND CRIME
TABLE 24.4M a j o r a n d t o t a l c o g n i z a b l e c r i m e s r e p o r t e d - d i s t r i c t w i s e , 1962 (T rue cases)
sN(0.
D istrict M urder Dacoity Robbery Housebreaking
Theft : ordinary &
cattleInfanticide O ther
offencesTotal
1 2 3 4 5 6 7 8 9 10
ANDHRA R E G IO N
, 1 A nantapur 61 2 3 284 516 1 553 1,420
2 G hittoor 51 . . . 13 365 705 1 595 1,730
3 Cuddapah 99 6 3 330 627 ... 689 1,754
4 East Godavari 43 1 8 363 815 . . . 573 1 ,803
5 G untur 70 . . . 4 481 1,084 . . . 1,633 3,272
6 Krishna 32 1 6 400 705 931 2,075
7 Kurnool 104 4 5 310 490 4 723 1,640
8 Ncllore 39 2 2 290 470 351 1,154
9i
Srikakulam 27 2 6 273 500 . . . 572 1,380
HO V isakhapatnam 36 3 3 129 477 353 1,00111 West G odavari 31 3 335 610 . . . 565 1,544
112 Crimes detected in (Vijayawada)
Railways 1 2 . . . 6 814 . . . 49 872
Total 594 23 56 3,566 7,813 6 7,587 19,645
TELANGANA R EG IO N
33 A dilabad 17 6 7 107 138 . . . 229 504
34 H yderabad 18 6 5 83 T61 179 452
15 K arim nagar 26 . . . 8 224 134 399 691
16 K hatnm am 25 1 1 99 219 321 666
17 M ahbubnagar 37 1 12 172 190 330 742
18 Medak 24 6 9 118 145 248 550
19 N algonda 36 . . . 5 113 . 179 . . . 500 833
2 0 Nizam abad 28 6 6 145 153 263 601
21 Ws ran gal 45 3 1 179 163 328 719
;22 H yderabad City 10 12 492 1,338 638 2,490
23 Crimes detected in (Secunderabad)
Railways 4 . . . 12 145 27 188
Total 27.0 29 66 1,644 2,965 6 3,462 8,436
T otal A ndhra Pradese 86.4 52 122 5,210 10,778 6 11,049 28,081
Source : Inspector G eneral o f Police, Andhra Pradesh
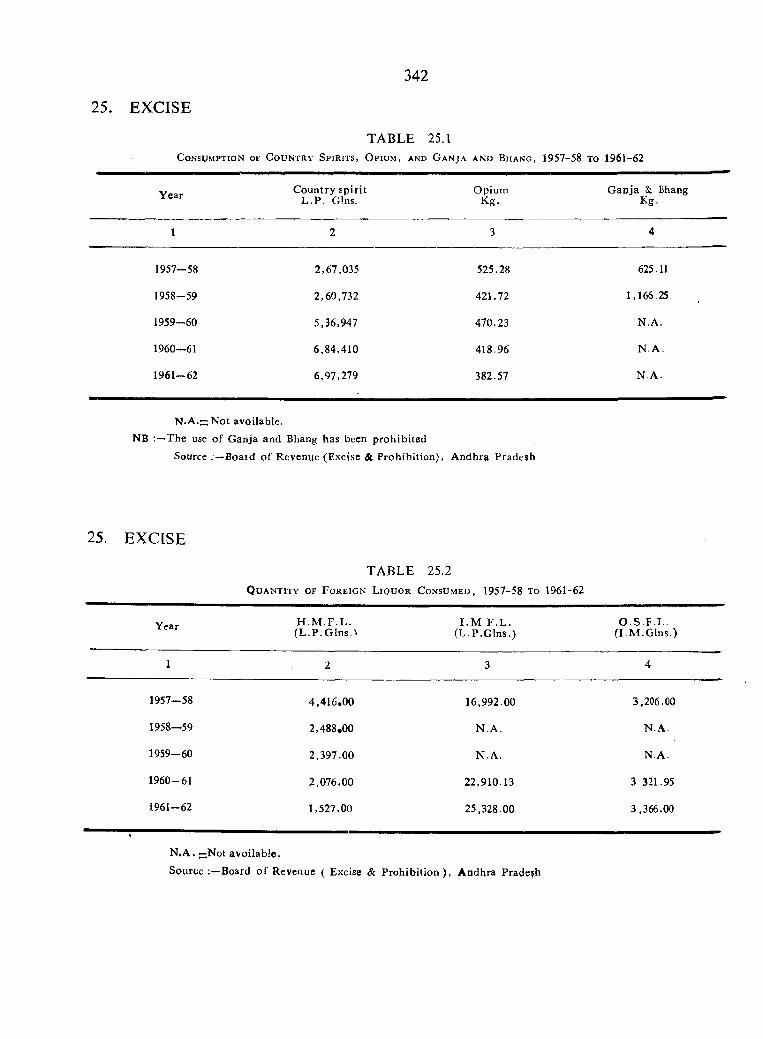
25. EXCISE
C o n s u m p t i o n
342
TABLE 25.1OF C o u n t r y S p i r i t s , O p i u m , a n d G a n j a AND B h a n g , 1957-58 t o 1961-62
Y ear C ountry sp irit O pium G an ja &. BhangL .P . Gins. K g. Kg.
1 2 3 4
1957-58 2,67,035 525.28 625.11
1958-59 2,60,732 421.72 1,166.25
1959-60 5,36,947 470.23 N.A.
1960—61 6,84,410 418.96 N .A .
1961—62 6,97,279 382.57 N .A .
N .A .= N ot avoilable.
NB The use of G anja and Bhang has been prohib ited
Source . —Boaid o f Revenue (Excise & Prohibition),, A ndhra Pradesh
25. EXCISE
TABLE 25.2Q u a n t i t y o f F o r e i g n L i q u o r C o n s u m e d , 1957-58 t o 1961-62
Year H .M .F .L . (L .P .G in s .)
I .M F .L . (L .P .G in s .)
O .S .F .L . (I .M .G in s .)
1 2 3 4
1957—58 4,416.00 16,992.00 3,206.00
1958—59 2,488.00 N .A . N .A .
1959-60 2,397.00 N .A . N .A.
1960-61 2,076.00 22,910.13 3 321.95
1961-62 1,527.00 25,328.00 3,366.00
N .A . —Not avoilable.
Source Board o f Revenue ( Excise & P ro h ib itio n ), A ndhra Prade?h

343
26 s o c r o ECONOMIC SURVEY
T A B L E 26.1P e r c e n t a g e D i s t r i b u t i o n o f E s t i m a t e d N u m b e r o f P o p u l a t i o n b y p e r C a p i t a M o n t h l y E x p e n d i t u r e C l a s s e s
M onth ly per Capita expenditure classes
in Rs.
R ural Urban State
Percentage C um ulative Percentage Cumulative Percentage Cum ulative percentage percentage percentage
1
0 - 8
8 -1 1
11-13
1 3 -1 5
15-18
18-21
2 1 -2 4
24—28
2 8 -3 4
3 4 -4 3
43—55
55 & a love
All Glasses
6.69
13.61
18.01
12.21
19.00
11.66
4.50
2.84
5.72
3.88
0 63
1.25
100.00
6.69
20.30
38.31
50.52
69.52
81.18
85.68
88.52
94.24
98.12
98 75
100.00
5.22
9.01
6 02
12.19
19.40
12.93
5.60
11.60
9.20
5.88
1.59
1.36
100.00
5.22
14.23
20.25
32.44
51.84
64.77
70.37
81.97
91.17
97.05
98.64
100.00
6.39
12.68
15.58
12 21
19.08
11.91
4.73
4.61
6.43
4.28
0.84
1.26
100.00
6.39
19.07
34.65
46.86
65.94
77.85
82.58
87.19
93.62
97.90
98.74
100.00
Soiree : 15th R ound, Socio Econom ic Survey, 1959-60, State sample
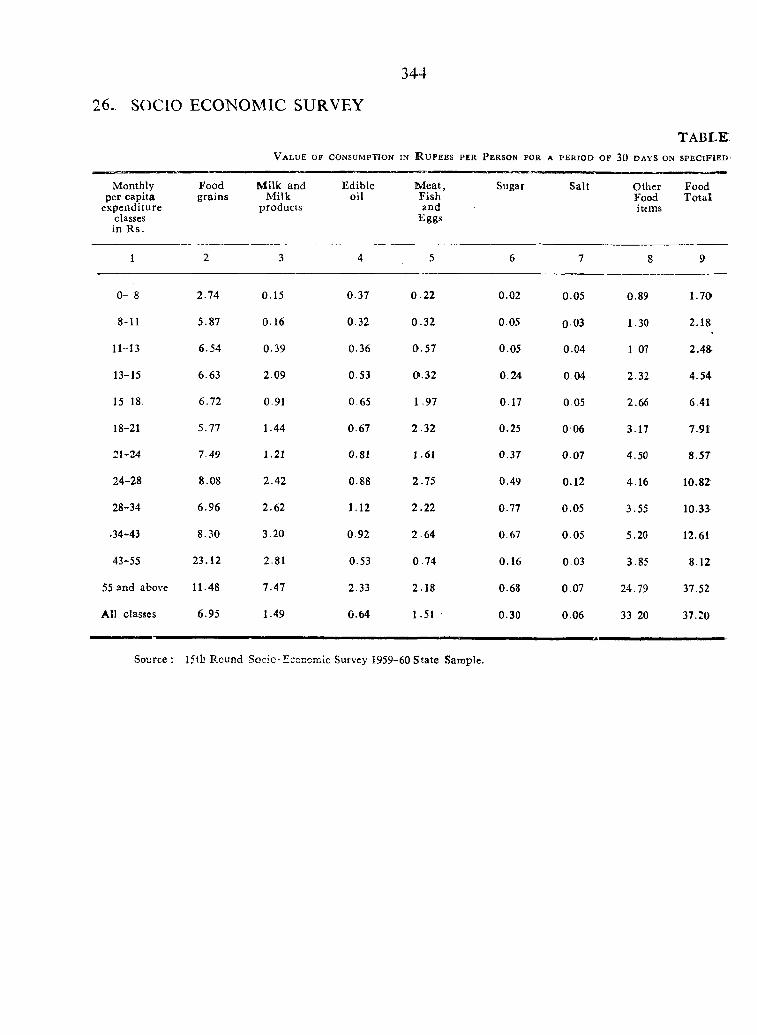
344
26. SOCIO ECONOMIC SURVEY
Monthly per capita
expenditure classcs in R s.
1
0 - 8
8-11
11-13
13-15
15-18.
18-21
21-24
24-28
28-34
►34-43
43-55
55 and above
All classes
T A B L EV a l u e o f c o n s u m p t i o n i n R u p e e s p e r P e r s o n f o r a p e r i o d o f 30 d a y s o n s p e c i f i e d
Foodgrains
M ilk and M ilk
products
Edibleoil
2.74
5.87
6.54
6.63
6.72
5.77
7.49
8.08
6.96
8.30
23.12
11.48
6.95
M eat,Fishand
Eggs
0.15
0.16
0.39
2.09
0.91
1.44
1.21
2.42
2.62
3.20
2.81
7.47
1.49
0.37
0.32
0.36
0.53
0 65
0.67
0.81
0.88
1.12
0.92
0.53
2.33
0.64
0.22
0 .32
0 .57
0>.32
1.97
2 .32
1.61
2.75
2.22
2 .64
0 .74
2.18
1.51
Sugar Salt O ther FoodFood T o ta litems
0.02 0.05 0.89 1.70
0.05 0 03 1.30 2.18
0.05 0.04 1 07 2.48-
0.24 0 04 2.32 4.54
0.17 0.05 2.66 6.41
0.25 0 06 3.17 7.91
0.37 0.07 4.50 8.57
0.49 0.12 4.16 10.82
0.77 0.05 3.55 10.33^
0.67 0.05 5.20 12.61
0.16 0 0 3 3.85 8.12
0.68 0.07 24.79 37.52
0.30 0.06 33 20 37.20
Source : 15th P.ound Socio-Eccncm ic Survey 1959-60 State Sample.
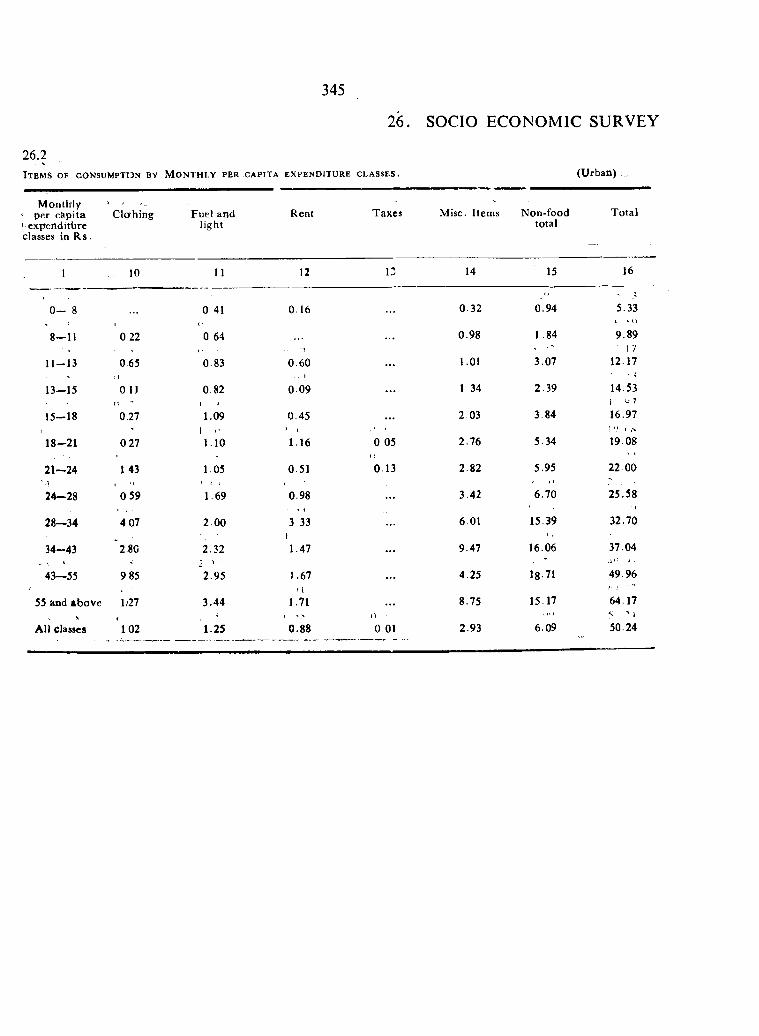
345
26. SOCIO ECONOMIC SURVEY
26.2. s.I t e m s o f c o n s u m p t h n b y M o n t h l y p e r c a p i t a e x p e n d i t u r e c l a s s e s .
M o n t h l y ’ ■' per capita Clofhing Fuel and' cxpertdifbre lightclasses in R s ■
Rent Taxes Misc. Items
(Urban)
Non-foodtotal
Total
10 11 12 13 14 15 16
0 - 8 . . . 0 41 0.16 0.32 0.94 5.33i '• O
8 -1 1 0 22( ■
0 64 0.98 1 .84 9.89■ A 1' ! 7
11-13 0.65 0.83 0 60 . . . 1.01 3.07 12.17' • I
13—15; \
o n . 0.82 0.09 . . . 1 34 2.39>
14.53I o 7
1 5 -1 8 o n1 '
1.09 0.45 . . . 2.03 3.84 16.97Mi t1
1 8 -2 1 0 27! ' • 1.10
J \
1.16 0 05 2.76 5.34: - ■ o
19.08
2 1 -2 4 1 43 1.05 0.51 0 13 2.82 5.95 22.00“ A
2 4 -2 8 0 59* I 1
1 69 0.98 . . . 3.42 6.70 25.58
2 8 -3 4 4 07 2.00i <
3 33 6.01 15.39 32.70
34-43 2 80 2.32!
1.47 . . . 9.47 16.06 37.04> 2 > •i<' >,
4 3 -5 5 9 85 2.95 1.67 . . . 4.25 18-71 49.96
55 and above li27 3.44/ i
1.71 . . . 8.75 15.17 64.17s i
All classes 102 1.25 0.88i 1
0.01 2.93 6.09 50.24
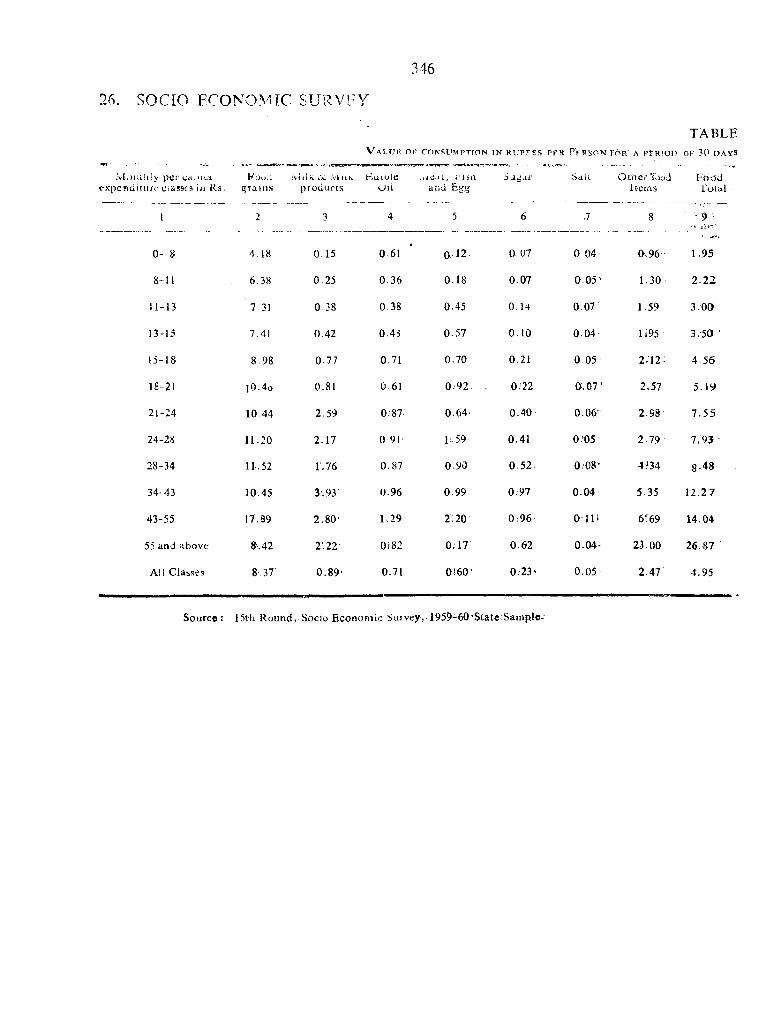
346
26. SOCIO ECONOMIC SURVFY
TABLEV a l u e o f coNSUMPTfON i n r u p fe s pf«' PfrsOn f o r a ptR'On o f 30 d a y s
ivijnihiy per ca,)iia F a u i iviiiii oc .'VI ilh. BiiiulecxpeFiditurc ciasses-iu . grains products Oil
■ uOtii, risd and Egg
I
0- 8
8-11
11-13
13-15
15-18
18-21
21-24
24-28
28-34
34-43
43-55
55 and above
All Classes
4.18
6.38
7 31
7.41
8-98
l0 .4 o
10 44
11.20
11.52
10.45
17.89
8'. 42
8.37'
0 .15
0.25
0.38
0.42
0.77
0.81
2.59
2.17
1.76
3'. 93
2.80'
2'. 22
0.89'
0 6 1
0 .3 6
0.38
0 .4 i
0 71
0.61
0:87'
0 91
0.87
0.96
1.29'
Oi82
0.71
0 12
0 .18
0.45
0 .57
0.70
0 .9 2
0.64
1^59
0 .90
0.99
2.20
0;17
0160
a 07
0.07
0.14
0.10
0.21
0.22-
0 .40
0.41
0 .52-
0.97
0:96
0.62-
0 .23 '
Ofiler 'food Items
FoddTotal
.7
0 04 -
0 .0 5 '
0.07-
0 .0 4 •
0 05
0 : 0 7 ’
0.06"
0.'05
0.08'
0 .04
0 H i
0.04-
0.05
0.96
1.30
1 59
l i95
2 ;i2
2.57
2,98
2.79
4?34
5 .35 ■
6^69
23.00
2.47
1.95
2.22
3 .00
3.-50 '
4 56
5 .1 9
7 .5 5
7 .9 3 ■
8-48
1 2 .2 7
14.04
26.87
4 .95
Source 15th R ound, Socio Economic Survey, 1959-60'State-Sample-
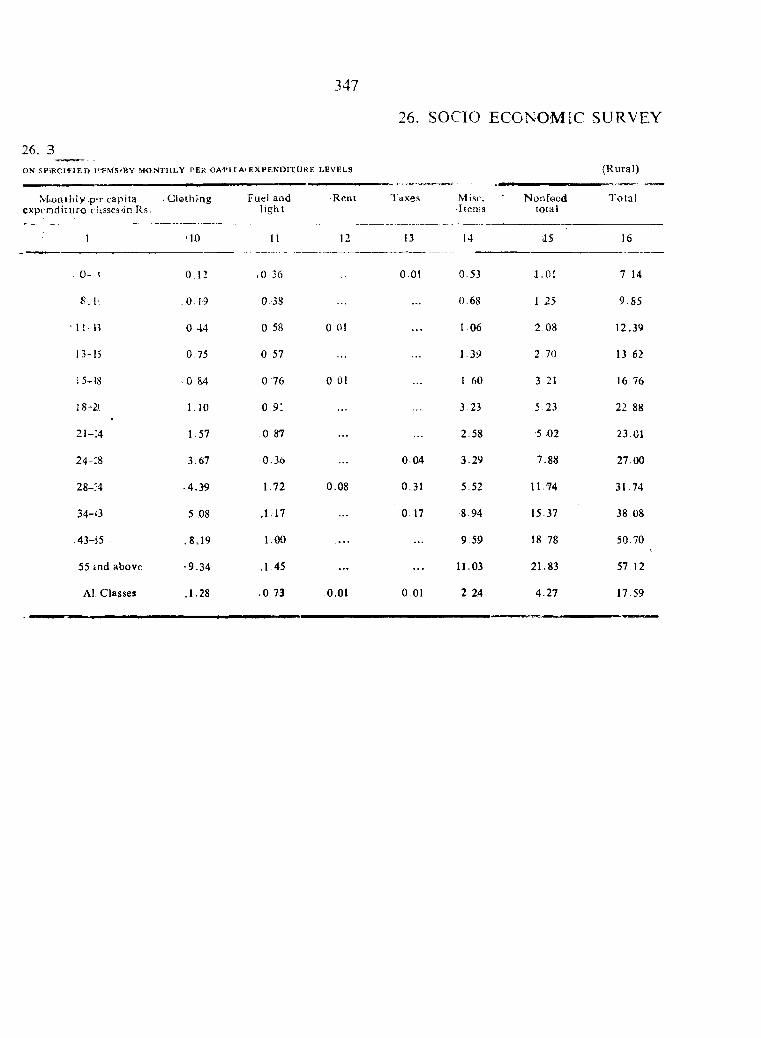
347
26 . 3
ON SP'iECI'FlED I'EMS'BY MONTHLY PER GAPITA> EXPENDITURE LEVELS
2 6 . S O C I O E C O N O M I C S U R V E Y
(Rural)
Mionthly.p'r,capita expenditure clisscstin Rs.
Clothiag Fuel and light
Rent Taxes Misr.Items
Nonfoodtotal
Total
1 -10 11 12 13 14 dS 16
. 0 - J 0 12 ,0 36 0.01 0.53 .1.01 7.14
8 .! ' .0 .19 0 38 . . . 0.68 1 25 9.85
■ 1 ! - n 0 44 0 58 0 01 . . . 1.06 2 08 12.39
13-15 0.75 0 57 1.39 2.70 13 62
i5r}8 . 0 &4 0 76 0 01 1 60 3 2J 16 76
18-2; 1.10 0.91 3 23 5 23 22 88
21-14 1.57 0 87 . . . 2.58 5 02 23.01
24-lS 3.67 0.36 0,04 3.29 7.88 27.00
28-:-4 <4.39 1.72 0.08 0.31 5.52 11.74 31.74
34-‘3 5.08 .1.17 0.17 8.94 15.37 38 08
-43-55 ,8 ,19 1.00 . . . 9 59 18 78 50.70
55 in d above •9.34 .1 45 . . . . . . 11.03 21.83 57.12
A1 Classes .1.28 ,0 73 O.Ol 0.01 2 24 4.27 17 59
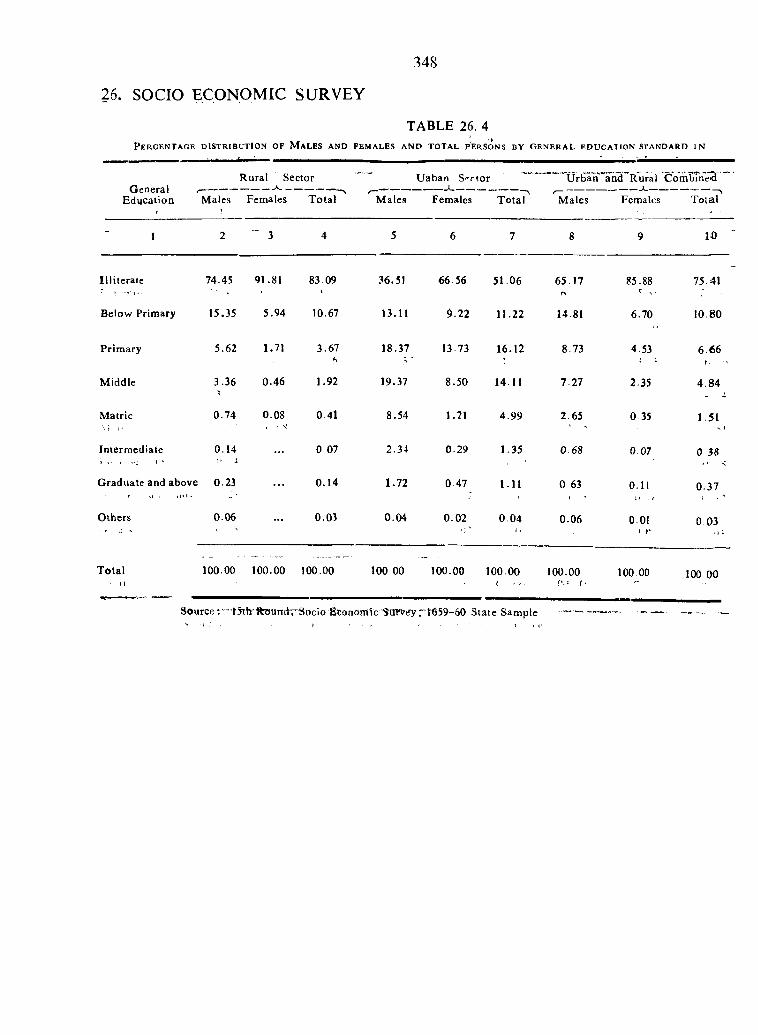
^ 4 8
TABLE 26. 4P e r c e n t a g e d i s t r i b u t i o n o f M a l e s a n d f e m a l e s a n d t o t a l p e r s o n s b y g e n e r a l e d u c a t i o n s t a n d a r d i n
26. SOCIO ECONOMIC SURVEY
GeneralEducation
f
R ural Sector
Males Females T otal
U aban S -rto r
M ales Females T o ta l
""“ UrBan and ’ Rural Com bined
M ales Females T otal
1 2 " 3 4 5 6 7 8 9 10
Prim ary
M iddle
M atric» i • • •
Interm ediate
G raduate and above 0.23
O thers 0.06
3.67A
Illiterate 74.45 91.81 83 09
Below Primary 15.35 5.94 10.67
5.62 1.71
3.36 0.46
0.74 0.08
0.14
3 6 .5J 66.56 51.06 65.17
13.11 9 .22 11.22 14.81
1.92
0.41
0 07
0.14
0.03
8.50 14.11
1.21 4.99
18.37 13-73 16.12
19.37
8.54
2.34 0.29 1.35
1.72 0.47 1.11
0.04 0.02 0.04
8.73
7.27
2.65
0.68
0 63
0.06
T otal 100.00 100.00 100.00 100 00 100.00 100-00 100.00
85.88
6.70
4-53
2-35
0.35
0 0 7
0.11
0.01■i
100 00
75.41
10.80
6.66
4 .84- -4
1.51
0 58
0.37\ - ^
0 0 3
100 00
Source : “-15tii”R:TJUnd™Socio fitonom tc Survey7't659-60 State Sample
TABLE 27.1
R e g u l a t e d M a r k e t s o f T e l a n g a n a , A r r i v a l s a n d
‘T h e i r V a l u a t i o n s , 1957-1958 t o 1961-62
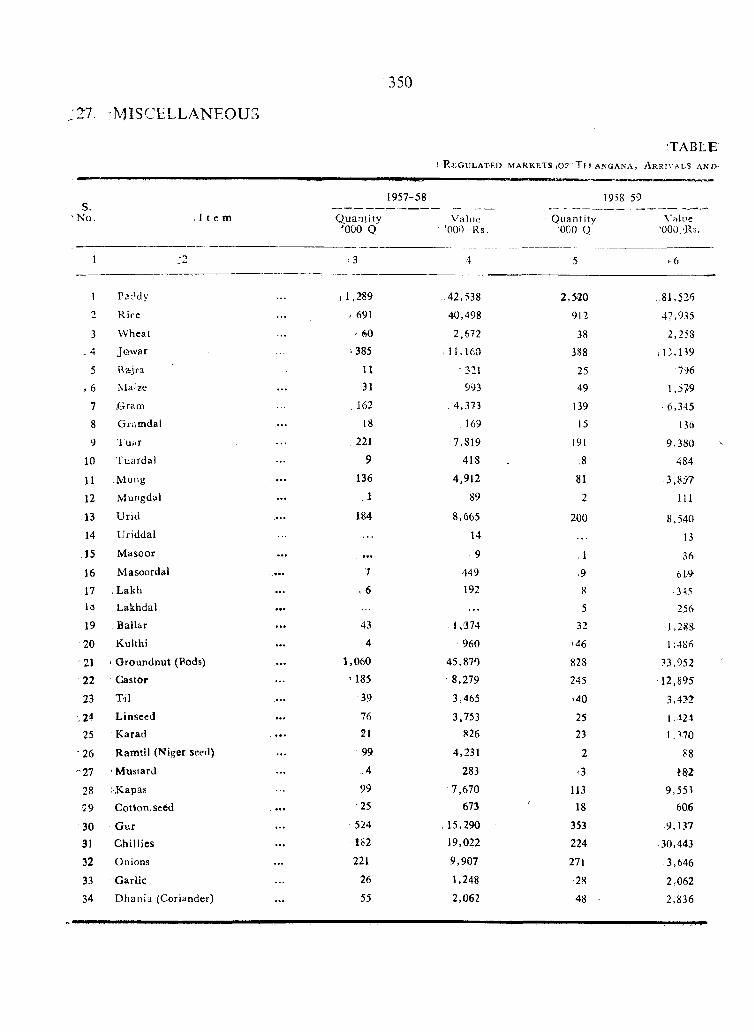
:27. MISCELLANEOUS
350
s.N o .
^ T A B L E! R,EGULATED m a r k e t s iO F 'T f I .A N G A N A , ARRIVALS ANI>
I t e m
1957-58
O uaritity ’000 Q
V'ahie ’000 . Rs.
1958-59
Quantitv'000 Q
VM uc ‘000.’Rs.
1 Paddy
2 Rice
3 W h ea t
_ 4 Jow ar
5 B a jra
,, 6 Ma'ze
7 .Gram
8 Gramdal
9 Tu.ir
10 Tuardal
11 ,Mung
12 Mungd^l
13 Uriel
14 U riddal
15 M asoor
16 Masoordal
17 Lakhla Lakhdal
19 Ballar
20 Kulthi
21 ' G roundnut (Pods)
22 Castor
23 T il
.24 Linseed
25 K arad
26 R am til (Niger seed)
'27 'M ustard
28 :K apas
29 Cotton, seed
30 G ur31 C hillies
32 Onions
33 G arlic
34 D h a n ia (Coriander)
1 ,2 8 9
- 691
60
■385
U
31
, 162
18
221
9
136
1
1 ,0 6 0
’ 185
39
76
21
99
.4
99
25
524
1S2
221
26
55
-4 2 ,5 3 8
4 0 ,4 9 8
2 ,6 7 2
i 11 ,160
- 32!
993
. 4 ,3 7 3
, 169
7 ,8 1 9
418
4 ,9 1 2
89
8 ,6 6 5
14
9
449
192
1 .3 7 4
960
4 5 ,8 7 0
' 8 ,2 7 9
3 ,4 6 5
3 ,753
826
4 ,2 3 1
283
-7 ,6 7 0
673
,1 5 ,2 9 0
19 ,022
9 ,9 0 7
1 ,248
2 ,0 6 2
2,520
912
38
388
25
49
139
15
191
.8
81
2
200
1
.9
85
32
'4 6
828
245
>40
25
23
2
-:3
113
18
353
224
271
28
48
, .81,526
47,935
2,258
i r . , n 9
7 9 6
1 , 5 7 9
■ 6 , 3 4 5
136
9 , 3 8 0
4 8 4
. 3 , 8 : 7 7
i l l
8 , 5 4 0
13
3-6
6 1 9
• 31,5
2 5 6
1,28:8-
1 ; 4 S 6
3 3 , 9 5 2
1 2 , 8 9 5
3 , 4 2 2
1.12-t ! , V70
88
1 8 2
9 , 5 5 5
6 0 6
9 , 1 3 7
- 3 0 , 4 4 3
3 , 6 4 6
2 , 0 6 2
2 , 8 3 6
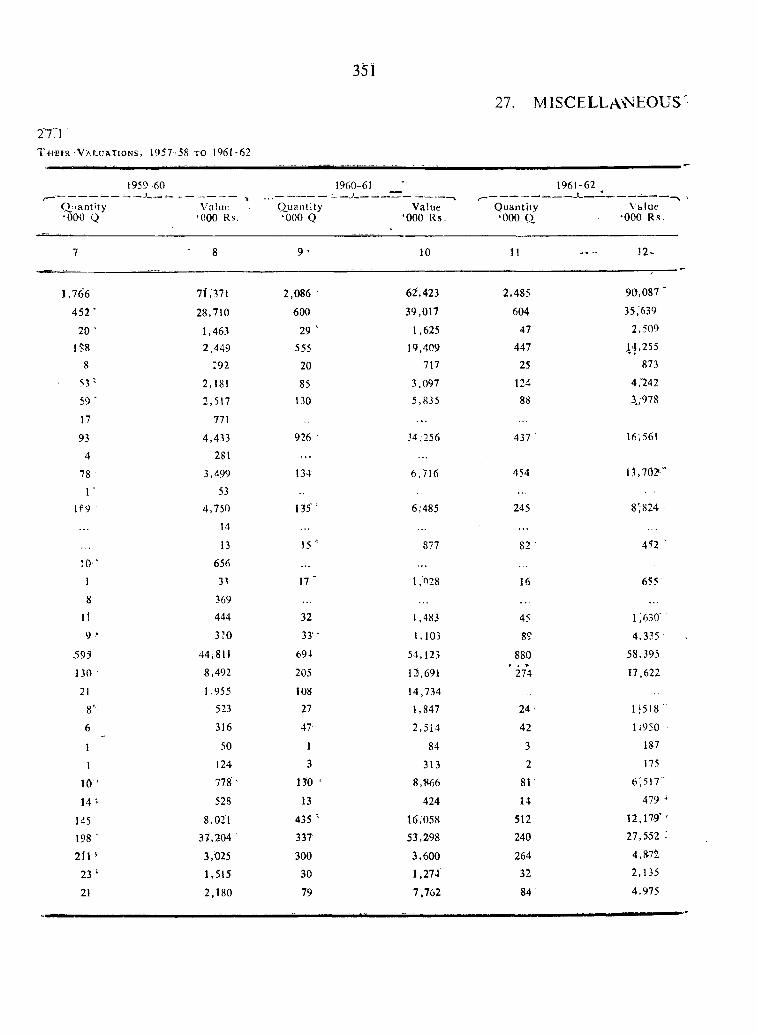
2771T « E f R V a l u a t i o n s , 1 9 5 7 - 5 8 t o 1 9 6 1 - 6 2
351
27. MISCELLA'NEOUS
1959-60
Q 'lan t'ty ‘oao Q
1 9 6 0 - 6 1
Vaiue . Q uantity ‘000 Rs. ‘000 Q
1 9 6 1 - 6 2
Value Quantity‘000 R s. ‘000 Q.
Value ‘000 Rs.
7 8 9 ’ 1 0 1 1 . . . . 1 2 -
1,766 71,'371 2,086 6i',423 2,485 90,087 '
452 ’ 28,710 600 39,017 604 35,639
2 0 ' 1,463 29 • 1,625 47 2,509
1 S8 2.449 555 ■ 19,409 447 .1 4 , 2 5 5
8 :92 2 0 717 25 873
5 ? ' 2,181 85 3.097 124 4,"242
59 ‘ 2,517 n o 5,835 8 8 A. 978
17 771 . . .
93 4,433 926 ■ 34 ;256 437 16;561
4 281
78 3,499 134 6,716 454 1.1,7020'
I ' 53U 9 4,750
14
1315 ' 6,^485 245 8;824 -
13 15 877 82 ' 4-52 '
! 0 ' 656
1 33 1 7 ' 1 ,n28 16 655
8 369
1 1 444 32 1,483 45 i;630 ’
9 ' 3?0 33'- 1,103 89 4,335
593 44,811 694 54,123 880 58,395
n o ■ 8,492 205 125,691 ' 2 7 4 17,622
2 1 1,955 108 14,734
8 ' 523 27 1,847 24 • 1}5I8
6 316 47 2,514 42 1.950 ^
I 50 1 84 3 187
1 124 3 313 2 175
1 0 ' 778 ' n o ' 8 , - 8 6 6 81 6,517‘
14 ‘ 528 13 424 14 479
145 ■ 8 , 0 2 1 435 16,058 512 12,17.9’ ■
198 ■ 3t,204 337- 5J,298 240 27,552 :
2 1 1 s 3,^25 300 3,600 264 4,872
23 ‘ 1,515 30 1,274 32 2,135
21 2,180 79 7,762 84 4.975
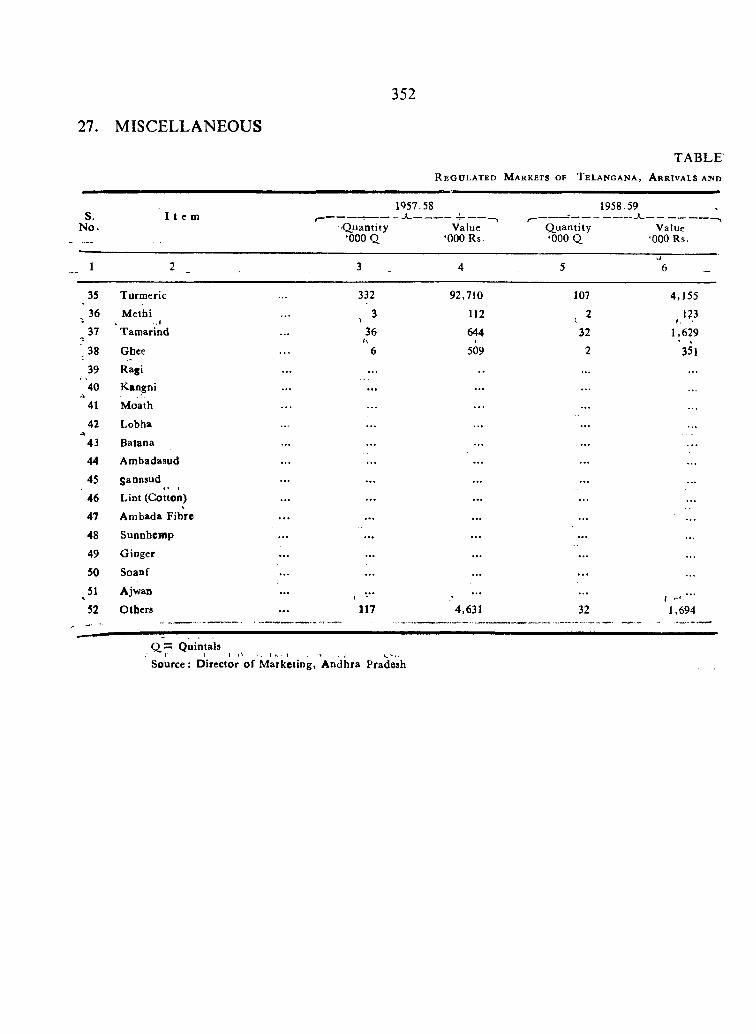
27. MISCELLANEOUS
352
T ABLER e g u l a t e d M a r k e t s o f T e l a n g a n a , A r r i v a l s a i n d
s .N o .
I t e m'Q uantity‘000 a
1957.58
Value ‘000 Rs
r— ” “ 'Q uantity ‘000 Q
1958.59
Value ‘000 Rs.
1 2_ _ ------- 3 _ 4 5 6
35 Turm eric 332 92,710 107 4,155
36% M ethi.. t
... 3 112 2 123i ■'- 37 Tam arind ... 36
(1644
i32 1,629
,3 8 Ghee 6 509 2 351
39 Ragi ... ... ...
40A
K tngni ... ... ...
41 M oath ... ...
42 Lobha ... ... ... ...
^43 Batana ... ... ...
44 Ambadasud ... ... ...
45 Sannsud ... ... ...
46 Lint (Cotton) ... ... ...
47 A m bada F ibre .. . ... ... ... ...
48 Sunnhemp ... ... ... ...
49 Ginger ... ... ...
50 Soanf ... ... . . .
51 Ajwan ... 1 •' , ...
52 O thers ... 117 4,631 32 1,694............... . ■ *.. . ............ ........... ,~ ---- ------ ----- *..
Q uintalsV 1 . I O • ; { s I . V . j -
Source: D irector o f M arketing, A ndhra Pradesh
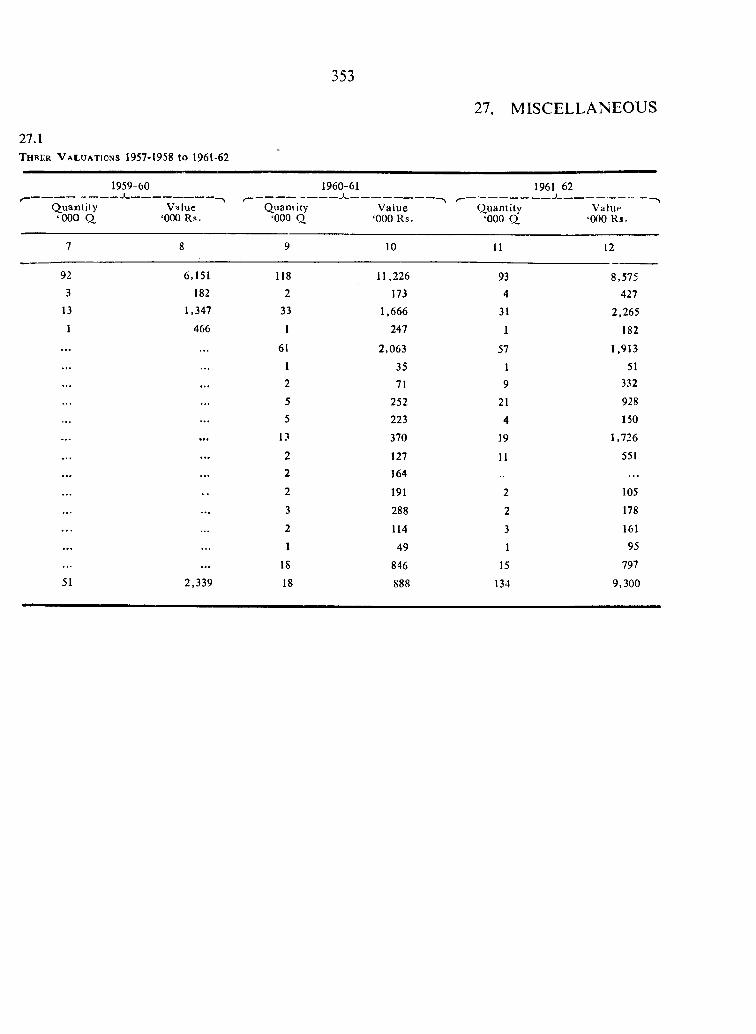
353
27.1T h e i i r V a l u a t i o n s 1957-1958 to 1961-62
27. MISCELLANEOUS
1959-60-- Jl_____
Q uan tity ‘OOO Q
Value ‘000 Rs.
1960-61
Q uantity V alue‘000 Q ‘000 Rs.
1961 62
Q uantitv Vatup‘000 Q ‘000 Rs.
10 11 12
9 2
3
13
1
6,151182
1,347
466
51 2,339
118
233
1
61
12
5
5
13
22
2
3
2
1
18
18
11,226
173
1,666247
2,063
35
71
252223
370
127164
191
288
114
49
846
934
31
1
57
19
21
4
19
11
2
2
3
1
15
1 3 4
8,575427
2,265
182
1,913
51332
928
150
1,726
551
105
178
16195
797
9,300
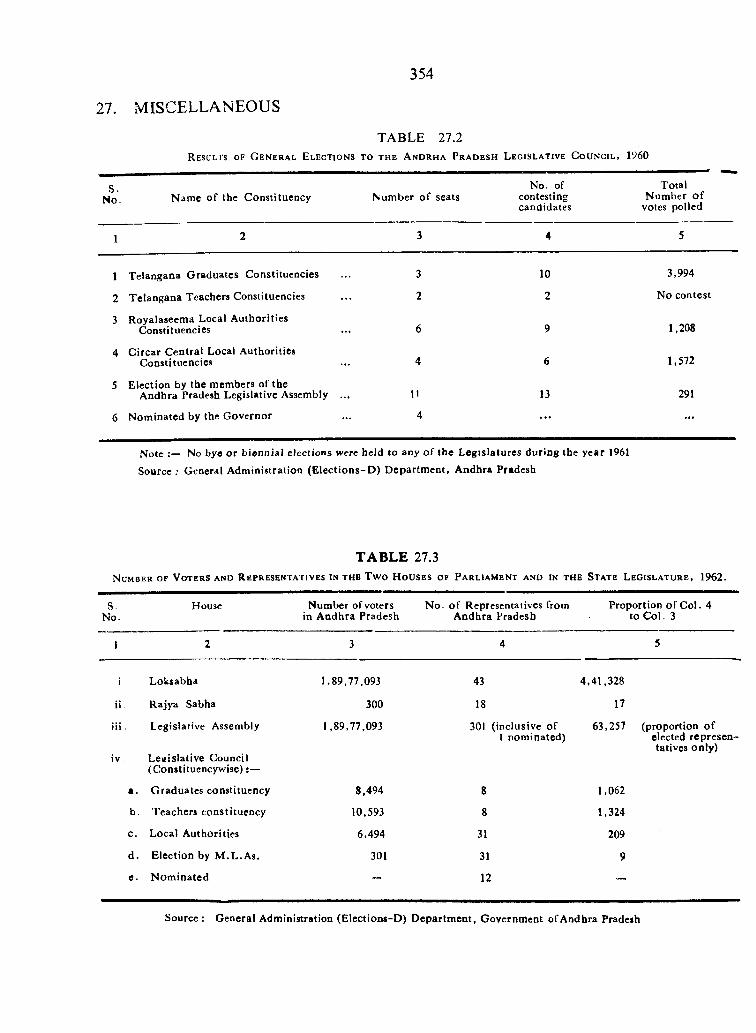
354
27. MISCELLANEOUS
TABLE 27.2R e s u l t s o f G e n e r a l E l e c t i o n s t o t h e A n d r h a P r a d e s h L e g i s l a t i v e C o u n c i l , I960
S.No. N am e o f the Constituency Num ber o f seats
No. of contesting candidates
Total N um ber o f
votes polled
1 2 3 4 5
1 Telangana G raduates Constituencies 3 10 3,994
2 Telangana Teachers Constituencies 2 2 No contest
3 Royalaseema Local A uthorities Constituencies 6 9 1,208
4 G ircar C entral Local Authorities Constituencies 4 6 1,572
5 Election by the members of theA ndhra Pradesh Legislative Assembly ... n 13 291
6 N om inated by the G overnor 4 . . . . . .
Note No bye o r biennial elections were held to any o f the L egislatures during the year 1961
Source ; General Adm inistration (E lec tions-D ) D epartm ent, Andhra Pradesh
TABLE 27.3N u m b e r o f V o t e r s a n d R e p r e s e n t a t i v e s i n t h e Tw o H o u s e s o f P a r l i a m e n t a n d i n t h e S t a t e L e g i s l a t u r e , 1962.
S.No.
House Number of voters in A ndhra Pradesh
N o. o f Representatives from A ndhra Pradesh
Proportion o f C ol. 4 to C ol. 3
1 2 3 4 5
i Loksabha 1,89,77.093 43 4,41,328
ii R ajya Sabha 300 18 17
iii
iv
Legislative Assembly
Leuislatlve Council (C onstituencyw ise):—
1,89,77,093 301 (inclusive of 1 nom inated)
63,257 (proportion o f elected representatives only)
a . G raduates constituency 8,494 8 1,062
b. Teachers constituency 10,593 8 1,324
c . Local A uthorities 6,494 31 209
d . Election by M .L .A s. 301 31 9
e- N om inated — 12 —
Source : General Administration (Elections-D) Department, Government of Andhra Pradeih
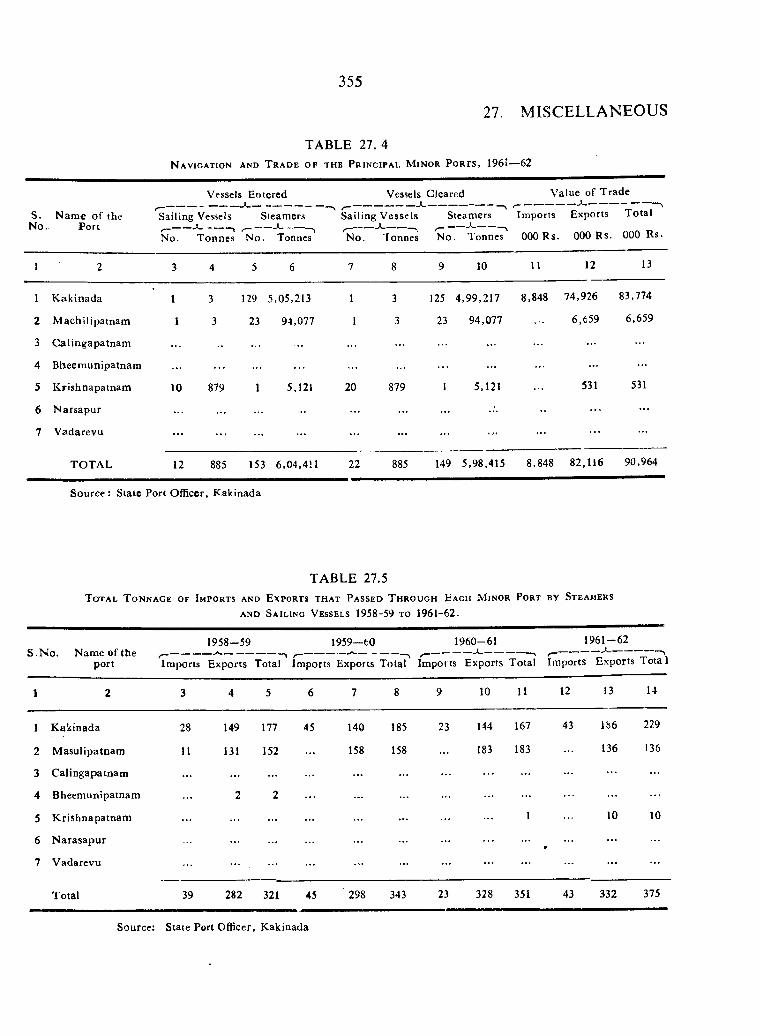
355
27. MISCELLANEOUS
TABLE 27. 4N a v i g a t i o n a n d T r a d e o f t h e P r i n c i p a l M i n o r P o r t s , 1961—62
VfsseJs Entered Vessels Cleared Value of T rade
S.N o.
N am e o f the Port
Sailing Vessels^ ------------- *--------------------^
No. T onnes
Steamersr - ^-------------------%N o. Tonnes
Sailing Vessels
N o. Tonnes
Steamers
N o. Tonnes
Im ports
000 R s.
Exports
000 Rs.
T otal
000 Rs.
1 2 3 4 5 6 7 8 9 10 11 12 13
1 K akinada 1 3 129 5,05,213 1 3 125 4,99,217 8,848 74,926 83,774
2 M achilipatnam 1 3 23 94,077 1 3 23 94,077 6,659 6,659
3 C alingapatnam . . . . . .
4 B heem unipatnam . . . . . .
5 K rishnapatnam 10 879 1 5,121 20 879 1 5,121 531 531
6 N arsapur . . .
7 V adarevu . . . . . . ................... . . . . . . . . .
TO TA L 12 885 153 6,04,411 22 885 149 5.98,415 8,848 82,116 90,964
Source: State Port Officer, Kakinada
TABLE 27.5T o t a l T o n n a g e o f I m p o r t s a n d E x p o r t s t h a t P a s s e d T h r o u g h E a c h M i n o r P o r t b y S t e a m e r s
a n d S a i l i n g V e s s e l s 1958-59 t o 1961-62.
1958-59 1959—60 1960-61 1961-62S .N o . Name of t h e ^ ----------------- *------------------------- » ,------------------------------------------- ^ ----------------- *--------------------- . ^ ------------------*------------ - '
port Im ports Exports Total Imports Exports Total Im ports Exports Total Imports Exports T o ta l
1 2 3 4 5 6 7 8 9 10 11 12 13 14
1 K akinada 28 149 177 45 140 185 23 144 167 43 186 229
2 M asulipatnani 11 131 152 . . . 158 158 183 183 136 136
3 C alingapatnam . . .. . . . . .
4 Bheemunipatnam 2 2 . . .
5 K rishnapatnam . . . . . . 1 10 10
6 N arasapur . . .
7 V adarevu . . . . . . . . . . . .
Total 39 282 321 45 298 343 23 328 351 43 332 375
Source: State Port Officer, K akinada
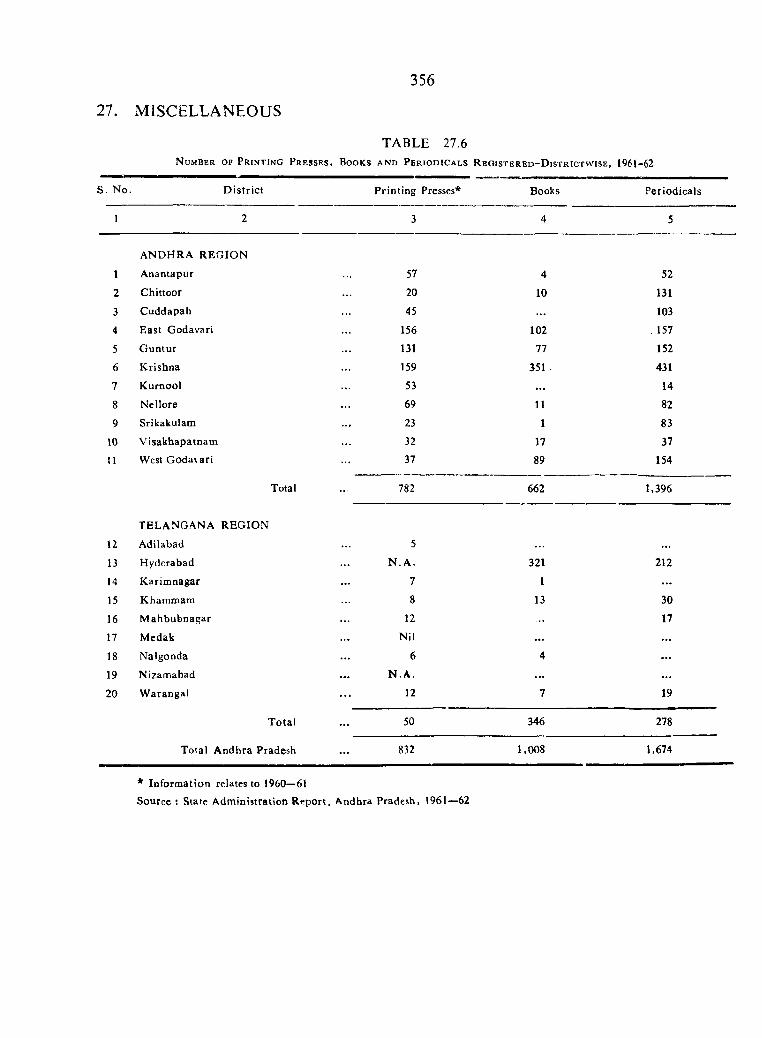
356
27. MISCELLANEOUS
N u m b e r o f P r i n t i n g P r e s s e s ,
TABLE 27.6B o o k s a n d P e r i o d i c a l s R e g i s t e r e d - D i s t r i c t w i s e , 1961-62
s . N o. D istric t P rin ting Presses* Books Periodicals
1 2 3 4 5
1ANDHRA R EG IO N
A nantapur 57 4 52
2 Chittoor 20 10 131
3 C uddapah 45 . . . 103
4 East Godavari 156 102 . 157
5 G untur 131 77 152
6 K rishna 159 351 431
7 Kurnool 53 . . . 14
8 Nellore 69 11 82
9 Srikakulam 23 1 83
\0 V isakhapatnam 32 17 37
Jl West Godavari 37 89 154
Total 782 662 1,396
12
TELANGANA REG IO N
Adilabad 5
13 Hyderabad N . A . 321 212
14 Karim nagar 7 1 . . .
15 Khammara 8 13 30
16 M ahbubnagar 12 17
17 M edak Nil . . . . . .
18 Nalgonda 6 4 . . .
19 Nizamabad N .A . . . . . . .
20 W arangai 12 7 19
T otal 50 346 278
Total A ndhra Pradesh 832 1,008 1,674
* Inform ation relates to 1960—61
Source : State A dm inistration R eport. Andhra Pradesh, 1961—62
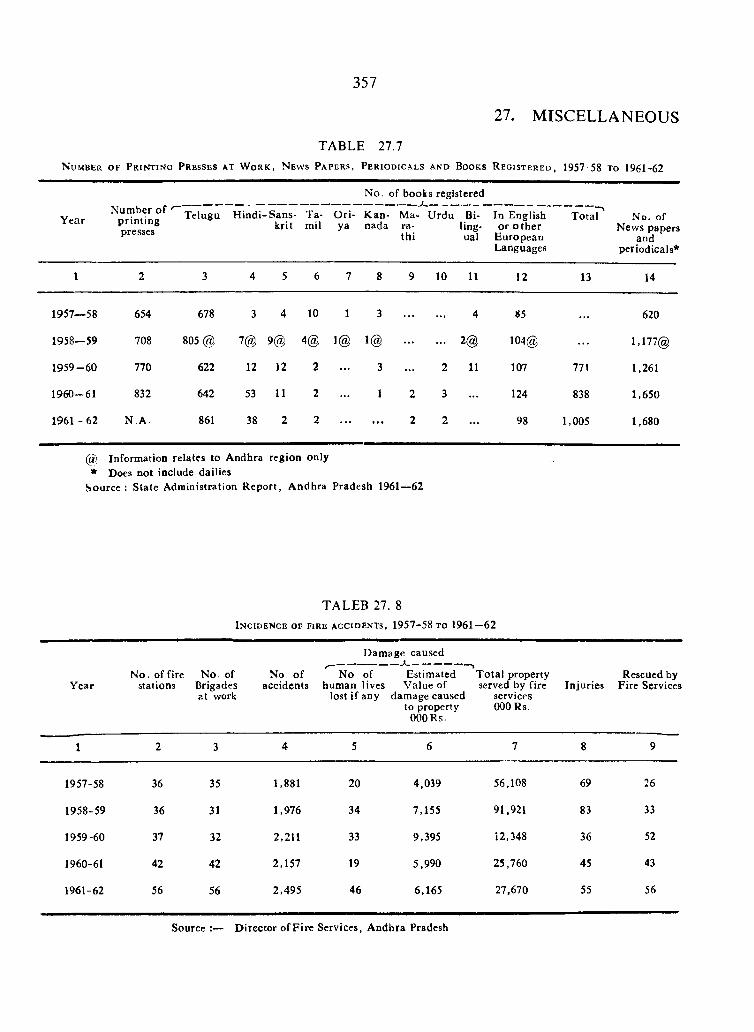
357
27. MISCELLANEOUS
TABLE 27.7N u m b e r o f P r i n t i n g P r e s s e s k t W o r k , N e w s P a p e r s , P e r i o d i c a l s a n d B o o k s R e g i s t e r e d , 1957-58 t o 1961-62
Y earNum ber of
p rin ting presses
N o. of books registered -----------------«------------------
Telugu H indi-Sans- Ta- O ri- K an- Ma- U rdu Bi- In Englishkrit mil ya nada ra- ling- or o th e r
th i ual E uropeanLanguages
Total No. ofNews papers
and periodicals*
1 2 3 4 5 6 7 8 9 10 11 12 13 14
1957—58 654 678 3 4 10 1 3 . . . . . . 4 85 . . . 620
1958—59 708 805 @ 7@ 9@ 4@ 1@ 1@ . . . . . . 2@ 104@ . . . 1.177@
1 9 59-60 770 622 12 12 2 . . . 3 . . . 2 11 107 771 1,261
1 9 6 0 - 61 832 642 53 11 2 1 2 3 . . . 124 838 1,650
1961 - 62 N .A . 861 38 2 2 . . . . . . 2 2 . . . 98 1,005 1,680
@ Information relates to Andhra region only* Does not include dailies
Source : State Administration R eport, A ndhra Pradesh 1961—62
TALEB 27. 8
I n c i d e n c e o f f i r e a c c i d e n t s , 1957-58 t o 1961—62
YearN o . of fire
stationsN o. of
Brigades a t work
No. o f accidents
Dam age caused
No of Estimated hum an lives Value of
lost if any damage caused to property
000 R s.
T o ta l property served by fire
services 000 R s.
InjuriesRescued by
Fire Services
1 2 3 4 5 6 7 8 9
1957-58 36 35 1,881 20 4,039 56,108 69 26
1958-59 36 31 1,976 34 7,155 91,921 83 33
1959-60 37 32 2,211 33 9,395 12,348 36 52
1960-61 42 42 2,157 19 5,990 25,760 45 43
1961-62 56 56 2,495 46 6,165 27,670 55 56
Source :— D irector o fF ire Services, A ndhra Pradesh
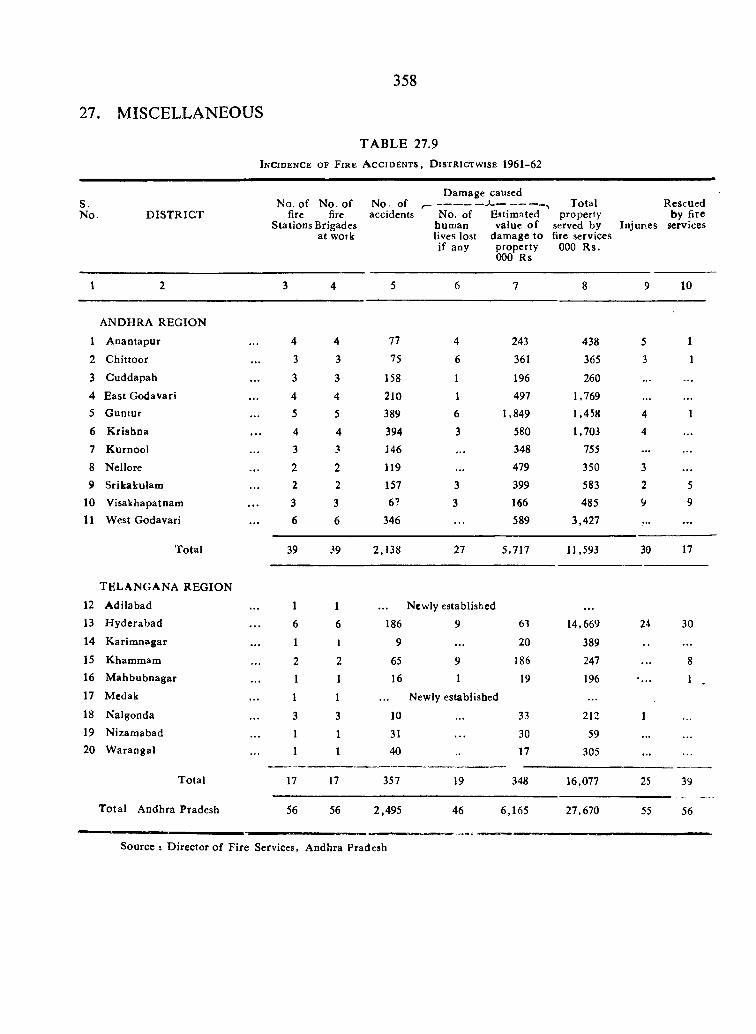
358
27. MISCELLANEOUS
TABLE 27.9I n c i d e n c e o f F i r e A c c i d e n t s , D i s t r i c t w i s e 1961-62
S.N o. D IST R IC T
No. o f N o. of fire fire
Stations Brigades at woik
No. of accidents
Damage caused
No. of human lives lost if any
Estimated value o f
damage to property 000 R s.
Total property
served by fire services
000 R s.
Injuries
Rescued by fire
services
1 2 3 4 5 6 7 8 9 10
ANDHRA R EG IO N
1 A nantapur 4 4 77 4 243 438 5 1
2 C hittoor 3 3 75 6 361 365 3 1
3 Cuddapah 3 3 158 1 196 260 . . .
4 East G odavari 4 4 210 1 497 1.7695 G untur 5 5 389 6 1,849 1,458 4 16 K rishna 4 4 394 3 580 1,703 4 • • •
7 K urnool 3 3 146 348 755 . . .
8 Nellore 2 2 119 . . . 479 350 39 Srikakulam 2 2 157 3 399 583 2 5
10 Visakhapatnam 3 3 67 3 166 485 911 West Godavari 6 6 346 589 3,427 V . . .
T otal 39 i9 2,138 27 5,717 11,593 30 17
TEL A N G A N A R EG IO N
12 A dilabad
13 H yderabad1
6
1
6 186
Newly established
9 61 14,669 24 3014 K arim nagar 1 I 9 . . . 20 389 . . .
15 Kham m am 2 2 65 9 186 247 . . . 816 M ahbubnagar 1 1 16 1 19 196 1 .17 Medak
18 Nalgonda1
3
1
3 10
Newly established
33 212 119 N izam abad 1 1 31 30 59 . . .
20 W arangal 1 1 40 17 305 . . .
T otal 17 17 357 19 348 16,077 25 39
T otal A ndhra Pradesh 56 56 2,495 46 6,165 27,670 55 56
Source : D irector o f F ire Services, Andhra Pradesh
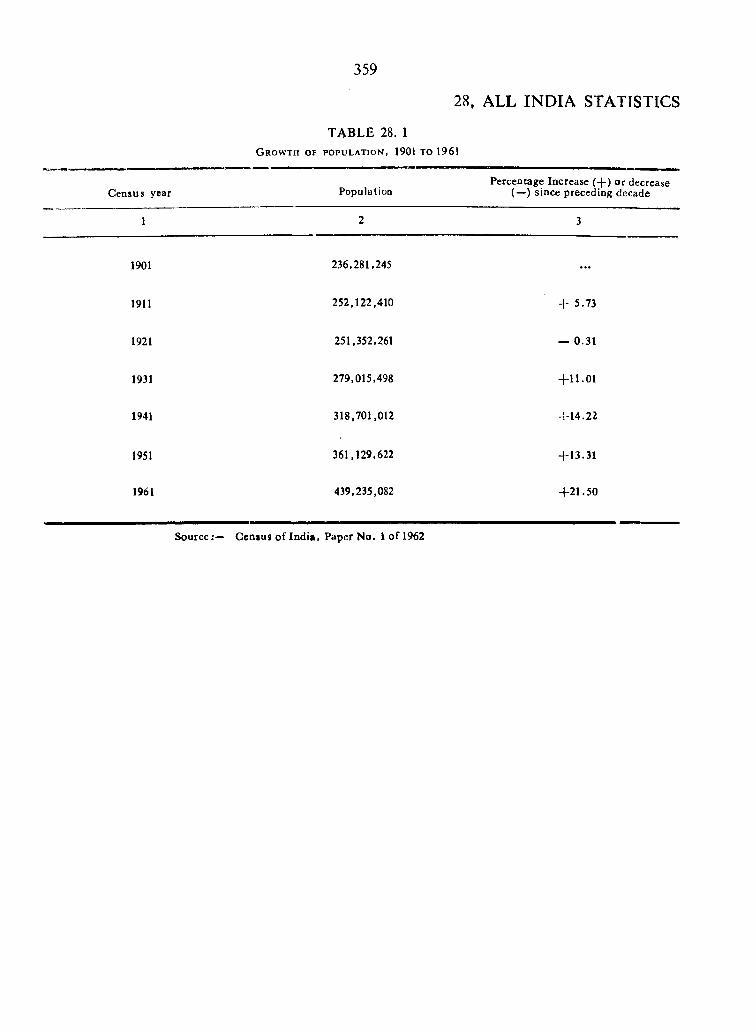
359
28, ALL INDIA STATISTICS
T A B L E 28. 1G r o w t h o f p o p u l a t i o n , 1901 t o 1961
C ensus year PopulationPercentage Increase ( - f ) or decrease
(—) since preceding decade
1 2 3
1901 236.281,245 . . .
1911 252,122,410 + 5.73
1921 251,352,261 — 0.31
1931 279,015,498 +11.01
1941 318,701,012 +14.22
1951 361,129,622 + 13.31
1961 439,235,082 +21.50
S o u r c c G e n i u s o f Ind ia , Paper No. 1 o f 1962
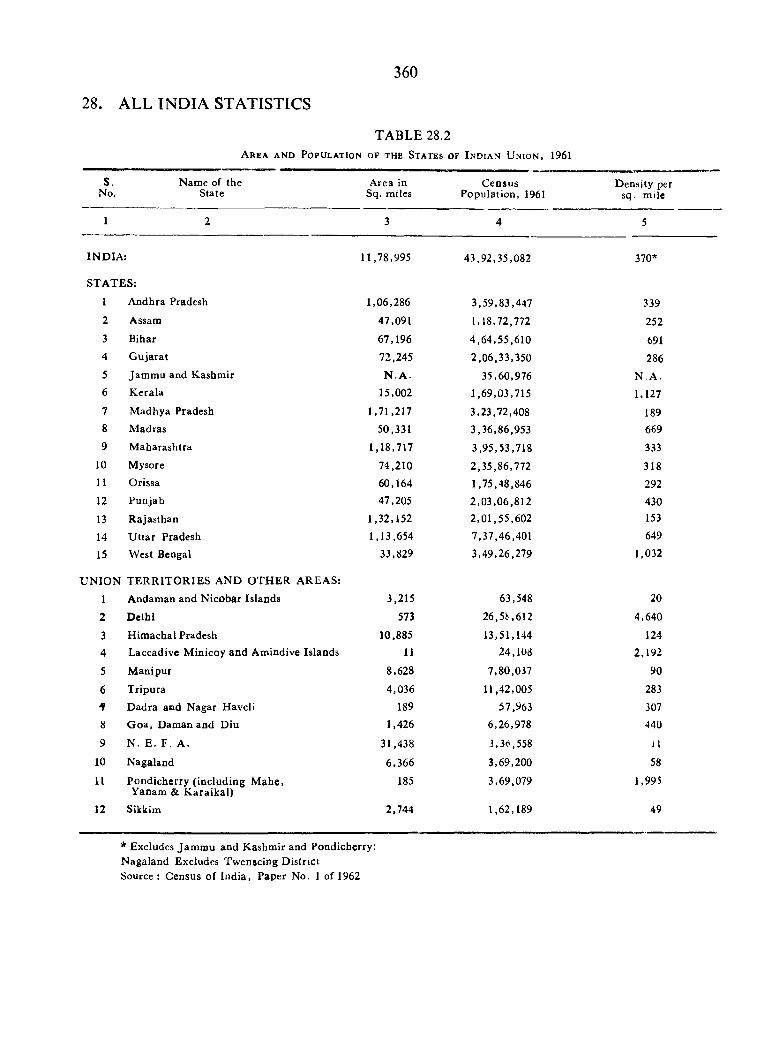
360
28. ALL IND IA STATISTICS
A r e a a n d P o p u l a t i o n
TABLE 28.2OF THE S t a t e s o f I n d i a n U n i o n , 1961
s. Name of the A r e a in C e n s u s Density perNo, State S q . miles Population, 1961 s q . mile
1 2 3 4 5
IN D IA : 11,78,995
STATES;
43.92,35,082 370*
1 A n d h r a P r a d e s h 1,06,286 3,59,83,447 3392 Assam 47,091 1,18,72,772 2523 Bihar 67,196 4 ,64,55,610 6914 G u j a r a t 72,245 2,06,33,350 2865 Jam m u and Kashmir N .A . 35,60,976 N .A .6 K erala 15,002 1,69,03,715 1,1277 M adhya Pradesh 1,71,217 3,23,72,408 1898 Madras 50,331 3,36,86,953 6699 M aharashtra 1,18,717 3,95,53,718 333
10 Mysore 74,210 2,35,86,772 31811 Orissa 60,164 1,75,48,846 29212 P u n j a b 47,205 2,03,06,812 430
13 Rajasthan 1,32,152 2,01,55,602 153
14 U ttar Pradesh 1,13,654 7,37,46,401 649
15 West Bengal
U N IO N T E R R IT O R IE S AND O T H E R AREAS:
33,829 3,49,26,279 1,032
1 Andaman and N icobar Islands 3,215 63,548 202 D elhi 573 26,5^,612 4,640
3 Him achal Pradesh 10,885 13,51,144 1244 Laccadive M inicoy and Amindive Islands 11 24,108 2,192
5 M anipur 8,628 7,80,037 90
6 Tripura 4,036 11,42,005 283
■9 D adra and Nagar Haveli 189 57,963 307
8 G oa, Daman aod Diu 1,426 6,26,978 440
9 N . E. F . A. 31,438 3,36,558 11
10 N a g a l a n d 6,366 3,69,200 58
11 Pondicherry (including M ahe, Yanam & K araikal)
185 3,69,079 1,995
12 Sikkim 2,744 1,62,189 49
* Excludes Jam m u and Kashmir and Pondicherry: N agaland Excludes Twenscing D istrict Source : Census of Ind ia , Paper No. 1 of 1962
TABL 28.3
W o r k e r s a n d N o n w o r k e r s i n t h e S t a t e s o f
I n d i a , 1961
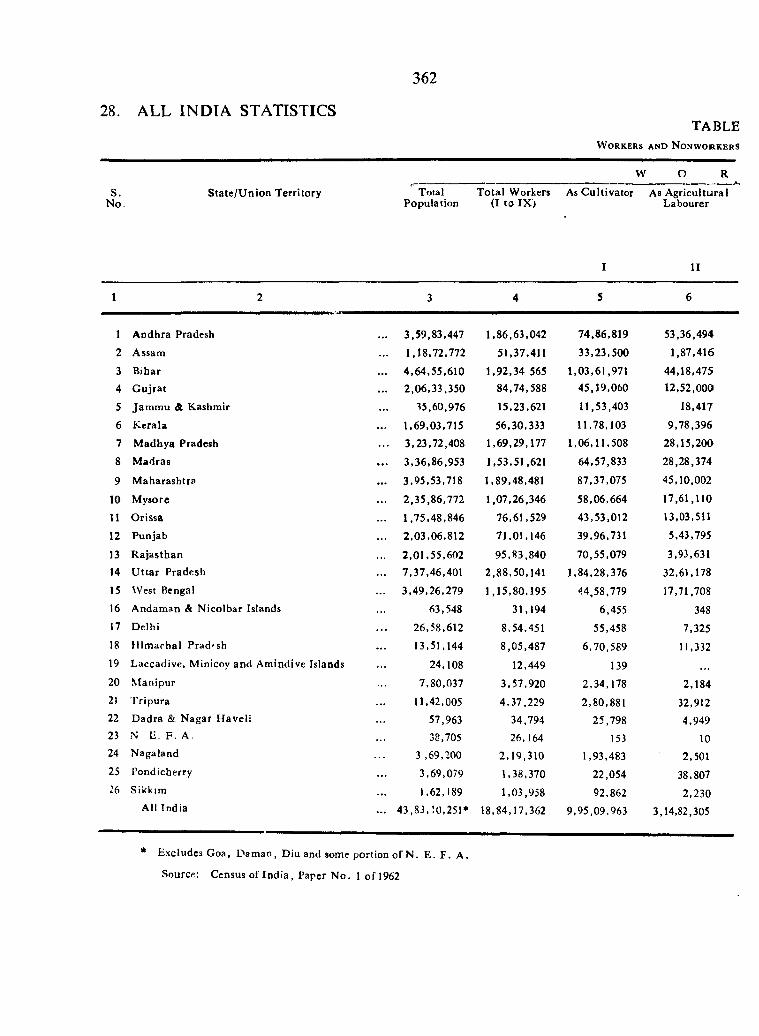
362
28. ALL INDIA STATISTICSt a b l e
W o r k e r s a n d N o n w o r k e r s
s .N o.
S ta te /U nion T erritory
W O R
TotalPopulation
T otal Workers (I to IX )
As C ultivator
I
As A gricultural Labourer
11
1 2 3 4 5 6
I A ndhra Pradesh ... 3,59,83.447 1,86,63,042 74.86,819 53,36,494
2 Assam ... 1,18,72,772 51.37,411 33,23,500 1,87,416
3 Bibar ... 4 ,64,55.610 1.92.34 565 1,03,61,971 44,18.475
4 G ujra t ... 2.06.33,350 84,74,588 45,19,060 12.52.000
5 Jam m u & Kashmir 35,60,976 15.23,621 11.53,403 J8.417
6 K erala ... 1,69.03.715 56,30,333 11,78,103 9,78,396
7 M adhya Pradesh ... 3,23,72,408 1,69.29,177 1,06,11,508 28,15,200
8 M adras ... 3,36,86,953 1,53,51,621 64,57,833 28.28,374
9 M aharashtra ... 3.95.53,718 1,89,48,481 87,37,075 45,10,002
10 M ysore ... 2 ,35,86.772 1,07,26,346 58,06,664 17,61,110
11 O rissa ... 1,75,48,846 76,61.529 43,53,012 13,03,511
12 Punjab ... 2,03.06.812 71.01,146 39,96,731 5,43,795
13 R ajasthan ... 2.01,55.602 95,83.840 70,55,079 3.93.631
14 U tta r Pradesh ... 7.37.46.401 2,88.50,141 1,84,28,376 32,61,178
15 W e s t Bengal ... 3.49.26,279 1,15,80,195 '14,58,779 17,71,70816 Andam an & N icolbar Islands 63,548 31,194 6,455 34817 D elhi 26,58,612 8,54,451 55,458 7,32518 H im achal P rad 'sh 13,51,144 8,05,487 6,70,589 11,33219 Laccadive, Minicoy and Amindive Islands 24,108 12,449 139 • «.
20 M anipur 7.80,037 3,57,920 2,34,178 2,18421 T ripura 11.42,005 4,37.229 2,80,881 32,91222 D adra & N agar H aveli 57,963 34,794 25,798 4,94923 N E. F . A. 38,705 26,164 153 1024 Nagaland 3,69,200 2,19,310 1.93,483 2,50125 Pondicherry 3,69,079 1,38.370 22,054 38,80726 Sikkim 1.62,189 1,03,958 92,862 2,230
All India ... 4 3 ,8 J,!0 ,25 I* 18,84,17,362 9,95,09.963 3,14,82,305
* Excludes Goa, D am an, Diu and some portion of N . E. F . A .
Source: Census of In d ia , Paper N o. 1 o f 1962
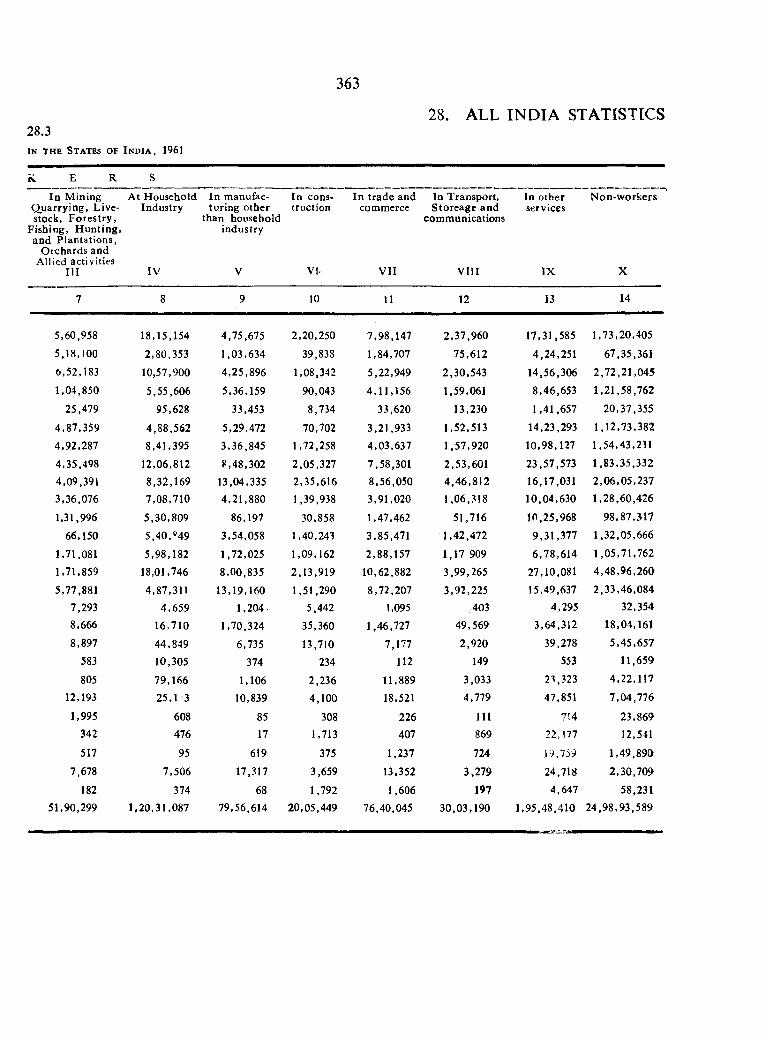
363
28. ALL INDIA STATISTICS28.3IN THE S t a t e s o f I n d i a , 1961
R E R S
In M ining Q uarry ing, Livestock, F orestry ,
Fishing, H unting , and Plantations,
O rchards and Allied activities
III
At Household Industry
IV
In manufacturing other
than household industry
V
In construction
VI-
In trade and commerce
V II
In Transport, S toreage and
communications
V III
In other services
IX
Non-w orkers
X
7 8 9 10 11 12 13 14
5,60,958 18,15,154 4,75,675 2,20,250 7,98,147 2,37,960 17,31,585 1,73,20,405
5,18.100 2,80,353 1,03,634 39,838 1,84,707 75,612 4,24,251 67,35,361
6,52,183 10,57,900 4,25,896 1,08,342 5,22,949 2,30,543 14,56,306 2,72,21,045
1,04,850 5,55,606 5,36,159 90,043 4,11,156 1,59,061 8,46,653 1,21,58,762
25,479 95,628 33,453 8,734 33,620 13,230 1,41,657 20,37,355
4,87,359 4,88,562 5,29,472 70,702 3,21,933 1,52,513 14,23,293 1,12,73,382
4,92,287 8,41,395 3,36,845 1,72,258 4.03,637 1,57,920 10,98,127 1,54,43,231
4,35,498 12,06,812 8,48,302 2,05,327 7,58,301 2,53,601 23,57,573 1,83,35,332
4,09,391 8,32,169 13,04,335 2,35,616 8,56,050 4,46,812 16,17,031 2,06,05,237
3,36,076 7,08,710 4,21,880 1,39,938 3,91,020 1,06,318 10,04,630 1,28,60,426
1,31,996 5,30,809 86,197 30,858 1,47,462 51,716 10,25,968 98,87,317
66,150 5,40,®49 3,54,058 1,40,243 3,85,471 1,42,472 9,31,377 1,32,05,666
1,71,081 5,98,182 1,72,025 1,09,162 2,88,157 1,17 909 6,78,614 1,05,71,762
1,71,859 18,01,746 8,00,835 2,13,919 10,62,882 3,99,265 27,10,081 4,48,96,260
5,77,881 4,87,311 13,19,160 1,51,290 8,72,207 3,92,225 15,49,637 2,33,46,084
7,293 4,659 1,204 5,442 1,095 403 4,295 32,354
8,666 16,710 1,70,324 35,360 1,46,727 49,569 3,64,312 18,04,161
8,897 44,849 6,735 13,710 7,177 2,920 39,278 5,45,657
583 10,305 374 234 112 149 553 11,659
805 79,166 1,106 2,236 11,889 3,033 23,323 4,22,117
12,193 25,1 3 10,839 4,100 18,521 4,779 47,851 7,04,776
1,995 608 85 308 226 111 7!4 23,869342 476 17 1,713 407 869 22,177 12,541
517 95 619 375 1,237 724 19,759 1,49,89a7.678 7,506 17,317 3,659 13,352 3,279 24,718 2,30,709
182 374 68 1,792 1,606 197 4,647 58,231
51,90,299 1,20,31,087 79,56,614 20,05,449 76,40,045 30,03,190 1,95,48,410 24.98,93,589
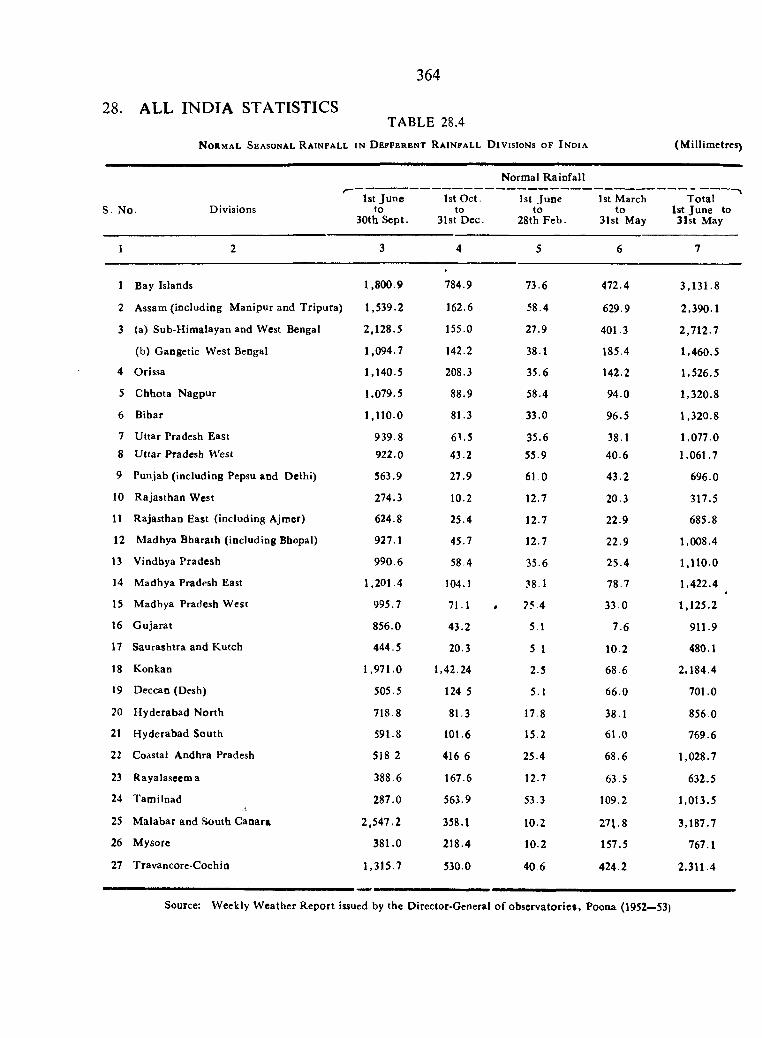
364
28. ALL INDIA STATISTICSTABLE 28.4
N ormal Seasonal R ainfall in D efferent Rainfall D ivisions of I ndia (Millimetres)
S. N o . Divisions1st June
to30th Sept.
1st Oct. to
31st Dec.
Normal Rainfall
1st June to
28th F e b .
1st March to
31st May
Total 1st June to 31st May
1 2 3 4 5 6 7
1 Bay Islands 1 ,800 .9 784.9 73.6 472.4 3 ,1 3 1 .8
2 Assam (including Manipur and Tripura) 1 ,539 .2 162.6 58.4 629.9 2 ,390 .1
3 (a) Sub-Himalayan and West Bengal 2 ,12 8 .5 155.0 27.9 401.3 2 ,7 1 2 .7
(b) Gangetic West Bengal 1 ,094 .7 142.2 38.1 185.4 1,460 .5
4 Orissa 1,140.5 208.3 35.6 142.2 1 ,526.5
5 Chhota Nagpur 1,079.5 88.9 58.4 94.0 1 .320 .8
6 Bibar 1 ,110 .0 81.3 33.0 96 .5 1 ,32 0 .8
7 U ttar Pradesh East 939 .8 61.5 35.6 38.1 1,077 .08 Uttar Pradesh West 922.0 43.2 55.9 4 0 .6 1 ,061 .7
9 Punjab (including Pepsu and Delhi) 563.9 27.9 61.0 43 .2 696.0
10 Rajasthan West 274.3 10.2 12.7 20.3 317.5
11 Rajasthan East (including Ajmer) 624.8 25.4 12.7 22.9 685.8
12 M adhya Bharath (including Bhopal) 927.1 45.7 12.7 22 .9 1 ,008.4
IJ Vindbya Pradesh 990 .6 58.4 35.6 25 .4 1 ,110 .0
14 Madhya Pradesh East 1 .201 .4 104.1 38.1 78.7 1 ,422.4
15 M adhya Pradesh West 995.7 71.1 75.4 33 .0 1 ,125 .2
16 Gujarat 856.0 43.2 5.1 7 .6 911.9
17 Saurashtra and Kutch 444.5 20.3 5 1 10.2 480.1
18 Konkan 1 ,9 7 1 .0 1,42.24 2.5 68.6 2 ,184 .4
19 Deccan (Desh) 505.5 124 5 5.1 66 .0 701.0
20 Hyderabad North 718.8 81.3 17.8 38.1 856.0
21 Hyderabad South 591.8 101.6 15.2 61 .0 769.6
22 Coastal Andhra Pradesh 518 2 416 6 25.4 68 .6 1 ,028.7
23 Rayalaseema 388.6 167.6 12.7 63.5 632.5
24 Tamilnad 287.0 563.9 53.3 109.2 1 ,013.5
25 M alabar and South Canara 2 ,5 4 7 .2 358.1 10.2 271.8 3 ,187.7
26 Mysore 381 .0 218.4 10.2 157.5 767.1
27 Travancore-Cochin 1,315 .7 530.0 40 6 424.2 2 ,311 .4
Source: W eekly W eather R eport issued by the Director-General o f observatories, Poona (1952—53)
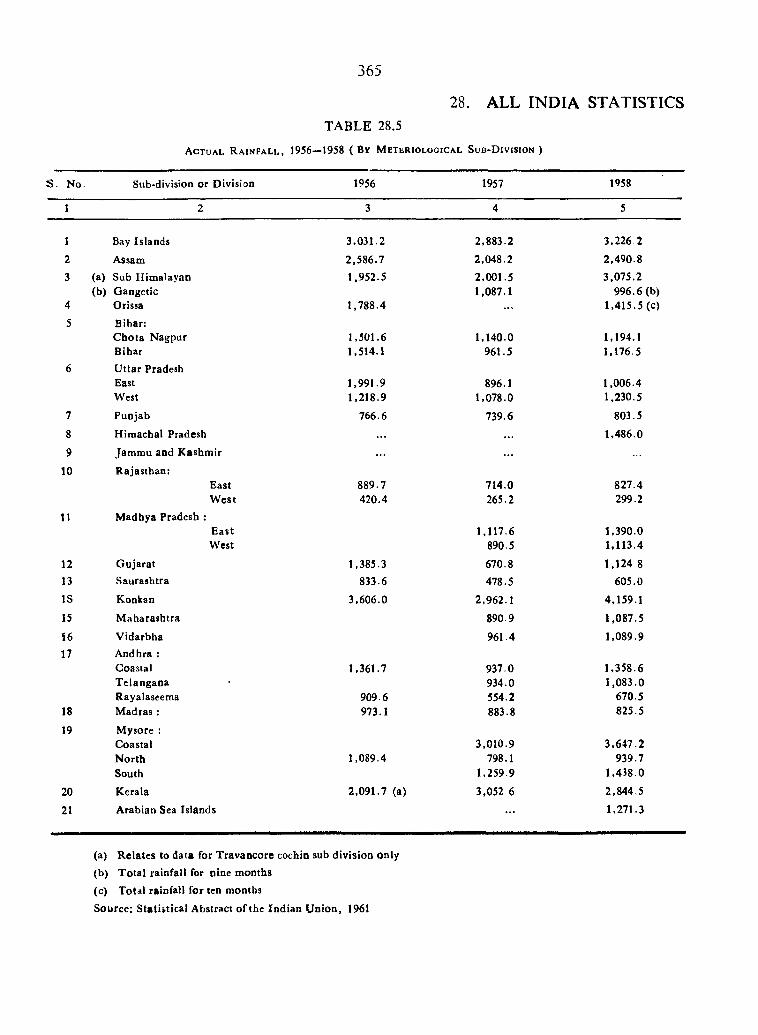
TABLE 28.5
A c t u a l R a i n f a l l , 1956—1958 ( B y M e t e r i o l o g i c a l S u b - D i v i s i o n )
365
28. ALL INDIA STATISTICS
S . No. Sub-division or Division 1956 1957 1958
1 2 3 4 5
1 Bay Islands 3,031.2 2,883.2 3,226 2
2 Assam 2,586.7 2,048.2 2,490.8
3 (a) Sub H im alayan 1.952.5 2,001.5 3,075.2(b) Gangetic 1,087.1 996 .6 (b )
4 Orissa 1,788.4 . . . 1,415.5 (c)
5 Bihar:C hota Nagpur 1,501.6 1,140.0 1,194.1B ihar 1,514.1 961.5 1,176.5
6 U tta r PradeshEast 1,991.9 896.1 1,006.4West 1,218.9 1,078.0 1,230.5
7 Punjab 766.6 739.6 803.5
8 Hiraachal Pradesh . . . . . . 1,486.0
9 Jam m u and K ashm ir • • • . . .
10 R ajasthan;East 889.7 714.0 827.4W est 420.4 265.2 299.2
11 M adhya Pradesh ;E ast 1,117.6 1,390.0West 890.5 1,113.4
12 G ujarat 1,385.3 670.8 1,124 8
13 Saurashtra 833.6 478.5 605.0IS Konkan 3,606.0 2,962.1 4,159.1
15 M aharashtra 890.9 1,087.5
16 V idarbha 961.4 1,089.917 Andhra :
Coastal 1,361.7 937.0 1,358.6T elangana 934.0 1,083.0Rayalaseema 909.6 554.2 670.5
18 M adras : 973.1 883.8 825.5
19 Mysore ;Coastal 3,010.9 3,647.2N orth 1,089.4 798.1 939.7South 1,259.9 1,438.0
20 K erala 2,091.7 (a) 3,052.6 2,844.5
21 A rabian Sea Islands . . . 1,271.3
(a) R elates to data for T ravaocore cochio sub division only
(b) T o ta l rainfall for nine months
(c) Total rainfall for ten months
Source: S tatistical Abstract of the Ind ian U nion , 1961
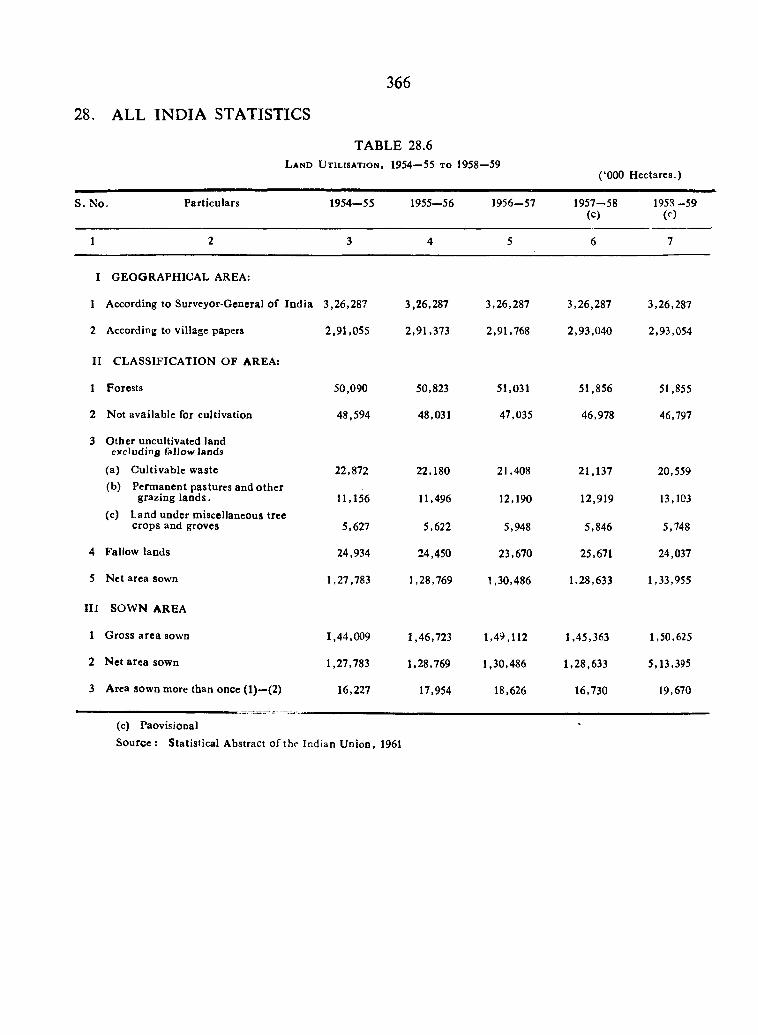
366
28. ALL INDIA STATISTICS
TABLE 28.6L a n d U t i l i s a t i o n , 1954—55 t o 1958—59
(‘000 H ectares.)
S. N o. P articulars 1954—55 1955—56 1956—57 1957-58(c)
1958-59 ( 0
1 2 3 4 5 6 7
I GEO GRA PHICA L AREA:
1 According to Surveyor-General o f In d ia 3,26,287 3,26,287 3,26,287 3,26,287 3,26,287
2 According to village papers 2,91,055 2,91,373 2,91,768 2,93,040 2,93,054
II CLA SSIFICA TIO N O F AREA:
1 Forests 50,090 50,823 51,031 51,856 51,855
2 Not available for cultivation 48,594 48,031 47,035 46,978 46,797
3 O ther uncultivated land excluding fallow lands
(a) C ultivab le w aste 22,872 22,180 21,408 21,137 20,559(b) Perm anent pastures and o ther
grazing lands. 11,156 11,496 12,190 12,919 13,103(c) Land under miscellaneous tree
crops and groves 5,627 5,622 5,948 5,846 5,748
4 Fallow lands 24,934 24,450 23,670 25,671 24,037
5 N et area sown 1,27,783 1,28,769 1,30,486 1,28,633 1,33,955
I I I SOW N AREA
1 G ross a rea sown 1,44,009 1,46,723 1,49,112 1,45,363 1,50,625
2 N et area sown 1,27.783 1,28,769 1,30,486 1,28,633 5,13,395
3 Area sown more than once (1)—(2) 16,227 17,954 18,626 16,730 19,670
(c) Paovisional
Source ; S tatistical Abstract o f the Indian U nion, 1961
TABLE 28.7
E s t i m a t e d A r e a a n d Y i e l d o f P r i n c i p a l C r o p s ,
1957-58 TO 1961-62
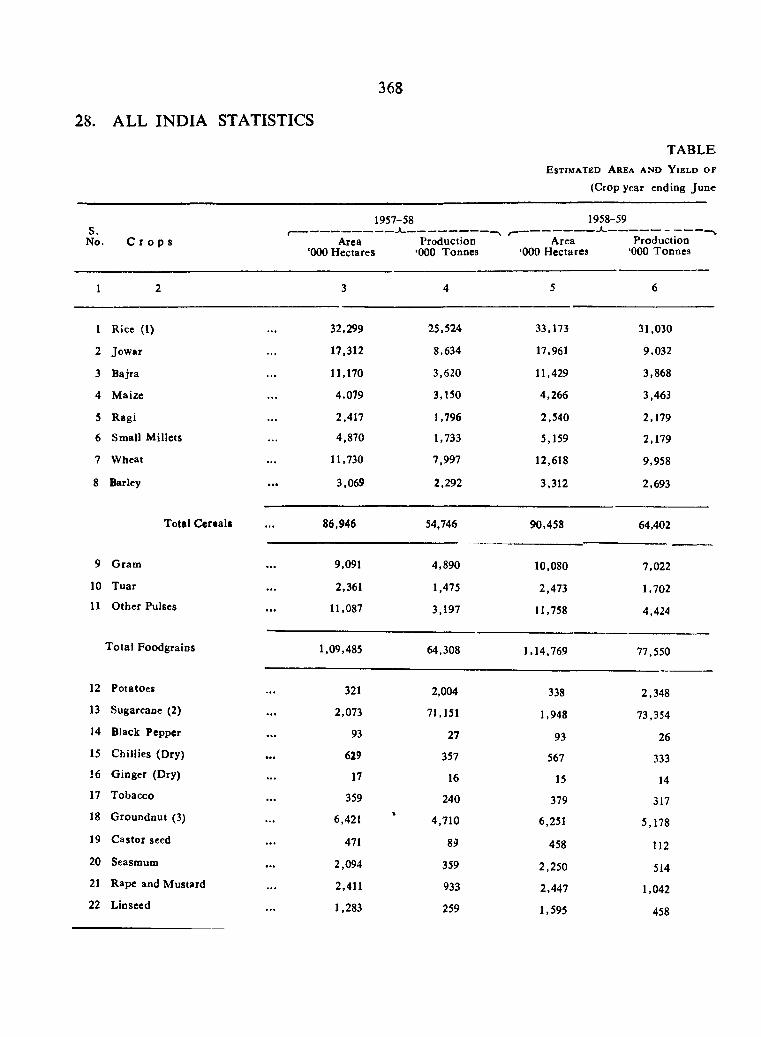
368
28. ALL INDIA STATISTICS
T A B L EE s t i m a t e d A r e a a n d Y i e l d o f
(Crop year ending Ju n e
S.No. C r o p s
1957-58
Area Production‘000 H ectares ‘000 Tonnes
1958-59
A rea Production‘000 H ectares ‘000 Tonnes
1 2 3 4 5 6
1 Ricc (1) 32,299 25,524 33,173 31,030
2 Jow ar 17,312 8,634 17,961 9,032
3 Bajra . . . 11,170 3,620 11,429 3,868
4 M aize . . . 4,079 3,150 4,266 3,463
5 Ragi . . . 2,417 1,796 2,540 2,179
6 Small M illets 4,870 1,733 5,159 2,179
7 W heat . . . 11,730 7,997 12,618 9,958
8 Barley . . . 3,069 2,292 3,312 2,693
Total C ereals . . . 86,946 54,746 90,458 64,402
9 G ram . . . 9,091 4,890 10,080 7,022
10 Tuar . . . 2,361 1,475 2,473 1,702
11 O ther Pulses . . . 11,087 3,197 11,758 4,424
T o ta l Foodgraios 1,09,485 64,308 1,14,769 77.550
12 Potatoes 321 2,004 338 2,34813 Sugarcane (2) 2,073 71,151 1,948 73,35414 Black Pepper 93 27 93 2615 C hillies (D ry) 629 357 567 33316 G inger (Dry) 17 16 15 1417 Tobacco 359 240 379 31718 G roundnut (3) 6,421
%4,710 6,251 5,178
19 C astor seed 471 89 458 11220 Seasmum 2,094 359 2,250 51421 Rape and M ustard 2,411 933 2,447 1,04222 Linseed 1,283 259 1,595 458
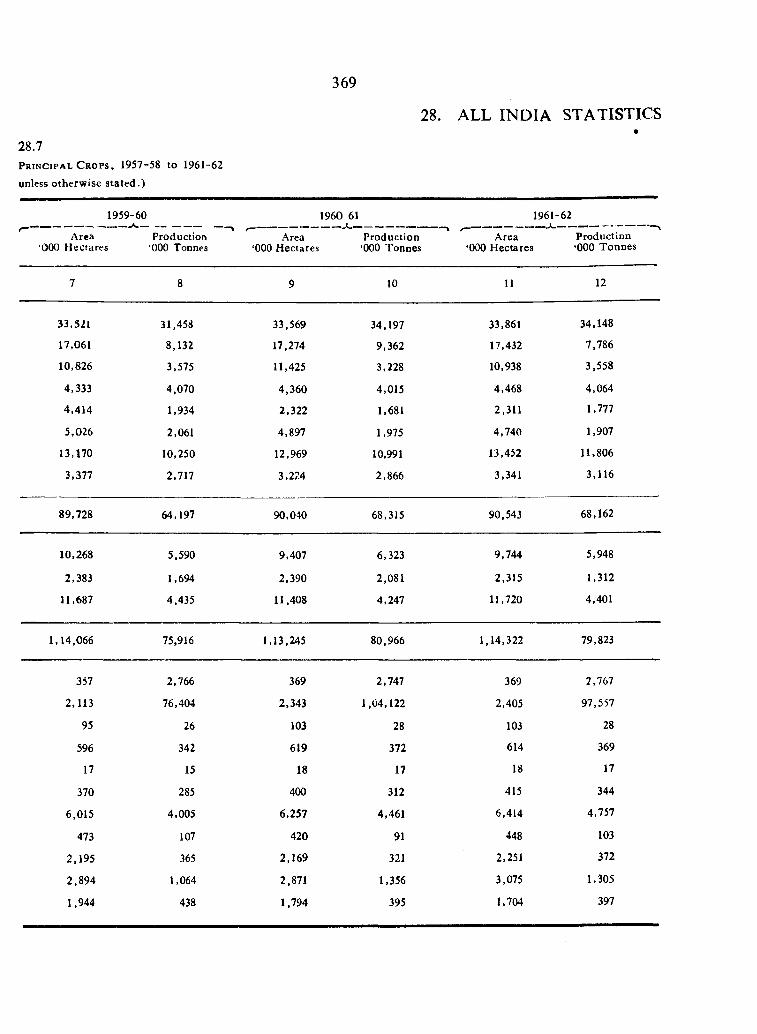
369
28. ALL INDIA STATISTICS
28.7P r i n c i p a l C ro p s , 1957-58 to 1961-62
unless o therw ise s ta ted .)
1959-60
Area ‘000 Hectares
Production ‘000 Tonnes
1960 61
Area Production‘000 Hectares ‘000 Tonnes
1961-62
Area ‘000 H ectares
Productinn ‘000 Tonnes
7 8 9 10 11 12
33,521 31,458 33,569 34,197 33,861 34,148
17,061 8,132 17,274 9,362 17,432 7,786
10,826 3,575 11,425 3,228 10,938 3,558
4,333 4,070 4,360 4,015 4,468 4,064
4,414 1,934 2,322 1,681 2,311 1,777
5,026 2,061 4,897 1,975 4,740 1,907
13,170 10,250 12,969 10,991 13,452 11,806
3,377 2,717 3,27.4 2,866 3,341 3,116
89,728 64,197 90,040 68,315 90,543 68,162
10,268 5,590 9,407 6,323 9,744 5,948
2,383 1,694 2,390 2,081 2,315 1,312
11,687 4,435 11,408 4,247 11,720 4,401
1,14,066 75,916 1,13,245 80,966 1,14,322 79,823
357 2,766 369 2,747 369 2,767
2,113 76,404 2,343 1,04,122 2,405 97,557
95 26 103 28 103 28
596 342 619 372 614 369
17 15 18 17 18 17
370 285 400 312 415 344
6,015 4,005 6,257 4,461 6,414 4,757
473 107 420 91 448 103
2,195 365 2,169 321 2,251 372
2,894 1,064 2,871 1,356 3,075 1,305
1,944 438 1,794 395 1,704 397
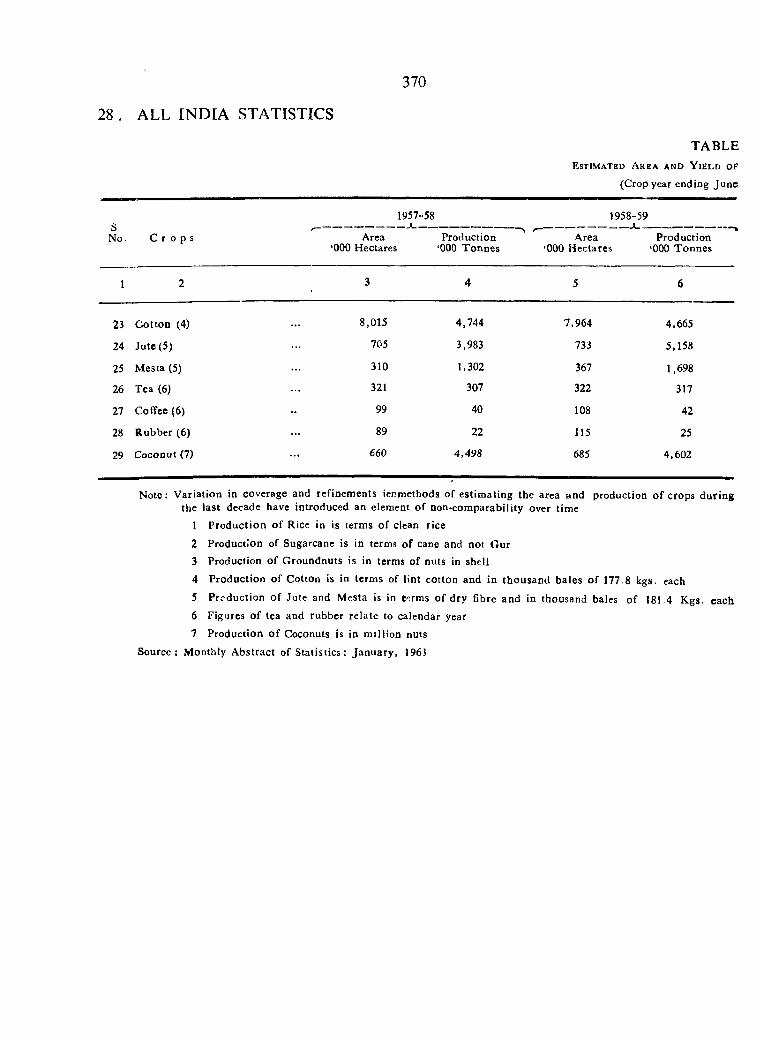
370
28 . ALL INDIA STATISTICS
TABLEE s t i m a t e d A r e a a n d Y i e l d o f
(Crop year ending June
S.No. C r o p s
1957-58
Area Production‘000 Hectares ‘000 T onnes
1958-59
Area ‘000 Hectares
Production ‘000 T onnes
1 2 3 4 5 6
23 C o t t o D (4) . . . 8,015 4,744 7,964 4,665
24 J u te (5) 705 3,983 733 5,158
25 Mesta (5) 310 1,302 367 1,698
26 T ea (6) 321 307 322 317
27 Coffee (6) •• 99 40 108 42
28 Rubber (6) . . . 89 22 115 25
29 Coconut (7) . . . 660 4,498 685 4,602
N ote: V ariation in coverage and refinem ents ienmethods of estim ating the area and production o f crops during the last decade have introduced an element o f non-com parability over time
1 P roduction o f Rice in is terms o f clean rice
2 Production of Sugarcane is in terms o f cane and not G ur3 Production of G roundnuts is in terms of nuts in shell
4 P roduction o f Cotton is in term s of lint cotton and in thousand bales o f 177.8 kgs. each
5 Prcduction o f Jute and Mesta is in term s o f dry fibre and in thousand bales o f 181.4 Kgs. each6 Figures of tea and rubber relate to calendar year
7 Production o f Coconuts is in m illion nuts
Source: Monthly A bstract of S tatistics: Jan u a ry , 1963
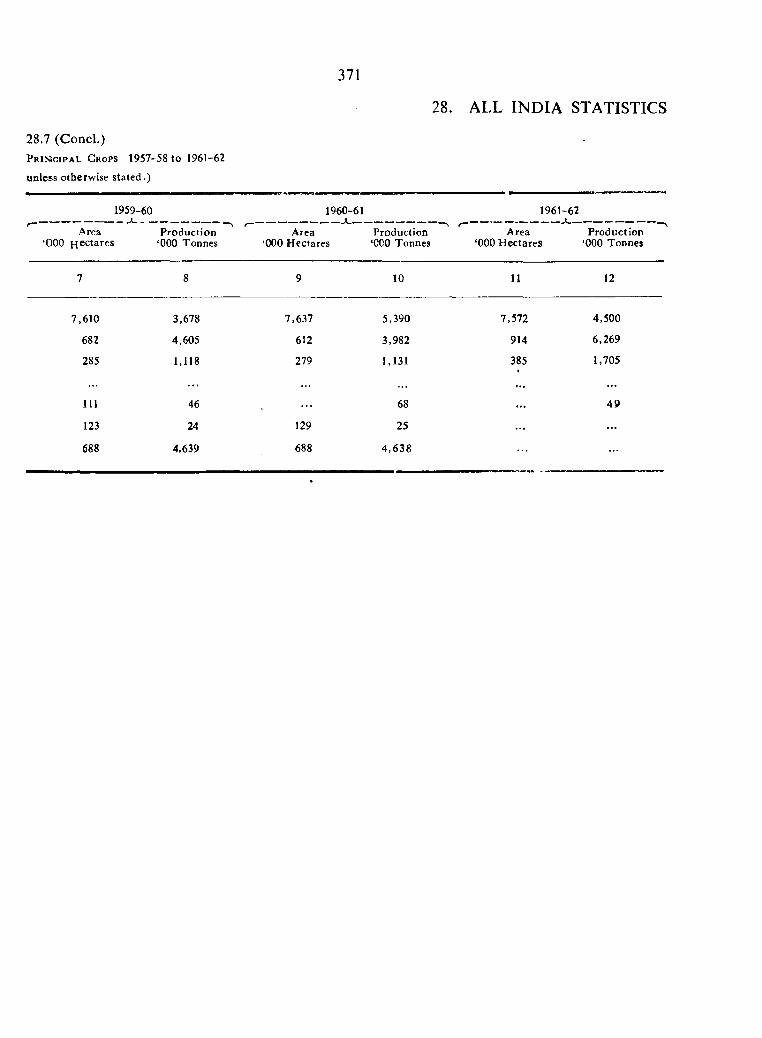
371
28. ALL INDIA STATISTICS
28.7 (Concl.)P r i n c i p a l C r o p s 1957-58 t o 1961-62
u n l e s s o t h e r w i s e s t a t e d . )
1959-60
Area ‘000 H ectares
Production ‘000 Tonnes
1960-61 1961-62
Area Production Area Production‘000 Hectares ‘000 Tonnes ‘000 H ectares ‘000 Tonnes
7 8 9 10 11 12
7,610 3,678 7,637 5,390 7,572 4,500
682 4,605 612 3,982 914 6,269
285 1,118 279 1,131 385 1,705
111 46 68 49
123 24 129 25 . . .
688 4,639 688 4 ,638 . . .
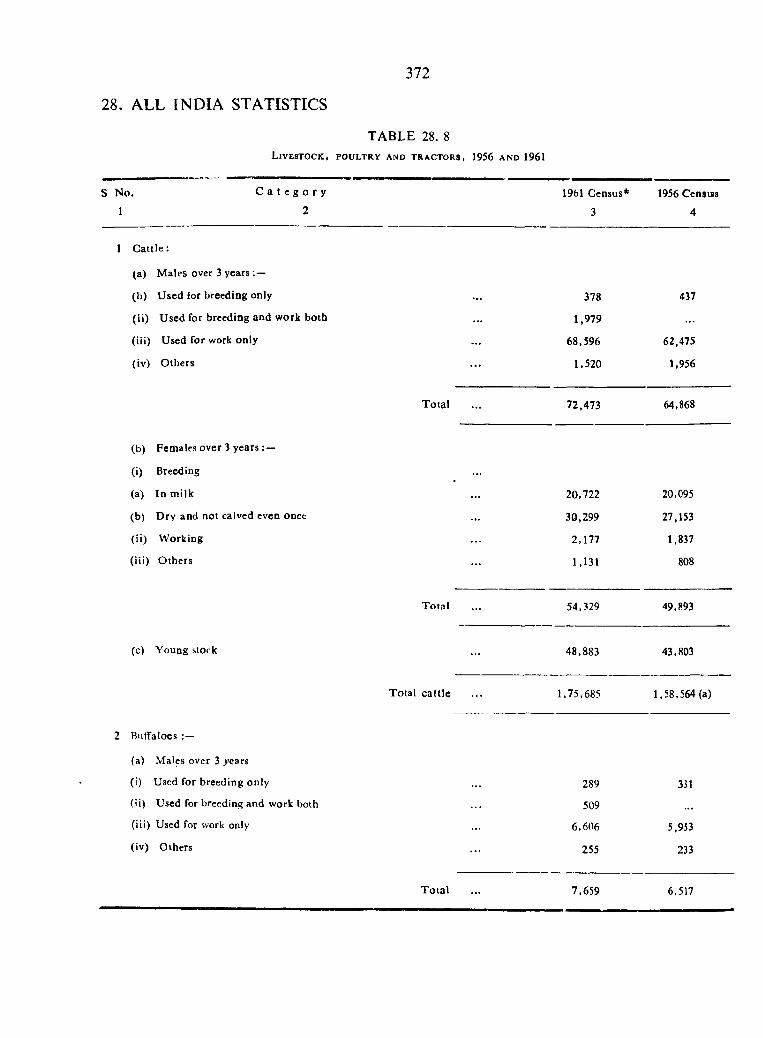
372
28. ALL INDIA STATISTICS
TABLE 28. 8L i v e s t o c k , p o u l t r y a n d t r a c t o r s , 1956 a n d 1961
S N o. C a t e g o r y
1 2
1961 Census*
3
1956 Census
4
1 C a tt le :
(a) M ales over 3 years ; —
(b) U sed for breeding only 378 437
(ii) Used for breeding and work both . . . 1,979 . . .
(ill) Used for work only . . . 68,596 62,475
(iv) O thers . . . 1,520 1,956
Total 72,473 64,868
(b) Females over 3 years
(i) Breeding
(a) In m ilk.
20,722 20,095
(b) D ry and not calved even once . . . 30,299 27,153
(ii) W orking . . . 2,177 1,837
(iii) O thers . . . 1,131 808
Total 54,329 49,893
(c) Young stock 48,883 43,803
Total cattle 1,75,685 1,58,564 (a)
2 RuflFaloes
(a) Males over 3 >’ears
(I) Used for breeding only 289 331
(ii) Used for breeding and work both 509 . . .
(iii) Used for work only 6,606 5,953
(iv) Others . . . 255 233
T o ta l 7,659 6,517
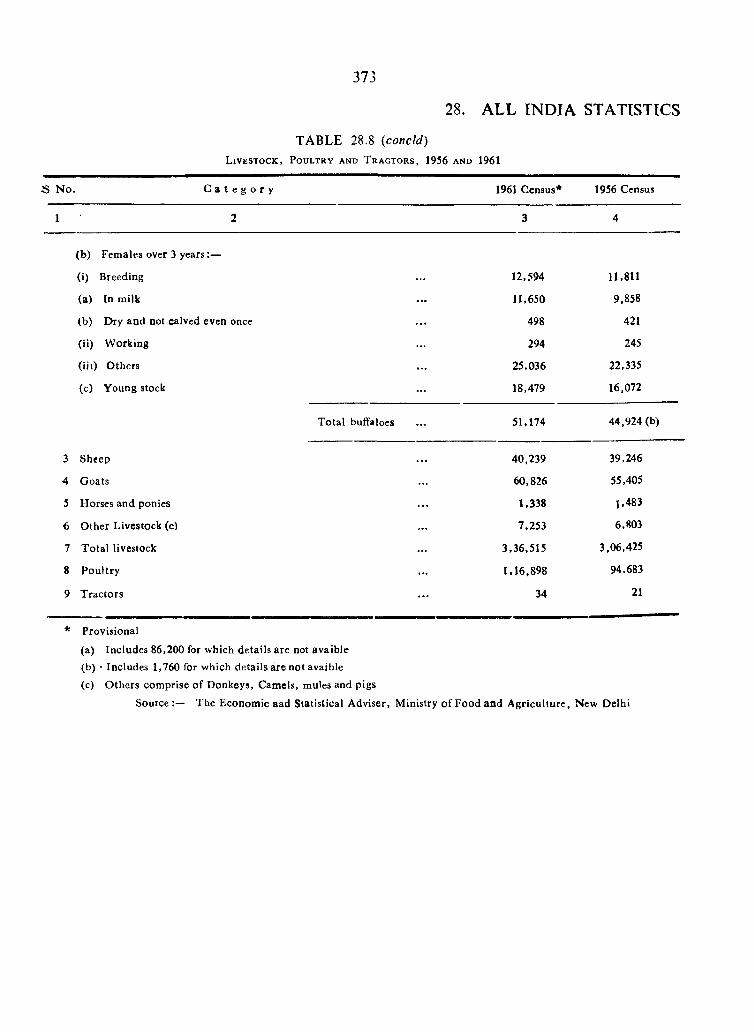
L i v e s t o c k ,
373
28.
TABLE 28.8 (.concld)P o u l t r y a n d T r a c t o r s , 1956 a n d
ALL IN D IA STATISTICS
1961
:s N o C a t e g o r y 1961 Census* 1956 Census
1 2 3 4
(b) Females over 3 years;—
(i) Breeding . . . 12,594 11,811
(a) In milk . . . 11,650 9,858
(b) Dry and not calved even once . . . 498 421
(ii) W orking 294 245
(iii) Others . . . 25,036 22,335
(c) Young stock . . . 18,479 16,072
Total buffaloes 51,174 44,924 (b)
3 Sheep . . . 40,239 39,246
4 Goats . . . 60,826 55,405
5 Horses and ponies . . . 1,338 1,483
6 O ther Livestock (c) . . . 7,253 6,803
7 T otal livestock . . . 3,36,515 3,06,425
8 Poultry 1,16,898 94.683
9 T ractors . . . 34 21
* Provisional
(a) Includes 86,200 for which details are not avaible(b) • Includes 1,760 for which details are not avaible
(c) O thers comprise o f Donkeys, Camels, mules and pigs
Source The Economic sad Statistical Adviser, Ministry o f Food and A griculture, New Delhi
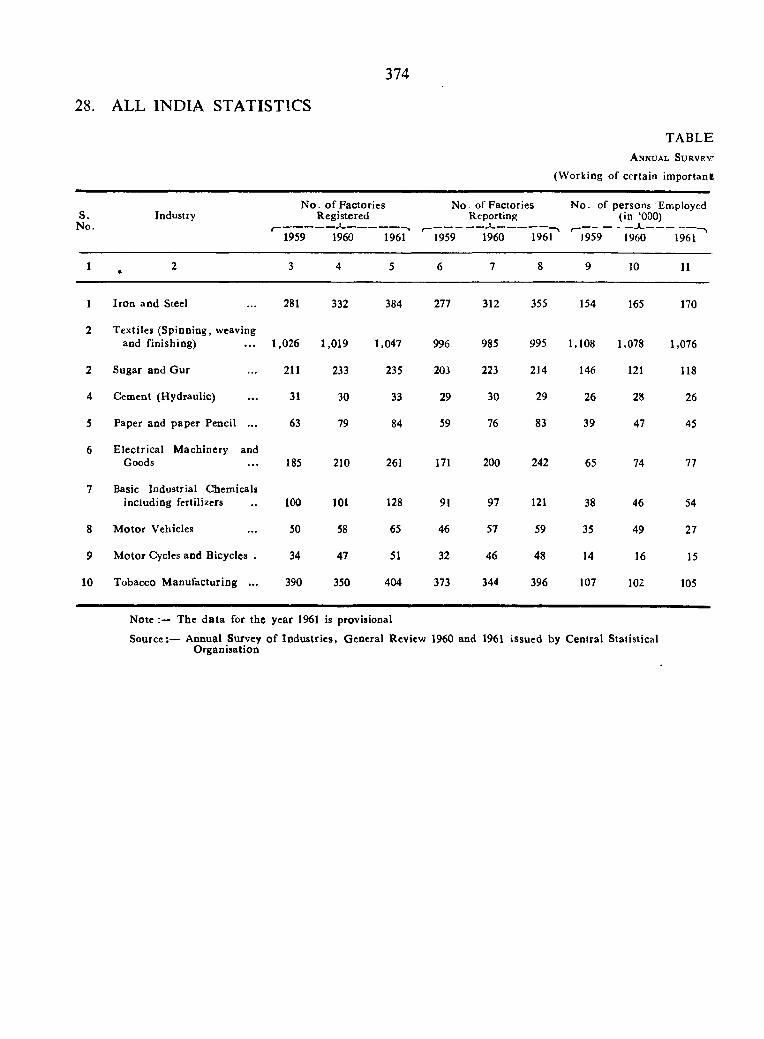
374
28. ALL INDIA STATISTICS
TABLEA n n u a l S u r v e y
(W orking of certain im portan t
S.No.
IndustryNo
'” l959
. o f Factories Registered
1960 196?
No
^” 1 9 5 9
. of Factories Reporting
1960 19 6 P
N o. of
'" l959
persons Employed (in ‘000)
1960 196l"^
1 2 3 4 5 6 7 8 9 10 11
1 Iron and Steel 281 332 384 277 312 355 154 165 170
2 Textiles (Spinning, weaving and finishing) 1,026 1,019 1,047 996 985 995 1,108 1,078 1,076
2 Sugar and G ur 211 233 235 203 223 214 146 121 118
4 Cement (H ydraulic) 31 30 33 29 30 29 26 28 26
5 Paper and paper Pencil ... 63 79 84 59 76 83 39 47 45
6 E lectrical M achinery andGoods 185 210 261 171 200 242 65 74 77
7 Basic Industrial Chemicals including fertilizers 100 101 128 91 97 121 38 46 54
8 M otor Vehicles 50 58 65 46 57 59 35 49 27
9 M otor Cycles and Bicycles . 34 47 51 32 46 48 14 16 15
10 Tobacco M anufacturing ... 390 350 404 373 344 396 107 102 105
Note The d a ta for the year 1961 is provisional
Source:— Annual Survey o f Industries, G eneral Review 1960 and 1961 issued by Central Statistical O rganisation
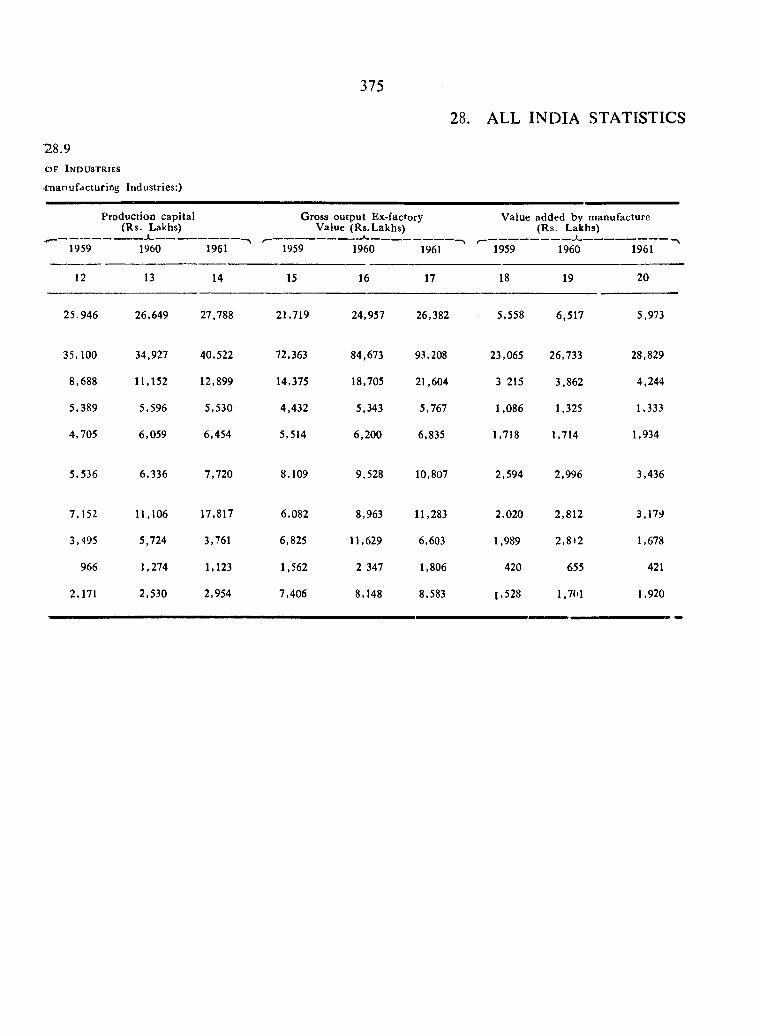
375
28. ALL INDIA STATISTICS
28.9O F I n d u s t r i e s
frnanufacturing Industries:)
Production capital (Rs. Lakhs)
■Gross output Ex-factory
Value (Rs.Lakhs)Value added by manufacture
(Rs. Lakhs)1 . .1959 1960 1961 1959 1960 1961 ^ 1959 1960 1961
12 13 14 15 16 17 18 19 20
25.946 26,649 27,788 21,719 24,957 26,382 5,558 6,517 5,973
35,100 34,927 40,522 72,363 84,673 93,208 23,065 26,733 28,829
8,688 11,152 12,899 14,375 18,705 21,604 3 215 3,862 4,244
5,389 5,596 5,530 4,432 5.343 5,767 1,086 1,325 1,333
4,705 6,059 6,454 5,514 6,200 6,835 1,718 1,714 1,934
5,536 6,336 7,720 8,109 9,528 10,807 2,594 2,996 3,436
7,152 11,106 17,817 6,082 8,963 11,283 2,020 2,812 3,179
3,495 5,724 3,761 6,825 11,629 6,603 1,989 2 ,8)2 1.678
966 1,274 1,123 1,562 2 347 1,806 420 655 421
2,171 2,530 2,954 7,406 8,148 8,583 1,528 1.7(*1 1,920
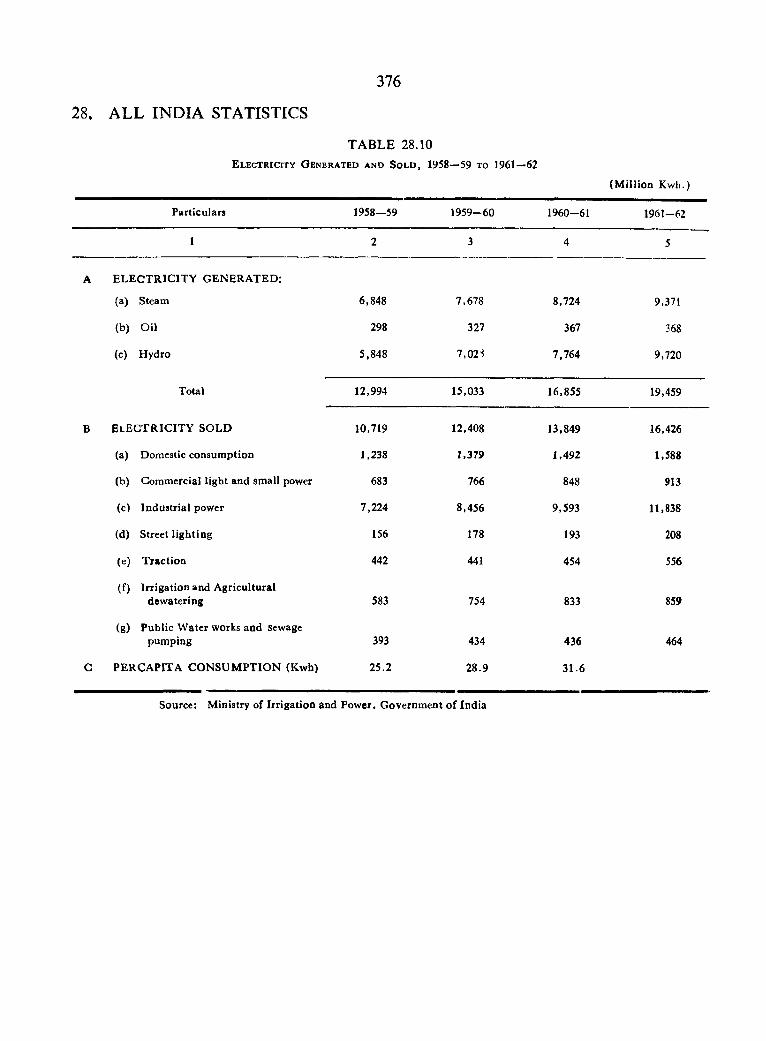
376
28. ALL INDIA STATISTICS
TABLE 28.10E l e c t r i c i t y G e n e r a t e d a n d S o l d , 1958—59 t o 1961—62
(M illion Kwh.)
Particulars 1958—59 1959-60 1960-61 1961-62
1 2 3 4 5
A E L E C T R IC IT Y G ENERATED:
(a) Steam 6,848 7,678 8,724 9,371
(b) O il 298 327 367 368
(c) Hydro 5,848 7,02S 7,764 9,720
Total 12,994 15,033 16,855 19,459
B e l e c t r i c i t y s o l d 10,719 12,408 13,849 16,426
(a) Domestic consum ption 1,238 1,379 1.492 1,588
(b) Commercial light and small power 683 766 848 913
(c) Industrial power 7,224 8,456 9,593 11,838
(d) Street lighting 156 178 193 208
(e) T raction 442 441 454 556
(0 Irrigation and A gricultural dew atering 583 754 833 859
(g) Public W ater works and Sewage pumping 393 434 436 464
G PERC A PITA c o n s u m p t i o n (Kwh) 25.2 28.9 31.6
Source: M inistry of Irrigation and Power, Governm ent o f India
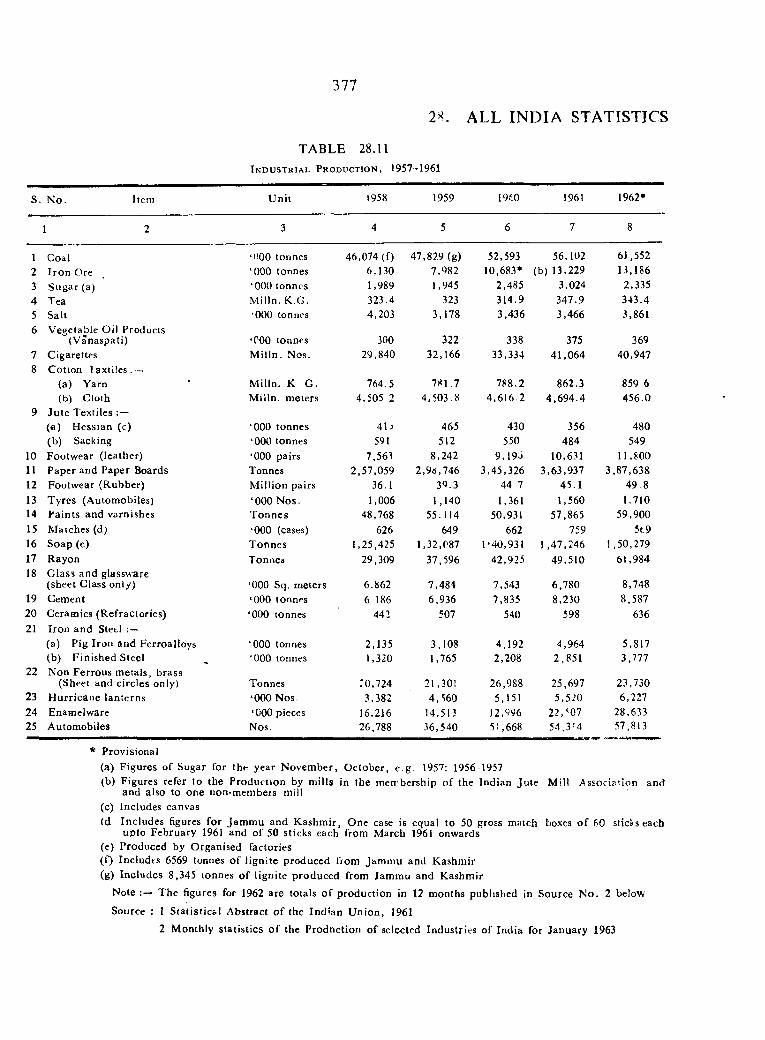
377
2> . ALL INDIA STATISTICS
TABLE 28.11I n d u s t r i a l P r o d u c t i o n , 1957-1961
S. N o. Item U nit 1958 1959 19f.O 1961 1962*
1 2 3 4 5 6 7 8
1 Coal ‘HOO tonnes 46,074 (f) 47,829 (g) 52,593 56,102 6J.5522 Iro n Ore ‘000 tonnes 6,130 7,982 10,683* ( b ) 13,229 13,1863 Sugar (a) ‘000 tonnes 1,989 1,945 2,485 3,024 2,3354 Tea M illn. K.G. 323.4 323 314.9 347.9 343.45 Sait •000 tonnes 4,203 3,178 3,436 3,466 3,8616 Vegetable Oil Products
(V anaspati) ‘COO tonnes 300 322 338 375 3697 Cigarettes M illn . Nos. 29,840 32,166 33,334 41,064 40,9478 Cotton la x t i l e s .—
(a) Yarn M illn. K G . 764.5 781.7 788.2 862.3 859.6(b) Cloth M illn. meters 4,505 2 4,503.8 4,616.2 4 ,694.4 456.0
9 Ju te Textiles(a) H essian (c) ‘000 tonnes 4U 465 430 356 480(b) Sacking ‘000 tonnes 591 512 550 484 549
10 Footwear (leather) ‘000 pairs 7,56^ 8,242 9 , l9 o 10,631 11,80011 Paper and Paper Boards Tonnes 2,57,059 2,9«,746 3,45,326 3,63,937 3,87,63812 Footwear (Rubber) M illion pairs 36.1 3^.3 44 7 45.1 49.813 Tyres (Automobiles) ‘000 Nos. 1,006 1,140 1,361 1,560 1.71014 Faints and varnishes T onnes 48,768 55.114 50,931 57,865 59,90015 M atches (d) ‘000 (cases) 626 649 662 759 5 t916 Soap (e) T onnes 1,25,425 1,32,087 l ‘40,93l 1,47,246 1,50,27917 Rayon Tonnes 29,309 37,596 42,925 49,510 61,98418 G lass and glassware
(sheet Ciass only) ‘000 Sq. meters 6.862 7,484 1,543 6,780 8,74819 Cement ‘000 tonnes 6 186 6,936 7,835 8,230 8,58720 Ceramics (Refractories) ‘000 tonnes 442 507 540 598 63621 Iron and Steel : —
(a) Pig Iron aud Ferroalloys ‘000 tonnes 2,135 3,108 4,192 4,964 5,817(b) Finished Steel ‘000 tonnes 1,320 1,765 2,208 2,851 3,117
22 Non Ferrous metals, brass (Sheet and circles oniy) Tonnes :0,724 21,301 26,988 25,697 23,730
23 H urricane lanterns ‘000 Nos. 3,382 4,560 5,151 5,520 6,22724 Enamelware ‘000 pieces 16,216 14,513 \2 ,996 22,^07 28,63325 Automobiles Nos. 26,788 36,540 51,668 54 ,3 '4 57,813
* Provisional(a) Figures of Sugar for tht^ year N ovem ber, O ctober, e g. 1957; 1956-1957(b) Figures refer to the Production by mills in the membership o f the Indian Ju te Mill Association and
and also to one non-membeis mill(c) Includes canvas(d Includes figures for Jam m u and K ashm ir, One case is equal to 50 gross match boxes o f 60 sticks each
upto February 1961 and of 50 sticks each from March 1961 onwards(e) Produced by Organised factories(f) Includes 6569 tonnes o f lignite produced from Jam m u and Kashmir(g) Includes 8,345 tonnes o f lignite produced from Jam mu and Kashm ir
Note The figures for 1962 are totals o f production in 12 months published in Source N o. 2 below
Source : 1 Statistical Abstract o f the Ind ian U nion, 1961
2 M onthly statistics o f the Prodnction of selected Industries of India for January 1963
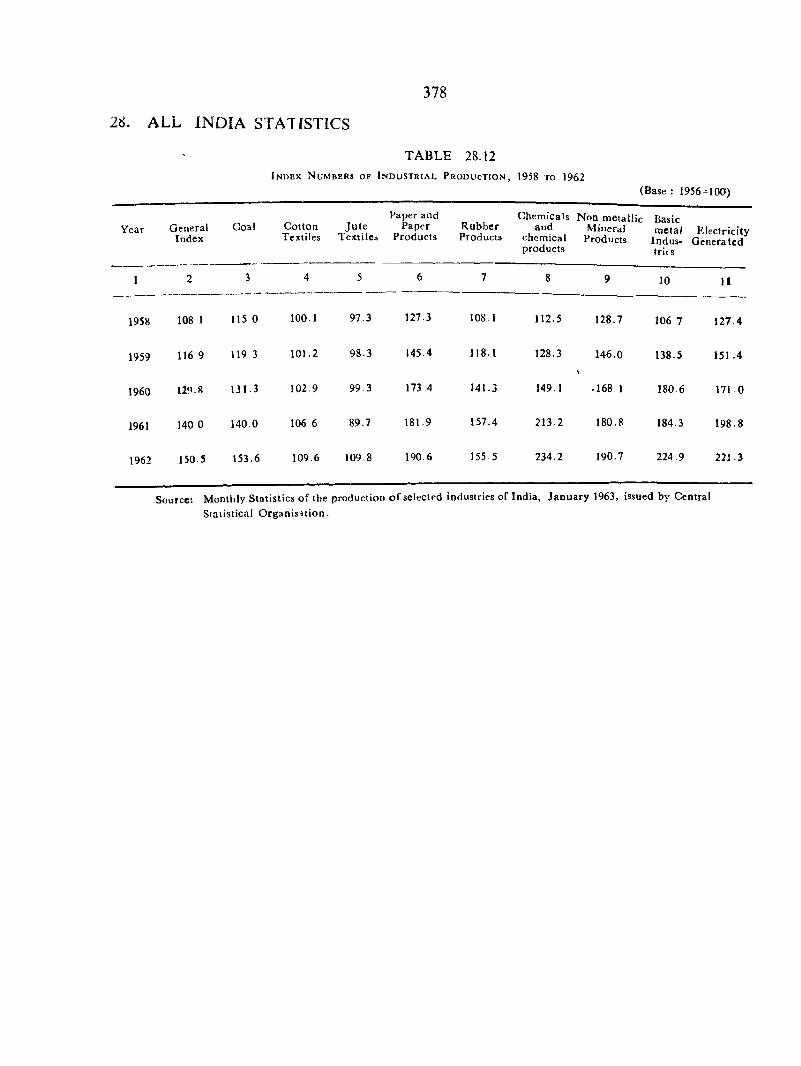
378
28. ALL INDIA STATISTICS
TABLE 28.12I n d e x N u m b e r s o f I n d u s t r i a l P r o d u c t i o n , 1958 t o 1962
(Base : 1956=100)
Paper and Chemicals Non m etallic BasicYptt General Goal Cotton Ju te Paper R ubber and Mineral m eta/ E lectricity
Index Textiles Textiles Products Products chemical Products Indus* G eneratedproducts trifs
1 2 3 4 5 6 7 8 9 10 11
1958 108 1 115 0 100.1 97 3 127 3 108.1 112.5 128.7 106 7 127.4
1959 116 9 119.3 101.2 98-3 145.4 H 8.1 128.3 146.0 138-5 151.4
1960 12‘».8 131.3 102.9 99 3 173 4 141.3 149.1 -168 1 180 6 1 7 1 0
1961 140 0 140.0 106 6 89.7 181 9 157.4 213 2 180.8 184.3 198-8
1962 150.5 153.6 109.6 109.8 190.6 1555 234.2 190.7 2 2 4 9 221-3
Source: Monthly Statistics of the production o f selected industries of India, January 1963, issued by Central Statistical O rganisation .
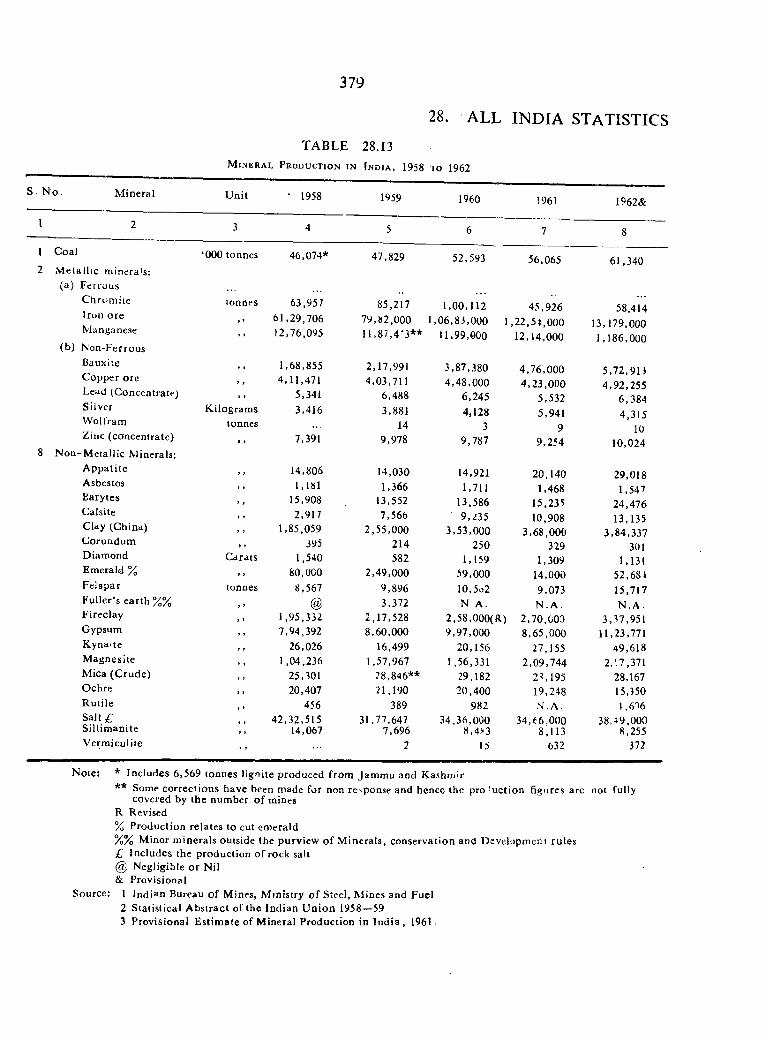
379
28. ALL INDIA STATISTICS
TABLE 28.13M i n e r a l P r o d u c t i o n i n T n d i a , 1958 t o 1962
S. N o . M ineral U nit • 1958 1959 1960 1961 1962&
1 2 3 4 5 6 7 8
1 Coal ‘000 tonnes 46,074* 47,829 52,593 56,065 61,3402 M etallic minerals;
(a) Ferrous C hrom ite tonnes 63,95 7 85,217 1,00,112 45,926 58,414Iron ore 61,29,706 79,82,000 J ,06,83,000 1,22,54.000 13,179,000Manganese • • 12,76,095 11,87,4 '3** 11,99,000 12,14,000 1,186,000
(b) N on-Ferrous Bauxite „ 1,68,855 2,17,991 3,87,380 4,76,000 5,72,91}C opper ore 4,11,471 4,03,711 4,48,000 4,23,000 4,92,255Lead (Concentrate) 5,341 6,488 6,245 5,532 6,384Silver Kilogram s 3,416 3,881 4,128 5,941 4,315W ollram tonnes 14 3 9 10Zinc (concentrate) , > 7,391 9,978 9,787 9,254 10,024
8 N on-M etallic M inerals; A ppatiic 14,806 14,030 14,921 20,140 29,018Asbestos >> 1,181 1,366 1,711 1,468 1,547Barytes 15,908 13,552 13,586 15,235 24,476Calsite >> 2,917 7,566 9,235 10,908 13,135Clay (China) 1,85,059 2,55,000 3,53,000 3,68,000 3,84,337Corundum , , 395 214 250 329 301Diamond C arats 1,540 582 1,159 1,309 1,131Emerald % >> 80.000 2,49,000 59,000 14,000 52,684Felspar tonnes 8,567 9,896 10,5o2 9,073 15,717Fuller's earth %% , , @ 3,372 N A. N .A . N .A .Fireclay , 7 1,95,332 2,17,528 2,58,000(R) 2,70,003 3,37,951Gypsum 7,94,392 8,60,000 9,97,000 8.65,000 11,23,771Kyna*te , , 26,026 16,499 20,156 27,155 49,618M agnesite , , 1,04,236 1,57,967 1,56,331 2,09,744 2,17,371Mica (C rude) , , 25,301 28,846** 29.182 2^,195 28,167Ochre , , 20,407 ?1,190 20.400 19,248 15,350R utile , 1 456 389 982 S . A . 1,6%S a l t£ 42,32,515 31,77,647 34,36,000 34,66,000 38,49,000Sillim anite , , 14,067 7,696 8,4X3 8,113 8,255Vermiculite ” 2 15 632 372
N ote: * Includes 6,569 tonnes lignite produced f ro m Jam m u and Kashmir** Some corrections have been made for non response and hence the pro ’ac tion figures are not fully
covered by the num ber o f mines R Revised% Production relates to cut emerald%% Minor minerals outside the purview o f M inerals, conservation and Development rules £ Includes the production o f rock salt @ Negligible o r Nil& Provisional
Source; 1 Indian Bureau o f Mines, M inistry o f Steel, M ines and Fuel2 Statistical A bstract of the Indian U nion 1958—593 Provisional E stim ate of M ineral Production in In d ia , 1961-
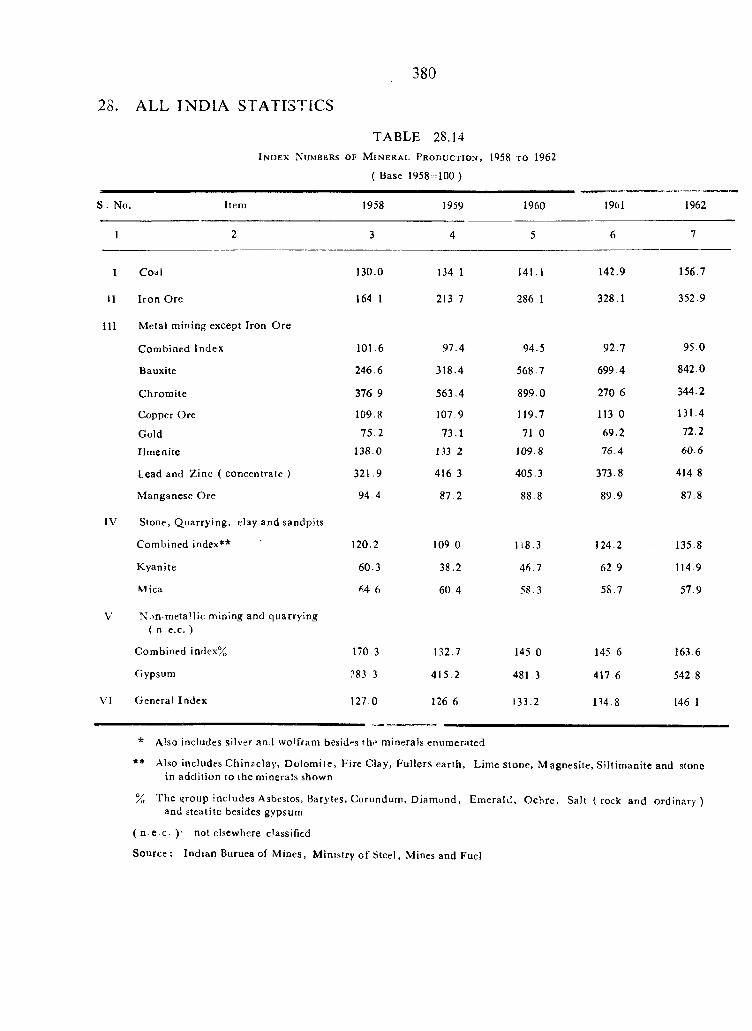
380
28. ALL INDIA STATISTICS
TABLE 28.14I n d e x N u m b e r s o f M i n e r a l P r o d u c t i o n , 1958 t o 1962
( Base 1958-100 )
S . No. Item 1958 1959 1960 19bl 1962
1 2 3 4 5 6 7
I Coal 130.0 134 1 141.1 142.9 156.7
tl Iron Ore 164 1 213 7 286 1 328.1 352.9
II I Metal mining except Iron Ore
Combined Index 101.6 97.4 94.5 92.7 95.0
Bauxite 246.6 318.4 568.7 699 4 842 0
C hrom ite 376 9 563.4 899.0 270 6 344.2
Copper Ore 109.8 107 9 119.7 113 0 131.4
Gold 75.2 73.1 71 0 69-2 72.2
Ilm enite 138.0 1.13 2 109.8 76.4 60 6
Lead and Zinc ( concentrate ) 321 .9 416 3 405.3 373-8 414 8
M anganese O re 94 4 87 2 88 8 89 9 87 8
IV Stone, Q uarrying, elay and sandpits
Combined index** 120.2 109 0 H 8.3 124 2 135 8
K yanite 60.3 38.2 46.7 62 9 114 9
Mica 64 6 60.4 58.3 58.7 57.9
V N.in-m eta'Iic mining and quarrying( n e.c. )
Combined index% 170 3 132 7 145 0 145 6 163 6
Hypsum ?83.3 415 2 481 3 417 6 542 8
VI General Index 127.0 126 6 133.2 134 8 146 1
* Also includes silver anrl w o'fram besides th'* minerals enumerated
** Also includes Chinaclay, D olom ite, F ire Clay, Fullers earth , Lime stone. M agnesite, Siltim anite and stone in addition to the minerals shown
% The group includes Asbestos, Barytes, Corundum, D iam ond, Em erald, O chre, Salt (rock and O r d i n a r y ) and steatite besides gypsum
( n e e. )• not elsewhere classified
Source: Indian Buruea of Mines, Ministry o f Steel, Mines and Fuel
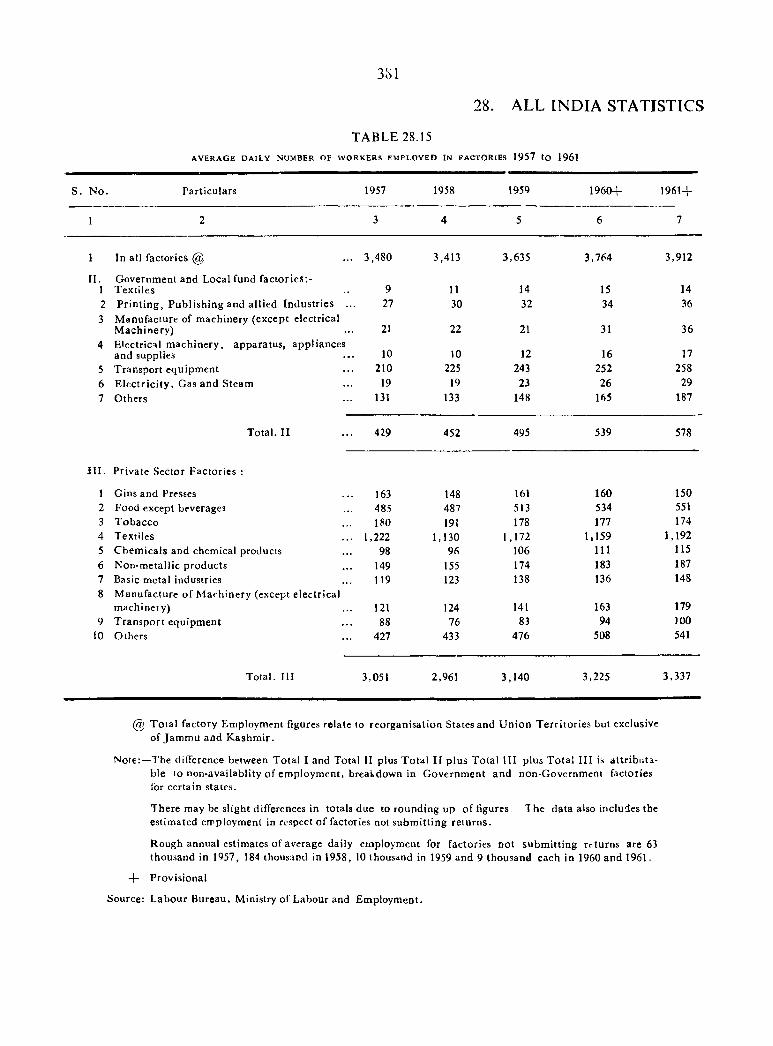
3cSl
28. ALL INDIA STATISTICS
TABLE 28.15AVERAGE DAILY NUMBER OF WORKERS EMPLOYED IN FACTORIES 1 9 5 7 t o 1961
S. N o. Particulars 1957 1958 1959 1960+ 1961 +
1 2 3 4 5 6 7
1 In all factories @ 3,480 3,413 3,635 3,764 3,912
I I . Government and Local fund factories:-1 Textiles 9 11 14 15 142 P rin ting , Publish ing and allied Industries ... 27 30 32 34 363 M anufacture of machinery (except electrical
M achinery) 21 22 21 31 364 Electrical m achinery, apparatus, appliances
and supplies 10 10 12 16 175 Transport equipm ent 210 225 243 252 2586 E lectric ity , Gas and Steam 19 19 23 26 297 Others 131 133 148 165 187
Total. II 429 452 495 539 578
I I I . Private Sector Factories :
1 Gins and Presses 163 148 161 160 1502 Food except beverages 485 487 513 534 5513 Tobacco 180 191 178 177 1744 Textiles 1,222 1,130 1,172 1,159 1,1925 C hem icals and chemical products 98 96 106 111 1156 Non-metallic products 149 155 174 183 1877 Basic metal industries 119 123 138 136 1488 M anufacture o f M achinery (except electrical
m achineiy) 121 124 141 163 1799 T ransport equipm ent 88 76 83 94 100
10 Others 427 433 476 508 541
Total. I l l 3,051 2,961 3,140 3,225 3,337
@ T otal factory Employment figures relate to reorganisation States and U nion T errito ries but exclusive of Jam m u and K ashm ir.
Note:—The difference between Total I and Total II plus T otal II plus Total III plus T o ta l I I I is a ttrib u ta ble to non-availablity of em ploym ent, breakdown in Governm ent and non-Government factories for certain states.
There may be slight differences in totals due to rounding up of figures. The data also includes the estimated ennployment in respect o f factories not subm itting retu rns.
Rough annual estimates of average daily employment for factories not subm itting returns are 63 thousand in 1957, 184 thousand in 1958, 10 thousand in 1959 and 9 thousand each in 1960 and 1961.
+ Provisional
Source: L abour Bureau, Ministry of Labour and Employment.
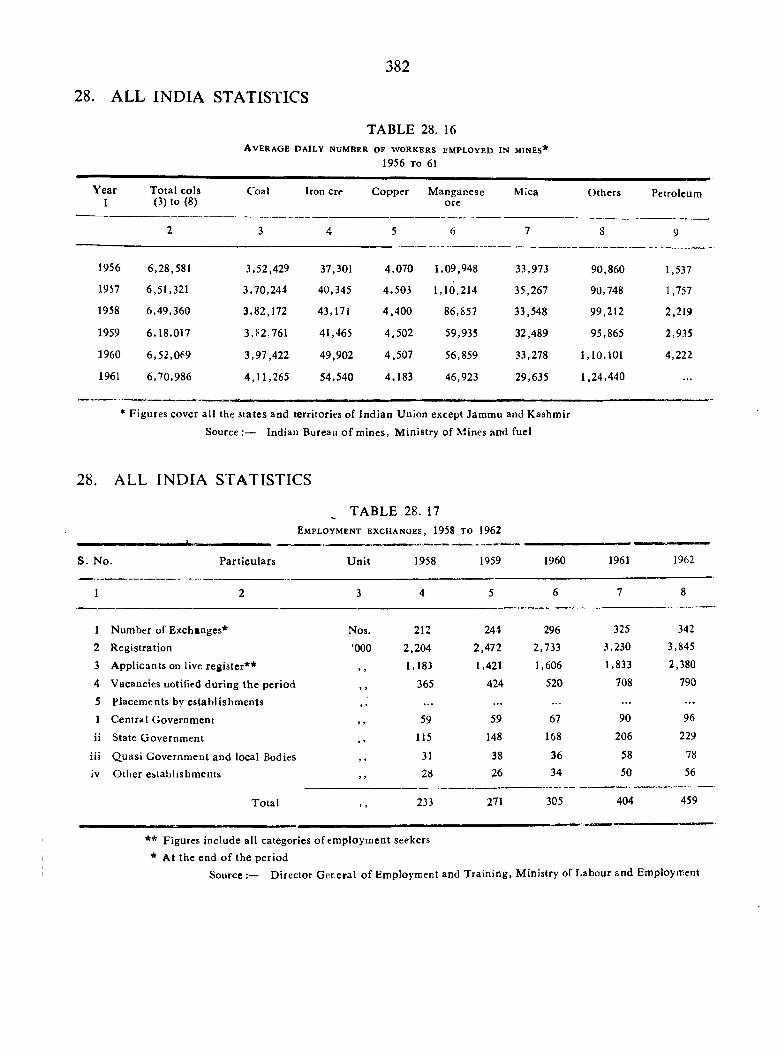
382
28. ALL INDIA STATISTICS
A v e r a g e d a i l y n u m b e r o f w o r k e r s e m p l o y e d i n m i n e s *
1956 TO 61
TABLE 28. 16
Year Total cols I (3) to (8)
Coal Iron ere C opper Manganeseore
Mica Others Petroleum
1956 6,28,581 3,52,429 37,301 4,070 1,09,948 33,973 90,860 1,537
1937 6,51,321 3,70,244 40,345 4,503 1,10,214 35,267 90,748 1,757
1958 6,49,360 3,82,172 43,171 4,400 86,857 33,548 99,212 2,219
1959 6,18,017 3,82:761 41,465 4,502 59,935 32,489 95,865 2,935
1960 6,52,069 3,97,422 49,902 4,507 56,859 33,278 1,10,101 4,222
1961 6,70,986 4,11,265 54,540 4,183 46,923 29,635 1,24,440
* Figures cover all the states and territories of Indian Union except Jammu and Kashmir
Source :— Indian Bureau o f m ines, M inistry of Mines and fuel
28. ALL INDIA STATISTICS
TABLE 28. 17E m p l o y m e n t e x c h a n g e s , 1958 t o 1962
S. N o. Particulars U nit 1958 1959 1960 1961 1962
1 2 3 4 5 6 7 8
1 Number of Exchanges* Nos. 212 244 296 325 342
2 Registration ‘000 2,204 2,472 2,733 3,230 3,845
3 A pplicants on live register** , , 1,18) 1,421 1,606 1,833 2,380
4 Vacancies notified during the period , , 365 424 520 708 790
5 placem ents by establishm ents , , . . . . . .
1 Central Governm ent , , 59 59 67 90 96
ii State G overnm ent 115 148 168 206 229
iii Q uasi G overnm ent and local Bodies 31 38 36 58 78
iv O ther establishm ents 28 26 34 50 56
T otal 233 271 305 404 459
** Figures include all categories o f em ploym ent seekers
* At the end o f the periodSource :— Director G ete ra l o f Employment and T rain ing , Ministry of Labour and Employrrent
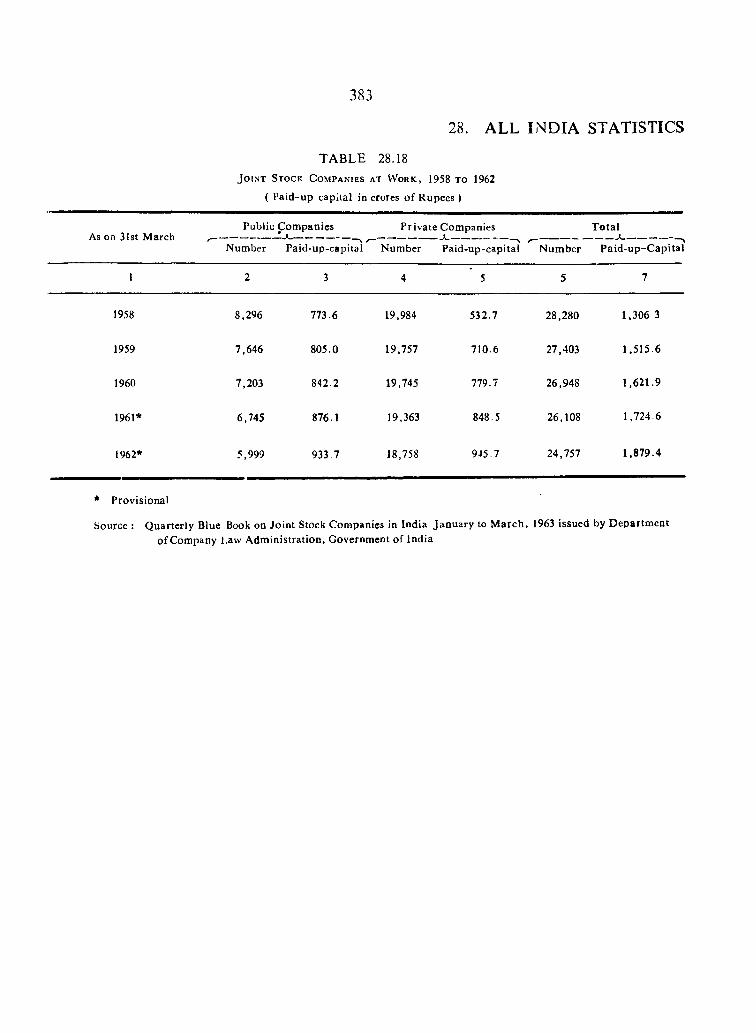
383
28. ALL INDIA STATISTICS
T A B L E
J o i n t S t o c k C o m p a n i e s
( Paid-up capital in
28.18
AT W o r k , 1958 t o 1962
crores o f Rupees )
As on 31st MarchPublic Com panies
Number Paid-up-capital
Private Companies ____ 1
T otal
Number Paid-up-capital N um ber Paid -up-C ap ita l
1 2 3 4 5 5 7
1958 8,296 773.6 19,984 532.7 28,280 1,306 3
1959 7,646 805.0 19,757 710.6 27,403 1.515.6
1960 7,203 842.2 19,745 779.7 26,948 1.621.9
1961* 6.745 876.1 19,363 848.5 26,108 1,724.6
1962* 5,999 933 7 18,758 945.7 24,757 1,879.4
* Provisional
Source : Q uarterly Blue Book on Joint Stock Companies in India January to M arch, 1963 issued by D epartm ent o f Company Law A dm inistration, Government of India
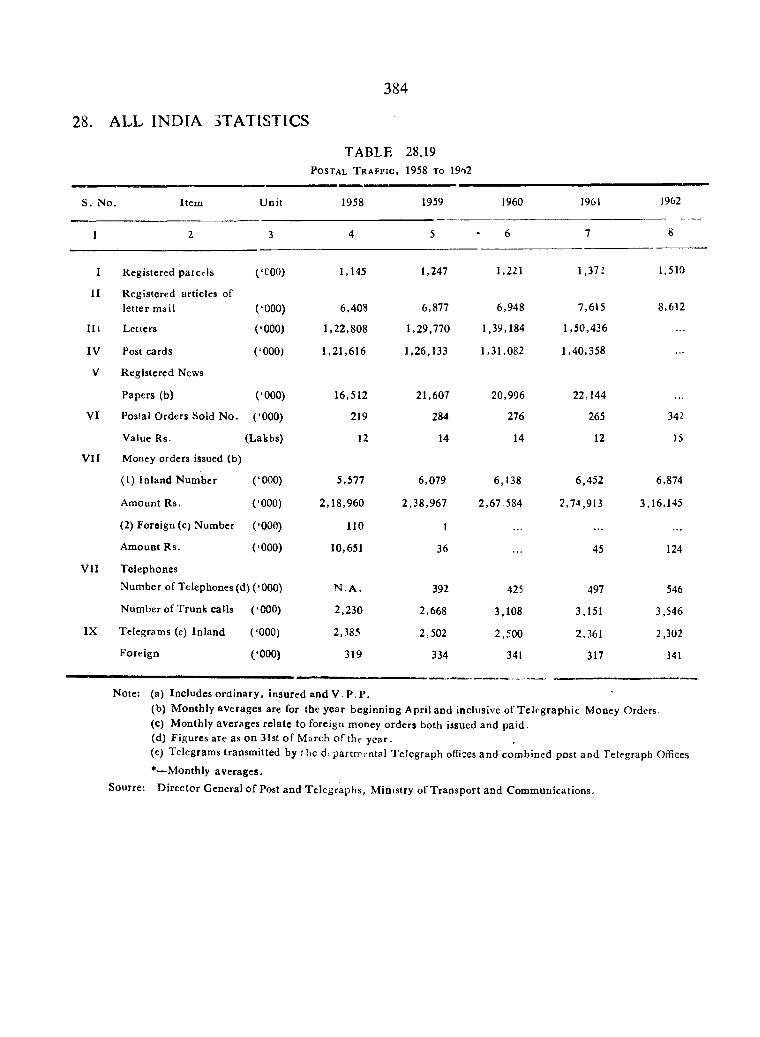
384
28. ALL INDIA STATISTICS
TABLE 28.19P o s t a l T r a f f i c , 1958 t o \9hl
S. No. Item U nit 1958 1959 1960 1961 1962
1 2 3 4 5 6 7 8
I Registered parcrls ( ‘COO) 1,145 1,247 1,221 1,37 : 1,510
II Registered articles of letter mail COOO) 6,408 6,877 6,948 7,615 8,612
H i Letters ( ‘000) 1,22,808 1,29,770 1,39,184 1,50,436 . . .
IV Post cards ( ‘000) 1,21,616 1,26,133 1,31,082 1,40,358
V Registered News
Papers (b) (•000) 16,512 21,607 20,996 22,144 . . .
VI Postal Orders Sold N o. ( ‘000) 219 284 276 265 342
Value Rs. (Lakbs) 12 14 14 12 15
VI t Money orders issued (b)
(1) Inland N um ber ( ‘000) 5,577 6,079
Amount Rs. ( ‘000) 2,18,960 2,38,967
(2) Foreign (c) Number ( ‘000) 110 1
Amount Rs. ( ‘000) 10,651 36
V II Telephones
Num ber of Telephones (d) ( ‘000) N .A . 392
Number of T runk calls ( ‘000) 2,230 2,668
IX Telegrams (e) In land ( ‘000) 2,385 2,502
Foreign ( ‘000) 319 334
6,138
2,67 584
425
3,108
2,500
341
6,452
2,74,913
45
497
3,151
2,361
317
6,874
3,16,145
124
546
3,546
2,302
341
Note: (a) Includes o rd inary , insured and V. P. P.(b) M onthly averages are for the year beginning April and inclusive of T elegraphic Money Orders.(c) M onthly averages relate to foreign money orders both issued and paid .(d) Figures are as on 31st o f M arch o f the year.(e) Telegrams transm itted by fhe d 'partm cn ta l T elegraph offices and com bined post and Telegraph Offices.
*—Monthly averages.
Sourre: D irector General o f Post and T elegraphs, M inistry of T ransport and Communications.
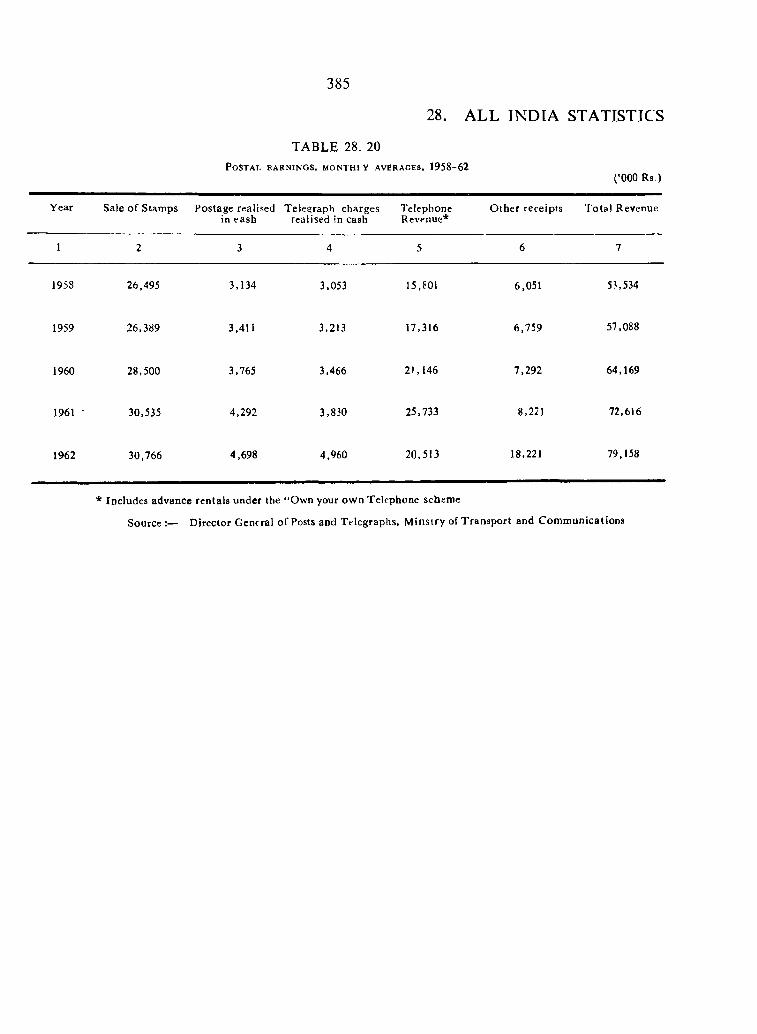
385
28. ALL INDIA STATISTICS
TABLE 28. 20P o s t a l e a r n i n g s , m o n t h i y a v e r a g e s , 1958-62
(‘000 Rs.)
Year Sale of Stamps Postage realised in eash
Telegraph charges realised in cash
TelephoneRevenue*
O ther receipts T o ta l Revenue
1 2 3 4 5 6 7
1958 26,495 3,134 3,053 15,?01 6,051 53,534
1959 26,389 3,411 3,213 17,316 6,759 57,088
1960 28,500 3,765 3,466 21,146 7,292 64,169
1961 • 30,535 4,292 3,830 25.733 8,221 72,616
1962 30,766 4,698 4,960 20,513 18,221 79,158
* Includes advance rentals under the “ Own your ow n Telephone scheme
Source D irector General o f Posts and Telegraphs, M insiry of T ransport and C om m unications
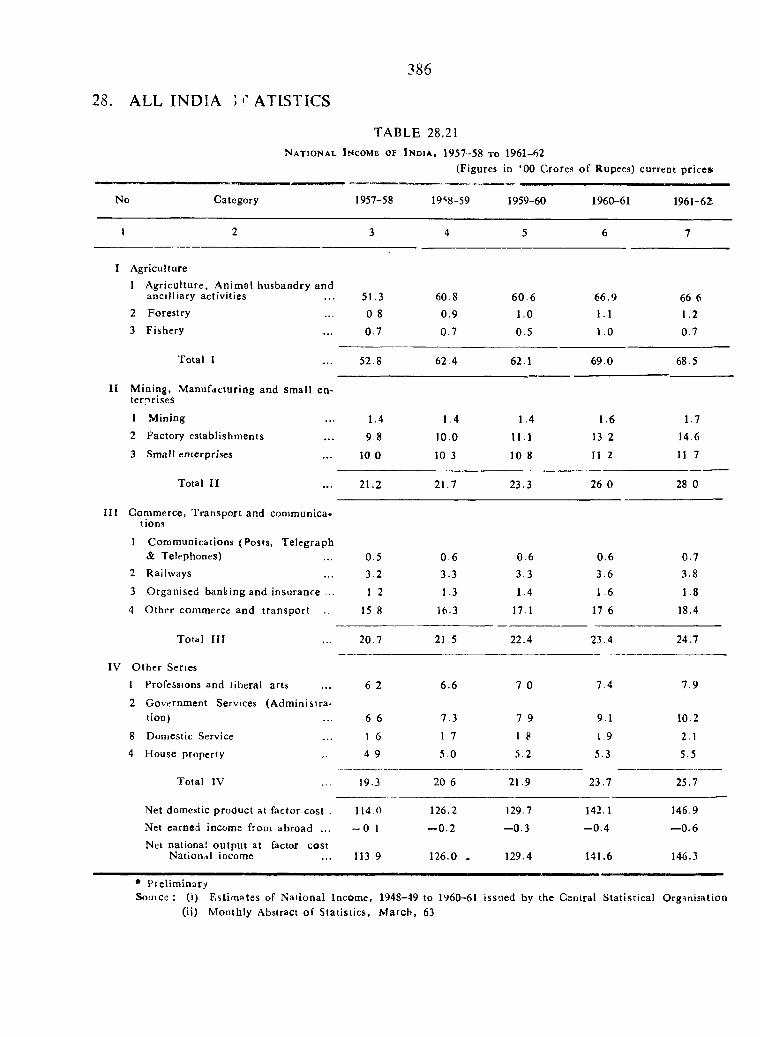
28. ALL INDIA ; ATISTICS
386
N a t i o n a l I n c o m e o f I n d i a , 1957-58 t o 1961-62(Figures in ‘00 Crores o f Rupees) current price*
TABLE 28.21
No Category 1957-58 19^8-59 1959-60 1960-61 1961-62
1 2 3 4 5 6 7
I Agriculture1 A griculture, A nim al husbandry and
ancilliary activities 51.3 60.8 60 .6 66.9 66 62 Forestry 0 8 0.9 1.0 1.1 1.23 Fishery 0.7 0.7 0.5 1.0 0.7
Total I 52.8 62 4 62.1 69.0 68.5
II M ining, M anufacturing and sm all en- t e r f » r i s e S
1 Mining 1.4 1.4 1.4 1.6 1.72 Factory establishm ents 9 8 10.0 11.1 13.2 14 6
3 Small enterprises 10 0 10 3 10 8 11 2 11.7
Total II 21.2 21.7 23.3 26 0 28 0
II I Commerce, T ransport and comm unications
I Com m unications (Posts, T elegraph & Telephones) 0.5 0.6 0 .6 0.6 0.7
2 Railways 3 2 3 3 3.3 3.6 3.8
3 O rganised banking and insurance .. 1 2 1.3 1.4 1.6 1.8
4 O ther commerce and tran spo rt 15.8 16.3 17.1 17 6 18.4
Total III 20.7 21 5 22.4 23.4 24.7
IV O ther Series1 Professions and liberal arts 6 2 6.6 7 0 7.4 7.92 Government Services (A dm inistra
tion) 6 6 7.3 7 9 9 1 10 2
8 Domestic Service 1 6 1 7 1 8 1.9 2.14 House property 4 9 5 0 5.2 5.3 5.5
Total IV 19.3 20 6 21.9 23.7 25.7
Net domestic product at factor cost . 114 0 126.2 129.7 142.1 146.9Net earned income from abroad ... - 0 1 - 0 . 2 - 0 .3 - 0 .4 —0.6Net national ou tpu t at factor cost
National income 113.9 126.0 , 129.4 141.6 146.3
* P ie l im in a rySouicc : (i) E stim ates of N ational Incom e, 1948-49 to 1^60-61 issued by tiie Central S tatistical Organisation
(ii) M onthly Abstract o f S tatistics, M arch , 63
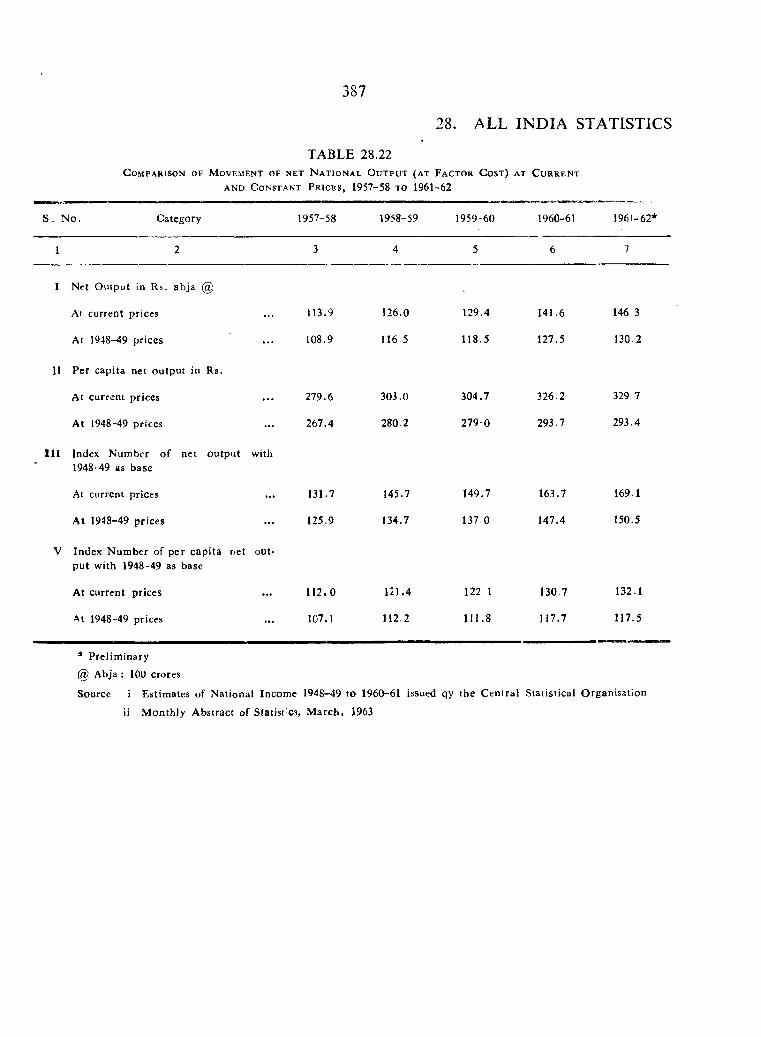
TABLE 28.22C o m p a r i s o n o f M o v e m e n t o f n e t N a t i o n a l O u t p u t ( a t F a c t o r C o s t ) a t C u r r e n t
A N D C o n s t a n t P r i c e s , 1957-58 t o 1961-62
387
28. ALL INDIA STATISTICS
S . N o. Category 1957-58 1958-59 1959-60 1960-61 1961-62*
1 2 3 4 5 6 7
I Net Oiupiit in Rs. abja @
At current prices . . . 113.9 126.0 129.4 141.6 146 3
At 1948-49 prices . . . 108.9 116.5 118.5 127.5 130.2
11 Per capita net output in Rs.
At current prices . . . 279.6 303.0 304.7 326.2 329 7
At 1948-49 prices . . . 267.4 280.2 279 0 293.7 293.4
I I I Index Number o f net output 1948-49 as base
with
At current prices . . . 131.7 145.7 149.7 163.7 169.1
At 1948-49 prices . . . 125.9 134.7 137.0 147.4 150.5
V Index N um ber of per cap ita net put with 1948-49 as base
out-
At current prices . . . 112.0 121.4 122 1 130.7 132.1
At 1948-49 prices . . . 107.1 112.2 111.8 117.7 117.5
* Prelim inary @ Abja : 100 crores
Source i Estimates of National Income 1948-49 to 1960-61 issued qy the C entral Statistical O rganisation
ii M onthly Abstract of Statistics, M arch, 1963
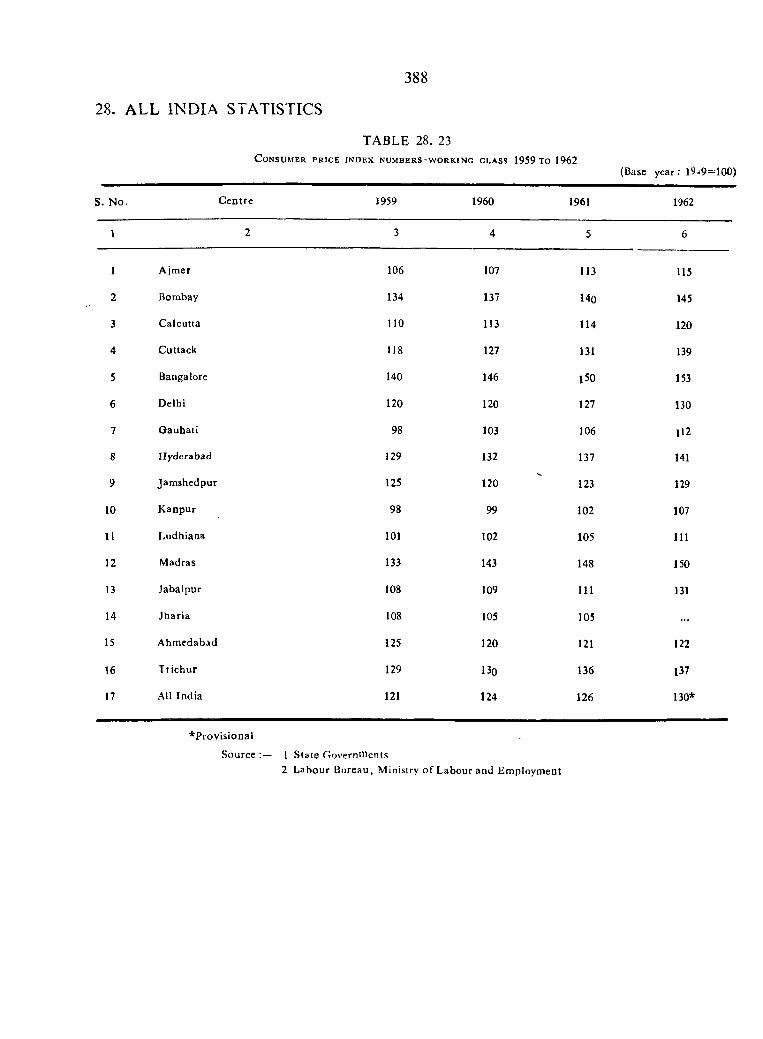
388
28. ALL INDIA STATISTICS
TABLE 28. 23Consumer price index numbers-working class 1959 to 1962
(Base year: 1949=100)
S. N o. C entre 1959 1960 1961 1962
1
2
3
4
5
6
7
8
9
10
11
12
13
14
15
16
17
Ajmer
Bombay
Calcutta
Cuttack
Bangalore
Delhi
Oauhati
Hyderabad
Jam shedpur
Kanpur
Ludhiana
Madras
Jabaipur
Jharia
Ahmedabad
Trichur
All India
106
134
HO
118
140
120
98
129
125
98
101
133
108
108
125
129
121
107
137
113
127
146
120
103
132
120
99
102
143
109
105
120
130
124
113
140
114
131
l50
127
106
137
123
102
105
148
111
105
121
136
126
115
145
120
139
153
130
ll2
141
129
107
111
150
131
122
I37
130*
*Provisional
Source :— 1 State Governments2 Labour Bureau, Ministry o f Labour and Employment
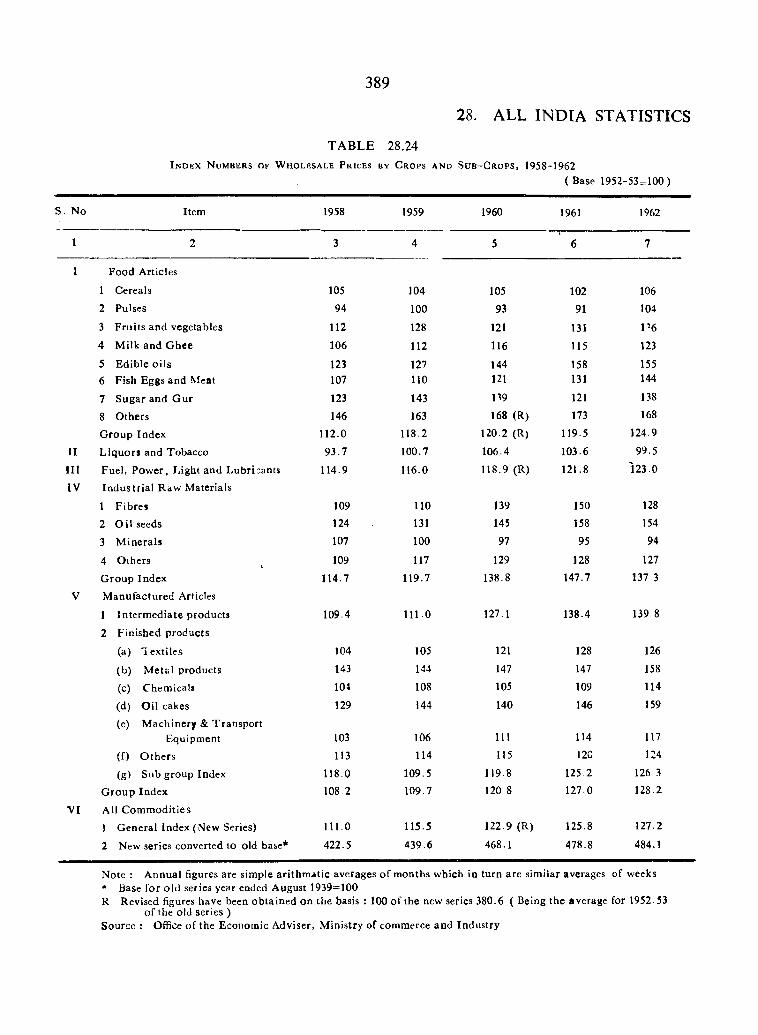
389
28. ALL INDIA STATISTICS
T A B L E
I n d e x N umbers of W holesale P rices
28.24BY C rops a n d S u b - C r o p s , 1958--1962
( Base 1952-53=100)
S . N o Item 1958 1959 1960 1961 1962
1 2 3 4 5 6 7
I F o o d Articles
1 Cereals 105 104 105 102 1062 Pulses 94 100 93 91 104
3 Fruits and vegetables 112 128 121 131 P 64 M ilk and G hee 106 112 116 115 123
5 E d ib le o i l s 123 127 144 158 1556 Fish Eggs and Meat 107 110 121 131 144
7 Sugar and G ur 123 143 m 121 138
8 O thers 146 163 168 (R) 173 168
G roup Index 112.0 118.2 120.2 (R) 119.5 124.9
II L iquors and T obacco 93.7 100.7 106.4 103.6 99.5
i n F ue l , Pow er, J.ight and Lubricants 114.9 116.0 118.9 (R) 121.8 123.0
IV Industria l R aw Materials
1 F ibres 109 110 139 150 128
2 O i l seeds 124 131 145 158 154
3 M in e r a ls 107 100 97 95 94
4 Others 109 117 129 128 127
G r o u p Index 114.7 119.7 138.8 147.7 137.3
V M anufactured Articles
1 In term ediate products 109.4 111.0 127.1 138.4 139 8
2 F inished products
(a) Textiles 104 105 121 128 126
(b) M etsl products 143 144 147 147 158
(c) C h em ica ls 104 108 105 109 114
(d) O i l cakes 129 144 140 146 159
(e) M achinery & T ransport Equipm ent 103 106 111 114 117
(f) O th e r s 113 114 115 120 124
(g) Sub group Index 118.0 109.5 119.8 125 2 126 3
G roup Index 108 2 109.7 120 8 127.0 128.2
VI All C om m odities
1 G eneral Index (New Series) 111.0 115.5 122.9 (R) 125.8 127.2
2 New series converted to old base* 422.5 439.6 468.1 478.8 484.1
Note : A nnual figures are simple arithm atic averages o f months which in turn are similar averages of weeks• Base for old series year ended August 1939=100R Revised figures have been obtained on the basis : 100 o f the new series 380.6 ( Being the average for 1952.53
of the old series )Source : Office o f the Economic Adviser, M inistry of commerce and Industry
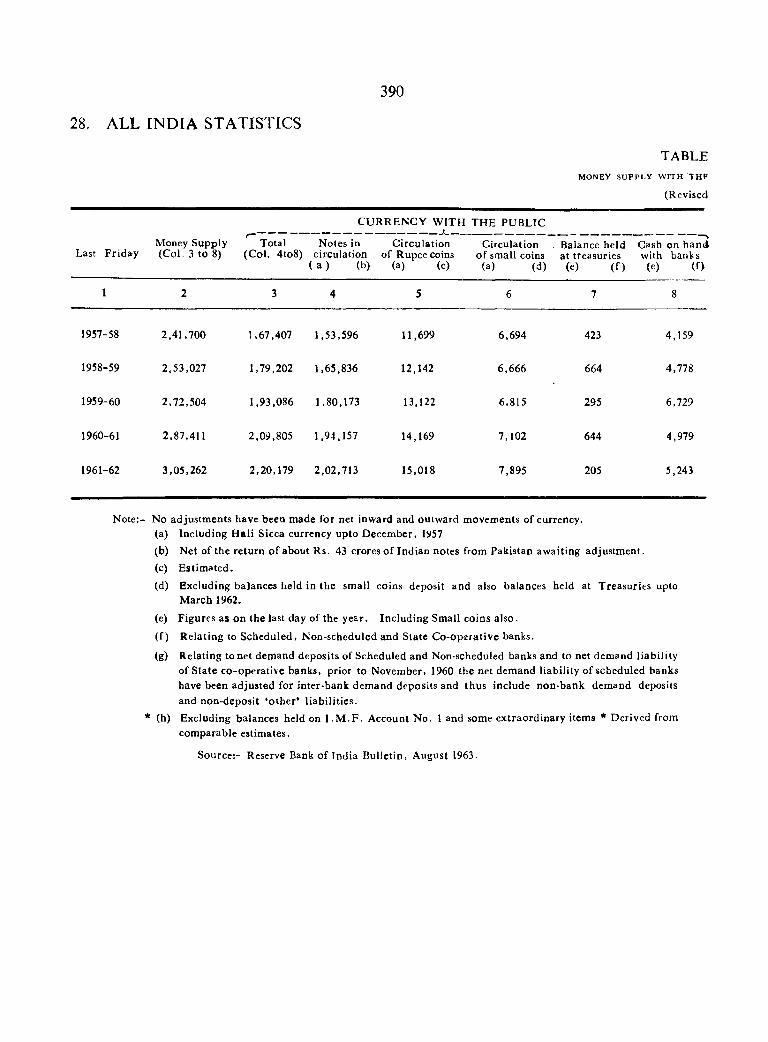
390
28. ALL INDIA STATISTICS
TABLEMONEY SUPPLY W ITH TH E
(R e v is e d
Last F ridayMoney Supply (C o l. 3 to 8)
Total (C ol. 4to8)
C U R R EN C Y W ITH
Notes in C irculation circulation of Rupee coins
( a ) (b) (a) (c)
THE PUBLIC
Circulation of small coins
(a) (d)
Balance held at treasuries
(e) (f)
Cash on hand, with banks
(e) (f)
1 2 3 4 5 6 7 8
1957-58 2,41,700 !,67,407 1,53,596 11,699 6,694 423 4,159
1958-59 2,53,027 1,79,202 1,65,836 12,142 6,666 664 4,778
1959-60 2,72,504 1,93,086 1,80,173 13,122 6,815 295 6,729
1960-61 2,87,411 2,09,805 1,94,157 14,169 7,102 644 4,979
1961-62 3,05,262 2,20,179 2,02,713 15,018 7,895 205 5,243
N ote:- No adjustm ents have been made for net inward and outward moveinents of currency.(a) Including h a l i Sicca currency upto D ecem ber, 1957(b) Net of the return o f about Rs. 43 crores o f Indian notes from Pakistan awaiting adjustm ent.(c) Estim ated.
(d) Excluding balances held in the small coins deposit and also balances held at Treasuries upto M arch 1962.
(e) Figures as on the last day of the year. Including Small coins also.
(f) R elating to Scheduled, Non-scheduled and Slate C o-oparative banks.
(g) Relating to net demand deposits of Scheduled and Non-scheduled banks and to net demand liabilityof State co-operative banks, prior to November, 1960 the net demand liability of scheduled bankshave been adjusted for inter-bank dem and deposits and thus include non-bank demand deposits and non-deposit ‘o th e r’ liab ilities.
* (h) Excluding balances held on l .M .F . Account No. 1 and some extraordinary items * Derived from comparable estimates.
Source:- Reserve Bank o f India B ulletin, August 1963.
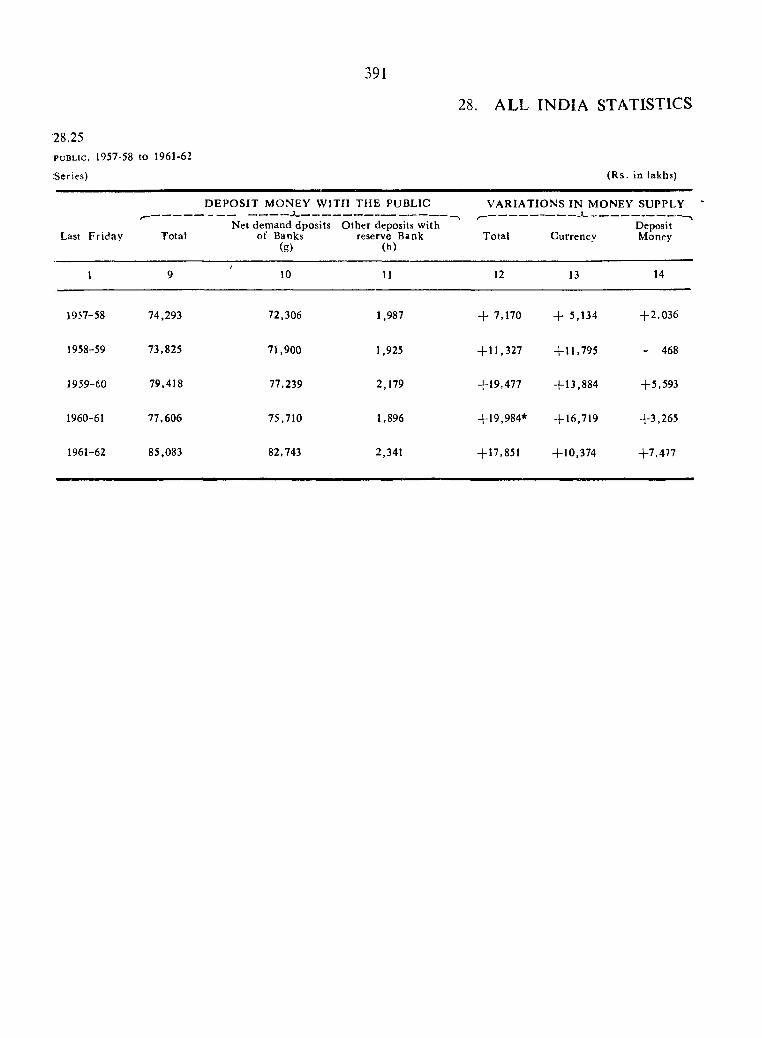
391
'28.25PUBLIC, 1957-58 to 1961-62
rSeries)
28. ALL INDIA STATISTICS
( R s . in lakhs)
Last F riday
D E PO SIT M ONEY W ITH TH E PUBLIC
Net demand dposits O ther deposits with Total of Banks reserve Bank
(g) (b)
VARLATIONS IN M ONEY SUPPLY_------------ «------------- -
DepositT otal Currency Money
1 10 11 12 13 14
1957-58
1958-59
1959-60
1960-61
1961-62
74.293
73,825
79,418
77,606
85,083
72,306
71,900
77.239
75,710
82,743
1,987
1,925
2,179
1,896
2,341
+ 7,170 + 5,134
+ 11 ,327
4-19,477
+19,984*
+17,851
+ 11,795
+ 13,884
+ 16,719
+ 10,374
+ 2 ,0 3 6
- 468
+ 5 ,593
+ 3 ,2 6 5
+ 7 ,477
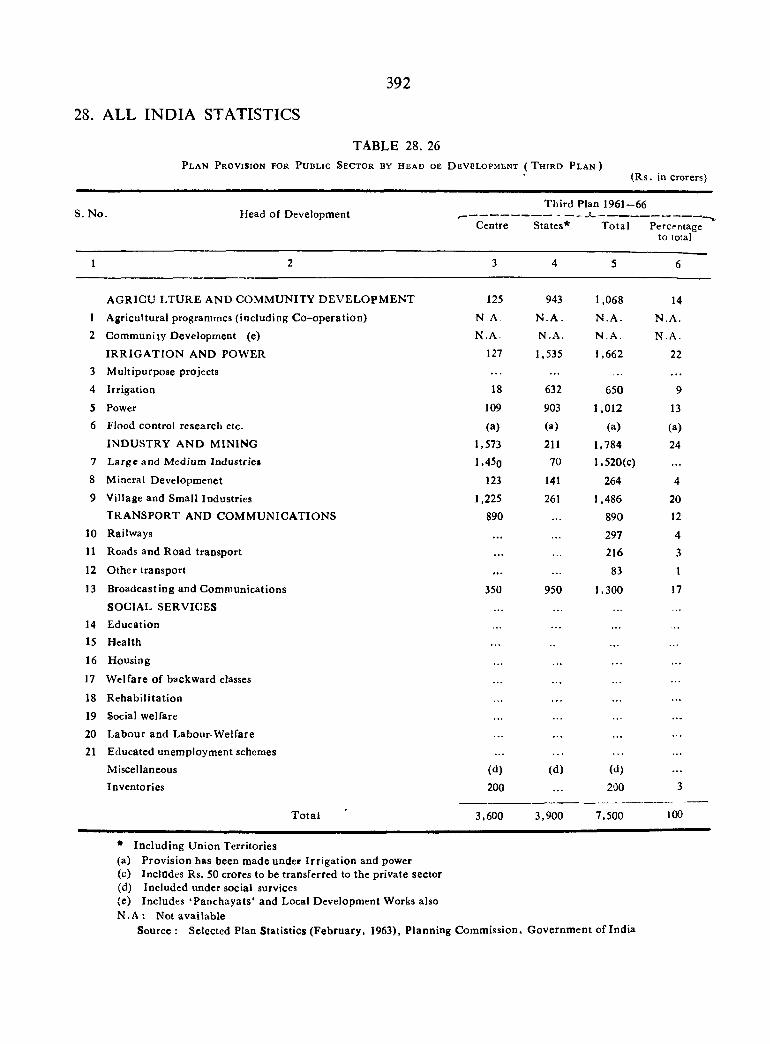
392
28. ALL INDIA STATISTICS
TABLE 28. 26P l a n P r o v i s i o n f o r P u b l i c S e c t o r b y h e a d o e D e v e l o p m e n t ( T h i r d P l a n )
(R s. in crorers)
S. No Head of DevelopmentCentre
T hird Plan 1961-66
States* T otal Percentage to total
1 2 3 4 5 6
A G R IC U L TU R E AND C O M M UN ITY D E V E L O PM E N T 125 943 1,068 141 A gricultural programmes (including C o-opera tion ) N .A . N .A . N .A . N .A .2 Com m uniiy Development (e) N .A . N.A. N .A . N .A .
IR R IG A T IO N AND PO W ER 127 1,535 1,662 223 M ultipurpose projects . . . . . . . . .
4 Irrigation 18 632 650 9
5 Power 109 903 1,012 136 Flood control research etc. (a) (a) (a) (a)
IN D U STRY A N D M IN IN G 1,573 211 1.784 247 L arge and M edium Industries l,45o 70 1.520(c)8 M ineral Developmenet 123 141 264 49 Village and Small Industries 1,225 261 1,486 20
TRA N SPO R T AND C O M M U N IC A T IO N S 890 890 1210 Railways 297 411 Roads and R oad transport 216 312 O ther transport . . . 83 I13 B roadcasting and C om m unications
SOCIAL SERVICES
350 950 1,300 17
14 E ducation . . .
15 Health
16 Housing
17 W elfare o f backw ard classes
18 R ehab ilita tion
19 Social welfare
20 L abour and Labour-W elfare . . .
21 Educated unem ploym ent schemes
Miscellaneous (d) (d) (d)Inventories 200 . . . 200 3
T o ta l 3,600 3,900 7,500 100
* Includ ing U nion Territories(a) P rovision has been made under Irrig a tio n and power(c) Includes Rs. 50 crores to be transferred to the private sector(d) Included under social survices(e) Includes ‘Panchayats* and Local D evelopm ent Works also N .A : Not available
Source ; Selected Plan S tatistics (F ebruary , 1963), P lanning C om m ission, G overnm ent of India
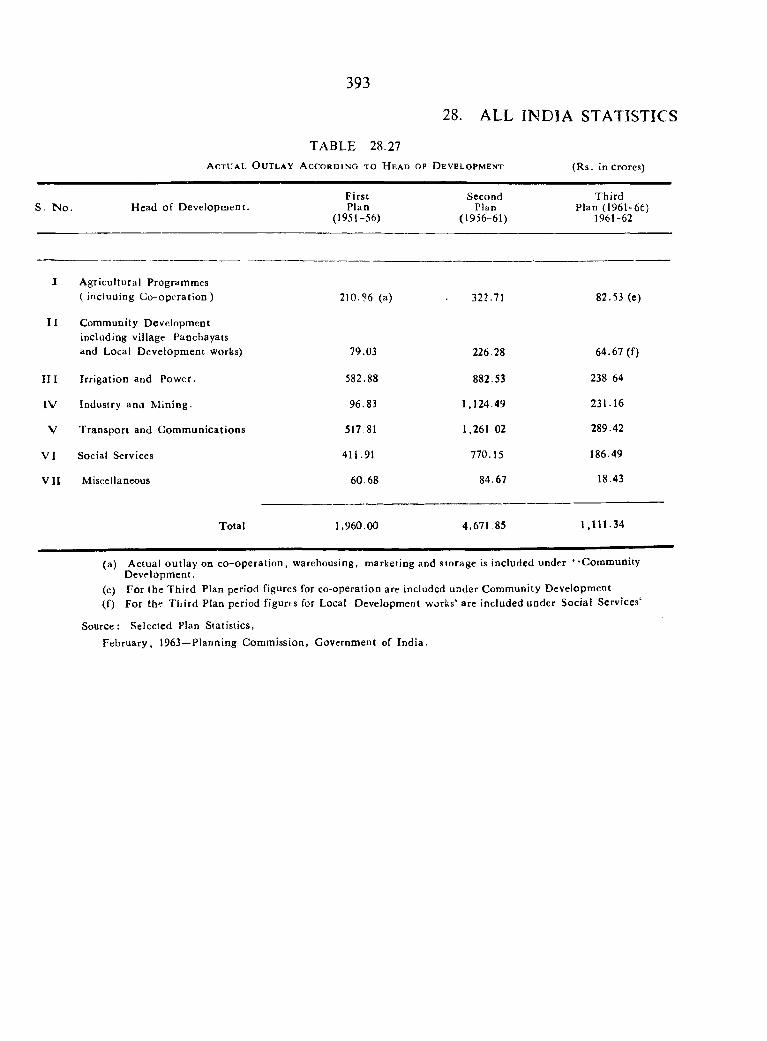
393
28. ALL INDIA STATISTICS
TABLE 28.27A c t u a l O u t l a y A c c o r d i n g t o H e a d o f D e v e l o p m e n t (Rs. in crores)
». N o . Head o f Developm ent.FirstPlan
(1951-56)
SecondPlan
(1956-61)
T hird Plan (1961-66)
1961-62
I A gricultural Programmes ( including C o-operation ) 210.?6 (a) 322.71 82.53 (e)
I I Community Development including village Panchayats and Local Developm ent works) 79.03 226 28 64.67 (f)
I I I Irrigation and Pow er. 582.88 882.53 238 64
IV Industry and M ining. 96.83 1,124.49 231.16
V Transport and C om m unications 517.81 1,261 02 289.42
V I Social Services 411.91 770.15 186.49
V II Miscellaneous 60 68 84.67 18.43
Total 1,960.00 4,671.85 1,111.34
(a) Actual outlay on co -operation , warehousing, marketing and storage is included under ‘ ‘Community Development.
(e) For the T hird Plan period figures for co-operation are included under Community Development(f) For th'^ T hird Plan period figures for Local Development works‘ are included under Social Services*
Source: Selected Plan Statistics,February , 1963—Planning Commission, Government of Ind ia .
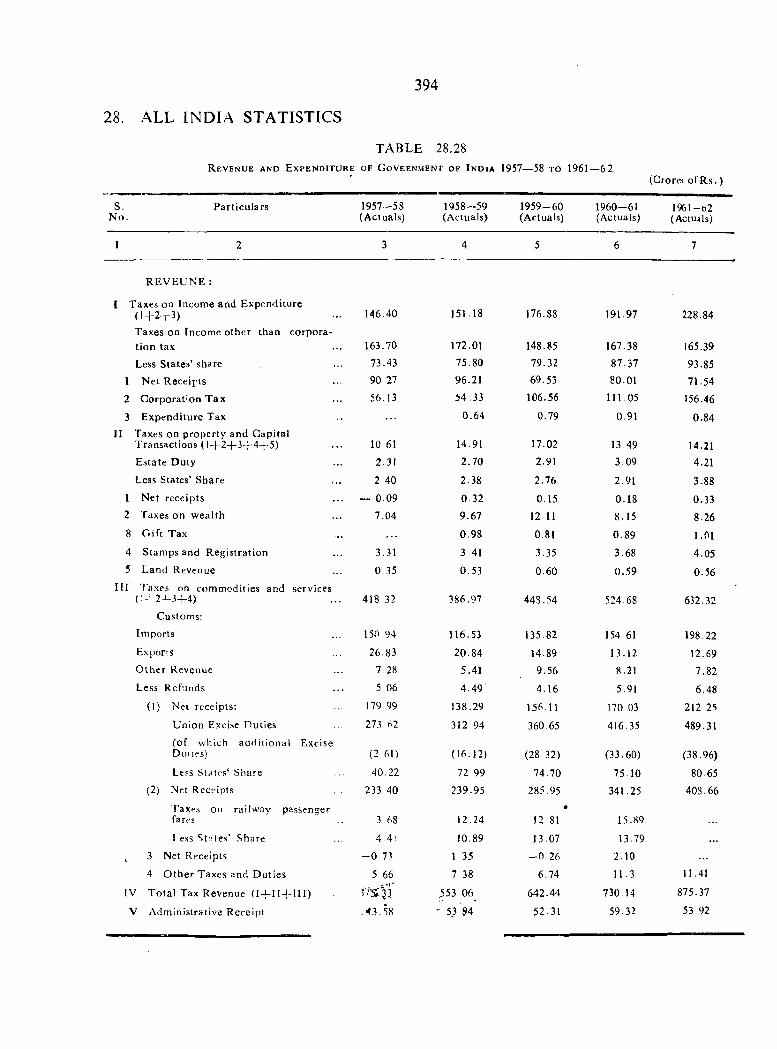
394
28. ALL INDIA STATISTICS
R e v e n u e a n d E x p e n d i t u r e
TABLE 28.28OF OOV EE NMEN T OF I n D I A 1957—58 TO 1961 —62
(Crorej o fR s .)
S. Particulars N o.
1957-58(Actuals)
1958-59(Actuals)
1959-60(Actuals)
1960-61(Actuals)
1961-02(Actuals)
1 2 3 4 5 6 7
R E V E U N E :
1 Taxes o n f n c o r a e a n d E x p e n d i t u r e (1 + 2 + 3 ) 146.40 151.18 176.88 191.97 228.84Taxes on Income other than corporation tax 163.70 172.01 148.85 167.38 165.39Less S tates’ share 73.43 75.80 79.32 87.37 93.85
1 N e t R e c e i p t s 90 27 96.21 69.53 80.01 71.542 Corporation T ax 56.13 54.33 106.56 111.05 156.463 Expenditure Tax 0.64 0.79 0.91 0.84
II Taxes on property and Capital Transactions (1 + 2 + 3 + 4 + 5 ) 10.61 14.91 17.02 13.49 14.21Estate Duty 2.31 2.70 2.91 3.09 4.21Less States’ Share 2.40 2.38 2.76 2.91 3.88
1 Net receipts — 0.09 0.32 0.15 0.18 0.332 Taxes on w ealth 7.04 9.67 12.11 8.15 8.268 C.ift Tax 0.98 0.81 0.89 1.014 Stamps and Registration 3.31 3.41 3.35 3.68 4.055 Land Revenue 0.35 0.53 0.60 0.59 0.56
II I '(’axes on commodities and services (1 + 2 + 3 + 4 ) 418 32 386.97 448.54 524.68 632.32
Customs:Imports 150.94 116.53 135.82 154 61 198.22Exports 26.83 20.84 14.89 13.12 12.69O ther Revenue 7.28 5.41 9.56 8.21 7.82Less Refunds 5 06 4 .49 ' 4.16 5.91 6.48
(1) Net receipts; 179 99 138.29 156.11 170 03 212 2S
Union Excise Duties 273 1 2 312 94 360.65 416.35 489.31(of which ad(1itional Excise Duties) (2 61) (16.12) (28 32) (33.60) (38.96)Less S ta tes 'S hare 40.22 72 99 74.70 75.10 80.65
(2) Net Receipts 233 40 239.95 285.95 341.25 408.66
Taxes on r a i l w a y passenger fares 3 68 12.24
•12 81 15.89
1 ess S tates’ Share 4.4! 10.89 13.07 13.79 ..., 3 Net Receipts - 0 73 1 35 - 0 26 2.10
4 O ther Taxes and Duties 5 66 7.38 6.74 11.3 11.41
IV T otal Tax Revenue ( I + I I + I I I ) 553 06 642.44 730.14 875.37
V Administrative Receipt .43.58 “ 53 ^4 52.31 59.32 53.92

395
28. ALL INDIA STATISTICS
•s. No.
TABLE 28.28R e v e n u e a n d E x p e n d i t u r e o f G o v e r n m e n t o f I n d i a , 1957-58 t o 1961-62
Particulars1957-58(Actuals)
1 9 5 8 -5 9(Actuals)
1 9 5 9 - 6 0(Actuals)
1 9 6 0 -6 1(Actuals)
1961—62(Actuals)
VI Net contribution of Public underTaking ?6 27 35.96
1 Railways ••• 6 29 6.26
2 Posts and Telegraph ... 3.71 6-42
3 Currency and M int ... 26.04 23 43
(Profits o f the Reserve Bank o f India. (30.00) (30.00)
4 O thers (a) ••• 0 23 —0 15
V II O ther Revenue ... 18.20 27.25
V III Total Revenue ( I V + V + V I- f VII) ... 673.38 670 21Expenditure
IX Collection o f taxes, duties and otherPrincipal Revenue (b) ... 16.56 19 44
X Civil Administration (c) .. . 42.01 48.11X I D efen ce services (Net) ... 256.72 250 93
X II Debt Services (d) ... 42 08 48 63
X III Pension, Superanuation and privypursfs (including allowance) ... 9.24 9.52
X V I E x trao rd 'nary charges (e)
XV Miscellaneous ( f ) ... 61.03 73 05
X V I Social and Developmental services (c) 154.14 175 74
X V II Contribution and Misc adjustm entbetween Union and state G ovts, (h) .. 45 90 46 25
X V III O ther Expenditure ... 3.65 3 79
X IX Total Expenditure ... 631.33 675-56
Surplus 4 - or Dificit (—) ... -j-42.05 —5 25
53 89
5 63
5 .13
43.00
(40.00)
—0 13
29.95
778.59
20.84
52 04
230 86
69 38
9.97
90 41
210.09
48.94
3.51
736 04
+ 4 2 .5 5
53.00
4.77
0 46
47.95
(40.00)
—0.18
35.00
877,46
22.43
58.66
247.55
77.09
10.04
3.68
117.82
236.40
48.55
3.99
826.21
+ 5 1 .2 5
65 69
20 66
0 .77
42.75
(42.50)
1.51
41.81
1,036.79
21.16
59.17
289.54
82.85
10 24
13 63
57.10
176 29
198.01
3.95
911.94
+ 1 2 4 .8 5
*Votes on compilation, (I) The figures o f total revenue and expenditure as given in the table differ from those in the Budget papers as receipts from forests, opium and currency and mint are shown on a net basis and States'share o f U nion Excise duties and additional duties o f excise are excluded.
(2) Figures under Revenue and Expenditure from 1957-58 to 1960-61 include self balancing items in respect o f grams under P L. 480 and Steel equalisation (a) including forests, opium, irrigation, electricity, road and water transport schemes, (b) Excluding forests, opium and States'share o f Union excise duties and additional excise duties(c) Comprises General Administration, Audit, Admin'stration o f justice, Jails, Police, Trible Areas aiTd External Affairs , (d) Include appropriation for reduction or avoidance of debt, (e) Include provision for grants to States for G .M F schemes, reliefin natural calamities etc From 1954-55 these items are transferred to miscellamous expenditure undere appropr-ate ministries. Since 1957 -58 it includes provision for transfer to the Special Development F md of grants received under P .L . 480 (f) Comprises grants to certain states, (g) Comprises irrigation and multipurpose river schemes, ports and pilotage, light houses and lightships, scientific deparments, education, medical & public health, agriculture, rural development, animal husbandry, co-operation, industries, (and supplies) aviation, broadcasting, civil works, post-war reconstruction and electricity SQ ^ ^ e^ ip^ ^ yate^ itv development projects, national extension service, labour and employment overseas com ;^ Jry|j£^ ^ >ix*i*c.«<^d|M |N ^laneous department, (h) Include grants- jn-aid to Slates, (i) Comprises famine, and printing, and pre-partition payments
Sourcc : Reserve Bank o f \ndMgm^X\n, March 1963 A
g < 0 - S S 6 : 5 > / I
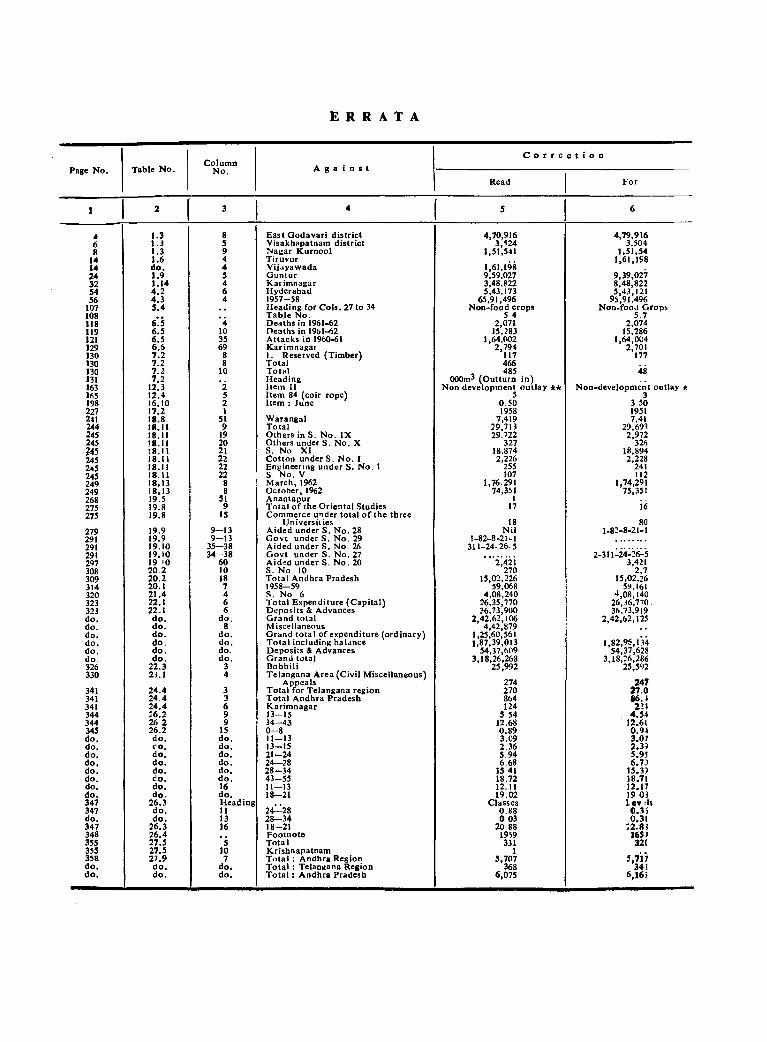
E R R A T A
Page N o . T ab le N o .C o lu m n
N o . A g a i n s tC o r r e c t i o n
R ead For
1 2 3 4 5 6
A 1.3 8 E a s t G o d a v a r i d is tr ic t 4 ,70,916 4,79 ,9166 l . J 5 V isak h a p a tn a m d is tr ic t 3,S24 3.5048 1.3 9 N a g a r K u rn o o l 1,51,541 1,51 .54
14 1.6 4 T iru v u r 1,61,19814 d o . 4 V ij jy a w a d a 1,61.19824 1 .9 5 G u n tu r 9,59,027 9,39 ,02732 1.14 4 K a tim n a g a r 3,48,822 8,48 ,82254 4 .2 6 H y d e ra b a d 5,43,173 5,4.1,12156 4 .3 4 1957-58 65,91,496 95,91,496
107 5 .4 H e a d in g fo r C o ls . 27 to 34 N o n -fo o d c ro p s N o n -fo o d G ro p s108 T a b le N o . 5 4 5 .7118 6 .5 4 D e a th s in 1961-62 2,071 2,074119 6 .5 10 H ea th s in I9&1-62 15,283 15,286121 6 .5 35 A tta c k s in 1960-61 1,64,002 1,64,004129 6 .6 69 K a rim n a g a r 2,794 2,701130 7 .2 8 1. R eserv ed (T im b e r) 117 177130 7 .2 8 T o ta l 466130 n . i 10 T o ta l , 485 48131 7 .2 H ead in g OOOm' (O u ttu rn in )163 12.3 ‘i I te m 11 N o n d e v e lo p m e n t o u tla y * * N o n -d e v e lo p m e n t ou tlay *165 12.4 5 Ite m 84 (c o ir ro p e ) 5 3198 16.10 2 Ite m : J u n e 0 .5 0 3 50227 17.2 1 1958 19512*1 18.8 51 W a ra n g a l 7,419 7,41244 IR .I l 9 T o ta l 29,713 29,693245 18.11 19 O th e rs in S . N o . IX 29.722 2,972245 18.11 20 O th e rs u n d e r S . N o . X 327 326245 ! 8 . l l 21 S . N o X I 18,874 18,894245 18.11 22 C o tto n u n d e r S. N o . I 2,226 2,228245 18.11 22 E ng in eerin g u n d e r S . N o . 1 255 241245 18.11 22 S N o . V 107 112249 18.13 8 M a rc h , 1962 1,76.291 1,74,291249 18.13 8 O c to b e r, 1962 74,351 75,351268 19.5 51 A n a n ta p u r 1275 19.8 9 T o ta l o f th e O r ie n ta l S tud ies 17 i6275 19.8 15 C o m m erce u n d e r to ta l o f th e th re e
U n iv e rs it ie s 18 80279 19.9 9— 13 A id e d u n d e r S . N o . 28 N il 1-82-8-21-1291 19.9 9 - 1 3 G o v t u n d e r S . N o . 2 9 1-82-8-21-1291 19.10 35—38 A id ed u n d e r S . N o , 26 311-24-26-5291 19.10 34—38 G o v t u n d e r S. N o . 27 . . . . . . 2-311-24-26-5297 19 10 60 A id ed u n d e r S . N o . 20 ‘2,421 3,421308 20 2 10 S . N o 10 270 2,7309 20 .2 18 T o ta l A n d h ra P rad esh 15,02,226 15,02.26314 20.1 7 1 958 -59 59,068 59,161320 2 1 .4 4 S . N o 6 4,08 ,240 4,08 ,140323 22.1 6 T o ta l E x p e n d itu re (C a p i ta l ) 26,35,770 26,36.770.323 22.1 6 D e p o s its & A dvances ?6,73,900 36,73,919d o . d o . d o . G ra n d to ta l 2,42,62,106 2,42 ,62,125d o . d o . 8 M isce llan eo u s 4,42,879d o . d o . d o . G ra n d to ta l o f e x p e n d itu re (o rd in a ry ) 1,25,60,561d o . d o . d o . T o ta l in c lu d in g b a la n c e 1,87,39,013 1,82,96,134d o . d o . d o . D e p o s its & A dvances 54,37,609 54,37,628d o . d o . d o . G ra n d to ta l 3,18,26,268 3,18,26,286326 22.3 3 B o b b il i 25,992 25,592330 2 i . l 4 T e la n g a n a A rea (C iv il M isce llan eo u s)
A ppc3 Is 274 247341 24 .4 3 T o ta l fo r T e la n g a n a reg io n 270 2 7 .0341 2 4 .4 3 T o ta l A n d h ra P ra d e s h 864 8 6 .4341 2 4 .4 6 K a r im n a g a r 124 2 ’.»344 56 ,2 9 13—15 5.54 4 .5 4344 26 2 9 34—43 12.68 12.61345 26 .2 15 0—8 0 .8 9 0 .9 4d o . d o . d o . 1 1 -1 3 3.09 3 .07d o . t*o. d o . 1 3 -1 5 2.36 2 .3 ?d o . d o . d o . 2 1 -2 4 5 .94 5.95d o . d o . d o . 24—28 6.68 6 .73d o . d o . d o . 2 8 - 3 4 15 41 15.39d o . d o . d o . 4 3 -5 5 18.72 18.71d o . d o . 16 11— 13 12.11 12.17d o . d o . d o . 18—21 19.02 19 03347 26 .3 H e a d in g C lasses le v e l s347 d o . 11 2 4 -2 8 0 .88 0 .3 Sd o . d o . 13 28—34 0 03 0.31347 26 .3 16 1 8 -2 1 20.88 ;2 .« J348 26 .4 , , F o o tn o te 1959 16S)355 27 .5 5 T o ta l 331 32(355 27.5 10 K ris h n a p a tn a m 1358 2 7 .9 7 T o ta l : A n d h ra R eg ion 5,707 5,717d o . d o . d o . T o ta l : TelanK ana R eg ion 368 34?d o . d o . d o . T o t a l : A n d h ra P ra d e sh 6,075 6,165


