Embed Size (px)
Citation preview
1
CITY OF BRADFORD METROPOLITAN DISTRICT COUNCIL
STATEMENT OF ACCOUNTS 2015-16
AND
ANNUAL GOVERNANCE STATEMENT
Contents Page FOREWORD AND STATEMENT OF RESPONSIBILITIES ................................................................. 2
THE NARRATIVE REPORT .......................................................................................................... ……9
MAIN FINANCIAL STATEMENTS
Movement in Reserves Statement ............................................................................................ 19
Comprehensive Income and Expenditure Statement ............................................................... 20
Balance Sheet ........................................................................................................................... 21
Cash Flow Statement................................................................................................................ 22
Notes to the Main Financial Statements ................................................................................... 23
SUPPLEMENTARY FINANCIAL STATEMENTS
Collection Fund Statement and Explanatory Notes .................................................................. 94
West Yorkshire Pension Fund and Explanatory Notes ............................................................. 97
GLOSSARY OF TERMS ................................................................................................................... 124
ANNUAL GOVERNANCE STATEMENT .......................................................................................... 129
Foreword and Statement of Responsibilities
2
Introduction to the Council’s Statement of Accounts The Council’s financial statements are set out in the pages following this foreword. They consist of the following: 1. The Narrative Report The Director of Finance’s Report summarises the most significant items reported in the accounts and outlines the overall financial position of the Council for 2015-16. The money spent by the Council and where the money comes from is shown in a series of charts. There is a distinction between revenue spending (the annual cost of providing services) and capital expenditure, which has a long-term benefit for the citizens of the Bradford District. 2. Movement in Reserves Statement This Statement shows the movement in the year on the different reserves held by the Council, analysed into “usable reserves” (i.e. those that can be applied to fund expenditure and other reserves.)
3. Comprehensive Income and Expenditure Statement The cost in the year of providing services in accordance with generally accepted accounting practices, rather than the amount to be funded in accordance with statute. The Council raises tax, and uses grants and other flows of income to cover the cost of services. The statutory financial result is shown in the Movement in Reserves Statement. This is different to the cost of services stated in accordance with generally accepted accounting practice, as shown in the Comprehensive Income and expenditure account. 4. Balance Sheet The Balance Sheet shows the value at the Balance Sheet date of the assets and liabilities recognised by the Council. 5. Cash Flow Statement The Cash Flow Statement shows the changes in cash and cash equivalents (short term investments of three months or less) of the Council during the reporting period. 6. Statement of Significant Accounting Policies The Council’s accounts follow International Financial Reporting Standards (IFRS) since the 2010-11 financial year. The accounting policies set out the specific principles, bases, conventions, rules and practices applied by the Council in preparing and presenting the financial statements. The accounting policies are based on interpretations and adaptations for the public sector set out in the CIPFA (Chartered Institute of Public Finance and Accountancy) Code of Practice on Local Authority Accounting in the United Kingdom (the Code). 7. Notes to the Main Financial Statements The notes disclose information required by the Code and information that makes the accounts easier to understand. They show the specific accounting policies and estimates used and breakdowns of figures shown in the main Financial Statements. 8. Collection Fund Statement The Collection Fund is an agent’s statement that reflects the statutory obligation for billing authorities to maintain a separate Collection Fund. The statement shows the transactions of the billing Authority (Bradford Council) in collecting Council Tax and non domestic rates and distributing it to major preceptors and the Government. 9. The Group Accounts As the Council does not have any material interests in subsidiaries, associates and jointly controlled entities it is not required to produce a set of Group Accounts.
10. The Pension Fund Account As the Council is the administering authority for the West Yorkshire Pension Fund, the activities of the fund are required to be reported alongside the Council’s main Financial Statements. 11. Glossary of Terms In order to help readers, a Glossary of Terms widely used in relation to local authority finance and referred to within these accounts is included at the back of the document. 12. Annual Governance Statement The Council is required to undertake an annual review of the effectiveness of its governance framework and system of internal control. The conclusions of this review are reported alongside the accounting statements.
Foreword and Statement of Responsibilities
3
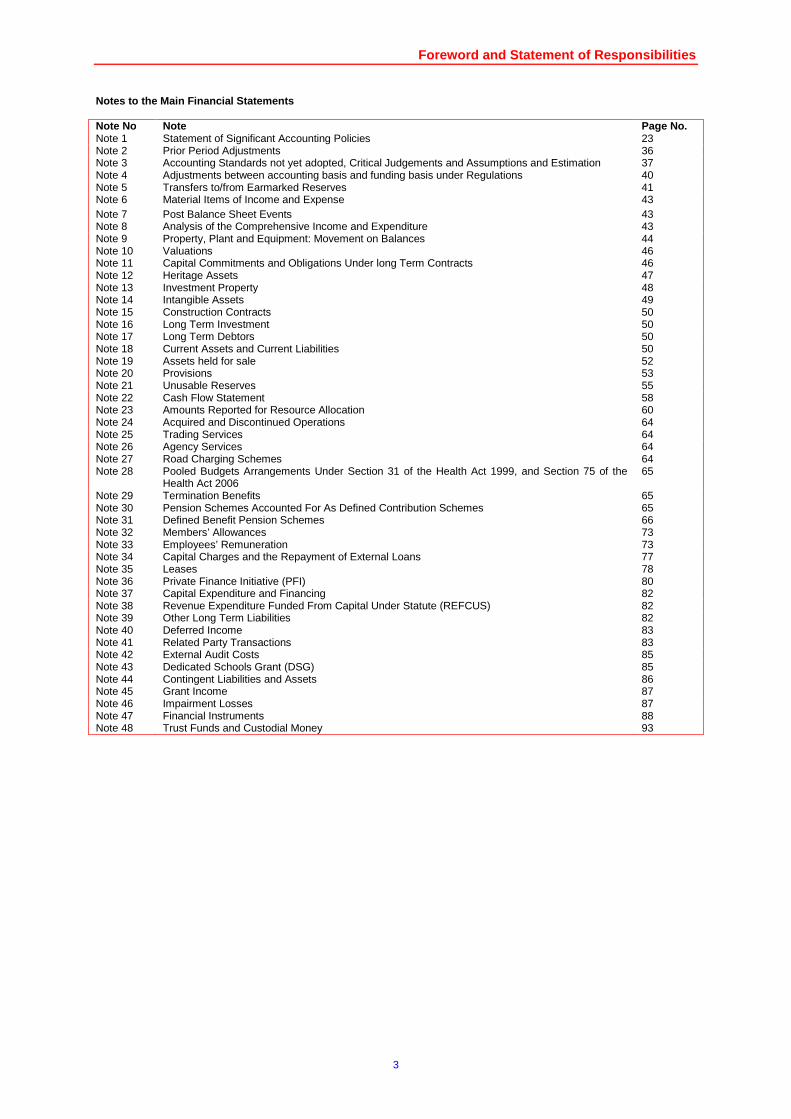
Notes to the Main Financial Statements Note No Note Page No. Note 1 Statement of Significant Accounting Policies 23 Note 2 Prior Period Adjustments 36 Note 3 Accounting Standards not yet adopted, Critical Judgements and Assumptions and Estimation 37 Note 4 Adjustments between accounting basis and funding basis under Regulations 40 Note 5 Transfers to/from Earmarked Reserves 41 Note 6 Material Items of Income and Expense 43 Note 7 Post Balance Sheet Events 43 Note 8 Analysis of the Comprehensive Income and Expenditure 43 Note 9 Property, Plant and Equipment: Movement on Balances 44 Note 10 Valuations 46 Note 11 Capital Commitments and Obligations Under long Term Contracts 46 Note 12 Heritage Assets 47 Note 13 Investment Property 48 Note 14 Intangible Assets 49 Note 15 Construction Contracts 50 Note 16 Long Term Investment 50 Note 17 Long Term Debtors 50 Note 18 Current Assets and Current Liabilities 50 Note 19 Assets held for sale 52 Note 20 Provisions 53 Note 21 Unusable Reserves 55 Note 22 Cash Flow Statement 58 Note 23 Amounts Reported for Resource Allocation 60 Note 24 Acquired and Discontinued Operations 64 Note 25 Trading Services 64 Note 26 Agency Services 64 Note 27 Road Charging Schemes 64 Note 28 Pooled Budgets Arrangements Under Section 31 of the Health Act 1999, and Section 75 of the
Health Act 2006 65
Note 29 Termination Benefits 65 Note 30 Pension Schemes Accounted For As Defined Contribution Schemes 65 Note 31 Defined Benefit Pension Schemes 66 Note 32 Members’ Allowances 73 Note 33 Employees’ Remuneration 73 Note 34 Capital Charges and the Repayment of External Loans 77 Note 35 Leases 78 Note 36 Private Finance Initiative (PFI) 80 Note 37 Capital Expenditure and Financing 82 Note 38 Revenue Expenditure Funded From Capital Under Statute (REFCUS) 82 Note 39 Other Long Term Liabilities 82 Note 40 Deferred Income 83 Note 41 Related Party Transactions 83 Note 42 External Audit Costs 85 Note 43 Dedicated Schools Grant (DSG) 85 Note 44 Contingent Liabilities and Assets 86 Note 45 Grant Income 87 Note 46 Impairment Losses 87 Note 47 Financial Instruments 88 Note 48 Trust Funds and Custodial Money 93
Foreword and Statement of Responsibilities
4
City of Bradford Metropolitan District Council's St atement of Responsibilities The Council is required to:
• Make arrangements for the proper administration of its financial affairs and to secure that one of its officers has the responsibility for the administration of those affairs. In this Council, that officer is the Director of Finance.
• Manage its affairs to secure economic, efficient and effective use of resources and safeguard its assets.
• Approve the Statement of Accounts.
The Director of Finance’s Responsibilities The Director of Finance is responsible for the preparation of the Council's Statement of Accounts in accordance with proper practices as set out in the CIPFA Code of Practice on Local Authority Accounting in the United Kingdom (the Code). In preparing this Statement of Accounts, the Director of Finance has:
• Selected suitable accounting policies and applied them consistently.
• Made judgements and estimates that were both reasonable and prudent.
• Kept proper and up to date accounting records.
• Taken reasonable steps for the prevention and detection of fraud and other irregularities.
• Complied with the Code of Practice on Local Authority Accounting. In addition he has issued:
• A manual on the practices to be adopted in the preparation of the Council’s year end accounts.
• Various corporate standards giving guidance on specific accounting issues. The financial statements are subject to audit by the Council’s external auditors. Certification of the Statement of Accounts
I certify that this statement of accounts presents a true and fair view of the financial position of the Council at 31 March 2016 and its income and expenditure for the year then ended. I authorise for issue the 2015-16 Statement of Accounts. Signed: Stuart McKinnon-Evans Director of Finance Date: 29 September 2016 Signed: Cllr Michael Johnson Chair of Governance and Audit Committee Date: 29 September 2016
Foreword and Statement of Responsibilities
5
Foreword and Statement of Responsibilities
6
Foreword and Statement of Responsibilities
7

Foreword and Statement of Responsibilities
8
The Narrative Report
9
The Narrative Report
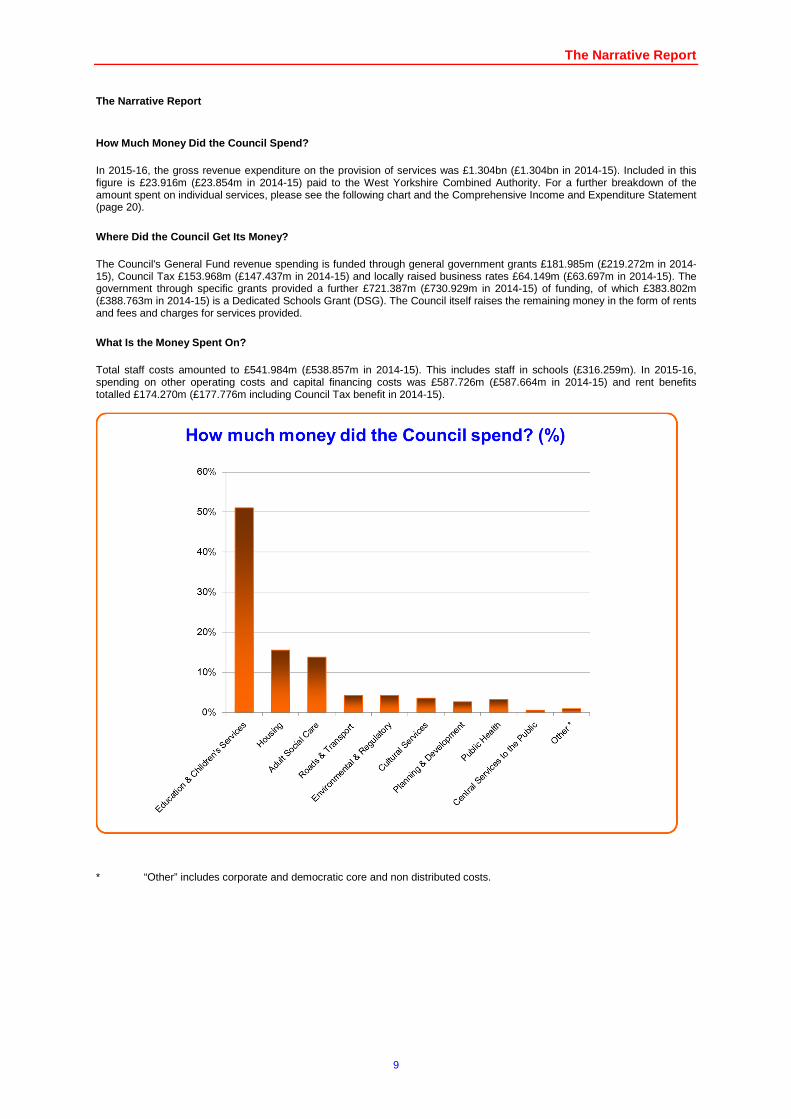
How Much Money Did the Council Spend? In 2015-16, the gross revenue expenditure on the provision of services was £1.304bn (£1.304bn in 2014-15). Included in this figure is £23.916m (£23.854m in 2014-15) paid to the West Yorkshire Combined Authority. For a further breakdown of the amount spent on individual services, please see the following chart and the Comprehensive Income and Expenditure Statement (page 20).
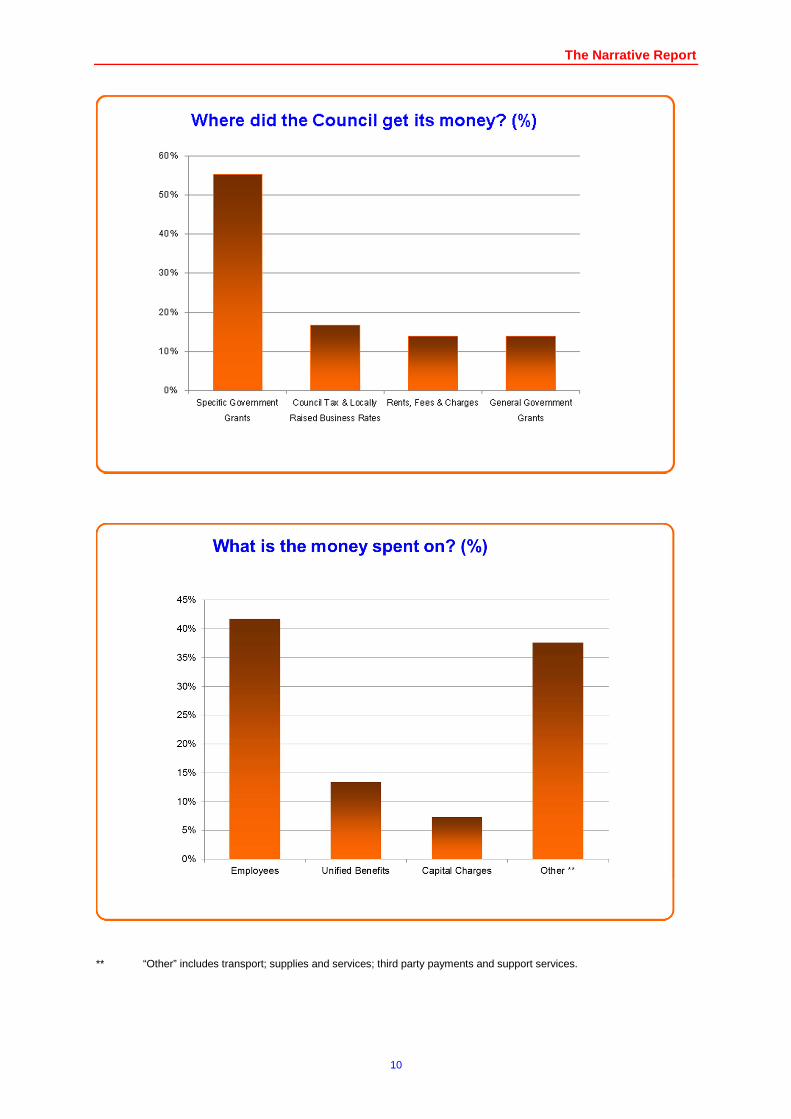
Where Did the Council Get Its Money? The Council's General Fund revenue spending is funded through general government grants £181.985m (£219.272m in 2014-15), Council Tax £153.968m (£147.437m in 2014-15) and locally raised business rates £64.149m (£63.697m in 2014-15). The government through specific grants provided a further £721.387m (£730.929m in 2014-15) of funding, of which £383.802m (£388.763m in 2014-15) is a Dedicated Schools Grant (DSG). The Council itself raises the remaining money in the form of rents and fees and charges for services provided.
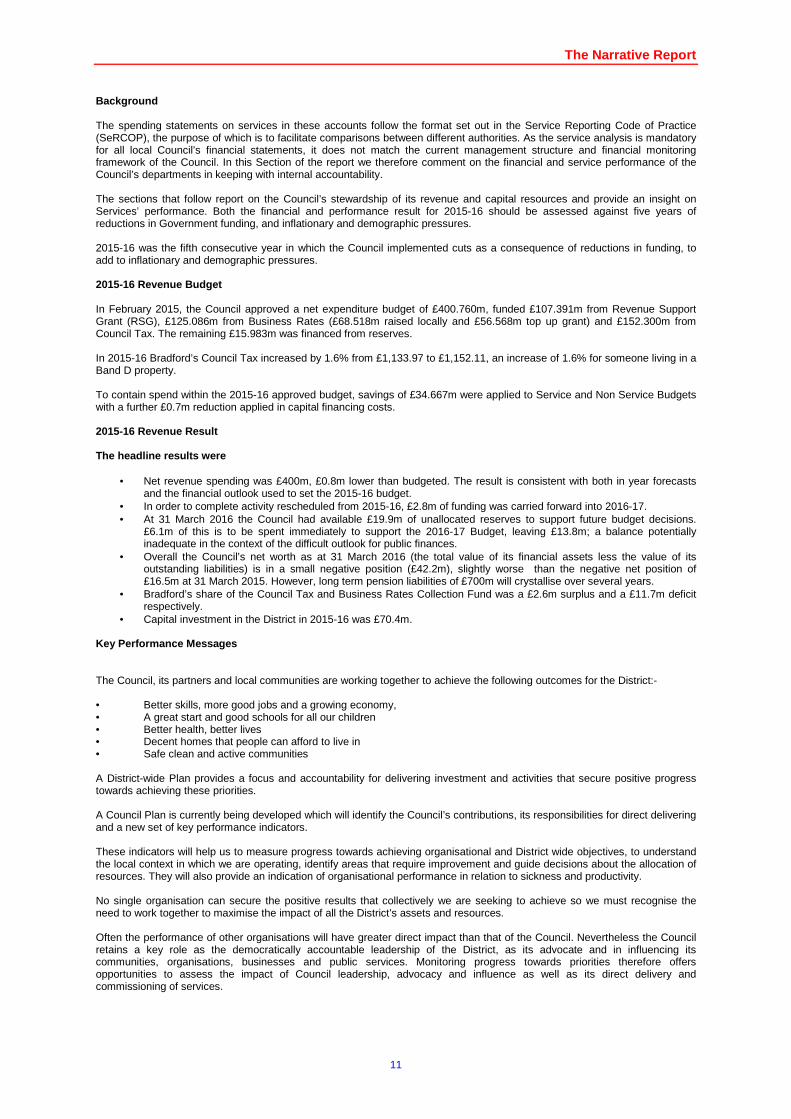
What Is the Money Spent On? Total staff costs amounted to £541.984m (£538.857m in 2014-15). This includes staff in schools (£316.259m). In 2015-16, spending on other operating costs and capital financing costs was £587.726m (£587.664m in 2014-15) and rent benefits totalled £174.270m (£177.776m including Council Tax benefit in 2014-15).
* “Other” includes corporate and democratic core and non distributed costs.
The Narrative Report
10
** “Other” includes transport; supplies and services; third party payments and support services.
The Narrative Report
11
Background The spending statements on services in these accounts follow the format set out in the Service Reporting Code of Practice (SeRCOP), the purpose of which is to facilitate comparisons between different authorities. As the service analysis is mandatory for all local Council’s financial statements, it does not match the current management structure and financial monitoring framework of the Council. In this Section of the report we therefore comment on the financial and service performance of the Council’s departments in keeping with internal accountability. The sections that follow report on the Council’s stewardship of its revenue and capital resources and provide an insight on Services’ performance. Both the financial and performance result for 2015-16 should be assessed against five years of reductions in Government funding, and inflationary and demographic pressures. 2015-16 was the fifth consecutive year in which the Council implemented cuts as a consequence of reductions in funding, to add to inflationary and demographic pressures. 2015-16 Revenue Budget In February 2015, the Council approved a net expenditure budget of £400.760m, funded £107.391m from Revenue Support Grant (RSG), £125.086m from Business Rates (£68.518m raised locally and £56.568m top up grant) and £152.300m from Council Tax. The remaining £15.983m was financed from reserves. In 2015-16 Bradford’s Council Tax increased by 1.6% from £1,133.97 to £1,152.11, an increase of 1.6% for someone living in a Band D property. To contain spend within the 2015-16 approved budget, savings of £34.667m were applied to Service and Non Service Budgets with a further £0.7m reduction applied in capital financing costs. 2015-16 Revenue Result The headline results were
• Net revenue spending was £400m, £0.8m lower than budgeted. The result is consistent with both in year forecasts and the financial outlook used to set the 2015-16 budget.
• In order to complete activity rescheduled from 2015-16, £2.8m of funding was carried forward into 2016-17. • At 31 March 2016 the Council had available £19.9m of unallocated reserves to support future budget decisions.
£6.1m of this is to be spent immediately to support the 2016-17 Budget, leaving £13.8m; a balance potentially inadequate in the context of the difficult outlook for public finances.
• Overall the Council’s net worth as at 31 March 2016 (the total value of its financial assets less the value of its outstanding liabilities) is in a small negative position (£42.2m), slightly worse than the negative net position of £16.5m at 31 March 2015. However, long term pension liabilities of £700m will crystallise over several years.
• Bradford’s share of the Council Tax and Business Rates Collection Fund was a £2.6m surplus and a £11.7m deficit respectively.
• Capital investment in the District in 2015-16 was £70.4m. Key Performance Messages The Council, its partners and local communities are working together to achieve the following outcomes for the District:- • Better skills, more good jobs and a growing economy, • A great start and good schools for all our children • Better health, better lives • Decent homes that people can afford to live in • Safe clean and active communities A District-wide Plan provides a focus and accountability for delivering investment and activities that secure positive progress towards achieving these priorities. A Council Plan is currently being developed which will identify the Council’s contributions, its responsibilities for direct delivering and a new set of key performance indicators. These indicators will help us to measure progress towards achieving organisational and District wide objectives, to understand the local context in which we are operating, identify areas that require improvement and guide decisions about the allocation of resources. They will also provide an indication of organisational performance in relation to sickness and productivity. No single organisation can secure the positive results that collectively we are seeking to achieve so we must recognise the need to work together to maximise the impact of all the District’s assets and resources. Often the performance of other organisations will have greater direct impact than that of the Council. Nevertheless the Council retains a key role as the democratically accountable leadership of the District, as its advocate and in influencing its communities, organisations, businesses and public services. Monitoring progress towards priorities therefore offers opportunities to assess the impact of Council leadership, advocacy and influence as well as its direct delivery and commissioning of services.
The Narrative Report
12
While the Council Plan will provide the framework for future performance monitoring and reporting, for the year 2015/16, the Council used 45 headline indicators to measure its performance and productivity. The indicators for 2015/16 tell us that performance in many key areas is improving and remains on target reflecting the positive impact of previous investment and policy decisions. However there continue to be areas where the District faces significant challenges and where performance is either deteriorating or not improving quickly enough. Good progress is being made on supporting children and families in the early years of life, effective child protection processes and in reducing the numbers of young people who are not in education, employment or training. However key indicators of school standards such as Key Stage 2 achievement and good GCSE’s and of school leadership are not improving fast enough or are getting worse. Educational attainment continues to be a priority area for improvement with performance being closely monitored and managed by the Education School Improvement Board as part of the Ofsted Inspection Improvement Plan. The District is moving to a school led approach to improvement but the Council has made resources available to support the recruitment, development and retention of outstanding school leaders, secured significant new resources for additional school places and is promoting an Education Covenant which makes clear the role that everyone can play in improving education. The Council’s increasing focus on preventative care, support to help people get back to independent living after an illness or hospital stay and on-going additional investment to address demographic changes means that many social care services are performing well. For example, Bradford is a top performer in terms of its rate of admissions to residential and nursing homes. Working with health services to use resources effectively is delivering good results in terms of reducing the numbers of delayed hospital discharges that are down to a lack of social care capacity. Demographic changes leading to rising demand for care mean that the Council will need to continue to work closely with health partners, keep promoting self care and invest more in early interventions in order to sustain good performance. Health and health inequalities continue to present significant challenges but the difference in life expectancy between the most and least deprived parts of the District is falling. The Council has made significant investments to support young and disadvantaged people who are furthest from the labour market into work and these have delivered positive benefits for a great many people. Working with business, Leeds City Region and others we have secured new apprenticeships, jobs and investment. Nevertheless, despite showing improvements employment rates continue to remain too low and the proportion of the population without qualifications too high, and therefore a continued focus on ways of securing inclusive growth that benefits everyone is necessary. The Council is performing well in its efforts to increase affordable housing supply by investing to bring empty homes back into use although the numbers of private housing conditions improved through Council interventions is below target. This is primarily due to an increasing demand for initial inspections of private sector housing conditions which is leading to less resource being available to actually make the improvements. The Council continues to provide support to vulnerable home owners. Perceptions of anti-social behaviour and community relations are worsening. The Council works closely with local communities to identify, monitor and address tensions and promotes active citizenship. The People Can campaign encourages people from all backgrounds to work individually and together to improve things for themselves and others. Activities encourage a sense of pride in community and locality. The Council’s Management team is still undertaking targeted work to improve the organisations sickness targets and whilst there has been a slight improvement, performance is still below target. In summary, 61% of all indicators are on target or within an accepted tolerance. This figure is down from 82% in 2014/15. In addition to service specific issues the change could reflect the challenges of improving performance or maintaining high performance at a time of reducing financial resources and increasing demand which require shifts in investment and focus to deliver transformational change.
The Narrative Report
13
Explanation of major variances in spending against budget
Net expenditure
Budget
£m Outturn
£m Variance
£m
Services to the public & businesses
Adult & Community Services 128.5 127.7 -0.8
Children's Services 124.0 125.6 1.6
Environment & Sport 66.4 63.8 -2.6
Public Health 0.1 0.1 -
Regeneration 67.0 65.6 -1.4
Revenues & Benefits 5.4 5.5 0.1
Total services to the public & businesses
391.4 388.3 -3.1
Support services and non service
Property Programme 1.3 1.3 -
Chief Executive 5.4 5.0 -0.4
City Solicitor 6.8 6.7 -0.1
Human Resources 7.8 7.0 -0.8
Finance (Excluding Revenues & Benefits) 22.2 21.9 -0.3
Non Service Budgets 1.2 -0.4 -1.6
Total support services and non service
44.7 41.5 -3.2
Central Budgets & Net Transfers To Reserves -38.1 -32.6 5.5
Deferred Expenditure 2.8 2.8 -
Total Council Spend
400.8 400.0 -0.8
Explanation of major variances in spending against the approved budget
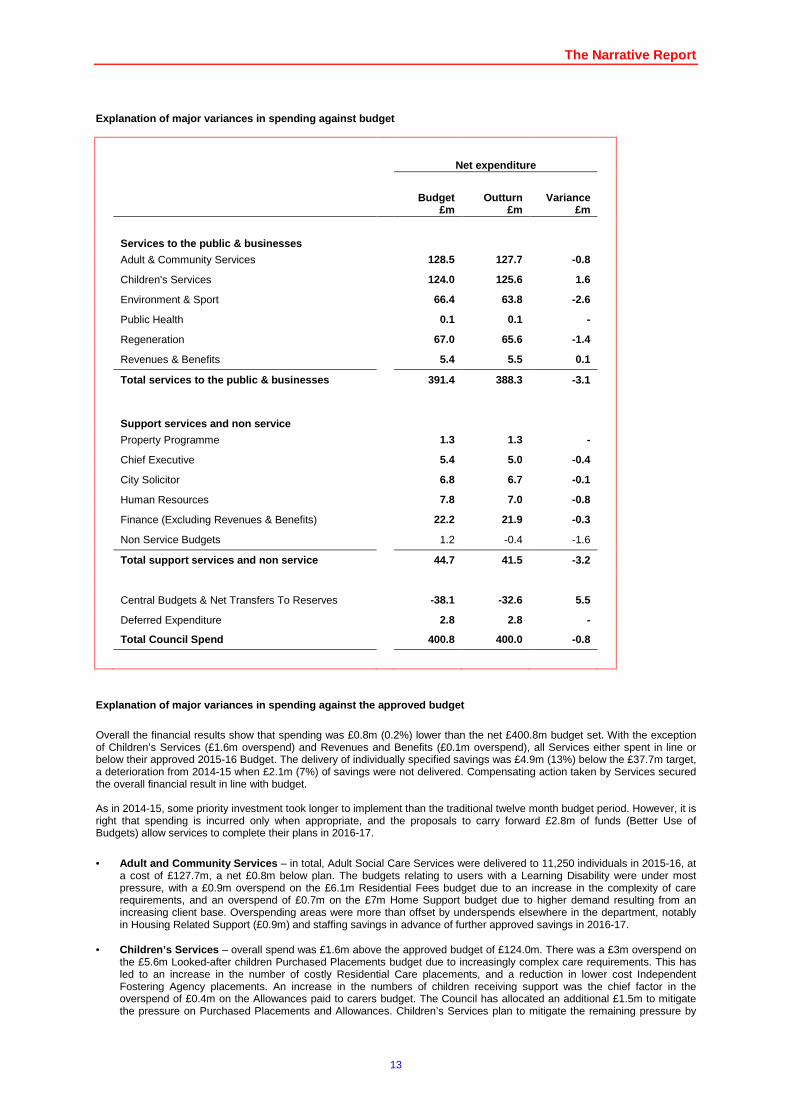
Overall the financial results show that spending was £0.8m (0.2%) lower than the net £400.8m budget set. With the exception of Children’s Services (£1.6m overspend) and Revenues and Benefits (£0.1m overspend), all Services either spent in line or below their approved 2015-16 Budget. The delivery of individually specified savings was £4.9m (13%) below the £37.7m target, a deterioration from 2014-15 when £2.1m (7%) of savings were not delivered. Compensating action taken by Services secured the overall financial result in line with budget. As in 2014-15, some priority investment took longer to implement than the traditional twelve month budget period. However, it is right that spending is incurred only when appropriate, and the proposals to carry forward £2.8m of funds (Better Use of Budgets) allow services to complete their plans in 2016-17.
• Adult and Community Services – in total, Adult Social Care Services were delivered to 11,250 individuals in 2015-16, at
a cost of £127.7m, a net £0.8m below plan. The budgets relating to users with a Learning Disability were under most pressure, with a £0.9m overspend on the £6.1m Residential Fees budget due to an increase in the complexity of care requirements, and an overspend of £0.7m on the £7m Home Support budget due to higher demand resulting from an increasing client base. Overspending areas were more than offset by underspends elsewhere in the department, notably in Housing Related Support (£0.9m) and staffing savings in advance of further approved savings in 2016-17.
• Children’s Services – overall spend was £1.6m above the approved budget of £124.0m. There was a £3m overspend on
the £5.6m Looked-after children Purchased Placements budget due to increasingly complex care requirements. This has led to an increase in the number of costly Residential Care placements, and a reduction in lower cost Independent Fostering Agency placements. An increase in the numbers of children receiving support was the chief factor in the overspend of £0.4m on the Allowances paid to carers budget. The Council has allocated an additional £1.5m to mitigate the pressure on Purchased Placements and Allowances. Children’s Services plan to mitigate the remaining pressure by
The Narrative Report
14
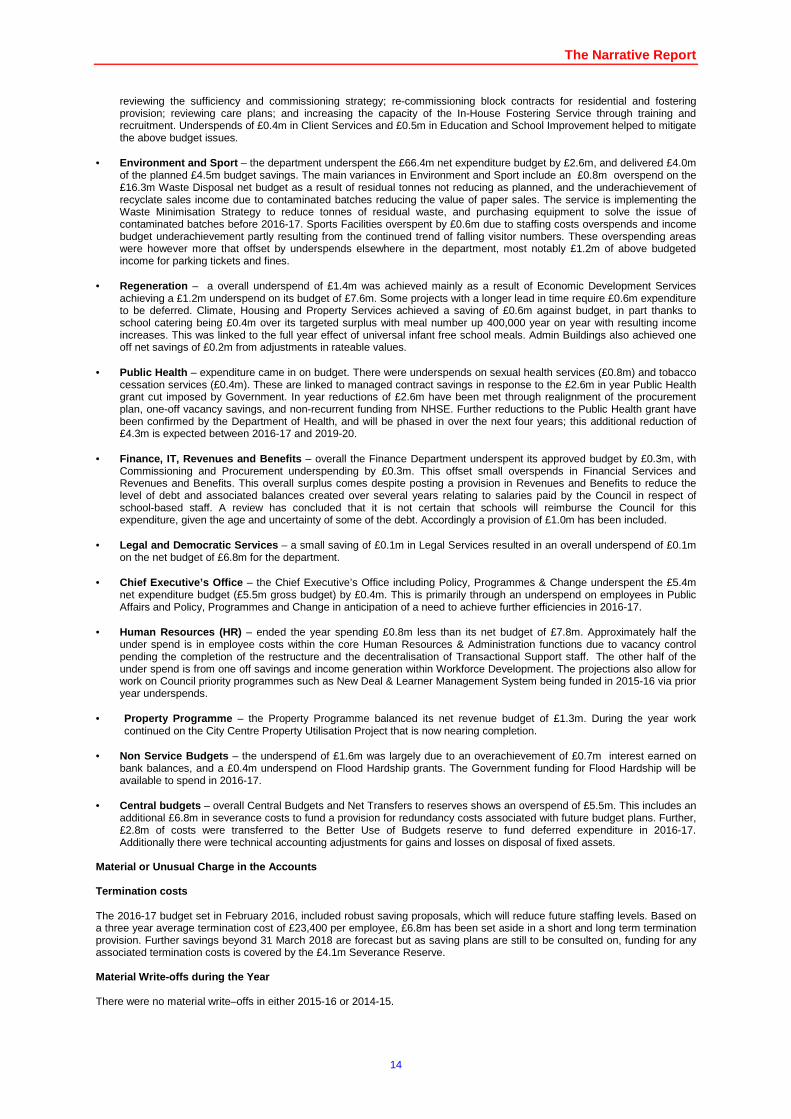
reviewing the sufficiency and commissioning strategy; re-commissioning block contracts for residential and fostering provision; reviewing care plans; and increasing the capacity of the In-House Fostering Service through training and recruitment. Underspends of £0.4m in Client Services and £0.5m in Education and School Improvement helped to mitigate the above budget issues.
• Environment and Sport – the department underspent the £66.4m net expenditure budget by £2.6m, and delivered £4.0m
of the planned £4.5m budget savings. The main variances in Environment and Sport include an £0.8m overspend on the £16.3m Waste Disposal net budget as a result of residual tonnes not reducing as planned, and the underachievement of recyclate sales income due to contaminated batches reducing the value of paper sales. The service is implementing the Waste Minimisation Strategy to reduce tonnes of residual waste, and purchasing equipment to solve the issue of contaminated batches before 2016-17. Sports Facilities overspent by £0.6m due to staffing costs overspends and income budget underachievement partly resulting from the continued trend of falling visitor numbers. These overspending areas were however more that offset by underspends elsewhere in the department, most notably £1.2m of above budgeted income for parking tickets and fines.
• Regeneration – a overall underspend of £1.4m was achieved mainly as a result of Economic Development Services achieving a £1.2m underspend on its budget of £7.6m. Some projects with a longer lead in time require £0.6m expenditure to be deferred. Climate, Housing and Property Services achieved a saving of £0.6m against budget, in part thanks to school catering being £0.4m over its targeted surplus with meal number up 400,000 year on year with resulting income increases. This was linked to the full year effect of universal infant free school meals. Admin Buildings also achieved one off net savings of £0.2m from adjustments in rateable values.
• Public Health – expenditure came in on budget. There were underspends on sexual health services (£0.8m) and tobacco
cessation services (£0.4m). These are linked to managed contract savings in response to the £2.6m in year Public Health grant cut imposed by Government. In year reductions of £2.6m have been met through realignment of the procurement plan, one-off vacancy savings, and non-recurrent funding from NHSE. Further reductions to the Public Health grant have been confirmed by the Department of Health, and will be phased in over the next four years; this additional reduction of £4.3m is expected between 2016-17 and 2019-20.
• Finance, IT, Revenues and Benefits – overall the Finance Department underspent its approved budget by £0.3m, with
Commissioning and Procurement underspending by £0.3m. This offset small overspends in Financial Services and Revenues and Benefits. This overall surplus comes despite posting a provision in Revenues and Benefits to reduce the level of debt and associated balances created over several years relating to salaries paid by the Council in respect of school-based staff. A review has concluded that it is not certain that schools will reimburse the Council for this expenditure, given the age and uncertainty of some of the debt. Accordingly a provision of £1.0m has been included.
• Legal and Democratic Services – a small saving of £0.1m in Legal Services resulted in an overall underspend of £0.1m
on the net budget of £6.8m for the department. • Chief Executive’s Office – the Chief Executive’s Office including Policy, Programmes & Change underspent the £5.4m
net expenditure budget (£5.5m gross budget) by £0.4m. This is primarily through an underspend on employees in Public Affairs and Policy, Programmes and Change in anticipation of a need to achieve further efficiencies in 2016-17.
• Human Resources (HR) – ended the year spending £0.8m less than its net budget of £7.8m. Approximately half the
under spend is in employee costs within the core Human Resources & Administration functions due to vacancy control pending the completion of the restructure and the decentralisation of Transactional Support staff. The other half of the under spend is from one off savings and income generation within Workforce Development. The projections also allow for work on Council priority programmes such as New Deal & Learner Management System being funded in 2015-16 via prior year underspends.
• Property Programme – the Property Programme balanced its net revenue budget of £1.3m. During the year work
continued on the City Centre Property Utilisation Project that is now nearing completion. • Non Service Budgets – the underspend of £1.6m was largely due to an overachievement of £0.7m interest earned on
bank balances, and a £0.4m underspend on Flood Hardship grants. The Government funding for Flood Hardship will be available to spend in 2016-17.
• Central budgets – overall Central Budgets and Net Transfers to reserves shows an overspend of £5.5m. This includes an
additional £6.8m in severance costs to fund a provision for redundancy costs associated with future budget plans. Further, £2.8m of costs were transferred to the Better Use of Budgets reserve to fund deferred expenditure in 2016-17. Additionally there were technical accounting adjustments for gains and losses on disposal of fixed assets.
Material or Unusual Charge in the Accounts Termination costs
The 2016-17 budget set in February 2016, included robust saving proposals, which will reduce future staffing levels. Based on a three year average termination cost of £23,400 per employee, £6.8m has been set aside in a short and long term termination provision. Further savings beyond 31 March 2018 are forecast but as saving plans are still to be consulted on, funding for any associated termination costs is covered by the £4.1m Severance Reserve. Material Write-offs during the Year There were no material write–offs in either 2015-16 or 2014-15.
The Narrative Report
15
The Council’s revenue result compared to the Compre hensive Income and Expenditure Statement (CIES) The previous paragraphs have explained the 2015-16 net spending that has been funded from local taxation. The CIES shows the accounting cost of providing services in accordance with generally accepted accounting practices. Compared to 2014-15 when the Council incurred a deficit of £24.7m on the provision of services, in 2015-16 the deficit increased to £85.3m. However, the deficit on the cost of providing services in 2015-16 is offset by a net £59.7m gain on Other Comprehensive Income and Expenditure. This comprises a £8.7m revaluation loss offset by a net £68.4m actuarial gain on the pension fund liability. As the corresponding figure in 2014-15 was a £76.2m Other Comprehensive Income deficit, overall this means that the CIES has moved from a £101m deficit in 2014-15 to a £25.6m deficit in 2015-16. After removing expenditure and income not chargeable against cash Council Tax, such as depreciation, in the Movement in Reserves Statement (see page 19), there was a reduction of £4.5m in school balances, no change on the General Fund Balance and a reduction of £11.8m in earmarked reserves. The Council’s Balance Sheet With the propsed four year 2016 Local Government Settlement confirming that the Council will continue to face real term reductions in funding in the years beyond 2015-16, the Council’s balance sheet at 31 March 2016, is a useful indicator of the Council’s long term financial health of the Council. In 2015-16 the Council’s net worth decreased from a negative £16.5m at 31 March 2015 to a negative net worth of £42.2m at 31 March 2016. The main movements that make up the decrease of £26m in the Council’s net worth were: • a £53m decrease in long term assets. • a £36m decrease in net current assets. • a £63m reduction in long term liabilities.
Capital Spending in 2015-16 The Council spent £70.6m in the year (£113,95m in 2014-15) including £0.6m of capitalised finance lease costs. This was £4.3m less than planned. The Saltaire Hydro and the Saltaire Extra/Intermediate Care Development were aborted in year and the costs of £0.2m spend on design and optional appraisal incurred in the past three years was charged to revenue. This means the net capital was £70.4m. In addition the Council received £0.3m in donated heritage assets.
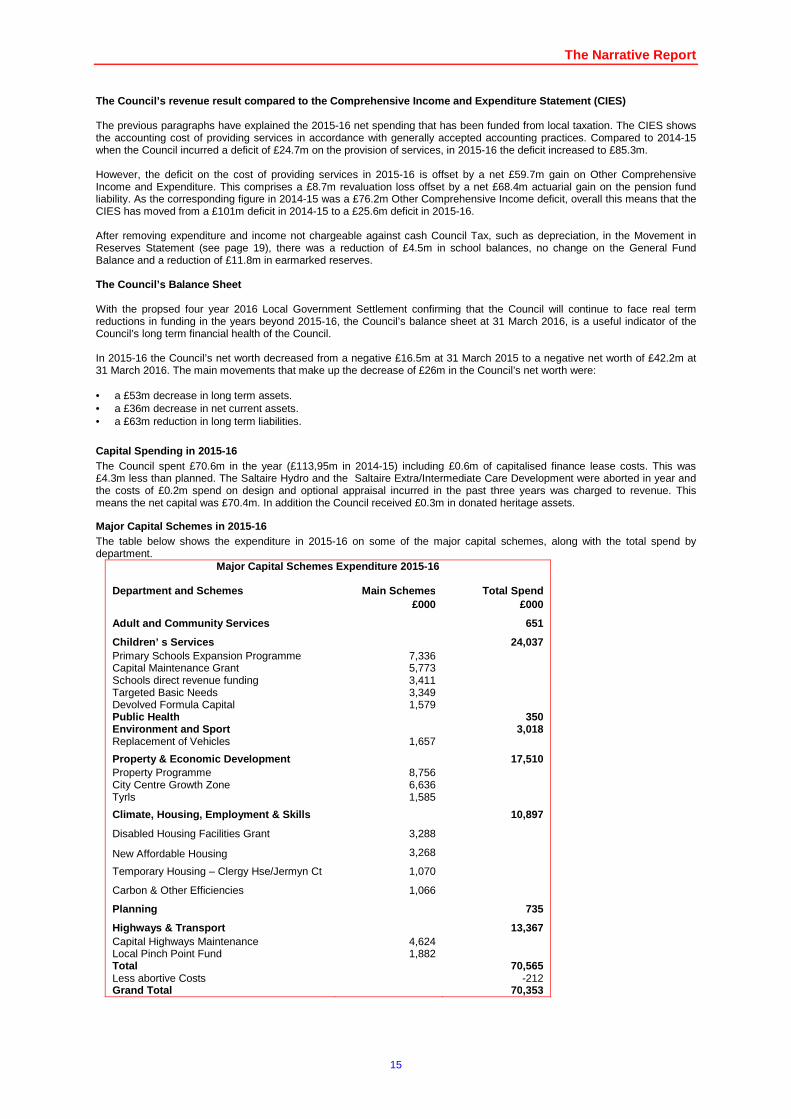
Major Capital Schemes in 2015-16 The table below shows the expenditure in 2015-16 on some of the major capital schemes, along with the total spend by department.
Major Capital Schemes Expenditure 2015-16
Department and Schemes Main Schemes Total Spend £000 £000
Adult and Community Services 651
Children’ s Services 24,037 Primary Schools Expansion Programme 7,336 Capital Maintenance Grant 5,773 Schools direct revenue funding 3,411 Targeted Basic Needs 3,349 Devolved Formula Capital 1,579 Public Health 350 Environment and Sport 3,018 Replacement of Vehicles 1,657
Property & Economic Development 17,510 Property Programme 8,756 City Centre Growth Zone 6,636 Tyrls 1,585
Climate, Housing, Employment & Skills 10,897
Disabled Housing Facilities Grant 3,288
New Affordable Housing 3,268
Temporary Housing – Clergy Hse/Jermyn Ct 1,070
Carbon & Other Efficiencies 1,066
Planning 735
Highways & Transport 13,367 Capital Highways Maintenance 4,624 Local Pinch Point Fund 1,882 Total 70,565 Less abortive Costs -212 Grand Total 70,353
The Narrative Report
16
Where the money came from to pay for the spending o n capital schemes in 2015-16 The Council has the freedom to borrow to fund capital investment but it must borrow responsibly and at affordable levels. It demonstrates that it has done so by setting and observing a range of prudential indicators covering the level of capital expenditure and the cost of financing it. One such measure is the Council’s Capital Financing Requirement (CFR). In 2015-16 it fell slightly from the level in 2014-15. However, it is the Council’s medium term strategy to reduce the cost of borrowing in line with the Council’s reduction in overall spend. Other than borrowing, the Council continues to receive capital grants towards certain projects and is able to reinvest its capital receipts or use revenue to fund capital spending. In 2015-16 the capital spending of £70.4m was funded as follows:
• £18.0m (26%) by borrowing generating capital financing charges which will form part of future revenue spending.
• £40m (56%) from government and other grants.
• £6.7m (10%) from revenue contributions and other revenue reserves.
• £5.1m (7%) from capital receipts from the sale of land and buildings.
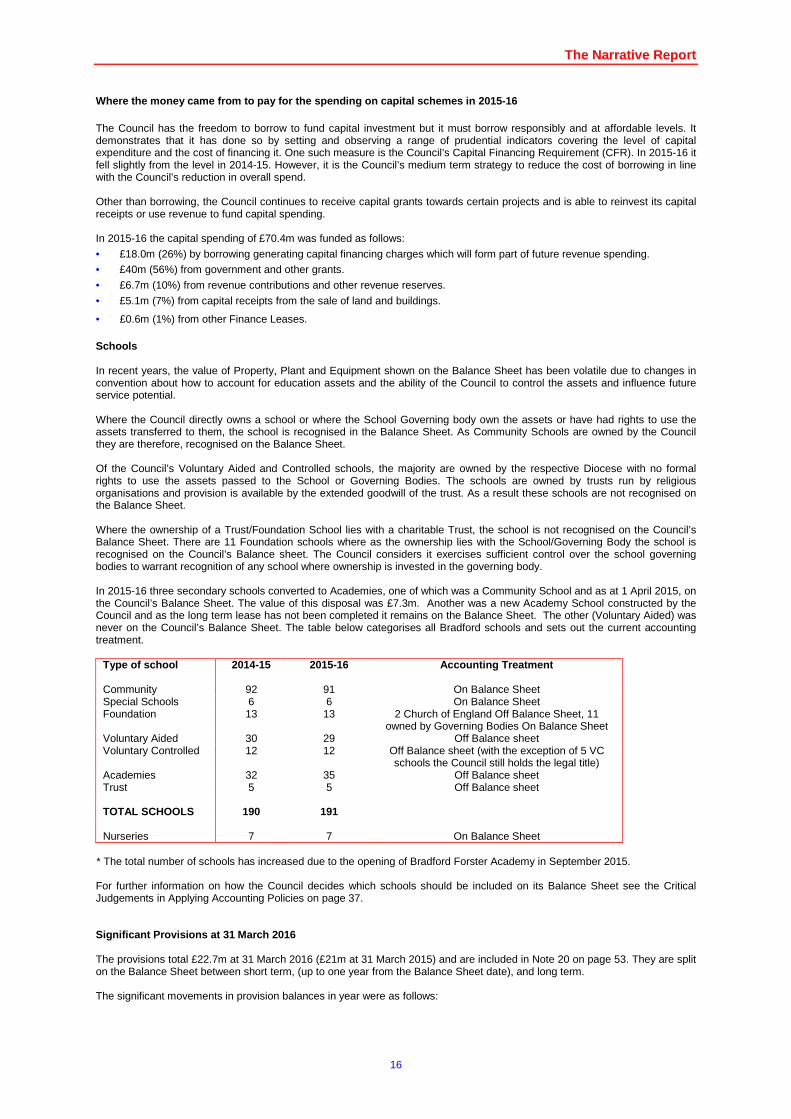
• £0.6m (1%) from other Finance Leases. Schools In recent years, the value of Property, Plant and Equipment shown on the Balance Sheet has been volatile due to changes in convention about how to account for education assets and the ability of the Council to control the assets and influence future service potential. Where the Council directly owns a school or where the School Governing body own the assets or have had rights to use the assets transferred to them, the school is recognised in the Balance Sheet. As Community Schools are owned by the Council they are therefore, recognised on the Balance Sheet. Of the Council’s Voluntary Aided and Controlled schools, the majority are owned by the respective Diocese with no formal rights to use the assets passed to the School or Governing Bodies. The schools are owned by trusts run by religious organisations and provision is available by the extended goodwill of the trust. As a result these schools are not recognised on the Balance Sheet. Where the ownership of a Trust/Foundation School lies with a charitable Trust, the school is not recognised on the Council’s Balance Sheet. There are 11 Foundation schools where as the ownership lies with the School/Governing Body the school is recognised on the Council’s Balance sheet. The Council considers it exercises sufficient control over the school governing bodies to warrant recognition of any school where ownership is invested in the governing body. In 2015-16 three secondary schools converted to Academies, one of which was a Community School and as at 1 April 2015, on the Council’s Balance Sheet. The value of this disposal was £7.3m. Another was a new Academy School constructed by the Council and as the long term lease has not been completed it remains on the Balance Sheet. The other (Voluntary Aided) was never on the Council’s Balance Sheet. The table below categorises all Bradford schools and sets out the current accounting treatment.
Type of school 2014-15 2015-16 Accounting Treatment Community 92 91 On Balance Sheet Special Schools 6 6 On Balance Sheet Foundation 13 13 2 Church of England Off Balance Sheet, 11
owned by Governing Bodies On Balance Sheet Voluntary Aided 30 29 Off Balance sheet Voluntary Controlled 12 12 Off Balance sheet (with the exception of 5 VC
schools the Council still holds the legal title) Academies 32 35 Off Balance sheet Trust 5 5 Off Balance sheet TOTAL SCHOOLS 190 191 Nurseries 7 7 On Balance Sheet
* The total number of schools has increased due to the opening of Bradford Forster Academy in September 2015. For further information on how the Council decides which schools should be included on its Balance Sheet see the Critical Judgements in Applying Accounting Policies on page 37. Significant Provisions at 31 March 2016 The provisions total £22.7m at 31 March 2016 (£21m at 31 March 2015) and are included in Note 20 on page 53. They are split on the Balance Sheet between short term, (up to one year from the Balance Sheet date), and long term. The significant movements in provision balances in year were as follows:
The Narrative Report
17
a) The cost of planned future termination costs in 2016-17 and future years arising from the detailed saving proposals approved as part of the 2016-17 Budget has been assessed as £8.4m.
b) The provision to cover the risk of day to day insurance losses has been reduced by £0.5m to £7.8m. c) The provision on personal property search fees has been increased to £0.2m. d) After charging £4.9m to the Council’s provision for the outcome of successful appeals against the Valuation Office’s
2010 Business Rates Valuation list, a further £3.4m has been set aside for outstanding appeals. This leaves Bradford’s estimated share of lost Business Rates income as a result of appeals at 31 March 2016 at £5.9m.
e) No provision was required on Equal Pay claims.
Reserves The Council’s policy is to use reserves to fund one-off expenditure or transitional activity while reducing its recurrent cost base. At 31 March 2016, the Council had £19.9m of unallocated reserves available to support future budget decisions. £6.1m of this has been used straight away to support the 2016-17 budget, leaving just £13.8m. The remaining £103m of earmarked reserves are set aside for future commitments, such as the integration of Health and Social Care, as well as specific financial risks. In addition, the Council has a General Fund balance of £10.8m, which is an operational contingency and is small in comparison to the Council’s annual expenditure. There are also £33.8m of balances ring-fenced for schools. A detailed analysis of all the Reserves held by the Council is set out in Note 5, Page 41. a) General Fund balance The General Fund balance acts as a necessary contingency against unforeseen events. At 31 March 2016 the General Fund balance remains at £10.8m and within the Council’s policy of 2.5% of the net budget requirement. b) Schools delegated balances At the 31 March 2016, ringfenced school balances were £33.8m, a decrease of £4.5m, compared to £38.3m at 31 March 2015. The balances of £33.8m comprise £18.9m held by schools and £14.9m held centrally for school contingencies. Of the £14.9m for school contingencies, £9.6m has been used straight away to fund the 2016-17 budget. The balances have been carried forward to schools’ budgets in 2016-17 in accordance with delegated arrangements.
Pensions Liabilities The Pension Fund deficit calculated by the Actuary decreased in 2015-16 by £33m. This is made up of a £69m net actuarial gains, relating to updated estimates by the actuary of the future value of assets and liabilities, reduced by £36m for net 2015-16 pension costs. The net actuarial gain of £69m mainly relates to the Local Government Pension Scheme (LGPS). It comprises a £115m actuarial gain on the estimated future pension liabilities, less a £46m reduction in the value of assets held to fund those benefits. The £115m actuarial gain is caused by an increased gap between the inflation rate and the discount rate. The more the inflation rate is above the discount rate, the lower the value of future promised pension benefits.
Council Tax and Non Domestic Rate Collection At 31 March 2016 the Council had collected 94.3% of the value of council tax bills for the year, exactly the same as at the same point last year. For non-domestic rates the figures are 96.9% collected at 31 March 2016 compared to 97.7% at the same time last year.
Collection Fund (Council Tax and Business Rates) a) Council Tax
After distributing in 2015-16 the opening surplus balance on the Council Tax Collection Fund, £2.7m, the Council Tax element of the Collection Fund ended the year £3.1m in credit. A surplus of £2.6m, Bradford’s 85% share, is reported in the accounting statements. The overachievement of Council tax income compared to the budgeted figure is due to a higher number of new properties being billed and a lower than forecast cost in the current year of providing Council Tax Reduction support.
b) Business rates The Business Rates retention scheme provides for Business Rates collected by Bradford Council to be shared between itself, central government and the West Yorkshire Integrated Fire Authority. Any difference between what the Council forecast it would raise in Business Rates in 2015-16 (£68.513m) and what it has actually raised results in either a surplus or deficit on the Collection Fund.
The Narrative Report
18
A deficit of £23.8m was outturned, Bradford’s share being £11.7m. After a statutory accounting adjustment, this is reduced to a deficit of £21.2m, in line with the forecast in January 2016, which was used to set the 2016-17 budget. Bradford’s share (49%) of this deficit was £10.4m. A reason for the deficit was the impact of appeals against rateable values. Successful appeals require the Council to refund business rates for 2015-16 and in many cases prior years. There was a high cost of refunds because of:
• Refunds due to rateable value reductions on GP surgeries backdated to prior years.
• Refunds on other rateable value reductions. This deficit on the Business Rates Collection Fund was fullyforecast when the 2016-17 budget was set. As a result, the deficit has already been budgeted for and there will be no additional pressure in future years.
2016-17 and beyond
The primary financial challenge is that the Council continues to face ongoing funding reductions. The 2015-16 Revenue Support Grant (RSG) of £107.4m was reduced from the 2014-15 RSG of £149.4m. In 2016-17, the RSG further reduces to £83.9m, a further reduction of £23.5m. In the face of funding reductions, the Council made significant budget reductions on the 2015-16 net budget of £400.8m. The 2016-17 budget included £27.4m of previously planned savings and a further £17.3m of new savings. Further savings of £24.3m were agreed for the 2017-18 budget with an estimated deficit of around £10m still to close. Disciplined management of net cost reduction through cost control and income growth will remain central to the Council’s financial strategy. As the Revenue Support Grant from Central Government declines, the Council will become increasingly reliant on Business Rates, Council Tax and income from fees and charges. This reliance on the Council’s local sources of funding will become more pronounced due to expected changes in the national Business Rates system, which are the subject of current Government consultation. By 2020-2021, local authorities will together retain 100% of Business Rates collected; some element of redistribution to reflect the different needs of areas and population is expected to remain; and councils will likely take on new functions. The system will likely mean that individual Councils will be more directly affected by the buoyancy of their local tax yields. Growth in Business Rates as an income stream also reflects the Council’s pursuit of the key objectives of creating more and better jobs, higher skill levels, and a growing economy. Part of this is the proposed introduction of discretionary business rate relief to encourage new developments, bringing listed buildings back into economic use, and to tackling vacant premises in core urban centres. The Council continues to be impacted by the conversion of schools to academies. As schools convert to academies, there are reductions to the Council’s Education Services Grant and Dedicated Schools Grant, which further reduces the income supporting the Council’s budget. When schools convert, accounting standards determine that their land and buildings can no longer be shown on the Council’s balance sheet. An increasing number of schools will convert to academies over the next few years, with more impact on the Council’s budget and balance sheet. The Council will work with health partners to produce a Sustainable Transformation Plan in 2016-17, to address the national challenges to NHS finances. This planning is bound up with the shortfall in funding for Adult Social Care, due to demographic changes, and its consequences for NHS organisation. In the context of the Care Act 2014, Adult Social Care Services and the NHS will increasingly integrate by 2020. The precise implications of these reforms are not yet definite, but they are likely to be financially significant. Discussions are underway, between Leaders of the Regions, Councils and Government about a devolution agreement, which will have financial consequences, again not yet clear. Finally, the result of the referendum on the European Union referendum brings further uncertainty. Overall, therefore, the Council’s financial climate remains turbulent, with the overriding certainty that it will be financially smaller by 2020. Stuart McKinnon-Evans Director of Finance
Movement in Reserves Statement
19
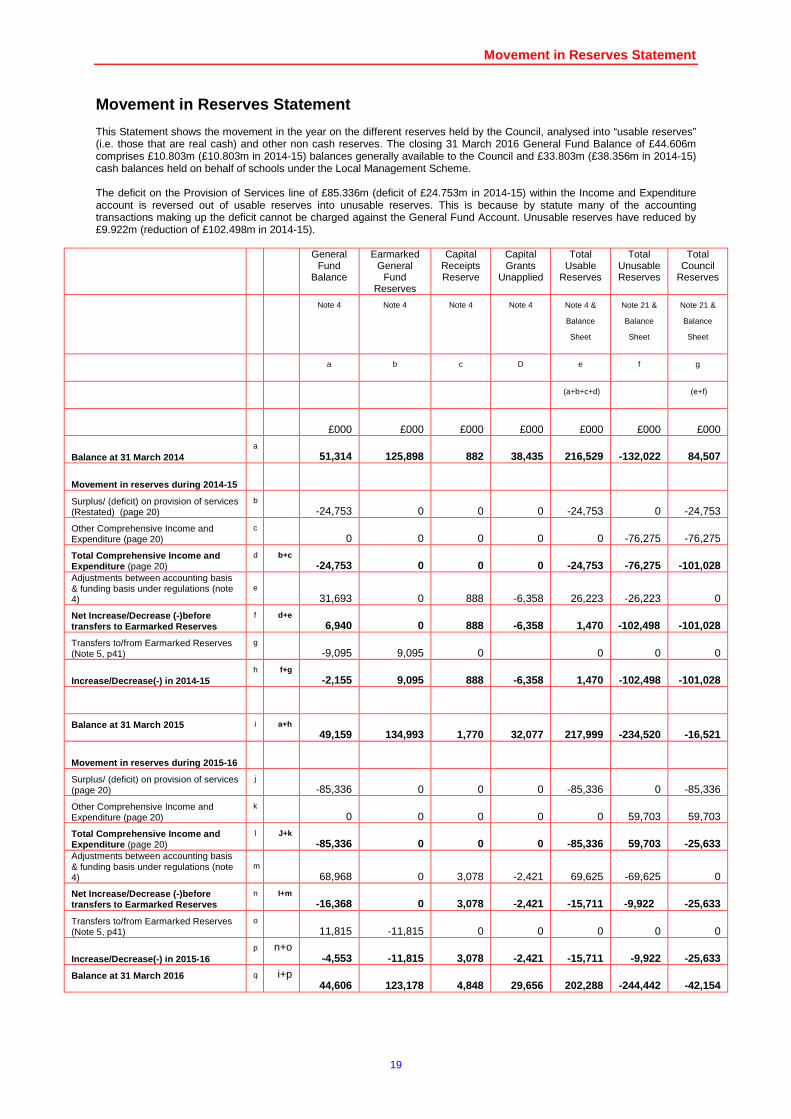
Movement in Reserves Statement This Statement shows the movement in the year on the different reserves held by the Council, analysed into “usable reserves” (i.e. those that are real cash) and other non cash reserves. The closing 31 March 2016 General Fund Balance of £44.606m comprises £10.803m (£10.803m in 2014-15) balances generally available to the Council and £33.803m (£38.356m in 2014-15) cash balances held on behalf of schools under the Local Management Scheme. The deficit on the Provision of Services line of £85.336m (deficit of £24.753m in 2014-15) within the Income and Expenditure account is reversed out of usable reserves into unusable reserves. This is because by statute many of the accounting transactions making up the deficit cannot be charged against the General Fund Account. Unusable reserves have reduced by £9.922m (reduction of £102.498m in 2014-15).
General Fund
Balance
Earmarked General
Fund Reserves
Capital Receipts Reserve
Capital Grants
Unapplied
Total Usable
Reserves
Total Unusable Reserves
Total Council
Reserves
Note 4 Note 4 Note 4 Note 4 Note 4 &
Balance
Sheet
Note 21 &
Balance
Sheet
Note 21 &
Balance
Sheet
a b c D e f g
(a+b+c+d) (e+f)
£000 £000 £000 £000 £000 £000 £000
Balance at 31 March 2014 a
51,314 125,898 882 38,435 216,529 -132,022 84,507
Movement in reserves during 2014-15
Surplus/ (deficit) on provision of services (Restated) (page 20)
b -24,753 0 0 0 -24,753 0 -24,753
Other Comprehensive Income and Expenditure (page 20)
c 0 0 0 0 0 -76,275 -76,275
Total Comprehensive Income and Expenditure (page 20)
d b+c -24,753 0 0 0 -24,753 -76,275 -101,028
Adjustments between accounting basis & funding basis under regulations (note 4)
e 31,693 0 888 -6,358 26,223 -26,223 0
Net Increase/Decrease (-)before transfers to Earmarked Reserves
f d+e 6,940 0 888 -6,358 1,470 -102,498 -101,028
Transfers to/from Earmarked Reserves (Note 5, p41)
g -9,095 9,095 0 0 0 0
Increase/Decrease(-) in 2014-15 h f+g
-2,155 9,095 888 -6,358 1,470 -102,498 -101,028
Balance at 31 March 2015
i a+h 49,159 134,993 1,770 32,077 217,999 -234,520 -16,521
Movement in reserves during 2015-16
Surplus/ (deficit) on provision of services (page 20)
j -85,336 0 0 0 -85,336 0 -85,336
Other Comprehensive Income and Expenditure (page 20)
k 0 0 0 0 0 59,703 59,703
Total Comprehensive Income and Expenditure (page 20)
l J+k -85,336 0 0 0 -85,336 59,703 -25,633
Adjustments between accounting basis & funding basis under regulations (note 4)
m 68,968 0 3,078 -2,421 69,625 -69,625 0
Net Increase/Decrease (-)before transfers to Earmarked Reserves
n I+m -16,368 0 3,078 -2,421 -15,711 -9,922 -25,633
Transfers to/from Earmarked Reserves (Note 5, p41)
o 11,815 -11,815 0 0 0 0 0
Increase/Decrease(-) in 2015-16 p n+o
-4,553 -11,815 3,078 -2,421 -15,711 -9,922 -25,633
Balance at 31 March 2016
q i+p 44,606 123,178 4,848 29,656 202,288 -244,442 -42,154
Comprehensive Income and Expenditure Statement
20
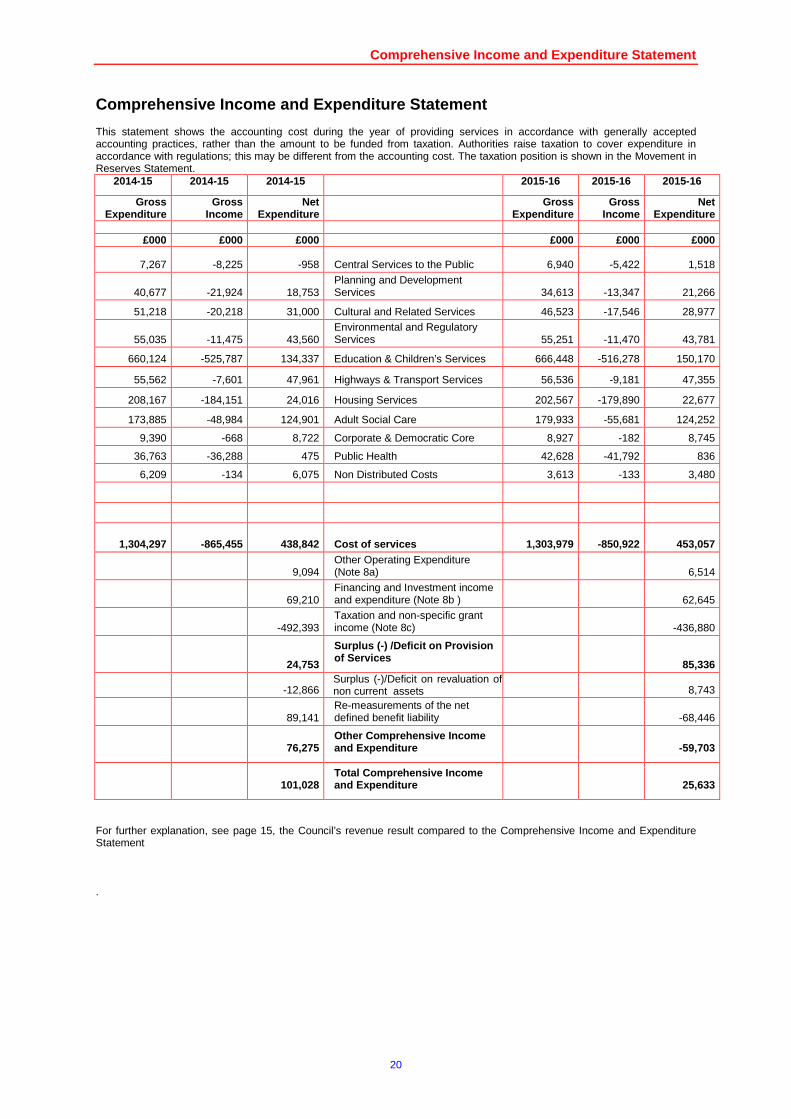
Comprehensive Income and Expenditure Statement This statement shows the accounting cost during the year of providing services in accordance with generally accepted accounting practices, rather than the amount to be funded from taxation. Authorities raise taxation to cover expenditure in accordance with regulations; this may be different from the accounting cost. The taxation position is shown in the Movement in Reserves Statement.
2014-15 2014-15 2014-15
2015-16 2015-16 2015-16
Gross Expenditure
Gross Income
Net Expenditure
Gross Expenditure
Gross Income
Net Expenditure
£000 £000 £000 £000 £000 £000
7,267 -8,225 -958 Central Services to the Public 6,940 -5,422 1,518
40,677 -21,924 18,753 Planning and Development Services 34,613 -13,347 21,266
51,218 -20,218 31,000 Cultural and Related Services 46,523 -17,546 28,977
55,035 -11,475 43,560 Environmental and Regulatory Services 55,251 -11,470 43,781
660,124 -525,787 134,337 Education & Children’s Services 666,448 -516,278 150,170
55,562 -7,601 47,961 Highways & Transport Services 56,536 -9,181 47,355
208,167 -184,151 24,016 Housing Services 202,567 -179,890 22,677
173,885 -48,984 124,901 Adult Social Care 179,933 -55,681 124,252
9,390 -668 8,722 Corporate & Democratic Core 8,927 -182 8,745
36,763 -36,288 475 Public Health 42,628 -41,792 836
6,209 -134 6,075 Non Distributed Costs 3,613 -133 3,480
1,304,297 -865,455 438,842 Cost of services 1,303,979 -850,922 453,057
9,094 Other Operating Expenditure (Note 8a) 6,514
69,210 Financing and Investment income and expenditure (Note 8b ) 62,645
-492,393 Taxation and non-specific grant income (Note 8c) -436,880
24,753
Surplus (-) /Deficit on Provision of Services
85,336
-12,866 Surplus (-)/Deficit on revaluation of non current assets 8,743
89,141 Re-measurements of the net defined benefit liability -68,446
76,275 Other Comprehensive Income and Expenditure -59,703
101,028 Total Comprehensive Income and Expenditure 25,633
For further explanation, see page 15, the Council’s revenue result compared to the Comprehensive Income and Expenditure Statement .
Balance Sheet
21
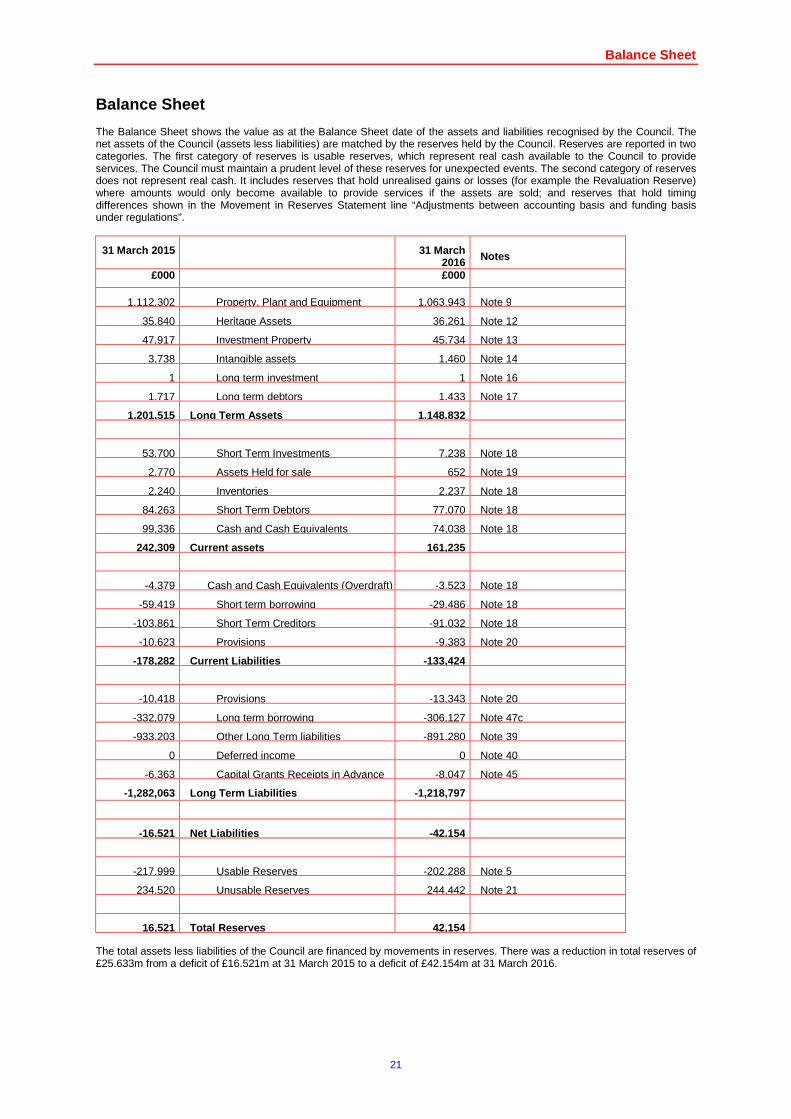
Balance Sheet The Balance Sheet shows the value as at the Balance Sheet date of the assets and liabilities recognised by the Council. The net assets of the Council (assets less liabilities) are matched by the reserves held by the Council. Reserves are reported in two categories. The first category of reserves is usable reserves, which represent real cash available to the Council to provide services. The Council must maintain a prudent level of these reserves for unexpected events. The second category of reserves does not represent real cash. It includes reserves that hold unrealised gains or losses (for example the Revaluation Reserve) where amounts would only become available to provide services if the assets are sold; and reserves that hold timing differences shown in the Movement in Reserves Statement line “Adjustments between accounting basis and funding basis under regulations”.
31 March 2015 31 March 2016 Notes
£000 £000
1,112,302 Property, Plant and Equipment 1,063,943 Note 9
35,840 Heritage Assets 36,261 Note 12
47,917 Investment Property 45,734 Note 13
3,738 Intangible assets 1,460 Note 14
1 Long term investment 1 Note 16
1,717 Long term debtors 1,433 Note 17
1,201,515 Long Term Assets 1,148,832
53,700 Short Term Investments 7,238 Note 18
2,770 Assets Held for sale 652 Note 19
2,240 Inventories 2,237 Note 18
84,263 Short Term Debtors 77,070 Note 18
99,336 Cash and Cash Equivalents 74,038 Note 18
242,309 Current assets 161,235
-4,379 Cash and Cash Equivalents (Overdraft) -3,523 Note 18
-59,419 Short term borrowing -29,486 Note 18
-103,861 Short Term Creditors -91,032 Note 18
-10,623 Provisions -9,383 Note 20
-178,282 Current Liabilities -133,424
-10,418 Provisions -13,343 Note 20
-332,079 Long term borrowing -306,127 Note 47c
-933,203 Other Long Term liabilities -891,280 Note 39
0 Deferred income 0 Note 40
-6,363 Capital Grants Receipts in Advance -8,047 Note 45
-1,282,063 Long Term Liabilities -1,218,797
-16,521 Net Liabilities -42,154
-217,999 Usable Reserves -202,288 Note 5
234,520 Unusable Reserves 244,442 Note 21
16,521 Total Reserves 42,154 The total assets less liabilities of the Council are financed by movements in reserves. There was a reduction in total reserves of £25.633m from a deficit of £16.521m at 31 March 2015 to a deficit of £42.154m at 31 March 2016.
Cash Flow Statement
22
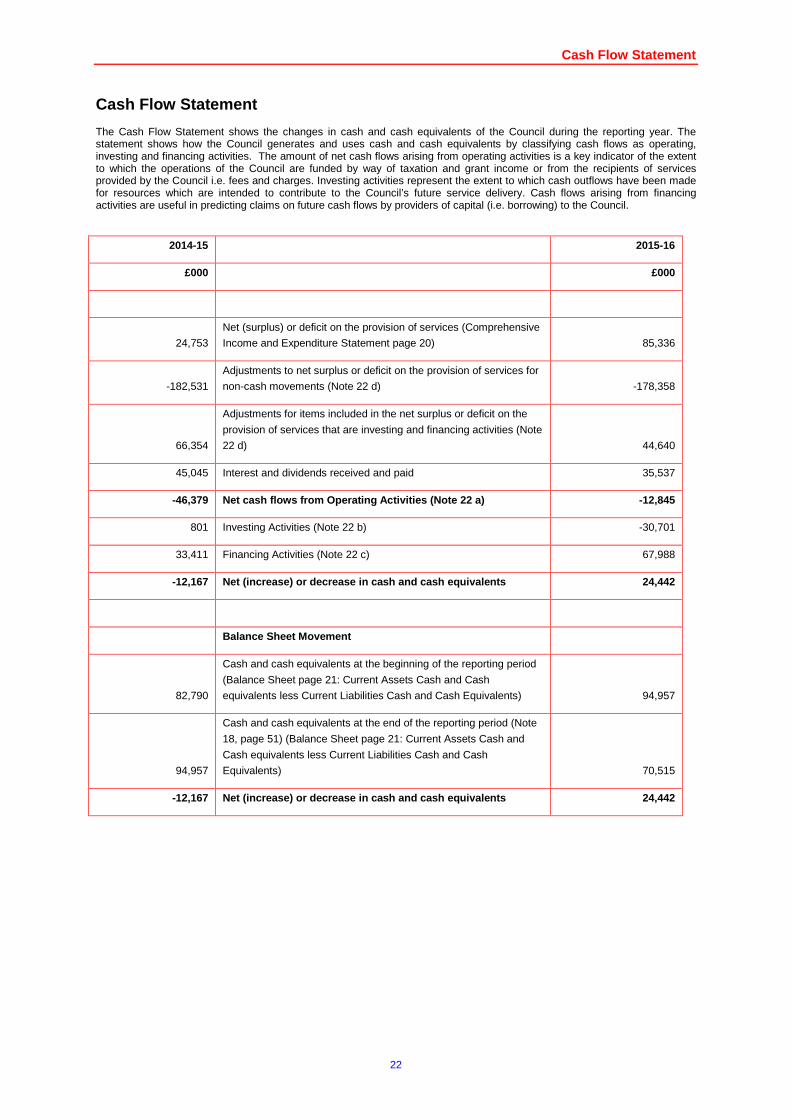
Cash Flow Statement The Cash Flow Statement shows the changes in cash and cash equivalents of the Council during the reporting year. The statement shows how the Council generates and uses cash and cash equivalents by classifying cash flows as operating, investing and financing activities. The amount of net cash flows arising from operating activities is a key indicator of the extent to which the operations of the Council are funded by way of taxation and grant income or from the recipients of services provided by the Council i.e. fees and charges. Investing activities represent the extent to which cash outflows have been made for resources which are intended to contribute to the Council’s future service delivery. Cash flows arising from financing activities are useful in predicting claims on future cash flows by providers of capital (i.e. borrowing) to the Council.
2014-15 2015-16
£000 £000
24,753
Net (surplus) or deficit on the provision of services (Comprehensive
Income and Expenditure Statement page 20) 85,336
-182,531
Adjustments to net surplus or deficit on the provision of services for
non-cash movements (Note 22 d) -178,358
66,354
Adjustments for items included in the net surplus or deficit on the
provision of services that are investing and financing activities (Note
22 d) 44,640
45,045 Interest and dividends received and paid 35,537
-46,379 Net cash flows from Operating Activities (N ote 22 a) -12,845
801 Investing Activities (Note 22 b) -30,701
33,411 Financing Activities (Note 22 c) 67,988
-12,167 Net (increase) or decrease in cash and cash equivalents 24,442
Balance Sheet Movement
82,790
Cash and cash equivalents at the beginning of the reporting period
(Balance Sheet page 21: Current Assets Cash and Cash
equivalents less Current Liabilities Cash and Cash Equivalents) 94,957
94,957
Cash and cash equivalents at the end of the reporting period (Note
18, page 51) (Balance Sheet page 21: Current Assets Cash and
Cash equivalents less Current Liabilities Cash and Cash
Equivalents) 70,515
-12,167 Net (increase) or decrease in cash and cash equivalents 24,442
Notes to the Main Financial Statements
23
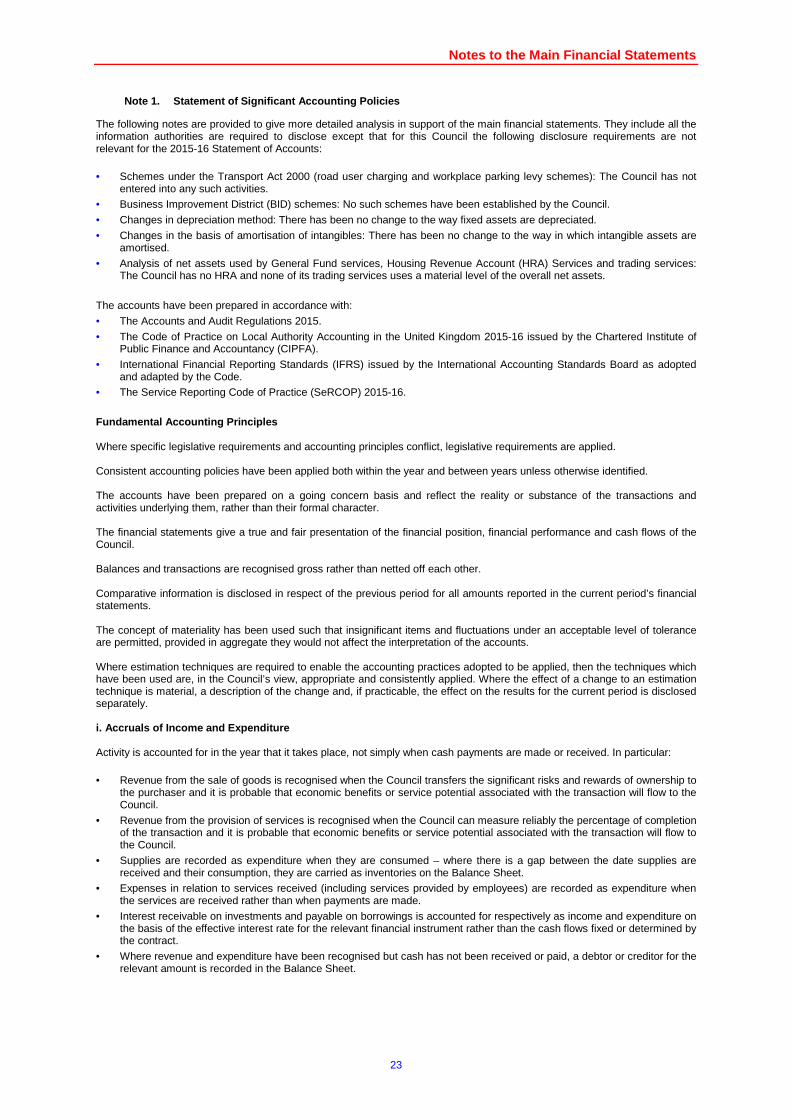
Statement of Significant Accounting Policies Note 1.
The following notes are provided to give more detailed analysis in support of the main financial statements. They include all the information authorities are required to disclose except that for this Council the following disclosure requirements are not relevant for the 2015-16 Statement of Accounts:
• Schemes under the Transport Act 2000 (road user charging and workplace parking levy schemes): The Council has not entered into any such activities.
• Business Improvement District (BID) schemes: No such schemes have been established by the Council.
• Changes in depreciation method: There has been no change to the way fixed assets are depreciated.
• Changes in the basis of amortisation of intangibles: There has been no change to the way in which intangible assets are amortised.
• Analysis of net assets used by General Fund services, Housing Revenue Account (HRA) Services and trading services: The Council has no HRA and none of its trading services uses a material level of the overall net assets.
The accounts have been prepared in accordance with:
• The Accounts and Audit Regulations 2015.
• The Code of Practice on Local Authority Accounting in the United Kingdom 2015-16 issued by the Chartered Institute of Public Finance and Accountancy (CIPFA).
• International Financial Reporting Standards (IFRS) issued by the International Accounting Standards Board as adopted and adapted by the Code.
• The Service Reporting Code of Practice (SeRCOP) 2015-16.
Fundamental Accounting Principles Where specific legislative requirements and accounting principles conflict, legislative requirements are applied. Consistent accounting policies have been applied both within the year and between years unless otherwise identified. The accounts have been prepared on a going concern basis and reflect the reality or substance of the transactions and activities underlying them, rather than their formal character. The financial statements give a true and fair presentation of the financial position, financial performance and cash flows of the Council. Balances and transactions are recognised gross rather than netted off each other. Comparative information is disclosed in respect of the previous period for all amounts reported in the current period’s financial statements. The concept of materiality has been used such that insignificant items and fluctuations under an acceptable level of tolerance are permitted, provided in aggregate they would not affect the interpretation of the accounts. Where estimation techniques are required to enable the accounting practices adopted to be applied, then the techniques which have been used are, in the Council’s view, appropriate and consistently applied. Where the effect of a change to an estimation technique is material, a description of the change and, if practicable, the effect on the results for the current period is disclosed separately. i. Accruals of Income and Expenditure Activity is accounted for in the year that it takes place, not simply when cash payments are made or received. In particular:
• Revenue from the sale of goods is recognised when the Council transfers the significant risks and rewards of ownership to the purchaser and it is probable that economic benefits or service potential associated with the transaction will flow to the Council.
• Revenue from the provision of services is recognised when the Council can measure reliably the percentage of completion of the transaction and it is probable that economic benefits or service potential associated with the transaction will flow to the Council.
• Supplies are recorded as expenditure when they are consumed – where there is a gap between the date supplies are received and their consumption, they are carried as inventories on the Balance Sheet.
• Expenses in relation to services received (including services provided by employees) are recorded as expenditure when the services are received rather than when payments are made.
• Interest receivable on investments and payable on borrowings is accounted for respectively as income and expenditure on the basis of the effective interest rate for the relevant financial instrument rather than the cash flows fixed or determined by the contract.
• Where revenue and expenditure have been recognised but cash has not been received or paid, a debtor or creditor for the relevant amount is recorded in the Balance Sheet.
Notes to the Main Financial Statements
24
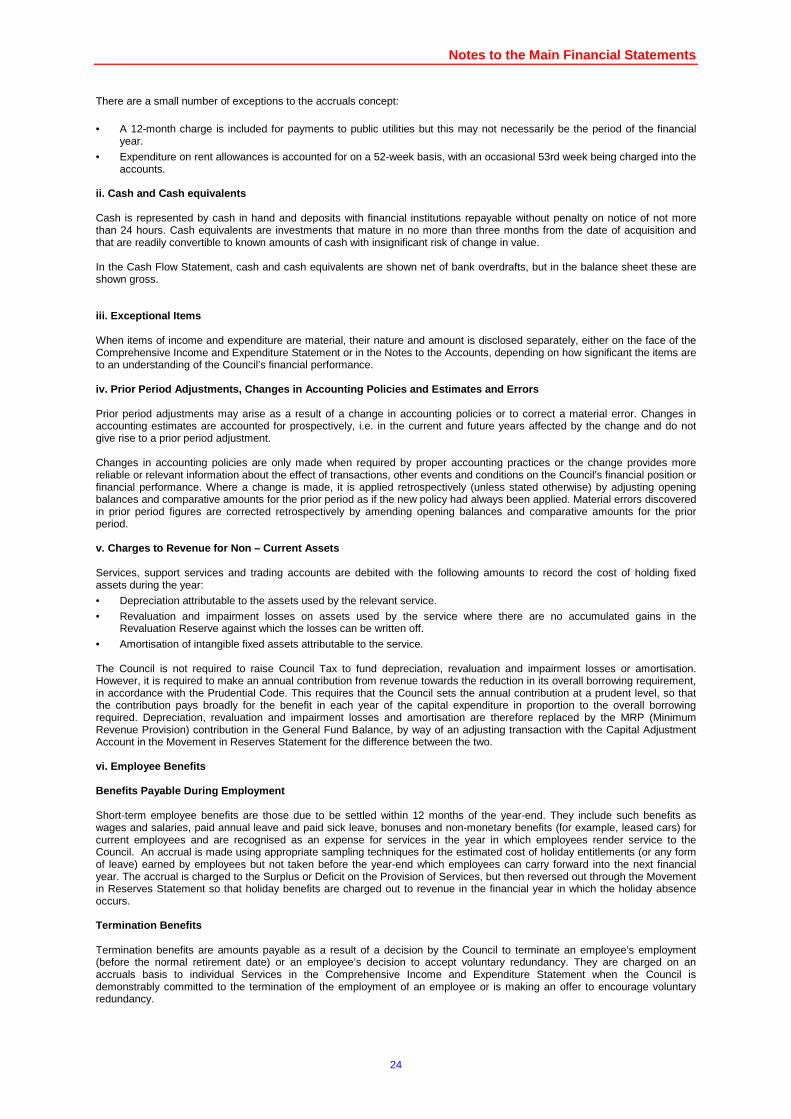
There are a small number of exceptions to the accruals concept:
• A 12-month charge is included for payments to public utilities but this may not necessarily be the period of the financial year.
• Expenditure on rent allowances is accounted for on a 52-week basis, with an occasional 53rd week being charged into the accounts.
ii. Cash and Cash equivalents Cash is represented by cash in hand and deposits with financial institutions repayable without penalty on notice of not more than 24 hours. Cash equivalents are investments that mature in no more than three months from the date of acquisition and that are readily convertible to known amounts of cash with insignificant risk of change in value. In the Cash Flow Statement, cash and cash equivalents are shown net of bank overdrafts, but in the balance sheet these are shown gross. iii. Exceptional Items When items of income and expenditure are material, their nature and amount is disclosed separately, either on the face of the Comprehensive Income and Expenditure Statement or in the Notes to the Accounts, depending on how significant the items are to an understanding of the Council’s financial performance. iv. Prior Period Adjustments, Changes in Accounting Policies and Estimates and Errors Prior period adjustments may arise as a result of a change in accounting policies or to correct a material error. Changes in accounting estimates are accounted for prospectively, i.e. in the current and future years affected by the change and do not give rise to a prior period adjustment. Changes in accounting policies are only made when required by proper accounting practices or the change provides more reliable or relevant information about the effect of transactions, other events and conditions on the Council’s financial position or financial performance. Where a change is made, it is applied retrospectively (unless stated otherwise) by adjusting opening balances and comparative amounts for the prior period as if the new policy had always been applied. Material errors discovered in prior period figures are corrected retrospectively by amending opening balances and comparative amounts for the prior period. v. Charges to Revenue for Non – Current Assets Services, support services and trading accounts are debited with the following amounts to record the cost of holding fixed assets during the year:
• Depreciation attributable to the assets used by the relevant service.
• Revaluation and impairment losses on assets used by the service where there are no accumulated gains in the Revaluation Reserve against which the losses can be written off.
• Amortisation of intangible fixed assets attributable to the service. The Council is not required to raise Council Tax to fund depreciation, revaluation and impairment losses or amortisation. However, it is required to make an annual contribution from revenue towards the reduction in its overall borrowing requirement, in accordance with the Prudential Code. This requires that the Council sets the annual contribution at a prudent level, so that the contribution pays broadly for the benefit in each year of the capital expenditure in proportion to the overall borrowing required. Depreciation, revaluation and impairment losses and amortisation are therefore replaced by the MRP (Minimum Revenue Provision) contribution in the General Fund Balance, by way of an adjusting transaction with the Capital Adjustment Account in the Movement in Reserves Statement for the difference between the two. vi. Employee Benefits Benefits Payable During Employment Short-term employee benefits are those due to be settled within 12 months of the year-end. They include such benefits as wages and salaries, paid annual leave and paid sick leave, bonuses and non-monetary benefits (for example, leased cars) for current employees and are recognised as an expense for services in the year in which employees render service to the Council. An accrual is made using appropriate sampling techniques for the estimated cost of holiday entitlements (or any form of leave) earned by employees but not taken before the year-end which employees can carry forward into the next financial year. The accrual is charged to the Surplus or Deficit on the Provision of Services, but then reversed out through the Movement in Reserves Statement so that holiday benefits are charged out to revenue in the financial year in which the holiday absence occurs. Termination Benefits Termination benefits are amounts payable as a result of a decision by the Council to terminate an employee’s employment (before the normal retirement date) or an employee’s decision to accept voluntary redundancy. They are charged on an accruals basis to individual Services in the Comprehensive Income and Expenditure Statement when the Council is demonstrably committed to the termination of the employment of an employee or is making an offer to encourage voluntary redundancy.
Notes to the Main Financial Statements
25
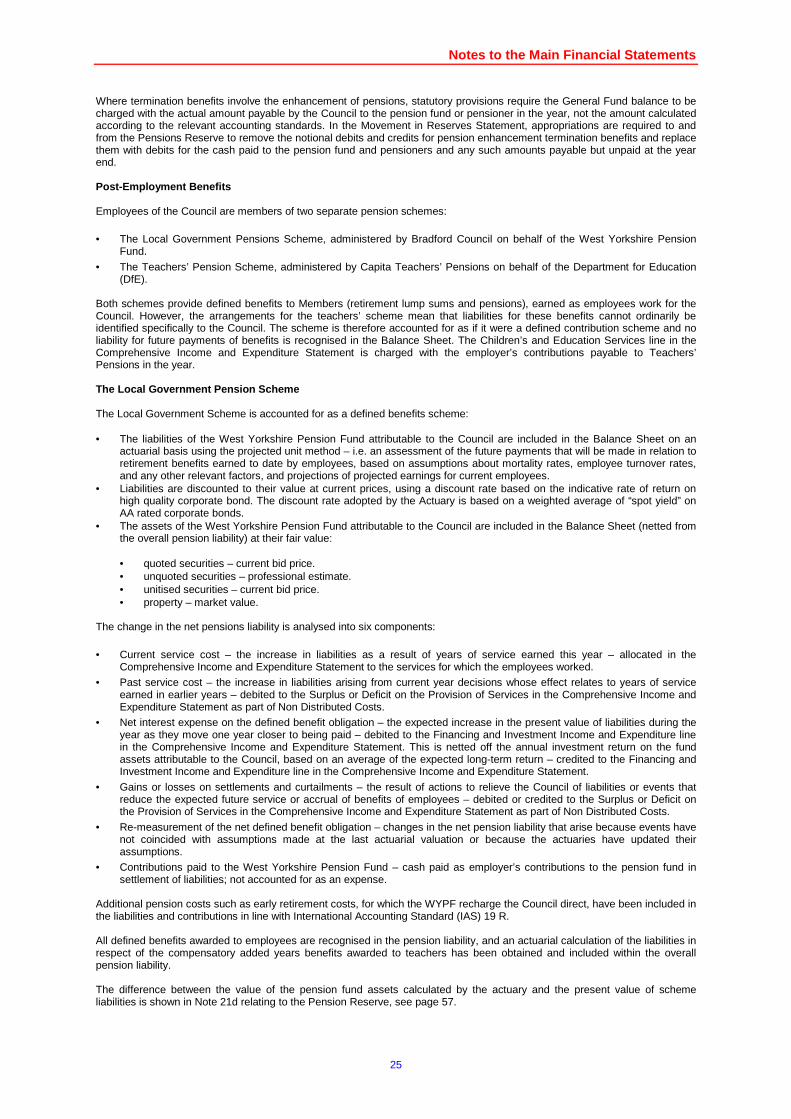
Where termination benefits involve the enhancement of pensions, statutory provisions require the General Fund balance to be charged with the actual amount payable by the Council to the pension fund or pensioner in the year, not the amount calculated according to the relevant accounting standards. In the Movement in Reserves Statement, appropriations are required to and from the Pensions Reserve to remove the notional debits and credits for pension enhancement termination benefits and replace them with debits for the cash paid to the pension fund and pensioners and any such amounts payable but unpaid at the year end. Post-Employment Benefits Employees of the Council are members of two separate pension schemes:
• The Local Government Pensions Scheme, administered by Bradford Council on behalf of the West Yorkshire Pension Fund.
• The Teachers’ Pension Scheme, administered by Capita Teachers’ Pensions on behalf of the Department for Education (DfE).
Both schemes provide defined benefits to Members (retirement lump sums and pensions), earned as employees work for the Council. However, the arrangements for the teachers’ scheme mean that liabilities for these benefits cannot ordinarily be identified specifically to the Council. The scheme is therefore accounted for as if it were a defined contribution scheme and no liability for future payments of benefits is recognised in the Balance Sheet. The Children’s and Education Services line in the Comprehensive Income and Expenditure Statement is charged with the employer’s contributions payable to Teachers’ Pensions in the year. The Local Government Pension Scheme The Local Government Scheme is accounted for as a defined benefits scheme: • The liabilities of the West Yorkshire Pension Fund attributable to the Council are included in the Balance Sheet on an
actuarial basis using the projected unit method – i.e. an assessment of the future payments that will be made in relation to retirement benefits earned to date by employees, based on assumptions about mortality rates, employee turnover rates, and any other relevant factors, and projections of projected earnings for current employees.
• Liabilities are discounted to their value at current prices, using a discount rate based on the indicative rate of return on high quality corporate bond. The discount rate adopted by the Actuary is based on a weighted average of “spot yield” on AA rated corporate bonds.
• The assets of the West Yorkshire Pension Fund attributable to the Council are included in the Balance Sheet (netted from the overall pension liability) at their fair value:
• quoted securities – current bid price. • unquoted securities – professional estimate. • unitised securities – current bid price. • property – market value.
The change in the net pensions liability is analysed into six components:
• Current service cost – the increase in liabilities as a result of years of service earned this year – allocated in the Comprehensive Income and Expenditure Statement to the services for which the employees worked.
• Past service cost – the increase in liabilities arising from current year decisions whose effect relates to years of service earned in earlier years – debited to the Surplus or Deficit on the Provision of Services in the Comprehensive Income and Expenditure Statement as part of Non Distributed Costs.
• Net interest expense on the defined benefit obligation – the expected increase in the present value of liabilities during the year as they move one year closer to being paid – debited to the Financing and Investment Income and Expenditure line in the Comprehensive Income and Expenditure Statement. This is netted off the annual investment return on the fund assets attributable to the Council, based on an average of the expected long-term return – credited to the Financing and Investment Income and Expenditure line in the Comprehensive Income and Expenditure Statement.
• Gains or losses on settlements and curtailments – the result of actions to relieve the Council of liabilities or events that reduce the expected future service or accrual of benefits of employees – debited or credited to the Surplus or Deficit on the Provision of Services in the Comprehensive Income and Expenditure Statement as part of Non Distributed Costs.
• Re-measurement of the net defined benefit obligation – changes in the net pension liability that arise because events have not coincided with assumptions made at the last actuarial valuation or because the actuaries have updated their assumptions.
• Contributions paid to the West Yorkshire Pension Fund – cash paid as employer’s contributions to the pension fund in settlement of liabilities; not accounted for as an expense.
Additional pension costs such as early retirement costs, for which the WYPF recharge the Council direct, have been included in the liabilities and contributions in line with International Accounting Standard (IAS) 19 R. All defined benefits awarded to employees are recognised in the pension liability, and an actuarial calculation of the liabilities in respect of the compensatory added years benefits awarded to teachers has been obtained and included within the overall pension liability. The difference between the value of the pension fund assets calculated by the actuary and the present value of scheme liabilities is shown in Note 21d relating to the Pension Reserve, see page 57.
Notes to the Main Financial Statements
26
In relation to retirement benefits, statutory provisions require the General Fund balance to be charged with the amount payable by the Council to the pension fund or directly to pensioners in the year, not the amount calculated according to the relevant accounting standards. In the Movement in Reserves Statement, this means that there are appropriations to and from the Pensions Reserve to remove the notional debits and credits for retirement benefits and replace them with debits for the cash paid to the pension fund and pensioners and any such amounts payable but unpaid at the year end. The negative balance that arises on the Pensions Reserve thereby measures the beneficial impact to the General Fund of being required to account for retirement benefits on the basis of cash flows rather than as benefits are earned by employees. Local Government Pension Scheme members retiring on or after 6 April 2006 can elect to take a higher lump sum in exchange for a lower retirement benefit. The commutation terms mean that it is less costly for the scheme to provide the lump sum than the pension, as more members take up this option, employers’ pension costs are reduced. At its inception it was assumed that 50% of members will take up the option to increase their lump sum to the maximum available. However, the 2015-16 figures are based on actual take-up levels up to 31 March 2016. Teachers’ Pensions The Council is responsible for the costs of any additional benefits awarded upon early retirement outside of the terms of the teacher’s scheme. These benefits are fully accrued in the pension liability. Discretionary Benefits The Council also has restricted powers to make discretionary awards of retirement benefits in the event of early retirements. Any liabilities estimated to arise as a result of an award to any member of staff (including teachers) are accrued in the year of the decision to make the award and accounted for using the same policies as are applied to the Local Government Pension Scheme. vii. Events After the Balance Sheet Date Events after the Balance Sheet date are those events, both favourable and unfavourable, that occur between the end of the reporting period and the date when the Statement of Accounts is authorised for issue. Two types of events can be identified: • Those that provide evidence of conditions that existed at the end of the reporting period – the Statement of Accounts is
adjusted to reflect such events. • Those that are indicative of conditions that arose after the reporting period - the Statement of Accounts is not adjusted to
reflect such events, but where a category of events would have a material effect, disclosure is made in the notes of the nature of the events and their estimated financial effect.
Events taking place after the date of authorisation for issue are not reflected in the Statement of Accounts. viii. Financial Instruments A financial instrument is defined as any contract that gives rise to a financial asset of one entity and a financial liability of another. The term covers both financial liabilities and financial assets and, includes the borrowing, trade payables, lending, trade receivables, investments and bank deposits of the Council. Financial Liabilities Financial liabilities are recognised on the Balance Sheet when the Council becomes a party to the contractual provisions of a financial instrument. They can be classified either as financial liabilities at amortised cost or as financial liabilities through profit and loss. Those classified as financial liabilities at amortised cost are initially measured at fair value and are carried at their amortised cost. Annual charges to the Financing and Investment Income and Expenditure line in the Comprehensive Income and Expenditure Statement for interest payable are based on the carrying amount of the liability, multiplied by the effective rate of interest for the instrument. The effective interest rate is the rate that exactly discounts estimated future cash payments over the life of the instrument to the amount at which it was originally recognised. For most of the borrowings that the Council has, this means that the amount presented in the Balance Sheet is the outstanding principal repayable (plus accrued interest); and interest charged to the Comprehensive Income and Expenditure Statement is the amount payable for the year according to the loan agreement. Where premiums and discounts have been charged to the Comprehensive Income and Expenditure Statement, regulations allow the impact on the General Fund balance to be spread over future years. The Council has a policy to spread the gain or loss over the term that was remaining on the loan against which the premium was payable or discount receivable when it was repaid, or ten years (if shorter). The reconciliation of amounts charged to the Comprehensive Income and Expenditure Statement to the net charge required against the General Fund is managed by a transfer to or from the Financial Instruments Adjustment Account in the Movement in Reserves Statement. Financial Assets Financial assets are classified into two types: • Loans and receivables – assets that have fixed or determinable payments but are not quoted in active market. • Available-for-sale financial assets – assets that have a quoted market price and/or do not have fixed or determinable
payments.
Notes to the Main Financial Statements
27
Loans and Receivables Loans and receivables are recognised on the Balance Sheet when the Council becomes a party to the contractual provisions of a financial instrument and are initially measured at fair value. They are subsequently measured at their amortised cost. Annual credits to the Financing and Investment Income and Expenditure line in the Comprehensive Income and Expenditure Statement for interest receivable are based on the carrying amount of the asset multiplied by the effective rate of interest for the instrument. Where a local authority has assets which are identified as impaired because of a likelihood arising from a past event that payments due under the contract will not be made, the asset is written down and a charge made to the relevant service (for receivables specific to that service) or the Financing and Investment Income and Expenditure line in the Comprehensive Income and Expenditure Statement. The impairment loss is measured as the difference between the carrying amount and the present value of the revised future cash flows discounted at the asset’s original effective interest rate. Any gains and losses that arise on the derecognition of an asset are credited or debited to Financing and Investment Income and Expenditure in the Comprehensive Income and Expenditure Statement. Available-for-Sale Financial Assets Available-for-sale financial assets are recognised on the Balance Sheet when the Council becomes a party to the contractual provisions of a financial instrument and are initially measured and carried at fair value. Where the asset has fixed or determinable payments, annual credits to Financing and Investment Income and Expenditure in the Comprehensive Income and Expenditure Statement for interest receivable are based on the amortised cost of the asset multiplied by the effective rate of interest for the instrument. Where there are no fixed or determinable payments, income (e.g. dividends) is credited to the Comprehensive Income and Expenditure Statement when it becomes receivable by the Council. Assets are maintained in the Balance Sheet at fair value. Values are based on the following principles: • Instruments with quoted market prices – the market price. • Other instruments with fixed and determinable payments – discounted cash flow analysis. • Equity shares with no quoted market prices – independent appraisal of company valuations.
The inputs to the measurement techniques are categorised in accordance with the following three levels: • Level 1 inputs – quoted prices (unadjusted) in active markets for identical assets that the authority can access at the
measurement date. • Level 2 inputs – inputs other than quoted prices included within Level 1 that are observable for the asset, either directly or
indirectly. • Level 3 inputs – unobservable inputs for the asset. Changes in fair value are balanced by an entry in the Available-for-Sale Reserve and the gain/loss is recognised in the Surplus or Deficit on Revaluation of Available-for-Sale Financial Assets. The exception is where impairment losses have been incurred – these are debited to Financing and Investment Income and Expenditure in the Comprehensive Income and Expenditure Statement, along with any net gain or loss for the asset accumulated in the Available-for-Sale Reserve. Where there is a gain or loss in fair value on Available for Sale Financial Assets, this change is shown separately within Other Comprehensive Income and Expenditure in the Income and Expenditure Account, under the heading “Gains and Losses reclassifiable into the Surplus or Deficit on the Provision of Service”. Changes in fair value on Available for Sale Financial Assets can be subsequently recognised in the Surplus or Deficit on Provision of Service on derecognition. Where assets are identified as impaired because of a likelihood arising from a past event that payments due under the contract will not be made (fixed or determinable payments) or fair value falls below cost, the asset is written down and a charge made to Financing and Investment Income and Expenditure in the Comprehensive Income and Expenditure Statement. If the asset has fixed or determinable payments, the impairment loss is measured as the difference between the carrying amount and the present value of the revised future cash flows discounted at the asset’s original effective interest rate. Otherwise, the impairment loss is measured as any shortfall of fair value against the acquisition cost of the instrument (net of any principal repayment and amortisation). Any gains and losses that arise on the derecognition of the asset are credited or debited to Financing and Investment Income and Expenditure in the Comprehensive Income and Expenditure Statement, along with any accumulated gains or losses previously recognised in the Available-for-Sale Reserve. Where fair value cannot be measured reliably, the instrument is carried at cost (less any impairment losses). ix. Foreign Currency Translation Where the Council has entered into a transaction denominated in a foreign currency, the transaction is converted into sterling at the exchange rate applicable on the date the transaction was effective. Where amounts in foreign currency are outstanding at the year end, they are reconverted at the spot exchange rate at 31 March. Resulting gains or losses are recognised in Financing and Investment Income and Expenditure in the Comprehensive Income and Expenditure Statement. x. Government Grants and Contributions
Notes to the Main Financial Statements
28
Whether paid on account, by instalments or in arrears, government grants and third party contributions and donations are recognised as due to the Council when there is reasonable assurance that: • The Council will comply with the conditions attached to the payments. • The grants or contributions will be received. Amounts recognised as due to the Council are not credited to the Comprehensive Income and Expenditure Statement until conditions attached to the grant or contribution have been satisfied. Conditions are stipulations that specify that the future economic benefits or service potential embodied in the asset acquired using the grant or contribution are required to be consumed by the recipient as specified, or future economic benefits or service potential must be returned to the transferor. Monies advanced as grants and contributions for which conditions have not been satisfied are carried in the Balance Sheet as creditors. When conditions are satisfied, the grant or contribution is credited to the relevant service (attributable revenue grants and contributions) or Taxation and Non-Specific Grant Income (non-ringfenced revenue grants and all capital grants) in the Comprehensive Income and Expenditure Statement. Where capital grants are credited to the Comprehensive Income and Expenditure Statement, they are reversed out of the General Fund Balance in the Movement in Reserves Statement. Where the grant has yet to be used to finance capital expenditure, it is posted to the Capital Grants Unapplied Reserve. Where it has been applied, it is posted to the Capital Adjustment Account. Amounts in the Capital Grants Unapplied Reserve are transferred to the Capital Adjustment Account once they have been applied to fund capital expenditure. Where grants can be treated as revenue or capital, they will in the first instance be treated as revenue grants, with the expectation that the grants are credited to the Comprehensive Income and Expenditure account and then transferred to a grant earmarked reserve. There is an expectation that the grants will be credited in full into the Comprehensive Income and Expenditure statement because where grants can be used either for a capital or revenue purpose, it is likely that the Council has met the conditions of the grant. In the unlikely event that the conditions have not been met, the grant will be treated as a receipt in advance and carried forward into the next financial year as a liability on the balance sheet.
Some grants credited to the grant earmarked reserves will be used for a capital purpose. In these instances, they will be transferred directly to the Capital Adjustment Account via the Movement in Reserves Statement as an adjustment between accounting basis and funding basis under regulations. This will have no impact on the net assets of the Council. Prior to the implementation of the above policy, some grants may have been credited to the capital grants unapplied reserve when they can be used for either a revenue or capital purpose. Where this has happened and grants have previously been credited to the capital grants unapplied reserve but are then identified as resourcing for a revenue purpose within the rules of the grants, they will be transferred directly via the Movement in Reserves from the capital grants unapplied reserve and into the grant earmarked reserve. xi. Heritage Assets The Council’s Heritage Assets are assets that are held by the Council principally for their contribution to knowledge and/or culture. They are recognised and measured including treatment of revaluation gains and losses in accordance with the Council’s accounting policies on Property, Plant and Equipment. However, some of the measurement rules are relaxed in relation to heritage assets as detailed below. These are assets which are intended to be preserved in trust for future generations because of their cultural, environmental or historical associations. Where it is practicable to obtain a valuation, heritage assets are held at current value. Valuation methods used by the authority include professional valuations and insurance valuations. The Council has recognised the major pieces of its museum collection on the Balance Sheet on the basis of the lower valuation completed by an external valuer. Civic regalia has been included using as its base the detailed insurance valuations (which are based on market values provided by an external valuer in 2010) held by the Council in respect of the collection. Where a current valuation is not practicable at a reasonable cost, heritage assets are held at historic cost, if this is known. If neither current valuation nor historic cost is available then heritage assets are not recognised on the balance sheet. The authority discloses information about the nature and scale of its collections of heritage assets, whether or not these have been identified on the balance sheet. In 2013-14, the accounting policy for one category of Heritage Assets changed, so that items in Museum collections are only included in the balance sheet, where an independent valuation by an expert is available The Council is unlikely to be able to recognise the majority of the ceramics, porcelain work, figurines, pottery, machinery, ephemera, photography, biological and geological records and specimens, books and manuscripts in future financial statements. This is due to the fact that obtaining valuations for the vast majority of these collections would involve a disproportionate cost of obtaining the information in comparison to the benefits to the users of the Council’s financial statements. The Council discloses information about the nature and scale of its collections of heritage assets, whether or not these have been identified on the balance sheet. Heritage assets are assumed to be held in perpetuity, and are therefore not depreciated. However, heritage assets are reviewed for impairment in the same way as any other tangible or intangible assets.
Notes to the Main Financial Statements
29
The Council has had a number of items kindly donated over the years, but it has insufficient information as to what the value would have been when they were donated. The Council has therefore not recognised any of these assets in the Donated Assets Account on the Balance Sheet prior to 1 April 2010, although their current value might be included as Long Term Assets on the Balance Sheet. Some assets are also classified as operational heritage assets where they are in addition to being held in trust for future generations, also used by the Council for other activities and services. In such cases, the assets are classified, valued and depreciated in accordance with their general type, for instance buildings. xii. Intangible Assets Expenditure on non-monetary assets that do not have physical substance but are controlled by the Council as a result of past events (e.g. software licences), is capitalised, when it is expected that future economic benefits or service potential will flow from the intangible asset to the Council. Internally generated assets are capitalised where it is demonstrable that the project is technically feasible and is intended to be completed (with adequate resources being available) and the Council will be able to generate future economic benefits or deliver service potential by being able to sell or use the asset. Expenditure is capitalised where it can be measured reliably as attributable to the asset and is restricted to that incurred during the development phase (research expenditure cannot be capitalised). Expenditure on the development of Council websites is not capitalised if the website is solely or primarily intended to promote or advertise the Council’s goods or services. Intangible assets are measured initially at cost. Amounts are only revalued where the fair value of the assets held by the Council can be determined by reference to an active market. In practice, no intangible asset held by the Council meets this criterion, and they are therefore carried at amortised cost. The depreciable amount of an intangible asset is amortised over its useful life to the relevant service in the Comprehensive Income and Expenditure Statement. An asset is tested for impairment whenever there is an indication that the asset might be impaired – any losses recognised are posted to the relevant services in the Comprehensive Income and Expenditure Statement. Any gain or loss arising on the disposal or abandonment of an intangible asset is posted to the Other Operating Expenditure line in the Comprehensive Income and Expenditure Statement. Where expenditure on intangible assets qualifies as capital expenditure for statutory purposes, amortisation, impairment losses and disposal gains and losses are not permitted to have an impact on the General Fund Balance. The gains and losses are therefore reversed out of the General Fund Balance in the Movement in Reserves Statement and posted to the Capital Adjustment Account and (for any sale proceeds greater than £10,000) the Capital Receipts Reserve. xiii. Interests in Companies and Other Entities The Council does not have any material interests in companies and other entities that have the nature of subsidiaries, associates and joint arrangements which would require it to prepare group accounts. The Council has financial relationships with a number of subsidiary and associated companies, in the main to manage the Building Schools for the Future (BSF) programme. None of them are material in size or nature. They are shown in the notes to the main financial statements and have been treated according to IAS 27 and IAS 28 (Associates).
xiv. Inventories and Long term Contracts Inventories are included in the Balance Sheet at the lower of cost and net realisable value. Long term contracts are accounted for on the basis of charging the Surplus or Deficit on the Provision of Services with the value of works and services received under the contract during the financial year. xv. Investment Property Investment properties are those that are used solely to earn rentals and/or capital appreciation. The definition is not met if the property is used in any way to facilitate the delivery of services or production of goods or is held for sale. Investment properties are measured initially at cost and subsequently at fair value, based on the highest and best use value of the asset. Properties are not depreciated but valuations are assessed annually to ensure they reflect market conditions at year end. Gains and losses on revaluation are posted to Financing and Investment Income and Expenditure in the Comprehensive Income and Expenditure Statement. The same treatment is applied to gains and losses on disposals. Rentals received in relation to investment properties are credited to Financing and Investment Income and result in a gain for the General Fund Balance. However, revaluation and disposal gains and losses are not permitted by statutory arrangements to have an impact on the General Fund Balance. The gains and losses are therefore reversed out of the General Fund Balance in the Movement in Reserves Statement and posted to the Capital Adjustment Account and (for any sale proceeds greater than £10,000) the Capital Receipts Reserve. xvi. Joint Arrangements Joint arrangements are activities undertaken by the Council in conjunction with other venturers that involve the use of the assets and resources of the venturers rather than the establishment of a separate entity. The Council recognises on its Balance Sheet the assets that it controls and the liabilities that it incurs and debits and credits the Comprehensive Income and Expenditure Statement with the expenditure it incurs and the share of income it earns from the activity of the operation.
Notes to the Main Financial Statements
30
Joint arrangements may also mean items of property, plant or equipment that are jointly controlled by the Council and other venturers, with the assets being used to obtain benefits for the venturers. The joint arrangement does not involve the establishment of a separate entity. The Council accounts for only its share of the joint arrangements, the liabilities and expenses that it incurs on its own behalf or jointly with others in respect of its interest in the joint arrangement and income that it earns from the arrangement. xvii. Leases Leases are classified as finance leases where the terms of the lease transfer substantially all the risks and rewards incidental to ownership of the property, plant or equipment from the lessor to the lessee. All other leases are classified as operating leases. Where a lease covers both land and buildings, the land and buildings elements are considered separately for classification. Arrangements that do not have the legal status of a lease but convey a right to use assets in return for payment are accounted for under this policy where fulfilment of the arrangement is dependent on the use of specific assets. The Council as Lessee Finance Leases Property, plant and equipment held under finance leases is recognised on the Balance Sheet at the commencement of the lease at its fair value measured at the inception of the lease (or the present value of the minimum lease payments, if lower). The asset recognised is matched by a liability for the obligation to pay the lessor. Initial direct costs of the Council are added to the carrying amount of the asset. Premiums paid on entry into a lease are applied to writing down the lease liability. Contingent rents are charged as expenses in the periods in which they are incurred. Lease payments are apportioned between: • a charge for the acquisition of the interest in the property – applied to write down the lease liability (together with any
premiums received). • finance charge (debited to Financing and Investment Income and Expenditure in the Comprehensive Income and
Expenditure Statement). Property, Plant and Equipment recognised under finance leases are accounted for using the policies applied generally to such assets, subject to depreciation being charged over the lease term if this is shorter than the asset’s estimated useful life (where ownership of the asset does not transfer to the Council at the end of the lease period). Operating leases Where the Council does not have the risks and rewards of ownership, the rental income is shown in the Income and Expenditure account as an expense of the Services benefiting from the use of the leased property, plant and equipment. The Council as Lessor Finance Leases Where the Council grants a lease on one of its assets, a finance lease exists where the economic reality is a sale. This is usually when the minimum lease payments approximate to the value of the asset. The accounting treatment is that the related asset is removed from the balance sheet as a disposal and the lease payments separated into deferred capital receipts and interest income. Any gain credited to the Comprehensive Income and Expenditure Statement on disposal is not permitted by statute to increase the General Fund Balance and is required to be treated as a capital receipt. Where a premium has been received, this is posted out of the General Fund Balance to the Capital Receipts Reserve in the Movement in Reserves Statement. Where the amount due in relation to the lease asset is to be settled by the payment of rentals in future financial years, this is posted out of the General Fund Balance to the Deferred Capital Receipts Reserve in the Movement in Reserves Statement. When the future lease rentals are received, the element for the capital receipt for the disposal of the asset is used to write down the lease debtor. At this point, the deferred capital receipts are transferred to the Capital Receipts Reserve. The written off value of disposals is not a charge against Council Tax, as the cost of fixed assets is fully provided for under separate arrangements for capital financing. Amounts are therefore appropriated to the Capital Adjustment Account from the General Fund Balance in the Movement in Reserves Statement. Operating Leases Where the Council grants an operating lease over a property or an item of plant or equipment, the asset is retained in the Balance Sheet. Rental income is credited to Other Operating Expenditure in the Comprehensive Income and Expenditure Statement. Credits are made on a straight line basis over the life of the lease, even if this does not match the pattern of payments (for example, there is a premium paid at the commencement of the lease). Initial direct costs incurred in negotiating and arranging the lease are added to the carrying amount of the relevant asset and charged as an expense over the lease term on the same basis as rental income.
Notes to the Main Financial Statements
31
xviii. Overheads and Support Services The costs of overheads and support services are charged to those that benefit from the supply or service in accordance with the costing principles of the CIPFA Service Reporting Code of Practice 2015-16 (SeRCOP). The total absorption costing principle is used – the full cost of overheads and support services are shared between users in proportion to the benefits received, with the exception of: • Corporate and Democratic Core – costs relating to the Council’s status as a multi-functional, democratic organisation. • Non Distributed Costs – the cost of discretionary benefits awarded to employees retiring early and impairment losses
chargeable on Assets Held for Sale. These two cost categories are defined in SeRCOP and accounted for as separate headings in the Comprehensive Income and Expenditure Statement, as part of Net Expenditure on Continuing Services. xix. Property, Plant and Equipment Assets that have physical substance and are held for use in the production of goods or services, for rental to others, or for administrative purposes and that are expected to be used during more than one financial year are classified as Property, Plant and Equipment. Recognition Expenditure on the acquisition, creation or enhancement of Property, Plant and Equipment above the de minimis level of £10,000 is capitalised on an accruals basis, provided that it is probable that the future economic benefits or service potential associated with the item will flow to the Council and the costs of the item can be measured reliably. Expenditure that maintains, but does not add to an asset’s potential to deliver future economic benefits or service potential (i.e. repairs and maintenance), is charged as an expense when it is incurred. Measurement Assets are initially measured at cost, comprising: • The purchase price. • Any costs attributable to bringing the asset to the location and condition necessary for it to be capable of operating in the
manner intended by management. The Council does not capitalise borrowing costs incurred whilst assets are under construction. The cost of assets acquired other than by purchase is deemed to be its current value, unless the acquisition does not have commercial substance (i.e. it will not lead to a variation in the cash flows of the Council). In the latter case, where an asset is acquired via an exchange, the cost of the acquisition is the carrying amount of the asset given up by the Council. Assets are then carried in the Balance Sheet using the following measurement bases: • Infrastructure and assets under construction – depreciated historical cost. • Dwellings – current value, determined using the basis of Existing Use Value for Social Housing (EUV-SH). • Community assets – the Council values community assets at current value, with the exception of one asset, which is
valued (£20.40m) at historical cost. • Surplus assets – fair value, estimated at highest and best use, determind from the perspective of market participants. • All other assets – current value, determined as the amount that would be paid for the asset in its existing use (existing use
value – EUV). Where there is no market based evidence of current value because of the specialist nature of an asset, Depreciated Replacement Cost (DRC) is used as an estimate of fair value. Where non-property assets (Vehicles, Plant, Furniture and Equipment) have short useful lives or low values (or both), depreciated historical cost basis is used as a proxy for fair value. Assets included in the Balance Sheet at fair value are revalued sufficiently regularly to ensure that their carrying amount is not materially different from their current value at year end, but as a minimum every five years. Increases in valuations are matched by credits to the Revaluation Reserve to recognise unrealised gains. Exceptionally, gains might be credited to the Comprehensive Income and Expenditure Statement where they arise from the reversal of a loss previously charged to a service. Where decreases in value are identified, they are accounted for by: • Where there is a balance of revaluation gains for the asset in the Revaluation Reserve, the carrying amount of the asset is
written down against that balance (up to the amount of the accumulated gains). • Where there is no balance in the Revaluation Reserve or an insufficient balance, the carrying amount of the asset is
written down against the relevant service line(s) in the Comprehensive Income and Expenditure Statement. The Revaluation Reserve contains revaluation gains recognised since 1 April 2007 only, the date of its formal implementation. Gains arising before that date have been consolidated into the Capital Adjustment Account.
Notes to the Main Financial Statements
32
Component Accounting The Council’s accounting policy from 1 April 2010 onwards is to apply component accounting to all assets being revalued, enhanced or acquired, with a net book value excluding land of £1m or more. Separate components will only be identified where their value is a minimum of 20% of the cost of the asset, and have a different life to other components of the asset. The main component classes to be separately valued will be the structure, plant and equipment, and ‘other’ to include unusual or one-off components. Where an existing asset is revalued into separate components, the actual or estimated value of the separate components will have to be derecognised. If the original cost is not known, the Council’s Asset Management service will use an appropriate index to calculate the net current value of the relevant component. The Council is also following the Code of Practices’ requirements for componentisation where assets are acquired or enhanced, with the Council’s £1m minimum value excluding land, for componentisation, as set out below: • When new assets are acquired, separate components with value over 20%, are recognised on initial recognition. This is
best assessed when the asset is first acquired. • Where an asset is enhanced, separate components (over 20% of total value) have been recognised. These components
will not just relate to the enhancement work, but to existing components as well. Impairment Assets are assessed at each year end as to whether there is any indication that an asset may be impaired. Where indications exist and any possible differences are estimated to be material, the recoverable amount of the asset is estimated and, where this is less than the carrying amount of the asset, an impairment loss is recognised for the shortfall. Where impairment losses are identified, they are accounted for by: • Where there is a balance of revaluation gains for the asset in the Revaluation Reserve, the carrying amount of the asset is
written down against that balance (up to the amount of the accumulated gains). • Where there is no balance in the Revaluation Reserve or an insufficient balance, the carrying amount of the asset is
written down against the relevant service in the Comprehensive Income and Expenditure Statement. Where an impaired loss is reversed subsequently, the reversal is credited to the relevant service in the Comprehensive Income and Expenditure Statement, up to the amount of the original loss, adjusted for depreciation that would have been charged if the loss had not been recognised. Depreciation Depreciation is provided for all Property, Plant and Equipment assets by the systemic allocation of their depreciable amounts. An exception is made for assets without a determinable finite useful life (i.e. freehold land and certain Community Assets) and assets that are not yet available for use (i.e. assets under construction). Depreciation is calculated on the following bases: • Dwellings and other buildings – straight-line allocation over the useful life of the property as estimated by the valuer. • Vehicles, plant, furniture and equipment –depreciated over 3 to 7 years as appropriate. • Infrastructure – straight-line allocation over 30 years. Where an item of Property, Plant and Equipment assets has major components whose cost is significant in relation to the total cost of the item, the components are depreciated separately. Revaluation gains are also depreciated, with an amount equal to the difference between current value depreciation charged on assets and the depreciation that would have been chargeable based on their historical cost being transferred each year from the Revaluation Reserve to the Capital Adjustment Account. Assets are not depreciated in their year of acquisition. Revalued assets do not have their useful economic life (UEL) or depreciation charges amended until the year following the revaluation. Disposals and Non-Current Assets Held for Sale When it becomes probable that the carrying amount of an asset will be recovered principally through a sale transaction rather than through its continuing use, it is reclassified as an Asset held for Sale. The asset is revalued immediately before reclassification and then carried at the lower of this amount and fair value less costs to sell. Where there is a subsequent decrease to fair value less costs to sell, the loss is posted to the Other Operating Expenditure in the Comprehensive Income and Expenditure Statement. Gains in fair value are recognised only up to the amount of any previous losses recognised in the Surplus or Deficit on Provision of Services. Depreciation is not charged on Assets Held for Sale. If assets no longer meet the criteria to be classified as Assets Held for Sale, they are reclassified back to non-current assets and valued at the lower of their carrying amount before they were classified as held for sale (adjusted for depreciation, amortisation or revaluations that would have been recognised had they not been classified as Held for Sale), and their recoverable amount at the date of the decision not to sell. Assets that are to be abandoned or scrapped are not reclassified as Assets Held for Sale.
Notes to the Main Financial Statements
33
When an asset is disposed of or decommissioned, the carrying amount of the asset in the Balance Sheet (whether Property, Plant and Equipment or Assets Held for sale) is written off to the Other Operating Expenditure in the Comprehensive Income and Expenditure Statement as part of the gain or loss on disposal. Receipts from disposals (if any) are credited to the same place in the Comprehensive Income and Expenditure Statement and accounted for as part of the gain or loss on disposal (i.e. netted off against the carrying value of the asset at the time of disposal). Any revaluation gains accumulated for the asset in the Revaluation Reserve are transferred to the Capital Adjustment Account. Amounts received for a disposal in excess of £10,000 are categorised as capital receipts. A proportion of receipts relating to housing disposals (75% for dwellings, 50% for land and other assets, net of statutory deductions and allowances) is payable to the Government. The balance of receipts is required to be credited to the Capital Receipts Reserve, and can then only be used for new capital investment (or set aside to reduce the Council’s underlying need to borrow), in the Capital Financing Requirement Statement. Receipts are appropriated to the Reserve from the General Fund Balance in the Movement in Reserves Statement. The written-off value of disposals is not a charge against Council Tax, as the cost of fixed assets is fully provided for under separate arrangements for capital financing. Amounts are appropriated to the Capital Adjustment Account from the General Fund Balance in the Movement in Reserves Statement. xx. Private Finance Initiative (PFI) and Similar Co ntracts PFI and similar contracts are agreements to receive services, where the responsibility for making available the property, plant and equipment needed to provide the services passes to the PFI contractor. As the Council is deemed to control the services that are provided under its PFI schemes, and as ownership of the property, plant and equipment will pass to the Council at the end of the contracts for no additional charge, the Council carries the assets used under the contracts on its Balance Sheet as part of Property, Plant and Equipment. The unitary payments made for the PFI schemes are split, using estimation techniques, into separate elements. Those elements impacting on the balance sheet are the repayment of the liability and capital lifecycle replacement costs. Other elements are the interest payable on the outstanding liability, the value of services received and contingent rent (contract inflationary increases) which impact on the Comprehensive Income and Expenditure statement. xxi. Provisions, Contingent Liabilities and Conting ent Assets Provisions Provisions are made where an event has taken place that gives the Council a legal or constructive obligation that probably requires settlement by a transfer of economic benefits or service potential, and a reliable estimate can be made of the amount of the obligation. For instance, the Council could be involved in a court case that could eventually result in the making of a settlement or the payment of compensation. Provisions are charged as an expense to the appropriate services in the Comprehensive Income and Expenditure Statement in the year that the Council becomes aware of the obligation, and are measured at the best estimate at the Balance Sheet date of the expenditure required to settle the obligation, taking into account relevant risks and uncertainties. When payments are eventually made, they are charged to the provision carried in the Balance Sheet. Estimated settlements are reviewed at the end of each financial year - where it becomes less than probable that a transfer of economic benefits will now be required (or a lower settlement than anticipated is made), the provision is reversed and credited back to the relevant service. Where some or all of the payment required to settle a provision is expected to be recovered from another party (e.g. from an insurance claim), this is only recognised as income for the relevant service if it is virtually certain that reimbursement will be received if the Council settles the obligation. The carrying value of debtors has been impaired to reflect bad and doubtful debts. The impairment is netted off the gross total of debtors in line with accounting practice and is not included in the provisions note. Known uncollectable debts have been written off in full. Contingent Liabilities A contingent liability arises where an event has taken place that gives the Council a possible obligation whose existence will only be confirmed by the occurrence or otherwise of uncertain future events not wholly within the control of the Council. Contingent liabilities also arise in circumstances where a provision would otherwise be made but either it is not probable that an outflow of resources will be required or the amount of the obligation cannot be measured reliably. Contingent liabilities are not recognised in the Balance Sheet but disclosed in a note to the accounts. Contingent Assets A contingent asset arises where an event has taken place that gives the Council a possible asset whose existence will only be confirmed by the occurrence or otherwise of uncertain future events not wholly within the control of the Council. Contingent assets are not recognised in the Balance Sheet but disclosed in a note to the accounts where it is probable that there will be an inflow of economic benefits or service potential. xxii. Reserves The Council sets aside specific amounts as reserves for future policy purposes or to cover contingencies. Reserves are created by appropriating amounts out of the General Fund Balance in the Movement in Reserves Statement. When expenditure to be
Notes to the Main Financial Statements
34
financed from a reserve is incurred, it is charged to the appropriate service in that year to score against the Surplus or Deficit on the Provision of Services in the Comprehensive Income and Expenditure Statement. The reserve is then appropriated back into the General Fund Balance in the Movement in Reserves Statement so that there is no net charge against Council Tax for the expenditure. These reserves are classed as usable reserves and itemised in Note 5 on page 41. Certain reserves are kept to manage the accounting processes for non-current assets, financial instruments, retirement and employee benefits. These reserves are classed as unusable reserves and explained in Note 21 on page 55. xxiii Revenue Expenditure Funded from Capital under Statute (REFCUS) Expenditure incurred during the year that may be capitalised under statutory provisions but that does not result in the creation of a non-current asset has been charged as expenditure to the relevant service in the Comprehensive Income and Expenditure Statement in the year. This includes grants and other assistance given to outside bodies and individuals for capital purposes. Where the Council has determined to meet the cost of this expenditure from existing capital resources or by borrowing, a transfer in the Movement in Reserves Statement from the General Fund Balance to the Capital Adjustment Account then reverses out the amounts charged so that there is no impact on the level of Council Tax. xxiv. Value Added Tax (VAT) VAT payable is included as an expense only to the extent that it is not recoverable from Her Majesty’s Revenue and Customs. VAT receivable is excluded from income.
xxv. Partnership Arrangements
Where the Council acts as the accountable body for specific grants or other schemes, they are accounted for on the following basis:
• If the Council controls the grant distribution process, all of the grant money received and the associated expenditure will be included in the Council’s accounts. Conversely if the Council does not control the award of grant, only the grant allocated to the Council itself and the associated expenditure is recognised in the Council’s accounts.
• Where the Council is the ultimate recipient of grant distributed by the decision making body, the grant receivable is included in the accounts on an accruals basis.
• Where liabilities may arise for the repayment of grant as a result of the Council’s status as an accountable body these will be recognised in the accounts of the Council in accordance with accounting policies.
xxvi. Council Tax and National Non Domestic Rates ( NNDR) In the Council’s capacity as billing authority it acts as an agent in collecting and distributing Council Tax income on behalf of the major preceptors and itself. The Code requires that only the Council’s share of income and expenditure and Balance Sheet items are included in the financial statements. The Council acts as an agent in collecting National Non Domestic Rates (NNDR) on behalf of the government, but also retains a 49% share of NNDR received. The budgeted, rather than actual, total of the 49% share of NNDR attributable to the Council is recognised in the Comprehensive Income and Expenditure Statement. The difference between the budgeted 49% share and the actual amount received is transferred to the Collection Fund Adjustment Account and credited or debited to the Comprehensive Income and Expenditure Statement in future years. As part of directly receiving a share of NNDR rates, the Council will also incur a share of the loss for repayments arising from appeals against NNDR valuations, which can be backdated to years prior to 1 April 2013. The Council has taken up a right allowed by statute to charge this cost to the Comprehensive Income and Expenditure Statement over a period of 5 years, starting in 2014-15.
xxvii. Acquired and Discontinued Operations Where the Council, has acquired material operations, or discontinued operations, further details will be provided. In general, the acquired or discontinued operations will also be shown separately in the Comprehensive Income and Expenditure Account. For example, Housing Options, provider of housing advice, was transferred to the Council in February 2014 and is shown separately in the Comprehensive Income and Expenditure Account. XXViii. Fair value measurement The Council measures some of its non-financial assets such as surplus assets and investment properties at fair value at each reporting date. Fair value is the price that would be received to sell an asset or paid to transfer a liability in an orderly transaction between market participants at the measurement date. The fair value measurement assumes that the transaction to sell the asset or transfer the liability takes place either:
• In the principal market for the asset or liability, or
• in the absence of a principal market, in the most advantageous market for the asset or liability. The Council measures the fair value of an asset or liability using the assumptions that market participants would use when pricing the asset or liability, assuming that market participants act in their economic best interest. When measuring the fair value of a non-financial asset, the Council takes into account a market participant’s ability to generate economic benefits by using the asset in its highest and best use or by selling it to another market participant that would use the asset in its highest and best use.

Notes to the Main Financial Statements
35
The Council uses appropriate valuation techniques for each circumstance and for which sufficient data is available, maximising the use of relevant observable inputs and minimising the use of unobservable inputs. Inputs to the valuation techniques in respect of assets and liabilities for which fair value is measured or disclosed in the Council’s financial statements are categorised within the fair value hierarchy, as follows:
• Level 1 – quoted price (unadjusted) in active markets for identical assets or liabilities that the Council can access at the measurement date.
• Level 2 – inputs other than quoted prices included within Level 1 that are observable for the asset or liability, either directly or indirectly.
• Level 3 – unobservable inputs for the asset or liability.
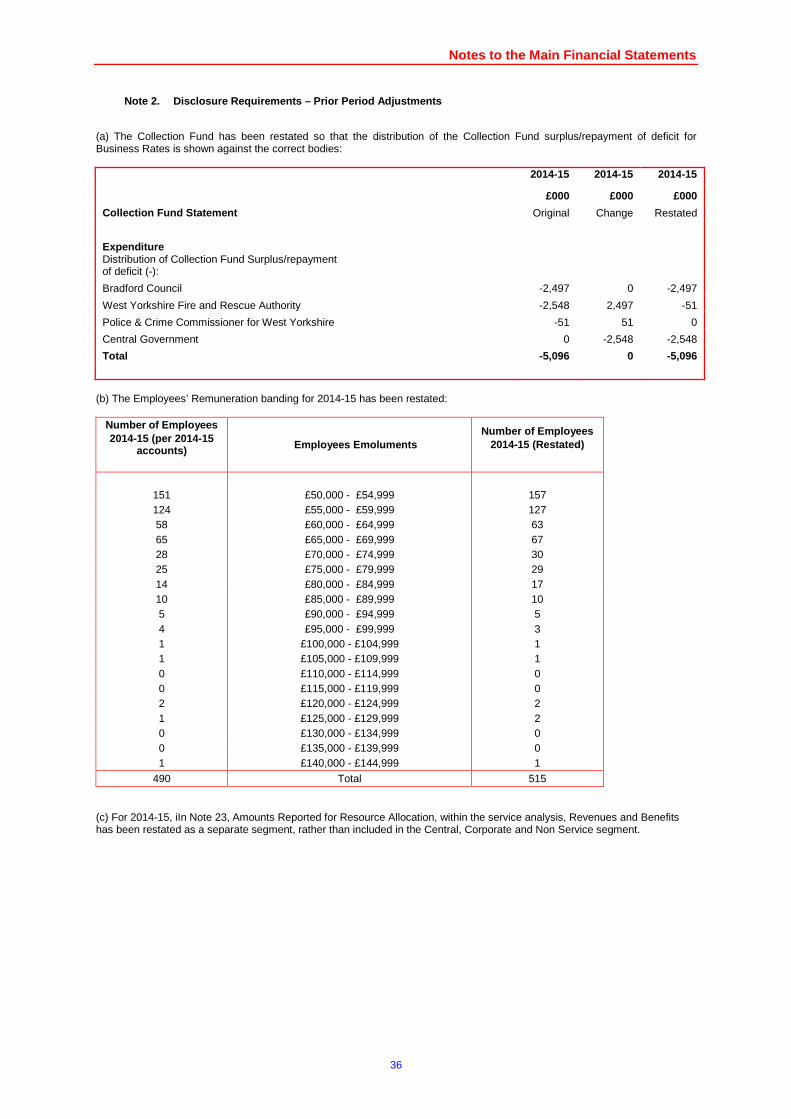
Notes to the Main Financial Statements
36
Disclosure Requirements – Prior Period Adjustments Note 2.
(a) The Collection Fund has been restated so that the distribution of the Collection Fund surplus/repayment of deficit for Business Rates is shown against the correct bodies:
2014-15 2014-15 2014-15
£000 £000 £000
Collection Fund Statement Original Change Restated
Expenditure Distribution of Collection Fund Surplus/repayment of deficit (-):
Bradford Council -2,497 0 -2,497
West Yorkshire Fire and Rescue Authority -2,548 2,497 -51
Police & Crime Commissioner for West Yorkshire -51 51 0
Central Government 0 -2,548 -2,548
Total -5,096 0 -5,096
(b) The Employees’ Remuneration banding for 2014-15 has been restated:
Number of Employees 2014-15 (per 2014-15
accounts)
Employees Emoluments Number of Employees
2014-15 (Restated)
151 £50,000 - £54,999 157 124 £55,000 - £59,999 127 58 £60,000 - £64,999 63 65 £65,000 - £69,999 67 28 £70,000 - £74,999 30 25 £75,000 - £79,999 29 14 £80,000 - £84,999 17 10 £85,000 - £89,999 10 5 £90,000 - £94,999 5 4 £95,000 - £99,999 3 1 £100,000 - £104,999 1 1 £105,000 - £109,999 1 0 £110,000 - £114,999 0 0 £115,000 - £119,999 0 2 £120,000 - £124,999 2 1 £125,000 - £129,999 2 0 £130,000 - £134,999 0 0 £135,000 - £139,999 0 1 £140,000 - £144,999 1
490 Total 515 (c) For 2014-15, iIn Note 23, Amounts Reported for Resource Allocation, within the service analysis, Revenues and Benefits has been restated as a separate segment, rather than included in the Central, Corporate and Non Service segment.
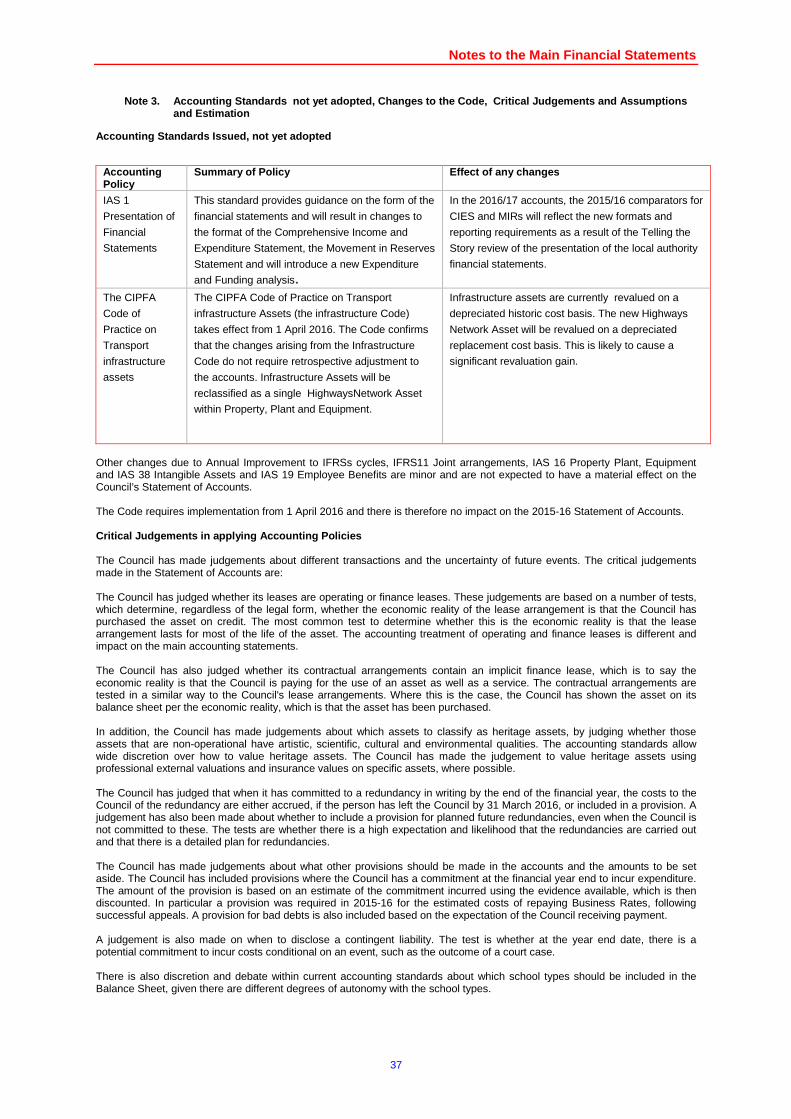
Notes to the Main Financial Statements
37
Accounting Standards not yet adopted, Changes to t he Code, Critical Judgements and Assumptions Note 3.and Estimation
Accounting Standards Issued, not yet adopted
Accounting Policy
Summary of Policy Effect of any changes
IAS 1
Presentation of
Financial
Statements
This standard provides guidance on the form of the
financial statements and will result in changes to
the format of the Comprehensive Income and
Expenditure Statement, the Movement in Reserves
Statement and will introduce a new Expenditure
and Funding analysis.
In the 2016/17 accounts, the 2015/16 comparators for
CIES and MIRs will reflect the new formats and
reporting requirements as a result of the Telling the
Story review of the presentation of the local authority
financial statements.
The CIPFA
Code of
Practice on
Transport
infrastructure
assets
The CIPFA Code of Practice on Transport
infrastructure Assets (the infrastructure Code)
takes effect from 1 April 2016. The Code confirms
that the changes arising from the Infrastructure
Code do not require retrospective adjustment to
the accounts. Infrastructure Assets will be
reclassified as a single HighwaysNetwork Asset
within Property, Plant and Equipment.
Infrastructure assets are currently revalued on a
depreciated historic cost basis. The new Highways
Network Asset will be revalued on a depreciated
replacement cost basis. This is likely to cause a
significant revaluation gain.
Other changes due to Annual Improvement to IFRSs cycles, IFRS11 Joint arrangements, IAS 16 Property Plant, Equipment and IAS 38 Intangible Assets and IAS 19 Employee Benefits are minor and are not expected to have a material effect on the Council’s Statement of Accounts. The Code requires implementation from 1 April 2016 and there is therefore no impact on the 2015-16 Statement of Accounts. Critical Judgements in applying Accounting Policies The Council has made judgements about different transactions and the uncertainty of future events. The critical judgements made in the Statement of Accounts are: The Council has judged whether its leases are operating or finance leases. These judgements are based on a number of tests, which determine, regardless of the legal form, whether the economic reality of the lease arrangement is that the Council has purchased the asset on credit. The most common test to determine whether this is the economic reality is that the lease arrangement lasts for most of the life of the asset. The accounting treatment of operating and finance leases is different and impact on the main accounting statements. The Council has also judged whether its contractual arrangements contain an implicit finance lease, which is to say the economic reality is that the Council is paying for the use of an asset as well as a service. The contractual arrangements are tested in a similar way to the Council's lease arrangements. Where this is the case, the Council has shown the asset on its balance sheet per the economic reality, which is that the asset has been purchased. In addition, the Council has made judgements about which assets to classify as heritage assets, by judging whether those assets that are non-operational have artistic, scientific, cultural and environmental qualities. The accounting standards allow wide discretion over how to value heritage assets. The Council has made the judgement to value heritage assets using professional external valuations and insurance values on specific assets, where possible. The Council has judged that when it has committed to a redundancy in writing by the end of the financial year, the costs to the Council of the redundancy are either accrued, if the person has left the Council by 31 March 2016, or included in a provision. A judgement has also been made about whether to include a provision for planned future redundancies, even when the Council is not committed to these. The tests are whether there is a high expectation and likelihood that the redundancies are carried out and that there is a detailed plan for redundancies. The Council has made judgements about what other provisions should be made in the accounts and the amounts to be set aside. The Council has included provisions where the Council has a commitment at the financial year end to incur expenditure. The amount of the provision is based on an estimate of the commitment incurred using the evidence available, which is then discounted. In particular a provision was required in 2015-16 for the estimated costs of repaying Business Rates, following successful appeals. A provision for bad debts is also included based on the expectation of the Council receiving payment. A judgement is also made on when to disclose a contingent liability. The test is whether at the year end date, there is a potential commitment to incur costs conditional on an event, such as the outcome of a court case. There is also discretion and debate within current accounting standards about which school types should be included in the Balance Sheet, given there are different degrees of autonomy with the school types.
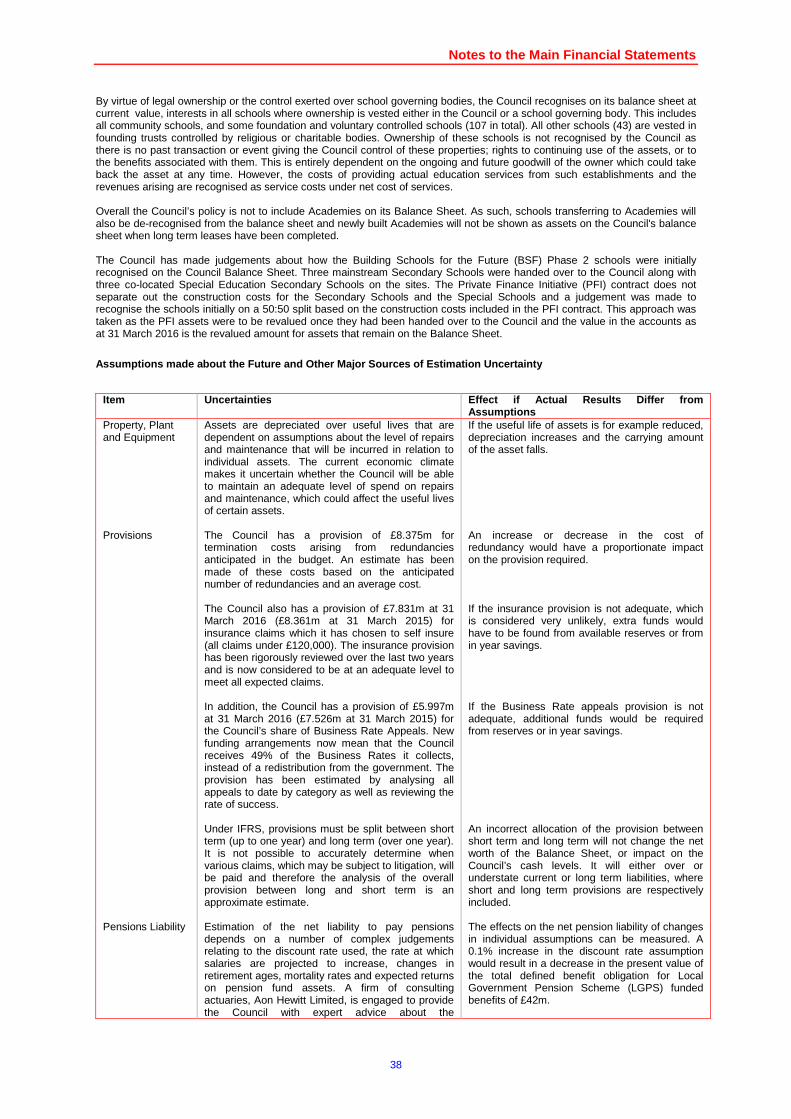
Notes to the Main Financial Statements
38
By virtue of legal ownership or the control exerted over school governing bodies, the Council recognises on its balance sheet at current value, interests in all schools where ownership is vested either in the Council or a school governing body. This includes all community schools, and some foundation and voluntary controlled schools (107 in total). All other schools (43) are vested in founding trusts controlled by religious or charitable bodies. Ownership of these schools is not recognised by the Council as there is no past transaction or event giving the Council control of these properties; rights to continuing use of the assets, or to the benefits associated with them. This is entirely dependent on the ongoing and future goodwill of the owner which could take back the asset at any time. However, the costs of providing actual education services from such establishments and the revenues arising are recognised as service costs under net cost of services. Overall the Council’s policy is not to include Academies on its Balance Sheet. As such, schools transferring to Academies will also be de-recognised from the balance sheet and newly built Academies will not be shown as assets on the Council's balance sheet when long term leases have been completed. The Council has made judgements about how the Building Schools for the Future (BSF) Phase 2 schools were initially recognised on the Council Balance Sheet. Three mainstream Secondary Schools were handed over to the Council along with three co-located Special Education Secondary Schools on the sites. The Private Finance Initiative (PFI) contract does not separate out the construction costs for the Secondary Schools and the Special Schools and a judgement was made to recognise the schools initially on a 50:50 split based on the construction costs included in the PFI contract. This approach was taken as the PFI assets were to be revalued once they had been handed over to the Council and the value in the accounts as at 31 March 2016 is the revalued amount for assets that remain on the Balance Sheet.
Assumptions made about the Future and Other Major S ources of Estimation Uncertainty
Item Uncertainties Effect if Actual Results Differ from
Assumptions Property, Plant and Equipment
Assets are depreciated over useful lives that are dependent on assumptions about the level of repairs and maintenance that will be incurred in relation to individual assets. The current economic climate makes it uncertain whether the Council will be able to maintain an adequate level of spend on repairs and maintenance, which could affect the useful lives of certain assets.
If the useful life of assets is for example reduced, depreciation increases and the carrying amount of the asset falls.
Provisions The Council has a provision of £8.375m for termination costs arising from redundancies anticipated in the budget. An estimate has been made of these costs based on the anticipated number of redundancies and an average cost. The Council also has a provision of £7.831m at 31 March 2016 (£8.361m at 31 March 2015) for insurance claims which it has chosen to self insure (all claims under £120,000). The insurance provision has been rigorously reviewed over the last two years and is now considered to be at an adequate level to meet all expected claims. In addition, the Council has a provision of £5.997m at 31 March 2016 (£7.526m at 31 March 2015) for the Council’s share of Business Rate Appeals. New funding arrangements now mean that the Council receives 49% of the Business Rates it collects, instead of a redistribution from the government. The provision has been estimated by analysing all appeals to date by category as well as reviewing the rate of success. Under IFRS, provisions must be split between short term (up to one year) and long term (over one year). It is not possible to accurately determine when various claims, which may be subject to litigation, will be paid and therefore the analysis of the overall provision between long and short term is an approximate estimate.
An increase or decrease in the cost of redundancy would have a proportionate impact on the provision required. If the insurance provision is not adequate, which is considered very unlikely, extra funds would have to be found from available reserves or from in year savings. If the Business Rate appeals provision is not adequate, additional funds would be required from reserves or in year savings. An incorrect allocation of the provision between short term and long term will not change the net worth of the Balance Sheet, or impact on the Council’s cash levels. It will either over or understate current or long term liabilities, where short and long term provisions are respectively included.
Pensions Liability Estimation of the net liability to pay pensions depends on a number of complex judgements relating to the discount rate used, the rate at which salaries are projected to increase, changes in retirement ages, mortality rates and expected returns on pension fund assets. A firm of consulting actuaries, Aon Hewitt Limited, is engaged to provide the Council with expert advice about the
The effects on the net pension liability of changes in individual assumptions can be measured. A 0.1% increase in the discount rate assumption would result in a decrease in the present value of the total defined benefit obligation for Local Government Pension Scheme (LGPS) funded benefits of £42m.
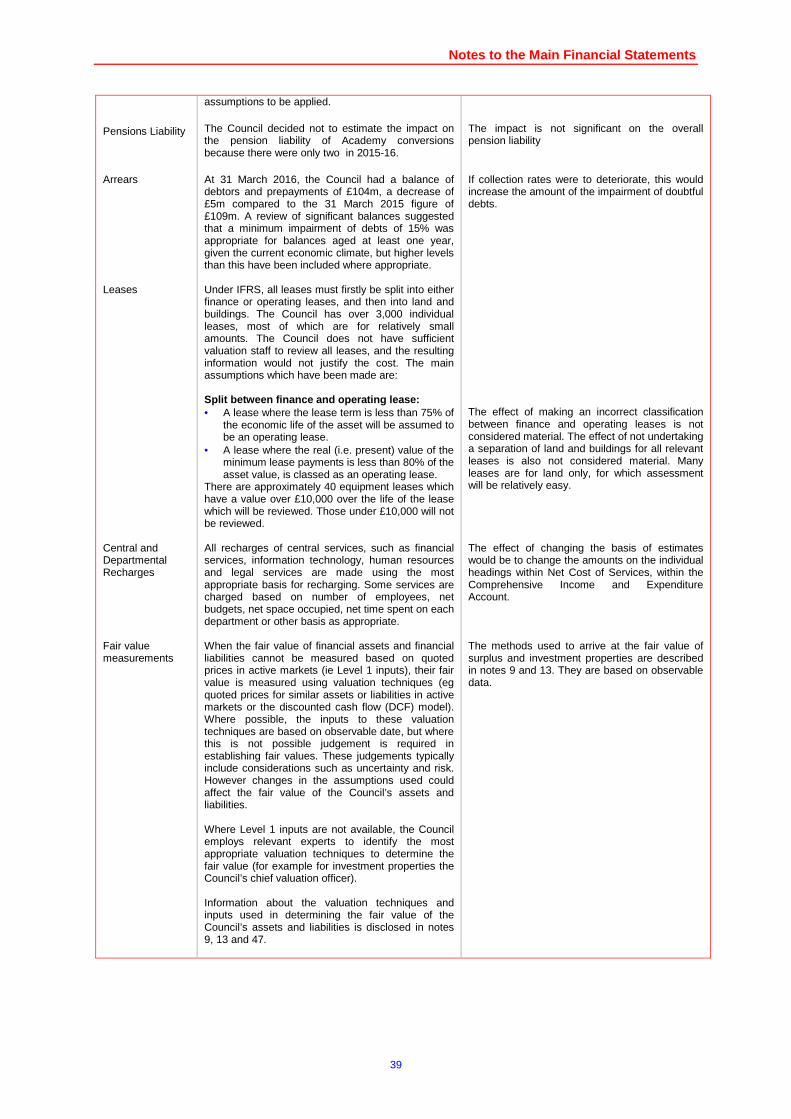
Notes to the Main Financial Statements
39
assumptions to be applied.
Pensions Liability
The Council decided not to estimate the impact on the pension liability of Academy conversions because there were only two in 2015-16.
The impact is not significant on the overall pension liability
Arrears At 31 March 2016, the Council had a balance of debtors and prepayments of £104m, a decrease of £5m compared to the 31 March 2015 figure of £109m. A review of significant balances suggested that a minimum impairment of debts of 15% was appropriate for balances aged at least one year, given the current economic climate, but higher levels than this have been included where appropriate.
If collection rates were to deteriorate, this would increase the amount of the impairment of doubtful debts.
Leases Under IFRS, all leases must firstly be split into either finance or operating leases, and then into land and buildings. The Council has over 3,000 individual leases, most of which are for relatively small amounts. The Council does not have sufficient valuation staff to review all leases, and the resulting information would not justify the cost. The main assumptions which have been made are: Split between finance and operating lease: • A lease where the lease term is less than 75% of
the economic life of the asset will be assumed to be an operating lease.
• A lease where the real (i.e. present) value of the minimum lease payments is less than 80% of the asset value, is classed as an operating lease.
There are approximately 40 equipment leases which have a value over £10,000 over the life of the lease which will be reviewed. Those under £10,000 will not be reviewed.
The effect of making an incorrect classification between finance and operating leases is not considered material. The effect of not undertaking a separation of land and buildings for all relevant leases is also not considered material. Many leases are for land only, for which assessment will be relatively easy.
Central and Departmental Recharges Fair value measurements
All recharges of central services, such as financial services, information technology, human resources and legal services are made using the most appropriate basis for recharging. Some services are charged based on number of employees, net budgets, net space occupied, net time spent on each department or other basis as appropriate. When the fair value of financial assets and financial liabilities cannot be measured based on quoted prices in active markets (ie Level 1 inputs), their fair value is measured using valuation techniques (eg quoted prices for similar assets or liabilities in active markets or the discounted cash flow (DCF) model). Where possible, the inputs to these valuation techniques are based on observable date, but where this is not possible judgement is required in establishing fair values. These judgements typically include considerations such as uncertainty and risk. However changes in the assumptions used could affect the fair value of the Council’s assets and liabilities. Where Level 1 inputs are not available, the Council employs relevant experts to identify the most appropriate valuation techniques to determine the fair value (for example for investment properties the Council’s chief valuation officer). Information about the valuation techniques and inputs used in determining the fair value of the Council’s assets and liabilities is disclosed in notes 9, 13 and 47.
The effect of changing the basis of estimates would be to change the amounts on the individual headings within Net Cost of Services, within the Comprehensive Income and Expenditure Account. The methods used to arrive at the fair value of surplus and investment properties are described in notes 9 and 13. They are based on observable data.
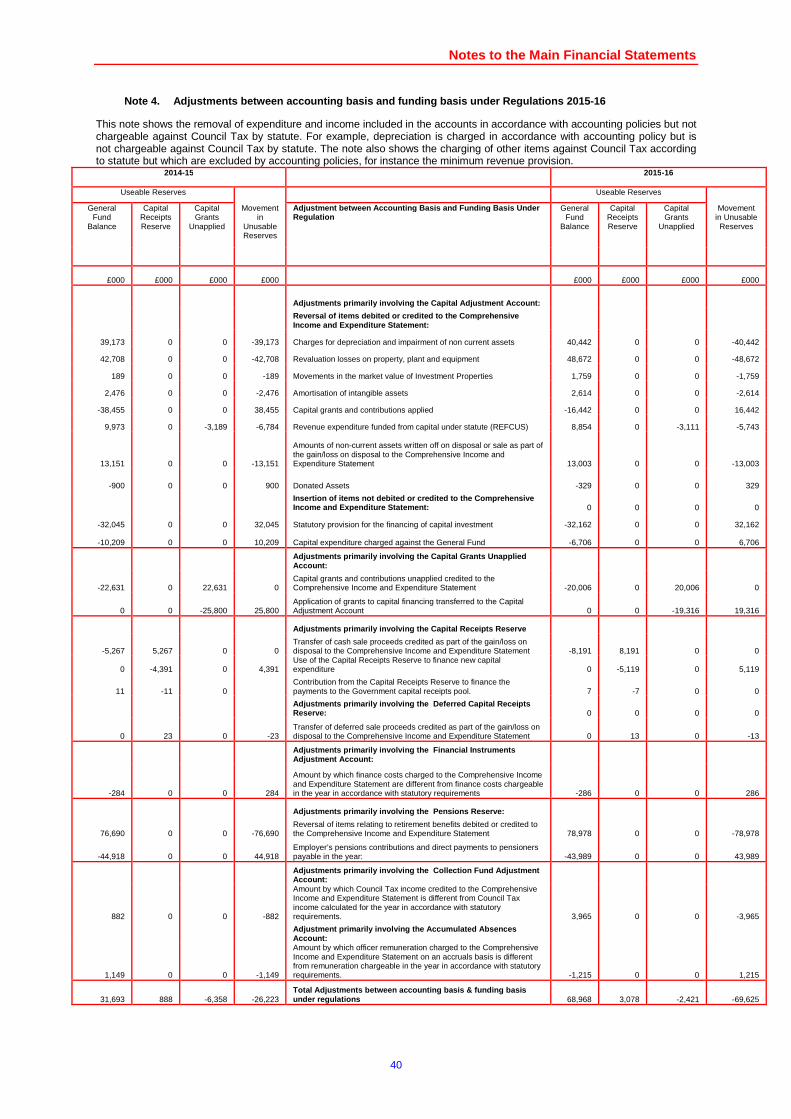
Notes to the Main Financial Statements
40
Adjustments between accounting basis and funding ba sis under Regulations 2015-16 Note 4.
This note shows the removal of expenditure and income included in the accounts in accordance with accounting policies but not chargeable against Council Tax by statute. For example, depreciation is charged in accordance with accounting policy but is not chargeable against Council Tax by statute. The note also shows the charging of other items against Council Tax according to statute but which are excluded by accounting policies, for instance the minimum revenue provision.
2014-15
2015-16
Useable Reserves Useable Reserves
General Fund
Balance
Capital Receipts Reserve
Capital Grants
Unapplied
Movement in
Unusable Reserves
Adjustment between Accounting Basis and Funding Bas is Under Regulation
General Fund
Balance
Capital Receipts Reserve
Capital Grants
Unapplied
Movement in Unusable Reserves
£000 £000 £000 £000
£000 £000 £000 £000
Adjustments primarily involving the Capital Adjustm ent Account:
Reversal of items debited or credited to the Compre hensive Income and Expenditure Statement:
39,173 0 0 -39,173 Charges for depreciation and impairment of non current assets 40,442 0 0 -40,442
42,708 0 0 -42,708 Revaluation losses on property, plant and equipment 48,672 0 0 -48,672
189 0 0 -189 Movements in the market value of Investment Properties 1,759 0 0 -1,759
2,476 0 0 -2,476 Amortisation of intangible assets 2,614 0 0 -2,614
-38,455 0 0 38,455 Capital grants and contributions applied -16,442 0 0 16,442
9,973 0 -3,189 -6,784 Revenue expenditure funded from capital under statute (REFCUS) 8,854 0 -3,111 -5,743
13,151 0 0 -13,151
Amounts of non-current assets written off on disposal or sale as part of the gain/loss on disposal to the Comprehensive Income and Expenditure Statement 13,003 0 0 -13,003
-900 0 0 900 Donated Assets -329 0 0 329
Insertion of items not debited or credited to the C omprehensive Income and Expenditure Statement: 0 0 0 0
-32,045 0 0 32,045 Statutory provision for the financing of capital investment -32,162 0 0 32,162
-10,209 0 0 10,209 Capital expenditure charged against the General Fund -6,706 0 0 6,706
Adjustments primarily involving the Capital Grants Unapplied Account:
-22,631 0 22,631 0 Capital grants and contributions unapplied credited to the Comprehensive Income and Expenditure Statement -20,006 0 20,006 0
0 0 -25,800 25,800 Application of grants to capital financing transferred to the Capital Adjustment Account 0 0 -19,316 19,316
Adjustments primarily involving the Capital Receipt s Reserve
-5,267 5,267 0 0 Transfer of cash sale proceeds credited as part of the gain/loss on disposal to the Comprehensive Income and Expenditure Statement -8,191 8,191 0 0
0 -4,391 0 4,391 Use of the Capital Receipts Reserve to finance new capital expenditure 0 -5,119 0 5,119
11 -11 0 Contribution from the Capital Receipts Reserve to finance the payments to the Government capital receipts pool. 7 -7 0 0
Adjustments primarily involving the Deferred Capit al Receipts Reserve: 0 0 0 0
0 23 0 -23 Transfer of deferred sale proceeds credited as part of the gain/loss on disposal to the Comprehensive Income and Expenditure Statement 0 13 0 -13
Adjustments primarily involving the Financial Inst ruments Adjustment Account:
-284 0 0 284
Amount by which finance costs charged to the Comprehensive Income and Expenditure Statement are different from finance costs chargeable in the year in accordance with statutory requirements -286 0 0 286
Adjustments primarily involving the Pensions Reser ve:
76,690 0 0 -76,690 Reversal of items relating to retirement benefits debited or credited to the Comprehensive Income and Expenditure Statement 78,978 0 0 -78,978
-44,918 0 0 44,918 Employer’s pensions contributions and direct payments to pensioners payable in the year: -43,989 0 0 43,989
Adjustments primarily involving the Collection Fun d Adjustment Account:
882 0 0 -882
Amount by which Council Tax income credited to the Comprehensive Income and Expenditure Statement is different from Council Tax income calculated for the year in accordance with statutory requirements. 3,965 0 0 -3,965
Adjustment primarily involving the Accumulated Abse nces Account:
1,149 0 0 -1,149
Amount by which officer remuneration charged to the Comprehensive Income and Expenditure Statement on an accruals basis is different from remuneration chargeable in the year in accordance with statutory requirements. -1,215 0 0 1,215
31,693 888 -6,358 -26,223 Total Adjustments between accounting basis & fundin g basis under regulations 68,968 3,078 -2,421 -69,625
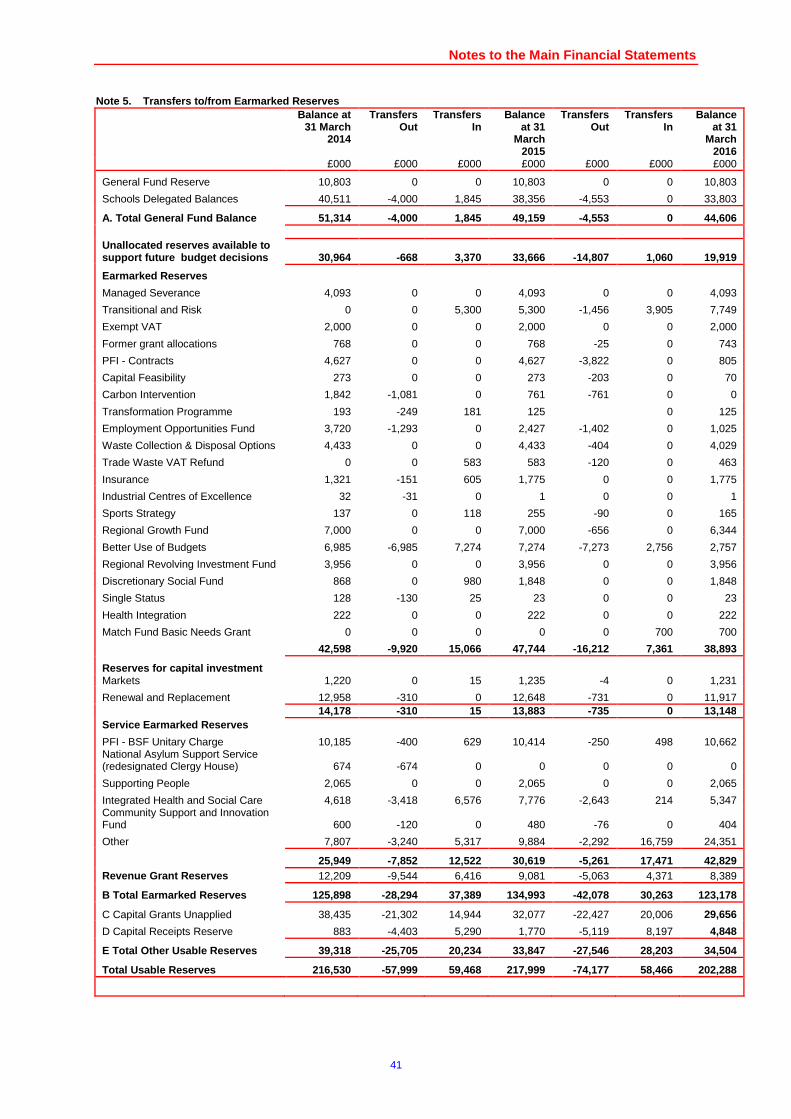
Notes to the Main Financial Statements
41
Transfers to/from Earmarked Reserves Note 5. Balance at
31 March 2014
Transfers Out
Transfers In
Balance at 31
March 2015
Transfers Out
Transfers In
Balance at 31
March 2016
£000 £000 £000 £000 £000 £000 £000
General Fund Reserve 10,803 0 0 10,803 0 0 10,803
Schools Delegated Balances 40,511 -4,000 1,845 38,356 -4,553 0 33,803
A. Total General Fund Balance 51,314 -4,000 1,845 4 9,159 -4,553 0 44,606 Unallocated reserves available to support future budget decisions 30,964 -668 3,370 33,666 -14,807 1,060 19,919
Earmarked Reserves
Managed Severance 4,093 0 0 4,093 0 0 4,093
Transitional and Risk 0 0 5,300 5,300 -1,456 3,905 7,749
Exempt VAT 2,000 0 0 2,000 0 0 2,000
Former grant allocations 768 0 0 768 -25 0 743
PFI - Contracts 4,627 0 0 4,627 -3,822 0 805
Capital Feasibility 273 0 0 273 -203 0 70
Carbon Intervention 1,842 -1,081 0 761 -761 0 0
Transformation Programme 193 -249 181 125 0 125
Employment Opportunities Fund 3,720 -1,293 0 2,427 -1,402 0 1,025
Waste Collection & Disposal Options 4,433 0 0 4,433 -404 0 4,029
Trade Waste VAT Refund 0 0 583 583 -120 0 463
Insurance 1,321 -151 605 1,775 0 0 1,775
Industrial Centres of Excellence 32 -31 0 1 0 0 1
Sports Strategy 137 0 118 255 -90 0 165
Regional Growth Fund 7,000 0 0 7,000 -656 0 6,344
Better Use of Budgets 6,985 -6,985 7,274 7,274 -7,273 2,756 2,757
Regional Revolving Investment Fund 3,956 0 0 3,956 0 0 3,956
Discretionary Social Fund 868 0 980 1,848 0 0 1,848
Single Status 128 -130 25 23 0 0 23
Health Integration 222 0 0 222 0 0 222
Match Fund Basic Needs Grant 0 0 0 0 0 700 700
42,598 -9,920 15,066 47,744 -16,212 7,361 38,893
Reserves for capital investment Markets 1,220 0 15 1,235 -4 0 1,231
Renewal and Replacement 12,958 -310 0 12,648 -731 0 11,917 14,178 -310 15 13,883 -735 0 13,148 Service Earmarked Reserves
PFI - BSF Unitary Charge 10,185 -400 629 10,414 -250 498 10,662 National Asylum Support Service (redesignated Clergy House) 674 -674 0 0 0 0 0
Supporting People 2,065 0 0 2,065 0 0 2,065
Integrated Health and Social Care 4,618 -3,418 6,576 7,776 -2,643 214 5,347 Community Support and Innovation Fund 600 -120 0 480 -76 0 404
Other 7,807 -3,240 5,317 9,884 -2,292 16,759 24,351
25,949 -7,852 12,522 30,619 -5,261 17,471 42,829 Revenue Grant Reserves 12,209 -9,544 6,416 9,081 -5,063 4,371 8,389
B Total Earmarked Reserves 125,898 -28,294 37,389 134,993 -42,078 30,263 123,178
C Capital Grants Unapplied 38,435 -21,302 14,944 32,077 -22,427 20,006 29,656
D Capital Receipts Reserve 883 -4,403 5,290 1,770 -5,119 8,197 4,848
E Total Other Usable Reserves 39,318 -25,705 20,234 33,847 -27,546 28,203 34,504
Total Usable Reserves 216,530 -57,999 59,468 217,99 9 -74,177 58,466 202,288
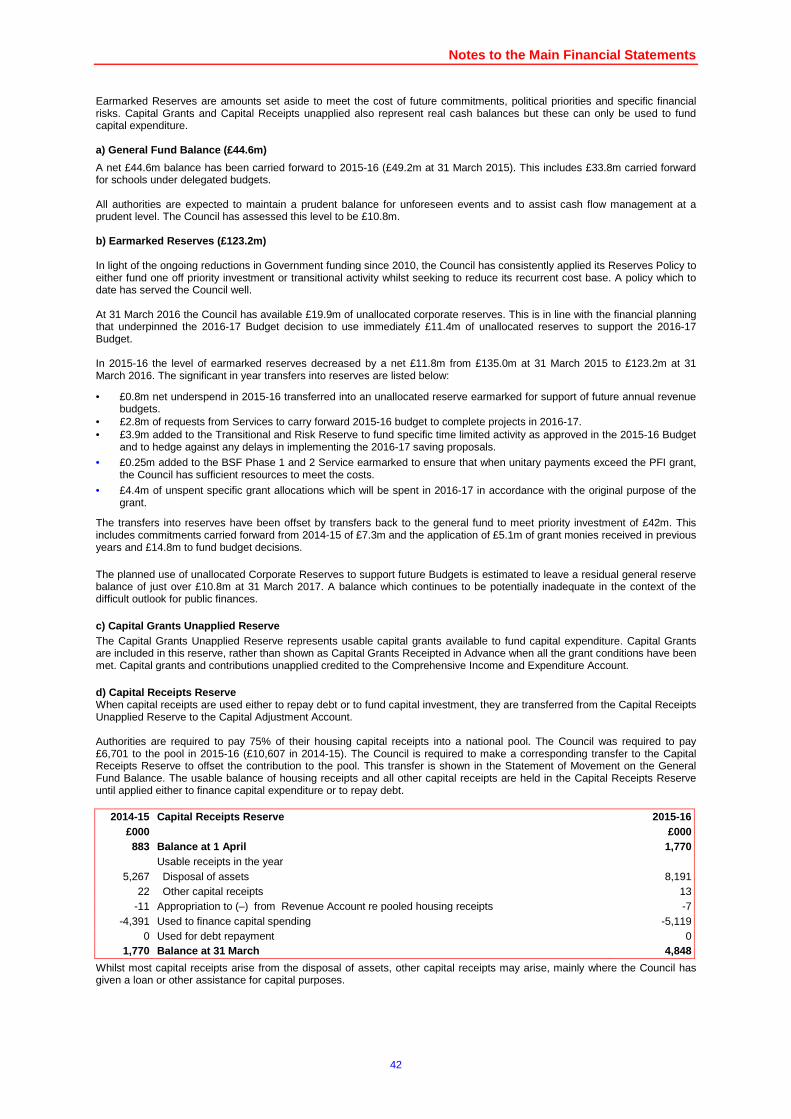
Notes to the Main Financial Statements
42
Earmarked Reserves are amounts set aside to meet the cost of future commitments, political priorities and specific financial risks. Capital Grants and Capital Receipts unapplied also represent real cash balances but these can only be used to fund capital expenditure. a) General Fund Balance (£44.6m)
A net £44.6m balance has been carried forward to 2015-16 (£49.2m at 31 March 2015). This includes £33.8m carried forward for schools under delegated budgets. All authorities are expected to maintain a prudent balance for unforeseen events and to assist cash flow management at a prudent level. The Council has assessed this level to be £10.8m. b) Earmarked Reserves (£123.2m) In light of the ongoing reductions in Government funding since 2010, the Council has consistently applied its Reserves Policy to either fund one off priority investment or transitional activity whilst seeking to reduce its recurrent cost base. A policy which to date has served the Council well. At 31 March 2016 the Council has available £19.9m of unallocated corporate reserves. This is in line with the financial planning that underpinned the 2016-17 Budget decision to use immediately £11.4m of unallocated reserves to support the 2016-17 Budget. In 2015-16 the level of earmarked reserves decreased by a net £11.8m from £135.0m at 31 March 2015 to £123.2m at 31 March 2016. The significant in year transfers into reserves are listed below:
• £0.8m net underspend in 2015-16 transferred into an unallocated reserve earmarked for support of future annual revenue budgets.
• £2.8m of requests from Services to carry forward 2015-16 budget to complete projects in 2016-17. • £3.9m added to the Transitional and Risk Reserve to fund specific time limited activity as approved in the 2015-16 Budget
and to hedge against any delays in implementing the 2016-17 saving proposals.
• £0.25m added to the BSF Phase 1 and 2 Service earmarked to ensure that when unitary payments exceed the PFI grant, the Council has sufficient resources to meet the costs.
• £4.4m of unspent specific grant allocations which will be spent in 2016-17 in accordance with the original purpose of the grant.
The transfers into reserves have been offset by transfers back to the general fund to meet priority investment of £42m. This includes commitments carried forward from 2014-15 of £7.3m and the application of £5.1m of grant monies received in previous years and £14.8m to fund budget decisions. The planned use of unallocated Corporate Reserves to support future Budgets is estimated to leave a residual general reserve balance of just over £10.8m at 31 March 2017. A balance which continues to be potentially inadequate in the context of the difficult outlook for public finances. c) Capital Grants Unapplied Reserve The Capital Grants Unapplied Reserve represents usable capital grants available to fund capital expenditure. Capital Grants are included in this reserve, rather than shown as Capital Grants Receipted in Advance when all the grant conditions have been met. Capital grants and contributions unapplied credited to the Comprehensive Income and Expenditure Account. d) Capital Receipts Reserve When capital receipts are used either to repay debt or to fund capital investment, they are transferred from the Capital Receipts Unapplied Reserve to the Capital Adjustment Account. Authorities are required to pay 75% of their housing capital receipts into a national pool. The Council was required to pay £6,701 to the pool in 2015-16 (£10,607 in 2014-15). The Council is required to make a corresponding transfer to the Capital Receipts Reserve to offset the contribution to the pool. This transfer is shown in the Statement of Movement on the General Fund Balance. The usable balance of housing receipts and all other capital receipts are held in the Capital Receipts Reserve until applied either to finance capital expenditure or to repay debt.
2014-15 Capital Receipts Reserve 2015-16 £000 £000 883 Balance at 1 April 1,770
Usable receipts in the year 5,267 Disposal of assets 8,191
22 Other capital receipts 13 -11 Appropriation to (–) from Revenue Account re pooled housing receipts -7
-4,391 Used to finance capital spending -5,119 0 Used for debt repayment 0
1,770 Balance at 31 March 4,848
Whilst most capital receipts arise from the disposal of assets, other capital receipts may arise, mainly where the Council has given a loan or other assistance for capital purposes.
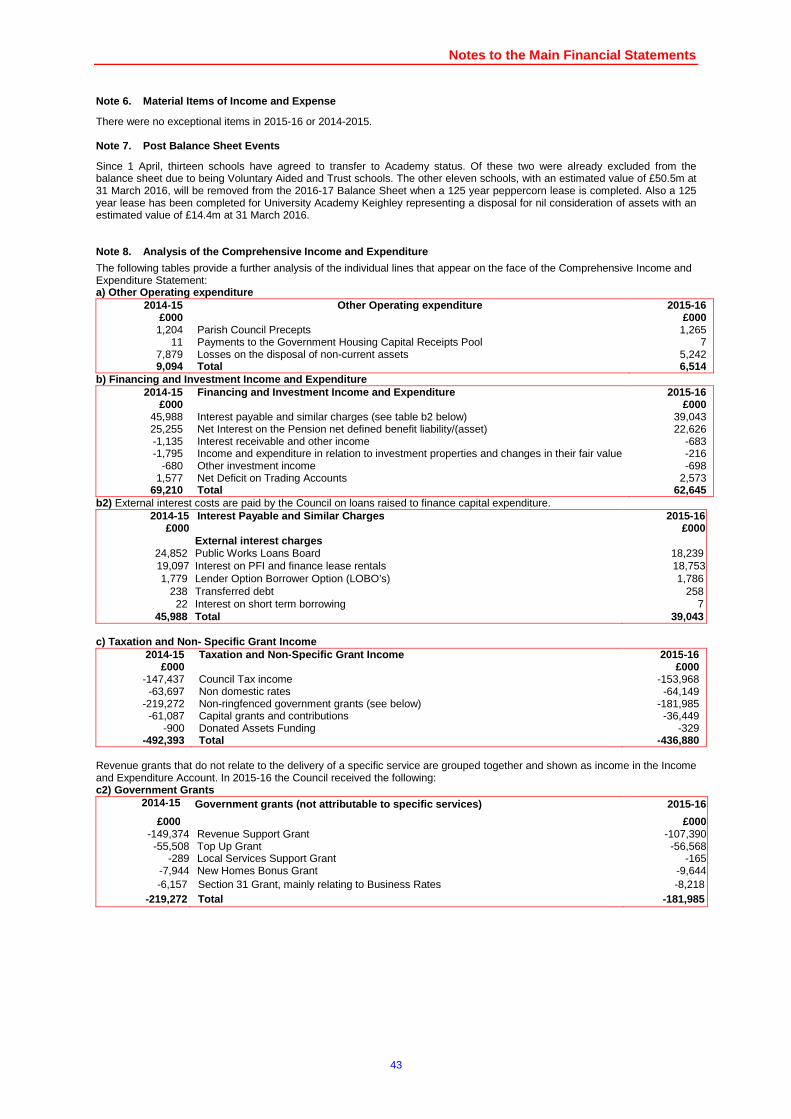
Notes to the Main Financial Statements
43
Material Items of Income and Expense Note 6.
There were no exceptional items in 2015-16 or 2014-2015.
Post Balance Sheet Events Note 7.
Since 1 April, thirteen schools have agreed to transfer to Academy status. Of these two were already excluded from the balance sheet due to being Voluntary Aided and Trust schools. The other eleven schools, with an estimated value of £50.5m at 31 March 2016, will be removed from the 2016-17 Balance Sheet when a 125 year peppercorn lease is completed. Also a 125 year lease has been completed for University Academy Keighley representing a disposal for nil consideration of assets with an estimated value of £14.4m at 31 March 2016.
Analysis of the Comprehensive Income and Expenditur e Note 8.
The following tables provide a further analysis of the individual lines that appear on the face of the Comprehensive Income and Expenditure Statement: a) Other Operating expenditure
2014-15 Other Operating expenditure 2015-16 £000 £000
1,204 Parish Council Precepts 1,265 11 Payments to the Government Housing Capital Receipts Pool 7
7,879 Losses on the disposal of non-current assets 5,242 9,094 Total 6,514
b) Financing and Investment Income and Expenditure 2014-15 Financing and Investment Income and Expenditure 2015-16
£000 £000 45,988 Interest payable and similar charges (see table b2 below) 39,043 25,255 Net Interest on the Pension net defined benefit liability/(asset) 22,626 -1,135 Interest receivable and other income -683 -1,795 Income and expenditure in relation to investment properties and changes in their fair value -216
-680 Other investment income -698 1,577 Net Deficit on Trading Accounts 2,573
69,210 Total 62,645 b2) External interest costs are paid by the Council on loans raised to finance capital expenditure.
2014-15 Interest Payable and Similar Charges 2015-16 £000 £000
External interest charges 24,852 Public Works Loans Board 18,239 19,097 Interest on PFI and finance lease rentals 18,753 1,779 Lender Option Borrower Option (LOBO’s) 1,786
238 Transferred debt 258 22 Interest on short term borrowing 7
45,988 Total 39,043 c) Taxation and Non- Specific Grant Income
2014-15 Taxation and Non -Specific Grant Income 2015-16 £000 £000
-147,437 Council Tax income -153,968 -63,697 Non domestic rates -64,149
-219,272 Non-ringfenced government grants (see below) -181,985 -61,087 Capital grants and contributions -36,449
-900 Donated Assets Funding -329 -492,393 Total -436,880
Revenue grants that do not relate to the delivery of a specific service are grouped together and shown as income in the Income and Expenditure Account. In 2015-16 the Council received the following: c2) Government Grants
2014-15 Government grants (not attributable to specific ser vices) 2015-16
£000 £000 -149,374 Revenue Support Grant -107,390 -55,508 Top Up Grant -56,568
-289 Local Services Support Grant -165 -7,944 New Homes Bonus Grant -9,644 -6,157 Section 31 Grant, mainly relating to Business Rates -8,218
-219,272 Total -181,985
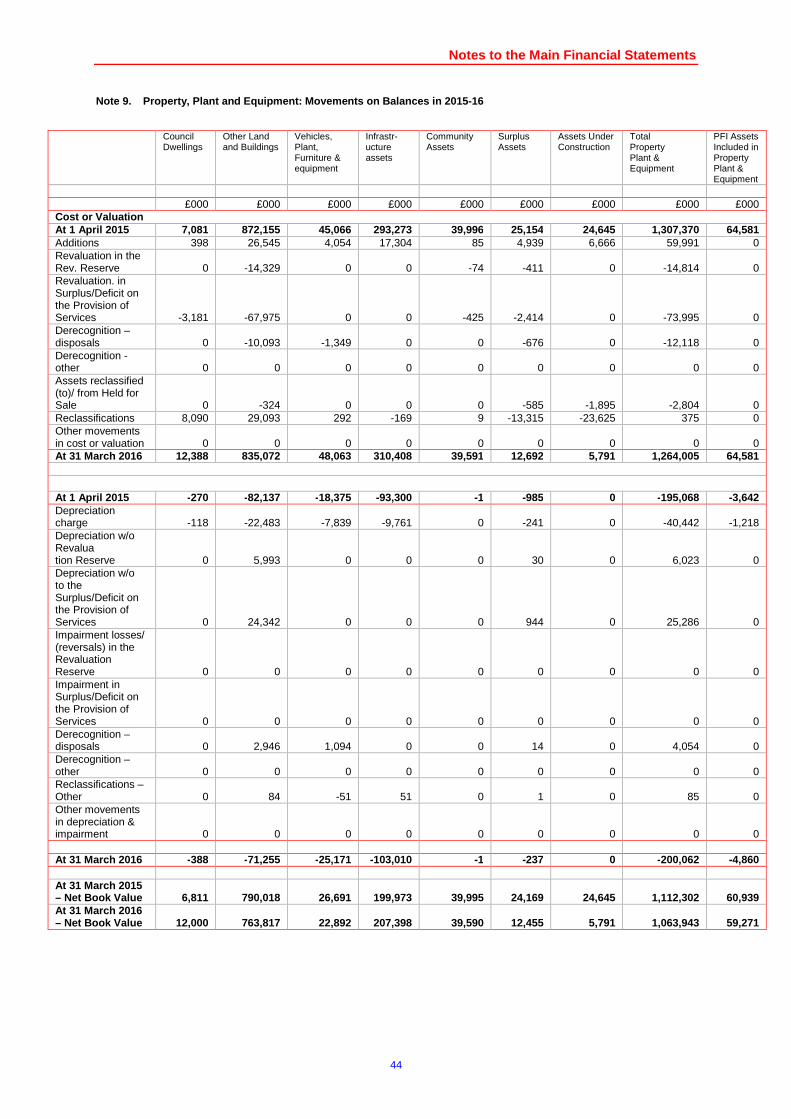
Notes to the Main Financial Statements
44
Property, Plant and Equipment: Movements on Balance s in 2015-16 Note 9.
Council
Dwellings
Other Land and Buildings
Vehicles, Plant, Furniture & equipment
Infrastr- ucture assets
Community Assets
Surplus Assets
Assets Under Construction
Total Property Plant & Equipment
PFI Assets Included in Property Plant & Equipment
£000 £000 £000 £000 £000 £000 £000 £000 £000 Cost or Valuation At 1 April 2015 7,081 872,155 45,066 293,273 39,996 25,154 24,645 1,307,370 64,581 Additions 398 26,545 4,054 17,304 85 4,939 6,666 59,991 0 Revaluation in the Rev. Reserve 0 -14,329 0 0 -74 -411 0 -14,814 0 Revaluation. in Surplus/Deficit on the Provision of Services -3,181 -67,975 0 0 -425 -2,414 0 -73,995 0 Derecognition – disposals 0 -10,093 -1,349 0 0 -676 0 -12,118 0 Derecognition - other 0 0 0 0 0 0 0 0 0 Assets reclassified (to)/ from Held for Sale 0 -324 0 0 0 -585 -1,895 -2,804 0 Reclassifications 8,090 29,093 292 -169 9 -13,315 -23,625 375 0 Other movements in cost or valuation 0 0 0 0 0 0 0 0 0 At 31 March 2016 12,388 835,072 48,063 310,408 39,591 12,692 5,791 1,264,005 64,581
At 1 April 2015 -270 -82,137 -18,375 -93,300 -1 -985 0 -195,068 -3,642 Depreciation charge -118 -22,483 -7,839 -9,761 0 -241 0 -40,442 -1,218 Depreciation w/o Revalua tion Reserve 0 5,993 0 0 0 30 0 6,023 0 Depreciation w/o to the Surplus/Deficit on the Provision of Services 0 24,342 0 0 0 944 0 25,286 0 Impairment losses/ (reversals) in the Revaluation Reserve 0 0 0 0 0 0 0 0 0 Impairment in Surplus/Deficit on the Provision of Services 0 0 0 0 0 0 0 0 0 Derecognition – disposals 0 2,946 1,094 0 0 14 0 4,054 0 Derecognition – other 0 0 0 0 0 0 0 0 0 Reclassifications – Other 0 84 -51 51 0 1 0 85 0 Other movements in depreciation & impairment 0 0 0 0 0 0 0 0 0 At 31 March 2016 -388 -71,255 -25,171 -103,010 -1 -237 0 -200,062 -4,860 At 31 March 2015 – Net Book Value 6,811 790,018 26,691 199,973 39,99 5 24,169 24,645 1,112,302 60,939 At 31 March 2016 – Net Book Value 12,000 763,817 22,892 207,398 39,5 90 12,455 5,791 1,063,943 59,271
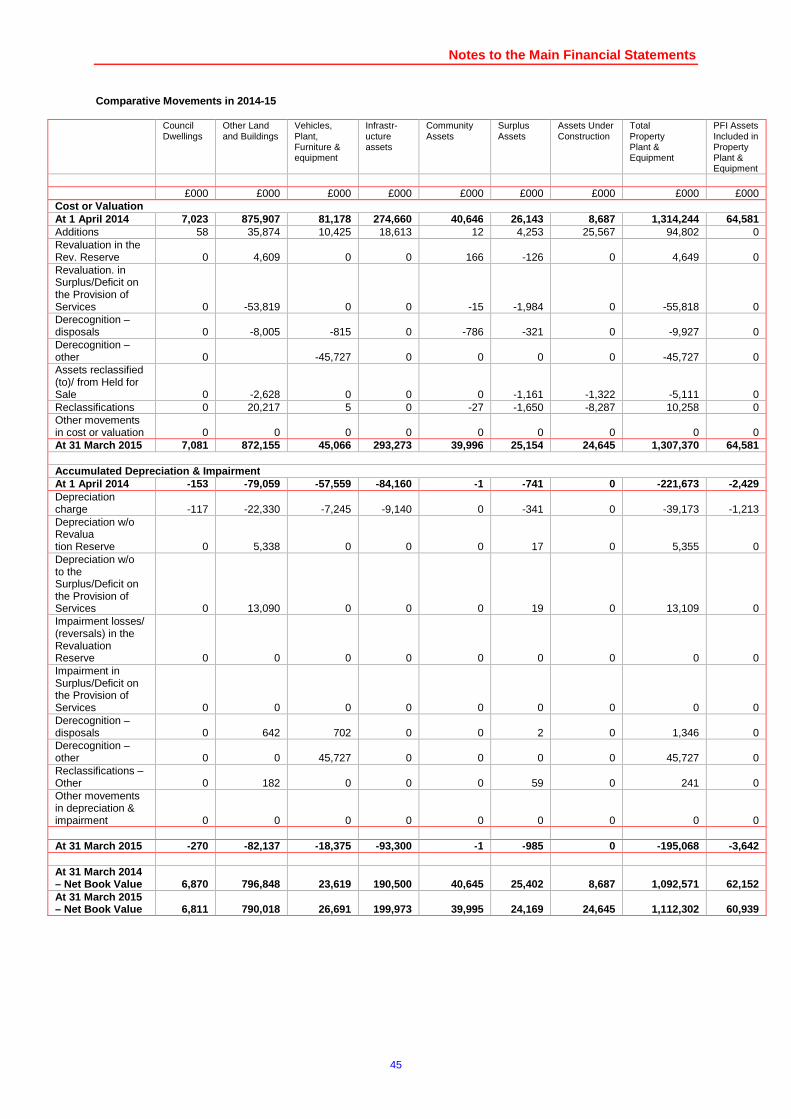
Notes to the Main Financial Statements
45
Comparative Movements in 2014-15
Council Dwellings
Other Land and Buildings
Vehicles, Plant, Furniture & equipment
Infrastr- ucture assets
Community Assets
Surplus Assets
Assets Under Construction
Total Property Plant & Equipment
PFI Assets Included in Property Plant & Equipment
£000 £000 £000 £000 £000 £000 £000 £000 £000 Cost or Valuation At 1 April 201 4 7,023 875,907 81,178 274,660 40,646 26,143 8,687 1,314,244 64,581 Additions 58 35,874 10,425 18,613 12 4,253 25,567 94,802 0 Revaluation in the Rev. Reserve 0 4,609 0 0 166 -126 0 4,649 0 Revaluation. in Surplus/Deficit on the Provision of Services 0 -53,819 0 0 -15 -1,984 0 -55,818 0 Derecognition – disposals 0 -8,005 -815 0 -786 -321 0 -9,927 0 Derecognition – other 0 -45,727 0 0 0 0 -45,727 0 Assets reclassified (to)/ from Held for Sale 0 -2,628 0 0 0 -1,161 -1,322 -5,111 0 Reclassifications 0 20,217 5 0 -27 -1,650 -8,287 10,258 0 Other movements in cost or valuation 0 0 0 0 0 0 0 0 0 At 31 March 2015 7,081 872,155 45,066 293,273 39,996 25,154 24,645 1,307,370 64,581
Accumulated Depreciation & Impairment At 1 April 201 4 -153 -79,059 -57,559 -84,160 -1 -741 0 -221,673 -2,429 Depreciation charge -117 -22,330 -7,245 -9,140 0 -341 0 -39,173 -1,213 Depreciation w/o Revalua tion Reserve 0 5,338 0 0 0 17 0 5,355 0 Depreciation w/o to the Surplus/Deficit on the Provision of Services 0 13,090 0 0 0 19 0 13,109 0 Impairment losses/ (reversals) in the Revaluation Reserve 0 0 0 0 0 0 0 0 0 Impairment in Surplus/Deficit on the Provision of Services 0 0 0 0 0 0 0 0 0 Derecognition – disposals 0 642 702 0 0 2 0 1,346 0 Derecognition – other 0 0 45,727 0 0 0 0 45,727 0 Reclassifications – Other 0 182 0 0 0 59 0 241 0 Other movements in depreciation & impairment 0 0 0 0 0 0 0 0 0 At 31 March 2015 -270 -82,137 -18,375 -93,300 -1 -985 0 -195,068 -3,642 At 31 March 2014 – Net Book Value 6,870 796,848 23,619 190,500 40,64 5 25,402 8,687 1,092,571 62,152 At 31 March 2015 – Net Book Value 6,811 790,018 26,691 199,973 39,99 5 24,169 24,645 1,112,302 60,939
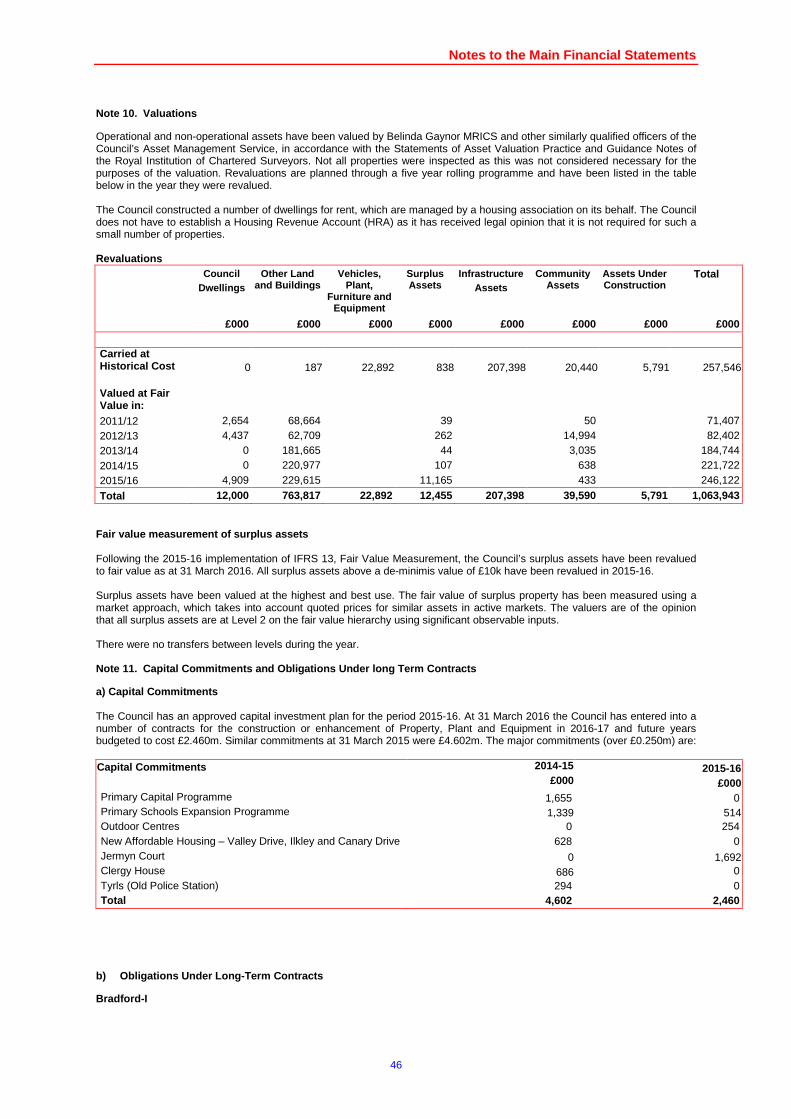
Notes to the Main Financial Statements
46
Valuations Note 10.
Operational and non-operational assets have been valued by Belinda Gaynor MRICS and other similarly qualified officers of the Council’s Asset Management Service, in accordance with the Statements of Asset Valuation Practice and Guidance Notes of the Royal Institution of Chartered Surveyors. Not all properties were inspected as this was not considered necessary for the purposes of the valuation. Revaluations are planned through a five year rolling programme and have been listed in the table below in the year they were revalued. The Council constructed a number of dwellings for rent, which are managed by a housing association on its behalf. The Council does not have to establish a Housing Revenue Account (HRA) as it has received legal opinion that it is not required for such a small number of properties. Revaluations
Council Dwellings
Other Land and Buildings
Vehicles, Plant,
Furniture and Equipment
Surplus Assets
Infrastructure Assets
Community Assets
Assets Under Construction
Total
£000 £000 £000 £000 £000 £000 £000 £000 Carried at Historical Cost 0 187 22,892 838 207,398 20,440 5,791 257,546 Valued at Fair Value in: 2011/12 2,654 68,664 39 50 71,407 2012/13 4,437 62,709 262 14,994 82,402 2013/14 0 181,665 44 3,035 184,744
2014/15 0 220,977 107 638 221,722
2015/16 4,909 229,615 11,165 433 246,122
Total 12,000 763,817 22,892 12,455 207,398 39,590 5,791 1,063,943 Fair value measurement of surplus assets Following the 2015-16 implementation of IFRS 13, Fair Value Measurement, the Council’s surplus assets have been revalued to fair value as at 31 March 2016. All surplus assets above a de-minimis value of £10k have been revalued in 2015-16. Surplus assets have been valued at the highest and best use. The fair value of surplus property has been measured using a market approach, which takes into account quoted prices for similar assets in active markets. The valuers are of the opinion that all surplus assets are at Level 2 on the fair value hierarchy using significant observable inputs. There were no transfers between levels during the year.
Capital Commitments and Obligations Under long Term Contracts Note 11.
a) Capital Commitments The Council has an approved capital investment plan for the period 2015-16. At 31 March 2016 the Council has entered into a number of contracts for the construction or enhancement of Property, Plant and Equipment in 2016-17 and future years budgeted to cost £2.460m. Similar commitments at 31 March 2015 were £4.602m. The major commitments (over £0.250m) are: Capital Commitments 2014-15 2015-16
£000 £000 Primary Capital Programme 1,655 0 Primary Schools Expansion Programme 1,339 514 Outdoor Centres 0 254 New Affordable Housing – Valley Drive, Ilkley and Canary Drive 628 0 Jermyn Court 0 1,692 Clergy House 686 0 Tyrls (Old Police Station) 294 0 Total 4,602 2,460
b) Obligations Under Long-Term Contracts
Bradford-I
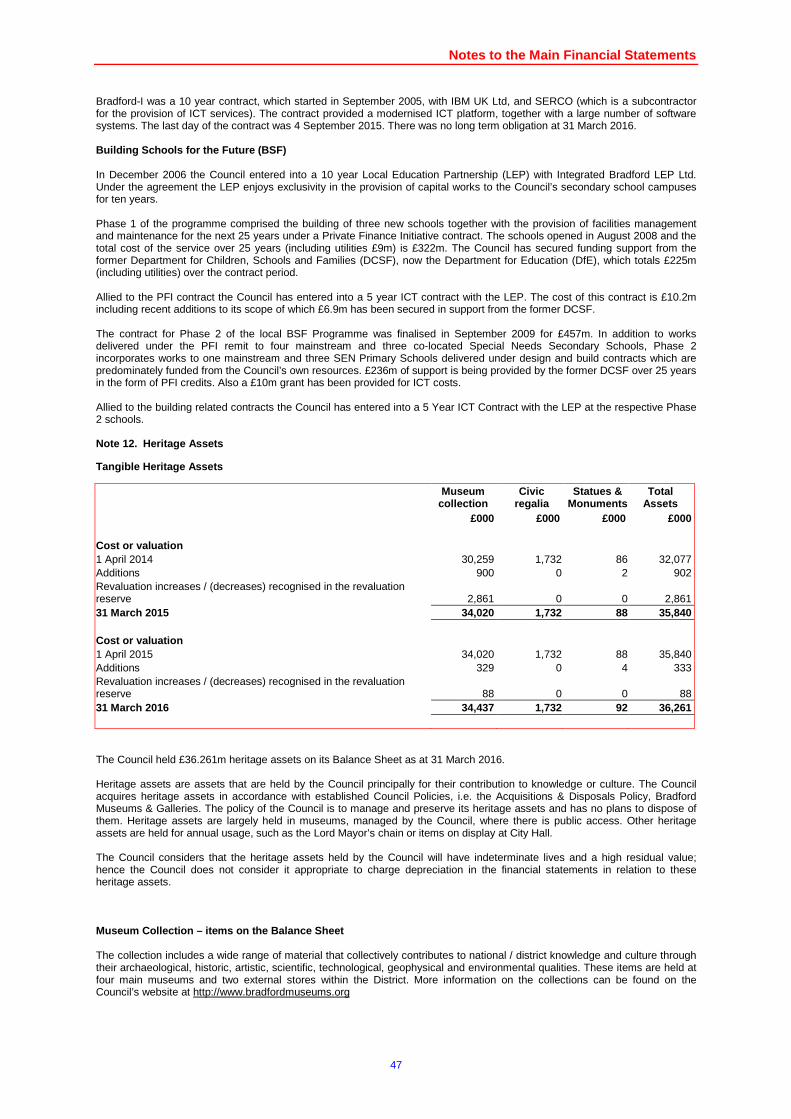
Notes to the Main Financial Statements
47
Bradford-I was a 10 year contract, which started in September 2005, with IBM UK Ltd, and SERCO (which is a subcontractor for the provision of ICT services). The contract provided a modernised ICT platform, together with a large number of software systems. The last day of the contract was 4 September 2015. There was no long term obligation at 31 March 2016. Building Schools for the Future (BSF) In December 2006 the Council entered into a 10 year Local Education Partnership (LEP) with Integrated Bradford LEP Ltd. Under the agreement the LEP enjoys exclusivity in the provision of capital works to the Council’s secondary school campuses for ten years. Phase 1 of the programme comprised the building of three new schools together with the provision of facilities management and maintenance for the next 25 years under a Private Finance Initiative contract. The schools opened in August 2008 and the total cost of the service over 25 years (including utilities £9m) is £322m. The Council has secured funding support from the former Department for Children, Schools and Families (DCSF), now the Department for Education (DfE), which totals £225m (including utilities) over the contract period. Allied to the PFI contract the Council has entered into a 5 year ICT contract with the LEP. The cost of this contract is £10.2m including recent additions to its scope of which £6.9m has been secured in support from the former DCSF. The contract for Phase 2 of the local BSF Programme was finalised in September 2009 for £457m. In addition to works delivered under the PFI remit to four mainstream and three co-located Special Needs Secondary Schools, Phase 2 incorporates works to one mainstream and three SEN Primary Schools delivered under design and build contracts which are predominately funded from the Council’s own resources. £236m of support is being provided by the former DCSF over 25 years in the form of PFI credits. Also a £10m grant has been provided for ICT costs. Allied to the building related contracts the Council has entered into a 5 Year ICT Contract with the LEP at the respective Phase 2 schools.
Heritage Assets Note 12.
Tangible Heritage Assets
Museum collection
Civic regalia
Statues & Monuments
Total Assets
£000 £000 £000 £000 Cost or valuation 1 April 2014 30,259 1,732 86 32,077 Additions 900 0 2 902 Revaluation increases / (decreases) recognised in the revaluation reserve 2,861 0 0 2,861 31 March 2015 34,020 1,732 88 35,840 Cost or valuation 1 April 2015 34,020 1,732 88 35,840 Additions 329 0 4 333 Revaluation increases / (decreases) recognised in the revaluation reserve 88 0 0 88 31 March 2016 34,437 1,732 92 36,261 The Council held £36.261m heritage assets on its Balance Sheet as at 31 March 2016. Heritage assets are assets that are held by the Council principally for their contribution to knowledge or culture. The Council acquires heritage assets in accordance with established Council Policies, i.e. the Acquisitions & Disposals Policy, Bradford Museums & Galleries. The policy of the Council is to manage and preserve its heritage assets and has no plans to dispose of them. Heritage assets are largely held in museums, managed by the Council, where there is public access. Other heritage assets are held for annual usage, such as the Lord Mayor’s chain or items on display at City Hall. The Council considers that the heritage assets held by the Council will have indeterminate lives and a high residual value; hence the Council does not consider it appropriate to charge depreciation in the financial statements in relation to these heritage assets. Museum Collection – items on the Balance Sheet The collection includes a wide range of material that collectively contributes to national / district knowledge and culture through their archaeological, historic, artistic, scientific, technological, geophysical and environmental qualities. These items are held at four main museums and two external stores within the District. More information on the collections can be found on the Council’s website at http://www.bradfordmuseums.org
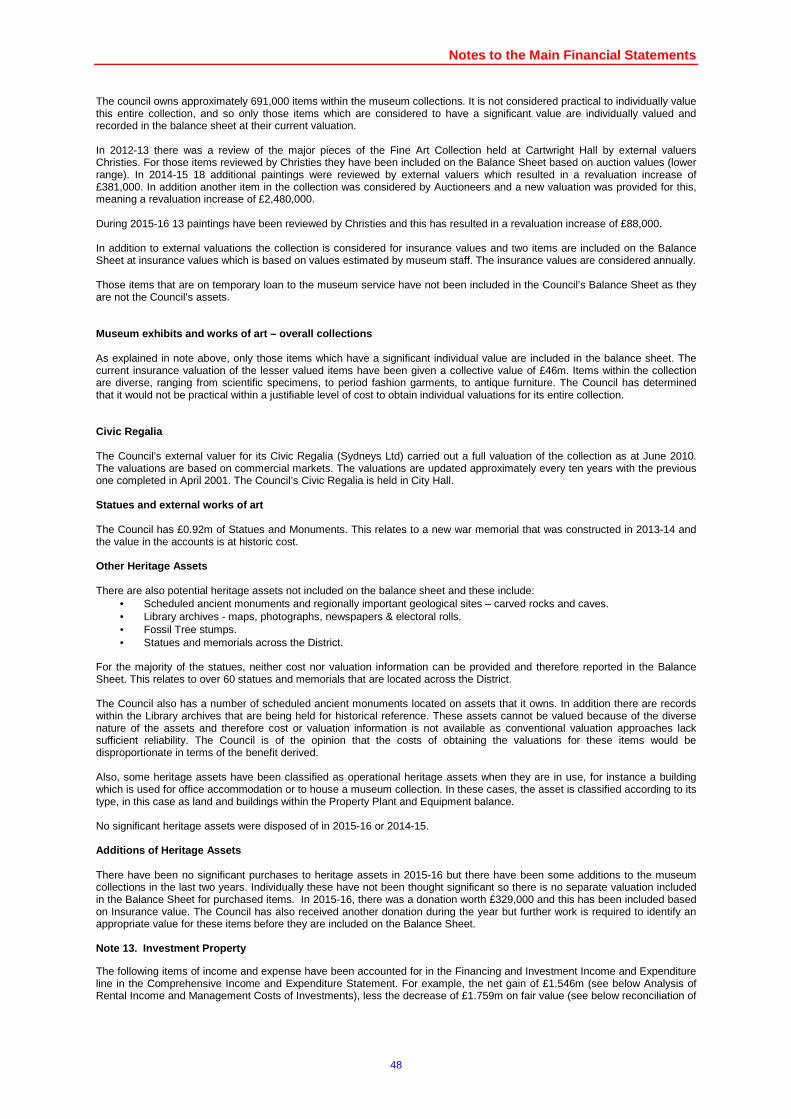
Notes to the Main Financial Statements
48
The council owns approximately 691,000 items within the museum collections. It is not considered practical to individually value this entire collection, and so only those items which are considered to have a significant value are individually valued and recorded in the balance sheet at their current valuation. In 2012-13 there was a review of the major pieces of the Fine Art Collection held at Cartwright Hall by external valuers Christies. For those items reviewed by Christies they have been included on the Balance Sheet based on auction values (lower range). In 2014-15 18 additional paintings were reviewed by external valuers which resulted in a revaluation increase of £381,000. In addition another item in the collection was considered by Auctioneers and a new valuation was provided for this, meaning a revaluation increase of £2,480,000. During 2015-16 13 paintings have been reviewed by Christies and this has resulted in a revaluation increase of £88,000. In addition to external valuations the collection is considered for insurance values and two items are included on the Balance Sheet at insurance values which is based on values estimated by museum staff. The insurance values are considered annually. Those items that are on temporary loan to the museum service have not been included in the Council’s Balance Sheet as they are not the Council’s assets. Museum exhibits and works of art – overall collecti ons As explained in note above, only those items which have a significant individual value are included in the balance sheet. The current insurance valuation of the lesser valued items have been given a collective value of £46m. Items within the collection are diverse, ranging from scientific specimens, to period fashion garments, to antique furniture. The Council has determined that it would not be practical within a justifiable level of cost to obtain individual valuations for its entire collection. Civic Regalia The Council’s external valuer for its Civic Regalia (Sydneys Ltd) carried out a full valuation of the collection as at June 2010. The valuations are based on commercial markets. The valuations are updated approximately every ten years with the previous one completed in April 2001. The Council’s Civic Regalia is held in City Hall. Statues and external works of art The Council has £0.92m of Statues and Monuments. This relates to a new war memorial that was constructed in 2013-14 and the value in the accounts is at historic cost. Other Heritage Assets There are also potential heritage assets not included on the balance sheet and these include:
• Scheduled ancient monuments and regionally important geological sites – carved rocks and caves. • Library archives - maps, photographs, newspapers & electoral rolls. • Fossil Tree stumps. • Statues and memorials across the District.
For the majority of the statues, neither cost nor valuation information can be provided and therefore reported in the Balance Sheet. This relates to over 60 statues and memorials that are located across the District. The Council also has a number of scheduled ancient monuments located on assets that it owns. In addition there are records within the Library archives that are being held for historical reference. These assets cannot be valued because of the diverse nature of the assets and therefore cost or valuation information is not available as conventional valuation approaches lack sufficient reliability. The Council is of the opinion that the costs of obtaining the valuations for these items would be disproportionate in terms of the benefit derived. Also, some heritage assets have been classified as operational heritage assets when they are in use, for instance a building which is used for office accommodation or to house a museum collection. In these cases, the asset is classified according to its type, in this case as land and buildings within the Property Plant and Equipment balance. No significant heritage assets were disposed of in 2015-16 or 2014-15. Additions of Heritage Assets There have been no significant purchases to heritage assets in 2015-16 but there have been some additions to the museum collections in the last two years. Individually these have not been thought significant so there is no separate valuation included in the Balance Sheet for purchased items. In 2015-16, there was a donation worth £329,000 and this has been included based on Insurance value. The Council has also received another donation during the year but further work is required to identify an appropriate value for these items before they are included on the Balance Sheet.
Investment Property Note 13.
The following items of income and expense have been accounted for in the Financing and Investment Income and Expenditure line in the Comprehensive Income and Expenditure Statement. For example, the net gain of £1.546m (see below Analysis of Rental Income and Management Costs of Investments), less the decrease of £1.759m on fair value (see below reconciliation of
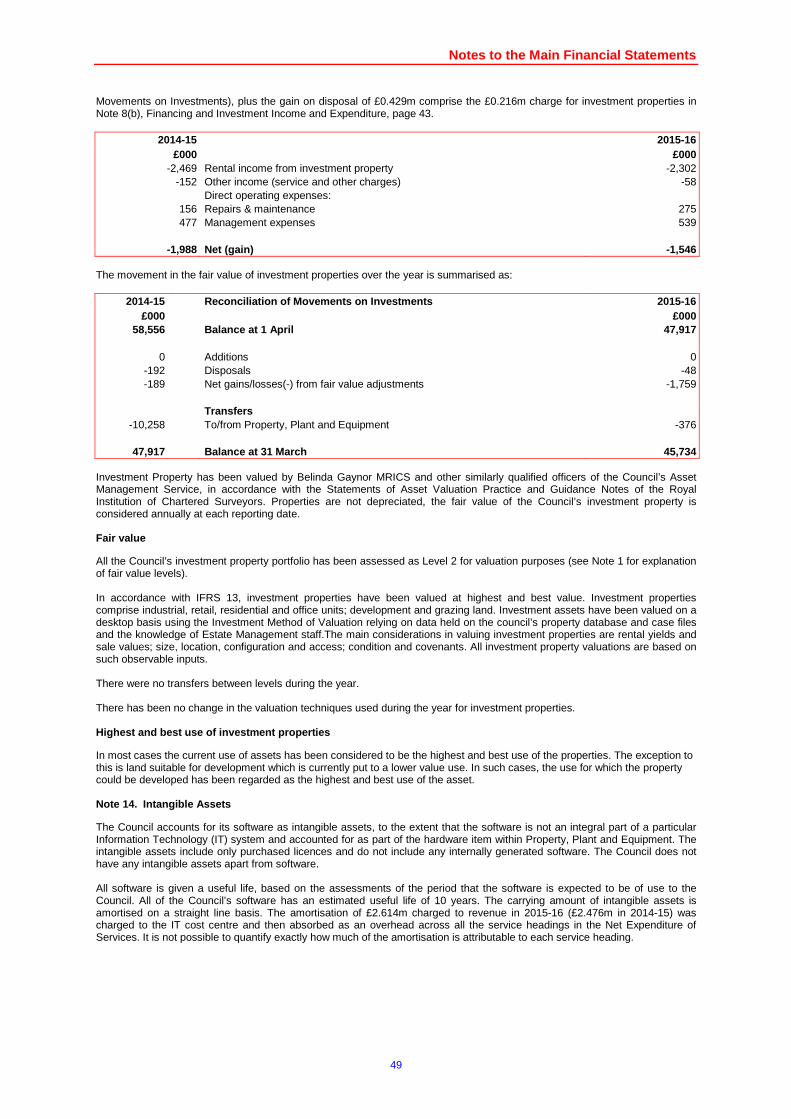
Notes to the Main Financial Statements
49
Movements on Investments), plus the gain on disposal of £0.429m comprise the £0.216m charge for investment properties in Note 8(b), Financing and Investment Income and Expenditure, page 43.
2014-15 2015-16 £000 £000
-2,469 Rental income from investment property -2,302 -152 Other income (service and other charges) -58
Direct operating expenses: 156 Repairs & maintenance 275 477 Management expenses 539
-1,988 Net (gain) -1,546
The movement in the fair value of investment properties over the year is summarised as:
2014-15 Reconciliation of Movements on Investments 2015-16 £000 £000
58,556 Balance at 1 April 47,917
0 Additions 0 -192 Disposals -48 -189 Net gains/losses(-) from fair value adjustments -1,759
Transfers
-10,258 To/from Property, Plant and Equipment -376
47,917 Balance at 31 March 45,734 Investment Property has been valued by Belinda Gaynor MRICS and other similarly qualified officers of the Council’s Asset Management Service, in accordance with the Statements of Asset Valuation Practice and Guidance Notes of the Royal Institution of Chartered Surveyors. Properties are not depreciated, the fair value of the Council’s investment property is considered annually at each reporting date. Fair value
All the Council’s investment property portfolio has been assessed as Level 2 for valuation purposes (see Note 1 for explanation of fair value levels). In accordance with IFRS 13, investment properties have been valued at highest and best value. Investment properties comprise industrial, retail, residential and office units; development and grazing land. Investment assets have been valued on a desktop basis using the Investment Method of Valuation relying on data held on the council’s property database and case files and the knowledge of Estate Management staff.The main considerations in valuing investment properties are rental yields and sale values; size, location, configuration and access; condition and covenants. All investment property valuations are based on such observable inputs. There were no transfers between levels during the year. There has been no change in the valuation techniques used during the year for investment properties. Highest and best use of investment properties
In most cases the current use of assets has been considered to be the highest and best use of the properties. The exception to this is land suitable for development which is currently put to a lower value use. In such cases, the use for which the property could be developed has been regarded as the highest and best use of the asset.
Intangible Assets Note 14.
The Council accounts for its software as intangible assets, to the extent that the software is not an integral part of a particular Information Technology (IT) system and accounted for as part of the hardware item within Property, Plant and Equipment. The intangible assets include only purchased licences and do not include any internally generated software. The Council does not have any intangible assets apart from software. All software is given a useful life, based on the assessments of the period that the software is expected to be of use to the Council. All of the Council’s software has an estimated useful life of 10 years. The carrying amount of intangible assets is amortised on a straight line basis. The amortisation of £2.614m charged to revenue in 2015-16 (£2.476m in 2014-15) was charged to the IT cost centre and then absorbed as an overhead across all the service headings in the Net Expenditure of Services. It is not possible to quantify exactly how much of the amortisation is attributable to each service heading.
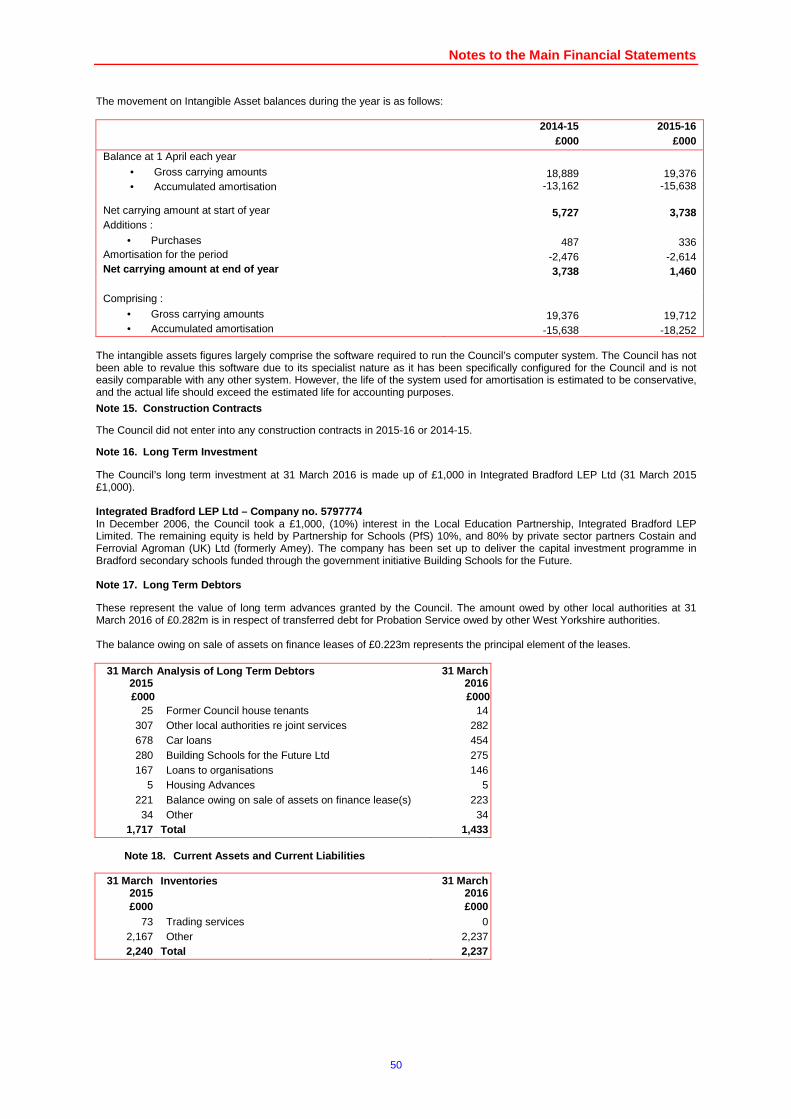
Notes to the Main Financial Statements
50
The movement on Intangible Asset balances during the year is as follows:
2014-15 2015-16 £000 £000 Balance at 1 April each year
• Gross carrying amounts 18,889 19,376 • Accumulated amortisation -13,162 -15,638
Net carrying amount at start of year 5,727 3,738 Additions :
• Purchases 487 336 Amortisation for the period -2,476 -2,614 Net carrying amount at end of year 3,738 1,460 Comprising :
• Gross carrying amounts 19,376 19,712 • Accumulated amortisation -15,638 -18,252
The intangible assets figures largely comprise the software required to run the Council’s computer system. The Council has not been able to revalue this software due to its specialist nature as it has been specifically configured for the Council and is not easily comparable with any other system. However, the life of the system used for amortisation is estimated to be conservative, and the actual life should exceed the estimated life for accounting purposes.
Construction Contracts Note 15.
The Council did not enter into any construction contracts in 2015-16 or 2014-15.
Long Term Investment Note 16.
The Council’s long term investment at 31 March 2016 is made up of £1,000 in Integrated Bradford LEP Ltd (31 March 2015 £1,000). Integrated Bradford LEP Ltd – Company no. 5797774 In December 2006, the Council took a £1,000, (10%) interest in the Local Education Partnership, Integrated Bradford LEP Limited. The remaining equity is held by Partnership for Schools (PfS) 10%, and 80% by private sector partners Costain and Ferrovial Agroman (UK) Ltd (formerly Amey). The company has been set up to deliver the capital investment programme in Bradford secondary schools funded through the government initiative Building Schools for the Future.
Long Term Debtors Note 17.
These represent the value of long term advances granted by the Council. The amount owed by other local authorities at 31 March 2016 of £0.282m is in respect of transferred debt for Probation Service owed by other West Yorkshire authorities. The balance owing on sale of assets on finance leases of £0.223m represents the principal element of the leases.
31 March 2015
Analysis of Long Term Debtors 31 March 2016
£000 £000 25 Former Council house tenants 14
307 Other local authorities re joint services 282 678 Car loans 454 280 Building Schools for the Future Ltd 275 167 Loans to organisations 146
5 Housing Advances 5 221 Balance owing on sale of assets on finance lease(s) 223 34 Other 34
1,717 Total 1,433
Current Assets and Current Liabilities Note 18.
31 March 2015 £000
Inventories 31 March 2016 £000
73 Trading services 0 2,167 Other 2,237 2,240 Total 2,237
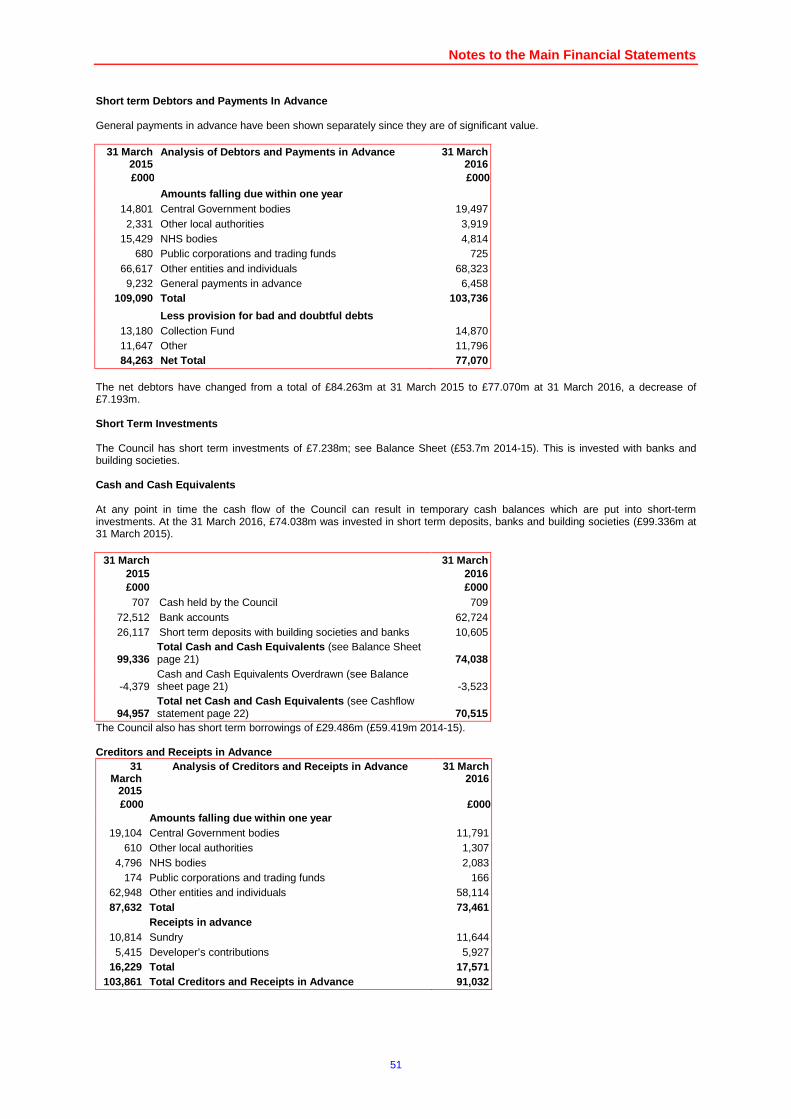
Notes to the Main Financial Statements
51
Short term Debtors and Payments In Advance General payments in advance have been shown separately since they are of significant value.
31 March 2015
Analysis of Debtors and Payments in Advance 31 March 2016
£000 £000 Amounts falling due within one year
14,801 Central Government bodies 19,497 2,331 Other local authorities 3,919
15,429 NHS bodies 4,814 680 Public corporations and trading funds 725
66,617 Other entities and individuals 68,323 9,232 General payments in advance 6,458
109,090 Total 103,736
Less provision for bad and doubtful debts 13,180 Collection Fund 14,870 11,647 Other 11,796 84,263 Net Total 77,070
The net debtors have changed from a total of £84.263m at 31 March 2015 to £77.070m at 31 March 2016, a decrease of £7.193m. Short Term Investments The Council has short term investments of £7.238m; see Balance Sheet (£53.7m 2014-15). This is invested with banks and building societies. Cash and Cash Equivalents At any point in time the cash flow of the Council can result in temporary cash balances which are put into short-term investments. At the 31 March 2016, £74.038m was invested in short term deposits, banks and building societies (£99.336m at 31 March 2015).
31 March 2015 £000
31 March 2016 £000
707 Cash held by the Council 709 72,512 Bank accounts 62,724 26,117 Short term deposits with building societies and banks 10,605
99,336 Total Cash and Cash Equivalents (see Balance Sheet page 21) 74,038
-4,379 Cash and Cash Equivalents Overdrawn (see Balance sheet page 21) -3,523
94,957 Total net Cash and Cash Equivalents (see Cashflow statement page 22) 70,515
The Council also has short term borrowings of £29.486m (£59.419m 2014-15). Creditors and Receipts in Advance
31 March
2015
Analysis of Creditors and Receipts in Advance 31 March 2016
£000 £000 Amounts falling due within one year
19,104 Central Government bodies 11,791 610 Other local authorities 1,307
4,796 NHS bodies 2,083 174 Public corporations and trading funds 166
62,948 Other entities and individuals 58,114 87,632 Total 73,461
Receipts in advance 10,814 Sundry 11,644 5,415 Developer’s contributions 5,927
16,229 Total 17,571 103,861 Total Creditors and Receipts in Advance 91,032

Notes to the Main Financial Statements
52
Assets held for sale Note 19.
Current Assets held for sale
2014-15 2015-16 £000 £000 Balance outstanding at start of year 2,277 2,770 Additions 0 54 Assets newly classified as held for sale: - Property, Plant and Equipment 4,873 3,470 Assets declassified: - Property, Plant and Equipment -3 -751 Assets sold -4,377 -4,891 Balance outstanding at year end 2,770 652
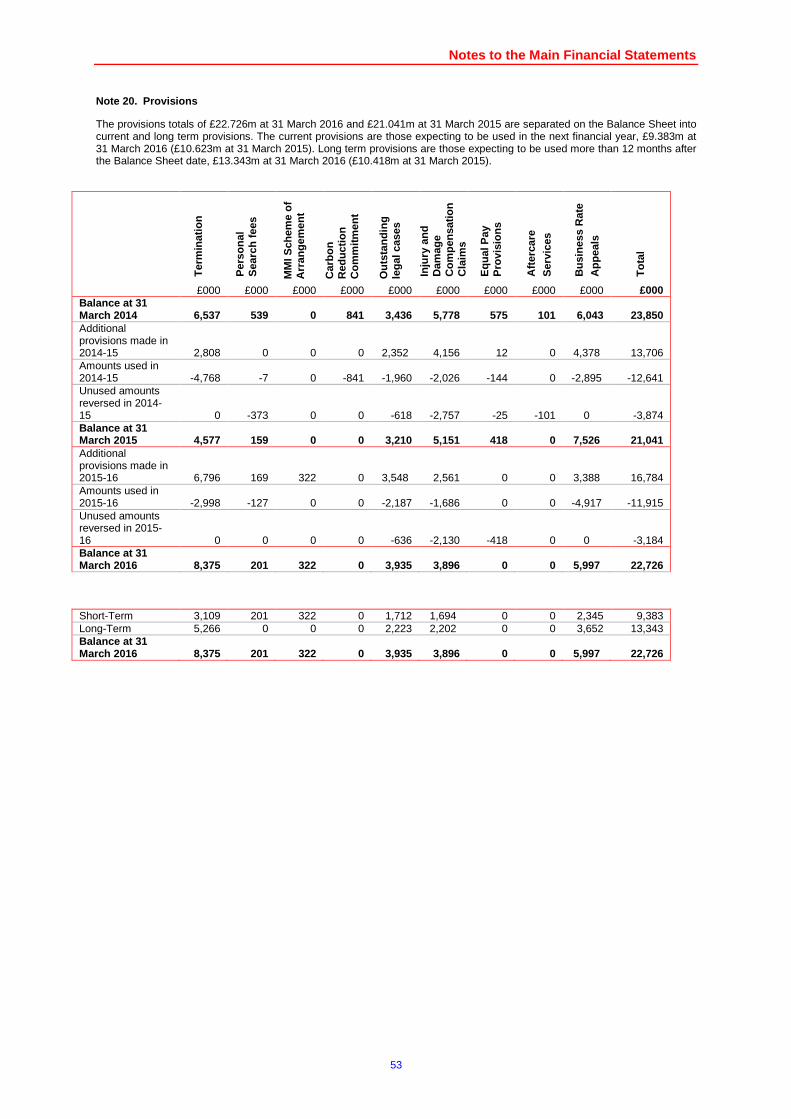
Notes to the Main Financial Statements
53
Provisions Note 20.
The provisions totals of £22.726m at 31 March 2016 and £21.041m at 31 March 2015 are separated on the Balance Sheet into current and long term provisions. The current provisions are those expecting to be used in the next financial year, £9.383m at 31 March 2016 (£10.623m at 31 March 2015). Long term provisions are those expecting to be used more than 12 months after the Balance Sheet date, £13.343m at 31 March 2016 (£10.418m at 31 March 2015).
Ter
min
atio
n
Per
sona
l S
earc
h fe
es
MM
I Sch
eme
of
Arr
ange
men
t
Car
bon
Red
uctio
n C
omm
itmen
t
Out
stan
ding
le
gal c
ases
Inju
ry a
nd
Dam
age
Com
pens
atio
n C
laim
s
Equ
al P
ay
Pro
visi
ons
Afte
rcar
e S
ervi
ces
Bus
ines
s R
ate
App
eals
Tot
al
£000 £000 £000 £000 £000 £000 £000 £000 £000 £000 Balance at 31 March 2014 6,537 539 0 841 3,436 5,778 575 101
6,043 23,850
Additional provisions made in 2014-15 2,808 0 0 0 2,352 4,156 12 0 4,378 13,706 Amounts used in 2014-15 -4,768 -7 0 -841 -1,960 -2,026 -144 0 -2,895 -12,641 Unused amounts reversed in 2014-15 0 -373 0 0 -618 -2,757 -25 -101 0 -3,874 Balance at 31 March 2015 4,577 159 0 0 3,210 5,151 418 0 7,526 21 ,041 Additional provisions made in 2015-16 6,796 169 322 0 3,548 2,561 0 0 3,388 16,784 Amounts used in 2015-16 -2,998 -127 0 0 -2,187 -1,686 0 0 -4,917 -11,915 Unused amounts reversed in 2015-16 0 0 0 0 -636 -2,130 -418 0 0 -3,184 Balance at 31 March 2016 8,375 201 322 0 3,935 3,896 0 0 5,997 22 ,726
Short-Term 3,109 201 322 0 1,712 1,694 0 0 2,345 9,383 Long-Term 5,266 0 0 0 2,223 2,202 0 0 3,652 13,343 Balance at 31 March 2016 8,375 201 322 0 3,935 3,896 0 0 5,997 22 ,726
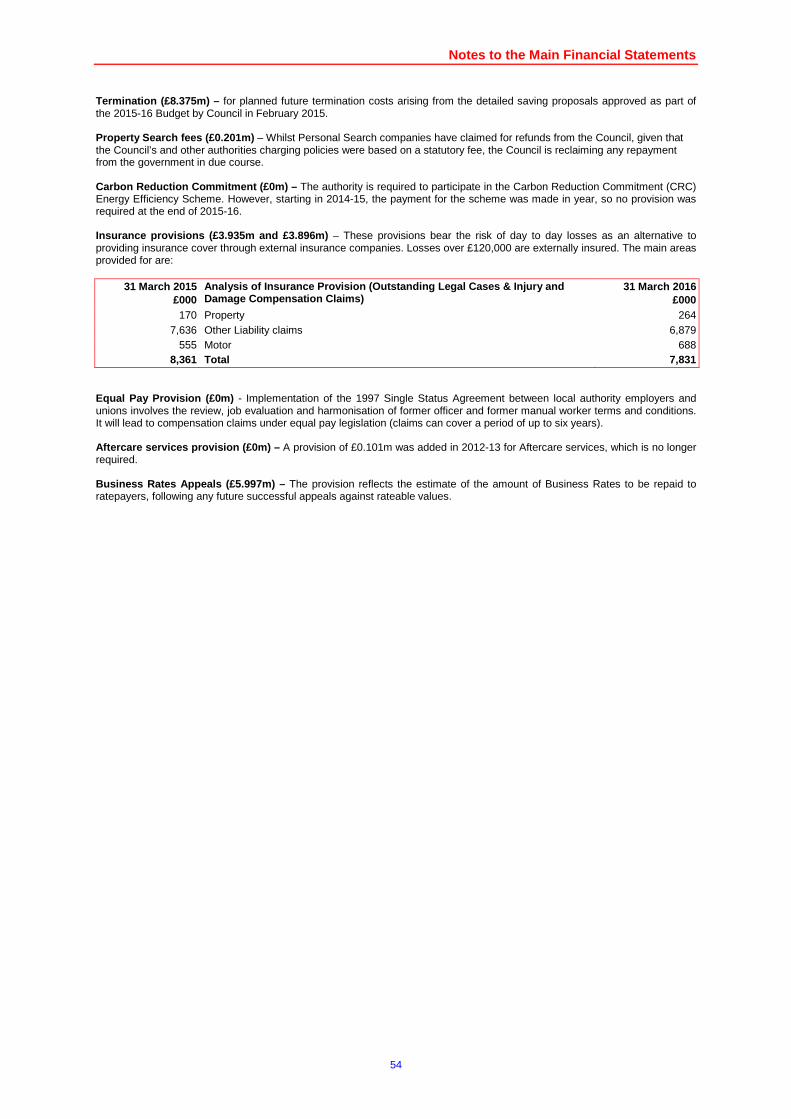
Notes to the Main Financial Statements
54
Termination (£8.375m) – for planned future termination costs arising from the detailed saving proposals approved as part of the 2015-16 Budget by Council in February 2015. Property Search fees (£0.201m) – Whilst Personal Search companies have claimed for refunds from the Council, given that the Council’s and other authorities charging policies were based on a statutory fee, the Council is reclaiming any repayment from the government in due course. Carbon Reduction Commitment (£0m) – The authority is required to participate in the Carbon Reduction Commitment (CRC) Energy Efficiency Scheme. However, starting in 2014-15, the payment for the scheme was made in year, so no provision was required at the end of 2015-16. Insurance provisions (£3.935m and £3.896m) – These provisions bear the risk of day to day losses as an alternative to providing insurance cover through external insurance companies. Losses over £120,000 are externally insured. The main areas provided for are:
31 March 2015 £000
Analysis of Insurance Provision (Outstanding Legal Cases & Injury and Damage Compensation Claims)
31 March 2016 £000
170 Property 264 7,636 Other Liability claims 6,879
555 Motor 688 8,361 Total 7,831
Equal Pay Provision (£0m) - Implementation of the 1997 Single Status Agreement between local authority employers and unions involves the review, job evaluation and harmonisation of former officer and former manual worker terms and conditions. It will lead to compensation claims under equal pay legislation (claims can cover a period of up to six years). Aftercare services provision (£0m) – A provision of £0.101m was added in 2012-13 for Aftercare services, which is no longer required. Business Rates Appeals (£5.997m) – The provision reflects the estimate of the amount of Business Rates to be repaid to ratepayers, following any future successful appeals against rateable values.
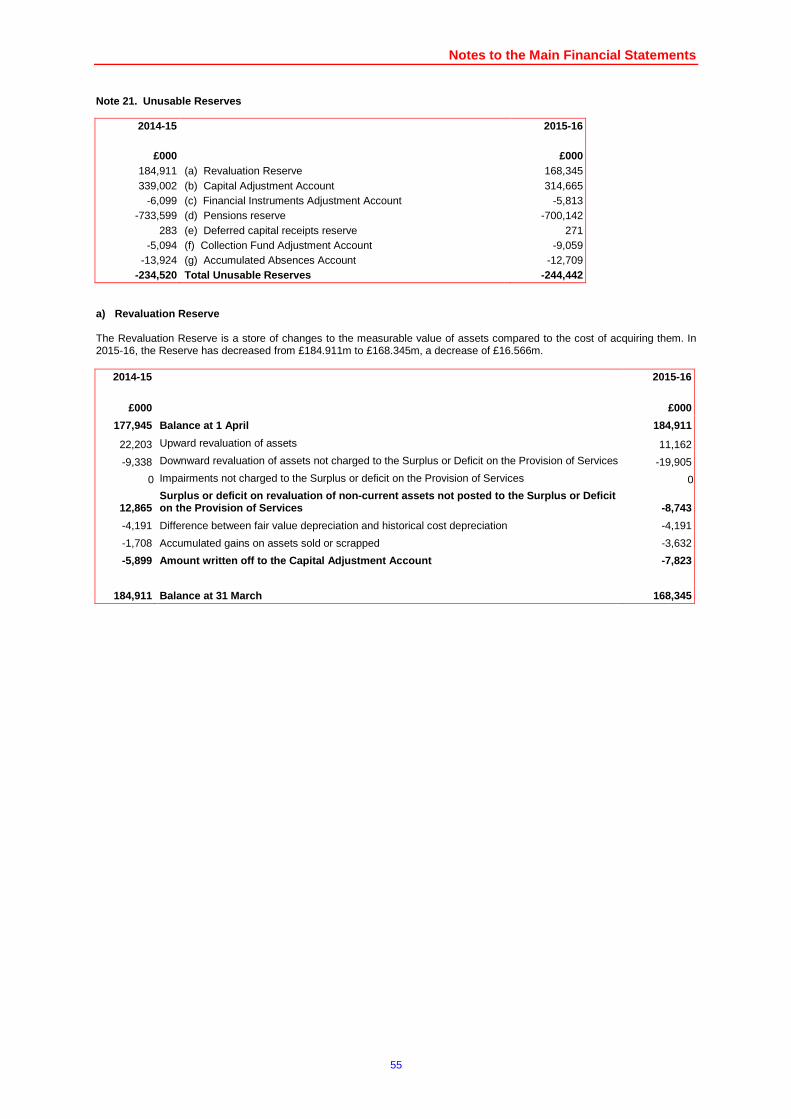
Notes to the Main Financial Statements
55
Unusable Reserves Note 21.
2014-15 2015-16
£000 £000 184,911 (a) Revaluation Reserve 168,345 339,002 (b) Capital Adjustment Account 314,665
-6,099 (c) Financial Instruments Adjustment Account -5,813 -733,599 (d) Pensions reserve -700,142
283 (e) Deferred capital receipts reserve 271 -5,094 (f) Collection Fund Adjustment Account -9,059
-13,924 (g) Accumulated Absences Account -12,709 -234,520 Total Unusable Reserves -244,442
a) Revaluation Reserve The Revaluation Reserve is a store of changes to the measurable value of assets compared to the cost of acquiring them. In 2015-16, the Reserve has decreased from £184.911m to £168.345m, a decrease of £16.566m.
2014-15
2015-16
£000 £000
177,945 Balance at 1 April 184,911
22,203 Upward revaluation of assets 11,162
-9,338 Downward revaluation of assets not charged to the Surplus or Deficit on the Provision of Services -19,905
0 Impairments not charged to the Surplus or deficit on the Provision of Services 0
12,865 Surplus or deficit on revaluation of non-current as sets not posted to the Surplus or Deficit on the Provision of Services -8,743
-4,191 Difference between fair value depreciation and historical cost depreciation -4,191
-1,708 Accumulated gains on assets sold or scrapped -3,632
-5,899 Amount written off to the Capital Adjustment Accoun t -7,823
184,911 Balance at 31 March 168,345
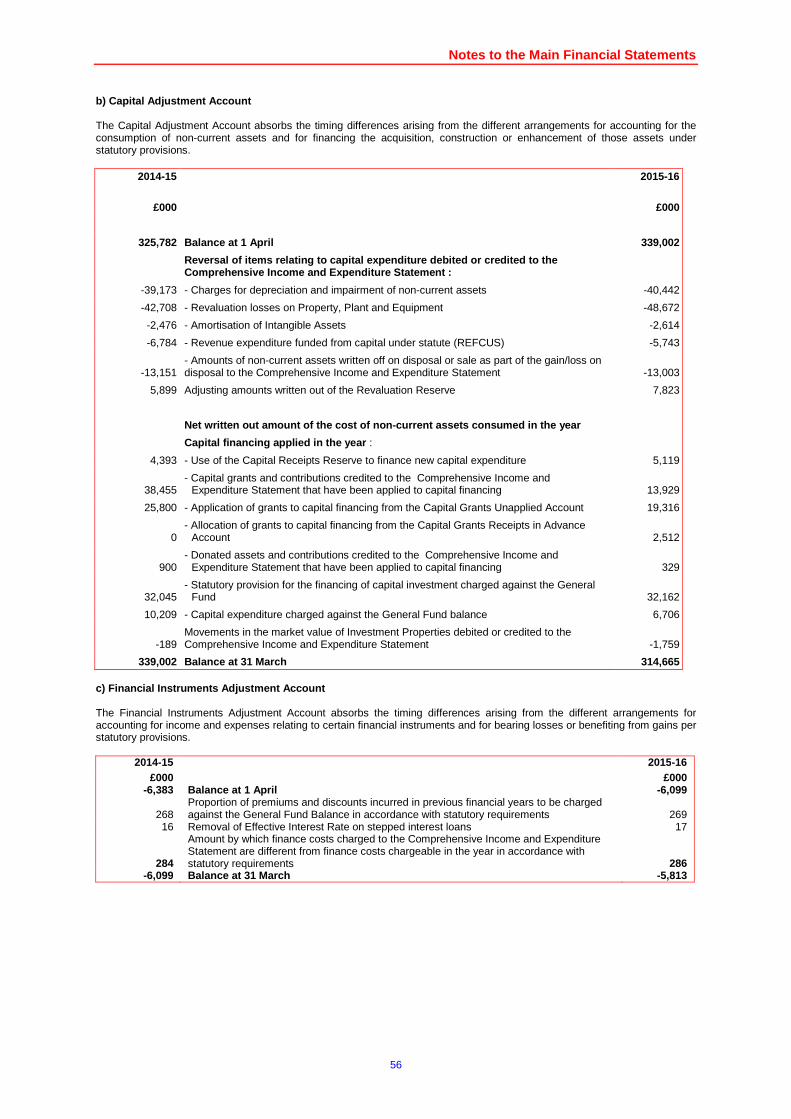
Notes to the Main Financial Statements
56
b) Capital Adjustment Account The Capital Adjustment Account absorbs the timing differences arising from the different arrangements for accounting for the consumption of non-current assets and for financing the acquisition, construction or enhancement of those assets under statutory provisions.
2014-15
2015-16
£000 £000
325,782 Balance at 1 April 339,002
Reversal of items relating to capital expenditure d ebited or credited to the Comprehensive Income and Expenditure Statement :
-39,173 - Charges for depreciation and impairment of non-current assets -40,442
-42,708 - Revaluation losses on Property, Plant and Equipment -48,672
-2,476 - Amortisation of Intangible Assets -2,614
-6,784 - Revenue expenditure funded from capital under statute (REFCUS) -5,743
-13,151 - Amounts of non-current assets written off on disposal or sale as part of the gain/loss on disposal to the Comprehensive Income and Expenditure Statement -13,003
5,899 Adjusting amounts written out of the Revaluation Reserve 7,823
Net written out amount of the cost of non-current a ssets consumed in the year
Capital financing applied in the year :
4,393 - Use of the Capital Receipts Reserve to finance new capital expenditure 5,119
38,455 - Capital grants and contributions credited to the Comprehensive Income and
Expenditure Statement that have been applied to capital financing 13,929
25,800 - Application of grants to capital financing from the Capital Grants Unapplied Account 19,316
0 - Allocation of grants to capital financing from the Capital Grants Receipts in Advance
Account 2,512
900 - Donated assets and contributions credited to the Comprehensive Income and
Expenditure Statement that have been applied to capital financing 329
32,045 - Statutory provision for the financing of capital investment charged against the General
Fund 32,162
10,209 - Capital expenditure charged against the General Fund balance 6,706
-189 Movements in the market value of Investment Properties debited or credited to the Comprehensive Income and Expenditure Statement -1,759
339,002 Balance at 31 March 314,665 c) Financial Instruments Adjustment Account The Financial Instruments Adjustment Account absorbs the timing differences arising from the different arrangements for accounting for income and expenses relating to certain financial instruments and for bearing losses or benefiting from gains per statutory provisions.
2014-15 2015-16 £000 £000
-6,383 Balance at 1 April -6,099
268 Proportion of premiums and discounts incurred in previous financial years to be charged against the General Fund Balance in accordance with statutory requirements 269
16 Removal of Effective Interest Rate on stepped interest loans 17
284
Amount by which finance costs charged to the Comprehensive Income and Expenditure Statement are different from finance costs chargeable in the year in accordance with statutory requirements 286
-6,099 Balance at 31 March -5,813
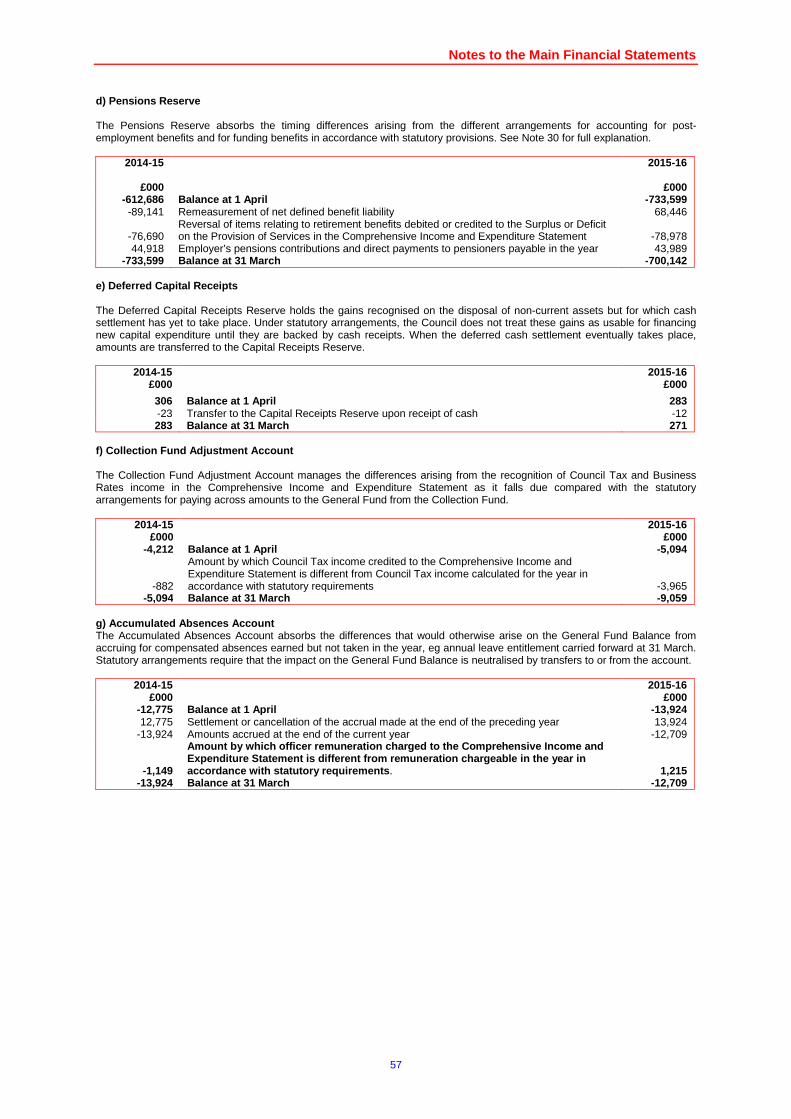
Notes to the Main Financial Statements
57
d) Pensions Reserve
The Pensions Reserve absorbs the timing differences arising from the different arrangements for accounting for post- employment benefits and for funding benefits in accordance with statutory provisions. See Note 30 for full explanation.
2014-15 2015-16
£000 £000 -612,686 Balance at 1 April -733,599 -89,141 Remeasurement of net defined benefit liability 68,446
-76,690 Reversal of items relating to retirement benefits debited or credited to the Surplus or Deficit on the Provision of Services in the Comprehensive Income and Expenditure Statement -78,978
44,918 Employer’s pensions contributions and direct payments to pensioners payable in the year 43,989 -733,599 Balance at 31 March -700,142
e) Deferred Capital Receipts The Deferred Capital Receipts Reserve holds the gains recognised on the disposal of non-current assets but for which cash settlement has yet to take place. Under statutory arrangements, the Council does not treat these gains as usable for financing new capital expenditure until they are backed by cash receipts. When the deferred cash settlement eventually takes place, amounts are transferred to the Capital Receipts Reserve.
2014-15 2015-16 £000 £000
306 Balance at 1 April 283 -23 Transfer to the Capital Receipts Reserve upon receipt of cash -12 283 Balance at 31 March 271
f) Collection Fund Adjustment Account The Collection Fund Adjustment Account manages the differences arising from the recognition of Council Tax and Business Rates income in the Comprehensive Income and Expenditure Statement as it falls due compared with the statutory arrangements for paying across amounts to the General Fund from the Collection Fund.
2014-15 2015-16 £000 £000
-4,212 Balance at 1 April -5,094
-882
Amount by which Council Tax income credited to the Comprehensive Income and Expenditure Statement is different from Council Tax income calculated for the year in accordance with statutory requirements -3,965
-5,094 Balance at 31 March -9,059 g) Accumulated Absences Account The Accumulated Absences Account absorbs the differences that would otherwise arise on the General Fund Balance from accruing for compensated absences earned but not taken in the year, eg annual leave entitlement carried forward at 31 March. Statutory arrangements require that the impact on the General Fund Balance is neutralised by transfers to or from the account.
2014-15 2015-16 £000 £000
-12,775 Balance at 1 April -13,924 12,775 Settlement or cancellation of the accrual made at the end of the preceding year 13,924
-13,924 Amounts accrued at the end of the current year -12,709
-1,149
Amount by which officer remuneration charged to the Comprehensive Income and Expenditure Statement is different from remuneratio n chargeable in the year in accordance with statutory requirements . 1,215
-13,924 Balance at 31 March -12,709
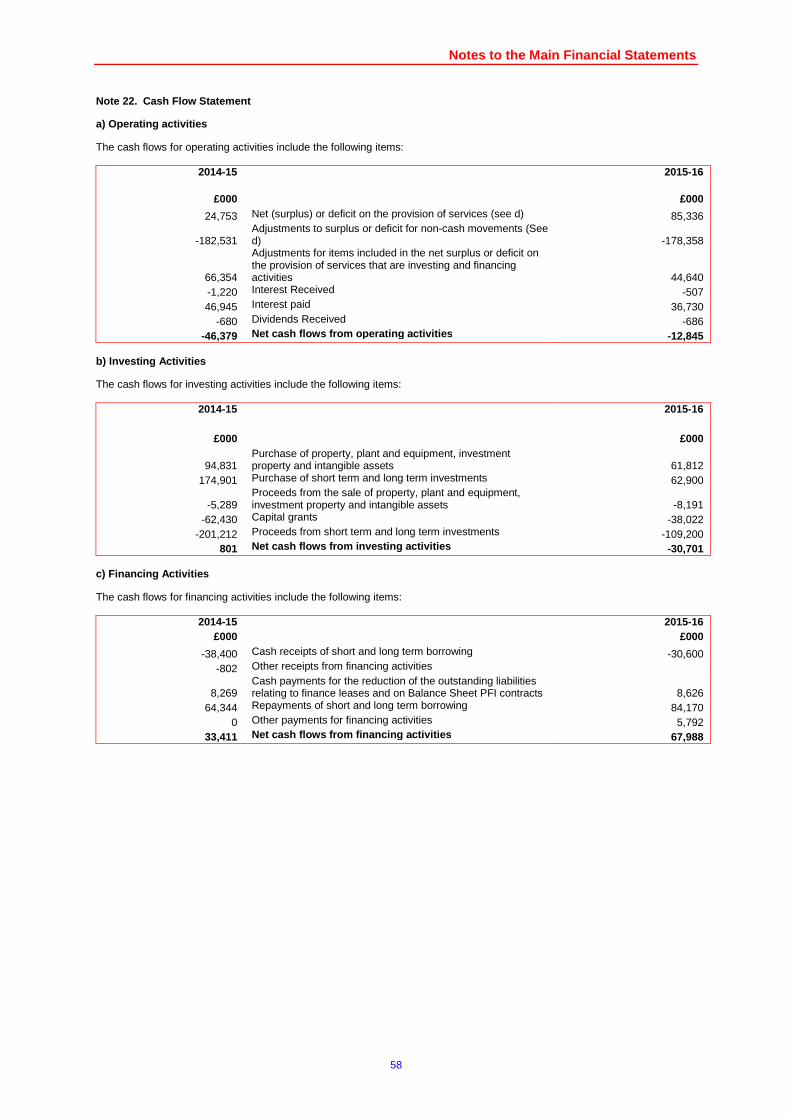
Notes to the Main Financial Statements
58
Cash Flow Statement Note 22.
a) Operating activities
The cash flows for operating activities include the following items:
2014-15 2015-16
£000 £000
24,753 Net (surplus) or deficit on the provision of services (see d) 85,336
-182,531 Adjustments to surplus or deficit for non-cash movements (See d) -178,358
66,354
Adjustments for items included in the net surplus or deficit on the provision of services that are investing and financing activities 44,640
-1,220 Interest Received -507 46,945 Interest paid 36,730
-680 Dividends Received -686 -46,379 Net cash flows from operating activities -12,845
b) Investing Activities
The cash flows for investing activities include the following items:
2014-15 2015-16
£000 £000
94,831 Purchase of property, plant and equipment, investment property and intangible assets 61,812
174,901 Purchase of short term and long term investments 62,900
-5,289 Proceeds from the sale of property, plant and equipment, investment property and intangible assets -8,191
-62,430 Capital grants -38,022 -201,212 Proceeds from short term and long term investments -109,200
801 Net cash flows from investing activities -30,701 c) Financing Activities
The cash flows for financing activities include the following items:
2014-15 2015-16 £000 £000
-38,400 Cash receipts of short and long term borrowing -30,600 -802 Other receipts from financing activities
8,269 Cash payments for the reduction of the outstanding liabilities relating to finance leases and on Balance Sheet PFI contracts 8,626
64,344 Repayments of short and long term borrowing 84,170 0 Other payments for financing activities 5,792
33,411 Net cash flows from financing activities 67,988
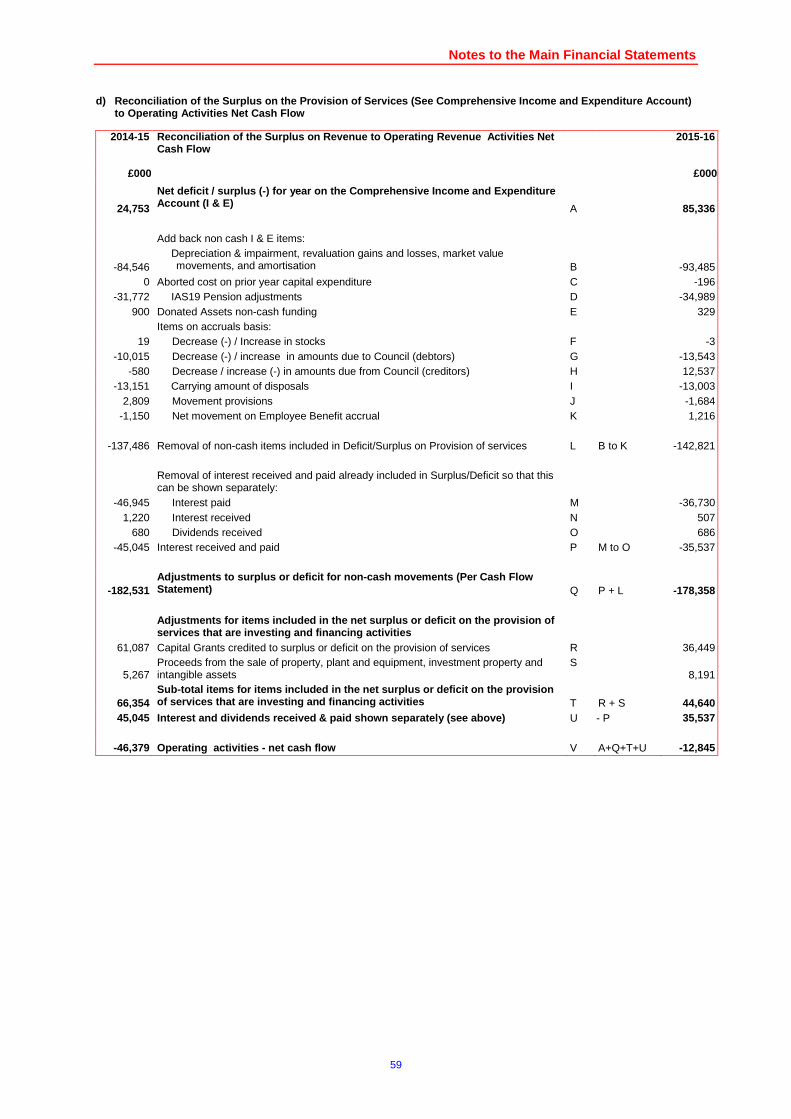
Notes to the Main Financial Statements
59
d) Reconciliation of the Surplus on the Provision o f Services (See Comprehensive Income and Expenditur e Account) to Operating Activities Net Cash Flow
2014-15
Reconciliation of the Surplus on Revenue to Operati ng Revenue Activities Net Cash Flow
2015-16
£000 £000
24,753
Net deficit / surplus (-) for year on the Comprehen sive Income and Expenditure Account (I & E)
A
85,336 Add back non cash I & E items:
-84,546 Depreciation & impairment, revaluation gains and losses, market value movements, and amortisation
B
-93,485
0 Aborted cost on prior year capital expenditure C -196 -31,772 IAS19 Pension adjustments D -34,989
900 Donated Assets non-cash funding E 329 Items on accruals basis:
19 Decrease (-) / Increase in stocks F -3 -10,015 Decrease (-) / increase in amounts due to Council (debtors) G -13,543
-580 Decrease / increase (-) in amounts due from Council (creditors) H 12,537 -13,151 Carrying amount of disposals I -13,003
2,809 Movement provisions J -1,684 -1,150 Net movement on Employee Benefit accrual K 1,216
-137,486 Removal of non-cash items included in Deficit/Surplus on Provision of services L B to K -142,821
Removal of interest received and paid already included in Surplus/Deficit so that this can be shown separately:
-46,945 Interest paid M -36,730 1,220 Interest received N 507
680 Dividends received O 686 -45,045 Interest received and paid P M to O -35,537
-182,531 Adjustments to surplus or deficit for non-cash move ments (Per Cash Flow Statement)
Q
P + L -178,358
Adjustments for items included in the net surplus o r deficit on the provision of services that are investing and financing activitie s
61,087 Capital Grants credited to surplus or deficit on the provision of services R 36,449
5,267 Proceeds from the sale of property, plant and equipment, investment property and intangible assets
S 8,191
66,354 Sub-total items for items included in the net surpl us or deficit on the provision of services that are investing and financing activi ties
T
R + S 44,640
45,045 Interest and dividends received & paid shown separa tely (see above) U - P 35,537
-46,379 Operating activities - net cash flow V A+Q+T+U -12,845
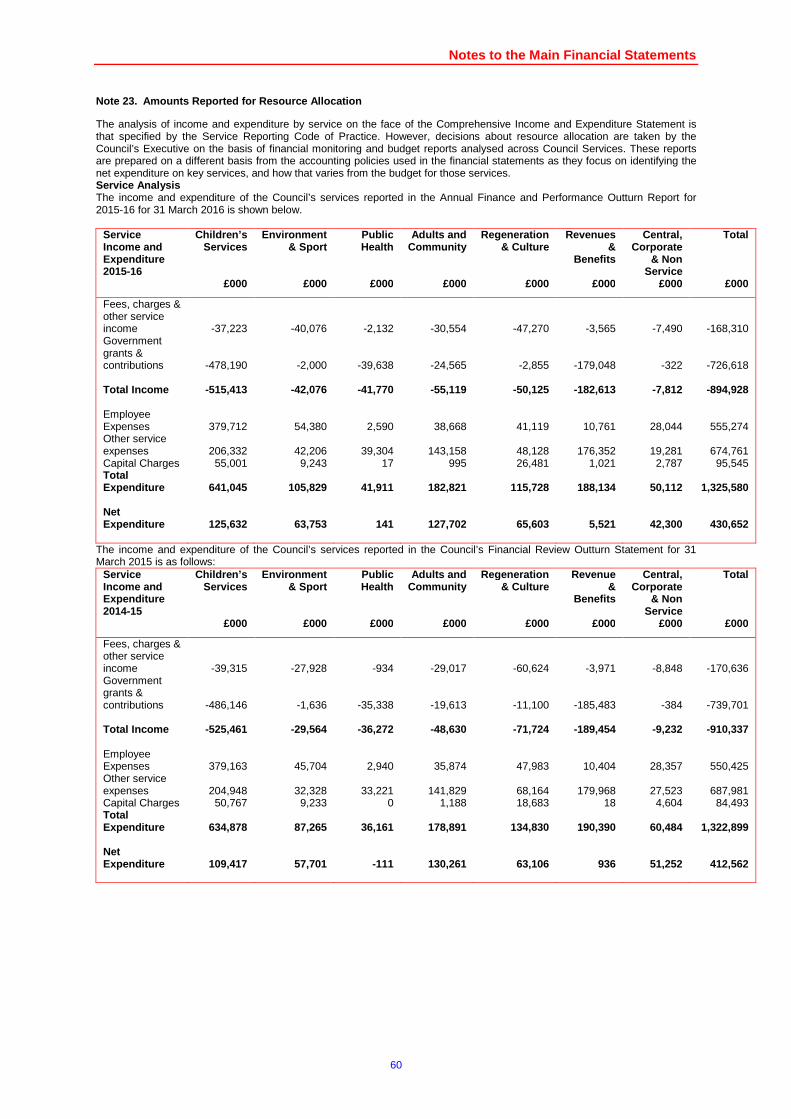
Notes to the Main Financial Statements
60
Amounts Reported for Resource Allocation Note 23.
The analysis of income and expenditure by service on the face of the Comprehensive Income and Expenditure Statement is that specified by the Service Reporting Code of Practice. However, decisions about resource allocation are taken by the Council’s Executive on the basis of financial monitoring and budget reports analysed across Council Services. These reports are prepared on a different basis from the accounting policies used in the financial statements as they focus on identifying the net expenditure on key services, and how that varies from the budget for those services. Service Analysis The income and expenditure of the Council’s services reported in the Annual Finance and Performance Outturn Report for 2015-16 for 31 March 2016 is shown below.
Service Income and Expenditure 2015-16
Children’s Services
Environment & Sport
Public Health
Adults and Community
Regeneration & Culture
Revenues &
Benefits
Central, Corporate
& Non Service
Total
£000 £000 £000 £000 £000 £000 £000 £000
Fees, charges & other service income -37,223 -40,076 -2,132 -30,554 -47,270 -3,565 -7,490 -168,310 Government grants & contributions -478,190 -2,000 -39,638 -24,565 -2,855 -179,048 -322 -726,618 Total Income -515,413 -42,076 -41,770 -55,119 -50,1 25 -182,613 -7,812 -894,928 Employee Expenses 379,712 54,380 2,590 38,668 41,119 10,761 28,044 555,274 Other service expenses 206,332 42,206 39,304 143,158 48,128 176,352 19,281 674,761 Capital Charges 55,001 9,243 17 995 26,481 1,021 2,787 95,545 Total Expenditure 641,045 105,829 41,911 182,821 115,728 188,134 50,112 1,325,580 Net Expenditure 125,632 63,753 141 127,702 65,603 5,521 42,300 430,652
The income and expenditure of the Council’s services reported in the Council’s Financial Review Outturn Statement for 31 March 2015 is as follows:
Service Income and Expenditure 2014-15
Children’s Services
Environment & Sport
Public Health
Adults and Community
Regeneration & Culture
Revenue &
Benefits
Central, Corporate
& Non Service
Total
£000 £000 £000 £000 £000 £000 £000 £000
Fees, charges & other service income -39,315 -27,928 -934 -29,017 -60,624 -3,971 -8,848 -170,636 Government grants & contributions -486,146 -1,636 -35,338 -19,613 -11,100 -185,483 -384 -739,701 Total Income -525,461 -29,564 -36,272 -48,630 -71,7 24 -189,454 -9,232 -910,337 Employee Expenses 379,163 45,704 2,940 35,874 47,983 10,404 28,357 550,425 Other service expenses 204,948 32,328 33,221 141,829 68,164 179,968 27,523 687,981 Capital Charges 50,767 9,233 0 1,188 18,683 18 4,604 84,493 Total Expenditure 634,878 87,265 36,161 178,891 134,830 1 90,390 60,484 1,322,899 Net Expenditure 109,417 57,701 -111 130,261 63,106 936 51,252 412,562
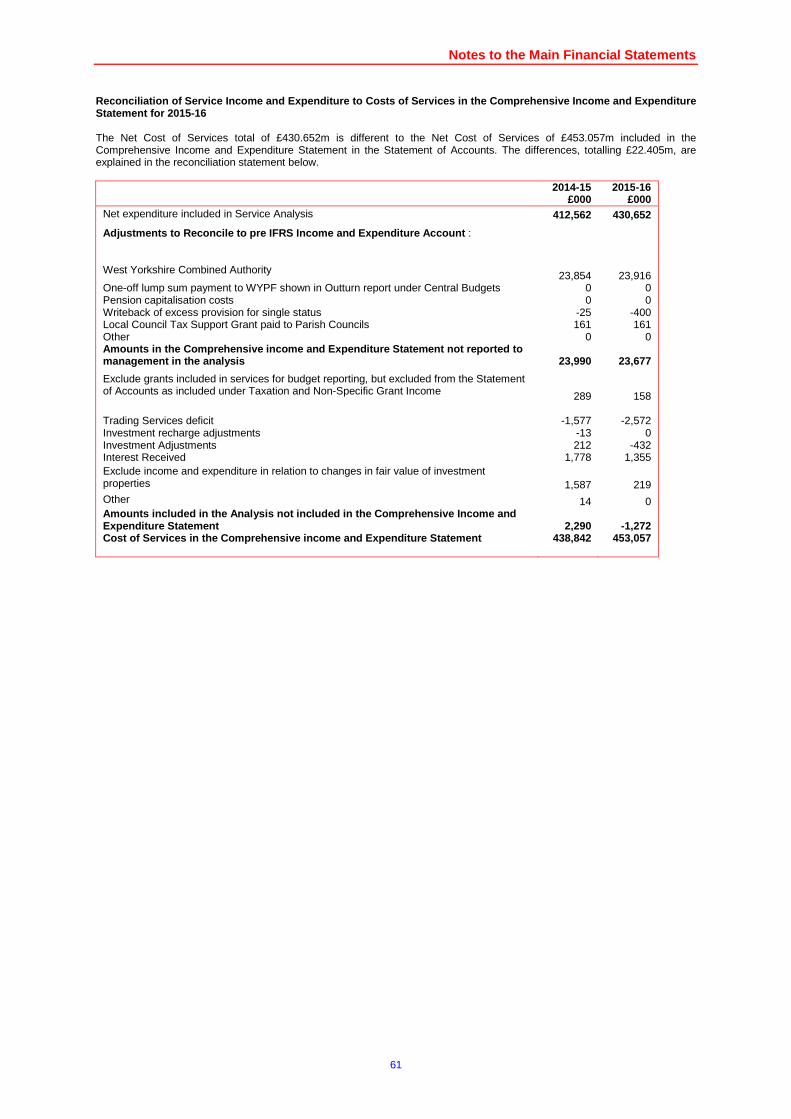
Notes to the Main Financial Statements
61
Reconciliation of Service Income and Expenditure to Costs of Services in the Comprehensive Income and Expenditure Statement for 2015-16 The Net Cost of Services total of £430.652m is different to the Net Cost of Services of £453.057m included in the Comprehensive Income and Expenditure Statement in the Statement of Accounts. The differences, totalling £22.405m, are explained in the reconciliation statement below.
2014-15 2015-16 £000 £000 Net expenditure included in Service Analysis 412,562 430,652
Adjustments to Reconcile to pre IFRS Income and Exp enditure Account :
West Yorkshire Combined Authority 23,854 23,916 One-off lump sum payment to WYPF shown in Outturn report under Central Budgets 0 0 Pension capitalisation costs 0 0 Writeback of excess provision for single status -25 -400 Local Council Tax Support Grant paid to Parish Councils 161 161 Other 0 0 Amounts in the Comprehensive income and Expenditure Statement not reported to management in the analysis 23,990 23,677
Exclude grants included in services for budget reporting, but excluded from the Statement of Accounts as included under Taxation and Non-Specific Grant Income 289 158 Trading Services deficit -1,577 -2,572 Investment recharge adjustments -13 0 Investment Adjustments 212 -432 Interest Received 1,778 1,355 Exclude income and expenditure in relation to changes in fair value of investment properties 1,587 219 Other 14 0 Amounts included in the Analysis not included in th e Comprehensive Income and Expenditure Statement 2,290 -1,272 Cost of Services in the Comprehensive income and Ex penditure Statement 438,842 453,057
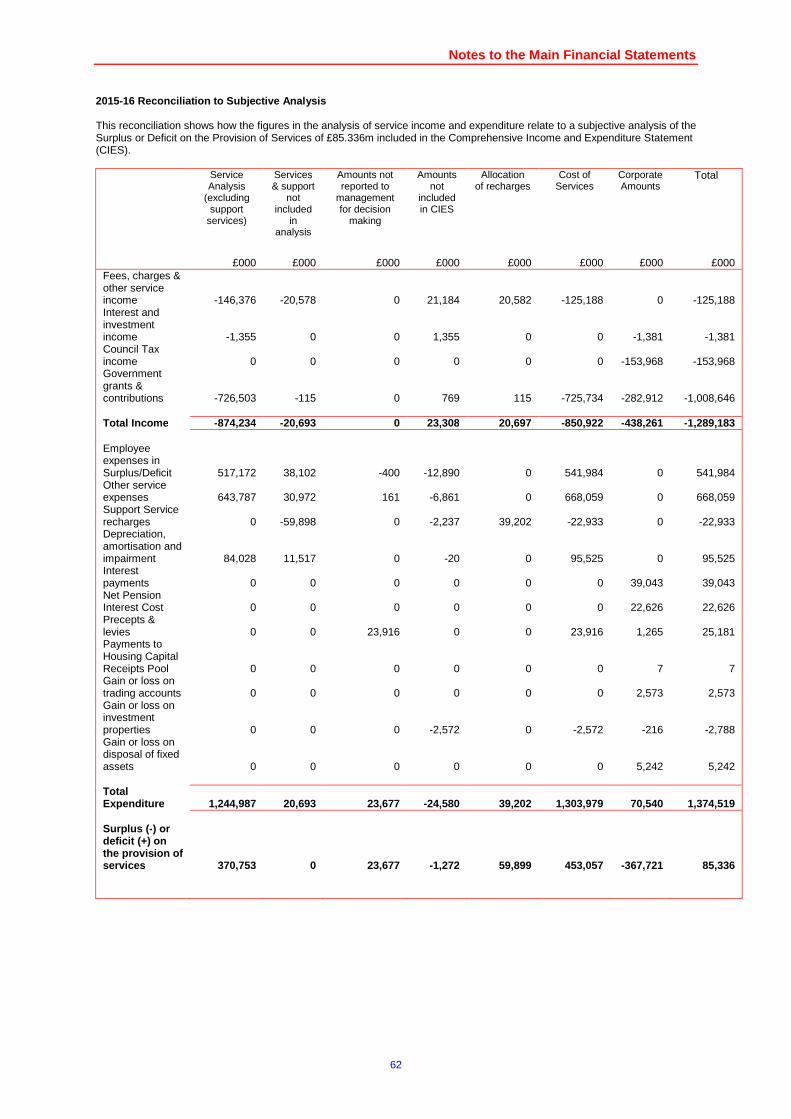
Notes to the Main Financial Statements
62
2015-16 Reconciliation to Subjective Analysis This reconciliation shows how the figures in the analysis of service income and expenditure relate to a subjective analysis of the Surplus or Deficit on the Provision of Services of £85.336m included in the Comprehensive Income and Expenditure Statement (CIES).
Service Analysis
(excluding support
services)
Services & support
not included
in analysis
Amounts not reported to
management for decision
making
Amounts not
included in CIES
Allocation of recharges
Cost of Services
Corporate Amounts
Total
£000 £000 £000
£000 £000 £000 £000 £000
Fees, charges & other service income -146,376 -20,578 0 21,184 20,582 -125,188 0 -125,188 Interest and investment income -1,355 0 0 1,355 0 0 -1,381 -1,381 Council Tax income 0 0 0 0 0 0 -153,968 -153,968 Government grants & contributions -726,503 -115 0 769 115 -725,734 -282,912 -1,008,646 Total Income -874,234 -20,693 0 23,308 20,697 -850,922 -438,261 -1,289,183 Employee expenses in Surplus/Deficit 517,172 38,102 -400 -12,890 0 541,984 0 541,984 Other service expenses 643,787 30,972 161 -6,861 0 668,059 0 668,059 Support Service recharges 0 -59,898 0 -2,237 39,202 -22,933 0 -22,933 Depreciation, amortisation and impairment 84,028 11,517 0 -20 0 95,525 0 95,525 Interest payments 0 0 0 0 0 0 39,043 39,043 Net Pension Interest Cost 0 0 0 0 0 0 22,626 22,626 Precepts & levies 0 0 23,916 0 0 23,916 1,265 25,181 Payments to Housing Capital Receipts Pool 0 0 0 0 0 0 7 7 Gain or loss on trading accounts 0 0 0 0 0 0 2,573 2,573 Gain or loss on investment properties 0 0 0 -2,572 0 -2,572 -216 -2,788 Gain or loss on disposal of fixed assets 0 0 0 0 0 0 5,242 5,242 Total Expenditure 1,244,987 20,693 23,677 -24,580 39,202 1,303,979 70,540 1,374,519 Surplus (-) or deficit (+) on the provision of services 370,753 0 23,677 -1,272 59,899 453,057 -36 7,721 85,336
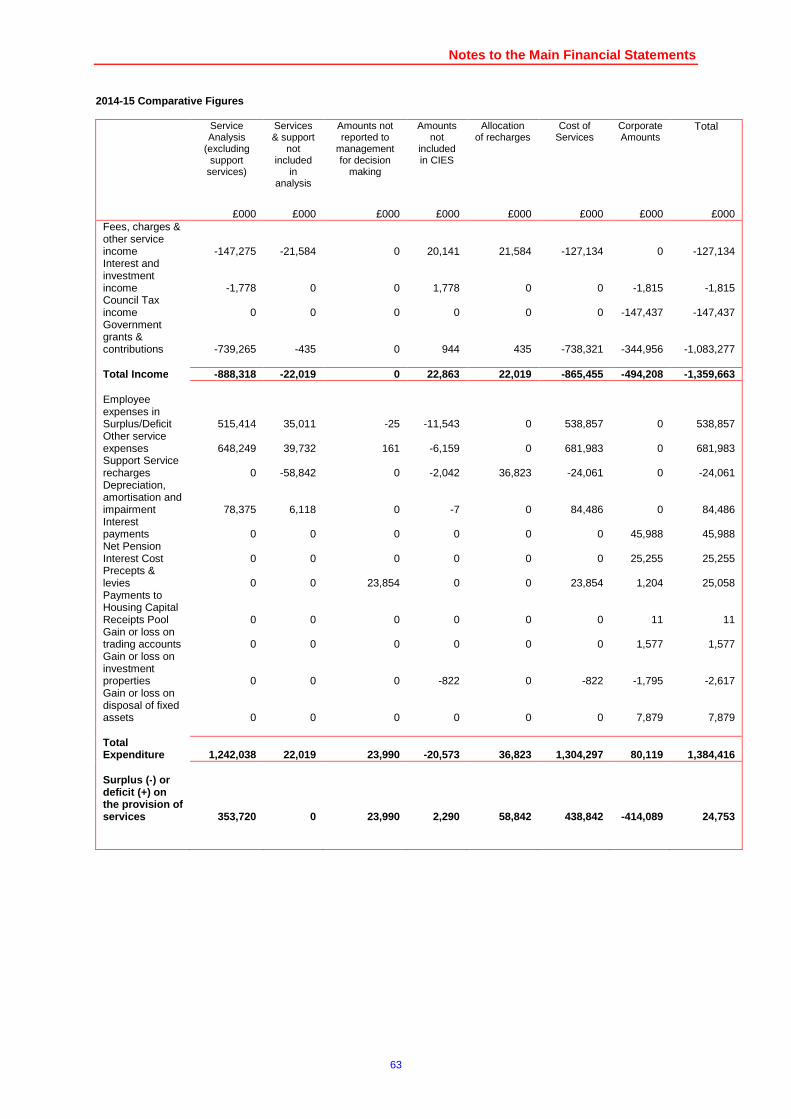
Notes to the Main Financial Statements
63
2014-15 Comparative Figures
Service Analysis
(excluding support
services)
Services & support
not included
in analysis
Amounts not reported to
management for decision
making
Amounts not
included in CIES
Allocation of recharges
Cost of Services
Corporate Amounts
Total
£000 £000 £000
£000 £000 £000 £000 £000
Fees, charges & other service income -147,275 -21,584 0 20,141 21,584 -127,134 0 -127,134 Interest and investment income -1,778 0 0 1,778 0 0 -1,815 -1,815 Council Tax income 0 0 0 0 0 0 -147,437 -147,437 Government grants & contributions -739,265 -435 0 944 435 -738,321 -344,956 -1,083,277 Total Income -888,318 -22,019 0 22,863 22,019 -865,455 -494,208 -1,359,663 Employee expenses in Surplus/Deficit 515,414 35,011 -25 -11,543 0 538,857 0 538,857 Other service expenses 648,249 39,732 161 -6,159 0 681,983 0 681,983 Support Service recharges 0 -58,842 0 -2,042 36,823 -24,061 0 -24,061 Depreciation, amortisation and impairment 78,375 6,118 0 -7 0 84,486 0 84,486 Interest payments 0 0 0 0 0 0 45,988 45,988 Net Pension Interest Cost 0 0 0 0 0 0 25,255 25,255 Precepts & levies 0 0 23,854 0 0 23,854 1,204 25,058 Payments to Housing Capital Receipts Pool 0 0 0 0 0 0 11 11 Gain or loss on trading accounts 0 0 0 0 0 0 1,577 1,577 Gain or loss on investment properties 0 0 0 -822 0 -822 -1,795 -2,617 Gain or loss on disposal of fixed assets 0 0 0 0 0 0 7,879 7,879 Total Expenditure 1,242,038 22,019 23,990 -20,573 36,823 1,304,297 80,119 1,384,416 Surplus (-) or deficit (+) on the provision of services 353,720 0 23,990 2,290 58,842 438,842 -414 ,089 24,753
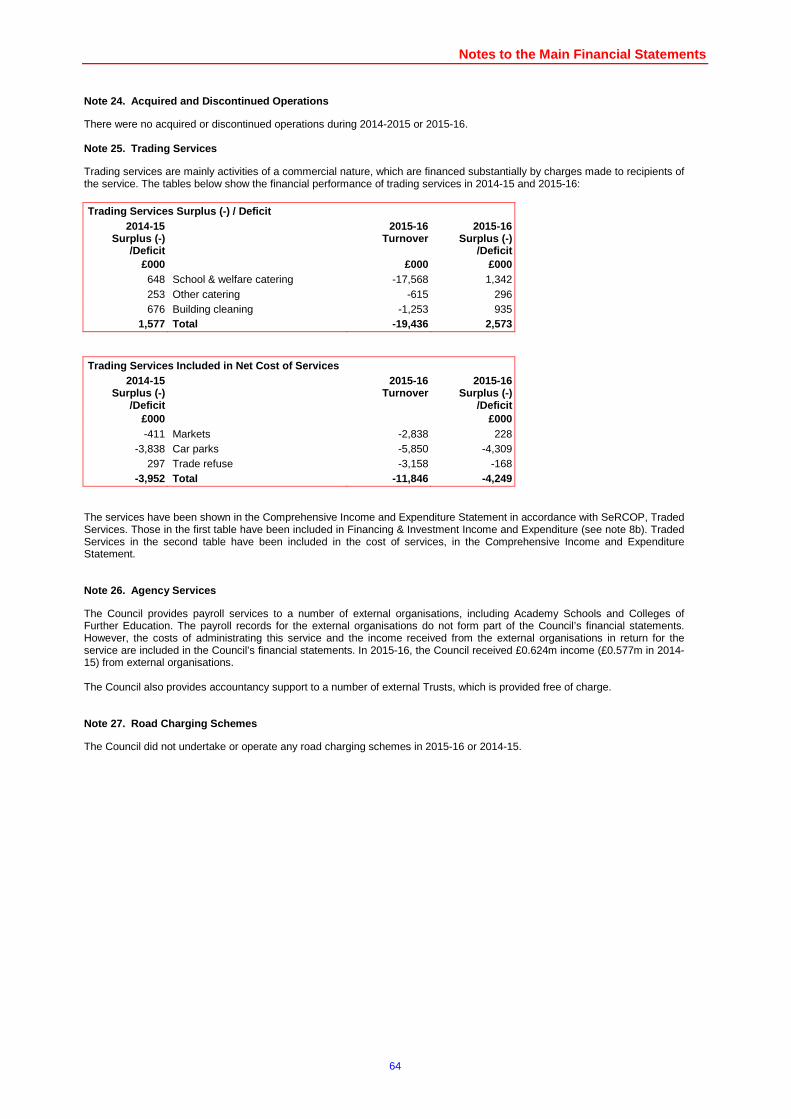
Notes to the Main Financial Statements
64
Acquired and Discontinued Operations Note 24.
There were no acquired or discontinued operations during 2014-2015 or 2015-16.
Trading Services Note 25.
Trading services are mainly activities of a commercial nature, which are financed substantially by charges made to recipients of the service. The tables below show the financial performance of trading services in 2014-15 and 2015-16: Trading Services Surplus (-) / Deficit
2014-15 Surplus (-)
/Deficit
2015-16 Turnover
2015-16 Surplus (-)
/Deficit £000 £000 £000 648 School & welfare catering -17,568 1,342 253 Other catering -615 296 676 Building cleaning -1,253 935
1,577 Total -19,436 2,573 Trading Services Included in Net Cost of Services
2014-15 Surplus (-)
/Deficit
2015-16 Turnover
2015-16 Surplus (-)
/Deficit £000 £000 -411 Markets -2,838 228
-3,838 Car parks -5,850 -4,309 297 Trade refuse -3,158 -168
-3,952 Total -11,846 -4,249 The services have been shown in the Comprehensive Income and Expenditure Statement in accordance with SeRCOP, Traded Services. Those in the first table have been included in Financing & Investment Income and Expenditure (see note 8b). Traded Services in the second table have been included in the cost of services, in the Comprehensive Income and Expenditure Statement.
Agency Services Note 26.
The Council provides payroll services to a number of external organisations, including Academy Schools and Colleges of Further Education. The payroll records for the external organisations do not form part of the Council’s financial statements. However, the costs of administrating this service and the income received from the external organisations in return for the service are included in the Council’s financial statements. In 2015-16, the Council received £0.624m income (£0.577m in 2014-15) from external organisations. The Council also provides accountancy support to a number of external Trusts, which is provided free of charge.
Road Charging Schemes Note 27.
The Council did not undertake or operate any road charging schemes in 2015-16 or 2014-15.
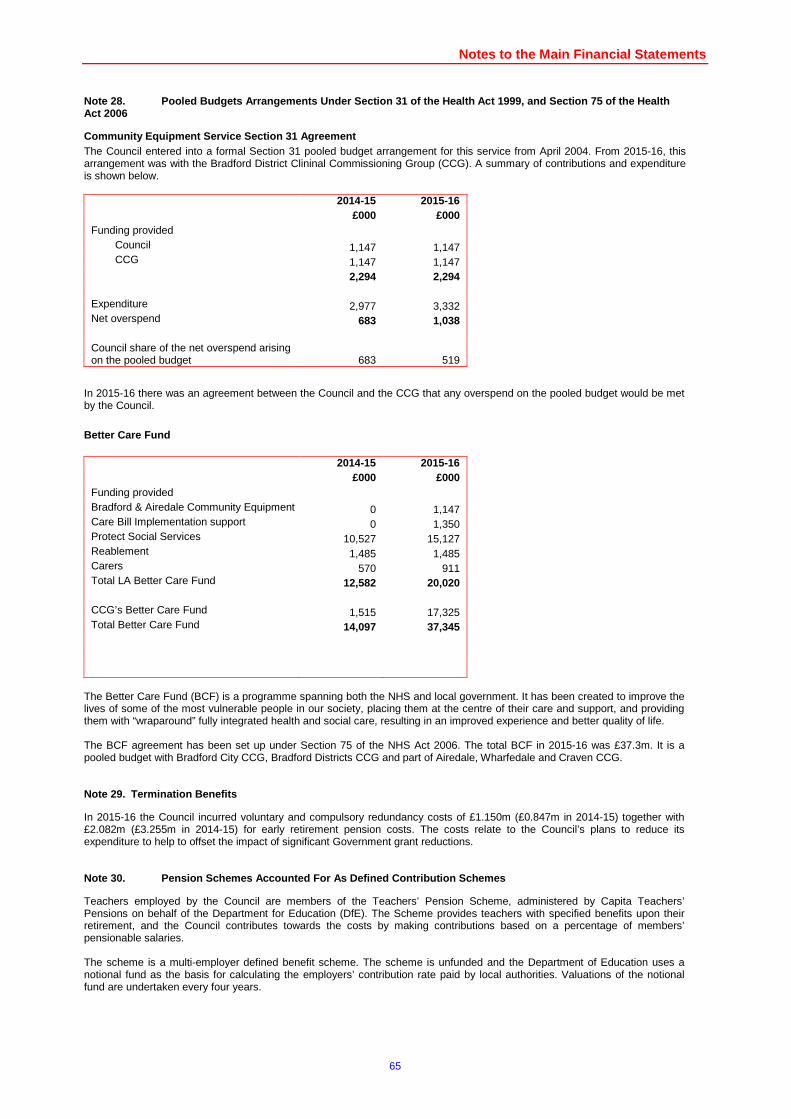
Notes to the Main Financial Statements
65
Pooled Budgets Arrangements Under Section 31 of the Health Act 1999, and Section 75 of the Health Note 28.Act 2006
Community Equipment Service Section 31 Agreement The Council entered into a formal Section 31 pooled budget arrangement for this service from April 2004. From 2015-16, this arrangement was with the Bradford District Clininal Commissioning Group (CCG). A summary of contributions and expenditure is shown below.
2014-15 2015-16 £000 £000 Funding provided
Council 1,147 1,147 CCG 1,147 1,147
2,294 2,294 Expenditure 2,977 3,332 Net overspend 683 1,038 Council share of the net overspend arising on the pooled budget 683 519
In 2015-16 there was an agreement between the Council and the CCG that any overspend on the pooled budget would be met by the Council.
Better Care Fund
2014-15 2015-16 £000 £000 Funding provided Bradford & Airedale Community Equipment 0 1,147 Care Bill Implementation support 0 1,350 Protect Social Services 10,527 15,127 Reablement 1,485 1,485 Carers 570 911 Total LA Better Care Fund 12,582 20,020 CCG’s Better Care Fund 1,515 17,325 Total Better Care Fund 14,097 37,345
The Better Care Fund (BCF) is a programme spanning both the NHS and local government. It has been created to improve the lives of some of the most vulnerable people in our society, placing them at the centre of their care and support, and providing them with “wraparound” fully integrated health and social care, resulting in an improved experience and better quality of life. The BCF agreement has been set up under Section 75 of the NHS Act 2006. The total BCF in 2015-16 was £37.3m. It is a pooled budget with Bradford City CCG, Bradford Districts CCG and part of Airedale, Wharfedale and Craven CCG.
Termination Benefits Note 29.
In 2015-16 the Council incurred voluntary and compulsory redundancy costs of £1.150m (£0.847m in 2014-15) together with £2.082m (£3.255m in 2014-15) for early retirement pension costs. The costs relate to the Council’s plans to reduce its expenditure to help to offset the impact of significant Government grant reductions.
Pension Schemes Accounted For As Defined Contributi on Schemes Note 30.
Teachers employed by the Council are members of the Teachers’ Pension Scheme, administered by Capita Teachers’ Pensions on behalf of the Department for Education (DfE). The Scheme provides teachers with specified benefits upon their retirement, and the Council contributes towards the costs by making contributions based on a percentage of members’ pensionable salaries. The scheme is a multi-employer defined benefit scheme. The scheme is unfunded and the Department of Education uses a notional fund as the basis for calculating the employers’ contribution rate paid by local authorities. Valuations of the notional fund are undertaken every four years.
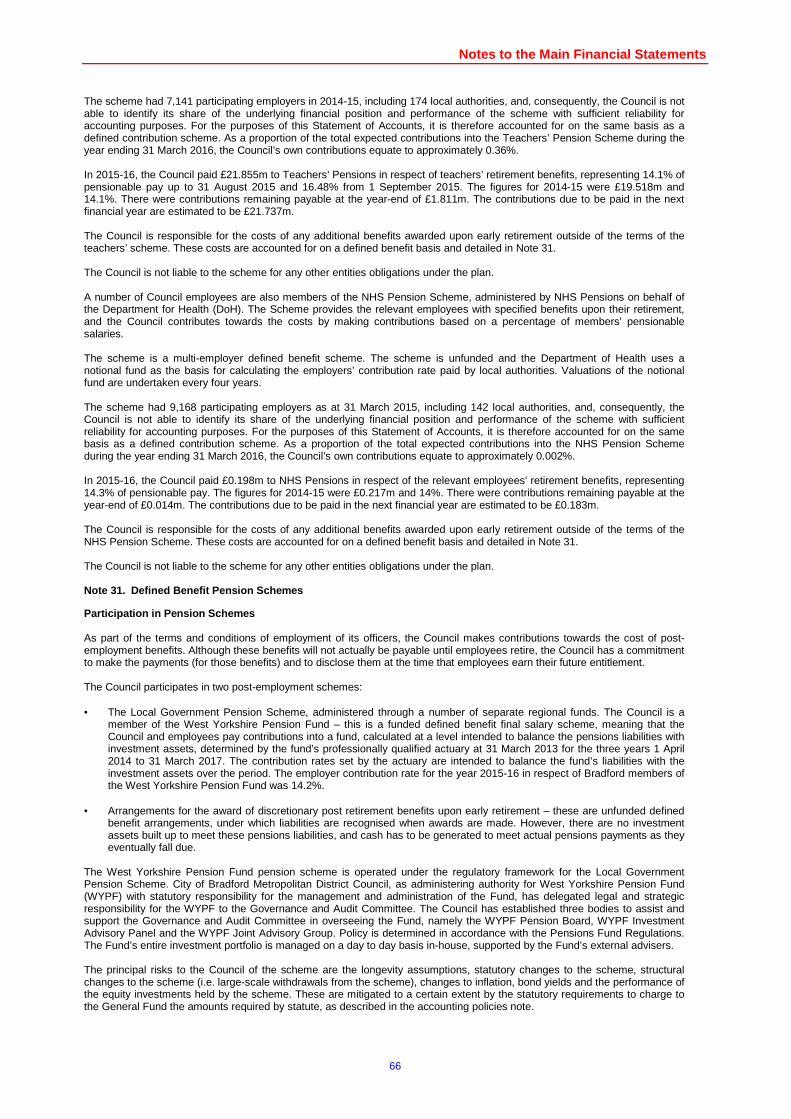
Notes to the Main Financial Statements
66
The scheme had 7,141 participating employers in 2014-15, including 174 local authorities, and, consequently, the Council is not able to identify its share of the underlying financial position and performance of the scheme with sufficient reliability for accounting purposes. For the purposes of this Statement of Accounts, it is therefore accounted for on the same basis as a defined contribution scheme. As a proportion of the total expected contributions into the Teachers’ Pension Scheme during the year ending 31 March 2016, the Council’s own contributions equate to approximately 0.36%. In 2015-16, the Council paid £21.855m to Teachers’ Pensions in respect of teachers’ retirement benefits, representing 14.1% of pensionable pay up to 31 August 2015 and 16.48% from 1 September 2015. The figures for 2014-15 were £19.518m and 14.1%. There were contributions remaining payable at the year-end of £1.811m. The contributions due to be paid in the next financial year are estimated to be £21.737m. The Council is responsible for the costs of any additional benefits awarded upon early retirement outside of the terms of the teachers’ scheme. These costs are accounted for on a defined benefit basis and detailed in Note 31. The Council is not liable to the scheme for any other entities obligations under the plan. A number of Council employees are also members of the NHS Pension Scheme, administered by NHS Pensions on behalf of the Department for Health (DoH). The Scheme provides the relevant employees with specified benefits upon their retirement, and the Council contributes towards the costs by making contributions based on a percentage of members’ pensionable salaries. The scheme is a multi-employer defined benefit scheme. The scheme is unfunded and the Department of Health uses a notional fund as the basis for calculating the employers’ contribution rate paid by local authorities. Valuations of the notional fund are undertaken every four years. The scheme had 9,168 participating employers as at 31 March 2015, including 142 local authorities, and, consequently, the Council is not able to identify its share of the underlying financial position and performance of the scheme with sufficient reliability for accounting purposes. For the purposes of this Statement of Accounts, it is therefore accounted for on the same basis as a defined contribution scheme. As a proportion of the total expected contributions into the NHS Pension Scheme during the year ending 31 March 2016, the Council’s own contributions equate to approximately 0.002%. In 2015-16, the Council paid £0.198m to NHS Pensions in respect of the relevant employees' retirement benefits, representing 14.3% of pensionable pay. The figures for 2014-15 were £0.217m and 14%. There were contributions remaining payable at the year-end of £0.014m. The contributions due to be paid in the next financial year are estimated to be £0.183m. The Council is responsible for the costs of any additional benefits awarded upon early retirement outside of the terms of the NHS Pension Scheme. These costs are accounted for on a defined benefit basis and detailed in Note 31. The Council is not liable to the scheme for any other entities obligations under the plan.
Defined Benefit Pension Schemes Note 31.
Participation in Pension Schemes As part of the terms and conditions of employment of its officers, the Council makes contributions towards the cost of post-employment benefits. Although these benefits will not actually be payable until employees retire, the Council has a commitment to make the payments (for those benefits) and to disclose them at the time that employees earn their future entitlement. The Council participates in two post-employment schemes: • The Local Government Pension Scheme, administered through a number of separate regional funds. The Council is a
member of the West Yorkshire Pension Fund – this is a funded defined benefit final salary scheme, meaning that the Council and employees pay contributions into a fund, calculated at a level intended to balance the pensions liabilities with investment assets, determined by the fund’s professionally qualified actuary at 31 March 2013 for the three years 1 April 2014 to 31 March 2017. The contribution rates set by the actuary are intended to balance the fund’s liabilities with the investment assets over the period. The employer contribution rate for the year 2015-16 in respect of Bradford members of the West Yorkshire Pension Fund was 14.2%.
• Arrangements for the award of discretionary post retirement benefits upon early retirement – these are unfunded defined
benefit arrangements, under which liabilities are recognised when awards are made. However, there are no investment assets built up to meet these pensions liabilities, and cash has to be generated to meet actual pensions payments as they eventually fall due.
The West Yorkshire Pension Fund pension scheme is operated under the regulatory framework for the Local Government Pension Scheme. City of Bradford Metropolitan District Council, as administering authority for West Yorkshire Pension Fund (WYPF) with statutory responsibility for the management and administration of the Fund, has delegated legal and strategic responsibility for the WYPF to the Governance and Audit Committee. The Council has established three bodies to assist and support the Governance and Audit Committee in overseeing the Fund, namely the WYPF Pension Board, WYPF Investment Advisory Panel and the WYPF Joint Advisory Group. Policy is determined in accordance with the Pensions Fund Regulations. The Fund’s entire investment portfolio is managed on a day to day basis in-house, supported by the Fund’s external advisers. The principal risks to the Council of the scheme are the longevity assumptions, statutory changes to the scheme, structural changes to the scheme (i.e. large-scale withdrawals from the scheme), changes to inflation, bond yields and the performance of the equity investments held by the scheme. These are mitigated to a certain extent by the statutory requirements to charge to the General Fund the amounts required by statute, as described in the accounting policies note.

Notes to the Main Financial Statements
67
Discretionary Post-retirement Benefits Discretionary post-retirement benefits on early retirement are an unfunded defined benefit arrangement, under which liabilities are recognised when awards are made. There are no plan assets built up to meet these pension liabilities.
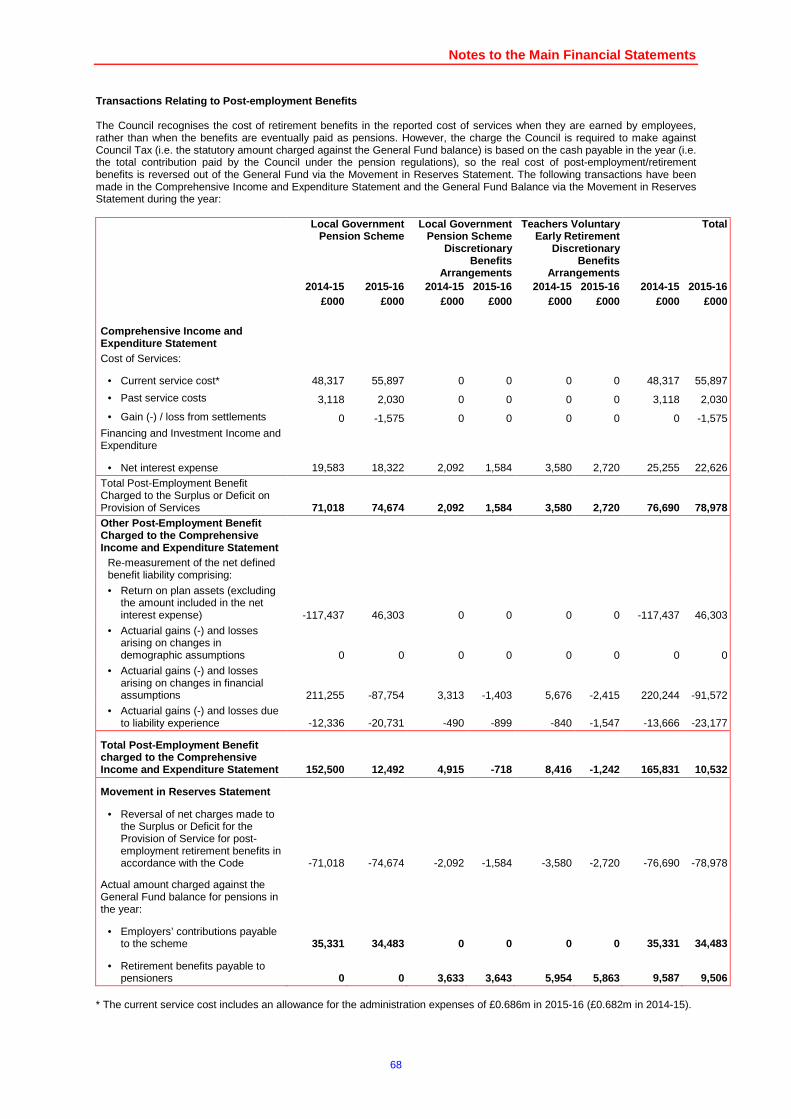
Notes to the Main Financial Statements
68
Transactions Relating to Post-employment Benefits The Council recognises the cost of retirement benefits in the reported cost of services when they are earned by employees, rather than when the benefits are eventually paid as pensions. However, the charge the Council is required to make against Council Tax (i.e. the statutory amount charged against the General Fund balance) is based on the cash payable in the year (i.e. the total contribution paid by the Council under the pension regulations), so the real cost of post-employment/retirement benefits is reversed out of the General Fund via the Movement in Reserves Statement. The following transactions have been made in the Comprehensive Income and Expenditure Statement and the General Fund Balance via the Movement in Reserves Statement during the year:
Local Government Pension Scheme
Local Government Pension Scheme
Discretionary Benefits
Arrangements
Teachers Voluntary Early Retirement
Discretionary Benefits
Arrangements
Total
2014-15 2015-16 2014-15 2015-16 2014-15 2015-16 2014-15 2015-16 £000 £000 £000 £000 £000 £000 £000 £000
Comprehensive Income and Expenditure Statement
Cost of Services:
• Current service cost* 48,317 55,897 0 0 0 0 48,317 55,897
• Past service costs 3,118 2,030 0 0 0 0 3,118 2,030
• Gain (-) / loss from settlements 0 -1,575 0 0 0 0 0 -1,575 Financing and Investment Income and Expenditure
• Net interest expense 19,583 18,322 2,092 1,584 3,580 2,720 25,255 22,626
Total Post-Employment Benefit Charged to the Surplus or Deficit on Provision of Services 71,018 74,674 2,092 1,584 3,580 2,720 76,690 78,978 Other Post-Employment Benefit Charged to the Comprehensive Income and Expenditure Statement
Re-measurement of the net defined benefit liability comprising:
• Return on plan assets (excluding the amount included in the net interest expense) -117,437 46,303 0 0 0 0 -117,437 46,303
• Actuarial gains (-) and losses arising on changes in demographic assumptions 0 0 0 0 0 0 0 0
• Actuarial gains (-) and losses arising on changes in financial assumptions 211,255 -87,754 3,313 -1,403 5,676 -2,415 220,244 -91,572
• Actuarial gains (-) and losses due to liability experience -12,336 -20,731 -490 -899 -840 -1,547 -13,666 -23,177
Total Post-Employment Benefit charged to the Comprehensive Income and Expenditure Statement 152,500 12,492 4,915 -718 8,416 -1,242 165,831 10,532
Movement in Reserves Statement
• Reversal of net charges made to the Surplus or Deficit for the Provision of Service for post-employment retirement benefits in accordance with the Code -71,018 -74,674 -2,092 -1,584 -3,580 -2,720 -76,690 -78,978
Actual amount charged against the General Fund balance for pensions in the year:
• Employers’ contributions payable to the scheme 35,331 34,483 0 0 0 0 35,331 34,483
• Retirement benefits payable to pensioners 0 0 3,633 3,643 5,954 5,863 9,587 9,506
* The current service cost includes an allowance for the administration expenses of £0.686m in 2015-16 (£0.682m in 2014-15).
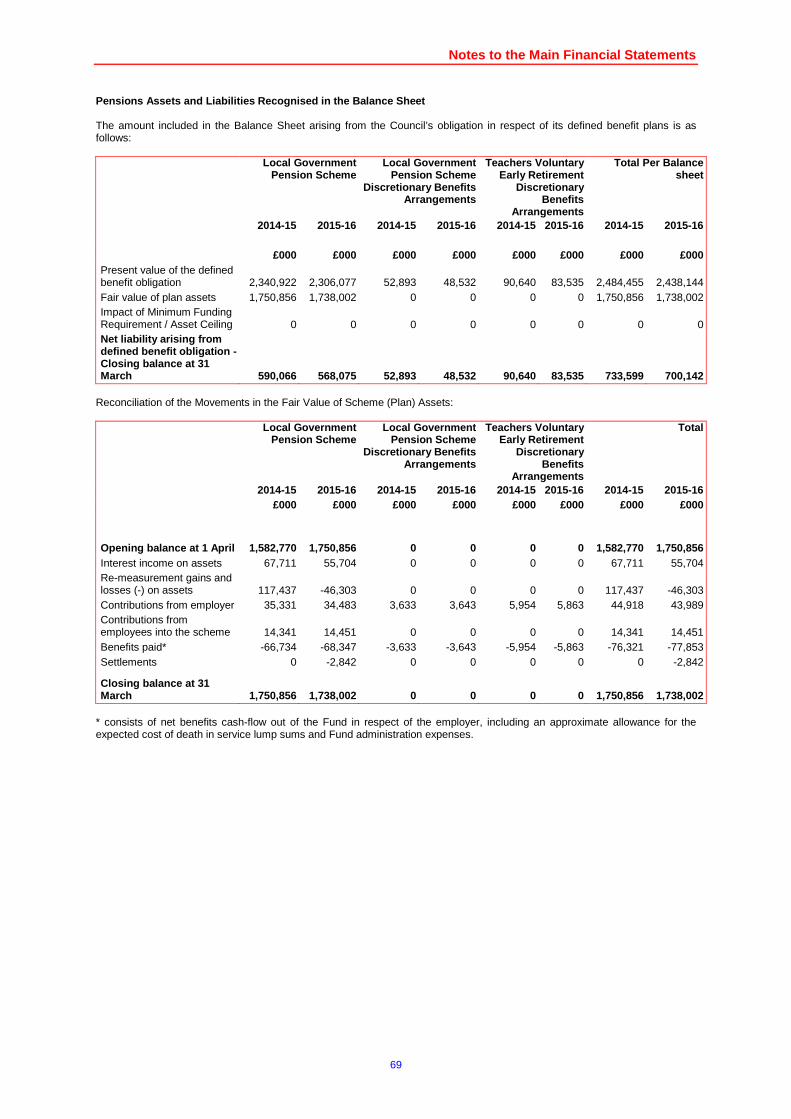
Notes to the Main Financial Statements
69
Pensions Assets and Liabilities Recognised in the B alance Sheet The amount included in the Balance Sheet arising from the Council’s obligation in respect of its defined benefit plans is as follows:
Local Government Pension Scheme
Local Government Pension Scheme
Discretionary Benefits Arrangements
Teachers Voluntary Early Retirement
Discretionary Benefits
Arrangements
Total Per Balance sheet
2014-15 2015-16 2014-15 2015-16 2014-15 2015-16 2014-15 2015-16 £000 £000 £000 £000 £000 £000 £000 £000
Present value of the defined benefit obligation 2,340,922 2,306,077 52,893 48,532 90,640 83,535 2,484,455 2,438,144 Fair value of plan assets 1,750,856 1,738,002 0 0 0 0 1,750,856 1,738,002 Impact of Minimum Funding Requirement / Asset Ceiling 0 0 0 0 0 0 0 0 Net liability arising from defined benefit obligation - Closing balance at 31 March 590,066 568,075 52,893 48,532 90,640 83,535 733,599 700,142
Reconciliation of the Movements in the Fair Value of Scheme (Plan) Assets:
Local Government Pension Scheme
Local Government Pension Scheme
Discretionary Benefits Arrangements
Teachers Voluntary Early Retirement
Discretionary Benefits
Arrangements
Total
2014-15 2015-16 2014-15 2015-16 2014-15 2015-16 2014-15 2015-16 £000 £000 £000 £000 £000 £000 £000 £000
Opening balance at 1 April 1,582,770 1,750,856 0 0 0 0 1,582,770 1,750,856 Interest income on assets 67,711 55,704 0 0 0 0 67,711 55,704 Re-measurement gains and losses (-) on assets 117,437 -46,303 0 0 0 0 117,437 -46,303 Contributions from employer 35,331 34,483 3,633 3,643 5,954 5,863 44,918 43,989 Contributions from employees into the scheme 14,341 14,451 0 0 0 0 14,341 14,451 Benefits paid* -66,734 -68,347 -3,633 -3,643 -5,954 -5,863 -76,321 -77,853 Settlements 0 -2,842 0 0 0 0 0 -2,842
Closing balance at 31 March 1,750,856 1,738,002 0 0 0 0 1,750,856 1,738,002
* consists of net benefits cash-flow out of the Fund in respect of the employer, including an approximate allowance for the expected cost of death in service lump sums and Fund administration expenses.
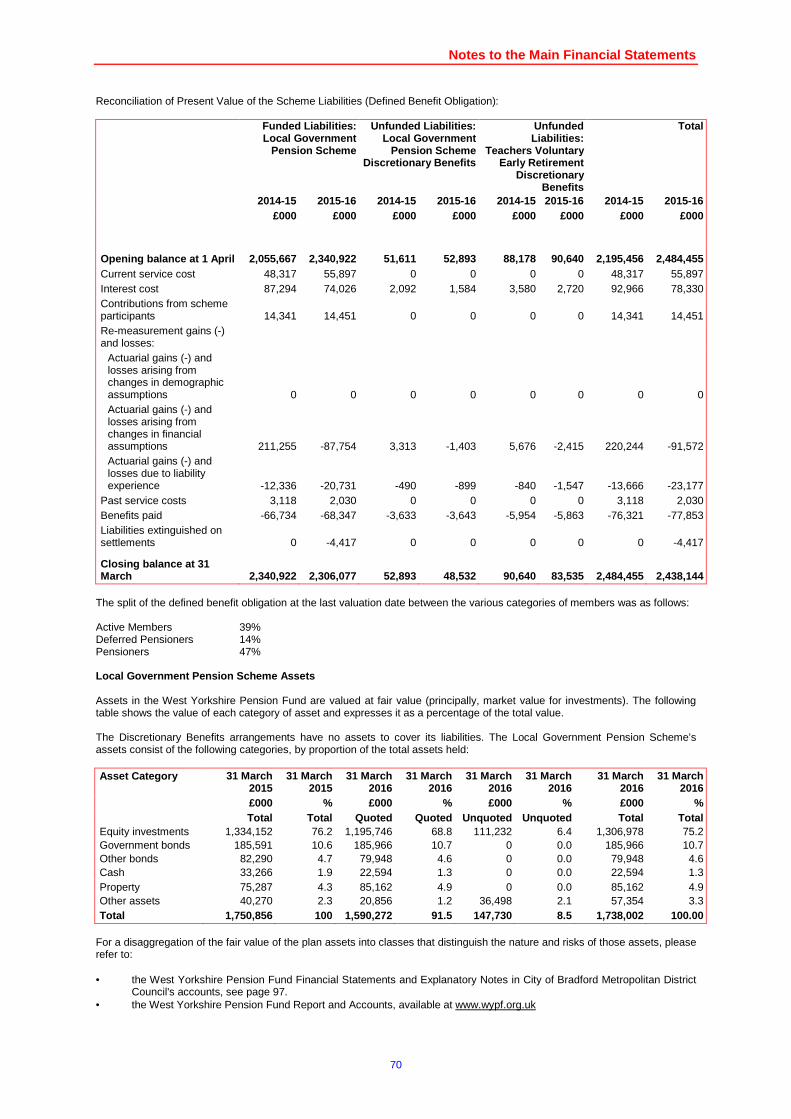
Notes to the Main Financial Statements
70
Reconciliation of Present Value of the Scheme Liabilities (Defined Benefit Obligation):
Funded Liabilities: Local Government
Pension Scheme
Unfunded Liabilities: Local Government
Pension Scheme Discretionary Benefits
Unfunded Liabilities:
Teachers Voluntary Early Retirement
Discretionary Benefits
Total
2014-15 2015-16 2014-15 2015-16 2014-15 2015-16 2014-15 2015-16 £000 £000 £000 £000 £000 £000 £000 £000
Opening balance at 1 April 2,055,667 2,340,922 51,611 52,893 88,178 90,640 2,195,456 2,484,455 Current service cost 48,317 55,897 0 0 0 0 48,317 55,897 Interest cost 87,294 74,026 2,092 1,584 3,580 2,720 92,966 78,330 Contributions from scheme participants 14,341 14,451 0 0 0 0 14,341 14,451 Re-measurement gains (-) and losses:
Actuarial gains (-) and losses arising from changes in demographic assumptions 0 0 0 0 0 0 0 0 Actuarial gains (-) and losses arising from changes in financial assumptions 211,255 -87,754 3,313 -1,403 5,676 -2,415 220,244 -91,572 Actuarial gains (-) and losses due to liability experience -12,336 -20,731 -490 -899 -840 -1,547 -13,666 -23,177
Past service costs 3,118 2,030 0 0 0 0 3,118 2,030 Benefits paid -66,734 -68,347 -3,633 -3,643 -5,954 -5,863 -76,321 -77,853 Liabilities extinguished on settlements 0 -4,417 0 0 0 0 0 -4,417
Closing balance at 31 March 2,340,922 2,306,077 52,893 48,532 90,640 83,535 2,484,455 2,438,144
The split of the defined benefit obligation at the last valuation date between the various categories of members was as follows: Active Members 39% Deferred Pensioners 14% Pensioners 47% Local Government Pension Scheme Assets Assets in the West Yorkshire Pension Fund are valued at fair value (principally, market value for investments). The following table shows the value of each category of asset and expresses it as a percentage of the total value. The Discretionary Benefits arrangements have no assets to cover its liabilities. The Local Government Pension Scheme’s assets consist of the following categories, by proportion of the total assets held: Asset Category 31 March
2015 31 March
2015 31 March
2016 31 March
2016 31 March
2016 31 March
2016 31 March
2016 31 March
2016 £000 % £000 % £000 % £000 % Total Total Quoted Quoted Unquoted Unquoted Total Total Equity investments 1,334,152 76.2 1,195,746 68.8 111,232 6.4 1,306,978 75.2 Government bonds 185,591 10.6 185,966 10.7 0 0.0 185,966 10.7 Other bonds 82,290 4.7 79,948 4.6 0 0.0 79,948 4.6 Cash 33,266 1.9 22,594 1.3 0 0.0 22,594 1.3 Property 75,287 4.3 85,162 4.9 0 0.0 85,162 4.9 Other assets 40,270 2.3 20,856 1.2 36,498 2.1 57,354 3.3 Total 1,750,856 100 1,590,272 91.5 147,730 8.5 1,738,002 100.00
For a disaggregation of the fair value of the plan assets into classes that distinguish the nature and risks of those assets, please refer to: • the West Yorkshire Pension Fund Financial Statements and Explanatory Notes in City of Bradford Metropolitan District
Council's accounts, see page 97. • the West Yorkshire Pension Fund Report and Accounts, available at www.wypf.org.uk
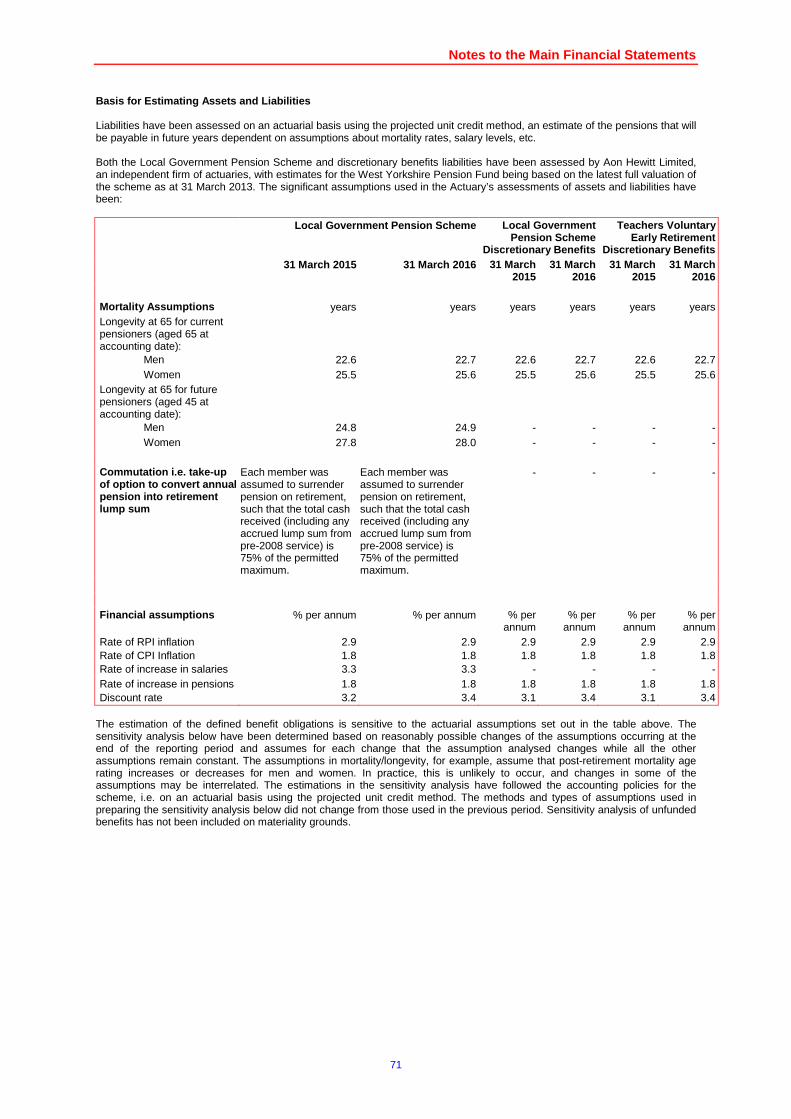
Notes to the Main Financial Statements
71
Basis for Estimating Assets and Liabilities Liabilities have been assessed on an actuarial basis using the projected unit credit method, an estimate of the pensions that will be payable in future years dependent on assumptions about mortality rates, salary levels, etc. Both the Local Government Pension Scheme and discretionary benefits liabilities have been assessed by Aon Hewitt Limited, an independent firm of actuaries, with estimates for the West Yorkshire Pension Fund being based on the latest full valuation of the scheme as at 31 March 2013. The significant assumptions used in the Actuary’s assessments of assets and liabilities have been: Local Government Pension Scheme Local Government
Pension Scheme Discretionary Benefits
Teachers Voluntary Early Retirement
Discretionary Benefits 31 March 2015 31 March 2016 31 March
2015 31 March
2016 31 March
2015 31 March
2016 Mortality Assumptions years years years years years years Longevity at 65 for current pensioners (aged 65 at accounting date):
Men 22.6 22.7 22.6 22.7 22.6 22.7 Women 25.5 25.6 25.5 25.6 25.5 25.6
Longevity at 65 for future pensioners (aged 45 at accounting date):
Men 24.8 24.9 - - - - Women 27.8 28.0 - - - -
Commutation i.e. take-up of option to convert annual pension into retirement lump sum
Each member was assumed to surrender pension on retirement, such that the total cash received (including any accrued lump sum from pre-2008 service) is 75% of the permitted maximum.
Each member was assumed to surrender pension on retirement, such that the total cash received (including any accrued lump sum from pre-2008 service) is 75% of the permitted maximum.
- - - -
Financial assumptions % per annum % per annum % per
annum % per
annum % per
annum % per
annum Rate of RPI inflation 2.9 2.9 2.9 2.9 2.9 2.9 Rate of CPI Inflation 1.8 1.8 1.8 1.8 1.8 1.8 Rate of increase in salaries 3.3 3.3 - - - - Rate of increase in pensions 1.8 1.8 1.8 1.8 1.8 1.8 Discount rate 3.2 3.4 3.1 3.4 3.1 3.4
The estimation of the defined benefit obligations is sensitive to the actuarial assumptions set out in the table above. The sensitivity analysis below have been determined based on reasonably possible changes of the assumptions occurring at the end of the reporting period and assumes for each change that the assumption analysed changes while all the other assumptions remain constant. The assumptions in mortality/longevity, for example, assume that post-retirement mortality age rating increases or decreases for men and women. In practice, this is unlikely to occur, and changes in some of the assumptions may be interrelated. The estimations in the sensitivity analysis have followed the accounting policies for the scheme, i.e. on an actuarial basis using the projected unit credit method. The methods and types of assumptions used in preparing the sensitivity analysis below did not change from those used in the previous period. Sensitivity analysis of unfunded benefits has not been included on materiality grounds.
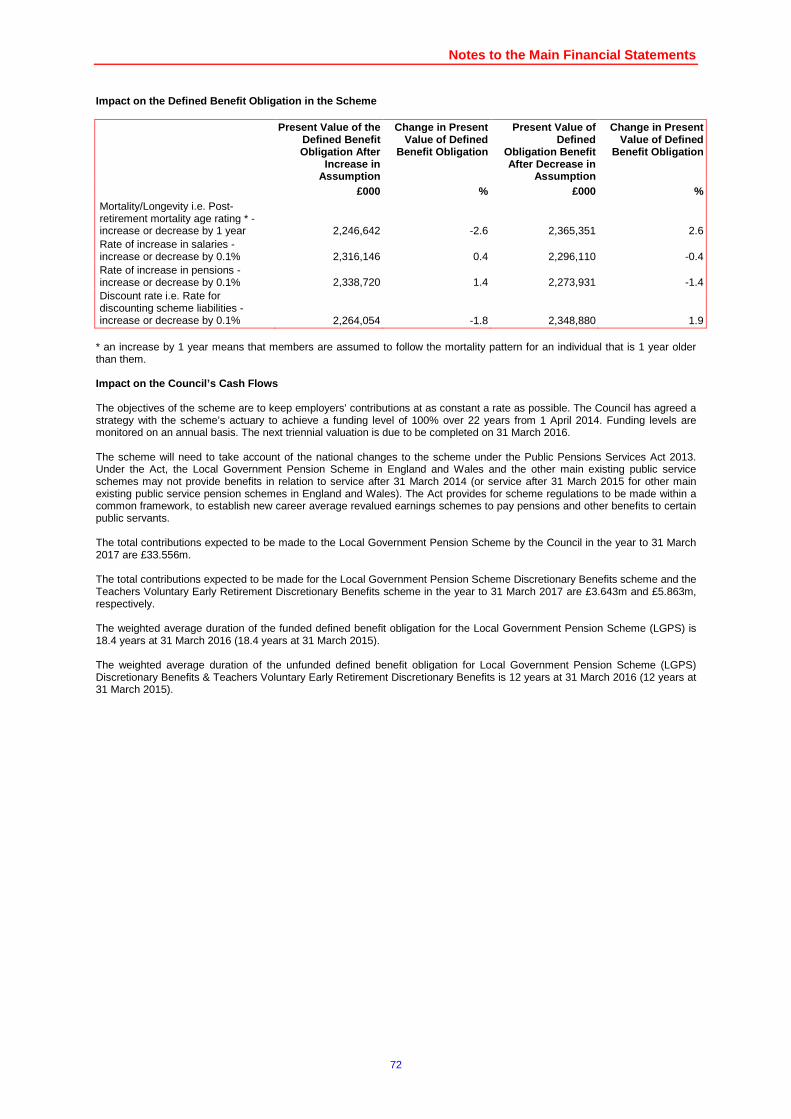
Notes to the Main Financial Statements
72
Impact on the Defined Benefit Obligation in the Sch eme Present Value of the
Defined Benefit Obligation After
Increase in Assumption
Change in Present Value of Defined
Benefit Obligation
Present Value of Defined
Obligation Benefit After Decrease in
Assumption
Change in Present Value of Defined
Benefit Obligation
£000 % £000 % Mortality/Longevity i.e. Post-retirement mortality age rating * - increase or decrease by 1 year 2,246,642 -2.6 2,365,351 2.6 Rate of increase in salaries - increase or decrease by 0.1% 2,316,146 0.4 2,296,110 -0.4 Rate of increase in pensions - increase or decrease by 0.1% 2,338,720 1.4 2,273,931 -1.4 Discount rate i.e. Rate for discounting scheme liabilities - increase or decrease by 0.1% 2,264,054 -1.8 2,348,880 1.9
* an increase by 1 year means that members are assumed to follow the mortality pattern for an individual that is 1 year older than them. Impact on the Council’s Cash Flows The objectives of the scheme are to keep employers’ contributions at as constant a rate as possible. The Council has agreed a strategy with the scheme’s actuary to achieve a funding level of 100% over 22 years from 1 April 2014. Funding levels are monitored on an annual basis. The next triennial valuation is due to be completed on 31 March 2016. The scheme will need to take account of the national changes to the scheme under the Public Pensions Services Act 2013. Under the Act, the Local Government Pension Scheme in England and Wales and the other main existing public service schemes may not provide benefits in relation to service after 31 March 2014 (or service after 31 March 2015 for other main existing public service pension schemes in England and Wales). The Act provides for scheme regulations to be made within a common framework, to establish new career average revalued earnings schemes to pay pensions and other benefits to certain public servants. The total contributions expected to be made to the Local Government Pension Scheme by the Council in the year to 31 March 2017 are £33.556m. The total contributions expected to be made for the Local Government Pension Scheme Discretionary Benefits scheme and the Teachers Voluntary Early Retirement Discretionary Benefits scheme in the year to 31 March 2017 are £3.643m and £5.863m, respectively. The weighted average duration of the funded defined benefit obligation for the Local Government Pension Scheme (LGPS) is 18.4 years at 31 March 2016 (18.4 years at 31 March 2015). The weighted average duration of the unfunded defined benefit obligation for Local Government Pension Scheme (LGPS) Discretionary Benefits & Teachers Voluntary Early Retirement Discretionary Benefits is 12 years at 31 March 2016 (12 years at 31 March 2015).
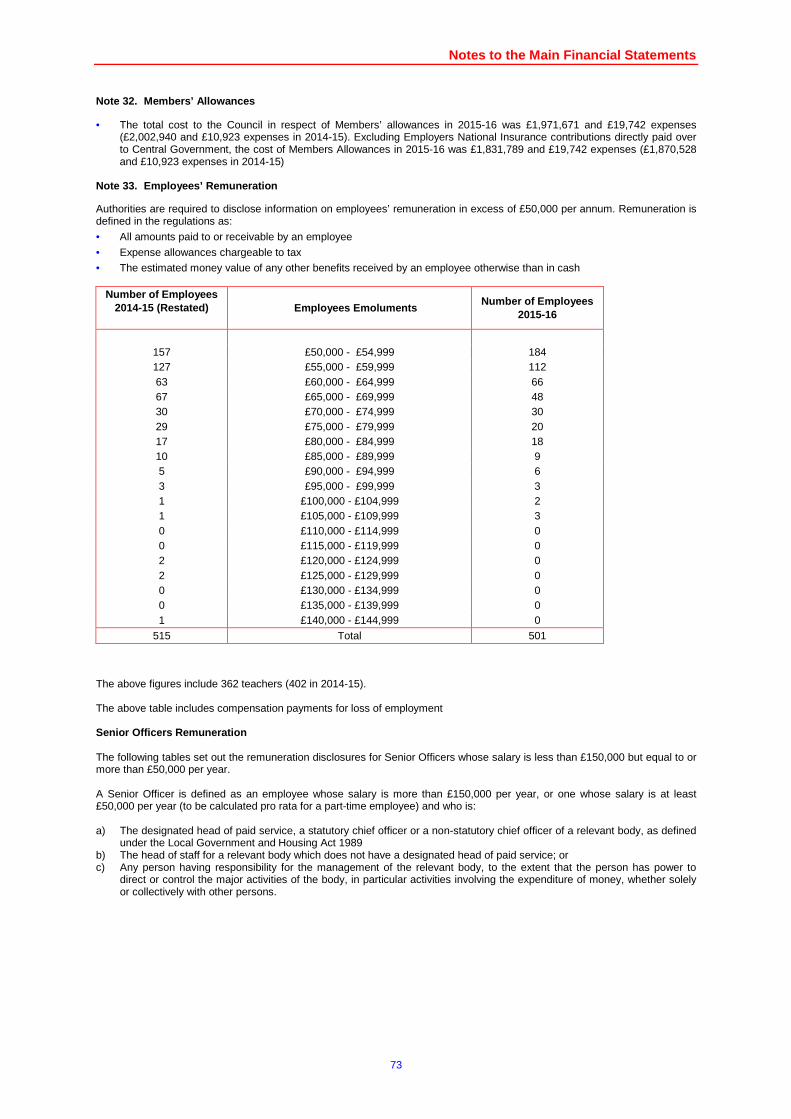
Notes to the Main Financial Statements
73
Members’ Allowances Note 32.
• The total cost to the Council in respect of Members’ allowances in 2015-16 was £1,971,671 and £19,742 expenses (£2,002,940 and £10,923 expenses in 2014-15). Excluding Employers National Insurance contributions directly paid over to Central Government, the cost of Members Allowances in 2015-16 was £1,831,789 and £19,742 expenses (£1,870,528 and £10,923 expenses in 2014-15)
Employees’ Remuneration Note 33.
Authorities are required to disclose information on employees’ remuneration in excess of £50,000 per annum. Remuneration is defined in the regulations as:
• All amounts paid to or receivable by an employee
• Expense allowances chargeable to tax
• The estimated money value of any other benefits received by an employee otherwise than in cash
Number of Employees 2014-15 (Restated)
Employees Emoluments
Number of Employees 2015-16
157 £50,000 - £54,999 184 127 £55,000 - £59,999 112 63 £60,000 - £64,999 66 67 £65,000 - £69,999 48 30 £70,000 - £74,999 30 29 £75,000 - £79,999 20 17 £80,000 - £84,999 18 10 £85,000 - £89,999 9 5 £90,000 - £94,999 6 3 £95,000 - £99,999 3 1 £100,000 - £104,999 2 1 £105,000 - £109,999 3 0 £110,000 - £114,999 0 0 £115,000 - £119,999 0 2 £120,000 - £124,999 0 2 £125,000 - £129,999 0 0 £130,000 - £134,999 0 0 £135,000 - £139,999 0 1 £140,000 - £144,999 0
515 Total 501
The above figures include 362 teachers (402 in 2014-15). The above table includes compensation payments for loss of employment Senior Officers Remuneration The following tables set out the remuneration disclosures for Senior Officers whose salary is less than £150,000 but equal to or more than £50,000 per year. A Senior Officer is defined as an employee whose salary is more than £150,000 per year, or one whose salary is at least £50,000 per year (to be calculated pro rata for a part-time employee) and who is: a) The designated head of paid service, a statutory chief officer or a non-statutory chief officer of a relevant body, as defined
under the Local Government and Housing Act 1989 b) The head of staff for a relevant body which does not have a designated head of paid service; or c) Any person having responsibility for the management of the relevant body, to the extent that the person has power to
direct or control the major activities of the body, in particular activities involving the expenditure of money, whether solely or collectively with other persons.
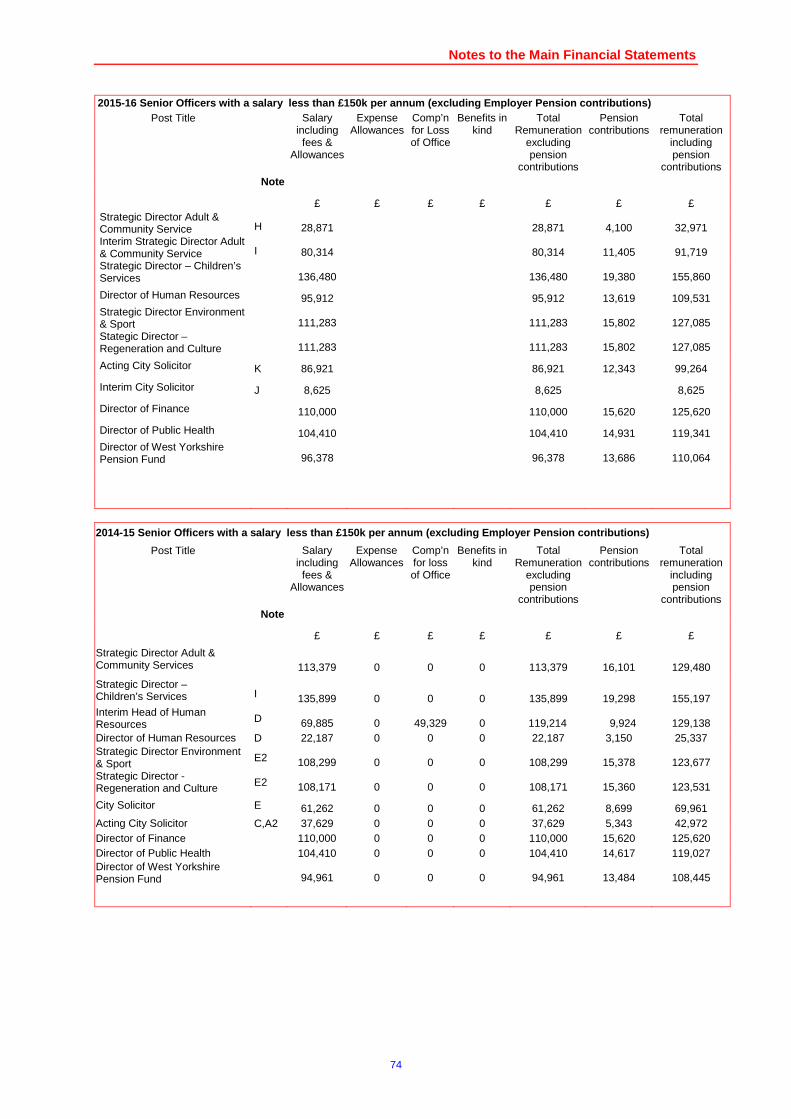
Notes to the Main Financial Statements
74
2015-16 Senior Officers with a salary less than £1 50k per annum (excluding Employer Pension contribut ions) Post Title Salary
including fees &
Allowances
Expense Allowances
Comp’n for Loss of Office
Benefits in kind
Total Remuneration
excluding pension
contributions
Pension contributions
Total remuneration
including pension
contributions Note
£ £ £ £ £ £ £ Strategic Director Adult & Community Service H 28,871 28,871 4,100 32,971 Interim Strategic Director Adult & Community Service I 80,314 80,314 11,405 91,719 Strategic Director – Children’s Services 136,480 136,480 19,380 155,860
Director of Human Resources 95,912 95,912 13,619 109,531 Strategic Director Environment & Sport 111,283 111,283 15,802 127,085 Stategic Director – Regeneration and Culture 111,283 111,283 15,802 127,085
Acting City Solicitor K 86,921 86,921 12,343 99,264
Interim City Solicitor J 8,625 8,625 8,625
Director of Finance 110,000 110,000 15,620 125,620
Director of Public Health 104,410 104,410 14,931 119,341 Director of West Yorkshire Pension Fund 96,378 96,378 13,686 110,064
2014-15 Senior Officers with a salary less than £1 50k per annum (excluding Employer Pension contribut ions)
Post Title Salary including fees &
Allowances
Expense Allowances
Comp’n for loss of Office
Benefits in kind
Total Remuneration
excluding pension
contributions
Pension contributions
Total remuneration
including pension
contributions Note
£ £ £ £ £ £ £
Strategic Director Adult & Community Services
113,379 0 0 0 113,379 16,101 129,480
Strategic Director – Children’s Services I 135,899 0 0 0 135,899 19,298 155,197 Interim Head of Human Resources D 69,885 0 49,329 0 119,214 9,924 129,138 Director of Human Resources D 22,187 0 0 0 22,187 3,150 25,337 Strategic Director Environment & Sport E2 108,299 0 0 0 108,299 15,378 123,677 Strategic Director - Regeneration and Culture E2 108,171 0 0 0 108,171 15,360 123,531
City Solicitor E 61,262 0 0 0 61,262 8,699 69,961 Acting City Solicitor C,A2 37,629 0 0 0 37,629 5,343 42,972 Director of Finance 110,000 0 0 0 110,000 15,620 125,620 Director of Public Health 104,410 0 0 0 104,410 14,617 119,027 Director of West Yorkshire Pension Fund 94,961 0 0 0 94,961 13,484 108,445
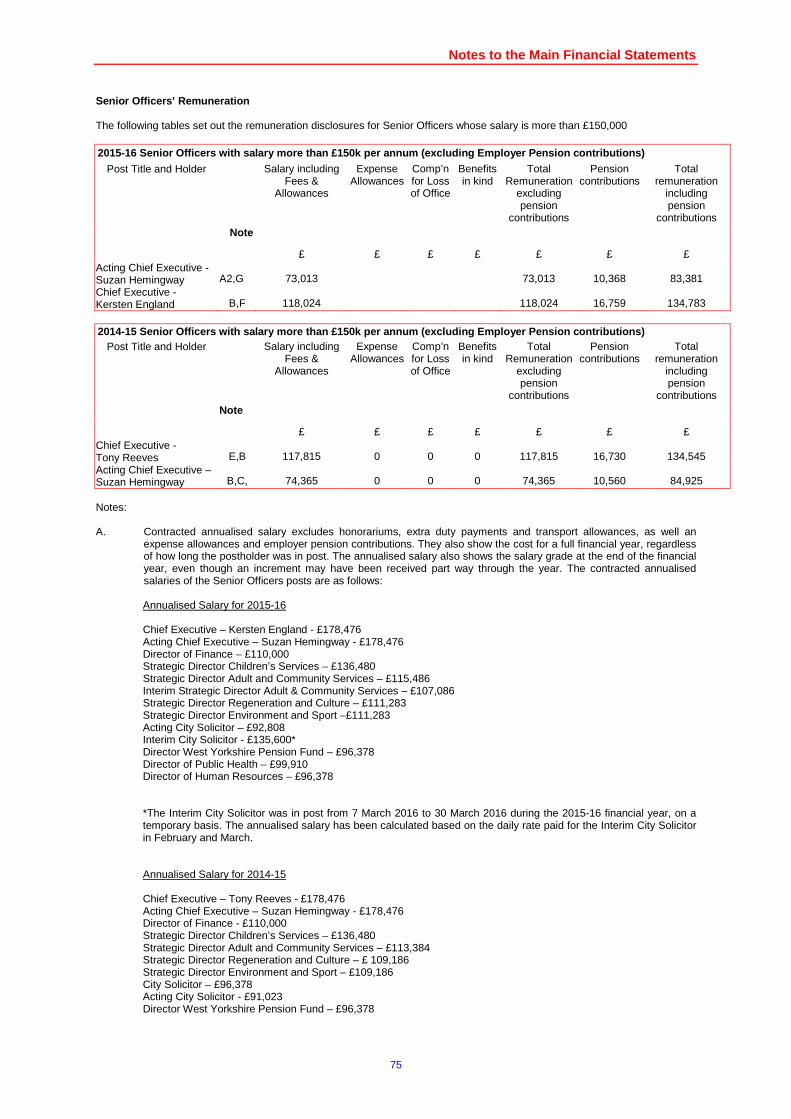
Notes to the Main Financial Statements
75
Senior Officers’ Remuneration The following tables set out the remuneration disclosures for Senior Officers whose salary is more than £150,000 2015-16 Senior Officers with salary more than £150k per annum (excluding Employer Pension contribution s)
Post Title and Holder Salary including Fees &
Allowances
Expense Allowances
Comp’n for Loss of Office
Benefits in kind
Total Remuneration
excluding pension
contributions
Pension contributions
Total remuneration
including pension
contributions Note
£ £ £ £ £ £ £ Acting Chief Executive - Suzan Hemingway A2,G 73,013 73,013 10,368 83,381 Chief Executive - Kersten England B,F 118,024 118,024 16,759 134,783 2014-15 Senior Officers with salary more than £150k per annum (excluding Employer Pension contribution s)
Post Title and Holder Salary including Fees &
Allowances
Expense Allowances
Comp’n for Loss of Office
Benefits in kind
Total Remuneration
excluding pension
contributions
Pension contributions
Total remuneration
including pension
contributions Note
£ £ £ £ £ £ £ Chief Executive - Tony Reeves E,B 117,815 0 0 0 117,815 16,730 134,545 Acting Chief Executive – Suzan Hemingway B,C, 74,365 0 0 0 74,365 10,560 84,925 Notes: A. Contracted annualised salary excludes honorariums, extra duty payments and transport allowances, as well an
expense allowances and employer pension contributions. They also show the cost for a full financial year, regardless of how long the postholder was in post. The annualised salary also shows the salary grade at the end of the financial year, even though an increment may have been received part way through the year. The contracted annualised salaries of the Senior Officers posts are as follows: Annualised Salary for 2015-16 Chief Executive – Kersten England - £178,476 Acting Chief Executive – Suzan Hemingway - £178,476 Director of Finance – £110,000 Strategic Director Children’s Services – £136,480 Strategic Director Adult and Community Services – £115,486 Interim Strategic Director Adult & Community Services – £107,086 Strategic Director Regeneration and Culture – £111,283 Strategic Director Environment and Sport –£111,283 Acting City Solicitor – £92,808 Interim City Solicitor - £135,600* Director West Yorkshire Pension Fund – £96,378 Director of Public Health – £99,910 Director of Human Resources – £96,378 *The Interim City Solicitor was in post from 7 March 2016 to 30 March 2016 during the 2015-16 financial year, on a temporary basis. The annualised salary has been calculated based on the daily rate paid for the Interim City Solicitor in February and March. Annualised Salary for 2014-15 Chief Executive – Tony Reeves - £178,476 Acting Chief Executive – Suzan Hemingway - £178,476 Director of Finance - £110,000 Strategic Director Children’s Services – £136,480 Strategic Director Adult and Community Services – £113,384 Strategic Director Regeneration and Culture – £ 109,186 Strategic Director Environment and Sport – £109,186 City Solicitor – £96,378 Acting City Solicitor - £91,023 Director West Yorkshire Pension Fund – £96,378
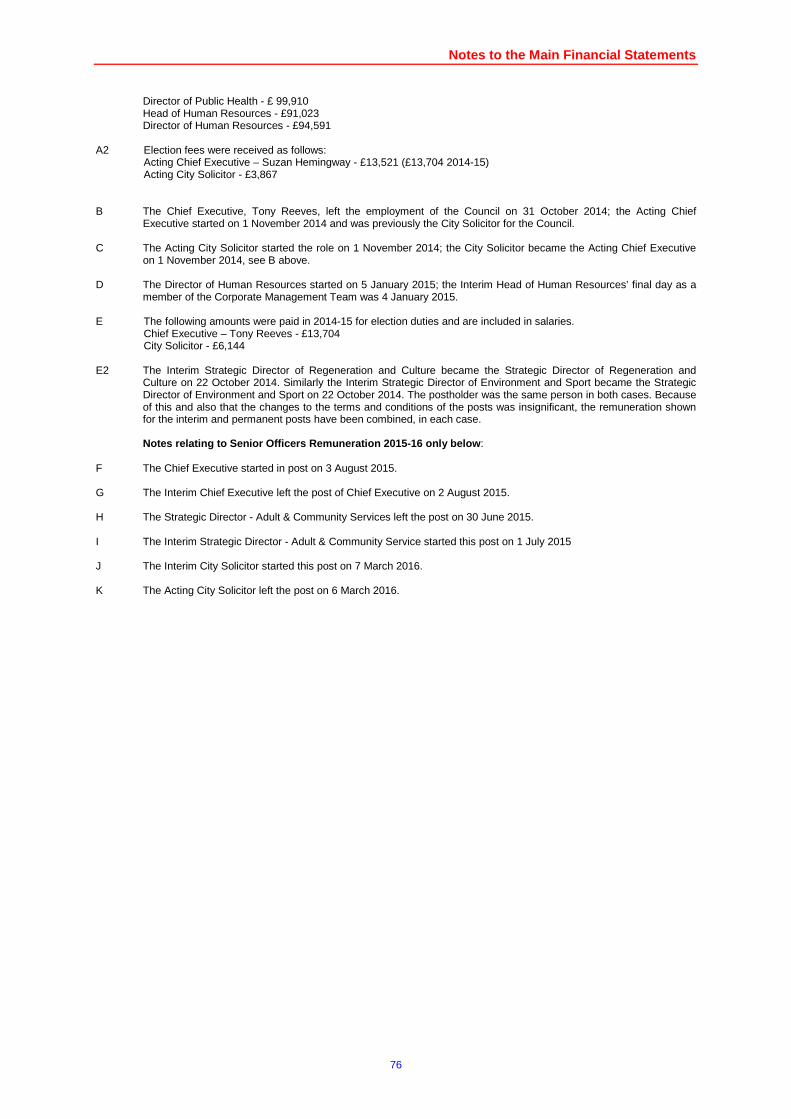
Notes to the Main Financial Statements
76
Director of Public Health - £ 99,910 Head of Human Resources - £91,023 Director of Human Resources - £94,591
A2 Election fees were received as follows: Acting Chief Executive – Suzan Hemingway - £13,521 (£13,704 2014-15) Acting City Solicitor - £3,867
B The Chief Executive, Tony Reeves, left the employment of the Council on 31 October 2014; the Acting Chief
Executive started on 1 November 2014 and was previously the City Solicitor for the Council. C The Acting City Solicitor started the role on 1 November 2014; the City Solicitor became the Acting Chief Executive
on 1 November 2014, see B above. D The Director of Human Resources started on 5 January 2015; the Interim Head of Human Resources’ final day as a
member of the Corporate Management Team was 4 January 2015. E The following amounts were paid in 2014-15 for election duties and are included in salaries. Chief Executive – Tony Reeves - £13,704 City Solicitor - £6,144
E2 The Interim Strategic Director of Regeneration and Culture became the Strategic Director of Regeneration and
Culture on 22 October 2014. Similarly the Interim Strategic Director of Environment and Sport became the Strategic Director of Environment and Sport on 22 October 2014. The postholder was the same person in both cases. Because of this and also that the changes to the terms and conditions of the posts was insignificant, the remuneration shown for the interim and permanent posts have been combined, in each case. Notes relating to Senior Officers Remuneration 2015 -16 only below :
F The Chief Executive started in post on 3 August 2015. G The Interim Chief Executive left the post of Chief Executive on 2 August 2015. H The Strategic Director - Adult & Community Services left the post on 30 June 2015. I The Interim Strategic Director - Adult & Community Service started this post on 1 July 2015 J The Interim City Solicitor started this post on 7 March 2016. K The Acting City Solicitor left the post on 6 March 2016.
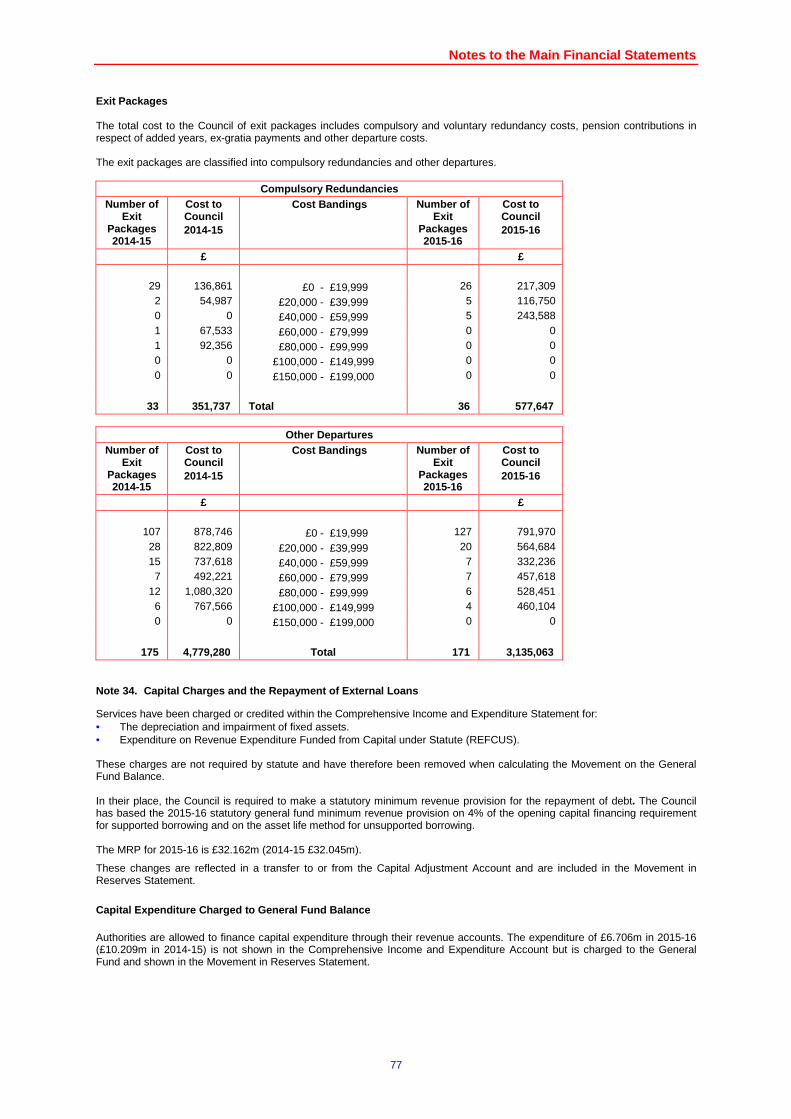
Notes to the Main Financial Statements
77
Exit Packages The total cost to the Council of exit packages includes compulsory and voluntary redundancy costs, pension contributions in respect of added years, ex-gratia payments and other departure costs. The exit packages are classified into compulsory redundancies and other departures.
Compulsory Redundancies Number of
Exit Packages 2014-15
Cost to Council 2014-15
Cost Bandings Number of Exit
Packages 2015-16
Cost to Council 2015-16
£ £
29 136,861 £0 - £19,999 26 217,309 2 54,987 £20,000 - £39,999 5 116,750 0 0 £40,000 - £59,999 5 243,588 1 67,533 £60,000 - £79,999 0 0 1 92,356 £80,000 - £99,999 0 0 0 0 £100,000 - £149,999 0 0 0 0 £150,000 - £199,000 0 0
33 351,737 Total 36 577,647
Other Departures
Number of Exit
Packages 2014-15
Cost to Council 2014-15
Cost Bandings Number of Exit
Packages 2015-16
Cost to Council 2015-16
£ £
107 878,746 £0 - £19,999 127 791,970 28 822,809 £20,000 - £39,999 20 564,684 15 737,618 £40,000 - £59,999 7 332,236 7 492,221 £60,000 - £79,999 7 457,618
12 1,080,320 £80,000 - £99,999 6 528,451 6 767,566 £100,000 - £149,999 4 460,104 0 0 £150,000 - £199,000 0 0
175 4,779,280 Total 171 3,135,063
Capital Charges and the Repayment of External Loans Note 34.
Services have been charged or credited within the Comprehensive Income and Expenditure Statement for: • The depreciation and impairment of fixed assets. • Expenditure on Revenue Expenditure Funded from Capital under Statute (REFCUS). These charges are not required by statute and have therefore been removed when calculating the Movement on the General Fund Balance. In their place, the Council is required to make a statutory minimum revenue provision for the repayment of debt. The Council has based the 2015-16 statutory general fund minimum revenue provision on 4% of the opening capital financing requirement for supported borrowing and on the asset life method for unsupported borrowing. The MRP for 2015-16 is £32.162m (2014-15 £32.045m).
These changes are reflected in a transfer to or from the Capital Adjustment Account and are included in the Movement in Reserves Statement.
Capital Expenditure Charged to General Fund Balance Authorities are allowed to finance capital expenditure through their revenue accounts. The expenditure of £6.706m in 2015-16 (£10.209m in 2014-15) is not shown in the Comprehensive Income and Expenditure Account but is charged to the General Fund and shown in the Movement in Reserves Statement.
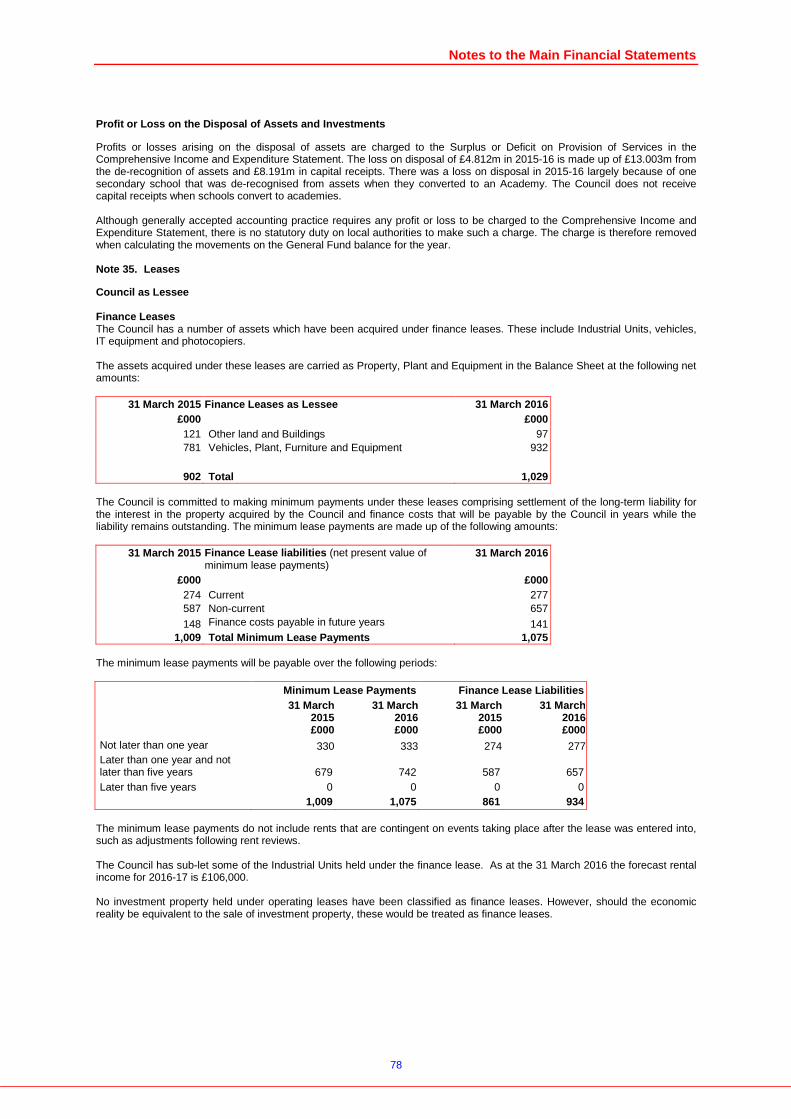
Notes to the Main Financial Statements
78
Profit or Loss on the Disposal of Assets and Invest ments
Profits or losses arising on the disposal of assets are charged to the Surplus or Deficit on Provision of Services in the Comprehensive Income and Expenditure Statement. The loss on disposal of £4.812m in 2015-16 is made up of £13.003m from the de-recognition of assets and £8.191m in capital receipts. There was a loss on disposal in 2015-16 largely because of one secondary school that was de-recognised from assets when they converted to an Academy. The Council does not receive capital receipts when schools convert to academies. Although generally accepted accounting practice requires any profit or loss to be charged to the Comprehensive Income and Expenditure Statement, there is no statutory duty on local authorities to make such a charge. The charge is therefore removed when calculating the movements on the General Fund balance for the year.
Leases Note 35.
Council as Lessee Finance Leases The Council has a number of assets which have been acquired under finance leases. These include Industrial Units, vehicles, IT equipment and photocopiers. The assets acquired under these leases are carried as Property, Plant and Equipment in the Balance Sheet at the following net amounts:
31 March 2015 Finance Leases as Lessee 31 March 2016 £000 £000 121 Other land and Buildings 97 781 Vehicles, Plant, Furniture and Equipment 932
902 Total 1,029
The Council is committed to making minimum payments under these leases comprising settlement of the long-term liability for the interest in the property acquired by the Council and finance costs that will be payable by the Council in years while the liability remains outstanding. The minimum lease payments are made up of the following amounts:
31 March 2015 Finance Lease liabilities (net present value of minimum lease payments)
31 March 2016
£000 £000 274 Current 277 587 Non-current 657
148 Finance costs payable in future years 141 1,009 Total Minimum Lease Payments 1,075
The minimum lease payments will be payable over the following periods: Minimum Lease Payments Finance Lease Liabilities
31 March 2015
31 March 2016
31 March 2015
31 March 2016
£000 £000 £000 £000 Not later than one year 330 333 274 277 Later than one year and not later than five years 679 742 587 657 Later than five years 0 0 0 0 1,009 1,075 861 934
The minimum lease payments do not include rents that are contingent on events taking place after the lease was entered into, such as adjustments following rent reviews. The Council has sub-let some of the Industrial Units held under the finance lease. As at the 31 March 2016 the forecast rental income for 2016-17 is £106,000. No investment property held under operating leases have been classified as finance leases. However, should the economic reality be equivalent to the sale of investment property, these would be treated as finance leases.
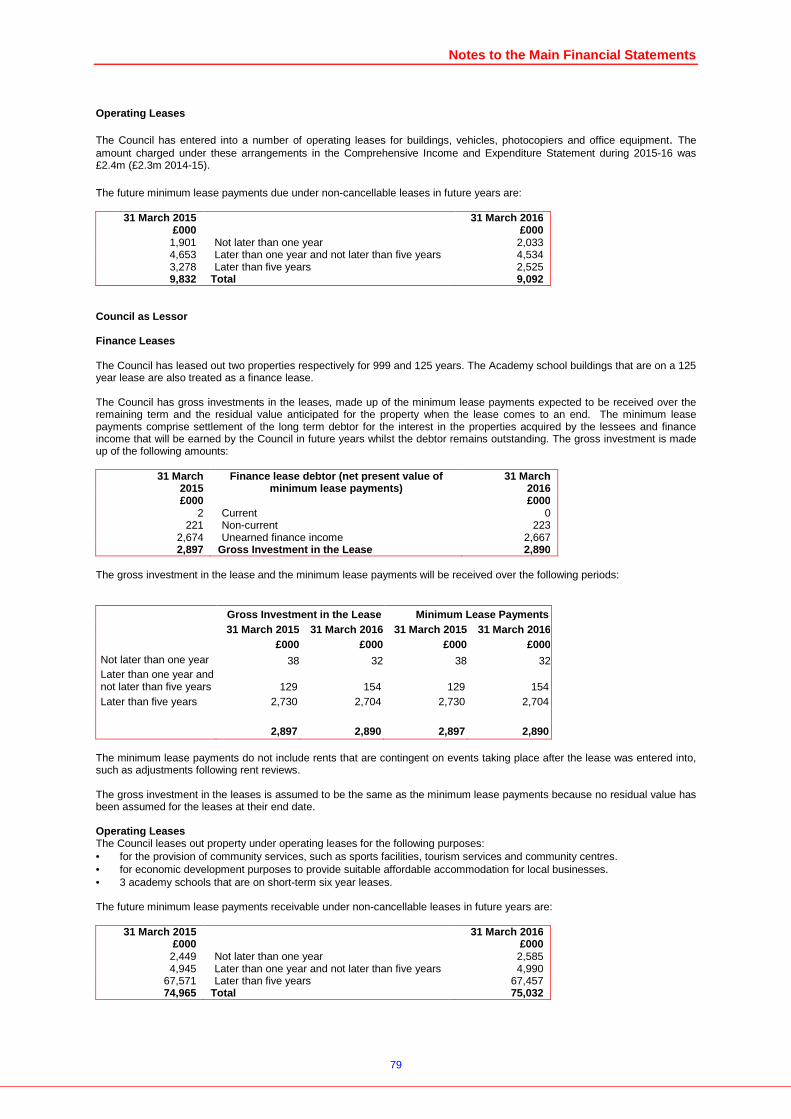
Notes to the Main Financial Statements
79
Operating Leases The Council has entered into a number of operating leases for buildings, vehicles, photocopiers and office equipment. The amount charged under these arrangements in the Comprehensive Income and Expenditure Statement during 2015-16 was £2.4m (£2.3m 2014-15). The future minimum lease payments due under non-cancellable leases in future years are:
31 March 2015 31 March 2016 £000 £000
1,901 Not later than one year 2,033 4,653 Later than one year and not later than five years 4,534 3,278 Later than five years 2,525 9,832 Total 9,092
Council as Lessor Finance Leases The Council has leased out two properties respectively for 999 and 125 years. The Academy school buildings that are on a 125 year lease are also treated as a finance lease. The Council has gross investments in the leases, made up of the minimum lease payments expected to be received over the remaining term and the residual value anticipated for the property when the lease comes to an end. The minimum lease payments comprise settlement of the long term debtor for the interest in the properties acquired by the lessees and finance income that will be earned by the Council in future years whilst the debtor remains outstanding. The gross investment is made up of the following amounts:
31 March 2015
Finance lease debtor (net present value of minimum lease payments)
31 March 2016
£000 £000 2 Current 0
221 Non-current 223 2,674 Unearned finance income 2,667 2,897 Gross Investment in the Lease 2,890
The gross investment in the lease and the minimum lease payments will be received over the following periods: Gross Investment in the Lease Minimum Lease Payments
31 March 2015 31 March 2016 31 March 2015 31 March 2016
£000 £000 £000 £000 Not later than one year 38 32 38 32 Later than one year and not later than five years 129 154 129 154 Later than five years 2,730 2,704 2,730 2,704 2,897 2,890 2,897 2,890
The minimum lease payments do not include rents that are contingent on events taking place after the lease was entered into, such as adjustments following rent reviews. The gross investment in the leases is assumed to be the same as the minimum lease payments because no residual value has been assumed for the leases at their end date. Operating Leases The Council leases out property under operating leases for the following purposes: • for the provision of community services, such as sports facilities, tourism services and community centres. • for economic development purposes to provide suitable affordable accommodation for local businesses. • 3 academy schools that are on short-term six year leases. The future minimum lease payments receivable under non-cancellable leases in future years are:
31 March 2015 31 March 2016 £000 £000
2,449 Not later than one year 2,585 4,945 Later than one year and not later than five years 4,990
67,571 Later than five years 67,457 74,965 Total 75,032
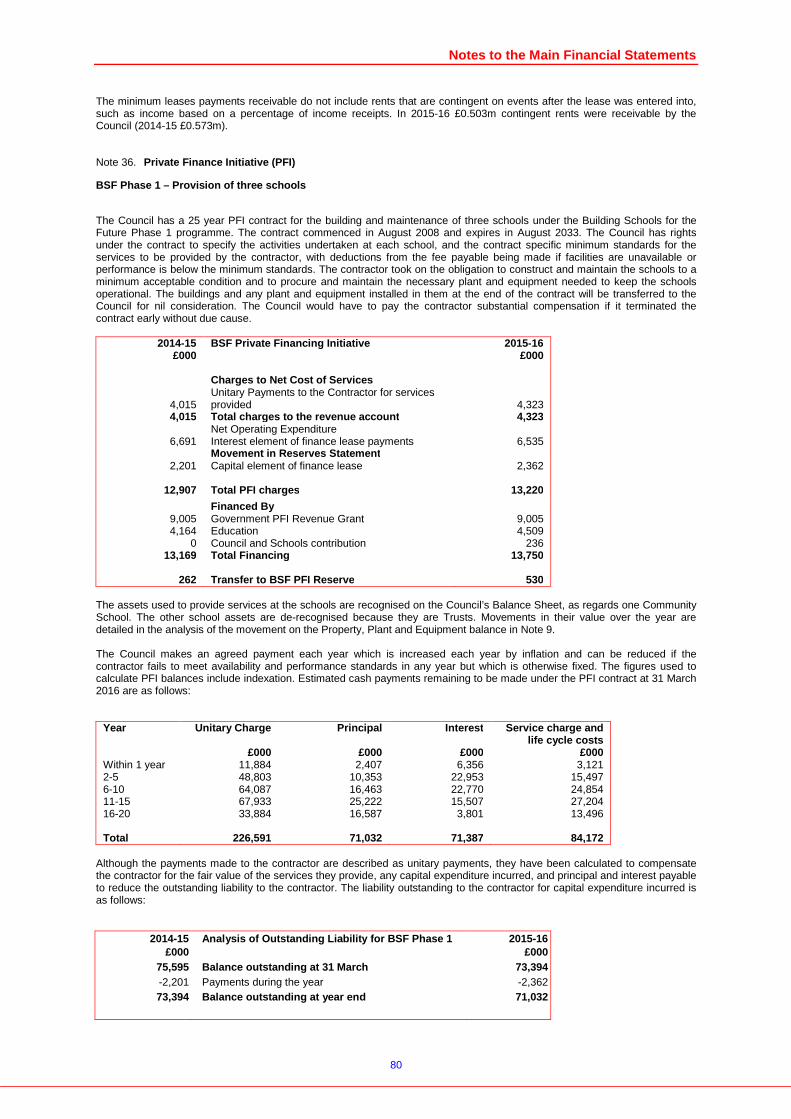
Notes to the Main Financial Statements
80
The minimum leases payments receivable do not include rents that are contingent on events after the lease was entered into, such as income based on a percentage of income receipts. In 2015-16 £0.503m contingent rents were receivable by the Council (2014-15 £0.573m).
Private Finance Initiative (PFI) Note 36.
BSF Phase 1 – Provision of three schools
The Council has a 25 year PFI contract for the building and maintenance of three schools under the Building Schools for the Future Phase 1 programme. The contract commenced in August 2008 and expires in August 2033. The Council has rights under the contract to specify the activities undertaken at each school, and the contract specific minimum standards for the services to be provided by the contractor, with deductions from the fee payable being made if facilities are unavailable or performance is below the minimum standards. The contractor took on the obligation to construct and maintain the schools to a minimum acceptable condition and to procure and maintain the necessary plant and equipment needed to keep the schools operational. The buildings and any plant and equipment installed in them at the end of the contract will be transferred to the Council for nil consideration. The Council would have to pay the contractor substantial compensation if it terminated the contract early without due cause.
2014-15 £000
BSF Private Financing Initiative 2015-16 £000
Charges to Net Cost of Services
4,015 Unitary Payments to the Contractor for services provided 4,323
4,015 Total charges to the revenue account 4,323 Net Operating Expenditure
6,691 Interest element of finance lease payments 6,535 Movement in Reserves Statement
2,201 Capital element of finance lease 2,362
12,907 Total PFI charges 13,220
Financed By 9,005 Government PFI Revenue Grant 9,005 4,164 Education 4,509
0 Council and Schools contribution 236 13,169 Total Financing 13,750
262 Transfer to BSF PFI Reserve 530
The assets used to provide services at the schools are recognised on the Council’s Balance Sheet, as regards one Community School. The other school assets are de-recognised because they are Trusts. Movements in their value over the year are detailed in the analysis of the movement on the Property, Plant and Equipment balance in Note 9. The Council makes an agreed payment each year which is increased each year by inflation and can be reduced if the contractor fails to meet availability and performance standards in any year but which is otherwise fixed. The figures used to calculate PFI balances include indexation. Estimated cash payments remaining to be made under the PFI contract at 31 March 2016 are as follows:
Year Unitary Charge Principal Interest Service charge and life cycle costs
£000 £000 £000 £000 Within 1 year 11,884 2,407 6,356 3,121 2-5 48,803 10,353 22,953 15,497 6-10 64,087 16,463 22,770 24,854 11-15 67,933 25,222 15,507 27,204 16-20 33,884 16,587 3,801 13,496 Total 226,591 71,032 71,387 84,172
Although the payments made to the contractor are described as unitary payments, they have been calculated to compensate the contractor for the fair value of the services they provide, any capital expenditure incurred, and principal and interest payable to reduce the outstanding liability to the contractor. The liability outstanding to the contractor for capital expenditure incurred is as follows:
2014-15 £000
Analysis of Outstanding Liability for BSF Phase 1 2 015-16 £000
75,595 Balance outstanding at 31 March 73,394 -2,201 Payments during the year -2,362 73,394 Balance outstanding at year end 71,032
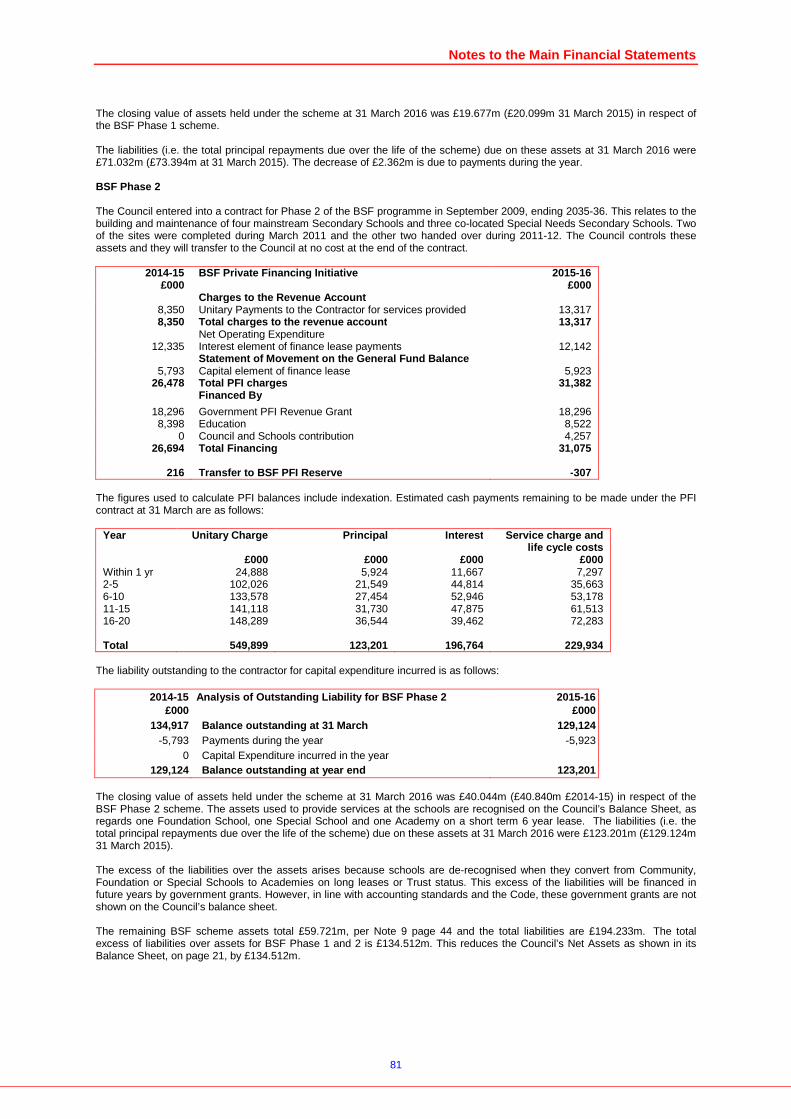
Notes to the Main Financial Statements
81
The closing value of assets held under the scheme at 31 March 2016 was £19.677m (£20.099m 31 March 2015) in respect of the BSF Phase 1 scheme. The liabilities (i.e. the total principal repayments due over the life of the scheme) due on these assets at 31 March 2016 were £71.032m (£73.394m at 31 March 2015). The decrease of £2.362m is due to payments during the year. BSF Phase 2 The Council entered into a contract for Phase 2 of the BSF programme in September 2009, ending 2035-36. This relates to the building and maintenance of four mainstream Secondary Schools and three co-located Special Needs Secondary Schools. Two of the sites were completed during March 2011 and the other two handed over during 2011-12. The Council controls these assets and they will transfer to the Council at no cost at the end of the contract.
2014-15 £000
BSF Private Financing Initiative 2015-16 £000
Charges to the Revenue Account 8,350 Unitary Payments to the Contractor for services provided 13,317 8,350 Total charges to the revenue account 13,317
Net Operating Expenditure 12,335 Interest element of finance lease payments 12,142
Statement of Movement on the General Fund Balance 5,793 Capital element of finance lease 5,923
26,478 Total PFI charges 31,382
Financed By 18,296 Government PFI Revenue Grant 18,296 8,398 Education 8,522
0 Council and Schools contribution 4,257 26,694 Total Financing 31,075
216 Transfer to BSF PFI Reserve -307
The figures used to calculate PFI balances include indexation. Estimated cash payments remaining to be made under the PFI contract at 31 March are as follows:
Year Unitary Charge Principal Interest Service charge and life cycle costs
£000 £000 £000 £000 Within 1 yr 24,888 5,924 11,667 7,297 2-5 102,026 21,549 44,814 35,663 6-10 133,578 27,454 52,946 53,178 11-15 141,118 31,730 47,875 61,513 16-20 148,289 36,544 39,462 72,283 Total 549,899 123,201 196,764 229,934
The liability outstanding to the contractor for capital expenditure incurred is as follows:
2014-15 £000
Analysis of Outstanding Liability for BSF Phase 2 2 015-16 £000
134,917 Balance outstanding at 31 March 129,124 -5,793 Payments during the year -5,923
0 Capital Expenditure incurred in the year 129,124 Balance outstanding at year end 123,201
The closing value of assets held under the scheme at 31 March 2016 was £40.044m (£40.840m £2014-15) in respect of the BSF Phase 2 scheme. The assets used to provide services at the schools are recognised on the Council’s Balance Sheet, as regards one Foundation School, one Special School and one Academy on a short term 6 year lease. The liabilities (i.e. the total principal repayments due over the life of the scheme) due on these assets at 31 March 2016 were £123.201m (£129.124m 31 March 2015). The excess of the liabilities over the assets arises because schools are de-recognised when they convert from Community, Foundation or Special Schools to Academies on long leases or Trust status. This excess of the liabilities will be financed in future years by government grants. However, in line with accounting standards and the Code, these government grants are not shown on the Council’s balance sheet. The remaining BSF scheme assets total £59.721m, per Note 9 page 44 and the total liabilities are £194.233m. The total excess of liabilities over assets for BSF Phase 1 and 2 is £134.512m. This reduces the Council’s Net Assets as shown in its Balance Sheet, on page 21, by £134.512m.
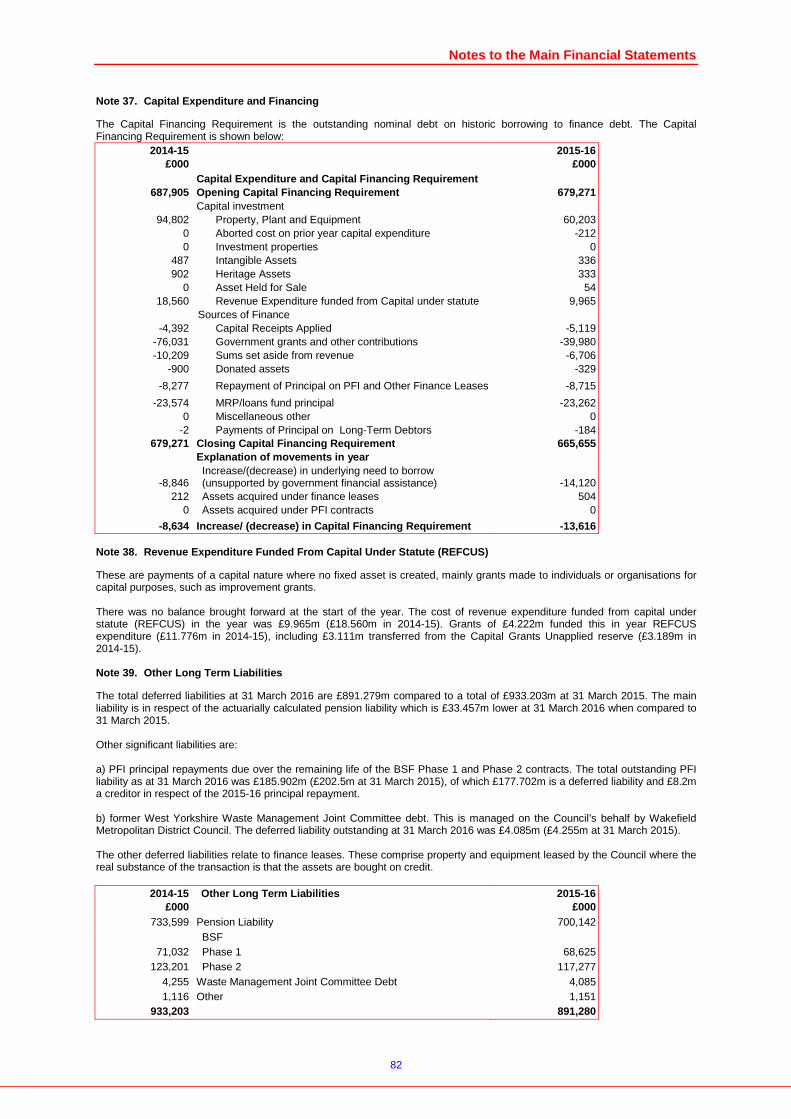
Notes to the Main Financial Statements
82
Capital Expenditure and Financing Note 37.
The Capital Financing Requirement is the outstanding nominal debt on historic borrowing to finance debt. The Capital Financing Requirement is shown below:
2014-15 £000
2015-16 £000
Capital Expenditure and Capital Financing Requireme nt 687,905 Opening Capital Financing Requirement 679,271
Capital investment 94,802 Property, Plant and Equipment 60,203
0 Aborted cost on prior year capital expenditure -212 0 Investment properties 0
487 Intangible Assets 336 902 Heritage Assets 333
0 Asset Held for Sale 54 18,560 Revenue Expenditure funded from Capital under statute 9,965
Sources of Finance -4,392 Capital Receipts Applied -5,119
-76,031 Government grants and other contributions -39,980 -10,209 Sums set aside from revenue -6,706
-900 Donated assets -329
-8,277 Repayment of Principal on PFI and Other Finance Leases -8,715
-23,574 MRP/loans fund principal -23,262 0 Miscellaneous other 0
-2 Payments of Principal on Long-Term Debtors -184 679,271 Closing Capital Financing Requirement 665,655
Explanation of movements in year
-8,846 Increase/(decrease) in underlying need to borrow (unsupported by government financial assistance) -14,120
212 Assets acquired under finance leases 504 0 Assets acquired under PFI contracts 0
-8,634 Increase/ (decrease) in Capital Financing Requireme nt -13,616
Revenue Expenditure Funded From Capital Under Statu te (REFCUS) Note 38.
These are payments of a capital nature where no fixed asset is created, mainly grants made to individuals or organisations for capital purposes, such as improvement grants. There was no balance brought forward at the start of the year. The cost of revenue expenditure funded from capital under statute (REFCUS) in the year was £9.965m (£18.560m in 2014-15). Grants of £4.222m funded this in year REFCUS expenditure (£11.776m in 2014-15), including £3.111m transferred from the Capital Grants Unapplied reserve (£3.189m in 2014-15).
Other Long Term Liabilities Note 39.
The total deferred liabilities at 31 March 2016 are £891.279m compared to a total of £933.203m at 31 March 2015. The main liability is in respect of the actuarially calculated pension liability which is £33.457m lower at 31 March 2016 when compared to 31 March 2015. Other significant liabilities are: a) PFI principal repayments due over the remaining life of the BSF Phase 1 and Phase 2 contracts. The total outstanding PFI liability as at 31 March 2016 was £185.902m (£202.5m at 31 March 2015), of which £177.702m is a deferred liability and £8.2m a creditor in respect of the 2015-16 principal repayment. b) former West Yorkshire Waste Management Joint Committee debt. This is managed on the Council’s behalf by Wakefield Metropolitan District Council. The deferred liability outstanding at 31 March 2016 was £4.085m (£4.255m at 31 March 2015). The other deferred liabilities relate to finance leases. These comprise property and equipment leased by the Council where the real substance of the transaction is that the assets are bought on credit.
2014-15 £000
Other Long Term Liabilities 2015-16 £000
733,599 Pension Liability 700,142 BSF
71,032 Phase 1 68,625 123,201 Phase 2 117,277
4,255 Waste Management Joint Committee Debt 4,085 1,116 Other 1,151
933,203 891,280

Notes to the Main Financial Statements
83
The combined liability shown on the Balance Sheet of PFI Phase 1 and Phase 2 is £185.902m. As with all the Long-Term liabilities and current liabilities, the liability of £185.902m impacts on the Balance Sheet by reducing the net assets of the authority. However, this liability is matched with a government grant for Phase 1 of £9.005m and £18.296m for Phase 2, totalling £27.301, see Note 45, page 87. The Phase 1 grant will be paid until 2033 and the Phase 2 grant will be paid until 2036.
Deferred Income Note 40.
There was no deferred income in 2015-16.
Related Party Transactions Note 41.
The Council has the following Related Party disclosures in relation to the following entities: West Yorkshire Joint Committee - The West Yorkshire Joint Committee comprises the Councils of Bradford, Leeds, Calderdale, Kirklees and Wakefield. Its services include the Archaeology Advisory Service, Archaeological Services, Archive Service, Ecology, Materials Testing Service, Analytical Services and Trading Standards Service. It has been set-up as a partnership. The Council's share of its expenses is included below in this note, see Other Public Bodies. Bradford Council makes an annual financial contribution to the West Yorkshire Joint Committee, based on its share of the service cost, and is represented on the management board. All the financial contributions are made on an annual basis. The Board manages the financial position and financial performance of the Joint Committee. Combined Authority - The Combined Authority comprises the Councils of Bradford, Leeds, Calderdale, Kirklees, Wakefield and includes York as an associate. The Leader of Bradford Council is a member of the Combined Authority. The West Yorkshire Transport Fund became a committee of the Combined Authority during 2014-15; Bradford's share of expenditure of this is shown separately below in this note, see Other Public Bodies. In future years, it is anticipated that the Combined Authority will receive capital grants, which will be spend on transport infrastructure projects across West Yorkshire. The 2015-16 financial year was the second year of operation. The value of its financial transactions is expected to expand in future years. Leeds City Region - The Leeds City Region comprises the Councils of Bradford, Leeds, Calderdale, Kirklees, Wakefield, York, Barnsley, Harrogate, Craven, Selby and North Yorkshire. It was set-up by a partnership agreement. The organisation accounts for grants held for the purpose of capital investment projects across the West Yorkshire Region. The accountable body for the Leeds City Region in the West Yorkshire Combined Authority. While the Leeds City Region holds significant capital grants, the cash flows are managed by Leeds City Council and a separate statement of accounts prepared. The accounts are subject to audit. Business Rates Pool - The Business Rates Pool comprises the Councils of Bradford, Leeds, Calderdale, Kirklees, Wakefield, York and Harrogate. Councils currently receive a 49% share of Business Rates, replacing direct government funding. The Pool redistributes levy income that would otherwise be paid over to Central Government. In 2015-16, Bradford Council received a repayment from the Pool of £0.183m (£0.127m 2014-15). Revolving Infrastructure Investment Fund - This fund is a Limited Liability Partnership comprising the Councils of Bradford, Leeds, Calderdale, Kirklees, Wakefield, York and Harrogate. It has been set up with the purpose of giving loans for infrastructure development across West Yorkshire. No loans have been agreed to date. The Council has the following Related Party Disclosures: Authorities are required to disclose transactions between themselves and related parties. In this context related parties are individuals or bodies which have the potential to influence or control the Council or to be influenced or controlled by the Council. The following information is provided.
Central Government The UK Government provides the statutory framework within which the Council operates, provides the majority of Council funding in the form of grants and prescribes the terms of many of the transactions the Council has with other parties. Details of Government grants for revenue purposes are set out in Note 45 which identifies the cash grants received in the year for inclusion in the Cash Flow Statement (page 22). Members The Leader and Portfolio Holders are responsible for the direct control of the policies of the Council. Therefore where the Council enters into material financial transactions with other entities over which the Leader and Portfolio Holder also exert influence, this is declared below. The Council’s Leader is a member of the West Yorkshire Combined Authority. The Council contributed £23.916m in revenue funding to the Transport Committee of the West Yorkshire Combined Authority in 2015-16 and received from the Committee a capital grant of £8.6m, see Other Public Bodies below. The Council’s Deputy Leader and Portfolio Holder for Housing, Planning and Transport is also the Council appointed chair of West Yorkshire Joint Services, Archives, Archaeology and Trading Standards Committee. The Council contributed £0.979m
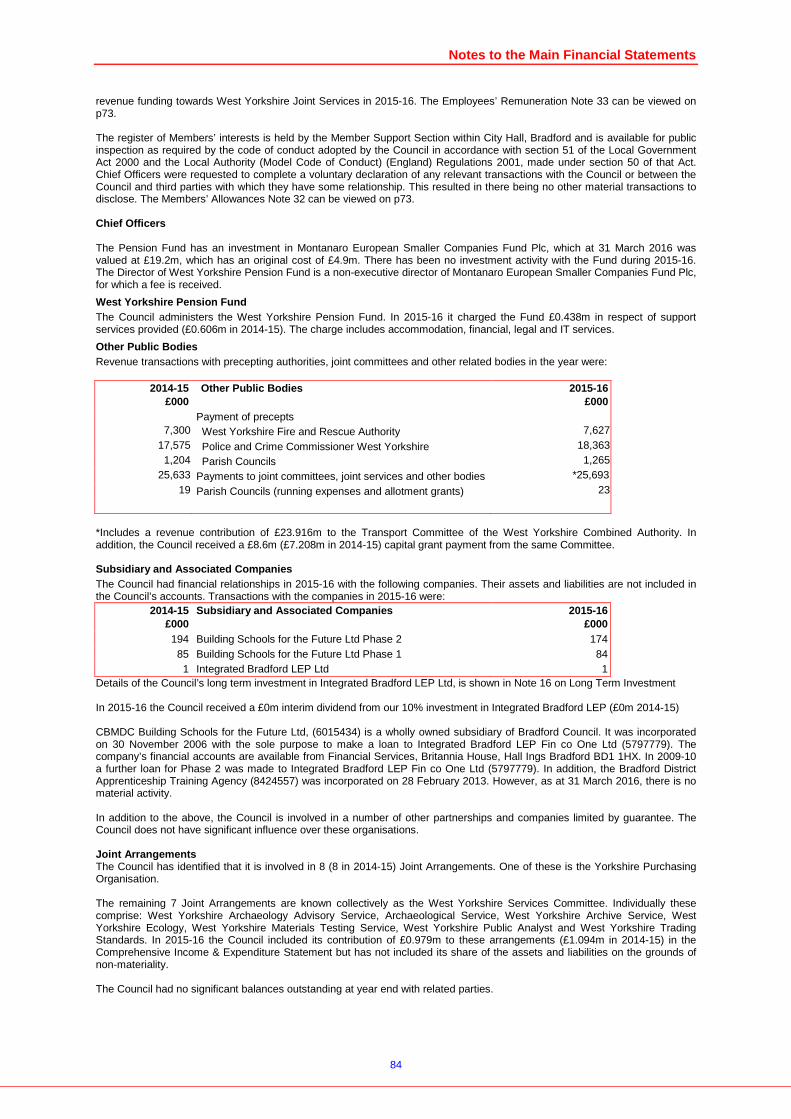
Notes to the Main Financial Statements
84
revenue funding towards West Yorkshire Joint Services in 2015-16. The Employees’ Remuneration Note 33 can be viewed on p73. The register of Members’ interests is held by the Member Support Section within City Hall, Bradford and is available for public inspection as required by the code of conduct adopted by the Council in accordance with section 51 of the Local Government Act 2000 and the Local Authority (Model Code of Conduct) (England) Regulations 2001, made under section 50 of that Act. Chief Officers were requested to complete a voluntary declaration of any relevant transactions with the Council or between the Council and third parties with which they have some relationship. This resulted in there being no other material transactions to disclose. The Members’ Allowances Note 32 can be viewed on p73. Chief Officers The Pension Fund has an investment in Montanaro European Smaller Companies Fund Plc, which at 31 March 2016 was valued at £19.2m, which has an original cost of £4.9m. There has been no investment activity with the Fund during 2015-16. The Director of West Yorkshire Pension Fund is a non-executive director of Montanaro European Smaller Companies Fund Plc, for which a fee is received.
West Yorkshire Pension Fund The Council administers the West Yorkshire Pension Fund. In 2015-16 it charged the Fund £0.438m in respect of support services provided (£0.606m in 2014-15). The charge includes accommodation, financial, legal and IT services.
Other Public Bodies Revenue transactions with precepting authorities, joint committees and other related bodies in the year were:
2014-15 £000
Other Public Bodies 2015-16 £000
Payment of precepts 7,300 West Yorkshire Fire and Rescue Authority 7,627
17,575 Police and Crime Commissioner West Yorkshire 18,363 1,204 Parish Councils 1,265
25,633 Payments to joint committees, joint services and other bodies *25,693 19 Parish Councils (running expenses and allotment grants) 23
*Includes a revenue contribution of £23.916m to the Transport Committee of the West Yorkshire Combined Authority. In addition, the Council received a £8.6m (£7.208m in 2014-15) capital grant payment from the same Committee. Subsidiary and Associated Companies The Council had financial relationships in 2015-16 with the following companies. Their assets and liabilities are not included in the Council’s accounts. Transactions with the companies in 2015-16 were:
2014-15 £000
Subsidiary and Associated Companies 2015-16 £000
194 Building Schools for the Future Ltd Phase 2 174 85 Building Schools for the Future Ltd Phase 1 84 1 Integrated Bradford LEP Ltd 1
Details of the Council’s long term investment in Integrated Bradford LEP Ltd, is shown in Note 16 on Long Term Investment In 2015-16 the Council received a £0m interim dividend from our 10% investment in Integrated Bradford LEP (£0m 2014-15) CBMDC Building Schools for the Future Ltd, (6015434) is a wholly owned subsidiary of Bradford Council. It was incorporated on 30 November 2006 with the sole purpose to make a loan to Integrated Bradford LEP Fin co One Ltd (5797779). The company’s financial accounts are available from Financial Services, Britannia House, Hall Ings Bradford BD1 1HX. In 2009-10 a further loan for Phase 2 was made to Integrated Bradford LEP Fin co One Ltd (5797779). In addition, the Bradford District Apprenticeship Training Agency (8424557) was incorporated on 28 February 2013. However, as at 31 March 2016, there is no material activity. In addition to the above, the Council is involved in a number of other partnerships and companies limited by guarantee. The Council does not have significant influence over these organisations. Joint Arrangements The Council has identified that it is involved in 8 (8 in 2014-15) Joint Arrangements. One of these is the Yorkshire Purchasing Organisation. The remaining 7 Joint Arrangements are known collectively as the West Yorkshire Services Committee. Individually these comprise: West Yorkshire Archaeology Advisory Service, Archaeological Service, West Yorkshire Archive Service, West Yorkshire Ecology, West Yorkshire Materials Testing Service, West Yorkshire Public Analyst and West Yorkshire Trading Standards. In 2015-16 the Council included its contribution of £0.979m to these arrangements (£1.094m in 2014-15) in the Comprehensive Income & Expenditure Statement but has not included its share of the assets and liabilities on the grounds of non-materiality. The Council had no significant balances outstanding at year end with related parties.
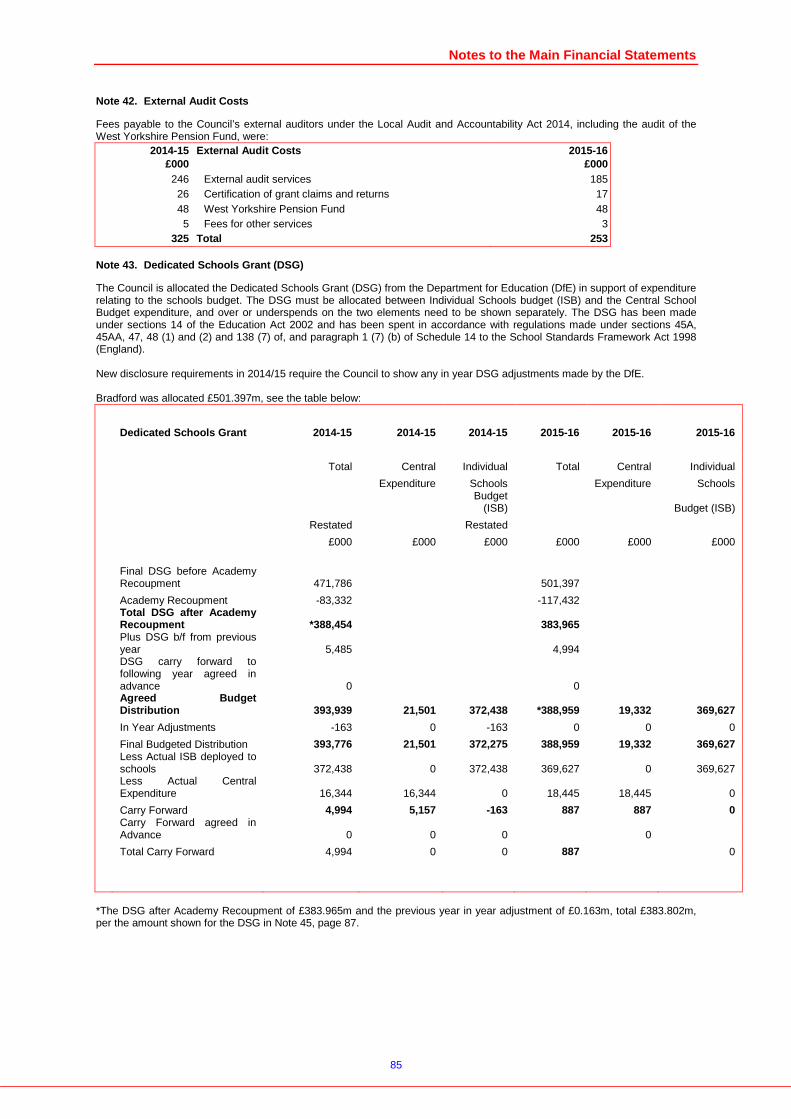
Notes to the Main Financial Statements
85
External Audit Costs Note 42.
Fees payable to the Council’s external auditors under the Local Audit and Accountability Act 2014, including the audit of the West Yorkshire Pension Fund, were:
2014-15 £000
External Audit Costs 2015-16 £000
246 External audit services 185 26 Certification of grant claims and returns 17 48 West Yorkshire Pension Fund 48 5 Fees for other services 3
325 Total 253
Dedicated Schools Grant (DSG) Note 43.
The Council is allocated the Dedicated Schools Grant (DSG) from the Department for Education (DfE) in support of expenditure relating to the schools budget. The DSG must be allocated between Individual Schools budget (ISB) and the Central School Budget expenditure, and over or underspends on the two elements need to be shown separately. The DSG has been made under sections 14 of the Education Act 2002 and has been spent in accordance with regulations made under sections 45A, 45AA, 47, 48 (1) and (2) and 138 (7) of, and paragraph 1 (7) (b) of Schedule 14 to the School Standards Framework Act 1998 (England). New disclosure requirements in 2014/15 require the Council to show any in year DSG adjustments made by the DfE. Bradford was allocated £501.397m, see the table below:
Dedicated Schools Grant 2014-15 2014-15 2014-15 201 5-16 2015-16 2015-16
Total Central Individual Total Central Individual
Expenditure Schools Expenditure Schools
Budget
(ISB) Budget (ISB)
Restated Restated
£000 £000 £000 £000 £000 £000
Final DSG before Academy Recoupment 471,786 501,397
Academy Recoupment -83,332 -117,432
Total DSG after Academy Recoupment *388,454 383,965
Plus DSG b/f from previous year 5,485 4,994
DSG carry forward to following year agreed in advance 0 0
Agreed Budget Distribution 393,939 21,501 372,438 *388,959 19,332 369,627
In Year Adjustments -163 0 -163 0 0 0
Final Budgeted Distribution 393,776 21,501 372,275 388,959 19,332 369,627
Less Actual ISB deployed to schools 372,438 0 372,438 369,627 0 369,627
Less Actual Central Expenditure 16,344 16,344 0 18,445 18,445 0
Carry Forward 4,994 5,157 -163 887 887 0
Carry Forward agreed in Advance 0 0 0 0
Total Carry Forward 4,994 0 0 887 0
*The DSG after Academy Recoupment of £383.965m and the previous year in year adjustment of £0.163m, total £383.802m, per the amount shown for the DSG in Note 45, page 87.
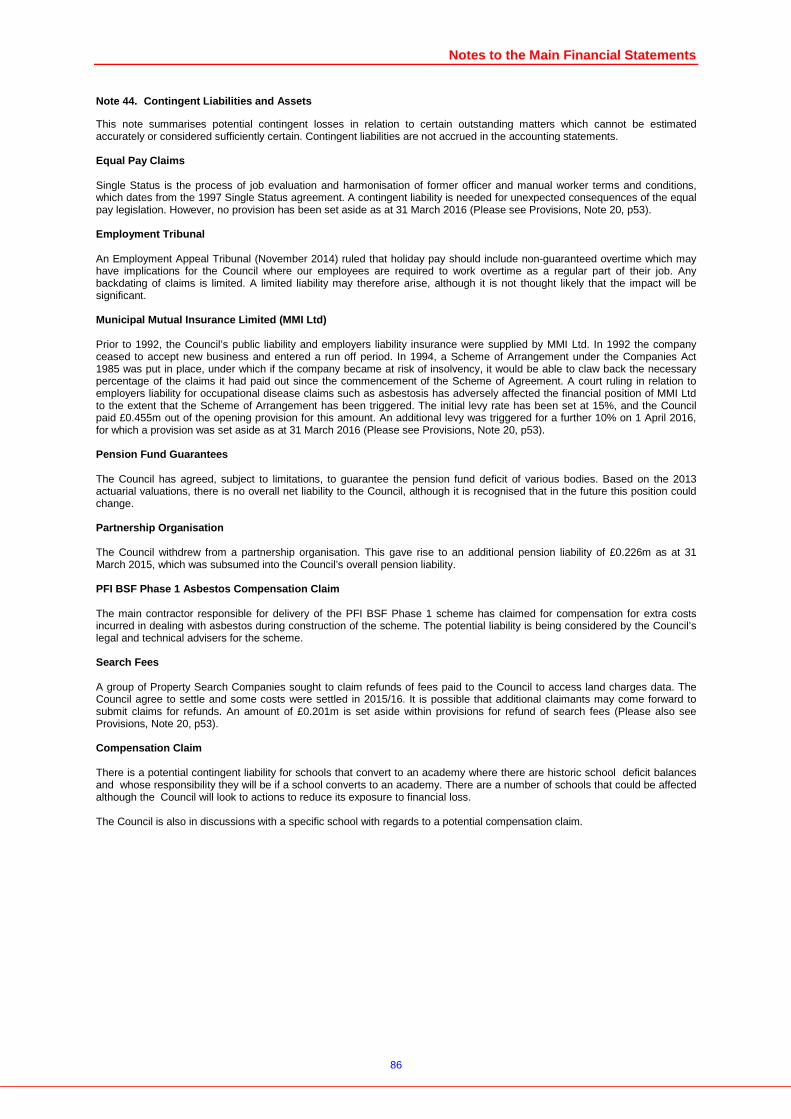
Notes to the Main Financial Statements
86
Contingent Liabilities and Assets Note 44.
This note summarises potential contingent losses in relation to certain outstanding matters which cannot be estimated accurately or considered sufficiently certain. Contingent liabilities are not accrued in the accounting statements. Equal Pay Claims Single Status is the process of job evaluation and harmonisation of former officer and manual worker terms and conditions, which dates from the 1997 Single Status agreement. A contingent liability is needed for unexpected consequences of the equal pay legislation. However, no provision has been set aside as at 31 March 2016 (Please see Provisions, Note 20, p53). Employment Tribunal An Employment Appeal Tribunal (November 2014) ruled that holiday pay should include non-guaranteed overtime which may have implications for the Council where our employees are required to work overtime as a regular part of their job. Any backdating of claims is limited. A limited liability may therefore arise, although it is not thought likely that the impact will be significant. Municipal Mutual Insurance Limited (MMI Ltd) Prior to 1992, the Council’s public liability and employers liability insurance were supplied by MMI Ltd. In 1992 the company ceased to accept new business and entered a run off period. In 1994, a Scheme of Arrangement under the Companies Act 1985 was put in place, under which if the company became at risk of insolvency, it would be able to claw back the necessary percentage of the claims it had paid out since the commencement of the Scheme of Agreement. A court ruling in relation to employers liability for occupational disease claims such as asbestosis has adversely affected the financial position of MMI Ltd to the extent that the Scheme of Arrangement has been triggered. The initial levy rate has been set at 15%, and the Council paid £0.455m out of the opening provision for this amount. An additional levy was triggered for a further 10% on 1 April 2016, for which a provision was set aside as at 31 March 2016 (Please see Provisions, Note 20, p53). Pension Fund Guarantees The Council has agreed, subject to limitations, to guarantee the pension fund deficit of various bodies. Based on the 2013 actuarial valuations, there is no overall net liability to the Council, although it is recognised that in the future this position could change. Partnership Organisation The Council withdrew from a partnership organisation. This gave rise to an additional pension liability of £0.226m as at 31 March 2015, which was subsumed into the Council’s overall pension liability. PFI BSF Phase 1 Asbestos Compensation Claim The main contractor responsible for delivery of the PFI BSF Phase 1 scheme has claimed for compensation for extra costs incurred in dealing with asbestos during construction of the scheme. The potential liability is being considered by the Council’s legal and technical advisers for the scheme. Search Fees A group of Property Search Companies sought to claim refunds of fees paid to the Council to access land charges data. The Council agree to settle and some costs were settled in 2015/16. It is possible that additional claimants may come forward to submit claims for refunds. An amount of £0.201m is set aside within provisions for refund of search fees (Please also see Provisions, Note 20, p53). Compensation Claim There is a potential contingent liability for schools that convert to an academy where there are historic school deficit balances and whose responsibility they will be if a school converts to an academy. There are a number of schools that could be affected although the Council will look to actions to reduce its exposure to financial loss. The Council is also in discussions with a specific school with regards to a potential compensation claim.
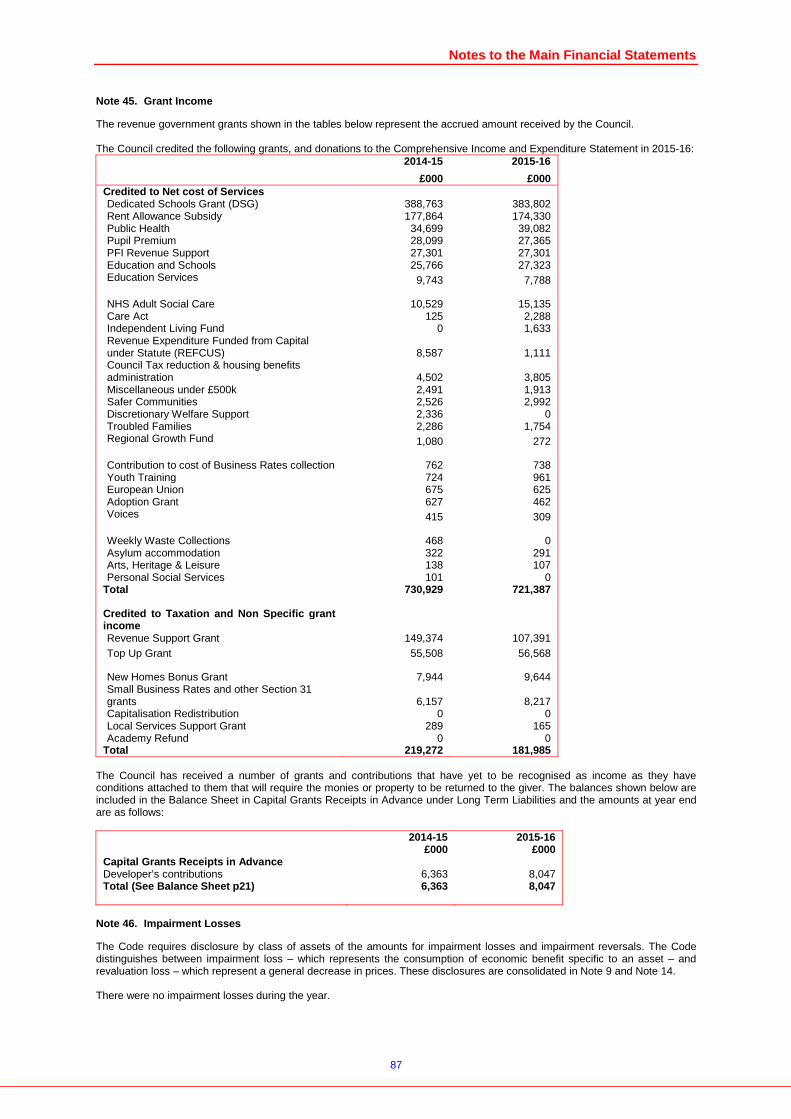
Notes to the Main Financial Statements
87
Grant Income Note 45.
The revenue government grants shown in the tables below represent the accrued amount received by the Council. The Council credited the following grants, and donations to the Comprehensive Income and Expenditure Statement in 2015-16:
2014-15 2015-16
£000 £000 Credited to Net cost of Services Dedicated Schools Grant (DSG) 388,763 383,802 Rent Allowance Subsidy 177,864 174,330 Public Health 34,699 39,082 Pupil Premium 28,099 27,365 PFI Revenue Support 27,301 27,301 Education and Schools 25,766 27,323 Education Services 9,743 7,788
NHS Adult Social Care 10,529 15,135 Care Act 125 2,288 Independent Living Fund 0 1,633 Revenue Expenditure Funded from Capital under Statute (REFCUS) 8,587 1,111 Council Tax reduction & housing benefits administration 4,502 3,805 Miscellaneous under £500k 2,491 1,913 Safer Communities 2,526 2,992 Discretionary Welfare Support 2,336 0 Troubled Families 2,286 1,754 Regional Growth Fund 1,080 272
Contribution to cost of Business Rates collection 762 738 Youth Training 724 961 European Union 675 625 Adoption Grant 627 462 Voices 415 309
Weekly Waste Collections 468 0 Asylum accommodation 322 291 Arts, Heritage & Leisure 138 107 Personal Social Services 101 0
Total 730,929 721,387
Credited to Taxation and Non Specific grant income Revenue Support Grant 149,374 107,391 Top Up Grant 55,508 56,568
New Homes Bonus Grant 7,944 9,644 Small Business Rates and other Section 31 grants 6,157 8,217 Capitalisation Redistribution 0 0 Local Services Support Grant 289 165 Academy Refund 0 0
Total 219,272 181,985 The Council has received a number of grants and contributions that have yet to be recognised as income as they have conditions attached to them that will require the monies or property to be returned to the giver. The balances shown below are included in the Balance Sheet in Capital Grants Receipts in Advance under Long Term Liabilities and the amounts at year end are as follows:
2014-15 2015-16 £000 £000 Capital Grants Receipts in Advance Developer’s contributions 6,363 8,047 Total (See Balance Sheet p 21) 6,363 8,047
Impairment Losses Note 46.
The Code requires disclosure by class of assets of the amounts for impairment losses and impairment reversals. The Code distinguishes between impairment loss – which represents the consumption of economic benefit specific to an asset – and revaluation loss – which represent a general decrease in prices. These disclosures are consolidated in Note 9 and Note 14. There were no impairment losses during the year.
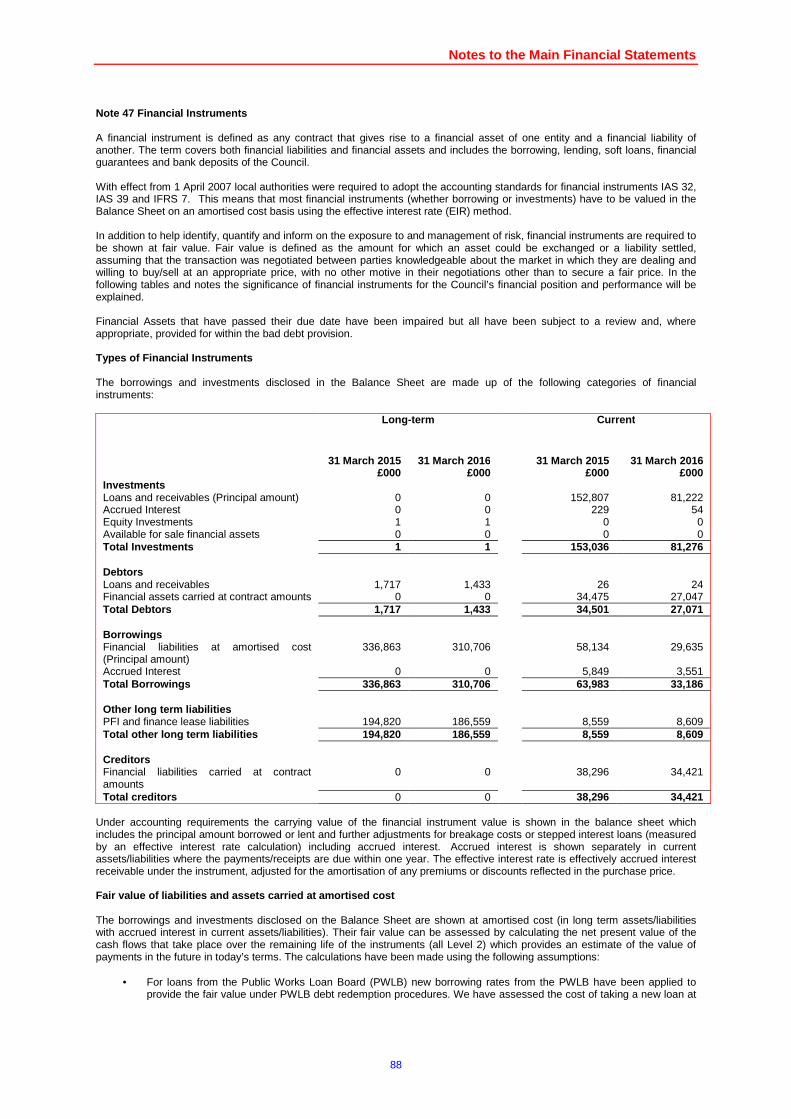
Notes to the Main Financial Statements
88
Note 47 Financial Instruments A financial instrument is defined as any contract that gives rise to a financial asset of one entity and a financial liability of another. The term covers both financial liabilities and financial assets and includes the borrowing, lending, soft loans, financial guarantees and bank deposits of the Council. With effect from 1 April 2007 local authorities were required to adopt the accounting standards for financial instruments IAS 32, IAS 39 and IFRS 7. This means that most financial instruments (whether borrowing or investments) have to be valued in the Balance Sheet on an amortised cost basis using the effective interest rate (EIR) method. In addition to help identify, quantify and inform on the exposure to and management of risk, financial instruments are required to be shown at fair value. Fair value is defined as the amount for which an asset could be exchanged or a liability settled, assuming that the transaction was negotiated between parties knowledgeable about the market in which they are dealing and willing to buy/sell at an appropriate price, with no other motive in their negotiations other than to secure a fair price. In the following tables and notes the significance of financial instruments for the Council’s financial position and performance will be explained. Financial Assets that have passed their due date have been impaired but all have been subject to a review and, where appropriate, provided for within the bad debt provision. Types of Financial Instruments The borrowings and investments disclosed in the Balance Sheet are made up of the following categories of financial instruments:
Long -term Current
31 March 2015
£000 31 March 2016
£000 31 March 2015
£000 31 March 2016
£000 Investments Loans and receivables (Principal amount) Accrued Interest Equity Investments Available for sale financial assets
0 0 1 0
0 0 1 0
152,807
229 0 0
81,222
54 0 0
Total Investments 1 1 153,036 81,276 Debtors Loans and receivables Financial assets carried at contract amounts
1,717
0
1,433
0
26
34,475
24
27,047 Total Debtors 1,717 1,433 34,501 27,071 Borrowings Financial liabilities at amortised cost (Principal amount) Accrued Interest
336,863
0
310,706
0
58,134
5,849
29,635
3,551
Total Borrowings 336,863 310,706 63,983 33,186 Other long term liabilities PFI and finance lease liabilities
194,820
186,559
8,559
8,609
Total other long term liabilities 194,820 186,559 8,559 8,609 Creditors Financial liabilities carried at contract amounts
0
0
38,296
34,421
Total creditors 0 0 38,296 34,421 Under accounting requirements the carrying value of the financial instrument value is shown in the balance sheet which includes the principal amount borrowed or lent and further adjustments for breakage costs or stepped interest loans (measured by an effective interest rate calculation) including accrued interest. Accrued interest is shown separately in current assets/liabilities where the payments/receipts are due within one year. The effective interest rate is effectively accrued interest receivable under the instrument, adjusted for the amortisation of any premiums or discounts reflected in the purchase price. Fair value of liabilities and assets carried at amo rtised cost The borrowings and investments disclosed on the Balance Sheet are shown at amortised cost (in long term assets/liabilities with accrued interest in current assets/liabilities). Their fair value can be assessed by calculating the net present value of the cash flows that take place over the remaining life of the instruments (all Level 2) which provides an estimate of the value of payments in the future in today’s terms. The calculations have been made using the following assumptions:
• For loans from the Public Works Loan Board (PWLB) new borrowing rates from the PWLB have been applied to provide the fair value under PWLB debt redemption procedures. We have assessed the cost of taking a new loan at
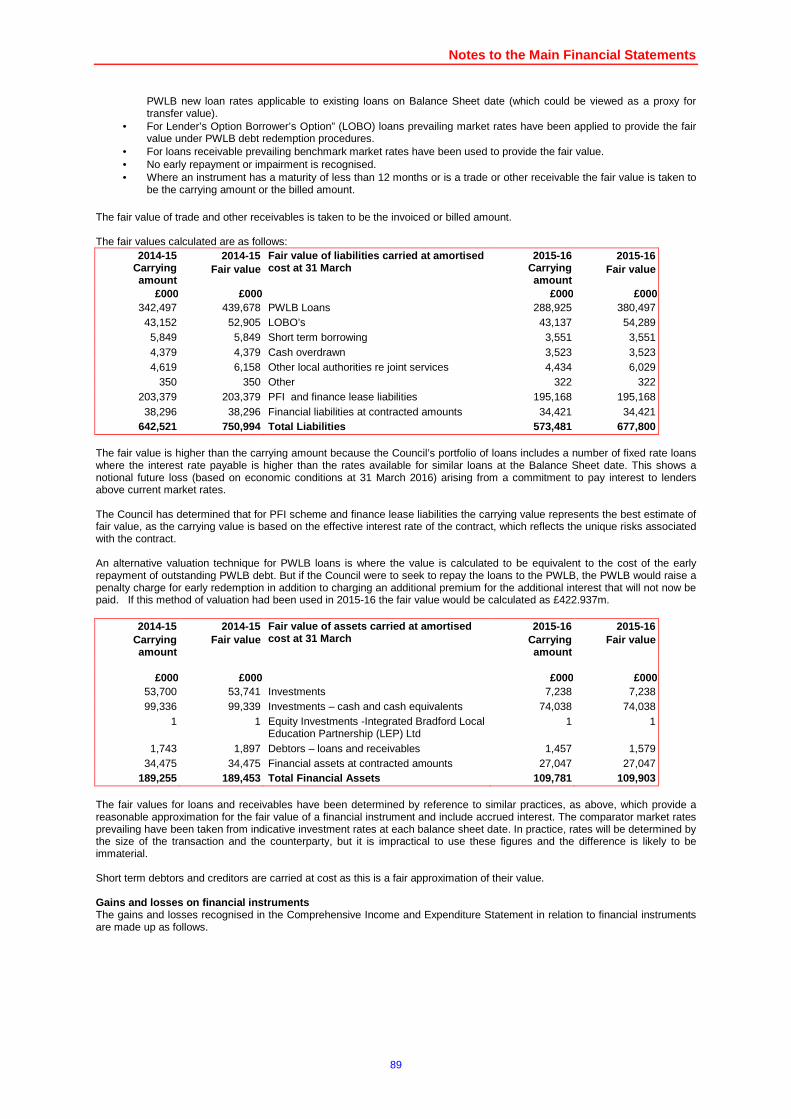
Notes to the Main Financial Statements
89
PWLB new loan rates applicable to existing loans on Balance Sheet date (which could be viewed as a proxy for transfer value).
• For Lender’s Option Borrower’s Option” (LOBO) loans prevailing market rates have been applied to provide the fair value under PWLB debt redemption procedures.
• For loans receivable prevailing benchmark market rates have been used to provide the fair value. • No early repayment or impairment is recognised. • Where an instrument has a maturity of less than 12 months or is a trade or other receivable the fair value is taken to
be the carrying amount or the billed amount.
The fair value of trade and other receivables is taken to be the invoiced or billed amount. The fair values calculated are as follows:
2014-15 Carrying amount
2014-15 Fair value
Fair value of liabilities carried at amortised cost at 31 March
2015-16 Carrying amount
2015-16 Fair value
£000 £000 £000 £000 342,497 439,678 PWLB Loans 288,925 380,497 43,152 52,905 LOBO’s 43,137 54,289 5,849 5,849 Short term borrowing 3,551 3,551 4,379 4,379 Cash overdrawn 3,523 3,523 4,619 6,158 Other local authorities re joint services 4,434 6,029
350 350 Other 322 322 203,379 203,379 PFI and finance lease liabilities 195,168 195,168 38,296 38,296 Financial liabilities at contracted amounts 34,421 34,421
642,521 750,994 Total Liabilities 573,481 677,800 The fair value is higher than the carrying amount because the Council’s portfolio of loans includes a number of fixed rate loans where the interest rate payable is higher than the rates available for similar loans at the Balance Sheet date. This shows a notional future loss (based on economic conditions at 31 March 2016) arising from a commitment to pay interest to lenders above current market rates. The Council has determined that for PFI scheme and finance lease liabilities the carrying value represents the best estimate of fair value, as the carrying value is based on the effective interest rate of the contract, which reflects the unique risks associated with the contract. An alternative valuation technique for PWLB loans is where the value is calculated to be equivalent to the cost of the early repayment of outstanding PWLB debt. But if the Council were to seek to repay the loans to the PWLB, the PWLB would raise a penalty charge for early redemption in addition to charging an additional premium for the additional interest that will not now be paid. If this method of valuation had been used in 2015-16 the fair value would be calculated as £422.937m.
2014-15 Carrying amount
2014-15 Fair value
Fair value of assets carried at amortised cost at 31 March
2015-16 Carrying amount
2015-16 Fair value
£000 £000 £000 £000
53,700 53,741 Investments 7,238 7,238 99,336 99,339 Investments – cash and cash equivalents 74,038 74,038
1 1 Equity Investments -Integrated Bradford Local Education Partnership (LEP) Ltd
1 1
1,743 1,897 Debtors – loans and receivables 1,457 1,579 34,475 34,475 Financial assets at contracted amounts 27,047 27,047
189,255 189,453 Total Financial Assets 109,781 109,903 The fair values for loans and receivables have been determined by reference to similar practices, as above, which provide a reasonable approximation for the fair value of a financial instrument and include accrued interest. The comparator market rates prevailing have been taken from indicative investment rates at each balance sheet date. In practice, rates will be determined by the size of the transaction and the counterparty, but it is impractical to use these figures and the difference is likely to be immaterial. Short term debtors and creditors are carried at cost as this is a fair approximation of their value. Gains and losses on financial instruments The gains and losses recognised in the Comprehensive Income and Expenditure Statement in relation to financial instruments are made up as follows.
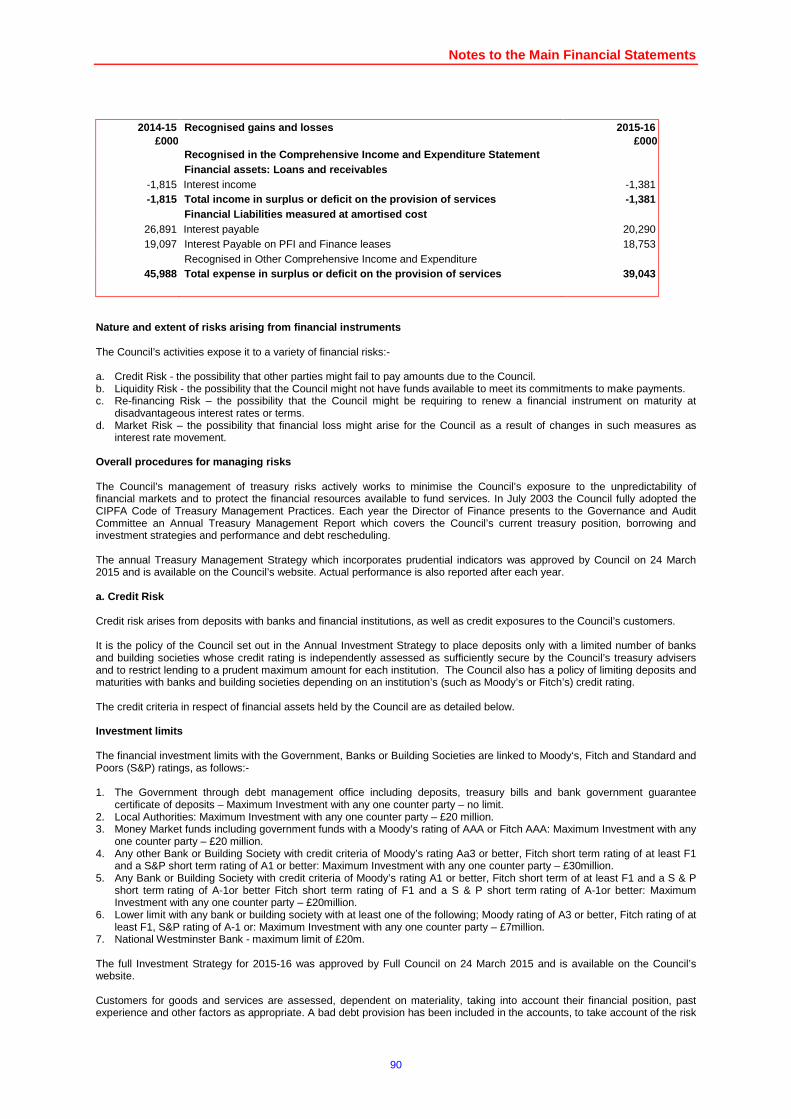
Notes to the Main Financial Statements
90
2014-15 Recognised gains and losses 2015-16 £000 £000
Recognised in the Comprehensive Income and Expendit ure Statement Financial assets: Loans and receivables
-1,815 Interest income -1,381 -1,815 Total income in surplus or deficit on the provision of services -1,381
Financial Liabilities measured at amortised cost 26,891 Interest payable 20,290 19,097 Interest Payable on PFI and Finance leases 18,753
Recognised in Other Comprehensive Income and Expenditure 45,988 Total expense in surplus or deficit on the provisio n of services 39,043
Nature and extent of risks arising from financial i nstruments The Council’s activities expose it to a variety of financial risks:- a. Credit Risk - the possibility that other parties might fail to pay amounts due to the Council. b. Liquidity Risk - the possibility that the Council might not have funds available to meet its commitments to make payments. c. Re-financing Risk – the possibility that the Council might be requiring to renew a financial instrument on maturity at
disadvantageous interest rates or terms. d. Market Risk – the possibility that financial loss might arise for the Council as a result of changes in such measures as
interest rate movement. Overall procedures for managing risks The Council’s management of treasury risks actively works to minimise the Council’s exposure to the unpredictability of financial markets and to protect the financial resources available to fund services. In July 2003 the Council fully adopted the CIPFA Code of Treasury Management Practices. Each year the Director of Finance presents to the Governance and Audit Committee an Annual Treasury Management Report which covers the Council’s current treasury position, borrowing and investment strategies and performance and debt rescheduling. The annual Treasury Management Strategy which incorporates prudential indicators was approved by Council on 24 March 2015 and is available on the Council’s website. Actual performance is also reported after each year. a. Credit Risk Credit risk arises from deposits with banks and financial institutions, as well as credit exposures to the Council’s customers. It is the policy of the Council set out in the Annual Investment Strategy to place deposits only with a limited number of banks and building societies whose credit rating is independently assessed as sufficiently secure by the Council’s treasury advisers and to restrict lending to a prudent maximum amount for each institution. The Council also has a policy of limiting deposits and maturities with banks and building societies depending on an institution’s (such as Moody’s or Fitch’s) credit rating. The credit criteria in respect of financial assets held by the Council are as detailed below. Investment limits The financial investment limits with the Government, Banks or Building Societies are linked to Moody‘s, Fitch and Standard and Poors (S&P) ratings, as follows:- 1. The Government through debt management office including deposits, treasury bills and bank government guarantee
certificate of deposits – Maximum Investment with any one counter party – no limit. 2. Local Authorities: Maximum Investment with any one counter party – £20 million. 3. Money Market funds including government funds with a Moody’s rating of AAA or Fitch AAA: Maximum Investment with any
one counter party – £20 million. 4. Any other Bank or Building Society with credit criteria of Moody’s rating Aa3 or better, Fitch short term rating of at least F1
and a S&P short term rating of A1 or better: Maximum Investment with any one counter party – £30million. 5. Any Bank or Building Society with credit criteria of Moody’s rating A1 or better, Fitch short term of at least F1 and a S & P
short term rating of A-1or better Fitch short term rating of F1 and a S & P short term rating of A-1or better: Maximum Investment with any one counter party – £20million.
6. Lower limit with any bank or building society with at least one of the following; Moody rating of A3 or better, Fitch rating of at least F1, S&P rating of A-1 or: Maximum Investment with any one counter party – £7million.
7. National Westminster Bank - maximum limit of £20m. The full Investment Strategy for 2015-16 was approved by Full Council on 24 March 2015 and is available on the Council’s website. Customers for goods and services are assessed, dependent on materiality, taking into account their financial position, past experience and other factors as appropriate. A bad debt provision has been included in the accounts, to take account of the risk
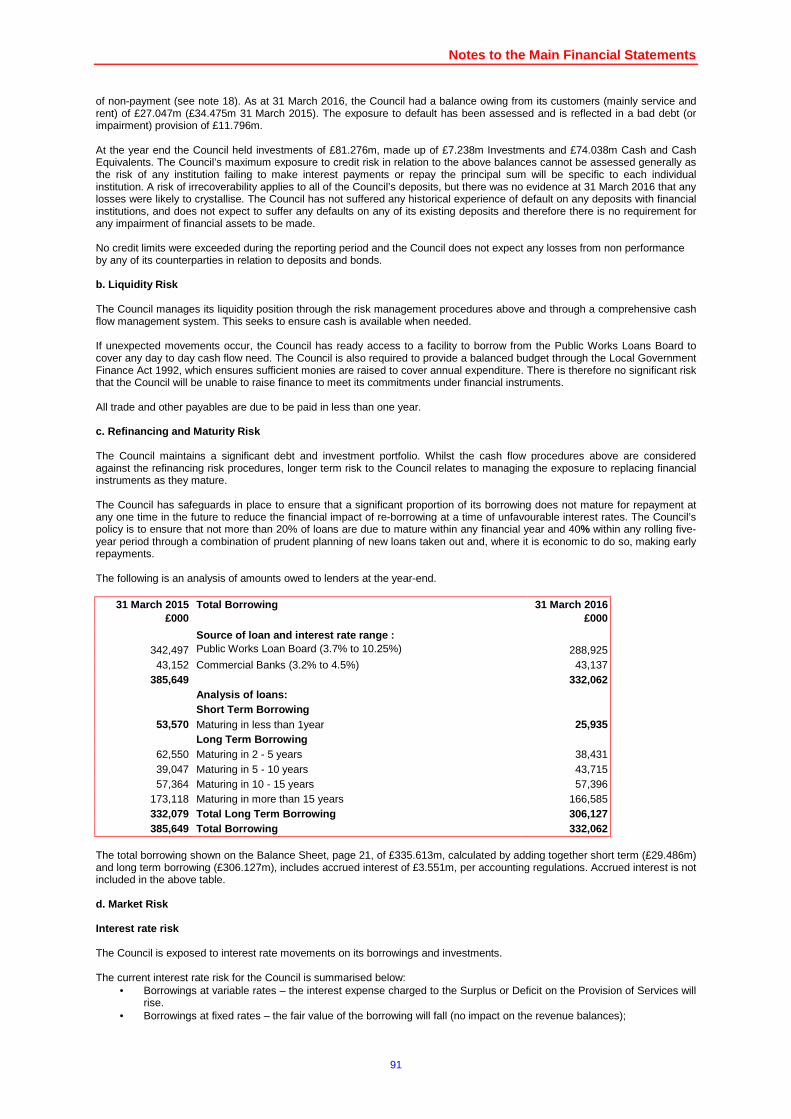
Notes to the Main Financial Statements
91
of non-payment (see note 18). As at 31 March 2016, the Council had a balance owing from its customers (mainly service and rent) of £27.047m (£34.475m 31 March 2015). The exposure to default has been assessed and is reflected in a bad debt (or impairment) provision of £11.796m. At the year end the Council held investments of £81.276m, made up of £7.238m Investments and £74.038m Cash and Cash Equivalents. The Council’s maximum exposure to credit risk in relation to the above balances cannot be assessed generally as the risk of any institution failing to make interest payments or repay the principal sum will be specific to each individual institution. A risk of irrecoverability applies to all of the Council’s deposits, but there was no evidence at 31 March 2016 that any losses were likely to crystallise. The Council has not suffered any historical experience of default on any deposits with financial institutions, and does not expect to suffer any defaults on any of its existing deposits and therefore there is no requirement for any impairment of financial assets to be made. No credit limits were exceeded during the reporting period and the Council does not expect any losses from non performance by any of its counterparties in relation to deposits and bonds. b. Liquidity Risk The Council manages its liquidity position through the risk management procedures above and through a comprehensive cash flow management system. This seeks to ensure cash is available when needed. If unexpected movements occur, the Council has ready access to a facility to borrow from the Public Works Loans Board to cover any day to day cash flow need. The Council is also required to provide a balanced budget through the Local Government Finance Act 1992, which ensures sufficient monies are raised to cover annual expenditure. There is therefore no significant risk that the Council will be unable to raise finance to meet its commitments under financial instruments. All trade and other payables are due to be paid in less than one year. c. Refinancing and Maturity Risk The Council maintains a significant debt and investment portfolio. Whilst the cash flow procedures above are considered against the refinancing risk procedures, longer term risk to the Council relates to managing the exposure to replacing financial instruments as they mature. The Council has safeguards in place to ensure that a significant proportion of its borrowing does not mature for repayment at any one time in the future to reduce the financial impact of re-borrowing at a time of unfavourable interest rates. The Council’s policy is to ensure that not more than 20% of loans are due to mature within any financial year and 40% within any rolling five-year period through a combination of prudent planning of new loans taken out and, where it is economic to do so, making early repayments. The following is an analysis of amounts owed to lenders at the year-end.
31 March 2015 £000
Total Borrowing 31 March 2016 £000
Source of loan and interest rate range : 342,497 Public Works Loan Board (3.7% to 10.25%) 288,925 43,152 Commercial Banks (3.2% to 4.5%) 43,137
385,649 332,062 Analysis of loans: Short Term Borrowing
53,570 Maturing in less than 1year 25,935 Long Term Borrowing
62,550 Maturing in 2 - 5 years 38,431 39,047 Maturing in 5 - 10 years 43,715 57,364 Maturing in 10 - 15 years 57,396
173,118 Maturing in more than 15 years 166,585 332,079 Total Long Term Borrowing 306,127 385,649 Total Borrowing 332,062
The total borrowing shown on the Balance Sheet, page 21, of £335.613m, calculated by adding together short term (£29.486m) and long term borrowing (£306.127m), includes accrued interest of £3.551m, per accounting regulations. Accrued interest is not included in the above table. d. Market Risk Interest rate risk The Council is exposed to interest rate movements on its borrowings and investments. The current interest rate risk for the Council is summarised below:
• Borrowings at variable rates – the interest expense charged to the Surplus or Deficit on the Provision of Services will rise.
• Borrowings at fixed rates – the fair value of the borrowing will fall (no impact on the revenue balances);
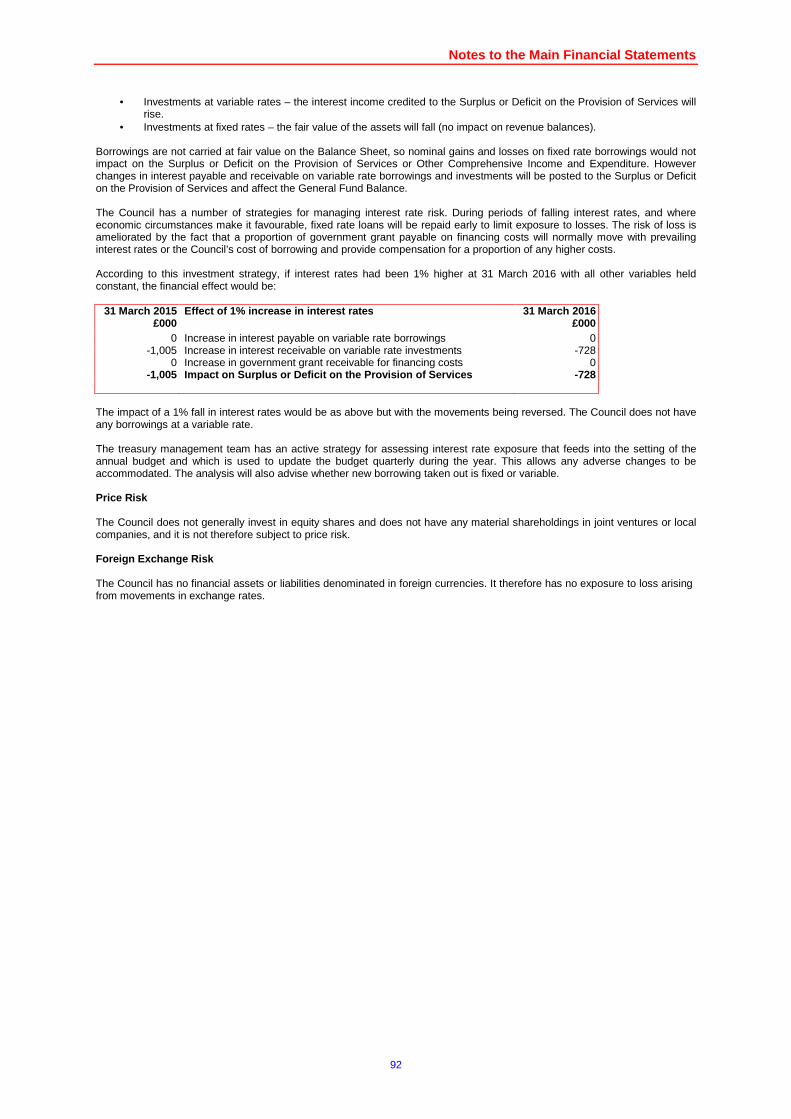
Notes to the Main Financial Statements
92
• Investments at variable rates – the interest income credited to the Surplus or Deficit on the Provision of Services will rise.
• Investments at fixed rates – the fair value of the assets will fall (no impact on revenue balances). Borrowings are not carried at fair value on the Balance Sheet, so nominal gains and losses on fixed rate borrowings would not impact on the Surplus or Deficit on the Provision of Services or Other Comprehensive Income and Expenditure. However changes in interest payable and receivable on variable rate borrowings and investments will be posted to the Surplus or Deficit on the Provision of Services and affect the General Fund Balance. The Council has a number of strategies for managing interest rate risk. During periods of falling interest rates, and where economic circumstances make it favourable, fixed rate loans will be repaid early to limit exposure to losses. The risk of loss is ameliorated by the fact that a proportion of government grant payable on financing costs will normally move with prevailing interest rates or the Council’s cost of borrowing and provide compensation for a proportion of any higher costs. According to this investment strategy, if interest rates had been 1% higher at 31 March 2016 with all other variables held constant, the financial effect would be:
31 March 2015 £000
Effect of 1% increase in interest rates 31 March 2016 £000
0 Increase in interest payable on variable rate borrowings 0 -1,005 Increase in interest receivable on variable rate investments -728
0 Increase in government grant receivable for financing costs 0 -1,005 Impact on Surplus or Deficit on the Provision of Se rvices -728
The impact of a 1% fall in interest rates would be as above but with the movements being reversed. The Council does not have any borrowings at a variable rate. The treasury management team has an active strategy for assessing interest rate exposure that feeds into the setting of the annual budget and which is used to update the budget quarterly during the year. This allows any adverse changes to be accommodated. The analysis will also advise whether new borrowing taken out is fixed or variable. Price Risk The Council does not generally invest in equity shares and does not have any material shareholdings in joint ventures or local companies, and it is not therefore subject to price risk. Foreign Exchange Risk The Council has no financial assets or liabilities denominated in foreign currencies. It therefore has no exposure to loss arising from movements in exchange rates.
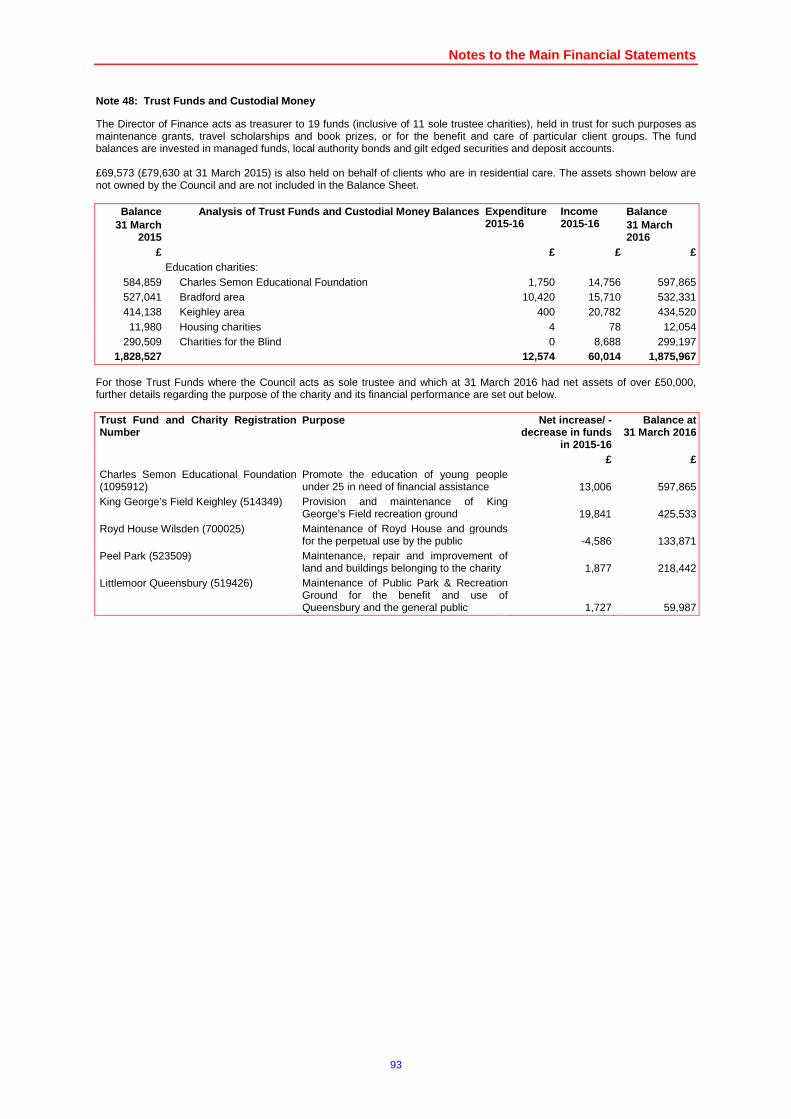
Notes to the Main Financial Statements
93
Note 48: Trust Funds and Custodial Money
The Director of Finance acts as treasurer to 19 funds (inclusive of 11 sole trustee charities), held in trust for such purposes as maintenance grants, travel scholarships and book prizes, or for the benefit and care of particular client groups. The fund balances are invested in managed funds, local authority bonds and gilt edged securities and deposit accounts. £69,573 (£79,630 at 31 March 2015) is also held on behalf of clients who are in residential care. The assets shown below are not owned by the Council and are not included in the Balance Sheet.
Balance 31 March
2015
Analysis of Trust Funds and Custodial Money Balance s Expenditure 2015-16
Income 2015-16
Balance 31 March 2016
£ £ £ £ Education charities:
584,859 Charles Semon Educational Foundation 1,750 14,756 597,865 527,041 Bradford area 10,420 15,710 532,331 414,138 Keighley area 400 20,782 434,520 11,980 Housing charities 4 78 12,054
290,509 Charities for the Blind 0 8,688 299,197 1,828,527 12,574 60,014 1,875,967
For those Trust Funds where the Council acts as sole trustee and which at 31 March 2016 had net assets of over £50,000, further details regarding the purpose of the charity and its financial performance are set out below. Trust Fund and Charity Registration Number
Purpose Net increase/ - decrease in funds
in 2015-16
Balance at 31 March 2016
£ £ Charles Semon Educational Foundation (1095912)
Promote the education of young people under 25 in need of financial assistance 13,006 597,865
King George’s Field Keighley (514349) Provision and maintenance of King George’s Field recreation ground 19,841 425,533
Royd House Wilsden (700025) Maintenance of Royd House and grounds for the perpetual use by the public -4,586 133,871
Peel Park (523509) Maintenance, repair and improvement of land and buildings belonging to the charity 1,877 218,442
Littlemoor Queensbury (519426) Maintenance of Public Park & Recreation Ground for the benefit and use of Queensbury and the general public 1,727 59,987
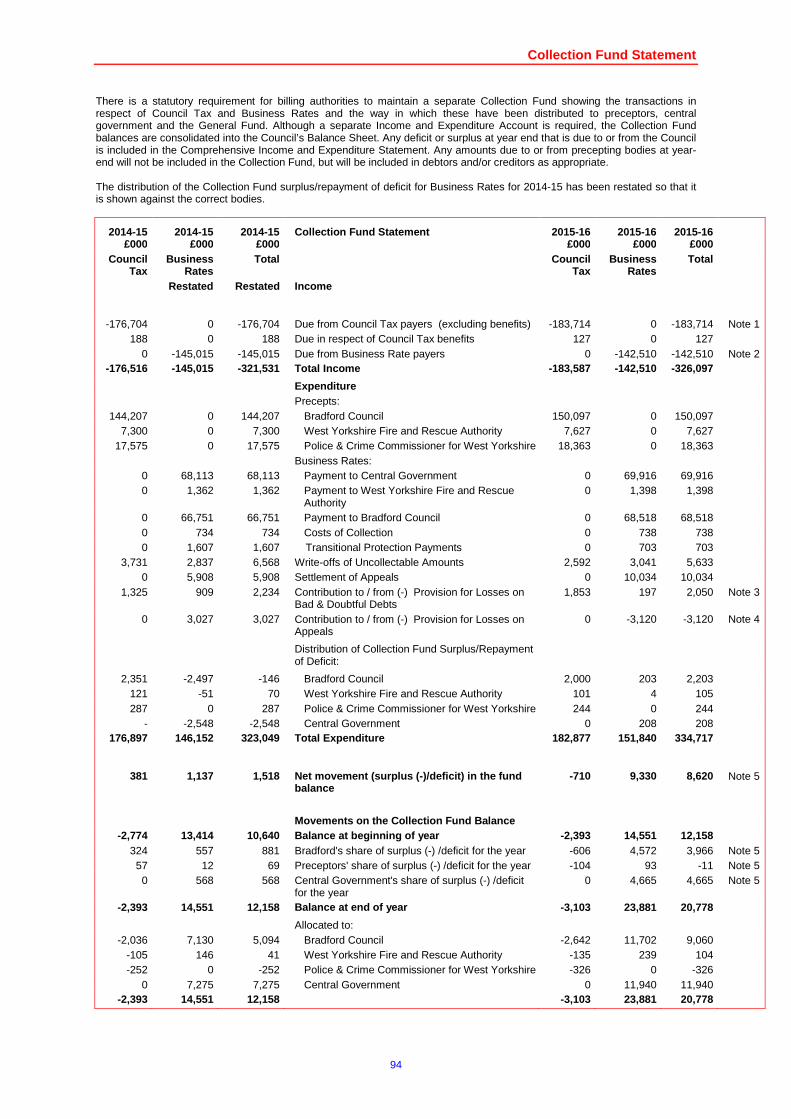
Collection Fund Statement
94
There is a statutory requirement for billing authorities to maintain a separate Collection Fund showing the transactions in respect of Council Tax and Business Rates and the way in which these have been distributed to preceptors, central government and the General Fund. Although a separate Income and Expenditure Account is required, the Collection Fund balances are consolidated into the Council’s Balance Sheet. Any deficit or surplus at year end that is due to or from the Council is included in the Comprehensive Income and Expenditure Statement. Any amounts due to or from precepting bodies at year-end will not be included in the Collection Fund, but will be included in debtors and/or creditors as appropriate. The distribution of the Collection Fund surplus/repayment of deficit for Business Rates for 2014-15 has been restated so that it is shown against the correct bodies.
2014-15 2014-15 2014-15 Collection Fund Statement 2015-16 2015-16 2015-16 £000 £000 £000 £000 £000 £000
Council Tax
Business Rates
Total Council Tax
Business Rates
Total
Restated Restated Income
-176,704 0 -176,704 Due from Council Tax payers (excluding benefits) -183,714 0 -183,714 Note 1 188 0 188 Due in respect of Council Tax benefits 127 0 127
0 -145,015 -145,015 Due from Business Rate payers 0 -142,510 -142,510 Note 2 -176,516 -145,015 -321,531 Total Income -183,587 -142,510 -326,097
Expenditure Precepts:
144,207 0 144,207 Bradford Council 150,097 0 150,097 7,300 0 7,300 West Yorkshire Fire and Rescue Authority 7,627 0 7,627
17,575 0 17,575 Police & Crime Commissioner for West Yorkshire 18,363 0 18,363 Business Rates:
0 68,113 68,113 Payment to Central Government 0 69,916 69,916 0 1,362 1,362 Payment to West Yorkshire Fire and Rescue
Authority 0 1,398 1,398
0 66,751 66,751 Payment to Bradford Council 0 68,518 68,518 0 734 734 Costs of Collection 0 738 738 0 1,607 1,607 Transitional Protection Payments 0 703 703
3,731 2,837 6,568 Write-offs of Uncollectable Amounts 2,592 3,041 5,633 0 5,908 5,908 Settlement of Appeals 0 10,034 10,034
1,325 909 2,234 Contribution to / from (-) Provision for Losses on Bad & Doubtful Debts
1,853 197 2,050 Note 3
0 3,027 3,027 Contribution to / from (-) Provision for Losses on Appeals
0 -3,120 -3,120 Note 4
Distribution of Collection Fund Surplus/Repayment of Deficit:
2,351 -2,497 -146 Bradford Council 2,000 203 2,203 121 -51 70 West Yorkshire Fire and Rescue Authority 101 4 105 287 0 287 Police & Crime Commissioner for West Yorkshire 244 0 244
- -2,548 -2,548 Central Government 0 208 208 176,897 146,152 323,049 Total Expenditure 182,877 151,840 334,717
381 1,137 1,518 Net movement (surplus (-)/deficit) in the fund balance
-710 9,330 8,620 Note 5
Movements on the Collection Fund Balance
-2,774 13,414 10,640 Balance at beginning of year -2,393 14,551 12,158 324 557 881 Bradford's share of surplus (-) /deficit for the year -606 4,572 3,966 Note 5 57 12 69 Preceptors' share of surplus (-) /deficit for the year -104 93 -11 Note 5 0 568 568 Central Government's share of surplus (-) /deficit
for the year 0 4,665 4,665 Note 5
-2,393 14,551 12,158 Balance at end of year -3,103 23,881 20,778
Allocated to: -2,036 7,130 5,094 Bradford Council -2,642 11,702 9,060
-105 146 41 West Yorkshire Fire and Rescue Authority -135 239 104 -252 0 -252 Police & Crime Commissioner for West Yorkshire -326 0 -326
0 7,275 7,275 Central Government 0 11,940 11,940 -2,393 14,551 12,158 -3,103 23,881 20,778
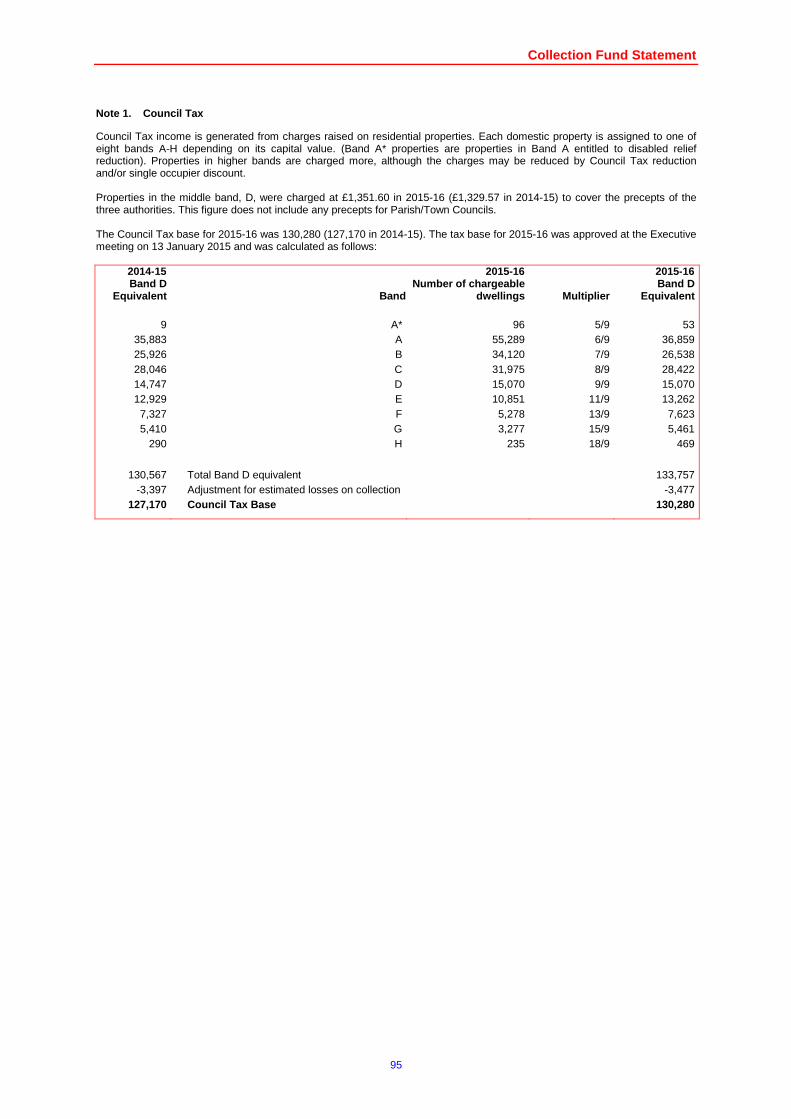
Collection Fund Statement
95
Council Tax Note 1.
Council Tax income is generated from charges raised on residential properties. Each domestic property is assigned to one of eight bands A-H depending on its capital value. (Band A* properties are properties in Band A entitled to disabled relief reduction). Properties in higher bands are charged more, although the charges may be reduced by Council Tax reduction and/or single occupier discount. Properties in the middle band, D, were charged at £1,351.60 in 2015-16 (£1,329.57 in 2014-15) to cover the precepts of the three authorities. This figure does not include any precepts for Parish/Town Councils. The Council Tax base for 2015-16 was 130,280 (127,170 in 2014-15). The tax base for 2015-16 was approved at the Executive meeting on 13 January 2015 and was calculated as follows:
2014-15 Band D
Equivalent Band
2015-16 Number of chargeable
dwellings Multiplier
2015-16 Band D
Equivalent
9 A* 96 5/9 53 35,883 A 55,289 6/9 36,859 25,926 B 34,120 7/9 26,538 28,046 C 31,975 8/9 28,422 14,747 D 15,070 9/9 15,070 12,929 E 10,851 11/9 13,262 7,327 F 5,278 13/9 7,623 5,410 G 3,277 15/9 5,461
290 H 235 18/9 469
130,567 Total Band D equivalent 133,757
-3,397 Adjustment for estimated losses on collection -3,477 127,170 Council Tax Base 130,280
Collection Fund Statement
96
Note 2. Business Rates (National Non-Domestic Rates )
The Council collects business rates on behalf of central government for its area. The rate in the pound of rateable value is set by central government. There are two multipliers: the small business non-domestic rating multiplier of 48.0p (47.1p in 2014-15) is applicable to those that qualify for the small business relief; and the non-domestic rating multiplier of 49.3p (48.2p in 2014-15) includes the supplement to pay for small business relief. In 2013-14, the local government finance regime was revised with the introduction of the retained business rates scheme. The main aim of the scheme is to give Councils a greater incentive to grow businesses in the District. It does, however, also increase the financial risk due to non-collection and the volatility of the Business Rates tax base. The scheme allows the Council to retain 49% of the total Business Rates received. Of the remainder, 50% is paid to Central Government and 1% is paid to West Yorkshire Fire and Rescue Authority (WYFRA). The business rates shares payable for 2015-16 were estimated before the start of the financial year as £69.916m to Central Government, £1.398m to WYFRA and £68.518m to Bradford Council. These sums have been paid in 2015-16 and charged to the Collection Fund in year. The total income from business rate payers collected in 2015-16 was £142.510m (£145.015m in 2014-15). This sum includes £0.703m of transitional protection payments from ratepayers, which under Government regulation should have a neutral impact on the business rate retention scheme. This sum has to be repaid to Central Government. The business rates income, after reliefs and provisions, was based on a total rateable value for the Council’s area of £388,095,364 for 2015-16 (£379,349,488 for 2014-15). Note 3. Provision for Council Tax and Business Bad Debts
In 2015-16, the total provision for Council Tax bad debts was increased by £1.853m, from £12.052m to £13.905m. Of the final balance, 85% is to cover Council Tax owed to the Council. The remaining 15% is to cover amounts owed to major preceptors. In 2015-16, the total provision for Business Rates bad debts was increased by £0.197m, from £5.931m to £6.128m. Of the final balance, 49% is to cover Business Rates owed to the Council. The remaining 51% is to cover amounts owed to Central Government (50%) and West Yorkshire Fire and Rescue Authority (1%). Note 4. Provision for Losses on Appeals
From 1 April 2013, the Council shares 49% of the risks and rewards of the income from Business Rates. The Council could potentially receive a shortfall in income from changes in the valuations of commercial premises, following appeals to the Valuation Agency. In 2015-16, the provision for losses on outstanding appeals was reduced by £3.120m, from £15.359m at 31 March 2015 to £12.239m at 31 March 2016. The Council’s 49% share of the £12.239m provision was £5.997m. Note 5. Collection Fund Balance
An accumulated surplus on the Collection Fund is attributable to amounts that are deemed to be collectable, but which have not yet been collected. In line with proper accounting practice for Council Tax, Business Rates and the Collection Fund, any surplus or deficit in year must be allocated in year to the Council and the preceptors in the required proportions. However, in order to reflect the fact that the Council is not allowed by statutory legislation to either fund deficits or use surpluses in year, the distribution is offset by an entry to the Collection Fund Adjustment Account in the Council’s Balance Sheet. This change does not therefore affect the statutory position, which is that any surplus or deficit on the Collection Fund must be used as an adjustment to the Council Tax and Business Rates in future years. An overall deficit of £8.620m arose in 2015-16 (£1.518m deficit in 2014-15), of which the Council’s share was a deficit of £3.966m (£0.881m deficit in 2014-15); Central Government's share was a deficit of £4.665m (£0.568m deficit in 2014-15); and the preceptors share was a surplus of £0.011m (£0.069m deficit in 2014-15). Note 6. Leeds City Region Pooling Arrangement The Council is a Member of the Leeds City Region Pool along with the other four West Yorkshire Authorities, Harrogate and York. Under the terms of the pooling arrangement, during the year, each authority will receive exactly the same funding as they would have if treated individually. The distribution of any levy income is retained in the region as opposed to being paid over to the Government.
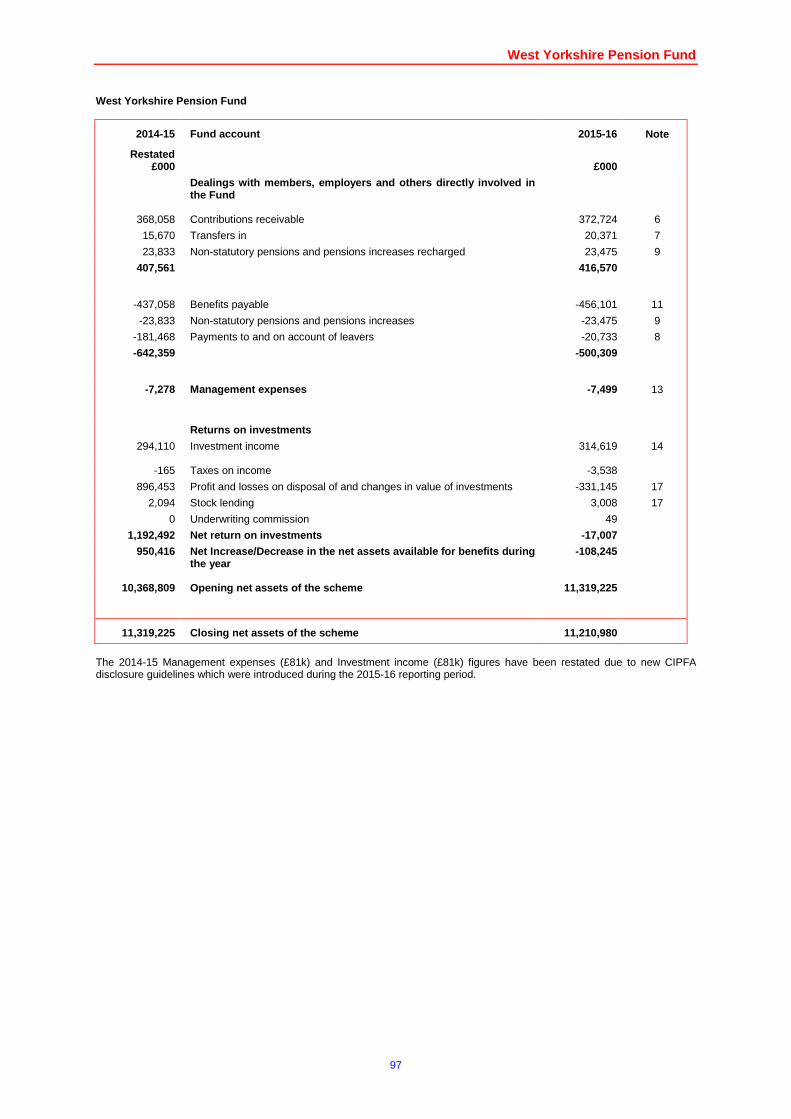
West Yorkshire Pension Fund
97
West Yorkshire Pension Fund
2014-15
Restated
Fund account 2015-16 Note
£000 £000
Dealings with members, employers and others directl y involved in the Fund
368,058 Contributions receivable 372,724 6
15,670 Transfers in 20,371 7
23,833 Non-statutory pensions and pensions increases recharged 23,475 9
407,561 416,570
-437,058 Benefits payable -456,101 11
-23,833 Non-statutory pensions and pensions increases -23,475 9
-181,468 Payments to and on account of leavers -20,733 8
-642,359 -500,309
-7,278 Management expenses -7,499 13
Returns on investments
294,110 Investment income 314,619 14
-165 Taxes on income -3,538
896,453 Profit and losses on disposal of and changes in value of investments -331,145 17
2,094 Stock lending 3,008 17
0 Underwriting commission 49
1,192,492 Net return on investments -17,007
950,416 Net Increase/Decrease in the net assets available f or benefits during the year
-108,245
10,368,809
Opening net assets of the scheme 11,319,225
11,319,225 Closing net assets of the scheme 11,210,980
The 2014-15 Management expenses (£81k) and Investment income (£81k) figures have been restated due to new CIPFA disclosure guidelines which were introduced during the 2015-16 reporting period.
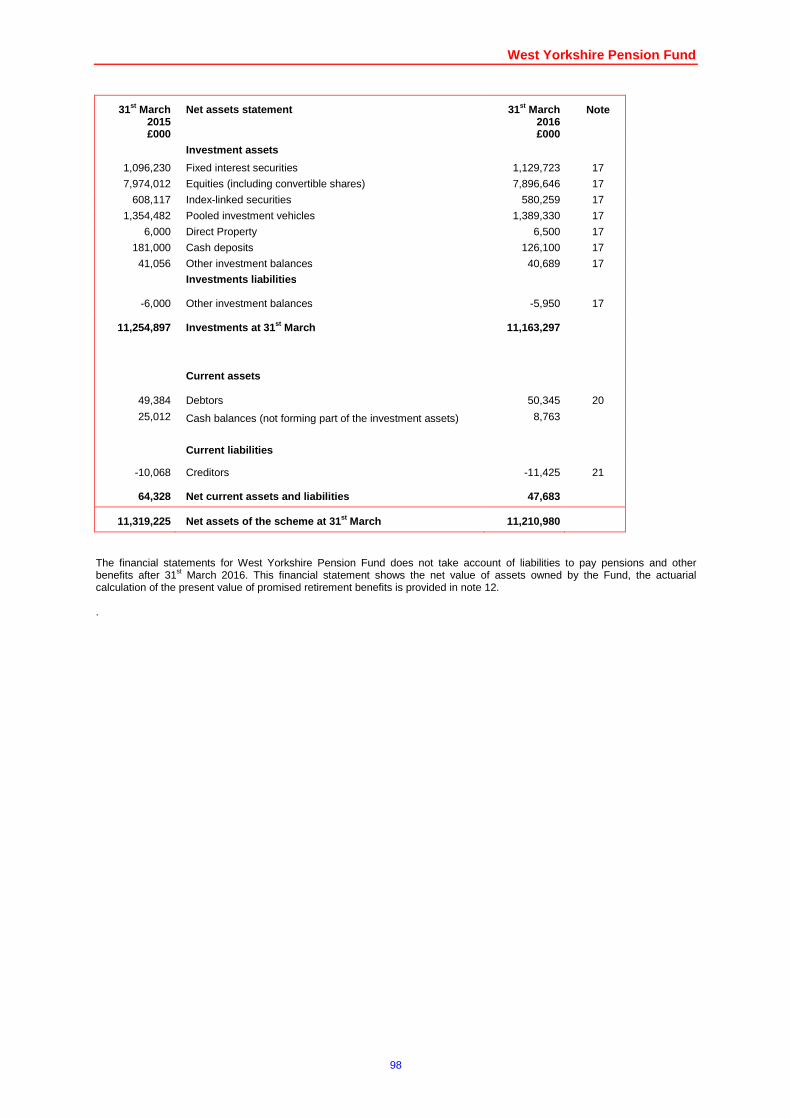
West Yorkshire Pension Fund
98
31st March 2015
Net assets statement 31st March 2016
Note
£000 £000 Investment assets
1,096,230 Fixed interest securities 1,129,723 17
7,974,012 Equities (including convertible shares) 7,896,646 17
608,117 Index-linked securities 580,259 17
1,354,482 Pooled investment vehicles 1,389,330 17
6,000 Direct Property 6,500 17
181,000 Cash deposits 126,100 17
41,056 Other investment balances 40,689 17
Investments liabilities
-6,000 Other investment balances -5,950 17
11,254,897 Investments at 31 st March 11,163,297
Current assets
49,384 Debtors 50,345 20
25,012 Cash balances (not forming part of the investment assets) 8,763
Current liabilities
-10,068 Creditors -11,425 21
64,328 Net current assets and liabilities 47,683
11,319,225 Net assets of the scheme at 31 st March 11,210,980
The financial statements for West Yorkshire Pension Fund does not take account of liabilities to pay pensions and other benefits after 31st March 2016. This financial statement shows the net value of assets owned by the Fund, the actuarial calculation of the present value of promised retirement benefits is provided in note 12. .
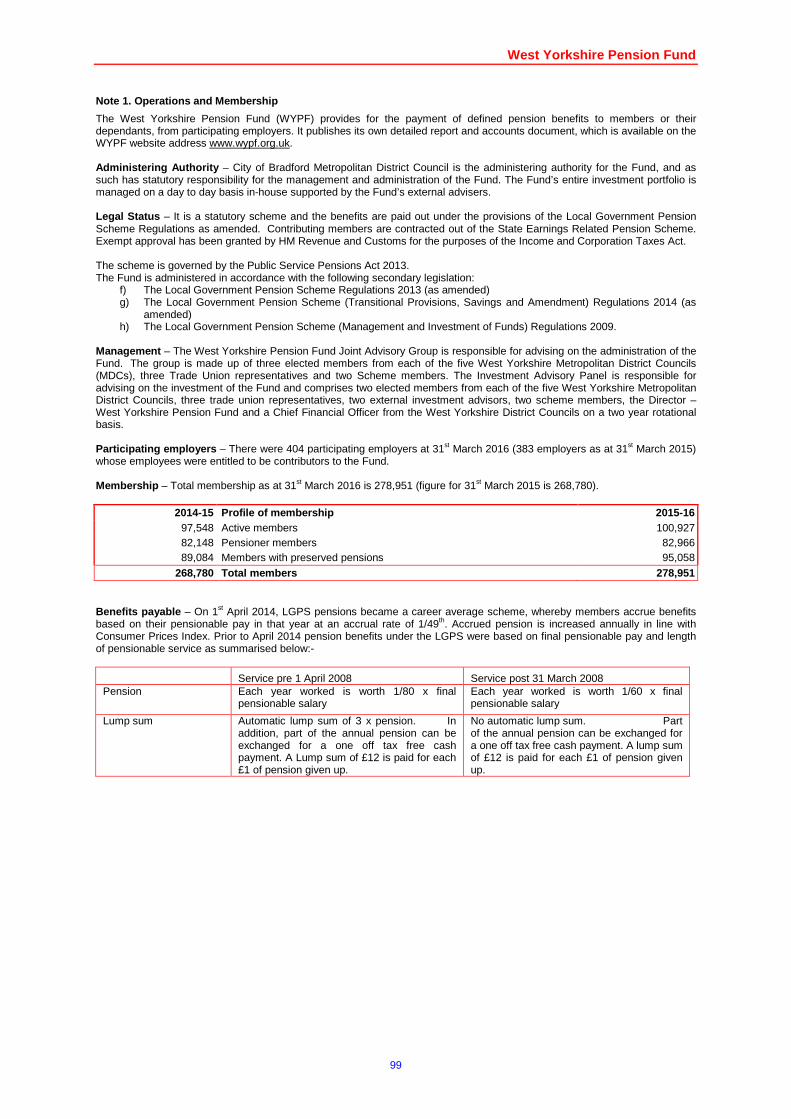
West Yorkshire Pension Fund
99
Note 1. Operations and Membership
The West Yorkshire Pension Fund (WYPF) provides for the payment of defined pension benefits to members or their dependants, from participating employers. It publishes its own detailed report and accounts document, which is available on the WYPF website address www.wypf.org.uk. Administering Authority – City of Bradford Metropolitan District Council is the administering authority for the Fund, and as such has statutory responsibility for the management and administration of the Fund. The Fund’s entire investment portfolio is managed on a day to day basis in-house supported by the Fund’s external advisers. Legal Status – It is a statutory scheme and the benefits are paid out under the provisions of the Local Government Pension Scheme Regulations as amended. Contributing members are contracted out of the State Earnings Related Pension Scheme. Exempt approval has been granted by HM Revenue and Customs for the purposes of the Income and Corporation Taxes Act. The scheme is governed by the Public Service Pensions Act 2013. The Fund is administered in accordance with the following secondary legislation:
f) The Local Government Pension Scheme Regulations 2013 (as amended) g) The Local Government Pension Scheme (Transitional Provisions, Savings and Amendment) Regulations 2014 (as
amended) h) The Local Government Pension Scheme (Management and Investment of Funds) Regulations 2009.
Management – The West Yorkshire Pension Fund Joint Advisory Group is responsible for advising on the administration of the Fund. The group is made up of three elected members from each of the five West Yorkshire Metropolitan District Councils (MDCs), three Trade Union representatives and two Scheme members. The Investment Advisory Panel is responsible for advising on the investment of the Fund and comprises two elected members from each of the five West Yorkshire Metropolitan District Councils, three trade union representatives, two external investment advisors, two scheme members, the Director – West Yorkshire Pension Fund and a Chief Financial Officer from the West Yorkshire District Councils on a two year rotational basis. Participating employers – There were 404 participating employers at 31st March 2016 (383 employers as at 31st March 2015) whose employees were entitled to be contributors to the Fund. Membership – Total membership as at 31st March 2016 is 278,951 (figure for 31st March 2015 is 268,780).
2014-15 Profile of membership 2015-16 97,548 Active members 100,927 82,148 Pensioner members 82,966 89,084 Members with preserved pensions 95,058
268,780 Total members 278,951 Benefits payable – On 1st April 2014, LGPS pensions became a career average scheme, whereby members accrue benefits based on their pensionable pay in that year at an accrual rate of 1/49th. Accrued pension is increased annually in line with Consumer Prices Index. Prior to April 2014 pension benefits under the LGPS were based on final pensionable pay and length of pensionable service as summarised below:-
Service pre 1 April 2008 Service post 31 March 2008 Pension Each year worked is worth 1/80 x final
pensionable salary Each year worked is worth 1/60 x final pensionable salary
Lump sum Automatic lump sum of 3 x pension. In addition, part of the annual pension can be exchanged for a one off tax free cash payment. A Lump sum of £12 is paid for each £1 of pension given up.
No automatic lump sum. Part of the annual pension can be exchanged for a one off tax free cash payment. A lump sum of £12 is paid for each £1 of pension given up.
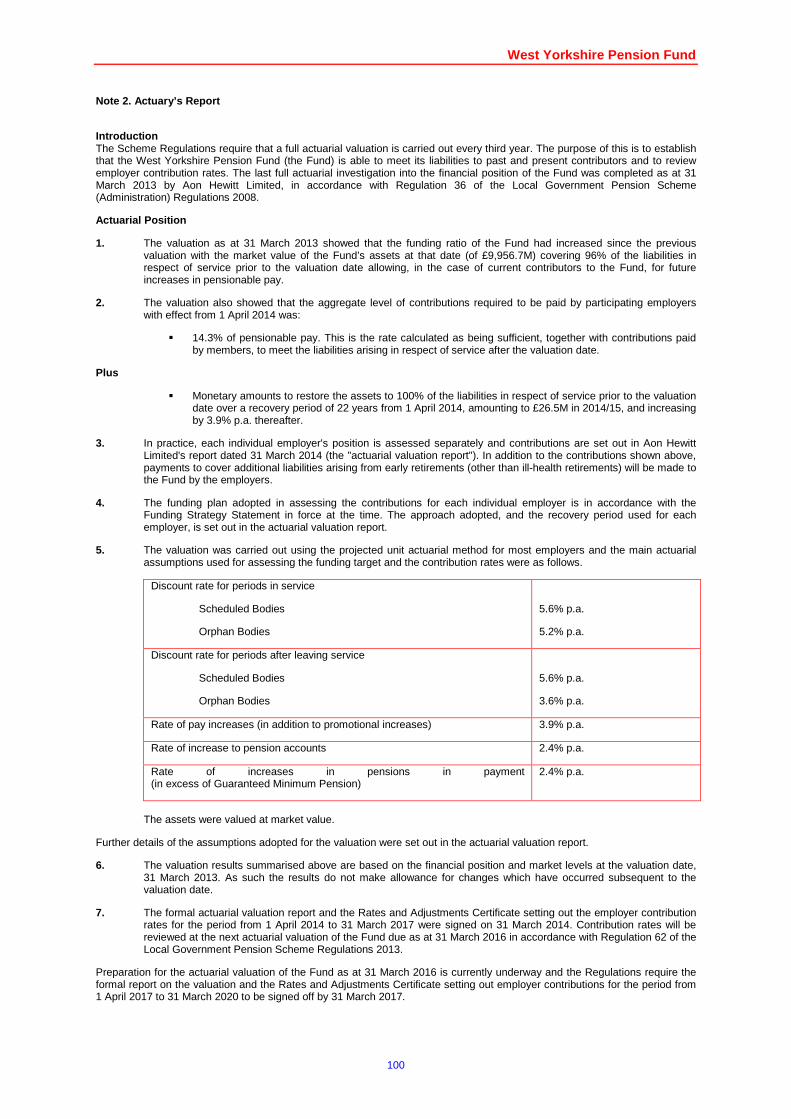
West Yorkshire Pension Fund
100
Note 2. Actuary’s Report
Introduction The Scheme Regulations require that a full actuarial valuation is carried out every third year. The purpose of this is to establish that the West Yorkshire Pension Fund (the Fund) is able to meet its liabilities to past and present contributors and to review employer contribution rates. The last full actuarial investigation into the financial position of the Fund was completed as at 31 March 2013 by Aon Hewitt Limited, in accordance with Regulation 36 of the Local Government Pension Scheme (Administration) Regulations 2008.
Actuarial Position
1. The valuation as at 31 March 2013 showed that the funding ratio of the Fund had increased since the previous valuation with the market value of the Fund’s assets at that date (of £9,956.7M) covering 96% of the liabilities in respect of service prior to the valuation date allowing, in the case of current contributors to the Fund, for future increases in pensionable pay.
2. The valuation also showed that the aggregate level of contributions required to be paid by participating employers with effect from 1 April 2014 was:
� 14.3% of pensionable pay. This is the rate calculated as being sufficient, together with contributions paid by members, to meet the liabilities arising in respect of service after the valuation date.
Plus
� Monetary amounts to restore the assets to 100% of the liabilities in respect of service prior to the valuation date over a recovery period of 22 years from 1 April 2014, amounting to £26.5M in 2014/15, and increasing by 3.9% p.a. thereafter.
3. In practice, each individual employer's position is assessed separately and contributions are set out in Aon Hewitt Limited's report dated 31 March 2014 (the "actuarial valuation report"). In addition to the contributions shown above, payments to cover additional liabilities arising from early retirements (other than ill-health retirements) will be made to the Fund by the employers.
4. The funding plan adopted in assessing the contributions for each individual employer is in accordance with the Funding Strategy Statement in force at the time. The approach adopted, and the recovery period used for each employer, is set out in the actuarial valuation report.
5. The valuation was carried out using the projected unit actuarial method for most employers and the main actuarial assumptions used for assessing the funding target and the contribution rates were as follows.
Discount rate for periods in service
Scheduled Bodies
Orphan Bodies
5.6% p.a.
5.2% p.a.
Discount rate for periods after leaving service
Scheduled Bodies
Orphan Bodies
5.6% p.a.
3.6% p.a.
Rate of pay increases (in addition to promotional increases) 3.9% p.a.
Rate of increase to pension accounts 2.4% p.a.
Rate of increases in pensions in payment (in excess of Guaranteed Minimum Pension)
2.4% p.a.
The assets were valued at market value.
Further details of the assumptions adopted for the valuation were set out in the actuarial valuation report.
6. The valuation results summarised above are based on the financial position and market levels at the valuation date, 31 March 2013. As such the results do not make allowance for changes which have occurred subsequent to the valuation date.
7. The formal actuarial valuation report and the Rates and Adjustments Certificate setting out the employer contribution rates for the period from 1 April 2014 to 31 March 2017 were signed on 31 March 2014. Contribution rates will be reviewed at the next actuarial valuation of the Fund due as at 31 March 2016 in accordance with Regulation 62 of the Local Government Pension Scheme Regulations 2013.
Preparation for the actuarial valuation of the Fund as at 31 March 2016 is currently underway and the Regulations require the formal report on the valuation and the Rates and Adjustments Certificate setting out employer contributions for the period from 1 April 2017 to 31 March 2020 to be signed off by 31 March 2017.

West Yorkshire Pension Fund
101
8. This Statement has been prepared by the Actuary to the Fund, Aon Hewitt Limited, for inclusion in the accounts of the Fund. It provides a summary of the results of their actuarial valuation which was carried out as at 31 March 2013. The valuation provides a snapshot of the funding position at the valuation date and is used to assess the future level of contributions required.
This Statement must not be considered without reference to the formal actuarial valuation report which details fully the context and limitations of the actuarial valuation.
Aon Hewitt Limited does not accept any responsibility or liability to any party other than our client, City of Bradford Metropolitan District Council, the Administering Authority of the Fund, in respect of this Statement.
9. The report on the actuarial valuation as at 31 March 2013 is available on the Fund's website at the following address:
http://www.wypf.org.uk/Member/Publications/Valuation/WYPF/Valuation_WYPF_Index.aspx
Aon Hewitt Limited
May 2016
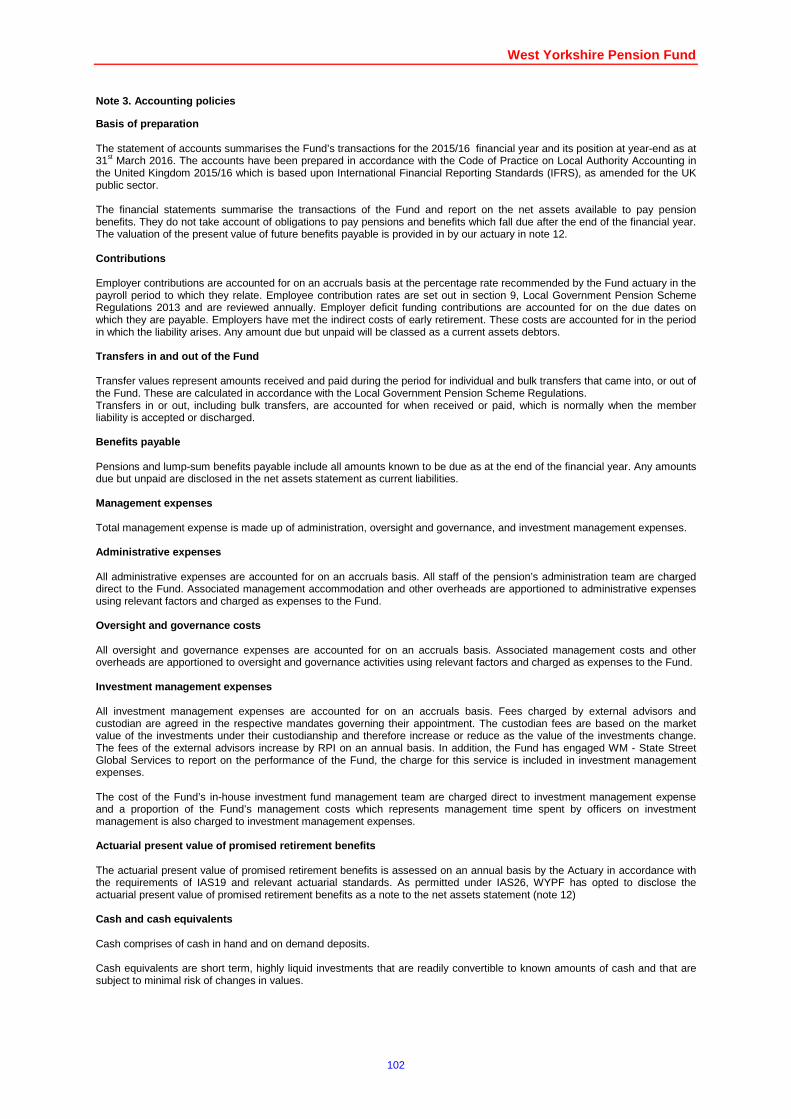
West Yorkshire Pension Fund
102
Note 3. Accounting policies
Basis of preparation The statement of accounts summarises the Fund’s transactions for the 2015/16 financial year and its position at year-end as at 31st March 2016. The accounts have been prepared in accordance with the Code of Practice on Local Authority Accounting in the United Kingdom 2015/16 which is based upon International Financial Reporting Standards (IFRS), as amended for the UK public sector. The financial statements summarise the transactions of the Fund and report on the net assets available to pay pension benefits. They do not take account of obligations to pay pensions and benefits which fall due after the end of the financial year. The valuation of the present value of future benefits payable is provided in by our actuary in note 12. Contributions Employer contributions are accounted for on an accruals basis at the percentage rate recommended by the Fund actuary in the payroll period to which they relate. Employee contribution rates are set out in section 9, Local Government Pension Scheme Regulations 2013 and are reviewed annually. Employer deficit funding contributions are accounted for on the due dates on which they are payable. Employers have met the indirect costs of early retirement. These costs are accounted for in the period in which the liability arises. Any amount due but unpaid will be classed as a current assets debtors. Transfers in and out of the Fund Transfer values represent amounts received and paid during the period for individual and bulk transfers that came into, or out of the Fund. These are calculated in accordance with the Local Government Pension Scheme Regulations. Transfers in or out, including bulk transfers, are accounted for when received or paid, which is normally when the member liability is accepted or discharged. Benefits payable Pensions and lump-sum benefits payable include all amounts known to be due as at the end of the financial year. Any amounts due but unpaid are disclosed in the net assets statement as current liabilities. Management expenses Total management expense is made up of administration, oversight and governance, and investment management expenses. Administrative expenses All administrative expenses are accounted for on an accruals basis. All staff of the pension’s administration team are charged direct to the Fund. Associated management accommodation and other overheads are apportioned to administrative expenses using relevant factors and charged as expenses to the Fund. Oversight and governance costs All oversight and governance expenses are accounted for on an accruals basis. Associated management costs and other overheads are apportioned to oversight and governance activities using relevant factors and charged as expenses to the Fund. Investment management expenses All investment management expenses are accounted for on an accruals basis. Fees charged by external advisors and custodian are agreed in the respective mandates governing their appointment. The custodian fees are based on the market value of the investments under their custodianship and therefore increase or reduce as the value of the investments change. The fees of the external advisors increase by RPI on an annual basis. In addition, the Fund has engaged WM - State Street Global Services to report on the performance of the Fund, the charge for this service is included in investment management expenses. The cost of the Fund’s in-house investment fund management team are charged direct to investment management expense and a proportion of the Fund’s management costs which represents management time spent by officers on investment management is also charged to investment management expenses. Actuarial present value of promised retirement bene fits The actuarial present value of promised retirement benefits is assessed on an annual basis by the Actuary in accordance with the requirements of IAS19 and relevant actuarial standards. As permitted under IAS26, WYPF has opted to disclose the actuarial present value of promised retirement benefits as a note to the net assets statement (note 12) Cash and cash equivalents Cash comprises of cash in hand and on demand deposits. Cash equivalents are short term, highly liquid investments that are readily convertible to known amounts of cash and that are subject to minimal risk of changes in values.
West Yorkshire Pension Fund
103
Investment income Interest income Interest due on fixed-interest securities, index-linked securities and short-term investments is accounted for on an accruals basis. Property related income Property related income is primarily rental income which is recognised on a straight line basis over the term of the lease. Lease incentives (rent free periods) have been recognised as part of the total rental income over the term of the lease. Dividend income Dividend income is recognised on the date the shares are quoted ex dividend. Any amount not received by the end of the reporting period is disclosed in the net assets statement as a current financial asset. Distribution from pooled funds Distributions from pooled funds are recognised at the date of issue. Any amount not received by the end of the reporting period is disclosed in the net assets statement as a current financial asset. Movement in the net market value of investments Changes in the net market value of investments (including investment properties) are recognised as income and comprise all realised and unrealised profits/losses during the accounting period. Taxation The Fund is a registered public service scheme under section 1(1) of Schedule 36 of the Finance Act 2004 and as such is exempt from UK income tax on interest received and from capital gains tax on the proceeds of investments sold. Income from overseas investments suffers withholding tax in the country of origin, unless exemption is permitted. Irrecoverable tax is accounted for as expense as it arises. Financial assets Financial assets are included in the net assets statement on a fair value basis as at the reporting date with the exception of any assets classified as loans and receivables, which are stated at nominal value. A financial asset is recognised in the net asset statement on the date the Fund becomes party to the contractual acquisition of the asset. From this date any gains or losses arising from changes in the fair value of the asset are recognised by the Fund. Valuation methodology Financial instruments include financial assets and financial liabilities. The fair value of a financial instrument is the amount at which the instrument could be exchanged in a transaction between willing parties, other than in a forced or liquidation sale. The methodologies adopted in valuing financial instruments are explained in greater detail in note 19 to the accounts. Wherever possible, fair values have been calculated using unadjusted quoted market prices in active markets. Where quoted market prices are not available, or are unreliable because of poor liquidity, fair values have been determined using valuation techniques which, to the extent possible, use market observable inputs, but in some cases use non-market observable inputs. Because a variety of estimation techniques are employed and significant estimates made, comparisons of fair values between financial institutions may not be meaningful. Readers of these financial statements are thus advised to use caution when using this data to evaluate the Fund’s financial position. Fair value information is not provided for items that do not meet the definition of a financial instrument. Loans and receivables The fair value of deposits is considered to be equal to their carrying value. Receivables are disclosed at their carrying value, and no discounting is performed on amounts receivable more greater than 12 months as these are adjusted rental incomes for rent free periods on investment properties.
Additional Voluntary Contributions (AVCs) West Yorkshire Pension Fund provides additional voluntary contribution (AVC) scheme for its members, the assets of which are invested separately from those of the pension fund. The Fund has appointed Scottish Widows, Prudential and Equitable Life as its AVC providers. AVC’s are paid to the AVC provider by employers and are specifically for providing additional benefits for individual contributors. Each AVC contributor receives an annual statement showing the amount held in their account and the movements in the year.
West Yorkshire Pension Fund
104
AVC’s are not included in the accounts in accordance with section 4(2)(b) of the Local Government Pension Scheme (management and Investment of Funds) Regulations 2009 (SI 2009/3093) but are disclosed as a note only, this is provided in note 10. Currency translation At the year end all foreign currency balances are translated into Sterling at exchange rates ruling at the financial year-end and any gains or losses arising are treated as part of the change in market value of investments. During the year foreign currencies are transacted as follows:
a.) Foreign currency purchases are translated into Sterling at the actual purchase rate, all commissions are charged as expense to management costs.
b.) Proceeds of sales of foreign assets are translated into Sterling
a. If there have been transactions in the same currency in the last 30 days, then the latest recorded transaction rate is used.
b. Else the mid-market rate on the date of receipt is used.
c.) Purchase of foreign investments are translated into Sterling using the rate at which the foreign currency was purchased or translated to Sterling.
d.) Balance of foreign currency income accounts are moved to capital account using the mid-market rate on the date of movement.
e.) Dividends from foreign investments are translated into Sterling using the mid-market rate on the date of receipt.
f.) When currency are sold we use the actual sale rate and commissions are charged to management expense.
Acquisition costs of investments Acquisition costs of investments are included in the purchase price. Netting A financial asset and a financial liability are offset and the net amount presented in the Net Assets Statement when, and only when, the Fund:
a) currently has a legally enforceable right to set off the recognised amounts, and b) intends either to settle on a net basis, or to realise the asset and settle the liability simultaneously.
Contingent liabilities and contractual commitments A contingent liability arises when an event has taken place that gives the Fund a possible obligation whose existence will only be confirmed by the occurrence or otherwise of uncertain future events not wholly within the control of the Fund. Contingent liabilities also arise in circumstances where a provision would otherwise be made but either it is not probable that an outflow of resources would be required or the amount of the obligation cannot be measured reliably. Contingent liabilities are not recognised in the Net Assets Statement but disclosed in note 24. Undrawn commitments relate to outstanding call payments due on unquoted limited partnership funds held in private equity, property and infrastructure parts of the portfolio. The amounts “called” by these funds are irregular in both size and timing over a period of between four and six years from the date of each original commitment. Investment transactions Investment transactions occurring up to 31st March 2016 but not settled until later are accrued in the accounts. Note 4. Critical accounting estimates, judgements a nd assumptions made about the future and other majo r sources of estimation uncertainty The preparation of the Fund’s financial statements in accordance with IFRS requires management to make judgements, estimates and assumptions in applying accounting policies that affect the reported amounts of assets, liabilities, income and expenses. Due to the inherent uncertainty in making estimates, actual results reported in future periods may be based upon amounts which differ from those estimates. Estimates, judgements and assumptions are continually evaluated and are based on historical experience and other factors, including expectations of future events that are believed to be reasonable under the circumstances. The significant judgements made by management in applying the Fund’s accounting policies and key sources of estimation uncertainty in these financial statements, which together are deemed critical to the Fund’s results and financial position, are explained below. a) Fair value of financial instruments In accordance with IFRS 7, the Fund categorises financial instruments carried on the net asset statement at fair value using a three-level hierarchy as disclosed in note 19. Financial instruments categorised as level 1 are valued using quoted market
West Yorkshire Pension Fund
105
prices and therefore there is minimal judgement applied in determining fair value. However, the fair value of financial instruments categorised as level 2 and, in particular level 3 is determined using valuation techniques including discounted cashflow analysis and valuation models. These require management judgement and contain significant estimation uncertainty. Reliance is placed on our third parties to perform these valuations and further due diligence is performed by the Fund to maintain confidence in the data provided. b) Retirement benefit obligations Under IFRS the Fund is required to disclose the actuarial present value of promised retirement benefits. This is disclosed in note 12 and is not shown in the primary financial statements. Significant judgement and estimates are used in formulating this information, all of which are disclosed in note 12. Note 5. Events after the Balance sheet These are events, both favourable and unfavourable, that occur between the end of the reporting period and the date when the financial statements are authorised for issue. Two types of events can be identified:
a) those that provide evidence of conditions that existed at the end of the reporting period (adjusting events after the reporting period), and
b) those that are indicative of conditions that arose after the reporting period (non-adjusting events after the reporting period)
There have been no such events since 31 March 2016, and up to the date when these accounts were authorised that require disclosure or any adjustments to these accounts. Note 6. Contributions receivable by category : Contributions from employers and employees:
2014-15 £000
Analysis of contributions received 2015-16 £000
259,528 Employers 262,685 108,530 Employees 110,039 368,058 Total contributions received 372,724
Contributions receivable by type of employer:
2014-15 £000
Analysis by type of employer 2015-16 £000
49,791 Administering Authority 48,289 281,946 Scheduled bodies 283,909 36,321 Admitted bodies 40,526
368,058 Total contributions received 372,724 Contributions are further analysed by type of contribution:
2014-15 £000
Contributions received by type 2015-16 £000
239,617 Employers normal contributions 242,691 104,965 Employees normal contributions 105,659
3,565 Employees additional contributions 4,380 19,888 Employers deficit contributions 19,994
23 Employers augmentation contributions 0 368,058 Total contributions received 372,724
Employers’ contribution rates and deficit contribut ions At the triennial valuation (31 March 2013) the Actuary calculated an employer rate for each employer. In addition to this some employers are also required to pay an additional monetary amount to cover any past service deficit, which is recoverable over an appropriate period. Employees’ contribution rates Employees’ contributions are as set out in the LGPS regulations from 1st April 2014, and there are several tiered employee contribution rates. For 2015/16 the rates start at 5.5% payable by employees with salaries up to £13,500 a year, and the highest rate is 12.5% to be paid on salaries over £151,800 a year.
West Yorkshire Pension Fund
106
Additional voluntary contributions The Fund has made provision for employees to make additional voluntary contributions (AVCs) under AVC Schemes with Equitable Life, Scottish Widows and Prudential. All contributions by employees to the AVC schemes are made direct to Equitable Life, Scottish Widows and Prudential, further details of which are shown in note 10. Note 7. Transfers in
2014-15 £000
Transfers in from other pension funds 2015-16 £000
14,670 Individual transfers in from other schemes 20,371 1,000 Bulk transfers in from other schemes 0
15,670 Total transfers in 20,371 Note 8. Payments to and on account of leavers
2014-15 £000
Payments to and on account of leavers 2015-16 £000
-452 Refund of contributions -979 -10,763 Individual transfers out to other schemes -18,205
-170,253 Bulk transfers out to other schemes -1,549
-181,468 Total transfers out -20,733 In the reporting period 2014/15 the Greater Manchester Pension Fund (GMPF) was chosen by the Ministry of Justice to administer the LGPS in respect of the National Probation Service, for this reason a bulk transfer of liabilities (£170m) relating to the Probation Service was made to GMPF Note 9. Non-statutory pensions and pensions increas e recharged
2014-15 £000
Non-statutory pensions and pensions increase rechar ged 2015-16 £000
23,833 Pensions 23,475 The costs of added years granted by participating employers for early retirement together with associated inflation proofing costs are reimbursed to the Fund, by the employer, out of current revenues. Costs of annual inflation proofing for non-participating employers are also recharged. Note 10. AVC scheme with Equitable Life, Scottish W idows and Prudential The Fund provides an AVC Scheme for its contributors, the assets of which are invested separately from the main Fund. The scheme providers are Equitable Life Assurance, Scottish Widows and Prudential, whereby additional benefits are secured on a money purchase basis for those contributors electing to pay additional voluntary contributions. As advised by the three companies the amounts administered under AVC arrangements are as follows:
2014-15 £000
Additional voluntary contributions 2015-16 £000
21,879 Value of funds at 1st April 24,282 4,304 Contributions received 4,604
32 Transfers and withdrawals 43 0 Internal transfers 0
2,081 Interest and bonuses / change in market value of assets -79 -4,253 Sale of investments to settle benefits due to members -4,641 24,043 Value of fund at 31 st March 24,209
The aggregate amounts of AVC investments are:-
2014-15 AVC investments 2015-16 £000 £000
3,003 Equitable Life 2,772 8,257 Prudential 9,779
12,783 Scottish Widows 11,658 24,043 Total 24,209
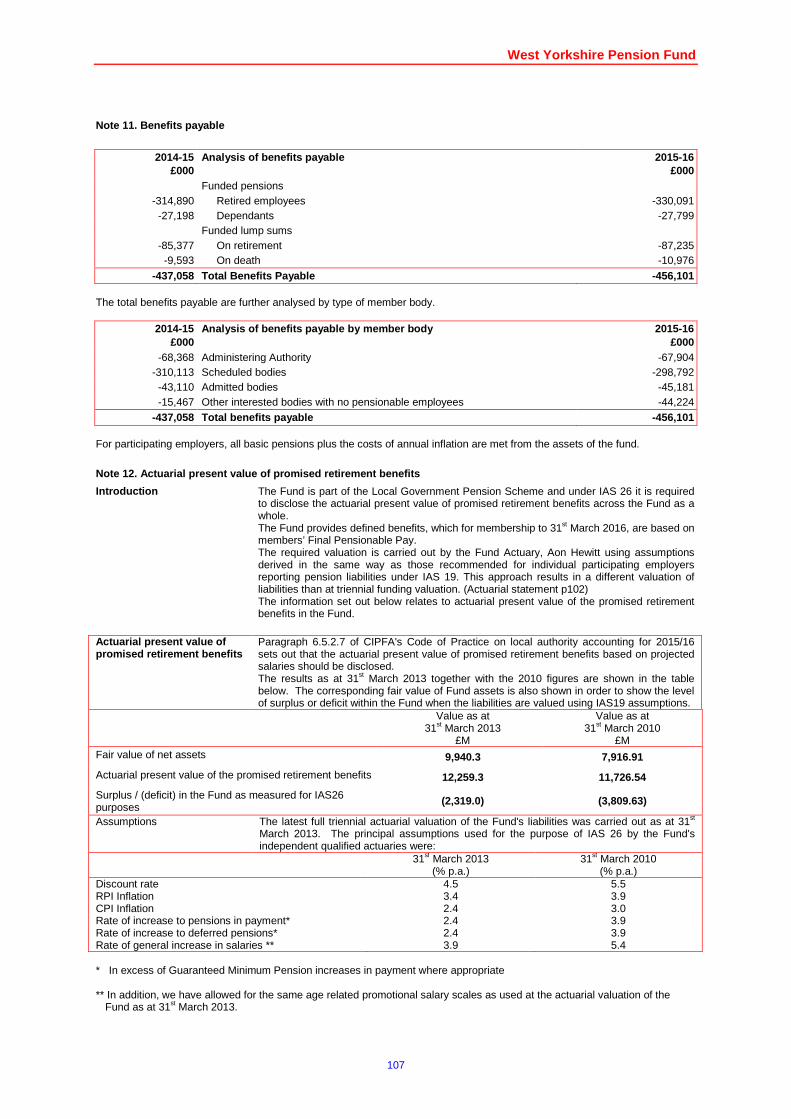
West Yorkshire Pension Fund
107
Note 11. Benefits payable
2014-15
£000 Analysis of benefits payable 2015-16
£000 Funded pensions
-314,890 Retired employees -330,091 -27,198 Dependants -27,799
Funded lump sums -85,377 On retirement -87,235 -9,593 On death -10,976
-437,058 Total Benefits Payable -456,101 The total benefits payable are further analysed by type of member body.
2014-15 £000
Analysis of benefits payable by member body 2015-16 £000
-68,368 Administering Authority -67,904 -310,113 Scheduled bodies -298,792 -43,110 Admitted bodies -45,181 -15,467 Other interested bodies with no pensionable employees -44,224
-437,058 Total benefits payable -456,101 For participating employers, all basic pensions plus the costs of annual inflation are met from the assets of the fund.
Note 12. Actuarial present value of promised retire ment benefits
Introduction The Fund is part of the Local Government Pension Scheme and under IAS 26 it is required to disclose the actuarial present value of promised retirement benefits across the Fund as a whole. The Fund provides defined benefits, which for membership to 31st March 2016, are based on members’ Final Pensionable Pay. The required valuation is carried out by the Fund Actuary, Aon Hewitt using assumptions derived in the same way as those recommended for individual participating employers reporting pension liabilities under IAS 19. This approach results in a different valuation of liabilities than at triennial funding valuation. (Actuarial statement p102) The information set out below relates to actuarial present value of the promised retirement benefits in the Fund.
Actuarial present value of promised retirement benefits
Paragraph 6.5.2.7 of CIPFA's Code of Practice on local authority accounting for 2015/16 sets out that the actuarial present value of promised retirement benefits based on projected salaries should be disclosed. The results as at 31st March 2013 together with the 2010 figures are shown in the table below. The corresponding fair value of Fund assets is also shown in order to show the level of surplus or deficit within the Fund when the liabilities are valued using IAS19 assumptions.
Value as at 31st March 2013
£M
Value as at 31st March 2010
£M Fair value of net assets 9,940.3 7,916.91
Actuarial present value of the promised retirement benefits 12,259.3 11,726.54
Surplus / (deficit) in the Fund as measured for IAS26 purposes
(2,319.0) (3,809.63)
Assumptions The latest full triennial actuarial valuation of the Fund's liabilities was carried out as at 31st March 2013. The principal assumptions used for the purpose of IAS 26 by the Fund's independent qualified actuaries were:
31st March 2013
(% p.a.) 31st March 2010
(% p.a.) Discount rate 4.5 5.5 RPI Inflation 3.4 3.9 CPI Inflation 2.4 3.0 Rate of increase to pensions in payment* 2.4 3.9 Rate of increase to deferred pensions* 2.4 3.9 Rate of general increase in salaries ** 3.9 5.4 * In excess of Guaranteed Minimum Pension increases in payment where appropriate ** In addition, we have allowed for the same age related promotional salary scales as used at the actuarial valuation of the
Fund as at 31st March 2013.
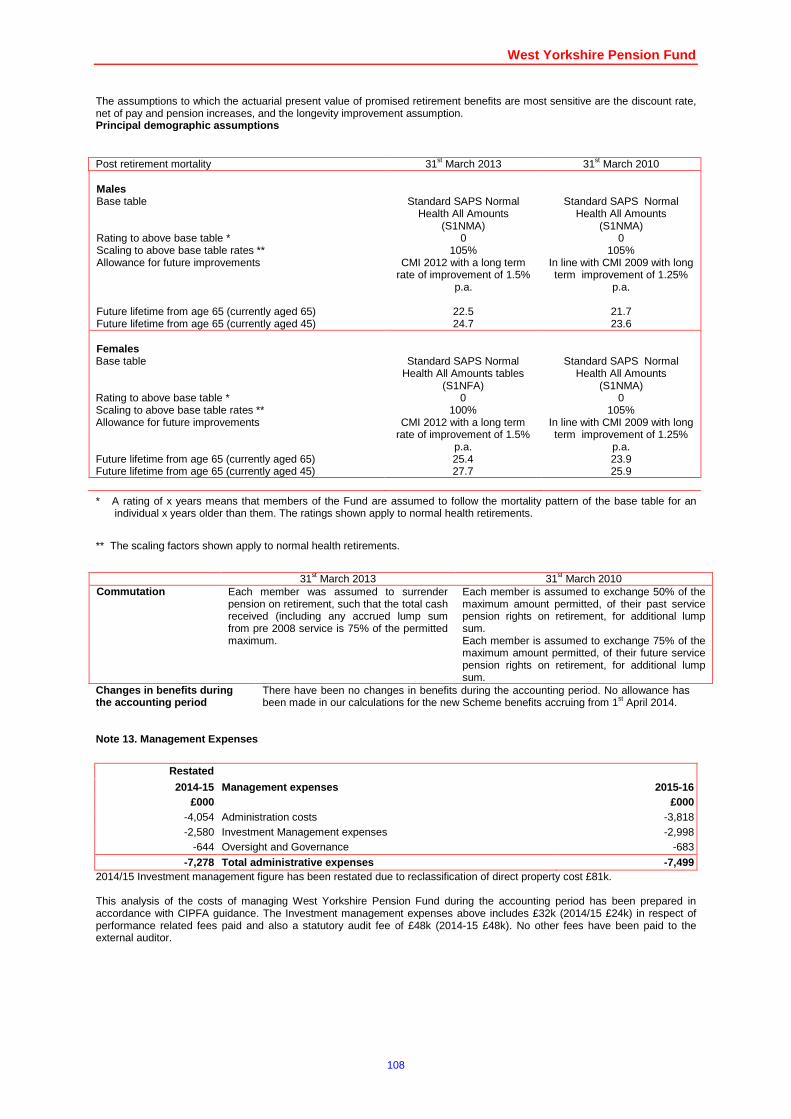
West Yorkshire Pension Fund
108
The assumptions to which the actuarial present value of promised retirement benefits are most sensitive are the discount rate, net of pay and pension increases, and the longevity improvement assumption. Principal demographic assumptions
Post retirement mortality 31st March 2013 31st March 2010 Males
Base table Standard SAPS Normal Health All Amounts
(S1NMA)
Standard SAPS Normal Health All Amounts
(S1NMA) Rating to above base table * 0 0 Scaling to above base table rates ** 105% 105% Allowance for future improvements CMI 2012 with a long term
rate of improvement of 1.5% p.a.
In line with CMI 2009 with long term improvement of 1.25%
p.a. Future lifetime from age 65 (currently aged 65) 22.5 21.7 Future lifetime from age 65 (currently aged 45) 24.7 23.6 Females
Base table Standard SAPS Normal Health All Amounts tables
(S1NFA)
Standard SAPS Normal Health All Amounts
(S1NMA) Rating to above base table * 0 0 Scaling to above base table rates ** 100% 105% Allowance for future improvements CMI 2012 with a long term
rate of improvement of 1.5% p.a.
In line with CMI 2009 with long term improvement of 1.25%
p.a. Future lifetime from age 65 (currently aged 65) 25.4 23.9 Future lifetime from age 65 (currently aged 45) 27.7 25.9
* A rating of x years means that members of the Fund are assumed to follow the mortality pattern of the base table for an individual x years older than them. The ratings shown apply to normal health retirements.
** The scaling factors shown apply to normal health retirements.
31st March 2013 31st March 2010 Commutation Each member was assumed to surrender
pension on retirement, such that the total cash received (including any accrued lump sum from pre 2008 service is 75% of the permitted maximum.
Each member is assumed to exchange 50% of the maximum amount permitted, of their past service pension rights on retirement, for additional lump sum. Each member is assumed to exchange 75% of the maximum amount permitted, of their future service pension rights on retirement, for additional lump sum.
Changes in benefits during the accounting period
There have been no changes in benefits during the accounting period. No allowance has been made in our calculations for the new Scheme benefits accruing from 1st April 2014.
Note 13. Management Expenses
Restated
2014-15 Management expenses 2015-16 £000 £000
-4,054 Administration costs -3,818 -2,580 Investment Management expenses -2,998
-644 Oversight and Governance -683
-7,278 Total administrative expenses -7,499 2014/15 Investment management figure has been restated due to reclassification of direct property cost £81k. This analysis of the costs of managing West Yorkshire Pension Fund during the accounting period has been prepared in accordance with CIPFA guidance. The Investment management expenses above includes £32k (2014/15 £24k) in respect of performance related fees paid and also a statutory audit fee of £48k (2014-15 £48k). No other fees have been paid to the external auditor.
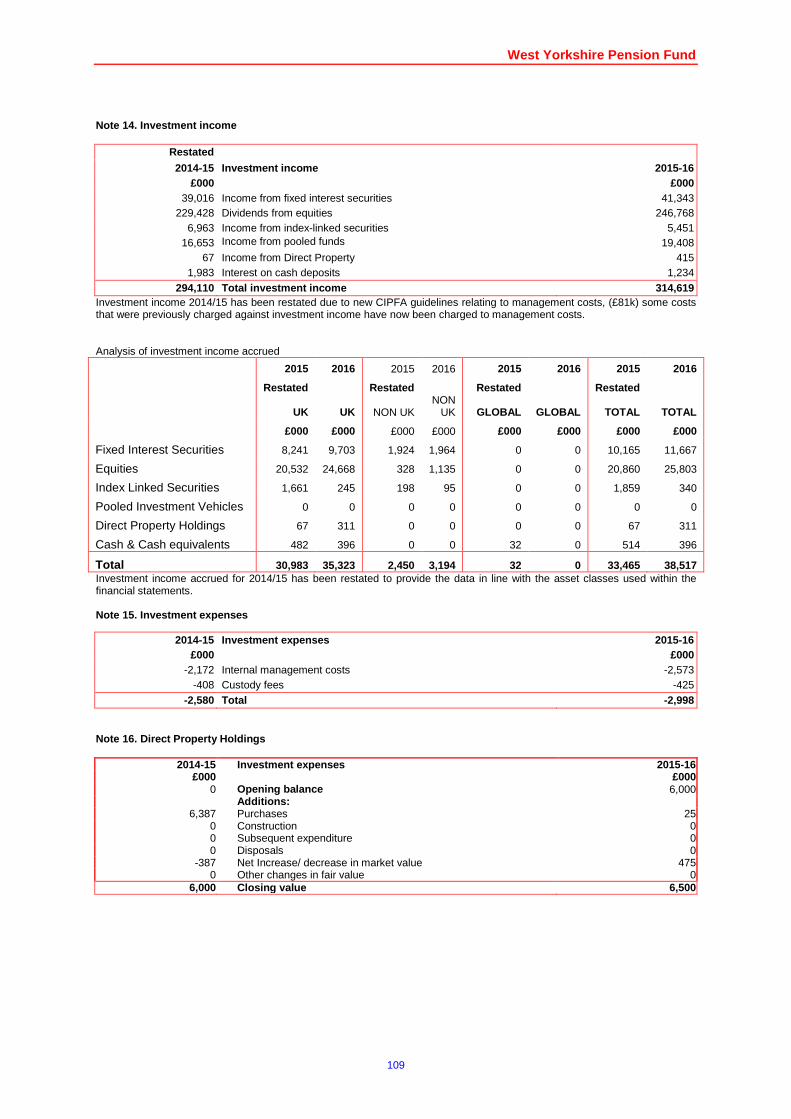
West Yorkshire Pension Fund
109
Note 14. Investment income
Restated
2014-15 Investment income 2015-16 £000 £000
39,016 Income from fixed interest securities 41,343 229,428 Dividends from equities 246,768
6,963 Income from index-linked securities 5,451 16,653 Income from pooled funds 19,408
67 Income from Direct Property 415 1,983 Interest on cash deposits 1,234
294,110 Total investment income 314,619 Investment income 2014/15 has been restated due to new CIPFA guidelines relating to management costs, (£81k) some costs that were previously charged against investment income have now been charged to management costs. Analysis of investment income accrued
2015 2016 2015 2016 2015 2016 2015 2016
Restated Restated Restated Restated
UK UK NON UK NON
UK GLOBAL GLOBAL TOTAL TOTAL
£000 £000 £000 £000 £000 £000 £000 £000
Fixed Interest Securities 8,241 9,703 1,924 1,964 0 0 10,165 11,667
Equities 20,532 24,668 328 1,135 0 0 20,860 25,803
Index Linked Securities 1,661 245 198 95 0 0 1,859 340
Pooled Investment Vehicles 0 0 0 0 0 0 0 0
Direct Property Holdings 67 311 0 0 0 0 67 311
Cash & Cash equivalents 482 396 0 0 32 0 514 396
Total 30,983 35,323 2,450 3,194 32 0 33,465 38,517 Investment income accrued for 2014/15 has been restated to provide the data in line with the asset classes used within the financial statements. Note 15. Investment expenses
2014-15 Investment expenses 2015-16 £000 £000
-2,172 Internal management costs -2,573 -408 Custody fees -425
-2,580 Total -2,998 Note 16. Direct Property Holdings
2014-15 Investment expenses 2015-16 £000 £000
0 Opening balance 6,000 Additions:
6,387 Purchases 25 0 Construction 0 0 Subsequent expenditure 0 0 Disposals 0
-387 Net Increase/ decrease in market value 475 0 Other changes in fair value 0
6,000 Closing value 6,500
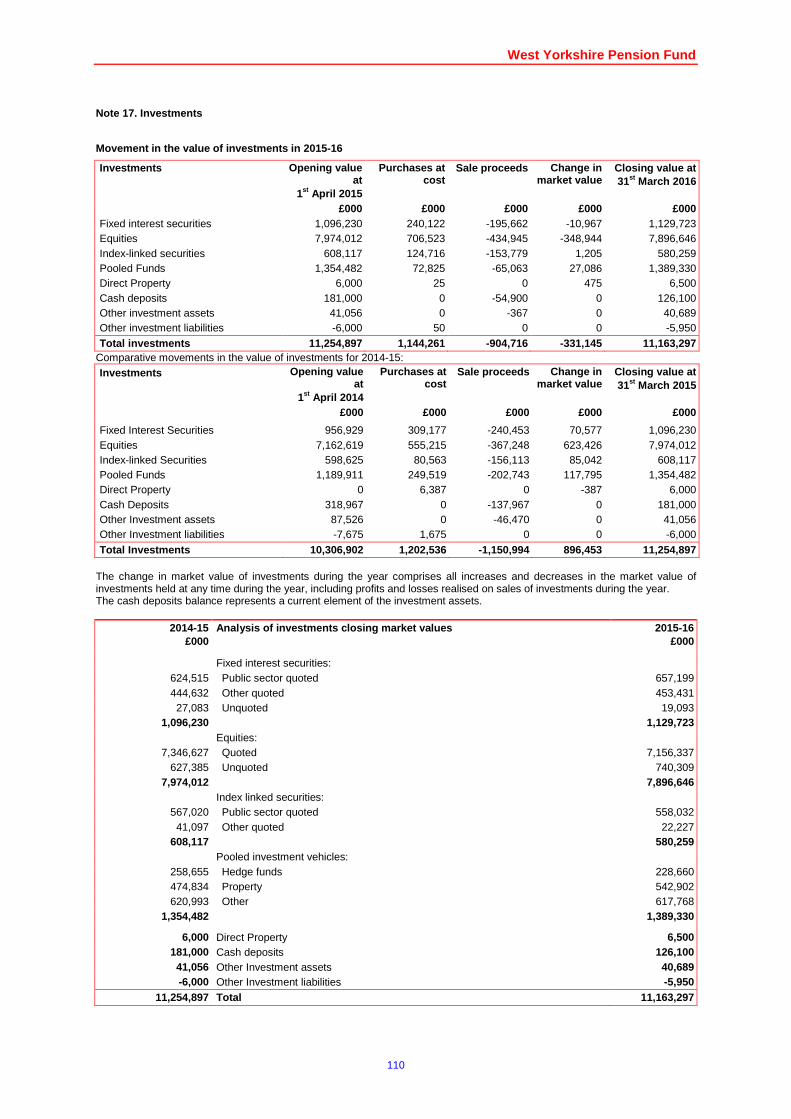
West Yorkshire Pension Fund
110
Note 17. Investments
Movement in the value of investments in 2015-16
Investments Opening value at
1st April 2015
Purchases at cost
Sale proceeds Change in market value
Closing value at 31st March 2016
£000 £000 £000 £000 £000 Fixed interest securities 1,096,230 240,122 -195,662 -10,967 1,129,723 Equities 7,974,012 706,523 -434,945 -348,944 7,896,646 Index-linked securities 608,117 124,716 -153,779 1,205 580,259 Pooled Funds 1,354,482 72,825 -65,063 27,086 1,389,330 Direct Property 6,000 25 0 475 6,500 Cash deposits 181,000 0 -54,900 0 126,100 Other investment assets 41,056 0 -367 0 40,689 Other investment liabilities -6,000 50 0 0 -5,950
Total investments 11,254,897 1,144,261 -904,716 -331,145 11,163,297 Comparative movements in the value of investments for 2014-15: Investments Opening value
at 1st April 2014
Purchases at cost
Sale proceeds Change in market value
Closing value at 31st March 2015
£000 £000 £000 £000 £000
Fixed Interest Securities 956,929 309,177 -240,453 70,577 1,096,230 Equities 7,162,619 555,215 -367,248 623,426 7,974,012 Index-linked Securities 598,625 80,563 -156,113 85,042 608,117 Pooled Funds 1,189,911 249,519 -202,743 117,795 1,354,482 Direct Property 0 6,387 0 -387 6,000 Cash Deposits 318,967 0 -137,967 0 181,000 Other Investment assets 87,526 0 -46,470 0 41,056 Other Investment liabilities -7,675 1,675 0 0 -6,000
Total Investments 10,306,902 1,202,536 -1,150,994 896,453 11,254,897 The change in market value of investments during the year comprises all increases and decreases in the market value of investments held at any time during the year, including profits and losses realised on sales of investments during the year. The cash deposits balance represents a current element of the investment assets.
2014-15 £000
Analysis of investments closing market values 2015-16 £000
Fixed interest securities: 624,515 Public sector quoted 657,199 444,632 Other quoted 453,431 27,083 Unquoted 19,093
1,096,230 1,129,723 Equities:
7,346,627 Quoted 7,156,337 627,385 Unquoted 740,309
7,974,012 7,896,646 Index linked securities:
567,020 Public sector quoted 558,032 41,097 Other quoted 22,227
608,117 580,259 Pooled investment vehicles:
258,655 Hedge funds 228,660 474,834 Property 542,902 620,993 Other 617,768
1,354,482 1,389,330
6,000 Direct Property 6,500 181,000 Cash deposits 126,100 41,056 Other Investment assets 40,689 -6,000 Other Investment liabilities -5,950
11,254,897 Total 11,163,297
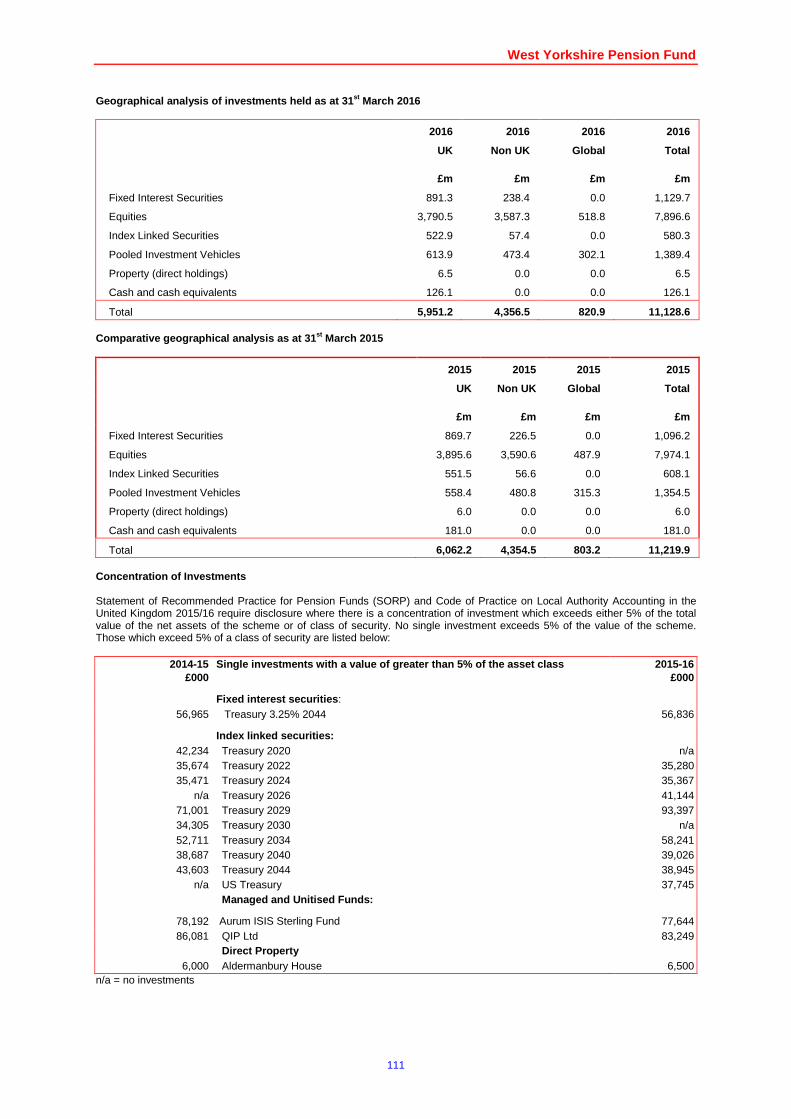
West Yorkshire Pension Fund
111
Geographical analysis of investments held as at 31 st March 2016
2016 2016 2016 2016
UK Non UK Global Total
£m £m £m £m
Fixed Interest Securities 891.3 238.4 0.0 1,129.7
Equities 3,790.5 3,587.3 518.8 7,896.6
Index Linked Securities 522.9 57.4 0.0 580.3
Pooled Investment Vehicles 613.9 473.4 302.1 1,389.4
Property (direct holdings) 6.5 0.0 0.0 6.5
Cash and cash equivalents 126.1 0.0 0.0 126.1
Total 5,951.2 4,356.5 820.9 11,128.6
Comparative geographical analysis as at 31 st March 2015
2015 2015 2015 2015
UK Non UK Global Total
£m £m £m £m
Fixed Interest Securities 869.7 226.5 0.0 1,096.2
Equities 3,895.6 3,590.6 487.9 7,974.1
Index Linked Securities 551.5 56.6 0.0 608.1
Pooled Investment Vehicles 558.4 480.8 315.3 1,354.5
Property (direct holdings) 6.0 0.0 0.0 6.0
Cash and cash equivalents 181.0 0.0 0.0 181.0
Total 6,062.2 4,354.5 803.2 11,219.9
Concentration of Investments Statement of Recommended Practice for Pension Funds (SORP) and Code of Practice on Local Authority Accounting in the United Kingdom 2015/16 require disclosure where there is a concentration of investment which exceeds either 5% of the total value of the net assets of the scheme or of class of security. No single investment exceeds 5% of the value of the scheme. Those which exceed 5% of a class of security are listed below:
2014-15 £000
Single investments with a value of greater than 5% of the asset class 2015-16 £000
Fixed interest securities : 56,965 Treasury 3.25% 2044 56,836
Index linked securities:
42,234 Treasury 2020 n/a 35,674 Treasury 2022 35,280 35,471 Treasury 2024 35,367
n/a Treasury 2026 41,144 71,001 Treasury 2029 93,397 34,305 Treasury 2030 n/a 52,711 Treasury 2034 58,241 38,687 Treasury 2040 39,026 43,603 Treasury 2044 38,945
n/a US Treasury 37,745 Managed and Unitised Funds:
78,192 Aurum ISIS Sterling Fund 77,644 86,081 QIP Ltd 83,249
Direct Property 6,000 Aldermanbury House 6,500
n/a = no investments
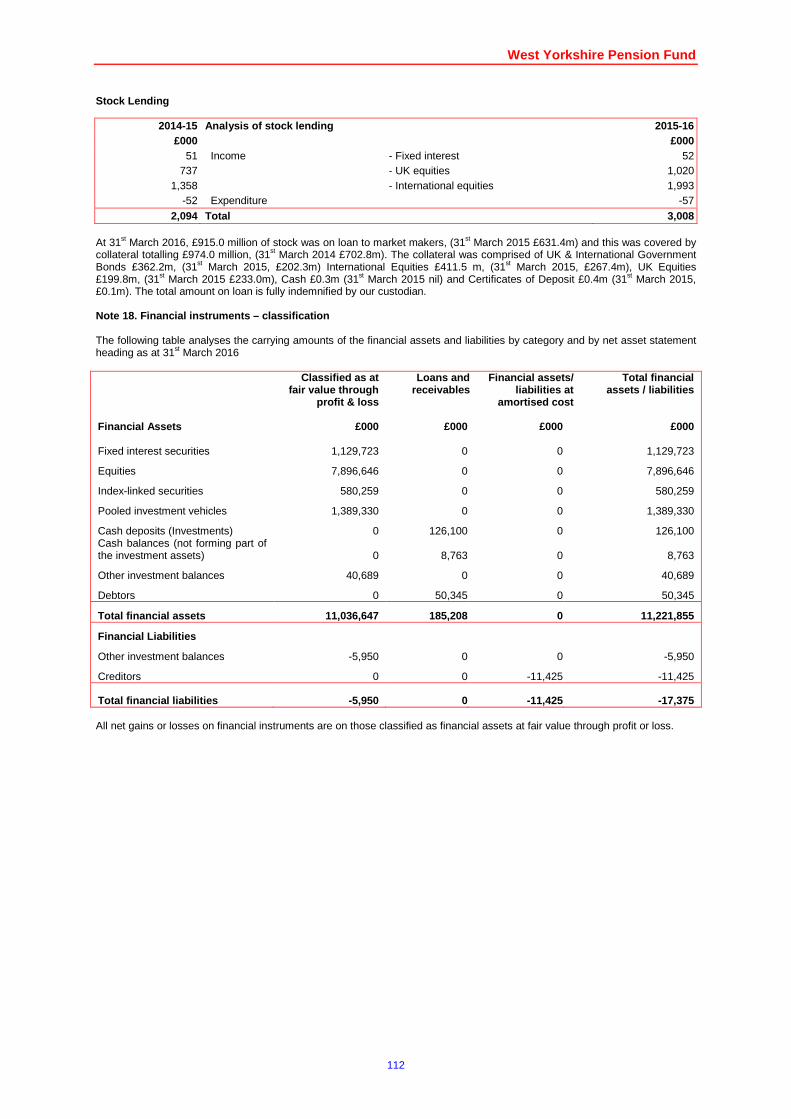
West Yorkshire Pension Fund
112
Stock Lending
2014-15 Analysis of stock lending 2015-16 £000 £000
51 Income - Fixed interest 52 737 - UK equities 1,020
1,358 - International equities 1,993 -52 Expenditure -57
2,094 Total 3,008 At 31st March 2016, £915.0 million of stock was on loan to market makers, (31st March 2015 £631.4m) and this was covered by collateral totalling £974.0 million, (31st March 2014 £702.8m). The collateral was comprised of UK & International Government Bonds £362.2m, (31st March 2015, £202.3m) International Equities £411.5 m, (31st March 2015, £267.4m), UK Equities £199.8m, (31st March 2015 £233.0m), Cash £0.3m (31st March 2015 nil) and Certificates of Deposit £0.4m (31st March 2015, £0.1m). The total amount on loan is fully indemnified by our custodian. Note 18. Financial instruments – classification The following table analyses the carrying amounts of the financial assets and liabilities by category and by net asset statement heading as at 31st March 2016
Classified as at fair value through
profit & loss
Loans and receivables
Financial assets/ liabilities at
amortised cost
Total financial assets / liabilities
Financial Assets £000 £000 £000 £000
Fixed interest securities 1,129,723 0 0 1,129,723
Equities 7,896,646 0 0 7,896,646
Index-linked securities 580,259 0 0 580,259
Pooled investment vehicles 1,389,330 0 0 1,389,330
Cash deposits (Investments) 0 126,100 0 126,100 Cash balances (not forming part of the investment assets) 0 8,763 0 8,763
Other investment balances 40,689 0 0 40,689
Debtors 0 50,345 0 50,345
Total financial assets 11,036,647 185,208 0 11,221,855
Financial Liabilities
Other investment balances -5,950 0 0 -5,950
Creditors 0 0 -11,425 -11,425
Total financial liabilities -5,950 0 -11,425 -17,375 All net gains or losses on financial instruments are on those classified as financial assets at fair value through profit or loss.
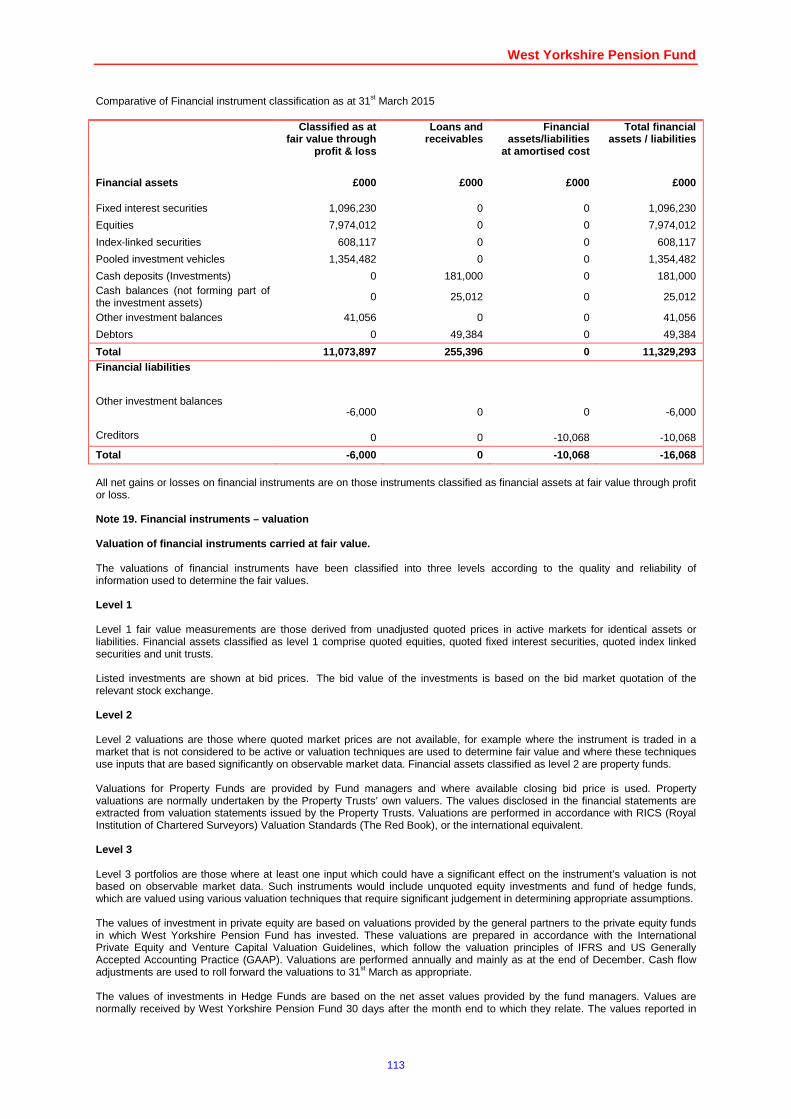
West Yorkshire Pension Fund
113
Comparative of Financial instrument classification as at 31st March 2015
Classified as at fair value through
profit & loss
Loans and receivables
Financial assets/liabilities
at amortised cost
Total financial assets / liabilities
Financial assets £000 £000 £000 £000
Fixed interest securities 1,096,230 0 0 1,096,230
Equities 7,974,012 0 0 7,974,012
Index-linked securities 608,117 0 0 608,117
Pooled investment vehicles 1,354,482 0 0 1,354,482
Cash deposits (Investments) 0 181,000 0 181,000 Cash balances (not forming part of the investment assets) 0 25,012 0 25,012
Other investment balances 41,056 0 0 41,056
Debtors 0 49,384 0 49,384
Total 11,073,897 255,396 0 11,329,293 Financial liabilities
Other investment balances -6,000 0 0 -6,000
Creditors 0 0 -10,068 -10,068
Total -6,000 0 -10,068 -16,068
All net gains or losses on financial instruments are on those instruments classified as financial assets at fair value through profit or loss. Note 19. Financial instruments – valuation Valuation of financial instruments carried at fair value. The valuations of financial instruments have been classified into three levels according to the quality and reliability of information used to determine the fair values. Level 1 Level 1 fair value measurements are those derived from unadjusted quoted prices in active markets for identical assets or liabilities. Financial assets classified as level 1 comprise quoted equities, quoted fixed interest securities, quoted index linked securities and unit trusts. Listed investments are shown at bid prices. The bid value of the investments is based on the bid market quotation of the relevant stock exchange. Level 2 Level 2 valuations are those where quoted market prices are not available, for example where the instrument is traded in a market that is not considered to be active or valuation techniques are used to determine fair value and where these techniques use inputs that are based significantly on observable market data. Financial assets classified as level 2 are property funds. Valuations for Property Funds are provided by Fund managers and where available closing bid price is used. Property valuations are normally undertaken by the Property Trusts’ own valuers. The values disclosed in the financial statements are extracted from valuation statements issued by the Property Trusts. Valuations are performed in accordance with RICS (Royal Institution of Chartered Surveyors) Valuation Standards (The Red Book), or the international equivalent. Level 3 Level 3 portfolios are those where at least one input which could have a significant effect on the instrument’s valuation is not based on observable market data. Such instruments would include unquoted equity investments and fund of hedge funds, which are valued using various valuation techniques that require significant judgement in determining appropriate assumptions. The values of investment in private equity are based on valuations provided by the general partners to the private equity funds in which West Yorkshire Pension Fund has invested. These valuations are prepared in accordance with the International Private Equity and Venture Capital Valuation Guidelines, which follow the valuation principles of IFRS and US Generally Accepted Accounting Practice (GAAP). Valuations are performed annually and mainly as at the end of December. Cash flow adjustments are used to roll forward the valuations to 31st March as appropriate. The values of investments in Hedge Funds are based on the net asset values provided by the fund managers. Values are normally received by West Yorkshire Pension Fund 30 days after the month end to which they relate. The values reported in
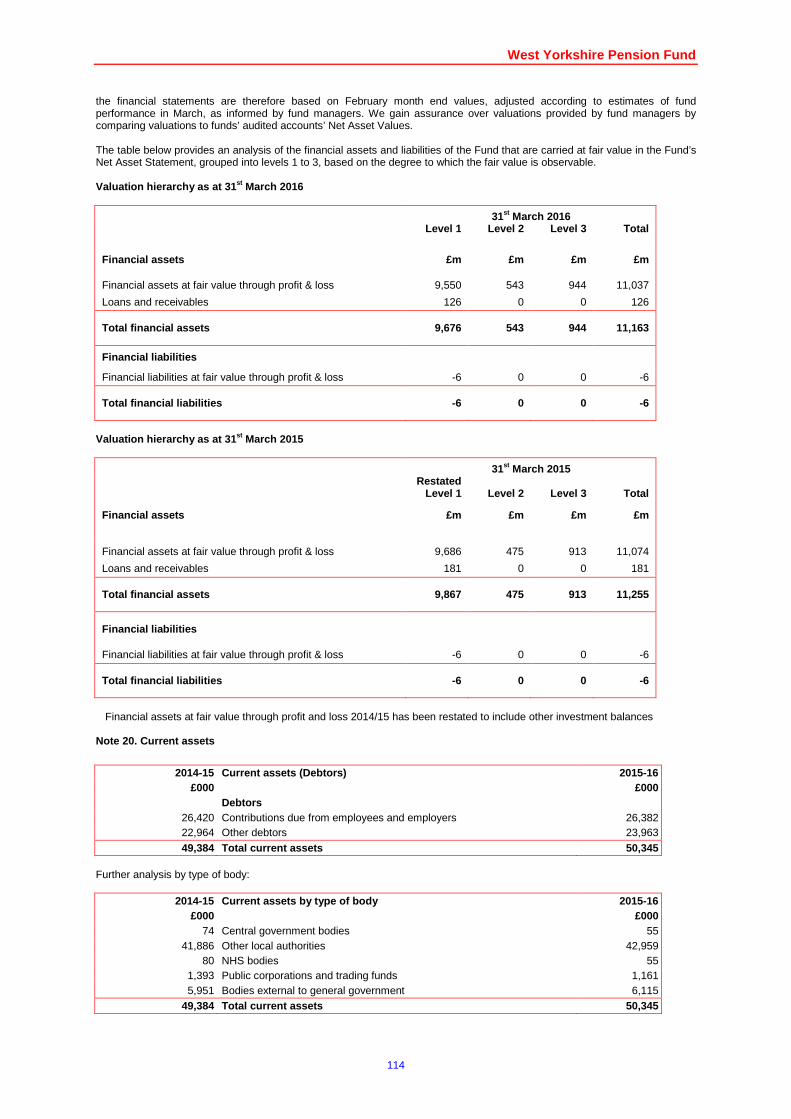
West Yorkshire Pension Fund
114
the financial statements are therefore based on February month end values, adjusted according to estimates of fund performance in March, as informed by fund managers. We gain assurance over valuations provided by fund managers by comparing valuations to funds’ audited accounts’ Net Asset Values. The table below provides an analysis of the financial assets and liabilities of the Fund that are carried at fair value in the Fund’s Net Asset Statement, grouped into levels 1 to 3, based on the degree to which the fair value is observable. Valuation hierarchy as at 31 st March 2016
31st March 2016 Level 1 Level 2 Level 3 Total
Financial assets £m £m £m £m
Financial assets at fair value through profit & loss 9,550 543 944 11,037
Loans and receivables 126 0 0 126
Total financial assets 9,676 543 944 11,163
Financial liabilities
Financial liabilities at fair value through profit & loss -6 0 0 -6
Total financial liabilities -6 0 0 -6
Valuation hierarchy as at 31 st March 2015
31st March 2015 Restated
Level 1
Level 2
Level 3
Total
Financial assets £m £m £m £m
Financial assets at fair value through profit & loss 9,686 475 913 11,074
Loans and receivables 181 0 0 181
Total financial assets 9,867 475 913 11,255
Financial liabilities
Financial liabilities at fair value through profit & loss -6 0 0 -6
Total financial liabilities -6 0 0 -6
Financial assets at fair value through profit and loss 2014/15 has been restated to include other investment balances
Note 20. Current assets
2014-15 Current assets (Debtors) 2015-16
£000 £000 Debtors
26,420 Contributions due from employees and employers 26,382 22,964 Other debtors 23,963
49,384 Total current assets 50,345 Further analysis by type of body:
2014-15 Current assets by type of body 2015-16 £000 £000
74 Central government bodies 55 41,886 Other local authorities 42,959
80 NHS bodies 55 1,393 Public corporations and trading funds 1,161 5,951 Bodies external to general government 6,115
49,384 Total current assets 50,345
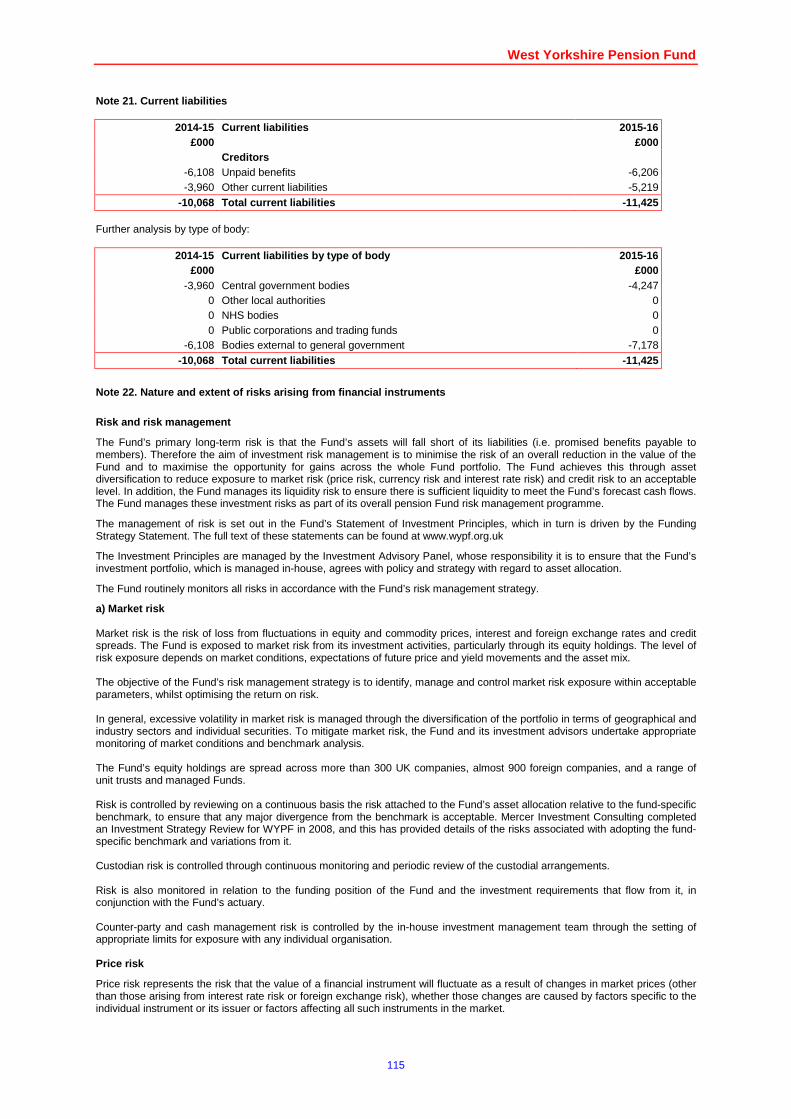
West Yorkshire Pension Fund
115
Note 21. Current liabilities
2014-15 Current liabilities 2015-16 £000 £000
Creditors -6,108 Unpaid benefits -6,206 -3,960 Other current liabilities -5,219
-10,068 Total current liabilities -11,425 Further analysis by type of body:
2014-15 Current liabilities by type of body 2015-16 £000 £000
-3,960 Central government bodies -4,247 0 Other local authorities 0 0 NHS bodies 0 0 Public corporations and trading funds 0
-6,108 Bodies external to general government -7,178 -10,068 Total current liabilities -11,425
Note 22. Nature and extent of risks arising from fi nancial instruments
Risk and risk management
The Fund’s primary long-term risk is that the Fund’s assets will fall short of its liabilities (i.e. promised benefits payable to members). Therefore the aim of investment risk management is to minimise the risk of an overall reduction in the value of the Fund and to maximise the opportunity for gains across the whole Fund portfolio. The Fund achieves this through asset diversification to reduce exposure to market risk (price risk, currency risk and interest rate risk) and credit risk to an acceptable level. In addition, the Fund manages its liquidity risk to ensure there is sufficient liquidity to meet the Fund’s forecast cash flows. The Fund manages these investment risks as part of its overall pension Fund risk management programme.
The management of risk is set out in the Fund’s Statement of Investment Principles, which in turn is driven by the Funding Strategy Statement. The full text of these statements can be found at www.wypf.org.uk
The Investment Principles are managed by the Investment Advisory Panel, whose responsibility it is to ensure that the Fund’s investment portfolio, which is managed in-house, agrees with policy and strategy with regard to asset allocation.
The Fund routinely monitors all risks in accordance with the Fund’s risk management strategy.
a) Market risk Market risk is the risk of loss from fluctuations in equity and commodity prices, interest and foreign exchange rates and credit spreads. The Fund is exposed to market risk from its investment activities, particularly through its equity holdings. The level of risk exposure depends on market conditions, expectations of future price and yield movements and the asset mix. The objective of the Fund’s risk management strategy is to identify, manage and control market risk exposure within acceptable parameters, whilst optimising the return on risk. In general, excessive volatility in market risk is managed through the diversification of the portfolio in terms of geographical and industry sectors and individual securities. To mitigate market risk, the Fund and its investment advisors undertake appropriate monitoring of market conditions and benchmark analysis. The Fund’s equity holdings are spread across more than 300 UK companies, almost 900 foreign companies, and a range of unit trusts and managed Funds. Risk is controlled by reviewing on a continuous basis the risk attached to the Fund’s asset allocation relative to the fund-specific benchmark, to ensure that any major divergence from the benchmark is acceptable. Mercer Investment Consulting completed an Investment Strategy Review for WYPF in 2008, and this has provided details of the risks associated with adopting the fund-specific benchmark and variations from it. Custodian risk is controlled through continuous monitoring and periodic review of the custodial arrangements. Risk is also monitored in relation to the funding position of the Fund and the investment requirements that flow from it, in conjunction with the Fund’s actuary. Counter-party and cash management risk is controlled by the in-house investment management team through the setting of appropriate limits for exposure with any individual organisation. Price risk
Price risk represents the risk that the value of a financial instrument will fluctuate as a result of changes in market prices (other than those arising from interest rate risk or foreign exchange risk), whether those changes are caused by factors specific to the individual instrument or its issuer or factors affecting all such instruments in the market.
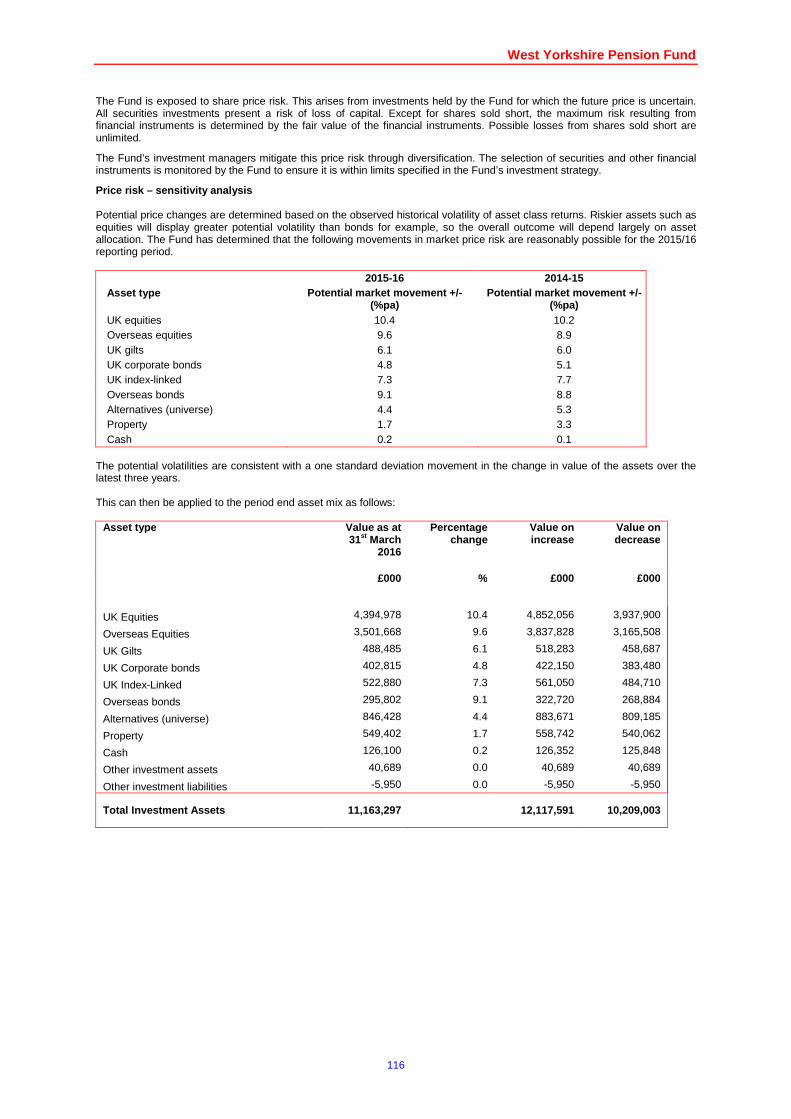
West Yorkshire Pension Fund
116
The Fund is exposed to share price risk. This arises from investments held by the Fund for which the future price is uncertain. All securities investments present a risk of loss of capital. Except for shares sold short, the maximum risk resulting from financial instruments is determined by the fair value of the financial instruments. Possible losses from shares sold short are unlimited.
The Fund’s investment managers mitigate this price risk through diversification. The selection of securities and other financial instruments is monitored by the Fund to ensure it is within limits specified in the Fund’s investment strategy.
Price risk – sensitivity analysis Potential price changes are determined based on the observed historical volatility of asset class returns. Riskier assets such as equities will display greater potential volatility than bonds for example, so the overall outcome will depend largely on asset allocation. The Fund has determined that the following movements in market price risk are reasonably possible for the 2015/16 reporting period.
2015-16 2014-15 Asset type Potential market movement +/-
(%pa) Potential market movement +/-
(%pa) UK equities 10.4 10.2 Overseas equities 9.6 8.9 UK gilts 6.1 6.0 UK corporate bonds 4.8 5.1 UK index-linked 7.3 7.7 Overseas bonds 9.1 8.8 Alternatives (universe) 4.4 5.3 Property 1.7 3.3 Cash 0.2 0.1
The potential volatilities are consistent with a one standard deviation movement in the change in value of the assets over the latest three years. This can then be applied to the period end asset mix as follows:
Asset type Value as at 31st March
2016
Percentage change
Value on increase
Value on decrease
£000 % £000 £000
UK Equities 4,394,978 10.4 4,852,056 3,937,900
Overseas Equities 3,501,668 9.6 3,837,828 3,165,508
UK Gilts 488,485 6.1 518,283 458,687
UK Corporate bonds 402,815 4.8 422,150 383,480
UK Index-Linked 522,880 7.3 561,050 484,710
Overseas bonds 295,802 9.1 322,720 268,884
Alternatives (universe) 846,428 4.4 883,671 809,185
Property 549,402 1.7 558,742 540,062
Cash 126,100 0.2 126,352 125,848
Other investment assets 40,689 0.0 40,689 40,689
Other investment liabilities -5,950 0.0 -5,950 -5,950
Total Investment Assets 11,163,297 12,117,591 10,2 09,003
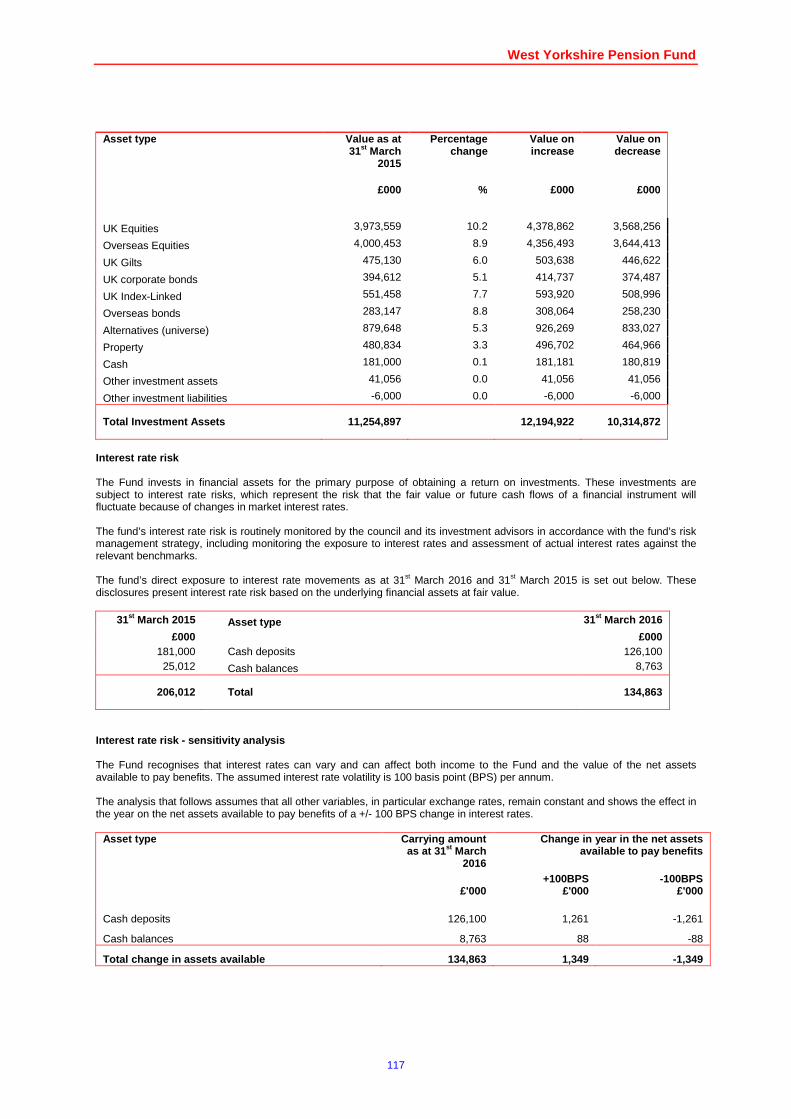
West Yorkshire Pension Fund
117
Asset type Value as at 31st March
2015
Percentage change
Value on increase
Value on decrease
£000 % £000 £000
UK Equities 3,973,559 10.2 4,378,862 3,568,256
Overseas Equities 4,000,453 8.9 4,356,493 3,644,413
UK Gilts 475,130 6.0 503,638 446,622
UK corporate bonds 394,612 5.1 414,737 374,487
UK Index-Linked 551,458 7.7 593,920 508,996
Overseas bonds 283,147 8.8 308,064 258,230
Alternatives (universe) 879,648 5.3 926,269 833,027
Property 480,834 3.3 496,702 464,966
Cash 181,000 0.1 181,181 180,819
Other investment assets 41,056 0.0 41,056 41,056
Other investment liabilities -6,000 0.0 -6,000 -6,000
Total Investment Assets 11,254,897 12,194,922 10,3 14,872
Interest rate risk The Fund invests in financial assets for the primary purpose of obtaining a return on investments. These investments are subject to interest rate risks, which represent the risk that the fair value or future cash flows of a financial instrument will fluctuate because of changes in market interest rates. The fund’s interest rate risk is routinely monitored by the council and its investment advisors in accordance with the fund’s risk management strategy, including monitoring the exposure to interest rates and assessment of actual interest rates against the relevant benchmarks. The fund’s direct exposure to interest rate movements as at 31st March 2016 and 31st March 2015 is set out below. These disclosures present interest rate risk based on the underlying financial assets at fair value.
31st March 2015 Asset type 31st March 2016
£000 £000 181,000 Cash deposits 126,100 25,012 Cash balances 8,763
206,012 Total 134,863
Interest rate risk - sensitivity analysis The Fund recognises that interest rates can vary and can affect both income to the Fund and the value of the net assets available to pay benefits. The assumed interest rate volatility is 100 basis point (BPS) per annum. The analysis that follows assumes that all other variables, in particular exchange rates, remain constant and shows the effect in the year on the net assets available to pay benefits of a +/- 100 BPS change in interest rates.
Ass et type Carrying amount as at 31 st March
2016
Change in year in the net assets available to pay benefits
+100BPS -100BPS £'000 £'000 £'000
Cash deposits 126,100 1,261 -1,261
Cash balances 8,763 88 -88
Total change in assets available 134,863 1,349 -1,349
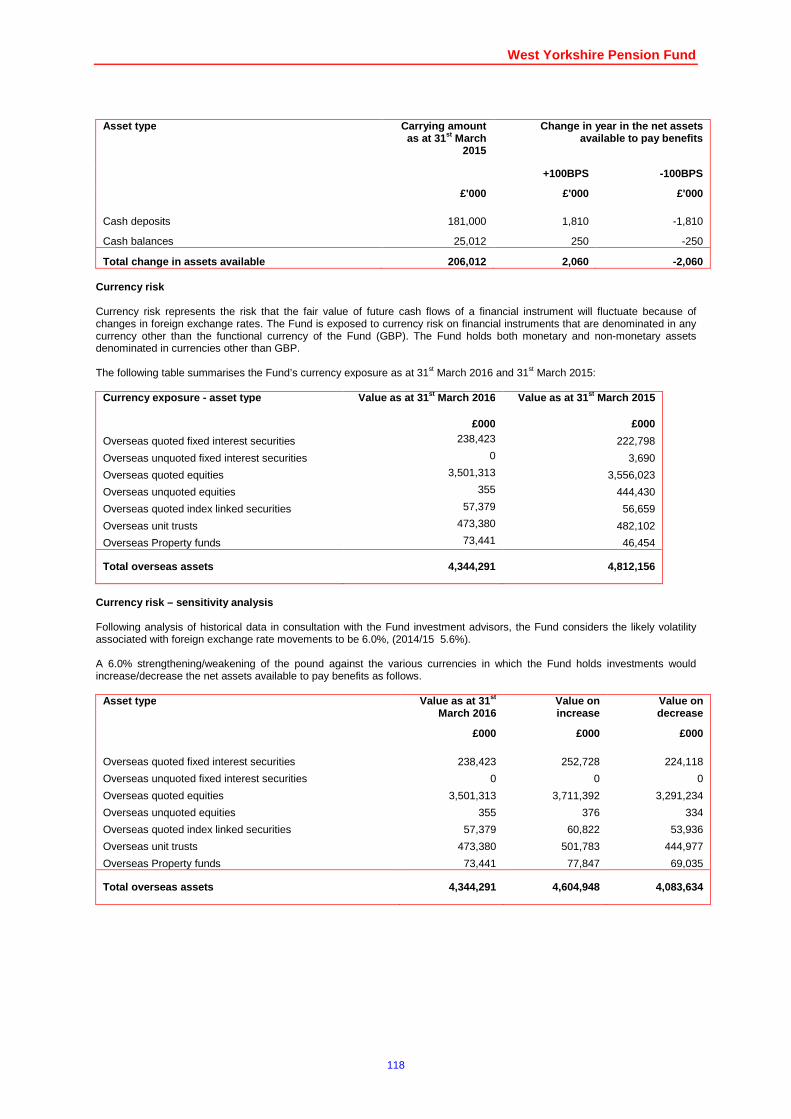
West Yorkshire Pension Fund
118
Asset type Carrying amount as at 31 st March
2015
Change in year in the net assets available to pay benefits
+100BPS -100BPS
£'000 £'000 £'000
Cash deposits 181,000 1,810 -1,810
Cash balances 25,012 250 -250
Total change in assets available 206,012 2,060 -2,060 Currency risk Currency risk represents the risk that the fair value of future cash flows of a financial instrument will fluctuate because of changes in foreign exchange rates. The Fund is exposed to currency risk on financial instruments that are denominated in any currency other than the functional currency of the Fund (GBP). The Fund holds both monetary and non-monetary assets denominated in currencies other than GBP. The following table summarises the Fund’s currency exposure as at 31st March 2016 and 31st March 2015:
Currency exposure - asset type Value as at 31 st March 2016 Value as at 31 st March 2015
£000 £000
Overseas quoted fixed interest securities 238,423 222,798
Overseas unquoted fixed interest securities 0 3,690
Overseas quoted equities 3,501,313 3,556,023
Overseas unquoted equities 355 444,430
Overseas quoted index linked securities 57,379 56,659
Overseas unit trusts 473,380 482,102
Overseas Property funds 73,441 46,454
Total overseas assets 4,344,291 4,812,156
Currency risk – sensitivity analysis Following analysis of historical data in consultation with the Fund investment advisors, the Fund considers the likely volatility associated with foreign exchange rate movements to be 6.0%, (2014/15 5.6%). A 6.0% strengthening/weakening of the pound against the various currencies in which the Fund holds investments would increase/decrease the net assets available to pay benefits as follows.
Asset type Value as at 31 st March 2016
Value on increase
Value on decrease
£000 £000 £000
Overseas quoted fixed interest securities 238,423 252,728 224,118
Overseas unquoted fixed interest securities 0 0 0
Overseas quoted equities 3,501,313 3,711,392 3,291,234
Overseas unquoted equities 355 376 334
Overseas quoted index linked securities 57,379 60,822 53,936
Overseas unit trusts 473,380 501,783 444,977
Overseas Property funds 73,441 77,847 69,035
Total overseas assets 4,344,291 4,604,948 4,083,634
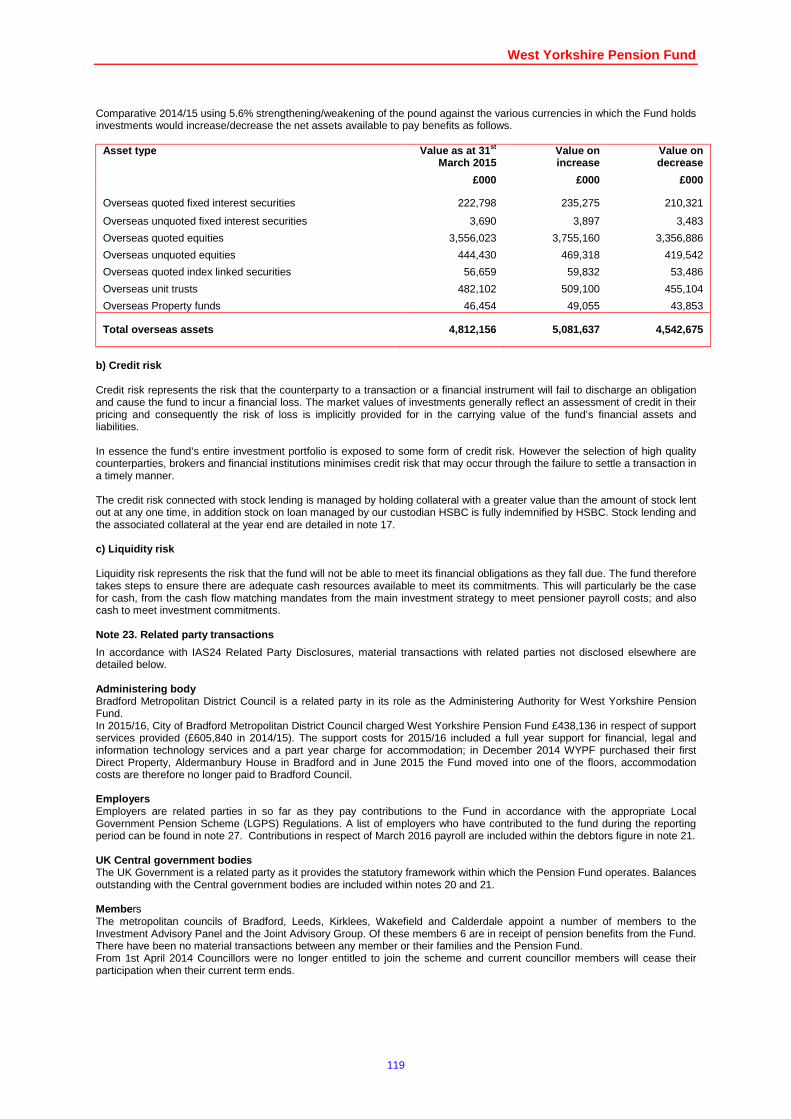
West Yorkshire Pension Fund
119
Comparative 2014/15 using 5.6% strengthening/weakening of the pound against the various currencies in which the Fund holds investments would increase/decrease the net assets available to pay benefits as follows.
Asset type Value as at 31 st March 2015
Value on increase
Value on decrease
£000 £000 £000
Overseas quoted fixed interest securities 222,798 235,275 210,321
Overseas unquoted fixed interest securities 3,690 3,897 3,483
Overseas quoted equities 3,556,023 3,755,160 3,356,886
Overseas unquoted equities 444,430 469,318 419,542
Overseas quoted index linked securities 56,659 59,832 53,486
Overseas unit trusts 482,102 509,100 455,104
Overseas Property funds 46,454 49,055 43,853
Total overseas assets 4,812,156 5,081,637 4,542,675
b) Credit risk Credit risk represents the risk that the counterparty to a transaction or a financial instrument will fail to discharge an obligation and cause the fund to incur a financial loss. The market values of investments generally reflect an assessment of credit in their pricing and consequently the risk of loss is implicitly provided for in the carrying value of the fund’s financial assets and liabilities. In essence the fund’s entire investment portfolio is exposed to some form of credit risk. However the selection of high quality counterparties, brokers and financial institutions minimises credit risk that may occur through the failure to settle a transaction in a timely manner. The credit risk connected with stock lending is managed by holding collateral with a greater value than the amount of stock lent out at any one time, in addition stock on loan managed by our custodian HSBC is fully indemnified by HSBC. Stock lending and the associated collateral at the year end are detailed in note 17. c) Liquidity risk Liquidity risk represents the risk that the fund will not be able to meet its financial obligations as they fall due. The fund therefore takes steps to ensure there are adequate cash resources available to meet its commitments. This will particularly be the case for cash, from the cash flow matching mandates from the main investment strategy to meet pensioner payroll costs; and also cash to meet investment commitments. Note 23. Related party transactions
In accordance with IAS24 Related Party Disclosures, material transactions with related parties not disclosed elsewhere are detailed below. Administering body Bradford Metropolitan District Council is a related party in its role as the Administering Authority for West Yorkshire Pension Fund. In 2015/16, City of Bradford Metropolitan District Council charged West Yorkshire Pension Fund £438,136 in respect of support services provided (£605,840 in 2014/15). The support costs for 2015/16 included a full year support for financial, legal and information technology services and a part year charge for accommodation; in December 2014 WYPF purchased their first Direct Property, Aldermanbury House in Bradford and in June 2015 the Fund moved into one of the floors, accommodation costs are therefore no longer paid to Bradford Council. Employers Employers are related parties in so far as they pay contributions to the Fund in accordance with the appropriate Local Government Pension Scheme (LGPS) Regulations. A list of employers who have contributed to the fund during the reporting period can be found in note 27. Contributions in respect of March 2016 payroll are included within the debtors figure in note 21. UK Central government bodies The UK Government is a related party as it provides the statutory framework within which the Pension Fund operates. Balances outstanding with the Central government bodies are included within notes 20 and 21. Membe rs The metropolitan councils of Bradford, Leeds, Kirklees, Wakefield and Calderdale appoint a number of members to the Investment Advisory Panel and the Joint Advisory Group. Of these members 6 are in receipt of pension benefits from the Fund. There have been no material transactions between any member or their families and the Pension Fund. From 1st April 2014 Councillors were no longer entitled to join the scheme and current councillor members will cease their participation when their current term ends.
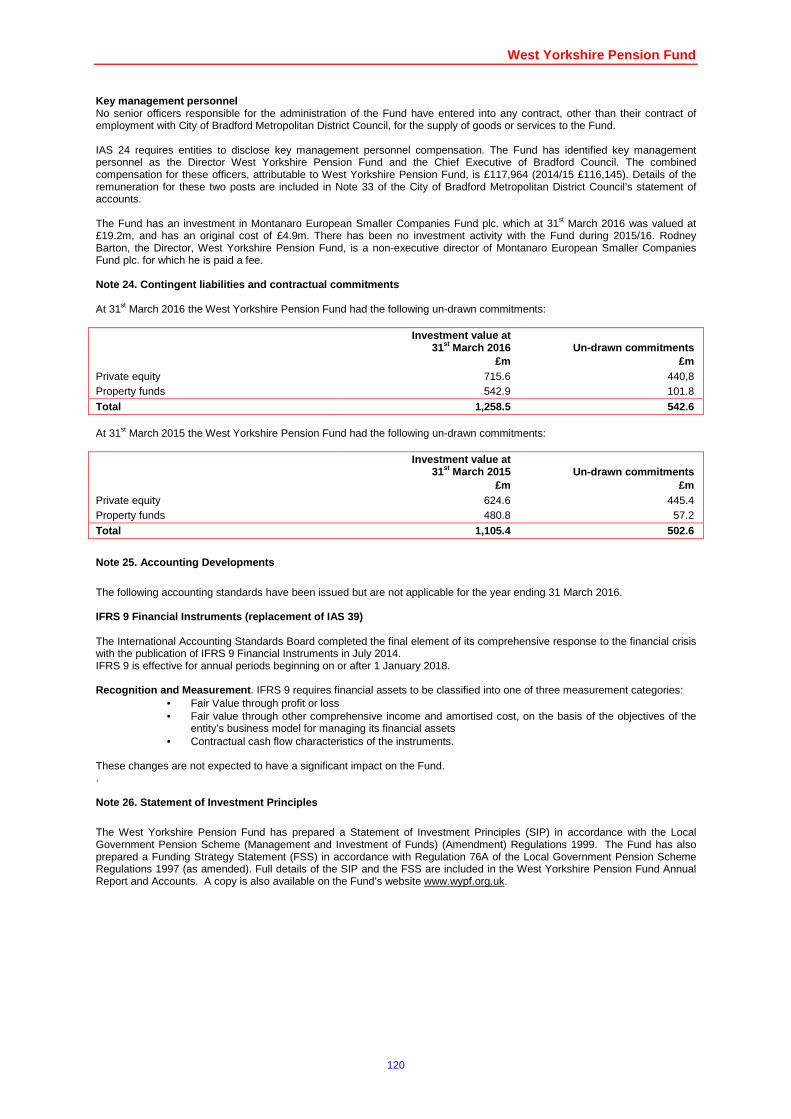
West Yorkshire Pension Fund
120
Key management personnel No senior officers responsible for the administration of the Fund have entered into any contract, other than their contract of employment with City of Bradford Metropolitan District Council, for the supply of goods or services to the Fund. IAS 24 requires entities to disclose key management personnel compensation. The Fund has identified key management personnel as the Director West Yorkshire Pension Fund and the Chief Executive of Bradford Council. The combined compensation for these officers, attributable to West Yorkshire Pension Fund, is £117,964 (2014/15 £116,145). Details of the remuneration for these two posts are included in Note 33 of the City of Bradford Metropolitan District Council’s statement of accounts. The Fund has an investment in Montanaro European Smaller Companies Fund plc. which at 31st March 2016 was valued at £19.2m, and has an original cost of £4.9m. There has been no investment activity with the Fund during 2015/16. Rodney Barton, the Director, West Yorkshire Pension Fund, is a non-executive director of Montanaro European Smaller Companies Fund plc. for which he is paid a fee. Note 24. Contingent liabilities and contractual com mitments At 31st March 2016 the West Yorkshire Pension Fund had the following un-drawn commitments:
Investment value at 31st March 2016
£m Un-drawn commitments
£m Private equity 715.6 440,8 Property funds 542.9 101.8
Total 1,258.5 542.6 At 31st March 2015 the West Yorkshire Pension Fund had the following un-drawn commitments:
Investment value at 31st March 2015
£m Un-drawn commitments
£m Private equity 624.6 445.4 Property funds 480.8 57.2
Total 1,105.4 502.6
Note 25. Accounting Developments
The following accounting standards have been issued but are not applicable for the year ending 31 March 2016. IFRS 9 Financial Instruments (replacement of IAS 39 ) The International Accounting Standards Board completed the final element of its comprehensive response to the financial crisis with the publication of IFRS 9 Financial Instruments in July 2014. IFRS 9 is effective for annual periods beginning on or after 1 January 2018. Recognition and Measurement . IFRS 9 requires financial assets to be classified into one of three measurement categories:
• Fair Value through profit or loss • Fair value through other comprehensive income and amortised cost, on the basis of the objectives of the
entity’s business model for managing its financial assets • Contractual cash flow characteristics of the instruments.
These changes are not expected to have a significant impact on the Fund. . Note 26. Statement of Investment Principles
The West Yorkshire Pension Fund has prepared a Statement of Investment Principles (SIP) in accordance with the Local Government Pension Scheme (Management and Investment of Funds) (Amendment) Regulations 1999. The Fund has also prepared a Funding Strategy Statement (FSS) in accordance with Regulation 76A of the Local Government Pension Scheme Regulations 1997 (as amended). Full details of the SIP and the FSS are included in the West Yorkshire Pension Fund Annual Report and Accounts. A copy is also available on the Fund’s website www.wypf.org.uk.

West Yorkshire Pension Fund
121
Note 27. List of Participating Employers Contributi ng to the Fund
In 2015/16 408 employers paid contributions into the Fund, at the end of the year there were 404 employers with active members. BRADFORD COUNCIL Leeds Council Calderdale MBC Kirklees Council Wakefield MDC Abbey Grange Ce Academy Abbey Park Primary Academy Absolutely Catering Ltd (Bgs) Accuro (Bbg Academy) Ackworth Parish Council Active Cleaning Ltd (Crofton Academy) Addingham Parish Council Affinity Trust Aireborough Learning Partnership Trust Airedale Academy All Saints Ce Jnr School Alwoodley Parish Council Amey Community Ltd (Bfd Bsf Phase 1 Fm Services) Amey Community Ltd Bradford Bsf Pase 2 Fm Services Amey Infrastructure Services Ltd (Wakefield) Amey LG Ltd (Calderdale) Appleton Academy Arts Council England Aspens Services Ltd Aspens Services Ltd (Leeds East Academy) Aspens Services Ltd (Leeds West Academy) Aspire Community Benefit Society Ltd Aspire-I B B G Academy Bardsey Primary Foundation School Barnardos (Askham Grange Prison) Barnardo's (Leeds Portage) Batley Girls Academy Batley Grammar School Beech Hill School Beeston Primary Trust Bell Lane Academy Belle Isle Tennant Management Belle Vue Girls Academy Bid Services Bingley Grammar School Birstall Primary Academy Bishop Wheeler Catholic Academy Trust Blessed Peter Snow Ca Trust (Kirklees) Bolton Brow Primary Academy Boothroyd Primary Academy Boston Spa School Bradford Academy Bradford College Bradford College Education Trust Bradford Councillors Bradford Diocesan Academies Trust Bradford District Credit Union Bradford Studio School Bradford University Bradshaw Primary School Bramley St Peter's C Of E School Brighouse Academy Brighter Futures Academy Trust Brooksbank School Sports College Bruntcliffe Trust School Bullough Contract Services (Bingley Grammar School) Bulloughs Contract Services Ltd Bulloughs Contract Services Ltd (Brighouse Academy) Burnley Road Academy Buttershaw Business & Enterprise College CAFCASS Calderdale & Kirklees Careers Calderdale College Calverley C Of E Primary School
Care Quality Commission Carillion Caroll Cleaning Company Ltd (Calderdale) Caroll Cleaning Company Ltd (Wakefield) Caroll Cleaning Company Ltd (Whetley) Carroll Cleaning Co Ltd (Birkenshaw Primary School) Carroll Cleaning Co Ltd (Bolton Brow Academy) Carroll Cleaning Co Ltd (Holy Trinity Primary) Carroll Cleaning Co Ltd (Lapage Primary School) Carroll Cleaning Co Ltd (Lee Mount Primary School) Carroll Cleaning Co Ltd (Ravenscliffe High School) Carroll Cleaning Co Ltd (St Joseph's Bradford) Carroll Cleaning Company (Crofton Academy) Carroll Cleaning Company Limited (Frizinghall) Carroll Cleaning Company Limited (Thornbury) Castle Hall Academy Castleford Academy Cater Link Ltd (Crigglestone St James Primary Academy) Catering Academy Catholic Care Chief Constable For West Yorkshire Christchurch CE Academy Churhcill Contract Services (Bbg Academy) Clayton Parish Council Coalfields Regeneration Cockburn High School Trust Cockburn School Academy Colne Valley High Academy Community Accord Compass (Radillion) Leeds Pfi Schools Compass Contract (Buttershaw School) Compass Contract Services Compass Contract Services (Chapel Allerton School) Compass Contract Services (Green Lane) Compass Contract Services (Spta) Compass Contract Services (Uk) Ltd Compass Contract Services (Uk) Ltd (Chartwells) Compass Contract Services (Uk) Ltd (Minsthorpe Acad) Compass Contract Services Ltd (Manor Corft) Consultant Cleaners Ltd (WY Fire) Co-Operative Academy Of Leeds Cottingley Primary Academy Craft Centre & Design Gallery Ltd Creative Support Limited Crescent Further Education Limited Crigglestone St James CE Primary Academy Crofton High Academy Darrington C Of E Primary School David Young Community Academy Deighton Gates Primary Foundation School Denby Dale Parish Council Diamond Wood Community Academy Dixons Academies Charitable Trust Education Bradford Education Leeds Ltd Elite Cleaning & Environmental Services Ltd English Basketball Enviroserve (Shelf J & I School) Featherstone Academy Feversham College Academy Feversham Primaryacademy Fieldhead Junior Infant & Nursery Academy First West Yorkshire Fleet Factors (Limited) Foxhill Primary School Garforth Academy Gawthorpe Community Academy Greenhead College Greenvale Homes Greetland Academy

West Yorkshire Pension Fund
122
Groundwork Wakefield Halifax High Halifax Opportunities Halifax Opportunities Trust (Calderdale) Hanson School Harden Primary School Havercroft Academy Heath View Academy Hebden Royd Town Council Heckmondwike Grammar School Academy Hemsworth Academy Hemsworth Town Council Hepworth Gallery Trust Hill Top First School Hollingwood Primary School Hollybank Trust Holme Valley Parish Council Holy Trinity Academy Home Farm Trust Honley High School Horbury Academy Horbury Bridge CE J & I School Horsforth School Academy Horsforth Town Council Horton Housing Association (CSL) Horton Housing Association (Ophrs) Huddersfield New College Huddersfield University Hugh Gaitskell Primary School Trust I S S Facilities Services Ltd Igen Igen Ltd Ilkley Grammar School Academy Ilkley Parish Council Incommunities Ind Clean Serv Ltd Initial Catering Services Initial Facilities Management Ltd Interserve (Facilities Management) Ltd Interserve (Fm) Ltd (P.C.C For West Yorkshire) Interserve Academies Trust Ltd (Crawshaw Academy) Interserve Project Services Ltd Iqra Academy Jerry Clay Lane Academy John Smeaton Academy Keelham Primary School Keepmoat Property Services Ltd Keighley Town Council Khalsa Science Academy Kids Killinghall Primary School King James School Kirkburton Parish Council Kirklees Active Leisure Kirklees College Kirklees Councillors Kirklees Neighbourhood Housing Knottingley St Botolphs C Of E Academy Lady Elizabeth Hastings Laisterdyke Gm Middle Lane End Primary Trust Leeds Beckett University Leeds Cc Councillors Leeds Centre For Integrated Living Leeds Citizens Advice Bureau Leeds City Academy Leeds City College Leeds College Of Art & Design Leeds College Of Building Leeds College Of Music Leeds East Primary Partnership Trust Leeds East-North East Homes Leeds Grande Theatre & Opera House Leeds Groundwork Trust Leeds Housing Concern
Leeds Institute For The Blind Leeds Metropolitan University Leeds MIND Leeds North West Education Partnership Leeds Racial Equality Leeds Trinity University College Leeds West-North West Homes Liberty Gas Group Ltd Lidget Green Community Co-Operative Learning Trust Lightcliffe CE J&I School Lighthouse School Lindley C E Infant Academy Lindley Junior School Academy Local Government Yorkshire & Humberside Longroyde Junior School Lpm Cleaning Ltd Making Space Manston St James Academy Mears Facilities Services (South) Mears Facilities Services (West) Mears Ltd Mellors Catering Services (Southfield Grange) Mellors Catering Services (Southfield Grange) Meltham Town Council Menston Parish Council Merlin Top Primary Academy Micklefield Parish Council Middleton Primary School Trust Minsthorpe Academy Trust Mirfield Free Grammar Academy Mitie (PFI Ltd) Mitie Pest Control Moor End Academy Trust Morley Town Council Mount Pellon Primary Academy Myrtle Park Primary School N I C Services Group Ltd (Cookridge Holy Trinity School) National Assembly For Wales National Coal Mining Museum New College Pontefract Nic Services Group Ltd Normanton Town Council North Halifax Grammar Academy North Halifax Partnership Ltd North Kirklees Cab Northern School Of Contemporary Dance Northorpe Hall Trust Notre Dame 6th Form College NPS (NE) NPS Leeds Limited Oakbank School Oakworth First School Oasis Academy Lister Park OFSTED Old Earth Academy One In A Million Free School Open College Network Yhr Ossett Academy & 6th Form College Ossett Pension (Trust) Otley Town Council Our Lady Of Victories Catholic Primary Academy Outwood Grange Academy Outwood Primary Academy Kirkhamgate Outwood Primary Academy Ledger Lane Outwood Primary Academy Lofthouse Gate Overthorpe C Of E Academy Park Lane Learning Trust Pennine Housing 2000 Limited People In Action (Leeds) Ltd Pinnacle Business Services (Leeds) Pinnacle Ltd (Kirklees) Pontefract Academies Trust Pontefract Education Trust Pool Parish Council Priesthorpe School Trust

West Yorkshire Pension Fund
123
Primrose Lane Primary Foundation School Prince Henrys Grammar Prospect Services Prospects Services Ltd 2012 (Bradford) Prov Compass Contract Services (Spta) Prov Kinsley Academy Prov Tns Catering (Spta) Prov Tns Catering Man Ltd (St Botolphs) Pudsey Grangefield Trust Rainbow Primary Free School Rastrick High School Academy Trust Rawdon Parish Council Ridge Crest Cleaning Ltd Ripon Diocesan C Of E Council For Social Aid-Cardigan House Ripon House Rm Education Plc Rodillian Academy Rooks Nest Academy Rothwell Church Of England Primary Academy Royds Community Association Royds Learning Trust Russell Hall First School Ryburn Valley Academy Ryecroft Primary Academy Ryhill Parish Council Salendine Nook Academy Trust Salterlee Academy Tust Samuel Lister Academy Sandal Magna Community Academy School Partnership Trust Academies Schools Lettings Solutions (Freeston Academy) Schools Linking Network Scout Road Academy Sea Fish Industry Shanks Waste Management Ltd Share Multi Academies Trust Shibden Head Primary Academy Shipley College Shirley Manor Primary Academy Sita UK Ltd Skills For Care South Elmsall Town Council South Hiendley Parish Council South Kirby & Moorthorpe Town Council South Leeds Academy South Oseet Infants Southern Electric Southfield Grange Trust Southmere Primary Academy Southway At The Rodillian Academy Ltd Spie Ltd St Annes Catholic Primary Academy St Annes Community Services St Annes Community Services (Bradford) St Chads C Of E Primary School St Giles Church Of England Academy St Helens CE Primary Academy St John's (CE) Primary Academy Trust St Johns CE Primary School
St Johns Hostel St Johns Primary Academy Rishworth St Michael & All Angels School St Michaels CE Academy Swallow Hill Community College Academy Taylor Shaw Taylor Shaw Ltd (Batley Girls High School) Taylor Shaw Ltd (Fieldhead Grimes Manston) Taylor Shaw Ltd (Parklands Primary) Taylorshaw Ltd (Cookridge Holy Trinity School) Taylorshaw Ltd (Crossgates Beechwood Whitelaith) Taylorshaw Ltd (Interserve Crawshaw) Taylorshaw Ltd (Swarcliffe Primary School) Temple Learning Academy The Anah Project The Beckfoot & Hazelbeck Academy Trust The Bishop Konstant Catholic Trust The Cathedral C Of E The Crossley Heath Academy Trust The Freeston Academy The Gorse Academies Trust The John Curwen Co-Operative Primary Academy The Lantern Learning Trust The Maltings Learning Trust The Police & Crime Commissioner For West Yorkshire Thornhill Community Academy Thornton Grammar School Todmorden Town Council Tong High School Trinity Academy Halifax Turning Point Turning Point (Wakefield) United Response University Academy Keighley UPP Residential Services Victoria Primary Academy Wakefield & District Housing Wakefield City Academy Wakefield College Wakefield Councillors Waterton Academy Trust West End Academy West Vale Primary School West Yorkshire Combined Authority West Yorkshire Valuation Tribunal Westborough High School Westwood Primary School Trust Wetherby Town Council Whitehill Community Academy William Henry Smith School Wolseley UK Ltd Woodhouse Grove School Woodkirk Academy Woodside Academy WRAT - Leeds East Academy WRAT - Leeds West Academy WY Fire & Rescue Yorkshire Housing Ltd YPO
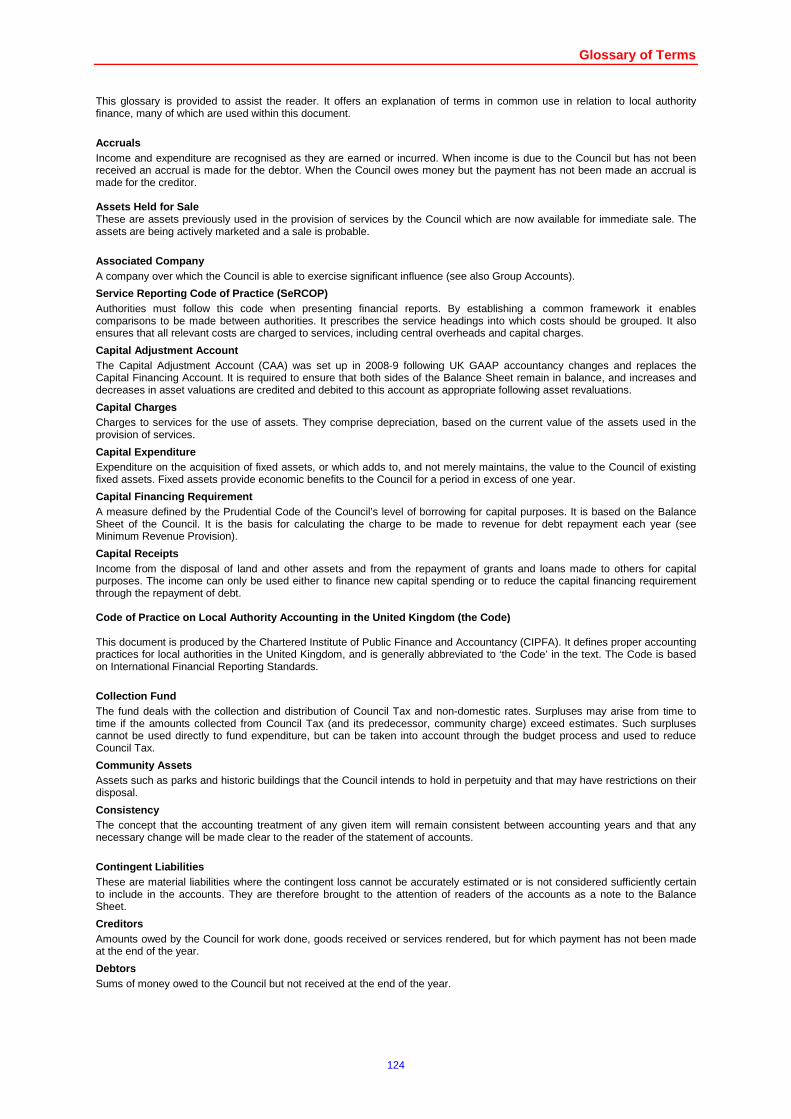
Glossary of Terms
124
This glossary is provided to assist the reader. It offers an explanation of terms in common use in relation to local authority finance, many of which are used within this document.
Accruals Income and expenditure are recognised as they are earned or incurred. When income is due to the Council but has not been received an accrual is made for the debtor. When the Council owes money but the payment has not been made an accrual is made for the creditor. Assets Held for Sale These are assets previously used in the provision of services by the Council which are now available for immediate sale. The assets are being actively marketed and a sale is probable.
Associated Company A company over which the Council is able to exercise significant influence (see also Group Accounts).
Service Reporting Code of Practice (SeRCOP) Authorities must follow this code when presenting financial reports. By establishing a common framework it enables comparisons to be made between authorities. It prescribes the service headings into which costs should be grouped. It also ensures that all relevant costs are charged to services, including central overheads and capital charges.
Capital Adjustment Account The Capital Adjustment Account (CAA) was set up in 2008-9 following UK GAAP accountancy changes and replaces the Capital Financing Account. It is required to ensure that both sides of the Balance Sheet remain in balance, and increases and decreases in asset valuations are credited and debited to this account as appropriate following asset revaluations.
Capital Charges Charges to services for the use of assets. They comprise depreciation, based on the current value of the assets used in the provision of services.
Capital Expenditure Expenditure on the acquisition of fixed assets, or which adds to, and not merely maintains, the value to the Council of existing fixed assets. Fixed assets provide economic benefits to the Council for a period in excess of one year.
Capital Financing Requirement A measure defined by the Prudential Code of the Council’s level of borrowing for capital purposes. It is based on the Balance Sheet of the Council. It is the basis for calculating the charge to be made to revenue for debt repayment each year (see Minimum Revenue Provision).
Capital Receipts Income from the disposal of land and other assets and from the repayment of grants and loans made to others for capital purposes. The income can only be used either to finance new capital spending or to reduce the capital financing requirement through the repayment of debt. Code of Practice on Local Authority Accounting in t he United Kingdom (the Code) This document is produced by the Chartered Institute of Public Finance and Accountancy (CIPFA). It defines proper accounting practices for local authorities in the United Kingdom, and is generally abbreviated to ‘the Code’ in the text. The Code is based on International Financial Reporting Standards.
Collection Fund The fund deals with the collection and distribution of Council Tax and non-domestic rates. Surpluses may arise from time to time if the amounts collected from Council Tax (and its predecessor, community charge) exceed estimates. Such surpluses cannot be used directly to fund expenditure, but can be taken into account through the budget process and used to reduce Council Tax.
Community Assets Assets such as parks and historic buildings that the Council intends to hold in perpetuity and that may have restrictions on their disposal.
Consistency The concept that the accounting treatment of any given item will remain consistent between accounting years and that any necessary change will be made clear to the reader of the statement of accounts.
Contingent Liabilities These are material liabilities where the contingent loss cannot be accurately estimated or is not considered sufficiently certain to include in the accounts. They are therefore brought to the attention of readers of the accounts as a note to the Balance Sheet.
Creditors Amounts owed by the Council for work done, goods received or services rendered, but for which payment has not been made at the end of the year.
Debtors Sums of money owed to the Council but not received at the end of the year.
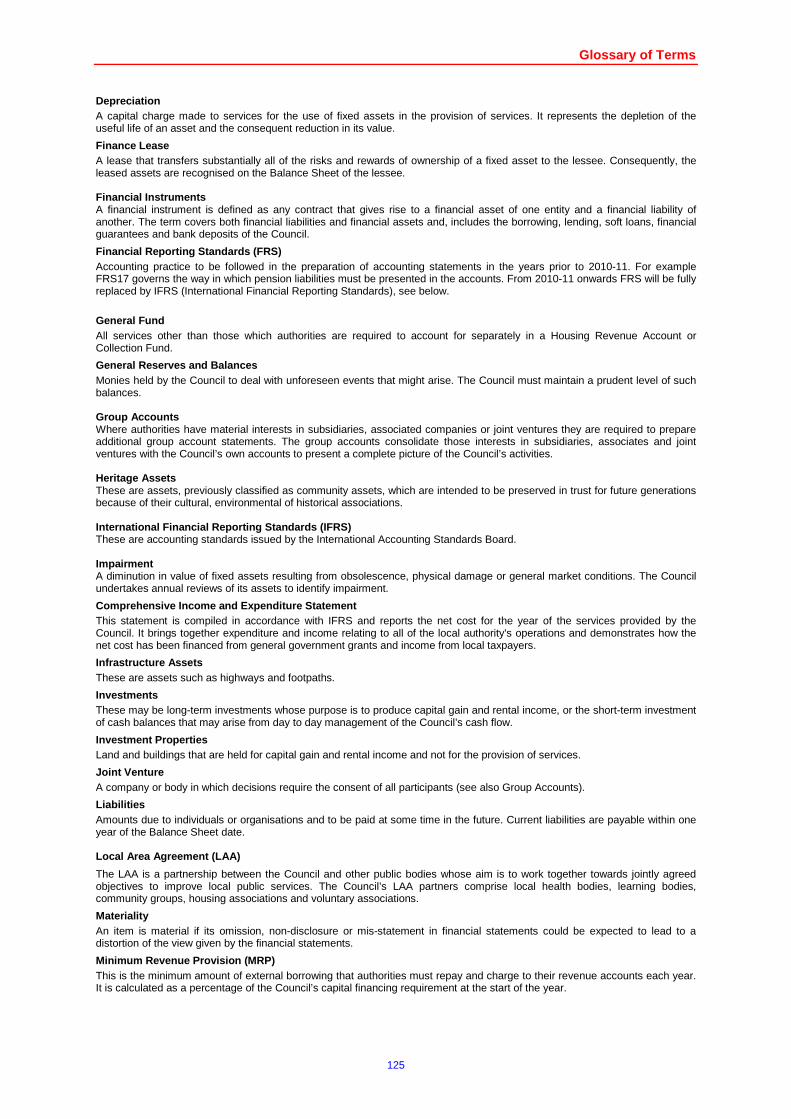
Glossary of Terms
125
Depreciation A capital charge made to services for the use of fixed assets in the provision of services. It represents the depletion of the useful life of an asset and the consequent reduction in its value.
Finance Lease A lease that transfers substantially all of the risks and rewards of ownership of a fixed asset to the lessee. Consequently, the leased assets are recognised on the Balance Sheet of the lessee. Financial Instruments A financial instrument is defined as any contract that gives rise to a financial asset of one entity and a financial liability of another. The term covers both financial liabilities and financial assets and, includes the borrowing, lending, soft loans, financial guarantees and bank deposits of the Council.
Financial Reporting Standards (FRS) Accounting practice to be followed in the preparation of accounting statements in the years prior to 2010-11. For example FRS17 governs the way in which pension liabilities must be presented in the accounts. From 2010-11 onwards FRS will be fully replaced by IFRS (International Financial Reporting Standards), see below.
General Fund All services other than those which authorities are required to account for separately in a Housing Revenue Account or Collection Fund.
General Reserves and Balances Monies held by the Council to deal with unforeseen events that might arise. The Council must maintain a prudent level of such balances. Group Accounts Where authorities have material interests in subsidiaries, associated companies or joint ventures they are required to prepare additional group account statements. The group accounts consolidate those interests in subsidiaries, associates and joint ventures with the Council’s own accounts to present a complete picture of the Council’s activities. Heritage Assets These are assets, previously classified as community assets, which are intended to be preserved in trust for future generations because of their cultural, environmental of historical associations. International Financial Reporting Standards (IFRS) These are accounting standards issued by the International Accounting Standards Board. Impairment A diminution in value of fixed assets resulting from obsolescence, physical damage or general market conditions. The Council undertakes annual reviews of its assets to identify impairment.
Comprehensive Income and Expenditure Statement This statement is compiled in accordance with IFRS and reports the net cost for the year of the services provided by the Council. It brings together expenditure and income relating to all of the local authority's operations and demonstrates how the net cost has been financed from general government grants and income from local taxpayers.
Infrastructure Assets These are assets such as highways and footpaths.
Investments These may be long-term investments whose purpose is to produce capital gain and rental income, or the short-term investment of cash balances that may arise from day to day management of the Council’s cash flow.
Investment Properties Land and buildings that are held for capital gain and rental income and not for the provision of services.
Joint Venture A company or body in which decisions require the consent of all participants (see also Group Accounts).
Liabilities Amounts due to individuals or organisations and to be paid at some time in the future. Current liabilities are payable within one year of the Balance Sheet date. Local Area Agreement (LAA)
The LAA is a partnership between the Council and other public bodies whose aim is to work together towards jointly agreed objectives to improve local public services. The Council’s LAA partners comprise local health bodies, learning bodies, community groups, housing associations and voluntary associations.
Materiality An item is material if its omission, non-disclosure or mis-statement in financial statements could be expected to lead to a distortion of the view given by the financial statements.
Minimum Revenue Provision (MRP) This is the minimum amount of external borrowing that authorities must repay and charge to their revenue accounts each year. It is calculated as a percentage of the Council’s capital financing requirement at the start of the year.
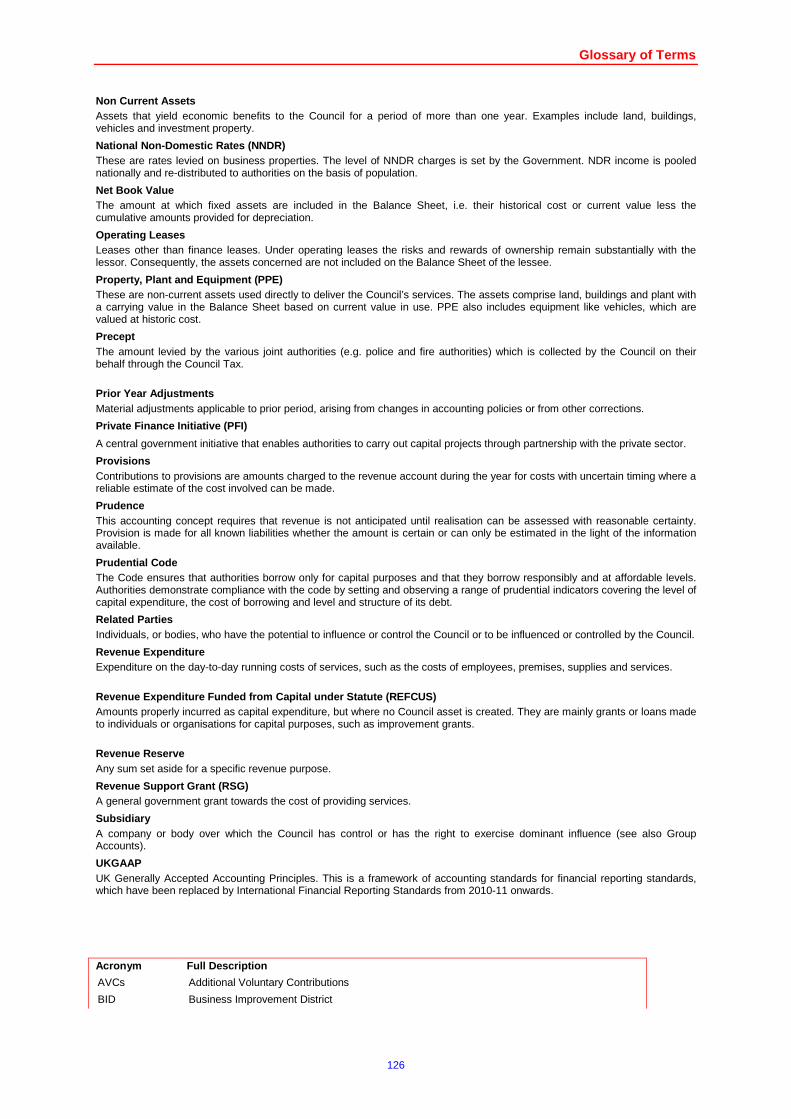
Glossary of Terms
126
Non Current Assets Assets that yield economic benefits to the Council for a period of more than one year. Examples include land, buildings, vehicles and investment property.
National Non-Domestic Rates (NNDR) These are rates levied on business properties. The level of NNDR charges is set by the Government. NDR income is pooled nationally and re-distributed to authorities on the basis of population.
Net Book Value The amount at which fixed assets are included in the Balance Sheet, i.e. their historical cost or current value less the cumulative amounts provided for depreciation.
Operating Leases Leases other than finance leases. Under operating leases the risks and rewards of ownership remain substantially with the lessor. Consequently, the assets concerned are not included on the Balance Sheet of the lessee.
Property, Plant and Equipment (PPE) These are non-current assets used directly to deliver the Council’s services. The assets comprise land, buildings and plant with a carrying value in the Balance Sheet based on current value in use. PPE also includes equipment like vehicles, which are valued at historic cost.
Precept The amount levied by the various joint authorities (e.g. police and fire authorities) which is collected by the Council on their behalf through the Council Tax.
Prior Year Adjustments Material adjustments applicable to prior period, arising from changes in accounting policies or from other corrections.
Private Finance Initiative (PFI)
A central government initiative that enables authorities to carry out capital projects through partnership with the private sector.
Provisions Contributions to provisions are amounts charged to the revenue account during the year for costs with uncertain timing where a reliable estimate of the cost involved can be made.
Prudence This accounting concept requires that revenue is not anticipated until realisation can be assessed with reasonable certainty. Provision is made for all known liabilities whether the amount is certain or can only be estimated in the light of the information available.
Prudential Code The Code ensures that authorities borrow only for capital purposes and that they borrow responsibly and at affordable levels. Authorities demonstrate compliance with the code by setting and observing a range of prudential indicators covering the level of capital expenditure, the cost of borrowing and level and structure of its debt.
Related Parties Individuals, or bodies, who have the potential to influence or control the Council or to be influenced or controlled by the Council.
Revenue Expenditure Expenditure on the day-to-day running costs of services, such as the costs of employees, premises, supplies and services.
Revenue Expenditure Funded from Capital under Statu te (REFCUS) Amounts properly incurred as capital expenditure, but where no Council asset is created. They are mainly grants or loans made to individuals or organisations for capital purposes, such as improvement grants.
Revenue Reserve Any sum set aside for a specific revenue purpose.
Revenue Support Grant (RSG) A general government grant towards the cost of providing services.
Subsidiary A company or body over which the Council has control or has the right to exercise dominant influence (see also Group Accounts).
UKGAAP UK Generally Accepted Accounting Principles. This is a framework of accounting standards for financial reporting standards, which have been replaced by International Financial Reporting Standards from 2010-11 onwards. Acronym Full Description
AVCs Additional Voluntary Contributions
BID Business Improvement District
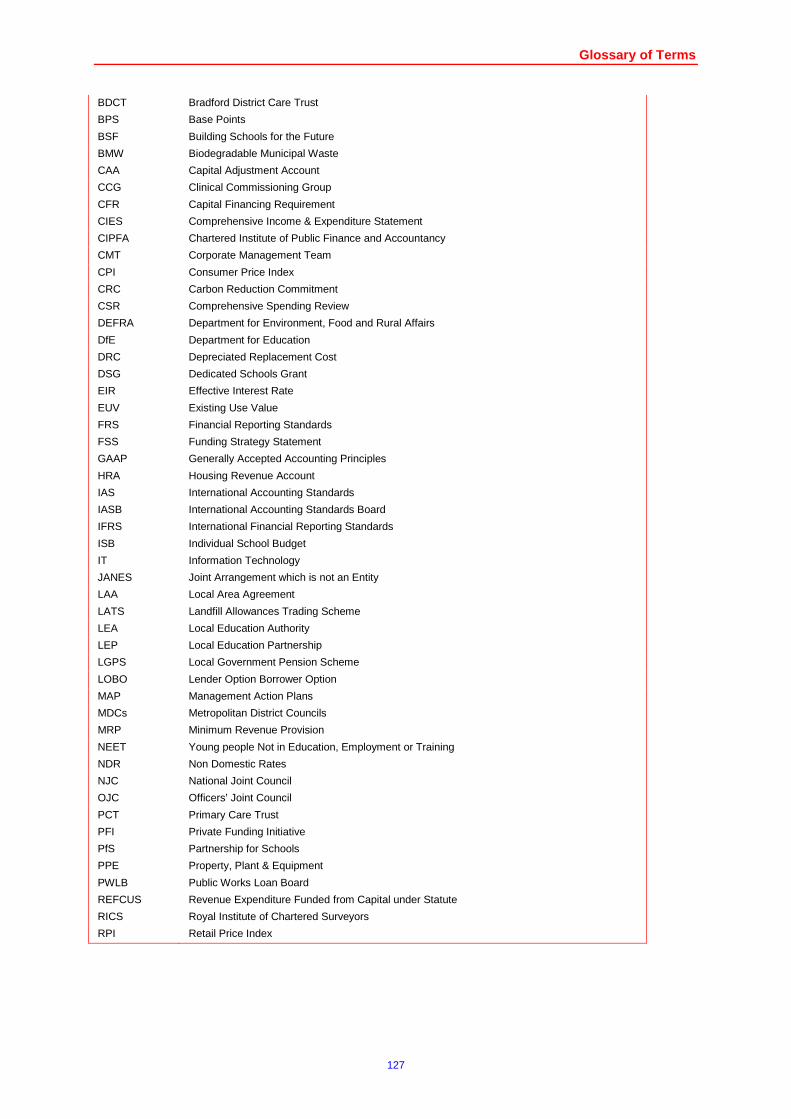
Glossary of Terms
127
BDCT Bradford District Care Trust
BPS Base Points
BSF Building Schools for the Future
BMW Biodegradable Municipal Waste
CAA Capital Adjustment Account
CCG Clinical Commissioning Group
CFR Capital Financing Requirement
CIES Comprehensive Income & Expenditure Statement
CIPFA Chartered Institute of Public Finance and Accountancy
CMT Corporate Management Team
CPI Consumer Price Index
CRC Carbon Reduction Commitment
CSR Comprehensive Spending Review
DEFRA Department for Environment, Food and Rural Affairs
DfE Department for Education
DRC Depreciated Replacement Cost
DSG Dedicated Schools Grant
EIR Effective Interest Rate
EUV Existing Use Value
FRS Financial Reporting Standards
FSS Funding Strategy Statement
GAAP Generally Accepted Accounting Principles
HRA Housing Revenue Account
IAS International Accounting Standards
IASB International Accounting Standards Board
IFRS International Financial Reporting Standards
ISB Individual School Budget
IT Information Technology
JANES Joint Arrangement which is not an Entity
LAA Local Area Agreement
LATS Landfill Allowances Trading Scheme
LEA Local Education Authority
LEP Local Education Partnership
LGPS Local Government Pension Scheme
LOBO Lender Option Borrower Option
MAP Management Action Plans
MDCs Metropolitan District Councils
MRP Minimum Revenue Provision
NEET Young people Not in Education, Employment or Training
NDR Non Domestic Rates
NJC National Joint Council
OJC Officers’ Joint Council
PCT Primary Care Trust
PFI Private Funding Initiative
PfS Partnership for Schools
PPE Property, Plant & Equipment
PWLB Public Works Loan Board
REFCUS Revenue Expenditure Funded from Capital under Statute
RICS Royal Institute of Chartered Surveyors
RPI Retail Price Index

Glossary of Terms
128
RSG Revenue Support Grant
SeRCOP Service Reporting Code of Practice
SIP Statement of Investment Principles
SOLACE Society of Local Authority Chief Executives
WDA Waste Disposal Authority
WYCA West Yorkshire Combined Authority
WYPF West Yorkshire Pension Fund
WYITA West Yorkshire Integrated Transport Authority
VAT Value Added Tax
YPO Yorkshire Purchasing Organisation
Annual Governance Statement
129
ANNUAL GOVERNANCE STATEMENT 2015-16
1. Scope and Purpose 1.1 Scope of Responsibility The City of Bradford Metropolitan District Council is responsible for ensuring that its business is conducted in
accordance with the law and proper standards, and that public money is safeguarded, properly accounted for, and used economically, efficiently and effectively. It also has a duty under the Local Government Act 1999 to make arrangements to secure continuous improvement in the way in which its functions are exercised.
In discharging its overall responsibility, the Council is responsible for putting in place proper arrangements for the
governance of its affairs, facilitating the effective exercise of its functions, as well as arrangements for the management of risk.
1.2 The purpose of the governance framework
The governance framework comprises the systems and processes, culture and values by which the Council and its partners are directed and controlled and those activities through which it accounts to, engages with and leads the community. It enables the Council to monitor the achievement of its strategic objectives and to consider whether those objectives have led to the delivery of appropriate, cost-effective services.
The framework has continued in place at the Council for the year ended 31 March 2016 and up to the date of approval of the statement of accounts. Whilst supporting the Council’s arrangements for risk management, it cannot eliminate all risk to the achievement of policies, aims and objectives and can therefore only provide reasonable and not absolute assurance of effectiveness.
2. The Governance Framework.
The systems and processes that comprise the Council’s governance comprise the following key elements: 2.1 Code of Corporate Governance.
The Council has approved and adopted a code of corporate governance which is consistent with and founded on the six core principles of the CIPFA/SOLACE framework “Delivering Good Governance in Local Government” –
• Focusing on the purpose of the authority and on outcomes for the community, and creating and implementing a vision for the local area.
• Members and officers working together to achieve a common purpose with clearly defined functions and roles. • Promoting the values of the authority and demonstrating the values of good governance through upholding high
standards of conduct and behaviour. • Taking informed and transparent decisions which are subject to effective scrutiny and managing risk. • Developing the capacity and capability of members and officers to be effective. • Engaging with local people and other stakeholders to ensure robust public accountability.
2.2 The Constitution of the Council
The Constitution, reviewed at Annual Council, provides the framework within which the Executive takes decisions in discharge of the Council’s functions, subject to the examination of a number of Overview and Scrutiny Committees. The Executive is collectively responsible for the decisions it makes and its decision making arrangements are designed to be open, transparent and accountable to local people.
2.3 Identification and communication of a clear vis ion of the Council’s purpose, its shared priorities with its
partners and intended outcomes for citizens and ser vice users. Bradford District Partnership requested the production of a District Plan in October 2015 to confirm shared vision, outcomes and priorities for action with partners over the next four years. The District Plan has been developed with key partners and partnerships, and builds on the BDP governance review, giving a clear responsibility for each outcome to a specific strategic partnership. The development of the plan also involved overview and scrutiny committee and area committee input. The final District Plan was agreed by Bradford District Partnership Board on 22 April 2016. Building on the outcomes and principles established via the Council’s New Deal approach it sets out a clear vision and agreed action over the next four years to 2020. A Council Plan is in development that identifies how the Council will deliver the commitments established in the District Plan. It is scheduled for Executive consideration on 19 July 2016 Internally, the Council’s purpose is defined as: “Working with people and partners for a healthier, caring, more prosperous and sustainable Bradford District.” The priorities identified in the plans are:
• Good schools and a great start in life for all our children
Annual Governance Statement
130
• Better skills, more and better jobs and a growing economy • Decent homes that people can afford to live in • Better health, better lives • Safe clean and active communities • A well run council which is cost effective and productive.
A plan for communicating and engaging on the key messages of the plan, and promoting its delivery is being developed.
2.4 Review of the Council’s vision and implications for its governance arrangements.
The Council Plan will be further developed and delivered through internal governance arrangements comprising six director-led boards, whose scope reflect the Plan’s defined priorities, overseen by the Executive. A review of Bradford District Partnership arrangements was carried out over late 2015, and implemented by April 2016. This involves a clear lead partnership for each of the agreed outcomes that form the Council and District’s vision. Each partnership is responsible for a “chapter” of the District Plan. Bradford District Partnership board are currently considering how they ensure greater accountability from the partnerships to the Board, via regular reporting on progress at future Board meetings. An updated handbook is also being produced.
. 2.5 Business Continuity Management.
The Council is committed to providing for business continuity, as detailed in the Civil Contingencies Act 2004, to ensure it can provide all its key functions in the event of an emergency or disruption, so far as is practicable. Assistant Directors lead on business continuity planning within their service areas. The Emergency Management Team has put in place processes that set out the Council’s approach to business continuity management.
2.6 Measuring the quality of services for users, en suring services are delivered in accordance with th e Council’s
objectives and represent the best use of resources. • The Council uses corporate and departmental service level performance measures to report and manage service
delivery. • The Annual and Mid-year Finance and Outturn Performance Reports, and Quarterly Financial Monitoring
Reports, present to the Executive and Corporate Overview & Scrutiny the current and forecast position on performance and finance in relation to the Council’s activities. The reports set out the key areas of progress, the key issues, areas for continued attention in relation to the Council’s corporate priorities and actions to address any areas of underperformance.
• The Council now has a well established way of measuring productivity and financial activity data to ensure that it is using its resources efficiently and providing value for money.
• A set of Corporate Indicators is in place that focuses on key Council priorities. The Corporate Performance Framework is revised in line with the changes to our performance arrangements. Performance will continue to be monitored through Departmental Management Teams, CMT, Council's Policy Programmes and Change Service within the Chief Executive’s department, Executive and Overview & Scrutiny Committees.
• There are service specific customer feedback and user engagement mechanisms in place, and user-specific engagement methodologies such as Learning Disabilities Partnership and Easier Access events that allow the Council systematically to gather customer insight.
• The Council continues to face significant budget cuts and a rising demand for services. In order to shape the future Council, it and its partners have invested in a wide ranging programme of consultation and engagement. The Council continues to use a range of tools to secure value for money, which are continuously developed. They include, for example, a commissioning-led approach to service planning, sharper procurement disciplines, benchmarking, finance and activity costing, competitive tendering, external peer review, business case appraisals, investment models, contract mechanisms and pricing regimes.
• Additionally the Council’s system of internal control is designed to support effective and efficient use of resources. 2.7 Defining the roles and responsibilities of the Executive, the non-executive, scrutiny and officer functions
including clear delegation arrangements and protoco ls for effective communication.
• A clear statement of the respective roles and responsibilities of the Executive, the members and senior officers including delegation arrangements and protocols for effective communication of committee decisions, can be found in the Council’s constitution.
• In addition, the Council’s financial management arrangements conform with the governance requirements of the CIPFA “Statement on the Role of the Chief Financial Officer in Local Government 2010”
• Role Profiles for all senior officers detail their key responsibilities
2.8 Embedding and communicating codes of conduct de fining the standards of behaviour for members and s taff across the organisation. The Council has approved a Code of Conduct for Elected Members and a procedure for dealing with complaints. The Standards Committee’s role was retained to have responsibility for overseeing the operation of the Code and for promoting high standards of conduct.
Annual Governance Statement
131
In addition, the Council’s Constitution establishes:-
• A protocol on member-officer relations providing rules and guidance for members, co-opted members and
officers in their working relations. • Protocols for members on gifts and hospitality and members’ use of Council resources including the use of
email and the internet. • Members and officers have been provided with guidance on the framework within which they are required to
undertake their different roles • Employees are expected to comply with the Council’s Code of Conduct for Employees.
2.9 Standing orders, standing financial instruction s, a scheme of delegation and documented supporting
procedures and strategies which clearly define how decisions are taken and how the processes and contr ols required to manage risks are implemented.
• Council standing orders for contracts and financial regulations are contained in the Constitution of the Council.
They are subject to annual review by officers before approval at the Governance and Audit Committee and adoption by full Council at the annual meeting.
• Key control booklets are maintained by Internal Audit, updated as required and placed on the Council’s intranet. • A scheme of delegation is provided in the Council’s constitution. • Additionally the Council has six Overview and Scrutiny Committees which are required to contribute to the
better decision making of the council, and secure continuous improvement in service delivery • Area Committees enable local communities to participate in Council activities • The Council has adopted a Risk Management Strategy and maintains both corporate and service risk registers
which identify actions required to mitigate any risks identified. The registers should be regularly maintained, reviewed and updated. In 2015-16 further work on risk management was required to establish the appropriate reporting structure.
• Risk management training is standard within project management and at particular key stages of project implementation.
2.10 Arrangements to ensure compliance with relevan t laws and regulations, internal policies and proce dures,
that expenditure is lawful and an anti fraud and co rruption strategy, all monitored by the Governance and Audit Committee.
• The Council’s Monitoring Officer is required to maintain an up to date version of the Constitution and to make
amendments and/or improvements as necessary to take account of changes in legislation, guidance, Council policy, decisions of the Council and the Executive.
• The Monitoring Officer, following consultation with the Chief Executive and the Section 151 Officer, is required to report to the Executive if she considers that any proposal, decision or omission would give rise to unlawfulness or maladministration. To assist the Monitoring Officer in this role, Legal Services monitor new legislation and disseminate this information to service departments.
• The Section 151 Officer is similarly required to report to the Executive and the Council’s External Auditor if he considers that any proposal, decision or course of action will involve incurring unlawful expenditure, or is likely to cause a loss or deficit.
• Each Strategic Director and the Chief Executive are required to confirm in an annual letter to the Section 151 officer that they have taken reasonable steps to ensure compliance with established policies, procedures, laws and regulations, including how risk management is embedded in the Departments. This is underpinned by performing the key control and fraud risk self assessments and levels of non compliance are duly considered.
• The Council has a Counter Fraud Policy and Strategy to protect public funds by actively seeking to deter and prevent fraud, corruption and theft and ensure that all possible risks are minimised.
• The reports of Internal and External auditors consider and inform compliance with regulations, policies and procedures.
• The Council has established internal control procedures designed to support compliance with established policies, practices, laws and regulations and to safeguard the Council’s assets and interests from loss
• All reports to Executive must be cleared by a member of the Council’s Management Team, the Monitoring Officer and the Director of Finance.
2.11 Information Governance Arrangements
• A separate and independent information security team supports the Senior Information Risk Owner (SIRO) to discharge his responsibilities in championing an information security culture, establishing policy, practice, process, training, knowledge and technology, and assessing the effectiveness of those arrangements.
• The SIRO is supported by a distributed network of Information Asset Owners (at Assistant Director level) who in turn are supported by department and or system-specific information security managers
• The Bradford team liaises closely with peer function in other public bodies in West Yorkshire and beyond, and with the Information Commissioner’s Office (ICO)
• The Council underwent a voluntary audit in 2015 by the ICO on the procedures supporting subject access requests, training and development and data sharing agreements, and its programme of work is informed by this audit.
2.12 Arrangements supporting whistle blowing and fo r receiving and investigating complaints from the p ublic.
• The Council has a whistle blowing policy embodied in the Confidential Reporting Code for Employees. This can be accessed on the Council’s web site.
Annual Governance Statement
132
• Under the Articles of the Constitution, the Governance and Audit Committee has a function to consider the effectiveness of the control environment and associated anti-fraud and anti-corruption arrangements.
• The Section 151 Officer has dedicated resources to undertake independent investigations and report on allegations of impropriety.
• The Council has a formal ‘Comments, Complaints and Compliments’ procedure on the “Contact us” section of the Council’s website. All members of the public have the right to complain to the Council in writing, by telephone or by speaking to a member of staff.
2.13 Developing the needs of members and senior off icers in relation to their strategic roles, support ed by
appropriate training.
• The Council supports members in undertaking their varied and evolving roles and responsibilities. A Member Learning and Development Strategy shapes the Member Development Programme which is run on a quarterly basis by the Human Resources Department.
• The Strategy introduces the key learning and development aims and objectives. It also identifies actions that will be taken to ensure all councillors have access to learning and development opportunities appropriate to their needs. The aim of this is to help councillors carry out their roles efficiently and effectively.
• The Council recognises that alongside members, employees are a key resource - the development of the two goes hand in hand. The Council’s workforce development programme provides a focus on effective workforce planning and development, embracing leadership and skills training for all staff.
2.14 Establishing clear channels of communication w ith all sections of the community and other stakeho lders,
ensuring accountability and encouraging dialogue.
• The Council has five Area committees to encourage community engagement and participation. • A principal form of securing dialogue with communities is by establishing and operating neighbourhood and
ward forums. • The Council supports a process of engagement with the District’s communities of interests that complements
our place based structures. • Overview and scrutiny arrangements provide for meetings to be open to the public, except where confidential
information or exempt information is likely to be disclosed. • The Council’s website and App provide a communication and wide ranging information link. • The Council provides information and news using social media. • The Council’s Contact Centre and face to face Customer Service Centres provide easy access to Council
services and information. • An extensive programme of consultation on the annual budget generated considerable engagement and input
into the establishment of the Council’s budget priorities. It raised awareness of the financial and demand challenges facing the district, confirming what matters most to local people and exploring public expectations and aspirations for involvement in future delivery.
• CMT agreed for the development of an improvement to our insight capacity in late 2015. Part of this suite of work involves to Council developing an E-panel to ensure a representative section of the population can be consulted on and surveyed. Support for the recruitment of people to the e-panel was commissioned in March 2016.
• Insight into issues that are important to people will be gathered in this way from Summer 2016. A perceptions survey will be conducted in Autumn 2016 Publications, media, including social media, the Council’s website. App and other publicity arrangements provide communication channels with the district’s citizens.
• The Annual Statement of Accounts provides a report on the Council’s financial activities for the year. • Financial information, including details of efficiency savings, is issued with Council Tax bills. • The Council has published a contracts register (which will be updated quarterly) and a grants register (which
will be updated annually) in accordance with the Local Government Transparency Code. 2.15 Incorporating good governance arrangements in respect of partnerships and other group working and
reflecting these in the Council’s overall governanc e arrangements.
• The role of the Governance and Audit Committee includes maintaining an overview of the Council’s partnership arrangements and overseeing any action plans for improvement arising, for example, from inspection reports.
• The Council has an agreed approach to collective bargaining with the recognised Trade Unions. This is undertaken through consultation and negotiation and is enshrined within the Council's Industrial Relations Framework. The Council takes a partnership approach to Industrial Relations, using the Industrial Relations Framework. This includes regular informal discussions between trade unions and management & formal OJC meetings at all levels across the Council - L1 (Corporate), L2 (Departmental) & L3 (Service).
• Bradford District Partnership (BDP), as the Local Strategic Partner for the area, ensures that the governance arrangements of the family of partnerships function well, in order to support the delivery of the Bradford District Strategy. The BDP reports to the Governance & Audit Committee on governance and functional business matters and to Overview and Scrutiny Committees on topic based performance and delivery.
• The Schools Forum is effective as the place where resource allocation decisions are made between the Council and the District’s schools
• To support the Health and Wellbeing Board, governance arrangements for senior leaders and managers in the health and social care economy have been established to oversee the development of integrated health and social care models, and to ensure oversight of the whole system of public and personal health and social care
Annual Governance Statement
133
3. Review of Effectiveness
The Council has responsibility for conducting, at least annually, a review of the effectiveness of its governance framework including the system of internal control. The review of effectiveness is informed by the work of the executive managers within the Council who have responsibility for the development and maintenance of the governance environment. Confirmations have been obtained from Strategic Directors and the Chief Executive that reasonable steps have been taken to ensure compliance with established policies, procedures, laws and regulations. They have been asked to confirm that risk management is embedded in their departments, provide a fraud risk assessment and to report, on a three year rolling programme, the level of compliance with key controls that are set out in the Key Control Booklets. The Council has in place a Governance and Audit Committee, independent of the Executive, to strengthen and consolidate its governance arrangements and provide the core functions as identified in CIPFA’s “Audit Committees – Practical Guidance for Local Authorities”.
The review is informed also by the work of the Internal Audit section which covers both the Council and the West Yorkshire Pension Fund. The key areas of assurance relate to the work detailed in their monitoring reports on the Council’s control environment which are reported at regular intervals to Governance and Audit Committee. The Head of Internal Audit is required to deliver an annual Internal Audit Opinion and report regularly to the Governance and Audit Committee as prescribed by Public Sector Internal Audit standards. A number of operational control issues have been identified from this and action is being taken to put improvements in place. Action plans for improvement are devised and implemented in response to recommendations from External Audit and other statutory agencies and inspectors. The Council liaises fully and promptly with the Local Government Ombudsman’s enquiries into complaints against the Council.
The Council liaises closely with the Information Commissioner’s Office in reporting and closing information security risks and incidents, and to ensure it discharges fully its duties under Data Protection legislation and policies.
4. Significant governance issues
The annual review has established that the Council has arrangements in place which provide a sound governance framework and system of internal control. However the Council is not complacent and seeks to continually improve the arrangements it has in place. The Governance and Audit Committee will be kept informed of progress. The specific governance issues set out in the 2014/15 Annual Governance Statement have been monitored through the year. Progress on these was reported to the Governance and Audit Committee in a detailed public report on the 29th January 2016. The following sections give a brief update on these risks. Whilst some of these risks have been mitigated during the 2015/16 financial year a number of risks are continuing to be monitored and remain high profile in 2016/17.
5. Governance challenges previously recognised and concluded during the year 5.1 Developing new and affordable models of care wi thin the governance arrangements that exist across the
health and social care system
The Council has agreed a reduction in the staffing budget of the Adults Department in the range of 2.5 million pounds over the period 2016\2018. Additional reductions in staffing are also required due to reduction in funding from the Better Care Fund. The quantum of savings will result in a full remodelling of the Council’s social care model. The intention is to move to a community based model of delivery, based on people’s assets as opposed to the current deficit model. Services will de developed with communities in order to better enable people to remain in and actively participate in them. The Council will continue to work with its NHS partner, voluntary and private sector partners to develop new models of integrated health and social care. Some new initiatives are planned for 2016/17 and are supported through the NHS Vanguard Programme. In 2016/17 the progress to deliver a new model will accelerate in order to deliver the above budget reductions and the Government's intention that the health and social care systems will be integrated from 2020. The Council agreed to raise the 2% Social Care Precept as part of its budget setting for 2016/17 and onwards. The additional income will go part way towards the increased costs of paying for care services as a result of the increase in the minimum wage. The monies raised have been passed on to social care providers as a contribution towards their additional costs.
The service offer will need to be delivered within its budget constraint which will result in real changes to how services are currently delivered. More information on Adult and Community Services transformation programmes can be found in “Adult and Community Services Portfolio of Transformation Programmes progress December 2014 – November 2015” – report to Health & Social Care Overview and Scrutiny committee 10th December 2015.
5.2 Ensuring that the Council’s risk management str ategy and practice is effectively embedded and refl ects the
dynamic risk environment faced by the Council.
During the year further progress on risk management was made. A training session was delivered to the Senior Leadership Team on the 7th August 2015. A report on risk management was tabled at the Corporate Overview and Scrutiny Committee on the 6th January 2016. The Committee made three recommendations –
Annual Governance Statement
134
• That risk management be incorporated into the Quarterly Finance and Performance Monitoring reports. • That a further progress report be presented to Overview and Scrutiny Committee in 12 months time • That relevant sections of the risk register be incorporated into the risk section of all reports to Overview and
Scrutiny Committees. In discussion, the Committee also asked for further consideration to be given to the process for collecting and refreshing information on changes in the risk environment from all areas of the Council’s operations as well as ensuring they were compatible with the risk registers of key partner organisations.
6. Governance challenges which require continuing r eview in 2016/17 6.1 Agreeing an operating and financial plan in the context of the intractable tensions between resour ces,
expectations of citizens and service users, and the statutory framework
The Council’s short and medium term plans will be developed and implemented as follows: District Plan The District Plan adopted by the Bradford District Partnership will be the vehicle for developing proposals about the future of the Council to around 2020. The working arrangements for each District Plan outcome vary to suit the maturity of the proposals and the gamut of views needed. The Council Plan The Council Plan will set out the overarching medium term priorities for what the Council will do, in collaboration with partners. Within the context the Medium Term Financial Strategy, which will be published in July 2016, budget proposals for 2017-19 will be made and publicly consulted upon from autumn 2016. Engagement with partners and the public more generally will build on existing channels and methods of engagement Council Budget 2016-2018 The Council’s proposed budget for 2016/17 and 2017/18 was consulted on, using familiar consultation mechanisms from previous years. The budget agreed in February 2016 Council, set the financial parameters for the District and Council Plans, and is now being implemented. Quarterly financial monitoring reports to Executive will track progress. Under all these arrangements, the tension between what is expected, required and affordable, and how to resolve it, remains centre stage, and features prominently in risk analyses.
6.2 Improving Educational Attainment and Managing O fsted Outcomes
The Local Authority’s (LA) school improvement function was inspected in June 2015. The lead document for the inspection was the LA’s Self Evaluation. Whilst the outcome of the inspection was heavily influenced by the continued poor overall outcomes achieved in Bradford’s schools, there was recognition that the Local Authority knows itself and the challenges it faces, and the inspectors were confident that the newly formulated school improvement strategy was the right way forward. The LA has been led to expect that its school improvement arrangements and outcomes will be re-inspected in autumn 2016. The new improvement strategy fully supports a school-led improvement system and sets out clear roles for the three strategic partners. The Government’s latest White Paper (March 2016) states that all remaining maintained schools will be academies or in the process of conversion by 2020. Whilst the Government has now revised the requirement for the very best schools to become academies, the guidance is still clear that all schools in underperforming local authorities will convert to academies. This is expected to apply in the Bradford District. As a result this clearly indicates a removal of the LA’s strategic role in education. However in the interim there is a clear understanding between the strategic partners about their respective roles.
• The LA to work with underperforming and schools causing concern to monitor, challenge and intervene when necessary to ensure their rapid improvement. The LA as a commissioner rather than deliverer of services.
• The five main partnerships of secondary, primary, catholic, special and nursery schools, to lead on the school-to-school support for improvement. This recognises that the expertise and capacity to have a positive impact on Bradford’s educational outcomes sits in our schools. However it is also recognised that external expertise is needed to accelerate improvement in Bradford and as a result schools have been working closely with colleagues from Wigan LA, and there have been recent negotiations with the Regional Schools Commissioner to bring two major, and successful, external sponsors to Bradford to lead improvements in a number of new academies
• The Teaching School Alliances (TSAs) have access to training resources and external funding so that school staff, at whatever stage they are in their careers, can access further training and development. There are five TSAs in the Bradford District
Future development of the school-led improvement strategy in Bradford is being directed through the post-Ofsted Action Plan that the LA produced in September 2015 and was being implemented prior to that date. The plan focuses on nine key improvement themes, each led by a senior LA officer (DCS, ADs and Heads of Service). The tracking of the progress and impact of the plan is carried out through a KPI (key performance indicator) monitor and monthly RAG ratings of each of the key activities. The outcomes of the plan are being evaluated by the Education
Annual Governance Statement
135
Improvement Strategic Board (EISB), which includes in its membership an external chair, four senior elected members, and key stakeholders from schools (including a governor rep), partnerships, teaching school alliances and the LA. The EISB holds all partners to account for the required improvements. In addition the Council’s Overview & Scrutiny Committee has a clear role in monitoring and evaluating progress. The Bradford Education Improvement Commissioning Board has also been set up to ensure that resources, mainly made available by Bradford Council and the Schools’ Forum, are allocated to schools, partnerships and teaching schools alliances where they will have greatest impact in addressing Bradford’s key priorities. The Commissioning Board is independently chaired, holds providers to account for the impact of allocated resources, and in turn is held to account by the Education Improvement Strategic Board (EISB). Plans are now being formulated to revise the post-Ofsted Action Plan in order to broaden its remit during a period of rapid change in education where multi-agency and multi–organisational working will need to be well co-ordinated to ensure the focus remains on the safety, health and well-being and educational outcomes of Bradford’s children and young people. Professor David Woods, a leading educational expert, who conducted a robust review of Bradford’s school improvement arrangements in the summer of 2014, continues to provide consultancy support as a critical friend. His work involves the scrutiny of our developments and documentation to ensure they are fit for purpose. Accountability for the raising of standards in Bradford is now shared between the three strategic partners (teaching school alliances, partnerships and LA). The Regional Schools Commissioner (RSC) is playing an increasing role in monitoring the performance of Bradford schools – overseeing the conversion of schools to academies and the formation of multi-academy trusts, and holding existing academies to account for their performance.
6.3 Safeguarding Vulnerable Children
The number of referrals to children's social services has reduced to 400 per month compared to 450 per month last year. There has been a reduction in the number of children on Child Protection Plans, from 646 in the last year to 487 in October 2015. This demonstrates the effectiveness of the work being done to reduce risks and safeguard children. The Action Plan developed following the Ofsted Inspection of Child Protection and Looked After Children in February and March 2014 has been completed and systems are in place to monitor child protection conferences and safeguarding arrangements by both the council and the Bradford Safeguarding Children's Board. All children who are subject to a Child Protection Plan have an allocated social worker and 87% of Child Protection conferences take place within the required timescale. The multi agency Child Sexual Exploitation Hub has had increase in staffing from the police and a review of the Hub is currently taking place. An independent review of Children's homes has been completed and a comprehensive transformation programme incorporating recommendations from that review is being implemented. The programme will refocus and strengthen our children's residential and foster care, in particular regarding placements for adolescents with complex needs. All the children's homes except one have been inspected under the new revised inspection regulations. 82% were judged to be good, one was graded outstanding and one requires improvement. The council is leading a programme of change with partner agencies to develop our Early Help offer which will see families supported earlier and prevent problems escalating. A multi-agency project board meets monthly and there are plans to pilot the new arrangements from April 2016.
6.4 Ensuring an effective integrated system of heal th and social care
With financial and performance pressures mounting in the NHS, the national quest continues for how an affordable and effective integrated system of health and social care should be organised and operate. Whilst governance arrangements are in place – with the Health and Wellbeing Board at the apex, supported by officer-level governance groups and a work programme; and while progress has been made in developing high-level visions, some new local initiatives of integrated care, there is not yet a shared and affordable plan of the health and social care system in the Bradford District for the medium term. The current planning mechanism is the district-wide Sustainability and Transformation Plan, seeking to set out what needs to be done on three fronts: health of people, quality of care, and cost. The magnitude of the challenge, the interconnectedness of the system, and the centrality of the issues to the Council’s key priority of Better Health, Better Lives, and the elusiveness of answers, mean these questions remain on the list of principal governance challenges.
6.5 Mitigating the effects of a loss of experience and expertise arising from staff reductions, especi ally where
loss of such resource impacts on the management of services protecting vulnerable people.
The impact of the loss of experience and expertise is being felt in all Council departments. From a governance and control perspective, this can surface as:
• Insufficient capacity, skill or knowledge, to identify and manage risks and resolve issues • Loss of corporate memory • Poor or insufficient practical service delivery.
Examples cited by departments include transport engineering, teachers and school leaders, and social care management.
Service managers are using a variety of mitigations to reduce the risk associated with continued downsizing:
• Dedicated retention and recruitment drives, particularly for teachers
Annual Governance Statement
136
• More stringent criteria for approving request for voluntary departure • Eliminating “single points of failure” • Sharing resources and expertise with other local authorities • Skills development programmes including Future Leaders Programme, and the Regeneration Academy,
and the workforce development strategy led by Human Resources • Short-term use of temporary staff • Restructuring to regularise collaborative working and skill sharing
Looking ahead, the governance challenge will remain of how the skills, knowledge and capacity can be secured and developed to ensure priority, more keenly defined in view of shrinking resources, can actually be delivered.
6.6 Establishing sound governance structures pertai ning to the West Yorkshire Combined Authority ensur ing
democratic accountability at the local level.
Projects funded by the West Yorkshire Combined Authority (WYCA) are controlled under their Assurance Framework. A rigorous project management system is in place for all Growth Fund and West Yorkshire+ Transport Fund projects. Reports have been presented to CBMDC Governance and Audit Committee and to Corporate O&S Committee on WYCA/Leeds City Region Enterprise Partnership (LEP). Governance arrangements are set through WYCA with direct involvement of the Leader of CBMDC on the Board and in the WY&Y Investment Committee. The Deputy Leader is also directly involved on transport, planning and housing matters. CBMDC elected members are also involved in WYCA’s own Governance and Audit Committee and Overview & Scrutiny committee and activity. The Leader of the Conservative Group is a political substitute member on the WYCA. The Leader of the Liberal Democrat Group, CBMDC sits on WYCA representing Liberal Democrats. Further changes to WYCA for legal compliance and effective operation are being progressed through the Business Plan 2015-16 and a Development Programme, including the recruitment of a Managing Director post to oversee the next significant phase of WYCA efficiency and transformation. This sees the WYCA, as a local authority body, working with the five primary Local Authority constituent members, including CBMDC. Governance and Audit Committee received an update on WYCA and LEP in Spring 2016. Established governance structures and arrangements are in operation with monitoring and continuous improvement. More substantial changes may be necessary in the light of sub-national devolution and other processes – local government & public services reconfiguration, public sector reform, democratic renewal etc. for 2016.
6.7 Impact on governance structures arising from de veloping policies for the delivery of regional devo lution.
A Devolution deal was agreed in March 2015 and implementation plan developed with Civil Servants on the technical aspects relating to transport, housing, business support, employment and skills. Since the General Election and under the new Government, devolution ambitions and expectations are progressing including specific legislative proposals set out in the Cities and Local Government Devolution Bill, the Buses Bill and Housing and Planning Bill amongst others. Further negotiations are in progress with HM Government and civil service. Governance structures, procedures and implications are being considered and developed, within the emerging legislative framework, to protect and promote the interests of local places and local government. These developments are expected to continue into 2016 and to secure appropriate opportunities, powers, resources and risk management to support local prosperity, economic growth, regeneration and investment. This is subject to Government policy and resource decisions, especially those to be pursued through the Spending Review 2015. This remains an open-ended process with political and senior management involvement from CBMDC with attention on powers and resources to achieve outcomes and the related governance arrangements to support democratic and civic interests. This remains a continuing challenge in 2016-17 for CBMDC given refinements to WYCA governance and operations, further Government policy change and sub-national devolution developments.
7. 2016/17 Governance Challenges
The risks detailed below will be reviewed through the 2016/17 financial year and progress against them will be reported to the Governance and Audit Committee.
1) Agreeing an operating and financial plan in the context of the intractable tensions between resources,
expectations of citizens and service users, and the statutory framework 2) Improving educational attainment 3) Safeguarding vulnerable children 4) Ensuring an effective integrated system of health and social care 5) Mitigating the effects of a loss of experience and expertise arising from staff reductions, especially where loss of
such resource impacts on the management of services protecting vulnerable people. 6) Establishing sound governance structures pertaining to the West Yorkshire Combined Authority ensuring
democratic accountability at the local level. 7) Impact on governance structures arising from developing policies for the delivery of regional devolution. 8) Implications of the EU Referendum Result
Annual Governance Statement
137
8. West Yorkshire Pension Fund
The Council is the administering authority for the West Yorkshire Pension Fund (WYPF). The WYPF produces its own Governance Compliance statement which has been prepared in accordance with the requirements of the provisions of the Local Government Pension Scheme (Amendment No. 3 Regulations 2007). The Council has established two bodies to assist and support the Governance & Audit Committee oversee the WYPF:
• the WYPF Investment Advisory Panel and • the WYPF Joint Advisory Group
The WYPF Investment Advisory panel has overall responsibility for overseeing and monitoring the management of WYPF’s investment portfolio and investment activity. In this capacity, the Panel is responsible for formulating the broad future policy for investment. A Director of Finance from one of the member Authorities sits on the Panel, this position is currently held by the Director of Resources for Kirklees MDC. The WYPF Joint Advisory Group has overall responsibility for overseeing and monitoring the WYPF’s pensions administration function, and for reviewing and responding to proposed changes to the Local Government Pension Scheme. In addition the group approves the budget estimates for the pensions administration and investment management functions of WYPF, and also receives WYPF’s Annual Report and Accounts. The Council is also responsible for the financial and management arrangements of the West Yorkshire Pension Fund and a separate assessment of the adequacy of these arrangements is also required. The following internal arrangements are in place to provide the Council with the necessary assurance. • The West Yorkshire Pension Fund has adopted the Council approved approach to risk management • Risk registers are maintained and management action plans (MAPs) are in place for risks assessed as requiring
active management • Risks are monitored and MAPs reassessed regularly • A risk management report is submitted annually to the WYPF Joint Advisory Group. There are not expected to be any issues arising from the annual report and review to be submitted to the Joint Advisory Group meeting in July 2016.
9. Statement
Over the coming year we propose to take steps to address the challenges identified above to further enhance our governance arrangements. We are satisfied that these steps will address the need for improvements that were identified in our review of effectiveness and will monitor their implementation and operation as part of our next annual review.
Signed: …………………………………………………………………………… Councillor Susan Hinchcliffe, Leader of Council Signed: …………………………………………………………………………… Kersten England, Chief Executive