Embed Size (px)
Citation preview
Annual Report and Audited Financial Statementsfor the financial period from 18 November 2019 (Constitution date) to 30 November 2020
State Street CCFAn open-ended umbrella common contractual fund with segregated liability between sub-funds authorised and regulated bythe Central Bank of Ireland pursuant to the European Communities (Undertaking for Collective Investment in TransferableSecurities) Regulations 2011, as amended.
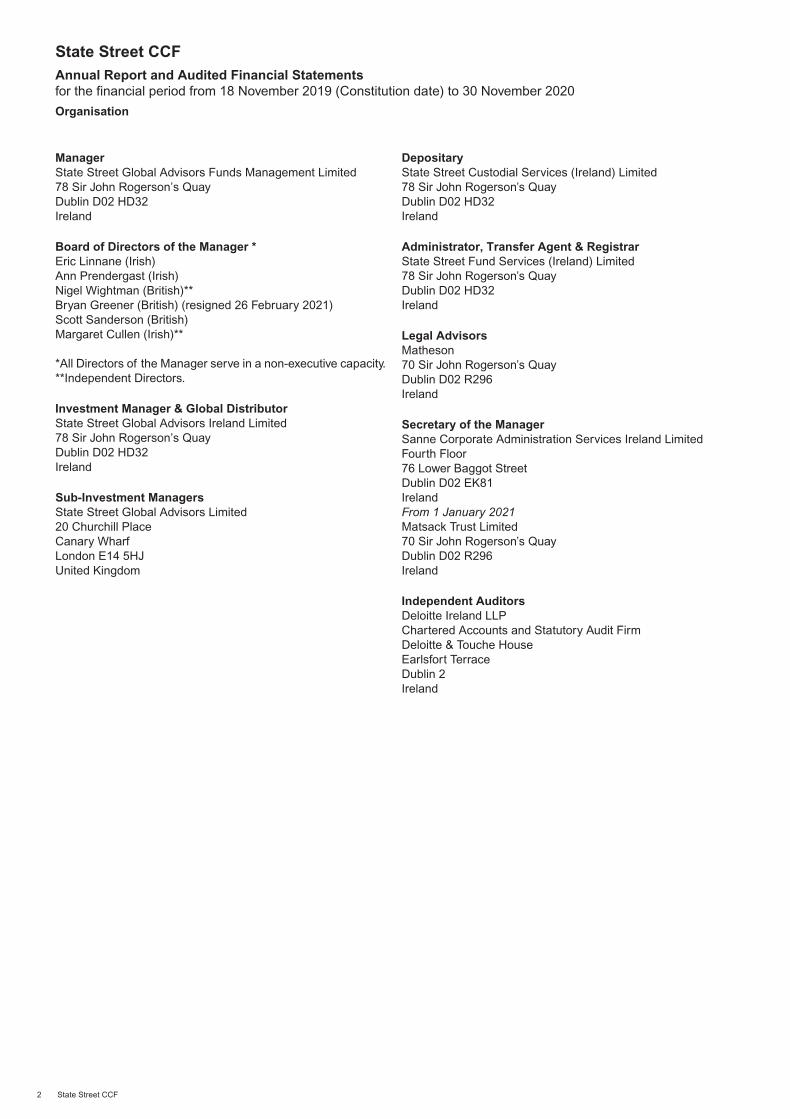
PageOrganisation 2
Background Information 3
Investment Managers’ Report 4
Statement of Responsibilities of the Manager 5
Report of the Depositary to the Unitholders of State Street CCF 6
Independent Auditors’ Report to the Unitholders of State Street CCF 7
Statement of Comprehensive Income 9
Statement of Financial Position 10
Statement of Changes in Equity 11
Statement of Cash Flows 12
Notes to the Financial Statements 13
Schedule of Investments 28State Street CCF World ESG Screened Index Equity Fund 28
Schedule of Significant Portfolio Changes (unaudited) 61
Appendix IRemuneration Policy (unaudited) 62
State Street CCFAnnual Report and Audited Financial Statementsfor the financial period from 18 November 2019 (Constitution date) to 30 November 2020
Contents
State Street CCF 1
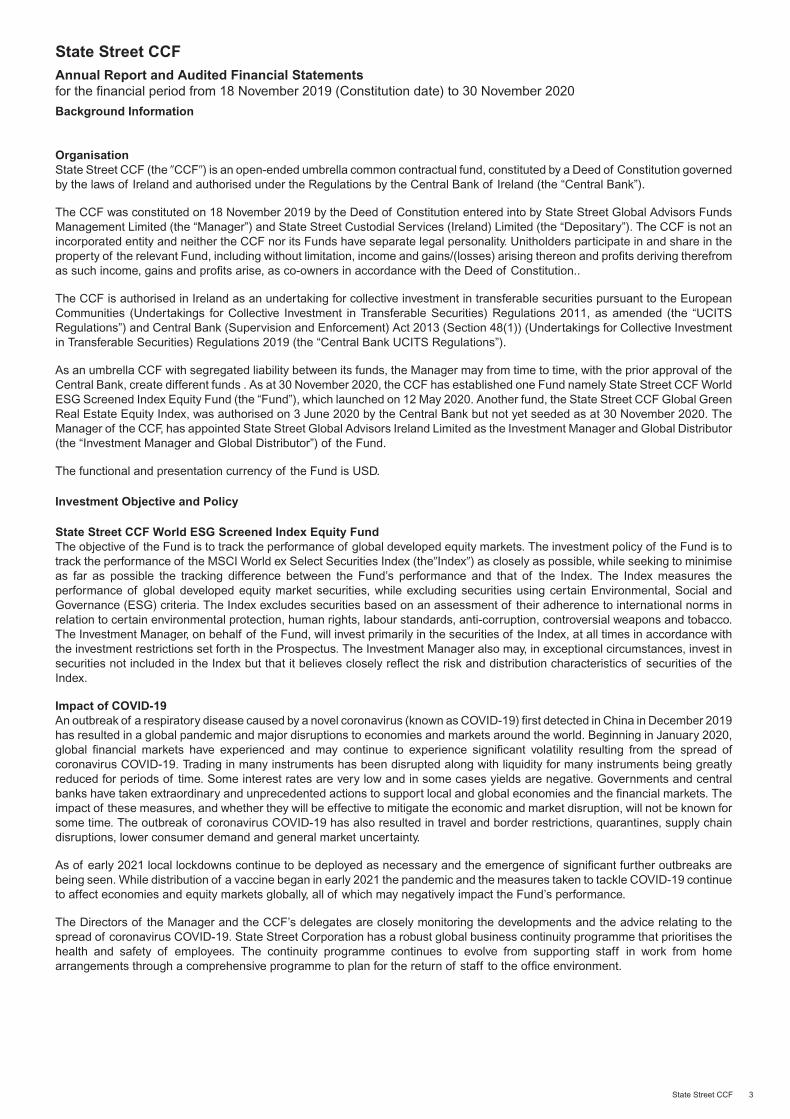
ManagerState Street Global Advisors Funds Management Limited78 Sir John Rogerson’s QuayDublin D02 HD32Ireland
Board of Directors of the Manager *Eric Linnane (Irish)Ann Prendergast (Irish)Nigel Wightman (British)**Bryan Greener (British) (resigned 26 February 2021)Scott Sanderson (British)Margaret Cullen (Irish)**
*All Directors of the Manager serve in a non-executive capacity.**Independent Directors.
Investment Manager & Global DistributorState Street Global Advisors Ireland Limited78 Sir John Rogerson’s QuayDublin D02 HD32Ireland
Sub-Investment ManagersState Street Global Advisors Limited20 Churchill PlaceCanary WharfLondon E14 5HJUnited Kingdom
DepositaryState Street Custodial Services (Ireland) Limited78 Sir John Rogerson’s QuayDublin D02 HD32Ireland
Administrator, Transfer Agent & RegistrarState Street Fund Services (Ireland) Limited78 Sir John Rogerson’s QuayDublin D02 HD32Ireland
Legal AdvisorsMatheson70 Sir John Rogerson’s QuayDublin D02 R296Ireland
Secretary of the ManagerSanne Corporate Administration Services Ireland LimitedFourth Floor76 Lower Baggot StreetDublin D02 EK81IrelandFrom 1 January 2021Matsack Trust Limited70 Sir John Rogerson’s QuayDublin D02 R296Ireland
Independent AuditorsDeloitte Ireland LLPChartered Accounts and Statutory Audit FirmDeloitte & Touche HouseEarlsfort TerraceDublin 2Ireland
State Street CCFAnnual Report and Audited Financial Statementsfor the financial period from 18 November 2019 (Constitution date) to 30 November 2020
Organisation
2 State Street CCF
OrganisationState Street CCF (the �CCF�) is an open-ended umbrella common contractual fund, constituted by a Deed of Constitution governedby the laws of Ireland and authorised under the Regulations by the Central Bank of Ireland (the “Central Bank”).
The CCF was constituted on 18 November 2019 by the Deed of Constitution entered into by State Street Global Advisors FundsManagement Limited (the “Manager”) and State Street Custodial Services (Ireland) Limited (the “Depositary”). The CCF is not anincorporated entity and neither the CCF nor its Funds have separate legal personality. Unitholders participate in and share in theproperty of the relevant Fund, including without limitation, income and gains/(losses) arising thereon and profits deriving therefromas such income, gains and profits arise, as co-owners in accordance with the Deed of Constitution..
The CCF is authorised in Ireland as an undertaking for collective investment in transferable securities pursuant to the EuropeanCommunities (Undertakings for Collective Investment in Transferable Securities) Regulations 2011, as amended (the “UCITSRegulations”) and Central Bank (Supervision and Enforcement) Act 2013 (Section 48(1)) (Undertakings for Collective Investmentin Transferable Securities) Regulations 2019 (the “Central Bank UCITS Regulations”).
As an umbrella CCF with segregated liability between its funds, the Manager may from time to time, with the prior approval of theCentral Bank, create different funds . As at 30 November 2020, the CCF has established one Fund namely State Street CCF WorldESG Screened Index Equity Fund (the “Fund”), which launched on 12 May 2020. Another fund, the State Street CCF Global GreenReal Estate Equity Index, was authorised on 3 June 2020 by the Central Bank but not yet seeded as at 30 November 2020. TheManager of the CCF, has appointed State Street Global Advisors Ireland Limited as the Investment Manager and Global Distributor(the “Investment Manager and Global Distributor”) of the Fund.
The functional and presentation currency of the Fund is USD.
Investment Objective and Policy
State Street CCF World ESG Screened Index Equity FundThe objective of the Fund is to track the performance of global developed equity markets. The investment policy of the Fund is totrack the performance of the MSCI World ex Select Securities Index (the�Index�) as closely as possible, while seeking to minimiseas far as possible the tracking difference between the Fund’s performance and that of the Index. The Index measures theperformance of global developed equity market securities, while excluding securities using certain Environmental, Social andGovernance (ESG) criteria. The Index excludes securities based on an assessment of their adherence to international norms inrelation to certain environmental protection, human rights, labour standards, anti-corruption, controversial weapons and tobacco.The Investment Manager, on behalf of the Fund, will invest primarily in the securities of the Index, at all times in accordance withthe investment restrictions set forth in the Prospectus. The Investment Manager also may, in exceptional circumstances, invest insecurities not included in the Index but that it believes closely reflect the risk and distribution characteristics of securities of theIndex.
Impact of COVID-19An outbreak of a respiratory disease caused by a novel coronavirus (known as COVID-19) first detected in China in December 2019has resulted in a global pandemic and major disruptions to economies and markets around the world. Beginning in January 2020,global financial markets have experienced and may continue to experience significant volatility resulting from the spread ofcoronavirus COVID-19. Trading in many instruments has been disrupted along with liquidity for many instruments being greatlyreduced for periods of time. Some interest rates are very low and in some cases yields are negative. Governments and centralbanks have taken extraordinary and unprecedented actions to support local and global economies and the financial markets. Theimpact of these measures, and whether they will be effective to mitigate the economic and market disruption, will not be known forsome time. The outbreak of coronavirus COVID-19 has also resulted in travel and border restrictions, quarantines, supply chaindisruptions, lower consumer demand and general market uncertainty.
As of early 2021 local lockdowns continue to be deployed as necessary and the emergence of significant further outbreaks arebeing seen. While distribution of a vaccine began in early 2021 the pandemic and the measures taken to tackle COVID-19 continueto affect economies and equity markets globally, all of which may negatively impact the Fund’s performance.
The Directors of the Manager and the CCF’s delegates are closely monitoring the developments and the advice relating to thespread of coronavirus COVID-19. State Street Corporation has a robust global business continuity programme that prioritises thehealth and safety of employees. The continuity programme continues to evolve from supporting staff in work from homearrangements through a comprehensive programme to plan for the return of staff to the office environment.
State Street CCFAnnual Report and Audited Financial Statementsfor the financial period from 18 November 2019 (Constitution date) to 30 November 2020
Background Information
State Street CCF 3
Investment Manager’s ReportThe report covers the financial period from 12 May 2020 (commencement date) to 30 November 2020 (the �Reporting Period�).
Market CommentaryThe global economy suffered from an unprecedented shock in March and April driven by government-imposed lockdowns to containthe spread of the COVID-19 pandemic. Policy makers responded with extensive, broad-based fiscal and monetary stimulus tosupport affected workers and businesses.
However, risks to recovery remained with increased geo-political tensions between the United States (US) and China over HongKong and concerns around the handling of COVID-19 crisis across the globe. Led by the US, economic growth rebounded stronglyacross the globe in the third quarter amid relaxation in COVID-19-related lockdowns, fiscal and monetary policy support and releaseof pent up demand. Though infection rates were re-surging in some developed economies, the worst seemed to be over as keyvaccine trials continued to make progress. However, growth momentum slowed toward the end of the third quarter as fiscal supportwaned and services growth remained restricted given persistent and rising COVID-19 cases. Weakening fiscal support,geo-political concerns related to the US election and worsening US-China relations remained key risks to recovery.
Global Equity rallied in July and August on the back of positive economic momentum and earnings data but lost their momentumin September amid concerns outlined above. Overall, global equities posted positive performance in the third quarter. The US dollarweakened in the third quarter as the euro rallied given the region’s relatively better efforts toward containing COVID-19 and progressmade toward the establishment of a fiscal union. Oil prices remained flat in the third quarter and traded within a limited range afterrallying sharply in the second quarter.
On the fiscal front, the European Union (EU) reached a historical agreement to create the EU recovery package and national fiscalpackages and moved a step closer to creating a fiscal union. On the monetary policy front, the European central bank (the “ECB”)left interest rates unchanged and continued its emergency stimulus program. The ECB stressed the need to review policy objectiveswith President Christine Lagarde suggesting that it could also adopt a strategy similar to the one announced by Fed Chair JeromePowell at Jackson Hole in August. In Asia, the Bank of Japan kept its key policy measures unchanged.
COVID-19 cases re-surged in the US and Europe during the second quarter and the start of the third quarter and continued toremain high in India, Brazil and Russia. However vaccine development showed progress with several Phase III results expected tobe distributed in the fourth quarter. The Euro area experienced uneven growth and had little positive news given the rising infectionrate. Italy and Spain, which depend much on tourism and hospitality, lagged, compared with countries such as Germany and France.Continued uncertainty over Brexit remained a risk to the recovery momentum in the United Kingdom and Europe.
The preliminary estimate for Japan’s third quarter GDP was stronger than expected, rising 5.0% quarter on quarter (“QoQ”)(+21.4% annualized). Consumer spending and net exports added a cumulative 5.4 percentage points (pp) to real GDP growth.Household consumption rebounded by 4.7% QoQ from -8.5% in the second quarter, pushing real GDP up by 2.6 pp. Exports alsoincreased 7.0% (follows a drop of 17.4% in Q2). China demonstrated across the board improvement in October withbetter-than-expected services output and consumption data. India’s GDP contracted by 7.5% year on year in Q3, a more moderatedecline than expected.
Incoming data in November continued to show robust support from manufacturing and housing despite a slowdown in services amidthe third wave of infections in the United States (US) and Europe. China, too, continued with its strong economic growth recovery.Although uncertainty over the US elections subsided with Joe Biden’s win, geo-political tensions between the US and Chinacontinued to simmer.
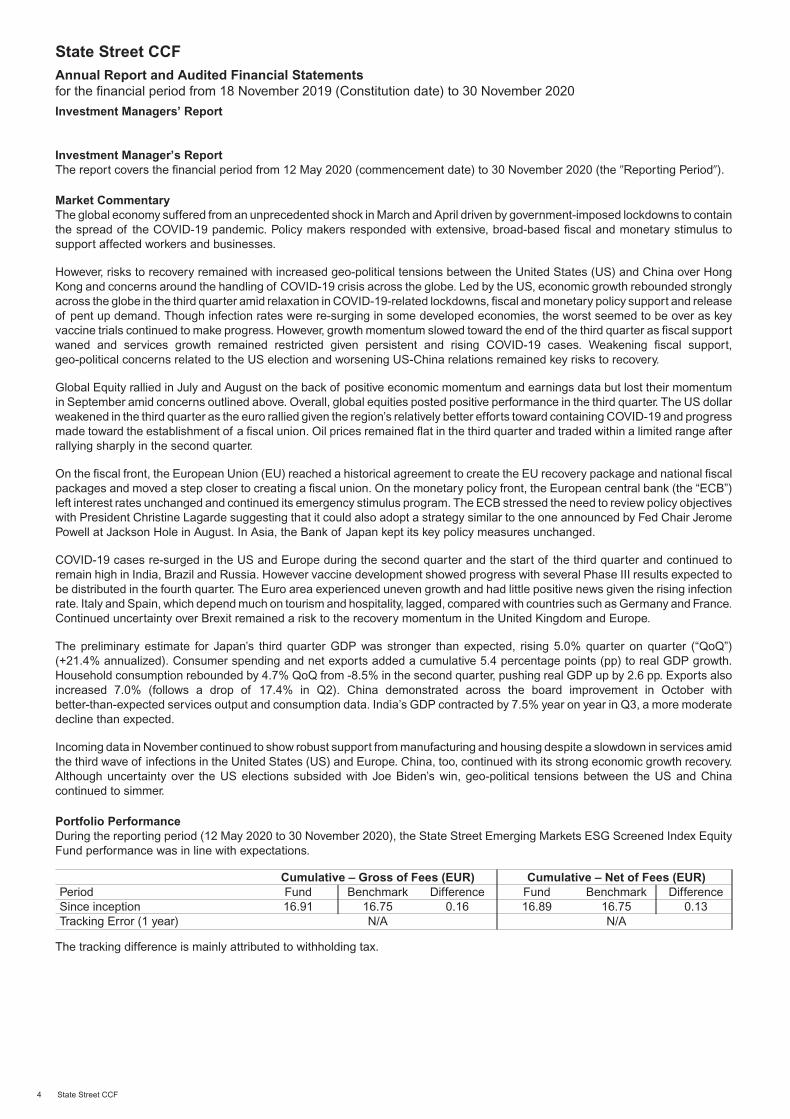
Portfolio PerformanceDuring the reporting period (12 May 2020 to 30 November 2020), the State Street Emerging Markets ESG Screened Index EquityFund performance was in line with expectations.
Cumulative – Gross of Fees (EUR) Cumulative – Net of Fees (EUR)Period Fund Benchmark Difference Fund Benchmark DifferenceSince inception 16.91 16.75 0.16 16.89 16.75 0.13Tracking Error (1 year) N/A N/A
The tracking difference is mainly attributed to withholding tax.
State Street CCFAnnual Report and Audited Financial Statementsfor the financial period from 18 November 2019 (Constitution date) to 30 November 2020
Investment Managers’ Report
4 State Street CCF
State Street Global Advisors Funds Management Limited as Manager of the CCF is required by the CCF Deed to prepare financialstatements for each financial year which give a true and fair view of the financial position of the CCF at the end of that financial year,the results of the CCF operations and changes in net assets for the financial year then ended. The Manager has elected to preparethe financial statements in accordance with International Financial Reporting Standards (“IFRS”) as adopted by the EuropeanUnion.
In preparing these financial statements, the Manager is required to:
- select suitable accounting policies and then apply them consistently;
- make judgements and estimates that are reasonable and prudent; and
- prepare the financial statements on the basis that the CCF will continue in operation unless it is inappropriate to presume this.
The Manager is responsible for keeping proper books of account which disclose with reasonable accuracy at any time the financialposition of the CCF and enable it to ensure that the financial statements are prepared in accordance with IFRS as adopted by theEuropean Union, and comply with the provisions of the Deed of Constitution and Irish Statute comprising the UCITS Regulations.In this regard the Manager has appointed State Street Fund Services (Ireland) Limited for the purpose of maintaining adequateaccounting records. It is also responsible for safeguarding the assets of the CCF. In this regard it has entrusted the assets of theCCF to the Depositary. The Manager has appointed State Street Custodial Services (Ireland) Limited as Depositary. The Managerhas a general responsibility for taking such steps as are reasonably open to it to prevent and detect fraud and other irregularities.
The financial statements are published on the website www.ssga.com. The Manager, together with the Investment Manager, isresponsible for the maintenance and integrity of the website as far as it relates to the publication of the financial statements of theCCF. Legislation in Ireland governing the preparation and dissemination of financial statements may differ from legislation in otherjurisdictions.
Dealings with Connected PersonsRegulation 43 of the UCITS Regulations “Restrictions on transactions with connected persons” states that “A responsible personshall ensure that any transaction between a UCITS and a connected person is a) conducted at arm’s length; and b) in the bestinterest of the unit-holders of the UCITS”.
As required under Central Bank’s UCITS Regulation 81.4, the Board of Directors of the Manager as the responsible person, issatisfied that (a) there are in place arrangements, evidenced by written procedures, to ensure that the obligations that areprescribed by Regulation 43(1) are applied to all transactions with a connected person; and (b) all transactions with connectedpersons that were entered into during the financial period to which the report relates complied with the obligations that areprescribed by Regulation 43(1).
For and on behalf of State Street Global Advisors Funds Management Limited
Director:
Director:
Date: 26 March 2021
State Street CCFAnnual Report and Audited Financial Statementsfor the financial period from 18 November 2019 (Constitution date) to 30 November 2020
Statement of Responsibilities of the Manager
State Street CCF 5
We have enquired into the conduct of the Manager in respect of the CCF for the financial period ended 30 November 2020, in ourcapacity as Depositary to the CCF.
This report including the opinion has been prepared for and solely for the Unitholders in the CCF as a body, in accordance withRegulation 34, (1), (3) and (4) in Part 5 of the European Communities (Undertakings for Collective Investment in TransferableSecurities) Regulations 2011, as amended, (‘the UCITS Regulations’), and for no other purpose. We do not, in giving this opinion,accept or assume responsibility for any other purpose or to any other person to whom this report is shown.
Responsibilities of the DepositaryOur duties and responsibilities are outlined in Regulation 34, (1), (3) and (4) in Part 5 of the UCITS Regulations. One of those dutiesis to enquire into the conduct of the CCF in each annual accounting period and report thereon to the unitholders.
Our report shall state whether, in our opinion, the CCF has been managed in that financial period in accordance with the provisionsof the CCF’s Deed of Constitution and the UCITS Regulations. It is the overall responsibility of the CCF to comply with theseprovisions. If the CCF has not so complied, we as Depositary must state why this is the case and outline the steps which we havetaken to rectify the situation.
Basis of Depositary’s OpinionThe Depositary conducts such reviews as it, in its reasonable opinion, considers necessary in order to comply with its duties asoutlined in Regulation 34, (1), (3) and (4) in Part 5 of the UCITS Regulations and to ensure that, in all material respects, the CCFhas been managed:(i) in accordance with the limitations imposed on its investment and borrowing powers by the provisions of the CCF’s Deed of
Constitution and the UCITS Regulations; and
(ii) otherwise in accordance with the CCF’s constitutional documentation and the appropriate regulations.
OpinionIn our opinion, the CCF has been managed during the period, in all material respects:(i) in accordance with the limitations imposed on the investment and borrowing powers of the Manager and the Depositary by
the Deed of Constitution, the UCITS Regulations and the Central Bank (Supervision and Enforcement) Act 2013(Section 48(1)) (Undertakings for Collective Investment in Transferable Securities) Regulations 2019 (‘the Central BankUCITS Regulations’); and
(ii) otherwise in accordance with the provisions of the Deed of Constitution, the UCITS Regulations and the Central Bank UCITSRegulation.
State Street Custodial Services (Ireland) Limited
78 Sir John Rogerson’s QuayDublin D02 HD32Ireland
Date: 26 March 2021
State Street CCFAnnual Report and Audited Financial Statementsfor the financial period from 18 November 2019 (Constitution date) to 30 November 2020
Report of the Depositary to the Unitholders of State Street CCF
6 State Street CCF
Deloitte Ireland LLP Chartered Accountants & Statutory Audit Firm
INDEPENDENT AUDITOR’S REPORT TO THE UNITHOLDERS OF STATE STREET CCF Report on the audit of the financial statements Opinion on the financial statements of State Street CCF (the ‘CCF’) In our opinion the CCF’s financial statements:
• give a true and fair view of the assets, liabilities and financial position of the CCF as at the period ended 30 November 2020 and of the result for the financial period from 12 May 2020 to 30 November 2020; and
• have been properly prepared in accordance with the relevant financial reporting framework, the applicable Regulations and the provisions of the CCF Deed.
The financial statements we have audited comprise:
• the Statement of Comprehensive Income; • the Statement of Financial Position; • the Statement of Changes in Net Assets Attributable to Equity Unitholders of the CCF; and • the related notes 1 to 21, including a summary of significant accounting policies as set out in note 1.
The relevant financial reporting framework that has been applied in their preparation is the Companies Act 2014 and International Financial Reporting Standards (IFRS) as adopted by the European Union (“the relevant financial reporting framework”). The applicable regulations that have been applied in their preparation is the European Communities (Undertakings for Collective Investment in Transferable Securities) Regulations, 2011 and Central Bank (Supervision and Enforcement) Act 2013 (Section 48(1)) (Undertakings for Collective Investment in Transferable Securities) Regulations, 2019 (“the UCITS Regulations”). Basis for opinion We conducted our audit in accordance with International Standards on Auditing (Ireland) (ISAs (Ireland)) and applicable law. Our responsibilities under those standards are described below in the “Auditor's responsibilities for the audit of the financial statements” section of our report. We are independent of the CCF in accordance with the ethical requirements that are relevant to our audit of the financial statements in Ireland, including the Ethical Standard issued by the Irish Auditing and Accounting Supervisory Authority, and we have fulfilled our other ethical responsibilities in accordance with these requirements. We believe that the audit evidence we have obtained is sufficient and appropriate to provide a basis for our opinion. Conclusions relating to going concern We have nothing to report in respect of the following matters in relation to which ISAs (Ireland) require us to report to you where:
• the Manager’s use of the going concern basis of accounting in preparation of the financial statements is not appropriate; or • the Manager has not disclosed in the financial statements any identified material uncertainties that may cast significant doubt about
the CCF’s ability to continue to adopt the going concern basis of accounting for a period of at least twelve months from the date when the financial statements are authorised for issue.
Other information The Manager is responsible for the other information. The other information comprises the information included in the the Annual Report and Audited Financial Statements, other than the financial statements and our auditor’s report thereon. Our opinion on the financial statements does not cover the other information and, except to the extent otherwise explicitly stated in our report, we do not express any form of assurance conclusion thereon. In connection with our audit of the financial statements, our responsibility is to read the other information and, in doing so, consider whether the other information is materially inconsistent with the financial statements or our knowledge obtained in the audit or otherwise appears to be materially misstated. If we identify such material inconsistencies or apparent material misstatements, we are required to determine whether there is a material misstatement in the financial statements or a material misstatement of the other information. If, based on the work we have performed, we conclude that there is a material misstatement of this other information, we are required to report that fact. We have nothing to report in this regard. Responsibilities of the Manager for the financial statements The Manager is responsible for the preparation and fair presentation of the financial statements in accordance with the relevant financial reporting framework, and for such internal control as the Manager determines is necessary to enable the preparation of financial statements that are free from material misstatement, whether due to fraud or error.
Continued on next page/
/Continued from previous page
INDEPENDENT AUDITOR’S REPORT TO THE UNITHOLDERS OF STATE STREET CCF In preparing the financial statements, the Manager is responsible for assessing the CCF’s ability to continue as a going concern, disclosing, as applicable, matters related to going concern and using the going concern basis of accounting unless the Manager either intend to liquidate the CCF or to cease operations, or have no realistic alternative but to do so. Auditor’s responsibilities for the audit of the financial statements Our objectives are to obtain reasonable assurance about whether the financial statements as a whole are free from material misstatement, whether due to fraud or error, and to issue an auditor's report that includes our opinion. Reasonable assurance is a high level of assurance, but is not a guarantee that an audit conducted in accordance with ISAs (Ireland) will always detect a material misstatement when it exists. Misstatements can arise from fraud or error and are considered material if, individually or in the aggregate, they could reasonably be expected to influence the economic decisions of users taken on the basis of these financial statements. As part of an audit in accordance with ISAs (Ireland), we exercise professional judgment and maintain professional scepticism throughout the audit. We also: • Identify and assess the risks of material misstatement of the financial statements, whether due to fraud or error, design and perform audit
procedures responsive to those risks, and obtain audit evidence that is sufficient and appropriate to provide a basis for our opinion. The risk of not detecting a material misstatement resulting from fraud is higher than for one resulting from error, as fraud may involve collusion, forgery, intentional omissions, misrepresentations, or the override of internal control.
• Obtain an understanding of internal control relevant to the audit in order to design audit procedures that are appropriate in the circumstances, but not for the purpose of expressing an opinion on the effectiveness of the CCF’s internal control.
• Evaluate the appropriateness of accounting policies used and the reasonableness of accounting estimates and related disclosures made by
the Manager.
• Conclude on the appropriateness of the Manager’s use of the going concern basis of accounting and, based on the audit evidence obtained, whether a material uncertainty exists related to events or conditions that may cast significant doubt on the CCF’s ability to continue as a going concern. If we conclude that a material uncertainty exists, we are required to draw attention in our auditor’s report to the related disclosures in the financial statements or, if such disclosures are inadequate, to modify our opinion. Our conclusions are based on the audit evidence obtained up to the date of the auditor’s report. However, future events or conditions may cause the entity (or where relevant, the group) to cease to continue as a going concern.
• Evaluate the overall presentation, structure and content of the financial statements, including the disclosures, and whether the financial
statements represent the underlying transactions and events in a manner that achieves fair presentation. We communicate with those charged with governance regarding, among other matters, the planned scope and timing of the audit and significant audit findings, including any significant deficiencies in internal control that the auditor identifies during the audit. This report is made solely to the CCF’s unitholders, as a body, in accordance with the applicable Regulations and the provisions of the CCF Deed. Our audit work has been undertaken so that we might state to the CCF’s unitholders those matters we are required to state to them in an auditor’s report and for no other purpose. To the fullest extent permitted by law, we do not accept or assume responsibility to anyone other than the CCF and the CCF’s unitholders as a body, for our audit work, for this report, or for the opinions we have formed. Report on other legal and regulatory requirements Opinion on other matters prescribed by the applicable Regulations Based solely on the work undertaken in the course of the audit, we report that: • We have obtained all the information and explanations which we consider necessary for the purposes of our audit. • In our opinion the accounting records of the CCF were sufficient to permit the financial statements to be readily and properly audited. • The financial statements are in agreement with the accounting records.
Christian MacManus For and on behalf of Deloitte Ireland LLP Chartered Accountants and Statutory Audit Firm Deloitte & Touche House, Earlsfort Terrace, Dublin 2 Date: 29 March 2021
StateStreet CCFWorld ESG
Screened IndexEquity Fund
USDNotes
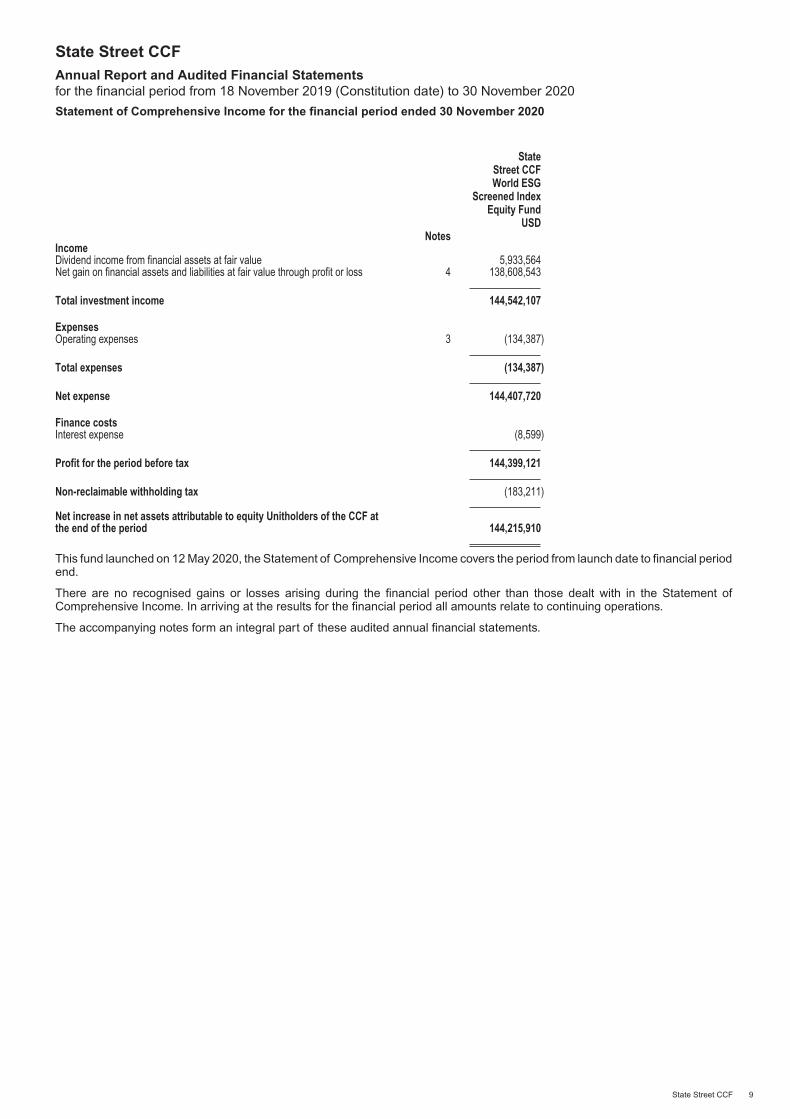
IncomeDividend income from financial assets at fair value 5,933,564Net gain on financial assets and liabilities at fair value through profit or loss 4 138,608,543
Total investment income 144,542,107
ExpensesOperating expenses 3 (134,387)
Total expenses (134,387)
Net expense 144,407,720
Finance costsInterest expense (8,599)
Profit for the period before tax 144,399,121
Non-reclaimable withholding tax (183,211)
Net increase in net assets attributable to equity Unitholders of the CCF atthe end of the period 144,215,910
This fund launched on 12 May 2020, the Statement of Comprehensive Income covers the period from launch date to financial periodend.
There are no recognised gains or losses arising during the financial period other than those dealt with in the Statement ofComprehensive Income. In arriving at the results for the financial period all amounts relate to continuing operations.
The accompanying notes form an integral part of these audited annual financial statements.
State Street CCFAnnual Report and Audited Financial Statementsfor the financial period from 18 November 2019 (Constitution date) to 30 November 2020
Statement of Comprehensive Income for the financial period ended 30 November 2020
State Street CCF 9
State Street CCF World ESGScreened Index Equity Fund
USDNotes
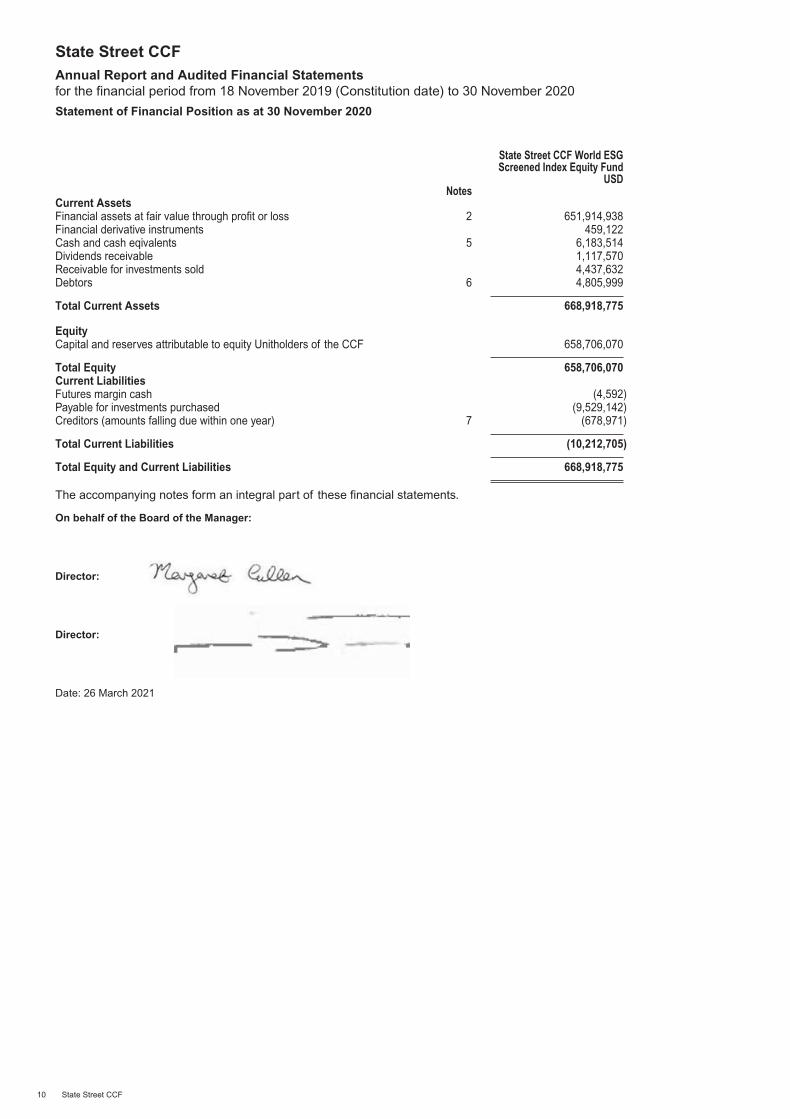
Current AssetsFinancial assets at fair value through profit or loss 2 651,914,938Financial derivative instruments 459,122Cash and cash eqivalents 5 6,183,514Dividends receivable 1,117,570Receivable for investments sold 4,437,632Debtors 6 4,805,999
Total Current Assets 668,918,775
EquityCapital and reserves attributable to equity Unitholders of the CCF 658,706,070
Total Equity 658,706,070Current LiabilitiesFutures margin cash (4,592)Payable for investments purchased (9,529,142)Creditors (amounts falling due within one year) 7 (678,971)
Total Current Liabilities (10,212,705)
Total Equity and Current Liabilities 668,918,775
The accompanying notes form an integral part of these financial statements.
On behalf of the Board of the Manager:
Director:
Director:
Date: 26 March 2021
State Street CCFAnnual Report and Audited Financial Statementsfor the financial period from 18 November 2019 (Constitution date) to 30 November 2020
Statement of Financial Position as at 30 November 2020
10 State Street CCF
StateStreet CCFWorld ESG
Screened IndexEquity Fund
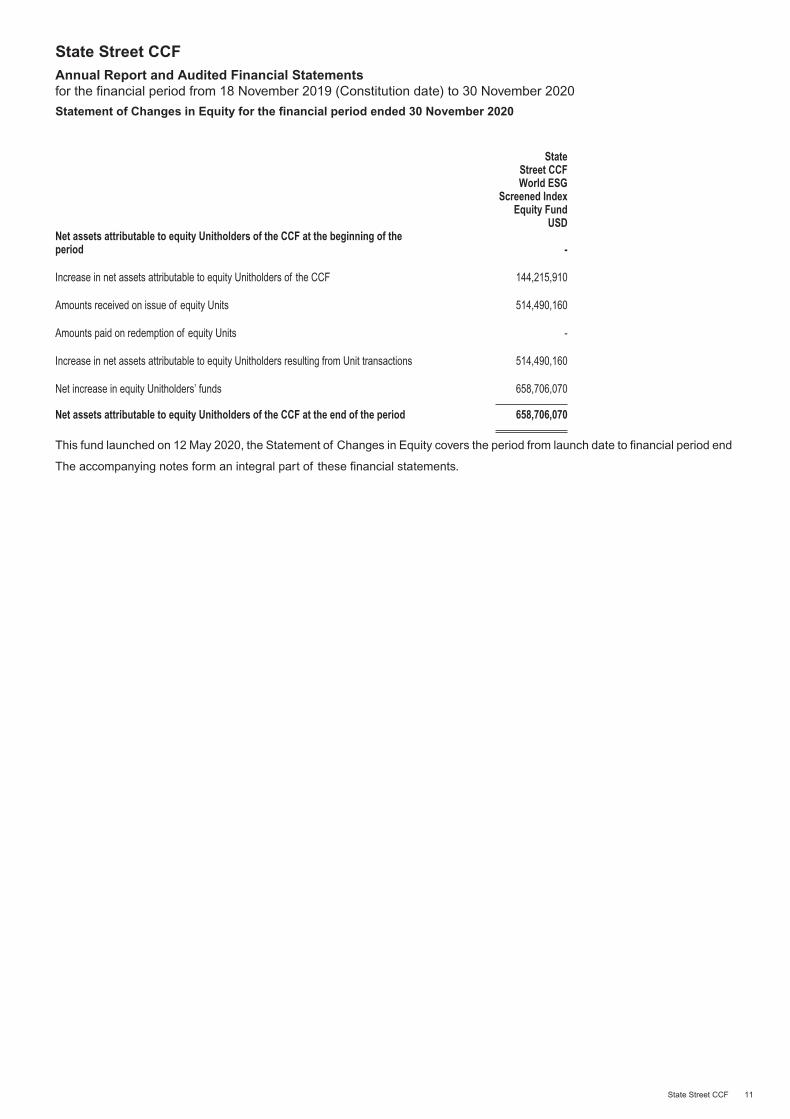
USDNet assets attributable to equity Unitholders of the CCF at the beginning of theperiod -
Increase in net assets attributable to equity Unitholders of the CCF 144,215,910
Amounts received on issue of equity Units 514,490,160
Amounts paid on redemption of equity Units -
Increase in net assets attributable to equity Unitholders resulting from Unit transactions 514,490,160
Net increase in equity Unitholders’ funds 658,706,070
Net assets attributable to equity Unitholders of the CCF at the end of the period 658,706,070
This fund launched on 12 May 2020, the Statement of Changes in Equity covers the period from launch date to financial period end
The accompanying notes form an integral part of these financial statements.
State Street CCFAnnual Report and Audited Financial Statementsfor the financial period from 18 November 2019 (Constitution date) to 30 November 2020
Statement of Changes in Equity for the financial period ended 30 November 2020
State Street CCF 11
StateStreet CCFWorld ESG
Screened IndexEquity Fund
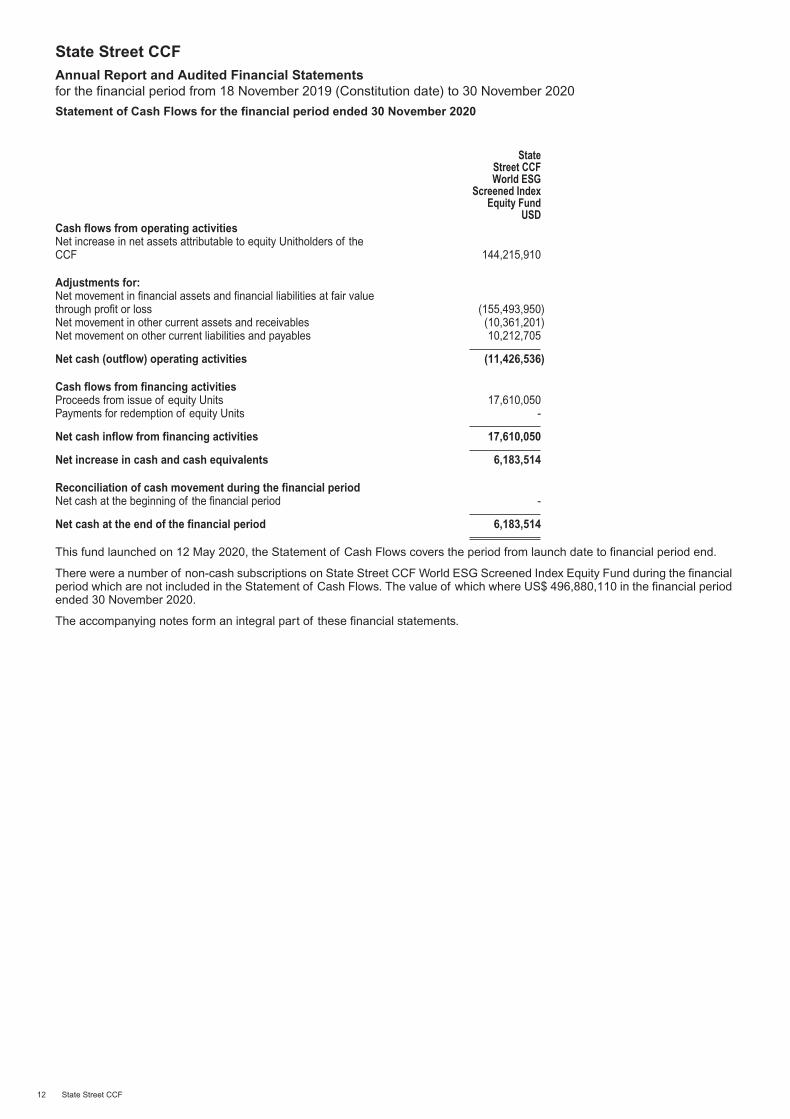
USDCash flows from operating activitiesNet increase in net assets attributable to equity Unitholders of theCCF 144,215,910
Adjustments for:Net movement in financial assets and financial liabilities at fair valuethrough profit or loss (155,493,950)Net movement in other current assets and receivables (10,361,201)Net movement on other current liabilities and payables 10,212,705
Net cash (outflow) operating activities (11,426,536)
Cash flows from financing activitiesProceeds from issue of equity Units 17,610,050Payments for redemption of equity Units -
Net cash inflow from financing activities 17,610,050
Net increase in cash and cash equivalents 6,183,514
Reconciliation of cash movement during the financial periodNet cash at the beginning of the financial period -
Net cash at the end of the financial period 6,183,514
This fund launched on 12 May 2020, the Statement of Cash Flows covers the period from launch date to financial period end.
There were a number of non-cash subscriptions on State Street CCF World ESG Screened Index Equity Fund during the financialperiod which are not included in the Statement of Cash Flows. The value of which where US$ 496,880,110 in the financial periodended 30 November 2020.
The accompanying notes form an integral part of these financial statements.
State Street CCFAnnual Report and Audited Financial Statementsfor the financial period from 18 November 2019 (Constitution date) to 30 November 2020
Statement of Cash Flows for the financial period ended 30 November 2020
12 State Street CCF
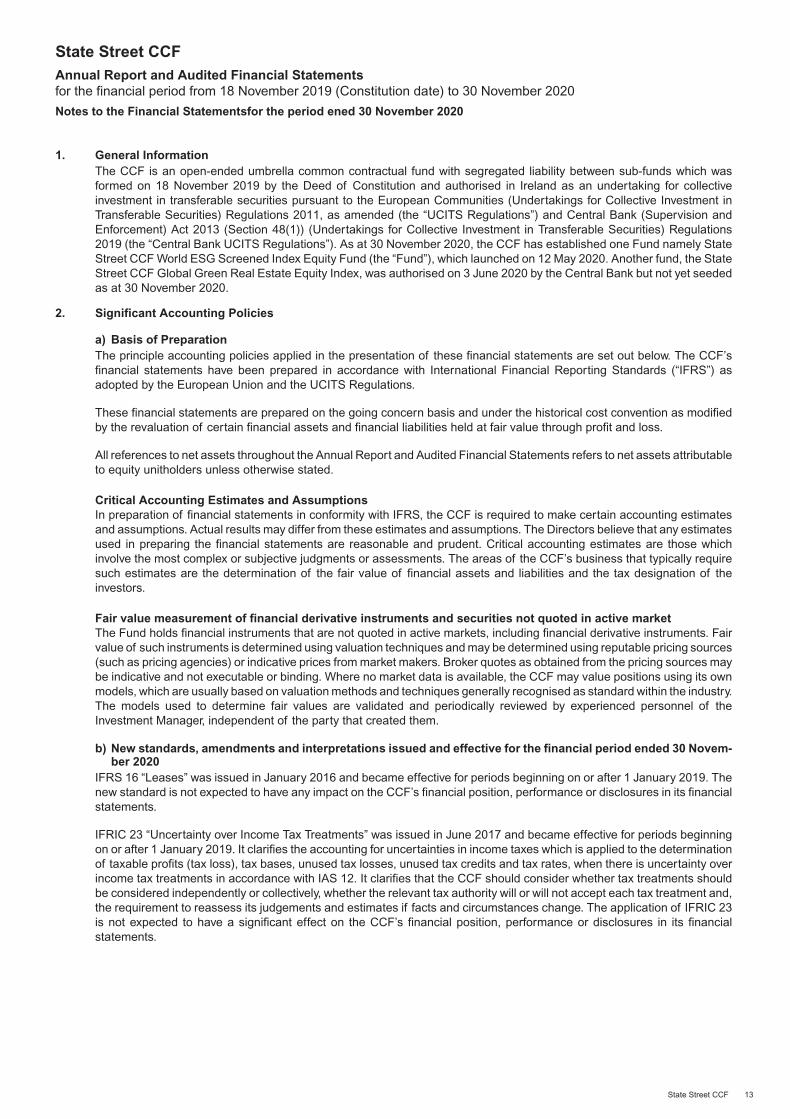
1. General InformationThe CCF is an open-ended umbrella common contractual fund with segregated liability between sub-funds which wasformed on 18 November 2019 by the Deed of Constitution and authorised in Ireland as an undertaking for collectiveinvestment in transferable securities pursuant to the European Communities (Undertakings for Collective Investment inTransferable Securities) Regulations 2011, as amended (the “UCITS Regulations”) and Central Bank (Supervision andEnforcement) Act 2013 (Section 48(1)) (Undertakings for Collective Investment in Transferable Securities) Regulations2019 (the “Central Bank UCITS Regulations”). As at 30 November 2020, the CCF has established one Fund namely StateStreet CCF World ESG Screened Index Equity Fund (the “Fund”), which launched on 12 May 2020. Another fund, the StateStreet CCF Global Green Real Estate Equity Index, was authorised on 3 June 2020 by the Central Bank but not yet seededas at 30 November 2020.
2. Significant Accounting Policies
a) Basis of PreparationThe principle accounting policies applied in the presentation of these financial statements are set out below. The CCF’sfinancial statements have been prepared in accordance with International Financial Reporting Standards (“IFRS”) asadopted by the European Union and the UCITS Regulations.
These financial statements are prepared on the going concern basis and under the historical cost convention as modifiedby the revaluation of certain financial assets and financial liabilities held at fair value through profit and loss.
All references to net assets throughout the Annual Report and Audited Financial Statements refers to net assets attributableto equity unitholders unless otherwise stated.
Critical Accounting Estimates and AssumptionsIn preparation of financial statements in conformity with IFRS, the CCF is required to make certain accounting estimatesand assumptions. Actual results may differ from these estimates and assumptions. The Directors believe that any estimatesused in preparing the financial statements are reasonable and prudent. Critical accounting estimates are those whichinvolve the most complex or subjective judgments or assessments. The areas of the CCF’s business that typically requiresuch estimates are the determination of the fair value of financial assets and liabilities and the tax designation of theinvestors.
Fair value measurement of financial derivative instruments and securities not quoted in active marketThe Fund holds financial instruments that are not quoted in active markets, including financial derivative instruments. Fairvalue of such instruments is determined using valuation techniques and may be determined using reputable pricing sources(such as pricing agencies) or indicative prices from market makers. Broker quotes as obtained from the pricing sources maybe indicative and not executable or binding. Where no market data is available, the CCF may value positions using its ownmodels, which are usually based on valuation methods and techniques generally recognised as standard within the industry.The models used to determine fair values are validated and periodically reviewed by experienced personnel of theInvestment Manager, independent of the party that created them.
b) New standards, amendments and interpretations issued and effective for the financial period ended 30 Novem-ber 2020
IFRS 16 “Leases” was issued in January 2016 and became effective for periods beginning on or after 1 January 2019. Thenew standard is not expected to have any impact on the CCF’s financial position, performance or disclosures in its financialstatements.
IFRIC 23 “Uncertainty over Income Tax Treatments” was issued in June 2017 and became effective for periods beginningon or after 1 January 2019. It clarifies the accounting for uncertainties in income taxes which is applied to the determinationof taxable profits (tax loss), tax bases, unused tax losses, unused tax credits and tax rates, when there is uncertainty overincome tax treatments in accordance with IAS 12. It clarifies that the CCF should consider whether tax treatments shouldbe considered independently or collectively, whether the relevant tax authority will or will not accept each tax treatment and,the requirement to reassess its judgements and estimates if facts and circumstances change. The application of IFRIC 23is not expected to have a significant effect on the CCF’s financial position, performance or disclosures in its financialstatements.
State Street CCFAnnual Report and Audited Financial Statementsfor the financial period from 18 November 2019 (Constitution date) to 30 November 2020
Notes to the Financial Statementsfor the period ened 30 November 2020
State Street CCF 13
2. Significant Accounting Policies (continued)
b) New standards, amendments and interpretations issued and effective for the financial period ended 30 No-vember 2020 (continued)
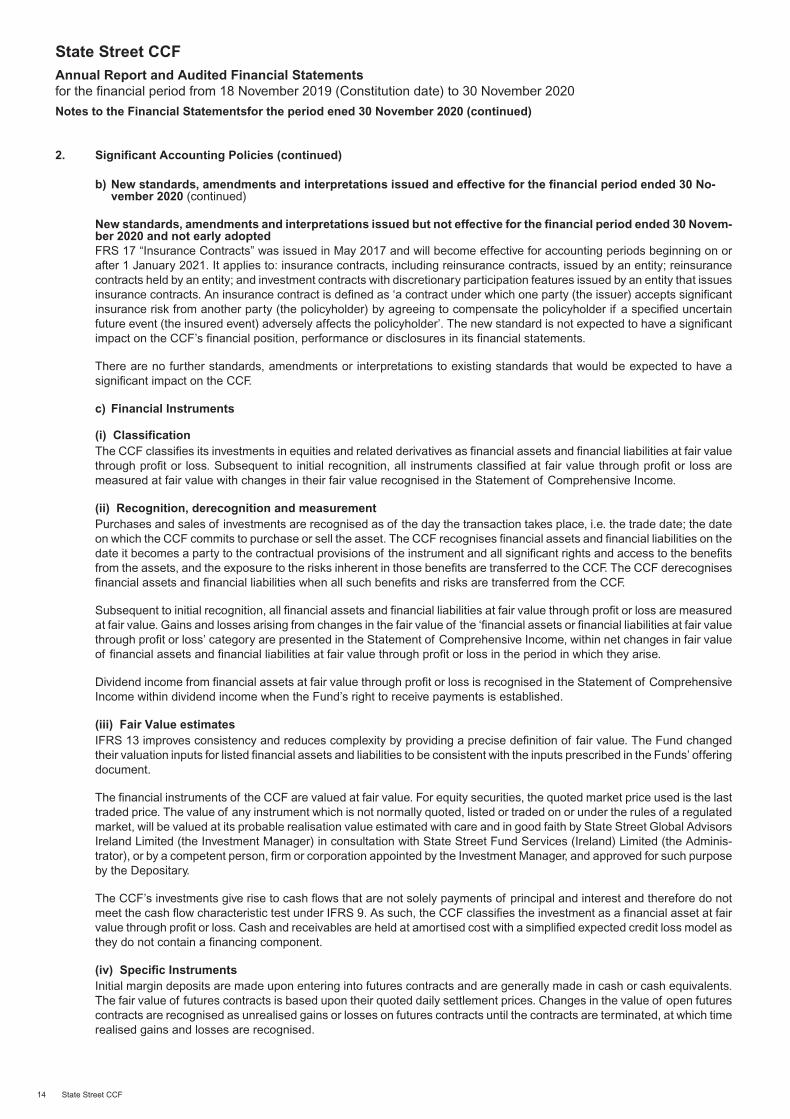
New standards, amendments and interpretations issued but not effective for the financial period ended 30 Novem-ber 2020 and not early adoptedFRS 17 “Insurance Contracts” was issued in May 2017 and will become effective for accounting periods beginning on orafter 1 January 2021. It applies to: insurance contracts, including reinsurance contracts, issued by an entity; reinsurancecontracts held by an entity; and investment contracts with discretionary participation features issued by an entity that issuesinsurance contracts. An insurance contract is defined as ‘a contract under which one party (the issuer) accepts significantinsurance risk from another party (the policyholder) by agreeing to compensate the policyholder if a specified uncertainfuture event (the insured event) adversely affects the policyholder’. The new standard is not expected to have a significantimpact on the CCF’s financial position, performance or disclosures in its financial statements.
There are no further standards, amendments or interpretations to existing standards that would be expected to have asignificant impact on the CCF.
c) Financial Instruments
(i) ClassificationThe CCF classifies its investments in equities and related derivatives as financial assets and financial liabilities at fair valuethrough profit or loss. Subsequent to initial recognition, all instruments classified at fair value through profit or loss aremeasured at fair value with changes in their fair value recognised in the Statement of Comprehensive Income.
(ii) Recognition, derecognition and measurementPurchases and sales of investments are recognised as of the day the transaction takes place, i.e. the trade date; the dateon which the CCF commits to purchase or sell the asset. The CCF recognises financial assets and financial liabilities on thedate it becomes a party to the contractual provisions of the instrument and all significant rights and access to the benefitsfrom the assets, and the exposure to the risks inherent in those benefits are transferred to the CCF. The CCF derecognisesfinancial assets and financial liabilities when all such benefits and risks are transferred from the CCF.
Subsequent to initial recognition, all financial assets and financial liabilities at fair value through profit or loss are measuredat fair value. Gains and losses arising from changes in the fair value of the ‘financial assets or financial liabilities at fair valuethrough profit or loss’ category are presented in the Statement of Comprehensive Income, within net changes in fair valueof financial assets and financial liabilities at fair value through profit or loss in the period in which they arise.
Dividend income from financial assets at fair value through profit or loss is recognised in the Statement of ComprehensiveIncome within dividend income when the Fund’s right to receive payments is established.
(iii) Fair Value estimatesIFRS 13 improves consistency and reduces complexity by providing a precise definition of fair value. The Fund changedtheir valuation inputs for listed financial assets and liabilities to be consistent with the inputs prescribed in the Funds’ offeringdocument.
The financial instruments of the CCF are valued at fair value. For equity securities, the quoted market price used is the lasttraded price. The value of any instrument which is not normally quoted, listed or traded on or under the rules of a regulatedmarket, will be valued at its probable realisation value estimated with care and in good faith by State Street Global AdvisorsIreland Limited (the Investment Manager) in consultation with State Street Fund Services (Ireland) Limited (the Adminis-trator), or by a competent person, firm or corporation appointed by the Investment Manager, and approved for such purposeby the Depositary.
The CCF’s investments give rise to cash flows that are not solely payments of principal and interest and therefore do notmeet the cash flow characteristic test under IFRS 9. As such, the CCF classifies the investment as a financial asset at fairvalue through profit or loss. Cash and receivables are held at amortised cost with a simplified expected credit loss model asthey do not contain a financing component.
(iv) Specific InstrumentsInitial margin deposits are made upon entering into futures contracts and are generally made in cash or cash equivalents.The fair value of futures contracts is based upon their quoted daily settlement prices. Changes in the value of open futurescontracts are recognised as unrealised gains or losses on futures contracts until the contracts are terminated, at which timerealised gains and losses are recognised.
State Street CCFAnnual Report and Audited Financial Statementsfor the financial period from 18 November 2019 (Constitution date) to 30 November 2020
Notes to the Financial Statementsfor the period ened 30 November 2020 (continued)
14 State Street CCF
2. Significant Accounting Policies (continued)
c) Financial Instruments (continued)
(iv) Specific Instruments (continued)
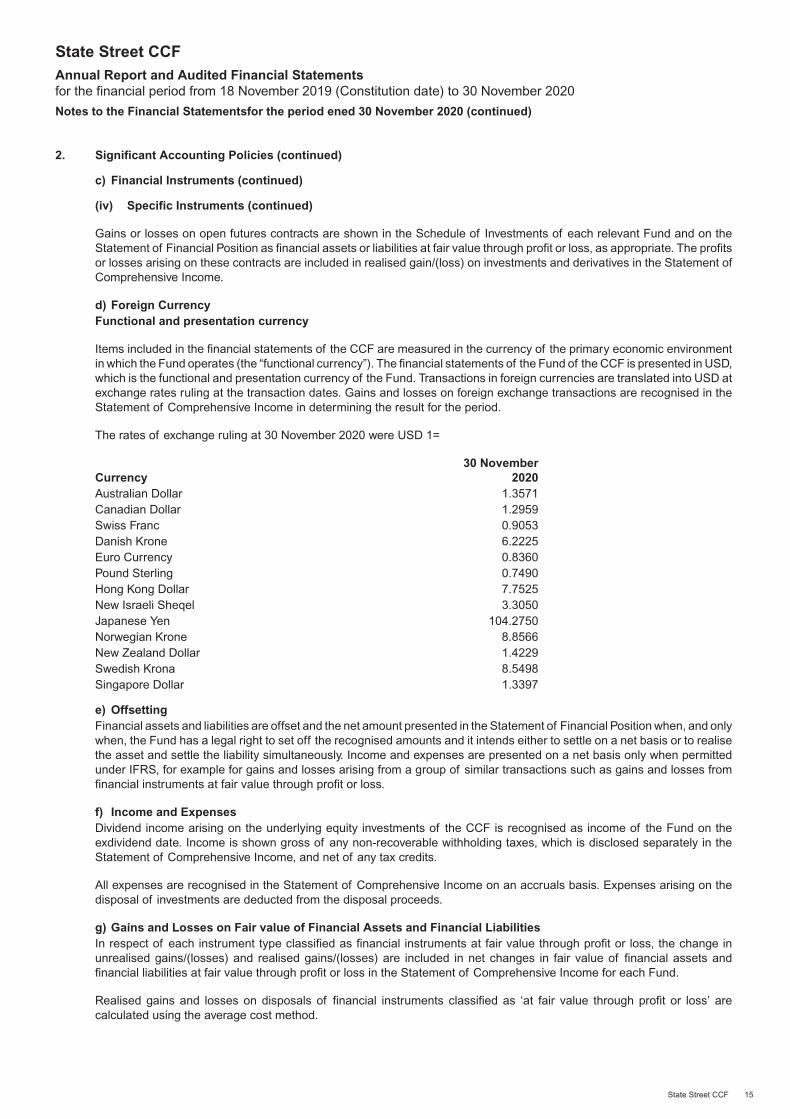
Gains or losses on open futures contracts are shown in the Schedule of Investments of each relevant Fund and on theStatement of Financial Position as financial assets or liabilities at fair value through profit or loss, as appropriate. The profitsor losses arising on these contracts are included in realised gain/(loss) on investments and derivatives in the Statement ofComprehensive Income.
d) Foreign CurrencyFunctional and presentation currency
Items included in the financial statements of the CCF are measured in the currency of the primary economic environmentin which the Fund operates (the “functional currency”). The financial statements of the Fund of the CCF is presented in USD,which is the functional and presentation currency of the Fund. Transactions in foreign currencies are translated into USD atexchange rates ruling at the transaction dates. Gains and losses on foreign exchange transactions are recognised in theStatement of Comprehensive Income in determining the result for the period.
The rates of exchange ruling at 30 November 2020 were USD 1=
Currency30 November
2020Australian Dollar 1.3571Canadian Dollar 1.2959Swiss Franc 0.9053Danish Krone 6.2225Euro Currency 0.8360Pound Sterling 0.7490Hong Kong Dollar 7.7525New Israeli Sheqel 3.3050Japanese Yen 104.2750Norwegian Krone 8.8566New Zealand Dollar 1.4229Swedish Krona 8.5498Singapore Dollar 1.3397
e) OffsettingFinancial assets and liabilities are offset and the net amount presented in the Statement of Financial Position when, and onlywhen, the Fund has a legal right to set off the recognised amounts and it intends either to settle on a net basis or to realisethe asset and settle the liability simultaneously. Income and expenses are presented on a net basis only when permittedunder IFRS, for example for gains and losses arising from a group of similar transactions such as gains and losses fromfinancial instruments at fair value through profit or loss.
f) Income and ExpensesDividend income arising on the underlying equity investments of the CCF is recognised as income of the Fund on theexdividend date. Income is shown gross of any non-recoverable withholding taxes, which is disclosed separately in theStatement of Comprehensive Income, and net of any tax credits.
All expenses are recognised in the Statement of Comprehensive Income on an accruals basis. Expenses arising on thedisposal of investments are deducted from the disposal proceeds.
g) Gains and Losses on Fair value of Financial Assets and Financial LiabilitiesIn respect of each instrument type classified as financial instruments at fair value through profit or loss, the change inunrealised gains/(losses) and realised gains/(losses) are included in net changes in fair value of financial assets andfinancial liabilities at fair value through profit or loss in the Statement of Comprehensive Income for each Fund.
Realised gains and losses on disposals of financial instruments classified as ‘at fair value through profit or loss’ arecalculated using the average cost method.
State Street CCFAnnual Report and Audited Financial Statementsfor the financial period from 18 November 2019 (Constitution date) to 30 November 2020
Notes to the Financial Statementsfor the period ened 30 November 2020 (continued)
State Street CCF 15
2. Significant Accounting Policies (continued)
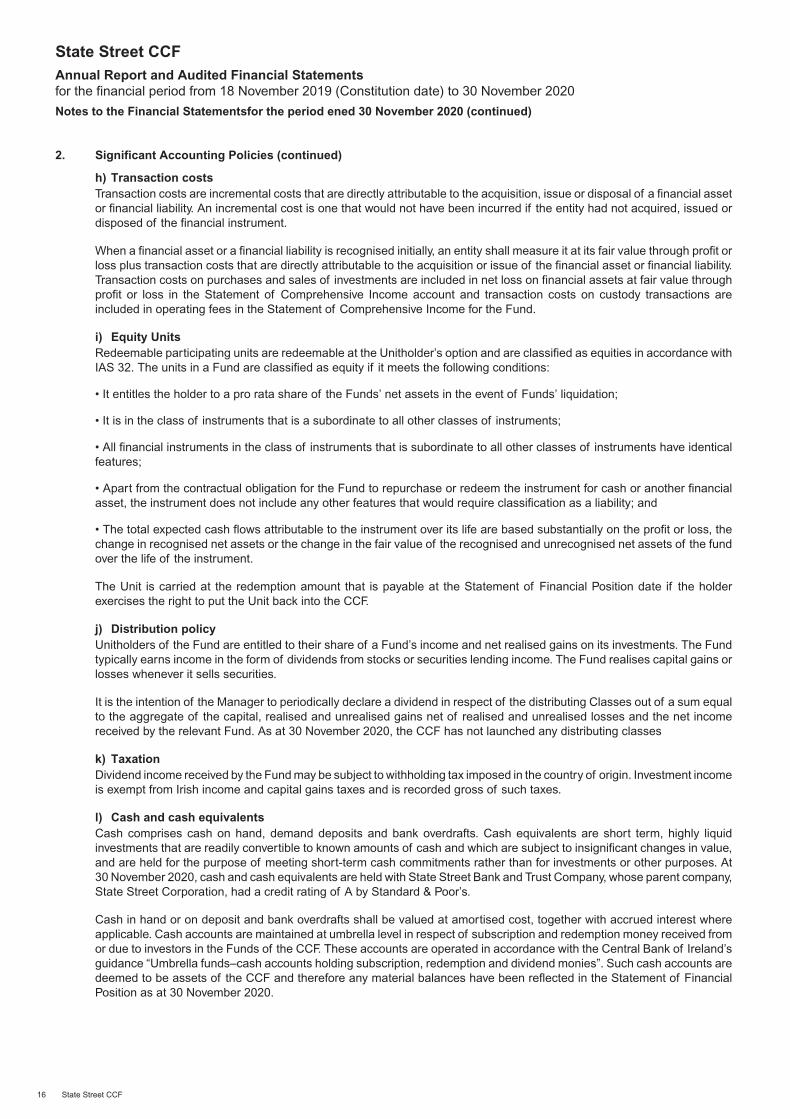
h) Transaction costsTransaction costs are incremental costs that are directly attributable to the acquisition, issue or disposal of a financial assetor financial liability. An incremental cost is one that would not have been incurred if the entity had not acquired, issued ordisposed of the financial instrument.
When a financial asset or a financial liability is recognised initially, an entity shall measure it at its fair value through profit orloss plus transaction costs that are directly attributable to the acquisition or issue of the financial asset or financial liability.Transaction costs on purchases and sales of investments are included in net loss on financial assets at fair value throughprofit or loss in the Statement of Comprehensive Income account and transaction costs on custody transactions areincluded in operating fees in the Statement of Comprehensive Income for the Fund.
i) Equity UnitsRedeemable participating units are redeemable at the Unitholder’s option and are classified as equities in accordance withIAS 32. The units in a Fund are classified as equity if it meets the following conditions:
• It entitles the holder to a pro rata share of the Funds’ net assets in the event of Funds’ liquidation;
• It is in the class of instruments that is a subordinate to all other classes of instruments;
• All financial instruments in the class of instruments that is subordinate to all other classes of instruments have identicalfeatures;
• Apart from the contractual obligation for the Fund to repurchase or redeem the instrument for cash or another financialasset, the instrument does not include any other features that would require classification as a liability; and
• The total expected cash flows attributable to the instrument over its life are based substantially on the profit or loss, thechange in recognised net assets or the change in the fair value of the recognised and unrecognised net assets of the fundover the life of the instrument.
The Unit is carried at the redemption amount that is payable at the Statement of Financial Position date if the holderexercises the right to put the Unit back into the CCF.
j) Distribution policyUnitholders of the Fund are entitled to their share of a Fund’s income and net realised gains on its investments. The Fundtypically earns income in the form of dividends from stocks or securities lending income. The Fund realises capital gains orlosses whenever it sells securities.
It is the intention of the Manager to periodically declare a dividend in respect of the distributing Classes out of a sum equalto the aggregate of the capital, realised and unrealised gains net of realised and unrealised losses and the net incomereceived by the relevant Fund. As at 30 November 2020, the CCF has not launched any distributing classes
k) TaxationDividend income received by the Fund may be subject to withholding tax imposed in the country of origin. Investment incomeis exempt from Irish income and capital gains taxes and is recorded gross of such taxes.
l) Cash and cash equivalentsCash comprises cash on hand, demand deposits and bank overdrafts. Cash equivalents are short term, highly liquidinvestments that are readily convertible to known amounts of cash and which are subject to insignificant changes in value,and are held for the purpose of meeting short-term cash commitments rather than for investments or other purposes. At30 November 2020, cash and cash equivalents are held with State Street Bank and Trust Company, whose parent company,State Street Corporation, had a credit rating of A by Standard & Poor’s.
Cash in hand or on deposit and bank overdrafts shall be valued at amortised cost, together with accrued interest whereapplicable. Cash accounts are maintained at umbrella level in respect of subscription and redemption money received fromor due to investors in the Funds of the CCF. These accounts are operated in accordance with the Central Bank of Ireland’sguidance “Umbrella funds–cash accounts holding subscription, redemption and dividend monies”. Such cash accounts aredeemed to be assets of the CCF and therefore any material balances have been reflected in the Statement of FinancialPosition as at 30 November 2020.
State Street CCFAnnual Report and Audited Financial Statementsfor the financial period from 18 November 2019 (Constitution date) to 30 November 2020
Notes to the Financial Statementsfor the period ened 30 November 2020 (continued)
16 State Street CCF
2. Significant Accounting Policies (continued)
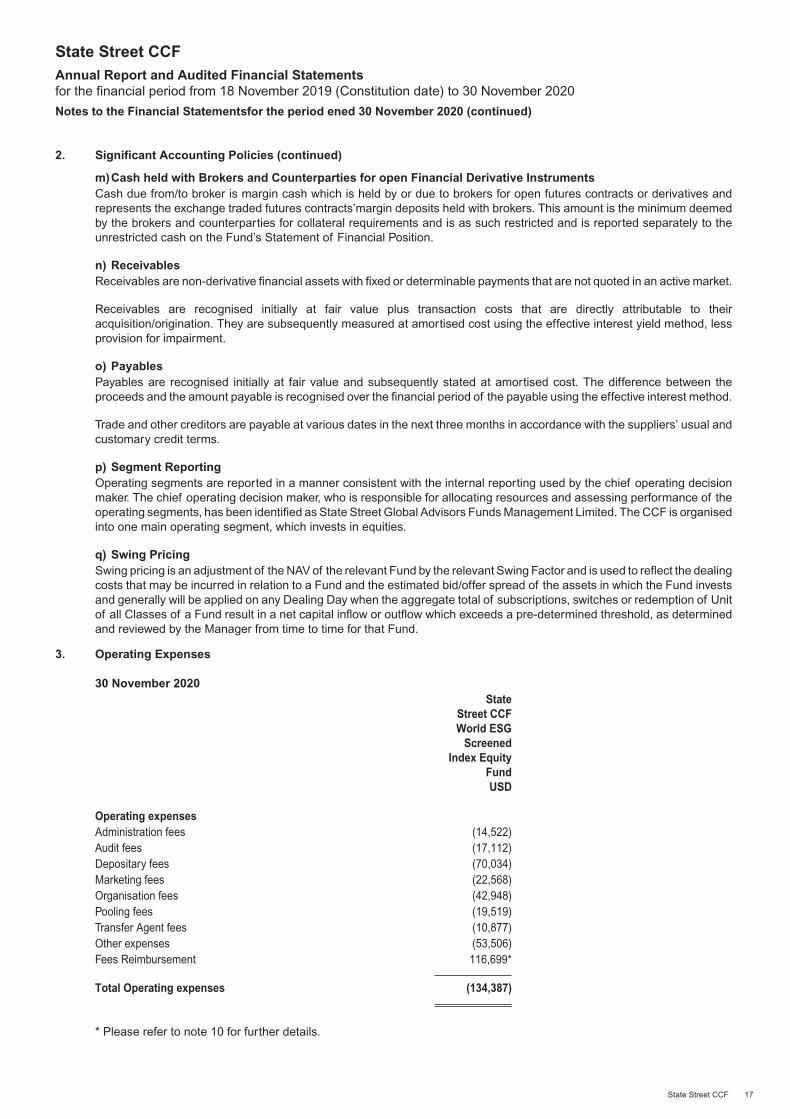
m)Cash held with Brokers and Counterparties for open Financial Derivative InstrumentsCash due from/to broker is margin cash which is held by or due to brokers for open futures contracts or derivatives andrepresents the exchange traded futures contracts’margin deposits held with brokers. This amount is the minimum deemedby the brokers and counterparties for collateral requirements and is as such restricted and is reported separately to theunrestricted cash on the Fund’s Statement of Financial Position.
n) ReceivablesReceivables are non-derivative financial assets with fixed or determinable payments that are not quoted in an active market.
Receivables are recognised initially at fair value plus transaction costs that are directly attributable to theiracquisition/origination. They are subsequently measured at amortised cost using the effective interest yield method, lessprovision for impairment.
o) PayablesPayables are recognised initially at fair value and subsequently stated at amortised cost. The difference between theproceeds and the amount payable is recognised over the financial period of the payable using the effective interest method.
Trade and other creditors are payable at various dates in the next three months in accordance with the suppliers’ usual andcustomary credit terms.
p) Segment ReportingOperating segments are reported in a manner consistent with the internal reporting used by the chief operating decisionmaker. The chief operating decision maker, who is responsible for allocating resources and assessing performance of theoperating segments, has been identified as State Street Global Advisors Funds Management Limited. The CCF is organisedinto one main operating segment, which invests in equities.
q) Swing PricingSwing pricing is an adjustment of the NAV of the relevant Fund by the relevant Swing Factor and is used to reflect the dealingcosts that may be incurred in relation to a Fund and the estimated bid/offer spread of the assets in which the Fund investsand generally will be applied on any Dealing Day when the aggregate total of subscriptions, switches or redemption of Unitof all Classes of a Fund result in a net capital inflow or outflow which exceeds a pre-determined threshold, as determinedand reviewed by the Manager from time to time for that Fund.
3. Operating Expenses
30 November 2020State
Street CCFWorld ESG
ScreenedIndex Equity
FundUSD
Operating expensesAdministration fees (14,522)Audit fees (17,112)Depositary fees (70,034)Marketing fees (22,568)Organisation fees (42,948)Pooling fees (19,519)Transfer Agent fees (10,877)Other expenses (53,506)Fees Reimbursement 116,699*
Total Operating expenses (134,387)
* Please refer to note 10 for further details.
State Street CCFAnnual Report and Audited Financial Statementsfor the financial period from 18 November 2019 (Constitution date) to 30 November 2020
Notes to the Financial Statementsfor the period ened 30 November 2020 (continued)
State Street CCF 17
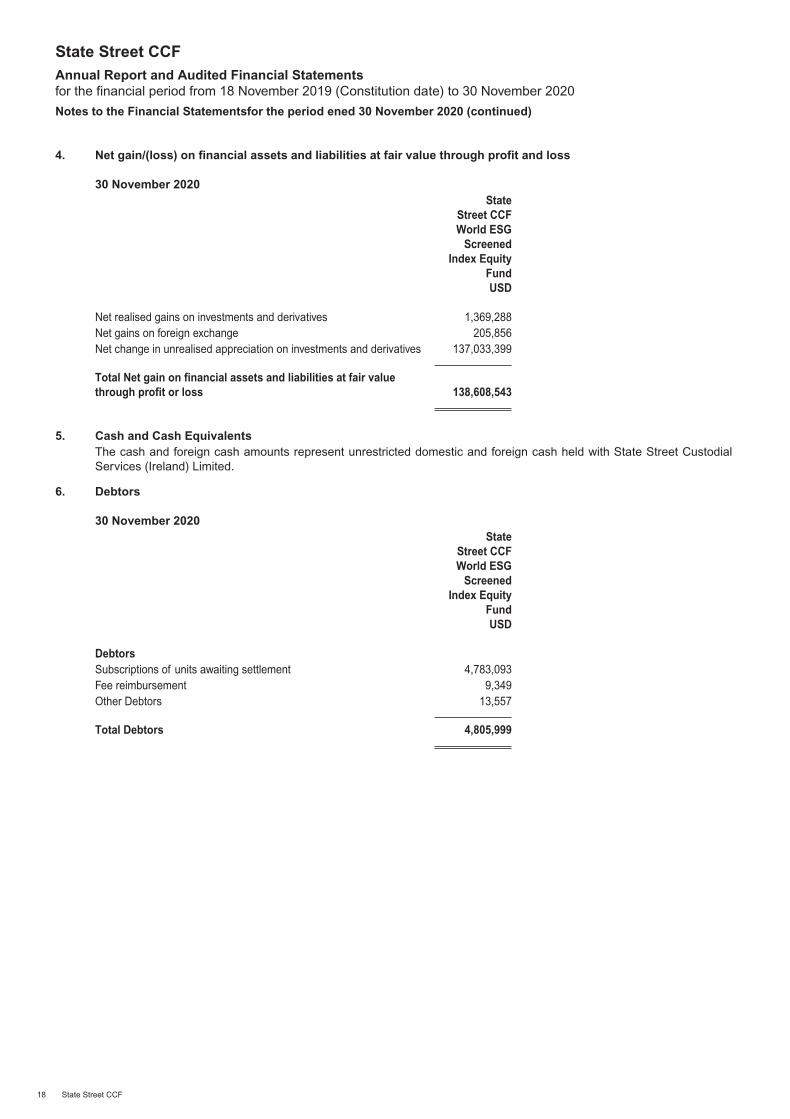
4. Net gain/(loss) on financial assets and liabilities at fair value through profit and loss
30 November 2020State
Street CCFWorld ESG
ScreenedIndex Equity
FundUSD
Net realised gains on investments and derivatives 1,369,288Net gains on foreign exchange 205,856Net change in unrealised appreciation on investments and derivatives 137,033,399
Total Net gain on financial assets and liabilities at fair valuethrough profit or loss 138,608,543
5. Cash and Cash EquivalentsThe cash and foreign cash amounts represent unrestricted domestic and foreign cash held with State Street CustodialServices (Ireland) Limited.
6. Debtors
30 November 2020State
Street CCFWorld ESG
ScreenedIndex Equity
FundUSD
DebtorsSubscriptions of units awaiting settlement 4,783,093Fee reimbursement 9,349Other Debtors 13,557
Total Debtors 4,805,999
State Street CCFAnnual Report and Audited Financial Statementsfor the financial period from 18 November 2019 (Constitution date) to 30 November 2020
Notes to the Financial Statementsfor the period ened 30 November 2020 (continued)
18 State Street CCF
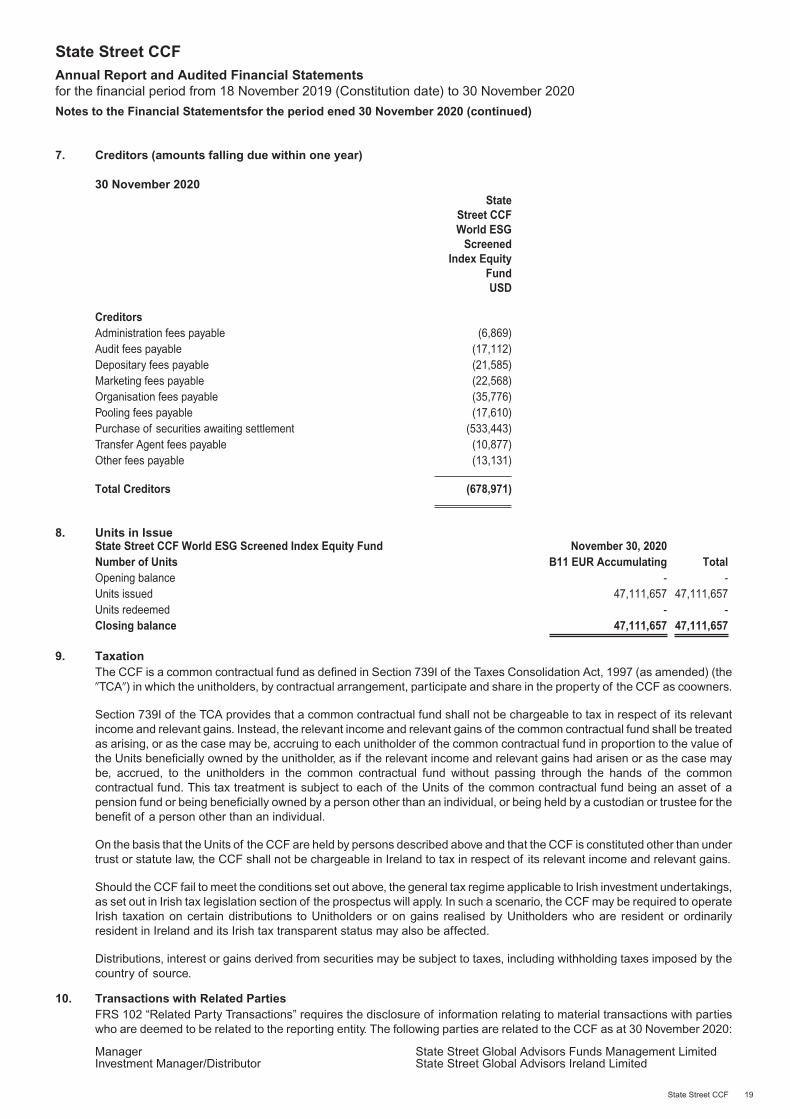
7. Creditors (amounts falling due within one year)
30 November 2020State
Street CCFWorld ESG
ScreenedIndex Equity
FundUSD
CreditorsAdministration fees payable (6,869)Audit fees payable (17,112)Depositary fees payable (21,585)Marketing fees payable (22,568)Organisation fees payable (35,776)Pooling fees payable (17,610)Purchase of securities awaiting settlement (533,443)Transfer Agent fees payable (10,877)Other fees payable (13,131)
Total Creditors (678,971)
8. Units in IssueState Street CCF World ESG Screened Index Equity Fund November 30, 2020Number of Units B11 EUR Accumulating TotalOpening balance - -Units issued 47,111,657 47,111,657Units redeemed - -Closing balance 47,111,657 47,111,657
9. TaxationThe CCF is a common contractual fund as defined in Section 739I of the Taxes Consolidation Act, 1997 (as amended) (the�TCA�) in which the unitholders, by contractual arrangement, participate and share in the property of the CCF as coowners.
Section 739I of the TCA provides that a common contractual fund shall not be chargeable to tax in respect of its relevantincome and relevant gains. Instead, the relevant income and relevant gains of the common contractual fund shall be treatedas arising, or as the case may be, accruing to each unitholder of the common contractual fund in proportion to the value ofthe Units beneficially owned by the unitholder, as if the relevant income and relevant gains had arisen or as the case maybe, accrued, to the unitholders in the common contractual fund without passing through the hands of the commoncontractual fund. This tax treatment is subject to each of the Units of the common contractual fund being an asset of apension fund or being beneficially owned by a person other than an individual, or being held by a custodian or trustee for thebenefit of a person other than an individual.
On the basis that the Units of the CCF are held by persons described above and that the CCF is constituted other than undertrust or statute law, the CCF shall not be chargeable in Ireland to tax in respect of its relevant income and relevant gains.
Should the CCF fail to meet the conditions set out above, the general tax regime applicable to Irish investment undertakings,as set out in Irish tax legislation section of the prospectus will apply. In such a scenario, the CCF may be required to operateIrish taxation on certain distributions to Unitholders or on gains realised by Unitholders who are resident or ordinarilyresident in Ireland and its Irish tax transparent status may also be affected.
Distributions, interest or gains derived from securities may be subject to taxes, including withholding taxes imposed by thecountry of source.
10. Transactions with Related PartiesFRS 102 “Related Party Transactions” requires the disclosure of information relating to material transactions with partieswho are deemed to be related to the reporting entity. The following parties are related to the CCF as at 30 November 2020:
Manager State Street Global Advisors Funds Management LimitedInvestment Manager/Distributor State Street Global Advisors Ireland Limited
State Street CCFAnnual Report and Audited Financial Statementsfor the financial period from 18 November 2019 (Constitution date) to 30 November 2020
Notes to the Financial Statementsfor the period ened 30 November 2020 (continued)
State Street CCF 19
10. Transactions with Related Parties (continued)
Administrator/Registrar/Transfer Agent State Street Fund Services (Ireland) LimitedInvestment Advisor and Sub Investment Manager State Street Global Advisors LimitedDepositary State Street Custodial Services (Ireland) LimitedDirectors of the Manager Eric Linnane, Ann Prendergast, Nigel Wightman, Bryan
Greener (up to his resignation), Scott Sanderson and Mar-garet Cullen
Directors of the IM common with the Manager Eric Linnane, Ann Prendergast and Scott Sanderson
Bryan Greener, up to his resignation on 26 February 2021, was also a Managing Director and Head of EMEA FundsManagement at SSGA.
Ann Prendergast is also a Senior Vice President and Head of SSGA in Ireland.
Eric Linnane is also a Managing Director and Head of Operations in Ireland at SSGA.
The Manager is entitled to charge a fee which will form part of the TER for each Fund. Different rates may be charged inrespect of different Classes of the same Fund. The management fee will be accrued daily based on the NAV of each Fundand will be paid monthly in arrears. The Investment Manager and any Sub-Investment Manager is entitled to charge a feewhich may be discharged from the fees received by the Manager, or, where appropriate, State Street’s transfer pricing policy.There were no management fees paid during the period for the existing unit class.
The Depositary and Administrator are entitled to receive fees, as may be agreed from time to time with the Manager. Thefees of the Administrator and Depositary shall be accrued daily based on the NAV of each Fund and will be paid monthlyin arrears. The Depositary is entitled to a fee not exceeding 0.004% per annum of the NAV of each fund and theAdministrator is entitled to a fee not exceeding 0.0045% per annum of the NAV of each fund.
Administration fees of USD 14,522 were charged during the financial period of which USD 6,869 remained payable at thefinancial period end. Depositary fees of USD 70,034 were charged during the financial period of which USD 21,585 wereoutstanding at the financial period end.
All Directors of the Manager who are employees of the Investment Manager have received no Directors’ fees.
The TER for each Class may be either fixed or capped at a maximum rate as set out in the Relevant Supplement as a portionof the NAV of the Class. The Manager has voluntarily agreed to reimburse such amounts as is necessary to ensure that theTER attributable to each Class does not exceed the maximum TER of 0.04%. There were fees reimbursed for USD 116,699as at 30 November 2020.
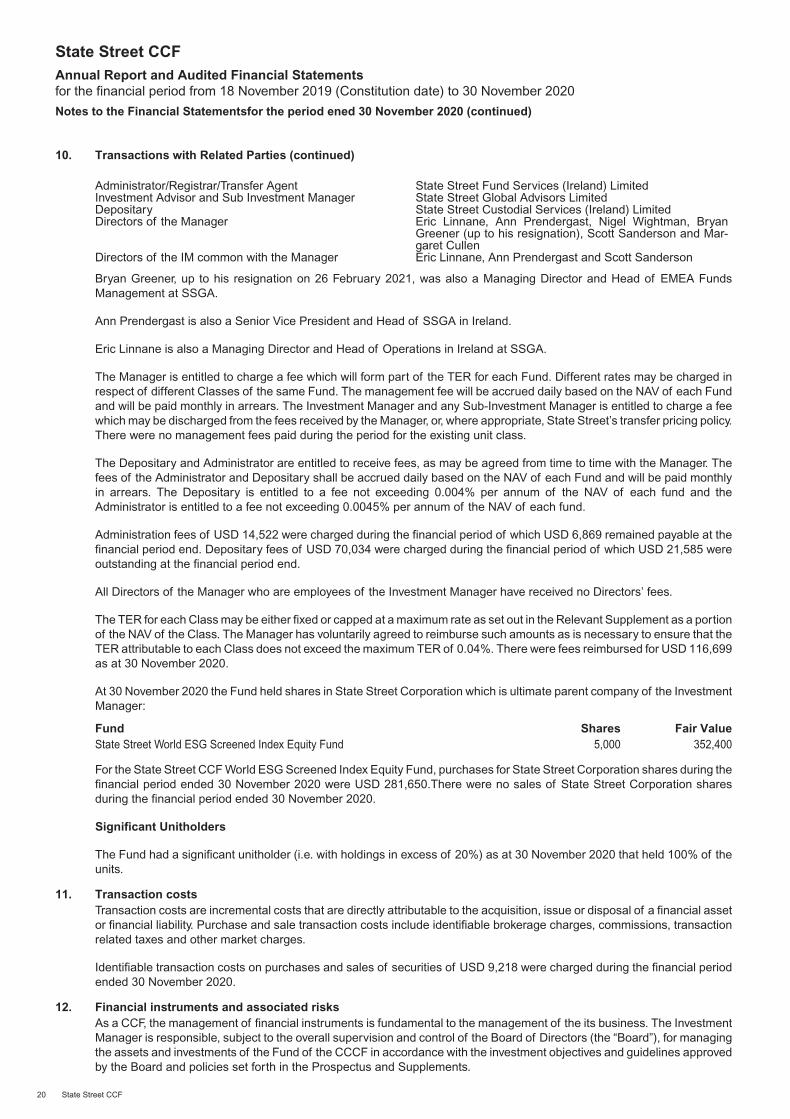
At 30 November 2020 the Fund held shares in State Street Corporation which is ultimate parent company of the InvestmentManager:
Fund Shares Fair ValueState Street World ESG Screened Index Equity Fund 5,000 352,400
For the State Street CCF World ESG Screened Index Equity Fund, purchases for State Street Corporation shares during thefinancial period ended 30 November 2020 were USD 281,650.There were no sales of State Street Corporation sharesduring the financial period ended 30 November 2020.
Significant Unitholders
The Fund had a significant unitholder (i.e. with holdings in excess of 20%) as at 30 November 2020 that held 100% of theunits.
11. Transaction costsTransaction costs are incremental costs that are directly attributable to the acquisition, issue or disposal of a financial assetor financial liability. Purchase and sale transaction costs include identifiable brokerage charges, commissions, transactionrelated taxes and other market charges.
Identifiable transaction costs on purchases and sales of securities of USD 9,218 were charged during the financial periodended 30 November 2020.
12. Financial instruments and associated risksAs a CCF, the management of financial instruments is fundamental to the management of the its business. The InvestmentManager is responsible, subject to the overall supervision and control of the Board of Directors (the “Board”), for managingthe assets and investments of the Fund of the CCCF in accordance with the investment objectives and guidelines approvedby the Board and policies set forth in the Prospectus and Supplements.
State Street CCFAnnual Report and Audited Financial Statementsfor the financial period from 18 November 2019 (Constitution date) to 30 November 2020
Notes to the Financial Statementsfor the period ened 30 November 2020 (continued)
20 State Street CCF
12. Financial instruments and associated risks (continued)
The CCF’s activities expose it to a variety of financial risks: market risk (including market price risk, foreign exchange riskand interest rate risk), credit risk and liquidity risk.
Global ExposurePer the UCITS Regulations, and as part of the risk management and reporting requirements, the global exposure of theFunds must be monitored and measured in accordance with the regulatory requirements. The CCF uses the commitmentapproach for the purposes of calculating global exposure.
Market RiskThe CCF’s market risk is affected by two main components: changes in market prices and foreign currency movements.
Market Price RiskMarket price risk is the risk that the value of the instrument will fluctuate as a result of changes in market prices (other thanthose arising from interest rate risk or currency risk), whether caused by factors specific to an individual investment, its issueror all factors affecting all instruments traded in the market. The Investment Manager considers the asset allocation of theportfolio in order to manage the risk associated with particular countries or industry sectors whilst continuing to follow theFund investment objective.
The Fund is exposed to price risk through its investment in equities. At 30 November 2020 the fair value of equities exposethe Fund to price risk. The movements in the prices of these investments result in movements in the performance of theFund.
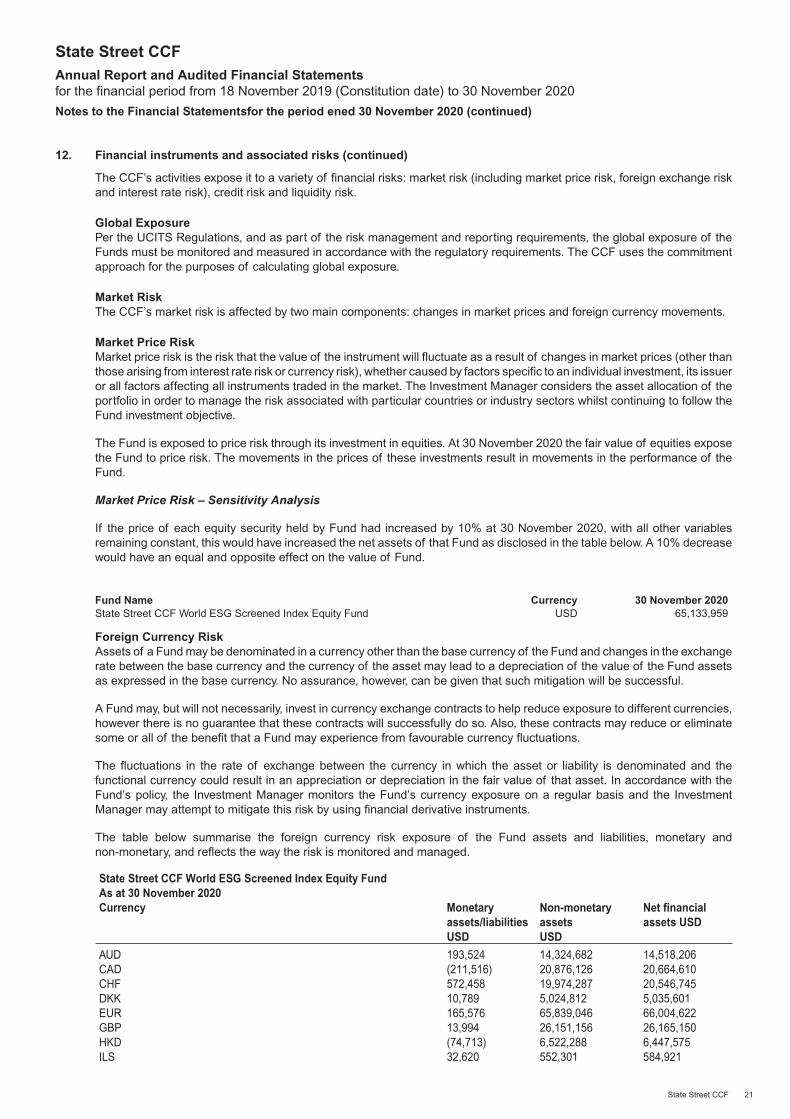
Market Price Risk – Sensitivity Analysis
If the price of each equity security held by Fund had increased by 10% at 30 November 2020, with all other variablesremaining constant, this would have increased the net assets of that Fund as disclosed in the table below. A 10% decreasewould have an equal and opposite effect on the value of Fund.
Fund Name Currency 30 November 2020State Street CCF World ESG Screened Index Equity Fund USD 65,133,959
Foreign Currency RiskAssets of a Fund may be denominated in a currency other than the base currency of the Fund and changes in the exchangerate between the base currency and the currency of the asset may lead to a depreciation of the value of the Fund assetsas expressed in the base currency. No assurance, however, can be given that such mitigation will be successful.
A Fund may, but will not necessarily, invest in currency exchange contracts to help reduce exposure to different currencies,however there is no guarantee that these contracts will successfully do so. Also, these contracts may reduce or eliminatesome or all of the benefit that a Fund may experience from favourable currency fluctuations.
The fluctuations in the rate of exchange between the currency in which the asset or liability is denominated and thefunctional currency could result in an appreciation or depreciation in the fair value of that asset. In accordance with theFund’s policy, the Investment Manager monitors the Fund’s currency exposure on a regular basis and the InvestmentManager may attempt to mitigate this risk by using financial derivative instruments.
The table below summarise the foreign currency risk exposure of the Fund assets and liabilities, monetary andnon-monetary, and reflects the way the risk is monitored and managed.
State Street CCF World ESG Screened Index Equity FundAs at 30 November 2020Currency Monetary
assets/liabilitiesUSD
Non-monetaryassetsUSD
Net financialassets USD
AUD 193,524 14,324,682 14,518,206CAD (211,516) 20,876,126 20,664,610CHF 572,458 19,974,287 20,546,745DKK 10,789 5,024,812 5,035,601EUR 165,576 65,839,046 66,004,622GBP 13,994 26,151,156 26,165,150HKD (74,713) 6,522,288 6,447,575ILS 32,620 552,301 584,921
State Street CCFAnnual Report and Audited Financial Statementsfor the financial period from 18 November 2019 (Constitution date) to 30 November 2020
Notes to the Financial Statementsfor the period ened 30 November 2020 (continued)
State Street CCF 21
12. Financial instruments and associated risks (continued)
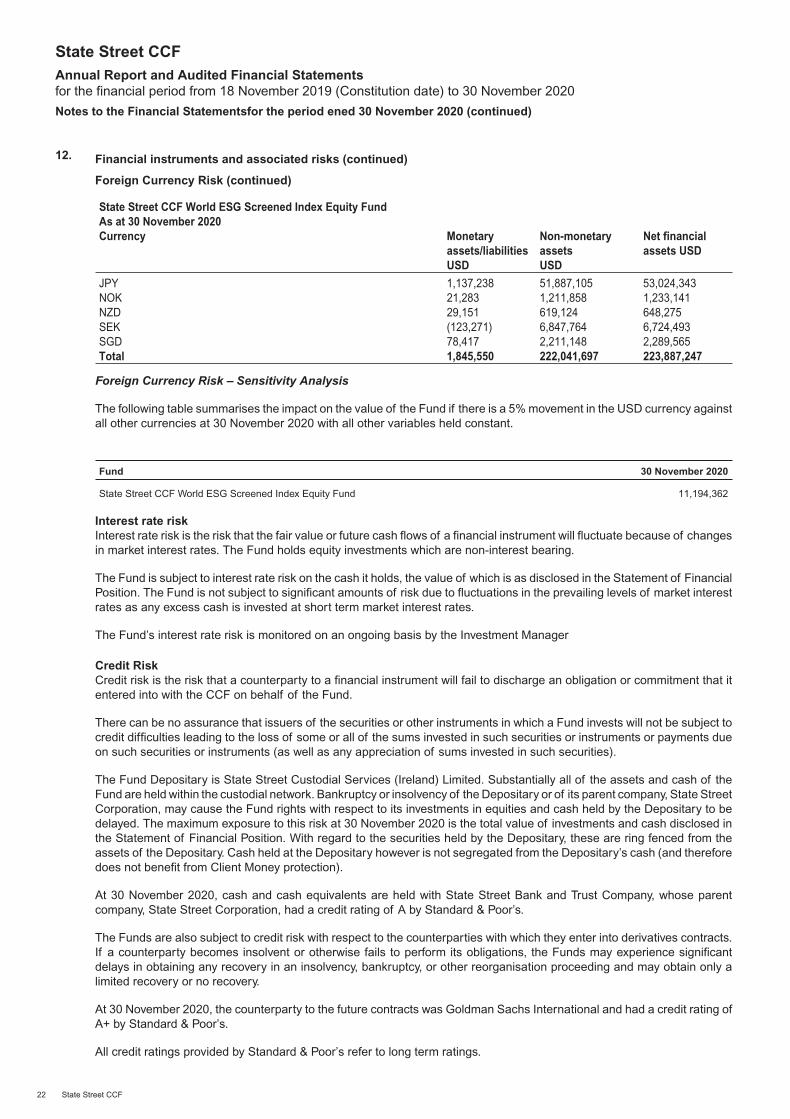
Foreign Currency Risk (continued)
State Street CCF World ESG Screened Index Equity FundAs at 30 November 2020Currency Monetary
assets/liabilitiesUSD
Non-monetaryassetsUSD
Net financialassets USD
JPY 1,137,238 51,887,105 53,024,343NOK 21,283 1,211,858 1,233,141NZD 29,151 619,124 648,275SEK (123,271) 6,847,764 6,724,493SGD 78,417 2,211,148 2,289,565Total 1,845,550 222,041,697 223,887,247
Foreign Currency Risk – Sensitivity Analysis
The following table summarises the impact on the value of the Fund if there is a 5% movement in the USD currency againstall other currencies at 30 November 2020 with all other variables held constant.
Fund 30 November 2020
State Street CCF World ESG Screened Index Equity Fund 11,194,362
Interest rate riskInterest rate risk is the risk that the fair value or future cash flows of a financial instrument will fluctuate because of changesin market interest rates. The Fund holds equity investments which are non-interest bearing.
The Fund is subject to interest rate risk on the cash it holds, the value of which is as disclosed in the Statement of FinancialPosition. The Fund is not subject to significant amounts of risk due to fluctuations in the prevailing levels of market interestrates as any excess cash is invested at short term market interest rates.
The Fund’s interest rate risk is monitored on an ongoing basis by the Investment Manager
Credit RiskCredit risk is the risk that a counterparty to a financial instrument will fail to discharge an obligation or commitment that itentered into with the CCF on behalf of the Fund.
There can be no assurance that issuers of the securities or other instruments in which a Fund invests will not be subject tocredit difficulties leading to the loss of some or all of the sums invested in such securities or instruments or payments dueon such securities or instruments (as well as any appreciation of sums invested in such securities).
The Fund Depositary is State Street Custodial Services (Ireland) Limited. Substantially all of the assets and cash of theFund are held within the custodial network. Bankruptcy or insolvency of the Depositary or of its parent company, State StreetCorporation, may cause the Fund rights with respect to its investments in equities and cash held by the Depositary to bedelayed. The maximum exposure to this risk at 30 November 2020 is the total value of investments and cash disclosed inthe Statement of Financial Position. With regard to the securities held by the Depositary, these are ring fenced from theassets of the Depositary. Cash held at the Depositary however is not segregated from the Depositary’s cash (and thereforedoes not benefit from Client Money protection).
At 30 November 2020, cash and cash equivalents are held with State Street Bank and Trust Company, whose parentcompany, State Street Corporation, had a credit rating of A by Standard & Poor’s.
The Funds are also subject to credit risk with respect to the counterparties with which they enter into derivatives contracts.If a counterparty becomes insolvent or otherwise fails to perform its obligations, the Funds may experience significantdelays in obtaining any recovery in an insolvency, bankruptcy, or other reorganisation proceeding and may obtain only alimited recovery or no recovery.
At 30 November 2020, the counterparty to the future contracts was Goldman Sachs International and had a credit rating ofA+ by Standard & Poor’s.
All credit ratings provided by Standard & Poor’s refer to long term ratings.
State Street CCFAnnual Report and Audited Financial Statementsfor the financial period from 18 November 2019 (Constitution date) to 30 November 2020
Notes to the Financial Statementsfor the period ened 30 November 2020 (continued)
22 State Street CCF
12. Financial instruments and associated risks (continued)
Credit Risk (continued)Offsetting financial assets and liabilities
The Fund was not subject to offsetting agreements during the financial period ended 30 November 2020.
Liquidity RiskLiquidity risk is the risk that the Fund will encounter difficulty in meeting obligations associated with financial liabilities.Moreover, the accumulation and disposal of holdings in some investments may be time consuming and may need to beconducted at unfavourable prices. The Fund may also encounter difficulties in disposing of assets at their fair value due toadverse market conditions leading to limited liquidity.
All of the CCF’s financial liabilities are payable within one month.
Liquidity ManagementThe Manager employs an appropriate liquidity risk management process, to ensure that each Sub-Fund is able to complywith its stated redemption obligations. These tools and arrangements are detailed as follows:
Redemption LimitsIf redemption requests received in respect of Units of a particular Fund on any Dealing Day total, in aggregate, more than10% of the outstanding Units of that Fund, the Manager may defer the excess redemption requests to subsequent DealingDays and shall redeem such Units rateably. If the Manager refuses to redeem Units for this reason, the requests forredemption on such date shall be reduced rateably and the Units to which each request relates which are not redeemedshall be redeemed on each subsequent Dealing Day (but shall not receive priority on such subsequent Dealing Day),provided that the Manager shall not be obliged to redeem more than 10% of the number of Units of a particular Fundoutstanding on any Dealing Day, until all the Units of the Fund to which the original request related have been redeemed.
Redemption in kindIn the Manager’s discretion, the Manager may choose to redeem Units in kind where the redeeming Unitholder requestssuch redemption. A determination to provide redemption in specie may be solely at the discretion of the Manager where aredeeming Unitholder requests redemption of a number of Units that represent 5% or more of the NAV of a Fund. In thisevent, the Manager will, if requested to do so by the redeeming Unitholder, sell the relevant assets on behalf of theUnitholder and the cost of such a sale will be charged to that Unitholder. For the avoidance of doubt, consent from aredeeming Unitholder will only be required where that Unitholder is requesting to redeem a number of Units less than 5%of NAV of the relevant Fund.
The Manager, on receiving a redemption request from a Unitholder, will elect that instead of the Units being redeemed incash, the redemption shall be satisfied in specie by the transfer to the Unitholder of Investments (and all liabilities attachedthereto) provided that the value thereof shall not exceed the amount which otherwise would have been payable on a cashredemption and provided that the transfer of Investments (and all liabilities attached thereto) is approved by the Depositary.
Temporary Suspension of DealingsThe Manager may at any time, with prior notification to the Depositary, temporarily suspend the calculation of the net assetvalue, or any of the issue, redemption and switching of Units in the following circumstances:
- where one or more stock exchanges or other markets which are the basis for valuing a significant part of the NAV areclosed, or during which trading is suspended;
- where in the opinion of the Manager it is impossible to sell or to value assets as a result of particular circumstances;
- where the communication technology normally used in determining the price of a security of the Fund fails or providesonly partial functionality;
- where the transfer of moneys for the purchase or sale of investments of the Fund is impractical;
- following a decision to merge a Fund or the CCF, if justified in order to protect the interest of Unitholders;
- where a Fund is a feeder fund and the net asset value calculation of the master UCITS (or Fund thereof) is suspended;
- the conditions set forth in the “Redemption Limits” section above are met;
- any period when the Manager determine that it is in the best interests of Unitholders to do so.
State Street CCFAnnual Report and Audited Financial Statementsfor the financial period from 18 November 2019 (Constitution date) to 30 November 2020
Notes to the Financial Statementsfor the period ened 30 November 2020 (continued)
State Street CCF 23
12. Financial instruments and associated risks (continued)
Compulsory RedemptionThe CCF and each Fund is established for a limited period and may have unlimited assets. The Units of any Fund, or theUnits of a particular Unitholder, as applicable, may be compulsorily redeemed by the Manager in the followingcircumstances:
- if no replacement Depositary shall have been appointed during the period of three months commencing on the date theDepositary or any replacement thereof shall have notified the Manager of its desire to retire as depositary or shall haveceased to be approved by the Central Bank;
- if the Manager in its sole discretion deems it appropriate because of material administrative disadvantage or adversepolitical, economic, fiscal, regulatory or other changes or circumstances affect the relevant Class;
- if the Manager determines that the continuation of the Fund or any Fund or Class is not economically viable;
- if any law shall be passed which renders it illegal or in the reasonable opinion of the Manager impracticable orinadvisable to continue the Fund or any of its Funds or Class;
- such Units are held by any person who no longer satisfies the Eligible Investor criteria or any other applicable eligibilityrequirements including but not limited to any person who might expose the CCF or any Fund to adverse tax or regulatoryconsequences or by any person in breach of the law or requirement of any country or governmental authority; or
- such Units are held by any person or persons in circumstances (whether directly or indirectly affecting such person orpersons and whether taken alone or in conjunction with any other person or persons connected or not, or any othercircumstances appearing to the Manager to be relevant) which, in the opinion of the Manager might result in the Fundincurring any liability to taxation or suffering pecuniary disadvantages which the Fund might not otherwise have incurredor suffered or the Fund being required to register under the 1940 Act, or similar statute successor thereto or to registerany class of its securities under the 1933 Act or similar statute successor thereto; or
- if within a period of three months from the date of the sole remaining Investment Manager expressing in writing to theManager its desire to retire the Manager shall have failed to appoint a new Investment Manager; or
- the Net Asset Value of the relevant Fund does not exceed or falls below the Base Currency equivalent ofUS$100,000,000 (or such other amount as may be approved by the Manager in respect of any Fund).
13. Fair Value HierarchyThe CCF classifies fair value measurements using a fair value hierarchy that reflects the significance of the inputs used inmaking the measurements.
The fair value hierarchy has the following levels:
Level 1 - Quoted prices (unadjusted) in active markets for identical assets or liabilities.
Level 2 - Inputs other than quoted prices included within level 1 that are observable for the asset or liability, either directly (asprices) or indirectly (derived from prices).
Level 3 - Inputs for the asset or liability that are not based on observable market data (unobservable inputs).
Furthermore, for those instruments which have significant unobservable inputs (Level 3), the amendment requiresdisclosures on the transfers into and out of Level 3, a reconciliation of the opening and closing balances, total gains andlosses for the year split between those recognised in the Statement of Comprehensive Income, purchases, sales issues andsettlements, and a sensitivity analysis of assumptions used in determining the fair value of Level 3 positions.
The level in the fair value hierarchy within which the fair value measurement is categorised in its entirety is determined onthe basis of the lowest level input that is significant to the fair value measurement in its entirety. For this purpose, thesignificance of an input is assessed against the fair value measurement in its entirety. If a fair value measurement usesobservable inputs that require significant adjustment based on unobservable inputs, that measurement is a Level 3measurement. Assessing the significance of a particular input to the fair value measurement in its entirety requiresjudgement, considering factors specific to the asset or liability.
The determination of what constitutes ‘observable’ requires significant judgement by the CCF. The CCF considersobservable data to be that market data that is readily available, regularly distributed or updated, reliable and verifiable, notproprietary, and provided by independent sources that are actively involved in the relevant market.
State Street CCFAnnual Report and Audited Financial Statementsfor the financial period from 18 November 2019 (Constitution date) to 30 November 2020
Notes to the Financial Statementsfor the period ened 30 November 2020 (continued)
24 State Street CCF
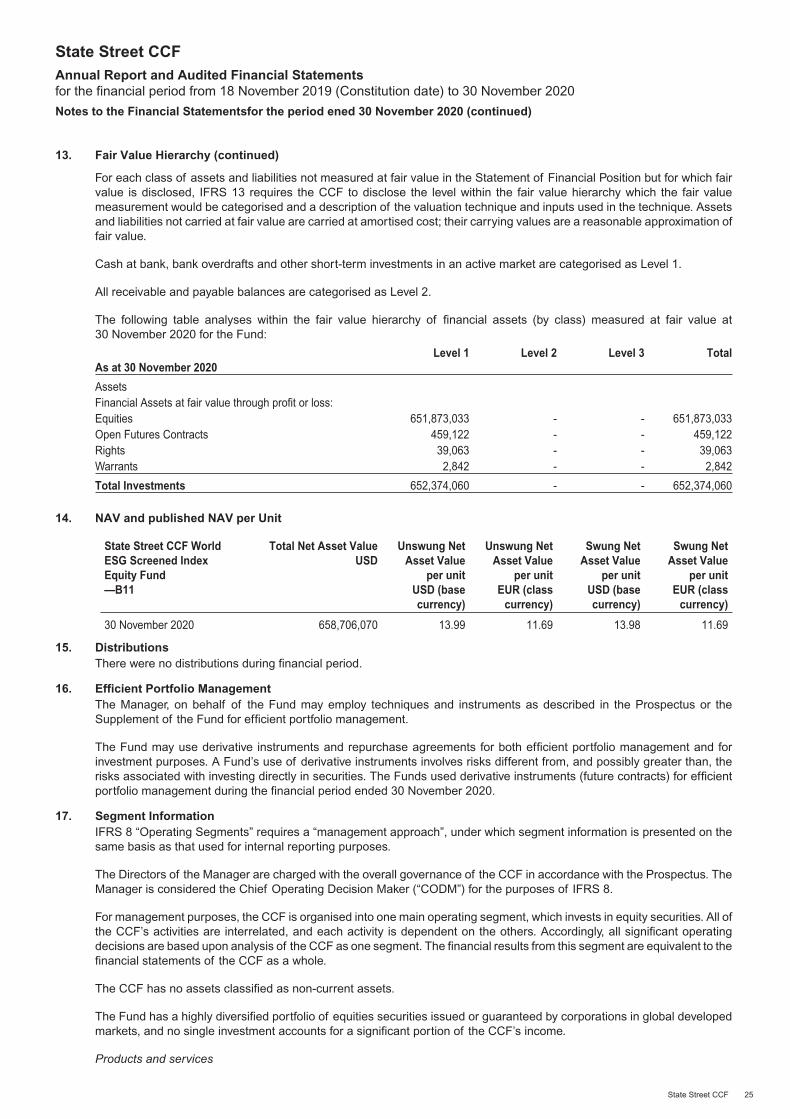
13. Fair Value Hierarchy (continued)
For each class of assets and liabilities not measured at fair value in the Statement of Financial Position but for which fairvalue is disclosed, IFRS 13 requires the CCF to disclose the level within the fair value hierarchy which the fair valuemeasurement would be categorised and a description of the valuation technique and inputs used in the technique. Assetsand liabilities not carried at fair value are carried at amortised cost; their carrying values are a reasonable approximation offair value.
Cash at bank, bank overdrafts and other short-term investments in an active market are categorised as Level 1.
All receivable and payable balances are categorised as Level 2.
The following table analyses within the fair value hierarchy of financial assets (by class) measured at fair value at30 November 2020 for the Fund:
As at 30 November 2020Level 1 Level 2 Level 3 Total
AssetsFinancial Assets at fair value through profit or loss:Equities 651,873,033 - - 651,873,033Open Futures Contracts 459,122 - - 459,122Rights 39,063 - - 39,063Warrants 2,842 - - 2,842
Total Investments 652,374,060 - - 652,374,060
14. NAV and published NAV per Unit
State Street CCF WorldESG Screened IndexEquity Fund—B11
Total Net Asset ValueUSD
Unswung NetAsset Value
per unitUSD (basecurrency)
Unswung NetAsset Value
per unitEUR (class
currency)
Swung NetAsset Value
per unitUSD (basecurrency)
Swung NetAsset Value
per unitEUR (class
currency)
30 November 2020 658,706,070 13.99 11.69 13.98 11.69
15. DistributionsThere were no distributions during financial period.
16. Efficient Portfolio ManagementThe Manager, on behalf of the Fund may employ techniques and instruments as described in the Prospectus or theSupplement of the Fund for efficient portfolio management.
The Fund may use derivative instruments and repurchase agreements for both efficient portfolio management and forinvestment purposes. A Fund’s use of derivative instruments involves risks different from, and possibly greater than, therisks associated with investing directly in securities. The Funds used derivative instruments (future contracts) for efficientportfolio management during the financial period ended 30 November 2020.
17. Segment InformationIFRS 8 “Operating Segments” requires a “management approach”, under which segment information is presented on thesame basis as that used for internal reporting purposes.
The Directors of the Manager are charged with the overall governance of the CCF in accordance with the Prospectus. TheManager is considered the Chief Operating Decision Maker (“CODM”) for the purposes of IFRS 8.
For management purposes, the CCF is organised into one main operating segment, which invests in equity securities. All ofthe CCF’s activities are interrelated, and each activity is dependent on the others. Accordingly, all significant operatingdecisions are based upon analysis of the CCF as one segment. The financial results from this segment are equivalent to thefinancial statements of the CCF as a whole.
The CCF has no assets classified as non-current assets.
The Fund has a highly diversified portfolio of equities securities issued or guaranteed by corporations in global developedmarkets, and no single investment accounts for a significant portion of the CCF’s income.
Products and services
State Street CCFAnnual Report and Audited Financial Statementsfor the financial period from 18 November 2019 (Constitution date) to 30 November 2020
Notes to the Financial Statementsfor the period ened 30 November 2020 (continued)
State Street CCF 25
17. Segment Information (continued)
All of the CCF’s revenues are derived from one product grouping, namely the portfolio securities invested in by the Fund.
Geographical areas
The CCF does not separately monitor revenues from different geographical areas. However Fund revenue may beconsidered as being attributed to the region, as stated in its investment policy.
Major customers
As the CCF is an investment vehicle, its distinct major customers are the institutional investors who purchase the Fund units.
18. Soft Commissions and Direct Brokerage ServicesThe CCF has not entered into any soft commission or direct brokerage services arrangements during the financial periodended 30 November 2020.
19. Commitment and Contingent LiabilitiesThere were no capital commitments and contingent liabilities as at 30 November 2020.
20. Segregated LiabilitiesThe CCF is an umbrella fund with segregated liability between its funds. As such, as a matter of Irish law the assets of eachFund will not be exposed to the liabilities of the CCF’s other Funds. Notwithstanding the foregoing there can be noassurance that, should an action be brought against the CCF in the court of another jurisdiction, the segregated nature ofthe Funds would necessarily be upheld. As at 30 November 2020 there was one active Fund in the CCF.
21. Significant Events During the financial periodState Street CCF was constituted on 18 November 2019.
State Street CCF World ESG Screened Index Equity Fund was launched on 12 May 2020.
State Street CCF Global Green Real Estate Equity Index was authorised on 3 June 2020 by the Central Bank but not yetseeded.
An addendum to the prospectus relating to the amendment of the financial period end for the CCF to 30 November wasnoted by the Central Bank of Ireland on 1 July 2020.
Impact of COVID-19
An outbreak of a respiratory disease caused by a novel coronavirus (known as COVID-19) first detected in China inDecember 2019 has resulted in a global pandemic and major disruptions to economies and markets around the world.Beginning in January 2020, global financial markets have experienced and may continue to experience significant volatilityresulting from the spread of coronavirus COVID-19. Trading in many instruments has been disrupted along with liquidity formany instruments being greatly reduced for periods of time. Some interest rates are very low and in some cases yields arenegative. Governments and central banks have taken extraordinary and unprecedented actions to support local and globaleconomies and the financial markets. The impact of these measures, and whether they will be effective to mitigate theeconomic and market disruption, will not be known for some time. The outbreak of coronavirus COVID-19 has also resultedin travel and border restrictions, quarantines, supply chain disruptions, lower consumer demand and general marketuncertainty.
The Directors of the Manager and the CCF’s delegates are closely monitoring the developments and the advice relating tothe spread of coronavirus COVID-19. State Street Corporation has a robust global business continuity programme thatprioritises the health and safety of employees. The continuity programme continues to evolve from supporting staff in workfrom home arrangements through a comprehensive programme to plan for the return of staff to the office environment.
There were no other significant events during the financial period.
22. Subsequent Events since the financial periodOn 1 January 2021, Matsack Trust Limited replaced Sanne Corporate Administration Services Ireland Limited as companysecretary for the CCF.
State Street CCFAnnual Report and Audited Financial Statementsfor the financial period from 18 November 2019 (Constitution date) to 30 November 2020
Notes to the Financial Statementsfor the period ened 30 November 2020 (continued)
26 State Street CCF
22. Subsequent Events since the financial period (continued)
Potential Implication of BrexitIn December 2020 a trade deal was agreed between the EU and UK which will govern their future trading relationship.
The details with regard to how financial services will be governed has yet to be finalised as of January 2021. Regardless theCCF is well positioned to continue to operate the business and service clients as a result of Brexit-related provisions whichwere made prior to the launch date.
Impact of COVID-19As of early 2021 local lockdowns continue to be deployed as necessary and the emergence of significant further outbreaksare being seen. While distribution of a vaccine began in early 2021 the pandemic and the measures taken to tackleCOVID-19 continue to affect economies and equity markets globally, all of which may negatively impact the Fund’sperformance.
Bryan Greener resigned as Director of the Manager effective 26 February 2021.
There were no significant events since the financial period end.
23. Approval of the Financial StatementsThe Directors of the Manager approved the financial statements on 26 March 2021.
State Street CCFAnnual Report and Audited Financial Statementsfor the financial period from 18 November 2019 (Constitution date) to 30 November 2020
Notes to the Financial Statementsfor the period ened 30 November 2020 (continued)
State Street CCF 27
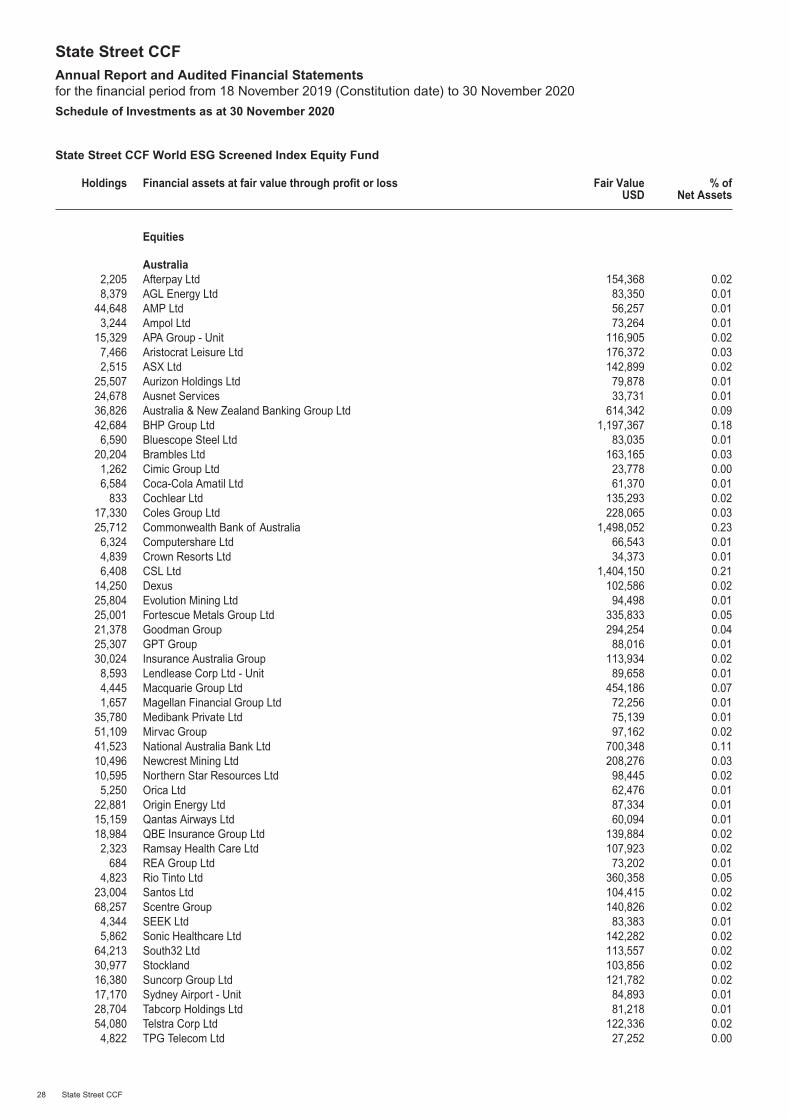
State Street CCF World ESG Screened Index Equity Fund
Holdings Financial assets at fair value through profit or loss Fair ValueUSD
% ofNet Assets
Equities
Australia2,205 Afterpay Ltd 154,368 0.028,379 AGL Energy Ltd 83,350 0.01
44,648 AMP Ltd 56,257 0.013,244 Ampol Ltd 73,264 0.01
15,329 APA Group - Unit 116,905 0.027,466 Aristocrat Leisure Ltd 176,372 0.032,515 ASX Ltd 142,899 0.02
25,507 Aurizon Holdings Ltd 79,878 0.0124,678 Ausnet Services 33,731 0.0136,826 Australia & New Zealand Banking Group Ltd 614,342 0.0942,684 BHP Group Ltd 1,197,367 0.186,590 Bluescope Steel Ltd 83,035 0.01
20,204 Brambles Ltd 163,165 0.031,262 Cimic Group Ltd 23,778 0.006,584 Coca-Cola Amatil Ltd 61,370 0.01
833 Cochlear Ltd 135,293 0.0217,330 Coles Group Ltd 228,065 0.0325,712 Commonwealth Bank of Australia 1,498,052 0.236,324 Computershare Ltd 66,543 0.014,839 Crown Resorts Ltd 34,373 0.016,408 CSL Ltd 1,404,150 0.21
14,250 Dexus 102,586 0.0225,804 Evolution Mining Ltd 94,498 0.0125,001 Fortescue Metals Group Ltd 335,833 0.0521,378 Goodman Group 294,254 0.0425,307 GPT Group 88,016 0.0130,024 Insurance Australia Group 113,934 0.028,593 Lendlease Corp Ltd - Unit 89,658 0.014,445 Macquarie Group Ltd 454,186 0.071,657 Magellan Financial Group Ltd 72,256 0.01
35,780 Medibank Private Ltd 75,139 0.0151,109 Mirvac Group 97,162 0.0241,523 National Australia Bank Ltd 700,348 0.1110,496 Newcrest Mining Ltd 208,276 0.0310,595 Northern Star Resources Ltd 98,445 0.025,250 Orica Ltd 62,476 0.01
22,881 Origin Energy Ltd 87,334 0.0115,159 Qantas Airways Ltd 60,094 0.0118,984 QBE Insurance Group Ltd 139,884 0.022,323 Ramsay Health Care Ltd 107,923 0.02
684 REA Group Ltd 73,202 0.014,823 Rio Tinto Ltd 360,358 0.05
23,004 Santos Ltd 104,415 0.0268,257 Scentre Group 140,826 0.024,344 SEEK Ltd 83,383 0.015,862 Sonic Healthcare Ltd 142,282 0.02
64,213 South32 Ltd 113,557 0.0230,977 Stockland 103,856 0.0216,380 Suncorp Group Ltd 121,782 0.0217,170 Sydney Airport - Unit 84,893 0.0128,704 Tabcorp Holdings Ltd 81,218 0.0154,080 Telstra Corp Ltd 122,336 0.024,822 TPG Telecom Ltd 27,252 0.00
State Street CCFAnnual Report and Audited Financial Statementsfor the financial period from 18 November 2019 (Constitution date) to 30 November 2020
Schedule of Investments as at 30 November 2020
28 State Street CCF
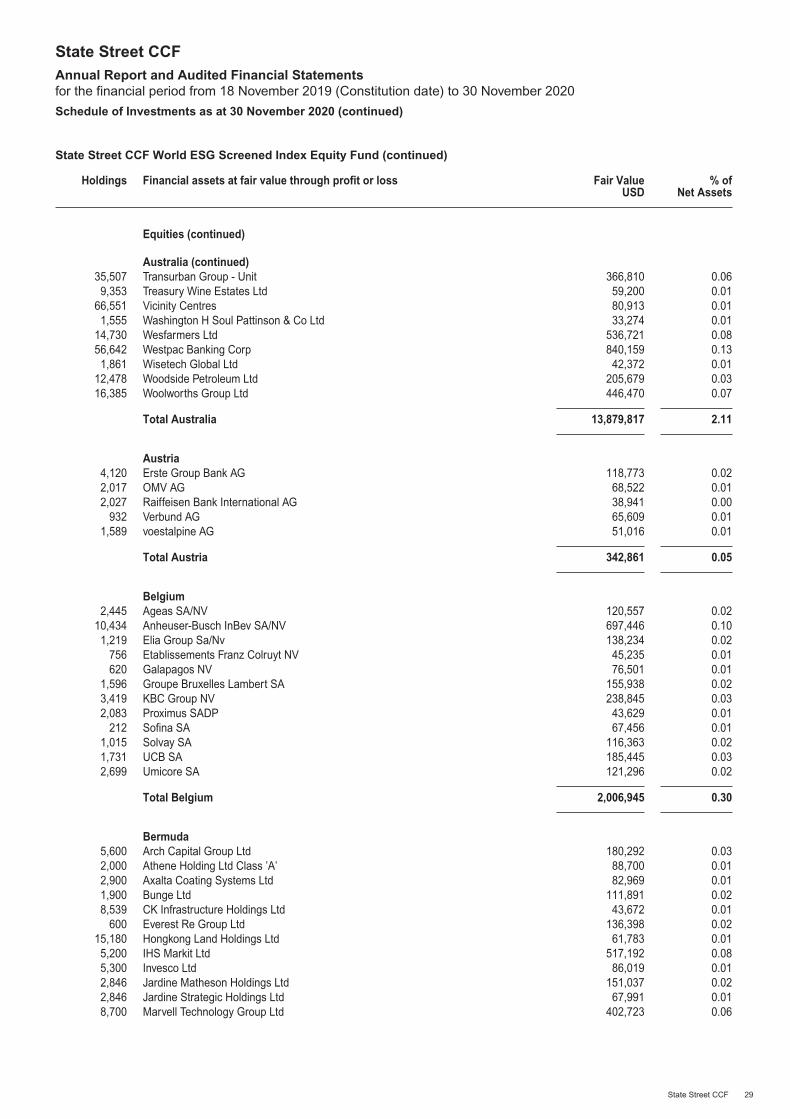
State Street CCF World ESG Screened Index Equity Fund (continued)
Holdings Financial assets at fair value through profit or loss Fair ValueUSD
% ofNet Assets
Equities (continued)
Australia (continued)35,507 Transurban Group - Unit 366,810 0.069,353 Treasury Wine Estates Ltd 59,200 0.01
66,551 Vicinity Centres 80,913 0.011,555 Washington H Soul Pattinson & Co Ltd 33,274 0.01
14,730 Wesfarmers Ltd 536,721 0.0856,642 Westpac Banking Corp 840,159 0.131,861 Wisetech Global Ltd 42,372 0.01
12,478 Woodside Petroleum Ltd 205,679 0.0316,385 Woolworths Group Ltd 446,470 0.07
Total Australia 13,879,817 2.11
Austria4,120 Erste Group Bank AG 118,773 0.022,017 OMV AG 68,522 0.012,027 Raiffeisen Bank International AG 38,941 0.00
932 Verbund AG 65,609 0.011,589 voestalpine AG 51,016 0.01
Total Austria 342,861 0.05
Belgium2,445 Ageas SA/NV 120,557 0.02
10,434 Anheuser-Busch InBev SA/NV 697,446 0.101,219 Elia Group Sa/Nv 138,234 0.02
756 Etablissements Franz Colruyt NV 45,235 0.01620 Galapagos NV 76,501 0.01
1,596 Groupe Bruxelles Lambert SA 155,938 0.023,419 KBC Group NV 238,845 0.032,083 Proximus SADP 43,629 0.01
212 Sofina SA 67,456 0.011,015 Solvay SA 116,363 0.021,731 UCB SA 185,445 0.032,699 Umicore SA 121,296 0.02
Total Belgium 2,006,945 0.30
Bermuda5,600 Arch Capital Group Ltd 180,292 0.032,000 Athene Holding Ltd Class ’A’ 88,700 0.012,900 Axalta Coating Systems Ltd 82,969 0.011,900 Bunge Ltd 111,891 0.028,539 CK Infrastructure Holdings Ltd 43,672 0.01
600 Everest Re Group Ltd 136,398 0.0215,180 Hongkong Land Holdings Ltd 61,783 0.015,200 IHS Markit Ltd 517,192 0.085,300 Invesco Ltd 86,019 0.012,846 Jardine Matheson Holdings Ltd 151,037 0.022,846 Jardine Strategic Holdings Ltd 67,991 0.018,700 Marvell Technology Group Ltd 402,723 0.06
State Street CCFAnnual Report and Audited Financial Statementsfor the financial period from 18 November 2019 (Constitution date) to 30 November 2020
Schedule of Investments as at 30 November 2020 (continued)
State Street CCF 29
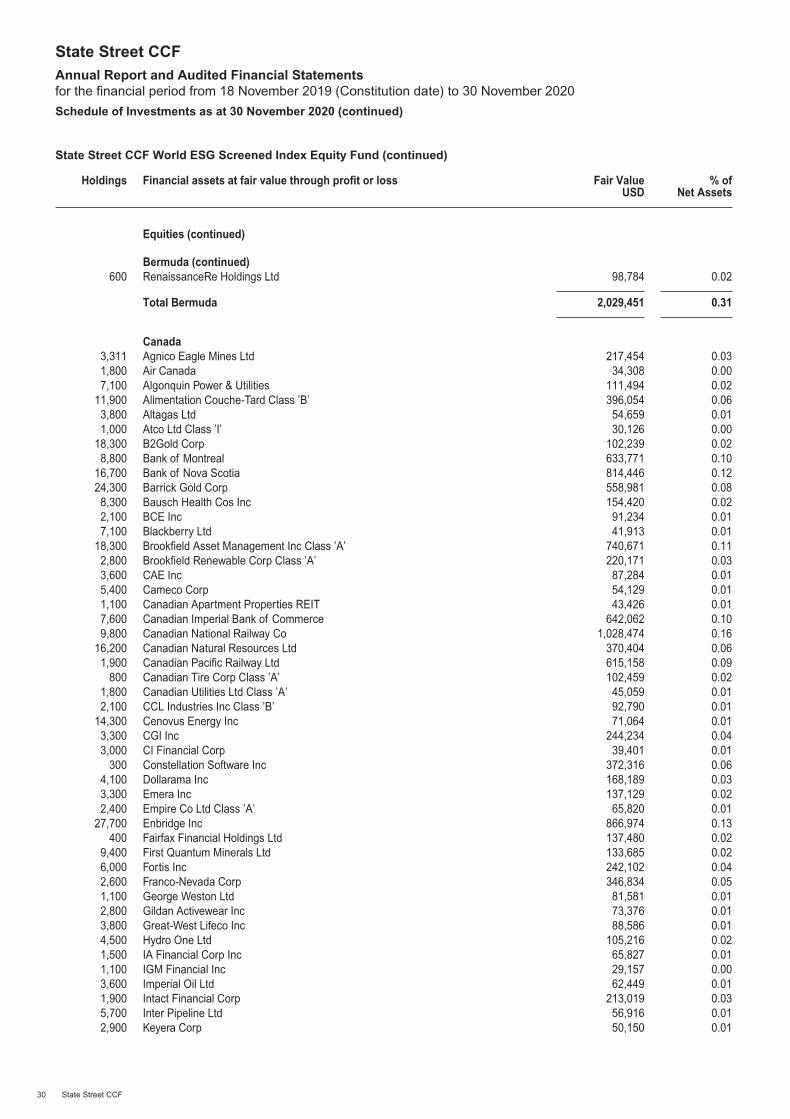
State Street CCF World ESG Screened Index Equity Fund (continued)
Holdings Financial assets at fair value through profit or loss Fair ValueUSD
% ofNet Assets
Equities (continued)
Bermuda (continued)600 RenaissanceRe Holdings Ltd 98,784 0.02
Total Bermuda 2,029,451 0.31
Canada3,311 Agnico Eagle Mines Ltd 217,454 0.031,800 Air Canada 34,308 0.007,100 Algonquin Power & Utilities 111,494 0.02
11,900 Alimentation Couche-Tard Class ’B’ 396,054 0.063,800 Altagas Ltd 54,659 0.011,000 Atco Ltd Class ’I’ 30,126 0.00
18,300 B2Gold Corp 102,239 0.028,800 Bank of Montreal 633,771 0.10
16,700 Bank of Nova Scotia 814,446 0.1224,300 Barrick Gold Corp 558,981 0.088,300 Bausch Health Cos Inc 154,420 0.022,100 BCE Inc 91,234 0.017,100 Blackberry Ltd 41,913 0.01
18,300 Brookfield Asset Management Inc Class ’A’ 740,671 0.112,800 Brookfield Renewable Corp Class ’A’ 220,171 0.033,600 CAE Inc 87,284 0.015,400 Cameco Corp 54,129 0.011,100 Canadian Apartment Properties REIT 43,426 0.017,600 Canadian Imperial Bank of Commerce 642,062 0.109,800 Canadian National Railway Co 1,028,474 0.16
16,200 Canadian Natural Resources Ltd 370,404 0.061,900 Canadian Pacific Railway Ltd 615,158 0.09
800 Canadian Tire Corp Class ’A’ 102,459 0.021,800 Canadian Utilities Ltd Class ’A’ 45,059 0.012,100 CCL Industries Inc Class ’B’ 92,790 0.01
14,300 Cenovus Energy Inc 71,064 0.013,300 CGI Inc 244,234 0.043,000 CI Financial Corp 39,401 0.01
300 Constellation Software Inc 372,316 0.064,100 Dollarama Inc 168,189 0.033,300 Emera Inc 137,129 0.022,400 Empire Co Ltd Class ’A’ 65,820 0.01
27,700 Enbridge Inc 866,974 0.13400 Fairfax Financial Holdings Ltd 137,480 0.02
9,400 First Quantum Minerals Ltd 133,685 0.026,000 Fortis Inc 242,102 0.042,600 Franco-Nevada Corp 346,834 0.051,100 George Weston Ltd 81,581 0.012,800 Gildan Activewear Inc 73,376 0.013,800 Great-West Lifeco Inc 88,586 0.014,500 Hydro One Ltd 105,216 0.021,500 IA Financial Corp Inc 65,827 0.011,100 IGM Financial Inc 29,157 0.003,600 Imperial Oil Ltd 62,449 0.011,900 Intact Financial Corp 213,019 0.035,700 Inter Pipeline Ltd 56,916 0.012,900 Keyera Corp 50,150 0.01
State Street CCFAnnual Report and Audited Financial Statementsfor the financial period from 18 November 2019 (Constitution date) to 30 November 2020
Schedule of Investments as at 30 November 2020 (continued)
30 State Street CCF
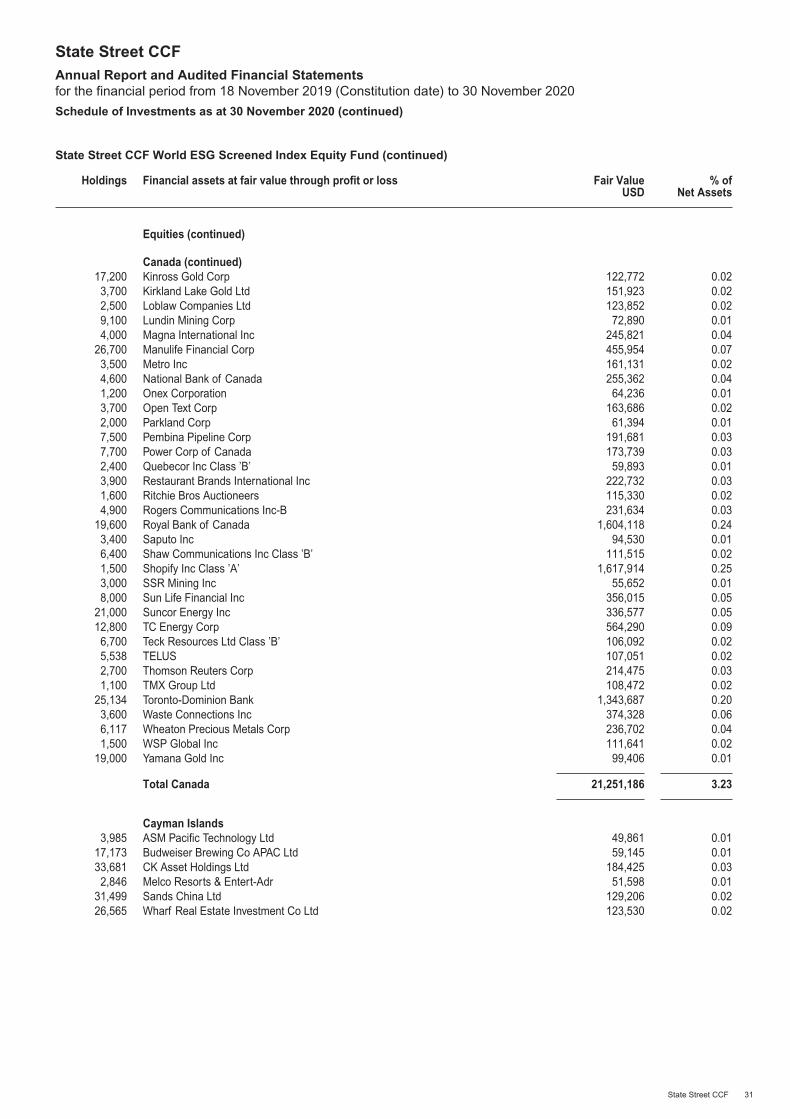
State Street CCF World ESG Screened Index Equity Fund (continued)
Holdings Financial assets at fair value through profit or loss Fair ValueUSD
% ofNet Assets
Equities (continued)
Canada (continued)17,200 Kinross Gold Corp 122,772 0.023,700 Kirkland Lake Gold Ltd 151,923 0.022,500 Loblaw Companies Ltd 123,852 0.029,100 Lundin Mining Corp 72,890 0.014,000 Magna International Inc 245,821 0.04
26,700 Manulife Financial Corp 455,954 0.073,500 Metro Inc 161,131 0.024,600 National Bank of Canada 255,362 0.041,200 Onex Corporation 64,236 0.013,700 Open Text Corp 163,686 0.022,000 Parkland Corp 61,394 0.017,500 Pembina Pipeline Corp 191,681 0.037,700 Power Corp of Canada 173,739 0.032,400 Quebecor Inc Class ’B’ 59,893 0.013,900 Restaurant Brands International Inc 222,732 0.031,600 Ritchie Bros Auctioneers 115,330 0.024,900 Rogers Communications Inc-B 231,634 0.03
19,600 Royal Bank of Canada 1,604,118 0.243,400 Saputo Inc 94,530 0.016,400 Shaw Communications Inc Class ’B’ 111,515 0.021,500 Shopify Inc Class ’A’ 1,617,914 0.253,000 SSR Mining Inc 55,652 0.018,000 Sun Life Financial Inc 356,015 0.05
21,000 Suncor Energy Inc 336,577 0.0512,800 TC Energy Corp 564,290 0.096,700 Teck Resources Ltd Class ’B’ 106,092 0.025,538 TELUS 107,051 0.022,700 Thomson Reuters Corp 214,475 0.031,100 TMX Group Ltd 108,472 0.02
25,134 Toronto-Dominion Bank 1,343,687 0.203,600 Waste Connections Inc 374,328 0.066,117 Wheaton Precious Metals Corp 236,702 0.041,500 WSP Global Inc 111,641 0.02
19,000 Yamana Gold Inc 99,406 0.01
Total Canada 21,251,186 3.23
Cayman Islands3,985 ASM Pacific Technology Ltd 49,861 0.01
17,173 Budweiser Brewing Co APAC Ltd 59,145 0.0133,681 CK Asset Holdings Ltd 184,425 0.032,846 Melco Resorts & Entert-Adr 51,598 0.01
31,499 Sands China Ltd 129,206 0.0226,565 Wharf Real Estate Investment Co Ltd 123,530 0.02
State Street CCFAnnual Report and Audited Financial Statementsfor the financial period from 18 November 2019 (Constitution date) to 30 November 2020
Schedule of Investments as at 30 November 2020 (continued)
State Street CCF 31
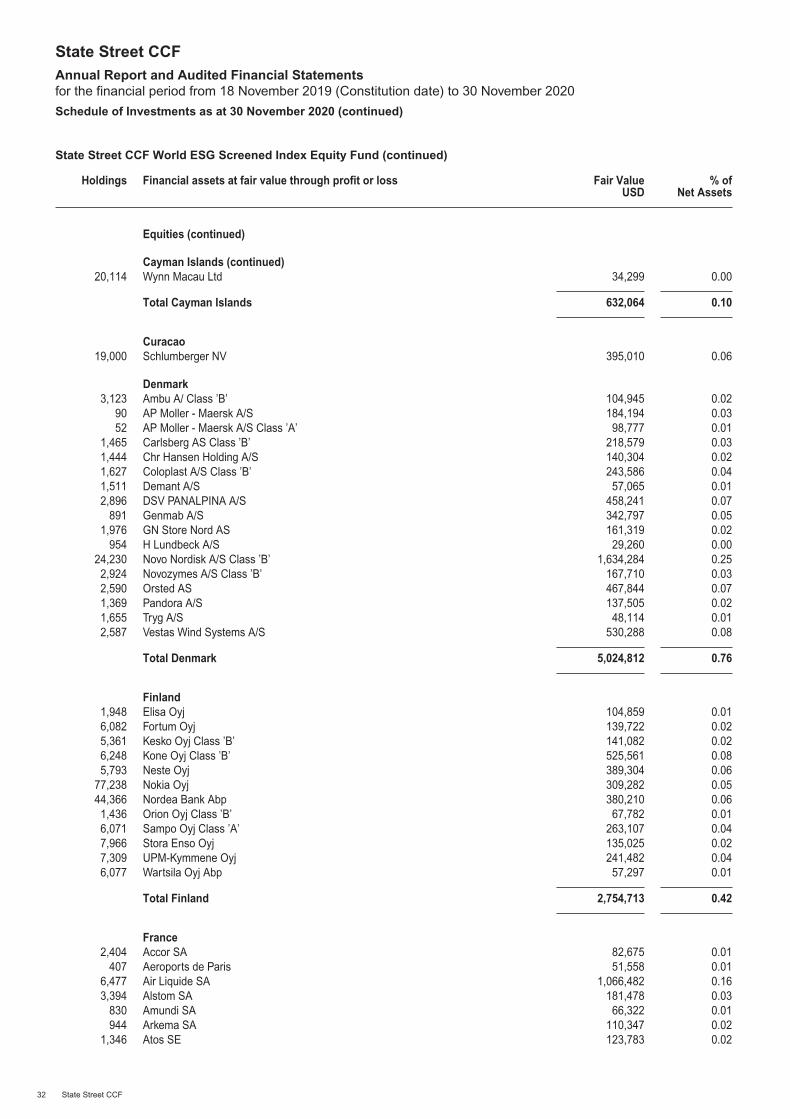
State Street CCF World ESG Screened Index Equity Fund (continued)
Holdings Financial assets at fair value through profit or loss Fair ValueUSD
% ofNet Assets
Equities (continued)
Cayman Islands (continued)20,114 Wynn Macau Ltd 34,299 0.00
Total Cayman Islands 632,064 0.10
Curacao19,000 Schlumberger NV 395,010 0.06
Denmark3,123 Ambu A/ Class ’B’ 104,945 0.02
90 AP Moller - Maersk A/S 184,194 0.0352 AP Moller - Maersk A/S Class ’A’ 98,777 0.01
1,465 Carlsberg AS Class ’B’ 218,579 0.031,444 Chr Hansen Holding A/S 140,304 0.021,627 Coloplast A/S Class ’B’ 243,586 0.041,511 Demant A/S 57,065 0.012,896 DSV PANALPINA A/S 458,241 0.07
891 Genmab A/S 342,797 0.051,976 GN Store Nord AS 161,319 0.02
954 H Lundbeck A/S 29,260 0.0024,230 Novo Nordisk A/S Class ’B’ 1,634,284 0.252,924 Novozymes A/S Class ’B’ 167,710 0.032,590 Orsted AS 467,844 0.071,369 Pandora A/S 137,505 0.021,655 Tryg A/S 48,114 0.012,587 Vestas Wind Systems A/S 530,288 0.08
Total Denmark 5,024,812 0.76
Finland1,948 Elisa Oyj 104,859 0.016,082 Fortum Oyj 139,722 0.025,361 Kesko Oyj Class ’B’ 141,082 0.026,248 Kone Oyj Class ’B’ 525,561 0.085,793 Neste Oyj 389,304 0.06
77,238 Nokia Oyj 309,282 0.0544,366 Nordea Bank Abp 380,210 0.061,436 Orion Oyj Class ’B’ 67,782 0.016,071 Sampo Oyj Class ’A’ 263,107 0.047,966 Stora Enso Oyj 135,025 0.027,309 UPM-Kymmene Oyj 241,482 0.046,077 Wartsila Oyj Abp 57,297 0.01
Total Finland 2,754,713 0.42
France2,404 Accor SA 82,675 0.01
407 Aeroports de Paris 51,558 0.016,477 Air Liquide SA 1,066,482 0.163,394 Alstom SA 181,478 0.03
830 Amundi SA 66,322 0.01944 Arkema SA 110,347 0.02
1,346 Atos SE 123,783 0.02
State Street CCFAnnual Report and Audited Financial Statementsfor the financial period from 18 November 2019 (Constitution date) to 30 November 2020
Schedule of Investments as at 30 November 2020 (continued)
32 State Street CCF
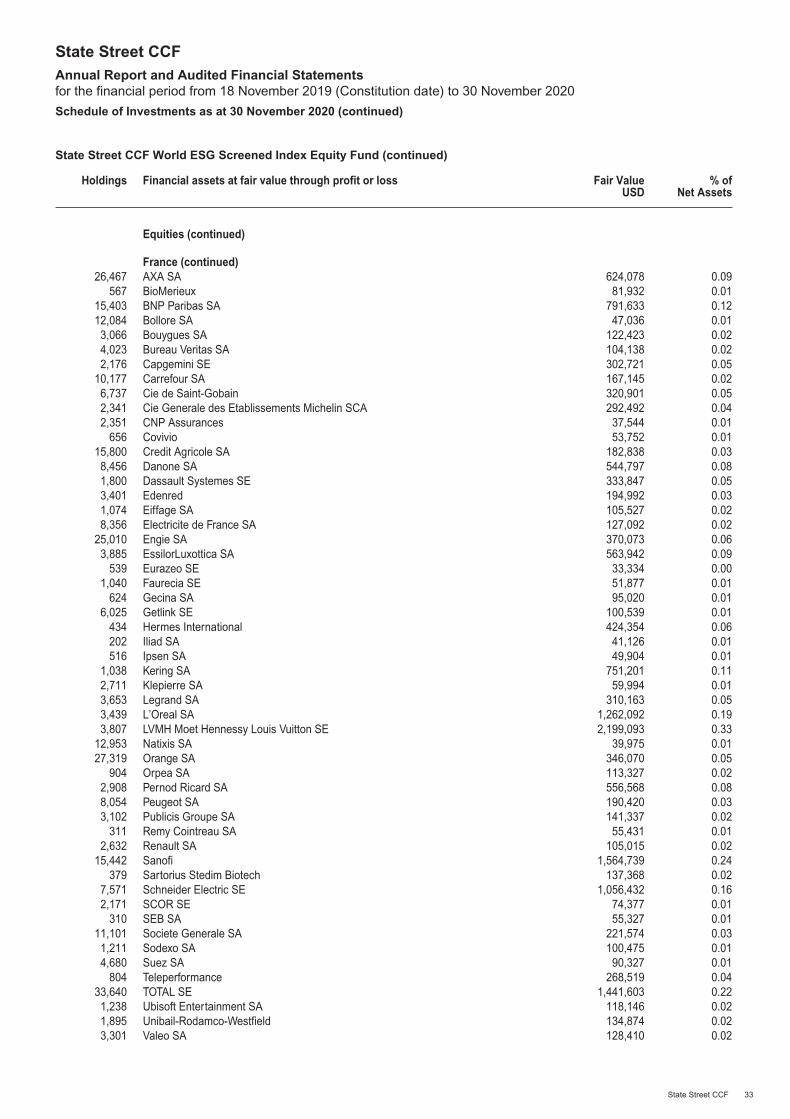
State Street CCF World ESG Screened Index Equity Fund (continued)
Holdings Financial assets at fair value through profit or loss Fair ValueUSD
% ofNet Assets
Equities (continued)
France (continued)26,467 AXA SA 624,078 0.09
567 BioMerieux 81,932 0.0115,403 BNP Paribas SA 791,633 0.1212,084 Bollore SA 47,036 0.013,066 Bouygues SA 122,423 0.024,023 Bureau Veritas SA 104,138 0.022,176 Capgemini SE 302,721 0.05
10,177 Carrefour SA 167,145 0.026,737 Cie de Saint-Gobain 320,901 0.052,341 Cie Generale des Etablissements Michelin SCA 292,492 0.042,351 CNP Assurances 37,544 0.01
656 Covivio 53,752 0.0115,800 Credit Agricole SA 182,838 0.038,456 Danone SA 544,797 0.081,800 Dassault Systemes SE 333,847 0.053,401 Edenred 194,992 0.031,074 Eiffage SA 105,527 0.028,356 Electricite de France SA 127,092 0.02
25,010 Engie SA 370,073 0.063,885 EssilorLuxottica SA 563,942 0.09
539 Eurazeo SE 33,334 0.001,040 Faurecia SE 51,877 0.01
624 Gecina SA 95,020 0.016,025 Getlink SE 100,539 0.01
434 Hermes International 424,354 0.06202 Iliad SA 41,126 0.01516 Ipsen SA 49,904 0.01
1,038 Kering SA 751,201 0.112,711 Klepierre SA 59,994 0.013,653 Legrand SA 310,163 0.053,439 L’Oreal SA 1,262,092 0.193,807 LVMH Moet Hennessy Louis Vuitton SE 2,199,093 0.33
12,953 Natixis SA 39,975 0.0127,319 Orange SA 346,070 0.05
904 Orpea SA 113,327 0.022,908 Pernod Ricard SA 556,568 0.088,054 Peugeot SA 190,420 0.033,102 Publicis Groupe SA 141,337 0.02
311 Remy Cointreau SA 55,431 0.012,632 Renault SA 105,015 0.02
15,442 Sanofi 1,564,739 0.24379 Sartorius Stedim Biotech 137,368 0.02
7,571 Schneider Electric SE 1,056,432 0.162,171 SCOR SE 74,377 0.01
310 SEB SA 55,327 0.0111,101 Societe Generale SA 221,574 0.031,211 Sodexo SA 100,475 0.014,680 Suez SA 90,327 0.01
804 Teleperformance 268,519 0.0433,640 TOTAL SE 1,441,603 0.221,238 Ubisoft Entertainment SA 118,146 0.021,895 Unibail-Rodamco-Westfield 134,874 0.023,301 Valeo SA 128,410 0.02
State Street CCFAnnual Report and Audited Financial Statementsfor the financial period from 18 November 2019 (Constitution date) to 30 November 2020
Schedule of Investments as at 30 November 2020 (continued)
State Street CCF 33

State Street CCF World ESG Screened Index Equity Fund (continued)
Holdings Financial assets at fair value through profit or loss Fair ValueUSD
% ofNet Assets
Equities (continued)
France (continued)7,379 Veolia Environnement SA 170,003 0.037,156 Vinci SA 731,880 0.11
11,347 Vivendi SA 341,775 0.05371 Wendel 42,049 0.01
3,180 Worldline SA 294,803 0.04
Total France 20,951,069 3.18
Germany2,470 Adidas AG 789,768 0.125,713 Allianz SE 1,350,786 0.20
12,577 BASF SE 922,685 0.1413,453 Bayer AG 776,784 0.124,534 Bayerische Motoren Werke AG 396,137 0.06
779 Bayerische Motoren Werke AG - Pref 51,624 0.01792 Bechtle AG 173,088 0.03
1,380 Beiersdorf AG 154,742 0.022,116 Brenntag AG 162,146 0.02
551 Carl Zeiss Meditec AG 73,688 0.0113,719 Commerzbank AG 85,500 0.011,506 Continental AG 205,729 0.032,381 Covestro AG 133,151 0.02
11,637 Daimler AG 785,794 0.121,632 Delivery Hero SE 197,660 0.03
26,886 Deutsche Bank AG 300,480 0.052,602 Deutsche Boerse AG 434,973 0.073,274 Deutsche Lufthansa AG 37,777 0.01
13,546 Deutsche Post AG 656,251 0.1045,640 Deutsche Telekom AG 825,197 0.134,926 Deutsche Wohnen SE 247,720 0.04
30,743 E.ON SE 333,768 0.052,872 Evonik Industries Ag 86,952 0.012,918 Fresenius Medical Care AG & Co KGaA 246,081 0.045,723 Fresenius SE & Co KGaA 256,719 0.04
952 Fuchs Petrolub SE - Pref 54,570 0.012,101 GEA Group AG 72,154 0.01
826 Hannover Rueck SE 138,625 0.022,038 HeidelbergCement AG 145,150 0.022,293 Hellofresh SE 135,169 0.021,423 Henkel AG & Co KGaA 137,707 0.022,440 Henkel AG & Co KGaA - Voting Rights 263,386 0.04
339 HOCHTIEF AG 32,806 0.0017,769 Infineon Technologies AG 627,456 0.10
889 KION Group AG 68,527 0.01977 Knorr-Bremse AG 125,377 0.02
1,138 LANXESS AG 79,852 0.011,110 LEG Immobilien AG 158,617 0.021,770 Merck KGaA 283,397 0.04
714 MTU Aero Engines AG 169,066 0.031,976 Muenchener Rueckversicherungs Via Gesellschaft AG in Muenchen 552,158 0.081,580 Nemetschek SE 125,307 0.022,097 Porsche Automobil Holding SE - Pref 133,699 0.02
State Street CCFAnnual Report and Audited Financial Statementsfor the financial period from 18 November 2019 (Constitution date) to 30 November 2020
Schedule of Investments as at 30 November 2020 (continued)
34 State Street CCF
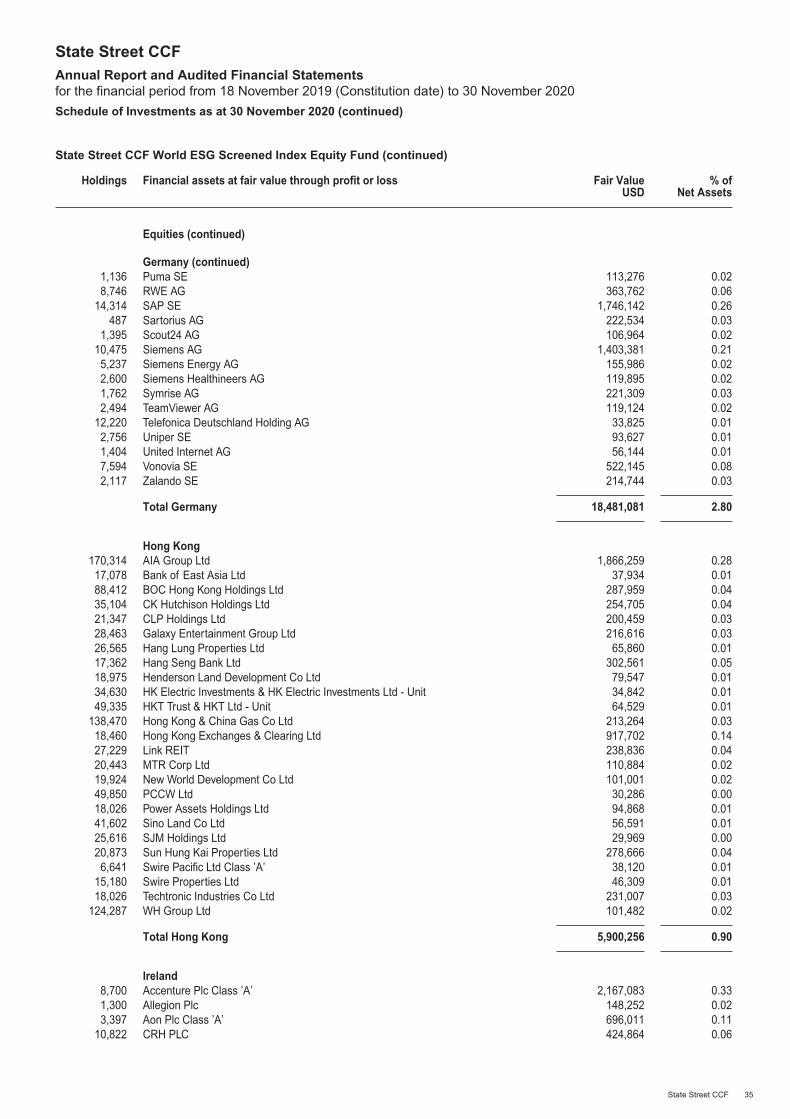
State Street CCF World ESG Screened Index Equity Fund (continued)
Holdings Financial assets at fair value through profit or loss Fair ValueUSD
% ofNet Assets
Equities (continued)
Germany (continued)1,136 Puma SE 113,276 0.028,746 RWE AG 363,762 0.06
14,314 SAP SE 1,746,142 0.26487 Sartorius AG 222,534 0.03
1,395 Scout24 AG 106,964 0.0210,475 Siemens AG 1,403,381 0.215,237 Siemens Energy AG 155,986 0.022,600 Siemens Healthineers AG 119,895 0.021,762 Symrise AG 221,309 0.032,494 TeamViewer AG 119,124 0.02
12,220 Telefonica Deutschland Holding AG 33,825 0.012,756 Uniper SE 93,627 0.011,404 United Internet AG 56,144 0.017,594 Vonovia SE 522,145 0.082,117 Zalando SE 214,744 0.03
Total Germany 18,481,081 2.80
Hong Kong170,314 AIA Group Ltd 1,866,259 0.2817,078 Bank of East Asia Ltd 37,934 0.0188,412 BOC Hong Kong Holdings Ltd 287,959 0.0435,104 CK Hutchison Holdings Ltd 254,705 0.0421,347 CLP Holdings Ltd 200,459 0.0328,463 Galaxy Entertainment Group Ltd 216,616 0.0326,565 Hang Lung Properties Ltd 65,860 0.0117,362 Hang Seng Bank Ltd 302,561 0.0518,975 Henderson Land Development Co Ltd 79,547 0.0134,630 HK Electric Investments & HK Electric Investments Ltd - Unit 34,842 0.0149,335 HKT Trust & HKT Ltd - Unit 64,529 0.01
138,470 Hong Kong & China Gas Co Ltd 213,264 0.0318,460 Hong Kong Exchanges & Clearing Ltd 917,702 0.1427,229 Link REIT 238,836 0.0420,443 MTR Corp Ltd 110,884 0.0219,924 New World Development Co Ltd 101,001 0.0249,850 PCCW Ltd 30,286 0.0018,026 Power Assets Holdings Ltd 94,868 0.0141,602 Sino Land Co Ltd 56,591 0.0125,616 SJM Holdings Ltd 29,969 0.0020,873 Sun Hung Kai Properties Ltd 278,666 0.046,641 Swire Pacific Ltd Class ’A’ 38,120 0.01
15,180 Swire Properties Ltd 46,309 0.0118,026 Techtronic Industries Co Ltd 231,007 0.03
124,287 WH Group Ltd 101,482 0.02
Total Hong Kong 5,900,256 0.90
Ireland8,700 Accenture Plc Class ’A’ 2,167,083 0.331,300 Allegion Plc 148,252 0.023,397 Aon Plc Class ’A’ 696,011 0.11
10,822 CRH PLC 424,864 0.06
State Street CCFAnnual Report and Audited Financial Statementsfor the financial period from 18 November 2019 (Constitution date) to 30 November 2020
Schedule of Investments as at 30 November 2020 (continued)
State Street CCF 35
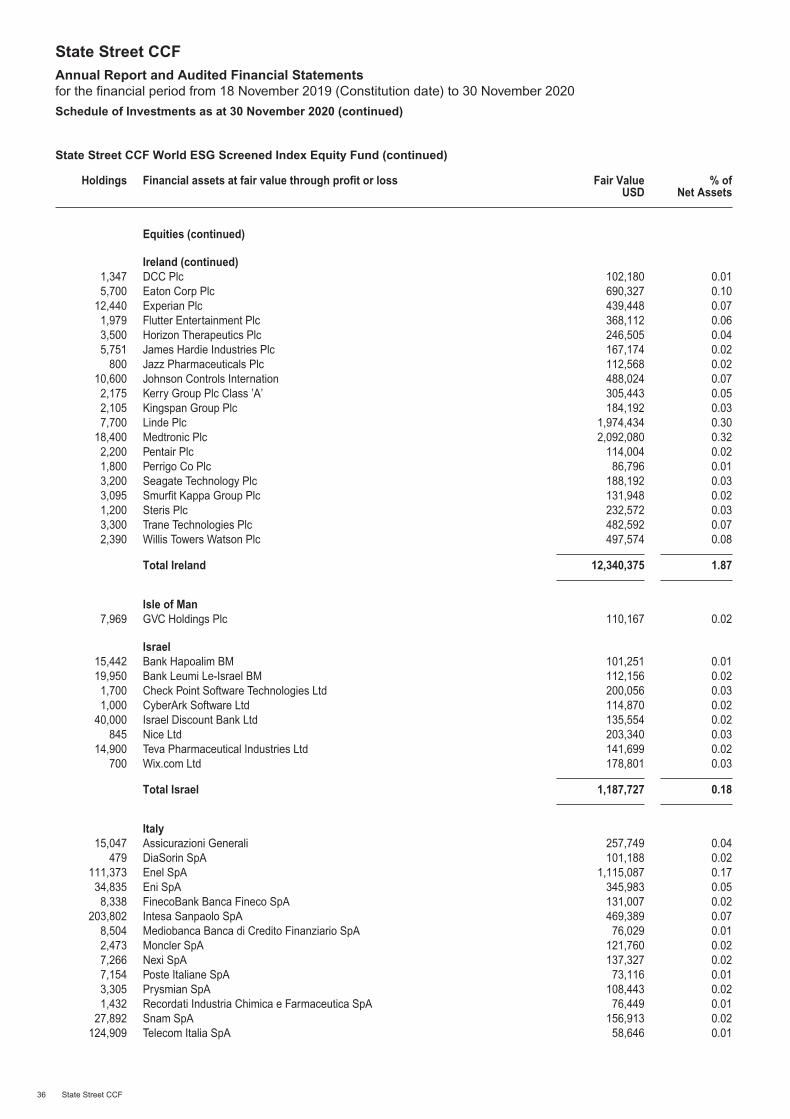
State Street CCF World ESG Screened Index Equity Fund (continued)
Holdings Financial assets at fair value through profit or loss Fair ValueUSD
% ofNet Assets
Equities (continued)
Ireland (continued)1,347 DCC Plc 102,180 0.015,700 Eaton Corp Plc 690,327 0.10
12,440 Experian Plc 439,448 0.071,979 Flutter Entertainment Plc 368,112 0.063,500 Horizon Therapeutics Plc 246,505 0.045,751 James Hardie Industries Plc 167,174 0.02
800 Jazz Pharmaceuticals Plc 112,568 0.0210,600 Johnson Controls Internation 488,024 0.072,175 Kerry Group Plc Class ’A’ 305,443 0.052,105 Kingspan Group Plc 184,192 0.037,700 Linde Plc 1,974,434 0.30
18,400 Medtronic Plc 2,092,080 0.322,200 Pentair Plc 114,004 0.021,800 Perrigo Co Plc 86,796 0.013,200 Seagate Technology Plc 188,192 0.033,095 Smurfit Kappa Group Plc 131,948 0.021,200 Steris Plc 232,572 0.033,300 Trane Technologies Plc 482,592 0.072,390 Willis Towers Watson Plc 497,574 0.08
Total Ireland 12,340,375 1.87
Isle of Man7,969 GVC Holdings Plc 110,167 0.02
Israel15,442 Bank Hapoalim BM 101,251 0.0119,950 Bank Leumi Le-Israel BM 112,156 0.021,700 Check Point Software Technologies Ltd 200,056 0.031,000 CyberArk Software Ltd 114,870 0.02
40,000 Israel Discount Bank Ltd 135,554 0.02845 Nice Ltd 203,340 0.03
14,900 Teva Pharmaceutical Industries Ltd 141,699 0.02700 Wix.com Ltd 178,801 0.03
Total Israel 1,187,727 0.18
Italy15,047 Assicurazioni Generali 257,749 0.04
479 DiaSorin SpA 101,188 0.02111,373 Enel SpA 1,115,087 0.1734,835 Eni SpA 345,983 0.058,338 FinecoBank Banca Fineco SpA 131,007 0.02
203,802 Intesa Sanpaolo SpA 469,389 0.078,504 Mediobanca Banca di Credito Finanziario SpA 76,029 0.012,473 Moncler SpA 121,760 0.027,266 Nexi SpA 137,327 0.027,154 Poste Italiane SpA 73,116 0.013,305 Prysmian SpA 108,443 0.021,432 Recordati Industria Chimica e Farmaceutica SpA 76,449 0.01
27,892 Snam SpA 156,913 0.02124,909 Telecom Italia SpA 58,646 0.01
State Street CCFAnnual Report and Audited Financial Statementsfor the financial period from 18 November 2019 (Constitution date) to 30 November 2020
Schedule of Investments as at 30 November 2020 (continued)
36 State Street CCF
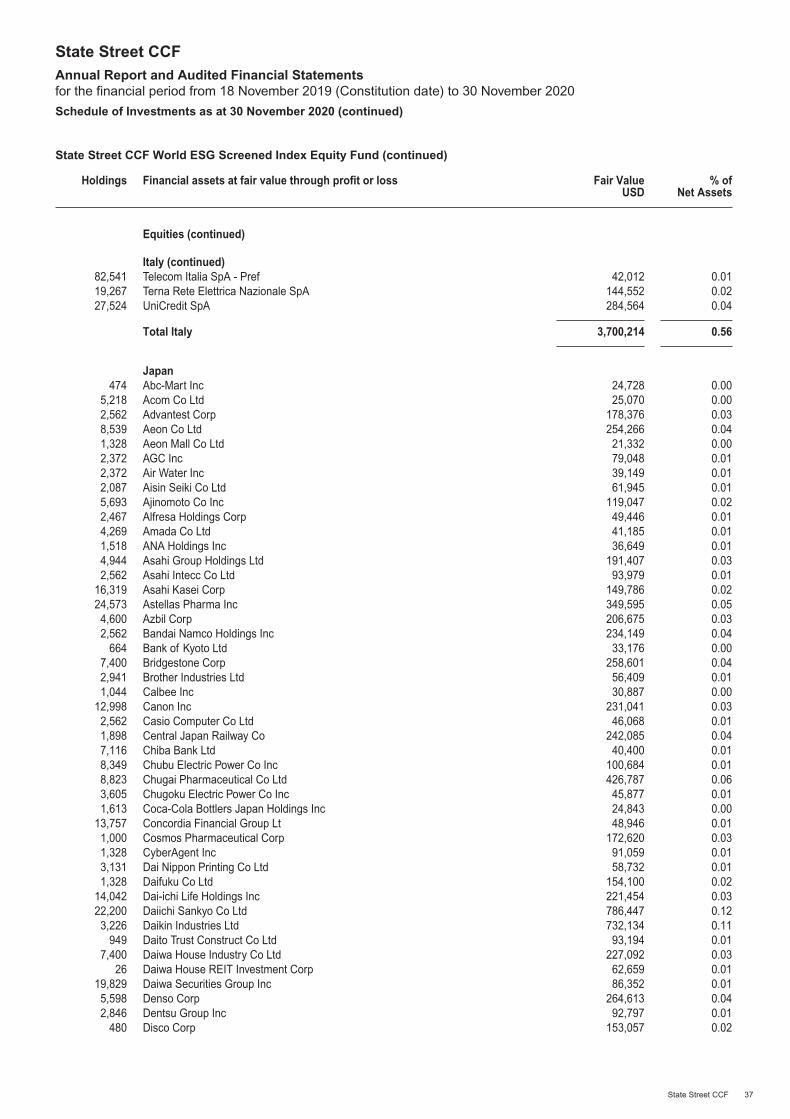
State Street CCF World ESG Screened Index Equity Fund (continued)
Holdings Financial assets at fair value through profit or loss Fair ValueUSD
% ofNet Assets
Equities (continued)
Italy (continued)82,541 Telecom Italia SpA - Pref 42,012 0.0119,267 Terna Rete Elettrica Nazionale SpA 144,552 0.0227,524 UniCredit SpA 284,564 0.04
Total Italy 3,700,214 0.56
Japan474 Abc-Mart Inc 24,728 0.00
5,218 Acom Co Ltd 25,070 0.002,562 Advantest Corp 178,376 0.038,539 Aeon Co Ltd 254,266 0.041,328 Aeon Mall Co Ltd 21,332 0.002,372 AGC Inc 79,048 0.012,372 Air Water Inc 39,149 0.012,087 Aisin Seiki Co Ltd 61,945 0.015,693 Ajinomoto Co Inc 119,047 0.022,467 Alfresa Holdings Corp 49,446 0.014,269 Amada Co Ltd 41,185 0.011,518 ANA Holdings Inc 36,649 0.014,944 Asahi Group Holdings Ltd 191,407 0.032,562 Asahi Intecc Co Ltd 93,979 0.01
16,319 Asahi Kasei Corp 149,786 0.0224,573 Astellas Pharma Inc 349,595 0.054,600 Azbil Corp 206,675 0.032,562 Bandai Namco Holdings Inc 234,149 0.04
664 Bank of Kyoto Ltd 33,176 0.007,400 Bridgestone Corp 258,601 0.042,941 Brother Industries Ltd 56,409 0.011,044 Calbee Inc 30,887 0.00
12,998 Canon Inc 231,041 0.032,562 Casio Computer Co Ltd 46,068 0.011,898 Central Japan Railway Co 242,085 0.047,116 Chiba Bank Ltd 40,400 0.018,349 Chubu Electric Power Co Inc 100,684 0.018,823 Chugai Pharmaceutical Co Ltd 426,787 0.063,605 Chugoku Electric Power Co Inc 45,877 0.011,613 Coca-Cola Bottlers Japan Holdings Inc 24,843 0.00
13,757 Concordia Financial Group Lt 48,946 0.011,000 Cosmos Pharmaceutical Corp 172,620 0.031,328 CyberAgent Inc 91,059 0.013,131 Dai Nippon Printing Co Ltd 58,732 0.011,328 Daifuku Co Ltd 154,100 0.02
14,042 Dai-ichi Life Holdings Inc 221,454 0.0322,200 Daiichi Sankyo Co Ltd 786,447 0.123,226 Daikin Industries Ltd 732,134 0.11
949 Daito Trust Construct Co Ltd 93,194 0.017,400 Daiwa House Industry Co Ltd 227,092 0.03
26 Daiwa House REIT Investment Corp 62,659 0.0119,829 Daiwa Securities Group Inc 86,352 0.015,598 Denso Corp 264,613 0.042,846 Dentsu Group Inc 92,797 0.01
480 Disco Corp 153,057 0.02
State Street CCFAnnual Report and Audited Financial Statementsfor the financial period from 18 November 2019 (Constitution date) to 30 November 2020
Schedule of Investments as at 30 November 2020 (continued)
State Street CCF 37
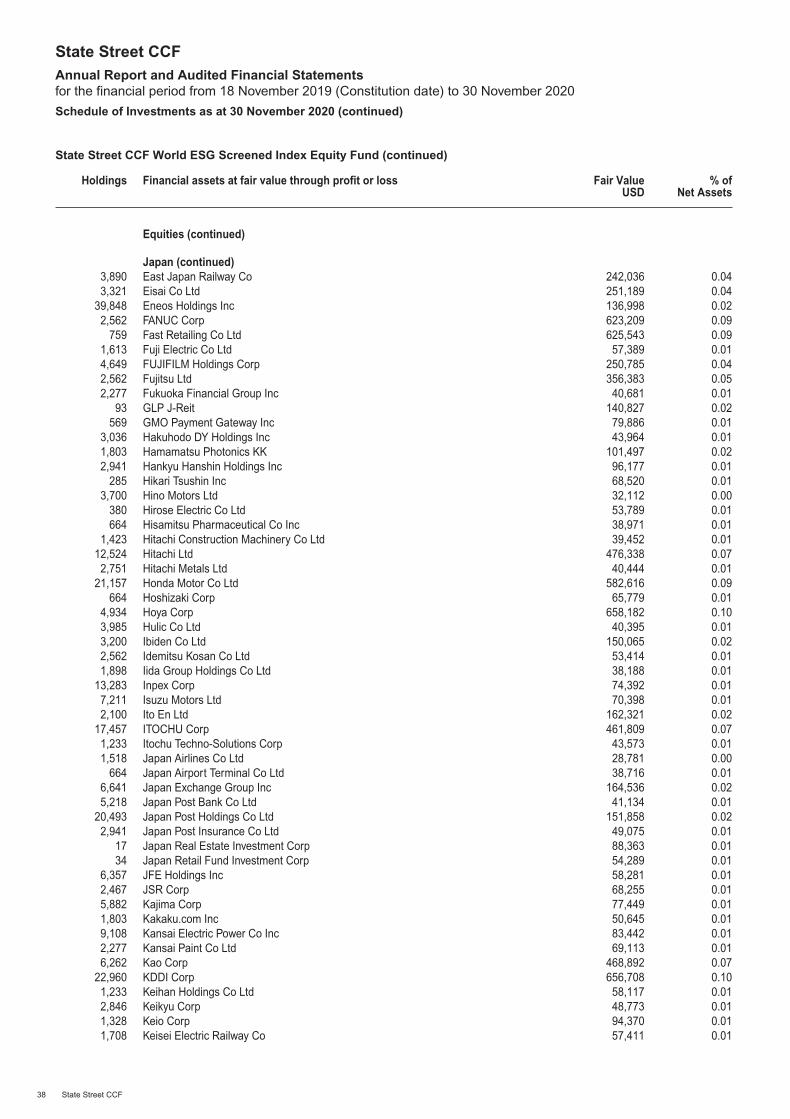
State Street CCF World ESG Screened Index Equity Fund (continued)
Holdings Financial assets at fair value through profit or loss Fair ValueUSD
% ofNet Assets
Equities (continued)
Japan (continued)3,890 East Japan Railway Co 242,036 0.043,321 Eisai Co Ltd 251,189 0.04
39,848 Eneos Holdings Inc 136,998 0.022,562 FANUC Corp 623,209 0.09
759 Fast Retailing Co Ltd 625,543 0.091,613 Fuji Electric Co Ltd 57,389 0.014,649 FUJIFILM Holdings Corp 250,785 0.042,562 Fujitsu Ltd 356,383 0.052,277 Fukuoka Financial Group Inc 40,681 0.01
93 GLP J-Reit 140,827 0.02569 GMO Payment Gateway Inc 79,886 0.01
3,036 Hakuhodo DY Holdings Inc 43,964 0.011,803 Hamamatsu Photonics KK 101,497 0.022,941 Hankyu Hanshin Holdings Inc 96,177 0.01
285 Hikari Tsushin Inc 68,520 0.013,700 Hino Motors Ltd 32,112 0.00
380 Hirose Electric Co Ltd 53,789 0.01664 Hisamitsu Pharmaceutical Co Inc 38,971 0.01
1,423 Hitachi Construction Machinery Co Ltd 39,452 0.0112,524 Hitachi Ltd 476,338 0.072,751 Hitachi Metals Ltd 40,444 0.01
21,157 Honda Motor Co Ltd 582,616 0.09664 Hoshizaki Corp 65,779 0.01
4,934 Hoya Corp 658,182 0.103,985 Hulic Co Ltd 40,395 0.013,200 Ibiden Co Ltd 150,065 0.022,562 Idemitsu Kosan Co Ltd 53,414 0.011,898 Iida Group Holdings Co Ltd 38,188 0.01
13,283 Inpex Corp 74,392 0.017,211 Isuzu Motors Ltd 70,398 0.012,100 Ito En Ltd 162,321 0.02
17,457 ITOCHU Corp 461,809 0.071,233 Itochu Techno-Solutions Corp 43,573 0.011,518 Japan Airlines Co Ltd 28,781 0.00
664 Japan Airport Terminal Co Ltd 38,716 0.016,641 Japan Exchange Group Inc 164,536 0.025,218 Japan Post Bank Co Ltd 41,134 0.01
20,493 Japan Post Holdings Co Ltd 151,858 0.022,941 Japan Post Insurance Co Ltd 49,075 0.01
17 Japan Real Estate Investment Corp 88,363 0.0134 Japan Retail Fund Investment Corp 54,289 0.01
6,357 JFE Holdings Inc 58,281 0.012,467 JSR Corp 68,255 0.015,882 Kajima Corp 77,449 0.011,803 Kakaku.com Inc 50,645 0.019,108 Kansai Electric Power Co Inc 83,442 0.012,277 Kansai Paint Co Ltd 69,113 0.016,262 Kao Corp 468,892 0.07
22,960 KDDI Corp 656,708 0.101,233 Keihan Holdings Co Ltd 58,117 0.012,846 Keikyu Corp 48,773 0.011,328 Keio Corp 94,370 0.011,708 Keisei Electric Railway Co 57,411 0.01
State Street CCFAnnual Report and Audited Financial Statementsfor the financial period from 18 November 2019 (Constitution date) to 30 November 2020
Schedule of Investments as at 30 November 2020 (continued)
38 State Street CCF

State Street CCF World ESG Screened Index Equity Fund (continued)
Holdings Financial assets at fair value through profit or loss Fair ValueUSD
% ofNet Assets
Equities (continued)
Japan (continued)2,672 Keyence Corp 1,365,532 0.211,898 Kikkoman Corp 118,130 0.022,182 Kintetsu Group Holdings Co Ltd 96,885 0.01
10,721 Kirin Holdings Co Ltd 233,749 0.04664 Kobayashi Pharmaceutical Co 79,916 0.01
4,200 Kobe Bussan Co Ltd 146,612 0.021,328 Koito Manufacturing Co Ltd 79,979 0.01
12,049 Komatsu Ltd 293,498 0.041,233 Konami Holdings Corp 64,680 0.01
474 Kose Corp 72,458 0.0113,472 Kubota Corp 267,502 0.044,175 Kuraray Co Ltd 41,480 0.011,328 Kurita Water Industries Ltd 49,032 0.014,175 Kyocera Corp 238,749 0.043,131 Kyowa Kirin Co Ltd 85,125 0.014,934 Kyushu Electric Power Co Inc 41,686 0.012,087 Kyushu Railway Co 43,992 0.011,300 Lasertec Corp 137,137 0.02
664 Lawson Inc 30,120 0.00759 LINE Corp 39,160 0.01
2,941 Lion Corp 69,608 0.013,416 LIXIL Group Corp 82,063 0.015,693 M3 Inc 525,323 0.082,941 Makita Corp 152,303 0.02
20,303 Marubeni Corp 118,479 0.022,467 Marui Group Co Ltd 45,093 0.017,400 Mazda Motor Corp 43,786 0.01
854 McDonald’s Holdings Co Japan Ltd 41,523 0.012,372 Medipal Holdings Corp 44,653 0.011,518 Meiji Holdings Co Ltd 107,436 0.02
949 Mercari Inc 43,502 0.014,744 MINEBEA MITSUMI Inc 98,906 0.013,700 Misumi Group Inc 116,207 0.02
16,603 Mitsubishi Chemical Holdings Corp 91,951 0.0117,552 Mitsubishi Corp 409,533 0.0623,719 Mitsubishi Electric Corp 348,819 0.0515,370 Mitsubishi Estate Co Ltd 265,907 0.042,087 Mitsubishi Gas Chemical Co Inc 44,312 0.014,175 Mitsubishi Heavy Industries Ltd 94,150 0.01
196,771 Mitsubishi UFJ Financial Group Inc 846,337 0.135,218 Mitsubishi UFJ Lease & Finance Co Ltd 23,970 0.00
21,537 Mitsui & Co Ltd 367,642 0.062,372 Mitsui Chemicals Inc 66,719 0.01
11,480 Mitsui Fudosan Co Ltd 240,169 0.042,800 Miura Co Ltd 147,418 0.02
31,337 Mizuho Financial Group Inc 398,944 0.061,613 MonotaRO Co Ltd 98,536 0.016,367 MS&AD Insurance Group Holdings Inc 185,316 0.037,495 Murata Manufacturing Co Ltd 656,167 0.101,423 Nabtesco Corp 58,817 0.012,467 Nagoya Railroad Co Ltd 67,948 0.013,226 NEC Corp 174,178 0.036,452 Nexon Co Ltd 195,215 0.03
State Street CCFAnnual Report and Audited Financial Statementsfor the financial period from 18 November 2019 (Constitution date) to 30 November 2020
Schedule of Investments as at 30 November 2020 (continued)
State Street CCF 39
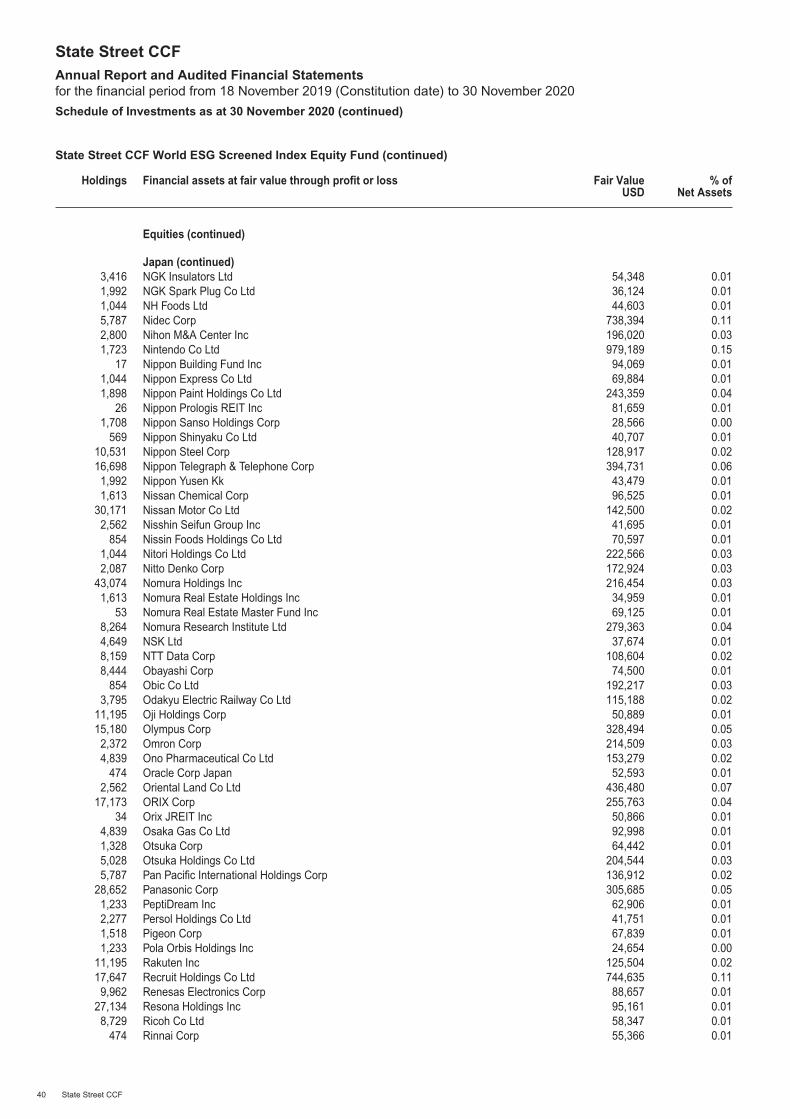
State Street CCF World ESG Screened Index Equity Fund (continued)
Holdings Financial assets at fair value through profit or loss Fair ValueUSD
% ofNet Assets
Equities (continued)
Japan (continued)3,416 NGK Insulators Ltd 54,348 0.011,992 NGK Spark Plug Co Ltd 36,124 0.011,044 NH Foods Ltd 44,603 0.015,787 Nidec Corp 738,394 0.112,800 Nihon M&A Center Inc 196,020 0.031,723 Nintendo Co Ltd 979,189 0.15
17 Nippon Building Fund Inc 94,069 0.011,044 Nippon Express Co Ltd 69,884 0.011,898 Nippon Paint Holdings Co Ltd 243,359 0.04
26 Nippon Prologis REIT Inc 81,659 0.011,708 Nippon Sanso Holdings Corp 28,566 0.00
569 Nippon Shinyaku Co Ltd 40,707 0.0110,531 Nippon Steel Corp 128,917 0.0216,698 Nippon Telegraph & Telephone Corp 394,731 0.061,992 Nippon Yusen Kk 43,479 0.011,613 Nissan Chemical Corp 96,525 0.01
30,171 Nissan Motor Co Ltd 142,500 0.022,562 Nisshin Seifun Group Inc 41,695 0.01
854 Nissin Foods Holdings Co Ltd 70,597 0.011,044 Nitori Holdings Co Ltd 222,566 0.032,087 Nitto Denko Corp 172,924 0.03
43,074 Nomura Holdings Inc 216,454 0.031,613 Nomura Real Estate Holdings Inc 34,959 0.01
53 Nomura Real Estate Master Fund Inc 69,125 0.018,264 Nomura Research Institute Ltd 279,363 0.044,649 NSK Ltd 37,674 0.018,159 NTT Data Corp 108,604 0.028,444 Obayashi Corp 74,500 0.01
854 Obic Co Ltd 192,217 0.033,795 Odakyu Electric Railway Co Ltd 115,188 0.02
11,195 Oji Holdings Corp 50,889 0.0115,180 Olympus Corp 328,494 0.052,372 Omron Corp 214,509 0.034,839 Ono Pharmaceutical Co Ltd 153,279 0.02
474 Oracle Corp Japan 52,593 0.012,562 Oriental Land Co Ltd 436,480 0.07
17,173 ORIX Corp 255,763 0.0434 Orix JREIT Inc 50,866 0.01
4,839 Osaka Gas Co Ltd 92,998 0.011,328 Otsuka Corp 64,442 0.015,028 Otsuka Holdings Co Ltd 204,544 0.035,787 Pan Pacific International Holdings Corp 136,912 0.02
28,652 Panasonic Corp 305,685 0.051,233 PeptiDream Inc 62,906 0.012,277 Persol Holdings Co Ltd 41,751 0.011,518 Pigeon Corp 67,839 0.011,233 Pola Orbis Holdings Inc 24,654 0.00
11,195 Rakuten Inc 125,504 0.0217,647 Recruit Holdings Co Ltd 744,635 0.119,962 Renesas Electronics Corp 88,657 0.01
27,134 Resona Holdings Inc 95,161 0.018,729 Ricoh Co Ltd 58,347 0.01
474 Rinnai Corp 55,366 0.01
State Street CCFAnnual Report and Audited Financial Statementsfor the financial period from 18 November 2019 (Constitution date) to 30 November 2020
Schedule of Investments as at 30 November 2020 (continued)
40 State Street CCF
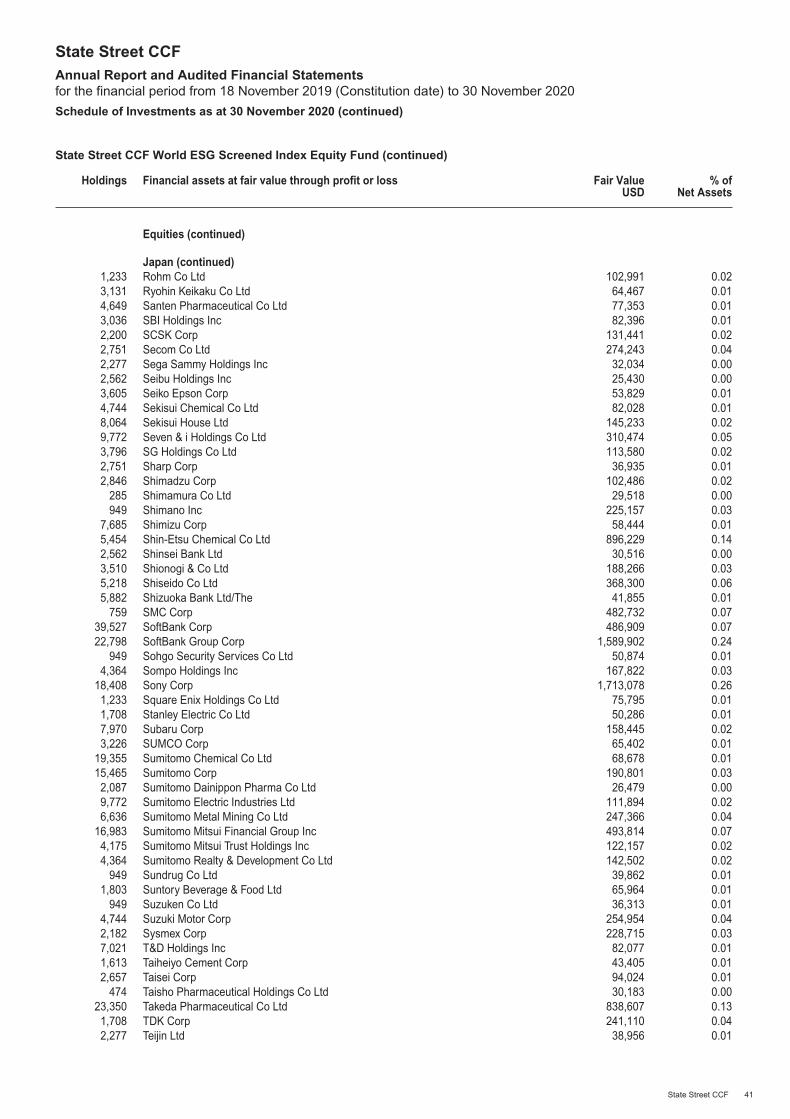
State Street CCF World ESG Screened Index Equity Fund (continued)
Holdings Financial assets at fair value through profit or loss Fair ValueUSD
% ofNet Assets
Equities (continued)
Japan (continued)1,233 Rohm Co Ltd 102,991 0.023,131 Ryohin Keikaku Co Ltd 64,467 0.014,649 Santen Pharmaceutical Co Ltd 77,353 0.013,036 SBI Holdings Inc 82,396 0.012,200 SCSK Corp 131,441 0.022,751 Secom Co Ltd 274,243 0.042,277 Sega Sammy Holdings Inc 32,034 0.002,562 Seibu Holdings Inc 25,430 0.003,605 Seiko Epson Corp 53,829 0.014,744 Sekisui Chemical Co Ltd 82,028 0.018,064 Sekisui House Ltd 145,233 0.029,772 Seven & i Holdings Co Ltd 310,474 0.053,796 SG Holdings Co Ltd 113,580 0.022,751 Sharp Corp 36,935 0.012,846 Shimadzu Corp 102,486 0.02
285 Shimamura Co Ltd 29,518 0.00949 Shimano Inc 225,157 0.03
7,685 Shimizu Corp 58,444 0.015,454 Shin-Etsu Chemical Co Ltd 896,229 0.142,562 Shinsei Bank Ltd 30,516 0.003,510 Shionogi & Co Ltd 188,266 0.035,218 Shiseido Co Ltd 368,300 0.065,882 Shizuoka Bank Ltd/The 41,855 0.01
759 SMC Corp 482,732 0.0739,527 SoftBank Corp 486,909 0.0722,798 SoftBank Group Corp 1,589,902 0.24
949 Sohgo Security Services Co Ltd 50,874 0.014,364 Sompo Holdings Inc 167,822 0.03
18,408 Sony Corp 1,713,078 0.261,233 Square Enix Holdings Co Ltd 75,795 0.011,708 Stanley Electric Co Ltd 50,286 0.017,970 Subaru Corp 158,445 0.023,226 SUMCO Corp 65,402 0.01
19,355 Sumitomo Chemical Co Ltd 68,678 0.0115,465 Sumitomo Corp 190,801 0.032,087 Sumitomo Dainippon Pharma Co Ltd 26,479 0.009,772 Sumitomo Electric Industries Ltd 111,894 0.026,636 Sumitomo Metal Mining Co Ltd 247,366 0.04
16,983 Sumitomo Mitsui Financial Group Inc 493,814 0.074,175 Sumitomo Mitsui Trust Holdings Inc 122,157 0.024,364 Sumitomo Realty & Development Co Ltd 142,502 0.02
949 Sundrug Co Ltd 39,862 0.011,803 Suntory Beverage & Food Ltd 65,964 0.01
949 Suzuken Co Ltd 36,313 0.014,744 Suzuki Motor Corp 254,954 0.042,182 Sysmex Corp 228,715 0.037,021 T&D Holdings Inc 82,077 0.011,613 Taiheiyo Cement Corp 43,405 0.012,657 Taisei Corp 94,024 0.01
474 Taisho Pharmaceutical Holdings Co Ltd 30,183 0.0023,350 Takeda Pharmaceutical Co Ltd 838,607 0.131,708 TDK Corp 241,110 0.042,277 Teijin Ltd 38,956 0.01
State Street CCFAnnual Report and Audited Financial Statementsfor the financial period from 18 November 2019 (Constitution date) to 30 November 2020
Schedule of Investments as at 30 November 2020 (continued)
State Street CCF 41
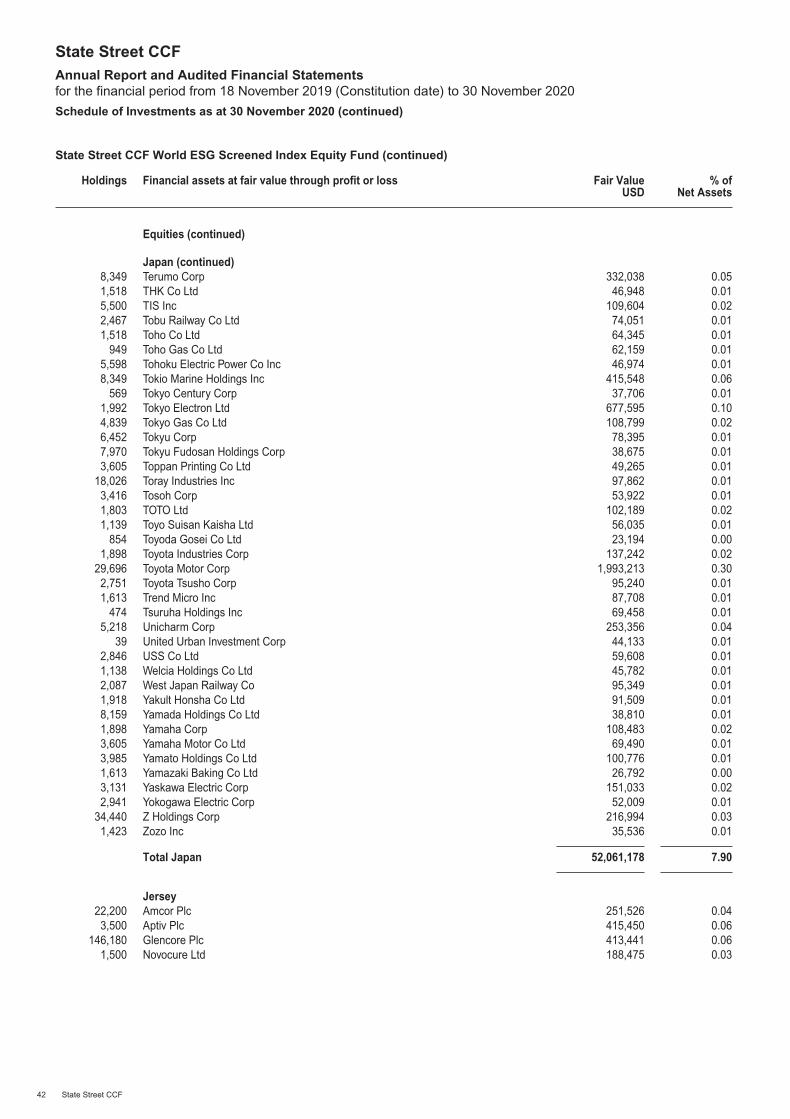
State Street CCF World ESG Screened Index Equity Fund (continued)
Holdings Financial assets at fair value through profit or loss Fair ValueUSD
% ofNet Assets
Equities (continued)
Japan (continued)8,349 Terumo Corp 332,038 0.051,518 THK Co Ltd 46,948 0.015,500 TIS Inc 109,604 0.022,467 Tobu Railway Co Ltd 74,051 0.011,518 Toho Co Ltd 64,345 0.01
949 Toho Gas Co Ltd 62,159 0.015,598 Tohoku Electric Power Co Inc 46,974 0.018,349 Tokio Marine Holdings Inc 415,548 0.06
569 Tokyo Century Corp 37,706 0.011,992 Tokyo Electron Ltd 677,595 0.104,839 Tokyo Gas Co Ltd 108,799 0.026,452 Tokyu Corp 78,395 0.017,970 Tokyu Fudosan Holdings Corp 38,675 0.013,605 Toppan Printing Co Ltd 49,265 0.01
18,026 Toray Industries Inc 97,862 0.013,416 Tosoh Corp 53,922 0.011,803 TOTO Ltd 102,189 0.021,139 Toyo Suisan Kaisha Ltd 56,035 0.01
854 Toyoda Gosei Co Ltd 23,194 0.001,898 Toyota Industries Corp 137,242 0.02
29,696 Toyota Motor Corp 1,993,213 0.302,751 Toyota Tsusho Corp 95,240 0.011,613 Trend Micro Inc 87,708 0.01
474 Tsuruha Holdings Inc 69,458 0.015,218 Unicharm Corp 253,356 0.04
39 United Urban Investment Corp 44,133 0.012,846 USS Co Ltd 59,608 0.011,138 Welcia Holdings Co Ltd 45,782 0.012,087 West Japan Railway Co 95,349 0.011,918 Yakult Honsha Co Ltd 91,509 0.018,159 Yamada Holdings Co Ltd 38,810 0.011,898 Yamaha Corp 108,483 0.023,605 Yamaha Motor Co Ltd 69,490 0.013,985 Yamato Holdings Co Ltd 100,776 0.011,613 Yamazaki Baking Co Ltd 26,792 0.003,131 Yaskawa Electric Corp 151,033 0.022,941 Yokogawa Electric Corp 52,009 0.01
34,440 Z Holdings Corp 216,994 0.031,423 Zozo Inc 35,536 0.01
Total Japan 52,061,178 7.90
Jersey22,200 Amcor Plc 251,526 0.043,500 Aptiv Plc 415,450 0.06
146,180 Glencore Plc 413,441 0.061,500 Novocure Ltd 188,475 0.03
State Street CCFAnnual Report and Audited Financial Statementsfor the financial period from 18 November 2019 (Constitution date) to 30 November 2020
Schedule of Investments as at 30 November 2020 (continued)
42 State Street CCF
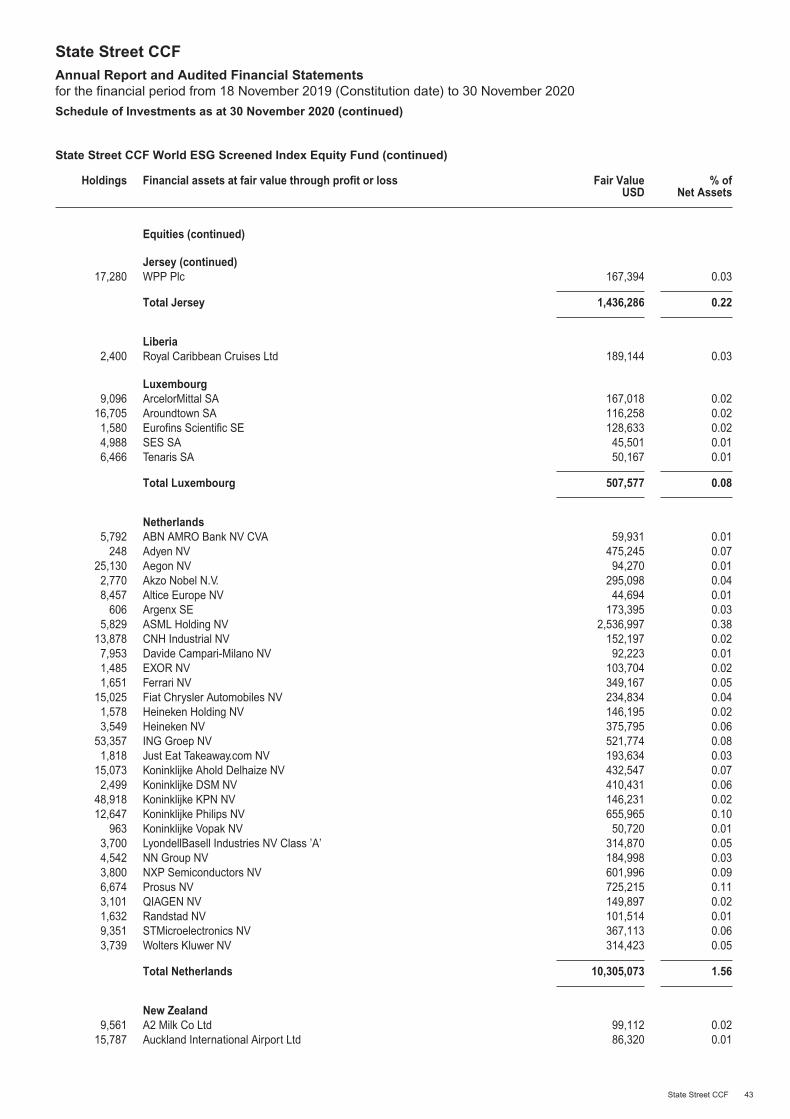
State Street CCF World ESG Screened Index Equity Fund (continued)
Holdings Financial assets at fair value through profit or loss Fair ValueUSD
% ofNet Assets
Equities (continued)
Jersey (continued)17,280 WPP Plc 167,394 0.03
Total Jersey 1,436,286 0.22
Liberia2,400 Royal Caribbean Cruises Ltd 189,144 0.03
Luxembourg9,096 ArcelorMittal SA 167,018 0.02
16,705 Aroundtown SA 116,258 0.021,580 Eurofins Scientific SE 128,633 0.024,988 SES SA 45,501 0.016,466 Tenaris SA 50,167 0.01
Total Luxembourg 507,577 0.08
Netherlands5,792 ABN AMRO Bank NV CVA 59,931 0.01
248 Adyen NV 475,245 0.0725,130 Aegon NV 94,270 0.012,770 Akzo Nobel N.V. 295,098 0.048,457 Altice Europe NV 44,694 0.01
606 Argenx SE 173,395 0.035,829 ASML Holding NV 2,536,997 0.38
13,878 CNH Industrial NV 152,197 0.027,953 Davide Campari-Milano NV 92,223 0.011,485 EXOR NV 103,704 0.021,651 Ferrari NV 349,167 0.05
15,025 Fiat Chrysler Automobiles NV 234,834 0.041,578 Heineken Holding NV 146,195 0.023,549 Heineken NV 375,795 0.06
53,357 ING Groep NV 521,774 0.081,818 Just Eat Takeaway.com NV 193,634 0.03
15,073 Koninklijke Ahold Delhaize NV 432,547 0.072,499 Koninklijke DSM NV 410,431 0.06
48,918 Koninklijke KPN NV 146,231 0.0212,647 Koninklijke Philips NV 655,965 0.10
963 Koninklijke Vopak NV 50,720 0.013,700 LyondellBasell Industries NV Class ’A’ 314,870 0.054,542 NN Group NV 184,998 0.033,800 NXP Semiconductors NV 601,996 0.096,674 Prosus NV 725,215 0.113,101 QIAGEN NV 149,897 0.021,632 Randstad NV 101,514 0.019,351 STMicroelectronics NV 367,113 0.063,739 Wolters Kluwer NV 314,423 0.05
Total Netherlands 10,305,073 1.56
New Zealand9,561 A2 Milk Co Ltd 99,112 0.02
15,787 Auckland International Airport Ltd 86,320 0.01
State Street CCFAnnual Report and Audited Financial Statementsfor the financial period from 18 November 2019 (Constitution date) to 30 November 2020
Schedule of Investments as at 30 November 2020 (continued)
State Street CCF 43
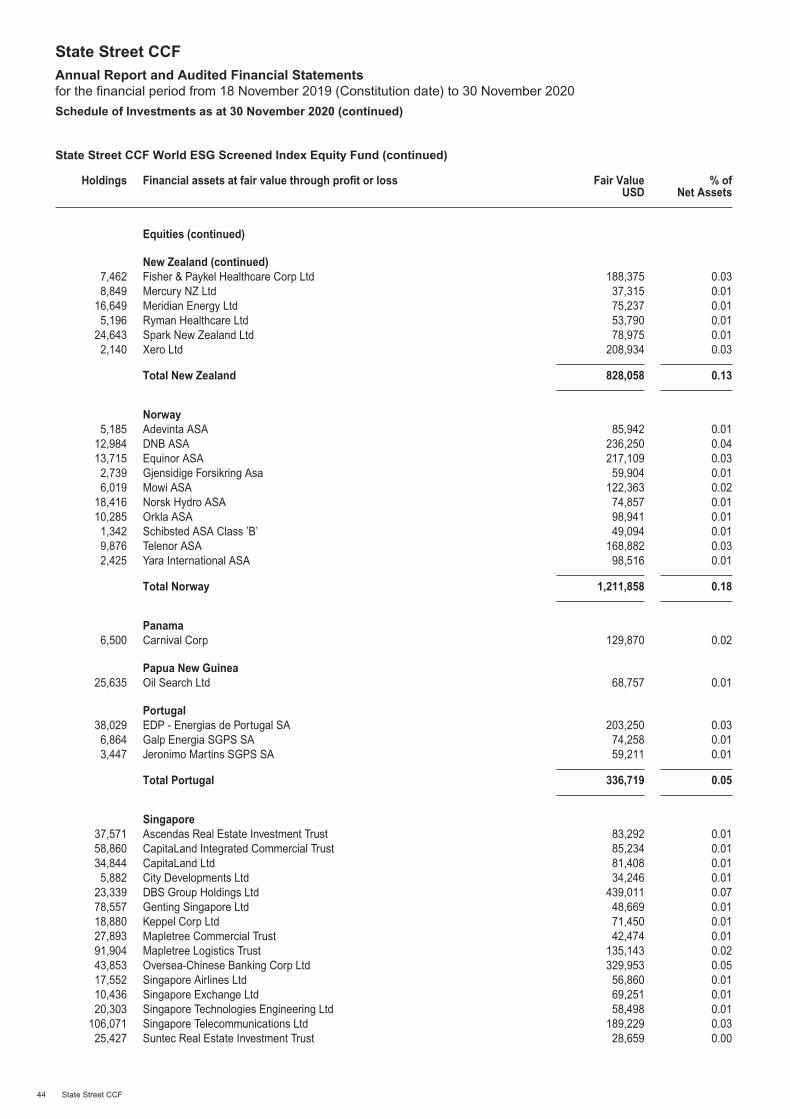
State Street CCF World ESG Screened Index Equity Fund (continued)
Holdings Financial assets at fair value through profit or loss Fair ValueUSD
% ofNet Assets
Equities (continued)
New Zealand (continued)7,462 Fisher & Paykel Healthcare Corp Ltd 188,375 0.038,849 Mercury NZ Ltd 37,315 0.01
16,649 Meridian Energy Ltd 75,237 0.015,196 Ryman Healthcare Ltd 53,790 0.01
24,643 Spark New Zealand Ltd 78,975 0.012,140 Xero Ltd 208,934 0.03
Total New Zealand 828,058 0.13
Norway5,185 Adevinta ASA 85,942 0.01
12,984 DNB ASA 236,250 0.0413,715 Equinor ASA 217,109 0.032,739 Gjensidige Forsikring Asa 59,904 0.016,019 Mowi ASA 122,363 0.02
18,416 Norsk Hydro ASA 74,857 0.0110,285 Orkla ASA 98,941 0.011,342 Schibsted ASA Class ’B’ 49,094 0.019,876 Telenor ASA 168,882 0.032,425 Yara International ASA 98,516 0.01
Total Norway 1,211,858 0.18
Panama6,500 Carnival Corp 129,870 0.02
Papua New Guinea25,635 Oil Search Ltd 68,757 0.01
Portugal38,029 EDP - Energias de Portugal SA 203,250 0.036,864 Galp Energia SGPS SA 74,258 0.013,447 Jeronimo Martins SGPS SA 59,211 0.01
Total Portugal 336,719 0.05
Singapore37,571 Ascendas Real Estate Investment Trust 83,292 0.0158,860 CapitaLand Integrated Commercial Trust 85,234 0.0134,844 CapitaLand Ltd 81,408 0.015,882 City Developments Ltd 34,246 0.01
23,339 DBS Group Holdings Ltd 439,011 0.0778,557 Genting Singapore Ltd 48,669 0.0118,880 Keppel Corp Ltd 71,450 0.0127,893 Mapletree Commercial Trust 42,474 0.0191,904 Mapletree Logistics Trust 135,143 0.0243,853 Oversea-Chinese Banking Corp Ltd 329,953 0.0517,552 Singapore Airlines Ltd 56,860 0.0110,436 Singapore Exchange Ltd 69,251 0.0120,303 Singapore Technologies Engineering Ltd 58,498 0.01
106,071 Singapore Telecommunications Ltd 189,229 0.0325,427 Suntec Real Estate Investment Trust 28,659 0.00
State Street CCFAnnual Report and Audited Financial Statementsfor the financial period from 18 November 2019 (Constitution date) to 30 November 2020
Schedule of Investments as at 30 November 2020 (continued)
44 State Street CCF
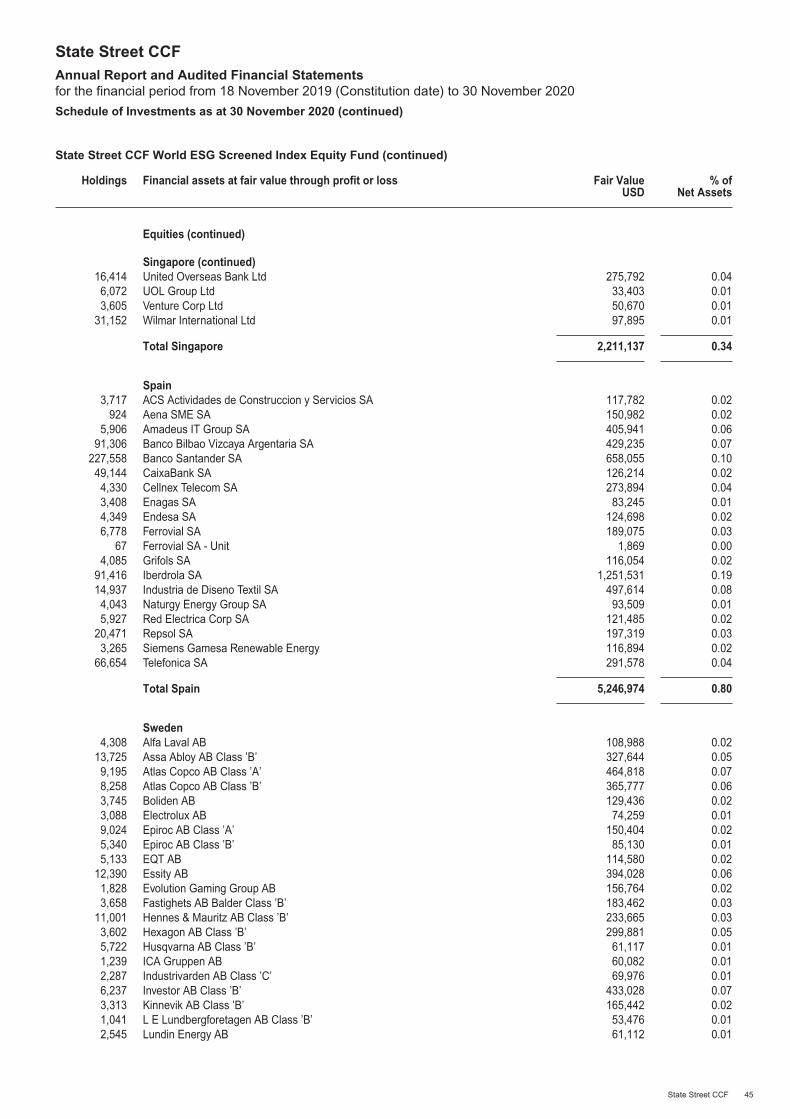
State Street CCF World ESG Screened Index Equity Fund (continued)
Holdings Financial assets at fair value through profit or loss Fair ValueUSD
% ofNet Assets
Equities (continued)
Singapore (continued)16,414 United Overseas Bank Ltd 275,792 0.046,072 UOL Group Ltd 33,403 0.013,605 Venture Corp Ltd 50,670 0.01
31,152 Wilmar International Ltd 97,895 0.01
Total Singapore 2,211,137 0.34
Spain3,717 ACS Actividades de Construccion y Servicios SA 117,782 0.02
924 Aena SME SA 150,982 0.025,906 Amadeus IT Group SA 405,941 0.06
91,306 Banco Bilbao Vizcaya Argentaria SA 429,235 0.07227,558 Banco Santander SA 658,055 0.1049,144 CaixaBank SA 126,214 0.024,330 Cellnex Telecom SA 273,894 0.043,408 Enagas SA 83,245 0.014,349 Endesa SA 124,698 0.026,778 Ferrovial SA 189,075 0.03
67 Ferrovial SA - Unit 1,869 0.004,085 Grifols SA 116,054 0.02
91,416 Iberdrola SA 1,251,531 0.1914,937 Industria de Diseno Textil SA 497,614 0.084,043 Naturgy Energy Group SA 93,509 0.015,927 Red Electrica Corp SA 121,485 0.02
20,471 Repsol SA 197,319 0.033,265 Siemens Gamesa Renewable Energy 116,894 0.02
66,654 Telefonica SA 291,578 0.04
Total Spain 5,246,974 0.80
Sweden4,308 Alfa Laval AB 108,988 0.02
13,725 Assa Abloy AB Class ’B’ 327,644 0.059,195 Atlas Copco AB Class ’A’ 464,818 0.078,258 Atlas Copco AB Class ’B’ 365,777 0.063,745 Boliden AB 129,436 0.023,088 Electrolux AB 74,259 0.019,024 Epiroc AB Class ’A’ 150,404 0.025,340 Epiroc AB Class ’B’ 85,130 0.015,133 EQT AB 114,580 0.02
12,390 Essity AB 394,028 0.061,828 Evolution Gaming Group AB 156,764 0.023,658 Fastighets AB Balder Class ’B’ 183,462 0.03
11,001 Hennes & Mauritz AB Class ’B’ 233,665 0.033,602 Hexagon AB Class ’B’ 299,881 0.055,722 Husqvarna AB Class ’B’ 61,117 0.011,239 ICA Gruppen AB 60,082 0.012,287 Industrivarden AB Class ’C’ 69,976 0.016,237 Investor AB Class ’B’ 433,028 0.073,313 Kinnevik AB Class ’B’ 165,442 0.021,041 L E Lundbergforetagen AB Class ’B’ 53,476 0.012,545 Lundin Energy AB 61,112 0.01
State Street CCFAnnual Report and Audited Financial Statementsfor the financial period from 18 November 2019 (Constitution date) to 30 November 2020
Schedule of Investments as at 30 November 2020 (continued)
State Street CCF 45
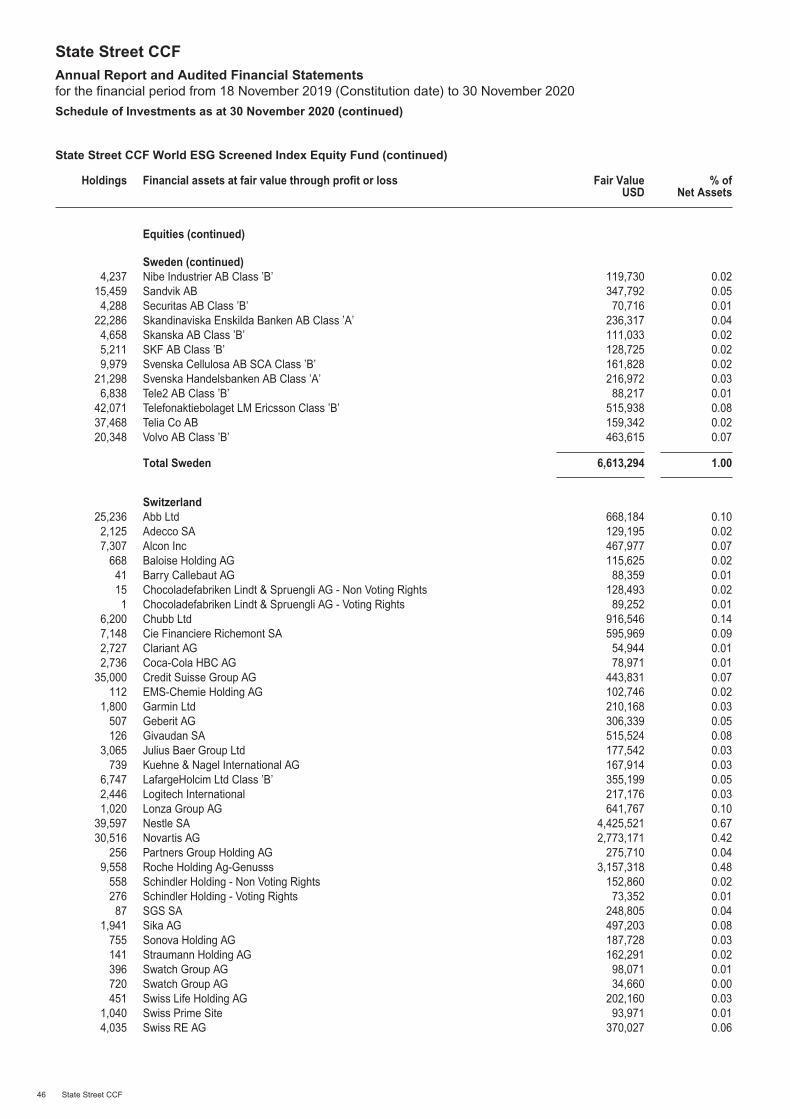
State Street CCF World ESG Screened Index Equity Fund (continued)
Holdings Financial assets at fair value through profit or loss Fair ValueUSD
% ofNet Assets
Equities (continued)
Sweden (continued)4,237 Nibe Industrier AB Class ’B’ 119,730 0.02
15,459 Sandvik AB 347,792 0.054,288 Securitas AB Class ’B’ 70,716 0.01
22,286 Skandinaviska Enskilda Banken AB Class ’A’ 236,317 0.044,658 Skanska AB Class ’B’ 111,033 0.025,211 SKF AB Class ’B’ 128,725 0.029,979 Svenska Cellulosa AB SCA Class ’B’ 161,828 0.02
21,298 Svenska Handelsbanken AB Class ’A’ 216,972 0.036,838 Tele2 AB Class ’B’ 88,217 0.01
42,071 Telefonaktiebolaget LM Ericsson Class ’B’ 515,938 0.0837,468 Telia Co AB 159,342 0.0220,348 Volvo AB Class ’B’ 463,615 0.07
Total Sweden 6,613,294 1.00
Switzerland25,236 Abb Ltd 668,184 0.102,125 Adecco SA 129,195 0.027,307 Alcon Inc 467,977 0.07
668 Baloise Holding AG 115,625 0.0241 Barry Callebaut AG 88,359 0.0115 Chocoladefabriken Lindt & Spruengli AG - Non Voting Rights 128,493 0.021 Chocoladefabriken Lindt & Spruengli AG - Voting Rights 89,252 0.01
6,200 Chubb Ltd 916,546 0.147,148 Cie Financiere Richemont SA 595,969 0.092,727 Clariant AG 54,944 0.012,736 Coca-Cola HBC AG 78,971 0.01
35,000 Credit Suisse Group AG 443,831 0.07112 EMS-Chemie Holding AG 102,746 0.02
1,800 Garmin Ltd 210,168 0.03507 Geberit AG 306,339 0.05126 Givaudan SA 515,524 0.08
3,065 Julius Baer Group Ltd 177,542 0.03739 Kuehne & Nagel International AG 167,914 0.03
6,747 LafargeHolcim Ltd Class ’B’ 355,199 0.052,446 Logitech International 217,176 0.031,020 Lonza Group AG 641,767 0.10
39,597 Nestle SA 4,425,521 0.6730,516 Novartis AG 2,773,171 0.42
256 Partners Group Holding AG 275,710 0.049,558 Roche Holding Ag-Genusss 3,157,318 0.48
558 Schindler Holding - Non Voting Rights 152,860 0.02276 Schindler Holding - Voting Rights 73,352 0.0187 SGS SA 248,805 0.04
1,941 Sika AG 497,203 0.08755 Sonova Holding AG 187,728 0.03141 Straumann Holding AG 162,291 0.02396 Swatch Group AG 98,071 0.01720 Swatch Group AG 34,660 0.00451 Swiss Life Holding AG 202,160 0.03
1,040 Swiss Prime Site 93,971 0.014,035 Swiss RE AG 370,027 0.06
State Street CCFAnnual Report and Audited Financial Statementsfor the financial period from 18 November 2019 (Constitution date) to 30 November 2020
Schedule of Investments as at 30 November 2020 (continued)
46 State Street CCF
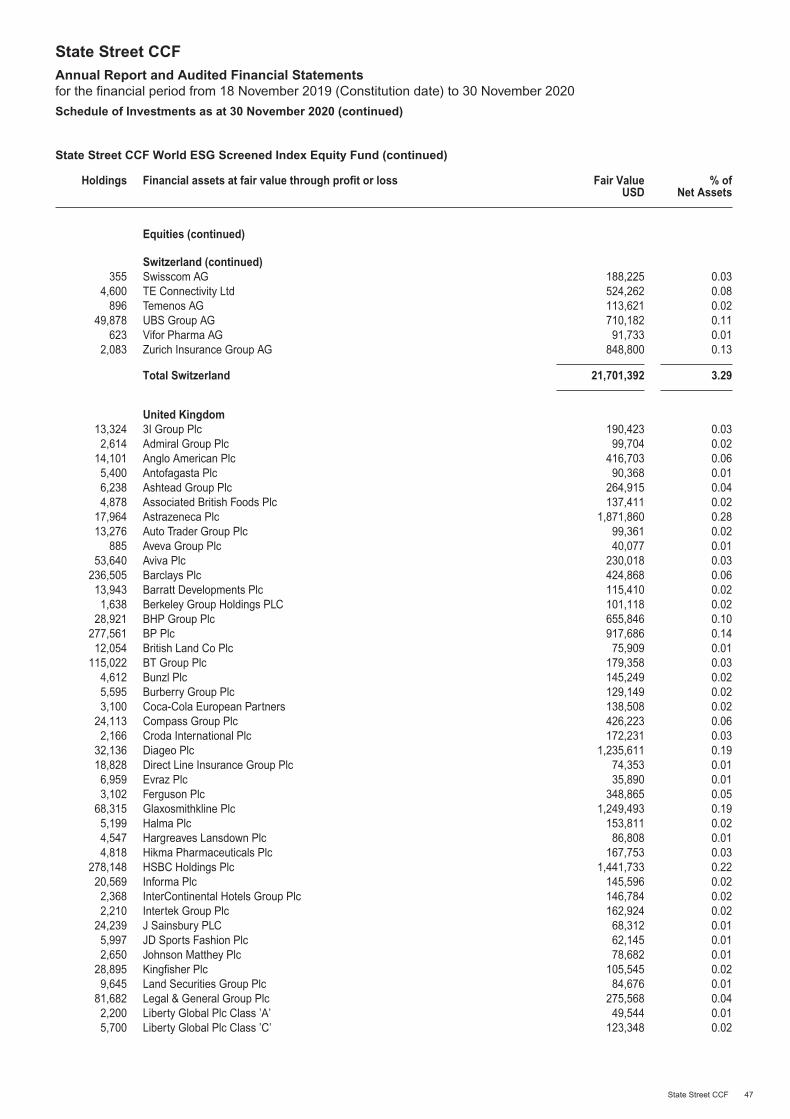
State Street CCF World ESG Screened Index Equity Fund (continued)
Holdings Financial assets at fair value through profit or loss Fair ValueUSD
% ofNet Assets
Equities (continued)
Switzerland (continued)355 Swisscom AG 188,225 0.03
4,600 TE Connectivity Ltd 524,262 0.08896 Temenos AG 113,621 0.02
49,878 UBS Group AG 710,182 0.11623 Vifor Pharma AG 91,733 0.01
2,083 Zurich Insurance Group AG 848,800 0.13
Total Switzerland 21,701,392 3.29
United Kingdom13,324 3I Group Plc 190,423 0.032,614 Admiral Group Plc 99,704 0.02
14,101 Anglo American Plc 416,703 0.065,400 Antofagasta Plc 90,368 0.016,238 Ashtead Group Plc 264,915 0.044,878 Associated British Foods Plc 137,411 0.02
17,964 Astrazeneca Plc 1,871,860 0.2813,276 Auto Trader Group Plc 99,361 0.02
885 Aveva Group Plc 40,077 0.0153,640 Aviva Plc 230,018 0.03
236,505 Barclays Plc 424,868 0.0613,943 Barratt Developments Plc 115,410 0.021,638 Berkeley Group Holdings PLC 101,118 0.02
28,921 BHP Group Plc 655,846 0.10277,561 BP Plc 917,686 0.1412,054 British Land Co Plc 75,909 0.01
115,022 BT Group Plc 179,358 0.034,612 Bunzl Plc 145,249 0.025,595 Burberry Group Plc 129,149 0.023,100 Coca-Cola European Partners 138,508 0.02
24,113 Compass Group Plc 426,223 0.062,166 Croda International Plc 172,231 0.03
32,136 Diageo Plc 1,235,611 0.1918,828 Direct Line Insurance Group Plc 74,353 0.016,959 Evraz Plc 35,890 0.013,102 Ferguson Plc 348,865 0.05
68,315 Glaxosmithkline Plc 1,249,493 0.195,199 Halma Plc 153,811 0.024,547 Hargreaves Lansdown Plc 86,808 0.014,818 Hikma Pharmaceuticals Plc 167,753 0.03
278,148 HSBC Holdings Plc 1,441,733 0.2220,569 Informa Plc 145,596 0.022,368 InterContinental Hotels Group Plc 146,784 0.022,210 Intertek Group Plc 162,924 0.02
24,239 J Sainsbury PLC 68,312 0.015,997 JD Sports Fashion Plc 62,145 0.012,650 Johnson Matthey Plc 78,682 0.01
28,895 Kingfisher Plc 105,545 0.029,645 Land Securities Group Plc 84,676 0.01
81,682 Legal & General Group Plc 275,568 0.042,200 Liberty Global Plc Class ’A’ 49,544 0.015,700 Liberty Global Plc Class ’C’ 123,348 0.02
State Street CCFAnnual Report and Audited Financial Statementsfor the financial period from 18 November 2019 (Constitution date) to 30 November 2020
Schedule of Investments as at 30 November 2020 (continued)
State Street CCF 47
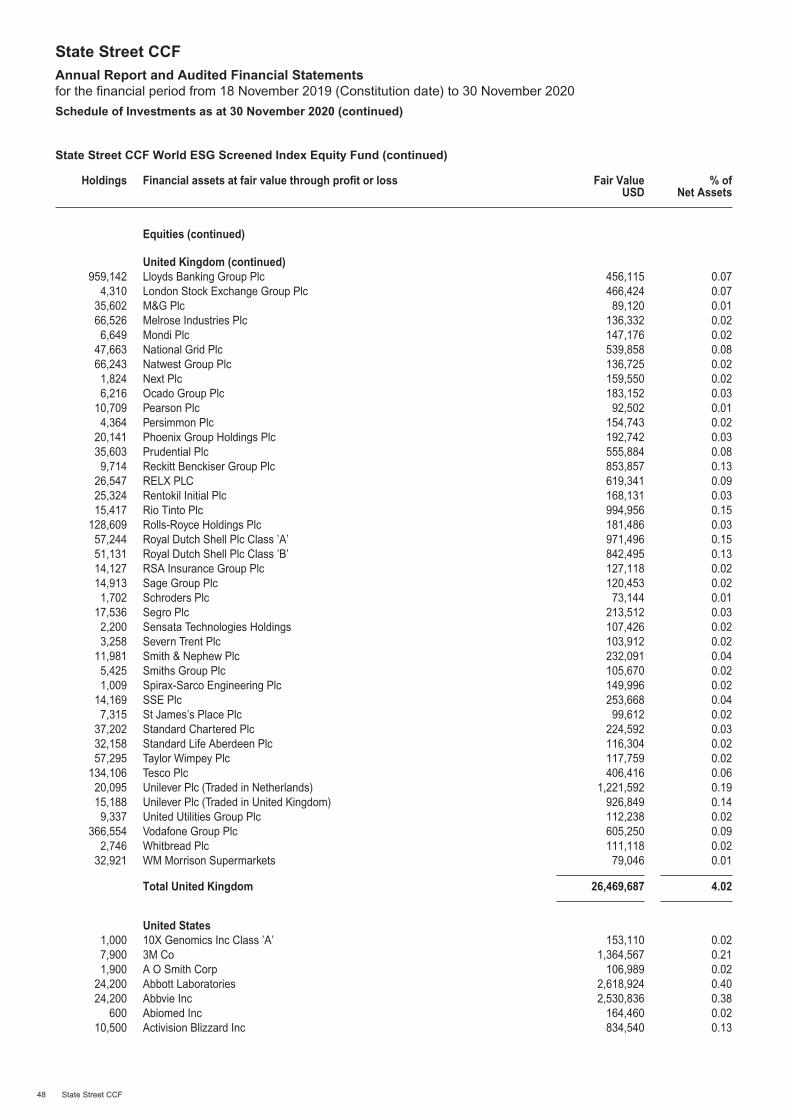
State Street CCF World ESG Screened Index Equity Fund (continued)
Holdings Financial assets at fair value through profit or loss Fair ValueUSD
% ofNet Assets
Equities (continued)
United Kingdom (continued)959,142 Lloyds Banking Group Plc 456,115 0.07
4,310 London Stock Exchange Group Plc 466,424 0.0735,602 M&G Plc 89,120 0.0166,526 Melrose Industries Plc 136,332 0.026,649 Mondi Plc 147,176 0.02
47,663 National Grid Plc 539,858 0.0866,243 Natwest Group Plc 136,725 0.021,824 Next Plc 159,550 0.026,216 Ocado Group Plc 183,152 0.03
10,709 Pearson Plc 92,502 0.014,364 Persimmon Plc 154,743 0.02
20,141 Phoenix Group Holdings Plc 192,742 0.0335,603 Prudential Plc 555,884 0.089,714 Reckitt Benckiser Group Plc 853,857 0.13
26,547 RELX PLC 619,341 0.0925,324 Rentokil Initial Plc 168,131 0.0315,417 Rio Tinto Plc 994,956 0.15
128,609 Rolls-Royce Holdings Plc 181,486 0.0357,244 Royal Dutch Shell Plc Class ’A’ 971,496 0.1551,131 Royal Dutch Shell Plc Class ’B’ 842,495 0.1314,127 RSA Insurance Group Plc 127,118 0.0214,913 Sage Group Plc 120,453 0.021,702 Schroders Plc 73,144 0.01
17,536 Segro Plc 213,512 0.032,200 Sensata Technologies Holdings 107,426 0.023,258 Severn Trent Plc 103,912 0.02
11,981 Smith & Nephew Plc 232,091 0.045,425 Smiths Group Plc 105,670 0.021,009 Spirax-Sarco Engineering Plc 149,996 0.02
14,169 SSE Plc 253,668 0.047,315 St James’s Place Plc 99,612 0.02
37,202 Standard Chartered Plc 224,592 0.0332,158 Standard Life Aberdeen Plc 116,304 0.0257,295 Taylor Wimpey Plc 117,759 0.02
134,106 Tesco Plc 406,416 0.0620,095 Unilever Plc (Traded in Netherlands) 1,221,592 0.1915,188 Unilever Plc (Traded in United Kingdom) 926,849 0.149,337 United Utilities Group Plc 112,238 0.02
366,554 Vodafone Group Plc 605,250 0.092,746 Whitbread Plc 111,118 0.02
32,921 WM Morrison Supermarkets 79,046 0.01
Total United Kingdom 26,469,687 4.02
United States1,000 10X Genomics Inc Class ’A’ 153,110 0.027,900 3M Co 1,364,567 0.211,900 A O Smith Corp 106,989 0.02
24,200 Abbott Laboratories 2,618,924 0.4024,200 Abbvie Inc 2,530,836 0.38
600 Abiomed Inc 164,460 0.0210,500 Activision Blizzard Inc 834,540 0.13
State Street CCFAnnual Report and Audited Financial Statementsfor the financial period from 18 November 2019 (Constitution date) to 30 November 2020
Schedule of Investments as at 30 November 2020 (continued)
48 State Street CCF
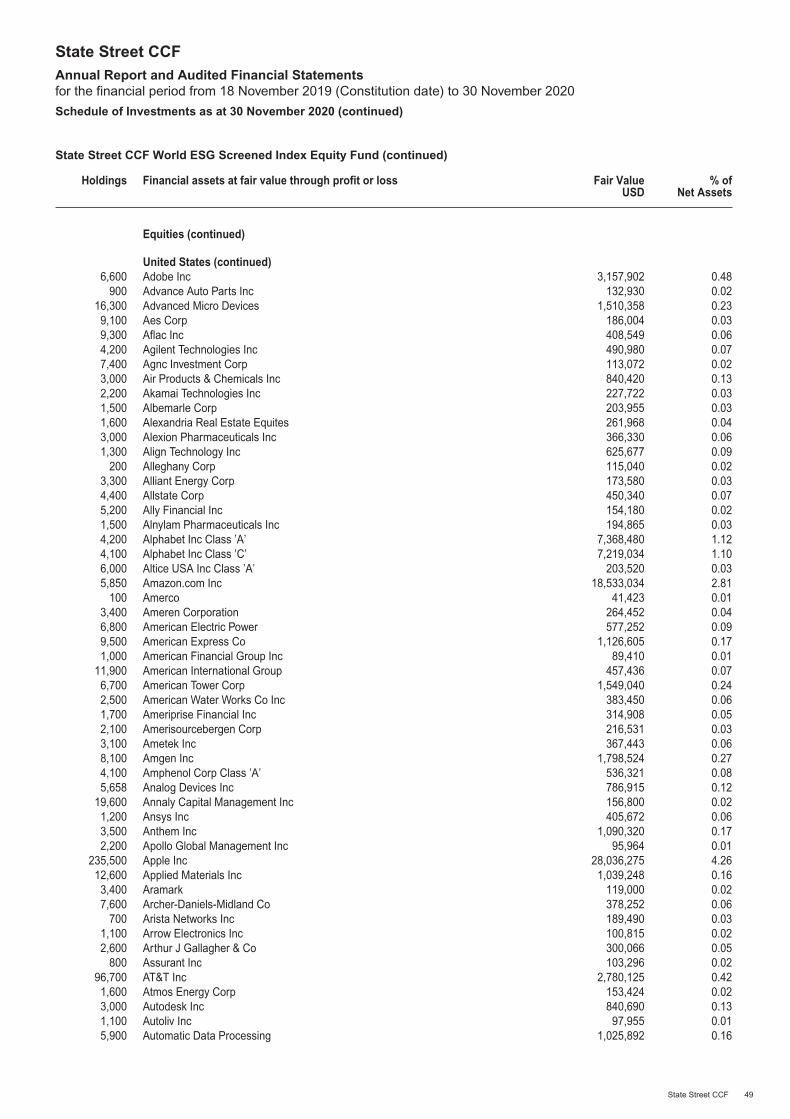
State Street CCF World ESG Screened Index Equity Fund (continued)
Holdings Financial assets at fair value through profit or loss Fair ValueUSD
% ofNet Assets
Equities (continued)
United States (continued)6,600 Adobe Inc 3,157,902 0.48
900 Advance Auto Parts Inc 132,930 0.0216,300 Advanced Micro Devices 1,510,358 0.239,100 Aes Corp 186,004 0.039,300 Aflac Inc 408,549 0.064,200 Agilent Technologies Inc 490,980 0.077,400 Agnc Investment Corp 113,072 0.023,000 Air Products & Chemicals Inc 840,420 0.132,200 Akamai Technologies Inc 227,722 0.031,500 Albemarle Corp 203,955 0.031,600 Alexandria Real Estate Equites 261,968 0.043,000 Alexion Pharmaceuticals Inc 366,330 0.061,300 Align Technology Inc 625,677 0.09
200 Alleghany Corp 115,040 0.023,300 Alliant Energy Corp 173,580 0.034,400 Allstate Corp 450,340 0.075,200 Ally Financial Inc 154,180 0.021,500 Alnylam Pharmaceuticals Inc 194,865 0.034,200 Alphabet Inc Class ’A’ 7,368,480 1.124,100 Alphabet Inc Class ’C’ 7,219,034 1.106,000 Altice USA Inc Class ’A’ 203,520 0.035,850 Amazon.com Inc 18,533,034 2.81
100 Amerco 41,423 0.013,400 Ameren Corporation 264,452 0.046,800 American Electric Power 577,252 0.099,500 American Express Co 1,126,605 0.171,000 American Financial Group Inc 89,410 0.01
11,900 American International Group 457,436 0.076,700 American Tower Corp 1,549,040 0.242,500 American Water Works Co Inc 383,450 0.061,700 Ameriprise Financial Inc 314,908 0.052,100 Amerisourcebergen Corp 216,531 0.033,100 Ametek Inc 367,443 0.068,100 Amgen Inc 1,798,524 0.274,100 Amphenol Corp Class ’A’ 536,321 0.085,658 Analog Devices Inc 786,915 0.12
19,600 Annaly Capital Management Inc 156,800 0.021,200 Ansys Inc 405,672 0.063,500 Anthem Inc 1,090,320 0.172,200 Apollo Global Management Inc 95,964 0.01
235,500 Apple Inc 28,036,275 4.2612,600 Applied Materials Inc 1,039,248 0.163,400 Aramark 119,000 0.027,600 Archer-Daniels-Midland Co 378,252 0.06
700 Arista Networks Inc 189,490 0.031,100 Arrow Electronics Inc 100,815 0.022,600 Arthur J Gallagher & Co 300,066 0.05
800 Assurant Inc 103,296 0.0296,700 AT&T Inc 2,780,125 0.421,600 Atmos Energy Corp 153,424 0.023,000 Autodesk Inc 840,690 0.131,100 Autoliv Inc 97,955 0.015,900 Automatic Data Processing 1,025,892 0.16
State Street CCFAnnual Report and Audited Financial Statementsfor the financial period from 18 November 2019 (Constitution date) to 30 November 2020
Schedule of Investments as at 30 November 2020 (continued)
State Street CCF 49

State Street CCF World ESG Screened Index Equity Fund (continued)
Holdings Financial assets at fair value through profit or loss Fair ValueUSD
% ofNet Assets
Equities (continued)
United States (continued)300 Autozone Inc 341,295 0.05
1,000 Avalara Inc 171,750 0.031,900 Avalonbay Communities Inc 316,521 0.056,100 Avantor Inc 166,408 0.031,100 Avery Dennison Corp 164,274 0.028,900 Baker Hughes Co 166,608 0.034,300 Ball Corp 412,843 0.06
107,400 Bank of America Corp 3,024,384 0.4611,400 Bank of New York Mellon Corp 445,968 0.076,600 Baxter International Inc 502,062 0.084,400 Becton Dickinson and Co 1,033,296 0.16
18,900 Berkshire Hathaway Inc Class ’B’ 4,326,399 0.663,200 Best Buy Co Inc 348,160 0.052,200 Biogen Inc 528,374 0.082,500 Biomarin Pharmaceutical Inc 196,750 0.03
300 Bio-Rad Laboratories Class ’A’ 161,550 0.022,000 Black Knight Inc 183,240 0.032,000 Blackrock Inc 1,396,700 0.219,000 Blackstone Group Inc Class ’A’ 535,950 0.08
600 Booking Holdings Inc 1,217,070 0.181,900 Booz Allen Hamilton Holdings 164,901 0.022,800 Borgwarner Inc 108,780 0.022,100 Boston Properties Inc 206,136 0.03
19,100 Boston Scientific Corp 633,165 0.1032,100 Bristol-Myers Squibb Co 2,003,040 0.305,400 Broadcom Inc 2,168,532 0.331,600 Broadridge Financial Solutions Inc 235,008 0.043,300 Brown & Brown Inc 148,599 0.024,200 Brown-Forman Corp Class ’B’ 338,772 0.05
900 Burlington Stores Inc 196,686 0.031,900 C.H. Robinson Worldwide Inc 178,543 0.03
100 Cable One Inc 198,067 0.035,600 Cabot Oil & Gas Corp 98,112 0.013,800 Cadence Design Systems Inc 441,940 0.071,300 Camden Property Trust 128,479 0.022,300 Campbell Soup Co 115,046 0.026,400 Capital One Financial Corp 548,096 0.084,000 Cardinal Health Inc 218,360 0.032,300 CarMax Inc 215,004 0.03
11,200 Carrier Global Corp 426,384 0.06900 Carvana Co 225,189 0.03
2,000 Catalent Inc 192,280 0.037,600 Caterpillar Inc 1,319,284 0.201,500 Cboe Global Markets Inc 136,980 0.024,400 CBRE Group Inc Class ’A’ 269,016 0.042,000 CDW Corp 260,980 0.041,700 Celanese Corp 219,861 0.038,000 Centene Corp 493,200 0.076,900 CenterPoint Energy Inc 160,011 0.02
13,400 CenturyLink Inc 140,030 0.022,200 Ceridian HCM Holding Inc 212,124 0.034,300 Cerner Corp 321,812 0.053,000 CF Industries Holdings Inc 111,900 0.02
State Street CCFAnnual Report and Audited Financial Statementsfor the financial period from 18 November 2019 (Constitution date) to 30 November 2020
Schedule of Investments as at 30 November 2020 (continued)
50 State Street CCF
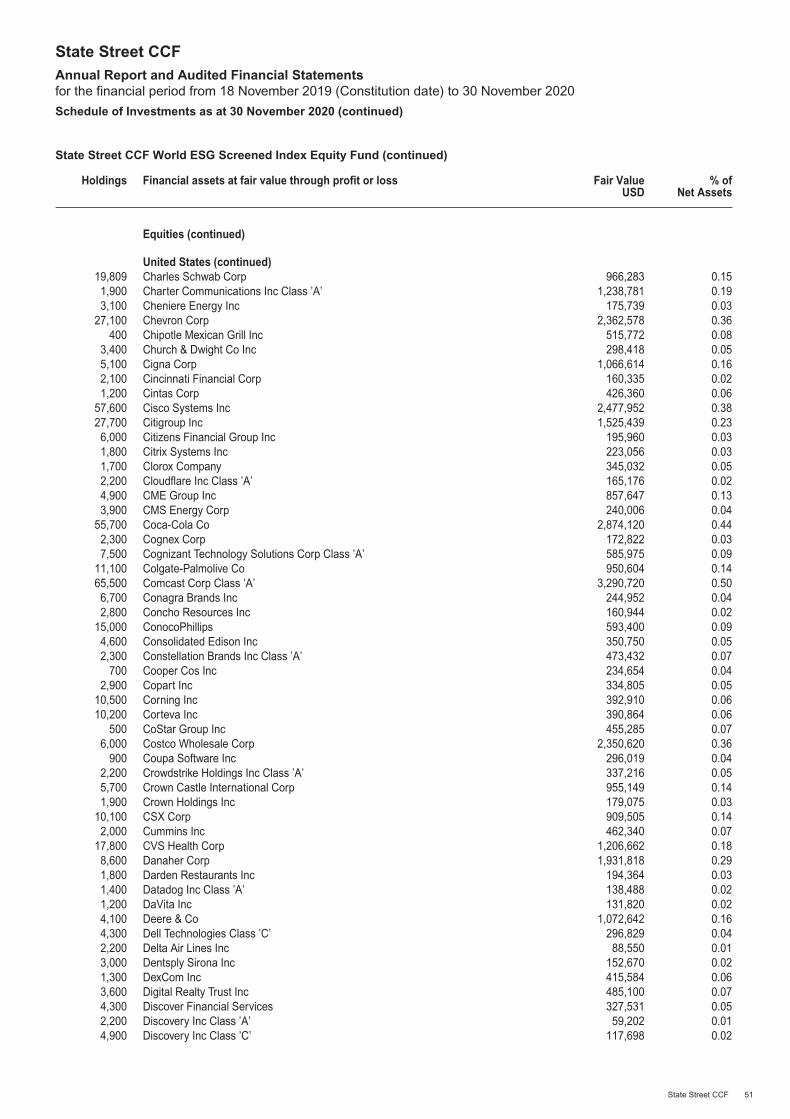
State Street CCF World ESG Screened Index Equity Fund (continued)
Holdings Financial assets at fair value through profit or loss Fair ValueUSD
% ofNet Assets
Equities (continued)
United States (continued)19,809 Charles Schwab Corp 966,283 0.151,900 Charter Communications Inc Class ’A’ 1,238,781 0.193,100 Cheniere Energy Inc 175,739 0.03
27,100 Chevron Corp 2,362,578 0.36400 Chipotle Mexican Grill Inc 515,772 0.08
3,400 Church & Dwight Co Inc 298,418 0.055,100 Cigna Corp 1,066,614 0.162,100 Cincinnati Financial Corp 160,335 0.021,200 Cintas Corp 426,360 0.06
57,600 Cisco Systems Inc 2,477,952 0.3827,700 Citigroup Inc 1,525,439 0.236,000 Citizens Financial Group Inc 195,960 0.031,800 Citrix Systems Inc 223,056 0.031,700 Clorox Company 345,032 0.052,200 Cloudflare Inc Class ’A’ 165,176 0.024,900 CME Group Inc 857,647 0.133,900 CMS Energy Corp 240,006 0.04
55,700 Coca-Cola Co 2,874,120 0.442,300 Cognex Corp 172,822 0.037,500 Cognizant Technology Solutions Corp Class ’A’ 585,975 0.09
11,100 Colgate-Palmolive Co 950,604 0.1465,500 Comcast Corp Class ’A’ 3,290,720 0.506,700 Conagra Brands Inc 244,952 0.042,800 Concho Resources Inc 160,944 0.02
15,000 ConocoPhillips 593,400 0.094,600 Consolidated Edison Inc 350,750 0.052,300 Constellation Brands Inc Class ’A’ 473,432 0.07
700 Cooper Cos Inc 234,654 0.042,900 Copart Inc 334,805 0.05
10,500 Corning Inc 392,910 0.0610,200 Corteva Inc 390,864 0.06
500 CoStar Group Inc 455,285 0.076,000 Costco Wholesale Corp 2,350,620 0.36
900 Coupa Software Inc 296,019 0.042,200 Crowdstrike Holdings Inc Class ’A’ 337,216 0.055,700 Crown Castle International Corp 955,149 0.141,900 Crown Holdings Inc 179,075 0.03
10,100 CSX Corp 909,505 0.142,000 Cummins Inc 462,340 0.07
17,800 CVS Health Corp 1,206,662 0.188,600 Danaher Corp 1,931,818 0.291,800 Darden Restaurants Inc 194,364 0.031,400 Datadog Inc Class ’A’ 138,488 0.021,200 DaVita Inc 131,820 0.024,100 Deere & Co 1,072,642 0.164,300 Dell Technologies Class ’C’ 296,829 0.042,200 Delta Air Lines Inc 88,550 0.013,000 Dentsply Sirona Inc 152,670 0.021,300 DexCom Inc 415,584 0.063,600 Digital Realty Trust Inc 485,100 0.074,300 Discover Financial Services 327,531 0.052,200 Discovery Inc Class ’A’ 59,202 0.014,900 Discovery Inc Class ’C’ 117,698 0.02
State Street CCFAnnual Report and Audited Financial Statementsfor the financial period from 18 November 2019 (Constitution date) to 30 November 2020
Schedule of Investments as at 30 November 2020 (continued)
State Street CCF 51
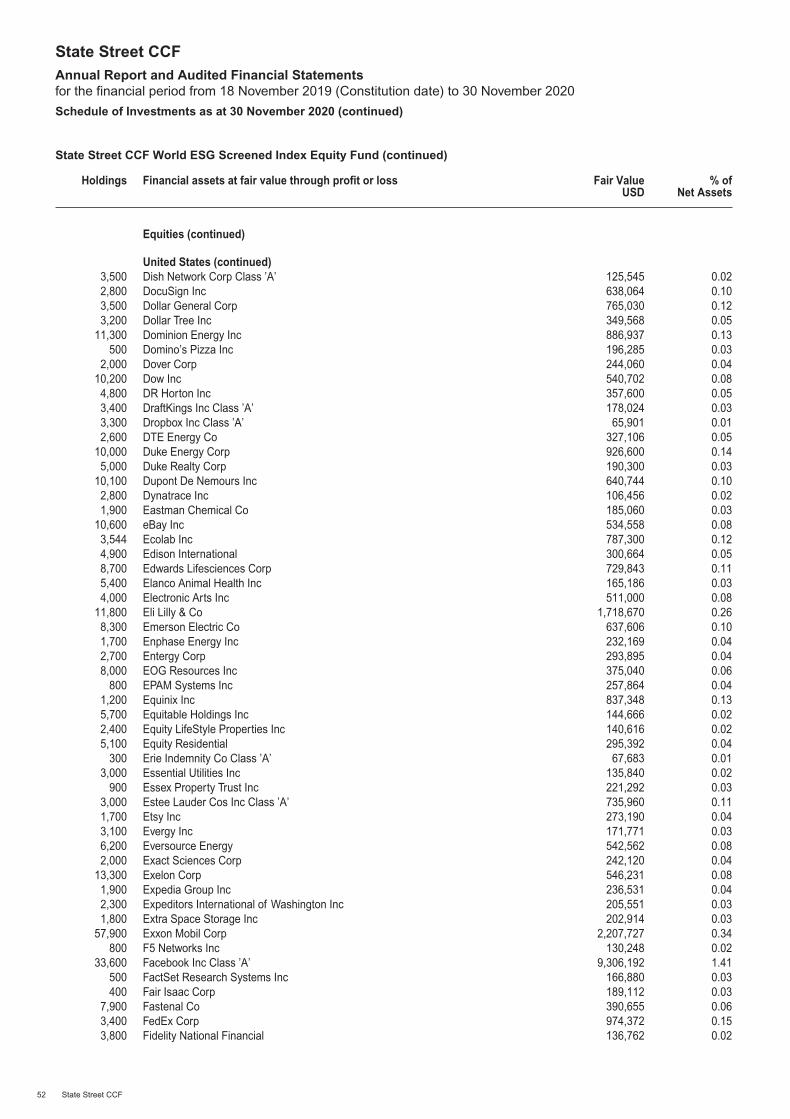
State Street CCF World ESG Screened Index Equity Fund (continued)
Holdings Financial assets at fair value through profit or loss Fair ValueUSD
% ofNet Assets
Equities (continued)
United States (continued)3,500 Dish Network Corp Class ’A’ 125,545 0.022,800 DocuSign Inc 638,064 0.103,500 Dollar General Corp 765,030 0.123,200 Dollar Tree Inc 349,568 0.05
11,300 Dominion Energy Inc 886,937 0.13500 Domino’s Pizza Inc 196,285 0.03
2,000 Dover Corp 244,060 0.0410,200 Dow Inc 540,702 0.084,800 DR Horton Inc 357,600 0.053,400 DraftKings Inc Class ’A’ 178,024 0.033,300 Dropbox Inc Class ’A’ 65,901 0.012,600 DTE Energy Co 327,106 0.05
10,000 Duke Energy Corp 926,600 0.145,000 Duke Realty Corp 190,300 0.03
10,100 Dupont De Nemours Inc 640,744 0.102,800 Dynatrace Inc 106,456 0.021,900 Eastman Chemical Co 185,060 0.03
10,600 eBay Inc 534,558 0.083,544 Ecolab Inc 787,300 0.124,900 Edison International 300,664 0.058,700 Edwards Lifesciences Corp 729,843 0.115,400 Elanco Animal Health Inc 165,186 0.034,000 Electronic Arts Inc 511,000 0.08
11,800 Eli Lilly & Co 1,718,670 0.268,300 Emerson Electric Co 637,606 0.101,700 Enphase Energy Inc 232,169 0.042,700 Entergy Corp 293,895 0.048,000 EOG Resources Inc 375,040 0.06
800 EPAM Systems Inc 257,864 0.041,200 Equinix Inc 837,348 0.135,700 Equitable Holdings Inc 144,666 0.022,400 Equity LifeStyle Properties Inc 140,616 0.025,100 Equity Residential 295,392 0.04
300 Erie Indemnity Co Class ’A’ 67,683 0.013,000 Essential Utilities Inc 135,840 0.02
900 Essex Property Trust Inc 221,292 0.033,000 Estee Lauder Cos Inc Class ’A’ 735,960 0.111,700 Etsy Inc 273,190 0.043,100 Evergy Inc 171,771 0.036,200 Eversource Energy 542,562 0.082,000 Exact Sciences Corp 242,120 0.04
13,300 Exelon Corp 546,231 0.081,900 Expedia Group Inc 236,531 0.042,300 Expeditors International of Washington Inc 205,551 0.031,800 Extra Space Storage Inc 202,914 0.03
57,900 Exxon Mobil Corp 2,207,727 0.34800 F5 Networks Inc 130,248 0.02
33,600 Facebook Inc Class ’A’ 9,306,192 1.41500 FactSet Research Systems Inc 166,880 0.03400 Fair Isaac Corp 189,112 0.03
7,900 Fastenal Co 390,655 0.063,400 FedEx Corp 974,372 0.153,800 Fidelity National Financial 136,762 0.02
State Street CCFAnnual Report and Audited Financial Statementsfor the financial period from 18 November 2019 (Constitution date) to 30 November 2020
Schedule of Investments as at 30 November 2020 (continued)
52 State Street CCF

State Street CCF World ESG Screened Index Equity Fund (continued)
Holdings Financial assets at fair value through profit or loss Fair ValueUSD
% ofNet Assets
Equities (continued)
United States (continued)8,400 Fidelity National Information Services Inc 1,246,644 0.199,700 Fifth Third Bancorp 245,798 0.042,300 First Republic Bank 297,988 0.057,400 FirstEnergy Corp 196,544 0.037,900 Fiserv Inc 909,922 0.141,200 FleetCor Technologies Inc 318,252 0.051,800 FMC Corp 208,818 0.03
53,300 Ford Motor Co 483,964 0.072,000 Fortinet Inc 246,460 0.044,100 Fortive Corp 287,533 0.041,900 Fortune Brands Home & Security Inc 158,650 0.024,900 Fox Corp Class ’A’ 141,316 0.022,400 Fox Corp Class ’B’ 68,112 0.014,100 Franklin Resources Inc 90,159 0.011,200 Gartner Inc 182,400 0.031,100 Generac Holdings Inc 237,160 0.04
132,300 General Electric Co 1,346,814 0.208,300 General Mills Inc 504,806 0.08
17,600 General Motors Co 771,584 0.122,000 Genuine Parts Co 196,740 0.03
17,300 Gilead Sciences Inc 1,049,591 0.164,100 Global Payments Inc 800,279 0.121,400 Globe Life Inc 130,340 0.022,300 GoDaddy Inc Class ’A’ 182,942 0.034,400 Goldman Sachs Group Inc 1,014,552 0.151,100 Guidewire Software Inc 134,728 0.02
12,000 Halliburton Co 199,080 0.034,900 Hartford Financial Services Group Inc 216,580 0.031,800 Hasbro Inc 167,454 0.033,700 HCA Healthcare Inc 555,407 0.082,300 HD Supply Holdings Inc 128,294 0.026,800 Healthpeak Properties Inc 196,248 0.03
600 Heico Corp 74,148 0.011,000 Heico Corp Class ’A’ 110,750 0.022,000 Henry Schein Inc 128,620 0.022,000 Hershey Co 295,780 0.043,800 Hess Corp 179,284 0.03
17,700 Hewlett Packard Enterprise 195,408 0.033,700 Hilton Worldwide Holdings In 383,431 0.063,700 Hologic Inc 255,781 0.04
15,200 Home Depot Inc 4,216,632 0.644,000 Hormel Foods Corp 188,720 0.039,800 Host Hotels & Resorts Inc 137,494 0.025,300 Howmet Aerospace Inc 124,338 0.02
20,300 HP Inc 445,179 0.07700 HubSpot Inc 276,031 0.04
1,800 Humana Inc 720,936 0.1114,100 Huntington Bancshares Inc 170,328 0.031,100 IAC/Interactivecorp 156,189 0.021,000 IDEX Corp 193,150 0.031,200 IDEXX Laboratories Inc 553,176 0.084,400 Illinois Tool Works Inc 928,796 0.142,000 Illumina Inc 644,180 0.10
State Street CCFAnnual Report and Audited Financial Statementsfor the financial period from 18 November 2019 (Constitution date) to 30 November 2020
Schedule of Investments as at 30 November 2020 (continued)
State Street CCF 53
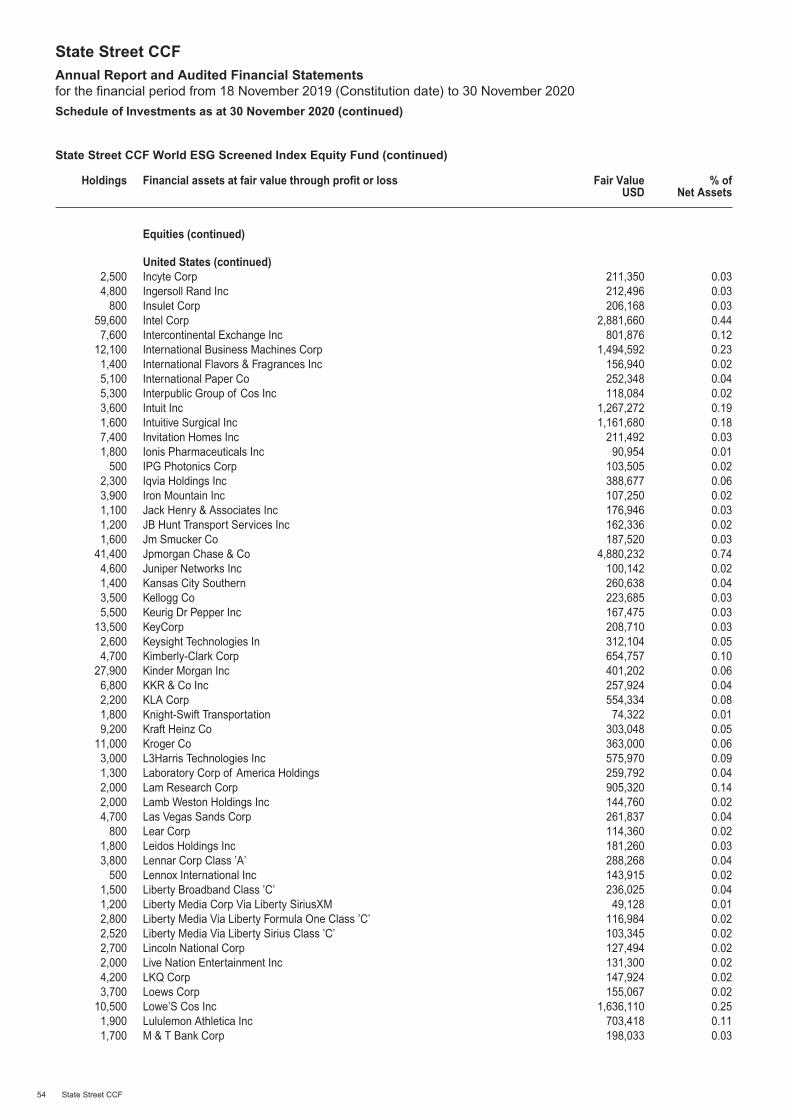
State Street CCF World ESG Screened Index Equity Fund (continued)
Holdings Financial assets at fair value through profit or loss Fair ValueUSD
% ofNet Assets
Equities (continued)
United States (continued)2,500 Incyte Corp 211,350 0.034,800 Ingersoll Rand Inc 212,496 0.03
800 Insulet Corp 206,168 0.0359,600 Intel Corp 2,881,660 0.447,600 Intercontinental Exchange Inc 801,876 0.12
12,100 International Business Machines Corp 1,494,592 0.231,400 International Flavors & Fragrances Inc 156,940 0.025,100 International Paper Co 252,348 0.045,300 Interpublic Group of Cos Inc 118,084 0.023,600 Intuit Inc 1,267,272 0.191,600 Intuitive Surgical Inc 1,161,680 0.187,400 Invitation Homes Inc 211,492 0.031,800 Ionis Pharmaceuticals Inc 90,954 0.01
500 IPG Photonics Corp 103,505 0.022,300 Iqvia Holdings Inc 388,677 0.063,900 Iron Mountain Inc 107,250 0.021,100 Jack Henry & Associates Inc 176,946 0.031,200 JB Hunt Transport Services Inc 162,336 0.021,600 Jm Smucker Co 187,520 0.03
41,400 Jpmorgan Chase & Co 4,880,232 0.744,600 Juniper Networks Inc 100,142 0.021,400 Kansas City Southern 260,638 0.043,500 Kellogg Co 223,685 0.035,500 Keurig Dr Pepper Inc 167,475 0.03
13,500 KeyCorp 208,710 0.032,600 Keysight Technologies In 312,104 0.054,700 Kimberly-Clark Corp 654,757 0.10
27,900 Kinder Morgan Inc 401,202 0.066,800 KKR & Co Inc 257,924 0.042,200 KLA Corp 554,334 0.081,800 Knight-Swift Transportation 74,322 0.019,200 Kraft Heinz Co 303,048 0.05
11,000 Kroger Co 363,000 0.063,000 L3Harris Technologies Inc 575,970 0.091,300 Laboratory Corp of America Holdings 259,792 0.042,000 Lam Research Corp 905,320 0.142,000 Lamb Weston Holdings Inc 144,760 0.024,700 Las Vegas Sands Corp 261,837 0.04
800 Lear Corp 114,360 0.021,800 Leidos Holdings Inc 181,260 0.033,800 Lennar Corp Class ’A’ 288,268 0.04
500 Lennox International Inc 143,915 0.021,500 Liberty Broadband Class ’C’ 236,025 0.041,200 Liberty Media Corp Via Liberty SiriusXM 49,128 0.012,800 Liberty Media Via Liberty Formula One Class ’C’ 116,984 0.022,520 Liberty Media Via Liberty Sirius Class ’C’ 103,345 0.022,700 Lincoln National Corp 127,494 0.022,000 Live Nation Entertainment Inc 131,300 0.024,200 LKQ Corp 147,924 0.023,700 Loews Corp 155,067 0.02
10,500 Lowe’S Cos Inc 1,636,110 0.251,900 Lululemon Athletica Inc 703,418 0.111,700 M & T Bank Corp 198,033 0.03
State Street CCFAnnual Report and Audited Financial Statementsfor the financial period from 18 November 2019 (Constitution date) to 30 November 2020
Schedule of Investments as at 30 November 2020 (continued)
54 State Street CCF
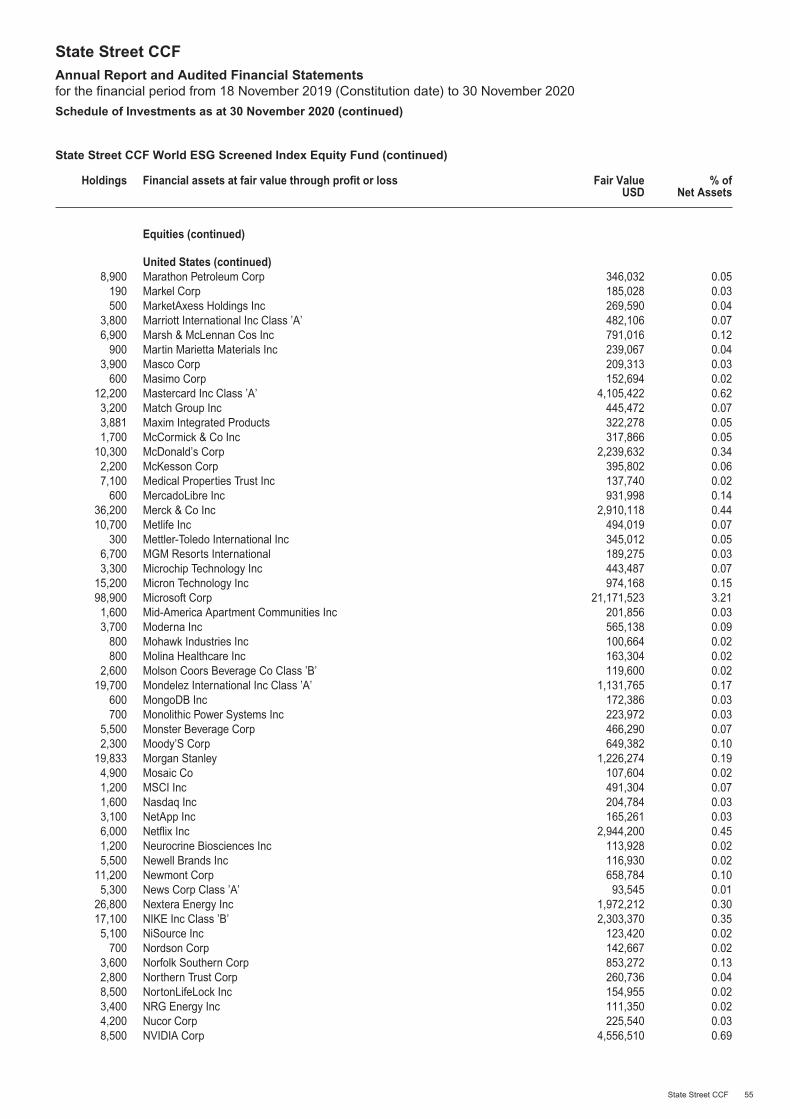
State Street CCF World ESG Screened Index Equity Fund (continued)
Holdings Financial assets at fair value through profit or loss Fair ValueUSD
% ofNet Assets
Equities (continued)
United States (continued)8,900 Marathon Petroleum Corp 346,032 0.05
190 Markel Corp 185,028 0.03500 MarketAxess Holdings Inc 269,590 0.04
3,800 Marriott International Inc Class ’A’ 482,106 0.076,900 Marsh & McLennan Cos Inc 791,016 0.12
900 Martin Marietta Materials Inc 239,067 0.043,900 Masco Corp 209,313 0.03
600 Masimo Corp 152,694 0.0212,200 Mastercard Inc Class ’A’ 4,105,422 0.623,200 Match Group Inc 445,472 0.073,881 Maxim Integrated Products 322,278 0.051,700 McCormick & Co Inc 317,866 0.05
10,300 McDonald’s Corp 2,239,632 0.342,200 McKesson Corp 395,802 0.067,100 Medical Properties Trust Inc 137,740 0.02
600 MercadoLibre Inc 931,998 0.1436,200 Merck & Co Inc 2,910,118 0.4410,700 Metlife Inc 494,019 0.07
300 Mettler-Toledo International Inc 345,012 0.056,700 MGM Resorts International 189,275 0.033,300 Microchip Technology Inc 443,487 0.07
15,200 Micron Technology Inc 974,168 0.1598,900 Microsoft Corp 21,171,523 3.211,600 Mid-America Apartment Communities Inc 201,856 0.033,700 Moderna Inc 565,138 0.09
800 Mohawk Industries Inc 100,664 0.02800 Molina Healthcare Inc 163,304 0.02
2,600 Molson Coors Beverage Co Class ’B’ 119,600 0.0219,700 Mondelez International Inc Class ’A’ 1,131,765 0.17
600 MongoDB Inc 172,386 0.03700 Monolithic Power Systems Inc 223,972 0.03
5,500 Monster Beverage Corp 466,290 0.072,300 Moody’S Corp 649,382 0.10
19,833 Morgan Stanley 1,226,274 0.194,900 Mosaic Co 107,604 0.021,200 MSCI Inc 491,304 0.071,600 Nasdaq Inc 204,784 0.033,100 NetApp Inc 165,261 0.036,000 Netflix Inc 2,944,200 0.451,200 Neurocrine Biosciences Inc 113,928 0.025,500 Newell Brands Inc 116,930 0.02
11,200 Newmont Corp 658,784 0.105,300 News Corp Class ’A’ 93,545 0.01
26,800 Nextera Energy Inc 1,972,212 0.3017,100 NIKE Inc Class ’B’ 2,303,370 0.355,100 NiSource Inc 123,420 0.02
700 Nordson Corp 142,667 0.023,600 Norfolk Southern Corp 853,272 0.132,800 Northern Trust Corp 260,736 0.048,500 NortonLifeLock Inc 154,955 0.023,400 NRG Energy Inc 111,350 0.024,200 Nucor Corp 225,540 0.038,500 NVIDIA Corp 4,556,510 0.69
State Street CCFAnnual Report and Audited Financial Statementsfor the financial period from 18 November 2019 (Constitution date) to 30 November 2020
Schedule of Investments as at 30 November 2020 (continued)
State Street CCF 55
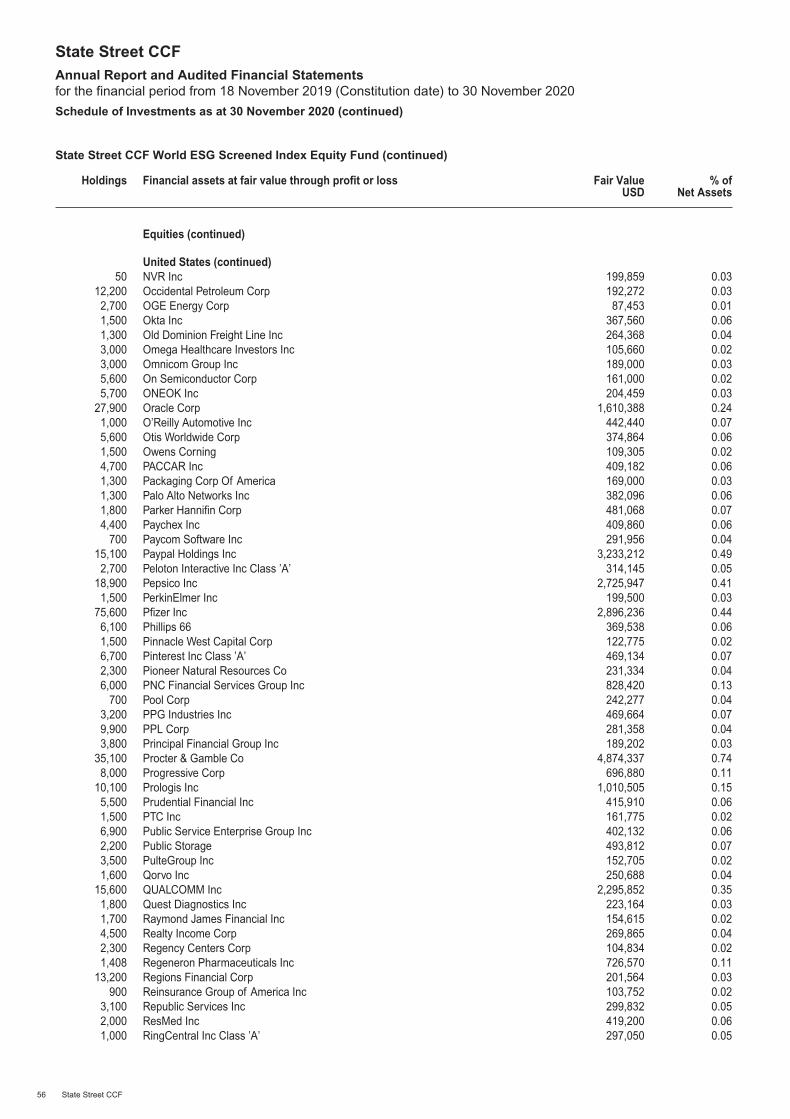
State Street CCF World ESG Screened Index Equity Fund (continued)
Holdings Financial assets at fair value through profit or loss Fair ValueUSD
% ofNet Assets
Equities (continued)
United States (continued)50 NVR Inc 199,859 0.03
12,200 Occidental Petroleum Corp 192,272 0.032,700 OGE Energy Corp 87,453 0.011,500 Okta Inc 367,560 0.061,300 Old Dominion Freight Line Inc 264,368 0.043,000 Omega Healthcare Investors Inc 105,660 0.023,000 Omnicom Group Inc 189,000 0.035,600 On Semiconductor Corp 161,000 0.025,700 ONEOK Inc 204,459 0.03
27,900 Oracle Corp 1,610,388 0.241,000 O’Reilly Automotive Inc 442,440 0.075,600 Otis Worldwide Corp 374,864 0.061,500 Owens Corning 109,305 0.024,700 PACCAR Inc 409,182 0.061,300 Packaging Corp Of America 169,000 0.031,300 Palo Alto Networks Inc 382,096 0.061,800 Parker Hannifin Corp 481,068 0.074,400 Paychex Inc 409,860 0.06
700 Paycom Software Inc 291,956 0.0415,100 Paypal Holdings Inc 3,233,212 0.492,700 Peloton Interactive Inc Class ’A’ 314,145 0.05
18,900 Pepsico Inc 2,725,947 0.411,500 PerkinElmer Inc 199,500 0.03
75,600 Pfizer Inc 2,896,236 0.446,100 Phillips 66 369,538 0.061,500 Pinnacle West Capital Corp 122,775 0.026,700 Pinterest Inc Class ’A’ 469,134 0.072,300 Pioneer Natural Resources Co 231,334 0.046,000 PNC Financial Services Group Inc 828,420 0.13
700 Pool Corp 242,277 0.043,200 PPG Industries Inc 469,664 0.079,900 PPL Corp 281,358 0.043,800 Principal Financial Group Inc 189,202 0.03
35,100 Procter & Gamble Co 4,874,337 0.748,000 Progressive Corp 696,880 0.11
10,100 Prologis Inc 1,010,505 0.155,500 Prudential Financial Inc 415,910 0.061,500 PTC Inc 161,775 0.026,900 Public Service Enterprise Group Inc 402,132 0.062,200 Public Storage 493,812 0.073,500 PulteGroup Inc 152,705 0.021,600 Qorvo Inc 250,688 0.04
15,600 QUALCOMM Inc 2,295,852 0.351,800 Quest Diagnostics Inc 223,164 0.031,700 Raymond James Financial Inc 154,615 0.024,500 Realty Income Corp 269,865 0.042,300 Regency Centers Corp 104,834 0.021,408 Regeneron Pharmaceuticals Inc 726,570 0.11
13,200 Regions Financial Corp 201,564 0.03900 Reinsurance Group of America Inc 103,752 0.02
3,100 Republic Services Inc 299,832 0.052,000 ResMed Inc 419,200 0.061,000 RingCentral Inc Class ’A’ 297,050 0.05
State Street CCFAnnual Report and Audited Financial Statementsfor the financial period from 18 November 2019 (Constitution date) to 30 November 2020
Schedule of Investments as at 30 November 2020 (continued)
56 State Street CCF
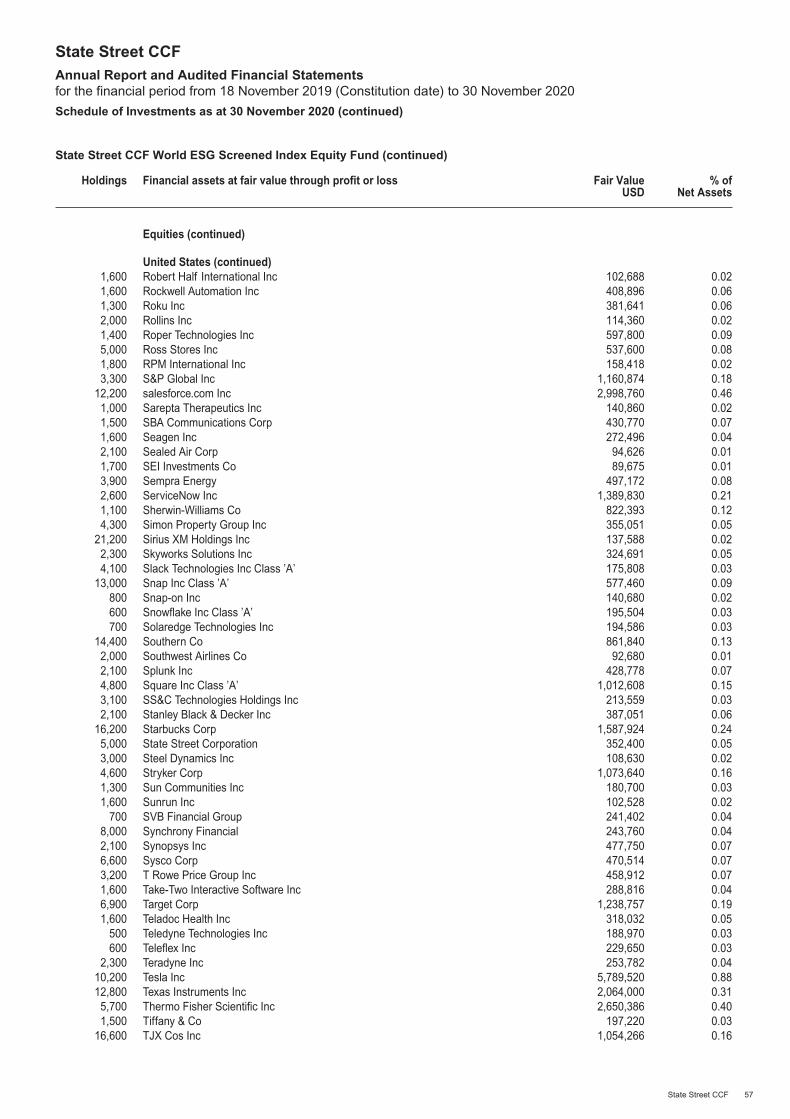
State Street CCF World ESG Screened Index Equity Fund (continued)
Holdings Financial assets at fair value through profit or loss Fair ValueUSD
% ofNet Assets
Equities (continued)
United States (continued)1,600 Robert Half International Inc 102,688 0.021,600 Rockwell Automation Inc 408,896 0.061,300 Roku Inc 381,641 0.062,000 Rollins Inc 114,360 0.021,400 Roper Technologies Inc 597,800 0.095,000 Ross Stores Inc 537,600 0.081,800 RPM International Inc 158,418 0.023,300 S&P Global Inc 1,160,874 0.18
12,200 salesforce.com Inc 2,998,760 0.461,000 Sarepta Therapeutics Inc 140,860 0.021,500 SBA Communications Corp 430,770 0.071,600 Seagen Inc 272,496 0.042,100 Sealed Air Corp 94,626 0.011,700 SEI Investments Co 89,675 0.013,900 Sempra Energy 497,172 0.082,600 ServiceNow Inc 1,389,830 0.211,100 Sherwin-Williams Co 822,393 0.124,300 Simon Property Group Inc 355,051 0.05
21,200 Sirius XM Holdings Inc 137,588 0.022,300 Skyworks Solutions Inc 324,691 0.054,100 Slack Technologies Inc Class ’A’ 175,808 0.03
13,000 Snap Inc Class ’A’ 577,460 0.09800 Snap-on Inc 140,680 0.02600 Snowflake Inc Class ’A’ 195,504 0.03700 Solaredge Technologies Inc 194,586 0.03
14,400 Southern Co 861,840 0.132,000 Southwest Airlines Co 92,680 0.012,100 Splunk Inc 428,778 0.074,800 Square Inc Class ’A’ 1,012,608 0.153,100 SS&C Technologies Holdings Inc 213,559 0.032,100 Stanley Black & Decker Inc 387,051 0.06
16,200 Starbucks Corp 1,587,924 0.245,000 State Street Corporation 352,400 0.053,000 Steel Dynamics Inc 108,630 0.024,600 Stryker Corp 1,073,640 0.161,300 Sun Communities Inc 180,700 0.031,600 Sunrun Inc 102,528 0.02
700 SVB Financial Group 241,402 0.048,000 Synchrony Financial 243,760 0.042,100 Synopsys Inc 477,750 0.076,600 Sysco Corp 470,514 0.073,200 T Rowe Price Group Inc 458,912 0.071,600 Take-Two Interactive Software Inc 288,816 0.046,900 Target Corp 1,238,757 0.191,600 Teladoc Health Inc 318,032 0.05
500 Teledyne Technologies Inc 188,970 0.03600 Teleflex Inc 229,650 0.03
2,300 Teradyne Inc 253,782 0.0410,200 Tesla Inc 5,789,520 0.8812,800 Texas Instruments Inc 2,064,000 0.315,700 Thermo Fisher Scientific Inc 2,650,386 0.401,500 Tiffany & Co 197,220 0.03
16,600 TJX Cos Inc 1,054,266 0.16
State Street CCFAnnual Report and Audited Financial Statementsfor the financial period from 18 November 2019 (Constitution date) to 30 November 2020
Schedule of Investments as at 30 November 2020 (continued)
State Street CCF 57

State Street CCF World ESG Screened Index Equity Fund (continued)
Holdings Financial assets at fair value through profit or loss Fair ValueUSD
% ofNet Assets
Equities (continued)
United States (continued)8,395 T-Mobile US Inc 1,116,031 0.171,600 Tractor Supply Co 225,296 0.03
500 Trade Desk Inc Class ’A’ 450,535 0.071,600 Tradeweb Markets Inc Class ’A’ 95,440 0.01
700 TransDigm Group Inc 405,433 0.062,600 TransUnion 236,834 0.043,500 Travelers Cos Inc 453,775 0.073,400 Trimble Inc 203,558 0.03
18,400 Truist Financial Corp 854,128 0.131,700 Twilio Inc Class ’A’ 544,153 0.08
10,100 Twitter Inc 469,751 0.07500 Tyler Technologies Inc 213,800 0.03
4,000 Tyson Foods Inc Class ’A’ 260,800 0.0412,900 Uber Technologies Inc 640,614 0.104,000 UDR Inc 153,880 0.022,900 UGI Corp 102,892 0.02
800 Ulta Salon Cosmetics & Fragrance 220,320 0.039,500 Union Pacific Corp 1,938,760 0.299,600 United Parcel Service Inc Class ’B’ 1,642,272 0.251,000 United Rentals Inc 226,980 0.03
13,300 UnitedHealth Group Inc 4,473,322 0.681,100 Universal Health Services Class ’B’ 143,638 0.02
19,100 US Bancorp 825,311 0.13600 Vail Resorts Inc 165,504 0.03
5,600 Valero Energy Corp 301,112 0.051,200 Varian Medical Systems Inc 208,776 0.031,800 Veeva Systems Inc Class ’A’ 498,366 0.085,100 Ventas Inc 244,341 0.04
14,600 Vereit Inc 103,514 0.021,400 VeriSign Inc 281,008 0.042,100 Verisk Analytics Inc 416,451 0.06
56,600 Verizon Communications Inc 3,419,206 0.523,500 Vertex Pharmaceuticals Inc 797,125 0.124,600 VF Corp 383,640 0.067,700 ViacomCBS Inc Class ’B’ 271,656 0.04
16,480 Viatris Inc 277,194 0.046,300 Vici Properties Inc 159,327 0.02
23,200 Visa Inc Class ’A’ 4,880,120 0.745,000 Vistra Energy Corp 93,400 0.011,100 VMware Inc Class ’A’ 153,879 0.022,400 Vornado Realty Trust 93,384 0.011,800 Voya Financial Inc 103,734 0.021,800 Vulcan Materials Co 251,370 0.04
10,400 Walgreens Boots Alliance Inc 395,304 0.0624,700 Walt Disney Co 3,655,847 0.555,800 Waste Management Inc 690,954 0.10
900 Waters Corp 208,809 0.03900 Wayfair Inc Class ’A’ 228,924 0.03
4,300 WEC Energy Group Inc 408,285 0.067,600 Welltower Inc 478,648 0.071,000 West Pharmaceutical Services Inc 275,160 0.044,100 Western Digital Corp 184,008 0.035,700 Western Union Co 128,592 0.02
State Street CCFAnnual Report and Audited Financial Statementsfor the financial period from 18 November 2019 (Constitution date) to 30 November 2020
Schedule of Investments as at 30 November 2020 (continued)
58 State Street CCF
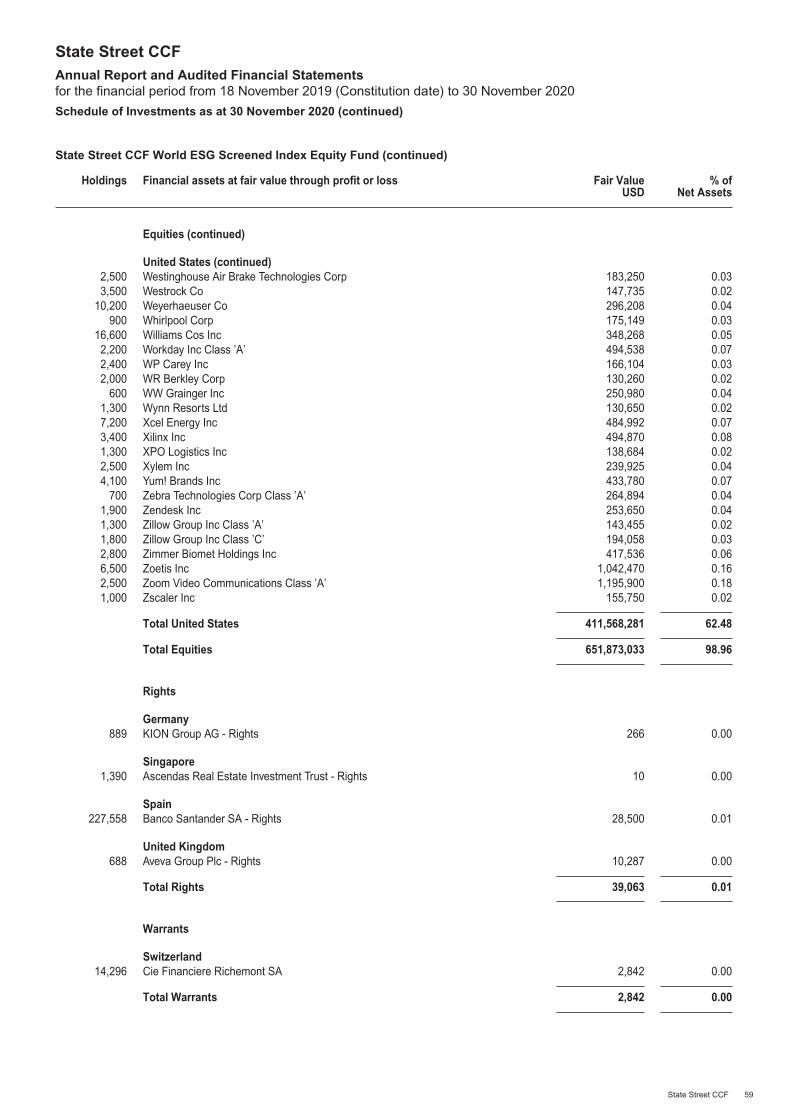
State Street CCF World ESG Screened Index Equity Fund (continued)
Holdings Financial assets at fair value through profit or loss Fair ValueUSD
% ofNet Assets
Equities (continued)
United States (continued)2,500 Westinghouse Air Brake Technologies Corp 183,250 0.033,500 Westrock Co 147,735 0.02
10,200 Weyerhaeuser Co 296,208 0.04900 Whirlpool Corp 175,149 0.03
16,600 Williams Cos Inc 348,268 0.052,200 Workday Inc Class ’A’ 494,538 0.072,400 WP Carey Inc 166,104 0.032,000 WR Berkley Corp 130,260 0.02
600 WW Grainger Inc 250,980 0.041,300 Wynn Resorts Ltd 130,650 0.027,200 Xcel Energy Inc 484,992 0.073,400 Xilinx Inc 494,870 0.081,300 XPO Logistics Inc 138,684 0.022,500 Xylem Inc 239,925 0.044,100 Yum! Brands Inc 433,780 0.07
700 Zebra Technologies Corp Class ’A’ 264,894 0.041,900 Zendesk Inc 253,650 0.041,300 Zillow Group Inc Class ’A’ 143,455 0.021,800 Zillow Group Inc Class ’C’ 194,058 0.032,800 Zimmer Biomet Holdings Inc 417,536 0.066,500 Zoetis Inc 1,042,470 0.162,500 Zoom Video Communications Class ’A’ 1,195,900 0.181,000 Zscaler Inc 155,750 0.02
Total United States 411,568,281 62.48
Total Equities 651,873,033 98.96
Rights
Germany889 KION Group AG - Rights 266 0.00
Singapore1,390 Ascendas Real Estate Investment Trust - Rights 10 0.00
Spain227,558 Banco Santander SA - Rights 28,500 0.01
United Kingdom688 Aveva Group Plc - Rights 10,287 0.00
Total Rights 39,063 0.01
Warrants
Switzerland14,296 Cie Financiere Richemont SA 2,842 0.00
Total Warrants 2,842 0.00
State Street CCFAnnual Report and Audited Financial Statementsfor the financial period from 18 November 2019 (Constitution date) to 30 November 2020
Schedule of Investments as at 30 November 2020 (continued)
State Street CCF 59
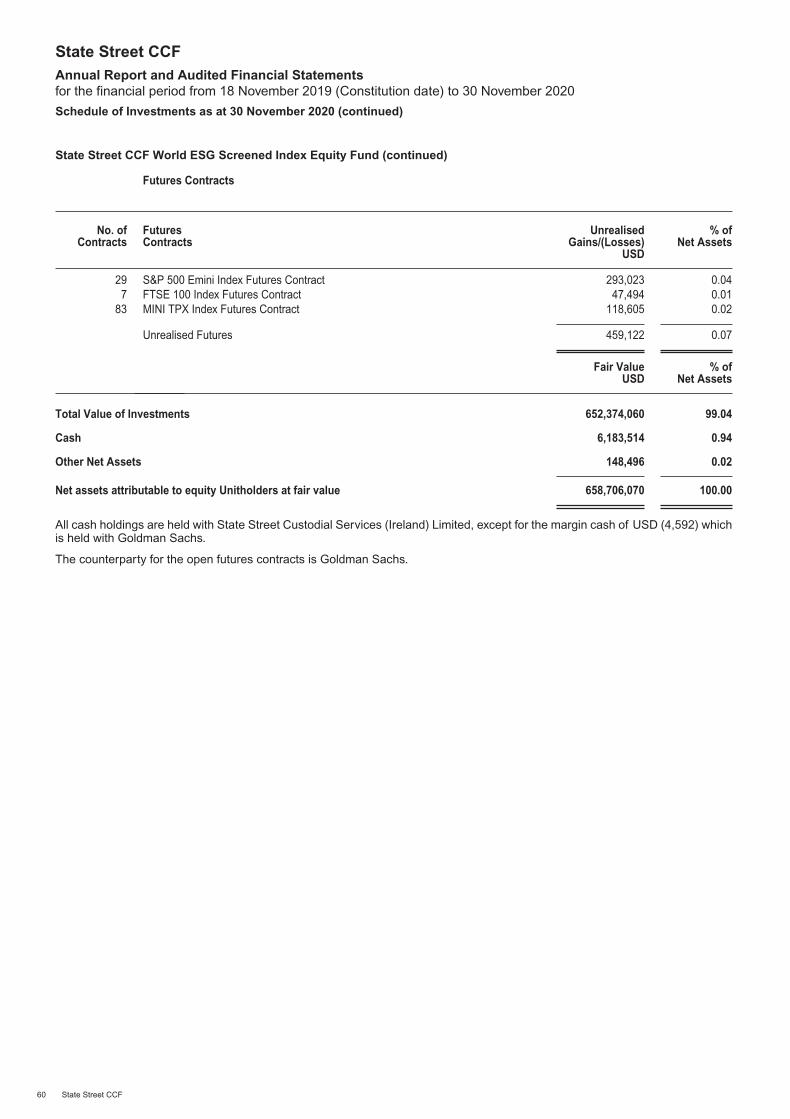
State Street CCF World ESG Screened Index Equity Fund (continued)
Futures Contracts
No. ofContracts
FuturesContracts
UnrealisedGains/(Losses)
USD
% ofNet Assets
29 S&P 500 Emini Index Futures Contract 293,023 0.047 FTSE 100 Index Futures Contract 47,494 0.01
83 MINI TPX Index Futures Contract 118,605 0.02
Unrealised Futures 459,122 0.07
Fair ValueUSD
% ofNet Assets
Total Value of Investments 652,374,060 99.04
Cash 6,183,514 0.94
Other Net Assets 148,496 0.02
Net assets attributable to equity Unitholders at fair value 658,706,070 100.00
All cash holdings are held with State Street Custodial Services (Ireland) Limited, except for the margin cash of USD (4,592) whichis held with Goldman Sachs.
The counterparty for the open futures contracts is Goldman Sachs.
State Street CCFAnnual Report and Audited Financial Statementsfor the financial period from 18 November 2019 (Constitution date) to 30 November 2020
Schedule of Investments as at 30 November 2020 (continued)
60 State Street CCF

State Street CCF World ESG Screened Index Equity FundListed below are the cumulative investment purchases and sales for the financial period ended 30 November 2020.
Portfolio Purchases Cost USD
Novartis AG 2,456,799
Zoom Video Communications Class ’A’ 654,866
Amazon.com Inc 480,787
Abbvie Inc 352,804
Uber Technologies Inc 257,890
Teladoc Health Inc 239,556
Analog Devices Inc 236,440
Crowdstrike Holdings Inc Class ’A’ 223,524
Brookfield Renewable Corp Class ’A’ 220,302
CyberArk Software Ltd 220,245
Moderna Inc 216,683
SoftBank Corp 212,617
Xero Ltd 208,976
Peloton Interactive Inc Class ’A’ 207,016
Blackrock Inc 205,493
Coupa Software Inc 199,615
Horizon Therapeutics Plc 197,211
HubSpot Inc 197,166
Snowflake Inc Class ’A’ 195,506
Procter & Gamble Co 193,882
Portfolio Sales Proceeds USD
Apple Inc 545,115
Alphabet Inc Class ’C’ 318,958
Bank of America Corp 231,523
SwedBank AB Class ’A’ 187,709
National Oilwell Varco Inc 178,580
Booking Holdings Inc 163,938
Oracle Corp 155,376
Maxim Integrated Products 132,857
Sofina SA 132,658
Swiss Life Holding AG 129,518
Diamondback Energy Inc 129,342
Zurich Insurance Group AG 129,148
Nestle SA 129,062
Analog Devices Inc 125,708
Aon Plc Class ’A’ 117,369
Iberdrola SA 110,339
Charter Communications Inc Class ’A’ 108,797
UBS Group AG 107,005
CyberArk Software Ltd 103,775
Chevron Corp 100,865
Chipotle Mexican Grill Inc 100,389
US Bancorp 96,003
Microsoft Corp 91,622
A copy of the list of changes in the portfolio during the financial period may be obtained free of charge from the Administrator.
State Street CCFAnnual Report and Audited Financial Statementsfor the financial period from 18 November 2019 (Constitution date) to 30 November 2020
Schedule of Significant Portfolio Changes (unaudited)
State Street CCF 61
Remuneration Policy (unaudited)
State Street Corporation (“SSC”), and its direct and indirect subsidiaries (together with SSC hereafter referred to as “State Street”)operate a group-wide compensation strategy including a remuneration policy that applies to all State Street entities globally. StateStreet Funds Management Limited (“SSGA FML”) does not employ any staff and has delegated certain activities in respect of theinvestment management and risk management of the State Street Common Contractual Fund (“CCF”) to SSGA Ireland Limited.SSGA Ireland Limited delegates the investment management of certain sub-funds of State Street CCF to SSGA Limited (together,the “Investment Managers”). As State Street subsidiaries, the Investment Managers are fully integrated into State Street’sgroup-wide compensation strategy and subject to the global and regional governing body structure of State Street to provideappropriate and effective control of the remuneration arrangements (incl. compliance with the relevant remuneration regulations)across the State Street group of affiliated entities. Under its publicly available charter, the Human Resources Committee (“HRC”)of SSC oversees all of State Street’s compensation plans, policies, and programs in which senior executives participate andincentive, retirement, welfare and equity plans in which certain other employees of SSC participate. It also oversees the alignmentof the incentive compensation arrangements with the State Street’s financial safety and soundness consistent with applicablerelated regulatory rules and guidance. The HRC approves the overall allocation of the Incentive Compensation (“IC”) Plan pool.State Street’s CEO allocates IC pools to business units and corporate functions based upon a variety of factors, which may includebudget performance, achievement of key goals and other considerations. The final expenditure and overall allocation betweencurrent and deferred awards are then reviewed by the HRC prior to payment.
State Street also has a separate UK Remuneration Committee (“UK RemCo”) in place with the primary duties:
• the oversight of the process for identifying and determining the remuneration of EU Identified Staff (“EUIS”) in the UK;• the oversight of decisions made by those with authority to determine the remuneration of EUIS in the UK; and• holistic oversight of regional remuneration matters, with a view providing a central forum for consideration of issues and
thereby enhancing consistency of approach across State Street EMEA.
State Street operates an annually reviewed global remuneration policy document (supplemented by any relevant addenda byjurisdiction or regulatory regime), which documents State Street’s existing remuneration framework. This policy is intended tocomply with applicable remuneration regulatory requirements including, but not limited to, those contained in the EU CRD IV, UCITSV Directive and AIFMD, and will be interpreted and administered accordingly. State Street’s remuneration policies and practicesapply on a global basis to all employees of the State Street group (incl. the Investment Manager and Sub-Investment Manager). Thekey principles that align State Street’s remuneration system with the business strategy are as follows:
• We emphasize total rewards;• We target the aggregate annual value of our Total Rewards Program to be competitive with our business peers;• We unequivocally support equal pay for work of equal value;• Funding for our Total Rewards Program is subject to affordability and is designed to be flexible based on corporate
performance;• We differentiate pay based on performance;• We align employees’ interests with unitholders’ interests• Our compensation plans are designed to comply with applicable regulations and related guidance, including prohibiting
incentives to take excessive risks.
Given our process of structured discretion in determining incentive pool funding and individual award decisions, the deferral ofincentive compensation, and the availability of ex-ante and ex-post adjustments, such as forfeitures and clawbacks, ourcompensation system is appropriately risk-sensitive and links current decisions and actions to future risk outcomes.
State Street operates a fully flexible, discretionary bonus policy (i.e. the amount of individual variable pay may fluctuate significantlyfrom one year to the next, depending on performance and the other factors described below, and even could be reduced to zero forany given year). The discretionary bonus policy is structured so as to achieve a balance between fixed and variable components,but also includes specific maximum pay ratios where required by local regulations. A number of employees in sales participate inStructured Incentive Plans, which aim to bring the variable compensation granted to plan participants into line with the revenuesthey generate as well as taking into account non-financial qualitative performance indicators. All such participants receivesufficiently high fixed compensation. Variable compensation is assigned on an individual basis by way of a review of bothquantitative and qualitative factors.
A proportionality assessment has been conducted to evaluate the risk profile of the UCITS Management Companies within SSGA.This analysis has concluded that the size, nature and complexity of the Management Companies and, where relevant, the fundsthat they manage, is sufficiently low and UCITS V’s remuneration requirements on the pay-out processes and establishment of aremuneration committee were disapplied. Accordingly, SSGA continues to operate current levels of deferral and stock-basedcompensation and has not made significant changes to Identified Staff remuneration structures in respect of the ManagementCompanies.
State Street CCFAnnual Report and Audited Financial Statementsfor the financial period from 18 November 2019 (Constitution date) to 30 November 2020
Appendix I
62 State Street CCF
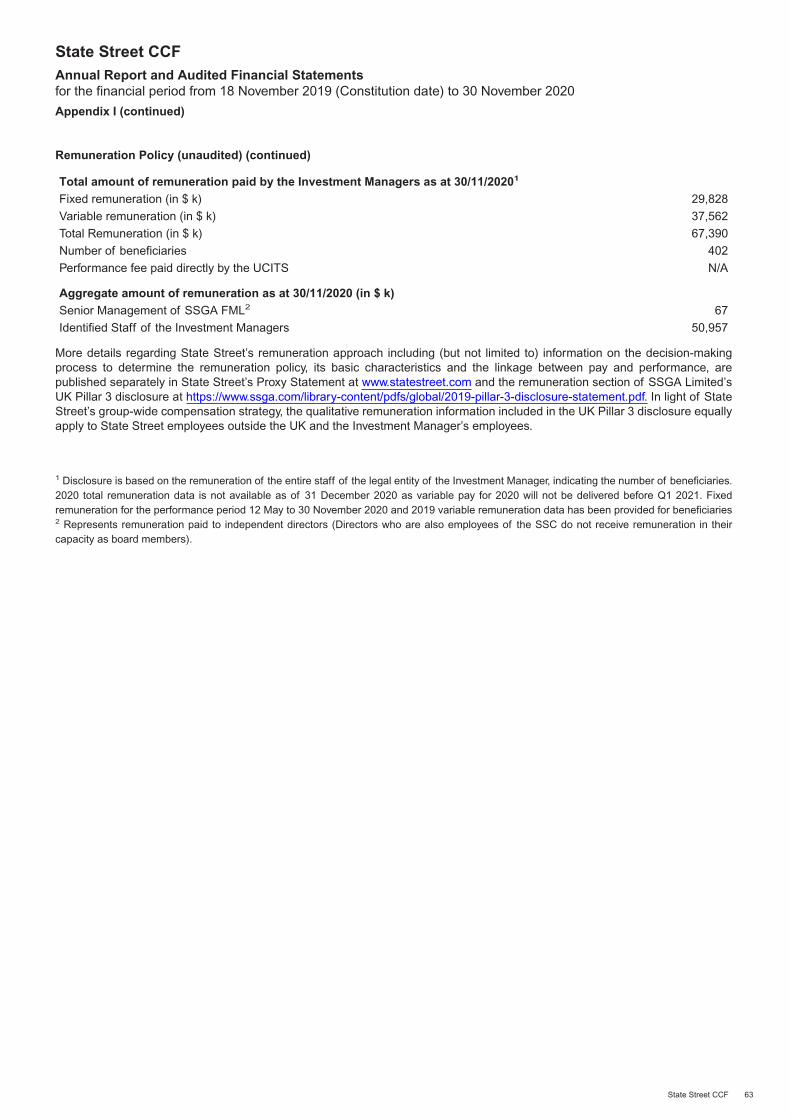
Remuneration Policy (unaudited) (continued)
Total amount of remuneration paid by the Investment Managers as at 30/11/20201
Fixed remuneration (in $ k) 29,828
Variable remuneration (in $ k) 37,562
Total Remuneration (in $ k) 67,390
Number of beneficiaries 402
Performance fee paid directly by the UCITS N/A
Aggregate amount of remuneration as at 30/11/2020 (in $ k)
Senior Management of SSGA FML2 67
Identified Staff of the Investment Managers 50,957
More details regarding State Street’s remuneration approach including (but not limited to) information on the decision-makingprocess to determine the remuneration policy, its basic characteristics and the linkage between pay and performance, arepublished separately in State Street’s Proxy Statement at www.statestreet.com and the remuneration section of SSGA Limited’sUK Pillar 3 disclosure at https://www.ssga.com/library-content/pdfs/global/2019-pillar-3-disclosure-statement.pdf. In light of StateStreet’s group-wide compensation strategy, the qualitative remuneration information included in the UK Pillar 3 disclosure equallyapply to State Street employees outside the UK and the Investment Manager’s employees.
1 Disclosure is based on the remuneration of the entire staff of the legal entity of the Investment Manager, indicating the number of beneficiaries.2020 total remuneration data is not available as of 31 December 2020 as variable pay for 2020 will not be delivered before Q1 2021. Fixedremuneration for the performance period 12 May to 30 November 2020 and 2019 variable remuneration data has been provided for beneficiaries2 Represents remuneration paid to independent directors (Directors who are also employees of the SSC do not receive remuneration in theircapacity as board members).
State Street CCFAnnual Report and Audited Financial Statementsfor the financial period from 18 November 2019 (Constitution date) to 30 November 2020
Appendix I (continued)
State Street CCF 63


