Embed Size (px)
Citation preview
Citation: Palachum, W.; Klangbud,
W.K.; Chisti, Y. Spray-Dried Nipa
Palm Vinegar Powder: Production
and Evaluation of Physicochemical,
Nutritional, Sensory, and Storage
Aspects. Fermentation 2022, 8, 272.
https://doi.org/10.3390/
fermentation8060272
Academic Editors: Michela Verni and
Carlo Giuseppe Rizzello
Received: 25 May 2022
Accepted: 10 June 2022
Published: 11 June 2022
Publisher’s Note: MDPI stays neutral
with regard to jurisdictional claims in
published maps and institutional affil-
iations.
Copyright: © 2022 by the authors.
Licensee MDPI, Basel, Switzerland.
This article is an open access article
distributed under the terms and
conditions of the Creative Commons
Attribution (CC BY) license (https://
creativecommons.org/licenses/by/
4.0/).
fermentation
Article
Spray-Dried Nipa Palm Vinegar Powder: Production andEvaluation of Physicochemical, Nutritional, Sensory, andStorage AspectsWilawan Palachum 1,2 , Wiyada Kwanhian Klangbud 1,2,* and Yusuf Chisti 3
1 Department of Medical Technology, School of Allied Health Sciences, Walailak University,Thasala, Nakhon Si Thammarat 80161, Thailand; [email protected]
2 Center of Excellence Research for Melioidosis and Microorganisms, Walailak University,Thasala, Nakhon Si Thammarat 80161, Thailand
3 School of Engineering, Massey University, Private Bag 11 222, Palmerston North 4442, New Zealand;[email protected]
* Correspondence: [email protected]
Abstract: Nipa palm vinegar (NPV) is a naturally fermented vinegar derived from the nipa palm(Nypa fruticans Wurmb) sap. This work optimized production of spray-dried nipa palm vinegarpowder. The influence of the various drier air inlet temperatures (150, 170, and 190 ◦C) and mal-todextrin DE10 carrier concentrations (15 and 20% w/v) in the feed, on the characteristics of theproduct powder was investigated. Nipa palm vinegar powder (NPVp) was evaluated in termsof the following responses: physicochemical and nutritional properties, sensory acceptability, andstorage stability. All processing variables affected the responses. Based on product desirability asthe optimization criterion, spray-drying with a hot air inlet temperature of 170 ◦C with a 15% w/vmaltodextrin DE10 in the feed was optimal. The nutritional characteristics of the product madeunder the above identified optimal conditions were (per 100 g dry product): a calorific value of366.2 kcal; 1.3 g protein; 88.1 g carbohydrate; 0.96 g fat; 883.9 mg potassium; 12.7 mg vitamin C; and105 mg gallic acid equivalent (GAE) phenolics content. The product, vacuum-packed and heat-sealedin aluminum laminated polyethylene bags, could be stored at 25 ◦C for at least 180 days withoutnoticeable loss in quality.
Keywords: nipa palm vinegar; nipa palm vinegar powder; Nypa fruticans Wurmb; spray-drying ofnipa palm vinegar
1. Introduction
Nipa palm (Nypa fruticans Wurmb) is a high-yielding sugar palm found commonly inmangrove ecosystems in Southeast Asia and Oceania [1–3]. In Thailand, nipa palm occursin southwestern coastal regions bordering the Gulf of Thailand [4]. Nipa palm trees aretapped for the sugar-rich nipa palm sap [1,5] that is consumed fresh, and fermented towine. The wine may be distilled to produce other alcoholic beverages, or further fermentedto produce nipa palm vinegar (NPV) [1,6]. Production of NPV from fresh sap involves atwo-stage fermentation. In the first stage, yeasts ferment the carbohydrates and sugarsto alcohols and carbon dioxide. In the second aerobic fermentation, acetic acid bacteriaconvert the ethanol to acetic acid [4,5].
NPV is used as a food condiment and also consumed locally between meals andbefore bedtime [4,7]. NPV is also used as a food preservative [1]. Various health benefitsare ascribed to NPV based mostly on in vitro studies [4,5,7,8]. NPV is mostly a regionalproduct. Its utility as a food condiment can be enhanced by drying it to a stable, easy todistribute, NPV powder.
Spray drying is generally the method of choice for liquid foods as it is rapid and lessdamaging to the sensory and nutritional characteristics. Spray drying involves atomizing
Fermentation 2022, 8, 272. https://doi.org/10.3390/fermentation8060272 https://www.mdpi.com/journal/fermentation

Fermentation 2022, 8, 272 2 of 13
the liquid into fine droplets in a hot gas stream to produce a dry powder [9]. Comparedto the liquid form, a dry product has a reduced volume and weight and superior storagestability over extended periods [10]. Spray drying is also widely used for other highlyheat-sensitive biological products such as pharmaceutical proteins and enzymes becausethe drying is rapid and, therefore, the activity loss is minimal [11]. A carrier agent suchas the polysaccharide maltodextrin (MD) is often added to liquid products prior to spraydrying. Maltodextrin acts as a filler, thickener, and texturizing agent. Maltodextrin is edibleand generally recognized as safe (GRAS) according to the classification of the United StatesFederal Drug Administration (FDA) [10,12,13].
Fruit juices [12–15] and certain vinegars are commonly spray dried. The latter includethe Chinese black vinegar [16,17], coconut water vinegar [18], and bamboo vinegar [19].Unlike some other vinegar powders, nipa palm vinegar powder is not commerciallyavailable. No work has been reported on the effects of spray drying on nutritional andsensory characteristics of NPV, the organoleptic characteristics of the nipa palm vinegarpowder (NPVp) in foods and beverages, and the storage stability of NPVp.
The present work aimed to identify the suitable conditions (drying air temperature,maltodextrin concentration in the NPV) for producing spray-dried NPV powder withacceptable sensory and nutritional attributes. The storage stability of the dried productwas assessed as an important commercial characteristic.
2. Materials and Methods2.1. Chemicals and Materials
The chemicals and reagents were of analytical grade and purchased from Sigma-Aldrich (St. Louis, MO, USA) unless specified otherwise. Maltodextrin with a dextroseequivalent (DE) value of 10 was obtained from Perfect Natural Food Powder and Flavor2002 (Thailand) Co., Ltd. (Kratumban, Samutsakorn, Thailand).
All materials used in preparing consumable products were of food grade or higherquality. Hygienic practices in food preparation were followed.
2.2. Nipa Palm Vinegar
The nipa palm (Nypa fruticans Wurmb) vinegar product was obtained from a localmarket (Kanapnak sub-district, Pak Phanang district, Nakhon Si Thammarat province;8◦12′25.1′ ′ N latitude, 100◦14′51.7′ ′ E longitude) in Thailand. The vinegar had been natu-rally fermented using a traditional local method, which involved incubating nipa palm sapfrom cut stalks in terracotta containers at room temperature (25–30 ◦C) for 40 days. Themicroorganisms found naturally in the raw sap were the fermenting agents [4]. The nipapalm vinegar lots were obtained from the same supplier. Fermented nipa palm vinegarhad a pH of 2.67 ± 0.02 and an acetic acid content of 4.42 ± 0.02% w/v (g/100 mL).
The nipa palm vinegar was transferred to a clean container and filtered through afine-mesh sifter (40 mesh, 420 µm) to remove any suspended matter and stored at 4 ◦Cuntil use.
2.3. Spray Drying of Nipa Palm Vinegar
Different concentrations of maltodextrin DE10 (10, 15, and 20% w/v (g/100 mL)) weremixed with nipa palm vinegar in different experiments. The resulting solution was filteredthrough a fine-mesh sifter (40 mesh, 420 µm) and used as the feed for spray drying.
A pilot-scale spray drier with a rotary atomizer (model SDE-10, JCS Technic LineCo., Ltd., Samutsakorn, Thailand) was used in all work. The cylindrical drying chambermade of stainless steel had an internal diameter of 0.9 m and a total height of 2.3 m. Thevariables studied were the maltodextrin concentration (10, 15, and 20% w/v) in the feedand the inlet air temperatures (150, 170, and 190 ◦C). The outlet air temperature was held at90 ◦C. The feed flow rate was controlled at 500 mL h−1. The atomization air flow rate wasalways 5 m3 h−1 and the fan blower speed was 13,000 rpm. The spray dried product (NPVpowder) was sifted through a 60-mesh (250 µm) sifter, collected, weighed, and kept in

Fermentation 2022, 8, 272 3 of 13
sealed containers for analysis. Based on the above noted dimensions of the drying chamberand the flow rate of the atomization air, the product residence time (or contact time withthe drying air) in the drying chamber was always well below 42 s.
Preliminary spray drying trials revealed no powder recovery in the cyclone when feedcontained 10% w/v of maltodextrin as the solid particles stuck to the walls of the dryingchamber. Therefore, the maltodextrin level in the redesigned experiments ranged from15% w/v (low, coded value = −1) to 20% w/v (high, coded value = 1).
2.3.1. Experimental Design
Based on preliminary studies, the experiments involved two factors: the inlet tem-perature (X1) and the maltodextrin concentration (X2). The factor X1 was studied at threelevels: coded values of −1 (low), 0 (medium), and 1 (high). The factor X2 was studied attwo levels with coded values of −1 (low) and 1 (high) (Table S1). The six experimentaltrials involving various combinations of factors were generated using Multilevel CategoricDesign (Table S2) implemented via the Design-Expert® software (trial version 13; Stat-Ease,Minneapolis, MN, USA; www.statease.com, accessed on 24 May 2022). The powder col-lected for each set of drying condition was used to calculate the product yield and analyzedfor physicochemical properties.
2.3.2. Selection of the Optimal Point
The optimization process entailed identifying the best independent factor values (i.e.,X1 and X2) to obtain a product with the desired characteristics. The desirability functionwas used to optimize the independent variables, with individual responses being combinedto provide the total desirability. The Design-Expert software was used for the numericoptimization. Each variable was optimized numerically using the desirability function(range 0–1). The goal was to maximize the product output yield and bulk density whileminimizing the moisture content and water activity. The constraints adopted for theestimating the overall desirability are shown in Table S3.
2.4. Physicochemical Characterization2.4.1. Product Yield
The product yield Y (%) of spray-dried NPV powders was calculated using the follow-ing equation:
Y (%) =(
W f /Wi
)× 100% (1)
where Wi was the mass of total solids fed (g) to the spray drier and Wf was the mass of thespray-dried NPV powder (g) recovered.
2.4.2. Bulk Density
The bulk density (BD, g mL−1) of NPV powder was determined according to themethod of Goula and Adamopoulos [20]. An exact mass (2 g) of NPV powder was trans-ferred to a 10 mL graduated cylinder. The cylinder was held on the vortex vibrator for1 min and the volume of the powder was measured. The bulk density was calculated as theknown mass divided by the measured volume.
2.4.3. Total Soluble Solids, Moisture Content, and Water Activity
The total soluble solids (TSS, ◦Bx) was measured using a refractometer (ATAGODR-A1, Tokyo, Japan).
The moisture content was determined using the oven drying method [21]. A preciselyweighed (2 g) sample of the NPV powder was oven-dried (105 ◦C) to a constant weight.Triplicate samples were measured.
The water activity was measured using a water activity meter (Aqualab Series 3TE;Decagon Devices, Pullman, WA, USA). Measurements were performed at room temperature.

Fermentation 2022, 8, 272 4 of 13
2.4.4. The pH and Acetic Acid Determination
The pH was determined using the Method 981.12 [21] with a pH meter (Mettler-Toledo,LLC, Columbus, OH, USA).
The acetic acid concentration of NPV powder was determined by colorimetric titra-tion [4,22]. The titrant was 1 M sodium hydroxide, and the indicator was 1% (w/v,g/100 mL) phenolphthalein solution. NPV powder (10 g) was added to a 250 mL Er-lenmeyer flask and dissolved in 20 mL distilled water. Then, three drops of 1% (w/v)phenolphthalein solution were added and mixed. The titrant volume at the endpoint whenthe color turned red was used to calculate the percentage of acetic acid in the sample. Eachmole of sodium hydroxide consumed was equivalent to 1 mol acetic acid in the sample.
2.4.5. Color Analysis
The electronic color parameters (L*, a*, and b*) of NPV powder were measured usingthe Hunterlab Miniscan/EX instrument (10◦ standard observer, illuminant D65; HunterAssociates Laboratory, Inc., Reston, VA, USA). The device had been calibrated to a whiteand black standard. For the measurements, the NPV powder sample was weighed andplaced on a transparent plastic plate of the instrument and the Hunter color parameters L*,a*, and b* were measured. L* denoted lightness in the dark–light spectrum range (black = 0,white = 100), a* was a hue in the red–green color range where negative values indicatedgreen and positive values indicated red, and b* was a hue in the yellow–blue spectral rangewhere negative values indicated blue and positive values indicated yellow [13,23].
2.5. Nutritional Characteristics
Nutritional composition of the NPVp was analyzed according to AOAC [21] methodas follows: total fat (Method 948.15); cholesterol (Method 976.26); protein (Method 981.10);total sugar (Method 925.35); dietary fiber (Method 985.29); the mineral profiles of calcium(Ca), sodium (Na), and iron (Fe) (Method 984.27); and ash (Method 923.03). The amountsof vitamin A (retinol), vitamin B1 (thiamin), and vitamin C (ascorbic acid) were quantifiedusing adaptations of published methods [24]. Carbohydrate content was determined bythe method of Sullivan and Carpenter [25]. The calorific value was obtained by using abomb calorimeter. The total phenolic content in the NPV samples was measured using themethod of Chatatikun and Kwanhian [8] with gallic acid as the standard.
2.6. Sensory Evaluations of NPV and NPV Powder
The sensory analyses of the NPV and the NPV powder had been reviewed andapproved by the Human Research Ethics Committee of Walailak University, Thailand(approval no. WUEC-20-048-01). A sensory evaluation involving 59 untrained panelistswas carried out in a sensory laboratory (Center for Scientific and Technological Equipment 3,Walailak University, Nakhon Si Thammarat, Thailand). The freshly prepared samples ofspray-dried NPV powder and the original NPV were evaluated by the panelists.
The recipe for sensory evaluation consisted of Recipe 1 (R1), Recipe 2 (R2), Recipe 3(R3), Recipe 4 (R4), Recipe 5 (R5), and Recipe 6 (R6). The original NPV was used as R1(control R1), and the rehydrated NPV powder was used as R2 (NPVp-3 product, controlR2). For sensory evaluations, 200 g NPV or NPVp was mixed with 800 g of drinking water(sample: water mass ratio of 1:4) to produce a drink.
In the beverage recipes (R3 and R4), the original NPV was used for R3 and NPVpowder was reconstituted as liquid vinegar as R4. For the preparation of the beverage, theNPV (200 g) was mixed with 200 g of honey (Thai Honey, Thailand; http://www.thaihoney.net, accessed on 24 May 2022) and 600 g of carbonated water (Singha Soda, Thailand;https://www.singhacorporation.com/singhasoda/, accessed on 24 May 2022). The massratio of NPV:honey:carbonated water was 1:1:3. The ingredients of R4 were the same as R3,but 200 g of NPVp was added instead of NPV.
For the food recipes (R5 and R6), vinegar was used to increase the acid taste of thefood. In recipe R6, 60 g NPVp was added to 1 L of sour soup (Thai sour fish soup made
Fermentation 2022, 8, 272 5 of 13
with sea mullet). While the ingredients for Recipe 5 were the same as for Recipe 6, NPVpwas replaced with 60 g of the original NPV.
The sensory attributes evaluated by the panelists for each sample were: color, odor,taste, and overall acceptability. Each sample (15 mL) was served in a random order in whiteplastic cups coded with three digits. To minimize any residual effects, the panelists wereinstructed to rinse their mouth with water and take all necessary time to score the samples.The participants were asked to score each sensory attribute on a 9-point scale (1 = dislikevery much to 9 = like very much) [26].
2.7. Assessment of Storage Stability of NPV Powder
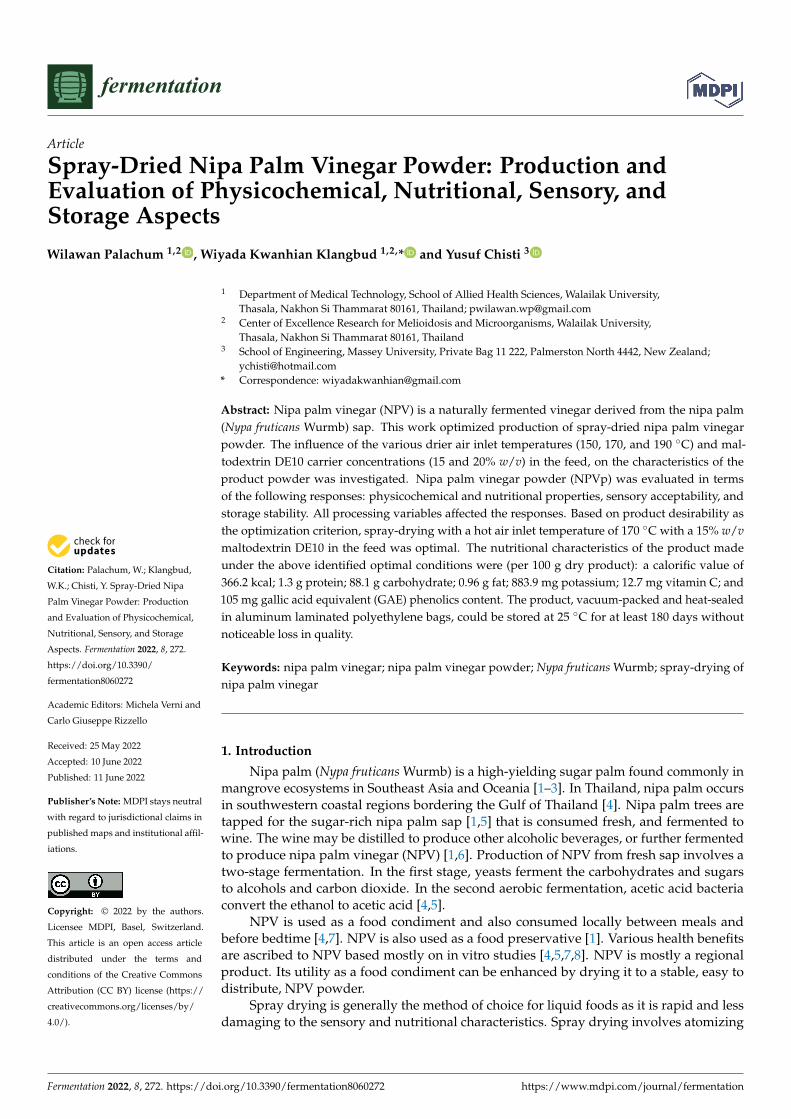
Spray-dried NPV powder (30 g) (product NPVp-3, Figure 1A) was packed in aluminum-laminated polyethylene bags and heat-sealed under vacuum (Figure 1B). The sealed sam-ples were kept at room temperature (25 ± 2 ◦C, 75% relative humidity) for 180 days. Entirebags were sampled at 30-day intervals for measuring the pH, the moisture content, wateractivity, color parameters, and microbial counts. Triplicate samples were analyzed.
Fermentation 2022, 8, x FOR PEER REVIEW 5 of 15
In the beverage recipes (R3 and R4), the original NPV was used for R3 and NPV pow-der was reconstituted as liquid vinegar as R4. For the preparation of the beverage, the NPV (200 g) was mixed with 200 g of honey (Thai Honey, Thailand; http://www.thai-honey.net) and 600 g of carbonated water (Singha Soda, Thailand; https://www.singha-corporation.com/singhasoda/). The mass ratio of NPV:honey:carbonated water was 1:1:3. The ingredients of R4 were the same as R3, but 200 g of NPVp was added instead of NPV.
For the food recipes (R5 and R6), vinegar was used to increase the acid taste of the food. In recipe R6, 60 g NPVp was added to 1 L of sour soup (Thai sour fish soup made with sea mullet). While the ingredients for Recipe 5 were the same as for Recipe 6, NPVp was replaced with 60 g of the original NPV.
The sensory attributes evaluated by the panelists for each sample were: color, odor, taste, and overall acceptability. Each sample (15 mL) was served in a random order in white plastic cups coded with three digits. To minimize any residual effects, the panelists were instructed to rinse their mouth with water and take all necessary time to score the samples. The participants were asked to score each sensory attribute on a 9-point scale (1 = dislike very much to 9 = like very much) [26].
2.7. Assessment of Storage Stability of NPV Powder Spray-dried NPV powder (30 g) (product NPVp-3, Figure 1A) was packed in alumi-
num-laminated polyethylene bags and heat-sealed under vacuum (Figure 1B). The sealed samples were kept at room temperature (25 ± 2 °C, 75% relative humidity) for 180 days. Entire bags were sampled at 30-day intervals for measuring the pH, the moisture content, water activity, color parameters, and microbial counts. Triplicate samples were analyzed.
Figure 1. The appearance of spray-dried NPV powder product NPVp-3 (A); the sealed aluminum-laminated polyethylene package containing the NPV powder for stability assessments (B).
Microbial Counts Each NPV powder sample (10 g) was homogenized with 90 mL of sterile 0.1% w/v
(g/100 mL) peptone solution (Himedia, Mumbai, India). Serial dilutions (9 mL) were pre-pared using sterile peptone solutions for plating. A portion (1 mL) of the appropriate di-lution was plated in duplicate on potato dextrose agar media (Merck, Germany) which had been aseptically acidified with 10% w/v (g/100 mL) tartaric acid (Ricca Chemical Co., Arlington, TX, USA). The plates were incubated at 25 °C for 5 days for the enumeration of yeasts and molds [27,28].
Figure 1. The appearance of spray-dried NPV powder product NPVp-3 (A); the sealed aluminum-laminated polyethylene package containing the NPV powder for stability assessments (B).
Microbial Counts
Each NPV powder sample (10 g) was homogenized with 90 mL of sterile 0.1% w/v(g/100 mL) peptone solution (Himedia, Mumbai, India). Serial dilutions (9 mL) wereprepared using sterile peptone solutions for plating. A portion (1 mL) of the appropriatedilution was plated in duplicate on potato dextrose agar media (Merck, Germany) whichhad been aseptically acidified with 10% w/v (g/100 mL) tartaric acid (Ricca Chemical Co.,Arlington, TX, USA). The plates were incubated at 25 ◦C for 5 days for the enumeration ofyeasts and molds [27,28].
2.8. Statistical Analysis
All analyses were performed on triplicate samples. The results were presented as meanvalues (±standard deviation). The results were analyzed by one-way ANOVA (Tukey’s test).The mean values at 95% significance level (p < 0.05) were taken as a significant difference.
3. Results and Discussion3.1. Effects of Spray Drying Conditions
Success in spray drying depends critically on the characteristics of the feed, particularlyon the concentration of the carrier [10]. The carrier in the present work was maltodextrinDE10. In addition, the inlet temperature of the drying air was important as too high atemperature could damage the product whereas an insufficiently high temperature would

Fermentation 2022, 8, 272 6 of 13
result in a poorly dried sticky product [10]. Preliminary studies were carried out to definethe suitable ranges of inlet air temperature and the carrier concentration. The maltodextrincontent had to be significantly higher than 10% w/v to produce a non-agglomeratingpowder with the required colloidal stability. In keeping with prior work on spray dryingof blueberry juice [29], a maltodextrin content of 10% w/v in the feed resulted in norecovery of the powder possibly because the material stuck to the walls of the spray drier.Therefore, two levels of maltodextrin DE10 concentrations (15 and 20% w/v) were testedin combination with three levels of air inlet temperature (150, 170, and 190 ◦C) ( Table S1).For the factor combinations used in the six experimental runs (Table S2), the measuredresponses of the physicochemical properties of the products are shown in Table 1. The datashown (Table 1) are the average values of two independent replicates. The mean squares ofaverage experimental results were subjected to analysis of variance (Table 2).
Table 1. Physicochemical properties of the spray-dried NPV powder formulations.
ProductCondition Y (%)
BD (g mL−1) MC (% w/w) aw TSS (◦Bx)Color
T(◦C)
MD(%) L* a* b*
NPVp-1 150 15 53.37 ± 0.14 0.46 ± 0.00 2.56 ± 0.06 0.31 ± 0.01 19.50 ± 0.71 91.75 ± 0.06 0.18 ± 0.01 7.91 ± 0.01NPVp-2 150 20 56.31 ± 0.44 0.47 ± 0.00 3.05 ± 0.07 0.36 ± 0.01 24.10 ± 0.14 91.95 ± 0.06 −0.27 ± 0.00 5.53 ± 0.04NPVp-3 170 15 53.62 ± 0.11 0.47 ± 0.00 2.08 ± 0.04 0.23 ± 0.00 20.00 ± 0.00 93.57 ± 0.62 0.38 ± 0.01 10.12 ± 0.12NPVp-4 170 20 58.29 ± 0.05 0.48 ± 0.01 3.03 ± 0.05 0.24 ± 0.00 23.70 ± 0.42 92.80 ± 0.13 0.49 ± 0.01 10.28 ± 0.02NPVp-5 190 15 47.04 ± 0.44 0.43 ± 0.00 2.63 ± 0.04 0.23 ± 0.00 20.00 ± 0.00 91.53 ± 0.04 −0.09 ± 0.00 6.29 ± 0.03NPVp-6 190 20 50.72 ± 0.02 0.46 ± 0.00 3.02 ± 0.03 0.24 ± 0.01 24.00 ± 0.00 92.14 ± 0.06 0.54 ± 0.00 6.21 ± 0.01
T, inlet temperature; MD, concentration (% w/v) of maltodextrin DE 10; Y, product yield; BD, bulk density; MC,moisture content, aw, water activity; TSS, total soluble solids. Results are mean values ± standard deviations ofmeasurements on duplicate samples of the final product.
Table 2. Analysis of variance (ANOVA) of physicochemical characteristic responses of spray-driedNPV powders.
Source of Variation Y BD MC aw TSSColor
L* a* b*
Model 31.94 ** 0.0005 ** 0.2966 ** 0.0054 ** 10.19 ** 1.16 ** 0.2132 ** 8.58 **Inlet temperature (X1) 57.9 ** 0.0008 ** 0.094 ** 0.0122 ** 0.0433 NS 35.19 ** 0.2295 ** 18.59 **
Maltodextrin concentration (X2) 42.41 ** 0.0007 ** 1.12 ** 0.0015 ** 50.43 ** 0.0099 NS 0.029 ** 1.76 **X1 × X2 0.7493 ** 0.0002 ** 0.0892 ** 0.0006 ** 0.21 NS 7.41 ** 0.289 ** 1.97 **
R2 0.9974 0.9814 0.9903 0.9940 0.9864 0.9342 0.9999 0.9996
Y, product yield; BD, bulk density; MC, moisture content; aw, water activity; TSS, total soluble solids.; R2 valuesindicate the goodness of fit of the theoretical models (see Table S4) to the experimental data; NS, nonsignificant(p > 0.05); **, significant (p < 0.05).
3.1.1. Yield of NPV Powder
The product yield of the spray-dried NPVp samples (NPVp-1 to NPVp-6) ranged from58.3 to 47.0% (Table 1). The inlet temperature and maltodextrin concentration both hadsubstantial effects (p < 0.05) on the yield of the powdered product (Table 2). As the air inlettemperature was increased from 150 ◦C to 190 ◦C, the product yield reduced by 19.3%. Thiswas consistent with similar findings reported for spray-drying of mountain tea extract [30],soluble sage (Salvia fruticosa Miller) [31], and a mandarin (Citrus unshiu) beverage [32]. Thedecreasing yield was associated with the melting of the powder at higher temperatures anddeposition on the walls of the drying chamber [30–32]. In contrast to the temperature effect,a raising of the maltodextrin concentration in the feed from 15% to 20% w/v increased theproduct yield (Table 1). This was simply the effect of a higher concentration of solublesolids in the feed [30,31].
The interactive effect of the variables on yield was positive (p < 0.05; Table 2). Theexperimental data agreed well with the predictive model (Table S4) as evidenced by R2
of 0.9974 (Table 2). Similar positive interactive effects of drying air temperature andmaltodextrin content in the feed, on product yield were reported by others [13,14,33].

Fermentation 2022, 8, 272 7 of 13
3.1.2. Bulk Density
A high bulk density reduces the volume for a given mass of product, reducing costof packaging and shipping. In addition, powders with high bulk densities have superiorflow properties compared to agglomerated powders with a low bulk density [10]. The bulkdensity of the NPV powders varied from 0.43 to 0.48 g mL−1 (Table 1). These values werehigher compared to data reported for spray-dried instant soluble sage [31] and spray-driedwhey protein mixes [34] made under conditions similar to those of the present work. Boththe inlet temperature and maltodextrin concentration significantly (p < 0.05) affected thebulk density of NPVp (Table 2). The experimental data of bulk density agreed well withthe predictive model (R2 = 0.9814; Table 2) shown in Table S4.
3.1.3. Moisture Content and Water Activity
Dry products generally have a good storage stability if the moisture content is less than5% [20,31,35]. In the present study, the moisture content of the NPV powders was in therange of 2.1–3.1% (Table 1). Individually, both the experimental factors (X1, X2) significantly(p < 0.05) affected the moisture contents of the NPV powders (Table 2). In addition, themoisture content was significantly affected (p < 0.05) by the interactive effect of the factors(Table 2). A similar behavior was reported during drying of amla juice [13]. A high dryingtemperature increased the rate of heat transfer into the drying particles, resulting in fasterevaporation of water [36]. A higher concentration of the carrier in the feed resulted in ahigher moisture content in the product (Table 2), although the moisture content was alwayswell below 5%. A similar effect of the carrier concentration was previously reported fordrying of amla juice [13].
The water activity of fruit and vegetable juice powders typically ranges from0.2 to 0.6 [10]. The NPVp samples in the present work had water activities in the rangeof 0.23–0.36 (Table 1). Food with a water activity of less than 0.6 is generally regarded asmicrobiologically stable [37], although deterioration may occur through chemical reactionssuch as oxidation. The effects of the factors (X1, X2) on water activity were comparableto their effects on the moisture content as discussed earlier in this section. An increasedconcentration of the carrier increased the water activity of the product, and this effect wasstatistically significant (p > 0.05) (Table 2). Similar effects of carriers have been reported inspray drying of various fruit juices [28,32,34].
3.1.4. Total Soluble Solids
A significantly high total soluble solids were observed in the product if the feedcontained 20% w/v maltodextrin instead of 15% w/v maltodextrin (Table 1). This wasunderstandable because the total soluble solids in the feed were higher if the carrierconcentration was higher. The total soluble solids were not significantly affected by theinlet temperature of the drying air as the minimum temperature used was satisfactory fordrying (Table 2). Similarly, the interactive effect of factors on total soluble solids was notsignificant (Table 2).
3.1.5. Color
All NPV powders had an off-white general appearance (Figure 1A; Table 1). Innumerical terms, the color was characterized by the parameters L*, a*, and b* (Table 1). TheL* lightness scale ranged from 0 (dark) to 100 (light), with 50 as the midpoint. Thus, theNPV powders had L* values of 91.5–93.6 (Table 1), indicating that they all were well towardthe lighter end of the scale. The low positive value of a* (−0.27 to 0.54; Table 1) revealed ahue slightly more green (a* = −100) than red (a* = 100). Furthermore, the low positive b*(5.53–10.28, Table 1) indicated that the color was slightly yellowish (b* = −100) rather thanblue (b* = 100). The product NPVp-3 is depicted in Figure 1A.
The a* and b* color values of the NPV powders were significantly affected (p < 0.05)by the inlet temperature and maltodextrin content, but maltodextrin concentration had noeffect on L* values (Table 2). Other work has shown similar trends of the drying temperature

Fermentation 2022, 8, 272 8 of 13
affecting the lightness (L*) of the spray dried product [37]. The hue of the product waslargely influenced by the white color of the native maltodextrin carrier.
3.2. Optimization of Design
The goal of the optimization step was to identify the optimum values of the inde-pendent variables for producing a product with the desired properties. The desirabilityfunction was created by optimizing independent variables and combining the individualresponses to produce an overall desirability. The numeric optimization was implementedusing the Design-Expert software. The values of the product yield, bulk density, moisturecontent, and water activity were set to the target values for generating the optimizedproduct (Table S3).
The highest value of overall desirability (0.921, Figure 2) could be obtained in a productthat combined a high product yield and bulk density with low moisture content and wateractivity. The product with a desirability of 0.921 was the NPVp-3 produced using an inlet airtemperature of 170 ◦C and a feed with 15% w/v of maltodextrin. For NPVp-3, the predictedvalues of the product yield, bulk density, moisture content, and water activity were 53.62%,0.47 g mL−1, 2.08% w/w, and 0.23, respectively. The NPVp-3 had the measured attributesvalues that were within 5% of the predicted values, thus validating the optimized model(Table S4).
Fermentation 2022, 8, x FOR PEER REVIEW 9 of 15
measured attributes values that were within 5% of the predicted values, thus validating the optimized model (Table S4).
Figure 2. The overall desirability response of the products made using various combinations of the drying air inlet temperature (X1 = A) and maltodextrin concentration (X2 = B). The product with the highest desirability (0.921) had a drying temperature of 170 °C and 15% w/v of maltodextrin content. Design points are shown as red circles.
3.3. Nutritional Characteristics A comparison of the nutritional parameters of the NPVp-3 powder with a commer-
cial product is shown in (Table 3). The NPVp-3 powder had around 96% of the calorific content as the commercial product possibly because of its lower level (91.5% of commer-cial product) of total carbohydrate compared to the commercial product (Table 3). The protein content of NPVp-3 was ∼27-fold greater compared to the commercial product and the total fat was also greater (∼10-fold; Table 3) possibly due to natural variations of fat and protein in the vinegar, depending its original source.
Figure 2. The overall desirability response of the products made using various combinations of thedrying air inlet temperature (X1 = A) and maltodextrin concentration (X2 = B). The product with thehighest desirability (0.921) had a drying temperature of 170 ◦C and 15% w/v of maltodextrin content.Design points are shown as red circles.
3.3. Nutritional Characteristics
A comparison of the nutritional parameters of the NPVp-3 powder with a commercialproduct is shown in (Table 3). The NPVp-3 powder had around 96% of the calorific contentas the commercial product possibly because of its lower level (91.5% of commercial product)of total carbohydrate compared to the commercial product (Table 3). The protein content ofNPVp-3 was ~27-fold greater compared to the commercial product and the total fat wasalso greater (~10-fold; Table 3) possibly due to natural variations of fat and protein in thevinegar, depending its original source.

Fermentation 2022, 8, 272 9 of 13
Table 3. Nutritional analysis of the NPVp-3 product compared with a commercial vinegar pow-der sample.
Test Item Unit/100 g a,b NPVp-3 Powder Commercial VinegarPowder d
Energy kcal 366.16 ± 3.92 380.9Protein g 1.33 ± 0.01 0.05
Crude fat g 0.96 ± 0.013 0.1Cholesterol mg Not detected 0
Carbohydrate g 88.05 ± 1.88 96.2Total sugars g 14.16 ± 0.85 3.5
Total dietary fiber g 0 ± 0.00 0.22Ash g 3.03 ± 0.01 -
MineralsCalcium (Ca) mg 30.92 ± 0.71 25
Iron (Fe) mg 0.54 ± 0.00 0.41Sodium (Na) mg 268.56 ± 0.12 79
Potassium (K) mg 883.90 ± 0.35 -Phosphorous (P) mg 35.90 ± 0.03 -Magnesium (Mg) mg 21.50 ± 0.13 -
Zinc (Zn) mg 0.26 ± 0.00 -Vitamins
Vitamin A µg 0.00 ± 0.00 0.54Vitamin B1 mg Not detected -Vitamin B2 mg Not detected -Vitamin C mg 12.68 ± 0.10 0.27
Other constituentsTotal phenolics
content µg GAE c g−1 1049.76 ± 20.03 -
Acetic acid % w/v 5.13 12a Samples were analyzed in triplicate. Data are average values ± standard deviations.; b Dry weight basis.;c GAE, gallic acid equivalent; d Values are based on the literature (Spice Barn® vinegar powder, Spice Barn, Inc.;https://spicebarn.com/vinegar_powder.htm (accessed on 24 May 2022)).
The NPVp-3 powder had similar levels of calcium and iron as the commercial product,but was considerably richer in the other minerals listed in Table 3. The total vitamin Cin NPVp-3 powder was nearly 47-fold greater than in the commercial product, possiblybecause the spray drying conditions used preserved a higher proportion of this heat-labilevitamin compared to the processing conditions used in making the commercial product.The commercial product had a small amount of vitamin A (Table 3), but this was too low tobe meaningful compared to ~900 µg daily requirement of this vitamin in adult males.
Gallic acid equivalent (GAE) is a commonly used measure of total phenolics in foods.Phenolics are antioxidants and also protect food against oxidative damage. The NPVp-3powder had a high level of total phenolics (~1050 µg GAE g−1; Table 3) compared toliterature data (167 µg GAE mL−1; [8]) for reported for NPV. The elevated level of phenolicswas explained at least partly by the concentrating effect of spray drying.
Natural liquid vinegars typically have more than 4 g of acetic acid per 100 mL (FDA,https://www.fda.gov/media/71937/download (accessed on 24 May 2022)). The NPVp-3powder had ~5% w/v acetic acid (Table 3) because much of it was lost by vaporizationduring drying.
3.4. Sensory Acceptance
The sensory evaluations of the beverage/food preparations containing the originalNPV and the product NPVp-3 for color, odor, taste, and overall acceptability are shown inFigure 3. The six recipes (R1–R6) were scored by the 59 panelists as previously explained.

Fermentation 2022, 8, 272 10 of 13
Fermentation 2022, 8, x FOR PEER REVIEW 11 of 15
3.4. Sensory Acceptance The sensory evaluations of the beverage/food preparations containing the original
NPV and the product NPVp-3 for color, odor, taste, and overall acceptability are shown in Figure 3. The six recipes (R1–R6) were scored by the 59 panelists as previously ex-plained.
Figure 3. Spider charts of sensory evaluation scores of the original NVP and the NPVp-3 powder used as a beverage and food additive: (A) Recipe R1 containing the original NPV (control R1) 200 g in 800 g of drinking water; (B) Recipe R2 containing 200 g of rehydrated NPV powder (control R2) in 800 g of drinking water; (C) Recipe R3 containing the original NPV (200 g), 200 g honey, and 600 g carbonated water; (D) Recipe R4 containing NPVp-3 (200 g), 200 g honey, and 600 g carbonated water; (E) Recipe R5 containing the original NPV (60 g) in 1 L of sour soup (Thai sour sea mullet fish soup); and (F) Recipe R6 containing NPVp-3 (60 g) in 1 L of sour soup (as above). The data are mean values ± standard deviations (n = 59). Each score was generated by 59 individuals using a 9-point hedonic scale (1 = dislike very much; 9 = like very much).
(Section 2.6). The test materials containing the original NPV were used as controls (R1, Figure 3A; R3, Figure 3C; R5, Figure 3E). The various drink/food recipes are explained in the caption of Figure 3. The recipes contained either the original NPV, or NPVp-3, mixed with: drinking water (R1, R2); honey and carbonated water (R3, R4); and Thai sour fish soup (R5, R6). The recipes containing NPVp-3 (R2, Figure 3B; R4, Figure 3D; R6, Fig-ure 3F) used the same ingredients as in the control preparations containing the original NPV (Section 2.6).
Figure 3. Spider charts of sensory evaluation scores of the original NVP and the NPVp-3 powderused as a beverage and food additive: (A) Recipe R1 containing the original NPV (control R1) 200 gin 800 g of drinking water; (B) Recipe R2 containing 200 g of rehydrated NPV powder (control R2) in800 g of drinking water; (C) Recipe R3 containing the original NPV (200 g), 200 g honey, and 600 gcarbonated water; (D) Recipe R4 containing NPVp-3 (200 g), 200 g honey, and 600 g carbonatedwater; (E) Recipe R5 containing the original NPV (60 g) in 1 L of sour soup (Thai sour sea mullet fishsoup); and (F) Recipe R6 containing NPVp-3 (60 g) in 1 L of sour soup (as above). The data are meanvalues ± standard deviations (n = 59). Each score was generated by 59 individuals using a 9-pointhedonic scale (1 = dislike very much; 9 = like very much).
The test materials containing the original NPV were used as controls (R1, Figure 3A;R3, Figure 3C; R5, Figure 3E). The various drink/food recipes are explained in the captionof Figure 3. The recipes contained either the original NPV, or NPVp-3, mixed with: drinkingwater (R1, R2); honey and carbonated water (R3, R4); and Thai sour fish soup (R5, R6). Therecipes containing NPVp-3 (R2, Figure 3B; R4, Figure 3D; R6, Figure 3F) used the sameingredients as in the control preparations containing the original NPV (Section 2.6).
The sensory scores of color, odor, taste, and overall acceptability for the recipes R1 andR2 (Figure 3A,B) were not substantially different. R1 and R2 received overall acceptancescores of 4.41 ± 1.63 and 4.73 ± 1.72, respectively. NPVp-3 recipe R2 received a little higherrating than the recipe R1 that contained the original NPV. The difference was explained bythe more intense vinegary odor and the characteristic sour flavor of NPV due to its highercontent of acetic acid.

Fermentation 2022, 8, 272 11 of 13
In the beverage recipes R3 and R4 (Figure 3C,D), the recipe R4 made with NPVp-3 scored somewhat higher than R3 (made with the original vinegar) for all the scoredattributes. Overall, the tasters better accepted the beverages made with NPVp-3.
Original NPV (Recipe R5) and NPVp-3 powder (Recipe R6) were used to season thefish soup (Figure 3E,F). The sensory parameter ratings for both were fairly comparable, butR6 scored somewhat higher than the original NPV. Although the differences were small,the tasters preferred the beverage recipe R4 (Figure 3D) based on NPVp-3 more than thesame product used as a food seasoning (R6, Figure 3F).
3.5. Product Stability during Storage
Variations in the relevant physicochemical parameters of NPVp-3 stored for variousperiods at 25 ◦C are shown in Table 4. The off-white appearance of the samples barelychanged during 180 days of storage (Table 4). In terms of the electronic color parameters(L*, a*, b*; Table 4), there were minor changes: a slight but fairly consistent increase in a*value with the length of storage, and a similar increase in the b* value. The sample lightness(L*) was always within 94.1 and 95.1 (Table 4).
Table 4. Effect of storage duration on appearance, pH, moisture content, water activity, color, andmicrobial contents (molds and yeasts) of the product NPVp-3 during storage at 25 ◦C.
Property Storage Duration (Days) A
0 30 60 90 120 180
Appearance
Fermentation 2022, 8, x FOR PEER REVIEW 13 of 16
The sensory scores of color, odor, taste, and overall acceptability for the recipes R1 and R2 (Figure 3A,B) were not substantially different. R1 and R2 received overall acceptance scores of 4.41 ± 1.63 and 4.73 ± 1.72, respectively. NPVp-3 recipe R2 received a little higher rating than the recipe R1 that contained the original NPV. The difference was explained by the more intense vinegary odor and the characteristic sour flavor of NPV due to its higher content of acetic acid.
In the beverage recipes R3 and R4 (Figure 3C,D), the recipe R4 made with NPVp-3 scored somewhat higher than R3 (made with the original vinegar) for all the scored attributes. Overall, the tasters better accepted the beverages made with NPVp-3.
Original NPV (Recipe R5) and NPVp-3 powder (Recipe R6) were used to season the fish soup (Figure 3E,F). The sensory parameter ratings for both were fairly comparable, but R6 scored somewhat higher than the original NPV. Although the differences were small, the tasters preferred the beverage recipe R4 (Figure 3D) based on NPVp-3 more than the same product used as a food seasoning (R6, Figure 3F).
3.5. Product Stability During Storage Variations in the relevant physicochemical parameters of NPVp-3 stored for various
periods at 25 °C are shown in Table 4. The off-white appearance of the samples barely changed during 180 days of storage (Table 4). In terms of the electronic color parameters (L*, a*, b*; Table 4), there were minor changes: a slight but fairly consistent increase in a* value with the length of storage, and a similar increase in the b* value. The sample lightness (L*) was always within 94.1 and 95.1 (Table 4).
Table 4. Effect of storage duration on appearance, pH, moisture content, water activity, color, and microbial contents (molds and yeasts) of the product NPVp-3 during storage at 25 °C.
Property Storage Duration (days) A 0 30 60 90 120 180
Appearance
pH 3.20 ± 0.01 ab 3.18 ± 0.01 a 3.18 ± 0.01 a 3.21 ± 0.01 b 3.21 ± 0.00 b 3.21 ± 0.00 b Moisture (% w/w) 2.61 ± 0.01 a 2.62 ± 0.02 a 2.61 ± 0.01 a 2.61 ± 0.01 a 2.62 ± 0.02 a 2.62 ± 0.01 a
Water activity 0.23 ± 0.00 a 0.23 ± 0.00 a 0.23 ± 0.00 a 0.23 ± 0.00 a 0.24 ± 0.00 a 0.24 ± 0.00 a Color
L* 94.13 ± 0.18 a 95.07 ± 0.13 bc 95.04 ± 0.05 bc 94.94 ± 0.07 bc 94.87 ± 0.04 bc 94.64 ± 0.07 b a* 0.37 ± 0.03 a 0.36 ± 0.01 a 0.42 ± 0.06 ab 0.49 ± 0.04 ab 0.54 ± 0.03 bc 0.58 ± 0.02 c b* 10.03 ± 0.04 a 10.26 ± 0.20 ab 10.44 ± 0.15 abc 10.53 ± 0.02 bc 10.67 ± 0.01 bc 10.78 ± 0.11 c
Molds (CFU g−1) 00.00 ± 0.00 a 00.00 ± 0.00 a 00.00 ± 0.00 a 00.00 ± 0.00 a 00.00 ± 0.00 a 00.00 ± 0.00 a Yeasts (CFU g−1) 00.00 ± 0.00 a 00.00 ± 0.00 a 00.00 ± 0.00 a 00.00 ± 0.00 a 00.00 ± 0.00 a 00.00 ± 0.00 a
All analyses were in triplicate. Data are average values ± standard deviations.; A Different superscript lowercase letters within a row indicate a significant difference (p < 0.05).
The moisture content of the product remained stable (2.62% w/w; Table 4) over the full duration of storage. Similarly, the water activity remained within 0.23–0.24
pH 3.20 ± 0.01 ab 3.18 ± 0.01 a 3.18 ± 0.01 a 3.21 ± 0.01 b 3.21 ± 0.00 b 3.21 ± 0.00 b
Moisture (% w/w) 2.61 ± 0.01 a 2.62 ± 0.02 a 2.61 ± 0.01 a 2.61 ± 0.01 a 2.62 ± 0.02 a 2.62 ± 0.01 a
Water activity 0.23 ± 0.00 a 0.23 ± 0.00 a 0.23 ± 0.00 a 0.23 ± 0.00 a 0.24 ± 0.00 a 0.24 ± 0.00 a
ColorL* 94.13 ± 0.18 a 95.07 ± 0.13 bc 95.04 ± 0.05 bc 94.94 ± 0.07 bc 94.87 ± 0.04 bc 94.64 ± 0.07 b
a* 0.37 ± 0.03 a 0.36 ± 0.01 a 0.42 ± 0.06 ab 0.49 ± 0.04 ab 0.54 ± 0.03 bc 0.58 ± 0.02 c
b* 10.03 ± 0.04 a 10.26 ± 0.20 ab 10.44 ± 0.15 abc 10.53 ± 0.02 bc 10.67 ± 0.01 bc 10.78 ± 0.11 c
Molds (CFU g−1) 00.00 ± 0.00 a 00.00 ± 0.00 a 00.00 ± 0.00 a 00.00 ± 0.00 a 00.00 ± 0.00 a 00.00 ± 0.00 a
Yeasts (CFU g−1) 00.00 ± 0.00 a 00.00 ± 0.00 a 00.00 ± 0.00 a 00.00 ± 0.00 a 00.00 ± 0.00 a 00.00 ± 0.00 a
All analyses were in triplicate. Data are average values ± standard deviations.; A Different superscript lowercaseletters within a row indicate a significant difference (p < 0.05).
The moisture content of the product remained stable (2.62% w/w; Table 4) over thefull duration of storage. Similarly, the water activity remained within 0.23–0.24 throughout(Table 4). NPV powder maintained its initial water activity level throughout the study. ThepH values were quite stable over the entire storage period (Table 4), although marginallyhigher in samples stored for 90 days and longer. A stable acidity (pH) and water activitylevel are particularly important in ensuring a long shelf-life of a food product. Stable valuesof these parameters indirectly suggest a lack of microbial growth [38].
The microbial count of the product did not change, and the product was essentiallysterile (Table 4). Absence of microbial growth was consistent with the low water activity(≤0.24; Table 4) of the product, as microbes do not proliferate if the water activity is lessthan 0.5 [10].
4. Conclusions
The NPV powder with the highest desirability could be produced using a dryingair inlet temperature of 170 ◦C in combination with a nipa palm vinegar feed containing15% w/v maltodextrin DE10. This product (NPVp-3) had nearly 47-fold higher vitaminC content than a commercial vinegar powder but only ~43% of the acidity (acetic acid)

Fermentation 2022, 8, 272 12 of 13
compared to the commercial product. The NPVp-3 powder was stable at room temperatureduring 180-days of storage. The excellent stability was explained by the low water activity(aw = 0.23) of the product, indicating highly effective drying by the method used. A rela-tively high content of the highly heat-sensitive vitamin C in the product indicated that thespray-drying treatment minimized damage to the product due to the short contact time(residence time in the drying chamber was less than 42 s) of the product with the drying air.The NPVp-3 was judged to be a good food seasoning and beverage ingredient.
Supplementary Materials: The following supporting information can be downloaded at: https://www.mdpi.com/article/10.3390/fermentation8060272/s1. Supplemental material for this articleis available at: Table S1. The levels of the various factors in experimental design. Table S2. The factorvalues used in producing the various powdered NPV products. Table S3. The constraints used inestimating the overall desirability. Table S4. The statistical models and comparison of predictionswith the measured values.
Author Contributions: Conceptualization, W.P. and W.K.K.; methodology, W.P. and W.K.K.; inves-tigation, W.P. and W.K.K.; resources, W.K.K.; writing—original draft preparation, W.P. and W.K.K.;writing—review and editing, W.P., W.K.K. and Y.C.; supervision, W.K.K. and Y.C.; funding acquisition,W.K.K. and W.P. All authors have read and agreed to the published version of the manuscript.
Funding: The research was funded by Agricultural Research Development Agency (Public Organiza-tion), Thailand, under project number CRP6205031430, and partially funded by the new strategicresearch project of Walailak University (P2P).
Institutional Review Board Statement: This study was conducted according to the guidelines ofthe Declaration of Helsinki, and approved by the Human Research Ethics Committee of WalailakUniversity (approval WUEC-20-048-01 dated 6 March 2020).
Informed Consent Statement: Informed consent was obtained from all participants of the sensorypanels involved in this study.
Data Availability Statement: All data relating to this study are included within this article. Datawill be made available on reasonable request.
Conflicts of Interest: The authors declare no conflict of interest.
References1. Cheablam, O.; Chanklap, B. Sustainable nipa palm (Nypa fruticans Wurmb.) product utilization in Thailand. Scientifica 2020,
2020, 3856203. [CrossRef] [PubMed]2. Hamilton, L.S.; Murphy, D.H. Use and management of Nipa palm (Nypa fruticans, arecaceae): A review. Econ. Bot. 1988, 42,
206–213. [CrossRef]3. Tsuji, K.; Ghazalli, M.N.F.; Ariffin, Z.; Nordin, M.S.; Khaidizar, M.I.; Dulloo, M.E.; Sebastian, L.S. Biological and ethnobotanical
characteristics of Nipa Palm (Nypa fructicans Wurmb.): A review. Sains Malays. 2011, 40, 1407–1412.4. Senghoi, W.; Klangbud, W.K. Antioxidants, inhibits the growth of foodborne pathogens and reduces nitric oxide activity in
LPS-stimulated RAW 264.7 cells of nipa palm vinegar. PeerJ 2021, 9, e12151. [CrossRef]5. Laklaeng, S.-N.; Kwanhian, W. Immunomodulation effect of Nypa fruticans palm vinegar. Walailak J. Sci. Technol. 2020, 17,
1200–1210. [CrossRef]6. Francisco-Ortega, J.; Zona, S. Sweet sap from palms, a source of beverages, alcohol, vinegar, syrup, and sugar. Vieraea 2013, 41,
91–113. [CrossRef]7. Yusoff, N.A.; Ahmad, M.; Al Hindi, B.; Widyawati, T.; Yam, M.F.; Mahmud, R.; Razak, K.N.; Asmawi, M.Z. Aqueous extract
of Nypa fruticans Wurmb. vinegar alleviates postprandial hyperglycemia in normoglycemic rats. Nutrients 2015, 7, 7012–7026.[CrossRef] [PubMed]
8. Chatatikun, M.; Kwanhian, W. Phenolic profile of nipa palm vinegar and evaluation of its antilipidemic activities. Evid. BasedComplement. Alternat. Med. 2020, 2020, 6769726. [CrossRef]
9. Santos, D.; Maurício, A.C.; Sencadas, V.; Santos, J.D.; Fernandes, M.H.; Gomes, P.S. Spray drying: An overview. Biomater. Phys.Chem. -New Ed. 2017, 9–35. [CrossRef]
10. Shishir, M.R.I.; Chen, W. Trends of spray drying: A critical review on drying of fruit and vegetable juices. Trends Food Sci. Technol.2017, 65, 49–67. [CrossRef]

Fermentation 2022, 8, 272 13 of 13
11. Muhamad, I.I.; Hassan, N.D.; Mamat, S.N.; Nawi, N.M.; Rashid, W.A.; Tan, N.A. Extraction technologies and solvents of phyto-compounds from plant materials: Physicochemical characterization and identification of ingredients and bioactive compoundsfrom plant extract using various instrumentations. In Ingredients Extraction by Physicochemical Methods in Food; Grumezescu, A.M.,Holban, A.M., Eds.; Elsevier: Amsterdam, The Netherlands, 2017; pp. 523–560. [CrossRef]
12. Braga, V.; Guidi, L.R.; de Santana, R.C.; Zotarelli, M.F. Production and characterization of pineapple-mint juice by spray drying.Powder Technol. 2020, 375, 409–419. [CrossRef]
13. Mishra, P.; Mishra, S.; Mahanta, C.L. Effect of maltodextrin concentration and inlet temperature during spray drying onphysicochemical and antioxidant properties of amla (Emblica officinalis) juice powder. Food Bioprod. Process. 2014, 92, 252–258.[CrossRef]
14. Abd Hashib, S.; Abd Rahman, N.; Suzihaque, M.; Ibrahim, U.K.; Hanif, N.E. Effect of slurry concentration and inlet temperaturetowards glass temperature of spray dried pineapple powder. Procedia Soc. Behav. Sci. 2015, 195, 2660–2667. [CrossRef]
15. Oberoi, D.P.S.; Sogi, D.S. Effect of drying methods and maltodextrin concentration on pigment content of watermelon juicepowder. J. Food Eng. 2015, 165, 172–178. [CrossRef]
16. Chen, J.-C.; Zheng, B.-D.; Zhao, Y.-Y.; Xu, J.; Wu, J.-J.; Luo, C.; Pang, J.; He, G.-Q. Hypolipidemic effects on lipid metabolism andlipase inhibition by black vinegar powder. J. Biobased Mater. Bioenergy 2012, 6, 634–639. [CrossRef]
17. Chen, J.; Tian, J.; Ge, H.; Liu, R.; Xiao, J. Effects of tetramethylpyrazine from Chinese black vinegar on antioxidant andhypolipidemia activities in HepG2 cells. Food Chem. Toxicol. 2017, 109, 930–940. [CrossRef]
18. Othaman, M.A.; Sharifudin, S.A.; Mansor, A.; Kahar, A.; Long, K. Coconut water vinegar: New alternative with improvedprocessing technique. J. Eng. Sci. Technol. 2014, 9, 293–302.
19. Yu, L.; Peng, Z.; Dong, L.; Wang, S.; Ding, L.; Huo, Y.; Wang, H. Bamboo vinegar powder supplementation improves theantioxidant ability of the liver in finishing pigs. Livest. Sci. 2018, 211, 80–86. [CrossRef]
20. Goula, A.M.; Adamopoulos, K.G. Spray drying of tomato pulp in dehumidified air: II. The effect on powder properties. J. FoodEng. 2005, 66, 35–42. [CrossRef]
21. AOAC International. Official Methods of Analysis of AOAC International, 21st ed.; AOAC International: Rockville, MD, USA, 2019.22. AOAC International. Official Methods of Analysis of AOAC International, 17th ed.; AOAC International: Rockville, MD, USA, 2000.23. Palachum, W.; Choorit, W.; Manurakchinakorn, S.; Chisti, Y. Guava pulp fermentation and processing to a vitamin B12-enriched
product. J. Food Process. Preserv. 2020, 44, e14566. [CrossRef]24. Chen, Z.; Chen, B.; Yao, S. High-performance liquid chromatography/electrospray ionization-mass spectrometry for simultaneous
determination of taurine and 10 water-soluble vitamins in multivitamin tablets. Anal. Chim. Acta 2006, 569, 169–175. [CrossRef]25. Sullivan, D.M.; Carpenter, D.E. Methods of Analysis for Nutrition Labeling; AOAC International: Rockville, MD, USA, 1993.26. Palachum, W.; Choorit, W.; Chisti, Y. Nutritionally enhanced probioticated whole pineapple juice. Fermentation 2021, 7, 178.
[CrossRef]27. FDA. Bacteriological Analytical Manual: Chapter 3: Aerobic Plate Count; US Food and Drug Administration: Silver Spring, MD, USA,
2001. Available online: https://www.fda.gov/food/laboratory-methods-food/bam-chapter-3-aerobic-plate-count (accessed on5 April 2022).
28. Tan, S.L.; Sulaiman, R.; Rukayadi, Y.; Ramli, N.S. Physical, chemical, microbiological properties and shelf life kinetic of spray-driedcantaloupe juice powder during storage. LWT 2021, 140, 110597. [CrossRef]
29. Saavedra-Leos, M.Z.; Leyva-Porras, C.; López-Martínez, L.A.; González-García, R.; Martínez, J.O.; Compeán Martínez, I.; Toxqui-Terán, A. Evaluation of the spray drying conditions of blueberry juice-maltodextrin on the yield, content, and retention ofquercetin 3-D-galactoside. Polymers 2019, 11, 312. [CrossRef] [PubMed]
30. Sahin-Nadeem, H.; Torun, M.; Özdemir, F. Spray drying of the mountain tea (Sideritis stricta) water extract by using differenthydrocolloid carriers. LWT 2011, 44, 1626–1635. [CrossRef]
31. Sahin-Nadeem, H.; Dinçer, C.; Torun, M.; Topuz, A.; Özdemir, F. Influence of inlet air temperature and carrier material on theproduction of instant soluble sage (Salvia fruticosa Miller) by spray drying. LWT 2013, 52, 31–38. [CrossRef]
32. Lee, K.-C.; Yoon, Y.S.; Li, F.-Z.; Eun, J.-B. Effects of inlet air temperature and concentration of carrier agents on physicochemicalproperties, sensory evaluation of spray-dried mandarin (Citrus unshiu) beverage powder. Appl. Biol. Chem. 2017, 60, 33–40.[CrossRef]
33. Ribeiro, C.M.C.M.; Magliano, L.C.d.S.A.; Costa, M.M.A.d.; Bezerra, T.K.A.; Silva, F.L.H.d.; Maciel, M.I.S. Optimization of thespray drying process conditions for acerola and seriguela juice mix. Food Sci. Technol. 2019, 39, 48–55. [CrossRef]
34. Both, E.; Boom, R.; Schutyser, M. Particle morphology and powder properties during spray drying of maltodextrin and wheyprotein mixtures. Powder Technol. 2020, 363, 519–524. [CrossRef]
35. Sinija, V.R.; Mishra, H.N. Moisture sorption isotherms and heat of sorption of instant (soluble) green tea powder and green teagranules. J. Food Eng. 2008, 86, 494–500. [CrossRef]
36. Solval, K.M.; Sundararajan, S.; Alfaro, L.; Sathivel, S. Development of cantaloupe (Cucumis melo) juice powders using spraydrying technology. LWT 2012, 46, 287–293. [CrossRef]
37. Quek, S.Y.; Chok, N.K.; Swedlund, P. The physicochemical properties of spray-dried watermelon powders. Chem. Eng. Process.Process Intensif. 2007, 46, 386–392. [CrossRef]
38. Han, N.S.; Ahmad, W.; Ishak, W.R.W. Quality characteristics of Pleurotus sajor-caju powder: Study on nutritional compositions,functional properties and storage stability. Sains Malays. 2016, 45, 1617–1623.


