Embed Size (px)
Citation preview

Spelling Consistency Affects Reading in YoungDutch Readers with and without Dyslexia
Anna M. T. Bosman1, Wietske Vonk2, and Margriet van Zwam2
1Radboud University NijmegenNijmegen, The Netherlands
2Max Planck Institute for PsycholinguisticsNijmegen, The Netherlands
Lexical-decision studies with experienced English and French readers have shown thatvisual-word identification is not only affected by pronunciation inconsistency of aword (i.e., multiple ways to pronounce a spelling body), but also by spelling inconsis-tency (i.e., multiple ways to spell a pronunciation rime). The aim of this study was tocompare the reading behavior of young Dutch readers with dyslexia to the behavior ofreaders without dyslexia. All students participated in a lexical-decision task in whichwe presented pronunciation-consistent words and pseudowords. Half of the pronunciation-consistent stimuli were spelling consistent and the other half were spelling inconsis-tent. All three reader groups, that is, students with dyslexia, age-match students, andreading-match students, read spelling-consistent words faster than spelling-inconsistentwords. Overall reading speed of students with dyslexia was similar to that of reading-match students, and was substantially slower than that of age-match students. The re-sults suggest that reading in students with or without dyslexia is similarly affected byspelling inconsistency. Subtle qualitative differences emerged, however, with respectto pseudoword identification. The conclusion was that the findings were best inter-preted in terms of a recurrent-feedback model.
Key Words: Dyslexia, reading, resonance models, spelling, spellingconsistency, visual-word perception
Frequency and consistency have been shown to affect visual-wordidentification in numerous studies with English readers. Beginning aswell as experienced readers process words that occur relatively oftenin the (written) language more quickly and with fewer errors thanwords that rarely appear in print (for frequency effects in beginningreaders, see Holligan & Johnston, 1988; for experienced readers,
Annals of Dyslexia, Vol. 56, No. 2, 2006Copyright ©2006 by The International Dyslexia Association®
ISSN 0736-9387
271
Monsell, 1991). Consistency also affects the speed and accuracy of single-word reading. Consistency refers to the extent to which spelling andsound covary in a predictable way. Here, we focus on the onset-rime/body distinction. The body in a monosyllabic word is what isleft after removing the initial consonant or consonant cluster. For ex-ample, the English spelling body UST, as in lust, is pronounced thesame in all monosyllabic words (e.g., must, dust, just), whereas thespelling body ULL in pull is pronounced differently from dull and hull.Thus, inconsistency at the body-rime level occurs when spelling bod-ies are pronounced differently, depending on the word in which theyappear. This type of inconsistency has been investigated in depth inthe English language. Words with inconsistent pronunciation bodiesgenerally produce slower naming responses and more errors(Andrews, 1982; Backman, Bruck, Hebert, & Seidenberg, 1984;Glushko, 1979; Jared, 1997, 2002; Jared, McRae, & Seidenberg, 1990;Seidenberg, Waters, Barnes, & Tanenhaus, 1984; Treiman, Mullennix,Bijeljac-Babic, & Richmond-Welty, 1995), and longer lexical-decisionlatencies and more errors (Andrews, 1982; Pugh, Rexer, & Katz, 1994;Stone, Vanhoy, & Van Orden, 1997; but see Jared et al., 1990) thanwords with consistent pronunciation bodies in both beginning and experienced readers. The evidence with respect to the interaction be-tween frequency and consistency is mixed. Some studies (lexical-decisionand/or naming) showed consistency effects for low-frequency wordsand no or minimal effects for high-frequency words (e.g., Backman etal. 1984; Seidenberg et al., 1984; Taraban & McClelland, 1987; Treimanet al., 1995; Pugh et al., 1994), whereas others found consistency effectsfor both high- and low-frequency words (Andrews, 1982; Jared, 1997).
So far, our discussion of the consistency effect has been limited tothe mapping from spelling to phonology. However, words may alsobe inconsistent in the opposite direction; that is, in the way they mapphonology to spelling. For example, the pronunciation body [iep] inEnglish is spelled two ways, EEP as in keep and EAP as in heap. Thepredominance of phonological spelling errors (e.g., deap where deepwas intended) in spelling tasks is a clear demonstration of the effect ofspelling inconsistency. Spelling inconsistency has been known to af-fect spelling performance in both beginning and experienced spellers(Barry & Seymour, 1988; Holmes & Ng, 1993; Kreiner & Gough, 1990;Peereman, Content, & Bonin, 1998; Perry, Ziegler, & Coltheart, 2002;Waters, Bruck, & Seidenberg, 1985; for an extensive overview, seeBosman & Van Orden, 1997).
The fact that pronunciation consistency affects reading perfor-mance and spelling consistency affects spelling performance has beenknown for a while. However, the question whether spelling inconsis-tency also affects reading was addressed less than a decade ago byStone et al. (1997). They presented English-speaking participants withfour types of words. The first set was bidirectionally consistent. An ex-ample is the word lust. Its spelling body UST is only pronounced oneway in the various words that share this spelling body, and its pro-
272 BOSMAN, VONK, AND VAN ZWAM

SPELLING CONSISTENCY AND DYSLEXIA 273
nunciation body [�st] is only spelled one way in the words thatshare this pronunciation body. A second set of words was bidirection-ally inconsistent. For example, the spelling body EAK in bleak hasmultiple pronunciations, as in break [breIk] and leak [lI´k], and thepronunciation body [I´k] has multiple spellings, as in freak and creek.The third and fourth sets of words were consistent in one directionbut inconsistent in the other. The example heap has a spelling bodyEAP that is always pronounced the same, but the pronunciation body[I´p] can be spelled multiple ways, as in creep and leap. The contrast-ing example hull has a pronunciation body [�l] that can only bespelled one way, but a spelling body ULL that can be pronouncedmultiple ways, [�l] as in dull and [U´l] as in pull.
Participants in the Stone et al. study performed a lexical-decisiontask. Presented with words and nonwords, they had to decide asquickly and as accurately as possible whether the word that appearedon the computer screen was a word or not. As expected, words withinconsistent pronunciation bodies yielded slower correct responsesand more errors than words with consistent pronunciation bodies.However, words with inconsistent spelling bodies and consistent pro-nunciation bodies (e.g., heap) also produced slower correct responsesand more errors than words that were consistent in both directions.Note that this is a rather unintuitive finding. Despite the fact thatthese words that can only be pronounced one way, the visual-identification process is still slower in case words can be spelled mul-tiple ways. In sum, words that are consistent in both directions wereprocessed more quickly and more accurately than words that were ei-ther inconsistent in one direction or in both directions. Bidirectionallyinconsistent words yielded responses comparable in speed and accu-racy to words inconsistent in only one direction.1
Shortly after Stone et al. published their findings, Ziegler,Montant, and Jacobs (1997) demonstrated a spelling-consistency effectin French in both lexical decision and naming. Peereman et al. (1998)contested the French findings by Ziegler and his colleagues, however.In a series of five experiments, they were unable to obtain the spelling-consistency effect. They argued that the presence of the effect in thestudy by Ziegler et al. was due to a confound between consistencyand subjective word frequency. A recent study by Lacruz and Folk(2004) revealed that the familiarity explanation put forward byPeereman et al. did not explain the effects obtained in English. They
1Inconsistent mapping from spelling to phonology in reading is also referred to as feed-forward inconsistency and inconsistent mapping from phonology to spelling as feed-back inconsistency (Stone et al., 1997). For spelling, it would be exactly the opposite;inconsistent mapping from phonology to spelling is feedforward inconsistency, and in-consistent mapping from spelling to phonology is feedback inconsistency. Because thisterminology is dependent on the task at hand, we decided to adopt the context-indepedendent terms coined by Vanhoy and Van Orden (2001), which is pronunciationconsistency (one way to pronounce a word) and spelling consistency (one way to spell aword).
found clear effects of feedback consistency in both lexical decision andnaming with familiarity controlled for. Lacruz and Folk suggestedthat language differences, with English more reliant on word bodiesthan French, may be responsible for the experimental differences.Thus, the null finding of feedback consistency by Peereman et al.needs to be further verified.
In a subsequent study, Ziegler and Ferrand (1998) demonstratedthe effect of spelling consistency in an auditory lexical-decision task.Their results showed that participants took longer and made more er-rors on spelling-inconsistent word than on spelling-consistent words(see also Ziegler, Ferrand, & Montant, 2004). Ziegler and colleagues,however, were not the first to demonstrate a spelling-consistency ef-fect in auditory-word perception. Already in 1979, Seidenberg andTanenhaus (see also Zecker, Tanenhaus, Alderman, & Siqueland,1986) showed that English-speaking students, who performed an au-ditory rhyme-detection task, were faster to decide that two ortho-graphically similar words (e.g., COAT-BOAT) rhymed than twoorthographically dissimilar words (e.g., VOTE-BOAT).
The consistency findings reported above all pertain to normalreading behavior, suggesting that they are part and parcel of unim-paired reading. The question arises whether students with reading im-pairments or dyslexia are similarly affected by consistency. Zecker(1991) investigated this issue by conducting an auditory rhyme-detection task with orthographically similar (e.g., BUM-GUM) anddissimilar (e.g., THUMB-GUM) word pairs. His participants consistedof a group of English-speaking reading-disabled and normally achiev-ing children. It appeared that disabled readers between 10.1 and 11.5years did show the consistency effect but the younger, disabled read-ers did not, whereas all normally achieving readers (aged between 7.0and 11.5) demonstrated the effect. Zecker’s results suggest that liter-acy development in reading-impaired children is to some extent quali-tatively different from that of children without a reading disability.This conclusion, however, is a little premature because the readinglevel of the reading-disabled children in his sample who did notdemonstrate the consistency effect was substantially lower than thatof the youngest readers in the normally achieving group. In fact, thedisabled readers (aged between 10.1 and 11.5) who appeared to besusceptible to the consistency variable had a reading level that wasequal to that of the youngest normally achieving readers (aged be-tween 7.0 and 8.5). Thus, the reading-disabled children had a delay ofabout three years. Equating the reading groups on reading level sug-gests that the difference between the groups on the auditory rhyme-detection task is merely quantitative.
Recently, Davies and Weekes (2005) revisited the issue of spellingand pronunciation consistency, and were the first to show bidirectional-consistency effects in the reading and spelling of students with andwithout dyslexia. They had their participants spell and read aloud a setof 48 monosyllabic English words. These words were assigned to four
274 BOSMAN, VONK, AND VAN ZWAM

SPELLING CONSISTENCY AND DYSLEXIA 275
groups of 12 words each. One group contained words that were con-sistent in both directions; one group had words that were inconsistentin both directions; one group consisted of words that were spelling-consistent and pronunciation-inconsistent; and one group had wordsthat were pronunciation-consistent and spelling-inconsistent. Theerror scores on the reading task showed the well-researched pronunciation-consistency effect for both groups, and a spelling-consistency effect forthe students with dyslexia only. The error scores on the spelling taskshowed a pronunciation-consistency effect as well as a spelling-consistency effect in both reader groups. In sum, Davies and Weekesshowed that a) both types of consistency also affect spelling perfor-mance, b) consistency effects occur in young unimpaired readers aswell as in readers with dyslexia, and c) consistency effects also emergein accuracy scores. They measured response latencies, but this depen-dent variable did not appear to produce one or both consistency ef-fects in reading.
As said, the majority of studies pertaining to consistency effectshave been conducted in English and some in French, made possible toa large extent by the work of Ziegler and colleagues. They computedbody-rime consistencies in both directions for a large number ofmonosyllabic words in both English (Ziegler, Stone, & Jacobs, 1997)and French (Ziegler, Jacobs, & Stone, 1996). Table I summarizes themean consistency levels of the four word categories in the English andFrench languages. Bosman and Mekking (2006) computed similarstatistics for the Dutch language on the CELEX database (Baayen,Piepenbrock, & van Rijn, 1993). Pronunciation consistency is equallyhigh in French (81.2%) and Dutch (84.5%), and substantially higherthan in English (69.3%), whereas spelling consistency is highest inDutch (36.8%) followed by English (27.7%), and they are both substan-tially higher than in French (2.8%). In all three languages, pronuncia-tion consistency is considerably higher than spelling consistency,which explains why spelling is more difficult than reading (Bosman &Van Orden, 1997).
In sum, these statistics suggest that pronunciation as well asspelling consistency should also affect reading behavior in Dutch.Although Dutch has about 15.5% pronunciation-inconsistent words, itshould be possible to select an appropriate set of words that fulfill thenecessary requirements. However, the fact that we conducted ourstudy with beginning readers limited the choice of acceptable stimulito such an extent that we decided to drop this variable, still leaving uswith the most interesting variable with respect to reading, namely,spelling consistency. Note that a spelling-consistency effect in a lan-guage that is relatively consistent, like Dutch, is less likely to happenthan in languages (like English and French) in which inconsistency isthe rule rather than the exception. More pronunciation-consistentmappings may be too efficient to afford spelling consistency effects,making the extension of such findings to a language like Dutch moreinteresting.

Stone et al. (1997) in English and Ziegler, Montani et al. (1997) inFrench used low-frequency words only because if consistency effectsare real, they are most likely to appear in low-frequency words. In ourstudy with young beginning readers, we used both high-frequencyand low-frequency words. We decided to enter the frequency variableas a means of assessing the sensitivity of our experimental design. Ithas been known that frequency affects reading in Dutch beginning(Bosman & de Groot, 1991; Reitsma & Vinke, 1986) and experiencedreaders (e.g., Brysbaert, 1996; de Groot, 1989; del Prado Martín et al.,2005). We expect to find a straightforward frequency effect as well as aspelling-consistency effect in low-frequency words. Whether or notthe spelling-consistency effect will emerge in high-frequency wordsremains to be seen. Based on earlier findings that showed nomarkedly different reading behavior in Dutch impaired and unim-paired readers in knowledge of coarse-grained and/or intermediate-grained phonological structure (Bosman, van Leerdam, & de Gelder,2000) and on the more recent work by Davies and Weekes (2005) onEnglish impaired and unimpaired readers, we expect a spelling-consistency effect in students with and without dyslexia.
As recommended by Backman, Mamen, and Ferguson (1984) andVellutino and Scanlon (1989), we used a combination of a reading-match and age-match design to assess the nature of potential differ-ences between impaired and unimpaired reading. The assumptions are:reading behavior of students with dyslexia that deviates from that ofreading-match as well as from age-match students signifies a qualitativedifference (i.e., a reading deficit), whereas, reading behavior of studentswith dyslexia similar to that of reading-match students and both differ-ent from that of age-match students signifies most likely a quantitativedifference (i.e., a reading delay). We agree, however, with Vellutino andScanlon (1989), who state that “. . . group differences favoring normalreaders with a CA-matched design and no group differences with an
276 BOSMAN, VONK, AND VAN ZWAM
Table I. Percentages of Pronunciation and Spelling Consistency LevelsBased on the Number of Word Occurrences of Body-Rime Relationships in
English (n = 2694), French (n = 1843), and Dutch (n = 6190) One-SyllableWords
Spelling
Consistent Inconsistent Total
E F D E F D E F DPronunciation
Consistent 19.3 2.6 33.6 49.9 78.6 50.9 69.3 81.2 84.5
Inconsistent 8.4 0.2 3.2 22.4 18.5 12.3 30.7 18.8 15.5
Total 27.7 2.8 36.8 72.3 97.2 63.2 100 100 100Note. English (E) figures from Ziegler, Stone, and Jacobs (1997), French (F)
from Ziegler, Jacobs, and Stone (1996), and the Dutch (D) are based onBosman and Mekking (2006).
SPELLING CONSISTENCY AND DYSLEXIA 277
RL-matched design may be a meaningful and theoretically pattern ofresults, if the data are organized by a reasonably plausble theory and ifthe hypotheses generated by this theory are supported by independentresearch” (p. 365). Thus, a pattern of results that is in line with one ofthe two possibilities is a first step in the quest for the nature of readingdisabilities. It requires additional research with a large variety of read-ing tasks to substantiate any claim.
In sum, the goal of the present experiment was to study similari-ties or differences in reading behavior of Dutch students with andwithout dyslexia using spelling-consistent and -inconsistent wordsand pseudowords in a lexical-decision task modeled after Stone et al.(1997) and Ziegler, Montani et al. (1997). In the Discussion, we will ex-plain in detail that the presence of spelling-consistency effects in read-ing is best explained in terms of a theoretical account that assumes fullrecurrence between relevant aspects of processing, thus feedforwardand feedback activation between orthography and phonology.
METHOD
PARTICIPANTSSixty-nine students from Dutch primary schools participated in thisstudy. Twenty-three students constituted the group of children withdyslexia. The 46 remaining students did not have reading problems.These students were matched to the children with dyslexia on eitherword-reading level (reading-match group; 23 students) or on chrono-logical age (age-match group; 23 students). The students with dyslexiawere recruited from a school for special education and scored morethan two years below their expected reading level. The students with-out reading problems attended a school for regular education.
Two weeks before the experiments were conducted, the word-reading and pseudoword-reading skills of all children were assessed.Word-reading level was measured with a standardized reading-decoding test (Brus & Voeten, 1973). The score on this test is the num-ber of words read correctly in one minute. Pseudoword reading wasassessed by means of a standardized pseudoword-reading test (vanden Bos, Spelberg, Scheepstra, & de Vries, 1994). The score on this testis the number of pseudowords read correctly in two minutes. Table IIpresents the scores on the reading tests and the mean ages of the threeexperimental groups.
Performance on the word-reading test of the students withdyslexia was not statistically different from that of students in thereading-match group (F < 1), but the reading-match group performedsignificantly better on the pseudoword-reading test than the studentswith dyslexia F(1, 44) = 7.0, p < .05, MSE = 112.7. The mean age of thestudents with dyslexia was not statistically different from the studentsin the age-match group (F < 1), but their word-reading and pseudoword-reading levels were significantly lower than that of thestudents in the age-match group, F(1,44) = 163.6, p < .0001, MSE =
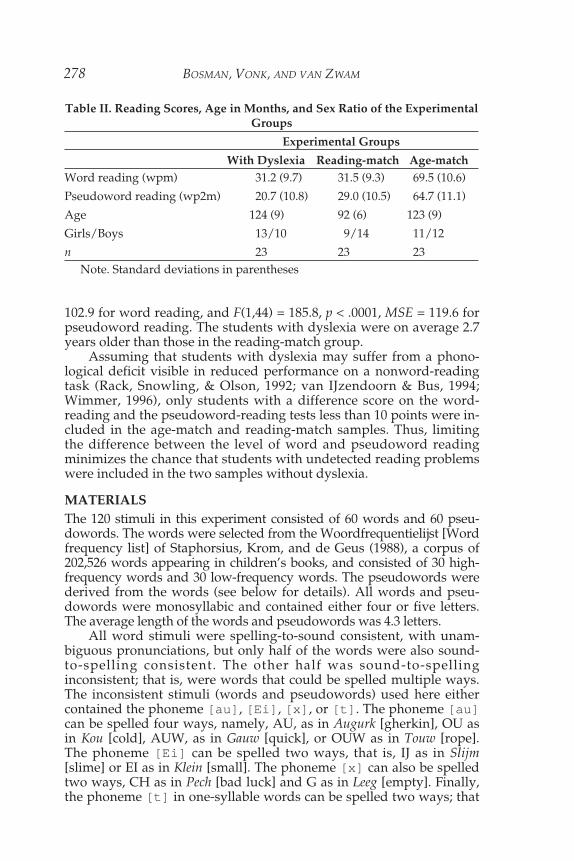
102.9 for word reading, and F(1,44) = 185.8, p < .0001, MSE = 119.6 forpseudoword reading. The students with dyslexia were on average 2.7years older than those in the reading-match group.
Assuming that students with dyslexia may suffer from a phono-logical deficit visible in reduced performance on a nonword-readingtask (Rack, Snowling, & Olson, 1992; van IJzendoorn & Bus, 1994;Wimmer, 1996), only students with a difference score on the word-reading and the pseudoword-reading tests less than 10 points were in-cluded in the age-match and reading-match samples. Thus, limitingthe difference between the level of word and pseudoword readingminimizes the chance that students with undetected reading problemswere included in the two samples without dyslexia.
MATERIALSThe 120 stimuli in this experiment consisted of 60 words and 60 pseu-dowords. The words were selected from the Woordfrequentielijst [Wordfrequency list] of Staphorsius, Krom, and de Geus (1988), a corpus of202,526 words appearing in children’s books, and consisted of 30 high-frequency words and 30 low-frequency words. The pseudowords werederived from the words (see below for details). All words and pseu-dowords were monosyllabic and contained either four or five letters.The average length of the words and pseudowords was 4.3 letters.
All word stimuli were spelling-to-sound consistent, with unam-biguous pronunciations, but only half of the words were also sound-to-spelling consistent. The other half was sound-to-spellinginconsistent; that is, were words that could be spelled multiple ways.The inconsistent stimuli (words and pseudowords) used here eithercontained the phoneme [au], [Ei], [x], or [t]. The phoneme [au]can be spelled four ways, namely, AU, as in Augurk [gherkin], OU asin Kou [cold], AUW, as in Gauw [quick], or OUW as in Touw [rope].The phoneme [Ei] can be spelled two ways, that is, IJ as in Slijm[slime] or EI as in Klein [small]. The phoneme [x] can also be spelledtwo ways, CH as in Pech [bad luck] and G as in Leeg [empty]. Finally,the phoneme [t] in one-syllable words can be spelled two ways; that
278 BOSMAN, VONK, AND VAN ZWAM
Table II. Reading Scores, Age in Months, and Sex Ratio of the ExperimentalGroups
Experimental Groups
With Dyslexia Reading-match Age-matchWord reading (wpm) 31.2 (9.7) 31.5 (9.3) 69.5 (10.6)
Pseudoword reading (wp2m) 20.7 (10.8) 29.0 (10.5) 64.7 (11.1)
Age 124 (9) 92 (6) 123 (9)
Girls/Boys 13/10 9/14 11/12
n 23 23 23Note. Standard deviations in parentheses
SPELLING CONSISTENCY AND DYSLEXIA 279
is, T as in Pret [fun], and D as in Tand [tooth]. The grapheme D is pro-nounced [t] only when it occurs in the final position of a word orsyllable; in all other cases, it is pronounced [d]. Dutch spelling bodiesmay have two inconsistent phonemes. For example, in the word Tijd[tEit], which is Dutch for time, both the [Ei] and [t] are inconsis-tent. Only words with one inconsistency in the body were selected.
The high-frequency words were words with a frequency greaterthan 17 and the low-frequency words were words with a frequencyless than 14. The mean frequency of the high-frequency words was94.3 (SD = 115.2, range from 18 to 422). The mean frequency of thelow-frequency words was 4.4 (SD = 3.8, ranged from 1-13). The meanfrequency of the consistent words was 49.4 (SD = 90.3) and of the in-consistent words was 49.3 (SD = 96.6). The difference in high-frequency and low-frequency words was significant (F[1, 56] = 17.60, p< .0001), but between consistent and inconsistent words was not (F <1). The differences in frequency comparing high-frequency consistentwords (M = 94.1) and high-frequency inconsistent words (M = 94.5),or low-frequency consistent words (M = 4.6) and low-frequency in-consistent words (M = 4.2) were not significant either, F < 1.
The pseudowords were derived from the words by changing oneor two letters, but maintaining the number of letters and maintainingthe inconsistent phoneme-grapheme relationship in the inconsistentstimuli. Consistent words were changed into consistent pseudowords.The entire list of stimulus materials is presented in the Appendix.
Two pseudo-random list orders were created, containing the sameset of 120 stimuli. The order of the items in List A was from 1 to 120,and the one in List B from 61-120, followed by 1 to 60. Care was takento present pseudowords derived from words as far apart as possible,and to avoid an order in which two or more consistent words or twoor more high-frequency or low-frequency words succeeded eachother. In both lists, each item occurred only once and the participantswere assigned randomly to one of the lists.
PROCEDUREParticipants were seated in front of a computer screen at a distance ofapproximately 50 cm. They were instructed that words they knew andwords they did not know would appear on the computer screen. Theywere asked to press as quickly and as accurately as possible the yesbutton on the button box, connected to the serial port of the computer,in case they knew the words, and to press the no-button in case theydid not know the word. Experience with young Dutch children per-forming lexical-decision tasks had taught us that the standard instruc-tion to press the no-button in case a pseudoword (or nonword)appeared on the screen led to long thinking times (Bosman & deGroot, 1996).
Following the offset of an auditory warning signal, there was a 250ms interval before the stimulus was presented on the screen. The stimu-lus remained on the screen until the participant had responded. If the

participant did not respond within 10 seconds, the stimulus disap-peared from the screen automatically. One second following the re-sponse, a new trial was presented. Lexical-decision latencies weremeasured from the onset of the stimulus until the onset of the key pressresponse. Prior to the experiment proper, participants were familiarizedwith the procedure in three practice trials in which they received feed-back. During and after these trials, they were able to ask questions re-garding anything that was related to the task. The response latencies onthe practice trials were excluded from the data set. Participants weretested individually and a session lasted about 10 minutes; they did notreceive feedback on experimental task performance.
RESULTS
Before subjecting the data to analysis, responses based on latencies ex-ceeding 10 seconds (14 responses of students with dyslexia and threeresponses from the students in the reading-match group) or responsesfaster than 250 ms (three responses of students with dyslexia) were re-moved from the data set. Moreover, latencies based on errors (stu-dents with dyslexia 16.7%, reading-match 10.0%, and age-match5.0%), and extremely long responses, that is three SD above the mean(students with dyslexia 1.2%, reading-match 1.1%, and age-match1.3%), were also excluded from the analyses. Prior to the analysesproper, the effect of list was investigated. No effect of list emerged, soit was decided to drop this variable from subsequent analyses.
A final remark concerns the application of the statistics used here.After Clark’s (1973) seminal article on the use of the proper F-test inpsycholinguistics, researchers started to report min F’, which enabledthem to generalize beyond the materials used. This test treats both thesubjects and the items as random effects in one and the same analysis.Shortly after Clark’s publication, Wike and Church (1976) criticizedthe min F’-test as being too conservative and, therefore, leading topossible type II errors. The result was that researchers started to re-port F1 (subject analysis) and F2 (item analysis) separately, withoutcomputing min F’. Raaijmakers, Schrijnemakers, and Gremmen (1999;see also Raaijmakers, 2003) showed that this is statistically incorrect.They also made clear that if proper measures are taken, that is, stimu-lus materials are matched or each stimulus appears in each condition(either by random assignment or by experimental manipulation), theproper test is the subject analysis (F1). In the present study, the stimuliwere matched and had to be treated as a fixed effect because the num-ber of stimuli that could be generated given the requirements hadreached its limits.
WORDSErrors. A 3 (group: dyslexia vs. reading-match vs. age-match) X 2
(frequency: high vs. low) X 2 (consistency: consistent vs. inconsistent)ANOVA was performed on the mean error scores of the participants.
280 BOSMAN, VONK, AND VAN ZWAM
SPELLING CONSISTENCY AND DYSLEXIA 281
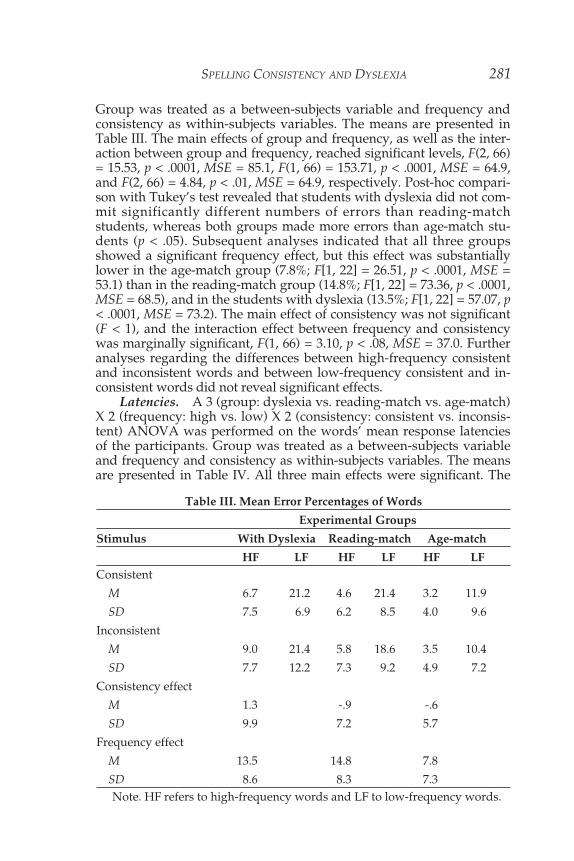
Group was treated as a between-subjects variable and frequency andconsistency as within-subjects variables. The means are presented inTable III. The main effects of group and frequency, as well as the inter-action between group and frequency, reached significant levels, F(2, 66)= 15.53, p < .0001, MSE = 85.1, F(1, 66) = 153.71, p < .0001, MSE = 64.9,and F(2, 66) = 4.84, p < .01, MSE = 64.9, respectively. Post-hoc compari-son with Tukey’s test revealed that students with dyslexia did not com-mit significantly different numbers of errors than reading-matchstudents, whereas both groups made more errors than age-match stu-dents (p < .05). Subsequent analyses indicated that all three groupsshowed a significant frequency effect, but this effect was substantiallylower in the age-match group (7.8%; F[1, 22] = 26.51, p < .0001, MSE =53.1) than in the reading-match group (14.8%; F[1, 22] = 73.36, p < .0001,MSE = 68.5), and in the students with dyslexia (13.5%; F[1, 22] = 57.07, p< .0001, MSE = 73.2). The main effect of consistency was not significant(F < 1), and the interaction effect between frequency and consistencywas marginally significant, F(1, 66) = 3.10, p < .08, MSE = 37.0. Furtheranalyses regarding the differences between high-frequency consistentand inconsistent words and between low-frequency consistent and in-consistent words did not reveal significant effects.
Latencies. A 3 (group: dyslexia vs. reading-match vs. age-match)X 2 (frequency: high vs. low) X 2 (consistency: consistent vs. inconsis-tent) ANOVA was performed on the words’ mean response latenciesof the participants. Group was treated as a between-subjects variableand frequency and consistency as within-subjects variables. The meansare presented in Table IV. All three main effects were significant. The
Table III. Mean Error Percentages of Words
Experimental Groups
Stimulus With Dyslexia Reading-match Age-match
HF LF HF LF HF LFConsistent
M 6.7 21.2 4.6 21.4 3.2 11.9
SD 7.5 6.9 6.2 8.5 4.0 9.6
Inconsistent
M 9.0 21.4 5.8 18.6 3.5 10.4
SD 7.7 12.2 7.3 9.2 4.9 7.2
Consistency effect
M 1.3 -.9 -.6
SD 9.9 7.2 5.7
Frequency effect
M 13.5 14.8 7.8
SD 8.6 8.3 7.3Note. HF refers to high-frequency words and LF to low-frequency words.
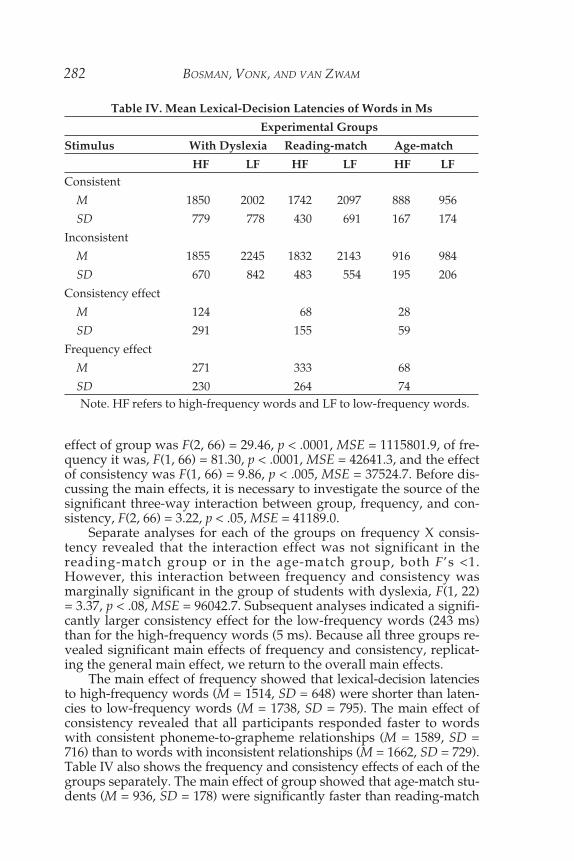
effect of group was F(2, 66) = 29.46, p < .0001, MSE = 1115801.9, of fre-quency it was, F(1, 66) = 81.30, p < .0001, MSE = 42641.3, and the effectof consistency was F(1, 66) = 9.86, p < .005, MSE = 37524.7. Before dis-cussing the main effects, it is necessary to investigate the source of thesignificant three-way interaction between group, frequency, and con-sistency, F(2, 66) = 3.22, p < .05, MSE = 41189.0.
Separate analyses for each of the groups on frequency X consis-tency revealed that the interaction effect was not significant in thereading-match group or in the age-match group, both F’s <1.However, this interaction between frequency and consistency wasmarginally significant in the group of students with dyslexia, F(1, 22)= 3.37, p < .08, MSE = 96042.7. Subsequent analyses indicated a signifi-cantly larger consistency effect for the low-frequency words (243 ms)than for the high-frequency words (5 ms). Because all three groups re-vealed significant main effects of frequency and consistency, replicat-ing the general main effect, we return to the overall main effects.
The main effect of frequency showed that lexical-decision latenciesto high-frequency words (M = 1514, SD = 648) were shorter than laten-cies to low-frequency words (M = 1738, SD = 795). The main effect ofconsistency revealed that all participants responded faster to wordswith consistent phoneme-to-grapheme relationships (M = 1589, SD =716) than to words with inconsistent relationships (M = 1662, SD = 729).Table IV also shows the frequency and consistency effects of each of thegroups separately. The main effect of group showed that age-match stu-dents (M = 936, SD = 178) were significantly faster than reading-match
282 BOSMAN, VONK, AND VAN ZWAM
Table IV. Mean Lexical-Decision Latencies of Words in Ms
Experimental Groups
Stimulus With Dyslexia Reading-match Age-match
HF LF HF LF HF LFConsistent
M 1850 2002 1742 2097 888 956
SD 779 778 430 691 167 174
Inconsistent
M 1855 2245 1832 2143 916 984
SD 670 842 483 554 195 206
Consistency effect
M 124 68 28
SD 291 155 59
Frequency effect
M 271 333 68
SD 230 264 74Note. HF refers to high-frequency words and LF to low-frequency words.
SPELLING CONSISTENCY AND DYSLEXIA 283
students (M = 1954, SD = 521), and students with dyslexia (M = 1988,SD = 731), with no significant difference emerging between the lattertwo; in both cases p < .0001, based on Fisher’s PLSD.
A final result of importance concerning the word stimuli was thesignificant interaction effect between group and frequency, F(2, 66) =10.36, p < .0001, MSE = 42641.3. Although all three groups showed sig-nificant frequency effects, the effect was substantially smaller in theage-match group than in the reading-match group, and in the groupof students with dyslexia. Note, neither the interaction effect betweengroup and consistency nor the one between frequency and consis-tency reached significant levels.
PSEUDOWORDSErrors. A 3 (group: dyslexia vs. reading-match vs. age-match) X 2
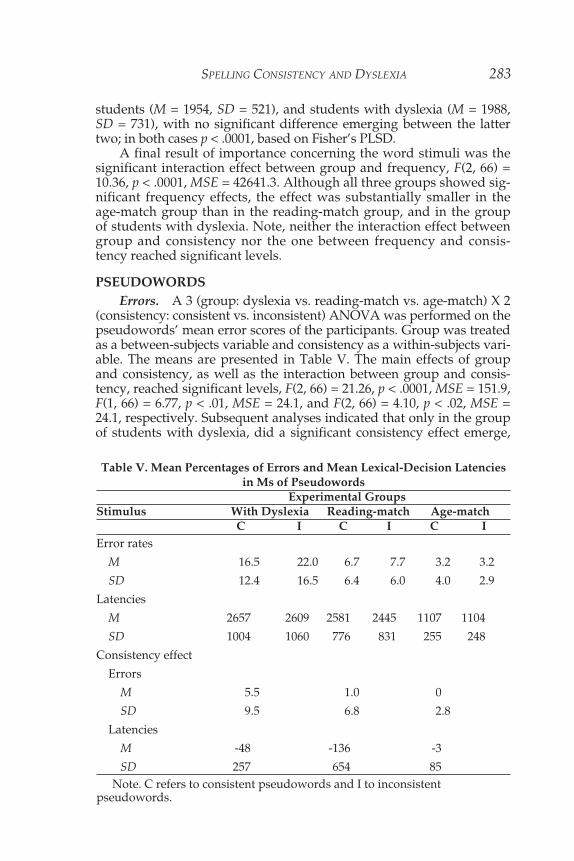
(consistency: consistent vs. inconsistent) ANOVA was performed on thepseudowords’ mean error scores of the participants. Group was treatedas a between-subjects variable and consistency as a within-subjects vari-able. The means are presented in Table V. The main effects of groupand consistency, as well as the interaction between group and consis-tency, reached significant levels, F(2, 66) = 21.26, p < .0001, MSE = 151.9,F(1, 66) = 6.77, p < .01, MSE = 24.1, and F(2, 66) = 4.10, p < .02, MSE =24.1, respectively. Subsequent analyses indicated that only in the groupof students with dyslexia, did a significant consistency effect emerge,
Table V. Mean Percentages of Errors and Mean Lexical-Decision Latenciesin Ms of Pseudowords
Experimental GroupsStimulus With Dyslexia Reading-match Age-match
C I C I C IError rates
M 16.5 22.0 6.7 7.7 3.2 3.2
SD 12.4 16.5 6.4 6.0 4.0 2.9
Latencies
M 2657 2609 2581 2445 1107 1104
SD 1004 1060 776 831 255 248
Consistency effect
Errors
M 5.5 1.0 0
SD 9.5 6.8 2.8
Latencies
M -48 -136 -3
SD 257 654 85Note. C refers to consistent pseudowords and I to inconsistent
pseudowords.

F(1, 22) = 7.79, p < .01, MSE = 44.8, with students with dyslexia commit-ting more errors to inconsistent than to consistent pseudowords. In theage-match and the reading-match group, this effect did not approachsignificance, both F’s < 1. Subsequent analyses of the main effect ofgroup indicated that age-match students did not make significantly dif-ferent numbers of errors than reading-match students, while bothgroups made fewer errors than students with dyslexia; in both cases p <.0001, based on Fisher’s PLSD.
Latencies. A 3 (group: dyslexia vs. reading-match vs. age-match)X 2 (consistency: consistent vs. inconsistent) ANOVA was performedon the pseudowords’ mean response latencies of the participants.Group was treated as a between-subjects variable and consistency as awithin-subjects variable. The means are presented in Table V. Neitherthe main effects of consistency nor the interaction between group andconsistency reached significant levels. Only the main effect of groupwas significant, F(2, 66) = 30.19, p < .0001, MSE = 1100137.9.Subsequent analyses indicated that age-match students were signifi-cantly faster on the pseudowords than reading-match students andstudents with dyslexia; in both cases, p < .0001, based on Fisher’sPLSD. Response times to pseudowords of reading-match students didnot differ significantly from students with dyslexia.
WORDS VERSUS PSEUDOWORDSErrors. Joint analysis of performance on words and pseu-
dowords will pertain to effects not tested in the analyses above. A 3(group: dyslexia vs. reading-match vs. age-match) X 2 (stimulus:word vs. pseudoword) X 2 (consistency: consistent vs. inconsistent)ANOVA was performed on the words’ and pseudowords’ meanerror scores of the participants. Group was treated as a between-subjects variable and stimulus and consistency as within-subjectsvariables. Conforming to the results of the analyses above, the maineffect of group was significant, F(2, 66) = 31.2, p < .0001, MSE = 102.3.The main effect of stimulus was not significant, but the interaction ef-fect between group and stimulus was, F(2, 66) = 7.56, p < .001, MSE =92.1. Subsequent analyses revealed that in the group of students withdyslexia, the number of errors made on words was not statisticallydifferent (M = 14.6%, SD = 4.8) from the number of errors made onpseudowords (M = 19.3%, SD = 13.8). In the reading-match and in theage-match group significantly more errors were made on words(12.6%, SD = 4.9, and 7.2%, SD = 4.1, respectively) than on pseu-dowords (7.2%, SD = 5.2, and 3.2%, SD = 3.2, respectively); reading-match students, F(1, 22) = 31.57, p < .0001, MSE = 21.5, and age-matchstudents, F(1, 22) = 12.31, p < .002, MSE = 30.8. The interaction effectbetween stimulus and consistency was marginally significant, F(1, 66)= 3.02, p < .09, MSE = 28.2. Subsequent analyses revealed that theconsistency effect of words was not significant, whereas of pseu-dowords it was, F(1, 68) = 6.20, p < .02, MSE = 26.3 (see above for fur-ther details).
284 BOSMAN, VONK, AND VAN ZWAM
SPELLING CONSISTENCY AND DYSLEXIA 285
Latencies. A 3 (group: dyslexia vs. reading-match vs. age-match)X 2 (stimulus: word vs. pseudoword) X 2 (consistency: consistent vs.inconsistent) ANOVA was performed on the words’ mean responselatencies of the participants. Group was treated as a between-subjectsvariable and stimulus and consistency as within-subjects variables.Conforming to the results of the analyses above, the main effect ofgroup was significant, F(2, 66) = 31.81, p < .001, MSE = 1514130.0. Themain effect of stimulus was also significant, revealing faster responselatencies for words (M = 1626 ms, SD = 716) than for pseudowords (M= 2084 ms, SD = 1011), F(2, 66) = 100.63, p < .0001, MSE = 1480607.6.More detailed analysis was required because of the significant interac-tion between stimulus and group, F(2, 66) = 10.28, p < .0001, MSE =143975.0. It appeared that the effect of stimulus was significant in allthree groups, but that this effect was substantially smaller in the age-match group (169 ms) than in the reading-match group (559 ms), andin the group of students with dyslexia (655 ms). Finally, the significantinteraction between stimulus and consistency (F[2, 66] = 7.78, p < .01,MSE = 40894.4) confirmed the absence of a consistency effect in thepseudoword condition and its presence in the word condition, F(1, 68)= 9.77, p < .003, MSE = 18984.3 (see above for further details).
DISCUSSION
The basic goal of the present study was to establish whether beginningreaders with and without dyslexia reliably show a spelling-consistency effect on visual-word identification probed using the lexical-decision task. All three groups had longer response latencies onwords that were spelling-inconsistent than words that were spelling-consistent. Only in the group of students with dyslexia did consistencyinteract with frequency: The spelling-consistency effect emerged in theset of low-frequency words only. The spelling-consistency effect in thetwo normal-reading groups emerged in both frequency conditions. Thisresult is in accordance with the findings by Lacruz and Folk (2004).Their study with adult participants who performed both naming andlexical decision also revealed frequency and spelling-consistency effects,but no interaction. See also Metsala, Stanovich, and Brown (1998), whoshowed that frequency and pronunciation consistency affected readingsimilarly in students with and without dyslexia.
The error scores of the word stimuli yielded no spelling-consis-tency effect, and no spelling-consistency effect showed up in the pseu-doword latencies of the three groups. The absence of a consistencyeffect on latencies of responses to pseudowords replicates the findingsby Stone et al. (1997) in English and Ziegler, Montani et al. (1997) inFrench. There was, however, one significant spelling-consistency ef-fect in the error scores of students with dyslexia: more errors weremade on inconsistent pseudowords than on consistent pseudowords.
Why we did not, like Davies and Weekes (2005), find a consis-tency effect in the error data of the words is readily explained by the
fact that all our stimuli were pronunciation-consistent, whereas half oftheir stimuli were pronunciation-inconsistent, causing another sourceof variation in their data. This showed up in their overall error rates:students with dyslexia had on average 42% reading errors and theirreading-match students committed 23% reading errors. The overallword-reading errors of our participants were substantially lower: 14%in the group of students with dyslexia, 13% in the reading-matchgroup, and 8% in the age-match group. The reduced number of errorsnevertheless afforded sufficient latitude for a significant frequency ef-fect. High-frequency words were identified more accurately than low-frequency words in all three reader groups, albeit the effect wasreduced in the age-match group. The latency data revealed the samepattern; all three reader groups identified high-frequency words morequickly than low-frequency words, and the effect was also reduced inthe age-match group.
Thus, all three groups demonstrated a spelling-consistency effectin the latencies of responses to words but not in the latencies of re-sponses to pseudowords, and all three groups showed a frequency ef-fect in the latency as well as the error data. Moreover, the overall errorrate of students with dyslexia was similar to that of reading-matchstudents, which, in turn, were higher than those of age-match stu-dents. Similarly with respect to the response latencies, students withdyslexia and reading-match students had similar response times,which, in turn, was higher than that of age-match students. Thesefindings indicate that the reading behavior of students with dyslexiain the present lexical-decision task does not differ qualitatively fromthat of students who are unimpaired readers. Word identification instudents with dyslexia resembles that of reading-match students, sug-gesting that the differences observed in comparisons of readers withdyslexia and age-match readers are quantitative in nature.
This conclusion must be qualified by the implications of the re-sults relating to performance on pseudowords. The pattern of resultswith respect to pseudoword latencies mimicked those of the word la-tencies: similarly fast responses by students with dyslexia and reading-match students, who, in turn, were slower than age-match students.But students with dyslexia made more errors on the pseudowordsthan reading-match and age-match students did, who made a similarnumber of errors on the pseudowords. Moreover, only students withdyslexia committed more errors on inconsistent pseudowords than onconsistent ones. The comparison of performance relating to word andpseudowords revealed that students with dyslexia had a similar num-ber of errors on words and pseudowords (14% and 19% respectively),whereas reading match (13% and 7%, respectively), and age-match(8% and 3%, respectively) committed more errors on word stimulithan on pseudoword stimuli. These findings suggest a subtle differ-ence between students with dyslexia and unimpaired readers pertain-ing to the production of responses to pseudowords. We will discusspotential reasons for this result below. This experimental finding con-
286 BOSMAN, VONK, AND VAN ZWAM
SPELLING CONSISTENCY AND DYSLEXIA 287
verges with the test results of the three reader groups (consult TableII). Recall, word-reading level of the students with dyslexia was simi-lar to that of the reading-match students (31.2 and 31.5, respectively),whereas pseudoword-reading level was lower than that of reading-match students (20.7 and 29.0, respectively).
Our findings motivate the conclusion that the word-identificationprocess is highly similar in all three groups (they all showed a fre-quency and a consistency effect, and the error rates were similar incomparisons between reading-match students and students withdyslexia), but word-identification speed of students with dyslexia wasat the level of students 2.5 years younger. Pseudoword identificationshowed a slightly different pattern. Although pseudoword-identificationspeed of the students with dyslexia was at the level of the reading-match students; they made many more errors. And, unlike the otherreader groups, they also exhibited a consistency effect in the errorrates of the pseudowords.
Many others who have studied dyslexia in both a pronunciation-consistent language like German and a pronunciation-inconsistentlanguage like English have arrived at the conclusion that studentswith developmental dyslexia display a pseudo- or nonword deficit(Goswami, Ziegler, Dalton, & Schneider, 2003; Griffiths & Snowling,2002; Rack et al., 1992; van IJzendoorn & Bus, 1994; Wimmer, 1996;Ziegler, Perry, Ma-Wyatt, Ladner, & Schulte-Körne, 2003).
A reliable spelling-consistency effect in conjunction with a pseu-doword-reading deficit in the students with dyslexia requires a theo-retical explanation that takes both into account. Many sophisticatedimplementations, localist as well distributed models, of normal andimpaired word identification have been developed (e.g., Coltheart,Rastle, Perry, Langdon, & Ziegler, 2001; Harm & Seidenberg, 1999,2001; Plaut, McClelland, Seidenberg, & Patterson, 1996; Plaut &Shallice, 1993). The assumption underlying these models is that visual-word identification involves the activation of three main as-pects; that is, orthography, phonology, and semantics. Initially, con-nectionist models simulated the most apparent aspect of reading only,namely, the covariations between orthography and phonology(Seidenberg & McClelland, 1989). All connectionist models were ei-ther strict feedforward models, in which activation is sent from letternodes to phonemes nodes, or feedforward with a simple recurrent as-pect. In later models, steps were taken to include semantics as well.Only recently did Harm and Seidenberg (2004) present simulations ofa network in which all three aspects were fully incorporated. Theirmodel is the most comprehensive version of a distributed word-perception model so far. It comprises recurrent-feedback relationshipsbetween semantics and phonology (i.e., feedforward and feedback),and feedforward relationships between orthography and semantics onthe one hand, and feedforward relationships between orthographyand phonology on the other. Between them, various connectionistmodels successfully simulated important intact and impaired word-
perception phenomena (e.g., regularization error, the frequency byregularity interaction, homophone effects, semantic errors, and thelike). Note that the regularization error in reading is a demonstrationof a pronunciation-consistency effect. The counterintuitive phe-nomenon of a possible alternative spelling affecting the word-readingprocess can only be understood when activation from phonology is al-lowed to be fed back to orthography. We, therefore, agree with Stoneet al. (1997) that spelling-consistency effects are strong evidence of thepresence of interactive or feedback processes in reading.
McClelland and Rumelhart’s (1981) interactive-activation model isthe first example of the incorporation of interactivity in which feedbackfrom a higher level (word level) is fed back to a lower level (letter level).Examples of subsequent developments are the resonance models byGrossberg and Stone (1986), Kawamoto and Zemblidge (1992), Stone(1994), and Van Orden and Goldinger (1994). Farrar and Van Orden(2001) implemented a resonance version of the triangle model, in whichorthography, phonology, and semantics had full-recurrent connectionsamong each other. The design of the resonance model of Van Ordenand colleagues actually predicts the occurrence of spelling-consistencyeffects in reading and pronunciation effects in spelling. The design oftheir model, however, does not state that a frequency by consistency in-teraction has to occur; rather, they state that consistency effects may bereduced or eliminated in high-frequency words (Van Orden,Pennington, & Stone, 1990). Because Van Orden and colleagues de-scribed and implemented a fully-recurrent network and because theypresented a theoretical account of developmental dyslexia in terms of aresonance model (Van Orden, Bosman, Goldinger, & Farrar, 1997), wewill take their model as an explanation of our findings.
The model consists of three families of nodes with fully-recurrentconnections: orthographic nodes, phonologic nodes, and semanticnodes (Figure 1). This means that there is a connection from each ofthe orthographic nodes to each of the phonologic and each of the se-mantic nodes, and there are backward connections from each of thephonologic and semantic nodes to the orthographic nodes, and simi-larly for the connections between phonologic and semantic nodes. Onpresentation of a printed word, the orthographic nodes get activated,which, in turn, activate phonologic and semantic nodes (feedforwardactivation). The recurrent connections cause the phonologic and se-mantic nodes to activate the orthographic nodes again (feedback acti-vation). Whenever the feedback activation pattern matches thefeedforward activation pattern, a temporarily stable, coherent dy-namic whole emerges. Similarly, when the network is presented witha spoken word, phonologic nodes get activated, which, in turn, acti-vate orthographic and semantic nodes. Again, the recurrent connec-tions cause the orthographic and semantic nodes to activate thephonologic nodes again, and whenever the feedback pattern matchesthe feedforward pattern, a temporarily stable, coherent dynamicwhole emerges.
288 BOSMAN, VONK, AND VAN ZWAM

SPELLING CONSISTENCY AND DYSLEXIA 289
An important property of the present network is the difference inoverall strength between node families, as illustrated by the relativeboldness of the arrows. Connection strength indicates the speed withwhich dynamics cohere. In the present case, the connections betweenorthographic and phonologic nodes are strongest. In alphabetic lan-guages, letters and phonemes correlate rather strongly. The letter P isalmost always pronounced as [p] (exceptions are the P in PHOENIX orPSYCHO), and the phoneme [p] is almost always written with a P. Therelations between phonemes and semantics are less strong. Knowingthat a word starts with the phoneme P does not provide us with muchinformation on its meaning (e.g., PAGE, PURE, or PRACTICAL do notshare much meaning). Although phonologic and semantic nodes shareonly weak connections, they are stronger than those between semanticand orthographic nodes. This is primarily because we learned to speakbefore we learned to read, and we speak more often than we read.Note that before children learn to read, the strongest connections willbe between phonologic and semantic nodes, but quickly after readinginstruction starts, the ones between orthographic and phonologicnodes will supersede as a result of the strong correlations between let-ters and phonemes. Thus, this recurrent network predicts that dynam-ics involving the relation between orthography and phonology coherebefore the dynamics between phonology and semantics, which, inturn, cohere before the dynamics between semantics and orthography.If this is true, it should not come as a surprise that phonology is anearly and omnipresent constraint in reading as well as in spelling. Forexamples on reading, we refer the reader to Frost (1998) and VanOrden, Pennington, and Stone (1990), and for various examples onspelling to Bosman and Van Orden (1997).
More important with respect to the current issue is that recurrencein the network predicts that it matters for reading that words can bespelled multiple ways and for spelling that words can be pronouncedmultiple ways. According to the model, during reading activation
Figure 1. Macrodynamics of a recurrent-network account.

from phonologic nodes is always fed back to orthographic nodes, in-consistency from phonology to orthography will negatively affectreading. Similarly, during spelling, activation from orthographicnodes is always fed back to the phonologic nodes and inconsistencyfrom orthography to phonology will negatively affect spelling. The ex-periments by Seidenberg and Tanenhaus (1979) and the one by Zecker(1991) presented earlier provide beautiful demonstrations of the inter-active nature of sound and spelling. Studies by Ziegler and colleaguesreveal similar effects in a letter-search task (Ziegler & Ferrand, 1998;Ziegler et al., 2004). With respect to semantics, the nature of the modelassumes that the role of semantics is comparable to that of orthogra-phy and phonology; that is, the relationships between semantics andorthography/phonology are also bidirectional. Thus, it should matterfor reading that a word is ambiguous with respect to meaning, andthat one meaning can be represented by more than one word. Studiesby Pecher (2001) and Rodd, Gaskell, and Marslen-Wilson (2002, 2004)showed that this was indeed the case.
Although Van Orden and colleagues never simulated develop-mental dyslexia, in one of their publications, they presented a sugges-tion of how to go about this (Van Orden et al., 1997). Their idea isbased on a neural analogy, without claiming anatomical plausibility.Post-mortem studies by Galaburda, Sherman, Rosen, Aboitiz, andGeschwind (1985) indicate anatomical anomalies (possibly as a resultof neural migration) in the brains of people with dyslexia. Locallysmall anomalies in neural positioning may cause large changes in thepatterns of interconnectivity between neurons in different regions ofthe brain. Translated in terms of our recurrent network, perhaps theproblem in developmental dyslexia arises from haphazard connec-tions rather than fully recurrent connections between orthographicand phonologic nodes. Haphazard connectivity precludes the emer-gence of fine-grain statistical structure (i.e., the level of letter-phonemerelationships), without preventing the development of coarse-grainstatistical structure (i.e., multiletter or whole-word level). Only whenthe network or for that matter the reader is able to develop fine-grainstatistical structure between letters and phonemes will pseudowordreading be possible. Moreover, in the case of words, the semantic-phonologic and/or the semantic-orthographic dynamic (see Figure 1)can come to a rescue, whereas these dynamics will not be able to helpwhen pseudowords are read. This also explains why readers with de-velopmental dyslexia display strong phonology effects in tasks in-volving words (e.g., Bosman et al., 2000; Van Orden & Goldinger,1996) and at the same time, show the absence of phonology whenreading pseudowords.
We briefly return to three empirical issues not discussed previ-ously. The first one is the fact that students with dyslexia and reading-match students display greater frequency effects than age-matchstudents. The difference between high- and low-frequency words ismost likely larger for students with limited print exposure (i.e., the
290 BOSMAN, VONK, AND VAN ZWAM

SPELLING CONSISTENCY AND DYSLEXIA 291
students with dyslexia and reading-match students). Suppose thatwith increasing experience, exposure to low-frequency words in-creases from two to 10 and those of high-frequency words from 100 to 200.That would mean a relatively larger increase for the low-frequencywords than for the high-frequency words. Thus, becoming a more ex-perienced reader would lead to smaller frequency effect. Note thatthis effect will show up in any network (not just recurrent ones).
The second effect that has not been discussed is the finding thatonly students with dyslexia presented a consistency effect on the accu-racy data of nonword decisions. Caution should be exercised when in-terpreting these results. The relatively small number of errors made inthe age-match (3.2%) and the reading-match group (7.2%) as com-pared to the group of students with dyslexia (19.3%) suggests that afloor effect has occurred in the former two groups. We refrain frompresenting an interpretation, because we are not yet convinced thatthis is a meaningful difference.
The third and final effect that requires attention is the presence of aninteraction effect between frequency and consistency of the word latencydata in the group of students with dyslexia, and its absence in the tworeading groups without dyslexia. One caveat: because resonance modelsare essentially nonlinear, any explanation is somewhat speculative, andneeds to be tested in future research. We can only present a suggestion.Building on the assumption that dyslexia is characterized by haphazardconnectivity in the orthographic-phonologic relationships, students withdyslexia are more reliant on the orthographic-semantic and the phonologic-semantic dynamics than students without dyslexia. These dy-namics can help to clear up the inconsistencies in the orthographic-phonologic dynamic more easily in high-frequency words than inlow-frequency words. Low-frequency inconsistent words suffer from adouble disadvantage; they are semantically less well known and they areinconsistent from phonology to orthography. This may be the reasonwhy a consistency effect emerges in low-frequency words only in stu-dents with dyslexia. In students without dyslexia, there is full connectiv-ity between orthography and phonology, and their word-identificationprocess is less reliant on the orthographic-semantic and the phonologic-semantic dynamics. The consistency effect can emerge in both high- andlow-frequency words because the orthographic-phonologic dynamic de-velops relatively independently. In sum, because overall coherence ismore important in students with than in students without dyslexia, theirword-identification process may subtly deviate from that of studentswithout. Three empirical findings support this conclusion: students withdyslexia have considerably slower decision times (more than twice asslow) compared to age-match students, their mean responses to low-frequency inconsistent words are the longest (2245 ms), and they are 100ms longer than that of reading-match students (2143 ms).
To conclude, the empirically established interactive nature ofspelling, sound, and meaning leads us to conclude that any word-perception model should incorporate the feedback principle. The feed-
back principle precludes that reading can be viewed as a linear sum oforthography + phonology + semantics. A system that includes feed-back and feedforward processes causes continuous nonlinear alter-ations of the activation patters among orthographic, phonologic, andsemantic nodes. We, therefore, agree with the conclusions drawn byHarm and Seidenberg (2001), who explained the impairments of twocases of acquired dyslexia in terms of a phonological impairment thatinteracts with the orthographic properties of stimuli. The way theyphrased their conclusion suggests that they are not attributing thecause of reading failure to either orthography or phonology.
We would like to take matters a little further than this, because webelieve that there is great utility in viewing reading (and for that matter,cognition in general) as an ongoing interaction between the organismand its environment (see Van Orden, Holden, Podgornik, & Aitchison,1999). Reading is just like any other cognitive task strongly contextuallysituated. The most obvious context in reading an alphabetical writingsystem is the word context. Letters and letter clusters change their rela-tionship to phonemes according to the contexts in which they appear.Other important contexts for visual-word identification are task vari-ables: response mode (e.g., naming, lexical decision, semantic catego-rization), target stimuli (e.g., homophones, regular words, exceptionwords, nonwords), filler stimuli (e.g., orthographically illegal pseu-dowords, orthographically legal pseudowords pseudohomophones),preceding trial (e.g., priming, [backward] masking), interstimulus-interval (ranging from 0 to seconds), response delay (e.g., immediate ordelayed), and so forth. To complicate matters even further, not only ex-perimental contexts codetermine the reading process. A reader’s per-sonal history and disposition provide yet another one. For example, theamount of print exposure, age, language experience, and functional im-pairments, like being deaf, blind, or having dyslexia, all contribute tothe outcome of the reading process. Viewing the reading process as theresult of the ongoing interaction between a person and the task at hand,without one having primacy over the other, has an important implica-tion prudently discussed by Van Orden and Kloos (2005). Thus, readingperformance of students with dyslexia is bound to be similar in somerespects and different in others. They may reveal themselves betweenand within tasks. The present experiment showed both differences andsimilarities within one task.
Address correspondence to Anna M. T. Bosman, Radboud Uni-versity Nijmegen, Faculty of Social Sciences, Department of SpecialEducation and Behavioural Sciences Institute, P.O. Box 9104, 6500 HENijmegen, The Netherlands. E-mail: [email protected]
References
Andrews, S. (1982). Phonological recoding: Is the regularity effect consistent? Memory &Cognition, 10, 565–575.
292 BOSMAN, VONK, AND VAN ZWAM
SPELLING CONSISTENCY AND DYSLEXIA 293
Baayen, R. H., Piepenbrock, R., & van Rijn, H. (1993). The CELEX lexical database (CD-ROM). Philadelphia: Linguistic Data Consortium, University of Pennsylvania.
Backman, J., Bruck, M., Hebert, M., & Seidenberg, M. S. (1984). Acquisition and use ofspelling-sound information in reading. Journal of Experimental Child Psychology,38, 114–133.
Backman, J. E., Mamen, M., & Ferguson, H. B. (1984). Reading level design: Conceptualand methodological issues in reading research. Psychological Bulletin, 96, 560–568.
Barry, C., & Seymour, P. H. K. (1988). Lexical priming and sound-to-spelling contingencyeffects in nonword spelling. Quarterly Journal of Experimental Psychology, 40A, 5–40.
Bosman, A. M. T., & de Groot, A. M. B. (1991). De ontwikkeling van woordbeelden bijbeginnende lezers en spellers [The development of orthographic images of begin-ning readers and spellers]. Pedagogische Studiën, 68, 199–215.
Bosman, A. M. T., & de Groot, A. M. B. (1996). Phonologic mediation is fundamental toreading: Evidence from beginning readers. The Quarterly Journal of ExperimentalPsychology, 49A, 715–744.
Bosman, A. M. T., & Mekking, A. J. (2006). Statistical analysis of the bidirectional incon-sistencies of spelling and sound in Dutch. Manuscript in preparation.
Bosman, A. M. T., van Leerdam, M., & de Gelder, B. (2000). The /O/ in OVER is differ-ent from the /O/ in OTTER: Phonological effects in Dutch students with andwithout dyslexia. Developmental Psychology, 36, 817–825.
Bosman, A. M. T., & Van Orden, G. C. (1997). Why spelling is more difficult than read-ing. In C. A. Perfetti, L. Rieben, & M. Fayol, (Eds.), Learning to spell (pp. 173–194).Hillsdale, NJ: Lawrence Erlbaum Associates.
Brus, B. T., & Voeten, M. J. M. (1973). Een-minuut test [One-minute test]. Nijmegen, theNetherlands: Berkhout.
Brysbaert, M. (1996). Word frequency affects naming latency in Dutch with age of ac-quisition controlled. European Journal of Cognitive Psychology, 8, 185–193.
Clark, H. H. (1973). The language-as-fixed-effect fallacy: A critique of language statisticsin psychological research. Journal of Verbal Learning and Verbal Behavior, 12,335–359.
Coltheart, M., Rastle, K., Perry, C., Langdon, R., & Ziegler, J. (2001). DRC: A dual routecascaded model of visual word recognition and reading aloud. PsychologicalReview, 108, 204–256.
Davies, R. A. I., & Weekes, B. S. (2005). Effects of feedforward and feedback consistencyon reading and spelling in dyslexia. Dyslexia, 11, 233–252.
de Groot, A. M. B. (1989). Representational aspects of word imageability and word fre-quency as assessed through word association. Journal of Experimental Psychology:Learning, Memory, and Cognition, 15, 824–845.
del Prado Martín, F. M., Deutsch, A., Frost, R., Schreuder, R., de Jong, N. H., & Baayen,R. H. (2005). Changing places: A cross-language perspective on frequency andfamily size in Dutch and Hebrew. Journal of Memory and Language, 53, 496–512.
Farrar, W. T., & Van Orden, G. C. (2001). Errors as multistable response options.Nonlinear Dynamics, Psychology, and Life Sciences, 5, 223–265.
Frost, R. (1998). Towards a strong phonological theory of visual word recognition: Trueissues and false trails. Psychological Bulletin, 123, 71–99.
Galaburda, A. M., Sherman, G. F., Rosen, G. D., Aboitiz, F., & Geschwind, N. (1985).Developmental dyslexia: Four consecutive patients with cortical anomalies.Annals of Neurology, 18, 222–233.
Glushko, R. J. (1979). The organization and activation of orthographic knowledge inreading aloud. Journal of Experimental Psychology: Human Perception andPerformance, 5, 674–691.
Goswami, U., Ziegler, J. C., Dalton, L., & Schneider, W. (2003). Nonword reading acrossorthographies: How flexible is the choice of reading units? AppliedPsycholinguistics, 24, 235–247.
Griffiths, Y. M., & Snowling, M. J. (2002). Predictors of exception word and nonwordreading in dyslexic children: The severity hypothesis. Journal of EducationalPsychology, 94, 34–43.
Grossberg, S., & Stone, G. O. (1986). Neural dynamics of word recognition and recall:Attentional priming, learning, and resonance. Psychological Review, 93, 46–74.
Harm, M. W., & Seidenberg, M. S. (1999). Phonology, reading acquisition, and dyslexia:Insights from connectionist models. Psychological Review, 106, 491–528.
Harm, M. W., & Seidenberg, M. S. (2001). Are there orthographic impairments inphonological dyslexia? Cognitive Neuropsychology, 18, 71–92.
Harm, M. W., & Seidenberg, M. S. (2004). Computing the meanings of words in reading:Cooperative division of labor between visual and phonological processes.Psychological Review, 111, 662–720.
Holligan, C., & Johnston, R. S. (1988). The use of phonological information by goodand poor readers in memory and reading tasks. Memory & Cognition, 16,522–532.
Holmes, V. M., & Ng, E. (1993). Word-specific knowledge, word-recognition strategies,and spelling ability. Journal of Memory and Language, 32, 230–257.
Jared, D. (1997). Spelling-sound consistency affects the naming of high-frequencywords. Journal of Memory and Language, 36, 505–529.
Jared, D. (2002). Spelling-sound consistency and regularity effects in word naming.Journal of Memory and Language, 46, 723–750.
Jared, D., McRae, K., & Seidenberg, M. S. (1990). The basis of consistency effect in wordnaming. Journal of Memory and Language, 29, 687–715.
Kawamoto, A. H., & Zemblidge, J. (1992). Pronunciation of homographs. Journal ofMemory and Language, 31, 349–374.
Kreiner, D. S., & Gough, P. B. (1990). Two ideas about spelling: Rules and word-specificmemory. Journal of Memory and Language, 29, 103–118.
Lacruz, I., & Folk, J. R. (2004). Feedforward and feedback consistency effects for high-and low-frequency words in lexical decision and naming. The Quarterly Journal ofExperimental Psychology, 57A, 1261–1284.
McClelland, J. L., & Rumelhart, D. E. (1981). An interactive activation model of contexteffects in letter perception: Part 1. An account of basic findings. PsychologicalReview, 88, 375–407.
Metsala, J. L., Stanovich, K. E., & Brown, G. D. A. (1998). Regularity effects and thephonological deficit model of reading disabilities: A meta-analytic review. Journalof Educational Psychology, 90, 279–293.
Monsell, S. (1991). The nature and locus of word frequency effects in reading. In D.Besner & G. W. Humphreys (Eds.), Basic processes in reading. Visual word recogni-tion (pp. 148–197). Hillsdale, NJ: Lawrence Erlbaum Associates.
Pecher, D. (2001). Perception is a two-way junction: Feedback semantics in word recog-nition. Psychonomic Bulletin & Review, 8, 545–551.
Peereman, R., Content, A., & Bonin, P. (1998). Is perception a two-way street? The caseof feedback consistency in visual word recognition. Journal of Memory andLanguage, 39, 151–174.
Perry, C., Ziegler, J. C., & Coltheart, M. (2002). How predictable is spelling? Developingand testing metrics of phoneme-grapheme contingency. The Quarterly Journal ofExperimental Psychology, 55A, 897–915.
Plaut, D. C., McClelland, J. L., Seidenberg, M. S., & Patterson, K. E. (1996).Understanding normal and impaired word reading: Computational principles inquasi-regular designs. Psychological Review, 103, 56–115.
Plaut, D. C., & Shallice, T. (1993). Deep dyslexia: A case study of connectionist neu-ropsychology. Cognitive Neuropsychology, 10, 377–500.
Pugh, K., Rexer, K., & Katz, L. (1994). Evidence for flexible coding in visual word recog-nition. Journal of Experimental Psychology: Human Perception and Performance, 20,807–825.
Raaijmakers, J. G. W. (2003). A further look at the “Language-as-fixed-effect fallacy”.Canadian Journal of Experimental Psychology, 57(3), 141–151.
Raaijmakers, J. G. W., Schrijnemakers, J. M. C., & Gremmen, F. (1999). How to deal with“The langauge-as-fixed-effect fallacy”: Common misconceptions and alternativesolutions. Journal of Memory and Language, 41, 416–426.
Rack, J. P., Snowling, M. J., & Olson, R. K. (1992). The nonword reading deficit in devel-opmental dyslexia: A review. Reading Research Quarterly, 27, 28–53.
Reitsma, P., & Vinke, J. (1986). Individuele verschillen in direct en indirect lezen[Individual differences in direct and indirect reading]. In P. Reitsma, A. G. Bus, &
294 BOSMAN, VONK, AND VAN ZWAM

SPELLING CONSISTENCY AND DYSLEXIA 295
W. H. J. van Bon (Eds.), Leren lezen en spellen: Ontwikkeling en problemen (pp.80–85). Lisse, the Netherlands: Swets & Zeitlinger.
Rodd, J., Gaskell, G., & Marslen-Wilson, W. (2002). Making sense of semantic ambigu-ity: Semantic competition in lexical access. Journal of Memory and Language, 46,245–266.
Rodd, J., Gaskell, G., & Marslen-Wilson, W. (2004). Modelling the effects of semanticambiguity in word recognition. Cognitive Science, 28, 89–104.
Seidenberg, M. S., & McClelland, D. J. (1989). A distributed, developmental model ofword recognition and naming. Psychological Review, 96, 523–568.
Seidenberg, M. S., & Tanenhaus, M. K. (1979). Orthographic effects in rhyme moni-toring. Journal of Experimental Psychology: Human Learning and Memory, 5,546–554.
Seidenberg, M. S., Waters, G. S., Barnes, M. A., & Tanenhaus, M. K. (1984). When doesirregular spelling or pronunciation influence word recognition? Journal of VerbalLearning and Verbal Behavior, 23, 383–404.
Staphorsius, G., Krom, P. S. H., & de Geus, K. (1988). Frequenties van woordvormen en let-terposities in jeugdliteratuur [Frequencies of word forms and letter positions in youth lit-erature]. Arnhem, the Netherlands: Cito.
Stone, G. O. (1994). Combining connectionist and symbolic properties in a single pro-cess. In S. D. Lima, L. Corigan, & G. K. Iverson (Eds.), The reality of linguistic rules(pp. 417–444). Amsterdam, the Netherlands: John Benjamins.
Stone, G. O., Vanhoy, M., & Van Orden, G. C. (1997). Perception is a two-way street:Feedforward and feedback phonology in visual word recognition. Journal ofMemory and Language, 36, 337–359.
Taraban, R., & McClelland, J. L. (1987). Conspiracy effects in word pronunciation.Journal of Memory and Language, 26, 608–631.
Treiman, R., Mullennix, J., Bijeljac-Babic, R., & Richmond-Welty, E. D. (1995). The spe-cial role of rimes in the description, use, and acquisition of English orthography.Journal of Experimental Psychology: General, 124, 107–136.
van den Bos, K. P., Spelberg, H. C. L., Scheepstra, A. J. M., & de Vries, J. R. (1994). DeKlepel: Een test voor de leesvaardigheid van pseudowoorden. [De Klepel: A test for pseu-doword reading skill]. Nijmegen, the Netherlands: Berkhout.
Vanhoy, M., & Van Orden, G. C. (2001). Pseudohomophones and word recognition.Memory & Cognition, 29, 522–529.
van IJzendoorn, M. H., & Bus, A. G. (1994). Meta-analytic confirmation of the nonwordreading deficit in developmental dyslexia. Reading Research Quarterly, 29,266–275.
Van Orden, G. C., Bosman, A. M. T., Goldinger, S. D., & Farrar, W. T. (1997). A recurrentnetwork account of reading, spelling, and dyslexia. In J. W. Donahoe & V.Packard Dorsel (Eds.), Neural network models of cognition: A biobehavioral foundation(pp. 522–538). Amsterdam, the Netherlands: Elsevier Science Publishers.
Van Orden, G. C., & Goldinger, S. D. (1994). Interdependence of form and function incognitive systems explains perception of printed words. Journal of ExperimentalPsychology: Human Perception and Performance, 20, 1269–1291.
Van Orden, G. C., & Goldinger, S. D. (1996). Phonologic mediation in skilled anddyslexic reading. In C. H. Chase, G. D. Rosen, & G. F. Sherman (Eds.),Developmental dyslexia: Neural, cognitive, and genetic mechanisms (pp. 185–223).Timonium, MD: York Press.
Van Orden, G. C., Holden, J. G., Podgornik, M. N., & Aitchison, C. S. (1999). Whatswimming says about reading: Coordination, context and homophone errors.Ecological Psychology, 11, 45–79.
Van Orden, G. C., & Kloos, H. (2005). The question of phonology and reading. In M. J.Snowling, & C. Hulme (Eds.), The science of reading: A handbook (pp. 61–78).Oxford, UK: Blackwell.
Van Orden, G. C., Pennington, B. F., & Stone, G. O. (1990). Word identification in read-ing and the promise of subsymbolic psycholinguistics. Psychological Review, 97,488–522.
Vellutino, F. R., & Scanlon, D. M. (1989). Some prerequisites for interpreting resultsfrom reading-level matched designs. Journal of Reading Behavior, 21, 361–385.
Waters, G. S., Bruck, M., & Seidenberg, M. (1985). Do children use similar processes toread and spell words? Journal of Experimental Child Psychology, 39, 511–530.
Wike, E. L., & Church, J. D. (1976). Comments on Clark’s “The language-as-fixed-effectsfallacy.” Journal of Verbal Learning and Verbal Behavior, 15, 249–255.
Wimmer, H. (1996). The nonword reading deficit in developmental dyslexia: Evidencefrom children learning to read German. Journal of Experimental Child Psychology,61, 80–90.
Zecker, S. G. (1991). The orthographic code: Developmental trends in reading-disabledand normally-achieving children. Annals of Dyslexia, 41, 178–192.
Zecker, S. G., Tanenhaus, M. K., Alderman, L., & Siqueland, L. (1986). Lateralization oflexical codes. Brain and Language, 29, 372–389.
Ziegler, J. C., & Ferrand, L. (1998). Orthography shapes the perception of speech: Theconsistency effect in auditory word recognition. Psychonomic Bulletin & Review, 5,683–689.
Ziegler, J. C., Ferrand, L., & Montant, M. (2004). Visual phonology: The effects of ortho-graphic consistency on different auditory word recognition tasks. Memory &Cognition, 32, 732–741.
Ziegler, J. C., Jacobs, A. M., & Stone, G. O. (1996). Statistical analysis of the bidirectionalinconsistency of spelling and sound in French. Behavior Research Methods,Instruments & Computers, 28, 504–515.
Ziegler, J. C., Perry, C., Ma-Wyatt, A., Ladner, D., & Schulte-Körne, G. (2003).Developmental dyslexia in different languages: Language-specific or universal?Journal of Experimental Child Psychology, 86, 169–193.
Ziegler, J. C., Montant, M., & Jacobs, A. M. (1997). The feedback consistency effect inlexical decision and naming. Journal of Memory and Language, 37, 533–554.
Ziegler, J. C., Stone, G. O., & Jacobs, A. M. (1997). What is the pronunciation for -oughand the spelling for /u/? A database for computing feedforward and feedbackconsistency in English. Behavior Research Methods, Instruments & Computers, 29,600–618.
Manuscript received April 30, 2006.Final version accepted September 3, 2006.
296 BOSMAN, VONK, AND VAN ZWAM

SPELLING CONSISTENCY AND DYSLEXIA 297
AP
PE
ND
IX
Mea
n re
spon
se la
tenc
ies
in m
s an
d p
erce
ntag
es c
orre
ct (
belo
w)
on a
ll D
utch
exp
erim
enta
l sti
mul
i (E
nglis
h tr
ansl
atio
nin
ital
ics)
of s
tud
ents
wit
h d
ysle
xia
(Dys
), re
adin
g-m
atch
(RM
), an
d a
ge-m
atch
(AM
) stu
den
ts.
Sti
mu
lus
Dys
RM
AM
Sti
mu
lus
Dys
RM
AM
Sti
mu
lus
Dys
RM
AM
Hig
h-f
req
uen
cy c
onsi
sten
t wor
ds
men
s20
0117
4778
8br
uin
1587
1731
841
deu
r16
9414
8781
2
hum
an4.
34.
30
brow
n4.
38.
70
door
00
0
kans
2252
2122
901
broe
r24
6122
2510
04zi
ek19
7213
2281
4
chan
ce0
130
brot
her
8.7
04.
3ill
00
0
lang
1587
1702
843
stoe
l22
6315
5690
6hu
is13
7414
3480
5
long
4.3
00
chai
r4.
30
4.3
hous
e0
04.
3
niks
2035
1812
902
klas
1524
1943
847
neer
1826
1842
1138
noth
ing
134.
34.
3cl
ass
8.7
00
dow
n39
.121
.78.
7
som
s19
4018
0892
2to
en18
6817
5295
2vu
ur15
0116
5992
8
som
etim
es0
8.7
4.3
then
4.3
04.
3fir
e0
8.7
4.3
Hig
h-f
req
uen
cy in
con
sist
ent w
ord
sle
eg16
3416
3410
46to
uw16
2619
6386
6vl
ug16
5217
7083
0
empt
y4.
38.
70
rope
4.3
4.3
0fa
st13
00
huid
1960
1615
836
trei
n17
7121
7790
8be
st21
9518
7410
27
skin
8.7
8.7
4.3
trai
n4.
313
8.7
best
21.7
4.3
0
fijn
2037
1540
951
klei
n15
2216
1783
6ro
nd20
5218
4296
8
fine
00
0sm
all
4.3
00
roun
d4.
34.
313
reis
1917
1952
871
dro
og26
3619
2789
9zi
ch20
8720
0287
9(c
onti
nued
)
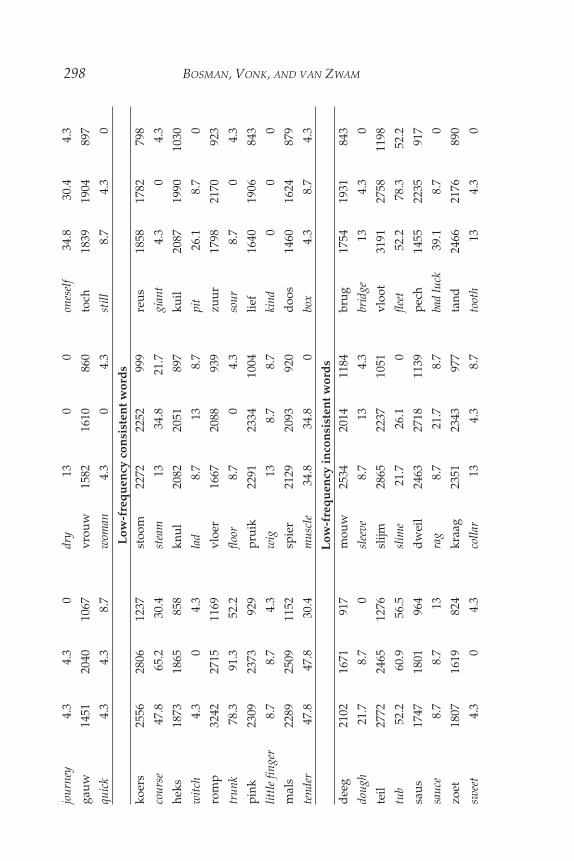
298 BOSMAN, VONK, AND VAN ZWAMjo
urne
y4.
34.
30
dry
130
0on
esel
f34
.830
.44.
3
gauw
1451
2040
1067
vrou
w15
8216
1086
0to
ch18
3919
0489
7
quic
k4.
34.
38.
7w
oman
4.3
04.
3st
ill8.
74.
30
Low
-fre
qu
ency
con
sist
ent w
ord
sko
ers
2556
2806
1237
stoo
m22
7222
5299
9re
us18
5817
8279
8
cour
se47
.865
.230
.4st
eam
1334
.821
.7gi
ant
4.3
04.
3
heks
1873
1865
858
knul
2082
2051
897
kuil
2087
1990
1030
wit
ch4.
30
4.3
lad
8.7
138.
7pi
t26
.18.
70
rom
p32
4227
1511
69vl
oer
1667
2088
939
zuur
1798
2170
923
trun
k78
.391
.352
.2flo
or8.
70
4.3
sour
8.7
04.
3
pink
2309
2373
929
prui
k22
9123
3410
04lie
f16
4019
0684
3
littl
e fin
ger
8.7
8.7
4.3
wig
138.
78.
7ki
nd0
00
mal
s22
8925
0911
52sp
ier
2129
2093
920
doo
s14
6016
2487
9
tend
er47
.847
.830
.4m
uscl
e34
.834
.80
box
4.3
8.7
4.3
Low
-fre
qu
ency
inco
nsi
sten
t wor
ds
dee
g21
0216
7191
7m
ouw
2534
2014
1184
brug
1754
1931
843
doug
h21
.78.
70
slee
ve8.
713
4.3
brid
ge13
4.3
0
teil
2772
2465
1276
slijm
2865
2237
1051
vloo
t31
9127
5811
98
tub
52.2
60.9
56.5
slim
e21
.726
.10
fleet
52.2
78.3
52.2
saus
1747
1801
964
dw
eil
2463
2718
1139
pech
1455
2235
917
sauc
e8.
78.
713
rag
8.7
21.7
8.7
bad
luck
39.1
8.7
0
zoet
1807
1619
824
kraa
g23
5123
4397
7ta
nd24
6621
7689
0
swee
t4.
30
4.3
colla
r13
4.3
8.7
toot
h13
4.3
0

SPELLING CONSISTENCY AND DYSLEXIA 299d
ijk18
9821
6210
10pr
et26
5421
3988
8he
md
2563
2497
1053
dike
21.7
8.7
0fu
n26
.10
0sh
irt
8.7
138.
7
Hig
h f
req
uen
cy-b
ased
con
sist
ent p
seu
dow
ord
s
bins
2435
2497
1007
grui
n29
0124
3696
9m
eus
2903
2522
1305
134.
30
130
4.3
34.8
130
wan
s25
2926
9412
48d
roer
2487
2701
1072
bien
3505
2450
1040
8.7
8.7
4.3
30.4
130
04.
30
kang
3206
2837
1331
broe
l26
4021
8010
13hu
im21
6120
5810
15
21.7
8.7
8.7
08.
70
8.7
4.3
4.3
sils
2823
3002
1280
klaa
n24
7524
3312
03ne
ek23
3217
5010
08
8.7
8.7
4.3
34.8
130
8.7
04.
3
nom
s21
7221
8489
6m
oen
2920
2668
1142
duu
k27
4128
1410
25
8.7
4.3
00
04.
360
.934
.813
Hig
h f
req
uen
cy-b
ased
inco
nsi
sten
t pse
ud
owor
ds
heeg
1943
2090
1058
jeut
2058
2438
981
dro
t25
2227
7310
82
.261
4.3
00
00
8.7
4.3
0
mui
d23
1120
6210
85vl
ein
2378
2975
1017
kest
2947
2800
1247
21.7
4.3
08.
70
052
.28.
74.
3
hijn
1852
2074
1196
krei
n25
5928
1510
86go
nd30
7531
3013
10
43.5
8.7
4.3
26.1
8.7
047
.88.
713
dei
s24
2926
0210
59st
oog
2793
2789
1125
pich
2442
2998
954
130
08.
74.
38.
713
4.3
0
fouw
2196
2872
1155
krou
w24
2324
8810
95vo
ch27
2125
3310
20
65.2
39.1
8.7
39.1
4.3
030
.48.
78.
7
(con
tinu
ed)

300 BOSMAN, VONK, AND VAN ZWAML
ow-f
req
uen
cy b
ased
con
sist
ent p
seu
dow
ord
sd
oers
2392
2309
1020
zwoo
m24
5625
4511
12w
euf
2233
2686
984
8.7
00
130
4.3
8.7
4.3
0
huks
2560
2725
1135
knum
2717
2848
951
dui
l24
6925
4211
06
8.7
00
8.7
4.3
013
4.3
0
som
p29
6627
7210
70kl
oer
2434
2560
1099
luun
2293
2527
1201
21.7
4.3
8.7
4.3
4.3
4.3
30.4
21.7
13
din
k26
9528
0611
02vl
uik
2561
2523
1192
liek
2424
2424
1161
39.1
134.
321
.70
4.3
8.7
00
raks
2484
3055
1130
blie
r27
0233
0112
45po
or22
7725
8810
80
8.7
8.7
04.
38.
74.
38.
70
4.3
Low
-fre
qu
ency
bas
ed in
con
sist
ent p
seu
dow
ord
ske
eg23
6826
2411
97sa
uw28
0722
8311
03pr
ug24
6824
5710
56
21.7
00
30.4
00
8.7
4.3
0
seis
2380
2328
1382
brijm
2817
2416
1052
ploo
t26
8728
7711
62
39.1
138.
713
4.3
04.
313
8.7
baus
2822
2431
1034
brei
l28
6027
1210
87be
ch22
0025
2810
72
1313
4.3
134.
30
134.
34.
3
noet
2272
2051
998
braa
g27
0328
0111
18ta
rd27
3829
3411
63
4.3
4.3
013
8.7
4.3
8.7
8.7
0
hijf
2394
2194
925
kret
2634
3016
1192
hers
2713
2732
1234
134.
30
8.7
138.
78.
70
0


![[Dyslexia and its neural signature]](https://img.dokumen.tips/doc/110x75/634f8f4aeb0b18f1440ae63f/dyslexia-and-its-neural-signature.jpg)