Embed Size (px)
Citation preview
27
2.1 Introduction: Historical Perspective
Modern chemical laboratories contain equipment capable of measuring many of the physical properties of single chemical compounds and mixtures of compounds, particularly their spectral properties, which can, if interpreted correctly, provide valuable information about both structure (of single compounds) and composition (of mixtures). Over the past 50 years, the author have witnessed enormous progress in the technical capabilities of this equipment. Automation and speed of analysis have greatly improved the ease of use and the versatility of the technology.
As an example, in the early days, measurement of the ultraviolet spectrum (UV) of a single compound could take up to 20 min – the operator had first to select the wavelength manually, use another knob to compensate a gauge, wait until the pointer found its stable position, mark the value found into a graph and repeat the procedure again and again with a changed wavelength. A long complicated process was thus required to achieve information about conjugation of multiple bonds in a compound (e.g. as in estrogens, ‘4-en-3-ones’ and vitamin D-type compounds). Later, tunable UV devices became part of analytical and preparative separation instruments (e.g. high performance liquid chromatography, HPLC), and today with the advent of computer data-handling, nobody is surprised by the speed at which they automati-cally monitor the UV output signal or even control the process of separation.
Infrared spectra (IR), though in the past very slowly produced on special paper that was susceptible to mechanical damage, could give a real insight into molecular
A. Kasal () and M. Budesinsky Institute of Organic Chemistry and Biochemistry, Academy of Sciences of the Czech Republic, Fleming Square 2, CZ166 10, Prague, 6, Czech Republic e-mail: [email protected]; [email protected]
W.J. Griffiths Institute of Mass Spectrometry, School of Medicine, Swansea University, Swansea SA2 8PP, UK e-mail: [email protected]
Chapter 2Spectroscopic Methods of Steroid Analysis
Alexander Kasal, Milos Budesinsky and William J. Griffiths
H.L.J. Makin and D.B. Gower (eds.), Steroid Analysis,DOI 10.10 / _2, © Springer Science+Business Media B.V. 201023 b135931
28 A. Kasal et al.
structure, freeing an experimenter from the need to prepare derivatives proving the existence of this or that functional group. Laborious ‘fingerprint’ comparison with the spectra of authentic reference samples was used for identification of individual steroids. Only much later, when spectrometers were linked to a computer with its own database to compare the sample in question with known standards, did paper printouts of the spectra cease to be the only means of storing evidence.
Mass spectroscopy (MS) was in the early days limited to volatile and low molecular weight compounds and derivatisation was part of the routine in any MS laboratory. Standard nuclear magnetic resonance (NMR) apparatus, which gives information about single atoms and their surrounding atoms, did not exist in those days and the method was then considered only to be useful for the demonstration of heterogeneous flaws in industrial products.
One has to admire the classical chemists of the late nineteenth and early twentieth centuries, who had none of these instruments, and yet produced results appreciated even today. For instance, Reinitzer (1888) discovered the molecular formula of cholesterol merely by precise elemental analysis of a series of cholesteryl ester dibromides and his formula remains unchallenged today. The quality and purity of his samples, as determined by melting points, have not been surpassed.
An interested reader may not necessarily personally use the techniques mentioned above but should, however, understand the information which these techniques can provide and the application of these methodologies to the examination of steroid structure. The novice seeking information about general aspects of the electro-magnetic spectra, their terminology, and the units employed, is advised to read the introductory section of any of the number of student texts, listed in the bibli-ography at the end of this chapter. This chapter will summarise the scope and limitations of each technique in the steroid field and is addressed particularly to the non-specialists who can derive benefit from an appreciation of the potential of these techniques in solving problems which arise during investigations involving steroids. Knowledge of steroid chemistry is a prerequisite to an understanding of steroid biochemistry – an increasingly important topic in biology and medicine. Potential readers of this book may therefore not be chemists and it is hoped that this chapter may prove useful. It is not intended to provide a comprehensive treatment of any of the topics. For this, the reader is referred to appropriate standard text-books (Williams and Fleming, 1987; Kirk, 1989; Kemp, 1991), and specialist books cited therein. This chapter is to be regarded as an introduction to the physico-chemical methods available to steroid chemists both in the past and today. Some of the electromagnetic techniques may not be as popular as they once were but still remain valuable and should not be ignored simply because they have been around for a long time. Other methodologies, particularly mass spectrometry (MS) and nuclear magnetic resonance are now more readily available to non-specialists and are increasingly finding application in steroid analysis – because of their increasing importance in this area, they are dealt with at greater length and in separate sections that follow.
292 Spectroscopic Methods of Steroid Analysis
2.2 Ultraviolet Absorption Spectroscopy and Related Methods
2.2.1 Introduction
When organic compounds absorb UV radiation, the UV light induces transitions of electrons between different energy levels. The transitions of interest in the present context are mainly from ground-state p-orbitals to unoccupied p-orbitals of higher energy. The latter are termed antibonding p-orbitals, and are designated by the symbol p*. After undergoing this transition by the absorption of a photon of appro-priate energy, the molecule is said to be in the excited state.
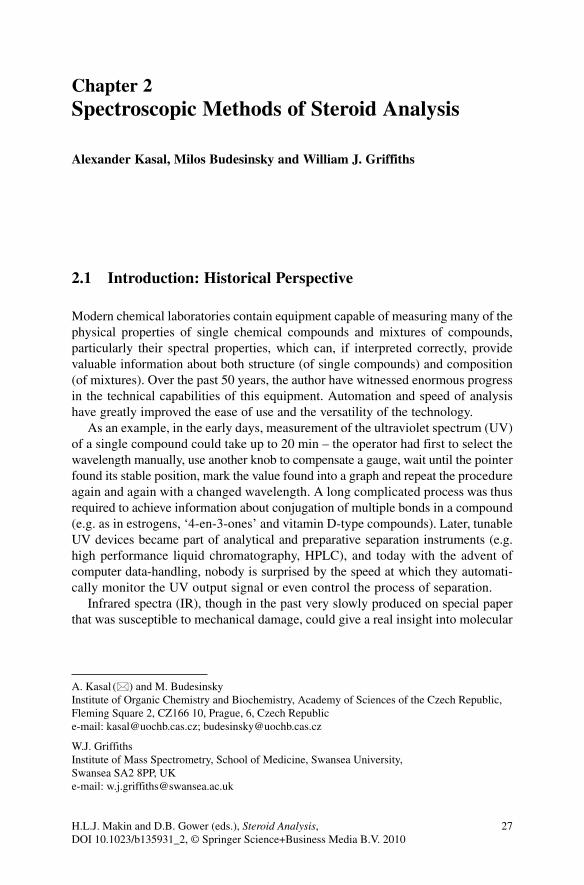
Compounds which can readily undergo p®p* transitions include conjugated dienes, trienes, and conjugated a,b-unsaturated ketones, esters or lactones, with structural features of the types C=C–C=C, C=C–C=C–C=C, or C=C–C=O, respec-tively. They also include aromatic rings, such as the phenolic ring A of the estro-gens. All such conjugated compounds absorb UV radiation strongly in the wavelength range between 220 and 350 nm, which is accessible to standard commercial UV–visible spectrophotometers. Figure 2.1 illustrates a typical UV absorption spectra. The wavelength (l) is normally expressed in nanometers (nm, 10–9 m); older units such as angström (Å) and millimicron (mm) are not used any more. Old data can be recalculated according to the following equation:
1 nm = 10 Å = 0.001 m
Any UV-absorbing part of a molecule is called a chromophore: this historic term derives from coloured substances, which contain functional groups (chromophore; chromos is colour in Greek) responsible for the absorption of radiation in the visible region of the electromagnetic spectrum (400–800 nm). Most of the steroids are white crystals, although a few coloured derivatives are also known (e.g. the 2,4-dinitrophenylhydrazones of steroid ketones are yellow or red).
HHO
200 225 250 275 300
Wavelength(nm)
Abs
orba
nce
325 350 375 400190
0,6
0,5
0,4
0,3
0,2
0,1
0,0
H
H
Fig. 2.1 UV spectrum of cholesta-5,7-dien-3b-ol
30 A. Kasal et al.
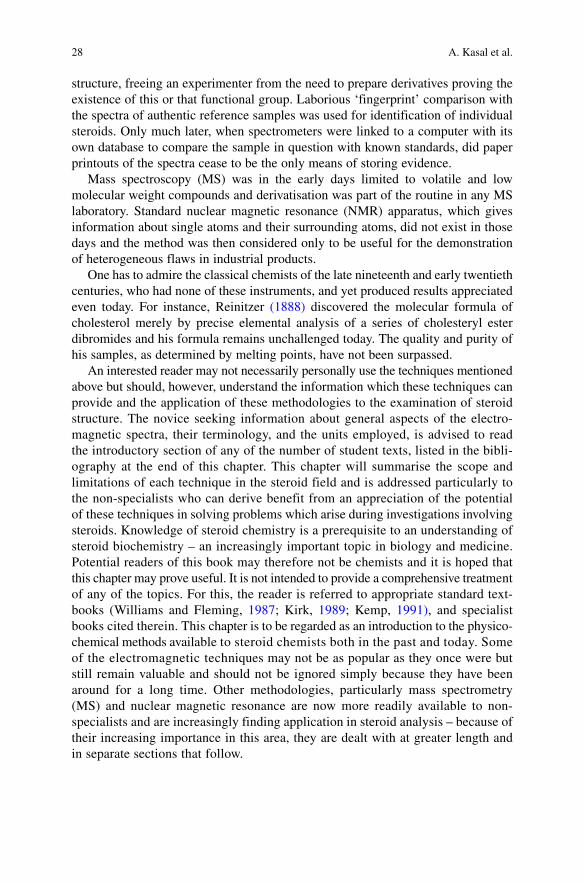
Electronic transitions also occur in other classes of organic compounds, which have no conjugated unsaturated systems, but the spectra in such cases are of rela-tively little practical value to organic chemists. For instance, absorption by isolated ethylenic double bonds in aliphatic compounds occurs at 170 nm and cannot therefore be recorded with standard commercial UV spectrophotometers. Special instruments are designed for absorption, which has a low probability and thus weak extinction (a small extinction coefficient e). If, however, –C=C– bands are attached to one or two tertiary carbon atoms, their absorption occurs at a slightly longer wavelength (“red shift”, see below) of about 200 nm and can then be detected quan-titatively with many instruments (Fig. 2.2).
Equally, isolated C=O groups show an extremely weak (e 20–100) absorption arising from the excitation of an electron from a non-bonding lone pair of the oxygen atom (n ® p* transition), in the wavelength range 280–320 nm. Such transitions, although “forbidden” by the so-called symmetry rules, do occur because of the loss of symmetry as the molecule vibrates. Since the extinction coefficient of these bands is from one to three orders smaller than usual, they have to be measured with correspondingly increased sample concentration or cell thickness. When the carbonyl group is conjugated with a double bond, the n ® p* transition of the C=O is over-shadowed by a very strong p ® p* absorption of the C=C–C=O system.
Even a weak band of an isolated carbonyl group may have its diagnostic value in structural problems: for instance, in the presence of a neighbouring axial Br atom, the C=O band at 300 nm has its absorption shifted by about 30 nm (a red shift), while an equatorial Br atom has practically no effect on the C=O absorption. Other neighbouring groups’ effects are also recognisable from this band.
In accordance with Lambert’s Law, the light absorbed is a fixed fraction of the incident light, irrespective of the source intensity. Beer’s Law states that the absorp-tion is proportional to the number of absorbing molecules. Together these laws lead to Eq. 2.1:
log10
(I0 /I) = el×c (2.1)
H
H
HO
200 225 250 275 300
Abs
orba
nce
325 350 375 400190
0,550,500,450,400,350,300,250,200,150,100,050,00
H
H
Fig. 2.2 UV spectrum of cholesta-4,6-dien-3b-ol
312 Spectroscopic Methods of Steroid Analysis
where I0 and I are the intensities of the incident and transmitted radiation, l is the
path length of the absorbing solution in cm, c is the concentration of the solution in mol/L, and e is the molar absorptivity, more commonly referred to by its older name as the molar extinction coefficient. Equation 2.1 leads directly to e being in units of dm3 mol−1 cm−1, the reciprocal of the units of the product l·c. The units of e are not generally expressed, when referring to the absorption maximum (l
max) of
an organic chromophore. The value of e is a characteristic of a particular compound at each wavelength. When the molecular weight is unknown, precluding use of e, the alternative expression E1%
l cm is used. This is the value of log
10(I
0/I), the so-called
absorbance (A) (formerly known as optical density) for a 1% solution in a cell of path length 1 cm.
2.2.2 Instrumentation
Conventional UV–visible spectrophotometers used to be based upon a scanning mono-chromator system. This produced a radiation beam of a wavelength, which changed through the required spectral range over a period of the order of minutes. The beam was split into two equal parts; one passed through the sample cell, where absorption of energy occurred according to the nature of the sample, the other passed through the reference cell with the solvent used. The light intensities of emerging beams were measured by photomultiplier tubes or photodiodes and the difference in light intensities of the two beams was plotted as a function of wave-length to give the absorption spectrum of the sample.
Modern instruments operate on a different principle, the whole spectral range being scanned almost instantaneously by a diode array. This comprises many hundreds of photodiodes, each of which collects the light received at a particular wavelength. Scan time to ‘read’ the entire array is typically in the range 5–100 ms, providing very rapid acquisition of the spectrum. Computer processing of the data permits the use of graphic displays, and storage and mathematical manipulation of the spectra.
2.2.3 Measurement of Spectra
Spectra are normally obtained for accurately weighed samples in very dilute solutions. A concentration in the approximate range 1–2 mg in 10 mL of solvent is typical when measuring the p ® p* transition of a conjugated system in a steroid. A silica cell, usually of 1 cm thickness (l = 1, in Eq. 2.1), is filled with the solution and put in the sample compartment of the spectrophotometer, with an identical cell filled with the pure solvent in the reference beam of the instrument. The intensities of light transmitted by the two cells are compared automatically as the spectrometer reads over the chosen wavelength span. This may cover the whole range from 220 nm through the visible spectrum, or be limited to that part of the spectrum where an absorption band is
32 A. Kasal et al.
expected. The spectrum is normally plotted on a chart as the value of log10
(I0/I) against
the wavelength. From the measured value of log10
(I0/I) at the absorption maximum
(lmax
), together with the path length of the cell (l), and the molar concentration of the solution (c), e can be calculated by application of Eq. 2.1.
The spectral chart normally shows one or more broad humps, each of them centered upon the absorption maximum for the chromophore concerned. Simple chro-mophores like conjugated dienes or enones give a single absorption maximum, although absorption occurs over a wide band of wavelengths, and gives a very broad peak, which spreads on either side of the maximum to a total width of some 35–40 nm. The absorption band may contain a number of inflections or ‘shoulders’. These are indications of vibrational fine structure; the wavelengths of shoulders are often quoted, as well as l
max, to aid comparison of spectra. They can be of considerable value
in the identification of particular compounds when compared with reference spectra.
2.2.4 Solvents
The choice of solvent is limited to those which are transparent to UV radiation over the wavelength range of interest, dissolve the sample at a concentration sufficient for measurement and do not react chemically with it. Ethanol and methanol mostly fulfil these conditions. They are transparent down to about 205 nm, dissolve steroid samples well and scarcely interact with them (they may occasionally lead to esteri-fication of steroid acids, which would not affect the value found; methanol, however, can add to a 3-oxo steroid forming a hemiacetal, which would reduce its already weak absorption). Water can be used to below 210 nm, but is rarely a suitable solvent for steroids. Diethyl ether and acetonitrile are suitable for many polar steroids, and are transparent to ~210 nm. Hydrocarbon solvents such as hexane or cyclohexane can be used down to about 190 nm for steroids of low polarity. All solvents should be of ‘spectroscopic grade’, available from commercial suppliers, to avoid errors due to traces of UV-absorbing impurities such as aromatic hydrocarbons.
Allowance must be made in many cases for shifts in UV absorption maxima depending upon the dipole moment of the solvent. The p ® p* transition, particu-larly of an a,b-unsaturated ketone, generates an excited state which is more polar than the ground state. Polar solvents, therefore, interact more strongly with the excited state, lowering its energy and thus shifting the absorption band to a some-what longer wavelength (“a red shift” or “bathochromic effect”): e.g. when changing from hexane to ethanol, the shift is about 10–15 nm. The changes are not uniform, they depend on the structure of a chromophore; a shift in the absorption maximum of the 3-keto-D4-system is smaller than that of the 3-keto-D4,6-system. Interestingly, the extinction coefficient is also affected by solvents (see Table 2.1); furthermore, a finger print structure of a band is usually lost in more polar solvents.
In contrast, the weak n ® p* transitions of ketones, including a,b-unsaturated ketones, have their maxima in the region of 280 nm in hydrocarbons but are ‘blue shifted’ (hypsochromic effect) on changing to hydroxylic solvents in the range 265–270 nm.
332 Spectroscopic Methods of Steroid Analysis
2.2.5 Effect of pH
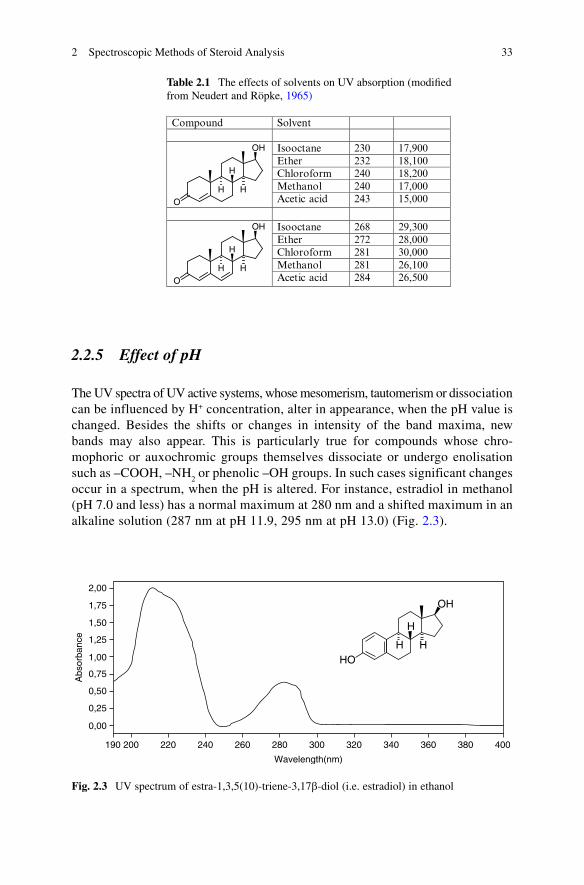
The UV spectra of UV active systems, whose mesomerism, tautomerism or dissociation can be influenced by H+ concentration, alter in appearance, when the pH value is changed. Besides the shifts or changes in intensity of the band maxima, new bands may also appear. This is particularly true for compounds whose chro-mophoric or auxochromic groups themselves dissociate or undergo enolisation such as –COOH, –NH
2 or phenolic –OH groups. In such cases significant changes
occur in a spectrum, when the pH is altered. For instance, estradiol in methanol (pH 7.0 and less) has a normal maximum at 280 nm and a shifted maximum in an alkaline solution (287 nm at pH 11.9, 295 nm at pH 13.0) (Fig. 2.3).
Table 2.1 The effects of solvents on UV absorption (modified from Neudert and Röpke, 1965)
Compound Solvent � �
Isooctane 230 17,900Ether 232 18,100Chloroform 240 18,200Methanol 240 17,000
O
OH
H H
H
Acetic acid 243 15,000
Isooctane 268 29,300Ether 272 28,000Chloroform 281 30,000Methanol 281 26,100
O
OH
H H
H
Acetic acid 284 26,500
200 220 240 260 280
Abs
orba
nce
300 320 340 360 380 400190
2,00
0,50
0,75
1,00
1,25
1,50
1,75
0,25
0,00
H
H
HO
OH
H
Wavelength(nm)
Fig. 2.3 UV spectrum of estra-1,3,5(10)-triene-3,17b-diol (i.e. estradiol) in ethanol
34 A. Kasal et al.
2.2.6 UV Absorption of Common Chromophores
Many UV absorption spectra covering all the types commonly found in steroids are given in an atlas (e.g. Neudert and Ropke, 1965). The most important chromophores found in steroids are given here.
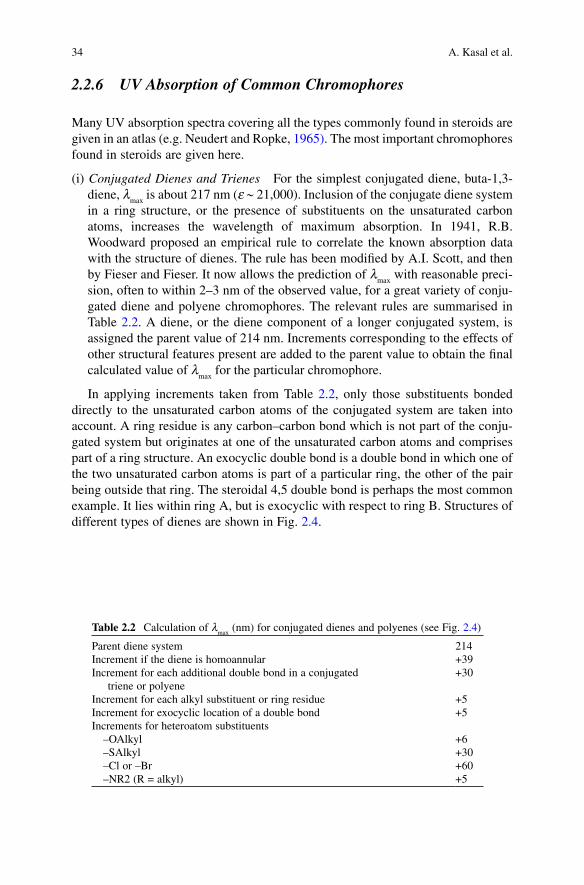
(i) Conjugated Dienes and Trienes For the simplest conjugated diene, buta-1,3-diene, l
max is about 217 nm (e ~ 21,000). Inclusion of the conjugate diene system
in a ring structure, or the presence of substituents on the unsaturated carbon atoms, increases the wavelength of maximum absorption. In 1941, R.B. Woodward proposed an empirical rule to correlate the known absorption data with the structure of dienes. The rule has been modified by A.I. Scott, and then by Fieser and Fieser. It now allows the prediction of l
max with reasonable preci-
sion, often to within 2–3 nm of the observed value, for a great variety of conju-gated diene and polyene chromophores. The relevant rules are summarised in Table 2.2. A diene, or the diene component of a longer conjugated system, is assigned the parent value of 214 nm. Increments corresponding to the effects of other structural features present are added to the parent value to obtain the final calculated value of l
max for the particular chromophore.
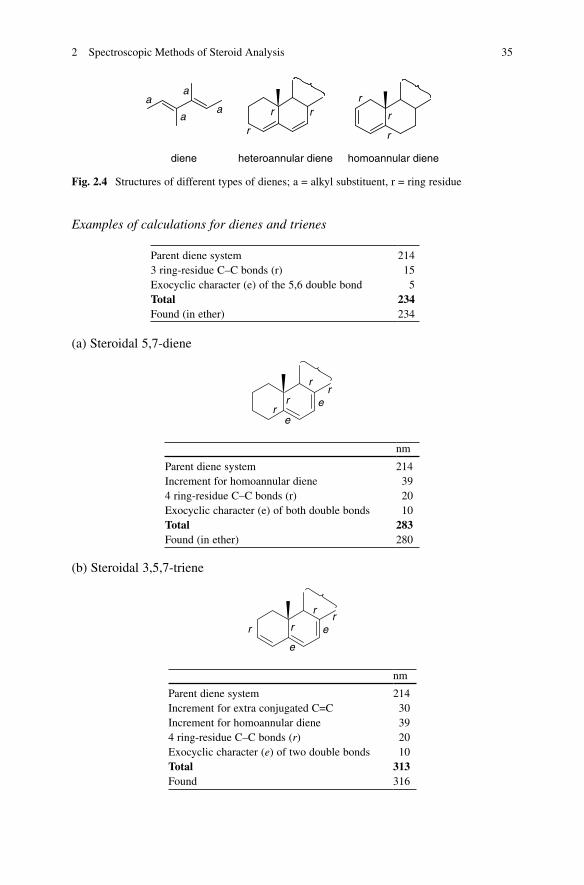
In applying increments taken from Table 2.2, only those substituents bonded directly to the unsaturated carbon atoms of the conjugated system are taken into account. A ring residue is any carbon–carbon bond which is not part of the conju-gated system but originates at one of the unsaturated carbon atoms and comprises part of a ring structure. An exocyclic double bond is a double bond in which one of the two unsaturated carbon atoms is part of a particular ring, the other of the pair being outside that ring. The steroidal 4,5 double bond is perhaps the most common example. It lies within ring A, but is exocyclic with respect to ring B. Structures of different types of dienes are shown in Fig. 2.4.
Table 2.2 Calculation of lmax
(nm) for conjugated dienes and polyenes (see Fig. 2.4)
Parent diene system 214Increment if the diene is homoannular +39Increment for each additional double bond in a conjugated
triene or polyene+30
Increment for each alkyl substituent or ring residue +5Increment for exocyclic location of a double bond +5Increments for heteroatom substituents –OAlkyl +6 –SAlkyl +30 –Cl or –Br +60 –NR2 (R = alkyl) +5
352 Spectroscopic Methods of Steroid Analysis
Examples of calculations for dienes and trienes
Parent diene system 2143 ring-residue C–C bonds (r) 15Exocyclic character (e) of the 5,6 double bond 5Total 234Found (in ether) 234
(a) Steroidal 5,7-diene
r
rr
re
e
nm
Parent diene system 214Increment for homoannular diene 394 ring-residue C–C bonds (r) 20Exocyclic character (e) of both double bonds 10Total 283Found (in ether) 280
(b) Steroidal 3,5,7-triene
r
rr
r e
e
nm
Parent diene system 214Increment for extra conjugated C=C 30Increment for homoannular diene 394 ring-residue C–C bonds (r) 20Exocyclic character (e) of two double bonds 10Total 313Found 316
heteroannular diene homoannular dienediene
aa
a
a r
r
r r
r
r
Fig. 2.4 Structures of different types of dienes; a = alkyl substituent, r = ring residue
36 A. Kasal et al.
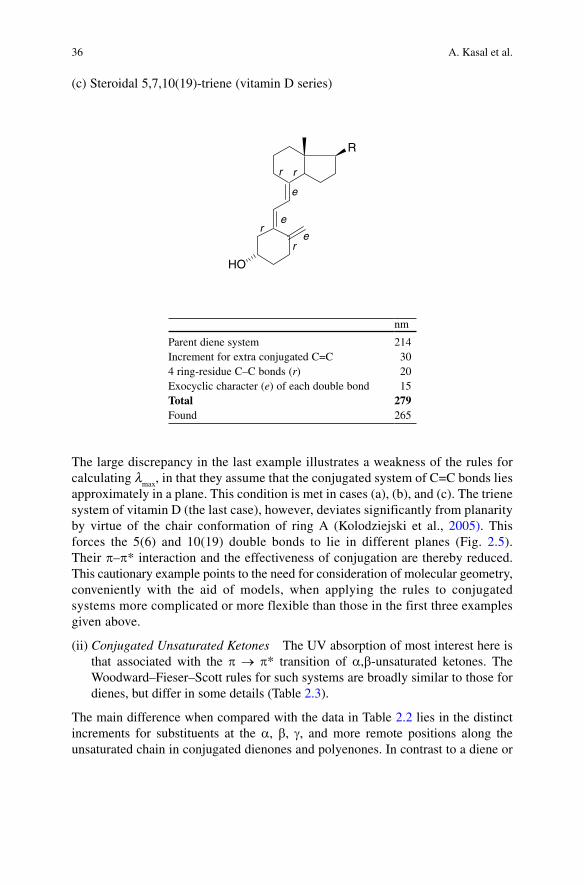
(c) Steroidal 5,7,10(19)-triene (vitamin D series)
HO
R
r r
r
r
e
e
e
nm
Parent diene system 214Increment for extra conjugated C=C 304 ring-residue C–C bonds (r) 20Exocyclic character (e) of each double bond 15Total 279Found 265
The large discrepancy in the last example illustrates a weakness of the rules for calculating l
max, in that they assume that the conjugated system of C=C bonds lies
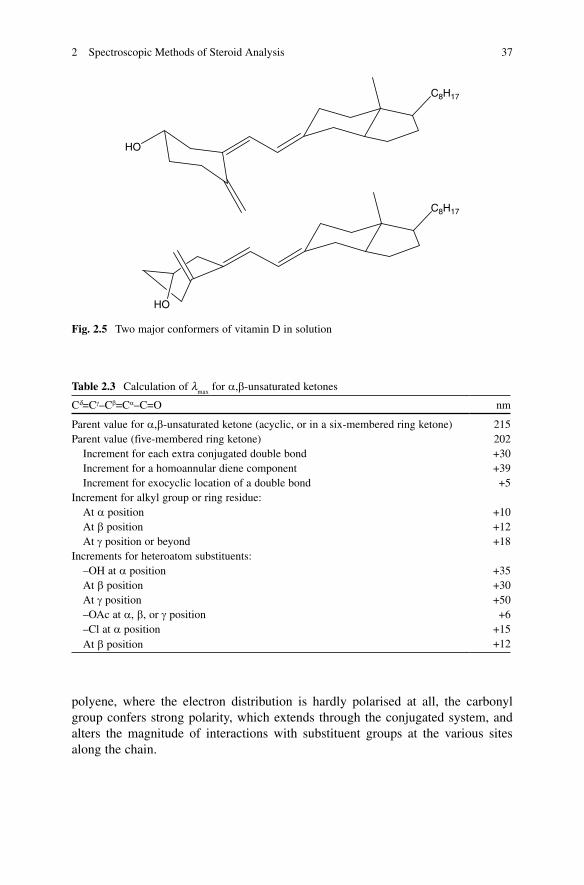
approximately in a plane. This condition is met in cases (a), (b), and (c). The triene system of vitamin D (the last case), however, deviates significantly from planarity by virtue of the chair conformation of ring A (Kolodziejski et al., 2005). This forces the 5(6) and 10(19) double bonds to lie in different planes (Fig. 2.5). Their p–p* interaction and the effectiveness of conjugation are thereby reduced. This cautionary example points to the need for consideration of molecular geometry, conveniently with the aid of models, when applying the rules to conjugated systems more complicated or more flexible than those in the first three examples given above.
(ii) Conjugated Unsaturated Ketones The UV absorption of most interest here is that associated with the p ® p* transition of a,b-unsaturated ketones. The Woodward–Fieser–Scott rules for such systems are broadly similar to those for dienes, but differ in some details (Table 2.3).
The main difference when compared with the data in Table 2.2 lies in the distinct increments for substituents at the a, b, g, and more remote positions along the unsaturated chain in conjugated dienones and polyenones. In contrast to a diene or
372 Spectroscopic Methods of Steroid Analysis
polyene, where the electron distribution is hardly polarised at all, the carbonyl group confers strong polarity, which extends through the conjugated system, and alters the magnitude of interactions with substituent groups at the various sites along the chain.
Table 2.3 Calculation of lmax
for a,b-unsaturated ketones
Cd=Cg–Cb=Ca–C=O nm
Parent value for a,b-unsaturated ketone (acyclic, or in a six-membered ring ketone) 215Parent value (five-membered ring ketone) 202 Increment for each extra conjugated double bond +30 Increment for a homoannular diene component +39 Increment for exocyclic location of a double bond +5Increment for alkyl group or ring residue: At a position +10 At b position +12 At g position or beyond +18Increments for heteroatom substituents: –OH at a position +35 At b position +30 At g position +50 –OAc at a, b, or g position +6 –Cl at a position +15 At b position +12
HO
C8H17
C8H17
HO
Fig. 2.5 Two major conformers of vitamin D in solution
38 A. Kasal et al.
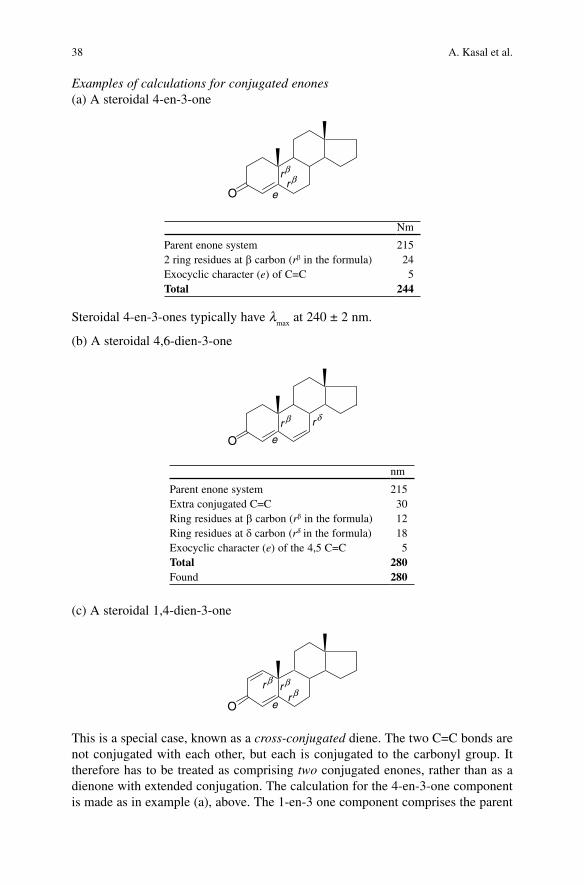
Examples of calculations for conjugated enones(a) A steroidal 4-en-3-one
O e
rβr β
Nm
Parent enone system 2152 ring residues at b carbon (rb in the formula) 24Exocyclic character (e) of C=C 5Total 244
Steroidal 4-en-3-ones typically have lmax
at 240 ± 2 nm.
(b) A steroidal 4,6-dien-3-one
O
r β
e
rδ
nm
Parent enone system 215Extra conjugated C=C 30Ring residues at b carbon (rb in the formula) 12Ring residues at d carbon (rd in the formula) 18Exocyclic character (e) of the 4,5 C=C 5Total 280Found 280
(c) A steroidal 1,4-dien-3-one
Or β
e
r βr β
This is a special case, known as a cross-conjugated diene. The two C=C bonds are not conjugated with each other, but each is conjugated to the carbonyl group. It therefore has to be treated as comprising two conjugated enones, rather than as a dienone with extended conjugation. The calculation for the 4-en-3-one component is made as in example (a), above. The 1-en-3 one component comprises the parent
392 Spectroscopic Methods of Steroid Analysis
enone (215 nm) with a single ring residue at the b position (rb; +12 nm), giving a total of 227 nm. The spectrum (l
max 244 nm) is essentially that of the 4-en-3-one
component but often shows a broadening on the low-wavelength side indicative of an underlying and somewhat weaker band, attributable to the 1-en-3-one moiety.
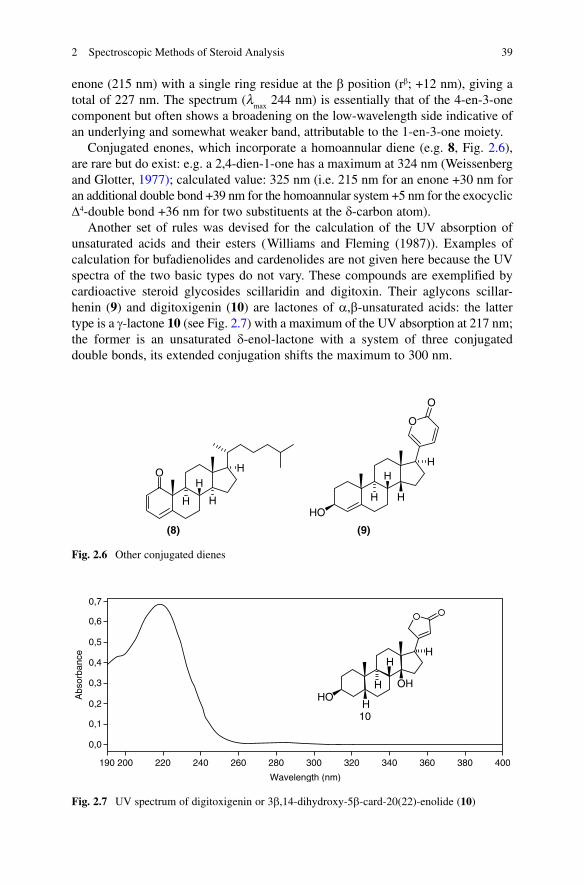
Conjugated enones, which incorporate a homoannular diene (e.g. 8, Fig. 2.6), are rare but do exist: e.g. a 2,4-dien-1-one has a maximum at 324 nm (Weissenberg and Glotter, 1977); calculated value: 325 nm (i.e. 215 nm for an enone +30 nm for an additional double bond +39 nm for the homoannular system +5 nm for the exocyclic D4-double bond +36 nm for two substituents at the d-carbon atom).
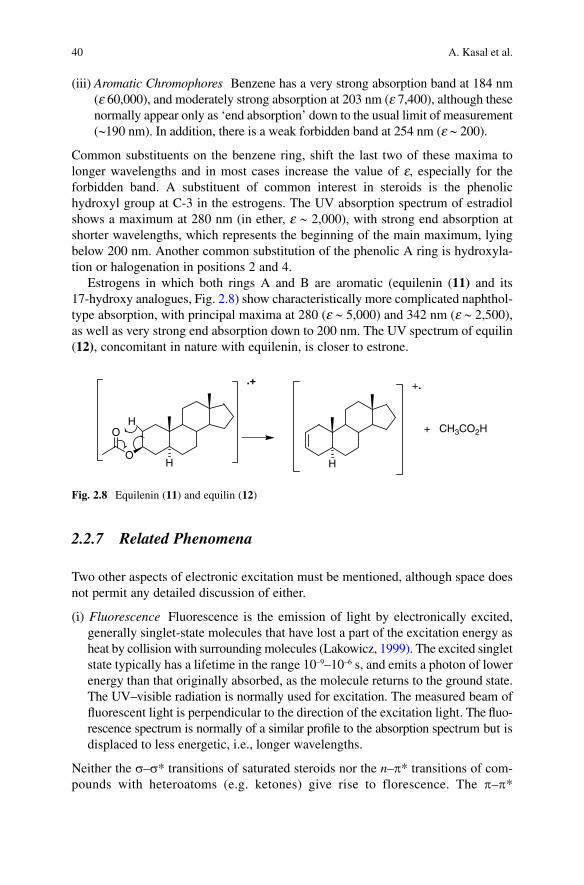
Another set of rules was devised for the calculation of the UV absorption of unsaturated acids and their esters (Williams and Fleming (1987)). Examples of calculation for bufadienolides and cardenolides are not given here because the UV spectra of the two basic types do not vary. These compounds are exemplified by cardioactive steroid glycosides scillaridin and digitoxin. Their aglycons scillar-henin (9) and digitoxigenin (10) are lactones of a,b-unsaturated acids: the latter type is a g-lactone 10 (see Fig. 2.7) with a maximum of the UV absorption at 217 nm; the former is an unsaturated d-enol-lactone with a system of three conjugated double bonds, its extended conjugation shifts the maximum to 300 nm.
Abs
orba
nce
0,7
0,6
0,5
0,4
0,3
0,2
0,1
0,0
H
H
H10
HOOH
H
200 220 240 260 280 300 320 340 360 380 400190
Wavelength (nm)
Fig. 2.7 UV spectrum of digitoxigenin or 3b,14-dihydroxy-5b-card-20(22)-enolide (10)
(8) (9)
O
H H
HH
HOH
O
O
H
H
H
Fig. 2.6 Other conjugated dienes
40 A. Kasal et al.
(iii) Aromatic Chromophores Benzene has a very strong absorption band at 184 nm (e 60,000), and moderately strong absorption at 203 nm (e 7,400), although these normally appear only as ‘end absorption’ down to the usual limit of measurement (~190 nm). In addition, there is a weak forbidden band at 254 nm (e ~ 200).
Common substituents on the benzene ring, shift the last two of these maxima to longer wavelengths and in most cases increase the value of e, especially for the forbidden band. A substituent of common interest in steroids is the phenolic hydroxyl group at C-3 in the estrogens. The UV absorption spectrum of estradiol shows a maximum at 280 nm (in ether, e ~ 2,000), with strong end absorption at shorter wavelengths, which represents the beginning of the main maximum, lying below 200 nm. Another common substitution of the phenolic A ring is hydroxyla-tion or halogenation in positions 2 and 4.
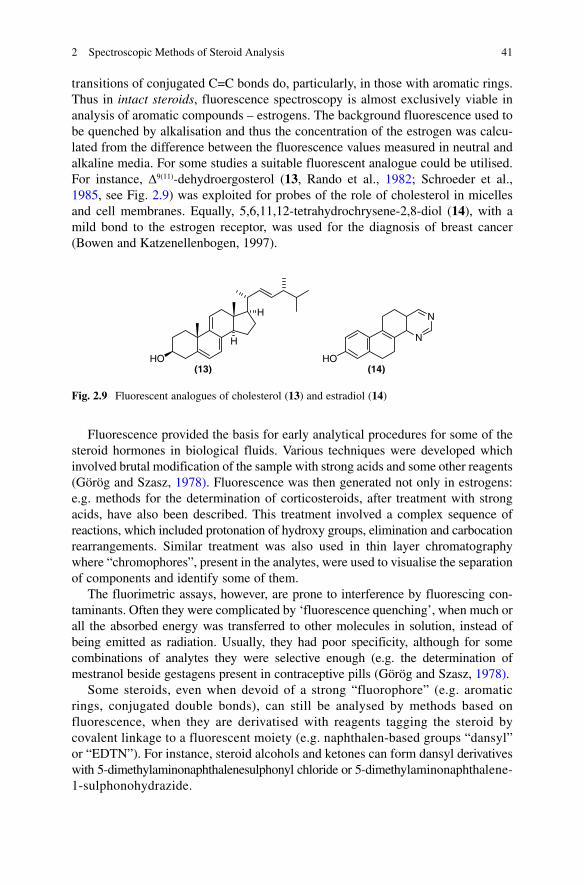
Estrogens in which both rings A and B are aromatic (equilenin (11) and its 17-hydroxy analogues, Fig. 2.8) show characteristically more complicated naphthol-type absorption, with principal maxima at 280 (e ~ 5,000) and 342 nm (e ~ 2,500), as well as very strong end absorption down to 200 nm. The UV spectrum of equilin (12), concomitant in nature with equilenin, is closer to estrone.
2.2.7 Related Phenomena
Two other aspects of electronic excitation must be mentioned, although space does not permit any detailed discussion of either.
(i) Fluorescence Fluorescence is the emission of light by electronically excited, generally singlet-state molecules that have lost a part of the excitation energy as heat by collision with surrounding molecules (Lakowicz, 1999). The excited singlet state typically has a lifetime in the range 10–9–10–6 s, and emits a photon of lower energy than that originally absorbed, as the molecule returns to the ground state. The UV–visible radiation is normally used for excitation. The measured beam of fluorescent light is perpendicular to the direction of the excitation light. The fluo-rescence spectrum is normally of a similar profile to the absorption spectrum but is displaced to less energetic, i.e., longer wavelengths.
Neither the s–s* transitions of saturated steroids nor the n–p* transitions of com-pounds with heteroatoms (e.g. ketones) give rise to florescence. The p–p*
Fig. 2.8 Equilenin (11) and equilin (12)
H H
O
O
H
.+ +.
+ CH3CO2H
412 Spectroscopic Methods of Steroid Analysis
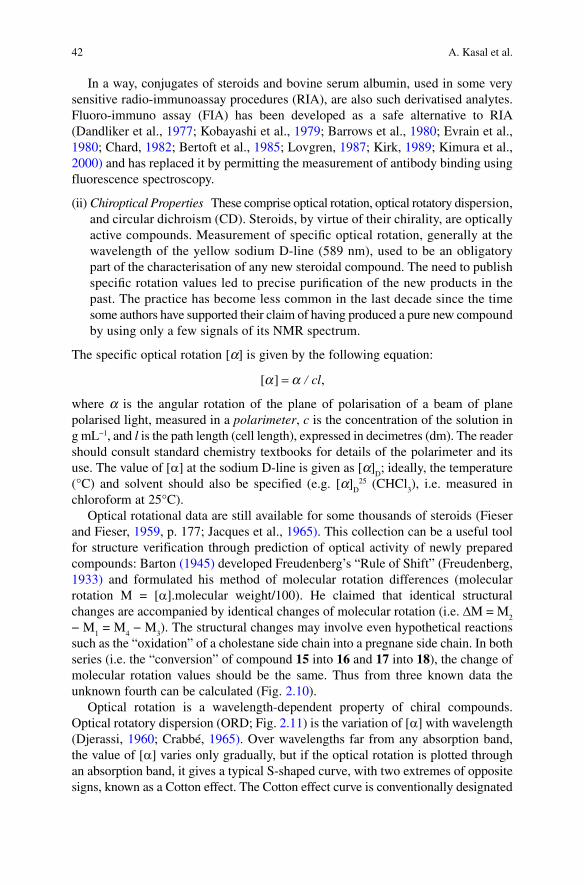
transitions of conjugated C=C bonds do, particularly, in those with aromatic rings. Thus in intact steroids, fluorescence spectroscopy is almost exclusively viable in analysis of aromatic compounds – estrogens. The background fluorescence used to be quenched by alkalisation and thus the concentration of the estrogen was calcu-lated from the difference between the fluorescence values measured in neutral and alkaline media. For some studies a suitable fluorescent analogue could be utilised. For instance, D9(11)-dehydroergosterol (13, Rando et al., 1982; Schroeder et al., 1985, see Fig. 2.9) was exploited for probes of the role of cholesterol in micelles and cell membranes. Equally, 5,6,11,12-tetrahydrochrysene-2,8-diol (14), with a mild bond to the estrogen receptor, was used for the diagnosis of breast cancer (Bowen and Katzenellenbogen, 1997).
Fluorescence provided the basis for early analytical procedures for some of the steroid hormones in biological fluids. Various techniques were developed which involved brutal modification of the sample with strong acids and some other reagents (Görög and Szasz, 1978). Fluorescence was then generated not only in estrogens: e.g. methods for the determination of corticosteroids, after treatment with strong acids, have also been described. This treatment involved a complex sequence of reactions, which included protonation of hydroxy groups, elimination and carbocation rearrangements. Similar treatment was also used in thin layer chromatography where “chromophores”, present in the analytes, were used to visualise the separation of components and identify some of them.
The fluorimetric assays, however, are prone to interference by fluorescing con-taminants. Often they were complicated by ‘fluorescence quenching’, when much or all the absorbed energy was transferred to other molecules in solution, instead of being emitted as radiation. Usually, they had poor specificity, although for some combinations of analytes they were selective enough (e.g. the determination of mestranol beside gestagens present in contraceptive pills (Görög and Szasz, 1978).
Some steroids, even when devoid of a strong “fluorophore” (e.g. aromatic rings, conjugated double bonds), can still be analysed by methods based on fluorescence, when they are derivatised with reagents tagging the steroid by covalent linkage to a fluorescent moiety (e.g. naphthalen-based groups “dansyl” or “EDTN”). For instance, steroid alcohols and ketones can form dansyl derivatives with 5-dimethylaminonaphthalenesulphonyl chloride or 5-dimethylaminonaphthalene-1-sulphonohydrazide.
N
N
HO(13) (14)
HO
H
H
Fig. 2.9 Fluorescent analogues of cholesterol (13) and estradiol (14)
42 A. Kasal et al.
In a way, conjugates of steroids and bovine serum albumin, used in some very sensitive radio-immunoassay procedures (RIA), are also such derivatised analytes. Fluoro-immuno assay (FIA) has been developed as a safe alternative to RIA (Dandliker et al., 1977; Kobayashi et al., 1979; Barrows et al., 1980; Evrain et al., 1980; Chard, 1982; Bertoft et al., 1985; Lovgren, 1987; Kirk, 1989; Kimura et al., 2000) and has replaced it by permitting the measurement of antibody binding using fluorescence spectroscopy.
(ii) Chiroptical Properties These comprise optical rotation, optical rotatory dispersion, and circular dichroism (CD). Steroids, by virtue of their chirality, are optically active compounds. Measurement of specific optical rotation, generally at the wavelength of the yellow sodium D-line (589 nm), used to be an obligatory part of the characterisation of any new steroidal compound. The need to publish specific rotation values led to precise purification of the new products in the past. The practice has become less common in the last decade since the time some authors have supported their claim of having produced a pure new compound by using only a few signals of its NMR spectrum.
The specific optical rotation [a] is given by the following equation:
[ ] ,cla a /=
where a is the angular rotation of the plane of polarisation of a beam of plane polarised light, measured in a polarimeter, c is the concentration of the solution in g mL−1, and l is the path length (cell length), expressed in decimetres (dm). The reader should consult standard chemistry textbooks for details of the polarimeter and its use. The value of [a] at the sodium D-line is given as [a]
D; ideally, the temperature
(°C) and solvent should also be specified (e.g. [a]D
25 (CHCl3), i.e. measured in
chloroform at 25°C).Optical rotational data are still available for some thousands of steroids (Fieser
and Fieser, 1959, p. 177; Jacques et al., 1965). This collection can be a useful tool for structure verification through prediction of optical activity of newly prepared compounds: Barton (1945) developed Freudenberg’s “Rule of Shift” (Freudenberg, 1933) and formulated his method of molecular rotation differences (molecular rotation M = [a].molecular weight/100). He claimed that identical structural changes are accompanied by identical changes of molecular rotation (i.e. DM = M
2
− M1 = M
4 − M
3). The structural changes may involve even hypothetical reactions
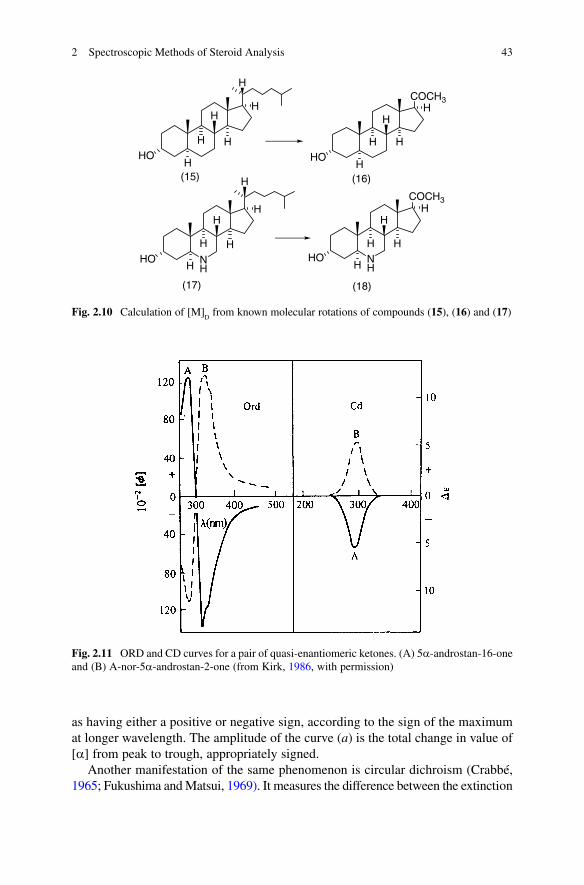
such as the “oxidation” of a cholestane side chain into a pregnane side chain. In both series (i.e. the “conversion” of compound 15 into 16 and 17 into 18), the change of molecular rotation values should be the same. Thus from three known data the unknown fourth can be calculated (Fig. 2.10).
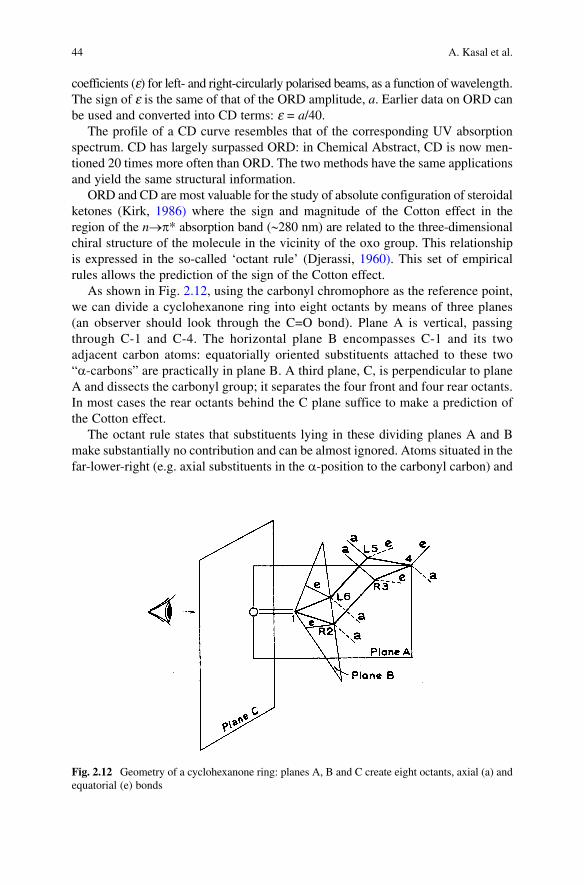
Optical rotation is a wavelength-dependent property of chiral compounds. Optical rotatory dispersion (ORD; Fig. 2.11) is the variation of [a] with wavelength (Djerassi, 1960; Crabbé, 1965). Over wavelengths far from any absorption band, the value of [a] varies only gradually, but if the optical rotation is plotted through an absorption band, it gives a typical S-shaped curve, with two extremes of opposite signs, known as a Cotton effect. The Cotton effect curve is conventionally designated
432 Spectroscopic Methods of Steroid Analysis
H H
H
HHO
H
NH
H H
H
HHO
H
NH
H H
H
HHO
H
H H
H
HHO
H
COCH3
COCH3
(15) (16)
(17) (18)
H
H
Fig. 2.10 Calculation of [M]D from known molecular rotations of compounds (15), (16) and (17)
Fig. 2.11 ORD and CD curves for a pair of quasi-enantiomeric ketones. (A) 5a-androstan-16-one and (B) A-nor-5a-androstan-2-one (from Kirk, 1986, with permission)
as having either a positive or negative sign, according to the sign of the maximum at longer wavelength. The amplitude of the curve (a) is the total change in value of [a] from peak to trough, appropriately signed.
Another manifestation of the same phenomenon is circular dichroism (Crabbé, 1965; Fukushima and Matsui, 1969). It measures the difference between the extinction
44 A. Kasal et al.
coefficients (e) for left- and right-circularly polarised beams, as a function of wavelength. The sign of e is the same of that of the ORD amplitude, a. Earlier data on ORD can be used and converted into CD terms: e = a/40.
The profile of a CD curve resembles that of the corresponding UV absorption spectrum. CD has largely surpassed ORD: in Chemical Abstract, CD is now men-tioned 20 times more often than ORD. The two methods have the same applications and yield the same structural information.
ORD and CD are most valuable for the study of absolute configuration of steroidal ketones (Kirk, 1986) where the sign and magnitude of the Cotton effect in the region of the n®p* absorption band (~280 nm) are related to the three-dimensional chiral structure of the molecule in the vicinity of the oxo group. This relationship is expressed in the so-called ‘octant rule’ (Djerassi, 1960). This set of empirical rules allows the prediction of the sign of the Cotton effect.
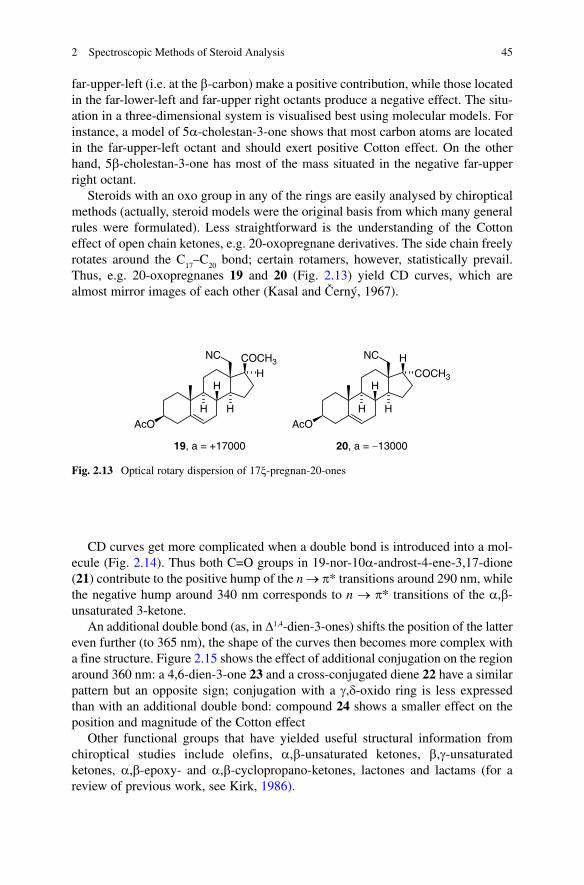
As shown in Fig. 2.12, using the carbonyl chromophore as the reference point, we can divide a cyclohexanone ring into eight octants by means of three planes (an observer should look through the C=O bond). Plane A is vertical, passing through C-1 and C-4. The horizontal plane B encompasses C-1 and its two adjacent carbon atoms: equatorially oriented substituents attached to these two “a-carbons” are practically in plane B. A third plane, C, is perpendicular to plane A and dissects the carbonyl group; it separates the four front and four rear octants. In most cases the rear octants behind the C plane suffice to make a prediction of the Cotton effect.
The octant rule states that substituents lying in these dividing planes A and B make substantially no contribution and can be almost ignored. Atoms situated in the far-lower-right (e.g. axial substituents in the a-position to the carbonyl carbon) and
Fig. 2.12 Geometry of a cyclohexanone ring: planes A, B and C create eight octants, axial (a) and equatorial (e) bonds
452 Spectroscopic Methods of Steroid Analysis
far-upper-left (i.e. at the b-carbon) make a positive contribution, while those located in the far-lower-left and far-upper right octants produce a negative effect. The situ-ation in a three-dimensional system is visualised best using molecular models. For instance, a model of 5a-cholestan-3-one shows that most carbon atoms are located in the far-upper-left octant and should exert positive Cotton effect. On the other hand, 5b-cholestan-3-one has most of the mass situated in the negative far-upper right octant.
Steroids with an oxo group in any of the rings are easily analysed by chiroptical methods (actually, steroid models were the original basis from which many general rules were formulated). Less straightforward is the understanding of the Cotton effect of open chain ketones, e.g. 20-oxopregnane derivatives. The side chain freely rotates around the C
17–C
20 bond; certain rotamers, however, statistically prevail.
Thus, e.g. 20-oxopregnanes 19 and 20 (Fig. 2.13) yield CD curves, which are almost mirror images of each other (Kasal and Černý, 1967).
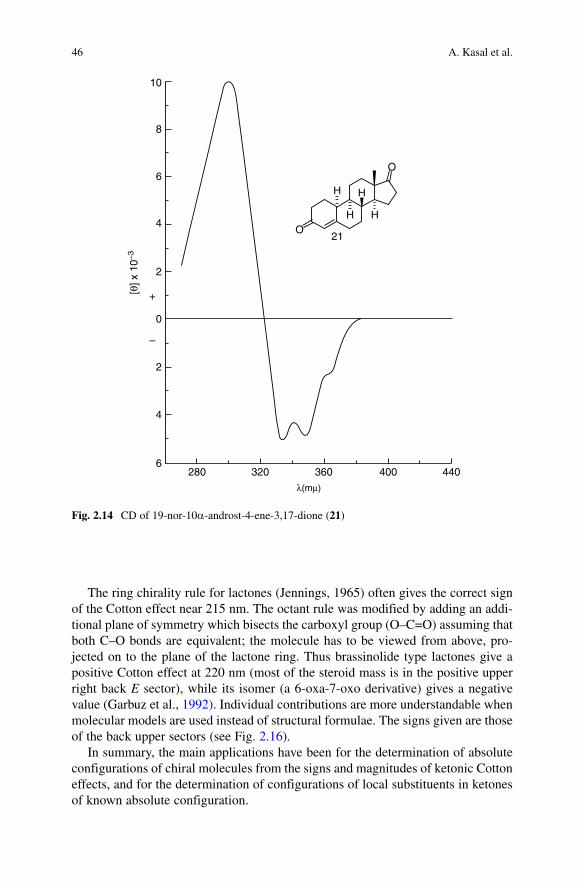
CD curves get more complicated when a double bond is introduced into a mol-ecule (Fig. 2.14). Thus both C=O groups in 19-nor-10a-androst-4-ene-3,17-dione (21) contribute to the positive hump of the n ® p* transitions around 290 nm, while the negative hump around 340 nm corresponds to n ® p* transitions of the a,b-unsaturated 3-ketone.
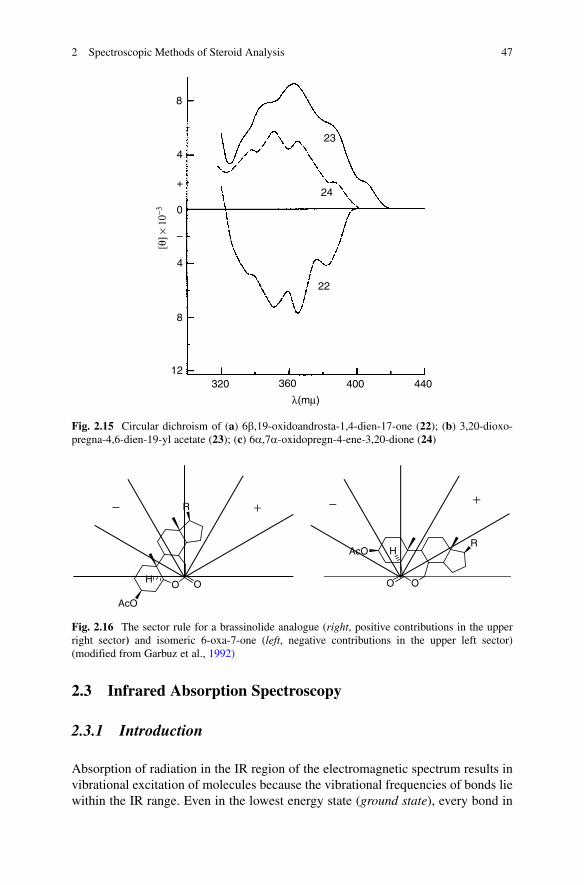
An additional double bond (as, in D1,4-dien-3-ones) shifts the position of the latter even further (to 365 nm), the shape of the curves then becomes more complex with a fine structure. Figure 2.15 shows the effect of additional conjugation on the region around 360 nm: a 4,6-dien-3-one 23 and a cross-conjugated diene 22 have a similar pattern but an opposite sign; conjugation with a g,d-oxido ring is less expressed than with an additional double bond: compound 24 shows a smaller effect on the position and magnitude of the Cotton effect
Other functional groups that have yielded useful structural information from chiroptical studies include olefins, a,b-unsaturated ketones, b,g-unsaturated ketones, a,b-epoxy- and a,b-cyclopropano-ketones, lactones and lactams (for a review of previous work, see Kirk, 1986).
COCH3
H
NC
H
H HAcOAcO
HCOCH3
NC
H
H H
19, a = +17000 20, a = −13000
Fig. 2.13 Optical rotary dispersion of 17x-pregnan-20-ones
46 A. Kasal et al.
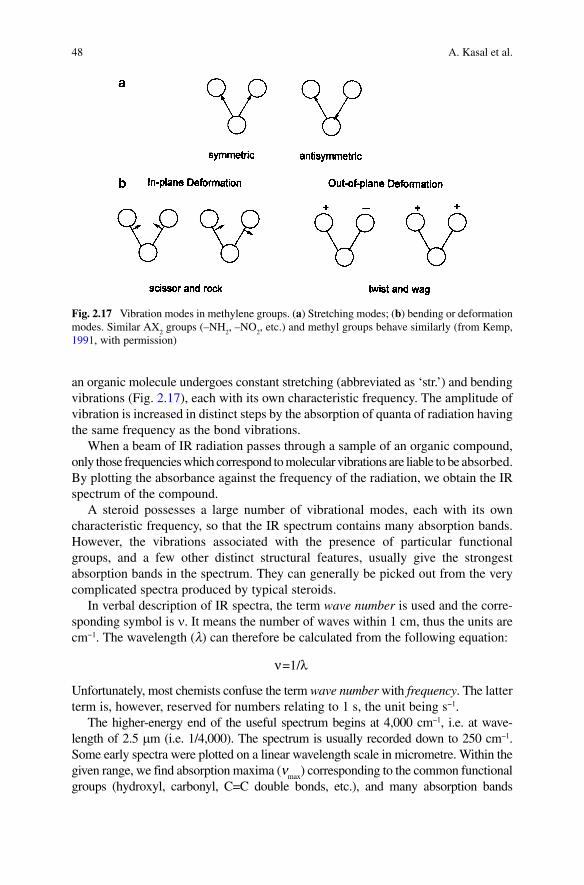
The ring chirality rule for lactones (Jennings, 1965) often gives the correct sign of the Cotton effect near 215 nm. The octant rule was modified by adding an addi-tional plane of symmetry which bisects the carboxyl group (O–C=O) assuming that both C–O bonds are equivalent; the molecule has to be viewed from above, pro-jected on to the plane of the lactone ring. Thus brassinolide type lactones give a positive Cotton effect at 220 nm (most of the steroid mass is in the positive upper right back E sector), while its isomer (a 6-oxa-7-oxo derivative) gives a negative value (Garbuz et al., 1992). Individual contributions are more understandable when molecular models are used instead of structural formulae. The signs given are those of the back upper sectors (see Fig. 2.16).
In summary, the main applications have been for the determination of absolute configurations of chiral molecules from the signs and magnitudes of ketonic Cotton effects, and for the determination of configurations of local substituents in ketones of known absolute configuration.
10
8
6
6
4
4
2
2
0
280 320 360 400 440
+
–
[θ] x
10–3
λ(mµ)
O
O
21
H
H
H
H
Fig. 2.14 CD of 19-nor-10a-androst-4-ene-3,17-dione (21)
472 Spectroscopic Methods of Steroid Analysis
8
4
+
–
0
4
[θ] ×
10−3
8
12
22
24
23
320 360 400 440
λ(mµ)
Fig. 2.15 Circular dichroism of (a) 6b,19-oxidoandrosta-1,4-dien-17-one (22); (b) 3,20-dioxo-pregna-4,6-dien-19-yl acetate (23); (c) 6a,7a-oxidopregn-4-ene-3,20-dione (24)
O
R
AcO
H
RAcO H
OO O
+−+−
Fig. 2.16 The sector rule for a brassinolide analogue (right, positive contributions in the upper right sector) and isomeric 6-oxa-7-one (left, negative contributions in the upper left sector) (modified from Garbuz et al., 1992)
2.3 Infrared Absorption Spectroscopy
2.3.1 Introduction
Absorption of radiation in the IR region of the electromagnetic spectrum results in vibrational excitation of molecules because the vibrational frequencies of bonds lie within the IR range. Even in the lowest energy state (ground state), every bond in
48 A. Kasal et al.
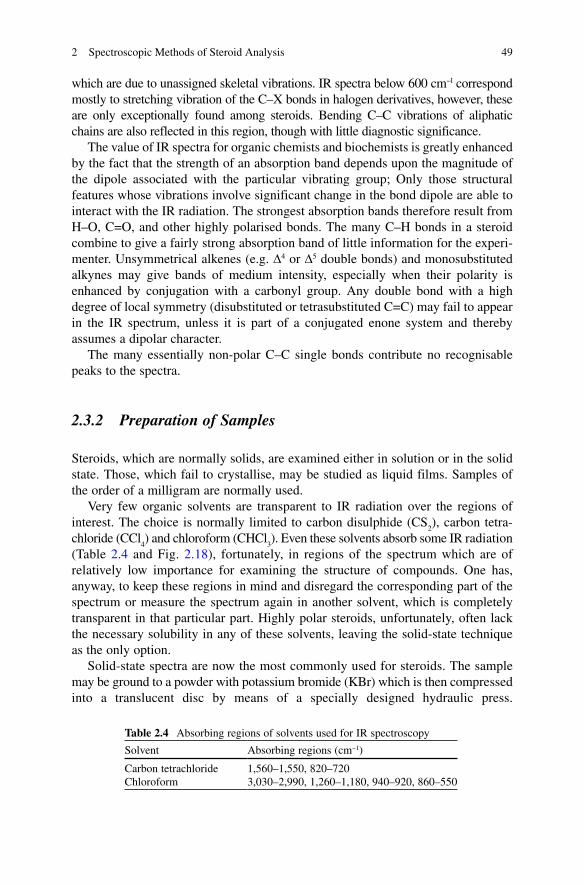
an organic molecule undergoes constant stretching (abbreviated as ‘str.’) and bending vibrations (Fig. 2.17), each with its own characteristic frequency. The amplitude of vibration is increased in distinct steps by the absorption of quanta of radiation having the same frequency as the bond vibrations.
When a beam of IR radiation passes through a sample of an organic compound, only those frequencies which correspond to molecular vibrations are liable to be absorbed. By plotting the absorbance against the frequency of the radiation, we obtain the IR spectrum of the compound.
A steroid possesses a large number of vibrational modes, each with its own characteristic frequency, so that the IR spectrum contains many absorption bands. However, the vibrations associated with the presence of particular functional groups, and a few other distinct structural features, usually give the strongest absorption bands in the spectrum. They can generally be picked out from the very complicated spectra produced by typical steroids.
In verbal description of IR spectra, the term wave number is used and the corre-sponding symbol is n. It means the number of waves within 1 cm, thus the units are cm−1. The wavelength (l) can therefore be calculated from the following equation:
ν λ=1/
Unfortunately, most chemists confuse the term wave number with frequency. The latter term is, however, reserved for numbers relating to 1 s, the unit being s−1.
The higher-energy end of the useful spectrum begins at 4,000 cm−1, i.e. at wave-length of 2.5 mm (i.e. 1/4,000). The spectrum is usually recorded down to 250 cm−1. Some early spectra were plotted on a linear wavelength scale in micrometre. Within the given range, we find absorption maxima (n
max) corresponding to the common functional
groups (hydroxyl, carbonyl, C=C double bonds, etc.), and many absorption bands
Fig. 2.17 Vibration modes in methylene groups. (a) Stretching modes; (b) bending or deformation modes. Similar AX
2 groups (–NH
2, –NO
2, etc.) and methyl groups behave similarly (from Kemp,
1991, with permission)
492 Spectroscopic Methods of Steroid Analysis
which are due to unassigned skeletal vibrations. IR spectra below 600 cm−l correspond mostly to stretching vibration of the C–X bonds in halogen derivatives, however, these are only exceptionally found among steroids. Bending C–C vibrations of aliphatic chains are also reflected in this region, though with little diagnostic significance.
The value of IR spectra for organic chemists and biochemists is greatly enhanced by the fact that the strength of an absorption band depends upon the magnitude of the dipole associated with the particular vibrating group; Only those structural features whose vibrations involve significant change in the bond dipole are able to interact with the IR radiation. The strongest absorption bands therefore result from H–O, C=O, and other highly polarised bonds. The many C–H bonds in a steroid combine to give a fairly strong absorption band of little information for the experi-menter. Unsymmetrical alkenes (e.g. D4 or D5 double bonds) and monosubstituted alkynes may give bands of medium intensity, especially when their polarity is enhanced by conjugation with a carbonyl group. Any double bond with a high degree of local symmetry (disubstituted or tetrasubstituted C=C) may fail to appear in the IR spectrum, unless it is part of a conjugated enone system and thereby assumes a dipolar character.
The many essentially non-polar C–C single bonds contribute no recognisable peaks to the spectra.
2.3.2 Preparation of Samples
Steroids, which are normally solids, are examined either in solution or in the solid state. Those, which fail to crystallise, may be studied as liquid films. Samples of the order of a milligram are normally used.
Very few organic solvents are transparent to IR radiation over the regions of interest. The choice is normally limited to carbon disulphide (CS
2), carbon tetra-
chloride (CCl4) and chloroform (CHCl
3). Even these solvents absorb some IR radiation
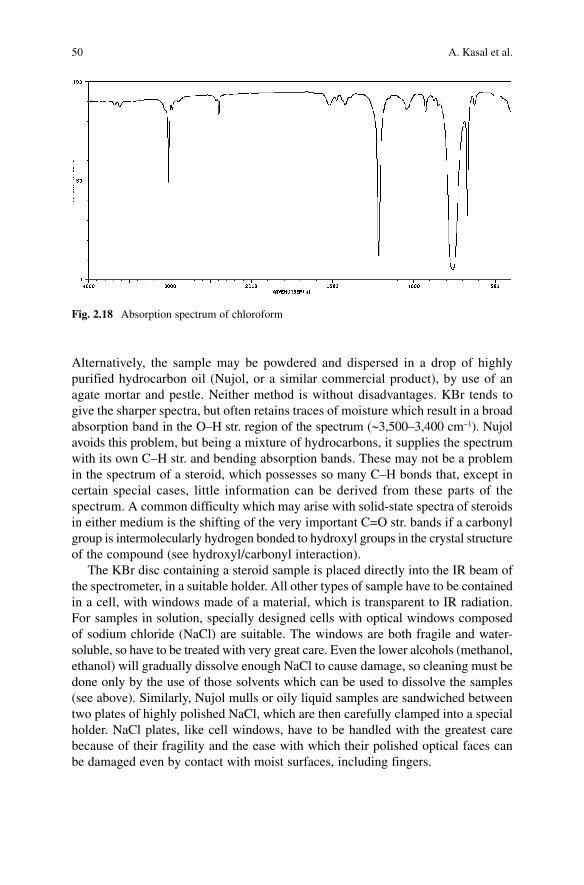
(Table 2.4 and Fig. 2.18), fortunately, in regions of the spectrum which are of relatively low importance for examining the structure of compounds. One has, anyway, to keep these regions in mind and disregard the corresponding part of the spectrum or measure the spectrum again in another solvent, which is completely transparent in that particular part. Highly polar steroids, unfortunately, often lack the necessary solubility in any of these solvents, leaving the solid-state technique as the only option.
Solid-state spectra are now the most commonly used for steroids. The sample may be ground to a powder with potassium bromide (KBr) which is then compressed into a translucent disc by means of a specially designed hydraulic press.
Table 2.4 Absorbing regions of solvents used for IR spectroscopy
Solvent Absorbing regions (cm−1)
Carbon tetrachloride 1,560–1,550, 820–720Chloroform 3,030–2,990, 1,260–1,180, 940–920, 860–550
50 A. Kasal et al.
Alternatively, the sample may be powdered and dispersed in a drop of highly purified hydrocarbon oil (Nujol, or a similar commercial product), by use of an agate mortar and pestle. Neither method is without disadvantages. KBr tends to give the sharper spectra, but often retains traces of moisture which result in a broad absorption band in the O–H str. region of the spectrum (~3,500–3,400 cm−1). Nujol avoids this problem, but being a mixture of hydrocarbons, it supplies the spectrum with its own C–H str. and bending absorption bands. These may not be a problem in the spectrum of a steroid, which possesses so many C–H bonds that, except in certain special cases, little information can be derived from these parts of the spectrum. A common difficulty which may arise with solid-state spectra of steroids in either medium is the shifting of the very important C=O str. bands if a carbonyl group is intermolecularly hydrogen bonded to hydroxyl groups in the crystal structure of the compound (see hydroxyl/carbonyl interaction).
The KBr disc containing a steroid sample is placed directly into the IR beam of the spectrometer, in a suitable holder. All other types of sample have to be contained in a cell, with windows made of a material, which is transparent to IR radiation. For samples in solution, specially designed cells with optical windows composed of sodium chloride (NaCl) are suitable. The windows are both fragile and water-soluble, so have to be treated with very great care. Even the lower alcohols (methanol, ethanol) will gradually dissolve enough NaCl to cause damage, so cleaning must be done only by the use of those solvents which can be used to dissolve the samples (see above). Similarly, Nujol mulls or oily liquid samples are sandwiched between two plates of highly polished NaCl, which are then carefully clamped into a special holder. NaCl plates, like cell windows, have to be handled with the greatest care because of their fragility and the ease with which their polished optical faces can be damaged even by contact with moist surfaces, including fingers.
Fig. 2.18 Absorption spectrum of chloroform
512 Spectroscopic Methods of Steroid Analysis
2.3.3 Instrumentation
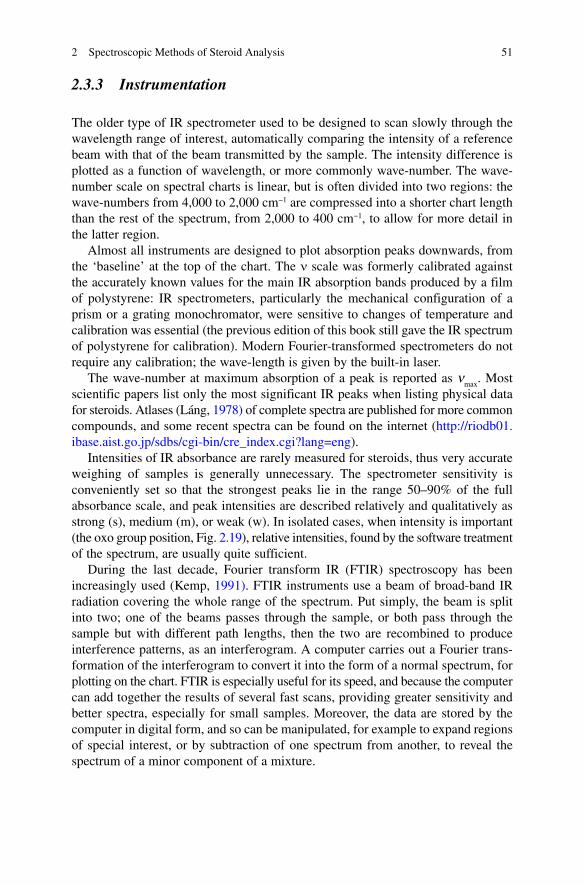
The older type of IR spectrometer used to be designed to scan slowly through the wavelength range of interest, automatically comparing the intensity of a reference beam with that of the beam transmitted by the sample. The intensity difference is plotted as a function of wavelength, or more commonly wave-number. The wave-number scale on spectral charts is linear, but is often divided into two regions: the wave-numbers from 4,000 to 2,000 cm−1 are compressed into a shorter chart length than the rest of the spectrum, from 2,000 to 400 cm−1, to allow for more detail in the latter region.
Almost all instruments are designed to plot absorption peaks downwards, from the ‘baseline’ at the top of the chart. The n scale was formerly calibrated against the accurately known values for the main IR absorption bands produced by a film of polystyrene: IR spectrometers, particularly the mechanical configuration of a prism or a grating monochromator, were sensitive to changes of temperature and calibration was essential (the previous edition of this book still gave the IR spectrum of polystyrene for calibration). Modern Fourier-transformed spectrometers do not require any calibration; the wave-length is given by the built-in laser.
The wave-number at maximum absorption of a peak is reported as nmax
. Most scientific papers list only the most significant IR peaks when listing physical data for steroids. Atlases (Láng, 1978) of complete spectra are published for more common compounds, and some recent spectra can be found on the internet (http://riodb01.ibase.aist.go.jp/sdbs/cgi-bin/cre_index.cgi?lang=eng).
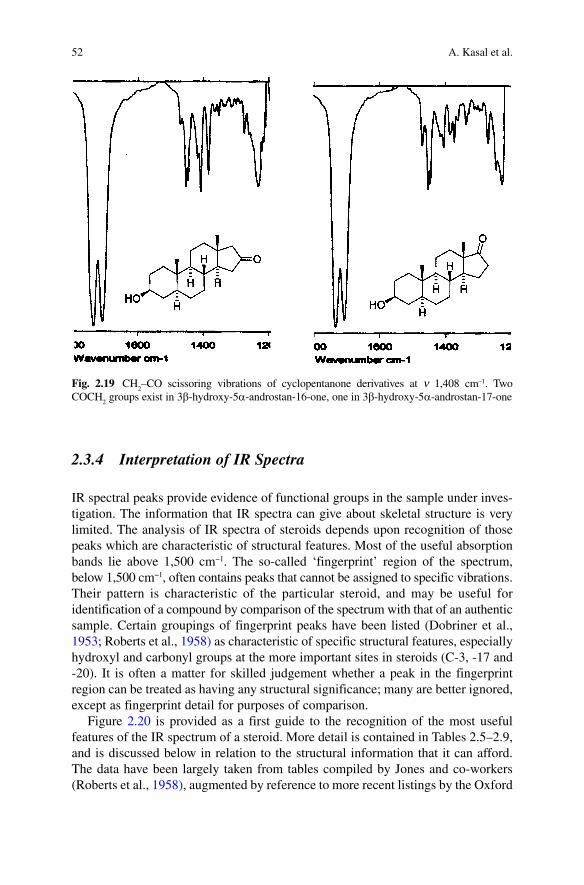
Intensities of IR absorbance are rarely measured for steroids, thus very accurate weighing of samples is generally unnecessary. The spectrometer sensitivity is conveniently set so that the strongest peaks lie in the range 50–90% of the full absorbance scale, and peak intensities are described relatively and qualitatively as strong (s), medium (m), or weak (w). In isolated cases, when intensity is important (the oxo group position, Fig. 2.19), relative intensities, found by the software treatment of the spectrum, are usually quite sufficient.
During the last decade, Fourier transform IR (FTIR) spectroscopy has been increasingly used (Kemp, 1991). FTIR instruments use a beam of broad-band IR radiation covering the whole range of the spectrum. Put simply, the beam is split into two; one of the beams passes through the sample, or both pass through the sample but with different path lengths, then the two are recombined to produce interference patterns, as an interferogram. A computer carries out a Fourier trans-formation of the interferogram to convert it into the form of a normal spectrum, for plotting on the chart. FTIR is especially useful for its speed, and because the computer can add together the results of several fast scans, providing greater sensitivity and better spectra, especially for small samples. Moreover, the data are stored by the computer in digital form, and so can be manipulated, for example to expand regions of special interest, or by subtraction of one spectrum from another, to reveal the spectrum of a minor component of a mixture.
52 A. Kasal et al.
2.3.4 Interpretation of IR Spectra
IR spectral peaks provide evidence of functional groups in the sample under inves-tigation. The information that IR spectra can give about skeletal structure is very limited. The analysis of IR spectra of steroids depends upon recognition of those peaks which are characteristic of structural features. Most of the useful absorption bands lie above 1,500 cm−1. The so-called ‘fingerprint’ region of the spectrum, below 1,500 cm−1, often contains peaks that cannot be assigned to specific vibrations. Their pattern is characteristic of the particular steroid, and may be useful for identification of a compound by comparison of the spectrum with that of an authentic sample. Certain groupings of fingerprint peaks have been listed (Dobriner et al., 1953; Roberts et al., 1958) as characteristic of specific structural features, especially hydroxyl and carbonyl groups at the more important sites in steroids (C-3, -17 and -20). It is often a matter for skilled judgement whether a peak in the fingerprint region can be treated as having any structural significance; many are better ignored, except as fingerprint detail for purposes of comparison.
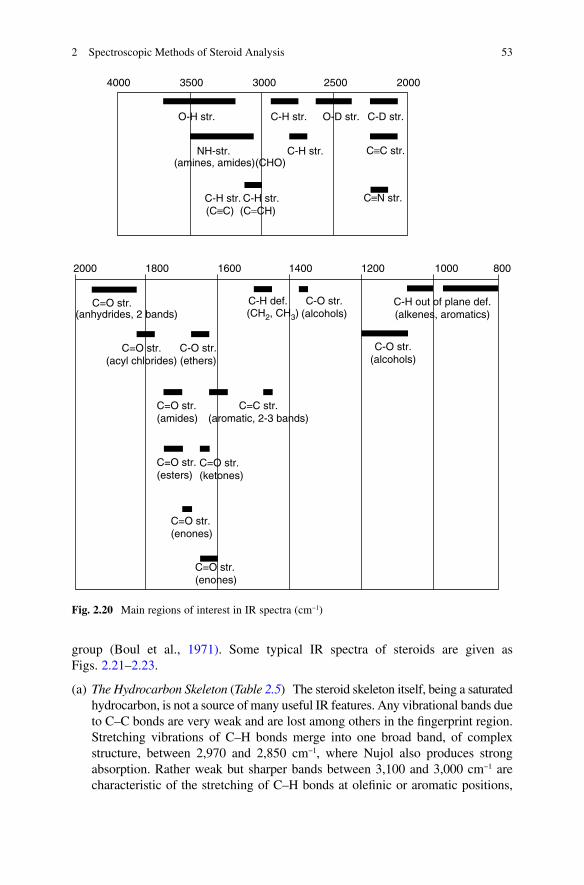
Figure 2.20 is provided as a first guide to the recognition of the most useful features of the IR spectrum of a steroid. More detail is contained in Tables 2.5–2.9, and is discussed below in relation to the structural information that it can afford. The data have been largely taken from tables compiled by Jones and co-workers (Roberts et al., 1958), augmented by reference to more recent listings by the Oxford
Fig. 2.19 CH2–CO scissoring vibrations of cyclopentanone derivatives at n 1,408 cm–1. Two
COCH2 groups exist in 3b-hydroxy-5a-androstan-16-one, one in 3b-hydroxy-5a-androstan-17-one
532 Spectroscopic Methods of Steroid Analysis
group (Boul et al., 1971). Some typical IR spectra of steroids are given as Figs. 2.21–2.23.
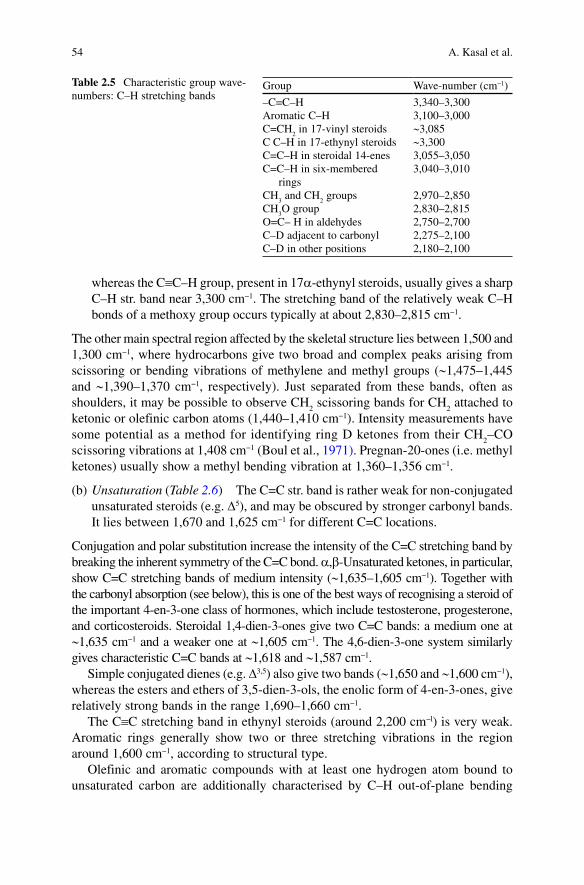
(a) The Hydrocarbon Skeleton (Table 2.5) The steroid skeleton itself, being a saturated hydrocarbon, is not a source of many useful IR features. Any vibrational bands due to C–C bonds are very weak and are lost among others in the fingerprint region. Stretching vibrations of C–H bonds merge into one broad band, of complex structure, between 2,970 and 2,850 cm−1, where Nujol also produces strong absorption. Rather weak but sharper bands between 3,100 and 3,000 cm−1 are characteristic of the stretching of C–H bonds at olefinic or aromatic positions,
4000
2000 1800 1600 1400 1200 1000 800
O-H str.
NH-str. C-H str.
C-H str. C-H str.
C≡C str.
(C≡C) (C=CH)
(CHO)(amines, amides)
C≡N str.
C-H str.
C=O str.
C=O str.(acyl chlorides)
C=O str.(amides)
C=O str.(esters)
C=O str.(ketones)
C=O str.(enones)
C=O str.(enones)
C=C str.(aromatic, 2-3 bands)
C-O str.(alcohols)
C-H out of plane def.(alkenes, aromatics)
C-H def. C-O str.(alcohols)(CH2, CH3)
C-O str.(ethers)
(anhydrides, 2 bands)
O-D str. C-D str.
3500 3000 2500 2000
Fig. 2.20 Main regions of interest in IR spectra (cm−1)
54 A. Kasal et al.
whereas the CºC–H group, present in 17a-ethynyl steroids, usually gives a sharp C–H str. band near 3,300 cm−1. The stretching band of the relatively weak C–H bonds of a methoxy group occurs typically at about 2,830–2,815 cm−1.
The other main spectral region affected by the skeletal structure lies between 1,500 and 1,300 cm−1, where hydrocarbons give two broad and complex peaks arising from scissoring or bending vibrations of methylene and methyl groups (~1,475–1,445 and ~1,390–1,370 cm−1, respectively). Just separated from these bands, often as shoulders, it may be possible to observe CH
2 scissoring bands for CH
2 attached to
ketonic or olefinic carbon atoms (1,440–1,410 cm−1). Intensity measurements have some potential as a method for identifying ring D ketones from their CH
2–CO
scissoring vibrations at 1,408 cm−1 (Boul et al., 1971). Pregnan-20-ones (i.e. methyl ketones) usually show a methyl bending vibration at 1,360–1,356 cm−1.
(b) Unsaturation (Table 2.6) The C=C str. band is rather weak for non-conjugated unsaturated steroids (e.g. D5), and may be obscured by stronger carbonyl bands. It lies between 1,670 and 1,625 cm−1 for different C=C locations.
Conjugation and polar substitution increase the intensity of the C=C stretching band by breaking the inherent symmetry of the C=C bond. a,b-Unsaturated ketones, in particular, show C=C stretching bands of medium intensity (~1,635–1,605 cm−1). Together with the carbonyl absorption (see below), this is one of the best ways of recognising a steroid of the important 4-en-3-one class of hormones, which include testosterone, progesterone, and corticosteroids. Steroidal 1,4-dien-3-ones give two C=C bands: a medium one at ~1,635 cm−1 and a weaker one at ~1,605 cm−1. The 4,6-dien-3-one system similarly gives characteristic C=C bands at ~1,618 and ~1,587 cm−1.
Simple conjugated dienes (e.g. D3,5) also give two bands (~1,650 and ~1,600 cm−1), whereas the esters and ethers of 3,5-dien-3-ols, the enolic form of 4-en-3-ones, give relatively strong bands in the range 1,690–1,660 cm−1.
The CºC stretching band in ethynyl steroids (around 2,200 cm−l) is very weak. Aromatic rings generally show two or three stretching vibrations in the region around 1,600 cm−1, according to structural type.
Olefinic and aromatic compounds with at least one hydrogen atom bound to unsaturated carbon are additionally characterised by C–H out-of-plane bending
Group Wave-number (cm−1)
–C=C–H 3,340–3,300Aromatic C–H 3,100–3,000C=CH
2 in 17-vinyl steroids ~3,085
C≡C–H in 17-ethynyl steroids ~3,300C=C–H in steroidal 14-enes 3,055–3,050C=C–H in six-membered
rings3,040–3,010
CH3 and CH
2 groups 2,970–2,850
CH3O group 2,830–2,815
O=C– H in aldehydes 2,750–2,700C–D adjacent to carbonyl 2,275–2,100C–D in other positions 2,180–2,100
Table 2.5 Characteristic group wave-numbers: C–H stretching bands
552 Spectroscopic Methods of Steroid Analysis
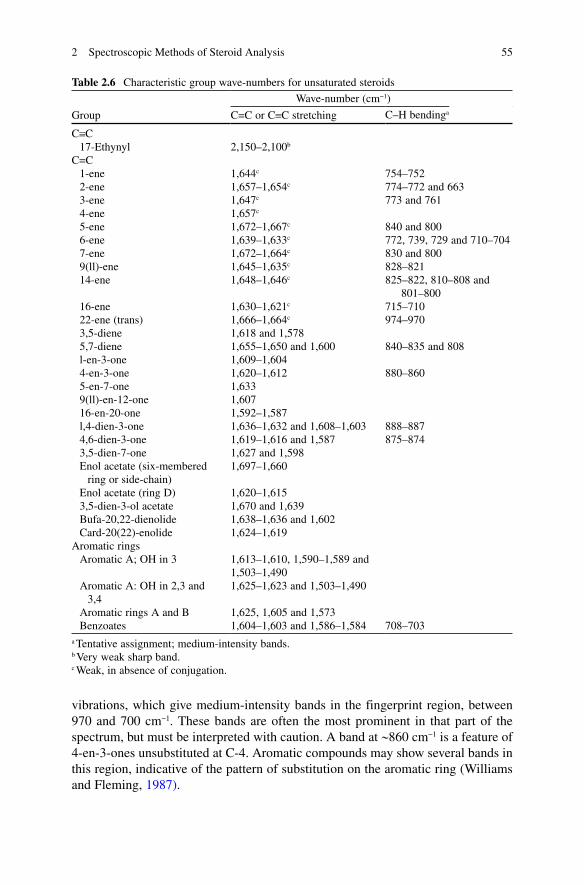
vibrations, which give medium-intensity bands in the fingerprint region, between 970 and 700 cm−1. These bands are often the most prominent in that part of the spectrum, but must be interpreted with caution. A band at ~860 cm−1 is a feature of 4-en-3-ones unsubstituted at C-4. Aromatic compounds may show several bands in this region, indicative of the pattern of substitution on the aromatic ring (Williams and Fleming, 1987).
Table 2.6 Characteristic group wave-numbers for unsaturated steroids
Group
Wave-number (cm−1)
C=C or CºC stretching C–H bendinga
CºC 17-Ethynyl 2,150–2,100b
C=C 1-ene 1,644c 754–752 2-ene 1,657–1,654c 774–772 and 663 3-ene 1,647c 773 and 761 4-ene 1,657c
5-ene 1,672–1,667c 840 and 800 6-ene 1,639–1,633c 772, 739, 729 and 710–704 7-ene 1,672–1,664c 830 and 800 9(ll)-ene 1,645–1,635c 828–821 14-ene 1,648–1,646c 825–822, 810–808 and
801–800 16-ene 1,630–1,621c 715–710 22-ene (trans) 1,666–1,664c 974–970 3,5-diene 1,618 and 1,578 5,7-diene 1,655–1,650 and 1,600 840–835 and 808 l-en-3-one 1,609–1,604 4-en-3-one 1,620–1,612 880–860 5-en-7-one 1,633 9(ll)-en-12-one 1,607 16-en-20-one 1,592–1,587 l,4-dien-3-one 1,636–1,632 and 1,608–1,603 888–887 4,6-dien-3-one 1,619–1,616 and 1,587 875–874 3,5-dien-7-one 1,627 and 1,598 Enol acetate (six-membered
ring or side-chain)1,697–1,660
Enol acetate (ring D) 1,620–1,615 3,5-dien-3-ol acetate 1,670 and 1,639 Bufa-20,22-dienolide 1,638–1,636 and 1,602 Card-20(22)-enolide 1,624–1,619Aromatic rings Aromatic A; OH in 3 1,613–1,610, 1,590–1,589 and
1,503–1,490 Aromatic A: OH in 2,3 and
3,41,625–1,623 and 1,503–1,490
Aromatic rings A and B 1,625, 1,605 and 1,573 Benzoates 1,604–1,603 and 1,586–1,584 708–703a Tentative assignment; medium-intensity bands.b Very weak sharp band.c Weak, in absence of conjugation.
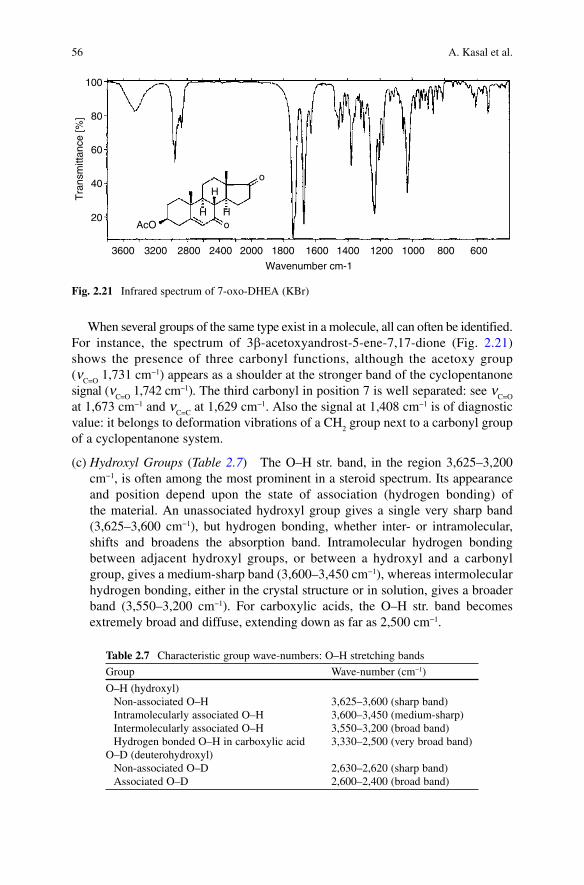
56 A. Kasal et al.
When several groups of the same type exist in a molecule, all can often be identified. For instance, the spectrum of 3b-acetoxyandrost-5-ene-7,17-dione (Fig. 2.21) shows the presence of three carbonyl functions, although the acetoxy group (n
C=O 1,731 cm−1) appears as a shoulder at the stronger band of the cyclopentanone
signal (nC=O
1,742 cm−1). The third carbonyl in position 7 is well separated: see nC=O
at 1,673 cm−1 and n
C=C at 1,629 cm−1. Also the signal at 1,408 cm−1 is of diagnostic
value: it belongs to deformation vibrations of a CH2 group next to a carbonyl group
of a cyclopentanone system.
(c) Hydroxyl Groups (Table 2.7) The O–H str. band, in the region 3,625–3,200 cm−1, is often among the most prominent in a steroid spectrum. Its appearance and position depend upon the state of association (hydrogen bonding) of the material. An unassociated hydroxyl group gives a single very sharp band (3,625–3,600 cm−1), but hydrogen bonding, whether inter- or intramolecular, shifts and broadens the absorption band. Intramolecular hydrogen bonding between adjacent hydroxyl groups, or between a hydroxyl and a carbonyl group, gives a medium-sharp band (3,600–3,450 cm−1), whereas intermolecular hydrogen bonding, either in the crystal structure or in solution, gives a broader band (3,550–3,200 cm−1). For carboxylic acids, the O–H str. band becomes extremely broad and diffuse, extending down as far as 2,500 cm−1.
3600
100
80
60
40
20
Tra
nsm
ittan
ce [%
]
3200 2800
o
o
HAcO
H
H
2400 2000 1800
Wavenumber cm-1
1600 1400 1200 1000 800 600
Fig. 2.21 Infrared spectrum of 7-oxo-DHEA (KBr)
Table 2.7 Characteristic group wave-numbers: O–H stretching bands
Group Wave-number (cm−1)
O–H (hydroxyl) Non-associated O–H 3,625–3,600 (sharp band) Intramolecularly associated O–H 3,600–3,450 (medium-sharp) Intermolecularly associated O–H 3,550–3,200 (broad band) Hydrogen bonded O–H in carboxylic acid 3,330–2,500 (very broad band)O–D (deuterohydroxyl) Non-associated O–D 2,630–2,620 (sharp band) Associated O–D 2,600–2,400 (broad band)
572 Spectroscopic Methods of Steroid Analysis
Many hydroxy steroids show a combination of associated and unassociated types of absorption, giving both a broad and a sharp band. It is often possible to distinguish between inter- and intramolecular association, with implications for molecular structure, by comparing spectra in solutions at different concentrations. If the interaction is intermolecular, low concentrations accentuate the 3,600 cm−1 band, whereas higher concentrations favour association, and so lead to an increase in the intensity of the broader lower-frequency band at the expense of the sharper one. Such spectral changes were used to investigate the state of aggregation of 5a-cholestanols in solution (Kunst et al., 1979). On the other hand, a spectrum which is independent of concentration, implies that hydrogen bonding is of an intramolecular type (i.e. between neigh-bouring functional groups). IR spectra therefore used to be a source of information on the conformation and configuration of the compound (Suga et al., 1972). Asymmetry in the shape of the O–H band may reflect contributions from different rotamers around the C–O bond (Boul et al., 1971). Deuterated hydroxyl groups show O–D str. bands at very much lower wave-numbers than O–H groups, the difference being about 1,000 cm−1.
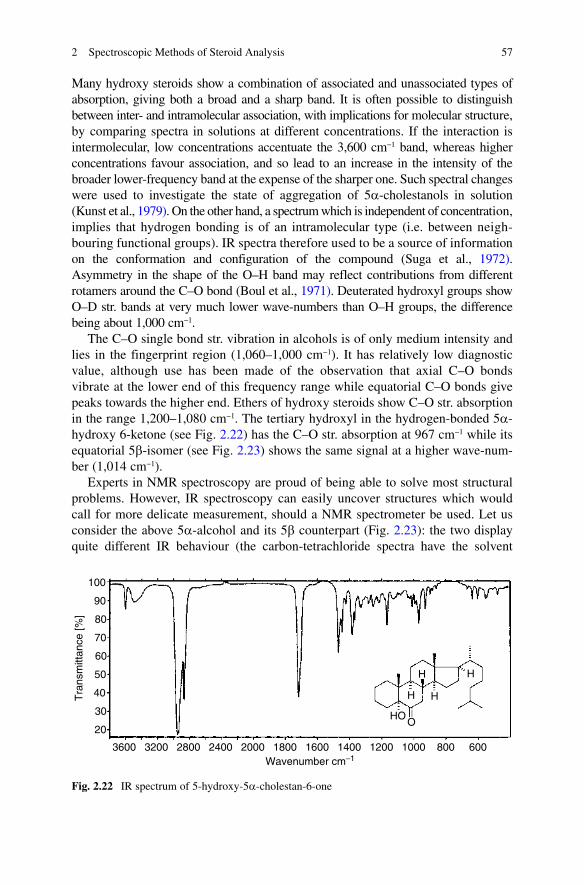
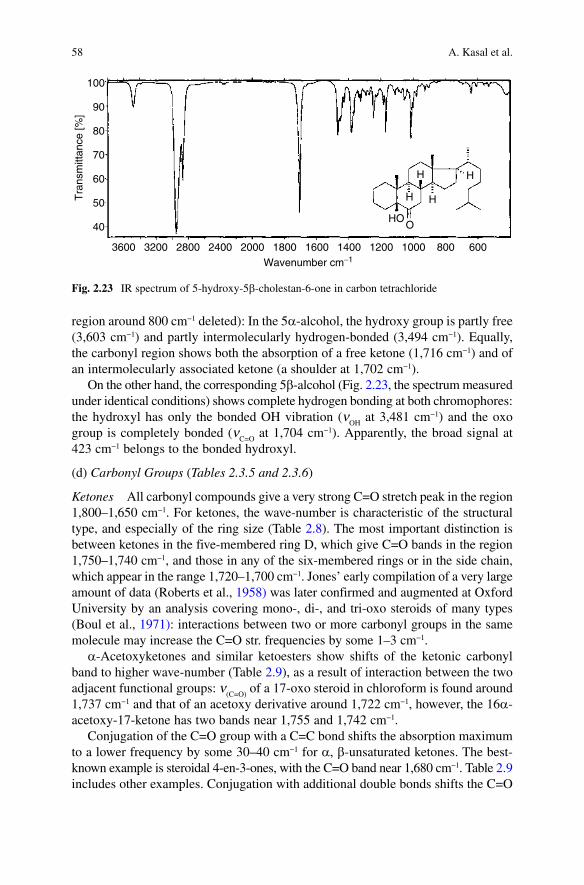
The C–O single bond str. vibration in alcohols is of only medium intensity and lies in the fingerprint region (1,060–1,000 cm−1). It has relatively low diagnostic value, although use has been made of the observation that axial C–O bonds vibrate at the lower end of this frequency range while equatorial C–O bonds give peaks towards the higher end. Ethers of hydroxy steroids show C–O str. absorption in the range 1,200–1,080 cm−1. The tertiary hydroxyl in the hydrogen-bonded 5a-hydroxy 6-ketone (see Fig. 2.22) has the C–O str. absorption at 967 cm−1 while its equatorial 5b-isomer (see Fig. 2.23) shows the same signal at a higher wave-num-ber (1,014 cm−1).
Experts in NMR spectroscopy are proud of being able to solve most structural problems. However, IR spectroscopy can easily uncover structures which would call for more delicate measurement, should a NMR spectrometer be used. Let us consider the above 5a-alcohol and its 5b counterpart (Fig. 2.23): the two display quite different IR behaviour (the carbon-tetrachloride spectra have the solvent
3600 3200 2800 2400 2000 1800 1600 1400 1200
HO
H
H H
H
O
1000 800 600Wavenumber cm−1
Tra
nsm
ittan
ce [%
]
100
90
80
70
60
50
40
30
20
Fig. 2.22 IR spectrum of 5-hydroxy-5a-cholestan-6-one
58 A. Kasal et al.
region around 800 cm−1 deleted): In the 5a-alcohol, the hydroxy group is partly free (3,603 cm−1) and partly intermolecularly hydrogen-bonded (3,494 cm−1). Equally, the carbonyl region shows both the absorption of a free ketone (1,716 cm−1) and of an intermolecularly associated ketone (a shoulder at 1,702 cm−1).
On the other hand, the corresponding 5b-alcohol (Fig. 2.23, the spectrum measured under identical conditions) shows complete hydrogen bonding at both chromophores: the hydroxyl has only the bonded OH vibration (n
OH at 3,481 cm−1) and the oxo
group is completely bonded (nC=O
at 1,704 cm−1). Apparently, the broad signal at 423 cm−1 belongs to the bonded hydroxyl.
(d) Carbonyl Groups (Tables 2.3.5 and 2.3.6)
Ketones All carbonyl compounds give a very strong C=O stretch peak in the region 1,800–1,650 cm−1. For ketones, the wave-number is characteristic of the structural type, and especially of the ring size (Table 2.8). The most important distinction is between ketones in the five-membered ring D, which give C=O bands in the region 1,750–1,740 cm−1, and those in any of the six-membered rings or in the side chain, which appear in the range 1,720–1,700 cm−1. Jones’ early compilation of a very large amount of data (Roberts et al., 1958) was later confirmed and augmented at Oxford University by an analysis covering mono-, di-, and tri-oxo steroids of many types (Boul et al., 1971): interactions between two or more carbonyl groups in the same molecule may increase the C=O str. frequencies by some 1–3 cm−1.
a-Acetoxyketones and similar ketoesters show shifts of the ketonic carbonyl band to higher wave-number (Table 2.9), as a result of interaction between the two adjacent functional groups: n
(C=O) of a 17-oxo steroid in chloroform is found around
1,737 cm−1 and that of an acetoxy derivative around 1,722 cm−1, however, the 16a-acetoxy-17-ketone has two bands near 1,755 and 1,742 cm−1.
Conjugation of the C=O group with a C=C bond shifts the absorption maximum to a lower frequency by some 30–40 cm−1 for a, b-unsaturated ketones. The best-known example is steroidal 4-en-3-ones, with the C=O band near 1,680 cm−1. Table 2.9 includes other examples. Conjugation with additional double bonds shifts the C=O
600
OHO
H H
HH
800
Tra
nsm
ittan
ce [%
]100
90
80
70
60
50
40
Wavenumber cm−13600 3200 2800 2400 2000 1800 1600 1400 1200 1000
Fig. 2.23 IR spectrum of 5-hydroxy-5b-cholestan-6-one in carbon tetrachloride
592 Spectroscopic Methods of Steroid Analysis
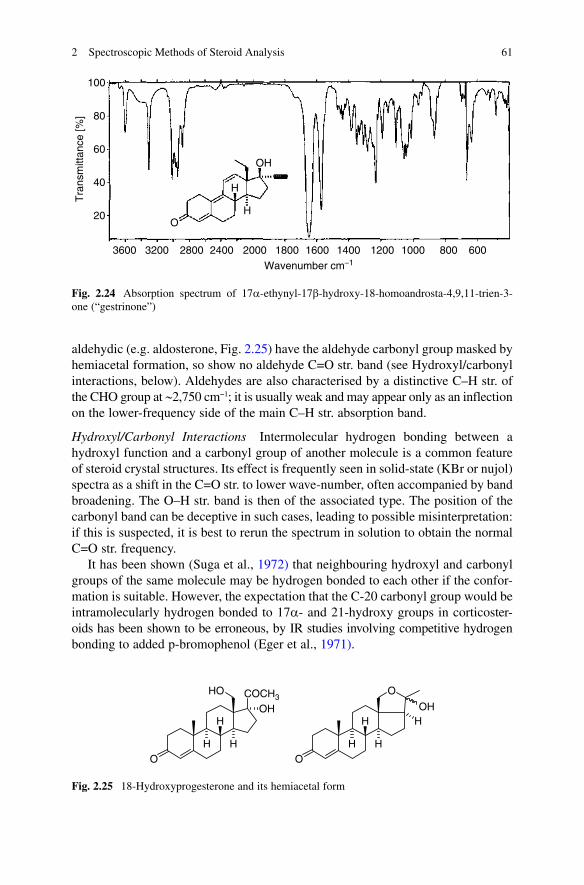
absorption still further: e.g. a trienone – (i.e. gestrinone, see Fig. 2.24) has its nC=O
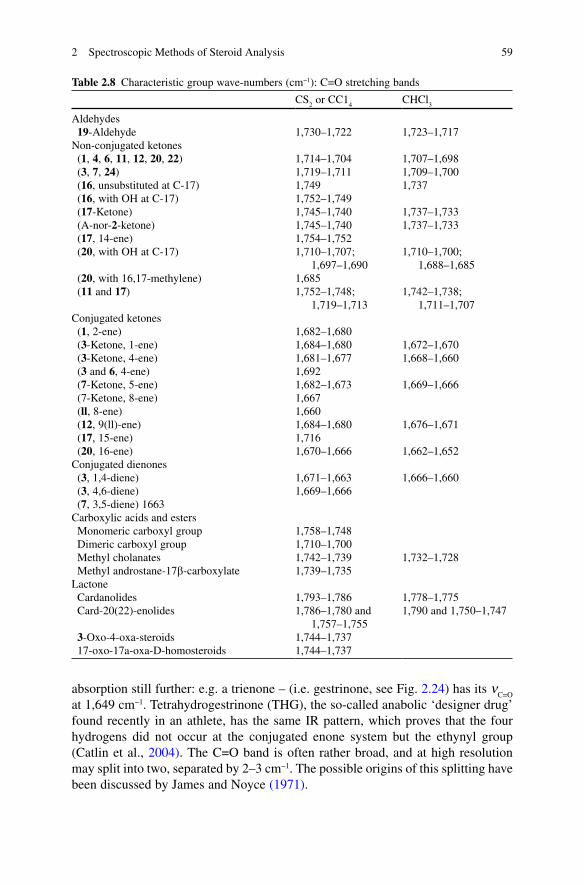
at 1,649 cm−1. Tetrahydrogestrinone (THG), the so-called anabolic ‘designer drug’ found recently in an athlete, has the same IR pattern, which proves that the four hydrogens did not occur at the conjugated enone system but the ethynyl group (Catlin et al., 2004). The C=O band is often rather broad, and at high resolution may split into two, separated by 2–3 cm−1. The possible origins of this splitting have been discussed by James and Noyce (1971).
Table 2.8 Characteristic group wave-numbers (cm−1): C=O stretching bands
CS2 or CC1
4CHCl
3
Aldehydes 19-Aldehyde 1,730–1,722 1,723–1,717Non-conjugated ketones (1, 4, 6, 11, 12, 20, 22) 1,714–1,704 1,707–1,698 (3, 7, 24) 1,719–1,711 1,709–1,700 (16, unsubstituted at C-17) 1,749 1,737 (16, with OH at C-17) 1,752–1,749 (17-Ketone) 1,745–1,740 1,737–1,733 (A-nor-2-ketone) 1,745–1,740 1,737–1,733 (17, 14-ene) 1,754–1,752 (20, with OH at C-17) 1,710–1,707;
1,697–1,6901,710–1,700;
1,688–1,685 (20, with 16,17-methylene) 1,685 (11 and 17) 1,752–1,748;
1,719–1,7131,742–1,738;
1,711–1,707Conjugated ketones (1, 2-ene) 1,682–1,680 (3-Ketone, 1-ene) 1,684–1,680 1,672–1,670 (3-Ketone, 4-ene) 1,681–1,677 1,668–1,660 (3 and 6, 4-ene) 1,692 (7-Ketone, 5-ene) 1,682–1,673 1,669–1,666 (7-Ketone, 8-ene) 1,667 (ll, 8-ene) 1,660 (12, 9(ll)-ene) 1,684–1,680 1,676–1,671 (17, 15-ene) 1,716 (20, 16-ene) 1,670–1,666 1,662–1,652Conjugated dienones (3, 1,4-diene) 1,671–1,663 1,666–1,660 (3, 4,6-diene) 1,669–1,666 (7, 3,5-diene) 1663Carboxylic acids and esters Monomeric carboxyl group 1,758–1,748 Dimeric carboxyl group 1,710–1,700 Methyl cholanates 1,742–1,739 1,732–1,728 Methyl androstane-17b-carboxylate 1,739–1,735Lactone Cardanolides 1,793–1,786 1,778–1,775 Card-20(22)-enolides 1,786–1,780 and
1,757–1,7551,790 and 1,750–1,747
3-Oxo-4-oxa-steroids 1,744–1,737 17-oxo-17a-oxa-D-homosteroids 1,744–1,737
60 A. Kasal et al.
Solvent Effects The frequencies quoted above refer to spectra in CCl4 or CS
2.
Table 2.9 includes data for CHCl3 as solvent, showing significant shifts to lower
frequency in some cases. Solvent shifts of the C=O band of selected 3-oxo and other steroids have been measured for various solvents, relative to saturated hydro-carbons (James and Ramgoolam, 1978). Polar solvents solvate the carbonyl group and hence reduce the energy difference between the ground and excited states which is manifest in a reduced frequency. Some spectroscopic features found in the C–H str. region for carbonyl compounds have been noted above (see section (a) The hydrocarbon skeleton, above).
Aldehydes The aldehydic C=O str. frequency lies in the region 1,730–1,720 cm−1 and, as in ketones, shows some solvent sensitivity. A few compounds that are formally
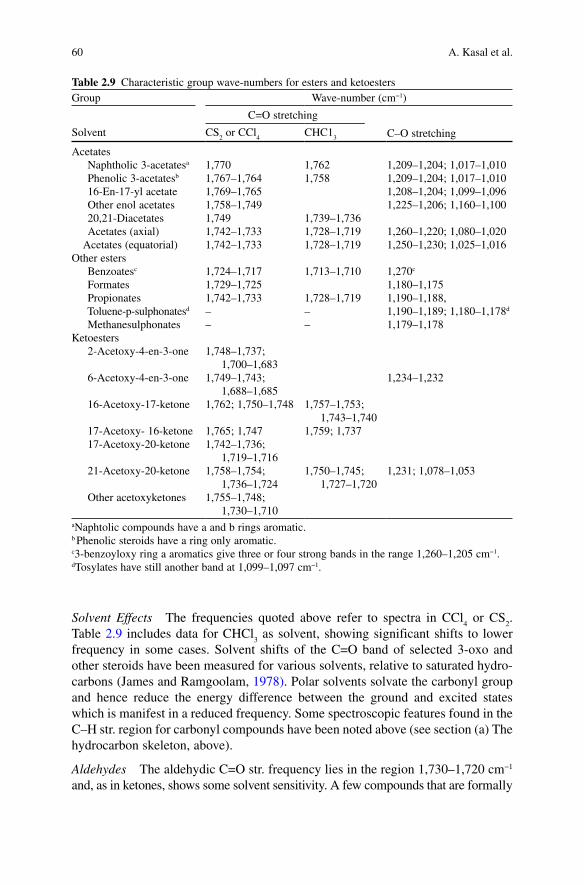
Table 2.9 Characteristic group wave-numbers for esters and ketoestersGroup Wave-number (cm−1)
C=O stretching
C–O stretchingSolvent CS2 or CCl
4CHC1
3
Acetates Naphtholic 3-acetatesa 1,770 1,762 1,209–1,204; 1,017–1,010 Phenolic 3-acetatesb 1,767–1,764 1,758 1,209–1,204; 1,017–1,010 16-En-17-yl acetate 1,769–1,765 1,208–1,204; 1,099–1,096 Other enol acetates 1,758–1,749 1,225–1,206; 1,160–1,100 20,21-Diacetates 1,749 1,739–1,736 Acetates (axial) 1,742–1,733 1,728–1,719 1,260–1,220; 1,080–1,020 Acetates (equatorial) 1,742–1,733 1,728–1,719 1,250–1,230; 1,025–1,016Other esters Benzoatesc 1,724–1,717 1,713–1,710 1,270c
Formates 1,729–1,725 1,180–1,175 Propionates 1,742–1,733 1,728–1,719 1,190–1,188, Toluene-p-sulphonatesd – – 1,190–1,189; 1,180–1,178d
Methanesulphonates – – 1,179–1,178Ketoesters 2-Acetoxy-4-en-3-one 1,748–1,737;
1,700–1,683 6-Acetoxy-4-en-3-one 1,749–1,743;
1,688–1,6851,234–1,232
16-Acetoxy-17-ketone 1,762; 1,750–1,748 1,757–1,753; 1,743–1,740
17-Acetoxy- 16-ketone 1,765; 1,747 1,759; 1,737 17-Acetoxy-20-ketone 1,742–1,736;
1,719–1,716 21-Acetoxy-20-ketone 1,758–1,754;
1,736–1,7241,750–1,745;
1,727–1,7201,231; 1,078–1,053
Other acetoxyketones 1,755–1,748; 1,730–1,710
aNaphtolic compounds have a and b rings aromatic.b Phenolic steroids have a ring only aromatic.c3-benzoyloxy ring a aromatics give three or four strong bands in the range 1,260–1,205 cm−1.dTosylates have still another band at 1,099–1,097 cm−1.
612 Spectroscopic Methods of Steroid Analysis
aldehydic (e.g. aldosterone, Fig. 2.25) have the aldehyde carbonyl group masked by hemiacetal formation, so show no aldehyde C=O str. band (see Hydroxyl/carbonyl interactions, below). Aldehydes are also characterised by a distinctive C–H str. of the CHO group at ~2,750 cm−1; it is usually weak and may appear only as an inflection on the lower-frequency side of the main C–H str. absorption band.
Hydroxyl/Carbonyl Interactions Intermolecular hydrogen bonding between a hydroxyl function and a carbonyl group of another molecule is a common feature of steroid crystal structures. Its effect is frequently seen in solid-state (KBr or nujol) spectra as a shift in the C=O str. to lower wave-number, often accompanied by band broadening. The O–H str. band is then of the associated type. The position of the carbonyl band can be deceptive in such cases, leading to possible misinterpretation: if this is suspected, it is best to rerun the spectrum in solution to obtain the normal C=O str. frequency.
It has been shown (Suga et al., 1972) that neighbouring hydroxyl and carbonyl groups of the same molecule may be hydrogen bonded to each other if the confor-mation is suitable. However, the expectation that the C-20 carbonyl group would be intramolecularly hydrogen bonded to 17a- and 21-hydroxy groups in corticoster-oids has been shown to be erroneous, by IR studies involving competitive hydrogen bonding to added p-bromophenol (Eger et al., 1971).
Tra
nsm
ittan
ce [%
]
600800
Wavenumber cm−13600
100
80
60
40
20
3200 2800 2400 2000 1800 1600 100012001400
H
H
O
OH
Fig. 2.24 Absorption spectrum of 17a-ethynyl-17b-hydroxy-18-homoandrosta-4,9,11-trien-3-one (“gestrinone”)
O
OH
O
H
H H
H
O
HO
H
H H
COCH3
OH
Fig. 2.25 18-Hydroxyprogesterone and its hemiacetal form
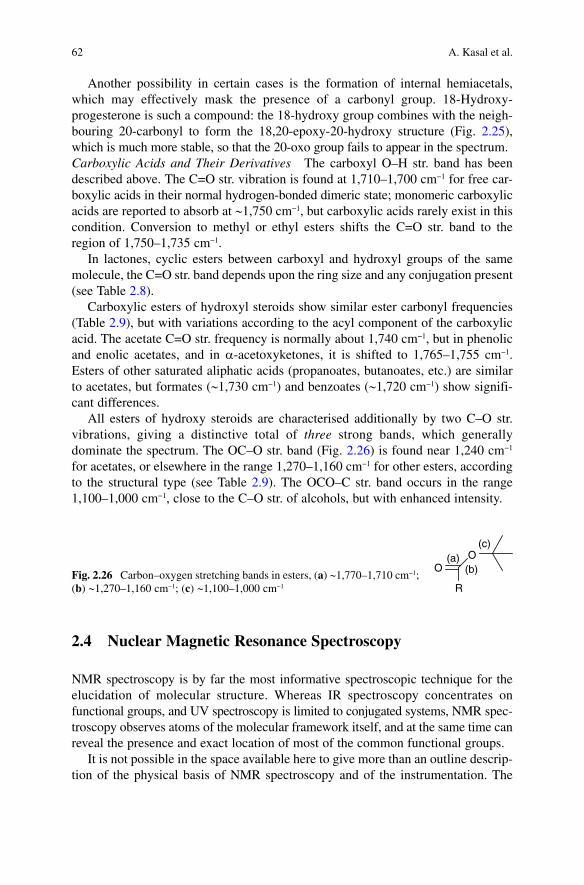
62 A. Kasal et al.
Another possibility in certain cases is the formation of internal hemiacetals, which may effectively mask the presence of a carbonyl group. 18-Hydroxy-progesterone is such a compound: the 18-hydroxy group combines with the neigh-bouring 20-carbonyl to form the 18,20-epoxy-20-hydroxy structure (Fig. 2.25), which is much more stable, so that the 20-oxo group fails to appear in the spectrum.Carboxylic Acids and Their Derivatives The carboxyl O–H str. band has been described above. The C=O str. vibration is found at 1,710–1,700 cm−1 for free car-boxylic acids in their normal hydrogen-bonded dimeric state; monomeric carboxylic acids are reported to absorb at ~1,750 cm−1, but carboxylic acids rarely exist in this condition. Conversion to methyl or ethyl esters shifts the C=O str. band to the region of 1,750–1,735 cm−1.
In lactones, cyclic esters between carboxyl and hydroxyl groups of the same molecule, the C=O str. band depends upon the ring size and any conjugation present (see Table 2.8).
Carboxylic esters of hydroxyl steroids show similar ester carbonyl frequencies (Table 2.9), but with variations according to the acyl component of the carboxylic acid. The acetate C=O str. frequency is normally about 1,740 cm−1, but in phenolic and enolic acetates, and in a-acetoxyketones, it is shifted to 1,765–1,755 cm−1. Esters of other saturated aliphatic acids (propanoates, butanoates, etc.) are similar to acetates, but formates (~1,730 cm−1) and benzoates (~1,720 cm−1) show signifi-cant differences.
All esters of hydroxy steroids are characterised additionally by two C–O str. vibrations, giving a distinctive total of three strong bands, which generally dominate the spectrum. The OC–O str. band (Fig. 2.26) is found near 1,240 cm−1 for acetates, or elsewhere in the range 1,270–1,160 cm−1 for other esters, according to the structural type (see Table 2.9). The OCO–C str. band occurs in the range 1,100–1,000 cm−1, close to the C–O str. of alcohols, but with enhanced intensity.
2.4 Nuclear Magnetic Resonance Spectroscopy
NMR spectroscopy is by far the most informative spectroscopic technique for the elucidation of molecular structure. Whereas IR spectroscopy concentrates on functional groups, and UV spectroscopy is limited to conjugated systems, NMR spec-troscopy observes atoms of the molecular framework itself, and at the same time can reveal the presence and exact location of most of the common functional groups.
It is not possible in the space available here to give more than an outline descrip-tion of the physical basis of NMR spectroscopy and of the instrumentation. The
R
OO(a)
(b)
(c)
Fig. 2.26 Carbon–oxygen stretching bands in esters, (a) ~1,770–1,710 cm−1; (b) ~1,270–1,160 cm−1; (c) ~1,100–1,000 cm−1
632 Spectroscopic Methods of Steroid Analysis
reader can find detailed information on these topics elsewhere (Ernst et al., 1987; Sanders and Hunter, 1987; Williams and Fleming, 1987; Kemp, 1991; Grant and Harris, 1996; Macomber, 1998; Claridge, 2000; Levitt, 2001; Friebolin, 2005). We are concerned here with the ways in which the organic chemist can use NMR spectroscopy to solve structural problems.
2.4.1 Basic Principles of NMR Spectroscopy
Certain atomic nuclei, including protons 1H, 13C, and 19F, possess nuclear spin (I) which gives them magnetic properties. Like bar magnets and compass needles, these nuclei tend to align their magnetic moments with that of an external magnetic field. The axis of spin precesses around the field direction, much as the axis of a spinning top precesses in the earth’s gravitational field (Fig. 2.27a). Quantum restrictions allow magnetic nuclei to be orientated in (2I + 1) ways; for 1H, 13C, and 19F, each with spin I = 1/2, there are two possible orientations, one aligned with the applied field and the other opposing it (Fig. 2.27b). These are low-energy and high-energy states, respectively. The difference between their energy levels is directly proportional to the strength of the applied magnetic field. The energy difference is actually very small, giving a Boltzmann distribution such that there is only a minute excess of nuclei in the lower energy state at equilibrium (of the order of 1 in 105 or 106) resulting in a pure macroscopic magnetisation M
0 (Fig. 2.27c).
When radiofrequency (RF) radiation at the precession frequency is applied to atomic nuclei oriented in a magnetic field, energy is absorbed and the populations of nuclei in the two energy states become more nearly equal; this is the so-called resonance condition. Saturation occurs if the numbers of nuclei in the two states become exactly equal; no more energy can then be absorbed. The absorbed energy
y
x
z
x
y
z
M0
B0
ω0 µ
z
a b c
Fig. 2.27 Behaviour of nuclei with spin 1/2 in external magnetic field B0
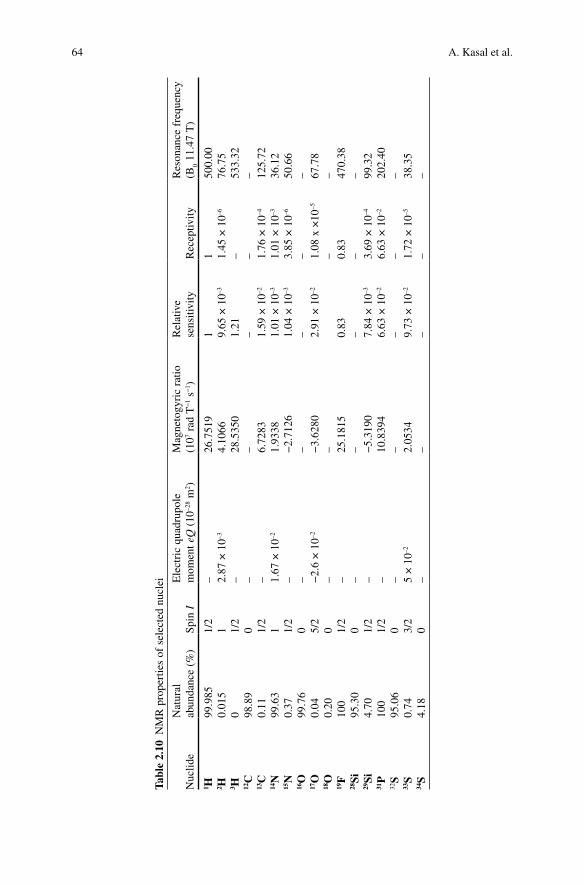
64 A. Kasal et al.
Tabl
e 2.
10 N
MR
pro
pert
ies
of s
elec
ted
nucl
ei
Nuc
lide
Nat
ural
ab
unda
nce
(%)
Spin
IE
lect
ric
quad
rupo
le
mom
ent e
Q (
10–2
8 m
2 )M
agne
togy
ric
ratio
(1
07 ra
d T
−1
s−1 )
Rel
ativ
e se
nsiti
vity
Rec
eptiv
ityR
eson
ance
fre
quen
cy
(B0
11.4
7 T
)1 H
99.9
851/
2–
26.7
519
11
500.
002 H
0.01
51
2.87
× 1
0–34.
1066
9.65
× 1
0–31.
45 ×
10–6
76.7
53 H
01/
2–
28.5
350
1.21
–53
3.32
12C
98.8
90
––
––
–13
C0.
111/
2–
6.72
831.
59 ×
10–2
1.76
× 1
0–412
5.72
14N
99.6
31
1.67
× 1
0–21.
9338
1.01
× 1
0–31.
01 ×
10–3
36.1
215
N0.
371/
2–
−2.
7126
1.04
× 1
0–33.
85 ×
10–6
50.6
616
O99
.76
0–
––
––
17O
0.04
5/2
−2.
6 ×
10–2
−3.
6280
2.91
× 1
0–21.
08 x
×10
–567
.78
18O
0.20
0–
––
–19
F10
01/
2–
25.1
815
0.83
0.83
470.
3828
Si95
.30
0–
––
––
29Si
4.70
1/2
–−
5.31
907.
84 ×
10–3
3.69
× 1
0–499
.32
31P
100
1/2
–10
.839
46.
63 ×
10–2
6.63
× 1
0–220
2.40
32S
95.0
60
––
––
–33
S0.
743/
25
× 1
0–22.
0534
9.73
× 1
0–21.
72 ×
10–5
38.3
534
S4.
180
––
––
–
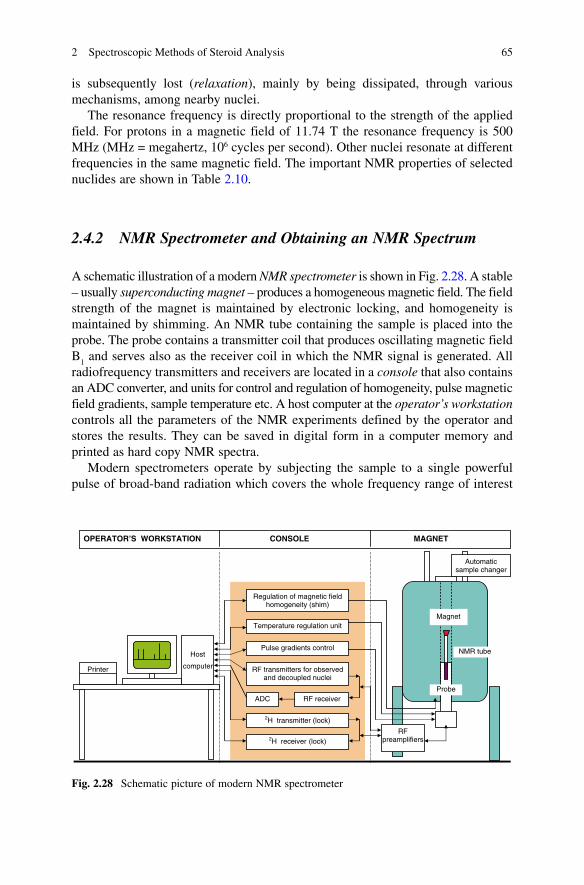
652 Spectroscopic Methods of Steroid Analysis
is subsequently lost (relaxation), mainly by being dissipated, through various mechanisms, among nearby nuclei.
The resonance frequency is directly proportional to the strength of the applied field. For protons in a magnetic field of 11.74 T the resonance frequency is 500 MHz (MHz = megahertz, 106 cycles per second). Other nuclei resonate at different frequencies in the same magnetic field. The important NMR properties of selected nuclides are shown in Table 2.10.
2.4.2 NMR Spectrometer and Obtaining an NMR Spectrum
A schematic illustration of a modern NMR spectrometer is shown in Fig. 2.28. A stable – usually superconducting magnet – produces a homogeneous magnetic field. The field strength of the magnet is maintained by electronic locking, and homogeneity is maintained by shimming. An NMR tube containing the sample is placed into the probe. The probe contains a transmitter coil that produces oscillating magnetic field B
1 and serves also as the receiver coil in which the NMR signal is generated. All
radiofrequency transmitters and receivers are located in a console that also contains an ADC converter, and units for control and regulation of homogeneity, pulse magnetic field gradients, sample temperature etc. A host computer at the operator’s workstation controls all the parameters of the NMR experiments defined by the operator and stores the results. They can be saved in digital form in a computer memory and printed as hard copy NMR spectra.
Modern spectrometers operate by subjecting the sample to a single powerful pulse of broad-band radiation which covers the whole frequency range of interest
Regulation of magnetic field homogeneity (shim)
ADC RF receiver
Temperature regulation unit
Pulse gradients control
RF transmitters for observed and decoupled nuclei
2H receiver (lock)
2H transmitter (lock)
Automatic sample changer
Magnet
Probe
NMR tube
Printer
Host
computer
RF preamplifiers
OPERATOR’S WORKSTATION CONSOLE MAGNET
Fig. 2.28 Schematic picture of modern NMR spectrometer
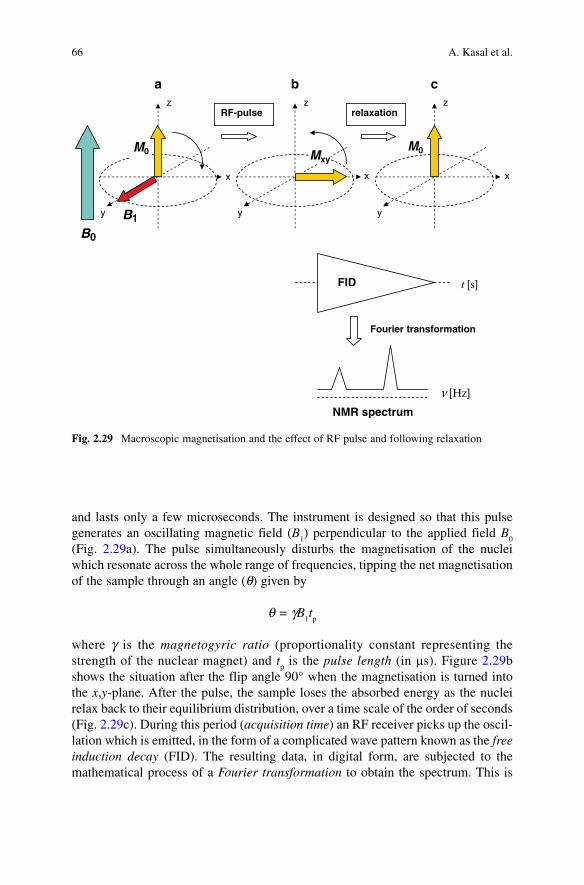
66 A. Kasal et al.
and lasts only a few microseconds. The instrument is designed so that this pulse generates an oscillating magnetic field (B
1) perpendicular to the applied field B
0
(Fig. 2.29a). The pulse simultaneously disturbs the magnetisation of the nuclei which resonate across the whole range of frequencies, tipping the net magnetisation of the sample through an angle (q) given by
q = gB1tp
where g is the magnetogyric ratio (proportionality constant representing the strength of the nuclear magnet) and t
p is the pulse length (in ms). Figure 2.29b
shows the situation after the flip angle 90° when the magnetisation is turned into the x,y-plane. After the pulse, the sample loses the absorbed energy as the nuclei relax back to their equilibrium distribution, over a time scale of the order of seconds (Fig. 2.29c). During this period (acquisition time) an RF receiver picks up the oscil-lation which is emitted, in the form of a complicated wave pattern known as the free induction decay (FID). The resulting data, in digital form, are subjected to the mathematical process of a Fourier transformation to obtain the spectrum. This is
y
x
y
x
z
B1
RF-pulse
NMR spectrum
y
x
z
M0
relaxation
B0
z
t [s]FID
a b
ν [Hz]
Fourier transformation
c
M0 Mxy
Fig. 2.29 Macroscopic magnetisation and the effect of RF pulse and following relaxation
672 Spectroscopic Methods of Steroid Analysis
done by a computer which both controls the spectrometer and collects and processes the data. The NMR spectra are usually obtained by summing the FIDs from a number of repeated pulses. The signal-to-noise ratio S/N is improved by a factor of ÷
–n,
where n is the number of pulses employed.
2.4.3 NMR Parameters
There are five NMR parameters which can be extracted from NMR spectra. They will be briefly discussed in the following paragraphs.
2.4.3.1 Chemical Shift
The great value of NMR spectra to chemists results from the fact that identical nuclei in different environments within a molecule resonate at slightly different frequencies. In a magnetic field B
0, the electrons surrounding each nucleus circulate
in such a way as to generate an induced field Bind
of opposite direction. The effec-tive magnetic field B
eff is proportional to B
0 according to the relation:
Beff
= B0 – B
ind = B
0–B
0s
where s is so called shielding constant that reflects the chemical surrounding of nucleus. The nuclei with a different chemical surrounding are exposed to different B
eff (they have different shielding constants s) and they resonate at different
frequencies:
n = gBeff/2p
Since it is not practical to measure resonance frequencies in the absolute values (MHz), the frequency differences (in Hz) are measured from the resonance of a chosen standard substance as chemical shifts. However, the chemical shifts in fre-quency units depend on the spectrometer frequency n
0 (or field B
0). For easy com-
parison of NMR data from different spectrometers the so called d-scale with chemical shifts expressed in dimensionless units (parts per million, ppm), defined by the relation:
d [ppm] = [(n(sample) – n(standard))/ n0(spectrometer)]·106
was introduced. The nuclei with higher d-values are often said to be deshielded (lowfield and/or paramagnetic shift) while the nuclei with lower d-values are shielded (upfield and/or diamagnetic shift). The chemical shift d-scale and the direction of shielding and deshielding effects is shown schematically in Fig. 2.30.
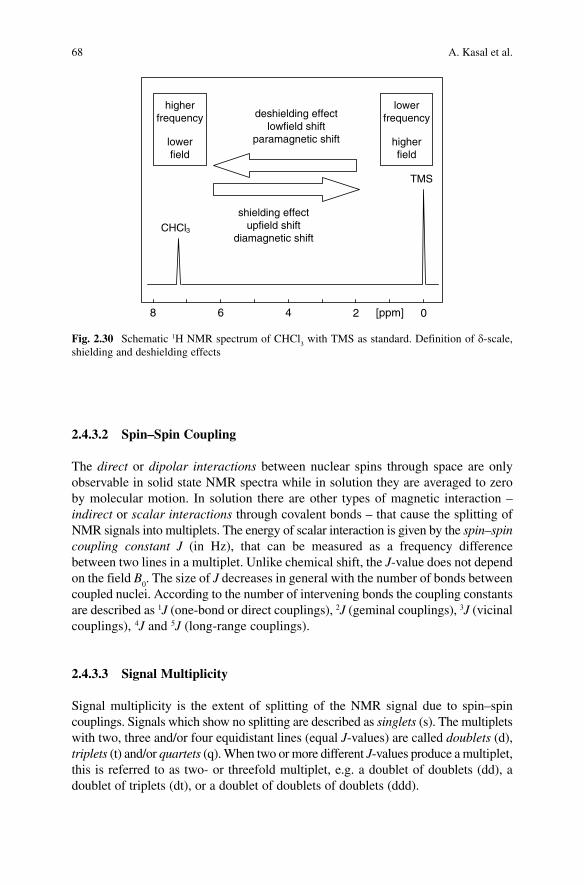
68 A. Kasal et al.
2.4.3.2 Spin–Spin Coupling
The direct or dipolar interactions between nuclear spins through space are only observable in solid state NMR spectra while in solution they are averaged to zero by molecular motion. In solution there are other types of magnetic interaction – indirect or scalar interactions through covalent bonds – that cause the splitting of NMR signals into multiplets. The energy of scalar interaction is given by the spin–spin coupling constant J (in Hz), that can be measured as a frequency difference between two lines in a multiplet. Unlike chemical shift, the J-value does not depend on the field B
0. The size of J decreases in general with the number of bonds between
coupled nuclei. According to the number of intervening bonds the coupling constants are described as 1J (one-bond or direct couplings), 2J (geminal couplings), 3J (vicinal couplings), 4J and 5J (long-range couplings).
2.4.3.3 Signal Multiplicity
Signal multiplicity is the extent of splitting of the NMR signal due to spin–spin couplings. Signals which show no splitting are described as singlets (s). The multiplets with two, three and/or four equidistant lines (equal J-values) are called doublets (d), triplets (t) and/or quartets (q). When two or more different J-values produce a multiplet, this is referred to as two- or threefold multiplet, e.g. a doublet of doublets (dd), a doublet of triplets (dt), or a doublet of doublets of doublets (ddd).
TMS
CHCl3
02468 [ppm]
deshielding effectlowfield shift
paramagnetic shift
shielding effectupfield shift
diamagnetic shift
higherfrequency
lowerfield
lowerfrequency
higherfield
Fig. 2.30 Schematic 1H NMR spectrum of CHCl3 with TMS as standard. Definition of d-scale,
shielding and deshielding effects
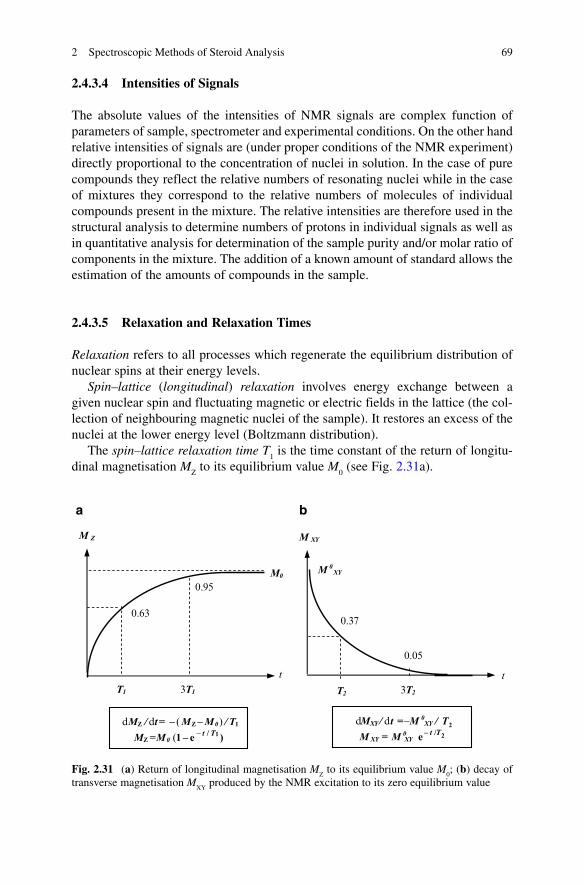
692 Spectroscopic Methods of Steroid Analysis
2.4.3.4 Intensities of Signals
The absolute values of the intensities of NMR signals are complex function of parameters of sample, spectrometer and experimental conditions. On the other hand relative intensities of signals are (under proper conditions of the NMR experiment) directly proportional to the concentration of nuclei in solution. In the case of pure compounds they reflect the relative numbers of resonating nuclei while in the case of mixtures they correspond to the relative numbers of molecules of individual compounds present in the mixture. The relative intensities are therefore used in the structural analysis to determine numbers of protons in individual signals as well as in quantitative analysis for determination of the sample purity and/or molar ratio of components in the mixture. The addition of a known amount of standard allows the estimation of the amounts of compounds in the sample.
2.4.3.5 Relaxation and Relaxation Times
Relaxation refers to all processes which regenerate the equilibrium distribution of nuclear spins at their energy levels.
Spin–lattice (longitudinal) relaxation involves energy exchange between a given nuclear spin and fluctuating magnetic or electric fields in the lattice (the col-lection of neighbouring magnetic nuclei of the sample). It restores an excess of the nuclei at the lower energy level (Boltzmann distribution).
The spin–lattice relaxation time T1 is the time constant of the return of longitu-
dinal magnetisation MZ to its equilibrium value M
0 (see Fig. 2.31a).
T1 3T1
t
0.63
0.95
M Z
M0
dMZ / dt= − ( MZ – M0 ) / T1
MZ =M0 (1 – e – t / T1 )
T2 3T2
t
0.37
0.05
M XY
M 0XY
dMXY/ dt = −M 0XY / T2
M XY = M 0XY e – t /T2
a b
Fig. 2.31 (a) Return of longitudinal magnetisation MZ to its equilibrium value M
0; (b) decay of
transverse magnetisation MXY
produced by the NMR excitation to its zero equilibrium value
70 A. Kasal et al.
Spin–spin (transversal) relaxation can be accomplished either by mutual energy exchange between two nuclei or by inhomogeneities in the magnetic field B
0. In
either case, this relaxation is an entropy driven process which does not change the energy of the target spins.
Spin–spin relaxation time T2 is the time constant of the steady decay of transverse
magnetisation MXY
produced by the NMR excitation to its zero equilibrium value (see Fig. 2.31b). The value of T
2 of a given nucleus determines the half-width (n
1/2)
of its NMR signal that is given by the relationship:
1/2 2= 1 / + *Tn np
where 1/pT2 is the natural half-width and n* is the line broadening caused by inhomo-
geneities of field B0.
The efficiencies of both types of relaxation depend critically on the similarity of the oscillation frequency (or correlation time) of the interacting nuclei in the lattice and resonance frequency of the target nuclei. The relaxation times therefore reflect molecular dynamics.
2.4.4 Factors Influencing the NMR Spectrum
The observed NMR spectrum can be influenced by internal factors (symmetry of the molecule, order of spectrum, dynamic processes) and external factors (spin decoupling, magnetic field B
0, solvent, concentration, temperature). Their effects
on the observed NMR spectrum are shortly discussed in the following paragraphs.
2.4.4.1 Symmetry of Molecule and Equivalence of Nuclei
The NMR spectrum reflects the symmetry of the molecule. Nuclei of the same isotope in the molecule can display the following type of equivalence.
Chemical shift equivalence shows the nuclei with same chemical shift (nuclei are isochronous) as the result of either symmetry of the molecule and/or accidental combination of shielding effects.
Nuclei related by one or more symmetry elements (centre, axis, plane) as a result of the symmetry of the molecule and/or the motional averaging (e.g. interconverting conformers). display symmetry equivalence. Symmetry equivalent nuclei have the same chemical shift.
Magnetically equivalent nuclei display not only the same chemical shifts but also the same coupling constants with each of the other nuclei in the molecule. The mutual spin–spin couplings of magnetically equivalent nuclei are not observed in NMR spectra.
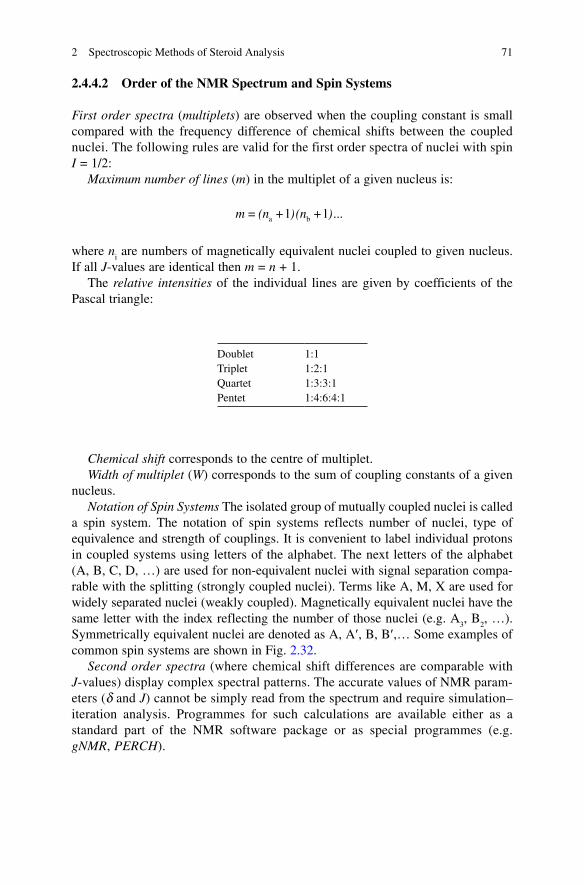
712 Spectroscopic Methods of Steroid Analysis
2.4.4.2 Order of the NMR Spectrum and Spin Systems
First order spectra (multiplets) are observed when the coupling constant is small compared with the frequency difference of chemical shifts between the coupled nuclei. The following rules are valid for the first order spectra of nuclei with spin I = 1/2:
Maximum number of lines (m) in the multiplet of a given nucleus is:
a b1 1m = (n + )(n + )...
where ni are numbers of magnetically equivalent nuclei coupled to given nucleus.
If all J-values are identical then m = n + 1.The relative intensities of the individual lines are given by coefficients of the
Pascal triangle:
Doublet 1:1Triplet 1:2:1Quartet 1:3:3:1Pentet 1:4:6:4:1
Chemical shift corresponds to the centre of multiplet.Width of multiplet (W) corresponds to the sum of coupling constants of a given
nucleus.Notation of Spin Systems The isolated group of mutually coupled nuclei is called
a spin system. The notation of spin systems reflects number of nuclei, type of equivalence and strength of couplings. It is convenient to label individual protons in coupled systems using letters of the alphabet. The next letters of the alphabet (A, B, C, D, …) are used for non-equivalent nuclei with signal separation compa-rable with the splitting (strongly coupled nuclei). Terms like A, M, X are used for widely separated nuclei (weakly coupled). Magnetically equivalent nuclei have the same letter with the index reflecting the number of those nuclei (e.g. A
3, B
2, …).
Symmetrically equivalent nuclei are denoted as A, A¢, B, B¢,… Some examples of common spin systems are shown in Fig. 2.32.
Second order spectra (where chemical shift differences are comparable with J-values) display complex spectral patterns. The accurate values of NMR param-eters (d and J) cannot be simply read from the spectrum and require simulation–iteration analysis. Programmes for such calculations are available either as a standard part of the NMR software package or as special programmes (e.g. gNMR, PERCH).
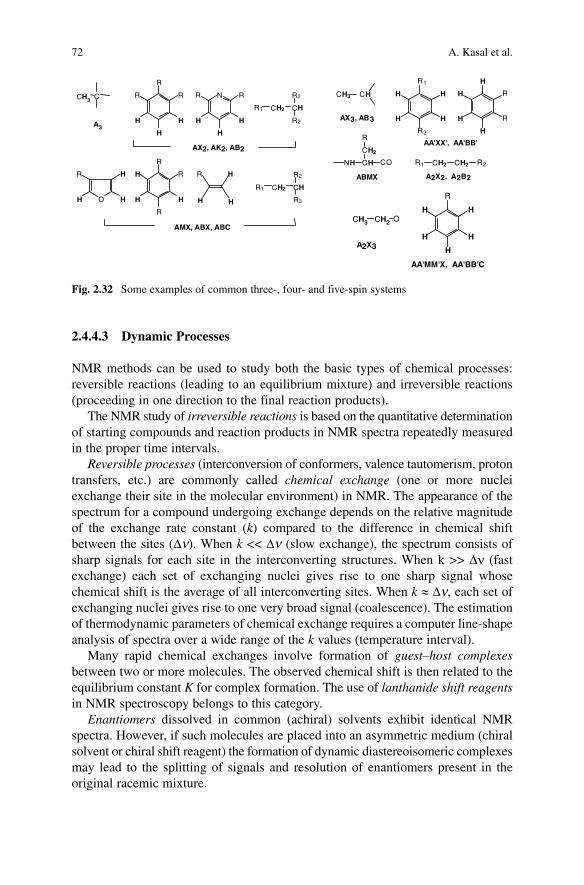
72 A. Kasal et al.
2.4.4.3 Dynamic Processes
NMR methods can be used to study both the basic types of chemical processes: reversible reactions (leading to an equilibrium mixture) and irreversible reactions (proceeding in one direction to the final reaction products).
The NMR study of irreversible reactions is based on the quantitative determination of starting compounds and reaction products in NMR spectra repeatedly measured in the proper time intervals.
Reversible processes (interconversion of conformers, valence tautomerism, proton transfers, etc.) are commonly called chemical exchange (one or more nuclei exchange their site in the molecular environment) in NMR. The appearance of the spectrum for a compound undergoing exchange depends on the relative magnitude of the exchange rate constant (k) compared to the difference in chemical shift between the sites (Dn). When k << Dn (slow exchange), the spectrum consists of sharp signals for each site in the interconverting structures. When k >> Dn (fast exchange) each set of exchanging nuclei gives rise to one sharp signal whose chemical shift is the average of all interconverting sites. When k » Dn, each set of exchanging nuclei gives rise to one very broad signal (coalescence). The estimation of thermodynamic parameters of chemical exchange requires a computer line-shape analysis of spectra over a wide range of the k values (temperature interval).
Many rapid chemical exchanges involve formation of guest–host complexes between two or more molecules. The observed chemical shift is then related to the equilibrium constant K for complex formation. The use of lanthanide shift reagents in NMR spectroscopy belongs to this category.
Enantiomers dissolved in common (achiral) solvents exhibit identical NMR spectra. However, if such molecules are placed into an asymmetric medium (chiral solvent or chiral shift reagent) the formation of dynamic diastereoisomeric complexes may lead to the splitting of signals and resolution of enantiomers present in the original racemic mixture.
CH3 C
A3
R
RR
H
HH
AX2, AK2, AB2
O
H
H
R
H
AMX, ABX, ABC
N RR
H
HH
CH2R1 CH
R2
R2
R
R
R
H
H
H
R
H
H
H
CH
R2
R3
CH2R1
CHCH3
AX3, AB3
R1
HH
HH
R2
A2X2, A2B2
RH
H
RH
H
CH2R1 CH2 R2
AA'XX', AA'BB'
COCHNH
CH2
R
ABMX
CH3
A2X3
R
HH
HH
H
AA'MM'X, AA'BB'C
CH2 O
Fig. 2.32 Some examples of common three-, four- and five-spin systems
732 Spectroscopic Methods of Steroid Analysis
2.4.4.4 Spin Decoupling and Nuclear Overhauser Effect
Spin decoupling (double resonance) is an NMR technique in which a second oscil-lating magnetic field B
2 is applied. When signals in a spectrum are split by mutual
spin coupling, it is possible to remove the coupling and so simplify the spectrum. For the simplest AX system, this is done by strongly irradiating nucleus A at its reso-nance frequency, causing it to flip rapidly between spin states, while applying the observing RF pulse and acquiring the spectrum. The X nucleus then sees only an averaged spin state of nucleus A, and is decoupled from it giving a singlet instead of doublet. If the A and X nuclei are the same isotope (e.g. protons), this experiment is referred to as selective homonuclear decoupling. If A and X nuclei are different (e.g. 1H and 13C), then it is referred to as selective heteronuclear decoupling.
Selective homonuclear proton decoupling allows the determination of mutually coupled protons (typically separated by two or three bonds), and thus helps in structure determination and signal assignment. Nowadays homonuclear decoupling experiments have been efficiently replaced by two-dimensional correlation spec-troscopy (2D-H,H-COSY), that permits simultaneous detection of all coupled protons in a sample.
In 13C NMR spectroscopy, different kinds of heteronuclear spin decouplings can be used. In proton broadband decoupled 13C NMR spectra a strong irradiation field B
2 is placed in the middle of the 1H spectrum covering the whole frequency range
of proton shifts. The spectrum then displays singlets for the carbon atoms of the molecule.
In a gated proton decoupling the decoupler is switched on during the so called relaxation delay and switched off during data acquisition. The obtained proton-coupled 13C NMR spectra contain carbon multiplets with intensity enhancement by the nuclear Overhauser effect (NOE, see below). This method is used when J(C,H) are required for structure analysis.
Inverse gated decoupling, with the proton decoupler switched on only during data acquisition, provides proton decoupled 13C NMR spectra with suppressed NOE. The relative intensities of signals are comparable and this technique can be used in a quantitative analysis of mixtures.
The nuclear Overhauser effect causes a change in intensity (usually increase) during decoupling experiments. The maximum intensity enhancement (NOE) depends on the magnetogyric ratios of the coupled nuclei. In the homonuclear case (proton–proton decoupling) the NOE is always less than 50%, while in heteronu-clear case (proton decoupling in 13C NMR spectra) NOE enhancement is commonly close to a maximum value of 200%.
2.4.4.5 Effect of Magnetic Field, Solvent, Concentration and Temperature
Higher magnetic field B0 increases the energy difference DE between spin states of
nuclei (DE = ghB0/2p) and the difference in populations of spin states na, nb according
to Boltzman law (na/nb = eDE/kBT) and therefore increases the sensitivity of the NMR
74 A. Kasal et al.
experiment and spectral resolution (increases separation of signals in Hz but it has no effect on coupling constants). Both these effects are very important since they can shorten measurement times and allow the study of smaller amounts of samples and the analysis of spectra that are too complex at lower magnetic fields B
0.
The NMR spectrum in solution is influenced by physical and chemical interactions between molecules of substrate as well as by interactions between molecules of substrate and solvent. These interactions (H-bonds, molecular associations, electric fields of polar molecules, Van der Waals forces etc.) lead to the dependence of chemical shifts (and to a smaller extent also coupling constants) on the substrate concentration, temperature, and solution pH.
The use of dilute solutions can reduce the effect of the substrate–substrate interactions while inert solvents minimise the substrate–solvent interactions. The change of dielectric constant of solvent mainly influences the chemical shifts of nuclei in the neighbourhood of substrate polar groups. Solvents capable of forming intermolecular hydrogen bonds (e.g. acetone, DMSO, etc.) have significant effects on the signals of labile hydrogen atoms (OH, NH, SH) of the substrate. Suppression of intermolecular exchange allows the observation of coupling constants of these protons which are not observed in other solvents. Aromatic solvents (benzene or pyridine) are strongly magnetically anisotropic. They can form dynamic collision complexes with a substrate containing a polar group and thus induce characteristic changes of chemical shifts in comparison with those observed in CDCl
3 (ASIS =
aromatic solvent induced shifts). Some physical properties and chemical shifts of common NMR solvents are summarised in Table 2.11.
Temperature dependence of NMR spectra can be observed in such cases when in a given temperature range, there are some dynamic processes with a rate comparable with the time-scale of NMR spectra (e.g. conformation interconversion).
2.4.5 NMR Spectra of Nuclides Potentially Usable in Steroids
In the structure analysis of steroids the 1H and 13C NMR spectra play the most important role. In some special cases valuable information can be obtained also from 2H, 3H, 17O and/or 19F NMR spectra. The NMR properties of these nuclei together with some characteristic features of their NMR spectra will shortly be discussed in the following paragraphs.
2.4.5.1 Proton NMR Spectra
Hydrogen 1H has an exceptional position in NMR spectroscopy of organic com-pounds due to its extensive occurrence and advantageous NMR properties (high natural abundance 99.98%, spin I = 1/2 and high sensitivity).
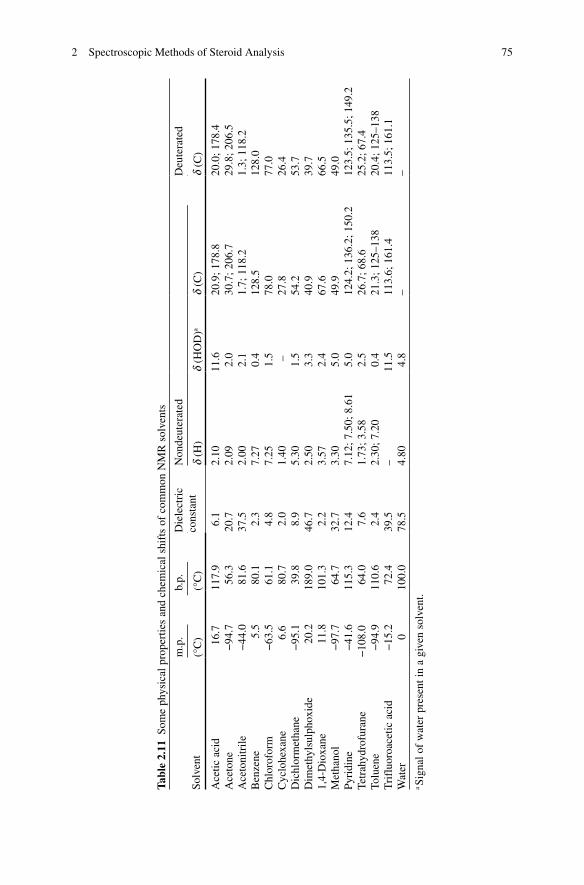
752 Spectroscopic Methods of Steroid Analysis
Tabl
e 2.
11 S
ome
phys
ical
pro
pert
ies
and
chem
ical
shi
fts
of c
omm
on N
MR
sol
vent
s
Solv
ent
m.p
.b.
p.D
iele
ctri
c co
nsta
ntN
onde
uter
ated
Deu
tera
ted
(°C
)(°
C)
d (H
)d
(HO
D)a
d (C
)d
(C)
Ace
tic a
cid
16.7
117.
96.
12.
1011
.620
.9; 1
78.8
20.0
; 178
.4A
ceto
ne−
94.7
56.3
20.7
2.09
2.0
30.7
; 206
.729
.8; 2
06.5
Ace
toni
trile
−44
.081
.637
.52.
002.
11.
7; 1
18.2
1.3;
118
.2B
enze
ne5.
580
.12.
37.
270.
412
8.5
128.
0C
hlor
ofor
m−
63.5
61.1
4.8
7.25
1.5
78.0
77.0
Cyc
lohe
xane
6.6
80.7
2.0
1.40
–27
.826
.4D
ichl
orm
etha
ne−
95.1
39.8
8.9
5.30
1.5
54.2
53.7
Dim
ethy
lsul
phox
ide
20.2
189.
046
.72.
503.
340
.939
.71,
4-D
ioxa
ne11
.810
1.3
2.2
3.57
2.4
67.6
66.5
Met
hano
l−
97.7
64.7
32.7
3.30
5.0
49.9
49.0
Pyri
dine
−41
.611
5.3
12.4
7.12
; 7.5
0; 8
.61
5.0
124.
2; 1
36.2
; 150
.212
3.5;
135
.5; 1
49.2
Tetr
ahyd
rofu
rane
−10
8.0
64.0
7.6
1.73
; 3.5
82.
526
.7; 6
8.6
25.2
; 67.
4To
luen
e−
94.9
110.
62.
42.
30; 7
.20
0.4
21.3
; 125
–138
20.4
; 125
–138
Tri
fluo
roac
etic
aci
d−
15.2
72.4
39.5
–11
.511
3.6;
161
.411
3.5;
161
.1W
ater
010
0.0
78.5
4.80
4.8
––
a Sig
nal o
f w
ater
pre
sent
in a
giv
en s
olve
nt.
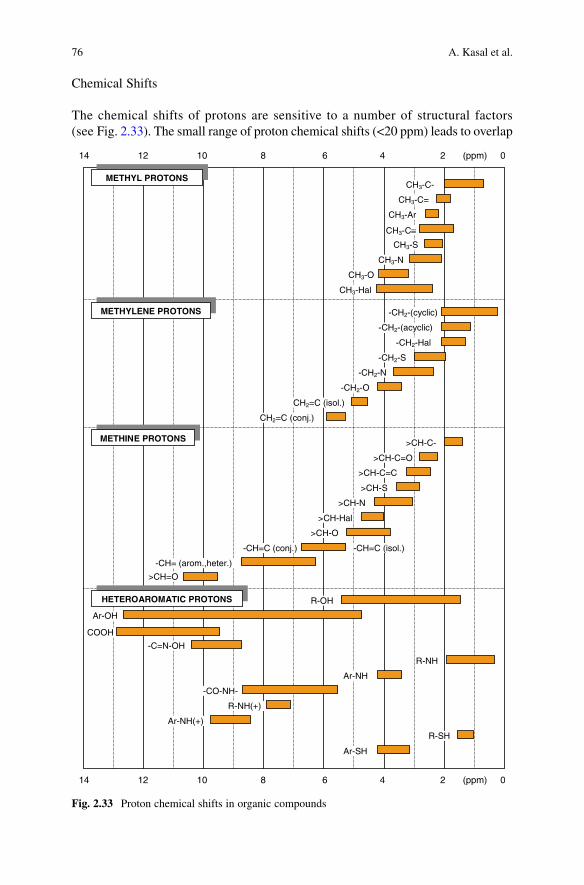
76 A. Kasal et al.
14 12 10 8 6 4 2 0(ppm)
14 12 10 8 6 4 2 0(ppm)
HETEROAROMATIC PROTONS
METHINE PROTONS
METHYLENE PROTONS
METHYL PROTONSCH3-C-
CH3-C=
CH3-Ar
CH3-C≡CH3-S
CH3-N
CH3-O
CH3-Hal
-CH2-(cyclic)
-CH2-(acyclic)
-CH2-Hal
-CH2-S
-CH2-N
-CH2-O
CH2=C (isol.)
CH2=C (conj.)
>CH-C-
>CH-C=O
>CH-C=C
>CH-S
>CH-N
>CH-Hal
>CH-O
-CH=C (conj.) -CH=C (isol.)
-CH= (arom.,heter.)
>CH=O
R-OH
Ar-OH
COOH
-C=N-OH
R-NH
Ar-NH
-CO-NH-
R-NH(+)
Ar-NH(+)
Ar-SH
R-SH
Fig. 2.33 Proton chemical shifts in organic compounds
Chemical Shifts
The chemical shifts of protons are sensitive to a number of structural factors (see Fig. 2.33). The small range of proton chemical shifts (<20 ppm) leads to overlap
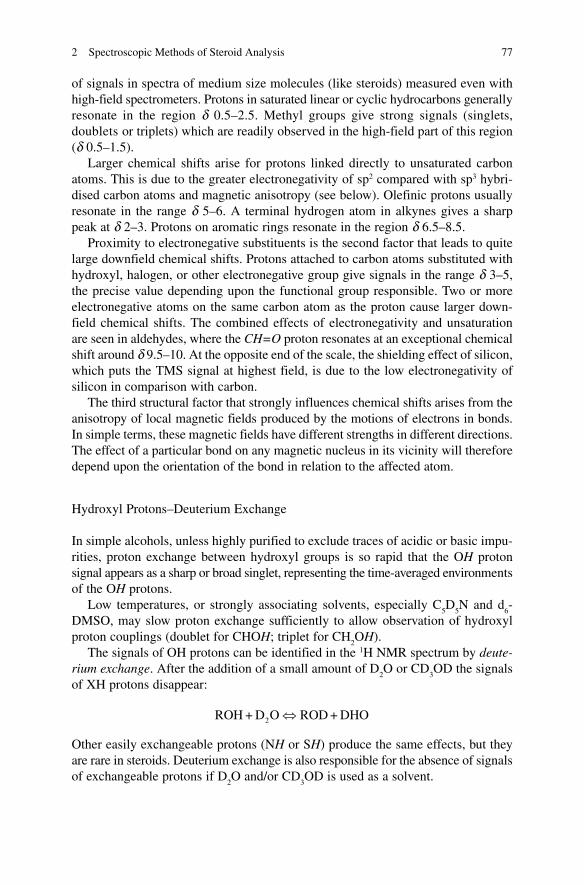
772 Spectroscopic Methods of Steroid Analysis
of signals in spectra of medium size molecules (like steroids) measured even with high-field spectrometers. Protons in saturated linear or cyclic hydrocarbons generally resonate in the region d 0.5–2.5. Methyl groups give strong signals (singlets, doublets or triplets) which are readily observed in the high-field part of this region (d 0.5–1.5).
Larger chemical shifts arise for protons linked directly to unsaturated carbon atoms. This is due to the greater electronegativity of sp2 compared with sp3 hybri-dised carbon atoms and magnetic anisotropy (see below). Olefinic protons usually resonate in the range d 5–6. A terminal hydrogen atom in alkynes gives a sharp peak at d 2–3. Protons on aromatic rings resonate in the region d 6.5–8.5.
Proximity to electronegative substituents is the second factor that leads to quite large downfield chemical shifts. Protons attached to carbon atoms substituted with hydroxyl, halogen, or other electronegative group give signals in the range d 3–5, the precise value depending upon the functional group responsible. Two or more electronegative atoms on the same carbon atom as the proton cause larger down-field chemical shifts. The combined effects of electronegativity and unsaturation are seen in aldehydes, where the CH=O proton resonates at an exceptional chemical shift around d 9.5–10. At the opposite end of the scale, the shielding effect of silicon, which puts the TMS signal at highest field, is due to the low electronegativity of silicon in comparison with carbon.
The third structural factor that strongly influences chemical shifts arises from the anisotropy of local magnetic fields produced by the motions of electrons in bonds. In simple terms, these magnetic fields have different strengths in different directions. The effect of a particular bond on any magnetic nucleus in its vicinity will therefore depend upon the orientation of the bond in relation to the affected atom.
Hydroxyl Protons–Deuterium Exchange
In simple alcohols, unless highly purified to exclude traces of acidic or basic impu-rities, proton exchange between hydroxyl groups is so rapid that the OH proton signal appears as a sharp or broad singlet, representing the time-averaged environments of the OH protons.
Low temperatures, or strongly associating solvents, especially C5D
5N and d
6-
DMSO, may slow proton exchange sufficiently to allow observation of hydroxyl proton couplings (doublet for CHOH; triplet for CH
2OH).
The signals of OH protons can be identified in the 1H NMR spectrum by deute-rium exchange. After the addition of a small amount of D
2O or CD
3OD the signals
of XH protons disappear:
2ROH + D O ROD + DHOÛ
Other easily exchangeable protons (NH or SH) produce the same effects, but they are rare in steroids. Deuterium exchange is also responsible for the absence of signals of exchangeable protons if D
2O and/or CD
3OD is used as a solvent.
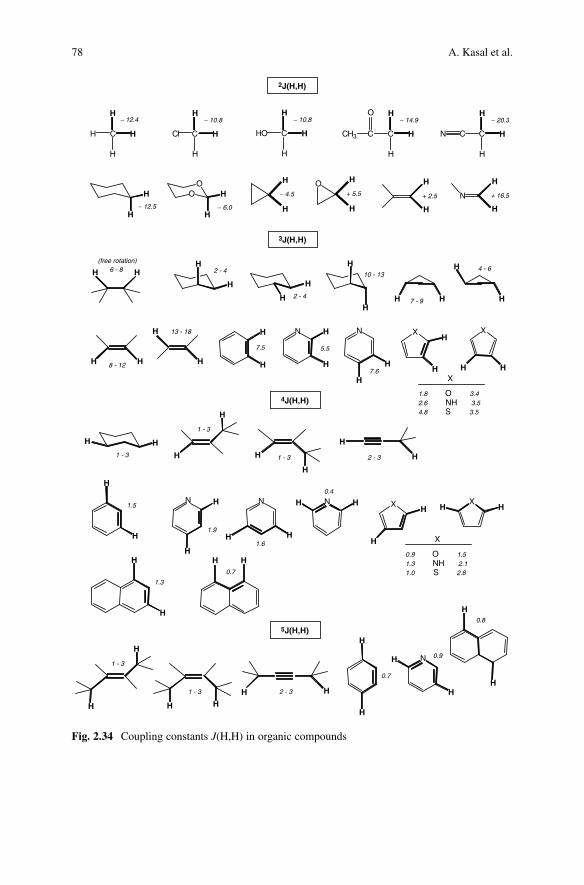
78 A. Kasal et al.
Fig. 2.34 Coupling constants J(H,H) in organic compounds
2J(H,H)
H
H
H H
3J(H,H)
1 - 3
H
1.5
5.5
N H
H
− 6.0
OO
H
H
− 12.4 − 10.8
C
H
H
H
H H
H
Cl C
H
C
H
HO
H
H
− 10.8 − 14.9
H
H
CH3 C
H
C
O− 20.3
H
H
C
H
N C
H
H
− 4.5 + 5.5
O
H
H H
H
+ 2.5 + 16.5
H
H
N
H H6 - 8(free rotation)
− 12.5
H
H2 - 4
2 - 4
H
H
10 - 13
H
HH H7 - 9 H
H 4 - 6
13 - 18
8 - 12 H
H
H
H
7.5
N
H
H7.6
X
H
HX
HHX
1.8 O 3.42.6 NH 3.54.8 S 3.5
4J(H,H)
1 - 3
HH
H
H
H
1 - 3
H
H
H2 - 3
H
HH0.7
1.6
N
H
N H
H
1.9H
0.4
N HH
0.9 O 1.51.3 NH 2.11.0 S 2.8
X
XHHX
H
H
H
1.3
H
5J(H,H)
H
1 - 3
H
HH
3-23-1 HH
H
0.7
H
0.8
H
H
NH
H
0.9
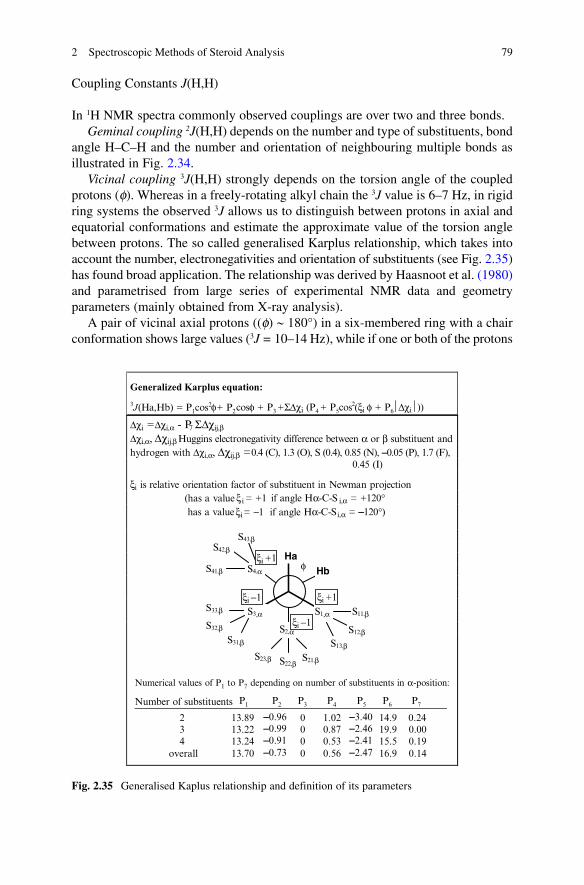
792 Spectroscopic Methods of Steroid Analysis
Coupling Constants J(H,H)
In 1H NMR spectra commonly observed couplings are over two and three bonds.Geminal coupling 2J(H,H) depends on the number and type of substituents, bond
angle H–C–H and the number and orientation of neighbouring multiple bonds as illustrated in Fig. 2.34.
Vicinal coupling 3J(H,H) strongly depends on the torsion angle of the coupled protons (f). Whereas in a freely-rotating alkyl chain the 3J value is 6–7 Hz, in rigid ring systems the observed 3J allows us to distinguish between protons in axial and equatorial conformations and estimate the approximate value of the torsion angle between protons. The so called generalised Karplus relationship, which takes into account the number, electronegativities and orientation of substituents (see Fig. 2.35) has found broad application. The relationship was derived by Haasnoot et al. (1980) and parametrised from large series of experimental NMR data and geometry parameters (mainly obtained from X-ray analysis).
A pair of vicinal axial protons ((f) ~ 180°) in a six-membered ring with a chair conformation shows large values (3J = 10–14 Hz), while if one or both of the protons
Fig. 2.35 Generalised Kaplus relationship and definition of its parameters
Generalized Karplus equation:3J(Ha,Hb) = P1cos2φ + P2cosφ + P3 + Σ∆χi (P4 + P5cos2(ξi φ + P6∆χi))
∆χi = ∆χi,α - P7 Σ∆χij,β∆χi,α, ∆χij,β Huggins electronegativity difference between α or β substituent andhydrogen with ∆χi,α, ∆χij,β = 0.4 (C), 1.3 (O), S (0.4), 0.85 (N), -0.05 (P), 1.7 (F),
0.45 (I)
ξi is relative orientation factor of substituent in Newman projection (has a value ξi = +1 if angle Hα-C-S i,α = +120°
has a valueξi = −1 if angle Hα-C-Si,α = -120°)
HaHb
S1,α
S2,α
S3,α
S4,α
ξi +1
S13,β
S11,β
S12,β
S21,βS22,βS23,β
S31,β
S32,β
S33,β
S41,β
S42,β
S43,β
Numerical values of P1 to P7 depending on number of substituents in α-position:
Number of substituents
234
overall
13.8913.2213.2413.70
14.919.915.516.9
0.000.190.14
0.24-0.96-0.99-0.91-0.73
-3.40-2.46-2.41-2.47
0000
1.020.870.530.56
ξi −1
ξi +1
ξi −1
φ
P1 P2 P3 P4 P5 P6 P7
80 A. Kasal et al.
are equatorial (f ~ 60°) the values are much smaller (3J = 2–5 Hz). This allows a clear distinction between axial and equatorial secondary alcohols, halides, and similar derivatives, from the width of the signal of the H–C–X proton (where X is OH, OAc, Br, F, etc.). An axial group X implies equatorial H, with a narrow signal, whereas equatorial X leaves H axial and results in a broad signal.
Long-range couplings (over four and five bonds) are usually observed only in rigid (mostly cyclic) systems with the proper geometry of single bonds and/or over multiple bonds.
The so-called “W” coupling (in a near-planar H–C–C–C–H zig-zag arrangement) appears as a fine splitting 1–3 Hz (e.g. between 1,3-diequatorial hydrogen atoms).
The size of allylic couplings (0–3 Hz) over four bonds in an Ha–C–C=C–H
b
fragment depends on the angle q between the double bond plane and the C–C–Ha
plane. The largest values are observed for q ~ 90°, with a maximum overlap of the p-electrons with the s-electrons of the C–H
a bond, and the smallest values
for q ~ 0°.Homoallylic couplings over five bonds (0–4 Hz) in an H
a–C–C=C–C–H
b frag-
ment reach their largest values when both angles q1 and q
2 (between the C–C–H
a
and C–C–Hb planes and the plane of the double bond) are close to 90°.
In aromatic rings characteristic values of 3J(ortho-) = 5.5–8.5 Hz, 4J(meta-) = 1–3 Hz and 5J(para-) = 0–1 Hz can be used to determine the positions of ring substituents.
2.4.5.2 Carbon-13 NMR Spectra
13C NMR spectra are the best source of direct information about the molecular framework. The 13C nucleus gives intrinsically weaker signals than 1H, and has low natural abundance (~1.1%). As a result, 13C NMR is less sensitive than 1H NMR by a factor of some 6,000. Nevertheless, modern FT NMR spectrometers have made 13C spectra routinely available for about 3 decades.
The range of chemical shifts for 13C nuclei is more than 200 ppm. TMS provides the usual reference signal at d 0.0; all other 13C signals appear at lower field. Figure 2.36 shows that many carbon-containing functional groups can be identified by characteristic chemical shifts.
13C nuclei interact with the spins of any attached protons, so most 13C signals are multiplets, unless they are deliberately decoupled from protons (see below). The 1J(C,H) coupling constant varies with structure, between 120 and 250 Hz; values for saturated ring compounds are at the lower end of the range. The n +1 rule applies (CH
3, quartet;
CH2, triplet; CH, doublet). Only those carbon atoms with no attached protons
(e.g. quaternary and carbonyl carbons) give singlet signals. Multiplets in the proton-coupled 13C spectrum of a steroid invariably overlap. It is virtually impossible to analyse the raw spectrum by inspection. To overcome this difficulty, broadband decoupling is used to remove all the signal splitting due to protons. Each 13C nucleus then resonates as a single sharp line. The number of carbon atoms in the molecule can be counted directly from the number of lines, except in the rare instance where two signals coincide.
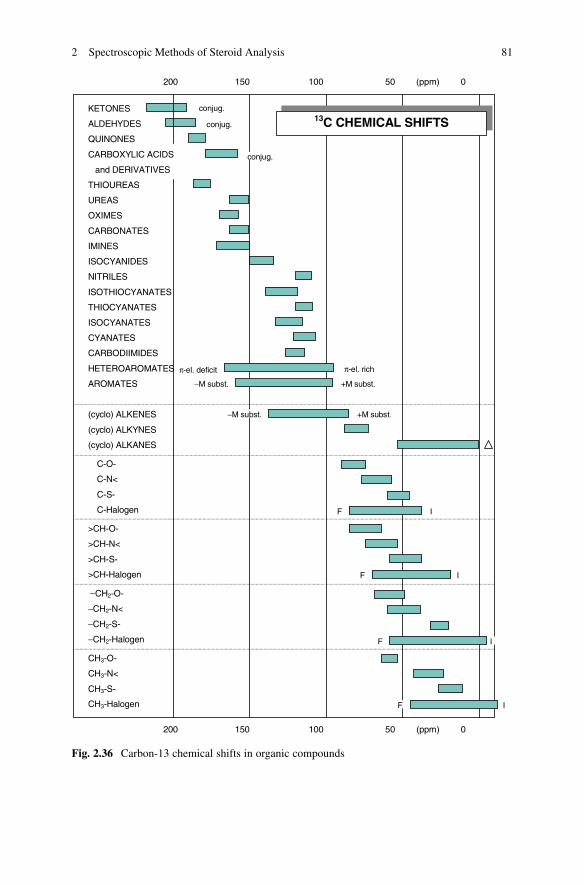
812 Spectroscopic Methods of Steroid Analysis
Fig. 2.36 Carbon-13 chemical shifts in organic compounds
KETONES
ALDEHYDES
QUINONES
CARBOXYLIC ACIDS
and DERIVATIVES
THIOUREAS
UREAS
OXIMES
CARBONATES
IMINES
ISOCYANIDES
NITRILES
ISOTHIOCYANATES
THIOCYANATES
ISOCYANATES
CYANATES
CARBODIIMIDES
HETEROAROMATES
AROMATES
(cyclo) ALKENES
(cyclo) ALKYNES
(cyclo) ALKANES
�
�
�
�
C-O-
C-N<
C-S-
C-Halogen
>CH-O-
>CH-N<
>CH-S-
>CH-Halogen
−CH2-O-
−CH2-N<
−CH2-S-
−CH2-Halogen
CH3-O-
CH3-N<
CH3-S-
CH3-Halogen
conjug.
conjug.
conjug.
π-el. rich
+M subst.
π-el. deficit
−M subst.
13C CHEMICAL SHIFTS
200 150 100 50 (ppm) 0
200 150 100 50 (ppm) 0
+M subst.−M subst.
F
F
F
F
I
I
I
I
82 A. Kasal et al.
The J(C,C) couplings are normally not observed, because the low natural abundance makes it extremely unlikely that two 13C atoms are present in the same molecule.
Unlike 1H spectra, signal intensities in routine 13C NMR spectra do not correspond to the number of nuclei. In particular, carbon atoms with no attached protons give much weaker signals than proton-bearing carbons, due to long relaxation times and weaker NOEs. The quantitative 13C NMR spectra are time-consuming since they require long-relaxation delays between pulses and suppression of NOE enhancement.
2.4.5.3 NMR Spectra of Other Nuclei
(a) Deuterium (2H)
Deuterium has a spin I = 1, a quadrupole moment (leading to broad lines) and very low natural abundance (0.015%) and therefore also low sensitivity. Nevertheless, it is possible to measure proton-decoupled 2H NMR spectra at natural abundance. The 2H chemical shifts (on the d-scale) are identical with 1H shifts. In fully deuterated samples the J(2H,2H) are very small (ca 40× smaller than J(1H,1H)) and not observable in broad deuterium signals. The couplings J(2H,1H) ~1–2 Hz are observed in 1H NMR spectra at the residual proton signals of deuterated solvents (e.g. pentets of CHD
2OD or CHD
2SOCD
3 in deuterated methanol and/or dimethyl sulphoxide
solution). Similarly in 13C NMR spectra the couplings J(13C,2H) are responsible for the splitting of signals of the common deuterated solvents (triplet of CDCl
3 with
J » 32 Hz or septets of CD3OD and CD
3SOCD
3 with J » 21 Hz).
The presence and location of deuterium in a molecule is often inferred from the absence of signals in the 1H spectrum. Replacement of a proton by deuterium causes an upfield shift of the methylene carbon by as much as 0.3–0.5 ppm (Eggert and Djerassi, 1973). Such isotope shifts have found use as an aid to 13C spectroscopic assignment. The presence of deuterium may also result in very small isotope shifts of signals from neighbouring nuclei.
Applications of 2H NMR have included the study of the mobility and motion of deuterium-labelled cholesterol in membranes (Dufourc and Smith, 1985) and in solution (Murari et al., 1985), and the determination of the sites of labelling resulting from steroid reactions (Hanson and Reese, 1985).
(b) Tritium (3H)
Tritium is a radioactive isotope (half-time 12.3 years) with zero natural abundance. It has spin I = 1/2 and very high sensitivity (1.2× higher than 1H). Due to the sharp lines and high sensitivity, tritium labeling even at a low level of 3H enrichment is sufficient. Chemical shifts of 3H are (in d-scale) identical with 1H shifts and coupling constants J(3H,1H) in 3H NMR spectra are usually eliminated by proton broadband decoupling.
3H NMR spectra at high isotopic incorporation have been used to determine the distribution of the radioactive label in some natural and synthetic steroid hormones (Al-Rawi et al., 1976; Altman and Silberman, 1977; Funke et al., 1983).
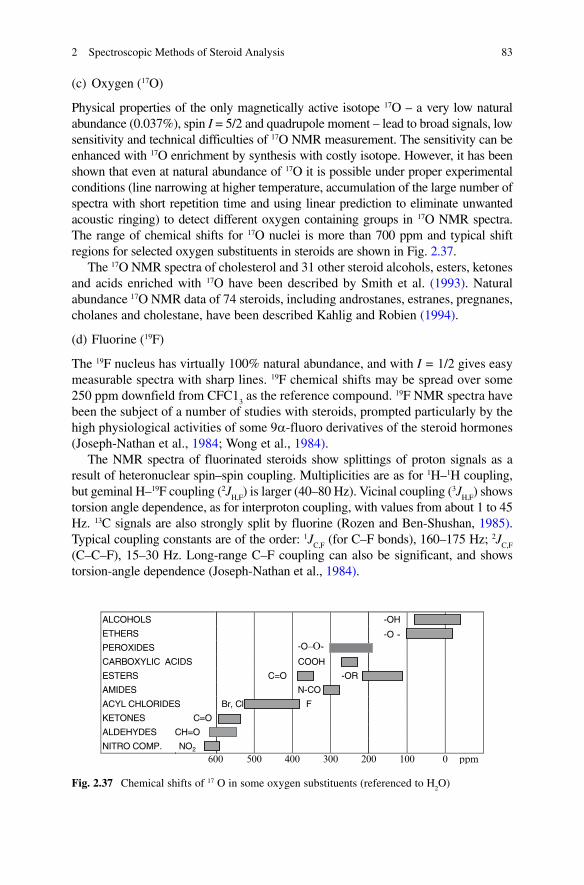
832 Spectroscopic Methods of Steroid Analysis
(c) Oxygen (17O)
Physical properties of the only magnetically active isotope 17O – a very low natural abundance (0.037%), spin I = 5/2 and quadrupole moment – lead to broad signals, low sensitivity and technical difficulties of 17O NMR measurement. The sensitivity can be enhanced with 17O enrichment by synthesis with costly isotope. However, it has been shown that even at natural abundance of 17O it is possible under proper experimental conditions (line narrowing at higher temperature, accumulation of the large number of spectra with short repetition time and using linear prediction to eliminate unwanted acoustic ringing) to detect different oxygen containing groups in 17O NMR spectra. The range of chemical shifts for 17O nuclei is more than 700 ppm and typical shift regions for selected oxygen substituents in steroids are shown in Fig. 2.37.
The 17O NMR spectra of cholesterol and 31 other steroid alcohols, esters, ketones and acids enriched with 17O have been described by Smith et al. (1993). Natural abundance 17O NMR data of 74 steroids, including androstanes, estranes, pregnanes, cholanes and cholestane, have been described Kahlig and Robien (1994).
(d) Fluorine (19F)
The 19F nucleus has virtually 100% natural abundance, and with I = 1/2 gives easy measurable spectra with sharp lines. 19F chemical shifts may be spread over some 250 ppm downfield from CFC1
3 as the reference compound. 19F NMR spectra have
been the subject of a number of studies with steroids, prompted particularly by the high physiological activities of some 9a-fluoro derivatives of the steroid hormones (Joseph-Nathan et al., 1984; Wong et al., 1984).
The NMR spectra of fluorinated steroids show splittings of proton signals as a result of heteronuclear spin–spin coupling. Multiplicities are as for 1H–1H coupling, but geminal H–19F coupling (2J
H,F) is larger (40–80 Hz). Vicinal coupling (3J
H,F) shows
torsion angle dependence, as for interproton coupling, with values from about 1 to 45 Hz. 13C signals are also strongly split by fluorine (Rozen and Ben-Shushan, 1985). Typical coupling constants are of the order: 1J
C,F (for C–F bonds), 160–175 Hz; 2J
C,F
(C–C–F), 15–30 Hz. Long-range C–F coupling can also be significant, and shows torsion-angle dependence (Joseph-Nathan et al., 1984).
ALCOHOLS -OH
ETHERS -O -PEROXIDES -O–O-
CARBOXYLIC ACIDS COOH
ESTERS C=O -OR
AMIDES N-CO
ACYL CHLORIDES Br, Cl F
KETONES C=O
ALDEHYDES CH=O
NITRO COMP. NO2
600 500 400 300 200 100 0 ppm
Fig. 2.37 Chemical shifts of 17 O in some oxygen substituents (referenced to H2O)
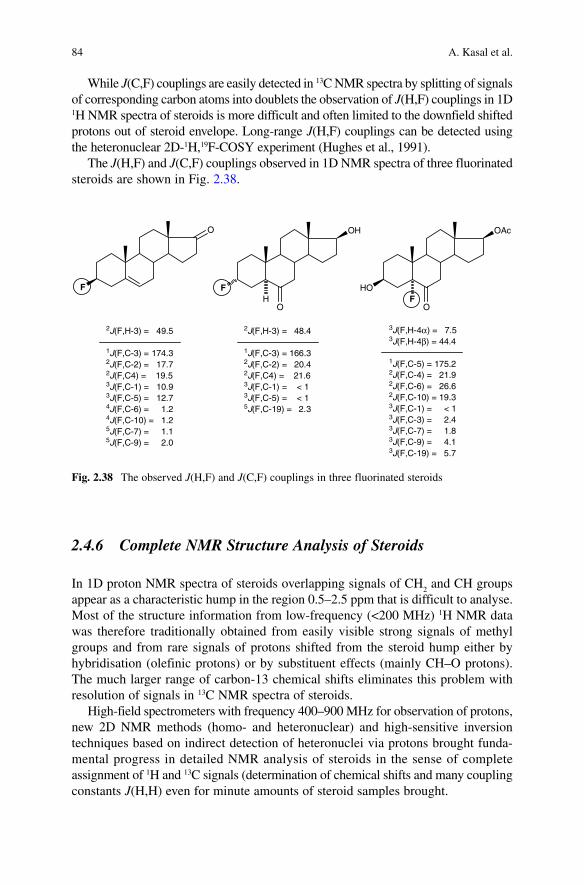
84 A. Kasal et al.
While J(C,F) couplings are easily detected in 13C NMR spectra by splitting of signals of corresponding carbon atoms into doublets the observation of J(H,F) couplings in 1D 1H NMR spectra of steroids is more difficult and often limited to the downfield shifted protons out of steroid envelope. Long-range J(H,F) couplings can be detected using the heteronuclear 2D-1H,19F-COSY experiment (Hughes et al., 1991).
The J(H,F) and J(C,F) couplings observed in 1D NMR spectra of three fluorinated steroids are shown in Fig. 2.38.
2.4.6 Complete NMR Structure Analysis of Steroids
In 1D proton NMR spectra of steroids overlapping signals of CH2 and CH groups
appear as a characteristic hump in the region 0.5–2.5 ppm that is difficult to analyse. Most of the structure information from low-frequency (<200 MHz) 1H NMR data was therefore traditionally obtained from easily visible strong signals of methyl groups and from rare signals of protons shifted from the steroid hump either by hybridisation (olefinic protons) or by substituent effects (mainly CH–O protons). The much larger range of carbon-13 chemical shifts eliminates this problem with resolution of signals in 13C NMR spectra of steroids.
High-field spectrometers with frequency 400–900 MHz for observation of protons, new 2D NMR methods (homo- and heteronuclear) and high-sensitive inversion techniques based on indirect detection of heteronuclei via protons brought funda-mental progress in detailed NMR analysis of steroids in the sense of complete assignment of 1H and 13C signals (determination of chemical shifts and many coupling constants J(H,H) even for minute amounts of steroid samples brought.
O
F
OH
F
OH
OAc
HO
OF
3J(F,H-4α) = 7.53J(F,H-4β) = 44.4
1J(F,C-5) = 175.22J(F,C-4) = 21.92J(F,C-6) = 26.62J(F,C-10) = 19.33J(F,C-1) = < 13J(F,C-3) = 2.43J(F,C-7) = 1.83J(F,C-9) = 4.13J(F,C-19) = 5.7
2J(F,H-3) = 49.5
1J(F,C-3) = 174.32J(F,C-2) = 17.72J(F,C4) = 19.53J(F,C-1) = 10.93J(F,C-5) = 12.74J(F,C-6) = 1.24J(F,C-10) = 1.25J(F,C-7) = 1.15J(F,C-9) = 2.0
2J(F,H-3) = 48.4
1J(F,C-3) = 166.32J(F,C-2) = 20.42J(F,C4) = 21.63J(F,C-1) = < 13J(F,C-5) = < 15J(F,C-19) = 2.3
Fig. 2.38 The observed J(H,F) and J(C,F) couplings in three fluorinated steroids
852 Spectroscopic Methods of Steroid Analysis
The choice of proper NMR strategy depends on the type of problem to be solved, complexity of spectra, amount of sample and accessible NMR facilities. In case of the structural modification of a known starting steroid by chemical reaction, evidence for the presence of a functional group in a certain position can be simply obtained from 1D and/or the 2D-H,H-COSY spectrum. On the other hand identification of a new steroid compound isolated from natural material will require a complete analysis of the steroid skeleton combining a set of homo- and heteronuclear 2D-NMR experiments. The biochemical study of the structure-activity may require a complete 3D-structure of the steroid molecule in solution based on a combination of the observed NOE contacts, coupling constants J(H,H) and molecular modeling.
Table 2.12 gives an overview of the NMR parameters and methods used in the NMR structural study of steroids and the corresponding structural information. The detailed analysis of 1H NMR spectra of steroids is achievable only with high-field NMR spectrometers (400 MHz and higher). An excellent review of the application of 2D-NMR methods in structural analysis of steroids has been published by Croasmun et al. (1994).
2.4.6.1 Dispersion of Signals in Steroid NMR Spectrum
NMR spectra of steroids are usually measured in CDCl3. Dispersion of signals can
be to a certain extent influenced by a change of solvent (mainly benzene or pyridine). Even small induced shifts can in some cases significantly simplify the analysis of spectra and enable the extraction of J(H,H) values in the region of strongly overlap-ping signals. The shifts induced with aromatic solvent (ASIS) are largest in steroids containing polar substituents and for protons in their neighbourhood. The observed changes of chemical shifts induced by benzene in the 1H and 13C NMR spectra of dehydroepiandrostanone are shown in Fig. 2.39.
Much larger shifts can be induced by lanthanide shift reagents (LSR). Para-magnetic lanthanide ion brings about dramatic changes in chemical shifts of nuclei in the substrate molecule. The size of lanthanide induced shifts (LIS) depends on the ratio of LSR and substrate. The relative LIS values for individual protons depend on the distance and orientation of a given proton and the lanthanide in the dynamic complex of LSR with a steroid. The disadvantage of LSR application is the line-broadening of the proton signal that increases with the LSR/substrate ratio and also with the increasing magnetic field of the spectrometer.
2.4.6.2 Connectivity Diagrams
NMR structure analysis is based on the detection of chemical bonds and spatially close atoms.
Heteronuclear 2D-methods (2D-H,C-HMQC, 2D-H,C-HSQC) correlate signals of directly bonded carbon and hydrogen atoms (C–H bonds).
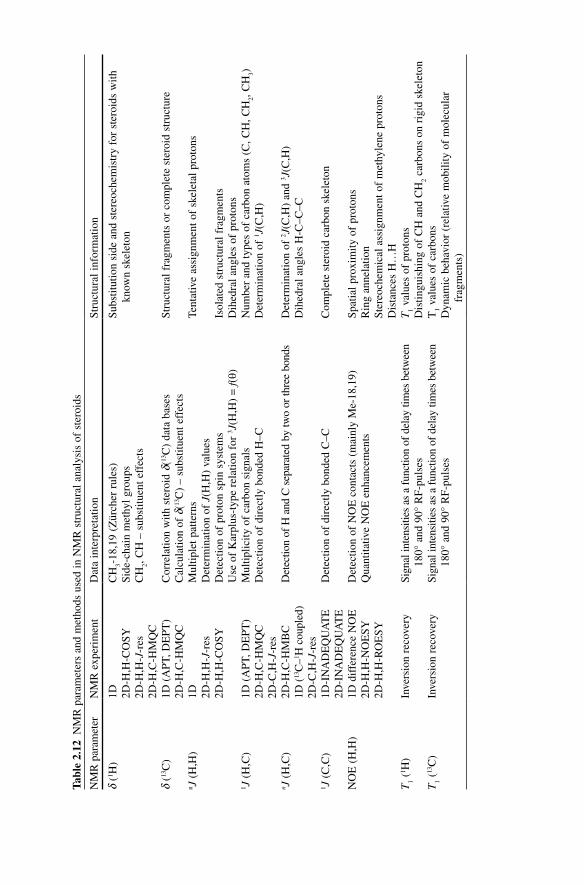
Tabl
e 2.
12 N
MR
par
amet
ers
and
met
hods
use
d in
NM
R s
truc
tura
l ana
lysi
s of
ste
roid
s
NM
R p
aram
eter
NM
R e
xper
imen
tD
ata
inte
rpre
tatio
nSt
ruct
ural
info
rmat
ion
d (1 H
)1D
CH
3-18
,19
(Zür
cher
rul
es)
Subs
titut
ion
side
and
ste
reoc
hem
istr
y fo
r st
eroi
ds w
ith
know
n sk
elet
on2D
-H,H
-CO
SYSi
de-c
hain
met
hyl g
roup
s2D
-H,H
-J-r
esC
H2,
CH
– s
ubst
ituen
t eff
ects
2D-H
,C-H
MQ
Cd
(13C
)1D
(A
PT, D
EPT
)C
orre
latio
n w
ith s
tero
id d
(13C
) da
ta b
ases
Stru
ctur
al f
ragm
ents
or
com
plet
e st
eroi
d st
ruct
ure
2D-H
,C-H
MQ
CC
alcu
latio
n of
d(13
C)
– su
bstit
uent
eff
ects
n J (
H,H
)1D
Mul
tiple
t pat
tern
sTe
ntat
ive
assi
gnm
ent o
f sk
elet
al p
roto
ns2D
-H,H
-J-r
esD
eter
min
atio
n of
J(H
,H)
valu
es2D
-H,H
-CO
SYD
etec
tion
of p
roto
n sp
in s
yste
ms
Isol
ated
str
uctu
ral f
ragm
ents
Use
of
Kar
plus
-typ
e re
latio
n fo
r 3 J
(H,H
) =
f(q)
Dih
edra
l ang
les
of p
roto
ns1 J
(H
,C)
1D (
APT
, DE
PT)
Mul
tiplic
ity o
f ca
rbon
sig
nals
Num
ber
and
type
s of
car
bon
atom
s (C
, CH
, CH
2, C
H3)
2D-H
,C-H
MQ
CD
etec
tion
of d
irec
tly b
onde
d H
–CD
eter
min
atio
n of
1 J(C
,H)
2D-C
,H-J
-res
n J (
H,C
)2D
-H,C
-HM
BC
Det
ectio
n of
H a
nd C
sep
arat
ed b
y tw
o or
thre
e bo
nds
Det
erm
inat
ion
of 2 J
(C,H
) an
d 3 J
(C,H
)1D
(13
C–1 H
cou
pled
)D
ihed
ral a
ngle
s H
-C–C
–C2D
-C,H
-J-r
es1 J
(C
,C)
1D-I
NA
DE
QU
AT
ED
etec
tion
of d
irec
tly b
onde
d C
–CC
ompl
ete
ster
oid
carb
on s
kele
ton
2D-I
NA
DE
QU
AT
EN
OE
(H
,H)
1D d
iffe
renc
e N
OE
Det
ectio
n of
NO
E c
onta
cts
(mai
nly
Me-
18,1
9)Sp
atia
l pro
xim
ity o
f pr
oton
s2D
-H,H
-NO
ESY
Qua
ntita
tive
NO
E e
nhan
cem
ents
Rin
g an
nela
tion
2D-H
,H-R
OE
SYSt
ereo
chem
ical
ass
ignm
ent o
f m
ethy
lene
pro
tons
Dis
tanc
es H
…H
T1
(1 H)
Inve
rsio
n re
cove
rySi
gnal
inte
nsiti
es a
s a
func
tion
of d
elay
tim
es b
etw
een
180°
and
90°
RF-
puls
esT
1 va
lues
of
prot
ons
Dis
tingu
ishi
ng o
f C
H a
nd C
H2
carb
ons
on r
igid
ske
leto
nT
1 (13
C)
Inve
rsio
n re
cove
rySi
gnal
inte
nsiti
es a
s a
func
tion
of d
elay
tim
es b
etw
een
180°
and
90°
RF-
puls
esT
1 va
lues
of
carb
ons
Dyn
amic
beh
avio
r (r
elat
ive
mob
ility
of
mol
ecul
ar
frag
men
ts)
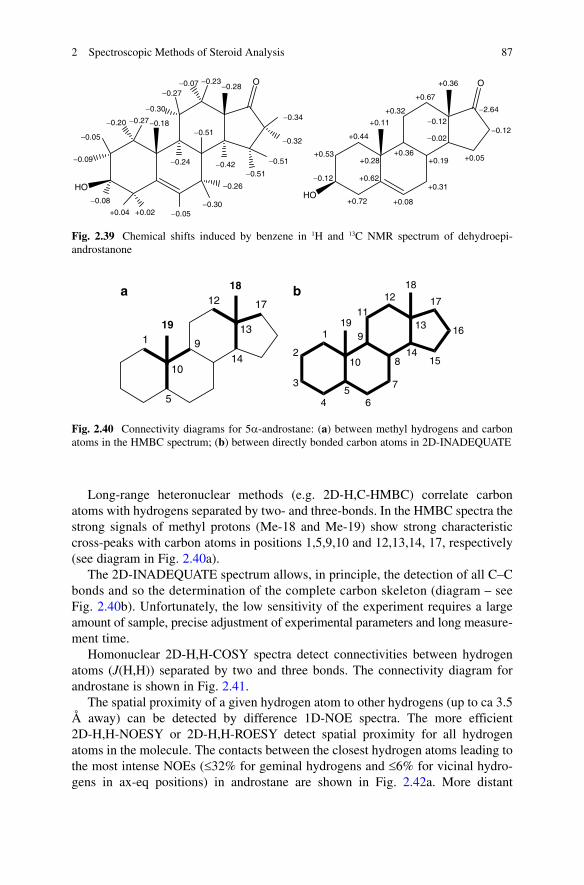
872 Spectroscopic Methods of Steroid Analysis
Long-range heteronuclear methods (e.g. 2D-H,C-HMBC) correlate carbon atoms with hydrogens separated by two- and three-bonds. In the HMBC spectra the strong signals of methyl protons (Me-18 and Me-19) show strong characteristic cross-peaks with carbon atoms in positions 1,5,9,10 and 12,13,14, 17, respectively (see diagram in Fig. 2.40a).
The 2D-INADEQUATE spectrum allows, in principle, the detection of all C–C bonds and so the determination of the complete carbon skeleton (diagram – see Fig. 2.40b). Unfortunately, the low sensitivity of the experiment requires a large amount of sample, precise adjustment of experimental parameters and long measure-ment time.
Homonuclear 2D-H,H-COSY spectra detect connectivities between hydrogen atoms (J(H,H)) separated by two and three bonds. The connectivity diagram for androstane is shown in Fig. 2.41.
The spatial proximity of a given hydrogen atom to other hydrogens (up to ca 3.5 Å away) can be detected by difference 1D-NOE spectra. The more efficient 2D-H,H-NOESY or 2D-H,H-ROESY detect spatial proximity for all hydrogen atoms in the molecule. The contacts between the closest hydrogen atoms leading to the most intense NOEs (£32% for geminal hydrogens and £6% for vicinal hydro-gens in ax-eq positions) in androstane are shown in Fig. 2.42a. More distant
O
HO
O
HO
−0.32
−0.34
−0.51
−0.51−0.42
−0.28−0.23−0.07
−0.27
−0.30
−0.18−0.27−0.20
−0.05
−0.09
−0.08
+0.04 +0.02 −0.05−0.30
−0.26
−0.51
−0.24
+0.44
+0.53
−0.12
+0.72
+0.62
+0.08
+0.31
+0.19+0.36
+0.28
+0.11
+0.32
+0.67
−0.12
−2.64
−0.12
+0.05
−0.02
+0.36
Fig. 2.39 Chemical shifts induced by benzene in 1H and 13C NMR spectrum of dehydroepi-androstanone
1
10
5
9
19
18
14
1712
13 1
10
5
919
18
14
1712
16
15
1113
6
7
8
4
2
3
a b
Fig. 2.40 Connectivity diagrams for 5a-androstane: (a) between methyl hydrogens and carbon atoms in the HMBC spectrum; (b) between directly bonded carbon atoms in 2D-INADEQUATE
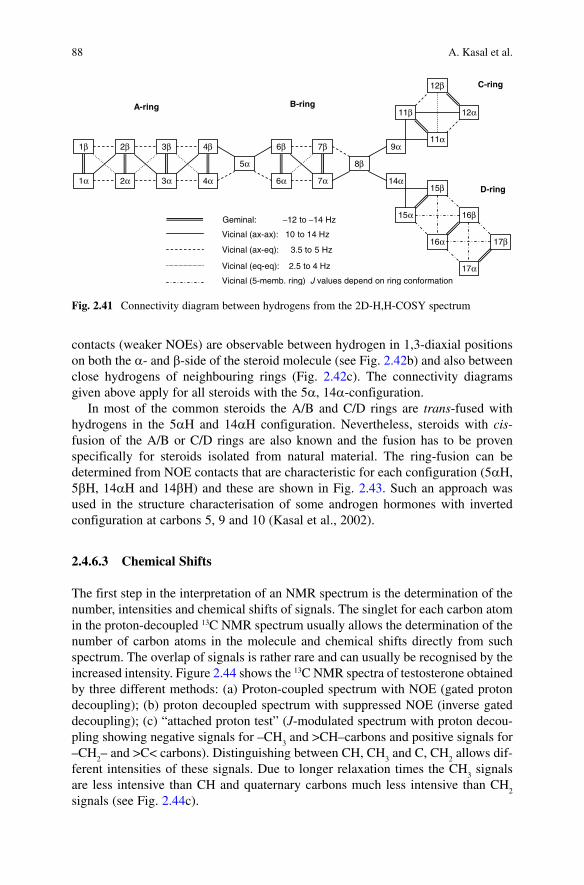
88 A. Kasal et al.
contacts (weaker NOEs) are observable between hydrogen in 1,3-diaxial positions on both the a- and b-side of the steroid molecule (see Fig. 2.42b) and also between close hydrogens of neighbouring rings (Fig. 2.42c). The connectivity diagrams given above apply for all steroids with the 5a, 14a-configuration.
In most of the common steroids the A/B and C/D rings are trans-fused with hydrogens in the 5aH and 14aH configuration. Nevertheless, steroids with cis-fusion of the A/B or C/D rings are also known and the fusion has to be proven specifically for steroids isolated from natural material. The ring-fusion can be determined from NOE contacts that are characteristic for each configuration (5aH, 5bH, 14aH and 14bH) and these are shown in Fig. 2.43. Such an approach was used in the structure characterisation of some androgen hormones with inverted configuration at carbons 5, 9 and 10 (Kasal et al., 2002).
2.4.6.3 Chemical Shifts
The first step in the interpretation of an NMR spectrum is the determination of the number, intensities and chemical shifts of signals. The singlet for each carbon atom in the proton-decoupled 13C NMR spectrum usually allows the determination of the number of carbon atoms in the molecule and chemical shifts directly from such spectrum. The overlap of signals is rather rare and can usually be recognised by the increased intensity. Figure 2.44 shows the 13C NMR spectra of testosterone obtained by three different methods: (a) Proton-coupled spectrum with NOE (gated proton decoupling); (b) proton decoupled spectrum with suppressed NOE (inverse gated decoupling); (c) “attached proton test” (J-modulated spectrum with proton decou-pling showing negative signals for –CH
3 and >CH–carbons and positive signals for
–CH2– and >C< carbons). Distinguishing between CH, CH
3 and C, CH
2 allows dif-
ferent intensities of these signals. Due to longer relaxation times the CH3 signals
are less intensive than CH and quaternary carbons much less intensive than CH2
signals (see Fig. 2.44c).
1α
2β
2α
1β
3α
4β
4α
3β 6β
6α
5α
7α
8β
7β 9α
14α
16α
16β
15β
15α
17α
17β
11α
12α
12β
11βA-ring B-ring
C-ring
D-ring
Geminal: −12 to −14 Hz
Vicinal (ax-ax): 10 to 14 Hz
Vicinal (eq-eq): 2.5 to 4 Hz
Vicinal (ax-eq): 3.5 to 5 Hz
Vicinal (5-memb. ring) J values depend on ring conformation
Fig. 2.41 Connectivity diagram between hydrogens from the 2D-H,H-COSY spectrum
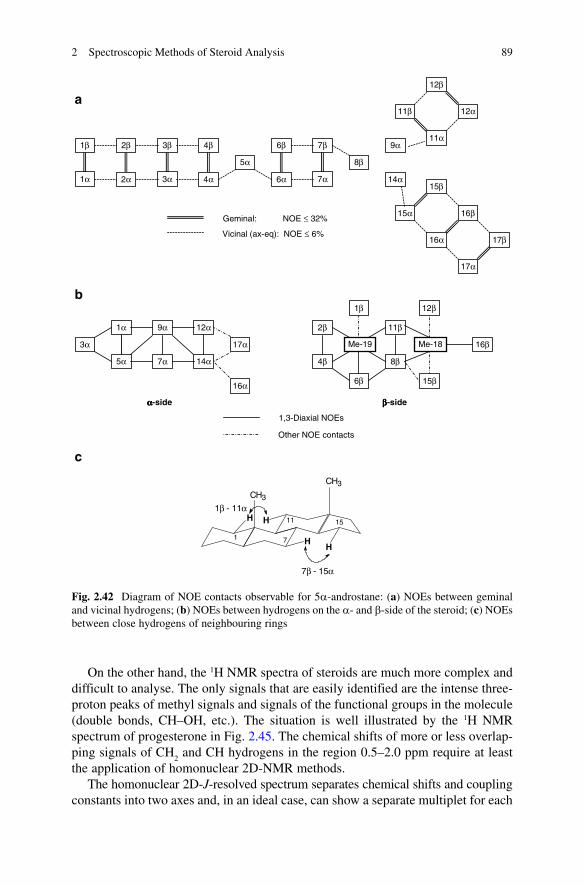
892 Spectroscopic Methods of Steroid Analysis
On the other hand, the 1H NMR spectra of steroids are much more complex and difficult to analyse. The only signals that are easily identified are the intense three-proton peaks of methyl signals and signals of the functional groups in the molecule (double bonds, CH–OH, etc.). The situation is well illustrated by the 1H NMR spectrum of progesterone in Fig. 2.45. The chemical shifts of more or less overlap-ping signals of CH
2 and CH hydrogens in the region 0.5–2.0 ppm require at least
the application of homonuclear 2D-NMR methods.The homonuclear 2D-J-resolved spectrum separates chemical shifts and coupling
constants into two axes and, in an ideal case, can show a separate multiplet for each
a
b
c
1α
2β
2α
1β
3α
4β
4α
3β 6β
6α
5α
7α
8β
7β 9α
14α
16α
16β
15β
15α
17α
17β
11α
12α
12β
11β
Geminal: NOE ≤ 32%
Vicinal (ax-eq): NOE ≤ 6%
H
H
H
H
CH3
CH3
1
1511
7
7β - 15α
1β - 11α
1,3-Diaxial NOEs
Other NOE contacts
5α
9α
7α
1α
14α
17α
16α
12α
3α
αααα-side
2β
4β
11β
8β
Me-19
1β
Me-18
6β 15β
12β
16β
ββββ-side
Fig. 2.42 Diagram of NOE contacts observable for 5a-androstane: (a) NOEs between geminal and vicinal hydrogens; (b) NOEs between hydrogens on the a- and b-side of the steroid; (c) NOEs between close hydrogens of neighbouring rings
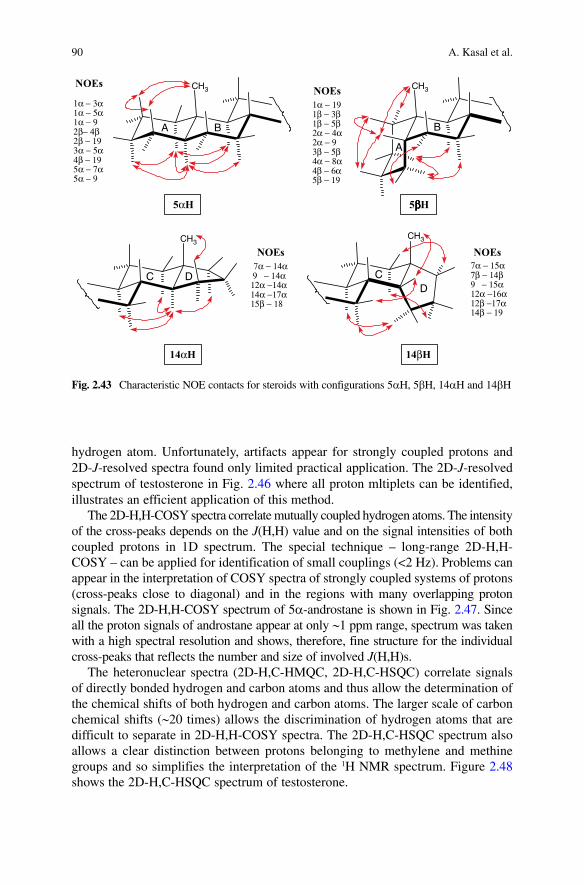
90 A. Kasal et al.
hydrogen atom. Unfortunately, artifacts appear for strongly coupled protons and 2D-J-resolved spectra found only limited practical application. The 2D-J-resolved spectrum of testosterone in Fig. 2.46 where all proton mltiplets can be identified, illustrates an efficient application of this method.
The 2D-H,H-COSY spectra correlate mutually coupled hydrogen atoms. The intensity of the cross-peaks depends on the J(H,H) value and on the signal intensities of both coupled protons in 1D spectrum. The special technique – long-range 2D-H,H-COSY – can be applied for identification of small couplings (<2 Hz). Problems can appear in the interpretation of COSY spectra of strongly coupled systems of protons (cross-peaks close to diagonal) and in the regions with many overlapping proton signals. The 2D-H,H-COSY spectrum of 5a-androstane is shown in Fig. 2.47. Since all the proton signals of androstane appear at only ~1 ppm range, spectrum was taken with a high spectral resolution and shows, therefore, fine structure for the individual cross-peaks that reflects the number and size of involved J(H,H)s.
The heteronuclear spectra (2D-H,C-HMQC, 2D-H,C-HSQC) correlate signals of directly bonded hydrogen and carbon atoms and thus allow the determination of the chemical shifts of both hydrogen and carbon atoms. The larger scale of carbon chemical shifts (~20 times) allows the discrimination of hydrogen atoms that are difficult to separate in 2D-H,H-COSY spectra. The 2D-H,C-HSQC spectrum also allows a clear distinction between protons belonging to methylene and methine groups and so simplifies the interpretation of the 1H NMR spectrum. Figure 2.48 shows the 2D-H,C-HSQC spectrum of testosterone.
Fig. 2.43 Characteristic NOE contacts for steroids with configurations 5aH, 5bH, 14aH and 14bH
CH3 CH3
CH3CH3
1α − 3α1α − 5α1α − 92β− 4β2β − 193α − 5α4β − 195α − 7α5α − 9
1α − 191β − 3β1β − 5β2α − 4α2α − 93β − 5β4α − 8α4β − 6α5β − 19
7α − 14α 9 − 14α12α −14α14α −17α15β − 18
7α − 15α7β − 14β9 − 15α12α −16α12β −17α14β − 19
5αH 5ββββH
14αH 14βH
NOEsNOEs
NOEs NOEs
A B
A
B
C D CD
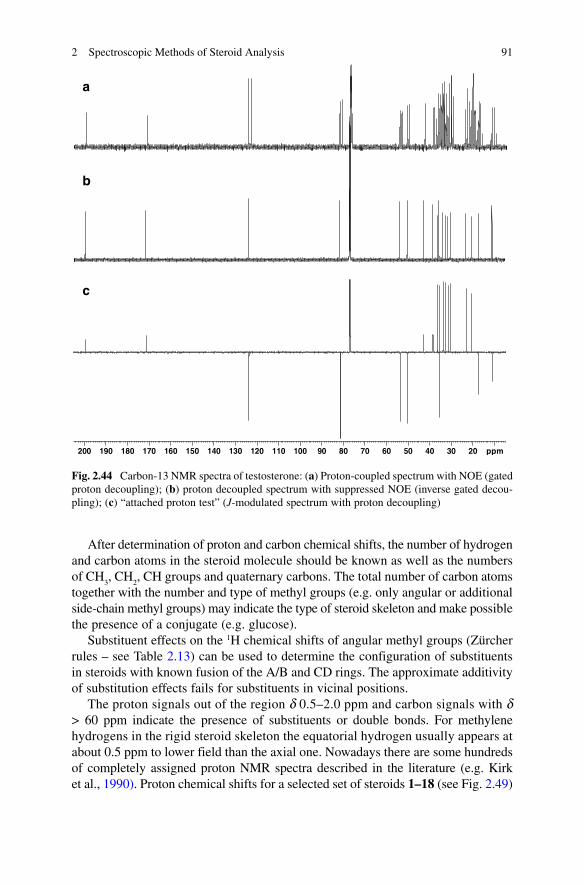
912 Spectroscopic Methods of Steroid Analysis
After determination of proton and carbon chemical shifts, the number of hydrogen and carbon atoms in the steroid molecule should be known as well as the numbers of CH
3, CH
2, CH groups and quaternary carbons. The total number of carbon atoms
together with the number and type of methyl groups (e.g. only angular or additional side-chain methyl groups) may indicate the type of steroid skeleton and make possible the presence of a conjugate (e.g. glucose).
Substituent effects on the 1H chemical shifts of angular methyl groups (Zürcher rules – see Table 2.13) can be used to determine the configuration of substituents in steroids with known fusion of the A/B and CD rings. The approximate additivity of substitution effects fails for substituents in vicinal positions.
The proton signals out of the region d 0.5–2.0 ppm and carbon signals with d > 60 ppm indicate the presence of substituents or double bonds. For methylene hydrogens in the rigid steroid skeleton the equatorial hydrogen usually appears at about 0.5 ppm to lower field than the axial one. Nowadays there are some hundreds of completely assigned proton NMR spectra described in the literature (e.g. Kirk et al., 1990). Proton chemical shifts for a selected set of steroids 1–18 (see Fig. 2.49)
2030405060708090100110120130140150160170180190200 ppm
a
b
c
Fig. 2.44 Carbon-13 NMR spectra of testosterone: (a) Proton-coupled spectrum with NOE (gated proton decoupling); (b) proton decoupled spectrum with suppressed NOE (inverse gated decou-pling); (c) “attached proton test” (J-modulated spectrum with proton decoupling)
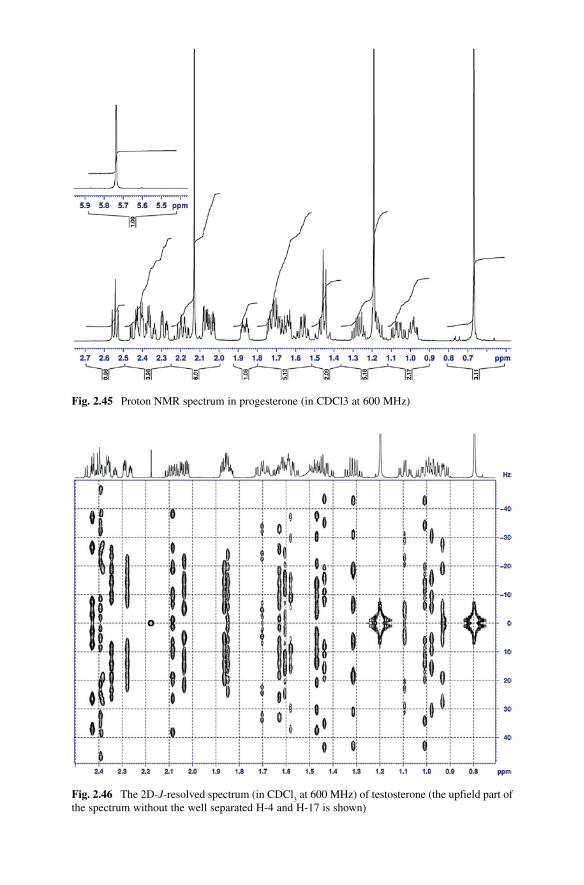
Fig. 2.45 Proton NMR spectrum in progesterone (in CDCl3 at 600 MHz)
Fig. 2.46 The 2D-J-resolved spectrum (in CDCl3 at 600 MHz) of testosterone (the upfield part of
the spectrum without the well separated H-4 and H-17 is shown)
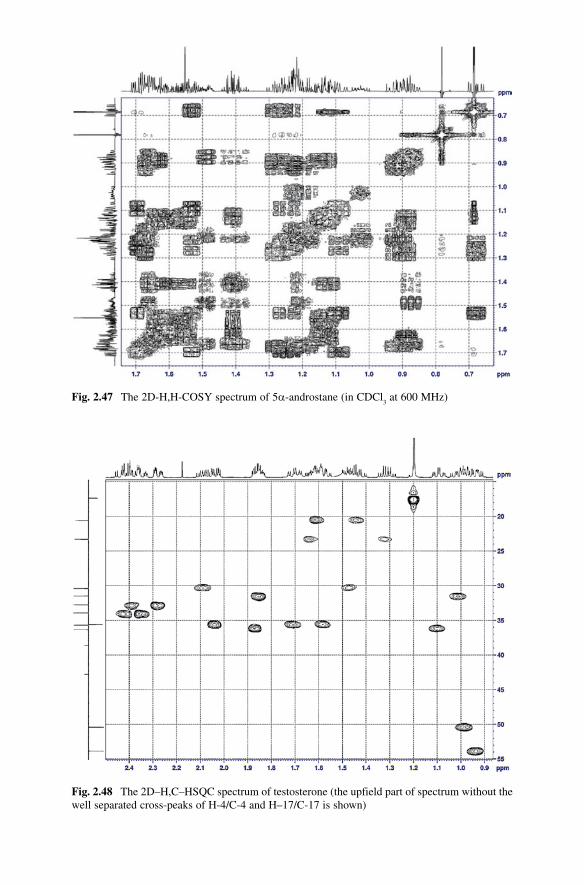
Fig. 2.47 The 2D-H,H-COSY spectrum of 5a-androstane (in CDCl3 at 600 MHz)
Fig. 2.48 The 2D–H,C–HSQC spectrum of testosterone (the upfield part of spectrum without the well separated cross-peaks of H-4/C-4 and H–17/C-17 is shown)
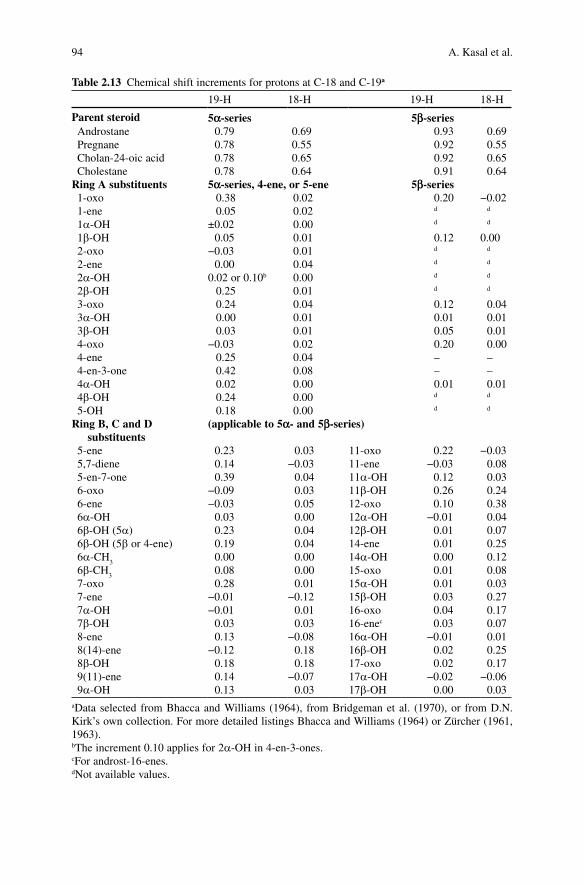
94 A. Kasal et al.
Table 2.13 Chemical shift increments for protons at C-18 and C-19a
19-H 18-H 19-H 18-H
Parent steroid 5a-series 5b-series Androstane 0.79 0.69 0.93 0.69 Pregnane 0.78 0.55 0.92 0.55 Cholan-24-oic acid 0.78 0.65 0.92 0.65 Cholestane 0.78 0.64 0.91 0.64Ring A substituents 5a-series, 4-ene, or 5-ene 5b-series 1-oxo 0.38 0.02 0.20 −0.02 1-ene 0.05 0.02 d d
1a-OH ±0.02 0.00 d d
1b-OH 0.05 0.01 0.12 0.00 2-oxo −0.03 0.01 d d
2-ene 0.00 0.04 d d
2a-OH 0.02 or 0.10b 0.00 d d
2b-OH 0.25 0.01 d d
3-oxo 0.24 0.04 0.12 0.04 3a-OH 0.00 0.01 0.01 0.01 3b-OH 0.03 0.01 0.05 0.01 4-oxo −0.03 0.02 0.20 0.00 4-ene 0.25 0.04 – – 4-en-3-one 0.42 0.08 – – 4a-OH 0.02 0.00 0.01 0.01 4b-OH 0.24 0.00 d d
5-OH 0.18 0.00 d d
Ring B, C and D substituents
(applicable to 5a- and 5b-series)
5-ene 0.23 0.03 11-oxo 0.22 −0.03 5,7-diene 0.14 −0.03 11-ene −0.03 0.08 5-en-7-one 0.39 0.04 11a-OH 0.12 0.03 6-oxo −0.09 0.03 11b-OH 0.26 0.24 6-ene −0.03 0.05 12-oxo 0.10 0.38 6a-OH 0.03 0.00 12a-OH −0.01 0.04 6b-OH (5a) 0.23 0.04 12b-OH 0.01 0.07 6b-OH (5b or 4-ene) 0.19 0.04 14-ene 0.01 0.25 6a-CH
30.00 0.00 14a-OH 0.00 0.12
6b-CH3
0.08 0.00 15-oxo 0.01 0.08 7-oxo 0.28 0.01 15a-OH 0.01 0.03 7-ene −0.01 −0.12 15b-OH 0.03 0.27 7a-OH −0.01 0.01 16-oxo 0.04 0.17 7b-OH 0.03 0.03 16-enec 0.03 0.07 8-ene 0.13 −0.08 16a-OH −0.01 0.01 8(14)-ene −0.12 0.18 16b-OH 0.02 0.25 8b-OH 0.18 0.18 17-oxo 0.02 0.17 9(11)-ene 0.14 −0.07 17a-OH −0.02 −0.06 9a-OH 0.13 0.03 17b-OH 0.00 0.03aData selected from Bhacca and Williams (1964), from Bridgeman et al. (1970), or from D.N. Kirk’s own collection. For more detailed listings Bhacca and Williams (1964) or Zürcher (1961, 1963).bThe increment 0.10 applies for 2a-OH in 4-en-3-ones.cFor androst-16-enes.dNot available values.
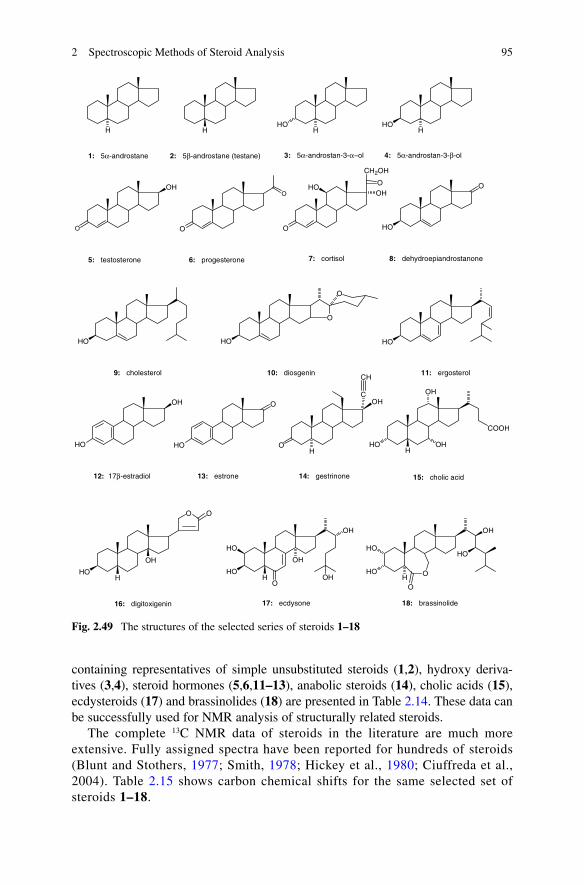
952 Spectroscopic Methods of Steroid Analysis
containing representatives of simple unsubstituted steroids (1,2), hydroxy deriva-tives (3,4), steroid hormones (5,6,11–13), anabolic steroids (14), cholic acids (15), ecdysteroids (17) and brassinolides (18) are presented in Table 2.14. These data can be successfully used for NMR analysis of structurally related steroids.
The complete 13C NMR data of steroids in the literature are much more extensive. Fully assigned spectra have been reported for hundreds of steroids (Blunt and Stothers, 1977; Smith, 1978; Hickey et al., 1980; Ciuffreda et al., 2004). Table 2.15 shows carbon chemical shifts for the same selected set of steroids 1–18.
H
1: 5α-androstane
H
3: 5α-androstan-3-α−ol
HHO
4: 5α-androstan-3-β-ol
5: testosterone
O
6: progesterone
9: cholesterol 11: ergosterol
HO
O
HO HO
12: 17β-estradiol
HO
13: estrone 14: gestrinone
16: digitoxigenin
HO
OH
OH
O
HOH
O O
OH
O
O
7: cortisol
CH2OH
OHO
OH
8: dehydroepiandrostanone
HO
O
10: diosgenin
HO
O
O
15: cholic acid
HHO OH
OH
COOH
17: ecdysone
HO
HO
O
OH
OH
OH
18: brassinolide
HO
HO
OH
HO
OHO
H
2: 5β-androstane (testane)
H
HO
OHC
CH
Fig. 2.49 The structures of the selected series of steroids 1–18
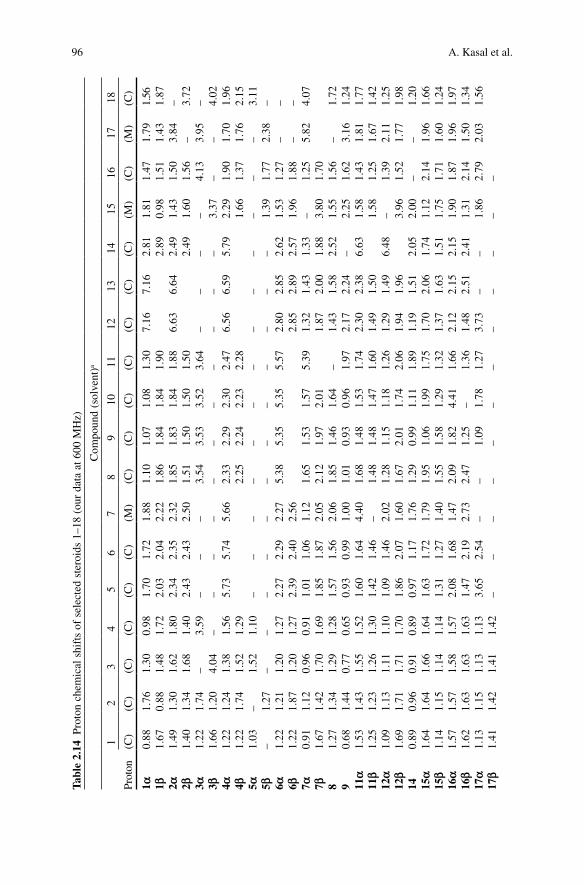
96 A. Kasal et al.
Tabl
e 2.
14 P
roto
n ch
emic
al s
hift
s of
sel
ecte
d st
eroi
ds 1
–18
(our
dat
a at
600
MH
z)
Com
poun
d (s
olve
nt)a
Prot
on
12
34
56
78
910
1112
1314
1516
1718
(C)
(C)
(C)
(C)
(C)
(C)
(M)
(C)
(C)
(C)
(C)
(C)
(C)
(C)
(M)
(C)
(M)
(C)
1a0.
881.
761.
300.
981.
701.
721.
881.
101.
071.
081.
307.
167.
162.
811.
811.
471.
791.
561b
1.67
0.88
1.48
1.72
2.03
2.04
2.22
1.86
1.84
1.84
1.90
2.89
0.98
1.51
1.43
1.87
2a1.
491.
301.
621.
802.
342.
352.
321.
851.
831.
841.
886.
636.
642.
491.
431.
503.
84–
2b1.
401.
341.
681.
402.
432.
432.
501.
511.
501.
501.
502.
491.
601.
56–
3.72
3a1.
221.
74–
3.59
––
–3.
543.
533.
523.
64–
––
–4.
133.
95–
3b1.
661.
204.
04–
––
––
––
––
––
3.37
––
4.02
4a1.
221.
241.
381.
565.
735.
745.
662.
332.
292.
302.
476.
566.
595.
792.
291.
901.
701.
964b
1.22
1.74
1.52
1.29
2.25
2.24
2.23
2.28
1.66
1.37
1.76
2.15
5a1.
03–
1.52
1.10
––
––
––
––
––
––
–3.
115b
–1.
27–
––
––
––
––
––
–1.
391.
772.
38–
6a1.
221.
211.
201.
272.
272.
292.
275.
385.
355.
355.
572.
802.
852.
621.
531.
27–
–6b
1.22
1.87
1.20
1.27
2.39
2.40
2.56
2.85
2.89
2.57
1.96
1.88
––
7a0.
911.
120.
960.
911.
011.
061.
121.
651.
531.
575.
391.
321.
431.
33–
1.25
5.82
4.07
7b1.
671.
421.
701.
691.
851.
872.
052.
121.
972.
011.
872.
001.
883.
801.
708
1.27
1.34
1.29
1.28
1.57
1.56
2.06
1.85
1.46
1.64
–1.
431.
582.
521.
551.
56–
1.72
90.
681.
440.
770.
650.
930.
991.
001.
010.
930.
961.
972.
172.
24–
2.25
1.62
3.16
1.24
11a
1.53
1.43
1.55
1.52
1.60
1.64
4.40
1.68
1.48
1.53
1.74
2.30
2.38
6.63
1.58
1.43
1.81
1.77
11b
1.25
1.23
1.26
1.30
1.42
1.46
–1.
481.
481.
471.
601.
491.
501.
581.
251.
671.
4212
a1.
091.
131.
111.
101.
091.
462.
021.
281.
151.
181.
261.
291.
496.
48–
1.39
2.11
1.25
12b
1.69
1.71
1.71
1.70
1.86
2.07
1.60
1.67
2.01
1.74
2.06
1.94
1.96
3.96
1.52
1.77
1.98
140.
890.
960.
910.
890.
971.
171.
761.
290.
991.
111.
891.
191.
512.
052.
00–
–1.
2015
a1.
641.
641.
661.
641.
631.
721.
791.
951.
061.
991.
751.
702.
061.
741.
122.
141.
961.
6615
b1.
141.
151.
141.
141.
311.
271.
401.
551.
581.
291.
321.
371.
631.
511.
751.
711.
601.
2416
a1.
571.
571.
581.
572.
081.
681.
472.
091.
824.
411.
662.
122.
152.
151.
901.
871.
961.
9716
b1.
621.
631.
631.
631.
472.
192.
732.
471.
25–
1.36
1.48
2.51
2.41
1.31
2.14
1.50
1.34
17a
1.13
1.15
1.13
1.13
3.65
2.54
––
1.09
1.78
1.27
3.73
––
1.86
2.79
2.03
1.56
17b
1.41
1.42
1.41
1.42
––
––
––
––
––
––
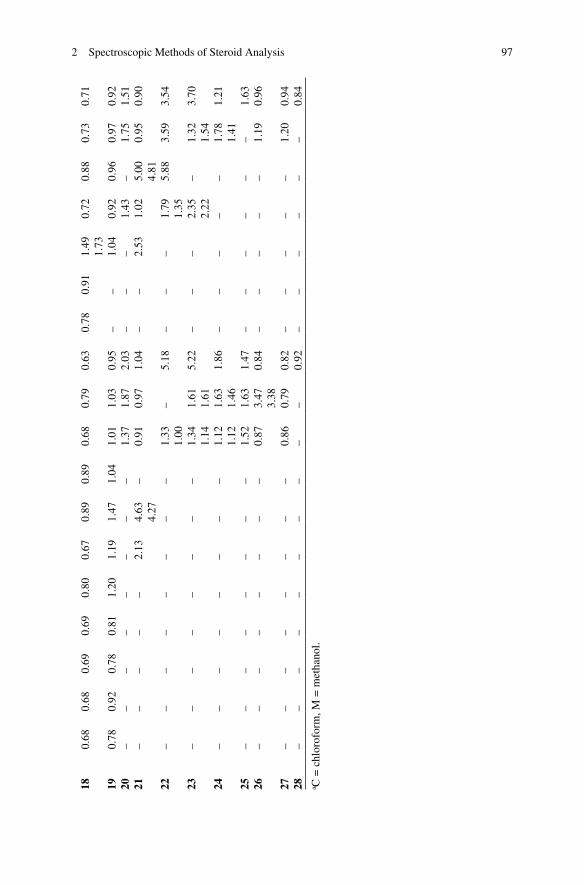
972 Spectroscopic Methods of Steroid Analysis
180.
680.
680.
690.
690.
800.
670.
890.
890.
680.
790.
630.
780.
911.
490.
720.
880.
730.
711.
7319
0.78
0.92
0.78
0.81
1.20
1.19
1.47
1.04
1.01
1.03
0.95
––
1.04
0.92
0.96
0.97
0.92
20–
––
––
––
–1.
371.
872.
03–
––
1.43
–1.
751.
5121
––
––
–2.
134.
63–
0.91
0.97
1.04
––
2.53
1.02
5.00
0.95
0.90
4.27
4.81
22–
––
––
––
–1.
33–
5.18
––
–1.
795.
883.
593.
541.
001.
3523
––
––
––
––
1.34
1.61
5.22
––
–2.
35–
1.32
3.70
1.14
1.61
2.22
1.54
24–
––
––
––
–1.
121.
631.
86–
––
––
1.78
1.21
1.12
1.46
1.41
25–
––
––
––
–1.
521.
631.
47–
––
––
–1.
6326
––
––
––
––
0.87
3.47
0.84
––
––
–1.
190.
963.
3827
––
––
––
––
0.86
0.79
0.82
––
––
–1.
200.
9428
––
––
––
––
––
0.92
––
––
––
0.84
a C =
chl
orof
orm
, M =
met
hano
l.
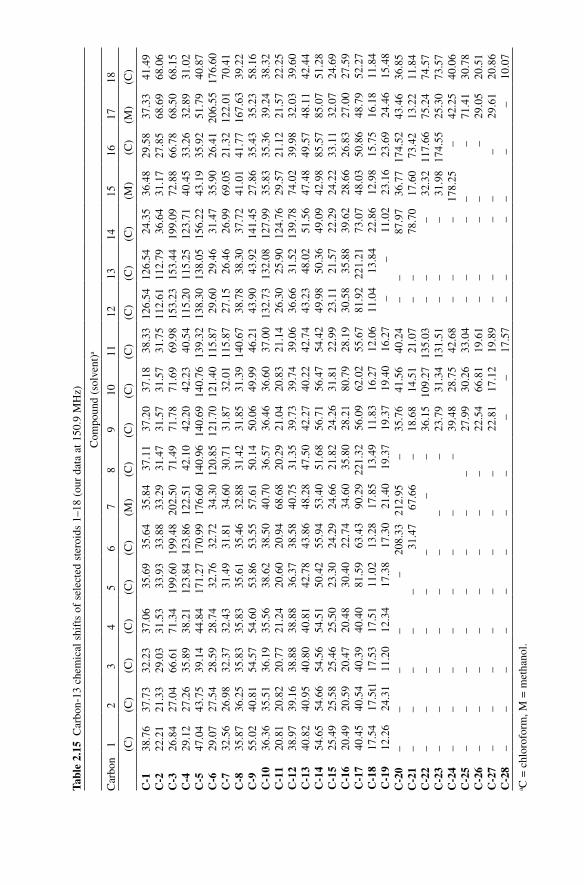
Tabl
e 2.
15 C
arbo
n-13
che
mic
al s
hift
s of
sel
ecte
d st
eroi
ds 1
–18
(our
dat
a at
150
.9 M
Hz)
Com
poun
d (s
olve
nt)a
Car
bon
12
34
56
78
910
1112
1314
1516
1718
(C)
(C)
(C)
(C)
(C)
(C)
(M)
(C)
(C)
(C)
(C)
(C)
(C)
(C)
(M)
(C)
(M)
(C)
C-1
38.7
637
.73
32.2
337
.06
35.6
935
.64
35.8
437
.11
37.2
037
.18
38.3
312
6.54
126.
5424
.35
36.4
829
.58
37.3
341
.49
C-2
22.2
121
.33
29.0
331
.53
33.9
333
.88
33.2
931
.47
31.5
731
.57
31.7
511
2.61
112.
7936
.64
31.1
727
.85
68.6
968
.06
C-3
26.8
427
.04
66.6
171
.34
199.
6019
9.48
202.
5071
.49
71.7
871
.69
69.9
815
3.23
153.
4419
9.09
72.8
866
.78
68.5
068
.15
C-4
29.1
227
.26
35.8
938
.21
123.
8412
3.86
122.
5142
.10
42.2
042
.23
40.5
411
5.20
115.
2512
3.71
40.4
533
.26
32.8
931
.02
C-5
47.0
443
.75
39.1
444
.84
171.
2717
0.99
176.
6014
0.96
140.
6914
0.76
139.
3213
8.30
138.
0515
6.22
43.1
935
.92
51.7
940
.87
C-6
29.0
727
.54
28.5
928
.74
32.7
632
.72
34.3
012
0.85
121.
7012
1.40
115.
8729
.60
29.4
631
.47
35.9
026
.41
206.
5517
6.60
C-7
32.5
626
.98
32.3
732
.43
31.4
931
.81
34.6
030
.71
31.8
732
.01
115.
8727
.15
26.4
626
.99
69.0
521
.32
122.
0170
.41
C-8
35.8
736
.25
35.8
335
.83
35.6
135
.46
32.8
831
.42
31.8
531
.39
140.
6738
.78
38.3
037
.72
41.0
141
.77
167.
6339
.22
C-9
55.0
240
.81
54.5
754
.60
53.8
653
.55
57.6
150
.14
50.0
649
.99
46.2
143
.90
43.9
214
1.45
27.8
635
.43
35.2
358
.16
C-1
036
.36
35.5
136
.19
35.5
638
.62
38.5
040
.70
36.5
736
.46
36.6
037
.00
132.
7313
2.08
127.
9935
.83
35.3
639
.24
38.3
2C
-11
20.8
120
.82
20.7
721
.24
20.6
020
.94
68.6
820
.29
21.0
420
.83
21.1
426
.30
25.9
012
4.76
29.5
721
.12
21.5
722
.25
C-1
238
.97
39.1
638
.88
38.8
836
.37
38.5
840
.75
31.3
539
.73
39.7
439
.06
36.6
631
.52
139.
7874
.02
39.9
832
.03
39.6
0C
-13
40.8
240
.95
40.8
040
.81
42.7
843
.86
48.2
847
.50
42.2
740
.22
42.7
443
.23
48.0
251
.56
47.4
849
.57
48.1
142
.44
C-1
454
.65
54.6
654
.56
54.5
150
.42
55.9
453
.40
51.6
856
.71
56.4
754
.42
49.9
850
.36
49.0
942
.98
85.5
785
.07
51.2
8C
-15
25.4
925
.58
25.4
625
.50
23.3
024
.29
24.6
621
.82
24.2
631
.81
22.9
923
.11
21.5
722
.29
24.2
233
.11
32.0
724
.69
C-1
620
.49
20.5
920
.47
20.4
830
.40
22.7
434
.60
35.8
028
.21
80.7
928
.19
30.5
835
.88
39.6
228
.66
26.8
327
.00
27.5
9C
-17
40.4
540
.54
40.3
940
.40
81.5
963
.43
90.2
922
1.32
56.0
962
.02
55.6
781
.92
221.
2173
.07
48.0
350
.86
48.7
952
.27
C-1
817
.54
17.5
t117
.53
17.5
111
.02
13.2
817
.85
13.4
911
.83
16.2
712
.06
11.0
413
.84
22.8
612
.98
15.7
516
.18
11.8
4C
-19
12.2
624
.31
11.2
012
.34
17.3
817
.30
21.4
019
.37
19.3
719
.40
16.2
7–
–11
.02
23.1
623
.69
24.4
615
.48
C-2
0–
––
––
208.
3321
2.95
–35
.76
41.5
640
.24
––
87.9
736
.77
174.
5243
.46
36.8
5C
-21
––
––
–31
.47
67.6
6–
18.6
814
.51
21.0
7–
–78
.70
17.6
073
.42
13.2
211
.84
C-2
2–
––
––
––
–36
.15
109.
2713
5.03
––
–32
.32
117.
6675
.24
74.5
7C
-23
––
––
––
––
23.7
931
.34
131.
51–
––
31.9
817
4.55
25.3
073
.57
C-2
4–
––
––
––
–39
.48
28.7
542
.68
––
–17
8.25
–42
.25
40.0
6C
-25
––
––
––
––
27.9
930
.26
33.0
4–
––
––
71.4
130
.78
C-2
6–
––
––
––
–22
.54
66.8
119
.61
––
––
–29
.05
20.5
1C
-27
––
––
––
––
22.8
117
.12
19.8
9–
––
––
29.6
120
.86
C-2
8–
––
––
––
––
–17
.57
––
––
––
10.0
7a C
= c
hlor
ofor
m, M
= m
etha
nol.
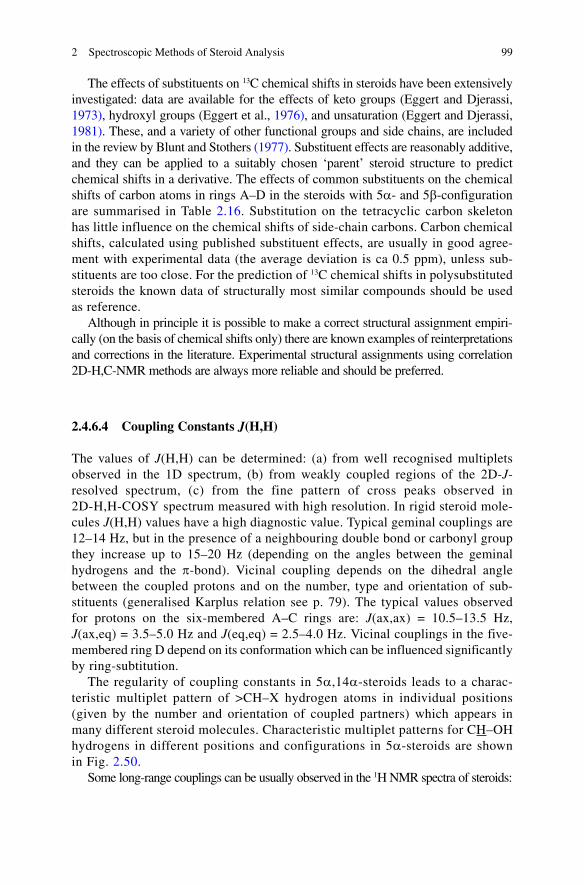
992 Spectroscopic Methods of Steroid Analysis
The effects of substituents on 13C chemical shifts in steroids have been extensively investigated: data are available for the effects of keto groups (Eggert and Djerassi, 1973), hydroxyl groups (Eggert et al., 1976), and unsaturation (Eggert and Djerassi, 1981). These, and a variety of other functional groups and side chains, are included in the review by Blunt and Stothers (1977). Substituent effects are reasonably additive, and they can be applied to a suitably chosen ‘parent’ steroid structure to predict chemical shifts in a derivative. The effects of common substituents on the chemical shifts of carbon atoms in rings A–D in the steroids with 5a- and 5b-configuration are summarised in Table 2.16. Substitution on the tetracyclic carbon skeleton has little influence on the chemical shifts of side-chain carbons. Carbon chemical shifts, calculated using published substituent effects, are usually in good agree-ment with experimental data (the average deviation is ca 0.5 ppm), unless sub-stituents are too close. For the prediction of 13C chemical shifts in polysubstituted steroids the known data of structurally most similar compounds should be used as reference.
Although in principle it is possible to make a correct structural assignment empiri-cally (on the basis of chemical shifts only) there are known examples of reinterpretations and corrections in the literature. Experimental structural assignments using correlation 2D-H,C-NMR methods are always more reliable and should be preferred.
2.4.6.4 Coupling Constants J(H,H)
The values of J(H,H) can be determined: (a) from well recognised multiplets observed in the 1D spectrum, (b) from weakly coupled regions of the 2D-J-resolved spectrum, (c) from the fine pattern of cross peaks observed in 2D-H,H-COSY spectrum measured with high resolution. In rigid steroid mole-cules J(H,H) values have a high diagnostic value. Typical geminal couplings are 12–14 Hz, but in the presence of a neighbouring double bond or carbonyl group they increase up to 15–20 Hz (depending on the angles between the geminal hydrogens and the p-bond). Vicinal coupling depends on the dihedral angle between the coupled protons and on the number, type and orientation of sub-stituents (generalised Karplus relation see p. 79). The typical values observed for protons on the six-membered A–C rings are: J(ax,ax) = 10.5–13.5 Hz, J(ax,eq) = 3.5–5.0 Hz and J(eq,eq) = 2.5–4.0 Hz. Vicinal couplings in the five-membered ring D depend on its conformation which can be influenced significantly by ring-subtitution.
The regularity of coupling constants in 5a,14a-steroids leads to a charac-teristic multiplet pattern of >CH–X hydrogen atoms in individual positions (given by the number and orientation of coupled partners) which appears in many different steroid molecules. Characteristic multiplet patterns for CH–OH hydrogens in different positions and configurations in 5a-steroids are shown in Fig. 2.50.
Some long-range couplings can be usually observed in the 1H NMR spectra of steroids:
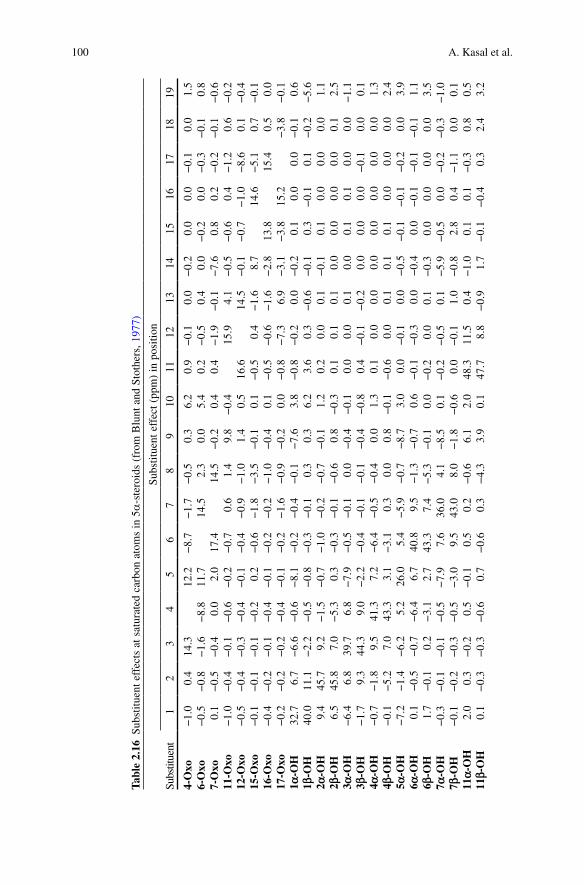
100 A. Kasal et al.
Tabl
e 2.
16 S
ubst
ituen
t eff
ects
at s
atur
ated
car
bon
atom
s in
5a
-ste
roid
s (f
rom
Blu
nt a
nd S
toth
ers,
197
7)
Subs
titue
nt
Subs
titue
nt e
ffec
t (pp
m)
in p
ositi
on
12
34
56
78
910
1112
1314
1516
1718
19
4-O
xo−
1.0
0.4
14.3
12.2
−8.
7−
1.7
−0.
50.
36.
20.
9−
0.1
0.0
−0.
20.
00.
0−
0.1
0.0
1.5
6-O
xo−
0.5
−0.
8−
1.6
−8.
811
.714
.52.
30.
05.
40.
2−
0.5
0.4
0.0
−0.
20.
0−
0.3
−0.
10.
87-
Oxo
0.1
−0.
5−
0.4
0.0
2.0
17.4
14.5
−0.
20.
40.
4−
1.9
−0.
1−
7.6
0.8
0.2
−0.
2−
0.1
−0.
611
-Oxo
−1.
0−
0.4
−0.
1−
0.6
−0.
2−
0.7
0.6
1.4
9.8
−0.
415
.94.
1−
0.5
−0.
60.
4−
1.2
0.6
−0.
212
-Oxo
−0.
5−
0.4
−0.
3−
0.4
−0.
1−
0.4
−0.
9−
1.0
1.4
0.5
16.6
14.5
−0.
1−
0.7
−1.
0−
8.6
0.1
−0.
415
-Oxo
−0.
1−
0.1
−0.
1−
0.2
0.2
−0.
6−
1.8
−3.
5−
0.1
0.1
−0.
50.
4−
1.6
8.7
14.6
−5.
10.
7−
0.1
16-O
xo−
0.4
−0.
2−
0.1
−0.
4−
0.1
−0.
2−
0.2
−1.
0−
0.4
0.1
−0.
5−
0.6
−1.
6−
2.8
13.8
15.4
0.5
0.0
17-O
xo−
0.2
−0.
2−
0.2
−0.
4−
0.1
−0.
2−
1.6
−0.
9−
0.2
0.0
−0.
8−
7.3
6.9
−3.
1−
3.8
15.2
−3.
8−
0.1
1a-O
H32
.76.
7−
6.6
−0.
6−
8.1
−0.
2−
0.4
−0.
1−
7.6
3.8
−0.
8−
0.2
0.0
−0.
20.
10.
00.
0−
0.1
0.6
1b-O
H40
.011
.1−
2.2
−0.
5−
0.8
−0.
3−
0.1
0.3
0.3
6.2
3.6
0.3
−0.
6−
0.1
0.3
−0.
10.
1−
0.2
−5.
62a
-OH
9.4
45.7
9.2
−1.
5−
0.7
−1.
0−
0.2
−0.
7−
0.1
1.2
0.2
0.0
0.1
−0.
10.
10.
00.
00.
01.
12b
-OH
6.5
45.8
7.0
−5.
30.
3−
0.3
−0.
1−
0.6
0.8
−0.
30.
10.
10.
10.
00.
00.
00.
00.
12.
53a
-OH
−6.
46.
839
.76.
8−
7.9
−0.
5−
0.1
0.0
−0.
4−
0.1
0.0
0.0
0.1
0.0
0.1
0.1
0.0
0.0
−1.
13b
-OH
−1.
79.
344
.39.
0−
2.2
−0.
4−
0.1
−0.
1−
0.4
−0.
80.
4−
0.1
−0.
20.
00.
00.
0−
0.1
0.0
0.1
4a-O
H−
0.7
−1.
89.
541
.37.
2−
6.4
−0.
5−
0.4
0.0
1.3
0.1
0.0
0.0
0.0
0.0
0.0
0.0
0.0
1.3
4b-O
H−
0.1
−5.
27.
043
.33.
1−
3.1
0.3
0.0
0.8
−0.
1−
0.6
0.0
0.1
0.1
0.1
0.0
0.0
0.0
2.4
5a-O
H−
7.2
−1.
4−
6.2
5.2
26.0
5.4
−5.
9−
0.7
−8.
73.
00.
0−
0.1
0.0
−0.
5−
0.1
−0.
1−
0.2
0.0
3.9
6a-O
H0.
1−
0.5
−0.
7−
6.4
6.7
40.8
9.5
−1.
3−
0.7
0.6
−0.
1−
0.3
0.0
−0.
40.
0−
0.1
−0.
1−
0.1
1.1
6b-O
H1.
7−
0.1
0.2
−3.
12.
743
.37.
4−
5.3
−0.
10.
0−
0.2
0.0
0.1
−0.
30.
00.
00.
00.
03.
57a
-OH
−0.
3−
0.1
−0.
1−
0.5
−7.
97.
636
.04.
1−
8.5
0.1
−0.
2−
0.5
0.1
−5.
9−
0.5
0.0
−0.
2−
0.3
−1.
07b
-OH
−0.
1−
0.2
−0.
3−
0.5
−3.
09.
543
.08.
0−
1.8
−0.
60.
0−
0.1
1.0
−0.
82.
80.
4−
1.1
0.0
0.1
11a-
OH
2.0
0.3
−0.
20.
5−
0.1
0.5
0.2
−0.
66.
12.
048
.311
.50.
4−
1.0
0.1
0.1
−0.
30.
80.
511
b-O
H0.
1−
0.3
−0.
3−
0.6
0.7
−0.
60.
3−
4.3
3.9
0.1
47.7
8.8
−0.
91.
7−
0.1
−0.
40.
32.
43.
2
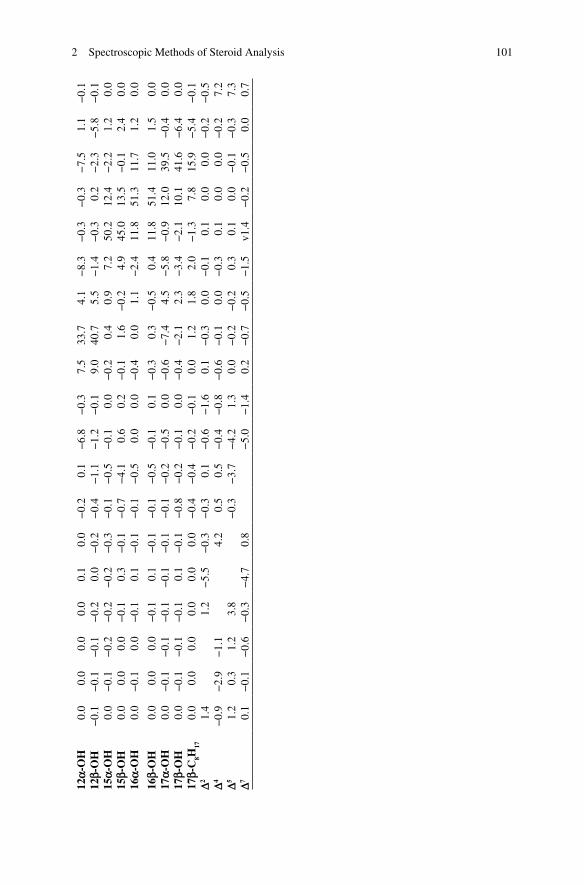
1012 Spectroscopic Methods of Steroid Analysis
12a-
OH
0.0
0.0
0.0
0.0
0.1
0.0
−0.
20.
1−
6.8
−0.
37.
533
.74.
1−
8.3
−0.
3−
0.3
−7.
51.
1−
0.1
12b-
OH
−0.
1−
0.1
−0.
1−
0.2
0.0
−0.
2−
0.4
−1.
1−
1.2
−0.
19.
040
.75.
5−
1.4
−0.
30.
2−
2.3
−5.
8−
0.1
15a-
OH
0.0
−0.
1−
0.2
−0.
2−
0.2
−0.
3−
0.1
−0.
5−
0.1
0.0
−0.
20.
40.
97.
250
.212
.4−
2.2
1.2
0.0
15b-
OH
0.0
0.0
0.0
−0.
10.
3−
0.1
−0.
7−
4.1
0.6
0.2
−0.
11.
6−
0.2
4.9
45.0
13.5
−0.
12.
40.
016
a-O
H0.
0−
0.1
0.0
−0.
10.
1−
0.1
−0.
1−
0.5
0.0
0.0
−0.
40.
01.
1−
2.4
11.8
51.3
11.7
1.2
0.0
16b-
OH
0.0
0.0
0.0
−0.
10.
1−
0.1
−0.
1−
0.5
−0.
10.
1−
0.3
0.3
−0.
50.
411
.851
.411
.01.
50.
017
a-O
H0.
0−
0.1
−0.
1−
0.1
−0.
1−
0.1
−0.
1−
0.2
−0.
50.
0−
0.6
−7.
44.
5−
5.8
−0.
912
.039
.5−
0.4
0.0
17b-
OH
0.0
−0.
1−
0.1
−0.
10.
1−
0.1
−0.
8−
0.2
−0.
10.
0−
0.4
−2.
12.
3−
3.4
−2.
110
.141
.6−
6.4
0.0
17b-
C8H
170.
00.
00.
00.
00.
00.
0−
0.4
−0.
4−
0.2
−0.
10.
01.
21.
82.
0−
1.3
7.8
15.9
−5.
4−
0.1
D21.
41.
2−
5.5
−0.
3−
0.3
0.1
−0.
6−
1.6
0.1
−0.
30.
0−
0.1
0.1
0.0
0.0
−0.
2−
0.5
D4−
0.9
−2.
9−
1.1
4.2
0.5
0.5
−0.
4−
0.8
−0.
6−
0.1
0.0
−0.
30.
10.
00.
0−
0.2
7.2
D51.
20.
31.
23.
8−
0.3
−3.
7−
4.2
1.3
0.0
−0.
2−
0.2
0.3
0.1
0.0
−0.
1−
0.3
7.3
D70.
1−
0.1
−0.
6−
0.3
−4.
70.
8−
5.0
−1.
40.
2−
0.7
−0.
5−
1.5
v1.4
−0.
2−
0.5
0.0
0.7
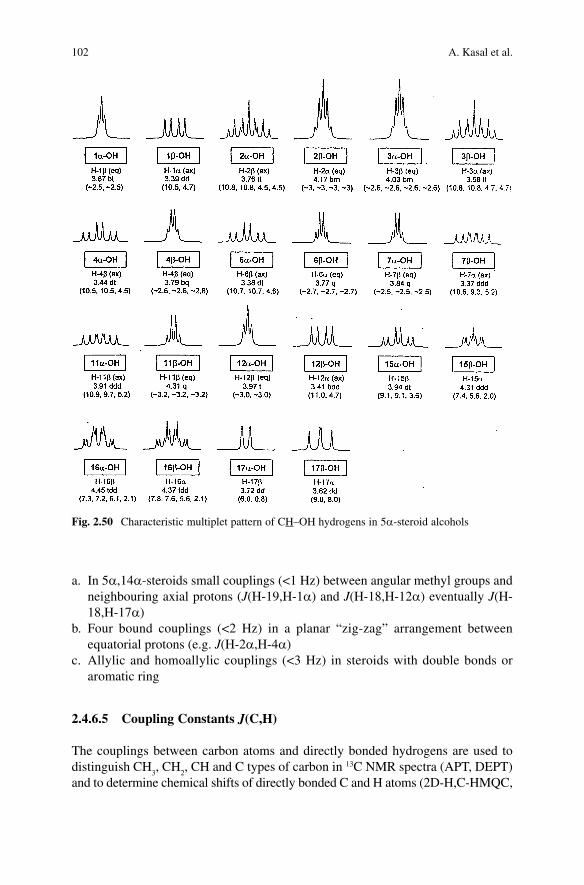
102 A. Kasal et al.
a. In 5a,14a-steroids small couplings (<1 Hz) between angular methyl groups and neighbouring axial protons (J(H-19,H-1a) and J(H-18,H-12a) eventually J(H-18,H-17a)
b. Four bound couplings (<2 Hz) in a planar “zig-zag” arrangement between equatorial protons (e.g. J(H-2a,H-4a)
c. Allylic and homoallylic couplings (<3 Hz) in steroids with double bonds or aromatic ring
2.4.6.5 Coupling Constants J(C,H)
The couplings between carbon atoms and directly bonded hydrogens are used to distinguish CH
3, CH
2, CH and C types of carbon in 13C NMR spectra (APT, DEPT)
and to determine chemical shifts of directly bonded C and H atoms (2D-H,C-HMQC,
Fig. 2.50 Characteristic multiplet pattern of CH–OH hydrogens in 5a-steroid alcohols
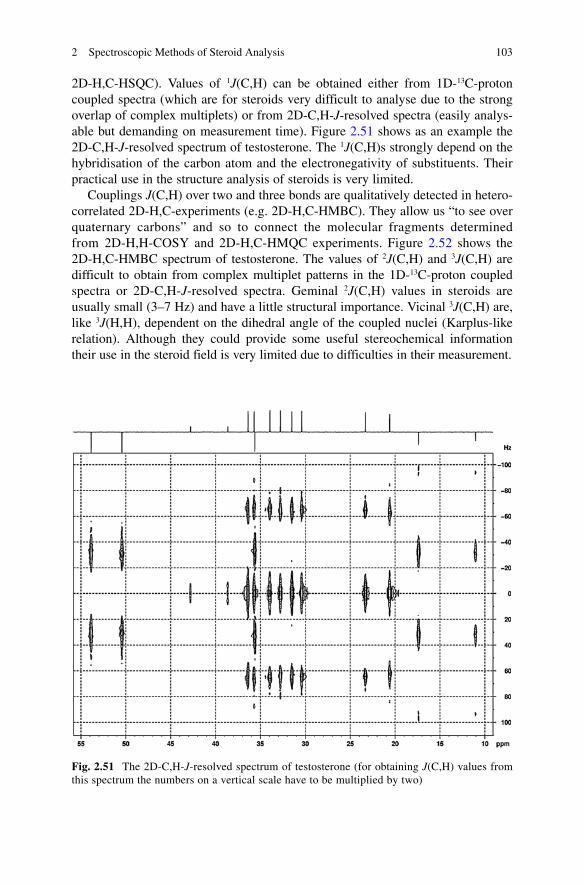
1032 Spectroscopic Methods of Steroid Analysis
Fig. 2.51 The 2D-C,H-J-resolved spectrum of testosterone (for obtaining J(C,H) values from this spectrum the numbers on a vertical scale have to be multiplied by two)
2D-H,C-HSQC). Values of 1J(C,H) can be obtained either from 1D-13C-proton coupled spectra (which are for steroids very difficult to analyse due to the strong overlap of complex multiplets) or from 2D-C,H-J-resolved spectra (easily analys-able but demanding on measurement time). Figure 2.51 shows as an example the 2D-C,H-J-resolved spectrum of testosterone. The 1J(C,H)s strongly depend on the hybridisation of the carbon atom and the electronegativity of substituents. Their practical use in the structure analysis of steroids is very limited.
Couplings J(C,H) over two and three bonds are qualitatively detected in hetero-correlated 2D-H,C-experiments (e.g. 2D-H,C-HMBC). They allow us “to see over quaternary carbons” and so to connect the molecular fragments determined from 2D-H,H-COSY and 2D-H,C-HMQC experiments. Figure 2.52 shows the 2D-H,C-HMBC spectrum of testosterone. The values of 2J(C,H) and 3J(C,H) are difficult to obtain from complex multiplet patterns in the 1D-13C-proton coupled spectra or 2D-C,H-J-resolved spectra. Geminal 2J(C,H) values in steroids are usually small (3–7 Hz) and have a little structural importance. Vicinal 3J(C,H) are, like 3J(H,H), dependent on the dihedral angle of the coupled nuclei (Karplus-like relation). Although they could provide some useful stereochemical information their use in the steroid field is very limited due to difficulties in their measurement.
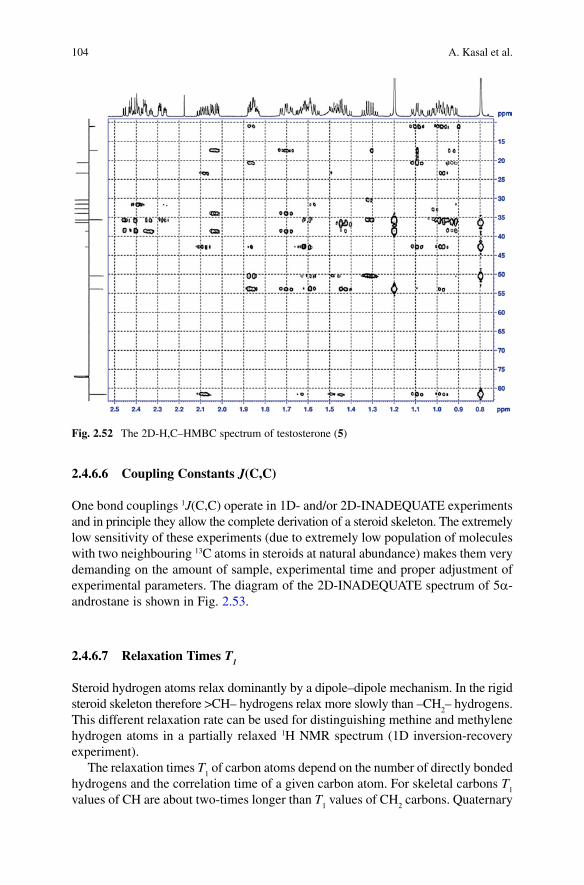
104 A. Kasal et al.
2.4.6.6 Coupling Constants J(C,C)
One bond couplings 1J(C,C) operate in 1D- and/or 2D-INADEQUATE experiments and in principle they allow the complete derivation of a steroid skeleton. The extremely low sensitivity of these experiments (due to extremely low population of molecules with two neighbouring 13C atoms in steroids at natural abundance) makes them very demanding on the amount of sample, experimental time and proper adjustment of experimental parameters. The diagram of the 2D-INADEQUATE spectrum of 5a-androstane is shown in Fig. 2.53.
2.4.6.7 Relaxation Times T1
Steroid hydrogen atoms relax dominantly by a dipole–dipole mechanism. In the rigid steroid skeleton therefore >CH– hydrogens relax more slowly than –CH
2– hydrogens.
This different relaxation rate can be used for distinguishing methine and methylene hydrogen atoms in a partially relaxed 1H NMR spectrum (1D inversion-recovery experiment).
The relaxation times T1 of carbon atoms depend on the number of directly bonded
hydrogens and the correlation time of a given carbon atom. For skeletal carbons T1
values of CH are about two-times longer than T1 values of CH
2 carbons. Quaternary
Fig. 2.52 The 2D-H,C–HMBC spectrum of testosterone (5)
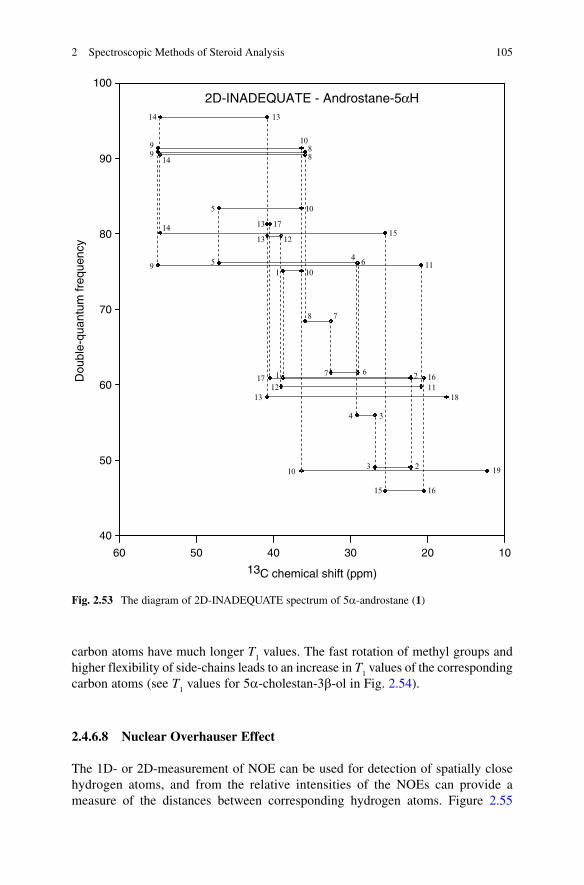
1052 Spectroscopic Methods of Steroid Analysis
2D-INADEQUATE - Androstane-5αH
13C chemical shift (ppm)
102030405060
Dou
ble-
quan
tum
freq
uenc
y
40
50
60
70
80
90
100
1910
1813
1615
1617
4 3
3 2
21
1 10
1112
119
1314
13 1715
14
5
5 10
109
8 7
7 6
46
88
914
13 12
Fig. 2.53 The diagram of 2D-INADEQUATE spectrum of 5a-androstane (1)
carbon atoms have much longer T1 values. The fast rotation of methyl groups and
higher flexibility of side-chains leads to an increase in T1 values of the corresponding
carbon atoms (see T1 values for 5a-cholestan-3b-ol in Fig. 2.54).
2.4.6.8 Nuclear Overhauser Effect
The 1D- or 2D-measurement of NOE can be used for detection of spatially close hydrogen atoms, and from the relative intensities of the NOEs can provide a measure of the distances between corresponding hydrogen atoms. Figure 2.55
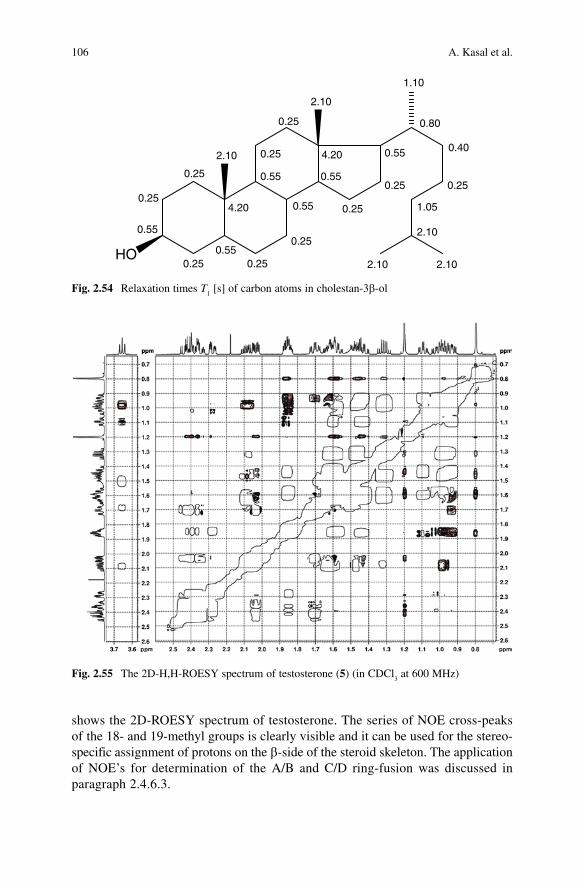
106 A. Kasal et al.
shows the 2D-ROESY spectrum of testosterone. The series of NOE cross-peaks of the 18- and 19-methyl groups is clearly visible and it can be used for the stereo-specific assignment of protons on the b-side of the steroid skeleton. The application of NOE’s for determination of the A/B and C/D ring-fusion was discussed in paragraph 2.4.6.3.
Fig. 2.55 The 2D-H,H-ROESY spectrum of testosterone (5) (in CDCl3 at 600 MHz)
HO
0.25
0.25
0.55
0.250.55
0.25
0.25
0.55
0.55
4.20
0.25
0.25
4.20
0.55
0.25
0.25
0.552.10
2.10
1.10
0.80
0.40
0.25
1.05
2.10
2.102.10
Fig. 2.54 Relaxation times T1 [s] of carbon atoms in cholestan-3b-ol
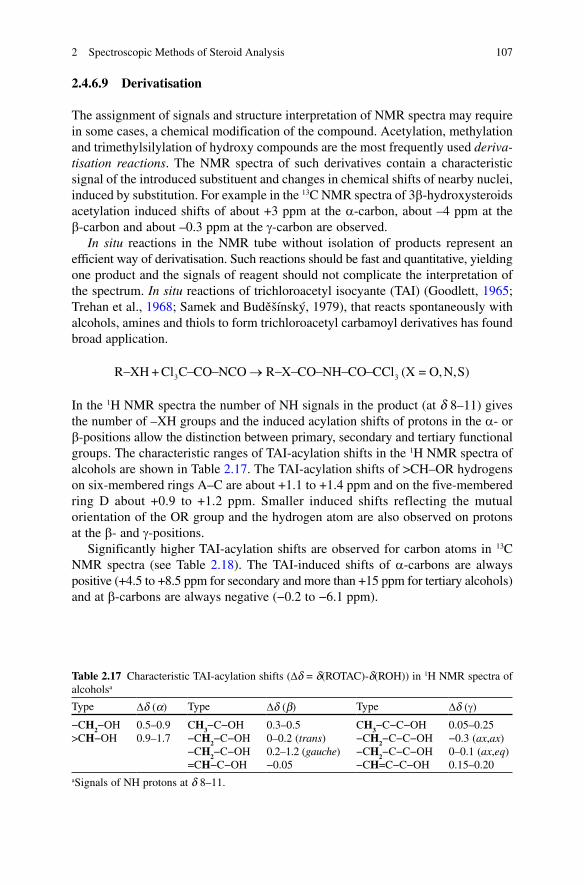
1072 Spectroscopic Methods of Steroid Analysis
2.4.6.9 Derivatisation
The assignment of signals and structure interpretation of NMR spectra may require in some cases, a chemical modification of the compound. Acetylation, methylation and trimethylsilylation of hydroxy compounds are the most frequently used deriva-tisation reactions. The NMR spectra of such derivatives contain a characteristic signal of the introduced substituent and changes in chemical shifts of nearby nuclei, induced by substitution. For example in the 13C NMR spectra of 3b-hydroxysteroids acetylation induced shifts of about +3 ppm at the a-carbon, about –4 ppm at the b-carbon and about –0.3 ppm at the g-carbon are observed.
In situ reactions in the NMR tube without isolation of products represent an efficient way of derivatisation. Such reactions should be fast and quantitative, yielding one product and the signals of reagent should not complicate the interpretation of the spectrum. In situ reactions of trichloroacetyl isocyante (TAI) (Goodlett, 1965; Trehan et al., 1968; Samek and Budešínský, 1979), that reacts spontaneously with alcohols, amines and thiols to form trichloroacetyl carbamoyl derivatives has found broad application.
3 3R XH + Cl C CO NCO R X CO NH CO CCl (X = O,N,S)- - - ® - - - - -
In the 1H NMR spectra the number of NH signals in the product (at d 8–11) gives the number of –XH groups and the induced acylation shifts of protons in the a- or b-positions allow the distinction between primary, secondary and tertiary functional groups. The characteristic ranges of TAI-acylation shifts in the 1H NMR spectra of alcohols are shown in Table 2.17. The TAI-acylation shifts of >CH–OR hydrogens on six-membered rings A–C are about +1.1 to +1.4 ppm and on the five-membered ring D about +0.9 to +1.2 ppm. Smaller induced shifts reflecting the mutual orientation of the OR group and the hydrogen atom are also observed on protons at the b- and g-positions.
Significantly higher TAI-acylation shifts are observed for carbon atoms in 13C NMR spectra (see Table 2.18). The TAI-induced shifts of a-carbons are always positive (+4.5 to +8.5 ppm for secondary and more than +15 ppm for tertiary alcohols) and at b-carbons are always negative (−0.2 to −6.1 ppm).
Table 2.17 Characteristic TAI-acylation shifts (Dd = d(ROTAC)-d(ROH)) in 1H NMR spectra of alcoholsa
Type Dd (a) Type Dd (b) Type Dd (g)
−CH2−OH 0.5–0.9 CH3−C−OH 0.3–0.5 CH3−C−C−OH 0.05–0.25>CH−OH 0.9–1.7 −CH2−C−OH 0–0.2 (trans) −CH2−C−C−OH −0.3 (ax,ax)
−CH2−C−OH 0.2–1.2 (gauche) −CH2−C−C−OH 0–0.1 (ax,eq)=CH−C−OH −0.05 −CH=C−C−OH 0.15–0.20
aSignals of NH protons at d 8–11.
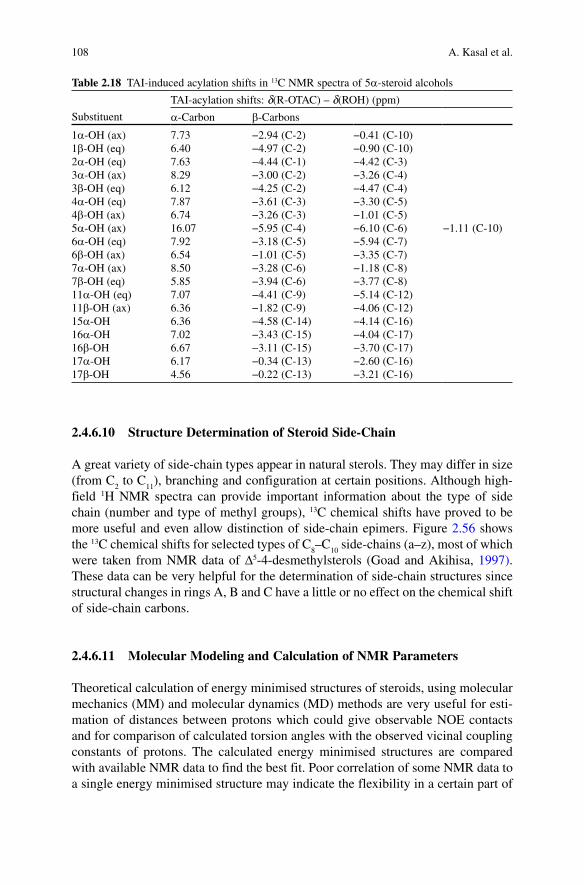
108 A. Kasal et al.
2.4.6.10 Structure Determination of Steroid Side-Chain
A great variety of side-chain types appear in natural sterols. They may differ in size (from C
2 to C
11), branching and configuration at certain positions. Although high-
field 1H NMR spectra can provide important information about the type of side chain (number and type of methyl groups), 13C chemical shifts have proved to be more useful and even allow distinction of side-chain epimers. Figure 2.56 shows the 13C chemical shifts for selected types of C
8–C
10 side-chains (a–z), most of which
were taken from NMR data of D5-4-desmethylsterols (Goad and Akihisa, 1997). These data can be very helpful for the determination of side-chain structures since structural changes in rings A, B and C have a little or no effect on the chemical shift of side-chain carbons.
2.4.6.11 Molecular Modeling and Calculation of NMR Parameters
Theoretical calculation of energy minimised structures of steroids, using molecular mechanics (MM) and molecular dynamics (MD) methods are very useful for esti-mation of distances between protons which could give observable NOE contacts and for comparison of calculated torsion angles with the observed vicinal coupling constants of protons. The calculated energy minimised structures are compared with available NMR data to find the best fit. Poor correlation of some NMR data to a single energy minimised structure may indicate the flexibility in a certain part of
Table 2.18 TAI-induced acylation shifts in 13C NMR spectra of 5a-steroid alcohols
TAI-acylation shifts: d(R-OTAC) – d(ROH) (ppm)
Substituent a-Carbon b-Carbons
1a-OH (ax) 7.73 −2.94 (C-2) −0.41 (C-10)1b-OH (eq) 6.40 −4.97 (C-2) −0.90 (C-10)2a-OH (eq) 7.63 −4.44 (C-1) −4.42 (C-3)3a-OH (ax) 8.29 −3.00 (C-2) −3.26 (C-4)3b-OH (eq) 6.12 −4.25 (C-2) −4.47 (C-4)4a-OH (eq) 7.87 −3.61 (C-3) −3.30 (C-5)4b-OH (ax) 6.74 −3.26 (C-3) −1.01 (C-5)5a-OH (ax) 16.07 −5.95 (C-4) −6.10 (C-6) −1.11 (C-10)6a-OH (eq) 7.92 −3.18 (C-5) −5.94 (C-7)6b-OH (ax) 6.54 −1.01 (C-5) −3.35 (C-7)7a-OH (ax) 8.50 −3.28 (C-6) −1.18 (C-8)7b-OH (eq) 5.85 −3.94 (C-6) −3.77 (C-8)11a-OH (eq) 7.07 −4.41 (C-9) −5.14 (C-12)11b-OH (ax) 6.36 −1.82 (C-9) −4.06 (C-12)15a-OH 6.36 −4.58 (C-14) −4.14 (C-16)16a-OH 7.02 −3.43 (C-15) −4.04 (C-17)16b-OH 6.67 −3.11 (C-15) −3.70 (C-17)17a-OH 6.17 −0.34 (C-13) −2.60 (C-16)17b-OH 4.56 −0.22 (C-13) −3.21 (C-16)
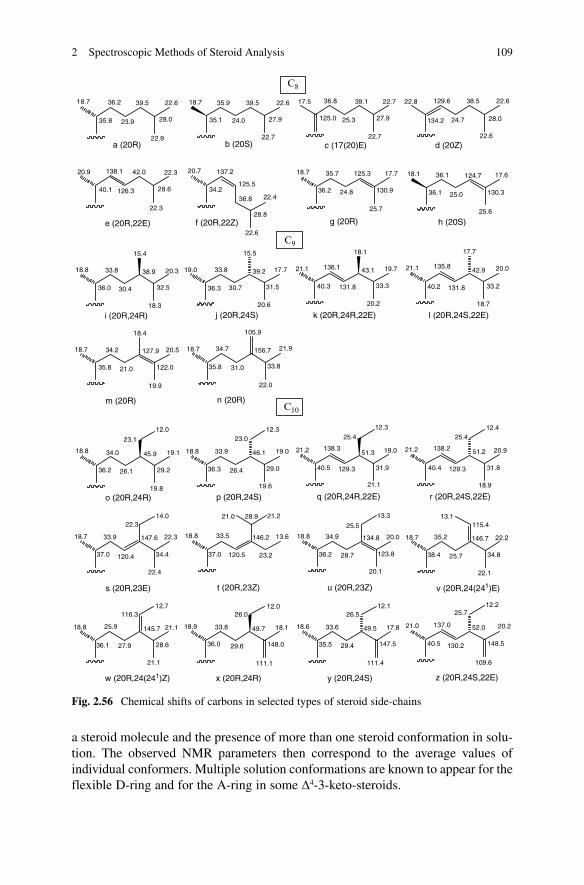
1092 Spectroscopic Methods of Steroid Analysis
a (20R) b (20S) c (17(20)E) d (20Z)
e (20R,22E) f (20R,22Z) g (20R) h (20S)
i (20R,24R) j (20R,24S) k (20R,24R,22E) l (20R,24S,22E)
m (20R) n (20R)
C8
C9
C10
o (20R,24R) p (20R,24S) q (20R,24R,22E) r (20R,24S,22E)
s (20R,23E) t (20R,23Z) u (20R,23Z) v (20R,24(241)E)
w (20R,24(241)Z) x (20R,24R) y (20R,24S) z (20R,24S,22E)
35.8
18.7 36.2
23.9
39.5
28.0
22.9
22.6
35.1
18.7 35.9
24.0
39.5
22.7
27.9
22.6
125.0
17.5 39.1
25.3
36.8
27.9
22.7
22.7
134.2
22.8
24.7
129.6 38.5
28.0
22.6
22.6
40.1
20.9 138.1
126.3
42.0
22.3
28.6
22.3 20.7
34.2
137.2
125.5
36.8
22.6
22.4
28.8
18.7 35.7
36.2
25.7
24.8 130.9
125.3 17.7
36.1
18.1
25.0
36.1 124.7
25.6
130.3
17.6
18.8
36.0
33.8
30.4
38.9
15.4
32.5
18.3
20.3 19.0 33.8
36.3 30.7
39.2
15.5
31.5
20.6
17.7 21.1 136.1
40.3 131.8
43.1
18.1
33.3
20.2
21.119.7
40.2
135.8
131.8
42.9
17.7
18.7
20.0
33.2
18.7 34.2
35.8 21.0
127.9
18.4
122.0
20.5
19.9
35.8
18.7 34.7 156.7
31.0
105.9
33.8
22.0
18.8
21.9
34.0
36.2
45.9
26.1 29.2
19.8
19.1
23.1
12.0
18.8 33.9
36.3 26.4
46.1
12.323.0
19.0
29.0
19.6
21.2 138.3
40.5 129.3
25.4
51.3
31.9
12.3
19.0
21.1
21.2
40.4 129.3
138.2
25.4
51.2
12.4
31.8
18.9
20.9
37.0
18.7
120.4
33.9 147.6
34.4
22.4
22.3
22.314.0
18.8 33.5
37.0 120.5 23.2
146.2 13.6
21.0 21.228.9
18.8
36.2
34.9
28.7
20.1
134.8
123.8
20.0
25.5
13.3
38.4
18.7
25.7
35.2 146.7
13.1115.4
34.8
22.1
22.2
18.8
36.1
25.9
27.9 28.6
21.1
21.1145.7
116.3
18.9
12.7
36.0
33.8
29.6
12.0
49.7
26.0
148.0
111.1
18.1 18.6
35.5
33.6
29.4 147.5
49.5
26.5
111.4
17.8
12.1
21.0
40.5
137.0 52.0
130.2
25.7
148.5
20.2
109.6
12.2
Fig. 2.56 Chemical shifts of carbons in selected types of steroid side-chains
a steroid molecule and the presence of more than one steroid conformation in solu-tion. The observed NMR parameters then correspond to the average values of individual conformers. Multiple solution conformations are known to appear for the flexible D-ring and for the A-ring in some D4-3-keto-steroids.
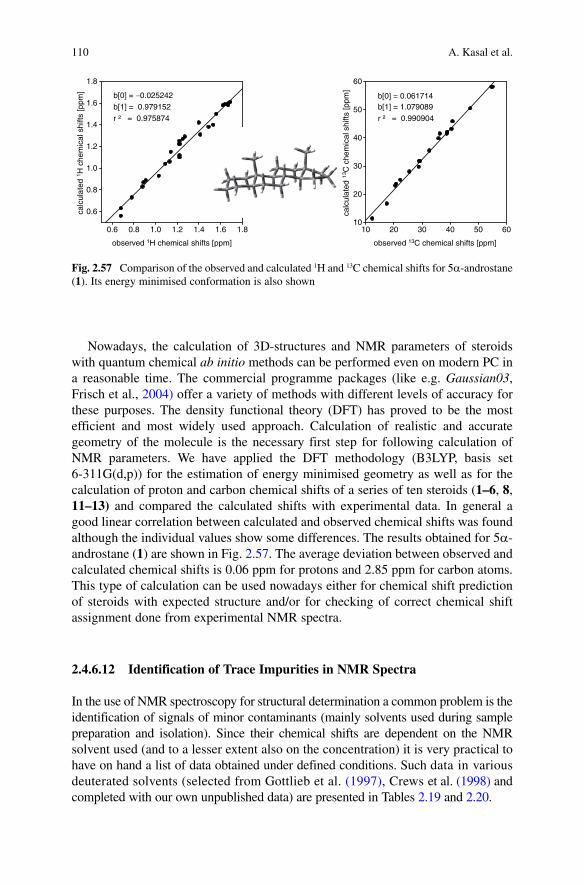
110 A. Kasal et al.
Nowadays, the calculation of 3D-structures and NMR parameters of steroids with quantum chemical ab initio methods can be performed even on modern PC in a reasonable time. The commercial programme packages (like e.g. Gaussian03, Frisch et al., 2004) offer a variety of methods with different levels of accuracy for these purposes. The density functional theory (DFT) has proved to be the most efficient and most widely used approach. Calculation of realistic and accurate geometry of the molecule is the necessary first step for following calculation of NMR parameters. We have applied the DFT methodology (B3LYP, basis set 6-311G(d,p)) for the estimation of energy minimised geometry as well as for the calculation of proton and carbon chemical shifts of a series of ten steroids (1–6, 8, 11–13) and compared the calculated shifts with experimental data. In general a good linear correlation between calculated and observed chemical shifts was found although the individual values show some differences. The results obtained for 5a-androstane (1) are shown in Fig. 2.57. The average deviation between observed and calculated chemical shifts is 0.06 ppm for protons and 2.85 ppm for carbon atoms. This type of calculation can be used nowadays either for chemical shift prediction of steroids with expected structure and/or for checking of correct chemical shift assignment done from experimental NMR spectra.
2.4.6.12 Identification of Trace Impurities in NMR Spectra
In the use of NMR spectroscopy for structural determination a common problem is the identification of signals of minor contaminants (mainly solvents used during sample preparation and isolation). Since their chemical shifts are dependent on the NMR solvent used (and to a lesser extent also on the concentration) it is very practical to have on hand a list of data obtained under defined conditions. Such data in various deuterated solvents (selected from Gottlieb et al. (1997), Crews et al. (1998) and completed with our own unpublished data) are presented in Tables 2.19 and 2.20.
observed 13C chemical shifts [ppm]
10 20 30 40 50 60
calc
ulat
ed 13
C c
hem
ical
shi
fts [p
pm]
10
20
30
40
50
60
b[0] = 0.061714b[1] = 1.079089
r ² = 0.990904
observed 1H chemical shifts [ppm]
0.6 0.8 1.0 1.2 1.4 1.6 1.8
calc
ulat
ed 1 H
che
mic
al s
hifts
[ppm
]
0.6
0.8
1.0
1.2
1.4
1.6
1.8
b[0] = −0.025242
b[1] = 0.979152
r ² = 0.975874
Fig. 2.57 Comparison of the observed and calculated 1H and 13C chemical shifts for 5a-androstane (1). Its energy minimised conformation is also shown
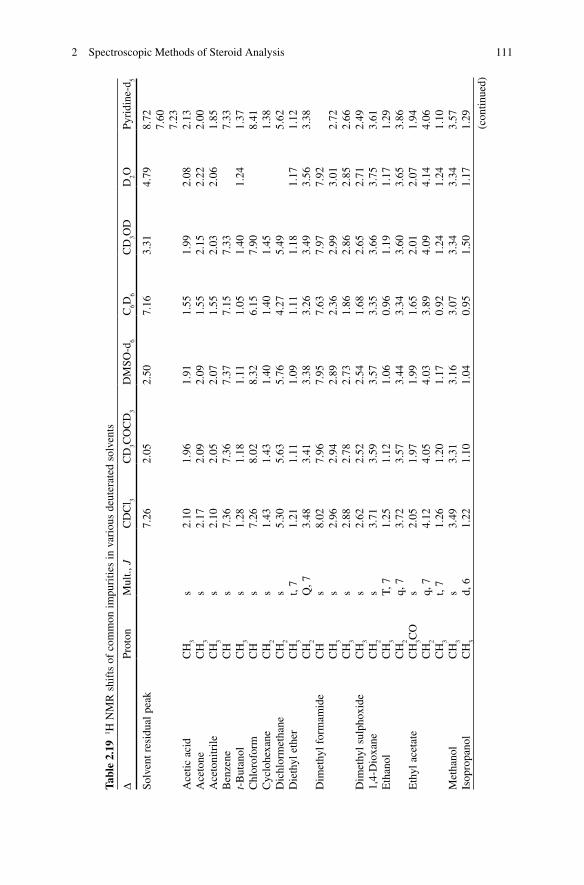
1112 Spectroscopic Methods of Steroid Analysis
Tabl
e 2.
19 1 H
NM
R s
hift
s of
com
mon
impu
ritie
s in
var
ious
deu
tera
ted
solv
ents
DPr
oton
Mul
t., J
CD
Cl 3
CD
3CO
CD
3D
MSO
-d6
C6D
6C
D3O
DD
2OPy
ridi
ne-d
5
Solv
ent r
esid
ual p
eak
7.26
2.05
2.50
7.16
3.31
4.79
8.72
7.60
7.23
Ace
tic a
cid
CH
3s
2.10
1.96
1.91
1.55
1.99
2.08
2.13
Ace
tone
CH
3s
2.17
2.09
2.09
1.55
2.15
2.22
2.00
Ace
toni
trile
CH
3s
2.10
2.05
2.07
1.55
2.03
2.06
1.85
Ben
zene
CH
s7.
367.
367.
377.
157.
337.
33t-
But
anol
CH
3s
1.28
1.18
1.11
1.05
1.40
1.24
1.37
Chl
orof
orm
CH
s7.
268.
028.
326.
157.
908.
41C
yclo
hexa
neC
H2
s1.
431.
431.
401.
401.
451.
38D
ichl
orm
etha
neC
H2
s5.
305.
635.
764.
275.
495.
62D
ieth
yl e
ther
CH
3t,
71.
211.
111.
091.
111.
181.
171.
12C
H2
Q, 7
3.48
3.41
3.38
3.26
3.49
3.56
3.38
Dim
ethy
l for
mam
ide
CH
s8.
027.
967.
957.
637.
977.
92C
H3
s2.
962.
942.
892.
362.
993.
012.
72C
H3
s2.
882.
782.
731.
862.
862.
852.
66D
imet
hyl s
ulph
oxid
eC
H3
s2.
622.
522.
541.
682.
652.
712.
491,
4-D
ioxa
neC
H2
s3.
713.
593.
573.
353.
663.
753.
61E
than
olC
H3
T, 7
1.25
1.12
1.06
0.96
1.19
1.17
1.29
CH
2q,
73.
723.
573.
443.
343.
603.
653.
86E
thyl
ace
tate
CH
3CO
s2.
051.
971.
991.
652.
012.
071.
94C
H2
q, 7
4.12
4.05
4.03
3.89
4.09
4.14
4.06
CH
3t,
71.
261.
201.
170.
921.
241.
241.
10M
etha
nol
CH
3s
3.49
3.31
3.16
3.07
3.34
3.34
3.57
Isop
ropa
nol
CH
3d,
61.
221.
101.
040.
951.
501.
171.
29(c
ontin
ued)
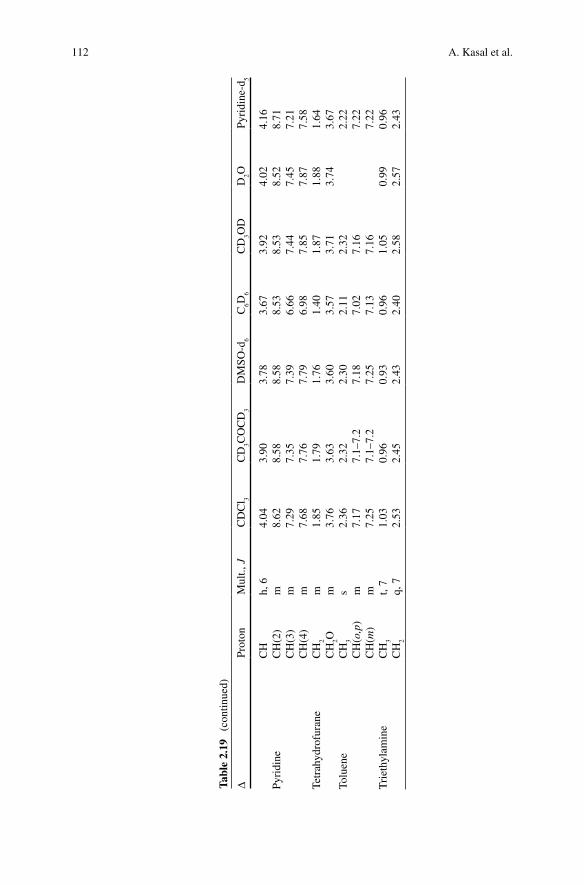
112 A. Kasal et al.
CH
h, 6
4.04
3.90
3.78
3.67
3.92
4.02
4.16
Pyri
dine
CH
(2)
m8.
628.
588.
588.
538.
538.
528.
71C
H(3
)m
7.29
7.35
7.39
6.66
7.44
7.45
7.21
CH
(4)
m7.
687.
767.
796.
987.
857.
877.
58Te
trah
ydro
fura
neC
H2
m1.
851.
791.
761.
401.
871.
881.
64C
H2O
m3.
763.
633.
603.
573.
713.
743.
67To
luen
eC
H3
s2.
362.
322.
302.
112.
322.
22C
H(o
,p)
m7.
177.
1–7.
27.
187.
027.
167.
22C
H(m
)m
7.25
7.1–
7.2
7.25
7.13
7.16
7.22
Tri
ethy
lam
ine
CH
3t,
71.
030.
960.
930.
961.
050.
990.
96C
H2
q, 7
2.53
2.45
2.43
2.40
2.58
2.57
2.43
Tabl
e 2.
19
(con
tinue
d)
DPr
oton
Mul
t., J
CD
Cl 3
CD
3CO
CD
3D
MSO
-d6
C6D
6C
D3O
DD
2OPy
ridi
ne-d
5
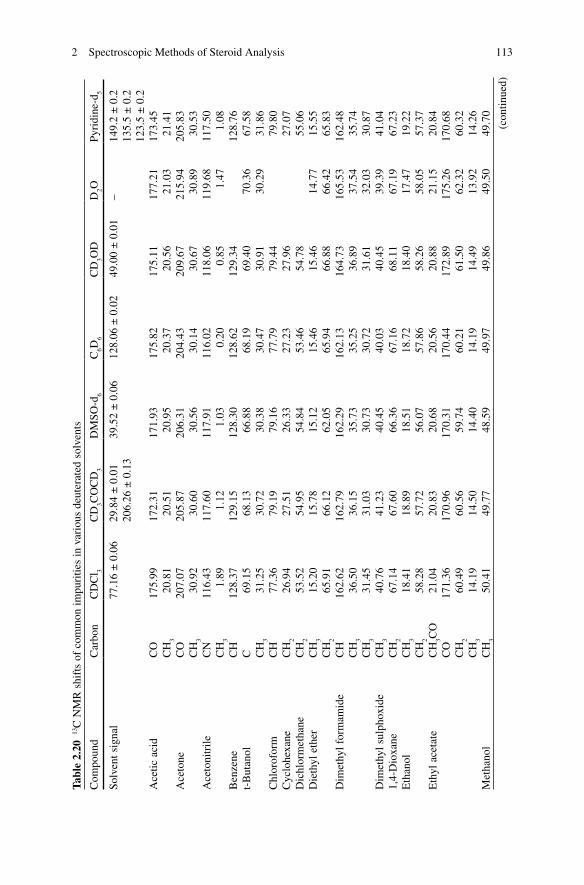
1132 Spectroscopic Methods of Steroid Analysis
Tabl
e 2.
20 13
C N
MR
shi
fts
of c
omm
on im
puri
ties
in v
ario
us d
eute
rate
d so
lven
ts
Com
poun
dC
arbo
nC
DC
l 3C
D3C
OC
D3
DM
SO-d
6C
6D6
CD
3OD
D2O
Pyri
dine
-d5
Solv
ent s
igna
l77
.16
± 0
.06
29.8
4 ±
0.0
139
.52
± 0
.06
128.
06 ±
0.0
249
.00
± 0
.01
–14
9.2
± 0
.220
6.26
± 0
.13
135.
5 ±
0.2
123.
5 ±
0.2
Ace
tic a
cid
CO
175.
9917
2.31
171.
9317
5.82
175.
1117
7.21
173.
45C
H3
20.8
120
.51
20.9
520
.37
20.5
621
.03
21.4
1A
ceto
neC
O20
7.07
205.
8720
6.31
204.
4320
9.67
215.
9420
5.83
CH
330
.92
30.6
030
.56
30.1
430
.67
30.8
930
.53
Ace
toni
trile
CN
116.
4311
7.60
117.
9111
6.02
118.
0611
9.68
117.
50C
H3
1.89
1.12
1.03
0.20
0.85
1.47
1.08
Ben
zene
CH
128.
3712
9.15
128.
3012
8.62
129.
3412
8.76
t-B
utan
olC
69.1
568
.13
66.8
868
.19
69.4
070
.36
67.5
8C
H3
31.2
530
.72
30.3
830
.47
30.9
130
.29
31.8
6C
hlor
ofor
mC
H77
.36
79.1
979
.16
77.7
979
.44
79.8
0C
yclo
hexa
neC
H2
26.9
427
.51
26.3
327
.23
27.9
627
.07
Dic
hlor
met
hane
CH
253
.52
54.9
554
.84
53.4
654
.78
55.0
6D
ieth
yl e
ther
CH
315
.20
15.7
815
.12
15.4
615
.46
14.7
715
.55
CH
265
.91
66.1
262
.05
65.9
466
.88
66.4
265
.83
Dim
ethy
l for
mam
ide
CH
162.
6216
2.79
162.
2916
2.13
164.
7316
5.53
162.
48C
H3
36.5
036
.15
35.7
335
.25
36.8
937
.54
35.7
4C
H3
31.4
531
.03
30.7
330
.72
31.6
132
.03
30.8
7D
imet
hyl s
ulph
oxid
eC
H3
40.7
641
.23
40.4
540
.03
40.4
539
.39
41.0
41,
4-D
ioxa
neC
H2
67.1
467
.60
66.3
667
.16
68.1
167
.19
67.2
3E
than
olC
H3
18.4
118
.89
18.5
118
.72
18.4
017
.47
19.2
2C
H2
58.2
857
.72
56.0
757
.86
58.2
658
.05
57.3
7E
thyl
ace
tate
CH
3CO
21.0
420
.83
20.6
820
.56
20.8
821
.15
20.8
4C
O17
1.36
170.
9617
0.31
170.
4417
2.89
175.
2617
0.68
CH
260
.49
60.5
659
.74
60.2
161
.50
62.3
260
.32
CH
314
.19
14.5
014
.40
14.1
914
.49
13.9
214
.26
Met
hano
lC
H3
50.4
149
.77
48.5
949
.97
49.8
649
.50
49.7
0
(con
tinue
d)
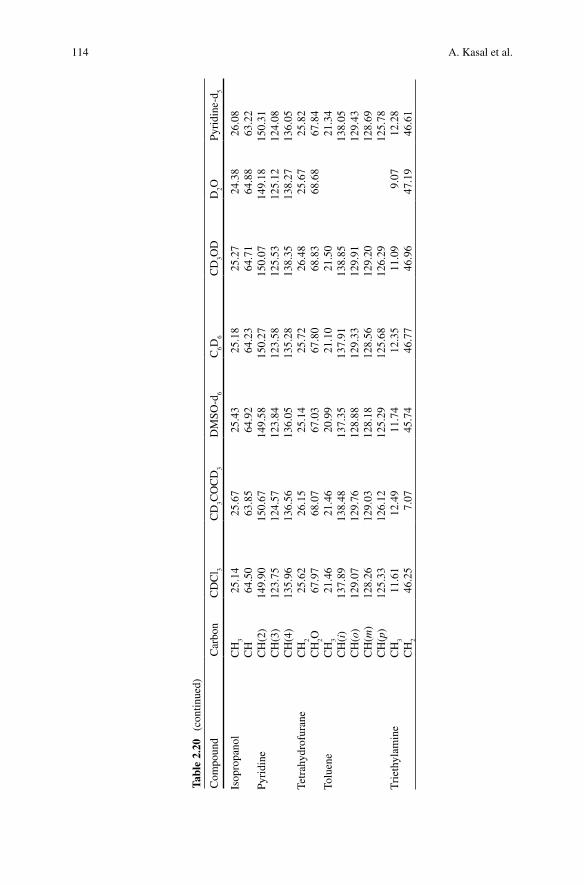
114 A. Kasal et al.
Isop
ropa
nol
CH
325
.14
25.6
725
.43
25.1
825
.27
24.3
826
.08
CH
64.5
063
.85
64.9
264
.23
64.7
164
.88
63.2
2Py
ridi
neC
H(2
)14
9.90
150.
6714
9.58
150.
2715
0.07
149.
1815
0.31
CH
(3)
123.
7512
4.57
123.
8412
3.58
125.
5312
5.12
124.
08C
H(4
)13
5.96
136.
5613
6.05
135.
2813
8.35
138.
2713
6.05
Tetr
ahyd
rofu
rane
CH
225
.62
26.1
525
.14
25.7
226
.48
25.6
725
.82
CH
2O67
.97
68.0
767
.03
67.8
068
.83
68.6
867
.84
Tolu
ene
CH
321
.46
21.4
620
.99
21.1
021
.50
21.3
4C
H(i
)13
7.89
138.
4813
7.35
137.
9113
8.85
138.
05C
H(o
)12
9.07
129.
7612
8.88
129.
3312
9.91
129.
43C
H(m
)12
8.26
129.
0312
8.18
128.
5612
9.20
128.
69C
H(p
)12
5.33
126.
1212
5.29
125.
6812
6.29
125.
78T
riet
hyla
min
eC
H3
11.6
112
.49
11.7
412
.35
11.0
99.
0712
.28
CH
246
.25
7.07
45.7
446
.77
46.9
647
.19
46.6
1
Tabl
e 2.
20
(con
tinue
d)
Com
poun
dC
arbo
nC
DC
l 3C
D3C
OC
D3
DM
SO-d
6C
6D6
CD
3OD
D2O
Pyri
dine
-d5
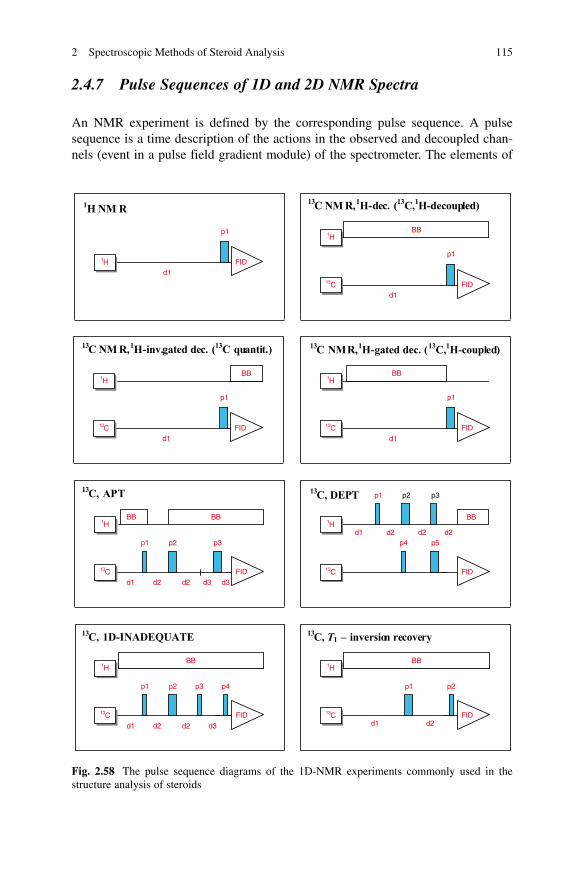
1152 Spectroscopic Methods of Steroid Analysis
2.4.7 Pulse Sequences of 1D and 2D NMR Spectra
An NMR experiment is defined by the corresponding pulse sequence. A pulse sequence is a time description of the actions in the observed and decoupled chan-nels (event in a pulse field gradient module) of the spectrometer. The elements of
1H FIDd1
p1
1H NM R
1H
13C FID
BB
d1
p1
13C NM R, 1H-dec. (13C,1H-decoupled)
1H
13C FID
BB
d1
p1
13C NM R, 1H-inv.gated dec. (13C quantit.)
1H
13C FID
BB
d1
p1
13C NMR, 1H-gated dec. (13C,1H-coupled)
1H
13C FID
BB
d1
p1
d2
p2
d3d2
p3
d3
BB
13C, APT
1H
13C FID
p4
p3
d1
p1
d2
p2
d2 p5
BB
d2
13C, DEPT
1H
13C FID
BB
d1
p1
d2
p2
d2
p3
d3
p4
13C, 1D-INADEQUATE
1H
13C FID
BB
d1
p2 p1
d2
13C, T1 – inversion recovery
Fig. 2.58 The pulse sequence diagrams of the 1D-NMR experiments commonly used in the structure analysis of steroids
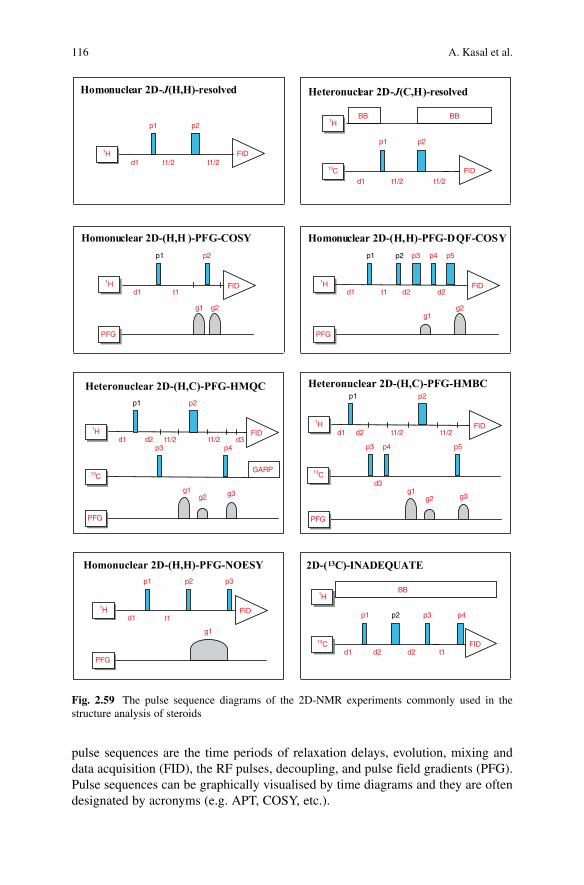
116 A. Kasal et al.
1H
13C FID
BB
d1
p1
t1/2
p2
t1/2
BB
Heteronuclear 2D-J(C,H)-resolved
1H FIDd1 t1/2t1/2
p1 p2
Homonuclear 2D-J(H,H)-resolved
1H
PFG
FIDt1 d1
p1
g1 g2
p2
Homonuclear 2D-(H,H )-PFG-COSY
1H
PFG
FIDt1 d1
p1
g1g2
p4p2 p3 p5
d2 d2
Homonuclear 2D-(H,H)-PFG-DQF-COSY
1H
PFG
FIDt1/2d1
p1
g1 g3
p2
d2
g2
13C
p4p3d3
GARP
t1/2
Heteronuclear 2D-(H,C)-PFG-HMQC
1H
PFG
FIDt1/2d1
p1
g1g3
p2
d2
g2
13C
p4p3
d3
t1/2
p5
Heteronuclear 2D-(H,C)-PFG-HMBC
1H
PFG
FID
p1
d1
g1
t1
p2 p3
Homonuclear 2D-(H,H)-PFG-NOESY
1H
13C FID
p3
t1
p1
d2
p4
BB
d2 d1
p2
2D-(13C)-INADEQUATE
Fig. 2.59 The pulse sequence diagrams of the 2D-NMR experiments commonly used in the structure analysis of steroids
pulse sequences are the time periods of relaxation delays, evolution, mixing and data acquisition (FID), the RF pulses, decoupling, and pulse field gradients (PFG). Pulse sequences can be graphically visualised by time diagrams and they are often designated by acronyms (e.g. APT, COSY, etc.).
1172 Spectroscopic Methods of Steroid Analysis
The effect of the RF pulse depends on its amplitude (power), length (in ms) and phase (along x, –x, y or –y axis). The RF pulse turns a macroscopic magnetisation (in the plane perpendicular to the pulse-axis) about an angle which depends on the pulse length and power.
Time periods (delays) serve for the relaxation of the spin-system, the achieve-ment of requested relations between magnetisation components or the modulation of phase and/or amplitude 2D NMR spectra.
Different types of decoupling (homo- or heteronuclear, selective or broadband) have been already discussed.
Gradient pulses of magnetic field (PFG) are used either for selection of certain nuclei in a given NMR experiment or for removing of RF pulse phase-cycling, that is otherwise (without PFG) needed in most of the advanced NMR experiments. Modern NMR spectrometers use PFG also for mapping the static field of the magnet and following gradient shimming (automatic optimisation of field homogeneity).
The pulse sequences of the 1D- and 2D-NMR experiments commonly used in the structure analysis of steroids are shown in Figs. 2.58 and 2.59.
2.5 Spectroscopic Methods of Steroid Analysis: Mass Spectrometry
2.5.1 Introduction
Simplistically a mass spectrometer consists of an “ion-source”, a “mass analyser”, a “detector” and a “data system”. Sample molecules are admitted to the “ion-source” where they are vaporised and ionised; the ions are separated according to their mass-to-charge ratio (m/z) in the “mass analyser” and are then detected. The resulting signals are transmitted to the “data system” and a plot of ion-abundance against m/z corre-sponds to a mass spectrum. In many cases, a “separating inlet” device precedes the ion-source, so that complex mixtures can be separated prior to admission to the mass spectrometer. Today, the “separating inlet” device is usually either a capillary gas chromatography (GC) column or a high performance liquid chromatography (HPLC) column, although capillary electrophoresis or thin layer chromatography can also be interfaced with mass spectrometry.
For steroid analysis a number of different types of ionisation methods are used to generate gas-phase ions and include; electron ionisation (EI), chemical ionisation (CI), electrospray (ES), atmospheric pressure chemical ionisation (APCI), atmo-spheric pressure photoinisation (APPI), and the recently introduced, desorption electrospray ionisation (DESI) technique. Other ionisation techniques used, but to a lesser extent are: fast atom bombardment (FAB), liquid secondary ion mass spec-trometry (LSIMS), matrix-assisted laser desorsption/ionsation (MALDI) and des-orption ionisation on-silicon (DIOS). The selection of the appropriate ionisation mode is one of the key decisions for the analyst to make, and thus we discuss the most important ionisation modes in some detail below.
118 A. Kasal et al.
In the early days of mass spectrometry, when EI was the dominant mode of ion formation, organic chemists were primarily interested in finding molecular ions as a simple means of structure determination. Realising that identification of the origin of individual fragment-ions might offer further valuable clues to structure; they postulated how these were formed. Soon they discovered that their traditional chemical intuition often failed. For instance finding [M-18]+ ions suggested the loss of water from the molecular-ion from which the presence in the molecule of a hydroxyl group might be inferred. However, many non-hydroxylated compounds still produced [M-18]+ ions in their spectra and a new chemistry of steroid fragmen-tation had to be proposed. Using known compounds, selectively labelled with deuterium, proved that some oxo derivatives also give [M-18]+ fragments, and water loss originated from quite unexpected positions (Trka and Kasal, 1980).
Enormous technological progress, in both instruments and computers, now enables spectroscopists to interpret mass spectra directly without the need to speculate. Exact mass measurements made at high resolution on all fragments provide information about their elemental composition, and tandem mass spectrometry (MS/MS) techniques make it possible to follow the fate of each fragment. Thus, the structure of unknown compounds can now often be found merely by using mass spectrometry.
The reader of this text, although a user of mass spectrometry technology, is likely not to be a mass spectrometry expert. However, he/she will need to know the scope and limitation of individual techniques. It will become evident that vacuum ionisation techniques i.e. EI, are most useful for volatile compounds; while atmospheric ionisa-tion methods such as ES and APCI are more suitable for less volatile compounds.
2.5.2 Ionisation Under Vacuum
Electron Ionisation (EI) and Chemical Ionisation (CI) The sample can be introduced into the EI or CI source via a direct inlet probe, or as the effluent from a GC column thereby providing the basis for GC–MS. EI involves the bombardment of gas-phase sample molecules (M) with high-energy electrons (e−), usually of 70 eV energy; the result is the generation of molecular ions (M+.), which are usually radical cations, and free electrons (e−) (Eq. 2.2).
+ .(g) (g)M e M 2e- -+ ® + (2.2)
In many cases the molecular ions (M+.) are unstable and fragment to generate more stable products (Eq. 2.3).
+ . +(g) (g) (g)M A +B® (2.3)
A pre-requisite of EI is that the sample to be ionised must be in the gas-phase, this is also true for GC, and has lead to the extensive development of derivatisation chemistry to allow the vaporisation of steroids and bile acids without their thermal decomposition (Blau and King, 1977; Blau and Halket, 1993).
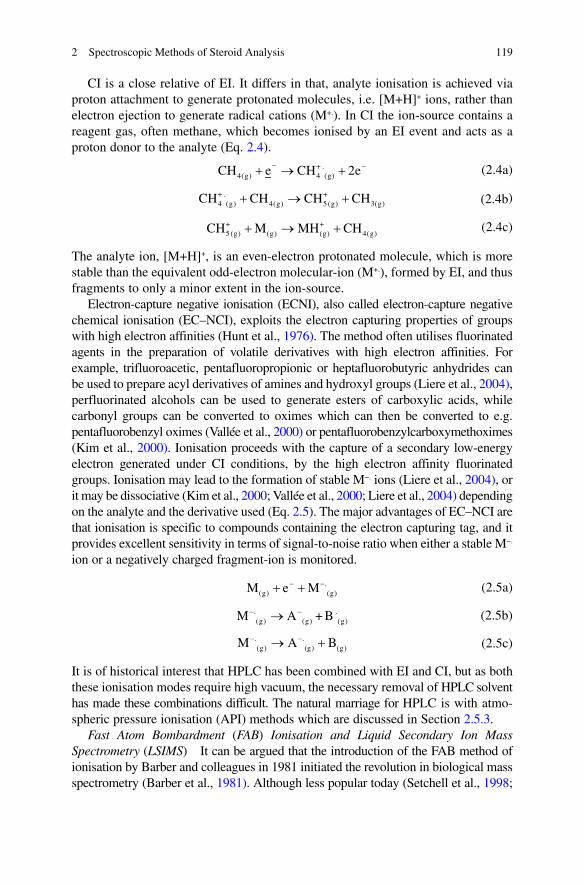
1192 Spectroscopic Methods of Steroid Analysis
CI is a close relative of EI. It differs in that, analyte ionisation is achieved via proton attachment to generate protonated molecules, i.e. [M+H]+ ions, rather than electron ejection to generate radical cations (M+.). In CI the ion-source contains a reagent gas, often methane, which becomes ionised by an EI event and acts as a proton donor to the analyte (Eq. 2.4).
+
4(g) 4 (g).CH e CH 2e- -+ ® +
(2.4a)
+ +4 (g) 4(g) 5 (g) 3(g)
.CH CH CH CH+ ® +
(2.4b)
+ +5(g) (g) (g) 4(g)CH M MH CH+ ® +
(2.4c)
The analyte ion, [M+H]+, is an even-electron protonated molecule, which is more stable than the equivalent odd-electron molecular-ion (M+.), formed by EI, and thus fragments to only a minor extent in the ion-source.
Electron-capture negative ionisation (ECNI), also called electron-capture negative chemical ionisation (EC–NCI), exploits the electron capturing properties of groups with high electron affinities (Hunt et al., 1976). The method often utilises fluorinated agents in the preparation of volatile derivatives with high electron affinities. For example, trifluoroacetic, pentafluoropropionic or heptafluorobutyric anhydrides can be used to prepare acyl derivatives of amines and hydroxyl groups (Liere et al., 2004), perfluorinated alcohols can be used to generate esters of carboxylic acids, while carbonyl groups can be converted to oximes which can then be converted to e.g. pentafluorobenzyl oximes (Vallée et al., 2000) or pentafluorobenzylcarboxymethoximes (Kim et al., 2000). Ionisation proceeds with the capture of a secondary low-energy electron generated under CI conditions, by the high electron affinity fluorinated groups. Ionisation may lead to the formation of stable M−. ions (Liere et al., 2004), or it may be dissociative (Kim et al., 2000; Vallée et al., 2000; Liere et al., 2004) depending on the analyte and the derivative used (Eq. 2.5). The major advantages of EC–NCI are that ionisation is specific to compounds containing the electron capturing tag, and it provides excellent sensitivity in terms of signal-to-noise ratio when either a stable M−. ion or a negatively charged fragment-ion is monitored.
(g) (g.
)M e M- -+ + (2.5a)
.(g) (g) ( )
.gM A + B- -® (2.5b)
. .((g) g) (g)M A B- -® + (2.5c)
It is of historical interest that HPLC has been combined with EI and CI, but as both these ionisation modes require high vacuum, the necessary removal of HPLC solvent has made these combinations difficult. The natural marriage for HPLC is with atmo-spheric pressure ionisation (API) methods which are discussed in Section 2.5.3.
Fast Atom Bombardment (FAB) Ionisation and Liquid Secondary Ion Mass Spectrometry (LSIMS) It can be argued that the introduction of the FAB method of ionisation by Barber and colleagues in 1981 initiated the revolution in biological mass spectrometry (Barber et al., 1981). Although less popular today (Setchell et al., 1998;
120 A. Kasal et al.
Bove et al., 2004), FAB was widely used for bile acid (Whitney et al., 1981; Ballatore et al., 1983; Egestad et al., 1985; Clayton et al., 1987; Wahlén et al., 1989) and steroid (Shackleton and Straub, 1982; Shackleton et al., 1983; Shackleton, 1983) analysis throughout the 1980s and into the early 1990s, and protocols developed for bile acid and steroid conjugate analysis during this era are easily incorporated into analytical procedures using API methods (Meng et al., 1996, 1997; Yang et al., 1997).
FAB is most suitable for the ionisation of polar or ionic molecules e.g. bile acids, steroid glucuronides and sulphates. FAB ionisation is achieved by the generation of a fast beam of neutral atoms (6–8 keV kinetic energy, usually Ar or Xe atoms) in the “FAB gun” by a process of ionisation, acceleration, and neutralisation, which impinge on a viscous solution of sample dissolved in a matrix, usually glycerol. In the positive-ion mode proton transfer reactions result in the formation of protonated molecules, i.e. [M+H]+ ions, while in the negative-ion mode, deprotonated molecules are formed, i.e. [M−H]− ions. Both protonated, and deprotonated molecules are stable and little fragmentation occurs in the ion-source. LSIMS is very similar to FAB; however a beam of Cs+ ions (20–30 keV) rather than a beam of neutral atoms is used to bombard the sample-containing matrix. LSIMS spectra are essentially identical to those generated by FAB, and in this chapter, for simplicity, both ionisation modes will be referred to as FAB. Negative-ion FAB was found to be particularly suitable for the ionisation of bile acids and steroid sulphates, alleviating the need for hydrolysis, solvolysis and derivatisation reactions required for GC–MS analysis (Whitney et al., 1981; Ballatore et al., 1983; Shackleton and Straub 1982; Shackleton et al., 1983; Shackleton 1983). FAB is a vacuum ionisation technique and is not suitable for combination with conventional flow-rate HPLC. However, capillary column HPLC has been success-fully interfaced with FAB (Yang et al., 1997).
Matrix-Assisted Laser Desorption/Ionisation (MALDI) is not extensively used for steroid and bile acid analysis at present, although some applications have been published (Schiller et al., 2000, 2001; Rujoi et al., 2003; Mims and Hercules, 2003, 2004). MALDI is usually combined with time-of-flight (TOF) analysers, and its major advantage is robustness and ease of use. The sample is mixed with a solution of matrix, often a-cyano-4-hydroxy-cinnamic acid in aqueous acetonitrile containing 0.1% trifluoroa-cetic acid, spotted on a stainless steel target plate and allowed to co-crystallise in air. The MALDI plate is then admitted to the high vacuum system of the mass spectrometer, and irradiated with laser light, usually of 337 nm from a N
2 laser. The matrix absorbs the
light energy with the result that the sample and matrix become ionised and vaporised. In the positive-ion mode [M+H]+ ions are usually formed, while [M−H]− ions are formed in the negative-ion mode. For steroid analysis, the most promising MALDI studies have been performed on steroids which have been derivatised so as to possess a preformed charge (Griffiths et al., 2003; Khan et al., 2006; Wang et al., 2006).
A relative of MALDI is DIOS which stands for desorption ionisation on silicon, and as the name suggests, a silicon support is used as an alternative to matrix. Siuzdak and colleagues have demonstrated the use of DIOS for the analysis of steroids in plasma (Shen et al., 2001).
1212 Spectroscopic Methods of Steroid Analysis
2.5.3 Atmospheric Pressure Ionisation
Electrospray (ES) Like FAB, ES is suitable for the analysis of polar and ionic biomolecules. ES occurs at atmospheric pressure and can be used with direct infusion of sample, or is readily coupled with HPLC. Fenn and colleagues were the first practitioners of ES mass spectrometry (Yamashita and Fenn, 1984a, b), and by the turn of the last century, ES had largely replaced FAB for the analysis of bile acids and steroid conjugates (Griffiths et al., 2005).
In ES, the analyte is dissolved in a solvent, very often methanol or ethanol, or an aqueous solution of methanol, ethanol, or acetonitrile, and sprayed from a metal or fused silica capillary (needle) of 20–100 mm i.d. at a flow-rate of 1–500 mL/min (Fig. 2.60, upper panel). An ES is achieved by raising the potential on the spray capillary to ~4 kV (+4 kV in the positive-ion mode, and −4 kV in the negative-ion mode) and applying a back-pressure to the contents of the capillary, e.g. via a syringe pump or HPLC pump. The resulting spray of charged droplets is directed toward a counter electrode which is at lower potential. As the spray of fine droplets travels towards the counter electrode, the droplets lose solvent, shrink and break up into smaller droplets (Fig. 2.60, lower panel). The small offspring droplets are derived from the surface of their predecessors, which contains the highest concentration of charge, and hence the offspring droplets are generated with an enhanced charge-to-mass ratio. Eventually, the droplets become so small that the charge density on the droplets exceeds the surface tension and gas-phase ions are desorbed (ion evaporation model (Iribarne and Thomson, 1976)), or alternatively very small droplets containing a single charged species completely lose solvent leaving the residual charged species free (charge residue model (Dole et al., 1968)). Surface active compounds tend to be enhanced in the small droplets, and hence are preferentially brought into the gas-phase. The counter electrode contains a circular orifice through which ions are transmitted into the vacuum chamber of the mass spectrometer. By traversing differentially pumped regions via skimmer lenses the ions are trans-mitted to the high vacuum region of the mass spectrometer for subsequent analysis. Early ES experiments were performed at flow rates of 5–50 mL/min, compatible with narrow-bore and micro-bore HPLC columns Weidolf et al., 1988; Wong et al., 1922, although today ES interfaces are compatible with 4.2 mm columns operating at 500 mL/min flow-rates. It should, however, be noted that ES is a concentration rather than a mass dependent process, which effectively means that maximum sensitivity is achieved with high-concentration, low-volume samples, rather than high-volume dilute samples. So theoretically a combination of low-flow-rate HPLC with ES should provide better sensitivity than conventional flow-rate HPLC with ES.
Low-flow-rate (<1 mL/min) ES provides a gain in sensitivity when compared to conventional flow-rate ES on account of the concentration dependence of the ES process, and the better ion formation and sampling characteristics of the low-flow-rate interface. Today, the terms micro-ES and nano-ES are both used to describe low-flow-rate ES and are interchangeable, although the terms were originally
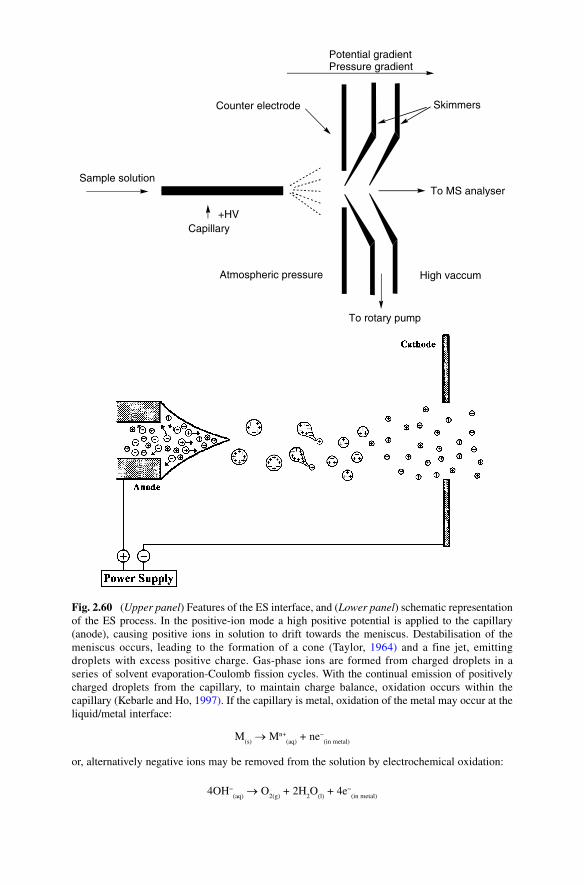
Sample solution
Capillary
Atmospheric pressure
To rotary pump
High vaccum
To MS analyser
SkimmersCounter electrode
Potential gradientPressure gradient
+HV
Fig. 2.60 (Upper panel) Features of the ES interface, and (Lower panel) schematic representation of the ES process. In the positive-ion mode a high positive potential is applied to the capillary (anode), causing positive ions in solution to drift towards the meniscus. Destabilisation of the meniscus occurs, leading to the formation of a cone (Taylor, 1964) and a fine jet, emitting droplets with excess positive charge. Gas-phase ions are formed from charged droplets in a series of solvent evaporation-Coulomb fission cycles. With the continual emission of positively charged droplets from the capillary, to maintain charge balance, oxidation occurs within the capillary (Kebarle and Ho, 1997). If the capillary is metal, oxidation of the metal may occur at the liquid/metal interface:
M(s)
® Mn+(aq)
+ ne−(in metal)
or, alternatively negative ions may be removed from the solution by electrochemical oxidation:
4OH−(aq)
® O2(g)
+ 2H2O
(l) + 4e−
(in metal)
1232 Spectroscopic Methods of Steroid Analysis
invented to discriminate between two slightly different forms of ES. The term micro-ES was initially coined by Emmett and Caprioli (1994), and used to refer to a miniaturised form of pressure driven ES (i.e. pumped flow) operated at sub microlitre per minute flow-rate. Alternatively, nano-ES was invented by Wilm and Mann (1994) and differs from micro-ES in that it is a pure form of ES, where sample flow is at nl/min rates and initiated by the electrical potential between the capillary tip and counter electrode, rather than being pressure driven. We prefer the term low-flow-rate ES to either micro-ES or nano-ES, and use it here to refer to ES operated at flow-rates of 1 mL/min and below.
Thermospray (TS) mass spectrometry predates ES (Blakeley et al., 1978). TS, like ES, is a technique which involves the spraying of analyte dissolved in solvent from a capillary into an ion-source at atmospheric pressure. But TS differs from ES in that vaporisation and ionisation are a result of thermally heating the spray, as opposed to raising the sprayer to a high potential. TS performs best with buffered aqueous mobile phase (0.1–0.01 M ammonium acetate). Droplets become charged by an uneven distribution of cations and anions between droplets, with the result that gaseous [M+H]+, [M+NH
4]+ or [M+Na]+ ions are formed in the positive-ion
mode in an ion-evaporation process similar to that occurring in ES. In the negative-ion mode [M−H]− ions are formed, and this mode is preferably used for the analysis of acidic compounds, e.g. bile acids, steroid sulphates and glucuronides. TS can be operated in either a “filament-on” or “filament-off” (direct ion-evaporation) mode. By the incorporation of a filament in the ion-source, analytes which are not readily ionised by direct ion-evaporation can be ionised in the “filament-on” mode via a CI process. Spectra of steroids and bile acids generated by ES and TS are similar; however, dehydration of the protonated or deprotonated molecule tends to occur to a much greater extent in TS than in ES (Eckers et al., 1991).
Atmospheric Pressure Chemical Ionisation (APCI) is a technique that has become popular for the ionisation of neutral steroids. It is very similar to TS described above (Covey et al., 1986). Analyte dissolved in solvent is sprayed into an atmospheric pressure ion-source. Vaporisation of sample and solvent is achieved by the application of heat, and ionisation of analyte is achieved by a CI event. The APCI source differs from the ES source in that it additionally contains a corona discharge needle. Analyte ionisation can be achieved by two processes:
(i) The first is a primary CI process. The nebulised spray results in small droplets of differing charge formed as a result of statistical random sampling of buffer ions
When the interface is operated in the negative-ion mode, potentials are reversed, and to maintain charge balance cations or neutral molecules in solution may become reduced at the walls of the capillary.
Cn+(aq)
+ ne− ® C(g/s)
H2O
(l) + 2e− ® H
2(g) + O2−
(aq)
(from Griffiths et al., 2001, with permission)
124 A. Kasal et al.
(cf. TS). The charged droplets will shrink as in the ES process with the eventual formation of gas-phase buffer ions, analyte molecules (M), and solvent molecules (Sv). If ammonium acetate, (NH
4+ CH
3CO
2−), is the buffer, gas-phase [NH
4]+ and
[CH3CO
2]− ions will be generated. The buffer ions will be free to react with analyte
molecules in a CI event which will generate analyte ions (Eqs. 2.6 and 2.7).
+ ++ ® +4 (g) (g) 3(g) (g)NH M NH MH (2.6a)
+ ++ ® +4 (g) (g) 4 (g)NH M M NH (2.6b)
+ ++ ® +4 (g) (g) 3(g) (g)NH Sv NH SvH (2.6c)
+ ++ ® +(g) (g) (g)SvH M M SvH
(2.6d)
In the positive-ion mode the exact products of the CI event will depend on the gas-phase basicity of the analyte, solvent and buffer. Adduct ions can also be formed, e.g. [M+NH
4]+ and [M+CH
3CN+H]+ in aqueous acetonitrile buffered with ammonium
acetate. When the ion-source is operated in the negative-ion mode the products of the CI event will depend on the gas-phase acidity of the sprayed components (Eq. 2.7).
- -®3 2 (g) (g) 3 2 (g) (g)CH CO +M CH CO H +[M H]- (2.7a)
- -® +3 2 (g) (g) 3 2 (g)CH CO +M M CH CO (2.7b)
(ii) APCI can also be achieved in a secondary process, in which electrons from the Corona discharge ionise nitrogen gas in the APCI source leading to the even-tual CI of the analyte. In the positive-ion mode, again the eventual products depend on the proton affinity of the components (Eq. 2.8), while in the negative-ion mode the gas-phase acidity of the components will define which deprotonated molecules are generated.
+ ® +· +·2 (g) (g) (g) 2(g)N +Sv Sv N (2.8a)
+ ® +· +(g) (g) (g) (g)Sv +Sv SvH [Sv-H]· (2.8b)
® ++ +(g) (g) (g) (g)SvH +M MH Sv (2.8c)
®+ +(g) (g) (g)SvH +M M+SvH (2.8d)
Both primary and secondary processes can operate simultaneously, although by turning the corona discharge needle off, only the primary processes proceed.
APCI has been extensively used for the ionisation of neutral steroids (Ma and Kim, 1997; Shimada and Mukai, 1998; Rule and Henion, 1999; Draisci et al., 2000; Lagana et al., 2000; Mitamura et al., 2000a, b; Nassar et al., 2001; Leinonen et al.,
1252 Spectroscopic Methods of Steroid Analysis
2002; Starcevic et al., 2003; Cristoni et al., 2004; Wang et al., 2004), oxysterols (Burkard et al., 2004), bile acid acyl glucosides and glucuronides (Goto et al., 1998, 2004), bile acids (Ikegawa et al., 1995) and steroid glucuronides (Kuuranne et al., 2000). It is compatible with HPLC operated at high-flow-rates (100–500 mL/min), and this makes it a favoured mode of ionisation for “high-throughput” analysis (Clarke and Goldman, 2005; Redor-Goldman et al., 2005a, b).
Electron Capture Atmospheric Pressure Chemical Ionisation (ECAPCI) is suitable for the ionisation of molecules which contain a group with high electron affinity, and it can be regarded as the atmospheric pressure equivalent of EC–NCI. For steroid analysis it is necessary to derivatise the steroid with an electron capturing group e.g. pentafluorobenzyl moiety, (Singh et al., 2000), 2-nitro-4-trifluorometh-ylphenylhydrazone moiety (Higashi et al., 2002). The resultant derivative is then introduced into a conventional APCI source operated in the negative-ion mode with the corona discharge needle “on”. Low-energy secondary electrons are generated as a side-product of N
2 ionisation, and are captured by the electron capturing group
tagged to the steroid to generate M−. ions (Eq. 2.9). When the pentafluorobenzyl derivatising group is employed, dissociative electron capture occurs with the loss of the pentafluorobenzyl radical and formation of a negative ion (A−) which reflects the structure of the original steroid. Alternatively, 2-nitro-4-trifluoromethylphenylhy-drazones give stable M−. ions which can be fragmented in a MS/MS experiment to give product ions (A−) and neutral fragments (B.), which reflect the structure of the steroid or are characteristic of the derivatising agent.
.+2(g) 2 (g)N + N 2ee - -® + (2.9a)
.(g) (g)e M M- -+ ® (2.9b)
.(g) g)
.(M A B- -® + (2.9c)
ECAPCI is specific to molecules containing an electron capturing group, and hence provides high specificity, and has been shown to provide enhancement in sensitivity compared to APCI of 20- (Higashi et al., 2005) to 200-fold (Singh et al., 2000). ECAPCI is used extensively for neurosteroid analysis, particularly by Higashi and colleagues (Higashi et al., 2002, 2003).
Atmospheric Pressure Photoionisataion (APPI) was introduced in 2000 by Robb, Covey and Bruins (2000). Photons (10 eV, 10.6 eV) are provided by a krypton lamp, and dopant molecules e.g. toluene (BzH), introduced into the ion-source in combination with analyte (M) and mobile phase, are vaporised and photoionised. This results in the formation of radical cations e.g. BzH+ (Eq. 2.10).
-+ ® ++·(g) (g)BzH h (10 or10.6 eV) BzH eu (2.10a)
+ ® ++· · +
(g) (g) (g) (g)BzH Sv Bz SvH
(2.10b)
+ ® ++ +
(g) (g) (g) (g)M SvH MH SV
(2.10c)
126 A. Kasal et al.
+ ® ++· +·
(g) (g) (g) (g)BzH M M BzH
(2.10d)
The radical cations, e.g. BzH+., react with solvent molecules (Sv) producing proto-nated solvent molecules (SvH+), if the proton affinity of the solvent molecule is higher than that of the benzyl radical (Bz.). The analyte is then ionised by proton transfer, if the proton affinity of the analyte is higher than that of the solvent molecule. Alternatively, if the proton affinity of the solvent molecule is lower than that of the benzyl radical (Bz.), a charge exchange reaction between the radical cation (BzH+.) and the analyte can take place. If the ionisation energy of the analyte is lower than that of the radical cation, the result is the formation of analyte radical cations (M+.) (Leinonen et al., 2002). APPI has been used for the analysis of ste-roids including, sterols (Trösken et al. 2004; Lembcke et al., 2005), corticosteroids (Greig et al., 2004), anabolic steroids (Leinonen et al., 2002), and estradiol deriva-tives (Shou et al., 2004). A disadvantage of the technique, as illustrated in the study of Greig et al. (2003) is the formation of overlapping [M+1]+. (due to the 13C iso-tope) and [M+H]+ ion-peaks. This can cause confusion in molecular weight determination.
2.5.4 Mass Analysers
Once a sample has been ionised it is transported from the ion-source to the mass analyser. Trapping mass analysers can provide an exception in that ionisation and mass analysis can be achieved in the trap itself. Mass analysers operate by separating ions according to their m/z. Early mass analysers used in steroid and bile acid research were based on magnetic-sectors, but such analysers are less widely used for biological applications today. However, ion-cyclotron-resonance (ICR) analysers, which also use a magnetic field to separate ions, are currently gaining popularity. As an alternative to using a magnetic field to separate ions, ions can be separated according to their behaviour in electrical fields, and electric field analysers consti-tute the majority of mass analysers in current use.
Magnetic-Sector Analysers Like all other mass analysers, magnetic-sector analy-sers separate ions according to their m/z. Usually, the magnetic-sector (B) is arranged in series with an electric-sector (E) and the combination (either EB or BE) can give resolutions in excess of 100,000 (10% valley definition) for ions in the steroid mass range. Modern magnetic-sector instruments are most commonly inter-faced with an EI source, with or without a GC inlet, although in the past they have been coupled to TS, FAB, MALDI and ES ion-sources. Magnetic-sectors are still used today for exact mass measurements (<5 ppm) made at high resolution (>10,000, 10% valley), and these instruments offer excellent dynamic range which is particularly important in isotope abundance measurements. Magnetic-sector analysers operate with keV ion-beams which can be a major advantage when the
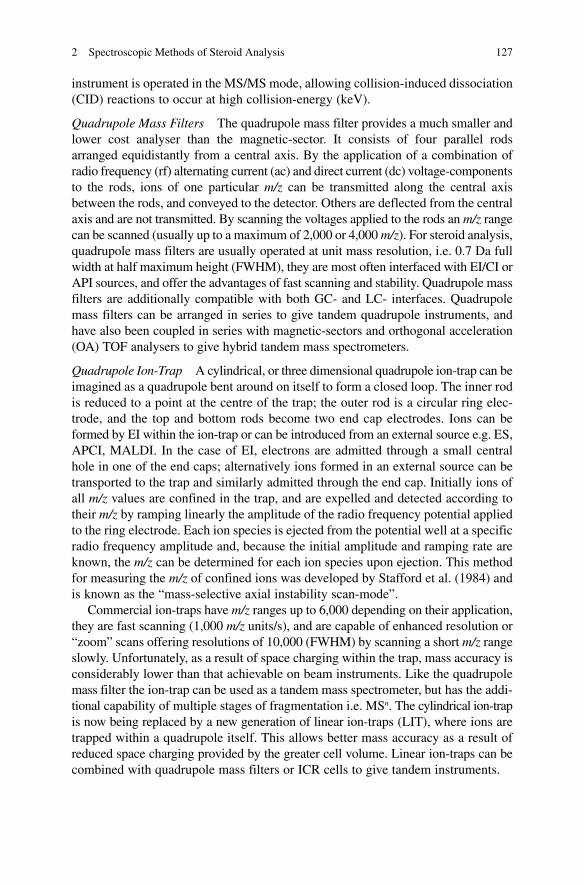
1272 Spectroscopic Methods of Steroid Analysis
instrument is operated in the MS/MS mode, allowing collision-induced dissociation (CID) reactions to occur at high collision-energy (keV).
Quadrupole Mass Filters The quadrupole mass filter provides a much smaller and lower cost analyser than the magnetic-sector. It consists of four parallel rods arranged equidistantly from a central axis. By the application of a combination of radio frequency (rf) alternating current (ac) and direct current (dc) voltage-components to the rods, ions of one particular m/z can be transmitted along the central axis between the rods, and conveyed to the detector. Others are deflected from the central axis and are not transmitted. By scanning the voltages applied to the rods an m/z range can be scanned (usually up to a maximum of 2,000 or 4,000 m/z). For steroid analysis, quadrupole mass filters are usually operated at unit mass resolution, i.e. 0.7 Da full width at half maximum height (FWHM), they are most often interfaced with EI/CI or API sources, and offer the advantages of fast scanning and stability. Quadrupole mass filters are additionally compatible with both GC- and LC- interfaces. Quadrupole mass filters can be arranged in series to give tandem quadrupole instruments, and have also been coupled in series with magnetic-sectors and orthogonal acceleration (OA) TOF analysers to give hybrid tandem mass spectrometers.
Quadrupole Ion-Trap A cylindrical, or three dimensional quadrupole ion-trap can be imagined as a quadrupole bent around on itself to form a closed loop. The inner rod is reduced to a point at the centre of the trap; the outer rod is a circular ring elec-trode, and the top and bottom rods become two end cap electrodes. Ions can be formed by EI within the ion-trap or can be introduced from an external source e.g. ES, APCI, MALDI. In the case of EI, electrons are admitted through a small central hole in one of the end caps; alternatively ions formed in an external source can be transported to the trap and similarly admitted through the end cap. Initially ions of all m/z values are confined in the trap, and are expelled and detected according to their m/z by ramping linearly the amplitude of the radio frequency potential applied to the ring electrode. Each ion species is ejected from the potential well at a specific radio frequency amplitude and, because the initial amplitude and ramping rate are known, the m/z can be determined for each ion species upon ejection. This method for measuring the m/z of confined ions was developed by Stafford et al. (1984) and is known as the “mass-selective axial instability scan-mode”.
Commercial ion-traps have m/z ranges up to 6,000 depending on their application, they are fast scanning (1,000 m/z units/s), and are capable of enhanced resolution or “zoom” scans offering resolutions of 10,000 (FWHM) by scanning a short m/z range slowly. Unfortunately, as a result of space charging within the trap, mass accuracy is considerably lower than that achievable on beam instruments. Like the quadrupole mass filter the ion-trap can be used as a tandem mass spectrometer, but has the addi-tional capability of multiple stages of fragmentation i.e. MSn. The cylindrical ion-trap is now being replaced by a new generation of linear ion-traps (LIT), where ions are trapped within a quadrupole itself. This allows better mass accuracy as a result of reduced space charging provided by the greater cell volume. Linear ion-traps can be combined with quadrupole mass filters or ICR cells to give tandem instruments.
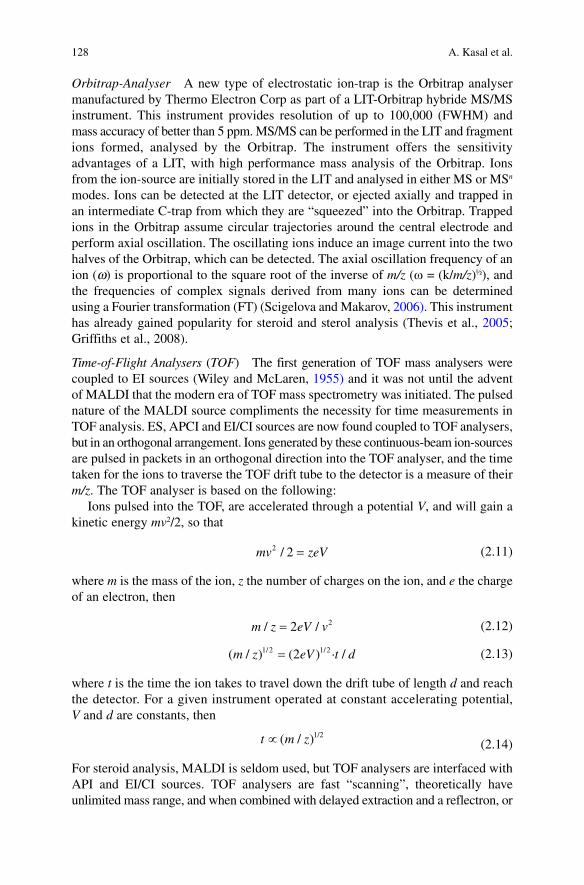
128 A. Kasal et al.
Orbitrap-Analyser A new type of electrostatic ion-trap is the Orbitrap analyser manufactured by Thermo Electron Corp as part of a LIT-Orbitrap hybride MS/MS instrument. This instrument provides resolution of up to 100,000 (FWHM) and mass accuracy of better than 5 ppm. MS/MS can be performed in the LIT and fragment ions formed, analysed by the Orbitrap. The instrument offers the sensitivity advantages of a LIT, with high performance mass analysis of the Orbitrap. Ions from the ion-source are initially stored in the LIT and analysed in either MS or MSn modes. Ions can be detected at the LIT detector, or ejected axially and trapped in an intermediate C-trap from which they are “squeezed” into the Orbitrap. Trapped ions in the Orbitrap assume circular trajectories around the central electrode and perform axial oscillation. The oscillating ions induce an image current into the two halves of the Orbitrap, which can be detected. The axial oscillation frequency of an ion (w) is proportional to the square root of the inverse of m/z (w = (k/m/z)½), and the frequencies of complex signals derived from many ions can be determined using a Fourier transformation (FT) (Scigelova and Makarov, 2006). This instrument has already gained popularity for steroid and sterol analysis (Thevis et al., 2005; Griffiths et al., 2008).
Time-of-Flight Analysers (TOF) The first generation of TOF mass analysers were coupled to EI sources (Wiley and McLaren, 1955) and it was not until the advent of MALDI that the modern era of TOF mass spectrometry was initiated. The pulsed nature of the MALDI source compliments the necessity for time measurements in TOF analysis. ES, APCI and EI/CI sources are now found coupled to TOF analysers, but in an orthogonal arrangement. Ions generated by these continuous-beam ion-sources are pulsed in packets in an orthogonal direction into the TOF analyser, and the time taken for the ions to traverse the TOF drift tube to the detector is a measure of their m/z. The TOF analyser is based on the following:
Ions pulsed into the TOF, are accelerated through a potential V, and will gain a kinetic energy mv2/2, so that
2 / 2mv zeV= (2.11)
where m is the mass of the ion, z the number of charges on the ion, and e the charge of an electron, then
= 2/ 2 /m z eV v (2.12)
=1/2 1/2( / ) (2 ) · /m z eV t d (2.13)
where t is the time the ion takes to travel down the drift tube of length d and reach the detector. For a given instrument operated at constant accelerating potential, V and d are constants, then
µ 1/2( / )t m z (2.14)
For steroid analysis, MALDI is seldom used, but TOF analysers are interfaced with API and EI/CI sources. TOF analysers are fast “scanning”, theoretically have unlimited mass range, and when combined with delayed extraction and a reflectron, or
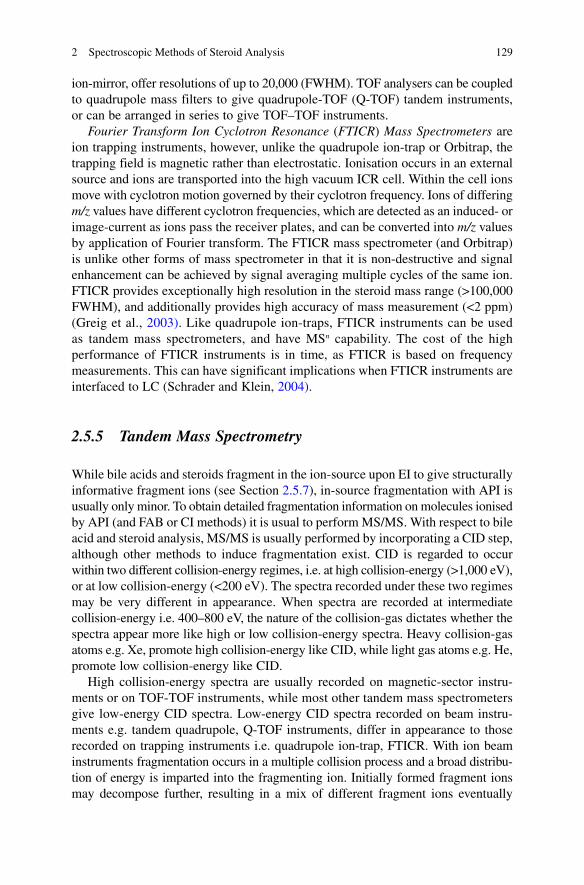
1292 Spectroscopic Methods of Steroid Analysis
ion-mirror, offer resolutions of up to 20,000 (FWHM). TOF analysers can be coupled to quadrupole mass filters to give quadrupole-TOF (Q-TOF) tandem instruments, or can be arranged in series to give TOF–TOF instruments.
Fourier Transform Ion Cyclotron Resonance (FTICR) Mass Spectrometers are ion trapping instruments, however, unlike the quadrupole ion-trap or Orbitrap, the trapping field is magnetic rather than electrostatic. Ionisation occurs in an external source and ions are transported into the high vacuum ICR cell. Within the cell ions move with cyclotron motion governed by their cyclotron frequency. Ions of differing m/z values have different cyclotron frequencies, which are detected as an induced- or image-current as ions pass the receiver plates, and can be converted into m/z values by application of Fourier transform. The FTICR mass spectrometer (and Orbitrap) is unlike other forms of mass spectrometer in that it is non-destructive and signal enhancement can be achieved by signal averaging multiple cycles of the same ion. FTICR provides exceptionally high resolution in the steroid mass range (>100,000 FWHM), and additionally provides high accuracy of mass measurement (<2 ppm) (Greig et al., 2003). Like quadrupole ion-traps, FTICR instruments can be used as tandem mass spectrometers, and have MSn capability. The cost of the high performance of FTICR instruments is in time, as FTICR is based on frequency measurements. This can have significant implications when FTICR instruments are interfaced to LC (Schrader and Klein, 2004).
2.5.5 Tandem Mass Spectrometry
While bile acids and steroids fragment in the ion-source upon EI to give structurally informative fragment ions (see Section 2.5.7), in-source fragmentation with API is usually only minor. To obtain detailed fragmentation information on molecules ionised by API (and FAB or CI methods) it is usual to perform MS/MS. With respect to bile acid and steroid analysis, MS/MS is usually performed by incorporating a CID step, although other methods to induce fragmentation exist. CID is regarded to occur within two different collision-energy regimes, i.e. at high collision-energy (>1,000 eV), or at low collision-energy (<200 eV). The spectra recorded under these two regimes may be very different in appearance. When spectra are recorded at intermediate collision-energy i.e. 400–800 eV, the nature of the collision-gas dictates whether the spectra appear more like high or low collision-energy spectra. Heavy collision-gas atoms e.g. Xe, promote high collision-energy like CID, while light gas atoms e.g. He, promote low collision-energy like CID.
High collision-energy spectra are usually recorded on magnetic-sector instru-ments or on TOF-TOF instruments, while most other tandem mass spectrometers give low-energy CID spectra. Low-energy CID spectra recorded on beam instru-ments e.g. tandem quadrupole, Q-TOF instruments, differ in appearance to those recorded on trapping instruments i.e. quadrupole ion-trap, FTICR. With ion beam instruments fragmentation occurs in a multiple collision process and a broad distribu-tion of energy is imparted into the fragmenting ion. Initially formed fragment ions may decompose further, resulting in a mix of different fragment ions eventually
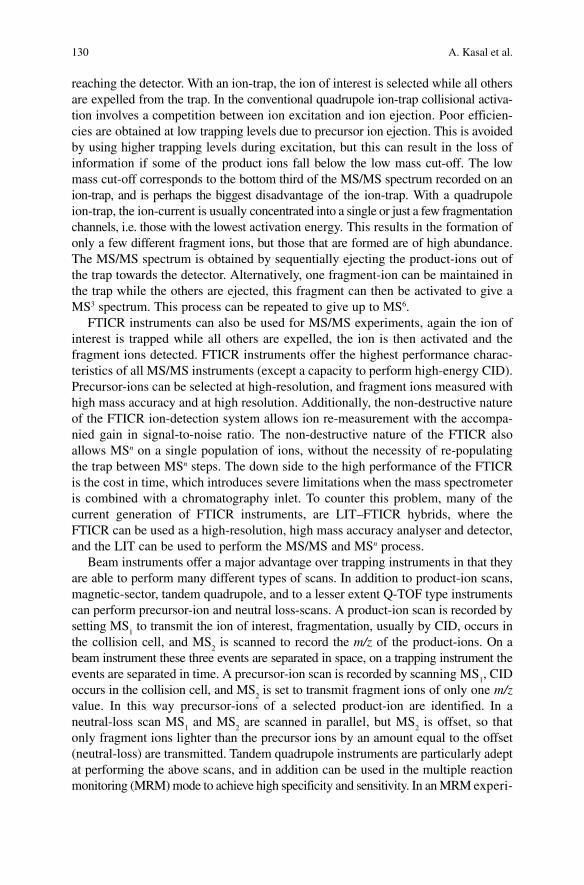
130 A. Kasal et al.
reaching the detector. With an ion-trap, the ion of interest is selected while all others are expelled from the trap. In the conventional quadrupole ion-trap collisional activa-tion involves a competition between ion excitation and ion ejection. Poor efficien-cies are obtained at low trapping levels due to precursor ion ejection. This is avoided by using higher trapping levels during excitation, but this can result in the loss of information if some of the product ions fall below the low mass cut-off. The low mass cut-off corresponds to the bottom third of the MS/MS spectrum recorded on an ion-trap, and is perhaps the biggest disadvantage of the ion-trap. With a quadrupole ion-trap, the ion-current is usually concentrated into a single or just a few fragmentation channels, i.e. those with the lowest activation energy. This results in the formation of only a few different fragment ions, but those that are formed are of high abundance. The MS/MS spectrum is obtained by sequentially ejecting the product-ions out of the trap towards the detector. Alternatively, one fragment-ion can be maintained in the trap while the others are ejected, this fragment can then be activated to give a MS3 spectrum. This process can be repeated to give up to MS6.
FTICR instruments can also be used for MS/MS experiments, again the ion of interest is trapped while all others are expelled, the ion is then activated and the fragment ions detected. FTICR instruments offer the highest performance charac-teristics of all MS/MS instruments (except a capacity to perform high-energy CID). Precursor-ions can be selected at high-resolution, and fragment ions measured with high mass accuracy and at high resolution. Additionally, the non-destructive nature of the FTICR ion-detection system allows ion re-measurement with the accompa-nied gain in signal-to-noise ratio. The non-destructive nature of the FTICR also allows MSn on a single population of ions, without the necessity of re-populating the trap between MSn steps. The down side to the high performance of the FTICR is the cost in time, which introduces severe limitations when the mass spectrometer is combined with a chromatography inlet. To counter this problem, many of the current generation of FTICR instruments, are LIT–FTICR hybrids, where the FTICR can be used as a high-resolution, high mass accuracy analyser and detector, and the LIT can be used to perform the MS/MS and MSn process.
Beam instruments offer a major advantage over trapping instruments in that they are able to perform many different types of scans. In addition to product-ion scans, magnetic-sector, tandem quadrupole, and to a lesser extent Q-TOF type instruments can perform precursor-ion and neutral loss-scans. A product-ion scan is recorded by setting MS
1 to transmit the ion of interest, fragmentation, usually by CID, occurs in
the collision cell, and MS2 is scanned to record the m/z of the product-ions. On a
beam instrument these three events are separated in space, on a trapping instrument the events are separated in time. A precursor-ion scan is recorded by scanning MS
1, CID
occurs in the collision cell, and MS2 is set to transmit fragment ions of only one m/z
value. In this way precursor-ions of a selected product-ion are identified. In a neutral-loss scan MS
1 and MS
2 are scanned in parallel, but MS
2 is offset, so that
only fragment ions lighter than the precursor ions by an amount equal to the offset (neutral-loss) are transmitted. Tandem quadrupole instruments are particularly adept at performing the above scans, and in addition can be used in the multiple reaction monitoring (MRM) mode to achieve high specificity and sensitivity. In an MRM experi-
1312 Spectroscopic Methods of Steroid Analysis
ment MS1 is set to transmit a defined precursor-ion and MS
2 a known fragment of
the precursor. The high-transmission of the quadrupole in this non-scanning mode results in high sensitivity, while the “parent-daughter” relationship provides specificity. In a given acquisition the quadrupoles can be set to monitor many such transitions.
2.5.6 Electron Impact Mass Spectra
While the early work using EI was performed mainly on natural steroids (see Section 2.5.8), increased structural information is usually obtained by preparation of derivatives which help to direct the localisation of charge and thus the fragmentation. More importantly, the analysis of steroid mixtures by GC/MS requires derivatisation because many naturally occurring steroids are polar and thermally labile even after removal of conjugating moieties. Pioneering work on methods to derivatise steroids was performed by Horning and co-workers (Horning, 1968).
Derivatives should be simple to prepare, result in single products, be thermally stable, and provide structurally informative mass spectra. General references can be found in books by Blau and King (1977), and Blau and Halket (1993), and information relating to steroid derivatisation for GC/MS can be found in these books and numerous reviews (Sjövall and Axelson, 1982; Shackleton et al., 1990; Wolthers and Kraan, 1999; Griffiths et al., 2005). Generally, the most useful derivatives of hydroxyl groups are trialkylsilyl ethers, of carboxyl groups methyl esters, and of carbonyl groups alkyl oximes. Trimethylsilyl (TMS) ethers are most commonly used because of their ease of preparation. Numerous methods and reagents have been described since the first report of their use in steroid analysis (Luukainen et al., 1961). References to reaction conditions useful for derivatisation of steroids are given in Table 2.22. Depending on their position and orientation, hydroxyl groups will react at different rates. This can be used to advantage in structure determinations, but normally conditions giving complete silylation are desired. Side reactions giving rise to artifacts are not common but should be kept in mind, especially when steroids containing an oxo group are reacted under forceful conditions. It is a drawback that the molecular ion of polyhydroxysteroid TMS ethers may not be seen because of extensive loss of trimethylsilanol giving [M−90]+ ions. Ethyl-, propyl-, or t-butyldimethylsilyl (t-BDMS) ethers may then help to define the molecular ion since loss of the alkyl group increases with the size of the group with possible appearance of an M-alkyl ion. However, steric hindrance may prevent reaction of bulky alkylsilyl reagents with hydroxyl groups in many positions. This can be used to advantage for preparation of mixed TMS-alkyldimethylsilyl derivatives as an aid in the interpretation of spectra and in quantitative analytical work.
Depending on reagent and conditions, oxo groups may react to form enol ethers. This has found special applications since molecular ions of enol-TMS ethers are usually abundant and fragmentation may be characteristic (Chambaz et al., 1973). However, it is often difficult to obtain single derivatives quantitatively, which complicates analyses of mixtures. Oxo groups are therefore usually converted into methyl oximes (MO) when biological mixtures are analysed. Thenot and Horning
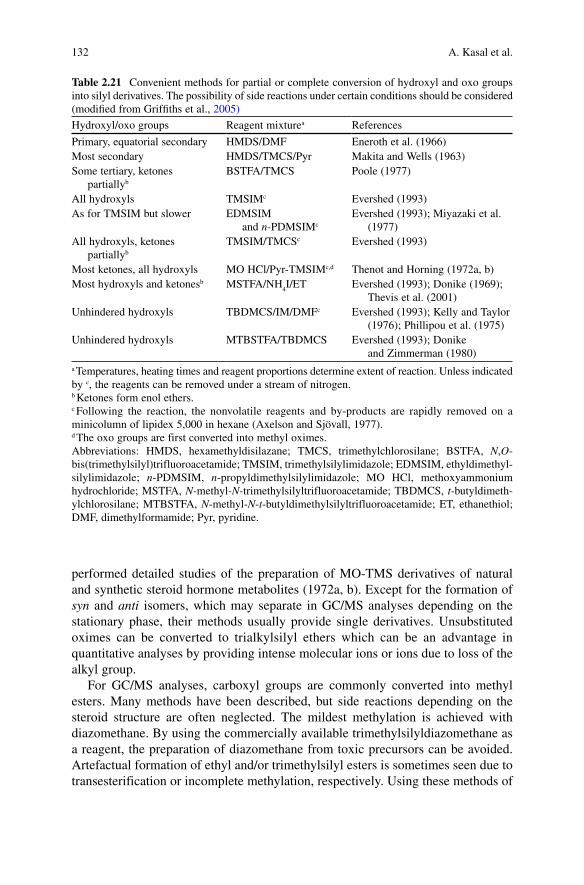
132 A. Kasal et al.
performed detailed studies of the preparation of MO-TMS derivatives of natural and synthetic steroid hormone metabolites (1972a, b). Except for the formation of syn and anti isomers, which may separate in GC/MS analyses depending on the stationary phase, their methods usually provide single derivatives. Unsubstituted oximes can be converted to trialkylsilyl ethers which can be an advantage in quantitative analyses by providing intense molecular ions or ions due to loss of the alkyl group.
For GC/MS analyses, carboxyl groups are commonly converted into methyl esters. Many methods have been described, but side reactions depending on the steroid structure are often neglected. The mildest methylation is achieved with diazomethane. By using the commercially available trimethylsilyldiazomethane as a reagent, the preparation of diazomethane from toxic precursors can be avoided. Artefactual formation of ethyl and/or trimethylsilyl esters is sometimes seen due to transesterification or incomplete methylation, respectively. Using these methods of
Table 2.21 Convenient methods for partial or complete conversion of hydroxyl and oxo groups into silyl derivatives. The possibility of side reactions under certain conditions should be considered (modified from Griffiths et al., 2005)
Hydroxyl/oxo groups Reagent mixturea References
Primary, equatorial secondary HMDS/DMF Eneroth et al. (1966)Most secondary HMDS/TMCS/Pyr Makita and Wells (1963)Some tertiary, ketones
partiallyb
BSTFA/TMCS Poole (1977)
All hydroxyls TMSIMc Evershed (1993)As for TMSIM but slower EDMSIM
and n-PDMSIMc
Evershed (1993); Miyazaki et al. (1977)
All hydroxyls, ketones partiallyb
TMSIM/TMCSc Evershed (1993)
Most ketones, all hydroxyls MO HCl/Pyr-TMSIMc,d Thenot and Horning (1972a, b)Most hydroxyls and ketonesb MSTFA/NH
4I/ET Evershed (1993); Donike (1969);
Thevis et al. (2001)Unhindered hydroxyls TBDMCS/IM/DMFc Evershed (1993); Kelly and Taylor
(1976); Phillipou et al. (1975)Unhindered hydroxyls MTBSTFA/TBDMCS Evershed (1993); Donike
and Zimmerman (1980)a Temperatures, heating times and reagent proportions determine extent of reaction. Unless indicated by c, the reagents can be removed under a stream of nitrogen.b Ketones form enol ethers.c Following the reaction, the nonvolatile reagents and by-products are rapidly removed on a minicolumn of lipidex 5,000 in hexane (Axelson and Sjövall, 1977).d The oxo groups are first converted into methyl oximes.Abbreviations: HMDS, hexamethyldisilazane; TMCS, trimethylchlorosilane; BSTFA, N,O-bis(trimethylsilyl)trifluoroacetamide; TMSIM, trimethylsilylimidazole; EDMSIM, ethyldimethyl-silylimidazole; n-PDMSIM, n-propyldimethylsilylimidazole; MO HCl, methoxyammonium hydrochloride; MSTFA, N-methyl-N-trimethylsilyltrifluoroacetamide; TBDMCS, t-butyldimeth-ylchlorosilane; MTBSTFA, N-methyl-N-t-butyldimethylsilyltrifluoroacetamide; ET, ethanethiol; DMF, dimethylformamide; Pyr, pyridine.
1332 Spectroscopic Methods of Steroid Analysis
derivatisation it is also possible to analyse steroid conjugates with neutral and acidic sugars by GC/MS.
Derivatisation can also be a means of introducing a functional group with special mass spectrometric properties e.g. suitable for detection by chemical ionisation. Hydroxyl groups may be converted into perfluoroacyl esters and carbonyl groups into perfluorobenzyl oximes (see Section 2.5.2). These have found use in quantitative GC/MS analysis but are not suitable for polyfunctional steroids because of partial reactions. It is also a disadvantage (unless used for precursor-ion scanning) that the property on which detection is based is located in the derivatising moiety and thus not specific for the steroid. The reactions are also sensitive to water and side products may disturb the analyses.
2.5.7 General Patterns of EI Fragmentation of Derivatised Steroids
There is a vast literature on EI mass spectra and fragmentation mechanisms of steroids and their derivatives. Detailed information can be obtained in numerous books and reviews (Zaretskii, 1976; Brooks and Gaskell, 1980; Budzikiewicz, 1980; Elliott, 1980; Gerst et al., 1997; Griffiths et al., 2005). Chemical ionisation of steroids has been also been reviewed (Lin and Smith, 1984).
The four most general types of fragmentation are: loss of a methyl group (angular or from a TMS group), loss of hydroxyl groups as water (or its equivalent in derivatives), loss of the side-chain, and loss of part of or the entire D-ring. Loss of the A-ring can also give ions useful for the localisation of substituents. These losses are seen in different combinations and the intensities of the fragment ions vary depending on the positions and orientation of substituents and the type of derivative. Positional isomers can usually be distinguished when suitable reference spectra are available (except in the case of double bonds that may isomerise in the ion-source), and stereoisomers often give spectra in which relative intensities of common ions differ reproducibly.
TMS ethers of polyhydroxysteroids and steroids with vicinal hydroxyl groups often lose the last trimethylsiloxy group without a hydrogen {–(CH
3)SiO, –89 Da}.
TMS ethers of steroids with a primary hydroxyl group (at C-18, C-19, or C-21) give ions at m/z 103 [CH
2OTMS]+ and/or [M−103]+. In most cases an ABCD-ring ion is
seen at an m/z value determined by the number of double bonds after loss of all hydroxyl functions and the nature of remaining substituents on the ring system (e.g. at m/z 257, 255, 253 and 251 with 1–4 double bonds, respectively, and at 14 Da higher for each oxo or methyl group present). Free oxo groups are more clearly seen (giving discrete ABCD-ring ion peaks) and localised than their methyloxime derivatives. In the case of sterols with a double bond in the side-chain, the loss of the side-chain is often accompanied by loss of two nuclear hydrogens resulting in an ABCD-ring ion 2 Da lower than for a saturated analogue. In some cases two ABCD ions are formed with or without transfer of two nuclear hydrogens (Griffiths
134 A. Kasal et al.
et al., 2005). Steroids without a side-chain (androgens, estrogens) will give ABCD-ring ions 1 Da heavier than those from steroids with a saturated side-chain. Spectra of TMS ethers show typical peaks at m/z 73 and 75.
TMS residues tend to migrate more readily than other functional groups. This can be both an advantage and a disadvantage in structure determinations. Steroids with more than one TMSO group often give an ion at m/z 147 [(CH
3)
3SiOSi(CH
3)
2]+
which is particularly prominent for vicinal OTMS structures (Sloan, et al., 1971). Estrogens and androgens with two TMSO groups in positions 15–18 give an ion at m/z 191 [(CH
3)
3SiO−CH=O+Si(CH
3)
3] due to migration of a TMSO group
(Gustafsson, et al., 1969). For example, m/z 191 is the base peak in spectra of C18
and C
19 steroids with three TMSO groups at positions 15a, 16a, and 17b. An ion
at m/z 191 is seen in spectra of many steroids with closely located TMSO groups but the steric requirements for the formation of the ion remain to be determined.
TMS groups may migrate within the steroid skeleton or between the side-chain and the skeleton. An example is the loss of 56 Da from [M]+ of TMS ethers of 3b-hydroxy-D5-steroids also having a carbonyl group in the D-ring or side-chain. Isotope labelling indicated transfer of the TMS group, probably to C-6, with loss of C-1–C-3 with the oxygen (CH
2=CHCH=O) (Björkhem et al., 1973). TMS ethers of
isomers of 20-hydroxy-5a-pregnan- and -5-pregnen-3-one steroids give fragment ions at [M−44]+ and [M−59]+ due to loss of CH
3CHO and CH
3CHO+CH
3 with migration
of the TMS group to the charged fragment (Smith et al., 1976). A corresponding D16 steroid loses the entire side-chain and D-ring with migration of the TMS group to the charged ABC ring [M−156+73]+. In addition to the m/z 103 [CH
2OTMS]+ typical
of TMS ethers of primary alcohols, the TMS ether of a 17-oxo-18-hydroxy-C19
steroid gives a peak at [M-CH
2O]+ due to TMS migration probably to the oxo group
(Smith et al., 1976). TMS ethers of 3-oxo-D4-steroids with a hydroxyl group in a C8
side-chain give an ion at m/z 196 which arises by a combination of the TMS group from the side-chain with a ring A fragment of 123 Da produced by cleavage through ring B. The importance of the carbonyl group is evident from the absence of migration in the analysis of the analogous methyl oximes. Table 2.22 lists common fragment ions and losses seen in mass spectra of TMS and MO-TMS derivatives of C
19 and C
21 steroids (Griffiths et al., 2005).
The effect of derivatisation can be seen in the spectra of testosterone and its trimethylsilyl derivatives: with the increasing number of TMSO groups, the stability of the molecular ion grows and its fragmentation declines thus making the spectrum clearer (Fig. 2.61).
2.5.8 Chemistry of EI Fragmentation of Steroids
Though the elemental composition of all fragments can be determined using high resolution mass spectrometry, it is still useful to understand the general patterns of carbonium ion decomposition which are reflected in the distribution of fragment ions in steroid EI mass spectra. On ionisation, the electron with the lowest ionisation
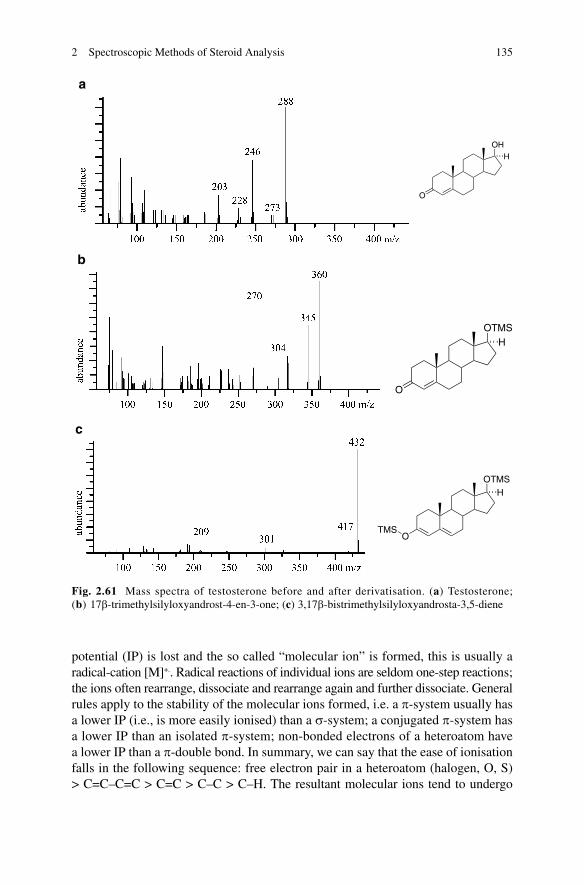
1352 Spectroscopic Methods of Steroid Analysis
Fig. 2.61 Mass spectra of testosterone before and after derivatisation. (a) Testosterone; (b) 17b-trimethylsilyloxyandrost-4-en-3-one; (c) 3,17b-bistrimethylsilyloxyandrosta-3,5-diene
a
O
HOH
b
O
HOTMS
c
O
HOTMS
TMS
potential (IP) is lost and the so called “molecular ion” is formed, this is usually a radical-cation [M]+.. Radical reactions of individual ions are seldom one-step reactions; the ions often rearrange, dissociate and rearrange again and further dissociate. General rules apply to the stability of the molecular ions formed, i.e. a p-system usually has a lower IP (i.e., is more easily ionised) than a s-system; a conjugated p-system has a lower IP than an isolated p-system; non-bonded electrons of a heteroatom have a lower IP than a p-double bond. In summary, we can say that the ease of ionisation falls in the following sequence: free electron pair in a heteroatom (halogen, O, S) > C=C–C=C > C=C > C–C > C–H. The resultant molecular ions tend to undergo
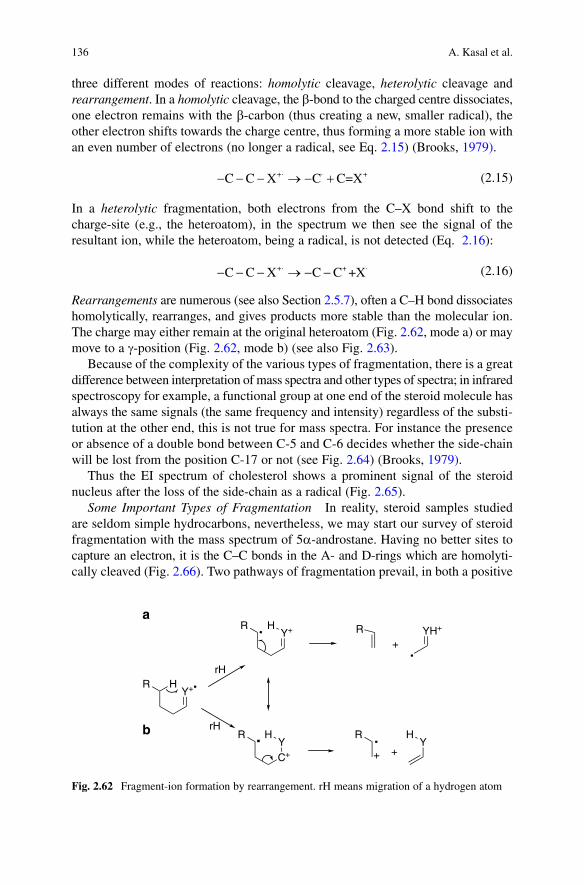
136 A. Kasal et al.
Y+H
Y+H YH+
C+Y
HY
H
R
R
R R
R
.
.
.
.
.
+
+
a
b
rH
rH
+
Fig. 2.62 Fragment-ion formation by rearrangement. rH means migration of a hydrogen atom
three different modes of reactions: homolytic cleavage, heterolytic cleavage and rearrangement. In a homolytic cleavage, the b-bond to the charged centre dissociates, one electron remains with the b-carbon (thus creating a new, smaller radical), the other electron shifts towards the charge centre, thus forming a more stable ion with an even number of electrons (no longer a radical, see Eq. 2.15) (Brooks, 1979).
- - - ® - ++· · +C C X C C=X (2.15)
In a heterolytic fragmentation, both electrons from the C–X bond shift to the charge-site (e.g., the heteroatom), in the spectrum we then see the signal of the resultant ion, while the heteroatom, being a radical, is not detected (Eq. 2.16):
- - - ® - -+· + ·C C X C C +X (2.16)
Rearrangements are numerous (see also Section 2.5.7), often a C–H bond dissociates homolytically, rearranges, and gives products more stable than the molecular ion. The charge may either remain at the original heteroatom (Fig. 2.62, mode a) or may move to a g-position (Fig. 2.62, mode b) (see also Fig. 2.63).
Because of the complexity of the various types of fragmentation, there is a great difference between interpretation of mass spectra and other types of spectra; in infrared spectroscopy for example, a functional group at one end of the steroid molecule has always the same signals (the same frequency and intensity) regardless of the substi-tution at the other end, this is not true for mass spectra. For instance the presence or absence of a double bond between C-5 and C-6 decides whether the side-chain will be lost from the position C-17 or not (see Fig. 2.64) (Brooks, 1979).
Thus the EI spectrum of cholesterol shows a prominent signal of the steroid nucleus after the loss of the side-chain as a radical (Fig. 2.65).
Some Important Types of Fragmentation In reality, steroid samples studied are seldom simple hydrocarbons, nevertheless, we may start our survey of steroid fragmentation with the mass spectrum of 5a-androstane. Having no better sites to capture an electron, it is the C–C bonds in the A- and D-rings which are homolyti-cally cleaved (Fig. 2.66). Two pathways of fragmentation prevail, in both a positive
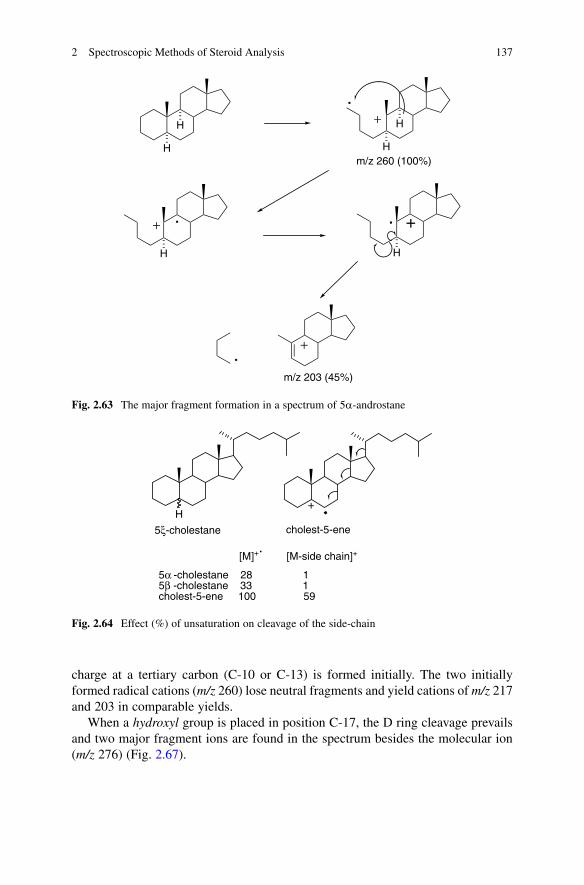
1372 Spectroscopic Methods of Steroid Analysis
HH
HH
.+ H
+ . +.
+.
m/z 260 (100%)
m/z 203 (45%)
H
Fig. 2.63 The major fragment formation in a spectrum of 5a-androstane
H+ .
5ξ-cholestane cholest-5-ene
5α -cholestane 28 15β -cholestane 33 1cholest-5-ene 100 59
[M]+.
[M-side chain]+
Fig. 2.64 Effect (%) of unsaturation on cleavage of the side-chain
charge at a tertiary carbon (C-10 or C-13) is formed initially. The two initially formed radical cations (m/z 260) lose neutral fragments and yield cations of m/z 217 and 203 in comparable yields.
When a hydroxyl group is placed in position C-17, the D ring cleavage prevails and two major fragment ions are found in the spectrum besides the molecular ion (m/z 276) (Fig. 2.67).
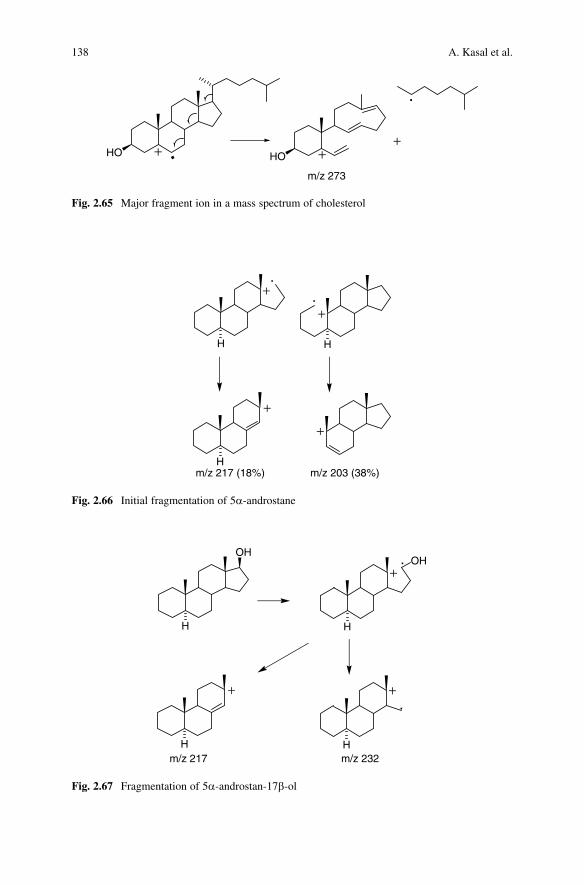
138 A. Kasal et al.
H H
H
+
m/z 217 m/z 232
OHOH
+.
H
+.
Fig. 2.67 Fragmentation of 5a-androstan-17b-ol
+ . +HO HO
m/z 273
.
+
Fig. 2.65 Major fragment ion in a mass spectrum of cholesterol
H H
H
+
+.
.
+
+
m/z 217 (18%) m/z 203 (38%)
Fig. 2.66 Initial fragmentation of 5a-androstane
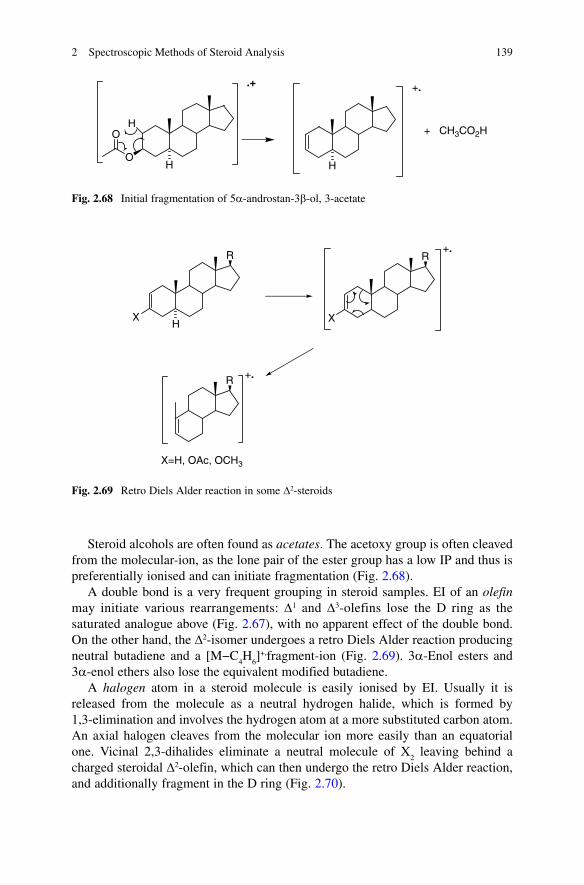
1392 Spectroscopic Methods of Steroid Analysis
H H
O
O
H
.+ +.
+ CH3CO2H
Fig. 2.68 Initial fragmentation of 5a-androstan-3b-ol, 3-acetate
Steroid alcohols are often found as acetates. The acetoxy group is often cleaved from the molecular-ion, as the lone pair of the ester group has a low IP and thus is preferentially ionised and can initiate fragmentation (Fig. 2.68).
A double bond is a very frequent grouping in steroid samples. EI of an olefin may initiate various rearrangements: D1 and D3-olefins lose the D ring as the saturated analogue above (Fig. 2.67), with no apparent effect of the double bond. On the other hand, the D2-isomer undergoes a retro Diels Alder reaction producing neutral butadiene and a [M−C
4H
6]+.fragment-ion (Fig. 2.69). 3a-Enol esters and
3a-enol ethers also lose the equivalent modified butadiene.A halogen atom in a steroid molecule is easily ionised by EI. Usually it is
released from the molecule as a neutral hydrogen halide, which is formed by 1,3-elimination and involves the hydrogen atom at a more substituted carbon atom. An axial halogen cleaves from the molecular ion more easily than an equatorial one. Vicinal 2,3-dihalides eliminate a neutral molecule of X
2 leaving behind a
charged steroidal D2-olefin, which can then undergo the retro Diels Alder reaction, and additionally fragment in the D ring (Fig. 2.70).
R
X
R
HX
R +.
X=H, OAc, OCH3
+.
Fig. 2.69 Retro Diels Alder reaction in some D2-steroids
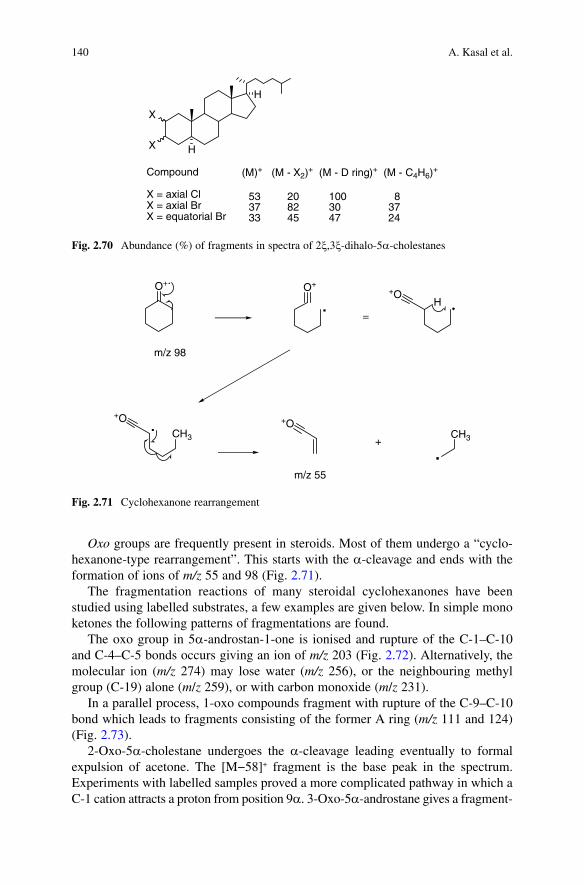
140 A. Kasal et al.
Oxo groups are frequently present in steroids. Most of them undergo a “cyclo-hexanone-type rearrangement”. This starts with the a-cleavage and ends with the formation of ions of m/z 55 and 98 (Fig. 2.71).
The fragmentation reactions of many steroidal cyclohexanones have been studied using labelled substrates, a few examples are given below. In simple mono ketones the following patterns of fragmentations are found.
The oxo group in 5a-androstan-1-one is ionised and rupture of the C-1–C-10 and C-4–C-5 bonds occurs giving an ion of m/z 203 (Fig. 2.72). Alternatively, the molecular ion (m/z 274) may lose water (m/z 256), or the neighbouring methyl group (C-19) alone (m/z 259), or with carbon monoxide (m/z 231).
In a parallel process, 1-oxo compounds fragment with rupture of the C-9–C-10 bond which leads to fragments consisting of the former A ring (m/z 111 and 124) (Fig. 2.73).
2-Oxo-5a-cholestane undergoes the a-cleavage leading eventually to formal expulsion of acetone. The [M−58]+ fragment is the base peak in the spectrum. Experiments with labelled samples proved a more complicated pathway in which a C-1 cation attracts a proton from position 9a. 3-Oxo-5a-androstane gives a fragment-
H
H
X
X
Compound
X = axial ClX = axial BrX = equatorial Br
(M)+ (M - X2)+ (M - D ring)+ (M - C4H6)+
53 20 100 837 82 30 3733 45 47 24
Fig. 2.70 Abundance (%) of fragments in spectra of 2x,3x-dihalo-5a-cholestanes
H
CH3 CH3
O+.O+
+O
+O +O
.
.
.
.
m/z 98
m/z 55
+
=
Fig. 2.71 Cyclohexanone rearrangement
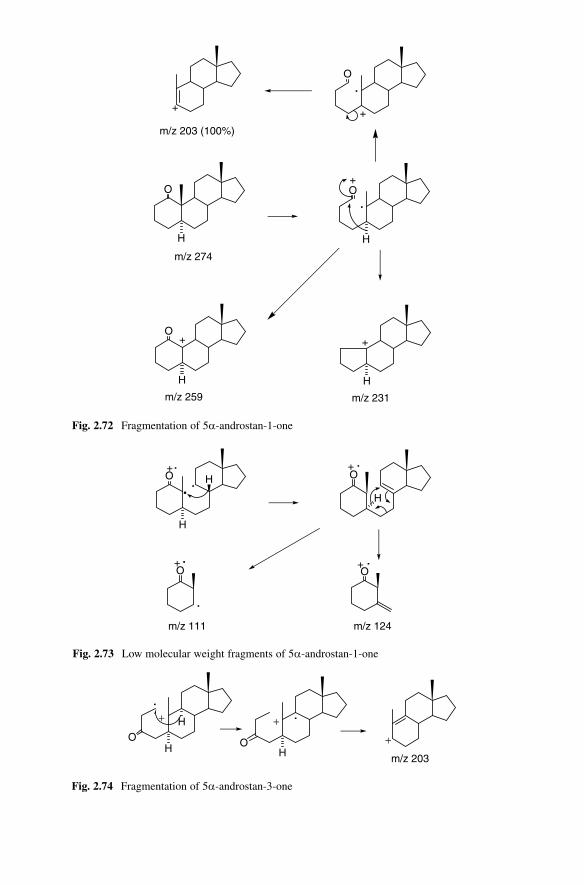
H
O
H
O
O
H
O
H
+
.
+
.
m/z 203 (100%)
+ +
m/z 259 m/z 231
m/z 274
+
Fig. 2.72 Fragmentation of 5a-androstan-1-one
H H
O O
H+.
+ .
+
m/z 203
Fig. 2.74 Fragmentation of 5a-androstan-3-one
H
O
H
+
m/z 111
+
..
.H O
m/z 124
.
O+
.
.O
+ .
Fig. 2.73 Low molecular weight fragments of 5a-androstan-1-one
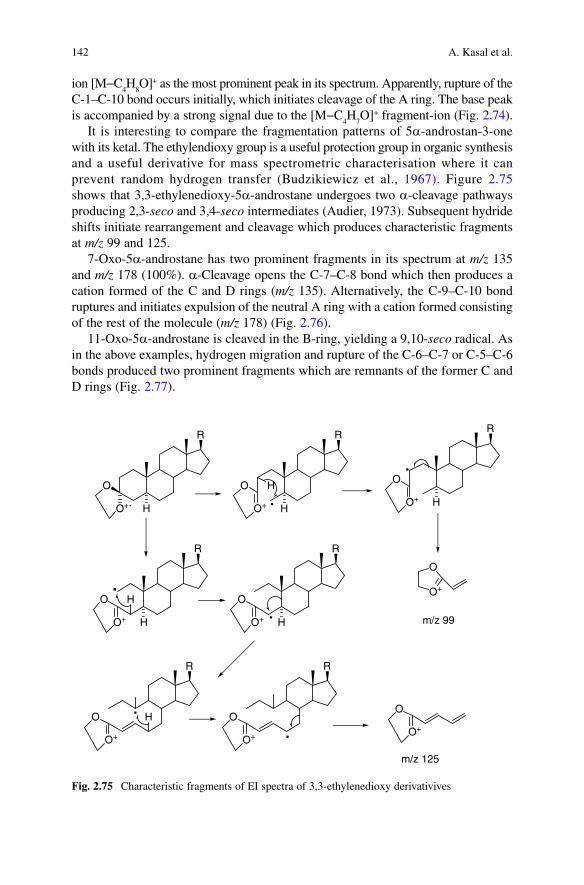
142 A. Kasal et al.
ion [M−C4H
8O]+ as the most prominent peak in its spectrum. Apparently, rupture of the
C-1–C-10 bond occurs initially, which initiates cleavage of the A ring. The base peak is accompanied by a strong signal due to the [M−C
4H
7O]+ fragment-ion (Fig. 2.74).
It is interesting to compare the fragmentation patterns of 5a-androstan-3-one with its ketal. The ethylendioxy group is a useful protection group in organic synthesis and a useful derivative for mass spectrometric characterisation where it can prevent random hydrogen transfer (Budzikiewicz et al., 1967). Figure 2.75 shows that 3,3-ethylenedioxy-5a-androstane undergoes two a-cleavage pathways producing 2,3-seco and 3,4-seco intermediates (Audier, 1973). Subsequent hydride shifts initiate rearrangement and cleavage which produces characteristic fragments at m/z 99 and 125.
7-Oxo-5a-androstane has two prominent fragments in its spectrum at m/z 135 and m/z 178 (100%). a-Cleavage opens the C-7–C-8 bond which then produces a cation formed of the C and D rings (m/z 135). Alternatively, the C-9–C-10 bond ruptures and initiates expulsion of the neutral A ring with a cation formed consisting of the rest of the molecule (m/z 178) (Fig. 2.76).
11-Oxo-5a-androstane is cleaved in the B-ring, yielding a 9,10-seco radical. As in the above examples, hydrogen migration and rupture of the C-6–C-7 or C-5–C-6 bonds produced two prominent fragments which are remnants of the former C and D rings (Fig. 2.77).
R
O
O+. H
O+
O
m/z 99
R
O
O+ H
R
O
O+ H
R
O
O+ H
R
O
O+ H
R
O
O+
R
O
O+
O
O+
H
.
.
.
.
H
H
.
.
m/z 125
Fig. 2.75 Characteristic fragments of EI spectra of 3,3-ethylenedioxy derivativives
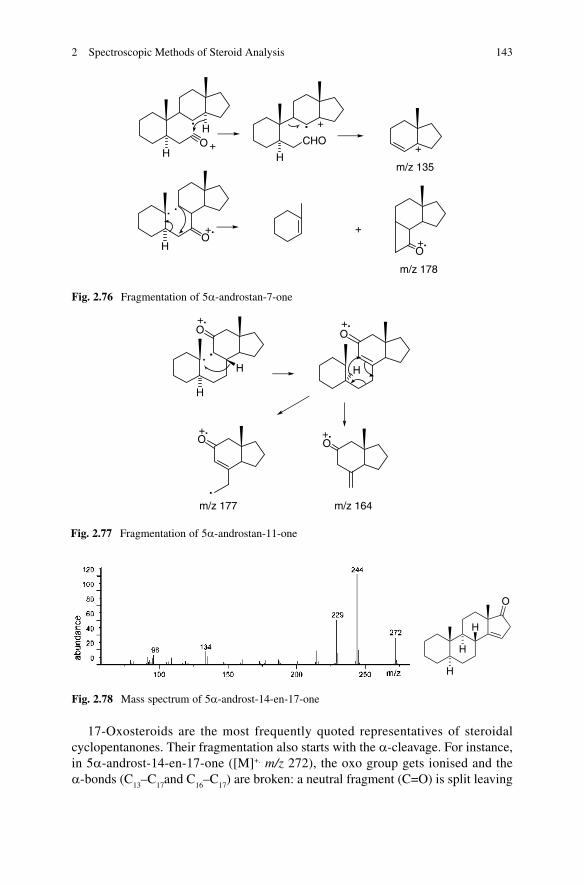
1432 Spectroscopic Methods of Steroid Analysis
OH
H
O
CHO
H
HO
+
+
+
.
+
. .
m/z 135
+.
.
m/z 178
+.
Fig. 2.76 Fragmentation of 5a-androstan-7-one
H
H
.
.
m/z 177
+.
.
m/z 164
+.
O O
O O
+. +.
H
Fig. 2.77 Fragmentation of 5a-androstan-11-one
17-Oxosteroids are the most frequently quoted representatives of steroidal cyclopentanones. Their fragmentation also starts with the a-cleavage. For instance, in 5a-androst-14-en-17-one ([M]+. m/z 272), the oxo group gets ionised and the a-bonds (C
13–C
17and C
16–C
17) are broken: a neutral fragment (C=O) is split leaving
O
H
H
H
Fig. 2.78 Mass spectrum of 5a-androst-14-en-17-one
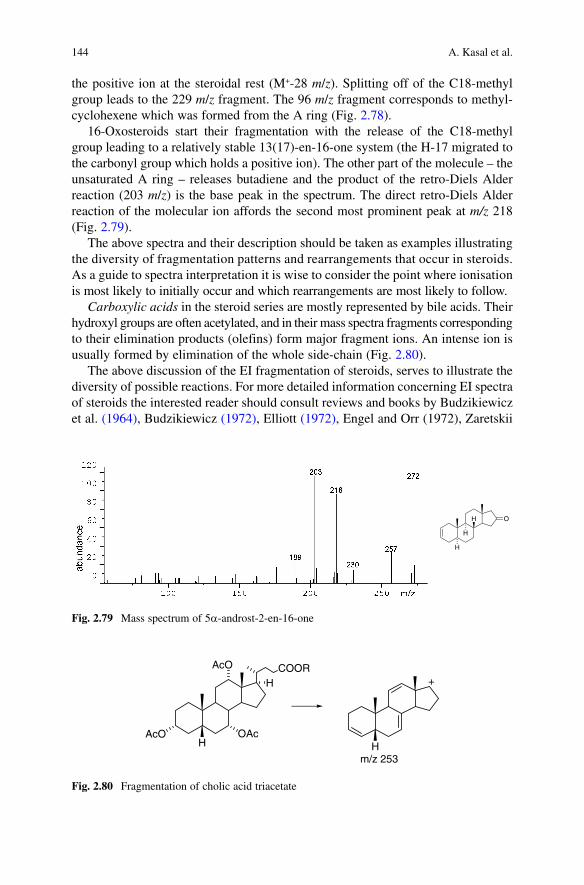
144 A. Kasal et al.
the positive ion at the steroidal rest (M+-28 m/z). Splitting off of the C18-methyl group leads to the 229 m/z fragment. The 96 m/z fragment corresponds to methyl-cyclohexene which was formed from the A ring (Fig. 2.78).
16-Oxosteroids start their fragmentation with the release of the C18-methyl group leading to a relatively stable 13(17)-en-16-one system (the H-17 migrated to the carbonyl group which holds a positive ion). The other part of the molecule – the unsaturated A ring – releases butadiene and the product of the retro-Diels Alder reaction (203 m/z) is the base peak in the spectrum. The direct retro-Diels Alder reaction of the molecular ion affords the second most prominent peak at m/z 218 (Fig. 2.79).
The above spectra and their description should be taken as examples illustrating the diversity of fragmentation patterns and rearrangements that occur in steroids. As a guide to spectra interpretation it is wise to consider the point where ionisation is most likely to initially occur and which rearrangements are most likely to follow.
Carboxylic acids in the steroid series are mostly represented by bile acids. Their hydroxyl groups are often acetylated, and in their mass spectra fragments corresponding to their elimination products (olefins) form major fragment ions. An intense ion is usually formed by elimination of the whole side-chain (Fig. 2.80).
The above discussion of the EI fragmentation of steroids, serves to illustrate the diversity of possible reactions. For more detailed information concerning EI spectra of steroids the interested reader should consult reviews and books by Budzikiewicz et al. (1964), Budzikiewicz (1972), Elliott (1972), Engel and Orr (1972), Zaretskii
COORH
HAcO OAc
AcO
H
+
m/z 253
Fig. 2.80 Fragmentation of cholic acid triacetate
H
H
H O
Fig. 2.79 Mass spectrum of 5a-androst-2-en-16-one
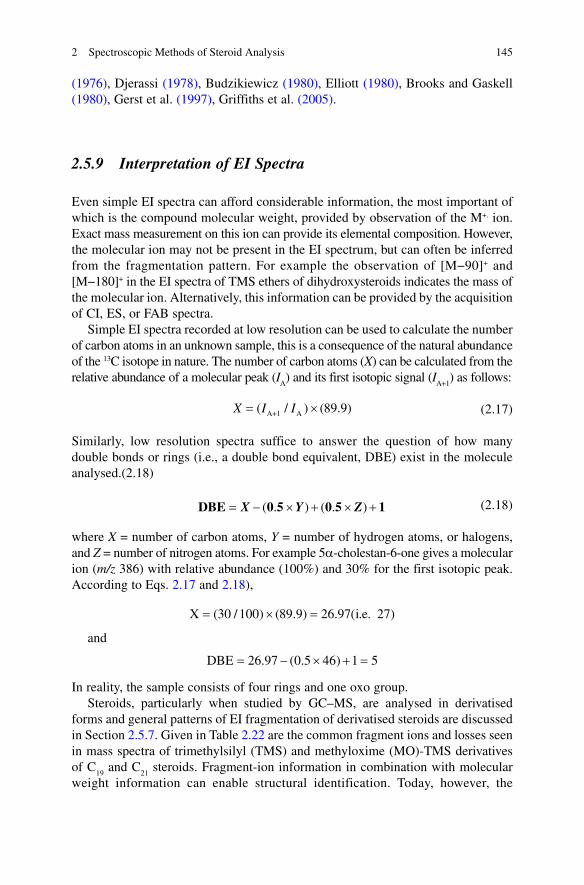
1452 Spectroscopic Methods of Steroid Analysis
(1976), Djerassi (1978), Budzikiewicz (1980), Elliott (1980), Brooks and Gaskell (1980), Gerst et al. (1997), Griffiths et al. (2005).
2.5.9 Interpretation of EI Spectra
Even simple EI spectra can afford considerable information, the most important of which is the compound molecular weight, provided by observation of the M+. ion. Exact mass measurement on this ion can provide its elemental composition. However, the molecular ion may not be present in the EI spectrum, but can often be inferred from the fragmentation pattern. For example the observation of [M−90]+ and [M−180]+ in the EI spectra of TMS ethers of dihydroxysteroids indicates the mass of the molecular ion. Alternatively, this information can be provided by the acquisition of CI, ES, or FAB spectra.
Simple EI spectra recorded at low resolution can be used to calculate the number of carbon atoms in an unknown sample, this is a consequence of the natural abundance of the 13C isotope in nature. The number of carbon atoms (X) can be calculated from the relative abundance of a molecular peak (I
A) and its first isotopic signal (I
A+1) as follows:
A+1 A( / ) (89.9)X I I= ´ (2.17)
Similarly, low resolution spectra suffice to answer the question of how many double bonds or rings (i.e., a double bond equivalent, DBE) exist in the molecule analysed.(2.18)
= - ´ + ´ +( . ) ( . )DBE 0 5 0 5 1X Y Z (2.18)
where X = number of carbon atoms, Y = number of hydrogen atoms, or halogens, and Z = number of nitrogen atoms. For example 5a-cholestan-6-one gives a molecular ion (m/z 386) with relative abundance (100%) and 30% for the first isotopic peak. According to Eqs. 2.17 and 2.18),
X (30 /100) (89.9) 26.97(i.e. 27)= ´ =
and
DBE 26.97 (0.5 46) 1 5= - ´ + =
In reality, the sample consists of four rings and one oxo group.Steroids, particularly when studied by GC–MS, are analysed in derivatised
forms and general patterns of EI fragmentation of derivatised steroids are discussed in Section 2.5.7. Given in Table 2.22 are the common fragment ions and losses seen in mass spectra of trimethylsilyl (TMS) and methyloxime (MO)-TMS derivatives of C
19 and C
21 steroids. Fragment-ion information in combination with molecular
weight information can enable structural identification. Today, however, the
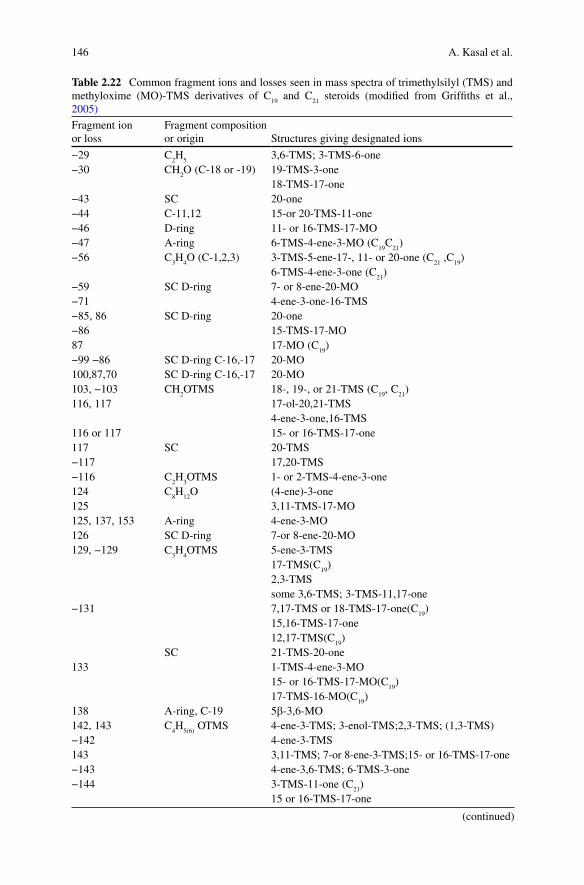
146 A. Kasal et al.
Table 2.22 Common fragment ions and losses seen in mass spectra of trimethylsilyl (TMS) and methyloxime (MO)-TMS derivatives of C
19 and C
21 steroids (modified from Griffiths et al.,
2005)
Fragment ion or loss
Fragment composition or origin Structures giving designated ions
−29 C2H
53,6-TMS; 3-TMS-6-one
−30 CH2O (C-18 or -19) 19-TMS-3-one
18-TMS-17-one−43 SC 20-one−44 C-11,12 15-or 20-TMS-11-one−46 D-ring 11- or 16-TMS-17-MO−47 A-ring 6-TMS-4-ene-3-MO (C
19C
21)
−56 C3H
4O (C-1,2,3) 3-TMS-5-ene-17-, 11- or 20-one (C
21 ,C
19)
6-TMS-4-ene-3-one (C21
)−59 SC D-ring 7- or 8-ene-20-MO−71 4-ene-3-one-16-TMS−85, 86 SC D-ring 20-one−86 15-TMS-17-MO87 17-MO (C
19)
−99 −86 SC D-ring C-16,-17 20-MO100,87,70 SC D-ring C-16,-17 20-MO103, −103 CH
2OTMS 18-, 19-, or 21-TMS (C
19, C
21)
116, 117 17-ol-20,21-TMS4-ene-3-one,16-TMS
116 or 117 15- or 16-TMS-17-one117 SC 20-TMS−117 17,20-TMS−116 C
2H
3OTMS 1- or 2-TMS-4-ene-3-one
124 C8H
12O (4-ene)-3-one
125 3,11-TMS-17-MO125, 137, 153 A-ring 4-ene-3-MO126 SC D-ring 7-or 8-ene-20-MO129, −129 C
3H
4OTMS 5-ene-3-TMS
17-TMS(C19
)2,3-TMSsome 3,6-TMS; 3-TMS-11,17-one
−131 7,17-TMS or 18-TMS-17-one(C19
)15,16-TMS-17-one12,17-TMS(C
19)
SC 21-TMS-20-one133 1-TMS-4-ene-3-MO
15- or 16-TMS-17-MO(C19
)17-TMS-16-MO(C
19)
138 A-ring, C-19 5b-3,6-MO142, 143 C
4H
5(6) OTMS 4-ene-3-TMS; 3-enol-TMS;2,3-TMS; (1,3-TMS)
−142 4-ene-3-TMS143 3,11-TMS; 7-or 8-ene-3-TMS;15- or 16-TMS-17-one−143 4-ene-3,6-TMS; 6-TMS-3-one−144 3-TMS-11-one (C
21)
15 or 16-TMS-17-one
(continued)
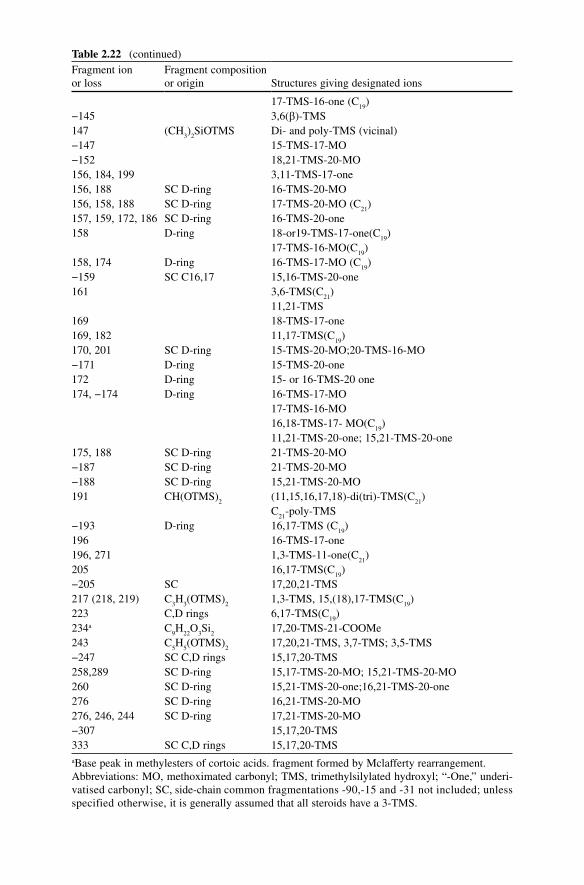
Fragment ion or loss
Fragment composition or origin Structures giving designated ions
17-TMS-16-one (C19
)−145 3,6(b)-TMS147 (CH
3)
2SiOTMS Di- and poly-TMS (vicinal)
−147 15-TMS-17-MO−152 18,21-TMS-20-MO156, 184, 199 3,11-TMS-17-one156, 188 SC D-ring 16-TMS-20-MO156, 158, 188 SC D-ring 17-TMS-20-MO (C
21)
157, 159, 172, 186 SC D-ring 16-TMS-20-one158 D-ring 18-or19-TMS-17-one(C
19)
17-TMS-16-MO(C19
)158, 174 D-ring 16-TMS-17-MO (C
19)
−159 SC C16,17 15,16-TMS-20-one161 3,6-TMS(C
21)
11,21-TMS169 18-TMS-17-one169, 182 11,17-TMS(C
19)
170, 201 SC D-ring 15-TMS-20-MO;20-TMS-16-MO−171 D-ring 15-TMS-20-one172 D-ring 15- or 16-TMS-20 one174, −174 D-ring 16-TMS-17-MO
17-TMS-16-MO16,18-TMS-17- MO(C
19)
11,21-TMS-20-one; 15,21-TMS-20-one175, 188 SC D-ring 21-TMS-20-MO−187 SC D-ring 21-TMS-20-MO−188 SC D-ring 15,21-TMS-20-MO191 CH(OTMS)
2(11,15,16,17,18)-di(tri)-TMS(C
21)
C21
-poly-TMS−193 D-ring 16,17-TMS (C
19)
196 16-TMS-17-one196, 271 1,3-TMS-11-one(C
21)
205 16,17-TMS(C19
)−205 SC 17,20,21-TMS217 (218, 219) C
3H
3(OTMS)
21,3-TMS, 15,(18),17-TMS(C
19)
223 C,D rings 6,17-TMS(C19
)234a C
9H
22O
3Si
217,20-TMS-21-COOMe
243 C5H
5(OTMS)
217,20,21-TMS, 3,7-TMS; 3,5-TMS
−247 SC C,D rings 15,17,20-TMS258,289 SC D-ring 15,17-TMS-20-MO; 15,21-TMS-20-MO260 SC D-ring 15,21-TMS-20-one;16,21-TMS-20-one276 SC D-ring 16,21-TMS-20-MO276, 246, 244 SC D-ring 17,21-TMS-20-MO−307 15,17,20-TMS333 SC C,D rings 15,17,20-TMSaBase peak in methylesters of cortoic acids. fragment formed by Mclafferty rearrangement.Abbreviations: MO, methoximated carbonyl; TMS, trimethylsilylated hydroxyl; “-One,” underi-vatised carbonyl; SC, side-chain common fragmentations -90,-15 and -31 not included; unless specified otherwise, it is generally assumed that all steroids have a 3-TMS.
Table 2.22 (continued)
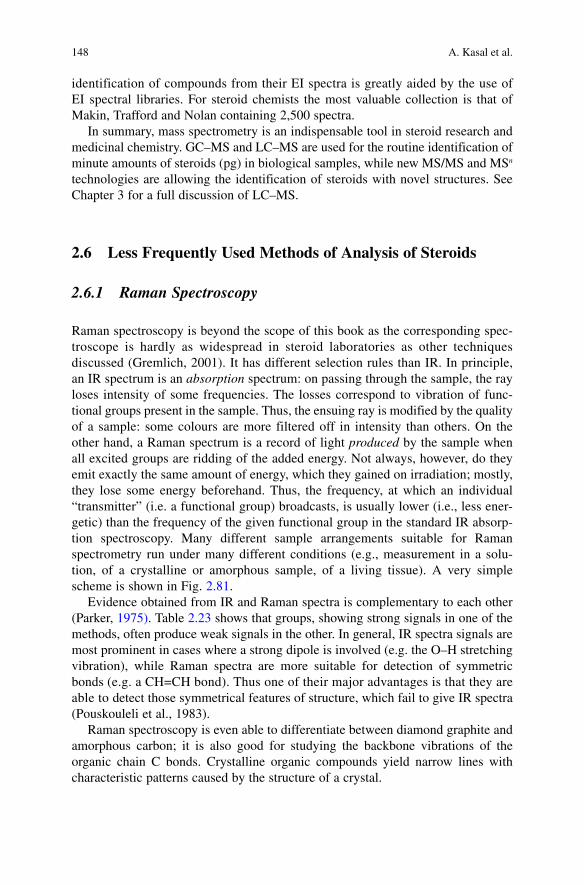
148 A. Kasal et al.
identification of compounds from their EI spectra is greatly aided by the use of EI spectral libraries. For steroid chemists the most valuable collection is that of Makin, Trafford and Nolan containing 2,500 spectra.
In summary, mass spectrometry is an indispensable tool in steroid research and medicinal chemistry. GC–MS and LC–MS are used for the routine identification of minute amounts of steroids (pg) in biological samples, while new MS/MS and MSn technologies are allowing the identification of steroids with novel structures. See Chapter 3 for a full discussion of LC–MS.
2.6 Less Frequently Used Methods of Analysis of Steroids
2.6.1 Raman Spectroscopy
Raman spectroscopy is beyond the scope of this book as the corresponding spec-troscope is hardly as widespread in steroid laboratories as other techniques discussed (Gremlich, 2001). It has different selection rules than IR. In principle, an IR spectrum is an absorption spectrum: on passing through the sample, the ray loses intensity of some frequencies. The losses correspond to vibration of func-tional groups present in the sample. Thus, the ensuing ray is modified by the quality of a sample: some colours are more filtered off in intensity than others. On the other hand, a Raman spectrum is a record of light produced by the sample when all excited groups are ridding of the added energy. Not always, however, do they emit exactly the same amount of energy, which they gained on irradiation; mostly, they lose some energy beforehand. Thus, the frequency, at which an individual “transmitter” (i.e. a functional group) broadcasts, is usually lower (i.e., less ener-getic) than the frequency of the given functional group in the standard IR absorp-tion spectroscopy. Many different sample arrangements suitable for Raman spectrometry run under many different conditions (e.g., measurement in a solu-tion, of a crystalline or amorphous sample, of a living tissue). A very simple scheme is shown in Fig. 2.81.
Evidence obtained from IR and Raman spectra is complementary to each other (Parker, 1975). Table 2.23 shows that groups, showing strong signals in one of the methods, often produce weak signals in the other. In general, IR spectra signals are most prominent in cases where a strong dipole is involved (e.g. the O–H stretching vibration), while Raman spectra are more suitable for detection of symmetric bonds (e.g. a CH=CH bond). Thus one of their major advantages is that they are able to detect those symmetrical features of structure, which fail to give IR spectra (Pouskouleli et al., 1983).
Raman spectroscopy is even able to differentiate between diamond graphite and amorphous carbon; it is also good for studying the backbone vibrations of the organic chain C bonds. Crystalline organic compounds yield narrow lines with characteristic patterns caused by the structure of a crystal.
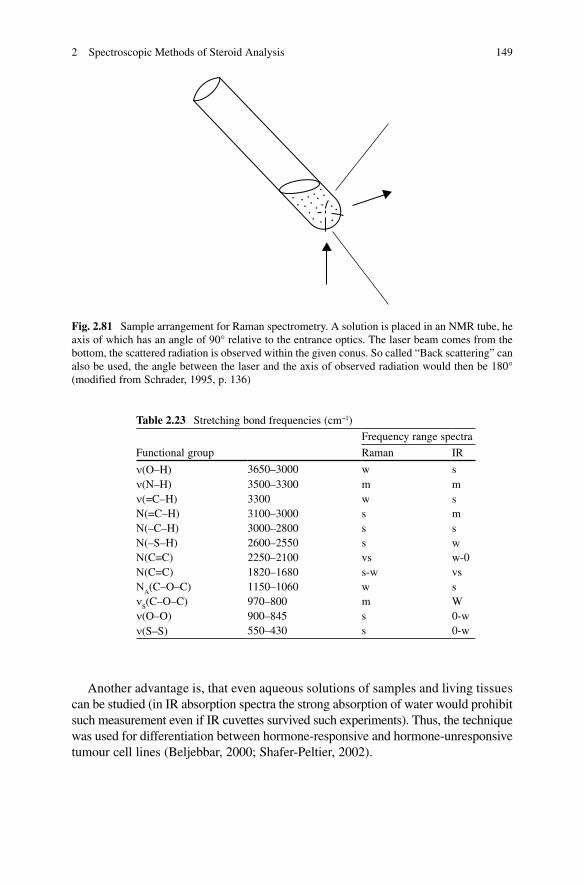
1492 Spectroscopic Methods of Steroid Analysis
Another advantage is, that even aqueous solutions of samples and living tissues can be studied (in IR absorption spectra the strong absorption of water would prohibit such measurement even if IR cuvettes survived such experiments). Thus, the technique was used for differentiation between hormone-responsive and hormone-unresponsive tumour cell lines (Beljebbar, 2000; Shafer-Peltier, 2002).
Fig. 2.81 Sample arrangement for Raman spectrometry. A solution is placed in an NMR tube, he axis of which has an angle of 90° relative to the entrance optics. The laser beam comes from the bottom, the scattered radiation is observed within the given conus. So called “Back scattering” can also be used, the angle between the laser and the axis of observed radiation would then be 180° (modified from Schrader, 1995, p. 136)
Table 2.23 Stretching bond frequencies (cm−1)
Frequency range spectra
Functional group Raman IR
n(O–H) 3650–3000 w sn(N–H) 3500–3300 m mn(=C–H) 3300 w sN(=C–H) 3100–3000 s mN(–C–H) 3000–2800 s sN(–S–H) 2600–2550 s wN(CºC) 2250–2100 vs w-0N(C=C) 1820–1680 s-w vsN
A(C–O–C) 1150–1060 w s
nS(C–O–C) 970–800 m W
n(O–O) 900–845 s 0-wn(S–S) 550–430 s 0-w
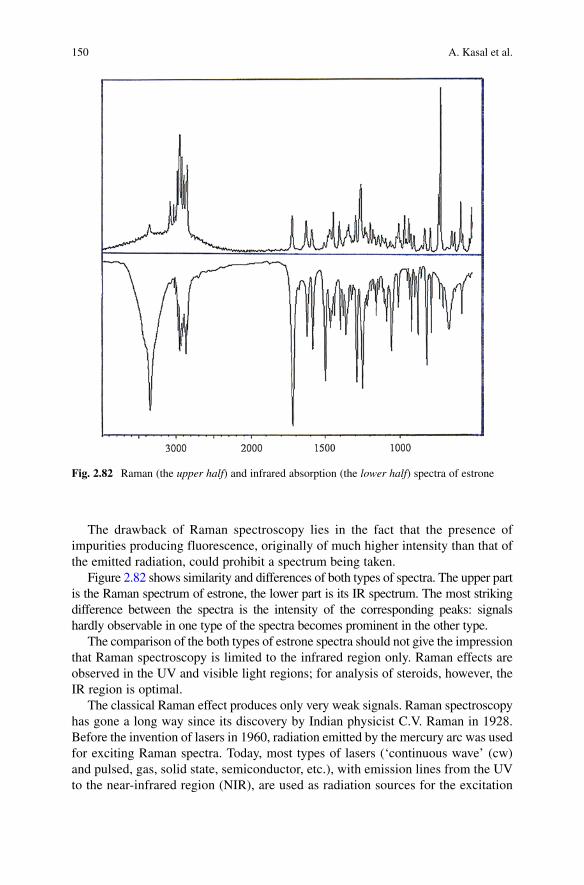
150 A. Kasal et al.
The drawback of Raman spectroscopy lies in the fact that the presence of impurities producing fluorescence, originally of much higher intensity than that of the emitted radiation, could prohibit a spectrum being taken.
Figure 2.82 shows similarity and differences of both types of spectra. The upper part is the Raman spectrum of estrone, the lower part is its IR spectrum. The most striking difference between the spectra is the intensity of the corresponding peaks: signals hardly observable in one type of the spectra becomes prominent in the other type.
The comparison of the both types of estrone spectra should not give the impression that Raman spectroscopy is limited to the infrared region only. Raman effects are observed in the UV and visible light regions; for analysis of steroids, however, the IR region is optimal.
The classical Raman effect produces only very weak signals. Raman spectroscopy has gone a long way since its discovery by Indian physicist C.V. Raman in 1928. Before the invention of lasers in 1960, radiation emitted by the mercury arc was used for exciting Raman spectra. Today, most types of lasers (‘continuous wave’ (cw) and pulsed, gas, solid state, semiconductor, etc.), with emission lines from the UV to the near-infrared region (NIR), are used as radiation sources for the excitation
Fig. 2.82 Raman (the upper half) and infrared absorption (the lower half) spectra of estrone
1512 Spectroscopic Methods of Steroid Analysis
of Raman spectra. Especially, NIR Raman spectra are excited mainly with a neodymium doped yttrium-aluminium garnet laser (Nd:YAG), emitting at 1,064 nm (at this wavelength, the spectra are practically free of fluorescence which otherwise represent a practical obstacle). Raman spectra can now be recorded with minimal sample preparation. Raman spectroscopy is capable of non-destructive analysis of any sample, cells and tissues included (Mazurek and Szostak, 2006; Cuffini et al., 2007; DeBeer et al., 2007).
In the past, Raman spectroscopy was not as much used in molecular structure determination as IR absorption spectroscopy (Schrader, 1995) (Steigner and Schrader, 1970), however, the use of lasers and fiber-optic probes have made Raman spectroscopy of steroids more available to everyday needs (Greek et al., 1998; Salmain et al., 2005). Several techniques have lately been discovered, which very successfully enhance the otherwise weak Raman effect. The resonance Raman spectroscopy (RRS) where resonance occurs when the photon energy of the excit-ing laser beam is approximately equal to the energy of an electric dipole allowed transition of a particular chromophore. The surface-enhanced Raman spectros-copy (SERS) employs the influence of small metal particles on the elementary process of Raman scattering. These two techniques may even be combined into surface-enhanced resonance Raman effect (SERRS). Such spectra are recorded with the same spectrometers as classical Raman spectra, although different condi-tions of the excitation and special sample techniques are used.
2.6.2 X-Ray Diffraction
In most cases, where the classical steroid skeleton is involved, structural problems were usually solved by more common methods (e.g. combination of MS and NMR spectroscopy), the reason being the inadequate level of technique: in certain cases (e.g. in solving structures of skeletal rearrangement), X-ray diffraction was the last resort. It required a perfect monocrystal of the product and a powerful instrument, which produced raw data on a photographic film that had to be very tediously solved by an experienced crystallographer.
The determination of crystal structures by X-ray crystallography has come a long way since its discovery in 1912. Dorothy Crowfoot Hodgkin became a sole winner of the 1964 Nobel Prize in Chemistry “for her determination by x-ray techniques of the structures of biologically important molecules.” Her first steroid studied was cholesteryl iodide. No longer is “a heavy atom” required for evaluation of the many diffractions. Commercial diffractometers with CCD detectors (“Charge-Coupled Device”) and professional analytical programmes take away a lot of tedious analysis by skilled experts.
Anyway, the method still cannot be used by amateurs and for practical use, a reader should at least understand the basic principle (the concept of reflections, whose geometry and intensities correspond to the position of atoms in the crystal) and then invite a professional for cooperation. Then, he may be asked for a perfect monocrystal
152 A. Kasal et al.
of his sample; often a polarisation microscope would reveal that the “beautiful” – in his eyes – crystal is a mere cluster of crystals only. If the growth of a crystal leads to twins of identical crystals, the problem of interfering diffractions can mostly be solved by adequate software. When several crystals grow independently into a complex product, a better crystallisation procedure will be recommended (Ladd and Palmer, 2003).
The strict demand for a monocrystal seems to clash with recent experience: the X-ray examination of polycrystalline materials has solved complete structure of medium-sized molecules, with up to 60 atoms in the asymmetric unit. The modern developments in the powder method have added a new and powerful tool for the deter-mination of the structure of the many substances that could be obtained only in microcrystalline form (particle size ca 10–3 m). Nevertheless, in powder diffraction work, fewer reflections are available than with single crystal X-ray crystallography. In addition, the problem of determining the unit cell, indices, space group, and intensities of reflections still make the work much more difficult for a crystallographer.
References
Al-Rawi JMA, Bloxsidge JP, Elvidge JA, Jones JR, Chambers VEM, Chambers VMA, Evans EA (1976) Tritium nuclear magnetic resonance pectroscopy. Part VI(1) Tritiated steroid hormones. Steroids. 28; 359–375.
Altman LJ, Silberman N (1977) Tritium nuclear magnetic resonance spectroscopy. Distribution patterns and nuclear Overhauser enhancements in some tritiated steroids. Steroids. 29; 557–565.
Axelson M, Sjövall J (1977) Analysis of unconjugated steroids in plasma by liquid-gel chromatography and glass capillary gas chromatography-mass spectrometry. J. Steroid Biochem. 8; 683–692.
Ballatore AM, Beckner CF, Caprioli RM, Hoffman NE, Liehr JG (1983) Synthesis and spectro-scopic analysis of modified bile salts. Steroids. 41; 197–206.
Barber M, Bordoli RS, Sedgwick RD, Tyler AN (1981) Fast atom bombardment of solids (FAB): a new ion source for mass spectrometry. J. Chem. Soc. Chem. Commun. 325–327.
Barrows GH, Stroupe SB, Riehm JD (1980) Nuclear uptake of a 17|3-estradiol-fluorescein derivative a marker of estrogen dependence. J. Clin. Pathol. 73; 330–339.
Barton DHR (1945) The application of the method of molecular rotation differences to steroids. Part I. Naturally occurring sterols and their simple derivatives. J. Chem. Soc. Chem. Commun. 813–819.
Beljebbar A, Romijn JC, Puppels GJ (2000) Investigation of androgen effects on prostate cancer cell lines by near infrared Raman microspectroscopy. Biomedical spectroscopy: vibration spectroscopy and other novel techniques. SPIE Proceedings, Vol 1, pp. 161–165.
Bertoft EJ, Maentausta OK, Löwgren TNE (1985) Anal. Chem. Symp. Ser. 23; 279.Bhacca NS, Williams DH (1964) Applications of NMR Spectroscopy in Organic Chemistry,
Holden-Day, San Francisco, CA.Björkhem I, Gustafsson JÅ, Sjövall J (1973) A novel fragmentation of trimethylsilyl ethers of
3|3-hydroxy-A5-steroids. Org. Mass. Spectrom. 7; 277–281.Blakeley CR, McAdams MJ, Vestal ML (1978) Crossed beam liquid chromatography-mass
spectrometry combination. J. Chromatogr. 158; 261–276.Blau K, Halket JM (1993) Handbook of Derivatives for Chromatography, 2nd edn. Wiley, Chichester.Blau K, King G (1977) Handbook of Derivatives for Chromatography. Heyden & Son, London.Blunt JW, Stothers JB (1977) 13C NMR spectra of steroids - a survey and commentary. Org. Magn.
Resonance. 9; 439–464.
1532 Spectroscopic Methods of Steroid Analysis
Boul AD, Blunt JW, Browne JW, Kumar V, Meakins GD, Pinhey JT, Thomas VEM (1971) Microbial hydroxylation of steroids. Part II. Structural information and infrared spectrometry: carbonyl, perturbed methylene, and hydroxyl vibrations of steroidal ketones and alcohols. J. Chem. Soc. Chem. Commun. 1130–1136.
Bove KE, Heubi JE, Balistreri WF, Setchell KD (2004) Bile acid synthetic defects and liver disease: a comprehensive review. Pediatr. Dev. Pathol. 7; 315–334.
Bowen CM, Katzenellenbogen A (1997) Synthesis and spectroscopic characterization of two azatetrahydrochrysenes as potential fluorescent ligands for the estrogen receptor. J. Org. Chem. 62; 7650–7657.
Bridgeman JE, Cherry PC, Clegg AS, Evans JM, Jones Sir ERH, Kasal A, Kumar V, Meakins GD, Morisawa Y, Richards EE, Woodgate PD (1970) Microbiological hydroxylation of steroids. Part I. Proton magnetic resonance spectra of ketones, alcohols, and acetates in the androstane, pregnane, and oestrane series. J. Chem. Soc. Chem. Commun. 250–257.
Brooks CJW (1979) Some aspects of mass spectrometry in research on steroids. Phil. Trans. R. Soc. Lond. A293; 53–67.
Brooks CJW, Gaskell SJ (1980) Hormones. In Biochemical Applications of Mass Spectrometry (eds Waller GR, Dermer OC). Wiley, New York, pp. 611–659.
Budzikiewicz H (1972) Steroids. In Biochemical Applications of Mass Spectrometry (ed Waller GR). Wiley, New York, pp. 251–289.
Budzikiewicz H (1980) Steroids. In Biochemical Applications of Mass Spectrometry (eds Waller GR, Dermer OC). Wiley, New York, pp. 211–228.
Budzikiewicz H, Djerassi C, Williams DH (1964) Structure Elucidation of Natural Products by Mass Spectrometry. Vol. II: Steroids, Terpenoids, Sugars and Miscellaneous Classes. Holden-Day, San Francisco, CA.
Budzikiewicz H, Djerassi C, Williams D (1967) Mass Spectrometry of Organic Compounds. Holden-Day, San Francisco, CA.
Burkard I, Rentsch KM, von Eckardstein A (2004) Determination of 24S- and 27-hydroxycholesterol in plasma by high-performance liquid chromatography-mass spectrometry. J. Lipid. Res. 45; 776–781.
Catlin DH, Sekera MH, Ahrens BD, Starcevic B, Chang YC, Hatton CK (2004) Tetrahyd- rogestrinone: discovery, synthesis, and detection in urine. Rapid Commun. Mass. Spectrom. 18; 1245–1249.
Chambaz EM, Defaye G, Madani C (1973) Trimethylsilyl ether-enol-trimethylsilyl ether. New type of derivative for the gas phase study of hormonal steroids. Anal. Chem. 45; 1090–1098.
Chard T (1982) An Introduction to Radioimmunoassay and Related Techniques, Elsevier, Amsterdam/New York/Oxford.
Ciuffreda P, Casati S, Manzocchi A (2004) Complete 1 H and 13C NMR spectral assignment of 17-hydroxy epimeric sterols with planar A or A and B rings. Magn. Reson. Chem. 42; 360–363.
Claridge TDW (2000) High-Resolution NMR Techniques in Organic Chemistry, Elsevier, Oxford.Clarke N, Goldman M (2005) Clinical applications of HTLC-MS/MS in the very high throughput
diagnostic environment: LC-MS/MS on steroids. Proceedings of 53rd ASMS Conference on Mass Spectrometry and Allied Topics, June 5–9, San Antonio, TX.
Clayton PT, Leonard JV, Lawson AM, Setchell KDR, Andersson S, Egestad B, Sjövall J (1987) Familial giant cell hepatitis associated with synthesis of 3p\7a -dihydroxy-and 3p\7a, 12a- trihydroxy-5-cholenoic acids. J. Clin. Invest. 79; 1031–1038.
Covey TR, Lee ED, Bruins AP, Henion JD (1986) Liquid chromatography/mass spectrometry. Anal. Chem. 58; 1451A–1461A.
Crabbé P (1965) Optical Rotatory Dispersion and Circular Dichroism in Organic Chemistry. Holden-Day, San Francisco, CA, p. 227.
Crews P, Rodríguez J, Jaspars M (1998) Organic Structure Analysis. Oxford University Press, Oxford.
Cristoni S, Cuccato D, Sciannamblo M, Bernardi LR, Biunno I, Gerthoux P, Russo G, Weber G, Mora S (2004) Analysis of 21-deoxycortisol, a marker of congenital adrenal hyperplasia, in blood by atmospheric pressure chemical ionization and electrospray ionization using multiple reaction monitoring. Rapid Commun. Mass. Spectrom. 18; 77–82.
154 A. Kasal et al.
Croasmun WR, Carlson MK (eds) (1994) Steroid Structural Analysis by Two-Dimensional NMR, In Two-Dimensional NMR Spectroscopy Applications for Chemists and Biochemists, 2nd edn. VCH, New York, pp. 785–840.
Cuffini SL, Ellena JF, Mascarenhas YP, Ayala AP, Sielser HW, Filho JM, Monti GA, Aiassa V, Sperandeo NR (2007) Physicochemical characterization of deflazacort: thermal analysis, crys-tallographic and spectroscopic study. Steroids. 72; 261–269.
Dandliker WB, Hicks AN, Levison SA, Brawn RJ (1977) Fluorescein-labelled estradiol: a probe for anti-estradiol antibody. Res. Commun. Chem. Pathol. Pharmacol. 18; 147–156.
De Beer TR, Baeyens WR, Vermeire A, Broes D, Remon JP, Vervaet C (2007) Raman spectro-scopic method for the determination of medroxyprogesterone acetate in a pharmaceutical suspension: validation of quantifying abilities, uncertainty assessment and comparison with the high performance liquid chromatography reference method. Anal. Chim. Acta. 589; 192–199.
Djerassi C (1960) Optical Rotatory Dispersion. McGraw-Hill, New York.Djerassi C (1978) Recent advances in the mass spectrometry of steroids. Pure Appl. Chem. 50;
171–184.Dobriner K, Katzenellenbogen ER, Jones RN (1953) Infrared Absorption Spectra of Steroids,
Vol 1. Interscience, New York.Dole M, Mack LL, Hines RL, Mobley RC, Ferguson LD, Alice MB (1968) Molecular beams of
macroions. J. Chem. Phys. 49; 2240–2249.Donike M (1969) N-Methyl-N-(trimethylsilyl)trifluoracetamide, a new silylation agent in the
silylated amide series. J. Chromatogr. 42; 103–104.Donike M, Zimmerman J (1980) Preparation of trimethylsilyl-, triethylsilyl-and tert-butyldimeth-
ylsilyl enol ethers of oxo steroids for gas chromatographic and mass spectrometric studies. J. Chromatogr. 202; 483–486.
Draisci R, Palleschi L, Ferretti E, Lucentini L, Cammarata P (2000) Quantitation of anabolic hormones and their metabolites in bovine serum and urine by liquid chromatography-tandem mass spectrometry. J. Chromatogr. A. 870; 511–522.
Dufourc EJ, Smith ICP (1985) 2H NMR evidence for antibiotic-induced cholesterol immobiliza-tion in biological model membranes. Biochemistry. 24; 331–334.
Eckers C, Eas PB, Haskins NJ (1991) The use of negative ion thermospray liquid chromatography/ tandem mass spectrometry for the determination of bile acids and their glycine conjugates. Biol. Mass. Spectrom. 20; 731–739.
Egestad B, Pettersson P, Skrede S, Sjövall J (1985) Fast atom bombardment mass spectrometry in the diagnosis of cerebrotendinous xanthomatosis. Scand. J. Lab. Invest. 45; 443–446.
Eger CH, Greiner MJ, Norton DA (1971) The participation of the 17|3 side group in binding. Steroids. 18; 231–245.
Eggert H, Djerassi C (1973) Carbon-13 nuclear magnetic resonance spectra of keto steroids. J. Org. Chem. 38; 3788–3792.
Eggert H, Djerassi C (1981) Carbon-13 nuclear magnetic resonance spectra of monounsaturated steroids. Evaluation of rules for predicting their chemical shifts. J. Org. Chem. 46; 5399–5401.
Eggert H, Van Antwer CL, Bhacca NS, Djerassi C (1976) Carbon-13 nuclear magnetic resonance spectra of hydroxy steroids. J. Org. Chem. 41; 71–78.
Elliott WH (1972) Bile acids. In Biochemical Applications of Mass Spectrometry (ed Waller GR). Wiley, New York, pp. 291–312.
Elliott WH (1980) Mass spectra of bile acids. In Biochemical Applications of Mass Spectrometry (eds Waller GR, Dermer OC). Wiley, New York, 229–253.
Emmett MR, Caprioli RM (1994) Micro-electrospray mass spectrometry: ultra-high sensitivity analysis of peptides and proteins. J. Am. Soc. Mass. Spectrom. 5; 605–613.
Eneroth P, Gordon B, Ryhage R, Sjövall J (1966) Identification of mono- and dihydroxy bile acids in human feces by gas-liquid chromatography and mass spectrometry. J. Lipid Res. 7; 511–523.
Engel LL, Orr JC (1972) Hormones. In Biochemical Applications of Mass Spectrometry (ed Waller GR). Wiley, New York, pp. 537–572.
1552 Spectroscopic Methods of Steroid Analysis
Ernst RR, Bodenhausen G, Wokaun A (1987) Principles of Nuclear Magnetic Resonance in One- and Two-Dimensions. Oxford University Press, London.
Evershed RP (1993) Advances in silylation. In Handbook of Derivatives for Chromatography, 2nd edn. (eds Blau K, Halket JM). Wiley, Chichester, pp. 51–108.
Evrain Ch, Rajkowski KM, Cittanova N, Jayle MF (1980) The preparation of three fluorescein-labelled derivatives of testosterone. Steroids. 35; 611–619.
Fieser LF, Fieser M (1959) Steroids. Reinhold, New York.Freudenberg K (1933) Regeln auf dem Gebiete der optischen Drehnung und ihre Anwendung in
der Konstitutions- und Konfigurations-Forschung. Chem. Ber. 66; 177–194.Friebolin H (2005) Basic One- and Two-Dimensional NMR Spectroscopy, 4th edn. Wiley,
Weinheim, Germany.Frisch MJ, Trucks GW, Schlegel HB, Scuseria GE, Robb MA, Cheeseman JR, Montgomery JA,
Vreven T, Kudin KN, Burant JC, Miriam JM, Iyengar SS, Tomasi J, Barone V, Mennucci B, Cossi M, Scalmani G, Rega N, Petersson GA, Nakatsuji H, Hada M, Ehara M, Toyota K, Fukuda R, Hasegawa J, Ishida M, Nakajima T, Honda Y, Kitao O, Nakai H, Klene M, Li X, Knox JE, Hratchian HP, Cross JB, Adamo C, Jaramillo J, Gomperts R, Stratmann RE, Yazyev O, Austin AJ, Cammi R, Pomelli C, Ochterski JW, Ayala PY, Morokuma K, Voth GA, Salvador P, Dannenberg JJ, Zakrzewski VG, Dapprich S, Daniels AD, Strain MC, Farkas O, Malick DK, Rabuck AD, Raghavachari K, Foresman JB, Ortiz JV, Cui Q, Baboul AG, Clifford S, Cioslowski J, Stefanov BB, Liu G, Liashenko A, Piskorz P, Komaromi I, Martin RL, Fox DJ, Keith T, Al-Laham MA, Peng CY, Nanayakkara A, Challacombe M, Gill PMW, Johnson B, Chen W, Wong MW, Gonzalez C, Pople JA (2004) Gaussian 03, Revision C. 02, Gaussian, Wallingford, CT.
Fukushima DK, Matsui M (1969) Optical rotatory dispersion and circular dichroism studies of C19-steroid N-acetylglucosaminides. Steroids. 14; 651.
Funke CW, Kasperen FM, Wallaart J, Wagenaars GN (1983) Tritium NMR-spectroscopy of ste-roids. J. Labelled Compd. Rad. 20; 843–853.
Garbuz NI, Yankovskaya GS, Kashkan ZhN, Kananovich OP, Kochanko NV (1992) Circular dichroism of steroids with a lactone ring B. Brassinosteroids and compounds related to them. Chem. Nat. Comp. 28; 63–68.
Gerst N, Ruan B, Pang J, Wilson WK, Schroepfer Jr GJ (1997) An updated look at the analysis of unsaturated C27 sterols by gas chromatography and mass spectrometry. J. Lipid Res. 38; 1685–1701.
Goad LJ, Akihisa T (1997) Analysis of Sterols. Blackie Academic & Professional, London.Goad LJ, Akihisa T (1997) Analysis of Sterols. Chapman & Hill, London.Goodlett VW (1965) Use of in situ reactions for characterization of alcohols and glycols by
nuclear magnetic resonance. Anal. Chem. 37; 431–432.Goto J, Murao N, Nakada C, Motoyama T, Oohashi J, Yanagihara T, Niwa T, Ikegawa S (1998)
Separation and characterization of carboxyl-linked glucuronides of bile acids in incubation mixture of rat liver microsomes. Steroids. 63; 186–192.
Goto T, Shibata A, Iida T, Mano N, Goto J (2004) Sensitive mass spectrometric detection of neu-tral bile acid metabolites. Formation of adduct ions with an organic anion in atmospheric pressure chemical ionization. Rapid Commun. Mass. Spectrom. 18; 2360–2364.
Gottlieb HE, Kotlyar V, Nudelman A (1997) NMR chemical shifts of common laboratory solvents as trace impurities. J. Org. Chem. 62; 7512–7515.
Görög S, Szasz Gy (1978) Analysis of Steroid Hormone Drugs. Akadémiai Kaidó, Budapest.Grant DM, Harris RK (eds) (1996) Encyclopedia of Nuclear Magnetic Resonance, Vols 1–9.
Wiley, Chichester.Greek S, Schulze HG, Blades MW, Haynes CA, Klein KF, Turner RFB (1998) Fiber-optic probes
with improved excitation and collection efficiency for deep-UV Raman and resonance Raman spectroscopy. Appl. Optics. 37; 170–180.
Greig MJ, Bolaños B, Quenzer T, Bylund JMR (2003) Fourier transform ion cyclotron resonance mass spectrometry using atmospheric pressure photoionization for high-resolution analyses of corticosteroids. Rapid Commun. Mass. Spectrom. 17; 2763–2768.
156 A. Kasal et al.
Gremlich HU (2001) Infrared and Raman spectroscopy. In Handbook of Analytical Techniques (eds Guenzler H, Williams A)hj45120104070803050, Vol 1. Wiley, Weinheim, Germany, pp. 465–507. (English).
Griffiths WJ, Jonsson AP, Liu S, Rai DK, Wang Y (2001) Electrospray and tandem mass spec-trometry in biochemistry. Biochem. J. 355; 545–561.
Griffiths WJ, Liu S, Alvelius G, Sjövall J (2003) Derivatisation for the characterisation of neutral oxosteroids by electrospray and matrix-assisted laser desorption/ionisation tandem mass spec-trometry: the Girard P derivative. Rapid Commun. Mass. Spectrom. 17; 924–935.
Griffiths WJ, Shackleton C, Sjövall J (2005) Steroid analysis. In The Encylopedia of Mass Spectrometry (ed. R.M. Caprioli), Vol 3. Elsevier, Oxford, pp. 447–472.
Griffiths WJ, Hornshaw M, Woffendin G, Baker SF, Lockhart A, Heidelberger S, Gustafsson M, Sjövall J, Wang Y (2008) Discovering oxysterols in plasma: a window on the metabolome. J. Proteome. Res. 7; 3602–3612
Gustafsson J-Å, Ryhage R, Sjövall J, Moriarty RM (1969) Migration of the trimethylsilyl group upon electron impact in steroids. J. Am. Chem. Soc. 91; 1234–1236.
Haasnoot CAG, de Leeuw FAAM, Altona C (1980) The relationship between proton-proton NMR coupling constants and substituent electronegativities—I: an empirical generalization of the Karplus equation. Tetrahedron. 36; 2783–2792.
Hanson JR, Reese PB (1985) A nuclear magnetic resonance study of the conversion of 4|3-acetoxy-3|3-hydroxy-A4 -steroids into 3p, 6p-diacetoxy-A4-steroids. J. Chem. Soc. [Perkin. 1] . 331–334.
Hickey JP, Butler IS, Pouskouleli G (1980) C-13 NMR-spectra of some representative hormonal steroids. J. Magn. Reson. 38; 501–506.
Higashi T, Takido N, Yamauchi A, Shimada K (2002) Electron-capturing derivatization of neutral steroids for increasing sensitivity in liquid chromatography/negative atmospheric pressure chemical ionization-mass spectrometry. Anal. Sci. 18; 1301–1307.
Higashi T, Takido N, Shimada K (2003) Detection and characterization of 20-oxosteroids in rat brains using LC-electron capture APCI-MS after derivatization with 2-nitro-4-trifluorometh-ylphenylhydrazine. Analyst. 128; 130–133.
Higashi T, Yamauchi A, Shimada K (2005) 2-Hydrazino-1-methylpyridine: a highly sensitive derivatization reagent for oxosteroids in liquid chromatography-electrospray ionization-mass spectrometry. J. Chromatogr. B 825; 214–222.
Horning EC (1968) Gas phase analytical methods for the study of steroid hormones and their metabolites. In Gas Phase Chromatography of Steroids (eds Eik-Nes KB, Horning EC). Springer, Berlin, pp. 1–71.
Hughes DW, Bain AD, Robinson VJ (1991) NMR analysis of fluorinated corticosteroids related to fluocinonide: detection of long-range 1H-19 F couplings using the heteronuclear equivalent of the COSY experiment. Magn. Reson. Chem. 29; 387–397.
Hunt DF, Stafford GC, Crow FW, Russell JW (1976) Pulsed positive negative ion chemical ioniza-tion mass spectrometry. Anal. Chem. 48; 2098–2104.
Ikegawa S, Goto T, Watanabe H, Goto J (1995) Stereoisomeric inversion of (25R)- and (25S)-3alpha, 7alpha, 12alpha-trihydroxy-5-beta-cholestanoic acids in rat liver peroxisome. Biol. Pharm. Bull. 18; 1027–1029.
Iribarne JV, Thomson BA (1976) On the evaporation of charged ions from small droplets. J. Chem. Phys. 64; 2287–2294.
Jacques J, Kagan H, Ourisson G (1965) Selected Constants, Optical Rotatory Power, 1a, Steroids. Pergamon, Oxford.
James KC, Noyce PA (1971) An infrared study of solvent effects on the carbonyl stretching bands of some androgen esters. J. Chem. Soc. (B) 2045–2050.
James KC, Rangoolam M (1978) Solvent effects on the carbonyl and ethylenic stretching frequen-cies in 3-keto unsaturated steroids. Spectrochim. Acta A. 34; 1145–1149.
Jennings JP, Klyne W, Scopes PM (1965) Optical rotatory dispersion. 24. Lactones. J. Chem. Soc. 7211–7242
Joseph-Nathan P, Espineira J, Santillan RL (1984) F-19-NMR study of fluorinated corticosteroids. Spectrochim. Acta A. 40; 347–349.
1572 Spectroscopic Methods of Steroid Analysis
Kasal A, Černý V (1967) Preparation and properties of some androstan-18-carboxylic acid derivatives. Collect Czech. Chem. C. 32; 3733–3745.
Kasal A, Budešínský M, Drašar P (2002) Analogues of androgen hormones with inverted configuration at carbons 5, 9 and 10. Steroids. 67; 57–70.
Kählig H, Robien W (1994) 17O NMR spectroscopic investigation of steroids at natural abun-dance. Magn. Reson. Chem. 32; 608–613.
Kebarle P, Ho Y (1997) On the mechanism of electrospray mass spectrometry. In Electrospray Ionization Mass Spectrometry: Fundamentals, Instrumentation and Applications (ed Cole RB). Wiley, New York, pp. 3–63.
Keller RJ (1986) The Sigma Chemical Library of FT-IR Spectra, Vol 1. Sigma Chemical Company, St. Louis, MO.
Kelly RW, Taylor PL (1976) tert -Butyl dimethylsilyl ethers as derivatives for qualitative analysis of steroids and prostaglandins by gas phase methods. Anal. Chem. 48; 465–467.
Kemp W (1991) Organic Spectroscopy, 3rd edn. Macmillan, London.Khan MA, Wang Y, Heidelberger S, Alvelius G, Liu S, Sjövall J, Griffiths WJ (2006) Analysis of
derivatised steroids by matrix-assisted laser desorption/ionisation and post-source decay mass spectrometry. Steroids. 71; 42–53.
Kim YS, Zhang H, Kim HY (2000) Profiling neurosteroids in cerebrospinal fluids and plasma by gas chromatography/electron capture negative chemical ionization mass spectrometry. Anal. Biochem. 277; 187–195.
Kimura H, Mukaida M, Wang G, Yuan J, Matsumoto K (2000) Dual-label time-resolved fluoroimmunoassay of psychopharmaceuticals and stimulants in serum. Forensic. Sci. Int. 113; 345–351.
Kirk DN (1986) The chiroptical properties of carbonyl compounds. Tetrahedron. 42; 777–818.Kirk DN (1989) Steroids: physical methods. Nat. Prod. Rep. 6; 394–404.Kirk DN, Toms HC, Douglas C, White KA, Smith KF, Latif S, Hubbard RWP (1990) A survey of
high-field 1 H N.M.R. spectra of steroid hormones, their hydroxylated derivatives, and related compounds. J. Chem. Soc. Chem. Commun. 2; 1567–1594.
Kobayashi Y, Miyai K, Tsubota N, Watanabe F (1979) Direct fluorescence polarisation immuno-assay of serum cortisol. Steroids. 34; 829–834.
Kolodziejski W, Woźniak K, Herold J, Dominiak PM, Kutner A (2005) Crystal and molecular structure of 1 a -hydroxylated analogs of vitamins D. J. Mol. Struct. 734; 149–155.
Kunst M, van Duijn D, Bordwijk P (1979) Hydrogen bonding of 5 a -cholestanol in carbon tetra-chloride. Recl. Trav. Chim. Pay-B. 98; 262–267.
Kuuranne T, Vahermo M, Leinonen A, Kostiainen R (2000) Electrospray and atmospheric pres-sure ionization tandem mass spectrometric behaviour of eight anabolic steroid glucuronides. J. Am. Soc. Mass. Spectrom. 11; 722–730.
Ladd M, Palmer R (2003) Structure Determination by X-Ray Crystallography, 4th edn. Kluwer, New York.
Lagana A, Bacaloni A, Fago G, Marino A (2000) Trace analysis of estrogenic chemicals in sewage effluent using liquid chromatography combined with tandem mass spectrometry. Rapid Commun. Mass. Spectrom. 14; 401–407.
Lakowicz JR (1999) Principles of Fluorescence Spectroscopy, 2nd edn. Plenum, New York.Láng L (ed) (1978) Absorption Spectra in the Infrared Region. Akadémiai Kiadó, Budapest.Leinonen A, Kuuranne T, Kostiainen R (2002) Liquid chromatography/mass spectrometry in anabolic
steroid analysis - optimization and comparison of three ionization techniques: electrospray ionisation, atmospheric pressure chemical ionization and atmospheric pressure photoionization. J. Mass. Spectrom. 37; 693–698.
Lembcke J, Ceglarek U, Fiedler GM, Baumann S, Leichtle A, Thiery J (2005) Rapid quantification of free and esterified phytosterols in human serum using APPI-LC-MS/MS. J. Lipid Res. 46; 21–26.
Levitt MH (2001) Spin Dynamics, Basics of Nuclear Magnetic Resonance. Wiley, Chichester.Liere P, Pianos A, Eychenne B, Cambourg A, Liu S, Griffiths W, Schumacher M, Sjövall J,
Baulieu EE (2004) Novel lipoidal derivatives of pregnenolone and dehydroepiandrosterone and absence of their sulfated counterparts in rodent brain. J. Lipid Res. 45; 2287–2302.
158 A. Kasal et al.
Lin YY, Smith LL (1984) Chemical ionization of steroids and other lipids. Mass. Spectrom. Rev. 3; 319–355.
Lövgren TNE (1987) Time-resolved fluoro-immunoassay of steroid hormones. J. Steroid Biochem. 27; 47–51.
Luukainen T, VandenHeuvel WJA, Haahti EO, Horning EC (1961) Gas chromatographic behav-iour of trimethylsilyl ethers of steroids. Biochim. Biophys. Acta. 52; 599–601.
Ma Y-C, Kim H-Y (1997) Determination of steroids by liquid chromatography/mass spectrometry. J. Am. Soc. Mass. Spectrom. 8; 1010–1020.
Macomber RD (1998) A Complete Introduction to Modern NMR Spectroscopy. Wiley, New York.Makin HLJ, Trafford DJH, Nolan J (1998) Mass Spectra and GC Data of Steroids. Androgens and
Estrogens. Wiley, New York.Makita M, Wells WW (1963) Quantitative analysis of fecal bile acids by gas-liquid chromatography.
Anal. Biochem. 5; 523.Mazurek S, Szostak R (2006) Quantitative determination of captopril and prednisolone in tablets
by FT-Raman spectroscopy. J. Pharm. Biomed. Anal. 40; 1225–1230.Meng LJ, Griffiths WJ, Sjövall J (1996) The identification of novel steroid N-acetylglucosaminides
in the urine of pregnant women. J. Steroid Biochem. Mol. Biol. 58; 585–598.Meng LJ, Griffiths WJ, Nazer H, Yang Y, Sjövall J (1997) High levels of (24S)-24-
hydroxycholesterol 3-sulfate 24-glucuronide in the serum and urine of children with severe cholestatic liver disease. J. Lipid Res. 38; 926–934.
Mims D, Hercules D (2003) Quantification of bile acids directly from urine by MALDI-TOF-MS. Anal. Bioanal. Chem. 375; 609–616.
Mims D, Hercules D (2004) Quantification of bile acids directly from plasma by MALDI-TOF-MS. Anal. Bioanal. Chem. 378; 1322–1326.
Mitamura K, Yatera M, Shimada K (2000a) Studies on neurosteroids XII. Determination of enzymatically formed catechol estrogens and guaiacol estrogens by rat brains using liquid chromatography mass spectrometry mass spectrometry. J. Chromatogr. B Biomed. Sci. Appl. 748; 89–96.
Mitamura K, Yatera M, Shimada K (2000b) Studies on neurosteroids Part XIII. Characterization of catechol estrogens in rat brains using liquid chromatography-mass spectrometry-mass spec-trometry. Analyst. 125; 811–814.
Miyazaki H, Ishibashi M, Itoh M, Nambara T (1977) Use of new silylating agents for identifica-tion of hydroxylated steroids by gas chromatography and gas chromatography-mass spectrom-etry. Biomed. Mass. Spectrom. 4; 23–25.
Murari MP, Murari R, Baumann WJ (1985) Motional anisotropy-induced unequal deuterium NMR spin-lattice relaxation of 3 a -deuteriumcholesterol and 3 b -deuteriumepicholesterol in solution as a measure of sterol motion about the molecular axis. Magn. Reson. Chem. 23; 243–245.
Nassar AE, Varshney N, Getek T, Cheng L (2001) Quantitative analysis of hydrocortisone in human urine using a high performance liquid chromatographic tandem mass spectrometric atmospheric pressure chemical ionization method. J. Chromatogr Sci. 39; 59–64.
Neudert W, Röpke H (1965) Atlas of Steroid Spectra. Springer, Berlin.Parker F (1975) Biochemical applications of infrared and Raman spectroscopy. Appl. Spectrosc.
29; 129–147.Phillipou G, Bigham DA, Seamark RF (1975) Steroid tert-butyldimethylsilyl ethers as derivatives
for mass fragmentography. Steroids. 26; 516–524.Poole CF (1977) Recent advances in the silylation of organic compounds for gas chromatography.
In Handbook of Derivatives for Chromatography (eds Blau K, King G). Heyden, London, pp. 152–200.
Pouskouleli G, Butler IS, Kourounakis P (1983) Laser Raman-spectra of some representative hormonal steroids. J. Mol. Struct. 102; 93–101.
Rando RR, Bangerter FW, Alecio MR (1982) The synthesis and properties of a functional fluo-rescent cholesterol analog. Biochim. Biophys. Acta. 684; 12–20.
Redor-Goldman M, Li S, Caulfield MP, Clarke NJ, Reitz RE (2005a) Direct quantification of total testosterone in human sera or plasma by high turbulent flow liquid chromatography-atmospheric pressure chemical ionization-tandem mass spectrometry (HTLC-ACPI-MS/MS). Endocrine Society 87th Annual Meeting, June 4–7, San Diego, CA.
1592 Spectroscopic Methods of Steroid Analysis
Redor-Goldman M, Li S, Caulfield MP, Clarke NJ, Reitz, RE (2005b) Detection and quantification of androstenedione, progesterone and 17-hydroxyprogesterone in human serum/plasma by high turbulent flow liquid chromatography-atmospheric pressure chemical ionization-tandem mass spectrometry. Endocrine Society 87th Annual Meeting, June 4–7, San Diego, CA.
Reinitzer F (1888) Beiträge zur Kenntniss des Cholesterins. Monatsh Chem. 9; 421–441.Robb DB, Covey TR, Bruins AP (2000) Atmospheric pressure photoionization: an ionization
method for liquid chromatography-mass spectrometry. Anal. Chem. 72; 3653–3659.Roberts G, Gallagher BS, Jones RN (1958) Infrared Absorption Spectra of Steroids, Vol 2.
Interscience, New York.Rozen S, Ben-Shushan G (1985) C-13 NMR of tertiary fluorosteroids as a stereochemical probe.
Magn. Reson. Chem. 23; 116–118.Rujoi M, Jin J, Borchman D, Tang D, Yappert MC (2003) Isolation and lipid characterization of
cholesterol-enriched fractions in cortical and nuclear human lens fibers. Invest Ophthalmol. Vis. Sci. 44; 1634–1642.
Rule G, Henion J (1999) High-throughput sample preparation and analysis using 96-well mem-brane solid-phase extraction and liquid chromatography-tandem mass spectrometry for the determination of steroids in human urine. J. Am. Soc. Mass Spectrom. 10; 1322–1327.
Salmain M, Vessières A, Jaouen G, Butler IS (2005) Analytical potential of near-infrared Fourier transform Raman spectra in the detection of solid transition metal carbonyl steroid hormones. J. Raman Spectrosc. 26; 31–38.
Samek Z, Budešínský M (1979) In situ reactions with trichloroacetyl isocyanate and their applica-tion to structural assignment of hydroxy compounds by 1 H NMR spectroscopy. A general comment. Collect. Czech. Chem. C. 44; 558–588.
Sanders JKM, Hunter BK (1987) Modern NMR Spectroscopy. Oxford University Press, Oxford.Schiller J, Arnhold J, Glander HJ, Arnold K (2000) Lipid analysis of human spermatozoa and
seminal plasma by MALDI-TOF mass spectrometry and NMR spectroscopy: effects of freez-ing and thawing. Chem. Phys. Lipids. 106; 145–156.
Schiller J, Hammerschmidt S, Wirtz H, Arnhold K (2001) Lipid analysis of bronchoalveolar lavage fluid (BAL) by MALDI-TOF mass spectrometry and 31P NMR spectroscopy. Chem. Phys. Lipids. 112; 67–79.
Schrader B (ed) (1995) Raman Spectrometers in Infrared and Raman Spectrometry. VCH, Weinheim, Germany.
Schrader W, Klein HW (2004) Liquid chromatography/Fourier transform ion cyclotron resonance mass spectrometry (LC-FTICR MS): an early overview. Anal. Bioanal. Chem. 379; 1013–1024.
Schroeder F, Dempsey ME, Fischer RT (1985) Sterol and squalene carrier protein interactions with D 5, 7, 9(11)-cholestatrien-3b -ol. J. Biol. Chem. 260; 2904–2911.
Scigelova M, Makarov A (2006) Orbitrap mass analyzer - overview and applications in proteom-ics. Proteomics. 6; 16–21.
Setchell KDR, Schwarz M, O’Connell NC, Lund EG, Davis DL, Lathe R, Thompson HR, Tyson RW, Sokol RJ, Russell DW (1998) Identification of a new inborn error in bile acid synthesis: mutation of the oxysterol 7 a -hydroxylase gene causes severe neonatal liver disease. J. Clin. Invest. 102; 1690–1703.
Shackleton CH (1983) Inborn errors of steroid biosynthesis: detection by a new mass-spectromet-ric method. Clin. Chem. 29; 246–249.
Shackleton CH, Straub KM (1982) Direct analysis of steroid conjugates: the use of secondary ion mass spectrometry. Steroids. 40; 35–51.
Shackleton CHL, Mattox VR, Honour JW (1983) Analysis of intact steroid conjugates by second-ary ion mass spectrometry (including FABMS) and by gas chromatography. J. Steroid Biochem. 19; 209–217.
Shackleton CHL, Merdinck J, Lawson AM (1990) Steroid and bile acid analyses. In Mass Spectrometry of Biological Materials (eds McEwen CN, Larsen BS). Marcel Dekker, New York, pp. 297–377.
Shafer-Peltier KE, Haka AS, Fitzmaurice M, Crowe J, Myles J, Dasari RR, Feld MS (2002) Raman microspectroscopic model of human breast tissue: implications for breast cancer diagnosis in vivo. J. Raman Spectrosc. 33; 552–563.
160 A. Kasal et al.
Shen Z, Thomas JJ, Averbuj C, Broo KM, Engelhard M, Crowell JE, Finn MG, Siuzdak G (2001) Porous silicon as a versatile platform for laser desorption/ionization mass spectrometry. Anal. Chem. 73; 612–619.
Shimada K, Mukai Y (1998) Studies on neurosteroids. VII. Determination of pregnenolone and its 3-stearate in rat brains using high-performance liquid chromatography-atmospheric pressure chemical ionization mass spectrometry. J. Chromatogr. B Biomed. Sci. Appl. 714; 153–160.
Shou WZ, Jiang X, Naidong W (2004) Development and validation of a high-sensitivity liquid chromatography/tandem mass spectrometry (LC/MS/MS) method with chemical derivatization for the determination of ethinyl estradiol in human plasma. Biomed. Chromatogr. 18; 414–421.
Singh G, Gutierrez A, Xu K, Blair IA (2000) Liquid chromatography/electron capture atmo-spheric pressure chemical ionization/mass spectrometry: analysis of pentafluorobenzyl deriva-tives of biomolecules and drugs in the attomole range. Anal. Chem. 72; 3007–3013.
Sjövall J, Axelson M (1982) Newer approaches to the isolation, identification and quantitation of steroids in biological materials. Vitam. Horm. 39; 31–144.
Sloan S, Harvey DJ, Vouros P (1971) Interaction and rearrangement of trimethylsiloxy functional groups. Structural significance of the m/z 147 ion in the mass spectra of trimethylsilyl steroidal ethers. Org. Mass. Spectrom. 5; 789–799.
Smith AG, Gaskell SJ, Brooks CJW (1976) Trimethylsilyl group migration during electron impact and chemical ionization mass spectrometry of the trimethylsilyl ethers of 20-hydroxy-5 a -pregnan-3-ones and 20-hydroxy-4-pregnen-3-ones. Biomed. Mass. Spectrom. 3; 161–165.
Smith LL, Herz JE, Ezell EL (1993) 17O nuclear magnetic resonance spectra of steroids. Steroids. 58; 260–267.
Smith WB (1978) C-13 NMR of steroids. Ann. Rep. NMR Spectrosc. 8; 199–226.Snatzke G (1967) Organic Rotatory Dispersion and Circular Dichroism in Organic Chemistry.
Heyden, London.Stafford Jr GC, Kelley PE, Syka JEP, Reynolds WE, Todd JFJ (1984) Recent improvements in and
analytical applications of advanced ion trap technology. Int. J. Mass. Spectrom. 60; 85–98.Starcevic B, DiStefano E, Wang C, Catlin DH (2003) Liquid chromatography-tandem mass spec-
trometry assay for human serum testosterone and trideuterated testosterone. J. Chromatogr. B Analyt. Technol. Biomed Life Sci. 792; 197–204.
Steigner E, Schrader B (1970) Elucidation of structure of steroids by Raman spectroscopy. Liebigs Ann. Chem. 735; 15–22.
Suga T, Shishibori T, Matsuura T (1972) Intramolecular hydrogen bonding in hydroxy-keto-steroids. J. Chem. Soc. Chem. Commun. 1; 171–173.
Taylor GI (1964) Disintegration of water drops in an electric field. Proc. R. Soc. Lond. A. 280; 383–397.
Thenot J-P, Horning E (1972a) MO-TMS derivatives of human urinary steroids for GC and GC-MS studies. Anal. Lett. 5; 21–33.
Thenot J-P, Horning E (1972b) GC-MS derivatization studies. The formation of dexamethasone MO-TMS. Anal. Lett. 5; 905–913.
Thevis M, Opferman G, Schmickler H, Schänzer W (2001) Mass spectrometry of steroid glucuronide conjugates. I. Electron impact fragmentation of 5 a /5|3-androstan-3a -ol-17-one glucuronides, 5 a -estran-3a -ol-17-one glucuronide and deuterium-labelled analogues. J. Mass. Spectrom. 36; 159–168.
Thevis M, Makarov AA, Horning S, Schanzer W (2005) Mass spectrometry of stanozolol and its analogues using electrospray ionization and collision-induced dissociation with quadrupole-linear ion trap and linear ion trap-orbitrap hybrid mass analyzers. Rapid Commun. Mass. Spectrom. 19; 3369–3378.
Trehan IR, Monder C, Bose AK (1968) N.M.R. spectral studies. V. Classification of steroid alco-hols by N.M.R. Spectroscopy. Tetrahedron Lett. 67–69.
Trka A, Kasal A (1980) Electron impact mass spectra of some vicinal trans-dihalo- and trans-hydroxyhalocholestanes. Collect. Czech. Chem. C. 45; 1720–1733.
1612 Spectroscopic Methods of Steroid Analysis
Trösken ER, Straube E, Lutz WK, Völkel W, Patten P (2004) Quantitation of lanosterol and its major metabolite FF-MAS in an inhibition assay of CYP51 by azoles with atmospheric pres-sure photoionization based LC-MS/MS. J. Am. Soc. Mass. Spectrom. 15; 1216–1221.
Vallée M, Rivera JD, Koob GF, Purdy RH, Fitzgerald RL (2000) Quantification of neurosteroids in rat plasma and brain following swim stress and allopregnanolone administration using negative chemical ionization gas chromatography/mass spectrometry. Anal. Biochem. 287; 153–166.
Wahlén E, Egestad B, Strandvik B, Sjövall J (1989) Ketonic bile acids in urine of infants during the neonatal period. J. Lipid Res. 30; 1847–1857.
Wang C, Catlin DH, Starcevic B, Leung A, DiStefano E, Lucas G, Hull L, Swerdloff RS (2004) Testosterone metabolic clearance and production rates determined by stable isotope dilution/ tandem mass spectrometry in normal men: influence of ethnicity and age. J. Clin. Endocrinol. Metab. 89; 2936–2941.
Wang Y, Hornshaw M, Alvelius G, Bodin K, Liu S, Sjövall J, Griffiths WJ (2006) Matrix-assisted laser desorption/ionization high-energy collision-induced dissociation of steroids: analysis of oxysterols in rat brain. Anal. Chem. 78; 164–173.
Wang Y, Karu K, Griffiths WJ (2007) Analysis of neurosterols and neurosteroids by mass spectrometry. Biochimie. 89; 182–191. Available online 2 November 2006.
Weidolf LOG, Lee ED, Henion JD (1988) Determination of boldenone sulfoconjugate and related steroid sulfates in equine urine by high performance liquid chromatograph/tandem mass spectrometry. Biomed. Environ. Mass. Spectrom. 15; 283–288.
Weissenberg M, Glotter E (1977) Reduction of 1-oxo-stroids by sodium-borohydride. J. Chem. Soc. Chem Commun. 1; 988–993.
Whitney J, Lewis S, Straub KM, Thaler MM, Burlingame AL (1981) Analysis of conjugated bile salts in human duodenal bile using fast atom bombardment and field desorption mass spectrometry. Koenshu–Iyo Masu Kenkyukai. 6; 33–44.
Wiley WC, McLaren IH (1955) Time-of-flight mass spectrometer with improved resolution. Rev. Sci. Instrum. 26; 1150.
Williams DH, Fleming I (1987) Spectroscopic Methods in Organic Chemistry, 4th edn. McGraw-Hill, London.
Wilm MS, Mann M (1994) Electrospray and Taylor-cone theory: Dole’s beam of macromolecules at last? Int. J. Mass. Spectrom. 136; 167–180.
Wolthers BG, Kraan GPB (1999) Clinical applications of gas chromatography and gas chromatography-mass spectrometry of steroids. J. Chromatogr. A. 843; 247–274.
Wong TC, Rutar V, Wang J (1984) Study of 1 H chemical shifts and couplings with 19F in 9a - fluorocortisol. Application of a novel 1H-13C chemical shift correlation technique with homo-nuclear decoupling. J. Am. Chem. Soc. 106; 7046–7051.
Wong T, Shackleton CHL, Covey TR, Ellis G (1992) Identification of the steroids in neonatal plasma that interfere with 17a-hydroxyprogesterone radioimmunoassays. Clin. Chem. 38; 1830–1837
Yamashita M, Fenn JB (1984a) Electrospray ion source. Another variation on the free-jet theme. J. Phys. Chem. 88; 4451–4459.
Yamashita M, Fenn JB (1984b) Negative ion production with the electrospray ion source. J. Phys. Chem. 88; 4671–4675.
Yang Y, Griffiths WJ, Nazer H, Sjövall J (1997) Analysis of bile acids and bile alcohols in urine by capillary column liquid chromatography-mass spectrometry using fast atom bombardment or electrospray ionisation and collision induced dissociation. Biomed. Chromatogr. 11; 240–255.
Zaretskii ZV (1976) Mass Spectrometry of Steroids. Wiley, New York.Zürcher RF (1961) Protonenresonanzspektroskopie und Steroidstruktur. I. Das C-19 Methylsignal
in Funktion der Substituenten. Helv. Chim. Acta. 44; 1380–1395.Zürcher RF (1963) Protonenresonanzspektroskopie und Steroidstruktur. II. Die Lage der C-18 und
C-19 Methylsignal in Funktion der Substituenten. Helv. Chim. Acta. 44; 1380–1395.


