Embed Size (px)
Citation preview
Pattern Recognition 36 (2003) 2213–2230www.elsevier.com/locate/patcog
Spectral embedding of graphs
Bin Luoa;b, Richard C. Wilsona, Edwin R. Hancocka ;∗aDepartment of Computer Science, University of York, York YO10 5DD, UK
bAnhui University, People’s Republic of China
Received 10 June 2002; accepted 3 January 2003
Abstract
In this paper we explore how to embed symbolic relational graphs with unweighted edges in a pattern-space. We adopta graph-spectral approach. We use the leading eigenvectors of the graph adjacency matrix to de�ne eigenmodes of theadjacency matrix. For each eigenmode, we compute vectors of spectral properties. These include the eigenmode perimeter,eigenmode volume, Cheeger number, inter-mode adjacency matrices and intermode edge-distance. We embed these vectors ina pattern-space using two contrasting approaches. The �rst of these involves performing principal or independent componentsanalysis on the covariance matrix for the spectral pattern vectors. The second approach involves performing multidimensionalscaling on the L2 norm for pairs of pattern vectors. We illustrate the utility of the embedding methods on neighbourhoodgraphs representing the arrangement of corner features in 2D images of 3D polyhedral objects. Two problems are investigated.The �rst of these is the clustering of graphs representing distinct objects viewed from di�erent directions. The second isthe identi�cation of characteristic views of single objects. These two studies reveal that both embedding methods result inwell-structured view spaces for graph-data extracted from 2D views of 3D objects.? 2003 Pattern Recognition Society. Published by Elsevier Ltd. All rights reserved.
Keywords: Graph spectra; Graph clustering; View based recognition; Principal component analysis; Independent component analysis;Multidimensional scaling
1. Introduction
Relational graphs have proved alluring as structural rep-resentations for both 2D and 3D shape in computational vi-sion. Barrow and Burstall [1] and Fischler and Enschlager[2] were among the �rst to demonstrate the potential ofrelational graphs as abstractions for pictorial information.Since then graph-based representations have been exploitedwidely for the purposes of shape representation, segmenta-tion, matching and recognition. However, one of the prob-lems that hinders the manipulation of large sets of graphsis that of measuring their similarity. This problem arises ina number of situations where graphs must be matched orclustered together. The large-scale matching problem arisesin tasks involving recognition from image databases [3].
∗ Corresponding author. Tel.: +44-1904-433374; fax: +44-1904-432767.
E-mail address: [email protected] (E.R. Hancock).
The graph-clustering task arises when the unsupervisedlearning of the class-structure of sets of graphs is at-tempted. Concrete examples here include the organisationof large structural data-bases [4] or the discovery of theview-structure of objects [5].One of the problems that hinders this endeavour is that
graphs are neither vectorial in nature nor easily transformedinto vectors. The reasons for this are twofold. First, thereis no canonical ordering of the nodes or edges of a graph.Hence, there is no natural way to map the nodes or edges tothe components of a vector. Second, most graph-matchingor graph manipulation problems are inexact in nature. Thatis to say that the graphs are noisy in nature and hence con-tain di�erent numbers of nodes or edges. Hence, even if anordering can be established then there needs to be a means ofdealing with pattern-vectors of di�erent length. Since theyare not easily vectorised, it is not straightforward to charac-terise the mean and variance of a set of graphs. Hence, stan-dard pattern recognition methods cannot be used to analyse
0031-3203/03/$30.00 ? 2003 Pattern Recognition Society. Published by Elsevier Ltd. All rights reserved.doi:10.1016/S0031-3203(03)00084-0
2214 B. Luo et al. / Pattern Recognition 36 (2003) 2213–2230
or cluster sets of graphs. One way around this problem isto adopt a pairwise clustering approach [6]. This involvesmeasuring the pairwise similarity of the graphs and cluster-ing them by searching for sets of graphs which exhibit astrong mutual a�nity to one-another.There are a number of ways in which the similarity of
graphs may be measured. One of the classical methods isto use the concept of graph edit distance. This is an ex-tension of the classical string edit distance, or Levenshteindistance [7], to graphs. The idea of using graph edit dis-tance was �rst explored by Fu and his co-workers [8,9].Here edit distances are computed using separate costs forthe relabeling, the insertion and the removal of both nodesand edges. Recently, Bunke [10,11] has shown that thegraph edit distance and the size of the maximum com-mon subgraph are related under certain restrictions on theedge and node edit costs. Torsello and Hancock [12] haveexploited this observation to e�ciently compute tree-editdistance. By using the Motzkin-Strauss theorem they showhow to compute an approximation to the edit distance us-ing relaxation labelling. Another approach to computinggraph similarity is to adopt a probabilistic framework. Herethere are two contributions worth mentioning. First, Christ-mas et al. [13] have developed an evidence combiningframework for graph-matching which uses probability dis-tribution functions to model the pairwise attribute relationsde�ned on graph-edges. Second, Wilson and Hancock [14]show how to measure graph-similarity using a probabilitydistribution which models the number of relabeling andgraph-edit operations when structural errors are present[14,15].Although graph-matching allows the pairwise compari-
son of shock-graphs, it does not allow space of structuralvariations to be explored in detail. Graph-matching may pro-vide a �ne measure of distance between structures, and thisin turn may be used to cluster similar graphs. However, itdoes not result in an ordering of the graphs that has met-rical signi�cance under structural variations due to gradedshape-changes. Hence, we aim to address the problem ofhow to organise graphs into a pattern-space in which simi-lar structures are close to one-another, and dissimilar struc-tures are far apart. In particular, we aim to embed graphsin a vector-space where the dimensions correspond to prin-cipal modes in structural variation. There are a number ofways in which this can be achieved. The �rst is to com-pute the distance between graphs and to use multidimen-sional scaling (MDS) to embed the individual graphs in alow-dimensional space [12]. However, this approach doesnot necessarily result in a pattern-space where the dimen-sions re�ect the modes of structural variation of the di�erentgraphs under study. The second approach is to extract featurevectors from the graphs. A pattern-space can be constructedfrom such vectors by performing modal analysis on theircovariance matrix. Unfortunately, and for the reasons notedabove, the process of embedding graphs in a vector-spaceis not a straightforward one.
To overcome the problem of how to map the structure of agraph onto a vector of �xed length, we turn to graph-spectraldecomposition methods. Spectral graph theory is a branchin mathematics which aims to characterise the properties ofunweighted graphs using the eigenvalues and eigenvectorsof the adjacency matrix or the closely related Laplacian ma-trix [16]. There are a number of well-known results. For in-stance, the degree of bijectivity of a graph is measured bythe eigenvalue gap, the distribution of cycle length can becomputed using a moments expansion of the eigenvalues,and the steady-state random walk on a graph is given bythe leading eigenvector of the adjacency matrix. Althoughconceptually alluring, the main problem with spectral prop-erties is that they are notoriously sensitive to small changesin the structure of the adjacency matrix.In this paper we work with the spectral decomposition
(or eigendecomposition) of the adjacency matrix. Associ-ated with each eigenmode is an adjacency matrix. We aimto investigate whether graphs can be represented in a sta-ble way using vectors of spectral attributes for the leadingeigenmodes of the adjacency matrix. The attributes studiedinclude the perimeter length, the volume and the Cheegerconstants for the mode adjacency matrices. We adopt thefollowing procedure for vectorising the graphs. Each com-ponent of the vector is taken to represent a di�erent spec-tral mode of the original graph adjacency matrix. The orderof the components of the vector is the magnitude order ofthe eigenvalues of the adjacency matrix. For each spectralmode, we use the components of the associated eigenvec-tors to compute spectral attributes. In this way we solvethe problem of �nding correspondences between nodes andvector-components.Once the feature-vectors for the eigenmodes of the ad-
jacency matrices are to hand, then we investigate two al-ternative routes to embedding them in a pattern-space. The�rst of these involves principal components analysis. Herewe construct the covariance matrix for the spectral patternvectors of the graphs. We project the pattern-vectors ontothe leading eigenvectors of the covariance matrix to give agraph pattern-space. The second approach is based on MDS.Here we compute a matrix of pairwise similarities betweenpairs of graphs using the L2 distance norm.
2. Graph spectra
In this paper we are concerned with the set of graphsG1; G2; : : : ; Gk ; : : : ; GN . The kth graph is denoted by Gk =(Vk ; Ek), where Vk is the set of nodes and Ek ⊆ Vk × Vk isthe edge-set. Our approach in this paper is a graph-spectralone. For each graph Gk we compute the adjacency matrixAk . This is a |Vk | × |Vk | matrix whose element with rowindex i and column index j is
Ak(i; j) =
{1 if (i; j)∈Ek ;0 otherwise:
(1)
B. Luo et al. / Pattern Recognition 36 (2003) 2213–2230 2215
From the adjacency matrices Ak ; k = 1; : : : ; N at hand, wecan calculate the eigenvalues �k by solving the equation|Ak − �kI |= 0 and the associated eigenvectors �!k by solv-ing the system of equations Ak�!k = �!k �
!k , where ! is
the eigenmode index. We order the eigenvectors accord-ing to the decreasing magnitude of the eigenvalues, i.e.|�1k |¿ |�2k |¿ · · ·¿ |�|Vk |k |. The eigenvectors are stacked inorder to construct the modal matrix �k =(�1k |�2k | : : : |�|Vk |
k ).With the eigenvalues and eigenvectors of the adjacency
matrix to hand, the spectral decomposition for the adjacencymatrix of the graph indexed k is
Ak =|Vk |∑!=1
�!k �!k (�
!k )T: (2)
If �k = diag(�1k ; : : : ; �|Vk |k ) is the diagonal matrix with the
eigenvalues of Ak as diagonal elements, then the spectraldecomposition of the adjacency matrix can be written as
Ak = �k�k�Tk : (3)
Associated with the eigenmode with index ! is the modeadjacency matrix:
S!k = �!k (�
!k )T: (4)
The aim in this paper is to explore whether the properties ofthese matrices can be used to construct feature vectors for thegraphs under study. We explore two di�erent approaches.The �rst of these involves computing features for individualmode adjacency matrices. The second involves the use ofrelational features which describe the arrangement of modeadjacency matrices.For each graph, we use only the �rst n eigenmodes of the
adjacency matrix. The truncated modal matrix is
�k = (�1k |�2k | : : : |�nk): (5)
3. Spectral features
Our aim is to use spectral features computed from theeigenmodes of the adjacencymatrices for graphs under studyto construct feature-vectors. To overcome the correspon-dence problem, we use the order of the eigenvalues to es-tablish the order of the components of the feature-vectors.We study a number of features suggested by spectral graphtheory.
3.1. Unary features
We commence by considering unary features for theeigenmodes of the adjacency matrix. The features studiedare listed below.
3.1.1. Leading eigenvaluesOur �rst vector of spectral features is constructed from the
ordered eigenvalues of the adjacency matrix. For the graph
indexed k, the vector is
Bk = (�1k ; �
2k ; : : : ; �
nk)T: (6)
This vector represents the spectrum of the graph Gk .
3.1.2. Eigenmode volumeThe volume Vol(S) of a subgraph S of a graph Gk is
de�ned to be the sum of the degrees of the nodes belongingto the subgraph, i.e.
Volk(S) =∑i∈SDk(i); (7)
where
Dk(i) =∑j∈Vk
Ei; j
is the degree of node i in the graph Gk . If Dk is the degreevector for the graph Gk , then the vector of volumes for theeigenmodes is found using the projection
Volk = �Tk Dk (8)
In other words, the volume associated with the eigenmodeindexed ! in the graph-indexed k is
Volk(!) =∑i∈Vk
�k(i; !)Dk(i): (9)
The eigenmodes volume feature-vector for the graph-indexedk is Bk = (Volk(1); Volk(2)); : : : ; Volk(n))T.
3.1.3. Eigenmode perimeterFor a subgraph S the set of perimeter nodes is �(S) =
{(u; v) | (u; v)∈E ∧ u∈ S ∧ v �∈ S}. The perimeter lengthof the subgraph is de�ned to be the number of edges in theperimeter set, i.e. �(S) = |�(S)|. Again, by analogy, theperimeter length of the adjacency matrix for the eigenmodeindexed ! is
�k(!) =∑� �=!
∑i∈Vk
∑j∈Vk
�k(i; !)�k(j; �)Ak(i; j): (10)
The perimeter values are ordered according to the modalindex to form the graph feature vector Bk=(�1k ; �
2k ; : : : ; �
nk)T.
3.1.4. Cheeger constantThe Cheeger constant for the subgraph S is de�ned as
H (S) =|�(S)|
min[Vol(S); Vol(S)]: (11)
The analogue of the Cheeger constants for the eigenmodesof the adjacency matrix is
Hk(!) =�k(!)
min[Volk(!); Volk(!)]; (12)
where
Volk(!) =n∑!=1
∑i∈Vk
�k(i; !)Dk(i)− Volk(!) (13)
2216 B. Luo et al. / Pattern Recognition 36 (2003) 2213–2230
is the volume of the complement of the eigenmode in-dexed !. Again, the eigenmode Cheeger numbers areordered to form a spectral feature-vector Bk = (Hk(1);Hk(2); : : : ; Hk(n))T.
3.2. Binary features
In addition to the unary features, we have studied pairwiseattributes for the eigenmodes.
3.2.1. Inter-mode adjacency matrixOur �rst pairwise representation is found by projecting the
adjacency matrix onto the basis spanned by the eigenvectors.The projection or inter-mode adjacency matrix is given by
Uk = �Tk Ak�k : (14)
The element of the matrix with row index u and columnindex v is
Uk(u; v) =∑i∈Vk
∑j∈Vk
�k(i; u)�k(j; v)Ak(i; j): (15)
These matrices are converted into long vectors. Thisis done by stacking the columns of the matrix Uk ineigenvalue order. The resulting vector is Bk = (Uk(1; 1);Uk(1; 2); : : : ; Uk(1; n); Uk(2; 1) : : : ; Uk(2; n; ); : : : ; Uk(n; n))T.Each entry in the long-vector corresponds to a di�erent pairof spectral eigenmodes.
3.2.2. Inter-mode distancesThe between mode distance is de�ned as the path length,
i.e. the minimum number of edges, between the most sig-ni�cant nodes associated with each eigenmode of the adja-cency matrix. The most signi�cant node associated a partic-ular eigenmode of the adjacency matrix is the one havingthe largest co-e�cient in the associated eigenvector. For theeigenmode indexed u in the graph indexed k, the most sig-ni�cant node is
iku = argmaxi�k(i; u): (16)
To compute the distance, we note that if we multiply theadjacency matrix Ak by itself l times, then the matrix (Ak)l
represents the distribution of paths of length l in the graphGk . In particular, the element (Ak)l(i; j) is the number ofpaths of length l edges between the nodes i and j. Hencethe minimum distance between the most signi�cant nodesof the eigenmode indexed u and v is
du;v = argminl(Ak)
l(iku ; ikv ): (17)
If we only use the �rst n leading eigenvectors to describethe graphs, the between mode distances for each graph canbe written as a n by n matrix which can be converted to an× n long-vector Bk = (d1;1; d1;2; : : : ; d1; n; d2;1 : : : dn;n)T.
4. Embedding the spectral vectors in a pattern space
In this section we describe three methods for embeddinggraphs in eigenspaces. The �rst of these involves perform-ing principal components analysis on the covariance ma-trices for the spectral pattern-vectors. The second involvesindependent component analysis (ICA). The third methodinvolves performing MDS on a set of pairwise distance be-tween vectors.
4.1. Pattern space embedding by PCA
Our �rst method makes use principal components anal-ysis and follows the parametric eigenspace idea of Muraseand Nayar [17]. The graphs extracted from each image arevectorised in the way outlined in Section 3. The N di�erentimage vectors are arranged in view order as the columns ofthe matrix:
S = [B1|B2| : : : |Bk | : : : |BN ]: (18)
Next, we compute the covariance matrix for the elementsin the di�erent rows of the matrix S. This is found by takingthe matrix product:
C = SST: (19)
We extract the principal components directions for the rela-tional data by performing an eigendecomposition on the co-variance matrix C. The eigenvalues �i are found by solvingthe eigenvalue equation
|C − �I |= 0 (20)
and the corresponding eigenvalues e i are found by solvingthe eigenvector equation
Cei = �ie i : (21)
We use the �rst 3 leading eigenvectors to represent thegraphs extracted from the images. The co-ordinate systemof the eigenspace is spanned by the three orthogonal vectorsby e=(e1; e2; e3). The individual graphs represented by thelong vectors Bk ; k = 1; 2; : : : ; N can be projected onto thiseigenspace using the formula
xk = eTBk : (22)
Hence each graph Gk is represented by a three-componentvector xk in the eigenspace.
4.2. Pattern space embedding by ICA
Our second approach uses ICA to embed the graphs ina pattern space. We explore how to decompose a set ofgraphs into signi�cantly di�erent independent components.These can then be used for graph clustering by projectingthe original graphs into the pattern space spanned by theindependent components.
B. Luo et al. / Pattern Recognition 36 (2003) 2213–2230 2217
The ICA algorithm used in this paper is Cardoso andSoulourniac’s JADE algorithm [3]. JADE is a statisticallybased algorithm. The main features of the algorithm are asfollows. As with other ICA algorithms, the �rst step is datawhitening or sphering. The aim is to eliminate correlationsfrom the data. This can be achieved by removing the meanof the data and using PCA on the data covariance matrix.As a result, the whitened vector set is Z =WB, where W isthe estimated whitening matrix. The second step of JADE isestimate the 4th-order cumulants Qz . In the noiseless case,Qz can be calculated as follows:
QZ (In) = E{|Z |2ZZT} − (n+ 1)In; (23)
where In is the n-order identity matrix and E(·) is the expec-tation operator. Next, a joint diagonalisation is performed to�nd a matrix V to minimise the non-diagonal entries of thecumulants matrices,
V = argmin�iOff(VTQZV ): (24)
Again we use the �rst 3 most signi�cant independent com-ponents to represent the graphs extracted from the images.The co-ordinate system of the pattern-space is spanned bythe three independent components by e= (V l; V 2; V 3). Theindividual graphs represented by the long vectors Zk ; k =1; 2; : : : ; N can be projected onto this pattern space using theformula xk = eTZk . Hence each graph Gk is represented bya 3-component vector xk in the pattern space.
4.3. Multidimensional scaling
MDS [18] is a procedure which allows data speci�ed interms of a matrix of pairwise distances to be embedded in aEuclidean space. The classical MDS method was proposedby Torgenson [19] and Gower [20]. Shepard and Kruskaldeveloped a di�erent scaling technique called ordinal scaling[21]. Here we intend to use the method to embed the graphsextracted from di�erent viewpoints in a low-dimensionalspace.To commence we require pairwise distances between
graphs. We do this by computing the L2 norms betweenthe spectral pattern vectors for the graphs. For the graphsindexed i1 and i2, the distance is
di1; i2 =K∑=1
[Bi1()− Bi2()]2: (25)
The pairwise similarities di1; i2 are used as the elementsof an N × N dissimilarity matrix D, whose elements arede�ned as follows:
Di1; i2 =
{di1; i2 if i1 �= i2;0 if i1 = i2:
(26)
In this paper, we use the classical MDS to embed theview-graphs in a Euclidean space using the matrix of pair-wise dissimilarities D. The �rst step of MDS is to calculatea matrix T whose element with row r and column c is givenby
Trc =−12[d2rc − d2r: − d2:c + d2::]; (27)
where
dr: =1N
N∑c=1
drc (28)
is the average dissimilarity value over the rth row, d:c is thesimilarly de�ned average value over the cth column and
d:: =1N 2
N∑r=1
N∑c=1
dr;c (29)
is the average similarity value over all rows and columns ofthe similarity matrix T .We subject the matrix T to an eigenvector analysis to ob-
tain a matrix of embedding co-ordinates X . If the rank of T isk; k6N , then we will have k non-zero eigenvalues. We ar-range these k non-zero eigenvalues in descending order, i.e.�1¿ �2¿ · · ·¿ �k ¿ 0. The corresponding ordered eigen-vectors are denoted by e i where �i is the ith eigenvalue. Theembedding co-ordinate system for the graphs obtained fromdi�erent views is
X = [f 1; f 2; : : : ; f k ]; (30)
where f i=√�ie i are the scaled eigenvectors. For the graph
indexed i, the embedded vector of co-ordinates is
xi = (Xi;1; Xi;2; Xi;3)T: (31)
5. View-based object recognition
To provide an experimental vehicle for our eigen-spacerepresentation of graphs, we focus on the problem of viewbased object recognition. This topic has been studied in thecomputer vision literature for over three decades [22–24].Stated simply, the idea is to compile a series of images of anobject as the set of possible viewing directions is spanned.The images are then subjected to some form of dimension-ality reduction [17] or information abstraction [24]. This isa process of learning [25,26] that may involve either featureextraction, principal components analysis or the abstractionof the main structures using a relational description [27].Once a condensed image representation is to hand, then theaim is to embed the di�erent images in a low-dimensionalrepresentation which can be traversed with viewing direc-tion. Recognition and pose recovery may be e�ected by�nding the closest representative view. In other words, theaim is to embed high-dimensional view based image data in
2218 B. Luo et al. / Pattern Recognition 36 (2003) 2213–2230
a low dimensional structure which is suitable for view in-dexing.Broadly speaking there are two di�erent approaches to
this problem. The �rst of these is to construct an eigenspace[17]. This approach was �rst introduced by Murase and Na-yar [17], and has since been re�ned in a number of di�erentways [28,29]. The idea is to perform principal componentsanalysis on the images collected as the viewing directionand illumination direction [30] are varied. This is achievedby �rst storing each image as a long-vector. Next the covari-ance matrix for the long-vectors is found. The eigenvectorsof the covariance matrix de�ne the directions of princi-pal components in the space spanned by the long-vectors.Dimensionality reduction is achieved by projecting theoriginal images onto the principal component directions andselecting the components corresponding to the leadingeigenvectors. The method has mainly been applied to pixelbased image representations.The second approach to the problem is older and involves
constructing a relational abstraction of the features presentin the raw images [23,22,31]. The aim here is to extract sur-faces or boundary groupings from 2.5D range data or 2Dimage data. From this data the view occurrence of the dif-ferent image structures is noted. Hence a group of imageswhich all yield the same feature con�guration are deemedto belong to a common view [32]. View indexing can beachieved by matching a relational arrangement of imagestructures to the set of corresponding representative viewgraphs. This approach to the problem has its origins in thework of Freeman on characteristic views. It has also stim-ulated the study of aspect graphs [22–24,33–37]. The topicdraws heavily on work from psychology [38,39] and di�er-ential topology [40,31].
6. Experiments
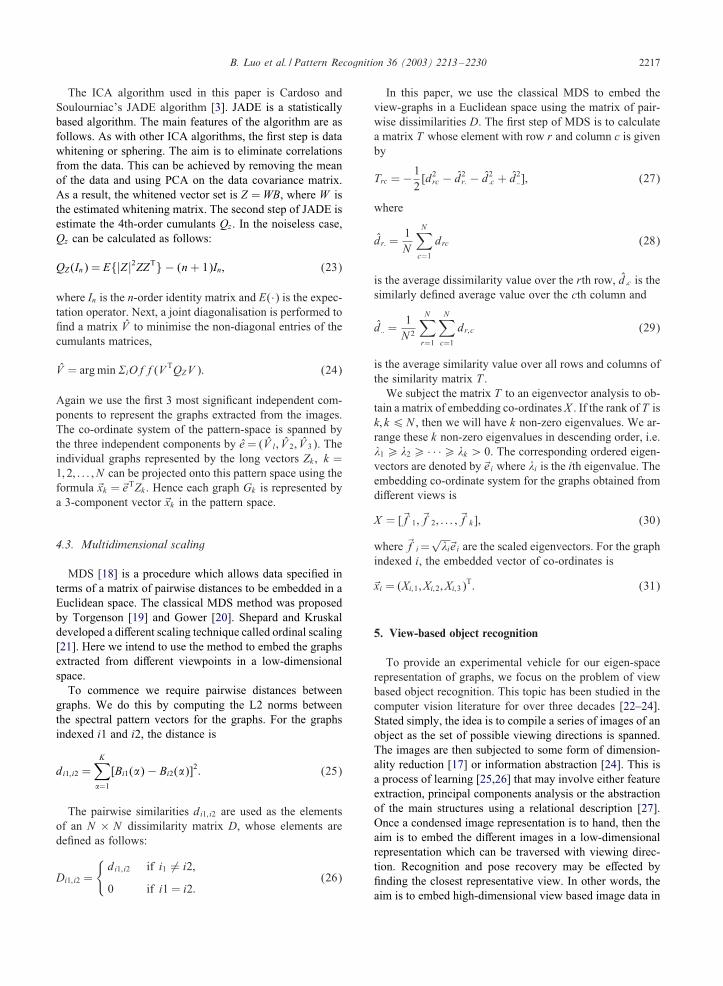
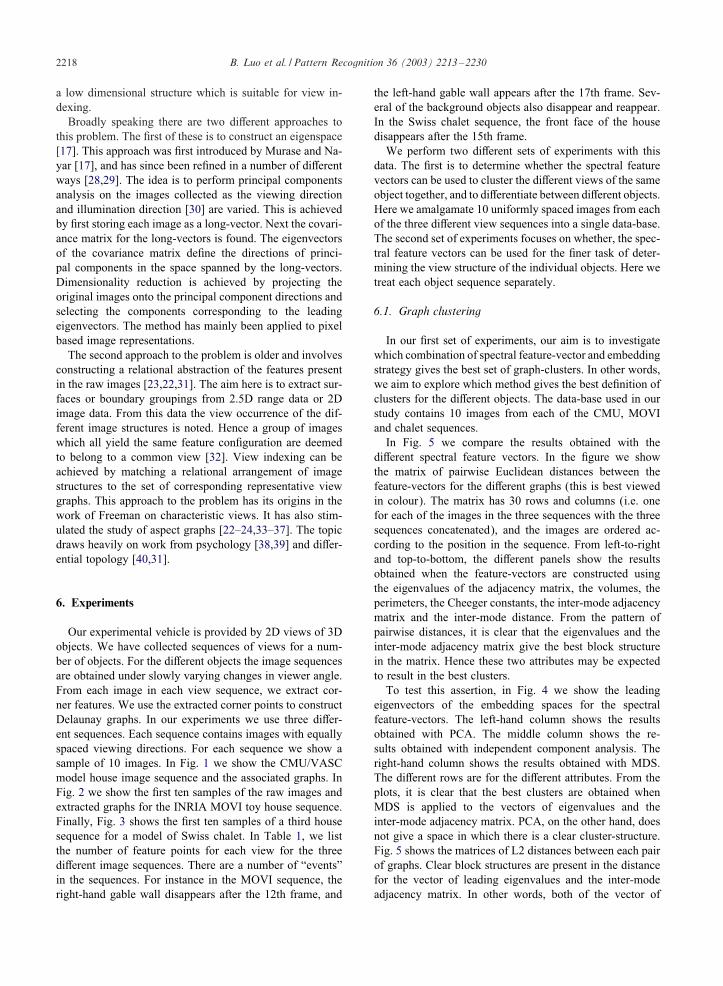
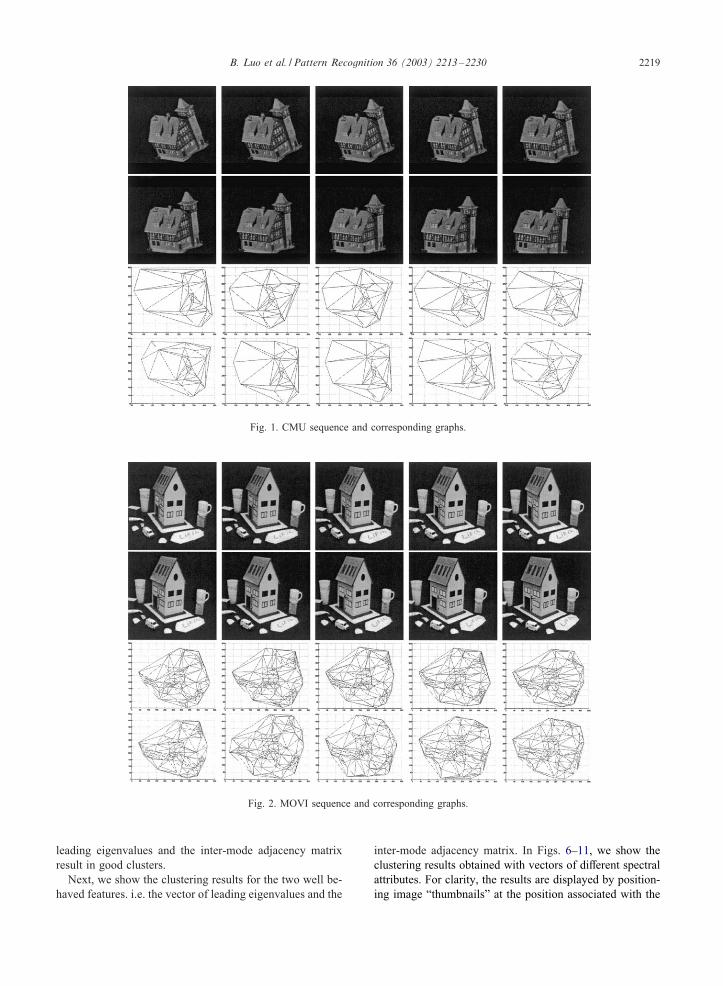
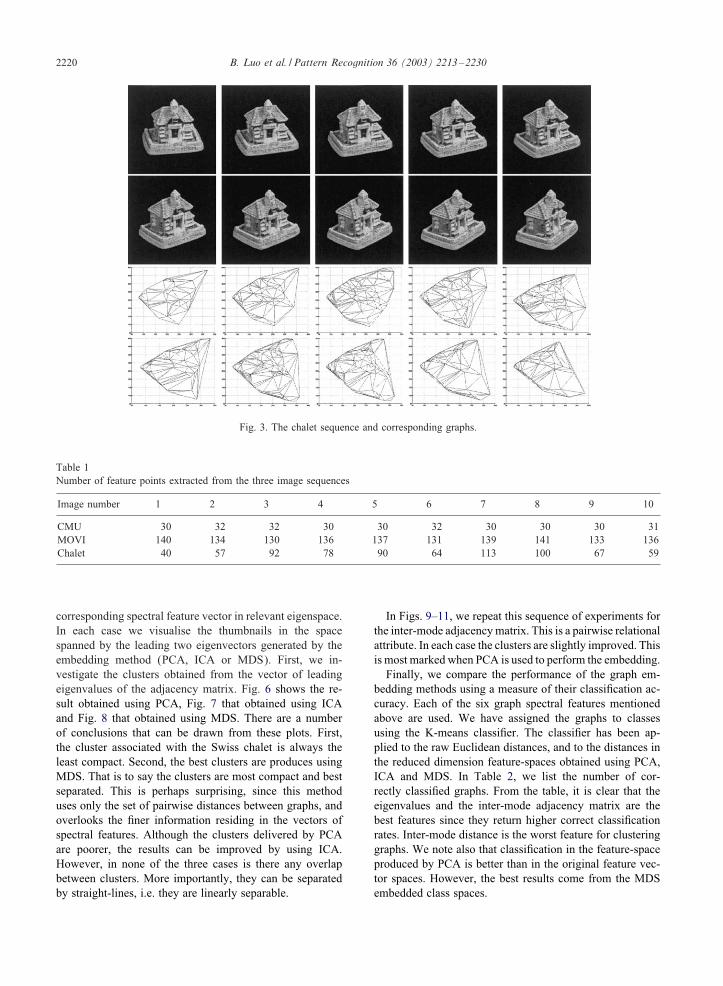
Our experimental vehicle is provided by 2D views of 3Dobjects. We have collected sequences of views for a num-ber of objects. For the di�erent objects the image sequencesare obtained under slowly varying changes in viewer angle.From each image in each view sequence, we extract cor-ner features. We use the extracted corner points to constructDelaunay graphs. In our experiments we use three di�er-ent sequences. Each sequence contains images with equallyspaced viewing directions. For each sequence we show asample of 10 images. In Fig. 1 we show the CMU/VASCmodel house image sequence and the associated graphs. InFig. 2 we show the �rst ten samples of the raw images andextracted graphs for the INRIA MOVI toy house sequence.Finally, Fig. 3 shows the �rst ten samples of a third housesequence for a model of Swiss chalet. In Table 1, we listthe number of feature points for each view for the threedi�erent image sequences. There are a number of “events”in the sequences. For instance in the MOVI sequence, theright-hand gable wall disappears after the 12th frame, and
the left-hand gable wall appears after the 17th frame. Sev-eral of the background objects also disappear and reappear.In the Swiss chalet sequence, the front face of the housedisappears after the 15th frame.We perform two di�erent sets of experiments with this
data. The �rst is to determine whether the spectral featurevectors can be used to cluster the di�erent views of the sameobject together, and to di�erentiate between di�erent objects.Here we amalgamate 10 uniformly spaced images from eachof the three di�erent view sequences into a single data-base.The second set of experiments focuses on whether, the spec-tral feature vectors can be used for the �ner task of deter-mining the view structure of the individual objects. Here wetreat each object sequence separately.
6.1. Graph clustering
In our �rst set of experiments, our aim is to investigatewhich combination of spectral feature-vector and embeddingstrategy gives the best set of graph-clusters. In other words,we aim to explore which method gives the best de�nition ofclusters for the di�erent objects. The data-base used in ourstudy contains 10 images from each of the CMU, MOVIand chalet sequences.In Fig. 5 we compare the results obtained with the
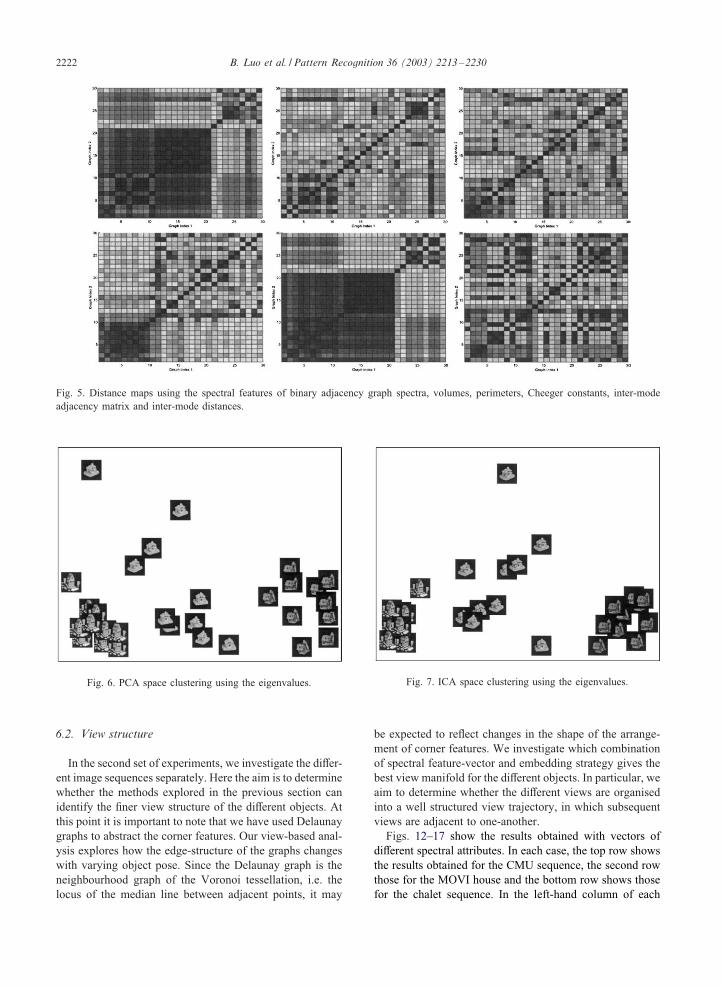
di�erent spectral feature vectors. In the �gure we showthe matrix of pairwise Euclidean distances between thefeature-vectors for the di�erent graphs (this is best viewedin colour). The matrix has 30 rows and columns (i.e. onefor each of the images in the three sequences with the threesequences concatenated), and the images are ordered ac-cording to the position in the sequence. From left-to-rightand top-to-bottom, the di�erent panels show the resultsobtained when the feature-vectors are constructed usingthe eigenvalues of the adjacency matrix, the volumes, theperimeters, the Cheeger constants, the inter-mode adjacencymatrix and the inter-mode distance. From the pattern ofpairwise distances, it is clear that the eigenvalues and theinter-mode adjacency matrix give the best block structurein the matrix. Hence these two attributes may be expectedto result in the best clusters.To test this assertion, in Fig. 4 we show the leading
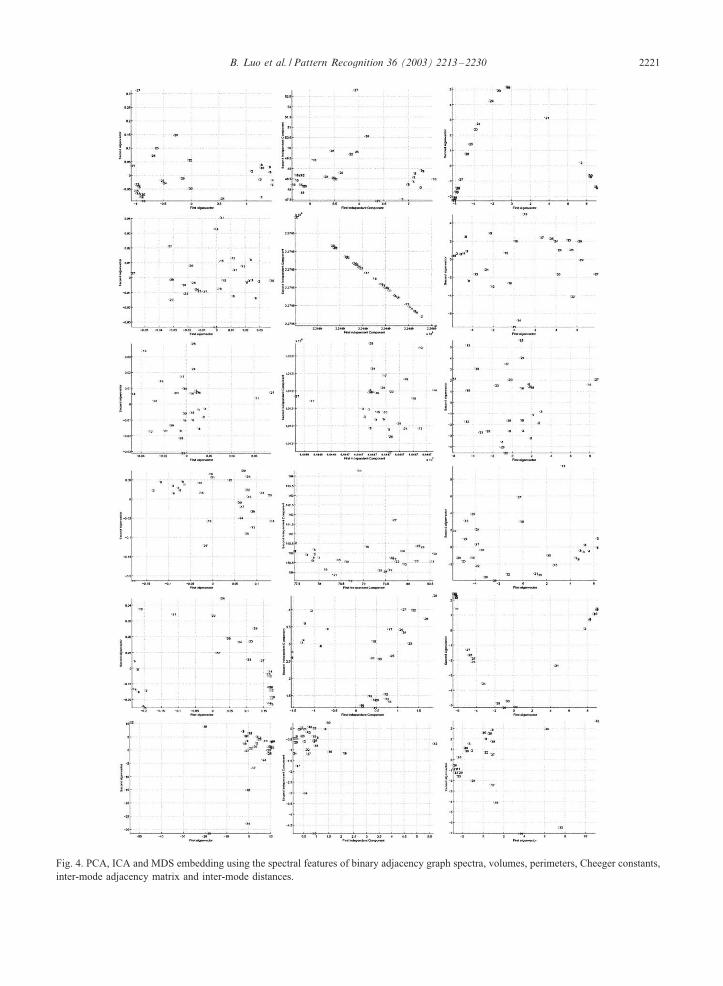
eigenvectors of the embedding spaces for the spectralfeature-vectors. The left-hand column shows the resultsobtained with PCA. The middle column shows the re-sults obtained with independent component analysis. Theright-hand column shows the results obtained with MDS.The di�erent rows are for the di�erent attributes. From theplots, it is clear that the best clusters are obtained whenMDS is applied to the vectors of eigenvalues and theinter-mode adjacency matrix. PCA, on the other hand, doesnot give a space in which there is a clear cluster-structure.Fig. 5 shows the matrices of L2 distances between each pairof graphs. Clear block structures are present in the distancefor the vector of leading eigenvalues and the inter-modeadjacency matrix. In other words, both of the vector of
B. Luo et al. / Pattern Recognition 36 (2003) 2213–2230 2219
Fig. 1. CMU sequence and corresponding graphs.
Fig. 2. MOVI sequence and corresponding graphs.
leading eigenvalues and the inter-mode adjacency matrixresult in good clusters.Next, we show the clustering results for the two well be-
haved features. i.e. the vector of leading eigenvalues and the
inter-mode adjacency matrix. In Figs. 6–11, we show theclustering results obtained with vectors of di�erent spectralattributes. For clarity, the results are displayed by position-ing image “thumbnails” at the position associated with the
2220 B. Luo et al. / Pattern Recognition 36 (2003) 2213–2230
Fig. 3. The chalet sequence and corresponding graphs.
Table 1Number of feature points extracted from the three image sequences
Image number 1 2 3 4 5 6 7 8 9 10
CMU 30 32 32 30 30 32 30 30 30 31MOVI 140 134 130 136 137 131 139 141 133 136Chalet 40 57 92 78 90 64 113 100 67 59
corresponding spectral feature vector in relevant eigenspace.In each case we visualise the thumbnails in the spacespanned by the leading two eigenvectors generated by theembedding method (PCA, ICA or MDS). First, we in-vestigate the clusters obtained from the vector of leadingeigenvalues of the adjacency matrix. Fig. 6 shows the re-sult obtained using PCA, Fig. 7 that obtained using ICAand Fig. 8 that obtained using MDS. There are a numberof conclusions that can be drawn from these plots. First,the cluster associated with the Swiss chalet is always theleast compact. Second, the best clusters are produces usingMDS. That is to say the clusters are most compact and bestseparated. This is perhaps surprising, since this methoduses only the set of pairwise distances between graphs, andoverlooks the �ner information residing in the vectors ofspectral features. Although the clusters delivered by PCAare poorer, the results can be improved by using ICA.However, in none of the three cases is there any overlapbetween clusters. More importantly, they can be separatedby straight-lines, i.e. they are linearly separable.
In Figs. 9–11, we repeat this sequence of experiments forthe inter-mode adjacencymatrix. This is a pairwise relationalattribute. In each case the clusters are slightly improved. Thisis most marked when PCA is used to perform the embedding.Finally, we compare the performance of the graph em-
bedding methods using a measure of their classi�cation ac-curacy. Each of the six graph spectral features mentionedabove are used. We have assigned the graphs to classesusing the K-means classi�er. The classi�er has been ap-plied to the raw Euclidean distances, and to the distances inthe reduced dimension feature-spaces obtained using PCA,ICA and MDS. In Table 2, we list the number of cor-rectly classi�ed graphs. From the table, it is clear that theeigenvalues and the inter-mode adjacency matrix are thebest features since they return higher correct classi�cationrates. Inter-mode distance is the worst feature for clusteringgraphs. We note also that classi�cation in the feature-spaceproduced by PCA is better than in the original feature vec-tor spaces. However, the best results come from the MDSembedded class spaces.
B. Luo et al. / Pattern Recognition 36 (2003) 2213–2230 2221
Fig. 4. PCA, ICA and MDS embedding using the spectral features of binary adjacency graph spectra, volumes, perimeters, Cheeger constants,inter-mode adjacency matrix and inter-mode distances.
2222 B. Luo et al. / Pattern Recognition 36 (2003) 2213–2230
Fig. 5. Distance maps using the spectral features of binary adjacency graph spectra, volumes, perimeters, Cheeger constants, inter-modeadjacency matrix and inter-mode distances.
Fig. 6. PCA space clustering using the eigenvalues.
6.2. View structure
In the second set of experiments, we investigate the di�er-ent image sequences separately. Here the aim is to determinewhether the methods explored in the previous section canidentify the �ner view structure of the di�erent objects. Atthis point it is important to note that we have used Delaunaygraphs to abstract the corner features. Our view-based anal-ysis explores how the edge-structure of the graphs changeswith varying object pose. Since the Delaunay graph is theneighbourhood graph of the Voronoi tessellation, i.e. thelocus of the median line between adjacent points, it may
Fig. 7. ICA space clustering using the eigenvalues.
be expected to re�ect changes in the shape of the arrange-ment of corner features. We investigate which combinationof spectral feature-vector and embedding strategy gives thebest view manifold for the di�erent objects. In particular, weaim to determine whether the di�erent views are organisedinto a well structured view trajectory, in which subsequentviews are adjacent to one-another.Figs. 12–17 show the results obtained with vectors of
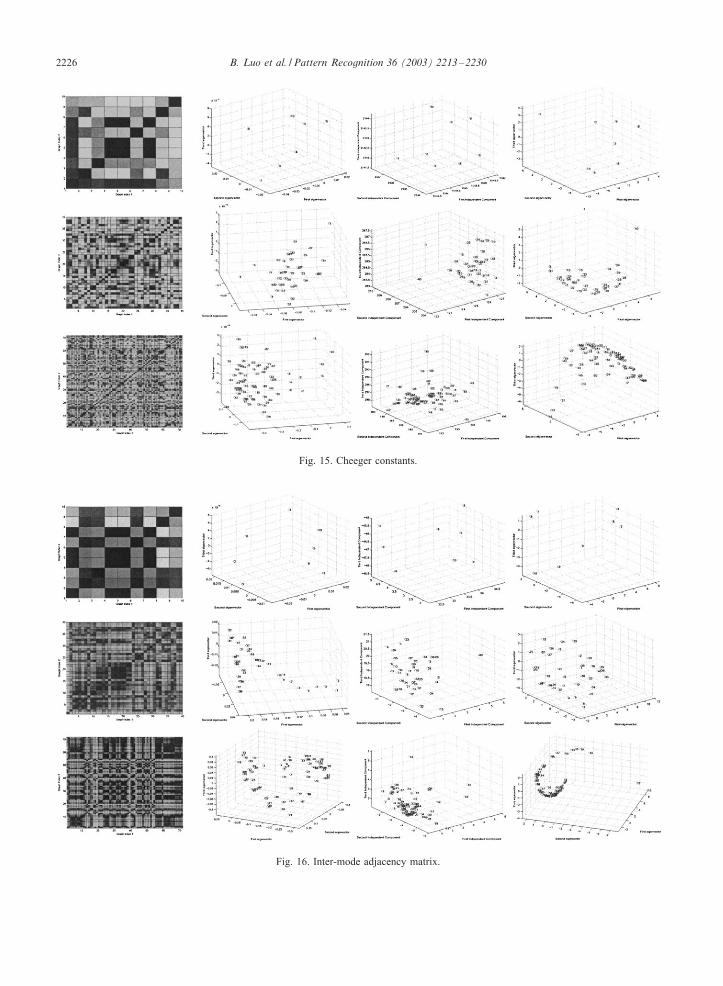
di�erent spectral attributes. In each case, the top row showsthe results obtained for the CMU sequence, the second rowthose for the MOVI house and the bottom row shows thosefor the chalet sequence. In the left-hand column of each

B. Luo et al. / Pattern Recognition 36 (2003) 2213–2230 2223
Fig. 8. MDS space clustering using the eigenvalues.
Fig. 9. PCA space clustering using the inter-mode adjacency matrix.
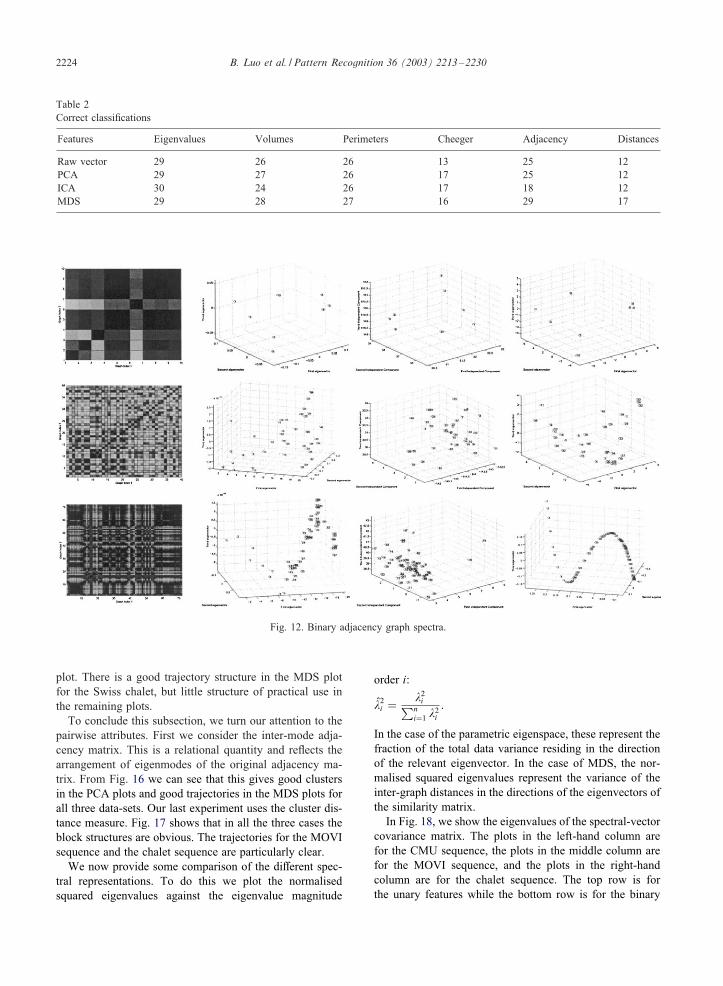
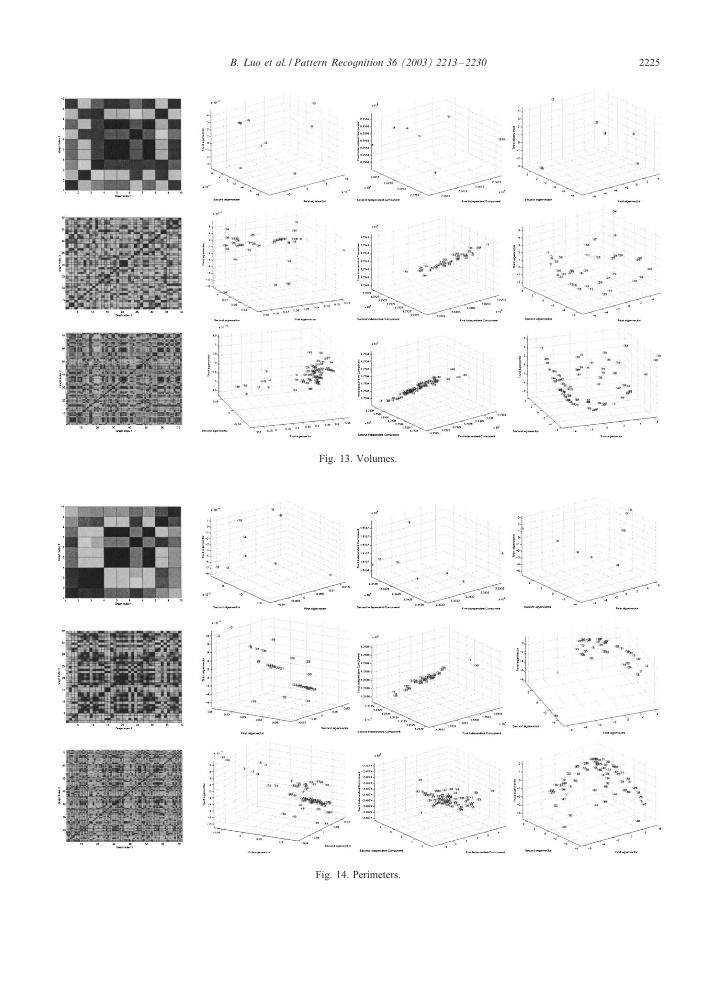
�gure, we show the matrix of pairwise distances betweenthe relevant spectral feature vectors. In the second column,we show the eigenspace extracted by applying PCA to thecovariance matrix for the spectral feature vectors. The thirdcolumn shows the eigenspace generated by applying ICA tothe covariance matrix. Finally, the right-hand column showsthe result of applying MDS to the matrix of distances.Figs. 12–15 show the results obtained when the unary at-
tributes are used. These are respectively vectors of orderedeigenvalues, volumes, perimeters and Cheeger constants.First, we compare the structure of the view-spaces obtainedusing PCA and MDS. Generally speaking, they are ratherdi�erent. In the case of PCA, a cluster structure emerges. Bycontrast, in MDS the di�erent views execute smooth trajec-tories. Hence, the output of PCA would appear to be best forlocating clusters of similar views, while MDS provides in-formation which might be more useful in constructing para-metric eigenspaces.
Fig. 10. ICA space clustering using the inter-mode adjacency ma-trix.
Fig. 11. MDS space clustering using the inter-mode adjacencymatrix.
We now turn to the di�erent spectral attributes in moredetail. The vector of leading eigenvalues of the adjacencymatrix give the smoothest and most uniformly distributedtrajectories when used in conjunction with MDS. They alsoresult in the least clustered distribution when PCA is ap-plied. The volume and perimeter give the most marked clus-ters in the distribution of pairwise distances, where the viewevent-structure for the MOVI sequence and the Swiss chaletsequence is clearly seen as a block-structure in the plots.However, in the case of the PCA and MDS plots the simi-larities are less marked. In the case of the volume attribute,in the PCA plots there is a clear cluster-structure, while inthe MDS plots there is a clear break in the trajectories. Inthe corresponding plots for the perimeter attribute there isneither clear cluster structure in the PCA plot, nor trajec-tory structure in the MDS plot. Finally, the Cheeger con-stant does not result in a clear block structure in the distance
2224 B. Luo et al. / Pattern Recognition 36 (2003) 2213–2230
Table 2Correct classi�cations
Features Eigenvalues Volumes Perimeters Cheeger Adjacency Distances
Raw vector 29 26 26 13 25 12PCA 29 27 26 17 25 12ICA 30 24 26 17 18 12MDS 29 28 27 16 29 17
Fig. 12. Binary adjacency graph spectra.
plot. There is a good trajectory structure in the MDS plotfor the Swiss chalet, but little structure of practical use inthe remaining plots.To conclude this subsection, we turn our attention to the
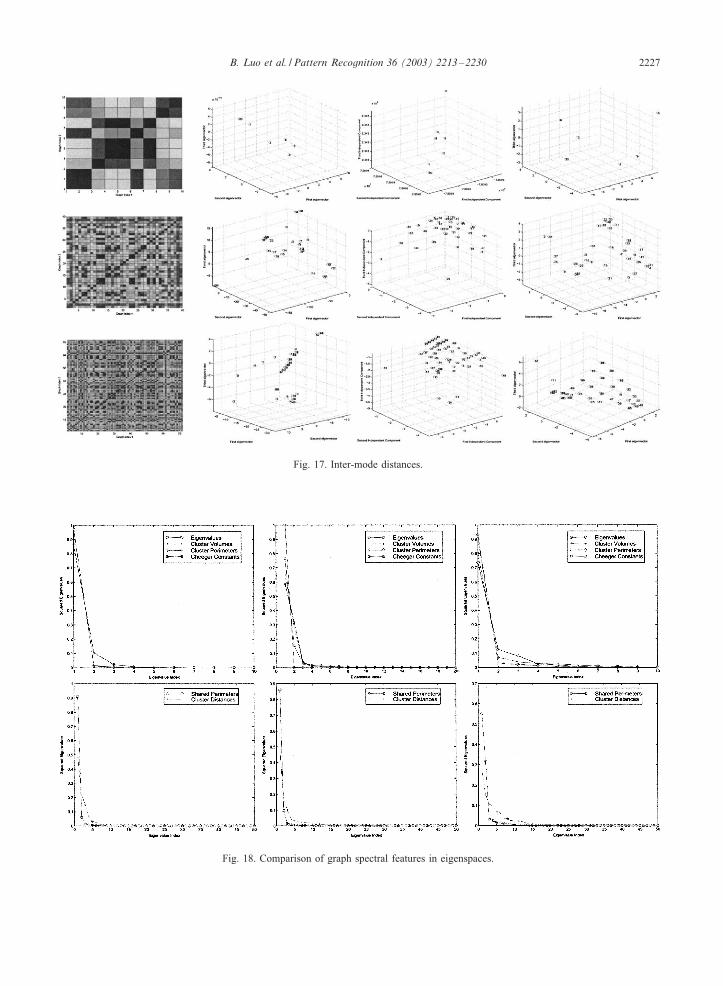
pairwise attributes. First we consider the inter-mode adja-cency matrix. This is a relational quantity and re�ects thearrangement of eigenmodes of the original adjacency ma-trix. From Fig. 16 we can see that this gives good clustersin the PCA plots and good trajectories in the MDS plots forall three data-sets. Our last experiment uses the cluster dis-tance measure. Fig. 17 shows that in all the three cases theblock structures are obvious. The trajectories for the MOVIsequence and the chalet sequence are particularly clear.We now provide some comparison of the di�erent spec-
tral representations. To do this we plot the normalisedsquared eigenvalues against the eigenvalue magnitude
order i:
�2i =�2i∑ni=1 �
2i:
In the case of the parametric eigenspace, these represent thefraction of the total data variance residing in the directionof the relevant eigenvector. In the case of MDS, the nor-malised squared eigenvalues represent the variance of theinter-graph distances in the directions of the eigenvectors ofthe similarity matrix.In Fig. 18, we show the eigenvalues of the spectral-vector
covariance matrix. The plots in the left-hand column arefor the CMU sequence, the plots in the middle column arefor the MOVI sequence, and the plots in the right-handcolumn are for the chalet sequence. The top row is forthe unary features while the bottom row is for the binary
B. Luo et al. / Pattern Recognition 36 (2003) 2213–2230 2225
Fig. 13. Volumes.
Fig. 14. Perimeters.
2226 B. Luo et al. / Pattern Recognition 36 (2003) 2213–2230
Fig. 15. Cheeger constants.
Fig. 16. Inter-mode adjacency matrix.
B. Luo et al. / Pattern Recognition 36 (2003) 2213–2230 2227
Fig. 17. Inter-mode distances.
Fig. 18. Comparison of graph spectral features in eigenspaces.
2228 B. Luo et al. / Pattern Recognition 36 (2003) 2213–2230
Fig. 19. Comparison of graph spectral features in MDS spaces.
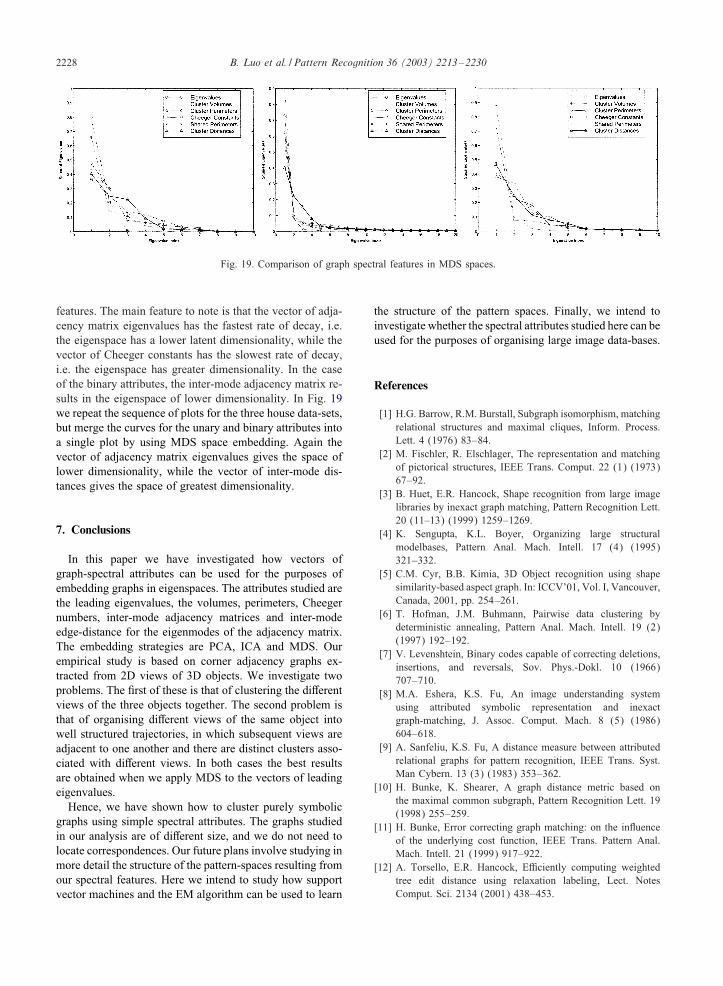
features. The main feature to note is that the vector of adja-cency matrix eigenvalues has the fastest rate of decay, i.e.the eigenspace has a lower latent dimensionality, while thevector of Cheeger constants has the slowest rate of decay,i.e. the eigenspace has greater dimensionality. In the caseof the binary attributes, the inter-mode adjacency matrix re-sults in the eigenspace of lower dimensionality. In Fig. 19we repeat the sequence of plots for the three house data-sets,but merge the curves for the unary and binary attributes intoa single plot by using MDS space embedding. Again thevector of adjacency matrix eigenvalues gives the space oflower dimensionality, while the vector of inter-mode dis-tances gives the space of greatest dimensionality.
7. Conclusions
In this paper we have investigated how vectors ofgraph-spectral attributes can be used for the purposes ofembedding graphs in eigenspaces. The attributes studied arethe leading eigenvalues, the volumes, perimeters, Cheegernumbers, inter-mode adjacency matrices and inter-modeedge-distance for the eigenmodes of the adjacency matrix.The embedding strategies are PCA, ICA and MDS. Ourempirical study is based on corner adjacency graphs ex-tracted from 2D views of 3D objects. We investigate twoproblems. The �rst of these is that of clustering the di�erentviews of the three objects together. The second problem isthat of organising di�erent views of the same object intowell structured trajectories, in which subsequent views areadjacent to one another and there are distinct clusters asso-ciated with di�erent views. In both cases the best resultsare obtained when we apply MDS to the vectors of leadingeigenvalues.Hence, we have shown how to cluster purely symbolic
graphs using simple spectral attributes. The graphs studiedin our analysis are of di�erent size, and we do not need tolocate correspondences. Our future plans involve studying inmore detail the structure of the pattern-spaces resulting fromour spectral features. Here we intend to study how supportvector machines and the EM algorithm can be used to learn
the structure of the pattern spaces. Finally, we intend toinvestigate whether the spectral attributes studied here can beused for the purposes of organising large image data-bases.
References
[1] H.G. Barrow, R.M. Burstall, Subgraph isomorphism, matchingrelational structures and maximal cliques, Inform. Process.Lett. 4 (1976) 83–84.
[2] M. Fischler, R. Elschlager, The representation and matchingof pictorical structures, IEEE Trans. Comput. 22 (1) (1973)67–92.
[3] B. Huet, E.R. Hancock, Shape recognition from large imagelibraries by inexact graph matching, Pattern Recognition Lett.20 (11–13) (1999) 1259–1269.
[4] K. Sengupta, K.L. Boyer, Organizing large structuralmodelbases, Pattern Anal. Mach. Intell. 17 (4) (1995)321–332.
[5] C.M. Cyr, B.B. Kimia, 3D Object recognition using shapesimilarity-based aspect graph. In: ICCV’01, Vol. I, Vancouver,Canada, 2001, pp. 254–261.
[6] T. Hofman, J.M. Buhmann, Pairwise data clustering bydeterministic annealing, Pattern Anal. Mach. Intell. 19 (2)(1997) 192–192.
[7] V. Levenshtein, Binary codes capable of correcting deletions,insertions, and reversals, Sov. Phys.-Dokl. 10 (1966)707–710.
[8] M.A. Eshera, K.S. Fu, An image understanding systemusing attributed symbolic representation and inexactgraph-matching, J. Assoc. Comput. Mach. 8 (5) (1986)604–618.
[9] A. Sanfeliu, K.S. Fu, A distance measure between attributedrelational graphs for pattern recognition, IEEE Trans. Syst.Man Cybern. 13 (3) (1983) 353–362.
[10] H. Bunke, K. Shearer, A graph distance metric based onthe maximal common subgraph, Pattern Recognition Lett. 19(1998) 255–259.
[11] H. Bunke, Error correcting graph matching: on the in�uenceof the underlying cost function, IEEE Trans. Pattern Anal.Mach. Intell. 21 (1999) 917–922.
[12] A. Torsello, E.R. Hancock, E�ciently computing weightedtree edit distance using relaxation labeling, Lect. NotesComput. Sci. 2134 (2001) 438–453.

B. Luo et al. / Pattern Recognition 36 (2003) 2213–2230 2229
[13] W.J. Christmas, J. Kittler, M. Petrou, Structural matching incomputer vision using probabilistic relaxation, IEEE Trans.Pattern Anal. Mach. Intell. 17 (8) (1995) 749–764.
[14] R.C. Wilson, E.R. Hancock, Structural matching by discreterelaxation, IEEE Trans. Pattern Anal. Mach. Intell. 19 (6)(1997) 634–648.
[15] R. Myers, R.C. Wilson, E.R. Hancock, Bayesian graph editdistance, IEEE Trans. Pattern Anal. Mach. Intell. 22 (2000)628–635.
[16] F.R.K. Chung, Spectral Graph Theory, CBMS series 92,American Mathematical Society, Providence, RI, 1997.
[17] H. Murase, S.K. Nayar, Illumination planning for objectrecognition using parametric eigenspaces, IEEE Trans. PatternAnal. Mach. Intell. 16 (12) (1994) 1219–1227.
[18] C. Chat�eld, A.J. Collins, Introduction to MultivariateAnalysis, Chapman & Hall, London, 1980.
[19] W.S. Torgerson, Multidimensional scaling. i. theory andmethods, Psychometrika 17 (1952) 401–419.
[20] J.C. Gower, Some distance properties of latent root and vectormethods used in multivariate analysis, Biometrika 53 (1966)325–328.
[21] J.B. Kruskal, Nonmetric multidimensional scaling: anumerical method, Psychometrika 29 (1964) 115–129.
[22] R. Wang, H. Freeman, Object recognition based oncharacteristic view classes, Proceedings of the ICPR, Vol. I,Oxford, UK, 1990, pp. 8–12.
[23] J.H. Stewman, K.W. Bowyer, Aspect graphs for convexplanar-face objects, Proceedings of the IEEE Workshop onComputer Vision, Miami, FL, 1987, pp. 123–130.
[24] Z. Gigus, J. Malik, Computing the aspect graph for linedrawings of polyhedral objects, IEEE Trans. Pattern Anal.Mach. Intell. 12 (2) (1990) 113–122.
[25] A.R. Pope, D.G. Lowe, Probabilistic models of appearance for3-D object recognition, Int. J. Comput. Vision 40 (2) (2000)149–167.
[26] J. Jia, K. Abe, Recognizing 3D objects by using modelslearned automatically from 2D training images, IEEE Trans.Pattern Anal. Mach. Intell. 14 (3) (2000) 315–338.
[27] A. Mohan, C. Papageorgiou, T. Poggio, Example-based objectdetection in images by components, IEEE Trans. Pattern Anal.Mach. Intell. 23 (4) (2001) 349–361.
[28] A. Leonardis, H. Bischof, Robust recognition usingeigenimages, Comput. Vision Image Understanding 78 (1)(2000) 99–118.
[29] A.M. Martinez, A.C. Kak, PCA versus LDA, IEEE Trans.Pattern Anal. Mach. Intell. 23 (2) (2001) 228–233.
[30] P.N. Belhumeur, D.J. Kriegman, What is the set of imagesof an object under all possible illumination conditions, Int. J.Comput. Vision 28 (3) (1998) 245–260.
[31] D.J. Kriegman, J. Ponce, Computing exact aspect graphs ofcurved objects: solids of revolution, Int. J. Comput. Vision 5(2) (1990) 119–135.
[32] M.S. Costa, L.G. Shapiro, 3D Object Recognition andPose with Relational Indexing, Comput. Vision and ImageUnderstanding 79 (3) (2000) 364–407.
[33] D.J. Kriegman, Computing stable poses of piecewise smoothobjects, Comput. Vision Graph. Image Process. 55 (2) (1992)109–118.
[34] R. Malik, T. Whangbo, Angle densities and recognition of3D objects, IEEE Trans. Pattern Anal. Mach. Intell. 19 (1)(1997) 52–57.
[35] S. Petitjean, The enumerative geometry of projectivealgebraic-surfaces and the complexity of aspect graphs, Int. J.Comput. Vision 19 (3) (1996) 261–287.
[36] J. Rieger, The geometry of view space of opaque objectsbounded by smooth surfaces, Artif. Intell. 44 (1990) 1–40.
[37] M. Seibert, A.M. Waxman, Adaptive 3-d object recognitionfrom multiple views, IEEE Trans. Pattern Anal. Mach. Intell.14 (2) (1992) 107–124.
[38] I. Biederman, Recognition by components: a theory of humanimage understanding, PsychR 94 (2) (1987) 115–147.
[39] I. Biederman, Geon based object recognition, in: BMVC’93,Guildford, UK, 1993.
[40] S. Petitjean, J. Ponce, D.J. Kriegman, Computing exact aspectgraphs of curved objects: algebraic surfaces, Int. J. Comput.Vision 9 (3) (1992) 231–255.
About the Author—BIN LUO received his BEng. degree in electronics and MEng. degree in computer science from Anhui university ofChina in 1984 and 1991, respectively. From 1996 to 1997, he was working as a British Council visiting scholar at the University of Yorkunder the Sino-British Friendship Scholarship Scheme(SBFSS). In 2002, he was awarded the Ph.D. degree in Computer Science from theUniversity of York, the United Kingdom. He is at present a professor at Anhui University of China.He has published some 60 papers in journals, edited books and refereed conferences. His current research interests include graph spectral
analysis, large image database retrieval, image and graph matching, statistical pattern recognition and image feature extraction.
About the Author—RICHARD WILSON read physics at St John’s College, University of Oxford, graduating with �rst class honours in1992. Between 1992 and 1995, he undertook research at the University of York on the topic of relational graph matching for which he wasawarded the D.Phil. degree. After a period of postdoctoral research, he was awarded an EPSRC Advanced Research Fellowship in 1998,which he currently holds in the Department of Computer Science at the University of York.He has published some 70 papers in journals, edited books and refereed conferences. He received an honourable mention in the 1997
Pattern Recognition Society awards and is currently an Associate Editor of the journal Pattern Recognition. His research interests are instatistical and structural pattern recognition, high-level vision and scene understanding.
About the Author—EDWIN HANCOCK studied physics as an undergraduate at the University of Durham and graduated with honours in1977. He remained at Durham to complete a Ph.D. in the area of high energy physics in 1981. Following this he worked for ten years asa researcher in the �elds of high-energy nuclear physics and pattern recognition at the Rutherford-Appleton Laboratory (now the CentralResearch Laboratory of the Research Councils). During this period he also held adjunct teaching posts at the University of Surrey and theOpen University.
2230 B. Luo et al. / Pattern Recognition 36 (2003) 2213–2230
In 1991 he moved to the University of York as a lecturer in the Department of Computer Science. He was promoted to Senior Lecturer in1997 and to Reader in 1998. In 1998, he was appointed to a Chair in Computer Vision.Professor Hancock now leads a group of some 15 faculty, research sta� and Ph.D. students working in the areas of computer vision
and pattern recognition. His main research interests are in the use of optimisation and probabilistic methods for high and intermediate levelvision. He is also interested in the methodology of structural and statistical pattern recognition. He is currently working on graph-matching,shape-from-X, image data-bases and statistical learning theory. His work has found applications in areas such as radar terrain analysis,seismic section analysis, remote sensing and medical imaging. Professor Hancock has published some 60 journal papers and 200 refereedconference publications. He was awarded the Pattern Recognition Society medal in 1991 for the best paper to be published in the journalPattern Recognition. The journal also awarded him an outstanding paper award in 1997.Professor Hancock has been a member of the Editorial Boards of the journals IEEE Transactions on Pattern Analysis and Machine
Intelligence, and, Pattern Recognition. He has also been a guest editor for special editions of the journals Image and Vision Computingand Pattern Recognition, and he is currently a guest editor of a special edition of IEEE Transactions on Pattern Analysis and MachineIntelligence devoted to energy minimisation methods in computer vision. He has been on the programme committees for numerous nationaland international meetings. In 1997, he established a new series of international meetings on energy minimisation methods in computervision and pattern recognition.


