Embed Size (px)
Citation preview
Spatial and temporal variability of dissolved organic matterquantity and composition in an oligotrophic subtropicalcoastal wetland
Meilian Chen • Nagamitsu Maie •
Kathleen Parish • Rudolf Jaffe
Received: 10 October 2012 / Accepted: 14 January 2013 / Published online: 5 February 2013
� Springer Science+Business Media Dordrecht 2013
Abstract Dissolved organic matter (DOM) is an
essential component of the carbon cycle and a critical
driver in controlling variety of biogeochemical and
ecological processes in wetlands. The quality of this
DOM as it relates to composition and reactivity is
directly related to its sources and may vary on temporal
and spatial scales. However, large scale, long-term
studies of DOM dynamics in wetlands are still scarce in
the literature. Here we present a multi-year DOM
characterization study for monthly surface water samples
collected at 14 sampling stations along two transects
within the greater Everglades, a subtropical, oligo-
trophic, coastal freshwater wetland-mangrove-estuarine
ecosystem. In an attempt to assess quantitative and
qualitative variations of DOM on both spatial and
temporal scales, we determined dissolved organic carbon
(DOC) values and DOM optical properties, respectively.
DOM quality was assessed using, excitation emission
matrix (EEM) fluorescence coupled with parallel factor
analysis (PARAFAC). Variations of the PARAFAC
components abundance and composition were clearly
observed on spatial and seasonal scales. Dry versus wet
season DOC concentrations were affected by dry-down
and re-wetting processes in the freshwater marshes,
while DOM compositional features were controlled by
soil and higher plant versus periphyton sources respec-
tively. Peat-soil based freshwater marsh sites could be
clearly differentiated from marl-soil based sites based on
EEM–PARAFAC data. Freshwater marsh DOM was
enriched in higher plant and soil-derived humic-like
compounds, compared to estuarine sites which were
more controlled by algae- and microbial-derived inputs.
DOM from fringe mangrove sites could be differentiated
between tidally influenced sites and sites exposed to long
inundation periods. As such coastal estuarine sites were
significantly controlled by hydrology, while DOM
dynamics in Florida Bay were seasonally driven by both
primary productivity and hydrology. This study exem-
plifies the application of long term optical properties
monitoring as an effective technique to investigate DOM
dynamics in aquatic ecosystems. The work presented
here also serves as a pre-restoration condition dataset for
DOM in the context of the Comprehensive Everglades
Restoration Plan (CERP).
Keywords DOM �Wetland � Spatial and temporal
variations � EEM-PARAFAC � Everglades
M. Chen � N. Maie � K. Parish � R. Jaffe (&)
Department of Chemistry and Biochemistry, Southeast
Environmental Research Center, Florida International
University, 3000 NE 151st Street, North Miami, FL
33199, USA
e-mail: [email protected]
Present Address:
M. Chen
Department of Ecology, Institute of Hydrobiology,
Jinan University, Guangzhou 510632, China
Present Address:
N. Maie
Department of Bio-environmental Sciences,
School of Veterinary Medicine, Kitasato University,
Towada, Aomori 034-8628, Japan
123
Biogeochemistry (2013) 115:167–183
DOI 10.1007/s10533-013-9826-4
Introduction
Dissolved organic matter (DOM) is an essential com-
ponent of the carbon cycle in wetlands and a critical
driver in controlling a variety of biogeochemical
processes and consequently the ecology of wetlands.
The quality of this DOM as it relates to composition and
reactivity is directly related to its sources and therefore
may vary on temporal and spatial scales (Larsen et al.
2010; Yamashita et al. 2010; Cawley et al. 2012a).
However, large scale, long-term studies of DOM
dynamics in wetlands are still scarce in the literature.
Few studies have reported on the effects of wetlands
restoration on DOM quality and quantity (Holl et al.
2009) and thus it is critical to understand DOM
dynamics in the Everglades prior to significant advance-
ments in the restoration efforts for this ecosystem.
The dynamics of DOM in wetlands is complex
given its variable sources and fate as a function of
diverse factors such as hydrology, geomorphology,
primary productivity, and organic matter degradation
processes (Qualls and Richardson 2003; Larsen et al.
2010; Yamashita et al. 2010; Chen et al. 2010; Cawley
et al. 2012a). Previous studies in the Everglades have
shown that DOM plays a critical biogeochemical role
in this oligotrophic wetland, since most of the N and P
are in an organic form (Boyer and Fourqurean 1997;
Boyer 2006). This subtropical coastal wetland is
characterized by a freshwater to marine gradient
ranging from freshwater marshes, through a mangrove
fringe to the seagrass dominated Florida Bay (FB)
estuary or the Gulf of Mexico. As such it is spatially
very diverse with regards to DOM sources (Lu et al.
2003; Maie et al. 2005). Furthermore, South Florida is
characterized by defined wet and dry seasons, with
most of the rainfall typically from May to October
suggesting that strong seasonal variations in DOM
dynamics are likely as a result of dry-down and re-
wetting (Larsen et al. 2010), variations in freshwater
discharge (Maie et al. 2006a, 2012) and associated
water management through canal inputs (Lu et al.
2003). Potential effects of climatic disturbances such
as hurricanes have also been suggested (Larsen et al.
2010; Maie et al. 2012).
Specific DOM sources in the Greater Everglades
have been identified as autochthonously produced by
local emergent, floating and submerged biomass
(Maie et al. 2006b, 2012; Davis et al. 2006; Scully
et al. 2004), in situ pore water diffusion (Larsen et al.
2010), soil organic matter oxidation (Yamashita et al.
2010), exchange between surface and ground water
(Chen et al. 2010), canal inputs (Lu et al. 2003;
Yamashita et al. 2010), export from fringe mangrove
communities (Jaffe et al. 2004; Romigh et al. 2006)
and photo-dissolution of re-suspended floc and sedi-
ments (Pisani et al. 2011; Shank et al. 2011). Despite
these studies, still little information is available on the
spatial and temporal variability of the quantity and
quality of DOM in the Everglades, which is critical for
the assessment of freshwater marsh and estuarine
biogeochemistry in the context of ongoing Ever-
glades’ restoration efforts and global climate change.
UV–Vis and fluorescence spectroscopic techniques
have been widely used to study the dynamics of DOM
in a variety of aquatic environments (Coble 1996;
Baker 2001; McKnight et al. 2001; Hudson et al. 2007;
Jaffe et al. 2008; Shank et al. 2010; Fellman et al.
2010). Fluorescence techniques including excitation
emission matrix (EEM) fluorescence, not only have
the advantages of high sample throughput and sensi-
tivity, but can also differentiate different types of
fluorophores, and therefore help constrain potential
sources of DOM (Coble 1996). In recent years, EEM
fluorescence combined with parallel factor analysis
(PARAFAC) has become one of the methods of choice
for DOM dynamics studies due to the ability of the
PARAFAC approach to further separate EEM spectra
into multiple groups of fluorophores (Stedmon et al.
2003; Cory and McKnight 2005; Jaffe et al. 2008;
Fellman et al. 2010; Hong et al. 2012). Thus, both
spatial and seasonal dynamics in DOM composition
have been successfully explored using fluorescence
techniques (e.g. Cawley et al. 2012a, b; Chari et al.
2012; Maie et al. 2012; Miller and McKnight 2010;
Omori et al. 2010; Yamashita et al. 2010; Fellman
et al. 2009; Kowalczuk et al. 2009; Borisover et al.
2009; Vouve et al. 2009).
Due to potentially different DOM sources and
environmental conditions in each of the sub-environ-
ments in the Everglades, the freshwater marshes,
fringe mangroves, and marine estuarine environments
are hypothesized to have spatially distinct DOM
characteristics (e.g. Maie et al. 2005), while seasonally
driven variations in precipitation, hydrology, and
primary productivity are hypothesized to control
temporal patterns in DOM sources and characteristics.
This study is aimed not only at investigating the spatial
and temporal trends of DOM quantity and quality in
168 Biogeochemistry (2013) 115:167–183
123
the geomorphologically and seasonally heterogeneous
environment of the Everglades, using bulk DOC and
UV–Vis measurements combined with EEM-PARA-
FAC fluorescence, but also to provide a long-term
database on DOM dynamics to serve as a reference for
pre-restoration conditions of this ecosystem.
Experimental
Sites description
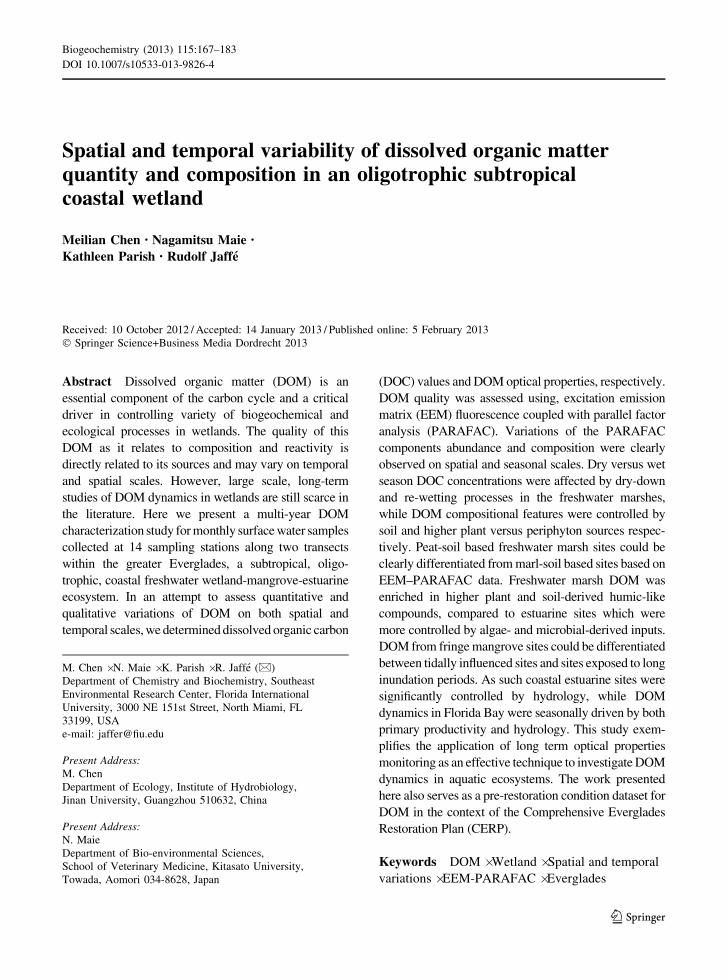
This study was conducted in Everglades National Park
(ENP), at 14 sites along two transects following two
major water flow paths draining the Everglades (Fig. 1),
and are permanent study sites of the Florida Coastal
Everglades long-term ecological research program (see
FCE-LTER sites at http://fce.lternet.edu/research/sites/).
The Everglades is a large, lotic, low-gradient peatland,
where water flows through the wetland as a slow sheet
flow along a topographic gradient of about 1 m per
56 km (Light and Dineen 1994). Vegetation zonation
patterns are clearly defined in this ecosystem. Fresh-
water marsh sites are dominated by sawgrass (Cladium
jamaicense), interspersed with tree islands, wet prairie
and slough communities. Periphyton mats are ubiq-
uitous in the oligotrophic Everglades and are a fun-
damental component base of local food webs (Belicka
et al. 2012) and regulators of nutrients cycling
(Browder et al. 1994). Shark River Slough (SRS) sites
are characterized by peat-based soil, while the soils at
the Taylor Slough (TS) sites are less organic-rich and
marl-based. Water in this system is largely from local
rainfall, and canal inputs that are regulated by the
South Florida Water Management District. A fringe of
mangrove forests is located along the coast and on
islands throughout FB. Seagrass communities (major
species: Thalassia testudinum) dominate the subtidal
FB. The upstream Everglades Agricultural Area (EAA)
and Water Conservation Areas (WCA) are connected
with Everglades National Park (ENP) through canals
and ENP receives point-source inputs of WCA water
through diverse pumping stations. During past decades,
surface water contributions to the system have increased
compared to precipitation, mainly as a result of canal
drainage from former wetlands turned agricultural fields
and from water management (Harvey and McCormick,
2009). Groundwater-surface water exchange with the
underlying Biscayne Aquifer is possible especially
during the dry season when the water head is low (Price
et al. 2006), and found to be enhanced through water
management practices (Harvey and McCormick, 2009).
As shown in Fig. 1, six of the study sites (SRS-1–6)
are located along the SRS, in a general N-to-SW water
flow direction. While the SRS-1–3 sites are all peat-
based freshwater marsh sites, the SRS-1 site is located
at the S-12 structure along the Tamiami canal which
controls canal inputs from the WCAs into the SRS.
Tidal influence affects SRS-6 and SRS-5, and reaches
SRS-4 with significant attenuation. As for the TS
transect, water enters from the L-31 W canal con-
trolled by the S332D pump structure, flowing through
the freshwater marsh to the mangrove estuaries and to
the subtidal FB, a shallow, compartmentalized,
lagoonal estuary (Briceno and Boyer 2010). Precipi-
tation, rather than the terrestrial runoff, is the largest
source of freshwater to the FB estuary. TS/Ph-6 and
TS/Ph-7 are oligohaline estuarine ecotone sites which
are affected by wind forcing tidal fluctuations featur-
ing hydrological exchange with FB particularly during
the dry season. TS/Ph-9, TS/Ph-10, and TS/Ph-11 are
sites situated along a NE-to-SW transect in FB. Unlike
the other 11 sites, these three sites are not located
along the predominant water flow path. Based on this
description, the sampling sites can be categorized as
freshwater marsh (peat; SRS-1–3), freshwater marsh
(marl; TS/Ph-1–3), mangrove estuarine (peat; SRS-
4–6), mangrove estuarine (marl; TS/Ph-6–7), and the
seagrass-dominated FB estuary (TS/Ph-9–11). Sites
SRS-1 and TS/Ph-1 are the two sites most influenced
by canal inputs. The exact locations, characteristics of
the vegetation, soil type, and hydrography for each site
are available at http://fce.lternet.edu/research/sites/.
Sampling
Surface water samples (topmost foot) were collected
monthly from October 2002 for DOC, FI (Fluorescence
Index) and SUVA (Specific UV Absorbance) to
September 2004, and from October 2004 for DOC,
FI, SUVA, and all other optical properties described
below, to September 2008 for 14 sites along the
shallow waters (maximum depth ca. 3 feet except for
SRS-5 & 6), of the SRS and TS/Ph-FB transects. Some
freshwater marsh sites, especially TS/Ph 1-3 sites, can
dry out during the peak of the dry season (typically
between January and May) resulting in occasionally
missing data for these sites in this dataset. Samples
Biogeochemistry (2013) 115:167–183 169
123
were collected in pre-cleaned, acid-washed, brown
high density polyethylene bottles (Nalgene). Contain-
ers were rinsed three times before sample collection.
All surface water samples were filtered in the lab with
pre-combusted 0.7 lm GF/F filters and stored in a
refrigerator until analyses within 1 week of collection.
Samples collected between May and October were
classified as wet season, while those collected between
November and April were classified as representative
of the dry season.
Analytical measurements of DOC, UV–Vis, EEM,
and PARAFAC modeling
Dissolved organic carbon concentrations were mea-
sured using the high-temperature catalytic combustion
method on a Shimadzu TOC-V total organic carbon
analyzer. The a(254) was determined using a Varian
Cary 50 bio spectrophotometer with a 1 cm quartz
cuvette scanning from 240 to 800 nm. DOC data were
used to determine SUVA, which is an indicator of
DOM aromaticity and defined as the UV absorption
at 254 nm in inverse meters normalized to DOC
concentration in mgC/L (Weishaar et al. 2003). Since
Fe is highly limited in the carbonate-based South
Florida environment, SUVA corrections due to Fe
interference were not conducted. The slope ratio (SR)
of 275–295 to 350–400 nm, a proxy for the molecular
weight (MW) distribution of DOM (Helms et al.
2008), was determined using the UV–Vis spectrum.
A Horiba Jovin Yvon SPEX Fluoromax-3 spectroflu-
orometer equipped with a 150 W continuous output
Xe arc lamp was applied to measure EEMs. Slits were
set at 5.7 nm for excitation and 2 nm for emission.
Forty-four emission scans were acquired at excitation
wavelength (kex) between 240 and 455 nm at 5 nm
steps. The emission wavelengths were scanned from
kex ? 10 nm to kex ? 250 nm (i.e. between 250 and
705 nm) in 2 nm steps. Fluorescence was acquired in
signal over reference ratio mode (S/R) to eliminate
potential fluctuations of the Xe lamp (Yamashita et al.
2010). The fluorescence intensity values were con-
verted to quinine sulfate unit (QSU) (Coble et al. 1993).
Lastly, for samples collected from October 2002 to
September 2004 the Fluorescence Index (FI1) was
determined as the ratio of the emission intensity at a
TS/Ph-11
Everglades
Florida BayTS/Ph-10
TS/Ph-9
TS/Ph-3
TS/Ph-1TS/Ph-2
TS/Ph-6TS/Ph-7
SRS-1
SRS-5SRS-6
SRS-4SRS-3
SRS-2
Royal Palm Ranger Station
WCAs
Fig. 1 Sampling sites along Shark River Slough (SRS-1–6),
Taylor Slough (TS/Ph-1–3, TS/Ph-6–7) and Florida Bay (TS/
Ph-9–11). Sub-environments: freshwater marsh (peat; SRS-
1–3), freshwater marsh (marl; TS/Ph-1–3), mangrove estuarine
(peat; SRS-4–6), mangrove estuarine (marl; TS/Ph-6–7), and
Florida Bay (FB) estuary (TS/Ph-9–11). WCAs Water Conser-
vation Areas, ENP Everglades National Park
170 Biogeochemistry (2013) 115:167–183
123
wavelength of 450 nm to that at 500 nm, obtained at
an excitation of 370 nm (McKnight et al. 2001). For
samples collected thereafter the ratio of the emission
intensity at a wavelength of 470 nm to that at 520 nm
was used, as this modified FI (FI2) has been shown to
be a more robust means to determine this parameter
(Jaffe et al. 2008). While only the FI data for the
2004–2008 period are presented here, the spatial and
seasonal patterns observed for the 2002–2004 sample
set (FI1) were very similar (Parish 2006). Additional
details on the optical measurements and post-acquisi-
tion steps for correction and standardization proce-
dures can be found elsewhere (Chen et al. 2010). FI is a
proxy of DOM source typically around 1.4 for
terrestrially derived fulvic acids and around 1.9 for
microbially derived fulvic acids (McKnight et al.
2001).
Parallel factor analysis can statistically decompose
EEMs into fluorescent groups (components), based on
an alternating least square (ALS) algorithm (Bro
1997). PARAFAC modeling can be achieved by either
creating and validating a complete dataset of EEMs, or
by fitting the EEMs to an already established PARA-
FAC model. In this study, a total of more than one
thousand samples of the monthly monitoring surface
water samples together with some Everglades/FB
surface water samples collected for other studies (e.g.
Yamashita et al. 2010; Maie et al., 2012), were used to
create an Everglades surface water PARAFAC model.
The analysis was carried out in MATLAB 7.0.4.
(Mathworks, Natick, MA) with the DOMFluor tool-
box and validated as previously described (Stedmon
and Bro 2008). Eight EEM-PARAFAC components
were obtained after PARAFAC modeling of the EEM
data, consisting of six humic-like and two protein-like
components. PARAFAC component spectral charac-
teristics and split-half validation can be found else-
where (Chen et al. 2010).
Results and discussion
Site-specific spatial and seasonal variability
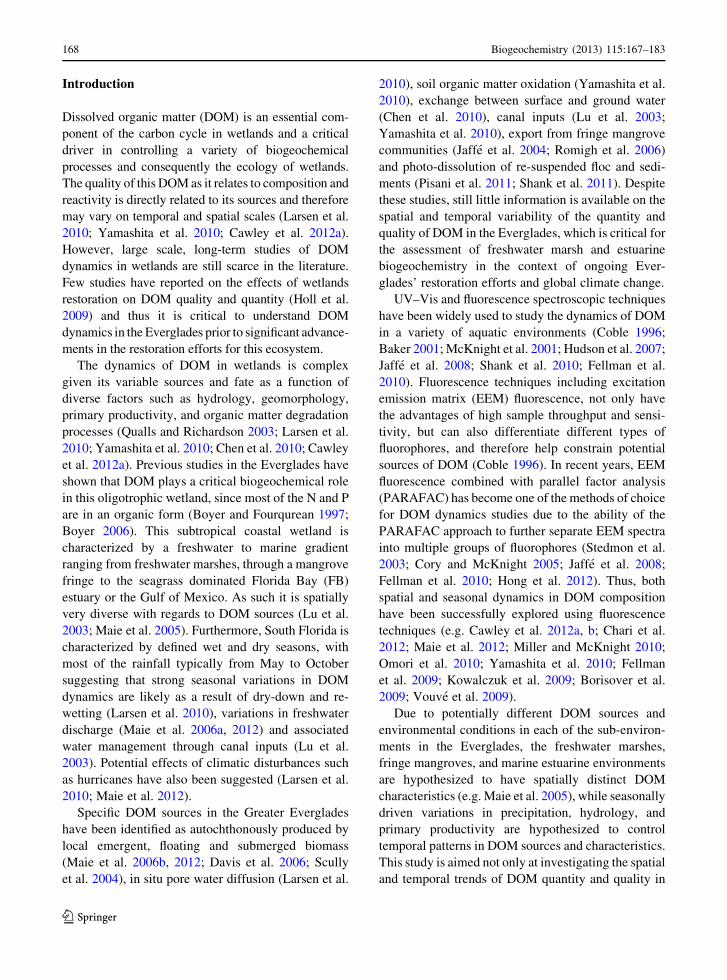
Site-specific spatial clustering
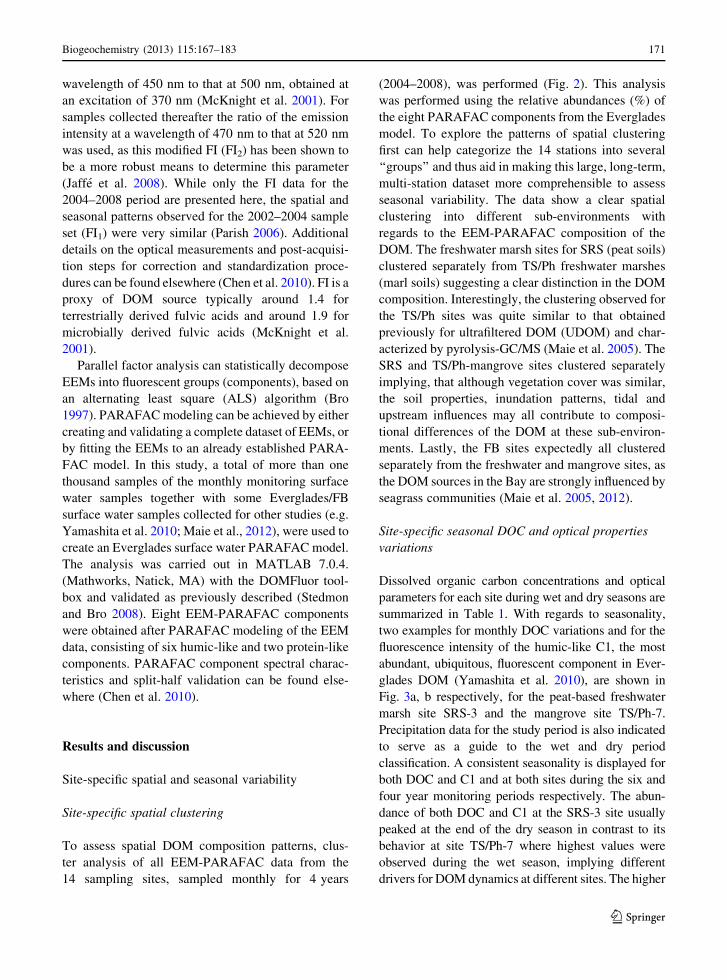
To assess spatial DOM composition patterns, clus-
ter analysis of all EEM-PARAFAC data from the
14 sampling sites, sampled monthly for 4 years
(2004–2008), was performed (Fig. 2). This analysis
was performed using the relative abundances (%) of
the eight PARAFAC components from the Everglades
model. To explore the patterns of spatial clustering
first can help categorize the 14 stations into several
‘‘groups’’ and thus aid in making this large, long-term,
multi-station dataset more comprehensible to assess
seasonal variability. The data show a clear spatial
clustering into different sub-environments with
regards to the EEM-PARAFAC composition of the
DOM. The freshwater marsh sites for SRS (peat soils)
clustered separately from TS/Ph freshwater marshes
(marl soils) suggesting a clear distinction in the DOM
composition. Interestingly, the clustering observed for
the TS/Ph sites was quite similar to that obtained
previously for ultrafiltered DOM (UDOM) and char-
acterized by pyrolysis-GC/MS (Maie et al. 2005). The
SRS and TS/Ph-mangrove sites clustered separately
implying, that although vegetation cover was similar,
the soil properties, inundation patterns, tidal and
upstream influences may all contribute to composi-
tional differences of the DOM at these sub-environ-
ments. Lastly, the FB sites expectedly all clustered
separately from the freshwater and mangrove sites, as
the DOM sources in the Bay are strongly influenced by
seagrass communities (Maie et al. 2005, 2012).
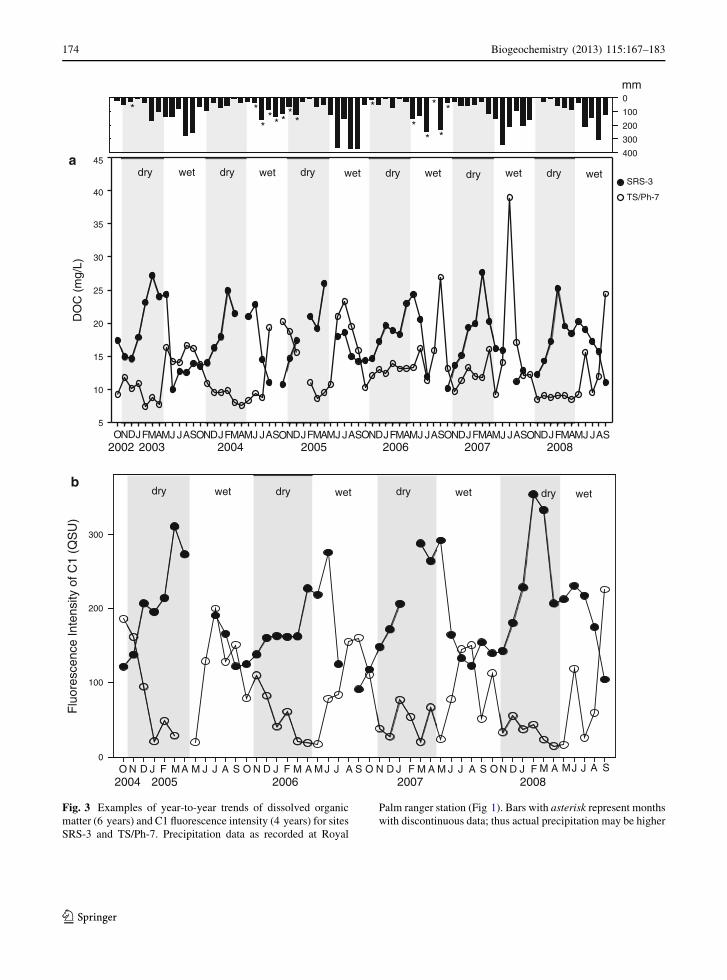
Site-specific seasonal DOC and optical properties
variations
Dissolved organic carbon concentrations and optical
parameters for each site during wet and dry seasons are
summarized in Table 1. With regards to seasonality,
two examples for monthly DOC variations and for the
fluorescence intensity of the humic-like C1, the most
abundant, ubiquitous, fluorescent component in Ever-
glades DOM (Yamashita et al. 2010), are shown in
Fig. 3a, b respectively, for the peat-based freshwater
marsh site SRS-3 and the mangrove site TS/Ph-7.
Precipitation data for the study period is also indicated
to serve as a guide to the wet and dry period
classification. A consistent seasonality is displayed for
both DOC and C1 and at both sites during the six and
four year monitoring periods respectively. The abun-
dance of both DOC and C1 at the SRS-3 site usually
peaked at the end of the dry season in contrast to its
behavior at site TS/Ph-7 where highest values were
observed during the wet season, implying different
drivers for DOM dynamics at different sites. The higher
Biogeochemistry (2013) 115:167–183 171
123
abundance during the dry season at the freshwater
marsh SRS-3 site may be attributed to a concentration
effect during the dry season’s high evaporation rates
and to the enhanced impact of canal water input from
the WCAs (Yamashita et al. 2010). This would enhance
DOM loadings at SRS particularly during the dry
season. Alternative hypotheses to be tested are an
increased soil or macrophyte-derived DOM pool and/or
enhanced ground-to-surface water exchange during the
dry season. Exchange between surface and groundwater
has been well established for the Everglades (Harvey
and McCormick 2009; Price et al. 2006; Harvey et al.
2006), and suggested to be enhanced during the dry
season (Price and Swart 2006). However, the case of the
mangrove estuarine site TS/Ph-7 is quite different. TS/
Ph-7 is a site located at the mouth of Taylor River which
is severely affected by the hydrological exchange
between the freshwater marshes and FB. Much higher
concentrations of DOC and humic-like DOM were
observed during the wet season as a result of terrestrial
end-member transport from the freshwater marsh and
export of DOC from the mangrove forest. In contrast,
enhanced FB water intrusions and mixing during the
dry season resulted in much lower DOC concentrations
and lower humic-like C1 abundance. Thus, different
hydrological processes seem to be the dominant drivers
of seasonality for both sites discussed above.
During the dry season, peat-based freshwater sites
SRS-1 and SRS-2 showed higher DOC values, with the
highest DOC concentration at SRS-1 (22.0 ± 5.3 mg/
L), while the offshore site TS/Ph-11 featured the lowest
abundance (3.6 ± 2.2 and 3.9 ± 1.6 mg/L for wet and
dry season respectively). This result may be explained
by a possible upstream input of DOC-rich waters from
the WCAs and agricultural drainage through canals
(Yamashita et al., 2010; Harvey and McCormick,
2009) during the dry season for the site in close
proximity of a canal and associated pumping station
(SRS-1). During wet season, peat-based mangrove
sites SRS-4–6 displayed higher SUVA values than the
other sites, indicating higher DOM aromaticity for the
chromophoric fraction (CDOM) exported from the
fringe mangroves (Jaffe et al. 2004). Among all,
mangrove site SRS-5 showed the highest SUVA values
(3.7 ± 1.1 L/mgC m) during the wet season, whereas
FB site TS/Ph-9 has the lowest (2.6 ± 0.6 L/mgC m).
While seagrass ecosystems are known to generate
CDOM (Maie et al. 2012; Cawley et al. 2012b), the
latter observation is not unexpected as most of the DOC
in FB is likely generated through primary productivity
and not from CDOM enriched soil derived DOC (Maie
et al. 2006a, b, 2012). For SR, the FB sites during wet
season showed highest values (*1.4) as compared to
significantly lower values at the freshwater SRS sites
(*0.9). This suggests that the CDOM MW was highest
for the freshwater SRS sites (i.e. higher plant and soil
derived; Yamashita et al. 2010), but lowest at the FB
sites (seagrass and microbially derived) during wet
season when the primary productivity is highest. As
expected, FI generally showed lower values for higher
plant/soil-dominated freshwater marsh and mangrove
fringe sites (*1.3–1.4), compared to higher values for
FB sites (*1.5). The exception was TS/Ph-2 which
showed a FI value of 1.5 during dry season. Most of the
freshwater marsh sites displayed a higher FI value
during the dry season than the wet, suggesting more
microbial-derived (periphyton) inputs during the dry
season.
Sub-environment based spatial and seasonal
variability:
DOC and bulk optical properties
Based on the above-described spatial patterns (Fig. 2),
which seem driven by plant cover characteristics and
SRS-6
SRS-3
SRS-2
SRS-1
TS/Ph-6
TS/Ph-7
TS/Ph-3
TS/Ph- 2
TS/Ph-1
TS/Ph-11
TS/Ph-9
TS/Ph-10
peat-based SRS freshwater marsh sites
SRS-5
SRS-4
0 10 20 30 40 50
Relative distance between clusters
peat-based SRS mangrove sites
marl-based TS freshwater marsh sites
marl-based TS mangrove sites
estuary-FB sites
Fig. 2 Cluster analysis (Ward method of normalized data) of
monthly EEM-PARAFAC data (4 years) for fourteen sampling
sites in the Everglades. Clusters produced match well with the
natural sub-environments
172 Biogeochemistry (2013) 115:167–183
123
Table 1 Summary of six-year DOC, SUVA and a (254) and four-year SR and FI (mean ± SD)
Parameter
Sites DOC (mg/L) SUVA (L/mgC m) a (254) (m-1) SR FI
SRS-1
Wet (n = 33) 18.9 ± 8.1 3.3 ± 0.9 133.1 ± 38.5 (n = 22) 0.9 ± 0.0 1.3 ± 0.1
Dry (n = 33) 22.0 ± 5.3 3.0 ± 0.3 148.0 ± 32.1 (n = 21) 0.9 ± 0.0 1.4 ± 0.0
SRS-2
Wet (n = 33) 20.8 ± 9.7 2.9 ± 0.8 121.1 ± 25.5 (n = 22) 0.9 ± 0.0 1.3 ± 0.0
Dry (n = 34) 21.3 ± 5.3 2.8 ± 0.2 138.0 ± 28.7 (n = 23) 0.9 ± 0.0 1.4 ± 0.0
SRS-3
Wet (n = 34) 17.2 ± 5.2 3.3 ± 0.8 120.2 ± 31.7 (n = 23) 0.9 ± 0.0 1.3 ± 0.0
Dry (n = 34) 18.8 ± 3.9 2.8 ± 0.2 122.8 ± 21.6 (n = 23) 1.0 ± 0.1 1.4 ± 0.0
SRS-4
Wet (n = 35) 16.3 ± 7.0 3.5 ± 1.1 124.6 ± 24.0 (n = 23) 1.0 ± 0.0 1.3 ± 0.0
Dry (n = 35) 16.0 ± 2.1 3.3 ± 0.3 120.1 ± 9.8 (n = 23) 1.0 ± 0.0 1.4 ± 0.0
SRS-5
Wet (n = 35) 14.0 ± 6.1 3.7 ± 1.1 115.1 ± 20.0 (n = 23) 1.0 ± 0.0 1.3 ± 0.0
Dry (n = 34) 14.2 ± 1.7 3.4 ± 0.5 111.3 ± 13.9 (n = 23) 1.1 ± 0.0 1.4 ± 0.0
SRS-6
Wet (n = 35) 11.0 ± 6.0 3.4 ± 1.1 81.3 ± 15.0 (n = 23) 1.1 ± 0.0 1.4 ± 0.0
Dry (n = 35) 9.7 ± 1.6 3.5 ± 0.3 77.4 ± 10.4 (n = 23) 1.1 ± 0.0 1.4 ± 0.0
TS/Ph-1
Wet (n = 19) 11.5 ± 8.0 2.7 ± 0.8 57.1 ± 11.7 (n = 12) 1.0 ± 0.0 1.4 ± 0.0
Dry (n = 7) 7.6 ± 1.5 2.9 ± 0.3 49.6 ± 7.4 (n = 5) 1.0 ± 0.0 1.4 ± 0.0
TS/Ph-2
Wet (n = 26) 9.2 ± 5.3 2.4 ± 0.9 44.8 ± 8.9 (n = 17) 1.0 ± 0.0 1.4 ± 0.0
Dry (n = 18) 6.3 ± 1.6 2.6 ± 0.3 38.6 ± 11.6 (n = 10) 1.0 ± 0.2 1.5 ± 0.0
TS/Ph-3
Wet (n = 26) 12.7 ± 6.6 2.6 ± 0.8 68.7 ± 22.0 (n = 18) 1.0 ± 0.0 1.3 ± 0.0
Dry (n = 16) 10.1 ± 2.9 2.6 ± 0.5 59.7 ± 8.8 (n = 9) 1.0 ± 0.1 1.4 ± 0.0
TS/Ph-6
Wet (n = 36) 14.6 ± 5.8 3.0 ± 0.8 97.1 ± 33.7 (n = 24) 1.2 ± 0.1 1.4 ± 0.0
Dry (n = 35) 12.3 ± 2.5 2.6 ± 0.5 72.5 ± 16.5 (n = 23) 1.2 ± 0.1 1.4 ± 0.0
TS/Ph-7
Wet (n = 36) 16.0 ± 6.9 3.0 ± 1.0 117.0 ± 58.4 (n = 24) 1.2 ± 0.1 1.4 ± 0.0
Dry (n = 35) 11.6 ± 2.8 2.3 ± 0.8 66.2 ± 35.6 (n = 23) 1.3 ± 0.1 1.4 ± 0.0
TS/Ph-9
Wet (n = 34) 8.2 ± 2.7 1.1 ± 0.3 20.8 ± 3.9 (n = 24) 1.4 ± 0.2 1.5 ± 0.0
Dry (n = 31) 7.1 ± 1.7 1.4 ± 0.3\ 23.5 ± 4.3 (n = 21) 1.2 ± 0.2 1.5 ± 0.1
TS/Ph-10
Wet (n = 32) 8.8 ± 4.4 1.2 ± 0.3 21.6 ± 9.3 (n = 24) 1.4 ± 0.2 1.5 ± 0.1
Dry (n = 33) 7.8 ± 2.3 1.3 ± 0.3 23.8 ± 7.1 (n = 23) 1.3 ± 0.2 1.5 ± 0.0
TS/Ph-11
Wet (n = 32) 3.6 ± 2.2 1.7 ± 0.3 12.5 ± 5.3 (n = 24) 1.4 ± 0.3 1.5 ± 0.1
Dry (n = 32) 3.9 ± 1.6 2.1 ± 0.3 18.3 ± 7.8 (n = 23) 1.2 ± 0.2 1.5 ± 0.1
DOC dissolved organic carbon, SUVA the UV absorption at 254 nm in inverse meters normalized to DOC in mgC/L, a (254) absorption
coefficient = UV absorbance at 254 nm times 2.303, divided by pathlength, SR slope ratio of UV absorbance (275–295 to 350–400 nm), FI
Fluorescence Index-fluorescence emission intensity ratio of 470–520 nm at excitation wavelength of 370 nm
Biogeochemistry (2013) 115:167–183 173
123
0
100
200
300
400
*
*
*
**
*
* *
*
**
**
*
mmF
luor
esce
nce
Inte
nsity
of C
1 (Q
SU
)
NO D J F MA M J J A S NO D J F M A M J J A S NO D J F M A M J J A S NO D J F M A MJ J A S2004 2005 2006 2007 2008
wet wet wetdry dry dry dryb
300
200
100
0
wet
wet
DO
C (
mg/
L)
5
10
15
20
25
30
35
40
45
ON JD MFM FAMJ JASONDJFMAMJ JASONDJFMAMJ JASONDJFMAMJ JASONDJFMAMJ JASONDJ AMJ JAS2002 2003 2004 2005 2006 2007 2008
wet wet wet wet drydry dry drydry drya
wetSRS-3
TS/Ph-7
Fig. 3 Examples of year-to-year trends of dissolved organic
matter (6 years) and C1 fluorescence intensity (4 years) for sites
SRS-3 and TS/Ph-7. Precipitation data as recorded at Royal
Palm ranger station (Fig 1). Bars with asterisk represent months
with discontinuous data; thus actual precipitation may be higher
174 Biogeochemistry (2013) 115:167–183
123
soil type, and considering that hydrological drivers
will likely exert much influence on seasonal patterns
(e.g. Maie et al. 2006a, 2012; Larsen et al. 2010), the
data was reorganized into monthly averages based on
sub-environment type as follows: peat-based freshwa-
ter marsh sites (SRS-1–3), marl-based freshwater
marsh sites (TS/Ph-1–3), SRS-mangrove sites (SRS-
4–6), TS/Ph-mangrove sites (TS/Ph-6, TS/Ph-7), and
estuary-FB sites (TS/Ph-9–11). An example for the
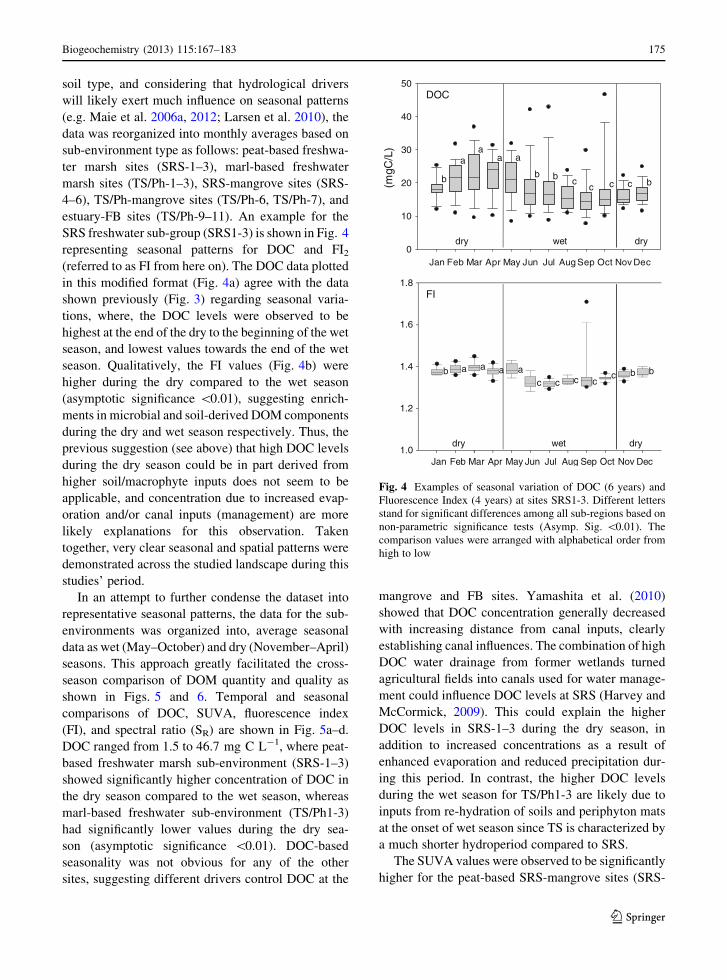
SRS freshwater sub-group (SRS1-3) is shown in Fig. 4
representing seasonal patterns for DOC and FI2
(referred to as FI from here on). The DOC data plotted
in this modified format (Fig. 4a) agree with the data
shown previously (Fig. 3) regarding seasonal varia-
tions, where, the DOC levels were observed to be
highest at the end of the dry to the beginning of the wet
season, and lowest values towards the end of the wet
season. Qualitatively, the FI values (Fig. 4b) were
higher during the dry compared to the wet season
(asymptotic significance \0.01), suggesting enrich-
ments in microbial and soil-derived DOM components
during the dry and wet season respectively. Thus, the
previous suggestion (see above) that high DOC levels
during the dry season could be in part derived from
higher soil/macrophyte inputs does not seem to be
applicable, and concentration due to increased evap-
oration and/or canal inputs (management) are more
likely explanations for this observation. Taken
together, very clear seasonal and spatial patterns were
demonstrated across the studied landscape during this
studies’ period.
In an attempt to further condense the dataset into
representative seasonal patterns, the data for the sub-
environments was organized into, average seasonal
data as wet (May–October) and dry (November–April)
seasons. This approach greatly facilitated the cross-
season comparison of DOM quantity and quality as
shown in Figs. 5 and 6. Temporal and seasonal
comparisons of DOC, SUVA, fluorescence index
(FI), and spectral ratio (SR) are shown in Fig. 5a–d.
DOC ranged from 1.5 to 46.7 mg C L-1, where peat-
based freshwater marsh sub-environment (SRS-1–3)
showed significantly higher concentration of DOC in
the dry season compared to the wet season, whereas
marl-based freshwater sub-environment (TS/Ph1-3)
had significantly lower values during the dry sea-
son (asymptotic significance \0.01). DOC-based
seasonality was not obvious for any of the other
sites, suggesting different drivers control DOC at the
mangrove and FB sites. Yamashita et al. (2010)
showed that DOC concentration generally decreased
with increasing distance from canal inputs, clearly
establishing canal influences. The combination of high
DOC water drainage from former wetlands turned
agricultural fields into canals used for water manage-
ment could influence DOC levels at SRS (Harvey and
McCormick, 2009). This could explain the higher
DOC levels in SRS-1–3 during the dry season, in
addition to increased concentrations as a result of
enhanced evaporation and reduced precipitation dur-
ing this period. In contrast, the higher DOC levels
during the wet season for TS/Ph1-3 are likely due to
inputs from re-hydration of soils and periphyton mats
at the onset of wet season since TS is characterized by
a much shorter hydroperiod compared to SRS.
The SUVA values were observed to be significantly
higher for the peat-based SRS-mangrove sites (SRS-
Jan Feb Mar Apr May Jun Jul Aug Sep Oct Nov Dec0
10
20
30
40
50
FI
Jan Feb Mar Apr May Jun Jul Aug Sep Oct Nov Dec1.0
1.2
1.4
1.6
1.8
wet dry dry
aaab ac c c c
c b b
wet dry dry
DOC
a aa
a
b b b cc c c b(m
gC/L
)
Fig. 4 Examples of seasonal variation of DOC (6 years) and
Fluorescence Index (4 years) at sites SRS1-3. Different letters
stand for significant differences among all sub-regions based on
non-parametric significance tests (Asymp. Sig. \0.01). The
comparison values were arranged with alphabetical order from
high to low
Biogeochemistry (2013) 115:167–183 175
123
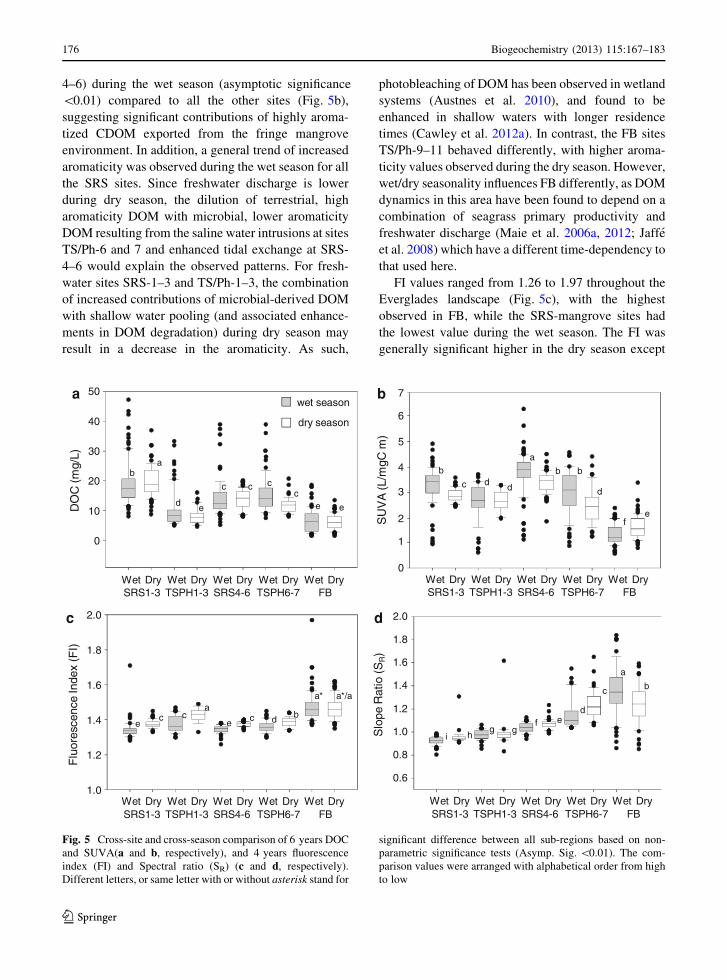
4–6) during the wet season (asymptotic significance
\0.01) compared to all the other sites (Fig. 5b),
suggesting significant contributions of highly aroma-
tized CDOM exported from the fringe mangrove
environment. In addition, a general trend of increased
aromaticity was observed during the wet season for all
the SRS sites. Since freshwater discharge is lower
during dry season, the dilution of terrestrial, high
aromaticity DOM with microbial, lower aromaticity
DOM resulting from the saline water intrusions at sites
TS/Ph-6 and 7 and enhanced tidal exchange at SRS-
4–6 would explain the observed patterns. For fresh-
water sites SRS-1–3 and TS/Ph-1–3, the combination
of increased contributions of microbial-derived DOM
with shallow water pooling (and associated enhance-
ments in DOM degradation) during dry season may
result in a decrease in the aromaticity. As such,
photobleaching of DOM has been observed in wetland
systems (Austnes et al. 2010), and found to be
enhanced in shallow waters with longer residence
times (Cawley et al. 2012a). In contrast, the FB sites
TS/Ph-9–11 behaved differently, with higher aroma-
ticity values observed during the dry season. However,
wet/dry seasonality influences FB differently, as DOM
dynamics in this area have been found to depend on a
combination of seagrass primary productivity and
freshwater discharge (Maie et al. 2006a, 2012; Jaffe
et al. 2008) which have a different time-dependency to
that used here.
FI values ranged from 1.26 to 1.97 throughout the
Everglades landscape (Fig. 5c), with the highest
observed in FB, while the SRS-mangrove sites had
the lowest value during the wet season. The FI was
generally significant higher in the dry season except
Flu
ores
cenc
e In
dex
(FI)
1.0
1.2
1.4
1.6
1.8
2.0
ec c
a
e c d b
a* a*/a
c
Wet Dry Wet Dry Wet Dry Wet Dry Wet DrySRS1-3 TSPH1-3 SRS4-6 TSPH6-7 FB
Slo
pe R
atio
(S
R)
0.6
0.8
1.0
1.2
1.4
1.6
1.8
2.0
i hg g
f ed
c
a
b
d
Wet Dry Wet Dry Wet Dry Wet Dry Wet DrySRS1-3 TSPH1-3 SRS4-6 TSPH6-7 FB
b
DO
C (m
g/L)
0
10
20
30
40
50
a
d e
c c cc
e e
wet season
dry season
a
Wet Dry Wet Dry Wet Dry Wet Dry Wet DrySRS1-3 TSPH1-3 SRS4-6 TSPH6-7 FB
b
c d d
a
b b
d
fe
bS
UV
A (L
/mgC
m)
0
4
5
7
6
3
2
1
Wet Dry Wet Dry Wet Dry Wet Dry Wet DrySRS1-3 TSPH1-3 SRS4-6 TSPH6-7 FB
Fig. 5 Cross-site and cross-season comparison of 6 years DOC
and SUVA(a and b, respectively), and 4 years fluorescence
index (FI) and Spectral ratio (SR) (c and d, respectively).
Different letters, or same letter with or without asterisk stand for
significant difference between all sub-regions based on non-
parametric significance tests (Asymp. Sig. \0.01). The com-
parison values were arranged with alphabetical order from high
to low
176 Biogeochemistry (2013) 115:167–183
123
0
5
10
15
20
25
30
35C7
0
5
10
15
20
25
30
35C3
Rel
ativ
e ab
unda
nce
of P
AR
AF
AC
com
pone
nts
(%)
0
10
20
30
40
50C1
0
5
10
15
20
25C2
0
4
8
12
16
20C4
0
5
10
15
20C5
0
4
8
12
16 C6
0
5
10
15
20C8
b b a aa* a*a*/a
ce d
ba
g hg*
e g/g*d f c
aa
cc
cc b
b
de
e d d d e de c
b a
de d d
ab c
ef f
d
ddc
c/c* c*
b
ba a
e f
dd
g h
d c
a
b
ff
ec
g ge
d
ab
wet season
dry season
Wet Dry Wet Dry Wet Dry Wet Dry Wet DrySRS1-3 TSPH1-3 SRS4-6 TSPH6-7 FB
Wet Dry Wet Dry Wet Dry Wet Dry Wet DrySRS1-3 TSPH1-3 SRS4-6 TSPH6-7 FB
Wet Dry Wet Dry Wet Dry Wet Dry Wet DrySRS1-3 TSPH1-3 SRS4-6 TSPH6-7 FB
Wet Dry Wet Dry Wet Dry Wet Dry Wet DrySRS1-3 TSPH1-3 SRS4-6 TSPH6-7 FB
Wet Dry Wet Dry Wet Dry Wet Dry Wet DrySRS1-3 TSPH1-3 SRS4-6 TSPH6-7 FB
Wet Dry Wet Dry Wet Dry Wet Dry Wet DrySRS1-3 TSPH1-3 SRS4-6 TSPH6-7 FB
Wet Dry Wet Dry Wet Dry Wet Dry Wet DrySRS1-3 TSPH1-3 SRS4-6 TSPH6-7 FB
Wet Dry Wet Dry Wet Dry Wet Dry Wet DrySRS1-3 TSPH1-3 SRS4-6 TSPH6-7 FB
Fig. 6 Cross-site and cross-season comparison of relative
abundance of EEM-PARAFAC components (relative abun-
dance as %). Different letters, or same letter with or without
asterisk stand for significant differences between sub-region
based on non-parametric significance tests (Asymp. Sig.\0.01).
The comparison values were arranged with alphabetical order
from high to low
Biogeochemistry (2013) 115:167–183 177
123
for FB, and were expectedly opposed to the SUVA
trends. Higher dry season FI values at the estuarine
mangrove sites reflect the tidal/marine DOM inputs
during that season, while the freshwater marsh sites
are less influenced by soil-derived DOM, and showing
an enriched microbial DOM signal during the dry
season. The short hydroperiod TS/Ph-1–3 freshwater
sites are more prone to such microbial sources,
supporting the fact that they showed higher FI value
than the other freshwater marsh and mangrove sites.
Slope ratio (SR) values are reported to be an optical
measure inversely proportional to MW of CDOM
(Helms et al. 2008). This parameter was previously
shown to increase along a general N-to-S transect
across the Everglades, with lower SR values in the
most northern WCAs and higher values in ENP
(Yamashita et al. 2010), suggesting a transition from
primarily soil derived DOM to biomass (including
periphyton) derived DOM along this transect. Simi-
larly, but at a smaller geographic scale, in this study an
increased SR value across the freshwater marsh to
mangrove fringe to marine estuary environments was
observed (Fig. 5d), suggesting a trend of decreasing
MW across the terrestrial to marine end-member. A
general trend of higher SR values during the dry season
(except for the FB sites) was observed, which is
consistent with the general trend of lower aromaticity
and increased microbial sources during the dry season
discussed above. This pattern suggests enhanced
contributions of high MW soil-derived CDOM during
the wet season, while lower MW microbial-derived
CDOM contributions are enhanced during the dry
season. Shallow water conditions during the dry
season (see above) may also enhance photo-degrada-
tion leading to a reduction in the overall MW of the
CDOM (Lou and Xie 2006). Higher SR values in FB
during the wet season may be associated with
enhanced low MW phytoplankton and/or seagrass
-derived CDOM inputs.
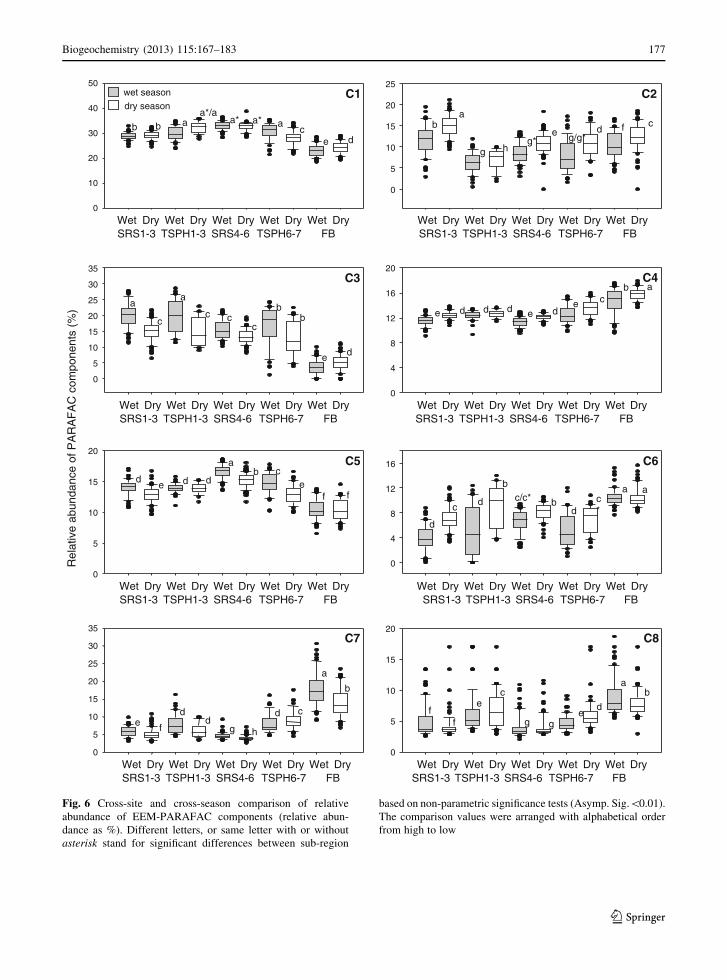
EEM-PARAFAC
With respect to the seasonal distribution of the EEM-
PARAFAC components, these are shown in Fig. 6a–h.
In Fig. 6a the distribution of component C1 (Ex/Em:
\260 (345)/462 nm), a humic-like component which
is ubiquitous in aquatic environments and abundant in
biomass and soil, showed the highest relative abun-
dance of the eight PARAFAC components observed.
The total EEM fluorescence corresponding to C1
ranged from 18.5 to 36.5 % with lowest relative
abundance in FB (Fig. 6a), implying a significant
terrestrial CDOM input to all sites. No consistent
seasonal pattern was observed. The relative abundance
of C1 % was slightly lower for FB sites during the wet
season due to higher seagrass and/or phytoplankton
inputs to the DOM pool, while TS/Ph-mangrove sites
displayed slightly lower values during the dry season
due to FB water intrusions during periods of low
freshwater head.
The C2 component (Ex/Em:\260/454 nm), which
is believed to be a humic-like photoproduct and/or
photo-refractory component (Chen et al. 2010), and
has also been found in high abundance in canal water
draining agricultural areas in the northern EAA
(Yamashita et al. 2010), displayed a pronounced and
uniform seasonal pattern of higher abundance during
the dry season for all sites (Fig. 6b). Highest abun-
dances were observed for the freshwater marsh sites of
SRS1-3 which are likely the most influenced by
drainage from the EAA, particularly during the dry
season (Yamashita et al. 2010). Accelerated oxidative
degradation and associated carbon export of peat due
to historical water drainage and land use change from
freshwater marshes to agricultural lands (i.e. EAA;
Harvey and McCormick, 2009; Schueneman, 2001),
may be responsible for the higher abundance of C2 in
the dry season when contributions from canal water
from the WCAs to ENP are proportionally more
important. Wang et al. (2002) reported that some of the
‘‘old’’ historic peat-derived DOM was transported by
canals from the northern Everglades southwards.
Similarly, Yamashita et al. (2010) reported significant
canal transport of C2 from the EAA towards ENP.
Thus it is not surprising that this component was
observed at higher relative abundance at the SRS-1–3
sites. In addition, enhanced influence of solar exposure
due to shallower water depth during the dry season
could also potentially contribute further to the higher
C2 abundance as a result of photochemical transfor-
mations of DOM. This phenomenon has been reported
for other large pulsed wetland (Cawley et al. 2012a).
Another humic-like component C3 (Ex/Em: \260
(305)/416 nm), which has been found to be usually
less abundant compared to C1, showed a clearer
seasonal pattern. Relative values of C3 % reached as
high as 28.7 % during the wet season in the marl-based
TS/Ph freshwater marsh sites, but were occasionally
178 Biogeochemistry (2013) 115:167–183
123
below detection for FB sites (Fig. 6c). A general trend
of higher C3 % values in the wet season compared to
the dry season, suggests its source from soils and
decomposition of higher plant organic matter. FB sites
behaved the opposite, possibly caused by the fact that
water discharge to FB from the Everglades peaks
during the latter part of the wet season. (Maie et al.
2006a, 2012).
The humic-like component C4 (Ex/Em: \260
(305)/376 nm) has traditionally been assigned as
‘marine humic-like’ (Coble 1996) but has also been
found in freshwaters (Chen et al. 2010; Yamashita
et al. 2010). As a result, it is referred to as a microbial
humic-like component. In this study a trend of slightly
higher abundance during the dry season was observed
for most stations (Fig. 6d). Such increased microbial
activity during the dry season is in agreement with the
patterns observed for the FI data (Fig. 5c). FB sites
showed a significantly higher abundance of C4 than
the rest freshwater marsh and mangrove sites, sug-
gesting a major marine end-member input for C4 from
either seagrass communities and/or phytoplankton.
Component C5 (Ex/Em: \260 (405)/[500 nm) is
believed to be a red-shifted humic-like component
which is also ubiquitous in biomass and soil but
generally less abundant than C1 in the Everglades
ecosystem (Yamashita et al. 2010). It showed similar
behavior to C1 but generally better defined spatial and
seasonal patterns (Fig. 6e), with mangroves sites
having significant higher abundance and FB sites the
lowest. Its abundance during the wet season domi-
nated over the dry season in most cases, as in the case
of C3. Components similar to C5 had been reported to
be relatively enriched in soils and sediments, espe-
cially in the humic acid fraction (Santin et al. 2009),
and thus could reflect enhanced soil derived DOM
contributions during the wet season.
Component C6 (Ex/Em: \260(325)/406 nm),
another humic-like component, is known to be pho-
tosensitive, and thus has been found enriched in
Everglades groundwater compared to surface waters
(Chen et al. 2010). It has also been reported to be
abundant in DOM derived from soil oxidation from
agricultural areas of the Everglades (Yamashita et al.
2010), and consequently can be expected to be
enriched in canal waters. Similar to C2, a general
trend of higher abundances of C6 during the dry
season was observed in this study, suggesting
enhanced canal water inputs to the freshwater marsh
sites during the dry season, and/or increased ground-
water input during the dry season when the water head
is low (Price et al. 2006). Unlike C2, however, C6 % at
sites SRS-1–3 was not highest, implying that other
drivers than inputs from canal water play a role in the
distribution of C6. FB sites showed relative higher
abundances, suggesting seagrass leachates or decom-
posing seagrass detritus as a possible source.
The abundance of component C7 (Ex/Em:
275/326 nm), classified as a protein-like (tyrosine-like
and/or blue-shifted tryptophan-like) component (Chen
et al. 2010; Yamashita et al. 2010), was significantly
higher at the FB sites, particularly during the wet season
(Fig. 6g) when the primary productivity was highest
(early wet season; Maie et al. 2012). There was also a
general trend of higher values during the wet season
when the biomass primary productivity is higher,
suggesting that C7 is mostly biomass-derived. TS/Ph-
mangrove sites showed higher values in the dry season
due to the higher protein-like DOM derived from FB
water intrusion, as previously observed for C4.
The relative abundance of the other protein-like
component (tryptophan-like), C8 (Ex/Em: 300/342 nm),
(Chen et al. 2010; Yamashita et al. 2010), was among
the lowest of all the PARAFAC components, and as
such is most sensitive to influences by the fluctuations
of other more abundant components. Thus, the C8
distribution (Fig. 6h) showed large ranges in abun-
dance values in the box plot, indicating sporadically
big variations for this component at each sub-
environment. Based on the above, these variations
will not be discussed further. However, consistent with
higher seagrass primary productivity-derived DOM,
it’s not surprising that both C7 and C8 showed relative
higher abundance at the FB sites during the wet season
(Maie et al. 2012).
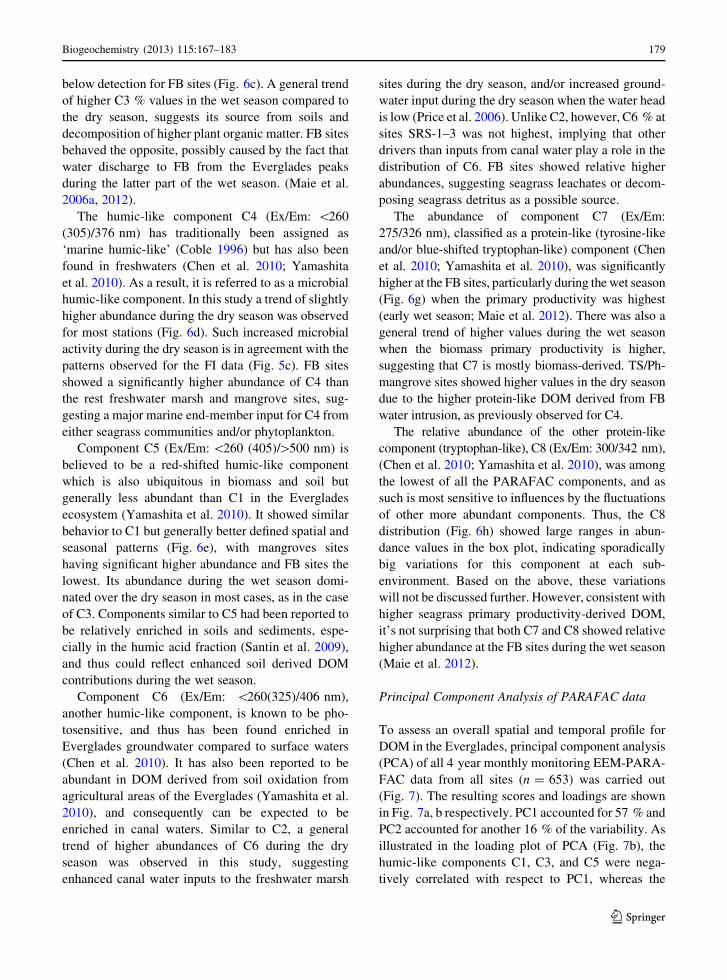
Principal Component Analysis of PARAFAC data
To assess an overall spatial and temporal profile for
DOM in the Everglades, principal component analysis
(PCA) of all 4 year monthly monitoring EEM-PARA-
FAC data from all sites (n = 653) was carried out
(Fig. 7). The resulting scores and loadings are shown
in Fig. 7a, b respectively. PC1 accounted for 57 % and
PC2 accounted for another 16 % of the variability. As
illustrated in the loading plot of PCA (Fig. 7b), the
humic-like components C1, C3, and C5 were nega-
tively correlated with respect to PC1, whereas the
Biogeochemistry (2013) 115:167–183 179
123
microbial humic-like and protein-like components C4,
C6, C7, and C8 were positively correlated with respect
to PC1. While PC1 seems to be a source-related
variable (‘terrestrial’ vs. ‘microbial’), PC2 seems to be
controlled primarily by component C2, suggesting
either the diagenetic status (i.e. photodegradation) of
the DOM (Chen et al. 2010), or the influence of DOM
inputs from the WCAs or agricultural soils (EEA;
Yamashita et al. 2010).
Hence, the PCA clustering of sample types seems to
make sense in that FB surface water samples were
dominated by microbial humic-like and protein-like
fluorophores (i.e. showing a positive PC1 value),
while the freshwater and mangrove sites seemed
DryWet
SRS1-3SRS4-6TS/Ph1-3TS/Ph6-7TS/Ph9-11
PC1(57%)-.6 -.4 -.2 0.0 .2 .4 .6
PC
2(16
%)
-1.0
-.5
0.0
.5
1.0
C4
C6
C7C5
C1
C3
C8
C2
terrestrial humic-like microbial humic-like and protein-like
Photodegraded and/orphotoproduced
b
aFig. 7 PCA of overall four-
year monthly monitoring
EEM-PARAFAC data
(n = 653). a score plot;
b loading plot
180 Biogeochemistry (2013) 115:167–183
123
controlled by the humic-like components (i.e. negative
PC1). Samples from the TS/Ph-mangrove sites
showed a broad distribution with regards to PC1,
ranging from FB waters to freshwater, suggesting a
strong seasonal influence, whereby dry season samples
were more closely influenced by FB water intrusions
(positive PC1), while wet season samples were clearly
hydrologically influenced by the upstream sources
(negative PC1). Similarly, wet season freshwater
marsh sites were more strongly influenced by humic-
like components (soil sources during wet season)
showing a more negative correlation with PC1 com-
pared to the dry season samples which were found to
be more microbially influenced. As for PC2, the
influence of C2 seems to be strongest on the SRS
freshwater marsh sites, as these are most influenced by
WCA derived DOM inputs. Expectedly, this effect
was enhanced during the dry season.
Conclusions
Clear variations in quantity and quality (i.e. compo-
sition) of DOM in the Everglades were observed on
both spatial and temporal scales. Local ecological
drivers such as biomass type and primary produc-
tivity as well as regional climatic influences such as
wet and dry seasons were all found to have a
significant effect on DOM dynamics. Hydrology is a
crucial component in the Everglades as a physical
driver controlling the water level, hydroperiod, water
residence time, vertical and horizontal hydrological
exchange, tidal mixing and salt water intrusions,
which can all influence DOM composition and
dynamics by affecting vegetation and soil types as
well as transport characteristics. The data presented
above suggests that soil type can affect DOM quality
and quantity in the Everglades. The lower value of
DOC in marl-based TS freshwater sites compared to
the SRS peat-based freshwater environments seems
to suggest that soil-OM is more important as a
sources of DOC compared to macrophyte-OM. Low
DOC in carbonate mud-based FB sites also sug-
gested lower inputs of sediment-derived DOC as
compared to the peat-based mangrove sites. This
difference was not only quantitative but also qual-
itative as reflected in higher microbial DOM contri-
butions for the TS/Ph and FB sites. In addition,
seasonal variations in primary productivity can also
affect DOM quantity and quality. Primary produc-
tivity is higher during the wet summer season
resulting in increased biomass leaching, exudation,
and throughfall in comparison to the dry season.
Primary productivity based changes in DOM dynam-
ics were particularly strong in FB where seagrass
communities are responsible for the production of a
significant portion of the DOM pool (Maie et al.
2005, 2006a, 2012).
Anthropogenic effects of water management in the
Everglades on water depth, water residence time, and
increased water delivery from the canals particularly
during the dry season, all represent important drivers
controlling DOM spatial and temporal patterns. In this
regard, the implementation of CERP, which to a large
degree targets enhancing the water delivery (higher
water flow and longer hydroperiods) to Everglades
National Park and FB, could have significant effects on
DOM dynamics. If hydrological restoration to pre-
drainage conditions is strongly canal drainage water
based, an unintended effect could be the enhancement of
contaminant delivery to the system (Harvey and
McCormick, 2009). This would include DOC derived
from the oxidation of former wetland peat deposits now
located in agricultural areas (i.e. EAA). The potential
effect on microbial loop dynamics, nutrient cycling and
associated trophic interactions are presently unclear.
This study exemplifies the effectiveness of applying
optical properties and in particular EEM-PARAFAC in
the assessment of DOM dynamics in wetland ecosys-
tems on large spatial and temporal scales. The data
presented herein are potentially transferable to other
large, subtropical, lotic wetlands such as the Pantanal
(Brazil) and the Okavango Delta (Botswana) regarding
the assessment of DOM dynamics. Such studies are
essential to better understand potential effects of
climate change, water management, and other anthro-
pogenic influences on carbon and nutrient cycling in
aquatic ecosystems and wetlands conservation.
Acknowledgments This study was funded by the National
Science Foundation through the FCE-LTER program (DEB-
9910514 and DBI-0220409). The authors thank the Wetland
Ecosystem Laboratory at SERC for logistic support, the SERC
Water Quality Laboratory for DOC analyses, and Y. Yamashita
for assistance with the PARAFAC modeling and helpful
discussions. MC thanks the Department of Chemistry &
Biochemistry and the FCE-LTER program for financial
support, and S. Jiang for assistance with the PCA analyses.
Precipitation Data were provided by the Florida Coastal
Everglades Long-Term Ecological Research (LTER) Program.
Biogeochemistry (2013) 115:167–183 181
123
Support to RJ through the George Barley endowment fund in
SERC is also acknowledged. This is SERC contribution #601.
References
Austnes K, Evans CD, Eliot-Laize C, Naden PS, Old GH (2010)
Effects of storm events on mobilization and in-stream
processing of dissolved organic matter (DOM) in a Welsh
peatland catchment. Biogeochemistry 99:157–173
Baker A (2001) Fluorescence excitation-emission matrix char-
acterization of some sewage-impacted rivers. Environ Sci
Technol 35:948–953
Belicka L, Sokol ER, Hoch LM, Jaffe R, Trexler JC (2012) A
molecular and stable isotopic approach to investigate algal
and detrital energy pathways in a freshwater marsh. Wet-
lands. doi:10.1007/s13157-012-0288-6
Borisover M, Laor Y, Parparov A, Bukhanovsky N, Lado M
(2009) Spatial and seasonal patterns of fluorescent organic
matter in Lake Kinneret (Sea of Galilee) and its catchment
basin. Water Res 43:3104–3116
Boyer JN (2006) Shifting N and P limitation along a north–south
gradient of mangrove estuaries in South Florida. Hydro-
biologia 269:167–177
Boyer JN, Fourqurean JW (1997) Spatial characterization of
water quality in Florida Bay and whitewater Bay by mul-
tivariate analyses: zones of similar influence. Estuaries
20(4):743–758
Briceno HO, Boyer JN (2010) Climatic controls on phyto-
plankton biomass in a sub-tropical estuary, Florida Bay,
USA. Estuaries Coasts 33:541–553
Bro R (1997) PARAFAC. Tutorial and applications. Chemo-
metrics Intell Lab Syst 38:149–171
Browder JA, Gleason PJ, Swift DR (1994) Periphyton in the
Everglades: spatial variation, environmental correlates,
and ecological implications. In: Davis S, Ogden J (eds)
Everglades: the ecosystem and its restoration. CRC Press,
West Palm Beach, pp 379–418
Cawley KM, Wolski P, Mladenov N, Jaffe R (2012a) Dissolved
organic matter biogeochemistry along a transect of the
Okavango Delta, Botswana. Wetlands. doi:10.1007/s13157-
012-0281-0
Cawley KM, Ding Y, Fourqurean J, Jaffe R (2012b) Charac-
terizing the sources and fate of dissolved organic matter in
Shark Bay, Australia: a preliminary study using optical
properties and stable isotopes. Mar Freshwater Res
63:1098–1107
Chari NVHK, Sarma NS, Rao-Pandi S, Narasimha-Murthy K
(2012) Seasonal and spatial constraints of fluorophores in
the Midwest Bay of Bengal by PARAFAC analysis of
excitation emission matrix spectra. Estuar Coast Shelf Sci
100:162–171
Chen M, Price R, Yamashita Y, Jaffe R (2010) Comparative
study of dissolved organic matter from groundwater and
surface water in the Florida coastal Everglades using multi-
dimensional spectrofluorometry combined with multivari-
ate statistics. Appl Geochem 25:872–880
Coble PG (1996) Characterization of marine and terrestrial
DOM in seawater using excitation–emission matrix spec-
troscopy. Mar Chem 51:325–346
Coble PG, Schultz CA, Mopper K (1993) Fluorescence con-
touring analysis of DOC intercalibration experiment sam-
ples: a comparison of techniques. Mar Chem 41:173–178
Cory RM, McKnight DM (2005) Fluorescence spectroscopy
reveals ubiquitous presence of oxidized and reduced qui-
nones in dissolved organic matter. Environ Sci Technol
39:8142–8149
Davis SE, Childers DL, Noe GB (2006) The contribution of
leaching to the rapid release of nutrients and carbon in the
early decay of wetland vegetation. Hydrobiologia 569:87–97
Fellman JB, Hood E, D’Amore DV, Edwards RT, White D
(2009) Seasonal changes in the chemical quality and bio-
degradability of dissolved organic matter exported from
soils to streams in coastal temperate rainforest watersheds.
Biogeochemistry 95:277–293
Fellman JB, Hood E, Spencer RGM (2010) Fluorescence
spectroscopy opens new windows into dissolved organic
matter dynamics in freshwater ecosystems: a review.
Limnol Oceanogr 55(6):2452–2462
Harvey JW, McCormick PV (2009) Groundwater significance to
changing hydrology, water chemistry and biological
communities of a floodplain ecosystem, Everglades, South
Florida. USA Hydrogeol J 17:185–201
Harvey JW, Newlin JT, Krupa SL (2006) Modeling decadal
timescale interactions between surface waters and ground
water in the central Everglades, Florida. USA J Hydrol
320:400–420
Helms JR, Stubbins A, Ritchie JD, Minor EC (2008) Absorption
spectral slopes and slope ratios as indicators of molecular
weight, source, and photobleaching of chromophoric dis-
solved organic matter. Limnol Oceanogr 53:955–969
Holl BS, Fiedler S, Jungkunst HF, Kalbitz K, Freibauer A,
Drosler M, Stahr K (2009) Characteristics of dissolved
organic matter following 20 years of peatland restoration.
Sci Total Environ 408:78–83
Hong H, Yang L, Guo W, Wang F, Yu X (2012) Characteriza-
tion of dissolved organic matter under contrasting hydro-
logic regimes in a subtropical watershed using PARAFAC
model. Biogeochemistry 109:163–174
Hudson N, Baker A, Reynolds D (2007) Fluorescence analysis
of dissolved organic matter in natural, waste and polluted
waters-a review. River Res Appl 23:631–649
Jaffe R, Boyer JN, Lu X, Maie N, Yang C, Scully NM, Mock S
(2004) Source characterization of dissolved organic matter
in a subtropical mangrove-dominated estuary by fluores-
cence analysis. Marine Chem 84:195–210
Jaffe R, McKnight D, Maie N, Cory R, McDowell WH,
Campbell JL (2008) Spatial and temporal variations in
DOM composition in ecosystems: the importance of long-
term monitoring of optical properties. J Geophys Res
113:G04032. doi:10.1029/2008JG000683
Kowalczuk P, Durako MJ, Young H, Khan AE, Cooper WJ,
Gonsior M (2009) Characterization of dissolved organic
matter fluorescence in the South Atlantic bight with use of
PARAFAC model: interannual variability. Marine Chem
113:182–196
Larsen LG, Aiken GR, Harvey JW, Noe GB, Crimaldi JP (2010)
Using fluorescence spectroscopy to trace seasonal DOM
dynamics, disturbance effects, and hydrologic transport in
the Florida Everglades. J Geophys Res. doi:10.1029/2009JG001140
182 Biogeochemistry (2013) 115:167–183
123
Light SS, Dineen JW (1994) Water control in the Everglades: a
historical perspective. In: Davis SM, Ogden JC (eds)
Everglades, the ecosystem and its restoration. St. Lucie
Press, Delray Beach, pp 47–84
Lou T, Xie H (2006) Photochemical alteration of the molecular
weight of dissolved organic matter. Chemosphere 65:2333–
2342
Lu XQ, Maie N, Hanna JV, Childers DL, Jaffe R (2003)
Molecular characterization of dissolved organic matter in
freshwater wetlands of the Florida Everglades. Water Res
37:2599–2606
Maie N, Yang C, Miyoshi T, Parish K, Jaffe R (2005) Chemical
characteristics of dissolved organic matter in an oligo-
trophic subtropical wetland/estuarine ecosystem. Limnol
Oceanogr 50(1):23–35
Maie N, Boyer JN, Yang C, Jaffe R (2006a) Spatial, geomor-
phological, and seasonal variability of CDOM in estuaries
of the Florida Coastal Everglades. Hydrobiologia 569:135–
150
Maie N, Jaffe R, Miyoshi T, Childers DL (2006b) Quantitative
and qualitative aspects of dissolved organic carbon leached
from senescent plants in an oligotrophic wetland. Bio-
geochemistry 78:285–314
Maie N, Yamashita Y, Cory RM, Boyer JN, Jaffe R (2012)
Application of excitation emission matrix fluorescence
monitoring in the assessment of spatial and seasonal driv-
ers of dissolved organic matter composition: sources and
physical disturbance controls. Appl Geochem 27:917–929
McKnight DM, Boyer EW, Westerhoff PK, Doran PT, Kulbe T,
Andersen DT (2001) Spectrofluorometric: characterization
of dissolved organic matter for indication of precursor
organic material and aromaticity. Limnol Oceanogr 46:
38–48
Miller MP, McKnight DM (2010) Comparison of seasonal
changes in fluorescent dissolved organic matter among
aquatic lake and stream sites in the Green Lakes Valley.
J Geophys Res. doi:1029/2009JG000985
Omori Y, Hama T, Ishii M, Saito S (2010) Relationship between
the seasonal change in fluorescent dissolved organic matter
and mixed layer depth in the subtropical western North
Pacific. J Geophys Res 115:C06001. doi:10.1029/2009
JC005526
Parish K (2006) Chemical characterization of dissolved organic
matter in an oligotrophic subtropical coastal ecosystem.
MS Thesis, Florida International University, pp 187
Pisani O, Yamashita Y, Jaffe R (2011) Photo-dissolution of
flocculent, detrital material in aquatic environments: con-
tributions to the dissolved organic matter pool. Water Res
45(13):3836–3844
Price RM, Swart PK (2006) Geochemical indicators of
groundwater recharge in the surficial aquifer system,
Everglades National Park, Florida, USA. Geological
Society of America Special Paper 404. GSA, Boulder, CO.
doi: 10.1130/2006.2404(21)
Price RM, Swart PK, Fourqurean JW (2006) Coastal ground-
water discharge—an additional source of phosphorus for
the oligotrophic wetlands of the Everglades. Hydrobiologia
569:23–36
Qualls RG, Richardson CJ (2003) Factors controlling concen-
tration, export, and decomposition of dissolved organic
nutrients in the Everglades of Florida. Biogeochemistry
62:197–229
Romigh MM, Davis SE, Rivera-Monroy VH, Twilley RR (2006)
Flux of organic carbon in a riverine mangrove wetland in
the Florida Everglades. Hydrobiologia 569:505–516
Santin C, Yamashita Y, Otero XL, Alvarez MA, Jaffe R (2009)
Characterizing humic substances from estuarine soils and
sediments by excitation-emission matrix spectroscopy and
parallel factor analysis. Biogeochemistry 96:131–147
Schueneman TJ (2001) Characterization of sulfur sources in the
EAA. Soil Crop Sci Soc Florida 60:49–52
Scully NM, Maie N, Dailey SK, Boyer JN, Jones RD, Jaffe R
(2004) Early diagenesis of plant-derived dissolved organic
matter along a wetland, mangrove, estuary ecotone. Limnol
Oceanogr 49(5):1667–1678
Shank GC, Lee R, Vahatalo A, Zepp RG, Bartels E (2010)
Production of chromophoric dissolved organic matter from
mangrove leaf litter and floating Sargassum colonies.
Marine Chem 119:172–181
Shank C, Evans A, Yamashita Y, Jaffe R (2011) Solar radiation–
enhanced dissolution of particulate organic matter from
coastal marine sediments. Limnol Oceanogr 56(2):577–
588. doi:10.4319/lo.2011.56.2.0577
Stedmon CA, Bro R (2008) Characterizing dissolved organic
matter fluorescence with parallel factor analysis: a tutorial.
Limnol Oceanogr Methods 6:572–579
Stedmon CA, Markagera S, Bro R (2003) Tracing dissolved
organic matter in aquatic environments using a new
approach to fluorescence spectroscopy. Marine Chem
82:239–254
Vouve F, Cotrim da Cunha L, Serve L, Vigo J, Salmon JM
(2009) Spatio-temporal variations of fluorescence proper-
ties of dissolved organic matter along the River Tet (Pyr-
enees-Orientales, France). Chem Ecol 25(6):435–452
Wang Y, Hsieh YP, Landing WM, Choi YH, Salters V,
Campbell D (2002) Chemical and carbon isotopic evidence
for the source and fate of dissolved organic matter in the
northern Everglades. Biogeochemistry 61:269–289
Weishaar JL, Aiken GR, Bergamaschi BA, Fram MS, Fujii R,
Mopper K (2003) Evaluation of specific ultraviolet absor-
bance as an indicator of the chemical composition and
reactivity of dissolved organic carbon. Environ Sci Tech-
nol 37:4702–4708
Yamashita Y, Scinto LJ, Maie N, Jaffe R (2010) Dissolved organic
matter characteristics across a subtropical wetland’s land-
scape: application of optical properties in the assessment of
environmental dynamics. Ecosystems 13:1006–1019
Biogeochemistry (2013) 115:167–183 183
123


