Embed Size (px)
Citation preview

Spatial and temporal patterns of plantcommunities near small mountain streams inmanaged forests
Lana E. D’Souza, Laura J. Six, Jonathan D. Bakker, and Robert E. Bilby
Abstract: Riparian plant communities along small streams occupy a small proportion of the total landscape but can providedisproportionally large ecological, social, and economic benefits. We examined plant communities at 25 study sites alongsmall fish-bearing streams in temperate managed forests of the Pacific Northwest spatially as a function of distance fromstream and temporally by assessing a chronosequence of stand ages: young (31–51 years), mature (52–70 years), and old(>100 years). We identified three distinct vegetation communities based on species cover and richness in shrub and herblayers: riparian (0–9 m), transitional (10–29 m), and upslope (30–80 m); 12 species were indicators of these vegetation com-munities. For tree species, basal area increased with stand age. Shrub species cover and richness were greatest in old stands,but herb species richness was highest in young stands. Composition varied with stand age; 15 species were indicators ofthese differences in composition. These results, together with information on successional and wetland status, suggest thatplant communities on small fish-bearing streams reflect geomorphic and fluvial settings but also follow successional patternsfound in natural forests. These stands will become some of the primary unharvested, older forests within the managed forestlandscape and provide insights for effective riparian management on sites impacted by historical management practices priorto the regulations requiring riparian buffers.
Résumé : Les communautés végétales riveraines le long des petits cours d’eau occupent une faible proportion du paysagetotal mais elles peuvent procurer des bénéfices sociaux, écologiques et économiques grandement disproportionnés. Nousavons étudié des communautés végétales dans 25 sites d’étude le long de petits cours d’eau contenant des poissons dans desforêts tempérées aménagées du Pacific Northwest, spatialement en fonction de la distance du cours d’eau et temporellementen évaluant une chronoséquence d’âges de peuplement : jeunes (31–51 ans), mature (52–70 ans) et vieux (>100 ans). Nousavons identifié trois communautés végétales distinctes sur la base de la couverture et de la richesse des espèces dans l’étagearbustif et herbacé : riveraine (0–9 m), transitionnelle (10–29 m) et pente ascendante (30–80 m); 12 espèces étaient indicatri-ces de ces communautés végétales. Chez les espèces arborescentes, la surface terrière augmentait avec l’âge du peuplement.La couverture et la richesse des espèces arbustives étaient la plus élevées dans les vieux peuplements mais la richesse desespèces herbacées était la plus élevée dans les jeunes peuplements. La composition variait selon l’âge du peuplement; 15espèces étaient indicatrices de ces différences de composition. Ces résultats, avec l’information sur le statut successionnel etde terre humide, indiquent que les communautés végétales le long des petits cours d’eau qui contiennent des poissons reflè-tent des cadres géomorphologiques et fluviaux mais qu’elles suivent également des patrons successionnels qu’on retrouvedans les forêts naturelles. Ces peuplements deviendront certaines des vieilles forêts primaires non récoltées dans le paysageforestier aménagé et fourniront des connaissances pour un aménagement riverain efficace sur les sites exposés à d’anciennespratiques d’aménagement, antérieures à la réglementation qui exige des zones tampons riveraines.
[Traduit par la Rédaction]
Introduction
Riparian areas serve as crucial interfaces between aquaticand terrestrial ecosystems. The ecological, social, and eco-nomic values of riparian areas have been increasingly recog-nized in the last few decades (Naiman et al. 2005), leading tothe adoption of regulations that guide forestry practices alongstreams (Lee et al. 2004). In forested systems, riparian buf-fers are commonly retained along streams that have pre-scribed buffer widths that include influential areas for
maintaining ecological processes, preserving environmentalcharacteristics, and protecting biota from upland managementactivities (Lee et al. 2004). Buffer width requirements varyregionally but generally increase with stream size and withthe presence of fish (Lee et al. 2004).When protecting drainage networks, small streams are par-
ticularly significant, as they constitute a substantial propor-tion of the stream length within watersheds. The steepertopography along many small streams restricts flooding im-pacts to a relatively narrow zone that limits the spatial extent
Received 4 February 2011. Accepted 26 October 2011. Published at www.nrcresearchpress.com/cjfr on xx January 2012.
L.E. D’Souza. Weyerhaeuser Global Timberlands Technology, P.O. Box 3777, MS 1B10, Federal Way, WA 98063, USA.L.J. Six and R.E. Bilby. Weyerhaeuser Global Timberlands Technology, P.O. Box 3777, MS 1A5, Federal Way, WA 98063, USA.J.D. Bakker. School of Environmental and Forest Sciences, University of Washington, Box 354115, Seattle, WA 98195, USA.
Corresponding author: Lana E. D’Souza (e-mail: [email protected]).
260
Can. J. For. Res. 42: 260–271 (2012) doi:10.1139/X11-171 Published by NRC Research Press
Can
. J. F
or. R
es. D
ownl
oade
d fr
om w
ww
.nrc
rese
arch
pres
s.co
m b
y C
SP S
taff
on
01/2
7/12
For
pers
onal
use
onl
y.

(width) of fluvial landforms and of the riparian plant com-munity (Richardson and Danehy 2007). This pattern hasbeen described for boreal (Renöfålt et al. 2005), hemiboreal(Hagan et al. 2006), temperate (Pabst and Spies 1998), mixedhardwood–conifer (Goebel et al. 2006), and tropical (Druckeret al. 2008) forests. Plant communities along small streamsmay serve as indicators for riparian areas and aid in deter-mining proper buffer width (Hagan et al. 2006).Plant communities along the smallest fish-bearing streams
have received less research attention than those along lower-ordered streams (Hagan et al. 2006) or large rivers (Naimanet al. 2005). Vegetation near small streams is often orderedalong a complex environmental gradient from active fluvialstreamside areas to hillslopes (Pabst and Spies 1998). Herb,shrub, and tree layers can respond at different spatial scalesto the environmental gradients caused by the stream (Lyonand Sagers 2003). For example, Hagan et al. (2006) founddistinct herbaceous vegetation in a narrow band near thechannel but found no differences in trees or shrubs. Speciesdistributions along small streams may also relate to theirfunctional strategies and attributes (e.g., successional status,shade tolerance, and wetland indicator status) (Grime 2001).Prior to the adoption of regulations guiding forestry practi-
ces along streams, logging often occurred down to thestreambank. The temporal effects of this historical manage-ment practice on the successional trajectory of riparian vege-tation are not well understood and baseline data may yieldimportant information for future buffer planning. Most suc-cessional studies on harvesting disturbance are limited eitherto the short-term effects on upslope plant community(Schoonmaker and McKee 1988; Hunt et al. 2003) or to ri-parian overstory contributions of large woody debris instreams (Bilby and Ward 1991; Dahlström et al. 2005). Up-slope studies have found that vegetation displays considerabletemporal variation, as the time since last disturbance influen-ces forest stand density, structure, canopy closure, and forestfloor organic matter and species richness (Halpern and Spies1995; Jules et al. 2008), especially during early successionprior to canopy closure (Halpern 1988; Schoonmaker andMcKee 1988). However, developmental processes and vege-tation in riparian plant communities may differ from thosefound in upslope areas given their unique hydrologic condi-tions and fluvial disturbances, and it is unknown if succes-sional and spatial patterns act independently or interact.The purpose of this study was to examine spatial and tem-
poral variation in plant communities along small fish-bearingstreams in western Washington. We focused on areas withinmanaged forests that were logged to the streambank to pro-vide insight for current and future riparian zone managementin these forests. We hypothesized that distinct plant commun-ities could be identified based on distance from stream andstand age. We expected these communities to be moststrongly evident in the herb layer, as this layer is more spe-cies rich and thus includes more opportunities for specializa-tion. Furthermore, we hypothesized that the species closelyassociated with these communities would have unique combi-nations of attributes such as wetland indicator status and suc-cessional status. Finally, we expected that riparian plantcommunities would demonstrate fewer changes over timethan upslope plant communities due to hydrologic disturb-
ance found in near-stream settings and that these commun-ities would again be most evident in the herb layer.
Methods
Study sitesThis study was conducted on managed forest lands in the
headwaters of the Skookumchuck and Newaukum riverswith a combined watershed areas covering >97 000 ha in thewestern Cascade Mountains, Washington, USA (122°W, 46°N). The regional climate is maritime with wet, mild wintersand dry, cool summers. Mean monthly temperature rangesfrom 4 °C in January to 18 °C in July and mean annual pre-cipitation is 140 cm, occurring mainly as rain at low eleva-tions and snow at higher elevations (Franklin and Dyrness1988). Geology consists of tertiary volcanic and sedimentaryrock with andesitic or basaltic soils (Evans 1987; Pringle1990). Topography is steep with deeply dissected terrain andincised stream valleys. The study area is within the westernhemlock forest zone (Franklin and Dyrness 1988), which istypically dominated by large, long-lived conifer trees, includ-ing Douglas-fir (Pseudotsuga menziesii (Mirb.) Franco),western hemlock (Tsuga heterophylla (Raf.) Sarg.), and west-ern redcedar (Thuja plicata Donn ex D. Don).Our 25 sites were adjacent to small fish-bearing streams
and were characterized by perennial flow, narrow widths,steep slopes, and relatively small watersheds (Table 1). Mostsites were located along third-order streams (21); two werealong second-order and two were along fourth-order streams.Each study site was associated with a stream and the adjacentmanaged forest stand (termed a “stand”). Stands dominatedby trees <70 years old had been logged to the streambankduring prior management and had typical silviculture man-agement techniques applied including thinning and fertiliza-tion. Older stands had not been logged previously but likelyburnt in wildfires and then regenerated naturally.We randomly selected sites in forest stands using a geo-
graphic information system. Criteria for stand selection in-cluded the stream characteristics described above and thepresence of mature riparian forest stands on north- or south-facing aspects (eliminating east- and west-facing stands) atmoderate elevations (250–520 m). Stands were excluded ifthey were impacted by a road or disturbance (e.g., landslide,windthrow, major flooding event) or if they included nonfor-ested wetlands or cliffs. A chronosequence design was usedto assess stand ages and vegetation relationships. All poten-tial stands were stratified into three stand age classes: young(31–51 years), mature (52–70 years), and old (>100 years).For young and mature stands, we randomly selected 11young and 10 mature stands. Only four old stands met ourselection criteria; all were sampled. The ideal chronose-quence would have been composed of all stand age classesfrom previously logged stands, but this was not feasible giventhe reality of the landscape and the timing of historical man-agement activities. For example, this landscape does not con-tain clearcuts >100 years old; the old stands that we sampledhad regenerated after wildfire.
Data collectionTo capture vegetation characteristics within each stand, we
established an 80 m × 20 m (0.16 ha) plot to enable uniform
D’Souza et al. 261
Published by NRC Research Press
Can
. J. F
or. R
es. D
ownl
oade
d fr
om w
ww
.nrc
rese
arch
pres
s.co
m b
y C
SP S
taff
on
01/2
7/12
For
pers
onal
use
onl
y.
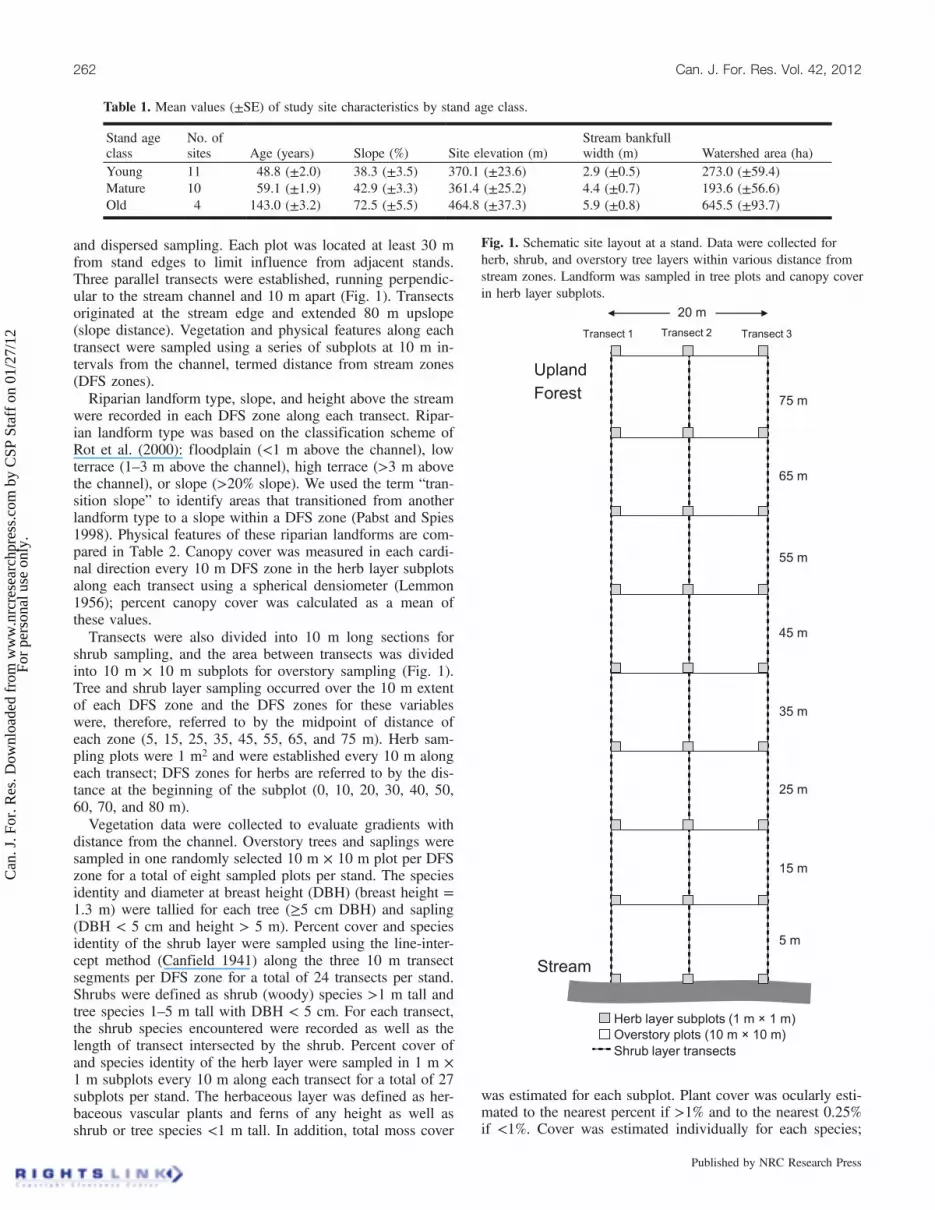
and dispersed sampling. Each plot was located at least 30 mfrom stand edges to limit influence from adjacent stands.Three parallel transects were established, running perpendic-ular to the stream channel and 10 m apart (Fig. 1). Transectsoriginated at the stream edge and extended 80 m upslope(slope distance). Vegetation and physical features along eachtransect were sampled using a series of subplots at 10 m in-tervals from the channel, termed distance from stream zones(DFS zones).Riparian landform type, slope, and height above the stream
were recorded in each DFS zone along each transect. Ripar-ian landform type was based on the classification scheme ofRot et al. (2000): floodplain (<1 m above the channel), lowterrace (1–3 m above the channel), high terrace (>3 m abovethe channel), or slope (>20% slope). We used the term “tran-sition slope” to identify areas that transitioned from anotherlandform type to a slope within a DFS zone (Pabst and Spies1998). Physical features of these riparian landforms are com-pared in Table 2. Canopy cover was measured in each cardi-nal direction every 10 m DFS zone in the herb layer subplotsalong each transect using a spherical densiometer (Lemmon1956); percent canopy cover was calculated as a mean ofthese values.Transects were also divided into 10 m long sections for
shrub sampling, and the area between transects was dividedinto 10 m × 10 m subplots for overstory sampling (Fig. 1).Tree and shrub layer sampling occurred over the 10 m extentof each DFS zone and the DFS zones for these variableswere, therefore, referred to by the midpoint of distance ofeach zone (5, 15, 25, 35, 45, 55, 65, and 75 m). Herb sam-pling plots were 1 m2 and were established every 10 m alongeach transect; DFS zones for herbs are referred to by the dis-tance at the beginning of the subplot (0, 10, 20, 30, 40, 50,60, 70, and 80 m).Vegetation data were collected to evaluate gradients with
distance from the channel. Overstory trees and saplings weresampled in one randomly selected 10 m × 10 m plot per DFSzone for a total of eight sampled plots per stand. The speciesidentity and diameter at breast height (DBH) (breast height =1.3 m) were tallied for each tree (≥5 cm DBH) and sapling(DBH < 5 cm and height > 5 m). Percent cover and speciesidentity of the shrub layer were sampled using the line-inter-cept method (Canfield 1941) along the three 10 m transectsegments per DFS zone for a total of 24 transects per stand.Shrubs were defined as shrub (woody) species >1 m tall andtree species 1–5 m tall with DBH < 5 cm. For each transect,the shrub species encountered were recorded as well as thelength of transect intersected by the shrub. Percent cover ofand species identity of the herb layer were sampled in 1 m ×1 m subplots every 10 m along each transect for a total of 27subplots per stand. The herbaceous layer was defined as her-baceous vascular plants and ferns of any height as well asshrub or tree species <1 m tall. In addition, total moss cover
was estimated for each subplot. Plant cover was ocularly esti-mated to the nearest percent if >1% and to the nearest 0.25%if <1%. Cover was estimated individually for each species;
Table 1. Mean values (±SE) of study site characteristics by stand age class.
Stand ageclass
No. ofsites Age (years) Slope (%) Site elevation (m)
Stream bankfullwidth (m) Watershed area (ha)
Young 11 48.8 (±2.0) 38.3 (±3.5) 370.1 (±23.6) 2.9 (±0.5) 273.0 (±59.4)Mature 10 59.1 (±1.9) 42.9 (±3.3) 361.4 (±25.2) 4.4 (±0.7) 193.6 (±56.6)Old 4 143.0 (±3.2) 72.5 (±5.5) 464.8 (±37.3) 5.9 (±0.8) 645.5 (±93.7)
Stream
20 m
5 m
15 m
25 m
35 m
45 m
55 m
65 m
75 m
Transect 1 Transect 2 Transect 3
Upland
Forest
Herb layer subplots (1 m × 1 m)
Overstory plots (10 m 10 m)×
Shrub layer transects
Fig. 1. Schematic site layout at a stand. Data were collected forherb, shrub, and overstory tree layers within various distance fromstream zones. Landform was sampled in tree plots and canopy coverin herb layer subplots.
262 Can. J. For. Res. Vol. 42, 2012
Published by NRC Research Press
Can
. J. F
or. R
es. D
ownl
oade
d fr
om w
ww
.nrc
rese
arch
pres
s.co
m b
y C
SP S
taff
on
01/2
7/12
For
pers
onal
use
onl
y.

therefore, total cover in a subplot exceeded 100% in somecases.Additionally, we categorized species by lifeform, origin,
shade tolerance, successional status, and wetland indicatorstatus. Lifeform (annual forbs, perennial forbs, ferns, grami-noids, woody plants), origin (native or nonnative to the Pa-cific Northwest), and shade tolerance (tolerant, intermediate,intolerant) were obtained from the PLANTS database(USDA 2010). Successional status (residual or invader) wasbased on seral origin in Pacific Northwest managed forests(Dyrness 1973; Halpern 1989) and late seral species as iden-tified by McKenzie et al. (2000). Residual species are thosecommonly present in undisturbed plant communities thatmay persist after disturbance, while invaders are species typi-cally absent from undisturbed plant communities or restrictedto disturbed habitats. Wetland indicator status (obligate wet-land, facultative wetland, facultative, facultative upland, obli-gate upland, not on list) was based on a classificationdeveloped by USDA Region 9 (Northwest) and reported inthe PLANTS database (USDA 2010).Unknown vascular plants encountered during the sampling
were collected for later identification and verified by the Uni-versity of Washington Herbarium. Vascular plants were clas-sified by genera if they could not be identified to species (11taxa) or as unknown plants if they could not be identified togenera (two taxa). Nomenclature follows Hitchcock andCronquist (1998).
Data analysisDFS zones were our unit of analysis, so subsamples within
each zone were averaged. Riparian landforms were character-ized by physical features but were not compared statistically,since landform diversity was low. Tree layer data were sum-marized as live tree density (trees per hectare) and basal area(square metres per hectare) for each overstory tree species.Overstory structural attributes were further examined by sum-marizing data by taxonomic group (conifers and hardwoods)and size class (small: <25 cm DBH, medium: 25–50 cmDBH, and large: >50 cm DBH). Shrub and herbaceous layerdata were summarized as percent cover by species; species-level data were then summed to yield total covers of shrubs,herbs, and moss. Species richness was calculated for eachvegetation layer.Proportional data were arcsine transformed prior to analy-
sis to improve normality, and hardwood basal area wassquare root transformed. A mixed-model ANOVA with asplit-plot design was used to test for differences in univariatevegetation metrics and distance from stream and stand age(Proc Mixed, SAS version 9.2 (2008); SAS Institute Inc.,
Cary, North Carolina). The series of subplots measured ateach site for sampling distance from stream constituted a spa-tial form of longitudinal data (Schabenberger and Pierce2002) that required a covariance model to account for thespatial correlation between subplots for analysis. A first-orderautoregressive (AR-1) covariance structure was selected usingAkaike’s information criterion (AIC values) (Littell et al.2006). The main effects of age and aspect were fixed effects,while stand was a random effect and the error term for thefixed effects. DFS zone was nested within stand. The interac-tion terms tested were age × DFS zone, aspect × DFS zone,age × aspect, and age × aspect × DFS zone. A similar modelwas used to test for differences in tree density by tree DBHsize classes (size), stand age classes (age), and size × age in-teractions, except size was nested within stand. Mean differ-ences were assessed using Fisher’s least significantdifference test with a = 0.05.Community composition of each vegetation layer was
tested for differences between DFS zones and to group simi-lar DFS zones into distinct plant community types; for this,we used permutational multivariate analysis of variance (An-derson 2001; R version 2.8.1 (2008); The R Foundation forStatistical Computing (available from http://www.r-project.org/). Species present on <5% of subplots were removed,and data were standardized by species maxima and stand to-tals as recommended by McCune and Grace (2002). To cor-rectly account for the whole- and split-plot error terms, theanalysis proceeded in two stages as recommended by Ander-son et al. (2008). First, the whole-plot model with four terms(stand, aspect, age, aspect × age) was analyzed using stand-level centroids (n = 25). If the whole-plot model was signifi-cant, the split-plot model with five terms (stand, DFS zone,age × DFS zone, aspect × DFS zone, DFS zone × aspect ×age) was tested using data from all DFS zones (n = 200 fortrees and shrubs, n = 225 for herbs). Where necessary, pair-wise tests were conducted to identify differences in mean val-ues. We were particularly interested in the age, DFS zone,and age × DFS zone terms. The interaction term was not sig-nificant for the vast majority of variables, so results are pre-sented separately for stand age and DFS zone.We used Indicator Species Analysis (R version 2.8.1) to
identify species that were strongly associated with the distinctcommunities identified in the compositional analyses (Du-frêne and Legendre 1997; McCune and Grace 2002). Thistechnique considers the abundance and fidelity of each spe-cies to a particular group; calculated indicator values rangefrom 0 (not present) to 100 (perfect indication) (McCuneand Grace 2002). Only species with strong indicator values(>25) that were statistically significant were considered to be
Table 2. Physical features of riparian landforms for all 25 sites (n = 8 plots per site) (data are sum-marized as mean (±SE)).
Landform No. of plots Transect slope (%)Distance fromstream (m)
Height abovestream (m)
Floodplain 9 9 (±1.3) 2.2 (±1.5) 1.0 (±0.2)Low terrace 1 35 0.0 3.5High terrace 2 12 (±0.4) 15.0 (±5.0) 5.3 (±0.6)Transitional slope 23 50 (±4.8) 3 (±1.4) 5.1 (±0.5)Slope 165 48 (±1.8) 41.6 (±1.5) 24.3 (±0.9)
D’Souza et al. 263
Published by NRC Research Press
Can
. J. F
or. R
es. D
ownl
oade
d fr
om w
ww
.nrc
rese
arch
pres
s.co
m b
y C
SP S
taff
on
01/2
7/12
For
pers
onal
use
onl
y.

indicators. Species functional characteristics were summar-ized for common species that occurred in >5% of all sampleunits.
Results
Site characteristicsAll stands had high canopy cover (mean of 94%); canopy
cover did not differ among DFS zones (p = 0.3094) or standage classes (p = 0.0733). Riparian landform type exhibitedlittle variation among DFS zones, as the topography was con-sistent and steep (averaging 51% slope, p = 0.5630). Thegreatest diversity of landforms was found immediately adja-cent to the stream: 60% floodplain, 32% low terrace, and 8%high terrace; however, in nearly all cases, landforms changedwithin the first 10 m (68%) to a slope landform and, thus, thelandform type for the DFS zone was classified as “transitionslope” (Table 2). Slopes were the only landform at all sitesfrom distances 30–80 m upslope. Due to the lack of variationin canopy cover and landform, we did not statistically testtheir effects on vegetation variables. In addition, aspect didnot affect any site variables and had no main effects on vege-tation variables.
Distance from streamTotal tree density averaged 514 trees·ha–1 and stand basal
area averaged 56.6 m2·ha–1; neither variable differed withDFS (p = 0.3243 and p = 0.2445, respectively). Hardwoodtree density was significantly higher in streamside plots thanin those farther from the stream, while conifer density in-creased with DFS (Fig. 2a). However, tree basal area did notdiffer with DFS for either taxonomic group (Fig. 2b). MeanDBH did not differ with DFS (p = 0.3790).Seven tree species occurred in the overstory (Abies amabi-
lis Douglas ex J. Forbes, Acer macrophyllum Pursh, Alnusrubra Bong., Prunus emarginata (Dougl. ex Hook.) D.Dietr., P. menziesii, T. plicata, and T. heterophylla), but P.menziesii and T. heterophylla comprised most (>75%) of thebasal area and tree density. These two species accounted forsimilar amounts of the stand basal area (43% and 40%, re-spectively), but T. heterophylla accounted for more of thetree density (52%) than P. menziesii (25%). Tree communitycomposition was similar across DFS zones (p = 0.172). Treerichness averaged 1.8 species per plot and did not differamong DFS zones (Fig. 2c).In total, 106 vascular plant species were identified in this
study. The herb layer comprised 95% of all species encoun-tered; the shrub layer contained only 23% of species.Although there was considerable overlap between these twolayers, five species were unique to the shrub layer: Oemleriacerasiformis, Rosa gymnocarpa, Rosa nutkana, Salix sitchen-sis, and Taxus brevifolia. Seven tree species were also presentin both the shrub and herb layers. Common species (thosethat occurred in >5% of all sample units) were mostly native(97%), facultative (56%), shade tolerant (78%), and perennialforbs or woody species (76%) Table 3).Moss cover was highest in the two subplots closest to the
stream (Fig. 3a), while herbaceous cover was significantlyhigher only at the stream (Fig. 3b). Herb richness was highestat the stream edge, declined to 40 m, and remained consistentthereafter (Fig. 3c). Shrub cover was greatest at the stream,
intermediate at 15 m, and lowest from 25 m upslope(Fig. 3d). Shrub richness was also highest at the streamedge, declined to 35 m, and was consistent thereafter(Fig. 3e). Of the 101 herb layer species, 66% were found atthe streamside subplots (DFS zone 0 m) compared with 54%in the transitional areas (DFS zones 10, 20, and 30 m), and36% in upslope areas (DFS zones >30 m).Shrub and herb layer community composition differed sig-
nificantly among DFS zones; in both layers, three distinctvegetation communities were evident: riparian areas (0–9 m),transitional areas (10–29 m), and upslope areas (30–80 m).Twelve species were indicators of these classes (Table 4)
Tre
e r
ichness
(spp.·
100 m
)–
2S
tand b
asal are
a (
m·h
a)
2–
1T
ree d
ensity (
trees·h
a)
–1
Distance from stream (m)
Fig. 2. Effect of distance from stream on hardwood and conifer (a)tree density, (b) stand basal area, and (c) total tree species richness.Bars indicate standard errors. For a given variable, letters indicatestatistically significant differences among distance from streamzones.
264 Can. J. For. Res. Vol. 42, 2012
Published by NRC Research Press
Can
. J. F
or. R
es. D
ownl
oade
d fr
om w
ww
.nrc
rese
arch
pres
s.co
m b
y C
SP S
taff
on
01/2
7/12
For
pers
onal
use
onl
y.

with some overlap between herb and shrub layers. In the herblayer, four herbs and one shrub were indicators of riparianareas; the strongest indicator, Cardamine angulata, is a facul-tative wetland species. In the shrub layer, three shrub species,Ribes bracteosum, Rubus spectabilis, and Oplopanax horri-dus, were indicators of riparian areas. The combined coverof these three species accounted for most of the shrub coverin the riparian area (60%) and less in the other communities(22% in transitional areas and 7% upslope areas). Vancouve-ria hexandra, a late-successional perennial forb, was the onlyindicator species found solely in transitional areas. Multiplespecies were indicators of both transitional and either riparianor upslope areas. Two species, Polystichum munitum (faculta-tive upland) and Berberis nervosa (obligate upland), were in-dicators of upslope areas.
Stand ageTree density was similar across stand ages, but basal area
was significantly higher in old than in young and maturestands (Table 5). Tree diameter did not vary by stand age(p = 0.4904), although young stands had fewer large treesthan old stands (Table 5). Tree species composition and rich-ness did not differ across age classes (Table 5), although thedensity of P. menziesii was 40% lower (85 versus 140 tree-s·ha–1) and that of T. plicata was 222% higher (112 versus35 trees·ha–1) in young than in old stands.Moss and herb covers did not differ among age classes
(Figs. 4a and 4b). Shrub cover was nearly double in oldthan in young and mature stands (Fig. 4c). Herb richnesswas highest in young stands, while shrub richness tended tobe higher in old stands (Figs. 4d and 4e).
Table 3. All common understory species (present on >5% of all sample units) in herb and shrub layers,with lifeform, origin, successional status, wetland indicator status, and shade tolerance.
Species Lifeform* Origin†Successionalstatus‡
Wetlandindicator§
Shadetolerance∥
Acer circinatum W N R FAC TAthyrium filix-femina F N R FAC TBerberis nervosa W N R UPL TBlechnum spicant F N R, LS FAC MBromus vulgaris G N R UPL TCardamine angulata P N I FACW N/ACircaea alpine P N R FAC TCorydalis scouleri P N R FAC N/ADicentra formosa P N I FACU TDryopteris austriaca F N R FAC N/AGalium triflorum P N R FACU N/AGaultheria shallon W N R FACU TLactuca muralis A E I NOL N/ALuzula parviflora G N I FAC TMaianthemum dilatatum P N R FAC N/AMontia sibirica A N I FAC TOplopanax horridus W N R FAC N/AOxalis oregano P N R NOL N/APolystichum munitum F N R FACU TRibes bracteosum W N R FAC N/ARubus spectabilis W N R FAC MRubus ursinus W N R FACU ISambucus racemosa W N R FACU TThuja plicata W N R FAC TTiarella trifoliata P N R, LS FAC N/ATolmiea menziesii P N R FAC N/ATrillium ovatum P N R, LS FACU N/ATsuga heterophylla W N R FACU TVaccinium ovalifolium W N R UPL MVaccinium parvifolium W N R NOL TVancouveria hexandra P N R NOL N/AViola sempervirens P N R NOL N/A
*Lifeforms: W, woody shrubs and tree seedlings; F, ferns; G, graminiods; P, perennial forbs; A, annual forbs (adaptedfrom the PLANTS database (USDA NRCS 2010)).
†Orgin status: N, native; E, exotic (USDA NRCS 2010).‡Successional status: R, residual species (Dyrness 1973; Halpern 1989); I, invader species (Dyrness 1973; Halpern
1989); LS, late seral species (McKenzie et al. 2000).§Wetland indicator status: FAC, facultative species; UPL, obligate upland species; FACW, facultative wetland species;
FACU, facultative upland species; NOL, not on list for USDA Region 9 (USDA NRCS 2010).∥Shade tolerance: T, tolerant; M, intermediate; I, intolerant; N/A, not available (USDA NRCS 2010).
D’Souza et al. 265
Published by NRC Research Press
Can
. J. F
or. R
es. D
ownl
oade
d fr
om w
ww
.nrc
rese
arch
pres
s.co
m b
y C
SP S
taff
on
01/2
7/12
For
pers
onal
use
onl
y.

Community composition by stand age class varied betweenherb and shrub layers. In the shrub layer, community compo-sition of old stands differed from those of the mature andyoung stands. In the herb layer, community composition dif-fered among all stand age classes. Fifteen species were iden-tified as indicators of one or more of stand ages (Table 6).Young stands had three indicator species, old stands hadseven indicator species, and no species were indicators solelyof mature stands. Herb layer species consisted primarily ofperennial residual species with few invader or annual speciespresent. All but one species was native, the exception beingLactuca muralis, an exotic, annual, invader species that wasan indicator of young and mature stands but was absent inold stands. Old stands supported some late-successional herbspecies (Blechnum spicant and Trillium ovatum) but differedin community composition primarily due to increased pres-
ence of shade-tolerant, residual shrubs (Acer circinatum, B.nervosa, Gaultheria shallon, Vaccinium ovalifolium, andVaccinium parviflorum) and saplings of shade-tolerant trees.
Discussion
This study examined spatial and temporal vegetation pat-terns along small fish-bearing streams in temperate managedforests. We found that distance from stream and stand age in-fluenced the plant community, but acted independently. Wesuggest that vegetation patterns found with distance fromstream are governed by the geomorphic and fluvial settingsthat influence the disturbance patterns and moisture availabil-ity along small montane streams, while the demonstratedtemporal patterns were consistent with successional processesfound with stand development. Plant attributes differed be-
Shru
b r
ichness
(spp.·
10 m
tra
nsect
)–
1S
hru
b c
over
(%)
Herb
ric
hness
(spp.·
m)
–2
Herb
cover
(%)
Moss c
over
(%)
Fig. 3. Effect of distance from stream on (a) moss cover, (b) herb cover, (c) herb richness, (d) shrub cover, and (e) shrub richness. Barsindicate standard errors. For a given variable, letters indicate statistically significant differences among distance from stream zones.
266 Can. J. For. Res. Vol. 42, 2012
Published by NRC Research Press
Can
. J. F
or. R
es. D
ownl
oade
d fr
om w
ww
.nrc
rese
arch
pres
s.co
m b
y C
SP S
taff
on
01/2
7/12
For
pers
onal
use
onl
y.

tween herb, shrub, and tree layers. There were few differen-ces in overstory vegetation with distance from stream orstand age. Herb and shrub layers displayed three distinctunderstory plant communities running perpendicular to thestream: riparian areas (0–10 m), transitional areas (10–30 m), and upslope areas (30–80 m). Additionally, herb com-position differed between all age classes with greatest speciesrichness in young stands, while shrub cover and species rich-ness were highest in old stands.
Distance from streamWe found that riparian areas on small fish-bearing streams
possessed limited areas with environmental conditions suit-able for floodplain plant species. Riparian landforms at ourstudy sites were relatively homogeneous; the greatest land-form diversity was observed within 10 m of the channeledge, which correspond to the narrow (10 m) riparian plantcommunities that we identified based on the herb and shrublayers. Vegetation along small streams is greatly influencedby underlying geomorphic processes that shape the stream
valley and landforms (Goebel et al. 2006). The incised val-leys found at our study sites restrict stream movement andcreate fewer fluvial landforms that are located immediatelyadjacent to the channel. The spatial compression and restric-tion of low-lying landforms creates a narrow riparian zonealong the channel that is a common feature in the V-shapedvalleys typical along streams in mountainous terrain (Pabstand Spies 1998; Rot et al. 2000).In addition to riparian landforms, the vegetation gradient
from stream edge to upslope at our study stands is likely in-fluenced by differing environmental gradients (Pabst andSpies 1999; Lyon and Sagers 2003). We did not observe dif-ferences in site characteristics (e.g., canopy cover or slopeconditions) with distance from stream, but other studiesfound that riparian areas along confined, small streams com-monly exhibit a physical environment characterized by verysteep environmental gradients in soil moisture, humidity, flu-vial disturbance, and light availability (Richardson and Da-nehy 2007). Vegetation response to environmental gradientsbased on plant traits can vary by functional group (Lyon and
Table 4. Herb and shrub indicator species from riparian (R) (0–9 m), transitional (T) (10–29 m), and upslope (UP) (30–80 m) areas.
R versus T R versus UP T versus UP
Species R T p R UP p T UP pHerb layerCardamine angulata R 61.0 0.4 0.001 62.3 0.1 0.001 5.1 1.0 0.214Circaea alpina R 30.8 3.2 0.018 39.6 0.0 0.001 13.5 0.1 0.005Ribes bracteosum R 44.1 0.5 0.001 47.7 0.0 0.001 5.6 0.0 0.035Rubus spectabilis R 23.5 1.3 0.013 26.2 0.4 0.001 5.9 1.6 0.379Tolmiea menziesii R 59.1 2.4 0.001 68.0 0.0 0.001 17.9 0.0 0.001Athyrium filix-femina R–T 39.6 15.8 0.066 60.9 1.7 0.001 32.7 2.3 0.001Oxalis oregana R–T 41.2 39.6 0.386 44.5 16.0 0.004 35.9 17.6 0.023Vancouveria hexandra T 1.7 29.3 0.033 2.4 12.8 0.430 20.7 6.2 0.036Polystichum munitum T–UP 26.3 64.4 0.006 26.7 60.4 0.005 48.8 44.9 0.564Berberis nervosa UP 0.0 20.0 0.04 0.0 45.3 0.004 3.3 37.7 0.003Shrub layerRibes bracteosum R 44.1 1.5 0.002 51.2 0.0 0.001 9.2 0.1 0.010Oplopanax horridus R–T 42.0 7.5 0.006 51.2 0.0 0.001 27.6 0.3 0.001Rubus spectabilis R–T 44.5 13.1 0.021 62.9 1.0 0.001 32.9 1.8 0.001Vaccinium ovalifolium T 0.2 26.7 0.020 0.4 8.6 0.298 20.1 2.7 0.002
Note: For each comparison, the data shown are the habitat indicator value in each zone and the p value for the larger indicatorvalue. Strong habitat indicator species (shown in bold) have indicator value > 25 and p ≤ 0.05.
Table 5. Overstory vegetation characteristics and tree sapling density (mean (±SE)) for young, mature, and old stand age classes.
Stand age class
Overstory vegetation characteristic Young (31–51 years) Mature (52–70 years) Old (100+ years) pCanopy cover (%) 93.1 (±0.6) 93.9 (±0.5) 95.7 (±0.9) 0.0654Tree density (trees·ha–1) 468.7 (±47.8) 534.1 (±45.5) 562.5 (±75.5) 0.4188Density by size class 0.0304Small trees <25 cm DBH (%) 36.0 (±4.0) 37.0 (±3.8) 47.8 (±6.4) —Midsized trees 25–50 cm DBH (%) 54.3 (±4.0)a 44.7 (±3.8)ab 30.8 (±6.4)b —Large trees >50 cm DBH (%) 9.7 (±4.0)a 18.3 (±3.8) b 21.4 (±6.4)b —Stand basal area (m2·ha–1) 44.7 (±5.4)a 57.7 (±5.2)ab 79.6 (±8.7)b 0.0081Tree diameter (DBH) 30.9 (±1.5) 32.9 (±1.4) 32.8 (±2.4) 0.4904Tree species richness per site 3.7 (±0.3) 3.4 (±0.3) 3.5 (±0.5) 0.2784Sapling density (trees·ha–1) 71.3 (±27.6) 38.4 (±26.4) * 0.3535
Note: For a given variable, letters indicate statistically significant differences among stand age classes.*Missing data.
D’Souza et al. 267
Published by NRC Research Press
Can
. J. F
or. R
es. D
ownl
oade
d fr
om w
ww
.nrc
rese
arch
pres
s.co
m b
y C
SP S
taff
on
01/2
7/12
For
pers
onal
use
onl
y.

Sagers 2003) and can be influenced by stream size (Lamband Mallik 2003). Low-ordered streams can have an over-story composition in the riparian area similar to upslope,while unique understory plant communities are present nearstream (Acker et al. 2003; Hagan et al. 2006). On the slightlylarger fish-bearing streams that we studied, overstory trees re-sponded to environmental conditions with greater proportionsof hardwoods at the streamside and understory plants had adistinct transitional community. Because of their larger maxi-mum size, the spatial scale at which patterning is detectablefor trees is greater than that for understory vegetation, dem-onstrating that herbs and shrubs are better indicators for thecompressed environmental gradients found in smaller riparianareas along confined channels.Despite their limited size, the riparian plant communities
along our study streams were more diverse and supported a
plant community distinct from that on the transitional andupland surfaces. Similar to others, we found a pattern of de-creasing abundance and species richness of understory herbsand shrubs (Pabst and Spies 1998; Dieterich et al. 2006) andmoss (Stewart and Mallik 2006) with distance from stream.Additionally, upslope plant communities had less understoryplant cover and few indicator species. The mechanisms re-sponsible for maintaining the gradient in plant communitycharacteristics along these small streams could be related tosusceptibility to fluvial disturbance and moisture availability.In this study, indicator species followed a gradient of faculta-tive wetland species in the riparian areas to facultative andobligate upland species in upslope habitats, suggesting amoisture gradient. Similar patterns in indicator species werereported by Goebel et al. (2006). Moss cover was highestclosest to the stream, further suggesting a moist microclimate
Herb
ric
hness (
spp.·
m)
–2
Herb
cover
(%)
Moss c
over
(%)
Shru
b c
over
(%)
Shru
b r
ichness (
spp.·
site
)–
1
Fig. 4. Effect of stand age class on (a) moss cover, (b) herb cover, (c) herb richness, (d) shrub cover, and (e) shrub richness. Bars indicatestandard errors. For a given variable, letters indicate statistically significant differences among stand age classes.
268 Can. J. For. Res. Vol. 42, 2012
Published by NRC Research Press
Can
. J. F
or. R
es. D
ownl
oade
d fr
om w
ww
.nrc
rese
arch
pres
s.co
m b
y C
SP S
taff
on
01/2
7/12
For
pers
onal
use
onl
y.

favorable to mosses (Hylander et al. 2002; Stewart and Mal-lik 2006) extended only a relatively short distance from thestream.
Effects of stand ageDespite differences in management history or stand initia-
tion processes, the vegetation at our study sites displayedsuccessional trends similar to those in found in natural forestsecosystems (Franklin et al. 2002). It is likely that the initialsite conditions found at all of our sites varied considerablywithin and between stands due to site variation and differenttypes and intensities of management activities and fire pres-ence (e.g., use of broadcast burning, wildfire, etc.). Whilethe initial effects of these activities remain unknown, theirimpacts on vegetation establishment and growth have likelydiminished over time as the stands developed. For example,a comparison of stands that initiated after logging or naturalwildfire in two age classes (25–40 and 70–100 years old)found few long-term effects on plant species diversity, com-position, or productivity between stands (Reich et al. 2001).Additionally, short-term effects of silviculture practices (Bai-ley et al. 1998; Thomas et al. 1999) may not be present inolder stands. A study of mature stands (51 years) found thatthinning and fertilization had few long-term effects (27 yearsafter treatment) on understory species richness or cover (Heand Barclay 2000). Similarities in understory vegetation atsites with differing stand histories suggest that plants arequite resilient to environmental change and that successionalprocesses are significant for predicting long-term vegetationresponse after short-term disturbance impacts have subsided.Early-successional patterns in managed forests are charac-
terized by shifts in abundance of residual and invader species(Halpern 1989). Consequently, plant species diversitythrough stand development is highest in early succession be-fore canopy closure, lowest in midsuccessional stands after
canopy closure, and intermediate in late succession as canopystructure diversifies (Jules et al. 2008). Most previous studieshave focused on the early aspects of this developmental se-quence (Halpern 1988; Schoonmaker and McKee 1988). Ourmidsuccessional stands were primarily composed of perennialresidual species with few invader or annual species and de-clining species richness. This suggests a general resiliency inthe plant community with a short-term presence of invaderspecies, which decline with increased presence of shade-tol-erant, residual shrubs (Schoonmaker and McKee 1988;Moola and Vasseur 2008). Unique from other studies, the ob-served differences were not related to overstory canopy cover,which was high in all stands, although the increased shrublayer cover likely further reduced light availability for theherbaceous layer in old stands, thus creating conditionswhere only the most shade-tolerant species could persist onthe forest floor.Although riparian and upslope areas had distinct composi-
tions, the absence of an age and distance from stream interac-tion indicates that riparian and upslope forests followedsimilar successional trajectories. Distance from stream pat-terns were consistent across varying stand ages, even thoughsteepness and stand initiations differed; either these differ-ence did not have a measureable impact or we were unableto detect interactions due to lack of statistical power. Thesimilarity in forest conditions in riparian areas along smallstreams and upslope areas is likely a reflection of the limitedoccurrence of low-lying landforms along these streams andthe fact that the types of disturbances most likely to impactthese riparian areas occur only rarely, such as debris torrentsor fire. Over time, we suspect that our stands will continue tofollow the successional patterns found in natural stands andwill achieve greater complexity and more open conditions asvertical and horizontal diversification occurs (Franklin et al.2002; Jules et al. 2008).
Table 6. Herb and shrub indicator species associated with young (Y), mature (M), and old (O) stand age classes.
Y versus M Y versus O M versus O
Species Y M p Y O p M O pHerb layerAthyrium filix-femina Y 24.4 7.5 0.035 32.5 3.1 0.027 14.1 4.5 0.325Galium triflorum Y 33.0 4.6 0.007 39.4 0.2 0.002 19.7 0.9 0.049Lactuca muralis Y–M 13.5 17.2 0.695 30.5 0.1 0.003 29.9 0.0 0.009Oxalis oregana Y–M 46.3 15.9 0.001 68.9 0.0 0.001 48.5 0.0 0.001Rubus ursinus Y–O 31.3 2.4 0.001 25.8 12.3 0.332 4.4 26.8 0.007Blechnum spicant Y–O 32.9 3.1 0.001 11.7 28.4 0.331 1.4 34.8 0.001Berberis nervosa M–O 6.2 27.1 0.011 3.1 49.4 0.001 11.3 41.7 0.007Gaultheria shallon O 17.9 5.1 0.075 8.6 47.9 0.002 2.8 55.6 0.001Trillium ovatum O 16.9 0.4 0.002 7.7 16.4 0.267 0.3 25.7 0.001Shrub layerRubus spectabilis Y 22.2 9.1 0.108 35.8 1.0 0.007 17.9 1.2 0.120Acer circinatum Y–O 25.8 7.2 0.017 21.3 19.7 0.806 8.2 27.2 0.032Gaultheria shallon O 1.8 9.2 0.753 0.2 46.5 0.001 0.1 48.7 0.001Thuja plicata O 5.8 4.4 0.782 0.6 56.0 0.001 0.5 56.1 0.001Tsuga heterophylla O 13.9 6.1 0.219 3.0 65.4 0.001 1.4 68.0 0.001Vaccinium ovalifolium O 13.5 0.3 0.002 2.9 30.2 0.001 0.1 36.6 0.001Vaccinium parviflorum O 23.7 13.3 0.242 15.9 36.9 0.035 10.5 43.3 0.004
Note: For each comparison, the data shown are the habitat indicator value in each zone and the p value for the larger indicator value.Strong habitat indicator species (shown in bold) have indicator value > 25 and p ≤ 0.05.
D’Souza et al. 269
Published by NRC Research Press
Can
. J. F
or. R
es. D
ownl
oade
d fr
om w
ww
.nrc
rese
arch
pres
s.co
m b
y C
SP S
taff
on
01/2
7/12
For
pers
onal
use
onl
y.

ConclusionsCumulatively in length, small fish-bearing streams com-
prise a substantial portion of regulated streams requiring buf-fers but are less studied than headwater or larger systems.These results examine the legacy of disturbance effects byfire and historical management practices such as logging tothe stream prior to the establishment of riparian buffers.Understanding the long-term response of riparian vegetationalong small streams to disturbance can help ensure that theecological properties of these areas are adequately protected.Riparian areas found on these streams support distinct anddiverse riparian plant communities that are limited in sizebut disproportionally important for conservation. Current for-est practices require riparian buffers that range in mean widthfrom ∼15 to 29 m (Lee et al. 2004). In this study, we foundthat riparian plant communities extended from the streamedge out 9 m with transitional plant communities from 10 to29 m from the stream edge. This study suggests that currentbuffer requirements should protect the riparian plant com-munities on small streams, but management activities couldinfluence transitional communities. In the future, riparianbuffers will support the majority of unharvested, older forestswithin managed forest landscape. Therefore, these areas areof considerable ecological significance within managed land-scapes. Additional research on the effects of forest manage-ment on the vegetation of streamside areas will be requiredto more fully appreciate how these systems are responding tocurrent buffer requirements.
AcknowledgmentsWe thank Steve Duke for statistical assistance, Janette
Bach for spatial analysis support, David Giblin for plant iden-tifications, John Heffner, Storm Beech, Peter James, SelinaHunstiger, John Cousins, Roxanne Nanninga, Scott Groce,and Kevin Biner for their excellent field support, and severalanonymous reviewers for their helpful input.
ReferencesAcker, S.A., Gregory, S.V., Lienkaemper, G., McKee, W.A.,
Swanson, F.J., and Miller, S.D. 2003. Composition, complexity,and tree mortality in riparian forests in the central WesternCascades of Oregon. For. Ecol. Manage. 173(1–3): 293–308.doi:10.1016/S0378-1127(02)00005-1.
Anderson, M.J. 2001. A new method for non-parametric multivariateanalysis of variance. Austral Ecol. 26(1): 32–46.
Anderson, M.J., Gorley, R.N., and Clarke, K.R. 2008. PERMA-NOVA+ for PRIMER: guide to software and statistical methods.PRIMER-E Ltd., Plymouth, U.K.
Bailey, J.D., Mayrsohn, C., Doescher, P.S., Pierre, E., and Tappeiner,J.C. 1998. Understory vegetation in old and young Douglas-firforests of western Oregon. For. Ecol. Manage. 112(3): 289–302.doi:10.1016/S0378-1127(98)00408-3.
Bilby, R.E., and Ward, J.W. 1991. Characteristics and function oflarge woody debris in streams draining old-growth, clear-cut, andsecond-growth forests in southwestern Washington. Can. J. Fish.Aquat. Sci. 48(12): 2499–2508. doi:10.1139/f91-291.
Canfield, R.H. 1941. Application of the Line Interception Method insampling range vegetation. J. For. 39(4): 388–394.
Dahlström, N., Jönsson, K., and Nilsson, C. 2005. Long-term dynamicsof large woody debris in a managed boreal forest stream. For. Ecol.Manage. 210(1–3): 363–373. doi:10.1016/j.foreco.2005.02.022.
Dieterich, M., Woodcock, T., Adams, K., and Mihuc, T. 2006.Indirect effects of forest management on riparian zone character-istics in the Adirondack uplands of New York. North. J. Appl. For.23(4): 273–279.
Drucker, D.P., Costa, F.R.C., and Magnusson, W.E. 2008. How wideis the riparian zone of small streams in tropical forests? A test withterrestrial herbs. J. Trop. Ecol. 24(1): 65–74. doi:10.1017/S0266467407004701.
Dufrêne, M., and Legendre, P. 1997. Species assemblages andindicator species: The need for a flexible asymmetrical approach.Ecol. Monogr. 67(3): 345–366.
Dyrness, C.T. 1973. Early stages of plant succession followinglogging and burning in the western Cascades of Oregon. Ecology,54(1): 57–69. doi:10.2307/1934374.
Evans, R.L. 1987. Soil survey of Lewis County, Washington. USDASoil Conservation Service, Washington State Department ofNatural Resources, and Washington State University AgriculturalResearch Center, Pullman, Wash.
Franklin, J.F., and Dyrness, C.T. 1988. Natural vegetation of Oregonand Washington. Oregon State University Press, Corvallis, Ore.
Franklin, J.F., Spies, T.A., Van Pelt, R., Carey, A.B., ThornburghDale, A., Berg, D.R., Lindenmayer, D.B., Harmon, M.E., Keeton,W.S., Shaw, D.C., Bible, K., and Chen, J. 2002. Disturbances andstructural development of natural forest ecosystems with silvicul-tural implications, using Douglas-fir forests as an example. For.Ecol. Manage. 155(1–3): 399–423. doi:10.1016/S0378-1127(01)00575-8.
Goebel, P.C., Pregitzer, K.S., and Palik, B.J. 2006. Landscapehierarchies influence riparian ground-flora communities inWisconsin, USA. For. Ecol. Manage. 230(1–3): 43–54. doi:10.1016/j.foreco.2006.04.035.
Grime, J.P. 2001. Plant strategies, vegetation processes, andecosystem properties. 2nd ed. John Wiley & Sons, Inc., New York.
Hagan, J.M., Pealer, S., and Whitman, A.A. 2006. Do small headwaterstreams have a riparian zone defined by plant communities? Can. J.For. Res. 36(9): 2131–2140. doi:10.1139/x06-114.
Halpern, C.B. 1988. Early successional pathways and the resistanceand resilience of forest communities. Ecology, 69(6): 1703–1715.doi:10.2307/1941148.
Halpern, C.B. 1989. Early successional patterns of forest species:interactions of life history traits and disturbance. Ecology, 70(3):704–720. doi:10.2307/1940221.
Halpern, C.B., and Spies, T.A. 1995. Plant species diversity in naturaland managed forests of the Pacific northwest. Ecol. Appl. 5(4):913–934. doi:10.2307/2269343.
He, F., and Barclay, H.J. 2000. Long-term response of understoryplant species to thinning and fertilization in a Douglas-firplantation on southern Vancouver Island, British Columbia. Can.J. For. Res. 30(4): 566–572. doi:10.1139/x99-237.
Hitchcock, C.L., and Cronquist, A. 1998. Flora of the PacificNorthwest. 11th ed. University of Washington Press, Seattle,Wash., and London, U.K. pp. 1–730.
Hunt, S.L., Gordon, A.M., Morris, D.M., and Marek, G.T. 2003.Understory vegetation in northern Ontario jack pine and blackspruce plantations: 20-year successional changes. Can. J. For. Res.33(9): 1791–1803. doi:10.1139/x03-088.
Hylander, K., Jonsson, B.G., and Nilsson, C. 2002. Evaluating bufferstrips along boreal streams using bryophytes as indicators. Ecol.Appl. 12(3): 797–806. doi:10.1890/1051-0761(2002)012[0797:EBSABS]2.0.CO;2.
Jules, M.J., Sawyer, J.O., and Jules, E.S. 2008. Assessing therelationships between stand development and understory vegeta-tion using a 420-year chronosequence. For. Ecol. Manage. 255(7):2384–2393. doi:10.1016/j.foreco.2007.12.042.
270 Can. J. For. Res. Vol. 42, 2012
Published by NRC Research Press
Can
. J. F
or. R
es. D
ownl
oade
d fr
om w
ww
.nrc
rese
arch
pres
s.co
m b
y C
SP S
taff
on
01/2
7/12
For
pers
onal
use
onl
y.

Lamb, E.G., and Mallik, A.U. 2003. Plant species traits across ariparian-zone/forest ecotone. J. Veg. Sci. 14(6): 853–858. doi:10.1111/j.1654-1103.2003.tb02218.x.
Lee, P., Smyth, C., and Boutin, S. 2004. Quantitative review ofriparian buffer width guidelines from Canada and the UnitedStates. J. Environ. Manage. 70(2): 165–180. doi:10.1016/j.jenvman.2003.11.009.
Lemmon, P.E. 1956. A spherical densiometer for estimating forestoverstory density. For. Sci. 2(4): 314–320.
Littell, R.C., Milliken, G.A., Stroup, W.P., Wolfinger, R.D., andSchabenberger, O. 2006. SAS for mixed models. 2nd ed. SASInstitute Inc., Cary, N.C.
Lyon, J., and Sagers, C.L. 2003. Correspondence analysis offunctional groups in a riparian landscape. Plant Ecol. 164(2):171–183. doi:10.1023/A:1021225819446.
McCune, B., and Grace, J.B. 2002. Analysis of ecologicalcommunities. MjM Software Design, Gleneden Beach, Ore.
McKenzie, D., Halpern, C.B., and Nelson, C.R. 2000. Overstoryinfluences on herb and shrub communities in mature forests ofwestern Washington, U.S.A. Can. J. For. Res. 30(10): 1655–1666.doi:10.1139/x00-091.
Moola, F.M., and Vasseur, L. 2008. The maintenance of understoryresidual flora with even-aged forest management: a review oftemperate forests in northeastern North America. Environ. Rev. 16:141–155. doi:10.1139/A08-005.
Naiman, R.J., Décamps, H., and McClain, M.E. 2005. Riparia:ecology, conservation and management of streamside commu-nities. Elsevier Academic Press, Burlington, Mass.
Pabst, R.J., and Spies, T.A. 1998. Distribution of herbs and shrubs inrelation to landform and canopy cover in riparian forests of coastalOregon. Can. J. Bot. 76(2): 298–315. doi:10.1139/b97-174.
Pabst, R.J., and Spies, T.A. 1999. Structure and composition ofunmanaged riparian forests in the coastal mountains of Oregon,USA. Can. J. For. Res. 29(10): 1557–1573. doi:10.1139/x99-133.
Pringle, R.F. 1990. Soil survey of Thurston County, WA. USDA Soil
Conservation Service, Washington State Department of NaturalResources, and Washington State University Agricultural ResearchCenter, Pullman, Wash.
Reich, P.B., Bakken, P., Carlson, D., Frelich, L.E., Friedman, S.K.,and Grigal, D.F. 2001. Influence of logging, fire, and forest typeon biodiversity and productivity in southern boreal forests.Ecology, 82(10): 2731–2748. doi:10.1890/0012-9658(2001)082[2731:IOLFAF]2.0.CO;2.
Renöfålt, B.M., Nilsson, C., and Jansson, R. 2005. Spatial andtemporal patterns of species richness in a riparian landscape. J.Biogeogr. 32(11): 2025–2037. doi:10.1111/j.1365-2699.2005.01328.x.
Richardson, J.S., and Danehy, R.J. 2007. A synthesis of the ecologyof headwater streams and their riparian zones in temperate forests.For. Sci. 53(2): 131–147.
Rot, B.W., Naiman, R.J., and Bilby, R.E. 2000. Stream channelconfiguration, landform, and riparian forest structure in theCascade Mountains, Washington. Can. J. Fish. Aquat. Sci. 57(4):699–707. doi:10.1139/f00-002.
Schabenberger, O., and Pierce, F.J. 2002. Contemporary statisticalmodels for the plant and soil sciences. CRC Press LLC, BocaRaton, Fla.
Schoonmaker, P., and McKee, A. 1988. Species composition anddiversity during secondary succession of coniferous forests in thewestern Cascade Mountains of Oregon. For. Sci. 34(4): 960–979.
Stewart, K.J., and Mallik, A.U. 2006. Bryophyte responses tomicroclimatic edge effects across riparian buffers. Ecol. Appl. 16(4): 1474–1486. doi:10.1890/1051-0761(2006)016[1474:BRTMEE]2.0.CO;2.
Thomas, S.C., Halpern, C.B., Falk, D.A., Liguori, D.A., and Austin,K.A. 1999. Plant diversity in managed forests: understoryresponses to thinning and fertilization. Ecol. Appl. 9(3): 864–879. doi:10.1890/1051-0761(1999)009[0864:PDIMFU]2.0.CO;2.
USDA NRCS. 2010. PLANTS database. National Plant Data Center,Baton Rouge, LA 70874-4490, USA.
D’Souza et al. 271
Published by NRC Research Press
Can
. J. F
or. R
es. D
ownl
oade
d fr
om w
ww
.nrc
rese
arch
pres
s.co
m b
y C
SP S
taff
on
01/2
7/12
For
pers
onal
use
onl
y.


