Embed Size (px)
Citation preview

M O L E C U L A R O N C O L O G Y 7 ( 2 0 1 3 ) 1 0 1 9e1 0 3 0
ava i l ab le a t www.sc ienced i rec t . com
www.elsevier .com/locate/molonc
SPARCL1 suppresses metastasis in prostate cancer
Yuzhu Xianga,b,1, Qingchao Qiua,i,1, Ming Jiangc,j, Renjie Jinc,Brian D. Lehmanne, Douglas W. Strandc, Bojana Jovanovicf,David J. DeGraffc, Yi Zhenga,b, Dina A. Yousifa, Christine Q. Simmonsa,Thomas C. Casec, Jia Yia, Justin M. Catesg, John Virostkoh, Xiusheng Hei,Xunbo Jinb, Simon W. Haywardc,f, Robert J. Matusikc,f,Alfred L. George Jr.a,d, Yajun Yia,d,*aDepartment of Medicine, Vanderbilt University, Nashville, TN 37232-0275, USAbMinimally Invasive Urology Center, Provincial Hospital Affiliated to Shandong University, Jinan 250021, ChinacVanderbilt Prostate Cancer Center and Department of Urologic Surgery, Vanderbilt University, Nashville,
TN 37232-0275, USAdInstitute for Integrative Genomics, Vanderbilt University, Nashville, TN 37232-0275, USAeDepartment of Biochemistry, Vanderbilt University, Nashville, TN 37232-0275, USAfDepartment of Cancer Biology, Vanderbilt University, Nashville, TN 37232-0275, USAgDepartment of Pathology, Microbiology and Immunology, Vanderbilt University, Nashville, TN 37232-0275, USAhDepartment of Radiology and Radiological Sciences, Vanderbilt University, Nashville, TN 37232-0275, USAiCancer Research Institute and Human Morphology Center, University of South China, Hengyang 421001, ChinajLaboratory of Nuclear Receptors and Cancer Research, Center for Medical Research,
Nantong University Medical School, Nantong, China
A R T I C L E I N F O
Article history:
Received 18 June 2013
Accepted 9 July 2013
Available online 20 July 2013
Keywords:
Prostate cancer
Gene expression signature
Abbreviations: CaP, cancer of the prostatin vivo Imaging System; OX, orthotopic xenGFP-positive PC3-Luc cells expressing empSCID, Severe combined immunodeficient; SP* Corresponding author. Division of Genetic M
0275, USA. Tel.: 615 936 2074; fax: 615 936 26E-mail addresses: [email protected]
[email protected] (R. Jin), [email protected] (B. Jovanovic), davidVanderbilt.edu (D.A. Yousif), christine.simm(J. Yi), [email protected] ([email protected] (S.W. Jin), [email protected] (Y. George Jr.), yajun.yi@vand
1 These authors contributed equally to thi1574-7891/$ e see front matter ª 2013 Publihttp://dx.doi.org/10.1016/j.molonc.2013.07.00
A B S T R A C T
Purpose:Metastasis, the main cause of death from cancer, remains poorly understood at the
molecular level.
Experimental design: Based on a pattern of reduced expression in human prostate cancer tis-
sues and tumor cell lines, a candidate suppressor gene (SPARCL1) was identified. We used
in vitro approaches to determine whether overexpression of SPARCL1 affects cell growth,
migration, and invasiveness. We then employed xenograft mouse models to analyze the
impact of SPARCL1 on prostate cancer cell growth and metastasis in vivo.
e gland; H.E., hematoxylin and eosin; IC, Intracardiac; IHC, Immunohistochemistry; IVIS,ografting; PC3-Luc, the bioluminescent human prostate carcinoma cell line; PC3-luc/EV,ty control vector; PC3-luc/SPARCL1, GFP-positive PC3-Luc cells overexpressing SPARCL1;ARCL1, secreted protein acidic and rich in cysteine-like 1.edicine, 536A Light Hall, Vanderbilt University, 2215 Garland Avenue, Nashville, TN 37232-61.(Y. Xiang), [email protected] (Q. Qiu), [email protected] (M. Jiang), re-
[email protected] (B.D. Lehmann), [email protected] (D.W. Strand), [email protected] (D.J. DeGraff), [email protected] (Y. Zheng), dina.a.yousif@[email protected] (C.Q. Simmons), [email protected] (T.C. Case), [email protected]), [email protected] (J. Virostko), [email protected] (X. He), jin-vanderbilt.edu (S.W. Hayward), [email protected] (R.J. Matusik), [email protected] (Y. Yi).s work.shed by Elsevier B.V. on behalf of Federation of European Biochemical Societies.8
M O L E C U L A R O N C O L O G Y 7 ( 2 0 1 3 ) 1 0 1 9e1 0 3 01020
Meta-analysis
Metastasis
SPARCL1 function in vivo
Results: SPARCL1 expression did not inhibit tumor cell proliferation in vitro. By contrast,
SPARCL1 did suppress tumor cell migration and invasiveness in vitro and tumor metastatic
growth in vivo, conferring improved survival in xenograft mouse models.
Conclusions: We present the first in vivo data suggesting that SPARCL1 suppresses metas-
tasis of prostate cancer.
ª 2013 Federation of European Biochemical Societies.
Published by Elsevier B.V. All rights reserved.
1. Introduction (Esposito et al., 2007), and prostate cancers (Taylor et al.,
In men, cancer of the prostate gland (CaP) is the most
commonly diagnosed non-cutaneous malignancy, accounting
for 29% of all cancer cases and the second most common
cause of death by cancer in the USA. In 2012, an estimated
241,740 men were diagnosed with CaP and 28,170 men died
of CaP (Siegel et al., 2012; Jemal et al., 2010). The majority of
cancer-associated deaths and essentially all CaP deaths are
due to metastases rather than primary tumor burden (Gupta
and Massague, 2006). Thus, decreasing mortality of CaP de-
pends on understanding the biology that underlies metastasis
such as identification of genes involved in cancer metastasis
that would benefit the design of more effective clinical inter-
vention strategies. There is a wealth of evidence indicating
that the acquisition of malignant progression and aggressive
traits of cancer can be promoted or inhibited by a set of
functional genes known as metastasis-regulatory genes in
various cancers (Cher et al., 1999). These can be broadly cate-
gorized as pro-metastasis or metastasis-suppressor genes.
Pro-metastasis genes drive conversion from non-metastatic
to metastatic cells (Seraj et al., 2000). Metastasis-suppressor
genes suppress the formation of metastases without affecting
primary tumor growth (Kauffman et al., 2003), a characteristic
that distinguishes them from tumor-suppressor genes.
To identify candidatemetastasis-regulatory genes in CaP, a
common and straightforward method is to identify a list of
differentially expressed genes (expression signature) from
analysis of transcriptional profiles of CaP correlated with
poor prognosis. However, the single study-based signature is
often underpowered, truncated, and lowquality. These limita-
tions can be overcome by combining related but independent
studies into a meta-analysis for larger sample size and lower
false discovery rate. There are a limited number of published
CaP gene-expression studies having clinical survival outcome
data for meta-analysis. We previously used a robust meta-
analysis of gene expression profiles from hundreds of breast
cancer datasets (Yi et al., 2007; Wu et al., 2009; Qiu et al.,
2013). Using this approach, we discovered a novel and
conserved gene expression signature predictive of metastasis
risk in multiple cancers (breast, lung, and prostate cancer)
(Qiu et al., 2013). We hypothesized that this expression signa-
ture is enriched for genes that are mechanistically involved
with cancer metastasis including CaP. We tested this idea
for a candidate gene, secreted protein acidic and rich in
cysteine-like 1 (SPARCL1).
There are sporadic data illustrating down-regulation of
SPARCL1 in lung (Bendik et al., 1998), colorectal (Yu et al.,
2011), urinary bladder (Zaravinos et al., 2011), pancreatic
2010; Chandran et al., 2007; Yu et al., 2004; Dhanasekaran
et al., 2001; Bendik et al., 1998; Nelson et al., 1998; Hurley
et al., 2012). Recombinant SPARCL1 inhibited spreading and
adhesion of bovine aortic endothelial cells (Brekken et al.,
2004) and endothelial cells on fibronectin substrates in vitro
(Girard and Springer, 1996). When its function was assessed
using cancer cell lines, SPARCL1 inhibited pancreatic
(Esposito et al., 2007) and prostate cancer cell migration and
invasion in vitro but did not restrict the growth of prostate can-
cer cells (Hurley et al., 2012), suggesting that SPARCL1 is a po-
tential suppressor of metastatic progression in prostate
cancer. However, all previous results on SPARCL1 in CaP
were derived from in vitro studies and clinical correlations.
No in vivo data have been published to determine whether
SPARCL1 contributes to CaP metastasis. Experiments, using
a colon cancer cell line overexpressing SPARCL1 and a com-
plementary model, suggested that SPARCL1 could reduce cell
proliferation, anchorage-independent growth, and invasion
in vitro and significantly inhibited orthotopic tumor growth
in vivo. On this basis, Hu et al. concluded that SPARCL1 func-
tions as a tumor suppressor in colon cancer (Hu et al., 2012).
The question of whether SPARCL1 can suppress metastasis
in CaP in vivo has not previously been addressed.
Consistent with previous studies, we found that SPARCL1
was down-regulated among human prostate tissue specimens
and cell lines representing various levels of tumorigenicity
andmetastatic tendencies. However, we show here, in a pros-
tate cancer model, that SPARCL1 does not inhibit tumor cell
growth in vitro but does suppress tumor metastasis in vivo.
Overexpression of SPARCL1 decreased the metastatic poten-
tial of human CaP (PC3) cells in both in vitro functional assays
and in vivo experimental metastasis models. Specifically,
SPARCL1 expression significantly inhibited tumor cell inva-
siveness and migration in vitro and capacity to metastasize
to distant organs in vivo. These observations suggest that
SPARCL1 can suppress metastasis in human CaP.
2. Materials and methods
2.1. Meta-analysis of human cancer profiles
The methods used for signature extraction, signature data-
base development, and EXALT analysis were previously
reported (Yi et al., 2007; Wu et al., 2009). Iterative EXALT anal-
ysis for identification of the 50-gene expression signature and
its association with CaP metastasis has been described else-
where (Qiu et al., 2013).
M O L E C U L A R O N C O L O G Y 7 ( 2 0 1 3 ) 1 0 1 9e1 0 3 0 1021
2.2. Clinical data
Clinical and gene-expression data for the 50-gene signature
validation were obtained from independently published human
cancer studies and theGeneExpressionOmnibus (GEO) provided
by the National Center for Biotechnology Information (NCBI).
2.3. Cell lines and primary tumor specimens
Cell lines were kindly provided as follows: PC3 and LNCaP
human prostate carcinoma cell lines from ATCC (American
Type Culture Collection, Manassas, VA, USA); the biolumines-
cent human prostate carcinoma cell line (PC3-Luc) from
Dr. K. Pienta (University of Michigan Medical Center); non-
tumorigenic human prostate epithelial cell lines NHPrE1 and
BHPrE1 from our own stocks (Jiang et al., 2010); ARCaPM cells
were from Novicure Biotechnology (Birmingham, AL, USA).
De-identified human malignant and nonmalignant prostate
tissue samples were collected and frozen immediately after
surgical resection through the Vanderbilt Cooperative Human
Tissue Network via the Department of Pathology in accor-
dance with Vanderbilt IRB protocols.
PC3, PC3-Luc, and LNCaP cells were cultured at 37 �C,5%
CO₂ in RPMI1640 containing 10% fetal bovine serum (FBS)
and 1% penicillin/streptomycin. ARCaPM cells were cultured
in MCaP-medium supplied by Novicure. Both NHPrE1 and
BHPrE1 cells were cultured in HPrE-conditional medium
described previously (Jiang et al., 2010).
2.4. Western Blotting
Equal amounts of cell or tissue lysates per lane were loaded
onto 10% SDS polyacrylamide gels. Membranes were incu-
bated with chicken polyclonal antibody specific for human
SPARCL1 (Abcam, Cambridge, United Kingdom) at a 1:2000
dilution, and then the membranes were re-probed using
mouse monoclonal antibody specific for human anti-b-actin
(Sigma Chemical Company, Saint Louis, MO, USA).
2.5. Construction of a SPARCL1 expression vector andestablishment of stable PC3-Luc cells overexpressingSPARCL1
The human gene SPARCL1 ORF (RC207583, OriGene Technolo-
gies, Inc, Rockville, MD) was subcloned into pBMN-I-GFP
(Addgene Inc., Cambridge, MA, USA) to obtain a pBMN-
SPARCL1-I-GFP plasmid. DNA sequencing was performed to
verify the sequence of the constructed plasmid.
Plasmids pBMN-SPARCL1-I-GFP and pBMN-I-GFP were
transfected into Phoenix cells by FuGENE 6 (Roche Applied Sci-
ence, Indianapolis, IN, USA). Retroviral particles were har-
vested and used to infect PC3-Luc cells. GFP-positive PC3-Luc
cells, either overexpressing SPARCL1 (PC3-luc/SPARCL1) or
empty control (PC3-luc/EV) were collected by fluorescence-
activated cell sorting.
2.6. Cell proliferation assay
PC3-luc/EV, PC3-luc/SPARCL1, PC3, and ARCaPM cells were
plated at a density of 10,000 cells/well in Costar 96-well cell
culture plates (CORNING, Tewksbury, MA, USA), respectively.
PC3 and ARCaPM were treated with and without recombinant
human SPARCL1 (hSPARCL1) (10 mg/ml). After incubation at
various time points (day 1, day 2, and day 3), 20 ml MTT [3-(4,
5-methylthiazol-2-yl)-2, 5-diphenyl-tetrazolium bromide] so-
lution (5 mg/ml; Sigma) per well was added for 1 h. Colori-
metric changes were read on a microtiter plate reader with a
570-nm filter. Cell viability was estimated by a standard MTT
assay (Price and McMillan, 1990) at various time intervals.
2.7. Colony formation in soft agarose
PC3-luc/EV, PC3-luc/SPARCL1, PC3, and ARCaPM cells (1 � 104)
were suspended in complete medium with a top layer of 0.3%
agarose and a bottom layer of 0.6% agarose in triplicate in 6-
well plates. Among them, PC3 and ARCaPM cells were treated
with and without recombinant human SPARCL1 (hSPARCL1)
(10 mg/ml). Complete medium was changed every week. Col-
ony formation was examined after 3 weeks. The colonies
were stained with 500 ml MTT solution (5 mg/ml; Sigma)/well
for 1 h. Scanned images of the colonies were analyzed with
the Image software.
2.8. Wound healing assay
A 12-well culture plate was placed on the magnetic platform
after which eachwell was set upwithmagnetically attachable
stencils (MAts) (Ashby et al., 2012) PC3-luc/EV or PC3-luc/
SPARCL1 (350,000 cells/well) were added to each well and
allowed to adhere. After overnight incubation, MAts were
removed leaving behind wounds with even-edges and equal-
distances. Images were taken immediately upon MAts
removal at 0 h and at 12 h. Percent wound closure was quan-
tified using T-scratch software (http://www.cse-lab.ethz.ch/).
2.9. Transwell migration assay
To assay cell migration, PC3 and ARCaPM were treated with
recombinant human SPARCL1 (hSPARCL1) (10 mg/ml) (R&D
Systems Inc., Minneapolis, MN). Cell migration was assayed
using the Cell Migration Colorimetric Assay Kit (Millipore) ac-
cording to the manufacturer’s instructions.
2.10. Transwell invasion assay
A cell invasion assay was performed using 6-well Transwell
polycarbonate membrane inserts with 8.0-mm pores (CoStar)
coated from the bottom with Matrigel (BD Biosciences, San
Jose, CA, USA) as an extracellular matrix barrier. PC3-luc/EV
or PC3-luc/SPARCL1 or ARCaPM cells (1 � 104) were detached
and seeded in the upper chamber and cultured in serum-
free medium for 48 h. ARCaPM cells were treated either with
or without recombinant human SPARCL1 (hSPARCL1) (10 mg/
ml) in the upper chamber medium. Cells were allowed to
migrate towards medium containing 10% FBS in the bottom
chamber. The non-migratory cells on the upper membrane
surface were removed with a cotton tip, and the invasive cells
attached to the lower membrane surface were fixed with 10%
neutral buffered formalin (Thermo Fisher Scientific, Waltham
MA, USA) and stained with modified Mayer’s hematoxylin

M O L E C U L A R O N C O L O G Y 7 ( 2 0 1 3 ) 1 0 1 9e1 0 3 01022
(Thermo Fisher Scientific). The numbers of migrated cells
were counted in 3 randomly selected fields under a micro-
scope. Data presented are representative of three individual
wells and repeated twice.
2.11. In vivo animal experiment studies
Severe combined immunodeficient (SCID) male mice
(Harlan, Indianapolis, IN) were housed and maintained under
specific pathogen-free conditions in facilities approved by the
Vanderbilt University Institutional Animal Care and Use Com-
mittee. Mice were kept at least 1 week before experimental
manipulation.
For orthotopic xenografting (OX) experiments, 10-week-old
SCID mice were randomized into two groups: PC3-luc/EV and
PC3-luc/SPARCL1. PC3-luc/EV or PC3-luc/SPARCL1 cells
(3 � 105 in 30 ml) mixing with neutralized collagen gel were
implanted into the mouse anterior prostate (AP) lobe through
a lower midline laparotomy incision (Park et al., 2010). The
liquid collagen gel containing PC3 cells became solid in vivo.
We then closed the incision of AP to let the solid gel piece
stay inside of the lumen of the AP lobe. There was no cell sus-
pension left in the space surrounding space of the prostatic
ducts. After PC3 xenografting, mice were imaged biweekly
for bioluminescence using an in vivo Imaging System (IVIS)
to monitor tumor growth. The end point for overall survival
time of each animal was recorded and determined using a
panel of clinical parameters including muscle wasting, loss
of fat deposits, and prominent bones (Yang et al., 2011). Ani-
mals were weighed at the initiation of the experiment and
monitored weekly. When the predetermined clinical parame-
ters were detected, the animals were weighed daily. If more
than 20% of their starting body weight was lost, mice were
euthanized. Upon sacrifice, the prostate and other organs
were removed for imaging and histological examination. Sur-
vival data were plotted on a KaplaneMeier curve, and the two
groups were compared using the Log-rank (ManteleCox) test
(the open-source R software, version 2.14.1 at www.r-
project.org).
Intracardiac (IC) injections were performed as previously
described (Park et al., 2010). In brief, 6-8-week-old SCID male
Figure 1 e Co-expression analysis of the 11 suppressor candidates from th
depicts 11 suppressor candidate gene expression patterns across 10 transcri
different expression profiling studies are represented in rows, and the 11 ca
represent the direction of differential gene expression within a given transc
match). Color intensity reflects the confidence levels of differential express
mice were randomized into two groups. PC3-luc/EV or PC3-
luc/SPARCL1 cells (5 � 105) were re-suspended in 100 ml PBS
and slowly injected into the left ventricle of the mice. IVIS
and radiographs (Faxitron)were used to confirmsuccessful in-
jections into the mouse body and to monitor metastasis
formation.
2.12. Bioluminescence imaging
Mice bearing PC3-luc/EV or PC3-luc/SPARCL1 tumors were
imaged for bioluminescent signal on a weekly basis as previ-
ous described (Yang et al., 2011). Mice were anesthetized and
imaged using an IVIS Imaging system 200 (Xenogen Corp.,
Alameda, CA). Tumor burden was measured based on total
photons per second with background subtraction per region
of interest (ROI).
Following ex vivo bioluminescence imaging, selected or-
gans were fixed in 10% neutral buffered formalin. Tissues
were then processed, embedded in paraffin, sectioned at
4 mm, and stained with hematoxylin and eosin (H.E.).
3. Results
3.1. Discovery of candidate suppressor genes
We recently reported an association between a 50-gene
expression signature and CaP metastasis (Qiu et al., 2013).
We hypothesized that genes enriched in the 50-gene signature
are mechanistically involved in CaP metastasis. In metastatic
tumors, the changes in expression of pro-metastasis and
metastasis-suppressor genes are expected to be divergent
(pro-metastasis genes being up-regulated while suppressors
are down-regulated) (Weigelt et al., 2005). Eleven of the 50
genes were downregulated in aggressive tumors. We used a
bioinformatic approach to determine if any of the 11 suppres-
sor candidate genes exhibited downregulation in human CaP
(Wu et al., 2009). We surveyed gene expression of the 11 can-
didates among data from 10 published transcriptional
profiling studies performed on normal or diseased prostate
tissues (Figure 1).
e 50-gene expression signature among CaP studies. Meta-heat map
ptional profiling studies in normal or diseased prostate tissue. The
ndidate genes are represented in columns. The colors in the heat map
riptional profile (red for up, green for down, and black for a missing
ion.
M O L E C U L A R O N C O L O G Y 7 ( 2 0 1 3 ) 1 0 1 9e1 0 3 0 1023
Differential gene expression (up or down) was determined
by a comparison between an experimental and control group
within each dataset, and the relative change of expression in
candidate genes was represented in rows by an experimental
sample group. Out of the 11 candidate genes, SPARC-like 1
(SPARCL1) displayed the most consistent profile among the
10 datasets (Figure 1). Upregulation of SPARCL1 was found in
nonmalignant (benign) (Welsh et al., 2001) and normal pros-
tate tissues (Taylor et al., 2010). Downregulation of SPARCL1
was observed in CaP samples (Wang et al., 2010), tumors
with high grade (T3B) (Kunderfranco et al., 2010), high Gleason
scores (GS > 7) (Taylor et al., 2010), androgen independent (AI)
status (Hendriksen et al., 2006), and metastatic prostate tu-
mors (Taylor et al., 2010; Chandran et al., 2007; Yu et al.,
2004; Dhanasekaran et al., 2001). Based on the ability of the
related protein SPARC’s influence on tumor progression, inva-
sion, and metastasis (Clark and Sage, 2008), we hypothesized
that SPARCL1 can suppress metastasis in human CaP.
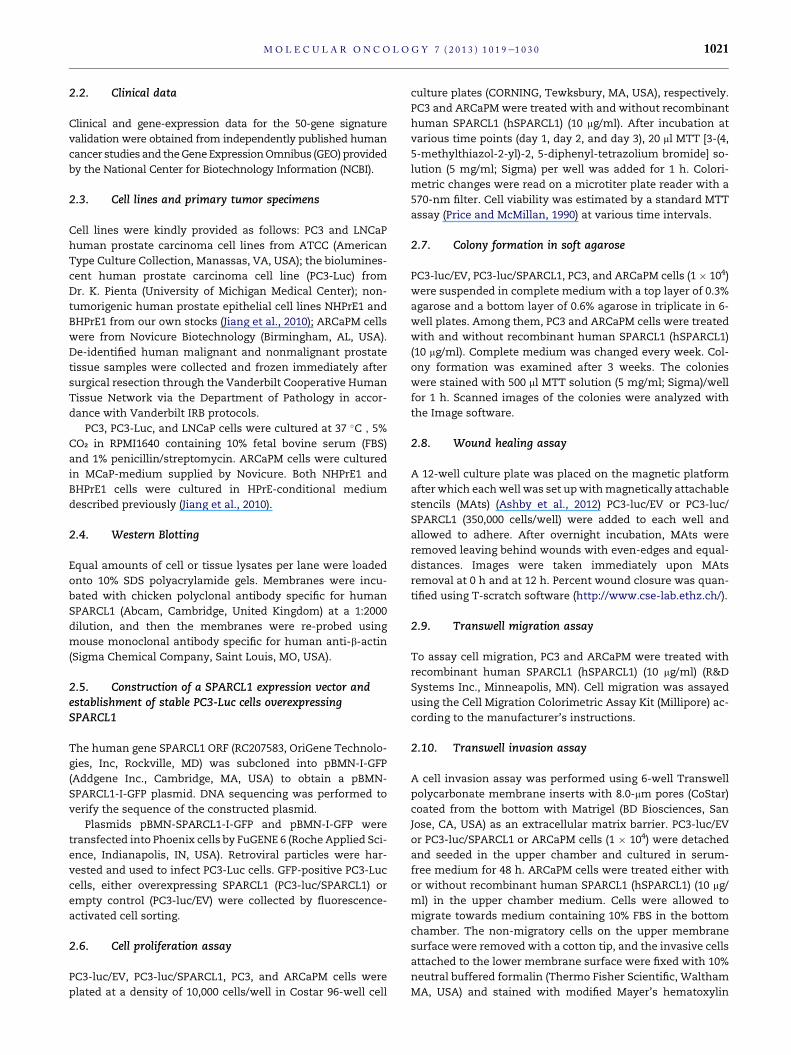
3.2. SPARCL1 protein expression is lost in invasivehuman CaP
To determine whether SPARCL1 protein expression is
decreased in human CaP, we evaluated SPARCL1 expression by
Western blot in protein lysates from five human patients with
high-grade CaP and one non-malignant tissue (Figure 2A).
Relative to a loading control b-actin, SPARCL1 levels were
downregulated in CaP samples in comparison to the non-
malignant sample. We examined SPARCL1 expression patterns
in a panel of human prostate cell lines (Figure 2B). SPARCL1
expression is undetectable in LNCaP, ARCaPM, and PC3 cancer
cells. In contrast, high expression of SPARCL1 was observed in
benign human prostate tissue and benign prostate cell lines
(NHPrE1) (Figure 2B).
3.3. Ectopic SPARCL1 expression decreases in vitrometastatic potential
To determine the impact of restoring SPARCL1 expression in a
model of aggressive human CaP, we ectopically expressed
SPARCL1 or an empty vector control (EV) in luciferase-
Figure 2 e SPARCL1 expression profiles in human prostate. (A) Prostate
high-grade CaP specimens. SPARCL1 expression was measured usingWest
probing with anti-b-actin (middle panel). Western blot results were quantifi
between each CaP sample and non-malignant sample were deduced (fold ch
Note that CaP samples expressed lower levels of endogenous SPARCL1 th
expression profiles in human CaP cell lines. AWestern blot was used to mea
Cell lysate samples included benign human prostate tissue and cell lines (N
PC3). The Western blot membrane was re-probed with anti-b-actin. The
expression within each cell line and were further normalized by the ratio fr
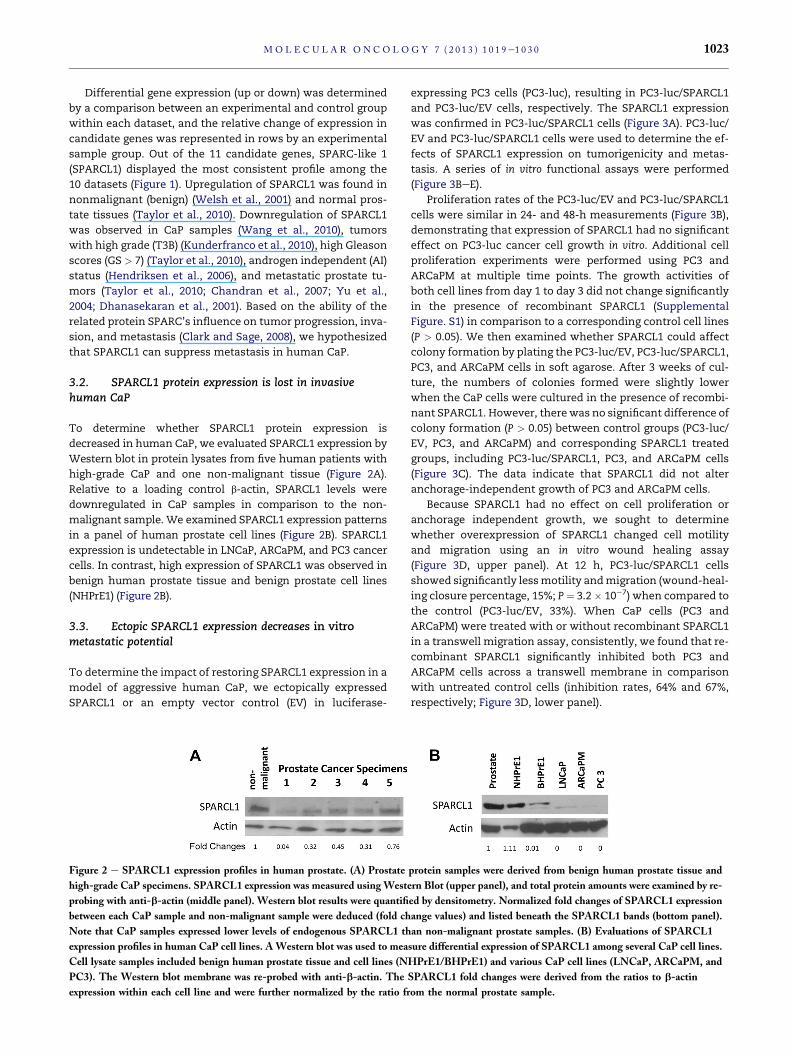
expressing PC3 cells (PC3-luc), resulting in PC3-luc/SPARCL1
and PC3-luc/EV cells, respectively. The SPARCL1 expression
was confirmed in PC3-luc/SPARCL1 cells (Figure 3A). PC3-luc/
EV and PC3-luc/SPARCL1 cells were used to determine the ef-
fects of SPARCL1 expression on tumorigenicity and metas-
tasis. A series of in vitro functional assays were performed
(Figure 3BeE).
Proliferation rates of the PC3-luc/EV and PC3-luc/SPARCL1
cells were similar in 24- and 48-h measurements (Figure 3B),
demonstrating that expression of SPARCL1 had no significant
effect on PC3-luc cancer cell growth in vitro. Additional cell
proliferation experiments were performed using PC3 and
ARCaPM at multiple time points. The growth activities of
both cell lines from day 1 to day 3 did not change significantly
in the presence of recombinant SPARCL1 (Supplemental
Figure. S1) in comparison to a corresponding control cell lines
(P > 0.05). We then examined whether SPARCL1 could affect
colony formation by plating the PC3-luc/EV, PC3-luc/SPARCL1,
PC3, and ARCaPM cells in soft agarose. After 3 weeks of cul-
ture, the numbers of colonies formed were slightly lower
when the CaP cells were cultured in the presence of recombi-
nant SPARCL1. However, therewas no significant difference of
colony formation (P > 0.05) between control groups (PC3-luc/
EV, PC3, and ARCaPM) and corresponding SPARCL1 treated
groups, including PC3-luc/SPARCL1, PC3, and ARCaPM cells
(Figure 3C). The data indicate that SPARCL1 did not alter
anchorage-independent growth of PC3 and ARCaPM cells.
Because SPARCL1 had no effect on cell proliferation or
anchorage independent growth, we sought to determine
whether overexpression of SPARCL1 changed cell motility
and migration using an in vitro wound healing assay
(Figure 3D, upper panel). At 12 h, PC3-luc/SPARCL1 cells
showed significantly lessmotility andmigration (wound-heal-
ing closure percentage, 15%; P¼ 3.2� 10�7) when compared to
the control (PC3-luc/EV, 33%). When CaP cells (PC3 and
ARCaPM) were treated with or without recombinant SPARCL1
in a transwell migration assay, consistently, we found that re-
combinant SPARCL1 significantly inhibited both PC3 and
ARCaPM cells across a transwell membrane in comparison
with untreated control cells (inhibition rates, 64% and 67%,
respectively; Figure 3D, lower panel).
protein samples were derived from benign human prostate tissue and
ern Blot (upper panel), and total protein amounts were examined by re-
ed by densitometry. Normalized fold changes of SPARCL1 expression
ange values) and listed beneath the SPARCL1 bands (bottom panel).
an non-malignant prostate samples. (B) Evaluations of SPARCL1
sure differential expression of SPARCL1 among several CaP cell lines.
HPrE1/BHPrE1) and various CaP cell lines (LNCaP, ARCaPM, and
SPARCL1 fold changes were derived from the ratios to b-actin
om the normal prostate sample.
Figure 3 e in vitro evaluation of SPARCL1 function. (A) Western Blot was used to confirm SPARCL1 expression in PC3-luc/SPARCL1 in
comparison to control PC3-luc/EV cells. The Western blot membrane was re-probed with anti-b-actin. (B) PC3-luc/EV control and PC3-luc/
SPARCL1 cells were seeded into quadruplicate wells of 96-well plates and their proliferation rates determined by MTT assay. Data were plotted as
mean relative growthSEM. (C) Anchorage-independent growth of CaP cells with SPARCL1 in soft agarose. PC3 and ARCaPM cells were treated
with and without recombinant SPARCL1 (10 mg/ml). PC3-luc/EV, PC3-luc/SPARCL1, PC3, and ARCaPM cells were examined for their
anchorage-independent growth in soft agarose. The comparisons of colony formation are plotted as a bar graph. (D) Motility and migration
analysis by wound healing assay (upper panel) and transwell migration assay (bottom panel). Upper panel, pictures were taken at 0 h and at 12 h.
Wound healing closure percentages were compared between PC3-luc/EV and PC3-luc/SPARCL1. Bottom panel, a vertical bar graph depicts
migration inhibition percentages in transwell assay from recombinant SPARCL1 treated PC3 and ARCaPM cells in comparison with
corresponding untreated control cells. (E) Images (left panel) and a bar graph of invasion cell counts (right panel) from representative transwell
invasion assays. The invasion PC3 cells (PC3-luc/EV and PC3-luc/SPARCL1) and ARCaPM cells treated with recombinant SPARCL1 (X-axis in
the bar graph) were examined for their invasiveness in transwell Matrigel invasion assays. The invasiveness is expressed in numbers of cell invading
Matrigel in Y-axis. The statistics analysis used for panels (B, C, D, E) is Student’s t test. *NS: non-significant.
M O L E C U L A R O N C O L O G Y 7 ( 2 0 1 3 ) 1 0 1 9e1 0 3 01024
We also evaluated the SPARCL1 effect on invasive capa-
bility of PC3 cells (PC3-luc/EV and PC3-luc/SPARCL1) and
ARCaPM cells. In a 48-h transwell-invasion assay, more PC3-
luc/EV cells invaded through the Matrigel coated basement
membrane compared to PC3-luc/SPARCL1 cells (Figure 3E,
left panel). In comparison to the empty vector control (PC3-
luc/EV) cells, SPARCL1 significantly decreased the invasive-
ness of PC3 cells by 2.7-fold in a transwell Matrigel invasion
assay (Figure 3E, right panel, P ¼ 0.008). We found that recom-
binant SPARCL1 could also reduce invasiveness of ARCaPM
cells (Figure 3E, right panel, P ¼ 0.022).
Results from these in vitro functional experiments
suggest that SPARCL1 expression does not alter PC3-luc
growth under either anchorage-dependent or independent
conditions. However, SPARCL1 suppressed prostate cancer
cell migration and invasion.
3.4. Effect of SPARCL1 on prostate cancer metastasis
Because SPARCL1 could suppress motility and invasion
in vitro, we evaluated the effect of SPARCL1 on the develop-
ment of metastases in vivo. To test this, we introduced PC3-
luc/EV and PC3-luc/SPARCL1 cells into a mouse prostate
(orthotopic xenograft [OX] model), (Figure 4) and mouse arte-
rial circulation via intracardiac injection (IC model, Figure 5)
(Park et al., 2010).
In either OX or IC mouse model, SCID mice xenografted
with PC3 tumors were then monitored for the development

Figure 4 e In vivo monitoring of orthotopic PC3 prostate tumor growth and metastasis with or without overexpression of SPARCL1. (A)
Representative ventral images of bioluminescence measurements for xenografted PC3 tumor growth and metastasis. Luciferase-tagged PC3-luc/
EV and PC3-luc/SPARCL1 cells were surgically implanted into the anterior prostate of male SCID mice. Ventral images of anesthetized
representative control (PC3-luc/EV) and experimental (PC3-luc/SPARCL1) mice are shown at weeks 1, 3, and 6 to monitor orthotopic prostate
tumor growth and tumor spread to other organs. All images were set using the same pseudocolor scale in radiance defined as photons/second/cm2/
steradian (p/sec/cm2/sr) to show relative bioluminescent changes over time. (B) Histological slides include orthotopic tumors and metastatic
tumors of PC3-luc/EV and PC3-luc/SPARCL1. Representative images were derived from mouse prostate stained with hematoxylin and eosin
(H&E) (upper left panel). The same tissue sections were analyzed by IHC using an anti-GFP antibody (upper right panel) to identify human PC3
cells in both PC3-luc/EV and PC3-luc/SPARCL1 samples. The original xenografted GFP-positive PC3 cells were found in xenografts tumor site.
Representative H&E-stained sections of metastasis organ specimens were derived from PC3-luc/EV and PC3-luc/SPARCL1 mice (middle and
bottom panels). The metastatic tumors were dissected from liver, pancreas, adrenal gland, kidney, and spleen. Scale bar[ 100 mm (C) PC3 growth
in mice. Whole body luminescence index shown as a function of time is displayed on the Y-axis as a measure of tumor burden. Bioluminescent
signals emitted from the PC3 tumors were quantified in photons/s/cm2 at each imaging time. Using week 1 time point as a base value, mean tumor
bioluminescence for each group per time point was normalized as mean log ratios. The plotted curves over time were used to compare the control
PC3-luc/EV mice (n [ 10, open circles) with the PC3-luc/SPARCL1 mice (n [ 8, closed circles). The PC3-luc/SPARCL1 cells grew less
aggressively with a statistically significant difference (P< 0.001) based on ANOVA analysis. (D) KaplaneMeier analysis for overall survival. Total
survival data were stratified into 2 groups (EV and SPARCL1 mouse groups) by SPARCL1 expression. The survival plot illustrates two types of
overall survival, a poor prognosis group (black dashed line, EV mouse group) and a good prognosis group (red solid line, SPARCL1 mouse group).
The overall survival time in days is displayed on the X-axis, and the Y-axis shows the probability of overall time survival. The end point for overall
survival time of each animal was recorded and determined using a panel of clinical parameters including muscle wasting, loss of fat deposits, and
prominent bones. The log-rank test p-value indicates the statistical significance of survival time differences between the two groups (P < 0.0001).
Mice inoculated with PC3-luc/SPARCL1 cells had a better survival probability.
M O L E C U L A R O N C O L O G Y 7 ( 2 0 1 3 ) 1 0 1 9e1 0 3 0 1025
of tumors at regular time intervals using noninvasive biolumi-
nescence imaging. Representative bioluminescence images
are presented from mice in OX model taken at 1, 3, and 6
weeks (Figure 4A) or mice in IC model at 10 min and 1, 2, 4,
and 5 weeks (Figure 5) post-xenografting. Data measured as
photon flux are shown in the same color scale for all mice
between control mouse group (Figure 4A upper panel and
Figure 5 upper panel, PC3-luc/EV) and SPARCL1 overexpres-
sion group (Figure 4A lower panel and Figure 5 lower panel,
PC3-luc/SPARCL1). These results demonstrated significant
differences in total tumor burden (Figure 4A left panel
and Figure 5) and metastases in multiple distant organ loca-
tions including liver, spleen, pancreas, adrenal gland, and kid-
ney, which were confirmed by dissected organ imaging
(Supplemental Figure S2). Osteolytic lesions were verified by
X-ray images (Figure 5 right upper panel). In both OX and IC
models,mice implantedwith PC3-luc/SPARCL1 cells displayed
smaller areas and less intense luciferase activities in the
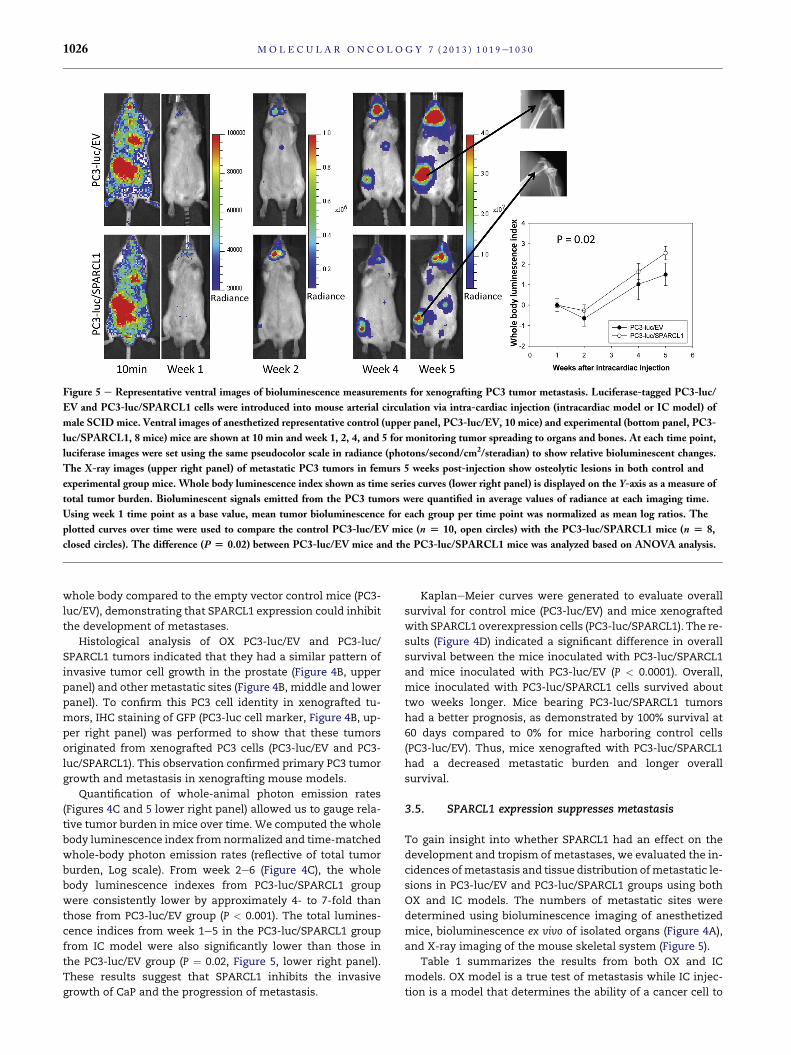
Figure 5 e Representative ventral images of bioluminescence measurements for xenografting PC3 tumor metastasis. Luciferase-tagged PC3-luc/
EV and PC3-luc/SPARCL1 cells were introduced into mouse arterial circulation via intra-cardiac injection (intracardiac model or IC model) of
male SCID mice. Ventral images of anesthetized representative control (upper panel, PC3-luc/EV, 10 mice) and experimental (bottom panel, PC3-
luc/SPARCL1, 8 mice) mice are shown at 10 min and week 1, 2, 4, and 5 for monitoring tumor spreading to organs and bones. At each time point,
luciferase images were set using the same pseudocolor scale in radiance (photons/second/cm2/steradian) to show relative bioluminescent changes.
The X-ray images (upper right panel) of metastatic PC3 tumors in femurs 5 weeks post-injection show osteolytic lesions in both control and
experimental group mice. Whole body luminescence index shown as time series curves (lower right panel) is displayed on the Y-axis as a measure of
total tumor burden. Bioluminescent signals emitted from the PC3 tumors were quantified in average values of radiance at each imaging time.
Using week 1 time point as a base value, mean tumor bioluminescence for each group per time point was normalized as mean log ratios. The
plotted curves over time were used to compare the control PC3-luc/EV mice (n [ 10, open circles) with the PC3-luc/SPARCL1 mice (n [ 8,
closed circles). The difference (P [ 0.02) between PC3-luc/EV mice and the PC3-luc/SPARCL1 mice was analyzed based on ANOVA analysis.
M O L E C U L A R O N C O L O G Y 7 ( 2 0 1 3 ) 1 0 1 9e1 0 3 01026
whole body compared to the empty vector control mice (PC3-
luc/EV), demonstrating that SPARCL1 expression could inhibit
the development of metastases.
Histological analysis of OX PC3-luc/EV and PC3-luc/
SPARCL1 tumors indicated that they had a similar pattern of
invasive tumor cell growth in the prostate (Figure 4B, upper
panel) and other metastatic sites (Figure 4B, middle and lower
panel). To confirm this PC3 cell identity in xenografted tu-
mors, IHC staining of GFP (PC3-luc cell marker, Figure 4B, up-
per right panel) was performed to show that these tumors
originated from xenografted PC3 cells (PC3-luc/EV and PC3-
luc/SPARCL1). This observation confirmed primary PC3 tumor
growth and metastasis in xenografting mouse models.
Quantification of whole-animal photon emission rates
(Figures 4C and 5 lower right panel) allowed us to gauge rela-
tive tumor burden in mice over time. We computed the whole
body luminescence index fromnormalized and time-matched
whole-body photon emission rates (reflective of total tumor
burden, Log scale). From week 2e6 (Figure 4C), the whole
body luminescence indexes from PC3-luc/SPARCL1 group
were consistently lower by approximately 4- to 7-fold than
those from PC3-luc/EV group (P < 0.001). The total lumines-
cence indices from week 1e5 in the PC3-luc/SPARCL1 group
from IC model were also significantly lower than those in
the PC3-luc/EV group (P ¼ 0.02, Figure 5, lower right panel).
These results suggest that SPARCL1 inhibits the invasive
growth of CaP and the progression of metastasis.
KaplaneMeier curves were generated to evaluate overall
survival for control mice (PC3-luc/EV) and mice xenografted
with SPARCL1 overexpression cells (PC3-luc/SPARCL1). The re-
sults (Figure 4D) indicated a significant difference in overall
survival between the mice inoculated with PC3-luc/SPARCL1
and mice inoculated with PC3-luc/EV (P < 0.0001). Overall,
mice inoculated with PC3-luc/SPARCL1 cells survived about
two weeks longer. Mice bearing PC3-luc/SPARCL1 tumors
had a better prognosis, as demonstrated by 100% survival at
60 days compared to 0% for mice harboring control cells
(PC3-luc/EV). Thus, mice xenografted with PC3-luc/SPARCL1
had a decreased metastatic burden and longer overall
survival.
3.5. SPARCL1 expression suppresses metastasis
To gain insight into whether SPARCL1 had an effect on the
development and tropism of metastases, we evaluated the in-
cidences ofmetastasis and tissue distribution ofmetastatic le-
sions in PC3-luc/EV and PC3-luc/SPARCL1 groups using both
OX and IC models. The numbers of metastatic sites were
determined using bioluminescence imaging of anesthetized
mice, bioluminescence ex vivo of isolated organs (Figure 4A),
and X-ray imaging of the mouse skeletal system (Figure 5).
Table 1 summarizes the results from both OX and IC
models. OX model is a true test of metastasis while IC injec-
tion is a model that determines the ability of a cancer cell to

M O L E C U L A R O N C O L O G Y 7 ( 2 0 1 3 ) 1 0 1 9e1 0 3 0 1027
successfully disseminate and colonize distal organs such as
bone. In both models, PC3-luc/EV and PC3-luc/SPARCL1 cells
were able to grow as visceralmetastases in a variety of soft tis-
sue sites such as liver, pancreas, adrenal gland, kidney, and
spleen with a similar propensity and pattern. Using the IC
model, both PC3-luc/EV and PC3-luc/SPARCL1 could spread
to the bone with osteolytic responses at week 5 post IC injec-
tions (Figure 5). Review of metastasis from sacrificed mice in
both models indicated that frequency of metastases for both
soft tissues and bones are consistently lower in PC3-luc/
SPARCL1 mice than those in PC3-luc/EV mice (Table 1).
When compared to PC3-luc-EV group, the total numbers of
final visceral metastasis for the PC3-luc/SPARCL1 group were
statistically significantly lower in both in vivo models, more
specifically, 27% lower in the OX model (P ¼ 0.01) and 45%
lower in the IC model (P < 0.001). In the IC model, metastatic
lesions among skeletal sites decreased in PC3-luc/SPARCL1
group but the difference was not statistically significant be-
tween PC3-luc/EV and PC3-luc/SPARCL1 (P ¼ 0.07).
4. Discussion
Currently, there are a limited number of known metastasis-
suppressor genes in human CaP. Examples include KAI1,
CD44, and MKK4 acting as metastasis-suppressor genes for
CaP (Steeg, 2003; Vander Griend and Rinker-Schaeffer, 2004).
Loss of these genes has been demonstrated during the clinical
progression of the disease. MKK4 expression in human pros-
tate cancers decreased with increasing Gleason grade (Steeg,
2003). Using a novel bioinformatic approach, we found
decreased expression of SPARCL1 to be associated with CaP
metastasis and demonstrate its ability to inhibit migration
and invasiveness in vitro and metastasis in vivo.
SPARCL1 expression is found in most normal human tis-
sues. High levels of SPARCL1 mRNA were found in prostate
Table 1 e Frequency of metastases at various anatomical sites.
Models Orthotopic
PC3 cells EV SPARCL1 P
Visceral sites
Liver 80(8/10)a 63(5/8)
Pancreases 60(6/10) 25(2/8)
Spleen 38(3/8) 38(3/8)
Adrenal glands 90(9/10) 50(4/8)
Kidney 100(10/10) 63(5/8)
Total metastasis 75(36/48) 48(19/40)
Skeletal sites
Tibia NAb NA
Femur NA NA
Mandible NA NA
Iliac crest NA NA
Ankle/paw NA NA
Humerus shoulder NA NA
Total metastases NA NA
P value was computed by Fisher exact test.A percentage (numbers of organs with metastasis/total organs inspectedb NA: data not available.
basal and columnar epithelium and cultured normal prostate
epithelial cells. No expression was detected in a CaP cell
line (LNCaP) or in immortalized poorly tumorigenic prostate
epithelium (Nelson et al., 1998). The immunostained
(IHC) for SPARCL1 staining pattern is also obtained in The Hu-
man Protein Atlas project (http://www.proteinatlas.org), in
which six high-grade and four low-grade CaP samples are
SPARCL1-negative while only one low grade CaP sample and
a normal prostate sample are SPARCL1-positive. Furthermore,
based on IHC analysis of human SPARCL1 expression on CaP
tissuemicroarrays (TMAs), a recent study demonstrated a sta-
tistically significant inverse correlation between Gleason
grades and SPARCL1 expression levels in 38 CaP patient sam-
ples (Hurley et al., 2012). There are multiple possible mecha-
nisms for loss of SPARCL1 expression in cancer cells. Based
on q-PCR of SPARCL1 gene copy numbers in PC3 cells, we
found no SPARCL1 gene deletion in PC3 cells, but through
data mining in public data sources (GEO and TCGA) we found
that SPARCL1 locus is hyper-methylated in PC3 cells (GEO
GSE12334) (Gal-Yam et al., 2008), breast cancer samples
(TCGA) (Cancer GenomeAtlas., 2012), and ovarian cancer sam-
ples (TCGA) ( Cancer Genome Atlas., 2011).
SPARCL1 is a secreted protein that binds to collagen 1 to
regulate collagen fibrillogenesis and results from a gene dupli-
cation of SPARC (Hambrock et al., 2003; Sullivan et al., 2006).
SPARCL1 is closely related to the anti-adhesive extracellular
matrix (ECM) protein known as BM-40 and SPARC. SPARC
and SPARCL1 share 62% identity over C-terminal region with
232 amino acid residues but there is a greater difference in
the highly acidic NH2-terminal domain of SPARCL1 (Girard
and Springer, 1995). Although SPARC and SPARCL1 are related
structurally and functionally, it is likely that the two proteins
have both distinct and overlapping physiological roles (Lloyd-
Burton and Roskams, 2012).
Using traditional in vitro approaches to study SPARCL1
function, a previous study on CaP cell lines demonstrated
Intra-cardiac
value EV SPARCL1 P value
90(9/10) 75(6/8)
67(6/9) 25(2/8)
44(4/9) 13(1/8)
80(8/10) 13(1/8)
80(8/10) 13(1/8)
0.01 73(35/48) 28(11/40) <0.001
40(8/20) 13(2/16)
30(6/20) 19(3/16)
70(7/10) 38(3/8)
5(1/20) 6(1/16)
3(1/40) 0(0/32)
15(3/20) 13(2/16)
20(26/130) 11(11/104) 0.07
).
M O L E C U L A R O N C O L O G Y 7 ( 2 0 1 3 ) 1 0 1 9e1 0 3 01028
that SPARCL1 decreased themigratory and invasive properties
of CaP cells but did not restrict the growth of prostate and CaP
cells (Hurley et al., 2012). The data suggest that SPARCL1 may
act as a suppressor of metastatic progression in prostate can-
cer. However, in vitro models do not accurately reflect in vivo
metastasis and are unable to determine SPARCL1 function
in vivo. Using an orthotopic mouse model for colon cancer, a
recent study reported that SPARCL1 inhibited tumor growth
in vivo and in vitro (Hu et al., 2012), suggesting that SPARCL1
functions as a tumor suppressor in colon cancer. Therefore,
it remains unclear whether there is a suppressive role for
SPARCL1 in CaP metastasis.
Our study is the first report to show the impact of SPARCL1
on CaP metastases in vivo and its impact on the overall sur-
vival of the mice. The two in vivo models (OX and IC injection)
have been successfully used for studying metastasis genes in
prostate cancer (Hafeez et al., 2012; Kim et al., 2003; Yang et al.,
1999; Josson et al., 2011; Xu et al., 2006). The visceral metas-
tasis patterns observed in the OX and IC models are similar
(Table 1), indicating metastatic spread via common lymphatic
or arterial circulation. SPARCL1 decreasedmetastatic progres-
sion significantly in both OX and IC models, suggesting an
important contribution to late stages of extravasation and/or
colonization.
Development ofmetastaseswasmonitored by in vivo biolu-
minescence imaging (Bondareva et al., 2009). We found that
whole-body (Figures 4C and 5, lower right panel) photon emis-
sion rates (reflective of total tumor burden) were significantly
diminished, suggesting that SPARCL1 can diminish distant
PC3 invasiveness and reduce metastatic lesions in both
visceral and skeletal sites. Because the frequencies of metas-
tases at various anatomical sites were measured at the end
point of each mouse (Table 1), our data represent final estab-
lishedmetastatic lesions in late stage cancer rather than early
metastatic development. Our results suggest that SPARCL1
was able to reduce the frequency of total visceral metastases
(P � 0.01) but had a smaller effect on the incidence of the
development of bone metastases (P ¼ 0.07).
Importantly, unlike SPARCL1’s role in colon cancer cells,
SPARCL1 did not inhibit CaP cell proliferation in vitro
(Figure 3B, C, and Supplemental S1) but did decrease luciferase
radiance in vivo (Figure 4, Figure 5 and Table 1). The radiance of
luciferin signals directly derives from the expression level of
active luciferase protein in PC3 cells. In our study, these sig-
nals correlated with primary tumor growth, local invasion,
and metastases, but it was difficult to distinguish the signals
of primary tumor growth from local invasion or metastases
in vivo (Figures 4A and 5). Therefore, we dissected primary
prostate tumors and metastatic foci. We measured primary
prostate tumor growth from moribund animals using lucif-
erase radiances and tumor volumes of primary prostate tu-
mors at sacrifice time (Supplemental Figure S3). Our data
reveal that there is a consistent pattern showing reduced
prostate tumor volumes and luciferase radiance in SPARCL1
group in comparisonwith EV group at sacrifice time. However,
the differences are not statistical significance (P > 0.05).
We realize that a major limitation in our study was the
varying time of animal sacrifice which was dependent on
moribundity in individual cases. Thus, time matched primary
tumors from the EV and SPARCL1 groups were not available
for tumor growth comparison. Therefore, while our data sug-
gest that SPARCL1 does not decrease primary tumor growth,
our data cannot exclude the possibility that SPARCL1 sup-
pressed primary tumor growth in vivo, and SPARCL1 may
play dual suppressive roles in primary tumor growth and
metastasis.
The mechanism on SPARCL1 function is still largely
unknown. In lung and pancreatic tumor xenografts, SPARCL1
is associated with desmoplasia (Brekken et al., 2004).
In SPARCL1-null mice, the dermal elastic modulus was
enhanced. The poor adhesive behavior of the fibroblasts cells
on gels formed in the presence of SPARCL1 was due to alter-
ations in fibril morphologies caused by SPARCL1, as opposed
to a direct interaction of the cells with SPARCL1 (Sullivan
et al., 2006). SPARC binds to collagen 1 to regulate collagen
fibrillogenesis and assembly (Hambrock et al., 2003; Sullivan
et al., 2006). A recent report suggests that SPARCL1 blocks
the activation of the Ras homolog gene family, member C
(RHOC), thereby inhibiting cellular movement (Hurley et al.,
2012). It is possible that SPARCL1 might inhibit the activation
of cancer associated fibroblasts (CAF) (Kalluri and Zeisberg,
2006) through remodeling of cancer extracellular matrix
(ECM) (Ramos et al., 1998). The aforementioned mechanisms
might be responsible for SPARCL1 suppressive function in
CaP, explaining how overexpression of SPARCL1 in PC-3 cells
compared to control cells confers a two-week survival advan-
tage for the mice (Figure 4).
In conclusion, we have provided evidence that SPARCL1
suppresses metastasis in CaP. This study sets the stage for
further investigations on the basic mechanisms that underlie
cancer metastasis. Additional studies on SPARCL1 will be
valuable for determining its mechanisms of metastasis sup-
pression in cancer.
Disclosure
The authors declare no disclosure.
Conflict of interest
The authors declare no conflict of interest.
Acknowledgments
Grant Support: This work was supported in part by a Howard
Temin Award from the National Cancer Institute at the Na-
tional Institutes of Health (CA114033 to YY), American Cancer
Society-Institutional Research Grant (#IRG-58-009-51 and
#IRG-58-009-53), and the Vanderbilt Clinical and Translational
Science Awards (CTSA) UL1 RR024975 from National Center
for Research Resources (NCRR), a part of the National Insti-
tutes of Health (NIH), (CRC1838 to YY), and the National Can-
cer Institute (4R01-CA076142-14 to RJM). DJDwas supported by
the American Cancer Society Great Lakes Division-Michigan
Cancer Research Fund Postdoctoral Fellowship.
M O L E C U L A R O N C O L O G Y 7 ( 2 0 1 3 ) 1 0 1 9e1 0 3 0 1029
The authors thank Dr. Harold L Moses and Dr. Jennifer
Pietenpol for assistance in experiments; Dr. K. Pienta for
providing bioluminescent human prostate carcinoma cell
line (PC3-Luc); The Vanderbilt Cooperative Human Tissue
Network for human tissue samples.
Appendix ASupplementary data
Supplementary data related to this article can be found at
http://dx.doi.org/10.1016/j.molonc.2013.07.008.
R E F E R E N C E S
Ashby, W.J., Wikswo, J.P., Zijlstra, A., 2012. Magneticallyattachable stencils and the non-destructive analysis of thecontribution made by the underlying matrix to cell migration.Biomaterials 33, 8189e8203.
Bendik, I., Schraml, P., Ludwig, C.U., 1998. Characterization ofMAST9/Hevin, a SPARC-like protein, that is down-regulated innon-small cell lung cancer. Cancer Res. 58, 626e629.
Bondareva, A., Downey, C.M., Ayres, F., Liu, W., Boyd, S.K.,Hallgrimsson, B., Jirik, F.R., 2009. The lysyl oxidase inhibitor,beta-aminopropionitrile, diminishes the metastaticcolonization potential of circulating breast cancer cells. PLoS.One 4, e5620.
Brekken, R.A., Sullivan, M.M., Workman, G., Bradshaw, A.D.,Carbon, J., Siadak, A., Murri, C., Framson, P.E., Sage, E.H., 2004.Expression and characterization of murine hevin (SC1), amember of the SPARC family of matricellular proteins.J. Histochem. Cytochem. 52, 735e748.
Cancer Genome Atlas Research Network, 2011. Integratedgenomic analyses of ovarian carcinoma. Nature 474, 609e615.
Cancer Genome Atlas Research Network, 2012. Comprehensivemolecular portraits of human breast tumours. Nature 490,61e70.
Chandran, U.R., Ma, C., Dhir, R., Bisceglia, M., Lyons-Weiler, M.,Liang, W., Michalopoulos, G., Becich, M., Monzon, F.A., 2007.Gene expression profiles of prostate cancer revealinvolvement of multiple molecular pathways in themetastatic process. BMC. Cancer 7, 64.
Cher, M.L., de Oliveira, J.G., Beaman, A.A., Nemeth, J.A.,Hussain, M., Wood Jr., D.P., 1999. Cellular proliferation andprevalence of micrometastatic cells in the bone marrow ofpatients with clinically localized prostate cancer. Clin. CancerRes. 5, 2421e2425.
Clark, C.J., Sage, E.H., 2008. A prototypic matricellular protein inthe tumor microenvironmentewhere there’s SPARC, there’sfire. J. Cell Biochem. 104, 721e732.
Dhanasekaran, S.M., Barrette, T.R., Ghosh, D., Shah, R.,Varambally, S., Kurachi, K., Pienta, K.J., Rubin, M.A.,Chinnaiyan, A.M., 2001. Delineation of prognostic biomarkersin prostate cancer. Nature 412, 822e826.
Esposito, I., Kayed, H., Keleg, S., Giese, T., Sage, E.H.,Schirmacher, P., Friess, H., Kleeff, J., 2007. Tumor-suppressorfunction of SPARC-like protein 1/Hevin in pancreatic cancer.Neoplasia 9, 8e17.
Gal-Yam, E.N., Egger, G., Iniguez, L., Holster, H., Einarsson, S.,Zhang, X., Lin, J.C., Liang, G., Jones, P.A., Tanay, A., 2008.Frequent switching of Polycomb repressive marks and DNAhypermethylation in the PC3 prostate cancer cell line. Proc.Natl. Acad. Sci. U. S. A 105, 12979e12984.
Girard, J.P., Springer, T.A., 1995. Cloning from purified highendothelial venule cells of hevin, a close relative of the
antiadhesive extracellular matrix protein SPARC. Immunity 2,113e123.
Girard, J.P., Springer, T.A., 1996. Modulation of endothelial celladhesion by hevin, an acidic protein associated with highendothelial venules. J. Biol. Chem. 271, 4511e4517.
Gupta, G.P., Massague, J., 2006. Cancer metastasis: building aframework. Cell 127, 679e695.
Hafeez, B.B., Zhong, W., Fischer, J.W., Mustafa, A., Shi, X.,Meske, L., Hong, H., Cai, W., Havighurst, T., Kim, K.,Verma, A.K., 2012. Plumbagin, a medicinal plant (Plumbagozeylanica)-derived 1,4-naphthoquinone, inhibits growth andmetastasis of human prostate cancer PC-3M-luciferase cells inan orthotopic xenograft mouse model. Mol. Oncol..
Hambrock, H.O., Nitsche, D.P., Hansen, U., Bruckner, P.,Paulsson, M., Maurer, P., Hartmann, U., 2003. SC1/hevin. Anextracellular calcium-modulated protein that binds collagen I.J. Biol. Chem. 278, 11351e11358.
Hendriksen, P.J., Dits, N.F., Kokame, K., Veldhoven, A., vanWeerden, W.M., Bangma, C.H., Trapman, J., Jenster, G., 2006.Evolution of the androgen receptor pathway duringprogression of prostate cancer. Cancer Res. 66, 5012e5020.
Hu, H., Zhang, H., Ge, W., Liu, X., Loera, S., Chu, P., Chen, H.,Peng, J., Zhou, L., Yu, S., Yuan, Y., Zhang, S., Lai, L.L.,Yen, Y.C.D., Zheng, S., 2012. Secreted protein acidic and rich incysteines-like 1 suppresses aggressiveness and predicts bettersurvival in colorectal cancers. Clin. Cancer Res. 18 (19),5438e5448.
Hurley, P.J., Marchionni, L., Simons, B.W., Ross, A.E., Peskoe, S.B.,Miller, R.M., Erho, N., Vergara, I.A., Ghadessi, M., Huang, Z.,Gurel, B., Park, B.H., Davicioni, E., Jenkins, R.B., Platz, E.A.,Berman, D.M., Schaeffer, E.M., 2012. Secreted protein, acidicand rich in cysteine-like 1 (SPARCL1) is down regulated inaggressive prostate cancers and is prognostic for poor clinicaloutcome. Proc. Natl. Acad. Sci. U. S. A 109 (37), 14977e14982.
Jemal, A., Siegel, R., Xu, J., Ward, E., 2010. Cancer statistics, 2010.CA Cancer J. Clin. 60, 277e300.
Jiang, M., Strand, D.W., Fernandez, S., He, Y., Yi, Y., Birbach, A.,Qiu, Q., Schmid, J., Tang, D.G., Hayward, S.W., 2010. Functionalremodeling of benign human prostatic tissues in vivo byspontaneously immortalized progenitor and intermediatecells. Stem Cells 28, 344e356.
Josson, S., Nomura, T., Lin, J.T., Huang, W.C., Wu, D., Zhau, H.E.,Zayzafoon, M., Weizmann, M.N., Gururajan, M., Chung, L.W.,2011. beta2-microglobulin induces epithelial to mesenchymaltransition and confers cancer lethality and bone metastasis inhuman cancer cells. Cancer Res. 71, 2600e2610.
Kalluri, R., Zeisberg, M., 2006. Fibroblasts in cancer. Nat. Rev.Cancer 6, 392e401.
Kauffman, E.C., Robinson, V.L., Stadler, W.M., Sokoloff, M.H.,Rinker-Schaeffer, C.W., 2003. Metastasis suppression: theevolving role of metastasis suppressor genes for regulatingcancer cell growth at the secondary site. J. Urol. 169,1122e1133.
Kim, S.J., Johnson, M., Koterba, K., Herynk, M.H., Uehara, H.,Gallick, G.E., 2003. Reduced c-Met expression by an adenovirusexpressing a c-Met ribozyme inhibits tumorigenic growth andlymph node metastases of PC3-LN4 prostate tumor cells in anorthotopic nude mouse model. Clin. Cancer Res. 9, 5161e5170.
Kunderfranco, P., Mello-Grand, M., Cangemi, R., Pellini, S.,Mensah, A., Albertini, V., Malek, A., Chiorino, G.,Catapano, C.V., Carbone, G.M., 2010. ETS transcription factorscontrol transcription of EZH2 and epigenetic silencing of thetumor suppressor gene Nkx3.1 in prostate cancer. PLoS. One 5,e10547.
Lloyd-Burton, S., Roskams, A.J., 2012. SPARC-like 1 (SC1) is adiversely expressed and developmentally regulatedmatricellular protein that does not compensate for theabsence of SPARC in the CNS. J. Comp. Neurol. 520, 2575e2590.
M O L E C U L A R O N C O L O G Y 7 ( 2 0 1 3 ) 1 0 1 9e1 0 3 01030
Nelson, P.S., Plymate, S.R., Wang, K., True, L.D., Ware, J.L., Gan, L.,Liu, A.Y., Hood, L., 1998. Hevin, an antiadhesive extracellularmatrix protein, is down-regulated in metastatic prostateadenocarcinoma. Cancer Res. 58, 232e236.
Park, S.I., Kim, S.J., McCauley, L.K., Gallick, G.E., 2010. Pre-clinical mouse models of human prostate cancer and theirutility in drug discovery. Curr. Protoc. Pharmacol. (Chapter14), Unit.
Price, P., McMillan, T.J., 1990. Use of the tetrazolium assay inmeasuring the response of human tumor cells to ionizingradiation. Cancer Res. 50, 1392e1396.
Qiu, Q.C., Lu, P.C., Xiang, Y.Z., Shyr, Y., Chen, X., Lehmann, B.D.,Viox, D.J., George Jr., A.L., Yi, Y., 2013. A data similarity-basedstrategy for meta-analysis of transcriptional profiles in cancer.PLoS. One 8, e54979.
Ramos, D.M., Chen, B., Regezi, J., Zardi, L., Pytela, R., 1998.Tenascin-C matrix assembly in oral squamous cell carcinoma.Int. J. Cancer 75, 680e687.
Seraj, M.J., Samant, R.S., Verderame, M.F., Welch, D.R., 2000.Functional evidence for a novel human breast carcinomametastasis suppressor, BRMS1, encoded at chromosome11q13. Cancer Res. 60, 2764e2769.
Siegel, R., Naishadham, D., Jemal, A., 2012. Cancer statistics, 2012.CA Cancer J. Clin. 62, 10e29.
Steeg, P.S., 2003. Metastasis suppressors alter the signaltransduction of cancer cells. Nat. Rev. Cancer 3, 55e63.
Sullivan, M.M., Barker, T.H., Funk, S.E., Karchin, A., Seo, N.S.,Hook, M., Sanders, J., Starcher, B., Wight, T.N.,Puolakkainen, P., Sage, E.H., 2006. Matricellular hevinregulates decorin production and collagen assembly. J. Biol.Chem. 281, 27621e27632.
Taylor, B.S., Schultz, N., Hieronymus, H., Gopalan, A., Xiao, Y.,Carver, B.S., Arora, V.K., Kaushik, P., Cerami, E., Reva, B.,Antipin, Y., Mitsiades, N., Landers, T., Dolgalev, I., Major, J.E.,Wilson, M., Socci, N.D., Lash, A.E., Heguy, A., Eastham, J.A.,Scher, H.I., Reuter, V.E., Scardino, P.T., Sander, C.,Sawyers, C.L., Gerald, W.L., 2010. Integrative genomic profilingof human prostate cancer. Cancer Cell 18, 11e22.
Vander Griend, D.J., Rinker-Schaeffer, C.W., 2004. A new look atan old problem: the survival and organ-specific growth ofmetastases. Sci. STKE, e3.
Wang, Y., Xia, X.Q., Jia, Z., Sawyers, A., Yao, H., Wang-Rodriquez, J., Mercola, D., McClelland, M., 2010. In silico
estimates of tissue components in surgical samples based onexpression profiling data. Cancer Res. 70, 6448e6455.
Weigelt, B., Peterse, J.L., van, V., 2005. Breast cancer metastasis:markers and models. Nat. Rev. Cancer 5, 591e602.
Welsh, J.B., Sapinoso, L.M., Su, A.I., Kern, S.G., Wang-Rodriguez, J.,Moskaluk, C.A., Frierson Jr., H.F., Hampton, G.M., 2001.Analysis of gene expression identifies candidate markers andpharmacological targets in prostate cancer. Cancer Res. 61,5974e5978.
Wu, J., Qiu, Q., Xie, L., Fullerton, J., Yu, J., Shyr, Y., George Jr., A.L.,Yi, Y., 2009. Web-based interrogation of gene expressionsignatures using EXALT. BMC. Bioinformatics 10, 420.
Xu, J., Wang, R., Xie, Z.H., Odero-Marah, V., Pathak, S., Multani, A.,Chung, L.W., Zhau, H.E., 2006. Prostate cancer metastasis: roleof the host microenvironment in promoting epithelial tomesenchymal transition and increased bone and adrenalgland metastasis. Prostate 66, 1664e1673.
Yang, M., Jiang, P., Sun, F.X., Hasegawa, S., Baranov, E.,Chishima, T., Shimada, H., Moossa, A.R., Hoffman, R.M., 1999.A fluorescent orthotopic bone metastasis model of humanprostate cancer. Cancer Res. 59, 781e786.
Yang, S.W., Chanda, D., Cody, J.J., Rivera, A.A., Waehler, R.,Siegal, G.P., Douglas, J.T., Ponnazhagan, S., 2011. Conditionallyreplicating adenovirus expressing TIMP2 increases survival ina mouse model of disseminated ovarian cancer. PLoS. One 6,e25131.
Yi, Y., Li, C., Miller, C., George Jr., A.L., 2007. Strategy for encodingand comparison of gene expression signatures. Genome Biol.8, R133.
Yu, S.J., Yu, J.K., Ge, W.T., Hu, H.G., Yuan, Y., Zheng, S., 2011.SPARCL1, Shp2, MSH2, E-cadherin, p53, ADCY-2 and MAPK areprognosis-related in colorectal cancer. World J. Gastroenterol.17, 2028e2036.
Yu, Y.P., Landsittel, D., Jing, L., Nelson, J., Ren, B., Liu, L.,McDonald, C., Thomas, R., Dhir, R., Finkelstein, S.,Michalopoulos, G., Becich, M., Luo, J.H., 2004. Gene expressionalterations in prostate cancer predicting tumor aggression andpreceding development of malignancy. J. Clin. Oncol. 22,2790e2799.
Zaravinos, A., Lambrou, G.I., Boulalas, I., Delakas, D.,Spandidos, D.A., 2011. Identification of common differentiallyexpressed genes in urinary bladder cancer. PLoS. One 6,e18135.


