Embed Size (px)
Citation preview
Linnane, A. et al. (2019) Southern Zone Rock Lobster Fishery
i
Southern Zone Rock Lobster (Jasus edwardsii) Fishery
Stock Assessment 2017/18
A. Linnane, R. McGarvey, J. Feenstra and P. Hawthorne
SARDI Publication No. F2007/000276-13 SARDI Research Report Series No. 1023
SARDI Aquatic Sciences PO Box 120 Henley Beach SA 5022
July 2019
Fishery Assessment Report to PIRSA Fisheries and Aquaculture
Linnane, A. et al. (2019) Southern Zone Rock Lobster Fishery
ii
Southern Zone Rock Lobster (Jasus edwardsii) Fishery
Stock Assessment 2017/18
Fishery Assessment Report to PIRSA Fisheries and Aquaculture
A. Linnane, R. McGarvey, J. Feenstra and P. Hawthorne
SARDI Publication No. F2007/000276-13 SARDI Research Report Series No. 1023
July 2019
Linnane, A. et al. (2019) Southern Zone Rock Lobster Fishery
iii
This report may be cited as: Linnane, A., McGarvey, R., Feenstra, J. and Hawthorne, P. (2019). Southern Zone Rock Lobster (Jasus edwardsii) Fishery 2017/18. Fishery Assessment Report to PIRSA Fisheries and Aquaculture. South Australian Research and Development Institute (Aquatic Sciences), Adelaide. SARDI Publication No. F2007/000276-13. SARDI Research Report Series No. 1023. 72pp.
South Australian Research and Development Institute SARDI Aquatic Sciences 2 Hamra Avenue West Beach SA 5024
Telephone: (08) 8207 5400 Facsimile: (08) 8207 5415 http://www.pir.sa.gov.au/research
DISCLAIMER
The authors warrant that they have taken all reasonable care in producing this report. The report has been through the SARDI internal review process, and has been formally approved for release by the Research Chief, Aquatic Sciences. Although all reasonable efforts have been made to ensure quality, SARDI does not warrant that the information in this report is free from errors or omissions. SARDI and its employees do not warrant or make any representation regarding the use, or results of the use, of the information contained herein as regards to its correctness, accuracy, reliability and currency or otherwise. SARDI and its employees expressly disclaim all liability or responsibility to any person using the information or advice. Use of the information and data contained in this report is at the user’s sole risk. If users rely on the information they are responsible for ensuring by independent verification its accuracy, currency or completeness. The SARDI Report Series is an Administrative Report Series which has not been reviewed outside the department and is not considered peer-reviewed literature. Material presented in these Administrative Reports may later be published in formal peer-reviewed scientific literature.
© 2019 SARDI
This work is copyright. Apart from any use as permitted under the Copyright Act 1968 (Cth), no part may be reproduced by any process, electronic or otherwise, without the specific written permission of the copyright owner. Neither may information be stored electronically in any form whatsoever without such permission. SARDI Publication No. F2007/000276-13 SARDI Research Report Series No. 1023
Author(s): A. Linnane, R. McGarvey, J. Feenstra and P. Hawthorne
Reviewer(s): B. Stobart, G. Ferguson (SARDI) and A. Jones (PIRSA) Approved by: S. Mayfield Science Leader – Fisheries
Signed: Date: 02 July 2019
Distribution: PIRSA Fisheries and Aquaculture, Southern Zone Rock Lobster licence holders, SAASC Library, Parliamentary Library, State Library and National Library
Circulation: Public Domain
Linnane, A. et al. (2019) Southern Zone Rock Lobster Fishery
iv
TABLE OF CONTENTS
TABLE OF CONTENTS ...................................................................................................................... iv
LIST OF TABLES ................................................................................................................................ vi
LIST OF FIGURES ............................................................................................................................. vii
ACKNOWLEDGEMENTS .................................................................................................................. viii
EXECUTIVE SUMMARY ...................................................................................................................... 1
1 INTRODUCTION .......................................................................................................................... 3
1.1 Overview ................................................................................................................................ 3
1.2 Description of the fishery .................................................................................................... 3 1.2.1 Access ................................................................................................................................ 3 1.2.2 Management arrangements ............................................................................................... 3 1.2.3 Marine parks ....................................................................................................................... 4 1.2.4 Recreational fishery ............................................................................................................ 5
1.3 Biology of Southern Rock Lobster ..................................................................................... 8 1.3.1 Distribution .......................................................................................................................... 8 1.3.2 Reproductive biology .......................................................................................................... 8 1.3.3 Early life history .................................................................................................................. 8 1.3.4 Stock structure.................................................................................................................... 9
1.4 Research program ................................................................................................................ 9
1.5 Information sources for assessment ................................................................................ 10 1.5.1 Commercial catch and effort data .................................................................................... 10 1.5.2 Recreational catch and effort data ................................................................................... 10 1.5.3 Voluntary catch sampling ................................................................................................. 11 1.5.4 Puerulus monitoring program ........................................................................................... 11 1.5.5 Fishery-Independent Monitoring Survey .......................................................................... 11 1.5.6 “qR” and “LenMod” stock assessment models ................................................................. 12
1.6 Harvest strategy .................................................................................................................. 12 1.6.1 Management plan ............................................................................................................. 12 1.6.2 Performance indicators .................................................................................................... 13 1.6.3 Allocation of access .......................................................................................................... 14
1.7 Stock status classification ................................................................................................. 14
2 METHODS .................................................................................................................................. 16
2.1 Commercial catch and effort statistics ............................................................................ 16
2.2 Recreational catch and effort data .................................................................................... 16
2.3 Voluntary catch sampling .................................................................................................. 16
2.4 Puerulus monitoring program ........................................................................................... 17
2.5 Fishery-Independent Monitoring Survey (FIMS) .............................................................. 17
2.6 “qR” and “LenMod” stock assessment models .............................................................. 18 2.6.1 qR model .......................................................................................................................... 19 2.6.2 LenMod ............................................................................................................................. 19
2.7 Assessment of fishery performance ................................................................................ 20
2.8 Quality assurance of data .................................................................................................. 20
3 RESULTS ................................................................................................................................... 22
3.1 Commercial catch and effort statistics ............................................................................ 22 3.1.1 Zone ................................................................................................................................. 22 3.1.2 Within-season trends ........................................................................................................ 24 3.1.3 Spatial trends .................................................................................................................... 27
Linnane, A. et al. (2019) Southern Zone Rock Lobster Fishery
v
3.1.4 Additional indices ............................................................................................................. 32
3.2 Recreational catch and effort ............................................................................................ 35
3.3 Voluntary catch sampling .................................................................................................. 35
3.4 Puerulus monitoring program ........................................................................................... 38
3.5 Fishery-Independent Monitoring Survey (FIMS) .............................................................. 40
3.6 “qR” and “LenMod” stock assessment models .............................................................. 42 3.6.1 Model fits .......................................................................................................................... 42 3.6.2 Model outputs ................................................................................................................... 42
4 DISCUSSION ............................................................................................................................. 44
4.1 Context of this Assessment .............................................................................................. 44
4.2 Determination of Stock Status .......................................................................................... 44
4.3 Stock Status ........................................................................................................................ 45
4.4 Assessment Uncertainties ................................................................................................. 46
4.5 Future Work ......................................................................................................................... 47
5 BIBLIOGRAPHY ........................................................................................................................ 48
6 APPENDICES ............................................................................................................................ 53
Appendix 1. SZRLF Catch, Effort and CPUE data ........................................................................ 53
Appendix 2. Computing confidence intervals for the FIMS indices of abundance .................. 55
Appendix 3. Specifications of the qR model including equations, assumptions and model parameters ........................................................................................................................................ 57
Appendix 4. Specifications of the length-structured model (LenMod) including equations, assumptions and model parameters. ............................................................................................ 61
Appendix 5. Model fits ..................................................................................................................... 70
Linnane, A. et al. (2019) Southern Zone Rock Lobster Fishery
vi
LIST OF TABLES
Table 1-1 Major management milestones for the SZRLF. .................................................................... 6 Table 1-2 Management arrangements for the SZRLF in 2017/18. ....................................................... 7 Table 1-3 CPUE bands and associated TACCs for the SZRLF harvest control rule.......................... 13 Table 1-4 Shares of Southern Rock Lobster allocated to the commercial, recreational and aboriginal
traditional fishing sectors in the SZRLF ..................................................................................... 14 Table 1-5 Stock status terminology (Stewardson et al. 2018). ........................................................... 15 Table 3-1 Chronology of TACC versus landed catch in the SZRLF. .................................................. 24 Table 6-1 Catch, Effort and CPUE (commercial and fishery independent survey) for the SZRLF from
1970 to 2017 by zone. ................................................................................................................ 53 Table 6-2 Catch, Effort and CPUE for the SZRLF from 1970 to 2017 by MFA. ................................. 54 Table 6-3 Variables of the qR model dynamics and likelihood assessment estimator. ...................... 60 Table 6-4 Catchability estimates from LenMod for the SZRLF. .......................................................... 64 Table 6-5 Parameters of the length-structured model (LenMod) model and their sources for the
Southern Zone Rock Lobster Fishery......................................................................................... 68
Linnane, A. et al. (2019) Southern Zone Rock Lobster Fishery
vii
LIST OF FIGURES
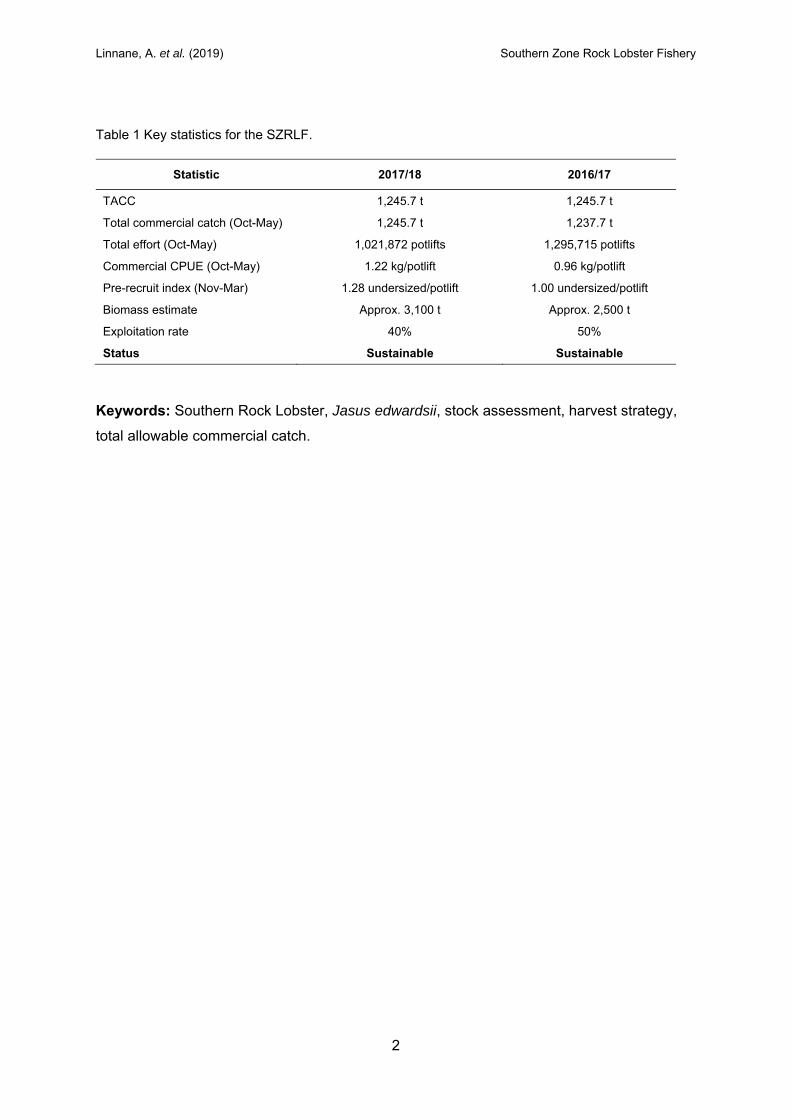
Figure 1-1 Marine Fishing Areas in the Southern and Northern Zones of the South Australian Rock Lobster Fishery. ............................................................................................................................ 5
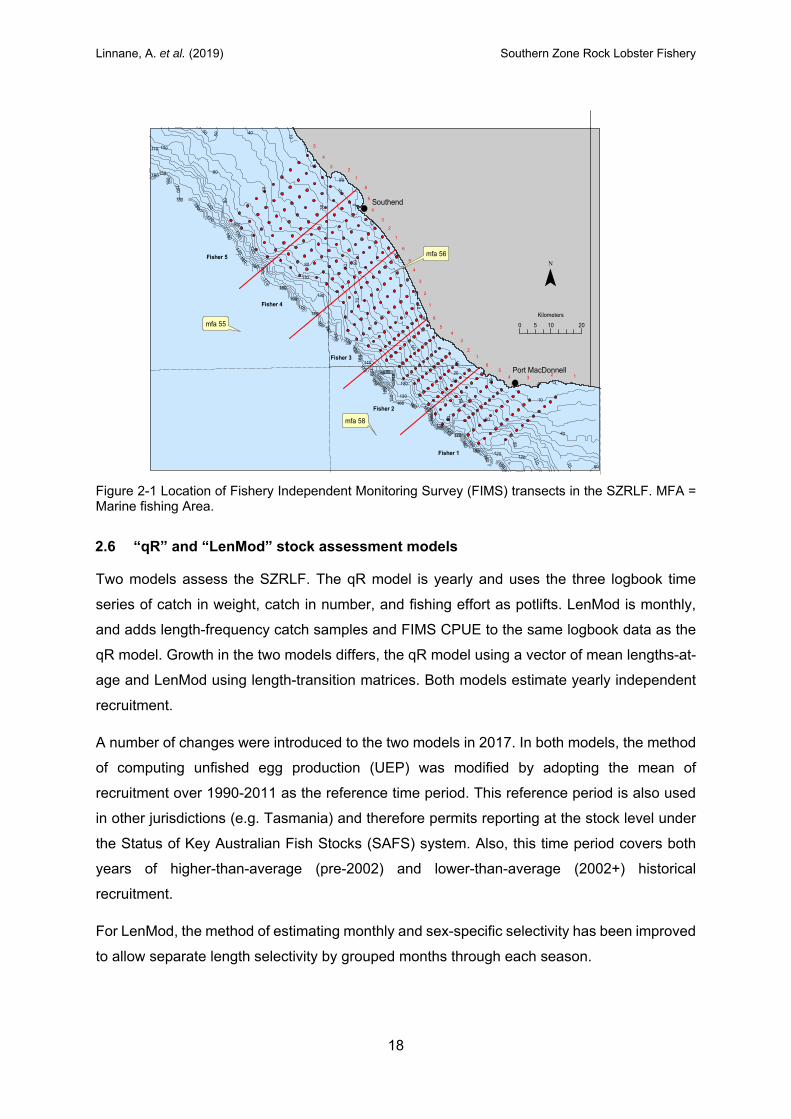
Figure 1-2 A commercial Southern Rock Lobster fishing pot. .............................................................. 5 Figure 1-3 Map of the closures and restrictions relevant to South Australia’s Rock Lobster Fishery. . 6 Figure 1-4 Southern Rock Lobster phyllosoma (left) and puerulus (right). ........................................... 9 Figure 2-1 Location of Fishery Independent Monitoring Survey (FIMS) transects in the SZRLF. MFA
= Marine fishing Area. ................................................................................................................ 18 Figure 3-1 Fishery dependent outputs for the SZRLF. (a) Catch and effort including total allowable
commercial catch (TACC) limit; (b) catch per unit effort (CPUE) including long-term average (dashed line); (c) pre-recruit index (PRI) including limit reference point (dashed line); and (d) mean weight. .............................................................................................................................. 23
Figure 3-2 Within-season fishery dependent trends in the SZRLF. (a) Catch and effort; (b) catch per unit effort (CPUE); (c) pre-recruit index (PRI); and (d) mean weight. ........................................ 26
Figure 3-3 Spatial fishery dependent trends in the SZRLF. (a) Catch and effort; (b) catch per unit effort (CPUE); (c) pre-recruit index (PRI); and (d) mean weight. ............................................... 28
Figure 3-4 Percentage of catch taken from four depth ranges in the SZRLF by zone (top) and across the primary MFAs (bottom) from 2003 to 2017. ......................................................................... 30
Figure 3-5 CPUE by depth in the SZRLF from 1970 to 2017. ............................................................ 31 Figure 3-6 Additional fishery dependent indices in the SZRLF. (a) Catch rate of spawning lobsters;
(b) predation mortality; (c) average number of days fished; and (d) levels of high-grading. ...... 34 Figure 3-7 Length frequency distributions of male and female lobsters combined in the SZRLF from
2015 to 2017 (red line indicates MLS at 98.5 mm CL). .............................................................. 36 Figure 3-8 A comparison of length frequency distributions (male and female lobsters combined) by
MFA in the 2017 season (MFA 51 not included due to limited data. Red line indicates MLS at 98.5 mm CL). .............................................................................................................................. 37
Figure 3-9 Puerulus settlement indices (mean ±SE) in the SZRLF from 1991 to 2017. Blue and black lines represent long-term mean (1991-2017) and median estimates respectively. ................... 39
Figure 3-10 Correlations between SZRLF puerulus settlement lagged by four years with logbook PRI and by five years with commercial CPUE. ................................................................................. 39
Figure 3-11 Comparison of legal size catch rates (nr/potlift) from commercial logbook data and fishery independent monitoring surveys. .................................................................................... 41
Figure 3-12 Comparison of undersized catch rates (nr/potlift) from commercial logbook data and fishery independent monitoring surveys. .................................................................................... 41
Figure 3-13 Fishery model outputs for the SZRLF. (a) Legal-size biomass; (b) Egg production; (c) % of unfished egg production; (d) Exploitation rate; and (e) Recruitment ...................................... 43
Figure 6-1 Fit of the qR model to catch in number of lobsters landed for the SZRLF, based on annual logbook catch totals from the fishery. ......................................................................................... 70
Figure 6-2 Fit of the qR model to catch in weight for the SZRLF, based on annual logbooks catch totals from the fishery. ................................................................................................................ 70
Figure 6-3 Fit of the LenMod model to monthly catch in number (Cn) for the SZRLF, based on logbook catch totals from the fishery. (Note: October closed to fishing in 2010). ...................... 71
Figure 6-4 Fit of the LenMod model to monthly catch per unit effort (CPUE) for the SZRLF, based on logbook catch totals from the fishery (Note: October closed to fishing in 2010). ....................... 71
Figure 6-5 Sample of model fit (black line) to commercial length frequency data for both males and females taken during the 2017 season in the SZRLF. ............................................................... 72

Linnane, A. et al. (2019) Southern Zone Rock Lobster Fishery
viii
ACKNOWLEDGEMENTS
Research presented in this report was commissioned by PIRSA Fisheries and Aquaculture
using funds obtained from licence fees paid by participants in the Southern Zone Rock
Lobster Fishery. SARDI Aquatic Sciences provided substantial in-kind support for the project.
We thank Lachlan McLeay, Kylie Odgers, Andrew Hogg, Damian Matthews and Brian
Foureur for collecting and collating the data. The report was formally reviewed by Dr. Greg
Ferguson, Dr. Ben Stobart, Prof. Gavin Begg (SARDI Aquatic Sciences) and Dr. Annabel
Jones (PIRSA Fisheries and Aquaculture) and approved for release by A/Prof. Stephen
Mayfield (SARDI Aquatic Sciences).
Linnane, A. et al. (2019) Southern Zone Rock Lobster Fishery
1
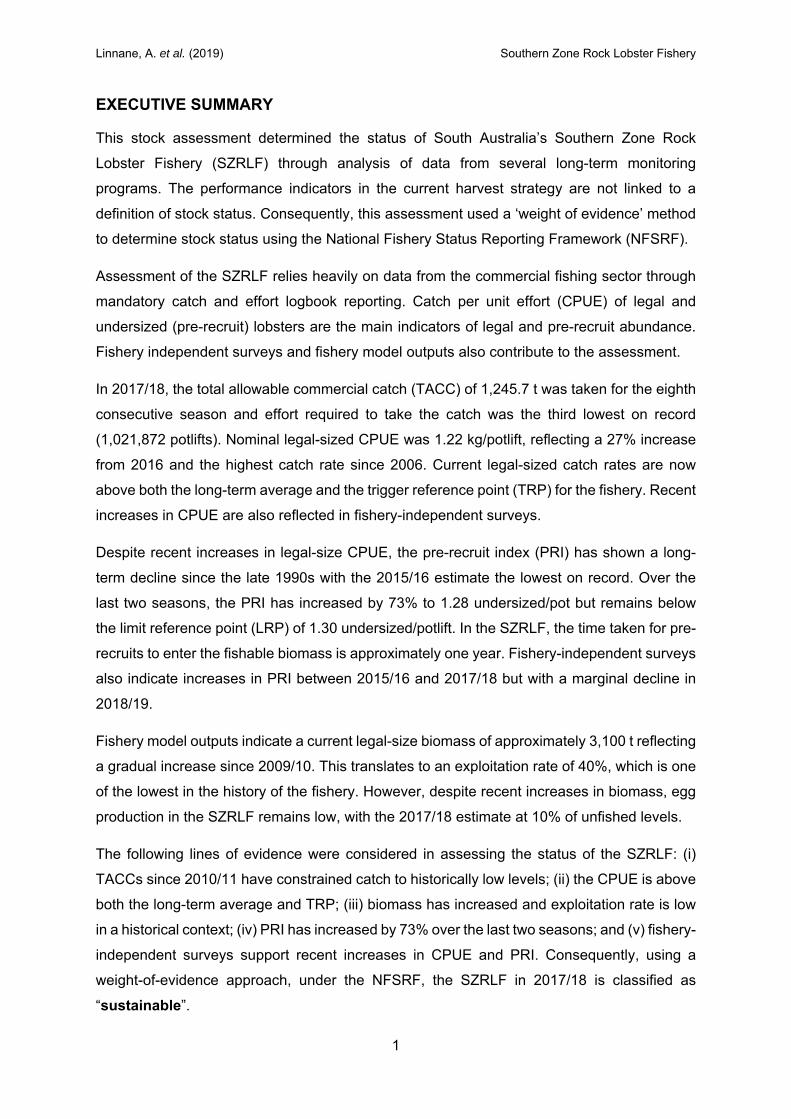
EXECUTIVE SUMMARY
This stock assessment determined the status of South Australia’s Southern Zone Rock
Lobster Fishery (SZRLF) through analysis of data from several long-term monitoring
programs. The performance indicators in the current harvest strategy are not linked to a
definition of stock status. Consequently, this assessment used a ‘weight of evidence’ method
to determine stock status using the National Fishery Status Reporting Framework (NFSRF).
Assessment of the SZRLF relies heavily on data from the commercial fishing sector through
mandatory catch and effort logbook reporting. Catch per unit effort (CPUE) of legal and
undersized (pre-recruit) lobsters are the main indicators of legal and pre-recruit abundance.
Fishery independent surveys and fishery model outputs also contribute to the assessment.
In 2017/18, the total allowable commercial catch (TACC) of 1,245.7 t was taken for the eighth
consecutive season and effort required to take the catch was the third lowest on record
(1,021,872 potlifts). Nominal legal-sized CPUE was 1.22 kg/potlift, reflecting a 27% increase
from 2016 and the highest catch rate since 2006. Current legal-sized catch rates are now
above both the long-term average and the trigger reference point (TRP) for the fishery. Recent
increases in CPUE are also reflected in fishery-independent surveys.
Despite recent increases in legal-size CPUE, the pre-recruit index (PRI) has shown a long-
term decline since the late 1990s with the 2015/16 estimate the lowest on record. Over the
last two seasons, the PRI has increased by 73% to 1.28 undersized/pot but remains below
the limit reference point (LRP) of 1.30 undersized/potlift. In the SZRLF, the time taken for pre-
recruits to enter the fishable biomass is approximately one year. Fishery-independent surveys
also indicate increases in PRI between 2015/16 and 2017/18 but with a marginal decline in
2018/19.
Fishery model outputs indicate a current legal-size biomass of approximately 3,100 t reflecting
a gradual increase since 2009/10. This translates to an exploitation rate of 40%, which is one
of the lowest in the history of the fishery. However, despite recent increases in biomass, egg
production in the SZRLF remains low, with the 2017/18 estimate at 10% of unfished levels.
The following lines of evidence were considered in assessing the status of the SZRLF: (i)
TACCs since 2010/11 have constrained catch to historically low levels; (ii) the CPUE is above
both the long-term average and TRP; (iii) biomass has increased and exploitation rate is low
in a historical context; (iv) PRI has increased by 73% over the last two seasons; and (v) fishery-
independent surveys support recent increases in CPUE and PRI. Consequently, using a
weight-of-evidence approach, under the NFSRF, the SZRLF in 2017/18 is classified as
“sustainable”.
Linnane, A. et al. (2019) Southern Zone Rock Lobster Fishery
2
Table 1 Key statistics for the SZRLF.
Statistic 2017/18 2016/17
TACC 1,245.7 t 1,245.7 t
Total commercial catch (Oct-May) 1,245.7 t 1,237.7 t
Total effort (Oct-May) 1,021,872 potlifts 1,295,715 potlifts
Commercial CPUE (Oct-May) 1.22 kg/potlift 0.96 kg/potlift
Pre-recruit index (Nov-Mar) 1.28 undersized/potlift 1.00 undersized/potlift
Biomass estimate Approx. 3,100 t Approx. 2,500 t
Exploitation rate 40% 50%
Status Sustainable Sustainable
Keywords: Southern Rock Lobster, Jasus edwardsii, stock assessment, harvest strategy,
total allowable commercial catch.
Linnane, A. et al. (2019) Southern Zone Rock Lobster Fishery
3
1 INTRODUCTION
1.1 Overview
Stock assessments for the South Australian Southern Zone Rock Lobster (Jasus edwardsii)
Fishery (SZRLF) have been produced annually since 1997 (Prescott et al. 1998). The current
report presents information on the fishery and biology of the species and provides a current
assessment of the status of the SZRLF in relation to the performance indicators provided in
the Management Plan for the fishery (PIRSA 2013).
1.2 Description of the fishery
1.2.1 Access
Southern Rock Lobster is a highly valued fishery species across the States of South Australia,
Victoria and Tasmania. Within South Australia, the fishery is divided into two zones; Northern
and Southern, with an approximate SZRLF value of $99.7 million in 2016/17 (Econsearch
2018). The SZRLF includes all South Australian waters between the mouth of the Murray River
and the Victorian border and covers an area of 22,000 km2 (Figure 1-1). It is divided into seven
Marine Fishing Areas (MFAs), but the majority of fishing occurs in four MFAs (51, 55, 56 and
58).
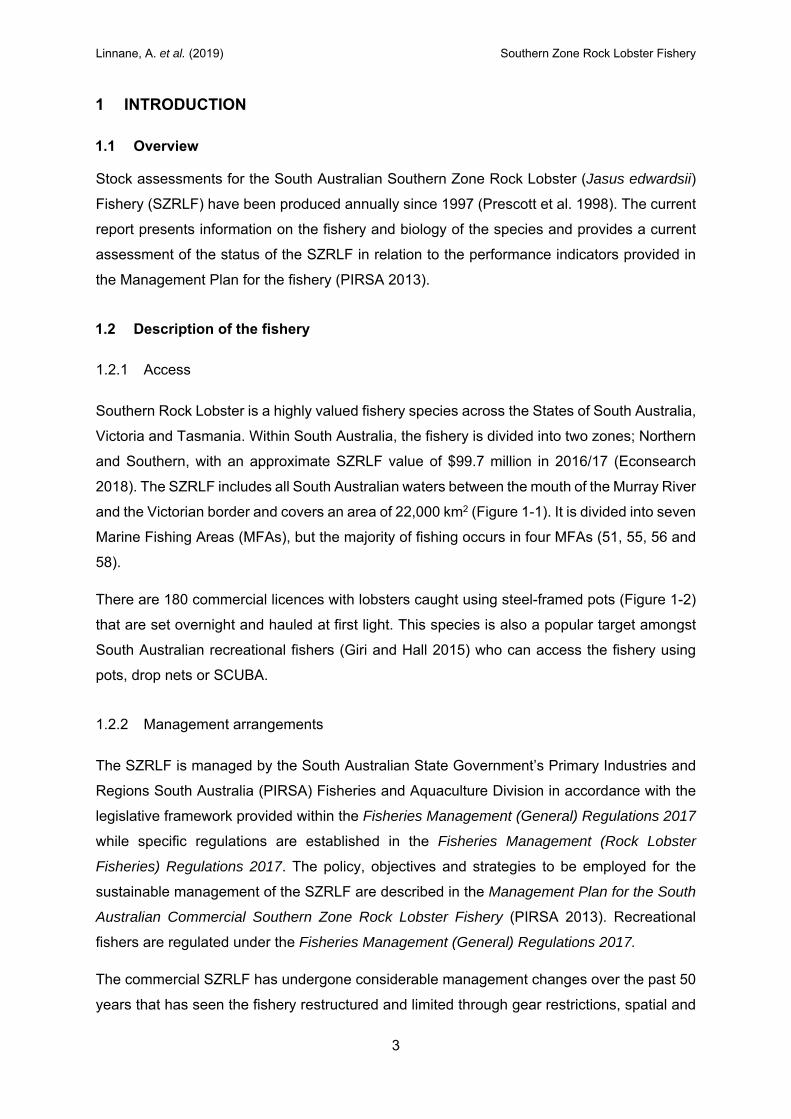
There are 180 commercial licences with lobsters caught using steel-framed pots (Figure 1-2)
that are set overnight and hauled at first light. This species is also a popular target amongst
South Australian recreational fishers (Giri and Hall 2015) who can access the fishery using
pots, drop nets or SCUBA.
1.2.2 Management arrangements
The SZRLF is managed by the South Australian State Government’s Primary Industries and
Regions South Australia (PIRSA) Fisheries and Aquaculture Division in accordance with the
legislative framework provided within the Fisheries Management (General) Regulations 2017
while specific regulations are established in the Fisheries Management (Rock Lobster
Fisheries) Regulations 2017. The policy, objectives and strategies to be employed for the
sustainable management of the SZRLF are described in the Management Plan for the South
Australian Commercial Southern Zone Rock Lobster Fishery (PIRSA 2013). Recreational
fishers are regulated under the Fisheries Management (General) Regulations 2017.
The commercial SZRLF has undergone considerable management changes over the past 50
years that has seen the fishery restructured and limited through gear restrictions, spatial and
Linnane, A. et al. (2019) Southern Zone Rock Lobster Fishery
4
temporal closures, size limits and the implementation of a total allowable commercial catch
(TACC) in 1993 (Table 1-1). The TACC is set annually and divided proportionally between
licence holders owning individual transferable quota (ITQ) units. The daily catch of individual
vessels is monitored electronically via catch and disposal records and mandatory commercial
logbooks. Details of management arrangements for the 2017/18 season are provided in Table
1-2.
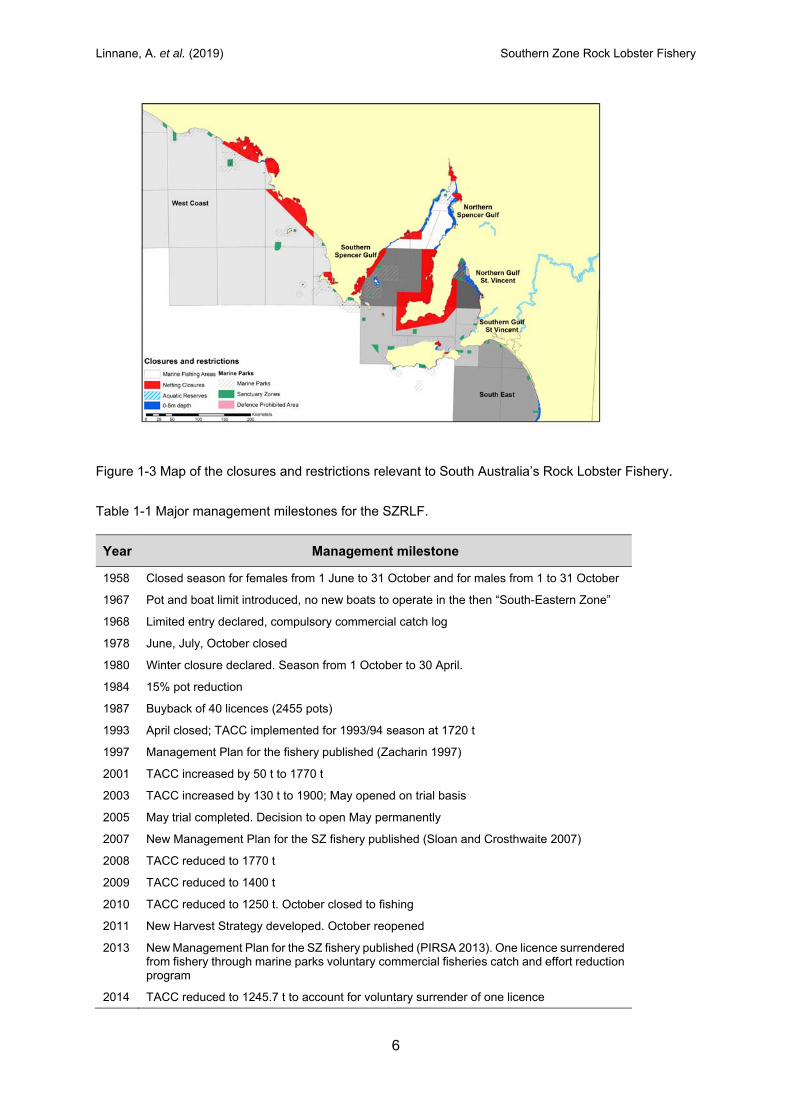
1.2.3 Marine parks
In alignment with international and national commitments, the South Australian Government
introduced 19 multiple-use marine parks on 1 October 2014. This network covers a total area
of 27,526 km2, encapsulating approximately 46% of South Australia’s waters (DEH 2009)
(Figure 1-3). The overarching aim of these parks is to protect and conserve marine biological
diversity. The marine park network includes four levels of protection that include; (i) general
and managed use zones; (ii) habitat protection zones; (iii) sanctuary zones; and (iv) restricted
zones. Of these, the sanctuary and restricted zones are the most relevant to fisheries as all
forms of fishing are prohibited within their boundaries. These zones account for approximately
6% of the State’s marine waters. A voluntary catch/effort reduction program was undertaken
prior to implementation of sanctuary zones. This program mitigated the risk to fish stocks
associated with displaced catch and effort from closed areas impacting on areas of the fishery
that remain open to fishing. One SZRLF licence was surrendered as part of the implementation
process.
Linnane, A. et al. (2019) Southern Zone Rock Lobster Fishery
5
1.2.4 Recreational fishery
There is an important recreational fishery for lobsters in the SZRLF. Recreational fishers are
allowed to use drop nets, pots or SCUBA to take lobsters during the same season as
commercial fishers. All recreational lobster pots must be registered.
Figure 1-1 Marine Fishing Areas in the Southern and Northern Zones of the South Australian Rock Lobster Fishery.
Figure 1-2 A commercial Southern Rock Lobster fishing pot.
Linnane, A. et al. (2019) Southern Zone Rock Lobster Fishery
6
Figure 1-3 Map of the closures and restrictions relevant to South Australia’s Rock Lobster Fishery.
Table 1-1 Major management milestones for the SZRLF.
Year Management milestone
1958 Closed season for females from 1 June to 31 October and for males from 1 to 31 October
1967 Pot and boat limit introduced, no new boats to operate in the then “South-Eastern Zone”
1968 Limited entry declared, compulsory commercial catch log
1978 June, July, October closed
1980 Winter closure declared. Season from 1 October to 30 April.
1984 15% pot reduction
1987 Buyback of 40 licences (2455 pots)
1993 April closed; TACC implemented for 1993/94 season at 1720 t
1997 Management Plan for the fishery published (Zacharin 1997)
2001 TACC increased by 50 t to 1770 t
2003 TACC increased by 130 t to 1900; May opened on trial basis
2005 May trial completed. Decision to open May permanently
2007 New Management Plan for the SZ fishery published (Sloan and Crosthwaite 2007)
2008 TACC reduced to 1770 t
2009 TACC reduced to 1400 t
2010 TACC reduced to 1250 t. October closed to fishing
2011 New Harvest Strategy developed. October reopened
2013 New Management Plan for the SZ fishery published (PIRSA 2013). One licence surrendered from fishery through marine parks voluntary commercial fisheries catch and effort reduction program
2014 TACC reduced to 1245.7 t to account for voluntary surrender of one licence
Linnane, A. et al. (2019) Southern Zone Rock Lobster Fishery
7
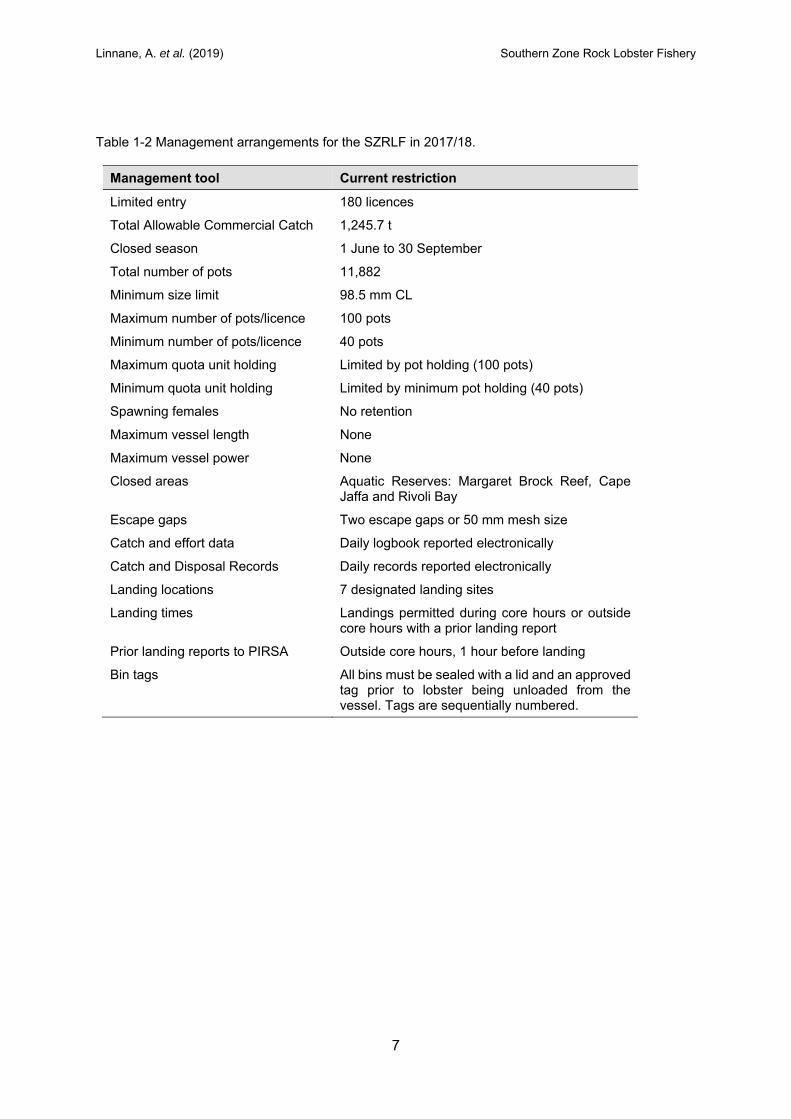
Table 1-2 Management arrangements for the SZRLF in 2017/18.
Management tool Current restriction
Limited entry 180 licences
Total Allowable Commercial Catch 1,245.7 t
Closed season 1 June to 30 September
Total number of pots 11,882
Minimum size limit 98.5 mm CL
Maximum number of pots/licence 100 pots
Minimum number of pots/licence 40 pots
Maximum quota unit holding Limited by pot holding (100 pots)
Minimum quota unit holding Limited by minimum pot holding (40 pots)
Spawning females No retention
Maximum vessel length None
Maximum vessel power None
Closed areas Aquatic Reserves: Margaret Brock Reef, Cape Jaffa and Rivoli Bay
Escape gaps Two escape gaps or 50 mm mesh size
Catch and effort data Daily logbook reported electronically
Catch and Disposal Records Daily records reported electronically
Landing locations 7 designated landing sites
Landing times Landings permitted during core hours or outside core hours with a prior landing report
Prior landing reports to PIRSA Outside core hours, 1 hour before landing
Bin tags All bins must be sealed with a lid and an approved tag prior to lobster being unloaded from the vessel. Tags are sequentially numbered.
Linnane, A. et al. (2019) Southern Zone Rock Lobster Fishery
8
1.3 Biology of Southern Rock Lobster
1.3.1 Distribution
Southern Rock Lobster are distributed around southern mainland Australia, Tasmania and
New Zealand. In Australia, the northern limits of distribution are Geraldton in Western Australia
and Coffs Harbour in northern New South Wales but the bulk of the population is found in
South Australia, Victoria, and Tasmania where they occur to depths of approximately 200 m.
Throughout its distribution, this species depends on algal-dominated reef habitat for shelter
and food availability (Phillips 2013).
1.3.2 Reproductive biology
Detailed reviews on the reproductive biology and life history of J. edwardsii are provided in
Phillips (2013). In brief, J. edwardsii mate from April to July after which fertilisation is external,
with the male depositing a spermatophore on the female’s sternal plates (MacDiarmid 1988).
The eggs are extruded shortly afterwards, with a brooding period of 3-4 months over the
Austral winter (June to August) (MacDiarmid 1989).
Female size of maturity (L50%) varies considerably which is likely to reflect spatial variation in
growth across the distribution of the species (Punt and Kennedy 1997; McGarvey et al. 1999).
In the SZRLF, L50% ranges from 68 mm carapace length (CL) in offshore waters (>100 m
depth) to 104 mm CL in the northern MFAs of 51 and 55 (Linnane et al. 2008; 2009; refer to
Figure 1-1 for MFA locations).
1.3.3 Early life history
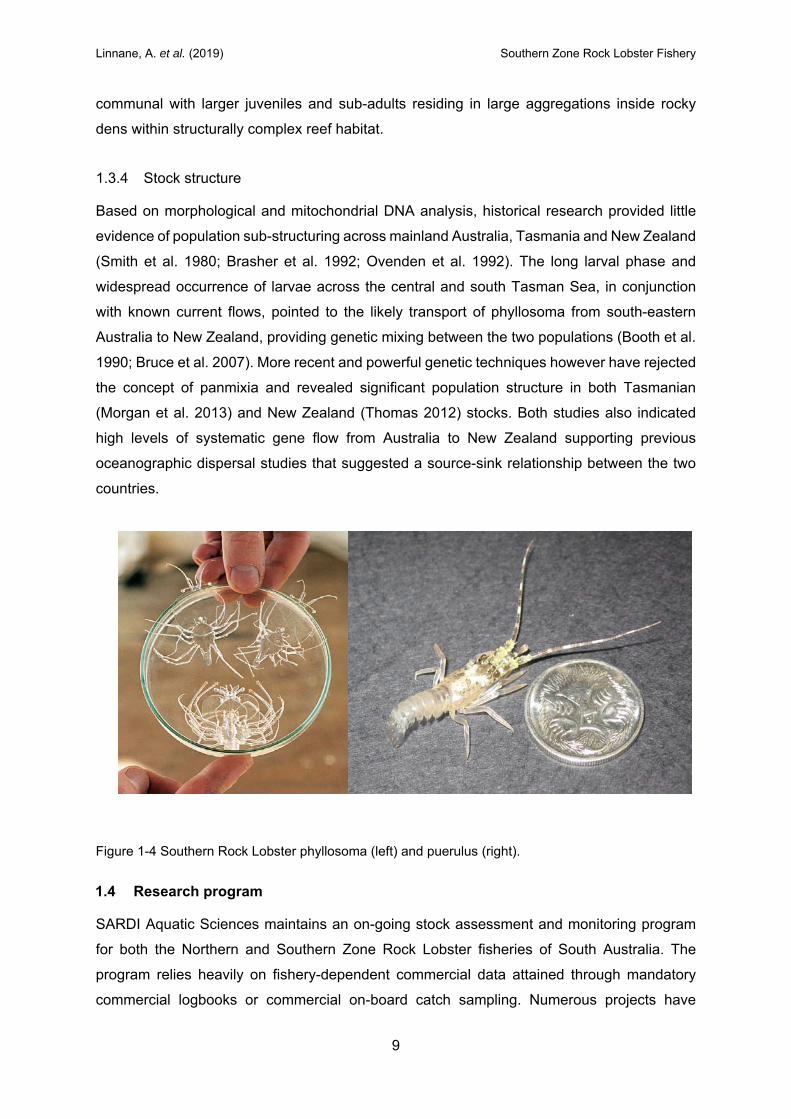
Larvae hatch in early spring and pass through a brief (10-14 days) nauplius period before
entering into a planktonic, leaf-like phase called a phyllosoma (Figure 1-4). Phyllosoma drift
passively and have a long offshore larval period, indicating that oceanographic conditions,
particularly currents and eddies, play an important part in their dispersal (Chiswell and Booth
2005; Chiswell and Booth 2008). Phyllosoma develop through a series of 11 stages over 12-
23 months before metamorphosing into the puerulus stage (Figure 1-4) (Booth et al. 1991;
Bruce et al. 1999). Puerulus are non-feeding but can actively swim thereby aiding settlement
onto suitable reef habitat (Booth et al. 1991; Phillips and McWilliam 2009).
In South Australia, the strength of westerly winds, during late winter and early spring, plays an
important role in inter-annual settlement variation (McGarvey and Matthews 2001; Linnane et
al. 2010). After inshore settlement, early juveniles (<20 mm CL) are solitary and normally found
in isolated holes and crevices. As they develop, juvenile lobsters become increasingly
Linnane, A. et al. (2019) Southern Zone Rock Lobster Fishery
9
communal with larger juveniles and sub-adults residing in large aggregations inside rocky
dens within structurally complex reef habitat.
1.3.4 Stock structure
Based on morphological and mitochondrial DNA analysis, historical research provided little
evidence of population sub-structuring across mainland Australia, Tasmania and New Zealand
(Smith et al. 1980; Brasher et al. 1992; Ovenden et al. 1992). The long larval phase and
widespread occurrence of larvae across the central and south Tasman Sea, in conjunction
with known current flows, pointed to the likely transport of phyllosoma from south-eastern
Australia to New Zealand, providing genetic mixing between the two populations (Booth et al.
1990; Bruce et al. 2007). More recent and powerful genetic techniques however have rejected
the concept of panmixia and revealed significant population structure in both Tasmanian
(Morgan et al. 2013) and New Zealand (Thomas 2012) stocks. Both studies also indicated
high levels of systematic gene flow from Australia to New Zealand supporting previous
oceanographic dispersal studies that suggested a source-sink relationship between the two
countries.
Figure 1-4 Southern Rock Lobster phyllosoma (left) and puerulus (right).
1.4 Research program
SARDI Aquatic Sciences maintains an on-going stock assessment and monitoring program
for both the Northern and Southern Zone Rock Lobster fisheries of South Australia. The
program relies heavily on fishery-dependent commercial data attained through mandatory
commercial logbooks or commercial on-board catch sampling. Numerous projects have
Linnane, A. et al. (2019) Southern Zone Rock Lobster Fishery
10
focussed on addressing key knowledge gaps or improving stock assessment over the years.
These have covered aspects such as marine mammal exclusion devices (Goldsworthy et al.
2010); data standardisation (Linnane and Walsh 2011); bio-economic decision support tools
for harvest strategy analyses (McGarvey et al. 2014); and fishery spatial and temporal
management (Linnane et al. 2016).
The primary outputs from the research program are a series of reports prepared annually for
the Primary Industries and Regions of South Australia (PIRSA), Fisheries and Aquaculture
Division. An annual Status Report provides the information required to make decisions in
accordance with the TACC decision rules provided in the harvest strategy. The annual Stock
Assessment Report provides comprehensive spatial and temporal fishery analyses and
fishery model outputs which are then integrated to determine a stock status. This report also
identifies future work to be undertaken.
1.5 Information sources for assessment
1.5.1 Commercial catch and effort data
The South Australian Rock Lobster Fishery is divided into 58 Marine Fishing Areas (MFAs) for
the purpose of statistical reporting and monitoring of commercial fishing activity (Figure 1-1).
All licenced fishers are required to log their fishing activities, recording specific details such as
MFA fished, species targeted, species caught, weight of catch, number of legal–sized lobsters
landed and fishing effort as potlifts. In addition to mandatory details, a number of voluntary
fields may also be completed such as number of undersized individuals, lobster mortalities
and levels of high-grading. These records must be submitted monthly to SARDI Aquatic
Sciences where they are entered into the South Australian Rock Lobster (SARL) database
which is routinely reviewed and cross-checked to ensure that the data satisfy management
and research needs. The current database is a compilation of catch and effort data collected
from 1970/71 to the present and provides the primary source of data used for stock
assessment. The data used in this assessment were finalised up to 31 May 2018.
1.5.2 Recreational catch and effort data
Quantifying the recreational sector’s contribution to the State’s total catch is important in
determining the overall status of fish stocks and contributes to resource allocation. There have
been three extensive recreational fishing surveys carried out in South Australia over the past
15 years. These are primarily State-wide telephone/diary surveys that were undertaken in
2004/05 (Currie et al. 2006), 2007/08 (Jones 2009) and 2013/14 (Giri and Hall 2015).
Linnane, A. et al. (2019) Southern Zone Rock Lobster Fishery
11
1.5.3 Voluntary catch sampling
Since 1991, in addition to commercial logbook data, commercial fishers and researchers have
collaborated in a voluntary catch sampling program. The program aims to attain additional
fishery information at finer spatial scales than recorded in commercial logbooks. An important
contribution from the program is lobster size data which are used to generate size frequency
distributions as well as provide input data for the length-based LenMod fishery model.
A previous study aimed at determining the optimal sampling strategy required to produce
quantifiable and minimum variances in mean lengths concluded that the optimal catch
sampling design should incorporate a high percentage of boats, where sampling was
undertaken on as many days as possible from a small fraction of the pots from each boat
(McGarvey and Pennington 2001). As a result, fishers contribute by recording data from up to
three pots per day (with escape gaps closed where used) while researchers generally record
data from all pots during on-board observer trips.
1.5.4 Puerulus monitoring program
Rates of puerulus and post-puerulus settlement have been monitored in the SZRLF since
1991/92. This program was initiated based on the settlement-recruitment relationship
observed in Western Australia where future commercial catches of Panulirus cygnus were
predicted from settlement indices using a 3–4 year time lag (Caputi et al. 1995). Though not
as explicit, similar relationships are now also evident in specific regions of some J. edwardsii
fisheries in both Australia and New Zealand (Gardner et al. 2001; Booth and McKenzie 2009;
Linnane et al. 2013; 2014).
1.5.5 Fishery-Independent Monitoring Survey
It has long been recognised that fishery-dependent abundance estimates can be influenced
by a range of factors associated with fishing behaviour (Thorson et al. 2017). For example,
catch rate estimates can be confounded by changes in fishing location and temporal targeting
of fish stocks. A fishery-independent monitoring survey (FIMS) has been undertaken in the
SZRLF since 2006/07. The primary aim of the FIMS is to determine legal and undersized
lobster abundances, as well as size frequency distributions, that are independent of targeted
fishing behaviour.
Linnane, A. et al. (2019) Southern Zone Rock Lobster Fishery
12
1.5.6 “qR” and “LenMod” stock assessment models
Two computer-based fishery stock assessment models have been developed for the South
Australian Rock Lobster Fishery. Each model provides outputs for both the Northern and
Southern Zone fisheries that take into account known biological information specific to each
region.
The primary data input to the qR model is catch by weight and catch by number. Outputs have
been presented in stock assessment reports for the fishery since 1997 (McGarvey et al.1997;
McGarvey and Matthews 2001) with a review in 2002 (Breen and McKoy 2002) concluding
that the qR model was an appropriate tool for assessing rock lobster stocks. The model has
been refined over time, most notably during the peer review process for publication of
McGarvey and Matthews (2001) and changes to biomass definitions in 2008.
The basic LenMod structure was developed by André Punt (Washington University) in the
1990s (Punt and Kennedy 1997). Variants of this length-based lobster model are now used
for management and quota setting in most J. edwardsii fisheries, notably in New Zealand,
Victoria and Tasmania. LenMod fits to catch in number and CPUE, while conditioning on catch
in weight. In addition, it also incorporates length-frequency data from voluntary catch sampling,
where the lobster population is broken down into size categories of differing CL.
The primary outputs from both models are: (i) legal-sized biomass; (ii) egg production; (iii) %
unfished egg production; (iv) exploitation rate (fraction of legal-sized biomass); and (v)
recruitment. In addition, both models have been extensively used in bio-economic analyses
and harvest strategy evaluations (McGarvey et al. 2014; 2015; 2016; 2017).
1.6 Harvest strategy
1.6.1 Management plan
A new Management Plan for the South Australian SZRLF was adopted in October 2013
(PIRSA 2013). A harvest strategy included in this management plan provides a structured
framework for decision-making that aims to ensure that the ecologically sustainable
development objectives of the Fisheries Management Act 2007 are achieved. The aim of this
harvest strategy is to rebuild the biomass of the resource and increase catch rates. A revised
TACC table (Table 1-3) for the harvest strategy decision rules was adopted in 2015. The
revised table was used for TACC setting for the fishery from the 2015/16 season.
Linnane, A. et al. (2019) Southern Zone Rock Lobster Fishery
13
1.6.2 Performance indicators
The SZRLF Harvest Control Rule (HCR) uses multiple performance indicators to monitor the
performance of the fishery (PIRSA 2013). Details of the HCR and its associated testing are
provided in McGarvey et al. (2016). Broadly, the HCR aims to target a constant sustainable
exploitation rate based on historical fishery performance and uses two fishery-dependent
indicators.
The primary indicator is commercial logbook catch per unit effort (CPUE; kg of legal-sized
lobster/potlift) based on data from October to May, inclusive. The secondary indicator is a
commercial logbook pre-recruit index (PRI; number of undersized lobsters/potlift) based on
data from November to March, inclusive. Additional indicators, not explicitly used to set a
TACC, but which contribute to the overall assessment, include the puerulus settlement index,
biomass estimates and levels of exploitation from model outputs and length-frequency data.
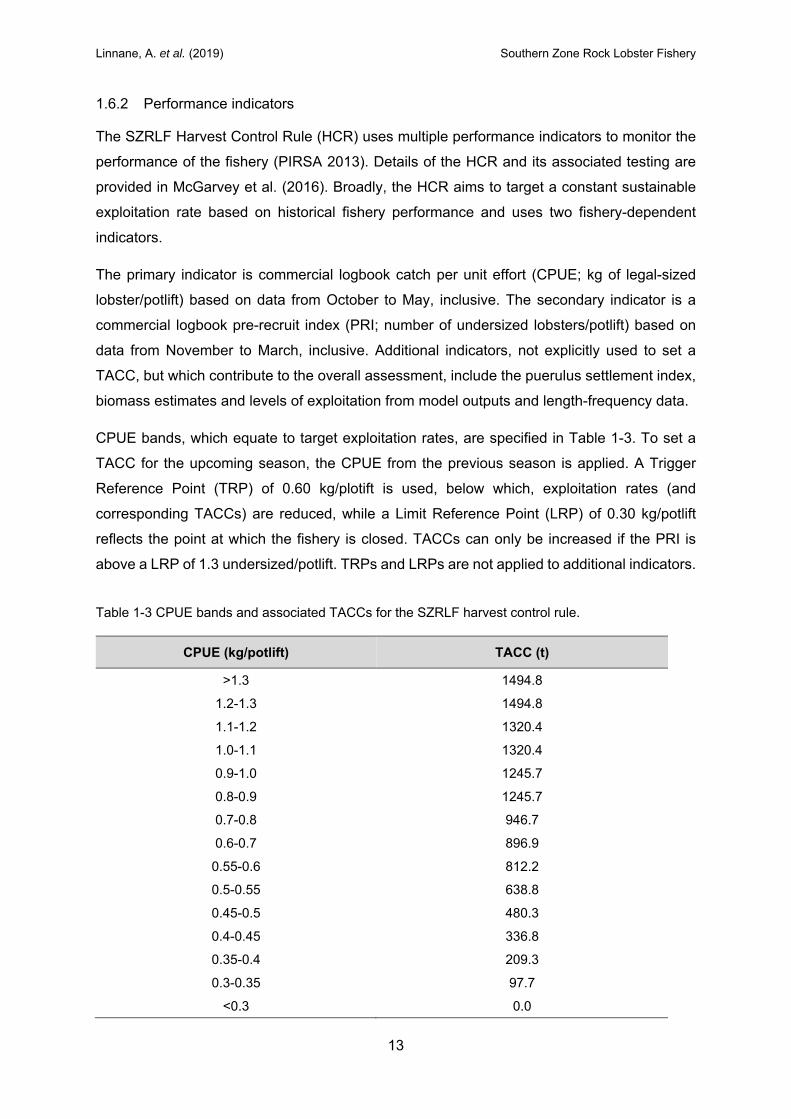
CPUE bands, which equate to target exploitation rates, are specified in Table 1-3. To set a
TACC for the upcoming season, the CPUE from the previous season is applied. A Trigger
Reference Point (TRP) of 0.60 kg/plotift is used, below which, exploitation rates (and
corresponding TACCs) are reduced, while a Limit Reference Point (LRP) of 0.30 kg/potlift
reflects the point at which the fishery is closed. TACCs can only be increased if the PRI is
above a LRP of 1.3 undersized/potlift. TRPs and LRPs are not applied to additional indicators.
Table 1-3 CPUE bands and associated TACCs for the SZRLF harvest control rule.
CPUE (kg/potlift) TACC (t)
>1.3 1494.8
1.2-1.3 1494.8
1.1-1.2 1320.4
1.0-1.1 1320.4
0.9-1.0 1245.7
0.8-0.9 1245.7
0.7-0.8 946.7
0.6-0.7 896.9
0.55-0.6 812.2
0.5-0.55 638.8
0.45-0.5 480.3
0.4-0.45 336.8
0.35-0.4 209.3
0.3-0.35 97.7
<0.3 0.0
Linnane, A. et al. (2019) Southern Zone Rock Lobster Fishery
14
1.6.3 Allocation of access
The Fisheries Management Act 2007 (the Act) provides that a management plan must specify
the share of the fishery to be allocated to each fishing sector under regulation (43(2)(h)). The
Act also provides that, in determining the share of aquatic resources to be allocated to a
particular fishing sector for an existing fishery, the share of aquatic resources to which that
fishing sector had access at the time the Minister requested the plan be prepared (based on
the most recent information available to the Minister) must be taken into account (regulation
(43(3))). The Minister formally requested that the most recent management plan for the SZRLF
to be prepared in June 2010. The shares allocated to each fishing sector in relation to the key
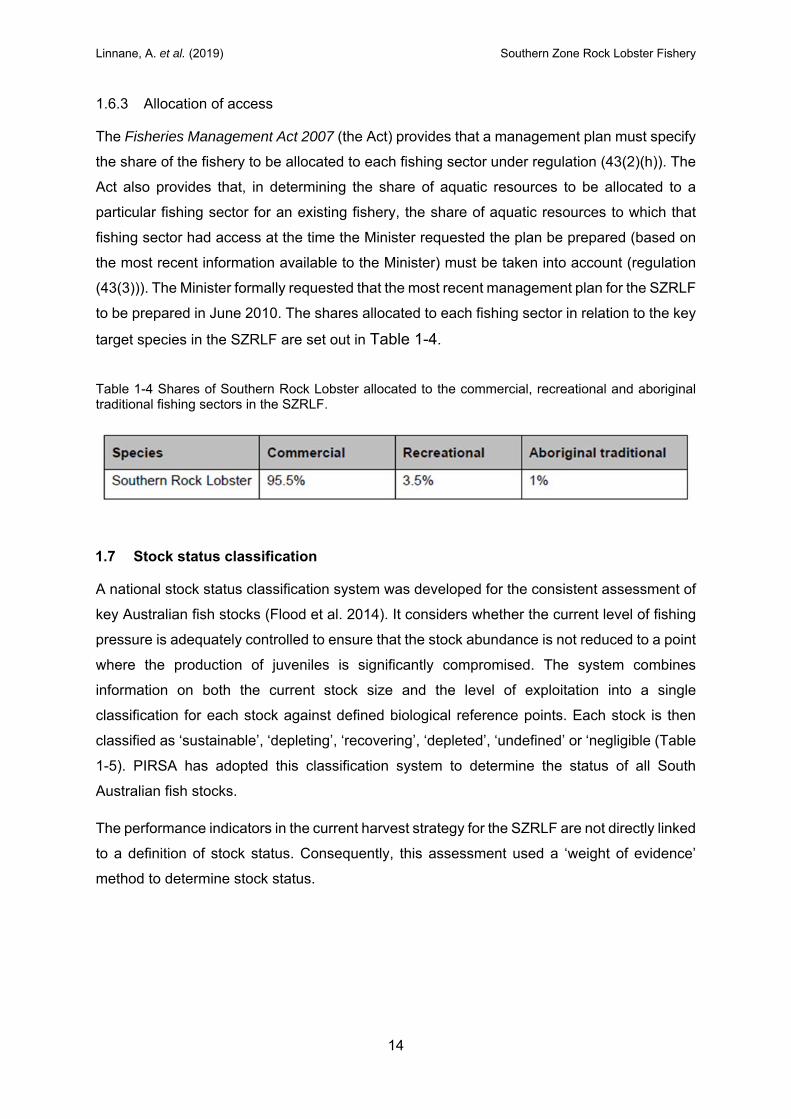
target species in the SZRLF are set out in Table 1-4.
Table 1-4 Shares of Southern Rock Lobster allocated to the commercial, recreational and aboriginal traditional fishing sectors in the SZRLF.
1.7 Stock status classification
A national stock status classification system was developed for the consistent assessment of
key Australian fish stocks (Flood et al. 2014). It considers whether the current level of fishing
pressure is adequately controlled to ensure that the stock abundance is not reduced to a point
where the production of juveniles is significantly compromised. The system combines
information on both the current stock size and the level of exploitation into a single
classification for each stock against defined biological reference points. Each stock is then
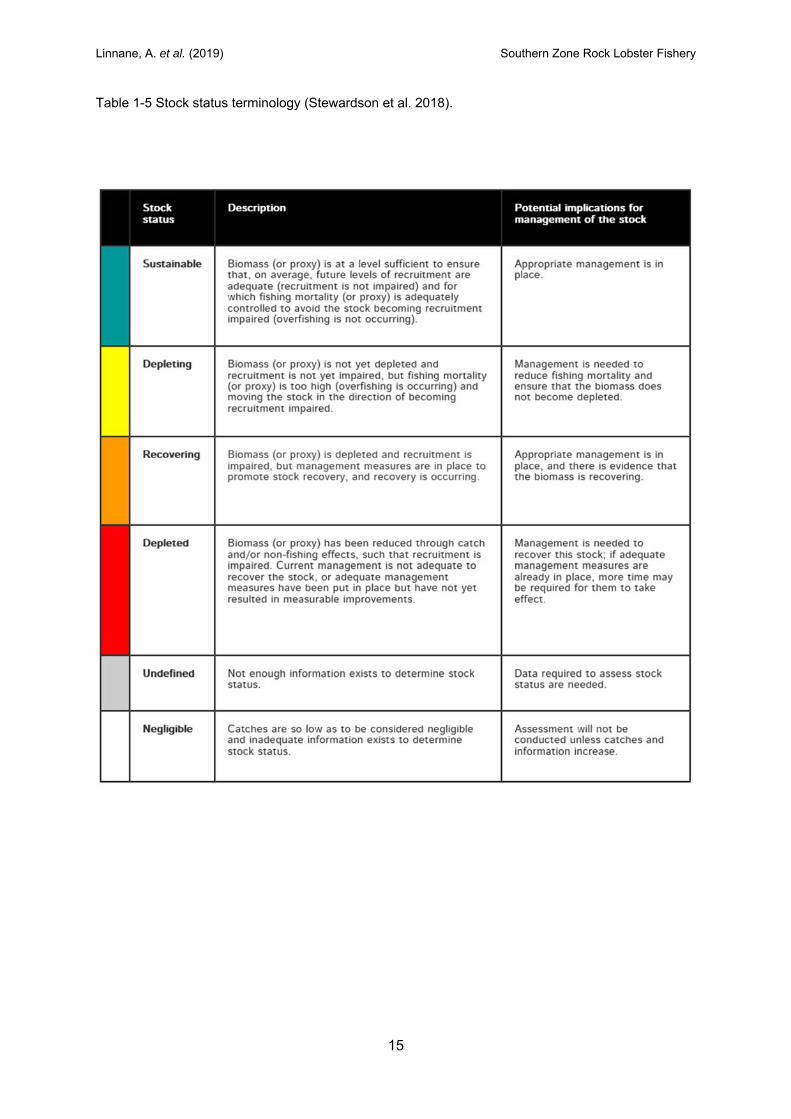
classified as ‘sustainable’, ‘depleting’, ‘recovering’, ‘depleted’, ‘undefined’ or ‘negligible (Table
1-5). PIRSA has adopted this classification system to determine the status of all South
Australian fish stocks.
The performance indicators in the current harvest strategy for the SZRLF are not directly linked
to a definition of stock status. Consequently, this assessment used a ‘weight of evidence’
method to determine stock status.
Linnane, A. et al. (2019) Southern Zone Rock Lobster Fishery
15
Table 1-5 Stock status terminology (Stewardson et al. 2018).
Linnane, A. et al. (2019) Southern Zone Rock Lobster Fishery
16
2 METHODS
2.1 Commercial catch and effort statistics
Commercial logbook catch and effort data are compulsorily recorded by licenced fishers in the
SZRLF. Logbooks are completed daily and submitted monthly to SARDI Aquatic Sciences.
Detailed analyses of these data are provided for the period between 1 January 1970 and 31
May 2018. For ease of reference, figures and text refer to the starting year of each season
(e.g. “2017” refers to the 2017/18 fishing season).
Important commercial data such as catch (tonnes (t)), effort (potlifts), CPUE (kg/potlift), mean
weight (kg) and PRI (number of undersized/potlift) were analysed both spatially and
temporally. Spatially, data were presented by zone, MFA and in some cases, depth range.
Temporally, data were presented by year and month.
In addition to the above, additional data sources recorded in the voluntary component of the
logbook are also presented but at a reduced spatial or temporal scale. While these are not
directly linked to setting the annual TACC, they are either deemed to contribute to the overall
understanding of the fishery or have been specifically requested by stakeholder groups. These
include catch rates of: (i) ovigerous (spawning) females and predation mortality as estimated
through catch rates of: (ii) dead lobsters and; (iii) octopus. The average numbers of days fished
(as a proxy for fishing effort) and estimated levels of fishery high-grading are also analysed.
2.2 Recreational catch and effort data
The specific details of the methodology used in the recreational surveys considered in this
stock assessment can be found in their respective reports (Jones 2009; Giri and Hall 2015).
The primary data collection was based on an online/telephone-diary approach; an off-site
method developed to provide cost-effective data over large spatial scales. A detailed
description of the telephone-diary design philosophy and method is provided in Henry and
Lyle (2003).
2.3 Voluntary catch sampling
Voluntary catch sampling datasheets are completed daily and submitted monthly to SARDI
Aquatic Sciences. Fishers and observers count, measure (mm CL), sex and record the
reproductive condition of female lobsters (ovigerous or non-ovigerous) from all pots sampled.
In addition, all bycatch are identified and counted. The latitude and longitude of each pot
sampled is recorded, thereby providing information at a finer-scale spatial resolution than that
of commercial logbooks.
Linnane, A. et al. (2019) Southern Zone Rock Lobster Fishery
17
In addition to providing input data for the length-based LenMod fishery model, the main output
from this sampling source in this report are annual size-frequency distributions of the catch.
Catch sampling generated data have also been previously used to document fine-scale spatio-
temporal trends in both bycatch species as well as sex ratios, female reproductive condition
and legal-sized catch rate trends in the target species (Brock et al. 2007; Linnane et al. 2016).
2.4 Puerulus monitoring program
Puerulus monitoring sites in the SZRLF are located at Blackfellows Caves, Livingstones
Beach, Beachport, Cape Jaffa and Kingston, with the collectors set in groups of 10 or 12 at
each site. The collectors are similar in design to those described by Booth and Tarring (1986)
and consist of angled wooden slats that mimic natural crevice habitat. The design has
remained unchanged throughout the sampling period. Sampling is undertaken monthly,
whereby collector heads are detached from a base by a diver, covered with a mesh bag and
hauled to the surface for counting.
The annual puerulus settlement index (PSI) is calculated as the mean monthly settlement on
all collectors combined. This index is then related to annual pre-recruit and commercial catch
rate indices based on previously estimated time lags.
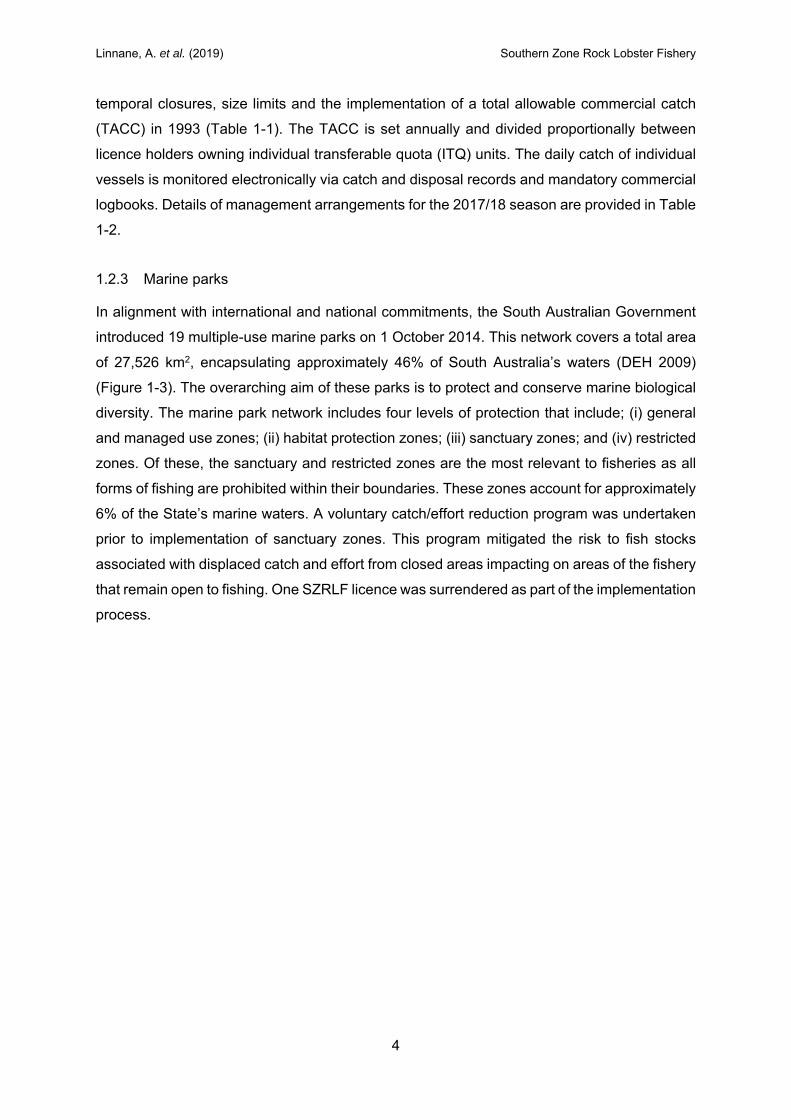
2.5 Fishery-Independent Monitoring Survey (FIMS)
The FIMS design consists of 29 transects, running from inshore (~10 m depth) to offshore
(~120 m depth) grounds in the SZRLF (Figure 2-1). Each transect line consists of 10 pots set
at predetermined locations that are independent of known fishing effort. Sampling is
undertaken in September and January of each season. Lobsters are counted, sexed,
measured, staged (females only) and tagged. Data are used to generate legal (number (nr)
/potlift) and undersized (nr/potlift) CPUE indices which are compared to those from fishery-
dependent logbook sources. FIMS abundance indices were calculated based on systematic
confidence interval estimates for clustered populations (McGarvey et al. 2016 and Appendix
2).
Linnane, A. et al. (2019) Southern Zone Rock Lobster Fishery
18
Figure 2-1 Location of Fishery Independent Monitoring Survey (FIMS) transects in the SZRLF. MFA = Marine fishing Area.
2.6 “qR” and “LenMod” stock assessment models
Two models assess the SZRLF. The qR model is yearly and uses the three logbook time
series of catch in weight, catch in number, and fishing effort as potlifts. LenMod is monthly,
and adds length-frequency catch samples and FIMS CPUE to the same logbook data as the
qR model. Growth in the two models differs, the qR model using a vector of mean lengths-at-
age and LenMod using length-transition matrices. Both models estimate yearly independent
recruitment.
A number of changes were introduced to the two models in 2017. In both models, the method
of computing unfished egg production (UEP) was modified by adopting the mean of
recruitment over 1990-2011 as the reference time period. This reference period is also used
in other jurisdictions (e.g. Tasmania) and therefore permits reporting at the stock level under
the Status of Key Australian Fish Stocks (SAFS) system. Also, this time period covers both
years of higher-than-average (pre-2002) and lower-than-average (2002+) historical
recruitment.
For LenMod, the method of estimating monthly and sex-specific selectivity has been improved
to allow separate length selectivity by grouped months through each season.
5
4
32
1
6
5
4
3
2
1
6
5
4
3
2
1
6
54
3
2
1
65
4 32 1
90
20
8060
40
100
7050
30
110
120
140
130
150
160
10
0
170
180
190
160
0
90
180
160
170
180
170
150
170
180
10130
180
170
170
180
170
120
80
10
170
50
170
80
120
170
10
180
90
100
160
170
160130
170
30
180
50
130
10
0
10
110
120
130
100
0
40
70
10
10
1060
110 70
170
80
160
120
70
160
140
140
10
160
50
80150
0
10
130
150
160
110
0 10 205
Kilometers
Fisher 5
Fisher 1
Fisher 2
Fisher 3
Fisher 4
mfa 56
mfa 55
mfa 58
Southend
Port MacDonnell
Linnane, A. et al. (2019) Southern Zone Rock Lobster Fishery
19
2.6.1 qR model
A detailed description of the qR model is provided in McGarvey and Matthews (2001). The qR
model fits to: (i) annual catch in weight and; (ii) annual catch in number of lobsters landed.
The model is effort conditioned and runs on a yearly time step. It incorporates a Baranov
survival model, and assumes that instantaneous fishing mortality rate varies yearly in
proportion to fishing effort. The estimation likelihoods for fitting to catch in weight and number
are normal with a shared estimated parameter for likelihood coefficient of variation, and are
maximised numerically. Recruitment estimates are reported for the start of each fishing
season. Annual stock biomass is reported as an integrated average over each year.
Stock assessment models normally rely on catch rate as a measure of relative fishable
biomass. The addition of catches in numbers to the fitted logbook data set, unavailable in most
fish stocks, provides information about yearly mean size of lobsters in the legal catch.
Information on mean size is normally available only from length-frequency samples, which can
show high sample variation and are subject to additional variation in the specific locations or
times during the season when length samples are taken. Catch in weight divided by catch in
number gives the yearly mean weight of an average landed lobster. Because reported catches
in weight and number constitute a 100% sample, the quality of information obtained about
changes in mean size from catch data is far more precise than that obtained from length
frequencies, which typically constitute a 0.1% to 1% sample. Thus, the logbook data informing
the qR model provide relative indices of abundance as yearly catch rates (in both weight and
number) and yearly mean landed weight. McGarvey et. al. (2005) demonstrated, using
independent individual-based simulated data, that adding catch in number dramatically
improves the accuracy and precision of stock assessment estimates in species that cannot be
aged. Further details of the qR model specifications including its equations, assumptions and
parameters are provided in Appendix 3.
2.6.2 LenMod
LenMod is a length-based assessment model. Lobster population numbers are estimated in 4
mm length bins. Catchability is estimated separately for each month. LenMod infers change
and absolute levels of stock abundance using maximum likelihood by fitting to four data
sources, and conditioning on a fifth: (i) nominal monthly CPUE (in weight) to which fishable
biomass is assumed to vary in direct proportion; (ii) monthly catch in number; (iii) length-
frequency proportions by length bin fitted by a multinomial likelihood; (iv) fishery-independent
monitoring survey (FIMS) CPUE and (v) catch in weight landed from all sources (commercial
and recreational), dead lobsters, and lobsters dying naturally (10% per year) are directly
removed from the model population in each time step. Data sources (ii) and (iii) both provide
Linnane, A. et al. (2019) Southern Zone Rock Lobster Fishery
20
LenMod with information on the size of lobsters in the catch which, interpreted in combination
with length-transition matrices, yield estimates of total mortality.
Length-transition matrices specify the proportion of lobsters in each length class that grow into
larger length classes during each summer and autumn moulting period. These length-
transition probabilities were estimated using extensive tag-recovery data mainly from the
1990s. The length-transition estimation method of McGarvey and Feenstra (2001) was
applied, which infers widely flexible growth curves to be inferred by modelling the parameters
predicting mean and variance of observed tag-recovery growth increments as polynomial
functions of (starting) CL. Growth matrices were estimated for each combination of sex and
twice-yearly moulting season. As growth rates of female lobsters are known to slow
substantially once they reach maturity, this flexible polynomial estimation method, which
accommodates non-linear growth rate versus starting length, provides a more accurate
estimation of female adult growth than a traditional von Bertalanffy model.
Full details of LenMod specifications including its equations, assumptions and parameters are
provided in Appendix 4.
2.7 Assessment of fishery performance
Overall fishery performance relies primarily on assessment of the biological performance
indicators detailed in Section 1.6.2. The key indicators are:
(i) Commercial CPUE of legal-sized lobster (kg of legal-sized lobster/potlift)
(ii) Commercial CPUE of undersized lobsters (number of undersized lobsters/potlift)
(iii) Estimates of legal-sized biomass and associated exploitation rates
(iv) Catch sampling length frequencies
(v) Puerulus settlement indices.
2.8 Quality assurance of data
All logbook, catch sampling and fishery-independent survey data are entered and validated
according to the quality assurance protocols identified for the SZRLF in the SARDI Information
Systems quality assurance and data integrity report (Vainickis 2010). The data are stored in
an Oracle database, backed up daily, with access restricted to SARDI Information Systems
staff. Extracts from the database are provided to SARDI rock lobster researchers on request.
All puerulus data are entered into Excel spreadsheets and stored on a SARDI network drive.
Data are extracted from the databases using established protocols. Accuracy of the data
extracted is checked by comparing pivot table summaries with previous data extractions. Data
Linnane, A. et al. (2019) Southern Zone Rock Lobster Fishery
21
catch summaries are also compared against independently validated summaries from quota
monitoring catch and disposal records. The analyses in this report were carried out
independently for multiple years at a time to confirm they were accurate compared to the
results of previous reports. The results, their interpretation and conclusions provided in the
report are discussed with peers, PIRSA Fisheries and Aquaculture, and SZRLF licence
holders. All co-authors review the report prior to the report being formally reviewed by at least
two independent scientists at SARDI in accordance with the SARDI report review process.
Linnane, A. et al. (2019) Southern Zone Rock Lobster Fishery
22
3 RESULTS
3.1 Commercial catch and effort statistics
3.1.1 Zone
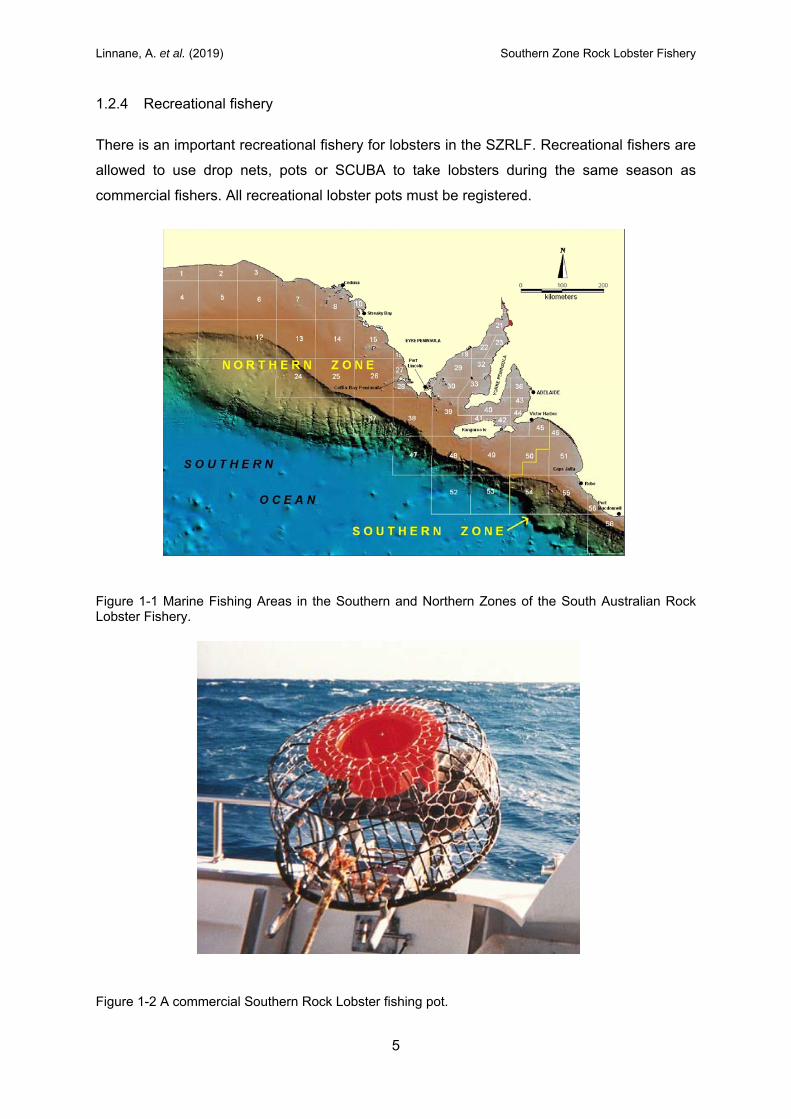
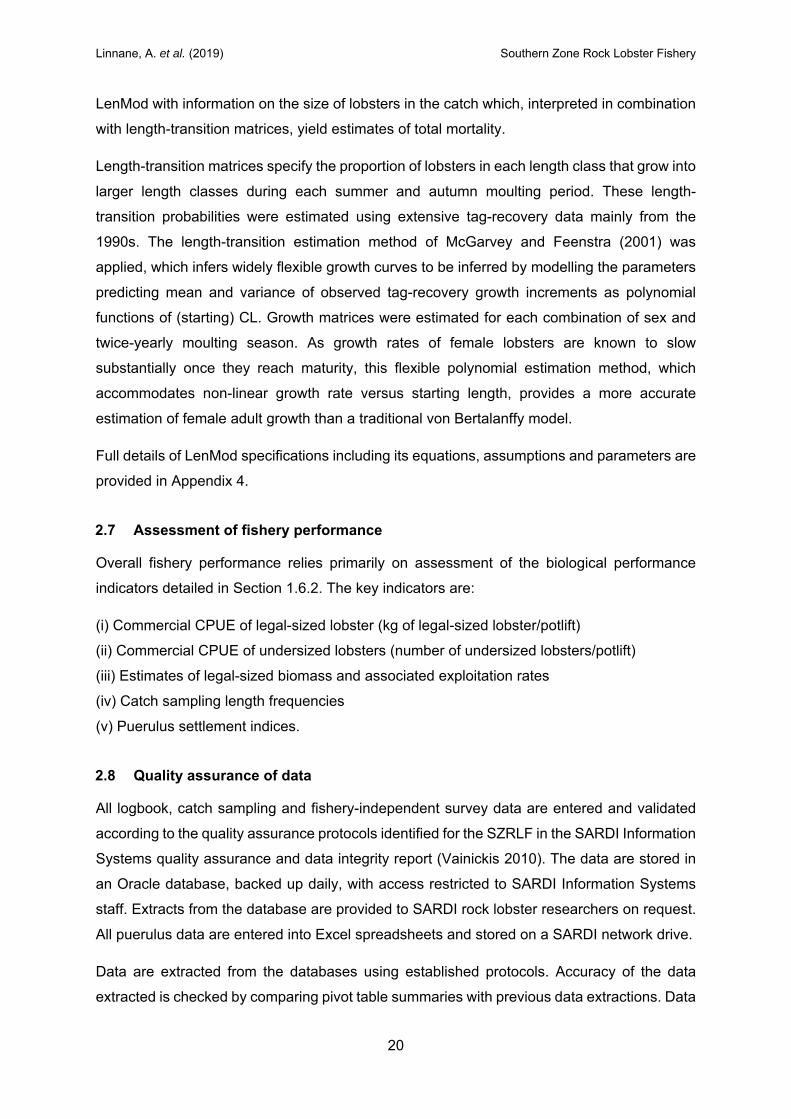
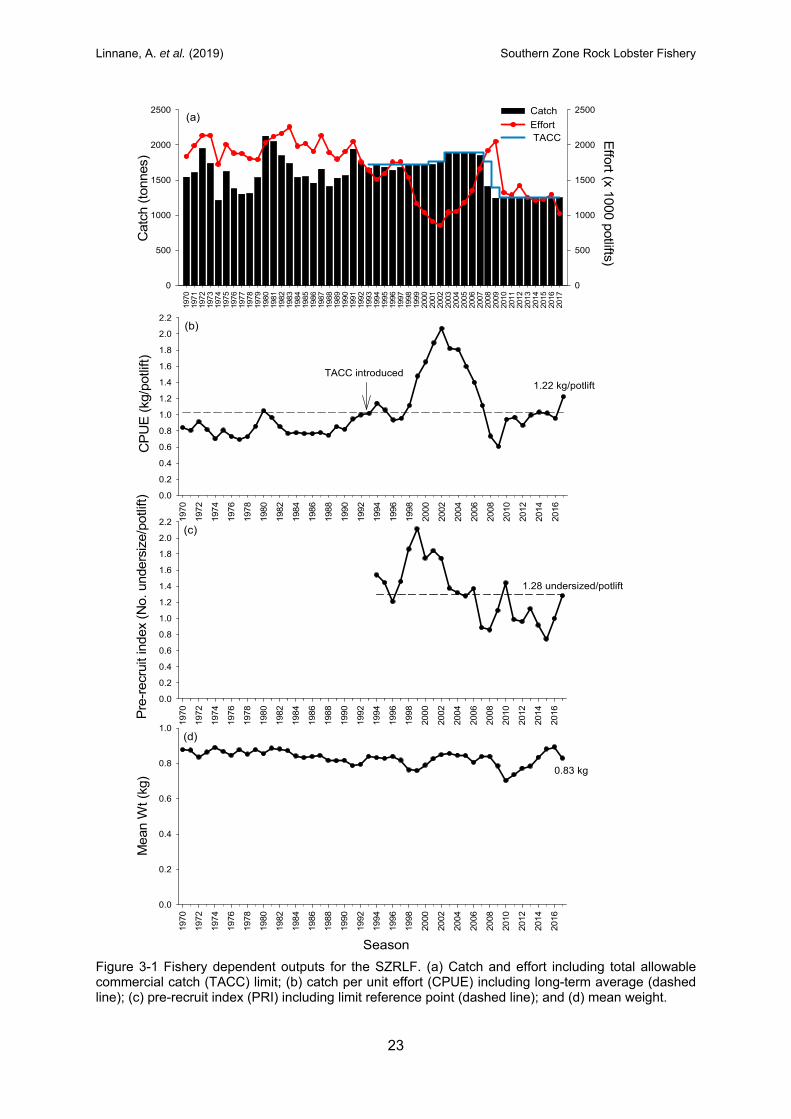
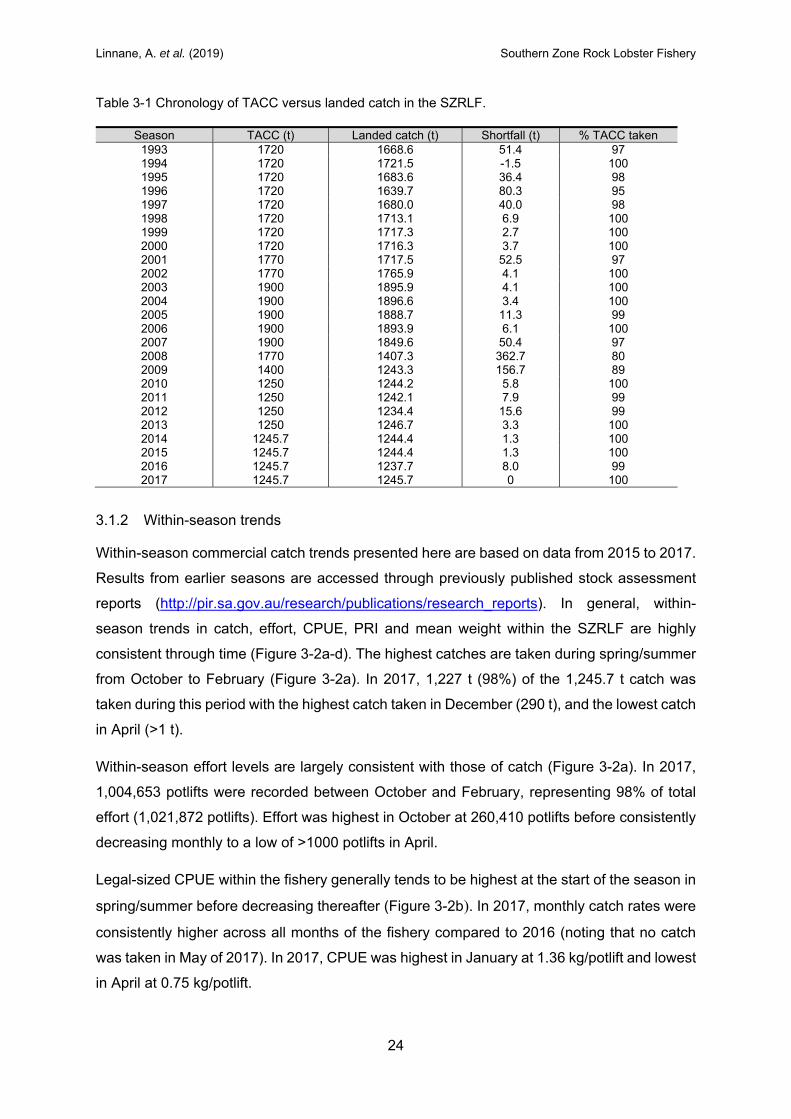
In 2017, the TACC in the SZRLF was 1,245.7 t and this was taken for the eighth consecutive
season (Figure 3-1a; Table 6-1). Current catch levels are low in a historical context and reflect
declines in catch and subsequent TACC reductions from 2007 to 2009 (Table 3-1). During this
timeframe, the TACC was reduced from 1,900 t to 1,250 t with a further reduction to 1,245.7 t
in 2014 due to the removal of one licence as part of the marine parks voluntary commercial
fisheries catch and effort reduction program. Catches have been stable since 2014, reflecting
the constant TACC level over this period.
Effort required to take the 1,245.7 t catch was 1,021,872 potlifts, a decrease of 21% from 2016
(1,295,715 potlifts) (Figure 3-1a; Table 6-1). Since 2009 (2,049,961 potlifts), effort has
generally declined in the fishery, with the 2017 estimate the third lowest on record.
In 2017, the nominal legal-sized CPUE was 1.22 kg/potlift, reflecting a 27% increase from
2016 and the highest catch rate since 2006 (Figure 3-1b; Table 6-1). Since 2010, catch rates
have been relatively stable in the fishery at approximately 1 kg/potlift. The 2017 estimate
represents the first time since 2007 that CPUE has been above the long-term average. CPUE
also remains above the TRP of 0.60 kg/potlift.
Overall, the zonal estimate of the logbook based PRI shows a consistent long-term decline
between 1999 and 2015 (Figure 3-1c). However, over the last two seasons PRI has increased
and in 2017, was 1.28 undersized/potlift, reflecting an increase of 73% from 2015 (0.74
undersized/potlift) and the highest since 2010. Despite these increases, the PRI remains
below the LRP of 1.30 undersized/potlift. In the SZRLF, the time taken for pre-recruits to enter
the fishable biomass is estimated to be approximately one year.
Legal-sized mean weight has remained relatively stable over time ranging between 0.7 and
0.9 kg (Figure 3-1d). In 2017, the mean weight decreased for the first time in seven seasons
to 0.83 kg having increased from 0.70 kg in 2010 to 0.89 kg in 2016. Variations in mean weight
generally reflect long-term patterns of recruitment, with low mean weights resulting from
influxes of small lobsters into the fishable biomass and high mean weights resulting from
several consecutive years of low recruitment.
Linnane, A. et al. (2019) Southern Zone Rock Lobster Fishery
23
Figure 3-1 Fishery dependent outputs for the SZRLF. (a) Catch and effort including total allowable commercial catch (TACC) limit; (b) catch per unit effort (CPUE) including long-term average (dashed line); (c) pre-recruit index (PRI) including limit reference point (dashed line); and (d) mean weight.
Catch
Effort TACC
1970
1971
1972
1973
1974
1975
1976
1977
1978
1979
1980
1981
1982
1983
1984
1985
1986
1987
1988
1989
1990
1991
1992
1993
1994
1995
1996
1997
1998
1999
2000
2001
2002
2003
2004
2005
2006
2007
2008
2009
2010
2011
2012
2013
2014
2015
2016
2017
Cat
ch (
tonn
es)
0
500
1000
1500
2000
2500
Effo
rt (x 1000
potlifts)
0
500
1000
1500
2000
2500
1970
1972
1974
1976
1978
1980
1982
1984
1986
1988
1990
1992
1994
1996
1998
2000
2002
2004
2006
2008
2010
2012
2014
2016
Pre
-recr
uit in
dex
(N
o. unde
rsiz
e/pot
lift)
0.0
0.2
0.4
0.6
0.8
1.0
1.2
1.4
1.6
1.8
2.0
2.2
(a)
Season
1970
1972
1974
1976
1978
1980
1982
1984
1986
1988
1990
1992
1994
1996
1998
2000
2002
2004
2006
2008
2010
2012
2014
2016
Mean
Wt (k
g)
0.0
0.2
0.4
0.6
0.8
1.0
(c)
1970
1972
1974
1976
1978
1980
1982
1984
1986
1988
1990
1992
1994
1996
1998
2000
2002
2004
2006
2008
2010
2012
2014
2016
CP
UE
(kg
/pot
lift)
0.0
0.2
0.4
0.6
0.8
1.0
1.2
1.4
1.6
1.8
2.0
2.2
TACC introduced 1.22 kg/potlift
(b)
(d)
1.28 undersized/potlift
0.83 kg
Linnane, A. et al. (2019) Southern Zone Rock Lobster Fishery
24
Table 3-1 Chronology of TACC versus landed catch in the SZRLF.
Season TACC (t) Landed catch (t) Shortfall (t) % TACC taken 1993 1720 1668.6 51.4 97 1994 1720 1721.5 -1.5 100 1995 1720 1683.6 36.4 98 1996 1720 1639.7 80.3 95 1997 1720 1680.0 40.0 98 1998 1720 1713.1 6.9 100 1999 1720 1717.3 2.7 100 2000 1720 1716.3 3.7 100 2001 1770 1717.5 52.5 97 2002 1770 1765.9 4.1 100 2003 1900 1895.9 4.1 100 2004 1900 1896.6 3.4 100 2005 1900 1888.7 11.3 99 2006 1900 1893.9 6.1 100 2007 1900 1849.6 50.4 97 2008 1770 1407.3 362.7 80 2009 1400 1243.3 156.7 89 2010 1250 1244.2 5.8 100 2011 1250 1242.1 7.9 99 2012 1250 1234.4 15.6 99 2013 1250 1246.7 3.3 100 2014 1245.7 1244.4 1.3 100 2015 1245.7 1244.4 1.3 100 2016 1245.7 1237.7 8.0 99 2017 1245.7 1245.7 0 100
3.1.2 Within-season trends
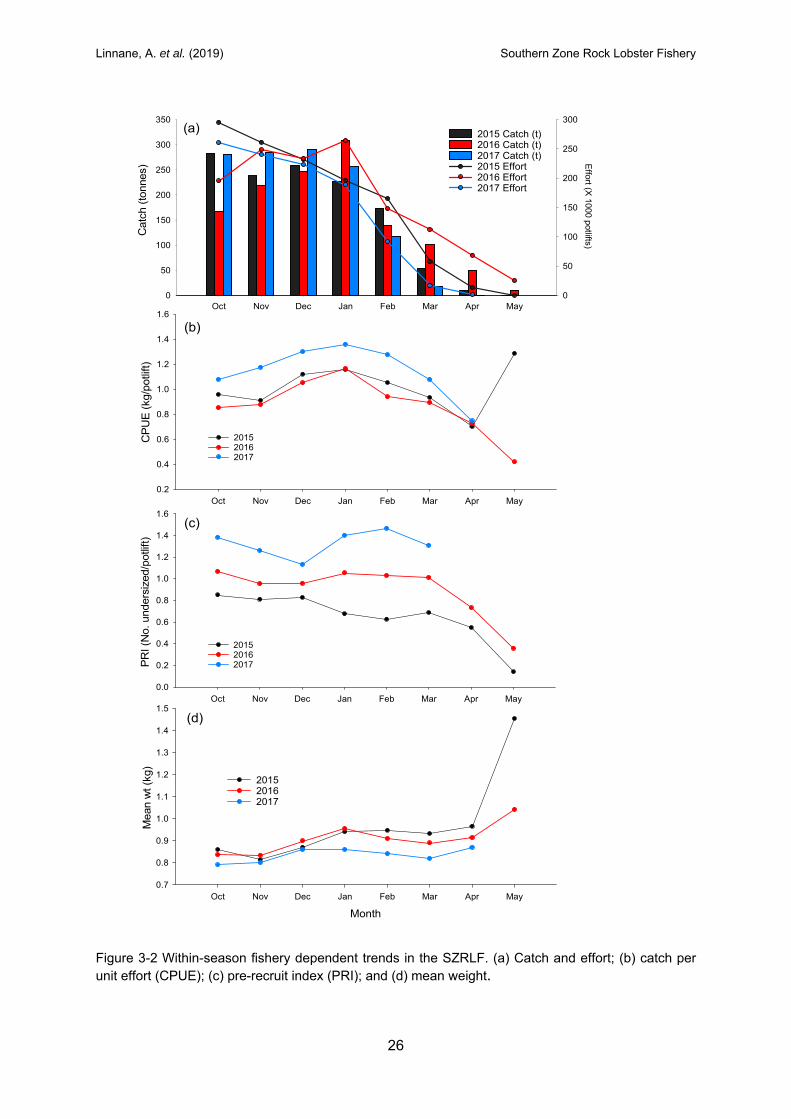
Within-season commercial catch trends presented here are based on data from 2015 to 2017.
Results from earlier seasons are accessed through previously published stock assessment
reports (http://pir.sa.gov.au/research/publications/research_reports). In general, within-
season trends in catch, effort, CPUE, PRI and mean weight within the SZRLF are highly
consistent through time (Figure 3-2a-d). The highest catches are taken during spring/summer
from October to February (Figure 3-2a). In 2017, 1,227 t (98%) of the 1,245.7 t catch was
taken during this period with the highest catch taken in December (290 t), and the lowest catch
in April (>1 t).
Within-season effort levels are largely consistent with those of catch (Figure 3-2a). In 2017,
1,004,653 potlifts were recorded between October and February, representing 98% of total
effort (1,021,872 potlifts). Effort was highest in October at 260,410 potlifts before consistently
decreasing monthly to a low of >1000 potlifts in April.
Legal-sized CPUE within the fishery generally tends to be highest at the start of the season in
spring/summer before decreasing thereafter (Figure 3-2b). In 2017, monthly catch rates were
consistently higher across all months of the fishery compared to 2016 (noting that no catch
was taken in May of 2017). In 2017, CPUE was highest in January at 1.36 kg/potlift and lowest
in April at 0.75 kg/potlift.
Linnane, A. et al. (2019) Southern Zone Rock Lobster Fishery
25
Similar trends are observed in the monthly catch rate of pre-recruits with CPUE generally
decreasing as the season progresses (Figure 3-2c). The PRI in 2017 was consistently higher
across all months compared to 2016. In 2017, the PRI was highest in February at 1.47
undersized/potlift and lowest in December at 1.13 undersized/potlift.
Monthly legal-sized mean weight generally increases as the season progresses with trends
broadly similar over the last three seasons (Figure 3-2d). In 2017, mean weight was lowest in
October at 0.79 kg and highest in April at 0.87 kg.
Linnane, A. et al. (2019) Southern Zone Rock Lobster Fishery
26
Figure 3-2 Within-season fishery dependent trends in the SZRLF. (a) Catch and effort; (b) catch per unit effort (CPUE); (c) pre-recruit index (PRI); and (d) mean weight.
Oct Nov Dec Jan Feb Mar Apr May
Cat
ch (
tonn
es)
0
50
100
150
200
250
300
350
Effo
rt (X 1
000 p
otlifts)
0
50
100
150
200
250
300
2015 Catch (t)2016 Catch (t)2017 Catch (t)2015 Effort2016 Effort2017 Effort
Oct Nov Dec Jan Feb Mar Apr May
CP
UE
(kg
/pot
lift)
0.2
0.4
0.6
0.8
1.0
1.2
1.4
1.6
2015 2016 2017
Oct Nov Dec Jan Feb Mar Apr May
PR
I (N
o. u
nder
size
d/po
tlift)
0.0
0.2
0.4
0.6
0.8
1.0
1.2
1.4
1.6
2015 2016 2017
Month
Oct Nov Dec Jan Feb Mar Apr May
Mea
n w
t (kg
)
0.7
0.8
0.9
1.0
1.1
1.2
1.3
1.4
1.5
2015 2016 2017
(a)
(b)
(c)
(d)
Linnane, A. et al. (2019) Southern Zone Rock Lobster Fishery
27
3.1.3 Spatial trends
3.1.3.1 Marine Fishing Areas (MFAs)
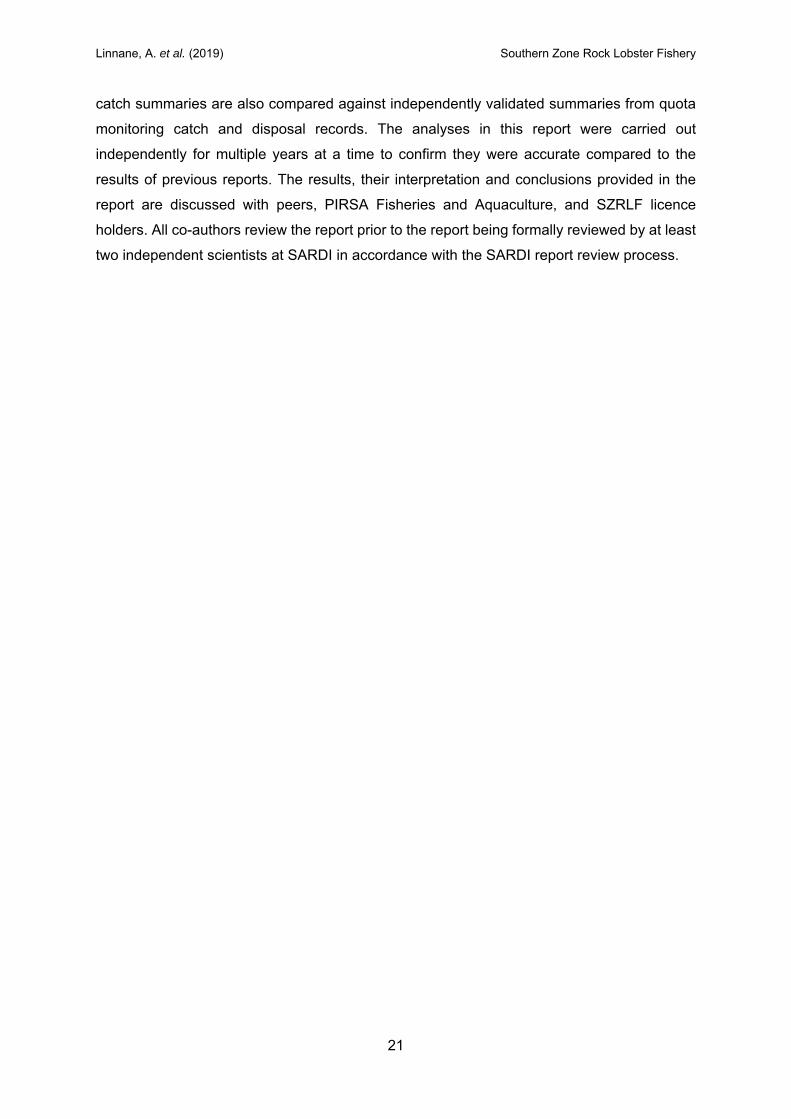
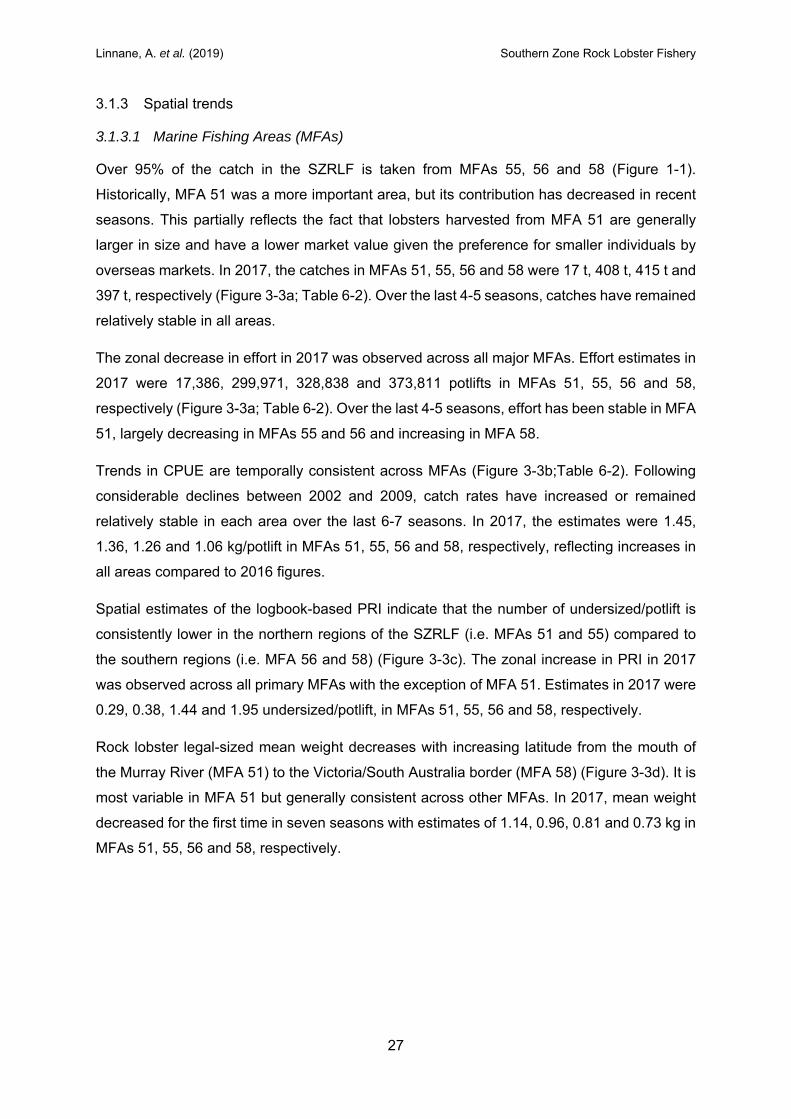
Over 95% of the catch in the SZRLF is taken from MFAs 55, 56 and 58 (Figure 1-1).
Historically, MFA 51 was a more important area, but its contribution has decreased in recent
seasons. This partially reflects the fact that lobsters harvested from MFA 51 are generally
larger in size and have a lower market value given the preference for smaller individuals by
overseas markets. In 2017, the catches in MFAs 51, 55, 56 and 58 were 17 t, 408 t, 415 t and
397 t, respectively (Figure 3-3a; Table 6-2). Over the last 4-5 seasons, catches have remained
relatively stable in all areas.
The zonal decrease in effort in 2017 was observed across all major MFAs. Effort estimates in
2017 were 17,386, 299,971, 328,838 and 373,811 potlifts in MFAs 51, 55, 56 and 58,
respectively (Figure 3-3a; Table 6-2). Over the last 4-5 seasons, effort has been stable in MFA
51, largely decreasing in MFAs 55 and 56 and increasing in MFA 58.
Trends in CPUE are temporally consistent across MFAs (Figure 3-3b;Table 6-2). Following
considerable declines between 2002 and 2009, catch rates have increased or remained
relatively stable in each area over the last 6-7 seasons. In 2017, the estimates were 1.45,
1.36, 1.26 and 1.06 kg/potlift in MFAs 51, 55, 56 and 58, respectively, reflecting increases in
all areas compared to 2016 figures.
Spatial estimates of the logbook-based PRI indicate that the number of undersized/potlift is
consistently lower in the northern regions of the SZRLF (i.e. MFAs 51 and 55) compared to
the southern regions (i.e. MFA 56 and 58) (Figure 3-3c). The zonal increase in PRI in 2017
was observed across all primary MFAs with the exception of MFA 51. Estimates in 2017 were
0.29, 0.38, 1.44 and 1.95 undersized/potlift, in MFAs 51, 55, 56 and 58, respectively.
Rock lobster legal-sized mean weight decreases with increasing latitude from the mouth of
the Murray River (MFA 51) to the Victoria/South Australia border (MFA 58) (Figure 3-3d). It is
most variable in MFA 51 but generally consistent across other MFAs. In 2017, mean weight
decreased for the first time in seven seasons with estimates of 1.14, 0.96, 0.81 and 0.73 kg in
MFAs 51, 55, 56 and 58, respectively.
Linnane, A. et al. (2019) Southern Zone Rock Lobster Fishery
28
Figure 3-3 Spatial fishery dependent trends in the SZRLF. (a) Catch and effort; (b) catch per unit effort (CPUE); (c) pre-recruit index (PRI); and (d) mean weight.
0
100
200
300
400
500
600
700
800
Eff
ort (
x100
0 po
tlifts
)
0
100
200
300
400
500
600
700
800
900
1000
0
100
200
300
400
500
600
700
800
0
100
200
300
400
500
600
700
800
900
1000
Cat
ch (
tonn
es)
0
100
200
300
400
500
600
700
800
0
100
200
300
400
500
600
700
800
900
1000
CatchEffort
MFA 56MFA 51 MFA 55 MFA 58
0
100
200
300
400
500
600
700
800
0
100
200
300
400
500
600
700
800
900
1000
CP
UE
(kg
/pot
lift)
0.0
0.5
1.0
1.5
2.0
2.5
1.45
0.0
0.5
1.0
1.5
2.0
2.5
1.36
0.0
0.5
1.0
1.5
2.0
2.5
1.26
0.0
0.5
1.0
1.5
2.0
2.5
1.06
PR
I (un
ders
ized
/po
tlift)
0.0
0.5
1.0
1.5
2.0
2.5
3.0
3.5
4.0
4.5
0.0
0.5
1.0
1.5
2.0
2.5
3.0
3.5
4.0
4.5
0.0
0.5
1.0
1.5
2.0
2.5
3.0
3.5
4.0
4.5
0.0
0.5
1.0
1.5
2.0
2.5
3.0
3.5
4.0
4.5
Season
1970
1972
1974
1976
1978
1980
1982
1984
1986
1988
1990
1992
1994
1996
1998
2000
2002
2004
2006
2008
2010
2012
2014
2016
Me
an w
eig
ht (
kg)
0.0
0.2
0.4
0.6
0.8
1.0
1.2
1.4
Season
1970
1972
1974
1976
1978
1980
1982
1984
1986
1988
1990
1992
1994
1996
1998
2000
2002
2004
2006
2008
2010
2012
2014
2016
0.0
0.2
0.4
0.6
0.8
1.0
1.2
1.4
Season
1970
1972
1974
1976
1978
1980
1982
1984
1986
1988
1990
1992
1994
1996
1998
2000
2002
2004
2006
2008
2010
2012
2014
2016
0.0
0.2
0.4
0.6
0.8
1.0
1.2
1.4
Season
1970
1972
1974
1976
1978
1980
1982
1984
1986
1988
1990
1992
1994
1996
1998
2000
2002
2004
2006
2008
2010
2012
2014
2016
0.0
0.2
0.4
0.6
0.8
1.0
1.2
1.4
(a)
(b)
(c)
(d)
Linnane, A. et al. (2019) Southern Zone Rock Lobster Fishery
29
3.1.3.2 Depth
In order to assess spatial trends by depth, logbook-derived catch from four depth categories
of 0-30, 31-60, 61-90 and >90 m were analysed. Over the last fifteen fishing seasons, over
80% of the annual catch has been taken from depths of <60 m (Figure 3-4). In 2017, 88% of
the total catch came from <60 m depth with 35% coming from 0-30 m and 53% from 31-60 m.
These trends were also reflected in each of the major MFAs (Figure 3-4).
Despite reflecting the majority of the annual catch, CPUE in depths of 0-30 m and 31-60 m is
consistently lower than offshore areas of 61-90 m and >90 m (Figure 3-5). Trends largely
reflect those at the zonal level with considerable decreases in all depth ranges from 2002 to
2009 before generally increasing over the last five to seven seasons. In 2017, estimates were
1.16, 1.18, 1.60 and 2.41 kg/potlift in 0-30, 31-60, 61-90 and >90 m, respectively, reflecting
increases in all depths compared to 2016.
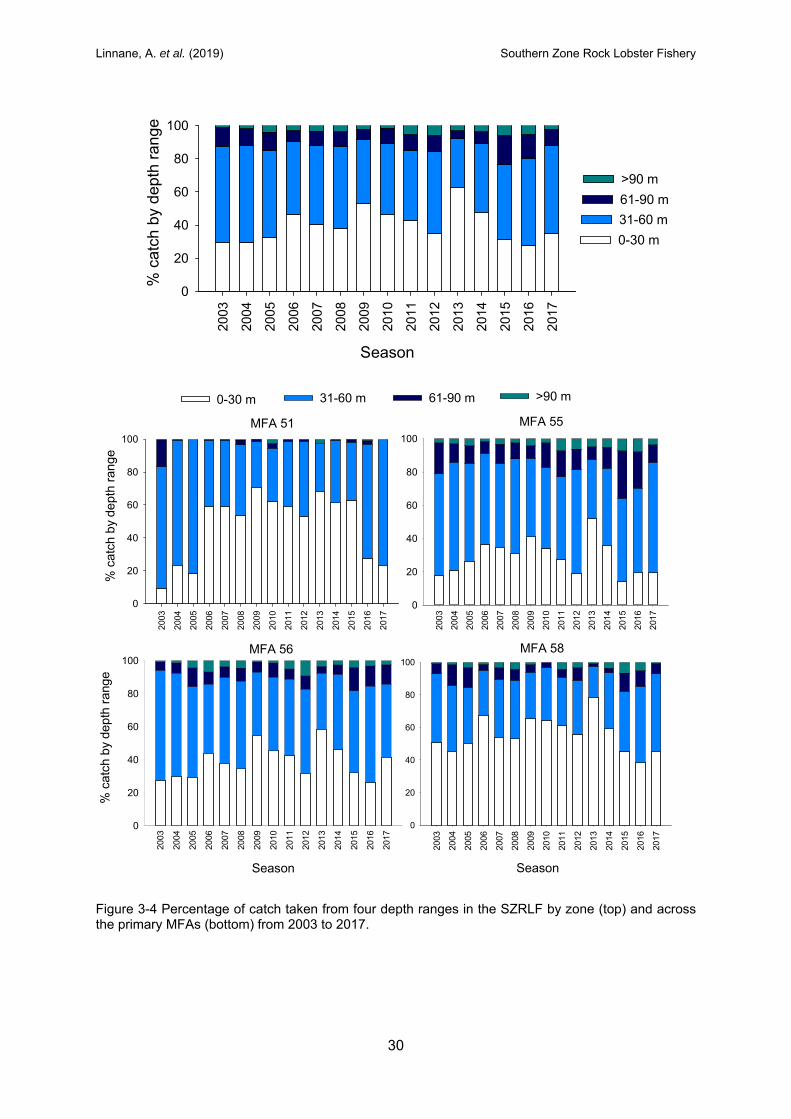
Linnane, A. et al. (2019) Southern Zone Rock Lobster Fishery
30
Figure 3-4 Percentage of catch taken from four depth ranges in the SZRLF by zone (top) and across the primary MFAs (bottom) from 2003 to 2017.
0-30 m
31-60 m
61-90 m
>90 m
Season
2003
2004
2005
2006
2007
2008
2009
2010
2011
2012
2013
2014
2015
2016
2017
% c
atch
by
dept
h ra
nge
0
20
40
60
80
100
0-30 m 31-60 m 61-90 m >90 m
2003
2004
2005
2006
2007
2008
2009
2010
2011
2012
2013
2014
2015
2016
2017
% c
atch
by
dept
h ra
nge
0
20
40
60
80
100
MFA 5120
03
2004
2005
2006
2007
2008
2009
2010
2011
2012
2013
2014
2015
2016
2017
0
20
40
60
80
100
MFA 55
Season
2003
2004
2005
2006
2007
2008
2009
2010
2011
2012
2013
2014
2015
2016
2017
% c
atch
by
dept
h ra
nge
0
20
40
60
80
100MFA 56
Season
2003
2004
2005
2006
2007
2008
2009
2010
2011
2012
2013
2014
2015
2016
2017
0
20
40
60
80
100
MFA 58
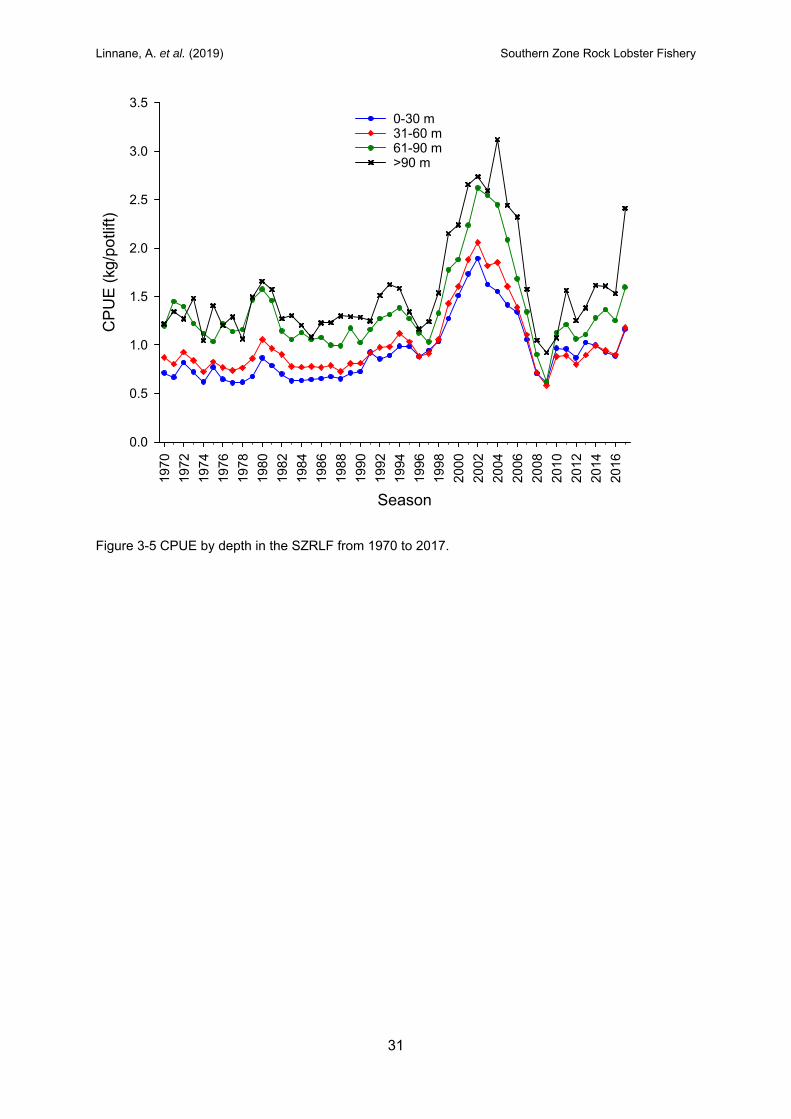
Linnane, A. et al. (2019) Southern Zone Rock Lobster Fishery
31
Figure 3-5 CPUE by depth in the SZRLF from 1970 to 2017.
Season
1970
1972
1974
1976
1978
1980
1982
1984
1986
1988
1990
1992
1994
1996
1998
2000
2002
2004
2006
2008
2010
2012
2014
2016
CP
UE
(kg
/po
tlift
)
0.0
0.5
1.0
1.5
2.0
2.5
3.0
3.50-30 m 31-60 m 61-90 m >90 m
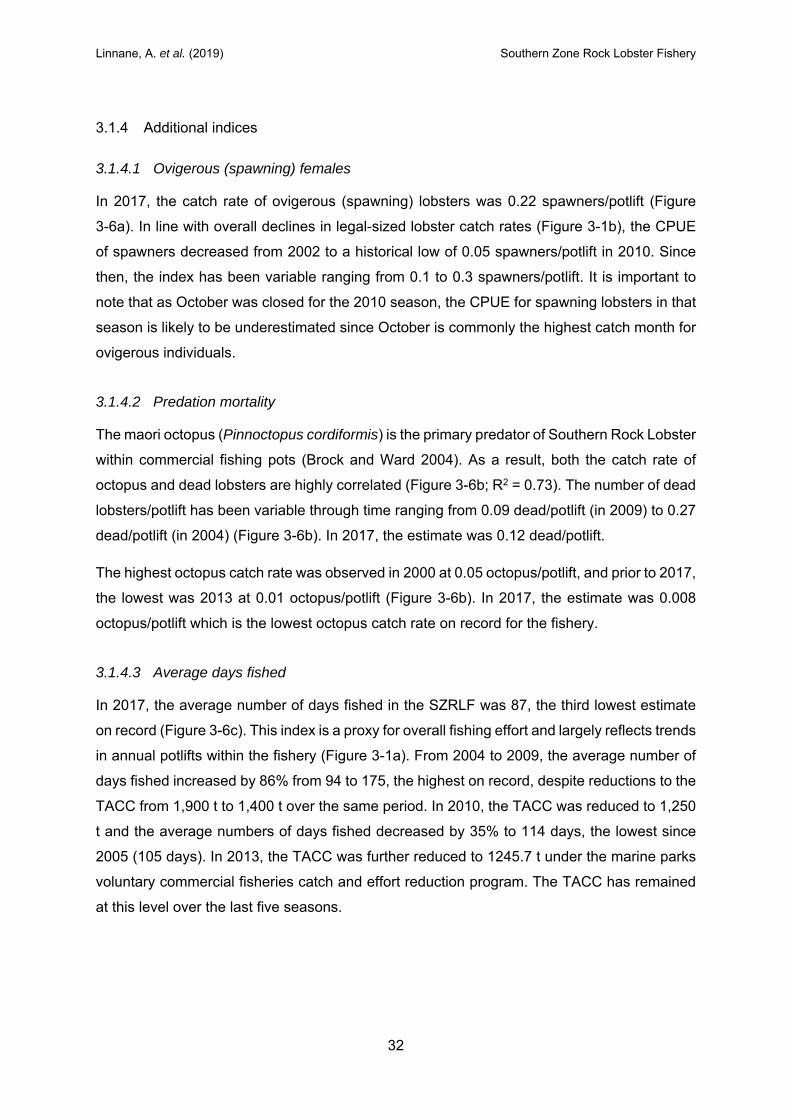
Linnane, A. et al. (2019) Southern Zone Rock Lobster Fishery
32
3.1.4 Additional indices
3.1.4.1 Ovigerous (spawning) females
In 2017, the catch rate of ovigerous (spawning) lobsters was 0.22 spawners/potlift (Figure
3-6a). In line with overall declines in legal-sized lobster catch rates (Figure 3-1b), the CPUE
of spawners decreased from 2002 to a historical low of 0.05 spawners/potlift in 2010. Since
then, the index has been variable ranging from 0.1 to 0.3 spawners/potlift. It is important to
note that as October was closed for the 2010 season, the CPUE for spawning lobsters in that
season is likely to be underestimated since October is commonly the highest catch month for
ovigerous individuals.
3.1.4.2 Predation mortality
The maori octopus (Pinnoctopus cordiformis) is the primary predator of Southern Rock Lobster
within commercial fishing pots (Brock and Ward 2004). As a result, both the catch rate of
octopus and dead lobsters are highly correlated (Figure 3-6b; R2 = 0.73). The number of dead
lobsters/potlift has been variable through time ranging from 0.09 dead/potlift (in 2009) to 0.27
dead/potlift (in 2004) (Figure 3-6b). In 2017, the estimate was 0.12 dead/potlift.
The highest octopus catch rate was observed in 2000 at 0.05 octopus/potlift, and prior to 2017,
the lowest was 2013 at 0.01 octopus/potlift (Figure 3-6b). In 2017, the estimate was 0.008
octopus/potlift which is the lowest octopus catch rate on record for the fishery.
3.1.4.3 Average days fished
In 2017, the average number of days fished in the SZRLF was 87, the third lowest estimate
on record (Figure 3-6c). This index is a proxy for overall fishing effort and largely reflects trends
in annual potlifts within the fishery (Figure 3-1a). From 2004 to 2009, the average number of
days fished increased by 86% from 94 to 175, the highest on record, despite reductions to the
TACC from 1,900 t to 1,400 t over the same period. In 2010, the TACC was reduced to 1,250
t and the average numbers of days fished decreased by 35% to 114 days, the lowest since
2005 (105 days). In 2013, the TACC was further reduced to 1245.7 t under the marine parks
voluntary commercial fisheries catch and effort reduction program. The TACC has remained
at this level over the last five seasons.

Linnane, A. et al. (2019) Southern Zone Rock Lobster Fishery
33
3.1.4.4 High-grading
In 2017, the estimate of high-grading (i.e. lobsters returned to the water due to low market
value) in the SZRLF was 25 t (Figure 3-6d). From 2003 to 2006, based on voluntary catch
returns, the amount of lobsters high-graded exceeded 100 t annually. However, since 2008,
estimates have not exceeded 30 t. The decrease between 2003 and 2008 is likely to reflect
overall declines in legal-sized catch rate across the fishery over this period (Figure 3-1b). It
should be highlighted that overall reported values in logbooks are likely to be conservative,
since high-grade estimates are recorded on a voluntary basis.
Linnane, A. et al. (2019) Southern Zone Rock Lobster Fishery
34
Figure 3-6 Additional fishery dependent indices in the SZRLF. (a) Catch rate of spawning lobsters; (b) predation mortality; (c) average number of days fished; and (d) levels of high-grading.
No.
Spa
wne
rs/p
otlif
t
0.0
0.1
0.2
0.3
0.4
0.5
0.6
Dea
d/po
tlift
0.08
0.10
0.12
0.14
0.16
0.18
0.20
0.22
0.24
0.26
0.28
0.30
Octopus/potlift
0.00
0.01
0.02
0.03
0.04
0.05
0.06
DeadOctopus
Ave
rage
num
ber
of d
ays
fishe
d
0
20
40
60
80
100
120
140
160
180
200
87 days
19
83
19
84
19
85
19
86
19
87
19
88
19
89
19
90
19
91
19
92
19
93
19
94
19
95
19
96
19
97
19
98
19
99
20
00
20
01
20
02
20
03
20
04
20
05
20
06
20
07
20
08
20
09
20
10
20
11
20
12
20
13
20
14
20
15
20
16
20
17
Lobs
ters
ret
urne
d to
wat
er (
tonn
es)
0
20
40
60
80
100
120
140
160
180
(a)
(b)
(c)
(d)
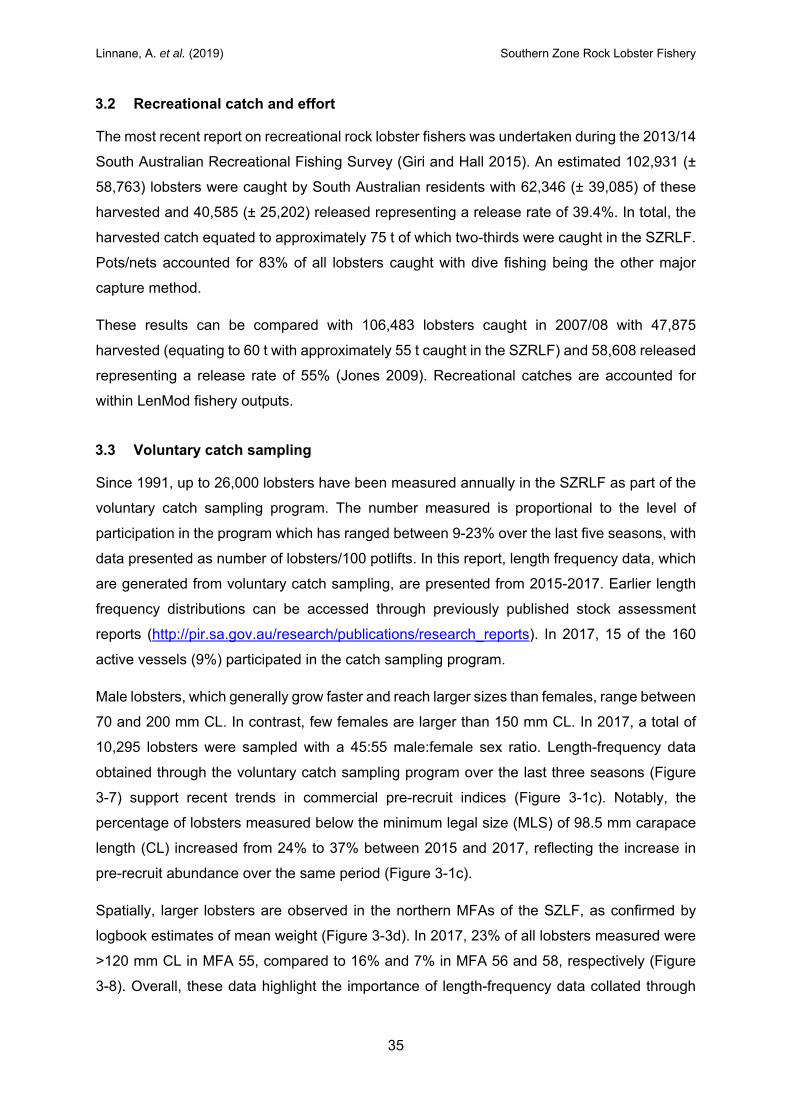
Linnane, A. et al. (2019) Southern Zone Rock Lobster Fishery
35
3.2 Recreational catch and effort
The most recent report on recreational rock lobster fishers was undertaken during the 2013/14
South Australian Recreational Fishing Survey (Giri and Hall 2015). An estimated 102,931 (±
58,763) lobsters were caught by South Australian residents with 62,346 (± 39,085) of these
harvested and 40,585 (± 25,202) released representing a release rate of 39.4%. In total, the
harvested catch equated to approximately 75 t of which two-thirds were caught in the SZRLF.
Pots/nets accounted for 83% of all lobsters caught with dive fishing being the other major
capture method.
These results can be compared with 106,483 lobsters caught in 2007/08 with 47,875
harvested (equating to 60 t with approximately 55 t caught in the SZRLF) and 58,608 released
representing a release rate of 55% (Jones 2009). Recreational catches are accounted for
within LenMod fishery outputs.
3.3 Voluntary catch sampling
Since 1991, up to 26,000 lobsters have been measured annually in the SZRLF as part of the
voluntary catch sampling program. The number measured is proportional to the level of
participation in the program which has ranged between 9-23% over the last five seasons, with
data presented as number of lobsters/100 potlifts. In this report, length frequency data, which
are generated from voluntary catch sampling, are presented from 2015-2017. Earlier length
frequency distributions can be accessed through previously published stock assessment
reports (http://pir.sa.gov.au/research/publications/research_reports). In 2017, 15 of the 160
active vessels (9%) participated in the catch sampling program.
Male lobsters, which generally grow faster and reach larger sizes than females, range between
70 and 200 mm CL. In contrast, few females are larger than 150 mm CL. In 2017, a total of
10,295 lobsters were sampled with a 45:55 male:female sex ratio. Length-frequency data
obtained through the voluntary catch sampling program over the last three seasons (Figure
3-7) support recent trends in commercial pre-recruit indices (Figure 3-1c). Notably, the
percentage of lobsters measured below the minimum legal size (MLS) of 98.5 mm carapace
length (CL) increased from 24% to 37% between 2015 and 2017, reflecting the increase in
pre-recruit abundance over the same period (Figure 3-1c).
Spatially, larger lobsters are observed in the northern MFAs of the SZLF, as confirmed by
logbook estimates of mean weight (Figure 3-3d). In 2017, 23% of all lobsters measured were
>120 mm CL in MFA 55, compared to 16% and 7% in MFA 56 and 58, respectively (Figure
3-8). Overall, these data highlight the importance of length-frequency data collated through
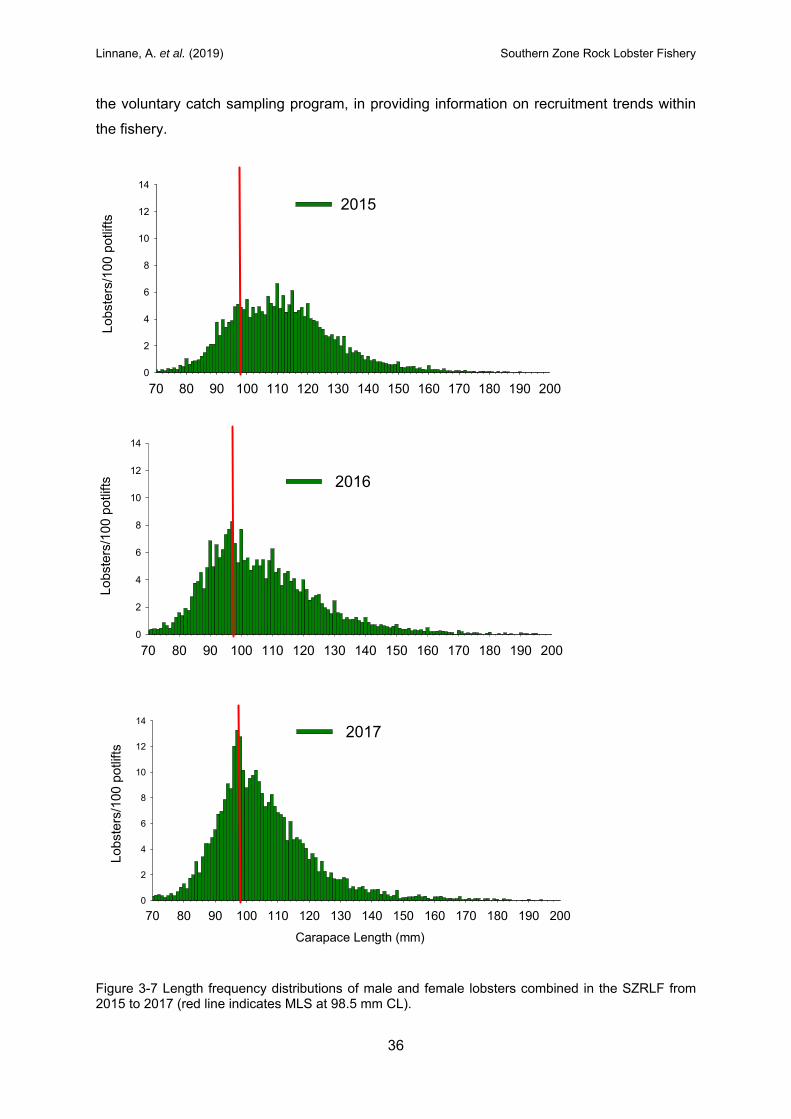
Linnane, A. et al. (2019) Southern Zone Rock Lobster Fishery
36
the voluntary catch sampling program, in providing information on recruitment trends within
the fishery.
Figure 3-7 Length frequency distributions of male and female lobsters combined in the SZRLF from 2015 to 2017 (red line indicates MLS at 98.5 mm CL).
70 80 90 100 110 120 130 140 150 160 170 180 190 200
Lobs
ters
/100
pot
lifts
0
2
4
6
8
10
12
14
2015
70 80 90 100 110 120 130 140 150 160 170 180 190 200
Lobs
ters
/100
pot
lifts
0
2
4
6
8
10
12
14
2017
Carapace Length (mm)
70 80 90 100 110 120 130 140 150 160 170 180 190 200
Lobs
ters
/100
pot
lifts
0
2
4
6
8
10
12
14
2016
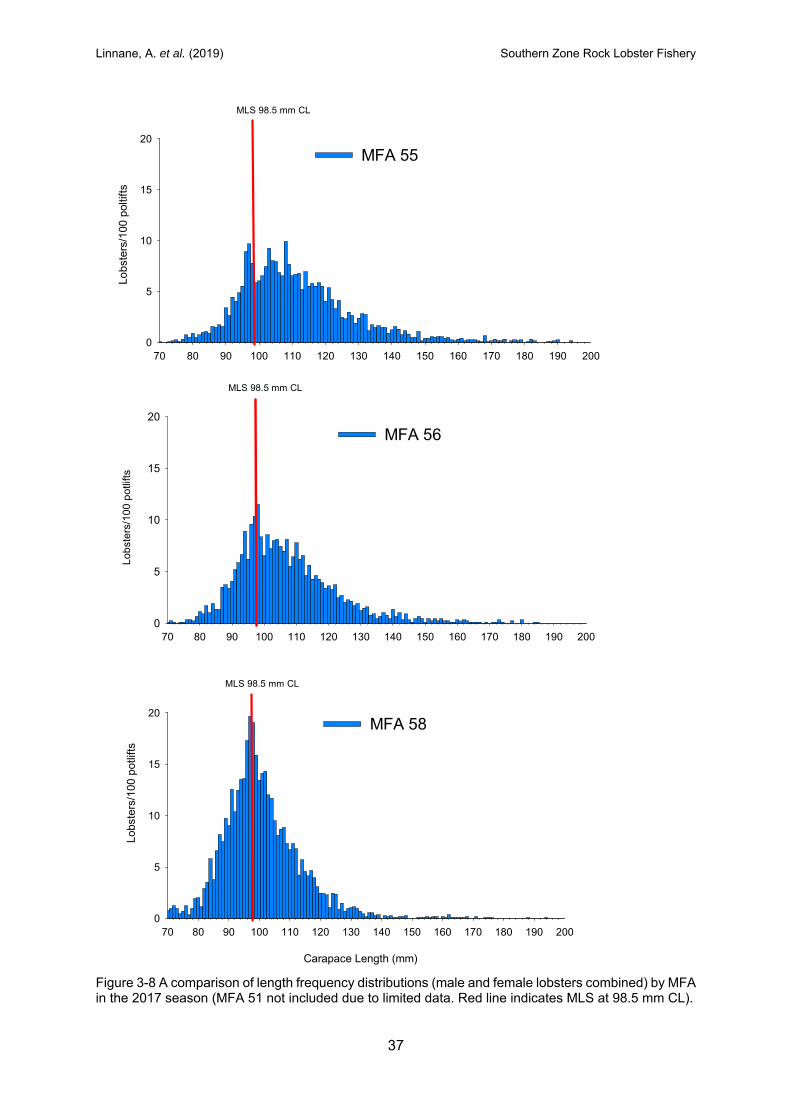
Linnane, A. et al. (2019) Southern Zone Rock Lobster Fishery
37
Figure 3-8 A comparison of length frequency distributions (male and female lobsters combined) by MFA in the 2017 season (MFA 51 not included due to limited data. Red line indicates MLS at 98.5 mm CL).
70 80 90 100 110 120 130 140 150 160 170 180 190 200
Lobs
ters
/100
pol
tifts
0
5
10
15
20
MLS 98.5 mm CL
MFA 55
70 80 90 100 110 120 130 140 150 160 170 180 190 200
Lo
bst
ers
/10
0 p
otli
fts
0
5
10
15
20
MLS 98.5 mm CL
MFA 56
70 80 90 100 110 120 130 140 150 160 170 180 190 200
Lobs
ters
/100
pot
lifts
0
5
10
15
20
MLS 98.5 mm CL
MFA 58
Carapace Length (mm)
Linnane, A. et al. (2019) Southern Zone Rock Lobster Fishery
38
3.4 Puerulus monitoring program
Puerulus settlement indices (PSIs) in the SZRLF have been highly variable over time (Figure
3-9). In 2017, the estimate was 1.76 puerulus/collector, reflecting the third highest PSI over
the last decade. Previous research has indicated that the period between settlement and
recruitment to legal size in the SZRLF is approximately five years with undersized numbers
correlated after four years (Linnane et al. 2014).
Based on this relationship, PSIs were correlated against both the logbook PRI and commercial
CPUE data lagged by four and five years, respectively, using data from 1991 to 2010 (Figure
3-10). CPUE and PRI data were closely correlated over the entire time series with a one year
lag (R2 = 0.77). More recently, the PSIs from 2002 to 2013 were correlated (R2 = 0.68) with
subsequent PRIs from 2006 to 2017 showing a weak correlation (R2 = 0.22) with CPUE from
2007 to 2017.
Three of the highest PSIs on record were observed from 2005 to 2007 which reflected
increases in PRIs in 2009 and 2010 (Figure 3-1c) and subsequent increases in catch rate as
these recruits entered into the fishery in 2010 and 2011 (Figure 3-1b). Recent trends over the
last six seasons indicate that recruitment to the fishery will be close to the long-term average
in the short-to-medium term.
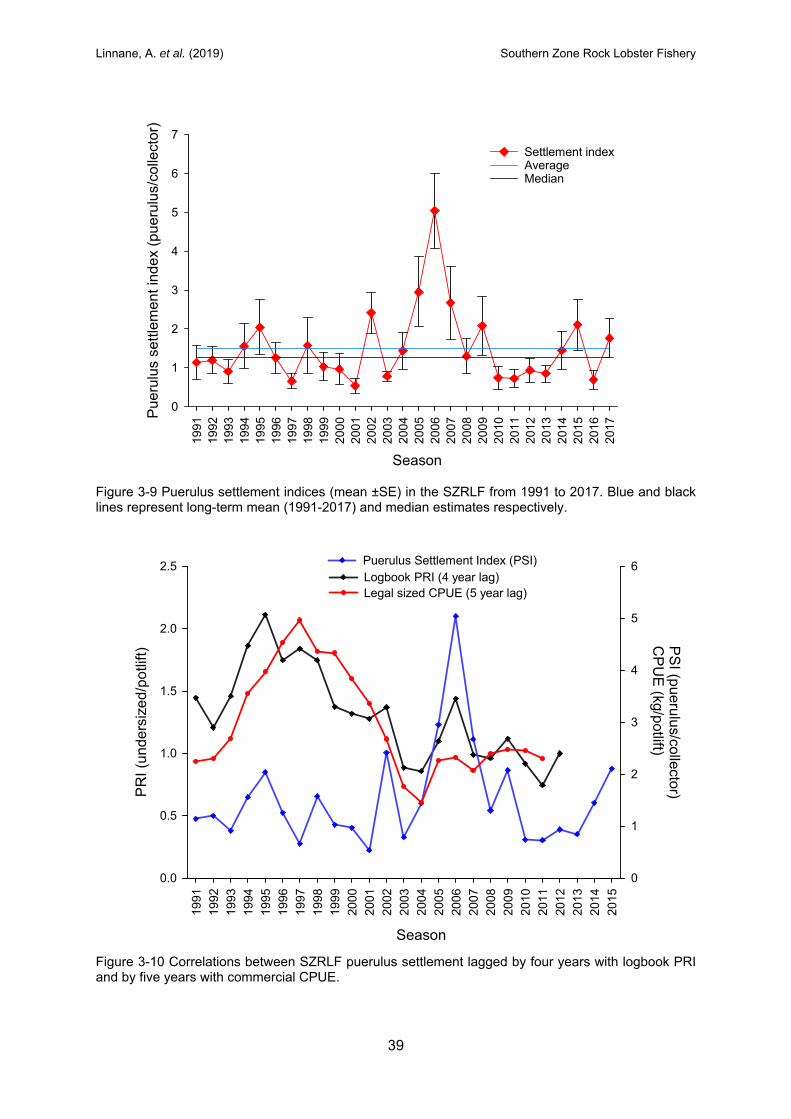
Linnane, A. et al. (2019) Southern Zone Rock Lobster Fishery
39
Figure 3-9 Puerulus settlement indices (mean ±SE) in the SZRLF from 1991 to 2017. Blue and black lines represent long-term mean (1991-2017) and median estimates respectively.
Figure 3-10 Correlations between SZRLF puerulus settlement lagged by four years with logbook PRI and by five years with commercial CPUE.
Season
1991
1992
1993
1994
1995
1996
1997
1998
1999
2000
2001
2002
2003
2004
2005
2006
2007
2008
2009
2010
2011
2012
2013
2014
2015
2016
2017
Pue
rulu
s se
ttle
men
t in
dex
(pue
rulu
s/co
llect
or)
0
1
2
3
4
5
6
7
Settlement indexAverageMedian
Season
1991
1992
1993
1994
1995
1996
1997
1998
1999
2000
2001
2002
2003
2004
2005
2006
2007
2008
2009
2010
2011
2012
2013
2014
2015
PR
I (u
nde
rsiz
ed/
pot
lift)
0.0
0.5
1.0
1.5
2.0
2.5
PS
I (pue
rulus/collector)
CP
UE
(kg/potlift)
0
1
2
3
4
5
6Logbook PRI (4 year lag) Puerulus Settlement Index (PSI)
Legal sized CPUE (5 year lag)
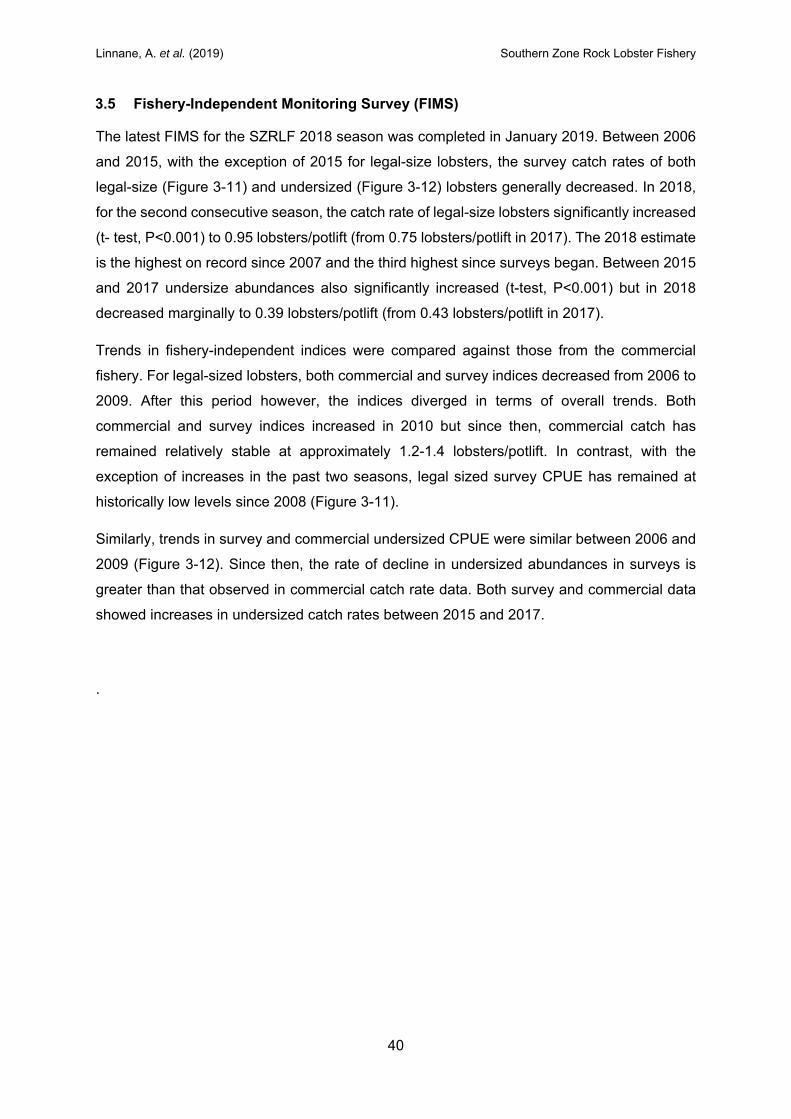
Linnane, A. et al. (2019) Southern Zone Rock Lobster Fishery
40
3.5 Fishery-Independent Monitoring Survey (FIMS)
The latest FIMS for the SZRLF 2018 season was completed in January 2019. Between 2006
and 2015, with the exception of 2015 for legal-size lobsters, the survey catch rates of both
legal-size (Figure 3-11) and undersized (Figure 3-12) lobsters generally decreased. In 2018,
for the second consecutive season, the catch rate of legal-size lobsters significantly increased
(t- test, P<0.001) to 0.95 lobsters/potlift (from 0.75 lobsters/potlift in 2017). The 2018 estimate
is the highest on record since 2007 and the third highest since surveys began. Between 2015
and 2017 undersize abundances also significantly increased (t-test, P<0.001) but in 2018
decreased marginally to 0.39 lobsters/potlift (from 0.43 lobsters/potlift in 2017).
Trends in fishery-independent indices were compared against those from the commercial
fishery. For legal-sized lobsters, both commercial and survey indices decreased from 2006 to
2009. After this period however, the indices diverged in terms of overall trends. Both
commercial and survey indices increased in 2010 but since then, commercial catch has
remained relatively stable at approximately 1.2-1.4 lobsters/potlift. In contrast, with the
exception of increases in the past two seasons, legal sized survey CPUE has remained at
historically low levels since 2008 (Figure 3-11).
Similarly, trends in survey and commercial undersized CPUE were similar between 2006 and
2009 (Figure 3-12). Since then, the rate of decline in undersized abundances in surveys is
greater than that observed in commercial catch rate data. Both survey and commercial data
showed increases in undersized catch rates between 2015 and 2017.
.
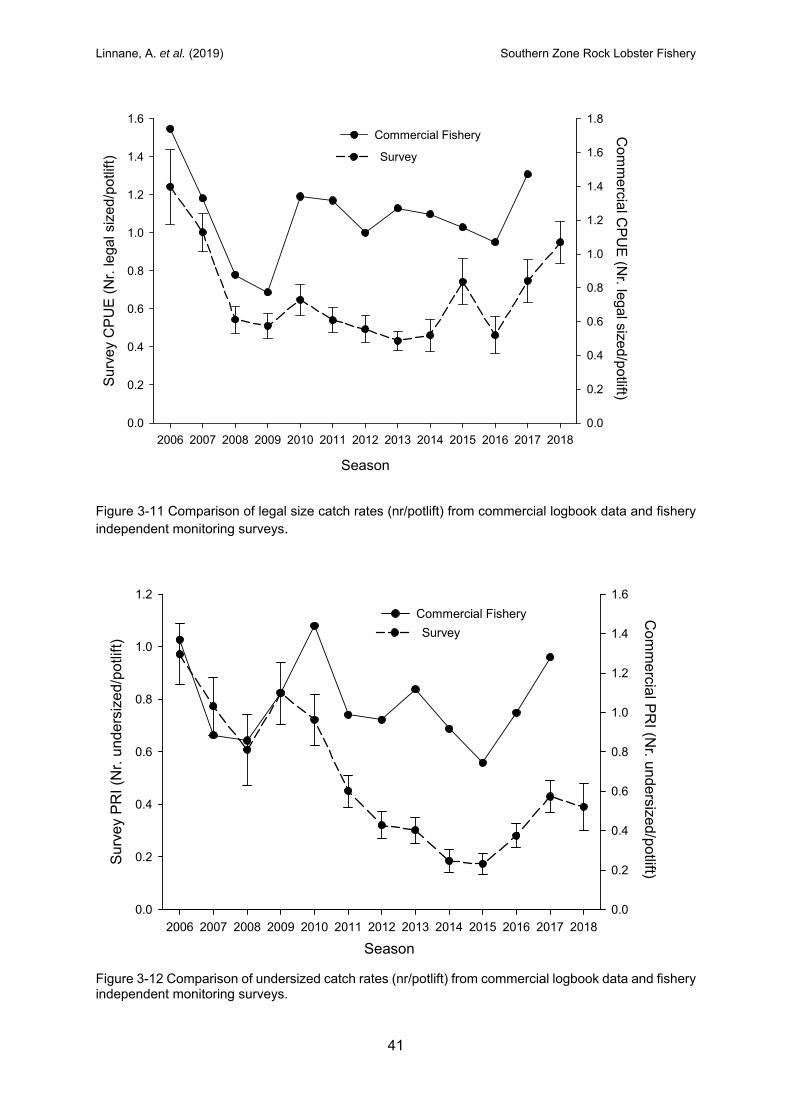
Linnane, A. et al. (2019) Southern Zone Rock Lobster Fishery
41
Figure 3-11 Comparison of legal size catch rates (nr/potlift) from commercial logbook data and fishery independent monitoring surveys.
Figure 3-12 Comparison of undersized catch rates (nr/potlift) from commercial logbook data and fishery independent monitoring surveys.
Season
2006 2007 2008 2009 2010 2011 2012 2013 2014 2015 2016 2017 2018
Com
mercial P
RI (N
r. undersized/potlift)
0.0
0.2
0.4
0.6
0.8
1.0
1.2
1.4
1.6
Sur
vey
PR
I (N
r. u
nder
size
d/po
tlift
)
0.0
0.2
0.4
0.6
0.8
1.0
1.2
Commercial Fishery
Survey
Season
2006 2007 2008 2009 2010 2011 2012 2013 2014 2015 2016 2017 2018
Com
me
rcial CP
UE
(Nr. legal sized
/potlift)
0.0
0.2
0.4
0.6
0.8
1.0
1.2
1.4
1.6
1.8S
urv
ey C
PU
E (
Nr.
lega
l siz
ed/p
otlif
t)
0.0
0.2
0.4
0.6
0.8
1.0
1.2
1.4
1.6Commercial Fishery
Survey
Linnane, A. et al. (2019) Southern Zone Rock Lobster Fishery
42
3.6 “qR” and “LenMod” stock assessment models
3.6.1 Model fits
Both the qR and LenMod fishery model show good fits to the available data (Appendix 5). For
qR, the model shows close agreement to logbook totals of yearly catch in number (Figure 6-1)
and annual catch in weight (Figure 6-2). For LenMod, model estimates of monthly catch in
number and monthly catch rate fitted closely to reported time series for catch in number (Cn)
(Figure 6-3) and catch rate (Figure 6-4) obtained from SZRLF logbook data. In addition, both
male and female model estimates fitted well to length-frequency data from voluntary catch
sampling as shown in monthly fits from the 2017 season (Figure 6-5).
3.6.2 Model outputs
There is close agreement from both the qR and LenMod models in relation to current fishery
trends within the SZRLF. From 2002 to 2009, estimates of legal-sized biomass, decreased by
63% from approximately 4,900 t to 1,800 t (Figure 3-13a). Since then, biomass has gradually
increased and in 2017, the estimate was approximately 3,100 t.
In line with declines in lobster biomass, egg production estimates decreased by 52% from
approximately 650 billion in 2003 to 310 billion in 2009 (Figure 3-13b). Over the last eight
seasons, egg production has generally increased, and in 2017 was estimated approximately
400 billion. However, despite recent increases, egg production estimates are low in a historical
context with current estimates equating to 10% of unfished levels (Figure 3-13c).
Exploitation rate increased from approximately 37% in 2002 to 69% in 2009 (Figure 3-13d) in
response to decreasing biomass over the same period (Figure 3-13d). Exploitation rate
decreased considerably in 2010 and has continued to gradually decline since. In 2017, the
estimate was approximately 40%, which is one of the lowest estimates on record.
Outputs from the qR model indicate that recruitment to the fishery declined from approximately
4 million individuals in 1999 to 1 million in 2008, a decrease of 75% (Figure 3-13e). Since then,
the estimate has been variable and in 2017 was approximately 3 million individuals. Temporal
trends in recruitment estimated both models are strongly correlated (R2=0.90) with PRI from
logbook data from 1995-2017 (Figure 3-13e).
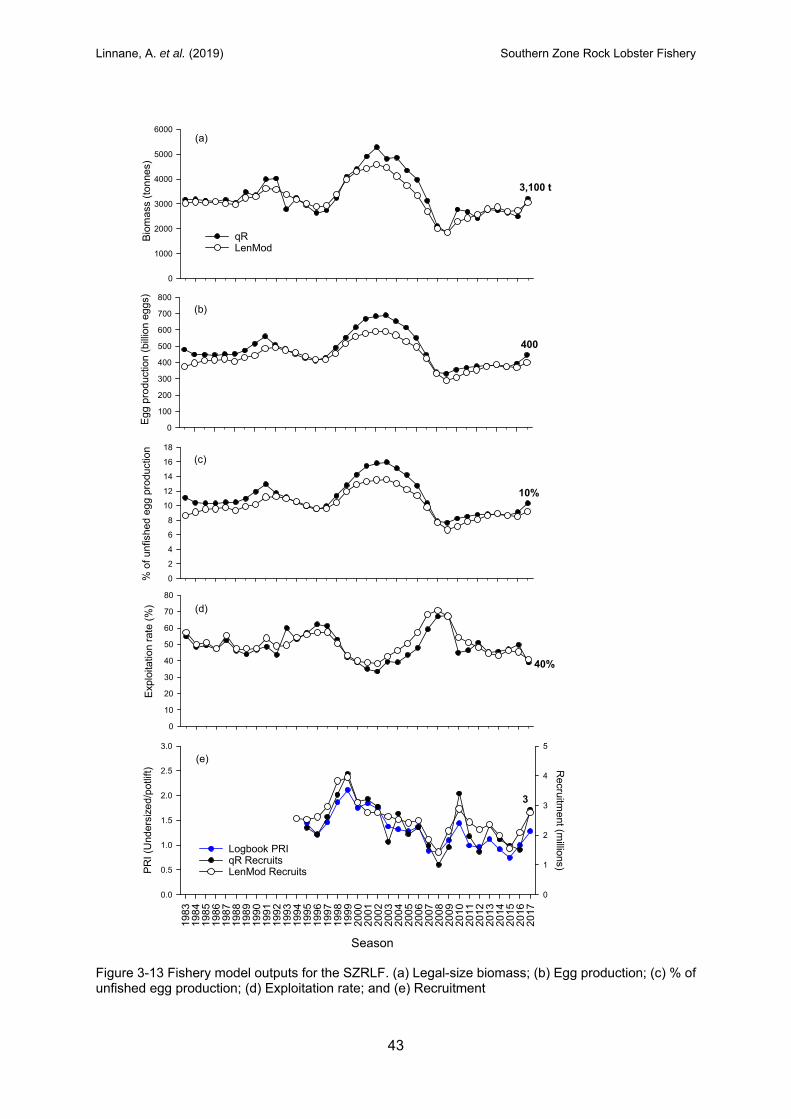
Linnane, A. et al. (2019) Southern Zone Rock Lobster Fishery
43
Figure 3-13 Fishery model outputs for the SZRLF. (a) Legal-size biomass; (b) Egg production; (c) % of unfished egg production; (d) Exploitation rate; and (e) Recruitment
3,100 t
Bio
mas
s (t
onne
s)
0
1000
2000
3000
4000
5000
6000
qRLenMod
400
Egg
pro
duct
ion
(bill
ion
eggs
)
0
100
200
300
400
500
600
700
800
10%
% o
f un
fishe
d eg
g pr
oduc
tion
0
2
4
6
8
10
12
14
16
18
40%
Exp
loita
tion
rate
(%
)
0
10
20
30
40
50
60
70
80
Season
1983
1984
1985
1986
1987
1988
1989
1990
1991
1992
1993
1994
1995
1996
1997
1998
1999
2000
2001
2002
2003
2004
2005
2006
2007
2008
2009
2010
2011
2012
2013
2014
2015
2016
2017
PR
I (U
nder
size
d/po
tlift
)
0.0
0.5
1.0
1.5
2.0
2.5
3.0
Recruitm
ent (m
illions)
0
1
2
3
4
5
Logbook PRI qR Recruits LenMod Recruits
(a)
(b)
(c)
(d)
(e)
3
Linnane, A. et al. (2019) Southern Zone Rock Lobster Fishery
44
4 DISCUSSION
4.1 Context of this Assessment
The previous SZRLF assessment, which considered data to 31 May 2017, classified the
fishery as “sustainable” (Linnane et al. 2018). The stock assessment and monitoring program
that underpins this classification has been reviewed on a number of occasions, the most recent
being in 2017 (Smith 2017). While concluding that “The monitoring strategies for the South
Australian Rock Lobster fishery are generally in line with best practice” the review provided a
number of recommendations to assist in improving the overall assessment. In terms of key
assessment indicators, these recommendations focused on catch rate standardisation and
improvements in model performance outputs.
While not included in the current report, standardised catch rate outputs were presented in
Linnane et al. (2018). These outputs were reviewed by the SZRLF Harvest Strategy Working
Group (HSWG), which noted the close agreement between nominal and standardised time-
series. The HSWG recommended that periodic catch rate standardisation should be
continued, but that in the context of this assessment, nominal catch could remain as the
primary indicator of lobster abundance. In terms of model outputs, the review recommended
consistency in terms of recruitment time-series (used to estimate %unfished egg production)
as well as changes to catchability scenarios. Over the past 12 months, both the qR and
LenMod models have been modified in response to these recommendations, with details
provided in Appendices 5 and 6 of this report. The overall outcome (as detailed in section 3.6),
is that both model are now highly consistent in terms of the current status of the SZRLF.
In 2017, the Management Advisory Committee (MAC) commenced a review of the
management plan for the SZRLF. As part of this process, the HSWG have, over the past 12
months, considered amendments to the current harvest strategy, which has included harvest
strategy testing of a range of potential proposals.
4.2 Determination of Stock Status
The status of the SZRLF was classified using the National Fishery Status Reporting
Framework (NFSRF) (Stewardson et al. 2018) of which the terminology of the classifications
was recently refined and amended in 2018 (Table 1-5). A weight-of-evidence approach was
used for the assignment of status and included fishery performance indicators and associated
trigger and limit reference points that are specified in the Management Plan (PIRSA 2013).
These include primary and secondary indicators from the commercial fishery data as well as
outputs from the qR and LenMod fishery models.
Linnane, A. et al. (2019) Southern Zone Rock Lobster Fishery
45
This overall assessment of the SZRLF resource relies heavily on commercial fishery-
dependent data collected by several long-term monitoring programs. In particular, the
assessment places considerable emphasis on assessing catch rate trends of both legal and
undersized lobsters across the entire zone. The current harvest strategy does not define a
pre-defined limit reference point that determines when the stock is depleted (i.e. recruitment
impaired because the adult stock no longer has the reproductive capacity to replenish itself).
Instead, a legal-size catch rate TRP of 0.60 kg/plotift is used, below which, exploitation rates
(and corresponding TACCs) are reduced, while a LRP of 0.30 kg/potlift reflects the point at
which the fishery is closed.
4.3 Stock Status
In 2017, the TACC in the SZRLF was taken for the eighth consecutive season. The current
catch level of 1,245.7 t is low in a historical context with effort required to take the TACC having
generally decreased since 2010. Reduced levels of catch have resulted in a considerable
improvement in SZRLF status. Between 2010 and 2016, catch rates remained relatively stable
in the fishery at approximately 1 kg/potlift before increasing by 27% to 1.22 kg/potlift in 2017.
This estimate is above both the long-term average and TRP for the fishery and the highest on
record since 2006. Increased catch rates were spatially consistent, having been observed
across all major MFAs of the SZRLF. In addition, legal-size catch rate increases were
observed over the last two seasons in fishery-independent surveys.
As well as reduced catch levels, recent increases in catch rate are likely driven by improved
recruitment to the fishable biomass, particularly in 2017. After a long-term decline from 1999
to 2015, where undersized abundances decreased by 65%, the PRI increased consecutively
over the last two seasons by 73% to 1.28 undersized/potlift, the highest since 2010. Given
that the period between PRI and recruitment to the fishery is approximately one year, this has
translated to increases in legal-size CPUE. Four additional sources of data support recent
recruitment increases: (i) independent model estimates of recruitment are highly correlated
with empirical recruitment indices; (ii) length frequency distributions indicate that the
percentage of lobsters measured below the MLS increased from 24% to 37% between 2015
and 2017, reflecting the increase in pre-recruit abundance over the same period; (iii) a
decrease in legal-sized mean weight, an indicator of higher recruitment levels to the fishery,
was observed for the first time in seven seasons in 2017; and (iv) PRI increases were observed
in 2016 and 2017 in fishery-independent surveys.
In the SZRLF, based on tag-recapture studies, the period between puerulus settlement and
the PRI is ~4 years, with recruitment into the fishery occurring one year later (i.e. 5 years after
Linnane, A. et al. (2019) Southern Zone Rock Lobster Fishery
46
settlement) (McGarvey et al. 1999; Linnane et al. 2013; 2014). While correlations between the
PRI and CPUE are strong using a one-year lag, consistent correlations between settlement
and recruitment are yet to emerge. For example, high levels of settlement observed in 2005,
2006 and 2009 reflected the increase in PRI in 2009, 2010 and 2013 which, combined with
reduced catch levels, is likely to have contributed to elevated commercial CPUE over recent
seasons. However, these relationships are not consistent over time as highlighted by the fact
that the recent increase in CPUE in 2017 came from one of the lowest settlements on record
in 2012.
Outputs from the qR and LenMod fishery models agree closely in relation to the current stock
status. Following a considerable decline between 2002 and 2009, legal-sized biomass has
gradually increased over the last eight seasons. Given that catch has remained stable over
this period, exploitation rate has decreased, with the 2017 estimate of 40% one of the lowest
on record. However, despite, recent increases in legal-size biomass, overall egg production
levels in the fishery remain low at just 10% of unfished levels.
In summary, the following lines of evidence were considered in assessing the stock status of
the SZRLF: (i) TACC levels since 2010/11 have constrained catch to historically low levels;
(ii) the CPUE is above both the long-term average and TRP; (iii) biomass levels have
increased and exploitation rate is low in a historical context; (iv) the PRI has increased by 73%
over the last two seasons; and (v) fishery-independent surveys support recent increases in
CPUE and PRI. Consequently, using a weight-of-evidence approach, under the NFSRF, the
SZRLF in 2017/18 is classified as “sustainable”.
4.4 Assessment Uncertainties
One of the notable uncertainties in this assessment is the reliance on fishery-dependent data
as an indicator of stock abundance. Specifically, catch rate estimates, based on fishery-
dependent data, can be influenced by factors such as gear selectivity, changes in fishing
patterns, fleet efficiency or fleet dynamics over time (Maunder et al. 2006). However, two lines
of evidence suggest that the catch rate trends detailed in this report are robust indicators of
overall lobster abundance. Firstly, trends are highly consistent across large spatial scales. For
example, across the four major MFAs of the fishery, catch rate simultaneously increased from
the mid-1990s to early 2000s, declined to historical lows from 2002 to 2009, before gradually
recovering over the next eight seasons. Similar trends were observed across a range of depth
categories within MFAs. Overall, these observations suggest recruitment in the SZRLF occurs
across large spatial scales with changes in trends sufficiently captured in the high level of
seasonal and spatial coverage (>1 million potlifts annually) used in catch rate estimates.
Linnane, A. et al. (2019) Southern Zone Rock Lobster Fishery
47
Secondly, a previous stock assessment report (Linnane et al. 2018) highlighted that when
nominal catch rate was standardised for factors such as year, month, depth, MFA, mean
weight, licence and consumer price index (CPI), both nominal and standardised time series
were closely aligned. The outcome was not unexpected, given that spatially, the catch appears
to be consistently taken from <60 m, while temporally, the majority of the catch is annually
taken from October through to February. While no difference was observed between the
approaches, the standardisation did not include some factors known to have important effects
on lobster catch rate in other lobster fisheries within south-eastern Australia. Specifically, data
pertaining to the effects of “vessel” and “skipper” were not available as part of the analyses.
Importantly, “vessel” has been identified as one of several factors to impact on legal-size
lobster catch rates in the Victorian rock lobster fishery (Feenstra et al. 2019). As a result, it is
strongly recommended that these data are captured within the fishery for future
standardisation analyses to ensure that these effects are appropriately accounted for.
From a modelling perspective, limitations associated with fishery-dependent estimates of
length frequencies should also be noted. As observed from the catch sampling program,
lobsters <70 and >210 mm CL are rarely landed by commercial fishing pots, which is
consistent with the size selectivity of trap-caught spiny lobsters in other fisheries (e.g. Goñi et
al. 2003). As a result, length frequency data that provide LenMod with information on size of
lobsters in the catch, which interpreted in combination with length-transition matrices, yield
estimates of mortality rate and absolute biomass, are limited to these specific size classes.
4.5 Future Work
As part of the review of the harvest strategy for the fishery undertaken in 2017/18,
consideration was given to potential egg production targets for South Australian rock lobster
fisheries. Currently, the Status of Australian Fish Stocks uses a LRP of 20% of unfished egg
production across the range of J. edwardsii in south-eastern Australia. It is proposed that
future work should consider what egg production targets are appropriate at the regional
fisheries scale in order to inform harvest strategies within those jurisdictions.
In addition, the Research Sub-Committee (RSC) of the MAC have recommended examining
for potential changes in growth rates within the fishery. This has been identified as a high
research priority given the importance of accurate growth transition matrices is the estimation
of legal-size biomass within fishery models. The most recent large-scale tag/recapture
program was undertaken from 1993 to 1996.
.
Linnane, A. et al. (2019) Southern Zone Rock Lobster Fishery
48
5 BIBLIOGRAPHY
Annala, J.H. and Breen, P.A. (1989) Yield- and egg-per-recruit analyses for the New Zealand rock lobster, Jasus edwardsii. New Zealand Journal of Marine and Freshwater Research 23: 93-105.
Booth, J.D. and Tarring, S.C. (1986) Settlement of the red rock lobster, Jasus edwardsii, near Gisborne, New Zealand. New Zealand Journal of Marine and Freshwater Research, 20: 291–297.
Booth, J.D., Street, R.J. and Smith, P.J. (1990) Systematic status of the rock lobsters Jasus edwardsii from New Zealand and J. novaehollandiae from Australia. New Zealand Journal of Marine and Freshwater Research 24: 239-49.
Booth, J.D., Carruthers, A.D., Bolt, C.D. and Stewart, R.A. (1991) Measuring the depth of settlement in the red rock lobster, Jasus edwardsii. New Zealand Journal of Marine and Freshwater Research 25: 123-32.
Booth, J.D., and McKenzie, A. 2009. Strong relationships between levels of puerulus settlement and recruited stock abundance in the red rock lobster (Jasus edwardsii) in New Zealand. Fisheries Research, 95:161-168.
Brasher, D.J., Ovenden, J.R. and White, R.W.G. (1992) Mitochondrial DNA variation and phylogenetic relationships of Jasus spp. (Decapoda: Palinuridae). Journal of Zoology 227: 1-16.
Breen, P.A. and McKoy, J.L. (2002) Review of current and past stock assessments for the South Australian Northern Zone Rock Lobster: Report by NIWA to the NZRL FMC Fishery. NIWA, Wellington.
Brock, D.J. and Ward, T.M. (2004). Octopus (Octopus maorum) bycatch and lobster (Jasus edwardsii) mortality in the South Australian Rock Lobster Fishery. Fisheries Bulletin 102: 430-440.
Brock, D.J., Hawthorne, P.J., Ward, T.M. and Linnane, A.J. (2007) Two monitoring methods that assess species composition and spatio-temporal trends in bycatch from an important temperate rock lobster (Jasus edwardsii) fishery. Marine and Freshwater Research, 58: 273-285.
Bruce, B., Bradford, R., Griffin, D., Gardner, C. and Young, J. (1999) A synthesis of existing data on larval rock lobster distribution in southern Australia. Final report to the Fisheries Research and Development Corporation, Canberra, pp. 1-57, 96/107.
Bruce, B., Griffin, D. and Bradford, R. (2007) Larval transport and recruitment processes of southern rock lobster. FRDC and CSIRO Marine and Atmospheric Research publication Nr. 2002/007. ISBN Nr 1 9210061 01 4.
Chiswell, S.M. and Booth, J.D. (2005) Distribution of mid- and late-stage Jasus edwardsii phyllosomas: implications for larval recruitment processes. New Zealand Journal of Marine and Freshwater Research 39: 1157-1170.
Chiswell, S.M. and Booth, J.D. (2008) Sources and sinks of larval settlement in Jasus edwardsii around New Zealand: Where do larvae come from and where do they go? Marine Ecology Progress Series 354: 201-217.
Caputi, N., Brown, R.S. and Chubb, C.F. (1995) Regional prediction of the western rock lobster, Panulirus cygnus, commercial catch in Western Australia. Crustaceana 68:245-256.
Currie, D.R., Sorokin, S.J., and Ward, T.J.M. (2006). Survey of recreational Rock Lobster Fishing in South Australia during 2004/05. South Australia Research and Development
Linnane, A. et al. (2019) Southern Zone Rock Lobster Fishery
49
Institute Research Report Series No. 123. South Australia Research Development Institute, South Australia. 36 pp.
Department for Environment and Heritage (2009) A technical report on the outer boundaries of South Australia’s marine parks network. Department for Environment and Heritage, South Australia.
Econsearch (2018) Economic Indicators for the South Australian Southern Zone Rock Lobster Fishery, 2016/17. A report to PIRSA Fisheries and Aquaculture. Adelaide, 72 pp.
Feenstra, J. McGarvey, R., Linnane, A., Haddon, M., Matthews, J. and Punt, A.E. (2019) Impacts on CPUE from vessel fleet composition changes in an Australian lobster (Jasus edwardsii) fishery, New Zealand Journal of Marine and Freshwater Research, DOI: 10.1080/00288330.2018.1556166.
Flood, M., Stobutzki, I., Andrews, J., Ashby, C., Begg, G., Fletcher, R., Gardner, C., Georgeson, L., Hansen, S., Hartmann, K., Hone, P., Horvat, P., Maloney, L., McDonald, B., Moore, A., Roelofs, A., Sainsbury, K., Saunders, T., Smith, T., Stewardson, C., Stewart, J., and Wise, B. (eds) (2014) Status of key Australian fish stocks reports 2014, Fisheries Research and Development Corporation, Canberra.
Gardner, C., Frusher, S.D., Kennedy, R.B. and Cawthorn, A. (2001) Relationship between settlement of southern rock lobster pueruli, Jasus edwardsii, and recruitment to the fishery in Tasmania, Australia. Marine and Freshwater Research 52:1271-5.
Giri, K., and Hall, K. (2015) South Australian Recreational Fishing Survey. Fisheries Victoria Internal Report Series No. 62.
Goldsworthy, S.D., Page, B., Shaughnessy, P.D. and Linnane, A. (2010) Mitigating seal interactions in the SRLF and the gillnet sector SESSF in South Australia. Report to the fisheries research and development institute. Adelaide: South Australian Research and Development Institute (Aquatic Sciences), p.213.
Goñi, R., Quetglas, A., and Reñones, O. (2003) Differential catchability of male and female European spiny lobster Palinurus elephas (Fabricius, 1787) in traps and trammelnets. Fisheries Research 65: 295-307.
Henry, G.W. and Lyle, J.M. (eds) (2003) The National Recreational and Indigenous Fishing Survey. Australian Government Department of Agriculture, Fisheries and Forestry, Canberra. FRDC Project No. 99/158.
Hobday, D. and Punt, A.E. (2001) Size-structured population modelling and risk assessment of the Victorian southern rock lobster, Jasus edwardsii, fishery. Marine and Freshwater Research 52: 1495-1507.
Johnston, S.J. and Bergh, M.O. (1993) Size-based estimates of survivorship for the South African rock lobster Jasus lalandii. Fisheries Research 18: 277-304.
Jones, K. (2009) South Australian Recreational fishing Survey. PIRSA Fisheries, Adelaide, 84 pp. South Australian Fisheries Management Series Paper No 54.
Linnane, A., Penny, S. and Ward, T. (2008) Contrasting fecundity, size at maturity and reproductive potential of southern rock lobster Jasus edwardsii in two South Australian fishing regions. Journal of the Marine Biological Association of the United Kingdom 88: 583-589.
Linnane, A., Penny, S., Hawthorne, P. and Hoare, M. (2009) Spatial differences in size of maturity and reproductive potential between inshore and offshore fisheries for southern rock lobster (Jasus edwardsii) in South Australia. Fisheries Research 96: 238–243.
Linnane, A., James, C., Middleton, J., Hawthorne, P., and Hoare, M. (2010) Impact of wind stress anomalies on the seasonal pattern of southern rock lobster (Jasus edwardsii) settlement in South Australia. Fisheries Oceanography 19: 290–300.
Linnane, A. et al. (2019) Southern Zone Rock Lobster Fishery
50
Linnane, A. and Walsh, P.H. (2011) Standardising data collection across the southern rock lobster fisheries of South Australia, Victoria and Tasmania. Report to the Fisheries Research and Development Corporation. South Australian Research and Development Institute (Aquatic Sciences), Adelaide. SARDI Publication No. F2010/000393-1. SARDI Research Report Series No. 447. 101pp.
Linnane, A., McGarvey, R., Hoare, M., and Hawthorne, P. (2013) The importance of conserving recruitment pulses in rock lobster (Jasus edwardsii) fisheries where puerulus settlement is low or highly sporadic, Marine Biology Research, 9:1, 97-103.
Linnane, A., McGarvey, R., Gardner, C., Walker, T.I., Matthews, J., Green, B., and Punt, A. (2014) Large-scale patterns in puerulus settlement and links to fishery recruitment in the southern rock lobster (Jasus edwardsii) across southeastern Australia. ICES Journal of Marine Science 71, 528–536.
Linnane, A., McGarvey, R., Matthews, J., Feenstra, J., Jones, A. and Toumazos, K. (2016) Informing spatial and temporal management of the South Australian Northern Zone Southern Rock Lobster (Jasus edwardsii) fishery. Final Report to the Fisheries Research and Development Corporation. Adelaide, ISBN 978-1-921563-89-8.
Linnane, A., McGarvey, R., Feenstra, J. and Hawthorne, P. (2018) Southern Zone Rock Lobster (Jasus edwardsii) Fishery 2016/17. Fishery Assessment Report to PIRSA Fisheries and Aquaculture. South Australian Research and Development Institute (Aquatic Sciences), Adelaide. SARDI Publication No. F2007/000276-12. SARDI Research Report Series No. 988. 81pp.
MacDiarmid, A.B. (1988) Experimental confirmation of external fertilisation in the southern temperate rock lobster Jasus edwardsii (Hutton) (Decapoda: Palinuridae). Journal of Experimental Marine Biology and Ecology 120: 277-85.
MacDiarmid, A.B. (1989) Moulting and reproduction of the spiny lobster Jasus edwardsii (Decapoda: Palinurudae) in northern New Zealand. Marine Biology 103: 303-10.
Maunder, M.N., Sibert, J.R., Fonteneau, A., Hampton, J., Kleiber, P. and Harley S.J. (2006) Interpreting catch per unit effort data to assess the status of individual stocks and communities. ICES Journal of Marine Science, 63: 1373-1385.
McGarvey, R., Matthews, J.M. and Prescott, J.H. (1997) Estimating lobster recruitment and exploitation rate from landings by weight and numbers, and age-specific weights. Marine and Freshwater Research 48: 1001-08.
McGarvey, R., Ferguson, G.J. and Prescott, J.H. (1999) Spatial variation in mean growth rates of rock lobster, Jasus edwardsii, in South Australian waters. Marine and Freshwater Research 50: 333-42.
McGarvey, R. and Feenstra, J.E. (2001) Estimating length-transition probabilities as polynomial functions of pre-moult length. Marine and Freshwater Research 52: 1517-1526.
McGarvey, R. and Matthews, J.M. (2001) Incorporating numbers harvested in dynamic estimation of yearly recruitment: onshore wind in interannual variation of South Australian rock lobster (Jasus edwardsii). Journal of the International Council for the Exploration of the Sea 58: 1092-99.
McGarvey, R. and Pennington, M. (2001) Designing and evaluating length-frequency surveys for trap fisheries with application to the southern rock lobster. Canadian Journal of Fisheries and Aquatic Sciences 58: 254-61.
McGarvey, R., Punt, A.E. and Matthews, J.M. (2005) Assessing the information content of catch-in-numbers: A simulation comparison of stock assessment methods based on catch and effort totals. In 'Fisheries Assessment and Management in Data-Limited Situations.' (Eds. G.H. Kruse, V.F. Gallucci, D.E. Hay, R.I. Perry, R.M. Peterman, T.C.
Linnane, A. et al. (2019) Southern Zone Rock Lobster Fishery
51
Shirley, P.D. Spencer, B. Wilson, and D. Woodby). Alaska Sea Grant College Program, University of Alaska, Fairbanks, pp. 635-653.
McGarvey, R., Punt, A.E., Gardner, C., Feenstra, J., Hartman K., Hoshino, E., Burch, P., Paterson, S., Matthews, J., Linnane, A., Rippin, L. and Morison, J. (2014) Bioeconomic decision support tools for Southern Rock Lobster. Report to the Australian Seafood Cooperative Research Centre. Project No. 2009/714.20. 200pp.
McGarvey, R.; Punt, A.E., Matthews, J.M., Feenstra, J.E., Gardner, C., Burch, P., Hartmann, K., Linnane, A. (2015) Comparing size-limit and quota policies to increase economic yield in a lobster fishery. Canadian Journal of Fisheries and Aquatic Sciences 72: 1292-1305.
McGarvey, R., Matthews, J.M., Feenstra, J.E., Punt, A.E. and Linnane, A. (2016) Using bioeconomic modeling to improve a harvest strategy for a quota-based lobster fishery. Fisheries Research 183: 549-558.
McGarvey, R., Linnane, A., Matthews, J.M., and Jones, A. (2017) Decision rules for quota setting to support spatial management in a lobster (Jasus edwardsii) fishery. ICES Journal of Marine Science 74: 588-597. doi:10.1093/icesjms/fsw177.
Morgan, E.M., Green, B.S., Murphy, N.P. and Strugnell, J.M. (2013) Investigation of genetic structure between deep and shallow populations of the southern rock lobster, Jasus edwardsii in Tasmania, Australia. PloS one, 8(10), p.e77978.
Ovenden, J.R., Brasher, D.J. and White, R.W.G. (1992) Mitochondrial DNA analyses of red rock lobster, Jasus edwardsii, supports an apparent absence of population subdivision throughout Australasia. Marine Biology 112: 319-26.
PIRSA (2013). The South Australian Fisheries Management Series. Paper Nr 63: Management Plan for the South Australian Commercial Southern Zone Rock Lobster Fishery. ISSN 1322-8072.
Phillips, B. (2013) Lobsters: Biology, Management, Aquaculture and fisheries, 2nd Edition. Wiley-Blackwell Publishing Ltd. ISBN: 978-0-470-67113-9.
Phillips, B.F. and McWilliam, P.S. (2009) Spiny lobster development: where does successful metamorphosis to the puerulus occur?: a review. Reviews in Fish Biology and Fisheries 19: 193-215.
Prescott, J., McGarvey, R., Ferguson, G., and Lorkin, M. (1996) Population dynamics of the southern rock lobster in South Australian waters. Final report to the Fisheries Research and Development Corporation 93/086 and 93/087, 1-64.
Prescott, J., McGarvey, R., Jones, A., Peso, A., Ferguson, G., Casement, D., Xiao, Y., and McShane, P. (1998) Southern Zone Rock Lobster. South Australian Fisheries Assessment Series 98/3. SARDI Aquatic Sciences, Adelaide. 22p.
Punt, A.E., and Kennedy, R.B. (1997) Population modelling of Tasmanian rock lobster, Jasus edwardsii, resources. Marine and Freshwater Research 48: 967-80.
Punt, A.E. (2003) The performance of a size-structured stock assessment method in the face of spatial heterogeneity in growth. Fisheries Research 65: 391-409.
Sloan, S., and Crosthwaite, K. (2007) Management plan for the South Australian southern zone rock lobster fishery. The South Australian Fishery Management Series. PIRSA Fisheries publication, Adelaide, Australia.
Smith, P.J., McKoy, J.L. and Machin, P.J. (1980) Genetic variation in the rock lobsters Jasus edwardsii and Jasus novaehollandiae. New Zealand Journal of Marine and Freshwater Research 14: 55-63.
Linnane, A. et al. (2019) Southern Zone Rock Lobster Fishery
52
Smith, T. (2017) Review of the Stock Assessment and Monitoring Program for the South Australian Rock Lobster Fishery. A report prepared for the South Australian Rock Lobster Advisory Council Inc. June, 2017.
Stewardson, C., Andrews, J., Ashby, C., Haddon M., Hartmann, K., Hone, P., Horvat, P., Klemke, J., Mayfield, S., Roelofs, A., Sainsbury, K., Saunders, T., Stewart, J., Nicol, S. and Wise, B. (eds) (2018) Status of Australian fish stocks reports 2018, Fisheries Research and Development Corporation, Canberra.
Thomas, L., (2012) Population genetics of the red rock lobster, Jasus edwardsii. Thesis submitted to the Victoria University of Wellington in partial fulfilment of the requirements for the degree of Master of Science in Marine Biology. 97 pp.
Thorson, J.T., Fonner, R., Haltuch, M.A., Ono, K., and Winker, H. (2017) Accounting for spatiotemporal variation and fisher targeting when estimating abundance from multispecies fishery data. Canadian Journal of Fisheries and Aquatic Sciences, 74: 1794-1807.
Vainickis, A.A. (2010) SARDI Aquatic Sciences Information Systems Quality Assurance and Data Integrity Report 2010. SARDI Publication No. F2009/000267-2. SARDI research Report Series 497. South Australian Research and Development Institute (Aquatic Sciences) Adelaide.
Zacharin, W. (Ed.) (1997) Management plan for the South Australian northern zone rock lobster fishery. Primary Industries and Resources South Australia, Adelaide, pp. 1-24.
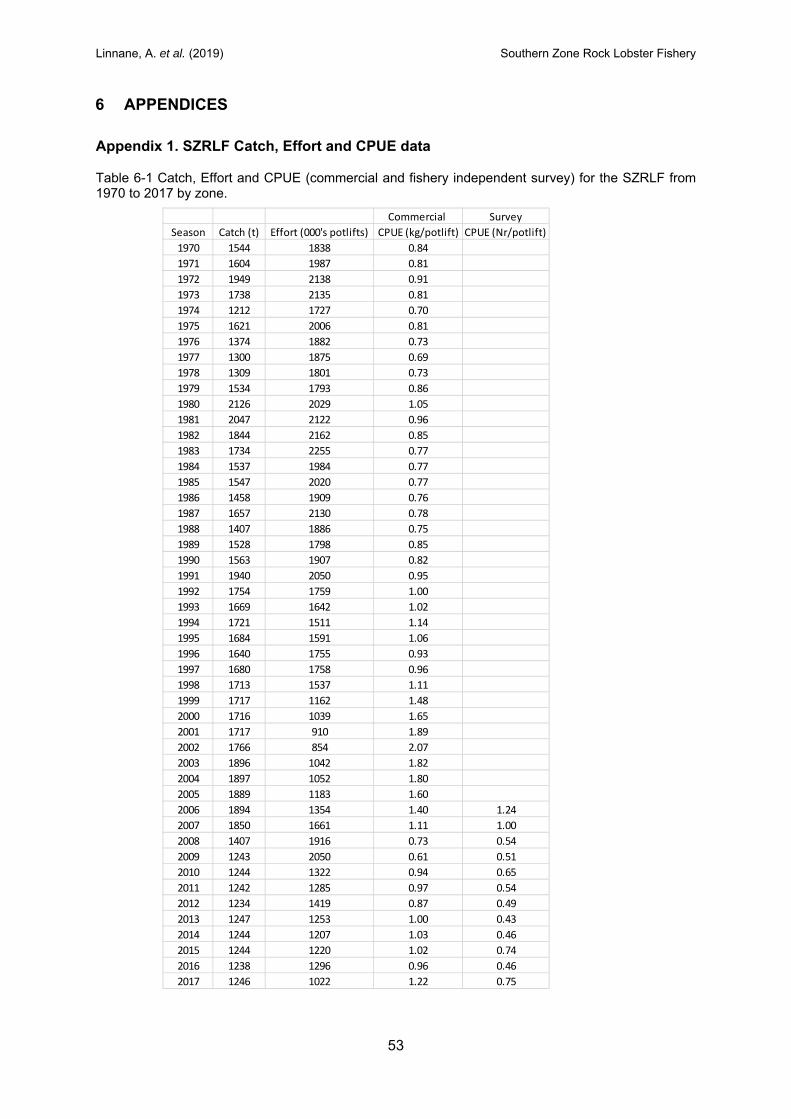
Linnane, A. et al. (2019) Southern Zone Rock Lobster Fishery
53
6 APPENDICES
Appendix 1. SZRLF Catch, Effort and CPUE data
Table 6-1 Catch, Effort and CPUE (commercial and fishery independent survey) for the SZRLF from 1970 to 2017 by zone.
Commercial Survey
Season Catch (t) Effort (000's potlifts) CPUE (kg/potlift) CPUE (Nr/potlift)
1970 1544 1838 0.84
1971 1604 1987 0.81
1972 1949 2138 0.91
1973 1738 2135 0.81
1974 1212 1727 0.70
1975 1621 2006 0.81
1976 1374 1882 0.73
1977 1300 1875 0.69
1978 1309 1801 0.73
1979 1534 1793 0.86
1980 2126 2029 1.05
1981 2047 2122 0.96
1982 1844 2162 0.85
1983 1734 2255 0.77
1984 1537 1984 0.77
1985 1547 2020 0.77
1986 1458 1909 0.76
1987 1657 2130 0.78
1988 1407 1886 0.75
1989 1528 1798 0.85
1990 1563 1907 0.82
1991 1940 2050 0.95
1992 1754 1759 1.00
1993 1669 1642 1.02
1994 1721 1511 1.14
1995 1684 1591 1.06
1996 1640 1755 0.93
1997 1680 1758 0.96
1998 1713 1537 1.11
1999 1717 1162 1.48
2000 1716 1039 1.65
2001 1717 910 1.89
2002 1766 854 2.07
2003 1896 1042 1.82
2004 1897 1052 1.80
2005 1889 1183 1.60
2006 1894 1354 1.40 1.24
2007 1850 1661 1.11 1.00
2008 1407 1916 0.73 0.54
2009 1243 2050 0.61 0.51
2010 1244 1322 0.94 0.65
2011 1242 1285 0.97 0.54
2012 1234 1419 0.87 0.49
2013 1247 1253 1.00 0.43
2014 1244 1207 1.03 0.46
2015 1244 1220 1.02 0.74
2016 1238 1296 0.96 0.46
2017 1246 1022 1.22 0.75
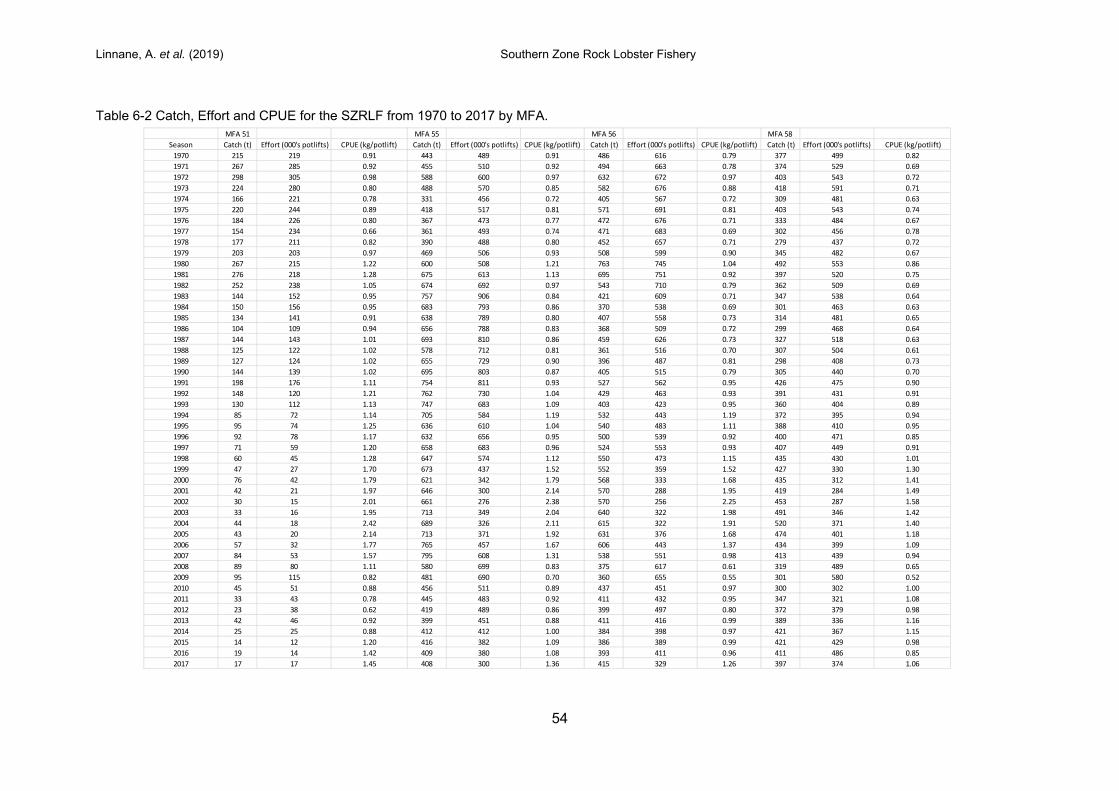
Linnane, A. et al. (2019) Southern Zone Rock Lobster Fishery
54
Table 6-2 Catch, Effort and CPUE for the SZRLF from 1970 to 2017 by MFA.
MFA 51 MFA 55 MFA 56 MFA 58
Season Catch (t) Effort (000's potlifts) CPUE (kg/potlift) Catch (t) Effort (000's potlifts) CPUE (kg/potlift) Catch (t) Effort (000's potlifts) CPUE (kg/potlift) Catch (t) Effort (000's potlifts) CPUE (kg/potlift)
1970 215 219 0.91 443 489 0.91 486 616 0.79 377 499 0.82
1971 267 285 0.92 455 510 0.92 494 663 0.78 374 529 0.69
1972 298 305 0.98 588 600 0.97 632 672 0.97 403 543 0.72
1973 224 280 0.80 488 570 0.85 582 676 0.88 418 591 0.71
1974 166 221 0.78 331 456 0.72 405 567 0.72 309 481 0.63
1975 220 244 0.89 418 517 0.81 571 691 0.81 403 543 0.74
1976 184 226 0.80 367 473 0.77 472 676 0.71 333 484 0.67
1977 154 234 0.66 361 493 0.74 471 683 0.69 302 456 0.78
1978 177 211 0.82 390 488 0.80 452 657 0.71 279 437 0.72
1979 203 203 0.97 469 506 0.93 508 599 0.90 345 482 0.67
1980 267 215 1.22 600 508 1.21 763 745 1.04 492 553 0.86
1981 276 218 1.28 675 613 1.13 695 751 0.92 397 520 0.75
1982 252 238 1.05 674 692 0.97 543 710 0.79 362 509 0.69
1983 144 152 0.95 757 906 0.84 421 609 0.71 347 538 0.64
1984 150 156 0.95 683 793 0.86 370 538 0.69 301 463 0.63
1985 134 141 0.91 638 789 0.80 407 558 0.73 314 481 0.65
1986 104 109 0.94 656 788 0.83 368 509 0.72 299 468 0.64
1987 144 143 1.01 693 810 0.86 459 626 0.73 327 518 0.63
1988 125 122 1.02 578 712 0.81 361 516 0.70 307 504 0.61
1989 127 124 1.02 655 729 0.90 396 487 0.81 298 408 0.73
1990 144 139 1.02 695 803 0.87 405 515 0.79 305 440 0.70
1991 198 176 1.11 754 811 0.93 527 562 0.95 426 475 0.90
1992 148 120 1.21 762 730 1.04 429 463 0.93 391 431 0.91
1993 130 112 1.13 747 683 1.09 403 423 0.95 360 404 0.89
1994 85 72 1.14 705 584 1.19 532 443 1.19 372 395 0.94
1995 95 74 1.25 636 610 1.04 540 483 1.11 388 410 0.95
1996 92 78 1.17 632 656 0.95 500 539 0.92 400 471 0.85
1997 71 59 1.20 658 683 0.96 524 553 0.93 407 449 0.91
1998 60 45 1.28 647 574 1.12 550 473 1.15 435 430 1.01
1999 47 27 1.70 673 437 1.52 552 359 1.52 427 330 1.30
2000 76 42 1.79 621 342 1.79 568 333 1.68 435 312 1.41
2001 42 21 1.97 646 300 2.14 570 288 1.95 419 284 1.49
2002 30 15 2.01 661 276 2.38 570 256 2.25 453 287 1.58
2003 33 16 1.95 713 349 2.04 640 322 1.98 491 346 1.42
2004 44 18 2.42 689 326 2.11 615 322 1.91 520 371 1.40
2005 43 20 2.14 713 371 1.92 631 376 1.68 474 401 1.18
2006 57 32 1.77 765 457 1.67 606 443 1.37 434 399 1.09
2007 84 53 1.57 795 608 1.31 538 551 0.98 413 439 0.94
2008 89 80 1.11 580 699 0.83 375 617 0.61 319 489 0.65
2009 95 115 0.82 481 690 0.70 360 655 0.55 301 580 0.52
2010 45 51 0.88 456 511 0.89 437 451 0.97 300 302 1.00
2011 33 43 0.78 445 483 0.92 411 432 0.95 347 321 1.08
2012 23 38 0.62 419 489 0.86 399 497 0.80 372 379 0.98
2013 42 46 0.92 399 451 0.88 411 416 0.99 389 336 1.16
2014 25 25 0.88 412 412 1.00 384 398 0.97 421 367 1.15
2015 14 12 1.20 416 382 1.09 386 389 0.99 421 429 0.98
2016 19 14 1.42 409 380 1.08 393 411 0.96 411 486 0.85
2017 17 17 1.45 408 300 1.36 415 329 1.26 397 374 1.06
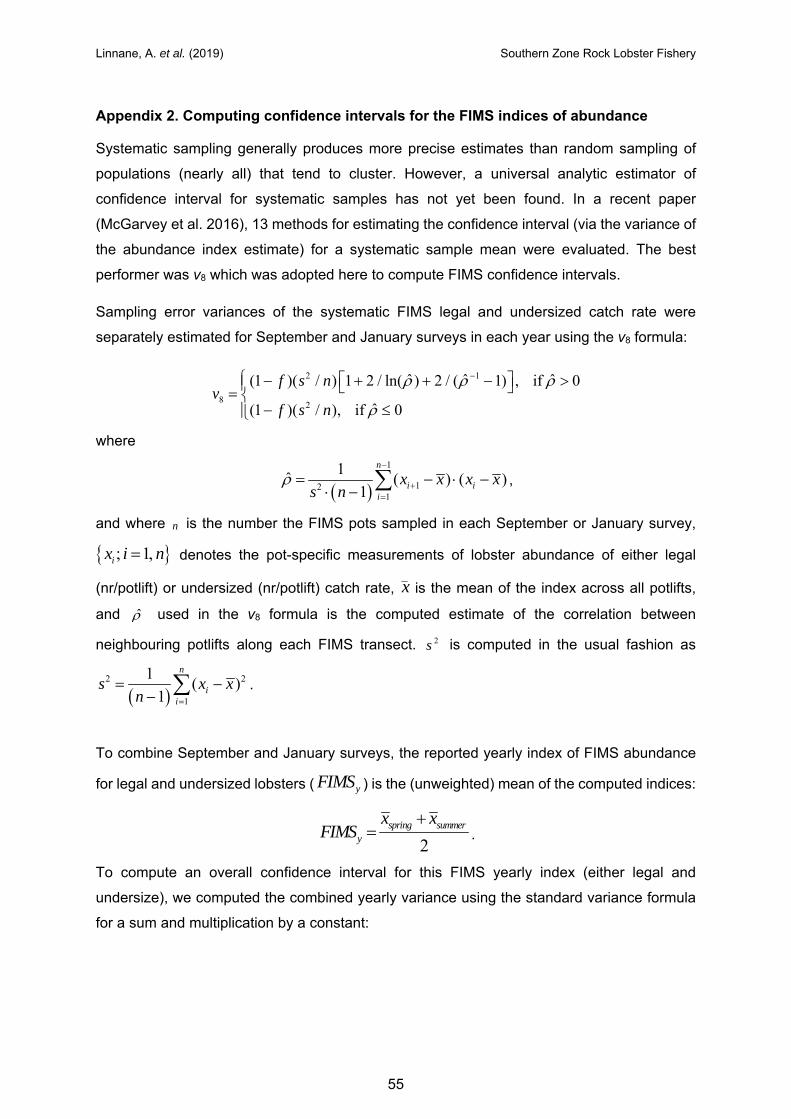
Linnane, A. et al. (2019) Southern Zone Rock Lobster Fishery
55
Appendix 2. Computing confidence intervals for the FIMS indices of abundance
Systematic sampling generally produces more precise estimates than random sampling of
populations (nearly all) that tend to cluster. However, a universal analytic estimator of
confidence interval for systematic samples has not yet been found. In a recent paper
(McGarvey et al. 2016), 13 methods for estimating the confidence interval (via the variance of
the abundance index estimate) for a systematic sample mean were evaluated. The best
performer was v8 which was adopted here to compute FIMS confidence intervals.
Sampling error variances of the systematic FIMS legal and undersized catch rate were
separately estimated for September and January surveys in each year using the v8 formula:
2 1
82
ˆ ˆ ˆ(1 )( / ) 1 2 / ln( ) 2 / ( 1) , if 0
ˆ(1 )( / ), if 0
f s nv
f s n
where
1
121
1ˆ ( ) ( )
1
n
i ii
x x x xs n
,
and where n is the number the FIMS pots sampled in each September or January survey,
; 1,ix i n denotes the pot-specific measurements of lobster abundance of either legal
(nr/potlift) or undersized (nr/potlift) catch rate, x is the mean of the index across all potlifts,
and ̂ used in the v8 formula is the computed estimate of the correlation between
neighbouring potlifts along each FIMS transect. 2s is computed in the usual fashion as
2 2
1
1( )
1
n
ii
s x xn
.
To combine September and January surveys, the reported yearly index of FIMS abundance
for legal and undersized lobsters ( yFIMS ) is the (unweighted) mean of the computed indices:
2
spring summery
x xFIMS
.
To compute an overall confidence interval for this FIMS yearly index (either legal and
undersize), we computed the combined yearly variance using the standard variance formula
for a sum and multiplication by a constant:
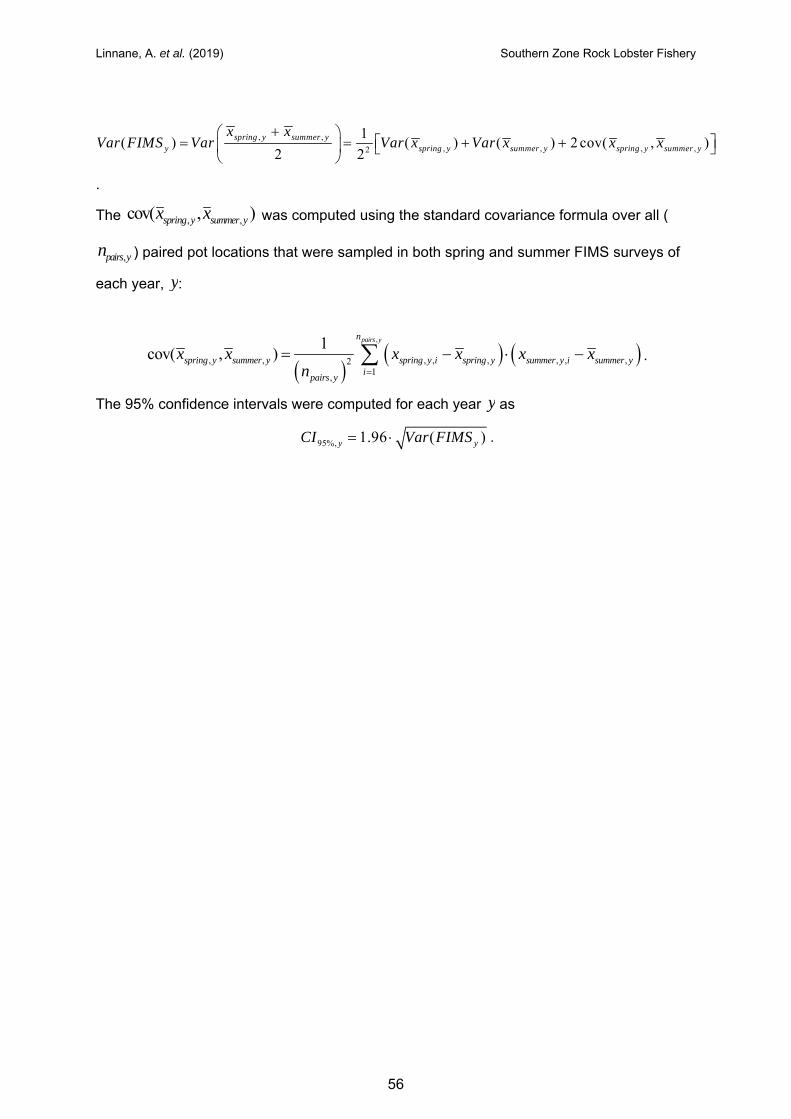
Linnane, A. et al. (2019) Southern Zone Rock Lobster Fishery
56
, ,, , , ,2
1( ) ( ) ( ) 2 cov( , )
2 2spring y summer y
y spring y summer y spring y summer y
x xVar FIMS Var Var x Var x x x
.
The , ,cov( , )spring y summer yx x was computed using the standard covariance formula over all (
,pairs yn ) paired pot locations that were sampled in both spring and summer FIMS surveys of
each year, y:
,
, , , , , , , ,21
,
1cov( , )
pairs yn
spring y summer y spring y i spring y summer y i summer yi
pairs y
x x x x x xn
.
The 95% confidence intervals were computed for each year y as
95%, 1.96 ( )y yCI Var FIMS .
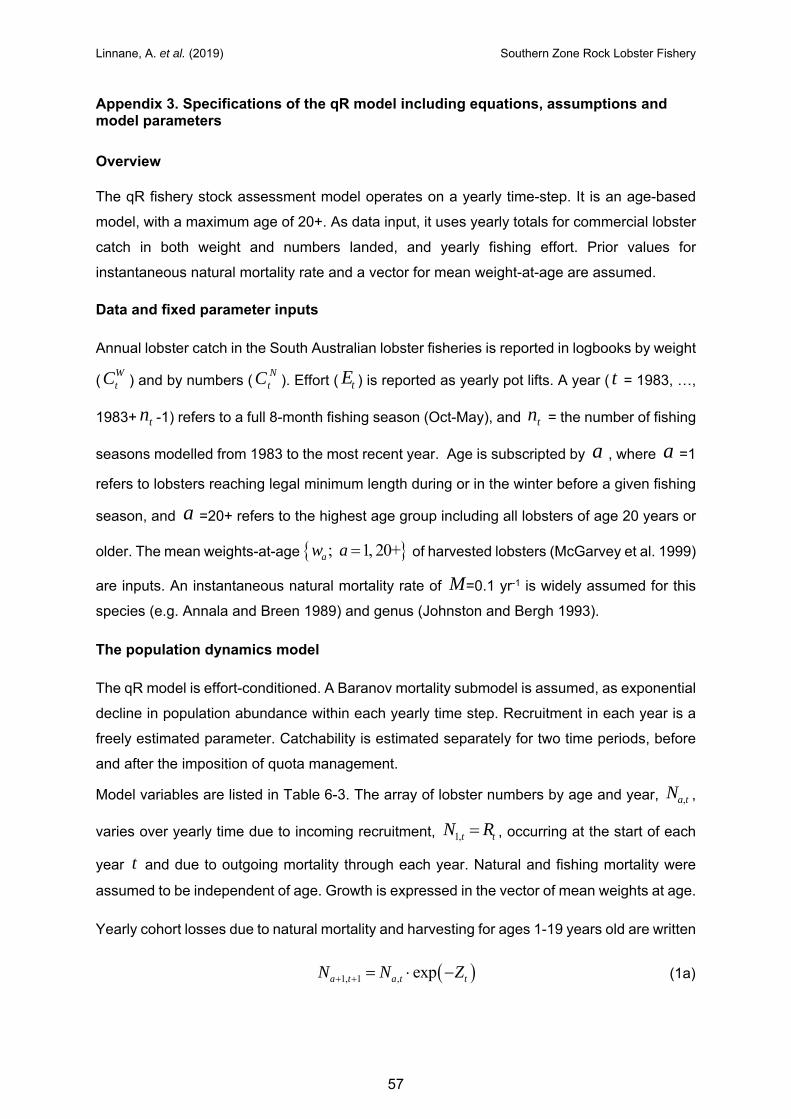
Linnane, A. et al. (2019) Southern Zone Rock Lobster Fishery
57
Appendix 3. Specifications of the qR model including equations, assumptions and model parameters
Overview
The qR fishery stock assessment model operates on a yearly time-step. It is an age-based
model, with a maximum age of 20+. As data input, it uses yearly totals for commercial lobster
catch in both weight and numbers landed, and yearly fishing effort. Prior values for
instantaneous natural mortality rate and a vector for mean weight-at-age are assumed.
Data and fixed parameter inputs
Annual lobster catch in the South Australian lobster fisheries is reported in logbooks by weight
(WtC ) and by numbers (
NtC ). Effort ( tE ) is reported as yearly pot lifts. A year ( t = 1983, …,
1983+ tn -1) refers to a full 8-month fishing season (Oct-May), and tn = the number of fishing
seasons modelled from 1983 to the most recent year. Age is subscripted by a , where a =1
refers to lobsters reaching legal minimum length during or in the winter before a given fishing
season, and a =20+ refers to the highest age group including all lobsters of age 20 years or
older. The mean weights-at-age ; 1, 20+aw a of harvested lobsters (McGarvey et al. 1999)
are inputs. An instantaneous natural mortality rate of M=0.1 yr-1 is widely assumed for this
species (e.g. Annala and Breen 1989) and genus (Johnston and Bergh 1993).
The population dynamics model
The qR model is effort-conditioned. A Baranov mortality submodel is assumed, as exponential
decline in population abundance within each yearly time step. Recruitment in each year is a
freely estimated parameter. Catchability is estimated separately for two time periods, before
and after the imposition of quota management.
Model variables are listed in Table 6-3. The array of lobster numbers by age and year, ,a tN ,
varies over yearly time due to incoming recruitment, 1,t tN R , occurring at the start of each
year t and due to outgoing mortality through each year. Natural and fishing mortality were
assumed to be independent of age. Growth is expressed in the vector of mean weights at age.
Yearly cohort losses due to natural mortality and harvesting for ages 1-19 years old are written
1, 1 , expa t a t tN N Z (1a)
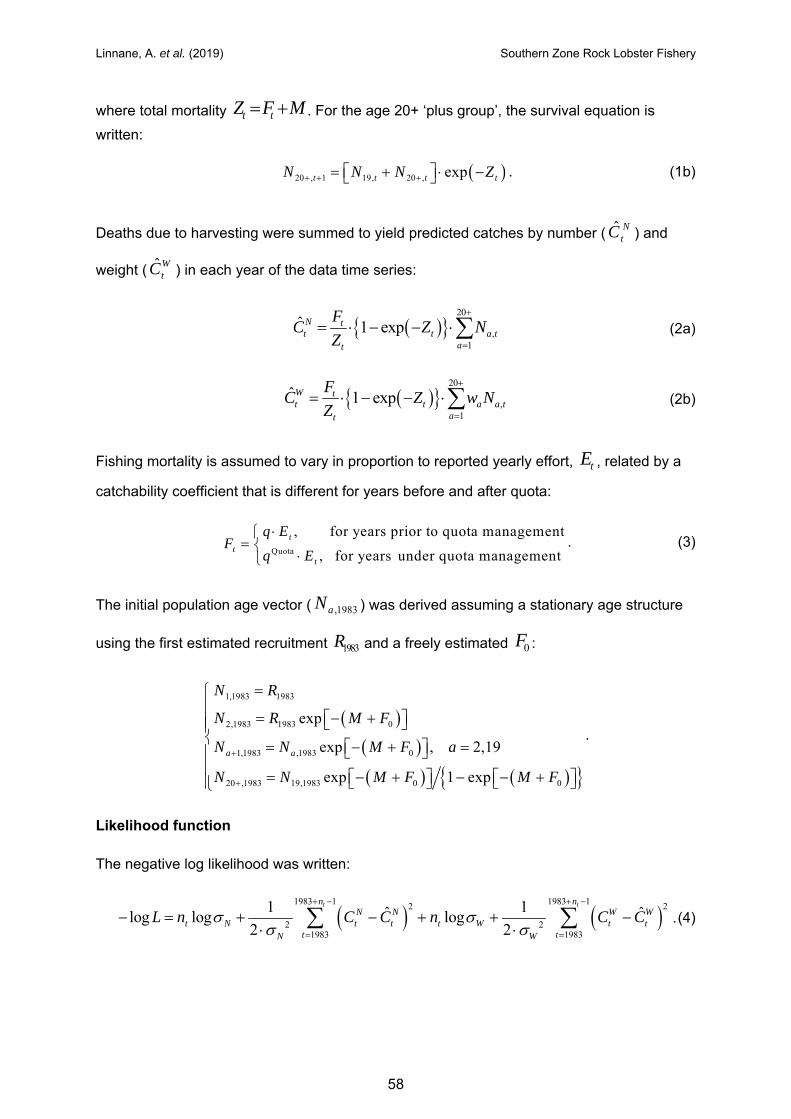
Linnane, A. et al. (2019) Southern Zone Rock Lobster Fishery
58
where total mortality t tZ F M . For the age 20+ ‘plus group’, the survival equation is
written:
20 , 1 19, 20 , expt t t tN N N Z . (1b)
Deaths due to harvesting were summed to yield predicted catches by number ( ˆ NtC ) and
weight ( ˆ WtC ) in each year of the data time series:
20
,1
ˆ 1 expN tt t a t
at
FC Z N
Z
(2a)
20
,1
ˆ 1 expW tt t a a t
at
FC Z w N
Z
(2b)
Fishing mortality is assumed to vary in proportion to reported yearly effort, tE , related by a
catchability coefficient that is different for years before and after quota:
Quota
, for years prior to quota management
, for years under quota management
t
t
t
q EF
q E
. (3)
The initial population age vector ( ,1983aN ) was derived assuming a stationary age structure
using the first estimated recruitment 1983R and a freely estimated 0F :
1,1983 1983
2,1983 1983 0
1,1983 ,1983 0
20 ,1983 19,1983 0 0
exp
exp , 2,19
exp 1 exp
a a
N R
N R M F
N N M F a
N N M F M F
.
Likelihood function
The negative log likelihood was written:
1983 1 1983 12 2
2 21983 1983
1 1ˆ ˆlog log log2 2
t tn nN N W W
t N t t t W t tt tN W
L n C C n C C
. (4)
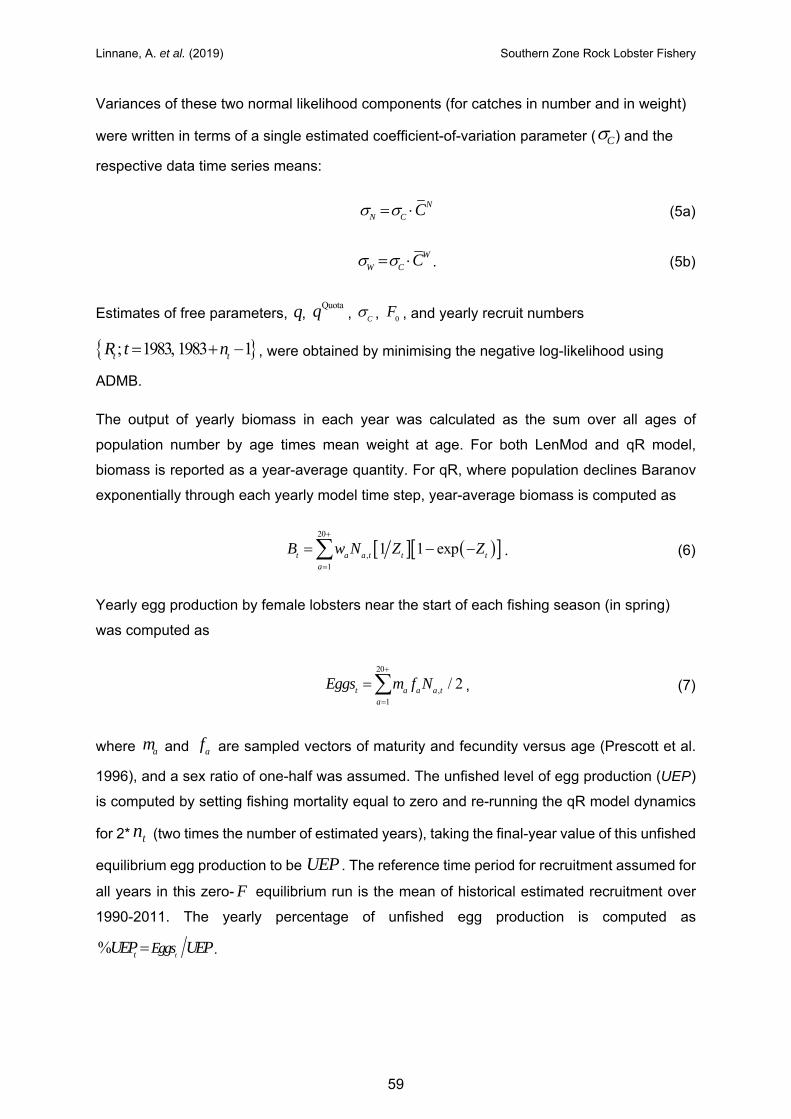
Linnane, A. et al. (2019) Southern Zone Rock Lobster Fishery
59
Variances of these two normal likelihood components (for catches in number and in weight)
were written in terms of a single estimated coefficient-of-variation parameter ( C ) and the
respective data time series means:
N
N C C (5a)
W
W C C . (5b)
Estimates of free parameters, q, Quotaq , C
, 0F , and yearly recruit numbers
; 1983, 1983 1t tR t n , were obtained by minimising the negative log-likelihood using
ADMB.
The output of yearly biomass in each year was calculated as the sum over all ages of
population number by age times mean weight at age. For both LenMod and qR model,
biomass is reported as a year-average quantity. For qR, where population declines Baranov
exponentially through each yearly model time step, year-average biomass is computed as
20
,1
1 1 expt a a t t ta
B w N Z Z
. (6)
Yearly egg production by female lobsters near the start of each fishing season (in spring)
was computed as
20
,1
/ 2t a a a ta
Eggs m f N
, (7)
where am and af are sampled vectors of maturity and fecundity versus age (Prescott et al.
1996), and a sex ratio of one-half was assumed. The unfished level of egg production (UEP)
is computed by setting fishing mortality equal to zero and re-running the qR model dynamics
for 2* tn (two times the number of estimated years), taking the final-year value of this unfished
equilibrium egg production to be UEP . The reference time period for recruitment assumed for
all years in this zero- F equilibrium run is the mean of historical estimated recruitment over
1990-2011. The yearly percentage of unfished egg production is computed as
%tt EggsUEP UEP .
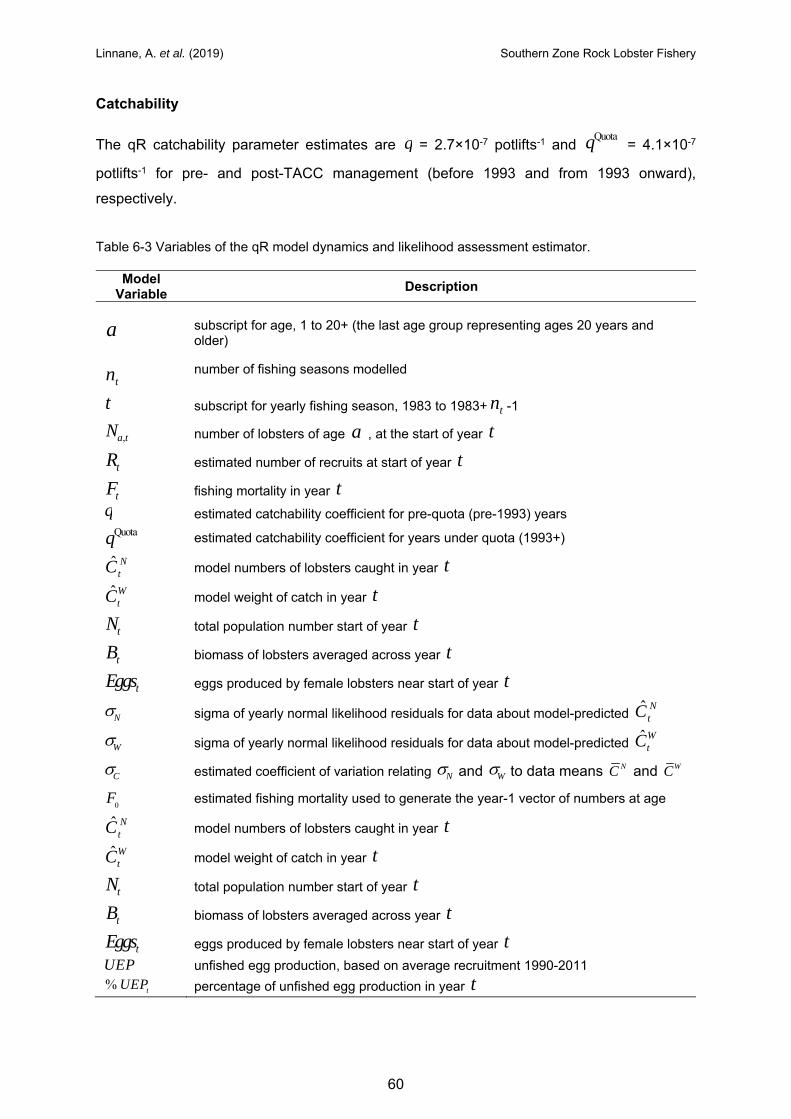
Linnane, A. et al. (2019) Southern Zone Rock Lobster Fishery
60
Catchability
The qR catchability parameter estimates are q = 2.7×10⁻⁷ potlifts-1 and Quotaq = 4.1×10⁻⁷
potlifts-1 for pre- and post-TACC management (before 1993 and from 1993 onward),
respectively.
Table 6-3 Variables of the qR model dynamics and likelihood assessment estimator.
Model Variable
Description
a
subscript for age, 1 to 20+ (the last age group representing ages 20 years and older)
tn number of fishing seasons modelled
t subscript for yearly fishing season, 1983 to 1983+ tn -1
,a tN number of lobsters of age a , at the start of year t
tR estimated number of recruits at start of year t
tF fishing mortality in year t
q estimated catchability coefficient for pre-quota (pre-1993) years Quotaq estimated catchability coefficient for years under quota (1993+)
ˆ NtC model numbers of lobsters caught in year t
ˆWtC model weight of catch in year t
tN total population number start of year t
tB biomass of lobsters averaged across year t
tEggs eggs produced by female lobsters near start of year t
N sigma of yearly normal likelihood residuals for data about model-predicted ˆ NtC
W sigma of yearly normal likelihood residuals for data about model-predicted ˆWtC
C estimated coefficient of variation relating N and W to data means NC and WC
0F estimated fishing mortality used to generate the year-1 vector of numbers at age
ˆ NtC model numbers of lobsters caught in year t
ˆWtC model weight of catch in year t
tN total population number start of year t
tB biomass of lobsters averaged across year t
tEggs eggs produced by female lobsters near start of year t
UEP unfished egg production, based on average recruitment 1990-2011
% tUEP percentage of unfished egg production in year t
Linnane, A. et al. (2019) Southern Zone Rock Lobster Fishery
61
Appendix 4. Specifications of the length-structured model (LenMod) including equations, assumptions and model parameters.
Overview
LenMod is a population dynamics model that operates on a fishing season defined over, for
the Southern Zone Rock Lobster Fishery, T = 9 time-steps (months), starting with the opening
of the fishing season in October ( i =1) to May ( i =8), with a multi-month June-September ( i
=9) time step covering each closed winter season. The duration of the i th time-step ( i =1,..,
T ) in units of years is denoted it . Lobster size-classes are in 4 mm bins, the lowest length
bin defined as 82.5-86.5 mm CL, with 29 bins for males and 21 for females. The model
population array, , ,sy i lN , is the number of lobsters by length bin ( l ), sex (s), fishing season (
y ; hereafter referred to as year), and month ( i ).
The population dynamics model
Basic dynamics
The equation that specifies , ,sy i lN takes account of natural mortality M (instantaneous yearly
rate), fishing mortality, growth, and settlement under the assumption that harvest occurs
before growth and settlement:
, 1, ', , , , ' , , ''
{1 }iMts s s s s sy i l l l i y i l y i l i l y
l
N X N e H R (1)
where
', ,sl l iX is the fraction of the animals of sex s in size-class 'l that grow into size-class l during
time-step i ;
si is the fraction of the settlement that occurs to sex s during time-step i ( 1s
is i
);
sl is the proportion of the settlement of animals of sex s that occurs to size-class l ;
, , 'sy i lH is the exploitation rate on animals of sex s in size-class 'l at the start of time-step i of
year y over all fleets; and
yR is the settlement of animals during year y :
Linnane, A. et al. (2019) Southern Zone Rock Lobster Fishery
62
2
,( ) /2y R y
yR R e (2)
where R is mean settlement, y is the “settlement residual” for year y , ,R y is the
standard deviation of the random fluctuations in settlement for year y :
start( )22
, 2
y yR
R y
R
if
otherwisestarty y (3)
R is the extent of variation in settlement for years after starty , and determines the extent
to which ,R y changes with time ( 1 means that the settlement will be closer to the mean
settlement for the years before starty ).
AvgTotLegyB is the year-average legal-sized biomass during year y , averaging across T
months, using mid-month population numbers (after half-month natural survival), where s
lW
is the weight of a lobster of size l and sex s:
/2, ,
1
1i
TMtAvgTotLeg s s
y l y i li s l LML
B W e NT
. (4)
Egg production is given by the following equation for the case in which spawning is assumed
to occur at the start of time-step mi of year y :
f, ,sy l l y i l
l
Eggs m f N (5)
where lm and lf are previously estimated vectors of maturity and fecundity versus length for
females in size-class l , si is the time-step in which spawning occurs ( si = month 1), and f, ,my i lN
is the total number of females. The unfished level of egg production is computed by setting all
estimated parameters to their values (except recruitment) from the stock assessment run,
setting catches to zero, and re-running LenMod for 40 years, sufficient to achieve equilibrium.
Recruitment for this zero-catch run is set to the average over the years 1990-2011. The % of
unfished egg production in each year is computed as the ratio of yEggs divided by the final
zero-catch equilibrium level of egg production.
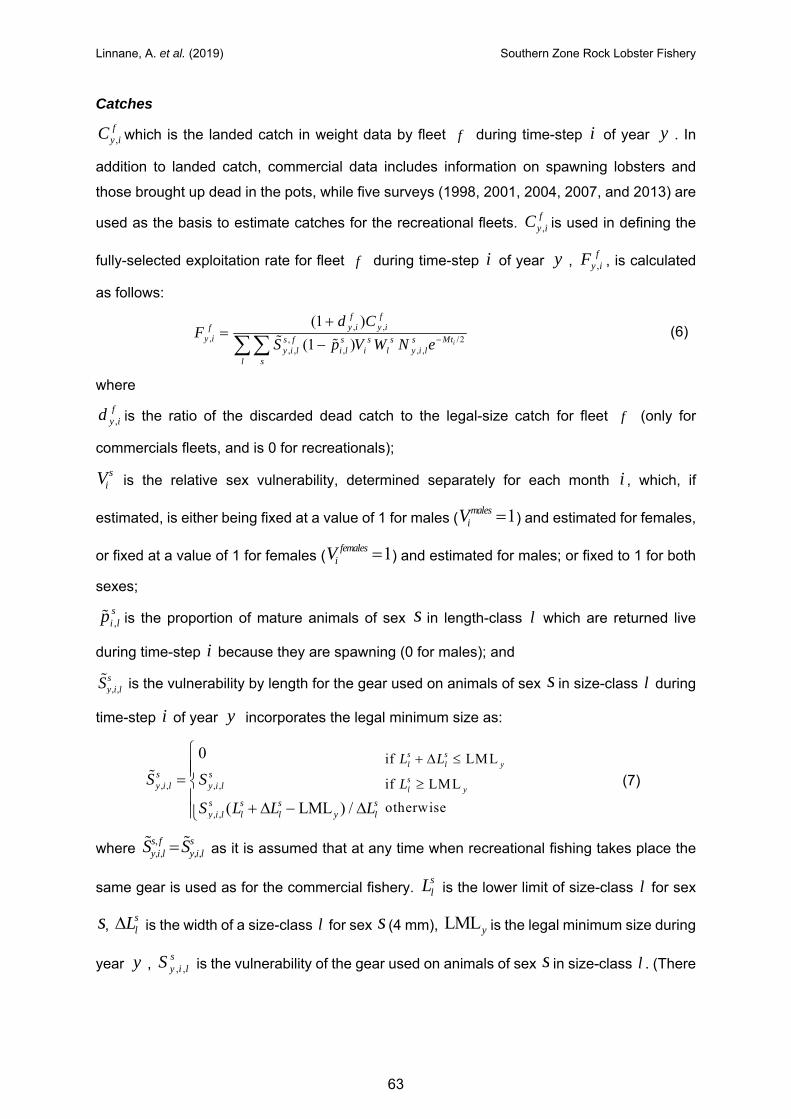
Linnane, A. et al. (2019) Southern Zone Rock Lobster Fishery
63
Catches
,fy iC which is the landed catch in weight data by fleet f during time-step i of year y . In
addition to landed catch, commercial data includes information on spawning lobsters and
those brought up dead in the pots, while five surveys (1998, 2001, 2004, 2007, and 2013) are
used as the basis to estimate catches for the recreational fleets. ,fy iC is used in defining the
fully-selected exploitation rate for fleet f during time-step i of year y , ,f
y iF , is calculated
as follows:
, ,, /2,
, , , , ,
(1 )
(1 ) i
f fy i y if
y i Mts f s s s sy i l i l i l y i l
l s
d CF
S p V W N e
(6)
where
,fy id is the ratio of the discarded dead catch to the legal-size catch for fleet f (only for
commercials fleets, and is 0 for recreationals);
siV is the relative sex vulnerability, determined separately for each month i , which, if
estimated, is either being fixed at a value of 1 for males ( 1malesiV ) and estimated for females,
or fixed at a value of 1 for females ( 1femalesiV ) and estimated for males; or fixed to 1 for both
sexes;
,si lp is the proportion of mature animals of sex s in length-class l which are returned live
during time-step i because they are spawning (0 for males); and
, ,sy i lS is the vulnerability by length for the gear used on animals of sex s in size-class l during
time-step i of year y incorporates the legal minimum size as:
, , , ,
, ,
0
( LML ) /
s sy i l y i l
s s s sy i l l l y l
S S
S L L L
if LML
if LML
otherwise
s sl l y
sl y
L L
L
(7)
where ,, , , ,
s f sy i l y i lS S as it is assumed that at any time when recreational fishing takes place the
same gear is used as for the commercial fishery. slL is the lower limit of size-class l for sex
s, slL is the width of a size-class l for sex s (4 mm), LMLy is the legal minimum size during
year y , , ,sy i lS is the vulnerability of the gear used on animals of sex s in size-class l . (There
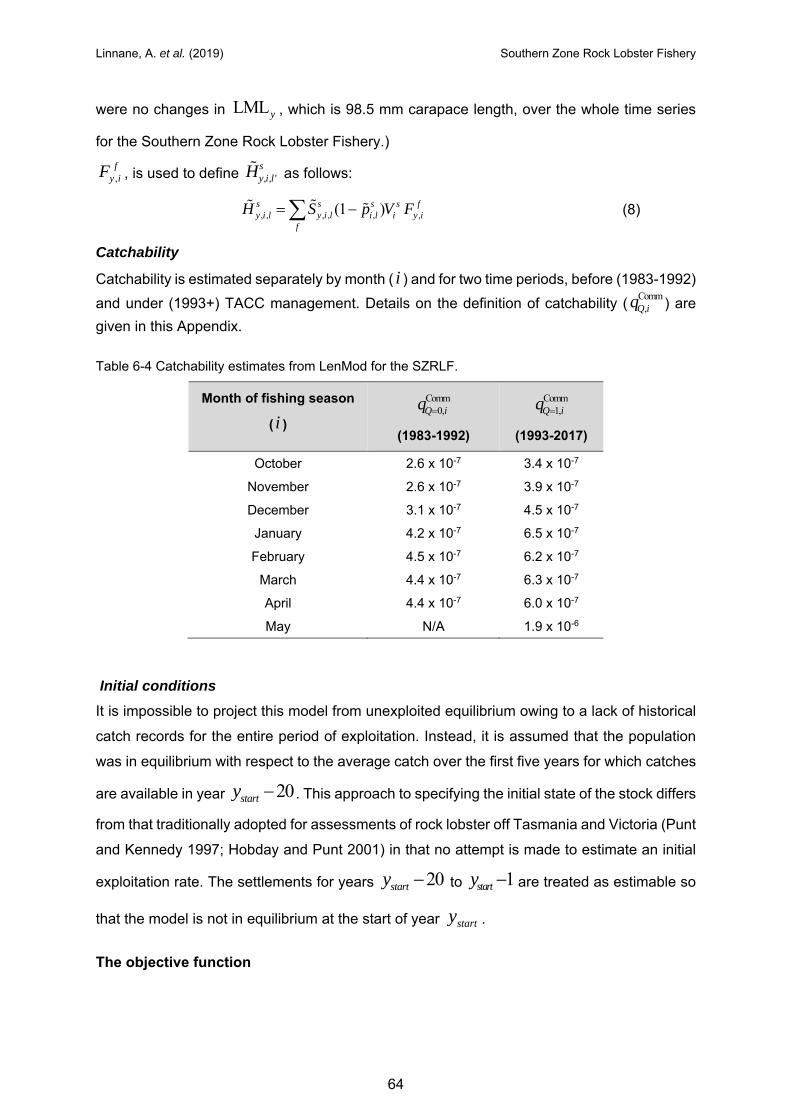
Linnane, A. et al. (2019) Southern Zone Rock Lobster Fishery
64
were no changes in LMLy , which is 98.5 mm carapace length, over the whole time series
for the Southern Zone Rock Lobster Fishery.)
,f
y iF , is used to define , , 'sy i lH as follows:
, , , , , ,(1 )s s s s fy i l y i l i l i y i
f
H S p V F (8)
Catchability
Catchability is estimated separately by month ( i ) and for two time periods, before (1983-1992)
and under (1993+) TACC management. Details on the definition of catchability (Comm
,Q iq ) are
given in this Appendix.
Table 6-4 Catchability estimates from LenMod for the SZRLF.
Month of fishing season
( i )
Comm0,Q iq
(1983-1992)
Comm1,Q iq
(1993-2017)
October 2.6 x 10⁻⁷ 3.4 x 10⁻⁷
November 2.6 x 10⁻⁷ 3.9 x 10⁻⁷
December 3.1 x 10⁻⁷ 4.5 x 10⁻⁷
January 4.2 x 10⁻⁷ 6.5 x 10⁻⁷
February 4.5 x 10⁻⁷ 6.2 x 10⁻⁷
March 4.4 x 10⁻⁷ 6.3 x 10⁻⁷
April 4.4 x 10⁻⁷ 6.0 x 10⁻⁷
May N/A 1.9 x 10⁻⁶
Initial conditions
It is impossible to project this model from unexploited equilibrium owing to a lack of historical
catch records for the entire period of exploitation. Instead, it is assumed that the population
was in equilibrium with respect to the average catch over the first five years for which catches
are available in year 20starty . This approach to specifying the initial state of the stock differs
from that traditionally adopted for assessments of rock lobster off Tasmania and Victoria (Punt
and Kennedy 1997; Hobday and Punt 2001) in that no attempt is made to estimate an initial
exploitation rate. The settlements for years 20starty to 1starty are treated as estimable so
that the model is not in equilibrium at the start of year starty .
The objective function
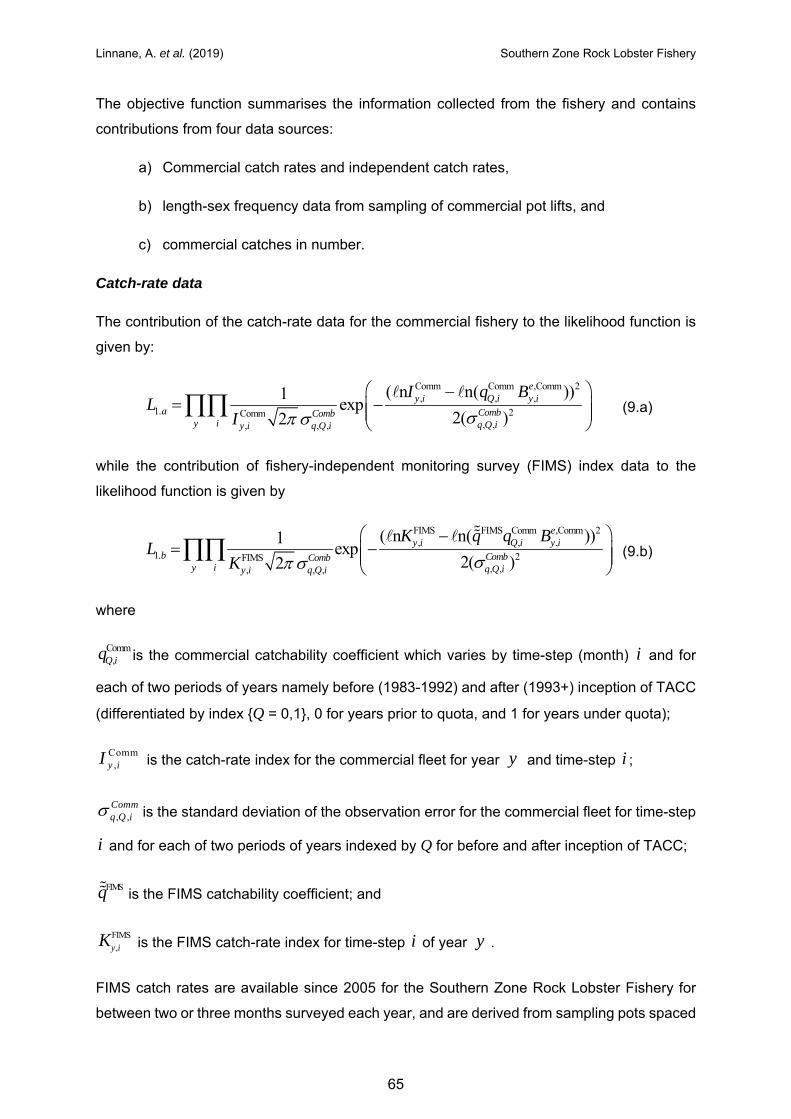
Linnane, A. et al. (2019) Southern Zone Rock Lobster Fishery
65
The objective function summarises the information collected from the fishery and contains
contributions from four data sources:
a) Commercial catch rates and independent catch rates,
b) length-sex frequency data from sampling of commercial pot lifts, and
c) commercial catches in number.
Catch-rate data
The contribution of the catch-rate data for the commercial fishery to the likelihood function is
given by:
Comm Comm ,Comm 2, , ,
1. 2Comm, ,, , ,
( n n( ))1exp
2( )2
ey i Q i y i
a CombComby i q Q iy i q Q i
I q BL
I
(9.a)
while the contribution of fishery-independent monitoring survey (FIMS) index data to the
likelihood function is given by
FIMS FIMS Comm ,Comm 2, , ,
1. 2FIMS, ,, , ,
( n n( ))1exp
2( )2
ey i Q i y i
b CombComby i q Q iy i q Q i
K q q BL
K
(9.b)
where
Comm,Q iq is the commercial catchability coefficient which varies by time-step (month) i and for
each of two periods of years namely before (1983-1992) and after (1993+) inception of TACC
(differentiated by index {Q = 0,1}, 0 for years prior to quota, and 1 for years under quota);
Comm,y iI is the catch-rate index for the commercial fleet for year y and time-step i ;
, ,Commq Q i is the standard deviation of the observation error for the commercial fleet for time-step
i and for each of two periods of years indexed by Q for before and after inception of TACC;
FIMSq is the FIMS catchability coefficient; and
FIMS
,y iK is the FIMS catch-rate index for time-step i of year y .
FIMS catch rates are available since 2005 for the Southern Zone Rock Lobster Fishery for
between two or three months surveyed each year, and are derived from sampling pots spaced
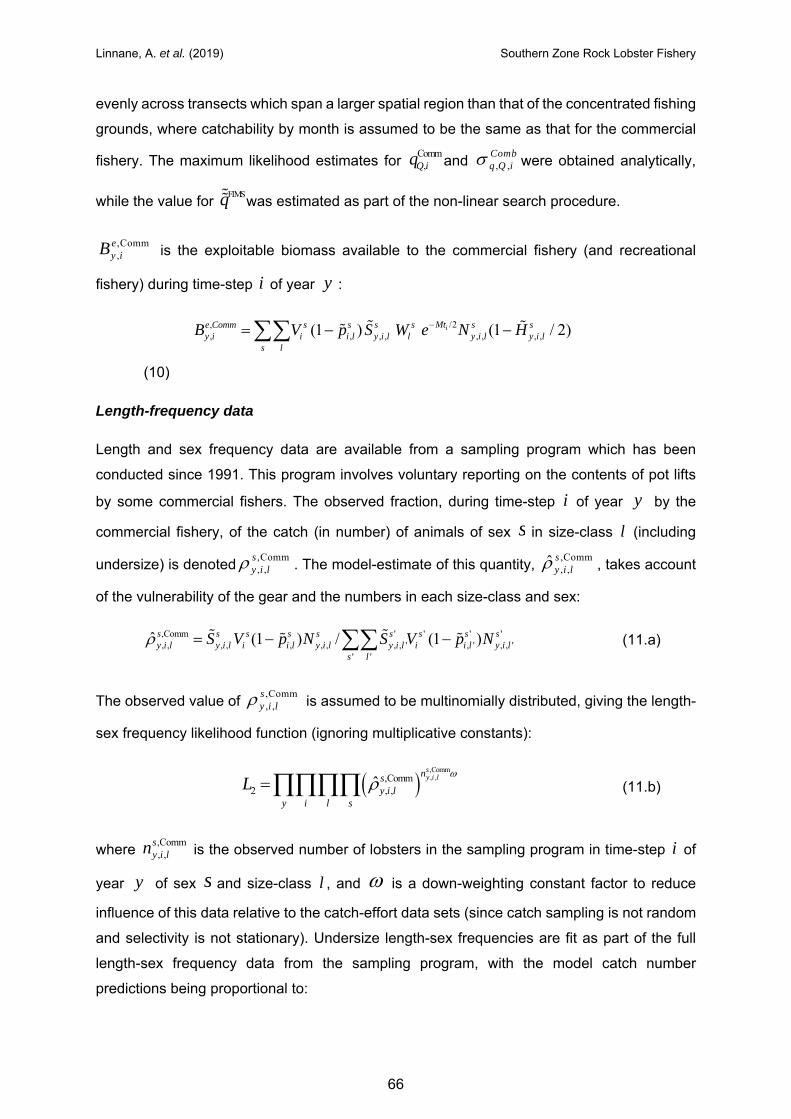
Linnane, A. et al. (2019) Southern Zone Rock Lobster Fishery
66
evenly across transects which span a larger spatial region than that of the concentrated fishing
grounds, where catchability by month is assumed to be the same as that for the commercial
fishery. The maximum likelihood estimates for Comm
,Q iq and , ,Combq Q i were obtained analytically,
while the value for FIMSq was estimated as part of the non-linear search procedure.
,Comm,
ey iB is the exploitable biomass available to the commercial fishery (and recreational
fishery) during time-step i of year y :
/2,, , , , , , , ,(1 ) (1 / 2)iMte Comm s s s s s s
y i i i l y i l l y i l y i ls l
B V p S W e N H
(10)
Length-frequency data
Length and sex frequency data are available from a sampling program which has been
conducted since 1991. This program involves voluntary reporting on the contents of pot lifts
by some commercial fishers. The observed fraction, during time-step i of year y by the
commercial fishery, of the catch (in number) of animals of sex s in size-class l (including
undersize) is denoted,Comm, ,
sy i l . The model-estimate of this quantity,
,Comm, ,
ˆ sy i l , takes account
of the vulnerability of the gear and the numbers in each size-class and sex:
,Comm ' ' ' ', , , , , , , , , ' , ' , , '
' '
ˆ (1 ) / (1 )s s s s s s s s sy i l y i l i i l y i l y i l i i l y i l
s l
S V p N S V p N (11.a)
The observed value of ,Comm, ,
sy i l is assumed to be multinomially distributed, giving the length-
sex frequency likelihood function (ignoring multiplicative constants):
,Comm, ,,Comm
2 , ,ˆsy i lns
y i ly i l s
L
(11.b)
where ,Comm, ,
sy i ln is the observed number of lobsters in the sampling program in time-step i of
year y of sex s and size-class l , and is a down-weighting constant factor to reduce
influence of this data relative to the catch-effort data sets (since catch sampling is not random
and selectivity is not stationary). Undersize length-sex frequencies are fit as part of the full
length-sex frequency data from the sampling program, with the model catch number
predictions being proportional to:
Linnane, A. et al. (2019) Southern Zone Rock Lobster Fishery
67
/2
, , , , ,(1 ) iMts s s sy i l i i l y i lS V p N e (12.a)
The length-sex frequencies for spawners are also assumed to be multinomial samples, except
the model catch number predictions being proportional to:
/2
, , , , ,iMts s s s
y i l i i l y i lS V p N e (12.b)
Catch-in-number
The commercial catches in number, ,Ny iC , are assumed to be lognormally distributed. The
contribution of these data to the likelihood function is therefore given by:
,Comm 2, ,
3 2,
ˆ( n n )1exp
22
N Ny i y i
Nf y i Ny i N
C CL
C
(13)
where /2 Comm, , , , , , ,
ˆ (1 ) iMtN s s s sy i i y i l i l y i l y i
s l
C V S p N e F and CommN is the standard deviation of
the observation error in catch numbers, assumed to apply over all time. The spawner discards
are also fitted under the assumption that they are lognormally distributed.
Parameter estimation
Table 6-5 lists the parameters of the population dynamics model and the objective function,
and highlights those parameters assumed to be known exactly and those parameters whose
values are estimated by fitting the model to the data. Vulnerability-at-length for specified
combinations of months is estimated, separately for each sex, by a logistic function of length.
Sex vulnerability by time-step is estimated. Female spawner fractions are based on auxiliary
information.
A constraint is placed on the settlement residuals to stabilise the estimation and prevent
confounding with mean recruitment. The following term was included in the objective function:
2 2,0.5 ( ) / ( ).y R y
y
P (14)
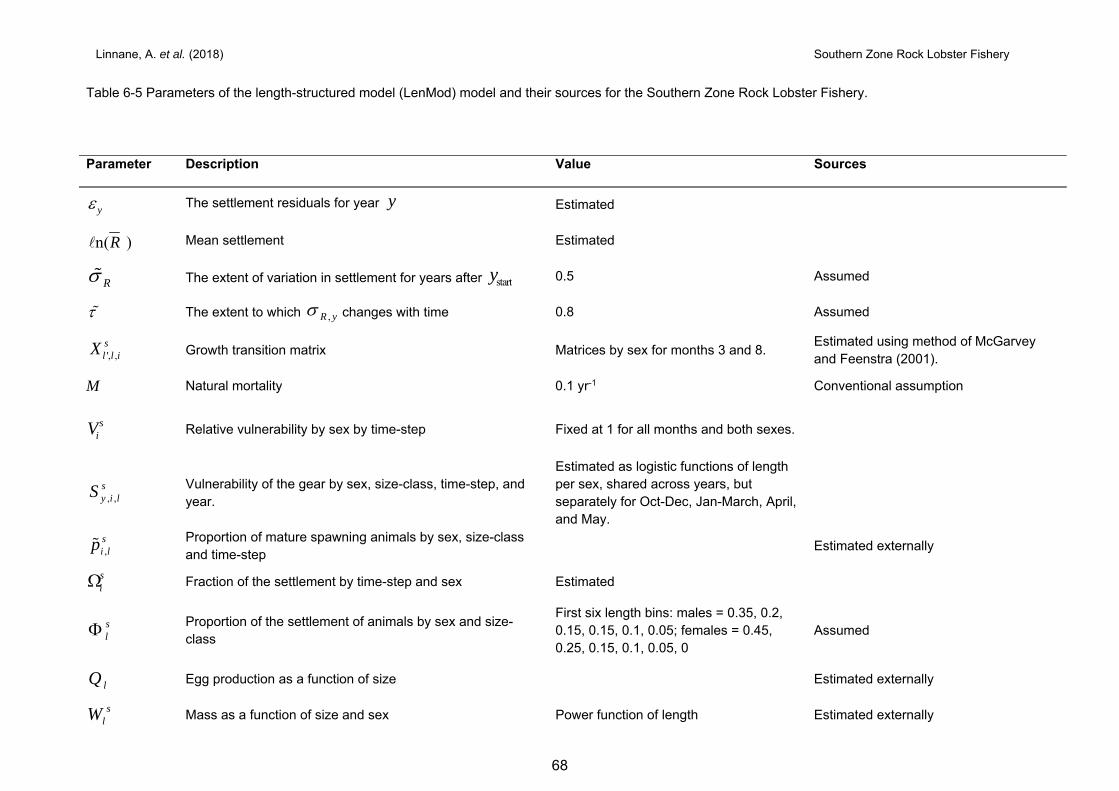
Linnane, A. et al. (2018) Southern Zone Rock Lobster Fishery
68
Table 6-5 Parameters of the length-structured model (LenMod) model and their sources for the Southern Zone Rock Lobster Fishery.
Parameter Description Value Sources
y The settlement residuals for year y Estimated
n( )R Mean settlement Estimated
R
The extent of variation in settlement for years after starty 0.5 Assumed
The extent to which ,R y changes with time 0.8 Assumed
', ,sl l iX Growth transition matrix Matrices by sex for months 3 and 8.
Estimated using method of McGarvey and Feenstra (2001).
M Natural mortality 0.1 yr-1 Conventional assumption
siV Relative vulnerability by sex by time-step Fixed at 1 for all months and both sexes.
, ,sy i lS
Vulnerability of the gear by sex, size-class, time-step, and year.
Estimated as logistic functions of length per sex, shared across years, but separately for Oct-Dec, Jan-March, April, and May.
,si lp
Proportion of mature spawning animals by sex, size-class and time-step
Estimated externally
si Fraction of the settlement by time-step and sex Estimated
sl
Proportion of the settlement of animals by sex and size-class
First six length bins: males = 0.35, 0.2, 0.15, 0.15, 0.1, 0.05; females = 0.45, 0.25, 0.15, 0.1, 0.05, 0
Assumed
lQ Egg production as a function of size Estimated externally
slW Mass as a function of size and sex Power function of length Estimated externally
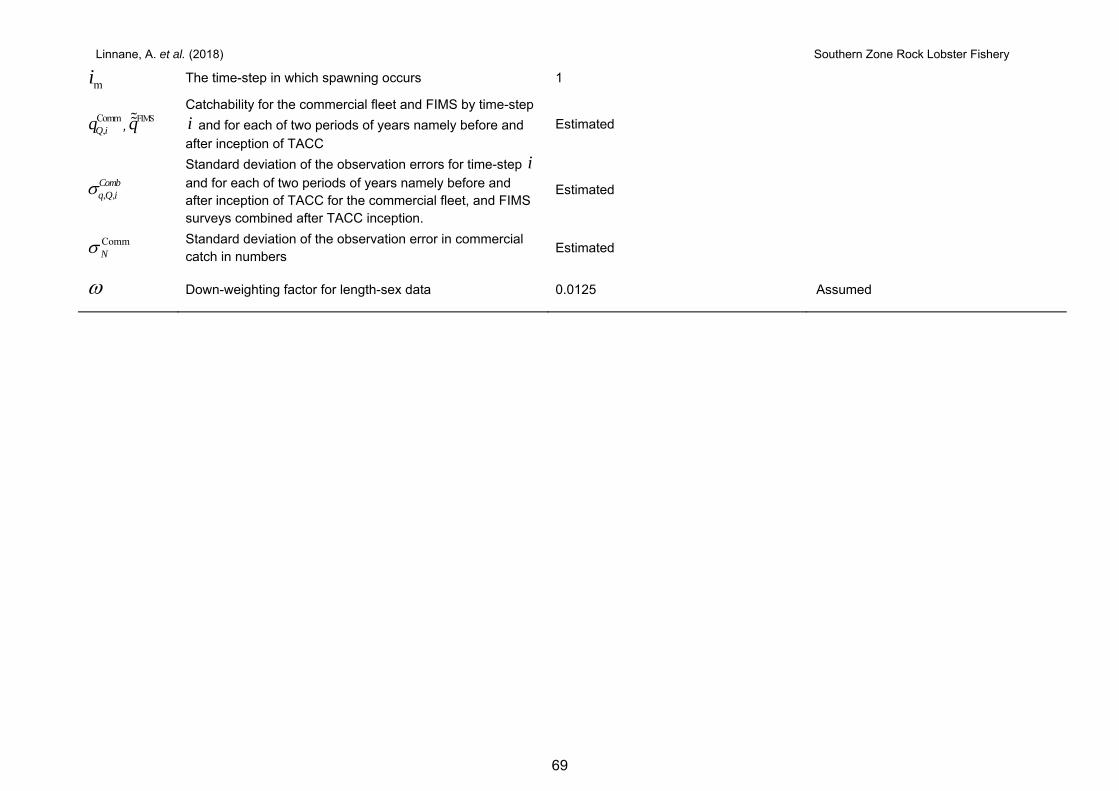
Linnane, A. et al. (2018) Southern Zone Rock Lobster Fishery
69
mi The time-step in which spawning occurs 1
Comm,Q iq ,
FIMSq
Catchability for the commercial fleet and FIMS by time-step
i and for each of two periods of years namely before and
after inception of TACC
Estimated
, ,Combq Q i
Standard deviation of the observation errors for time-step i
and for each of two periods of years namely before and after inception of TACC for the commercial fleet, and FIMS surveys combined after TACC inception.
Estimated
CommN
Standard deviation of the observation error in commercial catch in numbers
Estimated
Down-weighting factor for length-sex data 0.0125 Assumed
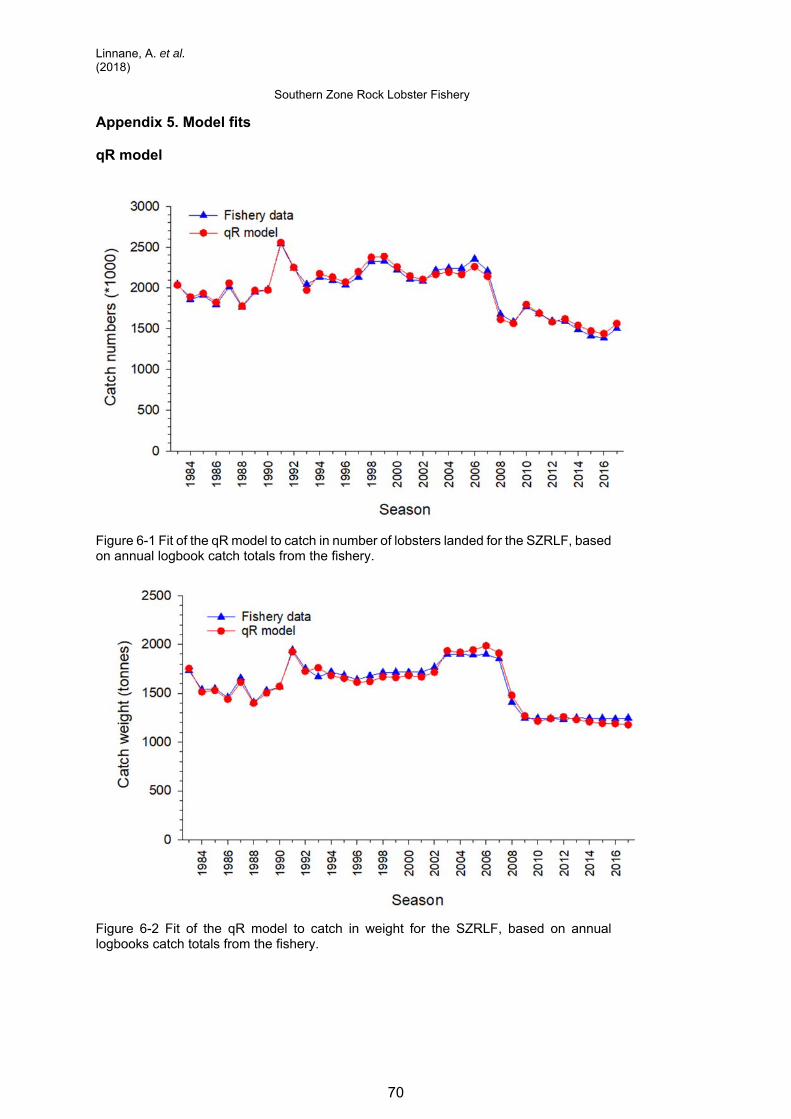
Linnane, A. et al. (2018) Southern Zone Rock Lobster Fishery
70
Appendix 5. Model fits
qR model
Figure 6-1 Fit of the qR model to catch in number of lobsters landed for the SZRLF, based on annual logbook catch totals from the fishery.
Figure 6-2 Fit of the qR model to catch in weight for the SZRLF, based on annual logbooks catch totals from the fishery.
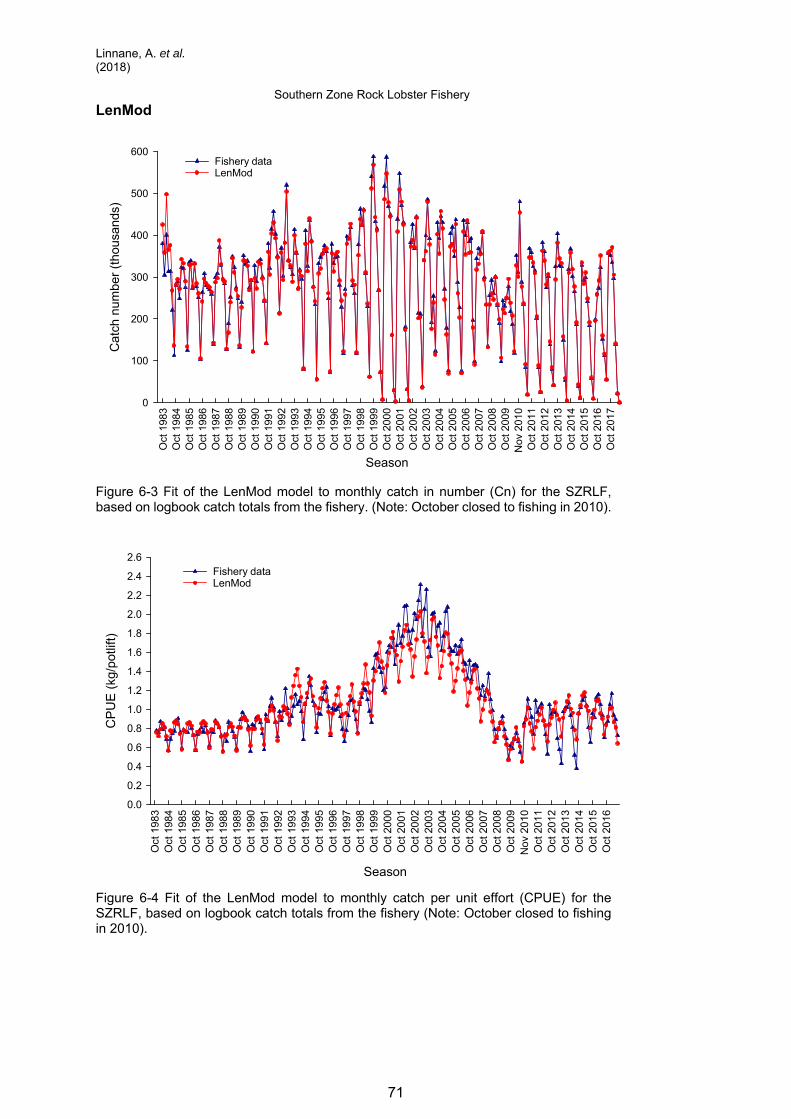
Linnane, A. et al. (2018) Southern Zone Rock Lobster Fishery
71
LenMod
Figure 6-3 Fit of the LenMod model to monthly catch in number (Cn) for the SZRLF, based on logbook catch totals from the fishery. (Note: October closed to fishing in 2010).
Figure 6-4 Fit of the LenMod model to monthly catch per unit effort (CPUE) for the SZRLF, based on logbook catch totals from the fishery (Note: October closed to fishing in 2010).
Season
Oct
198
3O
ct 1
984
Oct
198
5O
ct 1
986
Oct
198
7O
ct 1
988
Oct
198
9O
ct 1
990
Oct
199
1O
ct 1
992
Oct
199
3O
ct 1
994
Oct
199
5O
ct 1
996
Oct
199
7O
ct 1
998
Oct
199
9O
ct 2
000
Oct
200
1O
ct 2
002
Oct
200
3O
ct 2
004
Oct
200
5O
ct 2
006
Oct
200
7O
ct 2
008
Oct
200
9N
ov 2
010
Oct
201
1O
ct 2
012
Oct
201
3O
ct 2
014
Oct
201
5O
ct 2
016
Oct
201
7
Cat
ch n
umbe
r (t
hous
ands
)
0
100
200
300
400
500
600Fishery dataLenMod
Season
Oct
198
3O
ct 1
984
Oct
198
5O
ct 1
986
Oct
198
7O
ct 1
988
Oct
198
9O
ct 1
990
Oct
199
1O
ct 1
992
Oct
199
3O
ct 1
994
Oct
199
5O
ct 1
996
Oct
199
7O
ct 1
998
Oct
199
9O
ct 2
000
Oct
200
1O
ct 2
002
Oct
200
3O
ct 2
004
Oct
200
5O
ct 2
006
Oct
200
7O
ct 2
008
Oct
200
9N
ov 2
010
Oct
201
1O
ct 2
012
Oct
201
3O
ct 2
014
Oct
201
5O
ct 2
016
CP
UE
(kg
/pot
lift)
0.0
0.2
0.4
0.6
0.8
1.0
1.2
1.4
1.6
1.8
2.0
2.2
2.4
2.6Fishery dataLenMod
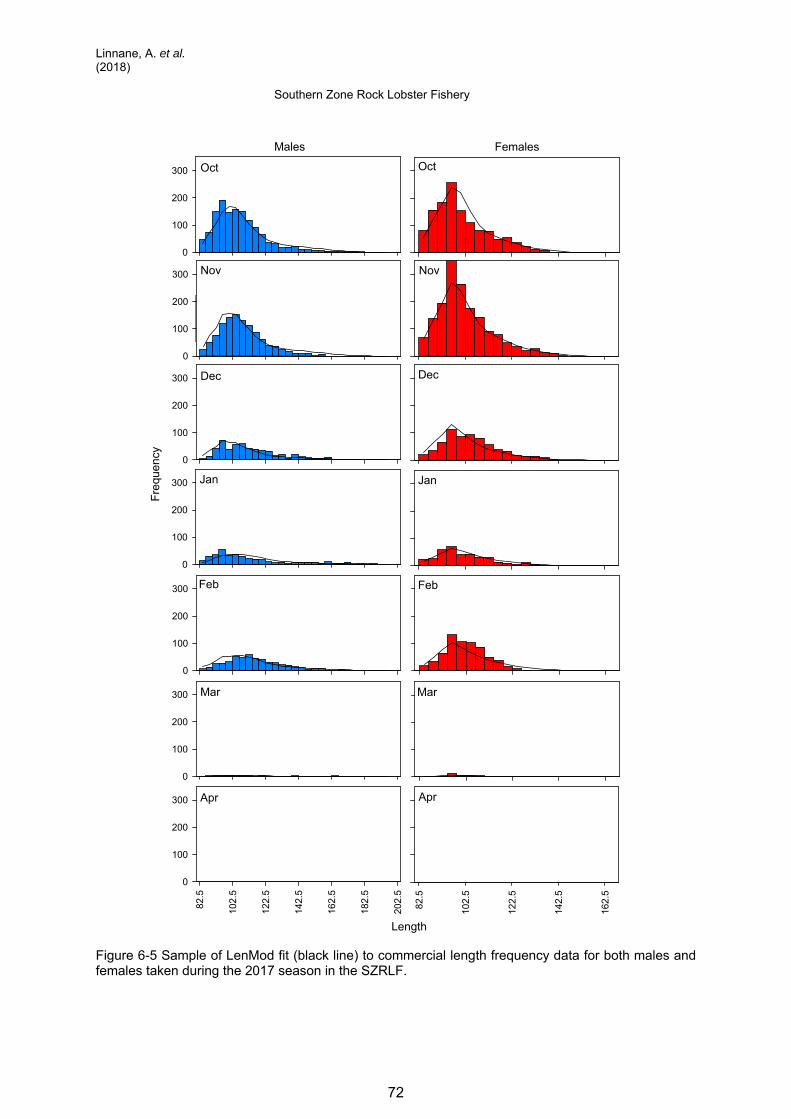
Linnane, A. et al. (2018) Southern Zone Rock Lobster Fishery
72
Figure 6-5 Sample of LenMod fit (black line) to commercial length frequency data for both males and females taken during the 2017 season in the SZRLF.
0
100
200
300
Data-MALES Plot 1 ZeroLength-bin-MALES vs Model-MALES
Length
82.5
102.
5
122.
5
142.
5
162.
5
182.
5
202.
5
0
100
200
300
0
100
200
300
0
100
200
300
Fre
quen
cy
0
100
200
300
0
100
200
300
0
100
200
300
Males
Nov
Dec
Jan
Feb
Mar
Apr
Data-FEMS Length-bin-FEMS vs Model-FEMS
82.5
102.
5
122.
5
142.
5
162.
5
Females
Nov
Dec
Jan
Feb
Mar
Apr
Oct Oct


