Embed Size (px)
Citation preview
RESEARCHSocioeconomic Drivers of Deforestation in theNorthern Ecuadorian Amazon
CARLOS F. MENA*
Department of Geography and Carolina Population CenterUniversity of North Carolina at Chapel Hill321 Saunders Hall, CB# 3220Chapel Hill, North Carolina 27599, USA
RICHARD E. BILSBORROW
Department of Biostatistics and Carolina Population CenterUniversity of North Carolina at Chapel HillChapel Hill, North Carolina 27599, USA
MICHAEL E. McCLAIN
Environmental Studies DepartmentFlorida International UniversityMiami, Florida, USA
ABSTRACT / Investigations of land use/land cover (LULC)change and forest management are limited by a lack ofunderstanding of how socioeconomic factors affect landuse. This lack also constrains the predictions of futuredeforestation, which is especially important in the Amazonbasin, where large tracts of natural forest are being con-verted to managed uses. Research presented in this articlewas conducted to address this lack of understanding. Its
objectives are (a) to quantify deforestation in the NorthernEcuadorian Amazon (NEA) during the periods 1986–1996and 1996–2002; and (b) to determine the significance andmagnitude of the effects of socioeconomic factors ondeforestation rates at both the parroquia (parish) and finca(farm) levels. Annual deforestation rates were quantified viasatellite image processing and geographic information sys-tems. Linear spatial lag regression analyses were then usedto explore relationships between socioeconomic factors anddeforestation. Socioeconomic factors were obtained, at thefinca level, from a detailed household survey carried out in1990 and 1999, and at the parroquia level from data in the1990 and 2001 Ecuadorian censuses of population. Wefound that the average annual deforestation rate was 2.5%and 1.8%/year for 1986–1996 and 1996–2002, respectively.At the parroquia level, variables representing demographicfactors (i.e., population density) and accessibility factors(i.e., road density), among others, were found to be signifi-cantly related to deforestation. At the farm level, the factorsrelated to deforestation were household size, distance byroad to main cities, education, and hired labor. The findingsof this research demonstrate both the severity of deforesta-tion in the Northern Ecuadorian Amazon and the array offactors affecting deforestation in the tropics.
Global deforestation is recognized as one of thecore problems of global environmental change (Cassel-Gintz and Petschel-Hels 2001; Klepeis and Turner II2001). Recent data illustrate the rapid rate of defores-tation. According to the United Nations Food andAgriculture Organization (FAO), 93,900 km2 of forestwere cleared per year during the 1990s, with annualrates of forest loss (positive for all continents withtropical forests): Africa 0.8%, Asia 0.1%, Oceania 0.2%,North and Central America 0.1%, and South America0.4% (Food and Agriculture Organization 2001). Spe-cific locations in Latin America showed annual defor-
estation rates much higher than the continental rates,such as Tuxtlas (Mexico) at 4.3%/year between 1976and 1986 (Dirzo 1992); the Western Amazon (Colom-bia, Ecuador, and Peru) at 0.65%/year between 1986and 1996 (Sierra 2000); and the Andean foothills ofColombia at 4.4%/year between 1938 and 1988 (Vinaand Cavelier 1999). Among the countries of SouthAmerica, Ecuador had the highest deforestation ratebetween 1990 and 2000, averaging 1.2%/year (Foodand Agriculture Organization 2001). The FAO esti-mated overall deforestation in Ecuador to be 2380km2/year from 1980 to 1990 and 1370 km2/year from1990 to 2000. Deforestation in Ecuador is concentratedalong two fronts: the Choco (northwestern coast, inEsmeraldas Province) and the Northeastern Amazo-nian region (Sierra 2000).
This article draws upon population environmenttheory in frontier settings to investigate the factors thatcontribute to deforestation in the Northern Ecuadori-an Amazon (NEA). We find that single-factor theoret-
KEY WORDS: Amazon; Ecuador; Deforestation; Population-environ-ment; Colonization; Socioeconomic drivers; Land use/land cover (LULC)
Published online March 16, 2006.
*Author to whom correspondence should be addressed; email: mena
@email.unc.edu
Environmental Management Vol. 37, No. 6, pp. 802–815 ª 2006 Springer Science+Business Media, Inc.
DOI: 10.1007/s00267-003-0230-z
ical approaches to explain deforestation in the NEApresent incomplete pictures of the deforestation pro-cess. In a recent meta-review of case studies, Geist andLambin (2001) conclude that tropical deforestation isdetermined by different combinations of proximatecauses and underlying driving forces that characterizesocial, political, economic, geographical, and historicalcircumstances. The methodological approach used inthis article includes (1) the quantification of thedeforestation process between 1986 and 2002 inthe NEA using classified satellite imagery; and (2) theanalysis of the demographic, socioeconomic, andbiophysical drivers of the deforestation by linkingdeforestation rates to household survey and censusdata to create statistical spatial models of deforestationfor the periods 1986–1996 and 1996–2002. For thisanalysis, two areal units are used: (1) parroquia (par-ish)—the smallest political unit in Ecuador; and (2)finca (farm)—the original farms of approximately 0.50km2, granted to the initial settlers arriving in the Ecu-adorian Amazon in the 1970s and 1980s and prior tothe subdivisions of the 1990s.
The results of this research show the importance ofdemographic and socioeconomic forces as drivers ofdeforestation. The research also shows some of thepredictors of deforestation function at different spatialscales. This study serves as an exploratory analysis ofthe complex problem of deforestation in the tropicsand provides a basis for future modeling of land useand land cover (LULC) dynamics in tropical forests.
The Northern Ecuadorian Amazon (NEA)
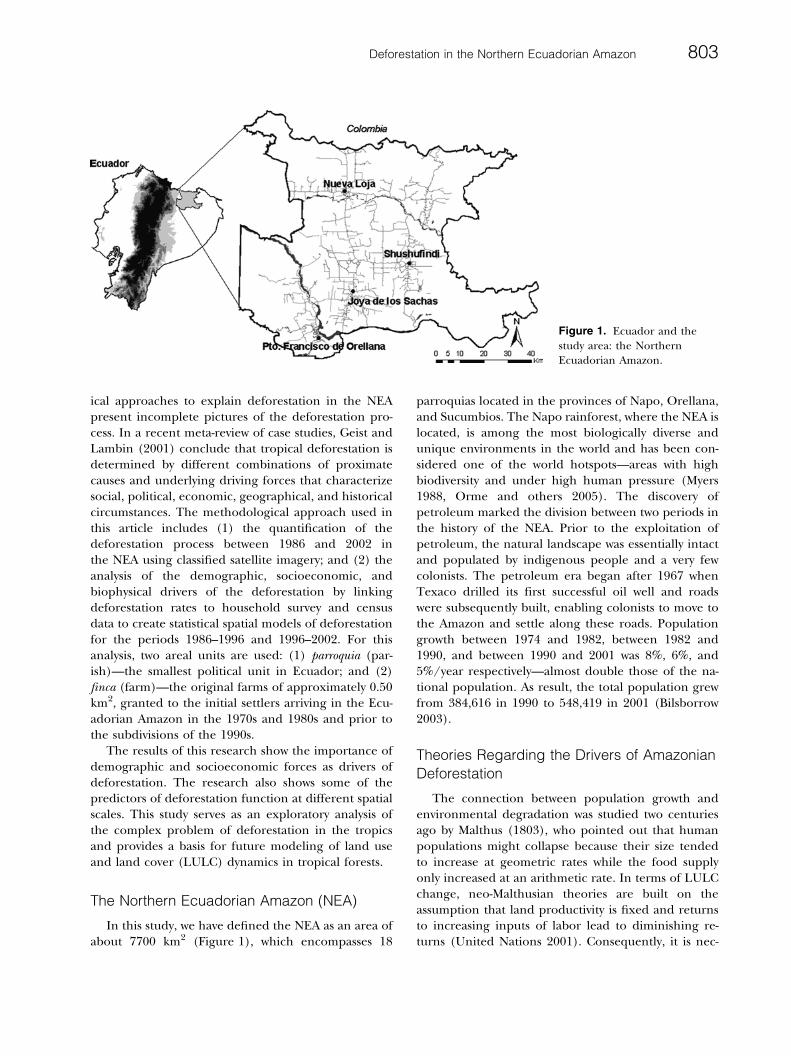
In this study, we have defined the NEA as an area ofabout 7700 km2 (Figure 1), which encompasses 18
parroquias located in the provinces of Napo, Orellana,and Sucumbios. The Napo rainforest, where the NEA islocated, is among the most biologically diverse andunique environments in the world and has been con-sidered one of the world hotspots—areas with highbiodiversity and under high human pressure (Myers1988, Orme and others 2005). The discovery ofpetroleum marked the division between two periods inthe history of the NEA. Prior to the exploitation ofpetroleum, the natural landscape was essentially intactand populated by indigenous people and a very fewcolonists. The petroleum era began after 1967 whenTexaco drilled its first successful oil well and roadswere subsequently built, enabling colonists to move tothe Amazon and settle along these roads. Populationgrowth between 1974 and 1982, between 1982 and1990, and between 1990 and 2001 was 8%, 6%, and5%/year respectively—almost double those of the na-tional population. As result, the total population grewfrom 384,616 in 1990 to 548,419 in 2001 (Bilsborrow2003).
Theories Regarding the Drivers of AmazonianDeforestation
The connection between population growth andenvironmental degradation was studied two centuriesago by Malthus (1803), who pointed out that humanpopulations might collapse because their size tendedto increase at geometric rates while the food supplyonly increased at an arithmetic rate. In terms of LULCchange, neo-Malthusian theories are built on theassumption that land productivity is fixed and returnsto increasing inputs of labor lead to diminishing re-turns (United Nations 2001). Consequently, it is nec-
Figure 1. Ecuador and thestudy area: the NorthernEcuadorian Amazon.
Deforestation in the Northern Ecuadorian Amazon 803
essary to expand agricultural lands to feed the growingpopulation. Some cross-national and regional studiesin frontier settings have shown that population growthcreates higher rates of deforestation (Ehrhardt-Marti-nez 1998; Parayil and Tong 1998). In an increasinglyclosed frontier environment, such as the NEA, we ex-pect to see that population pressure from increasedmembers of colonist leads to farm subdivision, andincreases in population density contribute to moredeforestation (Pan and Bilsborrow 2005).
In contrast to the Malthusian view, Boserup (1965,1981) argued that more people stimulate technologicalchanges that intensify land use so higher populationsper unit area can be supported without an overall de-cline in living standards. Boserupian theory sees therole of population pressure on natural resources as acatalytic factor in land use intensification. According toBoserup, the increase in labor per unit of land throughtime creates stages of intensification. Although not al-ways linked to population change, more modern con-ceptualizations of land use intensification areassociated with increases in other inputs besides labor(e.g., chemical fertilizers, pesticides, and irrigation);these measure increases in production over constantunits of land area and time (e.g., calories/hectare/years) (Bilsborrow and Carr 2000; Lambin 2000). Thedecrease in soil nutrients in some areas of the NEA,coupled with the expensive cost of remedial technol-ogy (e.g., fertilizer), may make the process of intensi-fication unsustainable for long periods of time;therefore, we expect to see that technology—definedbroadly, including loans and technical assistance—willinitially have a negative effect on deforestation ratesbut will change with time.
The household life cycle is another relevantparameter that explains land use change based ondemographic change. The household life cycle indi-cates how variations in consumption and labor avail-ability of the household drive land use—in this case,deforestation. McCracken and others (1999) and Perzand Walker (2002) identify five stages of a householdlife cycle of small farmers in the Brazilian Amazon.They describe the life cycle as the periods when (1)young parents recently arrive in the area (duration ofsettlement <5 years) and initiate forest clearing to growannual crops for subsistence; (2) parents with growingchildren (duration of settlement �5 years) becomeengaged in the cultivation of perennials and pasture, inaddition to annual crops; (3) older parents with teen-age children (duration of settlement �10 years) de-crease the cultivation of annuals but increase cattleraising and secondary vegetation begins to appear; (4)cultivation of pasture and perennial crops dominates,
with increasing secondary forest, as parents age andchildren reach young adulthood (duration of settle-ment �15 years); and (5) children begin to leave thefarm (duration of settlement >15 years), the presenceof perennials remained a large portion of farm landuse, and secondary forest succession further increases.We infer the effects of the household life cycle on landuse from the age of the head and duration ofsettlement. Consistent with the household life cycleapproach, we expect that farms with older heads ofhousehold and longer durations of settlement will havea negative effect on the primary forests and thereforehigher deforestation rates.
Pure demographic approaches ignore socioeco-nomic factors underlying deforestation. Studies ofenvironmental change in the developing worldshould consider the local social and economic factorsinvolved in population and social change, ratherthan solely population (Taylor and Garcia-Barrios1995). For example, there is little demand for landin the Bolivian Amazon, where population density islow. Thus, in areas where deforestation is highest,agricultural production for export, governmentalpolicies (e.g., road building), and subsidies havebeen identified as the main drivers of deforestation(Kaimowitz 1997). One of the paradigms that explainthe link between the different paths of developmentand land use change is the dual-economy theory. Inthis approach, there are two sectors: (1) a core—theurban, modern, productive center and (2) a periph-ery comprising mainly a rural, subsistence sector(Lewis 1954). The core and periphery sectors arelinked by mechanisms of polarization (core growths)and spread (periphery growths) (Brown 1991). Themodernization approach extends dual-economy the-ory to argue that environmental degradation (e.g.,deforestation) is a function of the level and rate ofdevelopment within a given country (Ehrhardt-Mar-tinez 1998). Thus, it is expected that develop-ment—defined in this study as the increasing use ofinfrastructure, urbanization, and extractive practicesto achieve economic growth—will affect deforestationin the NEA. The construction and improvement ofroads will contribute to deforestation because in-creases in accessibility open new lands for settlementand facilitate the transportation of cash crops.Increasing levels of other basic services (e.g., elec-tricity, piped water, and sewerage) might affectdeforestation in different ways. Besides being indica-tors of urbanization, they can modify the farmer�sexpectations about living conditions in urban andrural areas and constitute a push/pull factor forlocation of residency and mobility.
804 C. F. Mena and others
It is important to note that the factors mentionedabove must be considered interactive (e.g., in the Peru-vian lowland Amazon, where roads are rare and access isdifficult, deforestation is driven more by the availabilityof fertile lands (Imbernon 1999)). Economic policiesand credit are among other underlying factors that maycontribute to deforestation. In the Brazilian Amazon,especially during the 1970s and 1980s, credit and tax cutsto cattle ranchers were primary drivers of deforestation(Fearnside 1993; Moran 1993; Skole and Chomentowski1994). In the Ecuadorian Amazon, agrarian reform anda colonization law supported deforestation by legalizingspontaneous colonization along roads that had beenopened by oil companies (Uquillas 1984). We hypothe-size that deforestation in the NEA cannot be explainedby a single factor, but rather is driven by a number ofphysical, biotic, and socioeconomic agents. Technolog-ical and infrastructure changes (e.g., the form of loans,road networks, and public services expansion) andpopulation growth are also important drivers of thedeforestation.
Data and Methods
Rates of Deforestation
Three Landsat Thematic Mapper (TM) scenes from1986; 1996, and 2002 were classified for this study bythe Carolina Population Center (CPC)-Ecuador Pro-ject at the University of North Carolina at Chapel Hilland by Joseph Messina at Michigan State University.Image preprocessing steps included geometric andatmospheric corrections. Extensive fieldwork was usedto build a ground control database that allows theidentification of several vegetation types and culturalfeatures in the landscape. A hybrid supervised classifi-cation of images was performed to identify several landcover classes including, primary forest, successionalvegetation, pasture, agriculture, urbanization, water,and so forth (Walsh and others 2002). Postprocessingincluded positional and thematic quality assessments.The overall accuracy achieved for the classification was78.4%, and the users� accuracy for the primary forestclass—the class used in this study—was 90%. Annualdeforestation rates were quantified at parroquia andfinca levels using the following formula (Dirzo 1992;Ochoa-Gaona and Gonzales-Espinosa 2000):
r ¼ 1 � 1 � A1 � A2
A1
� �1=t
ð1Þ
where A1 is the area of forest at the beginning of theperiod, A2 is the area at the end, and t is the number ofyears for the period.
Statistical Models, Data, and Hypothesis
Ordinary least squares (OLS) or spatial regressionmodels are used to assess the magnitude and signifi-cance of the relationships between the dependentvariable, annual deforestation rates, and varioussocioeconomic variables, controlling for spatial auto-correlation. We used a weighted neighbor matrix W tocharacterize neighbors and their relative spatialweights. At the parroquia level, we used the Rookcontinuity, which defines two neighbors as those thatshare a common border. At the finca level, we con-sidered every farm within a 5-km area as a neighbor ofthe ‘‘target’’ farm. Therefore, the definition of neigh-borhood captured all farms from the correspondingcooperative or sector. Lagrange multiplier test statisticsdetermined if OLS or spatial regressions (Anselin1988, 2002, 2005) should be used to fit the models.OLS regression is defined as
y ¼ Xb þ e ð2Þ
and the spatial lag model as
y ¼ qWy þ Xb þ e ð3Þ
where y is the dependent variable, b the vector ofcoefficients, X the set of dependent variables, q theautoregressive parameter, and � is the vector of randomerror terms.
Four sets of models were created, at the parroquialevel and at the finca level for the periods 1986–1996and 1996–2002, where the dependent variables aredefined as the annual deforestation rates for the twoperiods and for the two levels of aggregation. Officialparroquia boundaries and finca boundaries were usedto extract the amount of primary forest from the LULCclassifications. The finca boundaries were built up fromusing Global Positioning System (GPS) in ground sur-veys; sketch maps were prepared jointly by the farmersand interviewers. Annual rates of deforestation weretransformed using an inverse-sine transformation(Bartlett 1947) to stabilize variance.
At the parroquia level, 18 parroquias in the core ofthe colonization area were selected for the analysis.This set of parroquias covers an area where satelliteimagery was available. In terms of independent vari-ables at the parroquia level, socioeconomic anddemographic data came from two information systemsproduced by the Ecuadorian government (INFOPLANand SIISE); both providing information on localdevelopment for several years. INFOPLAN and SIISEprovide data on population, infrastructure, poverty,and housing based on the 1990 and 2001 NationalEcuadorian Census of Population and Housing,respectively.
Deforestation in the Northern Ecuadorian Amazon 805
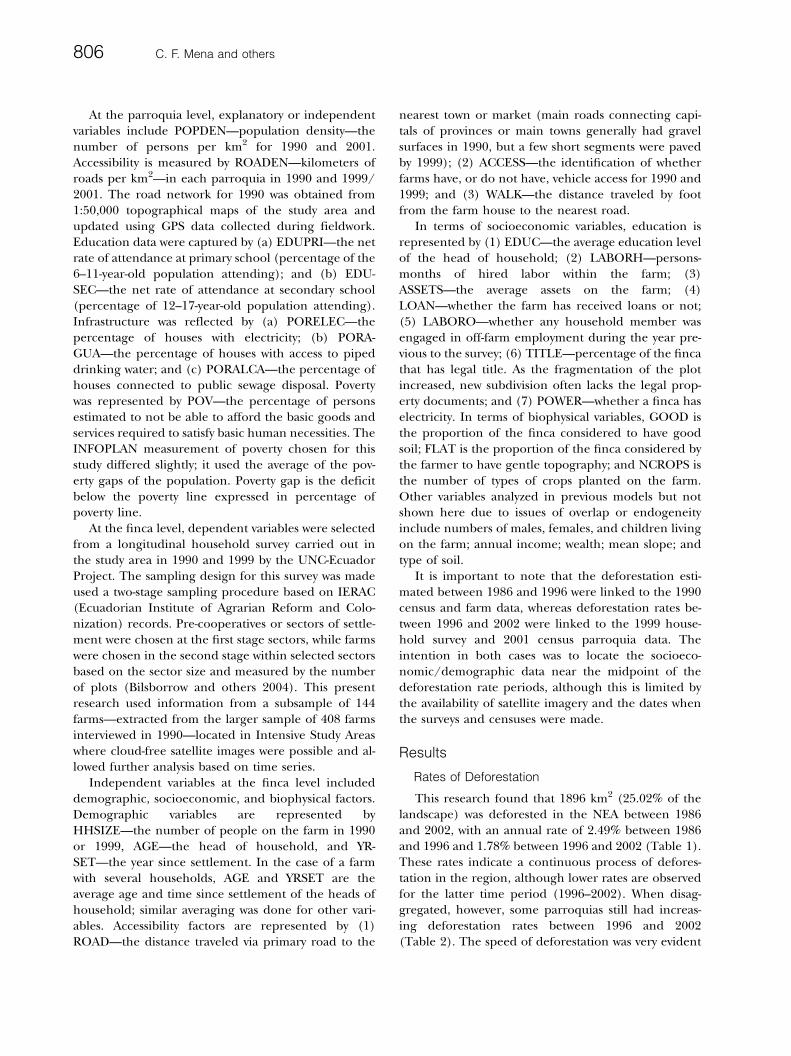
At the parroquia level, explanatory or independentvariables include POPDEN—population density—thenumber of persons per km2 for 1990 and 2001.Accessibility is measured by ROADEN—kilometers ofroads per km2—in each parroquia in 1990 and 1999/2001. The road network for 1990 was obtained from1:50,000 topographical maps of the study area andupdated using GPS data collected during fieldwork.Education data were captured by (a) EDUPRI—the netrate of attendance at primary school (percentage of the6–11-year-old population attending); and (b) EDU-SEC—the net rate of attendance at secondary school(percentage of 12–17-year-old population attending).Infrastructure was reflected by (a) PORELEC—thepercentage of houses with electricity; (b) PORA-GUA—the percentage of houses with access to pipeddrinking water; and (c) PORALCA—the percentage ofhouses connected to public sewage disposal. Povertywas represented by POV—the percentage of personsestimated to not be able to afford the basic goods andservices required to satisfy basic human necessities. TheINFOPLAN measurement of poverty chosen for thisstudy differed slightly; it used the average of the pov-erty gaps of the population. Poverty gap is the deficitbelow the poverty line expressed in percentage ofpoverty line.
At the finca level, dependent variables were selectedfrom a longitudinal household survey carried out inthe study area in 1990 and 1999 by the UNC-EcuadorProject. The sampling design for this survey was madeused a two-stage sampling procedure based on IERAC(Ecuadorian Institute of Agrarian Reform and Colo-nization) records. Pre-cooperatives or sectors of settle-ment were chosen at the first stage sectors, while farmswere chosen in the second stage within selected sectorsbased on the sector size and measured by the numberof plots (Bilsborrow and others 2004). This presentresearch used information from a subsample of 144farms—extracted from the larger sample of 408 farmsinterviewed in 1990—located in Intensive Study Areaswhere cloud-free satellite images were possible and al-lowed further analysis based on time series.
Independent variables at the finca level includeddemographic, socioeconomic, and biophysical factors.Demographic variables are represented byHHSIZE—the number of people on the farm in 1990or 1999, AGE—the head of household, and YR-SET—the year since settlement. In the case of a farmwith several households, AGE and YRSET are theaverage age and time since settlement of the heads ofhousehold; similar averaging was done for other vari-ables. Accessibility factors are represented by (1)ROAD—the distance traveled via primary road to the
nearest town or market (main roads connecting capi-tals of provinces or main towns generally had gravelsurfaces in 1990, but a few short segments were pavedby 1999); (2) ACCESS—the identification of whetherfarms have, or do not have, vehicle access for 1990 and1999; and (3) WALK—the distance traveled by footfrom the farm house to the nearest road.
In terms of socioeconomic variables, education isrepresented by (1) EDUC—the average education levelof the head of household; (2) LABORH—persons-months of hired labor within the farm; (3)ASSETS—the average assets on the farm; (4)LOAN—whether the farm has received loans or not;(5) LABORO—whether any household member wasengaged in off-farm employment during the year pre-vious to the survey; (6) TITLE—percentage of the fincathat has legal title. As the fragmentation of the plotincreased, new subdivision often lacks the legal prop-erty documents; and (7) POWER—whether a finca haselectricity. In terms of biophysical variables, GOOD isthe proportion of the finca considered to have goodsoil; FLAT is the proportion of the finca considered bythe farmer to have gentle topography; and NCROPS isthe number of types of crops planted on the farm.Other variables analyzed in previous models but notshown here due to issues of overlap or endogeneityinclude numbers of males, females, and children livingon the farm; annual income; wealth; mean slope; andtype of soil.
It is important to note that the deforestation esti-mated between 1986 and 1996 were linked to the 1990census and farm data, whereas deforestation rates be-tween 1996 and 2002 were linked to the 1999 house-hold survey and 2001 census parroquia data. Theintention in both cases was to locate the socioeco-nomic/demographic data near the midpoint of thedeforestation rate periods, although this is limited bythe availability of satellite imagery and the dates whenthe surveys and censuses were made.
Results
Rates of Deforestation
This research found that 1896 km2 (25.02% of thelandscape) was deforested in the NEA between 1986and 2002, with an annual rate of 2.49% between 1986and 1996 and 1.78% between 1996 and 2002 (Table 1).These rates indicate a continuous process of defores-tation in the region, although lower rates are observedfor the latter time period (1996–2002). When disag-gregated, however, some parroquias still had increas-ing deforestation rates between 1996 and 2002(Table 2). The speed of deforestation was very evident
806 C. F. Mena and others
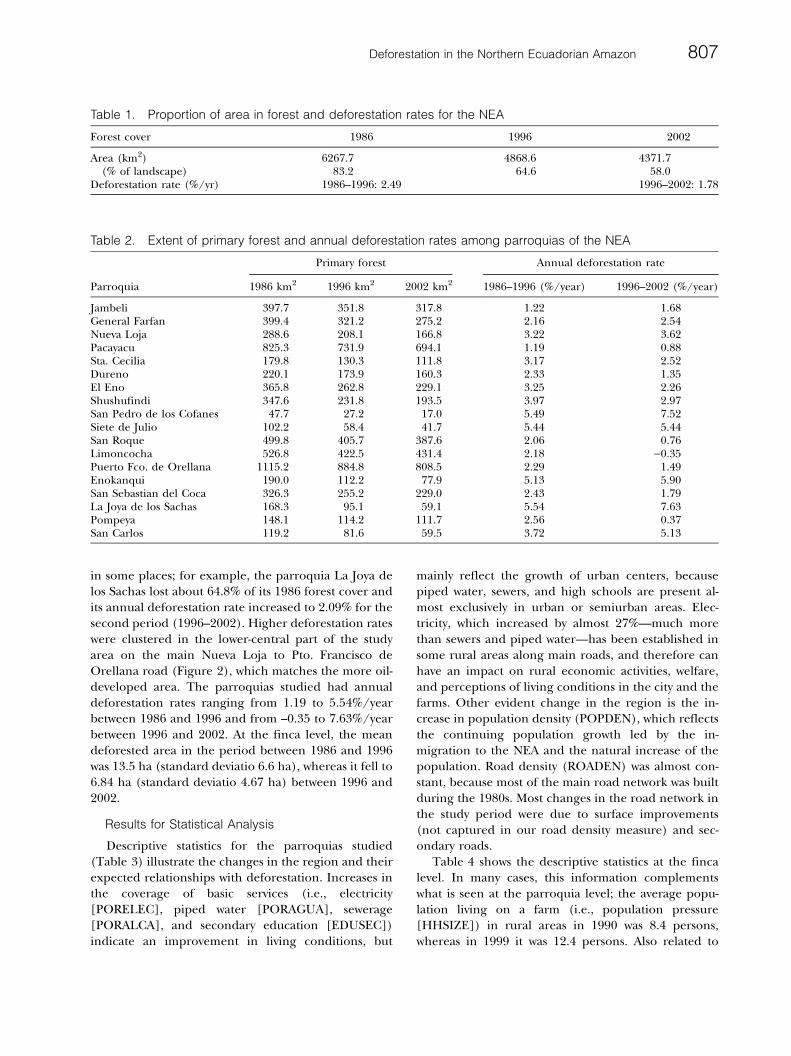
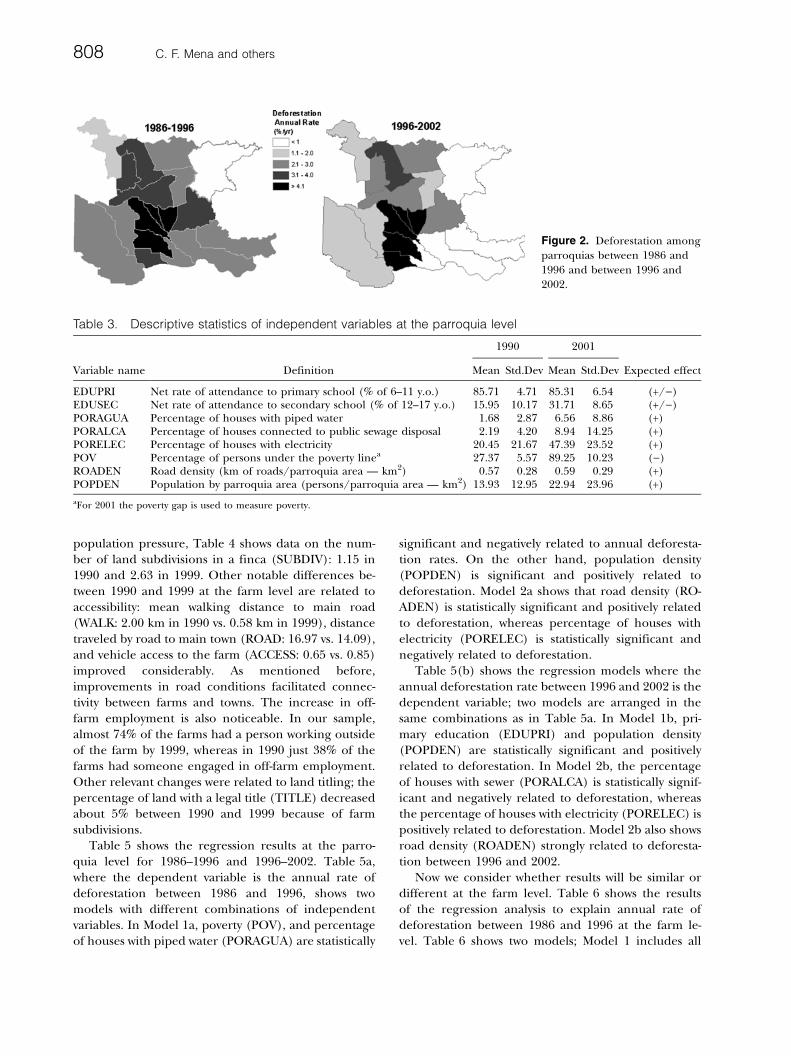
in some places; for example, the parroquia La Joya delos Sachas lost about 64.8% of its 1986 forest cover andits annual deforestation rate increased to 2.09% for thesecond period (1996–2002). Higher deforestation rateswere clustered in the lower-central part of the studyarea on the main Nueva Loja to Pto. Francisco deOrellana road (Figure 2), which matches the more oil-developed area. The parroquias studied had annualdeforestation rates ranging from 1.19 to 5.54%/yearbetween 1986 and 1996 and from –0.35 to 7.63%/yearbetween 1996 and 2002. At the finca level, the meandeforested area in the period between 1986 and 1996was 13.5 ha (standard deviatio 6.6 ha), whereas it fell to6.84 ha (standard deviatio 4.67 ha) between 1996 and2002.
Results for Statistical Analysis
Descriptive statistics for the parroquias studied(Table 3) illustrate the changes in the region and theirexpected relationships with deforestation. Increases inthe coverage of basic services (i.e., electricity[PORELEC], piped water [PORAGUA], sewerage[PORALCA], and secondary education [EDUSEC])indicate an improvement in living conditions, but
mainly reflect the growth of urban centers, becausepiped water, sewers, and high schools are present al-most exclusively in urban or semiurban areas. Elec-tricity, which increased by almost 27%—much morethan sewers and piped water—has been established insome rural areas along main roads, and therefore canhave an impact on rural economic activities, welfare,and perceptions of living conditions in the city and thefarms. Other evident change in the region is the in-crease in population density (POPDEN), which reflectsthe continuing population growth led by the in-migration to the NEA and the natural increase of thepopulation. Road density (ROADEN) was almost con-stant, because most of the main road network was builtduring the 1980s. Most changes in the road network inthe study period were due to surface improvements(not captured in our road density measure) and sec-ondary roads.
Table 4 shows the descriptive statistics at the fincalevel. In many cases, this information complementswhat is seen at the parroquia level; the average popu-lation living on a farm (i.e., population pressure[HHSIZE]) in rural areas in 1990 was 8.4 persons,whereas in 1999 it was 12.4 persons. Also related to
Table 1. Proportion of area in forest and deforestation rates for the NEA
Forest cover 1986 1996 2002
Area (km2) 6267.7 4868.6 4371.7(% of landscape) 83.2 64.6 58.0
Deforestation rate (%/yr) 1986–1996: 2.49 1996–2002: 1.78
Table 2. Extent of primary forest and annual deforestation rates among parroquias of the NEA
Primary forest Annual deforestation rate
Parroquia 1986 km2 1996 km2 2002 km2 1986–1996 (%/year) 1996–2002 (%/year)
Jambeli 397.7 351.8 317.8 1.22 1.68General Farfan 399.4 321.2 275.2 2.16 2.54Nueva Loja 288.6 208.1 166.8 3.22 3.62Pacayacu 825.3 731.9 694.1 1.19 0.88Sta. Cecilia 179.8 130.3 111.8 3.17 2.52Dureno 220.1 173.9 160.3 2.33 1.35El Eno 365.8 262.8 229.1 3.25 2.26Shushufindi 347.6 231.8 193.5 3.97 2.97San Pedro de los Cofanes 47.7 27.2 17.0 5.49 7.52Siete de Julio 102.2 58.4 41.7 5.44 5.44San Roque 499.8 405.7 387.6 2.06 0.76Limoncocha 526.8 422.5 431.4 2.18 )0.35Puerto Fco. de Orellana 1115.2 884.8 808.5 2.29 1.49Enokanqui 190.0 112.2 77.9 5.13 5.90San Sebastian del Coca 326.3 255.2 229.0 2.43 1.79La Joya de los Sachas 168.3 95.1 59.1 5.54 7.63Pompeya 148.1 114.2 111.7 2.56 0.37San Carlos 119.2 81.6 59.5 3.72 5.13
Deforestation in the Northern Ecuadorian Amazon 807
population pressure, Table 4 shows data on the num-ber of land subdivisions in a finca (SUBDIV): 1.15 in1990 and 2.63 in 1999. Other notable differences be-tween 1990 and 1999 at the farm level are related toaccessibility: mean walking distance to main road(WALK: 2.00 km in 1990 vs. 0.58 km in 1999), distancetraveled by road to main town (ROAD: 16.97 vs. 14.09),and vehicle access to the farm (ACCESS: 0.65 vs. 0.85)improved considerably. As mentioned before,improvements in road conditions facilitated connec-tivity between farms and towns. The increase in off-farm employment is also noticeable. In our sample,almost 74% of the farms had a person working outsideof the farm by 1999, whereas in 1990 just 38% of thefarms had someone engaged in off-farm employment.Other relevant changes were related to land titling; thepercentage of land with a legal title (TITLE) decreasedabout 5% between 1990 and 1999 because of farmsubdivisions.
Table 5 shows the regression results at the parro-quia level for 1986–1996 and 1996–2002. Table 5a,where the dependent variable is the annual rate ofdeforestation between 1986 and 1996, shows twomodels with different combinations of independentvariables. In Model 1a, poverty (POV), and percentageof houses with piped water (PORAGUA) are statistically
significant and negatively related to annual deforesta-tion rates. On the other hand, population density(POPDEN) is significant and positively related todeforestation. Model 2a shows that road density (RO-ADEN) is statistically significant and positively relatedto deforestation, whereas percentage of houses withelectricity (PORELEC) is statistically significant andnegatively related to deforestation.
Table 5(b) shows the regression models where theannual deforestation rate between 1996 and 2002 is thedependent variable; two models are arranged in thesame combinations as in Table 5a. In Model 1b, pri-mary education (EDUPRI) and population density(POPDEN) are statistically significant and positivelyrelated to deforestation. In Model 2b, the percentageof houses with sewer (PORALCA) is statistically signif-icant and negatively related to deforestation, whereasthe percentage of houses with electricity (PORELEC) ispositively related to deforestation. Model 2b also showsroad density (ROADEN) strongly related to deforesta-tion between 1996 and 2002.
Now we consider whether results will be similar ordifferent at the farm level. Table 6 shows the resultsof the regression analysis to explain annual rate ofdeforestation between 1986 and 1996 at the farm le-vel. Table 6 shows two models; Model 1 includes all
Table 3. Descriptive statistics of independent variables at the parroquia level
1990 2001
Variable name Definition Mean Std.Dev Mean Std.Dev Expected effect
EDUPRI Net rate of attendance to primary school (% of 6–11 y.o.) 85.71 4.71 85.31 6.54 (+/))EDUSEC Net rate of attendance to secondary school (% of 12–17 y.o.) 15.95 10.17 31.71 8.65 (+/))PORAGUA Percentage of houses with piped water 1.68 2.87 6.56 8.86 (+)PORALCA Percentage of houses connected to public sewage disposal 2.19 4.20 8.94 14.25 (+)PORELEC Percentage of houses with electricity 20.45 21.67 47.39 23.52 (+)POV Percentage of persons under the poverty linea 27.37 5.57 89.25 10.23 ())ROADEN Road density (km of roads/parroquia area — km2) 0.57 0.28 0.59 0.29 (+)POPDEN Population by parroquia area (persons/parroquia area — km2) 13.93 12.95 22.94 23.96 (+)
aFor 2001 the poverty gap is used to measure poverty.
Figure 2. Deforestation amongparroquias between 1986 and1996 and between 1996 and2002.
808 C. F. Mena and others
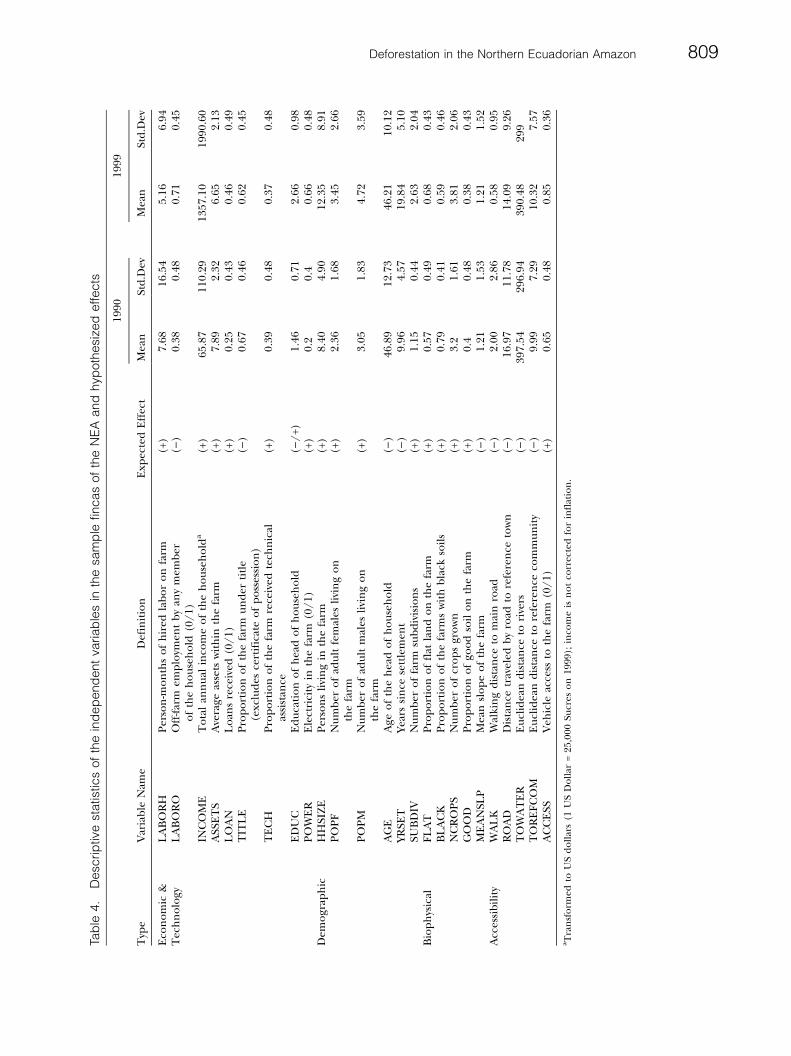
Table4.
Descriptivestatisticsof
theindep
endentvariablesinthesample
fincasof
theNEAandhypothesizedeffects
1990
1999
Typ
eV
aria
ble
Nam
eD
efin
itio
nE
xpec
ted
Eff
ect
Mea
nSt
d.D
evM
ean
Std
.Dev
Eco
no
mic
&L
AB
OR
HP
erso
n-m
on
ths
of
hir
edla
bo
ro
nfa
rm(+
)7.
6816
.54
5.16
6.94
Tec
hn
olo
gyL
AB
OR
OO
ff-f
arm
emp
loym
ent
by
any
mem
ber
of
the
ho
use
ho
ld(0
/1)
())
0.38
0.48
0.71
0.45
INC
OM
ET
ota
lan
nu
alin
com
eo
fth
eh
ou
seh
old
a(+
)65
.87
110.
2913
57.1
019
90.6
0A
SSE
TS
Ave
rage
asse
tsw
ith
inth
efa
rm(+
)7.
892.
326.
652.
13L
OA
NL
oan
sre
ceiv
ed(0
/1)
(+)
0.25
0.43
0.46
0.49
TIT
LE
Pro
po
rtio
no
fth
efa
rmu
nd
erti
tle
(exc
lud
esce
rtif
icat
eo
fp
oss
essi
on
)()
)0.
670.
460.
620.
45
TE
CH
Pro
po
rtio
no
fth
efa
rmre
ceiv
edte
chn
ical
assi
stan
ce(+
)0.
390.
480.
370.
48
ED
UC
Ed
uca
tio
no
fh
ead
of
ho
use
ho
ld()
/+)
1.46
0.71
2.66
0.98
PO
WE
RE
lect
rici
tyin
the
farm
(0/
1)(+
)0.
20.
40.
660.
48D
emo
grap
hic
HH
SIZ
EP
erso
ns
livi
ng
inth
efa
rm(+
)8.
404.
9012
.35
8.91
PO
PF
Nu
mb
ero
fad
ult
fem
ales
livi
ng
on
the
farm
(+)
2.36
1.68
3.45
2.66
PO
PM
Nu
mb
ero
fad
ult
mal
esli
vin
go
nth
efa
rm(+
)3.
051.
834.
723.
59
AG
EA
geo
fth
eh
ead
of
ho
use
ho
ld()
)46
.89
12.7
346
.21
10.1
2YR
SET
Year
ssi
nce
sett
lem
ent
())
9.96
4.57
19.8
45.
10SU
BD
IVN
um
ber
of
farm
sub
div
isio
ns
(+)
1.15
0.44
2.63
2.04
Bio
ph
ysic
alF
LA
TP
rop
ort
ion
of
flat
lan
do
nth
efa
rm(+
)0.
570.
490.
680.
43B
LA
CK
Pro
po
rtio
no
fth
efa
rms
wit
hb
lack
soil
s(+
)0.
790.
410.
590.
46N
CR
OP
SN
um
ber
of
cro
ps
gro
wn
(+)
3.2
1.61
3.81
2.06
GO
OD
Pro
po
rtio
no
fgo
od
soil
on
the
farm
(+)
0.4
0.48
0.38
0.43
ME
AN
SLP
Mea
nsl
op
eo
fth
efa
rm()
)1.
211.
531.
211.
52A
cces
sib
ilit
yW
AL
KW
alki
ng
dis
tan
ceto
mai
nro
ad()
)2.
002.
860.
580.
95R
OA
DD
ista
nce
trav
eled
by
road
tore
fere
nce
tow
n()
)16
.97
11.7
814
.09
9.26
TO
WA
TE
RE
ucl
idea
nd
ista
nce
tori
vers
())
397.
5429
6.94
390.
4829
9T
OR
EF
CO
ME
ucl
idea
nd
ista
nce
tore
fere
nce
com
mu
nit
y()
)9.
997.
2910
.32
7.57
AC
CE
SSV
ehic
leac
cess
toth
efa
rm(0
/1)
(+)
0.65
0.48
0.85
0.36
aT
ran
sfo
rmed
toU
Sd
oll
ars
(1U
SD
oll
ar=
25,0
00Su
cres
on
1999
);in
com
eis
no
tco
rrec
ted
for
infl
atio
n.
Deforestation in the Northern Ecuadorian Amazon 809
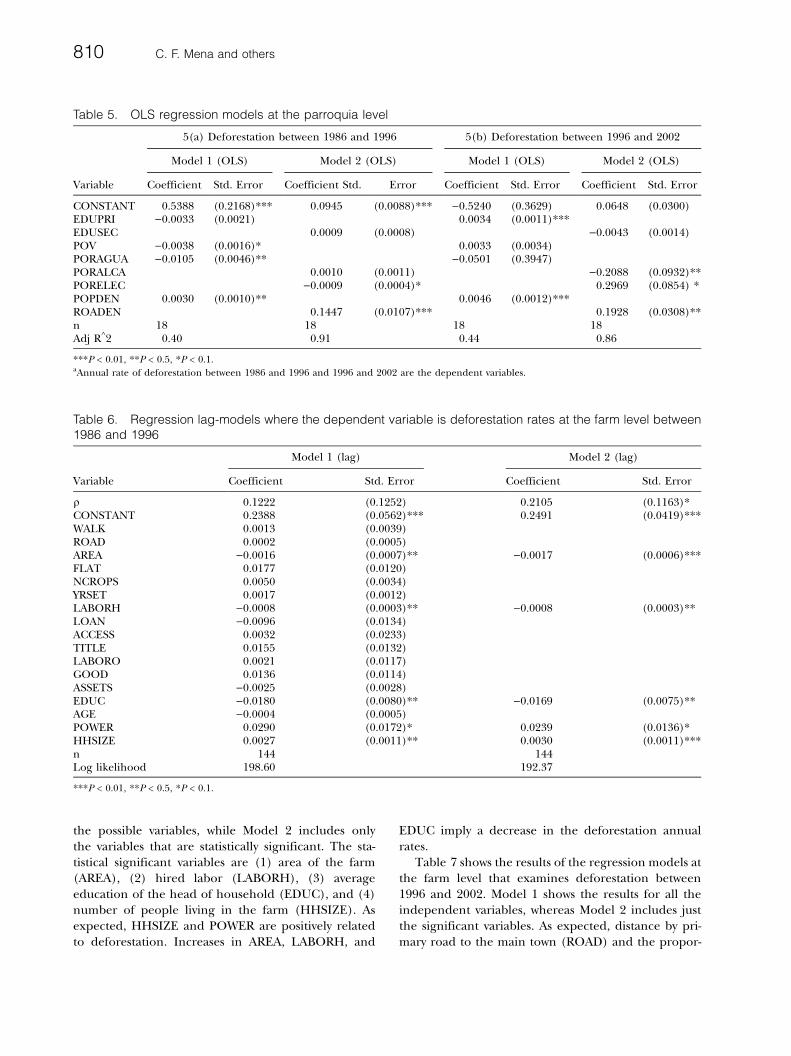
the possible variables, while Model 2 includes onlythe variables that are statistically significant. The sta-tistical significant variables are (1) area of the farm(AREA), (2) hired labor (LABORH), (3) averageeducation of the head of household (EDUC), and (4)number of people living in the farm (HHSIZE). Asexpected, HHSIZE and POWER are positively relatedto deforestation. Increases in AREA, LABORH, and
EDUC imply a decrease in the deforestation annualrates.
Table 7 shows the results of the regression models atthe farm level that examines deforestation between1996 and 2002. Model 1 shows the results for all theindependent variables, whereas Model 2 includes justthe significant variables. As expected, distance by pri-mary road to the main town (ROAD) and the propor-
Table 5. OLS regression models at the parroquia level
5(a) Deforestation between 1986 and 1996 5(b) Deforestation between 1996 and 2002
Model 1 (OLS) Model 2 (OLS) Model 1 (OLS) Model 2 (OLS)
Variable Coefficient Std. Error Coefficient Std. Error Coefficient Std. Error Coefficient Std. Error
CONSTANT 0.5388 (0.2168)*** 0.0945 (0.0088)*** )0.5240 (0.3629) 0.0648 (0.0300)EDUPRI )0.0033 (0.0021) 0.0034 (0.0011)***EDUSEC 0.0009 (0.0008) )0.0043 (0.0014)POV )0.0038 (0.0016)* 0.0033 (0.0034)PORAGUA )0.0105 (0.0046)** )0.0501 (0.3947)PORALCA 0.0010 (0.0011) )0.2088 (0.0932)**PORELEC )0.0009 (0.0004)* 0.2969 (0.0854) *POPDEN 0.0030 (0.0010)** 0.0046 (0.0012)***ROADEN 0.1447 (0.0107)*** 0.1928 (0.0308)**n 18 18 18 18Adj R^2 0.40 0.91 0.44 0.86
***P < 0.01, **P < 0.5, *P < 0.1.aAnnual rate of deforestation between 1986 and 1996 and 1996 and 2002 are the dependent variables.
Table 6. Regression lag-models where the dependent variable is deforestation rates at the farm level between1986 and 1996
Model 1 (lag) Model 2 (lag)
Variable Coefficient Std. Error Coefficient Std. Error
q 0.1222 (0.1252) 0.2105 (0.1163)*CONSTANT 0.2388 (0.0562)*** 0.2491 (0.0419)***WALK 0.0013 (0.0039)ROAD 0.0002 (0.0005)AREA )0.0016 (0.0007)** )0.0017 (0.0006)***FLAT 0.0177 (0.0120)NCROPS 0.0050 (0.0034)YRSET 0.0017 (0.0012)LABORH )0.0008 (0.0003)** )0.0008 (0.0003)**LOAN )0.0096 (0.0134)ACCESS 0.0032 (0.0233)TITLE 0.0155 (0.0132)LABORO 0.0021 (0.0117)GOOD 0.0136 (0.0114)ASSETS )0.0025 (0.0028)EDUC )0.0180 (0.0080)** )0.0169 (0.0075)**AGE )0.0004 (0.0005)POWER 0.0290 (0.0172)* 0.0239 (0.0136)*HHSIZE 0.0027 (0.0011)** 0.0030 (0.0011)***n 144 144Log likelihood 198.60 192.37
***P < 0.01, **P < 0.5, *P < 0.1.
810 C. F. Mena and others
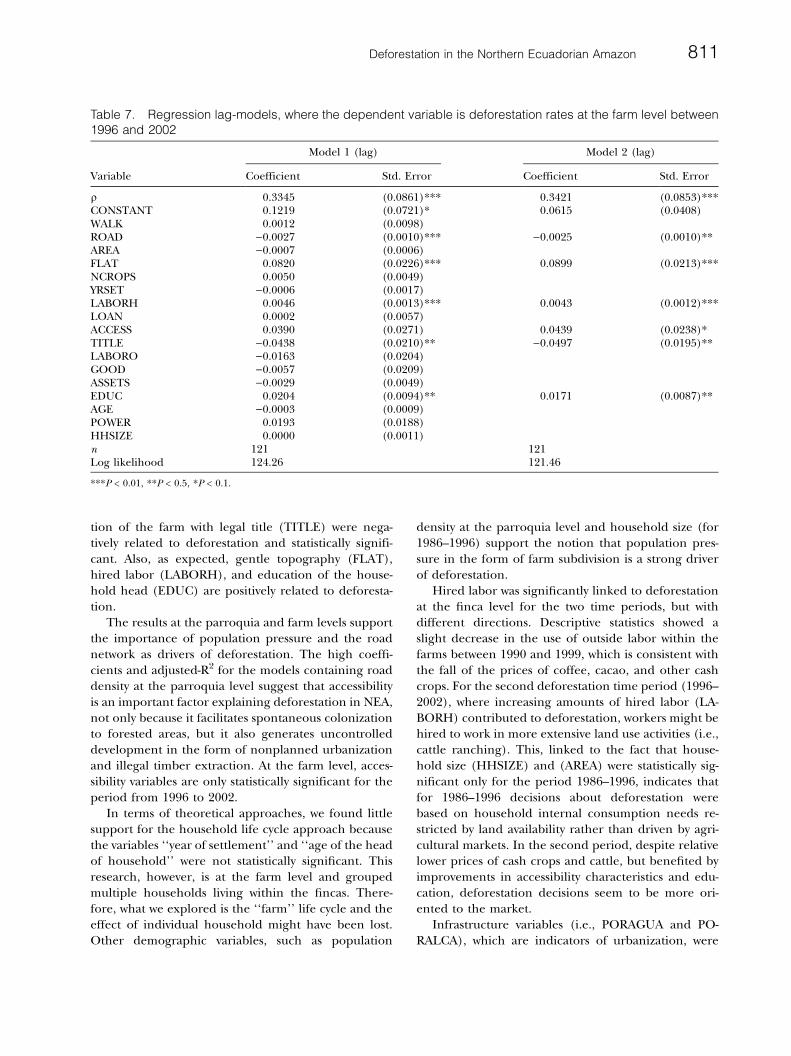
tion of the farm with legal title (TITLE) were nega-tively related to deforestation and statistically signifi-cant. Also, as expected, gentle topography (FLAT),hired labor (LABORH), and education of the house-hold head (EDUC) are positively related to deforesta-tion.
The results at the parroquia and farm levels supportthe importance of population pressure and the roadnetwork as drivers of deforestation. The high coeffi-cients and adjusted-R2 for the models containing roaddensity at the parroquia level suggest that accessibilityis an important factor explaining deforestation in NEA,not only because it facilitates spontaneous colonizationto forested areas, but it also generates uncontrolleddevelopment in the form of nonplanned urbanizationand illegal timber extraction. At the farm level, acces-sibility variables are only statistically significant for theperiod from 1996 to 2002.
In terms of theoretical approaches, we found littlesupport for the household life cycle approach becausethe variables ‘‘year of settlement’’ and ‘‘age of the headof household’’ were not statistically significant. Thisresearch, however, is at the farm level and groupedmultiple households living within the fincas. There-fore, what we explored is the ‘‘farm’’ life cycle and theeffect of individual household might have been lost.Other demographic variables, such as population
density at the parroquia level and household size (for1986–1996) support the notion that population pres-sure in the form of farm subdivision is a strong driverof deforestation.
Hired labor was significantly linked to deforestationat the finca level for the two time periods, but withdifferent directions. Descriptive statistics showed aslight decrease in the use of outside labor within thefarms between 1990 and 1999, which is consistent withthe fall of the prices of coffee, cacao, and other cashcrops. For the second deforestation time period (1996–2002), where increasing amounts of hired labor (LA-BORH) contributed to deforestation, workers might behired to work in more extensive land use activities (i.e.,cattle ranching). This, linked to the fact that house-hold size (HHSIZE) and (AREA) were statistically sig-nificant only for the period 1986–1996, indicates thatfor 1986–1996 decisions about deforestation werebased on household internal consumption needs re-stricted by land availability rather than driven by agri-cultural markets. In the second period, despite relativelower prices of cash crops and cattle, but benefited byimprovements in accessibility characteristics and edu-cation, deforestation decisions seem to be more ori-ented to the market.
Infrastructure variables (i.e., PORAGUA and PO-RALCA), which are indicators of urbanization, were
Table 7. Regression lag-models, where the dependent variable is deforestation rates at the farm level between1996 and 2002
Model 1 (lag) Model 2 (lag)
Variable Coefficient Std. Error Coefficient Std. Error
q 0.3345 (0.0861)*** 0.3421 (0.0853)***CONSTANT 0.1219 (0.0721)* 0.0615 (0.0408)WALK 0.0012 (0.0098)ROAD )0.0027 (0.0010)*** )0.0025 (0.0010)**AREA )0.0007 (0.0006)FLAT 0.0820 (0.0226)*** 0.0899 (0.0213)***NCROPS 0.0050 (0.0049)YRSET )0.0006 (0.0017)LABORH 0.0046 (0.0013)*** 0.0043 (0.0012)***LOAN 0.0002 (0.0057)ACCESS 0.0390 (0.0271) 0.0439 (0.0238)*TITLE )0.0438 (0.0210)** )0.0497 (0.0195)**LABORO )0.0163 (0.0204)GOOD )0.0057 (0.0209)ASSETS )0.0029 (0.0049)EDUC 0.0204 (0.0094)** 0.0171 (0.0087)**AGE )0.0003 (0.0009)POWER 0.0193 (0.0188)HHSIZE 0.0000 (0.0011)n 121 121Log likelihood 124.26 121.46
***P < 0.01, **P < 0.5, *P < 0.1.
Deforestation in the Northern Ecuadorian Amazon 811
negatively related to deforestation. In a cross-nationalstudy, Ehrhardt-Martinez (1998) suggests that therelationship between the level of urbanization and therate of deforestation is curvilinear: As countries be-come more urbanized, the rates of deforestation in-creases until moderate levels of urbanization areachieved, after which deforestation is slower. Thisexploratory study at the regional level suggests thatonce other factors are controlled (including popula-tion), improvement in public services attracts localrural population to urban areas which will, in turn,diminish deforestation. Ryder and Brown (2000) sug-gest that in the absence of new road-building projects(that allow access to new areas of land), young house-hold members prefer to search for income in urban-ized zones. Rudel and Horowitz (1996) observed asimilar trend earlier in province of Morona Santiago,where the second generation of colonists tended tomigrate away from their farms to larger towns in searchof a better or easier life.
Our research found a significant relationship be-tween annual deforestation and the type of landtenure for 1996–2002, although not for the earlierperiod. Rudel (1995), using ethnographic data fromthe southern Ecuadorian Amazon, found that formaltenure regimes did not affect deforestation becausegroups of small holdings already own and defendtheir lands within an informal system of land tenancy,which appears to have been the case here as well.Almost every farmer had a land title (escritura) orprovisional certificate of possession, in the 1990 sur-vey, but this changed dramatically after IERAC waseliminated in 1993. In the 1999 household survey,many farmers did not have title, in fact, most of thefarmers acquired part of a farm through subdivision.Baribieri and others (in press) also observe the neg-ative effect of title on deforestation, which mainlyreflects the effect of farm subdivision on stimulatingfurther deforestation.
Education shows mixed directions in relation todeforestation in the two time periods analyzed. Thesigns of the relationship, however, are consistent atthe parroquia and finca levels. For 1986–1996, pri-mary education (EDUC) in the parroquias studiedand education of the heads of households werenegatively related to deforestation, whereas for the1996–2002 period, primary education at the parro-quia and farm level were positively linked to defor-estation. Although off-farm employment is notstatistically significant, this research suggests that inthe early period more educated people were attractedby the insipient labor market, but later, betteropportunities for educated people to have access to
agricultural loans and markets led to the extensifica-tion of land use in the farms. Education, and othersocioeconomic factors such as electricity, can alsochange perceptions about opportunities in the farmand in the city and therefore create different strate-gies of land management. On the other hand, pov-erty at the parroquia level and assets at the fincalevel, were not statistical significant. The exception ispoverty (POV) for the 1986–1996 parroquia model.In this model, less poverty created more deforesta-tion. Richer parroquias might have the necessary re-sources to expand crop cultivation and increase cattleranching. Other variables at the finca level wereconsidered to explore the relationship betweenwealth and deforestation (e.g., annual income) butproblems of endogeneity limited their use. The cau-tionary note about the statistical modeling is relatedto the sample size and the sample selection effect andour inability to control for unobserved events.
Discussion and Conclusions
We found that annual deforestation rates at the re-gional level were consistent with the estimates of Sierra(2000). He calculated that approximately 55,600 haper year were cleared in the Napo Region during theperiod from 1986 to 1996 at an annual rate of 0.6%.However, this rate was for a much larger area, includ-ing larger tracks of undisturbed forest. This articleshows the severity of the deforestation in the core ofthe colonization area during the two time periodsstudied (1986–1996 and 1996–2002). Nevertheless,deforestation rates were not homogeneous across par-roquias. For example, San Pedro de los Cofanes, Joyade los Sachas, and Siete de Julio exhibited deforesta-tion rates almost eight times as high as the average ofthe Northern Oriente, whereas others such as SanRoque or General Farfan had far lower rates.
Official reports have pointed to colonization andagricultural expansion, timber extraction, monoculti-vation plantations, oil and mining, weak land titlingprograms, and poverty as the main overall causes offorest cover change in Ecuador (Food and AgricultureOrganization 2000). Earlier studies, conducted withthe same 1990 household survey data that was used inthis study and that rely in deforestation reports fromfarmers, show patterns in which larger cleared areasemerged among households with greater farm laborresources (in terms of male workers per household)(Marquette 1998), duration of settlement, soil quality,road access, and education (Pichon 1997; Pichon andothers 2002; Pan and Bilsborrow 2005). This study,linking remotely sensed estimations of deforestation
812 C. F. Mena and others
and socioeconomic survey and census data, is consis-tent with earlier findings and suggests that the rate ofdeforestation is driven by roads, demographic factors,education, infrastructure, hired labor, and topographiccharacteristics.
The set of factors that drive LULC change is scaledependent and it is mediated by decisions made at theindividual, household, and communities levels (Walshand others 2001). Roads in the NEA, for example, aredirect and underlying drivers of deforestation acrossspatial scales. At the national level, the Ecuadoriangovernment encourages roads construction for oilexploration and exploitation through pristine forests,protected natural areas, and indigenous ancestral ter-ritories. Roads then facilitate in-migration of a growingpopulation of poor peasants from the provinces of theCosta and the Sierra regions of Ecuador to cheaplands in the NEA (Uquillas 1984). At the local scale,besides the direct impact created during road build-ing, labor and input costs, wealth, commodity prices,and transportation costs depended on the availabilityand quality of roads (Murphy and others 1997). Theresults of this research confirm the importance ofroads as drivers of deforestation at both the parroquiaand finca levels but also suggest that the impact ofstrong predictors of deforestation, such as the effectsof accessibility and population pressure, can be ob-served at different levels of socioeconomic dataaggregation.
The National and local governments must considerfuture land use patterns created by the extensificationand improvement of the road network. The oil reservesfound in the NEA imply a continuous development ofthe oil infrastructure in the region. Although theopportunities of off-farm employment in the oilindustry would benefit the local labor force and theforest conservation by maintaining farmers out of theforest remnants and encouraging forest succession bythe abandonment of unproductive plots, it is morelikely that the emergent employment opportunities willbe transitory and the long-term effects will result in theadvance of the deforestation front and forest frag-mentation in protected areas and indigenous territo-ries. Another important policy implication is related toeducation. Although this research found that in thelater period (1996–2002) more education resulted inmore deforestation, we believe that increasing levels ofspecialized education that enhance the value of theforest for households and communities will curb thecurrent tendency.
One of the purposes of this research was to makeuse of freely available socioeconomic and spatialinformation to explore the relationships between
socioeconomic activities and environmental degrada-tion by linking remote sensing and geographic infor-mation systems. The variety of detailed studiesdiscussed here shed light on the complex interplay offactors driving deforestation. The intensity and ex-pense of gathering household data to sort out thiscomplexity, however, exceeds the budget possibilitiesof most local and regional resource managersattempting to form policies that balance developmentwith conservation. Managers and political decision-makers need rapid and inexpensive methods to predictthe extent of environmental problems as a function ofvarious aspects of development. The approach andresults documented here show that useful informationcan be obtained through relatively simple analysesinvolving publicly available data such as national cen-suses. We think, however, that the analyses at differentlevels of socioeconomic and demographic data aggre-gation are complementary due the scale dependency ofthe LULC drivers. Our approach is particularly suitedto the case of the Northern Ecuadorian Amazon, whereinternal/external migration is an essential factor tounderstanding socioeconomic dynamics and their ef-fects on the environment.
AcknowledgmentsThis research was partly supported by the Inter-
American Institute for Global Change Researchthrough its collaborative research network: ‘‘The An-dean Amazon Rivers Analysis and Management Pro-ject’’ (AARAM), Michael E. McClain (PrincipalInvestigator). It was also supported by the EcuadorProject based at the Carolina Population Center (CPC)and the Departments of Geography and Biostatistics atthe University of North Carolina in Chapel Hill, incollaboration with EcoCiencia (Ecuador); RichardE. Bilsborrow and Stephen J. Walsh are PrincipalInvestigators on the NASA grant (NCC5-295). Otherorganizations that supported different aspects of theProject are the Mellon Foundation, the Summit andCompton Foundations and PROFORS (ProgramaForestal Sucumbios, in Lago Agrio, Ecuador, funded byGTZ, the German foreign aid program), the Ministryof Environment of Ecuador, and Centro de Estudios dePoblacion y Desarrollo Social (CEPAR). Carlos F. Menathanks the NASA Earth System Fellowship(NNG04GR12H) that supports his doctoral studies. Wealso would like to thank Stephen Walsh, Brian Frizzelle,William Pan, William Vickers, and Esra Ozdenerol forproviding important data and comments on earlierdrafts.
Deforestation in the Northern Ecuadorian Amazon 813
Literature Cited
Anselin, L. 1988. Spatial econometrics: Methods and models.Kluwer Academic Publishers, Dordrecht.
Anselin, L. 2002. Under the hood: Issues in the specificationand interpretation of spatial regression models. AgriculturalEconomics 27:247–267.
Anselin, L. 2005. Exploring spatial data with GeoDa: Aworkbook. Spatial Analysis Laboratory, University of Illi-nois, Urbana-Champaign, Urbana, Illinois.
Barbieri, A. F., R. E. Bilsborrow, and W. K. Y. Pan. In press.Farm household lifecycles and land use in the EcuadorianAmazon. Population and Environment.
Bartlett, M. S. 1947. The use of transformations. Biometrics3:39–52.
Bilsborrow, R. E. 2003. Cambios demograficos y medio am-biente en la Region Amazonica de los paises andinos. Pages53–86 in CE. Aramburu, E. Bedoya (eds.), Amazonia: Pro-cesos demograficos y ambientales. Consorcio de Investiga-cion Economica y Social, Lima, Peru.
Bilsborrow, R. E., A. F. Barbieri, and W. K. Y. Pan. 2004.Changes in population and land use over time in theEcuadorian Amazon. Acta Amazonica 34:635–647.
Bilsborrow, R. E., and D. L. Carr. 2000. Population, agriculturalland use and the environment in developing countries. Pa-ges 35–56 in D. R. Lee, C. B. Barrett (eds.), Tradeoffs orsynergies? Agricultural intensification, economic develop-ment and the environment. CABI Publishing, New York.
Boserup, E. 1965. The conditions of agricultural growth. Theeconomics of agriculture under population pressure.Earthscan, London.
Boserup, E. 1981. Population and technological change. TheUniversity of Chicago Press, Chicago.
Brown, L. A. 1991. Place, migration, and development in thethird world: An alternative view. Routledge, London.
Cassel-Gintz, M., and G. Petschel-Hels. 2001. GIS-basedassessment of the threat to world forests by patterns of non-sustainable civilization nature interaction. Journal of Envi-ronmental Management 59:279–298.
Dirzo, R. 1992. Rates of deforestation in Los Tuxtlas, a neo-tropical area in Southeast Mexico. Conservation Biology 6:84–90.
Ehrhardt-Martinez, K. 1998. Social determinants of defores-tation in developing countries: a cross-national study. SocialForces 77:567–562.
Fearnside, P. M. 1993. Deforestation in Brazilian Amazonia:The effect of population and land tenure. Ambio 22:537–545.
Food and Agriculture Organization. 2000. Commented bib-liography: Forest cover changes in Ecuador. Forest Re-source Assessment Working Papers 30, FAO, Rome.
Food and Agriculture Organization. 2001. 2000 Global forestresource assessment. FAO, Rome.
Geist, H. J., and E. F. Lambin. 2001. What drives tropicaldeforestation? A meta-analysis of proximate and underlyingcauses of deforestation based on subnational case studyevidence. LUCC International Project Office, Louvain-la-Neuve.
Imbernon, J. 1999. A comparison of the driving forces behinddeforestation in the Peruvian and the Brazilian Amazon.Ambio 28:509–513.
Kaimowitz, D. 1997. Factors determining low deforestation inthe Bolivian Amazon. Ambio 26:537–540.
Klepeis, P., and B. L. Turner II. 2001. Integrated land historyand global change science: The example of SouthernYucatan Peninsular Region Project. Land Use Policy 18:27–39.
Lambin, E. F. 2000. Are agricultural land-use models able topredict changes in land use intensity? Agriculture, Ecosystemsand Environment 82:321–331.
Lewis, W. A. 1954. Economic development with unlimitedsupplies of labour. Manchester School of Economic and SocialStudies 22:139–191.
Malthus, T. R. 1803. On population (first essay on popula-tion, 1798). Reprint, Modern Library of Random House,New York.
Marquette, C. M. 1998. Land use patterns among smallfarmers settlers in the Northeaster Ecuadorian Amazon.Human Ecology 26:573–598.
McCracken, S., E. Brondizio, D. Nelson, E. F. Moran,A. Siqueira, and C. Rodriguez-Perraza. 1999. Remote sens-ing and GIS at the farm property level: Demography anddeforestation in the Brazilian Amazon. PhotogrammetricEngineering and Remote Sensing 65:1311–1320.
Moran, E. F. 1993. Deforestation and land use in the BrazilianAmazon. Human Ecology 21:1–21.
Murphy, L., R. E. Bilsborrow, and F. Pichon. 1997. Povertyand prosperity among migrant settlers in the Amazonrainforest frontier of Ecuador. The Journal of DevelopmentStudies 34:35–66.
Myers, N. 1988. Threatened Biotas ‘‘Hot Spots’’ in tropicalforest. The Environmentalist 8:187–208.
Ochoa-Gaona, S., and M. Gonzales-Espinosa. 2000. Land useand deforestation in the highlands of Chiapas, Mexico.Applied Geography 20:17–42.
Orme, C. D. L., R. G. Davies, M. Burgess, F. Eigenbrod,N. Pickup, V. A. Olson, A. J. Webster, T. Ding, P. C.Rasmussen, R. S. Ridgely, A. J. Stattersfield, P. M.Bennett, T. M. Blackburn, K. J. Gaston, and I. P. F.Owens. 2005. Global hotspots of species richness arenot congruent with endemism or threat. Nature 346:1016–1019.
Pan, W. K. Y., and R. E. Bilsborrow. 2005. The use of a mul-tilevel statistical model to analyze factors influencing landuse: a study of the Ecuadorian Amazon. Global and PlanetaryChange 47:232–252.
Parayil, G., and F. Tong. 1998. Pasture-led to logging-leddeforestation in the Brazilian Amazon. Global EnvironmentalChange 8:63–79.
Perz, S. G., and R. T. Walker. 2002. Households life cycles andsecondary forest cover among small farmer colonist in theAmazon. World Development 30:1009–1027.
Pichon, F. 1997. Settler households and land-use patterns inthe Amazon frontier: farm-level evidence from Ecuador.World Development 25:67–91.
814 C. F. Mena and others
Pichon, F., C. Marquette, L. Murphy, and R. E. Bilsborrow.2002. Endogenous patterns and processes of settler landuse and forest change in the Ecuadorian Amazon. Pages219–245 in C. Wood, R. Porro (eds.), Deforestation andland use in the Amazon. University Press of Florida,Gainesville, Florida.
Ryder, R., and L. A. Brown. 2000. Urban-system evolution onthe frontier of the Ecuadorian Amazon. Geographical Review90:511–535.
Rudel, T. 1983. Roads, speculators, and colonization in theEcuadorian Amazon. Human Ecology 11:385–401.
Rudel, T. 1995. When do property rights matter? Openaccess, informal social controls, and deforestation inthe Ecuadorian Amazon. Human Organization 54:187–194.
Rudel, T., and B. A. Horowitz. 1996. La deforestacion tropi-cal: pequenos agricultores y desmonte en la AmazonıaEcuatoriana. Abya-Yala, Quito.
Sierra, R. 2000. Dynamics and patterns of deforestation in theWestern Amazon: the Napo deforestation front, 1986–1996. Applied Geography 20:1–16.
Skole, D. L., and W. H. Chomentowski. 1994. Physical andhuman dimension of deforestation in Amazonia. BioScience44:314–322.
Taylor, P., and R. Garcia-Barrios. 1995. The social analysis ofecological change: from systems to intersecting processes.Social Science Information 34:5–30.
United Nations. 2001. World population monitoring 2001:population, environment and development. PopulationDivision, Department of Economic and Social Affairs,United Nations Secretariat, New York.
Uquillas, J. 1984. Colonization and spontaneous settlementin the Ecuadorian Amazon. Pages 261–284 in M. Schminkand C. Wood (eds.), Frontier in expansion in Amazonia.University of Florida Press, Gainesville.
Vina, A., and J. Cavelier. 1999. Deforestation rates (1938–1988) of tropical lowland forest on the Andean Foothills ofColombia. Biotropica 31:31–36.
Walsh, S. J., J. P. Messina, K. A. Crews-Meyer, R. E. Bilsborrow,and W. K. Y. Pan. 2002. Characterization and modelingpatterns of deforestation and agricultural extensification inthe Ecuadorian Amazon. Pages 189–214 in S. J. Walsh andK. A. Crews-Meyer (eds.), Linking people, place, and pol-icy. Kluwer Academic Publishers, Boston.
Walsh, S. J., T. W. Crawford, W. F. Welsh, and K. A. Crews-Meyer. 2001. A multiscale analysis of LULC and NDVIvariation in Nang Rong district, northeast Thailand. Agri-culture, Ecosystems & Environment 85:47–64.
Wood, C. H. and R. Porro. 2001. Hierarchical framework forintegrating the social and natural sciences in the study ofland use and environmental change in the Amazon. Pre-sented at the Open Meeting of the Global EnvironmentalChange Research Community. 6–8 October 2001. Rio deJaneiro, Brazil.
Deforestation in the Northern Ecuadorian Amazon 815


