Embed Size (px)
Citation preview

SMEAR EFFECTS OF VERTICAL DRAINS ON SOFT BANGKOK CLAY
Dennes T. Bergado,1 Associate Member, ASCE, Hiroshi Asakami,2 Marolo C. Alfaro,3 and A. S. Balasubramaniam,4 Fellow, ASCE
ABSTRACT: Smear effects due to the installation of prefabricated vertical drains were studied in the laboratory using special equipment and in the field using a full-scale test embankment. The prefabricated vertical drains were installed by two different sizes of mandrel. The test results showed that the smear zone can be assumed to be twice the equivalent mandrel diameter and the horizontal permeability coefficient in the smeared zone, k',„ was approximately equal the vertical permeability coefficient in the undisturbed zone, kv. A faster settlement rate and higher amounts of compression were observed in the small mandrel area than in the large mandrel area, suggesting lesser smear effects in the former than in the latter. The total settlement prediction using the method of Skempton and Bjerrum of 1957, with stress distribution using Poulos's 1967 method, yielded reasonable agreement with the observed values. More accurate settlement-rate predictions can be obtained using Asaoka's 1978 method when the prediction was based on settlement data having at least 60% consolidation.
INTRODUCTION
In this paper, smear effects due to the installation of prefabricated band drains on soft Bangkok clay were investigated in the laboratory by means of a large specially designed consolidation test apparatus with a centrally located prefabricated drain employing reconstituted soft Bangkok clay. In the field, the smear effects were investigated by monitoring the settlement behavior of a 5 m high full-scale test embankment constructed over soft Bangkok clay with prefabricated vertical band drains installed to an 8 m depth by two different sizes of mandrel. Both laboratory and full-scale investigations used Alidrains with cores made of polyethylene and filters made of polyester. The site of the test embankment was located inside the campus of the Asian Institute of Technology, which is 42 km north of Bangkok. Most of the results presented in this paper are derived from the work of Asakami (1989). The Central Plain of Thailand, in which Bangkok is located, is situated on a flat, deltaic-marine deposit with a north-south dimension of approximately 300 km and a width of 200 km. The general stratigraphy consists of sedimentary deposits forming alternate layers of clay and sand with gravel down to 1,000 m. The general soil profile and the
'Assoc. Prof., Div. of Geotech. and Transp. Engrg., Asian Inst, of Tech., P .O. Box 2754, Bangkok 10501, Thailand.
2Soil Engr., Civ. Engrg. Tech. Dept . , Tokyu Constr. Co., Ltd., 1-11-8 Shibuya, Shibuya-ku, Tokyo 150, Japan.
3Res. A s s o c , Div. of Geotech. and Transp. Engrg., Asian Inst, of Tech., P .O. Box 2754, Bangkok 10501, Thailand.
4Prof., Div. of Geotech. and Transp. Engrg., Asian Inst, of Tech., P.O. Box 2754, Bangkok 10501, Thailand.
Note. Discussion open until March 1, 1992. To extend the closing date one month, a written request must be filed with the ASCE Manager of Journals. The manuscript for this paper was submitted for review and possible publication on May 28, 1990. This paper is part of the Journal of Geotechnical Engineering, Vol. 117, No. 10, October, 1991. ©ASCE, ISSN0733-9410/91/0010-1509/$1.00 + $.15 per page. Paper No. 26216.
1509
J. Geotech. Engrg., 1991, 117(10): 1509-1530
Dow
nloa
ded
from
asc
elib
rary
.org
by
ASI
AN
IN
STIT
UT
E O
F T
EC
HN
OL
OG
Y o
n 02
/02/
16. C
opyr
ight
ASC
E. F
or p
erso
nal u
se o
nly;
all
righ
ts r
eser
ved.

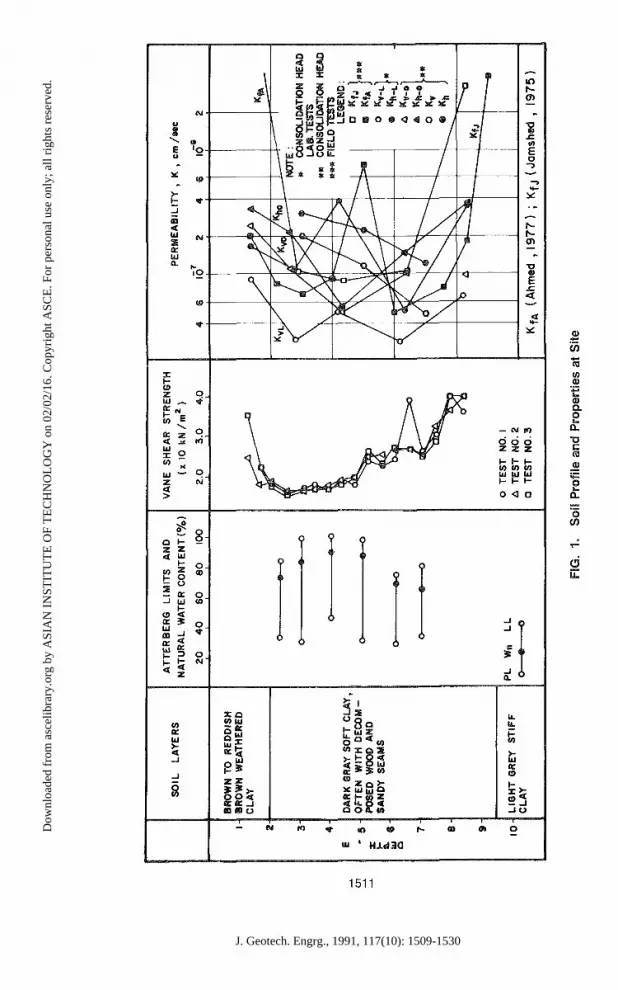
engineering soil properties of the uppermost layer of the test site are shown in Fig. 1. The ground-water table fluctuated with the season but is close to an average value of 1.5 m below the ground level.
The subsoil condition around Bangkok is subjected to the combined effects of ground subsidence generated by excessive pumping of ground water from underlying aquifers and compression of the soft Bangkok clay when loaded. The effect of ground subsidence (Bergado et al. 1988) was taken into consideration.
PREFABRICATED VERTICAL DRAINS
When the disturbance in the soil surrounding the vertical drain (smear zone) caused by drain installation is to be considered, additional soil drainage parameters are required for the disturbed soil. Consequently, both soil drainage parameters of the undisturbed zone and the smeared zone need to be investigated. Kjellman (1948) suggested that the equivalent diameter could be estimated from a consideration of the drain surface area. Thus, the equivalent diameter d of a band-shaped drain with width b and thickness a can be expressed by
„ « + b d = 2 (1) IT
which was later verified by finite-element analysis (Hansbo 1979). Subsequent studies [e.g. Rixner et al. (1986)] suggested the following modification:
A a + b /1\
d = -ir (2)
The consolidation equation with vertical drain introduced by Barron (1948) is given in the following form:
du — = dr
= <'i,
(d2U 1 dU —; + \drz r dr
(3)
where u = excess pore pressure; r = radial distance; t = time; and ch = horizontal coefficient of consolidation. Solutions of (3) were presented in which the delay in the process of consolidation caused by smear and well resistance could be calculated [i.e. Barron (1948) and Hansbo (1981)]. According to Hansbo (1981), the effects of smear and well resistance on the average degree of consolidation Uh at a certain depth z and at any time t can be taken into account using the following relationships:
Uh(t) = 1 - ^p(Z~h) (4)
where
T ' - % <5»
1510
J. Geotech. Engrg., 1991, 117(10): 1509-1530
Dow
nloa
ded
from
asc
elib
rary
.org
by
ASI
AN
IN
STIT
UT
E O
F T
EC
HN
OL
OG
Y o
n 02
/02/
16. C
opyr
ight
ASC
E. F
or p
erso
nal u
se o
nly;
all
righ
ts r
eser
ved.
SO
IL
LA
YE
RS
A
TT
ER
BE
RG
L
IMIT
S
AN
D
NA
TU
RA
L
WA
TE
R
CO
NT
EN
T
(%)
20
40
60
80
100
VA
NE
S
HE
AR
S
TR
EN
GT
H
(x
10
kN
/m2
)
2.0
3
.0
4.0
BR
OW
N T
O
RE
DD
ISH
S
RO
WN
W
EA
TH
ER
ED
C
LA
Y
X &
8
DA
RK
GR
AY
SO
FT
C
LA
Y,
OF
TE
N
WIT
H
DE
CO
M
PO
SE
D
WO
OD
A
ND
S
AN
DY
S
EA
MS
10
LIG
HT
G
RE
Y
ST
IFF
C
LA
Y
o-
o—
PL
W
„ O
•—
LL
-O
-o
-®
—o
O
TE
ST
N
O.
I £
TE
ST
N
O.2
D
T
ES
T
NO
.3
FIG
. 1.
S
oil
Pro
file
and
Pro
perti
es a
t Site
J. Geotech. Engrg., 1991, 117(10): 1509-1530
Dow
nloa
ded
from
asc
elib
rary
.org
by
ASI
AN
IN
STIT
UT
E O
F T
EC
HN
OL
OG
Y o
n 02
/02/
16. C
opyr
ight
ASC
E. F
or p
erso
nal u
se o
nly;
all
righ
ts r
eser
ved.

kh ch = — 7, (6)
(xs = In n- + kf, In s - \ + z(l - z) ^ = F„ + Fs + F, (7)
where n = spacing ratio DJd; De = diameter of equivalent cylinder of soil influencing each drain, which is equal to 1.135 for a square pattern and 1.055 for a triangular pattern; S = spacing; d = equivalent diameter of drain; s = djd; ds ~ diameter of smeared zone; kh = permeability coefficient of undisturbed soil in horizontal flow; k'h = corresponding permeability coefficient in the smeared zone; / = full drain length for drains closed at bottom (half drain length for drains open and drained at the bottom); qw = discharge capacity of the drain; Fn = drain spacing factor, equal to (In n - 3/4); Fs = a smear factor; equal to {khlk'h - 1) In s; F,. = well-resistance factor, equal to z(l — z) k,Jqw; z = distance from the top boundary; and the other terms are the usual soil properties.
SOIL PARAMETERS
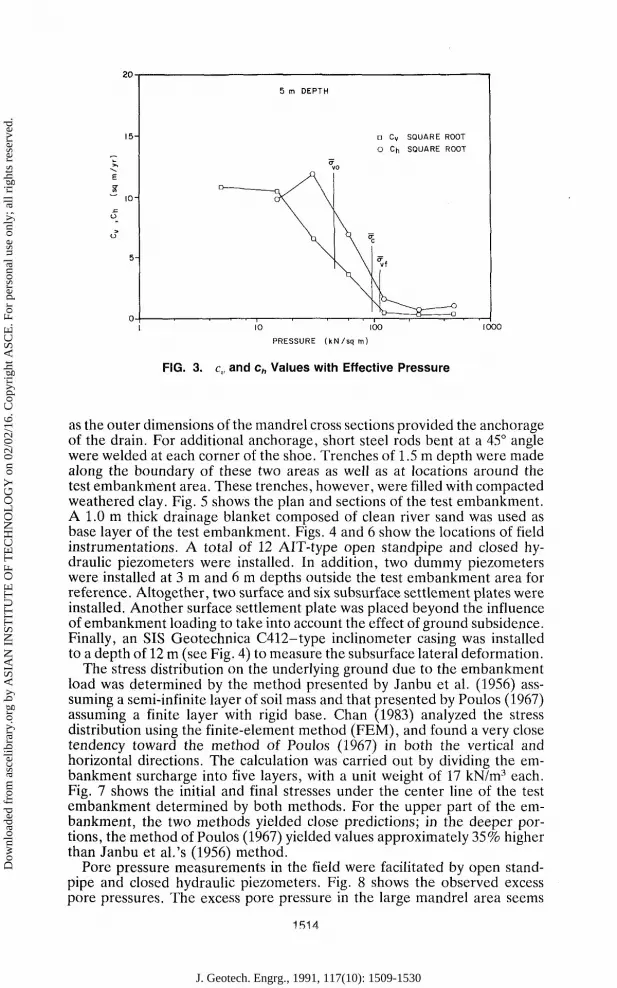
Field vane shear tests, which were conducted using a Geonor-type vane borer having a blade size of 6.5 cm X 13.5 cm, indicated an increase in undrained shear strength with depth as shown in Fig. 1. The profile of the field permeability, obtained by using hydraulic piezometers (Ahmed 1977; Jamshed 1975), with depth is also shown in Fig. 1. Higher permeability values were obtained in the field compared to the corresponding laboratory values. The higher values in the field are attributed to the presence of fissures, fine sand, and silt lenses in the soft Bangkok clay. In the laboratory, the permeability was obtained using a hydraulic consolidometer using either the Bishop type [2.5 in. (6.3 cm) diameter] or the Rowe type [6 in. (15.2 cm) diameter]. From oedometer tests, the preconsolidation pressures, &c in the vertically oriented samples were found to be generally larger than the horizontally oriented samples. Fig. 2 shows the preconsolidation pressure cr̂ , initial void ratio e0; CJ(\ + e0); and Cs/(1 + e0) determined from vertical samples plotted against depth together with the results of previous investigators. The coefficient of volume compressibility for both vertical (m„) and horizontal (mh) samples showed no prominent trend with respect to the sample orientation or depth. Both vertical (c„) and horizontal (c,,) coefficients of consolidation were determined by square root-time fitting methods with ch calculated from (6) at stress levels corresponding to K0 conditions. A typical plot on the variation of c„ and ch with effective pressure is shown in Fig. 3. Accordingly, c,, values are larger than c„ values as expected. Both indicated a drastic decrease with increasing effective pressure, becoming almost constant at higher stress levels starting from the point just after the preconsolidation pressure.
DRAIN INSTALLATION AND FULL-SCALE TEST EMBANKMENT
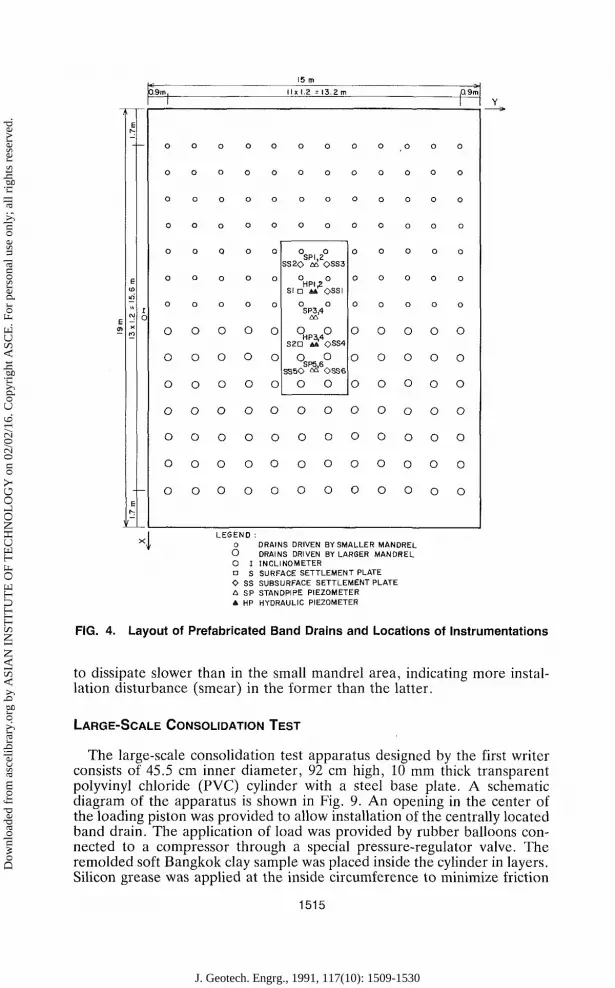
A total of 168 Alidrains with a cross-sectional dimension of 10 cm x 0.6 cm were installed to a depth of 8 m in a square pattern with 1.2 m center-to-center spacing. The layout of the drains is shown in Fig. 4. The installation was carried out by driving a small mandrel with outer dimensions of 4.5 cm x 15 cm in half of the embankment area and a large mandrel with 15 cm x 15 cm dimensions in the remaining half. An end shoe with the same size
1512
J. Geotech. Engrg., 1991, 117(10): 1509-1530
Dow
nloa
ded
from
asc
elib
rary
.org
by
ASI
AN
IN
STIT
UT
E O
F T
EC
HN
OL
OG
Y o
n 02
/02/
16. C
opyr
ight
ASC
E. F
or p
erso
nal u
se o
nly;
all
righ
ts r
eser
ved.

-2
-
-3
-
-5
-
-6-
PR
EC
0N8O
LID
AT
I0N
PR
ES
SU
RE
, o- c
(k
N/m
*
100 i_
20
0 I
Dl
*®@
30
0
MIN
.
\ Li U
TO
AIS
L
I M
AX
. fcG
tH
©
A
0 o a \7
10 :
AS
AK
AM
I (1
98
9)
MO
Y
(19
84
) H
O
(19
82
) A
SA
NIT
TO
NG
(1
98
0)
MU
KU
L(I
98
0)
PR
AP
AIT
RA
KU
L (
19
75
) K
AN
JAN
OP
HA
S
( 1
96
9)
INIT
IAL
VO
ID R
AT
IO,
t0
I 2
3
Cc
i + e
o 0
4
Cs
1 1
1
e m 0 @
8
• A
"f ^
<%
A
<%<7
• A
52
) ©
®
A
G
A
CD
•
A
0 0
®
^ D
A«
oo
a®
0
®
• °o
A
A
1 '
AS
• A®
e
A
^ 0%
®A
*•
0 A
m £
• A
A
©
e
. *
# •
.
.D-
D
^ 0
©
ClA
A
D
1—
1—
1 1
« A©
£
8 A @&
©
A
@
#0 gjo
A
A ®
% .
%
SA
©
A
A
FIG
. 2.
P
reco
nsol
idat
ion
Pre
ssur
e, In
itial
Voi
d R
atio
, CJ(
\ +
e0)
, an
d Q
/(1 +
e0)
Plo
tted
agai
nst
Dep
th
J. Geotech. Engrg., 1991, 117(10): 1509-1530
Dow
nloa
ded
from
asc
elib
rary
.org
by
ASI
AN
IN
STIT
UT
E O
F T
EC
HN
OL
OG
Y o
n 02
/02/
16. C
opyr
ight
ASC
E. F
or p
erso
nal u
se o
nly;
all
righ
ts r
eser
ved.
20
5 m DEPTH
D Cv SQUARE ROOT
O Ch SQUARE ROOT
\
1000
FIG. 3. c„ and ch Values with Effective Pressure
as the outer dimensions of the mandrel cross sections provided the anchorage of the drain. For additional anchorage, short steel rods bent at a 45° angle were welded at each corner of the shoe. Trenches of 1.5 m depth were made along the boundary of these two areas as well as at locations around the test embankment area. These trenches, however, were filled with compacted weathered clay. Fig. 5 shows the plan and sections of the test embankment. A 1.0 m thick drainage blanket composed of clean river sand was used as base layer of the test embankment. Figs. 4 and 6 show the locations of field instrumentations. A total of 12 AIT-type open standpipe and closed hydraulic piezometers were installed. In addition, two dummy piezometers were installed at 3 m and 6 m depths outside the test embankment area for reference. Altogether, two surface and six subsurface settlement plates were installed. Another surface settlement plate was placed beyond the influence of embankment loading to take into account the effect of ground subsidence. Finally, an SIS Geotechnica C412-type inclinometer casing was installed to a depth of 12 m (see Fig. 4) to measure the subsurface lateral deformation.
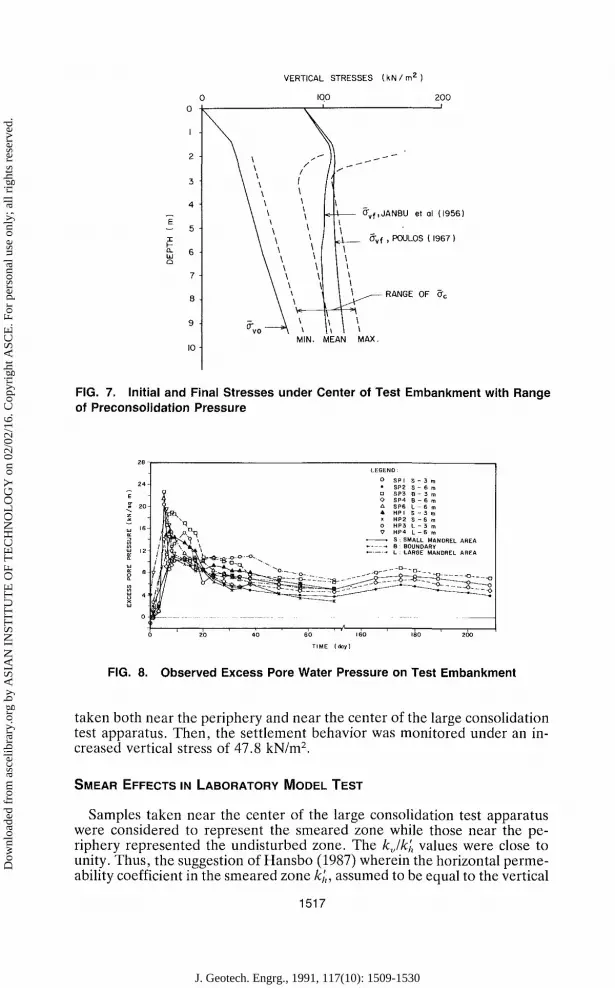
The stress distribution on the underlying ground due to the embankment load was determined by the method presented by Janbu et al. (1956) ass-suming a semi-infinite layer of soil mass and that presented by Poulos (1967) assuming a finite layer with rigid base. Chan (1983) analyzed the stress distribution using the finite-element method (FEM), and found a very close tendency toward the method of Poulos (1967) in both the vertical and horizontal directions. The calculation was carried out by dividing the embankment surcharge into five layers, with a unit weight of 17 kN/m3 each. Fig. 7 shows the initial and final stresses under the center line of the test embankment determined by both methods. For the upper part of the embankment, the two methods yielded close predictions; in the deeper portions, the method of Poulos (1967) yielded values approximately 35% higher than Janbu et al.'s (1956) method.
Pore pressure measurements in the field were facilitated by open stand-pipe and closed hydraulic piezometers. Fig. 8 shows the observed excess pore pressures. The excess pore pressure in the large mandrel area seems
PRESSURE ( k N / s q m)
1514
J. Geotech. Engrg., 1991, 117(10): 1509-1530
Dow
nloa
ded
from
asc
elib
rary
.org
by
ASI
AN
IN
STIT
UT
E O
F T
EC
HN
OL
OG
Y o
n 02
/02/
16. C
opyr
ight
ASC
E. F
or p
erso
nal u
se o
nly;
all
righ
ts r
eser
ved.
1
E en
E
E u> iri
C\J
=>
E
I o
X
0 . 9 m .
1
o
o
o
o
o
o
o
o
O
O
O
O
O
O
'
o
o
o
o
o
o
o
o
O
O
O
O
O
O
o
o
o
o
Q
o
o
o
O
O
O
O
O
O
O
O
O
O
O
O
O
o
o
o
O
O
O
O
LEGEND: 0
15 m
l l x l . 2 = 13.2m
O o o 0
O O O O
O O O O
O
o
o
o
o
o
o
O
O o
O O SPI.2
SS20 t& OSS3
O 0 HPI.2
SI D A» OSSI
O O SP3.4
O O HP3.4
S2D U OSS4
o o SP5.6
SS50 ca OSS6 O O
O O
0
0
0
0
O
O
O
O
O O O O
O O O O
O O O 0
DRAIN
o
o
o
o
o
o
o
o
O
O
O
O
O
O
o
o
o
o
o
o
o
o
O
O
O
O
O
O
S DRIVEN BY S M A L L E R M A N D R E L
o
o
o
o
o
o
o
o
O
O
O
O
O
O
,0.9m
1
0
o
o
o
0
o
o
o
O
O
O
O
O
O
Y
O DRAINS DRIVEN BY L A R G E R M A N D R E L
O I INCLINOMETER a S SURFACE SETTLEMENT PLATE <> SS SUBSURFACE SETTLEMENT PLATE fi SP STANDPIPE PIEZOMETER & HP HYDRAULIC PIEZOMETER
FIG. 4. Layout of Prefabricated Band Drains and Locations of Instrumentations
to dissipate slower than in the small mandrel area, indicating more installation disturbance (smear) in the former than the latter.
LARGE-SCALE CONSOLIDATION TEST
The large-scale consolidation test apparatus designed by the first writer consists of 45.5 cm inner diameter, 92 cm high, 10 mm thick transparent polyvinyl chloride (PVC) cylinder with a steel base plate. A schematic diagram of the apparatus is shown in Fig. 9. An opening in the center of the loading piston was provided to allow installation of the centrally located band drain. The application of load was provided by rubber balloons connected to a compressor through a special pressure-regulator valve. The remolded soft Bangkok clay sample was placed inside the cylinder in layers. Silicon grease was applied at the inside circumference to minimize friction
1515
J. Geotech. Engrg., 1991, 117(10): 1509-1530
Dow
nloa
ded
from
asc
elib
rary
.org
by
ASI
AN
IN
STIT
UT
E O
F T
EC
HN
OL
OG
Y o
n 02
/02/
16. C
opyr
ight
ASC
E. F
or p
erso
nal u
se o
nly;
all
righ
ts r
eser
ved.

FIG. 5. Plan and Sections of Test Embankment Showing Locations of Trenches
SP5 | HP3
FIG. 6. Longitudinal Section Showing Locations of Instrumentations
between the soil and the cylinder. A load of 10.2 kN/m2 was applied to reconstitute the remolded sample. When the estimated 90% consolidation was reached, a drain similar to that which was employed in the test embankment but with reduced dimensions of 4 cm x 0.60 cm was installed using a 6 cm x 6 cm mandrel. Specimens for laboratory tests were then
1516
J. Geotech. Engrg., 1991, 117(10): 1509-1530
Dow
nloa
ded
from
asc
elib
rary
.org
by
ASI
AN
IN
STIT
UT
E O
F T
EC
HN
OL
OG
Y o
n 02
/02/
16. C
opyr
ight
ASC
E. F
or p
erso
nal u
se o
nly;
all
righ
ts r
eser
ved.
VERTICAL STRESSES ( k N / m 2 )
100 200
MIN. MEAN MAX.
FIG. 7. Initial and Final Stresses under Center of Test Embankment with Range of Preconsolidation Pressure
2 4 -
2 0 -
I6-I
12
a
4
0 • i
/ /
/, i a ih
w5^-. W 'R
fLX^ ffi^\
- •
o
LEGEN0:
° SP1 S - 3 m • SP2 S - 6 m • SP3 B - 3 m O SP4 B - 6 m A SP6 L - 6 m 4 KPI S - 3 m i HP2 S - G m O HP3 L - 3 m V HP4 L - 6 m
• • S ; SMALL MANDREL AREA • > 8 : BOUNDARY ' • L : LARGE MANDREL AREA
'
FIG. 8. Observed Excess Pore Water Pressure on Test Embankment
taken both near the periphery and near the center of the large consolidation test apparatus. Then, the settlement behavior was monitored under an increased vertical stress of 47.8 kN/m2.
SMEAR EFFECTS IN LABORATORY MODEL TEST
Samples taken near the center of the large consolidation test apparatus were considered to represent the smeared zone while those near the periphery represented the undisturbed zone. The kjk'h values were close to unity. Thus, the suggestion of Hansbo (1987) wherein the horizontal permeability coefficient in the smeared zone k'h, assumed to be equal to the vertical
1517
J. Geotech. Engrg., 1991, 117(10): 1509-1530
Dow
nloa
ded
from
asc
elib
rary
.org
by
ASI
AN
IN
STIT
UT
E O
F T
EC
HN
OL
OG
Y o
n 02
/02/
16. C
opyr
ight
ASC
E. F
or p
erso
nal u
se o
nly;
all
righ
ts r
eser
ved.

FIG. 9. Schematic of Large-Scale Consolidation Test Apparatus
permeability coefficient kv in the undisturbed zone, was confirmed. The horizontal arid vertical permeability coefficients from the samples taken from the smeared and undisturbed zones indicated smaller values in the smeared zone than in the undisturbed zone. Furthermore, the horizontal permeability coefficient of undisturbed zone to the smeared zone ranged between 1.5 and 2.0, with an average value of 1.75. This ratio together with the ch value of about 1.5 m2/year, determined from oedometer test as shown in Fig. 10, was used to calculate the time-settlement relationship with the smear effect based on the solution of Hansbo (1981). It must be noted, however, that according to the assumption of Hansbo (1987), the diameter of the smeared zone (ds) was twice the equivalent diameter of the mandrel (dm). The time-settlement relationship was investigated considering the effect of smear at different values of khlk',„ ds, and c,, by plotting theoretical time-settlement relationship curves corresponding to five different values of ch (at 1.00, 1.25, 1.50, 1.75, and 2.00 m2/year) with certain values of k,Jk'h, as shown, typically, in Fig. 11 together with the observed time-settlement curve. It was found that for homogeneous soil, khlk'h does not have much affect when its value varies from 1.5 to 2.0. Also, the observed time-settlement curve was found to fit with the theoretical curve when d, = 2dm with ch equals 1.25 m2/year at the final stage of consolidation. Using khlkh = 1.75 and ds = 2dm, the c,, values back-calculated by the methods of Asaoka (1978) and Hansbo (1987) were found to be 1.32 m2/year and 1.39 m2/year, respectively. In Asaoka's method, the ch value is back-calculated using the following expression:
c->' + FJT (8)
1518
J. Geotech. Engrg., 1991, 117(10): 1509-1530
Dow
nloa
ded
from
asc
elib
rary
.org
by
ASI
AN
IN
STIT
UT
E O
F T
EC
HN
OL
OG
Y o
n 02
/02/
16. C
opyr
ight
ASC
E. F
or p
erso
nal u
se o
nly;
all
righ
ts r
eser
ved.

9 4-
% °c °vf
LEGEND :
® SMEARED :Vert ical
o : Horizontal m UNDISTURB : Vert ical a : Horizontal
LABORATORY
10 100
EFFECTIVE VERTICAL PRESSURE (kN/m 2 )
1000
FIG. 10. Coefficients of Consolidation from Oedometer Tests of Large-Scale Consolidation Test Samples with Effective Pressure
LABORATORY
k h / k h ' = I .75, d s = 2 d m
(BACK-CALCULATED Ch
BY ASAOKAS METHOD) BACK-CALCULATED Ch -BY HANSBO'S METHOD)
1.32 sq.m/yr
1.39 sq m/yr
1.00 sq m/yr
OBSERVED CURVE
60 80 (THOUSANDS) TIME ( M I N I
IO0 120
FIG. 11. Comparison of Observed and Calculated Settlement Rate
where $v = slope of the fitted line; and dt = time interval. On the other hand, in Hansbo's method, ch is back-calculated from (4) when Uh = 0.90. It was found that the back-calculated curves using both methods are in agreement with the observed curve, with slight discrepancies at earlier stages, which may be attributed to the fact that ch values vary with the change in effective stress as the consolidation process proceeds.
The diameter of the smeared zone was verified by comparing the ch values determined by the oedometer test with back-calculated ch values using a different ds and variable ch. When both the laboratory-determined and back-calculated ch values using a particular value of ds reasonably coincide, the extent of the smeared zone is then defined. Numerical methods may be
1519
J. Geotech. Engrg., 1991, 117(10): 1509-1530
Dow
nloa
ded
from
asc
elib
rary
.org
by
ASI
AN
IN
STIT
UT
E O
F T
EC
HN
OL
OG
Y o
n 02
/02/
16. C
opyr
ight
ASC
E. F
or p
erso
nal u
se o
nly;
all
righ
ts r
eser
ved.

required to consider variable c,, values. However, in this study, a simpler, hand calculation method is suggested. First, the excess pore water pressure is assumed to be equal along a certain horizontal section. Thus, the effective stresses and the corresponding ch values are assumed to be constant over this section. This assumption may be inadequate, but it is better than that with a constant ch value throughout the consolidation process. Consequently, a proposed procedure is made by assuming a constant ch value from a certain degree of consolidation, Ui_1 at any time, ?,-_!, to Ut corresponding to time th Fig. 12 shows the time versus degree of consolidation curve using Hansbo's (1987) solution (theoretical curve) together with the observed curve of the large-scale consolidation test indicating that the two curves are parallel to each other, at least between U^x and £/,-. The theoretical curve can then be shifted to fit the observed curve, as illustrated in Fig. 12, to back-calculate the ch values from the observed values corresponding to the degree of consolidation between Uj_x and £/,-. The following relationship can then be deduced based on Fig. 12:
t, = t a - (t„ ~ f,_,) (9)
where ta and tb denote time in the theoretical curve corresponding to U,- and £/,•_!, respectively. Substituting (4) and (7) into (8), we obtain
^i,^ + F^T^ D2 1
U, 8c. U,. .(10)
Therefore
cM
Dl 8(f, ~ t,^)
(F„ + F,) In 1 - I], 1 U,
(11)
When ?,-_i = 0, (10) is the same as (4); and when ti__l = 0, t, = t, and Cj = {Dy&ch,)(F„ + Fs), (11) is similar to but of a different form than the
LABORATORY
THEORETICAL CURVE
PARALLEL TO OBSERVED CURVE
BETWEEN U i _ i AND U j IS SHIFTED
TO FIT OBSERVED CURVE
FIG. 12. Observed and Theoretical Degree of Consolidation-Time Relationships of Large- Scale Consolidation Test
1520
J. Geotech. Engrg., 1991, 117(10): 1509-1530
Dow
nloa
ded
from
asc
elib
rary
.org
by
ASI
AN
IN
STIT
UT
E O
F T
EC
HN
OL
OG
Y o
n 02
/02/
16. C
opyr
ight
ASC
E. F
or p
erso
nal u
se o
nly;
all
righ
ts r
eser
ved.

observational settlement prediction method proposed by Asaoka (1978) wherein back-calculation was extensively used.
The back-calculations were carried out for different c,, values with every 10% increment of degree of consolidation corresponding to ds = 3dm; ds = 2dm; and ds = d„„ with khlk'h equal to an average value of 1.75. The results are shown in Fig. 13 together with those obtained from the oedometer test and with those back-calculated from the method of Asaoka (1978). The C/, values seem to confirm the consolidation behavior at high effective pressure; and those values calculated using the ds = 3d,,, relation are relatively close with those obtained from oedometer test. However, the friction between the soil and the cylinder possibly retards the rate of settlement. A higher back-calculated ch would result if there were no side friction. Therefore, the diameter of smeared zone at three times the equivalent mandrel diameter seems to be large, and an assumption that the diameter of the smeared zone is twice the equivalent mandrel diameter would be more appropriate.
SMEAR EFFECTS IN FULL-SCALE FIELD TEST
The settlement behavior (Fig. 14) monitored on the subsoil of the full-scale test embankment showed a faster settlement rate in the small mandrel area than in the large mandrel area, indicating a smaller smeared zone in the former than the latter. Slightly lower compression was also observed in the large mandrel area, which probably resulted from a larger smeared zone. The calculated settlement rates using the soil parameters from the reconstituted clay samples in the laboratory underpredicted the observed values. This is obviously attributed to the much lower laboratory-determined values of khlk'h and ch of the "homogeneous" reconstituted specimen compared to the corresponding actual values in the field. A graph, as shown in Fig. 15, was used to investigate the magnitudes of khlk'h and ch values between the large and small mandrel areas. The ch values are back-calculated corresponding to kh/k'h values using the method of Asaoka (1978) as in (8) with ds assumed to be equal to 2d,„. Assuming the same degree of disturbance
i 0
r •
\ °c VI __-_
LEGEND:
d 8 = 3 d m
<U=2<fm
— <S»=<!m
OBTAINED FROM OEDOMETER TEST
/ BY GRAPHICAL METHOD / °V, OF ASAOKA (1978)
_._-~___-̂._ *
10 100
EFFECTIVE VERTICAL PRESSURE U N / m 2 )
FIG. 13. Variation of Back-Calculated c,, Values with Effective Pressure
1521
J. Geotech. Engrg., 1991, 117(10): 1509-1530
Dow
nloa
ded
from
asc
elib
rary
.org
by
ASI
AN
IN
STIT
UT
E O
F T
EC
HN
OL
OG
Y o
n 02
/02/
16. C
opyr
ight
ASC
E. F
or p
erso
nal u
se o
nly;
all
righ
ts r
eser
ved.

2.0 m - SMALL MANDREL AREA 5.0 m - S M A L L MANDREL AREA 8.0 m - SMALL MANDREL AREA 2.0 m - LARGE MANDREL AREA 5.0 m - LARGE MANDREL AREA 8.0 m - LARGE MANDREL AREA
120 160
TIME (DAYS)
FIG. 14. Observed Time-Settlement Relationships of Test Embankment
B -i
7 -
6 -
5 -
4 -
3 -
2 -
'
FIELD
/ / LARGE MANDREL AREA , / /
/ /
/ /
/ /
/ /
/ / V / / ^ \ SMALL MANDREL AREA
0 2 4 6 8 10 12 14 16
C h ( m2/yr )
FIG. 15. Back- Calculated Sets of KJK',, and ch Values Assuming ds = 2d„,
occured during drain installation using different sizes of mandrel, then the magnitudes of k,Jk'h in the large and small mandrel areas would be equal. However, the zone of disturbance is larger in the large mandrel area. Hence, the result of the back-calculated c,, value in the large mandrel area is less than that of the small mandrel area. This clearly indicates the influence of the mandrel size to the horizontal coefficient of consolidation and the extent of the smeared zone.
SETTLEMENT ANALYSIS
The settlement of the soil sample in the laboratory large-scale consolidation test apparatus was observed for 68 days. Based on this observation,
1522
J. Geotech. Engrg., 1991, 117(10): 1509-1530
Dow
nloa
ded
from
asc
elib
rary
.org
by
ASI
AN
IN
STIT
UT
E O
F T
EC
HN
OL
OG
Y o
n 02
/02/
16. C
opyr
ight
ASC
E. F
or p
erso
nal u
se o
nly;
all
righ
ts r
eser
ved.

a final settlement of 8.10 cm was predicted using the graphical method of Asaoka (1978). An initial settlement of about 1.0 cm was estimated from the laboratory settlement curve using the square root-time fitting method. Consequently, the predicted consolidation settlement was about 7.10 cm. The consolidation settlement of about 13.20 cm was calculated by the conventional one-dimensional method using the soil parameters from the oedometer test results as tabulated in Table 1. The observed settlement was found to be smaller than the calculated value. This is attributed to the side friction between the soil sample and the cylinder (Nakase 1963; Hansbo 1960). The consolidation curves verified this assumption by indicating lower preconsolidation pressure for reconstituted samples taken from the mid-height of the cylinder compared to the corresponding sample from the top.
In the full-scale test embankment, the compression of the topmost 2 m thick, weathered clay subsoil seemed to have almost finished during the test embankment construction period. Hence, further settlement calculations were carried out only in the underlying soft clay layer assuming the stiff clay layer to be a rigid layer. The immediate settlement in the field, assumed to occur only during the construction period of five days, was calculated based on elastic theory using the method of Janbu et al. (1956) with the modified chart presented by Christian and Carrier (1978). Table 2 shows the calculated and observed immediate settlements. The values of undrained Young's modulus Eu were calculated by the correlation Eu = 145 Suv presented by Bergado and Khaleque (1986). Yielding was taken into account according to the correction factor of 0.90 determined using the method of D'Appolonia et al. (1971). The primary consolidation settlement tabulated
TABLE 1. Soil Parameters from Oedometer Tests
Parameter
(1)
Sample height Unit weight Compression index Swell index Initial void ratio Preconsolidation pressure Initial stress Applied stress
(2)
H
y
cc c, e0
uc
°M ACT
Quantity (3)
72.8 cm 14.7 kN/m3
0.80 0.13 2.31 12 kN/m2
1.71 kN/m2
47.8 kN/m2
TABLE 2. Predicted and Observed Immediate Settlements in Full-Scale Test Embankment
Depth (m)
(D 2 5 8
Predicted
Settlement (cm) (2)
6.6 3.0 0.4
Settlement yielding
considered (cm) (3)
7.3 3.3 0.4
Observed
Small mandrel
zone (cm) (4)
4.3 4,2 0.7
Large mandrel
zone (cm) (5)
4.1 4.0 0.6
1523
J. Geotech. Engrg., 1991, 117(10): 1509-1530
Dow
nloa
ded
from
asc
elib
rary
.org
by
ASI
AN
IN
STIT
UT
E O
F T
EC
HN
OL
OG
Y o
n 02
/02/
16. C
opyr
ight
ASC
E. F
or p
erso
nal u
se o
nly;
all
righ
ts r
eser
ved.

in Tables 3 and 4 was determined using the one-dimensional consolidation method and the method of Skempton and Bjerrum (1957), respectively, with the influence of three preconsolidation pressures (namely minimum, mean, and maximum values) taken into consideration. For the one-dimensional method, the stress distribution was estimated using the methods of Janbu et al. (1956) and Poulos (1967); and the pore pressure parameter (̂ 4) used for the Skempton-Bjerrum method was determined statistically from the work of Tsai (1982). The total settlements calculated using the aforementioned methods and neglecting the secondary compression were shown in Table 5 together with the result from the method of Asaoka (1978) based on the initial settlement observations for a period of 60 days after the embankment construction, as shown in Fig. 16.
The time at which 90% consolidation would occur was predicted by Hans-bo's (1987) method and by Asaoka's method, as shown in Table 6 wherein
TABLE 3. Predicted Primary Consolidation Settlements in Full-Scale Test Em bankment Using One-Dimensional Method
Depth (m)
(1)
2
5
8
PRECONSOLIDATION PRESSURE STRESS DISTRIBUTION
Minimum
Janbu et al.
(1956)
(cm)
(2)
66.9
28.2
6.7,
Poulos (1967)
(cm)
(3)
79.6
37.0
9.8
Mean
Janbu et al.
(1956)
(cm)
(4)
25.9
8.7
1.6
Poulos (1967)
(cm)
(5)
38.4
17.3
4.5
Maximum
Janbu et al. (1956) (cm)
(6)
14.4
6.4
1.6
Poulos (1967)
(cm)
(7)
16.5
7.7
2.1
TABLE 4. Predicted Primary Consolidation Settlements in Full-Scale Test Embankment Using Skempton and Bjerrum (1957) Method
Depth (m) (1)
2 5 8
Preconsolidation Pressure
Minimum (cm) (2)
53.4 28.8 8.5
Mean (cm) (3)
28.4 13.3 3.8
Maximum (cm) (4)
9.1 5.3 1.7
TABLE 5. Predicted Total Settlements in Full-Scale Test Embankment
Depth (m) (1)
2 5 8
Minimum
(Janbu etal. 1956) (cm)
74.2 31.5 7.2
(Poulos 1967) (cm)
86.9 40.3 10.3
Preconsolidation pressure stress distribution
ONE-DIMENSIONAL
Mean
(Janbu etal. 1956) (cm)
33.2 12.0 2.1
(Poulos 1967) (cm)
45.7 20.6 5.0
Maximum
(Janbu etal. 1956) (cm)
21.7 17.7 2.1
(Poulos 1967) (cm)
23.8 19.8 2.6
Skempto
Minimum (Poulos 1967) (cm)
60.7 32.2 9,0
I and Bjerrum (1957)
Mean (Poulos 1967) (cm)
35.7 16.6 4.3
Maximum (Poulos 1967) (cm)
16.4 12.4 2.3
Asao (197S (cm
29.0
1524
J. Geotech. Engrg., 1991, 117(10): 1509-1530
Dow
nloa
ded
from
asc
elib
rary
.org
by
ASI
AN
IN
STIT
UT
E O
F T
EC
HN
OL
OG
Y o
n 02
/02/
16. C
opyr
ight
ASC
E. F
or p
erso
nal u
se o
nly;
all
righ
ts r
eser
ved.

30
A t = 10 DAYS
ji, = 0.85
p, = 0.91
CONSOLIDATION ,
/J = 0.84
-/5. - 0.91
LEGEND : • SMALL MANDREL AREA m LARGE MANDREL AREA
FIG. 16. Predicted Total Settlement of Test Embankment Based on Asaoka's (1978) Method
TABLE 6.
Hansbo (1987) Ch using (11)
Small mandrel
area (days) (1)
147
Large mandrel
area (days) (2)
176
Predicted Time of 90% Consolidation
ASAOKA(1978)
C,, using (8)
Small mandrel
area (days) (3)
137
Large mandrel
area (days) (4)
249
C„ using (12)
Small mandrel
area (days) (6)
121
Large mandrel
area (days) (7)
166
constant ch values were being used. In Hansbo's method, the ch value was determined using (11) with the degree of consolidation between 53% and 60% in the large mandrel area and between 66% and 72% in the small mandrel area. In Asaoka's method, two cases were considered; namely one in which ch was determined from (8) and another in which ch was determined corresponding to a degree of consolidation of 60% for a large and 72% for a small mandrel area using the following expression used by Magnan et al. (1983):
ch= ~ f f ( ^ + Fs)ln(l - U„) (12)
1525
J. Geotech. Engrg., 1991, 117(10): 1509-1530
Dow
nloa
ded
from
asc
elib
rary
.org
by
ASI
AN
IN
STIT
UT
E O
F T
EC
HN
OL
OG
Y o
n 02
/02/
16. C
opyr
ight
ASC
E. F
or p
erso
nal u
se o
nly;
all
righ
ts r
eser
ved.
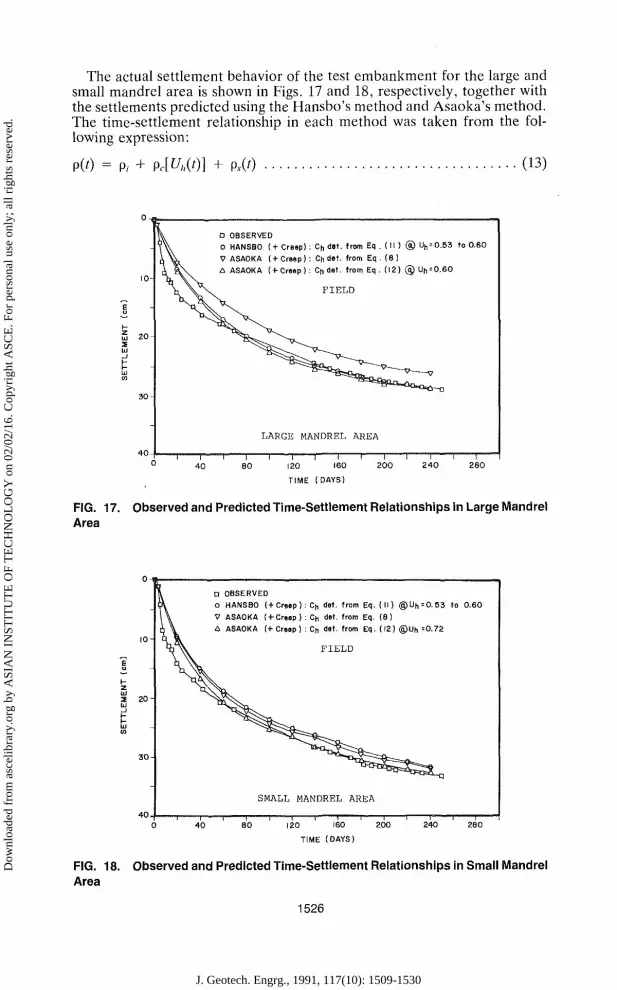
The actual settlement behavior of the test embankment for the large and small mandrel area is shown in Figs. 17 and 18, respectively, together with the settlements predicted using the Hansbo's method and Asaoka's method. The time-settlement relationship in each method was taken from the following expression:
p(') = p, + Pc[u„(i)] + p,(0 (13)
FIG. 17. Observed and Predicted Time-Settlement Relationships in Large Mandrel Area
TIME (DAYS)
FIG. 18. Observed and Predicted Time-Settlement Relationships in Small Mandrel Area
1526
J. Geotech. Engrg., 1991, 117(10): 1509-1530
Dow
nloa
ded
from
asc
elib
rary
.org
by
ASI
AN
IN
STIT
UT
E O
F T
EC
HN
OL
OG
Y o
n 02
/02/
16. C
opyr
ight
ASC
E. F
or p
erso
nal u
se o
nly;
all
righ
ts r
eser
ved.

and
UM - * - ^-mrrvl (14)
where p(t) = settlement at any time t; p, = immediate settlement; pc = final primary consolidation settlement; and ps(t) = secondary settlement at any time t. Secondary settlement was added to the predicted immediate and primary consolidation settlements only after an estimated 90% consolidation occurred. The secondary settlement at any time was determined using Asao-ka's (1978) method defined by the following (Magnan and Deroy 1980; Magnan et al. 1983):
P,(0 = P,[l ~ exp(M] (15)
and
K= ~^T (16)
where p,. = final secondary settlement; and (32 = second straight line of the Asaoka's graphical construction (see Fig. 16), which corresponds to the tail of the settlement curve.
If a constant ch value throughout the consolidation process were assumed and back-calculated from the early stage of consolidation, the theoretical curves would not coincide with the observed curve; because the ch values indeed vary with time. However, when constant ch was derived from the later stage of consolidation, the calculated settlement rate was closer to the observed values except for the case in the large mandrel area, where the c,, value was back-calculated based on the initial observed settlements using the Asaoka's method. With Asaoka's method, good predictions are usually possible after 60% consolidation has been achieved.
CONCLUSIONS
Smear effects were found to be important factors in evaluating the settlement rate when vertical drains are employed.
By back-calculation based on the observed time-settlement relationship of the laboratory large-scale consolidation test, the diameter of the smeared zone can be assumed to be twice the equivalent mandrel diameter ds = 2dm\ and the horizontal permeability coefficient in the smeared zone k'h was approximated to be equal to the vertical permeability coefficient in the undisturbed zone k„.
In the field, a faster settlement rate and slightly higher compression were observed in the small mandrel area than in the large mandrel area, indicating a smaller smeared zone in the former than in the latter. The back-calculated ch was found to be smaller in the large mandrel area than in the small mandrel area.
The total settlement prediction of the test embankment using the methods of Asaoka (1978) and Skempton and Bjerrum (1957) with stress distribution by Poulos (1967) yielded reasonable agreement with the observed values. A more accurate settlement rate can be predicted from the method of Asaoka (1978) when 60% consolidation has been attained.
1527
J. Geotech. Engrg., 1991, 117(10): 1509-1530
Dow
nloa
ded
from
asc
elib
rary
.org
by
ASI
AN
IN
STIT
UT
E O
F T
EC
HN
OL
OG
Y o
n 02
/02/
16. C
opyr
ight
ASC
E. F
or p
erso
nal u
se o
nly;
all
righ
ts r
eser
ved.

APPENDIX I. REFERENCES
Ahmed, M. M. (1977). "Determination of permeability profile of soft Rangsit clay by field and laboratory tests," thesis presented to the Asian Institute of Technology, at Bangkok, Thailand, in partial fulfillment of the requirements for the degree of Master of Engineering.
Asakami, H. (1989). "The smear effect of vertical band drains," thesis presented to the Asian Institute of Technology, at Bangkok, Thailand, in partial fulfillment of the requirements for the degree of Master of Engineering.
Asanittong, P. (1980). "Effects of displacement-type sand drain installation on the shear and compressibility parameter of soft Bangkok clay," thesis presented to the Asian Institute of Technology, at Bangkok, Thailand, in partial fulfillment of the requirements for the degree of Master of Engineering.
Asaoka, A. (1978). "Observational procedure of settlement prediction." Soils and Found., 18(4), 87-101.
Barron, R. A. (1948). "Consolidation of fine-grained soils by drain wells." Trans. ASCE: Paper No. 2346, ASCE, New York, N.Y., 718-754.
Bergado, D. T., Nutalaya, P., Balasubramaniam, A. S., Apaipong, W., Chang, C. C , and Khaw, L. G. (1988). "Causes, effects and predictions of land subsidence in AIT campus, Thailand." Bulletin Assoc. Engrg. Geol. America, 25(1), 57-81.
Bergado, D. T., and Khaleque, M. A. (1986). "Correlations of LLT pressuremeter, vane, and Dutch cone tests in Bangkok marine clay, Thailand." Proc. 2nd Symp. on the Pressuremeter and its Marine Applications, Texas A&M University, College Station, Tex.
Chan, J. Y. (1983). "Analyses of settlement of an embankment on soft Bangkok clay in AIT campus," thesis presented to the Asian Institute of Technology, at Bangkok, Thailand, in partial fulfillment of the requirements for the degree of Master of Engineering.
Christian, J. T., and Carrier, W. D., III. (1978). "Janbu, Bjerrum, and Kjaernsli's chart reinterpreted." Canadian Geotech. J., 15(1), 123-128.
D'Appolonia, D. J., Poulos, H. G., and Ladd, C. C. (1971). "Initial settlement of structure on clay." /. Soil Mech. Found. Engrg., ASCE, 97(10), 1359-1377.
Hansbo, S. (1960). "Consolidation of clay with special reference to influence of vertical sand drains." Proc, No. 18, Swedish Geotech. Inst., Linkoping, Sweden.
Hansbo, S. (1979). "Consolidation of clay by band shaped prefabricated drains." Ground Engrg., 12(5), 16-25.
Hansbo, S. (1981). "Consolidation of fine-grained soils by prefabricated drains," Paper 12/22: Proc, 10th Intl. Conf. Soil Mech. Found. Engrg., Stockholm, Sweden.
Hansbo, S. (1987). "Design aspects of vertical drains and lime column installation." Proc, 9th Southeast Asian Geotech. Conf., Bangkok, Thailand, 8-1-8-12.
Ho, Y. C. (1982). "Mechanical behavior of a trial embankment on Bangkok clay," thesis presented to the Asian Institute of Technology, at Bangkok, Thailand, in partial fulfillment of the requirements for the degree of Master of Engineering.
Jamshed, A. D. (1975). "Insitu and laboratory permeability of Bangkok clay at Nong Ngoo Hao and Rangsit," thesis presented to the Asian Institute of Technology, at Bangkok, Thailand, in partial fulfillment of the requirements for the degree of Master of Engineering.
Janbu, N., Bjerrum, L., and Kjaernsli, B. (1956). "Veileduing ved losning av fun-damenteringsoppgaver" (in Norwegian). Pub. No. 16., Norwegian Geotech. Inst., Oslo, Norway.
Kanjanophas, S. (1969).''Compressibility of Bangkok clay in weathered zone,'' thesis presented to the Asian Institute of Technology, at Bangkok, Thailand, in partial fulfillment of the requirements for the degree of Master of Engineering.
Kjellman, W. (1948). "Accelerating consolidation of fine-grained soils by means of cardboard wicks." Proc, 2nd Int. Conf. Soil Mech. Found. Engrg., Gebr. Kees-maat, The Netherlands, 2, 302-305.
Magnan, J. P., Pilot, G., andQueyroi, D. (1983). "Back-analysis of soil consolidation around vertical drains." Proc, 8th European Conf. Soil Mech. Found. Engrg., 2, 653-658.
1528
J. Geotech. Engrg., 1991, 117(10): 1509-1530
Dow
nloa
ded
from
asc
elib
rary
.org
by
ASI
AN
IN
STIT
UT
E O
F T
EC
HN
OL
OG
Y o
n 02
/02/
16. C
opyr
ight
ASC
E. F
or p
erso
nal u
se o
nly;
all
righ
ts r
eser
ved.

Magnan, J. P., and Deroy, J. M. (1980). "Analyse graphique des tassements observes sous les ouvrages." Bull. Llais. Lab. Ponts Chauss. (in French), Paris, France, 109, 45-52.
Moy, W. Y. (1984). "Properties of subsoil related to the stability and settlement of AIT test embankment," thesis presented to the Asian Institute of Technology, at Bangkok, Thailand, in partial fulfillment of the requirements for the degree of Master of Engineering.
Mukul, M. M. R. (1980). "Settlement characteristics of test embankment on soft clay foundation with and without sand drain," thesis presented to the Asian Institute of Technology, at Bangkok, Thailand, in partial fulfillment of the requirements for the degree of Master of Engineering.
Nakase, A. (1963). "Side friction in conventional consolidation test." Report No. 1, Port and Harbour Tech. Research Inst., Yokohama, Japan.
Poulos, H. G. (1967). "Stresses and displacements in an elastic layer underlain by a rough rigid base." Geotechnique, London, England, 17(4), 378-410.
Prapaitrakiil, N. (1975). "Settlement of friction piles on soft Bangkok clay," thesis presented to the Asian Institute of Technology, at Bangkok, Thailand, in partial fulfillment of the requirements for the degree of Master of Engineering.
Rixner, J. J., Kraemer, S. R., and Smith, A. D. (1986). "Prefabricated vertical drains." FWHAIRD-861168, Federal Highway Administration, Washington, D.C.
Skempton, A. W., andBjerrum, L. (1957). "A contribution to the settlement analysis of foundations on clay." Geotechnique, London, England, (7), 168-178.
Tsai, C. Y. (1982). "A monograph on the engineering properties of Bangkok subsoil," thesis presented to the Asian Institute of Technology, at Bangkok, Thailand, in partial fulfillment of the requirements for the degree of Master of Engineering.
APPENDIX II. NOTATION
The following symbols are used in this paper:
a = thickness of prefabricated band drain; b = width of prefabricated band drain;
Cc = compression index; Cs = swelling index; ch — horizontal coefficient of consolidation; cv = vertical coefficient of consolidation;
De = diameter of equivalent cylinder of soil influencing each drain; d = equivalent diameter of prefabricated band drain;
dm = equivalent diameter of mandrel; ds = diameter of smeared zone; dt = time interval;
Eu = undrained Young's modulus; e0 = initial void ratio; F„ = drain spacing factor; Fr = well-resistance factor; Fs = smear factor; H = sample height; k'h = horizontal permeability coefficient in smeared zone; kh = horizontal permeability coefficient in undisturbed zone; kv = vertical permeability coefficient in undisturbed zone;
mh = coefficient of volume compressibility for horizontally oriented samples;
mv = coefficient of volume compressibility for vertically oriented samples; n = spacing ratio;
1529
J. Geotech. Engrg., 1991, 117(10): 1509-1530
Dow
nloa
ded
from
asc
elib
rary
.org
by
ASI
AN
IN
STIT
UT
E O
F T
EC
HN
OL
OG
Y o
n 02
/02/
16. C
opyr
ight
ASC
E. F
or p
erso
nal u
se o
nly;
all
righ
ts r
eser
ved.

radial distance; spacing of prefabricated band drain; undrained vane shear strength; time; average degree of consolidation; excess pore water pressure; depth; slope of fitted line in Asaoka's (1978) method; factor equal to In $ldt; total settlement; primary consolidation settlement; immediate settlement; secondary consolidation settlement; preconsolidation pressure; effective overburden pressure; and final effective vertical pressure.
1530
J. Geotech. Engrg., 1991, 117(10): 1509-1530
Dow
nloa
ded
from
asc
elib
rary
.org
by
ASI
AN
IN
STIT
UT
E O
F T
EC
HN
OL
OG
Y o
n 02
/02/
16. C
opyr
ight
ASC
E. F
or p
erso
nal u
se o
nly;
all
righ
ts r
eser
ved.


