Embed Size (px)
Citation preview

www.EngineeringBooksPDF.com
Advance Praise for
Smart Power
“Smart Power paints a sharp picture of the historic challenges facing the utility
industry, its regulators, and the nation at large. Peter Fox-Penner’s urgent call for
a bottoms-up solution relying on local, state, and regional cooperation and cre-
ativity presages the work now ongoing across the country. Smart Power is an es-
sential read for policy makers looking for workable solutions for the next decade
and beyond.”
—Charles Gray, Executive Director of the National Association of
Regulatory Commissioners
“An absolutely terrific piece of work—remarkable scope and depth, while re-
maining accessible and pragmatic.”
—John Kwoka, Finnegan Professor of Economics, Northeastern University
“In Smart Power, Mr. Fox-Penner provides a valuable and insightful analysis of
where the U.S. electric power industry is headed and what it must do to success-
fully transition to a low-carbon environment. He recognizes that technology will
transform a centralized, passive power system into one that is dynamic, interac-
tive, and increasingly customer-centric. To succeed in this new framework, he
persuasively argues that the industry must add value by providing least-cost en-
ergy services, including energy efficiency. In the case of the investor-owned seg-
ment of the industry this will require a fundamental restructuring of investment
incentives by regulators. The public and cooperative sectors are better positioned,
since their business model provides ample incentive to deliver least-cost energy
solutions to their customer-owners. This book should be required reading for
all industry regulators as they prepare to confront the challenges of this new
paradigm.”
—Mark Crisson, Chief Executive Officer of the American Public Power Association
www.EngineeringBooksPDF.com
“Few economist/engineers understand the electricity system as well as Peter Fox-
Penner, and far fewer can explain it as lucidly.Whether or not you agree with
every detail, his vision of the opportunities, risks, uncertainties, and tipping
points of this vast and crucial industry is powerful and provocative.”
—Amory B. Lovins, Chairman and Chief Scientist, Rocky Mountain Institute
“This book provides a thoughtful vision of the opportunities for the electric
power industry to make use of new organizational and regulatory frameworks
and new technologies so that it can successfully adapt to climate change, energy
security, and economic efficiency challenges in the twenty-first century.”
—Paul Joskow, President of the Alfred P. Sloan Foundation
“If you’re serious about policies that place energy efficiency on a level playing
field with new energy supplies, and energy policy generally, this book is essential
reading.”
—Art Rosenfeld, former Commissioner of the California Energy Commission
“Smart Power is the most advanced look at how climate policies will change our
energy utilities, from power sources to operations to business models. It’s a must
read for anyone serious about climate solutions.”
—Joe Romm, Editor of ClimateProgress.org and Senior Fellow at the
Center for American Progress
“An excellent treatment of the critical issues facing the electricity industry.”
—Thomas R. Kuhn, President of the Edison Electric Institute
www.EngineeringBooksPDF.com

www.EngineeringBooksPDF.com

Smart Power
www.EngineeringBooksPDF.com

www.EngineeringBooksPDF.com
Smart PowerClimate Change, the Smart Grid,and the Future of Electric Utilities
Peter Fox-Penner
Washington | Covelo | London
www.EngineeringBooksPDF.com
Copyright © 2010 Peter Fox-Penner
All rights reserved under International and Pan-American Copyright Conventions. No
part of this book may be reproduced in any form or by any means without permission in
writing from the publisher: Island Press, Suite 300, 1718 Connecticut Ave., NW,Washing-
ton, DC 20009
ISLAND PRESS is a trademark of The Center for Resource Economics.
Library of Congress Cataloging-in-Publication Data
Fox-Penner, Peter S., 1955–
Smart power : climate change, the smart grid, and the future of electric utilities / Peter
Fox-Penner.
p. cm.
Includes bibliographical references and index.
ISBN 978-1-59726-705-2 (cloth : alk. paper)— ISBN 978-1-59726-706-9 (pbk. : alk.
paper)
1. Electric utilities—Deregulation—United States. 2. Electric power distribution—United
States. 3. Power resources—United States. I. Title.
HD9685.U5F6144 2010
333.793′20973—dc22 2010002239
Typesetting by KarenWenk
Printed on recycled, acid-free paper
Manufactured in the United States of America
10 9 8 7 6 5 4 3 2 1
www.EngineeringBooksPDF.com
ix
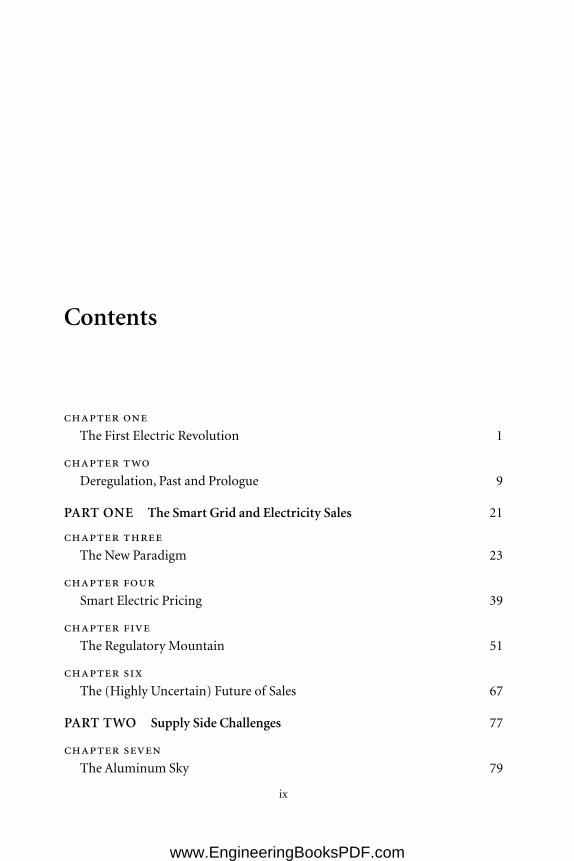
Contents
chapter one
The First Electric Revolution 1
chapter two
Deregulation, Past and Prologue 9
PART ONE The Smart Grid and Electricity Sales 21
chapter three
The New Paradigm 23
chapter four
Smart Electric Pricing 39
chapter five
The Regulatory Mountain 51
chapter six
The (Highly Uncertain) Future of Sales 67
PART TWO Supply Side Challenges 77
chapter seven
The Aluminum Sky 79
www.EngineeringBooksPDF.com
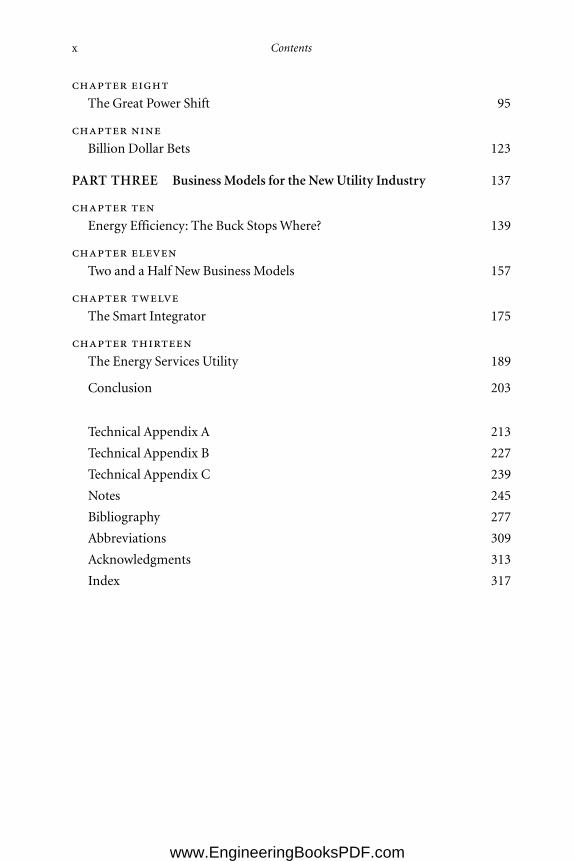
x Contents
chapter eight
The Great Power Shift 95
chapter nine
Billion Dollar Bets 123
PART THREE Business Models for the New Utility Industry 137
chapter ten
Energy Efficiency: The Buck StopsWhere? 139
chapter eleven
Two and a Half New Business Models 157
chapter twelve
The Smart Integrator 175
chapter thirteen
The Energy Services Utility 189
Conclusion 203
Technical Appendix A 213
Technical Appendix B 227
Technical Appendix C 239
Notes 245
Bibliography 277
Abbreviations 309
Acknowledgments 313
Index 317
www.EngineeringBooksPDF.com

Smart Power
www.EngineeringBooksPDF.com

www.EngineeringBooksPDF.com
chapter one
The First Electric Revolution
IN 1885, Muncie, Indiana, was a typical midwestern city. The rhythms of the
city were set by the sun and the canter of horses pulling wagonloads in from
the surrounding farms. The largest factory belonged to the Ball brothers, mak-
ers of the much beloved canning jars. By night, the city’s only light came from
smoky, flickering gas lamps. The countryside relied on candles and kerosene.
Over the next four decades, electricity transformed Muncie as it trans-
formed the world. Shopkeepers found that smokeless electric lights were far bet-
ter for attracting customers and less damaging to their goods. For the first time,
mothers could allow their children to read alone at night, free of the fear of acci-
dental but frequent lantern fires. The streets of Muncie were illuminated, and a
system of twenty-five fire alarm boxes alerted the fire department much faster
than a messenger could be sent by saddle.
Electricity, too, changed the Ball brothers’ factory. Before 1900 a team of
two glass blowers and three preteen boys worked by hand to make 1,000 jars a
day. The electric machines that replaced these workers took eight men to run
and—in the same amount of time—produced 42,000 jars. Historian David Nye
writes, “In Muncie’s foundries men seldom carried heavy loads, because an
1
www.EngineeringBooksPDF.com
overhead crane with a powerful electromagnet could carry materials from one
end of a plant to the other in less than two minutes. Three men operating it
could do the work that previously required thirty-six strong day laborers.”1
Insull’s Industry
AsMuncie and thousands of other cities electrified, one man was smiling. It was
not Thomas Edison, J. P. Morgan, or any of the many other electric inventors or
financiers of the era. It was Samuel Insull, the son of an English lay preacher,2
who devised an industry structure and business model that enabled electricity
to embark on an unbroken century of growth.
Insull rose from the personal staff of Thomas Edison to become CEO of
one of the earliest utility holding companies, Commonwealth Edison.3 Along
the way he mastered beyond all others the technology and economics of power
demand and supply, the importance of utility regulation, and the value of differ-
ent business and financial structures.
Insull’s visions of the industry rested on four pillars. First, it was cheaper to
serve customers when their power use was aggregated via the largest possible
web of interconnections—the system we now call the grid. Insull termed this
the massing of consumption. The second pillar was economies of scale in pro-
duction, or the industry’s natural monopoly attributes. Today some of these
scale effects have faded, but they were immutable in Insull’s days and for de-
cades thereafter.
When one’s costs go down as supply goes up, what is the logical sales strat-
egy? Sell more and charge less. Insull and the industry’s finest marketing force
sang “the gospel of consumption,” urging customers to buy ever more power
and giving them discounts when they did. This was pillar number three.
Finally, Insull recognized that an industry with declining costs, high capital
needs, and intensive political interaction would gain stability and protection
from regulation. He wrote:
For my own part, I cannot see how we can expect to obtain from the communities
in which we operate, or from the state having control over those communities, cer-
2 Smart Power
www.EngineeringBooksPDF.com
tain privileges so far as a monopoly is concerned, and at the same time contend
against regulation.4
In league with progressives like Robert M. La Follette, Sr., who favored govern-
ment control over trusts and other critical industries, a system of independent
state agencies was established to oversee utilities and their rates.
Insull pursued his vision ceaselessly, acquiring and combining small power
systems around the United States. The rest of investor-owned systems followed
suit. A scattered collection of small power plants owned by municipal govern-
ments and individuals became an industry of huge, centralized utilities, with
roughly one-third remaining in its original ownership form. Insull’s vision
of large supply, massed demand, increased consumption, and regulated rates
reigned supreme. And without it, electrification might not have happened.
Insull, perhaps more than any other single person, changed American life.
Over the span of the next four decades, nearly every urban home and shop got
electric power and lights. Housewives who had spent an entire day doing the
wash could now start an electric machine that finished in an hour. Factories saw
productivity gains as high as one hundred times pre-electric levels.With a radio
at the hearth of nearly every American household, and theaters soon to have
electric sound and later air conditioning, came the birth of mass communica-
tion and the modern entertainment industry.
Electric power became fundamental to our military strength. Well before
WorldWar II began, war planners called for a massive expansion of power pro-
duction. During the war years the War Production Board closely directed the
building of transmission lines and new federal hydroelectric facilities, especially
in the Columbia and Tennessee river valleys. Among other customers, the Ten-
nessee Valley Authority (TVA) supplied massive quantities of power to the se-
cret Tennessee laboratory that built Little Boy and Fat Man, the atomic bombs
dropped over Hiroshima and Nagasaki in 1945. By that same year, U.S. electric-
ity usage had increased 60% above prewar levels, introducing additional
economies of scale that had not been possible during the Great Depression.5
In the decades following the war, electrification permeated every facet of
the American economy. The maximum rating of a turbine generator has grown
The First Electric Revolution 3
www.EngineeringBooksPDF.com
by a factor of 1,000 since the power age of America began.6 The number of per-
sonal computers installed worldwide hit the one billion mark in June 2008.7 Pa-
tients in intensive care are wired to as many as a dozen electrical devices. War-
fare is increasingly electronic. Video screens are everywhere—even in elevators,
where the average viewer watches them for thirty seconds. The average Ameri-
can home used approximately 138 kilowatt-hours a month in 1950; today the
number is closer to a thousand (1 kilowatt-hour is ten hours of a 100-watt fluo-
rescent bulb or about half a load of laundry).8
In 2003 the National Academy of Engineering convened a jury to recognize
the most important technological developments of the century. The Academy
looked out across a country with nearly ten thousand power plants, six million
miles of power lines, and an inconceivable array of electric devices.9 The Acad-
emy had little trouble choosing electrification as the preeminent engineering
achievement of the twentieth century.10
But all things must pass, and after a century of dominance, the sun is setting
on Insull’s creation.
The Second Electric Revolution
Today the electric power industry faces challenges far larger than any in its his-
tory. These challenges are motivated by two worldwide policy imperatives. The
first imperative is the need to adopt policies reducing the impacts of global cli-
mate change. Scientists and policymakers now largely agree that greenhouse
gases (GHGs) are growing at a rate that will soon yield dangerously high con-
centrations in our atmosphere. To reduce the likelihood of severe damage from
storms, droughts, disease, and ecosystem shifts, GHG concentrations in the at-
mosphere must be limited to less than 450 parts per million.11
The second policy imperative is the need for greater energy security. Imbal-
ances between the supply and demand for oil, natural gas, and other fuels and
key commodities can pose a threat to the economic stability and security of im-
port-reliant countries such as the United States. Oil imports provide more than
half of U.S. oil consumption and continue to grow. The U.S. trade deficit, which
4 Smart Power
www.EngineeringBooksPDF.com
currently exceeds $1 trillion, is directly related to the cost of importing oil,
which contributes an estimated $700 billion a year.12 As world demand in-
creases, suppliers such as Saudi Arabia, Iran, and Russia will continue to gain
even more geopolitical leverage at an alarming rate: in 1980, the United States
bought 25% of its oil from the Organization of Petroleum Exporting Countries
(OPEC); by 2030 the figure will be 47%.
For countries dependent on imported oil, electric transportation consti-
tutes an important new pathway toward greater energy security. Because U.S.
electricity is made from many types of fuel, most of them from domestic
sources, every auto propelled by electric power reduces the demand for im-
ported oil. The development of lower-carbon transportation options could pro-
vide as much as $120 billion in consumer benefits by 2030.13With electric trans-
port products about to take off, the power industry must prepare for a role it has
never played before: bolstering our energy security by supplying power to an
electrified transport fleet.
Climate change in particular poses an extraordinary challenge for the busi-
ness of delivering electricity. Most policies under discussion call for U.S. green-
house gas reductions of 80% by 2050—well within the lifespan of many power
plants operating today. The latest science suggests even steeper cuts may be nec-
essary.14 To achieve this objective, the industry will have to make massive
changes in its fuel sources and generating plants at a wholly unprecedented
pace.A system of nearly onemillionmegawatts, operatingmainly on fossil fuels,
will require a trillion-dollar retooling in the span of the next several decades.15
In this massive reconstruction, the challenge is not simply one of swapping out
old plants for new ones. Every changemust be checked for its impact on reliabil-
ity and integrated into the continuous reliability management of the entire re-
gion. In some cases, new transmission capacity will be needed, introducing a
number of new questions and challenges.
The size and cost of the carbon reductions needed for a sound climate pol-
icy make greater energy efficiency an essential part of a sound climate policy.
Energy efficiency is universally viewed as the best and cheapest means of reduc-
ing carbon emissions. But the power industry was designed to make and sell as
The First Electric Revolution 5
www.EngineeringBooksPDF.com
much power as possible as cheaply as possible. Repurposing the industry to
both sell and save electricity raises extremely difficult financial, regulatory, and
managerial questions.
As the industry shifts its supply sources, builds transmission, and increases
its energy efficiency efforts, the technologies at the core of its operations will
shift dramatically. Over the next thirty years, the industry will adopt the so-
called Smart Grid, and the architecture of the system will shift from one based
exclusively on large sources and central control to one with many more smaller
sources and decentralized intelligence. The Smart Grid will mark a total trans-
formation of the industry’s operating model—the first major architectural
change since alternating current became the dominant system after the Chicago
World’s Fair in 1893.16
As the industry adjusts to these technology and paradigm shifts, its viability
requires that we change its financial and regulatory footings. Technology, eco-
nomics, and environmental considerations have rendered the foundations of
Insull’s business model obsolete. Thanks to the Smart Grid, the massing of con-
sumption will give way to individual control. The industry’s scale effects have
changed dramatically, though not entirely. Far from the gospel of consump-
tion, we now sing the praises of greater energy productivity and sustainability.
Regulation, Insull’s fourth pillar, remains in a form that no longer serves our
objectives.
The new electric power industry will have to be designed with three objec-
tives in mind—creating a decentralized control paradigm, retooling the system
for low-carbon supplies, and finding a business model that promotes much
more efficiency. These imperatives together will define the future of power. A
system and a business model that each took more than a century to evolve must
be extensively retooled in the span of a few decades. Many of the technologies
and institutions needed for the job are still being designed or tested. It is like re-
building our entire airplane fleet, along with our runways and air traffic control
system, while the planes are all up in the air filled with passengers.
This book explores the future of the power sector in three parts. Part 1 be-
gins by looking at how the industry interacts with its customers, including the
overall level of sales and how the shift in the industry’s operations enabled by
6 Smart Power
www.EngineeringBooksPDF.com
the so-called Smart Grid could revolutionize it. These new grid technologies
will transform electric pricing and create enormous regulatory challenges, all
with little or no growth in overall power sales. We examine these issues in the
next five chapters.
In the second part of the book, Chapters 7 to 9, we turn to the supply side of
the industry and the need to decarbonize our power sources.We’ll consider the
costs of, and tradeoffs between, large-scale power sources such as coal plants
and small-scale power sources close to customers. As one might imagine, the
transmission system plays a pivotal role in this discussion.
Part 3 turns to the question of how utilities can structure themselves to re-
spond to all of these challenges and remain viable investor-owned firms. This is
an especially difficult question, as the industry must finance hundreds of bil-
lions of dollars of investment and retool its operating paradigm without much
of an increase in power sales for many years to come. The book concludes by
showing how both the industry’s current business model and its regulatory
structuremust undergo a radical redesign to pursue a new economicmission: to
sell least-cost energy services, not larger amounts of kilowatt-hours.
While we might hope that an industry this important will always find a way
to keep the lights on, the same could be said of a global financial sector that col-
lapsed inmid-2008 with astonishing speed andmomentous repercussions. Even
within the power industry, a much smaller set of challenges ignited the Califor-
nia electricity crisis of 2000, bringing on rolling blackouts, bankruptcies, and
billions of dollars in increased electricity costs. Getting it as right as we can is
important—for our climate, our economy, and our safety and national security.
The First Electric Revolution 7
www.EngineeringBooksPDF.com

www.EngineeringBooksPDF.com
chapter two
Deregulation, Past and Prologue
IN 1990, the future of the power industry could be summarized in a single
word: deregulation. The majority of policymakers and academic experts
largely agreed that the power generators should follow in the footsteps of air-
lines, telephone companies, natural gas suppliers, and trucking firms and use
markets rather than regulators to set prices. A new breed of energy companies,
led most visibly by Enron, had made a very profitable transition from regulated
to deregulated natural gas companies. They were intent on replicating their suc-
cess in the much larger electric industry.1
Twenty years later the issues that absorb the industry—and that are the
main subjects of this book—are climate change, energy efficiency, and the im-
pacts of the Smart Grid. Whatever happened to deregulation? And what does
this say about the future, when the industry grapples with enormous, unpre-
dictable change?
As we are about to see, deregulation was oversold by its proponents and im-
plemented abysmally by federal and state policymakers. Poor execution led to a
crisis of epic proportion in California and a dismal track record in many other
parts of the United States. While many of the problems with power markets
9
www.EngineeringBooksPDF.com
have been fixed with much stronger oversight and better market designs, power
markets still face thorny problems and a fair number of unhappy customers.
Of the twenty-three states that deregulated retail rates, at least eight have ei-
ther suspended or scaled it back. Most of the remainder are reinstituting some
form of governmental planning or oversight process. In a nationwide survey
conducted in 2007, a majority of state regulators could not identify a success-
fully deregulated state, and about a third admitted they had serious plans to re-
regulate their own. Even in England, where retail power deregulation has been
most successful, the government is cautiously moving back toward greater util-
ity oversight.
Most importantly, however, the nature and urgency of the problems facing
the industry are not seen as problems that can be solved by less control over
electric rates. Had the legacy of deregulation been different, policymakers might
look to even greater scope for market forces. As we shall see, competition will
unquestionably play a big role in the future power industry—but it will be in a
form very different from Enron’s vision of an electron market free-for-all.
The Industry’s Tangled Structure
The economic and regulatory structure of the American power industry is a
contraption only a lawyer could love. From the engineering standpoint, there
are three vertical stages of production—generation, transmission, and distribu-
tion. Generators make the power in power plants, high-voltage lines transmit
the power to substations in your neighborhood, and the small wires and equip-
ment on the poles leading to your home or office are the distribution system.
Electrons are created in the generator and flow through the grid into your appli-
ances and lights. When a single company owns the entire system—from the
generator to your meter—and sells you the power made in its generators, it is
said to be vertically integrated.
The entire industry is not integrated, which gives rise to a framework in
which different parts of the system are governed by different laws.Wholesale (or
“bulk”) power refers to power traded between a generator and a distributor or
10 Smart Power
www.EngineeringBooksPDF.com
between two utilities, much like other wholesale markets. Under the Federal
Power Act, a federal agency called the Federal Energy Regulatory Commission
(FERC) has sole jurisdiction over pricing (rates) in the wholesale portion of the
industry. This includes all high-voltage transmission (over large distances), but
not lower-voltage local distribution systems. The FERC operates like a regula-
tory agency, with commissioners appointed by the president and confirmed by
the U.S. Senate. And although the FERC can set the rates for sending power
across any high-voltage line, it has almost no authority to order any kind of util-
ity to build a line where one is needed. This authority resides with each state.
All transactions over the distribution system are regulated by state public
service commissions (PSCs) under state laws, including the final retail sale of
the power to each customer. Each state’s laws set out the authority of its state
PSC. In every state except Nebraska (which has only public power), the laws re-
quire that the PSC set regulated, cost-based rates for transporting power over
the distribution system. Note, however, that transporting the power is legally
distinct from selling it.Where there is traditional rate regulation, the PSC is also
required to set cost-based rates for the sale of power to each customer class (e.g.,
residential, small commercial, large commercial, etc.), and the rates for trans-
port and sale are bundled into a single rate.
Tomakematters more complicated, there are also generators owned by fed-
eral, state, or local government agencies. These are subject to much less whole-
sale and transmission regulation because they are believed to be unlikely to
charge unfair rates and get away with it. Inmost states there are also distribution
systems owned by government agencies and nonprofit, customer-owned coop-
eratives (co-ops) that distribute and sell bundled retail power. These govern-
ment and co-op power sellers are seldom subject to state regulation because
they, too, are viewed as unlikely to charge unfair prices.
This complex industry and regulatory structure is summarized in Figure
2-1.You can think of it as a wholesale market of power plants and the grid regu-
lated by the FERC and retail distribution systems and integrated utilities rate-
regulated or deregulated by the states. Alongside them all are publicly owned
electric systems of all types that are usually not regulated by state or federal
Deregulation, Past and Prologue 11
www.EngineeringBooksPDF.com
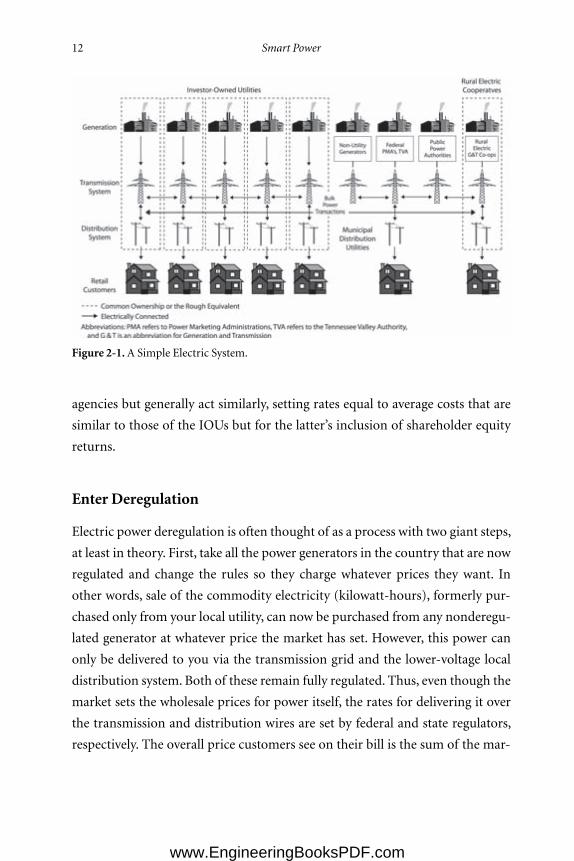
agencies but generally act similarly, setting rates equal to average costs that are
similar to those of the IOUs but for the latter’s inclusion of shareholder equity
returns.
Enter Deregulation
Electric power deregulation is often thought of as a process with two giant steps,
at least in theory. First, take all the power generators in the country that are now
regulated and change the rules so they charge whatever prices they want. In
other words, sale of the commodity electricity (kilowatt-hours), formerly pur-
chased only from your local utility, can now be purchased from any nonderegu-
lated generator at whatever price the market has set. However, this power can
only be delivered to you via the transmission grid and the lower-voltage local
distribution system. Both of these remain fully regulated. Thus, even though the
market sets the wholesale prices for power itself, the rates for delivering it over
the transmission and distribution wires are set by federal and state regulators,
respectively. The overall price customers see on their bill is the sum of the mar-
12 Smart Power
Figure 2-1.A Simple Electric System.
www.EngineeringBooksPDF.com
ket generation price and the two regulated delivery charges, the latter often ac-
counting for more than half the total bill.
The second step in idealized deregulation is to make sure competition
works well. Here, as in most other markets, power consumers should be able to
count on antitrust officials and utility regulators to monitor and fix problems
like price gouging in the newmarkets for generation if and when they occur.
That was the theory, at least. But due to the complex structure of the indus-
try, and the absence of a sufficient national political consensus, restructuring
did not proceed this way. Congress did not enact—nor did any president pro-
pose—a bill to deregulate generation and force all states to allow retail choice.
Instead, deregulation occurred incrementally at the federal (wholesale) level
and state by state at retail.
Not that people didn’t try. The movement to deregulate power began with
papers emanating from think tanks in the 1970s, fueled by dissatisfaction with
high power rates and the cost overruns at nuclear power plants in that era.
Led by Enron, a broad coalition trumpeted the benefits of electric deregula-
tion. Retail choice was to be the unshackling of “the last great monopoly in the
U.S.,”2 a move that would lower electric rates dramatically and allow electric
customers to choose the supplier of their choice. Kenneth Lay, Enron’s late
champion and chairman, said electric choice would be equivalent to “the largest
tax cut in history.”3 Industry-backed “consumer groups” published projections
of savings from deregulation as high as 43%.4 The U.S. Department of Energy,
falling in line with the prevailing winds, found that retail competition would
lower rates for consumers in every state.5 Other claimed benefits of deregulation
included job creation, improvements in the reliability of service, and a cleaner
environment.
Around 1994, the pro-deregulation forces began to get some traction. Al-
though they could not convince Congress to pass a bill deregulating either the
wholesale or the retail markets nationwide, they did convince the regulators at
the FERC that they already had the authority to take two key deregulatory steps.
First, they could create a system of “open access” in which any power generator
could use anyone else’s transmission system on a first-come, first-served basis to
Deregulation, Past and Prologue 13
www.EngineeringBooksPDF.com
deliver power from a generator to a state-regulated distribution system. Second,
the FERC started allowing some generators to make wholesale sales—sales only
to other utilities, not actual end users—at deregulated rates. Once federal regu-
lators enacted these key preconditions, advocates of deregulation could ap-
proach individual states. State legislatures could then vote to allow competition
among deregulated retailers of power, or “retail choice,” as it became known.
About half the states did just this, almost all in regions where retail rates were
well above the national average.
The Partial Fix
Why was deregulation introduced in this piecemeal fashion rather than as a
swift, one-shot measure? Some of the reasons are purely political. Many utilities
in states where electric rates were comparatively low, which included much of
the South,Midwest, andWest, thought regulation was working just fine in their
area. If it wasn’t broke, they argued, don’t fix it. The argument that competition
would force the cost of power down could not outweigh satisfaction with the
status quo and the raw lobbying power of the IOUs in their legislatures.
The remaining reasons for easing into partial restructuring had to do with
the difficulty of making sure deregulation would work. For competition to keep
prices under control, there would have to be many competing generators in
every area. Each of these generators has to be able to use the transmission and
distribution systems to send its power on terms equal to its competitors. In
other words, there are three essential preconditions to sound competition: a suf-
ficient number of competing power generators (“deconcentration”), a trans-
mission grid large enough to physically accommodate all competitors, and
“open access” rules so that power can be shipped from generators to customers.
Another important feature of successful markets is the ability of buyers to
react to price increases, that is, to use less when prices go up and more when
they go down. But most of us don’t even know that power prices vary hour by
hour, much less how to find out what they are and then react to them. Our ef-
forts to save power are based on our perception of annual savings, not on the
ability to adjust power within a day or a week.
14 Smart Power
www.EngineeringBooksPDF.com
Unfortunately, there were very few parts of the country in which any of
these conditions, let alone all, were achievable on the timetables deregulators
wanted. Establishing any one of these three preconditions would be a significant
political, regulatory, and financial challenge (as we shall soon see, the Smart
Grid does take care of one of the three). For the most part, state and federal pol-
icymakers did not want to do the political heavy lifting required to create these
conditions.
To give state policymakers the assurance that deregulation was going to
work, proponents agreed to put features into state bills that were intended to
protect against worst-case scenarios. These included the sorts of features one
might expect: a requirement that deregulated sellers register with the state and
prove their creditworthiness, periodic reports on the health of the new power
markets, and so on.
The most important protection, however, was to allow any electric cus-
tomers to stay with their current rate-regulated service if they did not want to
switch. This option to retain regulated rates was unprecedented. It was as if air-
lines were to offer passengers the option of buying any ticket they chose or buy-
ing a special ticket whose rates were still set by the Civil Aeronautics Board. It
was continued regulation right alongside deregulation, with customers free to
choose back and forth between them. But electricity is uniquely important, and
some regulators recalled that, when local phone service was deregulated, cus-
tomers were furious when they were told by government that they had to choose
a deregulated provider.
The regulated prices offered in deregulated markets became known as
“provider of last resort,”or POLR (pronounced“polar”), rates.One crucial deci-
sion remained: What rate should be set for POLR service? State policymakers
had been told repeatedly by deregulation’s cheerleaders that it was going to cre-
ate much cheaper electricity in their states—10% at the very least, and maybe a
lot more.
Although the opponents of deregulation were highly skeptical that prices
would drop, they knew the proponents would argue strongly that they would. If
so, there could be no harm in creating POLR rates 10% lower than current
prices and frozen for five or ten years. Who would want to stay on this POLR
Deregulation, Past and Prologue 15
www.EngineeringBooksPDF.com
rate if market prices were even lower? And if no one stayed on the regulated
POLR prices, regulated sales would wither away, achieving the ends deregulators
wanted.
The bluff worked. Governors and legislators adored this solution, as it al-
lowed them to deliver tangible rate savings to every electric ratepayer immedi-
ately upon the enactment of deregulation.Of course, these legislated rate reduc-
tions and freezes applied only to customers who stayed with their traditional
regulated utility. But this was seen as just the beginning of a new era of much
lower prices for everyone.
Following deregulation, the reality was that it quickly became quite difficult
for deregulated sellers to compete with the low, legislated POLR rates in many
states. When the price of fuels used to make power went up, deregulated sellers
had to raise their prices to cover their costs. Regulated POLR providers were ei-
ther barred from raising their prices or had to wait to get permission, keeping
lower prices much longer than their deregulated rivals.When this occurred, cus-
tomers understandably chose to stay with the regulated POLR rates.
As this scenario played out, deregulated sellers found they could hardly ever
offer small customers a price cheaper than the POLR provider, and almost no
small customers switched. In many other states, however, only a few percent of
residential customers switched to competitive suppliers, while roughly equal
numbers switched back to regulated service. They could sometimes offer better
rates to larger customers, and large customers often did migrate to competitive
providers
And then came California.
TheWestern Energy Crisis
May 2000 began as a fairly ordinary month in California, but it did not end that
way. On May 22, power prices suddenly spiked for no apparent reason. For the
first time ever, prices hit a “safety valve”price cap of 75 cents/kWh—over twenty
times the normal prices. Prices exceeded 25 cents (eight times the prior average)
for eighty-five hours between June and September, and hit the cap another
thirty-four hours in that period. Prices in all other hours continued to rise as
16 Smart Power
www.EngineeringBooksPDF.com
well and with them the costs of energy purchases by power buyers throughout
the western United States.
And this was only the beginning.Although prices calmed briefly in Septem-
ber, a November cold snap brought prices back to record levels. Supplies were
even lower than in the summer, and natural gas prices peaked at approximately
fifteen times their maximum level the year before. Through the first quarter of
2001, wholesale deregulated prices in the northwestern United States remained
near 50 cents/kWh, the highest ever seen in this typically low-priced region.
Meanwhile, California repeatedly faced shortages of supply, threatening the
reliability of the system and prompting the grid operator to declare supply
emergencies on fifty-five days in 2000, and the first intentional blackouts since
World War II. On December 14, 2000, the U.S. Department of Energy took the
extraordinary step of issuing an emergency order requiring all generators and
power marketers to sell their available surplus power to the California markets.
Despite the order, supplies offered to California continued to dwindle, and dur-
ing January and February 2001, the California grid operator was forced to im-
plement its most extreme emergency procedures for thirty-two consecutive
days. The system was in danger of imminent collapse and consumers experi-
enced rolling blackouts.6
As you can imagine, California’s governor and other state leaders were des-
perate to reduce power prices. Because the power markets were wholesale, and
therefore under the exclusive jurisdiction of the federal government, the state
could not itself impose price caps on the generators. Instead, it desperately
sought to build more of its own power generators, signed contracts with new
suppliers at fixed prices, and imposed some of the most successful short-term
conservation efforts in history. The FERC tried a series of measures to lower
prices, ultimately including caps on power prices in the entire western United
States. By June 2001, these actions succeeded in taming the market, and prices
fell almost as suddenly as they rose. On July 1, 2001, prices were back to about
6 cents/kWh and the crisis was over for good.
The crisis left a trail of economic devastation in California and beyond. Be-
tween June 2000 and 2001, Californians spent an estimated $33 billion more
than they had paid during the prior twelve months, in addition to suffering
Deregulation, Past and Prologue 17
www.EngineeringBooksPDF.com
through rolling blackouts and brownouts and the financial collapse of their util-
ities.7 Power buyers in the rest of theWest also paid much more for power, lead-
ing to rate increases of at least $9 billion outside of California. Largely due to the
crisis, California’s governor, Gray Davis, was ousted in a recall election in No-
vember 2003. But perhaps the greatest damage of all was to the idea that deregu-
lating retail electric sales was a good idea. No elected officials wanted to take a
chance that anything remotely resembling the crisis would ever occur in their
state.West Virginia senatorWalt Helmik summarized the views of many legisla-
tors in 2001 when he said, “Last year I thought it was a slam dunk that we were
going to do this. But since then other concerns have come up, especially the situ-
ation in California.”8 Momentum toward retail deregulation froze.
The final blows came between 2006 and 2008, when the 10% POLR rate re-
ductions enacted at the start of retail choice started expiring. In the decade since
the POLR rate discounts were enacted, power plant fuel costs had risen an aver-
age of 110% and general inflation had increased prices 25%.9 When regulators
readjusted regulated POLR prices to match current average supply costs, they
found that increases of 70% or more were necessary.10 Although regulated rates
(including POLR) increased by a similar amount, any illusions that deregula-
tion was going to create enormous and visible savings were dashed for good.11
Deregulation’s Legacy
The unhappy history of deregulation in the power industry creates an under-
standable air of caution among most industry policymakers. Proposals to
change the structure of the industry are now met with much greater skepticism
than they were in 1990. The proponents of change need to convince policymak-
ers that consumers will be substantially better off and that nothing will go
wrong—no blackouts, nomessy bankruptcies, and no lessening of the quality of
service.
The industry’s skepticism toward deregulation is part of a larger reassess-
ment of the idea occurring in the economics profession and policy circles. Even
before the financial markets collapsed in 2008, the reappraisal was suggesting
that the use of competition to achieve public ends was here to stay—but that
18 Smart Power
www.EngineeringBooksPDF.com
markets are prone to very severe problems if they are not adequately designed
and policed.12 While government agencies need not set prices, they cannot sit
back and assume that competition will deliver broad benefits without the care-
ful structuring and oversight, including effective systems to protect against
fraud, excessive risk taking, market power, and other problems.
Meanwhile, the era of deregulation has left the power industry with an even
messier structure than we had before deregulation began. About half the coun-
try is now served by state-regulated firms who own many generators, but also
buy much of their supplies, including nearly all of their renewable power. The
other half of the country is served by deregulated power retailers, ownedmainly
by large independent generators, delivering over fully regulated wires. Utilities
owned by municipalities, power districts, and other public entities are mostly
unregulated and also buy some supply from the wholesale markets. Customer-
owned cooperatives are similar and own many generators. Atop it all sits the
wholesale power market (price decontrolled) and the high-voltage grid (price
and access regulated), both overseen by the FERC.
Even without deregulation’s baggage, this byzantine legal and economic
structure makes sweeping organizational change in the industry quite difficult.
Every change must be weighed against its impact on many different industry
segments, each with different ownership, goals, strengths, and constraints. In
this regard, cross-cutting changes in the power industry face adjustment cost
and jurisdictional barriers similar to those bedeviling the reform of the health
care and financial services sectors.
The need to rapidly reduce the industry’s carbon footprint is also prompt-
ing a modest retreat toward regulation and integration. The pace at which the
industry must make investments in low-carbon generation, energy-saving tech-
nologies, and new grid capacity carries with it tremendous investment risks.
Regulation is designed to ensure that utilities do not earn excess profits, but also
that they earn enough to keep their businesses working well. In this situa-
tion, regulation provides a modicum of insurance against some risks, such as
technology failures or sudden policy shifts.13 With climate policies forcing big
changes and large, risky investments, more CEOs are thinking it worthwhile to
give up the prospects of earning higher, unregulated profits in exchange for a
Deregulation, Past and Prologue 19
www.EngineeringBooksPDF.com
little more protection against downside risks that aren’t well understood and
potentially huge.
Like every other disruptive technology, however, the changes brought on by
the Smart Grid do not respect traditional jurisdictional and financial bound-
aries. As we shall see in the next chapter, the Smart Grid will change the entire
industry’s operating paradigm and open up entirely new customer relation-
ships. Later we’ll see that the need for greater energy efficiency also raises tough
questions about industry structure, incentives, and responsibilities.
The future will be filled with a tension between the forces for change pro-
pelled by the Smart Grid and energy efficiency policies on one side and the per-
ception that keeping the current structure may be more reassuring to investors,
CEOs, and policymakers on the other. Deregulating more of the industry will be
a challenging proposition, caught between technological change that regulators
will be severely challenged to keep up with and memories of deregulatory prob-
lems they desperately want to avoid. As we will see in Part 3, the solution will be
business models and reformed regulation that plug deregulated competitors
into the right parts of the Smart Grid but preserve regulation and oversight in
the parts of the system that still need it.
20 Smart Power
www.EngineeringBooksPDF.com

part one
The Smart Grid andElectricity Sales
www.EngineeringBooksPDF.com

www.EngineeringBooksPDF.com
chapter three
The New Paradigm
SEQUIM,WASHINGTON, was not a likely place to start the transformation
of the world’s electric power systems. The town—pronounced Squim by the
locals—is knownmainly as a stop on the way to hiking or kayaking on the beau-
tifully forested Olympic Peninsula and for a climate that is ideal for growing
lavender. The town of nearly six thousand hosts an annual fair proudly billed as
the largest lavender event in North America.
But it was here in Sequim in early 2005 that researchers from the Pacific
Northwest National Laboratory (PNNL) convinced the tiny Clallam Public Util-
ity District—a utility too small to own a single power plant—to try something
that had never been tried before. The researchers wanted to equip volunteer
households with free, custom-designed computers that received electric prices
set every five minutes. With the help of appliance giant Whirlpool, they would
also be given thermostats, water heaters, and clothes dryers that could be pro-
grammed so that households would receive continuous feedback on the current
price and quantity of power they were using and adjust their load accordingly.
PNNL’s researchers knew that Clallam’s power use was growing, and that
Clallam’s large distribution cables, known as feeders, were expensive to replace.
23
www.EngineeringBooksPDF.com
They were influenced by experience in wholesale power markets, where auc-
tions are sometimes held to award capacity on oversubscribed transmission cir-
cuits to the highest bidder. In turn, wholesale markets were influenced by the
work of economists such as Bill Hogan and Vernon Smith. What if prices were
set to induce customers to keep their power use below the capacity of the nearly
overloaded feeder? Customers who wanted to keep using power could bid for
the right to use the feeder when it was filled up; other customers could bid to re-
duce their demand, in effect being paid by those bidding to use the feeder.
Another part of the experiment focused on the ability of the computers to
help Clallam boost reliability. The computers allowed Clallam to shut down by
remote control the heating element of the experiment’s clothes dryers for a
maximum of one minute if its operators needed a small balancing adjustment.
The dryer kept spinning—only the heat cycled off and on, invisible to all but
those who happened to be watching their own energy-monitoring computer at
the time.
Each family was given a few hundred dollars in a bank account and told that
they could keep whatever was left after their transactions were tallied at the end
of the period. After a few lessons on the software, which was designed to be ex-
ceptionally user-friendly, the experiment began. Jesse Berst, editor of the fledg-
ling Smart Grid News, declared it “the beginning of the GridWise era.” (GridWise
was a label the U.S. Department of Energy used for the smart grid that has since
evolved into a major trade group.)
The head of the PNNL research team, scientist Rob Pratt, was amazed at the
experiment’s results. The 112-household marketplace successfully kept demand
below the feeder’s capacity at all times, though not without some fairly severe
price spikes. Participating households saved an average of 10% of their power
bills by managing their use and reduced their use of peak power even more.
Many of the households asked to keep their equipment after the experiment
ended, which unfortunately was not an option.
It was not an experiment that could be immediately replicated or scaled up.
The specialized equipment cost about $1,000 per household. Customers were
happy to participate because they had a guarantee that their power bill could
24 Smart Power
www.EngineeringBooksPDF.com
not go up, only down—a promise reminiscent of the provider-of-last-resort
rate decreases that largely undid retail choice. Price spikes were tolerated be-
cause of this guarantee, removing the need to create market power monitoring.
The equipment worked seamlessly because a single government laboratory
made certain it did, offering free onsite assistance when anyone had a technical
glitch. Examined at close range, the GridWise Olympic Peninsula Testbed
Demonstration project foreshadowed both the Smart Grid’s tremendous prom-
ise and its equally large regulatory pitfalls.1
While the industry was busy coping with deregulation and its aftermath,
power technology marched on. Communications and sensing technology be-
came cheap and ubiquitous. Like all other technologies, nearly every kind of
electrical equipment changed from analog to digital control and became pro-
gressively more sophisticated. These changes have started to unlock an entirely
new vision of the power industry. To understand it, we are going to have to take
a brief architectural tour of the system.
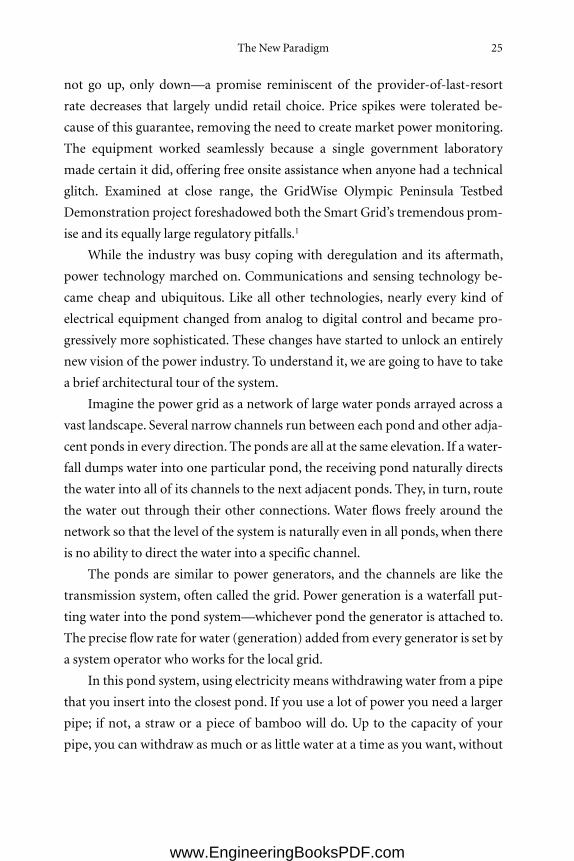
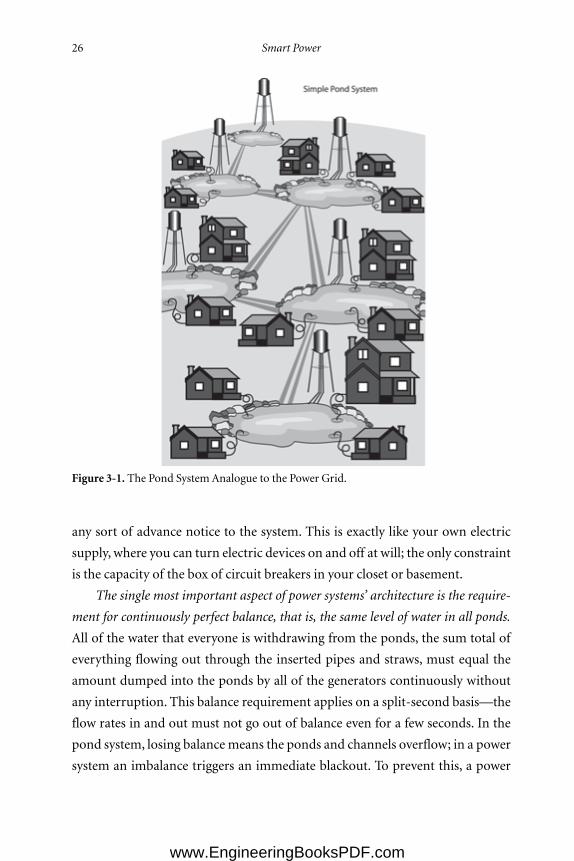
Imagine the power grid as a network of large water ponds arrayed across a
vast landscape. Several narrow channels run between each pond and other adja-
cent ponds in every direction. The ponds are all at the same elevation. If a water-
fall dumps water into one particular pond, the receiving pond naturally directs
the water into all of its channels to the next adjacent ponds. They, in turn, route
the water out through their other connections. Water flows freely around the
network so that the level of the system is naturally even in all ponds, when there
is no ability to direct the water into a specific channel.
The ponds are similar to power generators, and the channels are like the
transmission system, often called the grid. Power generation is a waterfall put-
ting water into the pond system—whichever pond the generator is attached to.
The precise flow rate for water (generation) added from every generator is set by
a system operator who works for the local grid.
In this pond system, using electricity means withdrawing water from a pipe
that you insert into the closest pond. If you use a lot of power you need a larger
pipe; if not, a straw or a piece of bamboo will do. Up to the capacity of your
pipe, you can withdraw as much or as little water at a time as you want, without
The New Paradigm 25
www.EngineeringBooksPDF.com
any sort of advance notice to the system. This is exactly like your own electric
supply, where you can turn electric devices on and off at will; the only constraint
is the capacity of the box of circuit breakers in your closet or basement.
The single most important aspect of power systems’ architecture is the require-
ment for continuously perfect balance, that is, the same level of water in all ponds.
All of the water that everyone is withdrawing from the ponds, the sum total of
everything flowing out through the inserted pipes and straws, must equal the
amount dumped into the ponds by all of the generators continuously without
any interruption. This balance requirement applies on a split-second basis—the
flow rates in and out must not go out of balance even for a few seconds. In the
pond system, losing balancemeans the ponds and channels overflow; in a power
system an imbalance triggers an immediate blackout. To prevent this, a power
26 Smart Power
Figure 3-1. The Pond SystemAnalogue to the Power Grid.
www.EngineeringBooksPDF.com

system operator who controls all of the generation in one region adjusts the
power output from all of them tomatch total consumption on the grid on a sec-
ond-by-second basis.
The requirement for perfect continuous balance may sound like a ridicu-
lously strict requirement, but it is one that power system designers and opera-
tors conquered long ago and live with every minute of every day. In real power
grids, system operators sit in secluded control centers and monitor the total
power being used in each part of the country continuously. In fact, the official
name for the system operators in this control center is the balancing authority,
and the area they are required to balance is called the balancing authority area.
With the help of computers that do most of the work, they adjust the generators
in that balancing area to match demand, instantaneously and exactly.
The Role of the Grid
The transmission grid is the system of channels that joins all of the ponds. But
why do we need these channels in the first place? Why don’t we just run each
pond as its own system, kept in perfect balance all by itself? Each pond could
have its own system operator who simply controlled generation in the pond to
match that pond’s users. This would satisfy the need for immediate balance
without the need to dig up the landscape and put channels all over the place.
This is the way the power industry began in the days of Muncie, Indiana.
Each town had one power plant, and there were no power lines between cities or
towns.Moreover, technological developments are forcing a new look at this sort
of design, nowadays referred to as microgrids. However, with current technolo-
gies and costs, microgrids are not yet cheaper than power from the large-scale
grid. In other words, if you want an electric power supply that is extremely reli-
able—that is, very rarely has blackouts—at the lowest possible price, you need a
fleet of large generators and a grid interconnecting them.
Importantly, it is the combined desire for high reliability and lowest cost
that creates the system we have. Were it not so, we would never have built the
large-scale grid. The goal of the power system is to provide nearly 100% reliable
service to everyone using electricity, regardless of the immediate amount of
The New Paradigm 27
www.EngineeringBooksPDF.com
power they are using. The goal of providing reliable service is made difficult by
the fact that all power generators break down unpredictably without notice,
even when annual maintenance is faithfully done. When a generator “trips”—
turns itself off suddenly, much like blowing the occasional fuse in the house—
the requirement for immediate balance nevertheless holds.
A generator tripping off is akin to a large water tower that had been filling
one of the ponds suddenly stopping. To maintain the exact water level in that
pond, and in all ponds, one of two things has to occur. Either you turn on an-
other source of water exactly as large as the one you lost instantly (a “reserve
generator”) or you immediately shut off downstream water users, whose total
use at that moment equals the supply you’ve lost. Either one or a combination of
these must happen to maintain immediate balance, although the consequences
for the users are dramatically different.
Large power generators trip off roughly 2 to 10% of the time, aside from
scheduled downtime for maintenance and refueling. There are also periods of
weeks when the generators must be taken out of service for maintenance or re-
fueling. These frequent outages don’t cause blackouts because the system opera-
tors keep reserve power plants ready at all times, fully operational and ready to
start instantly, much like keeping an idling car at the curb outside your house.
For every 100megawatts of plants on the system, operators keep about 15mega-
watts of spare capacity; about 5 megawatts or one third of this will be idling at
any time.
The grid, or interconnected system of ponds, itself allows the balancing au-
thority to reduce the number of reserve megawatts it must maintain to achieve
the same reliability by sharing these needed reserves. If one power plant goes out
in any pond, a reserve unit in any other pond connected by the channels can
kick in and make up the difference if the channels are wide and deep enough.
Instead of each pond needing one spare generator as large as the one in service, a
number of ponds can share a single reserve unit.
Numerically, this turns out to be a large savings. Take the extreme example
of one single power plant supplying a completely isolated system. The one plant
is either on or it has tripped off, always a possibility. To create nearly 100% reli-
able supply, you need a second generator just as large to provide backup or “re-
28 Smart Power
www.EngineeringBooksPDF.com
serves.” If each generator costs $100 million, you need $200 million worth of
generators total. One of those plants will sit idle nearly all the time, making
power only when the first plant trips or is down for maintenance.
Roughly speaking, with a system of good channels between ponds, one ex-
tra generator can provide the same backup power or reserves to about eight
other equal-sized generators in different ponds. The customers in each pond
share the cost of the one backup generator, so they have to pay only about $12.5
million (one-eighth of $100 million) for having reserve capacity when they
need it, rather than having to pay for a plant all by themselves that sits idle most
of the time.
Of course, you still have to pay for the transmission lines between power
plants, that is, the grid. As it happens, the transmission lines needed to provide
reserves are usually much cheaper to build than the equivalent number of
power plants, so that it is substantially cheaper to build fewer reserve generators
andmore power lines. There are several other economic advantages to intercon-
necting many generators via a network of lines—and, as we’ll see much later,
these advantages apply to decentralized minigrids as well as huge high-voltage
networks.2
The One-Way Grid
Another extremely important feature of the power grid is its one-way nature.
Among the millions of electric customers in any one region, the balancing au-
thority really has no idea who is using what in the way of electrical devices at any
one time. The only information that is communicated back to the authority in
real time is the total amount of power being used by all customers in each por-
tion of the balancing area—hundreds of thousands of customers or more.
Since each of us is free to turn on and off any of our electrical devices at will,
and across all utility customers we own vastly different appliance collections, we
are likely to use vastly different amounts of power. It would be both unfair and
grossly inefficient to charge every one of us the same amount for our power use
each month. The industry solved this problem by creating the traditional
(nowadays often called “dumb”) power meter still used today in many places.
The New Paradigm 29
www.EngineeringBooksPDF.com
Dumb meters cumulate the total electricity that you use over the course of a
month (or normal billing period). The power company reads your meter each
month and determines how much to bill you for. Since they don’t know when
you used the power, the price they charge per kilowatt-hour can have blocks
based on cumulative monthly use or different charges in summer versus winter,
but generally they don’t get much more complex than this.
When the power grid was originally developed, this was really the only fea-
sible approach. There was no Internet or Wi-Fi, of course, nor could devices be
equipped with communications microprocessors and sensors. Under these con-
ditions, there was a near-total disconnect between the industry’s instantaneous
balancing function and the utility’s pricing and billing activities. Balancing was
done by system operators based on aggregated use amounts communicated to
them in real time, but which they could control only by large-scale disconnec-
tion in emergencies; monthly charges were set based on the cumulative amount
used every month (quantity) and a simple price (rate) schedule. The main sig-
naling function of the rate schedule in the distant past, and still continued in
many parts of the United States, was to encourage greater consumption by pro-
gressively reducing average price as monthly use increased (so-called declining
block rates).
This economic and technical architecture is what led us to today’s industry
structure and business model. Utilities offer a service defined by these attrib-
utes: your immediate use is controlled only by you (up to a very high limit) and
can change as frequently and rapidly as you choose, using whatever devices you
choose; your service will be continuous and reliable regardless of this variability,
with very few blackouts; and you will be charged the average costs for the total
amount of electrical energy you use over a billing period (month).
Unpacking theMonthly Power Bill
One economic feature of power systems we haven’t discussed yet is the cost of
making and delivering power. The most expensive ingredient in the making of
power is the cost of the fuel consumed in the power plant: this is true for plants
fired by natural gas and coal. The exceptions are for those renewables whose fuel
30 Smart Power
www.EngineeringBooksPDF.com
is free (e.g., solar power) and nuclear power whose fuel costs are very low. The
second-largest costs are the annual costs of owning and maintaining power
plants, which apply to every form of generation—renewable and fossil, large
and small. The rest of the costs—water use, nonfuel supplies, labor, and admin-
istration—are not very large compared to fuel and capital.
As part of their balancing duties, operators have to choose which power
plant to turn on next as aggregate power use climbs over the course of a day.
Some power plants are cheap to run, but they must be kept running around the
clock. Other power plants are technically good at turning on quickly, which is
good when more power is needed during the middle of the day. However, the
plants that are most controllable are also the most expensive per kilowatt-hour
made.
This means that the cost of making a single kilowatt-hour changes by a
striking amount during the day, especially on very hot or cold days when elec-
tricity use is high. In the dead of night, the cheapest plants are making power
for about 3 to 5 cents/kWh. As power use rises in the morning hours the next
type of plant turned on costs about 6 or 7 cents. During the 100–200 hours each
year when demand is the highest, making power often costs 8 to 20 cents/kWh
or more, because the oldest, least efficient plants are turned on, and the cost
of making them available to run these few hours during the year must be
recovered.
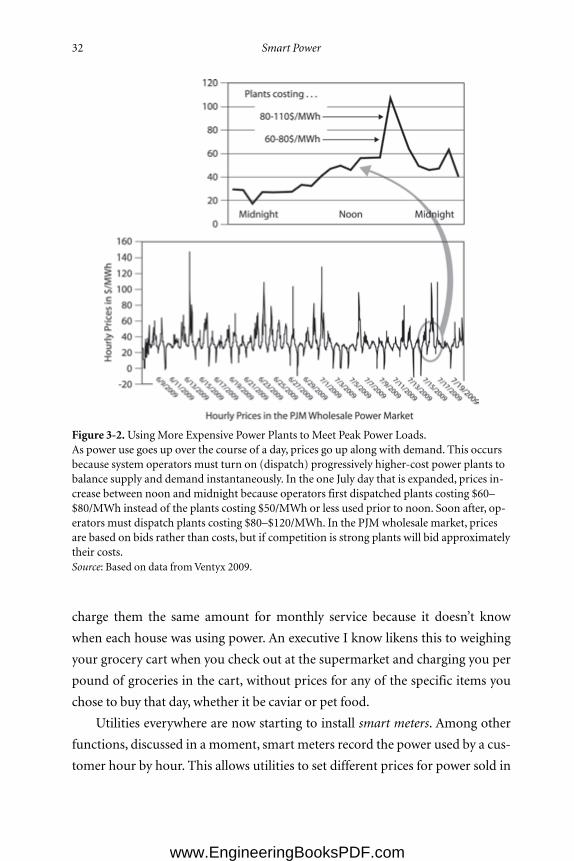
This is illustrated in Figure 3-2. The left-hand side shows actual hourly
prices during 2009. On days with mild climatic conditions and on weekends,
prices don’t spike up much each day, but on some days prices spike up quite a
lot. On the right, the figure magnifies one day with high prices and illustrates
why this happens. As demand kept rising on that day, system operators turned
to increasingly expensive plants. The cost of running these more expensive
plants drives up the hourly price.
A dumb electric meter adds up all of the kWh used over the course of a
month regardless of when that power was made and how much it cost to make.
Some homes use a lot of power during the expensive mid-day period, while oth-
ers use most of their power at night. If those two homes used the same monthly
total number of kWh, and they had a dumb meter, the power company has to
The New Paradigm 31
www.EngineeringBooksPDF.com
charge them the same amount for monthly service because it doesn’t know
when each house was using power. An executive I know likens this to weighing
your grocery cart when you check out at the supermarket and charging you per
pound of groceries in the cart, without prices for any of the specific items you
chose to buy that day, whether it be caviar or pet food.
Utilities everywhere are now starting to install smart meters. Among other
functions, discussed in a moment, smart meters record the power used by a cus-
tomer hour by hour. This allows utilities to set different prices for power sold in
32 Smart Power
Figure 3-2.Using More Expensive Power Plants to Meet Peak Power Loads.As power use goes up over the course of a day, prices go up along with demand. This occursbecause system operators must turn on (dispatch) progressively higher-cost power plants tobalance supply and demand instantaneously. In the one July day that is expanded, prices in-crease between noon and midnight because operators first dispatched plants costing $60–$80/MWh instead of the plants costing $50/MWh or less used prior to noon. Soon after, op-erators must dispatch plants costing $80–$120/MWh. In the PJM wholesale market, pricesare based on bids rather than costs, but if competition is strong plants will bid approximatelytheir costs.Source: Based on data fromVentyx 2009.
www.EngineeringBooksPDF.com
different parts of the day and then bill accordingly. The more power you use in
the expensive parts of the day, the more you pay at the end of the month, and
vice versa.
Smart meters and time-based pricing open up a panorama of new possibil-
ities. First, setting time-based prices and billing them becomes much easier, and
more pricing options can be offered. Second, smart meters can also work with
smart appliances that can be programmed to automatically respond to price
changes and other user commands to shift their use around within a day or even
a week. This is what the residents of Sequim could do in their experiment. Fi-
nally, these meters make it easier to integrate small-scale generators and storage
on customers’ premises. Any meter smart enough to keep track of use by time
period can also keep track of self-produced power, shift production patterns
around, and even figure out when to store electricity for later use in the rare
cases where storage is available.
There is no change whatsoever in the requirement that power grids always
be in balance.However, smart meters and time-based pricing create a new oper-
ating paradigm. Instead of system operators manually balancing the system by
turning on power plants, the users of the system can self-balance the system
by adjusting their own use, and their own self-production, in response to hourly
prices.
This is an elegant and intelligent new operating paradigm. Today, when
electricity use rises during a heat wave, grid operators don’t change anyone’s
power price and instead just crank up increasingly expensive and inefficient
power plants. Under the Smart Grid, they will signal that prices are rising as they
turn to these more expensive plants. Users who can shift their demand to later,
cooler hours, will turn things off automatically via their preprogrammed smart
appliances. If enough users reduce demand, system operators will stop turning
on additional plants, and prices will stop going up.
At present, the size of the feedback loop that has been implemented is still
fairly small and simplistic. System operators are still in charge of maintaining
moment to moment balance, and while they use prices and demand response
(DR) programs today as one helpful tool, they control plants manually and con-
tinuously—and will for a long time to come. Nevertheless, the combination of
The New Paradigm 33
www.EngineeringBooksPDF.com
time-based pricing and the technological ability for customers to respond to
price signals marks the beginning of a new era in the industry.
Enter the Smart Grid
If you’ve heard any energy speeches by candidate or President Obama or seen
any of the full-page ads by the likes of Google and IBM, you’ve probably heard
of the smart grid. This term has been used quite broadly in many ways, but what
it really means is combining time-based prices with the technologies that can be set
by users to automatically control their use and self-production, lowering their
power costs and offering other benefits such as increased reliability to the system as
a whole. It is also often more simply described as the marriage of modern infor-
mation technology (IT) and the electric system. Some definitions emphasize
that customers will have greater control over their energy use, others that the
Smart Grid will better enable local small-scale power production, and still oth-
ers that the system will be more reliable and more secure. These “definitions”
simply choose to emphasize one of the many benefits of the Smart Grid over
the others. For the most part, however, it all comes in one quite complicated
package.
Some discussions make little distinction between smart meters and the
Smart Grid as a whole. This isn’t quite right, since smart meters are only one
small, albeit critical, part of the new world. Another common oversimplifica-
tion occurs when discussions blend the high-voltage, upstream parts of the grid
with the local distribution systems. This is a little misleading, because the mar-
riage of IT and power is different at these two levels of the industry. The para-
digm shifts we have been talking about occur mainly downstream, in the local
distribution companies that are either state regulated or nonprofit.
In the transmission systems (i.e., the high-voltage parts of the grid), the im-
pact of smart technologies is quite different. In this part of the industry, the
amounts of power controlled and traded are huge, handled by very large lines
and system controllers who control hundreds of power plants. This part of the
grid has already been using hourly pricing as well as direct control of plants and
lines to balance the system and trade energy for many years.Moreover, the engi-
34 Smart Power
www.EngineeringBooksPDF.com
neers who design and operate system controls have long used some of the most
advanced computing and control tools available. “The way we look at it,” one
transmission engineer recently said, “the grid’s been smart for a while. It takes
some pretty sophisticated tools to monitor, dispatch, and control electricity
flow.”3
While this is true, computing technologies are evolving so quickly that new
Smart Grid technologies are constantly faster and better at monitoring the cur-
rent status of all power lines. In the future, systems will be able to forecast relia-
bility problems minutes or hours before they occur and allow operators to im-
plement preventive measures. They can also diagnose what went wrong when a
power line trips out much faster than they could before and possibly reroute
plants and lines to avoid problems. S. Massoud Amin, a professor of electrical
engineering, likens the advances to flying a modern jet plane:
One of the most important of these enabling technologies is the proposal to “fly”
the grid more like the way an advanced jet fighter is actually flown. Modern war-
planes are now so packed with sophisticated gear as to be nearly impossible to oper-
ate by human skill alone. Instead they rely on a battery of sensors and automatic
control agents that quickly gather information and act accordingly. . . . In avionics,
sensing parameters like the fighter’s angle of attack with respect to the position,
speed, and acceleration cause automatic controllers to assist the pilot in stabilizing
the aircraft via adjusting wing flaps, ailerons, or the amount of engine thrust to
achieve a more optimal flight path. The grid equivalent of this would be a heighten-
ing of the “situational awareness” of the grid and allowing fast-acting changes in
power production and power routing, thus altering the stream of electrical supply
and demand on a moment-by-moment basis.4
In short, the upstream impacts of the Smart Grid will be to lessen the likelihood
and severity of blackouts and to operate the systemmore efficiently overall. This
is all to the good, but it is just an incremental improvement over the current
structure and paradigm.
Downstream, for end users, the impacts of the Smart Grid are potentially
profound. Customers will face electric prices that vary within each day, and they
The New Paradigm 35
www.EngineeringBooksPDF.com
will have far more information and control over their power use and costs.With
software simple enough to run on a cell phone, they’ll monitor the energy used
by several appliances linked to their home network, controlling them immedi-
ately or programming them to react to prices. With the touch of a button you
will be able to program your air conditioner to turn off fifteen minutes out of
every hour when hourly electric prices exceed a certain set-point. Yes, you’ll be a
little warmer, but you’ll also save good money. And for the majority who don’t
want more complex power, appliances will all come preprogrammed so users
can connect them seamlessly at factory default settings.
By its technical architecture, the Smart Grid will also encourage small-scale
local generation, commonly referred to as distributed generation (DG), which
we’ll explore more deeply in Chapter 7. The widespread use of small generators
will force the grid to become bidirectional and create many systemwide, but
hard-to-measure, cost savings along with many regulatory challenges we’ll ex-
amine shortly.
Electricity Storage
Another change brought on by the Smart Grid will be the greater use of electric-
ity storage. The technologies that allow customers and utilities to communicate
and share grid control will easily accommodate storage devices. Cheap, large-
scale storage is correctly called a disruptive technology because if power can be
stored cheaply the entire paradigm of immediate balance is obliterated. First off,
balancing the grid gets infinitely easier—rather than worrying about turning
power plants on and off constantly, you just let the batteries do the balancing.
There is no need to turn power plants on in perfect synchronization with de-
mand. Instead, just let the batteries charge when there’s less demand and dis-
charge when there is more. And if everyone can store enough power onsite for
days or weeks, maintaining the grid in its current state isn’t really necessary: it
just needs to operate enough to recharge everyone’s storage units, much as we
refill our gas tanks once or twice a week. If electricity could be stored as cheaply
as gasoline, the utility industry would have the same structure as the oil indus-
try, with electric filling stations at every major crossroads.5
36 Smart Power
www.EngineeringBooksPDF.com
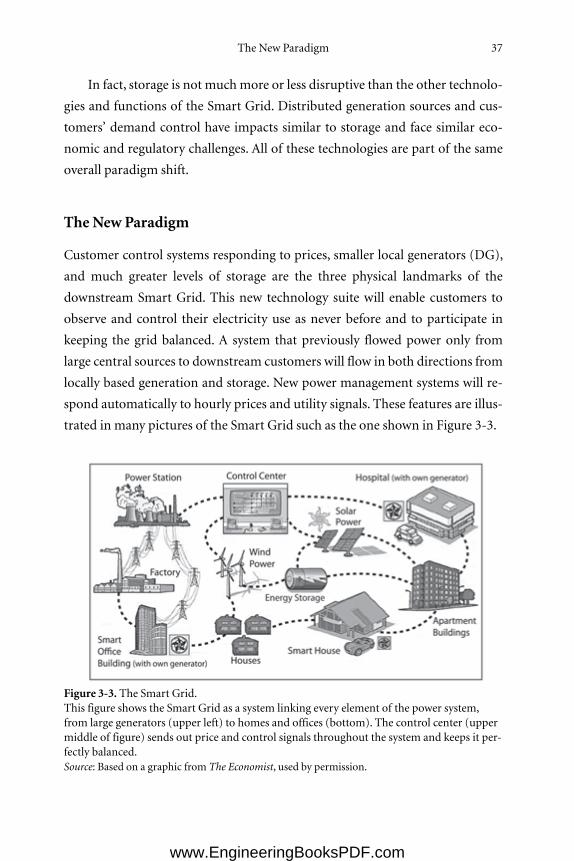
In fact, storage is not muchmore or less disruptive than the other technolo-
gies and functions of the Smart Grid. Distributed generation sources and cus-
tomers’ demand control have impacts similar to storage and face similar eco-
nomic and regulatory challenges. All of these technologies are part of the same
overall paradigm shift.
The New Paradigm
Customer control systems responding to prices, smaller local generators (DG),
and much greater levels of storage are the three physical landmarks of the
downstream Smart Grid. This new technology suite will enable customers to
observe and control their electricity use as never before and to participate in
keeping the grid balanced. A system that previously flowed power only from
large central sources to downstream customers will flow in both directions from
locally based generation and storage. New power management systems will re-
spond automatically to hourly prices and utility signals. These features are illus-
trated in many pictures of the Smart Grid such as the one shown in Figure 3-3.
The New Paradigm 37
Figure 3-3. The Smart Grid.This figure shows the Smart Grid as a system linking every element of the power system,from large generators (upper left) to homes and offices (bottom). The control center (uppermiddle of figure) sends out price and control signals throughout the system and keeps it per-fectly balanced.Source: Based on a graphic from The Economist, used by permission.
www.EngineeringBooksPDF.com

The Smart Grid will also redefine the concept of what it means to build and
operate the grid.Although human system operators will still have the final say—
like the fighter pilot who can still overrule the instruments, if he’s fast enough—
the intelligence and self-mediating role of prices will tend to self-balance the
system. System operators can rely less on what was previously the only means of
keeping grid balance—turning power plants on and off. They’ll also have much
more refined, and often self-activating, blackout-preventing tools on a scale
they scarcely imagined.
As tantalizing and revolutionary as these changes will be, they will not come
without adjustments and costs. Methods of setting electric rates developed over
decades, and that many electric customers greatly prefer, will have to change
dramatically. Themagnitude of the investments involved and the breadth of po-
tential benefits demands that Smart Grid investments be well evaluated and well
implemented. It’s going to be one heck of a ride.
38 Smart Power
www.EngineeringBooksPDF.com
chapter four
Smart Electric Pricing
IFWE CAN PUT in place the infrastructure of the Smart Grid, we will have
made a major advance on our way to a more efficient, more secure, and
climate-friendly power system. To deliver its full benefits, however, the new sys-
tem must still be managed day by day and hour by hour. That means delivering
an effective set of economic signals to producers and users in the form of more
flexible and accurate electric prices.
To system operators and the hundreds of power plants they balance, the
costs of making power unquestionably change each hour (even within an hour).
There is a very old value in power system engineering that is calculated to repre-
sent this constantly changing marginal cost known as system lambda.
Nearly all hour-to-hour “spot market” transactions between utilities use
some form of hourly price based on system lambda or the result of an hourly
computerized auction that matches buyers and sellers. If you set your Internet
browser to the site of the New England Independent System Operator (ISO)
(http://www.isonewengland.org), one of seven centralized hourly spot markets
in the United States, you’ll see an “LMP price ticker.” This ticker scrolls through
39
www.EngineeringBooksPDF.com
that hour’s price for 1 MWh power from their auction at each of fifteen delivery
points across New England.
Setting the prices that retail customers pay equal to these hourly wholesale
prices (plus a number of fixed delivery fees) is known as real time prices. Real-
time prices send accurate signals, but they also require constant vigilance and
adjustment, and they can easily change by 300% or more over the course of a
day. Because many customers find this a bit too much to cope with, the industry
has developed a number of less complicated time-varying rates. Because prices
tend to follow a daily pattern—highest between lunch and dinner,medium dur-
ing morning and late evening, and lowest in the middle of the night—one can
create stair steps or “blocks” of rates that go up as you move into the peak pe-
riod. These rates, known as time-of-use, or TOU, have been historically most
common because they do not require the real-time communication of price to
the customer, which until recently was cost-prohibitive. Customers only need to
know what time prices go up each day, and they can read this from a “bill-
stuffer” or find it on the utility’sWeb site.
The terminology in this area is a little obscure. Time-varying or time-
differentiated rates are sometimes called dynamic pricing. Demand response
(DR), is a broader concept that refers to all policies and programs that get cus-
tomers to shift their use around. Sending price signals is one of the best ways to
do this, but there are other, older approaches, such as allowing utilities to con-
trol customer loads directly.1 These “direct load control” programs work well,
but as the cost of price signaling keeps dropping and the Smart Grid era dawns,
the use of prices to induce customers to change their load rather than control-
ling them directly is gaining favor.
Because the price difference for TOU blocks are averaged across the whole
summer period, they are not nearly as large as the true production cost differ-
ences between mild and severe weather days. In critical peak pricing (CPP), the
utility can be given the flexibility to set very high rates, perhaps five or ten times
the usual, during just the ten to twenty days when there is a spike in demand
(e.g., a heat wave). Using pagers and the Internet, customers can be warned one
day in advance, so they can make plans to shift their use the next day.2 Figure
4-1 summarizes the main approaches to time-varying rates.
40 Smart Power
www.EngineeringBooksPDF.com
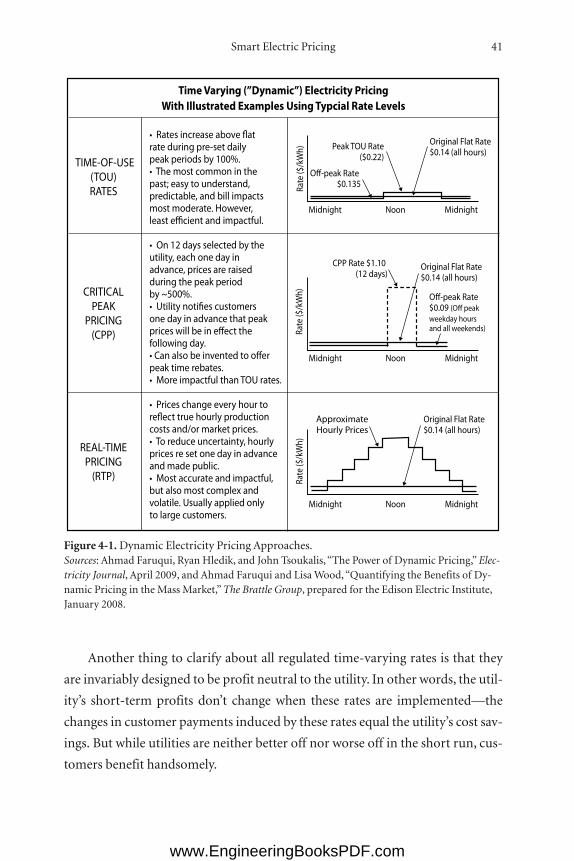
Another thing to clarify about all regulated time-varying rates is that they
are invariably designed to be profit neutral to the utility. In other words, the util-
ity’s short-term profits don’t change when these rates are implemented—the
changes in customer payments induced by these rates equal the utility’s cost sav-
ings. But while utilities are neither better off nor worse off in the short run, cus-
tomers benefit handsomely.
Figure 4-1. Dynamic Electricity Pricing Approaches.Sources: Ahmad Faruqui, Ryan Hledik, and John Tsoukalis, “The Power of Dynamic Pricing,” Elec-tricity Journal, April 2009, and Ahmad Faruqui and Lisa Wood, “Quantifying the Benefits of Dy-namic Pricing in the Mass Market,” The Brattle Group, prepared for the Edison Electric Institute,January 2008.
Smart Electric Pricing 41
text:IP_Fox-Penner 8/15/10 7:08 PM Page 41
www.EngineeringBooksPDF.com
SavingMoney by Shifting Load
The impact of charging customers time-varying prices is amazing. Even though
many electric customers can’t change the time they wash clothes or surf the net,
decades of results confirm that customers find small ways to shift their use in re-
sponse to dynamic rates. These small changes add up to dramatic impacts.
My colleague Ahmad Faruqui has been championing dynamic pricing for
decades and has studied carefully nearly every utility that has implemented it.
His research confirms that customers shift significantly in response to dynamic
prices, and the response gets better as the peak versus off-peak cost differences
are more faithfully translated into prices. Ahmad finds that typical TOU rates
reduce peak power demand by about 5%, and CPP achieves more than twice the
savings, or up to 20% of peak use.3 When you think about it, this is remarkable.
Simply changing the time profile of prices—without changing the total revenue
earned by a utility one bit, and without giving customers any new technology—
means that customers stop using 1 out of every 10 MW of power in peak peri-
ods. If this could be sustained nationally, we could defer building about 100,000
MW of power generators—about 200 medium-sized plants.
So far we have been talking only about how to set the profile of prices versus
time. Other than to say that these prices are communicated to customers via the
Internet or pagers we haven’t said how customers know what prices are chang-
ing to or what they can do when they find out. In the fully realized Smart Grid,
the prices will not only be communicated to customers, they will be conveyed
immediately to preprogrammed smart devices, which will react automatically.
Kurt Yeager, a former head of the Electric Power Research Institute, uses the
catchy phrase prices to devices.
At the moment there are only a few commercially available household de-
vices that can be programmed to take hourly price signals and adjust automati-
cally. The most common are programmable thermostats, which change heating
or cooling settings by time of day or whenever prices reach a certain point. In
the future, all major appliances will have this capability. (One manufacturer,
Whirlpool, has said that all its appliances will be Smart Grid–compatible by
2015).4 Another device, known as an in-home display, simply receives and dis-
42 Smart Power
www.EngineeringBooksPDF.com
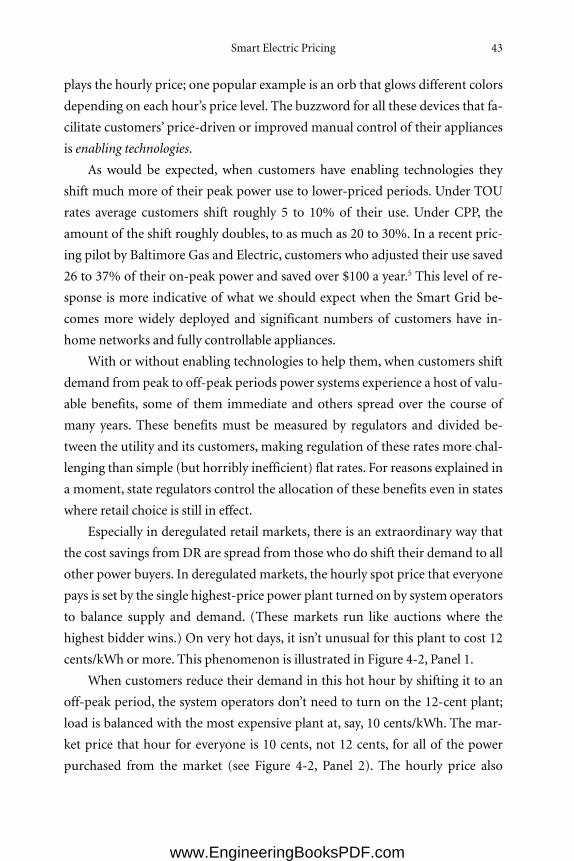
plays the hourly price; one popular example is an orb that glows different colors
depending on each hour’s price level. The buzzword for all these devices that fa-
cilitate customers’ price-driven or improved manual control of their appliances
is enabling technologies.
As would be expected, when customers have enabling technologies they
shift much more of their peak power use to lower-priced periods. Under TOU
rates average customers shift roughly 5 to 10% of their use. Under CPP, the
amount of the shift roughly doubles, to as much as 20 to 30%. In a recent pric-
ing pilot by Baltimore Gas and Electric, customers who adjusted their use saved
26 to 37% of their on-peak power and saved over $100 a year.5 This level of re-
sponse is more indicative of what we should expect when the Smart Grid be-
comes more widely deployed and significant numbers of customers have in-
home networks and fully controllable appliances.
With or without enabling technologies to help them, when customers shift
demand from peak to off-peak periods power systems experience a host of valu-
able benefits, some of them immediate and others spread over the course of
many years. These benefits must be measured by regulators and divided be-
tween the utility and its customers, making regulation of these rates more chal-
lenging than simple (but horribly inefficient) flat rates. For reasons explained in
a moment, state regulators control the allocation of these benefits even in states
where retail choice is still in effect.
Especially in deregulated retail markets, there is an extraordinary way that
the cost savings fromDR are spread from those who do shift their demand to all
other power buyers. In deregulated markets, the hourly spot price that everyone
pays is set by the single highest-price power plant turned on by system operators
to balance supply and demand. (These markets run like auctions where the
highest bidder wins.) On very hot days, it isn’t unusual for this plant to cost 12
cents/kWh or more. This phenomenon is illustrated in Figure 4-2, Panel 1.
When customers reduce their demand in this hot hour by shifting it to an
off-peak period, the system operators don’t need to turn on the 12-cent plant;
load is balanced with the most expensive plant at, say, 10 cents/kWh. The mar-
ket price that hour for everyone is 10 cents, not 12 cents, for all of the power
purchased from the market (see Figure 4-2, Panel 2). The hourly price also
Smart Electric Pricing 43
www.EngineeringBooksPDF.com
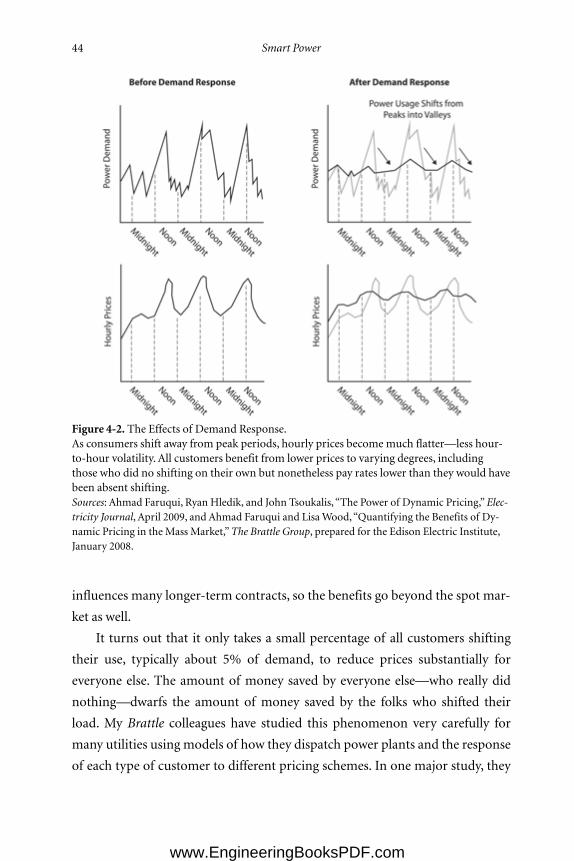
influences many longer-term contracts, so the benefits go beyond the spot mar-
ket as well.
It turns out that it only takes a small percentage of all customers shifting
their use, typically about 5% of demand, to reduce prices substantially for
everyone else. The amount of money saved by everyone else—who really did
nothing—dwarfs the amount of money saved by the folks who shifted their
load. My Brattle colleagues have studied this phenomenon very carefully for
many utilities using models of how they dispatch power plants and the response
of each type of customer to different pricing schemes. In one major study, they
44 Smart Power
Figure 4-2. The Effects of Demand Response.As consumers shift away from peak periods, hourly prices become much flatter—less hour-to-hour volatility. All customers benefit from lower prices to varying degrees, includingthose who did no shifting on their own but nonetheless pay rates lower than they would havebeen absent shifting.Sources: Ahmad Faruqui, Ryan Hledik, and John Tsoukalis, “The Power of Dynamic Pricing,”Elec-tricity Journal, April 2009, and Ahmad Faruqui and LisaWood,“Quantifying the Benefits of Dy-namic Pricing in the Mass Market,”The Brattle Group, prepared for the Edison Electric Institute,January 2008.
www.EngineeringBooksPDF.com
found that a dynamic pricing program that prompted customers to shift just
3% of their demand during the 100 highest-use hours in 2005 in the PJM mar-
ket (the Pennsylvania–New Jersey–Maryland Interconnection) would save the
shifting customers a midpoint estimate of $17.5 million immediately. Cus-
tomers who did not shift their loads benefited from the prices reduced by the
shift, saving a midpoint $120 million—over five times as much.6
Another benefit of DR comes from the fact that lowering the peak demand
reduces the need to build power plants and the associated grid. Remember when
the system operator didn’t need to turn on the plant that cost 12 cents? If there is
enough DR in the system, system planners figure that they’ll never need the
12-cent plant. If they don’t need it, customers who are shifting their loads are
helping the utility avoid building a whole power plant.
This avoided capacity cost is often the largest benefit from DR, even larger
than the energy savings to all customers.7 In fact, DR from both traditional and
Smart Grid sources is expected to eliminate 80% of all peak power growth
through 2016.8 However, unlike energy savings, avoided capacity costs don’t
flow to all customers immediately and are much more difficult to measure and
allocate.We return to this issue, which is even more critical to small generators,
shortly.9
Incidentally, there are other dimensions beyond hourly prices that are im-
portant for sound electricity pricing. One of them is to adopt higher per-kWh
prices as one’s total cumulative monthly use of power goes up, or increasing or
inclining block rates. This is something that can be done today, even with“dumb”
monthly meters. Prices that decline with higher usage levels were one of Samuel
Insull’s innovations, but they were designed for an era with declining long-term
marginal costs.10 Now that new power supplies cost more than existing plants it
makes no sense to give customers quantity discounts, which is what declining
block rates really are.
Dynamic Pricing—Barriers and Resistance
Dynamic pricing and DR are such a good idea that you might be wondering
why nearly a century has gone by without these prices becoming the norm. In
Smart Electric Pricing 45
www.EngineeringBooksPDF.com
B OX 4-1
Demand Response, Energy Efficiency, and Climate Change:Cousins, Not Clones
One would think that charging time-varying prices and shifting demand from
peak to off-peak should be classified as a form of energy conservation, and of-
tentimes demand response (DR) and energy efficiency are lumped together.
However, the total amount of energy and carbon saved from DR programs is
much, much smaller than the dollar savings. Obviously, changing when you
use power but keeping the amount the same is not the same as lowering the
amount you use. Moreover, when prices are reduced for everyone else, their
natural response is to use a little more power, not less. At the same time, it
turns out that when customers see any form of time-varying prices, some of
them are motivated by these prices to save electricity.
When all of these effects are added up, there is usually a small net savings
induced by dynamic pricing and DR. A recent estimate of the efficiency im-
pact of DR across all classes by my Brattle colleague Ryan Hledik estimates a
2.6% savings across all customer classes.* All in all, DR is a great cousin of en-
ergy efficiency policies, but it is not a substitute for the fundamental process
of replacing inefficient energy-using capital, or building in more efficiency in
the first place.
Roughly the same is true of CO2 emissions from the power sector. The
pure shifting of power use from peak to off-peak times doesn’t save much car-
bon, sometimes even increasing emissions slightly in coal-heavy regions of
the country. However, more aggressive DR is generally carbon-saving due to
two effects. First, more aggressive DR generally brings with it more efficiency
savings, hence lower emissions. Since renewable portfolio standards require
that renewable plants be built, fewer fossil-fueled plants are built. Second,
more aggressive DR lowers the need to build more power plants.
*Hledik, “How Green Is the Smart Grid?” Electricity Journal, April 2009.
text:IP_Fox-Penner 8/15/10 7:08 PM Page 46
www.EngineeringBooksPDF.com
the first place, it costs money to convert a utility’s systems to dynamic pricing,
and regulators always want to ensure that benefits exceed costs. Beyond this,
particular resistance has come from several directions.
The new equipment utilities have to install, including smart meters and the
systems that allow them to send out prices and record hourly use, are referred to
as advanced metering infrastructure (AMI). Think of AMI as the starter version
of the Smart Grid, missing most of the sophisticated customer controls I’ve de-
scribed but enabling many of the core functionalities. For example, AMI allows
dynamic pricing, but it also allows utilities to read meters electronically, elimi-
nating the meter readers who used to visit each home each month, and to save
other costs as well. Although costs continue to decline, it costs approximately
$200 to $500 per customer to install an advanced infrastructure, including the
communications hardware and software and other support systems.11
Probably the single biggest barrier to dynamic pricing has been utilities and
regulators hesitating at incurring these costs. At $200 to $500 per customer, the
bill adds up to billions for a large utility, adding to rates at a time of already high
electricity prices and economic retrenchment. To get regulators’ permission to
spend this kind of money, utilities put together a business case. They add up the
cost savings they expect to achieve from changes in Smart Grid–enabled opera-
tions and pass on to customers via lower rates from all aspects of their starter
Smart Grid. As Smart Grid investments become better understood, utilities in-
creasingly find that they can assemble a package of AMI outlays that provides
substantial net benefits to customers over its lifetime.
Nevertheless, because the Smart Grid is such a new area and overlays are
large, consumer representatives have various concerns, including the possibility
that utilities will spend too much or buy a system that works poorly or is soon
obsolete.12 Others are concerned that the added data on customers’ hourly use,
whether in the hands of utilities or third-party vendors, will be an invasion of
privacy. Still others, who see retail deregulation as a failure, distrust dynamic
pricing because it has a similar ideological heritage—a view that I think is
wholly understandable but misplaced.13
As one might expect, concern over the cost of implementing smart meters
has been greatest among older and less tech-savvy customers. “We vigorously
Smart Electric Pricing 47
www.EngineeringBooksPDF.com
oppose the mandatory imposition of these smart meters in peoples’ homes,”
notes Marti Doneghy, a representative of the American Association of Retired
Persons (AARP). “Everybody has to pay for this change, and a lot of the 50-plus
population simply isn’t that interested.”A more ominous note is struck by none
other than Richard Thaler, coauthor of Nudge, who likens the Smart Grid to
programming a VCR and bluntly says, “If it involves people actually doing
something, it won’t happen.”14 Smart Grid developers are keenly aware of this,
and think they have the problem licked, but no one can say for sure.
A second source of opposition comes from the fact that, regardless of the
product they are buying, customers dislike complex or volatile prices. This is
why true real-time pricing, the most accurate but volatile form of dynamic pric-
ing, is rare overall and largely confined to nonresidential customers. The other
forms of dynamic pricing use approximations, but they get most of the benefits
with much more predictable hourly rates.15
Many customers have grown to view flat rates as a“right” that is fair because
everyone pays the same price. Some households and businesses can’t change
their use patterns, such as the lunch counter that does nearly all of its business
between noon and 2 p.m. There is no technology on the horizon that fully re-
lieves the bill increase for this customer group from dynamic prices—although
energy efficiency is a good start. However, careful research has repeatedly shown
that only a few percent of all customers have net higher bills on well-designed
dynamic rates.16
Concerns over the costs of smart meters go hand-in-hand with the added
complexity of setting proper dynamic prices. Unlike flat rates, which are rela-
tively simple accounting calculations, dynamic prices require estimates of cus-
tomer price responsiveness and other econometric measurements unfamiliar to
nearly everyone other than economists. You need all these measurements in or-
der to make sure that the revenues earned by the utility after dynamic prices are
put in place do not lead to either excessive profits or excessive losses, both of
which regulation is supposed to prevent. In addition, the peak price must reflect
the capital costs avoided by the utility—ameasurement challenge we’re about to
explore in more detail.
48 Smart Power
www.EngineeringBooksPDF.com
All sources of resistance notwithstanding, the combination of better con-
trol technologies, concerns over electric rate increases, prodding and funding
from the Obama administration and the Federal Energy Regulatory Commis-
sion (FERC), and the need to tap every cost-effective source of carbon savings
are overcoming a century of price structure inertia. According to the Edison
Electric Institute, by 2015 almost fifty-two million customers (36% of the total)
in twenty-eight states will have smart meters;17 the Obama administration re-
cently accelerated this with $3.4 billion in smart meter grants. And, as the cur-
rent chair of the association of state regulators Fred Butler observed, “You can’t
have a smart grid with dumb rates.”18With smart meters onmore than a third of
all customers, dynamic pricing is poised to take a quantum leap in the next de-
cade. That, in turn, will flatten the price curve and save customers a great deal of
money, along with a little carbon.19
Smarter electric pricing will be the single most important hallmark of the
Smart Grid. Finding the political power to shift a nation built on flat power rates
onto dynamic prices will be regulation’s first giant adjustment to the Smart
Grid. For regulators, however, this is just the opener.
Smart Electric Pricing 49
www.EngineeringBooksPDF.com

www.EngineeringBooksPDF.com
chapter five
The Regulatory Mountain
Do you want to know what keeps me up at night? Not my programmers. Not my
investors. Not my health care costs. It’s state regulators.
—CEO of a leading Smart Grid firm
THE SMART GRID is a collection of technologies that enable a whole new
way of operating power systems. But from the standpoint of utility CFOs
and regulators, the Smart Grid is a collection of new kinds of transmission and
distribution investments, each yielding unfamiliar new products and service
streams. Utilities, regulators, and other stakeholders will have to evaluate these
investments by measuring their value to customers, their impact on utility rates,
and how customers and generators who use the new capabilities are charged for
their use.
The unenviable job of balancing the many benefits of utility Smart Grid in-
vestments—fuel saving, avoided capital outlays, and complex systemic costs—
with the capital costs of new systems will fall to state regulators.
51
www.EngineeringBooksPDF.com
Over and over, regulators will have to decide whether to put ratepayer
money into large, unfamiliar investments with the promise of enormous but
hard-to-measure benefits. The sort of tensions this creates are nicely highlighted
in a report by the Illinois Smart Grid Initiative. The Initiative first noted that
regulators ordinarily compare the cost of new utility investments to the benefits
ratepayers receive in the form of lower utility costs or better service. The Initia-
tive went on to note that
[m]uch of the cost to deploy smart grid technologies relates to upfront capital in-
vestments—and, many of the benefits are external to the utility operations, but are
predicated on this initial capital investment. Traditionally, utility investment deci-
sions are based on achieving the lowest present value of the revenue requirement
(i.e., the annual level of revenue that the regulator allows to be collected in
rates). . . .
. . . However, in the case of smart grid investments, much of the reduction in
future expenses are realized by the consumer or the larger community, not the util-
ity. . . . Using the traditional approach to valuing investments will almost assuredly
show, at least at this time, the smart grid investments will not reduce utility ex-
penses enough to justify investment. But if one considers the potential benefits of
using a smart grid that are outside of the utility, this calculus may change.1
This effort will tax the capabilities of even the best regulatory agencies in the
country and highlights the value of getting them more resources. But even with
the best and brightest talent to draw on, the Smart Grid’s regulatory challenges
will be monumental and will take time and patience to wade through en route
to a transformed future.
TheValue of Not Building Things
One of the largest quantifiable benefits from the Smart Grid is avoided capital
costs—the costs saved by either deferring or never building more upstream gen-
erators, transmission lines, or distribution systems. For the types of distributed
generation (DG) that provide energy mainly at peak times, the value of the
52 Smart Power
www.EngineeringBooksPDF.com
avoided capital can easily be five to ten times as large as the value of the saved
energy. These benefits flow quite similarly from demand response (DR), where
the customer chooses not to use more peak power, thereby avoiding the need to
build a peaking plant, and distributed generators providing peak power, which
substitutes for rather than avoids the upstream system. In both cases, the value
of these resources depends on the capital cost of the system the utility would
have built—the 12-cent plant in the example earlier in Chapter 4.
Measuring the costs of large and complex systems a utility would have built
in the absence of DG and DR scattered all around its system presents challenges
most regulatory practitioners love to hate. These calculations spawn acrimo-
nious debates about the precise size, location, attributes, and cost of the large
generators a utility would have built—the same debates that began in the 1980s
after Congress required that each state’s regulators determine avoided genera-
tion costs for each of their utilities, which said utilities would pay to certain
“qualified” independent power producers. Thanks to this requirement, nearly
every state has developed amethod of setting avoided generation costs every few
years, and there are many analytical approaches and computational models to
draw on. The process is cumbersome and contentious, but it happens.2
You may be asking yourself whether we might spare ourselves all this regu-
latory debating and use deregulated markets to set avoided capacity costs. It’s a
great idea, but it doesn’t quite work for the avoided capital costs. We are trying
to measure the difference in costs between two electric systems of equal quality
and reliability, one slightly smaller than the other. Because the electric power
system is a system of strongly interconnected plants and lines, you can’t measure
the true costs of a smaller system without doing a sort of hypothetical redesign
of the whole nearby grid. It’s a bit like asking your architect how much cheaper
your new house would be if you reduced the length of one internal room by 5
feet. The architect couldn’t give you an answer until he or she redesigned the
whole house to accommodate the smaller room.
Wholesale spot markets around the world are gradually adopting loca-
tional pricing, meaning that spot prices differ in every hour for many locations
on the high-voltage grid. This makes prices vary not only by hour, but also by
geography for each hour. This introduces a new way to value transmission, and
The Regulatory Mountain 53
www.EngineeringBooksPDF.com
therefore the avoided costs of not building transmission lines. One can think of
the value of transmission in any hour as the difference in locational prices be-
tween two nodes on the system. For example, if prices in Philadelphia are $60
per MWh this hour, while prices in Baltimore are $75 per MWh, then the value
of the transmission system between the two cities must be $15 per MWh in that
hour.
Strictly speaking, this is accurate, but we build transmission lines based on
their value over their lifetime of 40 years, not based on a single hour’s value.
However, for the purpose of paying those who use DR to curtail their load in
one hour an avoided transmission and distribution (T&D) cost, locational price
differences are a reasonable approximation. Several organized wholesale mar-
kets use approaches like this, and while the idea is conceptually sound, proper
implementation is quite complex. To give a flavor for the complexity, here are
the market rule requirements, simplified and stripped of their jargon, that two
experts recently noted were necessary:
1. The system operator’s ability to obtain good forecasts of the savings that
will occur in every location on the grid as prices rise in every hour
2. A sloping schedule of values for power either made or saved that is al-
lowed to rise as high as $3,500 per MWh
3. Requiring all those providing DR to buy or create a safety margin of
supplies in case their power reductions fail to materialize in the hour in
which they are counted on by the system
4. A plan for system operators to implement selective blackouts “in a
nondiscriminatory fashion” in case system operators can’t maintain the
necessary balance.3
The resolution of these issues is demanding considerable effort on the part of
federal and state regulators and the stakeholders in wholesale power markets,
who are almost all seasoned utilities, large private power traders, deregulated
generation companies, and large user groups. As the Smart Grid penetrates the
system more deeply, similar issues will affect the distribution systems and indi-
vidual customers, all strictly in the province of state regulation. This will de-
54 Smart Power
www.EngineeringBooksPDF.com
mand enormous efforts and new skills from state regulators—a theme I will re-
turn to more than once as the rest of the volume unfolds.
Markets also work for measuring another part of the avoided system capital
costs, the costs avoided by not building the generators no longer needed due to
locally saved or made power. Several organized power markets hold auctions for
additional generation capacity, and the prices set in these auctions for one MW
of new power supply are a good measure of the value of one MWh of peak us-
age. This approach works, but as with all other electric markets, the rules and
regulations involved are complex, controversial, and require ongoing regulator
involvement. “Set it and forget it” deregulation is a nonstarter.4
Deregulated wholesale markets all over the world employ dynamic pricing
in the sense that they allow spot prices to vary every hour, leading to prices
higher during peak periods due to the higher cost of the market supplying on-
peak. These higher and more volatile prices, which are often the source of con-
sumer complaints, are of course more lucrative for many small and renewable
energy sources, and therefore encourage more DG development in these mar-
kets. This leads the proponents of markets to emphasize that they do a better job
of encouraging DG and the DG industry in turn to generally support competi-
tive markets.
However, old-school generation deregulation isn’t much of an option for
now in the rest of the United States, and isn’t an option for valuing the avoided
capital costs of the rest of the electric system (i.e., transmission or distribution
savings). What is worse, because the transmission system is an interconnected
web where all plants share the same lines, attributing transmission savings to re-
duced supply is a very challenging analytic exercise. Alternative transmission
grids are extremely uncertain in their ability to get sited or built or their costs al-
located; we will see more about this when we look at the transmission system in
Chapter 7. The benefits of avoided transmission can also be very location-spe-
cific, and they can shift quite a lot over hours, seasons, and years. Regulators
have to decide whether they should pay generators the avoided costs measured
by the day, month, or year; the accompanying volatility and uncertainty make
the recipient’s revenue stream very risky.
Ever greater difficulties apply to measuring avoided distribution costs,
The Regulatory Mountain 55
www.EngineeringBooksPDF.com
where avoided costs are even more location dependent. Some customers may be
attached to a part of the distribution grid that is so new and so large that there
will be zero avoided distribution costs if customers at the end of the line in-
crease their self-generation or cut their demand.Other circuits may be nearing a
very expensive upgrade, so that DR or DG that prevents the utility from having
to expand that particular circuit is worth several hundred dollars per kilowatt—
almost as much as some small generators cost. This sensitivity makes rate set-
ting for DG and DRmuchmore complicated and necessitates sophisticated new
planning methods such as locational integrated resource planning (IRP).5
You might be saying to yourself, “I thought that if I put a generator in my
house it just runs my meter backward, in effect giving me credit on my power
bill 1-for-1 between kilowatt-hours bought versus generated.” If you live in one
of the forty-two states where utilities allow this practice, net metering, you’d be
right.6 In this case, utilities and/or regulators decided to solve the valuation
equation in a very simple way—namely, they assume that the value of distrib-
uted generation equals your current retail price. It isn’t the worst approximation
in the world, but it completely ignores all locational differences and scale effects.
It may be a good incentive policy but it is not a particularly accurate price signal.
Locational variability notwithstanding, avoided capital costs have a feature
that will prove critical when we discuss future scenarios for the growth of DG.
This category of avoided costs is lower for generators located on the high-
voltage grid, highest for DG in the middle of the distribution system, and lowest
when the generator is located at the customer’s end of the line. In light of the
fact that avoided capacity costs are, by far the highest relative value stream from
DG or DR, this means that it is most valuable to install DG in the middle of
the distribution system, not at the far end of the grid, that is, at your home or
factory.
Hard-to-Value Benefits
No one in history has done more to promote the cause of decentralizing the
electric system than Amory Lovins. Since his discoveries of the thermodynamic
56 Smart Power
www.EngineeringBooksPDF.com
inefficiencies in large power systems as a young physicist at Oxford, he has spent
much of the past forty years chronicling the vulnerabilities of the large-scale
electric grid and the benefits of DG.
Lovins’s most extensive treatise on distributed resources is his 2002 work
Small Is Profitable, produced with colleagues at his Rocky Mountain Institute.7
The volume is simultaneously a textbook on power systems economics, a hand-
book of small generator technology, and an extraordinarily detailed exposition
on the value of distributed resources.
Parsing the benefits of DG in minute detail, Lovins et al. arrive at a list of
207 separate benefits of distributed sources relative to large-scale supplies.
Many of these benefits are in the category of avoided capacity costs, which we’ve
just seen are measurable, albeit with some difficulty. Due to their economic im-
portance and measurability, they are always embedded in market or regulated
prices. The rest of the 207 suggested benefits are not so lucky. From the practical
standpoint, some of these are redundant and others are nearly impossible to
measure (“fostering adaptive learning”), but the taxonomy is an extremely use-
ful guide to the diffuse DG and DR benefits that aren’t included in the prices
paid to small generators or DR providers.
Table 5-1 condenses these hard-to-measure benefits into several simple cat-
egories. For each category (row), I provide an example or two, explain why util-
ities sometimes see offsetting disbenefits, identify the beneficiaries from this
particular type of benefit, and discuss how the current framework of DG rules
incentivizes the benefit, if at all.
The table illustrates that there are many technical and economic features of
the Smart Grid, DG, and DR that provide diffuse benefits to all system customers.
As an example, benefits like the reduced vulnerability of the grid to terrorist at-
tacks are hard to put a value on, but they clearly benefit our nation as a whole.
It falls to regulators and policymakers to say whether and how these dif-
fuse benefits will be incentivized or rewarded, and to balance them against oc-
casional disbenefits shown in the table. Tax credits, consumer subsidies, low-
interest loans, and many other approaches are sometimes used to provide
economic support for the DG benefits that can’t be included in the price paid
The Regulatory Mountain 57
text:IP_Fox-Penner 8/15/10 7:08 PM Page 57
www.EngineeringBooksPDF.com
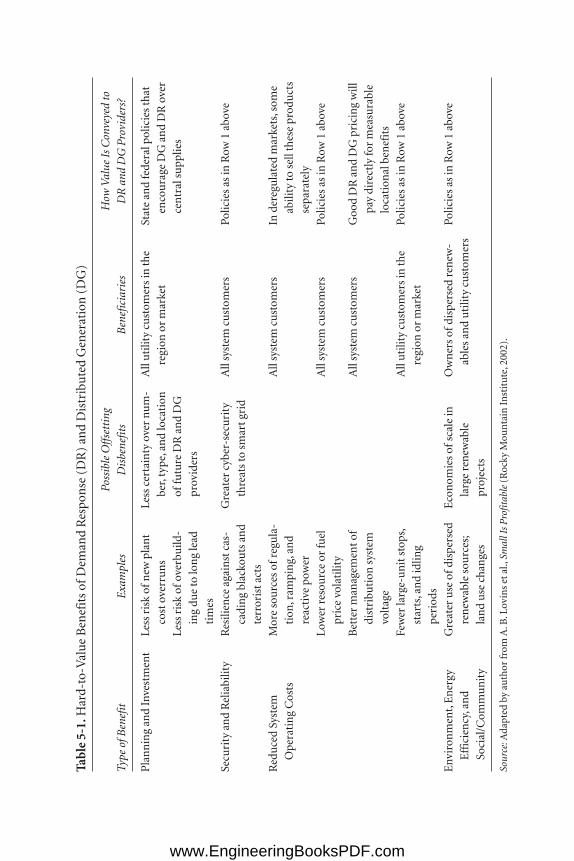
Tab
le 5
-1.H
ard-
to-V
alu
e B
enef
its
of D
eman
d R
espo
nse
(D
R)
and
Dis
trib
ute
d G
ener
atio
n (
DG
)
Poss
ible
Off
sett
ing
How
Val
ue Is
Con
veye
d to
Type
of B
enef
itE
xam
ples
Dis
bene
fits
Ben
efic
iari
esD
R a
nd D
G P
rovi
ders
?
Pla
nn
ing
and
Inve
stm
ent
Less
ris
k of
new
pla
nt
Less
cer
tain
ty o
ver
nu
m-
All
uti
lity
cust
omer
s in
the
Stat
e an
d fe
dera
l pol
icie
s th
at
cost
ove
rru
ns
ber,
type
, an
d lo
cati
on
regi
on o
r m
arke
ten
cou
rage
DG
an
d D
R o
ver
Less
ris
k of
ove
rbu
ild-
of fu
ture
DR
an
d D
G
cen
tral
su
pplie
s
ing
due
to lo
ng
lead
pr
ovid
ers
tim
es
Secu
rity
an
d R
elia
bilit
yR
esili
ence
aga
inst
cas
-G
reat
er c
yber
-sec
uri
ty
All
syst
em c
ust
omer
sPo
licie
s as
in R
ow 1
abo
ve
cadi
ng
blac
kou
ts a
nd
thre
ats
to s
mar
t gri
d
terr
oris
t act
s
Red
uce
d Sy
stem
M
ore
sou
rces
of r
egu
la-
All
syst
em c
ust
omer
sIn
der
egu
late
d m
arke
ts, s
ome
Ope
rati
ng
Cos
tsti
on, r
ampi
ng,
an
d ab
ility
to s
ell t
hes
e pr
odu
cts
reac
tive
pow
erse
para
tely
Low
er r
esou
rce
or fu
el
All
syst
em c
ust
omer
sPo
licie
s as
in R
ow 1
abo
ve
pric
e vo
lati
lity
Bet
ter
man
agem
ent o
f A
ll sy
stem
cu
stom
ers
Goo
d D
R a
nd
DG
pri
cin
g w
ill
dist
ribu
tion
sys
tem
pa
y di
rect
ly fo
r m
easu
rabl
e
volt
age
loca
tion
al b
enef
its
Few
er la
rge-
un
it s
tops
, A
ll u
tilit
y cu
stom
ers
in th
e Po
licie
s as
in R
ow 1
abo
ve
star
ts, a
nd
idlin
g re
gion
or
mar
ket
peri
ods
Env
iron
men
t, E
ner
gy
Gre
ater
use
of d
ispe
rsed
E
con
omie
s of
sca
le in
O
wn
ers
of d
ispe
rsed
ren
ew-
Polic
ies
as in
Row
1 a
bove
Eff
icie
ncy
, an
d re
new
able
sou
rces
; la
rge
ren
ewab
le
able
s an
d u
tilit
y cu
stom
ers
Soci
al/C
omm
un
ity
lan
d u
se c
han
ges
proj
ects
Sour
ce:A
dapt
ed b
y au
thor
from
A. B
. Lov
ins
et a
l., S
mal
l Is P
rofi
tabl
e(R
ocky
Mou
nta
in I
nst
itu
te, 2
002)
.
text:IP_Fox-Penner 8/15/10 7:08 PM Page 58
www.EngineeringBooksPDF.com
for DG power. Add continuing evaluation of these policies to the already long
list of ongoing work for the regulators of the Smart Grid.
Digging up the OldWires
For all its benefits, the Smart Grid will come with large costs, the most signifi-
cant of which will be the physical replacement or upgrading of the old electric
distribution infrastructure. As we saw in the last chapter, the grid is designed,
engineered, and operated to send power in one direction only. There are very
few places in the low-voltage distribution wires where significant amounts of
power are injected into the grid. But as downstream power generators become
much more common the electrical design and controls over the distribution
systems must be reengineered to allow power flows in two directions. This is
technically feasible, but it is a big engineering job that will inevitably raise local
issues.
To get a sense of the challenge, think of a city in which all of the streets go in
only one direction. The city decides that nearly every street will be changed into
a two-way thoroughfare. Exceptions are possible if the city decides that it is just
too difficult or expensive to make the switch on one particular street. It is not
hard to imagine that the city will need to build dozens of new traffic signals,
along with many new side roads, on and off-ramps, and other traffic manage-
ment features.
The distribution system will require the same sort of revamp. Wherever
power is put into the grid, hardware analogous to the fuse box in your home
must be added to keep the grid reliable and safe. Some parts of the local wires
will be costly to expand or reengineer because the wires are inaccessible. One of
the features of the Smart Grid is that it will tend to set power prices much higher
for delivery to congested or overloaded corners of the local grid. Homeowners
in these high-priced corners will love to generate power and earn a high price
for it, while those whomust buy everything at that same high price because they
have no roof space to mount solar cells will complain bitterly.
When the distribution company gets around to upgrading the congested,
high-priced corners of the system, the high prices will suddenly be eliminated.
The Regulatory Mountain 59
www.EngineeringBooksPDF.com
The homeowner who just invested a hefty sum on solar panels with the expecta-
tion that local prices would be high will now be the one complaining, while the
homeowner without roof space will be relieved. This phenomenon is close to
what is already observed in the parts of the high-voltage grid where locational
pricing is used in the wholesale power markets. It is one of several factors that
have significantly slowed the expansion of the high-voltage grid, and it may well
have the same effect at the local level.
Standards and Cyber-Security
The full vision of the Smart Grid includes utilities sending prices to customers,
and directly to their devices, and the devices adjusting themselves accordingly.
In order for utilities to use thousands of these devices to balance the system,
the utility will have to be able to turn at least some of the devices on and off in
emergencies. System controllers will need to know that the device is off, or on
halfway, so communication between the utility and its customer and their de-
vices must be via a two-way network.
All of this will work a lot more smoothly if the parts of the system all use the
same technical standards, so they automatically connect together, physically,
electrically, and in terms of their communication language. Greater standardi-
zation will give utilities and their regulators much more confidence that the
products they are investing in will work properly; they will give the same in-
creased confidence to individual customers, consultants, vendors, and investors,
whose investment and adoption decisions will undoubtedly be influenced by
standardization and overall ease of use.
The need for a two-way network between power system controllers and ul-
timately millions of homes, businesses, and devices raises a plethora of thorny
technical and regulatory questions. Every electrical appliance and every tele-
phone offered for sale in America uses the exact same plug and connects to its
network immediately and without effort. Realizing this degree of “plug and
play” interoperability means that, among other things:
• Price signals generated by the utility must be in an electronic format that
every device recognizes.
60 Smart Power
www.EngineeringBooksPDF.com
• A common language and format must be developed so devices recognize
commands from utilities and their own home control systems with com-
mands like turn off and turn on.
• Every smart meter must connect to every utility’s communication net-
work so it can send and receive information.
• Home or business control systems—computers dedicated to program-
ming devices and distributed generators and storage—must be able to
talk to the smart meter.
These are all technically achievable outcomes, but they are also likely to be made
difficult by several factors, some of which are unique to electric power.
One factor that is not unique is that good industry standards take time—
sometimes lots of time. You may not realize it, but technical standards of this
nature are not set by government agencies, they are set by nonprofit, industry-
managed organizations such as the Institute for Electrical and Electronics Engi-
neers (known as IEEE or I-triple-E) or the International Electrotechnical Con-
gress.8 These organizations convene committees of engineers who wrangle,
often for years, over how to write a standard.
Of course, every piece of equipment and every technical process utilities use
today is already the subject of numerous standards. The Smart Grid is such a
sweeping development that impacts the entire utility operating chain, from
power plant to customer meter. The following picture, limited only to commu-
nications networks along this chain, shows the numerous competing and over-
lapping standard protocols already in use today—twenty-five, plus or minus a
few, shown in Figure 5-1. To try and speed up the Smart Grid, the Obama ad-
ministration tapped the National Institute of Standards and Technology (NIST)
to accelerate the standards-setting effort.9 Following a U.S. Senate hearing on
their progress, one technology blogger wrote of NIST’s testimony: “There are so
many standards to consider, said Patrick Gallagher, deputy director of NIST,
that his organization’s primary responsibility is simply prioritizing the order in
which standards should be developed.”10
While the standard-setting organizations jockey for the right to lead each
standard-setting effort, firms that make devices are losing no time attempting to
establish their technologies as the de facto winners. Often this is done through
The Regulatory Mountain 61
www.EngineeringBooksPDF.com
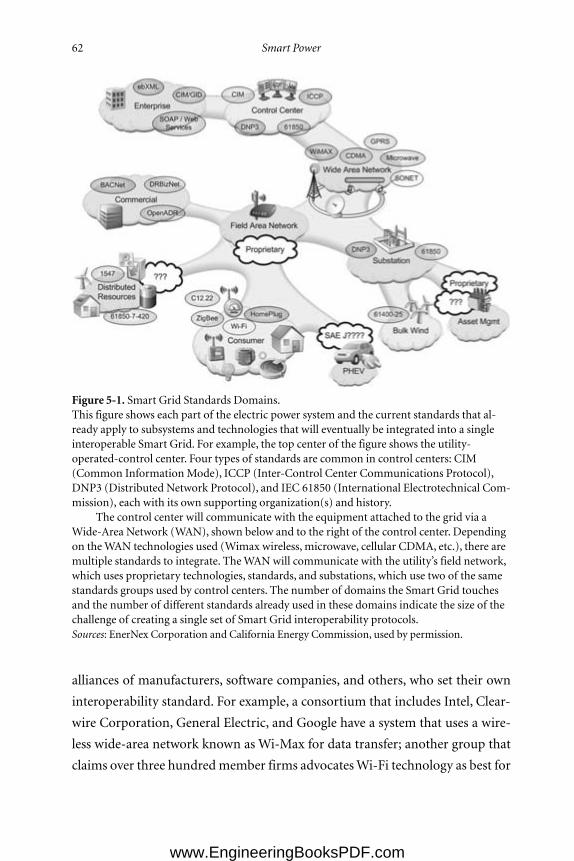
alliances of manufacturers, software companies, and others, who set their own
interoperability standard. For example, a consortium that includes Intel, Clear-
wire Corporation, General Electric, and Google have a system that uses a wire-
less wide-area network known as Wi-Max for data transfer; another group that
claims over three hundredmember firms advocatesWi-Fi technology as best for
62 Smart Power
Figure 5-1. Smart Grid Standards Domains.This figure shows each part of the electric power system and the current standards that al-ready apply to subsystems and technologies that will eventually be integrated into a singleinteroperable Smart Grid. For example, the top center of the figure shows the utility-operated-control center. Four types of standards are common in control centers: CIM(Common InformationMode), ICCP (Inter-Control Center Communications Protocol),DNP3 (Distributed Network Protocol), and IEC 61850 (International Electrotechnical Com-mission), each with its own supporting organization(s) and history.
The control center will communicate with the equipment attached to the grid via aWide-Area Network (WAN), shown below and to the right of the control center. Dependingon theWAN technologies used (Wimax wireless, microwave, cellular CDMA, etc.), there aremultiple standards to integrate. TheWANwill communicate with the utility’s field network,which uses proprietary technologies, standards, and substations, which use two of the samestandards groups used by control centers. The number of domains the Smart Grid touchesand the number of different standards already used in these domains indicate the size of thechallenge of creating a single set of Smart Grid interoperability protocols.Sources: EnerNex Corporation and California Energy Commission, used by permission.
www.EngineeringBooksPDF.com
the Smart Grid.11 Another consortium headed by Cisco, which makes equip-
ment for the Internet backbone, wants to make sure that all data uses Internet
protocol data packets.12
To cite another example, the push to accelerate Smart Grid standards is
prompting the engineering community to revisit the technical requirements for
downstream power sources—requirements that make it more difficult to use
these sources as backup power. Right now every state has different technical
rules for how generators can physically connect to utility grids, and many utili-
ties have special rules themselves. Similarly, state regulators are looking at their
DG policies, as when the state of New York recently raised the maximum allow-
able size for a customer-owned generator receiving the best terms almost ten-
fold, from 25 kilowatts to 2 megawatts.13
As Figure 5-1 shows, within any one utility, there is not a single control net-
work with one language—there are a series of networks, each with its own spe-
cialized language, role, and interfaces to the other systems it must talk to. Utili-
ties are extremely concerned about tampering with these systems. They are the
backbone of its hour-to-hour balancing function, their response to transformer
and outages large and small, and pretty much everything else. Yet these systems
are not standardized. The systems utilities use to monitor and control their own
distribution substations—the last point on their system they control before the
wire to your house—are known as supervisory control and data acquisition sys-
tems (SCADA systems). Every utility has a SCADA system, but Sandia Labs ex-
pert Garth Corey notes that there are more than a dozen different languages and
protocols used in the systems now in commercial use.14
To top it off, some officials in the U.S. Department of Defense (DOD) and
some in the private sector are starting to express deep concern over the in-
creased vulnerability of a Smart Grid to cyber attack. If devices can talk di-
rectly to power controllers, this might create a digital pathway for anyone with
a home computer to hack in to power systems controllers. One company,
IOActive, already claims to have invented a worm that can disable smart me-
ters, and urges a slowdown in standardization and deployment efforts until se-
curity issues can be addressed.15 In March 2009, the unofficial but self-pro-
claimed DOD Energy Blog reported that
The Regulatory Mountain 63
www.EngineeringBooksPDF.com
Tom Donahue, the CIA’s top cyber security analyst, made some news when he dis-
closed that cyber attackers have breached the electrical systems of multiple coun-
tries and have gone as far as powering down entire cities when their demands
weren’t met.
Of course, it’s not business as usual for the CIA to speak out so publicly:
“The CIA wouldn’t have changed its policy on disclosure if it wasn’t im-
portant. Donahue wouldn’t have said it publicly if he didn’t think the
threat was very large and that companies needed to fix things right now.”
But it’s not just that hackers are getting more organized and more powerful.
Grid breaches are occurring because new IT and communications technologies are
making life easier for operators . . . and at the same time, more dangerous for
customers.16
Onemonth later theWall Street Journal ran a front-page story claiming that both
the Chinese and the Russians had already hacked into the U.S. power grid and
were“mapping it” for possible damaging acts in the event of a confrontation.17
No one who can talk about it knows howmuch the need for security will se-
riously impede the Smart Grid’s deployment. Whereas cyber security is cer-
tainly an issue in all computer networks, the level of concern and control is
likely to be much higher for the Smart Grid than for many other applications.18
It is nearly certain that Smart Grid standards will ultimately lead to a far more
secure grid, but it is also quite possible that the need for security will signifi-
cantly slow the deployment of key elements of the system.
Matching Benefits and Costs
Our ability to adopt effective and accurate regulatory processes for paying DR
providers and distributed sources will be an absolutely critical factor driving the
progress of the Smart Grid and the location of future supplies upstream or
down. Good regulation will accurately assess the economic costs and benefits of
distributed versus centralized supplies, grappling with the issues of timeframe,
uncertainty, equity, and locational value. Historically, inquiries of this nature
64 Smart Power
www.EngineeringBooksPDF.com

have taxed the resources of even the best regulatory commissions, a point I re-
turn to at the end of the book.
While regulation is steadily improving the methods of measuring avoided
costs and building them into the payments to DR and DG providers, and exam-
ining other “barriers” to DR and DG, it is a slow process. Above all else, these
regulatory challenges will determine how fast and how well we move into a fu-
ture of interactive power systems unlocked by the Smart Grid.
The Regulatory Mountain 65
www.EngineeringBooksPDF.com

www.EngineeringBooksPDF.com
chapter six
The (Highly Uncertain) Future of Sales
WHEN I WAS A CHILD, my mother’s kitchen had three electric appli-
ances in it—a toaster, a mixer, and a fridge. Today, my kitchen has a mi-
crowave and convection oven, three laptops, five phone chargers, a CD player,
and nine cooking appliances, plus or minus a few.
According to Michael Simonovich at the California Lighting Technology
Center, “The average American kitchen uses 700 watts for lighting today,” but
his Center’s test kitchen is designed to change that. It is a perfectly typical Amer-
ican model: gleaming white melamine cabinets, faux marble counters, and re-
cessed lighting throughout. The kitchen is lit, brilliantly and evenly, with a crisp
white light, a kind I associate with halogen lamps rather than the advanced
LEDs (light-emitting diodes) that are actually installed.Mike tells me, gesturing
at the room,“This kitchen uses 100.”
Smart Grid or not, most of us tend to think that power demand must be
destined to rise steadily in the coming decades. It especially feels this way as we
connect to media and communications networks via an ever-larger number of
“apps” and devices, all of which run on electricity. And for the emerging
economies of the world this is true—electricity use is rising at a very rapid pace.
67
www.EngineeringBooksPDF.com
Yet despite the proliferation of devices and bandwidth, the United States
and Europe have becomemature power markets, with surprisingly modest fore-
casted growth. Power demand has become a race between new ways to use elec-
tricity and new ways to save power with all the devices we already have. There is
no clear frontrunner in this race. The future sales trajectory for electric power
has never been so uncertain, spanning a range from growth above current rates
to gradual sales declines over the next several decades. This is especially true
when you consider that the power customers make for themselves isn’t part of
industry sales.
The long-term trend in power sales has huge implications for the industry’s
future. If sales keep growing, power companies will have increasing revenues,
which has generally made them financially healthy and able to raise capital eas-
ily. Regulated or not, it is easier to recover the costs of new supplies by adding
them to power prices when sales are rising. Carbon emissions might be heading
up with sales, but the industry has the fiscal capability to shift to low-carbon
sources even if they involve high investment.
It is a different story if sales are declining. From the standpoint of the finan-
cial community, declining industries are not good candidates for new invest-
ment. The IOU part of the power industry has been viewed as a stable growth
sector with high-dividend yields, allowing it to raise lots of capital at reasonable
costs. In addition to changing the economic model and culture, a declining sales
industry will have to raise prices frequently, as the costs of removing carbon
emissions from existing sales will still be necessary. These costs will be spread
over fewer and fewer kilowatt-hours, raising prices. Relations with customers
and regulators will be unpleasant, with renewed agitation for deregulation as a
means of escaping higher prices.
Driving Future Sales
Six major factors influence long-term sales, three of them positive and three
negative. The positive factors are population growth, economic growth, and the
trend toward electrification, especially in automobiles. The negative factors are
68 Smart Power
www.EngineeringBooksPDF.com
higher electric prices, energy efficiency policies, and the onset of the Smart
Grid.
Population growth is the most straightforward effect and perhaps the most
surprising. According to the midrange U.S. census estimate, the United States
will grow by over 100 million people by 2050. Over a million people immigrate
into the United States a year; by 2050 it will be two million.1 Even if we could
keep per capita electricity use constant, as California has done for three decades,
we would increase total power sales by nearly 33%. Distribution companies will
also need to install about forty million more electric meters in new housing
units and expand their systems accordingly.
Economic activity and power use are, of course, related. The stronger the
U.S. economy grows, the more power is used by industrial and commercial
firms and the more residential customers buy and use electrical equipment. Be-
yond the simple correlation of growth and power use, however, there is a secular
trend toward electrification, that is, one not related to gross domestic product
(GDP) growth. Overall, electricity is gradually stealing market share from other
fuels for the overall mix of applications we use in the United States. In the resi-
dential sector, for example, electricity use is projected to grow six times faster
than natural gas use through 2030.
During the next century this trend will take a giant leap forward. In the
United States the largest use of energy outside the power sector is gasoline use
for personal vehicles. As plug-in hybrid-electric vehicles (PHEVs) are intro-
duced, electricity will gradually displace gasoline, boosting power sales at the
expense of oil-based fuels. Other technologies will also migrate to electrifica-
tion, though a few may migrate away from power toward natural gas or nongrid
energy sources as well.
Over the long run, PHEVs represent a large new use of electricity. The tim-
ing depends quite a lot on how quickly these vehicles will become affordable and
how well public policies encourage their adoption. To illustrate how widely
PHEV market penetration estimates vary, the U.S. Energy Information Admin-
istration (EIA) forecasts that PHEVs will represent only about 2% of all vehicle
sales by 20302 or only about 200,000 to 300,000 vehicles a year.3 In contrast, a
The (Highly Uncertain) Future of Sales 69
text:IP_Fox-Penner 8/15/10 7:08 PM Page 69
www.EngineeringBooksPDF.com
2007 study by the Electric Power Research Institute (EPRI) and the Natural Re-
sources Defense Council (NRDC) posits a midrange 2030 scenario with PHEVs
achieving a 50%market share, or 7.5 million vehicles a year.4
The impact of these differences on electricity use is enormous. Electric sales
generated by PHEV use according to the EIA forecast are insignificant; in the
EPRI/NRDC scenario, we will need 282 million megawatt-hours—the output
of thirty-eight large power plants—to “fuel” all these cars.5 In the words of two
industry consultants, “Rarely in history has an emerging technology offered
such an attractive opportunity for the industry.”6
Downshifting Sales
Youmight think that these positive factors would cause electricity sales forecasts
to show robust growth over the next fifty years, but they don’t. The numbers
come with a bit of a story.
When President Carter created the U.S. Department of Energy (DOE), he
wanted tomake sure that all Americans—not just large energy companies—had
access to accurate energy data. (Remember, this was long before the Internet
made information so widely accessible.) As part of his energy program, he cre-
ated the earlier-mentioned U.S. Energy Information Administration (EIA), the
government’s official energy forecaster. To keep EIA from appearing as if it was
advocating new policies, its official forecasts were required to assume no fu-
ture changes in energy policies beyond those fully enacted at the time of the
prediction.
This prohibition on assuming policy shifts has great merit, but it tends to
produce conservative results in times of rapid policy change. As of this writing,
the Obama administration has the most ambitious energy policy agenda in
modern times.As expected, EIA’s official forecasts reflect none of the energy leg-
islation in process.
Yet even with this built-in conservatism, EIA predicts very little electricity
growth—about 0.89% a year. Residential consumption is projected to increase
only about 0.8% a year; commercial energy growth clocks in at 1.7% a year. Re-
markably, industrial electric usage is projected to decline in the 23 years from
70 Smart Power
www.EngineeringBooksPDF.com
2007 to 2030.7 The utility industry’s own forecasts, which are typically even
more optimistic than EIA’s, are only a little higher, or about 1.15% per year over
all sectors.8
These rather tepid growth rates are explained largely by three forces that act
to reduce sales. First, electricity is going to be more expensive over the next fifty
years as the industry moves to low-carbon generation, expands transmission to
reach remote renewable sources, and installs the Smart Grid. EIA’s forecast, which
does not include the impacts of climate legislation, say that prices will rise by 12%
in inflation-adjusted terms by 2030. For example, the Environmental Protection
Agency’s (EPA) offered forecast of the impact of climate legislation on electric
prices found an average annual rate increase of about 1.72%;9 some estimates are
even higher. As prices rise in real terms, sales will decline over the long term.10
Policies that accelerate energy efficiency beyond those embedded in EIA’s
forecast are another source of lower sales. Extensive experience with energy effi-
ciency programs has shown that they are capable of having substantial impacts
on sales. EPRI estimates that moderate increases in efficiency policies would cut
the increase in total electricity sold beyond EIA’s estimates by about 33% in
2030.11 More optimistic estimates from organizations such as the American
Council on Energy Efficiency Economy (ACEEE) suggest that stronger effi-
ciency policies can reduce sales by more than 20%, reducing growth below zero
over the next thirty years.12
EIA’s official forecasts are barred from including the effects of stronger en-
ergy efficiency (EE) policies, including policies contained in proposed climate
legislation. Considering the ambitiousness of the proposed policies, the history
of measured efficiency program results, and a varied handful of forecasts of pro-
posed EE policy impacts, it is easily possible that stronger policies could reduce
EIA’s already-modest sales growth by at least one-half. The real outcome will de-
pend on the strength of the policy measures we adopt and our strategy for
achieving them.
Finally, there are additional impacts from dynamic pricing and the greater
control enabled by the Smart Grid. As we saw in the last chapter, dynamic
pricing alone led to energy savings of a few percent, even without enabling
technologies.
The (Highly Uncertain) Future of Sales 71
text:IP_Fox-Penner 8/15/10 7:08 PM Page 71
www.EngineeringBooksPDF.com
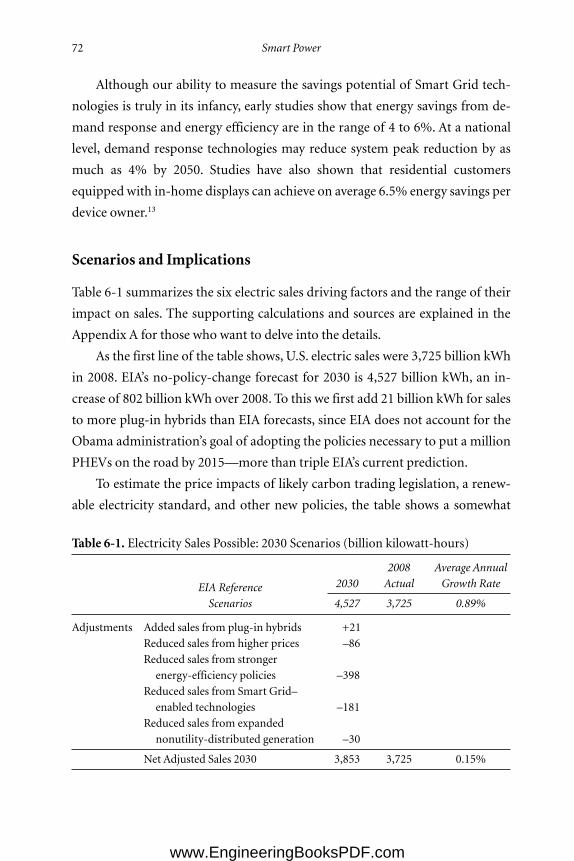
Although our ability to measure the savings potential of Smart Grid tech-
nologies is truly in its infancy, early studies show that energy savings from de-
mand response and energy efficiency are in the range of 4 to 6%. At a national
level, demand response technologies may reduce system peak reduction by as
much as 4% by 2050. Studies have also shown that residential customers
equipped with in-home displays can achieve on average 6.5% energy savings per
device owner.13
Scenarios and Implications
Table 6-1 summarizes the six electric sales driving factors and the range of their
impact on sales. The supporting calculations and sources are explained in the
Appendix A for those who want to delve into the details.
As the first line of the table shows, U.S. electric sales were 3,725 billion kWh
in 2008. EIA’s no-policy-change forecast for 2030 is 4,527 billion kWh, an in-
crease of 802 billion kWh over 2008. To this we first add 21 billion kWh for sales
to more plug-in hybrids than EIA forecasts, since EIA does not account for the
Obama administration’s goal of adopting the policies necessary to put a million
PHEVs on the road by 2015—more than triple EIA’s current prediction.
To estimate the price impacts of likely carbon trading legislation, a renew-
able electricity standard, and other new policies, the table shows a somewhat
72 Smart Power
Table 6-1. Electricity Sales Possible: 2030 Scenarios (billion kilowatt-hours)
2008 Average Annual
EIA Reference 2030 Actual Growth Rate
Scenarios 4,527 3,725 0.89%
Adjustments Added sales from plug-in hybrids +21
Reduced sales from higher prices –86
Reduced sales from stronger
energy-efficiency policies –398
Reduced sales from Smart Grid–
enabled technologies –181
Reduced sales from expanded
nonutility-distributed generation –30
Net Adjusted Sales 2030 3,853 3,725 0.15%
www.EngineeringBooksPDF.com
conservative calculation of additional sales reductions beyond the EIA reference
case. These estimated sales reductions, which come mainly from my own past
work in electric forecasting, punch in at 86 billion kWh.
To account for EE policies stronger than those assumed by EIA, we use
EPRI’s forecast of “realistically achievable” additional savings beyond EIA’s fore-
cast, 398 billion kWh. This forecast is useful because it attempts to capture only
the savings beyond EIA’s forecasts, using traditional EE measures. It is also con-
sidered—by both its authors and its critics—as a conservative estimate of what
could be achieved with strong EE policies. The EPRI study contained a more
ambitious scenario showing 544 billion kWh savings with stronger policies.
More recently ACEEE analyzed the very strong EE provisions of the Waxman–
Markey climate bill and estimated that these provisions alone would save 578
billion kWh by 2030. For the sake of conservatism I use the more modest EPRI
case of 398 billion kWh.14
The EPRI savings estimates included conventional demand side manage-
ment (DSM) technologies but did not attempt to include Smart Grid–enabled
EE. In a second EPRI study, three of my consulting colleagues, Ahmad Faruqui,
Sanem Sergici, and Ryan Hledik, recently completed an extensive survey of
Smart Grid–enabled EE savings. They found that Smart Grid technologies saved
residential customers about 4 to 7% on their electric bill, apart from all other
savings effects. To err on the conservative side, the table assumes 4% savings, or
an additional 181 billion kWh.
Finally, oncoming electricity and climate policies are likely to trigger an in-
crease in distributed generation (DG) not owned or marketed by utilities. As we
learned in the last chapter, the growth of DG will depend strongly on regulatory
policies that establish DG’s total value (hence its price). To estimate the possible
impacts of policies that promote DG, I rely on a special analysis that EIA con-
ducted of the impacts of part of the first climate bill to pass the U.S. House, the
Waxman–Markey bill.15 This study found that the renewable energy standard
(RES) provisions of Waxman–Markey would boost DG (i.e., reduce utility
sales) by about fifteen billion kWh by 2030. I also consider an older EIA study
that measured the impact of favorable tax credits and technology developments
on DG. Although it is an old study that uses many outdated assumptions, it is
The (Highly Uncertain) Future of Sales 73
text:IP_Fox-Penner 8/15/10 7:08 PM Page 73
www.EngineeringBooksPDF.com
indicative of the size of the policy-driven lift DG might receive over and above
EIA’s forecast. Based on all this, I assume DG policies could reduce sales by 30
billion kWh.
The bottom line of the table illustrates the billowing uncertainty surround-
ing future sales. EIA’s reference case shows 802 billion kWh of sales increase
through 2030, but the sum total of these adjustments reduces sales by 674 bil-
lion kWh—even when the administration reaches its PHEV sales goals. This
leaves a net increase of 128 billon kWh or 3.4% in 22 years. This represents an
average annual growth rate that is barely measurable—0.15%/year.While there
may be some “double-counting” of sales reduction stimulated by higher prices,
EE policies, and the Smart Grid, this illustration intentionally uses conservative
estimates for each element in the table.
This exercise is not meant to predict the level of sales 21 years from now. In-
stead, it shows that, for the first time ever, one can create plausible scenarios in
which sales go up handsomely and other equally plausible scenarios where they
go down a bit, at least through 2030. Economic growth is a particularly impor-
tant factor in electric sales.With economic growth at the same average pace ex-
perienced over the last 20 years (2.8%/year), instead of EIA’s 2.4%/year predic-
tion, 2030 power sales would increase by 12% percent over 2008 levels even with
my adjustments. Conversely, low economic growth (1.8%) would leave electric
sales about flat over the next thirty years, even with very small policy adjust-
ments. In this case, the industry would face two decades of worse-than-stagnant
sales.
The implications of this uncertainty for the industry are ominous. The
power industry has very long planning cycles, and it is expensive to change or
delay investments in new power supplies. Running out of generation has devas-
tating consequences, and it is always necessary to have sufficient supply on hand
to meet demand. If the trend in demand is variable or flat, however, planning
decisions get especially complicated. No utility, and no utility regulator, wants
to see a lot of money spent on a new power plant only to find, when it is finished
five years later, that it is no longer needed.
As a utility consultant, I already see the impacts of this uncertainty in many
of my clients. Utilities have a culture of building more plants and lines, and it is
74 Smart Power
www.EngineeringBooksPDF.com
also the primary way that regulated IOUs make money. Yet I’ve never seen utili-
ties as fearful of embarking on a construction program for a major plant as they
are today.
Sales uncertainty is also important because it greatly exacerbates the rest of
the challenges facing the industry. The scale of the investments required by the
industry to convert its generation base to low-carbon sources, build out the
transmission system and the Smart Grid, and contribute to energy efficiency ef-
forts would be staggering even for an industry with healthy sales. Lower sales
will make it harder (i.e., more expensive) to raise the capital to do all these
things. Higher-priced capital and lower sales mean that the price of each of the
lesser number of kilowatt-hours sold will be higher, further reducing sales.
A similar phenomenon was feared to occur in the power industry during
the 1980s, when very expensive nuclear plants caused rates to rise quickly. The
need to raise capital to finish nuclear plants with spiraling costs caused wide-
spread financial distress, the largest municipal bond default in history, and the
first utility bankruptcies since the Great Depression. The phenomenon became
known as a “death spiral,” where higher rates led to lower sales, which led to
higher rates, and so on.16
My sales scenarios notwithstanding, I don’t foresee anything approaching a
death spiral for the industry, save perhaps one or two utilities facing odd and
unfortunate circumstances. Having seen all this before, most of the industry’s
stakeholders understand that avoiding a financial train wreck is far better than
trying to survive one. In other words, large new plants will not be built with-
out fairly solid agreement between managers and customer representatives that
they are needed. Still, sales uncertainty adds an unusually high level of risk to
supply and capital planning at a time when the industry’s investment needs are
unprecedented.
The (Highly Uncertain) Future of Sales 75
www.EngineeringBooksPDF.com

www.EngineeringBooksPDF.com

part t wo
Supply Side Challenges
www.EngineeringBooksPDF.com

www.EngineeringBooksPDF.com
chapter seven
The Aluminum Sky
FOR A BIRD’S-EYE VIEW of the attitudes Americans hold toward electric
transmission, try perusing the energy blogs. One day about a year ago,
SolveClimate.com featured a post on grid expansion that inspired many re-
sponses. One commenter namedMike wrote:
If we want to implement a federal renewable portfolio standard, such as the 25%
proposed by the Obama administration, or the current watered-down version of
15% [proposed] in the Senate, then we will need to look at both local and remote
renewable resources.
Therefore,Mike concluded, we’ll need to build a lot more transmission lines.
Someone named Sheila also responded:
To be clear, very few people in the “West” want our open spaces permanently de-
stroyed and industrialized while our built environment bakes and sprawls and is
not allowed to produce its own energy, just so Big Energy can, once again, profiteer
on our backs.Whatwewant (unlike our legislators who are owned by Big Energy) is
79
www.EngineeringBooksPDF.com
LOTS . . . low interest loans for point of use solutions like efficiency and solar
rooftops. . . . The DOE determined, back in 2003, that 100% of the U.S. electricity
needs could easily be met by using super-cheap thin film PV on existing rooftops.
An additional 90% could be produced with the same material on in-city brown-
fields. So, 190% of U.S. electricity needs can be met in the built environment with-
out eminent domain, transmission-caused SF6 increases in global warming, water
waste, dead ecosystems or wasted taxpayer and ratepayer dollars.
These two views are emblematic of a longstanding and often ferocious debate
over U.S. transmission policy. At one end, new transmission lines are to be
avoided at all cost, replaced in their entirety by energy efficiency and distributed
generation. The alternative extreme is that the United States needs a vastly ex-
panded national grid—some call it a national transmission superhighway—
that enables nationwide power trading and better access to renewable resources.
One environmental expert likened this to forcing America to live under “an alu-
minum sky.”1
Neither of these polar views is likely to occur, but they correctly recognize
that transmission is the fulcrum onwhich the future of the industry will tip. The
availability and cost of transmission will be a truly pivotal factor driving supply
upstream or downstream, toward traditional (decarbonized) fuels or toward
large, new, renewable generators. It is a fork in the road to the power industry’s
future.
Transmission Planning
The regulatory approvals needed to build a large new transmission line create
one of the most difficult and time-consuming regulatory labyrinths in the en-
tire utility universe. Federal officials regulate the rates and terms of service for
high-voltage lines, including open access policies and all organizations that op-
erate the grid.However, the federal government does not itself do any grid plan-
ning, and it has almost no power to order lines to be built. Other federal agen-
cies control access to federal lands and must give a number of environmental
permits for most major lines.
80 Smart Power
www.EngineeringBooksPDF.com
The states retain nearly all of the power in transmission siting. A variety of
siting and environmental permits are needed for a new line, most issued by the
states. If a line passes through several states, each state follows its own permit
process. And although the Federal Energy Regulatory Commission (FERC) has
sole jurisdiction over transmission pricing, state public service commissions
have a de facto veto over most lines because they control the ultimate recovery
of costs from electric customers. They have many ways to penalize a utility that
builds a line, or allocates the cost of a line, in ways they do not like.
Anyone asking for any of these approvals generally needs to be part of a
transmission plan. Every region of the United States has a regional transmis-
sion planning organization. In areas where deregulation has taken whole or
partial root—Texas, the Midwest, and the mid- to upper-Atlantic coast, there
are nonprofit regional transmission organizations (RTOs) that lead regional
planning, in addition to their role operating regional power spot markets and
operating the grid itself. In the rest of the country planning is done by dedi-
cated regional entities such as the Southeast Regional Transmission Planning
group.
As we saw in Chapter 3, the transmission grid is like a network of water
channels. Unlike natural gas pipelines or the Internet, power cannot be routed
across its delivery network; it flows along the paths of least resistance from plant
to load.Whenever a large new line is added, the flows in the region of the line re-
arrange themselves to find the new lowest-resistance pathways.2
This feature of the grid is essential, but it should not be exaggerated. First,
significant flow rearrangement is important only for large new lines; small ones
have minor impacts outside their immediate area. Second, the flow impacts of
large lines diminish at a distance of one or two states away; only a small fraction
of the total grid is affected. Third, lines that use direct current (DC), rather than
the more common alternating current (AC) you have in your house, are differ-
ent—they are controllable and are used for point-to-point controlled deliveries.
Finally, there are some special technologies now in use that can control AC
transmission line flows, and they will see greater use over time. All these factors
make the impact of every large line somewhat specific to its attributes and elec-
trical location in the grid (Box 7-1).3
The Aluminum Sky 81
www.EngineeringBooksPDF.com
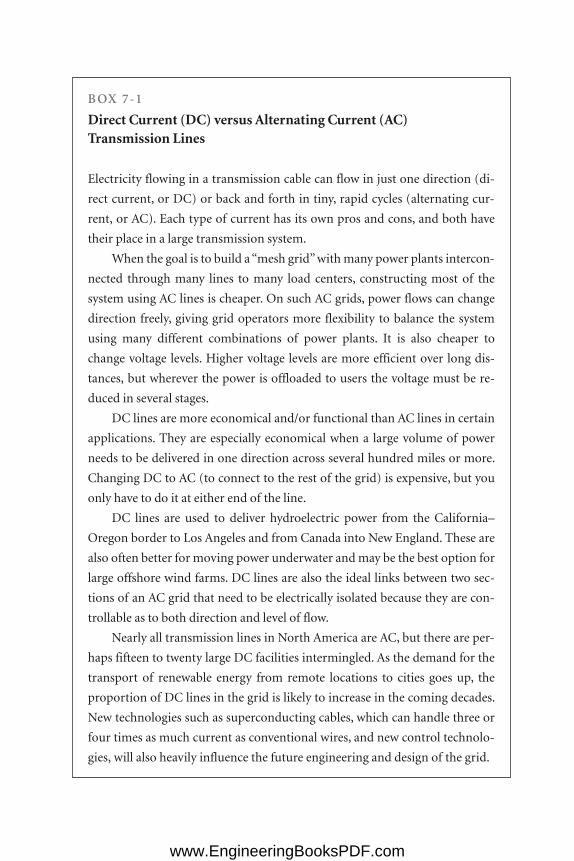
B OX 7-1
Direct Current (DC) versus Alternating Current (AC) Transmission Lines
Electricity flowing in a transmission cable can flow in just one direction (di-
rect current, or DC) or back and forth in tiny, rapid cycles (alternating cur-
rent, or AC). Each type of current has its own pros and cons, and both have
their place in a large transmission system.
When the goal is to build a “mesh grid” with many power plants intercon-
nected through many lines to many load centers, constructing most of the
system using AC lines is cheaper. On such AC grids, power flows can change
direction freely, giving grid operators more flexibility to balance the system
using many different combinations of power plants. It is also cheaper to
change voltage levels. Higher voltage levels are more efficient over long dis-
tances, but wherever the power is offloaded to users the voltage must be re-
duced in several stages.
DC lines are more economical and/or functional than AC lines in certain
applications. They are especially economical when a large volume of power
needs to be delivered in one direction across several hundred miles or more.
Changing DC to AC (to connect to the rest of the grid) is expensive, but you
only have to do it at either end of the line.
DC lines are used to deliver hydroelectric power from the California–
Oregon border to Los Angeles and from Canada into New England. These are
also often better for moving power underwater and may be the best option for
large offshore wind farms. DC lines are also the ideal links between two sec-
tions of an AC grid that need to be electrically isolated because they are con-
trollable as to both direction and level of flow.
Nearly all transmission lines in North America are AC, but there are per-
haps fifteen to twenty large DC facilities intermingled. As the demand for the
transport of renewable energy from remote locations to cities goes up, the
proportion of DC lines in the grid is likely to increase in the coming decades.
New technologies such as superconducting cables, which can handle three or
four times as much current as conventional wires, and new control technolo-
gies, will also heavily influence the future engineering and design of the grid.
text:IP_Fox-Penner 8/15/10 7:08 PM Page 82
www.EngineeringBooksPDF.com
In the planning entities, the planning process begins with proposals for
new generating plants and new lines. Transmission planners, who are typically
specialized electrical engineers, need to know—or rather, assume—where new
plants will be built during the next ten or more years. Otherwise, their com-
puter models can’t simulate how power will flow in their region from plants to
people. Proposals for lines come from utilities or sometimes from independent
(but regulated) transmission line developers. There are also many opportuni-
ties to increase the capacity of existing corridors with better wires and other
technologies.4
Utilities or independent owners of power plants who seek to build new
plants must ask to be connected and are put in a queue. A wind farm developer
might ask for a 600-megawatt connection to the farm he or she wants to place in
service five years from now at a specific location. Because it is national policy
to offer equal access to the transmission grid, any prospective plant builder with
a little funding can apply for a place in the queue—there is no binding re-
quirement that the plant ultimately be built. As a result, many builders apply for
spots in the queue; only one out of every five or ten queue entries is actually
completed.
Transmission planners look at their queue of “service requests” and esti-
mate the power sources that will be in place five or more years out. They run
many different scenarios and determine what parts of the regional network
need to be expanded to prevent overloads and maintain reliability under a wide
range of conditions. It is during these exercises that the impact of flow re-
arrangement from large new lines shows up in widely disparate places. They
may find, for example, that a new line added in one state causes a transformer
hundreds of miles away in another state to become overloaded. These exercises
culminate in a proposed transmission expansion plan.
Remarkably, once they do all this work the resulting plan is merely advisory.
No one is obligated to follow it, except in limited circumstances involving relia-
bility. No one can be forced to build any of the new lines in the plan. In addition,
planners don’t have any siting authority, nor do they know which line will ulti-
mately get siting approval, or on what timetable. Once again they make their
best guess, but if the line they choose as their “preferred plan” subsequently runs
The Aluminum Sky 83
www.EngineeringBooksPDF.com
into siting opposition and is delayed or canceled, it is quite literally back to the
drawing board for them.5
You would think that this process would have created a strong coupling be-
tween transmission planners, utilities, and state public service commissions.
However, deregulation and industry’s multiple layers of jurisdiction create a
structure that does not lend itself to coordinated expansion. In most states with
retail choice, for example, utilities can’t own or plan their generation, nor can
state regulators—the deregulated market builds new plants. When power gener-
ators were first deregulated, no one thought to create a logical planning process
for grid expansion, and we’ve been playing catch-up ever since. Even in areas
where utilities are state regulated, the regional planning process is sometimes
barely connected to state regulators and siting approvals.
In truth the reality isn’t as bad as it sounds. Transmission-owning utilities
are required to maintain reliability standards, facing penalties and embarrass-
ment if they don’t, so they are loath to ignore any specific directive from their
regional planners that clearly involves reliability. Because transmission is 100%
rate regulated, the cost of this reliability-enhancing project is added into trans-
mission rates as long as regulators agree. Regulators almost never refuse to allow
rates to cover grid investments that maintain reliability, fearing the wrath of
voters if blackouts occur. Quite a lot of what’s in regional plans gets built, espe-
cially upgrades involving one or two systems at most.
The biggest expansion problems tend to arise when there are elements of
the plan—especially brand new lines—that are not driven by reliability, but
rather represent multiple options for providing new supplies with different eco-
nomic and environmental consequences. For example, suppose planners find
that there are two options for expanding the grid, one adding a line to a group of
wind farms who want to sign contracts with local utilities and a second with a
line into a forested area with biomass plants and a proposed new gas-fired gen-
erator. Both options preserve reliability.
These options are sure to set off a heated discussion among nearly everyone
involved in the plan. When this occurs, the planning engineers point out to
everyone that they’re just engineers. No one elected them to pick and choose the
best option. Indeed, their transmission software only ensures that the grid is re-
84 Smart Power
text:IP_Fox-Penner 8/15/10 7:08 PM Page 84
www.EngineeringBooksPDF.com
liable—it doesn’t even show which option is cheapest. To plan for lowest cost,
you have to somehow integrate each utility’s generation portfolio planning ex-
ercise—the exercise of picking among different generator types as discussed in
Chapter 9. Transmission planning groups are just now starting to do this on a
trial basis.6
Yet no one else has been chosen to make the decision either. Because the
process is multistate, no one state regulatory commission has jurisdiction. State
regulators control rates for distribution companies and generators if they are
regulated. Public power and co-ops are subject to very limited FERC or state
control. The FERC has full authority to set the transmission rates for whichever
option is chosen, but it can only be reactive—it has no authority to pick the op-
tion in the first place, and it has zero authority to direct where generators are
built.
With its limited authority, the FERC made a valiant attempt to improve re-
gional transmission planning in 2007 by issuing Order 890. This order requires
every private transmission-owning utility and RTO to adhere to a set of plan-
ning principles, including coordination with others, transparency, information
exchange, and the inclusion of economic considerations. It was a big step, but
broad-scale resentment against federal intrusion, legitimate regional differ-
ences, and its own limited authority meant that the new process is far from uni-
versal and actionable regional plans. More recently, the Obama administration
has streamlined the process of federal transmission siting approvals, which will
also help.7
Paying for New Lines
The multifaceted impact of a new line often leads to debates over who should
pay for it, by way of its costs being included in some, but not other, utilities’
transmission rates. There are several schools of thought on payment responsi-
bility, or cost allocation as it is referred to in the industry. As its name suggests,
the beneficiary pays school believes that the costs of new lines should be allo-
cated to the ratepayers who benefit from the line. An alternative school believes
that the value of new transmission is inherently shared by everyone in a region,
The Aluminum Sky 85
www.EngineeringBooksPDF.com
as it is the network itself that provides reliable service to all, and that the envi-
ronmental benefits of adding clean new supplies are enjoyed widely in the re-
gion. This is treating transmission as a regional public good, but more com-
monly this approach is (sometimes derisively) referred to as “socializing the
costs” of new transmission or by the shorthand postage-stamp pricing.
One would think that it would be easy for economists to measure exactly
who benefits from a new transmission line, but as an economist practicing in
this area I can tell you that this a hugely challenging task. We can do it, but it
takes a lot of assumptions about future prices (fuels and carbon), the success or
failure of new plant proposals, and many other factors, all of which spark end-
less debate.
The results can differ vastly as well. Sometimes we find that the benefits are
spread widely over many customers in a region, and sometimes they are limited
to one part of the region. Often as not, the border between customers who gain
measurably from the project and customers whose net benefits are uncertain
doesn’t match state or utility boundaries, making it hard to match the costs
or benefits to particular groups of ratepayers. There are also legitimate philo-
sophical differences on cost allocation, including questions about how to divide
the value of greater reliability or allocate the value of better environmental
outcomes.
The upshot of these difficulties and the many varied circumstances involv-
ing lines means that no approach works perfectly in every instance. This has
stymied progress on creating a more routine approach to paying for lines, which
in turn means that protracted debates over who bears the costs are the norm
and not the exception for large new lines. The larger the line, and themore states
it crosses, the longer and more ferocious the debate.
Because cost allocation is tied to the (cost-based) transmission rates that
each company is allowed to charge, and transmission rates are federally jurisdic-
tional, the FERC is the final arbiter of cost allocation disputes.However, because
no one can force transmission owners to build a line, or the states to accept the
FERC’s allocation, the FERC usually must essentially seek a negotiated solution
or watch the project collapse out of frustration and delay.8
Everyone in the industry is acutely aware of this problem, and some solu-
tions are starting to emerge. Several RTOs have adopted default cost allocation
86 Smart Power
www.EngineeringBooksPDF.com
policies. They usually fail to quell all controversy, but they are a start. In most re-
gions and subregions, nearby states are starting to create organizations dedi-
cated to regional grid planning and cost allocation agreements. In the Midwest,
for example, the states involved in the Midwest Independent System Operator
(MISO) regional market have several new fora, one for general discussions, one
for debating cost allocations, and one for a smaller group of states that expects
to build an especially large amount of transmission.9 Similar groups and efforts
are under way in other regions.10
The Need for New Lines
The convoluted process of adding large transmission lines wouldn’t be too seri-
ous if we didn’t need them. This brings us to the all-important question of how
much transmission we really need.
In 2008 there was a little less than 40,000 MW of renewable capacity on the
U.S. grid, not counting large hydroelectric dams.11 There are already thirty-one
states with renewable portfolio standards (RPS) mandates to install increasing
amounts of renewable energy each year into the 2020s.12 The aggregate effect of
these mandates will be the addition of about 208,000 MW of renewable power
by 2030—a fivefold increase. Perhaps by coincidence, studies show that this is
also roughly the amount of renewable energy likely to be needed to meet the
carbon emissions caps in the current legislation under discussion. Assuming
these mandates aren’t repealed, the only question is whether this capacity will
come from small-scale sources (Sheila’s dream) or large-scale plants that need
transmission.
The potential sites for renewable plants needed to meet state standards and
carbon caps are located widely around the country, but as we will see in the next
chapter, their power is cheapest in the parts of the country where there are either
strong winds, high isolation, or plentiful and cheap biomass, geothermal, and
hydrokinetic resources. The National Renewable Energy Laboratory (NREL)
has carefully mapped these resources and the results are no surprise: wind is
strongest in the Great Plains and upper Rocky Mountain West, sunlight is
strongest in the desert Southwest, and woody biomass is most plentiful inMaine
and the rural Southeast.13
The Aluminum Sky 87
www.EngineeringBooksPDF.com
When you overlay a map of the large transmission lines in the United States
over any of these renewables resource maps, you notice something obvious:
the high-voltage grid wasn’t designed or located to get power from these
renewables-rich areas. It was created to move power from our current fleet of
coal, gas, and nuclear plants, which are mainly located near fuel sources or bod-
ies of water, to large cities and industries. Today, large transmission lines don’t
run out to the middle of the Dakotas or to the center of the Mohave Desert—
why would they? There is also a high concentration of strong wind off many of
the coastal areas of the country. Locating wind plants off coastal areas can pro-
duce very good wind energy, but obviously there aren’t any transmission lines
out into our coastal waters either.
In Chapter 5 we learned that balancing a grid with many large variable re-
newable sources requires additional balancing plants—demand response isn’t
yet sufficiently large or controllable, and large-scale storage is rarely feasible.
These balancing resources need transmission too. Following a detailed look at
the technical issues involved in relying on high levels of variable renewables,
the group charged with maintaining U.S. grid reliability (North American
Electric Reliability Corporation, or NERC) urged that new sources be spread
out as widely as possible to take advantage of wind and solar diversity. It also
said
High levels of variable generation will require significant transmission additions and
reinforcements to move wind, solar, and ocean power from their source points to de-
mand centers and provide other needed reliability services, such as greater access to
ramping and ancillary services [the correct technical name for what we’ve been call-
ing balancing resources]. Policy makers and government entities are encouraged to
work together to remove obstacles to transmission development, accelerate siting,
and approve needed permits.14
The upshot of all this is that a low-carbon future requires much more transmis-
sion grid per kilowatt-hour than our current high-carbon grid. It is difficult to
project the exact amount of new wire needed, but from a number of studies and
conversations with planners I estimate that we will need an additional 30,000
to 40,000 miles of new lines through 2030. By comparison, the current high-
88 Smart Power
www.EngineeringBooksPDF.com
voltage system is about 164,000 miles, and we’ve been adding about 1,000 miles
a year during the last decade.15
Although simple math suggests that 1,000 miles a year times twenty years
will yield 20,000 miles of lines, the reality is that this pace is much too slow. It
takes five to ten years to site and build new lines when everything goes right, and
generation must be planned in concert with the lines if they are going to be put
to use immediately. Transmission line construction during the next several de-
cades needs to be front-loaded to match industry policies, and that means a
kick-start to transmission additions.
Fortunately, there is a clear upswell of transmission activities across the
United States today. There are at least a dozen very large proposed transmission
projects or proposals in the works, most of them designed to deliver renewable
power to nearby states. Texas has approved a 2,300-mile series of lines to deliver
wind fromWest Texas to the rest of the state. The Western Governors’ Associa-
tion is working on a massive planning effort, and several large new lines are well
under way. Along the East Coast, a number of utilities and developers are pro-
posing DC lines that will deliver onshore or offshore renewables from Maine
and Canada into New England or offshore wind and other renewables north-
ward from the southeast.16 The latest figures for grid additions by all utilities in
the next five-year period add up to 32,000 miles—more new lines than have
been added in the last twenty-five years. It is doubtful that the industry can in-
crease the pace of its line construction by a factor of five so quickly, but if some-
thing close to this unprecedented pace of line construction can be planned, fi-
nanced, and built over the next several decades the grid should not be the
constraint on our national policy objectives.
ANational Transmission Superhighway?
Recognizing the need for transmission, economies of scale, and the concen-
tration of cheap renewables in specific locations, some groups have raised the
idea of building a national transmission supergrid often compared to the Inter-
state Highway System. One of the proposals, by the American Electric Power
Company, would be a system of 765-kilovolt lines crisscrossing the country, as
shown in Figure 7-1.17
The Aluminum Sky 89
www.EngineeringBooksPDF.com
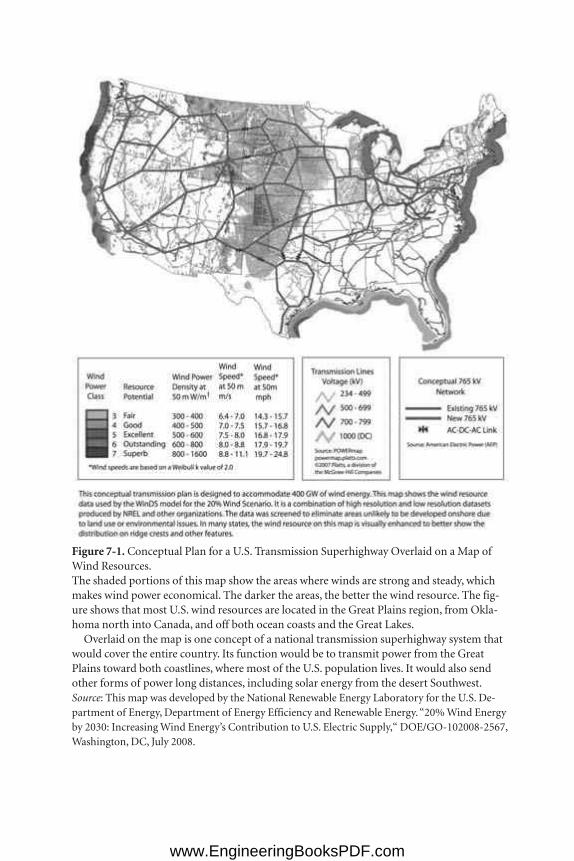
Figure 7-1. Conceptual Plan for a U.S. Transmission Superhighway Overlaid on a Map ofWind Resources.The shaded portions of this map show the areas where winds are strong and steady, whichmakes wind power economical. The darker the areas, the better the wind resource. The fig-ure shows that most U.S. wind resources are located in the Great Plains region, from Okla-homa north into Canada, and off both ocean coasts and the Great Lakes.
Overlaid on the map is one concept of a national transmission superhighway system thatwould cover the entire country. Its function would be to transmit power from the GreatPlains toward both coastlines, where most of the U.S. population lives. It would also sendother forms of power long distances, including solar energy from the desert Southwest.Source: This map was developed by the National Renewable Energy Laboratory for the U.S. De-partment of Energy, Department of Energy Efficiency and Renewable Energy. “20% Wind Energyby 2030: Increasing Wind Energy’s Contribution to U.S. Electric Supply,“ DOE/GO-102008-2567,Washington, DC, July 2008.
text:IP_Fox-Penner 8/15/10 7:08 PM Page 90
www.EngineeringBooksPDF.com

Other groups have advanced similar ideas in the United States and also in
Europe, where there is talk of a supergrid that will ship solar power made in the
Sahara desert north into southern Europe—perhaps backed up by natural gas
plants using North African gas supplies. Some of these plans rely on direct cur-
rent (DC) lines, which as just noted are cheaper and more controllable when
used to deliver power in one direction over very long distances.18
There are unquestionable scale economies in the use of high-voltage trans-
mission, both AC and DC, to move large amounts of power a long way. One
765-kV line can carry as much as five 375-kV single circuits while occupying
only about one-fifth as much land along its route (it does, however, use a much
taller tower). Even with these scale economies, there is little evidence that we
will need anything like a nationwide grid to achieve our policy goals.
The 30,000 to 40,000 miles of transmission we need is much smaller than a
nationwide transmission highway system. Nearly all of the studies of interre-
gional transmission options that measure total costs conclude that it is cheaper
to use renewable energy within its own region of the country rather than ship it
thousands of miles.19 There is also quite a lot of opposition to a national super-
grid from a variety of groups. Environmentalists’ fears concerning transmission
in general, captured in Sheila’s blog entry, are only multiplied by massive na-
tional build-out.20 Many local renewable developers and states also think that—
despite the questionable economics of long-distance renewables—a supergrid
will displace local resource development, depriving the region of new industries
and jobs.
A national supergrid also raises extremely challenging reliability and secu-
rity issues.While it is true that a more interconnected grid is inherently more re-
liable, this does not translate into a national supergrid improving customer-
level reliability relative to the alternatives. Very long lines in a power grid can
reduce reliability because they are harder to keep balanced and vulnerable to
weather events and physical disturbances, including acts of terror. As the Smart
Grid enters the picture, local distribution companies will have vastly improved
reliability management tools and will rely less and less on the large grid for
emergency backup. The entire question of grid design and the value of up-
stream versus downstream reliability enhancement deserve much more study,
The Aluminum Sky 91
www.EngineeringBooksPDF.com
but it is already clear that we cannot equate a large, longer grid with greater
reliability.21
Transmission Reform
Apart from those in the build-no-new-wires camp, there is general agreement
on the importance of accelerating transmission additions in the high-voltage
grid, provided energy efficiency and distributed generation are maximized first.
Nevertheless, so far there has been little agreement on changes in federal author-
ity designed to improve the present expansion process. Fearing that the federal
government will site new lines across their boundaries, the states have been very
reluctant to cede any authority over planning or siting approvals to the FERC or
any other federal agency.22
In every piece of federal energy legislation, including all of the major cli-
mate change bills, transmission expansion reform has been one of the most
controversial and hard-fought issues.Most governors andmembers of Congress
don’t like the idea of the FERC having the authority to overrule their siting pro-
cesses, and they are also opposed to any legislative mandate on cost allocation
because it might force their citizens to pay (albeit a very small amount) for grid
additions that provide no perceived benefit. Although small increases in the fed-
eral government’s authority to push grid expansion forward are quite likely,
substantial new legislative authority is unlikely unless current plans start hit-
ting road blocks. If current plans falter, all bets are off. The signs are that any
federal mandates will have to be crafted surgically to apply under rather limited
conditions.
It is much more likely that the regions of the country improve transmission
planning, siting, and cost allocation due to pressure within their region from
beleaguered utilities worried about meeting their mandates, renewable energy
developers, and the environmental community.
The fear of greater federal authority may be another motivating factor.
Whatever the cause, it is clear that the challenge is to finalize siting approvals
and cost allocation for what is on the drawing boards.
92 Smart Power
www.EngineeringBooksPDF.com
The Tipping Point
Over the next decade, the rate at which transmission expands will do much to
set the contours of the future industry. If a good portion of the current slate of
large projects break ground, the momentum will continue and the present
hearty rate of growth in large-scale renewables can proceed. This outcome will
mean that the regions somehow found a way, whether through new federal poli-
cies or self-motivation, to cooperate enough on planning, siting and cost alloca-
tion to speed up the grid expansion process and make it less risky than in the
past.
Realistically, less successful outcomes are entirely possible. Transmission ex-
pansion could falter for any of the customary reasons, not to mention some new
or unforeseen problems. Another decade or two in which new transmission lags
behind the need for new capacity will have dramatic consequences for the range
of supply choices we can access. And now, more than ever, the more supply op-
tions we have the better.
The Aluminum Sky 93
www.EngineeringBooksPDF.com

www.EngineeringBooksPDF.com
chapter eight
The Great Power Shift
SINCE ITS INCEPTION, the generating sector of the U.S. power industry,
and that of nearly every other nation on Earth, has relied heavily on fossil
fuels. Thomas Edison burned coal in all his original power plants; by 1898, 50
tons a day were hauled through the busy streets of downtown Chicago to early
power stations.1 Today the United States still relies on coal for half its power;
China 73% and India 75%. And coal use is rising worldwide. China alone is ex-
pected to commission 600,000 MW of new coal plants by 2030—more power
capacity than is in all of Europe.2,3
As ever-more coal trains roll, the world scientific community is calling for
an 80% reduction in greenhouse gas emissions by 2050, only forty years away. In
developed economies like that in the United States, every study of this problem
shows that electricity generators must be the first and the fastest to reduce their
carbon emissions. During the next half-century, an industry that has rarely
known anything but fossil-based generation will be forced to switch rapidly to
low-carbon fuels. I call it the Great Power Shift.
While we know the shift is on, we don’t quite know what the future sup-
ply picture will be. There are huge questions about the availability, cost, and
95
text:IP_Fox-Penner 8/15/10 7:08 PM Page 95
www.EngineeringBooksPDF.com
reliability of many low-carbon-generating technologies. In the decade that will
follow the present set of stopgap strategies, when the largest investments must
be made, the uncertainties grow exponentially.
Le Tour de Plants
In the power business it is traditional to classify power plants by their size and
their source of fuel. There are usually several different types of specific generat-
ing technologies that use each fuel, but in most cases the differences aren’t as
important within generators using one type of fuel as across generators using
other sources. Size matters too, so let’s begin with the larger sources and then
move downstream to small-scale technologies and fuels.
Natural Gas
During the last twenty years, by far the most common power plants built in the
United States use natural gas fuel. Gas combustion turbines are nearly identical
to the jet engines on large airliners, except that airline jets use liquid aviation
fuel. These engines are largely built in factories and shipped to a site, where five
to twenty or more are formed into a single plant. By themselves, these plants are
only economical if they run no more than a few hundred hours a year, so they
are turned on only on days when power demand is very high. For this reason
they are known as peaking plants, or peakers.
The second very common type of gas plant is a combined cycle generator.
These plants have a conventional boiler that makes steam to turn a turbine-
generator, just like the old science fair experiments. As its name suggests, how-
ever, a combined cycle gas turbine plant (CCGT, or often simply called a com-
bined cycle, or CC) integrates two combustion turbines with the steam boiler in
an extremely versatile and efficient arrangement. CCs have the highest energy
conversion efficiency of any power plant—over 60% in some cases—and can
run anywhere from 24/7 to a few hours a year with great controllability.
Natural gas CC technology has about the lowest cost and performance risk
of any major power source. The technology has been proven, and it gets a little
96 Smart Power
www.EngineeringBooksPDF.com
more efficient and cost-effective with each successive generation. The Energy
Information Administration (EIA) predicts that the cost of building new CCs
will drop from an already low $948 per kilowatt of capacity to $717/kW by 2030,
with a 6% efficiency improvement as well.4 Because natural gas emits less car-
bon than coal, and these plants are highly efficient, CCs have the lowest CO2
emissions of any fossil generator, so their status as a low-cost resource is not eas-
ily threatened by carbon prices.
The main risk of relying on gas-fired generators is, of course, high gas
prices. It is a very real risk. In recent years natural gas prices have careened be-
tween highs of $50 per million Btu and lows of $3.50, a range no other fuel can
touch. At present, new supplies of gas extracted from shale formations in the
United States are projected to continue to keep supplies ample and prices low
for many years, but threats to our gas supplies remain.5 For example, some gas
drilling uses chemical fluids to fracture gas formations underground, and there
is increasing concern that these fluids harmworkers and leak into the water sup-
ply. There are also objections to increased access to public lands, among other
issues.6
Utilities, regulators, and the grid’s reliability managers also worry that the
grid will rely too much on natural gas. Gas-fired power plants require an as-
sured supply of gas, especially on the coldest days of the year, which is also when
gas is most needed for home heating. Even though gas pipelines plan for such
contingencies, a small mistake can have terrible consequences. During an espe-
cially cold spell in January 2004, barely enough natural gas reached New En-
gland to heat homes and fuel the region’s power plants. Grid operators appealed
for voluntary conservation efforts and narrowly averted rolling blackouts—a
frightening prospect in the dead of winter.7 Heavy reliance on gas also exposes
power customers to price shocks when gas prices spike.
Low-Carbon Coal
Today coal-fired power plants everywhere in the world emit carbon dioxide in
their exhaust gases. The technology to remove this CO2 and store it away from
the atmosphere is called carbon capture and sequestration (CCS). A variety of
The Great Power Shift 97
www.EngineeringBooksPDF.com
CCS technologies are now being tested around the world, but there is not yet a
guarantee that they will be ready soon for widespread commercial use.8
Looking forward, there will probably be three types of low-carbon coal
plants. The first burns pulverized coal, nowadays often in “supercritical” or
“ultrasupercritical” boilers with astonishingly high temperatures and pressures.
A second, newer type of plant first converts coal to a synthetic type of natural
gas, capturing many of coal’s pollutants in the solid remnants, and then sends
the gas into a modified gas CC plant. There are only a few of these new inte-
grated gasification combined cycle (IGCC) plants in operation or under con-
struction, but they are likely to become more common.9 The third type of
power plant, oxy-fuel combustion, adds oxygen to the boiler to make postcom-
bustion removal of CO2 easier.
IGCC without CCS is already in use at commercial scale around the world;
the first commercial U.S. facility, a 630-MWDuke Energy plant in Edwardsport,
Indiana, is scheduled to generate by 2012.10 The main purpose of the U.S. De-
partment of Energy’s (DOE’s) FutureGen project in Mattoon, Illinois, is to
demonstrate how CCS can be added into IGCC plants to make a carbon-free
IGCC, a technical challenge even its proponents acknowledge is substantial. Re-
markably, China’s own 650-MW IGCC demonstration plant with CCS is also
scheduled to be ready by 2012.11
What about the 1,500 existing coal-fired units in the United States—and
the thousands more around the world that exist or are scheduled to be built
without CCS? American Electric Power and the Southern Company are each
testing 20-MW pilot units from different vendors that remove CO2 from a
power plant’s smokestack. In mid-2009, the DOE also announced funding for a
120-MW postcombustion demonstration at Basin Electric’s Antelope Valley
coal plant.12 As with IGCC technology, the question is not whether the technol-
ogy works, it is whether the cost and reliability of the process at commercial
scale yield a competitive total cost of power as low as that of the competing
options.13
Sequestering the CO2 after it is collected is an entirely separate process. Car-
bon sequestration takes the CO2 extracted from coal plants, in the form of a
slurry or cold liquid, and injects it into depleted oil wells, underground salt-
98 Smart Power
www.EngineeringBooksPDF.com
water aquifers, or other geological structures. While it may be surprising, most
of the main methods have been in small-scale use or larger trials for some time
now. So far, scientists think that there’s a 99% chance that properly sequestered
carbon will stay put for a thousand years.14 Moreover, there appear to be more
than enough sites with sequestration capacity to accommodate coal emissions
for the entire next century or more.15
The most important questions about sequestration are regulatory. At pres-
ent, no one is sure what legal liability the owner/operator of a sequestration site
has if the site fails by leaking CO2, perhaps catastrophically. Sequestration sites
may also pollute groundwater or nearby mineral deposits or have other unin-
tended harmful impacts. The legal framework established must assume that
these sites will be monitored and maintained for hundreds of years.
However, neither the Environmental Protection Agency (EPA) nor any
other federal agency yet has the authority to comprehensively classify and regu-
late sequestration.16 Environmental law experts such as Michael Gerrard, head
of Columbia University’s Center for Climate Change Law, predict that the regu-
latory scheme finally adopted will then face many years of litigation in the
courts before it becomes settled law.17
The system for sequestering CO2 will also require a massive physical infra-
structure that may not be feasible to finance and build, or may take longer than
we can afford. The Massachusetts Institute of Technology’s (MIT’s) Future of
Coal study points out that 60% of the current emissions fromU.S. coal plants, if
captured and converted to liquid CO2, would represent a flow rate of twenty
million barrels a day—about equal to our current national use of oil.18 After
studying the issue, three experts from the nonprofit Clean Air Task Force con-
cluded that the pipeline network needed to sequester all coal-derived CO2
would number at least 30,000 miles—but that this seemed achievable in view of
the fact that the United States added 150,000 miles of natural gas pipelines be-
tween 1960 and 1980.19
Finally, we cannot ignore concerns over the environmental costs and avail-
ability of coal. It is often assumed that coal is abundant in the United States—we
are sometimes referred to as the Saudi Arabia of coal—and that the environ-
mental consequences of mining are controllable and publicly acceptable.While
The Great Power Shift 99
www.EngineeringBooksPDF.com
these considerations are unlikely to slow the growth of coal outside the United
States, coal production in the United States may be reaching its peak, and both
environmental concerns and rising costs create uncertainties for a fuel whose
availability at low delivered costs was previously seldom questioned.20
A Nuclear Renaissance?
Depending on whom you talk to, nuclear power is either poised for a major ren-
aissance or destined for another set of costly failures. The 100 U.S. plants cur-
rently operating were built between 1967 and 1990. They now supply 20% of the
nation’s power with high reliability and low operating costs.21 These plants will
all retire during the next fifty years, leaving a huge hole in our electricity supply
from plants that do not produce greenhouse gases.
So far, seventeen U.S. nuclear power plants have applied for licenses—
though U.S. nuclear regulators don’t expect more than six to start construction
right away.22 Internationally, there were forty-one plants under construction as
of June 2008, primarily in Asia, with China reportedly planning to build 100 by
itself.23 Touting the greenhouse gas and environmental benefits of nuclear
power, the Republican Conference of the U.S. Congress recently released a plan
to build 100 new U.S. plants by 2030.24
By a wide margin, the fate of nuclear power rests with its capital costs. The
costs of everything other than plant construction—fuel, operations, waste dis-
posal, and decommissioning—add up to only a few cents per kilowatt-hour.25
The credit rating agency Moody’s recently concluded that the “risks of building
new nuclear generation are hard to ignore, entailing significantly higher busi-
ness and operating risk profiles, with construction risks, huge capital costs, and
continual shifts in national energy policy.”26 If new nuclear plants can be built
for about $4,000 per kilowatt of capacity—roughly twice the cost of a coal plant
and four times a gas-fired unit—they still produce competitive power because
all their fuel costs are so low, even counting waste disposal. However, if con-
struction costs $7,000 to $8,000/kW or more nuclear power is unlikely to be
economical.27
100 Smart Power
text:IP_Fox-Penner 8/15/10 7:08 PM Page 100
www.EngineeringBooksPDF.com
At this point the new U.S. plants are on the drawing boards and cost es-
timates span precisely this range. EIA estimates that new plants cost under
$4,000/kW, and most of the current companies building them predict costs in
this area. EIA also predicts prices will drop significantly (to under $3,000/kW)
as the industry gains construction experience, which is normal in the power
industry. Many other analysts are not so sanguine. A 2008 Congressional Bud-
get Office comparison of generating costs concluded that advanced nuclear
plants would cost 30 to 35% more than coal- or gas-fired power.28 Other ex-
perts, such as Joe Romm at Climate Progress, project nuclear costs far above the
alternatives.29
Of all the large technologies, nuclear power also faces the largest supply
chain challenges. Many of the parts in a nuclear plant, such as pressure relief
valves or containment structures, must be certified to meet higher standards
than other similar parts used in other generators. The materials used to make
these parts are often of a higher quality, and therefore more expensive, especially
in a period of rising commodity costs. Many of these parts are made by only a
handful of manufacturers in the world with the right certifications.30
The state of the nuclear workforce is a closely related concern. Citing statis-
tics from the Nuclear Energy Institute, two experts note that fully half the nu-
clear workforce will be eligible to retire within five years.31 A recruiter for a nu-
clear firm explained to me that his company is simply unable to recruit enough
new engineers to take the place of highly specialized retiring workers, in part be-
cause the number of U.S. nuclear engineering university programs has dropped
(from sixty-five to fewer than thirty) and because there are restrictions on the
foreign nationals they can hire. The Health Physics Society claims there is al-
ready a 30% shortage in radiation protection workers.32
Waste disposal also continues to be an issue. President Obama recently cut
the funding for the only long-term nuclear waste repository in the United
States, and there is scant progress at finding an alternative site.Waste is now be-
ing stored in temporary repositories adjacent to current reactor sites, raising the
threat of release by accident or acts of terror. In the same vein, a single major ac-
cident is likely to greatly slow if not stop any nuclear revival in its tracks.
The Great Power Shift 101
www.EngineeringBooksPDF.com

Onshore and Offshore Wind
Onshore wind power installations are becoming a common sight in rural Amer-
ica and every other windy part of the world. Modern wind turbines, ubiquitous
in pictures of the new energy economy, produce up to 5 MW each and have ro-
tors as wide as a football field. Wind farms, where turbines are mounted on huge
steel poles every 30 to 60 acres,33 can generate as much power on windy days as a
large nuclear plant—though the average farm is more like a tenth this size (83
MW).34
The economics of wind power are well established, and the technology is
entirely proven, making wind one of the least risky generation technologies
around. Any large site where the wind blows at least 25% of the time at speeds
above 9 miles per hour, and where there is nearby transmission able to absorb
the wind power at that spot, and where siting permission can be obtained is a
good place for a wind farm. Under these conditions, wind power costs about the
same as power from natural gas plants, not counting the costs of transmission
and grid integration. As technology improves, the cost of wind is expected to
drop at least another 10 or 20%.35
No surprise, then, that onshore wind has become by far the largest and
fastest growing renewable energy source in the world. In 2008 the United States
added over 8,000 MW of wind capacity; China was in second place with another
7,000 MW. The National Renewable Energy Laboratory long ago mapped the
entire country’s winds to determine the number of sites with economical wind
conditions. Their estimates of an economical wind resource immediately led
wind proponents to dub the United States the Saudi Arabia of wind and has re-
cently been estimated at 8,000 GW of available land-based wind resources.36
While no one questions the potential, wind has its own unique challenges
that temper its growth. The largest factors limiting wind development are un-
questionably the availability and cost of transmission. Wind power is much
more economical where winds are strong and steady, and (as shown in Figure
7-1) the most economical wind locations in the country are deep in the Great
Plains and off the U.S. coasts.
102 Smart Power
text:IP_Fox-Penner 8/15/10 7:08 PM Page 102
www.EngineeringBooksPDF.com
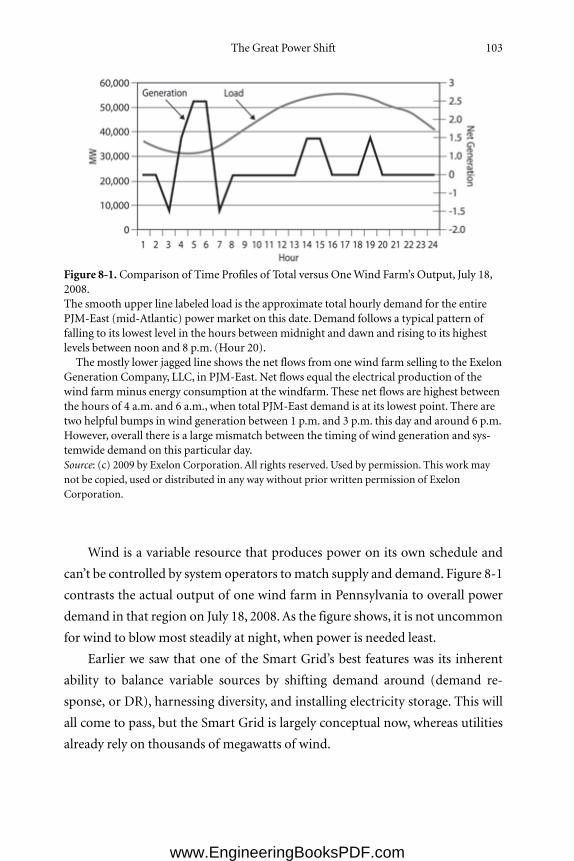
Wind is a variable resource that produces power on its own schedule and
can’t be controlled by system operators tomatch supply and demand. Figure 8-1
contrasts the actual output of one wind farm in Pennsylvania to overall power
demand in that region on July 18, 2008.As the figure shows, it is not uncommon
for wind to blowmost steadily at night, when power is needed least.
Earlier we saw that one of the Smart Grid’s best features was its inherent
ability to balance variable sources by shifting demand around (demand re-
sponse, or DR), harnessing diversity, and installing electricity storage. This will
all come to pass, but the Smart Grid is largely conceptual now, whereas utilities
already rely on thousands of megawatts of wind.
The Great Power Shift 103
Figure 8-1. Comparison of Time Profiles of Total versus OneWind Farm’s Output, July 18,2008.The smooth upper line labeled load is the approximate total hourly demand for the entirePJM-East (mid-Atlantic) power market on this date. Demand follows a typical pattern offalling to its lowest level in the hours between midnight and dawn and rising to its highestlevels between noon and 8 p.m. (Hour 20).The mostly lower jagged line shows the net flows from one wind farm selling to the Exelon
Generation Company, LLC, in PJM-East. Net flows equal the electrical production of thewind farmminus energy consumption at the windfarm. These net flows are highest betweenthe hours of 4 a.m. and 6 a.m., when total PJM-East demand is at its lowest point. There aretwo helpful bumps in wind generation between 1 p.m. and 3 p.m. this day and around 6 p.m.However, overall there is a large mismatch between the timing of wind generation and sys-temwide demand on this particular day.Source: (c) 2009 by Exelon Corporation. All rights reserved. Used by permission. This work maynot be copied, used or distributed in any way without prior written permission of ExelonCorporation.
www.EngineeringBooksPDF.com
Balancing the system on a scale of hundreds or thousands of megawatts
must be done by system operators on the high-voltage grid.Unfortunately, these
operators usually can’t yet count on massive amounts of controllable DR that
could balance generation and load. That leaves storage. In Chapter 5 we saw that
storing enough power to partially supply one neighborhood might soon be fea-
sible and economical. Unfortunately, storing the multimegawatt quantities grid
operators need to buffer large wind farms is a much bigger challenge and is not
expected to be feasible for many decades. (Storage is one of those rare technolo-
gies where costs do not drop at a large scale—at least not yet.)37
With no other current options, grid operators continue to balance the sys-
tem by turning controllable plants on and off. For this reason, the cost of power
from one wind farm alone is not a fair measure of the costs of electricity supply
from wind; you must also count the costs of complementary power from
backup sources as well. When these “grid integration” costs are counted, the
blended cost of wind and backup resources is roughly 30 to 50% higher than the
cost of wind power alone.38
Due to the technical demands of keeping grid balance, current engineering
studies suggest that it will become prohibitively expensive and/or unreliable to
use wind for much more than 30% of the system’s total power needs, at least for
now.39 These limits are a complex function of the amount of transmission avail-
able andmany other attributes of the region’s overall power system. This issue is
undergoing intensive study and debate, and the industry may well find ways to
achieve higher levels of wind reliance, especially if it can build more transmis-
sion lines.
Offshore wind plants are common in parts of Europe, and the United States
has just begun to lease offshore sites for wind development along its own ocean
coasts. Offshore winds are strong and steady, but turbines that sit as much as
18 miles offshore are much more expensive to install and maintain, transmis-
sion is expensive, and environmental permitting can be difficult. Offshore wind
is unlikely ever to be anywhere near as cheap as it is onshore—construction
costs are roughly double—but it may well play an important role in regions
where state and local officials want to encourage carbon reductions and energy
self-reliance, even if it costs a little more.40
104 Smart Power
www.EngineeringBooksPDF.com
Photovoltaic Solar
Photovoltaic (PV) panels, also known as solar cells, convert sunlight directly to
power, and are seen on many large roofs today, especially in Spain, Germany,
and California. The two basic classes of commercial PV technologies are silicon-
based flat panels and so-called thin-film technologies. Each has its own advan-
tages and market applications.
Silicon panels are the rigid, blackish-blue, glass-covered panels seen on
many rooftops, often in standard 3-foot by 4-foot sections.41 These panels have
steadily improved their efficiency and lowered their cost.When PV power began
in the 1980s, it cost over $1 per kilowatt-hour, too expensive for anything but
spacecraft.42 Today it is down to $0.19 to $0.32/kWh—still well above most
other sources, but only one-fourth the original cost.43 Meanwhile, the average
conversion efficiency for these cells has increased steadily, from 3% initially to
over 18% today.44
The second type of cells, now with about 10% of the market, are thin-film
technologies.45 These cells are made by depositing semiconductor materials on
flexible substrates, such as sheets of plastic roofing material. The most common
semiconductingmaterial is a combination of cadmium and tellurium, but other
chemical combinations are also used. Thin-film cells are cheaper to make and
more versatile, as they can be integrated into roofing materials, siding panels,
and even windows, where they are nearly invisible but still make power. How-
ever, thin-film cells are less efficient, so the power produced can be more expen-
sive per dollar invested.
Among all power-generating technologies, PV cells are the closest to a man-
ufactured, mass-produced product. PV panels are made in enormous factories
quite similar to semiconductor plants, with very high volumes. As with much
high-tech manufacturing, new facilities with lower costs are opening across
Asia; China now reportedly has more than 100 PV manufacturers.46 As cell pro-
duction increases and disperses, continued competition and cost efficiencies are
likely to reduce cell costs.
Unfortunately, however, PV installations are more than cells. PV panels of
all types need land, mounting systems, inverters that change the cells’ direct
The Great Power Shift 105
www.EngineeringBooksPDF.com
current output to alternating current, and a fair amount of wiring. These costs,
known as balance-of-system (BOS) costs, now almost equal the costs of the
panel—about $1,500 per kilowatt.47 “I can buy an entire gas-fired power plant
for what I pay for the balance of system,”grouses BobHemphill, president of the
worldwide developer AES Solar. Unlike mass-manufactured panels, BOS costs
are unlikely to decline so quickly. Still, total PV costs are expected to decline to
$3.50/watt, or about 13 cents per kWh, in the next decade or two—well within
the range of other power sources.48
As was true for wind farms, PV power varies with the weather and must be
paired with long-term and short-term backup supplies or storage to maintain
grid stability. This adds roughly the same magnitude of costs as wind requires
for grid integration and control, pushing the true average costs of PV power
into the range of 30 to 50 cents per kWh. Despite these high costs, its versatility
and environmental quality have made PV quite popular. There are a number of
federal and state tax credit and other subsidy programs, some of them reducing
the net costs of systems dramatically. With these aids, 342 MW of new PV cells
were added in 2008 in installations as small as a single rooftop and as large as a
13-MW plant at Nellis Air Force base in sunny Las Vegas.49
Concentrating Solar Power
As the name suggests, concentrating solar power (CSP) plants concentrate sun-
light with reflectors and use it to make power. These plants, sometimes also
called solar thermal electric, appeared briefly in the 1980s; an improved cohort
is now under construction in the United States. Unlike PV, this is strictly a large-
scale operation; one plant generates 80 to 200 MW using thousands of acres of
land.
There are two types of CSP plants entering commercial operation today.
The first uses long rows of parabolic mirrors to boil a special kind of fluid and
uses the resulting steam to turn a turbine generator. There are a handful of oper-
ating parabolic plants in the United States totaling 419 MW, several under con-
tract, and one under construction in Florida. The second type uses mirrors that
focus the sun on a single “power tower”where a working fluid (currently water)
106 Smart Power
www.EngineeringBooksPDF.com
is boiled at very high temperatures.50 There are not yet any U.S. operating power
towers (an experimental unit operated briefly in the 1990s), but one company,
BrightSource Energy, already has over 2,600 MW of new plants under contract
in the United States today.51
CSP plants require very high levels of sun and quite a bit of land, so they are
now economical, mainly in the desert Southwest. However, within that area
there is a very large solar resource, and many developers have scrambled to get
siting approvals for new plants they would like to build. Because much of the
land in this area is owned by the federal government, the siting work will pro-
ceed through the U.S. Department of the Interior’s Bureau of Land Manage-
ment (BLM). Remarkably, BLM reports that it has already received 158 applica-
tions for 97,000 MW of new CSP capacity—roughly one-eighth of all capacity
in the United States—covering 1.8 million acres.52
These astonishing numbers notwithstanding, CSP is still not a fully proven
technology and it faces its own unique impediments. CSP plants produce only
during the day while the sun shines brightly, which is a valuable time to make
power but still requires backup and grid integration like wind and PV. In con-
trast to wind and PV, however, the fact that CSP uses a working fluid makes it
possible that these plants can store solar energy as heat and then generate power
for a while after the sun goes down. This sort of internal storage will make CSP
plants close to equivalent to dispatchable peaking plants and will lower the
grid’s less visible integration and backup costs.
Transmission is another large uncertainty.As we saw in Chapter 7, the west-
ern U.S. grid was not designed tomove large amounts of power produced in un-
developed parts of the desert. While the federal government and western states
are setting their sights on changing this, it will take many years before the results
are known. Finally, some of the current CSP designs use large amounts of water,
which is obviously scarce in any desert area. So-called dry cooling, in which no
water is used for cooling, reduces water use extensively, but it also makes plants
less efficient and more expensive to build.
Assuming the technology works as expected, these plants should produce
power for 10 to 15 cents per kWh before the inclusion of backup or storage
costs. Estimates for the cost of added storage are speculative at this point; one
The Great Power Shift 107
www.EngineeringBooksPDF.com
analyst estimates about 1 cent per kWh, an increase of about 10%.53 For plants
that need it, dry cooling is estimated to cost another 10 to 20% as well.54 Since
CSP is relatively new, these costs should come down over time. EIA, for example,
forecasts costs dropping nearly 50% between 2010 and 2030, about as fast as PV
declines.55 For a technology that is already nearly competitive and has storage
and controllability, this represents a pretty attractive package.
Biomass Power
Biomass power is generated from four different streams of biomass fuel materi-
als: wood wastes from paper and furnituremanufacturers, forestry residue, agri-
cultural residue, and methane frommunicipal solid waste (“landfill methane”).
The most advanced biomass plants use the same integrated gasification com-
bined cycle technology (IGCC) technology as modern coal plants to improve ef-
ficiency and reduce air pollution. Biomass power plants in the paper and furni-
ture industry are also often cogenerators, as these industries have high needs for
process heat.
The actual generation of biopower emits just as much CO2 as any other
similar fossil-fueled plant, except for landfill methane. When dedicated crops
are grown for the facility, the atmospheric carbon absorbed during crop growth
roughly equals the amount emitted during generation. This particular arrange-
ment, known as closed-loop biomass, is considered net-zero carbon.56
The capital costs for biomass plants are similar to those of coal plants, so
biomass has tended to be used where plentiful, high-quality supplies of fuel cost
the same as or less than coal and where the waste heat can be used.57
Geothermal Energy
Geothermal power plants use ultrahot water from deep inside the earth to make
steam and generate electricity. Where natural formations allow easy access to
naturally superheated water, geothermal power technologies are a proven, reli-
able, cost-effective source of baseload power.58 The constraints on this technol-
ogy are entirely related to the availability of viable natural sites with nearby
108 Smart Power
www.EngineeringBooksPDF.com
transmission capacity.59 Currently there are about 3,000 MW of geothermal
power located entirely within four western states, Alaska, and Hawaii. Technical
advances could enable much broader use of geothermal heat in future decades;
the current resource and technology base is projected to provide a small but sig-
nificant zero-carbon contribution of about 25,000 MW by 2025.60
Hydroelectric and Hydrokinetic Energy
The industry has pretty much given up on building large new hydroelectric
plants in the United States (though not in Canada and some other parts of the
world). However, there is a new generation of “hydrokinetic” technologies that
make power from river and ocean currents and ocean waves. According to the
blog cleantechnica.com, at least one small riverine turbine is now submerged in
the Mississippi River near Minneapolis.61 The British and Danish governments
are also both sponsoring small new test machines that produce power from
wave energy, and the British recently announced plans to build by far the largest
wave energy machine in the world, a 20-MW unit off the coast of Cornwall.62
These systems are still untested and far from commercial, but they hold the pos-
sibility to supply vast amounts of low-carbon power in the distant future.63
Distributed (Small-Scale) Technologies
One bit of confusion sometimes muddles discussions of distributed sources.
Sometimes analysts treat all wind and PV power sources as if they are small, de-
centralized sources. This doesn’t work for capacity planners, who need to distin-
guish between large- and small-scale renewables, or equivalently, centralized
and distributed generation (DG). In this chapter, I follow the California Energy
Commission’s definition of DG as power sources less than 20MW connected to
the local distribution wires rather than the high-voltage transmission grid.64
There are four main electric technologies in DG’s future: combined heat-
and-power (CHP, or cogeneration) plants (also called microturbines or small
cogeneration), small wind installations, small PV plants, and fuel cells.65 Solar
hot water heating, daylighting, geothermal heat pumps, and other similar
The Great Power Shift 109
www.EngineeringBooksPDF.com
technologies use renewable energy to cost-effectively displace the need for elec-
tricity. Because they avoid the wasteful process of generating power and instead
use renewable energy directly, I don’t treat them as sources of electric power.66
The most common clean distributed source is CHP, which uses the waste
heat produced by electric generators to heat buildings and industrial processes,
squeezing far more useful energy out of a Btu of fuel thanmost non-CHP power
plants. As a result, end users’ total energy costs are much lower than they would
pay to buy heat and power separately. In order to use the waste steam from a
plant you need a heat-user (known as a steam host) that is the correct size to ab-
sorb the surplus steam, located close by, since steam can’t be piped very far.
Plants in the 5 to 20 MW range are well matched to the steam needs of factories
and large commercial or residential complexes, making this most commonly a
medium-scale technology. In New York City and some European and Russian
cities, there are networks of steam tunnels to many buildings that allow for the
use of waste heat from utility-size plants. Unfortunately, because creating these
tunnel networks is prohibitively costly, the United States is unlikely to expand
cogeneration on this very large scale.
The reasons why industrial-scale CHP has not been usedmore widely in the
United States are all related to regulatory and institutional hurdles. It can be dif-
ficult to make the necessary coordination arrangements with a large building
that will accept and use a generator’s waste heat. It also requires navigating
many siting, land use, and other rules to put generators into or near heat users.
Arrangements with utilities are also a frequent issue. Because cogenerators dis-
place utility sales, utilities don’t have an economic incentive to help them get es-
tablished—yet utilities have to connect up and monitor the cogenerator and
provide backup service when the cogenerator trips off (some cogenerators are
“off the grid,” in which case there is no backup, but most are not).67
Another new development spurring the growth of this technology is the
commercialization of home-sized CHP units, or microturbines. These tiny, gas-
fired power plants sit outside a home or business, make power, and send the
waste heat in to supplant the furnace or other heat sources. After many years of
development, several vendors now sell these units to homeowners and property
developers.
110 Smart Power
www.EngineeringBooksPDF.com
Power from these units is still much more expensive than large-scale cogen-
erators, though it is cheap compared to other small sources. Hooking them up
also involves locating heating, cooling, and electrical equipment much more
carefully than in the average building. On the other hand, because microtur-
bines are new to the market, EIA forecasts that they will become much cheaper
over the next two decades, to the point where they will be an extremely econom-
ical option for most new buildings if—and this is a big if—natural gas prices
stay moderate.
Small-scale wind installations are the third most common distributed
power source.68 Residential-scale turbines are units up to 100 kW in size, de-
signed to work with very little control or maintenance at medium wind levels
(9 mph average). Their power isn’t nearly as cheap as large-scale wind—12 to 15
cents/kWh versus 4 cents, excluding backup and integration—but it is one of
most economical power sources where the grid isn’t available (“off-grid”).
Despite its high on-grid cost, there are twenty-two manufacturers of small
turbines in the United States alone,69 and they are optimistic about their market
prospects, having experienced an eye-popping 53.8% growth between 2007 and
2008.70 This will be aided greatly by technology-driven cost reductions; EIA ex-
pects small turbine prices to drop 33% in real terms by 2030.
The final distributed technology is fuel cells. Contrary to an impression of-
ten conveyed in the media, fuel cells are not pollution-free electric generators;
they are a natural gas–fueled unit that makes power using an internal chemi-
cal process, like a battery in reverse. The future may hold fuel cells that use
pollution-free renewable sources, but for the foreseeable future natural gas fuel
cells will emit about the same pollutants as gas-fired microturbines. Fuel cells
also generate about the same waste heat as gas turbines; this heat can (and
should) be used in a cogeneration setting whenever possible.
The GeorgeW. Bush administration made a big push to commercialize fuel
cells, placing them at the center of an initiative to create a fuel cell vehicle known
as the FreedomCAR. However, fuel cells have remained stubbornly expensive,
far above the costs of CHP and wind and roughly equal to PV. Fuel cells large
enough to power a building are good sources of backup power, in place of much
noisier and polluting diesel generators. Overall, however, fuel cells are likely to
The Great Power Shift 111
www.EngineeringBooksPDF.com
remain a specialized form of DG used in remote locations where gas is available
or as a medium-scale backup power source.71
Choosing among the Options
Table 8-1 summarizes the results of our supply technology tour. The second col-
umn of the table shows the representative current costs of power for each option
as observed by regulators or measured by markets, and the third column does
the same for projected costs as of 2030. In the fourth column, I add in the costs
of carbon emissions based on an arbitrarily selected emissions price of $50/ton
CO2.72
The cost figures are a representative snapshot, and they have some impor-
tant limitations. As noted many times already, renewable resources in particular
are highly site-dependent, and costs may vary over a wide range from site to site.
State and local policies may greatly affect the relative costs of two options, as
when the California Solar Initiative gave rebates directly to customers installing
PV systems.
Cost estimates for 2030 have even larger limitations. These figures reflect
technical progress, which lowers the capital costs of every technology, some
more than others. However, we cannot forecast how support policies will
change, even though these policies could easily change the economic ranking of
different power options. Finally, the 2030 estimates don’t take into account re-
source depletion for any technology types—fossil fuel prices are constant in in-
flation-adjusted terms and the renewable resources are all at the same approxi-
mate quality. In the next chapter, we’ll eliminate this assumption and discover
that the size and pace of development can deplete the cheapest resource supplies
and force costs up, especially in periods of rapid change.
The fifth, sixth, and seventh columns of the table contain further infor-
mation on costs, constraints, and uncertainties. The fifth column notes the
main drivers of uncertainties in observed costs. The sixth column lists the main
factors affecting the systemic (“indirect”) costs or benefits related to each
power source, such as the savings in transmission and distribution investment
from DG or the costs of integrating variable sources. The seventh and final
112 Smart Power
www.EngineeringBooksPDF.com
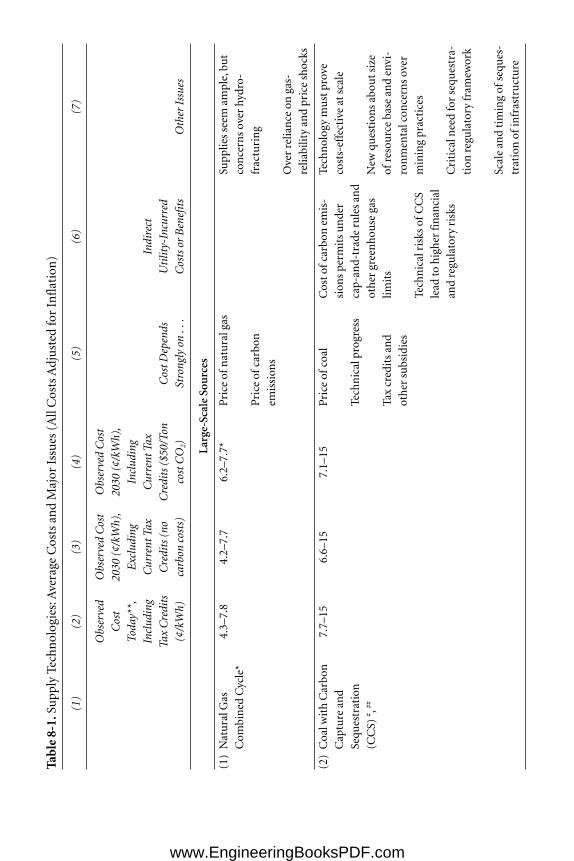
Table8-1.SupplyTechnologies:AverageCostsandMajorIssues(AllCostsAdjustedforInflation)
(1)
(2)
(3)
(4)
(5)
(6)
(7)
Observed
ObservedCost
ObservedCost
Cost
2030(¢/kWh),2030(¢/kWh),
Today**,
Excluding
Including
Including
CurrentTax
CurrentTax
Indirect
TaxCredits
Credits(no
Credits($50/Ton
CostDepends
Utility-Incurred
(¢/kWh)
carboncosts)
costCO2)
Stronglyon...
CostsorBenefits
OtherIssues
Lar
ge-S
cale
Sou
rces
(1)NaturalGas
4.3–7.8
4.2–7.7
6.2–7.7*
Priceofnaturalgas
Suppliesseem
ample,but
Com
binedCycle*
concernsoverhydro-
Priceofcarbon
fracturing
emissions
Overrelianceon
gas-
reliabilityandpriceshocks
(2)CoalwithCarbon
7.7–15
6.6–15
7.1–15
Priceofcoal
Costofcarbonem
is-
Technologymustprove
Captureand
sionspermitsunder
costs-effectiveatscale
Sequestration
Technicalprogress
cap-and-traderulesand
(CCS)
# ,##
othergreenhousegas
New
questionsaboutsize
Taxcreditsand
limits
ofresourcebaseandenvi-
othersubsidies
ronmentalconcernsover
TechnicalrisksofCCS
miningpractices
leadtohigherfinancial
andregulatoryrisks
Criticalneedforsequestra-
tion
regulatoryfram
ework
Scaleandtimingofseques-
trationofinfrastructure
www.EngineeringBooksPDF.com
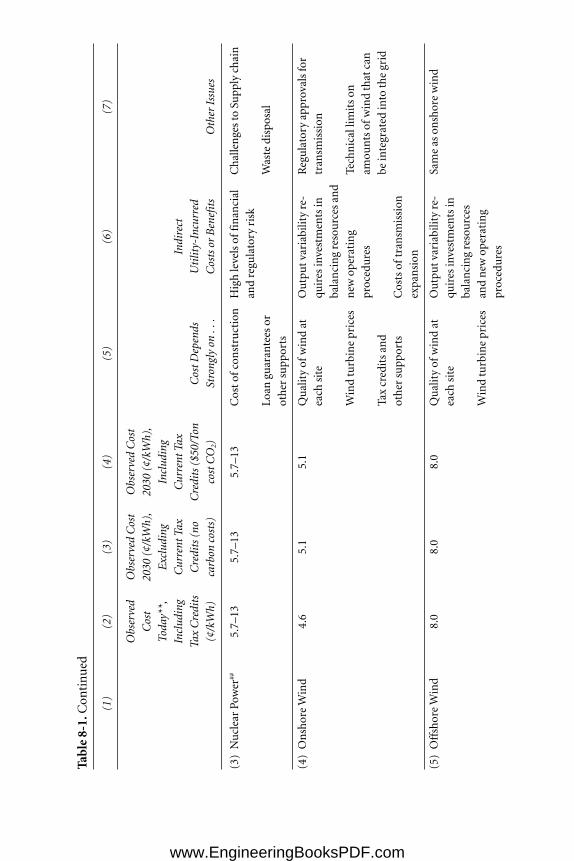
Table8-1.Continued
(1)
(2)
(3)
(4)
(5)
(6)
(7)
Observed
ObservedCost
ObservedCost
Cost
2030(¢/kWh),2030(¢/kWh),
Today**,
Excluding
Including
Including
CurrentTax
CurrentTax
Indirect
TaxCredits
Credits(no
Credits($50/Ton
CostDepends
Utility-Incurred
(¢/kWh)
carboncosts)
costCO2)
Stronglyon...
CostsorBenefits
OtherIssues
(3)NuclearPower
##5.7–13
5.7–13
5.7–13
Costofconstruction
Highlevelsoffinancial
ChallengestoSupplychain
andregulatoryrisk
Loan
guaranteesor
Wastedisposal
othersupports
(4)OnshoreWind
4.6
5.1
5.1
Qualityofwindat
Outputvariabilityre-
Regulatoryapprovalsfor
eachsite
quiresinvestmentsin
transm
ission
balancingresourcesand
Windturbineprices
new
operating
Technicallim
itson
procedures
amountsofwindthatcan
Taxcreditsand
beintegratedintothegrid
othersupports
Costsoftransm
ission
expansion
(5)OffshoreWind
8.0
8.0
8.0
Qualityofwindat
Outputvariabilityre-
Sameasonshorewind
eachsite
quiresinvestmentsin
balancingresources
Windturbineprices
andnew
operating
procedures
www.EngineeringBooksPDF.com
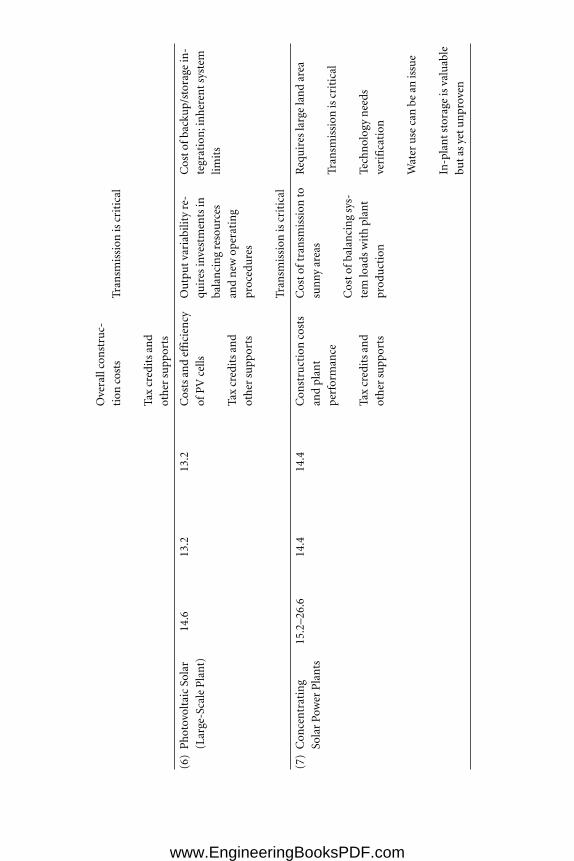
Overallconstruc-
tion
costs
Transm
ission
iscritical
Taxcreditsand
othersupports
(6)PhotovoltaicSolar
14.6
13.2
13.2
Costsandefficiency
Outputvariabilityre-
Costofbackup/storagein-
(Large-ScalePlant)
ofPVcells
quiresinvestmentsin
tegration;inherentsystem
balancingresources
limits
Taxcreditsand
andnew
operating
othersupports
procedures
Transm
ission
iscritical
(7)Concentrating
15.2–26.6
14.4
14.4
Constructioncosts
Costoftransm
ission
toRequireslargelandarea
SolarPowerPlants
andplant
sunny
areas
perform
ance
Transm
ission
iscritical
Costofbalancingsys-
Taxcreditsand
temloadswithplant
Technologyneeds
othersupports
production
verification
Waterusecanbean
issue
In-plantstorageisvaluable
butasyetunproven
www.EngineeringBooksPDF.com
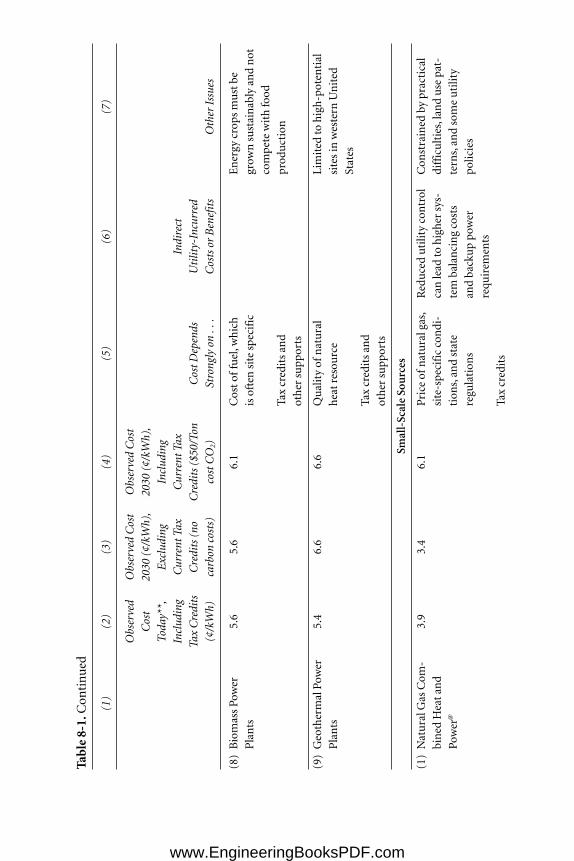
Table8-1.Continued
(1)
(2)
(3)
(4)
(5)
(6)
(7)
Observed
ObservedCost
ObservedCost
Cost
2030(¢/kWh),2030(¢/kWh),
Today**,
Excluding
Including
Including
CurrentTax
CurrentTax
Indirect
TaxCredits
Credits(no
Credits($50/Ton
CostDepends
Utility-Incurred
(¢/kWh)
carboncosts)
costCO2)
Stronglyon...
CostsorBenefits
OtherIssues
(8)BiomassPower
5.6
5.6
6.1
Costoffuel,which
Energycropsmustbe
Plants
isoftensitespecific
grow
nsustainablyandnot
competewithfood
Taxcreditsand
production
othersupports
(9)GeothermalPower
5.4
6.6
6.6
Qualityofnatural
Limitedtohigh-potential
Plants
heatresource
sitesinwesternUnited
States
Taxcreditsand
othersupports
Smal
l-Sc
ale
Sou
rces
(1)NaturalGasCom
-3.9
3.4
6.1
Priceofnaturalgas,
Reducedutilitycontrol
Constrainedbypractical
binedHeatand
site-specificcondi-
canleadtohighersys-
difficulties,landusepat-
Power
@tions,andstate
tembalancingcosts
terns,andsomeutility
regulations
andbackuppower
policies
requirem
ents
Taxcredits
www.EngineeringBooksPDF.com
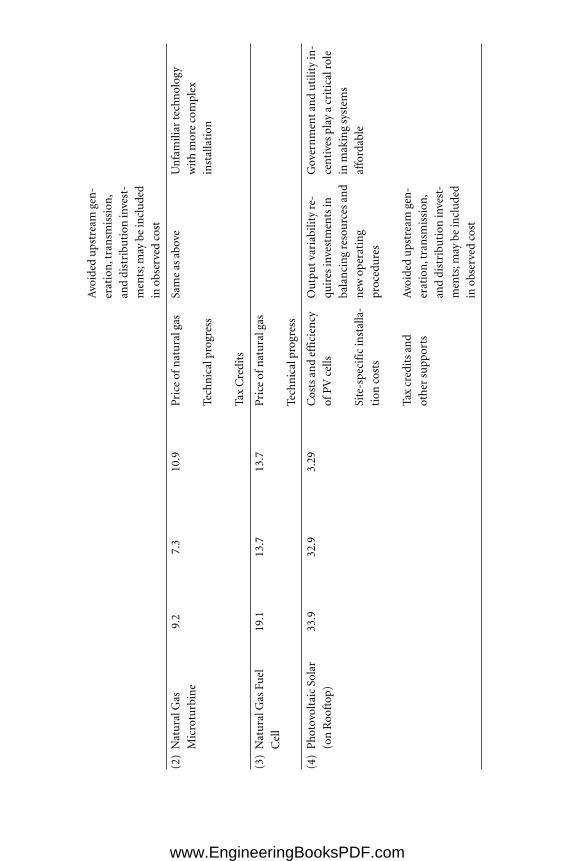
Avoidedupstreamgen-
eration,transm
ission,
anddistribution
invest-
ments;m
aybeincluded
inobservedcost
(2)NaturalGas
9.2
7.3
10.9
Priceofnaturalgas
Sameasabove
Unfamiliartechnology
Microturbine
withmorecomplex
Technicalprogress
installation
TaxCredits
(3)NaturalGasFuel
19.1
13.7
13.7
Priceofnaturalgas
Cell
Technicalprogress
(4)PhotovoltaicSolar
33.9
32.9
3.29
Costsandefficiency
Outputvariabilityre-
Governmentandutilityin-
(onRooftop)
ofPVcells
quiresinvestmentsin
centivesplayacriticalrole
balancingresourcesand
inmakingsystem
s
Site-specificinstalla-new
operating
affordable
tion
costs
procedures
Taxcreditsand
Avoidedupstreamgen-
othersupports
eration,transm
ission,
anddistribution
invest-
ments;m
aybeincluded
inobservedcost
www.EngineeringBooksPDF.com
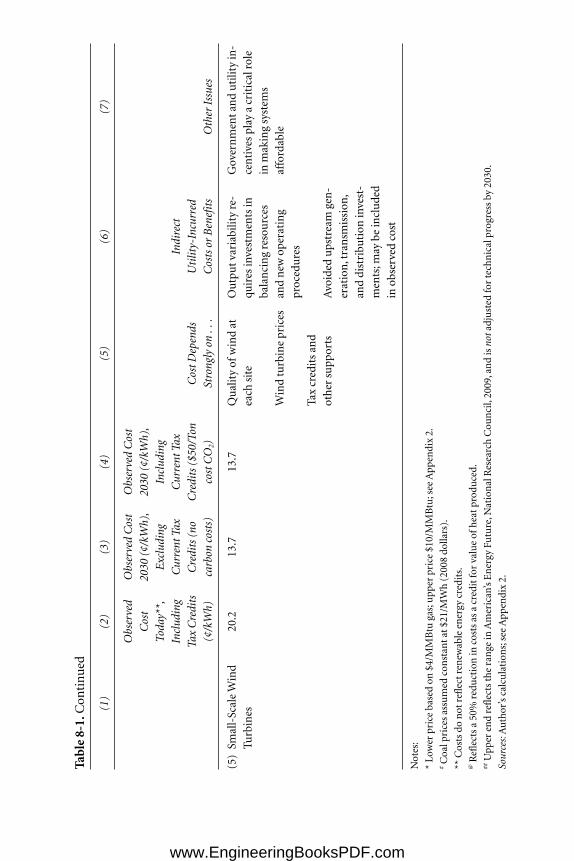
Table8-1.Continued
(1)
(2)
(3)
(4)
(5)
(6)
(7)
Observed
ObservedCost
ObservedCost
Cost
2030(¢/kWh),2030(¢/kWh),
Today**,
Excluding
Including
Including
CurrentTax
CurrentTax
Indirect
TaxCredits
Credits(no
Credits($50/Ton
CostDepends
Utility-Incurred
(¢/kWh)
carboncosts)
costCO2)
Stronglyon...
CostsorBenefits
OtherIssues
(5)Sm
all-ScaleWind
20.2
13.7
13.7
Qualityofwindat
Outputvariabilityre-
Governmentandutilityin-
Turbines
eachsite
quiresinvestmentsin
centivesplayacriticalrole
balancingresources
inmakingsystem
s
Windturbineprices
andnew
operating
affordable
procedures
Taxcreditsand
othersupports
Avoidedupstreamgen-
eration,transm
ission,
anddistribution
invest-
ments;m
aybeincluded
inobservedcost
Notes:
*Lowerpricebasedon
$4/M
MBtugas;upperprice$10/MMBtu;seeAppendix2.
#Coalpricesassumedconstantat$21/M
Wh(2008dollars).
**Costsdo
notreflectrenewableenergycredits.
@Reflectsa50%reductionincostsasacreditforvalueofheatproduced.
##UpperendreflectstherangeinAmerican’sEnergyFuture,NationalResearchCouncil,2009,andis
notadjustedfortechnicalprogressby2030.
Sour
ces:Author’scalculations;seeAppendix2.
www.EngineeringBooksPDF.com
column lists some overarching issues and constraints applicable to each gener-
ator type.
The first rows in the table show the large-scale sources, followed by a second
group of rows for the four main types of DG. In comparing these two sections it
becomes obvious that the observed costs of small-scale generators are still much
more expensive than their large-scale counterparts, with the exception of indus-
trial cogeneration, which is one of the cheapest power sources around. The third
column reveals that this gap does not decline over time, largely because both
large- and small-scale technologies improve the performance at roughly the
same rates. Only at the top end of the ranges for nuclear and coal CCS do lev-
elized costs compare, and even then the renewable figures do not include the
costs of backup power.
We know that the true cost gap is smaller than these figures show because
small-scale sources reduce the need for upstream generation, transmission, and
distribution investment.We also know that these avoided costs are hard to mea-
sure, require extensive regulatory involvement, and are very site and system de-
pendent. The gap in observable costs highlights the importance of the policies
and market structure changes that allow these costs to be measured and re-
flected in utility supply decisions. As we saw in Chapter 5, the regulatory chal-
lenges involved in setting the prices for the value streams DG provides are ex-
traordinary. Even with common federal policies and standards, most of the
calculations themselves will have to be made and debated on a system-by-
system and state-by-state basis.
The rows of the table begin with one devoted to natural gas combined cy-
cle plants. The two numbers shown in the cost column represent costs at very
low and very high gas prices, $4 and $10 per million Btu, respectively. The
small-scale gas options later in the table follow suit. Among the large-scale
sources natural gas remains the cheapest as long as prices stay around $6 or less
and fuel remains plentiful; CO2 costs are not that large a threat. However, it is
dangerous to rely too heavily on gas, and many regions already have large
amounts of gas-fired capacity. As to coal, the second row reveals that, even with
the estimated costs of sequestration added, low-carbon coal plants remain be-
low the costs of most forms of renewable energy. However, these numbers
The Great Power Shift 119
www.EngineeringBooksPDF.com
assume that CCS technologies work as promised and coal is plentiful, and these
are two big ifs.
Nuclear plants have a very wide construction cost range, as shown in the
third row. Depending on these costs, they could be competitive with all other
forms of generation or more expensive than everything but solar power. This
range brings with it large financial and regulatory risks. Due to the size and cost
of building a single nuclear plant—well over $10 billion—it is common to hear
a nuclear construction decision referred to as a “bet the company strategy.”
Among renewable sources, large-scale onshore wind (fourth row) is close to
being cost-competitive now, depending on the quality of the specific location
and grid integration costs. Biomass and geothermal power (eighth and ninth
rows) are also in line with the costs of coal and gas power, but this is the result of
a bit of circularity: utilities generally buy from or build on geothermal or bio-
mass sites wherever and whenever the quality of the nearby resource is such
that the costs of power match what they pay for a natural gas plant. The issue
with these technologies is that the supply of sites with costs this low is highly
constrained.
Solar PV remains the most expensive option, but its price (after tax credits)
closes in on the other options and could well overtake them with technical
breakthroughs. It is also the most versatile and modular of the supply options,
and it is very popular with consumers and policymakers. Concentrating solar
power, strictly a large-scale option, is a bit pricey now, but will be valuable if it
can incorporate storage, continue its rapid progress, and get transmission.
Comparing the third and fourth columns, you may be surprised to see that
putting a price on carbon does not knock the fossil fuel technologies out of eco-
nomic contention, at least a price of $50 per ton of CO2. Of course, CO2 prices
could be much higher than this or they could be lower, but as long as we have
the capital and fuel cost numbers for CCS coal and gas combined cycle plants
close to right, a carbon cap-and-trade policy seems far from a death knell for
traditional fuels employing carbon removal technologies.
In summary, we know that there are many supply options with low or no
greenhouse gases that are likely to work, or work already, but there are still a lot
of questions about performance and cost. The commodity energy from small-
120 Smart Power
www.EngineeringBooksPDF.com
scale options is still more expensive than large-scale sources, rendering regula-
tory policies that price the other DG value streams very important. Nearly every
option is expected to get cheaper over the next twenty years, but the guesses—
and that’s what they are—show a lot of variation.
Each new type of resource also has its own set of uncertainties and risks—
some unique, some shared. Natural gas can be pricey. Carbon capture and se-
questration technology isn’t available yet, there is no regulatory system for
sequestration, and there are concerns over the supply of coal and the impacts of
coal mining. The next generation of nuclear plants have uncertain capital costs
and many supply chain limitations. Onshore wind is inexpensive, but requires
substantial new transmission supplies and backup power and is presently lim-
ited due to integration issues. Photovoltaic, solar thermal, geothermal, biomass,
and hydrokinetic each have their own challenges.
Amidst all of these questions and uncertainties utilities have to keep the
lights on.They know their rate of sales growth is highly uncertain.They know the
amount of DG on their systems will grow, depending greatly on their cost levels
and local and national policy supports. With or without increasing sales, they
know new plants will be needed to replace older units being retired, and that
greenhouse gas limits will forcemany high-carbon plants into early retirement.
Deciding howmuch new supply is needed and choosing the generators that
fill the need is generally the biggest single decision a utility CEO will ever make.
Thousands of jobs, tens of billions of dollars, and the economic and environ-
mental future of the utility’s region is often at stake. The decision needs buy-in
from many state and local officials, including state regulators and siting boards,
as well as the business community, labor leaders, environmentalists, and the
utility’s own rank and file. And though it is extremely common to make small
adjustments in the plan over time, big mistakes are fatal.
If you’re wondering how utilities cope with this mess, meet Jim Jura.
The Great Power Shift 121
www.EngineeringBooksPDF.com

www.EngineeringBooksPDF.com
chapter nine
Billion Dollar Bets
JAMES J. JURA, CEO of the Associated Electric Cooperative in Springfield,
Missouri, is no newcomer to the power business. Before coming to Associ-
ated, he served as the top administrator of the Bonneville Power Administra-
tion, the federal government’s mammoth system of dams and transmission
lines in the Pacific Northwest.With an earlier stint at theWhite House Office of
Management and Budget, he’s no stranger to finance and accounting, either.
But as head of an electric cooperative that still projects sales growth, he
faces most of the challenges typical of utilities today. Associated is a kind of
super-cooperative, with 850,000 customers, eight power plants, and a transmis-
sion system that reaches to four states. It is governed by six regional co-ops
which are in turn owned by fifty-one distribution cooperatives in Iowa, Okla-
homa, and Missouri. In effect, it is the exclusive, self-owned power supply arm
of these fifty-one retail distributors.
Jura reports to a twelve-member board elected by the six regional co-ops.
Each year, he brings them a proposed long-term plan for their approval. “I work
for a co-op created to do a very simple thing,” Jura says, “provide a reliable
power supply at the lowest possible cost.” Yet “there’s a tremendous amount of
123
www.EngineeringBooksPDF.com
uncertainty out there.” Jura is proud of the fact that Associated was the first util-
ity in the state to purchase wind power on a large scale. Despite his energy effi-
ciency programs, he needs more supply in the next two years. He knows the
Smart Grid and distributed generation (DG) are coming, but he doesn’t see
them as large enough, fast enough, or cheap enough to close his resource gap.
Under his direction, Jura’s planners perform an annual ritual of examining
every one of their supply options, from another coal-fired plant (beyond the
two they already own), to wind, solar, natural gas, and a share in a new nuclear
plant developed by a nearby investor-owned company. Here’s how they do it.
Planning for the Next FewDecades
The first step in a supply plan is to determine the need for new supplies. In to-
day’s climate, this comes from replacing plants that become too old or expensive
to operate, plus a possible sliver of new sales growth remaining after demand re-
sponse (DR), energy efficiency programs, and customer-generated DG are sub-
tracted. Because not all plants supply the same type of power—some are better
for round-the-clock supply while others are better for episodic service—the
timing and nature of the need must be characterized.
Planners next create a handful of supply portfolios that fill the need and use
computer models to estimate the costs of each portfolio over the next twenty to
thirty years. Finally, they ask themselves what couldn’t be measured well in their
computer-generated cost estimates, including such things as the systemic cost
savings from increased DR and DG.
Candidate portfolios are always bedeviled by uncertainty over the options
we just examined. Should a utility build a coal plant in the next five years assum-
ing that carbon capture and sequestration (CCS) technology can be added on in
the decade following? Will natural gas prices be high, low, or medium a decade
from now? As we saw in the last chapter, for relatively untested large-scale tech-
nologies the cost of the plant itself is another major uncertainty. Will there be
breakthroughs that scramble the relative cost of the options?
The life cycle cost of these options is estimated using computer models that
actually simulate the operation of the system hour by hour for up to thirty years.
To account for a wide range of uncertainties, many scenarios are run. As an ex-
124 Smart Power
www.EngineeringBooksPDF.com
ample, every portfolio’s cost would be estimated with several price forecasts for
natural gas as well as different scenarios involving sales growth, future plant
costs, and so on.
Odd as it may seem, the advent of a carbon cap-and-trade system does not
in itself pose any momentous new hurdles to this planning process. Power
plants are already subject to many types of emissions rules, and the ability to
factor carbon emissions into a supply plan is already built in to most utility
planning software. Many planners started including an estimated cost for car-
bon allowances years ago.
This doesn’t mean, however, that climate change uncertainties are small or
easily managed. The predicted prices of carbon emissions permits vary tremen-
dously. Old coal-fired power plants produce about 1 ton of CO2 for every
megawatt-hour (MWh). Without carbon prices, 1 MWh of coal power costs
about $30. Estimates of the price of 1 ton of CO2 vary between $5 and $500 in
various simulations of carbonmarkets through 2050. Carbon prices at these ex-
tremes add anywhere between 17% ($5 added to $30) and 1666% ($500 added
to $30) to the original price of coal power. And it isn’t simply a matter of guess-
ing where prices will land within this range, as carbon allowances will be a
traded commodity likely to have considerable price volatility.1 In Europe, for ex-
ample, carbon allowance prices have varied between almost nothing and
$34/ton since 2005. So while we know how to factor uncertain carbon emissions
prices into utility plans, the fact that we don’t know allowance prices adds a
whopping new source of uncertainty to portfolio costs estimates.2
After months of calculation, consultations with stakeholders, and internal
debate, the moment of truth arrives and a portfolio is selected. Cheapest doesn’t
always win in these contests. In the first place, different portfolios will have dif-
ferent periods of being cheaper and more expensive over the decades, and the
answer to “what’s cheapest?” depends heavily on your time horizon. And apart
from the numbers showing the option with lowest expected cost, the size and al-
location of risks, political considerations, and administrative feasibility play an
important and sometimes determinative role.
What about Jim Jura and Associated? After looking at the options, the
board concluded that nuclear was just too expensive and risky. Although coal
was still viewed favorably as a long-term option, Jura called it “pretty much over
Billion Dollar Bets 125
www.EngineeringBooksPDF.com
for now until we get more policy certainty.” Instead, Associated chose a combi-
nation of a new wind farm and two new natural gas plants, one combined cycle
plant, and one peaking unit. Noting the uncertainties about fuel and carbon
prices, Jura called wind“a hedge for the future.”But wind wasn’t an option if de-
ployed by itself.“Out here, on a summer day the wind blows a lot at 1 a.m., but it
tapers down pretty fast from there.”
Associated was fortunate in that it is located in a region where both natural
gas and wind are readily available. Had it been in New England, for example,
state authorities may have been concerned about overreliance on natural gas—
New England is at the far end of the U.S. gas pipeline system. In the U.S. South-
east, it would probably have needed to consider biomass power, as neither wind
nor solar are especially strong there, or it may have chosen to gamble on nuclear
or coal.
If he had been in a region where state policymakers or his customers were
demanding more DG, he would have had to determine how much would be in-
stalled, the integration impacts on his system, and how much he would charge
for backup services. He might have chosen to add some local storage in a
few parts of his system where there were an unusually large number of small
generators or possibly configured some distribution or subtransmission lines
differently.
Associated adopted a strategy common to many utilities with access to
cheap wind these days—combine it with natural gas plants and some energy ef-
ficiency. However, as Jura’s comments suggest, this strategy is something of a
stopgap until there are more options, more policy certainty, and more progress
on the Smart Grid, DR, and DG.
Handicapping the Supply Scenarios
Across the longer horizon, there are a handful of ways the industry’s supply mix
might evolve—call them scenarios. Formally, scenarios are highly distilled views
of where the future will end up, useful because they help guide what the leg-
endary planner Pierre Wack called “the gentle art of reperceiving.”3 The costs
and uncertainties we saw in Table 8-1 suggest that any of these supply scenarios
remain possible, though some face larger challenges than others.
126 Smart Power
www.EngineeringBooksPDF.com
Scenarios make it easier to spot what planners call signposts—future events
that portend a shift in the direction toward one scenario or another. A signpost
may be a change in the availability of a key raw material, a technological break-
through, or a political development.
The first scenario, the one belonging to Sheila the blogger (whom you’ll re-
member from Chapter 7) is Small Scale Wins. Here the combined effects of DR
and energy efficiency, coupled with the greater use of small-scale and down-
stream storage, eliminate the need for added upstream supply.
In the opposing vision, the Traditional Triumphs. Here, coal with CCS and/
or new nuclear plants become cost-effective sources for baseload power, just as
they are in the world’s current system. Other planners might call this scenario
business as usual, except that in this case business as usual includes a price on
carbon emissions.
If all power can’t be made at the local level, perhaps it can nonetheless be
100% renewable. Completely Green aggregates large- and small-scale renewable
sources, along with DR and energy efficiency, in a scenario that relies on no new
gas, coal, or nuclear power. Vice President Gore’s Repower America campaign
called for this outcome in late 2008; more recently, Google’s energy team and
other researchers have produced more detailed proposals along these lines.4 We
have to ask ourselves, what if none of these scenarios occurs? I call this outcome
Most of the Above. In this final catchall scenario, no one type of supply domi-
nates, and the power grid evolves into an evenmore diverse and distributed fleet
of generators than it is today—nearly all of them low or no carbon.
Let’s start with Small Scale Wins, the scenario in which all new large-scale
plants and lines are no longer needed. In spite of the hype surrounding the
Smart Grid, the higher costs and regulatory impediments to rapid adoption
make this scenario exceedingly unlikely.
As Table 8-1 revealed, other than combined heat and power (cogeneration)
the observable costs of DG are still two to three times as high as large-scale
sources, and neither technological change nor a price on carbon will close the
gap. Regulatory and other support policies will also help, but they face many
challenges and implementation time lags.
If there is an economical path to this scenario it undoubtedly involves a
massive push to expand the use of combined heat-and-power (CHP) plants.
Billion Dollar Bets 127
www.EngineeringBooksPDF.com
There are somewhere between 76,000 and 85,000 MW of this type of plant in
use today at about 3,300 sites.5 Several analysts have estimated that a concerted
effort to encourage CHP plant use could lead to additional installations of
80,000 to 100,000 MW by 2030.6 There is every reason to believe that this cost-
effective potential is out there; the questions are whether industrial plants and
large commercial building developers will make this practice routine, and
whether local distribution utilities can and will expand their systems fast
enough to absorb this much local generation.7
It is less likely, but remotely possible, that an equally large increment of new
capacity would come from solar photovoltaic (PV) panels. This would require
that their costs drop much faster than the 23% drop predicted by 2030 that the
Energy Information Administration (EIA) estimates, along with an aggressive
rollout of the Smart Grid, local storage, federal and state tax supports, and a
supportive regulatory climate. All the necessary ingredients would have to align
with nearly magical precision to back out all other sources by 2030.8
Another factor that adds weight to my doubts about this scenario is the
rather downcast assessment of DG recently released by the State of California.
No U.S. state has a more favorable posture toward DG, or has spent more to im-
prove utility policies toward this technology, than the Golden State. Nonethe-
less, the California Energy Commission recently concluded the following:
The DG industry is still a nascent industry that survives despite difficult market
conditions.Many projects are highly customized and rely on incentives. The indus-
try is fragmented with many “small” developers installing PV and natural gas en-
gines provided by large, well-established equipment suppliers. There is fragmenta-
tion by technology type and diverse business models. . . . Due to low penetration
rates, DG installations do not have a large impact on, nor are they integrated with,
the state’s electric and natural gas infrastructures.9
The Commission estimated that a full-court press toward all forms of DG could
produce 26% of the state’s peak electricity demand by 2020, or a total of 18,600
MW. Of this total, however, 60% would have to come from CHP plants larger
than 20MW.Out of the remaining 7,610MW, 3,000MWwould come from PV,
128 Smart Power
www.EngineeringBooksPDF.com
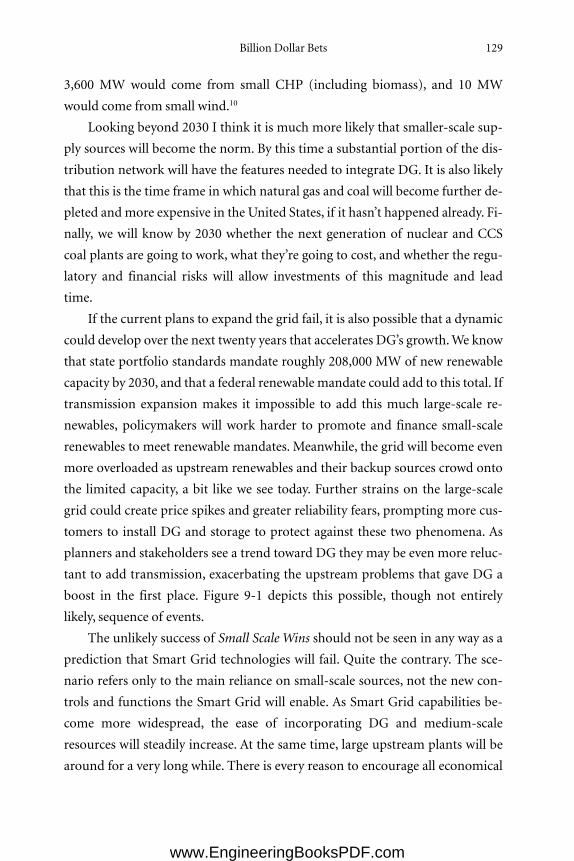
3,600 MW would come from small CHP (including biomass), and 10 MW
would come from small wind.10
Looking beyond 2030 I think it is much more likely that smaller-scale sup-
ply sources will become the norm. By this time a substantial portion of the dis-
tribution network will have the features needed to integrate DG. It is also likely
that this is the time frame in which natural gas and coal will become further de-
pleted andmore expensive in the United States, if it hasn’t happened already. Fi-
nally, we will know by 2030 whether the next generation of nuclear and CCS
coal plants are going to work, what they’re going to cost, and whether the regu-
latory and financial risks will allow investments of this magnitude and lead
time.
If the current plans to expand the grid fail, it is also possible that a dynamic
could develop over the next twenty years that accelerates DG’s growth.We know
that state portfolio standards mandate roughly 208,000 MW of new renewable
capacity by 2030, and that a federal renewable mandate could add to this total. If
transmission expansion makes it impossible to add this much large-scale re-
newables, policymakers will work harder to promote and finance small-scale
renewables to meet renewable mandates. Meanwhile, the grid will become even
more overloaded as upstream renewables and their backup sources crowd onto
the limited capacity, a bit like we see today. Further strains on the large-scale
grid could create price spikes and greater reliability fears, prompting more cus-
tomers to install DG and storage to protect against these two phenomena. As
planners and stakeholders see a trend toward DG they may be even more reluc-
tant to add transmission, exacerbating the upstream problems that gave DG a
boost in the first place. Figure 9-1 depicts this possible, though not entirely
likely, sequence of events.
The unlikely success of Small Scale Wins should not be seen in any way as a
prediction that Smart Grid technologies will fail. Quite the contrary. The sce-
nario refers only to the main reliance on small-scale sources, not the new con-
trols and functions the Smart Grid will enable. As Smart Grid capabilities be-
come more widespread, the ease of incorporating DG and medium-scale
resources will steadily increase. At the same time, large upstream plants will be
around for a very long while. There is every reason to encourage all economical
Billion Dollar Bets 129
www.EngineeringBooksPDF.com
DG, but the high costs, regulatory adjustments, changes in land use and con-
struction practices, and time required for the Smart Grid to mature all suggest
that DG cannot be our exclusive source of new low-carbon power in the current
half-century.
Traditional Triumphs and Completely Green are in direct opposition; better
prospects for one equate to a worse outlook for the other. At the intersection of
these two scenarios, nearly everyone in the power industry expects gas-fired
power to continue to play a very large role for at least the next decade. It is versa-
tile, proven, cheap, and ideal for supplying the balancing power needed to
smooth out wind and solar production. It is nearly impossible to imagine any
future without natural gas as the near-term choice for backing up solar and
wind, exactly as Jim Jura and Associated decided in their plan.
130 Smart Power
Figure 9-1.One Possible, Though Unlikely, Process ThatWould Accelerate Distributed Gen-eration (DG).
www.EngineeringBooksPDF.com
The prospects for low-carbon coal and nuclear, though much less certain,
are strong enough to keep them in contention. Neither of these can yet be con-
sidered a proven commercial technology in the United States; their survival ab-
solutely depends on constructing commercial units that perform well at com-
petitive prices. In both cases, there is strong research and development (R&D)
and early commercialization support, which will be essential to meet this goal.
As noted earlier, the U.S. Department of Energy just awarded grants to several
large CCS projects and is scheduled to give $16 billion in loan guarantees for an
initial first group of new nuclear plants, along with production tax credits for
power from the first 6,000 MW.11 As to coal, it is politically unrealistic to expect
that U.S. climate legislation will pass without significant support for coal plants
with CCS. As an example, the Waxman–Markey climate legislation allocates
bonus allowances of up to 72,000MWof CCS capacity in two phases and allows
coal-fired utilities to set up a unique self-funded R&D cooperative, in addition
to a mandate that all future coal units install CCS after 2020.12
For both coal and nuclear technologies, R&D efforts are occurring on a
worldwide basis. FutureGen has utilities with operations on six continents, and
the European Union has pledged to build up to twelve coal plants with CCS to
jumpstart the industry.13 China also has an active CCS research program, and
much nuclear R&D is also now offshore. The increasing use of these two fuels in
Asia and Europe means that U.S. companies and electric customers will not be
the sole public funding source for R&D, and will benefit from international
spillover.
Beyond R&D and capital costs, coal and nuclear’s success will also depend
on signposts in the regulation of their fuel cycles. Sequestration must have a
framework in place that enables financing and operation of a gigantic national
CO2 piping and storage infrastructure. Nuclear plants will need stable licensing
conditions and waste storage. And, of course, fuel must continue to be available,
with acceptable environmental costs, at prices that keep these forms of energy
competitive.
Coal has been a leader in the sector for a long time, and the first generation
of nuclear plants overcame many of these issues. Coal and uranium come from
Billion Dollar Bets 131
www.EngineeringBooksPDF.com
domestic or relatively stable and secure foreign suppliers, giving these fuels one
very attractive feature compared, for example, to our oil supplies. Economical
CCS and nuclear plants will unquestionably make it much easier for the world
to reduce greenhouse gas emissions. In view of these policy pluses, the future of
these sources hinges on their performance and costs.14
If nuclear and coal both stumble, Completely Green will be the inevitable
beneficiary. While it might be tempting to view this as extremely likely, renew-
able energy faces many challenges of its own. In most forecasts PV remains ex-
pensive, even through 2030, and so does concentrating solar power (CSP). CSP
also needs siting approvals and must manage its water demand. Offshore wind
has high siting costs and risks. Biomass resources face competing land use de-
mands and environmental questions. Above all, large-scale renewable develop-
ment requires transmission resources, integration and backup investments, and
Smart Grid deployment close to home.
There is little question that renewable energy supplies have the physical po-
tential to satisfy all our energy needs, but this is not the same thing as saying that
they can supply all our needs as cheaply as we can with another century of (ta-
pering) fossil fuel use. Analysts who have looked carefully at the cost of produc-
ing renewable power from progressively lower quality sites find that these costs
will rise as we use more of it. DOE’s massive study of wind energy, for example,
found that wind costs would approximately double, from around 6 cents/kWh
to 12 cents/kWh, as U.S. wind capacity grew to 800,000 MW.15 Another thor-
ough assessment of all renewable energy options for the State of California
found that the cost of renewables per kilowatt-hour would rise more than 500%
as cumulative development reached 250 billion kWh/yr.16
As with nuclear power, renewable power technologies have their own sup-
ply chain limits, and pressing against these raises costs or is simply unfeasible.
California’s analysis of its ability to meet its ambitious renewable mandates re-
ports that the time needed to develop projects and the relatively short period
until 2020 requires that multiple options and contingency plans will be needed,
raising the cost of achieving the goal if it can be achieved at all.17 In an interview
with one of the report’s authors, he relayed that one renewable industry repre-
132 Smart Power
www.EngineeringBooksPDF.com
sentative told him that they simply could not build more than a set amount of
new capacity in a decade.18
And theWinner Is . . .
Provided you do the judging around 2030, or better yet closer to 2050, any of the
four supply scenarios could come true. The most likely answer though, is Most
of the Above. Although the directional shift toward renewable and smaller
sources is unstoppable, the lowest-cost approach to meeting strong carbon lim-
its is likely to include either or both coal and nuclear units, provided at least one
works at its projected cost.
This finding is echoed by most researchers who have studied the future
power systems. Observers as diverse as the U.S. Environmental Protection
Agency, climate expert Joe Romm, the Electric Power Research Institute, Charles
River Associates, and the Stanford University Energy Modeling Forum have all
formulated broad national least-cost plans or simulations indicating a signifi-
cant role for CCS coal, nuclear, and many types of renewables. A handful of ex-
ceptions, including Google’s energy plan and one from the Natural Resources
Defense Council (NRDC), leave out one of the two traditional sources (CCS or
nuclear) but keep the rest.19 Table 9-1 shows the distribution of projected sup-
plies in 2030 from each main type of fuel from a sample of these studies.
Some experts go beyond least-cost prediction to say that, due to the urgency
of emissions reductions and of the extent of current and projected coal and nu-
clear power, one or both of these two sources must be a part of the future mix.
“There is no credible pathway towards prudent greenhouse gas stabilization tar-
gets without CO2 emissions reductions from existing coal power plants,” says
MIT’s Ernie Moniz, a former undersecretary of energy and professor of nuclear
engineering (he thinks nuclear is essential too).20 In an interview quoted in Cli-
mate Wire, Judi Greenwald of the Pew Center on Global Climate Change, a re-
spected climate think tank, said it more simply: “either CCS or nuclear power
has to work ‘in a big way’ or else the planet is in trouble.”21
This modeling and research suggests additional reasons favoringMost of the
Billion Dollar Bets 133
www.EngineeringBooksPDF.com
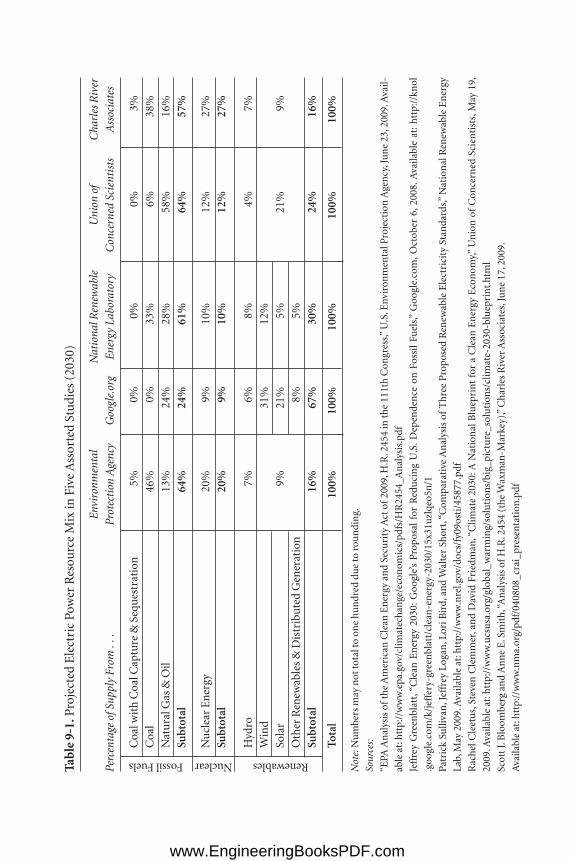
Tab
le 9
-1.P
roje
cted
Ele
ctri
c Po
wer
Res
ourc
e M
ix in
Fiv
e A
ssor
ted
Stu
dies
(20
30)
Envi
ronm
enta
l N
atio
nal R
enew
able
U
nion
of
Cha
rles
Riv
er
Perc
enta
ge o
f Sup
ply
From
...
Pro
tect
ion
Age
ncy
Goo
gle.
org
Ener
gy L
abor
ator
yC
once
rned
Sci
enti
sts
Ass
ocia
tes
Coa
l wit
h C
oal C
aptu
re &
Seq
ues
trat
ion
5%0%
0%0%
3%
Coa
l46
%0%
33%
6%38
%
Nat
ura
l Gas
& O
il13
%24
%28
%58
%16
%
Subt
otal
64%
24%
61%
64%
57%
Nu
clea
r E
ner
gy20
%9%
10%
12%
27%
Subt
otal
20%
9%10
%12
%27
%
Hyd
ro7%
6%8%
4%7%
Win
d31
%12
%
Sola
r9%
21%
5%21
%9%
Oth
er R
enew
able
s &
Dis
trib
ute
d G
ener
atio
n8%
5%
Subt
otal
16%
67%
30%
24%
16%
Tota
l10
0%10
0%10
0%10
0%10
0%
Not
e:N
um
bers
may
not
tota
l to
one
hun
dred
du
e to
rou
ndi
ng.
Sour
ces:
“EPA
An
alys
is o
f th
e A
mer
ican
Cle
an E
ner
gy a
nd
Secu
rity
Act
of
2009
, H.R
. 245
4 in
the
111t
h C
ongr
ess,”
U.S
. Env
iron
men
tal P
roje
ctio
n A
gen
cy, J
un
e 23
, 200
9. A
vail-
able
at:
htt
p://
ww
w.e
pa.g
ov/c
limat
ech
ange
/eco
nom
ics/
pdfs
/HR
2454
_An
alys
is.p
df
Jeff
rey
Gre
enbl
att,
“Cle
an E
ner
gy 2
030:
Goo
gle’
s P
ropo
sal
for
Red
uci
ng
U.S
. Dep
ende
nce
on
Fos
sil
Fuel
s,” G
oogl
e.co
m, O
ctob
er 6
, 200
8. A
vaila
ble
at:
htt
p://
knol
.goo
gle.
com
/k/j
effe
ry-g
reen
blat
t/cl
ean
-en
ergy
-203
0/15
x31u
zlqe
o5n
/1
Patr
ick
Sulli
van
, Jef
frey
Log
an, L
ori B
ird,
an
d W
alte
r Sh
ort,
“Com
para
tive
An
alys
is o
f T
hre
e P
ropo
sed
Ren
ewab
le E
lect
rici
ty S
tan
dard
s,” N
atio
nal
Ren
ewab
le E
ner
gy
Lab,
May
200
9. A
vaila
ble
at: h
ttp:
//w
ww
.nre
l.gov
/doc
s/fy
09os
ti/4
5877
Rac
hel
Cle
etu
s, S
teve
n C
lem
mer
, an
d D
avid
Fri
edm
an, “
Clim
ate
2030
: A N
atio
nal
Blu
epri
nt
for
a C
lean
En
ergy
Eco
nom
y,” U
nio
n o
f C
once
rned
Sci
enti
sts,
May
19,
2009
. Ava
ilabl
e at
: htt
p://
ww
w.u
csu
sa.o
rg/g
loba
l_w
arm
ing/
solu
tion
s/bi
g_pi
ctu
re_s
olu
tion
s/cl
imat
e-20
30-b
luep
rin
t.h
tml
Scot
t J. B
loom
berg
an
d A
nn
e E
. Sm
ith
, “A
nal
ysis
of H
.R. 2
454
(th
e W
axm
an-M
arke
y),”
Ch
arle
s R
iver
Ass
ocia
tes,
Jun
e 17
, 200
9.
Ava
ilabl
e at
: htt
p://
ww
w.n
ma.
org/
pdf/
0408
08_c
rai_
pres
enta
tion
Fossil Fuels Nuclear Renewables
text:IP_Fox-Penner 8/15/10 7:08 PM Page 134
www.EngineeringBooksPDF.com
Above that are not captured by most current analyses. First, the models used to
simulate climate strategies tend to have little or no ability to capture the diffi-
culty or timing of new transmission construction, which is a significant con-
straint on renewables. We also know comparatively little about the steepness of
the supply curve for some renewables, including whether integration costs will
increase or decrease as more renewables are added and technology improves.
There is also a value in diversifying fuel supplies supported by considera-
tions of both price stability and national security. This is the same portfolio
value theory used to build sound investment portfolios; many utilities and regu-
lators apply it in either a simplified or advanced form already. As power expert
Fereidoon Sioshansi put it after a long study of supply options;
[A]s I studied the various options to de-carbonize electricity generation even if one
were to include developing countries, I realized the limitations of each technology,
and it began to dawn onme that the task at hand is more daunting than I had imag-
ined. Pushing too hard or too fast on one technology or option would merely result
in problems somewhere else in the interconnected system.22
Finally, there is fairly strong political momentum behind all of the major forms
of energy, including the major renewables, in the United States today. They have
good trade associations and represent many American jobs scattered across
many congressional districts. Each can be expected to fight hard to keep its share
of the future supply market by way of R&D support, early commercialization
subsidies, and many other types of regulations and mandates.
As the industry reaches for 2050, a continuation in the shift toward renew-
able energy and smaller sources is inevitable. The Smart Grid will become the
norm, and downstream generation and storage will become far more common.
Yet it is also nearly certain that we will expand the high-voltage grid and build
thousands of megawatts of large power plants of some persuasion. The power
industry is going to have to do it all over the next fifty years: engineer a complex,
paradigm-busting distribution and information system, build transmission
faster than ever in recent history, learn how to integrate vast quantities of vari-
able renewables and small sources, and build new large plants from technologies
Billion Dollar Bets 135
www.EngineeringBooksPDF.com

that are mainly unproven. The estimated costs of the effort just until 2030 lie
somewhere around $2 trillion.23
Who is going to do all this? Regulated utilities? Public power? Deregulated
generation companies? Will these challenges force companies to specialize in
one part of the industry or to integrate vertically into all parts of the supply
chain? Above all, does governing this industry properly through its period of
upheaval call for changes in regulation and industry structure? It is time we
turned from the industry’s amazing physical transformation to ask how we
make a business out of all of this change, the subject of the next and final part of
this book.
136 Smart Power
www.EngineeringBooksPDF.com

part three
Business Models for theNew Utility Industry
www.EngineeringBooksPDF.com

chapter ten
Energy Efficiency: The Buck StopsWhere?
IF ENERGY EFFICIENCY (EE) is often the lowest-cost option, why don’t wetake more advantage of it? This is often posed as one of the great conun-
drums of American energy policy, sometimes to try to discredit the existence of
low-cost efficiency or the idea that we have any successful ways of accessing it.
The real answer lies in understanding the gap between what we measure as EE’s
cost and the economic actions of real-world consumers and energy firms. And
the first step in closing that gap is in setting the right market conditions for
those consumers and firms through policy mechanisms.
When we say an EE measure costs less than a new supply alternative, here is
what we mean: if you spend the capital to buy and install more efficient tech-
nologies in a building, the added cost will more than come back to you in sav-
ings over the lifetimes of the technologies. If you buy a more expensive air con-
ditioner that’s more efficient, your electricity bill savings over the next five or
ten years are larger than the added cost of buying the better unit.
Cost-effectiveness conclusions like this come from comparing the net pres-
ent value of the costs of EE to the alternative of building and fueling a new
power plant over its lifetime. A net present value takes a stream of costs and
139
benefits stretched out over years and reduces the stream to an equivalent single
dollar value paid today.
Investing in EE and buying more power are very different options, espe-
cially in the timing of the money outlays and the return of benefits. You have to
pay 100% of the costs of buying a more efficient appliance before you get a sin-
gle unit of benefit; the benefits are then stretched out over the next several years.
In contrast, regardless of how much it cost to build the power plant we buy
from, we only have to pay for it 1 kilowatt-hour at a time.
The use of net present value ensures that any comparison of the two op-
tions is accurate from the standpoint of modern financial theory. The problem
is people don’t act based on net present value. There are dozens of ways each of
us could save money over the next several decades if we spent money now and
waited patiently for the savings to materialize.Wemight be better off in the long
run, and society might be better off, but still we fail to act.
The notion that people do not act to maximize their welfare, defined and
measured by economic concepts such as net present value, is now a well-
accepted field of study known as behavioral economics.1 Thaler and Sunstein’s
popular book Nudge explains nicely why humans don’t always act with “eco-
nomic rationality”:
Those who reject paternalism often claim that human beings do a terrific job of
making choices, and if not terrific, certainly better than anyone else would do (espe-
cially if that someone else works for the government). Whether or not they have
ever studied economics, many people seem at least implicitly committed to the idea
of homo economicus, or economic man—the notion that each of us thinks and
chooses unfailingly well, and thus fits within the textbook picture of human beings
offered by economists.
If you look at economics textbooks, you will learn that homo economicus can
think like Albert Einstein, store as muchmemory as IBM’s Big Blue, and exercise the
willpower of Mahatma Gandhi. Really. But the folks that we know are not like that.
Real people have trouble with long division if they don’t have a calculator, some-
times forget their spouse’s birthday and have a hangover on New Year’s Day. They
are not homo economicus; they are homo sapien.2
140 Smart Power
The rationale for EE policies is strongly related to these behavioral insights.
Real-world people can’t absorb the information nor do the calculations needed
to evaluate energy-savings opportunities, and they respond to complex choices
with all-too-human inertia. In addition to pointing out that real people have
trouble with long division, Thaler and Sunstein note that decision making is es-
pecially “non-economic” when people are “inexperienced or poorly informed
and in which feedback is slow or infrequent”—an apt characterization of EE
decisions.3
If policies can help energy users overcome these limits without offsetting
waste or welfare losses, both society and the power customers who save will be
better off. Part of the welfare improvement is in the form of lower life cycle
power bills for those who conserve with no loss of comfort; the rest comes from
lower costs, higher employment, and lower environmental impacts for everyone
else.
Efficiency in National Climate Strategies
All over the world, nearly every study of climate policy options concludes that
the single cheapest option for CO2 savings is energy conservation. Among all
conservation options, electricity savings are almost always cheapest, and they
are excellent for boosting employment as well.4
Following a major assessment, the Intergovernmental Panel on Climate
Change (IPCC) concluded that most countries of the world could reduce car-
bon emissions by 11 to 85% in 2020 by making buildings more energy efficient
at less than $25/ton of CO2 saved.5 Nearly all other options cost more or have
lower potential, including every type of low-carbon energy supply and most
savings options in the transport sector.
These findings occur in essentially every other climate policy study, includ-
ing those byMcKinsey, EPRI, the Union of Concerned Scientists, EIA, the Inter-
national Energy Agency, and the U.S. Environmental Protection Agency.6 Cli-
mate policy experts across the political spectrum urge that energy efficiency be
the first action taken to reduce greenhouse gases. Eileen Claussen, head of the
Pew Center on Global Climate Change, calls energy efficiency “about as close as
Energy Efficiency: The Buck StopsWhere? 141
you can get to a silver bullet.”7 It is telling that the National Action Plan for En-
ergy Efficiency, the most sweeping set of efficiency policy proposals in decades,
was produced in 2006 by the Climate Change division of the EPA along with the
DOE.
For all the climate policy benefits of EE, however, you haven’t accomplished
anything until you get someone with sufficient information, motivation, and
capital to make an investment in greater efficiency. The industry has been con-
fronting this challenge for decades with very mixed results. Improving this per-
formance is essential for a successful climate policy.
The Barriers to Greater Efficiency
Policy wonks often use the word barrier to refer to all of the factors that cause
consumers not to install EE measures that pay for themselves over the measures’
lifetime. The barriers have been thoroughly studied and documented.8 The
main barriers—information, capital availability, transactions costs, and inaccu-
rate prices—can be described briefly as follows:
Information. EE is a field of expertise and specialization just like energy supply.
It takes training and experience to keep up on the cost and performance features
of energy use technologies and evaluate savings options for a specific building
or application. We should not expect most homeowners or businesspersons to
have the knowledge to do this. Furthermore, EE options raise important deci-
sions and tradeoffs right inside one’s home, office, or factory—tradeoffs much
more complicated than simply leaving your building alone and buying more
power. Because so many of our structures and energy needs are unique, each
energy-saving application must be somewhat tailored to each customer.
Researchers rarely measure or count as a cost the time required to educate
consumers as to their options, or to find them expert assistance, but these costs
can be large. As a result, EE programs that prescreen efficiency options for con-
sumers and give them hands-on assistance choosing measures that work for
their specific needs have proven to be valuable.
142 Smart Power
Capital availability. Every entity has a cost of borrowing money, whether from a
bank loan, new equity, or rich Uncle Harry. As borrowers approach their credit
limits, their borrowing costs rapidly reach a point where investments simply
can’t be financed. This is particularly harmful to EE because 100% of the cost of
efficiency is paid before any savings are realized; it is by definition an all-capital
option.
Even where businesses or consumers can borrow enough to finance effi-
ciency they often hesitate to use up their borrowing power for this purpose. EE
measures can take years to repay themselves. If circumstances change during
that period—the home or business relocates, energy prices change, or other
changes occur—that borrowing capacity might be needed for something else.
When asked why they did not adopt an EEmeasure that will repay itself within a
few years, many a businessperson has said roughly this, “I am in the business of
making and selling (fill in the blank). That’s what my investors invest in and
that’s what I am good at. I am not in the business of saving energy.Why should I
devote my scarce capital to EE investments, which I don’t understand and can’t
measure, when I am more confident I can make profits using my capital to do
something I know I am good at?”
Transaction costs. Transactions costs are a technical name for what might be bet-
ter called the hassle factor. Unlike buying more supply, which involves minimal
intrusion into our daily routines, EE measures require construction and/or op-
erational changes in homes or businesses. One has to be prepared to deal with
contractors, engineers, occupancy delays, and so on.
Anyone who has ever managed a construction project knows that all sorts
of things can go on, delaying or damaging equipment or property. One of my
consulting partners once tried to convince a LasVegas casino owner to install EE
measures in a new building under construction. He and the local utility had
arranged it so that the EE measures would be added as part of the overall con-
struction project, but the measures would extend the construction schedule by
five days. In exchange for the five-day delay, the casino owner would recoup the
efficiency investment within one year and save millions on the power bill for
Energy Efficiency: The Buck StopsWhere? 143
years afterward. But the casino owner said no—fearing that it interfered with
the carefully planned construction and opening schedule; even this minimal de-
lay was not acceptable.
Inaccurate price signals. Many energy decisions are made by a builder or land-
lord who will not pay electric bills for the equipment or building at hand. Two-
thirds of all water heaters, half of all furnaces, and a quarter to a third of all re-
frigerators are purchased this way.9 In this case there is no direct payback to the
builder or landlord who pays more for a more efficient technology. Even where
there is no problem of this sort electric prices almost always understate the true
cost of providing electricity. Electric regulators have generally resisted setting
prices that reflect either the true cost of production or the unpriced externalities
of power use. Higher, more accurate prices naturally encourage more conserva-
tion by increasing the value of the savings in the calculations we have been talk-
ing about. This is why dynamic pricing, discussed in Chapters 4 and 5, is so
important.
Using the term barriers to discuss these four factors conjures up visions of
some artificial boundaries that policymakers have mistakenly erected to prevent
the EE we would naturally adopt otherwise. This isn’t quite right. Apart from
lousy price signals, policymakers have done nothing to prevent Americans from
investing in EE—we just make our own private, self-interested choice to use
what capital we have in other ways. The more accurate way to refer to barriers is
to treat them as hidden, unmeasured costs that don’t enter into economists’ offi-
cial figures. Along with behavioral inertia, these hidden and usually unmea-
sured costs account for the difference between the investments made by energy
users and the investments that would be in society’s best interest.
However we choose to view them, if we want to harvest more of our EE po-
tential we need policies and business models that address the barriers directly,
that is, intervene to lower hidden costs. When, for example, someone offers
homeowners free energy audits by expert auditors, many homeowners take ad-
vantage of the offer. These auditors have the expertise needed and apply it to the
individual homeowner’s unique structure and preferences. Sometimes they
provide installation advice or assistance as well. By doing all this, the hidden
144 Smart Power
costs are reduced to practically nothing, and many more customers take advan-
tage of efficiency measures that are cost-effective.
Getting the Prices Right
When the subject of government involvement in EE comes up, the first thing
you’re likely to hear is that “we can’t possibly have a sound energy policy until
we get energy prices right.” Technically, the statement is accurate. However, like
so much of the policy rhetoric inWashington, this statement sometimes carries
with it some ideological baggage.
One aspect of getting prices right has to do with the time structure of elec-
tric rates. As we learned in Chapter 5, nearly all electricity prices in the country
are set at an annual average rate level, often in quantity tiers (e.g., one price for
the first 500 kWh per month, another price up to 1,000 kWh, and so on). It is
much more efficient to adopt dynamic pricing and charge the approximate
price of production each hour for generation. As we’ve seen, one of the most
important features of the Smart Grid is that it automatically enables dynamic
pricing.10
The second, very different aspect of getting prices right is the inclusion of
externalities in electricity’s price. Once again, there is no disputing the propriety
or desirability of including externalities when it is feasible (often it isn’t).
Among energy production externalities, the 800-pound gorilla is the control of
CO2 emissions.
Getting prices right is on solid theoretical ground, and it is more or less
doable. However, there is one seemingly tiny rhetorical leap from this position
to one that rejects public energy efficiency programs. The rationale goes like
this: Most electric regulatory policies have the effect of reducing electricity
prices below“free market” levels. Since underpricing electricity causes people to
use more of it, a combination of underpriced power plus publicly funded EE
programs is a wasteful contradiction. It is like the government giving out free
candy and then running programs for weight loss at the same time.
It is indeed regrettable that many utility regulations and pricing policies
tend to suppress prices when they should be higher. However, suggesting that
Energy Efficiency: The Buck StopsWhere? 145
nothing should be done until the marketplace exhausts all the efficiency in-
duced by deregulated prices is unrealistic, since deregulated prices are not a vi-
able option in most of the United States today.11 More importantly, regulated
and public sector utilities are slowly getting better at sending accurate price sig-
nals. Finally, EE programs can sometimes be designed to correct for pricing
deficiencies.
More importantly, an enormous body of evidence shows that the nonprice
market barriers have a greater impact on EE than inaccurate prices. Raising
prices to economically accurate levels certainly helps, but its impact is much
smaller than the impact of making customized information or low-cost capital
available, or helping out with the hassle factor.
A numerical example will show you why this makes sense. Suppose that
adding the cost of carbon externalities to electricity increases electric prices by
about 2 cents/kWh.When we plug the new numbers in a net present value cal-
culation, we find that an efficiency measure will now pay itself back in five years
rather than seven. This is good news, but there is ample evidence that con-
sumers will not buy technologies with either five- or seven-year paybacks with-
out assistance. Conversely, if you told these consumers you would give them a
loan, with no repayment required on their part, and they could keep the savings
after the loan was repaid from the energy savings, they will buy the technology
in either case. A formal analysis of this phenomenon by economists Adam Jaffe,
Richard Newell, and Robert Stavins found that upfront subsidies were three to
eight times as effective as higher prices.12
Sometimes one finds that an argument that we shouldwait to implement EE
until we have prices right really reflects a veiled discomfort with the degree of
“social engineering” that EE programs reflect. EE programs try to get customers
to change their energy choices or even bribe them to do so. Like most other
government-induced policies, they redistribute economic development from
power plant construction to investment in customer buildings and equipment.13
Ultimately, this is a question of political and social judgment. Governments
guide and limit the choices of their citizens in dozens of ways when they judge
that such limits leave their citizens better off. If EE policies demonstrate results
at reasonable costs—a crucial requirement—there is now widespread agree-
146 Smart Power
ment that government policies should enable information and capital that re-
duce energy use.
Energy Efficiency Policy Paths
Beyond sending good price signals, energy efficiency requires a raft of policies
that start with strong energy R&D and end with programs that actually place ef-
ficient technologies in residential and commercial structures, where nearly all
power is used.Although utilities often play an important role in R&D, the essen-
tial policy questions relate to its role at the deployment end of the spectrum.
At a high level, there are really only a handful of policy approaches that have
established strong records of achieving substantial efficiency gains at costs lower
than those of more supplies.14 The first proven approach is building codes and
efficiency standards for all types of household and commercial appliances.
Codes and standards save enormous amounts of energy. Appliance efficiency
standards have saved Americans more than $30 billion since the 1987 National
Appliance Energy Conservation Act,15 with projected total benefits reaching
$400 billion by 2030,16 not counting future standards that DOE is already re-
quired to implement.17 Several states that have adopted strong building stan-
dards report that a modern code-compliant building uses 75% less power than
the same-size building constructed before codes were adopted.18
But codes and standards also have their limits. They are exceedingly unpop-
ular with the construction and real estate industries and appliance manufactur-
ers; these powerful industries often oppose substantial increases in their man-
dates and succeed in weakening them. There are no national building codes, so
each state or locality can adopt whatever code it chooses or no code at all.
“Stricter codes have been fought bitterly by politically powerful builders’ lob-
bies,” says Clifford Krauss of the New York Times, who goes on to note that “the
energy requirements in building codes remain weak across half the country, and
at least seven states have virtually no rules.”19 In this light, the House of Repre-
sentatives made history when it passed the American Clean Energy and Security
Act (Waxman–Markey bill), which includes a requirement to establish the first
mandatory nationwide building efficiency code.20
Energy Efficiency: The Buck StopsWhere? 147
But no bill with national building codes has yet crossed the president’s desk,
and codes and standards have their limitations in any case. Unseen by most of
us, codes and standards go through a long, laborious process with industry
code-setting committees or the DOE. Building codes are updated on a three-
year cycle; appliance standards can take as many as seven years to get through
DOE’s process. In addition, enforcing building codes can also be expensive and
problematic. Building codes are enforced at the local level in most of the United
States. Raising building codes means that both builders and building inspectors
must go through a substantial training or retraining period to upgrade con-
struction and practices.21
It is an extremely good idea for every state to have a strong building energy
code alongside good national appliance efficiency standards. As the House-
passed climate bill recognizes, cost-effective codes and standards are necessary
elements of a sound climate policy. Nonetheless, the limitations on choice cre-
ated by codes, the difficulties of enforcement, and political reality all suggest
that these policies are better for setting the minimum levels of efficiency that
must be offered, not the maximum that can be achieved. There are many cost-
effective efficiency opportunities that do not lend themselves to a code-like
mandate.
The second good approach is utility energy efficiency programs. Utilities
offer a wide variety of programs, often incorporating just about every EE pol-
icy tool ever invented—free or low-cost audits, free technical assistance, low-
interest loans, and so on. However, the archetypal and most important utility
program offers a combination of upfront capital contribution, usually in the
form of a rebate, and technical assistance in building a better structure or choos-
ing a more efficient piece of hardware and getting it installed. To cite just two of
many examples, Progress Energy Florida offers a programwhere it will pay $450
toward the addition of a solar hot water heater in your home, reducing your hot
water costs by an estimated 85%. Progress offers technical assistance along with
the payment, and it works with the Florida Solar Energy Center to certify a
group of manufacturers and installers who are eligible to install the systems. In
California, the Savings-by-Design program will pay rebates for improving the
efficiency of a new commercial building above the levels required by California’s
already-strict building code. 22
148 Smart Power
When they are run well, utility programs can be extremely effective as well
as cost-effective. They represent one of the only potentially viable options for
tapping our national efficiency potential and thereby reaching our climate
change goals. However, utility regulation has not provided clear, consistent, or
widespread incentives for this to occur. Creating these incentives is one of the
industry’s most pressing needs and, consequently, an issue that permeates the
discussion in the next several chapters.
The only major alternative to utility EE programs is the provision of financ-
ing similar to utility rebates by public entities of one form or another. Low-
interest loans and access to revolving funds have both proven effective for gov-
ernment agencies that face chronic budget constraints. Missouri’s revolving
loan program—one of many good examples—has funded insulation upgrades
for public buildings,more efficient street lamps, and automated thermostats for
school districts, universities, cities, and counties across the state. The loan pay-
ments for this program are often low enough to be covered out of the efficiency
savings and are continuously cycled back into more loans. In total, the program
reduces the amount of taxpayer money spent on utilities.23
Outside the government sector, however, low-interest capital offers them-
selves have not been successful on a broad scale. By themselves, loan programs
do not address the information or transactions-cost barriers at all; in fact, by
creating another program that often requires extensive paperwork and credit
checks, the hassle factor is only increased. Over the years, many different types
of capital access programs have been tried. Some work better than others, and
while they are not sufficient, they certainly serve a useful function.24
Recently, government EE assistance has taken a giant new step in the form
of a new type of program known as municipal energy financing. Through these
programs, property owners can borrow at low rates from a designated financing
entity for EE improvements, and in many cases, renewable energy installation
as well. Loans are secured by property tax liens on houses, which take prece-
dence over mortgage and most other claims on the home (this is what enables
attractive interest rates). According to the DOE, there are now five of these pro-
grams in the United States, the first of which was the City of Berkeley, Califor-
nia’s Financing Initiative for Renewable and Solar Technologies.25
Municipal energy financing is perhaps the only EE option besides utility
Energy Efficiency: The Buck StopsWhere? 149
programs that can deploy building energy efficiency rapidly over a wide area,
with low-cost access to capital and reduced transactions cost. Combined with
other state and local policies, it represents a public-sector alternative to utility
EE leadership, as well as a potential complementary approach. However, the op-
tion is still quite new, and it is too early to tell how successful the idea will be and
how well it can be scaled up to serve the entire nation.
Finally, EE can simply be turned over to the private sector. There are already
several dozen for-profit firms known as energy service companies (ESCOs) that
specialize in designing and installing EE measures. When working indepen-
dently ESCOs frequently use a shared savings business model. The ESCO raises
its own capital and pays for all of the cost of efficient new equipment in some-
one’s structure, such as a new commercial air chiller in an office building. The
chiller lowers the power bill of the customer for its entire lifetime, compared to
the power bill with the old, inefficient chiller. The ESCO signs a contract that al-
lows it to receive and keep most of the difference between the old and new
power bill until it earns back all of the capital it spent on the new chiller, plus a
profit. After it has been repaid, most of the bill savings reverts to the customer.
Even more than utility programs, ESCOs and their shared-savings model
would seem to be an ideal solution to the main EE barriers. Because they spec,
install, and provide the capital for an EE measure, the customer sits back and
does almost nothing while an experienced firm does all the work and pays for
everything out of its own pocket. The customer sees only a lower power bill with
no capital of its own ever needed.
Unfortunately, the economics of the shared savings model severely limits
the markets and technologies ESCOs can install and still earn a profit. In com-
mercial buildings, ESCOs find it difficult to get customers to agree to measures
and terms that tap the full EE potential of a customer site. Instead, they usually
settle for doing the easier measures with rapid paybacks without installing the
bigger, longer savings measures. This phenomenon is less of a problem when
ESCOs contract with government agencies, who operate under mandates to tap
as much of their EE potential as they possibly can. Outside the government sec-
tor, however, the for-profit efficiency business can’t tap nearly as much effi-
ciency potential as utility or publicly funded programs.
150 Smart Power
Mandating Utility Energy Efficiency
The hottest new tool for promoting energy efficiency is the Energy Efficiency Re-
source Standard (EERS). The idea is disarmingly simple. Each year, tell every
seller of electric power tomeet a large fraction of its sales growthwith EE savings
rather than sales. In effect, you simply require an electric power seller to do
whatever it takes to make sure their customers buy less electricity and meet a
savings target.
Nineteen states have already implemented some form of EERS, and at least
one federal bill, the Save American Energy Act of 2009 (S.548), proposes to
adopt a nationwide EERS. Minnesota, Illinois, and Ohio have enacted laws that
require sales reductions that ramp up to 1.5% and 2% a year, respectively, by
2015.26 S.548 would require electricity and gas retailers to reduce their sales by
15% and 10%, respectively, by 2020. Since we know that EIA forecasts only 9.5%
nationwide electric sales growth between now and 2020, S.548 amounts to a
mandate that U.S. electric sales decline in the coming decade!
An EERS is a big policy hammer, and it works.27 However, it is hard to see
that this approach is a long-term solution. In my experience, legislated savings
targets are seldom set at an ambitious, achievable, and cost-effective level. In-
stead, they are typically a much lower negotiated compromise (for this reason,
S.548’s ambitious targets should be seen as an opening bid, not the level that will
gain passage of a bill). The challenges of measuring the true potential for cost-
effective conservation provide the perfect excuse to keep targets low.
For andAgainst Utility Involvement
Utilities’ current business model is based on selling more power rather than
less. Even in states where retail sales are deregulated and utilities only transmit
others’ power, lower sales mean lower profits. Utilities’ understandable ambiva-
lence toward conservation can be overcome either by mandates, as in the EERS,
or by changing their business model tomake conservation profitable. But before
we go about trying to change the core mission of utilities, we ought to ask
whether it is the best available means of improving the efficiency of power use.
Energy Efficiency: The Buck StopsWhere? 151
There’s a pretty good case to be made. First, utilities typically provide a
place where customers can get extremely up-to-date and unbiased information
on the performance and value of EE technologies. Utilities with strong EE pro-
grams are some of the best repositories of energy-efficiency expertise in the
world and certainly the best in their local areas.
Utilities also have unique advantages raising capital and effectively loaning
it to their customers, which is what they do when they give customers a rebate or
low-cost loan for efficiency upgrades. It has long been known that energy utili-
ties are one of the most capital-intensive sectors of the economy, and they are
adept at navigating between bankers and regulators when they need to raise
capital. Because they provide an essential service, and are generally quite credit-
worthy, they can often raise capital at lower interest rates than most other busi-
nesses. Since the value of EE measures depends critically on the cost of capital
employed, this is a valuable aspect of utility involvement.
In some ways, utilities are the ideal, and lowest hassle, financing entities for
efficiency capital. Utilities serve virtually every single building in their service
area. No matter how unusual a building or occupant, they know how much en-
ergy it uses, making it easier for them to design measures and estimate savings.
They also know the credit history of the customer, as they’ve been serving them
all along with billing and payment arrangements already in place. They have a
meter in place to measure savings, and they know it is rare that their customer
stops paying their power bill, which is how their efficiency loan is repaid. In
short, the captive relationship between the local distribution company and the
customer, once seen as a negative in the deregulation debates, is a positive one if
the distributor is also the efficiency capital and service provider.28
Another advantage of utility pilotage comes from the fact that many cus-
tomers trust utilities to offer relatively unbiased advice on saving energy com-
pared tomost other for-profit companies trying to sell them efficiencymeasures
or loans, including ESCOs. Because utilities are either regulated or publicly
owned, market research has shown that customers feel that their advice and the
terms of their programs are being monitored by their representatives to make
sure they are effective and fair.
152 Smart Power
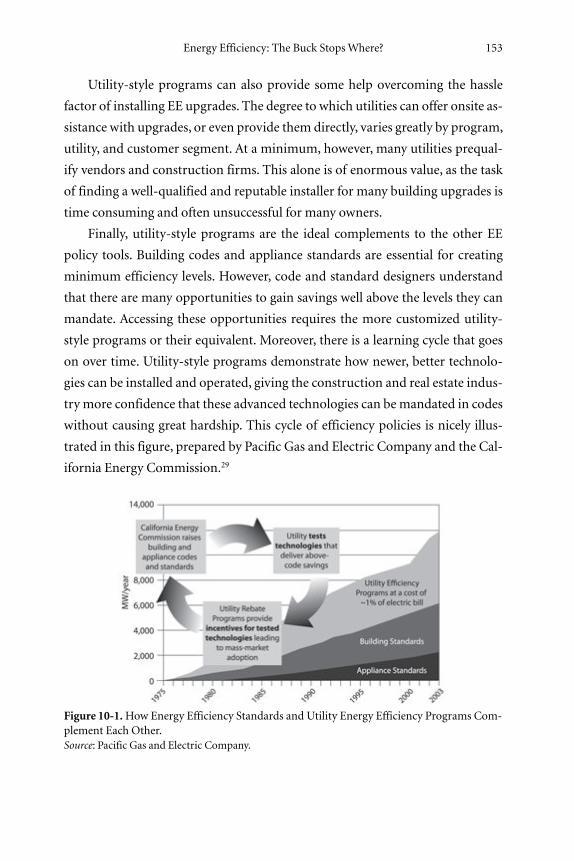
Utility-style programs can also provide some help overcoming the hassle
factor of installing EE upgrades. The degree to which utilities can offer onsite as-
sistance with upgrades, or even provide them directly, varies greatly by program,
utility, and customer segment. At a minimum, however, many utilities prequal-
ify vendors and construction firms. This alone is of enormous value, as the task
of finding a well-qualified and reputable installer for many building upgrades is
time consuming and often unsuccessful for many owners.
Finally, utility-style programs are the ideal complements to the other EE
policy tools. Building codes and appliance standards are essential for creating
minimum efficiency levels. However, code and standard designers understand
that there are many opportunities to gain savings well above the levels they can
mandate. Accessing these opportunities requires the more customized utility-
style programs or their equivalent. Moreover, there is a learning cycle that goes
on over time. Utility-style programs demonstrate how newer, better technolo-
gies can be installed and operated, giving the construction and real estate indus-
try more confidence that these advanced technologies can bemandated in codes
without causing great hardship. This cycle of efficiency policies is nicely illus-
trated in this figure, prepared by Pacific Gas and Electric Company and the Cal-
ifornia Energy Commission.29
Energy Efficiency: The Buck StopsWhere? 153
Figure 10-1.How Energy Efficiency Standards and Utility Energy Efficiency Programs Com-plement Each Other.Source: Pacific Gas and Electric Company.
The Government Option
There’s a nice bit of irony here. Of all of the policy options proven successful at
saving electricity, utilities helping customers install EE measures is one of the
best, with several unique advantages. When they really try, utilities are pretty
good at destroying their own sales! Incidentally, this applies to all types of utili-
ties—investor owned, government owned, and cooperatives. All are highly
trusted by their customers for energy assistance and all are capable of mounting
very effective programs.
Yet despite these advantages, the industry’s fundamental business and regu-
latory models encourage energy sales, not savings. Programs that are nearly the
same as those of utilities can be offered by government agencies, which obvi-
ously don’t have incentive conflicts, or offered by government agencies but de-
livered via utilities. In the state of Vermont, for example, a government agency
designs all of the energy efficiency programs, and the utilities offer each state-
designed program. According to a recent American Council for an Energy-
Efficient Economy (ACEEE) survey, of the fourteen states with the best energy
efficiency performance, nine rely primarily on utility programs, but five of the
leaders put state agencies in charge.30
There are pros and cons to getting utilities out of the energy efficiency busi-
ness. On the plus side, utilities would not face divided incentives, and we would
not have to order them around or change regulation. The regulatory and ad-
ministrative burdens of supervising these programs, which are costly and make
the programs less flexible than purely private offerings, would be eliminated.
Under the right conditions, governments can raise capital at even lower interest
rates than utilities, including tax-exempt financing.
However, there are also downsides to government management of EE fi-
nancing and deployment. First, government programs can be even more cum-
bersome to manage than those of utilities. There is also the chance that govern-
ment policies will shift unpredictably with the political tides. In the case of
energy efficiency, the United States has already gone through episodes of this
nature. In 1994, when Congress shifted fromDemocratic to Republican control,
one of the first acts of the new Congress was a somewhat successful attempt to
154 Smart Power
stop any activities at the DOE that resembled utility or ESCO deployment pro-
grams, such as the program where DOE pays to weatherize low-income
homes.31 The DOE was told to stay out of direct funding of or involvement in
any actual installation of efficient technologies (themarket would do it). The di-
rective adversely influenced many state efforts as well.
Another downside to government management of the EE function is the
amount of capital required. In the current economic climate, government bor-
rowing has become a very important issue. The United States and many other
countries around the world have critical needs for public capital to pay for
health care and other social services, revive the financial sector, improve public
education, provide for national and cyber security, and fund a deteriorating
public infrastructure.
The capital needs for EE are substantial, and even with the Obama stimulus
package and the relatively small EE efforts of the utility industry to date, the vast
majority of EE capital spending has been nonfederal. Until the Obama stimulus
package, the total federal budget for EE deployment was well under $1 billion a
year; the total of state funding was also of this rough magnitude. The federal
government didn’t even use its own capital for its own buildings, opting instead
for shared savings deals with ESCOs. Meanwhile, utilities are now spending al-
most $4 billion a year on EE programs and are likely to reach $10 billion in the
next few years.32
In view of the strong opposition to federal EE in 1994 and the other fiscal
needs of federal and state governments, it is difficult to imagine gaining ap-
proval for tax increases large enough to fund outlays of this magnitude. Also, if
funding like this was achieved based on a precarious political victory, with fu-
ture funding streams uncertain, the impact on planning and implementing a
sound efficiency and climate policy would be devastating. In contrast, regula-
tory utility EE policies can take a long time to establish, but once they are set
they are not usually rapidly reversed.
When it comes to this core element of our climate strategy, we have a criti-
cal choice to make. We can order utilities to do it, as we’re doing today, against
their own business interests. We can take them out of the role entirely, placing
the responsibility on our already-stretched state and local governments. Or, we
Energy Efficiency: The Buck StopsWhere? 155

can change regulation and utilities’ business mission to give them an incentive
to save energy as well as sell it. Any of these approaches might work, but as a na-
tion we aren’t doing any of the three today, and that’s a big mistake.
Although it would be great to fully finance and lead EE actions, I suspect
that utility leadership has a slight advantage over giving the job to the public
sector directly. As I’ve explained, utilities cover the entire country, have good
capital access, and have the best platform for building a specialized, high-quality
delivery system. I also believe that utilities will findmuchmore efficiency to har-
vest if they can make reasonable profits off it, not just answer to mandates. In
the rest of the book we explore what it takes to put utilities in the lead using in-
centives rather than energy efficiency mandates alone.
156 Smart Power
chapter eleven
Two and a Half New Business Models
IN ALL INDUSTRIES, but especially in electricity, the issues of economic
structure, regulation, and business model are inseparable. Regulation deter-
mines which portions of an industry must offer their services as a common car-
rier or are under an obligation to serve all customers. In these parts, regulation
also sets the allowed products, prices, and terms of service. The regulatory and
economic structure together establish reasonably well-defined incentives and
constraints around which the owners of the industry’s assets create business
models. The business model represents management’s strategy for maximizing
the profits allowed by regulation or markets. Figure 11-1 shows the relationship
between the three elements of the triad.
In this chapter, we begin to examine the feasibility for creating different tri-
ads of structure, regulation, and business models that will facilitate the electric
industry’s transformation to a smarter future. The industry of the future will
work best if all three parts of the triad are mutually reinforcing and consistent
with our policy goals.
The discussion is divided into four parts.We first examine the two common
present-day structure–regulation–business model triads. I label them by their
157
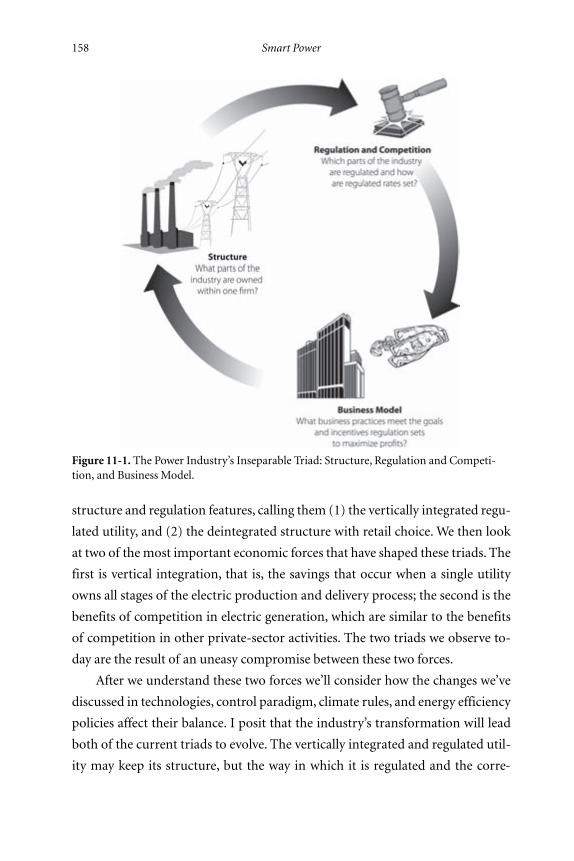
structure and regulation features, calling them (1) the vertically integrated regu-
lated utility, and (2) the deintegrated structure with retail choice. We then look
at two of themost important economic forces that have shaped these triads. The
first is vertical integration, that is, the savings that occur when a single utility
owns all stages of the electric production and delivery process; the second is the
benefits of competition in electric generation, which are similar to the benefits
of competition in other private-sector activities. The two triads we observe to-
day are the result of an uneasy compromise between these two forces.
After we understand these two forces we’ll consider how the changes we’ve
discussed in technologies, control paradigm, climate rules, and energy efficiency
policies affect their balance. I posit that the industry’s transformation will lead
both of the current triads to evolve. The vertically integrated and regulated util-
ity may keep its structure, but the way in which it is regulated and the corre-
158 Smart Power
Figure 11-1. The Power Industry’s Inseparable Triad: Structure, Regulation and Competi-tion, and Business Model.
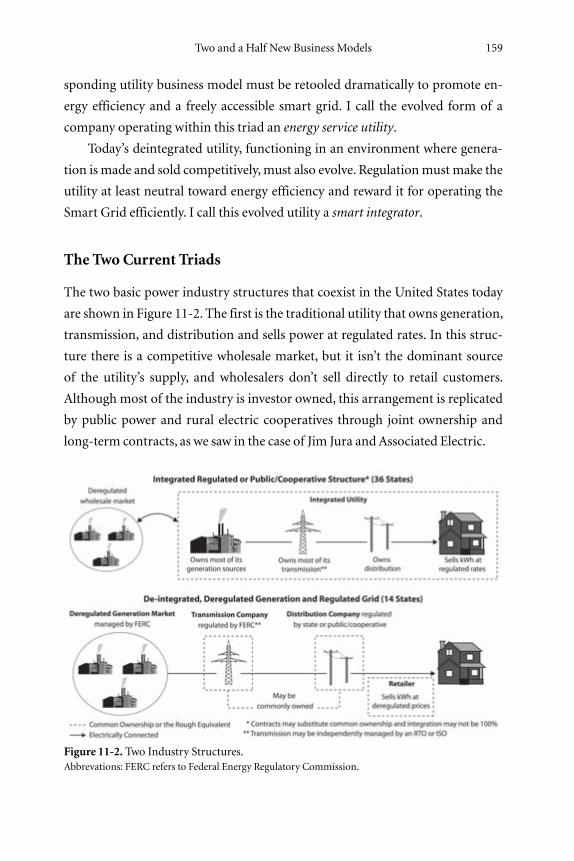
sponding utility business model must be retooled dramatically to promote en-
ergy efficiency and a freely accessible smart grid. I call the evolved form of a
company operating within this triad an energy service utility.
Today’s deintegrated utility, functioning in an environment where genera-
tion is made and sold competitively,must also evolve. Regulationmust make the
utility at least neutral toward energy efficiency and reward it for operating the
Smart Grid efficiently. I call this evolved utility a smart integrator.
The Two Current Triads
The two basic power industry structures that coexist in the United States today
are shown in Figure 11-2. The first is the traditional utility that owns generation,
transmission, and distribution and sells power at regulated rates. In this struc-
ture there is a competitive wholesale market, but it isn’t the dominant source
of the utility’s supply, and wholesalers don’t sell directly to retail customers.
Although most of the industry is investor owned, this arrangement is replicated
by public power and rural electric cooperatives through joint ownership and
long-term contracts, as we saw in the case of Jim Jura andAssociated Electric.
Figure 11-2. Two Industry Structures.Abbrevations: FERC refers to Federal Energy Regulatory Commission.
Two and a Half New Business Models 159
The second structure is one where competitive generators are the predomi-
nant source of supply and the transmission and distribution networks are com-
mon carriers, known in the power industry as open access. These competitors
ship their power to customers over large lines regulated by the FERC and distri-
bution systems regulated by the states. Deregulated retail sellers, often owned by
the same companies that own nearby generators, purchase power from genera-
tors, ship the power downstream, and remarket it to customers at retail.
As mentioned at the beginning of the chapter, these structures are the prod-
uct of two very significant economic forces. The first is the degree to which the
different segments (generation, transmission, distribution, retailing) have the
same owner, that is, are vertically integrated. The second is the industry’s cost
characteristics, which determine whether competition or regulation should
yield adequate investment and lower prices. Along with a good measure of po-
litical economy, these two forces have shaped the industry we have today, and
both will play a pivotal role in the industry’s future as well.
Vertical Integration,Old andNew
Formally speaking, the power system is a network for several reasons. First, the
value of diverse power sources can be maximized, or the costs of providing reli-
able supply minimized, by interconnecting all sources of power to a single grid
with a single control platform. That’s why nearly all generators of every type are
designed to plug in to the grid, and why there is only one set of wires and system
operators in almost every part of the world with electric service.
Network efficiencies also arise from interconnecting customers, each of
whose demands vary from moment to moment. When all these changing de-
mands are added together, it is cheaper to provide service to the group than it is
to serve each customer alone. This was Insull’s massing of consumption in his
original business model. As we saw in Chapter 5, the modern-day benefits of
networking customers go beyond aggregation of passive demanders to the
price- and control-sensitive interaction of customers and system operators.1
When there is this kind of interdependence between generators, customers,
and other parts of the system, it is often cheaper if many elements of the net-
160 Smart Power
work are commonly owned. There is an economic theory, attributed to econo-
mists Ronald Coase and Oliver E. Williamson, that explains this, but it comes
down to the fact that when different parts of a network need to work together in
complex ways, it is hard to describe how network parts must work together in a
written contract. Because contracts are incomplete and imperfect, the contract-
ing parties don’t always work well together when unusual circumstances occur.
In contrast, if you own the whole network you manage it as a single company
and command any needed adjustments to new developments.2 Integration is
also observed where lack of immediate performance by one small part of the
network can be costly to everyone on the network, a feature that fits electric
grids to a tee.3
Traditionally, nearly all economists agree that vertical integration made the
power system work more cheaply. 4 A number of economists who have studied
the question prior to the onset of the Smart Grid and related changes have con-
cluded that vertical economies are measurable and quite significant. In one ma-
jor 1996 study, Professor John Kwoka, Jr., found that vertical integration re-
duced the costs of the average large utility by 22%.5 Professor Robert J.Michaels
reviewed the literature in 2006 and found strong support for vertical economies
ranging from 1 or 2% to Kwoka’s double-digit levels.6
Over the years I’ve had occasion to see some of these integration economies
in action. I can recall sitting in the control room of a utility one morning look-
ing at the unit commitment computer. This computer indicated which of the
power plants was the cheapest one to start up to serve demand over the rest of
the day. The utility owned most of its power plants, but a few were owned by
others, with their availability determined by the terms of a complicated long-
term contract.
When the computer showed that the company’s own plants were cheapest
to turn on there was no question that these plants would be used. As long as the
plant was operable it went to work. When the computer indicated that a con-
tracted unit was cheapest, however, the personnel checked a thick binder that
summarized the plant’s contract. The contract determined whether, in this im-
mediate instance, the utility had the right to order the plant to turn on for the
precise period that would be cheapest. Sometimes it did and sometimes it
Two and a Half New Business Models 161
didn’t.Had the utility owned this generator there would be no doubt it would be
the one used.
As I’ve watched power sectors all over the world go through restructuring,
one of the things that has struck me is that vertical integration seems to be a
very durable feature. In the United States the original onset of retail choice re-
duced the fraction of assets owned by fully integrated IOUs by about 10%, but
since 2003 vertical integration measured by assets has gone halfway back, in-
creasing by about 5%. The reversal appears even more pronounced in Europe,
where national deregulation laws forced utilities to sell off their generation busi-
nesses. Whereas many of us thought this would mean that distribution systems
would not be owned by generators, and that the retailer would be independent
of everyone, the generation companies have steadily reintegrated into every-
thing except transmission, the one segment they cannot enter. Today, among
foreign electric companies in the world’s top 250 largest energy firms, the firms
who own generation are either fully integrated or also own distribution systems
as well as retailing operations. 7
The diminished allure of companies operating in just one industry seg-
ment—pure plays in Wall Street parlance—was explained in a 2002 report by
consultants Booz Allen Hamilton:
Traditionally an industry of vertically integrated companies, the boundaries of
which were defined by geography and historical accident, the utility sector has un-
dergone a fundamental and comprehensive restructuring in recent years. Regula-
tory mandate and market discipline have driven the development of intermediate,
wholesale markets and new “pure play” business models in transmission, genera-
tion (gas, nuclear), trading, and retail services. The market, recognizing that each of
these niches offers distinctive growth and risk characteristics, has generally ap-
plauded this trend. Indeed, as recently as a year ago, it appeared that the single most
important driver of an energy company’s market valuation was the strategic posi-
tion it elected to occupy on the industry’s value chain. But that was a year ago. . . .
Since then, the ground has shifted, and many of the assumptions underlying
energy companies’ strong valuations have been shaken. The industry lost $90 bil-
lion in market value in 2001, and continues to hemorrhage in 2002. Falling energy
162 Smart Power
prices, looming overcapacity, and a crisis of confidence have cast a pall over mer-
chant [deregulated] energy companies and generators. The California energy
crunch and the Enron debacle have stymied the progress of deregulation. And in-
vestors have stepped back from their lofty endorsements of “intellectual capital,”
“intangible assets,” and energy “pure plays.” In fact, investors appear reluctant to bet
on any particular strategic posture these days. As a result, average valuations as-
signed to different “plays” on the utility value chain have converged, while, at the
same time valuations within particular strategic niches have spread.8
While the cost savings from vertical integration can be substantial, neither
should they be blown out of proportion. There are many, many instances in the
industry in which contracts do an excellent job of substituting for common
ownership andmany others in which they do better. As in a host of other indus-
tries, cheap and ubiquitous information technology (IT) has made it possible to
turn a group of different companies and their assets into a single production
operation that works like a single company, even for industries in which contin-
uous service in real time is essential.9
More importantly, though, all the experience and evidence to date apply to
yesterday’s electric power industry. The sixty-four-thousand-dollar question is
whether the smart utility of the future will enable cheaper total service to cus-
tomers if it is vertically integrated.Would it instead be cheaper to customers to
avoid cross-ownership between generation and grid and operate only in one or
two of the segments?
The issue is far from settled. It is possible that the economic attributes of a
more distributed and intelligent smart power network make it easier for the
transmission and distribution operators to balance the system and keep costs
low without needing to own power plants. By sending price signals to genera-
tors large and small, they can get all the generation and all the control they need
when and how they need it. On the other hand, it may be that the vertical inte-
gration economies found in the old industry structure grow larger due to “sub-
tle and complex” factors we can’t yet foresee.10
One result is certain. As we saw in Chapter 5, the policies regulators or pub-
lic owners adopt regarding pricing and other aspects of the Smart Grid will have
Two and a Half New Business Models 163
an enormous impact on the economics of all other parts of the system. It is thus
unavoidable that these regulatory policies will do much to determine whether
integration is cheaper and/or more administratively feasible than separate own-
ership. Legislators or regulators also simply may impose a structural outcome.
This is exactly what state laws do in the fourteen states that have mandated retail
choice, where state laws forbid the owners of distribution systems from also
owning in-state power generators.11
In short, the winner of the tug-of-war between vertical economic efficiency
and regulation will determine whether integration survives the Smart Grid. To
assess the odds, we turn to integration’s countervailing force, competition.
The Benefits of Competition
Nearly everyone familiar with the industry remembers that utility regulation
arose out of a belief that power companies were natural monopolies. Natural
monopolies are characterized by economies of scale, that is, average production
costs go down as output goes up. The more precise, modern term for these cost
characteristics is subadditive costs—those where the cost of producing 200 units
of a product is less than twice the cost of producing 100 units.
In Figure 11-2 there are four segments of the industry: generation, trans-
mission, distribution, and retailing. When regulation was applied to the in-
dustry, no distinction was made between these segments; all segments were
regulated. A century later we know that natural monopoly attributes apply dif-
ferently to each industry segment. Transmission and distribution are still con-
sidered natural monopolies largely because it would be extremely intrusive, and
almost certainly inefficient, to have two sets of grid wires sitting side-by-side.
It would be like paying to dig two independent sets of ponds and canals, both
running to all the same locations.12 And two might not be enough for strong
competition.
The cost characteristics of the generation segment are much more compli-
cated. It is often thought that a natural monopoly in generation means that a
single large power plant is cheaper than several smaller plants. This is still true
up to a point, but plant-level scale economies have pretty much topped out. It is
164 Smart Power
no longer true, for example, that a 2,000 MW traditional power plant is cheaper
per kilowatt than a 1,000 MW version. In fact the average size of a traditional
power plant added by utilities peaked at 493 MW in 2003 and has since fallen
steadily to 171 MW in 2008. While this size trend is undoubtedly the product of
other factors in addition to scale effects, it does suggest that the cost dominance
of large plant economies has come to an end.13
If it is equally cheap to own fifty medium-sized plants versus five ultralarge
ones, there is still the question of whether it is cheaper to have fifty companies,
each owning one plant, or five or even fewer generating companies owning the
fifty plants. In economic jargon, this is called firm-level economies of scale (as op-
posed to plant-level scale effects). This is roughly equivalent to asking whether
the industry is an inherently competitive group of firms, a natural oligopoly
(several sellers), or a firm-level natural monopoly.
This leads directly to the two options in Figure 11-2. If a single company
owning all generators (whatever their sizes and types) is most efficient, it is a
true natural monopoly. In this case, you would probably want to establish and
regulate a generation monopolist. Once you do, you might as well let them inte-
grate into transmission and distribution, which are also natural monopolies,
and then regulate the whole thing, because this way they can also gain the cost
savings from vertical integration. This reasoning is the motivation for the inte-
grated regulated utility triad. If regulation itself does not introduce too many
inefficiencies, this ought to be cheapest, while protecting customers against mo-
nopoly abuse via regulation of rates.
The other possibility is that it is cheaper to let multiple generating compa-
nies, each owning enough generators to achieve a low-cost operating scale,
compete with each other to sell downstream. This approach is cheaper if com-
petition forces these companies to find more efficient ways to build and operate
plants than they would if they were regulated. Unleashing generation competi-
tion in this fashion would mean giving up some or all of the cost savings from
vertical integration, because many of the cost-savings practices from vertical in-
tegration interfere with, or are removed by, generator competition.14 But if the
cost savings gained from competition outweigh the savings lost from integra-
tion this is a good tradeoff to make.
Two and a Half New Business Models 165
text:IP_Fox-Penner 8/15/10 7:08 PM Page 165
The latter proposition reflects the thinking that led to deregulation in the
1990s. Multiple generation companies could own enough generators to achieve
firm-level economies of scale, but there would still be a large enough number of
companies to compete to sell power. For example, there might be only three or
four generation companies in any geographic area, but in many cases this is
enough to keep prices at roughly competitive levels (in other cases, it isn’t,
which is why competitive electric markets need to be watched carefully). Com-
panies that owned transmission and/or distribution would no longer be allowed
to be vertically integrated (i.e., own generators), or if they did they would not be
allowed to give them preferential treatment over competitive generators they
did not own.
Will Deregulation Blossom under the Smart Grid?
As we learned in Chapter 2, the California power crisis and states’ experience
with provider of last resort (POLR) rate increases has reversed the adoption of
retail choice. While a few states with retail deregulation are still debating
whether to turn back the clock, most of the current debate centers on whether
generation competition has worked at the wholesale level, and how wholesale
markets should be designed to make them work better.15
The transition to a smarter andmore distributed system adds a new chapter
to this ongoing debate. Proponents maintain that the coming more decentral-
ized structure is inherently better suited to generator competition. Indeed,
many Smart Grid proponents suggest that the benefits of retail choice and the
Smart Grid are integrally related.
There are two strains to this line of reasoning. The first looks broadly at our
experience with wholesale competition and the basic incentives of integrated
utilities. For example, many of the new generating technologies needed to meet
climate targets require innovation and risk taking by their owners. Proponents
note that these cost and performance risks are better handled by a competitive
generation sector because unregulated firms are run less conservatively, funded
by capital willing to take risks, and more experienced with innovation than reg-
ulated and publicly owned utilities.16 They also argue that regulated utilities are
166 Smart Power
resistant to unconventional generators because any outside source of power
tends to reduce their market share and ultimately slows their asset growth.
These proponents also note that deregulated wholesale markets in the
United States already have prices that vary not only by hour but also by location
on the power grid.While these locational marginal prices (LMPs) are unpopular
with some stakeholders, they increase revenues for competitive generators that
produce during high-price hours or can sell at high-priced locations on the grid.
These price signals and the receptivity of customers and grid operators to
greener and more innovative sources lower the barrier to low-carbon supplies
in competitive markets. They note, for example, that three times as much wind
energy is made in organized wholesale markets as in areas without them.17
There is room for disagreement with this overall view. As an example, sev-
eral of the states with extremely forward-looking climate policies and strong
commitments to renewable energy—California, Colorado, and Nevada, to
name three—do not have retail choice, and only one of the three operates in a
centralized wholesale market. However, there is one important and undisputed
reason why generation competition will work better when dynamic pricing be-
comes more widespread in its use: unlike today, demand will change with price.
One of the biggest problems with unregulated competitive electric markets
has been the fact that supply and demand cannot adjust the way markets are
supposed to “equilibrate” in the theory of competitive markets. In textbook
markets, when prices rise supply expands because new suppliers come into the
market and existing suppliers boost their output. Of equal importance, when
prices rise customers cut back on their demand. The combination of higher
supply and lower demand brings prices back down.
In the absence of dynamic pricing it is not so surprising that these markets
haven’t worked as well as they could—half of the participants in the market
couldn’t respond the way they should.18
The greater participation of customers in electricity markets is the center-
piece of the second strain of thought on retail choice and the Smart Grid.“Retail
electricity markets must integrate consumers as active partners in balancing the
electricity supply/demand equation,” write Robert Galvin and Kurt Yeager, for-
mer executives of Motorola and EPRI who founded a Smart Grid incubator. In
Two and a Half New Business Models 167
their view, markets with retail choice will unleash innovation and a drive for
quality that regulated utilities have long resisted.19 Many members of Smart
Grid trade groups agree, though they often speak in terms like“greater customer
control” rather than referring to deregulation directly. One leading Smart Grid
economist, L. Lynn Kiesling, writes that
Decentralized coordination is good, and is preferable to centralized control because
it harnesses the dispersed knowledge of many market participants, it honors differ-
ences in individual preferences, and it enables discovery of individual preference
and cost differences, through differences in consumer willingness to pay and pro-
ducer willingness to accept. Decentralized coordination leads to more robust and
resilient economic efficiency in the face of change and has more adaptive capacity
over time than a system that relies on centralized control.20
Inherent in this strain of thought is the idea that the hardware of the Smart Grid
will enable many new valuable energy-related applications that customers can
load into their computers or home energy management networks, much like
applications can be downloaded into our cell phones.21 The fear is that if regu-
lated distributors have too much control, innovation will be squelched.
However, it is not automatic that a single supplier of generation at dynamic
prices rather than many suppliers would negate the incentives for new applica-
tion development. Florida Power and Light (FPL), a utility that does not operate
in a retail choice state, has announced that it intends to launch a smart grid that
will feature an open applications development platform. Software developers
can offer FPL’s customers new ways to track and control their energy, uploading
their programs onto FPL’s customer software platform,much like iPhone appli-
cation developers upload their applications onto Apple’s iPhone system.At least
in Florida, the intelligence will come from the marketplace, but the electrons
will all come from FPL.
While there is little doubt that competition will perform better under dy-
namic pricing, it is far from clear that the industry’s technical transformation
and further deregulation are as essentially linked as these proponents argue. It is
entirely possible that the profound changes under way will compel further
168 Smart Power
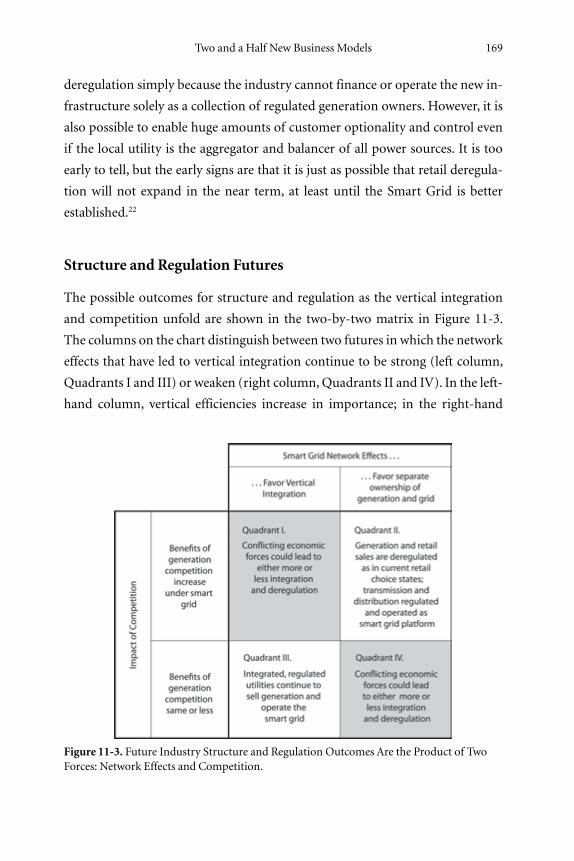
deregulation simply because the industry cannot finance or operate the new in-
frastructure solely as a collection of regulated generation owners. However, it is
also possible to enable huge amounts of customer optionality and control even
if the local utility is the aggregator and balancer of all power sources. It is too
early to tell, but the early signs are that it is just as possible that retail deregula-
tion will not expand in the near term, at least until the Smart Grid is better
established.22
Structure and Regulation Futures
The possible outcomes for structure and regulation as the vertical integration
and competition unfold are shown in the two-by-two matrix in Figure 11-3.
The columns on the chart distinguish between two futures in which the network
effects that have led to vertical integration continue to be strong (left column,
Quadrants I and III) or weaken (right column,Quadrants II and IV). In the left-
hand column, vertical efficiencies increase in importance; in the right-hand
Two and a Half New Business Models 169
Figure 11-3. Future Industry Structure and Regulation Outcomes Are the Product of TwoForces: Network Effects and Competition.
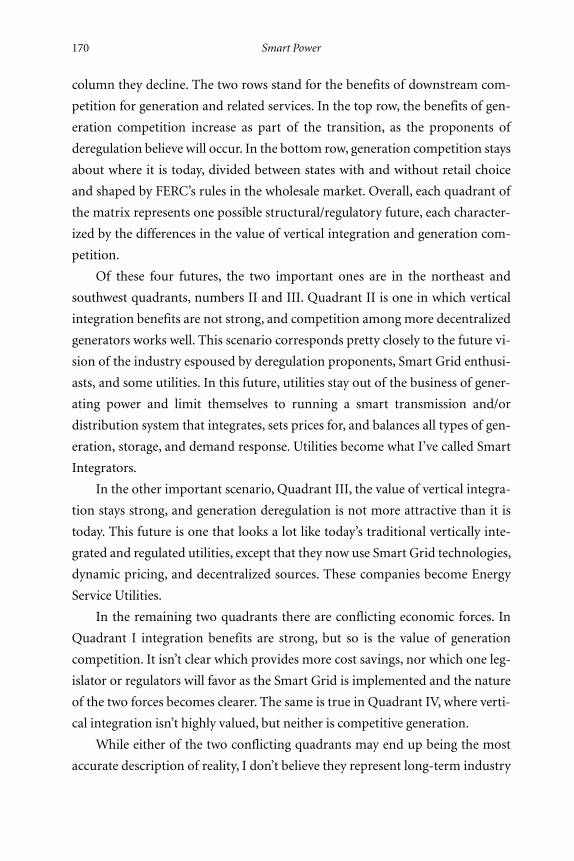
column they decline. The two rows stand for the benefits of downstream com-
petition for generation and related services. In the top row, the benefits of gen-
eration competition increase as part of the transition, as the proponents of
deregulation believe will occur. In the bottom row, generation competition stays
about where it is today, divided between states with and without retail choice
and shaped by FERC’s rules in the wholesale market. Overall, each quadrant of
the matrix represents one possible structural/regulatory future, each character-
ized by the differences in the value of vertical integration and generation com-
petition.
Of these four futures, the two important ones are in the northeast and
southwest quadrants, numbers II and III. Quadrant II is one in which vertical
integration benefits are not strong, and competition among more decentralized
generators works well. This scenario corresponds pretty closely to the future vi-
sion of the industry espoused by deregulation proponents, Smart Grid enthusi-
asts, and some utilities. In this future, utilities stay out of the business of gener-
ating power and limit themselves to running a smart transmission and/or
distribution system that integrates, sets prices for, and balances all types of gen-
eration, storage, and demand response. Utilities become what I’ve called Smart
Integrators.
In the other important scenario, Quadrant III, the value of vertical integra-
tion stays strong, and generation deregulation is not more attractive than it is
today. This future is one that looks a lot like today’s traditional vertically inte-
grated and regulated utilities, except that they now use Smart Grid technologies,
dynamic pricing, and decentralized sources. These companies become Energy
Service Utilities.
In the remaining two quadrants there are conflicting economic forces. In
Quadrant I integration benefits are strong, but so is the value of generation
competition. It isn’t clear which provides more cost savings, nor which one leg-
islator or regulators will favor as the Smart Grid is implemented and the nature
of the two forces becomes clearer. The same is true in Quadrant IV, where verti-
cal integration isn’t highly valued, but neither is competitive generation.
While either of the two conflicting quadrants may end up being the most
accurate description of reality, I don’t believe they represent long-term industry
170 Smart Power
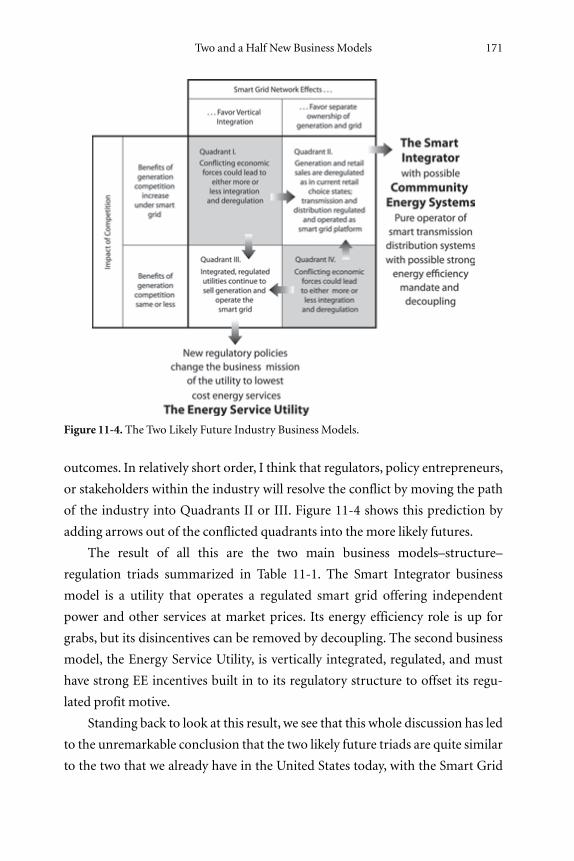
outcomes. In relatively short order, I think that regulators, policy entrepreneurs,
or stakeholders within the industry will resolve the conflict by moving the path
of the industry into Quadrants II or III. Figure 11-4 shows this prediction by
adding arrows out of the conflicted quadrants into the more likely futures.
The result of all this are the two main business models–structure–
regulation triads summarized in Table 11-1. The Smart Integrator business
model is a utility that operates a regulated smart grid offering independent
power and other services at market prices. Its energy efficiency role is up for
grabs, but its disincentives can be removed by decoupling. The second business
model, the Energy Service Utility, is vertically integrated, regulated, and must
have strong EE incentives built in to its regulatory structure to offset its regu-
lated profit motive.
Standing back to look at this result, we see that this whole discussion has led
to the unremarkable conclusion that the two likely future triads are quite similar
to the two that we already have in the United States today, with the Smart Grid
Two and a Half New Business Models 171
Figure 11-4. The Two Likely Future Industry Business Models.
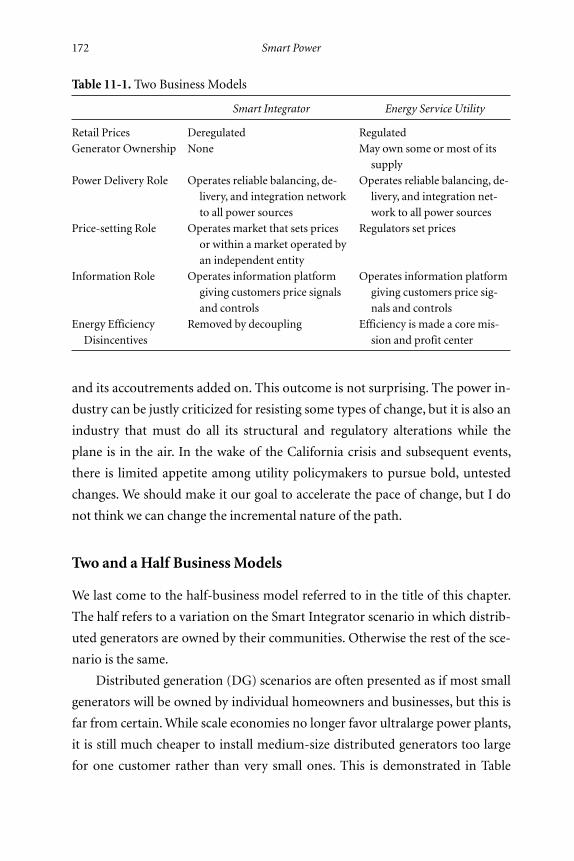
and its accoutrements added on. This outcome is not surprising. The power in-
dustry can be justly criticized for resisting some types of change, but it is also an
industry that must do all its structural and regulatory alterations while the
plane is in the air. In the wake of the California crisis and subsequent events,
there is limited appetite among utility policymakers to pursue bold, untested
changes. We should make it our goal to accelerate the pace of change, but I do
not think we can change the incremental nature of the path.
Two and aHalf BusinessModels
We last come to the half-business model referred to in the title of this chapter.
The half refers to a variation on the Smart Integrator scenario in which distrib-
uted generators are owned by their communities. Otherwise the rest of the sce-
nario is the same.
Distributed generation (DG) scenarios are often presented as if most small
generators will be owned by individual homeowners and businesses, but this is
far from certain.While scale economies no longer favor ultralarge power plants,
it is still much cheaper to install medium-size distributed generators too large
for one customer rather than very small ones. This is demonstrated in Table
172 Smart Power
Table 11-1. Two Business Models
Smart Integrator Energy Service Utility
Retail Prices Deregulated Regulated
Generator Ownership None May own some or most of its
supply
Power Delivery Role Operates reliable balancing, de- Operates reliable balancing, de-
livery, and integration network livery, and integration net-
to all power sources work to all power sources
Price-setting Role Operates market that sets prices Regulators set prices
or within a market operated by
an independent entity
Information Role Operates information platform Operates information platform
giving customers price signals giving customers price sig-
and controls nals and controls
Energy Efficiency Removed by decoupling Efficiency is made a core mis-
Disincentives sion and profit center
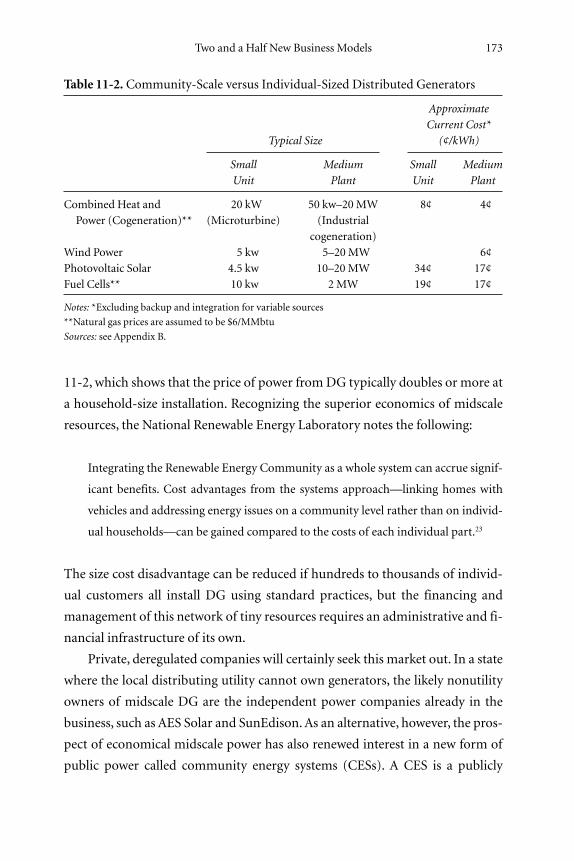
11-2, which shows that the price of power fromDG typically doubles or more at
a household-size installation. Recognizing the superior economics of midscale
resources, the National Renewable Energy Laboratory notes the following:
Integrating the Renewable Energy Community as a whole system can accrue signif-
icant benefits. Cost advantages from the systems approach—linking homes with
vehicles and addressing energy issues on a community level rather than on individ-
ual households—can be gained compared to the costs of each individual part.23
The size cost disadvantage can be reduced if hundreds to thousands of individ-
ual customers all install DG using standard practices, but the financing and
management of this network of tiny resources requires an administrative and fi-
nancial infrastructure of its own.
Private, deregulated companies will certainly seek this market out. In a state
where the local distributing utility cannot own generators, the likely nonutility
owners of midscale DG are the independent power companies already in the
business, such as AES Solar and SunEdison.As an alternative, however, the pros-
pect of economical midscale power has also renewed interest in a new form of
public power called community energy systems (CESs). A CES is a publicly
Two and a Half New Business Models 173
Table 11-2. Community-Scale versus Individual-Sized Distributed Generators
Approximate
Current Cost*
Typical Size (¢/kWh)
Small Medium Small Medium
Unit Plant Unit Plant
Combined Heat and 20 kW 50 kw–20MW 8¢ 4¢
Power (Cogeneration)** (Microturbine) (Industrial
cogeneration)
Wind Power 5 kw 5–20MW 6¢
Photovoltaic Solar 4.5 kw 10–20MW 34¢ 17¢
Fuel Cells** 10 kw 2MW 19¢ 17¢
Notes: *Excluding backup and integration for variable sources
**Natural gas prices are assumed to be $6/MMbtu
Sources: see Appendix B.
owned entity that owns locally located medium-scale electricity sources and
possibly energy storage or its own distribution wires. It sells the power it makes,
along with storage and other related services, to its customer-members.
Where the distribution system is already owned by the community, as in
about 2,000 cities and towns across America, the local public power company
can become the CES. However, this returns the structure back to vertical inte-
gration, a model we’ll explore in the next chapter. The more unusual possibility
is that a desire for community control and resistance to deregulated power sell-
ers will create an upsurge in nonprofit CESs where the distribution system is
investor-owned and barred from owning DG itself. The Galvin Electricity Ini-
tiative reports increased activity in this area from communities and other large
institutions such as universities. The public power community has also taken
notice and is promoting its own involvement in small-scale energy, albeit often
integrated with wires ownership.
In the next two chapters we take a closer look at the Smart Aggregator and
the Energy Service Utility. The good news is that all two and a half main busi-
ness models look capable of providing reliable service while the industry goes
through its coming technological upheaval. The bad news is that neither of the
models is proven, and experimentation with new regulatory and business mod-
els is always difficult while the plane is in the air.
174 Smart Power
chapter twelve
The Smart Integrator
THE SMART INTEGRATOR (SI) is a utility that operates the power grid
and its information and control systems but does not actually own or sell
the power delivered by the grid. Its mission will be to deliver electricity with su-
perb reliability from a wide variety of sources, from upstream plants to in-home
solar cells, all at prices set by regulator-approved market mechanisms. In addi-
tion to the physical maintenance and repair of the local wires (and often up-
stream as well), it must keep all generation plugged in to its system in balance
with demand and its customers fully empowered to shift their use in response to
price signals.
The customers enrolled in Northeast Utilities’ (NU’s) Smart Grid pilot pro-
gram are getting an early glimpse of a Smart Integrator utility at work. NU’s
utilities serve in New England, where every state except Vermont has retail
choice. NU’s Smart Grid pilot customers pay dynamic prices for their retail
power, though the power is not purchased from NU itself—customers choose
from among a number of deregulated retail suppliers. What they do get from
NU are the price signals that are sent to their programmable thermostats, prices
sent to their central air conditioners, a monitor that displays the costs of their
175
household power purchases in real time, aWeb site with additional services, and
an “energy orb” that changes colors as the price of power changes throughout
the day. The orb glows green when hourly real-time prices are low, yellow when
they are medium, and red when prices are high. In the future, NU customers
will be plugging their hybrid cars and solar panels into the same smart grid, sell-
ing power back to third parties at prices set by NU’s market software.
The physical and information technology (IT) architecture of the Smart In-
tegrator will be designed to fulfill such functions. There will be no change in the
utility’s obligation to ensure that the local grid can deliver all power that is de-
manded, and it responds to local blackouts as quickly as possible. It will con-
tinue to own the local lines, operate fleets of repair trucks, and respond to power
delivery complaints.
This part of the new mission is quite traditional. Every distribution com-
pany (often referred to as a distco) already operates a control center much like
the larger ones run by the high-voltage system operators (large utilities, inde-
pendent system operators, or regional transmission organizations). In it, they
monitor every one of their distribution circuits and watch for lines going down
or other local outages. They communicate frequently with the large-scale opera-
tors upstream, especially when problems occur. As we saw in Chapter 4, Smart
Grid systems offer the prospect of substantial improvements in these balancing
and reliability maintenance operations.
In this scenario, however, the Smart Integrator must attract, ensure, and
provide transportation for many generators, small and large. To do this, it will
need to provide the most open architecture possible for power sources of all
types. Each part of the system where generators might locate must be physically
and electrically designed to allow for flow into and out of the grid, a task in itself
for systems that are now designed solely for one-way flows. Since the utility will
not be able to direct where generators locate and how large they will be, plan-
ning the system’s capacity expansion to accommodate two-way flows will be a
large and continuing job, with enormous uncertainties attached.
The Smart Integrator will also need a second, highly secure but maximally
open platform for information, price, and control signals. Smart appliance
manufacturers, power management software vendors, community energy sys-
tems, and others will all want to send and receive the information they need to
176 Smart Power
decide whether to sell or buy on an hourly basis (actually, the most advanced
current systems reset price every five minutes). Along with all this information
provision there will be massive new accounting, billing, and settlement systems
to accommodate the much more complicated pricing and payment options of-
fered. This will be greatly facilitated by standards and interoperability protocols,
but as we saw in Chapter 5, this daunting objective is likely to take time.
The last Smart Integrator task will be the most difficult of all. This utility
will have to administer a market that determines the hourly (spot) prices its cus-
tomers use for trading. In addition to setting spot prices, policymakers will
probably insist that the utility offer some sort of provider of last resort (POLR)
service for retail customers who do not make or buy their own power from
deregulated sellers. As you’ll recall from Chapter 2, POLR service was one of the
main downfalls of retail choice; it will hopefully not repeat the performance in
the coming Smart Grid era.
Finally, unless Congress changes the Federal Power Act, the rules and me-
chanics for setting the local price, as well as the price for POLR service, will be
decided by state regulators for investor owned utilities (IOUs) and manage-
ments for public power and cooperatives. Establishing these price-settingmech-
anisms is a challenging task.
Setting Local Prices
The idea of using many sellers and buyers of power to establish electricity com-
petitive spot prices was settled quite some time ago, and it is used in many
“deregulated” electricity markets today (the quotes around deregulated to re-
mind you that there is still a huge amount of regulation in these markets, it is
just that regulators don’t set prices in advance).1 The largest electricity market in
the world, the PJM market in the U.S. mid-Atlantic region, sets prices for over
eight thousand separate locations on the electric grid every five minutes, and it
monitors every single price and location to make sure the price determined by
its software is the result of adequate competition.2
There is every expectation that the basic software systems that take supply
and demand offers, and from them determine a market-clearing price, can be
used for local smart power markets. In fact, this is essentially what the Pacific
The Smart Integrator 177
Northwest Labs researchers did in the Olympic Peninsula experiment. However,
establishing the IT platforms that set prices in the wholesale markets while
keeping the system functioning reliably has cost the RTOs and ISOs that admin-
ister them hundreds of millions of dollars. Ten years after the first of these mar-
kets was created, the systems are still exceedingly complex and hard to fix. Push-
ing this level of complexity into every distribution system will be a considerable
challenge.
One aspect of the local price-setting process sure to gain regulators’ atten-
tion is market power. In any market, there need to be several buyers and several
sellers in order to make competition robust and the resulting prices fair. De-
pending on the geography of the local grid, there may be places where there are
very few sellers of local power. To prevent these sellers from having too much
market power, local regulators will need to create backstop power supplies with
controlled prices or impose price controls on local sellers. Both approaches have
proven necessary in much larger wholesale markets, though especially the latter.
In the most advanced bid-based spot markets, FERC rules now require that the
price-setting software automatically check to make sure that there are enough
buy and sell bids to make every node in the market reasonably competitive. If
there aren’t, the price-setting computer automatically limits the prices that can
be bid. There must also be a full-time market monitor who examines competi-
tive issues and complaints. Analogous rules and procedures will be needed for
local markets.
Spot prices for energy are only part of the value of electricity supplied or
saved, and they are the easy part. As we saw in Chapter 5, the majority of the
value of demand response (DR) or distributed generation (DG) comes from its
ability to defer or displace expansion of the upstream grid and generators, or its
capacity value, along with other even more abstract benefits. As we also saw, the
value of these benefits often cannot be set easily bymarkets.3 In this case, regula-
tors must engage in lengthy proceedings to set methods of measuring the value,
and then utilities must administer them under the critical eye of regulators and
stakeholders.
Finally, in Chapter 5 we noted briefly that customers will supply some of
their own electricity service but will want to buy whatever they cannot self-
178 Smart Power

produce from the Smart Integrator. This service, traditionally called utility
backup power, is difficult to price without a number of case-specific calcula-
tions. For example, one customer may need backup power only once or twice a
month for a solid day or two, while another may need it on an ongoing but
highly unpredictable basis. Proceedings for setting fair capacity prices for cus-
tomers like this are especially hard-fought because customers who rely on the
Smart Integrator for all of their supply do not want to subsidize customers who
sporadically rely on the power grid only when they need it, and vice-versa.
Core Competencies for theMission
The number of regulated responsibilities the Smart Integrator will hold suggests
that, whatever its mission statement, it will be a creature greatly beholden to its
state regulatory commission or if public/cooperative, its governors. It will be
subject to many of the political and stakeholder-driven forces that now buffet
state regulatory proceedings. It will need to keep its skills at regulatory negotia-
tions extremely well honed, as they will be in constant use.4
The power delivery–balancing–reliability maintenance roles of the Smart
Integrator will evolve naturally from similar roles distribution utilities play to-
day with less system intelligence. Although the Smart Grid will make this work
far more sophisticated than current practices, the objectives will be the same,
and upgrading both the information and human resources seems to be a man-
ageable challenge.
Smart Integrators will need to build especially strong core competencies at
the evaluation and operation of IT systems and software. In this area, utilities
seem to have a long way to go. One software expert, Ali Vojdani, offers this
sobering assessment:
A comparison between the business planning environment in the utility and tele-
com or airline sector shows the contrast between flexible versus static design. Telcos
and airlines can change their entire pricing structure in a matter of hours in re-
sponse to changing business conditions or an advertising campaign by a competi-
tor. For example, when a major airline announces that it will introduce a fuel
The Smart Integrator 179
surcharge or collect fees for checked luggage or on-board food service, the entire in-
dustry typically matches in amatter of hours. . . . Utilities, by contrast, takemonths,
if not longer, to introduce a new tariff or adjust an existing one, and this greatly
hampers their ability to respond to consumer demand and changing requirements.5
Smart Integrators will also need to get extremely good at evaluating the eco-
nomics of new system and platform investments.When any new investment or
function for the system is proposed, regulators will want to know why it wasn’t
included the last time a similar investment was made. They will undoubtedly
ask many tough questions, including whether the current system should be re-
vised or discarded. They will also want to know what may be next in the invest-
ment pipeline.
The scale of the IT systems transformation and information management
tasks should not be underestimated. TwoMicrosoft utility consultants note that
the software utilities use for balancing generation sources will expand from a
few hundred generating sources at most to several million sources in a highly
decentralized grid, necessitating what they call “Internet-scale data acquisition.”
The number of control points in customers’ homes and offices eventually linked
to system operators will be vastly larger, creating a huge information manage-
ment task. The Electric Power Research Institute estimates that the amount of
annual data utilities must process will increase tenfold, from 100 terabytes of
data today to 1,000 terabytes of data (1 petabyte) when the Smart Grid is fully
operational. The Microsoft consultants remind us that “this data is meaningful
for decision support only if there is a way to query and analyze it.”6
The human capital needed to establish and maintain the new core compe-
tencies is perhaps the single largest management challenge to this business
model. A typical regulated utility public power agency or cooperative is pre-
dominantly staffed today by electrical engineers.Many of them have a good un-
derstanding of IT and/or economics. However, the Smart Integrator operating
in a significantly deregulated local setting is going to need dramatically greater
expertise in IT and regulatory economics. It is hard to imagine a power com-
pany with as many economists and IT experts as power engineers, but that is
probably where Smart Integrators are headed.
180 Smart Power
To Sell or to Save?
Throughout the United States the predominant method of setting the rates for
regulated utility services is cost-of-service (rate-of-return) regulation.7 A very
similar approach is used for public power and cooperatives, although their
profit incentives obviously differ. The Smart Integrator’s rates for distributing
power and all other services will be regulated, initially in this same manner.
The core principle of cost-of-service regulation is that revenues earned
should equal prudently incurred actual costs for the service provided plus a fair
return on prudently invested capital. Arithmetically,
Revenues = Costs + Return on Invested Capital.
Revenues for any product equal its average price times the quantity sold. To
determine the average rate necessary to provide adequate revenues (the “rev-
enue requirement”), regulators divide the required revenues by forecasted
power sales. In other words, they work backwards, dividing the revenue they
want to achieve by the quantity they expect to sell to get the average price the
utility needs. They later allocate the revenues into customer charges and inclin-
ing or declining quantity schedules, and adjust prices up and down to various
customer classes, but through it all they preserve the necessary average rate that
gives the right level of revenues at expected sales.
The sales number used in this formula is sometimes last year’s sales and
sometimes a forecast of next year’s sales, but either way it is a single number
plugged in to the formula to set the rate. Once the average rate is set, it applies
until the process is redone, typically two to five years. So, for example, if sales are
predicted to be 1,000 kWh and required revenues are $100, the average rate is set
at 10 cents/kWh ($100/1,000 kWh) until it is changed.
The simple act of setting a fixed, per-kWh rate and then leaving it there un-
til the next rate proceeding encourages larger sales by utilities and equivalently
discourages their energy efficiency (EE) efforts. As long as rates are set per kilo-
watt-hour, the more kilowatt-hours you sell once the rate is set the more rev-
enue you earn. Since every kilowatt-hour’s revenue includes a bit of profit, the
The Smart Integrator 181
more you sell, the more profits you earn. The sales incentive is largest for utili-
ties, who give their profits back to investors, but it also applies to public power
and cooperatives, who rebate their profits back to their public- and customer-
owners, respectively.
Here is a numerical example. Suppose a utility’s required revenues are
$1,000, $900 for costs determined to be prudent and $100 for reasonable profits.
Regulators expect a utility to sell 10,000 kWh, so they determine an average rate
of 10 cents/kWh ($1,000/10,000 kWh). If the utility sells exactly 10,000 kWh it
will earn its exact profits. If it gets lucky or is able to promote its own sales and
sell 11,000 kWh, it will earn $1,100 in revenues.When it sells 11,000 kWh, its ac-
tual costs are higher than the $900 regulators used to set the rate, as the utility
had to buy a little more power plant fuel than regulators guessed they would
when they estimated $900 in costs and 10,000 kWh sales. A good guess is that
costs only went up $50 when its sales increased from 10,000 to 11,000 kWh.
At the higher sales level, its revenues are $1,100, its costs are $950, and its
profits have gone up from the reasonably determined $100 to $150, an increase
of 50%. This increase did not require any approvals, new investments, or new
rates set by regulators—it is inherent in the process of setting a fixed per-kWh
rate before you know the actual level of sales a utility will have, or its costs, dur-
ing the time the rate will be in effect.
This sales incentive is largest and most important if a utility’s business
model is to own and sell power from generating plants, large or small. It is obvi-
ously also true for deregulated generation companies, since their unregulated
profit also increases with greater sales. For vertically integrated companies their
generation assets are usually their largest assets by value, so they contribute
the most to profits. But the sales incentive also exists for the Smart Integrator,
since it too earns more revenue and therefore more profit for every additional
kilowatt-hour it delivers.
Decoupling and Energy Sales Incentives
If you’ve read much about the utility industry lately you’ve undoubtedly heard
of revenue decoupling. Decoupling, which breaks the link between sales and rev-
182 Smart Power
enue, has been promoted heavily by EE and environmental advocates because it
acts to make a utility’s profits neutral with respect to energy sales. It is a modifi-
cation state regulators make to traditional rate setting that works well for Smart
Integrators.
To see how it works, remember that the imaginary utility in the last section
was expected to sell 10,000 kWh in a year. The utility, whose costs plus profits
were $1,000, was allowed to charge 10cents/kWh to earn $1,000 (10,000 kWh ×
10cents/kWh = $1,000). The utility had the incentive to boost its sales to 1,100
kWh, which raised its sales revenues to $1,100 and its profits by 50%.
Decoupling simply says to the utility,“If your energy efficiency efforts in the
next one or two years change your sales below 10,000 kWh we will still give you
$100 in profits in your revenues.”So if the utility’s EE efforts cause it to sell 9,000
kWh, and its profits go down by the normal arithmetic, then the utility gets to
automatically add a special surcharge to the 9,000 kWh sold so that it earns just
enough extra revenue to bring its profits back to $100.8 For this particular year,
its profits are $100 no matter how well it does reducing its own sales through
efficiency.
This is an improvement over doing nothing, but it is something of a short-
term fix.While the utility hasn’t lost its $100 in expected profits, its efficiency ef-
forts have now lowered its sales to 9,000 kWh. Investors will see the company as
one whose sales are declining, not growing. This is rarely attractive on Wall
Street regardless of whether regulators have guaranteed this year’s profits.
Slower growth means the utility won’t be needing to build more plants or lines
soon, which means that its invested capital and its capital-driven profits won’t
be going up either.All other things equal, investors discount the value of utilities
who face strong EE mandates even if they have decoupling, because the long-
term trajectory of utility capital investments is lower than it would otherwise be.
Smart Integrators, whose only business is operating delivery and manage-
ment platforms,won’t care as much if fewer power plants are going to be built in
their area. Lower amounts of power sales do mean lower amounts of power
transported and delivered over their lines, but this doesn’t harm their profit
growth prospects the way it hurts generation firms.Much of the Smart Integra-
tor’s asset growth will be needed to provide reliability, replace aging equipment,
The Smart Integrator 183
or make Smart Grid investments that improve operations, none of which are es-
pecially sensitive to sales levels. In addition, if the sales of kilowatt-hours deliv-
ered go down a lot, and with them the revenues required to earn fair profits, the
company can ask regulators to increase revenues by allowing it to charge for
other services, such as fees for interconnecting with its network. Regulators will
be setting prices for all of the value-added services the Smart Grid enables in any
case, leavingmany new product revenue streams the Smart Integrator can tap to
achieve profitability—all set by the regulators who try to provide the overall
right level of profit for all prudent investment.
Wall Street and the Smart Integrator
In the last chapter we saw that the aftermath of the California crisis removed
much of investors’ enthusiasm for companies in only one power industry seg-
ment. As the industry’s transformation continues andWall Street takes a look at
the numbers, the Street may recapture some of its enthusiasm for transmission
and distribution system pure plays, if not for each of the four segments alone.
The investment community has long viewed the transmission and espe-
cially the distribution segments of the utility business as the sleepy, slow-growth
parts of the business. Transmission assets are often only half the size of genera-
tion, and they tend to expand in lockstep with new plants anyway, as mentioned
earlier. Distribution systems have large asset values, often as large as total gener-
ating plants, but they grow slowly and depreciate slowly, throwing off compara-
tively little cash.
Data on the value of traditional IOU investments during the decade pre-
ceding 2008 bear this out. During this period the net value of all transmission
assets actually declined by about $50 million, indicating that the total transmis-
sion plant depreciated faster than it was replaced, much less upgraded. Even
more surprisingly, the net distribution plant also declined by a slight amount.
In contrast, total generating capacity in this period increased by almost 20%—
although essentially all of this asset growth was from independent power produc-
ers (IPPs).
184 Smart Power

One remarkable aspect of the coming transformation is that it will turn this
thinking on its ear.My 2008 study of investment needs through 2030 for the en-
tire power industry found that all three of the segments would require enor-
mous new capital outlays to decarbonize generation, implement the Smart
Grid, and continue to keep the lights on. We estimated that generation outlays
would be $500 to $950 billion, new transmission would cost $280 billion, and
distribution outlays would be the same magnitude as generation, $580 billion.
The distribution figures were without the costs unique to the Smart Grid IT,
whose costs we did not estimate. One anecdotal example of the high expected
growth in transmission and distribution outlays comes from National Grid, the
largest utility in the United States devoted exclusively to these two segments.
The company expects to more than double its investment outlays during the
four-year period from 2008 to 2012.9
These figures indicate all three segments of the industry are positioned for
substantial asset growth. From the standpoint of investors, the question will be
which one earns the highest expected return, taking the riskiness of the invest-
ment into account. Similarly, will combining several segments diversify risk
without lowering return in a manner other securities portfolios can’t match?
The answers to these questions will ultimately depend on the nature of the
risks borne by pure play companies, from regulators as well as from other mar-
ket and technology sources. It is a safe bet, though, that the level of technology
and cost risks in the generation segment dwarf those in transmission and distri-
bution. Remember Jim Jura’s billion dollar bet? Generation planners in the
coming era will have to guess whether and how fast demand in their area goes
up, whether their low carbon technology works, whether their fuel will remain
economical, and whether transmission will be available. All the while, DG and
dynamic pricing will be playing out downstream, possibly stealing away the
market for new generation entirely in one case or another.
The risks to returns on transmission and distribution assets will be plenti-
ful, but they are likely to be smaller and involve smaller specific assets. Regula-
tory risks may also be lowered by national policies that encourage transmission
and distribution upgrades. As an example, the FERC has already issued a policy
The Smart Integrator 185
statement reassuring transmission owners that if they choose to prematurely re-
tire existing transmission controls to install better smarter ones they will not
have to write off the older hardware.10 Only time will tell how each of the seg-
ments performs as an investment, and also whether integrated utilities who reap
vertical synergies will outperform future pure plays. From the basics, however, it
does seem that the distribution-centered Smart Integrator should provide a
good investment growth story if it performs well for customers and regulators.
WhoOwns the Customer?
One interesting question about the Smart Integrator model is whether it will
improve the bond between the utility and its customer. For many years, utilities’
market research has repeatedly found that utility customers feel that they have
no connection or contact with their utility. They receive a product that is invisi-
ble through a single black wire that hangs high above their home. They never see
a meter reader anymore and pay their bill monthly by mail or online. They
could easily go through their entire life not meeting a single employee of their
power company in person—all the more remarkable because they will be a cus-
tomer of their utility from the moment they move into their area until the mo-
ment they leave.
The current generation of utility leaders is acutely aware of this emotional
distance and tries hard to overcome it. One glance at the annual reports or mar-
keting campaigns of utilities today shows these attempts.A utility in my area has
a marketing slogan that reminds me that “it is connected to me by more than
wires.” Progress Energy echoes this message with their slogan “Some of our
most important connections to the community aren’t found on utility poles.”11
My own utility has an ad campaign showing its linemen, fully decked out in
their tool belts and hardhats, helping serve healthy lunches and walk school-
children across busy streets.
Across every type of utility I encounter, much of the enthusiasm for the
Smart Grid arises from a belief that the customer interaction at the heart of the
new paradigm will give it a tremendously valuable means of bonding with its
customers. There is just one hitch: when you turn on your computer to set your
186 Smart Power
home’s Smart Grid system, you’ll feel like you’re interacting with your utility
only if the screen that comes up has their logo and help-line phone number
on it.
Needless to say there are many other firms that sell home and business en-
ergy software that would like to provide the screen you bring up when it’s time
to reset your thermostat. So far, the customer interfaces in Smart Grid pilots
around the country are run by utilities and so they do “own the screen.” How-
ever, companies as significant as Google would like to become middlemen, and
are already arguing to state regulators that utilities should have to make energy
use information and control signals available to third party vendors like them.
Once again, regulators will be in the driver’s seat, setting the rules that allow
or prevent utilities from limiting who can stand between them and their
customers.
While this is a very important matter of branding and customer connec-
tion, it also bears on the core nature of the Smart Integrator business model. If
utilities own the screen customers use to interact with them then the relation-
ship is business to customer (“B2C”), whereas if the utility is serving energy
management applications designers and customer premises energy manage-
ment then the relationship is business to business (“B2B”). In a B2C model, the
utility will need a much more extensive network of customer care specialists,
much like cable companies have today, who can troubleshoot hardware and
software remotely and come onsite if needed. If the model is B2B, these needs
will be quite different, as its customers will be energy system vendors and in-
stallers who are infinitely more sophisticated in their interactions and needs.
Finally there is the important question of how the Smart Integrator will ap-
proach the crucial task of EE. Many utilities see EE assistance as a natural out-
growth of the energy management, control, and pricing functions provided by
Smart Grid software. There are undoubtedly synergies in the provision of Smart
Grid and EE investments that have barely been tapped, and that may fall natu-
rally to the local power and information distributor.
The ultimate question here, as in the next chapter’s Energy Service Utility
model, is how strong the incentives are to invest in building the unique core
competencies and systems needed to deliver EE, not to mention the investment
The Smart Integrator 187

dollars involved. If the EE incentives stop at decoupling, the Smart Integrator
will be neutral regarding energy efficiency and will take its cues from other reg-
ulatory policies and its perception of financial and intangible benefits. All other
things equal, strong incentives are better . . . which brings us to the doorstep of
the Energy Service Utility.
188 Smart Power
chapter thirteen
The Energy Services Utility
THEMISSION of the Energy Services Utility (ESU) is to provide lowest-cost
energy services to its customers—light, heat, cooling, computer-hours, and
the dozens of other things we get from power each day. An ESU is a regulated
entity whose prices and profits are controlled, though not without major
changes to traditional cost-of-service regulation. It is responsible for supplying
all retail generation customers demand with high reliability. It can own the gen-
erators that provide its supply, whether large upstream plants or small local
ones, but it is also required to purchase or transmit power from others attached
to its wires. Figure 13-1 illustrates the relationship between the ESU and its
customers.
The ESU shares nearly all the mission elements of the Smart Integrator (SI).
It must plan, expand, and operate the distribution grid reliably, including the
integration of distributed generators, microgrids, and community energy sys-
tems. It must also operate essentially the same information, control, and price-
setting platform the SI operates, providing universal dynamic pricing in a form
approved by regulators (as in the case of the SI). As it operates this platform,
it will have to contend with all the distance-to-the-customer issues we just
189
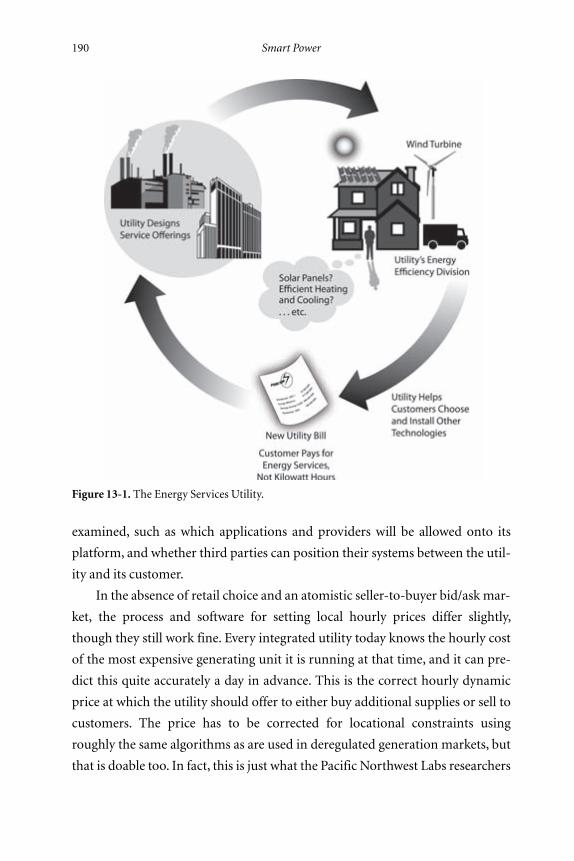
examined, such as which applications and providers will be allowed onto its
platform, and whether third parties can position their systems between the util-
ity and its customer.
In the absence of retail choice and an atomistic seller-to-buyer bid/ask mar-
ket, the process and software for setting local hourly prices differ slightly,
though they still work fine. Every integrated utility today knows the hourly cost
of the most expensive generating unit it is running at that time, and it can pre-
dict this quite accurately a day in advance. This is the correct hourly dynamic
price at which the utility should offer to either buy additional supplies or sell to
customers. The price has to be corrected for locational constraints using
roughly the same algorithms as are used in deregulated generation markets, but
that is doable too. In fact, this is just what the Pacific Northwest Labs researchers
190 Smart Power
Figure 13-1. The Energy Services Utility.
did in the Sequim experiment in Chapter 3, since utilities in that state do not of-
fer retail choice.
There are two principal aspects of the ESU model that diverge from that of
the SI. The first is that the ESU will not necessarily have an incentive to cooper-
ate with local generators who want to connect and sell power into its smart sys-
tem. Because it owns generators or contracts for supply, it may view them as the
competition. The second problem is the now-familiar disincentive to help cus-
tomers reduce their power use, also flowing from the ESU’s ownership of gener-
ation. Our ability to modify traditional regulation to overcome these two ad-
verse incentives effectively will be the primary mark of success for the ESU
business model.
Integrating Local Generators
There is little question that distributed generation (DG) at both the medium
and the household scale is going to grow steadily over the next fifty years. Amer-
ican Electric Power, a large midwestern utility, reports that DG is doubling every
year on its system.1 Even with its greater expense, customer-sited power is going
to be popular among green consumers who can afford it and will be promoted
by progressive state and local governments. Medium-scale power is likely to
be even more numerically significant, eventually becoming the dominant sup-
ply scale, some attached to the distribution system and some on high-voltage
transmission.
As a regulated firm, the ESU’s incentive to be cooperative in fulfilling these
duties will be determined by regulatory policies. As noted in Chapter 8, the fed-
eral government imposed an obligation on distribution utilities to purchase
from certain small generators way back in 1978, and directed state public utility
commissions to pass rules to facilitate these purchases.
By most accounts this scheme did not work especially well. Distribution
utilities saw outside generators as a threat to their market share and a gen-
eral headache to deal with without any corresponding upside whatsoever. The
federal law also included a pricing rule that many utilities felt was a subsidy to
small generators at their expense. Most of all, the scheme was adopted without
The Energy Services Utility 191
any change to the fundamental incentive structure or mission of regulated
distributors.
This time around these changes are an essential element of the ESU busi-
ness model. The ESU must be regulated and incentivized to run the most open
platform possible for new sources, in addition to its incentives to offer better
pricing and help customers save energy. It is worth noting that this is the same
ordeal regulators face in the SI model, where the distributor they regulate must
be rewarded for planning, investing, and operating its system efficiently to inte-
grate local supplies. The sole difference is that the ESU owns some generators, so
that it may feel less willing to cooperate without stronger regulatory penalties
and rewards.
A Profit Center or a Chore?
Today, utility energy efficiency (EE) programs are regulated via a ponderous
process that does not promote high performance. First, regulators or public
managers set out a savings goal or they adopt a planning principle that leads to a
calculated savings goal. They also often specify the amount of price increase
they are willing to tolerate as a result of all EE programs. Next the utility pre-
pares detailed plans for each of its programs, including such things as the pro-
posed level of rebates to be paid, how savings will be measured, eligible tech-
nologies, and total budgeted outlays. Regulators or the board of a public/
cooperative approve the plans and budgets, and the programs begin. After the
programs run for a year or so, the utility does an evaluation of savings achieved,
customer satisfaction, and money spent. If the utility earns performance incen-
tives, they are determined and allowed at this point.
The length of this cycle and the heavy degree of oversight make utility EE
efforts slow-moving and highly risk-averse. Most utilities do everything they
can to keep their initial savings goals quite modest so they can be sure tomeet or
exceed them and thereby avoid public embarrassment. Once goals are set, they
want to use the most tried-and-true programs to achieve their goals, again to
avoid criticism. There is no inherent reward for innovating or taking risks.
192 Smart Power
When a new idea comes up, the utility usually has to wait for another multiyear
planning cycle to try it out.
As a result of all this, many utilities currently see their EE activities as some-
thing they must do to keep their regulators happy—nothing more than a man-
dated cost center. Decoupling does practically nothing to change this, since
profits are the same regardless of their efforts. One utility CEO I know calls this
a “compliance mindset.” He recalls being questioned by a state regulator when
he proposed being allowed to earn profits on EE. “Why shouldn’t I just order
you to do it?” the regulator asked him. “If you want every i dotted and every t
crossed in your energy efficiency program, you will get that,” he replied. “But
why would any utility go beyond the bare minimum of complying with your
order?”
In a few states, regulation has taken a giant step forward recently by creating
genuine profit incentives for achieving high levels of customer energy savings.
In California, utilities get to keep, as profit, about 12% of the value of the energy
they help their customers save. In 2008, the San Francisco–based Pacific Gas &
Electric Company (PG&E) earned $41.9million profit this way.2 In Nevada, reg-
ulators treat expenditures on EE programs, once savings are proven, essentially
the same way they treat expenditures on a new power plant—both are capital
outlays on which the utility earns profits. In fact, the regulations add a small
premium on investments in EE, so that EE outlays earn the highest rate of re-
turn of any investment a Nevada utility can make.
These approaches, which are typically done in addition to decoupling, are
essential for changing the mission and culture of investor-owned utilities. They
focus the attention of utility managers and create a profit motive for running
good efficiency programs. For the first time, they put real money at stake.
PG&E’s president, Peter Darbee, tells investors that “PG&E’s plans are aligned
with customer needs and regulatory objectives.”3 That’s code for saying that the
public goal of saving energy is aligned with PG&E’s business interests.
EE profit incentives bring us to the threshold of the ESU but are not quite
enough to unlock the door. There is still a ponderous planning and evaluation
cycle, and the very real prospect of regulatory punishments, hence a lingering
The Energy Services Utility 193
compliance mindset. And while they are certainly significant, the profits from
efficiency are dwarfed by the profits on utilities’ other lines of business. At
PG&E, for example, their new investments in distribution wires, transmission,
and new supplies together total about $3.3 billion, netting their shareholders
about $340 million in pretax profits.
The states with utility efficiency incentives set the stage for an even more
ambitious vision of the ESU. To see the emerging vision in action, we need to
take two trips—one to Charlotte, North Carolina, and the second to the city of
Austin, Texas.
Duke—andOthers—Break theMold
A tradition-bound utility based in North Carolina run by the same CEO for two
decades is an unlikely place to incubate a new utility business model. But it is in
Charlotte that Duke Energy CEO Jim Rogers has stubbornly wrestled with his
own company’s legacy and regulators in four states to create a business in which
Duke and its profits are deeply linked to its customers’ energy use decisions.
Simply put, Rogers’ vision was to “redefine the boundaries” of the energy
utility. In his 2008 annual report, Rogers wrote the following:
The mission of electric utilities 100 years ago was to ensure universal access to elec-
tricity for all Americans. With that mission accomplished, the industry’s mission
for the 21st century is to go beyond the meter to provide universal access to energy
efficiency. We must provide energy that is affordable, reliable and increasingly
clean. This will drive economic growth and preserve our environment. This re-
quires new ways of thinking about our business. . . . Our mission for this century is
to redefine our boundaries—to go beyond the meter, creating new customer part-
nerships and providing universal access to clean and efficient energy.
In practical terms, what Rogers was talking about is the utility actually making
investments in more efficient hardware that would sit in its customers’ homes
and businesses. As in Nevada’s new efficiency incentives, these downstream in-
vestments would earn the utility regulated profits.
194 Smart Power
To move from vision to business model, Rogers and his team devised a
new approach known as the Save-a-Watt program. The original proposal had
three core ideas. First, the utility would make the installation of a basic package
of efficiency measures an automatic part of electric service. Every home and
office served by a utility has an electric meter, installed and paid for by the util-
ity; the costs of doing this are embedded in each electric service tariff. Why
not do this for a basic package of EE measures, like weather-stripping and attic
insulation?
The second element of Save-a-Watt was the profit incentive. In the original
proposal, regulators would allow Duke to earn as profit 90% of the difference
between the costs of EE and the costs of building the next power plant, all ex-
pressed on a per-kilowatt-hour basis. For example, if financing and installing at-
tic insulation cost an average of 3 cents/kWh saved, and a new power plant cost
6 cents/kWh produced, Duke could keep 90% of the 3 cent difference, or about
2.7 cents, as profit.
The final element of the original Save-a-Watt was an end to the heavily reg-
ulated planning and approval cycle. Since the utility was given the profit incen-
tive to seek out and make money on EE measures, why subject it to the long, ar-
duous, inflexible process of program preapproval? Instead, regulators would
oversee independent evaluations of the true savings achieved and their true cost
and allow the utility to earn 90% of the verified difference.
Save-a-Watt created quite a buzz in utility and EE policy circles. Tom Fried-
man praised the idea in aNew York Times column.National efficiency advocates
and environmental groups issued press releases praising the idea, and utility
policymakers across the country started paying close attention to it. Rogers was
profiled in the New York Times, Fortune Magazine, Power & Energy Magazine,
Corporate Leader, and Forbes and was named one of “The 50 Most Powerful
People in theWorld” byNewsweek. 4
But back in the states where Duke needed its regulatory approvals, Save-a-
Watt was in for some rough sledding. First, regulators were not comfortable giv-
ing up all control over the monies spent by Duke on ratepayers’ behalf. This
problem bedevils all utility EE efforts. Because regulators are often punished by
their citizens or their bosses (governors and legislatures) for allowing mistakes
The Energy Services Utility 195
to be made, regulators are enormously adverse to loosening their oversight of
utility expenditures of any type.
Regulators also discovered that the proposed profit incentive was, in their
opinion, too lucrative for the utility. To see this concern, note that the difference
between very inexpensive EE measures (costing, say, 1 cent/kWh saved) and the
cost of a new power plant (6 cents) is 5 cents. Under its proposal, Duke would
stand to earn 4.5 cents (90% of 5 cents) on an investment of a penny, a return on
investment of about 450%. Meanwhile, Duke’s ratepayers would have to pay, in
effect, 5.5 cents/kWh of service received, in effect paying 5.5 cents for a saved
kWh that cost Duke only a penny.
Through negotiations with stakeholders and regulators, Rogers and his EE
executive, Ted Schulz, have gained approval to implement their idea in four
states. While regulators have insisted on significantly more oversight than was
originally proposed, and have reset the profitability of the programs to levels
they are comfortable with, the core elements of the idea remain. The business
climate for the efficiency programs is entrepreneurial, with a premium on speed
to market and maximummarket penetration, not meeting arbitrarily set goals.
Ultimately, Rogers sees his utility representatives deeply involved in cus-
tomer EE investments, providing expert guidance and investment funding.
Much like many cutting-edge private Smart Grid energy management consult-
ants, Rogers sees his staff customizing each one of his customers’ energy man-
agement software systems to conform to the appliances they own, their comfort
preferences, and control features they value. Ultimately, the ESU may even
charge customers not in units of kilowatt-hours, but rather in units of heat,
light, or other service provided, a concept Rogers calls “value billing.”
As revolutionary as this concept sounds, a surprising number of traditional
utility executives are starting to speak in the same terms. Bill Post, chairman of
Arizona Public Service, the state’s largest utility, says that “Factually, we provide
electrons to our customers, but I don’t see our business that way,”he said in a re-
cent interview. Instead, he sees himself running a service company that “cools
your home, runs your computer, heats your stove,” and literally powers modern-
day life.5 Ralph Izzo, head of New Jersey’s Public Service Electric and Gas, says;
“Just aswemade universal access to energy a reality in the 20th century, so too,we
196 Smart Power
canmake universal access to energy efficiency a reality in the 21st. But to do this,
a new business and regulatorymodel is needed—one that encourages utilities to
invest in efficiency, in the same way we invest in pipes and wires to maintain the
energy delivery infrastructure, or the boilers and turbines of power plants.”6
“I would rather invest $10 billion inmakingmy customers more productive
with their use of energy than put $10 billion into a new nuclear plant,” Rogers
recently told me. If Save-a-Watt delivers on its promise, he may have his chance.
The Pecan Street Project
If Charlotte is an unusual locale for the first shareholder-based ESU, Texas is an
even less likely place for a pioneering attempt to apply the model to public
power. Energy production is the state’s largest product; Houston is the nation’s
energy capital. Unlike nearly every other state, Texas remains highly committed
to keeping electric deregulation for customers served by its IOUs. In an era of
plug-in hybrids and smart growth, it is building a massive new intrastate high-
way system.
None of this bothers Roger Duncan, the manager of the City-owned Austin
Energy (AE) or the city fathers of Austin,whooversee the utility’s operations.AE,
whose motto is “More than Electricity,” is in the midst of redesigning its entire
utility to be an ESU.Calling their new design Smart Grid 2.0,Austin explains:
It[s] focus is all about the grid beyond the meter and into the premise (e.g., home,
office, store, mall, building) with integration back to our utility grid. Our Smart
Grid 2.0 is about managing and leveraging Distributed Generation (Solar PV, Mi-
croWind, etc.), Storage, Plug-In HybridVehicles, ElectricVehicles and Smart Appli-
ances on the customer side of the meter. The vision . . . is to solve the energy prob-
lem in Austin, Texas, by reinventing the power sector via moving into new energy
models, including interconnecting with the transportation sector.7
Much of Smart Grid 2.0 involves the technologies and services that define a
public power version of the SI. However, there is no retail choice in Austin; its
power rates are set by the City, acting as AE’s regulator.
The Energy Services Utility 197
Austin’s EE offerings, though traditional in some ways, rival those of any
utility in the United States. AE gives up to $1,575 in rebates for home efficiency
measures and also offers assistance financing efficient air conditioners, solar
photovoltaic cells, and solar water heaters. Businesses can get rebates up to
$100,000 for energy management systems, $200,000 for improving data centers,
and other rebates for running buildings more efficiently, curtailing loads, or in-
stalling thermal storage. Beyond rebates, Austin offers one of the pioneering
municipal energy financing programs described in Chapter 10.
Most interestingly, Austin’s model also demonstrates that the close political
coupling between a municipal utility and local authorities can help create an in-
tegrated package of EE laws, incentives, and options. In addition to activities
typically associated with utilities, Austin’s program includes elements of smart
growth, such as promoting alternatives to auto travel and intelligent transport
systems, the creation of energy business incubators, and green workforce devel-
opment. The City also adopted an ordinance that requires all single-family
homeowners to perform a certified energy audit before selling their house. The
audit must be given to all prospective purchasers as well as the utility. This ordi-
nance breaks through a market barrier that has bedeviled residential efficiency
investments for decades, namely the inability to demonstrate the value of an EE
investment to the building’s next buyer.
While all of this shows tremendous promise, Austin’s transformation is a
work in progress. Funding constraints have delayed the roll-out of many of the
key investments, so many features of the newmodel are not yet up and running.
It will be years before Austin will be able to gauge the full economic feasibility
and degree of customer acceptance of many parts of its vision. Until then, al-
though the vision is clearly in place, the implementation jury is still out.
TheValue Proposition
The ESU is a radical concept that puts electric utilities into two diametrically
opposed businesses, one selling their traditional product and one helping cus-
tomers buy less of it. It combines the old product and service model with selling
investments and services inside customer premises. Yet utilities have limited ex-
198 Smart Power
perience selling on the “customer side of the meter” and most of what they have
sold to customers other than power has occurred under the compliance mind-
set. They will face competition from all sorts of more nimble rivals and will be
second-guessed by regulators every step of the way. What makes anyone think
this business model is manageable or profitable?
One can visualize a CEO pitching the attractiveness of the ESU model to a
group of skeptical, industry-savvy Wall Street analysts. What will it take for
them to rate the stock of an ESU a“buy”? A utility with the capabilities to deliver
customer energy services better than its unregulated competitors and earn a de-
cent, regulator-approved profit on it.A utility able to plan andmanage its gener-
ation investments so that they’re located in the right parts of its system (up-
stream or downstream) and just large enough to backfill the residual need for
low-carbon supplies.On top of all this, the utility has to do a good jobmanaging
the Smart Grid, conquering essentially all of the same challenges awaiting SIs.
The EE profit incentives conveyed by regulation are clearly the sine qua non
of the ESU. As we saw earlier in this chapter, serious incentives can be grafted
onto the current regulatory framework in several ways—by sharing the savings
(California), treating efficiency as utility capital (Nevada), or using Duke’s Save-
a-Watt approach.
These may be the best practical options, but as a financial and regulatory
matter they still define the utility’s fiscal mission as the sale of kilowatt-hours.
Every financial statement and every regulatory filing denominates the utility’s
accomplishments in units of energy, not units of energy saved or energy services
provided.
Yet it has always been the case that customers don’t purchase invisible com-
modity energy just for the sake of having energy. No one opens a bag of newly
purchased kWh to start munching on them. Instead, customers buy power to
combine it with machines that yield a cornucopia of services—light, heat, in-
dustrial motion, computing power, and hundreds of other applications. Elec-
tricity’s extraordinary value stems from its astonishing versatility and efficiency
at creating so many service streams from a single wire.
If it is energy services that we really want, why not measure and regulate
utilities in these units rather than kilowatt-hours? Suppose, for example, that
The Energy Services Utility 199
instead of setting a maximum rate utilities could charge per kilowatt-hour we
allowed them a maximum rate per lumen of light delivered, including the cost
of the bulb and fixture along with its input power? Under this approach, if a
more efficient light source came along, so that the bulb and input power were
cheaper for the utility to provide together than the existing, less-efficient combi-
nation, the utility would automatically have the incentive to install the more ef-
ficient technology.
As a simple hypothetical example, suppose that light from a typical fixture
cost $3 per million lumens of light. The utility sees that a new fixture could pro-
duce the same light for $2.80 per million lumens. It would change out the lights
(with the customer’s permission, of course) and split the savings with the cus-
tomer. Over time, as more and more customers reduced their lighting costs to
$2.80, regulators would readjust the base rate, to $2.80/mm lumens, giving the
utility a fair return on its investment. This is roughly how we regulated new util-
ity power plant investments for seventy-five years. Each new power plant gener-
ated power more efficiently and cheaply than the prior generation, and regula-
tors gradually reduced electricity prices over this period.
Defining utilities’ mission as delivering energy services rather than com-
modity power is not a new idea. All of the earliest electricity vendors, including
Edison, began by selling light, not power. Chicago’s first lighting salesman, P.S.
Kingsland, rented fifty arc lamps to customers for 15 cents an hour, while Edi-
son’s own companies competed with gas light by offering service by the bulb.8
Beyond the pricing model, however, power companies—though not yet regu-
lated—were deeply involved in delivering energy services, not kilowatt-hours.
According to historian JohnWasik:
Power company workers in 1882 were ombudsmen. Edison’s companies not only
produced and sold power, they made light bulbs, all of the fixtures, wired the build-
ings and installed the infrastructure to generate and transport electricity. Imagine
Microsoft, the software company, in addition to writing computer operating sys-
tems, making every component of the computer and supplying the electricity to
run them, wiring houses and owning and running power plants. Such was the nas-
cent electrical industry before the turn of the century.9
200 Smart Power
Amory Lovins and Roger Sant, among others, tried with little success to revive
the idea of selling energy service in the 1980s.10 Until recently, however, the idea
seemed attractive but impractical. You cannot sell what you cannot measure,
and our sensing and measuring technologies were too primitive and expensive
to quantify the many different types of energy services that come from electric-
ity. Think of the dozens of energy services electricity provides in your home: air
conditioning, cooking, television, phones, computers, baby monitors . . . the list
is nearly endless. How could we possibly measure, much less put a price on, the
exploding menagerie of services such a prolific energy source provides?
It is unlikely that we will. However, the technology of the Smart Grid will
enable us to measure some of the most important kinds of energy services with
more than enough precision to set regulated prices for them if we wish. It is al-
ready the case, for example, that commercial building leases include provisions
that promise to provide heat to every office within a certain temperature
band—a promise that is easy to implement with readily available temperature
sensors and energy management systems. Similarly, lighting and daylighting
companies now contract with commercial customers to provide a guaranteed
level and quality of lighting throughout their building, such as 50 foot-candles
of light at a height of 3 feet with a color rendition index of 80 or higher.11
In the global search for new business models that promote sustainability
the idea of turning a product into a life cycle service is gaining currency in many
sectors. Forward-thinking carpet manufacturers like Interface will sell you car-
peting services rather than carpets; you rent the carpet for as long as it lasts, and
then Interface takes it back to recycle it. Aircraft engine manufacturers will write
you a contract that sells you hours of service from their engines, not the engine
itself, even though the engine is flying all over the world installed in your air-
plane. So many software providers sell you the use of their product rather than
the software itself that the business model is now widely known as the software-
as-a service (SAAS) model.
There are an enormous number of practical issues and barriers that remain
before we can remold and regulate the utility industry mainly as an energy ser-
vices business. For many electric applications, the value of electricity is greatly
enhanced by consumers’ ability to choose the particular bundle of features they
The Energy Services Utility 201
want from among a huge variety of hardware manufacturers. In an energy ser-
vices relationship, the customers lose their unconstrained choice of energy-
using technologies.While this works for services for which features are not that
visible or important, such as heating or lighting, imagine ceding your choice of
television sets to your power company.
For the foreseeable future, the utility industry will have to experiment with
this new model, applying it to the types of services that customers and regula-
tors understand and can successfully price. If the model works well and Smart
Grid technology continues to improve, service provision may eventually sup-
plant much of the commodity sales model. Many vendors in many sectors have
a business model that includes both product- and service-type offerings, and
utilities will probably be no exception.
Even among the pioneers like Duke and Austin Energy, we are a long way
from proving this model works. But this is the business model that must be
carefully considered if we are to tap our efficiency resource without government
playing the primary financing and delivery role and without retail choice. It is
the only obvious policy path for states that do not want to deregulate retail
power prices but nevertheless want the most advanced utility sector possible.
Interestingly, it is the future business model most often mentioned by industry
CEOs, even those operating in deregulated states.12
For public power, the value proposition obviously does not revolve directly
around the rate of return on invested capital. However, the ability to deliver and
realize the value within public power’s constraints still must be established.
Austin Energy’s citizen-customers must be willing to pay as much as it costs to
provide EE services as well as paying for the rest of the SI services. The City has
to be able to raise and service the capital needed for energy services, keep the
rest of its business running well, and keep costs and rates acceptable. Even in
Texas, that’s a tall order.
202 Smart Power
Conclusion
OURJOURNEY has taken us from electricity’s first revolution to its second;
from Muncie, Indiana, to Austin, Texas, and Charlotte, North Carolina;
from Insull’s gospel of consumption to Rogers’s gospel of productivity. Along
the way, we’ve seen that changes in the technology and architecture of the grid
are slowly but steadily dismantling Insull’s model for the electric utility. But the
journey is far from complete, and we will soon cross some dramatic terrain.
The Smart Grid will give customers much greater control over their power
use andmake dynamic pricing universal in one form or another. It will force ex-
tensive changes in utilities’ operating procedures and unleash a tidal wave of
new regulatory challenges. Much of the regulatory conflict will center on the
perennially difficult issues of investment benefit measurement, allocation of
systemic costs, and the process of blending markets and regulation—problems
that cannot be solved by simply “letting the market decide.”
Electric sales will grow slowly, if at all, for the next few decades. Neverthe-
less, the need to scale back carbon emissions calls for hundreds of thousands of
megawatts of new generation, much of it from sources that are commercially
unproven, expensive, or difficult to tap. Distributed generators will provide a
203
steadily growing share of this power, but their costs will remain well above most
large-scale plants and their growth will be limited by the rate at which the grid
can be reengineered.
Despite certain inconvenient attributes, we will build many large natural
gas, wind, and solar plants and even more medium-sized versions of the same.
Coal plants with carbon capture or the next generation of nuclear units may
prove economical enough to be part of the mix by the 2020s, especially consid-
ering the large international R&D efforts behind them, global energy geopoli-
tics, and the domestic political support for these two forms of energy.
Financing this program of decarbonization on a stagnant sales base will be
challenging enough, but many new generators will also need transmission addi-
tions. The 20,000 to 30,000 miles of new lines needed falls far short of a nation-
wide transmission supergrid, but necessitates decision making and construc-
tion at a much faster pace than the industry has achieved in modern times. The
acceleration will require newmethods of regional planning and grid cost alloca-
tion that force a truce in a grid policy war that has gone on for decades.
Most important of all, the cardinal role of energy efficiency in any serious
national climate strategy requires policy choices and regulatory reform. Prop-
erly decoupling sales from profits is a useful first step, but it will fall short of the
metamorphosis needed for the coming era. The industry needs a new form of
regulation and new business models to match its new technologies and mission.
Second-Century Regulation
At its core, economic regulation is an instrument that rewards private firms for
shifting from the actions they would choose if left unfettered to efforts more in
line with our economic and social goals. The policymakers who fashioned elec-
tric regulation in the 1920s and 1930s understood this. They designed regula-
tion to do what America then wanted: the largest, cheapest commodity power
system possible, ignoring most environmental constraints and the promotion
of energy efficiency. In rural areas, where investor-owned firms could not invest
profitably, government-financed cooperatives would take their place; cities that
had municipal utilities with largely the same objectives would also grow. Cheap,
204 Smart Power
universal commodity power served a national mission to build a world-class in-
frastructure and increase our productivity to the point where our security was
assured and our middle class became the wealthiest consumer society in history.
These goals remain, but they are now joined by a realization that the world’s
carbon budget is vastly overspent and our economic infrastructure was not de-
signed for sustainability. A larger electric power industry is no longer automati-
cally the route to greater productivity and a better standard of living. In the
coming century the power industry we seek is not necessarily the largest, it is
one that can help its customers achieve the highest level of service possible con-
sistent with social and environmental sustainability. Its goal is not more, but
more from less.
The boundaries and business strategies of the utilities of the future will be
set by the objectives and incentives regulation provides. There are two poten-
tially feasible paths. In states that adopt or continue retail choice, Smart Integra-
tors can be regulated to operate energy and information platforms accessible to
all consumers and suppliers on a policy-consistent basis. Where conditions al-
low, the interplay of demand and supply can set prices, but the role of regulation
establishing and protecting suchmarkets, and overseeing the distribution utility
at the hub of the network, will create generations of work for regulators.
The second path leads from today’s integrated utilities, who continue to
supply commodity or provider of last resort (POLR) power. These utilities must
operate the same efficient, policy-consistent delivery platforms, but their incen-
tives to favor their own generation supplies bespeak a need for stronger energy
efficiency incentives and open access policies. Here regulation needs surgery
much more extensive than the grafting of decoupling onto the cost-of-service
framework. Energy Service Utilities must be regulated so as to be rewarded for
delivering lowest-cost energy services, whatever the combination of generation,
delivery, and efficiency capital needed.
NewRoles and Resources
Developing a new regulatory compact to fit the industry’s newmission is a Her-
culean task. Conceptually, the goal is to create rate-setting formulae that create
Conclusion 205
the incentive to invest efficiently for lowest-cost energy services while meet-
ing reliability rules, carbon limits, renewable standards, and other constraints.
Experience with other forms of incentive regulation shows that this will re-
quire experimentation, cutting-edge regulatory skills, and no small measure of
fortitude.
Absent very unlikely changes in federal law, this task will fall to fifty state
legislatures, governors, and utility commissions.Most legislatures and executive
branches will need to devote a huge effort to understanding the industry’s
changes and their options for reform. They must also avoid being captured by
one or another stakeholder, or simply taking the political path of least resistance
regardless of its ultimate viability. State commissions are in a little better shape,
having accumulated valuable experience and developed effective institutions for
sharing information and improving their quality. But little in their training or
history has prepared them for a mission so sweeping as the redesign of regula-
tion itself.
Today the average regulatory commission has a staff structure and core
competencies befitting its historic mission. It is composed primarily of lawyers
and accountants, many of whom have acquired an excellent understanding of
public utility economics and electric technology. There are a few engineers, even
fewer economists, and an extremely limited number of experts in electric infor-
mation technology.
These agencies do amazingly well with their limited resources, but recent
history has not been especially kind to them. Prior to the upheaval of the late
1970s, commissions were sometimes considered state government backwaters
that carried out nothing more than routine accounting tasks. In the late ’70s, in-
flation, twin energy shocks, and the cost overruns from early nuclear plants sent
electric rates to sky-high levels. State leaders lost faith in utility regulation as a
means of controlling excessive prices, and deregulation became the rage. Utility
commissions were caricatured as relics of a bygone era, with little or no future
role in the coming free energy markets. Budgets were cut, the best and brightest
staff members left, and a commissioner job became the least sought-after spot
for an ambitious up-and-comer.
206 Smart Power
As states gained experience with retail choice, they gradually learned that
their regulators had a much greater responsibility overseeing the system than
they originally understood. “Deregulation” required state regulatory commis-
sions that needed just as much authority, expertise, and independence as in reg-
ulation’s heyday, along with many new skills needed to understand complex
new markets. Meanwhile, when prices spiked or expectations were not met,
elected leaders in the state needed to blame someone. State utility commissions
were often the obvious choice.
Regulation by an independent commission is founded on a compact in
which regulators act quasi-judicially, without direct political interference by ei-
ther the governor or the legislative branch.1 Unfortunately, the California en-
ergy crisis and the perceived failure of retail deregulation has ushered in an era
in which legislatures and governors have bitterly criticized, threatened, and
sometimes replaced public service commissioners for alleged failures to protect
the public. After two decades of frequent criticism, some utility commissions
are understandably resistant to bold new regulatory experiments and reluctant
to allow utility rates to increase.2
Nothing could be more harmful to the future of the industry than a state
regulatory community too disempowered to manage professionally and impar-
tially the profound changes needed in regulation today. It is a matter of national
importance that state commissions have their independence restored and their
missions and resources reset to play their part in a transformation that is already
under way and will not stop.3 States need not change their policies on retail
choices, but they must revise their state regulatory compacts and upgrade their
commissions if they hope to reap the full economic benefits of the Smart Grid
and turn greenhouse gas policies into an engine of economic development.
A complete exploration of the policy and management changes state com-
missions deserve is a study in itself, if not a library of studies.However, a few sug-
gestions along these lines seem both obvious and feasible. The federal govern-
ment should dedicate funds sufficient to establish regulator training programs
that rival the best academic and professional programs in the world. The regu-
latory community should use these funds to establish a series of professional
Conclusion 207
accreditation programs. The university of modern regulation should have
courses of study in electric pricing methods, market oversight skills, communi-
cation networks, and other specializations.
Without constraining state policies for appointing regulators or hiring se-
nior staff, state commissioners and senior staff members should be required to
gain accreditation following their confirmation. The accreditation program
should also be available to federal regulators, governors’ energy staffs, and the
leaders of public power agencies and cooperatives. This educational require-
ment is as much a means of imbuing the culture of regulatory commissions
with an appetite for embracing andmanaging change as it is a means of impart-
ing specific knowledge.
In many states regulatory commissions have a number of responsibilities
beyond electric regulation and are hard-pressed to carry out all their duties with
their current resources and staff. The level of staffing varies widely in commis-
sions, from thirty in Mississippi (2 for every 100,000 ratepayers) to 996 in Cali-
fornia (if you count both the California Public Utility Commission and the Cal-
ifornia Energy Commission, this is 7 for every 100,000 ratepayers). To the
maximum extent possible, the electric and communications regulatory func-
tions should be given their own organizational structures, ample budgets, and
the resources and authority to hire excellent new staff where needed.
Commissions in many states (as well as the FERC) have made great strides
toward changing the process of regulation away from expensive and often inef-
fective adversarial litigation to collaborative, technical conferences, and other
modern processes. The new processes are ideal for examining the changes
needed in the regulatory compact, the benefits and costs of Smart Grid invest-
ments, energy efficiency policies, and many other new challenges. Their use
should be encouraged and expanded.
An upgrading of utility commissions bears some similarities to the resur-
gence of interest in revamping financial regulation in the wake of the 2008 mar-
ket crash. In both cases, regulatory agencies and their rules were created for in-
dustries with the technologies, products, and business operations of the early
twentieth century. In both cases, the industries have changed so much that the
old regulatory processes and goals no longer serve our national objectives. In
208 Smart Power
both cases, the magnitude of the challenge commands us to create the smartest,
most agile, and most highly skilled regulatory agencies possible.
Public Power’s Moment of Opportunity
Many of the forces buffeting investor-owned utilities (IOUs) are affecting mu-
nicipal utilities and cooperatives with equal force. All segments of the industry
face an imperative to adopt the Smart Grid cost-effectively and allow greater
customer control via dynamic pricing. As we saw with Jim Jura and Associated
Electric, they also face the same choices and uncertainties in supply options and
they are confronted by a similar need to meet climate change limitations.4
These imperatives give public power and cooperatives the same challenges
that IOUs must contend with, revising their mission and management and ac-
quiring new core competencies. If anything, the introduction of dynamic pric-
ing and the other core elements of the Smart Grid will be a bigger change in op-
erations and culture for many utilities in these segments than it is for most
IOUs. With smaller staffs and resources, publics and cooperatives will have the
equally difficult task of specifying, procuring, and operating IT platforms that
are still evolving rapidly, subject to rapid obsolescence, and uncertain as to their
acceptance by customers. Unlike IOUs, which keep a large layer of shareholder
equity, utilities in these segments have little protection against failed generation
or distribution investments. Yet the coming era is one of unprecedented new
risks in every kind of utility outlay.
In these segments, there is less of a distinction between government
and utility leadership in energy efficiency because the utility is itself quasi-
governmental. The challenge is rather the means of inducing these utilities to
make large customer efficiency investments. There is no external regulator that
can reward shareholders for doing a good job via monetary incentives, there are
only city councils and cooperative boards. These leaders can praise managers
that do a good job saving energy or even pay them bonuses, but this is largely
unexplored territory.
Because most public power and cooperatives have steered clear of re-
tail choice thus far, the obvious model for them is the Energy Services Utility.
Conclusion 209
However, in addition to a lack of external efficiency incentives, heavy invest-
ments in upstream supplies and the lesser ability to absorb losses on invest-
ments already made will create especially strong conflicts between saving and
selling more power.5 All in all, aligning the incentives of the managers of public
power firms with the national imperative of making customers more electricity-
efficient is an enormous and unresolved challenge.
These changes paint a picture of adversity for the public and cooperative
segments every bit as large and messy as the landscape confronting IOUs. At the
same time, there is an aspect of the coming changes that presents these segments
with one of the largest opportunities in their history. The current structure and
architecture of the industry, with very large generators at the far end of the high-
voltage grid, favors large utilities operating across enormous territories. The
coming age of decentralized sources and a smart grid will favor community-
scale sources located much closer to load.
This is an industry configuration that is inherently matched to municipal
utilities and cooperatives. These utilities are effectively owned by their commu-
nities, typically serving areas with medium-sized electric demands and geo-
graphic footprints. Community energy systems and so-called microgrids are
well-suited to these ownership forms.6
Historically, the IOUs have been very resistant to any expansion of public
power. A growth of community energy systems in Smart Integrator environ-
ments will require leadership and investment at a time when state and local gov-
ernments are besieged by problems from the economic downturn that began in
2008. In addition to possible IOU opposition, a hungry new generation of green
power entrepreneurs would like nothing more than to own and profit from the
microgrids and community energy systems; many IOUs also have deregulated
subsidiaries that are already active.
Nonetheless, the municipal and cooperative segments are facing a unique,
back-to-the-future moment. The industry’s architecture is being redesigned to
operate on a scale that better suits these segments, giving them an opportunity
to own and manage supply resources at the scale they have dominated for years.
In Muncie, Indiana, the small municipal utility, integrated into the massive
investor-owned American Electric Power System in 1911, may someday in the
210 Smart Power
not-too-distant future host a community energy system owned by the city or
another public agency.7
Making Power Smarter
Regardless of what we do, the lights in America will stay on. Barring an unusu-
ally successful physical or cyber attack, the grid will remain reliable. Electricity
will remain an absolute necessity, and most families and businesses will find it
affordable. State regulators will allow utilities to add greater intelligence to their
distribution systems and evolve toward dynamic pricing. Following enactment
of nationwide carbon emission limits, utilities will find ways of reducing their
greenhouse gases.
The question is not whether we make these changes, but whether we make
them well or poorly, costly or cost-effectively, quickly or at a tortured, halting
pace. Mother Nature’s timetable for the safe decarbonization of the power sec-
tor is not negotiable. With outright deregulation far too unpopular to offer a
simple fix, an aging regulatory approach based on deficient public objectives
must be changed firmly and quickly, with parallel changes in the public power
and cooperative segments led by the sectors themselves.
Much of the art of good public policy is learning when to let the market-
place, and the marketplace of ideas, run its course. It is unnecessary and proba-
bly counterproductive to force a choice between the Smart Integrator model
and the Energy Service Utility. As decarbonization proceeds and the Smart Grid
inhabits more of the industry’s skeleton, there is no doubt that the better model
will reveal itself if one is, in fact, better. It is necessary only that each state be
clear about its model and work hard to regulate it wisely.
There is, however, a critical decision we must make as a nation, and soon.
We must choose between putting state and local governments in charge of fi-
nancing and delivering energy efficiency or making it part of the industry’s mis-
sion and business. More accurate electricity and carbon prices are essential, but
not nearly sufficient to overcome the full range of market barriers. A source of
patient capital and trusted expertise is certainly needed. And the power of the
purse must be wielded, and wielded wisely. As the old saying goes, if everyone is
Conclusion 211

in charge, no one is in charge. We cannot expect efficiency to deliver its store-
house of low-cost savings without a motivated and accountable quartermaster.
Few of the changes I advocate need to come from new federal laws.National
policy clarity is needed on leadership in energy efficiency, and national re-
sources are needed to upgrade state commissions. Beyond this, the main locus
of institutional and regulatory change will occur in states, localities, and multi-
state planning regions, where governors must find new ways to cooperate on
electricity grid expansion.
As Insull knew, it was the cohesion between the industry’s economic prop-
erties, its division into firms and markets, and the incentives regulation con-
veyed that allowed the power industry to flourish. State by state and utility by
utility, the mission, structure, and governance of utilities must change. There
will and should be many variations, but without a harmonization of economics,
structure, and sound regulatory governance the industry will not perform well.
In the end, a smart power industry will not be the product of the oncoming
revolutions in control systems or generating technologies, grand as they are. It
will be the result of provisioning the industry for change. The intelligence of the
institutions we create, not that of the hardware and software we deploy, will de-
termine whether the industry that created the world’s wealthiest and most pow-
erful nation will lead that same nation to a new,more productive, andmore sus-
tainable future.
212 Smart Power
appendix a
Electricity Sales Scenarios
THIS APPENDIX describes the EIA electric sales forecast and adjustments
discussed in Chapter 6. The master table to this appendix, Electric Sales
Scenarios is shown on the next page. I discuss each portion of the table in order
from top to bottom.
Energy InformationAdministration Forecast
The baseline for all scenarios is the April 2009 Energy Information Administra-
tion (EIA) updated base case, which reflects the American Recovery and Re-
investment Act of 2009 (ARRA) but no other Obama-era energy policy enact-
ments. Table A-1 shows some of the results of this EIA forecast.
In this discussion, increased economic growth serves as a useful proxy for
economic growth, population and household growth (both number and physi-
cal footprint), and related variables. One could create many combined scenarios
with various combinations of these key drivers, but my goal is simply to create
several representative scenarios, not the full range of possibilities.
In the original Annual Energy Outlook (AEO) 2009 update, which relies
213
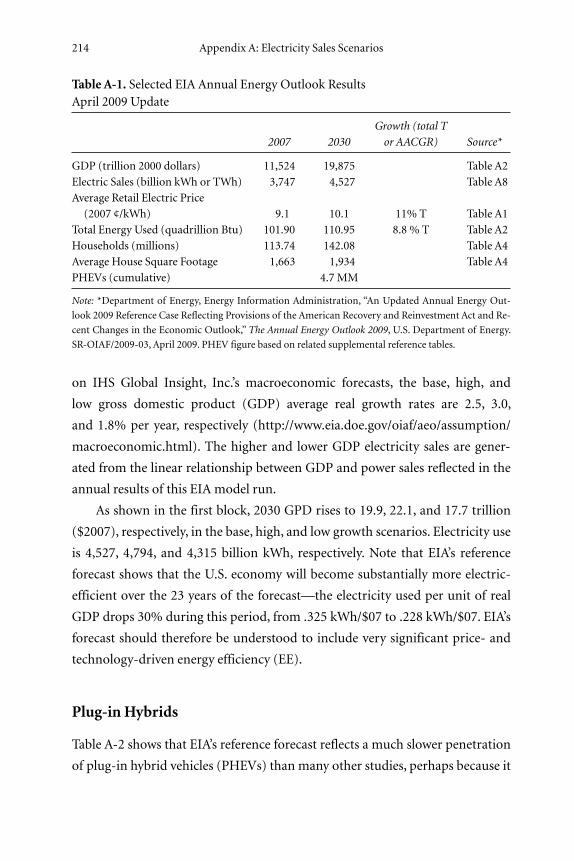
on IHS Global Insight, Inc.’s macroeconomic forecasts, the base, high, and
low gross domestic product (GDP) average real growth rates are 2.5, 3.0,
and 1.8% per year, respectively (http://www.eia.doe.gov/oiaf/aeo/assumption/
macroeconomic.html). The higher and lower GDP electricity sales are gener-
ated from the linear relationship between GDP and power sales reflected in the
annual results of this EIA model run.
As shown in the first block, 2030 GPD rises to 19.9, 22.1, and 17.7 trillion
($2007), respectively, in the base, high, and low growth scenarios. Electricity use
is 4,527, 4,794, and 4,315 billion kWh, respectively. Note that EIA’s reference
forecast shows that the U.S. economy will become substantially more electric-
efficient over the 23 years of the forecast—the electricity used per unit of real
GDP drops 30% during this period, from .325 kWh/$07 to .228 kWh/$07. EIA’s
forecast should therefore be understood to include very significant price- and
technology-driven energy efficiency (EE).
Plug-in Hybrids
Table A-2 shows that EIA’s reference forecast reflects a much slower penetration
of plug-in hybrid vehicles (PHEVs) than many other studies, perhaps because it
214 Appendix A: Electricity Sales Scenarios
Table A-1. Selected EIA Annual Energy Outlook ResultsApril 2009 Update
Growth (total T
2007 2030 or AACGR) Source*
GDP (trillion 2000 dollars) 11,524 19,875 Table A2
Electric Sales (billion kWh or TWh) 3,747 4,527 Table A8
Average Retail Electric Price
(2007 ¢/kWh) 9.1 10.1 11% T Table A1
Total Energy Used (quadrillion Btu) 101.90 110.95 8.8 % T Table A2
Households (millions) 113.74 142.08 Table A4
Average House Square Footage 1,663 1,934 Table A4
PHEVs (cumulative) 4.7 MM
Note: *Department of Energy, Energy Information Administration, “An Updated Annual Energy Out-
look 2009 Reference Case Reflecting Provisions of the American Recovery and Reinvestment Act and Re-
cent Changes in the Economic Outlook,” The Annual Energy Outlook 2009, U.S. Department of Energy.
SR-OIAF/2009-03, April 2009. PHEV figure based on related supplemental reference tables.
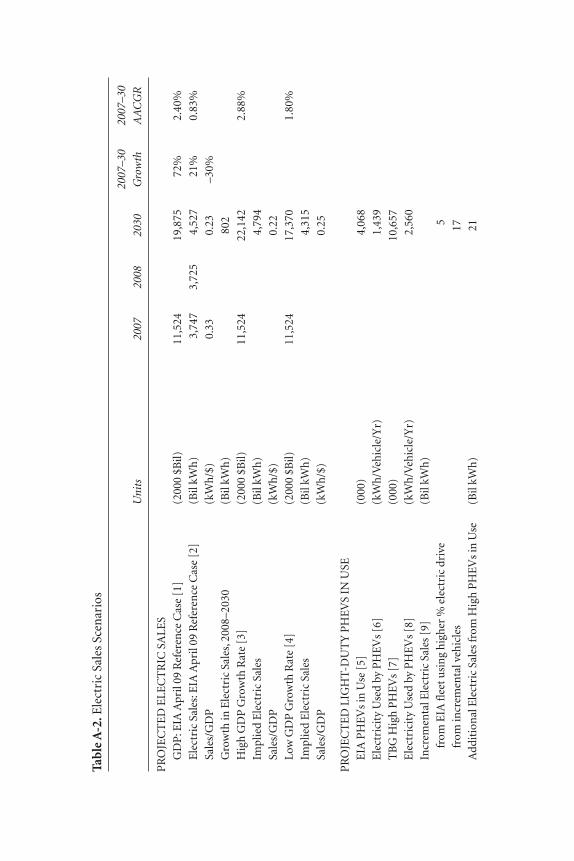
Tab
le A
-2.E
lect
ric
Sale
s Sc
enar
ios
2007
–30
2007
–30
Uni
ts20
0720
0820
30G
row
thA
AC
GR
PR
OJE
CT
ED
ELE
CT
RIC
SA
LES
GD
P: E
IA A
pril
09 R
efer
ence
Cas
e [1
](2
000
$Bil)
11,5
2419
,875
72%
2.40
%
Ele
ctri
c Sa
les:
EIA
Apr
il 09
Ref
eren
ce C
ase
[2]
(Bil
kWh
)3,
747
3,72
54,
527
21%
0.83
%
Sale
s/G
DP
(kW
h/$
)0.
330.
23–3
0%
Gro
wth
in E
lect
ric
Sale
s, 2
008–
2030
(Bil
kWh
)80
2
Hig
h G
DP
Gro
wth
Rat
e [3
](2
000
$Bil)
11,5
2422
,142
2.88
%
Impl
ied
Ele
ctri
c Sa
les
(Bil
kWh
)4,
794
Sale
s/G
DP
(kW
h/$
)0.
22
Low
GD
P G
row
th R
ate
[4]
(200
0 $B
il)11
,524
17,3
701.
80%
Impl
ied
Ele
ctri
c Sa
les
(Bil
kWh
)4,
315
Sale
s/G
DP
(kW
h/$
)0.
25
PR
OJE
CT
ED
LIG
HT
-DU
TY
PH
EV
S IN
USE
EIA
PH
EV
s in
Use
[5]
(000
)4,
068
Ele
ctri
city
Use
d by
PH
EV
s [6
](k
Wh
/Veh
icle
/Yr)
1,43
9
TB
G H
igh
PH
EV
s [7
](0
00)
10,6
57
Ele
ctri
city
Use
d by
PH
EV
s [8
](k
Wh
/Veh
icle
/Yr)
2,56
0
Incr
emen
tal E
lect
ric
Sale
s [9
](B
il kW
h)
from
EIA
flee
t usi
ng
hig
her
% e
lect
ric
driv
e5
from
incr
emen
tal v
ehic
les
17
Add
itio
nal
Ele
ctri
c Sa
les
from
Hig
h P
HE
Vs
in U
se(B
il kW
h)
21
BM:IP_Fox-Penner 8/15/10 7:10 PM Page 215
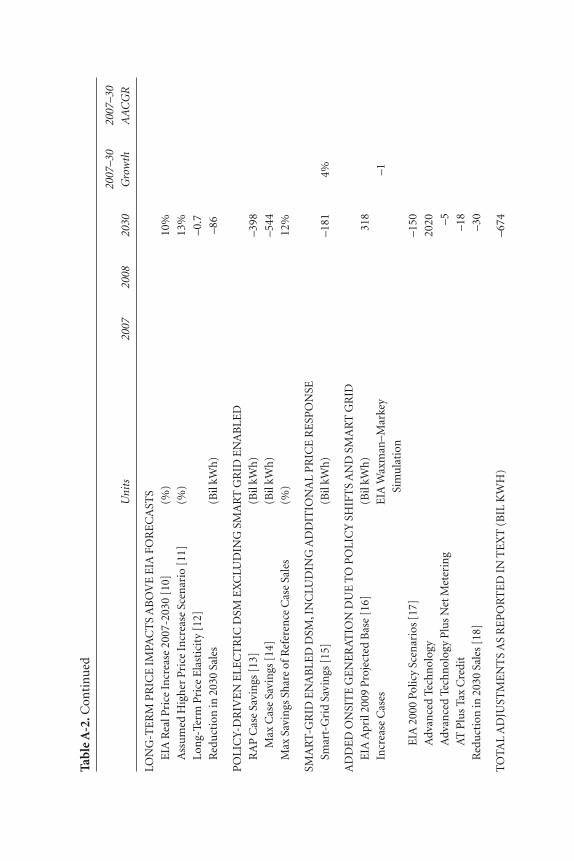
Tab
le A
-2.C
onti
nu
ed
2007
–30
2007
–30
Uni
ts20
0720
0820
30G
row
thA
AC
GR
LON
G-T
ER
M P
RIC
E I
MPA
CT
S A
BO
VE
EIA
FO
RE
CA
STS
EIA
Rea
l Pri
ce I
ncr
ease
200
7-20
30 [
10]
(%)
10%
Ass
um
ed H
igh
er P
rice
In
crea
se S
cen
ario
[11
](%
)13
%
Lon
g-Te
rm P
rice
Ela
stic
ity
[12]
–0.7
Red
uct
ion
in 2
030
Sale
s(B
il kW
h)
–86
PO
LIC
Y-D
RIV
EN
ELE
CT
RIC
DSM
EX
CLU
DIN
G S
MA
RT
GR
ID E
NA
BLE
D
RA
P C
ase
Savi
ngs
[13
](B
il kW
h)
–398
Max
Cas
e Sa
vin
gs [
14]
(Bil
kWh
)–5
44
Max
Sav
ings
Sh
are
of R
efer
ence
Cas
e Sa
les
(%)
12%
SMA
RT
-GR
ID E
NA
BLE
D D
SM, I
NC
LUD
ING
AD
DIT
ION
AL
PR
ICE
RE
SPO
NSE
Smar
t-G
rid
Savi
ngs
[15
](B
il kW
h)
–181
4%
AD
DE
D O
NSI
TE
GE
NE
RA
TIO
N D
UE
TO
PO
LIC
Y S
HIF
TS
AN
D S
MA
RT
GR
ID
EIA
Apr
il 20
09 P
roje
cted
Bas
e [1
6](B
il kW
h)
318
Incr
ease
Cas
esE
IA W
axm
an–M
arke
y –1
Sim
ula
tion
EIA
200
0 Po
licy
Scen
ario
s [1
7]–1
50
Adv
ance
d Te
chn
olog
y 20
20
Adv
ance
d Te
chn
olog
y P
lus
Net
Met
erin
g–5
AT
Plu
s Ta
x C
redi
t–1
8
Red
uct
ion
in 2
030
Sale
s [1
8]–3
0
TO
TAL
AD
JUST
ME
NT
S A
S R
EP
OR
TE
D I
N T
EX
T (
BIL
KW
H)
–674
BM:IP_Fox-Penner 8/15/10 7:10 PM Page 216
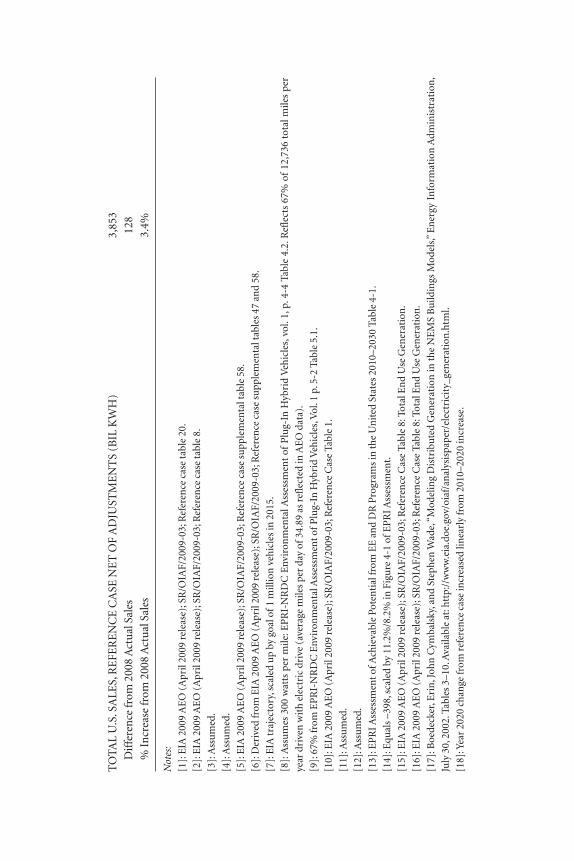
TO
TAL
U.S
. SA
LES,
RE
FER
EN
CE
CA
SE N
ET
OF
AD
JUST
ME
NT
S (B
IL K
WH
)3,
853
Dif
fere
nce
from
200
8 A
ctu
al S
ales
128
% I
ncr
ease
from
200
8 A
ctu
al S
ales
3.4%
Not
es:
[1]:
EIA
200
9 A
EO
(A
pril
2009
rel
ease
); S
R/O
IAF/
2009
-03;
Ref
eren
ce c
ase
tabl
e 20
.
[2]:
EIA
200
9 A
EO
(A
pril
2009
rel
ease
); S
R/O
IAF/
2009
-03;
Ref
eren
ce c
ase
tabl
e 8.
[3]:
Ass
um
ed.
[4]:
Ass
um
ed.
[5]:
EIA
200
9 A
EO
(A
pril
2009
rel
ease
); S
R/O
IAF/
2009
-03;
Ref
eren
ce c
ase
supp
lem
enta
l tab
le 5
8.
[6]:
Der
ived
from
EIA
200
9 A
EO
(A
pril
2009
rel
ease
); S
R/O
IAF/
2009
-03;
Ref
eren
ce c
ase
supp
lem
enta
l tab
les
47 a
nd
58.
[7]:
EIA
traj
ecto
ry, s
cale
d u
p by
goa
l of 1
mill
ion
veh
icle
s in
201
5.
[8]:
Ass
um
es 3
00 w
atts
per
mile
: EP
RI-
NR
DC
Env
iron
men
tal A
sses
smen
t of
Plu
g-In
Hyb
rid
Veh
icle
s, v
ol. 1
, p. 4
-4 T
able
4.2
. Ref
lect
s 67
% o
f 12
,736
tot
al m
iles
per
year
dri
ven
wit
h e
lect
ric
driv
e (a
vera
ge m
iles
per
day
of 3
4.89
as
refl
ecte
d in
AE
O d
ata)
.
[9]:
67%
from
EP
RI-
NR
DC
Env
iron
men
tal A
sses
smen
t of P
lug-
In H
ybri
d V
ehic
les,
Vol
. 1 p
. 5-2
Tab
le 5
.1.
[10]
: EIA
200
9 A
EO
(A
pril
2009
rel
ease
); S
R/O
IAF/
2009
-03;
Ref
eren
ce C
ase
Tabl
e 1.
[11]
: Ass
um
ed.
[12]
: Ass
um
ed.
[13]
: EP
RI A
sses
smen
t of A
chie
vabl
e Po
ten
tial
from
EE
an
d D
R P
rogr
ams
in th
e U
nit
ed S
tate
s 20
10–2
030
Tabl
e 4-
1.
[14]
: Equ
als
–398
, sca
led
by 1
1.2%
/8.2
% in
Fig
ure
4-1
of E
PR
I Ass
essm
ent.
[15]
: EIA
200
9 A
EO
(A
pril
2009
rel
ease
); S
R/O
IAF/
2009
-03;
Ref
eren
ce C
ase
Tabl
e 8:
Tot
al E
nd
Use
Gen
erat
ion
.
[16]
: EIA
200
9 A
EO
(A
pril
2009
rel
ease
); S
R/O
IAF/
2009
-03;
Ref
eren
ce C
ase
Tabl
e 8:
Tot
al E
nd
Use
Gen
erat
ion
.
[17]
: Boe
deck
er, E
rin
, Joh
n C
ymba
lsky
, an
d St
eph
en W
ade,
“M
odel
ing
Dis
trib
ute
d G
ener
atio
n in
th
e N
EM
S B
uild
ings
Mod
els,”
En
ergy
In
form
atio
n A
dmin
istr
atio
n,
July
30,
200
2. T
able
s 3–
10. A
vaila
ble
at: h
ttp:
//w
ww
.eia
.doe
.gov
/oia
f/an
alys
ispa
per/
elec
tric
ity_
gen
erat
ion
.htm
l.
[18]
: Yea
r 20
20 c
han
ge fr
om r
efer
ence
cas
e in
crea
sed
linea
rly
from
201
0–20
20 in
crea
se.
BM:IP_Fox-Penner 8/15/10 7:10 PM Page 217
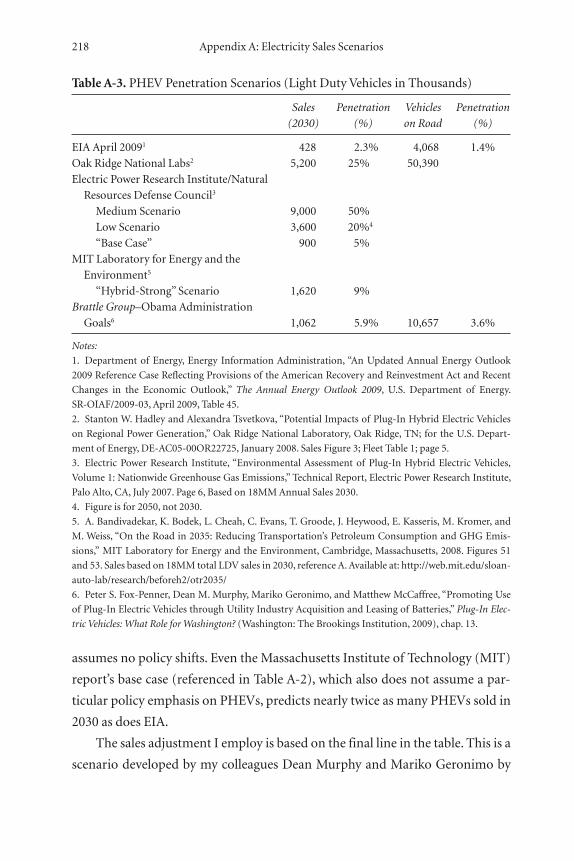
assumes no policy shifts. Even the Massachusetts Institute of Technology (MIT)
report’s base case (referenced in Table A-2), which also does not assume a par-
ticular policy emphasis on PHEVs, predicts nearly twice as many PHEVs sold in
2030 as does EIA.
The sales adjustment I employ is based on the final line in the table. This is a
scenario developed by my colleagues Dean Murphy and Mariko Geronimo by
218 Appendix A: Electricity Sales Scenarios
Table A-3. PHEV Penetration Scenarios (Light Duty Vehicles in Thousands)
Sales Penetration Vehicles Penetration
(2030) (%) on Road (%)
EIA April 20091 428 2.3% 4,068 1.4%
Oak Ridge National Labs2 5,200 25%.3 50,390
Electric Power Research Institute/Natural
Resources Defense Council3
Medium Scenario 9,000 50%.3
Low Scenario 3,600 20%43
“Base Case” 900 5%.
MIT Laboratory for Energy and the
Environment5
“Hybrid-Strong” Scenario 1,620 9%.
Brattle Group–Obama Administration
Goals6 1,062 5.9% 10,657 3.6%
Notes:
1. Department of Energy, Energy Information Administration, “An Updated Annual Energy Outlook
2009 Reference Case Reflecting Provisions of the American Recovery and Reinvestment Act and Recent
Changes in the Economic Outlook,” The Annual Energy Outlook 2009, U.S. Department of Energy.
SR-OIAF/2009-03, April 2009, Table 45.
2. Stanton W. Hadley and Alexandra Tsvetkova, “Potential Impacts of Plug-In Hybrid Electric Vehicles
on Regional Power Generation,” Oak Ridge National Laboratory, Oak Ridge, TN; for the U.S. Depart-
ment of Energy, DE-AC05-00OR22725, January 2008. Sales Figure 3; Fleet Table 1; page 5.
3. Electric Power Research Institute, “Environmental Assessment of Plug-In Hybrid Electric Vehicles,
Volume 1: Nationwide Greenhouse Gas Emissions,” Technical Report, Electric Power Research Institute,
Palo Alto, CA, July 2007. Page 6, Based on 18MM Annual Sales 2030.
4. Figure is for 2050, not 2030.
5. A. Bandivadekar, K. Bodek, L. Cheah, C. Evans, T. Groode, J. Heywood, E. Kasseris, M. Kromer, and
M. Weiss, “On the Road in 2035: Reducing Transportation’s Petroleum Consumption and GHG Emis-
sions,” MIT Laboratory for Energy and the Environment, Cambridge, Massachusetts, 2008. Figures 51
and 53. Sales based on 18MM total LDV sales in 2030, reference A. Available at: http://web.mit.edu/sloan-
auto-lab/research/beforeh2/otr2035/
6. Peter S. Fox-Penner, Dean M. Murphy, Mariko Geronimo, and Matthew McCaffree, “Promoting Use
of Plug-In Electric Vehicles through Utility Industry Acquisition and Leasing of Batteries,” Plug-In Elec-
tric Vehicles: What Role for Washington? (Washington: The Brookings Institution, 2009), chap. 13.
BM:IP_Fox-Penner 8/15/10 7:10 PM Page 218
scaling up EIA’s forecast to meet President Obama’s goal of one million plug-ins
in the fleet by 2015. Table A-3 shows that this scenario requires a little over dou-
ble the very low sales penetration in EIA’s forecast, much less than the remain-
der of the studies surveyed, with the exception of MIT’s base case. While it is
easy to envision scenarios with higher or lower PHEVs, the scenario we employ
is a plausible representation of an achievable policy-driven boost above EIA
forecasted levels.
In addition to adjusting the number of vehicles sold, I also adjust the elec-
tricity used by each vehicle. EIA assumes that about two-thirds of the PHEVs
sold in 2030 will have ten-mile ranges, while most other analysts assume that
40-mile-range vehicles will be standard. This impacts the electricity sales to ve-
hicles substantially, as the majority of vehicle-miles traveled by drivers in
PHEV-10s do not use electric power. In contrast, the more optimistic studies,
such as Electric Power Research Institute/Natural Resources Defense Council
(EPRI/NRDC), assume that about 67% of all miles are driven in electric mode.
The difference between these assumptions results in annual sales to vehicles of
1,439 kWh in EIA’s forecast and 2,560 kWh/year using EPRI/NRDC results.
To create a more aggressive scenario, I employ the EPRI/NRDC assump-
tions concerning sales per vehicle, though I do not employ their fleet penetra-
tion assumptions. The accompanying Table A-3 shows the two adjustments to
EIA’s forecast for PHEVs, one to increase penetration to the Brattle–Obama
goals scenario and the second to increase electric use per vehicle.
Long-Term Price Impacts
Long-term price impacts are the product of real price increases over and above
those in EIA’s forecast and the long-term price elasticity. EIA’s forecasts of price
increases should not include the impacts of a carbon cap and trade bill, a renew-
able electric standard, or any of the policies under discussion.
A plethora of studies attempt to examine the retail impacts of recent pro-
posed energy policies, including several specialized analyses by EIA itself. A
small sample of the results of these studies is shown in Table A-4.
No single study examines the impacts of all proposals under discussion, nor
Appendix A: Electricity Sales Scenarios 219
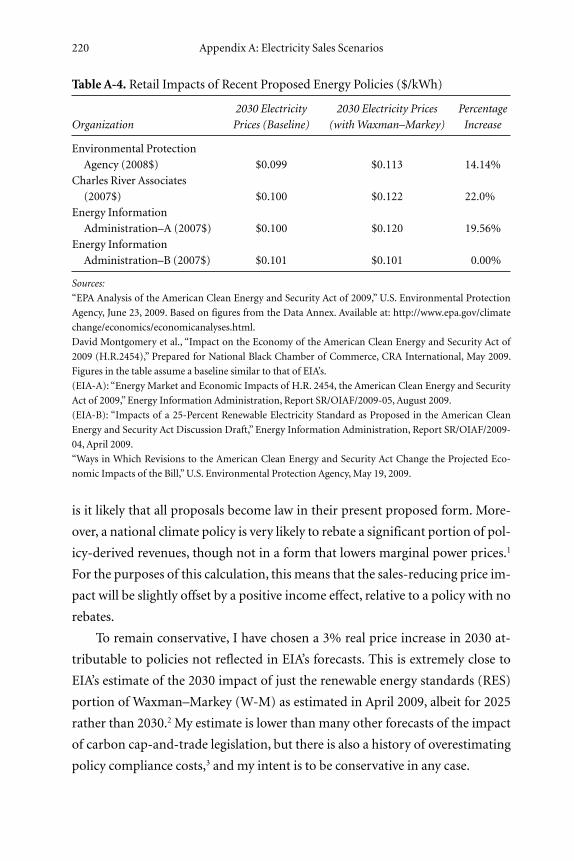
is it likely that all proposals become law in their present proposed form. More-
over, a national climate policy is very likely to rebate a significant portion of pol-
icy-derived revenues, though not in a form that lowers marginal power prices.1
For the purposes of this calculation, this means that the sales-reducing price im-
pact will be slightly offset by a positive income effect, relative to a policy with no
rebates.
To remain conservative, I have chosen a 3% real price increase in 2030 at-
tributable to policies not reflected in EIA’s forecasts. This is extremely close to
EIA’s estimate of the 2030 impact of just the renewable energy standards (RES)
portion of Waxman–Markey (W-M) as estimated in April 2009, albeit for 2025
rather than 2030.2 My estimate is lower than many other forecasts of the impact
of carbon cap-and-trade legislation, but there is also a history of overestimating
policy compliance costs,3 and my intent is to be conservative in any case.
220 Appendix A: Electricity Sales Scenarios
Table A-4. Retail Impacts of Recent Proposed Energy Policies ($/kWh)
2030 Electricity 2030 Electricity Prices Percentage
Organization Prices (Baseline) (withWaxman–Markey) Increase
Environmental Protection
Agency (2008$) $0.099 $0.113 14.14%
Charles River Associates
(2007$) $0.100 $0.122 22.0%0
Energy Information
Administration–A (2007$) $0.100 $0.120 19.56%
Energy Information
Administration–B (2007$) $0.101 $0.101 0.00%
Sources:
“EPA Analysis of the American Clean Energy and Security Act of 2009,” U.S. Environmental Protection
Agency, June 23, 2009. Based on figures from the Data Annex. Available at: http://www.epa.gov/climate
change/economics/economicanalyses.html.
David Montgomery et al., “Impact on the Economy of the American Clean Energy and Security Act of
2009 (H.R.2454),” Prepared for National Black Chamber of Commerce, CRA International, May 2009.
Figures in the table assume a baseline similar to that of EIA’s.
(EIA-A): “Energy Market and Economic Impacts of H.R. 2454, the American Clean Energy and Security
Act of 2009,” Energy Information Administration, Report SR/OIAF/2009-05, August 2009.
(EIA-B): “Impacts of a 25-Percent Renewable Electricity Standard as Proposed in the American Clean
Energy and Security Act Discussion Draft,” Energy Information Administration, Report SR/OIAF/2009-
04, April 2009.
“Ways in Which Revisions to the American Clean Energy and Security Act Change the Projected Eco-
nomic Impacts of the Bill,”U.S. Environmental Protection Agency,May 19, 2009.
For the elasticity term I employ a long-term price elasticity of –0.7. This is
approximately the level reported in Bernstein’s recent research and below the
level of most older estimates. Erring on the conservative side here is also di-
rected toward avoiding double-counting of these effects with EE and Smart
Grid–enabled efficiency.4
Additional Policy-Driven Energy Efficiency
At any price level, and with or without a carbon policy, EE efforts can be in-
creased or decreased through additional efforts ordered or incentivized by state
or federal agencies. The proposed W-M legislation contains a number of poli-
cies that would be expected to boost electricity savings above the EIA baseline,
including the ability to satisfy up to 20% of the RES mandate using verified effi-
ciency savings, accelerated building standards, and a federal program to man-
date higher building efficiency. A senate energy bill just reported out of Com-
mittee also has accelerated EE provisions.
At the state level a variety of EE policies are likely to trend upward over the
next twenty years, probably in areas federal policies do not emphasize. Tradi-
tionally, state EE incentives and mandates have primarily come in the form of
directed levels of effort and sometimes via the ability to use EE program savings
to comply with renewable portfolio standards (RPS) mandates. The American
Council for an Energy Efficient Economy’s (ACEEE’s) comparison of state ef-
forts shows that there is wide variation in state policies, and suggests that most
states could increase their programs substantially and remain cost-effective.5
Measuring the impacts of additional EE policies raises all of the issues in-
herent in any measurement of EE potential and the cost of overcoming market
barriers, topics discussed in more detail in Chapter 10. In this exercise we as-
sume the policy and measurement issues are sufficiently settled so as to enable
valid estimates of true electric sales savings incremental to the EIA reference
case.
The EPRI study6 used as the basis of my sales adjustment for expanded EE
efforts does not specify a policy approach, instead focusing on the available
cost-effective potential from a set of traditional (non–Smart Grid) efficiency
Appendix A: Electricity Sales Scenarios 221
technologies. Utility or state programs that target these measures should be able
to achieve the estimated savings over and above the EIA baseline. I employ the
“realistically achievable potential scenario” (RAP) results of 398 billion kWh,
the more conservative of the two EPRI cases. This scenario has been criticized as
being much too low by some efficiency experts;7 to the extent that it is, the
higher “max case” of 544 billion kWh is more appropriate and my conclusions
regarding the possibility of flat or negative sales growth are stronger.
It is an axiom of good EE planning that these programs should not target,
reward, or count as savings efficiency efforts that would have occurred anyway
(so-called free riders). Accordingly, properly designed EE policies will not create
savings that would have occurred in the EIA baseline and in the additional
unassisted price response cause by own-price elasticity.Moreover, my use of the
“realistically achievable” EE savings scenario as well as a relatively low price re-
sponse adjustment is also intended to offset what is certain to be a small amount
of overlap between savings categories.
A preliminary indication that my adjustment looks reasonable and achiev-
able comes from an analysis of the impact of W-M on electric demand prepared
by the ACEEE, which estimates that Titles I and II of the bill, which primarily
involve the renewable energy/energy efficiency portfolio standards, accelerated
building and appliance standards, and building and lighting EE, could save 505
billion kWh by 2030.8 This is 25% more than the EPRI RAP scenario, but quite
similar to the “maximum achievable” EPRI results.
Smart-Grid Enabled Energy Efficiency
There is a class of EE technologies, and their accompanying savings, that are en-
abled by Smart Grid technologies. The simplest such technologies are visual in-
dicators of current hourly energy prices, often in the form of globes that change
color as prices change, known as in-home displays (IHDs). Many other appli-
ances will be able to be remotely controlled. This will allow customers to shift
load, which does not reduce sales, but in some cases will allow customers to turn
off unneeded end uses more easily, locally or remotely. This is certain to reduce
222 Appendix A: Electricity Sales Scenarios
device-driven energy use, which is the fastest growing category of power use in
the United States today.9
Although some of these savings should be reflected in EIA’s forecasts, most
of them involve policy changes that will enable Smart Grid deployment. They
should not be reflected in the EPRI EE potential study because the EPRI study
included only existing devices and practices in its estimates. In any event, our
understanding of the size of EE savings the Smart Grid will enable is very pre-
liminary, based on a subset of the approximately 40 Smart Grid pilots under
way or completed in North America.
The most complete analysis of the particular EE measures and programs
specifically enabled by the Smart Grid comes from a 2008 EPRI study,The Green
Grid: Energy Savings and Carbon Emissions Reduced Enabled by a Smart Grid.10
The study finds five areas in which Smart Grid–enabled technologies create sig-
nificant incremental savings: (1) continuous commissioning of buildings and
other information-enabled technologies; (2) improved operational efficiency of
the distribution system, reducing line and substation losses; (3) enhanced de-
mand response and load control, which has a small energy savings effect; (4) re-
duced customer use purely from observing real-time prices; and (5) better util-
ity EE programs simply because information on savings will become more
accurate.
For each of these five areas, EPRI created three penetration scenarios as of
2030. For example, continuous commissioning was assumed to occur in some-
where between 5 and 20% of all commercial buildings by this date. Customer
feedback was assumed to occur in somewhere between 25 and 75% of all Amer-
ican homes. Overall, EPRI concluded that Smart Grid–enabled EE technologies
would save between 56 and 203 billion kWh by 2030. ACEEE has also done a re-
cent, preliminary estimate of Smart Grid–enabled EE; ACEEE finds that nearly
six times as much electric power can be saved through a “semiconductor-
enabled” efficiency strategy (1,242 billion kWh).11
I also draw on the work of my Brattle colleagues, led by Ahmad Faruqui.12
Ahmad’s team observed savings in the range of 4 to 7% from residential cus-
tomers purely from the effect of seeing price information, without increased
Appendix A: Electricity Sales Scenarios 223
ability to control devices. One would expect that device control, when coupled
with price transparency, would increase savings significantly, since it reduces the
cost of the efforts customers evidently are putting out to reduce their use manu-
ally in response to prices.
Offsetting these considerations, it is highly unlikely that the Smart Grid will
have penetrated all service areas, including rural utilities and difficult-to-reach
customer segments. Because Smart Grid deployment is highly dependent on the
pace of standardization, technological change, and regulatory policies, there are
very few analytically based deployment forecasts. One can think of the estimate
as a combination of 50% deployment of the Smart Grid and 8% savings from
Smart Grid–enabled EE or other similar combinations yielding approximately
the same outcome.
To avoid double counting and remain conservative, I estimate that Smart
Grid–enabled EE beyond the other adjustment categories is 4% of 2030 sales, or
181 billion kWh. This estimate is about 80% of EPRI’s range and far below
ACEEE’s estimate. As above, to the extent this is overly conservative the pros-
pects for sales growth diminish, and vice-versa.
Onsite Distributed Generation
Distributed generation (DG) made on the customer’s side of the meter is cer-
tainly part of electricity use, but it is not electricity sold by utilities unless the
utility actually owns the onsite generator. Although utilities ultimately may own
a substantial portion of onsite DG (see Chapter 13), for the purposes of this cal-
culation it is easiest to assume that all onsite power is not counted as utilities’
sales.13
There are many policy changes that may cause distributed power to in-
crease faster than forecasted in the EIA reference case. The currentW-M legisla-
tion and other federal RES proposals give three renewable energy credits (RECs)
for every MWh generated. Nevertheless, EIA’s simulation of W-M finds that the
legislation will cause an increase of only 3 to 5 billion kWh of onsite DG, in-
creasing it only about 2.5 to 4.0% by 2030.14 EIA’s simulation of the bill shows
about 50 billion kWh additional renewables (large as well as small scale) from
224 Appendix A: Electricity Sales Scenarios
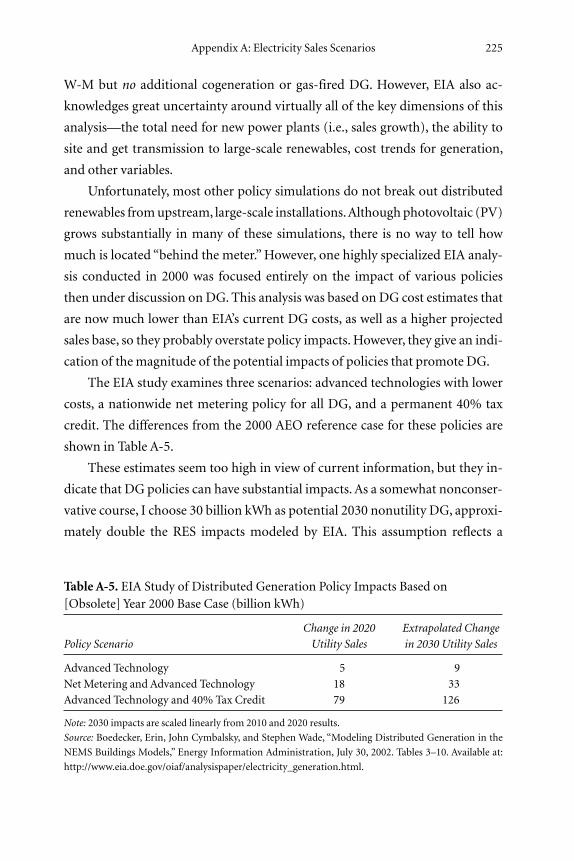
W-M but no additional cogeneration or gas-fired DG. However, EIA also ac-
knowledges great uncertainty around virtually all of the key dimensions of this
analysis—the total need for new power plants (i.e., sales growth), the ability to
site and get transmission to large-scale renewables, cost trends for generation,
and other variables.
Unfortunately, most other policy simulations do not break out distributed
renewables fromupstream, large-scale installations.Although photovoltaic (PV)
grows substantially in many of these simulations, there is no way to tell how
much is located “behind the meter.”However, one highly specialized EIA analy-
sis conducted in 2000 was focused entirely on the impact of various policies
then under discussion on DG. This analysis was based on DG cost estimates that
are now much lower than EIA’s current DG costs, as well as a higher projected
sales base, so they probably overstate policy impacts.However, they give an indi-
cation of themagnitude of the potential impacts of policies that promote DG.
The EIA study examines three scenarios: advanced technologies with lower
costs, a nationwide net metering policy for all DG, and a permanent 40% tax
credit. The differences from the 2000 AEO reference case for these policies are
shown in Table A-5.
These estimates seem too high in view of current information, but they in-
dicate that DG policies can have substantial impacts.As a somewhat nonconser-
vative course, I choose 30 billion kWh as potential 2030 nonutility DG, approxi-
mately double the RES impacts modeled by EIA. This assumption reflects a
Appendix A: Electricity Sales Scenarios 225
Table A-5. EIA Study of Distributed Generation Policy Impacts Based on[Obsolete] Year 2000 Base Case (billion kWh)
Change in 2020 Extrapolated Change
Policy Scenario Utility Sales in 2030 Utility Sales
Advanced Technology 5 9
Net Metering and Advanced Technology 18 33
Advanced Technology and 40% Tax Credit 79 126
Note: 2030 impacts are scaled linearly from 2010 and 2020 results.
Source: Boedecker, Erin, John Cymbalsky, and Stephen Wade, “Modeling Distributed Generation in the
NEMS Buildings Models,” Energy Information Administration, July 30, 2002. Tables 3–10. Available at:
http://www.eia.doe.gov/oiaf/analysispaper/electricity_generation.html.
possible future with strong local encouragement for community-based renew-
able development and improved availability of low-cost downstream storage
beyond that assumed by EIA.
I think these are highly possible outcomes. Sources in California, often a
bellwether for energy developments, report a rapid rise in interest by real estate
developers installing DG as part of large-scale developments. As the cost differ-
ences between DG at the 1 to 2 MW (not the individual household) and 100
MW scale decline, many new large-scale developments will routinely include
DG, with increasing penetration especially likely in the latter portion of the
forecast.
Total Adjustments to Sales
The adjustments discussed above are positive for PHEVs and negative (i.e.,
sales-reducing) for the remaining factors. The net impact of all these adjust-
ments is 674 billion kWh. This compares to the total EIA-estimated reference
case sales growth of 806 billion kWh between 2008 and 2030.
226 Appendix A: Electricity Sales Scenarios
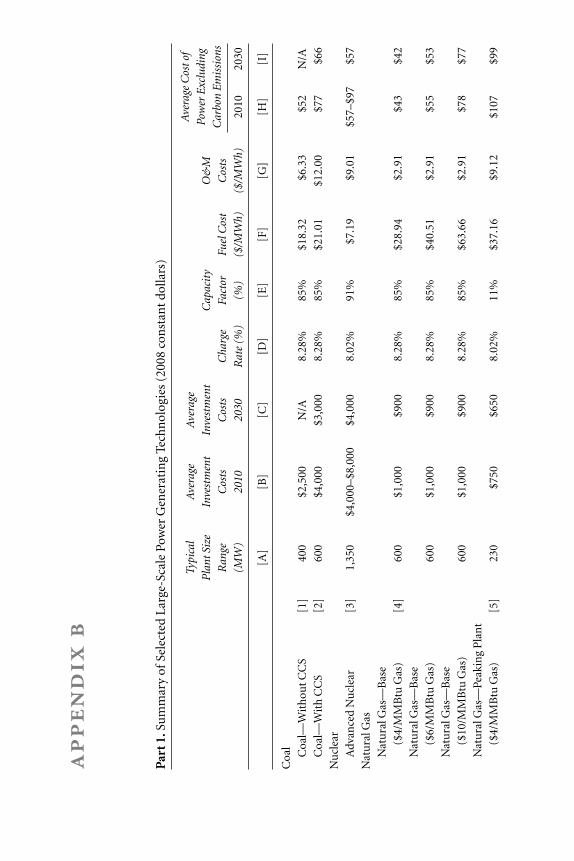
ap
pen
dix
b
Part1.SummaryofSelectedLarge-ScalePowerGeneratingTechnologies(2008constantdollars)
Typical
Average
Average
AverageCostof
PlantSize
Investment
Investment
Capacity
O&M
PowerExcluding
Range
Costs
Costs
Charge
Factor
FuelCost
Costs
CarbonEm
issions
(MW)
2010
2030
Rate(%
)(%
)($/MWh)
($/MWh)
2010
2030
[A]
[B]
[C]
[D]
[E]
[F]
[G]
[H]
[I]
Coal
Coal—WithoutCCS
[1]
400
$2,500
N/A
8.28%
85%
$18.32
$6.33
$52
N/A
Coal—WithCCS
[2]
600
$4,000
$3,000
8.28%
85%
$21.01
$12.00
$77
$66
Nuclear
AdvancedNuclear
[3]
1,350
$4,000–$8,000
$4,000
8.02%
91%
$7.19
$9.01
$57–$97
$57
NaturalGas
NaturalGas—Base
($4/MMBtuGas)
[4]
600
$1,000
$900
8.28%
85%
$28.94
$2.91
$43
$42
NaturalGas—Base
($6/MMBtuGas)
600
$1,000
$900
8.28%
85%
$40.51
$2.91
$55
$53
NaturalGas—Base
($10/MMBtuGas)
600
$1,000
$900
8.28%
85%
$63.66
$2.91
$78
$77
NaturalGas—PeakingPlant
($4/MMBtuGas)
[5]
230
$750
$650
8.02%
11%
$37.16
$9.12
$107
$99
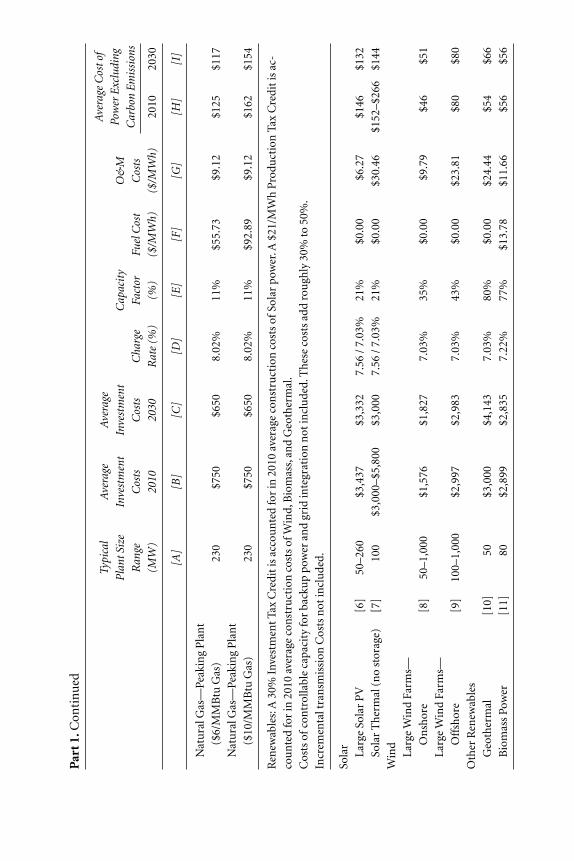
Part1.Continued
Typical
Average
Average
AverageCostof
PlantSize
Investment
Investment
Capacity
O&M
PowerExcluding
Range
Costs
Costs
Charge
Factor
FuelCost
Costs
CarbonEm
issions
(MW)
2010
2030
Rate(%
)(%
)($/MWh)
($/MWh)
2010
2030
[A]
[B]
[C]
[D]
[E]
[F]
[G]
[H]
[I]
NaturalGas—PeakingPlant
($6/MMBtuGas)
230
$750
$650
8.02%
11%
$55.73
$9.12
$125
$117
NaturalGas—PeakingPlant
($10/MMBtuGas)
230
$750
$650
8.02%
11%
$92.89
$9.12
$162
$154
Renewables:A30%InvestmentTaxCreditisaccountedforin2010averageconstructioncostsofSolarpower.A$21/MWhProductionTaxCreditisac-
countedforin2010averageconstructioncostsofWind,Biomass,andGeothermal.
Costsofcontrollablecapacityforbackuppowerandgridintegrationnotincluded.Thesecostsaddroughly30%to50%.
IncrementaltransmissionCostsnotincluded.
Solar
LargeSolarPV
[6]
50–260
$3,437
$3,332
7.56/7.03%
21%
$0.00
$6.27
$146
$132
SolarThermal(nostorage)
[7]
100
$3,000–$5,800
$3,000
7.56/7.03%
21%
$0.00
$30.46
$152–$266
$144
Wind
LargeWindFarms—
Onshore
[8]
50–1,000
$1,576
$1,827
7.03%
35%
$0.00
$9.79
$46
$51
LargeWindFarms—
Offshore
[9]
100–1,000
$2,997
$2,983
7.03%
43%
$0.00
$23.81
$80
$80
OtherRenewables
Geothermal
[10]
50$3,000
$4,143
7.03%
80%
$0.00
$24.44
$54
$66
BiomassPower
[11]
80$2,899
$2,835
7.22%
77%
$13.78
$11.66
$56
$56
Not
es:
[1]
and
[2]:
CC
S re
fers
to c
arbo
n c
aptu
re a
nd
sequ
estr
atio
n.
[4]
and
[5]:
Nat
ura
l gas
cos
ts a
t $6.
00/M
MB
tu.
[H]
and
[I]:
Cal
cula
ted
as (
[B] ×
[D] ×
1000
) / (
[E] ×
8760
) +
[F]
+ [
G]
, an
d ([
C] ×
[D] ×
1000
) / (
[E] ×
8760
) +
[F]
+ [
G]
, res
pect
ivel
y.
CO
2co
st is
cal
cula
ted
as [
J] ×
50 (
$ pe
r m
etri
c to
n).
[1]:
[A
]: A
EO
200
9 A
ssu
mpt
ion
s. T
able
8.2
.
[B]:
Au
thor
’s ju
dgm
ent b
ased
upo
n tw
enty
ext
ern
al s
tudi
es o
n c
oal p
lan
t cos
ts w
ith
out C
CS
in o
r ar
oun
d 20
10 (
such
as
DO
E; A
EO
200
9 A
ssu
mpt
ion
s; R
eED
S; E
PR
I TA
G; a
nd
an a
vera
ge o
f th
irty
-tw
o n
ew c
oal p
roje
cts
repo
rted
by
Ven
tyx)
.
[C]:
Coa
l wit
hou
t CC
S as
sum
ed to
be
obso
lete
in 2
030.
[D]:
Cal
cula
ted
usi
ng
a tw
enty
-yea
r M
AC
RS
tax
depr
ecia
tion
sch
edu
le. S
ee h
ttp:
//w
ww
.irs.
gov/
pub/
irs-
pdf/
p946
.
[E]:
Au
thor
est
imat
e.
[F]:
Cal
cula
ted
usi
ng
exte
rnal
stu
dies
list
ed in
[B
] an
d [C
]. W
hen
fuel
cos
ts n
ot r
epor
ted,
cos
t of c
oal a
ssu
med
to b
e $2
.00/
MM
Btu
. Hea
t rat
e of
9,2
00 B
tu/k
Wh
bas
ed o
n A
EO
2009
Ass
um
ptio
ns.
[G]:
Cal
cula
ted
usi
ng
exte
rnal
stu
dies
list
ed in
[B
] an
d [C
]. W
hen
O&
M c
osts
not
rep
orte
d, A
EO
200
9 A
ssu
mpt
ion
s ar
e u
sed.
[2]:
[A
]: A
EO
200
9 A
ssu
mpt
ion
s. T
able
8.2
.
[B]:
Au
thor
’s ju
dgm
ent
base
d u
pon
sev
en e
xter
nal
stu
dies
on
coa
l pla
nt
cost
s w
ith
CC
S in
or
arou
nd
2010
(su
ch a
s A
EO
200
9 A
ssu
mpt
ion
s; R
eED
S; C
RS;
an
d an
ave
rage
of
nin
e n
ew c
oal p
roje
cts
repo
rted
by
Ven
tyx)
.
[C]:
Au
thor
’s ju
dgm
ent b
ased
upo
n n
ine
exte
rnal
stu
dies
on
coa
l pla
nt c
osts
wit
h C
CS
in o
r ar
oun
d 20
30 (
such
as
AE
O 2
009
Ass
um
ptio
ns;
ReE
DS;
EP
RI
TAG
).
[D]:
Cal
cula
ted
usi
ng
a tw
enty
-yea
r M
AC
RS
tax
depr
ecia
tion
sch
edu
le. S
ee h
ttp:
//w
ww
.irs.
gov/
pub/
irs-
pdf/
p946
.
[E]:
Au
thor
est
imat
e.
[F]:
Cal
cula
ted
usi
ng
exte
rnal
stu
dies
list
ed in
[B
] an
d[C
]. W
hen
fuel
cos
ts n
ot r
epor
ted,
cos
t of c
oal a
ssu
med
to b
e $2
.00/
MM
Btu
. Hea
t rat
e of
10,
781
Btu
/kW
h b
ased
on
AE
O
2009
Ass
um
ptio
ns.
[G]:
Cal
cula
ted
usi
ng
exte
rnal
stu
dies
list
ed in
[B
] an
d [C
]. W
hen
O&
M c
osts
not
rep
orte
d, A
EO
200
9 A
ssu
mpt
ion
s ar
e u
sed.
For
coa
l wit
h C
CS,
O&
M in
clu
des
cost
s of
CO
2
tran
spor
t an
d st
orag
e.
[3]:
[A
]: A
EO
200
9 A
ssu
mpt
ion
s. T
able
8.2
.
[B]:
Cos
t ran
ge is
bas
ed u
pon
six
teen
ext
ern
al s
tudi
es o
n n
ucl
ear
plan
t cos
ts in
or
arou
nd
2010
(su
ch a
s D
OE
; AE
O 2
009
Ass
um
ptio
ns;
EP
RI
TAG
; MIT
; CR
S; N
EI;
an
d an
av-
erag
e of
thir
ty-f
our
new
nu
clea
r pr
ojec
ts r
epor
ted
by V
enty
x).
BM:IP_Fox-Penner 8/15/10 7:10 PM Page 229
Part1.Continued
[C]:Author’sjudgmentbaseduponsevenexternalstudiesonnuclearplantcostsinoraround2030(suchasDOE;AEO2009Assumptions;andReEDS).
[D]:Calculatedusingafifteen-yearMACRStaxdepreciationschedule.Seehttp://www.irs.gov/pub/irs-pdf/p946.pdf.
[E]:Calculatedfrom
AEO2009Assumptions.
[F]:Calculatedusingexternalstudieslistedin[B]and[C].Whenfuelcostsnotreported,costofuraniumassumedtobe$0.55/MMBtuHeatrateof10,434Btu/kWhbasedon
AEO2009Assumptions.
[G]:Calculatedusingexternalstudieslistedin[B]and[C].WhenO&Mcostsnotreported,AEO2009Assumptionsareused.Inaddition,O&Mincludescostofnuclearspent
fuelanddecommissioning(approximately$2/MWh).
[4]:[A]:Averageofsixty-threenewcombined-cyclenaturalgasprojectsasreportedintheJune2009versionofTheVelocitySuitefrom
Ventyx,Inc.
[B]:Author’sjudgmentbaseduponsixteenexternalstudiesonnaturalgascombinedcycleplantcostsinoraround2010(suchasDOE;AEO2009Assumptions;MIT;EPRI
TAG;NEI;CRS;andanaverageofsixty-threenewcombinedcyclegasprojectsreportedbyVentyx).
[C]:Author’sjudgmentbaseduponelevenexternalstudiesonnaturalgascombinedcycleplantcostsinoraround2030(suchasDOE;AEO2009Assumptions;andReEDS).
[D]:Calculatedusingatwenty-yearMACRStaxdepreciationschedule.Seehttp://www.irs.gov/pub/irs-pdf/p946.pdf.
[E]:CapacityfactorofnaturalgasCClarge-scaleplantfromAEO2009Assumptions.
[F]:Calculatedusingthreescenariosofnaturalgasprice.Heatrateof6,752Btu/kWhbasedonAEO2009Assumptions.
[G]:Calculatedusingexternalstudieslistedin[B]and[C].WhenO&Mcostsnotreported,AEO2009Assumptionsareused.
[5]:[A]:AEO2009Assumptions,Table8.2(foradvancedcombustionturbine).
[B]:Author’sjudgmentbaseduponnineexternalstudiesonnaturalgascombustionturbineplantcostsinoraround2010(suchasAEO2009Assumptions;ReEDS;andan
averageof40newcombustionturbinegasprojectsreportedbyVentyx).
[C]:Author’sjudgmentbasedupontenexternalstudiesonnaturalcom
bustionturbineplantcostsinoraround2030(suchasAEO2009Assumptions;andReEDS).
[D]:Calculatedusingafifteen-yearMACRStaxdepreciationschedule.Seehttp://www.irs.gov/pub/irs-pdf/p946.pdf.
[E]:Calculatedfrom
AEO2009Assumptions.
[F]:Calculatedusingthreescenariosofnaturalgasprice.Heatrateof9,289Btu/kWhbasedonAEO2009Assumptions.
[G]:Calculatedusingexternalstudieslistedin[B]and[C].WhenO&Mcostsnotreported,AEO2009Assumptionsareused.
[6]:[A]:Author’sestimate.
[B]:Calculatedfrom
fiveexternalstudiesonlargephotovoltaiccapitalcostsinoraround2010(RETI;ConnecticutIRP;MIT;AEO2009Assumptions;andanaverageofthree
newlargephotovoltaicprojectsreportedbyVentyx).(See“Sources”formoredetail.)
[C]:Calculatedfrom
twoexternalstudiesonlargephotovoltaiccapitalcostsinoraround2030(RETI;AEO2009Assumptions).(See“Sources”formoredetail.)
[D]:Calculatedusingafive-yearMACRStaxdepreciationschedule.Seehttp://www.dsireusa.org/incentives/incentive.cfm?Incentive_Code=US06F&re=1&ee=0.Taxdepreci-
ationbasisisreducedbyone-halftheITCamountin2010.7.56%
in2010;7.03%
in2030.Thetaxdepreciationbasisisreducedby15%(i.e.,one-halftheITCamount)in
2010,resultinginahigherchargerate.
[E]and[G]:Calculatedfrom
AEO2009Assumptions.
[7]:[A]:AEO2009Assumption.Table8.2.
[B]:Costrangeisbaseduponfourexternalstudiesonlargesolarthermalcapitalcostsinoraround2010(AEO2009Assumptions;CRS;MIT;andanaverageofnineteennew
largesolarthermalprojectsreportedbyVentyx).
[C]:Author’sjudgmentbasedupontwoexternalstudiesonlargesolarthermalcapitalcostsinoraround2030(AEO2009Assumptions;EPRITAG).
[D]:Calculatedusingafive-yearMACRStaxdepreciation
schedule.Seehttp://www.dsireusa.org/incentives/incentive.cfm?Incentive_Code=US06F&re=1&ee=0.7.56%in
2010;7.03%
in2030.Thetaxdepreciationbasisisreducedby15%(i.e.,one-halftheITCamount)in2010,resultinginahigherchargerate.
[E]and[G]:Calculatedfrom
AEO2009Assumptions.
[8]:[A]:Author’sjudgmentbaseduponAEO2009Assumptions,Table8.2.
[B]:Calculatedfrom
sixexternalstudiesonlargewindcapitalcostsinoraround2010(AEO2009Assumptions;DOE;CRS;EPRITAG;RETI;andanaverageof185newlarge
windprojectsreportedbyVentyx).(See“Sources”formoredetail.)
[C]:Calculatedfrom
twoexternalstudiesonlargewindcapitalcostsinoraround2030(AEO2009Assumptions;DOE).(See“Sources”formoredetail.)Notethatconsumer-
levelsubsidies,whichwouldreducecapitalcostsforwindfarms,arenotincludedin2030.
[D]:Calculatedusingafive-yearMACRStaxdepreciationschedule.Seehttp://www.dsireusa.org/incentives/incentive.cfm?Incentive_Code=US06F&re=1&ee=0.
[E]and[G]:Calculatedfrom
AEO2009Assumptions.
[9]:[A]:Author’sjudgmentbaseduponAEO2009Assumptions,Table8.2.
[B]:Calculatedfrom
threeexternalstudiesonlargeoffshorewindcapitalcostsinoraround2010(AEO2009Assumptions;DOE;andanaverageofsevennewlargeoffshore
windprojectsreportedbyVentyx).(See“Sources”formoredetail.)
[C]:Calculatedfrom
twoexternalstudiesonlargeoffshorewindcapitalcostsinoraround2030(AEO2009Assumptions;DOE).Notethatconsumer-levelsubsidies,which
wouldreducecapitalcostsforwindfarms,arenotincludedin2030.
[D]:Calculatedusingafive-yearMACRStaxdepreciationschedule.Seehttp://www.dsireusa.org/incentives/incentive.cfm?Incentive_Code=US06F&re=1&ee=0.
[E]and[G]:Calculatedfrom
AEO2009Assumptions.Capacityfactorbasedon2015projection.
[10]:[A]:AEO2009Assumptions.Table8.2.
[B]:Author’sjudgmentbaseduponsevenexternalstudiesongeothermalcapitalcostsinoraround2010(suchasCRS;RETI;ReEDS;andanaverageoftwenty-onenewgeo-
thermalprojectsreportedbyVentyx).
[C]:Calculatedfrom
fiveexternalstudiesongeothermalcapitalcostsinoraround2030(suchasAEO2009Assumptions;andReEDS).Notethatconsumer-levelsubsidies,
whichwouldreducecapitalcostsforgeothermalplants,arenotincludedin2030.
Part1.Continued
[D]:Calculatedusingafive-yearMACRStaxdepreciationschedule.Seehttp://www.dsireusa.org/incentives/incentive.cfm?Incentive_Code=US06F&re=1&ee=0.
[E]and[G]:Calculatedfrom
AEO2009Assumptions.
[11]:[A]:AEO2009Assumption.Table8.2.
[B]:Calculatedfrom
fourexternalstudiesonhydroelectriccapitalcostsinoraround2010(suchasReEDS;andanaverageofthirtynew
hydraulicturbineprojectsreported
byVentyx).
[C]:Calculatedfrom
fiveexternalstudiesonhydroelectriccapitalcostsinoraround2030(suchasAEO2009Assumptions;andReEDS).
[D]:Calculatedusingatwenty-yearMACRStaxdepreciationschedule.Seehttp://www.irs.gov/pub/irs-pdf/p946.pdf.
[E]:Calculatedfrom
AEO2009Assumptions.
[G]:Calculatedusingexternalstudieslistedin[B]and[C].WhenO&Mcostsnotreported,AEO2009assumptionsareused.
[12]:[A]:AEO2009Assumptions.Table8.2.
[B]:Calculatedfrom
sixexternalstudiesonbiom
asscapitalcostsinoraround2010(suchasAEO2009Assumptions;EPRITAG;M
IT;RETI;andanaverageoftwonewlarge
biom
asssteamturbineprojectsreportedbyVentyx).
[C]:Calculatedfrom
AEO2009Assumptions.Notethatconsumer-levelsubsidies,whichwouldreducecapitalcostsforbiom
assplants,arenotincludedin2030.
[D]:Calculatedusingaseven-yearMACRStaxdepreciationschedule.Seehttp://www.dsireusa.org/incentives/incentive.cfm?Incentive_Code=US06F&re=1&ee=0.
[E]:Calculatedfrom
AEO2009Assumptions.
[F]:Calculatedusingexternalstudieslistedin[B]and[C].Whenfuelcostsnotreported,costofbiom
assassumedtobe$1.00/MMBtu.Heatrateof9,646Btu/kWhbasedon
AEO2009Assumptions.
[G]:Calculatedusingexternalstudieslistedin[B]and[C].WhenO&Mcostsnotreported,AEO2009assumptionsareused.
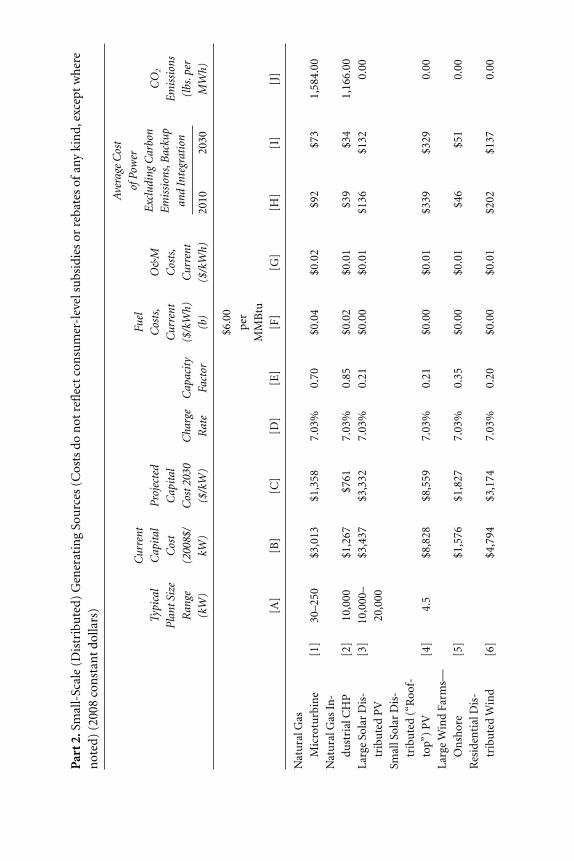
Part2.Small-Scale(Distributed)GeneratingSources(Costsdonotreflectconsumer-levelsubsidiesorrebatesofanykind,exceptwhere
noted)(2008constantdollars)
AverageCost
Current
Fuel
ofPower
Typical
Capital
Projected
Costs,
O&M
ExcludingCarbon
CO2
PlantSize
Cost
Capital
Current
Costs,
Emissions,Backup
Emissions
Range
(2008$/
Cost2030
Charge
Capacity
($/kWh)
Current
andIntegration
(lbs.per
(kW)
kW)
($/kW)
Rate
Factor
(b)
($/kWh)
2010
2030
MWh)
$6.00
per
MMBtu
[A]
[B]
[C]
[D]
[E]
[F]
[G]
[H]
[I]
[J]
NaturalGas
Microturbine
[1]
30–250
$3,013
$1,358
7.03%
0.70
$0.04
$0.02
$92
$73
1,584.00
NaturalGasIn-
dustrialCHP
[2]
10,000
$1,267
$761
7.03%
0.85
$0.02
$0.01
$39
$34
1,166.00
LargeSolarDis-
[3]
10,000–
$3,437
$3,332
7.03%
0.21
$0.00
$0.01
$136
$132
0.00
tributedPV
20,000
SmallSolarDis-
tributed(“Roof-
top”)PV
[4]
4.5
$8,828
$8,559
7.03%
0.21
$0.00
$0.01
$339
$329
0.00
LargeWindFarms—
Onshore
[5]
$1,576
$1,827
7.03%
0.35
$0.00
$0.01
$46
$51
0.00
ResidentialDis-
tributedWind
[6]
$4,794
$3,174
7.03%
0.20
$0.00
$0.01
$202
$137
0.00
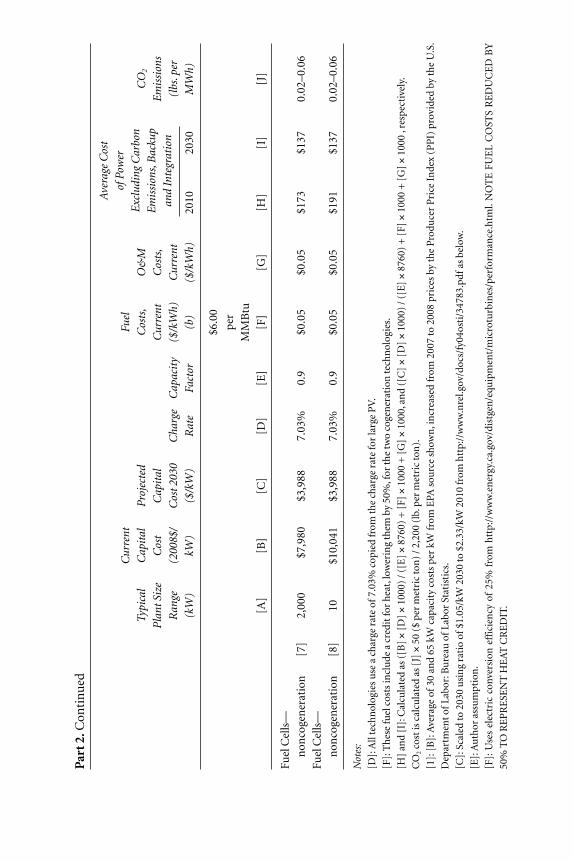
Part2.Continued
AverageCost
Current
Fuel
ofPower
Typical
Capital
Projected
Costs,
O&M
ExcludingCarbon
CO2
PlantSize
Cost
Capital
Current
Costs,
Emissions,Backup
Emissions
Range
(2008$/
Cost2030
Charge
Capacity
($/kWh)
Current
andIntegration
(lbs.per
(kW)
kW)
($/kW)
Rate
Factor
(b)
($/kWh)
2010
2030
MWh)
$6.00
per
MMBtu
[A]
[B]
[C]
[D]
[E]
[F]
[G]
[H]
[I]
[J]
FuelCells—
noncogeneration
[7]
2,000
$7,980
$3,988
7.03%
0.9
$0.05
$0.05
$173
$137
0.02–0.06
FuelCells—
noncogeneration
[8]
10$10,041
$3,988
7.03%
0.9
$0.05
$0.05
$191
$137
0.02–0.06
Notes:
[D]:Alltechnologiesuseachargerateof7.03%copiedfrom
thechargerateforlargePV.
[F]:Thesefuelcostsincludeacreditforheat,loweringthem
by50%,forthetwocogenerationtechnologies.
[H]and[I]:Calculatedas([B]×[D]×1000)/([E]×8760)+[F]×1000+[G]×1000,and([C]×[D]×1000)/([E]×8760)+[F]×1000+[G]×1000,respectively.
CO2costiscalculatedas[J]×50($permetricton)/2,200(lb.permetricton).
[1]:[B]:Averageof30and65kW
capacitycostsperkW
from
EPA
sourceshown,increasedfrom
2007to2008pricesbytheProducerPriceIndex(PPI)providedbytheU.S.
DepartmentofLabor:BureauofLaborStatistics.
[C]:Scaledto2030usingratioof$1.05/kW
2030to$2.33/kW
2010from
http://www.nrel.gov/docs/fy04osti/34783.pdfasbelow.
[E]:Authorassumption.
[F]:Useselectricconversion
efficiencyof25%from
http://www.energy.ca.gov/distgen/equipment/microturbines/performance.html.NOTEFUELCOSTSREDUCEDBY
50%TOREPRESENTHEATCREDIT.
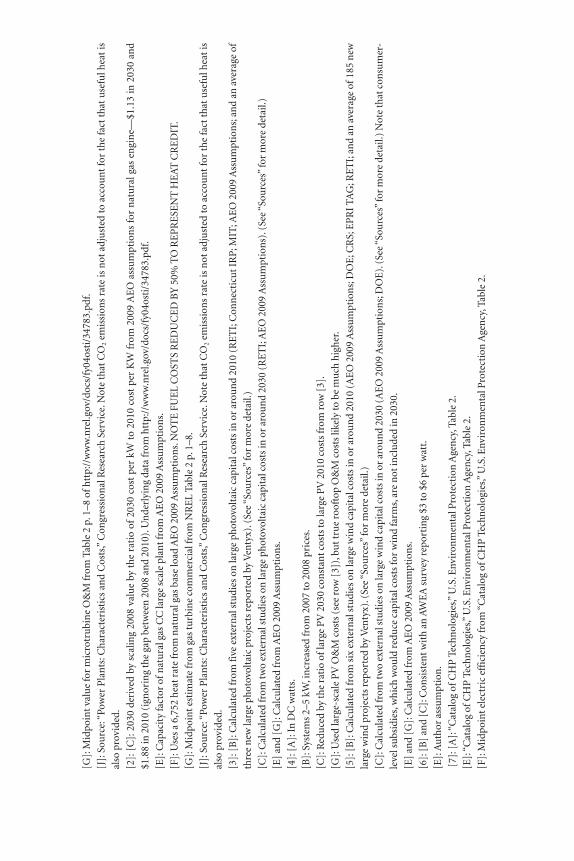
[G]:
Mid
poin
t val
ue
for
mic
rotr
ubi
ne
O&
M fr
om T
able
2 p
. 1–8
of h
ttp:
//w
ww
.nre
l.gov
/doc
s/fy
04os
ti/3
4783
.
[J]:
Sou
rce:
“Po
wer
Pla
nts
: Ch
arac
teri
stic
s an
d C
osts
,” C
ongr
essi
onal
Res
earc
h S
ervi
ce. N
ote
that
CO
2em
issi
ons
rate
is n
ot a
dju
sted
to a
ccou
nt
for
the
fact
th
at u
sefu
l hea
t is
also
pro
vide
d.
[2]:
[C
]: 2
030
deri
ved
by s
calin
g 20
08 v
alu
e by
th
e ra
tio
of 2
030
cost
per
kW
to
2010
cos
t pe
r K
W f
rom
200
9 A
EO
ass
um
ptio
ns
for
nat
ura
l gas
en
gin
e—$1
.13
in 2
030
and
$1.8
8 in
201
0 (i
gnor
ing
the
gap
betw
een
200
8 an
d 20
10).
Un
derl
yin
g da
ta fr
om h
ttp:
//w
ww
.nre
l.gov
/doc
s/fy
04os
ti/3
4783
.
[E]:
Cap
acit
y fa
ctor
of n
atu
ral g
as C
C la
rge
scal
e pl
ant f
rom
AE
O 2
009
Ass
um
ptio
ns.
[F]:
Use
s a
6,75
2 h
eat r
ate
from
nat
ura
l gas
bas
e lo
ad A
EO
200
9 A
ssu
mpt
ion
s. N
OT
E F
UE
L C
OST
S R
ED
UC
ED
BY
50%
TO
RE
PR
ESE
NT
HE
AT
CR
ED
IT.
[G]:
Mid
poin
t est
imat
e fr
om g
as tu
rbin
e co
mm
erci
al fr
om N
RE
L Ta
ble
2 p.
1–8
.
[J]:
Sou
rce:
“Po
wer
Pla
nts
: Ch
arac
teri
stic
s an
d C
osts
,” C
ongr
essi
onal
Res
earc
h S
ervi
ce. N
ote
that
CO
2em
issi
ons
rate
is n
ot a
dju
sted
to a
ccou
nt
for
the
fact
th
at u
sefu
l hea
t is
also
pro
vide
d.
[3]:
[B
]: C
alcu
late
d fr
om fi
ve e
xter
nal
stu
dies
on
larg
e ph
otov
olta
ic c
apit
al c
osts
in o
r ar
oun
d 20
10 (
RE
TI;
Con
nec
ticu
t IR
P; M
IT; A
EO
200
9 A
ssu
mpt
ion
s; a
nd
an a
vera
ge o
f
thre
e n
ew la
rge
phot
ovol
taic
pro
ject
s re
port
ed b
y V
enty
x). (
See
“Sou
rces
” fo
r m
ore
deta
il.)
[C]:
Cal
cula
ted
from
two
exte
rnal
stu
dies
on
larg
e ph
otov
olta
ic c
apit
al c
osts
in o
r ar
oun
d 20
30 (
RE
TI;
AE
O 2
009
Ass
um
ptio
ns)
. (Se
e “S
ourc
es”
for
mor
e de
tail.
)
[E]
and
[G]:
Cal
cula
ted
from
AE
O 2
009
Ass
um
ptio
ns.
[4]:
[A
]: I
n D
C w
atts
.
[B]:
Sys
tem
s 2–
5 kW
, in
crea
sed
from
200
7 to
200
8 pr
ices
.
[C]:
Red
uce
d by
the
rati
o of
larg
e P
V 2
030
con
stan
t cos
ts to
larg
e P
V 2
010
cost
s fr
om r
ow [
3].
[G]:
Use
d la
rge-
scal
e P
V O
&M
cos
ts (
see
row
[3]
), b
ut t
rue
roof
top
O&
M c
osts
like
ly to
be
mu
ch h
igh
er.
[5]:
[B
]: C
alcu
late
d fr
om s
ix e
xter
nal
stu
dies
on
larg
e w
ind
capi
tal c
osts
in o
r ar
oun
d 20
10 (
AE
O 2
009
Ass
um
ptio
ns;
DO
E; C
RS;
EP
RI
TAG
; RE
TI;
an
d an
ave
rage
of
185
new
larg
e w
ind
proj
ects
rep
orte
d by
Ven
tyx)
. (Se
e “S
ourc
es”
for
mor
e de
tail.
)
[C]:
Cal
cula
ted
from
two
exte
rnal
stu
dies
on
larg
e w
ind
capi
tal c
osts
in o
r ar
oun
d 20
30 (
AE
O 2
009
Ass
um
ptio
ns;
DO
E).
(Se
e “S
ourc
es”
for
mor
e de
tail.
) N
ote
that
con
sum
er-
leve
l su
bsid
ies,
wh
ich
wou
ld r
edu
ce c
apit
al c
osts
for
win
d fa
rms,
are
not
incl
ude
d in
203
0.
[E]
and
[G]:
Cal
cula
ted
from
AE
O 2
009
Ass
um
ptio
ns.
[6]:
[B
] an
d [C
]: C
onsi
sten
t wit
h a
n A
WE
A s
urv
ey r
epor
tin
g $3
to $
6 pe
r w
att.
[E]:
Au
thor
ass
um
ptio
n.
[7]:
[A
]: “
Cat
alog
of C
HP
Tec
hn
olog
ies,”
U.S
. Env
iron
men
tal P
rote
ctio
n A
gen
cy, T
able
2.
[E]:
“C
atal
og o
f CH
P T
ech
nol
ogie
s,” U
.S. E
nvir
onm
enta
l Pro
tect
ion
Age
ncy
, Tab
le 2
.
[F]:
Mid
poin
t ele
ctri
c ef
fici
ency
from
“C
atal
og o
f CH
P T
ech
nol
ogie
s,” U
.S. E
nvir
onm
enta
l Pro
tect
ion
Age
ncy
, Tab
le 2
.
BM:IP_Fox-Penner 8/15/10 7:10 PM Page 235
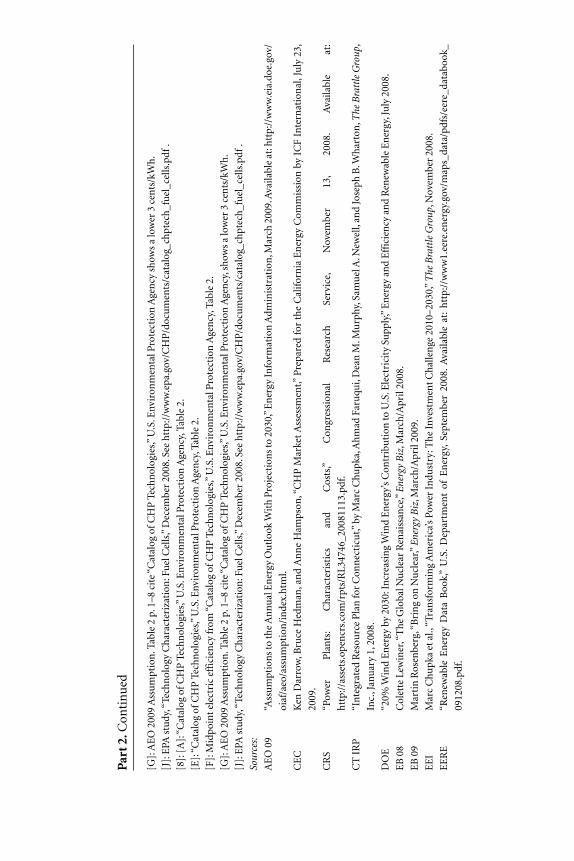
Part2.Continued
[G]:AEO2009Assumption.Table2p.1–8cite“CatalogofCHPTechnologies,”U.S.EnvironmentalProtectionAgencyshowsalower3cents/kWh.
[J]:EPA
study,“TechnologyCharacterization:FuelCells,”December2008.Seehttp://www.epa.gov/CHP/documents/catalog_chptech_fuel_cells.pdf.
[8]:[A]:“CatalogofCHPTechnologies,”U.S.EnvironmentalProtectionAgency,Table2.
[E]:“CatalogofCHPTechnologies,”U.S.EnvironmentalProtectionAgency,Table2.
[F]:Midpointelectricefficiencyfrom
“CatalogofCHPTechnologies,”U.S.EnvironmentalProtectionAgency,Table2.
[G]:AEO2009Assumption.Table2p.1–8cite“CatalogofCHPTechnologies,”U.S.EnvironmentalProtectionAgency,showsalower3cents/kWh.
[J]:EPA
study,“TechnologyCharacterization:FuelCells,”December2008.Seehttp://www.epa.gov/CHP/documents/catalog_chptech_fuel_cells.pdf.
Sources:
AEO09
“AssumptionstotheAnnualEnergyOutlookWithProjectionsto2030,”EnergyInformationAdm
inistration,March2009.Availableat:http://www.eia.doe.gov/
oiaf/aeo/assumption/index.html.
CEC
KenDarrow,BruceHedman,andAnneHampson,“CHPMarketAssessment,”PreparedfortheCaliforniaEnergyCom
missionbyICFInternational,July23,
2009.
CRS
“Power
Plants:
Characteristics
and
Costs,”
Congressional
Research
Service,
November
13,
2008.
Available
at:
http://assets.opencrs.com/rpts/RL34746_20081113.pdf.
CTIRP
“IntegratedResourcePlanforConnecticut,”byMarcChupka,AhmadFaruqui,DeanM.Murphy,SamuelA.Newell,andJosephB.Wharton,TheBrattleGroup,
Inc.,January1,2008.
DOE
“20%
WindEnergyby2030:IncreasingWindEnergy’sContributiontoU.S.ElectricitySupply,”EnergyandEfficiencyandRenewableEnergy,July2008.
EB08
ColetteLewiner,“TheGlobalNuclearRenaissance,”EnergyBiz,March/April2008.
EB09
MartinRosenberg,“BringonNuclear,”EnergyBiz,March/April2009.
EEI
MarcChupkaetal.,“TransformingAmerica’sPowerIndustry:TheInvestmentChallenge2010–2030,”TheBrattleGroup,November2008.
EERE
“RenewableEnergyDataBook,”U.S.DepartmentofEnergy,September2008.Availableat:http://www1.eere.energy.gov/maps_data/pdfs/eere_databook_
091208.pdf.
EPA
“CatalogofCHPTechnologies,”U.S.EnvironmentalProtectionAgency,December2008.
MIT06
“FutureofGeothermalEnergy:ImpactofEnhancedGeothermalSystems(EGS)ontheUnitedStatesinthe21stCentury,”MITReport,2006.
MIT09
“UpdateoftheMIT
2003
FutureofNuclearPower,”MIT
Energy
Initiative,2009.Availableathttp://web.mit.edu/nuclearpower/pdf/nuclearpower-up-
date2009.pdf.
NEI
“TheCostofNewGeneratingCapacity,”NuclearEnergyInstitute,February2009.
ReEDS
“ReEDSBaseCaseData,”NationalRenewableEnergyLaboratory,2008.Availableathttp://www.nrel.gov/analysis/reeds/pdfs/reeds_chap_2.pdf.
RETI
“RenewableEnergyTransmissionInitiativePhase1B—FinalReport,”BlackandVeatch,January2009.Availableat:http://www.energy.ca.gov/reti/documents/
index.html.
Severance
CraigA.Severance,“BusinessRisksandCostsofNew
NuclearPower,”postedontheClim
ateProgressBlog,2009.Availableathttp://climateprogress.org/wp-
content/uploads/2009/01/nuclear-costs-2009.pdf.
TAG
“Program
onTechnologyInnovation:IntegratedGenerationTechnologyOptions,”TheElectricPowerResearchInstitute,November2008.Availableat:http://
mydocs.epri.com
/docs/public/000000000001018329.pdf.
Ventyx
Thecostsrepresentedcomefrom
avarietyofsources,including,butnotlim
itedto,pressreleases,newsarticles,permits,Websites,andcompanycontacts—
as
reportedintheJune2009versionofTheVelocitySuitefrom
Ventyx,Inc.

appendix c
Further Discussion and ReadingRegarding Competition in thePower Industry
TWO PRIMARY explanations have been advanced to explain the apparent
gap between deregulation’s rhetoric and reality in the power industry. The
first is that competition was never a very sound idea in this industry, for equity
as well as for economic reasons. This view was espoused by economists such as
Harry Trebing and regulatory scholars like Judge Richard Cudahy, as well as by
parts of the industry itself.
More recent papers that are either skeptical of the case for deregulation or
entirely unconvinced come from Professors Borenstein, Bushnell, and Brennan,
as well as Richard Rosen, Jacqueline LangWeaver, and John Kelly. My own writ-
ings have also often been cautionary, noting that the case for retail choice (as
distinct from wholesale competition) was weak and that competitive conditions
in many markets were questionable.
The second explanation is described by policy analysts like Adam B. Sum-
mers of the Reason Foundation as“a government regulation failure,not amarket
239
failure.” This argument holds that politicians have not been able to stop them-
selves from placing controls on what were supposed to be deregulated markets
that prevent them from functioning properly. Articulations of this view are
found in recent books by James Sweeney and Charles Cicchetti and several arti-
cles by Professor Paul Joskow.
As the following studies show, there is a degree of truth in both schools of
thought. There were deep and pervasive flaws in the way we implemented elec-
tric competition in this country, wholesale as well as retail. The implementation
flaws were exacerbated by inadequate legislative and regulatory responses. Polit-
ical leaders found it impossible to allow electric prices to rise rapidly and unpre-
dictably, as they do in other deregulated markets. At the same time, electricity is
inherently ill-suited to be completely deregulated, and,where competition is ap-
propriate, the markets work only with strong, highly skilled monitoring and
enforcement.
Partial Bibliography: Studies ofWholesale and Retail Competition
A cross section of these studies includes the following scholarly works and pol-
icy papers.
Apt, Jay. “Competition Has Not Lowered U.S. Industrial Electricity Prices,” Electricity
Journal, March 2005: 52–56.
Barmack, Matthew, Edward Kahn, and Susan Tierney. “A Cost–Benefit Assessment of
Wholesale Electricity Restructuring and Competition in New England,” Analysis
Group, 2006.
Behr, Peter.“Probe of California Energy Crisis Facing Hurdles,”Washington Post, January
11, 2003: E01.
Blumsack, Seth A., Jay Apt, and Lester B. Lave.“Lessons from the Failure of U.S. Electric-
ity Restructuring,”Electricity Journal, March 2006: 15–32.
Blumstein, Carl, L. S. Friedman, and R. J. Green. “The History of Electricity Restructur-
ing in California.”CSEMWP 103, UCEI, August 2002.
Borenstein, Severin, and James Bushnell. “Electricity Restructuring: Deregulation or
Reregulation?”Regulation, 23 (2), 2000.
Brennan, Tim.“Questioning the Conventional ‘Wisdom,’“ Regulation, 24, (3), Fall 2001.
Brown, Matthew, H. “California’s Power Crisis: What Happened? What CanWe Learn?”
National Conference of State Legislatures,March 2001.
240 Appendix C: Further Discussion and Reading
Bushnell, James B., and Frank A. Wolak. “Regulation and the Leverage of Local Market
Power in the California Electricity Market,” July 1999.
“California Energy Crisis: Causes and Solutions,”Union of Concerned Scientists, http://
www.ucsusa.org/clean_energy/renewable_energy/page.cfm?pageID=68.
Chandley, John D., Carl R. Danner, Christopher E. Groves, et al. “California’s Elec-
tricity Markets: Structure, Crisis, and Needed Reforms,” LECG, LLC., January 17,
2003.
Cicchetti, Charles J., and Colin M. Long, with Kristina M Sepetys. Restructuring Electric-
ity Markets: A World Perspective Post California and Enron. Visions Communica-
tions, 2003.
Cudahy, Richard D. “The Coming Demise of Deregulation.” Yale Journal on Regulation,
Issue 10.1, 1993.
Faruqui, Ahmad, Hung-po Chao, Vic Niemeyer, Jeremy Platt, and Karl Stahlkopf. “Ana-
lyzing California’s Power Crisis,”Energy Journal, 22 (4), 2001: 29–51.
Harvey, Scott M., BruceM.McConihe, and Susan L. Pope.“Analysis of the Impact of Co-
ordinated Electricity Markets on Consumer Electricity Charges.”Draft, LECG, No-
vember 20, 2006.
Fox-Penner, Peter. “AWelcome Truce in the ElectricityWars.”Public Utilities Fortnightly,
48, 2005: 51.
Fox-Penner, Peter. “Electric Power Deregulation: Blessings and Blemishes: A Non-
Technical Review of the Issues Associated with Competition in Today’s Electric
Power Industry.” Prepared for the National Council on Competition and the Elec-
tric Industry,March 14, 2000.
Fox-Penner, Peter. Electricity Utility Restructuring. (Vienna,Virginia: Public Utilities Re-
ports), 1997.
Hogan,WilliamW. “WEPEX: Building the Structure for a Competitive Electricity Mar-
ket.” Presented at the FERC Technical Conference Concerning WEPEX, Washing-
ton, DC,August 1, 1996.
Joskow, Paul L. “California’s Electricity Crisis.”Oxford Review of Economic Policy, 2001:
365–388.
Joskow, Paul L. “Regulatory Failure, Regulatory Reform and Structural Change in the
Electric Power Industry,”Brookings Papers on Microeconomic Activity, Special Issue,
1989: 125–220, 1989.
Kahn, Michael, and Loretta Lynch. “California’s Electricity Options and Challenges Re-
port to Governor Gray Davis,” California Public Utilities Commission, August 2,
2000.
Kelly, John.“EMRI: Do Competition and ElectricityMix?”American Public Power Asso-
ciation, 2007.
Kelly, Susan, and Diane Moody. “Wholesale Electric Restructuring: Was 2004 the ‘Tip-
ping Point’?”Electricity Journal, March 2005: 11–18.
Appendix C: Further Discussion and Reading 241
Kleit, Andrew N., and Dek Terrell. “Measuring Potential Efficiency Gains from Deregu-
lation of Electricity Generation: A Bayesian Approach,” Review of Economics and
Statistics, August 2001: 523–530.
Kwoka, John E. “Restructuring the U.S. Electric Power Sector: A Review of Recent Stud-
ies.” Prepared for American Public Power Association, November 2006.
Mansur, Erin T. “Measuring Welfare in Restructured Electricity Markets,” Review of Eco-
nomics and Statistics, May 2008: 369–386.
Markiewicz, Kira, Nancy Rose, and Catherine Wolfram. “Has Restructuring Improved
Operating Efficiency at US Electricity Generating Plants?” CSEM WP 135, UCEI,
July 2004.
McCullough, Robert. “California Electricity Price Spikes: Factual Evidence,” January 15,
2003. http://www.mresearch.com/pdfs/76.pdf.
McCullough, Robert. Memorandum to McCullough Research Clients, “C66 and the Ar-
tificial Congestion of California Transmission in January 2001,” November 29,
2002.
Moody, Diane. “The Use—and Misuse—of Statistics in Evaluating the Benefits of Re-
structured Electricity Markets,” Electricity Journal, March 2007: 57–62.
Morrison, Jay A. “The Clash of Industry Visions,” Electricity Journal, January/February
2005: 14–30.
Pope, Susan L. “California Electricity Price Spikes: An Update on the Facts,” Harvard
Electricity Policy Group, December 9, 2002.
“Report to Congress on Competition in the Wholesale and Retail Markets for Electric
Energy.” Draft, The Electric Energy Market Competition Task Force and FERC,
June 5, 2006.
Rosen, Richard. “Regulating Power: An Idea Whose Time Is Back.” American Prospect,
2002: 22.
Summers, Adam B. “Call for Real Electricity Deregulation.” Ventura County Star, 2005.
Available through The Reason Foundation Web site: http://reason.org/news/show/
call-for-real-electricity-dere.
Sweeney, James L. The California Electricity Crisis. Standford: Hoover Institution Press,
2002: Chapters 2 and 4.
Taber, John, Duane Chapman, and Tim Mount. “Examining the Effects of Deregulation
on Retail Electricity Prices.” WP2005-14, February 2006.
“The Competitive Retail Electricity Markets and Customer Protections: Are Customers
Really Better Off?” Regulatory Compliance Services, March 2009.
Thornberg, Christopher F. “Of Megawatts and Men: Understanding the Causes of the
California Power Crisis.” The UCLA Anderson Forecast, 2002.
Tierney, Susan F. “Decoding Developments in Today’s Electric Industry—Ten Points in
the Prism.” Analysis Group, October 2007.
242 Appendix C: Further Discussion and Reading
BM:IP_Fox-Penner 8/15/10 7:10 PM Page 242

Trebing, Harry M. “The Networks as Infrastructure—The Reestablishment of Market
Power.” Journal of Economics Issues, 28, 1994.
Weare, Christopher. “The California Electricity Crisis: Causes and Policy Options,” Pub-
lic Policy Institute of California, 2003.
Weaver, Jaqueline Lang.“Can Energy Markets Be Trusted? The Effect of the Rise and Fall
of Enron on Energy Markets.”Houston Business and Tax Law Journal, 2004.
Wolak, Frank A. “What Went Wrong with California’s Re-structured Electricity Market?
(And How to Fix It).” Presented at the Stanford Institute for Economic Policy Re-
search, February 15, 2001.
Appendix C: Further Discussion and Reading 243

Notes
The First Electric Revolution
1. Nye, Electrifying America: Social Meanings, 1995: 13–14.
2. Goodell, Big Coal, 2007: 101.
3. Nye, Electrifying America: Social Meanings, 1995: 236.
4. Insull,Central Station Electric Service, 1915: 119–120.
5. EIA, 2009(a); and “TVA Goes toWar,” 2009.
6. Clark, Energy for Survival, 1974.
7. Gartner, Inc., “Gartner Says,” 2009.
8. EIA, 2009(b).
9. DOE,“The Smart Grid: An Introduction.”
10. National Academy of Engineering,“Greatest Engineering.”
11. Pachauri and Reisinger, (eds.) “Climate Change 2007: Synthesis Report,” 2007.
12. “Economic Security: Will the Third Oil Shock Be the Charm?” Clean Fuels Devel-
opment Coalition, September 2009.
13. Friedman.“Statement of the Union of Concerned Scientists before the House Com-
mittee on Energy and Commerce Subcommittee on Energy and Environment,”
April 24, 2009.
14. Gronewold,“IPCC Chief Raps G-8,” 2009.
15. Fox-Penner, “Transforming America’s Power Industry,” 2008.
16. Jonnes, “Empires of Light,” 2003.
245
Deregulation, Past and Prologue
1. Although it is now hard to imagine, this was an era in which Enron was widely seen
as one of the most innovative and successful companies in the world. The readers of
Fortune voted it America’s most respected company for six consecutive years, and its
influence on policymakers across the political spectrum was enormous. See Claeys,
“Changing Course: Latest RKS,” 2007.
2. Dao,“The End of the Last Great Monopoly,” 1996.
3. U.S. House Committee on Commerce, 1996.
4. Beder, “Electricity Deregulation Con Game,” 2003.
5. “DOE: Residential Consumers,” 1999.
6. CAISO,“Alerts,Warnings,” 2004, and “CAISO Urges,” 2001.
7. Sheffrin, memorandum to Market Issues/ADR Committee, CAISO, 2001(a) and
memorandum to CAISO Board of Governor,” 2001(b).
8. Kurt, “California Power Crunch Sends,” 2001.
9. Pfeifenberger, Basheda, and Schumacher, “Restructuring Revisited.” 2007: 68.
10. To clarify, the enormous increases in POLR rates were caused overwhelmingly by
increases in the cost of making electricity from fuels, labor, and power equipment.
The problem for policymakers, however, was that they had promised that deregula-
tion would lower prices relative to continued regulation. Since about half the states
deregulated and the other half did not, it was easy to see which category of states
had experienced lower rate increases during this period.While many perceived that
rates had actually increased faster in deregulated states, analysis by my Brattle col-
leagues (note 3 supra) show that the pace of rate increases was essentially identical
over the period.
There are many reasons why rates did not decline more in deregulated states. The
deregulated states were the more expensive states to begin with, where the costs of
doing anything are higher. Moreover, deregulated markets are designed to set the
price of power at the cost of the most expensive power plant operating in any hour,
whereas regulated prices are set at the average of high- and low-price plants operat-
ing in that same hour. (In the next chapter, we shall see that the Smart Grid is re-
moving this difference between regulated and deregulated rates, but the political
damage to deregulation’s reputation has long since occurred.) Market power and
poor market design also contributed to higher prices in some deregulated markets,
although much of this has now been removed.
In Chapter 11 we return to the question of competition’s role in the future struc-
ture of the industry. For more discussion and analysis of the impact of competition
on the industry, see Appendix C.
11. At this point, regulators and consumer representatives were unbridled in their out-
rage against deregulation. “The forced experiment called ‘deregulation’ was a tri-
246 Notes for pages 9–18
umph of ideology over the needs of average citizens,” said New York legislator
Richard Brodsky in 2007, as he introduced legislation to reregulate his state’s power
markets. Full page ads published by the Consumer Coalition asserted that, “The
promised benefits of electricity deregulation have failed to materialize.” Charles
Acquard, executive director of the National Association of State Utility Consumer
Advocates observed, “Nobody’s benefited from deregulation—period, end of
story.”
12. Davis, Paletta, and Smith,“Unraveling Reagan: Amid Turmoil, U.S. Turns Away from
Decades of Deregulation,” 2008. For a contrasting view see Winston, “Day of Reck-
oning for Microeconomists,” Sept., 1993: 1263–1289.
13. I argued this point in 2008 in testimony before the Colorado Public Utilities Com-
mission, Docket No. 08S-520E. MIT technology policy experts Charles Weiss and
William Bonvillian make a similar observation in the context of technology pol-
icy recommendations: “Technologies like biofuels and carbon capture and se-
questration are also secondary technologies, components to established energy
platforms or systems. However, they face immediate political and nonmarket eco-
nomic competition from established firms that are not likely to accept them. They
will require attention to all stages of the innovative process, from research to devel-
opment to prototyping to demonstration to incentives for market entry. Their im-
plementation will be unlikely without some form of government regulation or
mandate.”
The New Paradigm
1. The project is described in more detail in Hammerstrom et al., “Pacific Northwest
GridWiseTM Testbed 2007” and Chassin and Kiesling, “Decentralized Coordina-
tion,” 2008. Historical information on Gridwise is available at “How Did Gridwise
Start?” Gridwise and PNNL, gridwise.pnl.gove/foundations/history.stm. For repre-
sentative press coverage, see Carey,“A Smarter Electric Grid,” 2008, and Lohr,“Digi-
tal Tools Help Users,” 2008. I am indebted to Steve Hauser, Rob Pratt, and Jerry
Brous for oral information on the experiment.
2. Appendix 2A of my 1997 book, Electric Restructuring, contains a good summary of
the economic benefits of interconnection.
3. Rowland,“Get Smart,” 2009.
4. Amin,“For the Good of the Grid,” 2008: 48–59.
5. Interestingly, a company known as Better Place is promoting essentially this model
for electric cars. For the rest of our power uses, however, we are many decades away
from storage that has the capacity we need to run our homes in a small enough
package and at an affordable price.
Notes for pages 18–36 247
Smart Electric Pricing
1. Based on Karl Stahlkopf ’s (Hawaiian Electric Power) comments as a panelist on
“Emerging Smart Grid Technologies: The Future of U.S. Power Distribution,”mod-
erated by Peter Fox-Penner, Webinar presented to 2degrees Intelligent Grids Net-
work April 22, 2009, and Ahmad Faruqui, “Creating Value Through Demand Re-
sponse,” The Brattle Group, presented at Smart Grid E-Forum, October 23, 2008.
Other demand response programs that do not involve hourly prices—though they
always include some form of incentive payment—include interruptible or curtail-
able rates, demand bidding or buyback programs, and emergency demand re-
sponse. For example, the Hawaii Electric Company has a system that controls
250,000 electric hot water heaters. When power supplies are short on the island,
they can turn off some or all of the heaters for brief periods to regain system
balance.
2. This concept of critical peak pricing, the “stick,” can also be turned around and
made into a “carrot” in the form of a rebate when a customer reduces use below
some defined, typical levels during the same advance-notice periods.
3. Faruqui, “Creating Value through Demand Response,” 2008.
4. “Whirlpool Commits to Smart Grid–Compatible Appliances,” 2009.
5. “Baltimore Gas and Electric Company,” 2009.
6. “Quantifying Demand Response Benefits in PJM,”2007. The ratio of energy savings
between shifters and nonshifters depends on the size of the market and the number
of customers who are paying spot prices one way or another through their power
bill. This example is particularly large because PJM is the world’s largest spot mar-
ket, and many customers have prices indexed to PJM’s hourly prices (known as lo-
cational marginal prices, or LMPs). Nonetheless, energy savings have been found to
be significant in many different types of market structures, including regulated sys-
tems, for both shifting and nonshifting customers, and as noted in the text capacity
savings, which also eventually flow to both shifting and nonshifting customers,may
be larger. For an extensive review of the results of dynamic pricing, see Faruqui and
others, “Moving Toward Utility-Scale,” 2009; Cappers, Goldman, and Kathan, “De-
mand Response in U.S. Electricity,” 2009; Smart Grid: The Value Proposition for
Consumers E-forum presentations, U.S. Department of Energy, 2008(a), Hosted by
National Electric Manufacturers Association, October 23, 2008; Faruqui, “Creating
Value through Demand Response,” 2008; and Faruqui, Hledik, and Tsoukalis, “The
Power of Dynamic Pricing,” 2009: 42–56.
7. See Figure 3, Faruqui et al., “Moving toward Utility-Scale,” 2009.
8. NERC,“2008 Long-Term Reliability,” 2008.
9. It is harder to do this in deregulated markets, as capacity prices (i.e., the price of the
12-cent plant in the example) are set by a market for the short term and are quite
248 Notes for pages 39–45
volatile. In regulatedmarkets, the cost of the next power plant doesn’t changemuch,
and the calculation of peak price is easier to make with confidence.
10. Faruqui, “Inclining toward Efficiency,” 2008: 22–27.
11. Faruqui et al., “Moving toward Utility-Scale,” 2009. Section 6 of this report has an
excellent summary of the benefits of AMI and how utilities convey the benefits of
AMI to regulators—the“business case for AMI.”Another good reference in this area
is “Deciding on ‘Smart’Meters: The Technology Implications of Section 1252 of the
Energy Policy Act of 2005,” prepared by Plexus Research, Inc., for Edison Electric
Institute, September 2006.
12. Andy Satchwell, a consumer advocate working for the state of Indiana, listed six
concerns regarding utility Smart Grid investments: Six significant barriers: resource
allocation by utility: complicated process requiring coordination and technical ex-
pertise; cost of Smart Grid systems: cost increases dramatically based on communi-
cation technology and software system integration; rapidly changing technologies:
what is a prudent investment today?; stranded assets: changes in technology and un-
certainty of customer response; regulatory risks: cost recovery and unknown pay-
back periods; and tracking costs and benefits: complex and lack standard measure-
ments; and see Faruqui, “Breaking Out of the Bubble,” 2007: 46–48, 50–51.
13. It is true that many Smart Grid advocates emphasize the essential value of hourly
pricing in much the same way the advocates of retail competition once did the same
for deregulated pricing. They contrast a Smart Grid in which prices perform a self-
balancing function as inherently far more efficient than a regulated system run
without prices. (See, for example, Kiesling,“Project Energy Code—Markets,” 2009).
Much of this volume constitutes my explanation of why I think it is incorrect to
align retail deregulation and dynamic pricing. While I see enormous value in dy-
namic pricing, I do not think retail deregulation will increase because of it. If any-
thing, my view is that state regulation must play a central role in price-setting in or-
der to “get the prices right”—the converse of the more common economic view of
regulation. In this case, the proximate technical reason is that unregulated markets
will not include the price of generation, transmission, or distribution capacity.
These are system savings that only systemic processes can estimate and include—or,
in more formal language, these are quasi-public goods. Regulators should do a good
job of estimating them, but leaving them out of the price signal is clearly worse than
estimating and including them.
14. Greenberg, “The Smart Grid vs. Grandma,” 2009. Further opposition to large-scale
investment in smart meters is described in a recent Wall Street Journal, Smith,
“Smart Meter, Dumb Idea?” 2009.
15. In efficiency terms, there is no question: there is nothing economically rational
about flat rates. Customers who use power during off-peak periods, but who pay a
flat rate that blends cheaper off-peak power and pricey on-peak power to make the
Notes for pages 45–48 249
flat rate average are subsidizing customers who use more than their share of power
during the on-peak periods. Remember the analogy in the last chapter where every-
one paid for their groceries by the pound at the checkout counter regardless of what
they put in their cart? If the grocery store is charging a single price per pound for
groceries that covers its costs, the people who buy expensive heavy foods (steak) will
be subsidized by the people who buy cheap heavy foods (bulk potatoes).
The debate really surrounds the fairness aspect of dynamic prices. Is it fair to the
restaurant owner with the lunch trade to pay the same per kilowatt-hour as the
owner of the all-night café, even if the costs of serving them are different? There are
instances in which society has mandated that prices not reflect different costs for
fairness reasons. However, it does seem that there are many more markets in which
it isn’t perceived as fair when two customers pay the same price for two products
that cost different amounts tomake, and there does not seem to be any special social
attribute of peak-power users that calls for special treatment. Faruqui and Hledik
discuss the subject more completely in “Transition to Dynamic Pricing,” 2009: 27–
33 and Faruqui, “Breaking Out of the Bubble,” 2007: 46–48, 50–51.
16. For a very useful overview, see Brockway, “Advanced Metering Infrastructure,” 2008
and Faruqui andWood,“Quantifying the Benefits,” 2008.
17. “Smart Meters—Got Bugs?” 2009.
18. Fred Butler, chairman of the National Association of Regulatory Utility Commis-
sioners (NARUC) as well as the New Jersey state regulatory agency, as reported in
McClatchy-Tribune Regional News, Vock, “Smart Grid’s Growth Now,” 2009. The
complete quote is worth noting:
You can’t have a smart grid and dumb rates. We have been used to—for over 100
years—rates that are the same all day, every day. That’s not the way electricity is
produced.
19. Universal time-based pricing has been implemented for all large commercial and
industrial customers in many states, but mandating that all residential customers
pay dynamic prices, with no exceptions, has so far proven to be impossible.
As an alternative, regulators are starting to seriously consider making one form
of dynamic pricing (for example, time-of-use rates or peak-time rebate) the de-
fault rate but allowing residential customers to opt out of them, with only the sub-
mission of the right paperwork or email. Relying on the behavioral principles of
choice architecture in the face of the strong status quo effect, described in Thaler
and Sunstein’s Nudge (2008), experience to date suggests that enough customers
will remain on the default rates to reap the benefits of dynamic prices, as many as
50%. As explained in the text, it is not essential that every customer experience
dynamic prices, only that a sufficient number who really can react so as to shift
aggregate demand to a more constant and therefore cheaper time profile of
demand.
250 Notes for pages 48–49
The Regulatory Mountain
1. “Empowering Consumers,” without notes, 2009.
2. For a good, though not extremely recent, review of avoided cost practices, see
Beecher, “Avoided Cost: An Essential,” 1995. Many state public service commissions
have by now developed very sophisticated ways of measuring generation avoided
costs. The California Public Utility Commission’s (CPUC’s) methods are explained
in “Methodology and Forecast,” 2004, and “Interim Option on E3 Avoided,” 2004;
and E3, “CEE Cost-Effectiveness Tools,” 2007.
3. Centolella and Ott, “The Integration of Price Responsive Demand into PJM Whole-
sale Power Markets and System Operations,” March 9, 2009; 4.
4. In addition to the issues raised by the two PJM experts referenced above, a good ex-
ample of the ongoing debate occurred again in PJM when sellers complained that
market rules overpaid those who used DR to reduce peak demand. See Hogan,
“Providing Incentives for Efficient Demand Response,” October 29, 2009.
5. Small Is Profitable by Lovins et al., discusses locational IRP in Section 1.4. Available
at: www.smallisprofitable.org
6. Interstate Renewable Energy Council, 2009.
7. Lovins, et al. Small Is Profitable. For the sake of full disclosure, I reviewed this book
and my quote is on the original jacket cover. More recent cost information on DG
technologies, including recent data from RMI, is reviewed in Chapter 9.
8. For an overview, see http://standards.ieee.org/announcements/bkgnd_stdsprocess
.html.
9. The initial roadmap document is EPRI’s “Interim Smart Grid Roadmap,” 2009. For
two other useful overviews of Smart Grid standards issues, see “Introduction to In-
teroperability and Decision-Maker’s,” 2007; Gunther and others, “Smart Grid Stan-
dards Assessment,” 2009; and “Smart Grid Standards Adoption,” 2009.
10. Condon, “Lack of Standards,” 2009, and see Testimony of Gallagher, before the
Committee on Energy and Natural Resources, U.S. Senate, 2009. Also see Katie
Fehrenbacher’s May 17 post on earth2tech.com, “How to Hammer Out,” 2009, and
Highfill and Shah. “A Voice for Smart-Grid,” 2009.
11. http://www.waterefficiency.net/the-latest/aclara-wifi-standards.aspx.
12. Boyle, “A Smarter, Greener Grid,” 2008.
13. Brown, Testimony before the Subcommittee on Energy, 2009.
14. Personal communication, July 23, 2009.
15. “Smart Meters—Got Bugs?” 2009; Goodin, “Buggy ‘Smart Meters’,” 2009; and
Seltzer, “Drive-By-Blackouting,” 2009.
16. “Energy Security Wars: Grids vs. Hackers,” 2009.
17. Gorman, “Electricity Grid in U.S. Penetrated by Spies,” 2008.
18. In The Future of the Internet, law professor Jonathan Zittrain argues that security on
the Web will ideally occupy a middle ground between a completely uncontrolled
Notes for pages 52–64 251
BM:IP_Fox-Penner 8/15/10 7:10 PM Page 251
saboteurs [are] everywhere you click”or ubiquitous governmental enforcement and
regulation that will squelch creativity. In grid security, however, the balance is likely
to shift heavily toward much stronger security provisions and enforcement. See
Reed,“Fouling Our Own Net,” 2009.
The (Highly Uncertain) Future of Sales
1. U.S. Census Bureau, 2008.
2. EIA, 2009(c).
3. Based on 10–15 million in sales of cars and trucks in 2007; a popular estimate
among various sources. See Morgan & Company, Inc., 2008.
4. Figure 4-4 from EPRI’s report, “Environmental Assessment of Plug-In Hybrid Elec-
tric Vehicles,Volume 1: Nationwide Greenhouse Gas Emissions,”uses 15million ve-
hicles/year. See EPRI, 2007(a).
Morgan & Company have recorded 2007 sales at roughly 15 million. Richard
Cooper, vice president at J.D. Power, has recently estimated auto sales will reach 15
million by 2012–2014, and economists such as Diane Swonk and Mark Zandi have
made similar projections. Google’s “Clean Energy 2030,” report also uses this num-
ber as a benchmark for calculating future PHEV penetration.
5. See EPRI, 2007(a).
6. Letendre, Denholm, and Lilienthal, “Plug-In Hybrid and All-Electric Vehicles: New
Load or New Resource?” 2006.
7. EIA, 2009(d).
8. Based on net internal U.S. peak demand for 2008 and 2017. See NERC, 2008.
9. EPA,“EPA Analysis,” 2009.
10. EIA, 2009(d).
11. EPRI, 2009(a).
12. Schlegel, “Energy Efficiency and GlobalWarming,” 2007.
13. Faruqui, Hledik, and Davis, “Sizing Up the Smart Grid,” 2009.
14. See ACEEE’s “Savings Estimates for ACESA,” 2009(a).
15. Although EIA is prohibited from assuming policy changes in its forecasts, it is al-
lowed to forecast the impacts of policies if asked by a member of Congress. That’s
what happened here.
16. See Joskow, “Regulatory Failure, Regulatory Reform” 1989: 125–200; and Fox-
Penner, “Allowing for Regulation,” 1988.
TheAluminum Sky
1. Miller, “The Future of the Grid,”Testimony to U.S. House of Representatives, 2009.
2. For an accessible technical explanation of how transmission systems work, see my
1990 booklet, Electric Power Transmission andWheeling: A Technical Primer.
252 Notes for pages 69–81
3. For more technical discussions of the role of DC lines, see Peter Hartley’s presenta-
tion “HVDC Transmission: Part of the Energy Solution?” Economics Department
& James A. Baker III Institute for Public Policy, Rice University, and “Life Cycle
2007” by the Connecticut Siting Council.
4. See, for example, King, “Transforming the Electric Grid,” 2005; Silberglitt, Ettedgui,
and Hove, Strengthening the Grid, 2002.
5. Officially, at least, new lines in the final plan don’t get any preferential treatment in
their siting or environmental applications, and they sometimes aren’t even liked by
state utility commissions, who might have preferred another option.
6. Two early examples are the Joint Coordinated System Plan, an exercise by ten major
transmission owners or RTOs in the eastern United States (http://www.JCSPStudy
.org), and Osborn and Zhou, “Transmission Plan Based,” 2008. At this point, these
studies are purely experimental and advisory, so they have no official weight in
planning or siting. They also do not come close to proposing cost allocation for new
facilities, which would undoubtedly be contentious.
The Western Renewable Energy Zone project is perhaps the most advanced re-
gional planning process that integrates least-cost economics and is intended to pro-
ceed from study to plan to concrete line approvals. However, the process does not
displace full-scale resource planning at each major western utility. See Savage,
“Western Renewable Energy Zone,” 2009, and related information available at
http://www.westgov.org/wga/initiatives/wrez/.
7. Under the new process, the Department of Energy will select a single agency as the
point of contact for all federal permits for a proposed project. All other agencies is-
suing approvals must conduct their approval processes concurrently and coordi-
nate with the lead agency. See “Memorandum of Understanding among the U.S.
Department of Agriculture, Department of Commerce, Department of Defense,
Department of Energy, Environmental Protection Agency, the Council on Environ-
mental Quality, the Federal Energy Regulatory Commission, the Advisory Council
on Historic Preservation, and Department of the Interior, Regarding Coordination
in Federal Agency Review of Electric Transmission Facilities on Federal Land,” Oc-
tober 28, 2009.
8. A recent article in the trade publication Megawatt Daily, Tiernan examined the
comments of many parties toward the current transmission plans of large utilities.
Under the banner “Cost Allocation Clarity Needed, Parties Say,” the paper reported
that, “Regional transmission planning is a worthy goal to pursue in all parts of the
nation, but until cost allocation issues are resolved the best laid plans may not get
very far, a couple of different entities have told the Federal Energy Regulatory Com-
mission. In comments about Entergy’s revised Attachment K filing with FERC on
its open-access transmission tariff, a group of municipal utilities in the utility’s
territory had several qualms with Entergy’s regional transmission planning pro-
cess, including that Entergy has not entered into “seams” agreements with adjacent
Notes for pages 81–86 253
regions that would establish the framework for allocating costs of transmission
projects that affect both regions. Rather than highlight the positives of the trans-
mission planning process, Entergy’s filing to comply with Order 890 and FERC’s
September ruling for many utilities to file revised Attachment K plans shows a lack
of regional coordination on Entergy’s part, the munis told FERC last week. Entergy,
as well as Southern Company Services and others,made their filing last month, with
Entergy and Southern highlighting the Southeast Inter-Regional Participation Pro-
cess. But without clear cost allocation rules, the SIRPP effort will not produce any
tangible results to improve transmission planning in the region, said the municipal
systems, which included Lafayette Utilities System, the Municipal Energy Agency of
Mississippi and the Louisiana Energy and Power Authority.”
“That will continue to be the case until the commission addresses and resolves,
once and for all, inter-system and interregional cost allocation issues and similar
barriers to needed transmission development,” said the munis. In the Northwest,
the American Wind Energy Association and the Renewable Northwest Project had
similar comments on the transmission plans of Avista, Puget Sound Energy and
Bonneville Power Administration. The utilities’ Attachment K filings are inconsis-
tent with FERC’s requirements because they do not provide clear, upfront cost allo-
cation methodologies and instead refer to general guidelines adopted as part of the
ColumbiaGrid planning process, AWEA and RNP said. Investors need certainty on
cost allocationmethodologies in order to make decisions about which transmission
projects to pursue, the renewable interests said.”Megawatt Daily, January 14, 2009.
9. The umbrella organization is known as the Organization of MISO States. Its cost al-
location discussion group is known as the Cost Allocation and Regional Planning
project (CARP), and the subregional effort is known as the Upper Midwest Trans-
mission Development Initiative (UMTDI).
10. To cite just a few, the Western Governors’ Association is studying renewable energy
development potential and transmission expansion in the entire western grid; four
subregions have their own planning efforts as well. In New England the states be-
longing to the wholesale markets run by ISO–New England have the New England
States Committee on Electricity (NESCOE). The mid-South’s efforts run out of the
Southwest Power Pool and in the Pacific Northwest the Northwest Power Planning
Council has a long history of regional electric expansion and energy efficiency plan-
ning.
11. EIA, Table 16, 2009(c)
12. FERC,“Electric Market Overview,” 2009.
13. To view NREL’s renewable resource maps visit http://www.nrel.gov/renewable_re-
sources/. Interestingly, Shalini Vajjhala, formerly at Resources for the Future, exam-
ined NREL’s data and concluded that, “Contrary to popular belief that certain types
of renewable energy exist only in specific geographic regions, renewable energy po-
254 Notes for page 87
tential is widespread. Different states have different amounts and combinations of
resources, but 43 out of 48 states have above-average potential for at least one or
more renewable resources. This is promising. Few states are completely handi-
capped by a lack of potential resources.”However, Vajjhala concedes that her analy-
sis does not discriminate between the highly desirable utility-scale sites and less
concentrated resources, and also does not systematically measure siting difficulties.
See Vajjhala, “Siting Renewables,” 2006: 13.
14. NERC, “Accommodating High Levels,” 2009: ii [emphasis in original]; and “Inte-
grating Locationally-Constrained Resources,” 2008.
15. See, for example, NERC“2008 Long-Term Reliability Assessment,” and DOEs “20%
Wind Energy by 2030” (2008b).
16. A list of major new renewables line proposals as of 2009 is found in Fox-Penner,
“U.S. Transmission Investment,” 2009. The Edison Electric Institute compiles a
utility-by-utility list of projects of all sizes in“Transmission Projects Supporting Re-
newable Resources,” 2009.
17. To be fair, this plan was only conceptual, and it makes maximum use of all existing
extra-high-voltage (765,000-volt) lines already in existence. To complete the net-
work show, AEP estimates that only 19,000 additional miles would be needed,
which is fully in line with my estimate of 20,000 to 40,000miles. See AEP,“Interstate
TransmissionVision.”
18. For discussions supporting the idea, seeWood and Church,“Building the 21st Cen-
tury Transmission,” 2009.
19. “Joint Coordinated System Plan 2008,” Available at http://www.JCSPStudy.org;
Vajjhala et al., “Green Corridors,” 2008; Savage, “Western Renewable Energy Zone,”
2009, and DOE“20%Wind Energy by 2030,” 2008(b).
20. Longer elaborations of environmentalists’ concerns are found in Miller, “The Fu-
ture of the Grid,” 2009, and Sassoon,“Transmission Superhighway on Track,” 2009.
21. For some interesting introductory discussions, see Yeager, “Congress, Think Small,”
2009; Talukdar et al., “Cascading Failures: Survival versus Prevention,” 2003: 25–31;
Amin,“For the Good of the Grid,” 2008: 48–59; and Apt et al., “Electrical Blackouts:
A Systemic Problem,” 2004.
22. Following a good ten years of failed efforts, Congress added a small bit of federal sit-
ing authority to omnibus energy legislation passed in 2005 (now Section 216 (h)
of the Federal Power Act, a summary is available on the Department of Energy’s
Web site: http://www.oe.energy.gov/DocumentsandMedia/Summary_of_216_h__
rules_clean(1).pdf). The FERC was allowed to study and designate certain new
transmission line routes (“corridors”) that it found important to the national inter-
est. If a line was proposed on one of these corridors, and state authorities failed to
act on the application for a year, the FERC could approve the line and even con-
demn the land.
Notes for pages 88–92 255
This “backstop siting authority” is universally viewed as too narrow and weak to
make an impact. It is despised by many governors and state regulators, especially in
the eastern United States, and was weakened substantially by a recent court chal-
lenge. (See Piedmont Environmental Council v. FERC).
The Great Power Shift
1. Platt,The Electric City, 1991: 76.
2. World Coal Institute, “Key Elements of a Post-2012,” 2007.
3. EPRI,“Advanced Coal Power System,” 2008(a).
4. EIA,“Assumptions to the AEO,” 2009(f).
5. Proven U.S. natural gas reserves are about 10 years worth of annual gas demand, or
about 204 trillion cubic feet (TCF), excluding supplies from Canada and Mexico.
However, as pointed out to me by MIT gas expert Melanie Kenderdine, the gas sup-
ply industry has maintained a ten-year supply of proved reserves for twenty years
while extracting about 600 TCF in the period. In other words, the supply industry
has been able to serve all demand plus maintain a ten-year supply cushion for three
decades.
Estimates of total gas reserves, which include gas that is not yet proven to be eco-
nomically recoverable, yield more than 80 years’ supply—2074 TCF.“Potential Sup-
ply of Natural Gas in the United States,” report by Potential Gas Committee, Col-
orado School of Mines, December 31, 2008, and Smead and Pickering, “North
American Natural Gas,” 2008.
6. Bit Tooth Energy, a blog written by Professor David Summers of the University of
Missouri covers developments in unconventional gas drilling (http://www.bit-
tooth.blogspot.com); also see Mall, Buccino, and Nichols, “Drilling Down: Protect-
ingWestern,”October 2007.
7. See “Generators and ISO New England,” 2004: 4; and “ISO New England Probes,”
2004. In recent comments to the grid reliability regulator, the American Public
Power Association called the industry’s heavy reliance on gas power “the most im-
mediate threat to reliability.” Also see “APPA Comments to NERC,” 2008. England
has similar concerns, see “Dark Days Ahead,” from the August 6, 2009, Economist.
8. The status of these technologies is closely tracked by the U.S. Department of Energy
Office of Fossil Energy, the Electric Power Research Institute, and the MIT Energy
Initiative, among other groups. For a sample of their recent works, see EPRI, “Ad-
vanced Coal Power Systems,” 2008(a), and “The Future of Coal,” 2007. As this goes
to press, the U.S. Department of Energy’s largest CCS project, known as FutureGen,
is a 275 MW IGCC plant that faces a funding shortfall of an estimated $1 billion.
The project describes itself as the first facility to integrate advanced technologies for
coal gasification, electricity production, emissions control, CO2 capture and perma-
256 Notes for pages 95–98
nent storage, and hydrogen production at a commercial scale. See http://www
.futuregenalliance.org/about.stm (7/3/09), and Beattie, “Thanks, But No Thanks,”
2009. DOE also recently announced $408 million in funding for two CCS demon-
stration plants, an IGCC plant that will sequester captured CO2 by injecting it into a
depleted oil well and a 120-MWNorth Dakota power plant that will demonstrate a
new process to capture CO2 from coal plant exhaust gases. Energy Daily, July 2,
2009.
9. See the Gasification Technologies Council, http://www.gasification.org.
10. “A Milestone for Cleaner Coal,” 2009. In addition to DOE’s FutureGEN, the Ameri-
can Electric Power Company, the Southern Company, the Erora Group, Summit
Power, Tanaska, and BP all have proposed IGCC projects. See Biello, “How Fast Can
Carbon,” 2009.
11. Friedman,“China: A Sea Change,” 2009.
12. DOE,“Secretary Chu Announces,” 2009.
13. For an excellent discussion of CCS retrofits, see “Retrofitting of Coal-Fired,”
2009.
14. Metz and others, eds., Carbon Dioxide Capture and Storage, 2005: 34; also see Dun-
can, “Carbon Sequestration Risks,” 2009.
15. The World Coal Council estimates that current sequestration projects cost as little
as $6/ton, though this applies to a small number of pilot sites and not a full-scale
commercial sequestration network. See World Coal Institute, “Investing in CCS,”
2009(a).
For other estimates see Biello, “How Fast Can Carbon,” 2009; Sequestration ca-
pacity estimates are found in the following sources: DOE, “Carbon Sequestration
Atlas,” 2008; EIA “Nuclear Energy,” 2009(j); and “The Future of Coal,” 2007: 45.
16. A recent report from the Department of the Interior summarizes some of the high-
level regulatory issues:
First, a proposed regulatory framework must recognize carbon dioxide (CO2) as a
commodity, resource, contaminant, waste, or pollutant. Unlike most other re-
sources that are managed, CO2 is a material that is either being stored for disposal
or is extracted for use. CO2 is currently leased under the Mineral Leasing Act
(MLA) for uses such as refrigeration (in its solid form as dry ice), fire extinguishers,
and carbonation of water and soft drinks. CO2 also is used to enhance oil recovery,
which to some extent results in its sequestration. It is also important to recognize
that any discussion addressing the geologic sequestration of “carbon dioxide”must
distinguish between pure CO2 and CO2 mixed with other gases such as hydrogen
sulfide, carbon monoxide, methane, and oxides of nitrogen and sulfur. These im-
purities have the potential to impact the economics, technical feasibility, location
preferences, land use planning requirements, environmental impact mitigation,
multiple-resource conflict potential, and regulatory oversight of geologic CO2
Notes for pages 98–99 257
sequestration. Impurities in CO2 impact is value as a commodity, as well as its be-
havior in storage.
Second, carbon sequestration may potentially conflict with other land uses in-
cluding existing and future mines, oil and gas fields, coal resources, geothermal
fields, and drinking water sources. For example, sequestration in a formation
would limit all future possibility of extracting minerals from the formation with-
out some risk of venting the captured CO2. Carbon sequestration could also have
potential impacts on other surface land uses and programs such as recreation, graz-
ing, cultural resource protection, and community growth and development. These
impacts need to be addressed.
Third, a proposed statutory and regulatory framework must recognize the long-
term liability of any permitting decision to sequester CO2 and the required com-
mitment for stewardship of facilities over an extended period of time. The scope of
liability and term of stewardship will be among the longest ever attempted, lasting
up to thousands of years or more. This may prove to be a potential limiting factor
for siting, transportation, processing, and storage on Federal lands given the Bu-
reau of Land Management’s (BLM) multiple-use mission for long-term manage-
ment of the public lands.
Many existing Federal statutes and regulations potentially apply to some aspect
of the management of geologic sequestration of CO2. These include management
of other resources, waste disposal, groundwater protection, and human health and
safety. However, due in part to the many unique challenges discussed above, gaps
may exist in the current laws and limit our ability to address the range of circum-
stances, scope of potential liability, required timeframe of stewardship, and regula-
tory primacy differences between the states and Federal Government. (U.S. De-
partment of the Interior “Framework for Geological Carbon,” 2009(a))
As of this writing, EPA has proposed draft rules to regulate CO2 injections under the
Safe Drinking Water Act. The proposed rule, issued in 2008 after three years of
study, runs 221 pages and covers everything from conducting and filing initial geo-
logical surveys to financial conditions the sequestering firmmust meet, such as hav-
ing sufficient insurance in place. See EPA “Federal Requirements under the Under-
ground,” 2008.
17. Gronewold,“N.Y.’s Pioneering Effort,” 2009.
18. Deutch and others, “Update of the MIT 2003,” 2009.
19. Cohen, Fowler, andWaltzer, “‘NowGen’: Getting Real,” 2009.
20. See “Meeting Projected Coal Production,” 2008; and Smith, “U.S. Foresees,” 2009,
for recent discussions on the topic, and watch for reassessments of coal reserves
from the U.S. Geological Survey and EIA. For discussions of environmental con-
cerns, see http://www.epa.gov/owow/wetlands/guidance/mining.html.
258 Notes for pages 99–100
21. “Nuclear Power in the USA,” 2009. While the majority of plants were built during
this time, any further investment during this time came to a halt due safety and cost
concerns.
22. Jaczko, 2009.
23. See “Nuclear Energy Outlook 2008,” 2008; and Goering, “Nuclear Plants Being Re-
vivedWorldwide,” 2009.
24. See Alexander, “Blueprint for 100 New Nuclear,” 2009.
25. The availability and cost of nuclear fuel does not seem to be a problem; there are
ample deposits of uranium around the world. However, nuclear plants use large
amounts of cool water and must shut down for safety reasons if their water supply
becomes too warm. Since 2006, heat waves have caused water-related shutdowns in
several plants in the southern United States and threatened many others; the sum-
mer 2008 heat wave reportedly closed as much as one-third of France’s nuclear ca-
pacity. See Pagnamenta, “France Imports UK Electricity,” 2009; EDF, “Achieve-
ments: Controlling Human Impact on the Environment,” 2007; and Fleischauer,
“HeatWave Shutdown,” 2007.
26. Beattie, “Utilities Unprepared,” 2009.
27. The translation of nuclear power’s business risks are discussed by the major utility
bond rating agencies: Moody’s and Standard & Poor’s (for an example, see Hemp-
stead, “NewNuclear Generating Capacity,” 2008; and“Nuclear Plant Construction,”
2008). These risks are also discussed in Severance’s, “Business Risks to Utilities,”
2009.
28. Congressional Budget Office, “Nuclear Power’s Role,” 2008; and Cooper, “The Eco-
nomics of Nuclear Reactors,” 2009.
29. See Romm, “The Staggering Cost,” 2009(a); and “Warning to Taxpayers, Investors,”
Center for American Progress, January 7, 2009(b).
30. The IEEE reports that there are only four nuclear power plant manufacturers
worldwide. See McClure, “Energy Fixes: Smart Grid,” 2008.
31. See Toole and Winsor, “Nuclear Workforce Dwindles,” 2009; Gellatly, “Study: Nu-
clear Industry Needs 10K,” 2009; “Readiness of the U.S. Nuclear,” June 2008; IAEA,
“Nuclear Power Industry’s Ageing,” 2004; and “Draft:Workforce Planning,” 2009.
32. The shortages are not only in the white collar workforce.Many construction trades-
people on nuclear projects, such as welders, require advanced training and certifica-
tion. The supplies of these workers cannot be rapidly expanded—it takes time to
locate and train these workers. Two years ago, I heard a representative from a world-
wide nuclear engineering firm tell a conference that he estimated that building one
hundred nuclear plants in the United States in the next twenty years would require
every nuclear-certified welder in the world. Specialized training and R&D facilities
are also needed. See “Nuclear Energy for the Future,” 2008, for a recent catalog of
the industry’s R&D needs. Conversely, former Nuclear Regulatory Commission
Notes for pages 100–101 259
(NRC) chairman RichardMeserve recently noted to me in an email that enrollment
in nuclear engineering programs has started to increase.
33. Spacing of turbines is determined by the diameter of the turbine rotors, which aver-
age around 70 meters for a 1.6 MW unit. Spaced with 10 diameters between rows
and 3 to 5 diameters per turbine, the average utility-scale wind farm requires 30 to
60 acres, not including infrastructure. For a longer discussion on the spacing of
wind turbines see: “Wind Power Project Site,” 2005; “Wind Farm Area Calculator,”
National Renewable Energy Laboratory, available at: http://www.nrel.gov/analysis/
power_databook/calc_wind.php; and “Wind Web Tutorial,” American Wind En-
ergy Association, available at: http://www.awea.org/faq/.
34. Wiser and Bolinger, “2008Wind Technologies,” July 2009.
35. EIA shows wind farm overnight construction costs dropping from $1923/kW to
$1615 by 2030, a reduction of 16%.While U.S. DOE, Energy Efficiency and Renew-
able Energy’s (EERE’s) highly touted 20%-by-2030 report “20% Wind Energy by
2030,” 2008(a), expresses some doubt over the higher end of the range, it is clear
that manufacturers and installers have more innovation in the pipeline, such as car-
bon composite blades and new construction techniques. Also see Neville, “Prevail-
ing Winds,” 2008. Most other elements of wind power costs have also been declin-
ing, but rising commodity costs caused wind turbines to become more rather than
less expensive during the last five years. See U.S. DOE,“Cost Trends.”
36. DOE, EERE,“20%Wind Energy,” 2008(b).
37. There are large-scale storage technologies that help regulate (balance) the grid over
very short time scales (i.e., smoothing out power over a period of literally a few sec-
onds). These storage technologies are very promising and likely to see much greater
use in the high-voltage grid. However, these technologies do not balance load and
generation on the time scale shown in Figure 8-1. See “Bottling Electricity,” 2008;
and Gyuk,“Energy Storage Applications,” 2008.
38. It is also worth noting that wind power’s economics seems to work best in the large,
centralized, competitive wholesale markets, where each hour of output is priced
separately. This argument is laid out carefully in “Facilitating Wind Development,”
by Kirby and Milligan, 2008: 40–54, and is advanced by advocates for expanding
these wholesale markets nationwide, such as the COMPETE coalition (http://www
.competecoalition.com).
39. Many utilities have conducted studies of the costs of wind integration; two experts
at a Department of Energy laboratory summarized them as of a year ago and found
an average short-term integration cost of about 0.1 cents per kilowatt-hour, see
Wiser and Bolinger, “Annual Report on U.S. Wind,” 2008. A major study of this
question is due in October 2009 from the Federal Energy Regulatory Commission
as well. For an excellent nontechnical overview, see “IntegratingWind Power,” 2009.
40. Despite reports of high costs for offshore wind projects emanating from Europe
(e.g., Hansford and Rowson, “Capital Costs Undermine Offshore,” 2009; and Fair-
260 Notes for pages 102–104
ley, “Germany’s Green-Energy Gap,” 2009, interest in developing offshore wind re-
mains intense among governors and other economic development officials and
groups in coastal states. The governors of ten states on the eastern seaboard recently
sent a joint letter to the U.S. Congress opposing a “transmission superhighway”
from the wind-rich Dakotas to the East Coast, arguing that they preferred to de-
velop their own offshore wind.
41. Strictly speaking there are three types of crystalline silicon panels: single crystal,
polycrystalline, and ribbon; the first and most common variety are blue-black.
42. NREL,“Renewable Energy Cost Trends,” 2005.
43. See Pernick and Wilder, “Utility Solar Assessment (USA) Study,” 2008. These costs
do not include storage, backup, or integration.
44. “Increasing Efficiency,”Mitsubishi Electric Corporation.
45. Hand,“PVMaterials,” 2009.
46. Koning,“Renewable Energy: Feeling the Heat,” 2009.
47. Wiser, Barbose, and Peterman,“Tracking the Sun,” 2009: Figure 5.
48. For more detail, see Appendix B, Part 1, Summary of Selected Large-Scale Power
Generating Technologies. This table projects possible changes in the costs of large-
scale generating technologies up to 2030. For an interesting discussion of how BOS
costs might decline, see Newman and others, “Accelerating Solar Power Adoption,”
2009.
49. Sherwood, “U.S. Solar Market Trends 2008,” 2009. Many other utilities announced
plans for multi-megawatt PV installations; Pacific Gas and Electric, the San Fran-
cisco–based utility, shattered all records by announcing a plan to build a record-
breaking 550-MW PV plant in California. SEIA,“U.S. Solar Industry Year,” 2009.
50. SEIA, 2009: For good descriptions of the two technologies, see the Web sites of the
National Renewable Energy Laboratory and the DOE Office of Energy Efficiency
and Renewable Energy.
51. “PG&E and BrightSource,” 2009. Abengoa Solar has an 11 MW and a 20 MW solar
power tower operating in Seville, Spain, but there is little sign of interest in devel-
oping this technology commercially as of now in the United States. http://www
.abengoasolar.com/sites/solar/en/our_projects/solucar/ps10/index.html.
52. U.S. Department of Interior “Secretary Salazar, Senator Reid Announce,” 2009(b).
53. Kelly, “Large Plant Studies,” 2006.
54. The DOE estimates that dry cooling adds about 10% to the cost of power from a
CSP plant; estimates from the Electric Power Research Institute seem to be higher.
See Price, “Cooling for Parabolic,” 2008: 19.
55. EIA,“Assumptions to the AEO,”Table 8.13, 2009(f).
56. Some forestry practices may also produce zero carbon biomass. The Food, Conser-
vation, and Energy Act of 2008 (FCEA), known widely as the 2008 Farm Bill, recog-
nized a range of forestry activities for eligible carbon-offsets such as afforestation,
reforestation, conservation, forest management, and harvested wood products. In a
Notes for pages 105–108 261
letter from utilities and trade associations encouraging the inclusion of forestry
biomass inWaxman–Markey RES and offsets, it was estimated carbon-neutral bio-
mass has the potential to provide as much as one-third of the proposed Renewable
Energy Standards. (Available at: http://www.nafoalliance.org/LinkClick.aspx?file
ticket=03VDdh6B0ws%3d&tabid=65&mid=510).
57. All but four of the 190 U.S. biomass power plants are owned by private firms with
access to cheap fuel and independent power producers who contract for fuel. See
EIA,“Biomass Milestones,” and EIA,“Renewable Energy—Biomass Data and Infor-
mation: Biomass, Wood/Wood Waste, and Municipal Solid Waste.” Available at:
http://www.eia.doe.gov/fuelrenewable.html. With the onset of carbon limits, utili-
ties are showing much more interest in buying from or building biopower plants.
58. See Slack, “U.S. Geothermal Power Production,” 2008; and U.S. DOE, “Renewable
Energy Data Book,” 2008(b).
59. Because geothermal plant sites average 50 MW, they are not large enough to justify
long dedicated new transmission lines. This is a somewhat unique constraining fac-
tor.
60. A 2007 report by the Geothermal Energy Association calls geothermal energy “an
underestimated, underreported, underexplored, and understudied natural resource
that could have a large impact on America’s future energy supply.” The report cites
near-term resource estimates of 24,000 MW from the National Renewable Energy
Laboratory, primarily in California. See Fleischmann, “An Assessment of Geother-
mal,” 2007. Also see, U.S. Geological Survey “Assessment of Moderate- and High,”
2008; Bertani, “Long-Term Projections,” 2009; and Fridleifsson and others, “Possi-
ble Role and Contribution,” 2008. Google.org has also sponsored substantial re-
search into this energy resource.
61. See Schwartz, “First Commercial Hydrokinetic Turbine,” 2008. For an excellent
short overview of “damless” hydroprojects in the public power sector, see Hequet,
“Damless,” 2008.
62. Lobsenz,“UKMoves Forward,” 2009.
63. Sims,“Hydropower, Geothermal, and Ocean Energy,” 2008: 389–395.
64. Rawson and Sugar, “Distributed Generation and Cogeneration,” 2007: 1.
65. There are other important small-scale generation technologies I do not discuss here
purely to make the discussion more manageable. These include small-scale biomass
generators, which are significant in some DGmarkets (e.g., Appendix B, Part 2) and
small-scale hydropower. There are thousands of small hydroelectric dams in the
United States that can be upgraded with better technology, and many excellent new
small hydrotechnologies coming into the marketplace, but it is difficult to tell how
large a contribution small hydro will make.
The most common small-scale generator in the United States by far is the diesel
engine-sets. These units are plentiful because they have long been the cheapest
262 Notes for pages 108–109
small onsite generator. They can run on natural gas and other fuels, though diesel is
most common. Since nearly every large building in the United States is required to
have an emergency generator, there are an estimated 50,000 to 75,000 MW of these
engines sitting idle in basements and parking lots around the country. See Rocky
Mountain Institute “Micropower Database,” 2008; and “Market Forecasts,” Dis-
tributed-Generation.com. Available at: http://www.distributed-generation.com/
market_forecasts.htm.
Although they are cheap and reliable, they do not make power as efficiently as nat-
ural gas combined cycle power plants, even after you include the costs of transmis-
sion and distribution. (However, these units can be used much more efficiently for
cogeneration, which we’ll discuss in a moment). They produce much more air pollu-
tion per kilowatt-hour, including twice as much CO2 per kWh as natural gas power
plants. Worse still, they emit these pollutants in the worst possible locations, mainly
at ground level sites in the middle of congested urban areas. The environmental case
against increased reliance on diesel generators is elaborated in Greene and Hammer-
schlag, “Small and Clean Is Beautiful,” June 2000: 50–60. The authors note, for exam-
ple, that a 0.5% increase in generation from small diesel engines would increase total
nitrogen oxide pollution by 5% nationwide because these engines have no emissions
controls. For all these reasons, hardly anyone in the industry thinks diesel engines
should become a major contributor to the Smart Grid, and they don’t appear in the
Table 8-1. Emerging digital disesels that do not produce NOx are not discussed.
66. Electricity-displacing renewable energy technologies are recognized as a technology
group by the California Solar Initiative (see CPUC, California Solar Initiative, Pro-
gram Handbook, 2009: 19, Sec. 2.2.3).
67. In 1978 Congress enacted federally mandated regulatory reforms that forced utilities
to interconnect with cogenerators and pay them the utilities’ “avoided cost,” the com-
plicated regulatorily determined rates I have cautioned about several times already.
These reforms created a large wave of new cogeneration plants in the 1980s, but the
wave tapered off when the cost of gas and power declined in the 1990s. Also, power
plant owners figured out a way to use their own waste heat to make more power;
these are the gas combined cycle power plants we met at the start of the chapter.
68. Although Table 8.1 shows only two size categories, the National Renewable Energy
Laboratory uses three size classes—residential (under 30 kilowatts, the peak load of
one large house); medium (30 to 500 kW); and commercial scale (500 kW to 2 MW
or more per turbine). See “Wind Power: Wind Technology Today,” University of
Massachusetts at Amherst. For brevity, my table omits the middle category.
69. “AWEA Small Wind Turbine Global Market Study: 2009.”
70. Ibid.: 3; and Forsyth, “Small (Distributed) Wind Technology,” 2008.
71. Romm, The Hype about Hydrogen, (2004, 2005), explains why fuel cells are unlikely
to become a dominant energy source.
Notes for pages 110–112 263
BM:IP_Fox-Penner 8/15/10 7:10 PM Page 263
72. For another similar assessment see Figure 2.10 in the National Research Council’s
2009 Report, America’s Energy Future. The Council’s estimates do not include re-
newable credits, as do the 2010 estimates in my table, and are therefore higher for
renewable sources. Otherwise, the two sets of estimates are similar. See Appendix B
for further details and a graphical comparison of the two sets of estimates.
Billion Dollar Bets
1. U.S. lawmakers are aware of the problem of excessive volatility and are proposing
measures that will reduce it. These include allowing companies to bank their al-
lowances for use in one of the next several years and borrowing a limited number of
allowances from future years’ allocations. Other limits on volatility under discus-
sion are limits on allowance prices or price changes or the creation of allowance re-
serves that can be released if market prices become too high. For a discussion of
volatility reduction strategies in Waxman–Markey American Clean Energy and
Security Act of 2009, see National Commission on Energy Policy, “Forging the
Climate Consensus,” 2009. For a discussion of additional strategies using the
Bingaman–Specter Low Carbon Economy Act of 2007, see U.S. Senate, “Bingaman-
Specter Low Carbon Economy Act.”
2. For a longer discussion and analysis, see Celebi and Graves, “CO2 Price Volatility,”
2009; and Chupka, “Uncertainty, Volatility and Risk,” 2008. There are also plenty of
carbon-related risks other than allowance prices, such as the chance that carbon
policies will change or that low-carbon generating technologies won’t work as
planned.
3. “Scenarios: Shooting the Rapids.” Harvard Business Review, Nov–Dec 1985, no.
85617.Wikipedia puts it nicely as well: “Above all, scenario planning is a tool for col-
lective learning, reframing perceptions and preserving uncertainty when the latter
is pervasive. Too many decision makers want to bet on one future scenario, falling
prey to the seductive temptation of trying to predict the future rather than to enter-
tain multiple futures. Another trap is to take the scenarios too literally as though
they were static beacons that map out a fixed future. In actuality, their aim is to
bound the future but in a flexible way that permits learning and adjustment as the
future unfolds.”Available at: http://en.wikipedia.org/wiki/Scenario_planning.
4. See Google, “Clean Energy 2030,” 2008; and Sovacool and Watts, “Going Com-
pletely Renewable,” 2009.
5. See EIA, “Existing Capacity by Producer Type,” 2009(d); Shipley and others, “Com-
bined Heat and Power,” 2008; and Hedman,“CHPMarket Status,” 2005: 8.
6. For a selection of potential estimates, see Shipley and others, “Combined Heat and
Power,” 2008; CommitteeWorkshop on CombinedHeat and Power, 2009; “Cooling,
Heating, and Power,” 2003; “Combined Heat and Power Market,” 2004; Cleetus,
264 Notes for pages 112–128
Clemmer, and Friedman, “Climate 2030,” 2009; ACORE, “Outlook on Renewable
Energy,” 2007; Casten, “CHP: One of the Answers” 2009 (also for an industry per-
spective); and “Sector Profiles of Significant Large CHPMarkets,” 2004.
7. The U.S. has experienced some success encouraging CHP, albeit at a high price. In
1978 Congress passed the Public Utility Regulatory Policies Act (PURPA), which re-
quired distribution utilities to interconnect with “qualified” CHP plants and buy
their surplus power. The rate for purchasing the surplus was required to be that dis-
tributors avoided cost of generation, set by regulators if the utility was state regu-
lated. This is essentially the same avoided cost discussed in Chapter 5, with its many
measurements challenges. Some state regulators forced utilities to sign long-term
contracts with CHP plants to purchase at avoided cost rates that greatly overesti-
mated long-term avoided costs. This led to the de facto abandonment of this ap-
proach and formal repeal of PURPA in areas with fully developed wholesale power
markets. In the period between enactment in 1978 and de facto repeal in 1996, CHP
grew from 10,000 MW to 43,000 MW. (For additional discussion, see Fox-Penner,
“Impact of the Public Utility,” 1996.)
Both the Obama stimulus legislation and the proposed Waxman–Markey bill
provide substantial new support for CHP, primarily in the form of tax credits. See
U.S. Census “Summary of Energy Efficiency,” and United States Clean Heat &
Power Association,“Clean Heat.”
8. I should also note that microturbines look like they will become increasingly cost-
competitive, and if natural gas prices stay reasonable there is every reason to believe
that they will steadily gain market share in residential and commercial buildings.
Their growth will be constrained by the inevitable delays in adopting any new tech-
nology (even one with tax credits) and the pace of new building construction, since
these are much easier to install in new construction rather than to retrofit them into
existing buildings.
9. Rawson and Sugar, “Distributed Generation and Cogeneration,” 2007.
10. Ibid., 20. Unfortunately, the latest prognosis is even worse. Noting that it is “faced
with the slow development of new CHP in California,” the CEC launched a work-
shop to improve its CHP policies further, see Committee Workshop on Combined
Heat, 2009.
11. NEI,“Policies That Support New Nuclear Development,” 2009.
12. Ibid., and U.S. Congress, “American Clean Energy and Security,” 2009: 86–104.
13. “Carbon Capture and Geological Storage,” 2009.
14. In a recent survey of nuclear’s prospects, a world-class teamofMIT engineering pro-
fessors gave this downcast assessment:“The soberwarning is that if more is not done,
nuclear power will diminish as a practical and timely option for deployment at a
scale that would constitute a material contribution to climate change risk mitiga-
tion” (Deutch and others,“Update of theMIT 2003 Future of Nuclear Power,”2009).
Notes for pages 128–132 265
The Organisation for Economic Co-Operation and Development’s (OECD’s) 2008
Nuclear Energy Outlook puts a more positive slant on nuclear’s prospects, but its
conclusions reinforce the remote chance that nuclear will displace any of the alterna-
tives. Under its high-nuclear scenario,which assumes that all of the risk factors fall in
favor of nuclear and against coal and renewables, nuclear power would supply 22%
of the world’s electricity by 2050—about the same fraction it supplies today in the
United States. Obviously, over three-fourths of world power would come from coal,
gas, and renewables—and probably more in the United States. For more skeptical
views, see the works of Joe Romm (http://www.climateprogress.org) and Bradford,
“TheMyth(s) of the Nuclear Renaissance,”2009.
15. DOE,“20%Wind Energy,” 2008(b); and Baxter, “Energy Storage,” 2008: 102–112.
16. California Energy Commission,“Renewable Energy Transmission Initiative,” 2009.
17. Douglas and others, “33% Renewables Portfolio Standard,” 2009.
18. “Strategies to meet possible 33%,” 2009.
19. Petrill, “Creating a Secure Low,” 2008; Weyant, “EMF Briefing U.S. Climate,” 2009;
Romm, “Is 450 ppm (or Less) Possible?” 2009; Marshall, “Policy: Carbon Capture
and Storage,” 2009; EPA, “EPA Analysis of the American,” 2009; and Google, “Clean
Energy 2030,” 2008. The Energy Modeling Forum is actually a compendium of re-
sults from prominent energy sector models, each with different structures and dif-
ferent assumptions. Of the six models reviewed in EMF 22, one had very little CCS
coal and a second eliminated nuclear. Other studies of climate options that include
the full portfolio of options include EIA, “Energy Market and Economic Impacts,”
2009(k); Pacala and Socolow, “Stabilization Wedges,” 2004; IEA, “Energy Technol-
ogy Perspectives,” 2008(a); Sullivan and others, “Comparative Analysis of Three,”
2009; and Duke and Lashof, “The New Energy Economy,” 2008.
20. “Cutting CO2 emissions,” 2009.
21. Marshall, “Policy: Carbon Capture and Storage Moves,” 2009. Joe Romm also com-
ments on this point in “Is 450 ppm (or less) possible?” 2009.
22. Sioshansi, “Carbon Constrained,” 2009: 73.
23. Chupka and others, “Transforming America’s Power Industry,” 2008.
Energy Efficiency: The Buck StopsWhere?
1. “Behavioural economics is concerned with the empirical validity of these neoclassi-
cal assumptions about human behaviours and, where they prove invalid, with dis-
covering the empirical laws that describe behaviour correctly and as accurately as
possible. As a second item on its agenda, behavioural economics is concerned with
drawing out the implications, for the operations of the economic system and its in-
stitutions and for the public policy, of departures of actual behaviour from the neo-
classical assumptions.” The New Palgrave; A Dictionary of Economics, Eatwell, Mil-
gate, and Newman, eds. (London: Macmillan, 1987). Vol. 1, A to D: 221. A very
266 Notes for pages 132–140
interesting set of papers is in the proceedings of the 2008 Behavior, Energy, and Cli-
mate Conference, the Precourt Center for Energy Efficiency, Stanford University:
Available at: http//piee.standfor.edu/cgi-bin/htm/Behavior/2008_becc_conference
_online_progam.php.
2. Thaler and Sunstein.Nudge, 2008: 6–7.
3. Ibid.: 9
4. The boost in employment levels is tied to the fact that efficiency options often re-
quire manymore labor-hours per dollar spent in comparison to the construction of
power plants.While much of the material and manufacturing of power plants now
comes from outside the United States, most EE projects have a high proportion of
their budgets spent in the United States, creating direct and indirect employment.
Recent studies include Bezdek, “Renewable Energy and Energy,” 2007. For addi-
tional estimates see Pollin and others “Green Recovery,” 2008; and Pinderhughes,
“Green Collar Jobs,” 2007.
5. Levine and Ürge-Vorsatz, “IPCCWGIII Assessment Report,” 2007. Also see Figures
SPM9, SPM10 in “Climate Change 2007,” 2007.
6. McKinsey & Company,“Reducing U.S. Greenhouse Emissions 2007; Nadel,“Energy
Policy Trends,” 2009(a); Cleetus, Clemmer, and Friedman, “Climate 2030,” 2009;
and IEA,“Energy Efficiency Policy Recommendations,” 2007.
7. See Claussen,“Energy Efficiency, Climate Change,” 2004.
8. Gillingham,Newell, and Palmer. “Energy Efficiency Economics and Policy,” 2009.
9. Sathaye and Phadke.“Representing Energy Demand,” 2008.
10. Faruqui, “Will the Smart Grid Promote,” 2008. Also see, Parmesano,“Rate Design Is
the No. 1,” 2007: 18–25; and Kiesling, “Project Energy Code—Markets,” 2009, for
more on why prices are important.
11. First, the inaccuracies introduced by weaker price signals often do not greatly affect
the calculation of net benefits from many EE measures. Some measures, like more
efficient refrigerators, save energy during all hours, so using an average price is actu-
ally correct. For other measures that save on peak, using average prices underesti-
mates the value of EE. We aren’t tapping anywhere near the full EE potential even
with these underestimates.
Another reason why average pricing shouldn’t stop us is that many utilities and
EE experts don’t use average prices when they do cost-effectiveness calculations,
even if this is what customers are charged. For example,many residential customers
pay average rates of about 10 cents/kWh (although California is likely to be the first
state to change entirely to time-based pricing in the next few years). However, when
California utilities calculate the value of an efficiency measure, they use the fore-
casted cost of making power in every hour of the year from a model developed spe-
cially to ensure accurate EE calculations.
12. Jaffe, Newell, and Stavins, “Technological Change and the Environment,” 2000.
13. There is a vast literature debating the validity of market barriers and public
Notes for pages 140–146 267
efficiency policies. Several of the many good papers are references: “The elusive ne-
gawatt—Energy efficiency,” 2008; Jaffe, Newell, and Stavins,“Energy-Efficient Tech-
nologies,” 1999; Cavanagh,“Energy Efficiency in Buildings,”; Taylor andVanDoren,
“Myth Five—Price Signals,” 2007; “Quantifying the Effect of Market,” 2007; Suther-
land, “Market Barriers to Energy-Efficiency Investments,” 1991; Golove and Eto,
“Market Barriers to Energy Efficiency,” 1996; Dennis, “Compatibility of Economic,”
2006: 58–72; and Brown,“Market Failures and Barriers,” 2001: 1197–1207.A similar
and more principled objection comes from doubts that energy efficiency opportu-
nities are in fact low cost when all the costs and savings are measured accurately.
14. For a very important compendium of EE policy prescriptions, see the National Ac-
tion Plan for Energy Efficiency, 2006.
15. Meyers,McMahon, andMcNeil, “Realized and Prospective Impacts,” 2005.
16. deLaski, Testimony before the U.S. House, 2009.
17. ACEEE,“U.S. DOE Heats Up,” 2009(b).
18. Krauss, “Tightened Codes,” 2009.
19. Ibid. State-by-state information and other valuable information is on the Web site
of the Building Code Assistance Project, http://www.bcap-energy.org.
20. U.S. Congress, Section 201 of the American Clean Energy and Security Act (2009).
21. Building Codes Assistance Project, “Residential Building,” and “Commercial Build-
ing,” 2008.
22. “Solar Water Heater Rebate,” Progress Energy, 2009. Available at: http://www
.progress-energy.com/custservice/flares/save/solarheater.asp.
23. “Energy Revolving Fund: Low-Interest Loans for Energy Efficiency Improvements,”
Missouri Department of Natural Resources.Available at: http://dnr.mo.gov/energy/
financial/loan-information.htm.
24. Kats and Carey, “Upgrading America’s Homes,” 2009.
25. Johnson, “Municipal Energy Financing,” 2009. Also see New Rules.org. “Municipal
Financing for Renewables and Efficiency.” Available at: http://www.newrules.org/
energy/rules/municipal-financing-renewables-and-efficiency.
26. Kushler, York, andWhite, “Meeting Aggressive New State,” 2009: iii.
27. See Nadel, “Success with Energy Efficiency,” 2009(b); and Testimony before U.S.
House of Representatives, 2009(c).
28. I should also note that most utilities outsource a fair amount of their actual installa-
tion work to ESCOs, tapping their installation expertise. In a sense, utility programs
should be viewed as utilities being in charge of marketing, managing, and capitaliz-
ing the EE function, while ESCOs provide the implementation services.
29. “Implementing California’s Loading Order,” 2005. Graphics based on these data
were generated by PG&E for use in efficiency presentations.
30. Kushler, York, andWhite, “Meeting Aggressive New State,” 2009: 21.
31. Another somewhat smaller downside to government EE funding is that it could
make interactions between CO2 trading markets and EE projects a little less effec-
268 Notes for pages 147–155
tive. EE projects can qualify for offsets, which are akin to tradable carbon emissions
permits. If state governments are the primary local funders of EE projects, there
may be a temptation to take back the offsets rather than let the market use them to
incentivize greater savings. In the case of utility funding, it won’t matter quite as
much if the utility or the EE project gets the offset, as either entity will be incen-
tivized to use the permit efficiently.
32. Nadel, Testimony before the House of Representatives, 2009(c): 11.
Two and aHalf New BusinessModels
1. For useful references on network effects in economics, see Brennan, “Network ef-
fects as infrastructure challenges facing utilities and regulators,” 2009; Shy, The Eco-
nomics of Network Industries, 2001; and Moss, ed., Network Access, Regulation and
Antitrust, 2005: 1–5.
2. See Coase, 1988; andWilliamson, 1975, 1979.
3. For excellent formal discussions of the economics of vertical integration and net-
work effects, see Joskow, “Vertical Integration,” 2003; and Klein, “The Make-or-Buy
Decision,” 2004.
4. Joskow and Schmalensee,Markets for Power, 1988: 93.
5. See Kwoka,Power Structure Ownership, Integration, 1996: 141. I review the literature
ten years later in Fox-Penner, Electric Restructuring: A Guide to the Competitive Era,
1997. More recent studies include Kuhn and Machado, “Bilateral Market Power,”
2004; Finon, “Investment Risk Allocation,” 2008: 150–183; Greer, “A Test of Vertical
Economies,” 2008: 679–687; Arocena, “Cost and Quantity,” 2008: 39–58; Mansur,
“UpstreamCompetition,”2007: 125–156; Fraquelli, Piacenz, andDavide,“Cost Sav-
ings from Generation,” 2005: 289–308; and Nemoto and Goto, “Technological Ex-
ternalities,” 2004: 67–81. These recent studies are unanimous in their verdict that
vertical integration savings are significant.
6. Michaels, “Vertical Integration and the Restructuring,” 2006; Kwoka, Power Struc-
ture Ownership, Integration, 1996; and Faruqui, Sergici, andWood,“Moving toward
Utility-Scale,” 2009; Kwoka, Ozturk, and Pollit, “Divestiture Policy,” 2008; and
Kwoka,“Vertical Economies in Electric Power,” 2002.
7. These data come from FERC Form 1 filings collected by Ventyx and a classification
of lines of business in Platts Top 250 Energy Companies 2008, directed by Dr. José
Antonio García, of The Brattle Group’s Madrid office. Vertical integration is also
proving to be even prevalent in other deregulated network industries such as
telecommunications.
8. Jones et al., “Electric Utilities,” 2002.
9. In his extensive survey of vertical integration across all industries, Professor Peter
Klein writes:
Notes for pages 155–163 269
A second lesson is that vertical relations are often subtle and complex. While early
empirical work on transaction cost determinations of vertical integration tended
to focus on black-and-white distinctions between “make” or “buy,” researchers in-
creasingly recognize that a wide variety of contractual and organizational options
are available; there are many shades of gray. The literature on hybrids has grown
dramatically in the last ten years, while there are fewer studies of mundane issues
such as outsourcing versus in-house production per se.
10. Ibid.: 456.
11. EIA, 2009(i).
12. In Power Structure Ownership, Integration, 1996, Kwoka discusses the rare instances
in which cities have multiple distribution systems.
13. Plant additions are based on Velocity Suite data from Ventyx and reflect nameplate
capacity expansions as well as additions. Units less than 50 MW are omitted, em-
phasizing that this trend is occurring outside of the adoption of DG units (under
20MW).
14. When generation competition is introduced, it is theoretically preferable to forbid
the transmission owner from owning generators. This is because access to the grid
on reasonable terms is essential for competitive generators to be able to ship their
power to customers. If grid owners also own generators they have incentive to deny
access to generators they don’t own in order to lessen the competition faced by the
deregulated generators they do own. This incentive to foreclose transmission disap-
pears when grid owners do not own any generation as they no longer care which
generators are successful and which are not.
Throughout the world two approaches have been taken to removing this in-
centive. In the United Kingdom and most retail choice states, grid owners are sim-
ply not allowed to own generators. Obviously, in this case there will be no vertical
integration economies preserved. In the rest of the United States and much of
Europe, grid owners are allowed to own generators, but their transmission opera-
tors must grant equal access to any rival generator who wants to use their sys-
tem. This so-called open access transmission regime is how wholesale competition
operates in the United States. The extensive system of rules and procedures created
by the FERC to effectuate open access removes some but not all of the benefits of
vertical integration. For information on U.S. open access, see FERC’s Order No.
1000.
15. For a much more extensive bibliography of studies analyzing the impacts of whole-
sale and retail competition see Appendix C: Further Discussion and Reading Re-
garding Competition in the Power Industry.
16. Utility consultants Michael Beck andWilliam Klun write:
Change is Accelerating: Utilities are not renowned as incubators of change. Gener-
ally they’re managed as conservative, low risk businesses. Utilities don’t lead the
270 Notes for pages 163–166
way in the development of new technologies. R&D functions, if extant in a utility,
are primarily geared around monitoring, supporting and underwriting industry
organizations that undertake research for groups of companies. Given the critical
nature of electricity, new technologies are introduced only after careful testing and
usually in limited applications. There’s no reward provided for being first tomarket
with any development; in fact, there is more downside risk to any new technology
introduction than upside benefit. Industry history, therefore, is one of careful and
slow change.
17. See Compete (2009) for this and related statistics and studies. It is not clear from the
historical or economic record that deregulation was the necessary or causal force,
especially at retail. See the text following.
18. One of the best articulations of this view was written by then commissioner Jon
Wellinghoff and David Morenoff, “Recognizing the Importance of Demand Re-
sponse: The Second Half of the Wholesale Electric Market Equation,” Energy Law
Journal, 2007.
19. Galvin and Yeager,“Perfect Power,” 2009; Oatman and Crudele, “The Galvin Path to
Perfect Power,” 2007.
20. Kiesling, “Project Energy Code,” 2009.
21. This view is nicely articulated by Mark Jacobs, CEO of Reliant Energy, in a recent
interview in the journal Public Utilities Fortnightly by Burr, June 2008: 74.
Fortnightly: It’s been a year since the Texas price-to-beat structure was re-
moved. How has that affected competition in the state?
Jacobs: Inmy view, today we’re still in the early stages of seeing the benefits of a
competitive market. Most of the competition is still price-based as op-
posed to value-based.When we deregulated telecom in 1984, most of the
early competition was price based. All the technology we have in the
palms of our hands today was unthinkable 20 years ago when we deregu-
lated. It didn’t happen right out of the chute.
We’re going through a similar process in power. Now as a customer you
can pick a variable-rate plan, a fixed-rate plan, different tenors in terms of
your contract for power supply, and more degrees of freedom. But mainly
the products are differentiated around price. The next evolution in the
market will move beyond differential pricing and into value added
services.
Today in the retail business in Texas we sell a commodity. What we’re
working toward is providing people with a value-added service that helps
them buy that commodity. It sounds similar but it’s very different. Elec-
tricity purchases in Texas are a big line item, so helping people be
thoughtful about that and understand what they are buying, when they
buy it, will be valuable.
Notes for pages 167–168 271
Fortnightly: Arguably retail deregulation didn’t work in most states the first
time around because meters weren’t up to the task of delivering added
value. Is the meter the key?
Jacobs: The smart meter is kind of like computer hardware. By itself it doesn’t
do anything. We and other companies are providing the software to take
advantage of the hardware. We’re providing solutions that will give cus-
tomers valuable benefits—such as disaggregated rates and time-of-use
rates.
The smart meter is the enabling technology. It will allow the power of
competition to take over.
22. My thesis regarding climate policies and vertical integration is that policymakers
will want assurances that utilities will meet their emissions reductions targets and as
much assurance as possible regarding future prices and costs. If utilities rely primar-
ily on the market to supply energy sources and carbon emissions reductions, pro-
viding assurances regarding long-term costs will be difficult. They will undoubtedly
employ long-term contracts with fixed or formula prices, but integration has
proven to be preferable to such contracts in many cases.
I develop this line of reasoning a little further in my testimony in a Colorado reg-
ulatory proceeding, Public Utilities Commission of the State of Colorado, Docket No.
07A-447E, June 9, 2008. The reasons have less to do with how well retail competi-
tion works andmore to do with the continuance of vertical integration and the con-
tinuing importance of climate change, which will put a premium on assurances of
low-carbon supplies.
23. Carlisle, Elling, and Penney,“A Renewable Energy Community,” 2008: 1–2.
The Smart Integrator
1. Theory and practice are well explained in many works by Harvard professor
William Hogan, such as “Competitive Electricity Market Design: A Wholesale
Primer” (December 18, 1998) (57 pages), a compilation and update of introductory
materials from previous papers. Also see Stoft’s, “Power System Economics,” 2002,
and the seminal work by Schweppe et al., Spot Pricing of Electricity, 1998.
2. “eData Feed FAQs,” PJM Interconnection, available at: http://www/pjm.com/
Home/faqs/esuite-etools/edatafeed.aspx; “PJM Bus Model as of May 13, 2009,”
PJM Interconnection, available at: http://www.pjm.com/markets-and-operations/
energy/lmp-model-info/bus-price-model.aspx; and Reitzes and others, “Review of
PJM’s Market Power,” 2007.
3. Markets are starting to be established for generation capacity, but they are still
rather new and not fully accepted in the industry.Markets for other sources of value
from DG, and for the systemic costs DG imposes on systems, are either nonexistent
272 Notes for pages 169–178
or still in their infancy. All of these markets have been designed for large-scale
sources.While there is no theoretical reason why they won’t work at the local level,
we are far from knowing how practical it will be to implement them locally.
4. Here, I differ somewhat with the deregulation proponents, who believe that the
Smart Grid will unshackle the smart marketplace from regulators. My view is that
regulation will remain extremely pervasive even if retail prices are allowed to “float”
within regulated limits, and that state regulators will exert by far the largest influ-
ence shaping market outcomes for quite some time.
5. Vojdani, “Smart Integration,” 2008.
6. Arnold and Cochrane, “Future Opportunities for the Energy,” 2009. IBM’s utility
experts explain the large, advanced information systems Smart Grid utilities will
need in Welch and McLoughlin, “Information is Power,” available at: http://www-
03.ibm.com/industries/utilities/us/detail/resource/Y448128V62075A69.html.
7. You may have read or heard about more sophisticated forms of rate regulation that
are usually called incentive or performance-based regulation (PBR). This is a huge
family of regulatorymodels that range from very simple performance-based adjust-
ments to profits to complex mathematical formulas used to set rates. These are of-
ten excellent refinements on the basic cost-of-service regulation, but they don’t
change the fundamental incentives we are talking about here. They improve regula-
tory oversight, discourage wasteful spending, and they address specific incentive in-
compatibilities, but not the disincentives to sell less power. Nearly every regulatory
agency in the United States builds some aspects of PBR into its regulatory processes,
and the United Kingdom uses it exclusively to set transmission rates (it is com-
monly called RPI-X regulation there, a shorthand based on the rate-setting for-
mula). For further information see Sappington and others, “State of Performance-
Based Regulation,” 2001; and “Performance-Based Rates,” 2007.
8. In actuality it isn’t anywhere near automatic, but it works. Regulators have to first
make sure that the savings (9,000 kWh versus 10,000 kWh forecasted) come from
the utility’s EE efforts, not unusually mild weather or something else. This takes
some verification efforts. After this, the calculations and administrative procedures
are fairly straightforward. For additional information, see Smith, “Less Demand,
Same Great Revenue,” 2009; Weston, “Customer-Sited Resources,” 2008; and
NARUC,“Decoupling for Electric & Gas Utilities,” 2007.
9. National Grid,“General Information Pack,” 2009: 61.
10. FERC,“Smart Grid Policy,” 2009.
11. Ad 2: Progress Energy. http://www.progress-energy.com/aboutus/ads/index.asp
The Energy Services Utility
1. Power and Energy Magazine, “Store and Deliver.”
2. Darbee. “PG&E’s Vision: 2008 and Beyond,” 2009.
Notes for pages 179–193 273
3. Ibid.
4. Thompson, “A Green Coal Baron,” 2008; Schlosser, “How Duke Energy’s CEO Got
Started,” 2009; Thompson, “Meet the Maverick,” 2007; and “The Best CEOs in
America,” 2007.
5. “Coming Soon from a Utility,” 2006.
6. Izzo,“Climate Change,” 2007.
7. Andres Carvallo, “Austin Energy Plans Its Smart Grid 2.0,” 2009.
8. H. Platt,The Electric City, p. 22ff.
9. Wasik, “The Merchant of Power: Sam Insull, Thomas Edison, and the Creation of
the ModernMetropolis,” 2006.
10. The seminal works were Lovins’s Soft Energy Paths and Roger Sant’s 1983 article,
“The Coming Market for Energy Services,” Harvard Business Review, May–June
1980. My recent contribution to the discussion, “Fix Utilities before They Need a
Rescue,” also appears in theHarvard Business Review, July–August 2009.
11. The color rendition index (CRI) is a numerical measurement of the similarity of
light to sunlight, which is considered the best light for work tasks and color appreci-
ation. Sunlight has a CRI of 100, halogen bulbs have a CRI over 90, and good com-
pact fluorescent bulbs have a CRI better than 80.
12. As we saw in Chapter 11, National Grid owns no generation and operates entirely in
retail choice states. Nonetheless, its chairman, Steve Holliday, recently noted, “I can
see a situation where National Grid becomes more of a total provider of energy ser-
vices to our customers, a holistic manager of energy demand. We will get paid for
investing in the right technology at the right time, and providing the right advice to
help businesses and homeowners conserve energy, and for all the activity of getting
a better handle on the overall supply-and-demand balance.” See Burr, “Greenhouse
Gauntlet,” 2007.
Conclusion
1. Charles Phillips provides a classic overview of the role and function of independent
regulatory commissions: The Regulation of Public Utilities (Arlington, VA: Public
Utilities Reports, Inc.) 1993: 131; and Professor Janice Beecher, director of the Insti-
tute of Public Utilities at Michigan State University, explains the modern Commis-
sion’s duties at length in “Prudent Regulator,” 2008.
2. A small selection of recent episodes in which commissioners were criticized or their
removal was attempted includes “Analysis: Market Regulation,” Energy Economist,
2006; RMR, “The Corruption of Power”; and Jamison and others, “Disbanding the
Maryland Public Service Commission,” 2006.
3. There are many measures that can help professionalize commissions and strike the
proper balance between commission stakeholders, such as staggered appointments
274 Notes for pages 193–207
and requirements for bipartisan or independent appointments. Where commis-
sioners are elected the more common process of appointment and confirmation
should be considered.
4. The costs and challenges of meeting climate change limits will be different for
every utility within every segment of the industry, so generalizations and figures
applying to entire segments should not be taken out of context. With this caveat,
I note that the overall public power sector has the most balanced current car-
bon footprint due to the fact that it has rights to quite a lot of zero-carbon hy-
droelectric power. Nationwide, the sector gets 45% of its power from coal, 18%
from hydro, 17% from nuclear power, and 16% from natural gas. The coopera-
tive sector is much more carbon-intensive, with 80% of its power generated
by coal, 13% from nuclear power, and 7% from gas (as of 2005). American Pub-
lic Power Association 2009–10 statistical report, p. 24; and NRECA G&T Profiles
2005 from the NRECA Strategic Analysis, February, 2008 (http://www.nreca.org/
Coop_bythenos.doc).
5. Rural cooperatives and public power companies have extensive investments in large
traditional power plants. These entities do not havemuch, if any, shareholder equity
on their balance sheets. In contrast, their power plants are often financed by the is-
suance of bonds. The revenues to repay these bonds usually come from selling kilo-
watt-hours, not from other funding sources. The need to meet bond payment obli-
gations and the inability to draw on shareholder equity if revenues drop below
target levels can discourage attempts to lower energy sales.
6. Indeed, a community energy system (CES) is nearly identical to a municipal utility
or a cooperative, except that a CES is added into an area where the wires may be
owned and operated on an open access basis by a separate Smart Integrator. In this
sense, it is the unlikely child of public power and retail choice.
7. “American Electric Power Company, Inc.: Ohio Power Company and the Buck-
eye project agreements and bond closing documents, volume 1,” Lehman Broth-
ers Collection,Harvard Business School Baker Library Historical Collections, 1968.
Appendix A
1. Peter Fox-Penner and Marc Chupka, comment on “Preventing Windfalls for Pol-
luters but Preserving Prices—Waxman–Markey Gets It Right with Its Allocations to
Regulated Utilities,” Climate Progress, comment posted on May 27, 2009, http:/
/climateprogress.org/2009/05/27/exclusive-report-foxpenner-chupka-waxman-
markey-utility-allowances/.
2. See, for example, EIA, 2009(h): v.
3. See, for example, Harrington,Morgenstern, and Nelson,“On the Accuracy of Regu-
latory,” 2000: 297–322.
Notes for pages 209–220 275
4. See Neenan and Eom, “Price Elasticity of Demand,” 2008; and Fox-Penner, Hledik,
and Cajkusic. “Impact of Price Elasticity,” 2008, for recent surveys of the literature
and discussion.
5. Nadel and Pye, “Appliance and Equipment Efficiency,” 1996; and Eldridge et al.,
“The 2008 State Energy,” 2008.
6. EPRI, “Assessment of Achievable Potential,” 2009. The Brattle Group’s Ahmad
Faruqui served as principal investigator in this study.
7. ACEEE et al., “Joint Comments of the American Council,” 2009(d).
8. ACEEE,“H.R. 2454 Addresses Climate,” 2009(e).
9. MaCabrey, “Soaring electricity,” 2009.
10. Siddiqui, Parmenter, and Hurtado,“The Green Grid,” 2008.
11. Laitner, Poland-Knight, McKinney, and Ehrhardt-Martinez, “Semiconductor Tech-
nologies,” 2009.
12. See Faruqui, Sergici, and Sharif, “The Impact of Information Feedback,” 2009; and
Faruqui, Fox-Penner, and Hledik, “Smart-Grid Strategy,” 2009: 32–36, 60.
13. It is also true that onsite DG will need backup power and/or onsite storage, and that
either of these may be purchased from utilities. No attempt is made to deny or ex-
clude backup power supplied by utilities as a result of increased DG. Mechanically,
added onsite generation is deducted from total electricity used and sold in the EIA
reference. By this method, it is automatically the case that energy not generated on-
site (i.e., backup energy) is purchased conventionally. Since our interest is only in
physical energy sales, the fact that DG customers may incur capacity or other
standby charges does not enter the arithmetic in this appendix, but is inherent in
the decisions of customers to adopt DG technologies or purchase utility power.
14. EIA’s, 2009(k) and Table 8. “Electricity Supply,” 2009(g).
276 Notes for pages 221–224
Bibliography
2008 Behavior, Energy and Climate Change Conference presentations, November 16–
19, 2008, Sacramento, CA.
“A Milestone for Cleaner Coal Technology: Key Equipment Arrives at Duke Energy’s
IGCC Plant in Indiana.”Globe Investor, GlobeInvestor.com, June 24, 2009.
AEP.“History of AEP.” http://www.aep.com/about/history.
“Achievements: Controlling Human Impact on the Environment.” Electricité de
France, January 1, 2007. http://sustainable-development.edf.com/accueil-com-fr/
edf-developpement-durable/edf-sustainable-development/base-documentaire-en/
achievements/controlling-human-impact-on-the-environment/the-plan-aleas-
climatiques-extreme-weather-network-plan-107740.html.
“Advanced Metering and Demand Responsive Infrastructure: A Summary of the
Pier/CEC Reference Design, Related Research and Key Findings.” Draft, Prepared
for California Energy Commission, EnerNex Corporation, June 1, 2005.
Alexander, Lamar. “Blueprint for 100 New Nuclear Power Plants in 20 Years.” Prepubli-
cation copy, U.S. Senate, July 13, 2009 http://alexander.senate.gov/public/_pdfs/
blueprint.pdf.
American Council on Renewable Energy (ACORE).“The Outlook on Renewable Energy
in America.” January 2007.
American Council for an Energy-Efficient Economy (ACEEE). “H.R. 2454 Addresses
Climate Change through a Wide Variety of Energy Efficiency Measures.” American
277
Council for Energy Efficiency, June 1, 2009(e). http://aceee.org/energy/national/
HR2454_Estimate06-01.pdf.
———, et al. “Joint Comments of the American Council for an Energy-Efficient Econ-
omy, the Alliance to Save Energy, the Natural Resources Defense Council and En-
ergy Center of Wisconsin on the January 2009 Report; ‘Assessment of Achievable
Potential from Energy Efficiency and Demand Response Programs in the U.S.’ is-
sued by EPRI.” 2009(d).
———. “Quantifying the Effect of Market Failures and in the End-Use of Energy.” Feb-
ruary 2007.
———. “Savings Estimates for ACESA Rules’ Committee Version (Waxman–Markey),
Discussion Draft Analysis Chart, June 24, 2009(a).
———. “Success with Energy Efficiency Resource Standards.” January 2009(c).
———. “U.S. DOE Heats Up New Energy Standards for Home Furnaces.” ACEEE News
Release, April 23, 2009(b).
American Electric Power (AEP). “Interstate Transmission Vision for Wind Integration.”
http://www.aep.com/about/i765project/docs/WindTransmissionVisionWhitePaper
.pdf.
“America’s Energy Future: Technology and Transformation.” National Research Council
of The National Academies, 2009. http://www.nap.edu.
American Public Power Association (APPA). “2009–2010 APPA Annual Director & Sta-
tistical Report.” 2009: 24.
———. “APPA Comments to NERC on Reliability Impacts of Climate Change Ini-
tiatives.” July 16, 2008. http://www.appanet.org/files/PDFs/APPACommentsNERC
ReliabilityImpactsClimateChange71608.pdf.
———. “Restructuring at the Crossroads: FERC Electric Policy Reconsidered.” Decem-
ber 2004.
Amin, S. Massoud. “For the Good of the Grid.” IEEE power & energy magazine, Novem-
ber/December 2008: 53–54.
“Analysis: Market Regulation.” Energy Economist, November 1, 2006.
Apt, Jay. “Competition Has Not Lowered U.S. Industrial Electricity Prices.” Electricity
Journal, March 2005: 52–56.
Apt, Jay, et al., “Electrical Blackouts: A Systemic Problem.” Issues in Science and Technol-
ogy, June 22, 2004.
Arnold, Jon, and Larry Cochrane. “Future Opportunities for the Energy Ecosystem.”
Power Engineering, July 2009.
Arocena, Pablo. “Cost and Quality Gains from Diversification and Vertical Integration
in the Electricity Industry: A DEA Approach.” Energy Economics, January 2008: 39–
58.
“AWEA Small Wind Turbine Global Market Study.” American Wind Energy Association
(AWEA), 2009.
278 Bibliography
BM:IP_Fox-Penner 8/15/10 7:10 PM Page 278
Azagury, Jack, et al. “Building the Next Generation Utility.” Public Utilities Fortnightly,
January 2009.
“Baltimore Gas and Electric Company Unveils Plans for One of the Most Advanced
Smart Grid Initiatives in the Nation.”BusinessWire, July 13, 2009.
Bandivadekar, A., K. Bodek, L. Cheah, C. Evans, T. Groode, J. Heywood, E. Kasseris,
M. Kromer, and M. Weiss. On the Road in 2035: Reducing Transportation’s Petro-
leum Consumption and GHG Emissions. MIT Laboratory for Energy and the En-
vironment. Cambridge, Massachusetts: 2008. http://web.mit.edu/sloan-auto-lab/
research/beforeh2/otr2035/.
Barmack, Matthew, Edward Kahn and Susan Tierney. “A Cost–Benefit Assessment of
Wholesale Electricity Restructuring and Competition in New England.” Analysis
Group, 2006.
Basheda, G., M. Chupka, P. Fox-Penner, H. Pfeifenberger, and A. Schumacher. “Why Are
Electricity Prices Increasing? An Industry Perspective.” Prepared for The Edison
Foundation, by The Brattle Group, June 2006.
Baxter, Richard.“Energy Storage: An Expanding Role as a Distributed Resource.”Cogen-
eration and On-Site Power Production, May–June 2003: 69–72.
Beattie, Jeff. “Thanks, But No Thanks: Southern, AEP Exit FutureGen.” Energy Daily,
June 26, 2009.
———.“Only Six NewNukes to Break Ground Immediately—NRC.”Energy Daily, June
3, 2009.
———. “Utilities Unprepared for New Reactor Costs—Moody’s.” Energy Daily, August
14, 2009.
Beck, Michael J., and William Klun. “IOUs under Pressure.” Public Utilities Fortnightly,
June 2009: 37–41.
Beder, Sharon. “The Electricity Deregulation Con Game.” PR Watch, Third Quarter
2003, 10, (3).
Beecher, Janice A. “Avoided Cost: An Essential Concept for Integrated Resource Plan-
ning.” Center for Urban Policy and the Environment, Indianapolis, Indiana
University–Purdue University, 1995.
———. “The Prudent Regulator: Politics, Independence, Ethics, and the Public Inter-
est.” Energy Law Journal, July 1, 2008: 577–614.
Behr, Peter.“Probe of California Energy Crisis Facing Hurdles.”Washington Post, January
11, 2003: E01.
Benton, James C.“Senator Certain of Savings: Others Not So Sure Electric-Deregulation
Bills Benefit Customers, Schools.”Akron Beacon-Journal, March 29, 1999.
Bertani, Ruggero. “Long-Term Projections of Geothermal-Electric Development in the
World.” Enel Green Power, presented at GeoTHERMConference, Offenburg 2009.
Bezdek, Roger H.“Green Collar Jobs in the U.S. and Colorado, Economic Drivers for the
21st Century.”American Solar Energy Society, January 2009.
Bibliography 279
———.“Renewable Energy and Energy Efficiency: Economic Drivers for the 21st Cen-
tury.” American Solar Energy Society, 2007.
Biello, David. “How Fast Can Carbon Capture and Storage Fix Climate Change?” Scien-
tific American, April 10, 2009.
Blumsack, Seth A., Jay Apt, and Lester B. Lave.“Lessons from the Failure of U.S. Electric-
ity Restructuring.”Electricity Journal, March 2006: 51–32.
Blumstein, Carl, L. S. Friedman, and R. J. Green. “The History of Electricity Restructur-
ing in California.”CSEMWP 103, UCEI, August 2002.
Boedecker, Erin, John Cymbalsky, and Steven Wade. “Modeling Distributed Electricity
Generation in the NEMS Buildings Model.” EIA Forecast, Energy Information Ad-
ministration, U.S. Department of Energy, July 30, 2002. http://www.eia.doe.gov/
oiaf/analysispaper/electricity_generation.html.
Bohn, Roger E., Alvin K. Klevorick, and Charles G. Stalon.“Second Report onMarket Is-
sues in the California Power Exchange Energy Markets.” Prepared for the Federal
Energy Regulatory Commission,March 19, 1999.
“Bottling Electricity: Storage as a Strategic Tool for Managing Variability and Capacity
Concerns in the Modern Grid.” Electricity Advisory Committee, December 2008.
Borenstein, Severin, and James Bushnell. “Electricity Restructuring: Deregulation or
Reregulation?”Regulation, 23 (2), 2000.
Boyle,Matthew.“A smarter, greener grid.”Fortune, May 7, 2008.
Bradford, Peter A.“TheMyth(s) of the Nuclear Renaissance.”Environmental and Energy
Study Institute (EESI) Briefing,Washington, DC,May 21, 2009.
Bramble, Barbara J. “Roundtable for Sustainable Biofuels.” Presented at BIOMASS 2009:
Fueling Our Future,March 17–18, 2009.
Brennan, Tim.“Questioning the Conventional ‘Wisdom,’”Regulation, Fall 2001.
Brockway, Nancy. “Advanced Metering Infrastructure: What Regulators Need to Know
about Its Value to Residential Customers.” National Regulatory Research Institute,
February 13, 2008.
“Brodsky Introduces Reform Legislation to Reduce Electric Rates and Re-regulate En-
ergy Industry.” Yonkers Tribune, November 8, 2007. http://yonkerstribune.typepad
.com/yonkers_tribune/2007/11/brodsky-introdu.html.
Brown, Garry A. Testimony before the U.S. Senate, Subcommittee on Energy, Commit-
tee on Energy and Natural Resources on“Net Metering, Interconnection Standards,
and Distributed Generation.”May 7, 2009.
Brown, Marilyn A. “Market Failures and Barriers as a Basis for Clean Energy Policies,”
Energy Policy, November 2001: 1197–1207.
Brown, Matthew, H. “California’s Power Crisis: What Happened? What CanWe Learn?”
National Conference of State Legislatures,March 2001.
Brubaker, Harold.“After the Bubble.”Philadelphia Inquirer, May 3, 2009.
Building Codes Assistance Project. “Commercial Building Energy Codes—Usability and
Compliance Methods.”October 2008.
280 Bibliography
———. “Residential Building Energy Codes—Enforcement and Compliance Study.”
October 2008.
Burr, Michael T. “Conservation Compact: Utilities Test New Models to Encourage In-
vestment in Efficiency and Conservation.” Public Utilities Fortnightly, June 2008:
39–74.
———.“Greenhouse Gauntlet.”Public Utilities Fortnightly, June 2007: 41–51.
Bushnell, James, Alvin K. Klevorick, and RobertWilmouth.“Third Report onMarket Is-
sues in the California Power Exchange Energy Markets.” Prepared for the Federal
Energy Regulatory Committee,March 6, 2000.
Bushnell, James B., and Frank A. Wolak. “Regulation and the Leverage of Local Market
Power in the California Electricity Market.” UC Berkeley, Competition Policy Cen-
ter, July 1999.
“CEE Cost Effectiveness Tools.” Updated June 28, 2007. http://222.ethree.com/cpuc_
avoidedcosts.html.
California Energy Commission. “Renewable Energy Transmission Initiative—Phase
IB, Final Report.” January 2009. http://www.energy.ca.gov/2008publications/RETI-
1000-2008-003/RETI-1000-2008-003-F.PDF.
California ISO (CAISO). “Alerts, Warnings, and Emergencies.” April 2004. http://www
.caiso.com/awe/AlertsWarnings-WhitePaper.pdf.
———.“California ISO Urges Continued Conservation: Friday is Day 32 of Stage Three
Electrical Emergency.” February 15, 2001. http://www.caiso.com/docs/2001/02/15/
200102151719381517.pdf.
California Public Utilities Commission. “Interim Opinion on E3 Avoided Cost Method-
ology.” Rulemaking 04-04-225, April 22, 2004.
———.California Solar Initiative, ProgramHandbook. July 2009: 19, Sec. 2.2.3.
California State Senate. Steve Peace Bio. 2002. http://www.sen.ca.gov/ftp/sen/
SENATOR/_ARCHIVE_2002/DEPARTING/PEACE/BIO.htm.
Cappers, Peter, Charles Goldman, and David Kathan. “Demand Response in U.S. Elec-
tricity Markets: Empirical Evidence.” Lawrence Berkeley National Laboratory,
LBNL-2124E, Energy, July 12, 2009.
“Carbon Capture and Geological Storage in Emerging Countries: Financing the EU–
China Near Zero Emissions Coal Plant Project.”European Commission, eGovMon-
itor, June 26, 2009. http://www.egovmonitor.com/node/25910.
Carey, John.“A Smarter Electric Grid.”BusinessWeek, January 11, 2008.
Carlisle, N, J. Elling, and T. Penny. “A Renewable Energy Community: Key Elements.”
NREL/TP-540-42774, NREL, January 2008: 1–2.
Carvallo, Andres. “Austin Energy Plans Its Smart Grid 2.0.” CIO Master and Smart Grid
Master Blog, April 18, 2009. http://www.coimaster.com/2009/04/austin-energy-
plans-its -smart-grid-20.html.
Casten, Sean. “CHP: One of the answers (but not the question).” Presented to Efficient
Enterprises: Power American Industry, June 23, 2009.
Bibliography 281
Cavanagh, Ralph. “Energy Efficiency in Buildings and Equipment: Remedies for Perva-
sive Market Failures.” Prepared for the National Commission on Energy Policy, De-
cember 1, 2004.
Celebi, Metin, and Frank Graves. “Co2 Price Volatility: Consequences and Cures.” The
Brattle Group, January 2009.
Centolella, Paul, and Andrew Ott. “The Integration of Price Responsive Demand into
PJM Wholesale Power Markets and System Operations.” March 9, 2009: 4. http://
www.hks.harvard.edu/hepg/Papers/2009/Centolella%20%20Ott%20PJM%20PRD
%2003092009.pdf.
“Challenges For Sustainable Second Generation Biofuels.” CSBP, presented at Biomass
2009,Washington, DC,March 17, 2009.
Chandley, John D., Carl R. Danner, Christopher E. Groves, et al. “California’s Electricity
Markets: Structure, Crisis, and Needed Reforms.” LECG, LLC., January 17, 2003.
Chassin, David P., and Lynne Kiesling. “Decentralized Coordination through Digital
Technology,Dynamic Pricing, and Customer-Drive Control: The GridWise Testbed
Demonstration Project.”Electricity Journal, October 2008: 51–59.
Cheng, Roger. “Cisco Looking to Tap Growing Smart-Grid Market.”Wall Street Journal,
May 18, 2009.
Chupka,Marc. “Uncertainty,Volatility and Risk: Cap and Trade Economics.”The Brattle
Group, presented to The Aspen Institute Energy Policy Forum, July 8, 2008.
Chupka, Marc, et al. “Transforming America’s Power Industry: The Investment Chal-
lenge 2010–2030.”The Brattle Group, Prepared for The Edison Foundation,Novem-
ber 2008.
Cicchetti, Charles J., and Colin M. Long, with Kristina M Sepetys. Restructuring Electric-
ity Markets: A World Perspective Post California and Enron. Visions Communica-
tions, 2003.
Claeys, Richard. “Changing Course: Latest RKS Survey of State Utility Regulators Docu-
ments Retreat from Deregulation.” Business Wire, September 19, 2007. http://find
articles.com/p/articles/mi_m0EIN/is_2007_Sept_20/ai_n27380541.
Clark,Wilson. Energy for Survival. (Garden City: Anchor Books) 1974.
Claussen, Eileen. “Energy Efficiency, Climate Change and Our Nation’s Future.” Pre-
sented at Energy Efficiency Forum,Washington, DC, June 16, 2004.
Cleetus R., S. Clemmer, and D. Friedman. “Climate 2030: A National Blueprint for a
Clean Energy Economy.”Union of Concerned Scientists (UCS),May 2009.
“Climate Change 2007: Synthesis Report, Summary for Policymakers.” IPCC Working
Group, November 2007.
Coase, R. H. The Firm, the Market, and the Law. (Chicago: University of Chicago Press)
1988.
Cohen, Armond, Mike Fowler, and Kurt Waltzer. “‘NowGen’: Getting Real about Coal
Carbon Capture and Sequestration.”Electricity Journal, May 2009: 25–41.
282 Bibliography
Cohen, Linda R., and Roger G. Noll. “Privatizing Public Research.” Scientific American,
September 1994.
“Combined Heat and PowerMarket Potential for Opportunity Fuels.”Resource Dynam-
ics Corporation, August 2004.
“Coming Soon from a Utility Near You: More Power to the People.” [email protected].
Carey, October 11, 2006. http://knowledge.wpcarey.asu.edu/article.cfm?articleid=
1310.
Committee Workshop on Combined Heat and Power, Notice of Committee Workshop,
Docket No. 09-IEP-1H, California Energy Commission, July 23, 2009.
“Competitive Electricity Markets Drive Renewables, Demand Response, Conserva-
tion, Efficiency and Innovation.” Compete, May 20, 2009. http://www.compete
coalition.com/resources/competitive-electricity-markets-drive-renewables-demand-
response-conservation-efficiency-a.
Condon, Stephanie. “Lack of Standards Could Stymie Smart Grid.” CNET News, March
3, 2009. http://news.cnet.com/8301-13578_3-10187292-38.html.
Congressional Budget Office. “Nuclear Power’s Role in Generating Electricity.” A CBO
Study,Washington, DC,May 2008.
“Cooling, Heating, and Power for Industry: A Market Assessment.” Resource Dynamics
Corporation, August 2003.
Cooper, Mark. “The Economics of Nuclear Reactors: Renaissance or Relapse?” Institute
for Energy and the Environment,Vermont Law School, June 2009.
Creyts, Jon, Anton Derkach, Scott Nyquist, Ken Ostrowski, and Jack Stephenson. “Re-
ducing U.S. Greenhouse Emissions: How Much at What Cost?” U.S. Greenhouse
Gas Abatement Mapping Initiative, Executive Report. McKinsey & Company and
The Conference Board, 2007. http://www.mckinsey.com/clientservice/ccsi/pdf/US_
ghg_final_report.pdf.
Cudahy, Richard D. “The Coming Demise of Deregulation.” Yale Journal on Regulation,
Issue 10.1, 1993.
“Cutting CO2 emissions from existing coal plants.” MIT News, June 19, 2009.
http://web.mit.edu/newsoffice/2009/coal-0619.html.
Dao, James. “The End of the Last Great Monopoly.”New York Times, August 4, 1996.
Darbee, Peter A. “PG&E’s Vision: 2008 and Beyond.” Pacific Gas and Electric Corpora-
tion, February 26, 2009.
“Dark Days Ahead.”Economist. August 6, 2009.
Davis, Bob, Damian Paletta, and Rebecca Smith. “Unraveling Reagan: Amid Turmoil,
U.S. Turns Away from Decades of Deregulation.” Wall Street Journal, July 25,
2008.
“Deciding on ‘Smart’ Meters: The Technology Implications of Section 1252 of the En-
ergy Policy Act of 2005.” Prepared by: Plexus Research, Inc., for Edison Electric In-
stitute, September 2006.
Bibliography 283
deLaski, Andrew. Testimony before the U.S. House of Representatives, Energy and Com-
merce Committee; Hearing on: American Clean Energy and Security Act of 2009,
April 24, 2009.
Dennis, Keith. “The Compatibility of Economic Theory and Proactive Energy Efficiency
Policy.”Electricity Journal, Aug./Sep. 2006: 58–72
Dernbach, John C.“Energy Efficiency and Conservation as Ethical Responsibilities: Sug-
gestions for IPCC Working Group III.” January 27, 2008. http://papers.ssrn.com/
sol3/papers.cfm?abstract_id=1089423.
Deutch, JohnM., et al. “Update of the MIT 2003 Future of Nuclear Power.”MITEI,Mas-
sachusetts Institute of Technology, 2009.
“DOE Providing $408 Million for Two CO2 Capture Projects.” Energy Daily, July 2,
2009: 3.
“DOE: Residential Consumers in All States to Benefit from Deregulation.”Utility Spot-
light, 1999.
Douglas, Paul, et al. “33% Renewables Portfolio Standard: Implementation Analysis Pre-
liminary Results.”California Public Utilities Commission, June 2009.
“Duke Energy’s Jim Rogers Get Coveted ‘CEO of the Year’.” Media Relations and Event
Management, November 30, 2007.
Duke, Rick, and Dan Lashof. “The New Energy Economy: Putting America on the Path
to Solving GlobalWarming.”NRDC Issue Paper,May 2008.
Duncan, Ian. “Carbon Sequestration Risks, Opportunities, and Learning from the CO2–
EOR Industry.” To the Committee on Energy and Commerce, U.S. House of Repre-
sentatives, March 10, 2009.
“Economic Security:Will the Third Oil Shock Be the Charm?”Clean Fuels Development
Coalition, September 2009.
Edison Electric Institute (EEI). “Transmission Projects: Supporting Renewable Re-
sources.” February 2009.
Ehrhardt-Martinez, Karen, and John A.“Skip” Laitner. “The Size of the U.S. Energy Effi-
ciency Market: Generating a More Complete Picture.” American Council for an
Energy-Efficient Economy, E083,May 2008.
Eldridge,Maggie, et al., “The 2008 State Energy Efficiency Scorecard.”American Council
for an Energy-Efficient Economy, October 2008.
Electric Power Research Institute (EPRI).“Advanced Coal Power Systems with CO2 Cap-
ture: EPRI’s Coal Fleet for Tomorrow Vision.” Interim Report, Palo Alto, CA: Sep-
tember 2008(a): 5, 1–5.
———. “Assessment of Achievable Potential from Energy Efficiency and Demand Re-
sponse Programs in the U.S. (2010–2030).”Technical Report, Palo Alto, CA: January
2009(a).
———. “Environmental Assessment of Plug-In Hybrid Electric Vehicles Volume 1:
Nationwide Greenhouse Gas Emissions.” Technical Report, Palo Alto, CA: July
2007(a).
284 Bibliography
———. “Environmental Assessment of Plug-In Hybrid Electric Vehicles Volume 2:
United States Air Quality Analysis Based on AEO-2006 Assumptions for 2030.”
Technical Report, Palo Alto, CA: July 2007(b).
———. “Interim Smart Grid Roadmap.” Draft Report, Electric Power Research Institute
(EPRI), March 24, 2009(b).
———. “Program on Technology Innovation: Integrated Technology Options.” Techni-
cal Update, Palo Alto, CA: November 2008.
Electricity from Renewable Resources: Status, Prospects, and Impediments. (Washington,
DC: National Academies Press) 2009.
“Empowering Consumers Through a Modern Electric Grid.” Report of the Illinois
Smart Grid Initiative. April 2009: 20–21.
Energy Information Administration (EIA). “An Updated Annual Energy Outlook 2009
Reference Case Reflecting Provisions of the American Recovery and Reinvest-
ment Act and Recent Changes in the Economic Outlook.” The Annual Energy Out-
look 2009. SR-OIAF/2009-03 (2009). Washington, DC, April 2009(g). (Tables 2,
8, 45.)
———. “Annual Energy Outlook 2009 Early Release Overview.” DOE/EIA-0484 (2009).
Washington, DC, January 2009(c). http://www.eia.doe.gov/oiaf/ieo/.
———. “Nuclear Energy.” Annual Energy Review 2008. Section 9, DOE/EIA-0384(2008),
Washington, DC, June 2009(j).
———. “Appendix A: History of the U.S. Electric Power Industry, 1882–1991.” The
Changing Structure of the Electric Power Industry 2000: An Update. Washington, DC,
January 2009(a). http://www.eia.doe.gov/cneaf/electricity/chg_stru_update/appa
.html.
———. “Assumptions to the Annual Energy Outlook 2009.” DOE/EIA-0554(2009),
Washington, DC, March 2009(f). http://www.eia.doe.gov/oiaf/aeo/assumption/
pdf/0554(2009).pdf.
———. “Biomass Milestones.” http://www.eia.doe.gov/cneaf/solar.renewables/
renewable.energy.annual/backgrnd/chap6e.htm.
———. “Carbon Capture & Storage.” Presented at NARUC Winter Meeting, Washing-
ton, DC, February 17, 2009(e).
———. “Energy Market and Economic Impacts of H.R. 2454, the American Clean En-
ergy and Security Act of 2009.” Errata, SR/OIAF/2009-5, U.S. Department of En-
ergy, August 2009(k).
———. “Energy Market and Economic Impacts of S. 2191, the Lieberman–Warner Cli-
mate Security Act of 2007.” SR/OIAF/2008-01, Washington, DC, April 2008(a).
———. “Existing Capacity by Producer Type.” Energy Information Administration,
U.S. Department of Energy, January 21, 2009(d): http://www.eia.doe.gov/cneaf/
electricity/epa/epat2p3.html.
———. “History of Energy in the United States: 1635–2000 Total Energy.” Washington,
DC, September 2003. http://www.eia.doe.gov/emeu/aer/eh/frame.html.
Bibliography 285
BM:IP_Fox-Penner 8/15/10 7:10 PM Page 285
———. “Impacts of a 25-Percent Renewable Electricity Standard as Proposed in the
American Clean Energy and Security Act Discussion Draft.” SR/OIAF/2009-04,
Washington, DC,April 2009(h).
———. “New Commercial Reactor Designs.” November 2006. http://www.eia.doe.gov/
cneaf/nuclear/page/analysis/nucenviss2.html.
———. Status of Electricity Restructuring by State, May 2009(i). http://www.eia.doe
.gov/cneaf/electricity/page/restructuring/restructure_elect.html.
———. Table A2: “Energy Consumption by Sector and Source.” The Annual Energy
Outlook 2009–Early Release,Washington, DC, December 17, 2008(d).
———. Table 2.2: “Existing Capacity by Energy Source, 2007.” Electric Power Annual
2007,Washington, DC, January 26, 2007.
———. Table 5: “U.S. Average Monthly Bill by Sector, Census Division and State, 2007.”
Electric Sales, Revenue, and Price Report.Washington, DC, January 2009(b).
———.Table 127: “Imported Liquids by Source.” Supplemental Table to the Annual En-
ergy Outlook 2010, Washington, DC, December 14, 2009(l). http://www.eia.doe
.gov/oiaf/aeo/supplement/supref.html.
———. “The Electric Utility Industry Restructuring Act.” See Provisions of AB 1890,
Status of the California Electricity Situation, 1998. http://www.eia.doe.gov/cneaf/
electricity/california/assemblybill.html.
———.“WhatAreGreenhouseGases andHowMuchAre Emitted by theUnited States?”
Energy in Brief—What Everyone Should Know about Energy. Washington, DC, July
10, 2008(c). http://tonto.eia.doe.gov/energy_in_brief/greenhouse_gas.cfm.
———.“World Energy Demand and Economic Outlook.” International Energy Outlook
2008. DOE/EIA-0383 (2008),Washington, DC, June 2008(b).
“Energy Security Wars: Grids vs. Hackers.” The DOD Energy Blog, March 10, 2009.
http://dodenergy.blogspot.com/2009/03/energy-security-wars-grids-vs-hackers
.html.
Fairley, Peter. “Germany’s Green-Energy Gap.” IEEE Spectrum, July 2009. http://
spectrum.ieee.org/energy/policy/germanys-green-energy-gap/0.
“False Consciousness: Everybody Loved ENRON.”Brandweek, March 3, 2006.
Faruqui, Ahmad. “Breaking Out of the Bubble.” Public Utilities Fortnightly, March 2007:
46–51.
———. “Creating Value through Demand Response.” Presented at DOE’s Smart Grid
E-Forum,October 23, 2008.
———.“Inclining Toward Efficiency.”Public Utilities Fortnightly, August 2008: 22–27.
———. “Will the Smart Grid Promote Wise Energy Choices?” Presented at Illinois
Smart Grid Initiative, Chicago, IL, August 5, 2008.
Faruqui, Ahmad, Hung-po Chao, Vic Niemeyer, Jeremy Platt, and Karl Stahlkopf. “Ana-
lyzing California’s Power Crisis.”Energy Journal, 22 (4), 2001: 29–51.
Faruqui, Ahmad, and Lisa Wood. “Quantifying the Benefits of Dynamic Pricing In the
Mass Market.”The Brattle Group, January 2008.
286 Bibliography
Faruqui, Ahmad, and Ryan Hledik. “Transition to Dynamic Pricing.” Public Utilities
Fortnightly, March 2009: 27–33.
Faruqui, Ahmad. Ryan Hledik, and Clay Davis. “Sizing Up the Smart Grid.” Presentation
from The Brattle Group, March 17, 2009.
Faruqui, Ahmad, Peter Fox-Penner, and Ryan Hledik, “Smart-Grid Strategy: Quantify-
ing Benefits.”Public Utilities Fortnightly, July 2009: 32–36, 60.
Faruqui, Ahmad, Ryan Hledik, and John Tsoukalis. “The Power of Dynamic Pricing.”
Electricity Journal, April 2009: 42–56.
Faruqui, Ahmad, Ryan Hledik, SamNewell, and Johannes Pfeifenberger.“HowDynamic
Pricing Can Save $35 Billion in Electricity Costs.”The Brattle Group Discussion Pa-
per, May 16, 2007.
Faruqui, Ahmad, Sanem Sergici, and Ahmad Sharif, “The Impact of Information Feed-
back on Energy Consumption—A Survey of the Experimental Evidence.”The Brat-
tle Group 2009.
Faruqui, Ahmad, Sanem Sergici, and Lisa Wood, “Moving Toward Utility-Scale Deploy-
ment of Dynamic Pricing in Mass Markets.” IEEWhitepaper, June 2009.
Federal Energy Regulatory Commission (FERC). “Electric Market Overview: Renew-
able Portfolio Standards.” July 8, 2009. http://www.ferc.gov/market-oversight/mkt-
electric/overview/elec-ovr-rps.pdf.
———.“Final Report on Price Manipulation inWestern Markets.”Docket No. PA02-2-
000,March 2003.
———.“Order on Cost Filings.”Docket No. EL00-95-000, et al. January 26, 2006.
———.“Smart Grid Policy.”Docket No. PL09-04-000,March 19, 2009.
Federal Ministry for the Environment, Nature Conservation and Nuclear Safety (BMU).
“Renewable Energy: Employment Effects.” Berlin, Germany, June 2006.
Fehrenbacher, Katie.“How to Hammer Out Smart Grid Standards in 30 Days or Less, Or
Your Money Back.” Earth2tech.com, May 7, 2009. http://earth2tech.com/2009/05/
07/how-to-hammer-out-smart-grid-standards-in-30-days-or-less-or-your-money-
back/.
Finon, Dominique. “Investment Risk Allocation in Decentralised Electricity Markets:
The Need of Long-Term Contracts and Vertical Integration.” OPEC Review, June
2008: 150–183.
Fisher, Jolanka V., and Timothy P. Duane. “Trends in Electricity Consumption, Peak De-
mand and Generation Capacity in California and the Western Grid.” Program on
Workable Energy Regulation (POWER), PWP-85, September 2001.
Fleischauer, Eric. “Heat Wave Shutdown at Browns Ferry Stirs Nuclear Debate.” Climate
Ark: Climate Change and Global Warming Portal, September 2, 2007. http://www
.climateark.org/shared/reader/welcome.aspx?linkid=83238&keybold=climate%20
blogs.
Fleischmann, Daniel J. “An Assessment of Geothermal Resource Development Needs in
theWestern United States.” January 2007.
Bibliography 287
Flint, Alex. Statement before the Senate Republican Conference, Nuclear Energy Insti-
tute, June 8, 2009.
Forsyth, Trudy. “Small (Distributed) Wind Technology.” National Renewable Energy
Laboratory, June 2008.
Fox-Penner, Peter. “AWelcome Truce in the ElectricityWars.”Public Utilities Fortnightly,
2005: 48–51.
———.“Allowing for Regulation in Forecasting Load and Financial Performance.”Pub-
lic Utilities Fortnightly, January 7, 1988.
———. “Electric Power Deregulation: Blessings and Blemishes, A Non-Technical Re-
view of the Issues Associated with Competition in Today’s Electric Power Industry.”
Prepared for the National Council on Competition and the Electric Industry,
March 14, 2000.
———. Electric Power Transmission and Wheeling: A Technical Primer. (Edison Electric
Institute) 1990.
———. Electric Restructuring: A Guide to the Competitive Era. (Vienna, VA: Public Util-
ity Reports) 1997.
———. “Emerging Smart Grid Technologies: The Future of U.S. Power Distribution.”
Presented to the 2degrees Intelligent Grids NetworkWebinar, April 22, 2009.
———.“Fix Utilities before They Need a Rescue.”Harvard Business Review, July–August
2009: 18–19.
———. Prefiled Rebuttal Testimony before the Public Utilities Commission of Nevada,
Nevada Power Company’s 2001 Deferred Energy Filing, PUCN Docket No. 01-
11029, p. 77.
———. Testimony, Federal Energy Regulatory Commission, Docket No. EL0-95-000, et
al., regarding the Investigation of Practices of the CAISO and CALPX.
———. Prepared Rebuttal Testimony, Federal Energy Regulatory Commission, Docket
No. EL0-95-000, et al., (CA-349) regarding Market Fundamentals, March 20,
2003.
———. Testimony for Cheyenne Light, Fuel and Power Company. Docket No. 20003-
EP-01-59,March 2001.
———.“The Impact of the Public Utility Regulatory Policies Act of 1978 (PURPA): Ret-
rospect and Prospect.”Draft, U.S. Department of Energy, January 9, 1996.
———. “Transforming America’s Power Industry: The Investment Challenge.” Presen-
tation to The Edison Foundation, Phoenix, AZ, November 10, 2008.
———.“U.S. Transmission Investment: Policies and Prospects.”The Brattle Group, April
28, 2009.
Fox-Penner, Peter, andMarc Chupka.“PreventingWindfalls for Polluters but Preserving
Prices—Waxman–Markey Gets It Right with Its Allocations to Regulated Utilities.”
Climate Progress Blog, Posted May 27, 2009. http://climateprogress.org/2009/05/
27/exclusive-report-foxpenner-chupka-waxman-markey-utility-allowances/.
Fox-Penner, Peter, Dean M.Murhpy, Mariko Geronimo, and Matthew McCaffree. “Pro-
288 Bibliography
moting Use of Plug-In Electric Vehicles through Utility Industry Acquisition and
Leasing of Batteries.” Chapter 13 of Plug-In Electric Vehicles: What Role of Washing-
ton?, Washington, DC: The Brookings Institution, 2009.
Fox-Penner, Peter and Johannes Pfeifenberger. Affidavit, Federal Energy Regulatory
Commission, Docket No. EC05-43-000, April 11, 2005.
Fox-Penner, Peter, Ryan Hledik, and Igor Cajkusic. “The Impact of Price Elasticity on
Electric Industry Investments—Preliminary Findings.” Prepared for The Edison
Foundation,The Brattle Group, November 10, 2008.
Fraquelli, Giovanni, Massimiliano Placenza, and Davide Vannoni. “Cost Savings from
Generation and Distribution with an Application to Italian Electric Utilities.” Jour-
nal of Regulatory Economics, November 2005: 289–308.
Fridleifsson, I. B., et al. “The Possible Role and Contribution of Geothermal Energy to
the Mitigation of Climate Change.” IPCC Geothermal, February 11, 2008.
Friedman, David. “Statement of the Union of Concerned Scientists before the House
Committee on Energy and Commerce Subcommittee on Energy and Environ-
ment.” April 24, 2009.
Friedman, Lisa. “China: A Sea Change in the Nation’s Attitude toward Carbon Cap-
ture.”Climate Wire, June 22, 2009. http://www.eenews.net/climatewire/print/2009/
06/22/1.
FutureGen Alliance.“FutureGen Technology.” 2009. http://www.FutureGenAlliance.org.
Gallagher, Patrick D., Ph.D., Testimony before the Committee on Energy and Natural
Resources, U.S. Senate,March 3, 2009.
Galvin, Robert and Kurt Yeager. Perfect Power. (McGraw-Hill) 2009.
Gartner, Inc. “Gartner Says More Than 1 Billion PCs In Use Worldwide and Headed to
2 Billion Units by 2014.” Gartner, Inc., June 23, 2008. http://www.gartner.com/it/
page.jsp?id=703807.
Gellatly, Mike. “Nuclear Industry Needs 10KWorkers in 10 Years.”Aiken Standard, June
12, 2009. http://www.aikenstandard.com/Local/0612Study.
“Generators and ISO New EnglandWorkedWell Together during January Freeze, Says a
Preliminary Analysis.”Foster Natural Gas Report, April 1, 2004: 4.
Gillingham,Kenneth, Richard G.Newell and Karen Palmer.“Energy Efficiency Econom-
ics and Policy.” A Discussion Paper, Resources for the Future, RFF DP 09-13, April
2009.
Goering, Laurie. “Nuclear Plants Being RevivedWorldwide.”Chicago Tribune, March 11,
2009.
Gold, Russell. “Exxon Shale-Gas Find Looks Big.”Wall Street Journal, July 10, 2009.
Goldstein, Larry, et al. “Gas-Fired Distributed Energy Resources Technology Characteri-
zations.” NREL/TP-620-34783, NREL, November 2003.
Golove,William H., and Joseph H. Eto. “Market Barriers to Energy Efficiency: A Critical
Reappraisal of the Rationale for Public Policies to Promote Energy Efficiency.” LBL-
38059, Lawrence Berkeley National Laboratory,March 1996.
Bibliography 289
Goodell, Jeff. Big Coal: The Dirty Secret behind America’s Energy Future. (New York:
HoughtonMifflin Harcourt) 2007: 101.
Goodin, Dan. “Buggy ‘Smart Meters’ Open Door to Power-Grid Botnet.” Register, June
12, 2009. http://www.theregister.co.uk/2009/0612/smart_grid_securitiy_risks/print
.html.
Google. “Clean Energy 2030.” October 1, 2008. http://knoll.google.com/k/Jeffery-green
blatt/clean-energy-2030/15x31uzlqeo5n/1.
Gorman, Siobhan. “Electricity Grid in U.S. Penetrated by Spies.” Wall Street Journal,
April 8, 2009.
Greenberg, Andy. “The Smart Grid vs. Grandma.” Forbes.com, May 15, 2009. http://
www.forbes.com/2009/05/15/smart-grid-energy-technology-internet-infrastructure-
energy.html.
Greene, Nathanael, and Roel Hammerschlag. “Small and Clean Is Beautiful: Exploring
the Emissions of Distributed Generation and Pollution Prevention Policies.” Elec-
tricity Journal, June 2000: 50–60.
Greer, Monica L. “A Test of Vertical Economies for Non-vertically Integrated Firms: The
Case of Rural Electric Cooperatives.”Energy Economics, May 2008: 679–687.
Gronewold, Nathanial. “N.Y.’s Pioneering Effort to Store Power Plant Carbon Faces Le-
gal Gauntlet.”ClimateWire, April 22, 2009. http://www.eenews.net/cw/2009/04/22.
———. “IPCC Chief Raps G-8, Calls for Global Greenhouse Gas Emission Cuts After
2015.”New York Times, July 21, 2009.
Gunther, Erich W., et al. “Smart Grid Standards Assessment and Recommendations for
Adoption and Development.” Prepared for the California Energy Commission,
EnerNex Corporation, February 2009.
Gyuk, Imre.“Energy Storage Applications for the Electric Grid.”U.S. Department of En-
ergy, October 23, 2008.
Hadley, S. W., J. W. VanDyke, and T. K. Stovall, “Distributed Generation: Benefit Values
in Hard Numbers.”Public Utilities Fortnightly, April 2005: 46–53.
Hadley, Stanton W., and Alexandra Tsvetkova, “Potential Impacts of Plug-in Hybrid
Electric Vehicles on Regional Power Generation.” Oak Ridge National Laboratory.
Oak Ridge, TN; For the U.S. Department of Energy. ORNL/TM-2007/150, January
2008.
Hall, Bronwyn. “The Financing of Research and Development.” Working Paper 8773,
National Bureau of Economic Research, February 2002. http://www.nber.org/
papers/w8773.
Hamm,Gregory, andAdamBorison.“The Rush to Coal: Is the Analysis Complete?”Elec-
tricity Journal, Jan./Feb. 2008: 31–37.
Hammerstrom, D., et al. “Pacific Northwest GridWiseTM Testbed Demonstration Proj-
ects, Part I: The Olympic Peninsula Project 2007.” PNNL-17167, Pacific Northwest
National Laboratory, October 2007. http://www.gridwise.pnl.gov/docs/op_project
_final_report_pnnl17167.pdf.
290 Bibliography
Hand, Aaron. “PV Materials to See Exploding Growth.” PVSociety.com, May 7,
2009. http://www.pvsociety.com/article/231838-PV_Materials_to_See_Exploding_
Growth.php.
Hansford,Mark, and Jessica Rowson. “Capital Costs Undermine OffshoreWind Farms.”
New Civil Engineer (NCE), July 2, 2009. http://www.nce.co.uk/news/energy/
capital-costs-undermine-offhsore-wind/5204418.article.
Harrington W., R. D. Morgenstern, and P. Nelson, “On the Accuracy of Regulatory Cost
Estimates.” Journal of Policy Analysis and Management, Spring 2000: 297–322.
Harris, Catherine. “Special Report: How LowWill U.S. Auto Sales Go?” Investment Exec-
utive, April 22, 2009. http://www.investmentexecutive.com/client/en/News/Detail
News.asp?Id=49055&IdSection=147&cat=147.
Harvey, Scott M., BruceM.McConihe, and Susan L. Pope.“Analysis of the Impact of Co-
ordinated Electricity Markets on Consumer Electricity Charges.”Draft, LECG, No-
vember 20, 2006.
Hawkins, David G. Testimony before the Subcommittee on Energy and Environment,
“The Future of Coal under Climate Legislation.”March 10, 2009.
Haq, Zia. “Biomass for Electricity Generation.” Energy Information Administration,
May 13, 2002.
Hedman, Bruce. “CHP Market Status.” Presented at Gulf Coast Roadmapping Work-
shop, April 26, 2005.
Hempstead, Jim. “New Nuclear Generating Capacity: Potential Credit Implications for
U.S. Investor Owned Utilities.” Special Comment, Report Number 109152,Moody’s
Corporate Finance, May 2008.
Hesmondhalgh, Serena, Toby Brown, and David Robinson. “EU Climate and Energy
Policy for 2030 and the Implications for Carbon Capture and Storage.” The Brattle
Group for ALSTOM Power Systems,March 2009.
Hequet,Marc. “Damless Hydro Power.”Public Power, November/December 2008.
Highfill, Darren R., and Vishant Shah. “A Voice for Smart-Grid Security.” Public Utilities
Fortnightly, July 2009: 24–31.
Hledik, Ryan.“How Green Is the Smart Grid?”Electricity Journal, April 2009: 29–41.
Holly, Chris. “IPCC Chief Raps Obama’s Near-Term Climate Targets.”Energy Daily, Jan-
uary 21, 2009.
Hogan, William W. “Competitive Electricity Market Design: A Wholesale Primer.” De-
cember 17, 1998. http://www.hks.harvard.edu/fs/whogan/empr1298.pdf.
———. “Providing Incentives for Efficient Demand Response.” October 29, 2009.
http://www.hks.harvard.edu/fs/whogan/Hogan_Demand_Response_102909.pdf.
———. “WEPEX: Building the Structure for a Competitive Electricity Market.” Pre-
sented at the FERC Technical Conference Concerning WEPEX, Washington, DC,
August 1, 1996.
Hotinski, Roberta. “Stabilization Wedges: A Concept & Game.” Carbon Mitigation Ini-
tiative, Princeton Environmental Institute, January 2007.
Bibliography 291
“Implementing California’s Loading Order for Electricity Resources.” Staff Report, Cali-
fornia Energy Commission, CEC-400-2005-043, July 2005.
“Increasing Efficiency: New PV Cell Conversion Efficiency of 18.9% Represents the
World’s Highest for a Second Year Running.”Mitsubishi Electric CSR. http://global
.mitsubishielectric.com/company/csr/ecotopics/pv/cell/index.html.
Insull, Samuel.Central Station Electric Service. (Chicago: Privately Printed) 1915.
“Integrating Locationally—Constrained Resources into Transmission Systems: A Survey
of U.S. Practices.”WIRES (Working group for Investment in Reliable & Economic
Electric Systems) and CRA International, October 2008.
“Integrating Wind Power Into the Electric Grid.” National Conference of State Legisla-
tures, June 2009.
International Atomic Energy Agency (IAEA). “Workforce Planning for New Nuclear
Power Programmes.” Draft, Presented at IAEA’s Technical Meeting on Workforce
Planning to Support New Nuclear Power Programmes, Vienna, Austria, March 31–
April 2, 2009.
———.“The Nuclear Power Industry’s AgeingWorkforce: Transfer of Knowledge to the
Next Generation.” IAEA-TECDOC-1399,Vienna, Austria, June 2004.
International Energy Agency (IEA). “IEA Energy Efficiency Policy Recommendations to
the G8 2007 Summit.”Heiligendamm, June 2007.
———.“Energy Efficiency Policy Recommendations.” 2008(b).
———. “Energy Technology Perspectives 2008: Scenarios and Strategies to 2050.”
2008(a).
Interstate Renewable Energy Council. “Map of State Net Metering Rules.”August 2009.
“Introduction to Interoperability and Decision-Maker’s Interoperability Checklist, Ver-
sion 1.0.”Gridwise Architecture Council, April 2007.
“IOACTIVE Verifies Critical Flaws in Next Generation Energy Infrastructures.”
IOACTIVE Press Release,March 23, 2009.
“ISO New England Probes Mid-Jan Rolling BlackoutWarnings.”Dow Jones Energy Ser-
vices, March 2, 2004.
Izzo, Ralph. “Climate Change: Taking Hints, Taking Actions.” Keynote remarks at Clean
Air–Cool Planet: Global Warming and Energy Solutions Conference, October 12,
2007.
———.“Innovation: The Future of Energy.” Presented at Silberman College of Business
and Rothman Institute of Entrepreneurial Studies, Fairleigh Dickinson University,
November 5, 2008.
Jaczko, Gregory B. (NRC). Letter to The Honorable Thomas R. Carper, Chairman, Sub-
committee on Clean Air and Nuclear Safety, U.S. Senate regarding report on status
of its licensing and other regulatory issues,May 15, 2009.
Jaffe, Adam, Richard G. Newell, and Robert Stavins. “Technological Change and the En-
vironment.” National Bureau of Economic Research, October 2000.
292 Bibliography
———. “Energy-Efficient Technologies and Climate Change Policies: Issues and Evi-
dence.” John F. Kennedy School of GovernmentWorking Paper, December 1999.
Jamison, Mark A., et al. “Disbanding the Maryland Public Service Commission.” Case
No. 2006-2, PURC, July 2006.
Johnson, Claire B. “Municipal Energy Financing.” U.S. Department of Energy, June 1,
2009.
Johnson, Keith. “Ill Winds Blow for Clean Energy: Cheap, and Abundant, Natural Gas
Diminishes Alternative Projects’Appeal.”Wall Street Journal, July 9, 2009.
“Joint Coordinated System Plan.” http://www.JCSPStudy.org.
Jones, John, et al. “Electric Utilities: A New Operating Model.” Booz Allen Hamilton,
2002.
Jones, Kevin. “Battle of the Currents.” Electrical Apparatus, October 1, 2003. HighBeam
Research. http://www.highbeam.com/doc/1P3-433184831.html. (February 9, 2009).
Jonnes, Jill. Empires of Light. (NewYork: RandomHouse) 2003.
Joskow, Paul L. “California’s Electricity Crisis.”Oxford Review of Economic Policy, 2001:
365–388.
———. “Regulatory Failure, Regulatory Reform and Structural Change in the Electric
Power Industry.” Brookings Papers on Microeconomic Activity; Special Issue, 1989:
125–200.
———. “Vertical Integration.” Handbook of New Institutional Economics. (Boston:
Kluwer) 2003.
———.“Vertical Integration.”Chapter XX in Issues in Competition Law and Policy, (Sec-
tion of Antitrust Law), August 6, 2008.
Joskow, Paul L., and Donald B. Marron. “What Does a Negawatt Really Cost? Further
Thoughts and Evidence.”Electricity Journal, July 1993: 14–26.
Joskow, Paul L., and Richard Schmalensee. Market for Power: An Analysis of Electrical
Utility Deregulation. (Cambridge: MIT Press) 1998.
Kahn, Michael, and Loretta Lynch. “California’s Electricity Options and Challenges Re-
port to Governor Gray Davis.” California Public Utilities Commission, August 2,
2000.
Kaplan, Stan Mark. “Electric Power Transmission: Background and Policy Issues.” Con-
gressional Research Services (CRS) Report for Congress, April 14, 2009.
Kats, Greg, and David Carey. “Upgrading America’s Homes Comprehensive Residential
Energy Upgrade Financing.”May 2009.
Kearney, D. “Assessment of Thermal Energy Storage for Parabolic Trough Solar Power
Plants.” Presented at NREL’s TroughNet—2006 Parabolic Trough Technology
Workshop, Incline Village, Nevada, February 14, 2006.
Kelderman, Eric.“States Pull the Plug on Electricity Deregulation.” Stateline.org, July 21,
2005. http://www.stateline.org/live/ViewPage.action?siteNodeId=136&languageId
=1&contentId=44242.
Bibliography 293
Kelly, Bruce. “Large Plant Studies.” Presented at NREL’s TroughNet—2006 Parabolic
Trough TechnologyWorkshop, Incline Village, Nevada February 14, 2006.
Kelly, John.“EMRI: Do Competition and ElectricityMix?”American Public Power Asso-
ciation, 2007.
Kelly, Susan, and Diane Moody. “Wholesale Electric Restructuring: Was 2004 the “Tip-
ping Point”?”Electricity Journal, March 2005: 11–18.
Kelly, Suedeen. “Federal Legislation and Policy Update.” Federal Energy Regulatory
Commission. Presented at Pennsylvania Public Utility Law Conference,Harrisburg,
PA,May 7, 2009.
Kiesling, L. Lynne. “Project Energy Code—Markets, Technology and Institutions: In-
creasing Energy Efficiency through Decentralized Coordination.” Econalign, Series
Issue 2, February 2009.
King, Tom.“Transforming the Electric Grid.”Oak Ridge National Laboratory, January 6,
2005.
Kirby, Brendan, and Michael Milligan. “Facilitating Wind Development: The Impor-
tance of Electric Industry Structure.”Electricity Journal, April 2008: 40–54.
Klein, Peter G. “The Make-or-Buy Decision: Lessons from Empirical Studies.”Working
Paper No. 2004-07, CORI, April 2004. http://cori.missouri.edu/wps.
Kleit, Andrew N., and Dek Terrell. “Measuring Potential Efficiency Gains from Deregu-
lation of Electricity Generation: A Bayesian Approach.” Review of Economics and
Statistics, August 2001: 523–530.
Koning, Fabian.“Renewable Energy: Feeling the Heat.”Financial Times, June 3, 2009.
Krauss, Clifford. “Tightened Codes Bring a New Enforcer, the Energy Inspector.” New
York Times, July 18, 2009.
Kroposki, B., et al. “Renewable Systems Interconnection: Executive Summary.”Technical
Report NREL/TP-581-42292, NREL, February 2008.
Kwoka, John E. Power Structure: Ownership, Integration, and Competition in the U.S.
Electricity Industry. (Boston: Kluwer Academic) 1996.
———.“Restructuring the U.S. Electric Power Sector: A Review of Recent Studies.” Pre-
pared for the American Public Power Association, November 2006.
———.“Vertical Economies in Electric Power: Evidence on Integration and Its Alterna-
tives.” International Journal of Industrial Organization, May 2002: 653–671.
Kwoka, John, SanemOzturk, andMichael Pollitt.“Divestiture Policy andOperating Effi-
ciency in U.S. Electric Power Distribution.” EPRGWorking Paper 0819, July 2008.
Krewitt, Wolfram. “Future Technology Options for Electricity Generation: Technical
Trends, Costs and Environmental Performance.” Presented at Needs Conference on
External Costs of Energy Technologies, Brussels, February 16, 2009.
Kühn, Kai-Uwe, andMatildeMachado.“Bilateral Market Power andVertical Integration
in the Spanish Electricity Spot Market.”CEPR Discussion Papers, 2004.
294 Bibliography
Kurt, Kelly. “California Power Crunch Sends Deregulation Shockwaves.” Oklahoma
City Journal Record, 2001. http://findarticles.com/p/articles/mi_qn4182/is_/ai_
n10142982.
Kushler, Martin, Dan York, and Patti Witte. “Meeting Aggressive New State Goals for
Utility-Sector Energy Efficiency: Examining Key Factors Associated with High Sav-
ings.” American Council for an Energy-Efficient Economy (ACEEE), U091, March
2009.
Laitner, J. A. “Skip,” C. Poland-Knight, V. McKinney, and K. Ehrhardt-Martinez, “Semi-
conductor Technologies: The Potential to Revolutionize U.S. Energy Productivity.”
American Council for an Energy-Efficient Economy (ACEEE), Report E094, May
2009.
Lazzaro, Joseph. “Are Speculators Pushing Up Oil Again?”Daily Finance, April 23, 2009.
http://www.dailyfinance.com/story/are-speculators-pushing-up-oil-
again/1525943/.
Lesser, Jonathan, and Nicholas Puga.“PV vs. Solar.”Public Utilities Fortnightly, July 2008:
17–20, 27.
Letendre, Steven, Paul Henholm, and Peter Lilienthal. “Plug-In Hybrid and All-Electric
Vehicles: New Load, or New Resource?”Public Utilities Fortnightly, December 2006.
http://www.fortnightly.com/display_pdf.cfm?id=12012006_Cars.pdf.
Levine, Mark D., and Diana Ürge-Vorsatz. “IPCCWGIII Assessment Report: Chapter 6.
Mitigation Options in Buildings.”November 1, 2007.
Lobsenz, George. “UK Moves Forward on Seabed ‘Socket’ for Wave Energy.” Energy
Daily, July 28, 2009: 1, 3.
Lohr, Steve. “Digital Tools Help Users Save Energy, Study Finds.”New York Times, Janu-
ary 10, 2008.
Lovins, Amory, et al. “Energy Strategy: The Road Not Taken?” Foreign Affairs. October,
1976: 5–15.
———. Soft Energy Paths: Toward a Durable Peace. (NewYork: HarperCollins) 1979.
———. Small Is Profitable. (Snowmass: Rocky Mountain Institute) 2002.
Lynd, Robert S., and Helen M. Lynd.Middletown. (NewYork: Harcourt, Brace) 1929.
MaCabrey, Jean-Marie. “Soaring Electricity Use by New Electronic Devices Imperils Cli-
mate Change Efforts.”ClimateWire, May 14, 2009.
Mall, Amy, Sharon Buccino, and Jeremy Nichols. “Drilling Down: Protecting Western
Communities from the Health and Environmental Effects of Oil and Gas Produc-
tion.” Natural Resources Defense Council (NRDC), October 2007.
Mansur, Erin T. “MeasuringWelfare in Restructured Electricity Markets.”Review of Eco-
nomics and Statistics, May 2008: 369–386.
———. “Upstream Competition and Vertical Integration in Electricity Markets.” Jour-
nal of Law and Economics, February 2007: 125–156.
Bibliography 295
Markiewicz, Kira, Nancy Rose, and Catherine Wolfram. “Has Restructuring Improved
Operating Efficiency at US Electricity Generating Plants?” CSEM WP 135, UCEI,
July 2004.
Marshall, Christa. “Policy: Carbon Capture and Storage Moves to Center Stage in Cap-
and-Trade Debate.” Climate Wire, June 9, 2009. http://www.eenews.net/climate
wire/2009/06/09/2/.
McClure, George.“Energy Fixes: Smart Grid, Nuclear Plants.”Today’s Engineer, Novem-
ber 2008. http://www.todaysengineer.org/2008/Nov/energy.asp.
McCullough, Robert. “California Electricity Price Spikes: Factual Evidence.” January 15,
2003. http://www.mresearch.com/pdfs/76.pdf.
McCullough, Robert. Memorandum to McCullough Research Clients, “C66 and the Ar-
tificial Congestion of California Transmission in January 2001.” November 29,
2002.
McKinsey & Company. “Reducing U.S. Greenhouse Gas Emissions: How Much at What
Cost?”December 2007.
———.“Pathways to a Low-Carbon Economy: Version 2 of the Global Greenhouse Gas
Abatement Cost Curve.” 2009: 15.
“Meeting Projected Coal Production Demands in the USA: Upstream Issues, Challenges
and Strategies.” The National Commission on Energy Policy (NCEP), December
2008.
“Methodology and Forecast of Long Term Avoided Costs for the Evaluation of Califor-
nia Energy Efficiency Programs.” Prepared for CPUC,October 25, 2004.
Metz, Bert, et al. (eds.). Carbon Dioxide Capture and Storage. Report by the Intergov-
ernmental Panel on Climate Change, (Cambridge: Cambridge University Press)
2005.
Meyers, Stephen, James McMahon, and Michael McNeil. “Realized and Prospective Im-
pacts of U.S. Energy Standards for Residential Appliances: 2004 Update.” LBNL-
56417, Lawrence Berkeley National Laboratory,May 2005.
Michaels, Robert J. “Vertical Integration and the Restructuring of the U.S. Electricity In-
dustry.” Policy Analysis, (572), July 13, 2006.
Miller, Christopher G. “The Future of the Grid: Proposal for Reforming National Trans-
mission Policy.” Testimony before the Subcommittee on Energy and the Environ-
ment, Committee on Energy and Commerce, U.S. House of Representatives, June
12, 2009.
Moody, Diane. “The Use—and Misuse—of Statistics in Evaluating the Benefits of Re-
structured Electricity Markets.”Electricity Journal, March 2007: 57–62.
Morgan & Company, Inc. “North American Vehicle Forecast/Global Outlook.”Automo-
tive Forecast Services, 2008. http://www.morgancom.com/vehicleforecasts.htm.
Morrison, Jay A. “The Clash of Industry Visions.” Electricity Journal, January/February
2005: 14–30.
296 Bibliography
Moss, Diana L., and Peter Fox-Penner. “Introduction.” Network Access, Regulation and
Antitrust. (NewYork: Routledge) 2005: 1–9.
Motion of the California ISO and EOB, Docket No. El00-95-000 et al., March 3, 2003: 5.
Mudd, Michael J. Testimony before the U.S. Committee on Commerce, Science and
Transportation, April 9, 2008.
Nadel, Steven. “Success with Energy Efficiency Resource Standards.” ACEEE, January
2009(b).
———. “Energy Policy Trends: Looking Both Inside and Beyond ‘the Beltway’.” Ameri-
can Council for an Energy-Efficiency Economy, January 2009(a).
———. Testimony before the Senate Energy Committee, Hearing on Energy Efficiency
Resource Standards, April 22, 2009(c).
Nadel, Steven, and Miriam Pye. “Appliance and Equipment Efficiency Standards: Im-
pacts by State.”ACEEE report, 1996. http://www.aceee.org/pubs/a964.htm.
“NAFO praises biomass/carbon provisions in energy act.”Macon County News, July 9,
2009. http://www.maconnews.com/index.php?option=com_content&task=view&
id=5024&Itemid=116.
Nakashima, Ellen, and Steve Mufson.“Hackers Have Attacked Foreign Utilities, CIA An-
alyst Says.”Washington Post, January 19, 2008.
National Academy of Engineering. “Greatest Engineering Achievements of the 20th
Century.” 2009. http://www.greatachievements.org/.
“National Action Plan for Energy Efficiency Vision for 2025: A Framework for Change.”
November 2008. http://www.epa.gov/cleanenergy/energy-programs/napee/resources/
vision2025.html.
National Association of Regulatory Utility Commissioners (NARUC). “Decoupling for
Electric & Gas Utilities: Frequently Asked Questions (FAQ).” September 2007.
National Commission on Energy Policy. “Forging the Climate Consensus: Managing
Economic Risk in a Greenhouse Gas Cap-and-Trade Program.” July 2009.
National Grid. “General Information Pack.” June 2009: 61. http://www.nationalgrid
.com/corporate/Investor+Relations/Presentations+and+webcasts/2009-
10/General+Information+Pack+17Jun09.htm.
National Renewable Energy Laboratory (NREL).“Renewable Energy Cost Trends.” 2005.
http://www.nrel.gov/analysis/docs/cost_curves_2005.ppt.
———.“Renewable Systems Interconnection.” Executive Summary, February 2008.
Neenan, Bernard, and Jiyong Eom,“Price Elasticity of Demand for Electricity: A Primer
and Synthesis.” Electric Power Research Institute, 2008.
Nemoto, Jiro, and Mika Goto. “Technological Externalities and Economies of Vertical
Integration in the Electric Utility Industry.” International Journal of Industrial Orga-
nization, January 2004: 67–81.
Neuhoff, Karsten. “Large Scale Deployment of Renewables for Electricity Generation.”
CMIWorking Paper 59,March 14, 2006.
Bibliography 297
Neville, Angela, J. D. “Prevailing Winds: Trends in U.S. Wind Energy.” Power, December
1, 2008. http://www.powermag.com/renewables/wind/Prevailing-winds-Trends-
in-U-S-wind-energy_1573.html.
“New PV Cell Conversion Efficiency of 18.9% Represents the World’s Highest for the
Second Year Running.” Mitsubishi Electric, 2009. http://global.mitsubishielectric
.com/company/csr/ecotopics/pv/cell/index.html.
“NewYork Shopping Sees Growth in Every Metric.”Restructuring Today, July 1, 2008.
Newell, Samuel, and Ahmad Faruqui. “Dynamic Pricing: Potential Wholesale Market
Benefits in NewYork State.”The Brattle Group, August 2009.
Newman, Sam, et al. “Accelerating Solar Power Adoption: Compounding Cost Savings
across the Value Chain.” Rocky Mountain Institute, 2009. http://www.rmi.org/rmi/
Library/2009-03_AcceleratingSolarPowerAdoption.
Niles, Raymond C. “Property Rights and the Crisis of the Electric Grid.”Objective Stan-
dard, Vol. 3, Summer 2008.
North American Electric Reliability Corporation (NERC). “2008 Long-Term Reliability
Assessment 2008–2017.”October 2008.
———.“Accommodating High Levels of Variable Generation.”April 2009.
———. “Estimated 2017 Summer Margins, Resources and Demands.” 2008 Long Term
Reliability Assessment, October 2008: Tables 13a and 13e.
———. “Special Report: Electric Industry Concerns on the Reliability Impacts of Cli-
mate Change Initiatives.”November 2008: Chap. 8.
North, Gary. “Enron, Spawn of Business Journalism.” Column on LewRockwell.com,
February 6, 2002. http://www.lewrockwell.com/north/north92.html.
Nourai, Ali. “Store and Deliver.” Power Energy Magazine, Q.4, 2009. http://www.next
genpe.com/article/Issue-7/Renewables/Store-and-Deliver.
“Nuclear Energy for the Future: Required Research and Development Capabilities.” Bat-
telle, September 2008.
Nuclear Energy Institute (NEI). “Policies That Support New Nuclear Power Plant
Development.” Fact Sheet, January 2009. http://www.nei.org/resourcesandstats/
documentlibrary/newplants/factsheet/policiessupportnewplantdevelopment.
“Nuclear Energy Outlook 2008—Executive Summary.” Organisation for Economic
Co-operation and Development (OECD). Moulineaux, France, November 28,
2008.
“Nuclear Plant Construction Poses Risks to Credit Metrics, Ratings.” Global Credit Re-
search Announcement,Moody’s Investors Service, June 2, 2008.
“Nuclear Power in the USA.” The World Nuclear Association, July 2009. http://www
.world-nuclear.org/info/inf41.html.
Nye, David E. Electrifying America: Social Meanings of a New Technology. Cambridge:
MIT Press, 1995.
O’Malley, Martin. “Taking Control of Our Energy Future.” Keynote address given to the
298 Bibliography
Maryland Association of Counties (MACo) Annual Summer Conference, Ocean
City,MD,August 16, 2008.
Oatman, Gene, and Dave Crudele. “The Galvin Path to Perfect Power—A Technical As-
sessment.” The Galvin Electricity Initiative, January 2007.
Office of Trade and Economic Development. Energy Division. “Issues and Analyses for
theWashington State Legislature.” 2000 Biennial Energy Report, January 2001.
Osborn, D., and Z. Zhou. “Transmission Plan Based on Economic Studies.” Midwest
ISO,April 2008.
“PG&E and BrightSource Sign Record Solar Power Deal.” BrightSource Press Release,
May 13, 2009.
Pacala, S., and R. Socolow. “Stabilization Wedges: Solving the Climate Problem for the
Next 50 Years with Current Technologies.” Science, August 13, 2004: 968–972.
Pachauri, R. K., and A. Reisinger (eds.). “Climate Change 2007: Synthesis Report.” Inter-
national Panel on Climate Change, November 2007.
Pagnamenta, Robin. “France Imports UK Electricity as Plants Shut.” TimesOnLine, July
3, 2009. http://business.timesonline.co.uk/tol/business/industry_sectors/utilities/
article6626811.ece.
Paidipati, J., et al.“Rooftop Photovoltaics Market Penetration Scenarios.”NREL/SR-581-
42306, NREL, February 2008.
Parmesano, Hethie. “Rate Design Is the No. 1 Energy Efficiency Tool.”Electricity Journal,
July 2007: 18–25.
Paul, Anthony. “Electricity Consumption Efficiency a Top-Down Assessment of Poten-
tial.” Electricity and Environment Program, Resources for the Future. Presented at
the Behavior, Energy, and Climate Change Conference (BECC) in Sacramento
CA, November 17, 2008. http://piee.stanford.edu/cgi-bin/docs/behavior/becc/
2008/presentations/17-1E-02-Electricity_Consumption_Efficiency_-_A_Top-Down
_Assessment_of_Potential.pdf.
“Performance-Based Rates for U.S. Electric Utilities: A 2007 Status Report.” Newton-
Evans Research Company, Inc., June 2007.
Pernick, Ron, and Clint Wilder. “Utility Solar Assessment (USA) Study: Reaching Ten
Percent Solar by 2025.”Clean Edge, June 2008.
Peters, Mark. “Retail Electricity Suppliers Battle Utilities for Customers.” Wall Street
Journal Online, August 31, 2009.
Petrill, Ellen. “Creating a Secure Low-Carbon Future . . . A Framework for Action.”
ASERTTI, October 16, 2008.
“Pew Center Summary of H.R. 2454: American Clean Energy and Security Act of 2009
(Waxman–Markey).” Pew Center, 2009. http://www.pewclimate.org/acesa.
Pfeifenberger, J. P., G.N. Basheda, andA. C. Schumacher.“Restructuring Revisited.”Pub-
lic Utilities Fortnightly, June 2007: 68. http://www.fortnightly.com/pubs/06012007_
RestructuringRevisited%20.pdf.
Bibliography 299
Phillips, Charles F., Jr. The Regulation of Public Utilities. (Arlington, VA: Public Utilities
Report) 1993: 428–429.
Piedmont Environmental Council, v. Federal Energy Regulatory Commission, No. 07-1651
et al., U.S. Court of Appeals 4th Cir. 2008, 2009. http://pacer.ca4.uscourts.gov/
opinion.pdf/071651.P.pdf.
Pinderhughes, Raquel, Ph.D. “Green Collar Jobs: An Analysis of the Capacity of Green
Businesses to Provide High Quality Jobs for Men andWomen with Barriers to Em-
ployment.” for the City of Berkeley Office of Energy and Sustainable Development,
December 5, 2007.
Platt, Harold L.The Electric City. (Chicago: University of Chicago Press), 1991: 76.
Pollin, Robert, et al., “Green Recovery: A Program to Create Good Jobs and Start Build-
ing a Low-Carbon Economy.”Center for American Progress, September 2008.
“Point Carbon EUA OTC Assessment.”Historic Prices, Point Carbon, 2009. http://www
.pointcarbon.com/new/historicprices.
Pope, Susan L. “California Electricity Price Spikes: An Update on the Facts.” Harvard
Electricity Policy Group, December 9, 2002.
“Potential Gas Committee Reports Unprecedented Increase in Magnitude of U.S. Natu-
ral Gas Resource Base.” Press Release, Colorado School of Mines, June 18, 2009.
“Potential Supply of Natural Gas in the United States.” Potential Gas Committee, Col-
orado School of Mines, December 31, 2009.
Price, H. “Cooling for Parabolic Trough Power Plants.” NREL, presented at 2006 Para-
bolic Trough TechnologyWorkshop, Incline Village, NV, February 14, 2006.
“Quantifying Demand Response Benefits in PJM.” Prepared by The Brattle Group, Janu-
ary 29, 2007.
Rawson, Mark, and John Sugar. “Distributed Generation and Cogeneration Policy
Roadmap for California.” Staff Report, CEC-500-2007-021, California Energy
Commission,March 2007: 1.
“Recommendations for Improving Enforcement and Protecting Consumers in Deregu-
lated Energy Markets.” Attorney General’s Energy White Paper, State of California,
April 2004: 2.
“Readiness of the U.S. NuclearWorkforces for 21st Century Challenges.”A report of the
APS Panel on Public Affairs, American Physics Society. June 2008.
“Redefining Our Boundaries, 2008 Summary Annual Report.”Duke Energy, 2009
Reed, David.“Fouling Our Own Net.” IEEE Spectrum, February 2009: 18–19.
“Regulatory Issues for Direct-Use Geothermal Resource Development in Oregon.”Kevin
Rafferty, ed., Oregon Water Resources Department. http://geoheat.oit.edu/pdf/
tp114.pdf.
Reitzes, James D., et al.“Review of PJM’sMarket PowerMitigation Practices in Compari-
son toOtherOrganized ElectricityMarkets.”The Brattle Group, September 14, 2007.
“Report to Congress on Competition in the Wholesale and Retail Markets for Electric
300 Bibliography
Energy.” Draft, The Electric Energy Market Competition Task Force and FERC,
June 5, 2006.
“Retrofitting of Coal-Fired Power Plants for CO2 Emissions Reductions.” An MIT
Energy Initiative Symposium, Massachusetts Institute of Technology, March 23,
2009.
Rocky Mountain Institute. “Micropower Database: How Distributed Renewables and
Cogeneration are Beating Nuclear Power Stations.” May 3, 2008.
Romm, Joseph. “Is 450 ppm (or less) Politically Possible? Part 2: The Solution.” Center
for American Progress, April 22, 2008. http://climateprogress.org/2008/04/22/
is-450-ppm-or-less-politically-possible-part-2-the-solution/.
———. “The Self-Limiting Future of Nuclear Power.” Center for American Progress Ac-
tion Fund, June 2008.
———. “The Staggering Cost of Nuclear Power: Part One in a Series on a New Nuclear
Cost Study.” Center for American Progress, January 5, 2009(a). http://american
progress.org/issues/2009/01/nuclear_power.html/.
———. The Hype about Hydrogen. (Washington, DC: Island Press) 2004, 2005.
———. “Warning to Taxpayers, Investors: Nukes May Become Troubled Assets, Part Two
in a Series on a New Nuclear Cost Study.” Center for American Progress, January 7,
2009(b). http://americanprogress.org/issues/2009/01/nuclear_power_part2.html/.
Rosen, Richard. “Regulating Power: An Idea Whose Time Is Back.” American Prospect,
2002: 22.
Rowland, Kate. “Get Smart.” EnergyBiz Insider, June 29, 2009. http://www.energycentral
.com/articles/energybizinsider/ebi_detail.cfm?id=708.
Russo Marsh & Rogers, Inc. (RMR) “The Corruption of Power.” http://www.geoff
metcalf.com/loretta_20010329.html.
Sant, Roger W. “Coming Markets for Energy Services.” Harvard Business Review, May–
June 1980: 6–20.
Sappington, David, and others. “The State of Performance-Based Regulation in the U.S.
Electric Utility Industry.” Electricity Journal, October 2001: 71–79.
Sassoon, David. “House Testimony Undermines Wisdom of Massive Electric Grid
Expansion.” SolveClimate, June 17, 2009. http://solveclimate.com/blog/2009061/
house-testimony-undermines-wisdom-massive-electric-grid-expansion.
———. “Transmission Superhighway On Track to Carry Cheap, Dirty Coal Power to
Northeast.” SolveClimate, March 24, 2009. http://solveclimate.com/blog/20090324/
transmission-superhighway-track-carry-cheap-dirty-coal-power-northeast.
Satchwell, Andy. “Smart Grid Barriers and a Collaborative Solution.” June 24, 2008.
Sathaye, Jayant, and Amol Phadke. “Representing Energy Demand in Large Scale Mod-
els: Baselines, Market Failures, and Non-Energy Benefits.” Presented at Energy
Modeling Forum, Washington, DC, February 5, 2008.
Sauer, Amy, and Fredric Beck. “Loan Guarantee Provisions in the 2007 Energy Bills:
Bibliography 301
BM:IP_Fox-Penner 8/15/10 7:10 PM Page 301
Does Nuclear Power Pose Significant Taxpayer Risk and Liability?” Issue Brief, En-
vironmental and Energy Study Institute, October 30, 2007.
Savage, John.“Western Renewable Energy Zone (WREZ) Project.”Oregon Public Utility
Commission, April 8, 2009.
“Scenario Planning.”Wikipedia.org, accessed July 23, 2009.
Schlegel, Jeff. “Energy Efficiency and Global Warming: What Must Be Done.” Presenta-
tion at the ACEEE Conference: Energy Efficiency as a Resource, October 2, 2007.
Schlosser, Julie. “How Duke Energy’s CEO Got Started.” Fortune Magazine, August 11,
2009. http://money.cnn.com/2009/08/10/magazines/fortune/duke_energy_jim_
rogers.fortune/index.htm.
Schwartz, Ariel. “First Commercial Hydrokinetic Turbine Installed In US.” CleanTech-
nica, December 26, 2008. http://cleantechnica.com/2008/12/26/first-commercial-
hydrokinetic-turbine-installed-in-us/.
Schweppe, Fred, et al. Spot Pricing of Electricity. (Boston: Kluwer) 1988.
“Sector Profiles of Significant Large CHPMarkets.” Energy and Environmental Analysis,
Inc.,March 9, 2004.
Seltzer, Larry. “Drive By Blackouting.” PCMag.com, Blog, June 15, 2009.
“Sequim, Washington.” City-Data.com. http://www.city-data.com/housing/houses-
Sequim-Washington.html.
Severance, Craig A. “Business Risks to Utilities as New Nuclear Power Costs Escalate.”
Electricity Journal, May 2009: 112–120.
———. “Business Risks and Costs of New Nuclear Power.” Climate Progress, June 5,
2009. http://climateprogress.org/wp-content/uploads/2009/01/nuclear-costs-2009
.pdf.
Sheffrin, Anjali. Anjali Sheffrin to Market Issues/ADR Committee of the California ISO,
memorandum,Market Analysis Report, June 16, 2001(a).
———. Anjali Sheffrin to CAISO Board of Governors, memorandum, Market Analysis
Report for September 2001, October 9, 2001(b).
———.Anjali Sheffrin to Market Issues/ADR Committee of the California ISO,memo-
randum, January 13, 2000,Market Analysis Report.
Sherwood, Larry. “U.S. Market Trends: Solar and Distributed Wind.” Interstate Renew-
able Energy Council, September 24, 2007.
———.“U.S. Solar Market Trends 2008.” Interstate Renewable Energy Council, 2009.
Shipley, Anna, et al. “Combined Heat and Power: Effective Energy Solutions for a Sus-
tainable Future.” ORNL/TM-2008/224, Oak Ridge National Laboratory, December
1, 2008.
Shy, Oz. The Economics of Network Industries. (Cambridge: Cambridge University Press)
2001.
Siddiqui, Omar, K. Parmenter, and P. Hurtado. “The Green Grid: Energy Savings and
Carbon Emissions Reduced Enabled by a Smart Grid.” EPRI Technical Update
1016905, June 2008.
302 Bibliography
Silberglitt, Richard, Emile Ettedgui, and Anders Hove. Strengthening the Grid: Effects of
High-Temperature Superconducting Power Technologies on Reliability, Power Transfer
Capacity, and Energy Use. (RAND) 2002.
Sims, Ralph E.“Hydropower, Geothermal, and Ocean Energy.”MRS Bulletin, April 2008:
389–395. http://www/mrs.org/s_mrs/bin.aps?CID=12527&DID=206495.
Sioshansi, Fereidoon P. “Carbon Constrained: The Future of Electricity Generation.”
Electricity Journal, June 2009: 64–74.
Slack, Kara. “U.S. Geothermal Power Production and Development Update.” Geother-
mal Energy Association, August 2008.
“Smart Grid Standards Adoption: Utility Industry Perspective.” Prepared for Smart Grid
Utility ExecutiveWorking Group and Open SG Subcommittee,May 27, 2009.
“Smart Meters—Got Bugs?” Smart Grid Stimulus, June 17, 2009. http://www.smartgrid
stimulus.com/artman/publish/Watch_List_News-Digest/FOAs_for_Big_Smart_
Grid_Projects_a_No-Show_So_Far-687.html.
Smead, Richard G., and Gordon B. Pickering. “North American Natural Gas Supply As-
sessment.” Navigant Consulting, July 4, 2008.
Smith, Rebecca. “Smart Meter, Dumb Idea?”Wall Street Journal, April 27, 2009.
———.“Less Demand, Same Great Revenue.”Wall Street Journal, February 8, 2009
———.“U.S. Foresees a Thinner Cushion of Coal.”Wall Street Journal, June 8, 2009.
Solar Energy Industries Association (SEIA). “U.S. Solar Industry Year in Review 2008.”
Executive Summary, April 2009. http://www.seia.org/galleries/pdf/2008_Year_in_
Review-small.pdf.
Sovacool, Benjamin K., and Charmaine Watts. “Going Completely Renewable: Is It Pos-
sible (Let Alone Desirable)?”Electricity Journal, May 2009,Vol. 22, (4): 95–111.
Steinhurst,William, et al. “Energy Portfolio Management: Tools and Resources for State
Public Commissions.” Prepared by Synapse Energy Economics, for NARUC, Octo-
ber 2006.
Strader, Jim, and Paula C. Squires. “Electric Deregulation.” Virginia Business, August
2004.
“Strategies to Meet Possible 33% RPS in California Hatched.” Restructuring Today, July
22, 2009.
Stoft, Steven. “Power System Economics: Designing Markets for Electricity.” (New York:
Wiley-IEEE Press) 2002.
Sudarshan, Anant, and James Sweeney. “Deconstructing the ‘Rosenfeld Curve.’“ Stan-
ford University. July 1, 2008. http://piee.stanford.edu/cgi-in/docs/publications/
Deconstructing_the_Rosenfeld_Curve.pdf.
Sullivan, Patrick, et al. “Comparative Analysis of Three Proposed Federal Renewable
Electricity Standards.”NREL/TPL-6A2-45877, National Renewable Energy Labora-
tory, May 2009.
Summers, Adam B. “Call for Real Electricity Deregulation.” Ventura County Star, Octo-
ber 25, 2005. http://reason.org/news/show/122806.html.
Bibliography 303
Sutherland, Ronald J. “Market Barriers to Energy-Efficiency Investments.” Energy Jour-
nal, July 1, 1991: 15–34.
Sweeney, James L.The California Electricity Crisis. (Hoover Institution Press) July 2002.
“TVA Goes to War.” TVA Heritage. The Tennessee Valley Authority, Oak Ridge, TN.,
2009. http://www.tva.gov/heritage/war/index.htm.
Taber, John, Duane Chapman, and Tim Mount. “Examining the Effects of Deregulation
on Retail Electricity Prices.”WP2005-14, February 2006.
“Tackling Climate Change in the U.S.: Potential Carbon Emissions Reductions from En-
ergy Efficiency and Renewable Energy by 2030.” Edited by Charles F. Kutshcer,
American Solar Energy Society, January 2007.
Talukdar, Sarosh N., et al. “Cascading Failures: Survival versus Prevention.” Electricity
Journal, November 2003: 25–31.
Taylor, Jerry, and Peter Van Doren. “Myth Five—Price Signals Are Insufficient to Induce
Efficient Energy Investments.” Energy and American Society: Thirteen Myths. (New
York: Springer) 2007: Chapter 6.
Thaler, Richard H., and Cass R. Sunstein. Nudge. (New Haven: Yale University Press)
2008: 6–7.
“The Best CEOs in America.”Corporate Leader Magazine, November 2007.
“The Competitive Retail Electricity Markets and Customer Protections: Are customers
really better off?”Regulatory Compliance Services,March 2009.
“The Elusive Negawatt—Energy Efficiency.”Economist, May 10, 2008.
“The Energy Imperative: Technologies and the Role of Emerging Companies.”Report of
the President’s Council of Advisors on Science and Technology, November 2006.
“The Energy Imperative: Report Update.” Report of the President’s Council of Advisors
on Science and Technology, November 2008(a).
“The Future of Coal.”MIT Study, 2007. http://web.mit.edu/coal/.
The New Palgrave: A Dictionary of Economics. Eatwell, John, Murray Milgate, and Paul
Newman, eds. (London: Macmillan, 1987).
Thompson, Ben. “Meet the Maverick.” Power and Energy Magazine, December 2007:
38–41.
Thompson, Clive. “A Green Coal Baron?”New York Times, June 22, 2008.
Thornberg, Christopher F. “Of Megawatts and Men: Understanding the Causes of the
California Power Crisis.” The UCLAAnderson Forecast, 2002.
Tiernan, Tom.“Cost Allocation Clarity Needed, Parties Say.”Megawatt Daily, January 14,
2009.
Tierney, Susan F. “Decoding Developments in Today’s Electric Industry—Ten Points in
the Prism.”Analysis Group, October 2007.
Toole, W. R., and Susan Winsor. “Nuclear Workforce Dwindles While Needs for Future
Grow.” Aiken Standard, January 28, 2009. http://www.aikenstandard.com/OpEd
Columns/011909-winsor-column.
Tomain, Joseph P.“Building the iUtility.”Public Utilities Fortnightly, August 2008: 28–33.
304 Bibliography
Trebing, Harry M. “The Networks as Infrastructure—The Reestablishment of Market
Power.” Journal of Economics Issues, 28, 1994: 379–389.
Tutak, Jocelyn, and James R. Strittholt, “Assessing the Impact of Ecological Considera-
tions on Forest Biomass Projection.” Conservation Biology Institute, September
2009. http://www.consbio.org/what-we-do/assessing-the-impact-of-ecological-
considerations-on-forest-biomass-projections-for-the-southeastern-u.s.
UCEI (University of California Energy Institute). “Zonal Price and Quantity Data.”
http://www.ucei.berkeley.edu/.
“U.K. Says New Plants Must Capture Carbon.”Greenwire, April 23, 2009.
U.S. Census Bureau.“Table 1. Projections of the Population and Components of Change
for the United States: 2010 to 2050.” Population Division, August 14, 2008.
———. “Summary of Energy Efficiency Provisions and Funding Opportunities—
American Recovery and Reinvestment Act of 2009.” February 17, 2009.
U.S. Congress. House. “American Clean Energy and Security Act.” H.R. 2454, Sec. 111.
National Strategy, 111th Congress, 1st sess., June 26, 2009: 86–104.
U.S. Department of Defense (DOD). News Briefing—Secretary Rumsfeld and Gen.
Myers, Office of the Assistant Secretary of Defense (Public Affairs), February 12,
2002.
U.S. Department of Energy (DOE).“Secretary Chu Announces Two New Projects to Re-
duce Emissions from Coal Plants.” July 1, 2009. http://www.energy.gov/7559.htm.
———. Smart Grid E-Forums. “Smart Grid: The Value Proposition for Consumers.”
October 23, 2008(a).
———. Electricity Advisory Committee. “Keeping the Lights on in a New World.”
Washington, DC, January 2009. http://www.oe.energy.gov/eac.htm.
———. Energy Efficiency and Renewable Energy. “20%Wind Energy by 2030: Increas-
ing Wind Energy’s Contribution to U.S. Electric Supply.” DOE/GO-102008-2567,
Washington, DC, July 2008(b). http://www1.eere.energy.gov/windandhydro/pdfs/
41869.pdf.
———. “Cost Trends.” Energy Efficiency and Renewable Energy (EERE). http://www
.windpoweringamerica.gov/ne_economics_cost.asp.
———. “Growing America’s Energy Future: Biomass Program.” Energy Efficiency
and Renewable Energy (EERE). http://www1.eere.energy.gov/biomass/pdfs/
sustainability.pdf.
———. “Renewable Energy Data Book.” Energy Efficiency and Renewable Energy
(EERE). September 2008(c). http://www1.eere.energy.gov/maps_data/renewable_
energy.html.
———.Office of Electricity Delivery and Energy Reliability.“The Smart Grid: An Intro-
duction.” 2009. http://www.oe.energy.gov/1165.htm.
———. Office of Electricity Delivery and Energy Reliability. “Summary of Regulations
Implementing Federal Power Act Section 216(h).” September 2008. http://www
.oe.energy.gov/DocumentsandMedia/Summary_of_216_h__rules_clean(1).pdf.
Bibliography 305
———. Office of Fossil Energy, National Energy Technology Laboratory. Carbon Se-
questration Atlas of the United States and Canada, 2nd ed., 2008.
U.S. Department of the Interior (DOI). “Framework for Geological Carbon Sequestra-
tion on Public Land.”Report to Congress,Washington, DC, June 2009(a).
———.“Secretary Salazar, Senator Reid Announce ‘Fast-Track’ Initiatives for Solar En-
ergy Development on Western Lands.” Press Release, Washington, DC, June 29,
2009(b).
U.S. Environmental Protection Agency. “EPA Analysis of the Waxman–Markey Discus-
sion Draft: The American Clean Energy and Security Act of 2009.”Washington,DC,
April 20, 2009(a): 4, 30.
———. “EPA Analysis of the American Clean Energy and Security Act of 2009.” H.R.
2454 EPA Data Annex—ADAGE & IGEM v2.3, 111th Congress, Washington, DC,
June 23, 2009(b). http://www.epa.gov/climatechange/economics/pdfs/HR2454_
Analysis.pdf.
———. “Federal Requirements under the Underground Injection Control (UIC) Pro-
gram for Carbon Dioxide (CO2) Geologic Sequestration (GS) Wells.” Proposed
Rule, 40 CFR Parts 144 and 144, Federal Register, July 25, 2008.
———. “National Air Pollutant Emission Trends, 1900–1998. Trend Charts.” Summary
of National Emission Trends. (Washington, DC: Environmental Protection Agency)
March 2000.
U.S. Geological Survey. “Assessment of Moderate- and High-Temperature Geothermal
Resources of the United States.” Fact Sheet, 2008.
U.S. Government Accountability Office. “The Department of Energy: Key Steps Needed
to Help Ensure the Success of the New Loan Guarantee Program for Innovative
Technologies by Better Managing Its Financial Risk.” GAO-97-339R, GAO Report,
Washington, DC, February 28, 2007.
U.S. House Committee on Commerce. Subcommittee on Energy & Power. “Electricity
Regulation—A Vision for the Future: Testimony of Kenneth L. Lay.” 104th Con-
gress, May 15, 1996. Available from: Department of Energy. http://management
.energy.gov/documents/enron1996.pdf.
U.S. Nuclear Regulatory Commission. “Expected New Nuclear Power Plant Applica-
tions.” Updated September 28, 2009. http://www.nrc.gov/reactors/new-reactors/
new-licensing-files/expected-new-rx-applications.pdf.
U.S. Senate Committee on Energy and Natural Resources. “Bingaman–Specter ‘Low
Carbon Economy Act’ of 2007.” http://energy.senate.gov/public/_files/LowCarbon
EconomyActTwoPager0.pdf.
United States Clean Heat & Power Association.“Clean Heat and Power Provisions, of the
American Clean Energy and Security Act of 2009.” http://www.uschpa.org/files/
public/WMCHP.pdf.
Vajjhala, Shalini P. “Siting Renewable Energy Facilities: A Spatial Analysis of Prom-
306 Bibliography
ises and Pitfalls.” Resources for the Future Discussion Paper, RFF DP 06-34, July
2006.
Vajjhala, Shalini, et al. “Green Corridors: Linking Interregional Transmission Expansion
and Renewable Energy Policies.” Resources for the Future Discussion Paper, RFF
DP 08-06,March 2008: 13.
Ventyx Velocity Suite, 2009.
Vock, Daniel C. “Smart Grid’s Growth Now Depends on States.”McClatchy-Tribune Re-
gional News, March 17, 2009.
Vojdani, Ali. “Smart Integration: The Key to Unlock Demand Response Power from
Smart Metering Investments.”Metering International, (1), 2009: 108–109.
———.“Smart Integration: The Smart Grid Needs Infrastructure That Is Dynamic and
Flexible.” IEEE Power & Energy Magazine, November/December 2008: 71–79.
Wack, Pierre. “Shooting the Rapids.” Harvard Business Review, November 1985.
http://hbr.org/1985/11/scenarios/ar/1.
Wallsten, Scott J. “The R&D Boondoogle.”Regulation, January 17, 2001: 12–16.
Wasik, John F.The Merchant of Power. (NewYork: Palgrave MacMillan) 2006: 24.
Weare, Christopher. “The California Electricity Crisis: Causes and Policy Options.” Pub-
lic Policy Institute of California, 2003.
Weaver, Jaqueline Lang.“Can Energy Markets Be Trusted? The Effect of the Rise and Fall
of Enron on Energy Markets.”Houston Business and Tax Law Journal, Vol. 4, 2004.
http://www.hbtlj.org/v04/v04Weaverar.pdf.
Weiss, Charles, and William B. Bonvillian. Structuring an Energy Technology Revolu-
tion. (Cambridge,MA:MIT Press) 2009: 16.
Welch, Mark, and Kieran McLoughlin. “Information Is Power: The Intelligent Utility
Network.” IBM. http://www-03.ibm.com/industries/utilities/us/detail/resource/
Y448128V62075A69.html.
Wellinghoff, Jon, and David Morenoff, “Recognizing the Importance of Demand Re-
sponse: The Second Half of the Wholesale Electric Market Equation.” Energy Law
Journal, Vol. 28, 2007: 389–419.
Westervelt, Robert. “Experts Alarmed over U.S. Electrical Grid Penetration.”
SearchSecurity.com, April 8, 2009. http://searchsecurity.techtarget.com/news/
article/0,289142,sid14_gcil353208,00.html.
Weston, Frederick. “Customer-Sited Resources and Utility Profits: Aligning Incentives
with Public Policy Goals.” Presented at U.S. EPAWebinar, August 28, 2008.
Weyant, John P. “EMF Briefing on Climate Policy Scenarios: U.S. Domestic and In-
ternational Policy Architectures.” Overview, updated, June 12, 2009. http://emf
.stanford.edu/events/emfbriefing_on_climate_policy_scenarios_us_domestic_and_
international_policy_architectures.
“Whirlpool Commits to Smart Grid–Compatible Appliances.” Energy Daily, May 18,
2009.
Bibliography 307
Williamson, Oliver E. Transaction Cost Economics. (Northhampton, MA: Edward Elgar
Publishing) 1975.
———. “Transaction-Cost Economics: The Governance of Contractual Relations.”
Journal of Law and Economics, October 1979: 233–261.
“Wind Power Project Site.”Global Energy Concepts, October 2005.
“Wind Power: Wind Technology Today.” Community Wind Power Fact Sheet #1, Uni-
versity of Massachusetts at Amherst. http://www.ceere.org/rerl/about_wind/RERL_
Fact_Sheet_1_Wind_Technology.pdf.
Winston, Clifford. “Days of Reckoning for Microeconomists.” Journal of Economic Liter-
ature, September 1993: 1263–1289.
Wiser, Ray, Galen Barbose, and Carla Peterman.“Tracking the Sun: The Installed Cost of
Photovoltaics in the U.S. from 1998–2007.”Lawrence Berkeley National Laboratory,
February 2009.
Wiser, Ray, and Mark Bolinger. “2008 Wind Technologies Market Report.” Lawrence
Berkeley National Laboratory, July 2009.
———.“Annual Report onU.S.Wind Power Installation,Cost, and Performance Trends:
2007.”Report Summary, Lawrence Berkeley National Laboratory,May 2008.
Wolak, Frank A.“Report on Redesign of California Real-Time Energy and Ancillary Ser-
vices Market.”October 18, 1999.
———. “What Went Wrong with California’s Re-structured Electricity Market? (And
How to Fix It).” Presented at the Stanford Institute for Economic Policy Research,
February 15, 2001.
Wolak, Frank A., Robert Nordhaus, and Carl Shapiro. “The Competitiveness of the Cali-
fornia Energy and Ancillary ServiceMarket.”March 9, 2000. http://www.caiso.com/
docs/2000/08/01/2000080111213227437.pdf.
Wood, Pat, and Rob Church.“Building the 21st Century Transmission Super Grid: Tech-
nical and Political Challenges for Large Scale Renewable Electricity Production in
the U.S.”American Council on Renewable Energy (ACORE), April 2009.
World Coal Institute. “Coal Facts, 2008 Edition.” Online, December 2008. http://www
.worldcoal.org/assets_cm/files/PDF/coalfacts08.pdf.
———.“Coal Meeting Global Challenges.”Climate Policy Paper 1, June 17, 2009. http://
www.worldcoal.org/news/coal-news/the-road-to-copenhagen/.
———.“CCS and the Post-2012 Agreement.” Policy Paper 4, June 17, 2009. http://www
.worldcoal.org/news/coal-news/the-road-to-copenhagen/.
———. “Key Elements of a Post-2012 Agreement on Climate Change.” 2007.
http://www.worldcoal.org/bin/pdf/original_pdf_file/key_elements_of_post_2012_
agreement (03_06_2009).pdf.
———. “Investing in CSS.” Climate Policy Paper 5, June 17, 2009(a). http://www.world
coal.org/news/coal-news/the-road-to-copenhagen/.
Yeager, Kurt. “Congress, Think Small: We Don’t Need a National Supergrid, We Need
Microgrids.”AlterNet, June 25, 2009. http://www.alternet.org/story/140911.
308 Bibliography
Abbreviations
AARP American Association of Retired Persons
AC alternating current
ACEEE American Council for an Energy-Efficient Economy
AE Austin Energy
AEO Annual Energy Outlook
AEP American Electric Power Company
AMI advanced metering infrastructure
ARRA American Recovery and Reinvestment Act of 2009
AWEA AmericanWind Energy Association
B2B business to business
BLM Bureau of LandManagement
BOS balance-of-system
CARP cost allocation and regional planning
CC combined cycle
CCGT combined cycle gas turbine plant
CCS carbon capture and sequestration
CES community energy system
CHP combined heat-and-power
CIA Central Intelligence Agency
CIM common information mode
CO2 carbon dioxide
309
CPP critical peak pricing
CPUC California Public Utility Commission
CSP concentrating solar power
DC direct current
DG distributed generation
DNP3 distributed network protocol
DOD U.S. Department of Defense
DOE U.S. Department of Energy
DR demand response
DSM demand side management
EDF Environmental Defense Fund
EE energy efficiency
EERE U.S. Department of Energy’s Office of Energy Efficiency and Renewable
Energy
EERS Energy Efficiency Resource Standard
EIA Energy Information Administration
EPA Environmental Protection Agency
EPRI Electric Power Research Institute
ESCO energy service company
ESU Energy Service Utility
FERC Federal Energy Regulatory Commission
FPL Florida Power and Light
GDP gross domestic product
GHG greenhouse gas
IBM International Business Machines
ICCP Inter-Control Center Communications Protocol
IEEE Institute for Electrical and Electronics Engineers
IGCC integrated gasification combined cycle technology
IHD in-home display
IOU investor owned utility
IPCC Intergovernmental Panel on Climate Change
IRP integrated resource planning
ISO independent system operator
IT information technology
ITC investment tax credit
JCSP joint coordinated system plan
kWh kilowatt-hour
LEDs light-emitting diodes
LMPs locational marginal prices
MISO Midwest independent system operator
MIT Massachusetts Institute of Technology
310 Abbreviations
MWh megawatt-hour
NARUC National Association of Regulatory Utility Commissioners
NERC North American Electric Reliability Corporation
NESCOE New England States Committee on Electricity
NIST National Institute of Standards and Technology
NRDC Natural Resources Defense Council
NREL National Renewable Energy Laboratory
NU Northeast Utility
NYMEX NewYork Mercantile Exchange
NYSE NewYork Stock Exchange
OPEC Organization of Petroleum Exporting Countries
PBR performance-based regulation
PG&E Pacific Gas and Electric
PHEVs plug-in hybrid-electric vehicles
PJM Pennsylvania–New Jersey–Maryland Regional Transmission Organization
PNNL Pacific Northwest National Laboratory
POLR provider of last resort
PSCs public service commissions
PV photovoltaic
R&D research and development
RECs renewable energy credits
RES renewable energy standards*
RNP Renewable Northwest Project
RPS renewable portfolio standards
RTO regional transmission organization
SAAS software-as-service
SCADA supervisory control and data acquisition
SCE Southern California Edison
SDG&E San Diego Gas and Electric
SEIA Solar Energy Industries Association
T&D transmission and distribution
TCF trillion cubic feet
TOU time-of-use
TVA Tennessee Valley Authority
UMTDI Upper Midwest Transmission Development Initiative
WAN wide-area network
W-M Waxman–Markey
*Renewable portfolio standards (RPS) are requirements for obtaining a minimum percentage ofelectricity supplies from renewable sources placed on electricity retailers under state laws or publicutility regulations. Renewable energy standards (RES) are essentially the same requirements placedon all electricity sellers nationally by federal legislation.
Abbreviations 311

Acknowledgments
IAM INDEBTED to a vast number of friends, colleagues, and generous
strangers who have helped me think about and then write this book. The in-
spiration for the book came from two projects generously sponsored by Lou
Jahn and David Owens at the Edison Foundation that forced me to take a long-
term look at the industry. I am also grateful to The Brattle Group’s management,
led by Paul Carpenter, Matt O’Loughlin, and especially Hannes Pfeifenberger,
without whose support the book would not have been possible. The same can be
said of my editor, Todd Baldwin, who is an extraordinarily insightful reader in-
side a great institution.
I am greatly indebted to a number of experts and industry leaders who took
time out of their busy schedules to speak with me. This list includes Greg
Basheda, Richard Baxter, Paul Bonavia, Jason Bordoff, Tim Brennan, Jessica
Brahaney Cain, Angela Chuang,Mark Crisson, DonVon Dollen, Glenn English,
Jim Fama, Garth Corey, Jeff Genzer, Rob Gramlich, Chuck Gray, Bryan Han-
negan, Steve Hauser, Bob Hemphill, Revis James, Thomas Jenkin, Jim Jura,
Chris Kavalec, Melanie Kenderdine, Tom King, Karl Lewis, Richard Lynch, Che
McFarlan, Richard Meserve, Vince Minni, Ernie Moniz, Mike Oldak, Karen
313

Palmer, Rob Pratt, Snuller Price, Rhone Resch, Jim Rogers, Joe Romm, Jeff Ross,
Ted Schultz, Glen Sharp, Mike Siminovich, Rob Skidmore, Wally Tillman, Steve
Troese, Fong Wan, and Lisa Wood. I also thank Drew Bittner, Anne Hampson,
DeDe Hapner, Mark Johnson, Bonnie Jungerberg, Greg Kats, Sue Kelly, Troy
Larson, Marty Lobel, Nicole Lynch, Lina Matsumura, Diana Moss, Ren Orans,
Lawrence Pacheco, Marcia Rackstraw, Ben Rogers, Lynn Rzonca, Tami Sand-
berg, Omar Siddiqui, Rob Stavins, Jack Stirzaker, and Barbara Tynan.
My partners at Brattle were incredibly generous in their supply of references
and comments, especially cherished friend Joe Wharton, Ahmad Faruqui, Phil
Hanser, and Ryan Hledik (DR and the Smart Grid); Romkaew Broehm, Adam
Schumacher, and Gary Taylor (my partners in California litigation); Mariko
Geronimo and Dean Murphy (PHEV data); José García, Jamie Hagerbaumer,
and David Robinson (integration data); and Metin Celebi, Judy Chang, Marc
Chupka, and Patrick Fleming (carbon and supply side issues, notably Appen-
dix B).
The research assistants and corporate services team at Brattle that helped
me out, led by Laura Burns, were astonishing in their speed and capability. I es-
pecially thank Theirrien Clark, Chris Coakley, and Jenna Curto, as well as Lucas
Bressan, Ahmed Sharif, and alumni Scott Hennessey, Christina Leaton, Matt
McCaffree, and John Tsoukalis. While thanking all these colleagues, I emphasize
that all opinions in this book are mine alone, and not necessarily those of The
Brattle Group or these partners. None of the organizations I am affiliated with
sponsored or reviewed this work prior to its completion. All errors and omis-
sions are likewise my sole responsibility. Additions, corrections, apologies, and
supplemental information on this volume (including these acknowledgments)
will be posted at www.smartpowerbook.com.
Every book has its special heroes and heroines; this book has two. Marianne
Gray kept my office functioning well through a brutal, unpredictable period,
handled most of the manuscript, created the bibliography, and somehow man-
aged to remain sane. Heidi Bishop put up and kept up with a torrent of research
tasks that shifted from hour to hour with patience and just the right gallows hu-
mor, on top of keeping up with a wide assortment of ever-changing tasks. I will
always be grateful to them.
314 Acknowledgments
BM:IP_Fox-Penner 8/15/10 7:10 PM Page 314

Finally, my family has once again given me encouragement and help
throughout this project. My wife, Susan Vitka, did a superb job editing many
chapters, in addition to her love and moral support. I thank her, my daughter
Emily, my sisters, and the rest of my family with all my heart.
Peter Fox-Penner
Washington, DC—December 2009
Acknowledgments 315

Index
317
Access, 83
Accreditation, 208
ACEEE. SeeAmerican Council on Energy
Efficiency Economy
Advanced metering infrastructure (AMI),
47
AE. SeeAustin Energy
AES Solar, 106
Alternating current (AC), 81, 82
American Clean Energy and Security Act.
SeeWaxman–Markey climate bill
American Council on Energy Efficiency
Economy (ACEEE), 71, 73, 154, 221–
222
American Electric Power Company, 89–92,
90f, 98, 191, 210–211
American Recovery and Reinvestment Act
(ARRA), 213
AMI. SeeAdvanced metering infrastructure
Amin, S.Massoud, 35
Ancillary services, 88
Annual Energy Outlook, 213–214, 214t
Appliance standards, 147, 153
Arizona Public Service, 196
Associated Electric Cooperative, 123–126,
159
Atomic bombs, 3
Austin Energy (AE), 197–198
Automobile sales, 68, 69–70. See also Plug-in
hybrid-electric vehicles
Avoided capacity cost, 45
Avoided capital costs, 52–56
B2B and B2Cmodels, 187
Backstop power supplies, 178
Backup power. SeeUtility backup power
Balance
dumbmeters and, 30
need for continuous, 26–27, 33, 88
storage and, 36–37
wind power and, 103–104
Balance-of-system (BOS) costs, 106
Note: Page numbers with f, t, or b denote reference to a figure, table, or box, respectively.
Balancing authorities, 27
Bankruptcies, 75
Barriers to energy efficiency, 142–145
Basin Electric, 98
Behavioral economics, 140–141
Beneficiary pays pricing, 85
Benefits, hard-to-measure, 56–59, 58t, 86
Berst, Jesse, 24
Bills, overview of, 30–34, 32f
Biomass power plants, 108, 116t
Blackouts, 17
BLM. See Bureau of LandManagement
Blogs, 79–80
Bonneville Power Administration, 123
Booz Allen Hamilton, 162–163
BOS costs. See Balance-of-system costs
BrightSource Energy, 107
Building codes, 147–148, 153
Bulk power, 10, 14, 19, 53–54
Bureau of LandManagement (BLM), 107
Bush, GeorgeW., 111
Business models. See also Economic struc-
ture-regulation-business model triads;
Energy Services Utilities; Smart
Integrator
benefits of competition and, 164–166
community ownership and, 172–174,
173t
current, 159–160, 159f
deregulation, smart grid and, 166–169
of future, 169–172, 169f, 171f, 172t
overview of, 157–159, 158f
vertical integration and, 160–164
Butler, Fred, 49
California electricity crisis, 6, 16–18, 163
California Energy Commission, 128
California Lighting Technology Center,
67
Capacity, avoided capital costs and, 55
Cap-and-trade systems, 125
Capital availability, 142, 143, 155
Capital costs, 52–56, 100, 108
Carbon capture and sequestration (CCS)
technology, 97–100, 113t
Carbon trading legislation, 72–73, 72t
Carter, Jimmy, 70
CC plants. See Combined cycle plants
CCGT. See Combined cycle gas turbine
plants
CCS technology. See Carbon capture and se-
questration technology
Centralization, 2–3
CESs. See Community energy systems
CHP technology. See Combined heat-and-
power technology
CIM. See Common InformationMode
Cisco, 63
Clallam Public Utility District experiment,
23–25
Claussen, Eileen, 141–142
Clean Air Task Force, 99
Climate change, 4, 5, 19–20, 46b, 125
Coal power, 95–96, 97–100
Coase, Ronald, 161
Cogeneration. See Combined heat-and-
power technology
Combined cycle gas turbine plants (CCGT).
See Combined cycle plants
Combined cycle (CC) plants, 96–97
Combined heat-and-power (CHP) technol-
ogy, 109–110
Common InformationMode (CIM), 62f
Commonwealth Edison, 2
Community energy systems (CESs), 173–
174
Community ownership of distributed gen-
eration, 172–174, 173t
Competition, 13–16, 164–166. See also Eco-
nomic structure-regulation-business
model triads
Completely Green scenario, 127, 130–133
318 Index
Complexity, 48
Compliance mindset, 193
Concentrating solar power (CSP) plants,
106–108, 115t
Consumers, 36
Consumption,massing of, 2, 160
Contracts, 161
Control, 81, 91
Cooperatives, 11, 123–126, 159, 209–210
Corey, Garth, 63
Cost allocation, 85–87
Cost-effectiveness, 139–140
Cost-of-service regulation, 181
Costs
of different power options, 112, 113–118t,
119–121
increasing, 71
simulation of, 124–125
vertical integration and, 161
Critical peak pricing (CPP), 40, 41f, 42–45
CSP plants. See Concentrating solar power
plants
Current, 82
Customers, 186–188, 189–190, 190f
Cyber-security, 58t, 63–64
Cycles, 82
Darbee, Peter, 193
Davis, Gray, 18
Decentralization, 6, 56–57
Decision-making
behavioral economics and, 140–141
Completely Green scenario and, 127, 130–
133
different power options and, 121
Most of the Above scenario and, 127, 133–
136, 134t
Small ScaleWins scenario and, 127–130
Traditional Triumphs scenario and, 127,
130–133
transmission planning and, 84–85
Declining block rates, 30
Deconcentration, 14
Decoupling, 182–184
Demand, prices and, 31–33, 32f
Demand response (DR) pricing
avoided capital costs and, 53
barriers and resistance to, 45, 47–49
benefits of, 178
defined, 40
energy efficiency, climate change and,
46b
results of, 42–45
smart meters and, 33
valuation of benefits of, 56–59, 58t
Demand side management (DSM) tech-
nologies, 73
Department of Energy (DOE), 70, 80, 98,
154–155
Deployment, 147
Deregulation
California electricity crisis and, 16–18
current economic and regulatory struc-
ture and, 10–12, 12f
fate of under smart grid, 166–169
introduction of, 12–14
legacy of, 18–20
as non-viable option today, 146
overview of, 9–10
piecemeal introduction of, 14–16
transmission planning and, 84
DG. SeeDistributed generation
Direct current (DC), 81, 82, 91
Direct load control programs, 40
Disruptive technology, 36–37
Distcos, 176
Distributed (small-scale) technologies, 116–
118t
Distributed generation (DG)
accelerated growth of, 129, 130f
avoided capital costs and, 52–53
benefits of, 178
Index 319
community ownership of, 172–174, 173t
future technologies for, 109–112
onsite, 224–226, 225t
overview of, 36, 109
renewable energy standards and, 73–74
valuation of benefits of, 56–59, 58t
Distributed Network Protocol (DNP3), 62f
Distribution, 56
Diversification, 135
DNP3. SeeDistributed Network Protocol
DOE. SeeDepartment of Energy
Donahue, Tom, 64
Doneghy,Marti, 48
DR programs. SeeDemand response
programs
Dry-cooling, 107
Dryers, 24
DSM technologies. SeeDemand side man-
agement technologies
Duke Energy, 98, 194–196, 199
Dumbmeters, 29–30, 31–32
Duncan, Roger, 197–198
Dynamic pricing, 40, 71
Economic growth, 68, 69, 74
Economic structure-regulation-business
model triads
deintegrated with retail choice, 158, 159f,
160, 164–167
overview of, 158f, 157159
structure and regulation futures of, 169–
172, 169f, 171f
vertically integrated regulated utilities,
158, 159, 159f
Economies of scale, 164–166, 172–172, 173t
Edison, Thomas, 2, 200
Education, 208
EERS. See Energy Efficiency Resource
Standards
Efficiency. See Energy efficiency
EIA. See Energy Information
Administration
Electric Power Research Institute (EPRI), 70,
73, 180, 219, 221–224
Electric revolution, 2–4
Electrification, 68, 69–70
Emissions
biomass power and, 108
calls for reductions in, 5–6
carbon capture and sequestration tech-
nology and, 97–100, 113t
energy efficiency and, 141
reductions as driver for change, 4, 5, 19–
20
Enabling technologies, 43
Energy efficiency (EE)
barriers to, 142–145, 146
demand response pricing, climate change
and, 46b
emissions reduction and, 5–6
Energy Services Utilities and, 191, 192–
194
future electricity sales and, 69, 71, 72, 72t
government option for, 154–156
mandates for, 151
national climate strategies for, 141–142
overview of, 139–141
policy approaches for, 147–150
pricing accuracy and, 145–157
regulation of, 192
scenarios for, 221–222
Smart Grid-enabled, 222–224
Smart Integrator and, 187–188
utility involvement and, 151–153, 153f
Energy Efficiency Resource Standards
(EERS), 151
Energy Information Administration (EIA),
69, 70–71, 97, 101, 213–214, 214t
Energy orbs, 176
320 Index
Distributed generation (continued)
Energy security, 4, 58t, 91
Energy service companies (ESCOs), 150,
155
Energy Services Utilities (ESUs)
Duke Energy and, 194–197
energy efficiency and, 192–194
integrating local generators and, 191–192
overview of, 171–172, 172t, 189–191,
190f
Pecan Street project and, 197–198
public power, cooperatives and, 209–210
value of, 198–202
England, 10
Enron, 9, 13, 163
Environmental Protection Agency (EPA),
71, 99
EPA. See Environmental Protection Agency
EPRI. See Electric Power Research Institute
ESCOs. See Energy service companies
ESU. See Energy Services Utilities
Externalities, 145
Faruqui, Ahmad, 42, 73, 223–224
Federal Energy Regulatory Commission
(FERC), 11, 81, 85, 86, 92, 178, 185–186
Federal Power Act, 11, 177
Feedback, smart meters and, 33
Feeders, 23–25
FERC. See Federal Energy Regulatory
Commission
Financing Initiative for Renewable and Solar
Technologies, 149
Financing programs, 149, 152
Firm-level economies of scale, 165
Florida Power and Light (FPL), 168
Florida Progress, 148
FPL. See Florida Power and Light
Free riders, 222
Friedman, Tom, 195
Fuel cells, 111–112
Future of Coal (MIT) study, 99
FutureGen, 98, 131
Gallagher, Patrick, 61
Galvin, Robert, 167–168
Galvin Electricity Initiative, 174
Gas combustion turbines, 96
GDP growth. SeeGross domestic product
growth
Generation, distributed. SeeDistributed
generation
Generators
avoided capital costs and, 55–56
Energy Service Utilities and, 191–192
interconnectedness of, 28–29
ownership of, 11
selection of, 85
Smart Grid and, 34
Geothermal power plants, 108–109, 116t
Geronimo,Mariko, 218–219
Google, 127, 133, 187
Gore, Al, 127
Government ownership, 154–156
Greenwald, Judi, 133
Grid. See also Transmission lines
costs of, 29
defined, 25
flow rearrangement and, 81
Insull and, 2
one-way nature of, 29–30, 59
pond analogy for, 25–29
role of, 27–29
GridWise, 24
GridWise Olympic Peninsula Testbed
Demonstration project, 23–25
Gross domestic product (GDP) growth, 69,
214, 214t
Hackers, 63–64
Hard-to-measure benefits, 56–59, 58t, 86
Index 321
Hassle factor, 144
Health Physics Society, 101
Helmik, Walt, 18
Hemphill, Bob, 106
Hledik, Ryan, 46b, 73
Hogan, Bill, 24
Homo economicus, 140
Human capital, 180
Hybrid vehicles. See Plug-in hybrid-electric
vehicles
Hydroelectric power, 3, 82, 109
ICCP. See Inter-Control Center Communi-
cations Protocol
IEEC. See International Electrotechnical
Commission
IGCC plants. See Integrated gasification
combined cycle plants
IHS Global Insight, 214
Illinois Smart Grid Initiative report, 52
Immigration, 69
Inaccuracy in pricing, 142, 144–147
Incentives, 187–188, 191, 193, 195–196,
198
Increasing (inclining) block rates, 45
Independent power producers (IPPs), 184
Information, energy efficiency and, 142
Information technology, 163, 176, 179–180
Infrastructure, 47, 59–60, 80–81, 204
In-home displays, 42–43, 222
Insull, Samuel, 2–3, 45, 160
Integrated gasification combined cycle
(IGCC) technology, 98, 108
Integrated resource planning (IRP), 56
Integration, 33, 191–192. See also Vertical
integration
Interconnectedness, 28–29, 55, 63–64, 160–
161
Inter-Control Center Communications Pro-
tocol (ICCP), 62f
Interface, 201
Intergovernmental Panel on Climate
Change (IPCC), 141
International Electrotechnical Commission
(IEEC), 62f
Internet protocol data packages, 63
Internet-scale data acquisition, 180
Investment, 58t
Investor owned utilities (IOUs), 177, 184–
186, 209–210
IOActive, 63
IOUs. See Investor owned utilities
IPCC. See Intergovernmental Panel on Cli-
mate Change
IRP. See Integrated resource planning
Izzo, Ralph, 196–197
Jura, James J., 123–126, 159, 185
Kiesling, L. Lynn, 168
Kingsland, P.S., 200
Krauss, Clifford, 147
Kwoka, John, Jr., 161
Land resources, access to, 80–81
Landfill methane, 108
Languages, 63
Lay, Kenneth, 13
Liability, 99
Lighting, 67, 200
Lines. See Transmission lines
LMP price ticker, 39–40
LMPs. See Locational marginal prices
Loan programs, 149, 152
Locational marginal prices (LMPs), 167
Locational pricing, 53–54
Lovins, Amory, 56–57, 201
Low-carbon coal power plants, 97–100, 113t
Mandates, 151
Market conditions, 139
Market power, 178
322 Index
BM:IP_Fox-Penner 8/15/10 7:10 PM Page 322
Marketing, 2
Massing of consumption, 2, 160
Mesh grids, 82
Meters, 29–34, 31–32, 32f, 56, 63
Methane, 108
Michaels, Robert J., 161
Microgrids, 27
Microturbines, 110–111. See also Combined
heat-and-power technology
Middlemen, 187
Midwest Independent System Operator
(MISO) regional market, 87
Moniz, Ernie, 133
Monopolies, 2, 164
Monthly bills, 30–34, 32f
Most of the Above scenario, 127, 133–136,
134t
Muncie, Indiana, 1–2
Municipal energy financing, 149–150
Murphy, Dean, 218–219
National Action Plan for Energy Efficiency,
142
National Appliance Energy Conservation
Act, 147
National Grid, 185
National Institute of Standards and Tech-
nology (NIST), 61
National Renewable Energy Laboratory
(NREL), 87, 102, 173
National Resources Defense Council
(NRDC), 133, 219
Natural gas power plants, 96–97, 113t, 116t,
117t
Natural monopolies, 164
Natural oligopolies, 165
Natural Resources Defense Council
(NRDC), 70
NERC. SeeNorth American Electric Relia-
bility Corporation
Net metering, 56
Net present values, 139–140
New England Independent System Opera-
tor, 39–40
NIST. SeeNational Institute of Standards
and Technology
Nonprofit organizations, 61
North American Electric Reliability Corpo-
ration (NERC), 88
Northeast Utilities (NU), 175–176
NRDC. SeeNatural Resources Defense
Council
NU. SeeNortheast Utilities
Nuclear Energy Institute, 101
Nuclear power plants, 75, 100–101, 114t,
120
Nuclear weapons, 3
Nudge (Thaler and Sunstein), 140–141
Oceans, 109
Oil imports, 4–5
Oligopolies, 165
Onsite distributed generation, 224–226,
225t
Open access, 13–14
Operating costs, 58t
Orbs, 176
Order 890, 85
Oxy-fuel combustion, 98
Pacific Gas & Electricity Company (PG&E),
193
Pacific Northwest National Laboratory
(PNNL), 23, 178, 190–191
Parabolic solar power plants, 106
Paternalism, 140
Payment for new transmission lines, 85–87
Peaking plants, 96
Pecan Street project, 197–198
PG&E. See Pacific Gas & Electricity
Company
PHEV. See Plug-in hybrid-electric vehicles
Index 323
Photovoltaic (PV) solar power, 105–106,
115t, 117t
Planning, 58t, 80–81, 83–85, 124–125. See
also Scenarios
Plant-level scale effects, 165
Plug-in hybrid-electric vehicles (PHEV),
69–70, 72, 72t, 74, 214–219
PNNL. See Pacific Northwest National
Laboratory
Policy, 147–150. See also Transmission
planning
Politics, 154–155
POLR rates. See Providers of last resort rates
Pond analogy, 25–29, 26f
Population growth, 68, 69
Portfolios, 124–125, 135
Post, Bill, 196
Postage-stamp pricing, 86. See also Social-
ization of costs
Power, costs of making and delivering, 30–
31, 32f
Power bills, 30–34, 32f
Power lines. See Transmission lines
Power meters, 29–33, 63
Power options
biomass, 108, 116t
comparison of, 112, 113–118t, 119–121
Completely Green scenario and, 127, 130–
133
concentrating solar, 106–108, 115t
costs of owning and maintaining, 31
distributed (small-scale) technologies
and, 109–112, 116–118t
geothermal, 108–109, 116t
hydroelectric, hydrokinetic, 3, 82, 109
low-carbon coal, 97–100, 113t
Most of the Above scenario and, 127, 133–
136, 134t
natural gas, 96–97, 113t, 116t, 117t
nuclear, 75, 100–101, 114t, 120
overview of, 96
photovoltaic solar, 105–106, 115t, 117t
Small ScaleWins scenario and, 127–130
Traditional Triumphs scenario and, 127,
130–133
wind, 102–104, 103f, 111, 114t, 117t
Power tower plants, 106–107
Pratt, Rob, 24
Price caps, 16–17
Prices to devices, 42
Pricing. See alsoDemand response pricing
choice of, 15
dumbmeters and, 31–32, 32f
energy efficiency and, 142, 144–147, 145–
147
Energy Services Utilities and, 190–191
future electricity sales and, 69
gas-fired generators and, 97
jurisdiction over, 11, 81, 85
locational, 53–54
long-term scenarios for, 219–221, 220t
overview of, 39–41
payment for new transmission lines and,
85–87
reaction of buyers to, 14
Smart Integrator and, 176–177, 177–179
smart meters and, 32–33
Protections, deregulation and, 15
Providers of last resort (POLR) rates, 15–16,
18, 166, 177
Public service commissions (PSCs), 11
Public Service Electric and Gas, 196–197
Pure plays, 162–163
PV. See Photovoltaic solar power
Queues, 83
Rate-of-return regulation, 181
Rates. See Pricing
Rationality, 140–141
324 Index
Real time pricing, 40, 41f
Realistically achievable potential scenario,
222
Rebates, 149, 152, 198
Reform, 92
Regional transmission organizations
(RTOs), 81, 86–87
Regulation. See alsoDeregulation; Economic
structure-regulation-business model
triads
avoided capital costs and, 52–56
combined heat-and-power technology
and, 110
current structure of, 10–12, 12f
of energy efficiency programs, 192–193
Energy Services Utilities and, 189, 195–
196
federal vs. state for transmission infra-
structure, 80–81
Insull on, 2–3
new roles and resources for, 205–209
overview of, 51–52
purpose of, 204–205
sequestration and, 99
Smart Integrator and, 181–182
time-based pricing and, 43
Reliability, 27–28, 83, 84, 88
Renewable energy, 87, 91
Renewable energy standards (RES), 73–74
Renewable portfolio standards (RPS), 87,
221
Repower America campaign, 127
Reserve generators, 28–29
Resistance, 45, 47–49, 81
Resources, mapping of, 87–88
Retail choice, 14
Retail pricing, 40
Revolving loan program (Missouri), 149
Rivers, 109
Rogers, Jim, 194–196
Romm, Joe, 101, 133
RPS. See Renewable portfolio standards
RTOs. See Regional transmission
organizations
SAAS model. See Software-as-a-service
model
Sales
declining growth in, 70–72
decoupling and, 182–184
drivers of, 68–70
future of, 67–68, 214–219
scenarios for, 72–75, 72t
Sant, Roger, 201
Save American Energy Act (2009), 151
Save-A-Watt program, 195–197, 199
Savings-by-Design program, 148
SCADA systems. See Supervisory control
and data acquisition systems
Scale, economies of, 2, 164–166, 172–172,
173t
Scenarios
for additional policy-driven energy effi-
ciency, 221–222
Completely Green, 127, 130–133
Energy Information Administration 2009
forecast and, 213–214
for long-term price impacts, 219–221,
220t
Most of the Above, 127, 133–136, 134t
onsite distributed generation and, 224–
226, 225t
planning and, 124–125
for projected electric sales, 214, 215–217t,
218–219, 218t
Small ScaleWins, 127–130
Traditional Triumphs, 127, 130–133
Schulz, Ted, 196
Security, 4, 58t, 63–64, 91. See alsoWaxman–
Markey climate bill
Index 325
Sequestration, 98–99. See also Carbon cap-
ture and sequestration technology
Sequim, Washington, 23–25
Sergici, Sanem, 73
Service requests, 83
Shared savings, 150
Signposts, 127
Silicon photovoltaic panels, 105
Simonovich, Michael, 67
Simulations, 124–125
Sioshansi, Fereidoon, 135
Siting, 81, 92, 110
Small cogeneration. See Combined heat-
and-power technology
Small is Profitable (Lovins), 57
Small Scale Wins scenario, 127–130
Smart Grid
electricity storage and, 36–37
fate of deregulation under, 166–169
future electricity sales and, 69, 72
overview of, 6, 34–36, 37–38, 37f
savings from, 73
Small Scale Wins scenario and, 129–130
Smart Grid 2.0, 197–198
Smart Integrator (SI)
core competencies for, 179–180
customers and, 186–188
decoupling, energy sales incentives and,
182–184
local pricing and, 177–179
overview of, 171–172, 172t, 175–177
rate setting and, 181–182
Wall Street and, 184–186
Smart meters, 32–33, 63
Smith, Vernon, 24
Socialization of costs, 85–86
Software-as-a-service (SAAS) model, 201
Solar power, 105–108, 115t, 117t, 149
Solar thermal electric plants. See Concen-
trating solar power plants
SolveClimate.com blog post, 79–80
Southern Company, 98
Spikes, 31, 32f
Standardization, 60–63, 62f
Standards
energy efficiency and, 147–148, 151, 153,
153f
nuclear power and, 101
renewable energy, 73–74
States, 11, 81, 92, 207–208
Steam hosts, 110
Storage, 36–37, 104, 107–108
Subadditive costs, 164
Superconducting cables, 82
Supercritical boilers, 98
Superhighway, transmission, 80, 89–92, 90f,
204
Supervisory control and data acquisition
(SCADA) systems, 63
Supply and demand, 167
Supply chain, 101
Surplus power, 17
System lambda, 39
T&D costs. See Transmission and distribu-
tion costs
Tennessee Valley Authority (TVA), 3
Thaler, Richard, 48
The Green Grid study, 223
Thermostats, programmable, 42
Thin-film photovoltaic cells, 105
Time-based pricing, 32–34, 40–41, 41f, 42–
45, 44f
Time-of-use (TOU) rates, 40, 41f, 42–45
Trade deficit, 4–5
Traditional Triumphs scenario, 127, 130–133
Transaction costs, 142, 143–144
Transmission
avoided capital costs and, 55
concentrating solar power and, 107
326 Index
BM:IP_Fox-Penner 8/15/10 7:10 PM Page 326
interconnectedness of, 55
locational pricing and, 53–54
open access and, 13–14
selling power vs., 11
Smart Grid and, 34–35
Transmission and distribution (T&D) costs,
54
Transmission lines. See alsoGrid
current in, 82, 91
debate over, 79–80
need for new, 87–89
payment for new, 85–87
planning for, 80–81, 83–85, 92
reform and, 92
as superhighway, 80, 89–92, 90f
Turbines, 109, 111. See alsoWind power
plants
TVA. See Tennessee Valley Authority
Ultrasupercritical boilers, 98
Uncertainty, future electricity sales and, 72t,
74–75
Utilities, energy efficiency and, 148–149,
151–153, 153f
Utility backup power, 179
Valuation, 56–59, 58t–59t, 139–140
Value billing, 196
Vehicles, 68, 69–70. See also Plug-in hybrid-
electric vehicles
Vertical integration, 10, 158, 159–164, 159f,
169–172, 169f, 171f
Vojdani, Ali, 179–180
Volatility, 48
Voltage levels, 82
Wack, Pierre, 126
Wall Street, 184–186
WAN. SeeWide-Area Networks
War Production Board, 3
Wasik, John, 200
Waste disposal, 101
Water resources, 107, 108–109
Waxman–Markey climate bill, 73, 131, 147,
220–221
Western Governors’Association, 89
Whirlpool, 23, 42
Wholesale power, 10, 14, 19, 53–54
Wide-Area Networks (WAN), 62f
Wi-Fi technology, 62–63
Williamson, Oliver E., 161
Wi-Max, 62
Wind power plants, 102–104, 103f, 111,
114t, 117t
Wind resources, mapping of, 90f, 102
Yeager, Kurt, 42, 167–168
Index 327


329


