Embed Size (px)
Citation preview
SOUTHERN CALIFORNIA EDISON COMPANY
Smart Grid Deployment Plan Annual Update October 1, 2018
Smart Grid Deployment Plan Annual Update
Table Of Contents
Section Page
‐i‐
I. Executive Summary ............................................................................................................................................ 1
II. Plan Update ....................................................................................................................................................... 3
A. Proceedings ................................................................................................................................................... 3
B. Benefits ......................................................................................................................................................... 7
III. Projects Update ................................................................................................................................................ 9
A. Customer Empowerment.............................................................................................................................. 9
B. Distribution Automation/Reliability ............................................................................................................ 13
C. Transmission Automation/ Reliability ......................................................................................................... 19
D. Asset Management & Operational Efficiency ............................................................................................. 20
E. Security ........................................................................................................................................................ 20
F. Integrated & Cross Cutting Systems ............................................................................................................ 21
IV. Customer Engagement Timeline .................................................................................................................... 23
V. Risks ................................................................................................................................................................ 24
A. Introduction – Smart Grid Motivation ........................................................................................................ 24
B. Smart Grid Architecture Challenges ............................................................................................................ 25
C. Cost‐Efficient Smart Grid Design ................................................................................................................. 26
D. Standards Overview .................................................................................................................................... 26
1. National Institute of Standards and Technology Smart Grid Standards Coordination ........................... 28
2. Standards Development .......................................................................................................................... 29
3. Standards Conclusion .............................................................................................................................. 30
E. Cybersecurity Overview .............................................................................................................................. 30
VI. Metrics Update .......................................................................................................................................... 35
A. Customer Metrics/ AMI Metrics ................................................................................................................. 35
B. Plug‐in Electric Vehicle Metrics ................................................................................................................... 41
C. Storage Metrics ........................................................................................................................................... 41
D. Grid Operations Metrics ............................................................................................................................. 42
Appendix 1 ........................................................................................................................................................... 49
Appendix 2 ........................................................................................................................................................... 69
Appendix 3 ........................................................................................................................................................... 71

SMART GRID DEPLOYMENT PLAN ANNUAL UPDATE
1
I. Executive Summary
California’s landmark Smart Grid legislation, Senate Bill (SB) 17, established that “[i]t is the policy of the
state to modernize the state’s electrical transmission and distribution system to maintain safe, reliable,
efficient, and secure electrical service, with infrastructure that can meet future growth in demand and
achieve” various goals aimed at a cleaner energy future, energy efficiency, and more engaged
customers.1
SB 17 mandated that electric utilities submit smart grid deployment plans to the California Public
Utilities Commission (CPUC or Commission) for approval. Southern California Edison Company (SCE)
submitted its Smart Grid Deployment Plan on July 1, 2011.2 The Commission ruled on these plans during
its July 25, 2013 business meeting, voting unanimously to approve the plans submitted by Pacific Gas
and Electric Company (PG&E), San Diego Gas & Electric Company (SDG&E) and SCE, (jointly the IOUs).3
SB 17 also required that the Commission provide an annual report to the Governor and the Legislature
“on the commission’s recommendations for a smart grid, the plans and deployment of smart grid
technologies by the state’s electrical corporations, and the costs and benefits to ratepayers.”4 In turn,
the Commission ordered the California investor‐owned electric utilities (IOUs) to provide an annual
update on the status of their Smart Grid investments.5
In the annual update reports, SCE explains the following: (1) deployment of Smart Grid technologies;
(2) progress toward meeting the utility’s Smart Grid Deployment Plan; (3) the costs and benefits to
customers, where such assessments were feasible; (4) current deployment and investment initiatives;
(5) updates to security risk and privacy threat assessments; and (6) compliance with security rules,
guidelines, and standards.6 On August 2, 2013, the Commission issued Decision (D.)13‐07‐024 adopting
the report template and format used by the IOUs for their annual updates reporting on the progress of
their smart grid projects and initiatives.
On December 4, 2014, the Commission issued D.14‐12‐004 closing the Smart Grid rulemaking
proceeding, formally known as the Rulemaking to Consider Smart Grid Technologies Pursuant to Federal
Legislation and on the Commission's own Motion to Actively Guide Policy in California's Development of
a Smart Grid System. 7
In this latest annual report, the 7th update to the Smart Grid Deployment Plan, SCE provides an update
to cover the most recent reporting period of July 1, 2017 through June 30, 2018 (Reporting Period).
Through this Smart Grid Deployment Plan Update, SCE complies with its reporting obligation and assists
the Commission in developing the Commission’s annual report to the Governor and the Legislature.
1 Pub. Util. Code § 8360. 2 See Application (A.) 11‐07‐001. 3 Decision (D.) 13‐07‐024. 4 PUB. UTIL. CODE § 8367. 5 Decision (D.)10‐06‐047, Ordering Paragraph 15. 6 Id. 7 R.08‐12‐009.
SMART GRID DEPLOYMENT PLAN ANNUAL UPDATE
2
In the Smart Grid Deployment Plan, SCE described its deployment baseline and its vision for the Smart
Grid. This Update details SCE’s progress on specific projects. There are six types of projects:
1. Customer Empowerment; 2. Distribution Automation/Reliability; 3. Transmission Automation/Reliability; 4. Asset Management & Operation Efficiency; 5. Security; and 6. Integrated & Cross‐Cutting Systems.
SCE’s Customer Empowerment efforts provide customers with information regarding their energy
usage, as well as programs, rates, and technologies to enable energy conservation and peak load
reductions. This energy information (e.g., interval usage data, near real‐time usage, cost information
and event notifications) will better facilitate customers’ ability to participate in time‐variant rates.
These customer‐oriented efforts will also provide information accessible in a variety of ways (e.g., web
and mobile devices) to customers and authorized third‐party service providers.
Distribution Automation/Reliability (DAR) projects improve information and control capabilities for
distribution systems. These projects focus on accommodating distributed energy resources (DERs) and
clustered electric vehicle charging; the projects also mitigate outages by developing self‐healing circuit
technology. DAR projects will provide a consolidated solution to manage safety, reliability, and
compliance obligations.
Transmission Automation/Reliability (TAR) projects provide similar capabilities as DAR on the
transmission system. These projects allow us to incorporate utility‐sized intermittent power generation
such as solar and wind energy in a safe and reliable manner. TAR projects also enhance data collection
and automation to prevent wide‐scale blackouts.
Asset Management & Operation Efficiency projects improve the efficiency of grid operations. These
projects identify infrastructure replacements based on asset health rather than time in service; the
projects help prevent critical equipment failure.
Security projects address increased cyber and physical security requirements associated with
developing, implementing, operating, and managing Smart Grid systems and assets.
Integrated & Cross‐Cutting Systems refer to projects that support multiple Smart Grid domains (e.g.,
communications, data management and testing). An integrated approach creates a platform to deliver
benefits across utility operations and share those benefits with customers. Integrated systems also
enable information‐sharing between the utility, service partners, and customers.
These projects are intended to provide benefits to customers in the form of better system reliability,
improved safety and security, increased customer choice, and reduced costs. The Department of
Energy’s Office of Electricity Delivery and Energy Reliability (DOE) developed a methodology to quantify
Smart Grid benefits as part of the American Recovery and Reinvestment Act (ARRA) effort. For purposes
SMART GRID DEPLOYMENT PLAN ANNUAL UPDATE
3
of this report, SCE uses aspects of the DOE’s methodology in estimating the Smart Grid projects’
benefits.
SCE’s Smart Grid vision also carries with it risks and challenges. As noted in previous updates, the grid
was initially designed to carry power in one direction from the generator to the end use consumer.
Changes in state and federal energy policy and increasing adoption of new technology by customers
(e.g., distributed generation and energy storage) have led utilities to rethink the initial design and
develop a means to create a more flexible delivery system that remains safe, affordable and reliable.
This includes transitioning from more conventional technologies to smarter, computer‐based assets,
capable of communicating and optimizing the energy grid. This update details SCE’s continued activities
toward these goals. Importantly, this transition will be more cost‐effective if the technologies are based
on common standards. As SCE has maintained since Phase 1 of the Smart Grid OIR (R.08‐12‐009),
standards are necessary to help ensure interoperability and maximize market participation.
The importance of cybersecurity to the utility industry and to SCE has increased as systems and data
have become more integral to business operations, and as cyber threats continue to grow in number
and sophistication. SCE continues to work with the government and private industry to develop and
deploy critical infrastructure protection as evidenced by our implementation of a Common
Cybersecurity Services (CCS) platform currently deployed on our bulk electric system. SCE continues to
work with organizations such as NERC and NIST to satisfy and meet various cybersecurity protocols and
standards. The industry anticipates that Federal Energy Regulatory Commission (FERC) and NERC will
continue to require improved CIP reliability standards over the next several years, and SCE is committed
to comply with those requirements, as cybersecurity is critical for Smart Grid development.
As part of its smart grid efforts, SCE proactively engages with and educates residential customers,
business customers, governmental entities, and other stakeholders. During the Reporting Period, SCE
continued to inform customers about online energy management tools and services. SCE also provided
marketing, education and outreach to its customers regarding web presentment tools, time‐of‐use
(TOU) rates (including rates for plug‐in electric vehicles), and Budget Assistant.
In sum, SCE continued to advance its Smart Grid initiatives, consistent with the requirements of SB 17
and Decision (D.)13‐07‐024. SCE will continue to work with the Commission, fellow utilities, and
stakeholders to modernize the grid in support of state and federal energy policy objectives.
II. Plan Update
In this section, SCE provides an update on proceedings and benefits associated to the Smart Grid
Deployment Plan.
A. Proceedings SCE’s decision to invest in Smart Grid technologies and fund their deployment is significantly affected by
the policy environment in which it operates. This section provides a summary of key state and federal
regulatory proceedings and legislative activities impacting, or with the potential to impact, SCE
operations.

SMART GRID DEPLOYMENT PLAN ANNUAL UPDATE
4
On December 4, 2014, the Commission issued D.14‐12‐004 closing the Smart Grid Rulemaking
proceeding. Per this Decision, SCE now submits the mandated Smart Grid Deployment Plan Updates
and the quarterly ARRA project reports to the director of the Energy Division and the Executive
Director.8
The most significant proceeding affecting Smart Grid efforts is the General Rate Case (GRC), because the
GRC provides SCE with the base funding and authorization to perform Smart Grid‐related work. SCE
submitted its most recent GRC Application for a 2018 test year on September 1, 2016.9 As of the end of
the Reporting Period, this proceeding remains open.10
Within the Energy Storage rulemaking,11 on September 15, 2016, the Commission issued D.16‐09‐004
approving the results of SCE’s 2014 Energy Storage Request for Offer (RFO) Application, totaling 16.3
megawatts (MW) of distribution connected energy storage; and adopted the Joint IOUs’ protocol, which
helps ensure that above‐market costs are recovered from customers who depart bundled service after
an energy storage resource is procured.
Also, on September 15, 2016, the Commission issued D.16‐09‐007 approving SCE’s 2016 Energy Storage
Procurement Plan to procure, at a minimum, 20 MW of resource adequacy (RA) ‐only energy storage
and innovative use cases such as distribution deferral. On April 27, 2017, the Commission issued D.17‐
04‐039 addressing Track 2 issues, leaving storage targets unchanged. The decision implements
Assembly Bill (AB) 2868 by directing the IOUs to each propose, in their 2018 Storage Plans, up to 166
MW of additional investments and programs in distribution storage. This decision creates a new
“limiter” mechanism to adjust downward the procurement target for Energy Service Providers (ESPs)
and Community Choice Aggregators (CCAs) based on the quantity of IOU storage eligible for cost
allocation to ESPs and CCAs. Additionally, D.17‐04‐039 allows energy storage resources to reduce their
station power rate during charging activities to a wholesale rate, provided the storage device is
responding to a California Independent System Operator (CAISO) dispatch.
The Electric Program Investment Charge (EPIC) is administrated by the IOUs and the California Energy
Commission (CEC). The EPIC Program provides funding for applied research and development,
technology demonstration and deployment and market facilitation of clean energy technology. EPIC’s
annual budget is $162 million and is collected from customers using the following allocation: PG&E
(50.1%), SCE (41.1%) and SDG&E (8.8%), resulting in SCE’s triennial budget of approximately $66.5
million. The IOUs are limited to technology demonstrations and deployments. SCE has submitted and
received Commission approval for two triennial investment plan applications addressing investments in
years 2012‐2014 and investments in years 2015‐2017. On May 1, 2017, SCE submitted its 2018‐2020
Investment Plan Application to the Commission for approval.12 On January 16, 2018 the Commission
8 ARRA Projects: Tehachapi Wind Energy Storage Project (TSP) per Rulemaking R.08‐12‐009. 9 Application (A.)16‐09‐001. 10 D.18‐05‐045, issued June 4, 2018 extended the statutory deadline for this proceeding to December 3, 2018. 11 R.15‐03‐011. 12 A.17‐05‐005.

SMART GRID DEPLOYMENT PLAN ANNUAL UPDATE
5
issued D.18‐01‐008, approving $555 million in funding for the years 2018‐2020, to be collected from
customers of the IOUs using the same allocation. As a result, SCE’s budget is $228.1 million.13
The 21st Century Energy Systems Project (CES‐21) is a $35 million, five‐year cooperative research and
development agreement between SCE, PG&E, SDG&E and Lawrence Livermore National Laboratory,
which addresses cybersecurity and grid integration issues. SB 96 limits the CES‐21 Program budget to
$33 million for cybersecurity and $2 million for grid integration over a five‐year period.14 SCE is only
participating in the cybersecurity project that addresses machine‐to‐machine automated threat
response. The cybersecurity project is in progress, and on‐track to conclude at the end of the five‐year
period in October 2019. The IOUs, along with the Lawrence Livermore National Laboratory, brief
Commission staff on a biannual basis.
On September 25, 2013, the Commission issued Rulemaking (R.)13‐09‐011 to enhance the role of
Demand Response (DR) in meeting California’s resource planning needs and operational requirements.
The Rulemaking will establish policies to inform future DR program design. On September 29, 2016, the
Commission issued D.16‐09‐056 resolving the remaining Phase Two and Phase Three issues. The
resolution of the issues provide guidance to the IOU’s on their 2018‐2022 DR applications, which SCE
filed on January 17, 2017, to fund its portfolio of existing DR programs.15 On December 14, 2017, the
Commission issued D.17‐12‐003, authorizing SCE’s budget for the five‐year period of $751,027,000.16
On September 1, 2016, SCE filed its 2016 Rate Design Window (RDW) Application to, among other
things, update its standard TOU periods for non‐residential customers.17 SCE’s existing TOU periods
have remained relatively unchanged for three decades and are no longer aligned with today’s grid needs
and the economics of electricity costs. This is largely the result of the influx of renewable generation,
which has caused SCE’s peak costs to shift later in the day. To account for this, SCE proposed shifting its
current peak period (noon to 6 p.m.) to 4 p.m. to 9 p.m. SCE also proposed a super‐off‐peak period from
8 a.m. to 4 p.m. in the winter season to help enable appropriate consumption price signals in periods of
more abundant renewable supply. SCE received approval of these new TOU rate periods on July 13,
2018.18 Aligning TOU periods with underlying marginal costs will send more appropriate price signals to
customers, which can influence customers’ consumption patterns and work to reduce costs if customers
are able to shift their load to lower cost periods. The new time periods are expected to become
effective in March 2019, pending the approval of General Rate Case Phase II.
In December 21, 2017, SCE filed its 2018 RDW Application to migrate residential customers to TOU
rates. The proposal outlines the plan to move approximately 3.3 million residential customers to one of
two new TOU rates with peak times in the late afternoon and early evening (4 p.m. to 9 p.m. and 5 p.m.
13 D.18‐01‐008, p. 39. 14 SB 96, signed September 26, 2013. 15 A.17‐01‐018 16 D.17‐12‐003, p. 2. 17 A.16‐09‐003 18 D.18‐07‐006.
SMART GRID DEPLOYMENT PLAN ANNUAL UPDATE
6
to 8 p.m. peak periods) in 2020 and 2021. This proceeding is still open, and a decision is expected by July
2019.
On November 14, 2014 the Commission issued an Order Instituting Rulemaking (OIR) to consider
alternative‐fueled vehicle (AFV) programs, tariffs, and policies.19 This rulemaking will continue the work
started in R.09‐08‐009 to support California Executive Order B‐16‐2012, which sets a target of 1.5 million
zero‐emission vehicles on the roads in California by 2025.20 On March 30, 2016, the Commission issued
an Amended Scoping Memo and Ruling for the AFV OIR, to include within the scope of the proceeding
the transportation electrification (TE) issues contained in SB 350 and reprioritize the broad policy
activities in the AFV OIR.
On September 14, 2016, Commissioner Peterman issued an Assigned Commissioner Ruling (ACR)
directing that the IOUs file applications for programs and investments in TE.21 The ruling provides the
IOUs with flexibility to apply for programs/investments in almost all transportation sections. On January
20, 2017, SCE filed its application22 for a portfolio of investments and programs to help accelerate the
adoption of electric vehicles (EVs). The application proposed a portfolio of eight pilot projects and
investment programs. This application will be the first in a series of possibly annual applications for
funding of TE by SCE until the state achieves its 2030 and 2050 carbon goals. On June 6, 2018 the
Commission issued D.18‐05‐040 approving a budget of $738 million for the IOUs to implement TE
projects, $356,362,471 of which is allocated to SCE.23
In addition to Commission proceedings and filings, SCE’s smart grid deployment is also affected by
federal regulatory decisions, such as the CIP standards developed by the NERC and adopted by the FERC.
CIP standards set a regulatory cybersecurity framework for protecting SCE’s critical assets. The CIP V5
Standards were effective July 1, 2016. On January 21, 2016 FERC issued Order 822 approving NERC CIP
Version 6 with staggered implementation schedules through 2018. The proposed standards are
designed to mitigate the cybersecurity risks to bulk electric system facilities, systems, and equipment,
which, if destroyed, degraded, or otherwise rendered unavailable as a result of a cybersecurity incident,
would affect the reliable operation of the Bulk‐Power System.
Additionally, SCE is actively evaluating the impact of complying with NERC Reliability Standard CIP‐014‐1
(Physical Security) requirements for its bulk electric system to comport with SB 699. The purpose of CIP‐
014‐1 is to enhance physical security measures for the most critical Bulk‐Power System against physical
attacks.24 On June 11, 2015, the CPUC approved a new OIR to establish policies, procedures, and rules
19 R.13‐11‐007. 20 California Executive Order B‐16‐2012 was issued on March 23, 2012. 21 Assigned Commissioner Ruling Regarding the Filing of the Transportation Electrification Applications Pursuant
to SB 350. 22 A.17‐01‐021. 23 D.18‐05‐040, p. 118. 24 On July 17, 2014 FERC issued a Notice of Proposed Rulemaking to approve CIP‐014‐1.
SMART GRID DEPLOYMENT PLAN ANNUAL UPDATE
7
for the regulation of physical security risks to the electric supply facilities (Phase 1), and to establish
standards for disaster and emergency preparedness plans for electric and water facilities (Phase 2).25
On August 14, 2014, the Commission issued R.14‐08‐013 to establish policies, procedures, and rules to
guide California IOUs in developing their Distribution Resources Plan Proposals. The Rulemaking also
intends to evaluate the IOUs existing and future electric distribution infrastructure and planning
procedures with respect to incorporating DERs into the planning and operations of their electric
distribution systems. On September 28, 2017 the Commission issued D.17‐09‐026 regarding Track 1
Demonstration Projects A and B. The Commission issued D.18‐02‐004 on February 15, 2018 addressing
Track 3, Sub‐Track 1 and Sub‐Track 3 policy issues. The Commission addressed policy issues related to
Sub‐Track 2 in D.18‐03‐023, issued March 26, 2018.26
In the Integrated Distributed Energy Resources (IDER) proceeding, the Commission issued D.17‐09‐022
adopting an interim GHG adder.27
SCE is committed to making its grid smarter and maintaining reliability while improving interoperability
through new technologies that can accommodate disparate generation at a reasonable price. However,
the rate at which SCE is able to study, test, deploy and enable smart grid technology is largely
dependent upon the pace and outcome of regulatory processes and proceedings. SCE continues to
work with, and is guided by, the Commission in effectuating the goals of SB 17.
B. Benefits In this section, SCE provides an estimate of Smart Grid benefits accrued during the reporting period. In
identifying and estimating these benefits, SCE leveraged the publicly‐available methodology from the
DOE’s Office of Electricity Delivery and Energy Reliability. Using this approach, SCE developed a set of
smart grid assets, functions, and benefits, modifying DOE’s terminology when necessary to reflect SCE’s
specific Smart Grid investments. For this annual report, SCE reviewed the status of all Smart Grid
projects to determine which assets and functions were in place and producing benefits during the
reporting period.
SCE’s methodology categorizes benefits into five areas:
1. Operational; 2. Reliability; 3. Demand Response/ Energy Conservation; 4. Environmental; and 5. Other.
25 See R. 15‐06‐009. 26 For activities during the July 1, 2016 – June 30, 2017, please see SCE’s Smart Grid Annual Deployment Plan
Update, submitted October 1, 2017, pp. 6‐7. 27 R.14‐10‐003. For activities during the July 1, 2016 – June 30, 2017, please see SCE’s Smart Grid Annual
Deployment Plan Update, submitted October 1, 2017, p. 7.
SMART GRID DEPLOYMENT PLAN ANNUAL UPDATE
8
Operational benefits consist of reduced and avoided costs of utility operations, including procurement,
customer service and transmission and distribution (T&D) costs. Reliability benefits include the societal
value of avoided outages and reduced outage duration for all customer classes. Demand
Response/Energy Conservation benefits are reflected in measured load impacts from SCE’s DR
resources.28 Environmental benefits include avoided greenhouse gas and particulate emissions. Finally,
other benefits include areas that are difficult to quantify, such as safety and customer satisfaction. This
annual report includes estimates of operational, reliability, and demand response/conservation benefits
and provides descriptions of environmental benefits and other benefits.
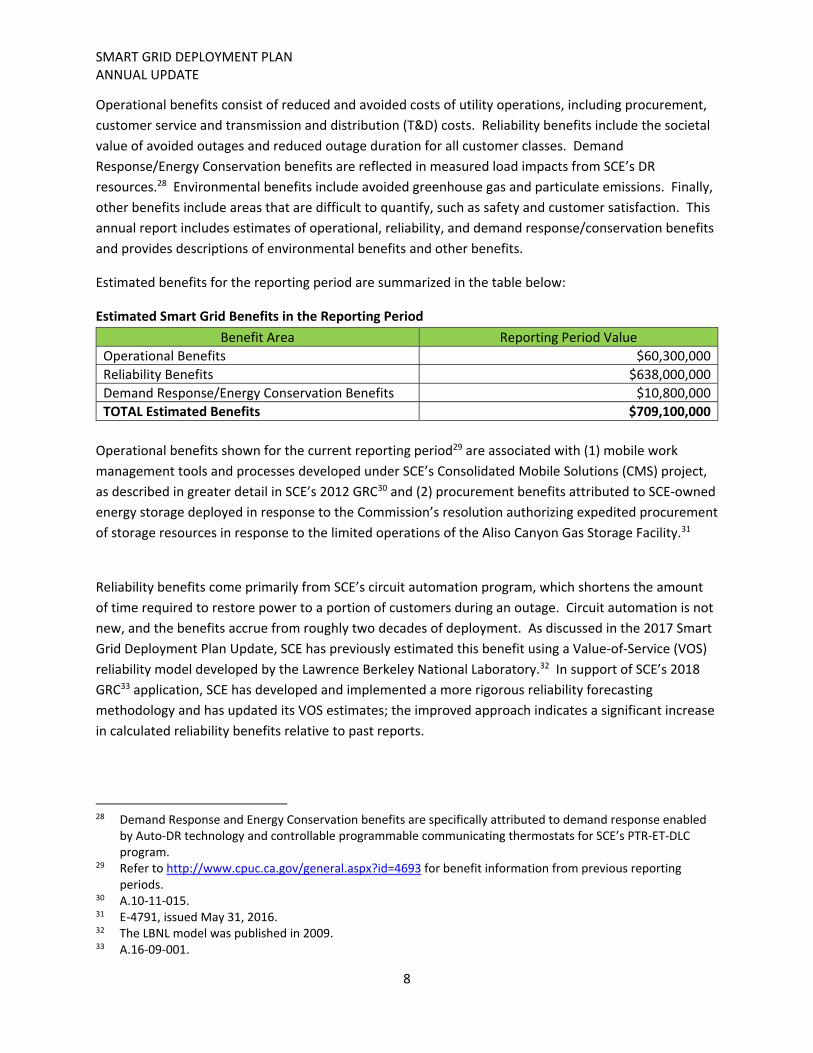
Estimated benefits for the reporting period are summarized in the table below:
Estimated Smart Grid Benefits in the Reporting Period
Benefit Area Reporting Period Value
Operational Benefits $60,300,000
Reliability Benefits $638,000,000
Demand Response/Energy Conservation Benefits $10,800,000
TOTAL Estimated Benefits $709,100,000
Operational benefits shown for the current reporting period29 are associated with (1) mobile work
management tools and processes developed under SCE’s Consolidated Mobile Solutions (CMS) project,
as described in greater detail in SCE’s 2012 GRC30 and (2) procurement benefits attributed to SCE‐owned
energy storage deployed in response to the Commission’s resolution authorizing expedited procurement
of storage resources in response to the limited operations of the Aliso Canyon Gas Storage Facility.31
Reliability benefits come primarily from SCE’s circuit automation program, which shortens the amount
of time required to restore power to a portion of customers during an outage. Circuit automation is not
new, and the benefits accrue from roughly two decades of deployment. As discussed in the 2017 Smart
Grid Deployment Plan Update, SCE has previously estimated this benefit using a Value‐of‐Service (VOS)
reliability model developed by the Lawrence Berkeley National Laboratory.32 In support of SCE’s 2018
GRC33 application, SCE has developed and implemented a more rigorous reliability forecasting
methodology and has updated its VOS estimates; the improved approach indicates a significant increase
in calculated reliability benefits relative to past reports.
28 Demand Response and Energy Conservation benefits are specifically attributed to demand response enabled
by Auto‐DR technology and controllable programmable communicating thermostats for SCE’s PTR‐ET‐DLC program.
29 Refer to http://www.cpuc.ca.gov/general.aspx?id=4693 for benefit information from previous reporting periods.
30 A.10‐11‐015. 31 E‐4791, issued May 31, 2016. 32 The LBNL model was published in 2009. 33 A.16‐09‐001.
SMART GRID DEPLOYMENT PLAN ANNUAL UPDATE
9
DR benefits are associated with commercial DR programs that use interval data, such as those gathered
by Edison SmartConnect meters to calculate energy reductions. These programs include the Aggregator
Managed Portfolio (AMP), Capacity Bidding Program (CBP), and Critical Peak Pricing (CPP). Participation
in these programs can be enhanced, with corresponding benefits to customers, by enabling automated
demand response (AutoDR). The MW of these resources are derived from the average ex post load
impacts from 2015, which are based on the Load Impact Protocols adopted in D.08‐04‐050, and the
avoided generation capacity value from the DR Cost‐Effectiveness template adopted in D.10‐12‐024.
Distribution and Substation Automation, and the communications networks that enable such
automation, support realization of DER potential, enhancing the ability of DERs to provide new services.
Environmental benefits in the form of reduced greenhouse gas emissions have resulted from several of
SCE’s smart grid initiatives. Energy storage deployment, peak demand reduction, and energy
conservation programs all result in fewer emissions. Reducing truck usage due to the smart meter
program has also produced lower emissions. This report does not provide an estimated value of these
benefits.
III. Projects Update
In this section, SCE provides an update regarding its deployment projects and pilot projects described in
its July 1, 2011 Smart Grid Deployment Plan. The projects have been grouped in six categories:
A. Customer Empowerment; B. Distribution Automation/Reliability; C. Transmission Automation/Reliability; D. Asset Management & Operational Efficiency; E. Security; and F. Integrated & Cross Cutting Systems.
Throughout Section III, the dollar amounts associated with specific projects refer to the total amount
spent from July 1, 2017 through June 30, 2018.34 SCE has requested a number of technology‐related
programs and projects as part of its 2018 General Rate Case, which has yet to be fully adjudicated.
Depending on the outcome of that proceeding, SCE may have a number of additional items to
incorporate into the next Smart Grid Deployment Plan Update.35
A. Customer Empowerment
SCE’s customer empowerment efforts support the Commission’s Smart Grid vision, which includes
customers “who are informed about the Smart Grid and [are able] to use electricity more efficiently and
save money.” 36 In support of this vision, SCE’s customer empowerment efforts will provide customers
with accessible information regarding their energy information. Furthermore, SCE continues to develop
34 Refer to http://www.cpuc.ca.gov/general.aspx?id=4693 for project and cost information from previous
reporting periods. 35 See Application (A.)16‐09‐001. 36 Decision Adopting Requirements for Smart Grid Deployment Plans Pursuant to Senate Bill 17 (Padilla), Chapter
327, Statues of 2009, June 24, 2010.
SMART GRID DEPLOYMENT PLAN ANNUAL UPDATE
10
rates and programs to encourage energy conservation and peak load reductions. SCE provides this
energy information while protecting each customer’s data privacy, in accordance with the Commission’s
decision adopting rules to protect the privacy of customer’s electric usage data.37
Generally, projects in this area develop communication infrastructure, information systems, and energy
management services, along with customer‐facing tools, services, programs, dynamic rates and
outreach capabilities. Furthermore, SCE’s efforts will provide automated interval usage information to
customer‐authorized third parties.
The following discussion provides descriptions and updates regarding the customer empowerment
projects.
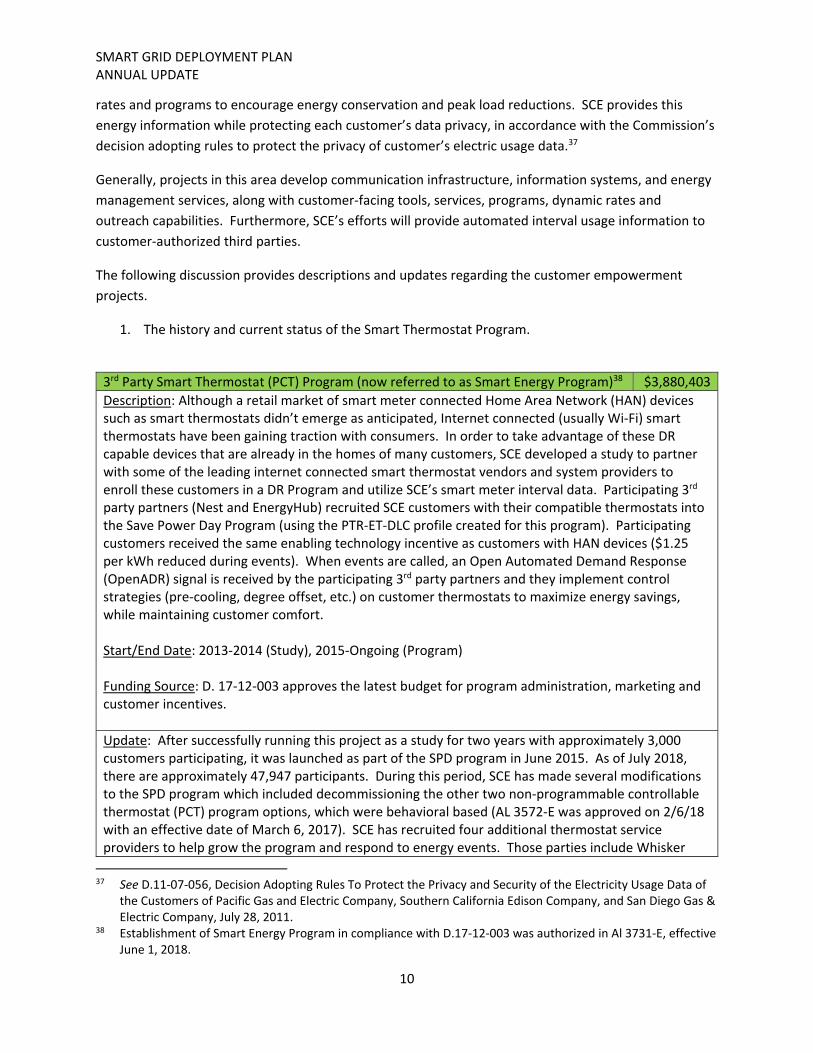
1. The history and current status of the Smart Thermostat Program.
3rd Party Smart Thermostat (PCT) Program (now referred to as Smart Energy Program)38 $3,880,403
Description: Although a retail market of smart meter connected Home Area Network (HAN) devices such as smart thermostats didn’t emerge as anticipated, Internet connected (usually Wi‐Fi) smart thermostats have been gaining traction with consumers. In order to take advantage of these DR capable devices that are already in the homes of many customers, SCE developed a study to partner with some of the leading internet connected smart thermostat vendors and system providers to enroll these customers in a DR Program and utilize SCE’s smart meter interval data. Participating 3rd party partners (Nest and EnergyHub) recruited SCE customers with their compatible thermostats into the Save Power Day Program (using the PTR‐ET‐DLC profile created for this program). Participating customers received the same enabling technology incentive as customers with HAN devices ($1.25 per kWh reduced during events). When events are called, an Open Automated Demand Response (OpenADR) signal is received by the participating 3rd party partners and they implement control strategies (pre‐cooling, degree offset, etc.) on customer thermostats to maximize energy savings, while maintaining customer comfort. Start/End Date: 2013‐2014 (Study), 2015‐Ongoing (Program) Funding Source: D. 17‐12‐003 approves the latest budget for program administration, marketing and customer incentives.
Update: After successfully running this project as a study for two years with approximately 3,000 customers participating, it was launched as part of the SPD program in June 2015. As of July 2018, there are approximately 47,947 participants. During this period, SCE has made several modifications to the SPD program which included decommissioning the other two non‐programmable controllable thermostat (PCT) program options, which were behavioral based (AL 3572‐E was approved on 2/6/18 with an effective date of March 6, 2017). SCE has recruited four additional thermostat service providers to help grow the program and respond to energy events. Those parties include Whisker
37 See D.11‐07‐056, Decision Adopting Rules To Protect the Privacy and Security of the Electricity Usage Data of
the Customers of Pacific Gas and Electric Company, Southern California Edison Company, and San Diego Gas & Electric Company, July 28, 2011.
38 Establishment of Smart Energy Program in compliance with D.17‐12‐003 was authorized in Al 3731‐E, effective June 1, 2018.
SMART GRID DEPLOYMENT PLAN ANNUAL UPDATE
11
Labs (formerly WeatherBug), Venstar Inc., Zen Ecosystems and Simple. Enrollment growth in SPD has largely been due to incentivizing customers to enroll into the program as a Commission‐approved Aliso Canyon remediation action. D.16‐06‐029 authorized SCE to offer a $75 program enrollment in the form of an SCE bill credit for qualified SCE customers. SCE received authorization in D. 17‐12‐003 to continue offering the $75 technology incentive. Other changes include a new name for the program: Smart Energy Program (SEP), revising the event window to 11 am to 8 pm on non‐holiday weekdays, establishing a minimum of one hour and maximum of four hour events, allowing multiple events in a day, and providing an energy incentive of $0.07 per kWh reduced and a capacity payment of up to $10 per month from June to September. SCE estimates reaching up to 130,000 program enrollments by 2020.
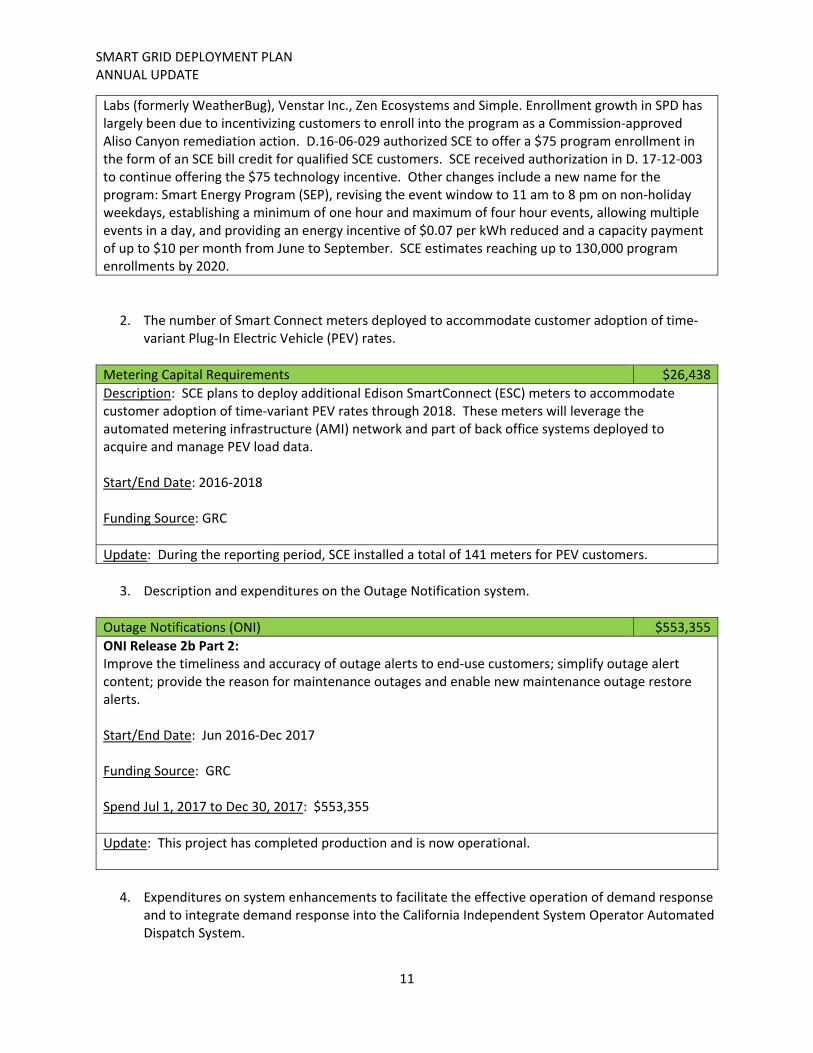
2. The number of Smart Connect meters deployed to accommodate customer adoption of time‐variant Plug‐In Electric Vehicle (PEV) rates.
Metering Capital Requirements $26,438
Description: SCE plans to deploy additional Edison SmartConnect (ESC) meters to accommodate customer adoption of time‐variant PEV rates through 2018. These meters will leverage the automated metering infrastructure (AMI) network and part of back office systems deployed to acquire and manage PEV load data. Start/End Date: 2016‐2018 Funding Source: GRC
Update: During the reporting period, SCE installed a total of 141 meters for PEV customers.
3. Description and expenditures on the Outage Notification system.
Outage Notifications (ONI) $553,355
ONI Release 2b Part 2: Improve the timeliness and accuracy of outage alerts to end‐use customers; simplify outage alert content; provide the reason for maintenance outages and enable new maintenance outage restore alerts. Start/End Date: Jun 2016‐Dec 2017 Funding Source: GRC Spend Jul 1, 2017 to Dec 30, 2017: $553,355
Update: This project has completed production and is now operational.
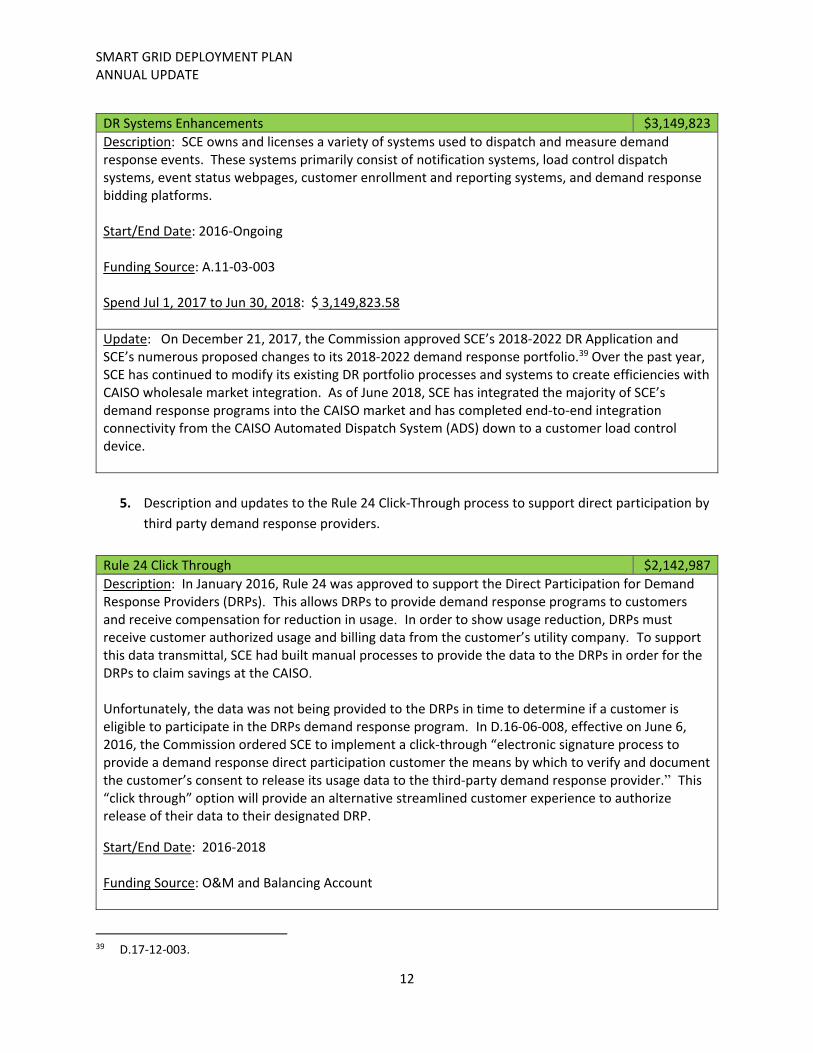
4. Expenditures on system enhancements to facilitate the effective operation of demand response
and to integrate demand response into the California Independent System Operator Automated Dispatch System.
SMART GRID DEPLOYMENT PLAN ANNUAL UPDATE
12
DR Systems Enhancements $3,149,823
Description: SCE owns and licenses a variety of systems used to dispatch and measure demand response events. These systems primarily consist of notification systems, load control dispatch systems, event status webpages, customer enrollment and reporting systems, and demand response bidding platforms. Start/End Date: 2016‐Ongoing Funding Source: A.11‐03‐003 Spend Jul 1, 2017 to Jun 30, 2018: $ 3,149,823.58
Update: On December 21, 2017, the Commission approved SCE’s 2018‐2022 DR Application and SCE’s numerous proposed changes to its 2018‐2022 demand response portfolio.39 Over the past year, SCE has continued to modify its existing DR portfolio processes and systems to create efficiencies with CAISO wholesale market integration. As of June 2018, SCE has integrated the majority of SCE’s demand response programs into the CAISO market and has completed end‐to‐end integration connectivity from the CAISO Automated Dispatch System (ADS) down to a customer load control device.
5. Description and updates to the Rule 24 Click‐Through process to support direct participation by
third party demand response providers.
Rule 24 Click Through $2,142,987
Description: In January 2016, Rule 24 was approved to support the Direct Participation for Demand Response Providers (DRPs). This allows DRPs to provide demand response programs to customers and receive compensation for reduction in usage. In order to show usage reduction, DRPs must receive customer authorized usage and billing data from the customer’s utility company. To support this data transmittal, SCE had built manual processes to provide the data to the DRPs in order for the DRPs to claim savings at the CAISO. Unfortunately, the data was not being provided to the DRPs in time to determine if a customer is eligible to participate in the DRPs demand response program. In D.16‐06‐008, effective on June 6, 2016, the Commission ordered SCE to implement a click‐through “electronic signature process to provide a demand response direct participation customer the means by which to verify and document the customer’s consent to release its usage data to the third‐party demand response provider.” This “click through” option will provide an alternative streamlined customer experience to authorize release of their data to their designated DRP.
Start/End Date: 2016‐2018 Funding Source: O&M and Balancing Account
39 D.17‐12‐003.

SMART GRID DEPLOYMENT PLAN ANNUAL UPDATE
13
Update: Phase One of the Click Through project, which required implementing a streamlined customer authorization process, was implemented on March 30, 2018. The capabilities included a two‐page 4 click authorization and My Account authentication process. Unlike Green Button Connect, it allows a customer to start and end on the 3rd party site. As of July 2018, SCE has not received any customer complaints of the new process. The team is actively working on Click Through Phase Two, which will implement additional enhancements such as a guest log‐in option and performance metrics. Testing of the new capabilities will begin the last week of August. We have scheduled implementation of Phase 2 for November 2018.
6. Description and funding for SCE’s Residential Time of Use Opt‐In Pilot.
Residential TOU Opt‐In Pilot $1,502,842
Description: On July 3, 2015, the Commission issued D.15‐07‐001 on Residential Rate Reform (RROIR) which sets forth a path for restructuring the tiered rate plan and transitioning residential customers to time differentiated rates. As part of that transition, SCE launched a TOU Opt‐in Pilot on June 1, 2016 for 22,000 customers to test retention and behavior on various TOU rates. Start/End Date: June 1, 2016 – December 31, 2017. Funding Source: RROIR Memo Account Budget: $8,000,000 ‐ $10,000,000
Update: The pilot ran through Dec 31, 2017 and it tested impacts and reactions of three rates only available for the Pilot.
7. Description and funding for SCE’s Residential Time of Use Default Pilot
Residential TOU Default Pilot $1,861,152
Description: As an additional element of the transition initiated by D.15‐07‐001, SCE launched a TOU Default Pilot in December of 2017, targeting 400,000 customers to test retention and behavior on various TOU rates. Customers were randomly selected and assigned one of two new TOU default rates.
Start/End Date: Launched December 2017 Funding Source: RROIR Memo Account Budget: $21,000,000
Update: Communication launched in December 2017, informing customers of upcoming change, potential impacts to their bill, and customer options. Customers could opt out of TOU altogether, switch to a different TOU option, or do nothing and wait to be defaulted in March of 2018. Messaging and retention of customers will be tracked to inform the full rollout of residential TOU beginning in 2020.
SMART GRID DEPLOYMENT PLAN ANNUAL UPDATE
14
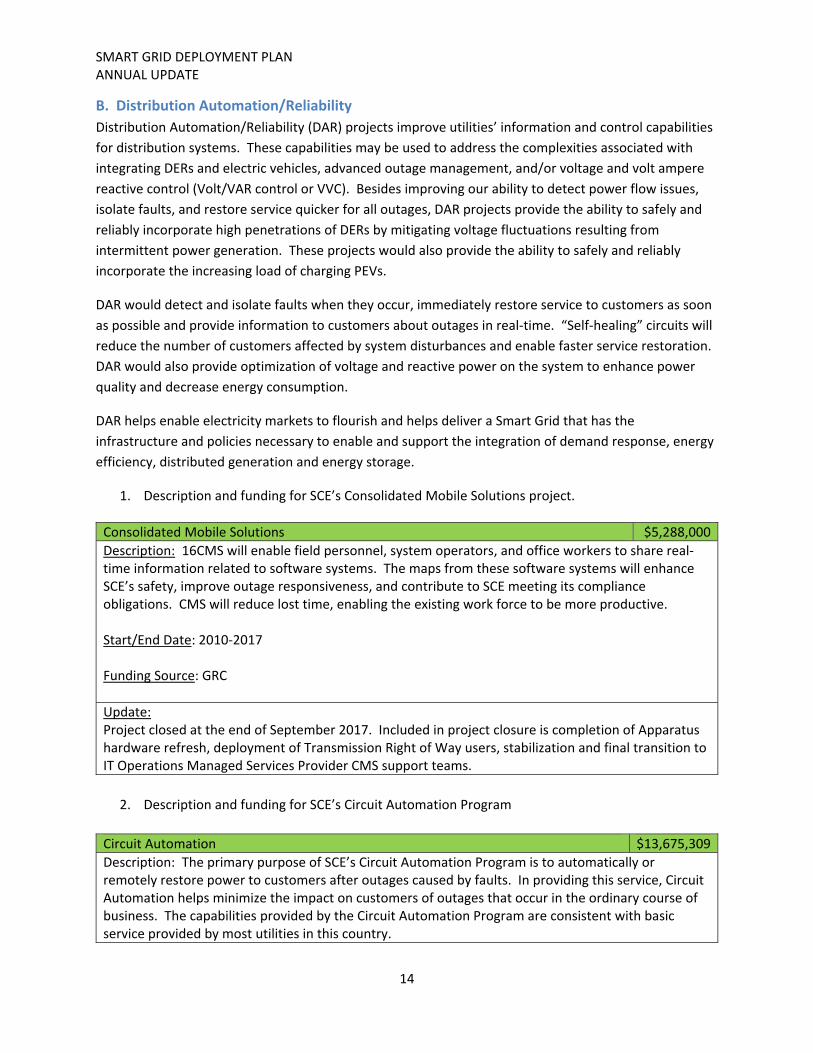
B. Distribution Automation/Reliability
Distribution Automation/Reliability (DAR) projects improve utilities’ information and control capabilities
for distribution systems. These capabilities may be used to address the complexities associated with
integrating DERs and electric vehicles, advanced outage management, and/or voltage and volt ampere
reactive control (Volt/VAR control or VVC). Besides improving our ability to detect power flow issues,
isolate faults, and restore service quicker for all outages, DAR projects provide the ability to safely and
reliably incorporate high penetrations of DERs by mitigating voltage fluctuations resulting from
intermittent power generation. These projects would also provide the ability to safely and reliably
incorporate the increasing load of charging PEVs.
DAR would detect and isolate faults when they occur, immediately restore service to customers as soon
as possible and provide information to customers about outages in real‐time. “Self‐healing” circuits will
reduce the number of customers affected by system disturbances and enable faster service restoration.
DAR would also provide optimization of voltage and reactive power on the system to enhance power
quality and decrease energy consumption.
DAR helps enable electricity markets to flourish and helps deliver a Smart Grid that has the
infrastructure and policies necessary to enable and support the integration of demand response, energy
efficiency, distributed generation and energy storage.
1. Description and funding for SCE’s Consolidated Mobile Solutions project.
Consolidated Mobile Solutions $5,288,000
Description: 16CMS will enable field personnel, system operators, and office workers to share real‐time information related to software systems. The maps from these software systems will enhance SCE’s safety, improve outage responsiveness, and contribute to SCE meeting its compliance obligations. CMS will reduce lost time, enabling the existing work force to be more productive. Start/End Date: 2010‐2017 Funding Source: GRC
Update: Project closed at the end of September 2017. Included in project closure is completion of Apparatus hardware refresh, deployment of Transmission Right of Way users, stabilization and final transition to IT Operations Managed Services Provider CMS support teams.
2. Description and funding for SCE’s Circuit Automation Program
Circuit Automation $13,675,309
Description: The primary purpose of SCE’s Circuit Automation Program is to automatically or remotely restore power to customers after outages caused by faults. In providing this service, Circuit Automation helps minimize the impact on customers of outages that occur in the ordinary course of business. The capabilities provided by the Circuit Automation Program are consistent with basic service provided by most utilities in this country.
SMART GRID DEPLOYMENT PLAN ANNUAL UPDATE
15
Start/End Date: 2010‐Ongoing Funding Source: GRC
Update: SCE has recognized that automating distribution circuits can help improve overall system performance and increase the reliability of the system. In order to maintain a reliable system, SCE has integrated remote control switches and remote sectionalizing reclosers within its distribution system. Between July 1, 2017 and June 30, 2018, SCE installed 357 remote control switches and 6 remote sectionalizing reclosers.
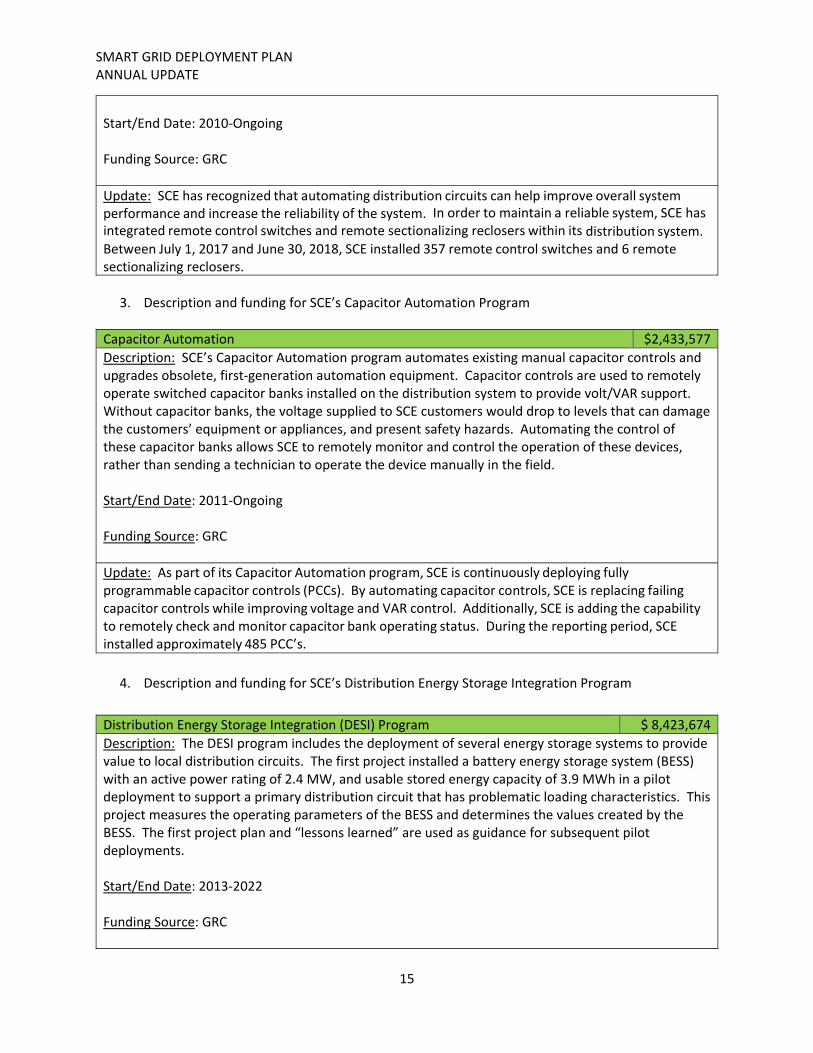
3. Description and funding for SCE’s Capacitor Automation Program
Capacitor Automation $2,433,577
Description: SCE’s Capacitor Automation program automates existing manual capacitor controls and upgrades obsolete, first‐generation automation equipment. Capacitor controls are used to remotely operate switched capacitor banks installed on the distribution system to provide volt/VAR support. Without capacitor banks, the voltage supplied to SCE customers would drop to levels that can damage the customers’ equipment or appliances, and present safety hazards. Automating the control of these capacitor banks allows SCE to remotely monitor and control the operation of these devices, rather than sending a technician to operate the device manually in the field. Start/End Date: 2011‐Ongoing Funding Source: GRC
Update: As part of its Capacitor Automation program, SCE is continuously deploying fully programmable capacitor controls (PCCs). By automating capacitor controls, SCE is replacing failing capacitor controls while improving voltage and VAR control. Additionally, SCE is adding the capability to remotely check and monitor capacitor bank operating status. During the reporting period, SCE installed approximately 485 PCC’s.
4. Description and funding for SCE’s Distribution Energy Storage Integration Program
Distribution Energy Storage Integration (DESI) Program $ 8,423,674
Description: The DESI program includes the deployment of several energy storage systems to provide value to local distribution circuits. The first project installed a battery energy storage system (BESS) with an active power rating of 2.4 MW, and usable stored energy capacity of 3.9 MWh in a pilot deployment to support a primary distribution circuit that has problematic loading characteristics. This project measures the operating parameters of the BESS and determines the values created by the BESS. The first project plan and “lessons learned” are used as guidance for subsequent pilot deployments. Start/End Date: 2013‐2022 Funding Source: GRC
SMART GRID DEPLOYMENT PLAN ANNUAL UPDATE
16
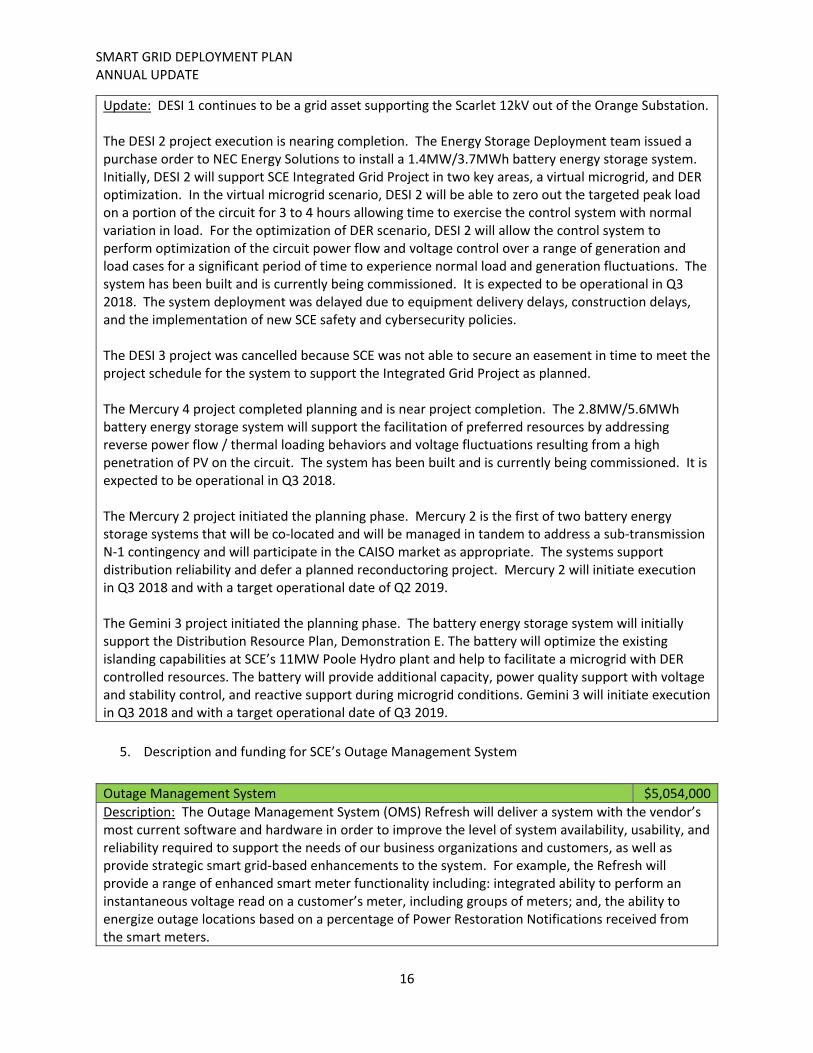
Update: DESI 1 continues to be a grid asset supporting the Scarlet 12kV out of the Orange Substation. The DESI 2 project execution is nearing completion. The Energy Storage Deployment team issued a purchase order to NEC Energy Solutions to install a 1.4MW/3.7MWh battery energy storage system. Initially, DESI 2 will support SCE Integrated Grid Project in two key areas, a virtual microgrid, and DER optimization. In the virtual microgrid scenario, DESI 2 will be able to zero out the targeted peak load on a portion of the circuit for 3 to 4 hours allowing time to exercise the control system with normal variation in load. For the optimization of DER scenario, DESI 2 will allow the control system to perform optimization of the circuit power flow and voltage control over a range of generation and load cases for a significant period of time to experience normal load and generation fluctuations. The system has been built and is currently being commissioned. It is expected to be operational in Q3 2018. The system deployment was delayed due to equipment delivery delays, construction delays, and the implementation of new SCE safety and cybersecurity policies. The DESI 3 project was cancelled because SCE was not able to secure an easement in time to meet the project schedule for the system to support the Integrated Grid Project as planned. The Mercury 4 project completed planning and is near project completion. The 2.8MW/5.6MWh battery energy storage system will support the facilitation of preferred resources by addressing reverse power flow / thermal loading behaviors and voltage fluctuations resulting from a high penetration of PV on the circuit. The system has been built and is currently being commissioned. It is expected to be operational in Q3 2018. The Mercury 2 project initiated the planning phase. Mercury 2 is the first of two battery energy storage systems that will be co‐located and will be managed in tandem to address a sub‐transmission N‐1 contingency and will participate in the CAISO market as appropriate. The systems support distribution reliability and defer a planned reconductoring project. Mercury 2 will initiate execution in Q3 2018 and with a target operational date of Q2 2019. The Gemini 3 project initiated the planning phase. The battery energy storage system will initially support the Distribution Resource Plan, Demonstration E. The battery will optimize the existing islanding capabilities at SCE’s 11MW Poole Hydro plant and help to facilitate a microgrid with DER controlled resources. The battery will provide additional capacity, power quality support with voltage and stability control, and reactive support during microgrid conditions. Gemini 3 will initiate execution in Q3 2018 and with a target operational date of Q3 2019.
5. Description and funding for SCE’s Outage Management System
Outage Management System $5,054,000
Description: The Outage Management System (OMS) Refresh will deliver a system with the vendor’s most current software and hardware in order to improve the level of system availability, usability, and reliability required to support the needs of our business organizations and customers, as well as provide strategic smart grid‐based enhancements to the system. For example, the Refresh will provide a range of enhanced smart meter functionality including: integrated ability to perform an instantaneous voltage read on a customer’s meter, including groups of meters; and, the ability to energize outage locations based on a percentage of Power Restoration Notifications received from the smart meters.
SMART GRID DEPLOYMENT PLAN ANNUAL UPDATE
17
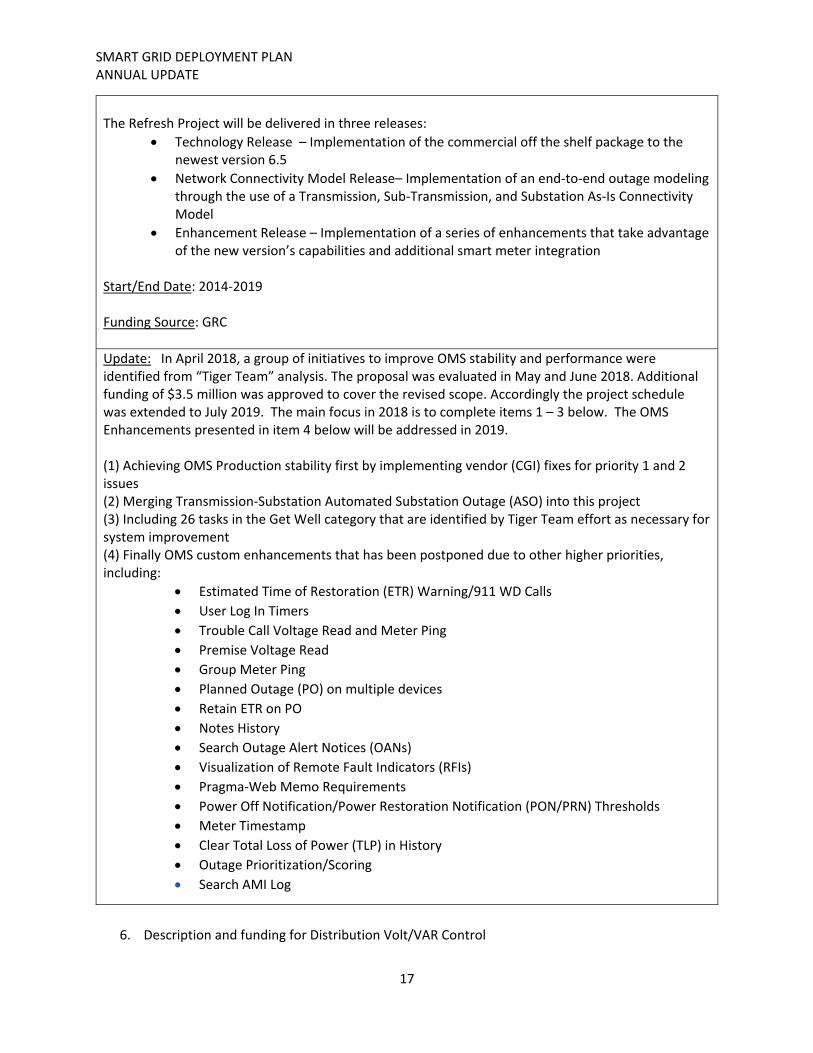
The Refresh Project will be delivered in three releases:
Technology Release – Implementation of the commercial off the shelf package to the newest version 6.5
Network Connectivity Model Release– Implementation of an end‐to‐end outage modeling through the use of a Transmission, Sub‐Transmission, and Substation As‐Is Connectivity Model
Enhancement Release – Implementation of a series of enhancements that take advantage of the new version’s capabilities and additional smart meter integration
Start/End Date: 2014‐2019 Funding Source: GRC
Update: In April 2018, a group of initiatives to improve OMS stability and performance were identified from “Tiger Team” analysis. The proposal was evaluated in May and June 2018. Additional funding of $3.5 million was approved to cover the revised scope. Accordingly the project schedule was extended to July 2019. The main focus in 2018 is to complete items 1 – 3 below. The OMS Enhancements presented in item 4 below will be addressed in 2019. (1) Achieving OMS Production stability first by implementing vendor (CGI) fixes for priority 1 and 2 issues (2) Merging Transmission‐Substation Automated Substation Outage (ASO) into this project (3) Including 26 tasks in the Get Well category that are identified by Tiger Team effort as necessary for system improvement (4) Finally OMS custom enhancements that has been postponed due to other higher priorities, including:
Estimated Time of Restoration (ETR) Warning/911 WD Calls
User Log In Timers
Trouble Call Voltage Read and Meter Ping
Premise Voltage Read
Group Meter Ping
Planned Outage (PO) on multiple devices
Retain ETR on PO
Notes History
Search Outage Alert Notices (OANs)
Visualization of Remote Fault Indicators (RFIs)
Pragma‐Web Memo Requirements
Power Off Notification/Power Restoration Notification (PON/PRN) Thresholds
Meter Timestamp
Clear Total Loss of Power (TLP) in History
Outage Prioritization/Scoring
Search AMI Log
6. Description and funding for Distribution Volt/VAR Control
SMART GRID DEPLOYMENT PLAN ANNUAL UPDATE
18
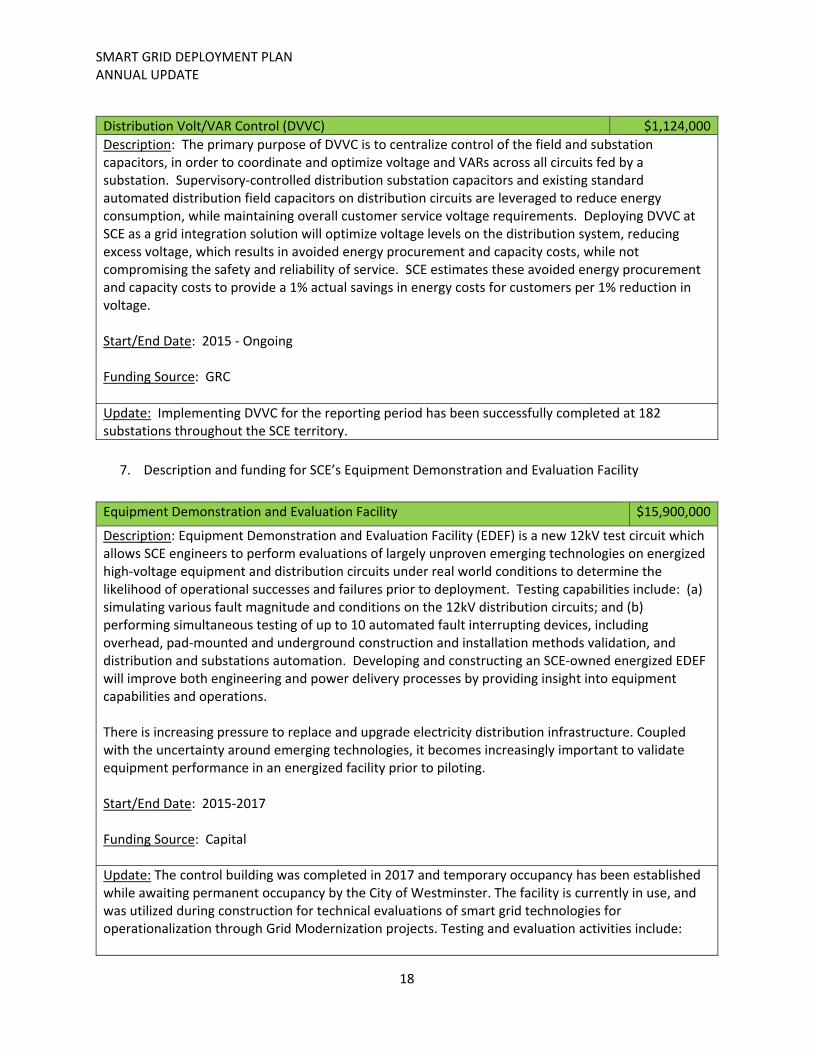
Distribution Volt/VAR Control (DVVC) $1,124,000
Description: The primary purpose of DVVC is to centralize control of the field and substation capacitors, in order to coordinate and optimize voltage and VARs across all circuits fed by a substation. Supervisory‐controlled distribution substation capacitors and existing standard automated distribution field capacitors on distribution circuits are leveraged to reduce energy consumption, while maintaining overall customer service voltage requirements. Deploying DVVC at SCE as a grid integration solution will optimize voltage levels on the distribution system, reducing excess voltage, which results in avoided energy procurement and capacity costs, while not compromising the safety and reliability of service. SCE estimates these avoided energy procurement and capacity costs to provide a 1% actual savings in energy costs for customers per 1% reduction in voltage. Start/End Date: 2015 ‐ Ongoing Funding Source: GRC
Update: Implementing DVVC for the reporting period has been successfully completed at 182 substations throughout the SCE territory.
7. Description and funding for SCE’s Equipment Demonstration and Evaluation Facility
Equipment Demonstration and Evaluation Facility $15,900,000
Description: Equipment Demonstration and Evaluation Facility (EDEF) is a new 12kV test circuit which allows SCE engineers to perform evaluations of largely unproven emerging technologies on energized high‐voltage equipment and distribution circuits under real world conditions to determine the likelihood of operational successes and failures prior to deployment. Testing capabilities include: (a) simulating various fault magnitude and conditions on the 12kV distribution circuits; and (b) performing simultaneous testing of up to 10 automated fault interrupting devices, including overhead, pad‐mounted and underground construction and installation methods validation, and distribution and substations automation. Developing and constructing an SCE‐owned energized EDEF will improve both engineering and power delivery processes by providing insight into equipment capabilities and operations. There is increasing pressure to replace and upgrade electricity distribution infrastructure. Coupled with the uncertainty around emerging technologies, it becomes increasingly important to validate equipment performance in an energized facility prior to piloting. Start/End Date: 2015‐2017 Funding Source: Capital
Update: The control building was completed in 2017 and temporary occupancy has been established while awaiting permanent occupancy by the City of Westminster. The facility is currently in use, and was utilized during construction for technical evaluations of smart grid technologies for operationalization through Grid Modernization projects. Testing and evaluation activities include:

SMART GRID DEPLOYMENT PLAN ANNUAL UPDATE
19
High Impedance Fault Detection ‐ This project demonstrated an innovative approach to improve public safety by detecting wiredowns (WDs) on high impedance surface (asphalt, concrete, sand, etc.).
Real‐Time Diagnostics ‐ Evaluating and demonstrating technologies that can monitor and assess SCE equipment (cable, splices, transformers, switches etc.) and indicate remaining life or existing condition.
Remote Integrated Switch ‐ Advanced automation for fault detection and auto circuit reconfiguration that can isolate and restore load quickly without operator intervention.
Hybrid Pole ‐ Advanced distribution sectional poles that are more fire‐resistant and provide installation efficiencies when compared to existing wood pole replacements.
Field area network ‐ Demonstrated new field area network communications network and integration with distribution automated devices.
Underground Remote Fault Indicator ‐ Demonstrated underground remote fault indicators with new capabilities, such as installation without an outage, submersible, integrated radio, power harvesting, bi‐directional power flow detection, and real‐time current monitoring.
8. Description and funding for SCE’s Aliso Canyon Energy Storage Projects
Aliso Canyon Energy Storage $292,638
Description: In order to address the increased risk of outages due to the shutdown of the Aliso Canyon natural gas storage facility the Commission issued Resolution E‐4791, which ordered SCE to hold an energy storage solicitation. This Resolution also allowed SCE to submit applications for utility‐owned storage. In response, SCE managed the development and deployment of the Aliso Canyon Energy Storage (ACES) projects A & B (also known as Mira Loma Units 2 & 3) located adjacent to SCE’s Mira Loma Substation in Ontario, California. The two identical 10 MW/40 MWh energy storage systems (totaling 20 MW/80 MWh) are co‐located in one facility and were deemed commercially operable on December 30, 2016. The systems are bid into CAISO wholesale generation market for day ahead and real time dispatch. Start/End Date: 2016‐ Ongoing Funding Source: A.17‐03‐020
Update: During the reporting period, SCE implemented the following upgrades:
Installed a new Transmission System 1 (T1) communication circuit and a Remote Terminal Unit for the Grid Control Center’s interface.
Developed and installed an integrated control system interface.
Connected the BESS fire alarm panel to plant’s existing monitoring service to all remote monitoring and notification of a fire at the plant.
Upgraded circuit breaker relays to allow for remote operation. The plant is now completed automated; breakers can be opened and closed from the Mountainview Control Center.
SMART GRID DEPLOYMENT PLAN ANNUAL UPDATE
20
C. Transmission Automation/ Reliability
Transmission Automation/Reliability (TAR) includes projects that provide wide‐area monitoring,
protection and control to enhance the resiliency of the transmission system. TAR also includes projects
aimed at providing the ability to safely and reliably incorporate utility‐sized intermittent power
generation such as centralized solar and wind energy. TAR projects help mitigate voltage fluctuations
resulting from integrating intermittent resources.
The wide‐area capabilities of TAR provide the ability to monitor bulk power system conditions, including
but not limited to voltage, current, frequency and phase angle, across the IOU geographic area in near
real‐time. This functionality provides system operators with current information about emerging
threats to transmission system stability, enabling preventive action to avoid wide‐scale black outs. In
addition, the wide‐area capabilities of TAR also include projects for coordination of high‐speed
communicating transmission protection equipment that detect conditions in the transmission systems
and automatically respond to stabilize the system.
There are no active projects in this category during the reporting period.
D. Asset Management & Operational Efficiency
Asset Management & Operational Efficiency (AMOE) enhances monitoring, operating and optimization
capabilities to achieve more efficient grid operations and improve asset management. AMOE includes
projects that will allow SCE to manage the maintenance and replacement of energy infrastructure based
on the health of the equipment versus a time‐based approach. This functionality will reduce the
likelihood of failures of critical energy infrastructure as well as manage costs associated with
maintaining and replacing equipment.
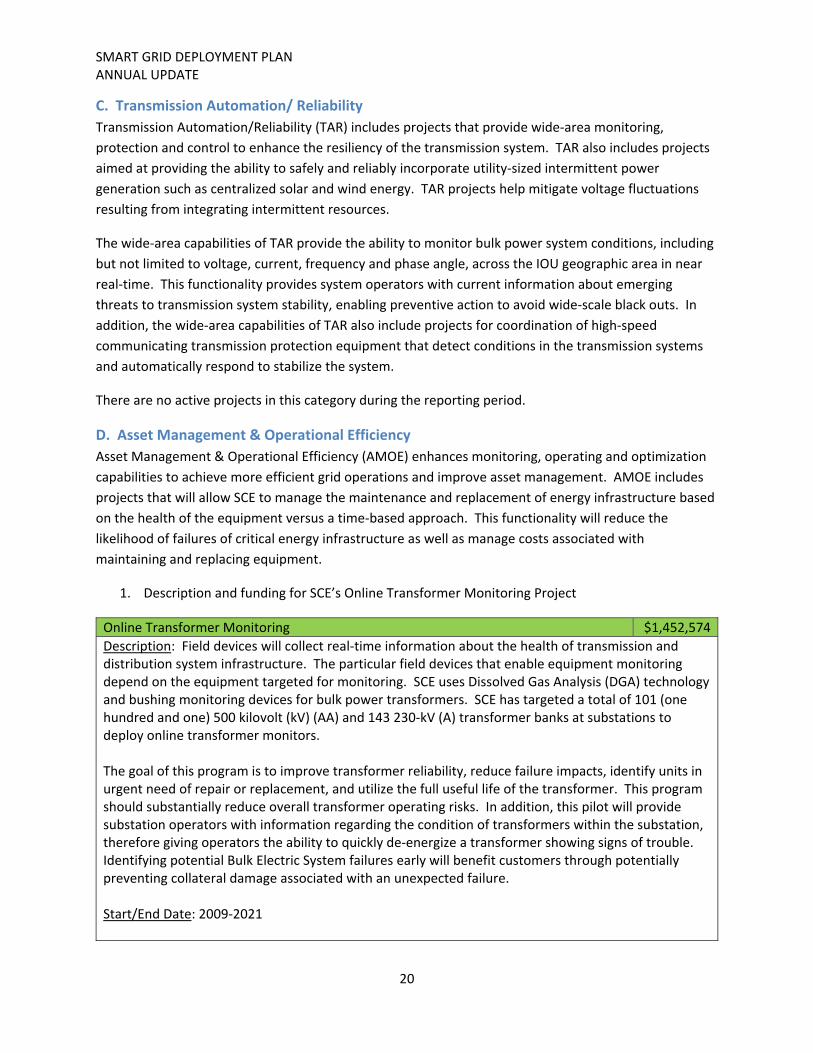
1. Description and funding for SCE’s Online Transformer Monitoring Project
Online Transformer Monitoring $1,452,574
Description: Field devices will collect real‐time information about the health of transmission and distribution system infrastructure. The particular field devices that enable equipment monitoring depend on the equipment targeted for monitoring. SCE uses Dissolved Gas Analysis (DGA) technology and bushing monitoring devices for bulk power transformers. SCE has targeted a total of 101 (one hundred and one) 500 kilovolt (kV) (AA) and 143 230‐kV (A) transformer banks at substations to deploy online transformer monitors. The goal of this program is to improve transformer reliability, reduce failure impacts, identify units in urgent need of repair or replacement, and utilize the full useful life of the transformer. This program should substantially reduce overall transformer operating risks. In addition, this pilot will provide substation operators with information regarding the condition of transformers within the substation, therefore giving operators the ability to quickly de‐energize a transformer showing signs of trouble. Identifying potential Bulk Electric System failures early will benefit customers through potentially preventing collateral damage associated with an unexpected failure. Start/End Date: 2009‐2021

SMART GRID DEPLOYMENT PLAN ANNUAL UPDATE
21
Funding Source: Capital
Update: In 2018 SCE developed a master template software program that will accommodate the 101 (AA) and 143 (A) transformer banks. Transformer data from Vincent Substation is streaming to the Alhambra Control Center. Currently, SCE is scheduling and installing various IT and telecommunication components at several stations, so that final testing and in‐servicing can be completed.
E. Security
Physical and cybersecurity protection of the electric grid is essential and becomes more important as the
Smart Grid is deployed. The communications and control systems that enable Smart Grid capabilities
have the potential to increase the reliability risks of Smart Grid deployments if they are not properly
secured. The Security program includes a comprehensive set of capabilities to address the increased
physical and cybersecurity requirements associated with developing, implementing, operating, and
managing Smart Grid systems and edge devices. These projects would implement security throughout
the network to resist attack, manage compliance and risk, and support security from the physical to
application layers.
The Common Cybersecurity Services (CCS) platform project was completed and deployed during the
2016 update reporting period.
F. Integrated & Cross Cutting Systems
Integrated and cross‐cutting systems refer to projects that support multiple Smart Grid domains, such as
grid communications, application platforms, data management and analytics, advanced technology
testing, as well as workforce development and technology training. An integrated approach helps
ensure that investments are managed efficiently while creating the platform to deliver customers a
stream of benefits across utility operations.
Integrated communications systems provide solutions to connect and enable sensors, metering,
maintenance, and grid asset control networks. In the mid‐to‐long term, integrated and cross cutting
systems will enable information exchange with the utility, service partners and customers using secure
networks. Data management and analytics projects will improve SCE’s ability to utilize new streams of
data from transmission and distribution automation and Smart Meters for improved operations,
planning, asset management, and enhanced services for customers.
Advanced technology testing and standards certification are a foundational capability for the utilities to
evaluate new devices from vendors and test them in a demonstration environment prior to deployment
onto the electric system. This reduces the risks associated with new technology projects, and helps the
utilities maximize technology performance and interoperability.
Workforce development and advanced technology training enable the successful deployment of new
technologies, ensuring that the utilities’ workforces are prepared to make use of new technologies and
tools, maximizing the value of these technology investments.
1. Description and funding for SCE’s Advanced Technology Fenwick Lab Facility
SMART GRID DEPLOYMENT PLAN ANNUAL UPDATE
22
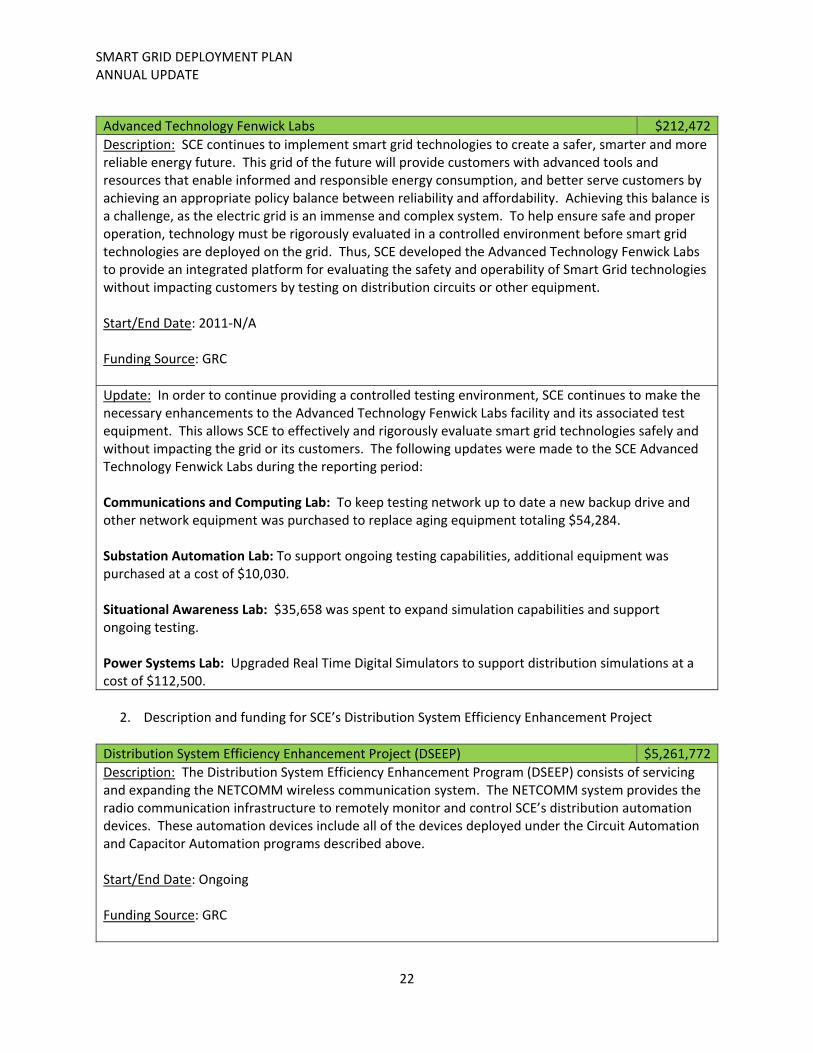
Advanced Technology Fenwick Labs $212,472
Description: SCE continues to implement smart grid technologies to create a safer, smarter and more reliable energy future. This grid of the future will provide customers with advanced tools and resources that enable informed and responsible energy consumption, and better serve customers by achieving an appropriate policy balance between reliability and affordability. Achieving this balance is a challenge, as the electric grid is an immense and complex system. To help ensure safe and proper operation, technology must be rigorously evaluated in a controlled environment before smart grid technologies are deployed on the grid. Thus, SCE developed the Advanced Technology Fenwick Labs to provide an integrated platform for evaluating the safety and operability of Smart Grid technologies without impacting customers by testing on distribution circuits or other equipment. Start/End Date: 2011‐N/A Funding Source: GRC
Update: In order to continue providing a controlled testing environment, SCE continues to make the necessary enhancements to the Advanced Technology Fenwick Labs facility and its associated test equipment. This allows SCE to effectively and rigorously evaluate smart grid technologies safely and without impacting the grid or its customers. The following updates were made to the SCE Advanced Technology Fenwick Labs during the reporting period: Communications and Computing Lab: To keep testing network up to date a new backup drive and other network equipment was purchased to replace aging equipment totaling $54,284. Substation Automation Lab: To support ongoing testing capabilities, additional equipment was purchased at a cost of $10,030. Situational Awareness Lab: $35,658 was spent to expand simulation capabilities and support ongoing testing. Power Systems Lab: Upgraded Real Time Digital Simulators to support distribution simulations at a cost of $112,500.
2. Description and funding for SCE’s Distribution System Efficiency Enhancement Project
Distribution System Efficiency Enhancement Project (DSEEP) $5,261,772
Description: The Distribution System Efficiency Enhancement Program (DSEEP) consists of servicing and expanding the NETCOMM wireless communication system. The NETCOMM system provides the radio communication infrastructure to remotely monitor and control SCE’s distribution automation devices. These automation devices include all of the devices deployed under the Circuit Automation and Capacitor Automation programs described above. Start/End Date: Ongoing Funding Source: GRC
SMART GRID DEPLOYMENT PLAN ANNUAL UPDATE
23
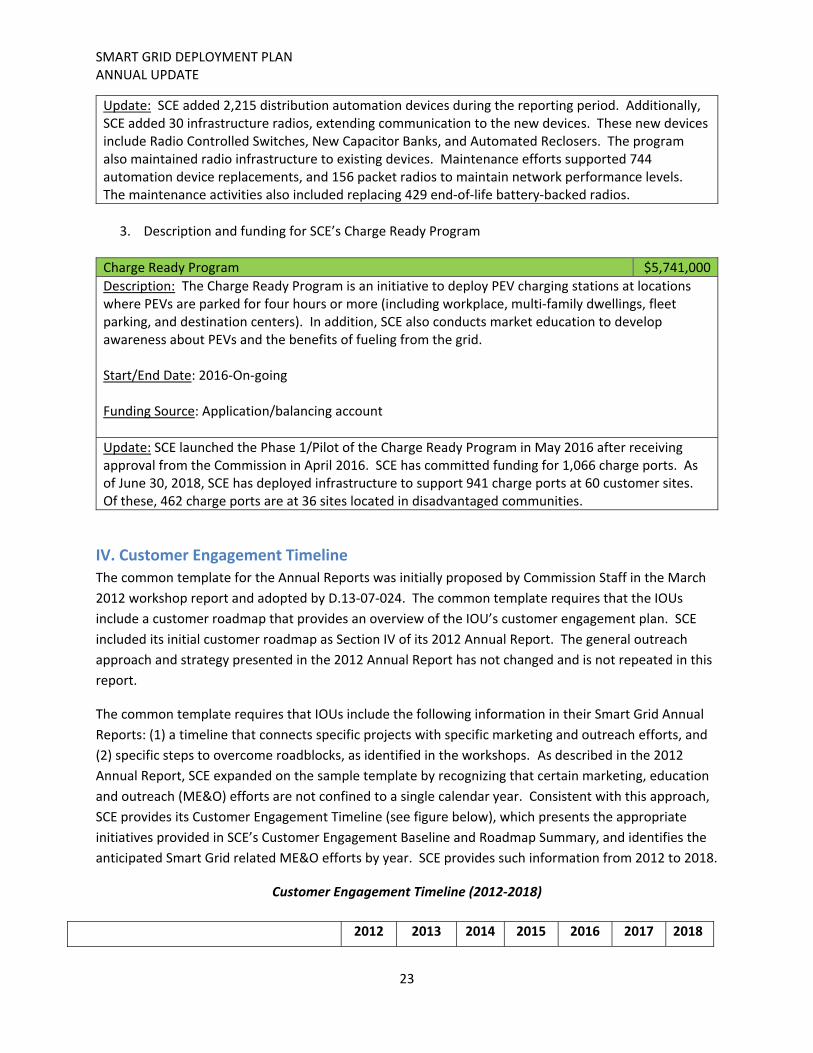
Update: SCE added 2,215 distribution automation devices during the reporting period. Additionally, SCE added 30 infrastructure radios, extending communication to the new devices. These new devices include Radio Controlled Switches, New Capacitor Banks, and Automated Reclosers. The program also maintained radio infrastructure to existing devices. Maintenance efforts supported 744 automation device replacements, and 156 packet radios to maintain network performance levels. The maintenance activities also included replacing 429 end‐of‐life battery‐backed radios.
3. Description and funding for SCE’s Charge Ready Program
Charge Ready Program $5,741,000
Description: The Charge Ready Program is an initiative to deploy PEV charging stations at locations where PEVs are parked for four hours or more (including workplace, multi‐family dwellings, fleet parking, and destination centers). In addition, SCE also conducts market education to develop awareness about PEVs and the benefits of fueling from the grid. Start/End Date: 2016‐On‐going Funding Source: Application/balancing account
Update: SCE launched the Phase 1/Pilot of the Charge Ready Program in May 2016 after receiving approval from the Commission in April 2016. SCE has committed funding for 1,066 charge ports. As of June 30, 2018, SCE has deployed infrastructure to support 941 charge ports at 60 customer sites. Of these, 462 charge ports are at 36 sites located in disadvantaged communities.
IV. Customer Engagement Timeline
The common template for the Annual Reports was initially proposed by Commission Staff in the March
2012 workshop report and adopted by D.13‐07‐024. The common template requires that the IOUs
include a customer roadmap that provides an overview of the IOU’s customer engagement plan. SCE
included its initial customer roadmap as Section IV of its 2012 Annual Report. The general outreach
approach and strategy presented in the 2012 Annual Report has not changed and is not repeated in this
report.
The common template requires that IOUs include the following information in their Smart Grid Annual
Reports: (1) a timeline that connects specific projects with specific marketing and outreach efforts, and
(2) specific steps to overcome roadblocks, as identified in the workshops. As described in the 2012
Annual Report, SCE expanded on the sample template by recognizing that certain marketing, education
and outreach (ME&O) efforts are not confined to a single calendar year. Consistent with this approach,
SCE provides its Customer Engagement Timeline (see figure below), which presents the appropriate
initiatives provided in SCE’s Customer Engagement Baseline and Roadmap Summary, and identifies the
anticipated Smart Grid related ME&O efforts by year. SCE provides such information from 2012 to 2018.
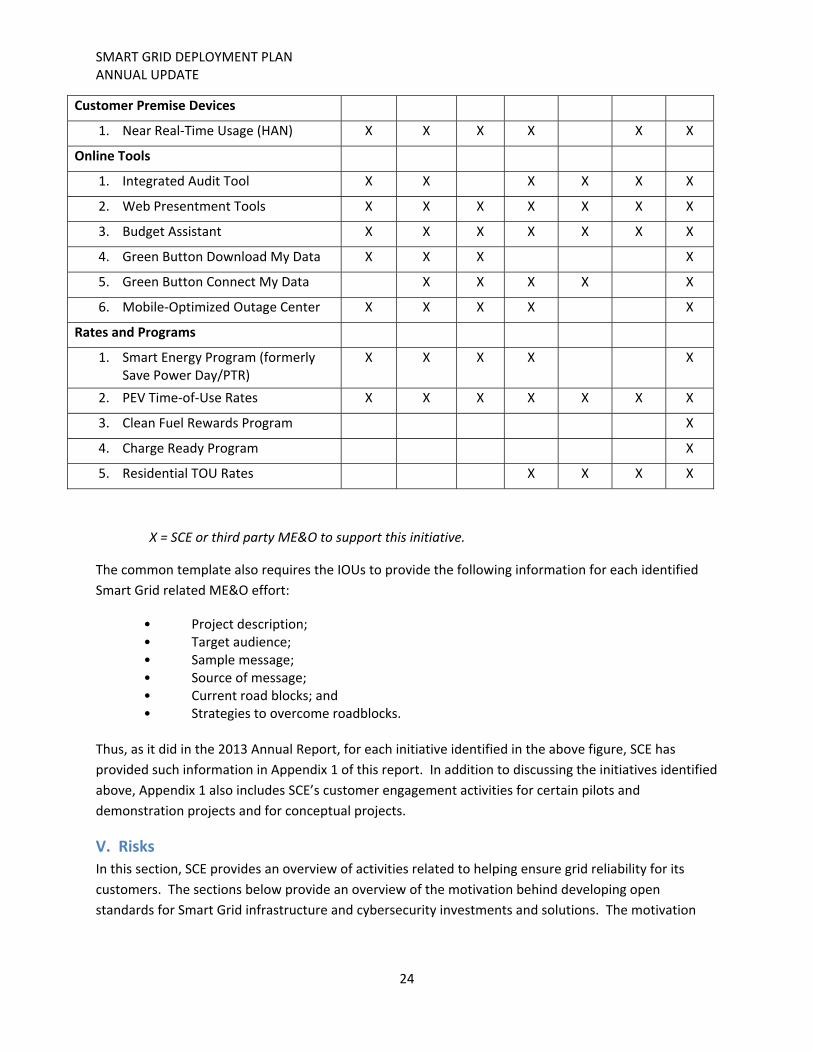
Customer Engagement Timeline (2012‐2018)
2012 2013 2014 2015 2016 2017 2018
SMART GRID DEPLOYMENT PLAN ANNUAL UPDATE
24
Customer Premise Devices
1. Near Real‐Time Usage (HAN) X X X X X X
Online Tools
1. Integrated Audit Tool X X X X X X
2. Web Presentment Tools X X X X X X X
3. Budget Assistant X X X X X X X
4. Green Button Download My Data X X X X
5. Green Button Connect My Data X X X X X
6. Mobile‐Optimized Outage Center X X X X X
Rates and Programs
1. Smart Energy Program (formerly Save Power Day/PTR)
X X X X X
2. PEV Time‐of‐Use Rates X X X X X X X
3. Clean Fuel Rewards Program X
4. Charge Ready Program X
5. Residential TOU Rates X X X X
X = SCE or third party ME&O to support this initiative.
The common template also requires the IOUs to provide the following information for each identified
Smart Grid related ME&O effort:
• Project description; • Target audience; • Sample message; • Source of message; • Current road blocks; and • Strategies to overcome roadblocks.
Thus, as it did in the 2013 Annual Report, for each initiative identified in the above figure, SCE has
provided such information in Appendix 1 of this report. In addition to discussing the initiatives identified
above, Appendix 1 also includes SCE’s customer engagement activities for certain pilots and
demonstration projects and for conceptual projects.
V. Risks
In this section, SCE provides an overview of activities related to helping ensure grid reliability for its
customers. The sections below provide an overview of the motivation behind developing open
standards for Smart Grid infrastructure and cybersecurity investments and solutions. The motivation

SMART GRID DEPLOYMENT PLAN ANNUAL UPDATE
25
behind developing a smarter grid and its associated architecture remains consistent with those
presented in SCE’s 2011 Smart Grid Deployment Plan (A.11‐07‐001) and approved in D.13‐07‐024.
A. Introduction – Smart Grid Motivation
Progressive policy objectives and customer adoption continue SCE’s efforts to integrate renewable
resources, distributed generation, electric transportation, and energy storage. A thoughtfully designed,
smarter electric grid will allow SCE to utilize new energy technologies to monitor, predict, and
accommodate the increasing adoption of renewable and distributed resources. The primary risks
associated with the introduction of emerging technologies in general are: 1) Technology Maturity; 2)
Market Structure/Regulatory Uncertainty; and 3) People/Process Change Management.
Challenges imposed by the technology evolution include:
1) Existing infrastructure becoming obsolete due to evolving technology; 2) New technology adoption causing Assets to become obsolete before their complete
lifecycle; 3) New technology adopted to interface to other technologies that become obsolete; 4) Misalignment between depreciation rules and the technology lifecycle, and; 5) General misalignment between depreciation rules and revenue requirements (i.e.
discontinuous impacts on rates with accelerated depreciation).
The market and regulatory uncertainties present another host of challenges, including the following:
1) Market structure uncertainty creating uncertainty on what entity should build and own the infrastructure. This results in reduced infrastructure investment on an overall basis
2) Market structure uncertainty creating uncertainty in the rate of adopting technology, and in the infrastructure required
3) Regulatory input to the market structure possibly sub‐optimizing the market, and therefore creating misalignment with infrastructure requirements and ownership
4) Customer and third parties (e.g. aggregators) interaction and acceptance of the market will evolve and influence market success/failure
The people and process issues include:
1) Significant changes in process and impacts on roles and responsibilities 2) Diverse perspectives (e.g. utilities, customers, regulators, 3rd parties) will require significant
consensus‐building. Attendant delays may create sub‐optimal results 3) Resistance to change from perceived or real failures of market or regulatory solutions may
create a perception of resistance to change
These risks are mitigated and challenges managed through mechanisms like comprehensive testing of
emerging technologies in lab environments, demonstration projects to further test technologies and
concepts, and structured implementation of deployable technologies on the grid. The smarter grid
envisioned through this deployment plan requires not only consensus on roadmaps and projects, but
also fact‐based results from realistic and accurate simulations, laboratory testing, pilot demonstrations,
and thoughtful implementation of emerging, smart technologies.
SMART GRID DEPLOYMENT PLAN ANNUAL UPDATE
26
The Distribution Resource Plan process is working to promote a thorough understanding across multiple
stakeholders regarding the challenges and opportunities of high penetration of renewables and DERs.
The demonstration projects proposed and the associated workshops associated with each
demonstration project foster opportunities to develop and deploy a modern infrastructure that
attempts to optimize the technology decisions made by the utility as well as customers and resource
providers. This collaborative effort and early demonstration of key technologies and processes is critical
to informing stakeholders and reaching consensus.
B. Smart Grid Architecture Challenges
We are shifting today’s electric grid to increasingly rely on technology to maintain or improve system
stability and reliability, promote customer choice, help customers actively manage their energy use, and
achieve a higher level of resilience. To do this, we must obtain an even more in‐depth understanding of
systems theory, power systems, computer science and utility operations. Applying these diverse and
specialized disciplines in a coordinated approach that yields cost‐efficient, manageable and reliable
solutions requires a clear Smart Grid strategy and architecture approach. The key architecture challenge
in evolving the electric grid is to help ensure that introducing automation, connectivity and advanced
control systems does not inadvertently increase cybersecurity risks or create a system that is too
complex or too fragile to manage.
Utilities have tended to rely heavily on highly‐customized solutions that were organized in a silo of
proprietary devices, communications, security, configuration and control systems. This approach is
commonly known as “security by obscurity.” While this approach was efficient for each individual
project with clear scope, schedule and cost objectives, it resulted in a higher cost of maintenance and
operation, and a higher cost of introducing new capabilities because each silo requires integration. An
integrated approach to systems design, coupled with a common services architecture is required to
overcome this architecture challenge.
C. Cost‐Efficient Smart Grid Design
A reasonably cost‐efficient approach to deploying Smart Grid capabilities involves organizing
technologies and systems into loosely coupled, standards‐based layers capable of supporting common
services. A Smart Grid common services architecture delivers the capability for any device in the
forward deployed networks to access common services (such as cybersecurity, device management,
network monitoring, etc.) in SCE’s control centers. The common services architecture supports multi‐
vendor interoperability by enforcing standards across the architecture and drives implementation and
operational costs down by simplifying the systems design. We simplify system design by eliminating
silos that extend from the application layer through the security, communications and device layers.
D. Standards Overview
SCE has consistently supported the development of open standards. SCE recognizes that standardizing
key areas can yield benefits to both consumers and service providers. Such benefits include enabling
market innovation, reducing complexity, reducing equipment costs and protecting investments
necessary to help ensure long term deployments. In addition, participating in standards development
has given SCE the ability to prevent vendor “lock‐ins” and to foster interoperability with legacy systems.

SMART GRID DEPLOYMENT PLAN ANNUAL UPDATE
27
SCE’s approach to standards and interoperability includes supporting the development of the actual
standard, laboratory testing and evaluation, and field trials.
SCE has identified over 70 standards of interest for Smart Grid development. These standards are found
in specific areas, including system integration/architecture, data formats, communications, security and
electrical interconnections/power quality. Many of these standards are being developed by the Institute
of Electrical and Electronics Engineers (IEEE) and the International Electrotechnical Commission (IEC).
SCE is or has been involved in the development of standards and the testing and verification of the
standards within these organizations, including:
IEEE P2030: Guide for Smart Grid Interoperability
IEEE1547: Distributed Energy Resource Interconnection Standard
IEC 61850: Substation Automation
IEC 62351: Power systems management and associated information exchange – Data and communications security
Rule 21: California IOUs Standard to interconnect of distributed generation
Underwriters Laboratories (UL)1741: Standard that mainly fallow IEEE 1547 but will incorporate a revision to California Rule 21
It is important to acknowledge that extensive involvement in developing standards can pose many
challenges to an organization. Such challenges include finding internal resources, both human and
financial, to support the relatively long and exhaustive process. Standards often require fairly senior
staff that is experienced and knowledgeable. Senior staff is then under significant pressure to not only
support important core job functions, but to also support the standards development. From a financial
perspective, organizations not only need to finance staff for participating in standards development and
paying applicable fees, but additionally some organizations resort to expensive consultants to fill in gaps
when full‐time staff is severely impacted and/or unavailable. Specifically, substantive participation in
IEC standards can be difficult, because it is challenging for regional electrical utilities to justify extensive
overseas travel.
Many of the standards that used to be in the stage of infancy or nonexistence are now mature enough
be demonstrated. Standards like Smart Energy 2.0, OpenADE and OpenADR2.0 are available and ready
for use. As a result, since 2013 SCE has been reducing its involvement with many smart grid standards.
SCE helped drive and mature standards during the early days of smart grid technology and now has
made a strategic decision to continue supporting the industry by focusing on applying and
demonstrating these standards through continued involvement in certain industry alliances (such as the
OpenADR Alliance). We also support the industry by requiring open standards for participation in our
programs. Most recently, SCE, SDG&E and PG&E sought authorization from the Commission to publicly
release license rights of four cybersecurity software applications and make them open source. These
applications were developed under the 21st Century Energy Systems (CES‐21) Program pursuant to
Public Utilities (PU) Code section 851 and General Order (GO) 173. Additionally, SCE still maintains some
degree of involvement in key standards groups including IEEE, SAE and IEC.
SMART GRID DEPLOYMENT PLAN ANNUAL UPDATE
28
By testing U.S and European Solar PV Inverters, SCE has acquired extensive knowledge of their
performance. Furthermore, this testing has provided assessments of what advanced inverter features
can make an impact and provide grid support during higher penetration of these resources. SCE, with
the sponsorship of the DOE, has been installing power quality monitors in the distribution system to
gather actual field data in order to propose standards that will be meaningful and provide actual
benefits to the grid. Since 2013, SCE has been proactively involved in the California Rule 21 Smart
Inverter Working Group. This standard created the first set of advanced features of solar PV inverter in
the U.S. These features are meant to reduce their effects of higher penetrations in the grid. SCE has
been also strongly involved with the IEEE1547 where it has been providing technical support to this
standard. The technical support includes field knowledge of distribution circuit performance, laboratory
testing knowledge on how solar PV inverters perform, and what advanced features would be beneficial
to the U.S. grid. SCE has published over 30 reports and research papers (DOE, IEEE, etc.) on solar PV
inverters that has been used to the development of standards.
1. NIST Smart Grid Standards Coordination
The 2007 Energy Independence and Security Act (EISA) gave NIST the “primary responsibility to
coordinate development of a framework that includes protocols and model standards for information
management to achieve interoperability of Smart Grid devices and systems.” To achieve this mandate,
NIST devised a three‐phased approach to identify an initial set of standards, while providing a robust
process for continued development and implementation of standards as needs and opportunities arise
and as technology advances.
In 2009, NIST created the Smart Grid Interoperability Panel (SG Panel) as a public/private partnership to
coordinate the identification and development of Smart Grid standards. Since then the SG Panel has
grown to an organization representing twenty‐two stakeholder categories and over 770 member
organizations ranging from electric utilities to consumer electronics providers. One of the obligations of
the SG Panel is to produce and maintain a Catalog of Standards that could be used for developing and
deploying a robust and interoperable Smart Grid.40
SCE is a strong supporter of the NIST/SG Panel standards process. Since its onset, SCE has participated
in the effort and held leadership positions within the governing board, the architecture committee and
various Priority Action Plans (PAPs). SCE’s director of Advanced Technology is a former governing board
member for the “at‐large” category. Additionally, SCE’s Director of Engineering Advancement is a
former member of SG Panel’s Implementation & Methods Committee (IMC). Furthermore, SCE has
received various SG Panel recognitions for its efforts in PAPs. SCE has participated in the first 16 PAPs,
including:
PAP 5: Standard Meter Data Profiles
PAP 8: Common Information Model (CIM) for Distribution Grid Management
PAP 11: Common Objective Models for Electric Transportation
PAP 15: Harmonize Power Line Carrier Standards for Appliance Communication in the Home
40 Energy Independence and Security Act of 2007, Title XIII, Section 1305.
SMART GRID DEPLOYMENT PLAN ANNUAL UPDATE
29
PAPs have been an effective tool in identifying gaps among Smart Grid standards while providing
standards development organizations (SDOs) with meaningful recommendations. However, PAP groups
occasionally expand their focus beyond the immediate task. PAPs require proper NIST/SG Panel
leadership and oversight to avoid “scope creep.” SCE has demonstrated this leadership by providing
sound technical advice.
SCE remained a committed leader of the NIST standards effort through its final transition to the SG
Panel. SCE’s decision to withdraw from the SG Panel came when it was time to focus on system
demonstrations and deployments. Resources that were previously allocated to standards development
were transitioned to large demonstration projects such as the Irvine Smart Grid Demonstration (ISGD)
project.
2. Standards Development
SCE’s vision of a Smart Grid requires developing, evaluating and implementing open standards. SCE
identified five categories that represent the basis for developing the Smart Grid: System Integration &
Architecture, Data, Communication, Security, and Electrical Interconnection standards. SCE has
identified existing standards within these major categories and identified “gaps” within the existing
standards. SCE prioritized the standards and assigned resources to either lead, support or monitor the
particular standard. Using this process, SCE identified over seventy applicable standards and assigned
resources to lead or support over forty standards. Some of the more notable standards either led or
actively supported by SCE include:
IEC 61850: Substation Automation
Smart Energy 2.0: Home Area Network Communications
North American Energy Standards Board (NAESB) Energy Services Provider Interface (ESPI):
Automated Metered Data Exchange (e.g. Green Button)
SAE J2836 & J2847: Electric Vehicle to Grid Communications
SAE J2894: Electric Vehicle Charging Power Quality
IEEE 1547: Distributed Energy Resources Interconnection
ANSI C37.118: Synchrophasor Measurements
IEEE P2030: Guide for SG Interoperability of Energy Technology
OpenADR: Automated Demand Response
Rule 21: California IOUs Standard to interconnect of distributed generation
UL1741: Standard that mainly fallow IEEE 1547 but will incorporate a revision to California Rule
21
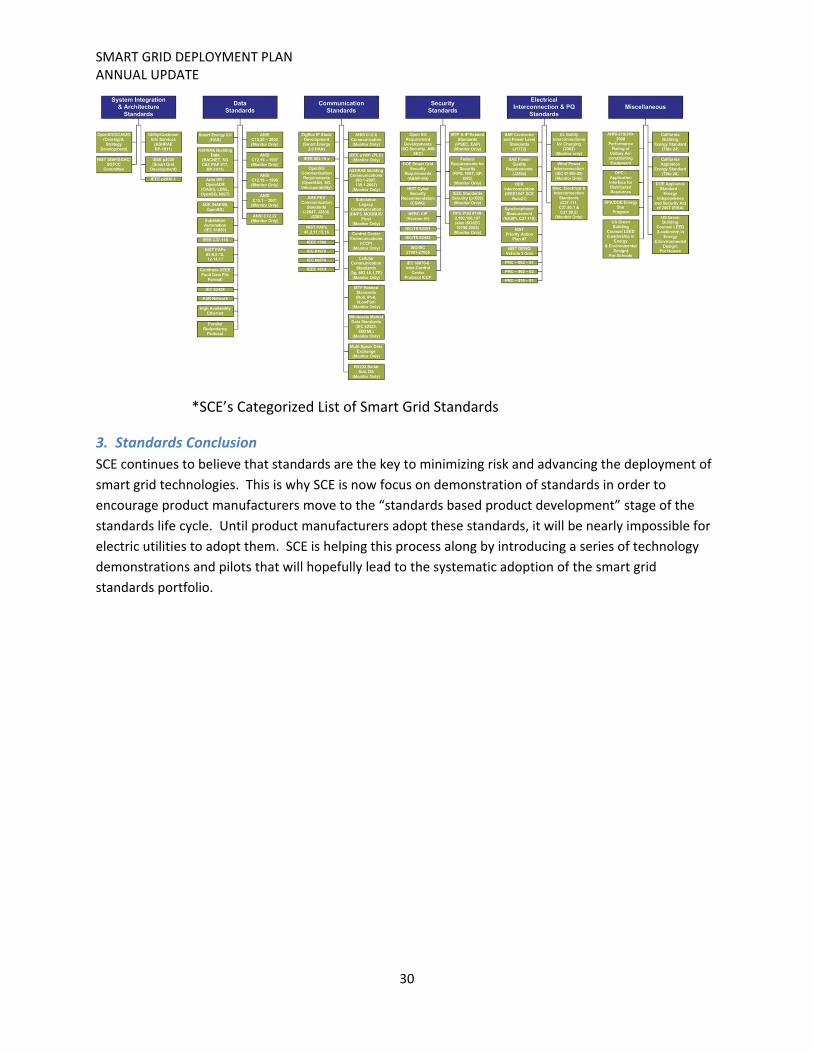
SMART GRID DEPLOYMENT PLAN ANNUAL UPDATE
30
*SCE’s Categorized List of Smart Grid Standards
3. Standards Conclusion
SCE continues to believe that standards are the key to minimizing risk and advancing the deployment of
smart grid technologies. This is why SCE is now focus on demonstration of standards in order to
encourage product manufacturers move to the “standards based product development” stage of the
standards life cycle. Until product manufacturers adopt these standards, it will be nearly impossible for
electric utilities to adopt them. SCE is helping this process along by introducing a series of technology
demonstrations and pilots that will hopefully lead to the systematic adoption of the smart grid
standards portfolio.
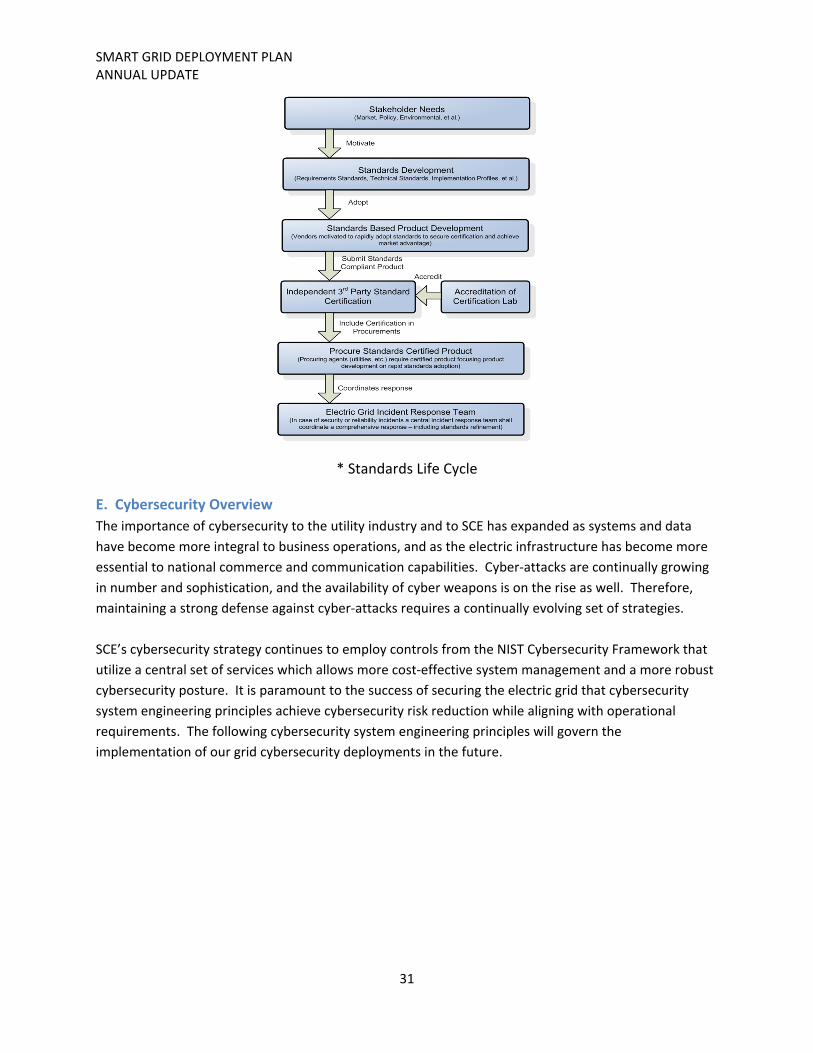
SMART GRID DEPLOYMENT PLAN ANNUAL UPDATE
31
* Standards Life Cycle
E. Cybersecurity Overview
The importance of cybersecurity to the utility industry and to SCE has expanded as systems and data
have become more integral to business operations, and as the electric infrastructure has become more
essential to national commerce and communication capabilities. Cyber‐attacks are continually growing
in number and sophistication, and the availability of cyber weapons is on the rise as well. Therefore,
maintaining a strong defense against cyber‐attacks requires a continually evolving set of strategies.
SCE’s cybersecurity strategy continues to employ controls from the NIST Cybersecurity Framework that
utilize a central set of services which allows more cost‐effective system management and a more robust
cybersecurity posture. It is paramount to the success of securing the electric grid that cybersecurity
system engineering principles achieve cybersecurity risk reduction while aligning with operational
requirements. The following cybersecurity system engineering principles will govern the
implementation of our grid cybersecurity deployments in the future.

SMART GRID DEPLOYMENT PLAN ANNUAL UPDATE
32
Maximize Isolation from Internet Facing Technology Service Layers
The most common threat vectors are malicious code delivered through web pages,
sophisticated malware sent through email, and compromise of external facing systems with
known vulnerabilities. All of these threat vectors are perpetrated via the Internet and are risks
SCE’s office automation networks face as part of doing business. Electric grid networks have no
need for Internet services and must have their supporting service layers isolated from these
threats. This requires dedicated service layers to support grid systems and minimizing cross‐
domain functions. This does not mean all systems must be individually isolated, but IT systems
supporting Internet facing services inherently carry higher risk that, when avoidable, should not
be transferred to the electric grid through shared services.
Centralized Monitoring and Response
Establishing centralized monitoring across grid assets is critical to advancing SCE’s grid
cybersecurity posture. Systems isolated from central monitoring force SCE into a disjointed and
reactive security posture. The cost to remediate a cybersecurity incident when forced into a
reactive posture is far greater than is the cost of heading off an incident with early detection.
This is especially true in the event of a coordinated attack across multiple systems
simultaneously. Cybersecurity architecture must be able to support centralized detection of
threats across systems to facilitate incident response coordination to minimize incident impact.
Nonrepudiation of System Activity
The greatest potential threat impact to SCE control systems would be from a malicious insider.
Insiders have the ability to use their privileged physical and electronic access to compromise
systems or add unauthorized systems to grid networks for nefarious purposes. Establishing
nonrepudiation and attribution of all system activities to an individual is the greatest deterrent
to an insider threat. This requires a combination of preventative and detective controls that
force users and devices to identify and authenticate themselves prior to being granted access
and enables correlation of all activity in support of centralize cybersecurity monitoring and
response.
Grid System Network Segmentation
In the event of a cybersecurity incident, it is imperative that a compromised system can be
segmented from other control systems to contain a breach. Control systems that are
architected in a flat network design, relying upon each other for operation, reduce the ability to
contain threats. Each control system must have the ability to operate on its own. Automated
triggers for segmentation upon breach detection are critical to minimizing the potential impact
from attack.
SMART GRID DEPLOYMENT PLAN ANNUAL UPDATE
33
Operational Alignment with Technology
Deploying advanced cybersecurity technology without operational alignment and process
integration does very little to reduce risk. Grid system operations have evolved around the
organizational unit providing custodianship to each individual grid system. The future
cybersecurity architecture must align with operations support groups to prevent disruption of
operations and facilitate coordinated response to cybersecurity threats.
Legacy Grid System Capability Integration
The lifecycle of many grid systems is far longer than the typical IT system lifecycle. Thus many
legacy systems that do not support modern networking and operating systems are critical
components of the grid network. Implementation of cybersecurity capabilities that affect these
systems must be configured in a manner that does not impact the reliable operation of these
critical systems and should be evaluated as part of any architecture or technology changes.
The goal of this strategy is to develop an enhanced cybersecurity service layer architected in a manner
that can be scaled to protect a wide‐scale routable grid network hosting multiple systems. Enhancing
the current state to support this direction requires a series of coordinated infrastructure initiatives. The
following cybersecurity initiatives are in scope for our grid cybersecurity enhancement efforts:
• Secure administration environments
• Device access controls • User access controls • Advanced malware protections • Vulnerability management • Data encryption services • System monitoring services
These initiatives must aim to both rectify cybersecurity deficiencies in current system architectures as
well as develop a scalable architecture to support future grid applications.
Secure Administration Environments
Privileged credentials are the primary target of cybersecurity adversaries. Loss of control of these
accounts can result in catastrophic system failure and prolonged service outage. Attacks which
compromise these accounts are most commonly perpetrated by either privilege escalation attacks or
malicious insiders. The purpose of designing secure administration environments is to prevent and
deter both of these threats.
SMART GRID DEPLOYMENT PLAN ANNUAL UPDATE
34
Malicious insiders are primarily deterred by implementing strong nonrepudiation controls. This effort
will extend strong multifactor authentication from the control network across all grid systems for
interactive user access. Additionally, all shared accounts and service accounts (accounts without a
person’s name) will be managed by a password vaulting system requiring users to authenticate with
their multifactor token prior to granting access to the account. This enables attribution of all system
activity to a user ID, and helps ensure that malicious insiders will know their activity is being logged.
The other common threat vectors previously mentioned are privilege escalation attacks. These attacks
initially occur when a lower tiered system, such as a workstation or Human Machine Interface, is
compromised with a virus that has taken full control over that particular machine. Part of the
implementation of a secure administration environment is to minimize network account privileges to
minimum required and implement access tiers to minimize the potential loss of control from any one
system or account. This will require the implementation of additional security monitoring systems and
access management applications to segment and monitor access without hindering operational
productivity.
Device Access Controls
A fundamental cybersecurity control is profiling, authenticating, and monitoring devices connected to
the network. Forcing an attacker to launch an attack from a compromised SCE‐controlled device is far
easier to defend against than a device designed by an attacker. Additionally, Internet Protocol (IP)
connected devices outside of physically secure buildings such as cameras or control systems in the yard
can be impersonated and their connections used to launch an attack. This effort will implement central
network access control systems to allow authorized devices to connect to the network and provide an
automated inventory of all devices. This system will be tuned to operate in a monitor‐alert mode for
critical control systems and automated protection control for non‐critical systems.
In the event network access control is successfully circumvented, this effort also aims to deploy network
fingerprinting technology to develop a baseline profile of a system’s behavior and alert when that profile
changes. For example, if a camera is profiled as a system that streams video and suddenly it starts trying
to make remote access connections to systems, an alert will be generated for critical systems and an
automated response for noncritical systems.
SMART GRID DEPLOYMENT PLAN ANNUAL UPDATE
35
User Access Controls
This effort will extend multifactor authentication to all end‐user interactive access from a centrally
managed set of systems. The access control systems will need to have components extended into each
of the grid system networks so that they may be centrally managed while still maintaining their system
autonomy in the event of a network outage. This will simplify monitoring and provisioning user access
as all access logs will be fed into an event monitoring and analytics system.
This effort will also include implementing least privilege measures, to help ensure that grid system users
do not have access to systems outside their area of responsibility. This requires integrating user access
authorizations with provisioning system access. This is achieved using a cross‐domain solution between
the administrative networks where the identity management systems reside and the access control
systems on the grid network. This system will also be in‐scope for modification to accommodate
centralization of access management.
Malware Protections
Current grid system networks primarily employ a blacklisting strategy to protect against malware.
Blacklisting strategies are only able to detect known malware. As exhibited in both the Stuxnet and
Black Energy attacks on critical infrastructure, malware is highly likely to be customized to avoid
detection by blacklisting systems. Given the nature of grid systems’ mostly static application
configuration compared to business networks, they are ideal for taking an application whitelisting
approach. This authorizes a specific set of applications and processes to run on a given system and
prevents all other applications or code from executing. This effort will implement this approach
ubiquitously across grid system networks where feasible.
In the event that the application whitelisting system is defeated, behavior analysis detection systems
will be implemented at both the system and network levels. This type of system analyzes the behavior
of zero‐day software to detect if it employs techniques common to cyber‐attack. The system can then
be tuned to either stop a piece of malware and/or alert on its detection. This will occur in tandem (not
in‐line) at the firewalls as all files pass through it and locally at the system level. Upon confirmation of
malware detection, the firewalls and systems can automatically be triggered to block the malware from
executing or traversing the network.
Vulnerability Management
Since the beginning of software development, there have been mistakes made in code or security
control oversights that result in a system being vulnerable to a known attack logged in a public
vulnerability database. A vulnerability management system (VMS) is critical to tracking known
vulnerabilities and facilitating remediation. This effort will deploy new vulnerability scanning appliances
to provide ubiquitous coverage of all grid networks.
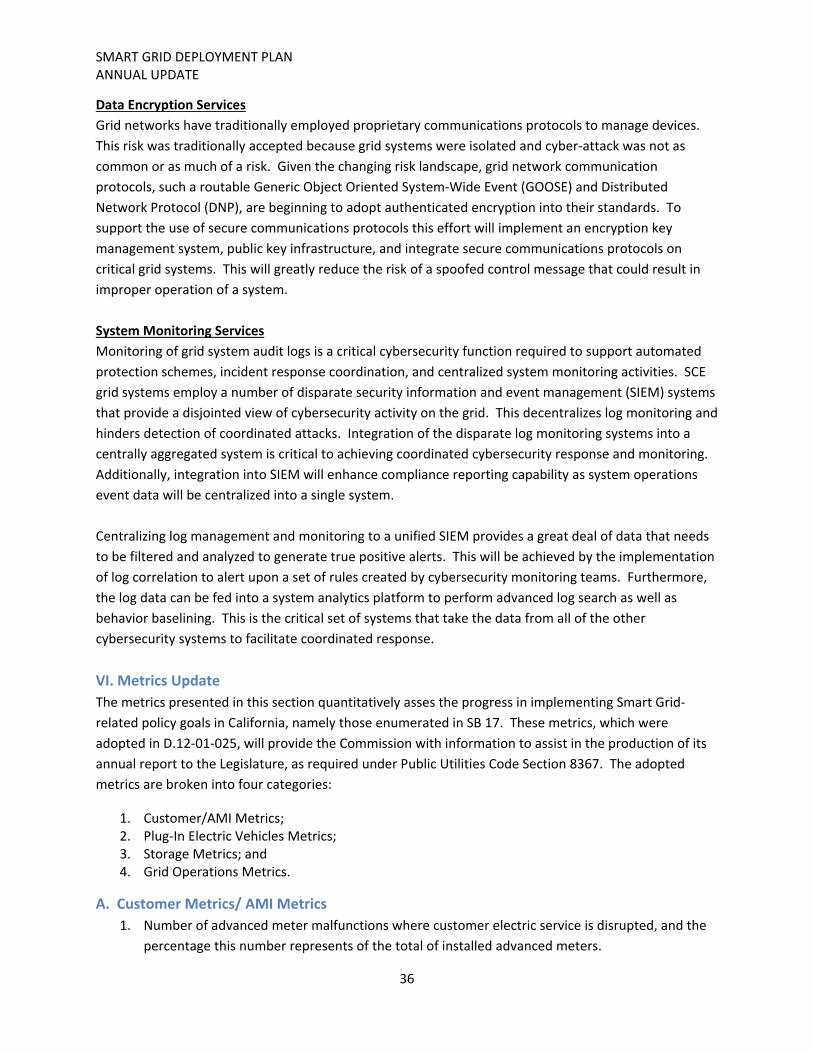
SMART GRID DEPLOYMENT PLAN ANNUAL UPDATE
36
Data Encryption Services
Grid networks have traditionally employed proprietary communications protocols to manage devices.
This risk was traditionally accepted because grid systems were isolated and cyber‐attack was not as
common or as much of a risk. Given the changing risk landscape, grid network communication
protocols, such a routable Generic Object Oriented System‐Wide Event (GOOSE) and Distributed
Network Protocol (DNP), are beginning to adopt authenticated encryption into their standards. To
support the use of secure communications protocols this effort will implement an encryption key
management system, public key infrastructure, and integrate secure communications protocols on
critical grid systems. This will greatly reduce the risk of a spoofed control message that could result in
improper operation of a system.
System Monitoring Services
Monitoring of grid system audit logs is a critical cybersecurity function required to support automated
protection schemes, incident response coordination, and centralized system monitoring activities. SCE
grid systems employ a number of disparate security information and event management (SIEM) systems
that provide a disjointed view of cybersecurity activity on the grid. This decentralizes log monitoring and
hinders detection of coordinated attacks. Integration of the disparate log monitoring systems into a
centrally aggregated system is critical to achieving coordinated cybersecurity response and monitoring.
Additionally, integration into SIEM will enhance compliance reporting capability as system operations
event data will be centralized into a single system.
Centralizing log management and monitoring to a unified SIEM provides a great deal of data that needs
to be filtered and analyzed to generate true positive alerts. This will be achieved by the implementation
of log correlation to alert upon a set of rules created by cybersecurity monitoring teams. Furthermore,
the log data can be fed into a system analytics platform to perform advanced log search as well as
behavior baselining. This is the critical set of systems that take the data from all of the other
cybersecurity systems to facilitate coordinated response.
VI. Metrics Update
The metrics presented in this section quantitatively asses the progress in implementing Smart Grid‐
related policy goals in California, namely those enumerated in SB 17. These metrics, which were
adopted in D.12‐01‐025, will provide the Commission with information to assist in the production of its
annual report to the Legislature, as required under Public Utilities Code Section 8367. The adopted
metrics are broken into four categories:
1. Customer/AMI Metrics; 2. Plug‐In Electric Vehicles Metrics; 3. Storage Metrics; and 4. Grid Operations Metrics.
A. Customer Metrics/ AMI Metrics
1. Number of advanced meter malfunctions where customer electric service is disrupted, and the
percentage this number represents of the total of installed advanced meters.
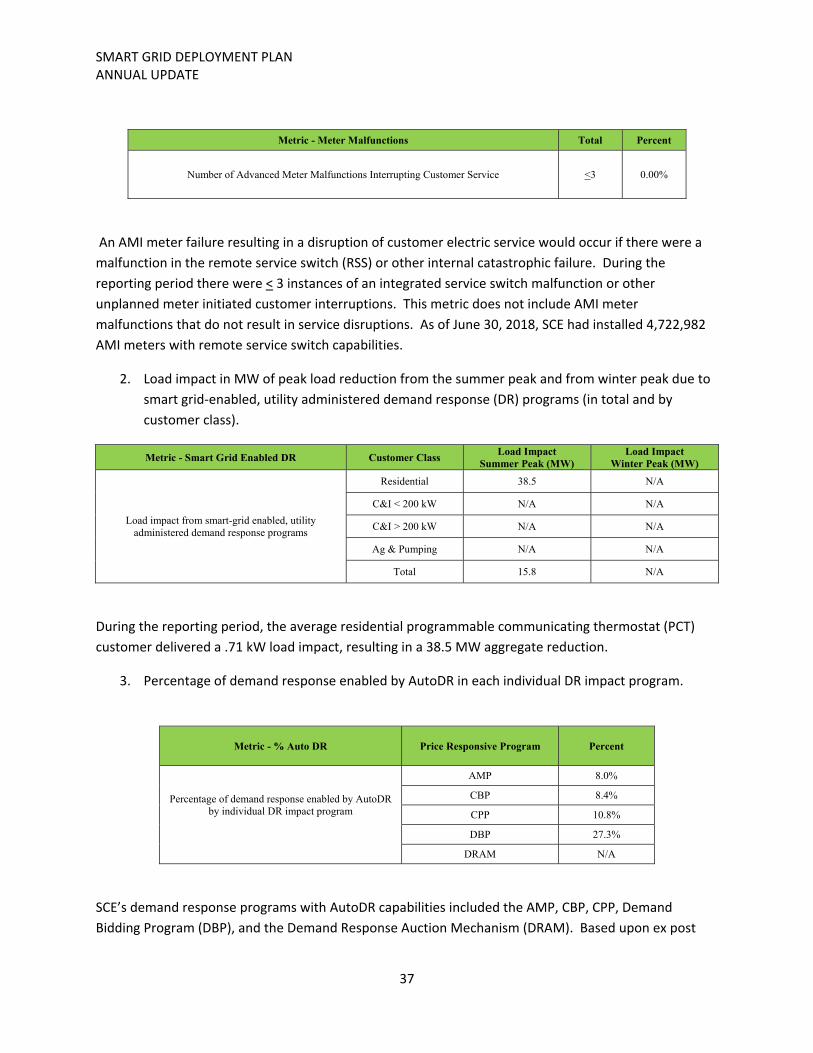
SMART GRID DEPLOYMENT PLAN ANNUAL UPDATE
37
Metric - Meter Malfunctions Total Percent
Number of Advanced Meter Malfunctions Interrupting Customer Service <3 0.00%
An AMI meter failure resulting in a disruption of customer electric service would occur if there were a
malfunction in the remote service switch (RSS) or other internal catastrophic failure. During the
reporting period there were < 3 instances of an integrated service switch malfunction or other
unplanned meter initiated customer interruptions. This metric does not include AMI meter
malfunctions that do not result in service disruptions. As of June 30, 2018, SCE had installed 4,722,982
AMI meters with remote service switch capabilities.
2. Load impact in MW of peak load reduction from the summer peak and from winter peak due to
smart grid‐enabled, utility administered demand response (DR) programs (in total and by
customer class).
Metric - Smart Grid Enabled DR Customer Class Load Impact
Summer Peak (MW) Load Impact
Winter Peak (MW)
Load impact from smart-grid enabled, utility administered demand response programs
Residential 38.5 N/A
C&I < 200 kW N/A N/A
C&I > 200 kW N/A N/A
Ag & Pumping N/A N/A
Total 15.8 N/A
During the reporting period, the average residential programmable communicating thermostat (PCT)
customer delivered a .71 kW load impact, resulting in a 38.5 MW aggregate reduction.
3. Percentage of demand response enabled by AutoDR in each individual DR impact program.
Metric - % Auto DR Price Responsive Program Percent
Percentage of demand response enabled by AutoDR by individual DR impact program
AMP 8.0%
CBP 8.4%
CPP 10.8%
DBP 27.3%
DRAM N/A
SCE’s demand response programs with AutoDR capabilities included the AMP, CBP, CPP, Demand
Bidding Program (DBP), and the Demand Response Auction Mechanism (DRAM). Based upon ex post
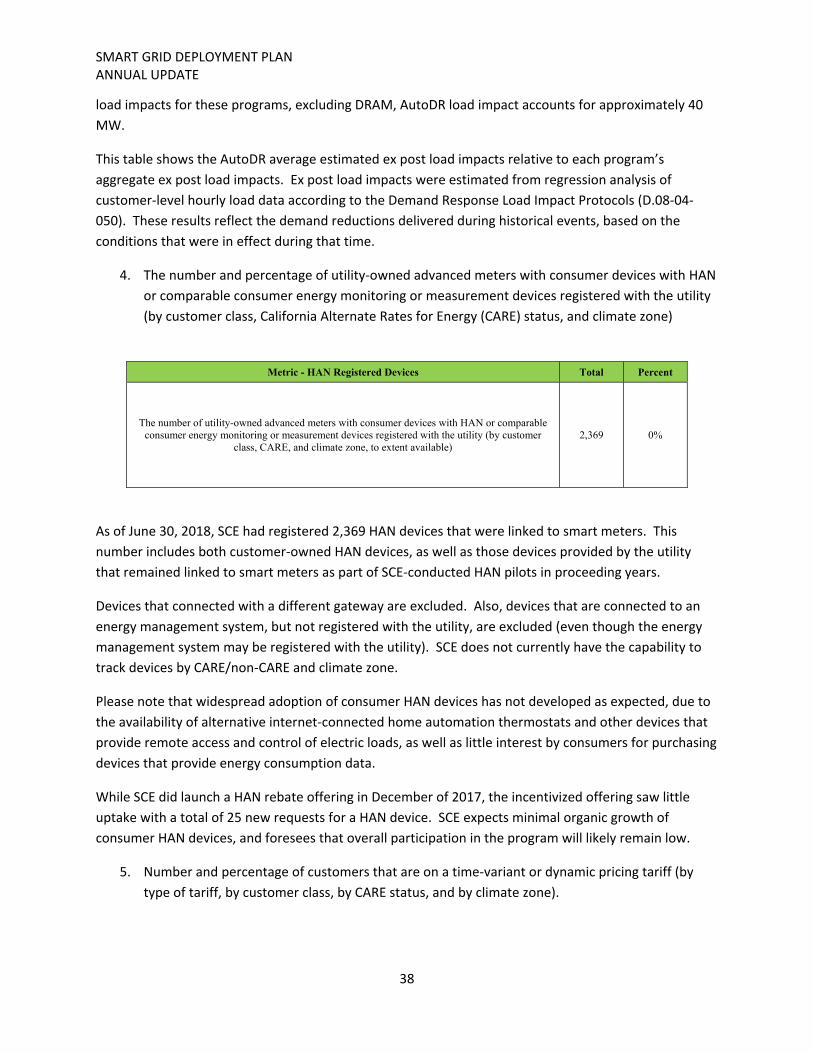
SMART GRID DEPLOYMENT PLAN ANNUAL UPDATE
38
load impacts for these programs, excluding DRAM, AutoDR load impact accounts for approximately 40
MW.
This table shows the AutoDR average estimated ex post load impacts relative to each program’s
aggregate ex post load impacts. Ex post load impacts were estimated from regression analysis of
customer‐level hourly load data according to the Demand Response Load Impact Protocols (D.08‐04‐
050). These results reflect the demand reductions delivered during historical events, based on the
conditions that were in effect during that time.
4. The number and percentage of utility‐owned advanced meters with consumer devices with HAN
or comparable consumer energy monitoring or measurement devices registered with the utility
(by customer class, California Alternate Rates for Energy (CARE) status, and climate zone)
Metric - HAN Registered Devices Total Percent
The number of utility-owned advanced meters with consumer devices with HAN or comparable consumer energy monitoring or measurement devices registered with the utility (by customer
class, CARE, and climate zone, to extent available) 2,369 0%
As of June 30, 2018, SCE had registered 2,369 HAN devices that were linked to smart meters. This
number includes both customer‐owned HAN devices, as well as those devices provided by the utility
that remained linked to smart meters as part of SCE‐conducted HAN pilots in proceeding years.
Devices that connected with a different gateway are excluded. Also, devices that are connected to an
energy management system, but not registered with the utility, are excluded (even though the energy
management system may be registered with the utility). SCE does not currently have the capability to
track devices by CARE/non‐CARE and climate zone.
Please note that widespread adoption of consumer HAN devices has not developed as expected, due to
the availability of alternative internet‐connected home automation thermostats and other devices that
provide remote access and control of electric loads, as well as little interest by consumers for purchasing
devices that provide energy consumption data.
While SCE did launch a HAN rebate offering in December of 2017, the incentivized offering saw little
uptake with a total of 25 new requests for a HAN device. SCE expects minimal organic growth of
consumer HAN devices, and foresees that overall participation in the program will likely remain low.
5. Number and percentage of customers that are on a time‐variant or dynamic pricing tariff (by
type of tariff, by customer class, by CARE status, and by climate zone).
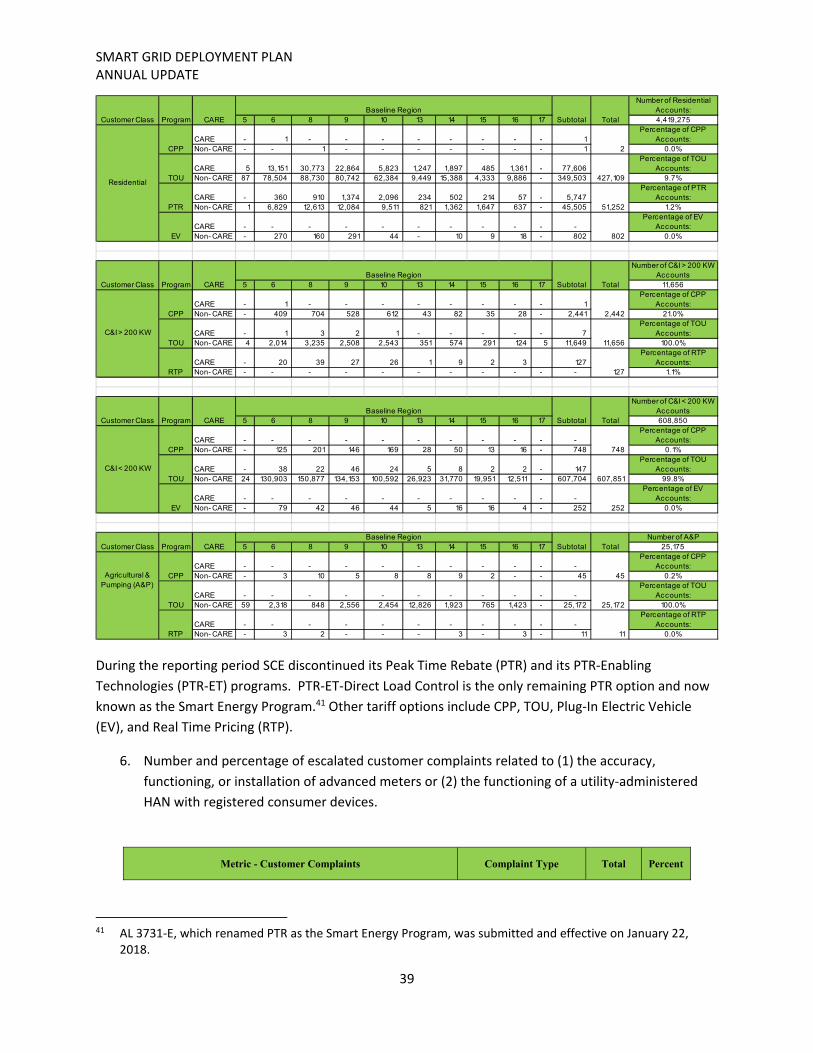
SMART GRID DEPLOYMENT PLAN ANNUAL UPDATE
39
During the reporting period SCE discontinued its Peak Time Rebate (PTR) and its PTR‐Enabling
Technologies (PTR‐ET) programs. PTR‐ET‐Direct Load Control is the only remaining PTR option and now
known as the Smart Energy Program.41 Other tariff options include CPP, TOU, Plug‐In Electric Vehicle
(EV), and Real Time Pricing (RTP).
6. Number and percentage of escalated customer complaints related to (1) the accuracy,
functioning, or installation of advanced meters or (2) the functioning of a utility‐administered
HAN with registered consumer devices.
Metric - Customer Complaints Complaint Type Total Percent
41 AL 3731‐E, which renamed PTR as the Smart Energy Program, was submitted and effective on January 22,
2018.
Number of Residential Accounts:
5 6 8 9 10 13 14 15 16 17 4,419,275
CARE - 1 - - - - - - - - 1 Percentage of CPP
Accounts:Non- CARE - - 1 - - - - - - - 1 0.0%
CARE 5 13,151 30,773 22,864 5,823 1,247 1,897 485 1,361 - 77,606 Percentage of TOU
Accounts:Non- CARE 87 78,504 88,730 80,742 62,384 9,449 15,388 4,333 9,886 - 349,503 9.7%
CARE - 360 910 1,374 2,096 234 502 214 57 - 5,747 Percentage of PTR
Accounts:Non- CARE 1 6,829 12,613 12,084 9,511 821 1,362 1,647 637 - 45,505 1.2%
CARE - - - - - - - - - - - Percentage of EV
Accounts:Non- CARE - 270 160 291 44 - 10 9 18 - 802 0.0%
Number of C&I > 200 KW Accounts
5 6 8 9 10 13 14 15 16 17 11,656
CARE - 1 - - - - - - - - 1 Percentage of CPP
Accounts:Non- CARE - 409 704 528 612 43 82 35 28 - 2,441 21.0%
CARE - 1 3 2 1 - - - - - 7 Percentage of TOU
Accounts:Non- CARE 4 2,014 3,235 2,508 2,543 351 574 291 124 5 11,649 100.0%
CARE - 20 39 27 26 1 9 2 3 127 Percentage of RTP
Accounts:Non- CARE - - - - - - - - - - - 1.1%
Number of C&I < 200 KW Accounts
5 6 8 9 10 13 14 15 16 17 608,850
CARE - - - - - - - - - - - Percentage of CPP
Accounts:Non- CARE - 125 201 146 169 28 50 13 16 - 748 0.1%
CARE - 38 22 46 24 5 8 2 2 - 147 Percentage of TOU
Accounts:Non- CARE 24 130,903 150,877 134,153 100,592 26,923 31,770 19,951 12,511 - 607,704 99.8%
CARE - - - - - - - - - - - Percentage of EV
Accounts:Non- CARE - 79 42 46 44 5 16 16 4 - 252 0.0%
Number of A&P 5 6 8 9 10 13 14 15 16 17 25,175
CARE - - - - - - - - - - - Percentage of CPP
Accounts:Non- CARE - 3 10 5 8 8 9 2 - - 45 0.2%
CARE - - - - - - - - - - - Percentage of TOU
Accounts:Non- CARE 59 2,318 848 2,556 2,454 12,826 1,923 765 1,423 - 25,172 100.0%
CARE - - - - - - - - - - - Percentage of RTP
Accounts:Non- CARE - 3 2 - - - 3 - 3 - 11 0.0%
45
25,172
RTP 11
2,442
11,656
127
748
Total
2
427,109
51,252
802
Residential
SubtotalBaseline Region
Customer Class Program CARE
Baseline RegionSubtotal Total
CPP
TOU
PTR
EV
Customer Class Program
Customer Class Program CARE
C&I > 200 KW
CPP
TOU
RTP
C&I < 200 KW
CPP
TOU
EV
Total
CAREBaseline Region
Subtotal Total
607,851
252
Customer Class Program CAREBaseline Region
Subtotal
Agricultural & Pumping (A&P)
CPP
TOU
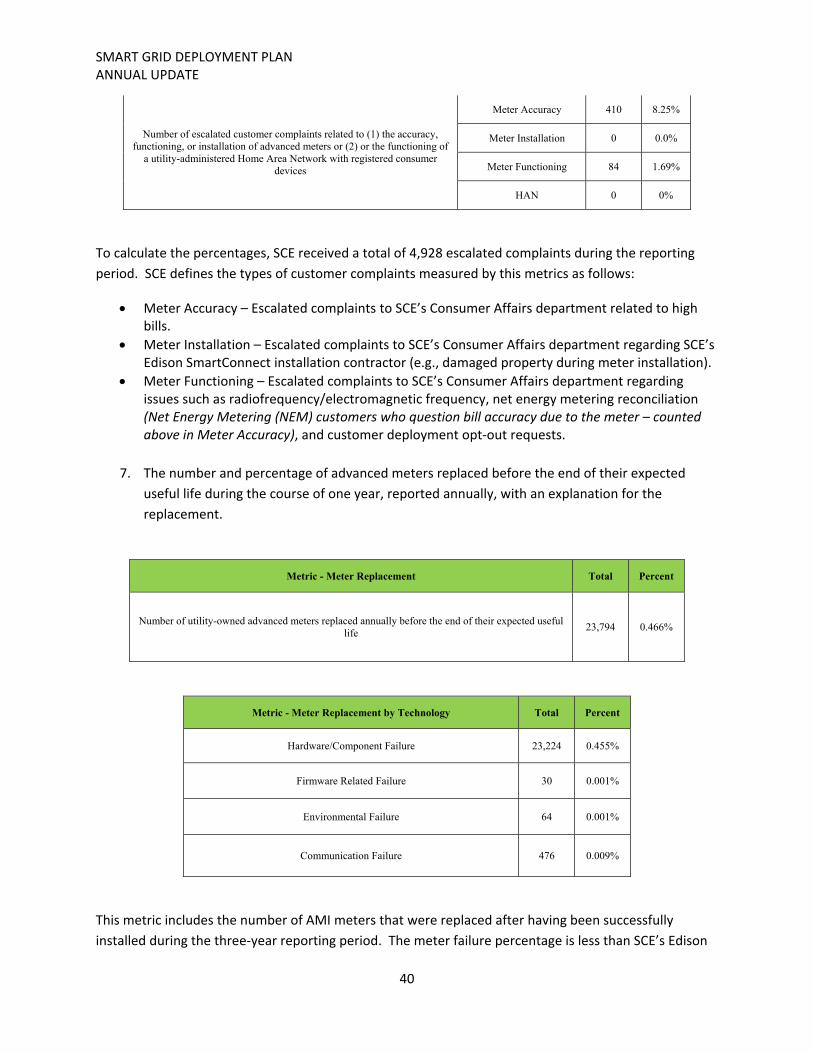
SMART GRID DEPLOYMENT PLAN ANNUAL UPDATE
40
Number of escalated customer complaints related to (1) the accuracy, functioning, or installation of advanced meters or (2) or the functioning of
a utility-administered Home Area Network with registered consumer devices
Meter Accuracy 410 8.25%
Meter Installation 0 0.0%
Meter Functioning 84 1.69%
HAN 0 0%
To calculate the percentages, SCE received a total of 4,928 escalated complaints during the reporting
period. SCE defines the types of customer complaints measured by this metrics as follows:
Meter Accuracy – Escalated complaints to SCE’s Consumer Affairs department related to high bills.
Meter Installation – Escalated complaints to SCE’s Consumer Affairs department regarding SCE’s Edison SmartConnect installation contractor (e.g., damaged property during meter installation).
Meter Functioning – Escalated complaints to SCE’s Consumer Affairs department regarding issues such as radiofrequency/electromagnetic frequency, net energy metering reconciliation (Net Energy Metering (NEM) customers who question bill accuracy due to the meter – counted above in Meter Accuracy), and customer deployment opt‐out requests.
7. The number and percentage of advanced meters replaced before the end of their expected
useful life during the course of one year, reported annually, with an explanation for the
replacement.
Metric - Meter Replacement Total Percent
Number of utility-owned advanced meters replaced annually before the end of their expected useful life
23,794 0.466%
Metric - Meter Replacement by Technology Total Percent
Hardware/Component Failure 23,224 0.455%
Firmware Related Failure 30 0.001%
Environmental Failure 64 0.001%
Communication Failure 476 0.009%
This metric includes the number of AMI meters that were replaced after having been successfully
installed during the three‐year reporting period. The meter failure percentage is less than SCE’s Edison
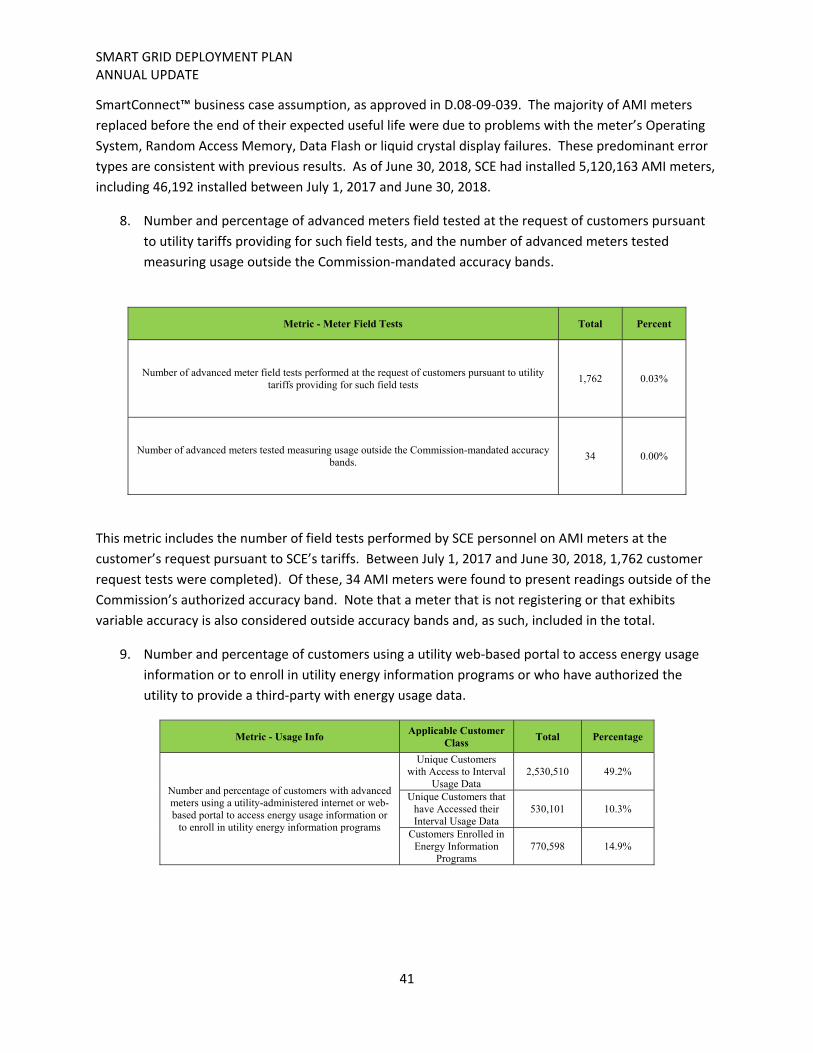
SMART GRID DEPLOYMENT PLAN ANNUAL UPDATE
41
SmartConnect™ business case assumption, as approved in D.08‐09‐039. The majority of AMI meters
replaced before the end of their expected useful life were due to problems with the meter’s Operating
System, Random Access Memory, Data Flash or liquid crystal display failures. These predominant error
types are consistent with previous results. As of June 30, 2018, SCE had installed 5,120,163 AMI meters,
including 46,192 installed between July 1, 2017 and June 30, 2018.
8. Number and percentage of advanced meters field tested at the request of customers pursuant
to utility tariffs providing for such field tests, and the number of advanced meters tested
measuring usage outside the Commission‐mandated accuracy bands.
Metric - Meter Field Tests Total Percent
Number of advanced meter field tests performed at the request of customers pursuant to utility tariffs providing for such field tests
1,762 0.03%
Number of advanced meters tested measuring usage outside the Commission-mandated accuracy bands. 34 0.00%
This metric includes the number of field tests performed by SCE personnel on AMI meters at the
customer’s request pursuant to SCE’s tariffs. Between July 1, 2017 and June 30, 2018, 1,762 customer
request tests were completed). Of these, 34 AMI meters were found to present readings outside of the
Commission’s authorized accuracy band. Note that a meter that is not registering or that exhibits
variable accuracy is also considered outside accuracy bands and, as such, included in the total.
9. Number and percentage of customers using a utility web‐based portal to access energy usage
information or to enroll in utility energy information programs or who have authorized the
utility to provide a third‐party with energy usage data.
Metric - Usage Info Applicable Customer
Class Total Percentage
Number and percentage of customers with advanced meters using a utility-administered internet or web-based portal to access energy usage information or
to enroll in utility energy information programs
Unique Customers with Access to Interval
Usage Data 2,530,510 49.2%
Unique Customers that have Accessed their Interval Usage Data
530,101 10.3%
Customers Enrolled in Energy Information
Programs 770,598 14.9%
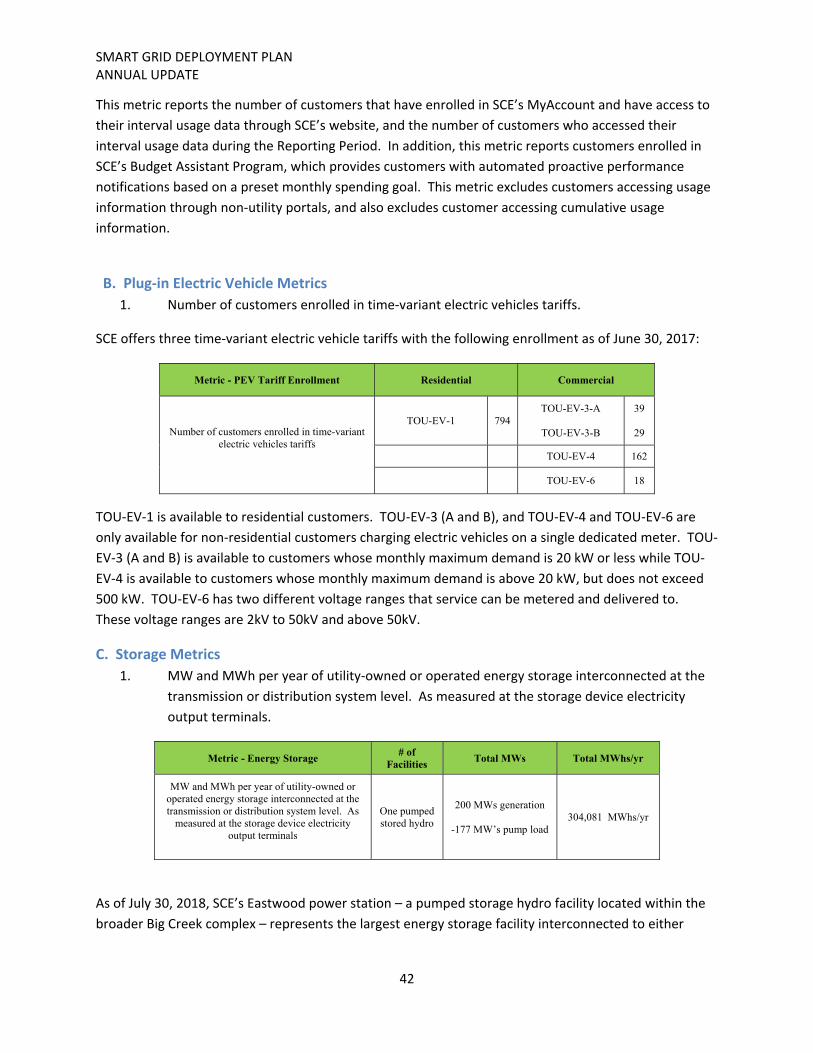
SMART GRID DEPLOYMENT PLAN ANNUAL UPDATE
42
This metric reports the number of customers that have enrolled in SCE’s MyAccount and have access to
their interval usage data through SCE’s website, and the number of customers who accessed their
interval usage data during the Reporting Period. In addition, this metric reports customers enrolled in
SCE’s Budget Assistant Program, which provides customers with automated proactive performance
notifications based on a preset monthly spending goal. This metric excludes customers accessing usage
information through non‐utility portals, and also excludes customer accessing cumulative usage
information.
B. Plug‐in Electric Vehicle Metrics
1. Number of customers enrolled in time‐variant electric vehicles tariffs.
SCE offers three time‐variant electric vehicle tariffs with the following enrollment as of June 30, 2017:
Metric - PEV Tariff Enrollment Residential Commercial
Number of customers enrolled in time-variant electric vehicles tariffs
TOU-EV-1 794 TOU-EV-3-A
TOU-EV-3-B
39
29
TOU-EV-4 162
TOU-EV-6 18
TOU‐EV‐1 is available to residential customers. TOU‐EV‐3 (A and B), and TOU‐EV‐4 and TOU‐EV‐6 are
only available for non‐residential customers charging electric vehicles on a single dedicated meter. TOU‐
EV‐3 (A and B) is available to customers whose monthly maximum demand is 20 kW or less while TOU‐
EV‐4 is available to customers whose monthly maximum demand is above 20 kW, but does not exceed
500 kW. TOU‐EV‐6 has two different voltage ranges that service can be metered and delivered to.
These voltage ranges are 2kV to 50kV and above 50kV.
C. Storage Metrics
1. MW and MWh per year of utility‐owned or operated energy storage interconnected at the
transmission or distribution system level. As measured at the storage device electricity
output terminals.
Metric - Energy Storage # of
Facilities Total MWs Total MWhs/yr
MW and MWh per year of utility-owned or operated energy storage interconnected at the transmission or distribution system level. As
measured at the storage device electricity output terminals
One pumped stored hydro
200 MWs generation
-177 MW’s pump load 304,081 MWhs/yr
As of July 30, 2018, SCE’s Eastwood power station – a pumped storage hydro facility located within the
broader Big Creek complex – represents the largest energy storage facility interconnected to either
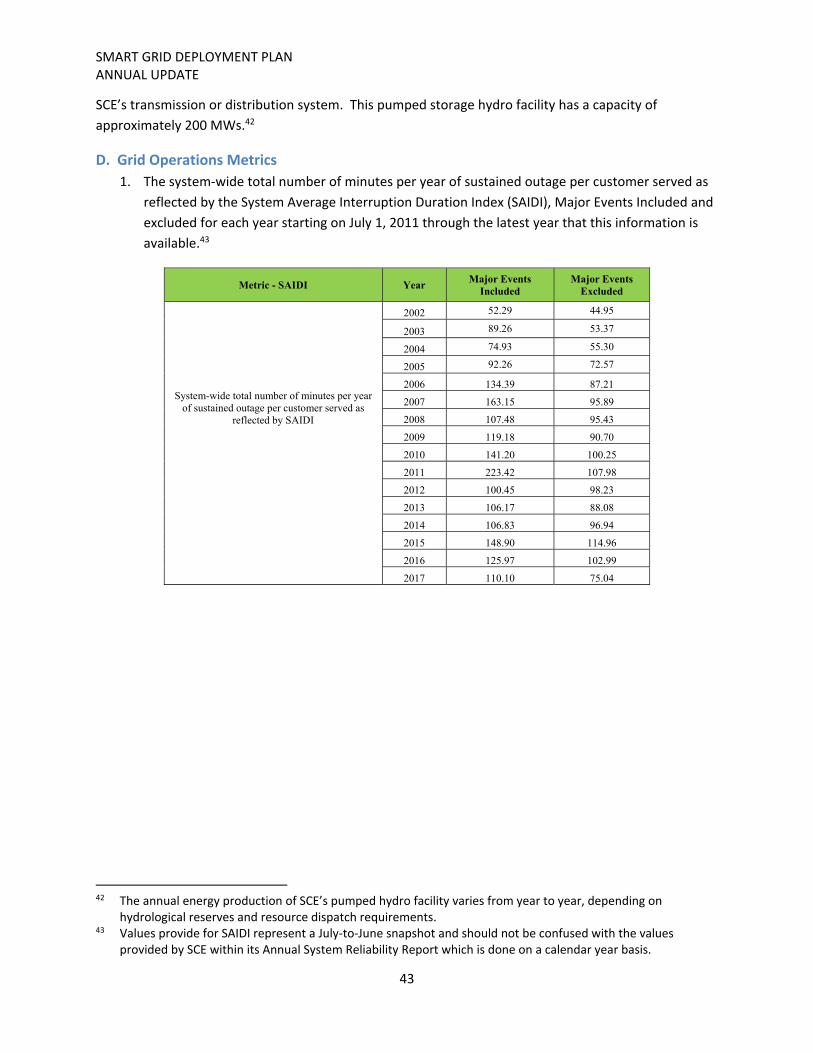
SMART GRID DEPLOYMENT PLAN ANNUAL UPDATE
43
SCE’s transmission or distribution system. This pumped storage hydro facility has a capacity of
approximately 200 MWs.42
D. Grid Operations Metrics
1. The system‐wide total number of minutes per year of sustained outage per customer served as
reflected by the System Average Interruption Duration Index (SAIDI), Major Events Included and
excluded for each year starting on July 1, 2011 through the latest year that this information is
available.43
Metric - SAIDI Year Major Events
Included Major Events
Excluded
System-wide total number of minutes per year of sustained outage per customer served as
reflected by SAIDI
2002 52.29 44.95
2003 89.26 53.37
2004 74.93 55.30
2005 92.26 72.57
2006 134.39 87.21
2007 163.15 95.89
2008 107.48 95.43
2009 119.18 90.70
2010 141.20 100.25
2011 223.42 107.98
2012 100.45 98.23
2013 106.17 88.08
2014 106.83 96.94
2015 148.90 114.96
2016 125.97 102.99
2017 110.10 75.04
42 The annual energy production of SCE’s pumped hydro facility varies from year to year, depending on
hydrological reserves and resource dispatch requirements. 43 Values provide for SAIDI represent a July‐to‐June snapshot and should not be confused with the values
provided by SCE within its Annual System Reliability Report which is done on a calendar year basis.
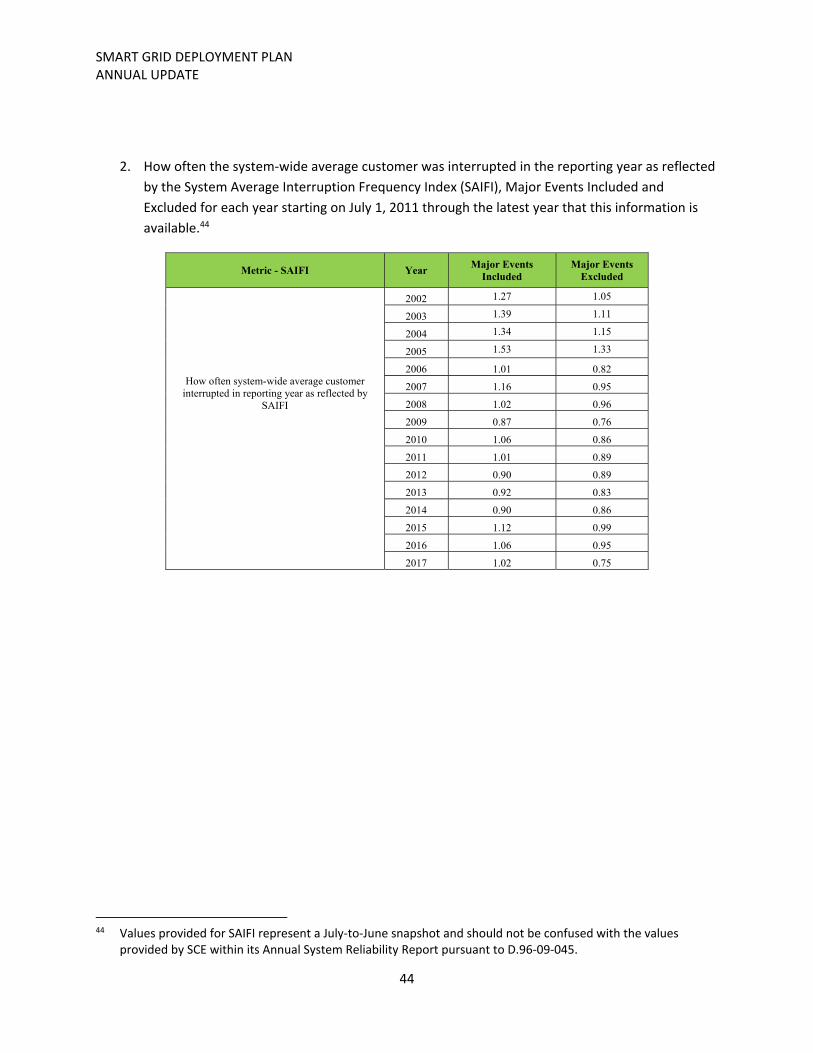
SMART GRID DEPLOYMENT PLAN ANNUAL UPDATE
44
2. How often the system‐wide average customer was interrupted in the reporting year as reflected
by the System Average Interruption Frequency Index (SAIFI), Major Events Included and
Excluded for each year starting on July 1, 2011 through the latest year that this information is
available.44
Metric - SAIFI Year Major Events
Included Major Events
Excluded
How often system-wide average customer interrupted in reporting year as reflected by
SAIFI
2002 1.27 1.05
2003 1.39 1.11
2004 1.34 1.15
2005 1.53 1.33
2006 1.01 0.82
2007 1.16 0.95
2008 1.02 0.96
2009 0.87 0.76
2010 1.06 0.86
2011 1.01 0.89
2012 0.90 0.89
2013 0.92 0.83
2014 0.90 0.86
2015 1.12 0.99
2016 1.06 0.95
2017 1.02 0.75
44 Values provided for SAIFI represent a July‐to‐June snapshot and should not be confused with the values
provided by SCE within its Annual System Reliability Report pursuant to D.96‐09‐045.
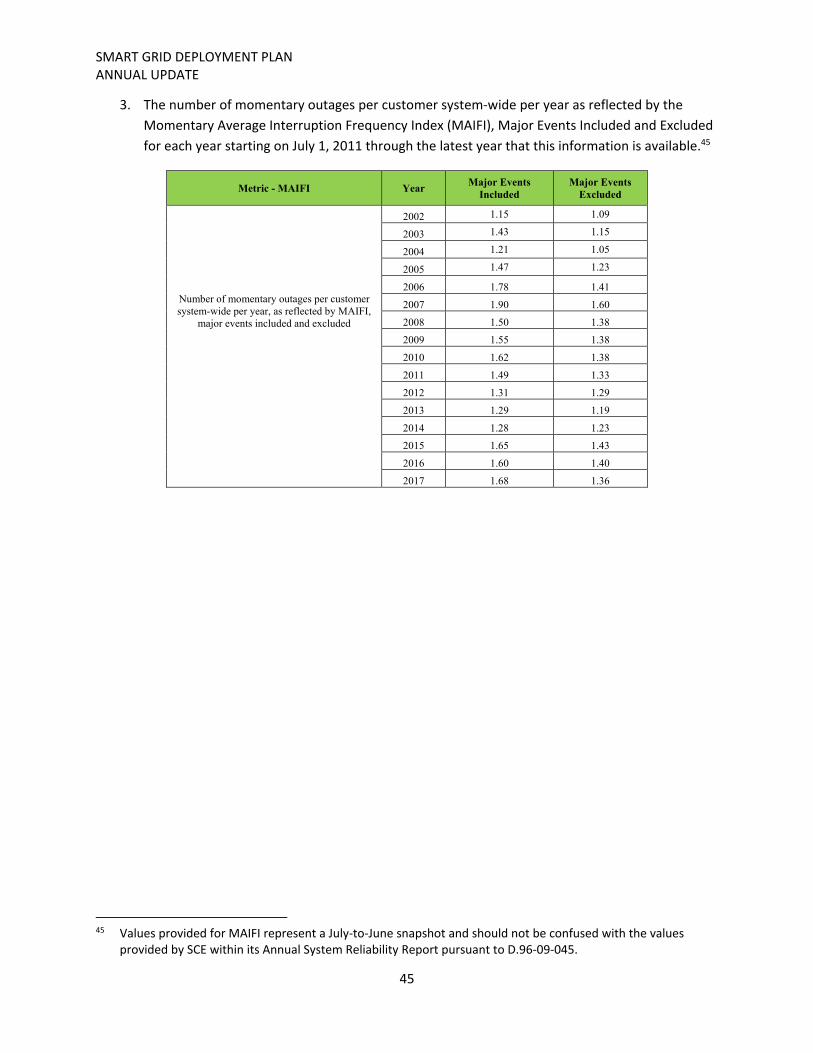
SMART GRID DEPLOYMENT PLAN ANNUAL UPDATE
45
3. The number of momentary outages per customer system‐wide per year as reflected by the
Momentary Average Interruption Frequency Index (MAIFI), Major Events Included and Excluded
for each year starting on July 1, 2011 through the latest year that this information is available.45
Metric - MAIFI Year Major Events
Included Major Events
Excluded
Number of momentary outages per customer system-wide per year, as reflected by MAIFI,
major events included and excluded
2002 1.15 1.09
2003 1.43 1.15
2004 1.21 1.05
2005 1.47 1.23
2006 1.78 1.41
2007 1.90 1.60
2008 1.50 1.38
2009 1.55 1.38
2010 1.62 1.38
2011 1.49 1.33
2012 1.31 1.29
2013 1.29 1.19
2014 1.28 1.23
2015 1.65 1.43
2016 1.60 1.40
2017 1.68 1.36
45 Values provided for MAIFI represent a July‐to‐June snapshot and should not be confused with the values
provided by SCE within its Annual System Reliability Report pursuant to D.96‐09‐045.
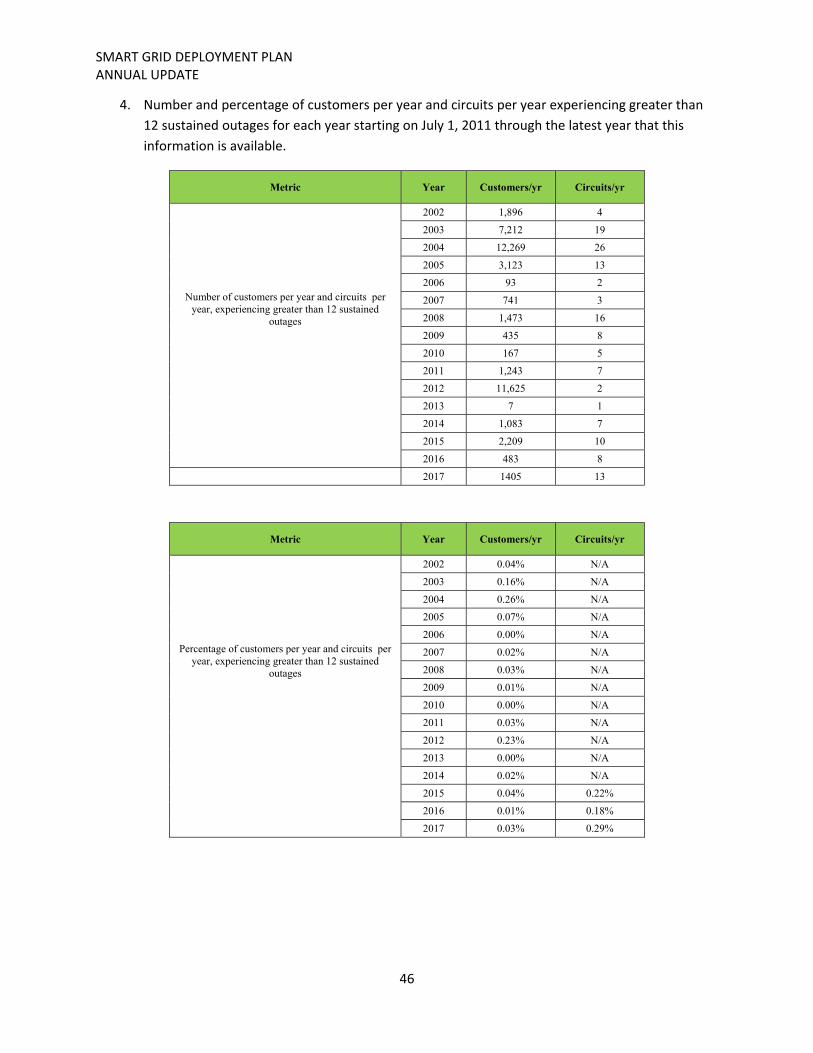
SMART GRID DEPLOYMENT PLAN ANNUAL UPDATE
46
4. Number and percentage of customers per year and circuits per year experiencing greater than
12 sustained outages for each year starting on July 1, 2011 through the latest year that this
information is available.
Metric Year Customers/yr Circuits/yr
Number of customers per year and circuits per year, experiencing greater than 12 sustained
outages
2002 1,896 4
2003 7,212 19
2004 12,269 26
2005 3,123 13
2006 93 2
2007 741 3
2008 1,473 16
2009 435 8
2010 167 5
2011 1,243 7
2012 11,625 2
2013 7 1
2014 1,083 7
2015 2,209 10
2016 483 8
2017 1405 13
Metric Year Customers/yr Circuits/yr
Percentage of customers per year and circuits per year, experiencing greater than 12 sustained
outages
2002 0.04% N/A
2003 0.16% N/A
2004 0.26% N/A
2005 0.07% N/A
2006 0.00% N/A
2007 0.02% N/A
2008 0.03% N/A
2009 0.01% N/A
2010 0.00% N/A
2011 0.03% N/A
2012 0.23% N/A
2013 0.00% N/A
2014 0.02% N/A
2015 0.04% 0.22%
2016 0.01% 0.18%
2017 0.03% 0.29%
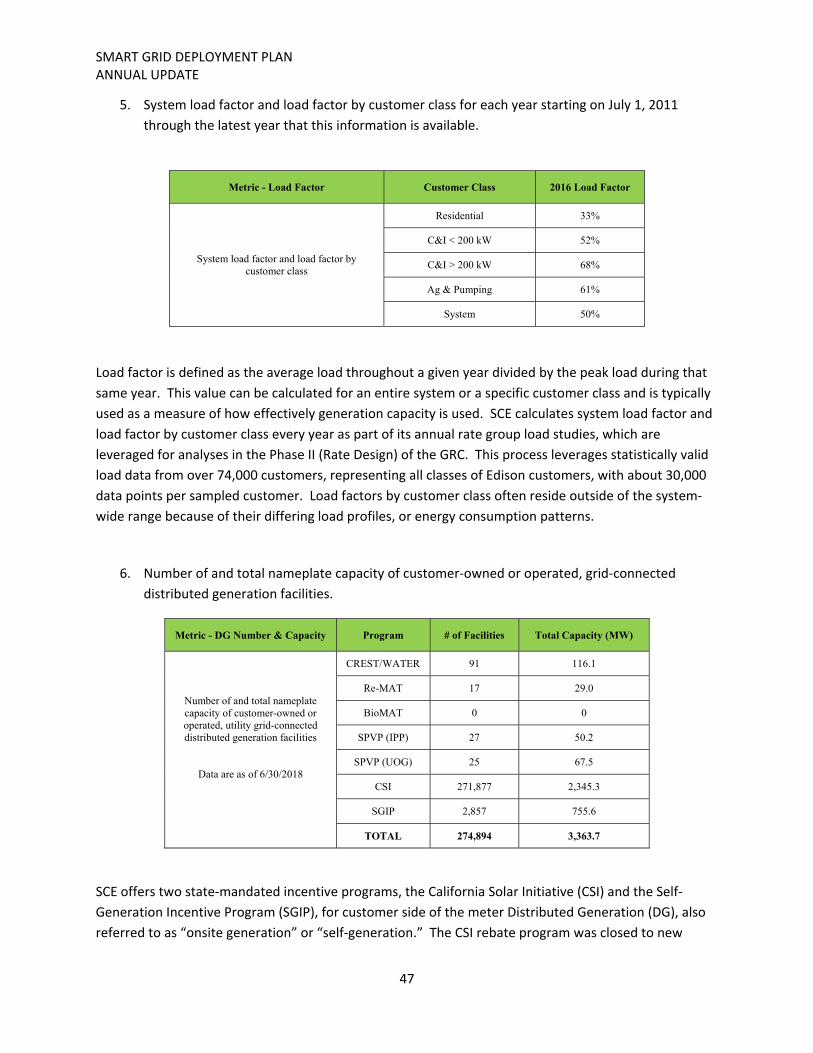
SMART GRID DEPLOYMENT PLAN ANNUAL UPDATE
47
5. System load factor and load factor by customer class for each year starting on July 1, 2011
through the latest year that this information is available.
Metric - Load Factor Customer Class 2016 Load Factor
System load factor and load factor by customer class
Residential 33%
C&I < 200 kW 52%
C&I > 200 kW 68%
Ag & Pumping 61%
System 50%
Load factor is defined as the average load throughout a given year divided by the peak load during that
same year. This value can be calculated for an entire system or a specific customer class and is typically
used as a measure of how effectively generation capacity is used. SCE calculates system load factor and
load factor by customer class every year as part of its annual rate group load studies, which are
leveraged for analyses in the Phase II (Rate Design) of the GRC. This process leverages statistically valid
load data from over 74,000 customers, representing all classes of Edison customers, with about 30,000
data points per sampled customer. Load factors by customer class often reside outside of the system‐
wide range because of their differing load profiles, or energy consumption patterns.
6. Number of and total nameplate capacity of customer‐owned or operated, grid‐connected
distributed generation facilities.
Metric - DG Number & Capacity Program # of Facilities Total Capacity (MW)
Number of and total nameplate capacity of customer-owned or operated, utility grid-connected distributed generation facilities
Data are as of 6/30/2018
CREST/WATER 91 116.1
Re-MAT 17 29.0
BioMAT 0 0
SPVP (IPP) 27 50.2
SPVP (UOG) 25 67.5
CSI 271,877 2,345.3
SGIP 2,857 755.6
TOTAL 274,894 3,363.7
SCE offers two state‐mandated incentive programs, the California Solar Initiative (CSI) and the Self‐
Generation Incentive Program (SGIP), for customer side of the meter Distributed Generation (DG), also
referred to as “onsite generation” or “self‐generation.” The CSI rebate program was closed to new

SMART GRID DEPLOYMENT PLAN ANNUAL UPDATE
48
applicants on Dec 31, 2016. This program provided incentives for 63,942 facilities representing 898 MW
of generation capacity. Its intention was to jump‐start the solar industry in California. While CSI
installations continued at a very heavy pace during the Reporting Period, very few relied upon an
incentive program. The SGIP program has increased due to the addition of Advanced Energy Storage
technology, i.e. batteries that can pair with any existing SGIP technology, including, but not limited to
solar, fuel cells, or wind.
SCE also supports programs and policies related to the procurement of utility‐side of the meter DG, also
called “wholesale” or “system‐side generation” because it is intended to net export onto the electrical
system on the other side of the customer meter or connect to the distribution system directly. SCE
offers a renewable feed‐in tariff under the Renewable Energy Market Adjusting Tariff (Re‐MAT) and the
Bioenergy Market Adjusting Tariff (BioMAT) programs which executes a power purchase agreement
where SCE will pay for either the total or excess energy a customer generates through facilities not
greater than 3 MW. SCE’s Re‐MAT program allows for the integration of 140 MWs of renewable
generation, with 53 MWs of Re‐MAT generation currently contracted for with SCE as of September
2018.
SCE’s Bio‐MAT program allows for the integration of 115 MWs of renewable bioenergy generation, with
8 MWs of Bio‐MAT generation currently contracted for with SCE as of September 2018. Projects under
both Re‐MAT and BioMAT are currently delivering electricity to customers within SCE’s service territory.
SCE’s Solar Photovoltaic Program (SPVP) allows SCE, over a five‐year period, to build and operate no less
than 91 MW of utility‐owned solar photovoltaic capacity and to execute contracts up to 125 MW for
generation from similar facilities owned and maintained by independent power producers (IPPs)
through a competitive solicitation process.46 This program is primarily applicable to rooftop solar PV
facilities with a small portion of ground‐mounted facilities.
7. Total electricity deliveries from customer‐owned or operated, grid‐connected distributed
generation facilities, reported by month and by ISO sub‐Load Aggregation Point.
Metric - DG Electric Deliveries Program GWhs
Total annual electricity deliveries from customer-owned or operated, utility grid-connected DG facilities
* Data are as available for period 1/1/2011 – 4/30/2018
CREST/WATER* 1,103.2
Re-MAT* 107.2
BioMAT 0
SPVP (IPP)* 354.2
SPVP (Utility owned Generation
(UOG))* 630.4
Net Surplus Compensation
(NSC) 157
46 The Renewable Auction Mechanism (RAM) component of SPVP involves procuring 284 MW DC of SPVP
through RAM (256 MW AC). This 256 MW AC is subject to RAM protocols and practices. Please see D.13‐05‐033, Attachment 1.
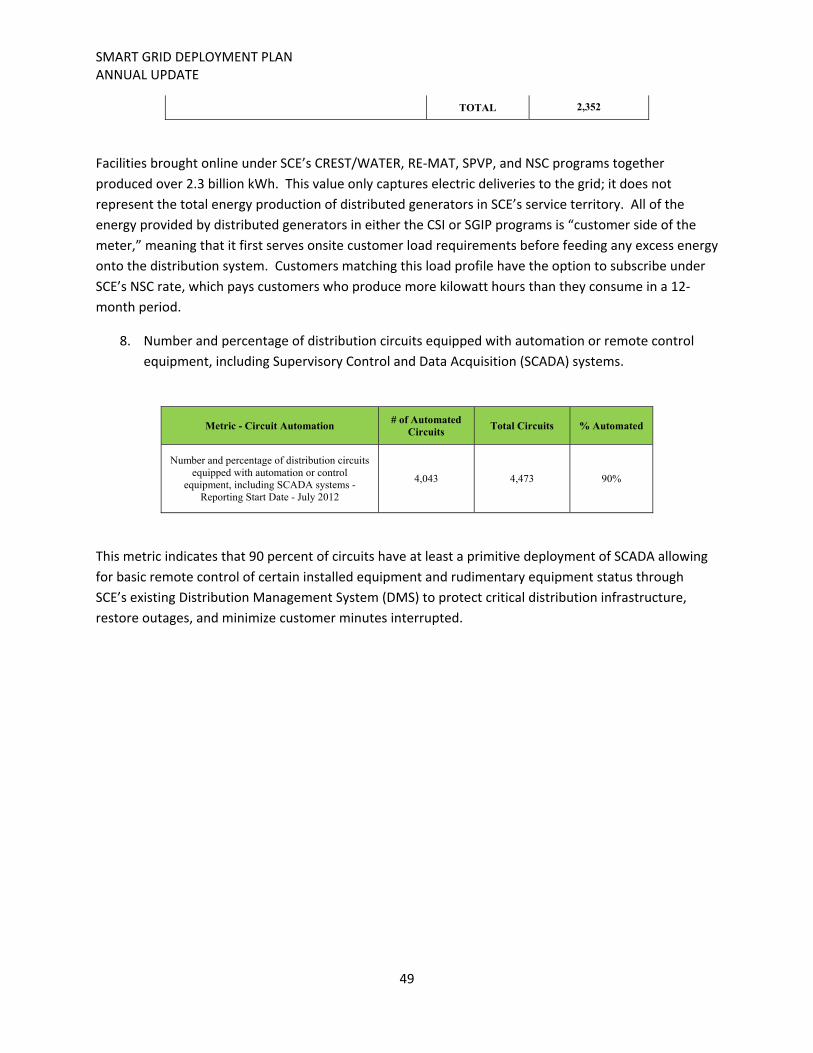
SMART GRID DEPLOYMENT PLAN ANNUAL UPDATE
49
TOTAL 2,352
Facilities brought online under SCE’s CREST/WATER, RE‐MAT, SPVP, and NSC programs together
produced over 2.3 billion kWh. This value only captures electric deliveries to the grid; it does not
represent the total energy production of distributed generators in SCE’s service territory. All of the
energy provided by distributed generators in either the CSI or SGIP programs is “customer side of the
meter,” meaning that it first serves onsite customer load requirements before feeding any excess energy
onto the distribution system. Customers matching this load profile have the option to subscribe under
SCE’s NSC rate, which pays customers who produce more kilowatt hours than they consume in a 12‐
month period.
8. Number and percentage of distribution circuits equipped with automation or remote control
equipment, including Supervisory Control and Data Acquisition (SCADA) systems.
Metric - Circuit Automation # of Automated
Circuits Total Circuits % Automated
Number and percentage of distribution circuits equipped with automation or control
equipment, including SCADA systems - Reporting Start Date - July 2012
4,043 4,473 90%
This metric indicates that 90 percent of circuits have at least a primitive deployment of SCADA allowing
for basic remote control of certain installed equipment and rudimentary equipment status through
SCE’s existing Distribution Management System (DMS) to protect critical distribution infrastructure,
restore outages, and minimize customer minutes interrupted.
SMART GRID DEPLOYMENT PLAN ANNUAL UPDATE
50
Appendix 1
Smart Grid Customer Engagement by Initiative
SMART GRID DEPLOYMENT PLAN ANNUAL UPDATE
51
Smart Grid Engagement by Initiative. As requested by CPUC staff in its March 1, 2012 Smart Grid Workshop Report, the information presented in this appendix provides the customer engagement elements (i.e., project description, target audience, sample message, source of message, current road blocks and strategies to overcome roadblocks) for the following initiatives:
Customer Premise Devices
1. Near Real‐Time Usage (HAN)
Online Tools
1. Integrated Audit Tool 2. Web Presentment Tools 3. Budget Assistant 4. Green Button Download My Data 5. Green Button Connect My Data 6. Mobile‐Optimized Outage Center
Rates and Programs
1. Smart Energy Program (formerly Save Power Days/PTR) 2. PEV Time‐of‐Use Rates 3. Clean Fuel Rewards Program 4. Charge Ready Program 5. Residential TOU Rates
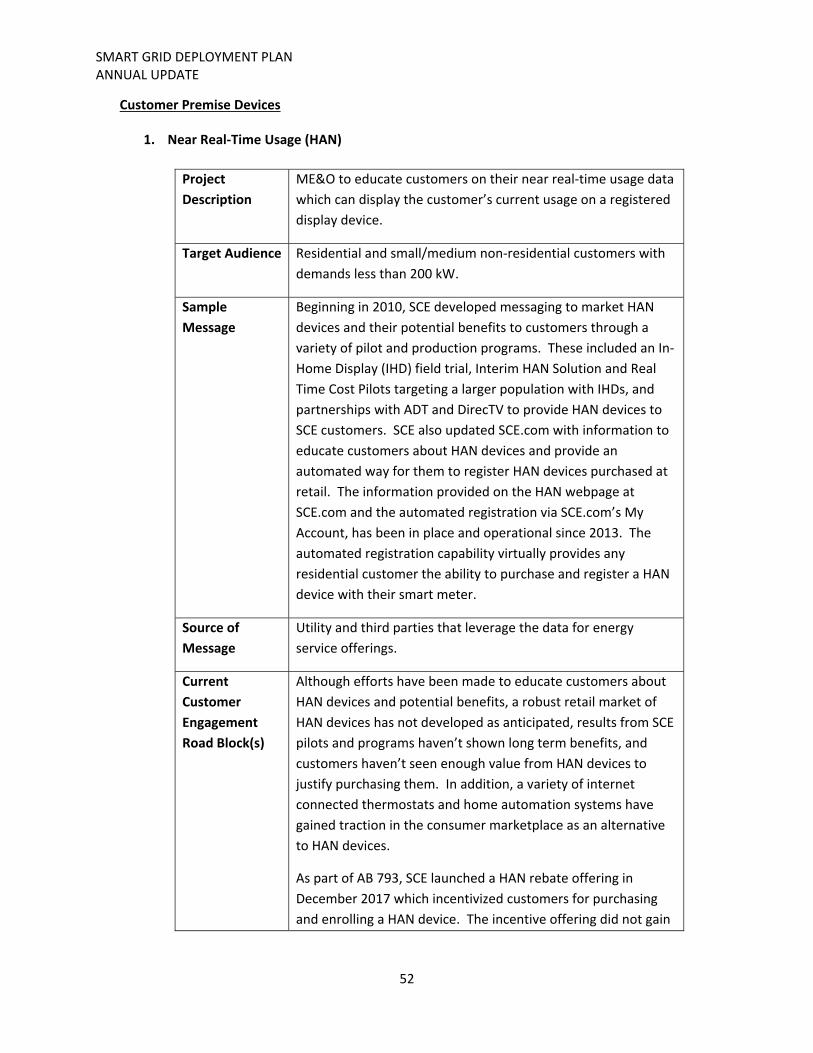
SMART GRID DEPLOYMENT PLAN ANNUAL UPDATE
52
Customer Premise Devices
1. Near Real‐Time Usage (HAN)
Project
Description
ME&O to educate customers on their near real‐time usage data
which can display the customer’s current usage on a registered
display device.
Target Audience Residential and small/medium non‐residential customers with
demands less than 200 kW.
Sample
Message
Beginning in 2010, SCE developed messaging to market HAN
devices and their potential benefits to customers through a
variety of pilot and production programs. These included an In‐
Home Display (IHD) field trial, Interim HAN Solution and Real
Time Cost Pilots targeting a larger population with IHDs, and
partnerships with ADT and DirecTV to provide HAN devices to
SCE customers. SCE also updated SCE.com with information to
educate customers about HAN devices and provide an
automated way for them to register HAN devices purchased at
retail. The information provided on the HAN webpage at
SCE.com and the automated registration via SCE.com’s My
Account, has been in place and operational since 2013. The
automated registration capability virtually provides any
residential customer the ability to purchase and register a HAN
device with their smart meter.
Source of
Message
Utility and third parties that leverage the data for energy
service offerings.
Current
Customer
Engagement
Road Block(s)
Although efforts have been made to educate customers about
HAN devices and potential benefits, a robust retail market of
HAN devices has not developed as anticipated, results from SCE
pilots and programs haven’t shown long term benefits, and
customers haven’t seen enough value from HAN devices to
justify purchasing them. In addition, a variety of internet
connected thermostats and home automation systems have
gained traction in the consumer marketplace as an alternative
to HAN devices.
As part of AB 793, SCE launched a HAN rebate offering in
December 2017 which incentivized customers for purchasing
and enrolling a HAN device. The incentive offering did not gain

SMART GRID DEPLOYMENT PLAN ANNUAL UPDATE
53
traction and only accounted for 25 new enrollments through
June 30, 2018.
Strategy to
Overcome
Roadblocks
Based on consumer needs and the evolving marketplace, HAN
devices have been superseded by internet connected home
automation devices such as smart thermostats. SCE’s strategy
has been to support the needs of the marketplace and develop
programs that utilize devices being purchased and installed by
our customers. However, SCE will continue to support
customers who purchase HAN devices and connect them to
their smart meter.

SMART GRID DEPLOYMENT PLAN ANNUAL UPDATE
54
Online Tools
1. Enhanced Energy Advisor Tool (EEAT) aka Integrated Audit Tool
Project
Description
Our Enhanced Energy Advisor Tool (EEAT) is a "do‐it‐yourself"
online survey where customers can complete a five‐minute
survey about their homes at www.sce.com/energysurvey. The
survey asks customers to share characteristics about their
homes’ structures, heating & cooling, appliances and other
installed equipment. Once the survey is complete and a
customer is logged in, customers can:
• View their historical Energy Use and compare their
usage to similar neighbors
Receive helpful “Ways to Save” or customized tips based on
their survey input that will help lower energy consumption.
In 2018, SCE added a direct link inside all SCE My Accounts to
help customers easily navigate to the survey.
Target Audience Residential and business customers.
Sample
Message
“Ready to find simple and often low‐ or no‐cost ways to make
your home more energy efficient? Reducing your monthly bill
could be easier than you think. Our Energy Advisor is an online
survey that gives you customized savings recommendations.
Plus, find out what uses the most energy in your home so you
can maximize on your savings.”
Source of
Message
Utility
Current
Customer
Engagement
Road Block(s)
A workpaper is being developed in order to claim kilowatt and
demand savings for completing surveys. SCE estimates
completing this in late 2018 or early 2019.
Strategy to
Overcome
Roadblocks
Develop marketing initiatives to drive customer participation
and engagement. Once participation reaches 30,000 SCE can
start developing a workpaper.
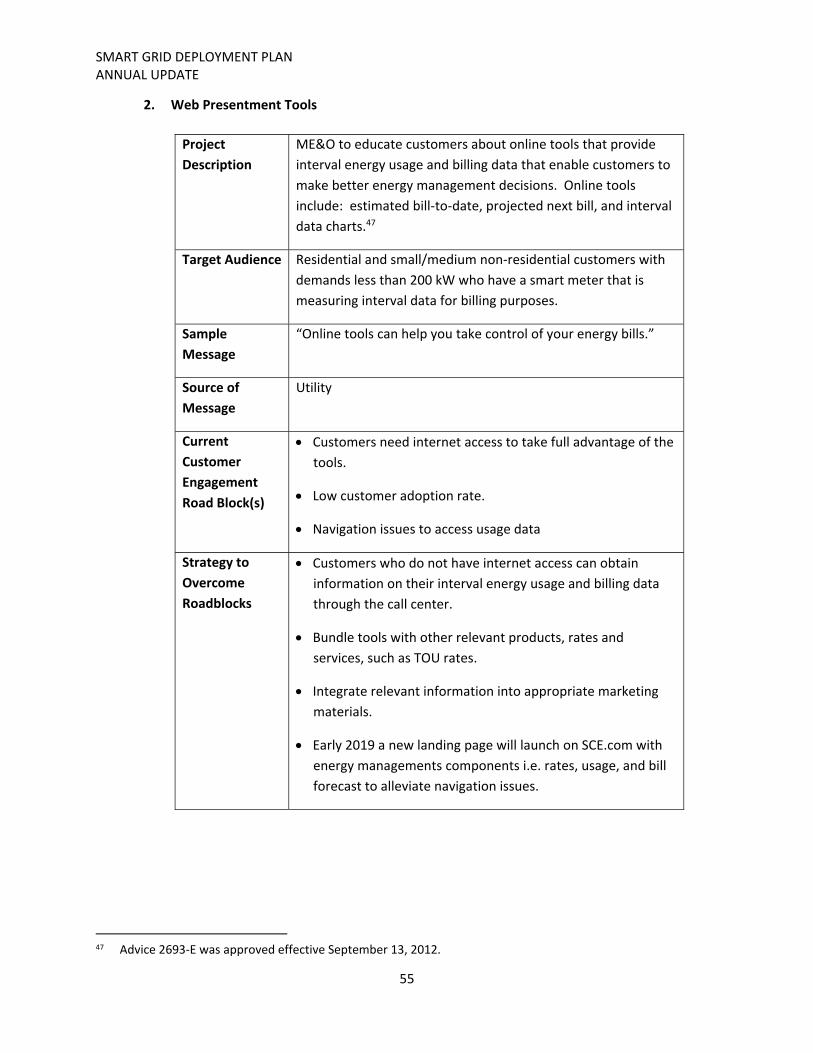
SMART GRID DEPLOYMENT PLAN ANNUAL UPDATE
55
2. Web Presentment Tools
Project
Description
ME&O to educate customers about online tools that provide
interval energy usage and billing data that enable customers to
make better energy management decisions. Online tools
include: estimated bill‐to‐date, projected next bill, and interval
data charts.47
Target Audience Residential and small/medium non‐residential customers with
demands less than 200 kW who have a smart meter that is
measuring interval data for billing purposes.
Sample
Message
“Online tools can help you take control of your energy bills.”
Source of
Message
Utility
Current
Customer
Engagement
Road Block(s)
Customers need internet access to take full advantage of the
tools.
Low customer adoption rate.
Navigation issues to access usage data
Strategy to
Overcome
Roadblocks
Customers who do not have internet access can obtain
information on their interval energy usage and billing data
through the call center.
Bundle tools with other relevant products, rates and services, such as TOU rates.
Integrate relevant information into appropriate marketing
materials.
Early 2019 a new landing page will launch on SCE.com with
energy managements components i.e. rates, usage, and bill
forecast to alleviate navigation issues.
47 Advice 2693‐E was approved effective September 13, 2012.
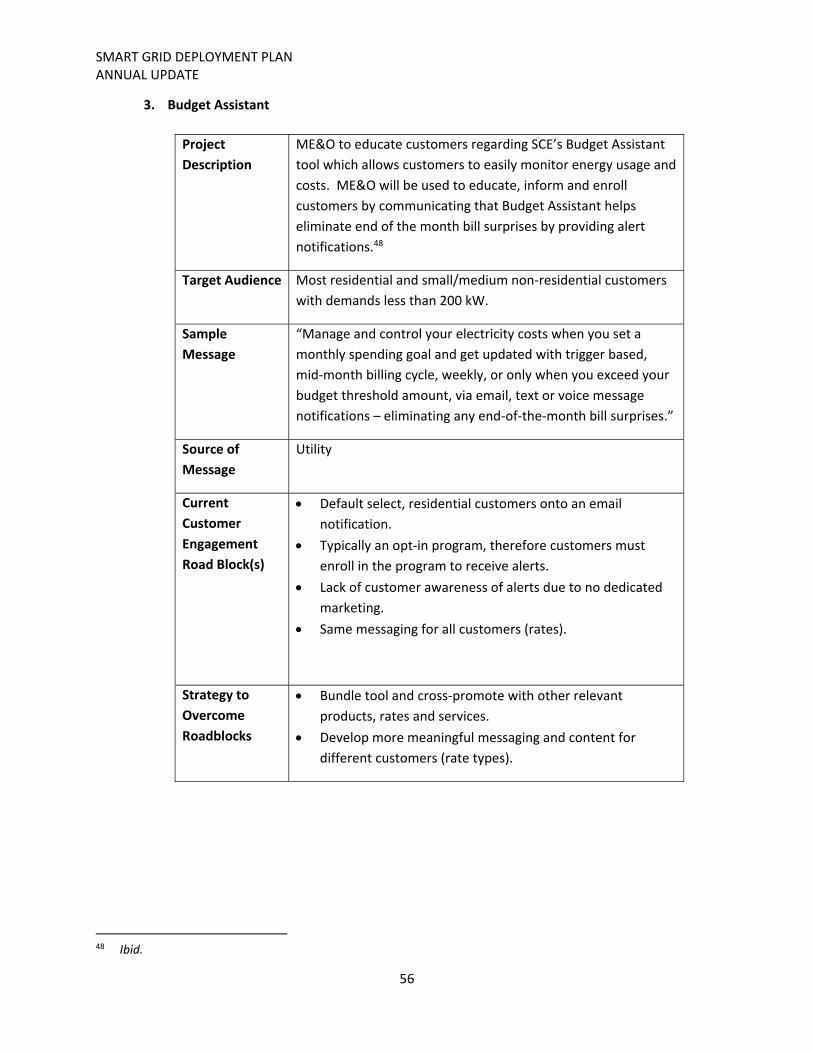
SMART GRID DEPLOYMENT PLAN ANNUAL UPDATE
56
3. Budget Assistant
Project
Description
ME&O to educate customers regarding SCE’s Budget Assistant
tool which allows customers to easily monitor energy usage and
costs. ME&O will be used to educate, inform and enroll
customers by communicating that Budget Assistant helps
eliminate end of the month bill surprises by providing alert
notifications.48
Target Audience Most residential and small/medium non‐residential customers
with demands less than 200 kW.
Sample
Message
“Manage and control your electricity costs when you set a
monthly spending goal and get updated with trigger based,
mid‐month billing cycle, weekly, or only when you exceed your
budget threshold amount, via email, text or voice message
notifications – eliminating any end‐of‐the‐month bill surprises.”
Source of
Message
Utility
Current
Customer
Engagement
Road Block(s)
Default select, residential customers onto an email
notification.
Typically an opt‐in program, therefore customers must
enroll in the program to receive alerts.
Lack of customer awareness of alerts due to no dedicated
marketing.
Same messaging for all customers (rates).
Strategy to
Overcome
Roadblocks
Bundle tool and cross‐promote with other relevant
products, rates and services.
Develop more meaningful messaging and content for
different customers (rate types).
48 Ibid.
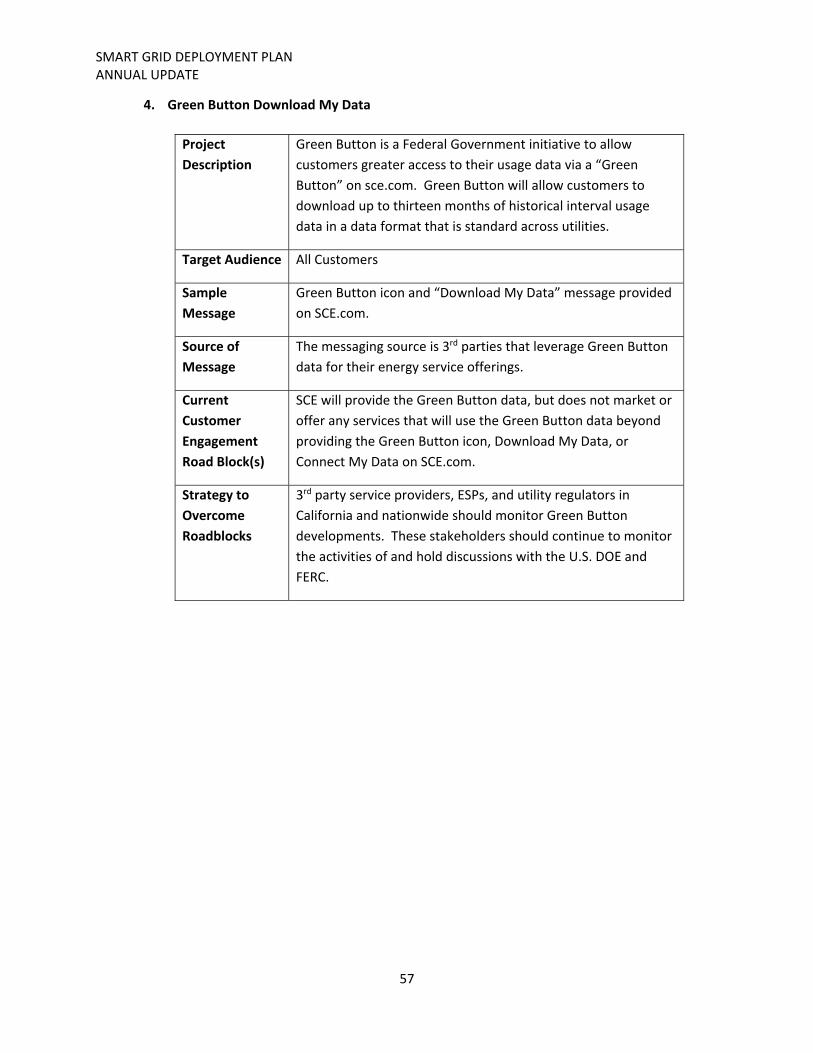
SMART GRID DEPLOYMENT PLAN ANNUAL UPDATE
57
4. Green Button Download My Data
Project
Description
Green Button is a Federal Government initiative to allow
customers greater access to their usage data via a “Green
Button” on sce.com. Green Button will allow customers to
download up to thirteen months of historical interval usage
data in a data format that is standard across utilities.
Target Audience All Customers
Sample
Message
Green Button icon and “Download My Data” message provided
on SCE.com.
Source of
Message
The messaging source is 3rd parties that leverage Green Button
data for their energy service offerings.
Current
Customer
Engagement
Road Block(s)
SCE will provide the Green Button data, but does not market or
offer any services that will use the Green Button data beyond
providing the Green Button icon, Download My Data, or
Connect My Data on SCE.com.
Strategy to
Overcome
Roadblocks
3rd party service providers, ESPs, and utility regulators in
California and nationwide should monitor Green Button
developments. These stakeholders should continue to monitor
the activities of and hold discussions with the U.S. DOE and
FERC.
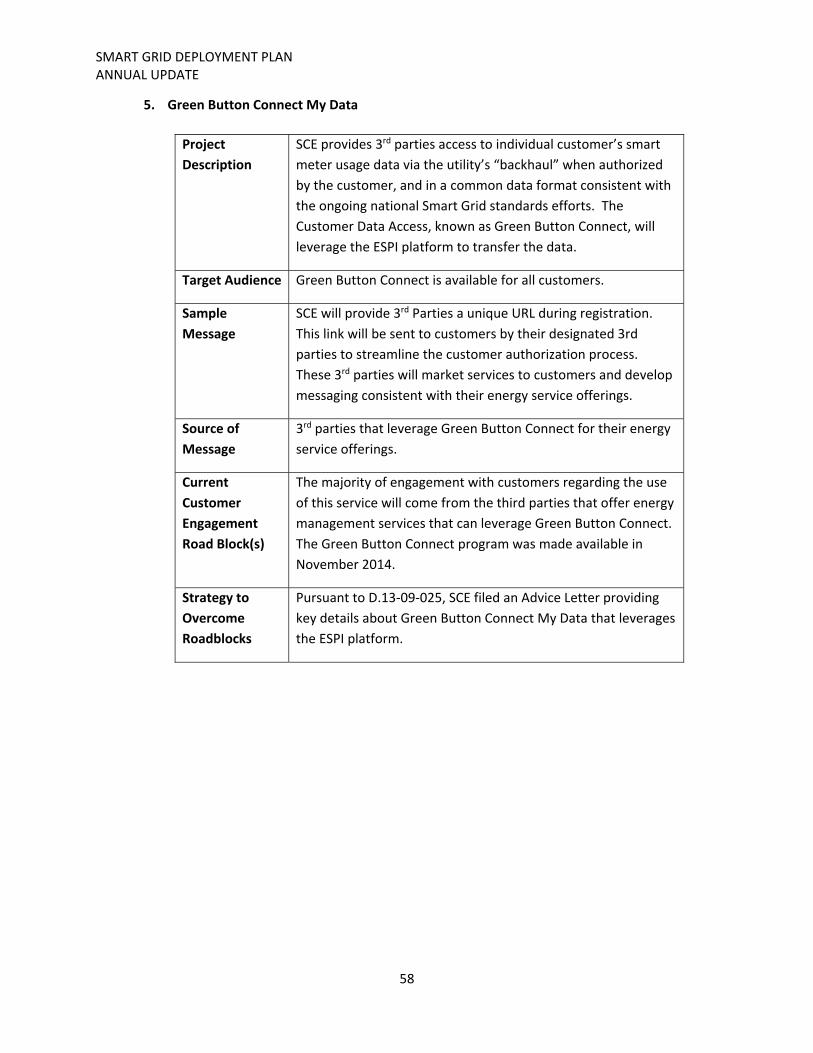
SMART GRID DEPLOYMENT PLAN ANNUAL UPDATE
58
5. Green Button Connect My Data
Project
Description
SCE provides 3rd parties access to individual customer’s smart
meter usage data via the utility’s “backhaul” when authorized
by the customer, and in a common data format consistent with
the ongoing national Smart Grid standards efforts. The
Customer Data Access, known as Green Button Connect, will
leverage the ESPI platform to transfer the data.
Target Audience Green Button Connect is available for all customers.
Sample
Message
SCE will provide 3rd Parties a unique URL during registration.
This link will be sent to customers by their designated 3rd
parties to streamline the customer authorization process.
These 3rd parties will market services to customers and develop
messaging consistent with their energy service offerings.
Source of
Message
3rd parties that leverage Green Button Connect for their energy
service offerings.
Current
Customer
Engagement
Road Block(s)
The majority of engagement with customers regarding the use
of this service will come from the third parties that offer energy
management services that can leverage Green Button Connect.
The Green Button Connect program was made available in
November 2014.
Strategy to
Overcome
Roadblocks
Pursuant to D.13‐09‐025, SCE filed an Advice Letter providing
key details about Green Button Connect My Data that leverages
the ESPI platform.
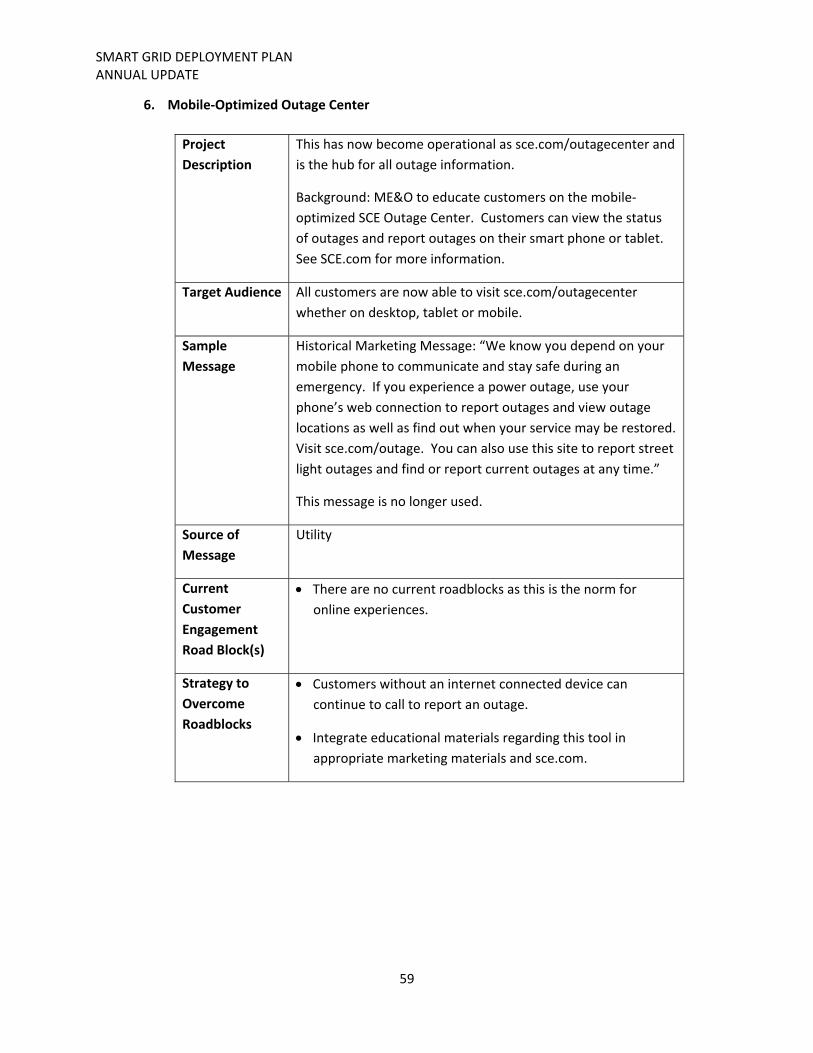
SMART GRID DEPLOYMENT PLAN ANNUAL UPDATE
59
6. Mobile‐Optimized Outage Center
Project
Description
This has now become operational as sce.com/outagecenter and
is the hub for all outage information.
Background: ME&O to educate customers on the mobile‐
optimized SCE Outage Center. Customers can view the status
of outages and report outages on their smart phone or tablet.
See SCE.com for more information.
Target Audience All customers are now able to visit sce.com/outagecenter
whether on desktop, tablet or mobile.
Sample
Message
Historical Marketing Message: “We know you depend on your
mobile phone to communicate and stay safe during an
emergency. If you experience a power outage, use your
phone’s web connection to report outages and view outage
locations as well as find out when your service may be restored.
Visit sce.com/outage. You can also use this site to report street
light outages and find or report current outages at any time.”
This message is no longer used.
Source of
Message
Utility
Current
Customer
Engagement
Road Block(s)
There are no current roadblocks as this is the norm for
online experiences.
Strategy to
Overcome
Roadblocks
Customers without an internet connected device can
continue to call to report an outage.
Integrate educational materials regarding this tool in
appropriate marketing materials and sce.com.
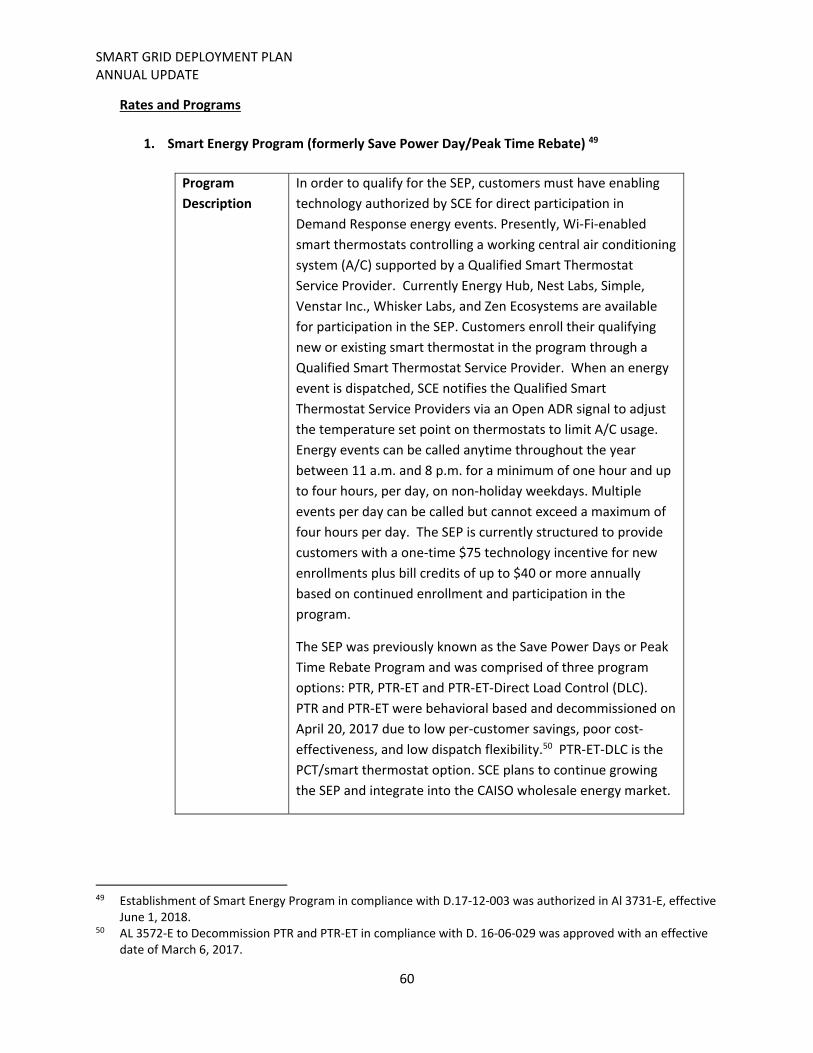
SMART GRID DEPLOYMENT PLAN ANNUAL UPDATE
60
Rates and Programs
1. Smart Energy Program (formerly Save Power Day/Peak Time Rebate) 49
Program
Description
In order to qualify for the SEP, customers must have enabling
technology authorized by SCE for direct participation in
Demand Response energy events. Presently, Wi‐Fi‐enabled
smart thermostats controlling a working central air conditioning
system (A/C) supported by a Qualified Smart Thermostat
Service Provider. Currently Energy Hub, Nest Labs, Simple,
Venstar Inc., Whisker Labs, and Zen Ecosystems are available
for participation in the SEP. Customers enroll their qualifying
new or existing smart thermostat in the program through a
Qualified Smart Thermostat Service Provider. When an energy
event is dispatched, SCE notifies the Qualified Smart
Thermostat Service Providers via an Open ADR signal to adjust
the temperature set point on thermostats to limit A/C usage.
Energy events can be called anytime throughout the year
between 11 a.m. and 8 p.m. for a minimum of one hour and up
to four hours, per day, on non‐holiday weekdays. Multiple
events per day can be called but cannot exceed a maximum of
four hours per day. The SEP is currently structured to provide
customers with a one‐time $75 technology incentive for new
enrollments plus bill credits of up to $40 or more annually
based on continued enrollment and participation in the
program.
The SEP was previously known as the Save Power Days or Peak
Time Rebate Program and was comprised of three program
options: PTR, PTR‐ET and PTR‐ET‐Direct Load Control (DLC).
PTR and PTR‐ET were behavioral based and decommissioned on
April 20, 2017 due to low per‐customer savings, poor cost‐
effectiveness, and low dispatch flexibility.50 PTR‐ET‐DLC is the
PCT/smart thermostat option. SCE plans to continue growing
the SEP and integrate into the CAISO wholesale energy market.
49 Establishment of Smart Energy Program in compliance with D.17‐12‐003 was authorized in Al 3731‐E, effective
June 1, 2018. 50 AL 3572‐E to Decommission PTR and PTR‐ET in compliance with D. 16‐06‐029 was approved with an effective
date of March 6, 2017.

SMART GRID DEPLOYMENT PLAN ANNUAL UPDATE
61
Target Audience Residential customers with a smart meter that is measuring
interval data for billing purposes and who purchase and install a
qualifying thermostat.
Sample
Message
“A BRILLIANT WAY TO SAVE ENERGY AND COSTS.
Why enroll in the Smart Energy Program?
A Wi‐Fi‐enabled smart thermostat is one of the easiest and
most efficient ways to reduce your electricity usage and help
you save on air‐conditioning (A/C) costs at home. And now you
can earn up to $150 from SCE and SoCalGas® ($75 SCE plus $75
SoCalGas) in a combined rebate and bill credits. There has
never been a better time to purchase a qualifying energy‐
efficient smart thermostat and enroll in the Smart Energy
Program.
HOW DOES THE PROGRAM WORK?
Simply enroll your new or existing qualifying smart
thermostat in a smart thermostat program of an
authorized vendor who participates in our Smart
Energy Program.
When an energy event is called, your smart thermostat
service provider may notify you prior to the start of an
event and adjust your A/C temperature setting to
reduce energy usage during the event.
Events can be called anytime throughout the year
between 11 a.m. and 8 p.m. for a minimum of one hour
and up to four hours, per day, on non‐holiday
weekdays. Multiple events per day can be called but
cannot exceed a maximum of four hours per day.
Earn up to $40 in bill credits every year for participating
from June 1 through September 30, plus get additional savings for participating in energy events. You can
expect to see bill credits on your monthly SCE
statements.
You always have the option to adjust your temperature
setting at your discretion.
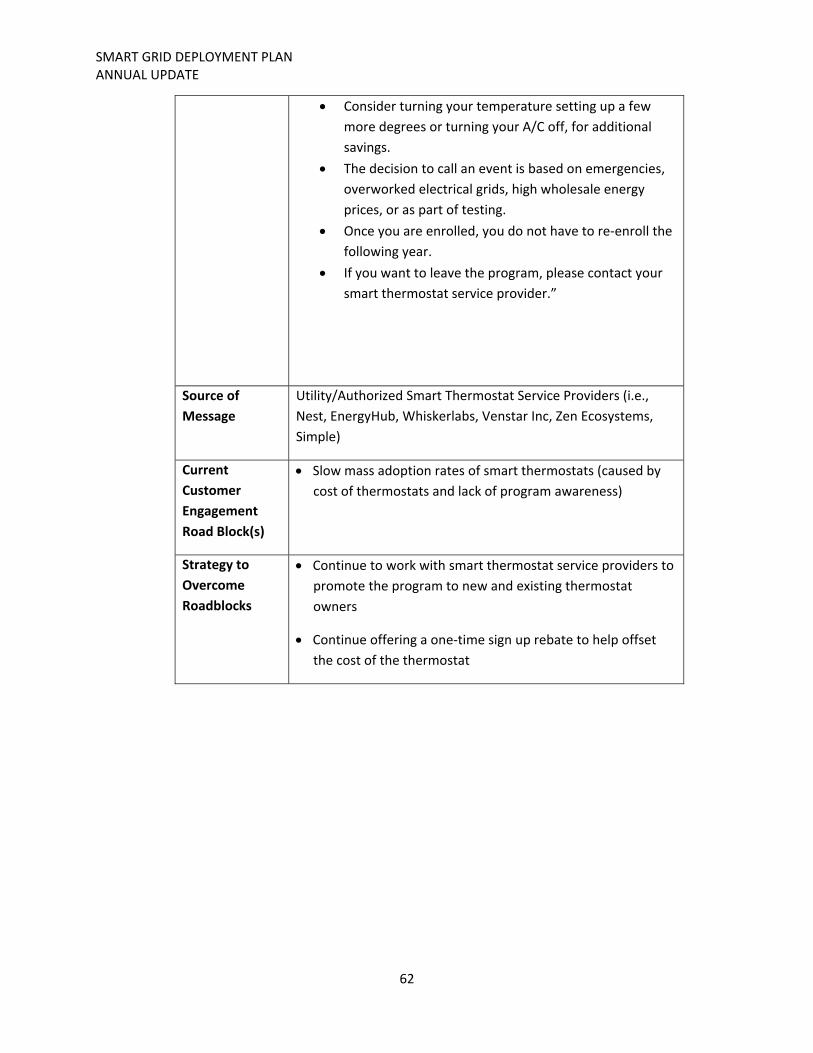
SMART GRID DEPLOYMENT PLAN ANNUAL UPDATE
62
Consider turning your temperature setting up a few
more degrees or turning your A/C off, for additional
savings.
The decision to call an event is based on emergencies,
overworked electrical grids, high wholesale energy
prices, or as part of testing.
Once you are enrolled, you do not have to re‐enroll the
following year.
If you want to leave the program, please contact your
smart thermostat service provider.”
Source of
Message
Utility/Authorized Smart Thermostat Service Providers (i.e.,
Nest, EnergyHub, Whiskerlabs, Venstar Inc, Zen Ecosystems,
Simple)
Current
Customer
Engagement
Road Block(s)
Slow mass adoption rates of smart thermostats (caused by
cost of thermostats and lack of program awareness)
Strategy to
Overcome
Roadblocks
Continue to work with smart thermostat service providers to
promote the program to new and existing thermostat
owners
Continue offering a one‐time sign up rebate to help offset
the cost of the thermostat
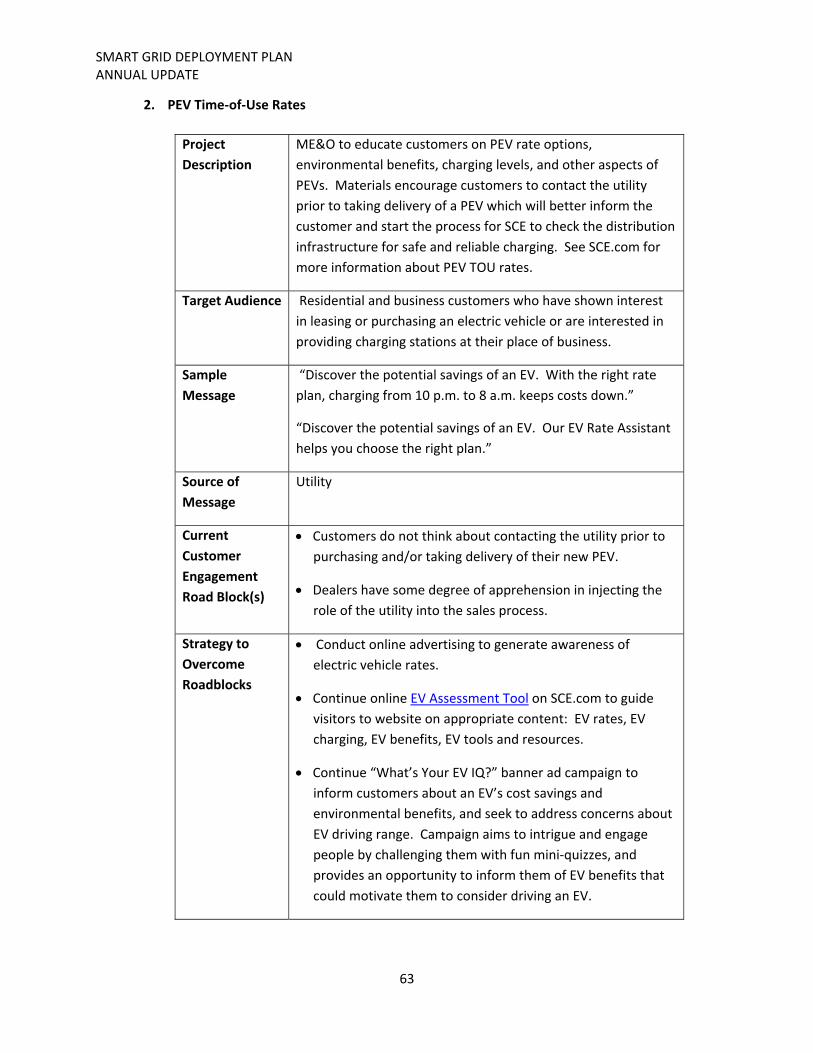
SMART GRID DEPLOYMENT PLAN ANNUAL UPDATE
63
2. PEV Time‐of‐Use Rates
Project
Description
ME&O to educate customers on PEV rate options,
environmental benefits, charging levels, and other aspects of
PEVs. Materials encourage customers to contact the utility
prior to taking delivery of a PEV which will better inform the
customer and start the process for SCE to check the distribution
infrastructure for safe and reliable charging. See SCE.com for
more information about PEV TOU rates.
Target Audience Residential and business customers who have shown interest
in leasing or purchasing an electric vehicle or are interested in
providing charging stations at their place of business.
Sample
Message
“Discover the potential savings of an EV. With the right rate
plan, charging from 10 p.m. to 8 a.m. keeps costs down.”
“Discover the potential savings of an EV. Our EV Rate Assistant
helps you choose the right plan.”
Source of
Message
Utility
Current
Customer
Engagement
Road Block(s)
Customers do not think about contacting the utility prior to
purchasing and/or taking delivery of their new PEV.
Dealers have some degree of apprehension in injecting the
role of the utility into the sales process.
Strategy to
Overcome
Roadblocks
Conduct online advertising to generate awareness of
electric vehicle rates.
Continue online EV Assessment Tool on SCE.com to guide
visitors to website on appropriate content: EV rates, EV
charging, EV benefits, EV tools and resources.
Continue “What’s Your EV IQ?” banner ad campaign to
inform customers about an EV’s cost savings and
environmental benefits, and seek to address concerns about
EV driving range. Campaign aims to intrigue and engage
people by challenging them with fun mini‐quizzes, and
provides an opportunity to inform them of EV benefits that
could motivate them to consider driving an EV.

SMART GRID DEPLOYMENT PLAN ANNUAL UPDATE
64
Developing business EV Rate Assistant Tool to allow business customers to evaluate their rate options available to serve
transportation electrification charging equipment.
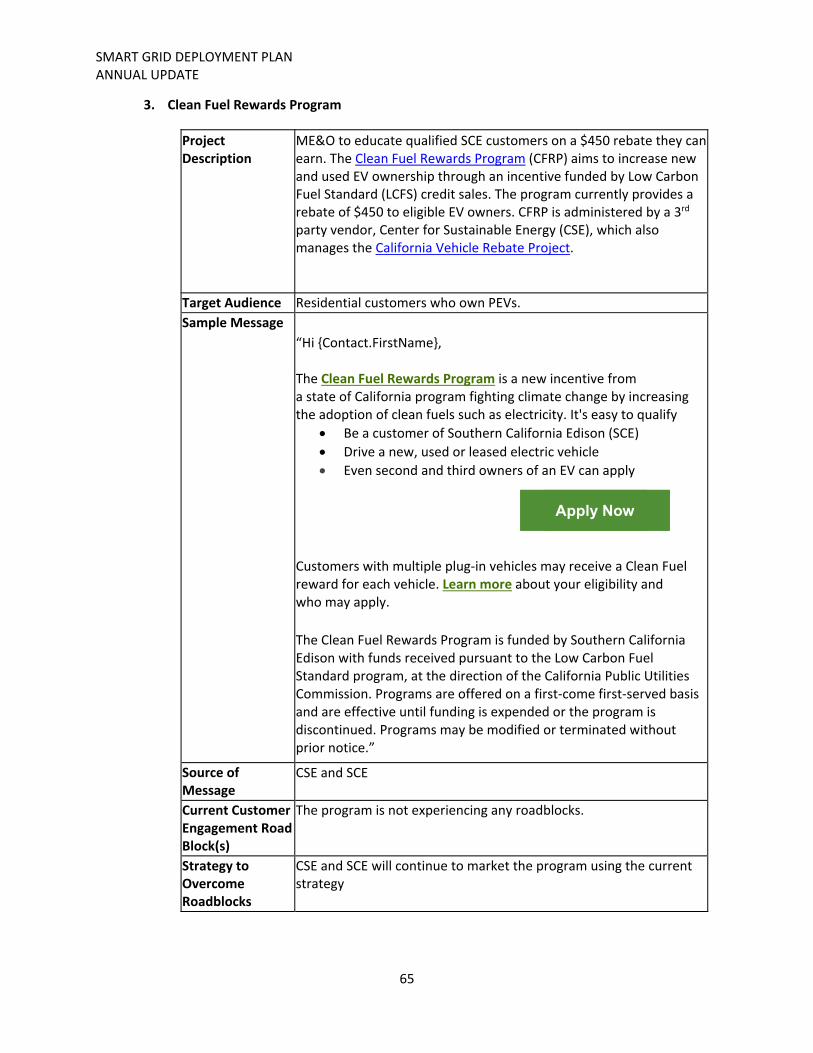
SMART GRID DEPLOYMENT PLAN ANNUAL UPDATE
65
3. Clean Fuel Rewards Program
Project Description
ME&O to educate qualified SCE customers on a $450 rebate they can earn. The Clean Fuel Rewards Program (CFRP) aims to increase new and used EV ownership through an incentive funded by Low Carbon Fuel Standard (LCFS) credit sales. The program currently provides a rebate of $450 to eligible EV owners. CFRP is administered by a 3rd party vendor, Center for Sustainable Energy (CSE), which also manages the California Vehicle Rebate Project.
Target Audience Residential customers who own PEVs.
Sample Message “Hi {Contact.FirstName}, The Clean Fuel Rewards Program is a new incentive from a state of California program fighting climate change by increasing the adoption of clean fuels such as electricity. It's easy to qualify
Be a customer of Southern California Edison (SCE)
Drive a new, used or leased electric vehicle
Even second and third owners of an EV can apply
Apply Now
Customers with multiple plug‐in vehicles may receive a Clean Fuel reward for each vehicle. Learn more about your eligibility and who may apply.
The Clean Fuel Rewards Program is funded by Southern California Edison with funds received pursuant to the Low Carbon Fuel Standard program, at the direction of the California Public Utilities Commission. Programs are offered on a first‐come first‐served basis and are effective until funding is expended or the program is discontinued. Programs may be modified or terminated without prior notice.”
Source of Message
CSE and SCE
Current Customer Engagement Road Block(s)
The program is not experiencing any roadblocks.
Strategy to Overcome Roadblocks
CSE and SCE will continue to market the program using the current strategy
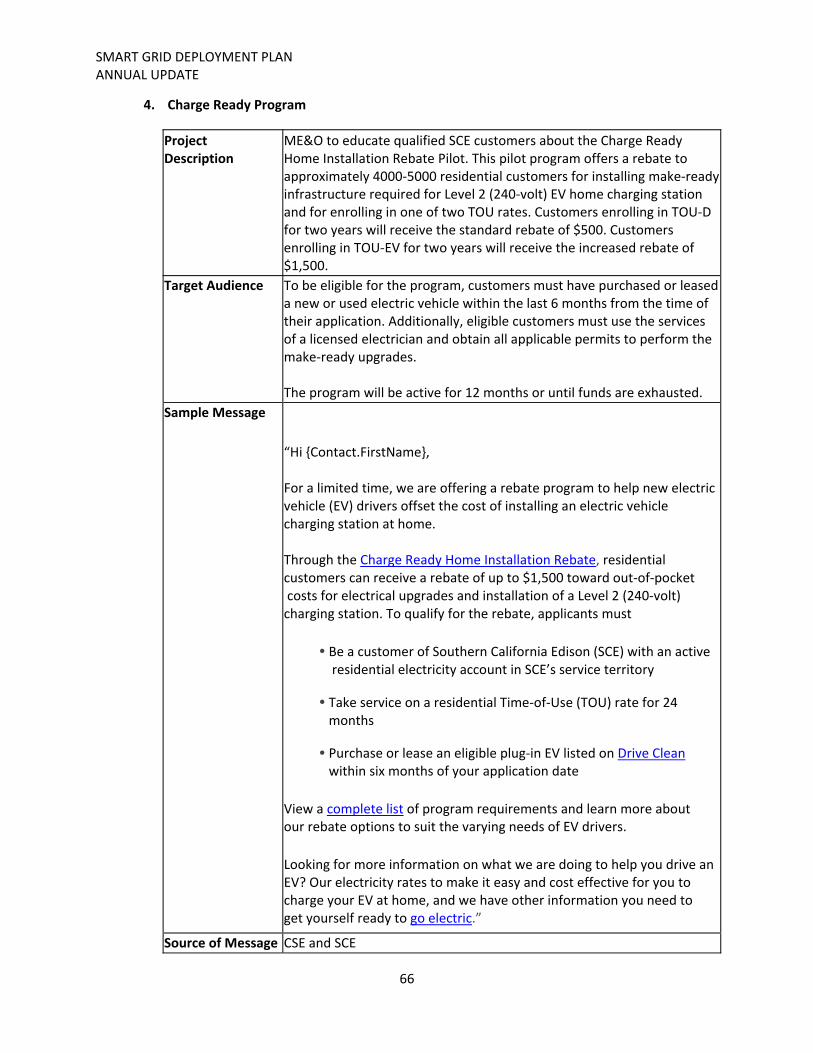
SMART GRID DEPLOYMENT PLAN ANNUAL UPDATE
66
4. Charge Ready Program
Project Description
ME&O to educate qualified SCE customers about the Charge Ready Home Installation Rebate Pilot. This pilot program offers a rebate to approximately 4000‐5000 residential customers for installing make‐ready infrastructure required for Level 2 (240‐volt) EV home charging station and for enrolling in one of two TOU rates. Customers enrolling in TOU‐D for two years will receive the standard rebate of $500. Customers enrolling in TOU‐EV for two years will receive the increased rebate of $1,500.
Target Audience To be eligible for the program, customers must have purchased or leased a new or used electric vehicle within the last 6 months from the time of their application. Additionally, eligible customers must use the services of a licensed electrician and obtain all applicable permits to perform the make‐ready upgrades. The program will be active for 12 months or until funds are exhausted.
Sample Message
“Hi {Contact.FirstName}, For a limited time, we are offering a rebate program to help new electric vehicle (EV) drivers offset the cost of installing an electric vehicle charging station at home. Through the Charge Ready Home Installation Rebate, residential customers can receive a rebate of up to $1,500 toward out‐of‐pocket costs for electrical upgrades and installation of a Level 2 (240‐volt) charging station. To qualify for the rebate, applicants must
• Be a customer of Southern California Edison (SCE) with an active residential electricity account in SCE’s service territory
• Take service on a residential Time‐of‐Use (TOU) rate for 24 months
• Purchase or lease an eligible plug‐in EV listed on Drive Clean within six months of your application date
View a complete list of program requirements and learn more about our rebate options to suit the varying needs of EV drivers.
Looking for more information on what we are doing to help you drive an EV? Our electricity rates to make it easy and cost effective for you to charge your EV at home, and we have other information you need to get yourself ready to go electric.”
Source of Message CSE and SCE
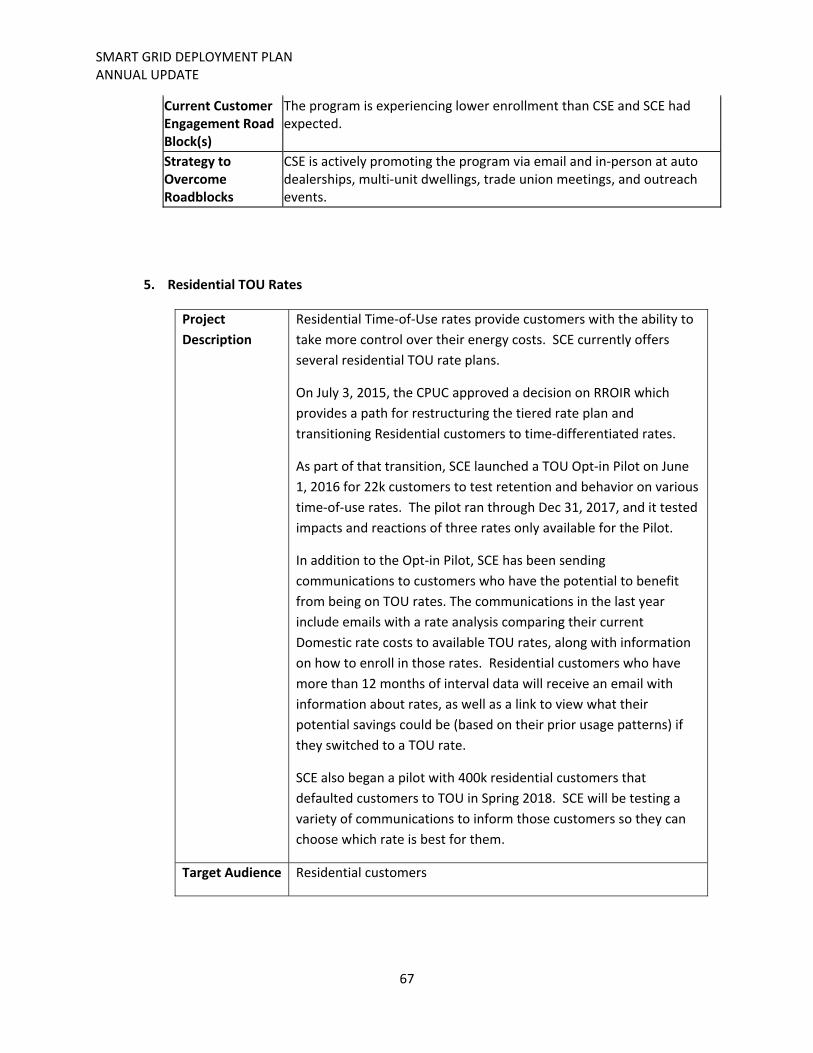
SMART GRID DEPLOYMENT PLAN ANNUAL UPDATE
67
Current Customer Engagement Road Block(s)
The program is experiencing lower enrollment than CSE and SCE had expected.
Strategy to Overcome Roadblocks
CSE is actively promoting the program via email and in‐person at auto dealerships, multi‐unit dwellings, trade union meetings, and outreach events.
5. Residential TOU Rates
Project
Description
Residential Time‐of‐Use rates provide customers with the ability to
take more control over their energy costs. SCE currently offers
several residential TOU rate plans.
On July 3, 2015, the CPUC approved a decision on RROIR which
provides a path for restructuring the tiered rate plan and
transitioning Residential customers to time‐differentiated rates.
As part of that transition, SCE launched a TOU Opt‐in Pilot on June
1, 2016 for 22k customers to test retention and behavior on various
time‐of‐use rates. The pilot ran through Dec 31, 2017, and it tested
impacts and reactions of three rates only available for the Pilot.
In addition to the Opt‐in Pilot, SCE has been sending
communications to customers who have the potential to benefit
from being on TOU rates. The communications in the last year
include emails with a rate analysis comparing their current
Domestic rate costs to available TOU rates, along with information
on how to enroll in those rates. Residential customers who have
more than 12 months of interval data will receive an email with
information about rates, as well as a link to view what their
potential savings could be (based on their prior usage patterns) if
they switched to a TOU rate.
SCE also began a pilot with 400k residential customers that
defaulted customers to TOU in Spring 2018. SCE will be testing a
variety of communications to inform those customers so they can
choose which rate is best for them.
Target Audience Residential customers
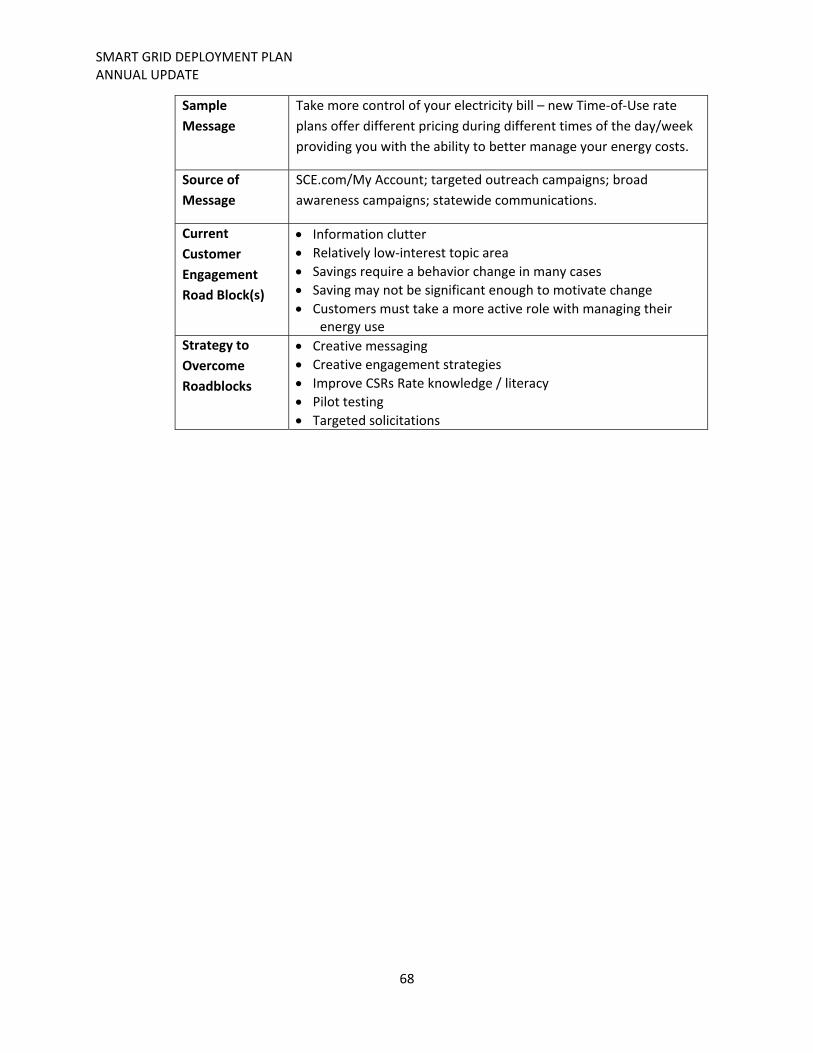
SMART GRID DEPLOYMENT PLAN ANNUAL UPDATE
68
Sample
Message
Take more control of your electricity bill – new Time‐of‐Use rate
plans offer different pricing during different times of the day/week
providing you with the ability to better manage your energy costs.
Source of
Message
SCE.com/My Account; targeted outreach campaigns; broad
awareness campaigns; statewide communications.
Current
Customer
Engagement
Road Block(s)
Information clutter
Relatively low‐interest topic area Savings require a behavior change in many cases
Saving may not be significant enough to motivate change
Customers must take a more active role with managing their energy use
Strategy to
Overcome
Roadblocks
Creative messaging
Creative engagement strategies
Improve CSRs Rate knowledge / literacy
Pilot testing Targeted solicitations
SMART GRID DEPLOYMENT PLAN ANNUAL UPDATE
69
Pilot and Demonstration Programs. In addition to the initiatives described above, SCE has launched a
Customer Empowerment pilot. Generally, SCE will provide pilots to a limited target audience for a
limited duration and SCE will not provide ME&O to its general customer population. However, pilots are
expected to provide SCE with an improved assessment of potential messaging, customer engagement
roadblocks, and potential strategies to overcome such roadblocks. Information regarding specific SCE
Customer Empowerment efforts is provided below:
TOU Opt‐in Pilot. The TOU Opt‐in Pilot was launched on June 1, 2016 an in effort to test a
number of objectives in the pilot design to help inform 2019 TOU residential default. These
objectives include but are not limited to the following:
a. Assessing customer understanding acceptance and satisfaction with, as well as
customer engagement and retention in various TOU rate options.
b. Assessing the degree of hardship that might result from default TOU rates on senior
households and economically vulnerable customers (and perhaps others) as
directed by Public Utilities Code Section 745.
c. Assessing adoption rates for enabling technology for customer on TOU rates.
d. Assessing the effectiveness of education and outreach options.
The pilot was completed on December 31, 2017.
TOU Default Pilot. The TOU Default launched on March 1, 2018 with 400,000 customers to
test retention and behavior on various TOU rates.
Communications launched in December 2017, informing customers of upcoming changes,
potential impacts to their bills and customer options.
Customers could opt out of the TOU altogether, switch to a different TOU option, or do
nothing and wait to be defaulted in March of 2018.
Messaging and retention of customers will be tracked to inform the full rollout of residential
TOU beginning in 2020.

SMART GRID DEPLOYMENT PLAN ANNUAL UPDATE
70
Appendix 2
Map of Baseline Regions
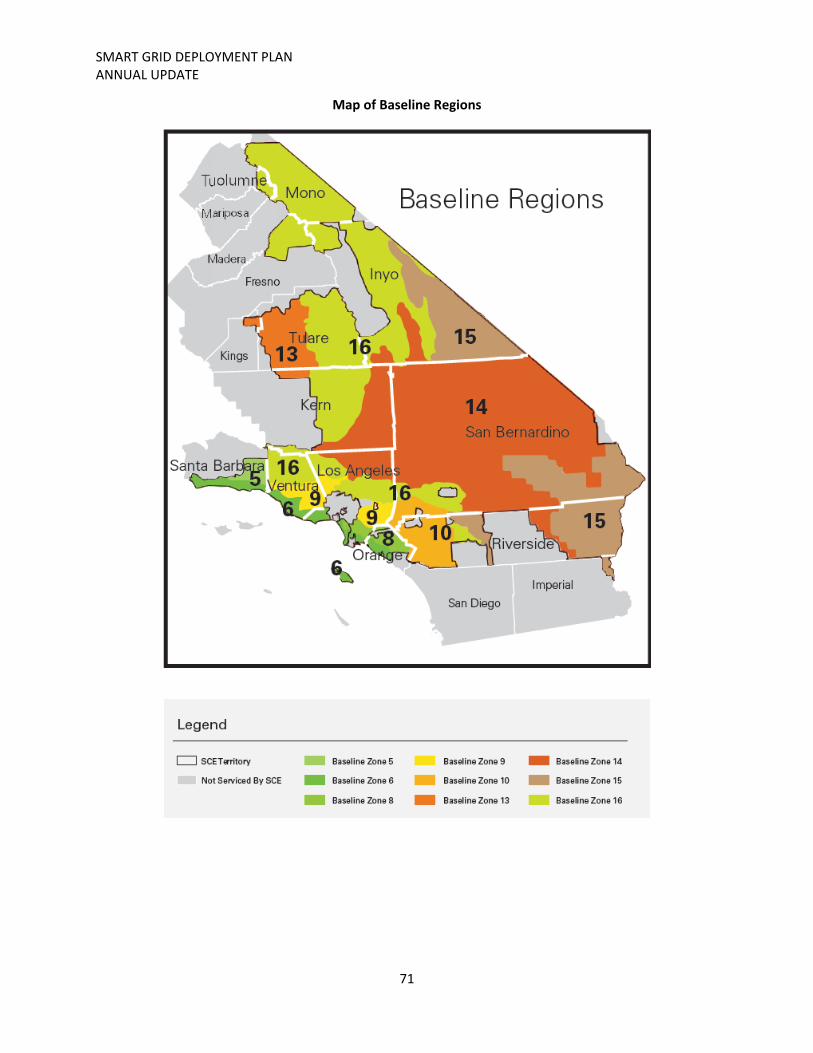
SMART GRID DEPLOYMENT PLAN ANNUAL UPDATE
71
Map of Baseline Regions

SMART GRID DEPLOYMENT PLAN ANNUAL UPDATE
72
Appendix 3
Table of Acronyms
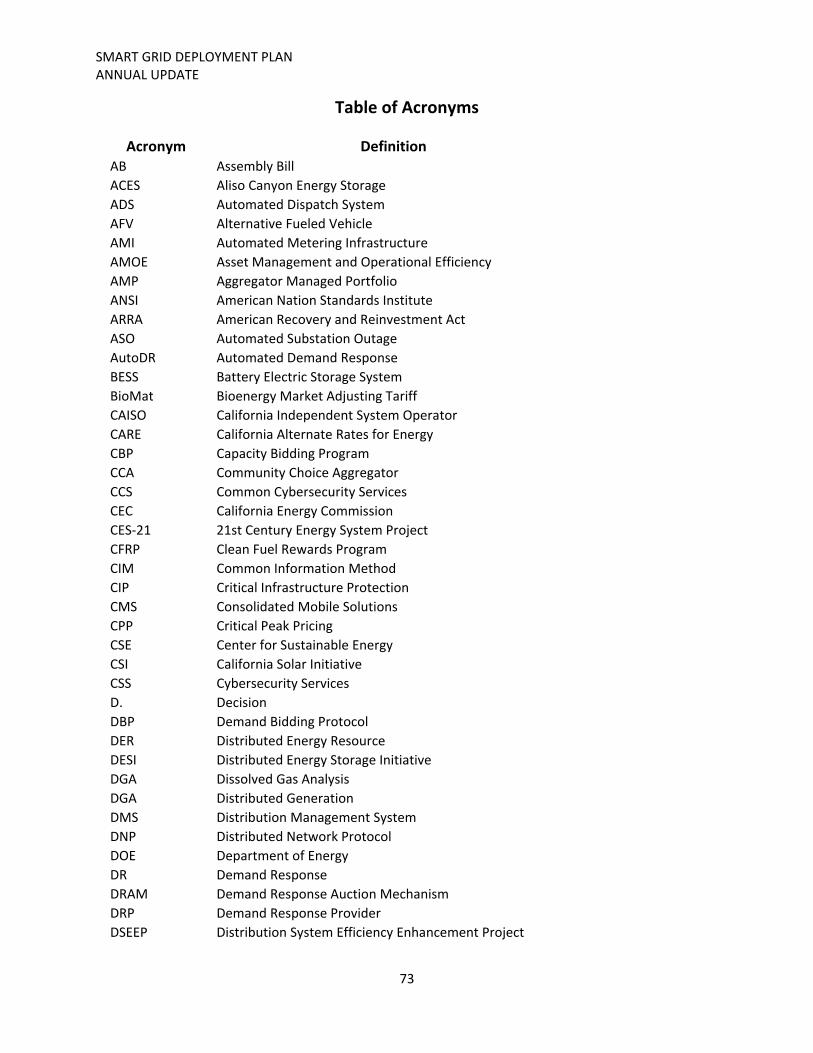
SMART GRID DEPLOYMENT PLAN ANNUAL UPDATE
73
Table of Acronyms
Acronym Definition AB Assembly Bill
ACES Aliso Canyon Energy Storage
ADS Automated Dispatch System
AFV Alternative Fueled Vehicle
AMI Automated Metering Infrastructure
AMOE Asset Management and Operational Efficiency
AMP Aggregator Managed Portfolio
ANSI American Nation Standards Institute
ARRA American Recovery and Reinvestment Act
ASO Automated Substation Outage
AutoDR Automated Demand Response
BESS Battery Electric Storage System
BioMat Bioenergy Market Adjusting Tariff
CAISO California Independent System Operator
CARE California Alternate Rates for Energy
CBP Capacity Bidding Program
CCA Community Choice Aggregator
CCS Common Cybersecurity Services
CEC California Energy Commission
CES‐21 21st Century Energy System Project
CFRP Clean Fuel Rewards Program
CIM Common Information Method
CIP Critical Infrastructure Protection
CMS Consolidated Mobile Solutions
CPP Critical Peak Pricing
CSE Center for Sustainable Energy
CSI California Solar Initiative
CSS Cybersecurity Services
D. Decision
DBP Demand Bidding Protocol
DER Distributed Energy Resource
DESI Distributed Energy Storage Initiative
DGA Dissolved Gas Analysis
DGA Distributed Generation
DMS Distribution Management System
DNP Distributed Network Protocol
DOE Department of Energy
DR Demand Response
DRAM Demand Response Auction Mechanism
DRP Demand Response Provider
DSEEP Distribution System Efficiency Enhancement Project

SMART GRID DEPLOYMENT PLAN ANNUAL UPDATE
74
DVVC Distribution Volt/VAR Control
EDEF Equipment Demonstration and Evaluation Facility
EEAT Enhanced Energy Advisor Tool
EISA Energy Independence and Security Act
EM&T Energy Management and Technology
ESP Energy Service Provider
ESPI Energy Services Provider Interface
ETR Estimated Time of Restoration
EV Electric Vehicle
FERC Federal Energy Regulatory Commission
GOOSE Generic Object Oriented System‐Wide Event
GRC General Rate Case
HAN Home Area Network
IEC International Electrotechnical Commission
IEEE Institute of Electrical and Electronics Engineers
IHD In Home Display
IMC Implementation and Methods
IP Internet Protocol
IPP Independent Power Producer
ISGD Irvine Smart Grid Demonstration
kV kilovolt
LCFS Low Carbon Fuel Standard
LLNL Lawrence Livermore National Laboratory
MAIFI Momentary Average Interruption Frequency Index
ME&O Marketing, Education and Outreach
NAESB North American Energy Standards Board
NEM Net Energy Metering
NERC North American Electric Reliability Corporation
NIST National Institute of Standards and Technology
NSC Net Surplus Compensation
OAN Outage Alert Notice
OIR Order Instituted Rulemaking
OMS Outage Management System
ONI Outage Notification
PAP Priority Action Plan
PCC Programmable Capacitor Controls
PCT Programmable Controllable Thermostat
PEV Plug‐In Electric Vehicle
PON Power Off Notification
PRN Power Restoration Notification
PTR Peak Time Rebate
PTR‐ET Peak Time Rebate Enabling Technologies
PTR‐ET‐DLC Peak Time Rebate Enabling Technologies Direct Load Control
R. Rulemaking
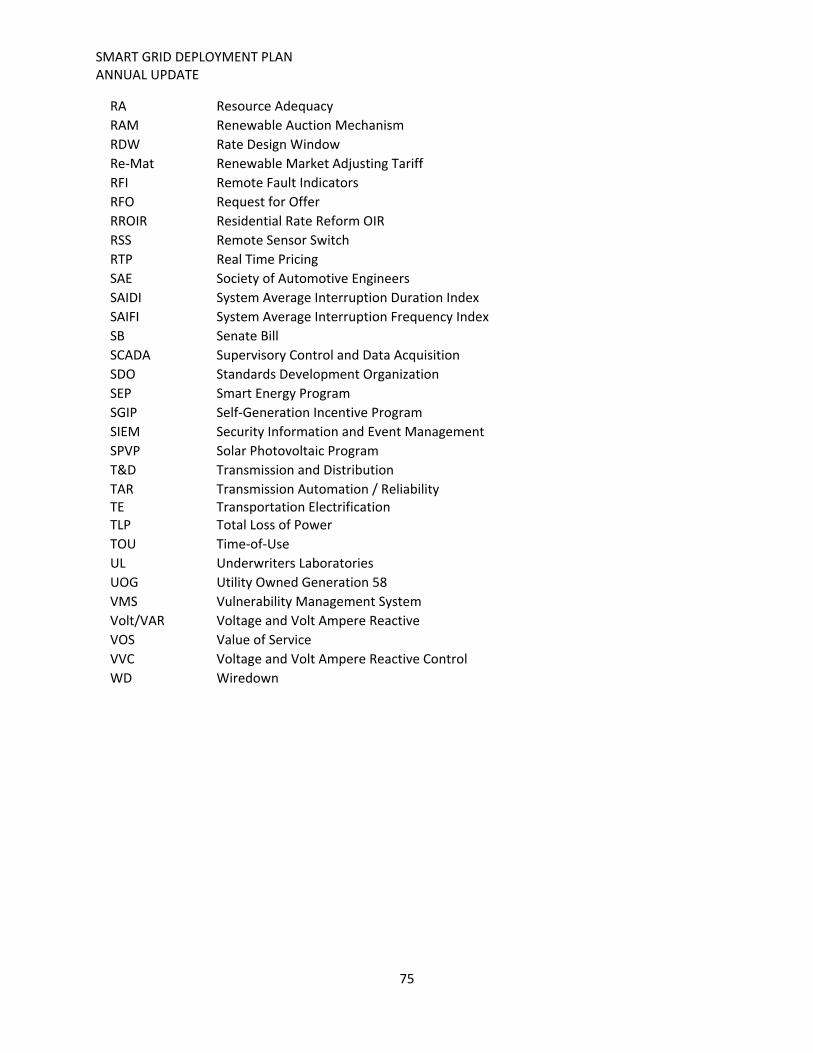
SMART GRID DEPLOYMENT PLAN ANNUAL UPDATE
75
RA Resource Adequacy
RAM Renewable Auction Mechanism
RDW Rate Design Window
Re‐Mat Renewable Market Adjusting Tariff
RFI Remote Fault Indicators
RFO Request for Offer
RROIR Residential Rate Reform OIR
RSS Remote Sensor Switch
RTP Real Time Pricing
SAE Society of Automotive Engineers
SAIDI System Average Interruption Duration Index
SAIFI System Average Interruption Frequency Index
SB Senate Bill
SCADA Supervisory Control and Data Acquisition
SDO Standards Development Organization
SEP Smart Energy Program
SGIP Self‐Generation Incentive Program
SIEM Security Information and Event Management
SPVP Solar Photovoltaic Program
T&D Transmission and Distribution
TAR Transmission Automation / Reliability TE Transportation Electrification TLP Total Loss of Power
TOU Time‐of‐Use
UL Underwriters Laboratories
UOG Utility Owned Generation 58
VMS Vulnerability Management System
Volt/VAR Voltage and Volt Ampere Reactive
VOS Value of Service
VVC Voltage and Volt Ampere Reactive Control
WD Wiredown


