Embed Size (px)
Citation preview
SLPAT 2011
2nd Workshop onSpeech and Language Processing
for Assistive Technologies
Proceedings
July 30, 2011Edinburgh, Scotland, UK
c©2011 The Association for Computational Linguistics
Order copies of this and other ACL proceedings from:
Association for Computational Linguistics (ACL)209 N. Eighth StreetStroudsburg, PA 18360USATel: +1-570-476-8006Fax: [email protected]
ISBN 978-1-937284-14-5 / 1-937284-14-X
ii
Introduction
We are pleased to bring you these Proceedings of the Second Workshop on Speech and LanguageProcessing for Assistive Technologies (SLPAT), held in Edinburgh, Scotland on 30 July, 2011. Wereceived 19 paper submissions, of which 9 were chosen for oral presentation and another 6 for posterpresentation – all 15 papers are included in this volume. In addition, five demo proposals were accepted,and short abstracts of these demos are also included here.
This workshop was intended to bring researchers from all areas of speech and language technology witha common interest in making everyday life more accessible for people with physical, cognitive, sensory,emotional or developmental disabilities. This workshop builds on the first such workshop (co-locatedwith NAACL HLT 2010); it provides an opportunity for individuals from research communities, and theindividuals with whom they are working, to share research findings, and to discuss present and futurechallenges and the potential for collaboration and progress.
While Augmentative and Alternative Communication (AAC) is a particularly apt application area forspeech and Natural Language Processing (NLP) technologies, we purposefully made the scope of theworkshop broad enough to include assistive technologies (AT) as a whole, even those falling outsideof AAC. While we encouraged work that validates methods with human experimental trials, we alsoaccepted work on basic-level innovations and philosophy, inspired by AT/AAC related problems. Thuswe have aimed at broad inclusivity, which is also manifest in the diversity of our Program Committee.
We are very excited to have four invited speakers. Sylvia Grant, Darryal Stark and Greg McMurchie willspeak on their experiences and perspectives as users of AAC technology. Norman Alm will chair thisexpert panel and facilitate discussion between the panel and workshop participants. Norman has a wealthof research experience in applying NLP technologies to AAC and we look forward to a truly interactiveand informative session. We would like to thank all four speakers for taking the time to participate andprovide their collective insight to the workshop.
We would also like to thank the members of the Program Committee for completing their reviewspromptly, and for providing useful feedback for deciding on the program and preparing the final versionsof the papers. Thanks also to Marie Candito, Bonnie Webber and Miles Osborne for assistance withlogistics and to Brian Roark for his guidance and support. Finally, thanks to the authors of the papers, forsubmitting such interesting and diverse work, and to the presenters of demos and commercial exhibitions.
Melanie Fried-Oken, Peter Ljunglof, Kathy McCoy and Annalu Waller
Co-organizers of the workshop
iii

Organizers:
Melanie Fried-Oken, Oregon Health & Science UniversityPeter Ljunglof, University of Gothenburg & Chalmers University of TechnologyKathleen F. McCoy, University of DelawareAnnalu Waller, University of Dundee
Program Committee:
Jan Alexandersson, German Research Center for Artificial IntelligenceNorman Alm, University of DundeeJohn Arnott, University of DundeeMelanie Baljko, York University, CanadaJan Bedrosian, Western Michigan UniversityRolf Black, University of DundeeTorbjørg Breivik, the Language Council of NorwayTim Bunnell, University of DelawareRob Clark, University of EdinburghAnn Copestake, University of CambridgeStuart Cunningham, University of SheffieldRickard Domeij, Stockholm, UniversityAlistair D.N. Edwards, University of YorkMichael Elhadad, Ben-Gurion UniversityBjorn Granstrom, Royal Institute of Technology, StockholmPhil Green, Sheffield UniversityMark Hasegawa-Johnson, University of IllinoisPer-Olof Hedvall, Lund UniversityGraeme Hirst, University of TorontoLinda Hoag, Kansas State UniversityHarry Howard, Tulane UniversityMatt Huenerfauth, CUNYSofie Johansson Kokkinakis, University of GothenburgSimon Judge, Barnsley NHS & Sheffield UniversitySimon King, University of EdinburghGreg Lesher, Dynavox Technologies, Inc.Jeremy Linskell, Electronic Assistive Technology Service, Tayside NHSMats Lundalv, DART, Gothenburg, SwedenOrnella Mich, Foundazione Bruno KesslerYael Netzer, Ben-Gurion UniversityAlan Newell, University of DundeeTorbjørn Nordgard, Lingit A/S, NorwayHelen Petrie, University of YorkKaren Petrie, University of DundeeEhud Reiter, University of AberdeenBitte Rydeman, Lund UniversityHoward Shane, Children’s Hospital BostonFraser Shein, Bloorview Kids Rehab, CanadaRichard Sproat, Oregan Health and Science UniversityKumiko Tanaka-Ishii, University of TokyoNava Tintarev, University of AberdeenTonio Wandmacher, Commissariat a l’energie atomique, FranceJan-Oliver Wuelfing, Fraunhofer Centre Birlinghoven, Germany
v

Table of Contents
An on-line system for remote treatment of aphasiaAnna Pompili, Alberto Abad, Isabel Trancoso, Jose Fonseca, Isabel Pavao Martins, Gabriela Leal
and Luisa Farrajota . . . . . . . . . . . . . . . . . . . . . . . . . . . . . . . . . . . . . . . . . . . . . . . . . . . . . . . . . . . . . . . . . . . . . . . . . . . 1
Acoustic transformations to improve the intelligibility of dysarthric speechFrank Rudzicz . . . . . . . . . . . . . . . . . . . . . . . . . . . . . . . . . . . . . . . . . . . . . . . . . . . . . . . . . . . . . . . . . . . . . . . . . . 11
Towards technology-assisted co-construction with communication partnersBrian Roark, Andrew Fowler, Richard Sproat, Christopher Gibbons and Melanie Fried-Oken . . . 22
Trap Hunting: Finding Personal Data Management Issues in Next Generation AAC DevicesJoseph Reddington and Lizzie Coles-Kemp. . . . . . . . . . . . . . . . . . . . . . . . . . . . . . . . . . . . . . . . . . . . . . . .32
Asynchronous fixed-grid scanning with dynamic codesRuss Beckley and Brian Roark . . . . . . . . . . . . . . . . . . . . . . . . . . . . . . . . . . . . . . . . . . . . . . . . . . . . . . . . . . . 43
Improving the Accessibility of Line Graphs in Multimodal DocumentsCharles Greenbacker, Peng Wu, Sandra Carberry, Kathleen McCoy, Stephanie Elzer, David Mc-
Donald, Daniel Chester and Seniz Demir . . . . . . . . . . . . . . . . . . . . . . . . . . . . . . . . . . . . . . . . . . . . . . . . . . . . . . 52
Indian Language Screen Readers and Syllable Based Festival Text-to-Speech Synthesis SystemAnila Susan Kurian, Badri Narayan, Nagarajan Madasamy, Ashwin Bellur, Raghava Krishnan,
Kasthuri G, Vinodh M. Vishwanath, Kishore Prahallad and Hema A. Murthy . . . . . . . . . . . . . . . . . . . . . . 63
READ–IT: Assessing Readability of Italian Texts with a View to Text SimplificationFelice Dell’Orletta, Simonetta Montemagni and Giulia Venturi . . . . . . . . . . . . . . . . . . . . . . . . . . . . . . 73
Source Language Categorization for improving a Speech into Sign Language Translation SystemVeronica Lopez-Ludena, Ruben San-Segundo, Syaheerah Lufti, Juan Manuel Lucas-Cuesta, Julian
David Echevarry and Beatriz Martınez-Gonzalez . . . . . . . . . . . . . . . . . . . . . . . . . . . . . . . . . . . . . . . . . . . . . . . 84
What does it mean to communicate (not) emotionally?Jan-Oliver Wulfing and Lisa Hoffmann . . . . . . . . . . . . . . . . . . . . . . . . . . . . . . . . . . . . . . . . . . . . . . . . . . . 94
Arabic Text to Arabic Sign Language Translation System for the Deaf and Hearing-Impaired CommunityAbdulaziz Almohimeed, Mike Wald and R.I. Damper . . . . . . . . . . . . . . . . . . . . . . . . . . . . . . . . . . . . . 101
Lekbot: A talking and playing robot for children with disabilitiesPeter Ljunglof, Britt Claesson, Ingrid Mattsson Muller, Stina Ericsson, Cajsa Ottesjo, Alexander
Berman and Fredrik Kronlid . . . . . . . . . . . . . . . . . . . . . . . . . . . . . . . . . . . . . . . . . . . . . . . . . . . . . . . . . . . . . . . . . 110
Using lexical and corpus resources for augmenting the AAC-lexiconKatarina Heimann Muhlenbock and Mats Lundalv . . . . . . . . . . . . . . . . . . . . . . . . . . . . . . . . . . . . . . . . 120
Experimental Identification of the Use of Hedges in the Simplification of Numerical ExpressionsSusana Bautista, Raquel Hervas, Pablo Gervas, Richard Power and Sandra Williams . . . . . . . . . 128
Towards an on-demand Simple Portuguese WikipediaArnaldo Candido Jr, Ann Copestake, Lucia Specia and Sandra Maria Aluısio . . . . . . . . . . . . . . . . 137
SLPAT Demo SessionAnnalu Waller (editor) . . . . . . . . . . . . . . . . . . . . . . . . . . . . . . . . . . . . . . . . . . . . . . . . . . . . . . . . . . . . . . . . . 148
vii

Workshop Program
Saturday, July 30
08:15–08:45 Registration
08:45–09:00 Opening remarks
Session: Speech impairment
09:00–09:30 An on-line system for remote treatment of aphasiaAnna Pompili, Alberto Abad, Isabel Trancoso, Jose Fonseca, Isabel Pavao Martins,Gabriela Leal and Luisa Farrajota
09:30–10:00 Acoustic transformations to improve the intelligibility of dysarthric speechFrank Rudzicz
10:00–10:30 Towards technology-assisted co-construction with communication partnersBrian Roark, Andrew Fowler, Richard Sproat, Christopher Gibbons and MelanieFried-Oken
10:30–11:00 Coffee break
Session: Access for physical impairment
11:00–11:30 Trap Hunting: Finding Personal Data Management Issues in Next Generation AACDevicesJoseph Reddington and Lizzie Coles-Kemp
User panel, Posters and Demonstrations
11:30–12:40 Invited user panel, chaired by Norman Alm
12:40–14:00 Lunch, Posters and Demonstrations
ix
Saturday, July 30 (continued)
Session: Visual impairment
14:00–14:30 Asynchronous fixed-grid scanning with dynamic codesRuss Beckley and Brian Roark
14:30–15:00 Improving the Accessibility of Line Graphs in Multimodal DocumentsCharles Greenbacker, Peng Wu, Sandra Carberry, Kathleen McCoy, Stephanie Elzer,David McDonald, Daniel Chester and Seniz Demir
15:00–15:30 Indian Language Screen Readers and Syllable Based Festival Text-to-Speech SynthesisSystemAnila Susan Kurian, Badri Narayan, Nagarajan Madasamy, Ashwin Bellur, Raghava Kr-ishnan, Kasthuri G, Vinodh M. Vishwanath, Kishore Prahallad and Hema A. Murthy
15:30–16:00 Coffee break, Posters and Demonstrations
Session: Language simplification / hearing impairments
16:00–16:30 READ–IT: Assessing Readability of Italian Texts with a View to Text SimplificationFelice Dell’Orletta, Simonetta Montemagni and Giulia Venturi
16:30–17:00 Source Language Categorization for improving a Speech into Sign Language TranslationSystemVeronica Lopez-Ludena, Ruben San-Segundo, Syaheerah Lufti, Juan Manuel Lucas-Cuesta, Julian David Echevarry and Beatriz Martınez-Gonzalez
17:00–17:45 Review of workshop and discussion on future SLPAT activities
Poster papers
What does it mean to communicate (not) emotionally?Jan-Oliver Wulfing and Lisa Hoffmann
Arabic Text to Arabic Sign Language Translation System for the Deaf and Hearing-Impaired CommunityAbdulaziz Almohimeed, Mike Wald and R.I. Damper
Lekbot: A talking and playing robot for children with disabilitiesPeter Ljunglof, Britt Claesson, Ingrid Mattsson Muller, Stina Ericsson, Cajsa Ottesjo,Alexander Berman and Fredrik Kronlid
Using lexical and corpus resources for augmenting the AAC-lexiconKatarina Heimann Muhlenbock and Mats Lundalv
x

Saturday, July 30 (continued)
Experimental Identification of the Use of Hedges in the Simplification of Numerical Ex-pressionsSusana Bautista, Raquel Hervas, Pablo Gervas, Richard Power and Sandra Williams
Towards an on-demand Simple Portuguese WikipediaArnaldo Candido Jr, Ann Copestake, Lucia Specia and Sandra Maria Aluısio
Demonstrations
SLPAT Demo SessionAnnalu Waller (editor)
xi

Proceedings of the 2nd Workshop on Speech and Language Processing for Assistive Technologies, pages 1–10,Edinburgh, Scotland, UK, July 30, 2011. c©2011 Association for Computational Linguistics
An on-line system for remote treatment of aphasia
Anna Pompili, Alberto Abad,Isabel Trancoso
L2F - Spoken Language Systems LabINESC-ID/IST, Lisbon, Portugal
{anna,alberto,imt}@l2f.inesc-id.pt
Jose Fonseca, Isabel P. Martins,Gabriela Leal, Luisa Farrajota
LEL - Language Research LaboratoryLisbon Faculty of Medicine, Portugal
Abstract
Aphasia treatment for the recovery of lostcommunication functionalities is possiblethrough frequent and intense speech therapysessions. In this sense, speech and languagetechnology may provide important support inimproving the recovery process. The aim ofthe project Vithea (Virtual Therapist for Apha-sia Treatment) is to develop an on-line sys-tem designed to behave as a virtual thera-pist, guiding the patient in performing train-ing exercises in a simple and intuitive fashion.In this paper, the fundamental components ofthe Vithea system are presented, with particu-lar emphasis on the speech recognition mod-ule. Furthermore, we report encouraging au-tomatic word naming recognition results usingdata collected from speech therapy sessions.
1 Introduction
Aphasia is a communication disorder that can af-fect various aspects of language, including hearingcomprehension, speech production, and reading andwriting fluency. It is caused by damage to one ormore of the language areas of the brain. Many timesthe cause of the brain injury is a cerebral vascularaccident (CVA), but other causes can be brain tu-mors, brain infections and severe head injury dueto an accident. Unfortunately, in the last decadesthe number of individuals that suffer CVAs has dra-matically increased, with an estimated 600.000 newcases each year in the EU. Typically, a third ofthese cases present language deficiencies (Pedersenet al., 1995). This kind of language disorder in-volves countless professional, family and economic
problems, both from the point of view of the individ-ual and the society. In this context, two remarkableconsiderations have led to the development of thePortuguese national project Vithea (Virtual Thera-pist for Aphasia treatment).
First are the enormous benefits that speech andlanguage technology (SLT) may bring to the dailylives of people with physical impairment. Informa-tion access and environment control are two areaswhere SLT has been beneficially applied, but SLTalso has great potential for diagnosis, assessmentand treatment of several speech disorders (Hawleyet al., 2005). For instance, a method for speech in-telligibility assessment using both automatic speechrecognition and prosodic analysis is proposed in(Maier et al., 2009). This method is applied to thestudy of patients that have suffered a laryngotomyand to children with cleft lip and palate. (Castillo-Guerra and Lovey, 2003) presents a method fordysarthria assessment using features extracted frompathological speech signals. In (Yin et al., 2009), theauthors describe an approach to pronunciation veri-fication for a speech therapy application.
The second reason for undertaking the Vitheaproject is that several aphasia studies have demon-strated the positive effect of speech therapy activi-ties for the improvement of social communicationabilities. These have focused on specific linguisticimpairments at the phonemic, semantic or syntac-tic levels (Basso, 1992). In fact, it is believed moreand more that the intensity of speech therapy pos-itively influences language recovery in aphasic pa-tients (Bhogal et al., 2003).
These compelling reasons have motivated the de-
1
velopment of an on-line system for the treatmentof aphasic patients incorporating recent advances inspeech and language technology in Portuguese. Thesystem will act as a “virtual therapist”, simulating anordinary speech therapy session, where by means ofthe use of automatic speech recognition (ASR) tech-nology, the virtual therapist will be able to recognizewhat was said by the patient and to validate if it wascorrect or not. As a result of this novel and special-ized stimulation method for the treatment of aphasia,patients will have access to word naming exercisesfrom their homes at any time, which will certainlycause an increase in the number of training hours,and consequently it has the potential to bring signif-icant improvements to the rehabilitation process.
In section 2 we provide a brief description of dif-ferent aphasia syndromes, provide an overview ofthe most commonly adopted therapies for aphasia,and describe the therapeutic focus of our system.Section 3 is devoted to an in depth description ofthe functionalities that make up the system, whilesection 4 aims at detailing its architecture. Finally,section 5 describes the automatic speech recognitionmodule and discusses the results achieved within theautomatic naming recognition task.
2 About the aphasia disorder
2.1 Classification of aphasia
It is possible to distinguish two different types ofaphasia on the basis of the fluency of the speech pro-duced: fluent and non-fluent aphasia. The speechof someone with fluent aphasia has normal articula-tion and rhythm, but is deficient in meaning. Typi-cally, there are word-finding problems that most af-fect nouns and picturable action words. Non-fluentaphasic speech is slow and labored, with short ut-terance length. The flow of speech is more or lessimpaired at the levels of speech initiation, the find-ing and sequencing of articulatory movements, andthe production of grammatical sequences. Speech ischoppy, interrupted, and awkwardly articulated.
Difficulty of recalling words or names is the mostcommon language disorder presented by aphasic in-dividuals (whether fluent or non-fluent). In fact, itcan be the only residual defect after rehabilitation ofaphasia (Wilshire and Coslett, 2000).
2.2 Common therapeutic approaches
There are several therapeutic approaches for thetreatment of the various syndromes of aphasia. Of-ten these methods are focused on treating a specificdisorder caused from aphasia. The most commonlyused techniques are output focused, such as the stim-ulation method and the Melodical Intonation Ther-apy (MIT) (Albert et al., 1994). Other methods arelinguistic-oriented learning approaches, such as thelexical-semantic therapy or the mapping techniquefor the treatment of agrammatism. Still, severalnon-verbal methods for the treatment of some se-vere cases of non-fluent aphasia, such as the visualanalog communication, iconic communication, vi-sual action and drawing therapies, are currently used(Sarno, 1981; Albert, 1998).
Although there is an extensive list of treatmentsspecifically designed to recover from particular dis-orders caused by aphasia, one class of rehabilita-tion therapy especially important aims to improvethe recovery from word retrieval problems, given thewidespread difficulty of recalling words or names.Naming ability problems are typically treated withsemantic exercises like Naming Objects or Namingcommon actions (Adlam et al., 2006). The approachtypically followed is to subject the patient to a set ofexercises comprising a set of stimuli in a variety oftasks. The stimuli are chosen based on their seman-tic content. The patient is asked to name the subjectthat has been shown.
2.3 Therapeutic focus of the Vithea system
The focus of the Vithea system is on the recoveryof word naming ability for aphasic patients. So far,experiments have only been made with fluent apha-sia patients, but even for this type of aphasia, majordifferences may be found. Particularly, patients withTranscortical sensorial aphasia, Conduction aphasiaand Anomic aphasia (Goodglass, 1993) have beenincluded in our studies.
Although the system has been specifically de-signed for aphasia treatment, it may be easilyadapted to the treatment or diagnosis of other dis-orders in speech production. In fact, two of thepatients that have participated in our experimen-tal study were diagnosed with acquired apraxia ofspeech (AOS), which typically results from a stroke,
2
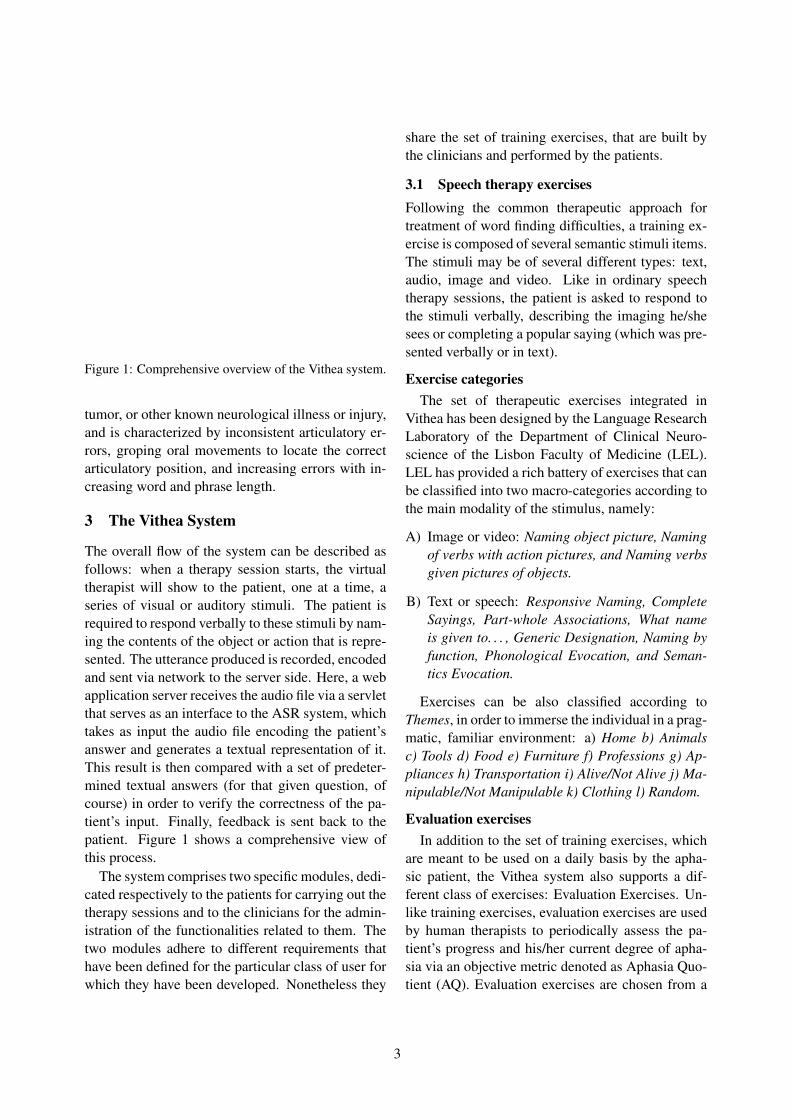
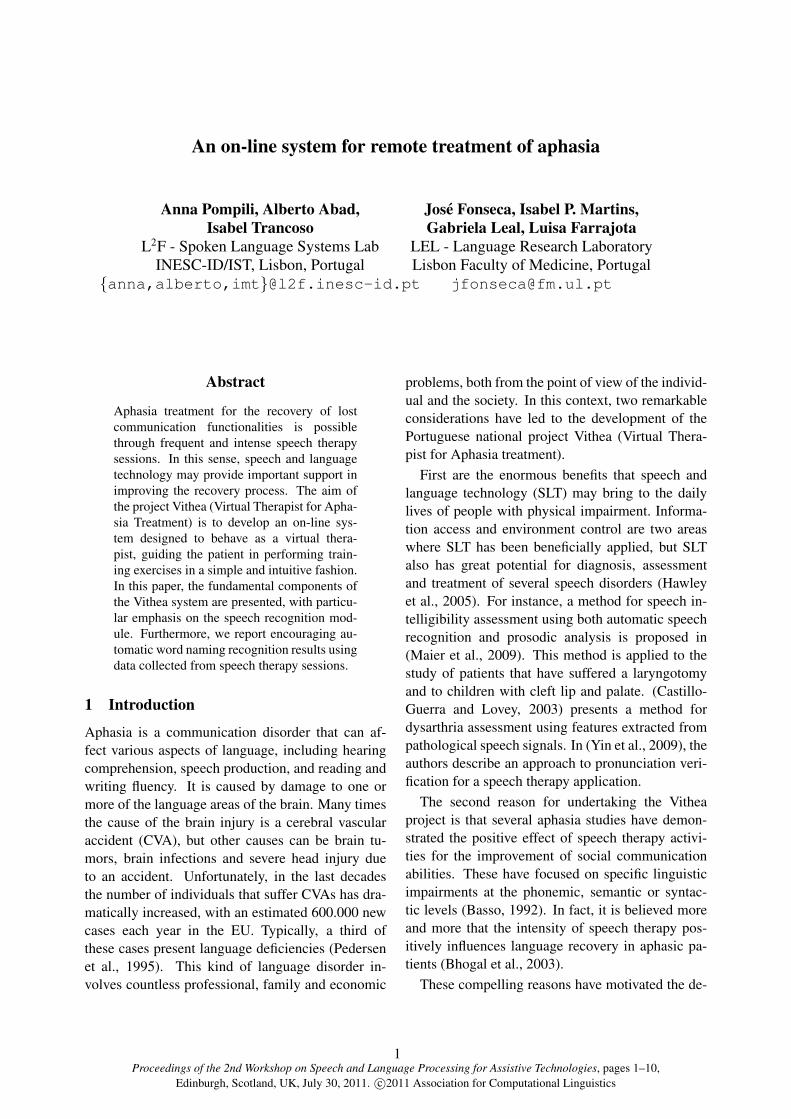
Figure 1: Comprehensive overview of the Vithea system.
tumor, or other known neurological illness or injury,and is characterized by inconsistent articulatory er-rors, groping oral movements to locate the correctarticulatory position, and increasing errors with in-creasing word and phrase length.
3 The Vithea System
The overall flow of the system can be described asfollows: when a therapy session starts, the virtualtherapist will show to the patient, one at a time, aseries of visual or auditory stimuli. The patient isrequired to respond verbally to these stimuli by nam-ing the contents of the object or action that is repre-sented. The utterance produced is recorded, encodedand sent via network to the server side. Here, a webapplication server receives the audio file via a servletthat serves as an interface to the ASR system, whichtakes as input the audio file encoding the patient’sanswer and generates a textual representation of it.This result is then compared with a set of predeter-mined textual answers (for that given question, ofcourse) in order to verify the correctness of the pa-tient’s input. Finally, feedback is sent back to thepatient. Figure 1 shows a comprehensive view ofthis process.
The system comprises two specific modules, dedi-cated respectively to the patients for carrying out thetherapy sessions and to the clinicians for the admin-istration of the functionalities related to them. Thetwo modules adhere to different requirements thathave been defined for the particular class of user forwhich they have been developed. Nonetheless they
share the set of training exercises, that are built bythe clinicians and performed by the patients.
3.1 Speech therapy exercisesFollowing the common therapeutic approach fortreatment of word finding difficulties, a training ex-ercise is composed of several semantic stimuli items.The stimuli may be of several different types: text,audio, image and video. Like in ordinary speechtherapy sessions, the patient is asked to respond tothe stimuli verbally, describing the imaging he/shesees or completing a popular saying (which was pre-sented verbally or in text).
Exercise categoriesThe set of therapeutic exercises integrated in
Vithea has been designed by the Language ResearchLaboratory of the Department of Clinical Neuro-science of the Lisbon Faculty of Medicine (LEL).LEL has provided a rich battery of exercises that canbe classified into two macro-categories according tothe main modality of the stimulus, namely:
A) Image or video: Naming object picture, Namingof verbs with action pictures, and Naming verbsgiven pictures of objects.
B) Text or speech: Responsive Naming, CompleteSayings, Part-whole Associations, What nameis given to. . . , Generic Designation, Naming byfunction, Phonological Evocation, and Seman-tics Evocation.
Exercises can be also classified according toThemes, in order to immerse the individual in a prag-matic, familiar environment: a) Home b) Animalsc) Tools d) Food e) Furniture f) Professions g) Ap-pliances h) Transportation i) Alive/Not Alive j) Ma-nipulable/Not Manipulable k) Clothing l) Random.
Evaluation exercisesIn addition to the set of training exercises, which
are meant to be used on a daily basis by the apha-sic patient, the Vithea system also supports a dif-ferent class of exercises: Evaluation Exercises. Un-like training exercises, evaluation exercises are usedby human therapists to periodically assess the pa-tient’s progress and his/her current degree of apha-sia via an objective metric denoted as Aphasia Quo-tient (AQ). Evaluation exercises are chosen from a
3
subset of the previously mentioned classes of ther-apeutic exercises, namely: Naming object picture,Naming of verbs with action pictures, and Namingverbs given pictures of objects.
3.2 Patient ModuleThe patient module is meant to be used by aphasicindividuals to perform the therapeutic exercises.
Visual design considerationsMost of the users for whom this module is in-
tended have had a CVA. Because of this, they mayhave some forms of physical disabilities such as re-duced arm mobility, and therefore they may experi-ence problems using a mouse. Acknowledging thiseventuality, particular attention has been given to thedesign of the graphical user interface (GUI) for thismodule, making it simple to use both at the presen-tation level and in terms of functionality provided.Driven by the principle of accessibility, we designedthe layout in an easy to use and understand fashion,such that the interaction should be predictable andunmistakable.
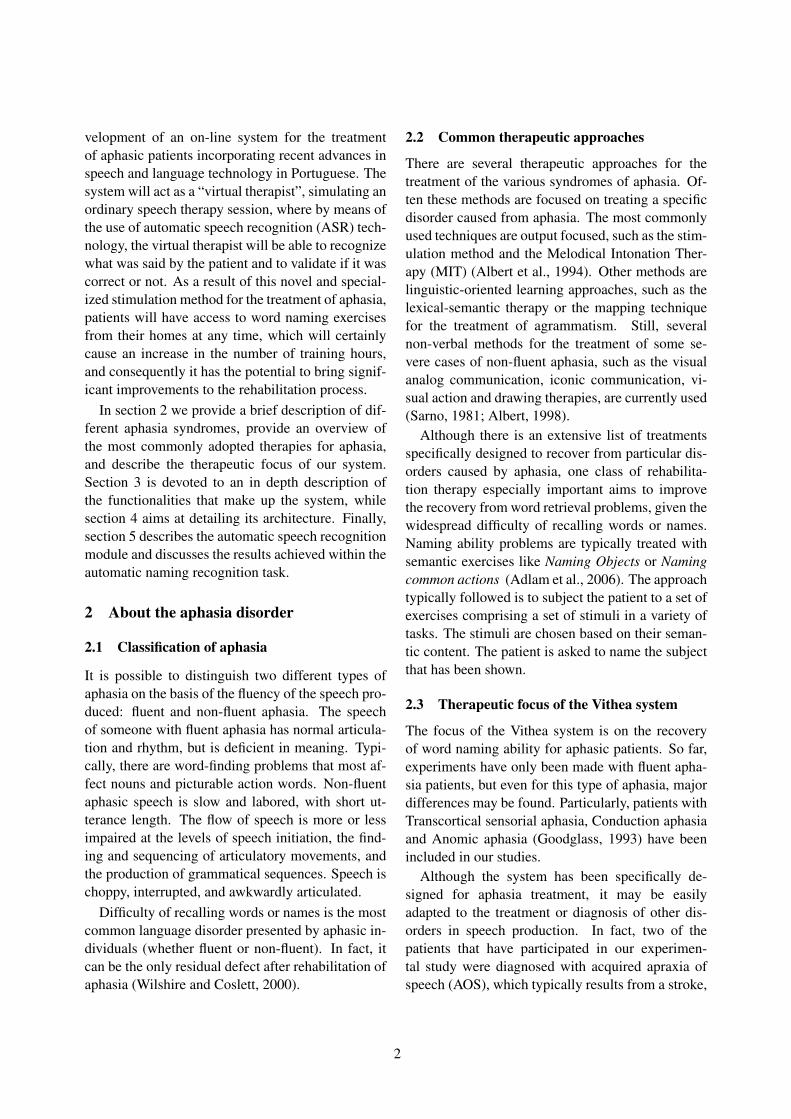
Moreover, even though aphasia is increasing inthe youngest age groups, it still remains a predomi-nant disorder among elderly people. This age groupis prone to suffer from visual impairments. Thus,we carefully considered the graphic elements cho-sen, using big icons for representing our interfaceelements. Figure 2 illustrates some screenshots ofthe Patient Module on the top.
Exercise protocolOnce logged into the system, the virtual therapist
guides the patient in carrying out the training ses-sions, providing a list of possible exercises to be per-formed. When the patient choses to start a trainingexercise, the system will present target stimuli oneat a time in a random way. After the evaluation ofthe patient’s answer by the system, the patient canlisten again to his/her previous answer, record againan utterance (up to a number of times chosen beforestarting the exercise) or pass to the next exercise.
Patient trackingBesides permitting training sessions, the patient
module has the responsibility of storing statisticaland historical data related to user sessions. User ut-terances and information about each user access to
the system are stored in a relational database. Par-ticularly, start and end time of the whole trainingsession, of a training exercise, and of each stimulusare collected. On the one hand, we log every accessin order to evaluate the impact and effectiveness ofthe program by seeing the frequency with which itis used. On the other hand, we record the total timeneeded to accomplish a single stimulus or to end awhole exercise in order to estimate user performanceimprovements.
3.3 Clinician Module
The clinician module is specifically designed to al-low clinicians to manage patient data, to regulatethe creation of new stimuli and the alteration of theexisting ones, and to monitor user performance interms of frequency of access to the system and userprogress. The module is composed by three sub-modules: User, Exercise, Statistic.
User sub-moduleThis module allows the management of a knowl-
edge base of patients. Besides basic informationrelated to the user personal profile, the databasealso stores for each individual his/her type of apha-sia, his/her aphasia severity (7-level subjective scale)and AQ information.
Exercise sub-moduleThis module allows the clinician to create, update,
preview and delete stimuli from an exercise. An ex-ercise is composed of a varying number of stimuli.In addition to the canonical valid answer, the systemaccepts for each stimulus an extended word list com-prising three extra valid answers. This list allows thesystem to consider the most frequent synonyms anddiminutives.
Since the stimuli are associated with a wide as-sortment of multimedia files, besides the manage-ment of the set of stimuli, the sub-module also pro-vides a rich Web based interface to manage thedatabase of multimedia resources used within thestimuli. Figure 2c shows a screenshot listing somemultimedia files. From this list, it is possible to se-lect a desired file in order to edit or delete it.
In this context, a preview feature has also beenprovided. The system is capable of handling a widerange of multimedia encoding: audio (accepted file
4
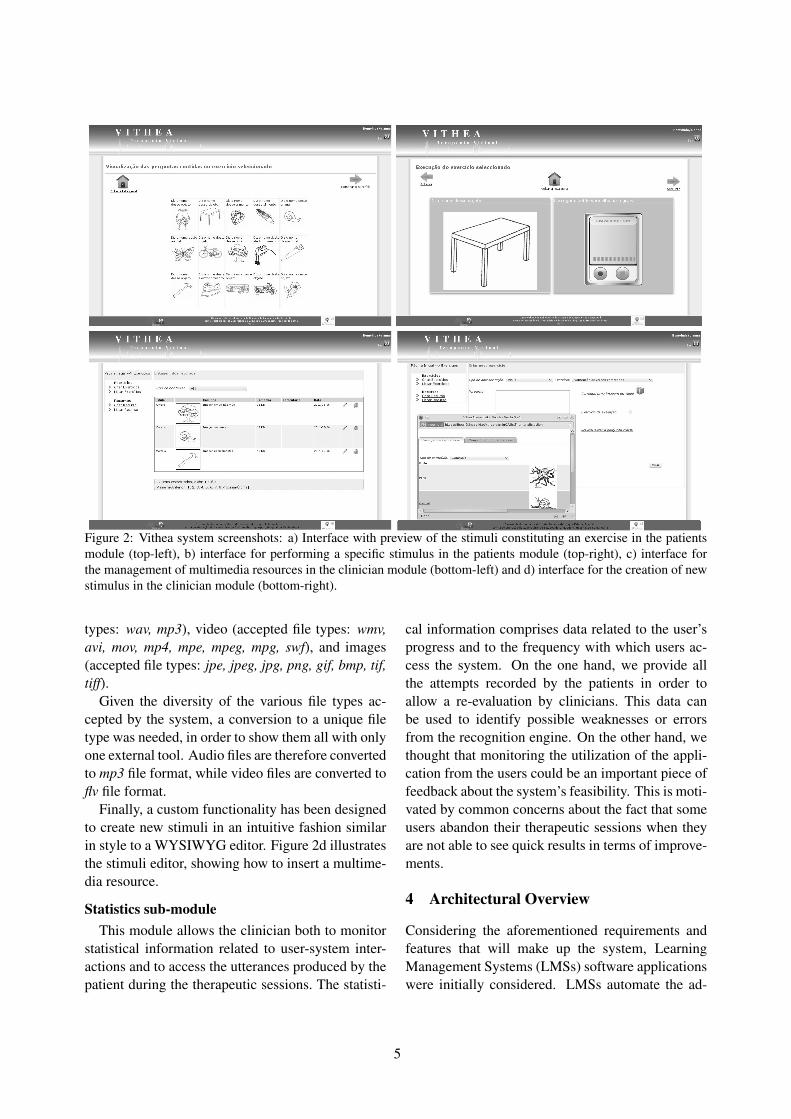
Figure 2: Vithea system screenshots: a) Interface with preview of the stimuli constituting an exercise in the patientsmodule (top-left), b) interface for performing a specific stimulus in the patients module (top-right), c) interface forthe management of multimedia resources in the clinician module (bottom-left) and d) interface for the creation of newstimulus in the clinician module (bottom-right).
types: wav, mp3), video (accepted file types: wmv,avi, mov, mp4, mpe, mpeg, mpg, swf), and images(accepted file types: jpe, jpeg, jpg, png, gif, bmp, tif,tiff).
Given the diversity of the various file types ac-cepted by the system, a conversion to a unique filetype was needed, in order to show them all with onlyone external tool. Audio files are therefore convertedto mp3 file format, while video files are converted toflv file format.
Finally, a custom functionality has been designedto create new stimuli in an intuitive fashion similarin style to a WYSIWYG editor. Figure 2d illustratesthe stimuli editor, showing how to insert a multime-dia resource.
Statistics sub-moduleThis module allows the clinician both to monitor
statistical information related to user-system inter-actions and to access the utterances produced by thepatient during the therapeutic sessions. The statisti-
cal information comprises data related to the user’sprogress and to the frequency with which users ac-cess the system. On the one hand, we provide allthe attempts recorded by the patients in order toallow a re-evaluation by clinicians. This data canbe used to identify possible weaknesses or errorsfrom the recognition engine. On the other hand, wethought that monitoring the utilization of the appli-cation from the users could be an important piece offeedback about the system’s feasibility. This is moti-vated by common concerns about the fact that someusers abandon their therapeutic sessions when theyare not able to see quick results in terms of improve-ments.
4 Architectural Overview
Considering the aforementioned requirements andfeatures that will make up the system, LearningManagement Systems (LMSs) software applicationswere initially considered. LMSs automate the ad-
5
ministration of training events, manage the log-in ofregistered users, manage course catalog, record datafrom learners and provide reports to the manage-ment (Aydin and Tirkes, 2010). Thus, an in-depthevaluation of the currently widespread solutions wascarried out (Pompili, 2011). Concretely, eight differ-ent LMSs (Atutor, Chamilo, Claroline, eFront, Ilias,Moodle, Olat, Sakai) were studied in detail. Unfor-tunately, the outcome of this study revealed impor-tant drawbacks.
The main problem noticed is that LMSs are typi-cally feature-rich tools that try to be of general pur-pose use, sometimes resulting in the loss of theirusefulness to the average user. Often the initial userreaction to the interface of these tools is confusion:the most disorienting challenge is figuring out whereto get the information needed. As previously men-tioned, patients who have had a CVA may experi-ence physical deficiencies, thus the Vithea systemneeds an easy to use and understandable interface.We dedicated some effort trying to personalize LMSsolutions, but most of them do not allow easy sim-plification of the presentation layout.
Moreover, while there were several differencesbetween the functionalities that the evaluated LMSsprovided in terms of training exercises, they all pre-sented various limitations in their implementation.Eventually, we had to acknowledge that it wouldhave been extremely complex to customize the eval-uated frameworks to meet the Vithea project require-ments without introducing major structural changesto the code.
Besides, the average user for whom the Vitheasystem is intended is not necessarily accustomedwith computers and even less with these tools, whichin most cases are developed for environments suchas universities or huge organizations. This meansthat our users may lack the technical skills neces-sary to work with an LMS, and the extra effort ofunderstanding the system would result in a loss ofmotivation.
Therefore, considering the conclusions from thisstudy, we have opted to build a modular, portableapplication which will totally adhere to our require-ments. With these purposes in mind, the system hasbeen designed as a multi-tier web application, beingaccessible everywhere from a web browser. The im-plementation of the whole system has been achieved
by integrating different technologies of a heteroge-neous nature. In fact, the presentation tier exploitsAdobe R©Flash R©technology in order to support richmultimedia interaction. The middle tier comprisesthe integration of our own speech recognition sys-tem, AUDIMUS, and some of the most advancedopen source frameworks for the development of webapplications, Apache Tiles, Apache Struts 2, Hiber-nate and Spring. In the data tier, the persistenceof the application data is delegated to the relationaldatabase MySQL. This is where the system main-tains information related to patient clinical data, ut-terances produced during therapeutic sessions, train-ing exercises, stimuli and statistical data related bothto the frequency with which the system is used, andto the patient progress.
4.1 Speech-related components of the system
Audio RecorderIn order to record the patient’s utterances, the
Vithea system takes advantage of opportunities of-fered by Adobe R©Flash R©technology. This allowseasy integration in most browsers without any re-quired extra plugin, while avoiding the need for se-curity certificates to attest to the reliability of anexternal component running in the client machinewithin the browser. This choice was mainly moti-vated from the particular kind of users who will usethe system, allowing them to enjoy the advantagesof the virtual therapist without the frustration of ad-ditional configuration. A customized component hasbeen developed following the aforementioned prin-ciples of usability in terms of designing the user in-terface. Keeping simplicity and understandabilityas our main guidelines, we used a reduced set oflarge symbols and we tried to keep the number ofinteractions required to a bare minimum. Therefore,recording and sending an utterance to the server re-quires only that the patient starts the recording whenready, and then stops it when finished. Another ac-tion is required to play back the recorded audio.
Automatic Speech Recognition EngineAUDIMUS is the Automatic Speech Recognition
engine integrated into the Vithea system. The AU-DIMUS framework has been developed during thelast years of research at the Spoken Language Pro-cessing Lab of INESC-ID (L2F), it has been success-
6
fully used for the development of several ASR appli-cations such as the recognition of Broadcast News(BN) (Meinedo et al., 2010). It represents an essen-tial building block, being the component in chargeof receiving the patient answers and validating thecorrectness of the utterances with respect to the ther-apeutic exercises. In the following section, this spe-cific module of the Vithea architecture is assessedand described in more detail.
5 The Vithea speech recognition module
5.1 The AUDIMUS hybrid speech recognizer
AUDIMUS is a hybrid recognizer that follows theconnectionist approach (Boulard and Morgan, 1993;Boulard and Morgan, 1994). It combines the tem-poral modeling capacity of Hidden Markov Mod-els (HMMs) with the pattern discriminative classi-fication of multilayer perceptrons (MLP). A Markovprocess is used to model the basic temporal natureof the speech signal, while an artificial neural net-work is used to estimate posterior phone probabili-ties given the acoustic data at each frame. Each MLPis trained on distinct feature sets resulting from dif-ferent feature extraction processes, namely Percep-tual Linear Predictive (PLP), log-RelAtive SpecTrAlPLP (RASTA-PLP) and Modulation SpectroGram(MSG).
The AUDIMUS decoder is based on the WeightedFinite State Transducer (WFST) approach to largevocabulary speech recognition (Mohri et al., 2002).
The current version of AUDIMUS for the Euro-pean Portuguese language uses an acoustic modeltrained with 57 hours of downsampled BroadcastNews data and 58 hours of mixed fixed-telephoneand mobile-telephone data (Abad and Neto, 2008).
5.2 Word Naming Recognition task
We refer to word recognition as the task that per-forms the evaluation of the utterances spoken by thepatients, in a similar way to the role of the thera-pist in a rehabilitation session. This task representsthe main challenge addressed by the virtual ther-apist system. Its difficulty is related to the utter-ances produced by aphasic individuals that are fre-quently interleaved with disfluencies like hesitation,repetitions, and doubts. In order to choose the bestapproach to accomplish this critical task, prelimi-
nary evaluations were performed with two sub-setsof the Portuguese Speech Dat II corpus. These con-sist of word spotting phrases using embedded key-words: the development set is composed of 3334utterances, while the evaluation set comprises 481utterances. The number of keywords is 27. Two dif-ferent approaches were compared: the first basedon large vocabulary continuous speech recognition(LVCSR), the second based on the acoustic match-ing of speech with keyword models in contrast toa background model. Experimental results showedpromising performance indicators by the latter ap-proach, both in terms of Equal Error Rate (EER),False Alarm (FA) and False Rejection (FR). Thus,on the basis of these outcomes, background model-ing based keyword spotting (KWS) was consideredmore appropriate for this task.
Background modeling based KWS
In this work, an equally-likely 1-gram modelformed by the possible target keywords and a com-peting background model is used for word detec-tion. While keyword models are described by theirsequence of phonetic units provided by an auto-matic grapheme-to-phoneme module, the problemof background modeling must be specifically ad-dressed. The most common method consists ofbuilding a new phoneme classification network thatin addition to the conventional phoneme set, alsomodels the posterior probability of a backgroundunit representing “general speech”. This is usuallydone by using all the training speech as positive ex-amples for background modeling and requires re-training the acoustic networks. Alternatively, theposterior probability of the background unit can beestimated based on the posterior probabilities of theother phones (Pinto et al., 2007). We followed thesecond approach, estimating the posterior probabil-ity of a garbage unit as the mean probability of thetop-6 most likely outputs of the phonetic network ateach time frame. In this way there is no need foracoustic network re-training. Then, a likelihood-dependent decision threshold (determined with tele-phonic data for development) is used to prune thebest recognition hypotheses to a reduced set of sen-tences where the target keyword is searched for.
7
5.3 Experiments with real dataCorpus of aphasic speech
A reduced speech corpus composed of data col-lected during therapy sessions of eight different pa-tients has been used to assess the performance ofthe speech recognition module. As explained above,two of them (patients 2 and 7) were diagnosed withAOS. Each of the sessions consists of naming ex-ercises with 103 objects per patient. Each object isshown with an interval of 15 seconds from the pre-vious. The objects and the presentation order are thesame for all patients. Word-level transcription andsegmentation were manually produced for the pa-tient excerpts in each session, totaling 996 segments.The complete evaluation corpus has a duration of ap-proximately 1 hour and 20 minutes.
Evaluation criteriaA word naming exercise is considered to be com-
pleted correctly whenever the targeted word is saidby the patient (independently of its position, amountof silence before the valid answer, etc...). It isworth noticing that this is not necessarily the crite-rion followed in therapy tests by speech therapists.In fact, doubts, repetitions, corrections, approxima-tion strategies and other similar factors are usuallyconsidered unacceptable in word naming tests, sincetheir presence is an indicator of speech pathologies.However, for the sake of comparability between ahuman speech therapist evaluation and an automaticevaluation, we keep this simplified evaluation crite-rion. In addition to the canonical valid answer toevery exercise, an extended word list containing themost frequent synonyms and diminutives has beendefined, for a total KWS vocabulary of 252 words.Only answers included in this list have been ac-cepted as correct in both manual and automatic eval-uation.
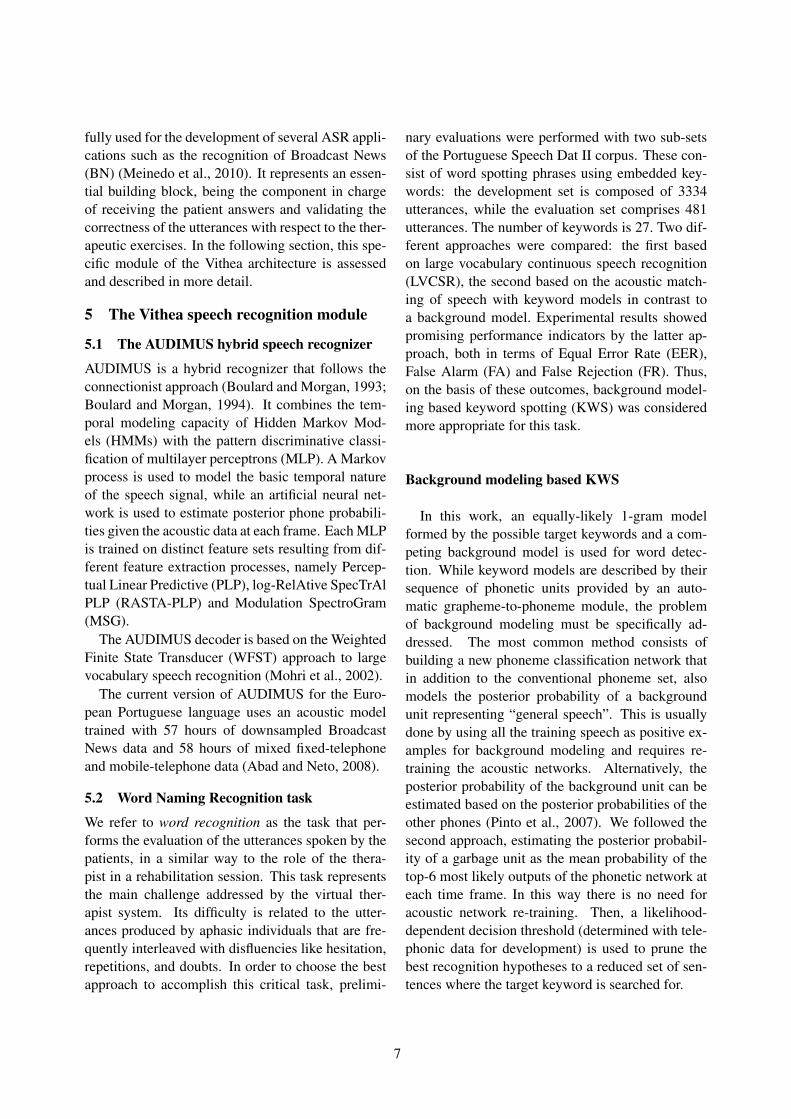
ResultsWord naming scores are calculated for each
speaker as the number of positive word detectionsdivided by the total number of exercises (leftmostplot of Figure 3). The correlation between the hu-man evaluation assessed during ordinary therapeu-tic sessions and the automatic evaluation assessedwith the word recognition task has resulted in a Per-son’s coefficient of 0.9043. This result is considered
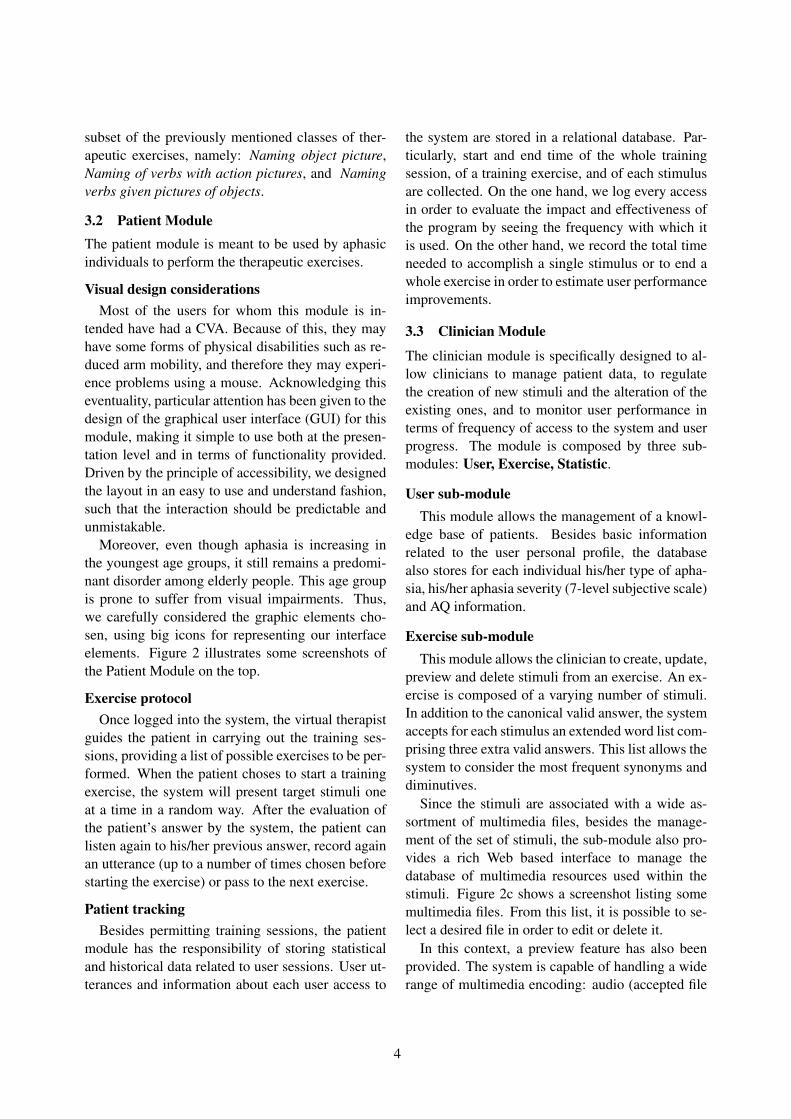
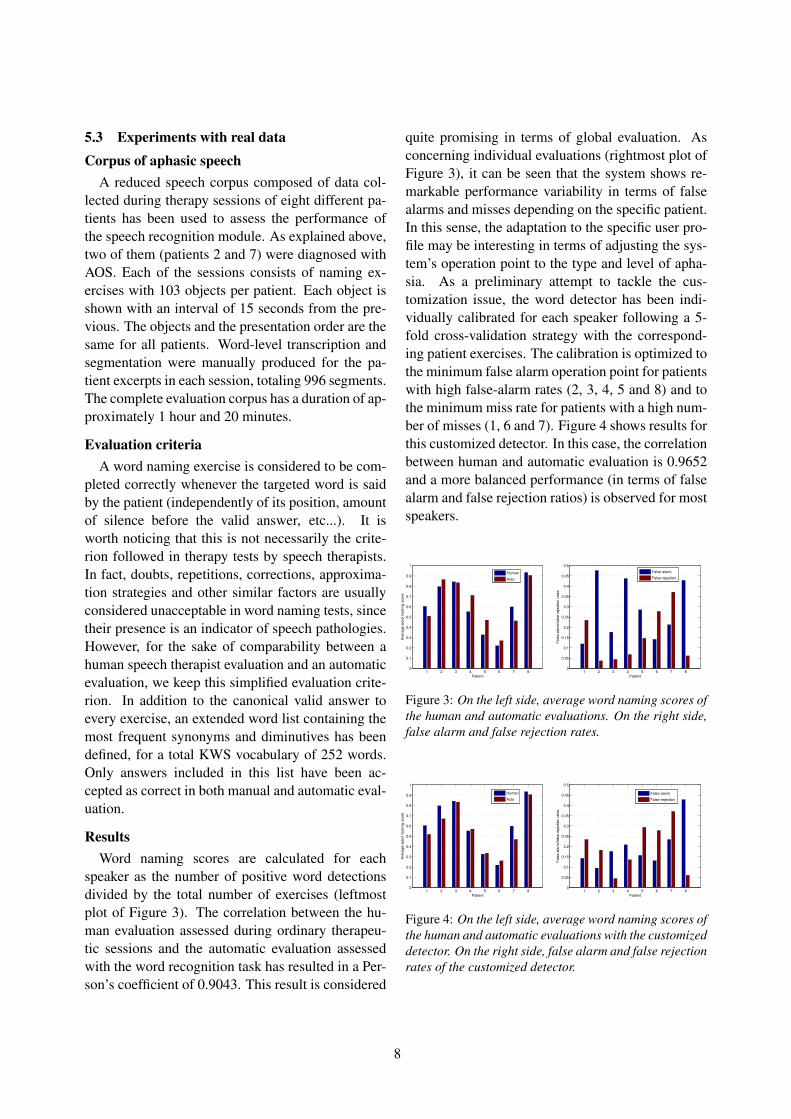
quite promising in terms of global evaluation. Asconcerning individual evaluations (rightmost plot ofFigure 3), it can be seen that the system shows re-markable performance variability in terms of falsealarms and misses depending on the specific patient.In this sense, the adaptation to the specific user pro-file may be interesting in terms of adjusting the sys-tem’s operation point to the type and level of apha-sia. As a preliminary attempt to tackle the cus-tomization issue, the word detector has been indi-vidually calibrated for each speaker following a 5-fold cross-validation strategy with the correspond-ing patient exercises. The calibration is optimized tothe minimum false alarm operation point for patientswith high false-alarm rates (2, 3, 4, 5 and 8) and tothe minimum miss rate for patients with a high num-ber of misses (1, 6 and 7). Figure 4 shows results forthis customized detector. In this case, the correlationbetween human and automatic evaluation is 0.9652and a more balanced performance (in terms of falsealarm and false rejection ratios) is observed for mostspeakers.
1 2 3 4 5 6 7 80
0.1
0.2
0.3
0.4
0.5
0.6
0.7
0.8
0.9
1
Patient
Ave
rag
e w
ord
na
min
g s
co
re
Human
Auto
1 2 3 4 5 6 7 80
0.05
0.1
0.15
0.2
0.25
0.3
0.35
0.4
0.45
0.5
Patient
Fa
lse
ala
rm/f
als
e r
eje
ctio
n r
ate
s
False alarm
False rejection
Figure 3: On the left side, average word naming scores ofthe human and automatic evaluations. On the right side,false alarm and false rejection rates.
1 2 3 4 5 6 7 80
0.1
0.2
0.3
0.4
0.5
0.6
0.7
0.8
0.9
1
Patient
Ave
rag
e w
ord
na
min
g s
co
re
Human
Auto
1 2 3 4 5 6 7 80
0.05
0.1
0.15
0.2
0.25
0.3
0.35
0.4
0.45
0.5
Patient
Fa
lse
ala
rm/f
als
e r
eje
ctio
n r
ate
s
False alarm
False rejection
Figure 4: On the left side, average word naming scores ofthe human and automatic evaluations with the customizeddetector. On the right side, false alarm and false rejectionrates of the customized detector.
8
Analysis of word detection errorsThe most common cause for false alarms is the
presence of many “invented” nonexistent wordswithout semantic meaning, which are very oftenphonetically very close to the target words. Theseparaphasic errors were present in all types of fluentaphasia and AOS that we have observed, but not forall patients. In many of these errors, the stressed syl-lable is often pronounced right, or at least its rhyme.As the typical stress pattern in Portuguese is in thepenultimate syllable, most often the last syllable isalso pronounced correctly (e.g. borco / porco). Inpatients that try to say the word by approximation,that is, by successive attempts to get closer to thetarget word, but using only existent words, the dif-ferences between the percentages of miss and falsealarms are not so remarkable.
One characteristic of aphasic patients that some-times causes keywords to be missed (both when cor-rectly or incorrectly pronounced) is pauses in be-tween syllables. This may justify the inclusion ofalternative pronunciations, in case such pronuncia-tions are considered acceptable by therapists. Ad-ditionally, more sophisticated speech tools may alsobe integrated, such as tools for computing the good-ness of pronunciation (Witt, 1999). This would al-low a different type of assessment of the pronuncia-tion errors, which may provide useful feedback forthe therapist and the patients.
6 Conclusions and future work
6.1 Conclusions
This paper described how automatic speech recog-nition technology has contributed to build up a sys-tem that will act as a virtual therapist, being capa-ble of facilitating the recovery of people who have aparticular language disorder: aphasia. Early experi-ments conducted to evaluate ASR performance withspeech from aphasic patients yielded quite promis-ing results.
The virtual therapist has been designed follow-ing relevant accessibility principles tailored to theparticular category of users targeted by the system.Special attention has been devoted to the user in-terface design: web page layout and graphical ele-ments have been chosen keeping in mind the possi-bility that a user may experience reduced arm mobil-
ity and the technology that has been integrated wasselected with the idea of minimizing possible diffi-culties in using the system. A pedagogical approachhas been followed in planning the functionalities ofthe virtual therapist. This has been mainly drivenby the fundamental idea of avoiding an extra featurerich tool which could have resulted in frustration forsome patients, who seek help for recovery and donot need to learn how to use complex software.
Overall, since the system is a web application, itallows therapy sessions anywhere at anytime. Thus,we expect that this will bring significant improve-ments to the quality of life of the patients allowingmore frequent, intense rehabilitation sessions andthus a faster recovery.
6.2 Future work
The Vithea system has recently achieved the firstphase of a project which still entails several im-provements. Even though, Naming objects and Nam-ing common actions are the most commonly usedexercises during the rehabilitation therapies, the sys-tem has been designed to allow a more comprehen-sive set of therapeutic exercises which will be im-plemented during the next refinement phase. Also,at this stage, we plan to make available the currentversion of the system to real patients in order to re-ceive effective feedback on the system.
In the subsequent improvement phase, we will in-tegrate the possibility of providing help, both seman-tic and phonological to the patient whenever the vir-tual therapist is asked for. Hints could be given bothin the form of a written solution or as a speech syn-thesized production based on Text To Speech (TTS).Furthermore, we are considering the possibility ofincorporating an intelligent animated agent that to-gether with the exploitation of synthesized speech,will behave like a sensitive and effective clinician,providing positive encouragements to the user.
Acknowledgements
This work was funded by the FCT projectRIPD/ADA/109646/2009, and partially supportedby FCT (INESC-ID multiannual funding) throughthe PIDDAC Program funds. The authors would liketo thank to Prof. Dr. M. T. Pazienza, A. Costa and thereviewers for their precious comments.
9
ReferencesA. Abad and J. P. Neto. 2008. International Confer-
ence on Computational Processing of Portuguese Lan-guage, Portugal. Automatic classification and tran-scription of telephone speech in radio broadcast data.
A. L. R. Adlam, K. Patterson, T. T. Rogers, P. J. Nestor,C. H. Salmond, J. Acosta-Cabronero and J. R. Hodges.2006. Brain. Semantic dementia and PrimaryProgressive Aphasia: two side of the same coin?,129:3066–3080.
M. L. Albert, R. Sparks and N. A. Helm. 1994. Neu-rology. Report of the Therapeutics and TechnologyAssessment Subcommittee of the American Academyof Neurology. Assesment: melodic intonation therapy,44:566–568.
M. L. Albert. 1998. Arch Neurol-Chicago Treatment ofaphasia, 55:1417–1419.
C. C. Aydin and G. Tirkes. 2010. Education Engineer-ing. Open source learning management systems in e-learning and Moodle, 54:593–600.
A. Basso. 1992. Aphasiology. Prognostic factors inaphasia, 6(4):337–348.
S. K. Bhogal, R. Teasell and M. Speechley. 2003.Stroke. Intensity of aphasia therapy, impact on recov-ery, 34:987–993.
H. Bourlard and N. Morgan. 1993. IEEE Transactionson Neural Networks. Continuous speech recognitionby connectionist statistical methods, 4(6):893–909.
H. Bourlard and N. Morgan. 1994. Springer. Connec-tionist speech recognition: a hybrid approach.
D. Caseiro, I. Trancoso, C. Viana and M. Barros.2003. International Congress of Phonetic Sciences,Barcelona, Spain. A Comparative Description of GtoPModules for Portuguese and Mirandese Using FiniteState Transducers.
E. Castillo-Guerra and D. F. Lovey. 2003. 25th AnnualConference IEEE Engineering in Medicine and Biol-ogy Society. A Modern Approach to Dysarthria Clas-sification.
H. Goodglass. 1993. Understanding aphasia: technicalreport. Academy Press, University of California. SanDiego.
M. S. Hawley, P. D. Green, P. Enderby, S. P. Cunninghamand R. K. Moore. 2005. Interspeech. Speech technol-ogy for e-inclusion of people with physical disabilitiesand disordered speech, 445–448.
A. Maier, T. Haderlein, U. Eysholdt, F. Rosanowski,A. Batliner, M. Schuster and E. Noth. 2009. SpeechCommunication. PEAKS - A System for the AutomaticEvaluation of Voice and Speech Disorders, 51(5):425–437.
H. Meinedo and J. P. Neto. 2000. International Con-ference on Spoken Language Processing, Beijing,
China. Combination Of Acoustic Models In Contin-uous Speech Recognition Hybrid Systems, 2:931–934.
H. Meinedo, A. Abad, T. Pellegrini, I. Trancoso andJ. P. Neto. 2010. Fala 2010, Vigo, Spain. The L2FBroadcast News Speech Recognition System.
M. Mohri, F. Pereira and M. Riley. 2002. ComputerSpeech and Language. Weighted Finite-State Trans-ducers in Speech Recognition, 16:69–88.
P. M. Pedersen, H. S. Jørgensen, H. Nakayama,H. O. Raaschou and T. S. Olsen. 1995. Ann Neu-rol Aphasia in acute stroke: incidence, determinants,and recovery, 38(4):659–666.
J. Pinto, A. Lovitt and H. Hermansky. 2007. Inter-speech. Exploiting Phoneme Similarities in HybridHMM-ANN Keyword Spotting, 1817–1820.
A. Pompili. 2011. Thesis, Department of Computer Sci-ence, University of Rome. Virtual therapist for apha-sia treatment.
M. T. Sarno. 1981. Recovery and rehabilitation in apha-sia, 485–530. Acquired Aphasia, Academic Press,New York.
C. E. Wilshire and H. B. Coslett. 2000. Disorders ofword retrieval in aphasia theories and potential appli-cations, 82–107. Aphasia and Language: Theory topractice, The Guilford Press, New York.
S. M. Witt. 1999. Use of speech recognition in Computerassisted Language Learning. PhD thesis, Departmentof Engineering, University of Cambridge.
S. -C. Yin, R. Rose, O. Saz and E. Lleida. 2009. IEEE In-ternational Conference on Acoustics, Speech and Sig-nal Processing. A study of pronunciation verificationin a speech therapy application, 4609–4612.
10
Proceedings of the 2nd Workshop on Speech and Language Processing for Assistive Technologies, pages 11–21,Edinburgh, Scotland, UK, July 30, 2011. c©2011 Association for Computational Linguistics
Acoustic transformations to improve the intelligibility of dysarthric speech
Frank RudziczUniversity of Toronto, Department of Computer Science
6 King’s College RoadToronto, Ontario, Canada
Abstract
This paper describes modifications to acous-tic speech signals produced by speakers withdysarthria in order to make those utter-ances more intelligible to typical listeners.These modifications include the correction oftempo, the adjustment of formant frequenciesin sonorants, the removal of aberrant voic-ing, the deletion of phoneme insertion errors,and the replacement of erroneously droppedphonemes. Through simple evaluations of in-telligibility with naıve listeners, we show thatthe correction of phoneme errors results in thegreatest increase in intelligibility and is there-fore a desirable mechanism for the eventualcreation of augmentative application softwarefor individuals with dysarthria.
1 Introduction
Dysarthria is a set of neuromotor disorders that im-pair the physical production of speech. These im-pairments reduce the normal control of the primaryvocal articulators but do not affect the regular com-prehension or production of meaningful, syntacti-cally correct language. For example, damage to therecurrent laryngeal nerve reduces control of vocalfold vibration (i.e., phonation), which can result inaberrant voicing. Inadequate control of soft palatemovement caused by disruption of the vagus cra-nial nerve may lead to a disproportionate amount ofair being released through the nose during speech(i.e., hypernasality). The lack of articulatory controlalso leads to various involuntary non-speech soundsincluding velopharyngeal or glottal noise (Rosen
and Yampolsky, 2000). More commonly, a lackof tongue and lip dexterity often produces heavilyslurred speech and a more diffuse and less differen-tiable vowel target space (Kent and Rosen, 2004).
The neurological damage that causes dysarthriausually affects other physical activity as well whichcan have a drastically adverse affect on mobilityand computer interaction. For instance, severelydysarthric speakers are 150 to 300 times slower thantypical users in keyboard interaction (Hosom et al.,2003; Hux et al., 2000). However, since dysarthricspeech is often only 10 to 17 times slower than thatof typical speakers (Patel, 1998), speech is a viableinput modality for computer-assisted interaction.
Consider a dysarthric individual who must travelinto a city by public transportation. This might in-volve purchasing tickets, asking for directions, or in-dicating intentions to fellow passengers, all withina noisy and crowded environment. A personalportable communication device in this scenario (ei-ther hand-held or attached to a wheelchair) wouldtransform relatively unintelligible speech spokeninto a microphone to make it more intelligible beforebeing played over a set of speakers. Such a systemcould facilitate interaction and overcome difficult orfailed attempts at communication in daily life.
We propose a system that avoids drawbacks ofother voice-output communication aids that outputonly synthetic speech. Before software for such adevice is designed, our goal is to establish and evalu-ate a set of modifications to dysarthric speech to pro-duce a more intelligible equivalent. Understandingthe utility of each of these techniques will be crucialto effectively designing the proposed system.
11
2 Background and related work
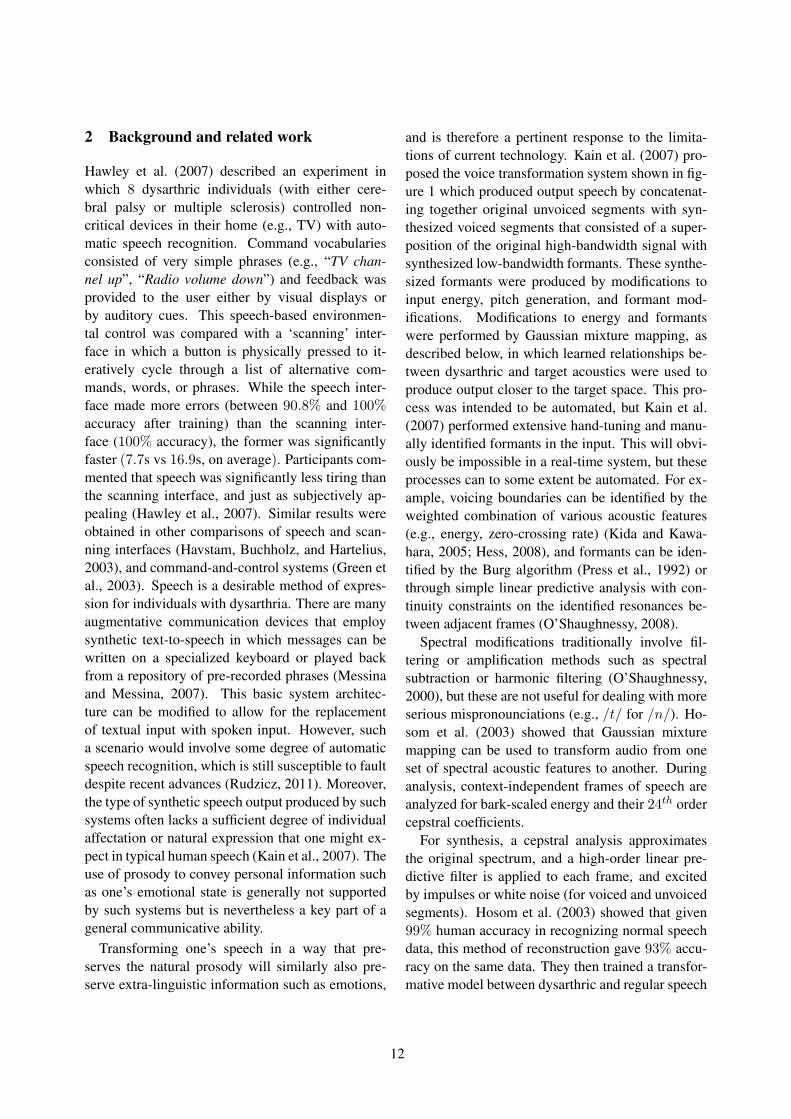
Hawley et al. (2007) described an experiment inwhich 8 dysarthric individuals (with either cere-bral palsy or multiple sclerosis) controlled non-critical devices in their home (e.g., TV) with auto-matic speech recognition. Command vocabulariesconsisted of very simple phrases (e.g., “TV chan-nel up”, “Radio volume down”) and feedback wasprovided to the user either by visual displays orby auditory cues. This speech-based environmen-tal control was compared with a ‘scanning’ inter-face in which a button is physically pressed to it-eratively cycle through a list of alternative com-mands, words, or phrases. While the speech inter-face made more errors (between 90.8% and 100%accuracy after training) than the scanning inter-face (100% accuracy), the former was significantlyfaster (7.7s vs 16.9s, on average). Participants com-mented that speech was significantly less tiring thanthe scanning interface, and just as subjectively ap-pealing (Hawley et al., 2007). Similar results wereobtained in other comparisons of speech and scan-ning interfaces (Havstam, Buchholz, and Hartelius,2003), and command-and-control systems (Green etal., 2003). Speech is a desirable method of expres-sion for individuals with dysarthria. There are manyaugmentative communication devices that employsynthetic text-to-speech in which messages can bewritten on a specialized keyboard or played backfrom a repository of pre-recorded phrases (Messinaand Messina, 2007). This basic system architec-ture can be modified to allow for the replacementof textual input with spoken input. However, sucha scenario would involve some degree of automaticspeech recognition, which is still susceptible to faultdespite recent advances (Rudzicz, 2011). Moreover,the type of synthetic speech output produced by suchsystems often lacks a sufficient degree of individualaffectation or natural expression that one might ex-pect in typical human speech (Kain et al., 2007). Theuse of prosody to convey personal information suchas one’s emotional state is generally not supportedby such systems but is nevertheless a key part of ageneral communicative ability.
Transforming one’s speech in a way that pre-serves the natural prosody will similarly also pre-serve extra-linguistic information such as emotions,
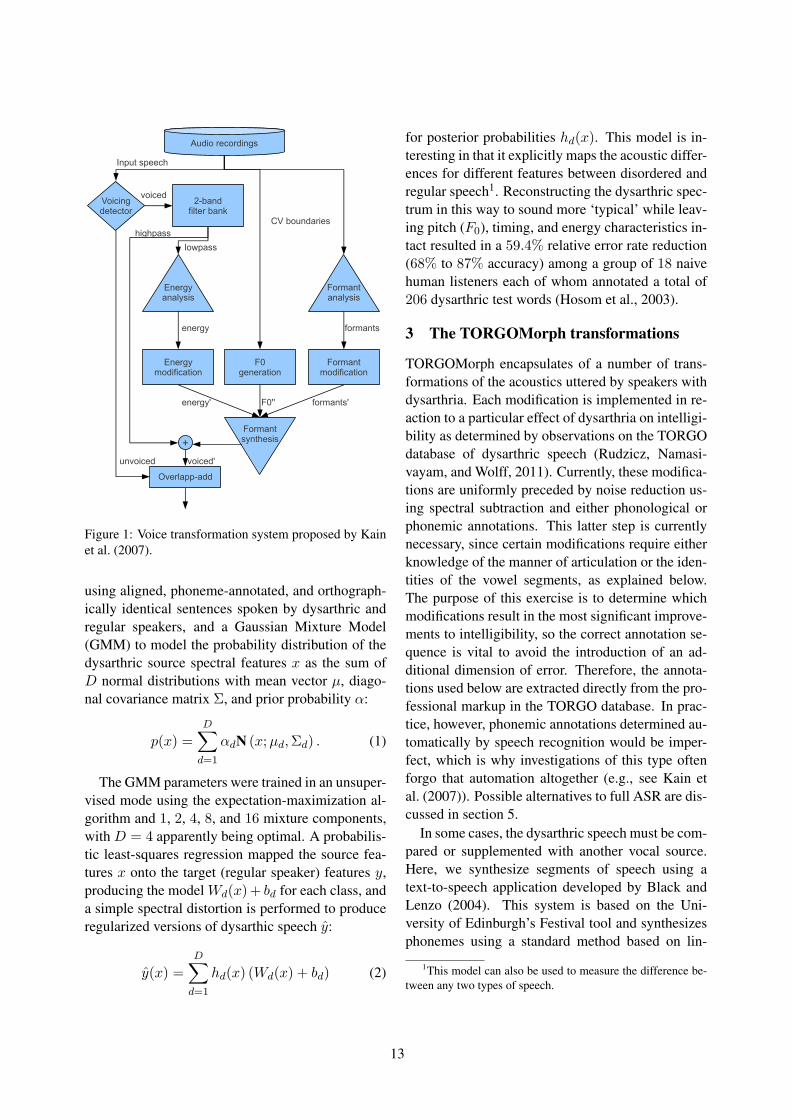
and is therefore a pertinent response to the limita-tions of current technology. Kain et al. (2007) pro-posed the voice transformation system shown in fig-ure 1 which produced output speech by concatenat-ing together original unvoiced segments with syn-thesized voiced segments that consisted of a super-position of the original high-bandwidth signal withsynthesized low-bandwidth formants. These synthe-sized formants were produced by modifications toinput energy, pitch generation, and formant mod-ifications. Modifications to energy and formantswere performed by Gaussian mixture mapping, asdescribed below, in which learned relationships be-tween dysarthric and target acoustics were used toproduce output closer to the target space. This pro-cess was intended to be automated, but Kain et al.(2007) performed extensive hand-tuning and manu-ally identified formants in the input. This will obvi-ously be impossible in a real-time system, but theseprocesses can to some extent be automated. For ex-ample, voicing boundaries can be identified by theweighted combination of various acoustic features(e.g., energy, zero-crossing rate) (Kida and Kawa-hara, 2005; Hess, 2008), and formants can be iden-tified by the Burg algorithm (Press et al., 1992) orthrough simple linear predictive analysis with con-tinuity constraints on the identified resonances be-tween adjacent frames (O’Shaughnessy, 2008).
Spectral modifications traditionally involve fil-tering or amplification methods such as spectralsubtraction or harmonic filtering (O’Shaughnessy,2000), but these are not useful for dealing with moreserious mispronounciations (e.g., /t/ for /n/). Ho-som et al. (2003) showed that Gaussian mixturemapping can be used to transform audio from oneset of spectral acoustic features to another. Duringanalysis, context-independent frames of speech areanalyzed for bark-scaled energy and their 24th ordercepstral coefficients.
For synthesis, a cepstral analysis approximatesthe original spectrum, and a high-order linear pre-dictive filter is applied to each frame, and excitedby impulses or white noise (for voiced and unvoicedsegments). Hosom et al. (2003) showed that given99% human accuracy in recognizing normal speechdata, this method of reconstruction gave 93% accu-racy on the same data. They then trained a transfor-mative model between dysarthric and regular speech
12
Audio recordings
Voicingdetector
2-bandfilter bank
Energyanalysis
Formantanalysis
Energymodification
F0generation
Formantmodification
Formantsynthesis+
Overlapp-add
Input speech
voiced
unvoiced
highpass
lowpass
energy
energy'
CV boundaries
formants
formants'F0''
voiced'
Figure 1: Voice transformation system proposed by Kainet al. (2007).
using aligned, phoneme-annotated, and orthograph-ically identical sentences spoken by dysarthric andregular speakers, and a Gaussian Mixture Model(GMM) to model the probability distribution of thedysarthric source spectral features x as the sum ofD normal distributions with mean vector µ, diago-nal covariance matrix Σ, and prior probability α:
p(x) =
D∑d=1
αdN (x;µd,Σd) . (1)
The GMM parameters were trained in an unsuper-vised mode using the expectation-maximization al-gorithm and 1, 2, 4, 8, and 16 mixture components,with D = 4 apparently being optimal. A probabilis-tic least-squares regression mapped the source fea-tures x onto the target (regular speaker) features y,producing the model Wd(x) + bd for each class, anda simple spectral distortion is performed to produceregularized versions of dysarthic speech y:
y(x) =
D∑d=1
hd(x) (Wd(x) + bd) (2)
for posterior probabilities hd(x). This model is in-teresting in that it explicitly maps the acoustic differ-ences for different features between disordered andregular speech1. Reconstructing the dysarthric spec-trum in this way to sound more ‘typical’ while leav-ing pitch (F0), timing, and energy characteristics in-tact resulted in a 59.4% relative error rate reduction(68% to 87% accuracy) among a group of 18 naivehuman listeners each of whom annotated a total of206 dysarthric test words (Hosom et al., 2003).
3 The TORGOMorph transformations
TORGOMorph encapsulates of a number of trans-formations of the acoustics uttered by speakers withdysarthria. Each modification is implemented in re-action to a particular effect of dysarthria on intelligi-bility as determined by observations on the TORGOdatabase of dysarthric speech (Rudzicz, Namasi-vayam, and Wolff, 2011). Currently, these modifica-tions are uniformly preceded by noise reduction us-ing spectral subtraction and either phonological orphonemic annotations. This latter step is currentlynecessary, since certain modifications require eitherknowledge of the manner of articulation or the iden-tities of the vowel segments, as explained below.The purpose of this exercise is to determine whichmodifications result in the most significant improve-ments to intelligibility, so the correct annotation se-quence is vital to avoid the introduction of an ad-ditional dimension of error. Therefore, the annota-tions used below are extracted directly from the pro-fessional markup in the TORGO database. In prac-tice, however, phonemic annotations determined au-tomatically by speech recognition would be imper-fect, which is why investigations of this type oftenforgo that automation altogether (e.g., see Kain etal. (2007)). Possible alternatives to full ASR are dis-cussed in section 5.
In some cases, the dysarthric speech must be com-pared or supplemented with another vocal source.Here, we synthesize segments of speech using atext-to-speech application developed by Black andLenzo (2004). This system is based on the Uni-versity of Edinburgh’s Festival tool and synthesizesphonemes using a standard method based on lin-
1This model can also be used to measure the difference be-tween any two types of speech.
13

ear predictive coding with a pronunciation lexiconand part-of-speech tagger that assists in the selectionof intonation parameters (Taylor, Black, and Caley,1998). This system is invoked by providing the ex-pected text uttered by the dysarthic speaker. In or-der to properly combine this purely synthetic sig-nal and the original waveforms we require identicalsampling rates, so we resample the former by a ra-tional factor using a polyphase filter with low-passfiltering to avoid aliasing (Hayes, 1999). Since thediscrete phoneme sequences themselves can differ,we find an ideal alignment between the two by theLevenshtein algorithm (Levenshtein, 1966), whichprovides the total number of insertion, deletion, andsubstitution errors.
The following sections detail the components ofTORGOMorph, which is outlined in figure 2. Thesecomponents allow for a cascade of one transfor-mation followed by another, although we can alsoperform these steps independently to isolate theireffects. In all cases, the spectrogram is derivedwith the fast Fourier transform given 2048 bins onthe range of 0–5 kHz. Voicing boundaries are ex-tracted in a unidimensional vector aligned with thespectrogram using the method of Kida and Kawa-hara (2005) which uses GMMs trained with zero-crossing rate, amplitude, and the spectrum as in-put parameters. A pitch (F0) contour is also ex-tracted from the source by the method proposed byKawahara et al. (2005), which uses a Viterbi-like po-tential decoding of F0 traces described by cepstraland temporal features. That work showed an errorrate of less than 0.14% in estimating F0 contours ascompared with simultaneously-recorded electroglot-tograph data. These contours are not in general mod-ified by the methods proposed below, since Kain etal. (2007) showed that using original F0 results inthe highest intelligibility among alternative systems.Over a few segments, however, these contours cansometimes be decimated in time during the modi-fication proposed in section 3.3 and in some casesremoved entirely (along with all other acoustics) inthe modification proposed in section 3.2.
3.1 High-pass filter on unvoiced consonants
The first acoustic modification is based on the ob-servation that unvoiced consonants are improperlyvoiced in up to 18.7% of plosives (e.g. /d/ for /t/)
Input acoustics
Transformed acoustics
Spectral subtraction
High-pass filtering of voiceless consonants
(section 3.1)
Splicing: correcting pronunciation errors
(section 3.2)
Morphing in time (section 3.3)
Morphing in frequency (section 3.4)
Figure 2: Outline of the TORGOMorph system. Theblack path indicates the cascade to be used in practice.Solid arrows indicate paths taken during evaluation.
and up to 8.5% of fricatives (e.g. /v/ for /f/) indysarthric speech in the TORGO database. Voicedconsonants are typically differentiated from their un-voiced counterparts by the presence of the voice bar,which is a concentration of energy below 150 Hzindicative of vocal fold vibration that often persiststhroughout the consonant or during the closure be-fore a plosive (Stevens, 1998). Empirical analysisof TORGO data suggests that for at least two maledysarthric speakers this voice bar extends consider-ably higher, up to 250 Hz.
In order to correct these mispronunciations, thevoice bar is filtered out of all acoustic sub-sequencesannotated as unvoiced consonants. For this task weuse a high-pass Butterworth filter, which is “maxi-mally flat” in the passband2 and monotonic in mag-nitude in the frequency domain (Butterworth, 1930).Here, this filter is computed on a normalized fre-quency range respecting the Nyquist frequency, sothat if a waveform’s sampling rate is 16 kHz, thenormalized cutoff frequency for this component isf∗Norm = 250/(1.6× 104/2) = 3.125× 10⁻². TheButterworth filter is an all-pole transfer function be-tween signals, and we use the 10th-order low-pass
2The passband is the frequency range in which the compo-nent magnitudes in the original signal should not be changed.
14
Butterworth filter whose magnitude response is
|B(z; 10)|2 = |H(z; 10)|2 =1
1 +(jz/jz∗Norm
)2×10
(3)where z is the complex frequency in polar coordi-nates and z∗Norm is the cutoff frequency in that do-main (Hayes, 1999). This allows the transfer func-tion
B(z; 10) = H(z; 10) =1
1 + z10 +∑10
i=1 ciz10−i
(4)whose poles occur at known symmetric intervalsaround the unit complex-domain circle (Butter-worth, 1930). These poles are then transformedby the Matlab function zp2ss, which produces thestate-space coefficients αi and βi that describe theoutput signal resulting from applying the low-passButterworth filter to the discrete signal x[n]. Thesecoefficients are further converted by
~a = z∗Norm~α−1
~b = −z∗Norm(~α−1~β
) (5)
giving the high-pass Butterworth filter with the samecutoff frequency of z∗Norm. This continuous systemis converted to the discrete equivalent through theimpulse-invariant discretization method and is im-plemented by the difference equation
y[n] =10∑k=1
aky[n− k] +10∑k=0
bkx[n− k]. (6)
As previously mentioned, this equation is applied toeach acoustic sub-sequence annotated as unvoicedconsonants, thereby smoothly removing the energybelow 250 Hz.
3.2 Splicing: correcting dropped and insertedphoneme errors
The Levenshtein algorithm finds a best possiblealignment of the phoneme sequence in actually ut-tered speech and the expected phoneme sequence,given the known word sequence. Isolating phonemeinsertions and deletions are therefore a simple matterof iteratively adjusting the source speech accordingto that alignment. There are two cases where actionis required:
insertion error In this case a phoneme is presentwhere it ought not be. In the TORGO database,these insertion errors tend to be repetitions ofphonemes occurring in the first syllable of aword, according to the International SpeechLexicon Dictionary (Hasegawa-Johnson andFleck, 2007). When an insertion error is iden-tified the entire associated segment of the sig-nal is simply removed. In the case that the as-sociated segment is not surrounded by silence,adjacent phonemes can be merged togetherwith time-domain pitch-synchronous overlap-add (Moulines and Charpentier, 1990).
deletion error The vast majority of accidentallydeleted phonemes in the TORGO database arefricatives, affricates, and plosives. Often, theseinvolve not properly pluralizing nouns (e.g.,book instead of books). Given their high pre-ponderance of error, these phonemes are theonly ones we insert into the dysarthric sourcespeech. Specifically, when the deletion of aphoneme is recognized with the Levenshteinalgorithm, we simply extract the associatedsegment from the aligned synthesized speechand insert it into the appropriate spot in thedysarthric speech. For all unvoiced fricatives,affricates, and plosives no further action is re-quired. When these phonemes are voiced, how-ever, we first extract and remove the F0 curvefrom the synthetic speech, linearly interpolatethe F0 curve from adjacent phonemes in thesource dysarthric speech, and resynthesize withthe synthetic spectrum and interpolated F0. Ifinterpolation is not possible (e.g., the syntheticvoiced phoneme is to be inserted beside an un-voiced phoneme), we simply generate a flat F0
equal to the nearest natural F0 curve.
3.3 Morphing in time
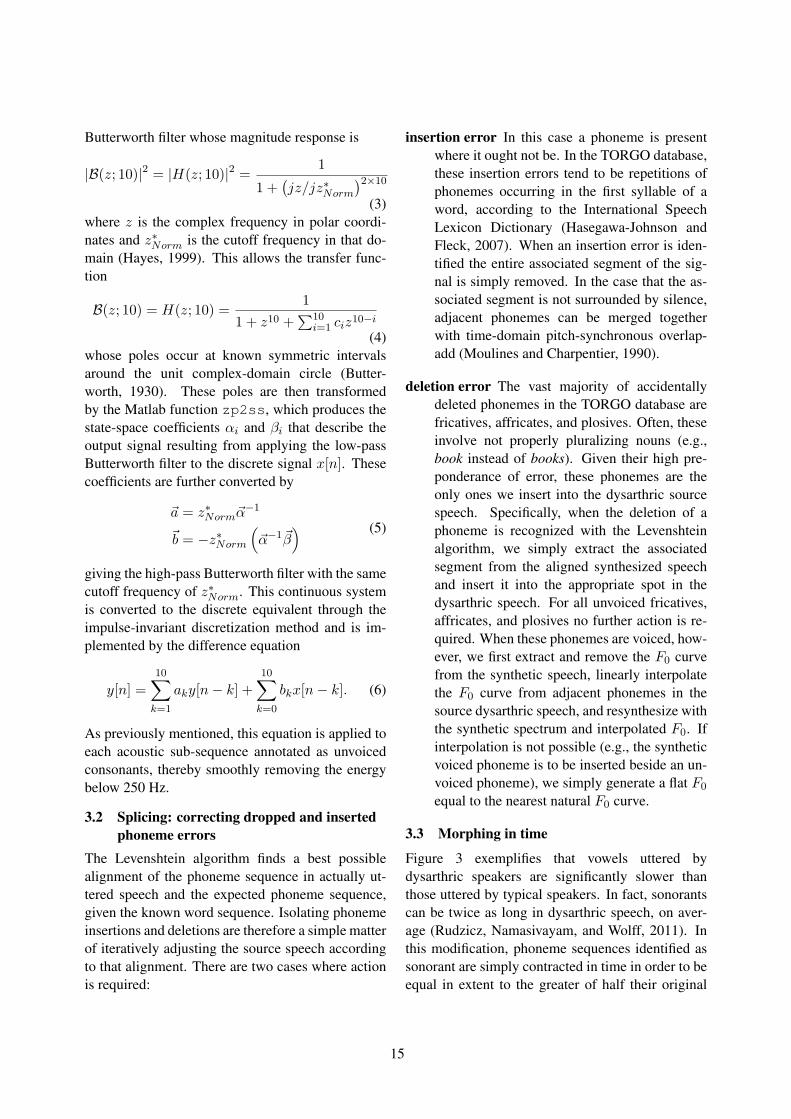
Figure 3 exemplifies that vowels uttered bydysarthric speakers are significantly slower thanthose uttered by typical speakers. In fact, sonorantscan be twice as long in dysarthric speech, on aver-age (Rudzicz, Namasivayam, and Wolff, 2011). Inthis modification, phoneme sequences identified assonorant are simply contracted in time in order to beequal in extent to the greater of half their original
15
(a) (b)
Figure 3: Repetitions of /iy p ah/ over 1.5s by (a) a malespeaker with athetoid CP, and (b) a female control in theTORGO database. Dysarthric speech is notably slowerand more strained than regular speech.
length or the equivalent synthetic phoneme’s length.In all cases this involved shortening the dysarthricsource sonorant.
Since we wish to contract the length of a signalsegment here without affecting its pitch or frequencycharacteristics, we use a phase vocoder based ondigital short-time Fourier analysis (Portnoff, 1976).Here, Hamming-windowed segments of the sourcephoneme are analyzed with a z-transform givingboth frequency and phase estimates for up to 2048frequency bands. During pitch-preserving time-scaled warping, we specify the magnitude spectrumdirectly from the input magnitude spectrum withphase values chosen to ensure continuity (Sethares,2007). Specifically, for the frequency band at fre-quency F and frames j and k > j in the modifiedspectrogram, the phase θ is predicted by
θ(F )k = θ
(F )j + 2πF (j − k). (7)
In our case the discrete warping of the spectrograminvolves simple decimation by a constant factor. Thespectrogram is then converted into a time-domainsignal modified in tempo but not in pitch relativeto the original phoneme segment. This conversionis accomplished simply through the inverse Fouriertransform.
3.4 Morphing in frequency
Formant trajectories inform the listener as to theidentities of vowels, but the vowel space ofdysarthric speakers tends to be constrained (Kainet al., 2007). In order to improve a listener’s abil-ity to differentiate between the vowels, this modifi-cation component identifies formant trajectories inthe acoustics and modifies these according to theknown vowel identity of a segment. Here, formantsare identified with a 14th-order linear-predictive
coder with continuity constraints on the identi-fied resonances between adjacent frames (Snell andMilinazzo, 1993; O’Shaughnessy, 2008). Band-widths are determined by the negative natural log-arithm of the pole magnitude, as implemented inthe STRAIGHT analysis system (Banno et al., 2007;Kawahara, 2006).
For each identified vowel in the dysarthricspeech3, formant candidates are identified at eachframe in time up to 5 kHz. Only those time frameshaving at least 3 such candidates within 250 Hz ofexpected values are considered. The expected valuesof formants are derived from analyses performed byAllen et al. (1987). Given these subsets of candidatetime frames in the vowel, the one having the highestspectral energy within the middle 50% of the lengthof the vowel is established as the anchor position,and the three formant candidates within the expectedranges are established as the anchor frequencies forformants F1 to F3. If more than one formant can-didate falls within expected ranges, the one with thelowest bandwidth becomes the anchor frequency.
Given identified anchor points and targetsonorant-specific frequencies and bandwidths,there are several methods to modify the spectrum.The most common may be to learn a statisticalconversion function based on Gaussian mixturemapping, as described earlier, typically preceded byalignment of sequences using dynamic time warping(Stylianou, 2008). Here, we use the STRAIGHTmorphing implemented by Kawahara and Matsui(2003), among others. The transformation of aframe of speech xA for speaker A is performed witha multivariate frequency-transformation functionTAβ given known targets β using
TAβ(xA) =
∫ xA
0exp
(log
(δTAβ(λ)
δλ
))δλ
=
∫ xA
0exp
((1− r) log
(δTAA(λ)
δλ
)+ r log
(δTAβ(λ)
δλ
))δλ
=
∫ xA
0
(δTAβ(λ)
δλ
)rδλ,
(8)
3Accidentally inserted vowels are also included here, unlesspreviously removed by the splicing technique in section 3.2.
16
time (ms)
freq
uen
cy (
Hz)
1300 1400 1500 1600 1700 1800 1900 20000
500
1000
1500
2000
2500
3000
3500
4000
4500
5000
(a)
time (ms)
freq
uen
cy (
Hz)
1300 1400 1500 1600 1700 1800 1900 20000
500
1000
1500
2000
2500
3000
3500
4000
4500
5000
(b)
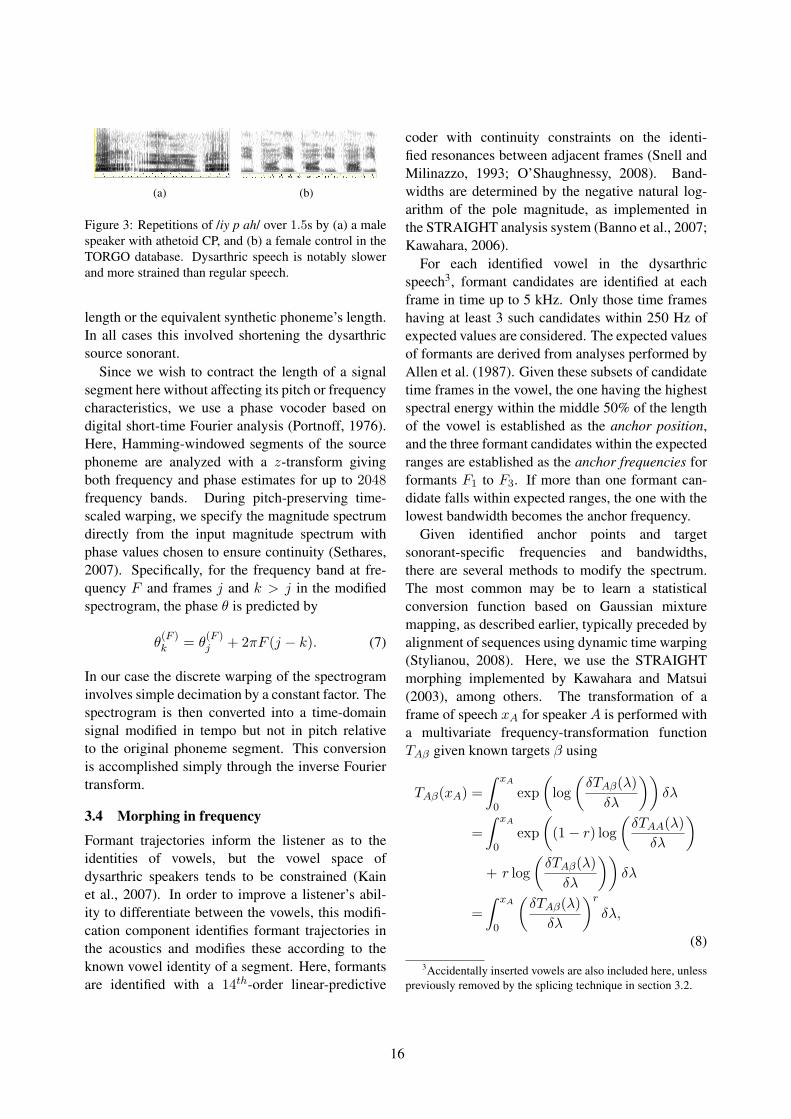
Figure 4: Spectrograms for (a) the dysarthric original and(b) the frequency-modified renditions of the word fear.Circles represent indicative formant locations.
where λ is the frame-based time dimension andwhere 0 ≤ r ≤ 1 is an interpolative rate at whichto perform morphing (i.e., r = 1 implies completeconversion of the parameters of speakerA to param-eter set β and r = 0 implies no conversion.) (Kawa-hara et al., 2009). An example of the results of thismorphing technique is shown in figure 4 in whichthe three identified formants are shifted to their ex-pected frequencies.
This method tracks formants and warps the fre-quency space automatically, whereas Kain et al.(2007) perform these functions manually. A futureimplementation may use Kalman filters to reduce thenoise inherent in trajectory tracking. Such an ap-proach has shown significant improvements in for-mant tracking, especially for F1 (Yan et al., 2007).
4 Intelligibility experiments withTORGOMorph
The intelligibility of both purely synthetic and mod-ified speech signals can be measured objectively bysimply having a set of participants transcribe whatthey hear from a selection of word, phrase, or sen-tence prompts (Spiegel et al., 1990), although no sin-gle standard has emerged as pre-eminent (Schroeter,2008). Hustad (2006) suggested that orthographictranscriptions provide a more accurate predictor ofintelligibility among dysarthric speakers than themore subjective estimates used in clinical settings,e.g., Enderby (1983). That study had 80 listenerswho transcribed audio (which is an atypically largegroup for this task) and showed that intelligibilityincreased from 61.9% given only acoustic stimuli to66.75% given audiovisual stimuli on the transcrip-
tion task in normal speech. In the current work, wemodify only the acoustics of dysarthric speech; how-ever future work might consider how to prompt lis-teners in a more multimodal context.
In order to gauge the intelligibility of our mod-ifications, we designed a simple experiment inwhich human listeners attempt to identify words insentence-level utterances under a number of acousticscenarios. Sentences are either uttered by a speakerwith dysarthria, modified from their original sourceacoustics, or manufactured by a text-to-speech syn-thesizer. Each participant is seated at a personalcomputer with a simple graphical user interface witha button which plays or replays the audio (up to 5times), a text box in which to write responses, anda second button to submit those responses. Audio isplayed over a pair of headphones. The participantsare told to only transcribe the words with which theyare reasonably confident and to ignore those thatthey cannot discern. They are also informed thatthe sentences are grammatically correct but not nec-essarily semantically coherent, and that there is noprofanity. Each participant listens to 20 sentencesselected at random with the constraints that at leasttwo utterances are taken from each category of au-dio, described below, and that at least five utter-ances are also provided to another listener, in orderto evaluate inter-annotator agreement. Participantsare self-selected to have no extensive prior experi-ence in speaking with individuals with dysarthria,in order to reflect the general population. Althoughdysarthric utterances are likely to be contextualizedwithin meaningful conversations in real-world situ-ations, such pragmatic aspects of discourse are notconsidered here in order to concentrate on acousticeffects alone. No cues as to the topic or semanticcontext of the sentences are given, as there is noevidence that such aids to comprehension affect in-telligibility (Hustad and Beukelman, 2002). In thisstudy we use sentence-level utterances uttered bymale speakers from the TORGO database.
Baseline performance is measured on the originaldysarthric speech. Two other systems are used forreference:
Synthetic Word sequences are produced by theCepstral commercial text-to-speech system us-ing the U.S. English voice ‘David’. This sys-
17
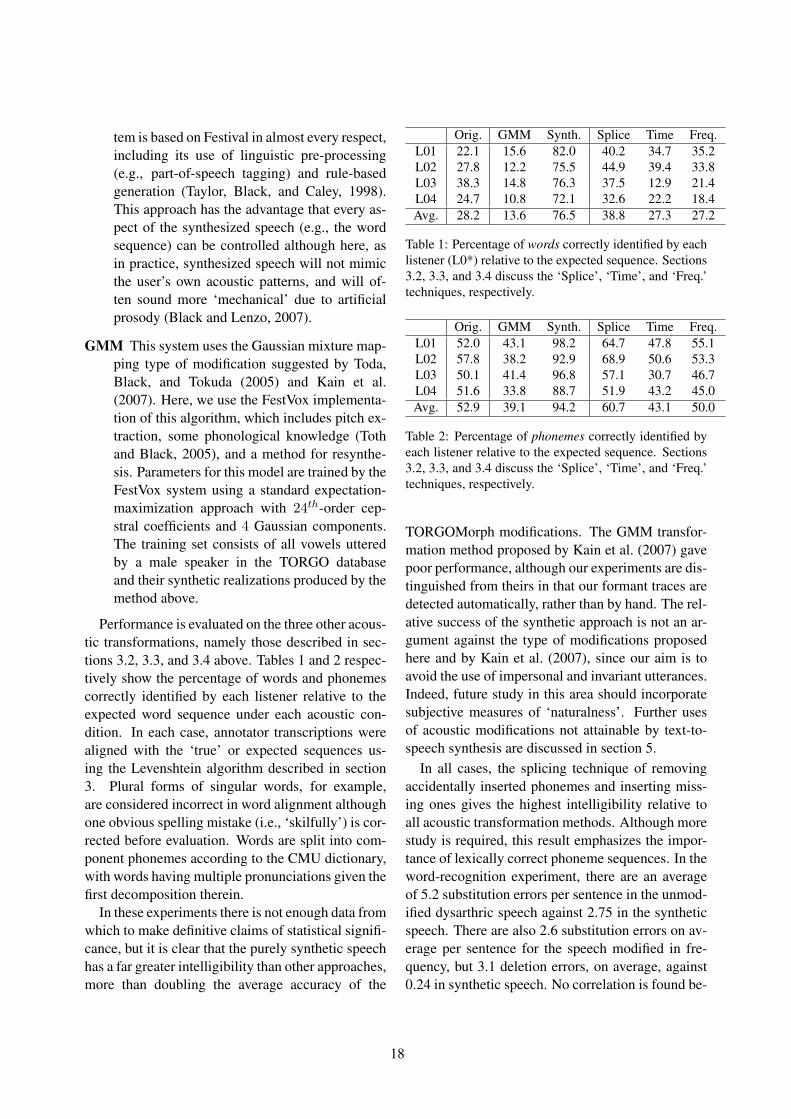
tem is based on Festival in almost every respect,including its use of linguistic pre-processing(e.g., part-of-speech tagging) and rule-basedgeneration (Taylor, Black, and Caley, 1998).This approach has the advantage that every as-pect of the synthesized speech (e.g., the wordsequence) can be controlled although here, asin practice, synthesized speech will not mimicthe user’s own acoustic patterns, and will of-ten sound more ‘mechanical’ due to artificialprosody (Black and Lenzo, 2007).
GMM This system uses the Gaussian mixture map-ping type of modification suggested by Toda,Black, and Tokuda (2005) and Kain et al.(2007). Here, we use the FestVox implementa-tion of this algorithm, which includes pitch ex-traction, some phonological knowledge (Tothand Black, 2005), and a method for resynthe-sis. Parameters for this model are trained by theFestVox system using a standard expectation-maximization approach with 24th-order cep-stral coefficients and 4 Gaussian components.The training set consists of all vowels utteredby a male speaker in the TORGO databaseand their synthetic realizations produced by themethod above.
Performance is evaluated on the three other acous-tic transformations, namely those described in sec-tions 3.2, 3.3, and 3.4 above. Tables 1 and 2 respec-tively show the percentage of words and phonemescorrectly identified by each listener relative to theexpected word sequence under each acoustic con-dition. In each case, annotator transcriptions werealigned with the ‘true’ or expected sequences us-ing the Levenshtein algorithm described in section3. Plural forms of singular words, for example,are considered incorrect in word alignment althoughone obvious spelling mistake (i.e., ‘skilfully’) is cor-rected before evaluation. Words are split into com-ponent phonemes according to the CMU dictionary,with words having multiple pronunciations given thefirst decomposition therein.
In these experiments there is not enough data fromwhich to make definitive claims of statistical signifi-cance, but it is clear that the purely synthetic speechhas a far greater intelligibility than other approaches,more than doubling the average accuracy of the
Orig. GMM Synth. Splice Time Freq.L01 22.1 15.6 82.0 40.2 34.7 35.2L02 27.8 12.2 75.5 44.9 39.4 33.8L03 38.3 14.8 76.3 37.5 12.9 21.4L04 24.7 10.8 72.1 32.6 22.2 18.4Avg. 28.2 13.6 76.5 38.8 27.3 27.2
Table 1: Percentage of words correctly identified by eachlistener (L0*) relative to the expected sequence. Sections3.2, 3.3, and 3.4 discuss the ‘Splice’, ‘Time’, and ‘Freq.’techniques, respectively.
Orig. GMM Synth. Splice Time Freq.L01 52.0 43.1 98.2 64.7 47.8 55.1L02 57.8 38.2 92.9 68.9 50.6 53.3L03 50.1 41.4 96.8 57.1 30.7 46.7L04 51.6 33.8 88.7 51.9 43.2 45.0Avg. 52.9 39.1 94.2 60.7 43.1 50.0
Table 2: Percentage of phonemes correctly identified byeach listener relative to the expected sequence. Sections3.2, 3.3, and 3.4 discuss the ‘Splice’, ‘Time’, and ‘Freq.’techniques, respectively.
TORGOMorph modifications. The GMM transfor-mation method proposed by Kain et al. (2007) gavepoor performance, although our experiments are dis-tinguished from theirs in that our formant traces aredetected automatically, rather than by hand. The rel-ative success of the synthetic approach is not an ar-gument against the type of modifications proposedhere and by Kain et al. (2007), since our aim is toavoid the use of impersonal and invariant utterances.Indeed, future study in this area should incorporatesubjective measures of ‘naturalness’. Further usesof acoustic modifications not attainable by text-to-speech synthesis are discussed in section 5.
In all cases, the splicing technique of removingaccidentally inserted phonemes and inserting miss-ing ones gives the highest intelligibility relative toall acoustic transformation methods. Although morestudy is required, this result emphasizes the impor-tance of lexically correct phoneme sequences. In theword-recognition experiment, there are an averageof 5.2 substitution errors per sentence in the unmod-ified dysarthric speech against 2.75 in the syntheticspeech. There are also 2.6 substitution errors on av-erage per sentence for the speech modified in fre-quency, but 3.1 deletion errors, on average, against0.24 in synthetic speech. No correlation is found be-
18
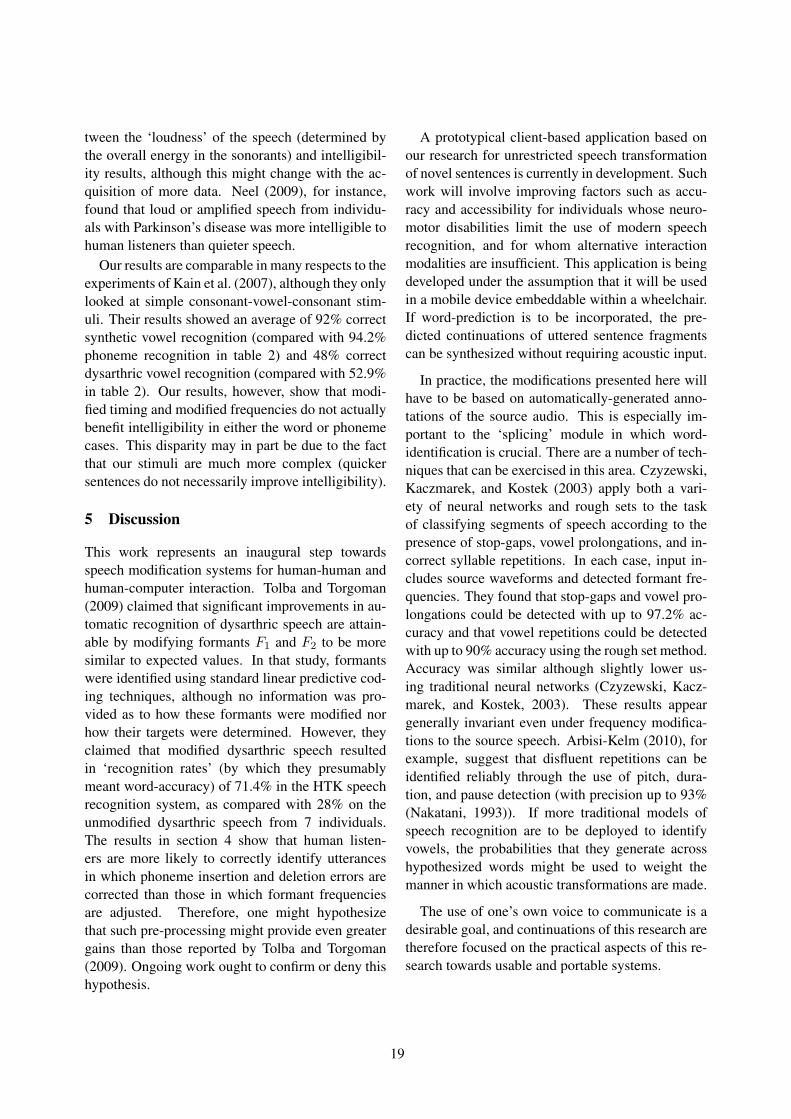
tween the ‘loudness’ of the speech (determined bythe overall energy in the sonorants) and intelligibil-ity results, although this might change with the ac-quisition of more data. Neel (2009), for instance,found that loud or amplified speech from individu-als with Parkinson’s disease was more intelligible tohuman listeners than quieter speech.
Our results are comparable in many respects to theexperiments of Kain et al. (2007), although they onlylooked at simple consonant-vowel-consonant stim-uli. Their results showed an average of 92% correctsynthetic vowel recognition (compared with 94.2%phoneme recognition in table 2) and 48% correctdysarthric vowel recognition (compared with 52.9%in table 2). Our results, however, show that modi-fied timing and modified frequencies do not actuallybenefit intelligibility in either the word or phonemecases. This disparity may in part be due to the factthat our stimuli are much more complex (quickersentences do not necessarily improve intelligibility).
5 Discussion
This work represents an inaugural step towardsspeech modification systems for human-human andhuman-computer interaction. Tolba and Torgoman(2009) claimed that significant improvements in au-tomatic recognition of dysarthric speech are attain-able by modifying formants F1 and F2 to be moresimilar to expected values. In that study, formantswere identified using standard linear predictive cod-ing techniques, although no information was pro-vided as to how these formants were modified norhow their targets were determined. However, theyclaimed that modified dysarthric speech resultedin ‘recognition rates’ (by which they presumablymeant word-accuracy) of 71.4% in the HTK speechrecognition system, as compared with 28% on theunmodified dysarthric speech from 7 individuals.The results in section 4 show that human listen-ers are more likely to correctly identify utterancesin which phoneme insertion and deletion errors arecorrected than those in which formant frequenciesare adjusted. Therefore, one might hypothesizethat such pre-processing might provide even greatergains than those reported by Tolba and Torgoman(2009). Ongoing work ought to confirm or deny thishypothesis.
A prototypical client-based application based onour research for unrestricted speech transformationof novel sentences is currently in development. Suchwork will involve improving factors such as accu-racy and accessibility for individuals whose neuro-motor disabilities limit the use of modern speechrecognition, and for whom alternative interactionmodalities are insufficient. This application is beingdeveloped under the assumption that it will be usedin a mobile device embeddable within a wheelchair.If word-prediction is to be incorporated, the pre-dicted continuations of uttered sentence fragmentscan be synthesized without requiring acoustic input.
In practice, the modifications presented here willhave to be based on automatically-generated anno-tations of the source audio. This is especially im-portant to the ‘splicing’ module in which word-identification is crucial. There are a number of tech-niques that can be exercised in this area. Czyzewski,Kaczmarek, and Kostek (2003) apply both a vari-ety of neural networks and rough sets to the taskof classifying segments of speech according to thepresence of stop-gaps, vowel prolongations, and in-correct syllable repetitions. In each case, input in-cludes source waveforms and detected formant fre-quencies. They found that stop-gaps and vowel pro-longations could be detected with up to 97.2% ac-curacy and that vowel repetitions could be detectedwith up to 90% accuracy using the rough set method.Accuracy was similar although slightly lower us-ing traditional neural networks (Czyzewski, Kacz-marek, and Kostek, 2003). These results appeargenerally invariant even under frequency modifica-tions to the source speech. Arbisi-Kelm (2010), forexample, suggest that disfluent repetitions can beidentified reliably through the use of pitch, dura-tion, and pause detection (with precision up to 93%(Nakatani, 1993)). If more traditional models ofspeech recognition are to be deployed to identifyvowels, the probabilities that they generate acrosshypothesized words might be used to weight themanner in which acoustic transformations are made.
The use of one’s own voice to communicate is adesirable goal, and continuations of this research aretherefore focused on the practical aspects of this re-search towards usable and portable systems.
19
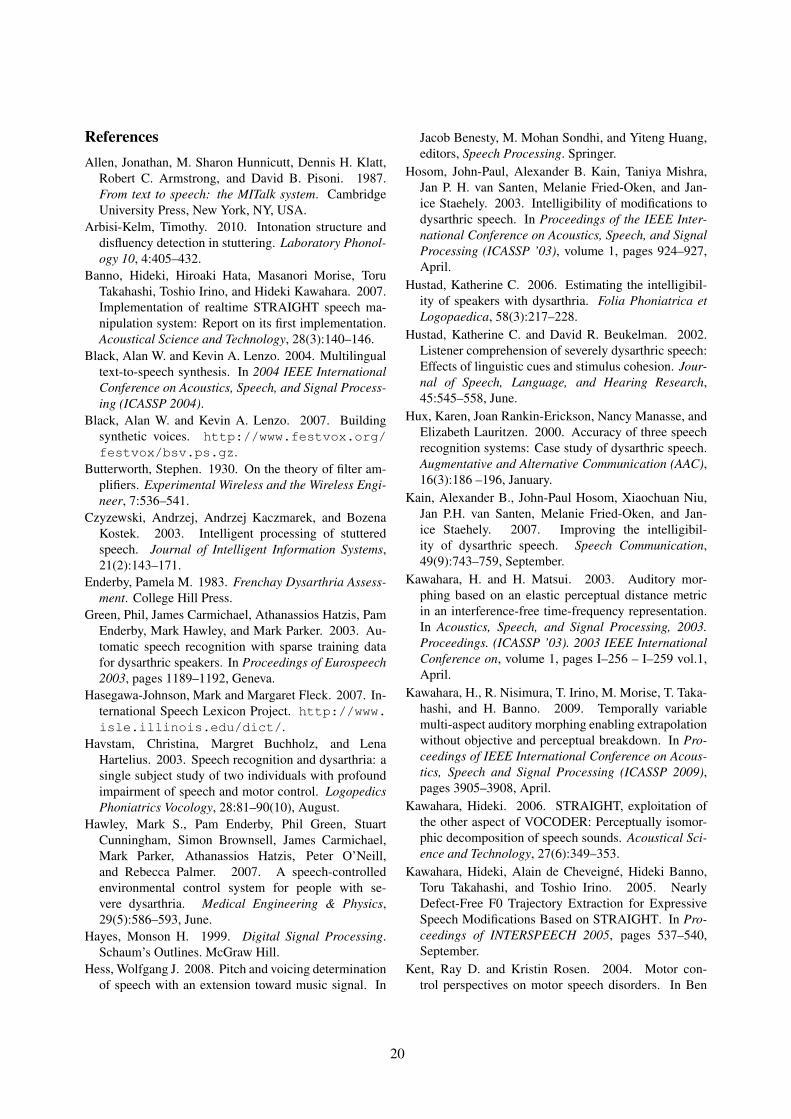
ReferencesAllen, Jonathan, M. Sharon Hunnicutt, Dennis H. Klatt,
Robert C. Armstrong, and David B. Pisoni. 1987.From text to speech: the MITalk system. CambridgeUniversity Press, New York, NY, USA.
Arbisi-Kelm, Timothy. 2010. Intonation structure anddisfluency detection in stuttering. Laboratory Phonol-ogy 10, 4:405–432.
Banno, Hideki, Hiroaki Hata, Masanori Morise, ToruTakahashi, Toshio Irino, and Hideki Kawahara. 2007.Implementation of realtime STRAIGHT speech ma-nipulation system: Report on its first implementation.Acoustical Science and Technology, 28(3):140–146.
Black, Alan W. and Kevin A. Lenzo. 2004. Multilingualtext-to-speech synthesis. In 2004 IEEE InternationalConference on Acoustics, Speech, and Signal Process-ing (ICASSP 2004).
Black, Alan W. and Kevin A. Lenzo. 2007. Buildingsynthetic voices. http://www.festvox.org/festvox/bsv.ps.gz.
Butterworth, Stephen. 1930. On the theory of filter am-plifiers. Experimental Wireless and the Wireless Engi-neer, 7:536–541.
Czyzewski, Andrzej, Andrzej Kaczmarek, and BozenaKostek. 2003. Intelligent processing of stutteredspeech. Journal of Intelligent Information Systems,21(2):143–171.
Enderby, Pamela M. 1983. Frenchay Dysarthria Assess-ment. College Hill Press.
Green, Phil, James Carmichael, Athanassios Hatzis, PamEnderby, Mark Hawley, and Mark Parker. 2003. Au-tomatic speech recognition with sparse training datafor dysarthric speakers. In Proceedings of Eurospeech2003, pages 1189–1192, Geneva.
Hasegawa-Johnson, Mark and Margaret Fleck. 2007. In-ternational Speech Lexicon Project. http://www.isle.illinois.edu/dict/.
Havstam, Christina, Margret Buchholz, and LenaHartelius. 2003. Speech recognition and dysarthria: asingle subject study of two individuals with profoundimpairment of speech and motor control. LogopedicsPhoniatrics Vocology, 28:81–90(10), August.
Hawley, Mark S., Pam Enderby, Phil Green, StuartCunningham, Simon Brownsell, James Carmichael,Mark Parker, Athanassios Hatzis, Peter O’Neill,and Rebecca Palmer. 2007. A speech-controlledenvironmental control system for people with se-vere dysarthria. Medical Engineering & Physics,29(5):586–593, June.
Hayes, Monson H. 1999. Digital Signal Processing.Schaum’s Outlines. McGraw Hill.
Hess, Wolfgang J. 2008. Pitch and voicing determinationof speech with an extension toward music signal. In
Jacob Benesty, M. Mohan Sondhi, and Yiteng Huang,editors, Speech Processing. Springer.
Hosom, John-Paul, Alexander B. Kain, Taniya Mishra,Jan P. H. van Santen, Melanie Fried-Oken, and Jan-ice Staehely. 2003. Intelligibility of modifications todysarthric speech. In Proceedings of the IEEE Inter-national Conference on Acoustics, Speech, and SignalProcessing (ICASSP ’03), volume 1, pages 924–927,April.
Hustad, Katherine C. 2006. Estimating the intelligibil-ity of speakers with dysarthria. Folia Phoniatrica etLogopaedica, 58(3):217–228.
Hustad, Katherine C. and David R. Beukelman. 2002.Listener comprehension of severely dysarthric speech:Effects of linguistic cues and stimulus cohesion. Jour-nal of Speech, Language, and Hearing Research,45:545–558, June.
Hux, Karen, Joan Rankin-Erickson, Nancy Manasse, andElizabeth Lauritzen. 2000. Accuracy of three speechrecognition systems: Case study of dysarthric speech.Augmentative and Alternative Communication (AAC),16(3):186 –196, January.
Kain, Alexander B., John-Paul Hosom, Xiaochuan Niu,Jan P.H. van Santen, Melanie Fried-Oken, and Jan-ice Staehely. 2007. Improving the intelligibil-ity of dysarthric speech. Speech Communication,49(9):743–759, September.
Kawahara, H. and H. Matsui. 2003. Auditory mor-phing based on an elastic perceptual distance metricin an interference-free time-frequency representation.In Acoustics, Speech, and Signal Processing, 2003.Proceedings. (ICASSP ’03). 2003 IEEE InternationalConference on, volume 1, pages I–256 – I–259 vol.1,April.
Kawahara, H., R. Nisimura, T. Irino, M. Morise, T. Taka-hashi, and H. Banno. 2009. Temporally variablemulti-aspect auditory morphing enabling extrapolationwithout objective and perceptual breakdown. In Pro-ceedings of IEEE International Conference on Acous-tics, Speech and Signal Processing (ICASSP 2009),pages 3905–3908, April.
Kawahara, Hideki. 2006. STRAIGHT, exploitation ofthe other aspect of VOCODER: Perceptually isomor-phic decomposition of speech sounds. Acoustical Sci-ence and Technology, 27(6):349–353.
Kawahara, Hideki, Alain de Cheveigne, Hideki Banno,Toru Takahashi, and Toshio Irino. 2005. NearlyDefect-Free F0 Trajectory Extraction for ExpressiveSpeech Modifications Based on STRAIGHT. In Pro-ceedings of INTERSPEECH 2005, pages 537–540,September.
Kent, Ray D. and Kristin Rosen. 2004. Motor con-trol perspectives on motor speech disorders. In Ben
20
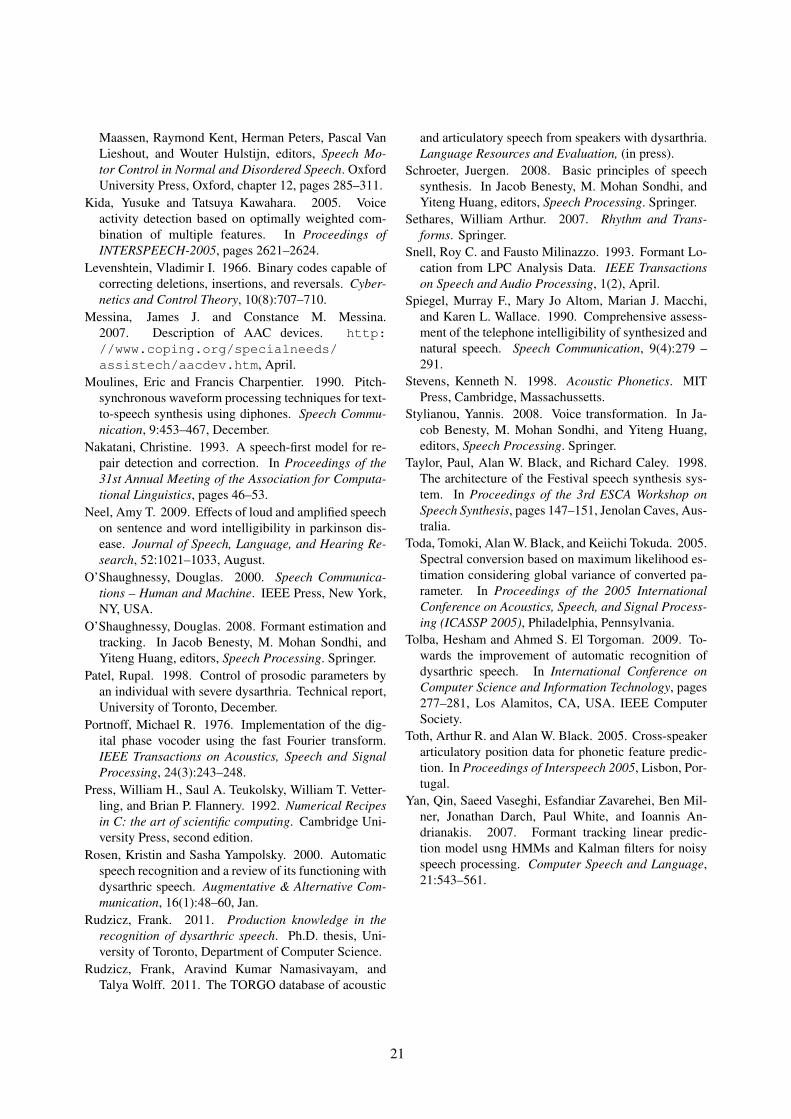
Maassen, Raymond Kent, Herman Peters, Pascal VanLieshout, and Wouter Hulstijn, editors, Speech Mo-tor Control in Normal and Disordered Speech. OxfordUniversity Press, Oxford, chapter 12, pages 285–311.
Kida, Yusuke and Tatsuya Kawahara. 2005. Voiceactivity detection based on optimally weighted com-bination of multiple features. In Proceedings ofINTERSPEECH-2005, pages 2621–2624.
Levenshtein, Vladimir I. 1966. Binary codes capable ofcorrecting deletions, insertions, and reversals. Cyber-netics and Control Theory, 10(8):707–710.
Messina, James J. and Constance M. Messina.2007. Description of AAC devices. http://www.coping.org/specialneeds/assistech/aacdev.htm, April.
Moulines, Eric and Francis Charpentier. 1990. Pitch-synchronous waveform processing techniques for text-to-speech synthesis using diphones. Speech Commu-nication, 9:453–467, December.
Nakatani, Christine. 1993. A speech-first model for re-pair detection and correction. In Proceedings of the31st Annual Meeting of the Association for Computa-tional Linguistics, pages 46–53.
Neel, Amy T. 2009. Effects of loud and amplified speechon sentence and word intelligibility in parkinson dis-ease. Journal of Speech, Language, and Hearing Re-search, 52:1021–1033, August.
O’Shaughnessy, Douglas. 2000. Speech Communica-tions – Human and Machine. IEEE Press, New York,NY, USA.
O’Shaughnessy, Douglas. 2008. Formant estimation andtracking. In Jacob Benesty, M. Mohan Sondhi, andYiteng Huang, editors, Speech Processing. Springer.
Patel, Rupal. 1998. Control of prosodic parameters byan individual with severe dysarthria. Technical report,University of Toronto, December.
Portnoff, Michael R. 1976. Implementation of the dig-ital phase vocoder using the fast Fourier transform.IEEE Transactions on Acoustics, Speech and SignalProcessing, 24(3):243–248.
Press, William H., Saul A. Teukolsky, William T. Vetter-ling, and Brian P. Flannery. 1992. Numerical Recipesin C: the art of scientific computing. Cambridge Uni-versity Press, second edition.
Rosen, Kristin and Sasha Yampolsky. 2000. Automaticspeech recognition and a review of its functioning withdysarthric speech. Augmentative & Alternative Com-munication, 16(1):48–60, Jan.
Rudzicz, Frank. 2011. Production knowledge in therecognition of dysarthric speech. Ph.D. thesis, Uni-versity of Toronto, Department of Computer Science.
Rudzicz, Frank, Aravind Kumar Namasivayam, andTalya Wolff. 2011. The TORGO database of acoustic
and articulatory speech from speakers with dysarthria.Language Resources and Evaluation, (in press).
Schroeter, Juergen. 2008. Basic principles of speechsynthesis. In Jacob Benesty, M. Mohan Sondhi, andYiteng Huang, editors, Speech Processing. Springer.
Sethares, William Arthur. 2007. Rhythm and Trans-forms. Springer.
Snell, Roy C. and Fausto Milinazzo. 1993. Formant Lo-cation from LPC Analysis Data. IEEE Transactionson Speech and Audio Processing, 1(2), April.
Spiegel, Murray F., Mary Jo Altom, Marian J. Macchi,and Karen L. Wallace. 1990. Comprehensive assess-ment of the telephone intelligibility of synthesized andnatural speech. Speech Communication, 9(4):279 –291.
Stevens, Kenneth N. 1998. Acoustic Phonetics. MITPress, Cambridge, Massachussetts.
Stylianou, Yannis. 2008. Voice transformation. In Ja-cob Benesty, M. Mohan Sondhi, and Yiteng Huang,editors, Speech Processing. Springer.
Taylor, Paul, Alan W. Black, and Richard Caley. 1998.The architecture of the Festival speech synthesis sys-tem. In Proceedings of the 3rd ESCA Workshop onSpeech Synthesis, pages 147–151, Jenolan Caves, Aus-tralia.
Toda, Tomoki, Alan W. Black, and Keiichi Tokuda. 2005.Spectral conversion based on maximum likelihood es-timation considering global variance of converted pa-rameter. In Proceedings of the 2005 InternationalConference on Acoustics, Speech, and Signal Process-ing (ICASSP 2005), Philadelphia, Pennsylvania.
Tolba, Hesham and Ahmed S. El Torgoman. 2009. To-wards the improvement of automatic recognition ofdysarthric speech. In International Conference onComputer Science and Information Technology, pages277–281, Los Alamitos, CA, USA. IEEE ComputerSociety.
Toth, Arthur R. and Alan W. Black. 2005. Cross-speakerarticulatory position data for phonetic feature predic-tion. In Proceedings of Interspeech 2005, Lisbon, Por-tugal.
Yan, Qin, Saeed Vaseghi, Esfandiar Zavarehei, Ben Mil-ner, Jonathan Darch, Paul White, and Ioannis An-drianakis. 2007. Formant tracking linear predic-tion model usng HMMs and Kalman filters for noisyspeech processing. Computer Speech and Language,21:543–561.
21
Proceedings of the 2nd Workshop on Speech and Language Processing for Assistive Technologies, pages 22–31,Edinburgh, Scotland, UK, July 30, 2011. c©2011 Association for Computational Linguistics
Towards technology-assisted co-construction with communication partners
Brian Roark†, Andrew Fowler†, Richard Sproat†, Christopher Gibbons◦, Melanie Fried-Oken◦†Center for Spoken Language Understanding ◦Child Development & Rehabilitation Center
Oregon Health & Science University{roark,fowlera,sproatr}@cslu.ogi.edu {gibbons,mfo}@ohsu.edu
Abstract
In this paper, we examine the idea oftechnology-assisted co-construction, wherethe communication partner of an AAC usercan make guesses about the intended mes-sages, which are included in the user’s wordcompletion/prediction interface. We run somehuman trials to simulate this new interfaceconcept, with subjects predicting words as theuser’s intended message is being generated inreal time with specified typing speeds. Re-sults indicate that people can provide substan-tial keystroke savings by providing word com-pletion or prediction, but that the savings arenot as high as n-gram language models. In-terestingly, the language model and humanpredictions are complementary in certain keyways – humans doing a better job in somecircumstances on contextually salient nouns.We discuss implications of the enhanced co-construction interface for real-time messagegeneration in AAC direct selection devices.
1 IntroductionIndividuals who cannot use standard keyboards fortext entry because of physical disabilities have anumber of alternative text entry methods that per-mit typing. Referred to as keyboard emulationwithin augmentative and alternative communication(AAC), there are many different access options forthe user, ranging from direct selection of letters withany anatomical pointer (e.g., head, eyes) to use of abinary switch – triggered by button-press, eye-blinkor even through event related potentials (ERP) suchas the P300 detected in EEG signals. These optionsallow the individual to indirectly select a symbolbased on some process for scanning through alter-natives (Lesher et al., 1998). Typing speed is a chal-lenge, yet is critically important for usability, andas a result there is a significant line of research into
the utility of statistical language models for improv-ing typing speed (McCoy et al., 2007; Koester andLevine, 1996; Koester and Levine, 1997; Koesterand Levine, 1998). Methods of word, symbol,phrase and message prediction via statistical lan-guage models are widespread in both direct selec-tion and scanning devices (Darragh et al., 1990; Liand Hirst, 2005; Trost et al., 2005; Trnka et al.,2006; Trnka et al., 2007; Wandmacher and Antoine,2007; Todman et al., 2008). To the extent that thepredictions are accurate, the number of keystrokesrequired to type a message can be dramatically re-duced, greatly speeding typing.
AAC devices for spontaneous and novel text gen-eration are intended to empower the user of the sys-tem, to place them in control of their own com-munication, and reduce their reliance on others formessage formulation. As a result, all such devices(much like standard personal computers) are builtfor a single user, with a single keyboard and/or alter-native input interface, which is driven by the user ofthe system. The unilateral nature of these high tech-nology solutions to AAC stands in contrast to com-mon low technology solutions, which rely on collab-oration between the individual formulating the mes-sage and their communication partner. Many adultswith acquired neurological conditions rely on com-munication partners for co-construction of messages(Beukelman et al., 2007).
One key reason why low-tech co-constructionmay be preferred to high-tech stand-alone AAC sys-tem solutions is the resulting speed of communica-tion. Whereas spoken language reaches more thanone hundred words per minute and an average speedtypist using standard touch typing will achieve ap-proximately 35 words per minute, a user of an AACdevice will typically input text in the 3-10 words perminute range. With a communication partner guess-
22
ing the intended message and requesting confirma-tion, the communication rate can speed up dramati-cally. For face-to-face communication – a modalitythat is currently very poorly served by AAC devices– such a speedup is greatly preferred, despite anypotential authorship questions.
Consider the following low-tech scenario. Sandyis locked-in, with just a single eye-blink serving toprovide binary yes/no feedback. Sandy’s commu-nication partner, Kim, initiates communication byverbally stepping through an imagined row/columngrid, first by number (to identify the row); then byletter. In such a way, Sandy can indicate the firstdesired symbol. Communication can continue inthis way until Kim has a good idea of the word thatSandy intends and proposes the word. If Sandy saysyes, the word has been completed, much as auto-matic word completion may occur within an AACdevice. But Kim doesn’t necessarily stop with wordcompletion; subsequent word prediction, phrase pre-diction, in fact whole utterance prediction can fol-low, driven by Kim’s intuitions derived from knowl-edge of Sandy, true sensitivity to context, topic, so-cial protocol, etc. It is no wonder that such methodsare often chosen over high-tech alternatives.
In this paper, we present some preliminary ideasand experiments on an approach to providing tech-nology support to this sort of co-construction duringtyping. The core idea is to provide an enhanced in-terface to the communication partner (Kim in the ex-ample above), which does not allow them to directlycontribute to the message construction, but ratherto indirectly contribute, by predicting what they be-lieve the individual will type next. Because most textgeneration AAC devices typically already rely uponsymbol, word and phrase prediction from statisticallanguage models to speed text input, the predictionsof the conversation partner could be used to influ-ence (or adapt) the language model. Such adaptationcould be as simple as assigning high probability towords or symbols explicitly predicted by the com-munication partner, or as complex as deriving thetopic or context from the partner’s predictions andusing that context to improve the model.
Statistical language models in AAC devices cancapture regularities in language, e.g., frequent wordcollocations or phrases and names commonly usedby an individual. People, however, have access to
much more information than computational mod-els, including rich knowledge of language, any rel-evant contextual factors that may skew prediction,familiarity with the AAC user, and extensive worldknowledge – none of which can be easily included inthe kinds of simple statistical models that constitutethe current state of the art. People are typically quitegood at predicting what might come next in a sen-tence, particularly if it is part of a larger discourse ordialogue. Indeed, some of the earliest work lookingat statistical models of language established the en-tropy of English by asking subjects to play a simplelanguage guessing game (Shannon, 1950). The so-called “Shannon game” starts with the subject guess-ing the first letter of the text. Once they have guessedcorrectly, it is uncovered, and the subject guessesthe next letter, and so on. A similar game could beplayed with words instead of letters. The number ofguesses required is a measure of entropy in the lan-guage. People are understandably very good at thisgame, often correctly predicting symbols on the firsttry for very long stretches of text. No purely com-putational model can hope to match the contextualsensitivity, partner familiarity, or world knowledgethat a human being brings to such a task.
A co-construction scenario differs from a Shan-non game in terms of the time constraints underwhich it operates. The communication partner insuch a scenario must offer completions and predic-tions to the user in a way that actually speeds com-munication relative to independent text generation.Given an arbitrary amount of time, it is clear thatpeople have greater information at their disposal forpredicting subsequent content; what happens undertime constraints is less clear. Indeed, in this paperwe demonstrate that the time constraints put humansubjects at a strong disadvantage relative to languagemodels in the scenarios we simulated. While it isfar from clear that this disadvantage will also applyin scenarios closer to the motivating example givenabove, it is certainly the case that providing usefulinput is a challenging task.
The principal benefit of technology-assisted co-construction with communication partners is makinguse of the partner’s knowledge of language and con-text, as well as their familiarity with the AAC userand the world, to yield better predictions of likelycontinuations than are currently made by the kinds
23
of relatively uninformed (albeit state of the art) com-putational language models. A secondary benefit isthat such an approach engages the conversation part-ner in a high utility collaboration during the AACuser’s turn, rather than simply sitting and waiting forthe reply to be produced. Lack of engagement is aserious obstacle to successful conversation in AAC(Hoag et al., 2004). The slow speed of AAC input isitself a contributing factor to AAC user dissatisfac-tion with face-to-face conversation, one of the mostcritical modes of human social interaction, and theone least served by current technology. Because ofthe slow turnaround, the conversation partner tendsto lose focus and interest in the conversation, leadingto shorter and less satisfying exchanges than thoseenjoyed by those using spoken language. A systemwhich leverages communication partner predictionswill more fully engage the conversation partner inthe process, rather than forcing them to wait for aresponse with nothing to do.
Importantly, an enhanced interface such as thatproposed here provides predictive input from thecommunication partner, but not direct compositionalinput. The responsibility of selecting symbols andwords during text entry remains with the AAC user,as the sole author of the text. In the preliminaryexperiments presented later in the paper, we simu-late a direct selection typing system with word pre-diction, and measure the utility of human generatedword completions and predictions relative to n-grammodels. In such a scenario, n-gram predictions canbe replaced or augmented by human predictions.This illustrates how easily technology assisted co-construction with communication partners could po-tentially be integrated into a user’s interface.
Despite the lack of speedup achieved versus n-gram models in the results reported below, the po-tential for capturing communication partner intu-itions about AAC user intended utterances seems acompelling topic for future research.
2 Background and Related WorkOver the past forty years, there has been a vastarray of technological solutions to aid AAC userswho present with severe speech and physical im-pairments, from methods for generating possibleresponses, to techniques for selecting among re-sponses. The simplest methods to generate lan-
guage involve the use of pre-stored phrases, such as“hello”, “thank you”, “I love you”, etc., which areavailable on many AAC devices. Some studies haveindicated that use of such phrases improves the per-ception of fluid communication (McCoy et al., 2007;Hoag et al., 2008).
Prediction options vary in AAC devices, rang-ing from letter-by-letter prediction – see Higgin-botham (1992) and Lesher et al. (1998) for somereviews – to word-based prediction. Some systemscan be quite sophisticated, for example incorporat-ing latent semantic analysis to aid in the better mod-eling of discourse-level information (Wandmacherand Antoine, 2007). The WebCrawler project in Jef-frey Higginbotham’s lab uses topic-related wordlistsmined from the Web to populate a user’s AAC de-vice with terminology that is likely to be of utility tothe current topic of conversation.
Going beyond word prediction, there has beenan increased interest in utterance-based approaches(Todman et al., 2008), which extend predictionfrom the character or word level to the levelof whole sentences. For example, systems likeFrameTalker/Contact (Higginbotham and Wilkins,1999; Wilkins and Higginbotham, 2006) populatethe AAC device with pre-stored phrases that can beorganized in various ways. In a similar vein, re-cent work reported in Wisenburn and Higginbotham(2008; 2009) proposed a novel method that uses au-tomatic speech recognition (ASR) on the speech ofthe communication partner, extracts noun phrasesfrom the speech, and presents those noun phrases onthe AAC device, with frame sentences that the AACuser can select. Thus if the communication partnersays “Paris”, the AAC user will be able to selectfrom phrases like “Tell me more about Paris” or “Iwant to talk about Paris”. This can speed up the con-versation by providing topically-relevant responses.Perhaps the most elaborate system of this kind is theHow Was School Today system (Reiter et al., 2009).This system, which is geared towards children withsevere communication disabilities, uses data fromsensors, the Web, and other sources as input for anatural language generation system. The system ac-quires information about the child’s day in school:which classes he or she attended, what activitiesthere were, information about visitors, food choicesat the cafeteria, and so forth. The data are then used
24
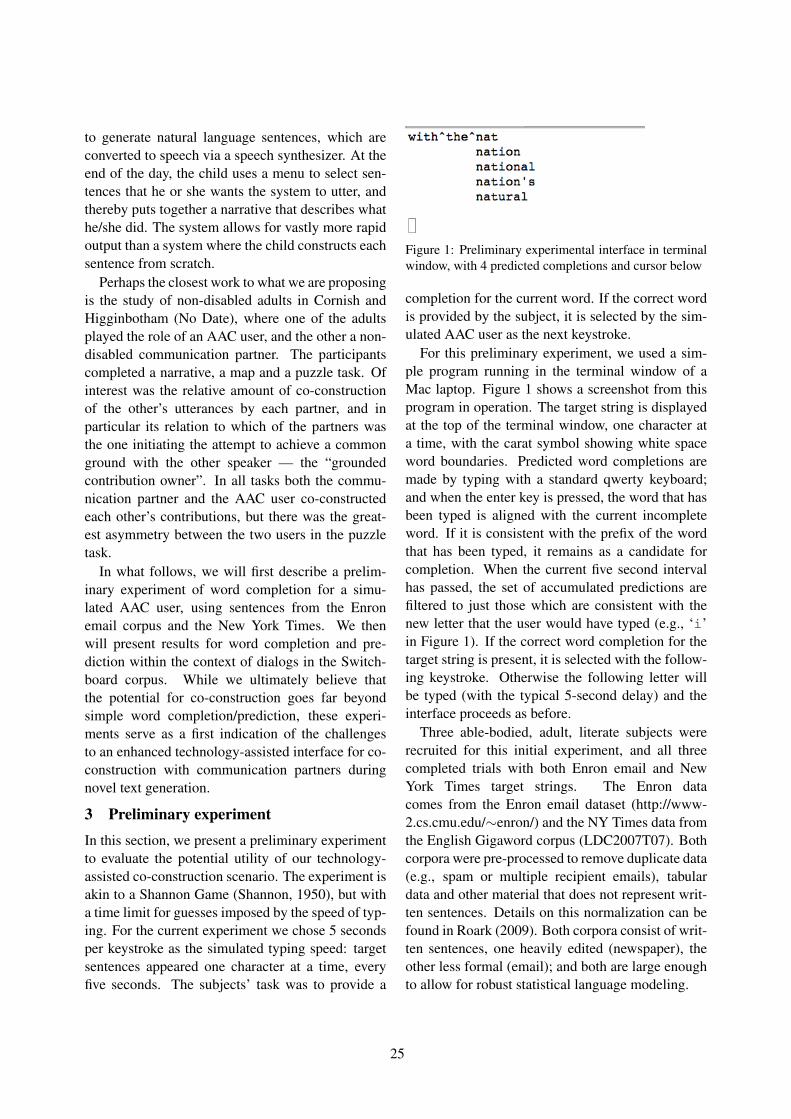
to generate natural language sentences, which areconverted to speech via a speech synthesizer. At theend of the day, the child uses a menu to select sen-tences that he or she wants the system to utter, andthereby puts together a narrative that describes whathe/she did. The system allows for vastly more rapidoutput than a system where the child constructs eachsentence from scratch.
Perhaps the closest work to what we are proposingis the study of non-disabled adults in Cornish andHigginbotham (No Date), where one of the adultsplayed the role of an AAC user, and the other a non-disabled communication partner. The participantscompleted a narrative, a map and a puzzle task. Ofinterest was the relative amount of co-constructionof the other’s utterances by each partner, and inparticular its relation to which of the partners wasthe one initiating the attempt to achieve a commonground with the other speaker — the “groundedcontribution owner”. In all tasks both the commu-nication partner and the AAC user co-constructedeach other’s contributions, but there was the great-est asymmetry between the two users in the puzzletask.
In what follows, we will first describe a prelim-inary experiment of word completion for a simu-lated AAC user, using sentences from the Enronemail corpus and the New York Times. We thenwill present results for word completion and pre-diction within the context of dialogs in the Switch-board corpus. While we ultimately believe thatthe potential for co-construction goes far beyondsimple word completion/prediction, these experi-ments serve as a first indication of the challengesto an enhanced technology-assisted interface for co-construction with communication partners duringnovel text generation.
3 Preliminary experimentIn this section, we present a preliminary experimentto evaluate the potential utility of our technology-assisted co-construction scenario. The experiment isakin to a Shannon Game (Shannon, 1950), but witha time limit for guesses imposed by the speed of typ-ing. For the current experiment we chose 5 secondsper keystroke as the simulated typing speed: targetsentences appeared one character at a time, everyfive seconds. The subjects’ task was to provide a
Figure 1: Preliminary experimental interface in terminalwindow, with 4 predicted completions and cursor below
completion for the current word. If the correct wordis provided by the subject, it is selected by the sim-ulated AAC user as the next keystroke.
For this preliminary experiment, we used a sim-ple program running in the terminal window of aMac laptop. Figure 1 shows a screenshot from thisprogram in operation. The target string is displayedat the top of the terminal window, one character ata time, with the carat symbol showing white spaceword boundaries. Predicted word completions aremade by typing with a standard qwerty keyboard;and when the enter key is pressed, the word that hasbeen typed is aligned with the current incompleteword. If it is consistent with the prefix of the wordthat has been typed, it remains as a candidate forcompletion. When the current five second intervalhas passed, the set of accumulated predictions arefiltered to just those which are consistent with thenew letter that the user would have typed (e.g., ‘i’in Figure 1). If the correct word completion for thetarget string is present, it is selected with the follow-ing keystroke. Otherwise the following letter willbe typed (with the typical 5-second delay) and theinterface proceeds as before.
Three able-bodied, adult, literate subjects wererecruited for this initial experiment, and all threecompleted trials with both Enron email and NewYork Times target strings. The Enron datacomes from the Enron email dataset (http://www-2.cs.cmu.edu/∼enron/) and the NY Times data fromthe English Gigaword corpus (LDC2007T07). Bothcorpora were pre-processed to remove duplicate data(e.g., spam or multiple recipient emails), tabulardata and other material that does not represent writ-ten sentences. Details on this normalization can befound in Roark (2009). Both corpora consist of writ-ten sentences, one heavily edited (newspaper), theother less formal (email); and both are large enoughto allow for robust statistical language modeling.
25
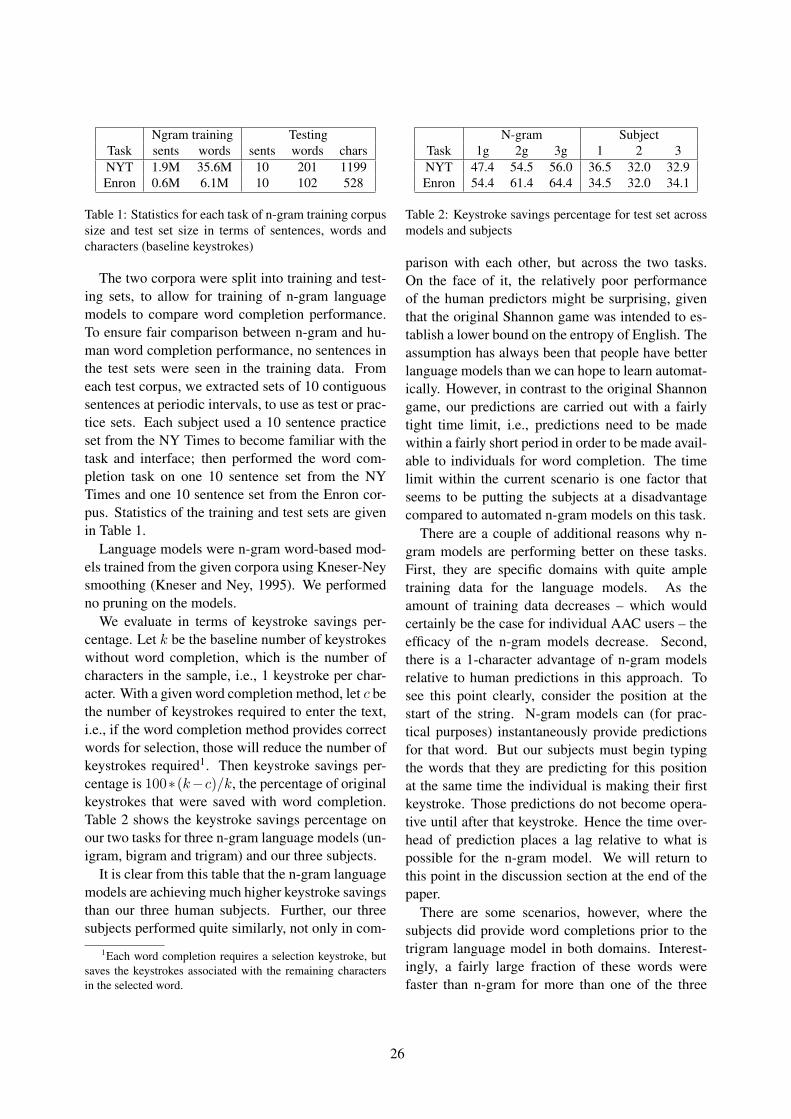
Ngram training TestingTask sents words sents words charsNYT 1.9M 35.6M 10 201 1199Enron 0.6M 6.1M 10 102 528
Table 1: Statistics for each task of n-gram training corpussize and test set size in terms of sentences, words andcharacters (baseline keystrokes)
The two corpora were split into training and test-ing sets, to allow for training of n-gram languagemodels to compare word completion performance.To ensure fair comparison between n-gram and hu-man word completion performance, no sentences inthe test sets were seen in the training data. Fromeach test corpus, we extracted sets of 10 contiguoussentences at periodic intervals, to use as test or prac-tice sets. Each subject used a 10 sentence practiceset from the NY Times to become familiar with thetask and interface; then performed the word com-pletion task on one 10 sentence set from the NYTimes and one 10 sentence set from the Enron cor-pus. Statistics of the training and test sets are givenin Table 1.
Language models were n-gram word-based mod-els trained from the given corpora using Kneser-Neysmoothing (Kneser and Ney, 1995). We performedno pruning on the models.
We evaluate in terms of keystroke savings per-centage. Let k be the baseline number of keystrokeswithout word completion, which is the number ofcharacters in the sample, i.e., 1 keystroke per char-acter. With a given word completion method, let c bethe number of keystrokes required to enter the text,i.e., if the word completion method provides correctwords for selection, those will reduce the number ofkeystrokes required1. Then keystroke savings per-centage is 100∗(k−c)/k, the percentage of originalkeystrokes that were saved with word completion.Table 2 shows the keystroke savings percentage onour two tasks for three n-gram language models (un-igram, bigram and trigram) and our three subjects.
It is clear from this table that the n-gram languagemodels are achieving much higher keystroke savingsthan our three human subjects. Further, our threesubjects performed quite similarly, not only in com-
1Each word completion requires a selection keystroke, butsaves the keystrokes associated with the remaining charactersin the selected word.
N-gram SubjectTask 1g 2g 3g 1 2 3NYT 47.4 54.5 56.0 36.5 32.0 32.9Enron 54.4 61.4 64.4 34.5 32.0 34.1
Table 2: Keystroke savings percentage for test set acrossmodels and subjects
parison with each other, but across the two tasks.On the face of it, the relatively poor performanceof the human predictors might be surprising, giventhat the original Shannon game was intended to es-tablish a lower bound on the entropy of English. Theassumption has always been that people have betterlanguage models than we can hope to learn automat-ically. However, in contrast to the original Shannongame, our predictions are carried out with a fairlytight time limit, i.e., predictions need to be madewithin a fairly short period in order to be made avail-able to individuals for word completion. The timelimit within the current scenario is one factor thatseems to be putting the subjects at a disadvantagecompared to automated n-gram models on this task.
There are a couple of additional reasons why n-gram models are performing better on these tasks.First, they are specific domains with quite ampletraining data for the language models. As theamount of training data decreases – which wouldcertainly be the case for individual AAC users – theefficacy of the n-gram models decrease. Second,there is a 1-character advantage of n-gram modelsrelative to human predictions in this approach. Tosee this point clearly, consider the position at thestart of the string. N-gram models can (for prac-tical purposes) instantaneously provide predictionsfor that word. But our subjects must begin typingthe words that they are predicting for this positionat the same time the individual is making their firstkeystroke. Those predictions do not become opera-tive until after that keystroke. Hence the time over-head of prediction places a lag relative to what ispossible for the n-gram model. We will return tothis point in the discussion section at the end of thepaper.
There are some scenarios, however, where thesubjects did provide word completions prior to thetrigram language model in both domains. Interest-ingly, a fairly large fraction of these words werefaster than n-gram for more than one of the three
26
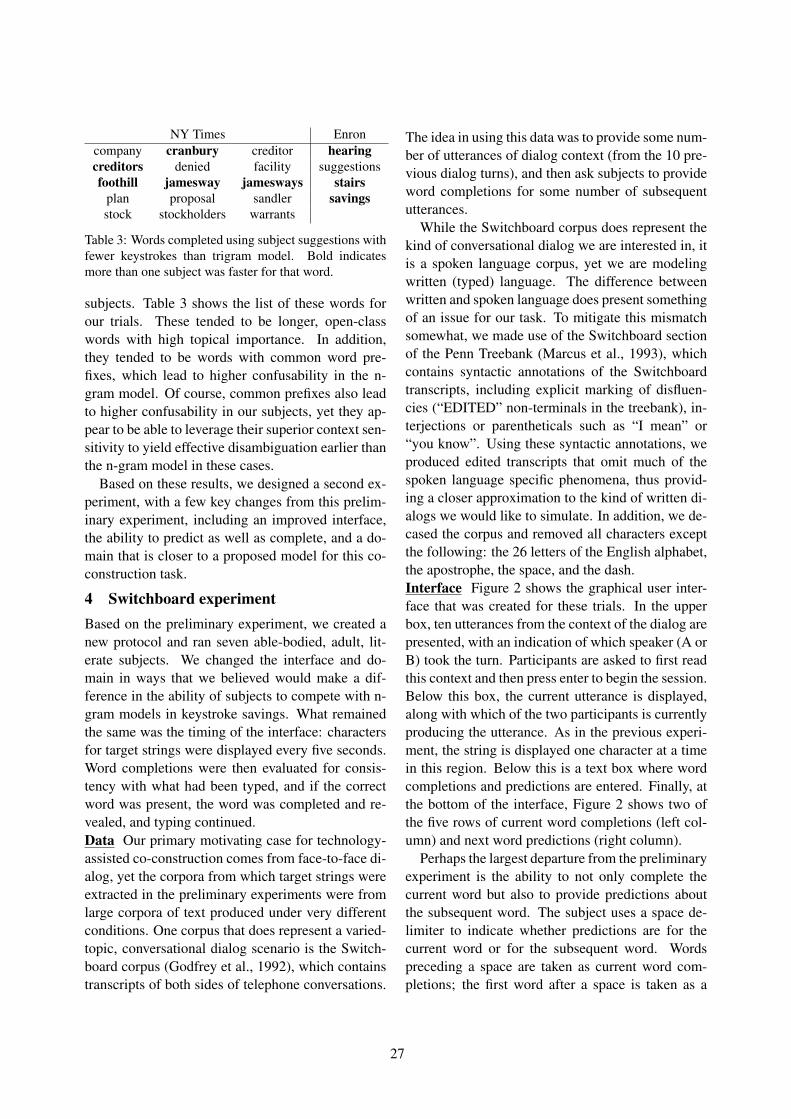
NY Times Enroncompany cranbury creditor hearingcreditors denied facility suggestionsfoothill jamesway jamesways stairs
plan proposal sandler savingsstock stockholders warrants
Table 3: Words completed using subject suggestions withfewer keystrokes than trigram model. Bold indicatesmore than one subject was faster for that word.
subjects. Table 3 shows the list of these words forour trials. These tended to be longer, open-classwords with high topical importance. In addition,they tended to be words with common word pre-fixes, which lead to higher confusability in the n-gram model. Of course, common prefixes also leadto higher confusability in our subjects, yet they ap-pear to be able to leverage their superior context sen-sitivity to yield effective disambiguation earlier thanthe n-gram model in these cases.
Based on these results, we designed a second ex-periment, with a few key changes from this prelim-inary experiment, including an improved interface,the ability to predict as well as complete, and a do-main that is closer to a proposed model for this co-construction task.
4 Switchboard experimentBased on the preliminary experiment, we created anew protocol and ran seven able-bodied, adult, lit-erate subjects. We changed the interface and do-main in ways that we believed would make a dif-ference in the ability of subjects to compete with n-gram models in keystroke savings. What remainedthe same was the timing of the interface: charactersfor target strings were displayed every five seconds.Word completions were then evaluated for consis-tency with what had been typed, and if the correctword was present, the word was completed and re-vealed, and typing continued.Data Our primary motivating case for technology-assisted co-construction comes from face-to-face di-alog, yet the corpora from which target strings wereextracted in the preliminary experiments were fromlarge corpora of text produced under very differentconditions. One corpus that does represent a varied-topic, conversational dialog scenario is the Switch-board corpus (Godfrey et al., 1992), which containstranscripts of both sides of telephone conversations.
The idea in using this data was to provide some num-ber of utterances of dialog context (from the 10 pre-vious dialog turns), and then ask subjects to provideword completions for some number of subsequentutterances.
While the Switchboard corpus does represent thekind of conversational dialog we are interested in, itis a spoken language corpus, yet we are modelingwritten (typed) language. The difference betweenwritten and spoken language does present somethingof an issue for our task. To mitigate this mismatchsomewhat, we made use of the Switchboard sectionof the Penn Treebank (Marcus et al., 1993), whichcontains syntactic annotations of the Switchboardtranscripts, including explicit marking of disfluen-cies (“EDITED” non-terminals in the treebank), in-terjections or parentheticals such as “I mean” or“you know”. Using these syntactic annotations, weproduced edited transcripts that omit much of thespoken language specific phenomena, thus provid-ing a closer approximation to the kind of written di-alogs we would like to simulate. In addition, we de-cased the corpus and removed all characters exceptthe following: the 26 letters of the English alphabet,the apostrophe, the space, and the dash.Interface Figure 2 shows the graphical user inter-face that was created for these trials. In the upperbox, ten utterances from the context of the dialog arepresented, with an indication of which speaker (A orB) took the turn. Participants are asked to first readthis context and then press enter to begin the session.Below this box, the current utterance is displayed,along with which of the two participants is currentlyproducing the utterance. As in the previous experi-ment, the string is displayed one character at a timein this region. Below this is a text box where wordcompletions and predictions are entered. Finally, atthe bottom of the interface, Figure 2 shows two ofthe five rows of current word completions (left col-umn) and next word predictions (right column).
Perhaps the largest departure from the preliminaryexperiment is the ability to not only complete thecurrent word but also to provide predictions aboutthe subsequent word. The subject uses a space de-limiter to indicate whether predictions are for thecurrent word or for the subsequent word. Wordspreceding a space are taken as current word com-pletions; the first word after a space is taken as a
27
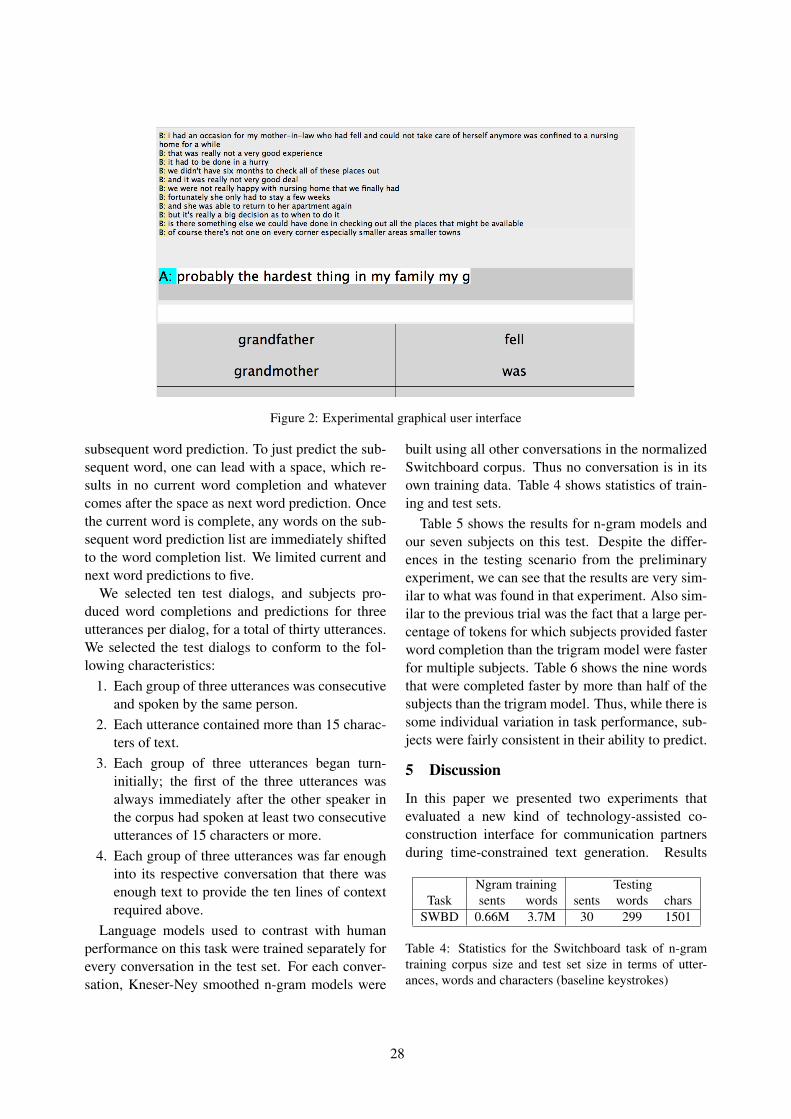
Figure 2: Experimental graphical user interface
subsequent word prediction. To just predict the sub-sequent word, one can lead with a space, which re-sults in no current word completion and whatevercomes after the space as next word prediction. Oncethe current word is complete, any words on the sub-sequent word prediction list are immediately shiftedto the word completion list. We limited current andnext word predictions to five.
We selected ten test dialogs, and subjects pro-duced word completions and predictions for threeutterances per dialog, for a total of thirty utterances.We selected the test dialogs to conform to the fol-lowing characteristics:
1. Each group of three utterances was consecutiveand spoken by the same person.
2. Each utterance contained more than 15 charac-ters of text.
3. Each group of three utterances began turn-initially; the first of the three utterances wasalways immediately after the other speaker inthe corpus had spoken at least two consecutiveutterances of 15 characters or more.
4. Each group of three utterances was far enoughinto its respective conversation that there wasenough text to provide the ten lines of contextrequired above.
Language models used to contrast with humanperformance on this task were trained separately forevery conversation in the test set. For each conver-sation, Kneser-Ney smoothed n-gram models were
built using all other conversations in the normalizedSwitchboard corpus. Thus no conversation is in itsown training data. Table 4 shows statistics of train-ing and test sets.
Table 5 shows the results for n-gram models andour seven subjects on this test. Despite the differ-ences in the testing scenario from the preliminaryexperiment, we can see that the results are very sim-ilar to what was found in that experiment. Also sim-ilar to the previous trial was the fact that a large per-centage of tokens for which subjects provided fasterword completion than the trigram model were fasterfor multiple subjects. Table 6 shows the nine wordsthat were completed faster by more than half of thesubjects than the trigram model. Thus, while there issome individual variation in task performance, sub-jects were fairly consistent in their ability to predict.
5 Discussion
In this paper we presented two experiments thatevaluated a new kind of technology-assisted co-construction interface for communication partnersduring time-constrained text generation. Results
Ngram training TestingTask sents words sents words chars
SWBD 0.66M 3.7M 30 299 1501
Table 4: Statistics for the Switchboard task of n-gramtraining corpus size and test set size in terms of utter-ances, words and characters (baseline keystrokes)
28
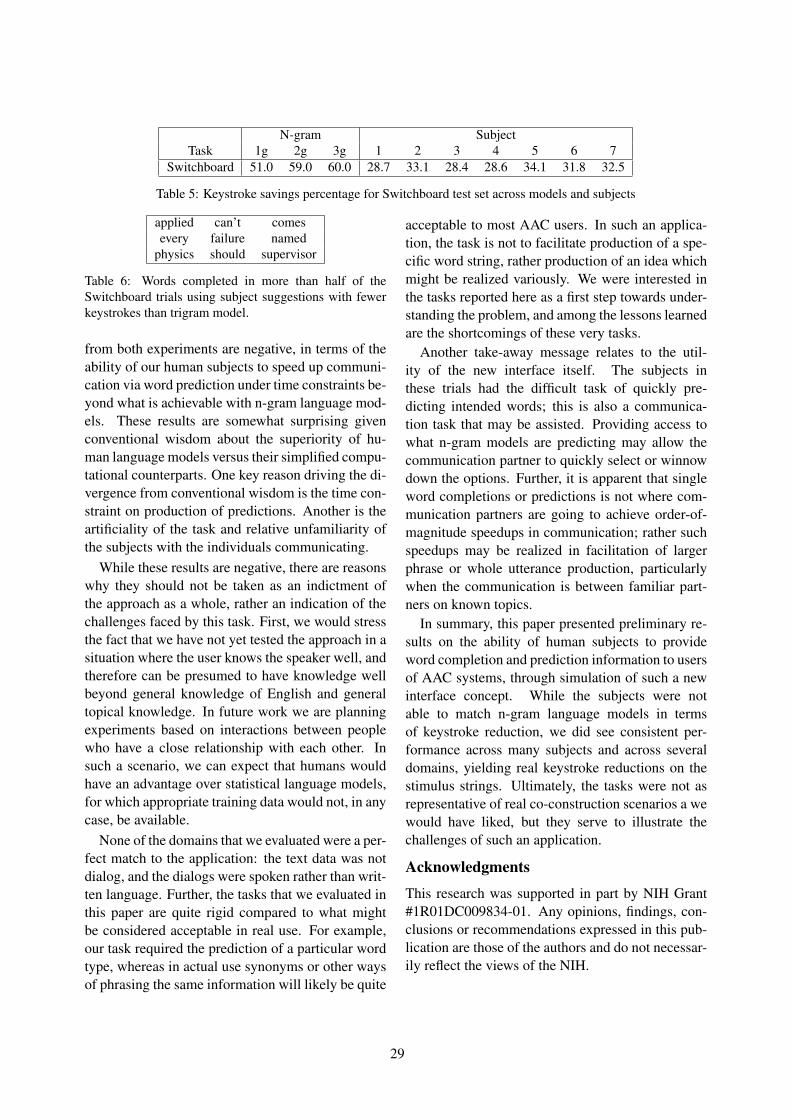
N-gram SubjectTask 1g 2g 3g 1 2 3 4 5 6 7
Switchboard 51.0 59.0 60.0 28.7 33.1 28.4 28.6 34.1 31.8 32.5
Table 5: Keystroke savings percentage for Switchboard test set across models and subjects
applied can’t comesevery failure named
physics should supervisor
Table 6: Words completed in more than half of theSwitchboard trials using subject suggestions with fewerkeystrokes than trigram model.
from both experiments are negative, in terms of theability of our human subjects to speed up communi-cation via word prediction under time constraints be-yond what is achievable with n-gram language mod-els. These results are somewhat surprising givenconventional wisdom about the superiority of hu-man language models versus their simplified compu-tational counterparts. One key reason driving the di-vergence from conventional wisdom is the time con-straint on production of predictions. Another is theartificiality of the task and relative unfamiliarity ofthe subjects with the individuals communicating.
While these results are negative, there are reasonswhy they should not be taken as an indictment ofthe approach as a whole, rather an indication of thechallenges faced by this task. First, we would stressthe fact that we have not yet tested the approach in asituation where the user knows the speaker well, andtherefore can be presumed to have knowledge wellbeyond general knowledge of English and generaltopical knowledge. In future work we are planningexperiments based on interactions between peoplewho have a close relationship with each other. Insuch a scenario, we can expect that humans wouldhave an advantage over statistical language models,for which appropriate training data would not, in anycase, be available.
None of the domains that we evaluated were a per-fect match to the application: the text data was notdialog, and the dialogs were spoken rather than writ-ten language. Further, the tasks that we evaluated inthis paper are quite rigid compared to what mightbe considered acceptable in real use. For example,our task required the prediction of a particular wordtype, whereas in actual use synonyms or other waysof phrasing the same information will likely be quite
acceptable to most AAC users. In such an applica-tion, the task is not to facilitate production of a spe-cific word string, rather production of an idea whichmight be realized variously. We were interested inthe tasks reported here as a first step towards under-standing the problem, and among the lessons learnedare the shortcomings of these very tasks.
Another take-away message relates to the util-ity of the new interface itself. The subjects inthese trials had the difficult task of quickly pre-dicting intended words; this is also a communica-tion task that may be assisted. Providing access towhat n-gram models are predicting may allow thecommunication partner to quickly select or winnowdown the options. Further, it is apparent that singleword completions or predictions is not where com-munication partners are going to achieve order-of-magnitude speedups in communication; rather suchspeedups may be realized in facilitation of largerphrase or whole utterance production, particularlywhen the communication is between familiar part-ners on known topics.
In summary, this paper presented preliminary re-sults on the ability of human subjects to provideword completion and prediction information to usersof AAC systems, through simulation of such a newinterface concept. While the subjects were notable to match n-gram language models in termsof keystroke reduction, we did see consistent per-formance across many subjects and across severaldomains, yielding real keystroke reductions on thestimulus strings. Ultimately, the tasks were not asrepresentative of real co-construction scenarios a wewould have liked, but they serve to illustrate thechallenges of such an application.
Acknowledgments
This research was supported in part by NIH Grant#1R01DC009834-01. Any opinions, findings, con-clusions or recommendations expressed in this pub-lication are those of the authors and do not necessar-ily reflect the views of the NIH.
29
ReferencesD.R. Beukelman, S. Fager, L. Ball, and A. Dietz. 2007.
AAC for adults with acquired neurological conditions:A review. Augmentative and Alternative Communica-tion, 23(3):230–242.
Jennifer Cornish and Jeffrey Higginbotham. No Date.Assessing AAC interaction III: Effect of task typeon co-construction & message repair. AAC-RERC, available from http:aac-rerc.psu.edu/_userfiles/asha3.pdf.
J.J. Darragh, I.H. Witten, and M.L. James. 1990. Thereactive keyboard: A predictive typing aid. Computer,23(11):41–49.
J.J. Godfrey, E.C. Holliman, and J. McDaniel. 1992.Switchboard: A telephone speech corpus for researchand develpment. In Proceedings of ICASSP, volume I,pages 517–520.
D. Jeffery Higginbotham and David Wilkins. 1999.Frametalker: A system and method for utilizing com-munication frames in augmented communication tech-nologies. US Patent No. 5,956,667.
D. Jeffery Higginbotham. 1992. Evaluation of keystrokesavings across five assistive communication technolo-gies. Augmentative and Alternative Communication,8:258–272.
Linda A. Hoag, Jan L. Bedrosian, Kathleen F. McCoy,and Dallas Johnson. 2004. Informativeness and speedof message delivery trade-offs in augmentative andalternative communication. Journal of Speech, Lan-guage, and Hearing Research, 47:1270–1285.
Linda A. Hoag, Jan L. Bedrosian, Kathleen F. Mc-Coy, and Dallas Johnson. 2008. Hierarchy ofconversational rule violations involving utterance-based augmentative and alternative communicationsystems. Augmentative and Alternative Communica-tion, 24(2):149–161.
R. Kneser and H. Ney. 1995. Improved backing-off form-gram language modeling. In Proceedings of theIEEE International Conference on Acoustics, Speech,and Signal Processing (ICASSP), pages 181–184.
Heidi H. Koester and Simon Levine. 1996. Ef-fect of a word prediction feature on user perfor-mance. Augmentative and Alternative Communica-tion, 12(3):155–168.
Heidi H. Koester and Simon Levine. 1997. Keystroke-level models for user performance with word predic-tion. Augmentative and Alternative Communication,13(4):239257.
Heidi H. Koester and Simon Levine. 1998. Modelsimulations of user performance with word predic-tion. Augmentative and Alternative Communication,14(1):25–36.
G.W. Lesher, B.J. Moulton, and D.J. Higginbotham.1998. Techniques for augmenting scanning commu-nication. Augmentative and Alternative Communica-tion, 14:81–101.
J. Li and G. Hirst. 2005. Semantic knowledge in wordcompletion. In Proceedings of the 7th InternationalACM Conference on Computers and Accessibility.
Mitchell P. Marcus, Beatrice Santorini, and Mary AnnMarcinkiewicz. 1993. Building a large annotated cor-pus of English: The Penn Treebank. ComputationalLinguistics, 19(2):313–330.
Kathleen F. McCoy, Jan L. Bedrosian, Linda A. Hoag,and Dallas E. Johnson. 2007. Brevity and speed ofmessage delivery trade-offs in augmentative and alter-native communication. Augmentative and AlternativeCommunication, 23(1):76–88.
Ehud Reiter, Ross Turner, Norman Alm, Rolf Black,Martin Dempster, and Annalu Waller. 2009. Us-ing NLG to help language-impaired users tell storiesand participate in social dialogues. In 12th EuropeanWorkshop on Natural Language Generation, pages 1–8. Association for Computational Linguistics.
B. Roark. 2009. Open vocabulary language modelingfor binary response typing interfaces. TechnicalReport #CSLU-09-001, Center for Spoken LanguageProcessing, Oregon Health & Science University.cslu.ogi.edu/publications/ps/roark09.pdf.
C.E. Shannon. 1950. Prediction and entropy of printedEnglish. Bell System Technical Journal, 30:50–64.
John Todman, Norman Alm, D. Jeffery Higginbotham,and Portia File. 2008. Whole utterance approaches inAAC. Augmentative and Alternative Communication,24(3):235–254.
K. Trnka, D. Yarrington, K.F. McCoy, and C. Pennington.2006. Topic modeling in fringe word prediction forAAC. In Proceedings of the International Conferenceon Intelligent User Interfaces, pages 276–278.
K. Trnka, D. Yarrington, J. McCaw, K.F. McCoy, andC. Pennington. 2007. The effects of word predic-tion on communication rate for AAC. In Proceed-ings of HLT-NAACL; Companion Volume, Short Pa-pers, pages 173–176.
H. Trost, J. Matiasek, and M. Baroni. 2005. The lan-guage component of the FASTY text prediction sys-tem. Applied Artificial Intelligence, 19(8):743–781.
T. Wandmacher and J.Y. Antoine. 2007. Methods to in-tegrate a language model with semantic informationfor a word prediction component. In Proceedings ofthe Conference on Empirical Methods in Natural Lan-guage Processing (EMNLP), pages 506–513.
David Wilkins and D. Jeffery Higginbotham. 2006. Theshort story of Frametalker: An interactive AAC de-vice. Perspectives on Augmentative and AlternativeCommunication, 15(1):18–21.
30

Bruce Wisenburn and D. Jeffery Higginbotham. 2008.An AAC application using speaking partner speechrecognition to automatically produce contextually rel-evant utterances: Objective results. Augmentative andAlternative Communication, 24(2):100–109.
Bruce Wisenburn and D. Jeffery Higginbotham. 2009.Participant evaluations of rate and communication ef-ficacy of an AAC application using natural languageprocessing. Augmentative and Alternative Communi-cation, 25(2):78–89.
31
Proceedings of the 2nd Workshop on Speech and Language Processing for Assistive Technologies, pages 32–42,Edinburgh, Scotland, UK, July 30, 2011. c©2011 Association for Computational Linguistics
Trap Hunting: Finding Personal Data Management Issues in NextGeneration AAC Devices
Joseph ReddingtonRoyal Holloway College
Egham, [email protected]
Lizzie Coles-KempRoyal Holloway College
Egham, [email protected]
Abstract
Advances in natural language generation andspeech processing techniques, combined withchanges in the commercial landscape, havebrought within reach dramatic improvementsin Augmentative Alternative Communication(AAC). These improvements, though over-whelmingly positive, amplify a family of per-sonal data use problems. This paper arguesthat the AAC design and implementation pro-cess needs to identify and address personaldata use problems. Accordingly, this paperexplores personal data management problemsand proposes responses. This paper is situatedin the context of AAC technology but the re-sponses could be generalised for other com-munities affected by low digital literacy, lowliteracy levels and cognitive challenges.
1 Introduction
Electronic Augmentative and Alternative Commu-nication (AAC) systems enable individuals with se-vere speech impairment to verbally communicatetheir needs, often using Text-to-Speech technology.Such devices are designed to give communicationimpaired people greater independence and improvedopportunities of social integration. The devices en-able users to construct utterances, many of which de-scribe themselves or aspects of their lives, includingtheir actions with others and, as such, can be con-sidered ‘personal data’. Recent work by Patel andRadhakrishnan (2007), Black et al. (2010), Reiteret al. (2009), and Reddington and Tintarev (2011)makes explicit use of personal data (about both the
user and other parties) to improve the functionalityof AAC devices. Depending on context, the use ofthese utterances, in an institutional setting, may becontrolled under data protection legislation, or (e.g.domestically) their use may be influenced more bysocial norms within the context. A key factor in per-sonal data management is the highly contextual na-ture of privacy related issues; privacy concerns andpractices are situated in their context (Nissenbaum,2009) and influenced by cultural issues (Milberg etal., 2000).
The diversity of technology in the AAC sectoris set to increase dramatically. Apple’s iPad1 hascaused a huge investment in tablet technology. Mul-tiple, third party applications (e.g. proloque2go2,myVoice3, and verbally4) already exist that allowthis new range of tablets to function as AAC devices.
The effect of this research movement maturingat a time when many new devices and producersare entering the market foreshadows probable ma-jor changes and innovations in coming years. Thisincludes a risk of the “panoply of different privacyproblems” that privacy theorist Solove (2008) fore-saw as a result of diversifying and enhancing tech-nologies.
The authors’ position is that it is very timely toexplore personal data management problems in thisnew AAC landscape and in so doing identify trapsthat AAC design might stumble into as this technol-ogy change gathers pace. This perspective can con-
1http://www.apple.com/ipad/, retrieved May 20112http://www.proloquo2go.com, retrieved May 20113http://new.myvoiceaac.com, retrieved May 20114http://verballyapp.com/index.html,retrieved May 2011
32
tribute to the design of technologies and governancestructures that are able to both identify and respondto such traps.
As AAC devices are designed to be used in all ar-eas of the AAC user’s life, there are a broad rangeof personal data management problems, which arehighly context sensitive and incorporate legal, so-cial, and technical issues. This complex problemspace centres on informational privacy issues thatcontribute to a wider family of personal data man-agement problems that can be found in contexts ofAAC use.
This paper situates the personal data managementproblems in the use of natural language generationand speech processing techniques in AAC. It consid-ers all of the following as personal data: utterancesconstructed by the system, communication logs andre-communication of stored utterances. Followingan overview of state-of-the-art AAC and discussionof how functionality development in next-generationAAC devices maps to the use of personal data, Sec-tion 2 identifies and explores personal data use prob-lems in three AAC-specific examples. Section 3presents possible responses to problems introducedby the examples and Section 4 considers a gov-ernance framework that enables emergent personaldata management problems with future AAC de-vices to be identified and considers its applicabilityfor other communities.
1.1 Personal data generated, and used, by AACdevices
Today, AAC devices may excel at needs-based com-munication (e.g. “I am hungry”, “I’m cold”, “getthe phone”) but they are limited for real conversa-tion (Soto et al., 2006). So, in the current genera-tion of AAC devices, the implications for both per-sonal data generation and its use are relatively smallbecause the linguistic capabilities are small. Typi-cal AAC devices tend towards a hierarchical struc-ture of pages, each of which typically focuses on acontext (e.g. shopping) or a category (e.g. clothes,sports), rather than observations or recent personalstories (Beukelman and Mirenda, 2005). However,Higginbotham et al. (2007) report that spontaneousconversation with typical devices is slow and diffi-cult (new utterances are typically constructed at arate of between 8 and 10 words per minute, slightly
more if e.g. word prediction is used). Todman etal. (2008) propose utterance-based devices in whichdevices focus on prepared phrases to facilitate socialcommunication rather than needs-based communi-cation; however, in general, new utterances must beprepared in advance either by the user or a carer,with a large time and energy cost. It is this im-plementation of functionality designed to speed uputterance production that restricts the production ofpersonal data rather than the underlying technology.A study by Rackensperger et al. (2005) shows thatusing pre-programmed phrases can reduce the abil-ity for self-expression; as a result, the range of per-sonal data produced is likely to be limited. As anexample, there is a particular difficulty in commu-nicating recent or single use events such as talkingabout one’s day or talking about yesterday’s tele-vision: such utterances are expensive to prepare inadvance due to the potential for limited and low-probability use. Thus, AAC users tend to be pas-sive, responding to questions with single words orshort sentences, and personal stories tend to be toldas a monologue or a sequence of pre-stored utter-ances (Soto et al., 2006).
To develop the potential for interaction, and there-fore increase the degree to which AAC devices cansupport increased independence, recent research hasexamined the potential for location-aware devicesto offer different content to the user under differ-ent conditions (Dominowska et al., 2002; Patel andRadhakrishnan, 2007), and for devices that generatenew phrases automatically. In the later case: Blacket al. (2010) use external data to populate a commu-nication device, and Reiter et al. (2009) use a NLGengine to generate text from a database of personalfacts. These innovations could allow users to in-crease social interaction and reduce the device main-tenance, complementing the growing range of AACsystems with internet connectivity.
1.1.1 Impact on personal dataAs the capability for interaction increases, the po-
tential for increased personal data also increases.For example:
• utterances generated from geo-location enableddevices can potentially include informationabout people (data subjects) other than the
33
AAC user, as well as increased informationabout the device users themselves;
• utterances generated from input by teachers,care staff and parents can again potentially con-tain information about other data subjects, aswell as increase the range of information aboutdevice users themselves;
• internet access as a medium brings a range ofissues for personal data use in terms of themethods used to broadcast and replay utter-ances and it greatly increases the possibilitiesfor data input (potentially including informa-tion about third parties) into the utterances;
• the general browsing facility of internet accessincreases the ability of users to communicatewith the wider world, carrying with it a setof personal data management and privacy is-sues, much of which is the subject of on-goingresearch (Kani-Zabihi and Coles-Kemp, 2010;Kumaraguru and Cranor, 2005; Spiekermannand Cranor, 2009).
Increasing the potential for interaction and givingmore control to the AAC user will increase the rangeof personal data generated and hence the range ofpotential personal data use problems. Moreover,the increased creation of novel utterances and wideropportunity to relay such utterances potentially in-crease intellectual property issues.
AAC devices are designed to increase social inter-action in all settings and therefore the devices, andtheir supporting approaches, must be equally effec-tive in all situations. This is a challenge for any typeof personal data management that includes aspectsof privacy. Also, AAC users themselves developtheir uses and desires for communication (Rack-ensperger et al., 2005). Therefore, any approach topersonal data management has to be highly contextsensitive and capable of responding to changing re-quirements.
1.2 Related work in AAC literature
Although ethics in the context of complex disabil-ities is well studied, there is little direct researchinto privacy and personal data management issues
in AAC: much of the work is in small accompany-ing sections to other research contributions and fo-cuses directly on personal data dissemination. Forexample, Smith (2005) notes that externally dis-played lexicons (such as a communications board)violate some aspects of privacy and proposes findingways to ensure that vocabulary can be delivered dis-creetly without affecting access. Similarly, Black etal. (2010) address privacy as part of a discussion ofsecurity. Additionally, there is some meta-work thatlooks at the ethics of research into AAC rather thanAAC itself: Pennington et al. (2007) notes that thedata collected by AAC devices makes identificationof the individual trivial, especially when consideringthe relatively small pool of users, a theme that is alsoexamined in work by Lesher et al. (2000) on loggingoutput of AAC devices.
Privacy has also been raised explicitly in theAAC community by researchers considering de-sign frameworks for next generation devices, e.g.,Rackensperger et al. (2005) and DeRuyter et al.(2007). There is also a growing body of AAC re-search that, in discussing next generation AAC tech-nology, raises a wide range of implicit issues re-lated to privacy and ICT mediated communication.These issues include: anonymity; personalisation ofservices; identity management; autonomy; and thechanging of relationship boundaries through media-tion. These are topics that feature in traditional pri-vacy research, but with added complexity.
Therefore, work on the future of AAC and in-ternet connectivity (in particular key features high-lighted in DeRuyter et al. (2007)) have great bear-ing on personal data management, although privacyand personal data management are not directly dis-cussed. DeRuyter et al. (2007) discuss simplifiedusability, including ‘embeddedness’ functionality:making AAC devices unobtrusive in their environ-ment. When simplifying usability, there is a ten-sion between requiring user intervention and deci-sion making automation. For example, where shouldconsent mechanisms related to personal informationdisclosure be placed?
Discussions on future AAC functionality also em-phasise adaptive technology that personalises AACuse so that AAC devices are able to recognise a userand adjust functionality accordingly (DeRuyter etal., 2007). However, adaptation algorithms designed
34
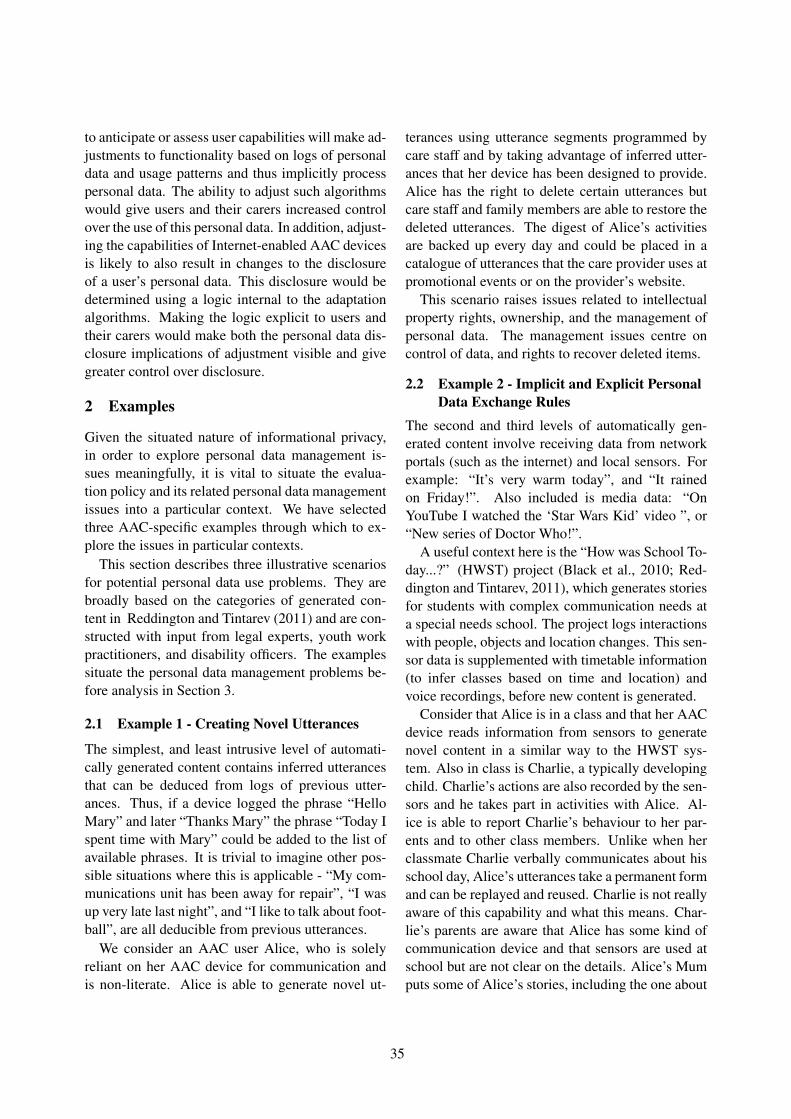
to anticipate or assess user capabilities will make ad-justments to functionality based on logs of personaldata and usage patterns and thus implicitly processpersonal data. The ability to adjust such algorithmswould give users and their carers increased controlover the use of this personal data. In addition, adjust-ing the capabilities of Internet-enabled AAC devicesis likely to also result in changes to the disclosureof a user’s personal data. This disclosure would bedetermined using a logic internal to the adaptationalgorithms. Making the logic explicit to users andtheir carers would make both the personal data dis-closure implications of adjustment visible and givegreater control over disclosure.
2 Examples
Given the situated nature of informational privacy,in order to explore personal data management is-sues meaningfully, it is vital to situate the evalua-tion policy and its related personal data managementissues into a particular context. We have selectedthree AAC-specific examples through which to ex-plore the issues in particular contexts.
This section describes three illustrative scenariosfor potential personal data use problems. They arebroadly based on the categories of generated con-tent in Reddington and Tintarev (2011) and are con-structed with input from legal experts, youth workpractitioners, and disability officers. The examplessituate the personal data management problems be-fore analysis in Section 3.
2.1 Example 1 - Creating Novel Utterances
The simplest, and least intrusive level of automati-cally generated content contains inferred utterancesthat can be deduced from logs of previous utter-ances. Thus, if a device logged the phrase “HelloMary” and later “Thanks Mary” the phrase “Today Ispent time with Mary” could be added to the list ofavailable phrases. It is trivial to imagine other pos-sible situations where this is applicable - “My com-munications unit has been away for repair”, “I wasup very late last night”, and “I like to talk about foot-ball”, are all deducible from previous utterances.
We consider an AAC user Alice, who is solelyreliant on her AAC device for communication andis non-literate. Alice is able to generate novel ut-
terances using utterance segments programmed bycare staff and by taking advantage of inferred utter-ances that her device has been designed to provide.Alice has the right to delete certain utterances butcare staff and family members are able to restore thedeleted utterances. The digest of Alice’s activitiesare backed up every day and could be placed in acatalogue of utterances that the care provider uses atpromotional events or on the provider’s website.
This scenario raises issues related to intellectualproperty rights, ownership, and the management ofpersonal data. The management issues centre oncontrol of data, and rights to recover deleted items.
2.2 Example 2 - Implicit and Explicit PersonalData Exchange Rules
The second and third levels of automatically gen-erated content involve receiving data from networkportals (such as the internet) and local sensors. Forexample: “It’s very warm today”, and “It rainedon Friday!”. Also included is media data: “OnYouTube I watched the ‘Star Wars Kid’ video ”, or“New series of Doctor Who!”.
A useful context here is the “How was School To-day...?” (HWST) project (Black et al., 2010; Red-dington and Tintarev, 2011), which generates storiesfor students with complex communication needs ata special needs school. The project logs interactionswith people, objects and location changes. This sen-sor data is supplemented with timetable information(to infer classes based on time and location) andvoice recordings, before new content is generated.
Consider that Alice is in a class and that her AACdevice reads information from sensors to generatenovel content in a similar way to the HWST sys-tem. Also in class is Charlie, a typically developingchild. Charlie’s actions are also recorded by the sen-sors and he takes part in activities with Alice. Al-ice is able to report Charlie’s behaviour to her par-ents and to other class members. Unlike when herclassmate Charlie verbally communicates about hisschool day, Alice’s utterances take a permanent formand can be replayed and reused. Charlie is not reallyaware of this capability and what this means. Char-lie’s parents are aware that Alice has some kind ofcommunication device and that sensors are used atschool but are not clear on the details. Alice’s Mumputs some of Alice’s stories, including the one about
35
Figure 1: An example information flow
Charlie and the water fight, up on their family blog.This scenario raises issues of consent to obtain
data from sensor sources and of processing the sen-sor data. It also raises questions related to the dis-semination of personal data - about the user andother data subjects. In this scenario, personal data isprocessed in two contexts: school and Alice’s home.This shows the complex array of stakeholders in-volved in managing personal data. Moreover, thereare questions of how non-AAC users are informedof the implications of AAC use in the school or inany other setting. Implicitly there is a problem ofensuring that AAC and non-AAC users are treatedequally in terms of the personal data rights, which inturn raises issues of how verbal and AAC generatedutterances are valued in the social context.
2.3 Example 3 - Control over Data Sharing
An additional level of complexity is the creation ofnarrative flow. Narratives are groups of messagesthat together relate an experience or tell a story. Thisadds the problem of creating a narrative structureand consistent style to the data-mining exercise (forNLG work on the importance of narrative informa-tion exchange see e.g. (Reiter et al., 2008)). Anexample might be:
I had my breakfast quickly because I wasexcited to go to the arcade. I got on thebus, I went to the arcade, I played in the
arcade and won a cuddly bear.
Now consider that Alice and Charlie are joinedby Bob, who is also an AAC user on the same sys-tem as Alice. Alice and Bob’s devices are capable ofsharing data at all levels. At the device level, Aliceand Bob share raw data to confirm, for example, thattheir system clocks are in sync and that they have thesame records of people who are in the same room. Itis also possible at the social episode level that Al-ice’s system can import utterances from Bob’s sys-tem so that Alice could say ‘Bob liked the swim-ming’. It is important to note that in this scenario,if Alice deletes an utterance from her machine ‘Theteacher gave me a bad mark on my work’, Bob couldstill use the deleted story because Alice is unable todelete the disseminations. However, data sharing isnot only between device users. Data sharing couldalso take place between the agencies involved in Al-ice and Bob’s care and support. Figure 1 shows thisdata sharing taking place on three levels: device, in-dividual AAC user, and institutional.
This scenario raises the issues of personal dataflow control and indicates that controls for the flowof personal data have to be set at all three levels.Importantly, when personal data flows are managedat these levels responses will always be sociotech-nical in nature; therefore they include technical re-sponses, governance responses and technology prac-tice responses. This is a familiar combination of re-
36
sponses in privacy management (Paine et al., 2007)
3 Finding traps and responding to them
Section 2 demonstrated a family of personal data useproblems. These problems address various aspectsof using personal data in the context of AAC de-vices. Our family of problems partly relate to theoft used definition of privacy from Westin (1967):“the claim of individuals, groups, or institutions todetermine for themselves when, how, and to whatextent information about them is communicated toothers”. This is not a hierarchy with a root problemand a tree structure of related problems but a fam-ily of problems with complex relations and whichare enmeshed rather than conceptually linear. An-alytically, the family has four members: IPR; com-pliance responsibility; institutional personal data ac-cess and disclosure rights; and individual personaldata access and disclosure rights. Each family mem-ber is addressed in this section. Whitley points outthat Whitley (2009) “Wittgenstein (1956) tells usthat language is a social activity and hence that spe-cialised terms like privacy are arrived at socially.”.The social construction of concepts related to per-sonal data mean that personal data issues will be en-meshed in particular contexts and, as a result, thesignificance of these issues will vary from context tocontext.
Discussions with legal experts and practitioners(see Acknowledgements) revealed that responses tothese problems occur at the institutional, individ-ual, and technical levels, and an individual inter-pretation of personal data management issues under-pins all responses. This is true of all personal datamanagement issues; however, in the case of AACusers, the individual level will be a unique combina-tion of AAC user, family, and care workers. At thenext level is the sociocultural system in place withineach institutional context, which contains the per-sonal data management policies, procedures, prac-tices and institutional values. This sociocultural sys-tem is supported by technological controls used tocontrol personal data information flow.
Unlike spoken conversation, AAC devices createembodiments of conversations that can be perma-nently stored or logged. Then conversations becomedata that largely focuses on living individuals, ei-
ther the users themselves or their family and friends.Under certain conditions processing this data will beregulated by data protection legislation. In other set-tings the processing will be governed more by so-cial norms. Furthermore, the permanent nature ofthese embodiments means that they can carry copy-right. Then there is a natural question of informa-tion flow control, the need for rights managementand traditional information security issues such asconfidentiality and access control. However, privacyis also an elastic concept (Allen, 1988) and is oftenconsidered wider than the Westin definition, includ-ing aspects of identity and relationship management.As the work of Smith (2005) and Rackenspergeret al. (2005) shows, use of AAC devices is relatedto notions of self and relationship to others. Thenotions of self and relationship to others are a cen-tral aspect of privacy (Kani-Zabihi and Coles-Kemp,2010) (Barnard-Wills and Ashenden, 2010) and thelink between personal data use and privacy and iden-tity issues should not be ignored when consideringthese personal data management problems.
3.1 A Family of Personal Data Use Problems
Practically, any technical, regulatory, or social re-sponse to personal data use issues in AAC must beable to operate in a range of contexts and support auser as they blend and adjust contexts. For example,an AAC user may use their device at home, in formaleducation, in youth group activities, and in socialsettings. These different contexts may include manyof the same people, but the personal data controlrequirements and the regulatory and personal datamanagement frameworks are likely to differ fromcontext to context. A further level of complexity inthe case of AAC users is that capabilities and back-grounds differ widely within the AAC community(DeRuyter et al., 2007) and any personal data man-agement approach has to adjust to these varying ca-pabilities and different perspectives.
Technical responses would primarily be formedby meshing the AAC functionality into the underly-ing technical architecture of each device. Technicalresponses include personal information flow controlover the network; encryption of sensitive utterances,e.g. health or financial information (such as creditcard numbers), stored on the AAC device; accesscontrol to location databases and so on.
37
3.1.1 Management of IPR
Automatically generated text in AAC devices canbe coupled or merged with input from other sources,increasing the ability of users to develop additionalnovel utterances. Given the digital nature of the ut-terances, there is potentially a close comparison withmusic copyright, which has three sets of rights: me-chanical, rights related to the creation of the lyricsand performing. Using music copyright as the paral-lel, consider the situation where an AAC user, Alicesay, imports text from a novel under copyright (me-chanical rights) and adapts it by adding other textand other copyright material in order to create herown monologue (intellectual property rights). An-other AAC user, Bob say, then downloads Alice’smonologue and performs it through his AAC de-vice at a concert for a school (performing rights).Clearly the majority of instances carry an implicitrights clearance, particularly in the content and per-forming rights elements of this example. However,if the monologue was posted on YouTube and thenbecame sampled by a recording artist or made into adigital novel, rights clearance may not apply. Com-municating the rules relating to copyright and ensur-ing understanding can be problematic.
Social and institutional responses to IPR prob-lems are largely related to awareness training andthe agreement of ‘ground rules’ or social contracts incommunities such as schools and youth clubs wherethe legal issues and social expectations are madeclear. The traditional methods for negotiating andagreeing ground rules is heavily based on the use ofinformational literature, one-to-one and group dis-cussion (Barnard-Wills and Ashenden, 2010). Thesemethods do not translate well into an environmentwhere users may have cognitive development issues,or may be non-literate. It could be envisaged thatguardians and parents would be used to negotiateand agree the ground rules and then left with thetask of communicating the ground rules to their de-pendents. The difficulty in this is that at the sametime, AAC users can become very skilled in theuse of technology and may well develop practicesthat involve copyright material, in a way that theirguardians have not been able to communicate effec-tively. In order to respond to this mismatch of ca-pabilities, methods of engagement need to be sought
that ensure AAC users are as integral as possible tothe establishment of such rules.
3.1.2 Management of compliance responsibilityDue to the digital nature of AAC utterances, per-
sonal data output by a device is regulated by dataprotection legislation when being processed in thecontext of institutions such as schools, health, or so-cial service. In the UK, this legislation is the DataProtection Act 1998. Under the Act there are eightprinciples of personal data management and the re-quirement that there must be a data controller whois responsible for compliance with the legislation.The term ‘data subject’ denotes individuals to whomthe personal data relates. If Alice and Bob wereyoung adults with sufficient cognitive abilities theywould likely be the data controllers. However, asspeech, language and communication disabilities areregularly a pan-disability, Alice and Bob may alsobe cognitively impaired and a parent or guardian islikely to be regarded as the data controller.
Typically, the mechanism for specifying compli-ance requirements is via the creation of a compli-ance schedule. In the case of AAC use, a complianceschedule for AAC devices is likely to be between theinstitution (school or health services) and the par-ents. The compliance schedule would establish theresponsibility for data processing and agree the rela-tionship between parents and institutions. Note thatthe AAC user’s capabilities for technology can po-tentially exceed that of their guardians and parents.The relationship the AAC user has to the technol-ogy is quite possibly very different from that of theparent or guardian. If effective compliance manage-ment is to be achieved, new engagement methodsneed to be sought to ensure that AAC users are ac-tively engaged in the establishment of complianceschedules. The connection between the individual,the institution (school) and privacy legislation is il-lustrated in Figure 2.
3.1.3 Management of institutional personaldata access and disclosure rights
A set of rights must be agreed as part of the com-pliance schedule when AAC devices are used inschool and healthcare settings. Many AAC deviceshave their data backed up to a central database. An
38
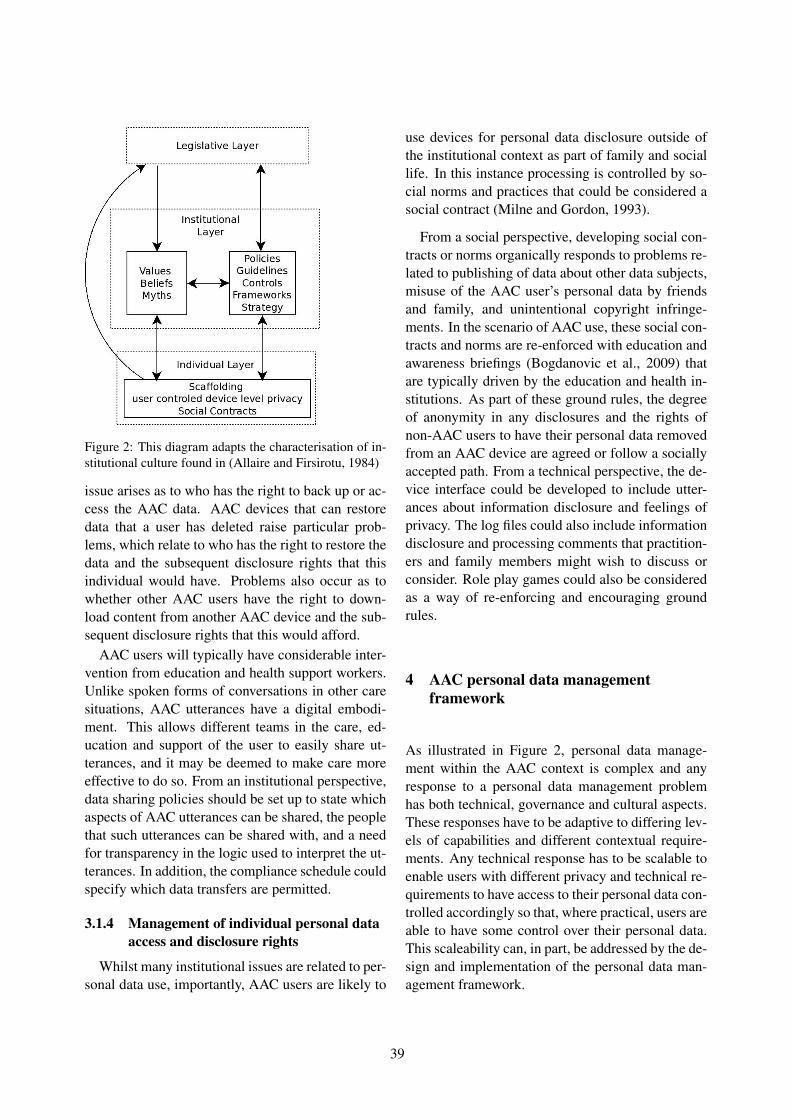
Figure 2: This diagram adapts the characterisation of in-stitutional culture found in (Allaire and Firsirotu, 1984)
issue arises as to who has the right to back up or ac-cess the AAC data. AAC devices that can restoredata that a user has deleted raise particular prob-lems, which relate to who has the right to restore thedata and the subsequent disclosure rights that thisindividual would have. Problems also occur as towhether other AAC users have the right to down-load content from another AAC device and the sub-sequent disclosure rights that this would afford.
AAC users will typically have considerable inter-vention from education and health support workers.Unlike spoken forms of conversations in other caresituations, AAC utterances have a digital embodi-ment. This allows different teams in the care, ed-ucation and support of the user to easily share ut-terances, and it may be deemed to make care moreeffective to do so. From an institutional perspective,data sharing policies should be set up to state whichaspects of AAC utterances can be shared, the peoplethat such utterances can be shared with, and a needfor transparency in the logic used to interpret the ut-terances. In addition, the compliance schedule couldspecify which data transfers are permitted.
3.1.4 Management of individual personal dataaccess and disclosure rights
Whilst many institutional issues are related to per-sonal data use, importantly, AAC users are likely to
use devices for personal data disclosure outside ofthe institutional context as part of family and sociallife. In this instance processing is controlled by so-cial norms and practices that could be considered asocial contract (Milne and Gordon, 1993).
From a social perspective, developing social con-tracts or norms organically responds to problems re-lated to publishing of data about other data subjects,misuse of the AAC user’s personal data by friendsand family, and unintentional copyright infringe-ments. In the scenario of AAC use, these social con-tracts and norms are re-enforced with education andawareness briefings (Bogdanovic et al., 2009) thatare typically driven by the education and health in-stitutions. As part of these ground rules, the degreeof anonymity in any disclosures and the rights ofnon-AAC users to have their personal data removedfrom an AAC device are agreed or follow a sociallyaccepted path. From a technical perspective, the de-vice interface could be developed to include utter-ances about information disclosure and feelings ofprivacy. The log files could also include informationdisclosure and processing comments that practition-ers and family members might wish to discuss orconsider. Role play games could also be consideredas a way of re-enforcing and encouraging groundrules.
4 AAC personal data managementframework
As illustrated in Figure 2, personal data manage-ment within the AAC context is complex and anyresponse to a personal data management problemhas both technical, governance and cultural aspects.These responses have to be adaptive to differing lev-els of capabilities and different contextual require-ments. Any technical response has to be scalable toenable users with different privacy and technical re-quirements to have access to their personal data con-trolled accordingly so that, where practical, users areable to have some control over their personal data.This scaleability can, in part, be addressed by the de-sign and implementation of the personal data man-agement framework.
39
4.1 Extending the existing framework
The personal data management problems related toAAC use have links with work in the mainstreamprivacy and consent research communities. Sec-tion 2 illustrates that AAC use adds additional lay-ers of complexity to privacy and consent issues and,as a result, adds additional requirements to any per-sonal data management framework. Due to spaceconstraints the factors are merely highlighted to notethat each is a large piece of research in its own right.
The required extensions fall into three areas:
4.1.1 Technical capabilityTechnical capability, in addition to education, is a
factor in assessing ability to manage privacy (Coles-Kemp et al., 2010; Kumaraguru and Cranor, 2005;Buchanan et al., 2007) because a relatively sophisti-cated level of technical capability is required to im-plement the privacy controls. Technical capabilityand education levels are likely to be lower, on aver-age, in AAC users.
4.1.2 Family rolesAAC users typically remain ‘scaffolded’ by fam-
ily and the family will therefore remain involved indecisions about personal data disclosure. Whilst,family plays an important role at the start of an indi-vidual’s internet journey5, typically this interventionrecedes over time and the design of privacy controlsdoes not traditionally cater for varying levels of userindependence in decision making. This needs to beaddressed by the management framework.
4.1.3 Governance system designResponses to personal data management issues
use a governance system composed of policy, reg-ulation, and practices to support the use of pri-vacy enhancing technologies. Engagement withsuch a system is notoriously inconsistent because oflanguage and conceptual complexities (Kani-Zabihiand Coles-Kemp, 2010; Bogdanovic et al., 2009;Bonnici and Coles-Kemp, 2010; McDonald andCranor, 2008; McDonald and Cranor, 2009). It isreasonable to assume that such a governance sys-tem would require specific modifications for the
5UK online Centres (2010) “Digital engagement un-derstanding customers”, a study (available for download atwww.ukonlinecentres.com/research/research/centres-research)
AAC community to make policies more understand-able, to allow for adaptations in privacy and internetsafety education and to enable the role of family indecision support. However, it should also be keptin mind that similar modifications could be madefor other communities with lower levels of digitalliteracy, literacy and cognitive challenges. Whilstthe problems themselves are AAC-specific and theproblems are brought about, in part, by the directionof development of AAC technology, the governanceresponses respond to underlying problems found ina range of communities.
5 Conclusions
Advances in text-to-speech technology and mobilecomputing have made a range of AAC devices avail-able to the public. Advances in natural languagegeneration and speech processing techniques haveco-incided with changes to the commercial land-scape to bring dramatic advances in AAC capabil-ities within reach. These advances in AAC design,though overwhelmingly positive, do result in a fam-ily of personal data use problems that were not en-countered with previous generations of the devices.This paper argued that AAC devices can only signifi-cantly support users with communication difficultiesto achieve greater independence and social inclusionif their design and implementation both addressesand identifies personal data problems.
Acknowledgments
The authors wish to thank the staff of the HWSTproject, the Natural Language Generation Groupat Aberdeen and the Sociotechnical Group, withinthe Information Security Group at Royal Holloway.The work was developed with input from legal ex-perts, youth work practitioners, and disability offi-cers: in particular Robert Carolina, Amanda Gerry,and Karen Wood are gratefully acknowledged. Sim-ilarly, the insights of Nava Tintarev, Sarah Mof-fat, and Margaret Mitchell made this work pos-sible. This paper was produced in collaborationwith the Visualisation and Other Methods of Ex-pression (VOME) project, which is supported bythe Technology Strategy Board; the Engineering andPhysical Sciences Research Council and the Eco-nomic and Social Research Council [grant numberEP/G00255X/1].
40
References
Y. Allaire and M.E. Firsirotu. 1984. Theories of organi-zational culture. Organization studies, 5(3):193.
A.L. Allen. 1988. Uneasy access: Privacy for women ina free society. Rowman & Littlefield Pub Inc.
S. Balandin, N. Berg, and A. Waller. 2006. Assessingthe loneliness of older people with cerebral palsy. Dis-ability & Rehabilitation, 28(8):469–479.
D. Barnard-Wills and D. Ashenden. 2010. Public sectorengagement with online identity management. Iden-tity in the Information Society, pages 1–18.
DR Beukelman and P. Mirenda. 2005. Augmentative andalternative communication: Supporting children andadults with complex communication needs3rd ed. PaulH. Brookes, Baltimore, MD.
R. Black, J. Reddington, E. Reiter, N. Tintarev, andA. Waller. 2010. Using NLG and sensors to supportpersonal narrative for children with complex commu-nication needs. In Proceedings of the NAACL HLT2010 Workshop on Speech and Language Processingfor Assistive Technologies, pages 1–9, Los Angeles,California, June. Association for Computational Lin-guistics.
D. Bogdanovic, C. Crawford, and L. Coles-Kemp. 2009.The need for enhanced privacy and consent dialogues.Information Security Technical Report, 14(3):167–172.
C.J. Bonnici and L. Coles-Kemp. 2010. PrincipledElectronic Consent Management: A Preliminary Re-search Framework. In 2010 International Conferenceon Emerging Security Technologies, pages 119–123.IEEE.
T. Buchanan, C. Paine, A.N. Joinson, and U.D. Reips.2007. Development of measures of online privacyconcern and protection for use on the internet. Jour-nal of the American Society for Information Scienceand Technology, 58(2):157–165.
L. Coles-Kemp and E. Kani-Zabihi. 2010. On-line pri-vacy and consent: a dialogue, not a monologue. InProceedings of the 2010 workshop on New securityparadigms, pages 95–106. ACM.
L. Coles-Kemp, Y.L. Lai, M. Ford, and C. Hyperion.2010. Privacy on the Internet: Attitudes and Be-haviours.
J. Cornwell, I. Fette, G. Hsieh, M. Prabaker, J. Rao,K. Tang, K. Vaniea, L. Bauer, L. Cranor, J. Hong,et al. 2007. User-controllable security and privacyfor pervasive computing. In Mobile Computing Sys-tems and Applications, 2007. HotMobile 2007. EighthIEEE Workshop on, pages 14–19. IEEE.
F. DeRuyter, D. McNaughton, K. Caves, D.N. Bryen, andM.B. Williams. 2007. Enhancing AAC connections
with the world. Augmentative and Alternative Com-munication, 23(3):258–270.
E. Dominowska, D. Roy, and R. Patel. 2002. An adaptivecontext-sensitive communication aid. In Proceedingsof the 17th Annual International Conference Technol-ogy and Persons with Disabilities.
P. Golle, F. McSherry, and I. Mironov. 2008. Data collec-tion with self-enforcing privacy. ACM Transactions onInformation and System Security (TISSEC), 12(2):1–24.
D. J. Higginbotham, H.Shane, S. Russell, and K.Caves.2007. Access to AAC: Present, past, and fu-ture. Augmentative and Alternative Communication,23(3):243–257.
M.A. Kamp, P. Slotty, S. Sarikaya-Seiwert, H.J. Steiger,and D. Hanggi. Traumatic brain injuries in illustratedliterature: experience from a series of over 700 headinjuries in the asterix comic books. Acta Neurochirur-gica, pages 1–5.
E. Kani-Zabihi and L. Coles-Kemp. 2010. Service UsersRequirements for Tools to Support Effective On-linePrivacy and Consent Practices. In Procedings of the15th Conference on Secure IT Systems, Nordic 2010.
C.M. Karat, C. Brodie, and J. Karat. 2006. Usable pri-vacy and security for personal information manage-ment. Communications of the ACM, 49(1):56–57.
P. Kumaraguru and L.F. Cranor. 2005. Privacy indexes:A survey of westins studies. Institute for Software Re-search International.
G.W. Lesher, G.J. Rinkus, B.J. Moulton, and D.J. Higgin-botham. 2000. Logging and analysis of augmentativecommunication. In Proceedings of the RESNA AnnualConference. Citeseer.
A.M. McDonald and L.F. Cranor. 2008. The cost of read-ing privacy policies. ACM Transactions on Computer-Human Interaction, 4(3):1–22.
A. McDonald and L. Cranor. 2009. An empirical studyof how people perceive online behavioral advertising.
S.J. Milberg, H.J. Smith, and S.J. Burke. 2000. Infor-mation privacy: Corporate management and nationalregulation. Organization Science, pages 35–57.
G.R. Milne and M.E. Gordon. 1993. Direct mail privacy-efficiency trade-offs within an implied social contractframework. Journal of Public Policy & Marketing,12(2):206–215.
H. Nissenbaum. 2009. Privacy in context: Technology,policy, and the integrity of social life. Stanford LawBooks.
C. Paine, U.D. Reips, S. Stieger, A. Joinson, andT. Buchanan. 2007. Internet users’ perceptions ofprivacy concerns’ and privacy actions’. InternationalJournal of Human-Computer Studies, 65(6):526–536.
41
R. Patel and R. Radhakrishnan. 2007. Enhancing Accessto Situational Vocabulary by Leveraging GeographicContext. Assistive Technology Outcomes and Benefits,page 99.
L. Pennington, J. Marshall, and J. Goldbart. 2007. De-scribing participants in AAC research and their com-municative environments: Guidelines for research andpractice. Disability & Rehabilitation, 29(7):521–535.
T. Rackensperger, C. Krezman, D. Mcnaughton, M.B.Williams, and K. D’silva. 2005. When I first got it,I wanted to throw it off a cliff: The challenges andbenefits of learning AAC technologies as described byadults who use AAC. Augmentative and AlternativeCommunication, 21(3):165–186.
J. Reddington and N. Tintarev. 2011. Automatically gen-erating stories from sensor data. In Proceedings of the15th international conference on Intelligent user inter-faces, pages 407–410. ACM.
S. Reilly, J. Douglas, and J. Oates. 2004. Evidence-basedpractice in speech pathology. Whurr, London.
E. Reiter, F. Portet A. Gatt, and M. van der Meulen. 2008.The importance of narrative and other lessons from anevaluation of an NLG system that summarises clinicaldata. In International Natural Language GenerationConference (INLG), pages 147–156.
E. Reiter, R. Turner, N. Alm, R. Black, M. Dempster,and A. Waller. 2009. Using NLG to help language-impaired users tell stories and participate in social di-alogues. In European Workshop on Natural LanguageGeneration (ENLG-09).
M.M. Smith. 2005. The dual challenges of aided com-munication and adolescence. Augmentative and Alter-native Communication, 21(1):67–79.
D.J. Solove. 2008. Understanding privacy. Harvard uni-versity press.
G. Soto, E. Hartmann, and D. Wilkins. 2006. Exploringthe elements of narrative that emerge in the interac-tions between an 8-year-old child who uses an AACdevice and her teacher. Augmentative and AlternativeCommunication, 22(4):231–241.
S. Spiekermann and L.F. Cranor. 2009. Engineering pri-vacy. Software Engineering, IEEE Transactions on,35(1):67–82.
J. Todman, N. Alm, J. Higginbotham, and P. File. 2008.Whole utterance approaches in AAC. Augmentativeand Alternative Communication, 24(3):235–254.
A.F. Westin. 1967. Privacy and freedom, volume 97.London.
E.A. Whitley. 2009. Informational privacy, consent andthe. Information security technical report, 14(3):154–159.
L. Wittgenstein. 1956. Philosophical investiga-tions.(trans. GEM Anscombe) Basil Blackwell.
42
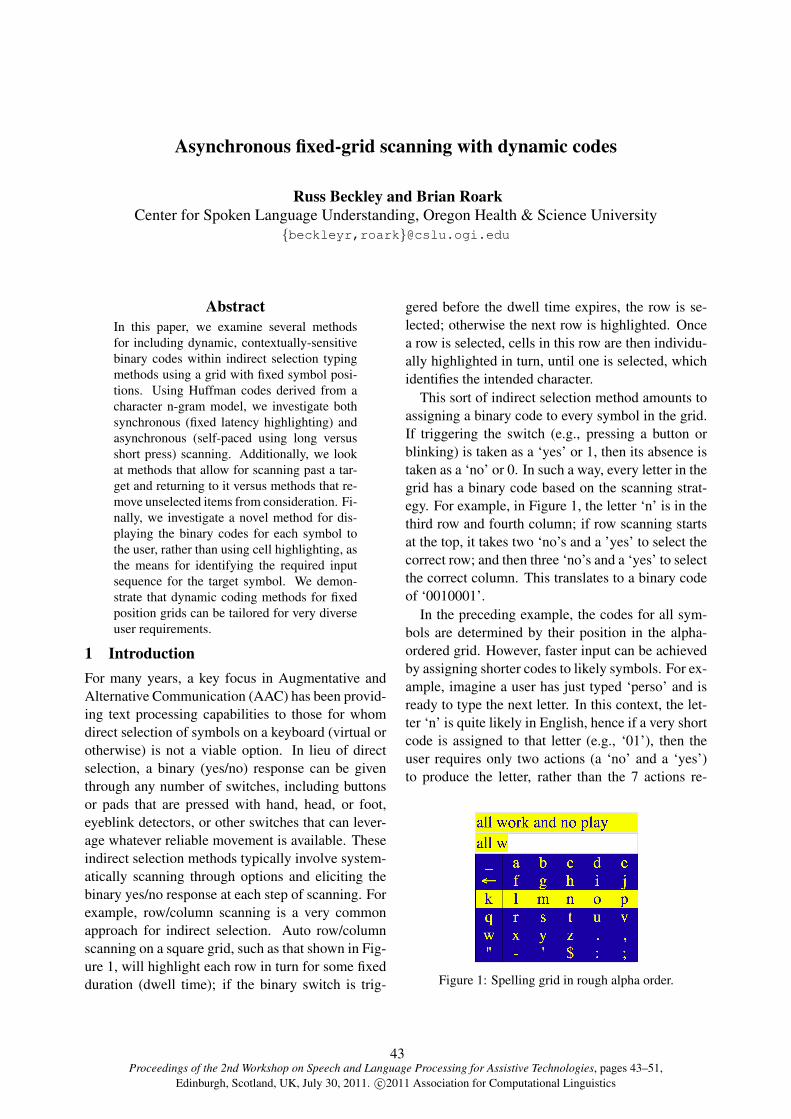
Proceedings of the 2nd Workshop on Speech and Language Processing for Assistive Technologies, pages 43–51,Edinburgh, Scotland, UK, July 30, 2011. c©2011 Association for Computational Linguistics
Asynchronous fixed-grid scanning with dynamic codes
Russ Beckley and Brian RoarkCenter for Spoken Language Understanding, Oregon Health & Science University
{beckleyr,roark}@cslu.ogi.edu
AbstractIn this paper, we examine several methodsfor including dynamic, contextually-sensitivebinary codes within indirect selection typingmethods using a grid with fixed symbol posi-tions. Using Huffman codes derived from acharacter n-gram model, we investigate bothsynchronous (fixed latency highlighting) andasynchronous (self-paced using long versusshort press) scanning. Additionally, we lookat methods that allow for scanning past a tar-get and returning to it versus methods that re-move unselected items from consideration. Fi-nally, we investigate a novel method for dis-playing the binary codes for each symbol tothe user, rather than using cell highlighting, asthe means for identifying the required inputsequence for the target symbol. We demon-strate that dynamic coding methods for fixedposition grids can be tailored for very diverseuser requirements.
1 IntroductionFor many years, a key focus in Augmentative andAlternative Communication (AAC) has been provid-ing text processing capabilities to those for whomdirect selection of symbols on a keyboard (virtual orotherwise) is not a viable option. In lieu of directselection, a binary (yes/no) response can be giventhrough any number of switches, including buttonsor pads that are pressed with hand, head, or foot,eyeblink detectors, or other switches that can lever-age whatever reliable movement is available. Theseindirect selection methods typically involve system-atically scanning through options and eliciting thebinary yes/no response at each step of scanning. Forexample, row/column scanning is a very commonapproach for indirect selection. Auto row/columnscanning on a square grid, such as that shown in Fig-ure 1, will highlight each row in turn for some fixedduration (dwell time); if the binary switch is trig-
gered before the dwell time expires, the row is se-lected; otherwise the next row is highlighted. Oncea row is selected, cells in this row are then individu-ally highlighted in turn, until one is selected, whichidentifies the intended character.
This sort of indirect selection method amounts toassigning a binary code to every symbol in the grid.If triggering the switch (e.g., pressing a button orblinking) is taken as a ‘yes’ or 1, then its absence istaken as a ‘no’ or 0. In such a way, every letter in thegrid has a binary code based on the scanning strat-egy. For example, in Figure 1, the letter ‘n’ is in thethird row and fourth column; if row scanning startsat the top, it takes two ‘no’s and a ’yes’ to select thecorrect row; and then three ‘no’s and a ‘yes’ to selectthe correct column. This translates to a binary codeof ‘0010001’.
In the preceding example, the codes for all sym-bols are determined by their position in the alpha-ordered grid. However, faster input can be achievedby assigning shorter codes to likely symbols. For ex-ample, imagine a user has just typed ‘perso’ and isready to type the next letter. In this context, the let-ter ‘n’ is quite likely in English, hence if a very shortcode is assigned to that letter (e.g., ‘01’), then theuser requires only two actions (a ‘no’ and a ‘yes’)to produce the letter, rather than the 7 actions re-
Figure 1: Spelling grid in rough alpha order.
43
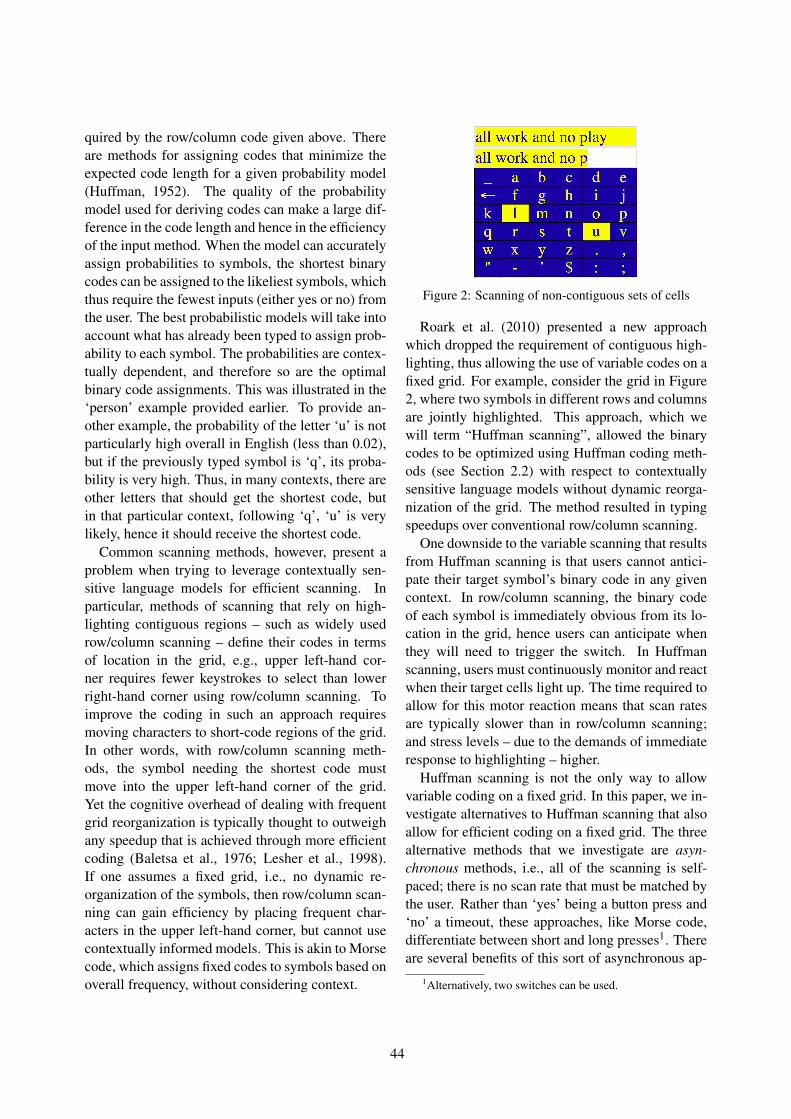
quired by the row/column code given above. Thereare methods for assigning codes that minimize theexpected code length for a given probability model(Huffman, 1952). The quality of the probabilitymodel used for deriving codes can make a large dif-ference in the code length and hence in the efficiencyof the input method. When the model can accuratelyassign probabilities to symbols, the shortest binarycodes can be assigned to the likeliest symbols, whichthus require the fewest inputs (either yes or no) fromthe user. The best probabilistic models will take intoaccount what has already been typed to assign prob-ability to each symbol. The probabilities are contex-tually dependent, and therefore so are the optimalbinary code assignments. This was illustrated in the‘person’ example provided earlier. To provide an-other example, the probability of the letter ‘u’ is notparticularly high overall in English (less than 0.02),but if the previously typed symbol is ‘q’, its proba-bility is very high. Thus, in many contexts, there areother letters that should get the shortest code, butin that particular context, following ‘q’, ‘u’ is verylikely, hence it should receive the shortest code.
Common scanning methods, however, present aproblem when trying to leverage contextually sen-sitive language models for efficient scanning. Inparticular, methods of scanning that rely on high-lighting contiguous regions – such as widely usedrow/column scanning – define their codes in termsof location in the grid, e.g., upper left-hand cor-ner requires fewer keystrokes to select than lowerright-hand corner using row/column scanning. Toimprove the coding in such an approach requiresmoving characters to short-code regions of the grid.In other words, with row/column scanning meth-ods, the symbol needing the shortest code mustmove into the upper left-hand corner of the grid.Yet the cognitive overhead of dealing with frequentgrid reorganization is typically thought to outweighany speedup that is achieved through more efficientcoding (Baletsa et al., 1976; Lesher et al., 1998).If one assumes a fixed grid, i.e., no dynamic re-organization of the symbols, then row/column scan-ning can gain efficiency by placing frequent char-acters in the upper left-hand corner, but cannot usecontextually informed models. This is akin to Morsecode, which assigns fixed codes to symbols based onoverall frequency, without considering context.
Figure 2: Scanning of non-contiguous sets of cells
Roark et al. (2010) presented a new approachwhich dropped the requirement of contiguous high-lighting, thus allowing the use of variable codes on afixed grid. For example, consider the grid in Figure2, where two symbols in different rows and columnsare jointly highlighted. This approach, which wewill term “Huffman scanning”, allowed the binarycodes to be optimized using Huffman coding meth-ods (see Section 2.2) with respect to contextuallysensitive language models without dynamic reorga-nization of the grid. The method resulted in typingspeedups over conventional row/column scanning.
One downside to the variable scanning that resultsfrom Huffman scanning is that users cannot antici-pate their target symbol’s binary code in any givencontext. In row/column scanning, the binary codeof each symbol is immediately obvious from its lo-cation in the grid, hence users can anticipate whenthey will need to trigger the switch. In Huffmanscanning, users must continuously monitor and reactwhen their target cells light up. The time required toallow for this motor reaction means that scan ratesare typically slower than in row/column scanning;and stress levels – due to the demands of immediateresponse to highlighting – higher.
Huffman scanning is not the only way to allowvariable coding on a fixed grid. In this paper, we in-vestigate alternatives to Huffman scanning that alsoallow for efficient coding on a fixed grid. The threealternative methods that we investigate are asyn-chronous methods, i.e., all of the scanning is self-paced; there is no scan rate that must be matched bythe user. Rather than ‘yes’ being a button press and‘no’ a timeout, these approaches, like Morse code,differentiate between short and long presses1. Thereare several benefits of this sort of asynchronous ap-
1Alternatively, two switches can be used.
44
proach: individuals who struggle with the timing re-quirements of auto, step or directed scanning canproceed without having to synchronize their move-ments to the interface; individuals can interrupt theircommunication – e.g., for side talk – for an arbitraryamount of time and come back to it in exactly thesame state; and it reduces the stress of constantlymonitoring the scanning sequence and reacting to itwithin the time limits of the interface.
The last of our alternative methods is a novel ap-proach that displays the code for each symbol atonce as a series of dots and dashes underneath thesymbol – as used in Morse code – rather than us-ing cell highlighting to prompt the user as in theother conditions. Unlike Morse code, these codesare derived using Huffman coding based on n-gramlanguage models, thus change with every context.Since they are displayed for the user, no code mem-orization is required. This novel interface differsfrom Huffman scanning in several ways, so we alsopresent intermediate methods that differ in only oneor another dimension, so that we can assess the im-pact of each characteristic.
Our results show that displaying entire codes atonce for asynchronous scanning was a popular andeffective method for indirect selection, despite thefact that it shared certain dis-preferred characteris-tics with the least popular of our methods. Thispoints the way to future work investigating methodsto combine the preferred characteristics from our setof alternatives into a yet more effective interface.
2 Background and Related Work2.1 Indirect selectionSome of the key issues influencing the work in thispaper have already been mentioned above, such asthe tradeoffs between fixed versus dynamic grids.For a full presentation of the range of indirect selec-tion methods commonly in use, we refer the read-ers to Beukelman and Mirenda (1998). But in thissection we will highlight several key distinctions ofparticular relevance to this work.
As mentioned in the previous section, indirect se-lection strategies allow users to select target sym-bols through a sequence of simpler operations, typi-cally a yes/no indication. This is achieved by scan-ning through options displayed in the user inter-face. Beukelman and Mirenda (1998) mention cir-
cular scanning (around a circular interface), linearscanning (one at a time), and group-item scanning(e.g., row/column scanning to find the desired cell).Another variable in scanning is the speed of scan-ning – e.g., how long does the highlighting lingeron the options before advancing. Finally, there aredifferences in selection control strategy. Beukel-man and Mirenda (1998) mention automatic scan-ning, where highlighted options are selected by ac-tivating a switch, and advance automatically if theswitch is not activated within the specified dwelltime; step scanning, where highlighted options areselected when the switch is not activated within thespecified dwell time, and advance only if the switchis activated; and directed scanning, where the high-lighting moves while the switch is activated and se-lection occurs when the switch is released. In all ofthese methods, synchrony with the scan rate of theinterface is paramount.
Speech and language pathologists working withAAC users must assess the specific capabilities ofthe individual to determine their best interface op-tion. For example, an individual who has difficultyprecisely timing short duration switch activation butcan hold a switch more easily might do better withdirected scanning.
Morse code, with its dots and dashes, is also an in-direct selection method that has been used in AAC,but it is far less common than the above mentionedapproaches due to the overhead of memorizing thecodes. Once learned, however, this approach canbe an effective communication strategy, as discussedwith specific examples in Beukelman and Mirenda(1998). Often the codes are entered with switchesthat allow for easy entry of both dots and dashes,e.g., using two switches, one for dot and one fordash. In this study, we have one condition thatis similar to Morse code in using dots and dashes,but without requiring code memorization2. The in-terface used for the experiments identifies dots anddashes with short and long keypresses.
2Thanks to a reviewer for pointing out that DynaVox Series5 displays dynamically-assigned codes for non-letter buttons intheir Morse code interface, much as we do for the entire symbolset. In contrast to our approach, their codes are not assignedusing probabilistic models, rather to contrast with the standardMorse codes, which are used for the letters. Further, the cursorthat we use to identify position within the code (see Section 3.5)is not used in the Dynavox interface.
45
2.2 Binary codes
In indirect selection, the series of actions required toselect a given character is determined by the binarycode. As mentioned in Section 1, row/column scan-ning assigns binary codes based on location withinthe grid. Ordering the symbols so that frequentcharacters are located in the upper left-hand cor-ner of the grid will provide those frequent charac-ters with short codes with a row/column scanningapproach, though not the minimal possible binarycodes. Given a probability distribution over sym-bols, there are known algorithms for building a bi-nary code that has the minimum expected bits ac-cording to the distribution, i.e., codes will be op-timally short (Huffman, 1952). The quality of thecodes, however, depends on the quality of the prob-ability model, i.e., whether the model fits the actualdistribution in that context.
Roark et al. (2010) presented a scanning approachfor a fixed grid that used Huffman codes derivedfrom n-gram language models (see Section 2.3).The approach leveraged better probability models toachieve shorter code lengths, and achieved an over-all speedup over row/column scanning for the 10subjects in the trial, despite the method being closelytied to reaction time. The method requires monitor-ing of the target cell in the grid and reaction when itis highlighted, since the pattern of highlighting is notpredictable from symbol position in the grid, unlikerow/column scanning.
2.3 Language modeling
Language models assign probabilities to strings inthe language being modeled, which has broad utilityfor many tasks in speech and language processing.The most common language modeling approach isthe n-gram model, which estimates probabilities ofstrings as the product of the conditional probabilityof each symbol given previous symbols in the string,under a Markov assumption. That is, for a stringS = s1 . . . sn of n symbols, a k+1-gram model isdefined as
P(S) = P(s1)n∏
i=2
P(si | s1 . . . si−1)
≈ P(s1)
n∏i=2
P(si | si−k . . . si−1)
where the approximation is made by imposing theMarkov assumption. Note that the probability of thefirst symbol s1 is typically conditioned on the factthat it is first in the string. Each of the conditionalprobabilities in such a model is a multinomial dis-tribution over the symbols in a vocabulary Σ, andthe models are typically regularized (or smoothed)to avoid assigning zero probability to strings in Σ∗.See Chen and Goodman (1998) for an excellentoverview of modeling and regularization methods.
For the current application, the conditional prob-ability P(si | si−k . . . si−1) can be used to as-sign probabilities to all possible next symbols, andthese probabilities can be used to assign Huff-man codes. For example, if the user has typed‘the perso’ and is preparing to type the next letter,we estimate P( n | t h e p e r s o ) as well asP( m | t h e p e r s o ) and every other possi-ble next symbol, from a large corpus. Note thatsmoothing methods mentioned above ensure that ev-ery symbol receives non-zero probability mass. Alsonote that the space character (represented above as‘ ’) is a symbol in the model, hence the models takeinto account context across word boundaries. Giventhese estimated probabilities, known algorithms forassigning Huffman codes are used to assign shortcodes to the most likely next symbols, in a way thatminimizes expected code length.
3 Methods
Since this paper aims to compare new methods withHuffman scanning presented in Roark et al. (2010),we follow that paper in many key respects, includingtraining data, test protocol, and evaluation measures.For all trials we use a 6×6 grid, as shown in Fig-ures 1 and 2, which includes the 26 characters in theEnglish alphabet, 8 punctuation characters (comma,period, double quote, single quote, dash, dollar sign,colon and semi-colon), a white space delimiter (de-noted with underscore) and a delete symbol (de-noted with ←). Unlike Roark et al. (2010), ourgrid is in rough alphabetic order rather than in fre-quency order. In that paper, they compared Huffmanscanning with row/column scanning, which wouldhave been put at a disadvantage with alphabetic or-der, since frequent characters would have receivedlonger codes than they do in a frequency orderedgrid. In this paper, however, all of the approaches
46
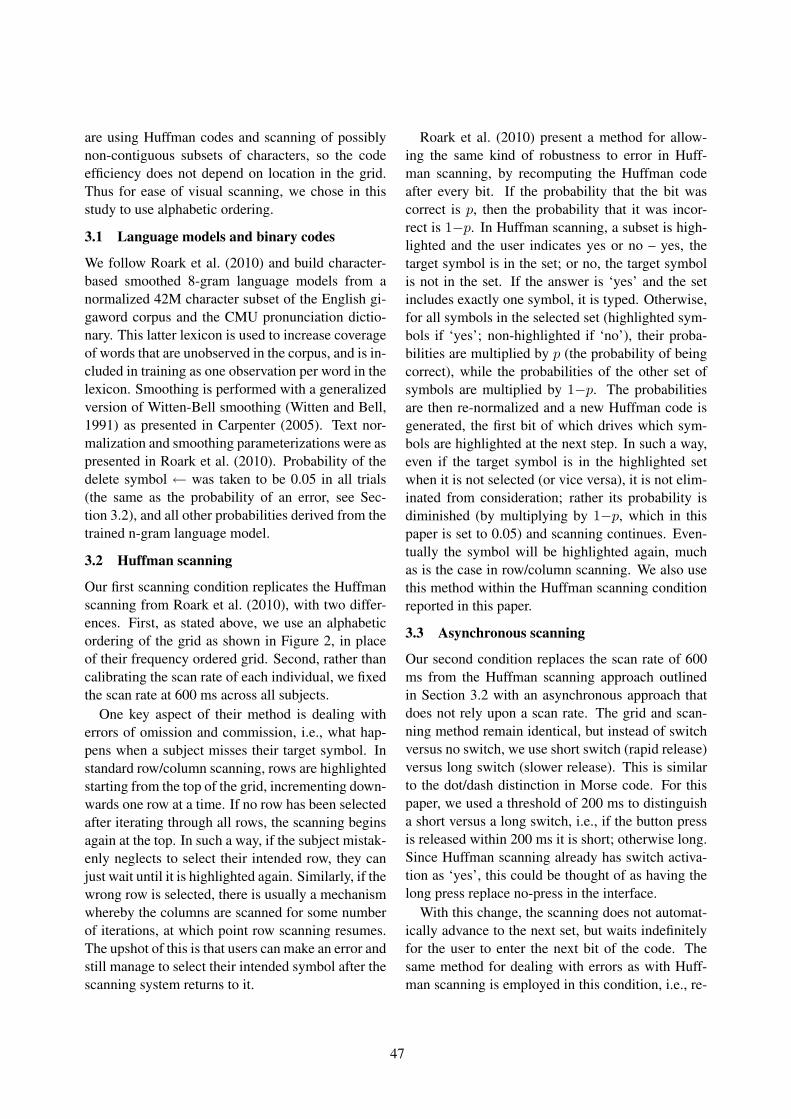
are using Huffman codes and scanning of possiblynon-contiguous subsets of characters, so the codeefficiency does not depend on location in the grid.Thus for ease of visual scanning, we chose in thisstudy to use alphabetic ordering.
3.1 Language models and binary codes
We follow Roark et al. (2010) and build character-based smoothed 8-gram language models from anormalized 42M character subset of the English gi-gaword corpus and the CMU pronunciation dictio-nary. This latter lexicon is used to increase coverageof words that are unobserved in the corpus, and is in-cluded in training as one observation per word in thelexicon. Smoothing is performed with a generalizedversion of Witten-Bell smoothing (Witten and Bell,1991) as presented in Carpenter (2005). Text nor-malization and smoothing parameterizations were aspresented in Roark et al. (2010). Probability of thedelete symbol ← was taken to be 0.05 in all trials(the same as the probability of an error, see Sec-tion 3.2), and all other probabilities derived from thetrained n-gram language model.
3.2 Huffman scanning
Our first scanning condition replicates the Huffmanscanning from Roark et al. (2010), with two differ-ences. First, as stated above, we use an alphabeticordering of the grid as shown in Figure 2, in placeof their frequency ordered grid. Second, rather thancalibrating the scan rate of each individual, we fixedthe scan rate at 600 ms across all subjects.
One key aspect of their method is dealing witherrors of omission and commission, i.e., what hap-pens when a subject misses their target symbol. Instandard row/column scanning, rows are highlightedstarting from the top of the grid, incrementing down-wards one row at a time. If no row has been selectedafter iterating through all rows, the scanning beginsagain at the top. In such a way, if the subject mistak-enly neglects to select their intended row, they canjust wait until it is highlighted again. Similarly, if thewrong row is selected, there is usually a mechanismwhereby the columns are scanned for some numberof iterations, at which point row scanning resumes.The upshot of this is that users can make an error andstill manage to select their intended symbol after thescanning system returns to it.
Roark et al. (2010) present a method for allow-ing the same kind of robustness to error in Huff-man scanning, by recomputing the Huffman codeafter every bit. If the probability that the bit wascorrect is p, then the probability that it was incor-rect is 1−p. In Huffman scanning, a subset is high-lighted and the user indicates yes or no – yes, thetarget symbol is in the set; or no, the target symbolis not in the set. If the answer is ‘yes’ and the setincludes exactly one symbol, it is typed. Otherwise,for all symbols in the selected set (highlighted sym-bols if ‘yes’; non-highlighted if ‘no’), their proba-bilities are multiplied by p (the probability of beingcorrect), while the probabilities of the other set ofsymbols are multiplied by 1−p. The probabilitiesare then re-normalized and a new Huffman code isgenerated, the first bit of which drives which sym-bols are highlighted at the next step. In such a way,even if the target symbol is in the highlighted setwhen it is not selected (or vice versa), it is not elim-inated from consideration; rather its probability isdiminished (by multiplying by 1−p, which in thispaper is set to 0.05) and scanning continues. Even-tually the symbol will be highlighted again, muchas is the case in row/column scanning. We also usethis method within the Huffman scanning conditionreported in this paper.
3.3 Asynchronous scanning
Our second condition replaces the scan rate of 600ms from the Huffman scanning approach outlinedin Section 3.2 with an asynchronous approach thatdoes not rely upon a scan rate. The grid and scan-ning method remain identical, but instead of switchversus no switch, we use short switch (rapid release)versus long switch (slower release). This is similarto the dot/dash distinction in Morse code. For thispaper, we used a threshold of 200 ms to distinguisha short versus a long switch, i.e., if the button pressis released within 200 ms it is short; otherwise long.Since Huffman scanning already has switch activa-tion as ‘yes’, this could be thought of as having thelong press replace no-press in the interface.
With this change, the scanning does not automat-ically advance to the next set, but waits indefinitelyfor the user to enter the next bit of the code. Thesame method for dealing with errors as with Huff-man scanning is employed in this condition, i.e., re-
47
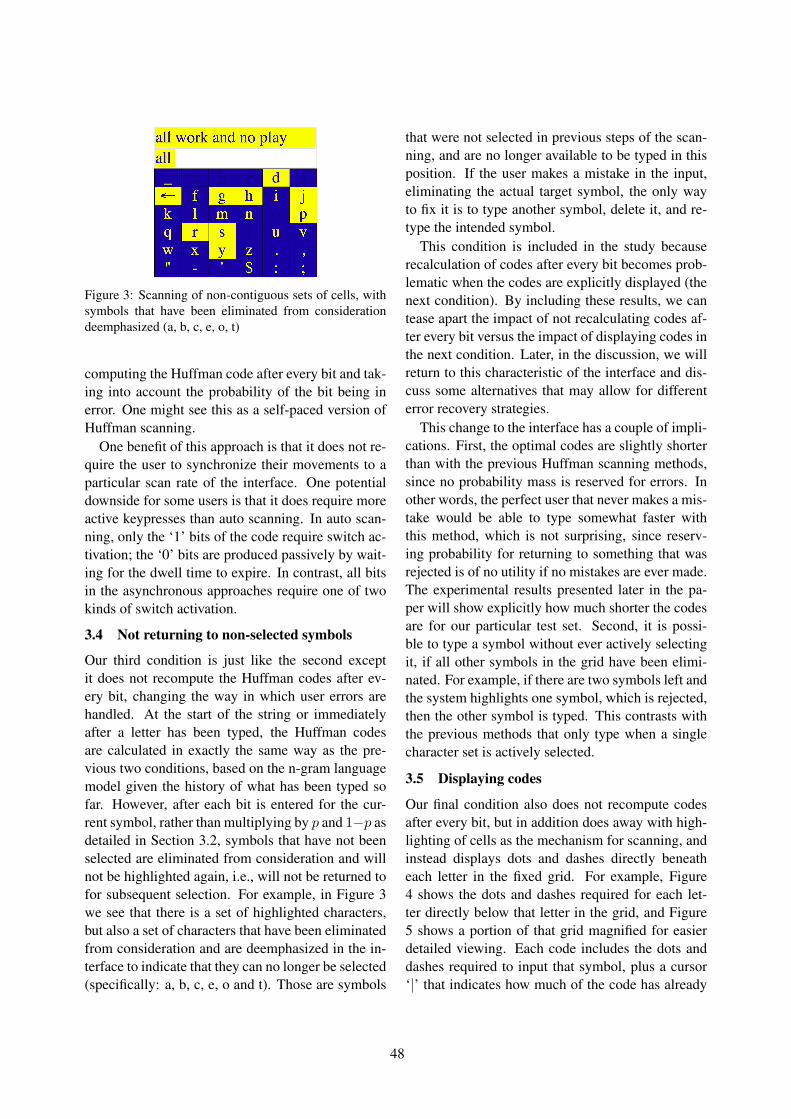
Figure 3: Scanning of non-contiguous sets of cells, withsymbols that have been eliminated from considerationdeemphasized (a, b, c, e, o, t)
computing the Huffman code after every bit and tak-ing into account the probability of the bit being inerror. One might see this as a self-paced version ofHuffman scanning.
One benefit of this approach is that it does not re-quire the user to synchronize their movements to aparticular scan rate of the interface. One potentialdownside for some users is that it does require moreactive keypresses than auto scanning. In auto scan-ning, only the ‘1’ bits of the code require switch ac-tivation; the ‘0’ bits are produced passively by wait-ing for the dwell time to expire. In contrast, all bitsin the asynchronous approaches require one of twokinds of switch activation.
3.4 Not returning to non-selected symbols
Our third condition is just like the second exceptit does not recompute the Huffman codes after ev-ery bit, changing the way in which user errors arehandled. At the start of the string or immediatelyafter a letter has been typed, the Huffman codesare calculated in exactly the same way as the pre-vious two conditions, based on the n-gram languagemodel given the history of what has been typed sofar. However, after each bit is entered for the cur-rent symbol, rather than multiplying by p and 1−p asdetailed in Section 3.2, symbols that have not beenselected are eliminated from consideration and willnot be highlighted again, i.e., will not be returned tofor subsequent selection. For example, in Figure 3we see that there is a set of highlighted characters,but also a set of characters that have been eliminatedfrom consideration and are deemphasized in the in-terface to indicate that they can no longer be selected(specifically: a, b, c, e, o and t). Those are symbols
that were not selected in previous steps of the scan-ning, and are no longer available to be typed in thisposition. If the user makes a mistake in the input,eliminating the actual target symbol, the only wayto fix it is to type another symbol, delete it, and re-type the intended symbol.
This condition is included in the study becauserecalculation of codes after every bit becomes prob-lematic when the codes are explicitly displayed (thenext condition). By including these results, we cantease apart the impact of not recalculating codes af-ter every bit versus the impact of displaying codes inthe next condition. Later, in the discussion, we willreturn to this characteristic of the interface and dis-cuss some alternatives that may allow for differenterror recovery strategies.
This change to the interface has a couple of impli-cations. First, the optimal codes are slightly shorterthan with the previous Huffman scanning methods,since no probability mass is reserved for errors. Inother words, the perfect user that never makes a mis-take would be able to type somewhat faster withthis method, which is not surprising, since reserv-ing probability for returning to something that wasrejected is of no utility if no mistakes are ever made.The experimental results presented later in the pa-per will show explicitly how much shorter the codesare for our particular test set. Second, it is possi-ble to type a symbol without ever actively selectingit, if all other symbols in the grid have been elimi-nated. For example, if there are two symbols left andthe system highlights one symbol, which is rejected,then the other symbol is typed. This contrasts withthe previous methods that only type when a singlecharacter set is actively selected.
3.5 Displaying codes
Our final condition also does not recompute codesafter every bit, but in addition does away with high-lighting of cells as the mechanism for scanning, andinstead displays dots and dashes directly beneatheach letter in the fixed grid. For example, Figure4 shows the dots and dashes required for each let-ter directly below that letter in the grid, and Figure5 shows a portion of that grid magnified for easierdetailed viewing. Each code includes the dots anddashes required to input that symbol, plus a cursor‘|’ that indicates how much of the code has already
48
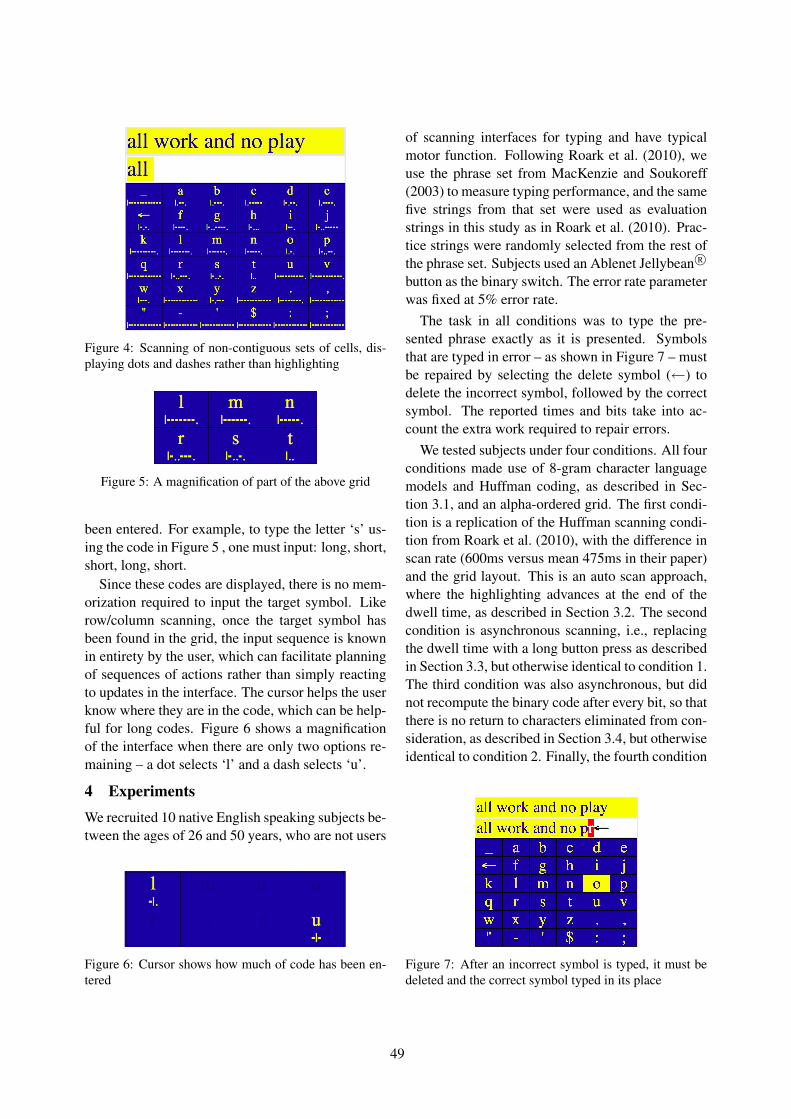
Figure 4: Scanning of non-contiguous sets of cells, dis-playing dots and dashes rather than highlighting
Figure 5: A magnification of part of the above grid
been entered. For example, to type the letter ‘s’ us-ing the code in Figure 5 , one must input: long, short,short, long, short.
Since these codes are displayed, there is no mem-orization required to input the target symbol. Likerow/column scanning, once the target symbol hasbeen found in the grid, the input sequence is knownin entirety by the user, which can facilitate planningof sequences of actions rather than simply reactingto updates in the interface. The cursor helps the userknow where they are in the code, which can be help-ful for long codes. Figure 6 shows a magnificationof the interface when there are only two options re-maining – a dot selects ‘l’ and a dash selects ‘u’.
4 ExperimentsWe recruited 10 native English speaking subjects be-tween the ages of 26 and 50 years, who are not users
Figure 6: Cursor shows how much of code has been en-tered
of scanning interfaces for typing and have typicalmotor function. Following Roark et al. (2010), weuse the phrase set from MacKenzie and Soukoreff(2003) to measure typing performance, and the samefive strings from that set were used as evaluationstrings in this study as in Roark et al. (2010). Prac-tice strings were randomly selected from the rest ofthe phrase set. Subjects used an Ablenet Jellybean R©
button as the binary switch. The error rate parameterwas fixed at 5% error rate.
The task in all conditions was to type the pre-sented phrase exactly as it is presented. Symbolsthat are typed in error – as shown in Figure 7 – mustbe repaired by selecting the delete symbol (←) todelete the incorrect symbol, followed by the correctsymbol. The reported times and bits take into ac-count the extra work required to repair errors.
We tested subjects under four conditions. All fourconditions made use of 8-gram character languagemodels and Huffman coding, as described in Sec-tion 3.1, and an alpha-ordered grid. The first condi-tion is a replication of the Huffman scanning condi-tion from Roark et al. (2010), with the difference inscan rate (600ms versus mean 475ms in their paper)and the grid layout. This is an auto scan approach,where the highlighting advances at the end of thedwell time, as described in Section 3.2. The secondcondition is asynchronous scanning, i.e., replacingthe dwell time with a long button press as describedin Section 3.3, but otherwise identical to condition 1.The third condition was also asynchronous, but didnot recompute the binary code after every bit, so thatthere is no return to characters eliminated from con-sideration, as described in Section 3.4, but otherwiseidentical to condition 2. Finally, the fourth condition
Figure 7: After an incorrect symbol is typed, it must bedeleted and the correct symbol typed in its place
49
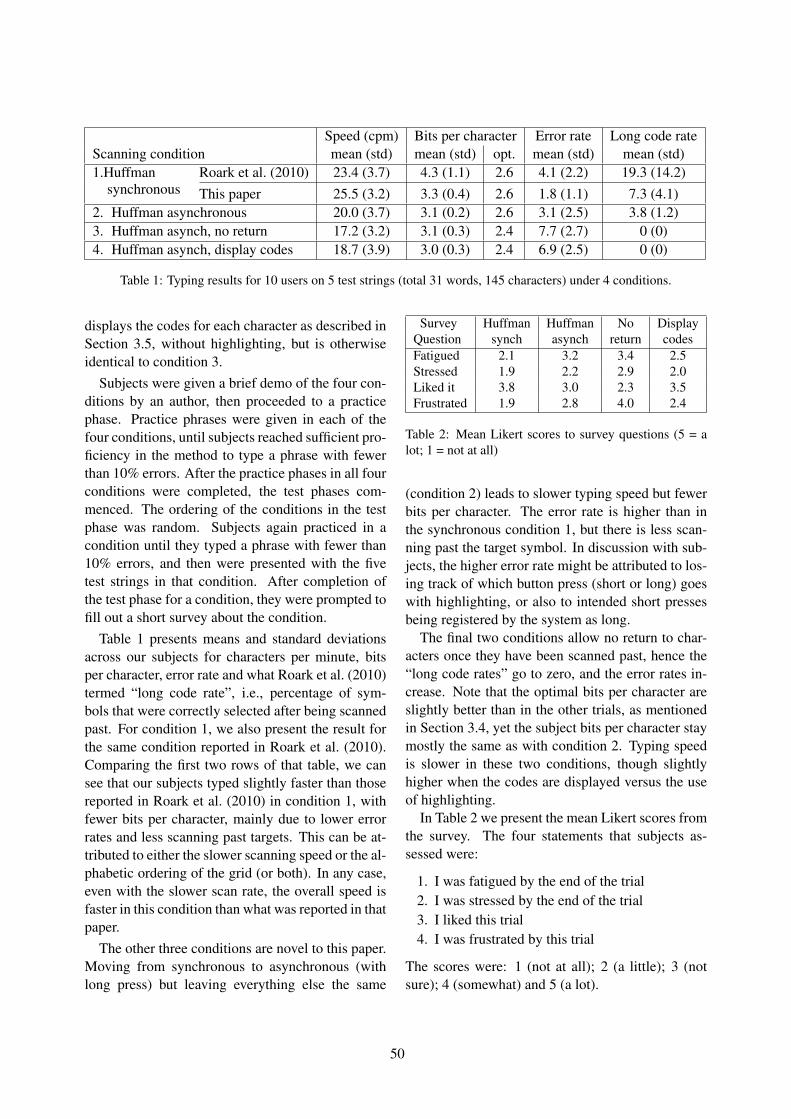
Speed (cpm) Bits per character Error rate Long code rateScanning condition mean (std) mean (std) opt. mean (std) mean (std)1.Huffman Roark et al. (2010) 23.4 (3.7) 4.3 (1.1) 2.6 4.1 (2.2) 19.3 (14.2)
synchronous This paper 25.5 (3.2) 3.3 (0.4) 2.6 1.8 (1.1) 7.3 (4.1)2. Huffman asynchronous 20.0 (3.7) 3.1 (0.2) 2.6 3.1 (2.5) 3.8 (1.2)3. Huffman asynch, no return 17.2 (3.2) 3.1 (0.3) 2.4 7.7 (2.7) 0 (0)4. Huffman asynch, display codes 18.7 (3.9) 3.0 (0.3) 2.4 6.9 (2.5) 0 (0)
Table 1: Typing results for 10 users on 5 test strings (total 31 words, 145 characters) under 4 conditions.
displays the codes for each character as described inSection 3.5, without highlighting, but is otherwiseidentical to condition 3.
Subjects were given a brief demo of the four con-ditions by an author, then proceeded to a practicephase. Practice phrases were given in each of thefour conditions, until subjects reached sufficient pro-ficiency in the method to type a phrase with fewerthan 10% errors. After the practice phases in all fourconditions were completed, the test phases com-menced. The ordering of the conditions in the testphase was random. Subjects again practiced in acondition until they typed a phrase with fewer than10% errors, and then were presented with the fivetest strings in that condition. After completion ofthe test phase for a condition, they were prompted tofill out a short survey about the condition.
Table 1 presents means and standard deviationsacross our subjects for characters per minute, bitsper character, error rate and what Roark et al. (2010)termed “long code rate”, i.e., percentage of sym-bols that were correctly selected after being scannedpast. For condition 1, we also present the result forthe same condition reported in Roark et al. (2010).Comparing the first two rows of that table, we cansee that our subjects typed slightly faster than thosereported in Roark et al. (2010) in condition 1, withfewer bits per character, mainly due to lower errorrates and less scanning past targets. This can be at-tributed to either the slower scanning speed or the al-phabetic ordering of the grid (or both). In any case,even with the slower scan rate, the overall speed isfaster in this condition than what was reported in thatpaper.
The other three conditions are novel to this paper.Moving from synchronous to asynchronous (withlong press) but leaving everything else the same
Survey Huffman Huffman No DisplayQuestion synch asynch return codesFatigued 2.1 3.2 3.4 2.5Stressed 1.9 2.2 2.9 2.0Liked it 3.8 3.0 2.3 3.5Frustrated 1.9 2.8 4.0 2.4
Table 2: Mean Likert scores to survey questions (5 = alot; 1 = not at all)
(condition 2) leads to slower typing speed but fewerbits per character. The error rate is higher than inthe synchronous condition 1, but there is less scan-ning past the target symbol. In discussion with sub-jects, the higher error rate might be attributed to los-ing track of which button press (short or long) goeswith highlighting, or also to intended short pressesbeing registered by the system as long.
The final two conditions allow no return to char-acters once they have been scanned past, hence the“long code rates” go to zero, and the error rates in-crease. Note that the optimal bits per character areslightly better than in the other trials, as mentionedin Section 3.4, yet the subject bits per character staymostly the same as with condition 2. Typing speedis slower in these two conditions, though slightlyhigher when the codes are displayed versus the useof highlighting.
In Table 2 we present the mean Likert scores fromthe survey. The four statements that subjects as-sessed were:
1. I was fatigued by the end of the trial2. I was stressed by the end of the trial3. I liked this trial4. I was frustrated by this trial
The scores were: 1 (not at all); 2 (a little); 3 (notsure); 4 (somewhat) and 5 (a lot).
50
The results in Table 2 show high frustration andstress with condition 3, and much lower fatigue,stress and frustration (hence higher ‘liking’) for con-dition 4, where the codes are displayed. Overall,there seemed to be a preference for Huffman syn-chronous, followed by displaying the codes.
5 DiscussionThere are several take-away lessons from this ex-periment. First, the frustration and slowdown thatresult from the increased error rates in condition 3make this a dispreferred solution, even though dis-allowing returning to symbols that have been ruledout in scanning reduced the bits per character (opti-mal and in practice). Yet in order to display a stablecode in condition 4 (which was popular), recalcula-tion of codes after every bit (as is done in the firsttwo conditions) is not an option. To make condi-tion 4 more effective, some effective means for al-lowing scanning to return to symbols that have beenscanned past must be devised.
Second, asynchronous scanning does seem to bea viable alternative to auto scanning, which may beof utility for certain AAC users. Such an approachmay be well suited to individuals using two switchesfor asynchronous row/column scanning. Other usersmay find the increased level of switch activation re-quired for scanning in these conditions too demand-ing. One statistic not shown in Table 1 is numberof keypresses required. In condition 1, some of the“bits” required to type the character are produced bynot pressing the button. In the other three conditions,all “bits” result from either a short or long press, sothe button is pressed for every bit. In condition 1,the mean number of key presses per character was1.5, which is approximately half of the total buttonpresses required per character in the other methods.
Future directions include investigations intomethods that combine some of the strengths of thevarious approaches. In particular, we are interestedin methods that allow for the direct display of codesfor either synchronous or asynchronous scanning,but which also allow for scanning past and return totarget characters that were mistakenly not selected.The benefit of displaying codes – allowing for an-ticipation and planning in scanning – are quite high,and this paper has not exhausted the exploration ofsuch approaches. Among the alternatives being con-
sidered are: requiring all codes to have a short press(confirmation) bit as the last bit of the code; havinga “reset” symbol or gesture; and recalculating codesafter some number of bits, greater than one. Eachof these methods would somewhat increase the op-timal bits per character, but may result in superioruser performance. Finally, we intend to include ac-tive AAC users in subsequent studies of these meth-ods.
ReferencesG. Baletsa, R. Foulds, and W. Crochetiere. 1976. Design
parameters of an intelligent communication device. InProceedings of the 29th Annual Conference on Engi-neering in Medicine and Biology, page 371.
D. Beukelman and P. Mirenda. 1998. Augmentative andAlternative Communication: Management of SevereCommunication Disorders in Children and Adults.Paul H. Brookes, Baltimore, MD, second edition.
B. Carpenter. 2005. Scaling high-order character lan-guage models to gigabytes. In Proceedings of the ACLWorkshop on Software, pages 86–99.
Stanley Chen and Joshua Goodman. 1998. An empiricalstudy of smoothing techniques for language modeling.Technical Report, TR-10-98, Harvard University.
D.A. Huffman. 1952. A method for the construction ofminimum redundancy codes. In Proceedings of theIRE, volume 40(9), pages 1098–1101.
G.W. Lesher, B.J. Moulton, and D.J. Higginbotham.1998. Techniques for augmenting scanning commu-nication. Augmentative and Alternative Communica-tion, 14:81–101.
I.S. MacKenzie and R.W. Soukoreff. 2003. Phrase setsfor evaluating text entry techniques. In Proceedings ofthe ACM Conference on Human Factors in ComputingSystems (CHI), pages 754–755.
B. Roark, J. de Villiers, C. Gibbons, and M. Fried-Oken.2010. Scanning methods and language modeling forbinary switch typing. In Proceedings of the NAACL-HLT Workshop on Speech and Language Processingfor Assistive Technologies (SLPAT), pages 28–36.
I.H. Witten and T.C. Bell. 1991. The zero-frequencyproblem: Estimating the probabilities of novel eventsin adaptive text compression. IEEE Transactions onInformation Theory, 37(4):1085–1094.
51
Proceedings of the 2nd Workshop on Speech and Language Processing for Assistive Technologies, pages 52–62,Edinburgh, Scotland, UK, July 30, 2011. c©2011 Association for Computational Linguistics
Improving the Accessibility of Line Graphs in Multimodal Documents
Charles F. Greenbacker Peng Wu Sandra Carberry Kathleen F. McCoyStephanie Elzer* David D. McDonald† Daniel Chester Seniz Demir‡
Dept. of Computer & Information Sciences, University of Delaware, USA[charlieg|pwu|carberry|mccoy|chester]@cis.udel.edu
*Dept. of Computer Science, Millersville University, USA [email protected]†SIFT LLC., Boston, Massachusetts, USA [email protected]
‡TUBITAK BILGEM, Gebze, Kocaeli, Turkey [email protected]
Abstract
This paper describes our work on improv-ing access to the content of multimodal docu-ments containing line graphs in popular mediafor people with visual impairments. We pro-vide an overview of our implemented system,including our method for recognizing and con-veying the intended message of a line graph.The textual description of the graphic gener-ated by our system is presented at the most rel-evant point in the document. We also describeongoing work into obtaining additional propo-sitions that elaborate on the intended message,and examine the potential benefits of analyz-ing the text and graphical content together inorder to extend our system to produce sum-maries of entire multimodal documents.
1 Introduction
Individuals with visual impairments have difficultyaccessing the information contained in multimodaldocuments. Although screen-reading software canrender the text of the document as speech, the graph-ical content is largely inaccessible. Here we con-sider information graphics (e.g., bar charts, linegraphs) often found in popular media sources suchas Time magazine, Businessweek, and USA Today.These graphics are typically intended to convey amessage that is an important part of the overall story,yet this message is generally not repeated in the ar-ticle text (Carberry et al., 2006). People who areunable to see and assimilate the graphical materialwill be left with only partial information.
While some work has addressed the accessibilityof scientific graphics through alternative means like
touch or sound (see Section 7), such graphs are de-signed for an audience of experts trained to use themfor data visualization. In contrast, graphs in popularmedia are constructed to make a point which shouldbe obvious without complicated scientific reasoning.We are thus interested in generating a textual pre-sentation of the content of graphs in popular media.Other research has focused on textual descriptions(e.g., Ferres et al. (2007)); however in that work thesame information is included in the textual summaryfor each instance of a graph type (i.e., all summariesof line graphs contain the same sorts of informa-tion), and the summary does not attempt to presentthe overall intended message of the graph.
SIGHT (Demir et al., 2008; Elzer et al., 2011) isa natural language system whose overall goal is pro-viding blind users with interactive access to multi-modal documents from electronically-available pop-ular media sources. To date, the SIGHT projecthas concentrated on simple bar charts. Its user in-terface is implemented as a browser helper objectwithin Internet Explorer that works with the JAWSscreen reader. When the system detects a bar chartin a document being read by the user, it prompts theuser to use keystrokes to request a brief summary ofthe graphic capturing its primary contribution to theoverall communicative goal of the document. Thesummary text can either be read to the user withJAWS or read by the user with a screen magnifiertool. The interface also enables the user to requestfurther information about the graphic, if desired.
However, SIGHT is limited to bar charts only.In this work, we follow the methodology put forthby SIGHT, but investigate producing a summary of
52
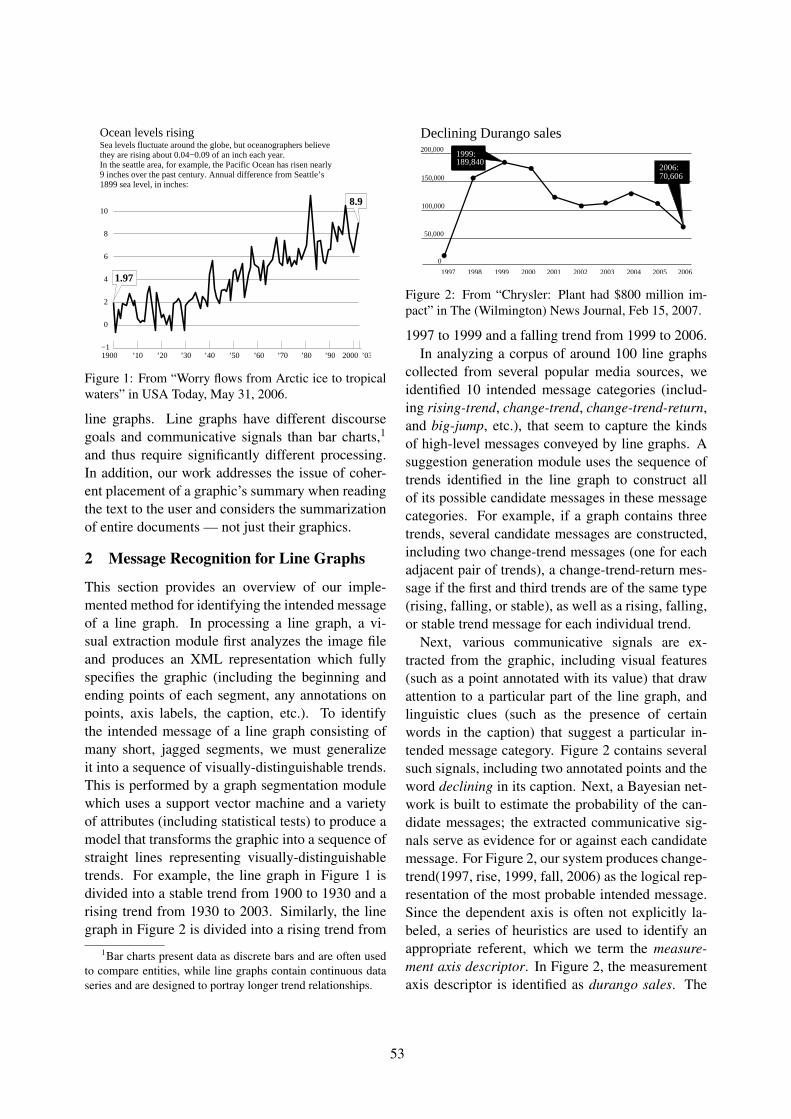
−1
0
2
4
6
8
1900 ’10 ’20 ’50 ’60 ’70 ’80 ’90 ’03’30 ’40 2000
108.9
1.97
9 inches over the past century. Annual difference from Seattle’sIn the seattle area, for example, the Pacific Ocean has risen nearly they are rising about 0.04−0.09 of an inch each year.Sea levels fluctuate around the globe, but oceanographers believeOcean levels rising
1899 sea level, in inches:
Figure 1: From “Worry flows from Arctic ice to tropicalwaters” in USA Today, May 31, 2006.
line graphs. Line graphs have different discoursegoals and communicative signals than bar charts,1
and thus require significantly different processing.In addition, our work addresses the issue of coher-ent placement of a graphic’s summary when readingthe text to the user and considers the summarizationof entire documents — not just their graphics.
2 Message Recognition for Line Graphs
This section provides an overview of our imple-mented method for identifying the intended messageof a line graph. In processing a line graph, a vi-sual extraction module first analyzes the image fileand produces an XML representation which fullyspecifies the graphic (including the beginning andending points of each segment, any annotations onpoints, axis labels, the caption, etc.). To identifythe intended message of a line graph consisting ofmany short, jagged segments, we must generalizeit into a sequence of visually-distinguishable trends.This is performed by a graph segmentation modulewhich uses a support vector machine and a varietyof attributes (including statistical tests) to produce amodel that transforms the graphic into a sequence ofstraight lines representing visually-distinguishabletrends. For example, the line graph in Figure 1 isdivided into a stable trend from 1900 to 1930 and arising trend from 1930 to 2003. Similarly, the linegraph in Figure 2 is divided into a rising trend from
1Bar charts present data as discrete bars and are often usedto compare entities, while line graphs contain continuous dataseries and are designed to portray longer trend relationships.
200620052004200320021997 1998 1999 20012000
200,000
150,000
1999:189,840
70,6062006:
50,000
100,000
Declining Durango sales
0
Figure 2: From “Chrysler: Plant had $800 million im-pact” in The (Wilmington) News Journal, Feb 15, 2007.
1997 to 1999 and a falling trend from 1999 to 2006.In analyzing a corpus of around 100 line graphs
collected from several popular media sources, weidentified 10 intended message categories (includ-ing rising-trend, change-trend, change-trend-return,and big-jump, etc.), that seem to capture the kindsof high-level messages conveyed by line graphs. Asuggestion generation module uses the sequence oftrends identified in the line graph to construct allof its possible candidate messages in these messagecategories. For example, if a graph contains threetrends, several candidate messages are constructed,including two change-trend messages (one for eachadjacent pair of trends), a change-trend-return mes-sage if the first and third trends are of the same type(rising, falling, or stable), as well as a rising, falling,or stable trend message for each individual trend.
Next, various communicative signals are ex-tracted from the graphic, including visual features(such as a point annotated with its value) that drawattention to a particular part of the line graph, andlinguistic clues (such as the presence of certainwords in the caption) that suggest a particular in-tended message category. Figure 2 contains severalsuch signals, including two annotated points and theword declining in its caption. Next, a Bayesian net-work is built to estimate the probability of the can-didate messages; the extracted communicative sig-nals serve as evidence for or against each candidatemessage. For Figure 2, our system produces change-trend(1997, rise, 1999, fall, 2006) as the logical rep-resentation of the most probable intended message.Since the dependent axis is often not explicitly la-beled, a series of heuristics are used to identify anappropriate referent, which we term the measure-ment axis descriptor. In Figure 2, the measurementaxis descriptor is identified as durango sales. The
53
intended message and measurement axis descriptorare then passed to a realization component whichuses FUF/SURGE (Elhadad and Robin, 1996) togenerate the following initial description:
This graphic conveys a changing trend indurango sales, rising from 1997 to 1999and then falling to 2006.
3 Identifying a Relevant Paragraph
In presenting a multimodal document to a user via ascreen reader, if the author does not specify a read-ing order in the accessibility preferences, it is notentirely clear where the description of the graph-ical content should be given. The text of scien-tific articles normally makes explicit references toany graphs contained in the document; in this case,it makes sense to insert the graphical descriptionalongside the first such reference. However, popularmedia articles rarely contain explicit references tographics. We hypothesize that describing the graphi-cal content together with the most relevant portion ofthe article text will result in a more coherent presen-tation. Results of an experiment described in Sec-tion 3.3 suggest the paragraph which is geograph-ically closest to the graphic is very often not rele-vant. Thus, our task becomes identifying the portionof the text that is most relevant to the graph.
We have developed a method for identifying themost relevant paragraph by measuring the similaritybetween the graphic’s textual components and thecontent of each individual paragraph in the docu-ment. An information graphic’s textual componentsmay consist of a title, caption, and any additionaldescriptions it contains (e.g., the five lines of text inFigure 1 beneath the caption Ocean levels rising).An initial method (P-KL) based on KL divergencemeasures the similarity between a paragraph and thegraphic’s textual component; a second method (P-KLA) is an extension of the first that incorporatesan augmented version of the textual component.
3.1 Method P-KL: KL DivergenceKullback-Leibler (KL) divergence (Kullback, 1968)is widely used to measure the similarity between twolanguage models. It can be expressed as:
DKL(p||q) =∑i∈V
p(i)logp(i)
q(i)
where i is the index of a word in vocabulary V , andp and q are two distributions of words. Liu et al.(Liu and Croft, 2002) applied KL divergence to textpassages in order to improve the accuracy of docu-ment retrieval. For our task, p is a smoothed worddistribution built from the line graph’s textual com-ponent, and q is another smoothed word distributionbuilt from a paragraph in the article text. Smoothingaddresses the problem of zero occurrences of a wordin the distributions. We rank the paragraphs by theirKL divergence scores from lowest to highest, sincelower scores indicate a higher similarity.
3.2 Method P-KLA: Using Augmented Text
In analyzing paragraphs relevant to the graphics, werealized that they included words that were germaneto describing information graphics in general, butnot related to the domains of individual graphs. Thisled us to build a set of “expansion words” that tend toappear in paragraphs relevant to information graph-ics. If we could identify domain-independent termsthat were correlated with information graphics ingeneral, these expansion words could then be addedto the textual component of a graphic when measur-ing its similarity to a paragraph in the article text.
We constructed the expansion word set using aniterative process. The first step is to use P-KL toidentify m pseudo-relevant paragraphs in the cor-responding document for each graphic in the train-ing set (the current implementation uses m = 3).This is similar to pseudo-relevance feedback used inIR (Zhai, 2008), except only a single query is usedin the IR application, whereas we consider manypairs of graphics and documents to obtain an ex-pansion set applicable to any subsequent informa-tion graphic. Given n graphics in the training set,we identify (up to) m ∗ n relevant paragraphs.
The second step is to extract a set of words re-lated to information graphics from these m ∗n para-graphs. We assume the collection of pseudo-relevantparagraphs was generated by two models, one pro-ducing words relevant to the information graphicsand another producing words relevant to the topicsof the individual documents. Let Wg represent theword frequency vector yielding words relevant tothe graphics, Wa represent the word frequency vec-tor yielding words relevant to the document topics,and Wp represent the word frequency vector of the
54
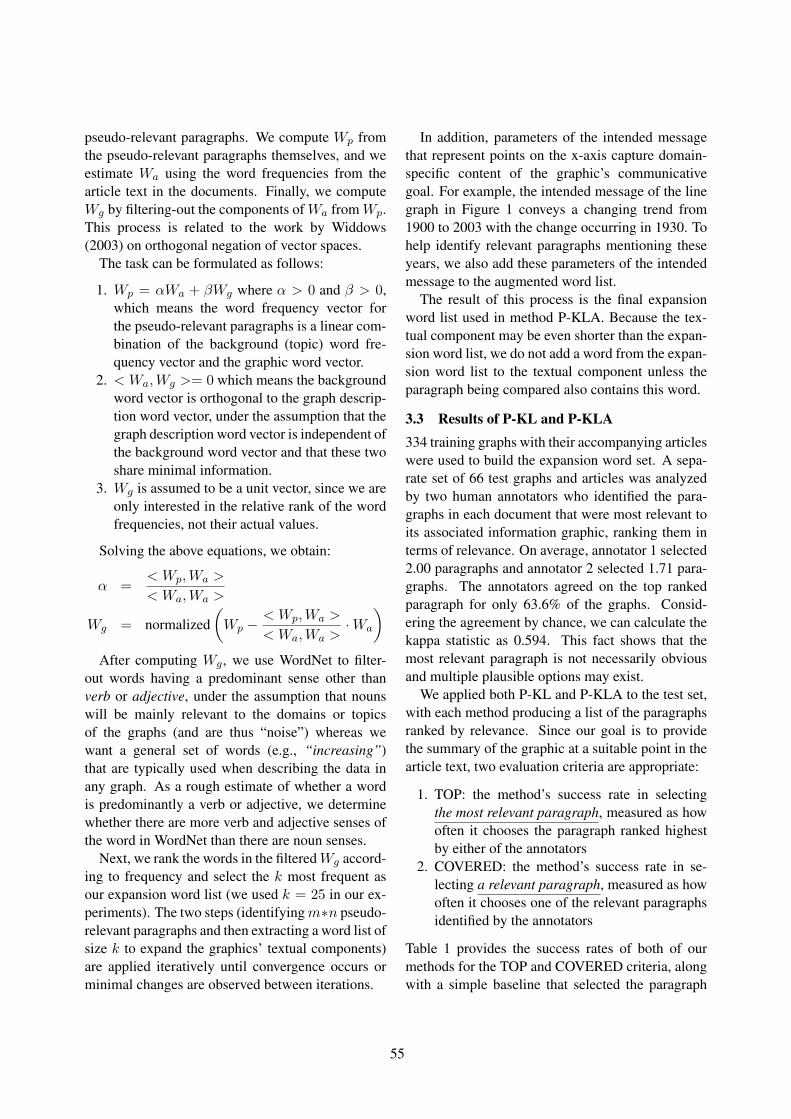
pseudo-relevant paragraphs. We compute Wp fromthe pseudo-relevant paragraphs themselves, and weestimate Wa using the word frequencies from thearticle text in the documents. Finally, we computeWg by filtering-out the components ofWa fromWp.This process is related to the work by Widdows(2003) on orthogonal negation of vector spaces.
The task can be formulated as follows:
1. Wp = αWa + βWg where α > 0 and β > 0,which means the word frequency vector forthe pseudo-relevant paragraphs is a linear com-bination of the background (topic) word fre-quency vector and the graphic word vector.
2. < Wa,Wg >= 0 which means the backgroundword vector is orthogonal to the graph descrip-tion word vector, under the assumption that thegraph description word vector is independent ofthe background word vector and that these twoshare minimal information.
3. Wg is assumed to be a unit vector, since we areonly interested in the relative rank of the wordfrequencies, not their actual values.
Solving the above equations, we obtain:
α =< Wp,Wa >
< Wa,Wa >
Wg = normalized(Wp −
< Wp,Wa >
< Wa,Wa >·Wa
)After computing Wg, we use WordNet to filter-
out words having a predominant sense other thanverb or adjective, under the assumption that nounswill be mainly relevant to the domains or topicsof the graphs (and are thus “noise”) whereas wewant a general set of words (e.g., “increasing”)that are typically used when describing the data inany graph. As a rough estimate of whether a wordis predominantly a verb or adjective, we determinewhether there are more verb and adjective senses ofthe word in WordNet than there are noun senses.
Next, we rank the words in the filteredWg accord-ing to frequency and select the k most frequent asour expansion word list (we used k = 25 in our ex-periments). The two steps (identifyingm∗n pseudo-relevant paragraphs and then extracting a word list ofsize k to expand the graphics’ textual components)are applied iteratively until convergence occurs orminimal changes are observed between iterations.
In addition, parameters of the intended messagethat represent points on the x-axis capture domain-specific content of the graphic’s communicativegoal. For example, the intended message of the linegraph in Figure 1 conveys a changing trend from1900 to 2003 with the change occurring in 1930. Tohelp identify relevant paragraphs mentioning theseyears, we also add these parameters of the intendedmessage to the augmented word list.
The result of this process is the final expansionword list used in method P-KLA. Because the tex-tual component may be even shorter than the expan-sion word list, we do not add a word from the expan-sion word list to the textual component unless theparagraph being compared also contains this word.
3.3 Results of P-KL and P-KLA334 training graphs with their accompanying articleswere used to build the expansion word set. A sepa-rate set of 66 test graphs and articles was analyzedby two human annotators who identified the para-graphs in each document that were most relevant toits associated information graphic, ranking them interms of relevance. On average, annotator 1 selected2.00 paragraphs and annotator 2 selected 1.71 para-graphs. The annotators agreed on the top rankedparagraph for only 63.6% of the graphs. Consid-ering the agreement by chance, we can calculate thekappa statistic as 0.594. This fact shows that themost relevant paragraph is not necessarily obviousand multiple plausible options may exist.
We applied both P-KL and P-KLA to the test set,with each method producing a list of the paragraphsranked by relevance. Since our goal is to providethe summary of the graphic at a suitable point in thearticle text, two evaluation criteria are appropriate:
1. TOP: the method’s success rate in selectingthe most relevant paragraph, measured as howoften it chooses the paragraph ranked highestby either of the annotators
2. COVERED: the method’s success rate in se-lecting a relevant paragraph, measured as howoften it chooses one of the relevant paragraphsidentified by the annotators
Table 1 provides the success rates of both of ourmethods for the TOP and COVERED criteria, alongwith a simple baseline that selected the paragraph
55
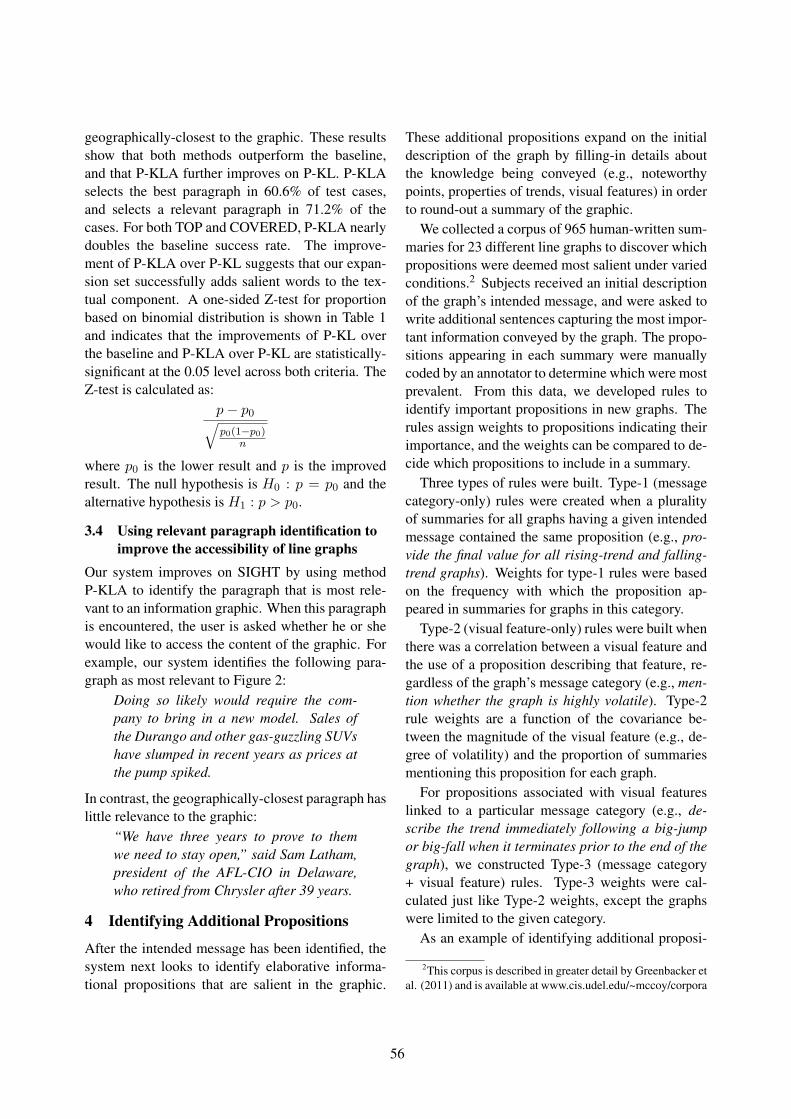
geographically-closest to the graphic. These resultsshow that both methods outperform the baseline,and that P-KLA further improves on P-KL. P-KLAselects the best paragraph in 60.6% of test cases,and selects a relevant paragraph in 71.2% of thecases. For both TOP and COVERED, P-KLA nearlydoubles the baseline success rate. The improve-ment of P-KLA over P-KL suggests that our expan-sion set successfully adds salient words to the tex-tual component. A one-sided Z-test for proportionbased on binomial distribution is shown in Table 1and indicates that the improvements of P-KL overthe baseline and P-KLA over P-KL are statistically-significant at the 0.05 level across both criteria. TheZ-test is calculated as:
p− p0√p0(1−p0)
n
where p0 is the lower result and p is the improvedresult. The null hypothesis is H0 : p = p0 and thealternative hypothesis is H1 : p > p0.
3.4 Using relevant paragraph identification toimprove the accessibility of line graphs
Our system improves on SIGHT by using methodP-KLA to identify the paragraph that is most rele-vant to an information graphic. When this paragraphis encountered, the user is asked whether he or shewould like to access the content of the graphic. Forexample, our system identifies the following para-graph as most relevant to Figure 2:
Doing so likely would require the com-pany to bring in a new model. Sales ofthe Durango and other gas-guzzling SUVshave slumped in recent years as prices atthe pump spiked.
In contrast, the geographically-closest paragraph haslittle relevance to the graphic:
“We have three years to prove to themwe need to stay open,” said Sam Latham,president of the AFL-CIO in Delaware,who retired from Chrysler after 39 years.
4 Identifying Additional Propositions
After the intended message has been identified, thesystem next looks to identify elaborative informa-tional propositions that are salient in the graphic.
These additional propositions expand on the initialdescription of the graph by filling-in details aboutthe knowledge being conveyed (e.g., noteworthypoints, properties of trends, visual features) in orderto round-out a summary of the graphic.
We collected a corpus of 965 human-written sum-maries for 23 different line graphs to discover whichpropositions were deemed most salient under variedconditions.2 Subjects received an initial descriptionof the graph’s intended message, and were asked towrite additional sentences capturing the most impor-tant information conveyed by the graph. The propo-sitions appearing in each summary were manuallycoded by an annotator to determine which were mostprevalent. From this data, we developed rules toidentify important propositions in new graphs. Therules assign weights to propositions indicating theirimportance, and the weights can be compared to de-cide which propositions to include in a summary.
Three types of rules were built. Type-1 (messagecategory-only) rules were created when a pluralityof summaries for all graphs having a given intendedmessage contained the same proposition (e.g., pro-vide the final value for all rising-trend and falling-trend graphs). Weights for type-1 rules were basedon the frequency with which the proposition ap-peared in summaries for graphs in this category.
Type-2 (visual feature-only) rules were built whenthere was a correlation between a visual feature andthe use of a proposition describing that feature, re-gardless of the graph’s message category (e.g., men-tion whether the graph is highly volatile). Type-2rule weights are a function of the covariance be-tween the magnitude of the visual feature (e.g., de-gree of volatility) and the proportion of summariesmentioning this proposition for each graph.
For propositions associated with visual featureslinked to a particular message category (e.g., de-scribe the trend immediately following a big-jumpor big-fall when it terminates prior to the end of thegraph), we constructed Type-3 (message category+ visual feature) rules. Type-3 weights were cal-culated just like Type-2 weights, except the graphswere limited to the given category.
As an example of identifying additional proposi-
2This corpus is described in greater detail by Greenbacker etal. (2011) and is available at www.cis.udel.edu/~mccoy/corpora
56
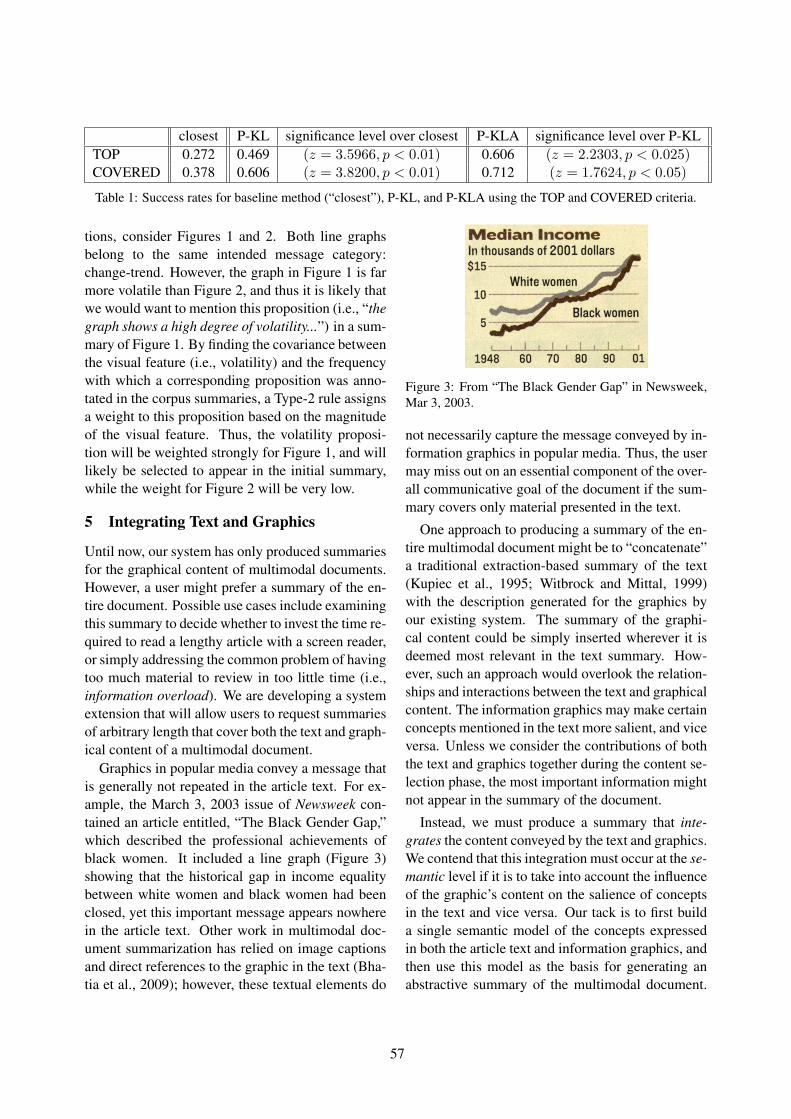
closest P-KL significance level over closest P-KLA significance level over P-KLTOP 0.272 0.469 (z = 3.5966, p < 0.01) 0.606 (z = 2.2303, p < 0.025)COVERED 0.378 0.606 (z = 3.8200, p < 0.01) 0.712 (z = 1.7624, p < 0.05)
Table 1: Success rates for baseline method (“closest”), P-KL, and P-KLA using the TOP and COVERED criteria.
tions, consider Figures 1 and 2. Both line graphsbelong to the same intended message category:change-trend. However, the graph in Figure 1 is farmore volatile than Figure 2, and thus it is likely thatwe would want to mention this proposition (i.e., “thegraph shows a high degree of volatility...”) in a sum-mary of Figure 1. By finding the covariance betweenthe visual feature (i.e., volatility) and the frequencywith which a corresponding proposition was anno-tated in the corpus summaries, a Type-2 rule assignsa weight to this proposition based on the magnitudeof the visual feature. Thus, the volatility proposi-tion will be weighted strongly for Figure 1, and willlikely be selected to appear in the initial summary,while the weight for Figure 2 will be very low.
5 Integrating Text and Graphics
Until now, our system has only produced summariesfor the graphical content of multimodal documents.However, a user might prefer a summary of the en-tire document. Possible use cases include examiningthis summary to decide whether to invest the time re-quired to read a lengthy article with a screen reader,or simply addressing the common problem of havingtoo much material to review in too little time (i.e.,information overload). We are developing a systemextension that will allow users to request summariesof arbitrary length that cover both the text and graph-ical content of a multimodal document.
Graphics in popular media convey a message thatis generally not repeated in the article text. For ex-ample, the March 3, 2003 issue of Newsweek con-tained an article entitled, “The Black Gender Gap,”which described the professional achievements ofblack women. It included a line graph (Figure 3)showing that the historical gap in income equalitybetween white women and black women had beenclosed, yet this important message appears nowherein the article text. Other work in multimodal doc-ument summarization has relied on image captionsand direct references to the graphic in the text (Bha-tia et al., 2009); however, these textual elements do
Figure 3: From “The Black Gender Gap” in Newsweek,Mar 3, 2003.
not necessarily capture the message conveyed by in-formation graphics in popular media. Thus, the usermay miss out on an essential component of the over-all communicative goal of the document if the sum-mary covers only material presented in the text.
One approach to producing a summary of the en-tire multimodal document might be to “concatenate”a traditional extraction-based summary of the text(Kupiec et al., 1995; Witbrock and Mittal, 1999)with the description generated for the graphics byour existing system. The summary of the graphi-cal content could be simply inserted wherever it isdeemed most relevant in the text summary. How-ever, such an approach would overlook the relation-ships and interactions between the text and graphicalcontent. The information graphics may make certainconcepts mentioned in the text more salient, and viceversa. Unless we consider the contributions of boththe text and graphics together during the content se-lection phase, the most important information mightnot appear in the summary of the document.
Instead, we must produce a summary that inte-grates the content conveyed by the text and graphics.We contend that this integration must occur at the se-mantic level if it is to take into account the influenceof the graphic’s content on the salience of conceptsin the text and vice versa. Our tack is to first builda single semantic model of the concepts expressedin both the article text and information graphics, andthen use this model as the basis for generating anabstractive summary of the multimodal document.
57
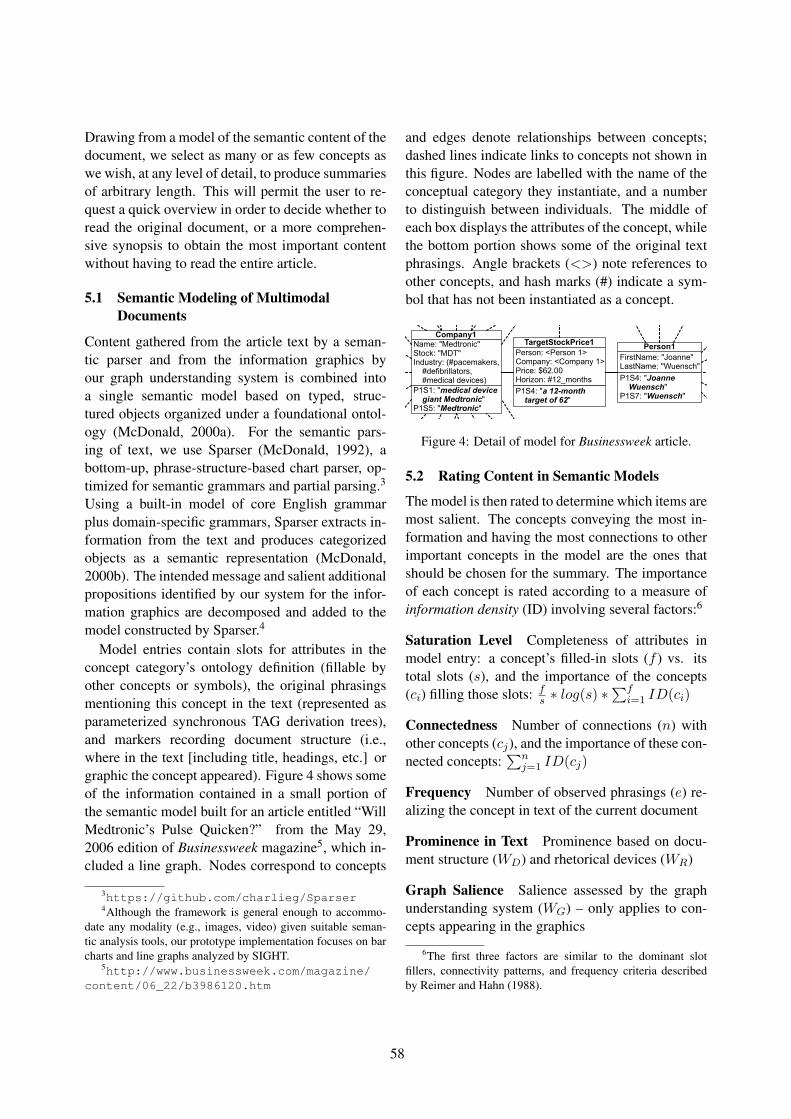
Drawing from a model of the semantic content of thedocument, we select as many or as few concepts aswe wish, at any level of detail, to produce summariesof arbitrary length. This will permit the user to re-quest a quick overview in order to decide whether toread the original document, or a more comprehen-sive synopsis to obtain the most important contentwithout having to read the entire article.
5.1 Semantic Modeling of MultimodalDocuments
Content gathered from the article text by a seman-tic parser and from the information graphics byour graph understanding system is combined intoa single semantic model based on typed, struc-tured objects organized under a foundational ontol-ogy (McDonald, 2000a). For the semantic pars-ing of text, we use Sparser (McDonald, 1992), abottom-up, phrase-structure-based chart parser, op-timized for semantic grammars and partial parsing.3
Using a built-in model of core English grammarplus domain-specific grammars, Sparser extracts in-formation from the text and produces categorizedobjects as a semantic representation (McDonald,2000b). The intended message and salient additionalpropositions identified by our system for the infor-mation graphics are decomposed and added to themodel constructed by Sparser.4
Model entries contain slots for attributes in theconcept category’s ontology definition (fillable byother concepts or symbols), the original phrasingsmentioning this concept in the text (represented asparameterized synchronous TAG derivation trees),and markers recording document structure (i.e.,where in the text [including title, headings, etc.] orgraphic the concept appeared). Figure 4 shows someof the information contained in a small portion ofthe semantic model built for an article entitled “WillMedtronic’s Pulse Quicken?” from the May 29,2006 edition of Businessweek magazine5, which in-cluded a line graph. Nodes correspond to concepts
3https://github.com/charlieg/Sparser4Although the framework is general enough to accommo-
date any modality (e.g., images, video) given suitable seman-tic analysis tools, our prototype implementation focuses on barcharts and line graphs analyzed by SIGHT.
5http://www.businessweek.com/magazine/content/06_22/b3986120.htm
and edges denote relationships between concepts;dashed lines indicate links to concepts not shown inthis figure. Nodes are labelled with the name of theconceptual category they instantiate, and a numberto distinguish between individuals. The middle ofeach box displays the attributes of the concept, whilethe bottom portion shows some of the original textphrasings. Angle brackets (<>) note references toother concepts, and hash marks (#) indicate a sym-bol that has not been instantiated as a concept.
P1S1: "medical device giant Medtronic"P1S5: "Medtronic"
Name: "Medtronic"Stock: "MDT"Industry: (#pacemakers, #defibrillators, #medical devices)
Company1
P1S4: "Joanne Wuensch"P1S7: "Wuensch"
FirstName: "Joanne"LastName: "Wuensch"
Person1
P1S4: "a 12-month target of 62"
Person: <Person 1>Company: <Company 1>Price: $62.00Horizon: #12_months
TargetStockPrice1
Figure 4: Detail of model for Businessweek article.
5.2 Rating Content in Semantic Models
The model is then rated to determine which items aremost salient. The concepts conveying the most in-formation and having the most connections to otherimportant concepts in the model are the ones thatshould be chosen for the summary. The importanceof each concept is rated according to a measure ofinformation density (ID) involving several factors:6
Saturation Level Completeness of attributes inmodel entry: a concept’s filled-in slots (f ) vs. itstotal slots (s), and the importance of the concepts(ci) filling those slots: f
s ∗ log(s) ∗∑f
i=1 ID(ci)
Connectedness Number of connections (n) withother concepts (cj), and the importance of these con-nected concepts:
∑nj=1 ID(cj)
Frequency Number of observed phrasings (e) re-alizing the concept in text of the current document
Prominence in Text Prominence based on docu-ment structure (WD) and rhetorical devices (WR)
Graph Salience Salience assessed by the graphunderstanding system (WG) – only applies to con-cepts appearing in the graphics
6The first three factors are similar to the dominant slotfillers, connectivity patterns, and frequency criteria describedby Reimer and Hahn (1988).
58
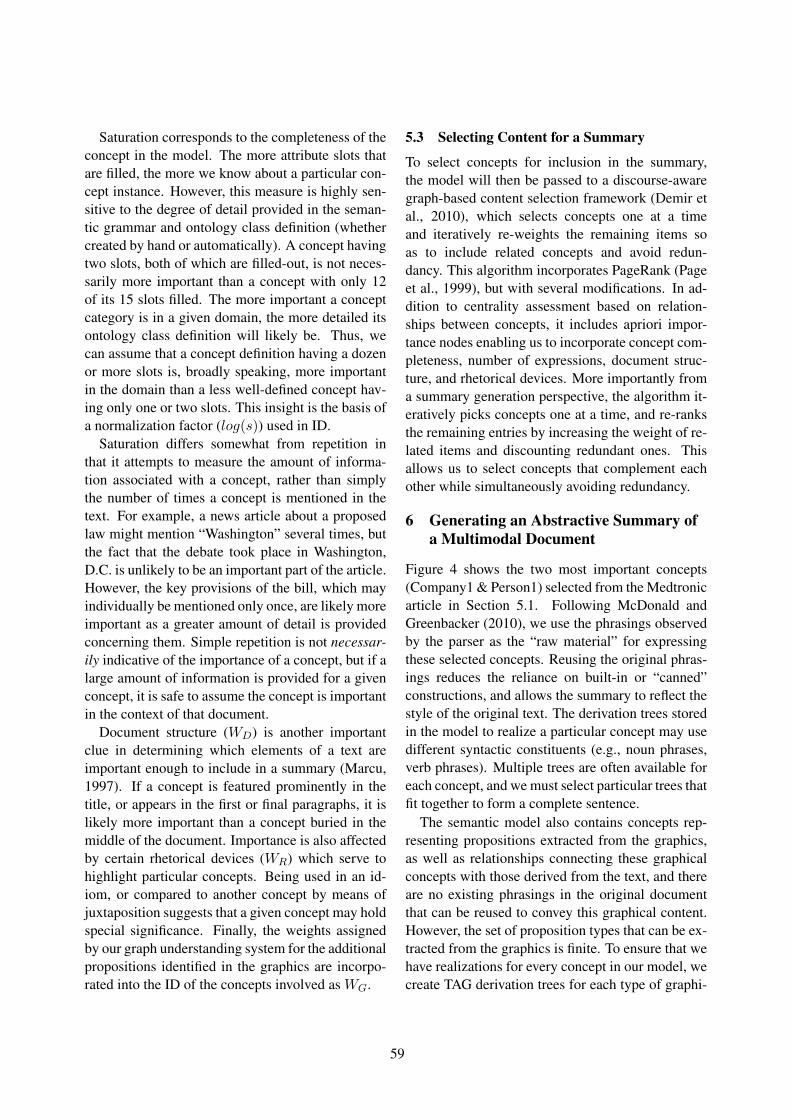
Saturation corresponds to the completeness of theconcept in the model. The more attribute slots thatare filled, the more we know about a particular con-cept instance. However, this measure is highly sen-sitive to the degree of detail provided in the seman-tic grammar and ontology class definition (whethercreated by hand or automatically). A concept havingtwo slots, both of which are filled-out, is not neces-sarily more important than a concept with only 12of its 15 slots filled. The more important a conceptcategory is in a given domain, the more detailed itsontology class definition will likely be. Thus, wecan assume that a concept definition having a dozenor more slots is, broadly speaking, more importantin the domain than a less well-defined concept hav-ing only one or two slots. This insight is the basis ofa normalization factor (log(s)) used in ID.
Saturation differs somewhat from repetition inthat it attempts to measure the amount of informa-tion associated with a concept, rather than simplythe number of times a concept is mentioned in thetext. For example, a news article about a proposedlaw might mention “Washington” several times, butthe fact that the debate took place in Washington,D.C. is unlikely to be an important part of the article.However, the key provisions of the bill, which mayindividually be mentioned only once, are likely moreimportant as a greater amount of detail is providedconcerning them. Simple repetition is not necessar-ily indicative of the importance of a concept, but if alarge amount of information is provided for a givenconcept, it is safe to assume the concept is importantin the context of that document.
Document structure (WD) is another importantclue in determining which elements of a text areimportant enough to include in a summary (Marcu,1997). If a concept is featured prominently in thetitle, or appears in the first or final paragraphs, it islikely more important than a concept buried in themiddle of the document. Importance is also affectedby certain rhetorical devices (WR) which serve tohighlight particular concepts. Being used in an id-iom, or compared to another concept by means ofjuxtaposition suggests that a given concept may holdspecial significance. Finally, the weights assignedby our graph understanding system for the additionalpropositions identified in the graphics are incorpo-rated into the ID of the concepts involved as WG.
5.3 Selecting Content for a Summary
To select concepts for inclusion in the summary,the model will then be passed to a discourse-awaregraph-based content selection framework (Demir etal., 2010), which selects concepts one at a timeand iteratively re-weights the remaining items soas to include related concepts and avoid redun-dancy. This algorithm incorporates PageRank (Pageet al., 1999), but with several modifications. In ad-dition to centrality assessment based on relation-ships between concepts, it includes apriori impor-tance nodes enabling us to incorporate concept com-pleteness, number of expressions, document struc-ture, and rhetorical devices. More importantly froma summary generation perspective, the algorithm it-eratively picks concepts one at a time, and re-ranksthe remaining entries by increasing the weight of re-lated items and discounting redundant ones. Thisallows us to select concepts that complement eachother while simultaneously avoiding redundancy.
6 Generating an Abstractive Summary ofa Multimodal Document
Figure 4 shows the two most important concepts(Company1 & Person1) selected from the Medtronicarticle in Section 5.1. Following McDonald andGreenbacker (2010), we use the phrasings observedby the parser as the “raw material” for expressingthese selected concepts. Reusing the original phras-ings reduces the reliance on built-in or “canned”constructions, and allows the summary to reflect thestyle of the original text. The derivation trees storedin the model to realize a particular concept may usedifferent syntactic constituents (e.g., noun phrases,verb phrases). Multiple trees are often available foreach concept, and we must select particular trees thatfit together to form a complete sentence.
The semantic model also contains concepts rep-resenting propositions extracted from the graphics,as well as relationships connecting these graphicalconcepts with those derived from the text, and thereare no existing phrasings in the original documentthat can be reused to convey this graphical content.However, the set of proposition types that can be ex-tracted from the graphics is finite. To ensure that wehave realizations for every concept in our model, wecreate TAG derivation trees for each type of graphi-
59
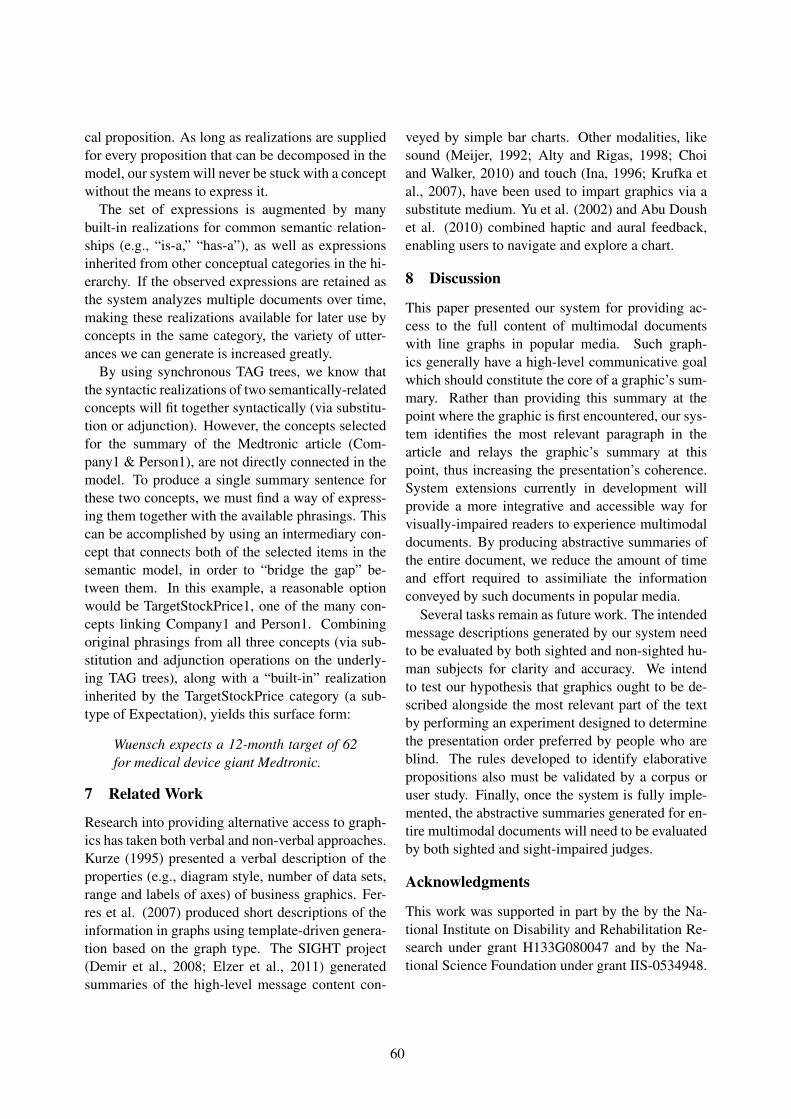
cal proposition. As long as realizations are suppliedfor every proposition that can be decomposed in themodel, our system will never be stuck with a conceptwithout the means to express it.
The set of expressions is augmented by manybuilt-in realizations for common semantic relation-ships (e.g., “is-a,” “has-a”), as well as expressionsinherited from other conceptual categories in the hi-erarchy. If the observed expressions are retained asthe system analyzes multiple documents over time,making these realizations available for later use byconcepts in the same category, the variety of utter-ances we can generate is increased greatly.
By using synchronous TAG trees, we know thatthe syntactic realizations of two semantically-relatedconcepts will fit together syntactically (via substitu-tion or adjunction). However, the concepts selectedfor the summary of the Medtronic article (Com-pany1 & Person1), are not directly connected in themodel. To produce a single summary sentence forthese two concepts, we must find a way of express-ing them together with the available phrasings. Thiscan be accomplished by using an intermediary con-cept that connects both of the selected items in thesemantic model, in order to “bridge the gap” be-tween them. In this example, a reasonable optionwould be TargetStockPrice1, one of the many con-cepts linking Company1 and Person1. Combiningoriginal phrasings from all three concepts (via sub-stitution and adjunction operations on the underly-ing TAG trees), along with a “built-in” realizationinherited by the TargetStockPrice category (a sub-type of Expectation), yields this surface form:
Wuensch expects a 12-month target of 62for medical device giant Medtronic.
7 Related Work
Research into providing alternative access to graph-ics has taken both verbal and non-verbal approaches.Kurze (1995) presented a verbal description of theproperties (e.g., diagram style, number of data sets,range and labels of axes) of business graphics. Fer-res et al. (2007) produced short descriptions of theinformation in graphs using template-driven genera-tion based on the graph type. The SIGHT project(Demir et al., 2008; Elzer et al., 2011) generatedsummaries of the high-level message content con-
veyed by simple bar charts. Other modalities, likesound (Meijer, 1992; Alty and Rigas, 1998; Choiand Walker, 2010) and touch (Ina, 1996; Krufka etal., 2007), have been used to impart graphics via asubstitute medium. Yu et al. (2002) and Abu Doushet al. (2010) combined haptic and aural feedback,enabling users to navigate and explore a chart.
8 Discussion
This paper presented our system for providing ac-cess to the full content of multimodal documentswith line graphs in popular media. Such graph-ics generally have a high-level communicative goalwhich should constitute the core of a graphic’s sum-mary. Rather than providing this summary at thepoint where the graphic is first encountered, our sys-tem identifies the most relevant paragraph in thearticle and relays the graphic’s summary at thispoint, thus increasing the presentation’s coherence.System extensions currently in development willprovide a more integrative and accessible way forvisually-impaired readers to experience multimodaldocuments. By producing abstractive summaries ofthe entire document, we reduce the amount of timeand effort required to assimiliate the informationconveyed by such documents in popular media.
Several tasks remain as future work. The intendedmessage descriptions generated by our system needto be evaluated by both sighted and non-sighted hu-man subjects for clarity and accuracy. We intendto test our hypothesis that graphics ought to be de-scribed alongside the most relevant part of the textby performing an experiment designed to determinethe presentation order preferred by people who areblind. The rules developed to identify elaborativepropositions also must be validated by a corpus oruser study. Finally, once the system is fully imple-mented, the abstractive summaries generated for en-tire multimodal documents will need to be evaluatedby both sighted and sight-impaired judges.
Acknowledgments
This work was supported in part by the by the Na-tional Institute on Disability and Rehabilitation Re-search under grant H133G080047 and by the Na-tional Science Foundation under grant IIS-0534948.
60
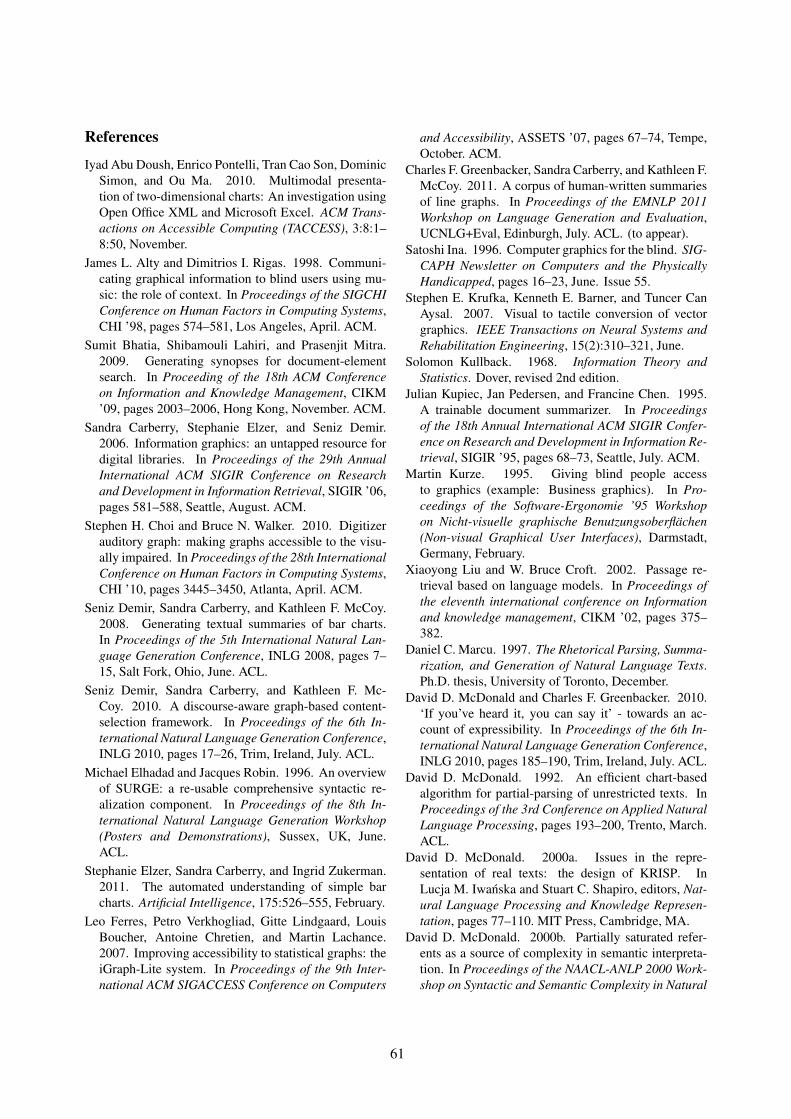
References
Iyad Abu Doush, Enrico Pontelli, Tran Cao Son, DominicSimon, and Ou Ma. 2010. Multimodal presenta-tion of two-dimensional charts: An investigation usingOpen Office XML and Microsoft Excel. ACM Trans-actions on Accessible Computing (TACCESS), 3:8:1–8:50, November.
James L. Alty and Dimitrios I. Rigas. 1998. Communi-cating graphical information to blind users using mu-sic: the role of context. In Proceedings of the SIGCHIConference on Human Factors in Computing Systems,CHI ’98, pages 574–581, Los Angeles, April. ACM.
Sumit Bhatia, Shibamouli Lahiri, and Prasenjit Mitra.2009. Generating synopses for document-elementsearch. In Proceeding of the 18th ACM Conferenceon Information and Knowledge Management, CIKM’09, pages 2003–2006, Hong Kong, November. ACM.
Sandra Carberry, Stephanie Elzer, and Seniz Demir.2006. Information graphics: an untapped resource fordigital libraries. In Proceedings of the 29th AnnualInternational ACM SIGIR Conference on Researchand Development in Information Retrieval, SIGIR ’06,pages 581–588, Seattle, August. ACM.
Stephen H. Choi and Bruce N. Walker. 2010. Digitizerauditory graph: making graphs accessible to the visu-ally impaired. In Proceedings of the 28th InternationalConference on Human Factors in Computing Systems,CHI ’10, pages 3445–3450, Atlanta, April. ACM.
Seniz Demir, Sandra Carberry, and Kathleen F. McCoy.2008. Generating textual summaries of bar charts.In Proceedings of the 5th International Natural Lan-guage Generation Conference, INLG 2008, pages 7–15, Salt Fork, Ohio, June. ACL.
Seniz Demir, Sandra Carberry, and Kathleen F. Mc-Coy. 2010. A discourse-aware graph-based content-selection framework. In Proceedings of the 6th In-ternational Natural Language Generation Conference,INLG 2010, pages 17–26, Trim, Ireland, July. ACL.
Michael Elhadad and Jacques Robin. 1996. An overviewof SURGE: a re-usable comprehensive syntactic re-alization component. In Proceedings of the 8th In-ternational Natural Language Generation Workshop(Posters and Demonstrations), Sussex, UK, June.ACL.
Stephanie Elzer, Sandra Carberry, and Ingrid Zukerman.2011. The automated understanding of simple barcharts. Artificial Intelligence, 175:526–555, February.
Leo Ferres, Petro Verkhogliad, Gitte Lindgaard, LouisBoucher, Antoine Chretien, and Martin Lachance.2007. Improving accessibility to statistical graphs: theiGraph-Lite system. In Proceedings of the 9th Inter-national ACM SIGACCESS Conference on Computers
and Accessibility, ASSETS ’07, pages 67–74, Tempe,October. ACM.
Charles F. Greenbacker, Sandra Carberry, and Kathleen F.McCoy. 2011. A corpus of human-written summariesof line graphs. In Proceedings of the EMNLP 2011Workshop on Language Generation and Evaluation,UCNLG+Eval, Edinburgh, July. ACL. (to appear).
Satoshi Ina. 1996. Computer graphics for the blind. SIG-CAPH Newsletter on Computers and the PhysicallyHandicapped, pages 16–23, June. Issue 55.
Stephen E. Krufka, Kenneth E. Barner, and Tuncer CanAysal. 2007. Visual to tactile conversion of vectorgraphics. IEEE Transactions on Neural Systems andRehabilitation Engineering, 15(2):310–321, June.
Solomon Kullback. 1968. Information Theory andStatistics. Dover, revised 2nd edition.
Julian Kupiec, Jan Pedersen, and Francine Chen. 1995.A trainable document summarizer. In Proceedingsof the 18th Annual International ACM SIGIR Confer-ence on Research and Development in Information Re-trieval, SIGIR ’95, pages 68–73, Seattle, July. ACM.
Martin Kurze. 1995. Giving blind people accessto graphics (example: Business graphics). In Pro-ceedings of the Software-Ergonomie ’95 Workshopon Nicht-visuelle graphische Benutzungsoberflachen(Non-visual Graphical User Interfaces), Darmstadt,Germany, February.
Xiaoyong Liu and W. Bruce Croft. 2002. Passage re-trieval based on language models. In Proceedings ofthe eleventh international conference on Informationand knowledge management, CIKM ’02, pages 375–382.
Daniel C. Marcu. 1997. The Rhetorical Parsing, Summa-rization, and Generation of Natural Language Texts.Ph.D. thesis, University of Toronto, December.
David D. McDonald and Charles F. Greenbacker. 2010.‘If you’ve heard it, you can say it’ - towards an ac-count of expressibility. In Proceedings of the 6th In-ternational Natural Language Generation Conference,INLG 2010, pages 185–190, Trim, Ireland, July. ACL.
David D. McDonald. 1992. An efficient chart-basedalgorithm for partial-parsing of unrestricted texts. InProceedings of the 3rd Conference on Applied NaturalLanguage Processing, pages 193–200, Trento, March.ACL.
David D. McDonald. 2000a. Issues in the repre-sentation of real texts: the design of KRISP. InLucja M. Iwanska and Stuart C. Shapiro, editors, Nat-ural Language Processing and Knowledge Represen-tation, pages 77–110. MIT Press, Cambridge, MA.
David D. McDonald. 2000b. Partially saturated refer-ents as a source of complexity in semantic interpreta-tion. In Proceedings of the NAACL-ANLP 2000 Work-shop on Syntactic and Semantic Complexity in Natural
61
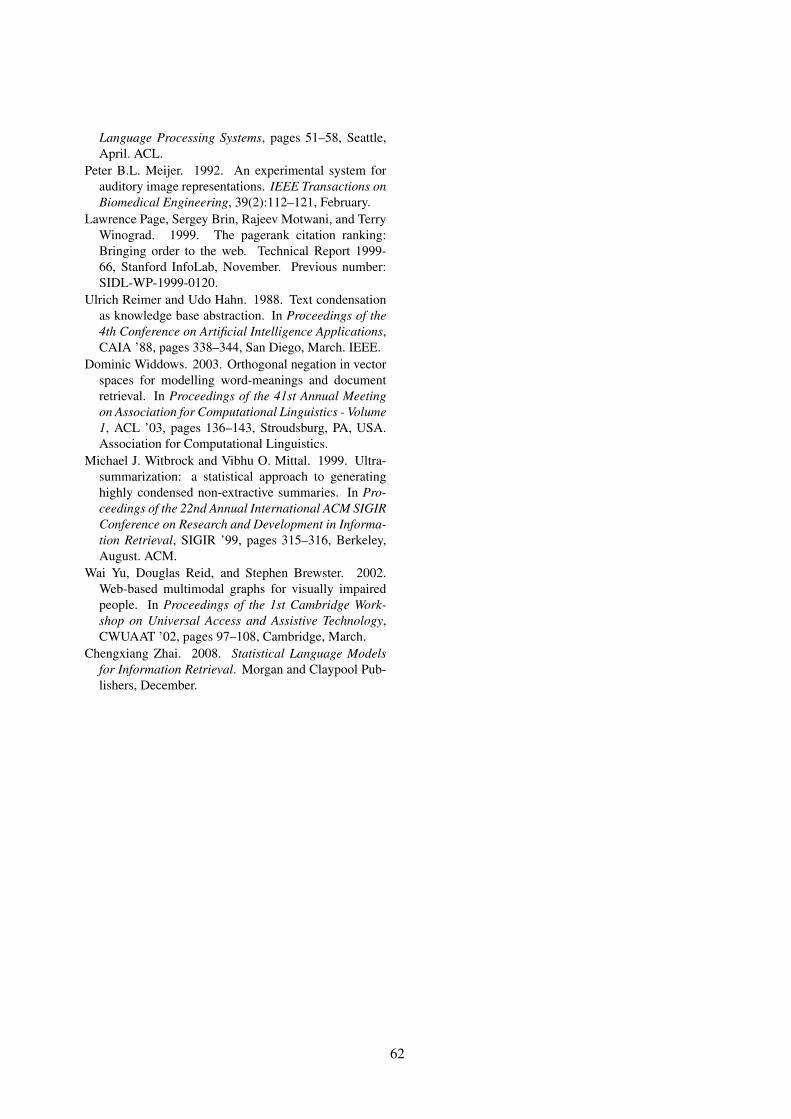
Language Processing Systems, pages 51–58, Seattle,April. ACL.
Peter B.L. Meijer. 1992. An experimental system forauditory image representations. IEEE Transactions onBiomedical Engineering, 39(2):112–121, February.
Lawrence Page, Sergey Brin, Rajeev Motwani, and TerryWinograd. 1999. The pagerank citation ranking:Bringing order to the web. Technical Report 1999-66, Stanford InfoLab, November. Previous number:SIDL-WP-1999-0120.
Ulrich Reimer and Udo Hahn. 1988. Text condensationas knowledge base abstraction. In Proceedings of the4th Conference on Artificial Intelligence Applications,CAIA ’88, pages 338–344, San Diego, March. IEEE.
Dominic Widdows. 2003. Orthogonal negation in vectorspaces for modelling word-meanings and documentretrieval. In Proceedings of the 41st Annual Meetingon Association for Computational Linguistics - Volume1, ACL ’03, pages 136–143, Stroudsburg, PA, USA.Association for Computational Linguistics.
Michael J. Witbrock and Vibhu O. Mittal. 1999. Ultra-summarization: a statistical approach to generatinghighly condensed non-extractive summaries. In Pro-ceedings of the 22nd Annual International ACM SIGIRConference on Research and Development in Informa-tion Retrieval, SIGIR ’99, pages 315–316, Berkeley,August. ACM.
Wai Yu, Douglas Reid, and Stephen Brewster. 2002.Web-based multimodal graphs for visually impairedpeople. In Proceedings of the 1st Cambridge Work-shop on Universal Access and Assistive Technology,CWUAAT ’02, pages 97–108, Cambridge, March.
Chengxiang Zhai. 2008. Statistical Language Modelsfor Information Retrieval. Morgan and Claypool Pub-lishers, December.
62
Proceedings of the 2nd Workshop on Speech and Language Processing for Assistive Technologies, pages 63–72,Edinburgh, Scotland, UK, July 30, 2011. c©2011 Association for Computational Linguistics
Indian Language Screen Readers and Syllable Based Festival Text-to-SpeechSynthesis System
Anila Susan Kurian, Badri Narayan, Nagarajan Madasamy, Ashwin Bellur,Raghava Krishnan, Kasthuri G., Vinodh M.V., Hema A. Murthy
IIT-Madras, India{anila,badri,nagarajan,ashwin,raghav,kasthuri,vinodh}@lantana.tenet.res.in
Kishore PrahalladIIIT-Hyderabad, India
Abstract
This paper describes the integration of com-monly used screen readers, namely, NVDA[[NVDA 2011]] and ORCA[[ORCA 2011]] withText to Speech (TTS) systems for Indian lan-guages. A participatory design approach wasfollowed in the development of the integratedsystem to ensure that the expectations of vi-sually challenged people are met. Given thatIndia is a multilingual country (22 official lan-guages), a uniform framework for an inte-grated text-to-speech synthesis systems withscreen readers across six Indian languages aredeveloped, which can be easily extended toother languages as well. Since Indian lan-guages are syllable centred, syllable-basedconcatenative speech synthesizers are built.
This paper describes the development andevaluation of syllable-based Indian lan-guage Text-To-Speech (TTS) synthesis sys-tem (around festival TTS) with ORCA andNVDA, for Linux and Windows environmentsrespectively. TTS systems for six Indian Lan-guages, namely, Hindi, Tamil, Marathi, Ben-gali, Malayalam and Telugu were built. Us-ability studies of the screen readers were per-formed. The system usability was evaluatedby a group of visually challenged people basedon a questionnaire provided to them. Anda Mean Opinion Score(MoS) of 62.27% wasachieved.
1 Introduction
India is home to the world’s largest number of vi-sually challenged (VC) population[[Chetna India2010]]. No longer do VC persons need to depend
on others to access common information that oth-ers take for granted, such as newspapers, bank state-ments, and scholastic transcripts. Assistive tech-nologies (AT), enable physically challenged personsto become part of the mainstream in the society.A screen reader is an assistive technology poten-tially useful to people who are visually challenged,visually impaired, illiterate or learning disabled,to use/access standard computer software, such asWord Processors, Spreadsheets, Email and the Inter-net.
Over the last three years, Indian Institute of Tech-nology, Madras (IIT Madras)[[Training for VC,IITM 2008 ]], has been conducting a training pro-gramme for visually challenged people, to enablethem to use the computer using a screen reader. Thescreen reader used was JAWS[[JAWS 2011]], withEnglish as the language. Although, the VC personshave benefited from this programme, most of themfelt that:
• The English accent was difficult to understand.
• Most students would have preferred a reader intheir native language.
• They would prefer English spoken in Indian ac-cent.
• The price for the individual purchase of JAWSwas very high.
Although some Indian languages have been incor-porated with screen readers like JAWS and NVDA,no concerted effort has been made to test the efficacy
63
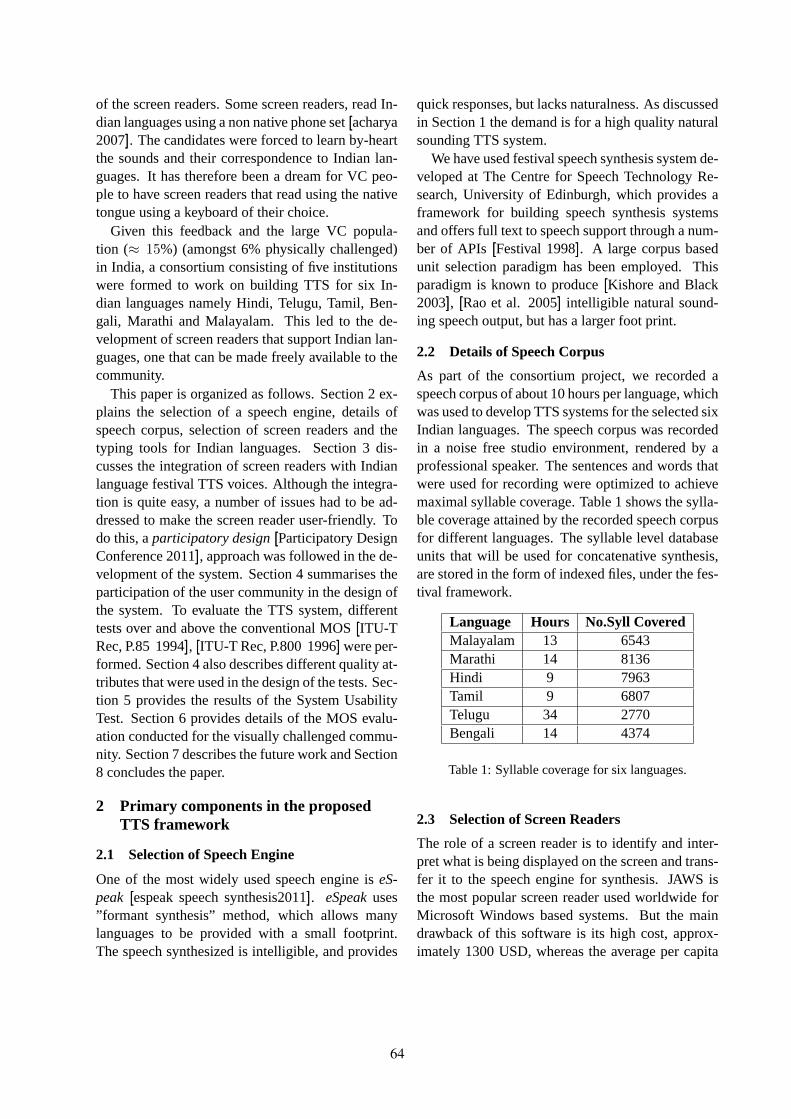
of the screen readers. Some screen readers, read In-dian languages using a non native phone set[[acharya2007]]. The candidates were forced to learn by-heartthe sounds and their correspondence to Indian lan-guages. It has therefore been a dream for VC peo-ple to have screen readers that read using the nativetongue using a keyboard of their choice.
Given this feedback and the large VC popula-tion (≈ 15%) (amongst 6% physically challenged)in India, a consortium consisting of five institutionswere formed to work on building TTS for six In-dian languages namely Hindi, Telugu, Tamil, Ben-gali, Marathi and Malayalam. This led to the de-velopment of screen readers that support Indian lan-guages, one that can be made freely available to thecommunity.
This paper is organized as follows. Section 2 ex-plains the selection of a speech engine, details ofspeech corpus, selection of screen readers and thetyping tools for Indian languages. Section 3 dis-cusses the integration of screen readers with Indianlanguage festival TTS voices. Although the integra-tion is quite easy, a number of issues had to be ad-dressed to make the screen reader user-friendly. Todo this, aparticipatory design[[Participatory DesignConference 2011]], approach was followed in the de-velopment of the system. Section 4 summarises theparticipation of the user community in the design ofthe system. To evaluate the TTS system, differenttests over and above the conventional MOS[[ITU-TRec, P.85 1994]], [[ITU-T Rec, P.800 1996]] were per-formed. Section 4 also describes different quality at-tributes that were used in the design of the tests. Sec-tion 5 provides the results of the System UsabilityTest. Section 6 provides details of the MOS evalu-ation conducted for the visually challenged commu-nity. Section 7 describes the future work and Section8 concludes the paper.
2 Primary components in the proposedTTS framework
2.1 Selection of Speech Engine
One of the most widely used speech engine iseS-peak [[espeak speech synthesis2011]]. eSpeakuses”formant synthesis” method, which allows manylanguages to be provided with a small footprint.The speech synthesized is intelligible, and provides
quick responses, but lacks naturalness. As discussedin Section 1 the demand is for a high quality naturalsounding TTS system.
We have used festival speech synthesis system de-veloped at The Centre for Speech Technology Re-search, University of Edinburgh, which provides aframework for building speech synthesis systemsand offers full text to speech support through a num-ber of APIs[[Festival 1998]]. A large corpus basedunit selection paradigm has been employed. Thisparadigm is known to produce[[Kishore and Black2003]], [[Rao et al. 2005]] intelligible natural sound-ing speech output, but has a larger foot print.
2.2 Details of Speech Corpus
As part of the consortium project, we recorded aspeech corpus of about 10 hours per language, whichwas used to develop TTS systems for the selected sixIndian languages. The speech corpus was recordedin a noise free studio environment, rendered by aprofessional speaker. The sentences and words thatwere used for recording were optimized to achievemaximal syllable coverage. Table 1 shows the sylla-ble coverage attained by the recorded speech corpusfor different languages. The syllable level databaseunits that will be used for concatenative synthesis,are stored in the form of indexed files, under the fes-tival framework.
Language Hours No.Syll CoveredMalayalam 13 6543Marathi 14 8136Hindi 9 7963Tamil 9 6807Telugu 34 2770Bengali 14 4374
Table 1: Syllable coverage for six languages.
2.3 Selection of Screen Readers
The role of a screen reader is to identify and inter-pret what is being displayed on the screen and trans-fer it to the speech engine for synthesis. JAWS isthe most popular screen reader used worldwide forMicrosoft Windows based systems. But the maindrawback of this software is its high cost, approx-imately 1300 USD, whereas the average per capita
64
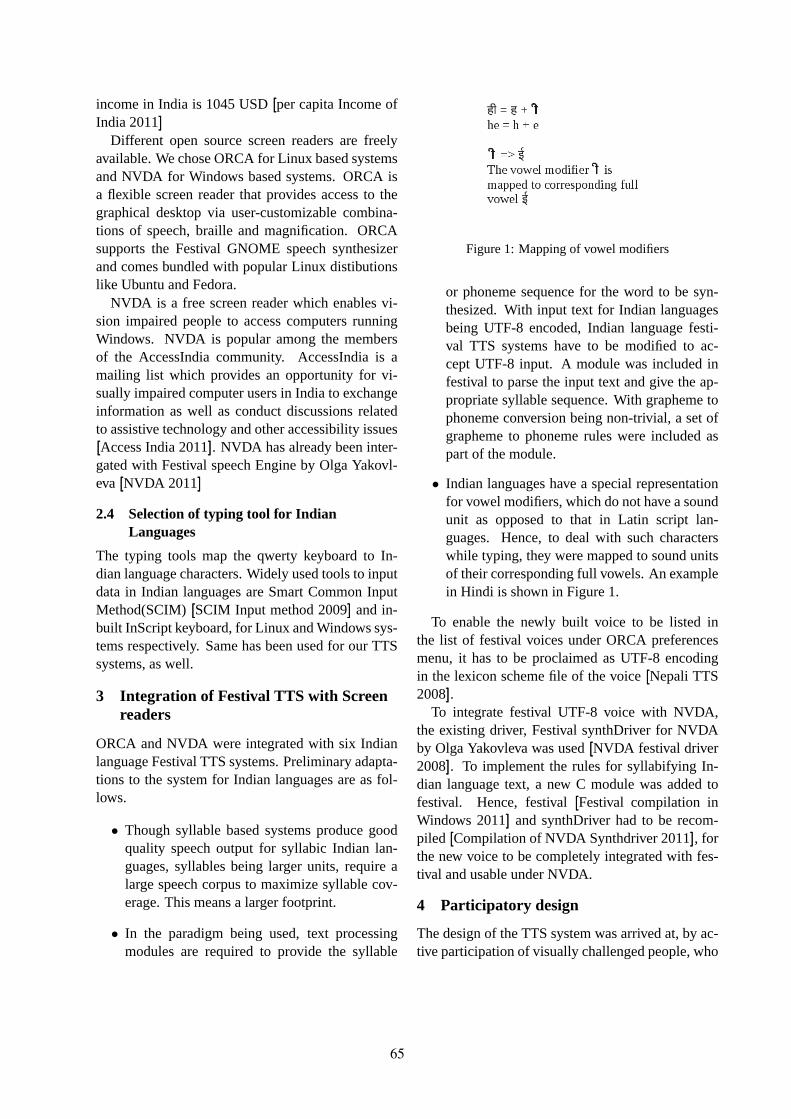
income in India is 1045 USD[[per capita Income ofIndia 2011]]
Different open source screen readers are freelyavailable. We chose ORCA for Linux based systemsand NVDA for Windows based systems. ORCA isa flexible screen reader that provides access to thegraphical desktop via user-customizable combina-tions of speech, braille and magnification. ORCAsupports the Festival GNOME speech synthesizerand comes bundled with popular Linux distibutionslike Ubuntu and Fedora.
NVDA is a free screen reader which enables vi-sion impaired people to access computers runningWindows. NVDA is popular among the membersof the AccessIndia community. AccessIndia is amailing list which provides an opportunity for vi-sually impaired computer users in India to exchangeinformation as well as conduct discussions relatedto assistive technology and other accessibility issues[[Access India 2011]]. NVDA has already been inter-gated with Festival speech Engine by Olga Yakovl-eva[[NVDA 2011]]
2.4 Selection of typing tool for IndianLanguages
The typing tools map the qwerty keyboard to In-dian language characters. Widely used tools to inputdata in Indian languages are Smart Common InputMethod(SCIM)[[SCIM Input method 2009]] and in-built InScript keyboard, for Linux and Windows sys-tems respectively. Same has been used for our TTSsystems, as well.
3 Integration of Festival TTS with Screenreaders
ORCA and NVDA were integrated with six Indianlanguage Festival TTS systems. Preliminary adapta-tions to the system for Indian languages are as fol-lows.
• Though syllable based systems produce goodquality speech output for syllabic Indian lan-guages, syllables being larger units, require alarge speech corpus to maximize syllable cov-erage. This means a larger footprint.
• In the paradigm being used, text processingmodules are required to provide the syllable
Figure 1: Mapping of vowel modifiers
or phoneme sequence for the word to be syn-thesized. With input text for Indian languagesbeing UTF-8 encoded, Indian language festi-val TTS systems have to be modified to ac-cept UTF-8 input. A module was included infestival to parse the input text and give the ap-propriate syllable sequence. With grapheme tophoneme conversion being non-trivial, a set ofgrapheme to phoneme rules were included aspart of the module.
• Indian languages have a special representationfor vowel modifiers, which do not have a soundunit as opposed to that in Latin script lan-guages. Hence, to deal with such characterswhile typing, they were mapped to sound unitsof their corresponding full vowels. An examplein Hindi is shown in Figure 1.
To enable the newly built voice to be listed inthe list of festival voices under ORCA preferencesmenu, it has to be proclaimed as UTF-8 encodingin the lexicon scheme file of the voice[[Nepali TTS2008]].
To integrate festival UTF-8 voice with NVDA,the existing driver, Festival synthDriver for NVDAby Olga Yakovleva was used[[NVDA festival driver2008]]. To implement the rules for syllabifying In-dian language text, a new C module was added tofestival. Hence, festival[[Festival compilation inWindows 2011]] and synthDriver had to be recom-piled [[Compilation of NVDA Synthdriver 2011]], forthe new voice to be completely integrated with fes-tival and usable under NVDA.
4 Participatory design
The design of the TTS system was arrived at, by ac-tive participation of visually challenged people, who
65
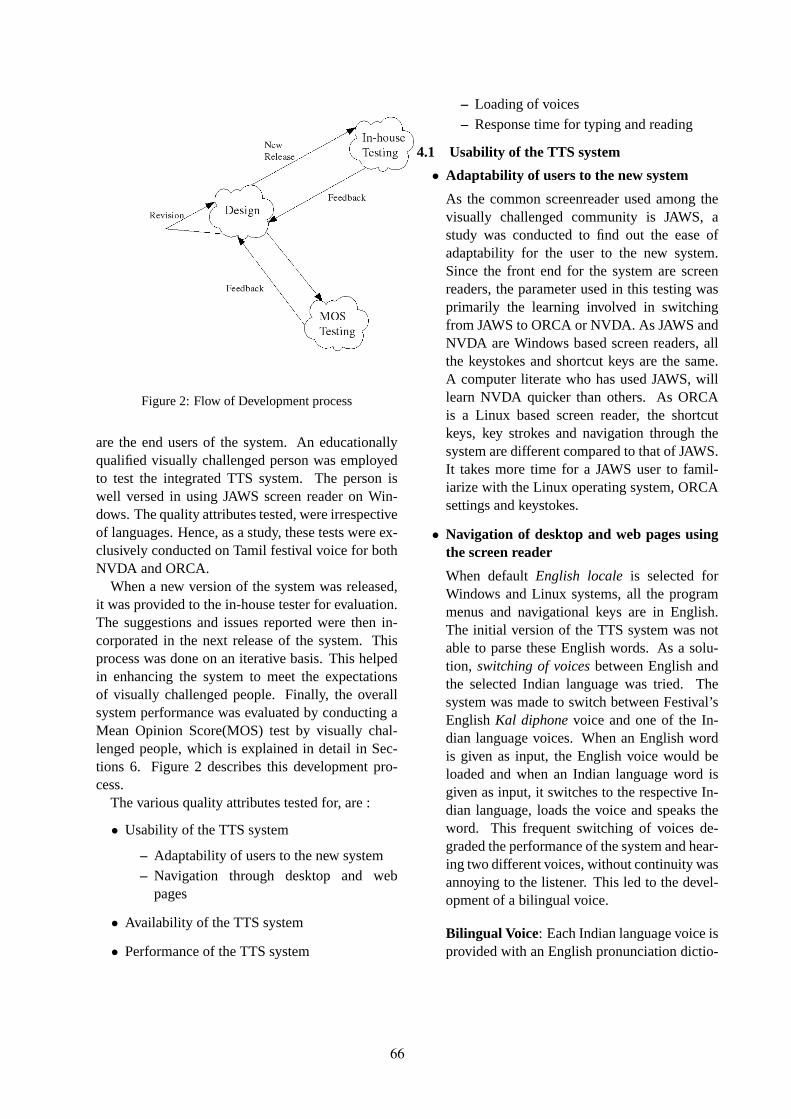
Figure 2: Flow of Development process
are the end users of the system. An educationallyqualified visually challenged person was employedto test the integrated TTS system. The person iswell versed in using JAWS screen reader on Win-dows. The quality attributes tested, were irrespectiveof languages. Hence, as a study, these tests were ex-clusively conducted on Tamil festival voice for bothNVDA and ORCA.
When a new version of the system was released,it was provided to the in-house tester for evaluation.The suggestions and issues reported were then in-corporated in the next release of the system. Thisprocess was done on an iterative basis. This helpedin enhancing the system to meet the expectationsof visually challenged people. Finally, the overallsystem performance was evaluated by conducting aMean Opinion Score(MOS) test by visually chal-lenged people, which is explained in detail in Sec-tions 6. Figure 2 describes this development pro-cess.
The various quality attributes tested for, are :
• Usability of the TTS system
– Adaptability of users to the new system– Navigation through desktop and web
pages
• Availability of the TTS system
• Performance of the TTS system
– Loading of voices– Response time for typing and reading
4.1 Usability of the TTS system
• Adaptability of users to the new system
As the common screenreader used among thevisually challenged community is JAWS, astudy was conducted to find out the ease ofadaptability for the user to the new system.Since the front end for the system are screenreaders, the parameter used in this testing wasprimarily the learning involved in switchingfrom JAWS to ORCA or NVDA. As JAWS andNVDA are Windows based screen readers, allthe keystokes and shortcut keys are the same.A computer literate who has used JAWS, willlearn NVDA quicker than others. As ORCAis a Linux based screen reader, the shortcutkeys, key strokes and navigation through thesystem are different compared to that of JAWS.It takes more time for a JAWS user to famil-iarize with the Linux operating system, ORCAsettings and keystokes.
• Navigation of desktop and web pages usingthe screen reader
When defaultEnglish locale is selected forWindows and Linux systems, all the programmenus and navigational keys are in English.The initial version of the TTS system was notable to parse these English words. As a solu-tion, switching of voicesbetween English andthe selected Indian language was tried. Thesystem was made to switch between Festival’sEnglishKal diphonevoice and one of the In-dian language voices. When an English wordis given as input, the English voice would beloaded and when an Indian language word isgiven as input, it switches to the respective In-dian language, loads the voice and speaks theword. This frequent switching of voices de-graded the performance of the system and hear-ing two different voices, without continuity wasannoying to the listener. This led to the devel-opment of a bilingual voice.
Bilingual Voice: Each Indian language voice isprovided with an English pronunciation dictio-
66
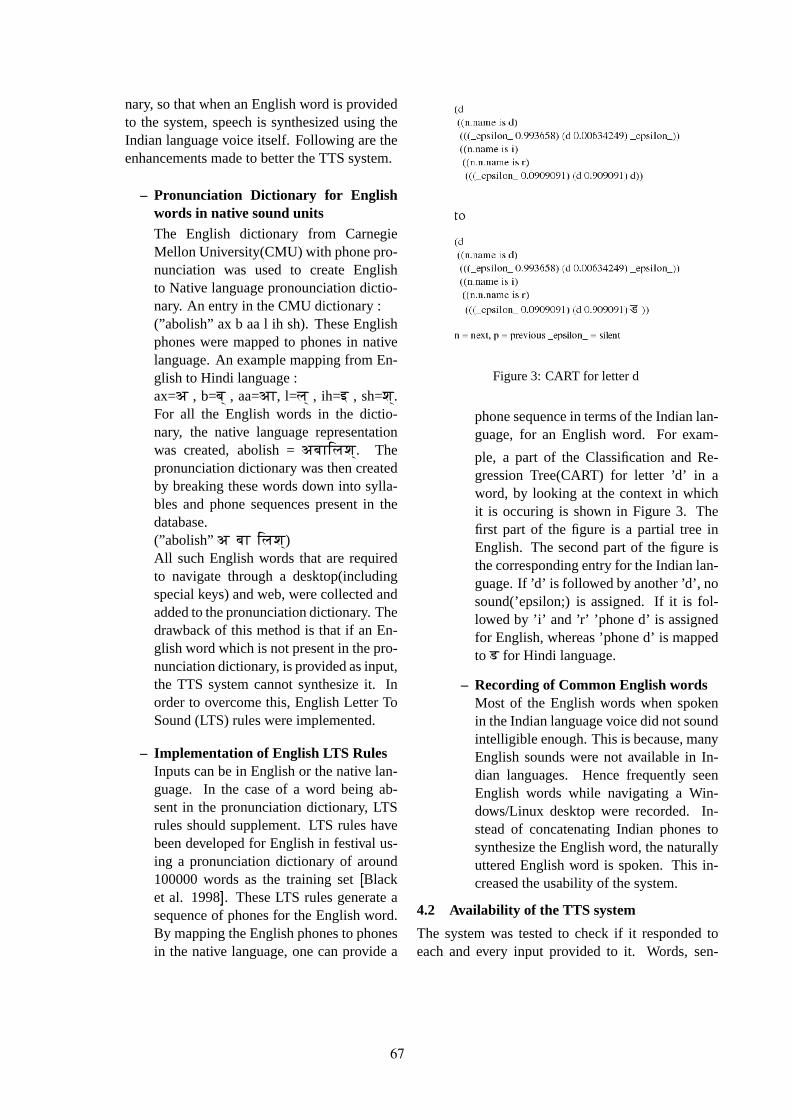
nary, so that when an English word is providedto the system, speech is synthesized using theIndian language voice itself. Following are theenhancements made to better the TTS system.
– Pronunciation Dictionary for Englishwords in native sound unitsThe English dictionary from CarnegieMellon University(CMU) with phone pro-nunciation was used to create Englishto Native language pronounciation dictio-nary. An entry in the CMU dictionary :(”abolish” ax b aa l ih sh). These Englishphones were mapped to phones in nativelanguage. An example mapping from En-glish to Hindi language :ax=a , b=b , aa=aA, l=l , ih=i , sh=ш.For all the English words in the dictio-nary, the native language representationwas created, abolish =abAElш. Thepronunciation dictionary was then createdby breaking these words down into sylla-bles and phone sequences present in thedatabase.(”abolish”a bA Elш)All such English words that are requiredto navigate through a desktop(includingspecial keys) and web, were collected andadded to the pronunciation dictionary. Thedrawback of this method is that if an En-glish word which is not present in the pro-nunciation dictionary, is provided as input,the TTS system cannot synthesize it. Inorder to overcome this, English Letter ToSound (LTS) rules were implemented.
– Implementation of English LTS RulesInputs can be in English or the native lan-guage. In the case of a word being ab-sent in the pronunciation dictionary, LTSrules should supplement. LTS rules havebeen developed for English in festival us-ing a pronunciation dictionary of around100000 words as the training set[[Blacket al. 1998]]. These LTS rules generate asequence of phones for the English word.By mapping the English phones to phonesin the native language, one can provide a
Figure 3: CART for letter d
phone sequence in terms of the Indian lan-guage, for an English word. For exam-
ple, a part of the Classification and Re-gression Tree(CART) for letter ’d’ in aword, by looking at the context in whichit is occuring is shown in Figure 3. Thefirst part of the figure is a partial tree inEnglish. The second part of the figure isthe corresponding entry for the Indian lan-guage. If ’d’ is followed by another ’d’, nosound(’epsilon;) is assigned. If it is fol-lowed by ’i’ and ’r’ ’phone d’ is assignedfor English, whereas ’phone d’ is mappedtoX for Hindi language.
– Recording of Common English wordsMost of the English words when spokenin the Indian language voice did not soundintelligible enough. This is because, manyEnglish sounds were not available in In-dian languages. Hence frequently seenEnglish words while navigating a Win-dows/Linux desktop were recorded. In-stead of concatenating Indian phones tosynthesize the English word, the naturallyuttered English word is spoken. This in-creased the usability of the system.
4.2 Availability of the TTS system
The system was tested to check if it responded toeach and every input provided to it. Words, sen-
67
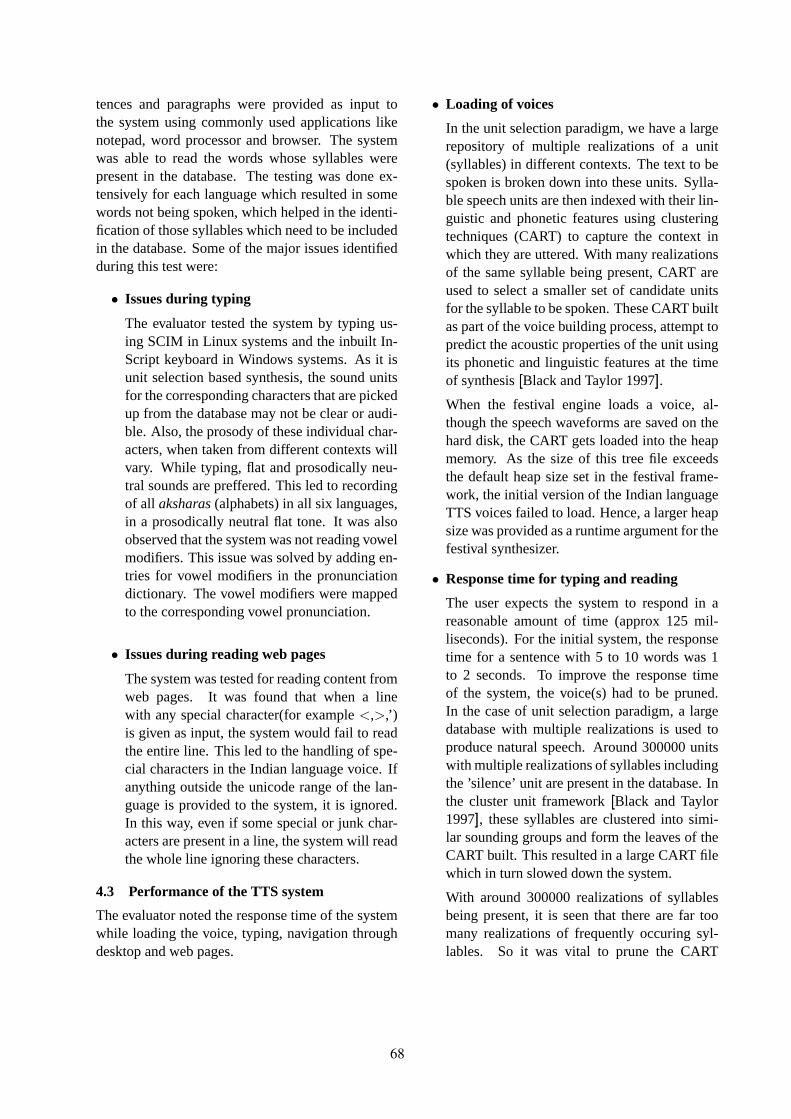
tences and paragraphs were provided as input tothe system using commonly used applications likenotepad, word processor and browser. The systemwas able to read the words whose syllables werepresent in the database. The testing was done ex-tensively for each language which resulted in somewords not being spoken, which helped in the identi-fication of those syllables which need to be includedin the database. Some of the major issues identifiedduring this test were:
• Issues during typing
The evaluator tested the system by typing us-ing SCIM in Linux systems and the inbuilt In-Script keyboard in Windows systems. As it isunit selection based synthesis, the sound unitsfor the corresponding characters that are pickedup from the database may not be clear or audi-ble. Also, the prosody of these individual char-acters, when taken from different contexts willvary. While typing, flat and prosodically neu-tral sounds are preffered. This led to recordingof all aksharas(alphabets) in all six languages,in a prosodically neutral flat tone. It was alsoobserved that the system was not reading vowelmodifiers. This issue was solved by adding en-tries for vowel modifiers in the pronunciationdictionary. The vowel modifiers were mappedto the corresponding vowel pronunciation.
• Issues during reading web pages
The system was tested for reading content fromweb pages. It was found that when a linewith any special character(for example<,>,’)is given as input, the system would fail to readthe entire line. This led to the handling of spe-cial characters in the Indian language voice. Ifanything outside the unicode range of the lan-guage is provided to the system, it is ignored.In this way, even if some special or junk char-acters are present in a line, the system will readthe whole line ignoring these characters.
4.3 Performance of the TTS system
The evaluator noted the response time of the systemwhile loading the voice, typing, navigation throughdesktop and web pages.
• Loading of voices
In the unit selection paradigm, we have a largerepository of multiple realizations of a unit(syllables) in different contexts. The text to bespoken is broken down into these units. Sylla-ble speech units are then indexed with their lin-guistic and phonetic features using clusteringtechniques (CART) to capture the context inwhich they are uttered. With many realizationsof the same syllable being present, CART areused to select a smaller set of candidate unitsfor the syllable to be spoken. These CART builtas part of the voice building process, attempt topredict the acoustic properties of the unit usingits phonetic and linguistic features at the timeof synthesis[[Black and Taylor 1997]].
When the festival engine loads a voice, al-though the speech waveforms are saved on thehard disk, the CART gets loaded into the heapmemory. As the size of this tree file exceedsthe default heap size set in the festival frame-work, the initial version of the Indian languageTTS voices failed to load. Hence, a larger heapsize was provided as a runtime argument for thefestival synthesizer.
• Response time for typing and reading
The user expects the system to respond in areasonable amount of time (approx 125 mil-liseconds). For the initial system, the responsetime for a sentence with 5 to 10 words was 1to 2 seconds. To improve the response timeof the system, the voice(s) had to be pruned.In the case of unit selection paradigm, a largedatabase with multiple realizations is used toproduce natural speech. Around 300000 unitswith multiple realizations of syllables includingthe ’silence’ unit are present in the database. Inthe cluster unit framework[[Black and Taylor1997]], these syllables are clustered into simi-lar sounding groups and form the leaves of theCART built. This resulted in a large CART filewhich in turn slowed down the system.
With around 300000 realizations of syllablesbeing present, it is seen that there are far toomany realizations of frequently occuring syl-lables. So it was vital to prune the CART
68
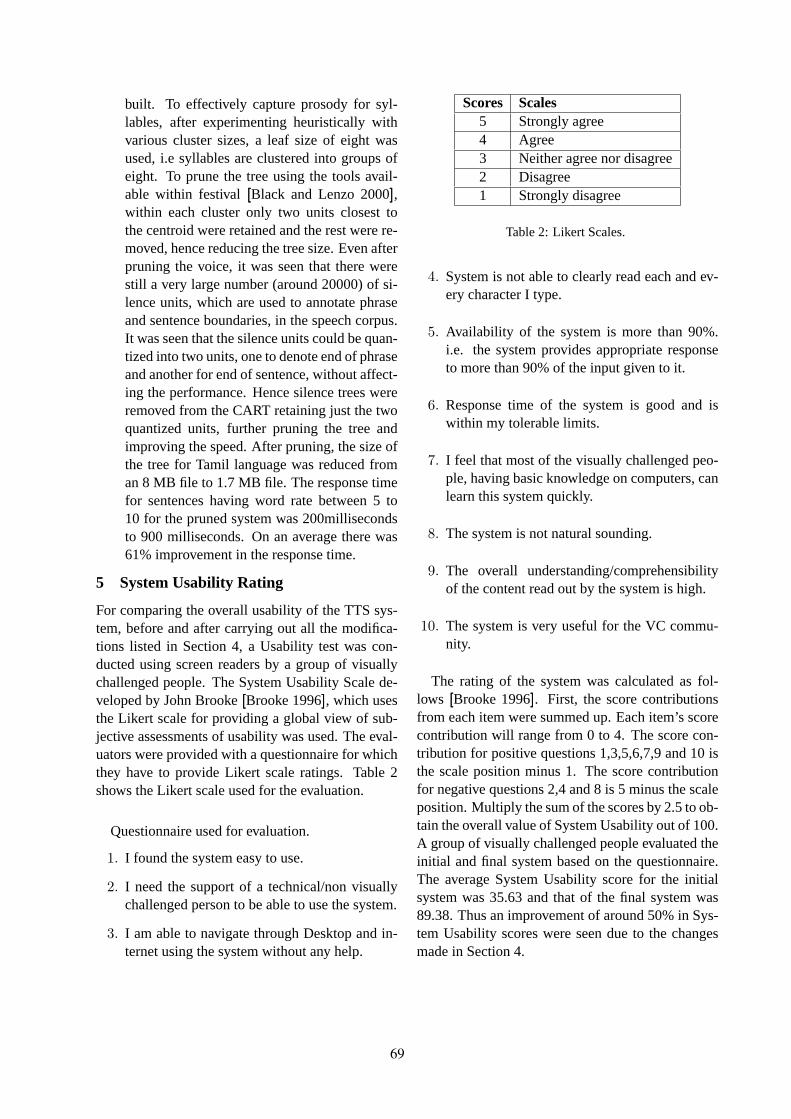
built. To effectively capture prosody for syl-lables, after experimenting heuristically withvarious cluster sizes, a leaf size of eight wasused, i.e syllables are clustered into groups ofeight. To prune the tree using the tools avail-able within festival[[Black and Lenzo 2000]],within each cluster only two units closest tothe centroid were retained and the rest were re-moved, hence reducing the tree size. Even afterpruning the voice, it was seen that there werestill a very large number (around 20000) of si-lence units, which are used to annotate phraseand sentence boundaries, in the speech corpus.It was seen that the silence units could be quan-tized into two units, one to denote end of phraseand another for end of sentence, without affect-ing the performance. Hence silence trees wereremoved from the CART retaining just the twoquantized units, further pruning the tree andimproving the speed. After pruning, the size ofthe tree for Tamil language was reduced froman 8 MB file to 1.7 MB file. The response timefor sentences having word rate between 5 to10 for the pruned system was 200millisecondsto 900 milliseconds. On an average there was61% improvement in the response time.
5 System Usability Rating
For comparing the overall usability of the TTS sys-tem, before and after carrying out all the modifica-tions listed in Section 4, a Usability test was con-ducted using screen readers by a group of visuallychallenged people. The System Usability Scale de-veloped by John Brooke[[Brooke 1996]], which usesthe Likert scale for providing a global view of sub-jective assessments of usability was used. The eval-uators were provided with a questionnaire for whichthey have to provide Likert scale ratings. Table 2shows the Likert scale used for the evaluation.
Questionnaire used for evaluation.
1. I found the system easy to use.
2. I need the support of a technical/non visuallychallenged person to be able to use the system.
3. I am able to navigate through Desktop and in-ternet using the system without any help.
Scores Scales5 Strongly agree4 Agree3 Neither agree nor disagree2 Disagree1 Strongly disagree
Table 2: Likert Scales.
4. System is not able to clearly read each and ev-ery character I type.
5. Availability of the system is more than 90%.i.e. the system provides appropriate responseto more than 90% of the input given to it.
6. Response time of the system is good and iswithin my tolerable limits.
7. I feel that most of the visually challenged peo-ple, having basic knowledge on computers, canlearn this system quickly.
8. The system is not natural sounding.
9. The overall understanding/comprehensibilityof the content read out by the system is high.
10. The system is very useful for the VC commu-nity.
The rating of the system was calculated as fol-lows [[Brooke 1996]]. First, the score contributionsfrom each item were summed up. Each item’s scorecontribution will range from 0 to 4. The score con-tribution for positive questions 1,3,5,6,7,9 and 10 isthe scale position minus 1. The score contributionfor negative questions 2,4 and 8 is 5 minus the scaleposition. Multiply the sum of the scores by 2.5 to ob-tain the overall value of System Usability out of 100.A group of visually challenged people evaluated theinitial and final system based on the questionnaire.The average System Usability score for the initialsystem was 35.63 and that of the final system was89.38. Thus an improvement of around 50% in Sys-tem Usability scores were seen due to the changesmade in Section 4.
69
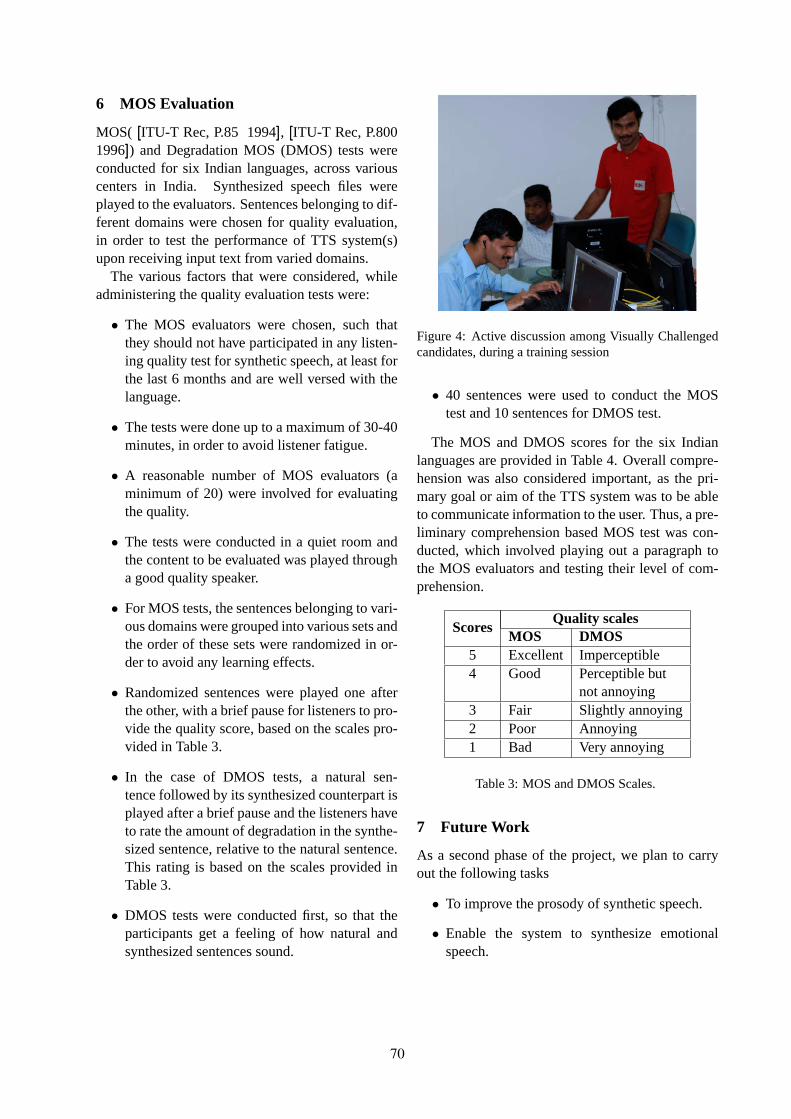
6 MOS Evaluation
MOS( [[ITU-T Rec, P.85 1994]], [[ITU-T Rec, P.8001996]]) and Degradation MOS (DMOS) tests wereconducted for six Indian languages, across variouscenters in India. Synthesized speech files wereplayed to the evaluators. Sentences belonging to dif-ferent domains were chosen for quality evaluation,in order to test the performance of TTS system(s)upon receiving input text from varied domains.
The various factors that were considered, whileadministering the quality evaluation tests were:
• The MOS evaluators were chosen, such thatthey should not have participated in any listen-ing quality test for synthetic speech, at least forthe last 6 months and are well versed with thelanguage.
• The tests were done up to a maximum of 30-40minutes, in order to avoid listener fatigue.
• A reasonable number of MOS evaluators (aminimum of 20) were involved for evaluatingthe quality.
• The tests were conducted in a quiet room andthe content to be evaluated was played througha good quality speaker.
• For MOS tests, the sentences belonging to vari-ous domains were grouped into various sets andthe order of these sets were randomized in or-der to avoid any learning effects.
• Randomized sentences were played one afterthe other, with a brief pause for listeners to pro-vide the quality score, based on the scales pro-vided in Table 3.
• In the case of DMOS tests, a natural sen-tence followed by its synthesized counterpart isplayed after a brief pause and the listeners haveto rate the amount of degradation in the synthe-sized sentence, relative to the natural sentence.This rating is based on the scales provided inTable 3.
• DMOS tests were conducted first, so that theparticipants get a feeling of how natural andsynthesized sentences sound.
Figure 4: Active discussion among Visually Challengedcandidates, during a training session
• 40 sentences were used to conduct the MOStest and 10 sentences for DMOS test.
The MOS and DMOS scores for the six Indianlanguages are provided in Table 4. Overall compre-hension was also considered important, as the pri-mary goal or aim of the TTS system was to be ableto communicate information to the user. Thus, a pre-liminary comprehension based MOS test was con-ducted, which involved playing out a paragraph tothe MOS evaluators and testing their level of com-prehension.
ScoresQuality scales
MOS DMOS5 Excellent Imperceptible4 Good Perceptible but
not annoying3 Fair Slightly annoying2 Poor Annoying1 Bad Very annoying
Table 3: MOS and DMOS Scales.
7 Future Work
As a second phase of the project, we plan to carryout the following tasks
• To improve the prosody of synthetic speech.
• Enable the system to synthesize emotionalspeech.
70
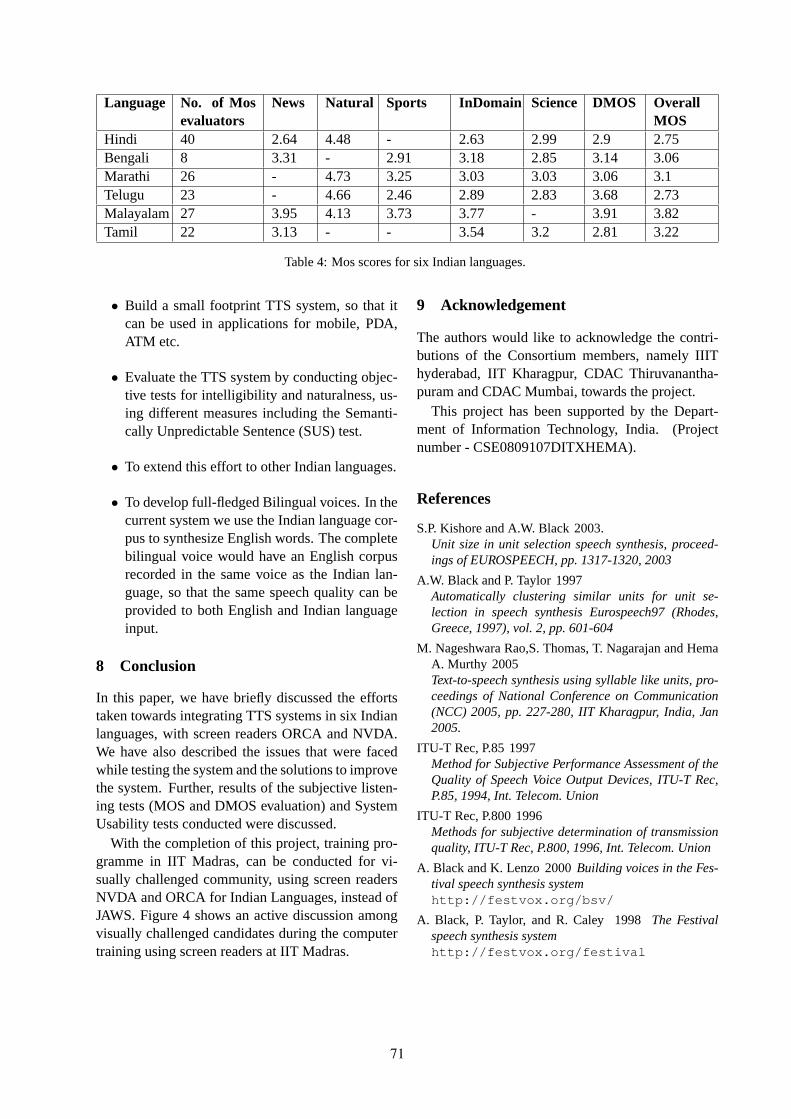
Language No. of Mosevaluators
News Natural Sports InDomain Science DMOS OverallMOS
Hindi 40 2.64 4.48 - 2.63 2.99 2.9 2.75Bengali 8 3.31 - 2.91 3.18 2.85 3.14 3.06Marathi 26 - 4.73 3.25 3.03 3.03 3.06 3.1Telugu 23 - 4.66 2.46 2.89 2.83 3.68 2.73Malayalam 27 3.95 4.13 3.73 3.77 - 3.91 3.82Tamil 22 3.13 - - 3.54 3.2 2.81 3.22
Table 4: Mos scores for six Indian languages.
• Build a small footprint TTS system, so that itcan be used in applications for mobile, PDA,ATM etc.
• Evaluate the TTS system by conducting objec-tive tests for intelligibility and naturalness, us-ing different measures including the Semanti-cally Unpredictable Sentence (SUS) test.
• To extend this effort to other Indian languages.
• To develop full-fledged Bilingual voices. In thecurrent system we use the Indian language cor-pus to synthesize English words. The completebilingual voice would have an English corpusrecorded in the same voice as the Indian lan-guage, so that the same speech quality can beprovided to both English and Indian languageinput.
8 Conclusion
In this paper, we have briefly discussed the effortstaken towards integrating TTS systems in six Indianlanguages, with screen readers ORCA and NVDA.We have also described the issues that were facedwhile testing the system and the solutions to improvethe system. Further, results of the subjective listen-ing tests (MOS and DMOS evaluation) and SystemUsability tests conducted were discussed.
With the completion of this project, training pro-gramme in IIT Madras, can be conducted for vi-sually challenged community, using screen readersNVDA and ORCA for Indian Languages, instead ofJAWS. Figure 4 shows an active discussion amongvisually challenged candidates during the computertraining using screen readers at IIT Madras.
9 Acknowledgement
The authors would like to acknowledge the contri-butions of the Consortium members, namely IIIThyderabad, IIT Kharagpur, CDAC Thiruvanantha-puram and CDAC Mumbai, towards the project.
This project has been supported by the Depart-ment of Information Technology, India. (Projectnumber - CSE0809107DITXHEMA).
References
S.P. Kishore and A.W. Black 2003.Unit size in unit selection speech synthesis, proceed-ings of EUROSPEECH, pp. 1317-1320, 2003
A.W. Black and P. Taylor 1997Automatically clustering similar units for unit se-lection in speech synthesis Eurospeech97 (Rhodes,Greece, 1997), vol. 2, pp. 601-604
M. Nageshwara Rao,S. Thomas, T. Nagarajan and HemaA. Murthy 2005Text-to-speech synthesis using syllable like units, pro-ceedings of National Conference on Communication(NCC) 2005, pp. 227-280, IIT Kharagpur, India, Jan2005.
ITU-T Rec, P.85 1997Method for Subjective Performance Assessment of theQuality of Speech Voice Output Devices, ITU-T Rec,P.85, 1994, Int. Telecom. Union
ITU-T Rec, P.800 1996Methods for subjective determination of transmissionquality, ITU-T Rec, P.800, 1996, Int. Telecom. Union
A. Black and K. Lenzo 2000Building voices in the Fes-tival speech synthesis systemhttp://festvox.org/bsv/
A. Black, P. Taylor, and R. Caley 1998The Festivalspeech synthesis systemhttp://festvox.org/festival
71
Festival Speech Synthesis Systemhttp://www.cstr.ed.ac.uk/projects/festival/
ORCA Screen reader.http://live.gnome.org/Orca
NVDA Screen reader.http://www.nvda-project.org/
Festival synthDriver for NVDA by Olga Yakovleva:http://www.box.net/shared/jcnnzz7xu6
SCIM Input method.http://apps.sourceforge.net/mediawiki/scim/index.phphttps://help.Ubuntu.com/community/SCIM
Festival compilation in Windows.http://www.eguidedog.net/doc_build_win_festival.php
Participatory Design Conferencehttp://www.publicsphereproject.org/drupal/node/235
J. Brooke 1996 “SUS: a ”quick and dirty” usabilityscale”. In P. W. Jordan, B. Thomas, B. A. Weerd-meester, A. L. McClelland. Usability Evaluation inIndustry.http://hell.meiert.org/core/pdf/sus.pdf
Nepali TTS User Manual. 2008.http://www.bhashasanchar.org/textspeech_intro.php
JAWS Screen reader.http://www.freedomscientific.com/jaws-hq.asp
espeak speech synthesishttp://espeak.sourceforge.net/
Training for Visually Challenged by IIT Madrashttp://www.lantana.tenet.res.in/TTSconsortiumWiki/doku.php?id=start/
Acharya Multilingual Computing for literacy and educa-tionhttp://acharya.iitm.ac.in/ Last updatedon 2007-03-19
Chetna Indiahttp://chetnaindia.org/our_values.htm
Per capita Income of India, 2011http://www.financialexpress.com/news/Per-capita-income-in-India-is-Rs-46-492/744155/
Access India mailing listhttp://accessindia.org.in/mailman/listinfo/accessindia_accessindia.org.in
Compilation of NVDA Synthdriverhttp://www.lantana.tenet.res.in/TTSconsortiumWiki/doku.php?id=start
72
Proceedings of the 2nd Workshop on Speech and Language Processing for Assistive Technologies, pages 73–83,Edinburgh, Scotland, UK, July 30, 2011. c©2011 Association for Computational Linguistics
READ–IT:Assessing Readability of Italian Texts with a View to Text Simplification
Felice Dell’Orletta, Simonetta Montemagni and Giulia VenturiIstituto di Linguistica Computazionale “Antonio Zampolli” (ILC–CNR)
via G. Moruzzi, 1 – Pisa (Italy){felice.dellorletta,simonetta.montemagni,giulia.venturi}@ilc.cnr.it
Abstract
In this paper, we propose a new approach toreadability assessment with a specific view tothe task of text simplification: the intendedaudience includes people with low literacyskills and/or with mild cognitive impairment.READ–IT represents the first advanced read-ability assessment tool for what concerns Ital-ian, which combines traditional raw text fea-tures with lexical, morpho-syntactic and syn-tactic information. In READ–IT readabilityassessment is carried out with respect to bothdocuments and sentences where the latter rep-resents an important novelty of the proposedapproach creating the prerequisites for align-ing the readability assessment step with thetext simplification process. READ–IT showsa high accuracy in the document classificationtask and promising results in the sentence clas-sification scenario.
1 Introduction
Recently, there has been increasing interest in theexploitation of results from Natural Language Pro-cessing (NLP) for the development of assistive tech-nologies. Here, we address this topic by reportingthe first but promising results in the developmentof a software architecture for the Italian languageaimed at assisting people with low literacy skills(both native and foreign speakers) or who have lan-guage disabilities in reading texts.
Within an information society, where everyoneshould be able to access all available information,improving access to written language is becomingmore and more a central issue. This is the case, for
instance, of administrative and governmental infor-mation which should be accessible to all members ofthe society, including people who have reading dif-ficulties for different reasons: because of a low edu-cation level or because of the fact that the languagein question is not their mother tongue, or becauseof language disabilities. Health related informationrepresents another crucial domain which should beaccessible to a large and heterogenous target group.Understandability in general and readability in par-ticular is also an important issue for accessing infor-mation over the web as stated in the Web ContentAccessibility Guidelines (WCAG) proposed by theWeb Accessibility Initiative of the W3C.
In this paper, we describe the approach we devel-oped for automatically assessing the readability ofnewspaper texts with a view to the specific task oftext simplification. The paper is organized as fol-lows: Section 2 describes the background literatureon the topic; Section 3 introduces the main featuresof our approach to readability assessment, with Sec-tion 4 illustrating its implementation in the READ-IT prototype; Sections 5 and 6 describe the experi-mental setting and discuss achieved results.
2 Background
Readability assessment has been a central researchtopic for the past 80 years which is still attractingconsiderable interest nowadays. Over the last tenyears, within the NLP community the automatic as-sessment of readability has received increasing at-tention: if on the one hand the availability of sophis-ticated NLP technologies makes it possible to moni-tor a wide variety of factors affecting the readability
73
of a text, on the other hand there is a wide rangeof both human- and machine-oriented applicationswhich can benefit from it.
Traditional readability formulas focus on a lim-ited set of superficial text features which are takenas rough approximations of the linguistic factors atplay in readability assessment. For example, theFlesch-Kincaid measure (the most common readingdifficulty measure still in use, Kincaid (1975)) is alinear function of the average number of syllablesper word and of the average number of words persentence, where the former and latter are used assimple proxies for lexical and syntactic complexityrespectively. For Italian, there are two readabilityformulas: an adaptation of the Flesh-Kincaid for En-glish to Italian known as the Flesch-Vacca formula(Franchina and Vacca, 1986); the GulpEase index(Lucisano and Piemontese, 1988), assessing read-ability on the basis of the average number of char-acters per word and the average number of wordsper sentence.
A widely acknowledged fact is that all traditionalreadability metrics are quick and easy to calculatebut have drawbacks. For example, the use of sen-tence length as a measure of syntactic complexity as-sumes that a longer sentence is more grammaticallycomplex than a shorter one, which is often but notalways the case. Word syllable count is used start-ing from the assumption that more frequent wordsare more likely to have fewer syllables than less fre-quent ones (an association that is related to Zipf’sLaw, Zipf (1935)); yet, similarly to the previouscase, word length does not necessarily reflects itsdifficulty. The unreliability of these metrics has beenexperimentally demonstrated by several recent stud-ies in the field: to mention only a few Si and Callan(2001), Petersen and Ostendorf (2006), Feng (2009).
On the front of the assessment of the lexical dif-ficulty of a given text, a first step forward is rep-resented by vocabulary-based formulas such as theDale-Chall formula (Chall and Dale, 1995), usinga combination of average sentence length and wordfrequency counts. In particular, for what concernsthe latter it reconstructs the percentage of wordsnot on a list of 3000 “easy” words by matching itsown list to the words in the material being evalu-ated, to determine the appropriate reading level. Ifvocabulary-based measures represent an improve-
ment in assessing the readability of texts which waspossible due to the availability of frequency dictio-naries and reference corpora, they are still unsatis-factory for what concerns sentence structure.
Over the last ten years, work on readability de-ployed sophisticated NLP techniques, such as syn-tactic parsing and statistical language modeling, tocapture more complex linguistic features and usedstatistical machine learning to build readability as-sessment tools. A variety of different NLP-basedapproaches to the automatic readability assessmenthas been proposed so far, differing with respect to:a) the typology of features taken into account (e.g.lexical, syntactic, semantic, discourse), and, for eachtype, at the level of the inventory of used individualfeatures; b) the intended audience of the texts underevaluation, which strongly influences the readabilityassessment, and last but not least c) the applicationwithin which readability assessment is carried out.
Interesting alternatives to static vocabulary-basedmeasures have been put forward by Si and Callan(2001) who used unigram language models com-bined with sentence length to capture content in-formation from scientific web pages, or by Collins-Thompson and Callan (2004) who adopted a sim-ilar language modeling approach (Smoothed Uni-gram model) to predict reading difficulty of shortpassages and web documents. These approaches canbe seen as a generalization of the vocabulary-basedapproach, aimed at capturing finer-grained and moreflexible information about vocabulary usage. If un-igram language models help capturing importantcontent information and variation of word usage,they do not cover other types of features which arereported to play a significant role in the assessmentof readability. More recently, the role of syntac-tic features started being investigated (Schwarm andOstendorf, 2005; Heilman et al., 2007; Petersen andOstendorf, 2009): in these studies syntactic structureis tracked through a combination of features from n-gram (trigram, bigram and unigram) language mod-els and parse trees (parse tree height, number ofnoun phrases, verb phrases and subordinated clausesor SBARs) with more traditional features.
Yet, besides lexical and syntactic complexity fea-tures there are other important factors, such as thestructure of the text, the definition of discourse topic,discourse cohesion and coherence and so on, play-
74
ing a central role in determining the reading diffi-culty of a text. More recent approaches esploredthe role of these features in readability assessment:this is the case, for instance, of Barzilay and Lap-ata (2008) or Feng (2010). The last few years havebeen characterised by approaches based on the com-bination of features ranging over different linguisticlevels, namely lexical, syntactic and discourse (seee.g. Pitler and Nenkova (2008), Kate (2010)).
Another important factor determining the typol-ogy of features to be considered for assessing read-ability has to do with the intended audience ofreaders: it is commonly agreed that reading easedoes not follow from intrinsic text properties alone,but it is also affected by the expected audience.Among the studies addressing readability with re-spect to specific audiences, it is worth mentioninghere: Schwarm and Ostendorf (2005) and Heilmanet al. (2007) dealing with language learners, or Feng(2009) focussing on people with mild intellectualdisabilities. Interestingly,Heilman et al. (2007) dif-ferentiate the typology of used features when ad-dressing first (L1) or second (L2) language learn-ers: they argue that grammatical features are morerelevant for L2 than for L1 learners. Feng (2009)propose a set of cognitively motivated features op-erating at the discourse level specifically addressingthe cognitive characteristics of the expected users.When readability is targeted towards adult compe-tent language users a more prominent role is playedby discourse features (Pitler and Nenkova, 2008).
Applications which can benefit from an automaticreadability assessment range from the selection ofreading material tailored to varying literacy levels(e.g. for L1/L2 students or low literacy people)and the ranking of documents by reading difficulty(e.g. in returning the results of web queries) to NLPtasks such as automatic document summarization,machine translation as well as text simplification.Again, also the application making use of the read-ability assessment, which is in turn strictly related tothe intended audience of readers, strongly influencesthe typology of features to be taken into account.
Advanced NLP–based readability metrics devel-oped so far typically deal with English, with a fewattempts devoted to other languages, namely French(Collins-Thompson and Callan, 2004), Portuguese(Aluisio et al., 2010) and German (Bruck, 2008).
3 Our Approach
Our approach to readability assessment was devel-oped with a specific application in mind, i.e. textsimplification, and addresses a specific target audi-ence of readers, namely people characterised by lowliteracy skills and/or by mild cognitive impairment.Following the most recent approaches, we treat read-ability assessment as a classification task: in partic-ular, given the available corpora for the Italian lan-guage as well as the type of target audience, we re-sorted to a binary classification aimed at discerningeasy–to–read textual objects from difficult–to–readones. The language dealt with is Italian: to ourknowledge, this is the first attempt of an advancedmethodology for readability assessment for this lan-guage. Our approach focuses on lexical and syntac-tic features, whose selection was influenced by theapplication, the intended audience and the languagedealt with (both for its intrinsic linguistic featuresand for the fact of being a less resourced language).Following Roark (2007), in the features selectionprocess we preferred easy-to-identify features whichcould be reliably identified within the output of NLPtools. Last but not least, as already done by Aluisioet al. (2010) the set of selected syntactic features alsoincludes simplification oriented ones, with the finalaim of aligning the readability assessment step withthe text simplification process.
Another qualifying feature of our approach toreadability assessment consists in the fact that weare dealing with two types of textual objects: docu-ments and sentences. The latter represents an impor-tant novelty of our work since so far most researchfocused on readability classification at the documentlevel (Skory and Eskenazi, 2010). When the tar-get application is text simplification, we strongly be-lieve that also assessing readability at the sentencelevel could be very useful. We know that methodsdeveloped so far perform well to characterize thelevel of an entire document, but they are unreliablefor short texts and thus also for single sentences.Sentence-based readability assessment thus repre-sents a further challenge we decided to tackle: infact, if all sentences occurring in simplified texts canbe assumed to be easy-to-read sentences, the reversedoes not necessarily hold since not all sentences oc-curring in complex texts are difficult-to-read sen-
75
tences. Since there are no training data at the sen-tence level, it becomes difficult – if not impossible– to evaluate the effectiveness of our approach, i.e.erroneous readability assessments within the classof difficult-to-read texts may either correspond tothose easy–to–read sentences occurring within com-plex texts or represent real classification errors. Inorder to overcome this problem in the readability as-sessment of individual sentences, we introduced anotion of distance with respect to easy-to-read sen-tences. In this way, the prerequisites are created forthe integration of the two processes of readability as-sessment and text simplification. Before, text read-ability was assessed with respect to the entire doc-ument and text simplification was carried out at thesentence level: due to the decoupling of the two pro-cesses, the impact of simplification operations on theoverall readability level of the text was not alwaysimmediately clear. With sentence-based readabilityassessment, this should be no longer a problem.
4 READ–IT
Our approach to readability assessment has been im-plemented in a software prototype, henceforth re-ferred to as READ–IT. READ–IT operates on syn-tactically (i.e. dependency) parsed texts and it as-signs to each considered reading object - either adocument or a sentence - a score quantifying itsreadability. READ–IT is a classifier based on Sup-port Vector Machines using LIBSVM (Chang andLin, 2001) that, given a set of features and a trainingcorpus, creates a statistical model using the featurestatistics extracted from the training corpus. Sucha model is used in the assessment of readability ofunseen documents and sentences.
The set of features used to build the statisticalmodel can be parameterized through a configura-tion file: as we will see, the set of relevant fea-tures used for readability assessment at the docu-ment level differs from the those used at the sen-tence level. This also creates the prerequisites forspecialising the readability assessment measure withrespect to more specific target audiences: as pointedout in Heilman et al. (2007) different types of fea-tures come into play e.g. when addressing L1 or L2language learners. Here follows the complete list offeatures used in the reported experiments.
4.1 Features
The features used for predicting readability are or-ganised into four main categories: namely, raw textfeatures, lexical features as well as morpho-syntacticand syntactic features. This proposed four–fold par-tition closely follows the different levels of linguis-tic analysis automatically carried out on the text be-ing evaluated, i.e. tokenization, lemmatization, PoStagging and dependency parsing. Such a partitionwas meant to identify those easy to extract featureswith high discriminative power in order to reducethe linguistic pre-processing of texts guaranteeing atthe same time a reliable readability assessment.
Raw Text FeaturesThey refer to those features typically used within tra-ditional readability metrics. They include SentenceLength, calculated as the average number of wordsper sentence, and Word Length, calculated as the av-erage number of characters per words.
Lexical FeaturesBasic Italian Vocabulary rate features: these fea-tures refer to the internal composition of the vocab-ulary of the text. To this end, we took as a refer-ence resource the Basic Italian Vocabulary by DeMauro (2000), including a list of 7000 words highlyfamiliar to native speakers of Italian. In particular,we calculated two different features correspondingto: i) the percentage of all unique words (types)on this reference list (calculated on a per–lemmabasis); ii) the internal distribution of the occurringbasic Italian vocabulary words into the usage clas-sification classes of ‘fundamental words’ (very fre-quent words), ‘high usage words’ (frequent words)and ‘high availability words’ (relatively lower fre-quency words referring to everyday objects or ac-tions and thus well known to speakers). Whereasthe latter represents a novel feature in the readabilityassessment literature, the former originates from theDale-Chall formula (Chall and Dale, 1995) and, asimplemented here, it can be seen as the complementof the type out-of-vocabulary rate features used byPetersen and Ostendorf (2009).Type/Token Ratio: this feature refers to the ratiobetween the number of lexical types and the num-ber of tokens. This feature, which can be consid-ered as an indicator of expressive language delay or
76
disorder as shown in Wright (2003) for adults andin Retherford (2003) for children, has already beenused for readability assessment purposes by Aluisioet al. (2010). Due to its sensitivity to sample size,this feature has been computed for text samples ofequivalent length.
Morpho–syntactic FeaturesLanguage Model probability of Part-Of-Speechunigrams: this feature is based on a unigram lan-guage model assuming that the probability of a tokenis independent of its context. The model is simplydefined by a list of types (POS) and their individualprobabilities. This feature has already been shownto be a reliable indicator for automatic readabilityassessment (see, for example, Pitler and Nenkova(2008) and Aluisio et al. (2010)).Lexical density: this feature refers to the ratio ofcontent words (verbs, nouns, adjectives and adverbs)to the total number of lexical tokens in a text. Con-tent words have already been used for readability as-sessment by Aluisio et al. (2010) and Feng (2010).Verbal mood: this feature refers to the distributionof verbs according to their mood. It is a novel andlanguage–specific feature exploiting the predictivepower of the Italian rich verbal morphology.
Syntactic FeaturesUnconditional probability of dependency types:this feature refers to the unconditional probability ofdifferent types of syntactic dependencies (e.g. sub-ject, direct object, modifier, etc.) and can be seenas the dependency-based counterpart of the ‘phrasetype rate’ feature used by Nenkova (2010).Parse tree depth features: parse tree depth can beindicative of increased sentence complexity as statedby, to mention only a few, Yngve (1960), Frazier(1985) and Gibson (1998). This set of features ismeant to capture different aspects of the parse treedepth and includes the following measures: a) thedepth of the whole parse tree, calculated in terms ofthe longest path from the root of the dependency treeto some leaf; b) the average depth of embedded com-plement ‘chains’ governed by a nominal head andincluding either prepositional complements or nomi-nal and adjectival modifiers; c) the probability distri-bution of embedded complement ‘chains’ by depth.The first feature has already been used in syntax-
based readability assessment studies (Schwarm andOstendorf, 2005; Heilman et al., 2007; Nenkova,2010); the latter two are reminiscent of the ‘headnoun modifiers’ feature used by Nenkova (2010).Verbal predicates features: this set of features cap-tures different aspects of the behaviour of verbalpredicates. They range from the number of verbalroots with respect to number of all sentence rootsoccurring in a text to their arity. The arity of verbalpredicates is calculated as the number of instanti-ated dependency links sharing the same verbal head(covering both arguments and modifiers). Althoughthere is no obvious relation between the number ofverb dependents and sentence complexity, we be-lieve that both a low and a high number of depen-dents can make sentence readability quite complex,although for different reasons (elliptical construc-tions in the former case, a high number of modifiersin the latter). Within this feature set we also con-sidered the distribution of verbal predicates by arity.To our knowledge, this set of features has never beenused so far for readability assessment purposes.Subordination features: subordination is widelyacknowledged to be an index of structural complex-ity in language. As in Aluisio et al. (2010), this setof features has been introduced here with a specificview to the text simplification task. A first featurewas meant to measure the distribution of subordi-nate vs main clauses. For subordinates, we alsoconsidered their relative ordering with respect tothe main clause: according to Miller and Weinert(1998), sentences containing subordinate clauses inpost–verbal rather than in pre–verbal position areeasier to read. Two further features were intro-duced to capture the depth of embedded subordinateclauses since it is a widely acknowledged fact thathighly complex sentences contain deeply embeddedsubordinate clauses: in particular, a) the averagedepth of ‘chains’ of embedded subordinate clausesand b) the probability distribution of embedded sub-ordinate clauses ‘chains’ by depth.Length of dependency links feature: both Lin(1996) and Gibson (1998) showed that the syntacticcomplexity of sentences can be predicted with mea-sures based on the length of dependency links. Thisis also demonstrated in McDonald and Nivre (2007)who claim that statistical parsers have a drop in ac-curacy when analysing long dependencies. Here, the
77
dependency length is measured in terms of the wordsoccurring between the syntactic head and the depen-dent. This feature is the dependency-based counter-part of the ‘phrase length’ feature used for readabil-ity assessment by Nenkova (2010) and Feng (2010).
5 The Corpora
One challenge in this work was finding an appropri-ate corpus. Although a possibly large collection oftexts labelled with their target grade level (such asthe Weekly Reader for English) would be ideal, weare not aware of any such collection that exists forItalian in electronic form. Instead, to test our ap-proach to automatically identify the readability of agiven text, we used two different corpora: a news-paper corpus, La Repubblica (henceforth, “Rep”),and an easy–to–read newspaper, Due Parole (hence-forth, “2Par”) which was specifically written for anaudience of adults with a rudimentary literacy levelor with mild intellectual disabilities. The articles in2Par were written by Italian linguists expert in textsimplification using a controlled language both atthe lexicon and sentence structure levels (Piemon-tese, 1996) .
There are different motivations underlying the se-lection of these two corpora for our study. On thepractical side, to our knowledge 2Par is the onlyavailable corpus of simplified texts addressing awide audience characterised by a low literacy level.So, the use of 2Par represented the only possible op-tion on the front of simplified texts. For the selectionof the second corpus we opted for texts belongingto the same class, i.e. newspapers: this was aimedat avoiding interferences due to textual genre varia-tion in the measure of text readability. This is con-firmed by the fact that the two corpora show a sim-ilar behaviour with respect to a number of differentparameters, which according to the literature on reg-ister variation (Biber, 2009) are indicative of textualgenre differences: e.g. lexical density, the noun/verbratio, the percentage of verbal roots, etc. On theother hand, the two corpora differ significantly withrespect to the distribution of features typically cor-related with text complexity, e.g. the composition ofthe used vocabulary (e.g. the percentage of wordsbelonging to the Basic Italian Vocabulary in Rep is4.14% and in 2Par is 48.04%) or, from the syntactic
point of view, the average parse tree height (which inRep is 5.71 and in 2Par 3.67), the average number ofverb phrases per sentence (which in Rep is 2.40 andin 2Par 1.25), the depth of nested structures (e.g. theaverage depth of embedded complement ‘chains’ inRep is 1.44 and in 2Par is 1.30), the proportion ofmain vs subordinate clauses (in Rep main and sub-ordinate clauses represent respectively 65.11% and34.88% of the cases; in 2Par there is 79.66% of mainclauses and 20.33% of subordinate clauses).
The Rep/2Par pair of corpora is somehow remi-niscent of corpora used in other readability studies,such as Encyclopedia Britannica and Britannica El-ementary, but with a main difference: whereas theEnglish corpora consist of paired original/simplifiedtexts, which we might define as “parallel monolin-gual corpora”, the selected Italian corpora ratherpresent themselves as “comparable monolingualcorpora”, without any pairing of the full–simplifiedversions of the same article. Comparability is guar-anteed here by the inclusion of texts belonging to thesame textual genre: we expect such comparable cor-pora to be usefully exploited for readability assess-ment because of the emphasis on style over topic.
Although these corpora do not provide an ex-plicit grade–level ranking for each article, broadcategories are distinguished, namely easy–to–readvs difficult–to–read texts. The two paired com-plex/simplified corpora were used to train and testdifferent language models described in Section 6.As already pointed out, such a distinction is reliablein a document classification scenario, while at thesentence classification level it poses the remarkableissue of discerning easy–to–read sentences withindifficult–to–read documents (i.e. Rep).
6 Experiments and Results
READ–IT was tested on the 2Par and Rep cor-pora automatically POS tagged by the Part–Of–Speech tagger described in Dell’Orletta (2009) anddependency–parsed by the DeSR parser (Attardi,2006) using Support Vector Machine as learning al-gorithm. Three different sets of experiments weredevised to test the performance of READ-IT in thefollowing subtasks: i) document readability classifi-cation, ii) sentence readability classification and iii)detection of easy–to–read sentences within difficult–
78
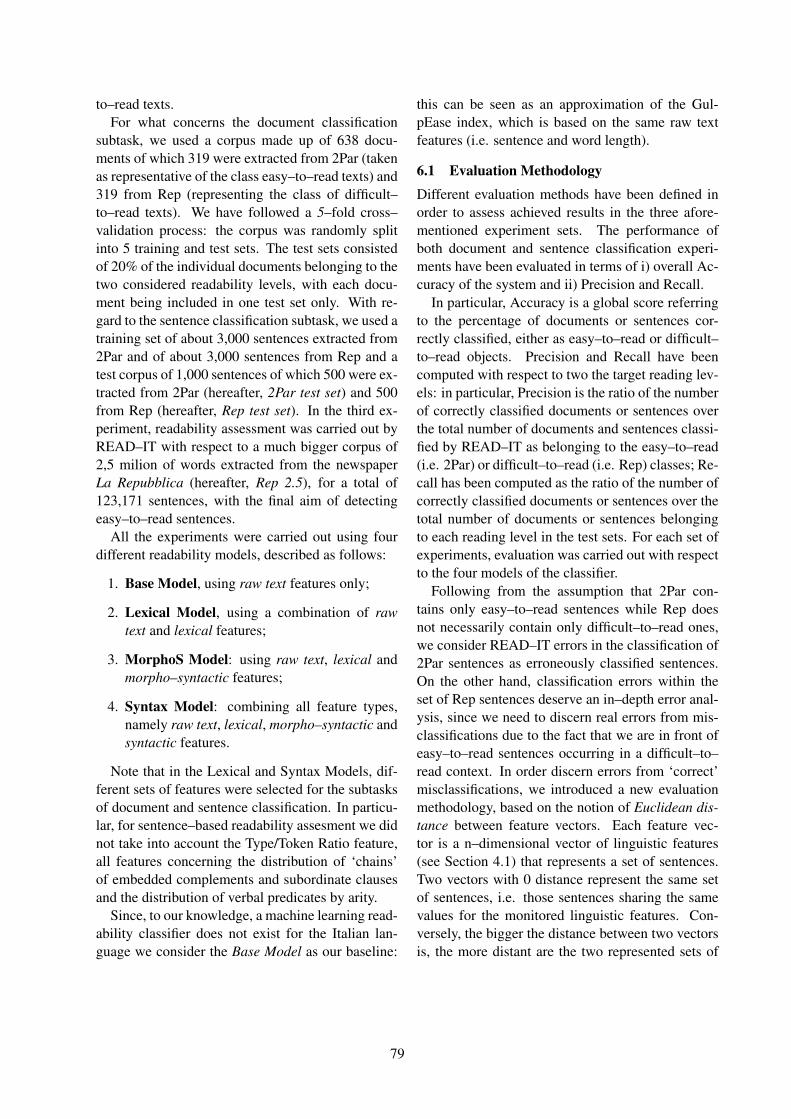
to–read texts.For what concerns the document classification
subtask, we used a corpus made up of 638 docu-ments of which 319 were extracted from 2Par (takenas representative of the class easy–to–read texts) and319 from Rep (representing the class of difficult–to–read texts). We have followed a 5–fold cross–validation process: the corpus was randomly splitinto 5 training and test sets. The test sets consistedof 20% of the individual documents belonging to thetwo considered readability levels, with each docu-ment being included in one test set only. With re-gard to the sentence classification subtask, we used atraining set of about 3,000 sentences extracted from2Par and of about 3,000 sentences from Rep and atest corpus of 1,000 sentences of which 500 were ex-tracted from 2Par (hereafter, 2Par test set) and 500from Rep (hereafter, Rep test set). In the third ex-periment, readability assessment was carried out byREAD–IT with respect to a much bigger corpus of2,5 milion of words extracted from the newspaperLa Repubblica (hereafter, Rep 2.5), for a total of123,171 sentences, with the final aim of detectingeasy–to–read sentences.
All the experiments were carried out using fourdifferent readability models, described as follows:
1. Base Model, using raw text features only;
2. Lexical Model, using a combination of rawtext and lexical features;
3. MorphoS Model: using raw text, lexical andmorpho–syntactic features;
4. Syntax Model: combining all feature types,namely raw text, lexical, morpho–syntactic andsyntactic features.
Note that in the Lexical and Syntax Models, dif-ferent sets of features were selected for the subtasksof document and sentence classification. In particu-lar, for sentence–based readability assesment we didnot take into account the Type/Token Ratio feature,all features concerning the distribution of ‘chains’of embedded complements and subordinate clausesand the distribution of verbal predicates by arity.
Since, to our knowledge, a machine learning read-ability classifier does not exist for the Italian lan-guage we consider the Base Model as our baseline:
this can be seen as an approximation of the Gul-pEase index, which is based on the same raw textfeatures (i.e. sentence and word length).
6.1 Evaluation MethodologyDifferent evaluation methods have been defined inorder to assess achieved results in the three afore-mentioned experiment sets. The performance ofboth document and sentence classification experi-ments have been evaluated in terms of i) overall Ac-curacy of the system and ii) Precision and Recall.
In particular, Accuracy is a global score referringto the percentage of documents or sentences cor-rectly classified, either as easy–to–read or difficult–to–read objects. Precision and Recall have beencomputed with respect to two the target reading lev-els: in particular, Precision is the ratio of the numberof correctly classified documents or sentences overthe total number of documents and sentences classi-fied by READ–IT as belonging to the easy–to–read(i.e. 2Par) or difficult–to–read (i.e. Rep) classes; Re-call has been computed as the ratio of the number ofcorrectly classified documents or sentences over thetotal number of documents or sentences belongingto each reading level in the test sets. For each set ofexperiments, evaluation was carried out with respectto the four models of the classifier.
Following from the assumption that 2Par con-tains only easy–to–read sentences while Rep doesnot necessarily contain only difficult–to–read ones,we consider READ–IT errors in the classification of2Par sentences as erroneously classified sentences.On the other hand, classification errors within theset of Rep sentences deserve an in–depth error anal-ysis, since we need to discern real errors from mis-classifications due to the fact that we are in front ofeasy–to–read sentences occurring in a difficult–to–read context. In order discern errors from ‘correct’misclassifications, we introduced a new evaluationmethodology, based on the notion of Euclidean dis-tance between feature vectors. Each feature vec-tor is a n–dimensional vector of linguistic features(see Section 4.1) that represents a set of sentences.Two vectors with 0 distance represent the same setof sentences, i.e. those sentences sharing the samevalues for the monitored linguistic features. Con-versely, the bigger the distance between two vectorsis, the more distant are the two represented sets of
79
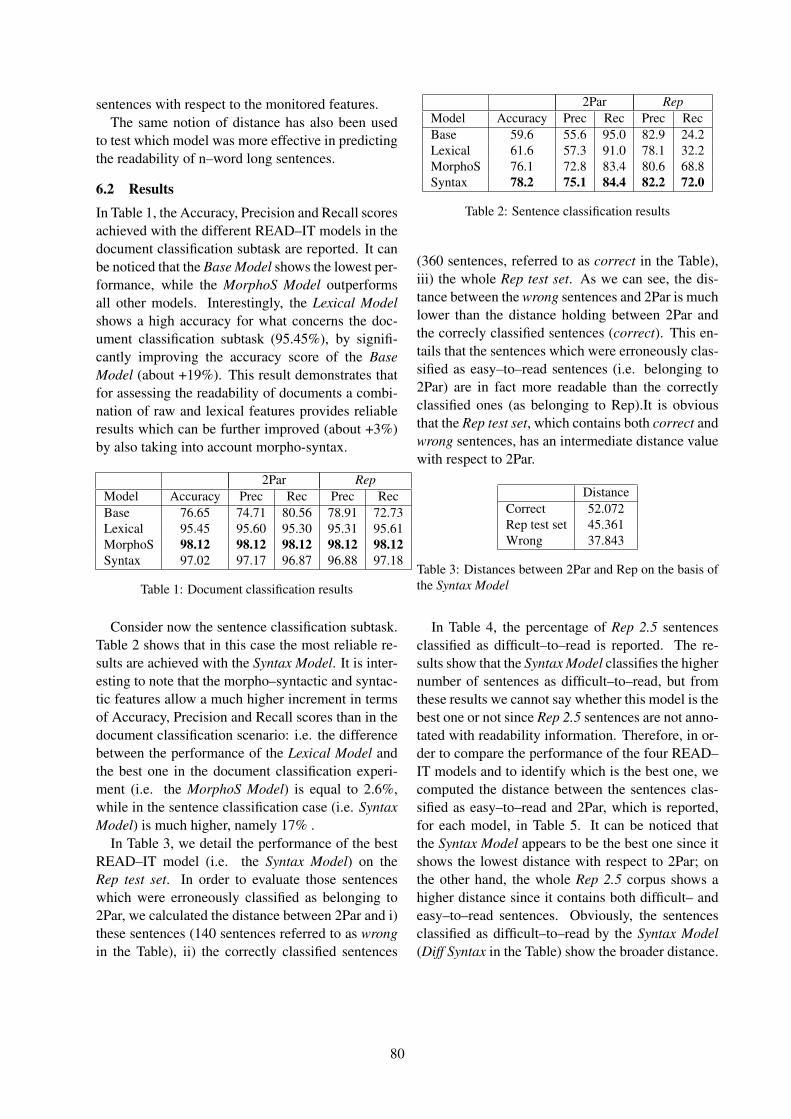
sentences with respect to the monitored features.The same notion of distance has also been used
to test which model was more effective in predictingthe readability of n–word long sentences.
6.2 Results
In Table 1, the Accuracy, Precision and Recall scoresachieved with the different READ–IT models in thedocument classification subtask are reported. It canbe noticed that the Base Model shows the lowest per-formance, while the MorphoS Model outperformsall other models. Interestingly, the Lexical Modelshows a high accuracy for what concerns the doc-ument classification subtask (95.45%), by signifi-cantly improving the accuracy score of the BaseModel (about +19%). This result demonstrates thatfor assessing the readability of documents a combi-nation of raw and lexical features provides reliableresults which can be further improved (about +3%)by also taking into account morpho-syntax.
2Par RepModel Accuracy Prec Rec Prec RecBase 76.65 74.71 80.56 78.91 72.73Lexical 95.45 95.60 95.30 95.31 95.61MorphoS 98.12 98.12 98.12 98.12 98.12Syntax 97.02 97.17 96.87 96.88 97.18
Table 1: Document classification results
Consider now the sentence classification subtask.Table 2 shows that in this case the most reliable re-sults are achieved with the Syntax Model. It is inter-esting to note that the morpho–syntactic and syntac-tic features allow a much higher increment in termsof Accuracy, Precision and Recall scores than in thedocument classification scenario: i.e. the differencebetween the performance of the Lexical Model andthe best one in the document classification experi-ment (i.e. the MorphoS Model) is equal to 2.6%,while in the sentence classification case (i.e. SyntaxModel) is much higher, namely 17% .
In Table 3, we detail the performance of the bestREAD–IT model (i.e. the Syntax Model) on theRep test set. In order to evaluate those sentenceswhich were erroneously classified as belonging to2Par, we calculated the distance between 2Par and i)these sentences (140 sentences referred to as wrongin the Table), ii) the correctly classified sentences
2Par RepModel Accuracy Prec Rec Prec RecBase 59.6 55.6 95.0 82.9 24.2Lexical 61.6 57.3 91.0 78.1 32.2MorphoS 76.1 72.8 83.4 80.6 68.8Syntax 78.2 75.1 84.4 82.2 72.0
Table 2: Sentence classification results
(360 sentences, referred to as correct in the Table),iii) the whole Rep test set. As we can see, the dis-tance between the wrong sentences and 2Par is muchlower than the distance holding between 2Par andthe correcly classified sentences (correct). This en-tails that the sentences which were erroneously clas-sified as easy–to–read sentences (i.e. belonging to2Par) are in fact more readable than the correctlyclassified ones (as belonging to Rep).It is obviousthat the Rep test set, which contains both correct andwrong sentences, has an intermediate distance valuewith respect to 2Par.
DistanceCorrect 52.072Rep test set 45.361Wrong 37.843
Table 3: Distances between 2Par and Rep on the basis ofthe Syntax Model
In Table 4, the percentage of Rep 2.5 sentencesclassified as difficult–to–read is reported. The re-sults show that the Syntax Model classifies the highernumber of sentences as difficult–to–read, but fromthese results we cannot say whether this model is thebest one or not since Rep 2.5 sentences are not anno-tated with readability information. Therefore, in or-der to compare the performance of the four READ–IT models and to identify which is the best one, wecomputed the distance between the sentences clas-sified as easy–to–read and 2Par, which is reported,for each model, in Table 5. It can be noticed thatthe Syntax Model appears to be the best one since itshows the lowest distance with respect to 2Par; onthe other hand, the whole Rep 2.5 corpus shows ahigher distance since it contains both difficult– andeasy–to–read sentences. Obviously, the sentencesclassified as difficult–to–read by the Syntax Model(Diff Syntax in the Table) show the broader distance.
80
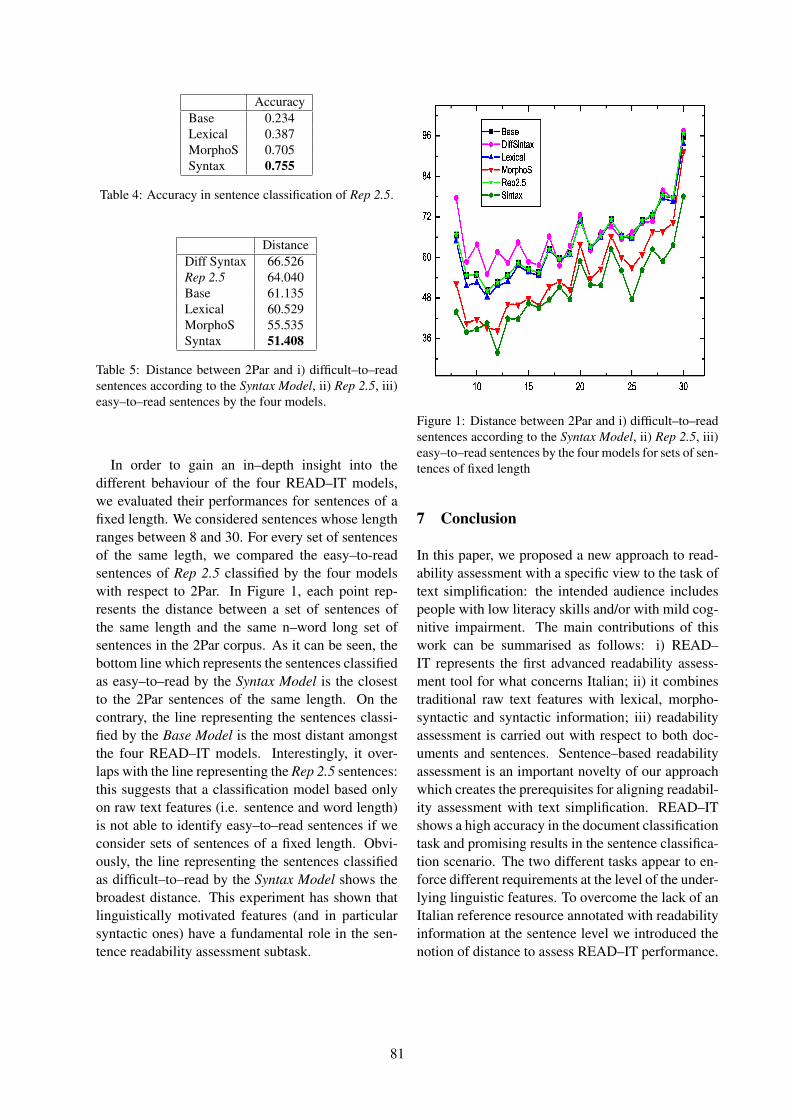
AccuracyBase 0.234Lexical 0.387MorphoS 0.705Syntax 0.755
Table 4: Accuracy in sentence classification of Rep 2.5.
DistanceDiff Syntax 66.526Rep 2.5 64.040Base 61.135Lexical 60.529MorphoS 55.535Syntax 51.408
Table 5: Distance between 2Par and i) difficult–to–readsentences according to the Syntax Model, ii) Rep 2.5, iii)easy–to–read sentences by the four models.
In order to gain an in–depth insight into thedifferent behaviour of the four READ–IT models,we evaluated their performances for sentences of afixed length. We considered sentences whose lengthranges between 8 and 30. For every set of sentencesof the same legth, we compared the easy–to-readsentences of Rep 2.5 classified by the four modelswith respect to 2Par. In Figure 1, each point rep-resents the distance between a set of sentences ofthe same length and the same n–word long set ofsentences in the 2Par corpus. As it can be seen, thebottom line which represents the sentences classifiedas easy–to–read by the Syntax Model is the closestto the 2Par sentences of the same length. On thecontrary, the line representing the sentences classi-fied by the Base Model is the most distant amongstthe four READ–IT models. Interestingly, it over-laps with the line representing the Rep 2.5 sentences:this suggests that a classification model based onlyon raw text features (i.e. sentence and word length)is not able to identify easy–to–read sentences if weconsider sets of sentences of a fixed length. Obvi-ously, the line representing the sentences classifiedas difficult–to–read by the Syntax Model shows thebroadest distance. This experiment has shown thatlinguistically motivated features (and in particularsyntactic ones) have a fundamental role in the sen-tence readability assessment subtask.
Figure 1: Distance between 2Par and i) difficult–to–readsentences according to the Syntax Model, ii) Rep 2.5, iii)easy–to–read sentences by the four models for sets of sen-tences of fixed length
7 Conclusion
In this paper, we proposed a new approach to read-ability assessment with a specific view to the task oftext simplification: the intended audience includespeople with low literacy skills and/or with mild cog-nitive impairment. The main contributions of thiswork can be summarised as follows: i) READ–IT represents the first advanced readability assess-ment tool for what concerns Italian; ii) it combinestraditional raw text features with lexical, morpho-syntactic and syntactic information; iii) readabilityassessment is carried out with respect to both doc-uments and sentences. Sentence–based readabilityassessment is an important novelty of our approachwhich creates the prerequisites for aligning readabil-ity assessment with text simplification. READ–ITshows a high accuracy in the document classificationtask and promising results in the sentence classifica-tion scenario. The two different tasks appear to en-force different requirements at the level of the under-lying linguistic features. To overcome the lack of anItalian reference resource annotated with readabilityinformation at the sentence level we introduced thenotion of distance to assess READ–IT performance.
81
Acknowledgements
The research reported in the paper has been partlysupported by the national project “Migrations” ofthe National Council of Research (CNR) in theframework of the line of research Advanced tech-nologies and linguistic and cultural integration inthe school. In particular the authors would liketo thank Eva Maria Vecchi who contributed to theprerequisites of the proposed readability assessmentmethodology reported in the paper.
ReferencesSandra Aluisio, Lucia Specia, Caroline Gasperin and
Carolina Scarton. 2010. Readability assessment fortext simplification. In Proceedings of the NAACL HLT2010 Fifth Workshop on Innovative Use of NLP forBuilding Educational Applications, pp. 1–9.
Giuseppe Attardi. 2006. Experiments with a multilan-guage non-projective dependency parser. In Proceed-ings of the Tenth Conference on Computational Nat-ural Language Learning (CoNLL-X ’06), New YorkCity, New York, pp. 166–170.
Regina Barzilay and Mirella Lapata. 2008. Modelinglocal coherence: An entity-based approach. In Com-putational Linguistics, 34(1), pp. 1–34.
Douglas Biber and Susan Conrad. 2009. Register, genre,and style. Cambridge, Cambridge University Press.
Tim vor der Bruck, Sven Hartrumpf, Hermann Helbig.2008. A Readability Checker with Supervised Learn-ing using Deep Syntactic and Semantic Indicators. InProceedings of the 11th International Multiconference:Information Society - IS 2008 - Language Technolo-gies, Ljubljana, Slovenia, pp. 92–97.
Jeanne S. Chall and Edgar Dale. 1995. ReadabilityRevisited: The New Dale–Chall Readability Formula.Brookline Books, Cambridge, MA.
Chih-Chung Chang and Chih-Jen Lin. 2001. LIB-SVM: a library for support vector machines. Soft-ware available at http://www.csie.ntu.edu.tw/˜cjlin/libsvm
Kevyn Collins-Thompson and Jamie Callan. 2004. Alanguage modeling approach to predicting reading dif-ficulty. In Proceedings of the HLT / NAACL, pp. 193–200.
Felice Dell’Orletta. 2009. Ensemble system for Part-of-Speech tagging. In Proceedings of Evalita’09, Eval-uation of NLP and Speech Tools for Italian, ReggioEmilia, December.
Tullio De Mauro. 2000. Il dizionario della lingua ital-iana. Torino, Paravia.
Lijun Feng, Martin Jansche, Matt Huenerfauth andNoemie Elhadad. 2010. A comparison of features forautomatic readability assessment. In Proceedings ofthe 23rd International Conference on ComputationalLinguistics (COLING 2010), pp. 276–284.
Lijun Feng, Noemie Elhadad and Matt Huenerfauth.2009. Cognitively motivated features for readabilityassessment. In Proceedings of the 12th Conference ofthe European Chapter of the Association for Compu-tational Linguistics (EACL ’09), pp. 229–237.
V. Franchina and Roberto Vacca. 1986. Adaptation ofFlesh readability index on a bilingual text written bythe same author both in Italian and English languages.In Linguaggi (3), pp. 47–49.
Lyn Frazier. 1985. Syntactic complexity. In D.R.Dowty, L. Karttunen and A.M. Zwicky (eds.), NaturalLanguage Parsing, Cambridge University Press, Cam-bridge, UK.
Edward Gibson. 1998. Linguistic complexity: Localityof syntactic dependencies. In Cognition, 68(1), pp. 1-76.
Michael J. Heilman, Kevyn Collins and Jamie Callan.2007. Combining Lexical and Grammatical Featuresto Improve Readability Measures for First and SecondLanguage Texts. In Proceedings of the Human Lan-guage Technology Conference, pp. 460–467.
Michael J. Heilman, Kevyn Collins and Maxine Eske-nazi. 2008. An analysis of statistical models and fea-tures for reading difficulty prediction. In Proceedingsof the Third Workshop on Innovative Use of NLP forBuilding Educational Applications (EANL ’08), pp.71–79.
Rohit J. Kate, Xiaoqiang Luo, Siddharth Patwardhan,Martin Franz, Radu Florian, Raymond J. Mooney,Salim Roukos, Chris Welty. 2010. Learning to Pre-dict Readability using Diverse Linguistic Features. InProceedings of the 23rd International Conference onComputational Linguistics (COLING 2010), pp. 546–554.
J. Peter Kincaid, Lieutenant Robert P. Fishburne, RichardL. Rogers and Brad S. Chissom. 1975. Derivationof new readability formulas for Navy enlisted person-nel. Research Branch Report, Millington, TN: Chiefof Naval Training, pp. 8–75.
George Kingsley Zipf. 1988. The Psychobiology of Lan-guage. Houghton–Miflin, Boston.
Dekan Lin. 1996. On the structural complexity of nat-ural language sentences. In Proceedings of COLING1996, pp. 729–733.
Pietro Lucisano and Maria Emanuela Piemontese. 1988.Gulpease. Una formula per la predizione della diffi-colta dei testi in lingua italiana. In Scuola e Citta (3),pp. 57–68.
82
Ryan McDonald and Joakim Nivre. 2007. Character-izing the Errors of Data-Driven Dependency ParsingModels. In Proceedings of EMNLP-CoNLL, 2007, pp.122-131.
Jim Miller and Regina Weinert. 1998. Spontaneous spo-ken language. Syntax and discourse. Oxford, Claren-don Press.
Ani Nenkova, Jieun Chae, Annie Louis, and Emily Pitler.2010. Structural Features for Predicting the LinguisticQuality of Text Applications to Machine Translation,Automatic Summarization and Human–Authored Text.In E. Krahmer, M. Theune (eds.), Empirical Methodsin NLG, LNAI 5790, Springer-Verlag Berlin Heidel-berg, pp. 222–241.
Sarah E. Petersen and Mari Ostendorf. 2006. A machinelearning approach to reading level assessment. Uni-versity of Washington CSE Technical Report.
Sarah E. Petersen and Mari Ostendorf. 2009. A ma-chine learning approach to reading level assessment.In Computer Speech and Language (23), pp. 89–106.
Maria Emanuela Piemontese. 1996. Capire e farsicapire. Teorie e tecniche della scrittura controllataNapoli, Tecnodid.
Emily Pitler and Ani Nenkova. 2008. Revisiting read-ability: A unified framework for predicting text qual-ity. In Proceedings of the 2008 Conference on Em-pirical Methods in Natural Language Processing, pp.186–195.
Kristine Retherford. 2003. Normal development: adatabase of communication and related behaviors.Eau Claire, WI: Thinking Publications.
Brian Roark, Margaret Mitchell and Kristy Hollingshead.2007. Syntactic complexity measures for detectingmild cognitive impairment. In Proceedings of theWorkshop on BioNLP 2007: Biological, Translational,and Clinical Language Processing, pp. 1–8.
Sarah E. Schwarm and Mari Ostendorf. 2005. Read-ing level assessment using support vector machinesand statistical language models. In Proceedings ofthe 43rd Annual Meeting on Association for Compu-tational Linguistics (ACL 05), pp. 523–530.
Luo Si and Jamie Callan. 2001. A statistical model forscientific readability. In Proceedings of the tenth in-ternational conference on Information and knowledgemanagement, pp. 574–576.
Adam Skory and Maxine Eskenazi. 2010. Predictingcloze task quality for vocabulary training. In Proceed-ings of the NAACL HLT 2010 Fifth Workshop on In-novative Use of NLP for Building Educational Appli-cations, pp. 49–56.
Victor H.A. Yngve. 1960. A model and an hypothesis forlanguage structure. In Proceedings of the AmericanPhilosophical Society, pp. 444-466.
Heather Harris Wright, Stacy W. Silverman and MarilynNewhoff. 2003. Measures of lexical diversity in apha-sia. In Aphasiology, 17(5), pp. 443-452.
83
Proceedings of the 2nd Workshop on Speech and Language Processing for Assistive Technologies, pages 84–93,Edinburgh, Scotland, UK, July 30, 2011. c©2011 Association for Computational Linguistics
Source Language Categorization for improving a Speech into Sign Lan-
guage Translation System
V. López-Ludeña, R. San-Segundo, S. Lutfi, J.M. Lucas-Cuesta, J.D. Echevarry, B.
Martínez-González Grupo de Tecnología del Habla
Universidad Politécnica de Madrid {veronicalopez|lapiz|syaheerah|juanmak|jdec|beatrizmartinez}@die.upm.es
Abstract
This paper describes a categorization mod-ule for improving the performance of a Spanish into Spanish Sign Language (LSE) translation system. This categorization module replaces Spanish words with asso-ciated tags. When implementing this mod-ule, several alternatives for dealing with non-relevant words have been studied. Non-relevant words are Spanish words not rele-vant in the translation process. The catego-rization module has been incorporated into a phrase-based system and a Statistical Fi-nite State Transducer (SFST). The evalua-tion results reveal that the BLEU has increased from 69.11% to 78.79% for the phrase-based system and from 69.84% to 75.59% for the SFST.
Keywords: Source language categoriza-tion, Speech into Sign Language transla-tion. Lengua de Signos Española (LSE).
1 Introduction
In the world, there are around 70 million people with hearing deficiencies (information from World Federation of the Deaf http://www.wfdeaf.org/). Deafness brings about significant communication problems: most deaf people are unable to use writ-ten languages, having serious problems when ex-pressing themselves in these languages or understanding written texts. They have problems with verb tenses, concordances of gender and number, etc., and they have difficulties when creat-ing a mental image of abstract concepts. This fact can cause deaf people to have problems when ac-cessing information, education, job, social relation-
ship, culture, etc. According to information from INE (Statistic Spanish Institute), in Spain, there are 1,064,000 deaf people. 47% of deaf population do not have basic studies or are illiterate, and only between 1% and 3% have finished their studies (as opposed to 21% of Spanish hearing people). An-other example are the figures from the National Deaf Children’s Society (NDCS), Cymru, reveal-ing for the first time a shocking attainment gap between deaf and hearing pupils in Wales. In 2008, deaf pupils were 30% less likely than hearing pu-pils to gain five A*-C grades at General Certificate of Secondary Education (GCSE) level, while at key stage 3 only 42% of deaf pupils achieved the core subject indicators, compared to 71% of their hearing counterparts. Another example is a study carried out in Ireland in 2006; of 330 respondents “38% said they did not feel confident to read a newspaper and more than half were not fully con-fident in writing a letter or filling out a form” (Conroy, 2006).
Deaf people use a sign language (their mother tongue) for communicating and there are not enough sign-language interpreters and communica-tion systems. In Spain, there is the Spanish Sign Language (Lengua de Signos Española LSE) that is the official sign language. In the USA, there are 650,000 Deaf people (who use a sign language). Although there are more people with hearing defi-ciencies, there are only 7,000 sign-language inter-preters, i.e. a ratio of 93 deaf people to 1 interpreter. In Finland we find the best ratio, 6 to 1, and in Slovakia the worst with 3,000 users to 1 interpreter (Wheatley and Pabsch, 2010). In Spain this ratio is 221 to 1. This information shows the need to develop automatic translation systems with new technologies for helping hearing and Deaf people to communicate between themselves.
84
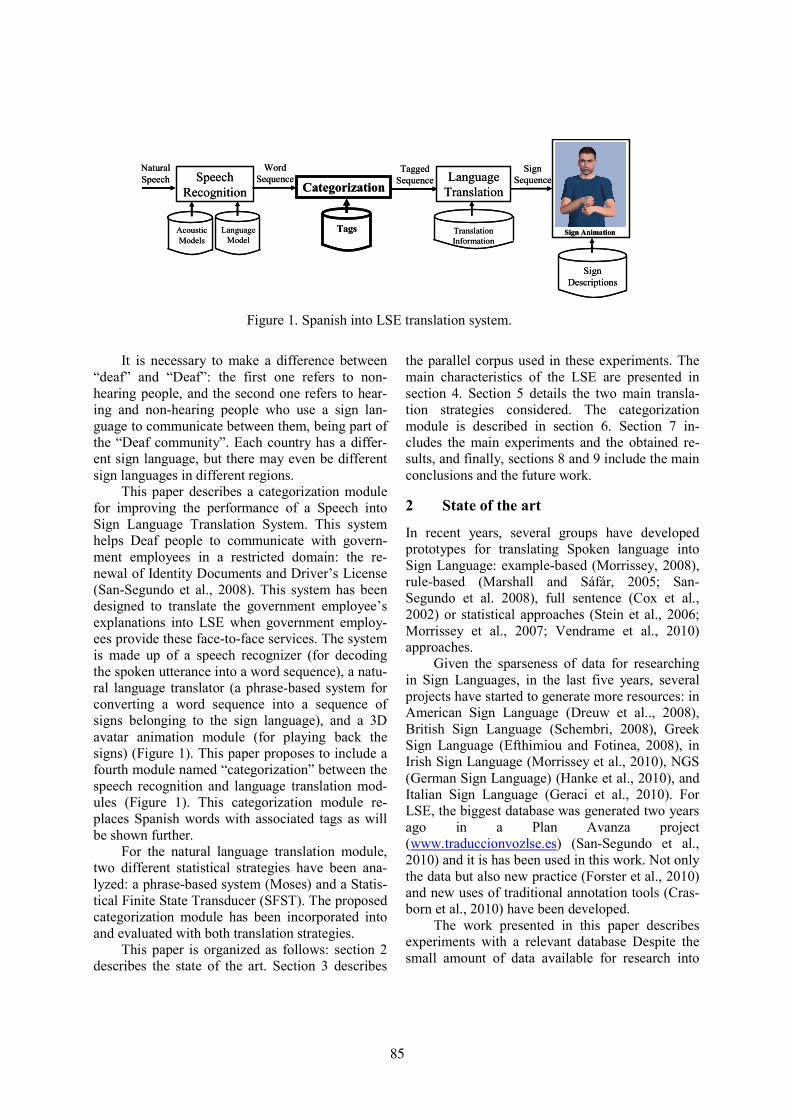
Speech Recognition
Language Translation
Word Sequence
Translation Information
Acoustic Models
Language Model
Sign Animation
Sign Descriptions
Sign Sequence
Natural Speech
Categorization
Tagged Sequence
Tags
Speech Recognition
Language Translation
Word Sequence
Translation Information
Acoustic Models
Language Model
Sign Animation
Sign Descriptions
Sign Sequence
Natural Speech
Categorization
Tagged Sequence
Tags
Figure 1. Spanish into LSE translation system.
It is necessary to make a difference between
“deaf” and “Deaf”: the first one refers to non-hearing people, and the second one refers to hear-ing and non-hearing people who use a sign lan-guage to communicate between them, being part of the “Deaf community”. Each country has a differ-ent sign language, but there may even be different sign languages in different regions.
This paper describes a categorization module for improving the performance of a Speech into Sign Language Translation System. This system helps Deaf people to communicate with govern-ment employees in a restricted domain: the re-newal of Identity Documents and Driver’s License (San-Segundo et al., 2008). This system has been designed to translate the government employee’s explanations into LSE when government employ-ees provide these face-to-face services. The system is made up of a speech recognizer (for decoding the spoken utterance into a word sequence), a natu-ral language translator (a phrase-based system for converting a word sequence into a sequence of signs belonging to the sign language), and a 3D avatar animation module (for playing back the signs) (Figure 1). This paper proposes to include a fourth module named “categorization” between the speech recognition and language translation mod-ules (Figure 1). This categorization module re-places Spanish words with associated tags as will be shown further.
For the natural language translation module, two different statistical strategies have been ana-lyzed: a phrase-based system (Moses) and a Statis-tical Finite State Transducer (SFST). The proposed categorization module has been incorporated into and evaluated with both translation strategies.
This paper is organized as follows: section 2 describes the state of the art. Section 3 describes
the parallel corpus used in these experiments. The main characteristics of the LSE are presented in section 4. Section 5 details the two main transla-tion strategies considered. The categorization module is described in section 6. Section 7 in-cludes the main experiments and the obtained re-sults, and finally, sections 8 and 9 include the main conclusions and the future work.
2 State of the art
In recent years, several groups have developed prototypes for translating Spoken language into Sign Language: example-based (Morrissey, 2008), rule-based (Marshall and Sáfár, 2005; San-Segundo et al. 2008), full sentence (Cox et al., 2002) or statistical approaches (Stein et al., 2006; Morrissey et al., 2007; Vendrame et al., 2010) approaches.
Given the sparseness of data for researching in Sign Languages, in the last five years, several projects have started to generate more resources: in American Sign Language (Dreuw et al.., 2008), British Sign Language (Schembri, 2008), Greek Sign Language (Efthimiou and Fotinea, 2008), in Irish Sign Language (Morrissey et al., 2010), NGS (German Sign Language) (Hanke et al., 2010), and Italian Sign Language (Geraci et al., 2010). For LSE, the biggest database was generated two years ago in a Plan Avanza project (www.traduccionvozlse.es) (San-Segundo et al., 2010) and it is has been used in this work. Not only the data but also new practice (Forster et al., 2010) and new uses of traditional annotation tools (Cras-born et al., 2010) have been developed.
The work presented in this paper describes experiments with a relevant database Despite the small amount of data available for research into
85
sign languages, the system presented in this paper demonstrates a very good performance compared to similar systems previously developed. The pre-sented results are also the best results for translat-ing Spanish into LSE using the biggest database that includes these languages.
In Europe, the two main research projects in-volving sign languages are DICTA-SIGN (Hanke et al., 2010; Efthimiou et al., 2010) and SIGN-SPEAK (Dreuw et al., 2010a and 2010b), both financed by The European Commission within the Seventh Frame Program. DICTA-SIGN (http://www.dictasign.eu/) aims to develop the technologies necessary to make Web 2.0 interac-tions in sign language possible: users sign to a webcam using a dictation style. The computer rec-ognizes the signed phrases, converts them into an internal representation of sign language, and then it has an animated avatar that signs them back to the users. In SIGN-SPEAK (http://www.signspeak.eu/), the overall goal is to develop a new vision-based technology for recog-nizing and translating continuous sign language into text.
3 Parallel corpus
This section describes the first Spanish-LSE paral-lel corpus developed for language processing in two specific domains: the renewal of the Identity Document (ID) and Driver’s License (DL). This corpus has been obtained with the collaboration of Local Government Offices where these services are provided. Over several weeks, the most fre-quent explanations (from the government employ-ees) and the most frequent questions (from the user) were taken down. In this period, more than 5,000 sentences were noted and analyzed.
Not all the sentences refer to ID or DL re-newal (Government Offices provide more ser-vices), so sentences had to be selected manually. This was possible because every sentence was tagged with the information about the service be-ing provided when it was collected. Finally, 1360 sentences were collected: 1,023 pronounced by government employees and 337 by users. These sentences have been translated into LSE, both in text (sequence of glosses) and in video (containing replayed sentences by native LSE signers), and compiled in an excel file. Videos are not used in
this study but they were collected for generating a complete parallel corpus.
This corpus was increased to 4,080 by incor-porating different variants for Spanish sentences (maintaining the LSE translation) (San-Segundo et al. 2010). Table 1 summarizes the main features of this database.
Spanish LSE
Sentence pairs 4,080 Different sentences 3,342 1,289 Words/signs per sentence 7.7 5.7 Running words 31,501 23,256 Vocabulary 1,232 636
Table 1. Main statistics of the corpus For the experiments presented in this paper,
this database has been divided randomly into three sets: training (75%), development (12.5%) and test (12.5%). The training set was used for tuning the speech recognizer (vocabulary and language mod-el) and training the translation models. The devel-opment set was used for tuning the translation systems and finally, the test set was used for evalu-ating the categorization module.
4 Spanish Sign Language (LSE)
Spanish Sign Language (LSE), just like other sign languages, has a visual-gestural channel, but it also has grammatical characteristics similar to spoken languages. Sign languages have complex gram-mars and professional linguists have found all of the necessarily linguistic characteristics for classi-fying sign languages as “true languages”. In lin-guistic terms, sign languages are as complex as spoken languages, despite the common misconcep-tion that they are a “simplification” of spoken lan-guages. For example, The United Kingdom and USA share the same language. However, British Sign Language is completely different from Amer-ican Sign Language. W. Stokoe (Stokoe, 1960) supports the idea that sign languages have four dimensions (three space dimensions plus time), and spoken languages have only one dimension, time, so it cannot say that sign languages are a simplification of any other language.
One important difference between spoken languages and sign languages is sequentially. Pho-nemes in spoken languages are produced in a se-quence. On the other hand, sign languages have a
86
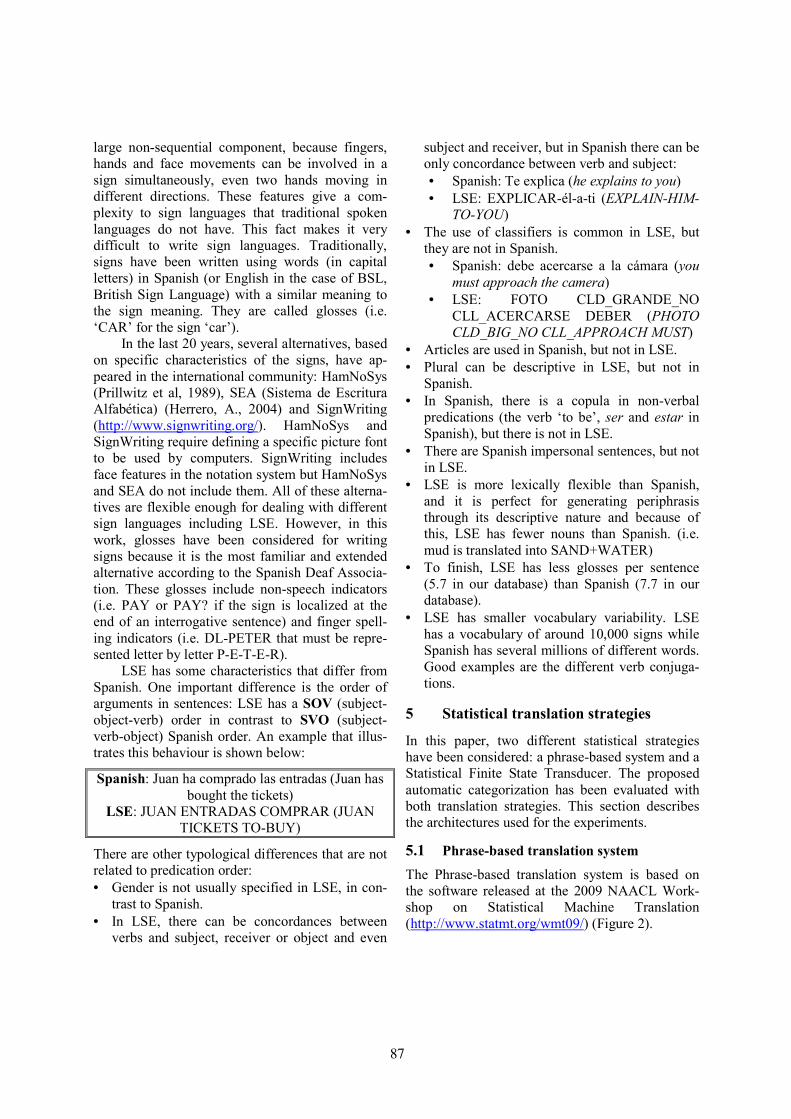
large non-sequential component, because fingers, hands and face movements can be involved in a sign simultaneously, even two hands moving in different directions. These features give a com-plexity to sign languages that traditional spoken languages do not have. This fact makes it very difficult to write sign languages. Traditionally, signs have been written using words (in capital letters) in Spanish (or English in the case of BSL, British Sign Language) with a similar meaning to the sign meaning. They are called glosses (i.e. ‘CAR’ for the sign ‘car’).
In the last 20 years, several alternatives, based on specific characteristics of the signs, have ap-peared in the international community: HamNoSys (Prillwitz et al, 1989), SEA (Sistema de Escritura Alfabética) (Herrero, A., 2004) and SignWriting (http://www.signwriting.org/). HamNoSys and SignWriting require defining a specific picture font to be used by computers. SignWriting includes face features in the notation system but HamNoSys and SEA do not include them. All of these alterna-tives are flexible enough for dealing with different sign languages including LSE. However, in this work, glosses have been considered for writing signs because it is the most familiar and extended alternative according to the Spanish Deaf Associa-tion. These glosses include non-speech indicators (i.e. PAY or PAY? if the sign is localized at the end of an interrogative sentence) and finger spell-ing indicators (i.e. DL-PETER that must be repre-sented letter by letter P-E-T-E-R).
LSE has some characteristics that differ from Spanish. One important difference is the order of arguments in sentences: LSE has a SOV (subject-object-verb) order in contrast to SVO (subject-verb-object) Spanish order. An example that illus-trates this behaviour is shown below:
Spanish: Juan ha comprado las entradas (Juan has bought the tickets)
LSE: JUAN ENTRADAS COMPRAR (JUAN TICKETS TO-BUY)
There are other typological differences that are not related to predication order: • Gender is not usually specified in LSE, in con-
trast to Spanish. • In LSE, there can be concordances between
verbs and subject, receiver or object and even
subject and receiver, but in Spanish there can be only concordance between verb and subject: • Spanish: Te explica (he explains to you) • LSE: EXPLICAR-él-a-ti (EXPLAIN-HIM-
TO-YOU) • The use of classifiers is common in LSE, but
they are not in Spanish. • Spanish: debe acercarse a la cámara (you
must approach the camera) • LSE: FOTO CLD_GRANDE_NO
CLL_ACERCARSE DEBER (PHOTO CLD_BIG_NO CLL_APPROACH MUST)
• Articles are used in Spanish, but not in LSE. • Plural can be descriptive in LSE, but not in
Spanish. • In Spanish, there is a copula in non-verbal
predications (the verb ‘to be’, ser and estar in Spanish), but there is not in LSE.
• There are Spanish impersonal sentences, but not in LSE.
• LSE is more lexically flexible than Spanish, and it is perfect for generating periphrasis through its descriptive nature and because of this, LSE has fewer nouns than Spanish. (i.e. mud is translated into SAND+WATER)
• To finish, LSE has less glosses per sentence (5.7 in our database) than Spanish (7.7 in our database).
• LSE has smaller vocabulary variability. LSE has a vocabulary of around 10,000 signs while Spanish has several millions of different words. Good examples are the different verb conjuga-tions.
5 Statistical translation strategies
In this paper, two different statistical strategies have been considered: a phrase-based system and a Statistical Finite State Transducer. The proposed automatic categorization has been evaluated with both translation strategies. This section describes the architectures used for the experiments.
5.1 Phrase-based translation system
The Phrase-based translation system is based on the software released at the 2009 NAACL Work-shop on Statistical Machine Translation (http://www.statmt.org/wmt09/) (Figure 2).
87
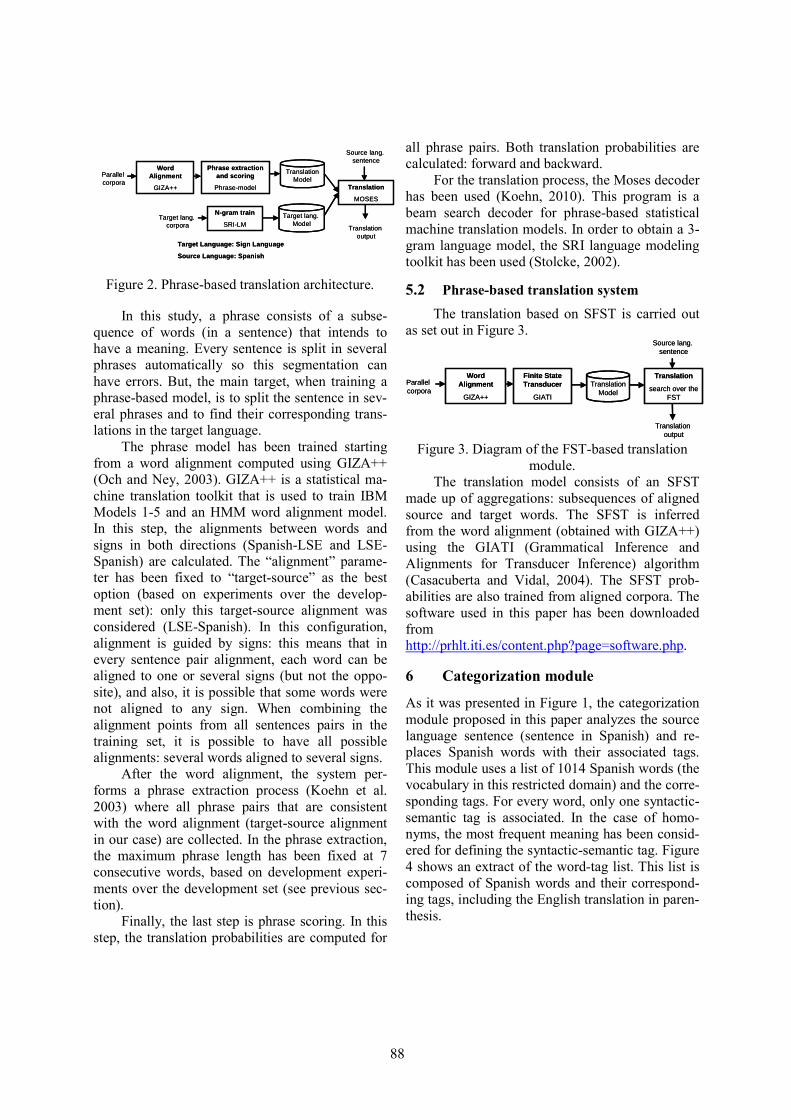
Word Alignment
GIZA++
Phrase extraction and scoring
Phrase-model
Parallel corpora
N-gram train
SRI-LMTarget lang.
corpora
Translation
MOSES
Source lang. sentence
Translation output
TranslationModel
Target lang. Model
Target Language: Sign Language
Source Language: Spanish
Word Alignment
GIZA++
Phrase extraction and scoring
Phrase-model
Parallel corpora
N-gram train
SRI-LMTarget lang.
corpora
Translation
MOSES
Source lang. sentence
Translation output
TranslationModel
Target lang. Model
Target Language: Sign Language
Source Language: Spanish
Figure 2. Phrase-based translation architecture.
In this study, a phrase consists of a subse-quence of words (in a sentence) that intends to have a meaning. Every sentence is split in several phrases automatically so this segmentation can have errors. But, the main target, when training a phrase-based model, is to split the sentence in sev-eral phrases and to find their corresponding trans-lations in the target language.
The phrase model has been trained starting from a word alignment computed using GIZA++ (Och and Ney, 2003). GIZA++ is a statistical ma-chine translation toolkit that is used to train IBM Models 1-5 and an HMM word alignment model. In this step, the alignments between words and signs in both directions (Spanish-LSE and LSE-Spanish) are calculated. The “alignment” parame-ter has been fixed to “target-source” as the best option (based on experiments over the develop-ment set): only this target-source alignment was considered (LSE-Spanish). In this configuration, alignment is guided by signs: this means that in every sentence pair alignment, each word can be aligned to one or several signs (but not the oppo-site), and also, it is possible that some words were not aligned to any sign. When combining the alignment points from all sentences pairs in the training set, it is possible to have all possible alignments: several words aligned to several signs.
After the word alignment, the system per-forms a phrase extraction process (Koehn et al. 2003) where all phrase pairs that are consistent with the word alignment (target-source alignment in our case) are collected. In the phrase extraction, the maximum phrase length has been fixed at 7 consecutive words, based on development experi-ments over the development set (see previous sec-tion).
Finally, the last step is phrase scoring. In this step, the translation probabilities are computed for
all phrase pairs. Both translation probabilities are calculated: forward and backward.
For the translation process, the Moses decoder has been used (Koehn, 2010). This program is a beam search decoder for phrase-based statistical machine translation models. In order to obtain a 3-gram language model, the SRI language modeling toolkit has been used (Stolcke, 2002).
5.2 Phrase-based translation system
The translation based on SFST is carried out as set out in Figure 3.
Word Alignment
GIZA++
Finite State Transducer
GIATI
Parallel corpora
Translation
search over the FST
TranslationModel
Source lang. sentence
Translation output
Word Alignment
GIZA++
Finite State Transducer
GIATI
Parallel corpora
Translation
search over the FST
TranslationModel
Source lang. sentence
Translation output
Figure 3. Diagram of the FST-based translation module.
The translation model consists of an SFST made up of aggregations: subsequences of aligned source and target words. The SFST is inferred from the word alignment (obtained with GIZA++) using the GIATI (Grammatical Inference and Alignments for Transducer Inference) algorithm (Casacuberta and Vidal, 2004). The SFST prob-abilities are also trained from aligned corpora. The software used in this paper has been downloaded from http://prhlt.iti.es/content.php?page=software.php.
6 Categorization module
As it was presented in Figure 1, the categorization module proposed in this paper analyzes the source language sentence (sentence in Spanish) and re-places Spanish words with their associated tags. This module uses a list of 1014 Spanish words (the vocabulary in this restricted domain) and the corre-sponding tags. For every word, only one syntactic-semantic tag is associated. In the case of homo-nyms, the most frequent meaning has been consid-ered for defining the syntactic-semantic tag. Figure 4 shows an extract of the word-tag list. This list is composed of Spanish words and their correspond-ing tags, including the English translation in paren-thesis.
88
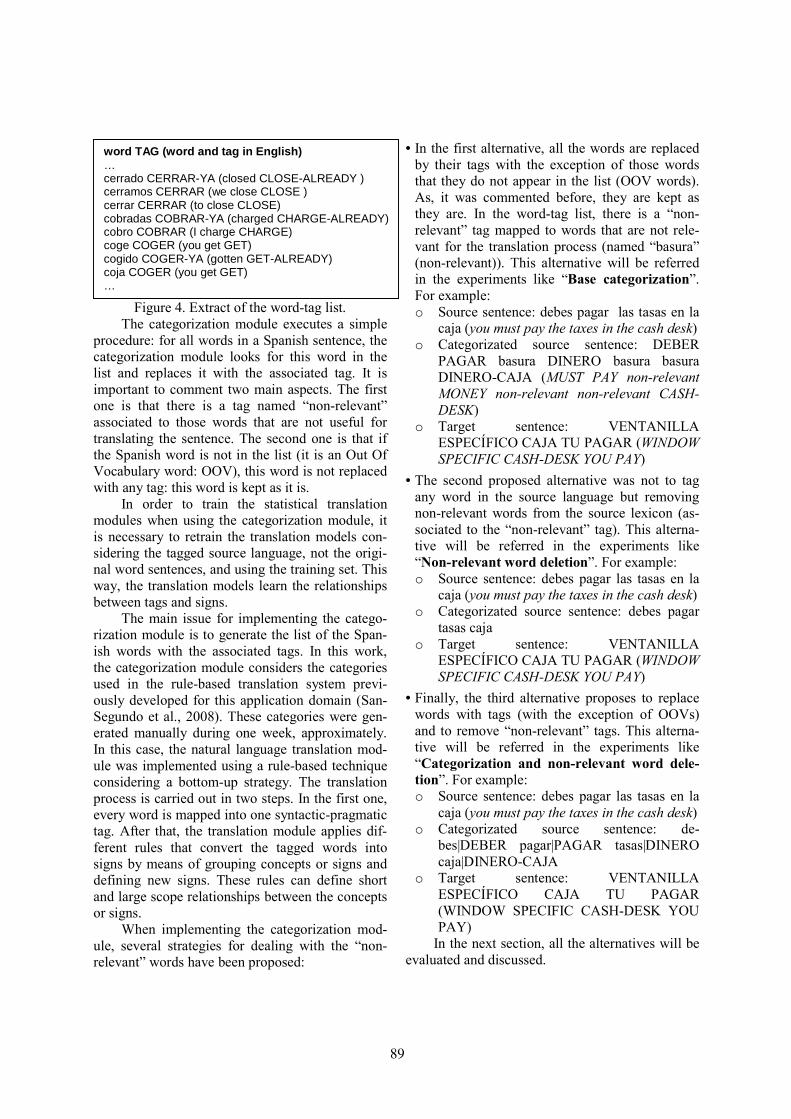
Figure 4. Extract of the word-tag list.
The categorization module executes a simple procedure: for all words in a Spanish sentence, the categorization module looks for this word in the list and replaces it with the associated tag. It is important to comment two main aspects. The first one is that there is a tag named “non-relevant” associated to those words that are not useful for translating the sentence. The second one is that if the Spanish word is not in the list (it is an Out Of Vocabulary word: OOV), this word is not replaced with any tag: this word is kept as it is.
In order to train the statistical translation modules when using the categorization module, it is necessary to retrain the translation models con-sidering the tagged source language, not the origi-nal word sentences, and using the training set. This way, the translation models learn the relationships between tags and signs.
The main issue for implementing the catego-rization module is to generate the list of the Span-ish words with the associated tags. In this work, the categorization module considers the categories used in the rule-based translation system previ-ously developed for this application domain (San-Segundo et al., 2008). These categories were gen-erated manually during one week, approximately. In this case, the natural language translation mod-ule was implemented using a rule-based technique considering a bottom-up strategy. The translation process is carried out in two steps. In the first one, every word is mapped into one syntactic-pragmatic tag. After that, the translation module applies dif-ferent rules that convert the tagged words into signs by means of grouping concepts or signs and defining new signs. These rules can define short and large scope relationships between the concepts or signs.
When implementing the categorization mod-ule, several strategies for dealing with the “non-relevant” words have been proposed:
• In the first alternative, all the words are replaced by their tags with the exception of those words that they do not appear in the list (OOV words). As, it was commented before, they are kept as they are. In the word-tag list, there is a “non-relevant” tag mapped to words that are not rele-vant for the translation process (named “basura” (non-relevant)). This alternative will be referred in the experiments like “Base categorization”. For example: o Source sentence: debes pagar las tasas en la
caja (you must pay the taxes in the cash desk) o Categorizated source sentence: DEBER
PAGAR basura DINERO basura basura DINERO-CAJA (MUST PAY non-relevant MONEY non-relevant non-relevant CASH-
DESK) o Target sentence: VENTANILLA
ESPECÍFICO CAJA TU PAGAR (WINDOW SPECIFIC CASH-DESK YOU PAY)
• The second proposed alternative was not to tag any word in the source language but removing non-relevant words from the source lexicon (as-sociated to the “non-relevant” tag). This alterna-tive will be referred in the experiments like “Non-relevant word deletion”. For example: o Source sentence: debes pagar las tasas en la
caja (you must pay the taxes in the cash desk) o Categorizated source sentence: debes pagar
tasas caja o Target sentence: VENTANILLA
ESPECÍFICO CAJA TU PAGAR (WINDOW SPECIFIC CASH-DESK YOU PAY)
• Finally, the third alternative proposes to replace words with tags (with the exception of OOVs) and to remove “non-relevant” tags. This alterna-tive will be referred in the experiments like “Categorization and non-relevant word dele-
tion”. For example: o Source sentence: debes pagar las tasas en la
caja (you must pay the taxes in the cash desk) o Categorizated source sentence: de-
bes|DEBER pagar|PAGAR tasas|DINERO caja|DINERO-CAJA
o Target sentence: VENTANILLA ESPECÍFICO CAJA TU PAGAR (WINDOW SPECIFIC CASH-DESK YOU PAY)
In the next section, all the alternatives will be evaluated and discussed.
word TAG (word and tag in English) … cerrado CERRAR-YA (closed CLOSE-ALREADY ) cerramos CERRAR (we close CLOSE ) cerrar CERRAR (to close CLOSE) cobradas COBRAR-YA (charged CHARGE-ALREADY) cobro COBRAR (I charge CHARGE) coge COGER (you get GET) cogido COGER-YA (gotten GET-ALREADY) coja COGER (you get GET) …
89
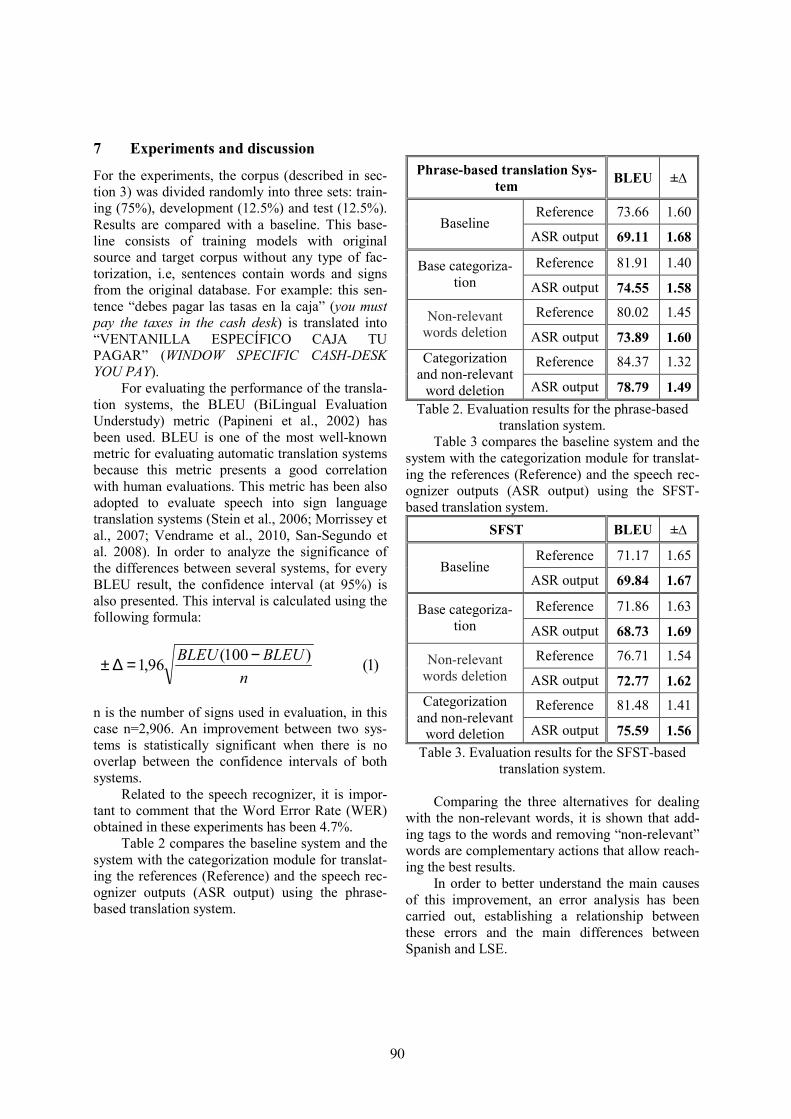
7 Experiments and discussion
For the experiments, the corpus (described in sec-tion 3) was divided randomly into three sets: train-ing (75%), development (12.5%) and test (12.5%). Results are compared with a baseline. This base-line consists of training models with original source and target corpus without any type of fac-torization, i.e, sentences contain words and signs from the original database. For example: this sen-tence “debes pagar las tasas en la caja” (you must pay the taxes in the cash desk) is translated into “VENTANILLA ESPECÍFICO CAJA TU PAGAR” (WINDOW SPECIFIC CASH-DESK YOU PAY).
For evaluating the performance of the transla-tion systems, the BLEU (BiLingual Evaluation Understudy) metric (Papineni et al., 2002) has been used. BLEU is one of the most well-known metric for evaluating automatic translation systems because this metric presents a good correlation with human evaluations. This metric has been also adopted to evaluate speech into sign language translation systems (Stein et al., 2006; Morrissey et al., 2007; Vendrame et al., 2010, San-Segundo et al. 2008). In order to analyze the significance of the differences between several systems, for every BLEU result, the confidence interval (at 95%) is also presented. This interval is calculated using the following formula:
)1()100(
96,1n
BLEUBLEU −=∆±
n is the number of signs used in evaluation, in this case n=2,906. An improvement between two sys-tems is statistically significant when there is no overlap between the confidence intervals of both systems.
Related to the speech recognizer, it is impor-tant to comment that the Word Error Rate (WER) obtained in these experiments has been 4.7%.
Table 2 compares the baseline system and the system with the categorization module for translat-ing the references (Reference) and the speech rec-ognizer outputs (ASR output) using the phrase-based translation system.
Phrase-based translation Sys-
tem BLEU ±∆
Reference 73.66 1.60 Baseline
ASR output 69.11 1.68
Reference 81.91 1.40 Base categoriza-tion ASR output 74.55 1.58
Reference 80.02 1.45 Non-relevant words deletion ASR output 73.89 1.60
Reference 84.37 1.32 Categorization and non-relevant
word deletion ASR output 78.79 1.49
Table 2. Evaluation results for the phrase-based translation system.
Table 3 compares the baseline system and the system with the categorization module for translat-ing the references (Reference) and the speech rec-ognizer outputs (ASR output) using the SFST-based translation system.
SFST BLEU ±∆
Reference 71.17 1.65 Baseline
ASR output 69.84 1.67
Reference 71.86 1.63 Base categoriza-tion ASR output 68.73 1.69
Reference 76.71 1.54 Non-relevant words deletion ASR output 72.77 1.62
Reference 81.48 1.41 Categorization and non-relevant
word deletion ASR output 75.59 1.56
Table 3. Evaluation results for the SFST-based translation system.
Comparing the three alternatives for dealing
with the non-relevant words, it is shown that add-ing tags to the words and removing “non-relevant” words are complementary actions that allow reach-ing the best results.
In order to better understand the main causes of this improvement, an error analysis has been carried out, establishing a relationship between these errors and the main differences between Spanish and LSE.
90
The most important type of error (35% of the cases) is related to the fact that in Spanish there are more words than signs in LSE (7.7 for Spanish and 5.7 for LSE in this corpus). This circumstance provokes different types of errors: generation of many phrases in the same output, producing a high number of insertions. When dealing with long sen-tences there is the risk that the translation model cannot deal properly with the big distortion. This produces important changes in order and some-times the sentence is truncated producing several deletions.
The second most important source of errors (25% of the cases) is related to the fact that when translating Spanish into LSE, there is a relevant number of words in the testing set that they do not appear in the training set due to the higher variabil-ity presented in Spanish. These words are named Out Of Vocabulary words. For example, in Span-ish there are many verb conjugations that are trans-lated into the same sign sequence. So, when a new conjugation appears in the evaluation set, it is an OOV that provokes a translation error.
Other important source of errors corresponds to ordering errors provoked by the different order in predication: LSE has a SOV (Subject-Object-Verb) while Spanish SVO (Subject-Verb-Object). In this case, the frequency is close to 20%
Finally, there are others causes of errors like the wrong generation of the different classifiers needed in LSE and not presented in Spanish (11%) and the existence of some deletions when translat-ing very specific names, even when they are in the training set. Some of these names (i.e. ‘mud’ is translated into SAND + WATER) need some pe-riphrasis in LSE that not always are properly gen-erated.
Based on this error analysis, the main causes of the translation errors are related to the different variability in the vocabulary for Spanish and LSE (much higher in Spanish), the different number for words or signs in the sentences (higher in Spanish) and the different predication order.
The categorization module allows reducing the variability in the source language (for example, several verb conjugations are tagged with the same tag) and also the number of tokens composing the input sentence (when removing non-relevant words). Also, reducing the source language vari-ability and the number of tokens provoke an im-portant reduction on the number of source-target
alignments the system has to train. When having a small corpus, as it is the case of many sign lan-guages, this reduction of alignment points permits to obtain better training models with less data, improving the results. These aspects allow increas-ing the system performance. Presumably, if there were a very large corpus of Spanish-to-Spanish-Sign-Language available, the system could learn better translation models and the improvement reached with this categorization module would be lower.
The evaluation results reveal that the BLEU has increased from 69.11% to 78.79% for the phrase-based system and from 69.84% to 75.59% for the SFST.
8 Conclusions
This paper describes a categorization module for improving a Spanish into Spanish Sign Language Translation System. This module allows incorpo-rating syntactic-semantic information during the translation process reducing the source language variability and the number of words composing the input sentence. These two aspects reduce the trans-lation error rate considering two statistical transla-tion systems: phrase-based and SFST-based translation systems. This system is used to translate government employee’s explanations into LSE when providing a personal service for renewing the Identity Document and Driver’s License.
9 Future work
The main issue for implementing the categoriza-tion module is to generate the list of the Spanish words with the associated tags. Generating this list manually is a subjective, slow and difficult task. Because of this, in the near future, authors will work on the possibility to define a procedure for calculating this list automatically.
Acknowledgments
The authors would like to thank the eSIGN consor-tium for permitting the use of the eSIGN Editor and the 3D avatar. The authors would also like to thank discussions and suggestions from the col-leagues at GTH-UPM. This work has been sup-ported by Plan Avanza Exp Nº: TSI-020100-2010-489), INAPRA (MEC ref: DPI2010-21247-C02-
91
02), and SD-TEAM (MEC ref: TIN2008-06856-C05-03) projects and FEDER program.
References
Casacuberta F., E. Vidal. 2004. “Machine Translation with Inferred Stochastic Finite-State Transducers”. Computational Linguistics, Vol. 30, No. 2, pp. 205-225, 2004.
Conroy, P. 2006. Signing in and Signing Out: The Edu-cation and Employment Experiences of Deaf Adults in Ireland. Research Report, Irish Deaf Society, Dub-lin. 2006.
Cox, S.J., Lincoln M., Tryggvason J., Nakisa M., Wells M., Mand Tutt, and Abbott, S., 2002 “TESSA, a sys-tem to aid communication with deaf people”. In ASSETS 2002, Edinburgh, Scotland, pp 205-212, 2002.
Crasborn O., Sloetjes H. 2010. “Using ELAN for anno-tating sign language corpora in a team setting”. In 4th Workshop on the Representation and Processing of Sign Languages: Corpora and Sign Language Tech-nologies (CSLT 2010), Valletta, Malta, 2010. pp 61-65
Dreuw P., Neidle C., Athitsos V., Sclaroff S., and Ney H. 2008. “Benchmark Databases for Video-Based Automatic Sign Language Recognition”. In Interna-tional Conference on Language Resources and Eval-uation (LREC), Marrakech, Morocco, May 2008. pp 1115-1121.
Dreuw P., Ney H., Martinez G., Crasborn O., Piater J., Miguel Moya J., and Wheatley M., 2010 “The Sign-Speak Project - Bridging the Gap Between Signers and Speakers”. In 4th Workshop on the Representa-tion and Processing of Sign Languages: Corpora and Sign Language Technologies (CSLT 2010), Valletta, Malta, 2010a. pp 73-80.
Dreuw P., Forster J., Gweth Y., Stein D., Ney H., Mar-tinez G., Verges Llahi J., Crasborn O., Ormel E., Du W., Hoyoux T., Piater J., Moya Lazaro JM, and Wheatley M. 2010 “SignSpeak - Understanding, Recognition, and Translation of Sign Languages”. In 4th Workshop on the Representation and Processing of Sign Languages: Corpora and Sign Language Technologies (CSLT 2010), Valletta, Malta, May 2010b. pp 65-73
Efthimiou E., and Fotinea, E., 2008 “GSLC: Creation and Αnnotation of a Greek Sign Language Corpus for HCI” LREC 2008. pp 1-10.
Efthimiou E., Fotinea S., Hanke T., Glauert J., Bowden R., Braffort A., Collet C., Maragos P., Goudenove F. 2010. “DICTA-SIGN: Sign Language Recognition,
Generation and Modelling with application in Deaf Communication”. In 4th Workshop on the Represen-tation and Processing of Sign Languages: Corpora and Sign Language Technologies (CSLT 2010), Val-letta, Malta, May 2010. pp 80-84.
Forster J., Stein D., Ormel E., Crasborn O., Ney H. 2010. “Best Practice for Sign Language Data Collec-tions Regarding the Needs of Data-Driven Recogni-tion and Translation”. In 4th Workshop on the Representation and Processing of Sign Languages: Corpora and Sign Language Technologies (CSLT 2010), Valletta, Malta, May 2010. pp 92-98.
Geraci C., Bayley R., Branchini C., Cardinaletti A., Cecchetto C., Donati C., Giudice S., Mereghetti E., Poletti F., Santoro M., Zucchi S. 2010. “Building a corpus for Italian Sign Language. Methodological is-sues and some preliminary results”. In 4th Workshop on the Representation and Processing of Sign Lan-guages: Corpora and Sign Language Technologies (CSLT 2010), Valletta, Malta, May 2010. pp 98-102.
Hanke T., König L., Wagner S., Matthes S. 2010. “DGS Corpus & Dicta-Sign: The Hamburg Studio Setup”. In 4th Workshop on the Representation and Process-ing of Sign Languages: Corpora and Sign Language Technologies (CSLT 2010), Valletta, Malta, May 2010. pp 106-110.
Herrero, A., 2004 “Escritura alfabética de la Lengua de Signos Española” Universidad de Alicante. Servicio de Publicaciones.
Koehn P., F.J. Och D. Marcu. 2003. “Statistical Phrase-based translation”. Human Language Technology Conference 2003 (HLT-NAACL 2003), Edmonton, Canada, 2003. pp. 127-133.
Koehn, Philipp. 2010. “Statistical Machine Transla-tion”. phD. Cambridge University Press.
Marshall, I., Sáfár, E. (2005) “Grammar Development for Sign Language Avatar-Based Synthesis”, In Pro-ceedings HCII 2005, 11th International Conference on Human Computer Interaction (CD-ROM), Las Vegas, USA, July 2005. pp 1-10.
Morrissey S., Way A., Stein D., Bungeroth J., and Ney H., 2007 “Towards a Hybrid Data-Driven MT Sys-tem for Sign Languages. Machine Translation Sum-mit (MT Summit)”, Copenhagen, Denmark, 2007. pp 329-335.
Morrissey, S. 2008. “Data-Driven Machine Translation for Sign Languages”. Thesis. Dublin City University, Dublin, Ireland.
Morrissey S., Somers H., Smith R., Gilchrist S., Danda-pat S., 2010 “Building Sign Language Corpora for Use in Machine Translation”. In 4th Workshop on
92
the Representation and Processing of Sign Lan-guages: Corpora and Sign Language Technologies (CSLT 2010), Valletta, Malta, May 2010. pp 172-178.
Och J., Ney. H., 2003. “A systematic comparison of various alignment models”. Computational Linguis-tics, Vol. 29, No. 1, 2003. pp. 19-51.
Papineni K., S. Roukos, T. Ward, W.J. Zhu. 2002 “BLEU: a method for automatic evaluation of ma-chine translation”. 40th Annual Meeting of the Asso-ciation for Computational Linguistics (ACL), Philadelphia, PA. 2002. pp. 311-318.
Prillwitz, S., R. Leven, H. Zienert, T. Hanke, J. Henning, et-al. 1989. “Hamburg Notation System for Sign Languages – An introductory Guide”. Interna-tional Studies on Sign Language and the Communi-cation of the Deaf, Volume 5. Institute of German Sign Language and Communication of the Deaf, University of Hamburg, 1989.
San-Segundo R., Barra R., Córdoba R., D’Haro L.F., Fernández F., Ferreiros J., Lucas J.M., Macías-Guarasa J., Montero J.M., Pardo J.M, 2008. “Speech to Sign Language translation system for Spanish”. Speech Communication, Vol 50. 2008. pp. 1009-1020.
San-Segundo, R., Pardo, J.M., Ferreiros, F., Sama, V., Barra-Chicote, R., Lucas, JM., Sánchez, D., García. A., “Spoken Spanish Generation from Sign Lan-guage” Interacting with Computers, Vol. 22, No 2, 2010. pp. 123-139.
Schembri. A., 2008 ”British Sign Language Corpus Project: Open Access Archives and the Observer’s Paradox”. Deafness Cognition and Language Re-search Centre, University College London. LREC 2008. pp 1-5.
Stein, D., Bungeroth, J. and Ney, H.: 2006 “Morpho-Syntax Based Statistical Methods for Sign Language Translation”. 11th Annual conference of the Euro-pean Association for Machine Translation, Oslo, Norway, June 2006. pp 223-231.
Stolcke A., 2002. “SRILM – An Extensible Language Modelling Toolkit”. Proc. Intl. Conf. on Spoken Language Processing, vol. 2, Denver USA, 2002. pp. 901-904,
Stokoe W., Sign Language structure: an outline of the visual communication systems of the American deaf, Studies in Linguistics, Buffalo University Paper 8, 1960.
Vendrame M., Tiotto G., 2010. ATLAS Project: Fore-cast in Italian Sign Language and Annotation of Cor-pora. In 4th Workshop on the Representation and
Processing of Sign Languages: Corpora and Sign Language Technologies (CSLT 2010), Valletta, Mal-ta, May 2010. pp 239-243.
Wheatley, M., Annika Pabsch, 2010. “Sign Language in Europe”. In 4th Workshop on the Representation and Processing of Sign Languages: Corpora and Sign Language Technologies. LREC. Malta 2010. pp 251-255.
93
Proceedings of the 2nd Workshop on Speech and Language Processing for Assistive Technologies, pages 94–100,Edinburgh, Scotland, UK, July 30, 2011. c©2011 Association for Computational Linguistics
What does it mean to communicate (not) emotionally?
Jan-Oliver Wülfing
Fraunhofer Centre Birlinghoven IZB Schloß Birlinghoven
D-53754 Sankt Augustin jan-oliver.wuelfing @izb.fraunhofer.de
Lisa Hoffmann Fraunhofer Institute for
Applied Information Technology FIT Schloß Birlinghoven
D-53754 Sankt Augustin [email protected]
Abstract
Communication is an essential part of our life. Though, not only communication is the key – it is all about emotional (prosodic) communication. Due to empirical research, people, who are augmentative communicators and speak with a voice output communication aid, want to express their emotions in the same way as everybody else – it is one of their deepest interests (Portnuff, 2006; Hoffmann and Wülfing, 2010). So far, current devices lack the opportunity of emotional utterances. This circumstance leads not only to a huge usability deficit, but furthermore, it is an obstacle to develop emotional competence and to behave as well as regulate one´s emotion adequately (Blackstone and Wilkins, 2009). This article aims to increase the sensitivity for the importance of emotional communication. Furthermore, it tries to give first suggestions for implementing an usable device that supports users with a voice output communication aid to express emotional utterances. This could be done by using phrase-generation, as mentiond by Vanderheyden and Pennigton (1998).
1 Introduction
One can hardly imagine how it would be to communicate without an emotional output. If we talk to each other, every conversation is influenced by our emotions. Sometimes we want to hide our feelings; however, more often we want to send an underlying message with our prosodic utterance. For example, imagine someone goes for a walk
with their best friend, the sun is shining and the birds are chirping – this kind of situation and the feeling it evokes will probably be reflected by their prosodic utterance: “Dude, it`s awesome weather today!” Or imagine furthermore, the same person gets into a fight with this friend while walking in the sun; it certainly must not be pointed out that the emotion and therefore the reaction would differ. Though, communication and emotion seem inevitably associated, it is still not possible for people with complex communication needs to talk emotionally, since current voice output communication aids (VOCA) do not offer prosodic speech output. A circumstance that leads to several drawbacks; starting with disadvantages in social and academic arrangements.
1.1 What is a prosodic utterance?
Prosodic utterances are the key for daily communication processes. They depend on the emotion, i.e. it is reflected by an utterance through the pitch, the rhythm, and the volume of the voice. These differences are called prosody and, hence, it is possible to express very different types of emotions. Prosodic utterances influence the behaviour of the listener (Strom, 1998). The one and the same utterance can differ in their meaning. A good example of this is irony or subtle utterances. They may or may not be serious depending also on their prosodic features. Either way, the listener is going to react and this reaction relies not only on the accurate comprehension but also on the prosody of the speaker´s intended utterance (Battachi et al., 1997). In the case of augmentative communicators and their use of a
94
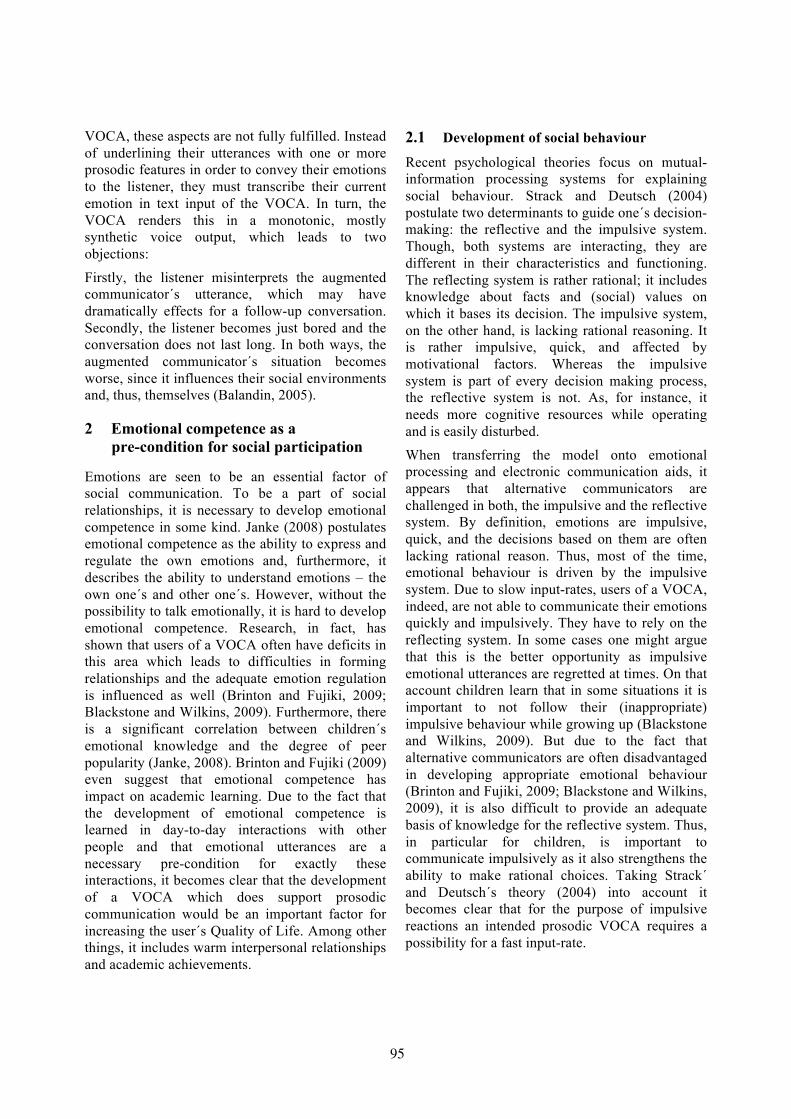
VOCA, these aspects are not fully fulfilled. Instead of underlining their utterances with one or more prosodic features in order to convey their emotions to the listener, they must transcribe their current emotion in text input of the VOCA. In turn, the VOCA renders this in a monotonic, mostly synthetic voice output, which leads to two objections:
Firstly, the listener misinterprets the augmented communicator´s utterance, which may have dramatically effects for a follow-up conversation. Secondly, the listener becomes just bored and the conversation does not last long. In both ways, the augmented communicator´s situation becomes worse, since it influences their social environments and, thus, themselves (Balandin, 2005).
2 Emotional competence as a pre-condition for social participation
Emotions are seen to be an essential factor of social communication. To be a part of social relationships, it is necessary to develop emotional competence in some kind. Janke (2008) postulates emotional competence as the ability to express and regulate the own emotions and, furthermore, it describes the ability to understand emotions – the own one´s and other one´s. However, without the possibility to talk emotionally, it is hard to develop emotional competence. Research, in fact, has shown that users of a VOCA often have deficits in this area which leads to difficulties in forming relationships and the adequate emotion regulation is influenced as well (Brinton and Fujiki, 2009; Blackstone and Wilkins, 2009). Furthermore, there is a significant correlation between children´s emotional knowledge and the degree of peer popularity (Janke, 2008). Brinton and Fujiki (2009) even suggest that emotional competence has impact on academic learning. Due to the fact that the development of emotional competence is learned in day-to-day interactions with other people and that emotional utterances are a necessary pre-condition for exactly these interactions, it becomes clear that the development of a VOCA which does support prosodic communication would be an important factor for increasing the user´s Quality of Life. Among other things, it includes warm interpersonal relationships and academic achievements.
2.1 Development of social behaviour
Recent psychological theories focus on mutual-information processing systems for explaining social behaviour. Strack and Deutsch (2004) postulate two determinants to guide one´s decision- making: the reflective and the impulsive system. Though, both systems are interacting, they are different in their characteristics and functioning. The reflecting system is rather rational; it includes knowledge about facts and (social) values on which it bases its decision. The impulsive system, on the other hand, is lacking rational reasoning. It is rather impulsive, quick, and affected by motivational factors. Whereas the impulsive system is part of every decision making process, the reflective system is not. As, for instance, it needs more cognitive resources while operating and is easily disturbed.
When transferring the model onto emotional processing and electronic communication aids, it appears that alternative communicators are challenged in both, the impulsive and the reflective system. By definition, emotions are impulsive, quick, and the decisions based on them are often lacking rational reason. Thus, most of the time, emotional behaviour is driven by the impulsive system. Due to slow input-rates, users of a VOCA, indeed, are not able to communicate their emotions quickly and impulsively. They have to rely on the reflecting system. In some cases one might argue that this is the better opportunity as impulsive emotional utterances are regretted at times. On that account children learn that in some situations it is important to not follow their (inappropriate) impulsive behaviour while growing up (Blackstone and Wilkins, 2009). But due to the fact that alternative communicators are often disadvantaged in developing appropriate emotional behaviour (Brinton and Fujiki, 2009; Blackstone and Wilkins, 2009), it is also difficult to provide an adequate basis of knowledge for the reflective system. Thus, in particular for children, is important to communicate impulsively as it also strengthens the ability to make rational choices. Taking Strack´ and Deutsch´s theory (2004) into account it becomes clear that for the purpose of impulsive reactions an intended prosodic VOCA requires a possibility for a fast input-rate.
95
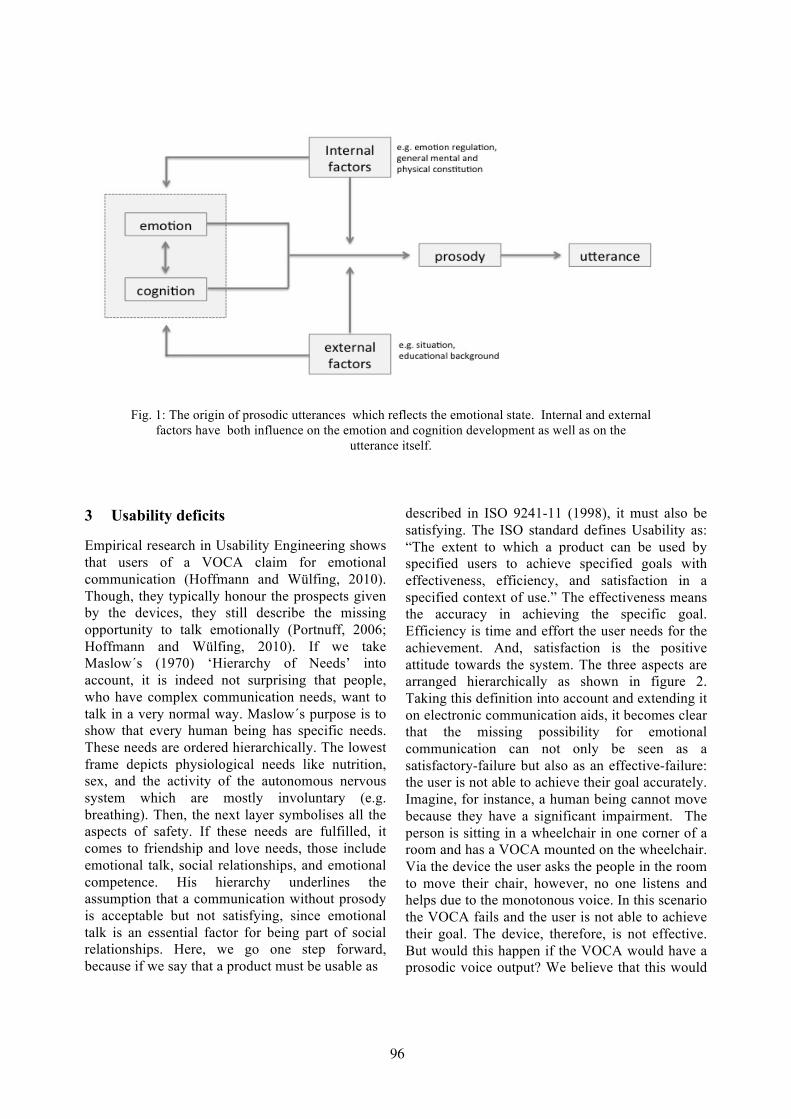
3 Usability deficits
Empirical research in Usability Engineering shows that users of a VOCA claim for emotional communication (Hoffmann and Wülfing, 2010). Though, they typically honour the prospects given by the devices, they still describe the missing opportunity to talk emotionally (Portnuff, 2006; Hoffmann and Wülfing, 2010). If we take Maslow´s (1970) ‘Hierarchy of Needs’ into account, it is indeed not surprising that people, who have complex communication needs, want to talk in a very normal way. Maslow´s purpose is to show that every human being has specific needs. These needs are ordered hierarchically. The lowest frame depicts physiological needs like nutrition, sex, and the activity of the autonomous nervous system which are mostly involuntary (e.g. breathing). Then, the next layer symbolises all the aspects of safety. If these needs are fulfilled, it comes to friendship and love needs, those include emotional talk, social relationships, and emotional competence. His hierarchy underlines the assumption that a communication without prosody is acceptable but not satisfying, since emotional talk is an essential factor for being part of social relationships. Here, we go one step forward, because if we say that a product must be usable as
described in ISO 9241-11 (1998), it must also be satisfying. The ISO standard defines Usability as: “The extent to which a product can be used by specified users to achieve specified goals with effectiveness, efficiency, and satisfaction in a specified context of use.” The effectiveness means the accuracy in achieving the specific goal. Efficiency is time and effort the user needs for the achievement. And, satisfaction is the positive attitude towards the system. The three aspects are arranged hierarchically as shown in figure 2. Taking this definition into account and extending it on electronic communication aids, it becomes clear that the missing possibility for emotional communication can not only be seen as a satisfactory-failure but also as an effective-failure: the user is not able to achieve their goal accurately. Imagine, for instance, a human being cannot move because they have a significant impairment. The person is sitting in a wheelchair in one corner of a room and has a VOCA mounted on the wheelchair. Via the device the user asks the people in the room to move their chair, however, no one listens and helps due to the monotonous voice. In this scenario the VOCA fails and the user is not able to achieve their goal. The device, therefore, is not effective. But would this happen if the VOCA would have a prosodic voice output? We believe that this would
Fig. 1: The origin of prosodic utterances which reflects the emotional state. Internal and external factors have both influence on the emotion and cognition development as well as on the
utterance itself.
96
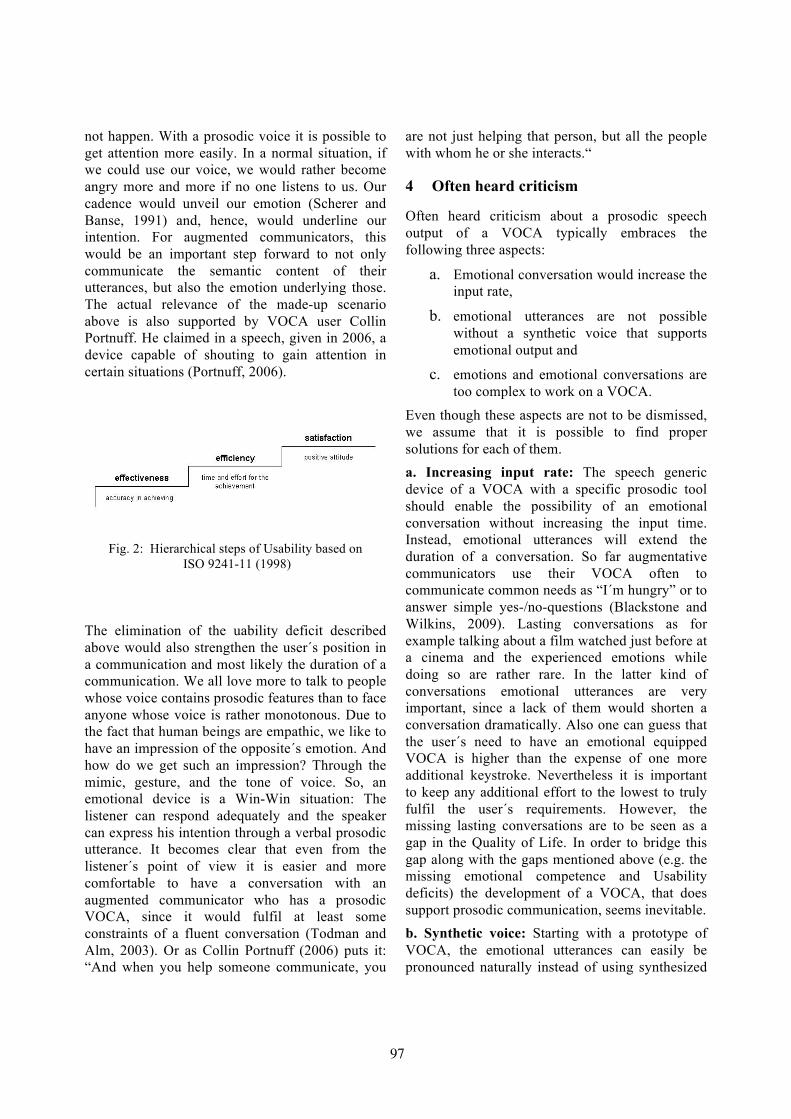
not happen. With a prosodic voice it is possible to get attention more easily. In a normal situation, if we could use our voice, we would rather become angry more and more if no one listens to us. Our cadence would unveil our emotion (Scherer and Banse, 1991) and, hence, would underline our intention. For augmented communicators, this would be an important step forward to not only communicate the semantic content of their utterances, but also the emotion underlying those. The actual relevance of the made-up scenario above is also supported by VOCA user Collin Portnuff. He claimed in a speech, given in 2006, a device capable of shouting to gain attention in certain situations (Portnuff, 2006).
Fig. 2: Hierarchical steps of Usability based on ISO 9241-11 (1998)
The elimination of the uability deficit described above would also strengthen the user´s position in a communication and most likely the duration of a communication. We all love more to talk to people whose voice contains prosodic features than to face anyone whose voice is rather monotonous. Due to the fact that human beings are empathic, we like to have an impression of the opposite´s emotion. And how do we get such an impression? Through the mimic, gesture, and the tone of voice. So, an emotional device is a Win-Win situation: The listener can respond adequately and the speaker can express his intention through a verbal prosodic utterance. It becomes clear that even from the listener´s point of view it is easier and more comfortable to have a conversation with an augmented communicator who has a prosodic VOCA, since it would fulfil at least some constraints of a fluent conversation (Todman and Alm, 2003). Or as Collin Portnuff (2006) puts it: “And when you help someone communicate, you
are not just helping that person, but all the people with whom he or she interacts.“
4 Often heard criticism
Often heard criticism about a prosodic speech output of a VOCA typically embraces the following three aspects:
a. Emotional conversation would increase the input rate,
b. emotional utterances are not possible without a synthetic voice that supports emotional output and
c. emotions and emotional conversations are too complex to work on a VOCA.
Even though these aspects are not to be dismissed, we assume that it is possible to find proper solutions for each of them. a. Increasing input rate: The speech generic device of a VOCA with a specific prosodic tool should enable the possibility of an emotional conversation without increasing the input time. Instead, emotional utterances will extend the duration of a conversation. So far augmentative communicators use their VOCA often to communicate common needs as “I´m hungry” or to answer simple yes-/no-questions (Blackstone and Wilkins, 2009). Lasting conversations as for example talking about a film watched just before at a cinema and the experienced emotions while doing so are rather rare. In the latter kind of conversations emotional utterances are very important, since a lack of them would shorten a conversation dramatically. Also one can guess that the user´s need to have an emotional equipped VOCA is higher than the expense of one more additional keystroke. Nevertheless it is important to keep any additional effort to the lowest to truly fulfil the user´s requirements. However, the missing lasting conversations are to be seen as a gap in the Quality of Life. In order to bridge this gap along with the gaps mentioned above (e.g. the missing emotional competence and Usability deficits) the development of a VOCA, that does support prosodic communication, seems inevitable. b. Synthetic voice: Starting with a prototype of VOCA, the emotional utterances can easily be pronounced naturally instead of using synthesized
97
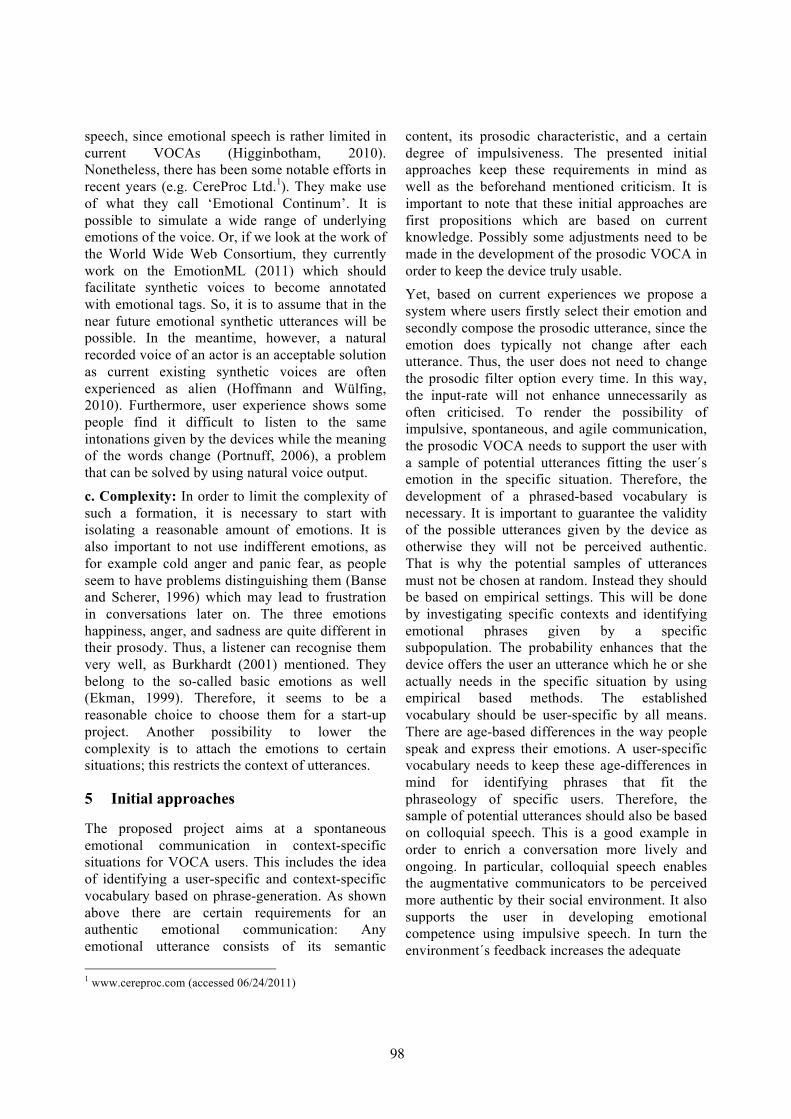
speech, since emotional speech is rather limited in current VOCAs (Higginbotham, 2010). Nonetheless, there has been some notable efforts in recent years (e.g. CereProc Ltd.1). They make use of what they call ‘Emotional Continum’. It is possible to simulate a wide range of underlying emotions of the voice. Or, if we look at the work of the World Wide Web Consortium, they currently work on the EmotionML (2011) which should facilitate synthetic voices to become annotated with emotional tags. So, it is to assume that in the near future emotional synthetic utterances will be possible. In the meantime, however, a natural recorded voice of an actor is an acceptable solution as current existing synthetic voices are often experienced as alien (Hoffmann and Wülfing, 2010). Furthermore, user experience shows some people find it difficult to listen to the same intonations given by the devices while the meaning of the words change (Portnuff, 2006), a problem that can be solved by using natural voice output. c. Complexity: In order to limit the complexity of such a formation, it is necessary to start with isolating a reasonable amount of emotions. It is also important to not use indifferent emotions, as for example cold anger and panic fear, as people seem to have problems distinguishing them (Banse and Scherer, 1996) which may lead to frustration in conversations later on. The three emotions happiness, anger, and sadness are quite different in their prosody. Thus, a listener can recognise them very well, as Burkhardt (2001) mentioned. They belong to the so-called basic emotions as well (Ekman, 1999). Therefore, it seems to be a reasonable choice to choose them for a start-up project. Another possibility to lower the complexity is to attach the emotions to certain situations; this restricts the context of utterances.
5 Initial approaches
The proposed project aims at a spontaneous emotional communication in context-specific situations for VOCA users. This includes the idea of identifying a user-specific and context-specific vocabulary based on phrase-generation. As shown above there are certain requirements for an authentic emotional communication: Any emotional utterance consists of its semantic 1 www.cereproc.com (accessed 06/24/2011)
content, its prosodic characteristic, and a certain degree of impulsiveness. The presented initial approaches keep these requirements in mind as well as the beforehand mentioned criticism. It is important to note that these initial approaches are first propositions which are based on current knowledge. Possibly some adjustments need to be made in the development of the prosodic VOCA in order to keep the device truly usable. Yet, based on current experiences we propose a system where users firstly select their emotion and secondly compose the prosodic utterance, since the emotion does typically not change after each utterance. Thus, the user does not need to change the prosodic filter option every time. In this way, the input-rate will not enhance unnecessarily as often criticised. To render the possibility of impulsive, spontaneous, and agile communication, the prosodic VOCA needs to support the user with a sample of potential utterances fitting the user´s emotion in the specific situation. Therefore, the development of a phrased-based vocabulary is necessary. It is important to guarantee the validity of the possible utterances given by the device as otherwise they will not be perceived authentic. That is why the potential samples of utterances must not be chosen at random. Instead they should be based on empirical settings. This will be done by investigating specific contexts and identifying emotional phrases given by a specific subpopulation. The probability enhances that the device offers the user an utterance which he or she actually needs in the specific situation by using empirical based methods. The established vocabulary should be user-specific by all means. There are age-based differences in the way people speak and express their emotions. A user-specific vocabulary needs to keep these age-differences in mind for identifying phrases that fit the phraseology of specific users. Therefore, the sample of potential utterances should also be based on colloquial speech. This is a good example in order to enrich a conversation more lively and ongoing. In particular, colloquial speech enables the augmentative communicators to be perceived more authentic by their social environment. It also supports the user in developing emotional competence using impulsive speech. In turn the environment´s feedback increases the adequate
98
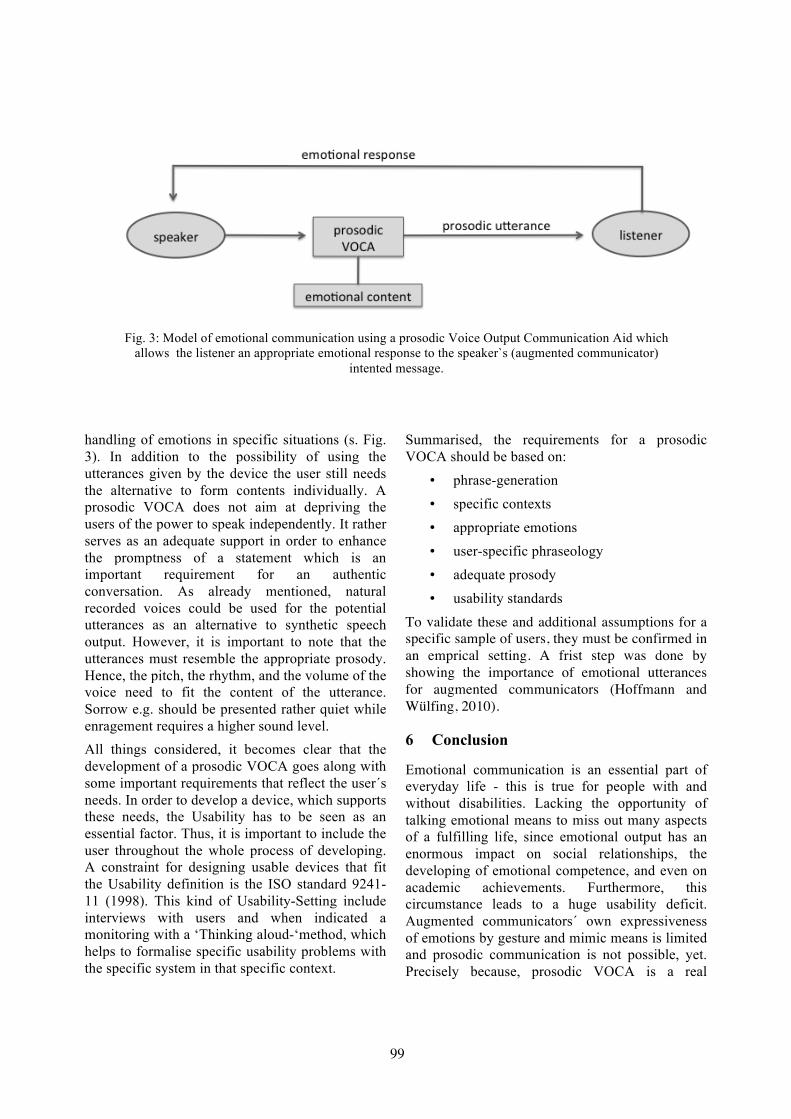
handling of emotions in specific situations (s. Fig. 3). In addition to the possibility of using the utterances given by the device the user still needs the alternative to form contents individually. A prosodic VOCA does not aim at depriving the users of the power to speak independently. It rather serves as an adequate support in order to enhance the promptness of a statement which is an important requirement for an authentic conversation. As already mentioned, natural recorded voices could be used for the potential utterances as an alternative to synthetic speech output. However, it is important to note that the utterances must resemble the appropriate prosody. Hence, the pitch, the rhythm, and the volume of the voice need to fit the content of the utterance. Sorrow e.g. should be presented rather quiet while enragement requires a higher sound level. All things considered, it becomes clear that the development of a prosodic VOCA goes along with some important requirements that reflect the user´s needs. In order to develop a device, which supports these needs, the Usability has to be seen as an essential factor. Thus, it is important to include the user throughout the whole process of developing. A constraint for designing usable devices that fit the Usability definition is the ISO standard 9241-11 (1998). This kind of Usability-Setting include interviews with users and when indicated a monitoring with a ‘Thinking aloud-‘method, which helps to formalise specific usability problems with the specific system in that specific context.
Summarised, the requirements for a prosodic VOCA should be based on:
• phrase-generation • specific contexts • appropriate emotions • user-specific phraseology • adequate prosody • usability standards
To validate these and additional assumptions for a specific sample of users, they must be confirmed in an emprical setting. A frist step was done by showing the importance of emotional utterances for augmented communicators (Hoffmann and Wülfing, 2010).
6 Conclusion
Emotional communication is an essential part of everyday life - this is true for people with and without disabilities. Lacking the opportunity of talking emotional means to miss out many aspects of a fulfilling life, since emotional output has an enormous impact on social relationships, the developing of emotional competence, and even on academic achievements. Furthermore, this circumstance leads to a huge usability deficit. Augmented communicators´ own expressiveness of emotions by gesture and mimic means is limited and prosodic communication is not possible, yet. Precisely because, prosodic VOCA is a real
Fig. 3: Model of emotional communication using a prosodic Voice Output Communication Aid which allows the listener an appropriate emotional response to the speaker`s (augmented communicator)
intented message.
99
innovation. It gives people with complex communications needs the opportunity to express themselves emotionally. It would encourage their participation in social life and, thus, also their Quality of Life. Still, there is a lot of criticism involving this topic, however, with adequate methods and ideas it does seem possible that some day in the future users of a VOCA will be able to communicate emotionally.
References Susan Balandin (2005). Ageing and AAC: Start early,
age well! In Jens Boenisch and Karin Otto (eds.), Leben im Dialog – Unterstützte Kommunikation über die gesamte Lebensspanne (466-478). Von Loeper, Karlsruhe.
Marco W. Battachi, Thomas Suslow, and Margherita
Renna (1997). Emotion & Sprache – Zur Definition der Emotion und ihren Beziehungen zu kognitiven Prozessen, dem Gedächtnis und der Sprache. Peter Lang, Frankfurt a.M.
Rainer Banse and Klaus R. Scherer (1996). Acoustic
profiles in vocal emotion expression. In: Journal of Personality and Social Psychology, 70(3), 614-636.
Sarah W. Blackstone and David P. Wilkins (2009).
Exploring the Importance of Emotional Competence in Children With Complex Communication Needs. In: Perspectives on Augmentative and Alternative Communication, 18, 78-87.
Felix Burkhardt (2001). Simulation emotionaler
Sprechweise mit Sprachsyntheseverfahren. In: Reihe Berichte aus der Kommunikationstechnik. Shaker, Aachen.
Bonnie Brinton and Martin Fujiki (2009). Meet me
more than half way: Emotional competence in conversation using AAC. In: Perspectives on Augmentative and Alternative Communication, 18, 73-77.
Paul Ekman (1999). Basic Emotions. In: Tim Dalgleish
and Mick Power (Eds.), Handbook of Cognition and Emotion. John Wiley & Sons, Sussex, U.K.
Emotion Markup Language 1.0 (2011) W3C working
draft. http://www.w3.org/TR/2011/WD-emotionml-20110407/ (accessed 06/24/2011).
Jeffrey Higginbotham (2010). Humanizing Vox Artificialis: The Role of Speech Synthesis in Augmentative and Alternative Communication. In: John Mullennix and Steven Stern (Eds.), Computer Synthesized Speech Technologies – Tools for Aiding Impairment (50-70). IGI Global, Hershey, PA.
Lisa Hoffmann and Jan-O. Wülfing (2010). Usability of
Electronic Communication Aids in the Light of Daily Use. In: Proceedings of the 14th Biennial Conference of the International Society for Augmentative and Alternative Communication (259). Barcelona, Spain
ISO 9241-11 (1998). Ergonomic requirements for office
work with visual display terminals (VDTs) – Part 11: Guidance on usability.
Bettina Janke (2008). Emotionswissen und
Sozialkompetenz von Kindern im Alter von drei bis zehn Jahren. In: Empirische Pädagogik, 22(2), 127-144.
Abraham H. Maslow (1970). Motivation and
Personality. Harper & Row, New York, NY. Colin Portnuff (2006). AAC: A user´s perspective.
Webcast available as part of the AAC-RERC Webcast Series. http://aac-rerc.psu.edu/index-8121.php.html (accessed 03/30/2011).
Klaus R. Scherer, Rainer Banse, Harald G. Wallbott,
and Thomas Goldbeck (1991). Vocal Cues in Emotion Encoding and Decoding. In: Motivation and Emotion, 15(2), 123-148.
Fritz Strack and Roland Deutsch (2004). Reflective and
Impulsive Determinants of Social Behavior. In: Personality and Social Psychology Review, 8(3), 220-247.
Volker F. Strom (1998). Automatische Erkennung von
Satzmodus, Akzentuierung und Phrasengrenzen. PhD thesis, University of Bonn.
John Todman and Norman Alm (2003). Modelling
conversational pragmatics in communications aids. In: Journal of Pragmatics, 35, 523-538.
Peter B. Vanderheyden and Christopher A. Pennigton
(1998). An Augmentative Communication Interface Based on Conversational Schemata. In: Vibhu O. Mittal, Holly A. Yanco, John Aronis, Richard C. Simpson and Richard Simpson (Eds.): Assistive Technology and AI, LNAI 1458, 109-125.
100
Proceedings of the 2nd Workshop on Speech and Language Processing for Assistive Technologies, pages 101–109,Edinburgh, Scotland, UK, July 30, 2011. c©2011 Association for Computational Linguistics
Arabic Text to Arabic Sign Language Translation System for the Deaf andHearing-Impaired Community
Abdulaziz AlmohimeedUniversity of Southampton
United [email protected]
Mike WaldUniversity of Southampton
United [email protected]
R. I. DamperUniversity of Southampton
United [email protected]
Abstract
This paper describes a machine translationsystem that offers many deaf and hearing-impaired people the chance to access pub-lished information in Arabic by translatingtext into their first language, Arabic Sign Lan-guage (ArSL). The system was created underthe close guidance of a team that includedthree deaf native signers and one ArSL in-terpreter. We discuss problems inherent inthe design and development of such transla-tion systems and review previous ArSL ma-chine translation systems, which all too oftendemonstrate a lack of collaboration betweenengineers and the deaf community. We de-scribe and explain in detail both the adaptedtranslation approach chosen for the proposedsystem and the ArSL corpus that we collectedfor this purpose. The corpus has 203 signedsentences (with 710 distinct signs) with con-tent restricted to the domain of instructionallanguage as typically used in deaf education.Evaluation shows that the system producestranslated sign sentences outputs with an av-erage word error rate of 46.7% and an averageposition error rate of 29.4% using leave-one-out cross validation. The most frequent sourceof errors is missing signs in the corpus; thiscould be addressed in future by collectingmore corpus material.
1 Introduction
Machine translation (MT) has developed rapidlysince 1947, when Warren Weaver first suggestedthe use of computers to translate natural languages(Augarten, 1984). Presently, this technology offers
a potential chance for ArSL signers to benefit by,for instance, giving them access to texts published inArabic. ArSL and general sign language (SL) haveinherent ambiguity problems that should be takeninto account while designing any ArSL translationsystem. Therefore, ArSL translation must be donethrough close collaboration with the deaf commu-nity and signing experts. This paper describes afull prototype MT system that translates Arabictexts into deaf and hearing-impaired peoples’ firstlanguage, Arabic Sign Language (ArSL). It is theresult of extended collaboration between engineersand a team consisting of three deaf native signersand one ArSL interpreter.
Most existing systems have wrongly assumedthat ArSL is dependent on the Arabic language(Mohandes, 2006; Alnafjan, 2008; Halawani, 2008;Al-Khalifa, 2010). These systems make word-to-sign translations without regard to ArSL’s uniquelinguistic characteristics, such as its own grammar,structure, and idioms, as well as regional variations(Abdel-Fateh, 2004) or translate into finger-spellingsigns that only exist in Arabic, not in ArSL.
This paper begins by providing a brief back-ground of ArSL. It then addresses the problems andmisconceptions plaguing previous ArSL systems.Thereafter, it describes related works built on theassumption of one of the two misconceptions men-tioned above. The rest of the paper will present anexample-based machine translation (EBMT) systemthat translates published Arabic texts to make themaccessible to deaf and hearing-impaired people whouse ArSL.
101
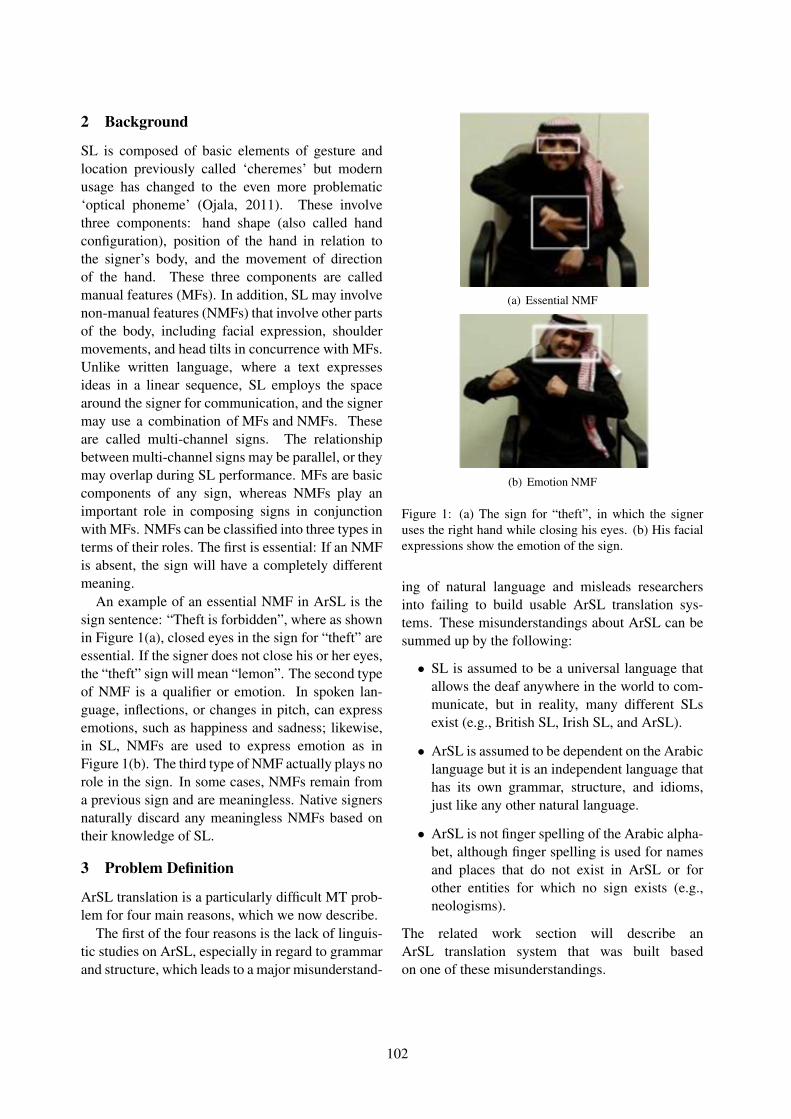
2 Background
SL is composed of basic elements of gesture andlocation previously called ‘cheremes’ but modernusage has changed to the even more problematic‘optical phoneme’ (Ojala, 2011). These involvethree components: hand shape (also called handconfiguration), position of the hand in relation tothe signer’s body, and the movement of directionof the hand. These three components are calledmanual features (MFs). In addition, SL may involvenon-manual features (NMFs) that involve other partsof the body, including facial expression, shouldermovements, and head tilts in concurrence with MFs.Unlike written language, where a text expressesideas in a linear sequence, SL employs the spacearound the signer for communication, and the signermay use a combination of MFs and NMFs. Theseare called multi-channel signs. The relationshipbetween multi-channel signs may be parallel, or theymay overlap during SL performance. MFs are basiccomponents of any sign, whereas NMFs play animportant role in composing signs in conjunctionwith MFs. NMFs can be classified into three types interms of their roles. The first is essential: If an NMFis absent, the sign will have a completely differentmeaning.
An example of an essential NMF in ArSL is thesign sentence: “Theft is forbidden”, where as shownin Figure 1(a), closed eyes in the sign for “theft” areessential. If the signer does not close his or her eyes,the “theft” sign will mean “lemon”. The second typeof NMF is a qualifier or emotion. In spoken lan-guage, inflections, or changes in pitch, can expressemotions, such as happiness and sadness; likewise,in SL, NMFs are used to express emotion as inFigure 1(b). The third type of NMF actually plays norole in the sign. In some cases, NMFs remain froma previous sign and are meaningless. Native signersnaturally discard any meaningless NMFs based ontheir knowledge of SL.
3 Problem Definition
ArSL translation is a particularly difficult MT prob-lem for four main reasons, which we now describe.
The first of the four reasons is the lack of linguis-tic studies on ArSL, especially in regard to grammarand structure, which leads to a major misunderstand-
(a) Essential NMF
(b) Emotion NMF
Figure 1: (a) The sign for “theft”, in which the signeruses the right hand while closing his eyes. (b) His facialexpressions show the emotion of the sign.
ing of natural language and misleads researchersinto failing to build usable ArSL translation sys-tems. These misunderstandings about ArSL can besummed up by the following:
• SL is assumed to be a universal language thatallows the deaf anywhere in the world to com-municate, but in reality, many different SLsexist (e.g., British SL, Irish SL, and ArSL).
• ArSL is assumed to be dependent on the Arabiclanguage but it is an independent language thathas its own grammar, structure, and idioms,just like any other natural language.
• ArSL is not finger spelling of the Arabic alpha-bet, although finger spelling is used for namesand places that do not exist in ArSL or forother entities for which no sign exists (e.g.,neologisms).
The related work section will describe anArSL translation system that was built basedon one of these misunderstandings.
102
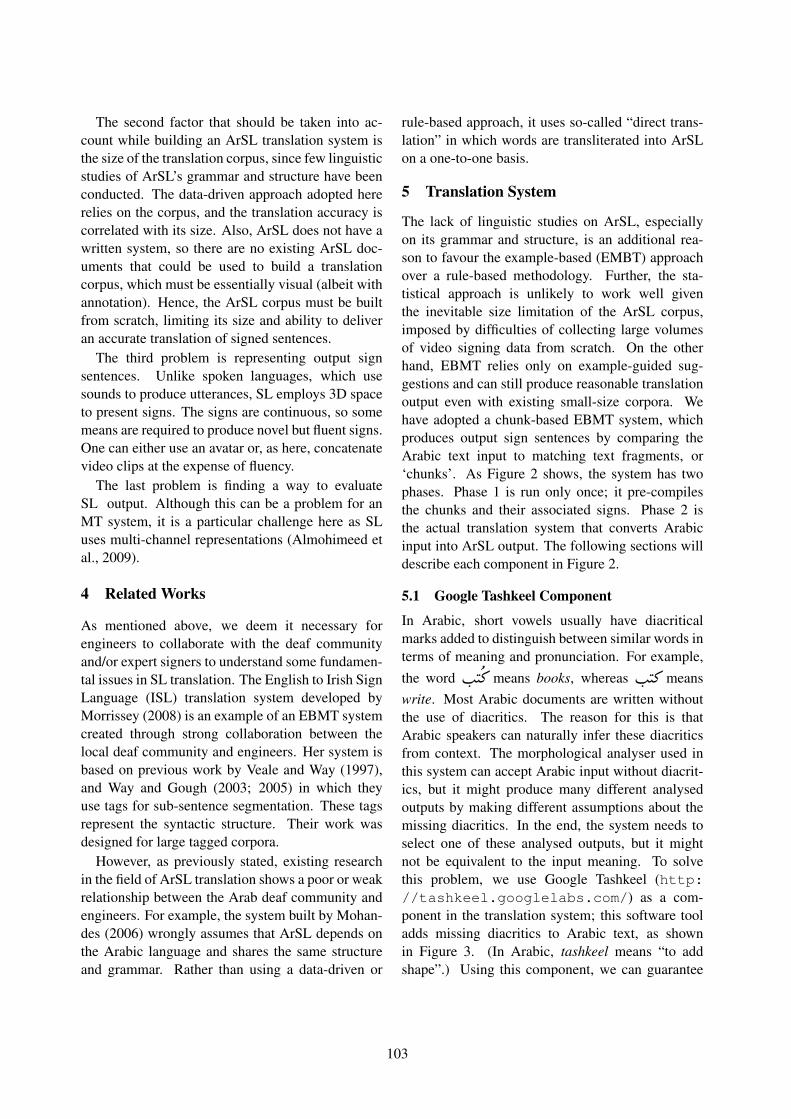
The second factor that should be taken into ac-count while building an ArSL translation system isthe size of the translation corpus, since few linguisticstudies of ArSL’s grammar and structure have beenconducted. The data-driven approach adopted hererelies on the corpus, and the translation accuracy iscorrelated with its size. Also, ArSL does not have awritten system, so there are no existing ArSL doc-uments that could be used to build a translationcorpus, which must be essentially visual (albeit withannotation). Hence, the ArSL corpus must be builtfrom scratch, limiting its size and ability to deliveran accurate translation of signed sentences.
The third problem is representing output signsentences. Unlike spoken languages, which usesounds to produce utterances, SL employs 3D spaceto present signs. The signs are continuous, so somemeans are required to produce novel but fluent signs.One can either use an avatar or, as here, concatenatevideo clips at the expense of fluency.
The last problem is finding a way to evaluateSL output. Although this can be a problem for anMT system, it is a particular challenge here as SLuses multi-channel representations (Almohimeed etal., 2009).
4 Related Works
As mentioned above, we deem it necessary forengineers to collaborate with the deaf communityand/or expert signers to understand some fundamen-tal issues in SL translation. The English to Irish SignLanguage (ISL) translation system developed byMorrissey (2008) is an example of an EBMT systemcreated through strong collaboration between thelocal deaf community and engineers. Her system isbased on previous work by Veale and Way (1997),and Way and Gough (2003; 2005) in which theyuse tags for sub-sentence segmentation. These tagsrepresent the syntactic structure. Their work wasdesigned for large tagged corpora.
However, as previously stated, existing researchin the field of ArSL translation shows a poor or weakrelationship between the Arab deaf community andengineers. For example, the system built by Mohan-des (2006) wrongly assumes that ArSL depends onthe Arabic language and shares the same structureand grammar. Rather than using a data-driven or
rule-based approach, it uses so-called “direct trans-lation” in which words are transliterated into ArSLon a one-to-one basis.
5 Translation System
The lack of linguistic studies on ArSL, especiallyon its grammar and structure, is an additional rea-son to favour the example-based (EMBT) approachover a rule-based methodology. Further, the sta-tistical approach is unlikely to work well giventhe inevitable size limitation of the ArSL corpus,imposed by difficulties of collecting large volumesof video signing data from scratch. On the otherhand, EBMT relies only on example-guided sug-gestions and can still produce reasonable translationoutput even with existing small-size corpora. Wehave adopted a chunk-based EBMT system, whichproduces output sign sentences by comparing theArabic text input to matching text fragments, or‘chunks’. As Figure 2 shows, the system has twophases. Phase 1 is run only once; it pre-compilesthe chunks and their associated signs. Phase 2 isthe actual translation system that converts Arabicinput into ArSL output. The following sections willdescribe each component in Figure 2.
5.1 Google Tashkeel Component
In Arabic, short vowels usually have diacriticalmarks added to distinguish between similar words interms of meaning and pronunciation. For example,the word I.
�J�» means books, whereas I.
�J» means
write. Most Arabic documents are written withoutthe use of diacritics. The reason for this is thatArabic speakers can naturally infer these diacriticsfrom context. The morphological analyser used inthis system can accept Arabic input without diacrit-ics, but it might produce many different analysedoutputs by making different assumptions about themissing diacritics. In the end, the system needs toselect one of these analysed outputs, but it mightnot be equivalent to the input meaning. To solvethis problem, we use Google Tashkeel (http://tashkeel.googlelabs.com/) as a com-ponent in the translation system; this software tooladds missing diacritics to Arabic text, as shownin Figure 3. (In Arabic, tashkeel means “to addshape”.) Using this component, we can guarantee
103
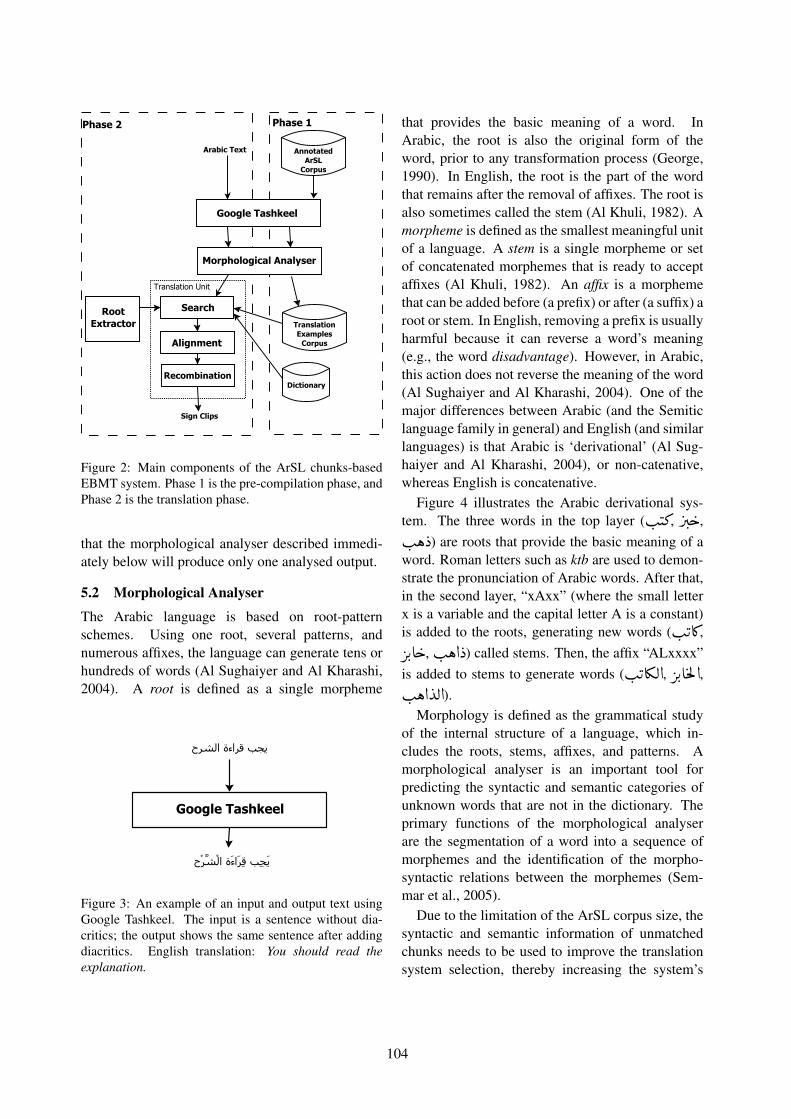
Phase 2 Phase 1
Sign Clips
Arabic Text AnnotatedArSLCorpus
Google Tashkeel
Morphological Analyser
RootExtractor Translation
ExamplesCorpus
Search
Alignment
RecombinationDictionary
Translation Unit
Figure 2: Main components of the ArSL chunks-basedEBMT system. Phase 1 is the pre-compilation phase, andPhase 2 is the translation phase.
that the morphological analyser described immedi-ately below will produce only one analysed output.
5.2 Morphological Analyser
The Arabic language is based on root-patternschemes. Using one root, several patterns, andnumerous affixes, the language can generate tens orhundreds of words (Al Sughaiyer and Al Kharashi,2004). A root is defined as a single morpheme
Google Tashkeel
يجب قراءة الشرح
يجب قراءة الشرح
Figure 3: An example of an input and output text usingGoogle Tashkeel. The input is a sentence without dia-critics; the output shows the same sentence after addingdiacritics. English translation: You should read theexplanation.
that provides the basic meaning of a word. InArabic, the root is also the original form of theword, prior to any transformation process (George,1990). In English, the root is the part of the wordthat remains after the removal of affixes. The root isalso sometimes called the stem (Al Khuli, 1982). Amorpheme is defined as the smallest meaningful unitof a language. A stem is a single morpheme or setof concatenated morphemes that is ready to acceptaffixes (Al Khuli, 1982). An affix is a morphemethat can be added before (a prefix) or after (a suffix) aroot or stem. In English, removing a prefix is usuallyharmful because it can reverse a word’s meaning(e.g., the word disadvantage). However, in Arabic,this action does not reverse the meaning of the word(Al Sughaiyer and Al Kharashi, 2004). One of themajor differences between Arabic (and the Semiticlanguage family in general) and English (and similarlanguages) is that Arabic is ‘derivational’ (Al Sug-haiyer and Al Kharashi, 2004), or non-catenative,whereas English is concatenative.
Figure 4 illustrates the Arabic derivational sys-tem. The three words in the top layer (I.
�J», Q�.
g,
I. ëX) are roots that provide the basic meaning of a
word. Roman letters such as ktb are used to demon-strate the pronunciation of Arabic words. After that,in the second layer, “xAxx” (where the small letterx is a variable and the capital letter A is a constant)is added to the roots, generating new words (I.
�KA¿,
QK. A
g, I. ë@X) called stems. Then, the affix “ALxxxx”
is added to stems to generate words (I.�KA¾Ë@, QK. A
mÌ'@,
I. ë@YË@).
Morphology is defined as the grammatical studyof the internal structure of a language, which in-cludes the roots, stems, affixes, and patterns. Amorphological analyser is an important tool forpredicting the syntactic and semantic categories ofunknown words that are not in the dictionary. Theprimary functions of the morphological analyserare the segmentation of a word into a sequence ofmorphemes and the identification of the morpho-syntactic relations between the morphemes (Sem-mar et al., 2005).
Due to the limitation of the ArSL corpus size, thesyntactic and semantic information of unmatchedchunks needs to be used to improve the translationsystem selection, thereby increasing the system’s
104
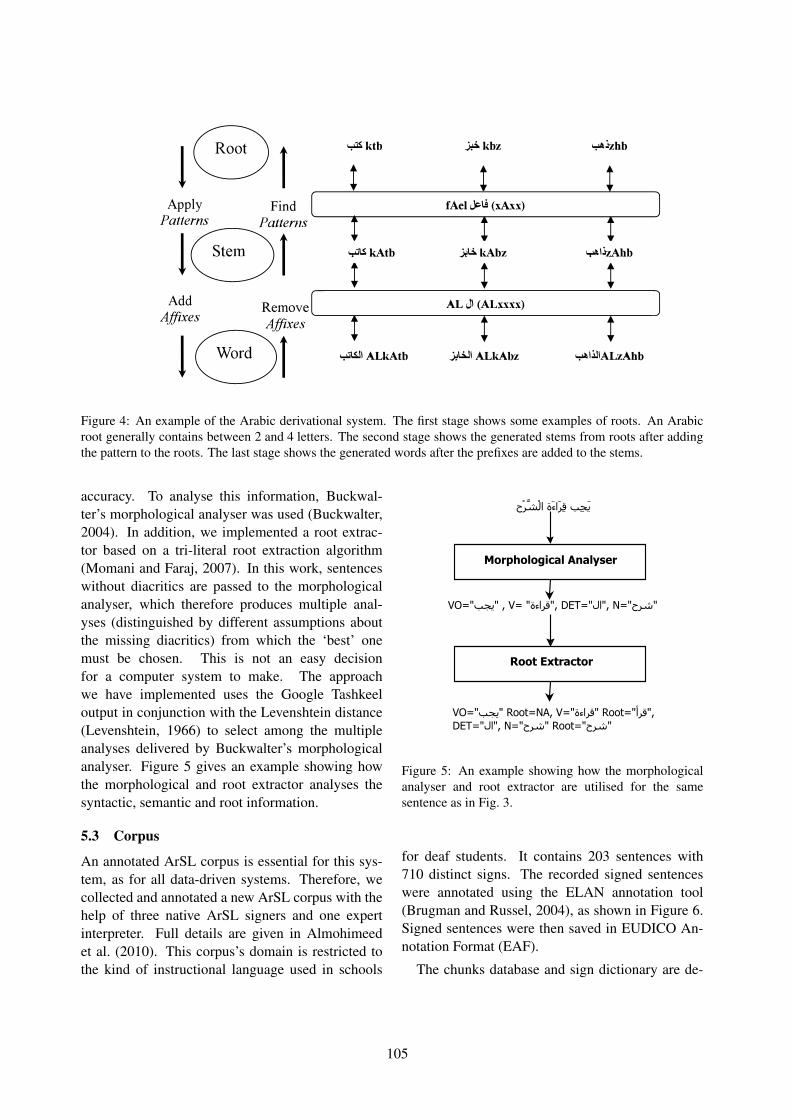
Figure 4: An example of the Arabic derivational system. The first stage shows some examples of roots. An Arabicroot generally contains between 2 and 4 letters. The second stage shows the generated stems from roots after addingthe pattern to the roots. The last stage shows the generated words after the prefixes are added to the stems.
accuracy. To analyse this information, Buckwal-ter’s morphological analyser was used (Buckwalter,2004). In addition, we implemented a root extrac-tor based on a tri-literal root extraction algorithm(Momani and Faraj, 2007). In this work, sentenceswithout diacritics are passed to the morphologicalanalyser, which therefore produces multiple anal-yses (distinguished by different assumptions aboutthe missing diacritics) from which the ‘best’ onemust be chosen. This is not an easy decisionfor a computer system to make. The approachwe have implemented uses the Google Tashkeeloutput in conjunction with the Levenshtein distance(Levenshtein, 1966) to select among the multipleanalyses delivered by Buckwalter’s morphologicalanalyser. Figure 5 gives an example showing howthe morphological and root extractor analyses thesyntactic, semantic and root information.
5.3 Corpus
An annotated ArSL corpus is essential for this sys-tem, as for all data-driven systems. Therefore, wecollected and annotated a new ArSL corpus with thehelp of three native ArSL signers and one expertinterpreter. Full details are given in Almohimeedet al. (2010). This corpus’s domain is restricted tothe kind of instructional language used in schools
يجب قراءة الشرح
VO="يجب" , V= "قراءة", DET="ال", N="شرح"
VO="يجب" Root=NA, V="قراءة" Root="قرأ", DET="ال", N="شرح" Root="شرح"
Morphological Analyser
Root Extractor
Figure 5: An example showing how the morphologicalanalyser and root extractor are utilised for the samesentence as in Fig. 3.
for deaf students. It contains 203 sentences with710 distinct signs. The recorded signed sentenceswere annotated using the ELAN annotation tool(Brugman and Russel, 2004), as shown in Figure 6.Signed sentences were then saved in EUDICO An-notation Format (EAF).
The chunks database and sign dictionary are de-
105
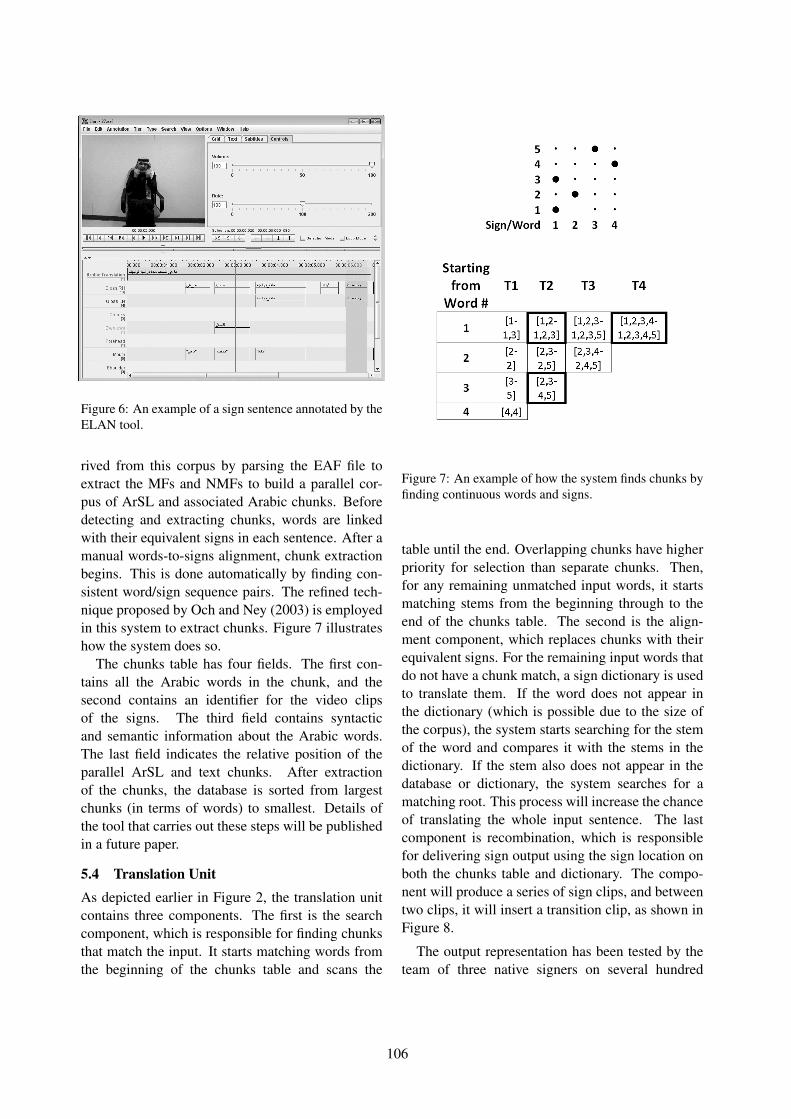
Figure 6: An example of a sign sentence annotated by theELAN tool.
rived from this corpus by parsing the EAF file toextract the MFs and NMFs to build a parallel cor-pus of ArSL and associated Arabic chunks. Beforedetecting and extracting chunks, words are linkedwith their equivalent signs in each sentence. After amanual words-to-signs alignment, chunk extractionbegins. This is done automatically by finding con-sistent word/sign sequence pairs. The refined tech-nique proposed by Och and Ney (2003) is employedin this system to extract chunks. Figure 7 illustrateshow the system does so.
The chunks table has four fields. The first con-tains all the Arabic words in the chunk, and thesecond contains an identifier for the video clipsof the signs. The third field contains syntacticand semantic information about the Arabic words.The last field indicates the relative position of theparallel ArSL and text chunks. After extractionof the chunks, the database is sorted from largestchunks (in terms of words) to smallest. Details ofthe tool that carries out these steps will be publishedin a future paper.
5.4 Translation UnitAs depicted earlier in Figure 2, the translation unitcontains three components. The first is the searchcomponent, which is responsible for finding chunksthat match the input. It starts matching words fromthe beginning of the chunks table and scans the
Figure 7: An example of how the system finds chunks byfinding continuous words and signs.
table until the end. Overlapping chunks have higherpriority for selection than separate chunks. Then,for any remaining unmatched input words, it startsmatching stems from the beginning through to theend of the chunks table. The second is the align-ment component, which replaces chunks with theirequivalent signs. For the remaining input words thatdo not have a chunk match, a sign dictionary is usedto translate them. If the word does not appear inthe dictionary (which is possible due to the size ofthe corpus), the system starts searching for the stemof the word and compares it with the stems in thedictionary. If the stem also does not appear in thedatabase or dictionary, the system searches for amatching root. This process will increase the chanceof translating the whole input sentence. The lastcomponent is recombination, which is responsiblefor delivering sign output using the sign location onboth the chunks table and dictionary. The compo-nent will produce a series of sign clips, and betweentwo clips, it will insert a transition clip, as shown inFigure 8.
The output representation has been tested by theteam of three native signers on several hundred
106
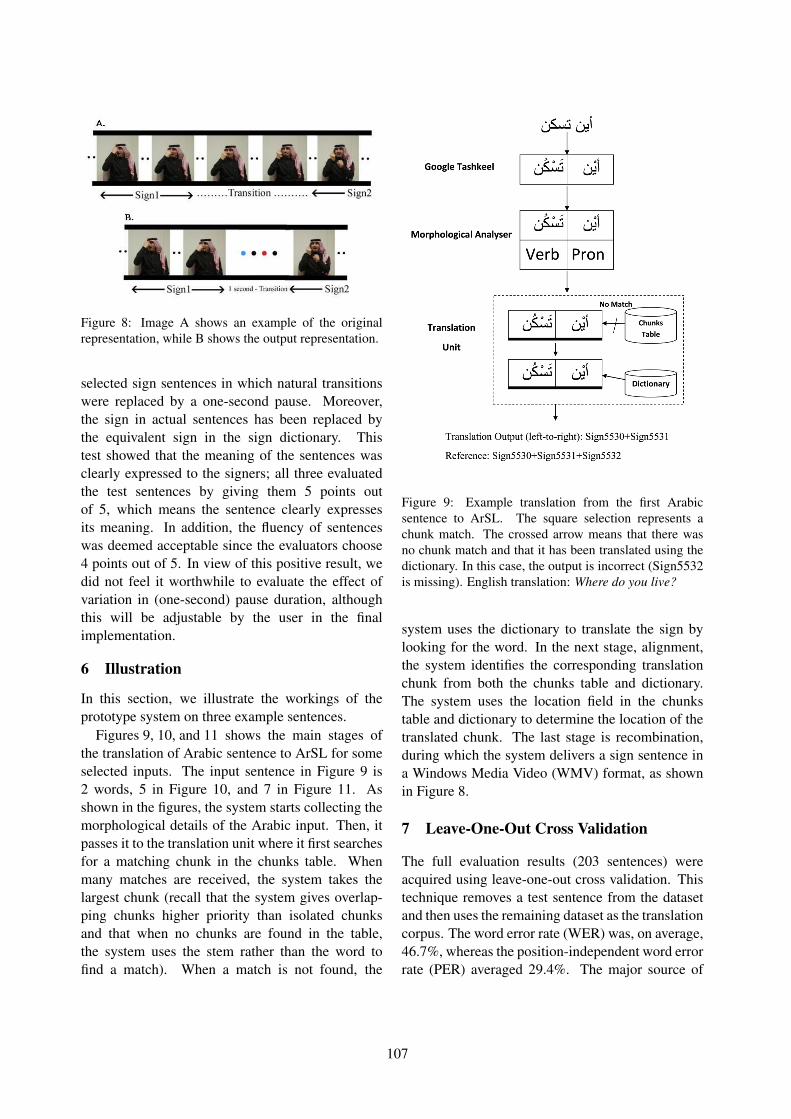
Figure 8: Image A shows an example of the originalrepresentation, while B shows the output representation.
selected sign sentences in which natural transitionswere replaced by a one-second pause. Moreover,the sign in actual sentences has been replaced bythe equivalent sign in the sign dictionary. Thistest showed that the meaning of the sentences wasclearly expressed to the signers; all three evaluatedthe test sentences by giving them 5 points outof 5, which means the sentence clearly expressesits meaning. In addition, the fluency of sentenceswas deemed acceptable since the evaluators choose4 points out of 5. In view of this positive result, wedid not feel it worthwhile to evaluate the effect ofvariation in (one-second) pause duration, althoughthis will be adjustable by the user in the finalimplementation.
6 Illustration
In this section, we illustrate the workings of theprototype system on three example sentences.
Figures 9, 10, and 11 shows the main stages ofthe translation of Arabic sentence to ArSL for someselected inputs. The input sentence in Figure 9 is2 words, 5 in Figure 10, and 7 in Figure 11. Asshown in the figures, the system starts collecting themorphological details of the Arabic input. Then, itpasses it to the translation unit where it first searchesfor a matching chunk in the chunks table. Whenmany matches are received, the system takes thelargest chunk (recall that the system gives overlap-ping chunks higher priority than isolated chunksand that when no chunks are found in the table,the system uses the stem rather than the word tofind a match). When a match is not found, the
Figure 9: Example translation from the first Arabicsentence to ArSL. The square selection represents achunk match. The crossed arrow means that there wasno chunk match and that it has been translated using thedictionary. In this case, the output is incorrect (Sign5532is missing). English translation: Where do you live?
system uses the dictionary to translate the sign bylooking for the word. In the next stage, alignment,the system identifies the corresponding translationchunk from both the chunks table and dictionary.The system uses the location field in the chunkstable and dictionary to determine the location of thetranslated chunk. The last stage is recombination,during which the system delivers a sign sentence ina Windows Media Video (WMV) format, as shownin Figure 8.
7 Leave-One-Out Cross Validation
The full evaluation results (203 sentences) wereacquired using leave-one-out cross validation. Thistechnique removes a test sentence from the datasetand then uses the remaining dataset as the translationcorpus. The word error rate (WER) was, on average,46.7%, whereas the position-independent word errorrate (PER) averaged 29.4%. The major source of
107
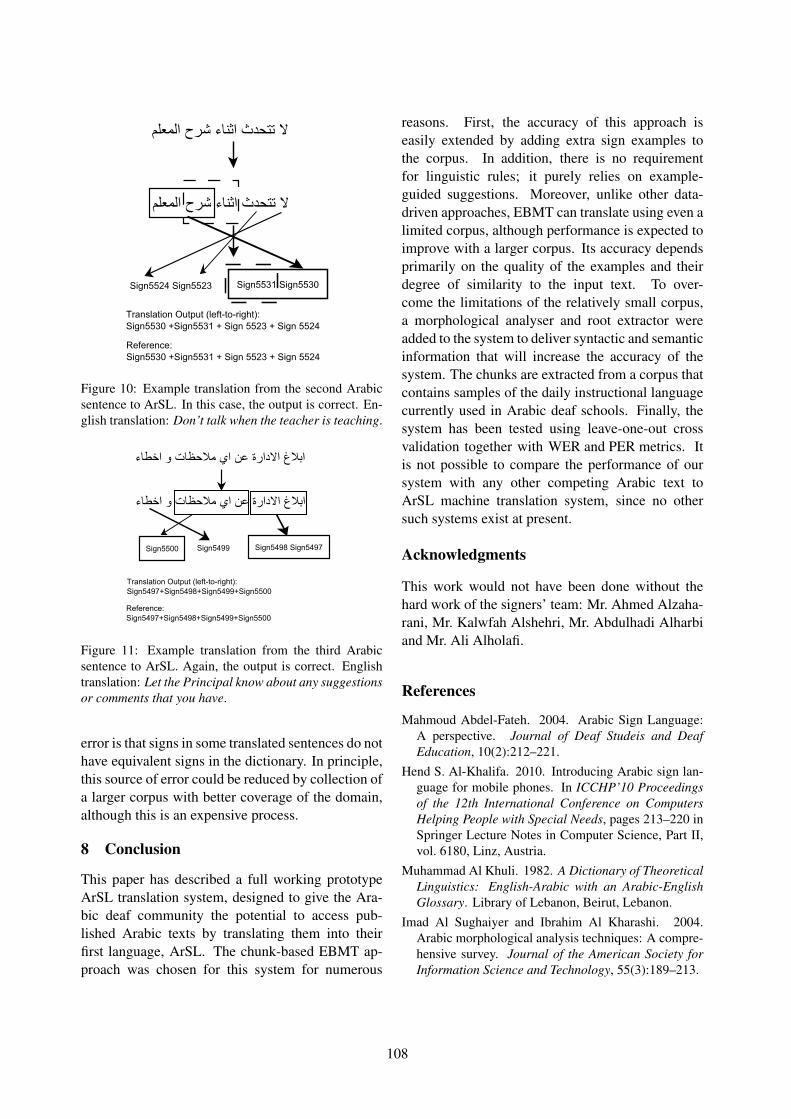
Figure 10: Example translation from the second Arabicsentence to ArSL. In this case, the output is correct. En-glish translation: Don’t talk when the teacher is teaching.
Figure 11: Example translation from the third Arabicsentence to ArSL. Again, the output is correct. Englishtranslation: Let the Principal know about any suggestionsor comments that you have.
error is that signs in some translated sentences do nothave equivalent signs in the dictionary. In principle,this source of error could be reduced by collection ofa larger corpus with better coverage of the domain,although this is an expensive process.
8 Conclusion
This paper has described a full working prototypeArSL translation system, designed to give the Ara-bic deaf community the potential to access pub-lished Arabic texts by translating them into theirfirst language, ArSL. The chunk-based EBMT ap-proach was chosen for this system for numerous
reasons. First, the accuracy of this approach iseasily extended by adding extra sign examples tothe corpus. In addition, there is no requirementfor linguistic rules; it purely relies on example-guided suggestions. Moreover, unlike other data-driven approaches, EBMT can translate using even alimited corpus, although performance is expected toimprove with a larger corpus. Its accuracy dependsprimarily on the quality of the examples and theirdegree of similarity to the input text. To over-come the limitations of the relatively small corpus,a morphological analyser and root extractor wereadded to the system to deliver syntactic and semanticinformation that will increase the accuracy of thesystem. The chunks are extracted from a corpus thatcontains samples of the daily instructional languagecurrently used in Arabic deaf schools. Finally, thesystem has been tested using leave-one-out crossvalidation together with WER and PER metrics. Itis not possible to compare the performance of oursystem with any other competing Arabic text toArSL machine translation system, since no othersuch systems exist at present.
Acknowledgments
This work would not have been done without thehard work of the signers’ team: Mr. Ahmed Alzaha-rani, Mr. Kalwfah Alshehri, Mr. Abdulhadi Alharbiand Mr. Ali Alholafi.
References
Mahmoud Abdel-Fateh. 2004. Arabic Sign Language:A perspective. Journal of Deaf Studeis and DeafEducation, 10(2):212–221.
Hend S. Al-Khalifa. 2010. Introducing Arabic sign lan-guage for mobile phones. In ICCHP’10 Proceedingsof the 12th International Conference on ComputersHelping People with Special Needs, pages 213–220 inSpringer Lecture Notes in Computer Science, Part II,vol. 6180, Linz, Austria.
Muhammad Al Khuli. 1982. A Dictionary of TheoreticalLinguistics: English-Arabic with an Arabic-EnglishGlossary. Library of Lebanon, Beirut, Lebanon.
Imad Al Sughaiyer and Ibrahim Al Kharashi. 2004.Arabic morphological analysis techniques: A compre-hensive survey. Journal of the American Society forInformation Science and Technology, 55(3):189–213.
108
Abdulaziz Almohimeed, Mike Wald, and R. I. Damper.2009. A new evaluation approach for sign lan-guage machine translation. In Assistive Technologyfrom Adapted Equipment to Inclusive Environments,AAATE 2009, Volume 25, pages 498–502, Florence,Italy.
Abdulaziz Almohimeed, Mike Wald, and Robert Damper.2010. An Arabic Sign Language corpus for instruc-tional language in school. In Proceedings of the Sev-enth International Conference on Language Resourcesand Evaluation, LREC, pages 81–91, Valetta, Malta.
Abeer Alnafjan. 2008. Tawasoul. Master’s thesis, De-partment of Computer Science, King Saud University,Riyadh, Saudi Arabia.
Stan Augarten. 1984. Bit by Bit: An Illustrated Historyof Computers. Tickner and Fields, New York, NY.
Hennie Brugman and Albert Russel. 2004. Annotatingmultimedia/multi-modal resources with ELAN. InProceedings of the Fourth International Conferenceon Language Resources and Evaluation, LREC, pages2065–2068, Lisbon, Portugal.
Tim Buckwalter. 2004. Issues in arabic orthography andmorphology analysis. In Proceedings of the Workshopon Computational Approaches to Arabic Script-basedLanguages, CAASL, pages 31–34, Geneva, Switzer-land.
Metri George. 1990. Al Khaleel: A Dictionary of ArabicSyntax Terms. Library of Lebanon, Beirut, Lebanon.
Sami M. Halawani. 2008. Arabic Sign Language transla-tion system on mobile devices. IJCSNS InternationalJournal of Computer Science and Network Security,8(1):251–256.
Vladimir I. Levenshtein. 1966. Binary codes capable ofcorrecting deletions, insertions, and reversals. SovietPhysics Doklady, 10(8):707–710.
Mohamed Mohandes. 2006. Automatic translation ofArabic text to Arabic Sign Language. ICGST Interna-
tional Journal on Artificial Intelligence and MachineLearning, 6(4):15–19.
Mohanned Momani and Jamil Faraj. 2007. A novelalgorithm to extract tri-literal arabic roots. In Proceed-ings ACS/IEEE International Conference on Com-puter Systems and Applications, pages 309–315, Am-man, Jordan.
Sara Morrissey. 2008. Data-Driven Machine Transla-tion for Sign Languages. Ph.D. thesis, Dublin CityUniversity, Dublin, Ireland.
Franz Josef Och and Hermann Ney. 2003. A systematiccomparison of various statistical alignment models.Computational Linguistics, 29(1):19–51.
Sinja Ojala. 2011. Studies on individuality in speech andsign. Technical Report No. 135, TUCS Dissertations,Turku Centre for Computer Science, University ofTurku, Finland.
Nasredine Semmar, Faıza Elkateb-Gara, and ChristianFluhr. 2005. Using a stemmer in a natural languageprocessing system to treat Arabic for cross-languageinformation retrieval. In Proceedings of the FifthConference on Language Engineering, pages 1–10,Cairo, Egypt.
Tony Veale and Andy Way. 1997. Gaijin: A bootstrap-ping approach to example-based machine translation.In Proceedings of the Second Conference on RecentAdvances in Natural Language Processing, RANLP,pages 27–34, Tzigov Chark, Bulgaria.
Andy Way and Nano Gough. 2003. wEBMT: developingand validating an example-based machine translationsystem using the world wide web. ComputationalLinguistics, 29(3):421–457.
Andy Way and Nano Gough. 2005. Comparing example-based and statistical machine translation. NaturalLanguage Engineering, 11(3):295–309.
109
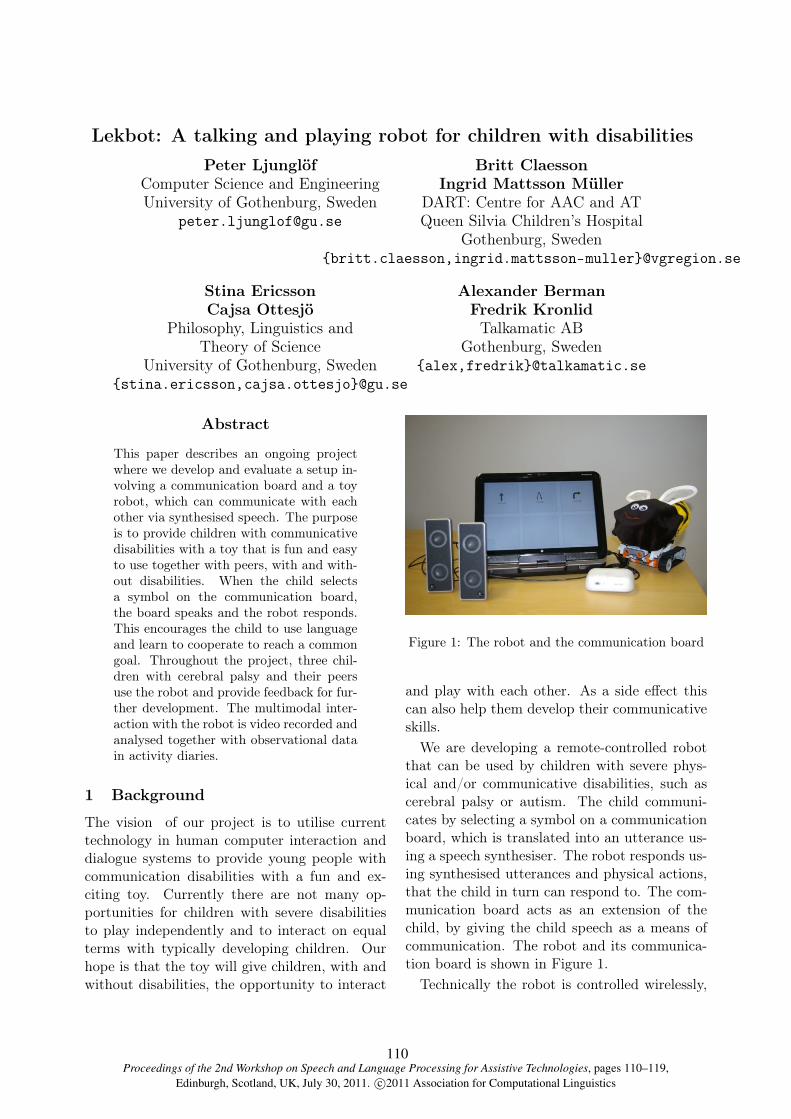
Proceedings of the 2nd Workshop on Speech and Language Processing for Assistive Technologies, pages 110–119,Edinburgh, Scotland, UK, July 30, 2011. c©2011 Association for Computational Linguistics
Lekbot: A talking and playing robot for children with disabilitiesPeter Ljunglöf
Computer Science and EngineeringUniversity of Gothenburg, Sweden
Britt ClaessonIngrid Mattsson Müller
DART: Centre for AAC and ATQueen Silvia Children’s Hospital
Gothenburg, Sweden{britt.claesson,ingrid.mattsson-muller}@vgregion.se
Stina EricssonCajsa Ottesjö
Philosophy, Linguistics andTheory of Science
University of Gothenburg, Sweden{stina.ericsson,cajsa.ottesjo}@gu.se
Alexander BermanFredrik KronlidTalkamatic AB
Gothenburg, Sweden{alex,fredrik}@talkamatic.se
Abstract
This paper describes an ongoing projectwhere we develop and evaluate a setup in-volving a communication board and a toyrobot, which can communicate with eachother via synthesised speech. The purposeis to provide children with communicativedisabilities with a toy that is fun and easyto use together with peers, with and with-out disabilities. When the child selectsa symbol on the communication board,the board speaks and the robot responds.This encourages the child to use languageand learn to cooperate to reach a commongoal. Throughout the project, three chil-dren with cerebral palsy and their peersuse the robot and provide feedback for fur-ther development. The multimodal inter-action with the robot is video recorded andanalysed together with observational datain activity diaries.
1 Background
The vision of our project is to utilise currenttechnology in human computer interaction anddialogue systems to provide young people withcommunication disabilities with a fun and ex-citing toy. Currently there are not many op-portunities for children with severe disabilitiesto play independently and to interact on equalterms with typically developing children. Ourhope is that the toy will give children, with andwithout disabilities, the opportunity to interact
Figure 1: The robot and the communication board
and play with each other. As a side effect thiscan also help them develop their communicativeskills.We are developing a remote-controlled robot
that can be used by children with severe phys-ical and/or communicative disabilities, such ascerebral palsy or autism. The child communi-cates by selecting a symbol on a communicationboard, which is translated into an utterance us-ing a speech synthesiser. The robot responds us-ing synthesised utterances and physical actions,that the child in turn can respond to. The com-munication board acts as an extension of thechild, by giving the child speech as a means ofcommunication. The robot and its communica-tion board is shown in Figure 1.Technically the robot is controlled wirelessly,
110
with no speech recognition. The spoken dialogueis there for the benefit of the child, and enablesthe child to engage in a spoken dialogue, withouthaving the physical and/or cognitive ability todo so. Our hope is that this will facilitate thechild’s own language development while havingfun with the radio-controlled robot.
1.1 The Lekbot project
The Lekbot project is a collaboration betweenDART,1 Talkamatic AB and the University ofGothenburg. It is funded by VINNOVA2 andruns from March 2010 to August 2011.The project is similar to the TRIK project
(Ljunglöf et al., 2009), which developed a draw-ing robot that was controlled in the same man-ner as above. The very limited user study thatwas conducted suggested that the product hadgreat potential. The current project can be seenas a continuation of TRIK, where we perform amore full-scale user study, with video recording,transcription, interaction analyses, etc.
1.2 Dialogue systems and robots
Most existing dialogue systems are meant to beused by competent language users without phys-ical, cognitive or communicative disabilities; ei-ther they are supposed to be spoken to (e.g.,phone based systems), or one has to be able totype the utterances (e.g., the interactive agentsthat can be found on the web). Dialogue sys-tems for users with disabilities have so far beentargeted at people with physical disabilities, whoneed help in performing daily activities.Dialogue systems have also been used for sec-
ond language learning; i.e., learning a new lan-guage for already language competent people.Two examples are the artificial agent “Ville: TheVirtual Language Tutor” (Beskow et al., 2004),and “SCILL: Spoken Conversational Interfacefor Language Learning”, a system for practicingMandarin Chinese (Seneff et al., 2004).However, we are not aware of any examples
where a dialogue system is used for communicat-1Centre for AAC and AT at the Queen Silvia Chil-
dren’s Hospital2The Swedish Governmental Agency for Innovation
Systems
ing with people with communication disorders.With the advent of tablet computers, there
now exist several spoken-language and touch-screen apps for children’s games and interactiveand linguistic training. In these apps, the in-teraction is between the child and the tablet,whereas in Lekbot the child and the tablet acttogether as one dialogue participant, interact-ing with the robot. The Lekbot robot is also aphysical agent, acting in the world, thus addinganother dimension to the interaction.When it comes to robots, there are a number
of past and present research projects on robotsand children. An early inspiration is the LOGOrobot developed at Massachusetts Institute ofTechnology for teaching children to use com-puters and program simple applications (Papert,1993). There are several robots focusing on chil-dren with disabilities (Robins et al., 2008; Sal-dien et al., 2006; Kozima et al., 2007; Lee et al.,2008; Arent and Wnuk, 2007), and most com-monly autism. Some of these communicate withchildren in different ways. For instance, KAS-PAR is a child-sized humanoid robot for chil-dren with autism, and it trains interactional ca-pabilities through gesture imitation.3 Probo, de-veloped for hospitalised children, produces non-sense speech intended to convey different feel-ings.4 KOALA is a small round ball that in-teracts with children with autism using lightsand sounds (Arent and Wnuk, 2007). However,none of these robots and research projects in-volves natural language communication in anyform between the child and the robot.
2 Project description
Our basic idea is to use a dialogue systemto stimulate play and interaction for childrenwith severe communicative disabilities. Thereare already communication boards connected tospeech synthesis in the form of communicationsoftware on computers. The main values thatthis project adds to existing systems are that:
• the child is offered an exciting, creative andfun activity
3http://kaspar.feis.herts.ac.uk/4http://probo.vub.ac.be/
111
• the child can play and interact with otherpeers on equal terms
• the child can explore language in stimulat-ing cooperation with the robot and withother children
By being able to use a symbol-based communi-cation board the children are given an opportu-nity to play, interact, explore language, and atthe same time learn to use tools for alternativeand augmentative communication.
2.1 Description of the system
The child has a communication board that cantalk; when the child points at one of the symbolsit is translated to an utterance which the boardexpresses via speech synthesis in Swedish. Thisis recognised by a robot that moves around in theroom, and performs the commands that the childexpresses through the board. The robot has anincarnation as a toy animal, currently a bumble-bee. It has a very basic personality which meansthat it can take the initiative, without the childtelling it, refuse actions, or even negotiate withthe child.The inspiration for the robot comes from robot
toys such as babies, dogs and dinosaurs, butalso from electronic pets such as Tamagotchi andTalking Tom. The main difference is that ourrobot is able to have a dialogue with the child,to find out what to do, or just to be teasinglyplayful.The Lekbot robot can move forward and back-
ward, and turn right and left. Furthermore itcan perform actions such as laughing, dancing,yawning, farting and eating. The functionalityis constantly improving during the evaluation, tokeep the children interested in playing with therobot.
2.2 Needs and potential
The target audience is children with severephysical, cognitive or communicative disabilities.These children depend on assistive devices andpersons to be able to interact with other peopleand artifacts. The idea is that the robot will bea fun toy that gives the child an opportunity tocontrol the artifacts itself, without the help of
other people. Hopefully this will increase thechild’s confidence, and also promote languagedevelopment.
2.2.1 The importance of playPlay may be defined by the following terms
(Knutsdotter Olofsson, 1992):
• spontaneous; the child takes the initiative,not the adults
• not goal-oriented; the game does not havean explicit purpose
• fun and pleasurable
• repeating; that it can be played many timesas one wants
• voluntary
For children with severe disabilities, playing re-quires adult help, and it is difficult for the adultnot to control the game, especially if the childhas problems communicating what it wants. Of-ten play is used as a tool for development train-ing, and many times play is so scheduled thatit is no longer spontaneous (Brodin and Lind-strand, 2007). A toy that is always available forthe child to play with whenever it wants, andon its own terms can help the child to play “forreal”.Children learn from each other, and a toy that
is used on equal terms by children, with andwithout disabilities, encourages interaction thatotherwise would not have been possible betweenchildren with such diverse backgrounds.
2.2.2 Educational advantagesAs discussed in section 3.3 later, the setup
works without the robot and the communicationboard actually listening to each others’ speech –instead, they communicate wirelessly. However,there is an important educational point in hav-ing them (apparently) communicate using spo-ken language. It provides the child with an ex-perience of participating in a spoken dialogue,even though the child is not physically able tospeak. For children who are more advanced intheir language development, the robot can offer
112
the opportunity to understand the basic proper-ties of the dialogue, such as taking turns, askingand answering questions, the importance of pro-viding sufficient information, and cooperating toachieve a shared goal. Another educational ad-vantage is that the child learns to use tools foralternative and augmentative communication.
3 Implementation
This section describes some technical aspects ofthe implementation of the Lekbot system.
3.1 Components
The final Lekbot setup consists of the followingcomponents:
• a simple LEGO Mindstorms robot whichcan turn and move in all directions, canperform different specialised actions, andhas a “costume” which makes it look likea bumble-bee
• a touch-screen computer which functions asa communication board, and a custom sup-port frame for the computer
• the dialogue system GoDiS (Larsson, 2002),using Acapela Multimedia text-to-speechwith Swedish voices
• Bluetooth communication and wireless au-dio transmission, from the touch-screencomputer to the robot, and two sets of loud-speakers, for the computer and the robot
If the target user already has his or her ownWin-dows based communication device, with adaptedaccessibility for him or her, this special softwarefor the robot play can be installed on this device.Note that it is the communication board com-
puter that controls the robot via the dialoguesystem, but the intention is that it should seemlike the robot is autonomous. Every utteranceby the robot is executed by the speech synthe-siser, and then sent to the robot via radio.
3.2 LEGO Mindstorms
The robot is built using LEGO MindstormsNXT,5 a kind of technical lego which can be con-
5http://mindstorms.lego.com/
trolled and programmed via a computer. Apartfrom being cheap, this technology makes it easyto build a prototype and to modify it during thecourse of the project.
3.3 Perfect speech recognition
Typically, the most error-prone component of aspoken dialogue system is speech recognition;the component responsible for correctly inter-preting speech. This of course becomes evenmore problematic when working with languagelearning or communication disorders, since inthese situations it is both more difficult and moreimportant that the computer correctly hears andunderstands the user’s utterances. An advan-tage of the Lekbot setup is that we will, in asense, have “perfect speech recognition”, sincewe are cheating a bit. The robot does not ac-tually have to listen for the speech generated bythe communication board; since the informationis already electronically encoded, it can insteadbe transferred wirelessly. This means that therobot will never hear “go forward and then stop”when the communication board actually says “goforward seven steps”.
3.4 The GoDiS dialogue manager
A dialogue system typically consists of severalcomponents: speech recogniser, natural lan-guage interpreter, dialogue manager, languagegenerator, speech synthesiser and a short-termmemory for keeping track of the dialogue state.One can make a distinction between dialoguesystems, which (ideally) are general and reusableover several domains, and dialogue system appli-cations, which are specific to a certain domain.The dialogue manager is the “intelligence” of thesystem, keeping track of what has been said sofar and deciding what should be said next.The GoDiS dialogue manager (Larsson, 2002)
has been developed at the Department of Philos-ophy, Linguistics and Theory of Science at theUniversity of Gothenburg over several years. Itis designed to be easily adaptable to new do-mains, but nevertheless be able to handle a va-riety of simpler or more complex dialogues. Forexample, GoDiS can either take initiative andprompt a user for information, or take a back
113
seat and let the experienced user provide infor-mation in any desired order, without having towait for the right question from the system.From the viewpoint of dialogue systems re-
search, there are some interesting aspects in theLekbot setting:
• Constantly changing environment : the sur-roundings of the robot can change all thetime, and the dialogue system needs toadapt
• Alternative input modalities: instead ofspeech input, we are using a touch screen in-terface, on which the symbols on the screenalso changes depending on the current dia-logue state
• Utterance generation: it is important for ev-eryone, but in particular children with com-municative disabilities, that information ispresented in a correct way – with correctand consequent grammar, lexicon and pro-nunciation
3.5 Utterance generation
Clear pronunciation is important, and perhapseven more important when we are dealing withcommunicative disabilities. We are experiment-ing with using different utterance generationstrategies and stressing important words to makethe children understand the robot better. Inter-estingly, user feedback from children and pre-schools during the project has also indicatedwhen default intonation does not work and needsto be modified.The Lekbot system uses two different voices,
one for the touch screen, acting as the child’svoice, and one for the robot. Whereas the touch-screen voice is a vocalisation of something thechild has already seen on the screen, the utter-ances of the robot have no visualisations. Hence,it is particularly important that the robot’s ut-terances are as clear as possible, and the TTSvoice chosen for the robot is therefore the voicethat was determined to have the best and mostflexible intonation in informal perception testsat the start of the project.
3.5.1 Contextual intonationWe have incorporated models of information
structure in GoDiS to enable the appropriateassignment of phonological emphasis (Ericsson,2005).Lekbot uses a fairly basic dialogue-move-to-
string mapping for the creation of output utter-ances, which are then fed to the speech synthe-siser. Determining the information structure ofan utterance to be generated, involves the deter-mination of what is informative in the utterance– the focus – and what is a reflection of some-thing already in the context – the ground (Vall-duví, 1992). The system assigns emphasis to allalternatives, that is, all contrasting elements, inalternative questions, that are produced by therobot. Consider the following example:
User : Go forward.
Robot : Do you want me to go forwarda lot or go forward a little?
For the generation of the robot utterance, thesystem determines “go forward a lot” and “goforward a little” as alternatives, and assigns em-phasis to these. Future development of the sys-tem may involve the inclusion of informationstructure also for utterances other than non-alternative questions, to determine appropriateintonation assignment more generally.Unfortunately, we have not yet been able to
use this feature in the actual demonstration sys-tem, since the Swedish TTS voices do not em-phasise properly with regard to the markup. In-stead we have tuned the utterances lexically andsyntactically to make the best possible use of thedefault TTS intonation.
4 Evaluation
We are evaluating the Lekbot system duringspring and summer 2011, in parallel with con-tinued development, in the spirit of eXtremeProgramming (XP). Some major themes in XPthat were deemed particularly interesting in thisproject are i) the need to involve the users inthe development process, ii) to work in short it-erations with frequent releases to get a nearlyconstant feedback from users, and iii) to always
114
prioritise the tasks that provide the greatest ben-efit to users.
4.1 Users
A test group was recruited consisting of threetarget children with peers and staff, at threedifferent pre-schools, was recruited. The targetchildren, two boys and one girl are in the ages 4–6 years, two boys and one girl. They have cere-bral palsy with complex communication needs.They also have a poor gross motor control, butare able to use their hands for activating a touchscreen on a computer. They serve as the testgroup and as a basis for the specifications of thefurther development of the system. During thecourse of development the children in the testgroup use the system to verify that it works asintended and help to identify the most importantqualities to develop. The project group workswith one month iterations with a new public re-lease every second month. Therefore, the usershave in the end used about six releases of therobot.Along with the target children, three typically
developed peers, of the same age, or slightlyyounger, were recruited at each pre-school. Thethree peers were all girls. Hence, there are threegroups of children playing with the robot. Atvarious occasions other children in the pre-schoolgroup are involved in the robot play.The children were assessed regarding their re-
ceptive language levels by using Test for Re-ception of Grammar (TROG) (Bishop et al.,1998). Their communication levels were es-timated by the project group in cooperationwith the pre-school staff using CommunicationFunction Classification System (CFCS) for In-dividuals with Cerebral Palsy (Hidecker et al.,2009). The pre-school staff also completedSwedish Early Communicative Development In-ventories (SECDI) forms for each child (Eriks-son and Berglund, 1999; Berglund and Eriksson,2000). A pre-school form (Förskoleformulär) wasalso completed (Granlund and Olsson, 1998). Itconsists of questions concerning the child’s en-gagement in various situations, the pre-schoolteacher’s perception of the interaction betweenher and the child as well as the interaction be-
tween the child and other children.With the two youngest target children TROG
testing was not feasible, while the oldest one ap-peared to have some difficulties in understand-ing verbs, prepositions and sentences containingthese components, thus a bit lower than his age.The three peers showed results matching theirage. From here on the target children will benamed Per, Hans and Greta.The purpose of CFCS is to classify the every
day communication performance of an individ-ual with cerebral palsy. The levels are rangedbetween 1 and 5, where 1 is the highest and 5the lowest.
• The 6 year old Per shows a level of 3: Ef-fective sender and effective receiver with fa-miliar partners.
• The 5 year old Hans is estimated to level5: Seldom effective sender and effective re-ceiver with familiar partners, and
• The 4 year old Greta is at level 4: Incon-sistent sender and/or receiver with familiarpartners.
• All the peers, of course, reach the level of 1.
The CFCS levels will be estimated over againwhen the Lekbot testing is finished.The results of SECDI and the pre-school form
will be presented at a later stage of the Lekbotproject, as they will be redistributed.
4.2 Evaluation tools and methods
The tools used to evaluate the robot play arethree:
• Talking Mats,6 which is an established com-munication tool that uses a mat with at-tached symbols as the basis for communi-cation. It is designed to help people withcommunicative and cognitive difficulties tothink about issues discussed with them, andprovide them with a way to effectively ex-press their opinions. Both the target chil-dren and their peers were interviewed aboutthe robot and the interaction, in order to get
6http://www.talkingmats.com
115
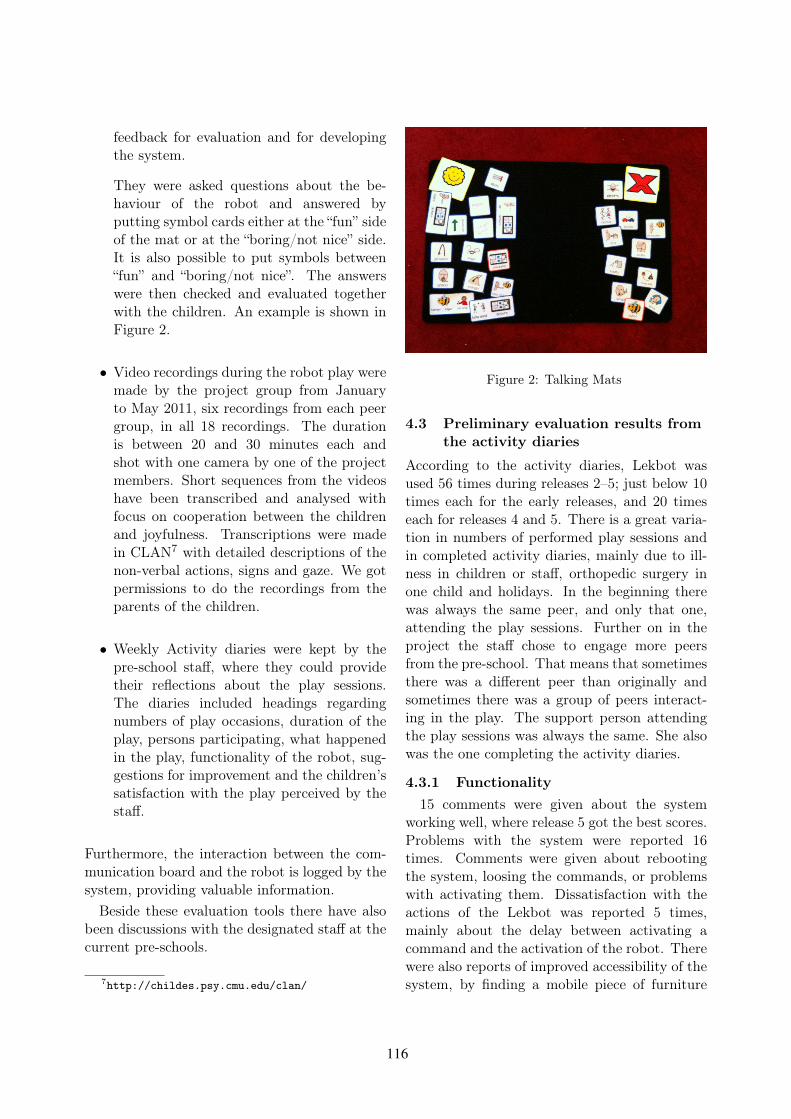
feedback for evaluation and for developingthe system.
They were asked questions about the be-haviour of the robot and answered byputting symbol cards either at the “fun” sideof the mat or at the “boring/not nice” side.It is also possible to put symbols between“fun” and “boring/not nice”. The answerswere then checked and evaluated togetherwith the children. An example is shown inFigure 2.
• Video recordings during the robot play weremade by the project group from Januaryto May 2011, six recordings from each peergroup, in all 18 recordings. The durationis between 20 and 30 minutes each andshot with one camera by one of the projectmembers. Short sequences from the videoshave been transcribed and analysed withfocus on cooperation between the childrenand joyfulness. Transcriptions were madein CLAN7 with detailed descriptions of thenon-verbal actions, signs and gaze. We gotpermissions to do the recordings from theparents of the children.
• Weekly Activity diaries were kept by thepre-school staff, where they could providetheir reflections about the play sessions.The diaries included headings regardingnumbers of play occasions, duration of theplay, persons participating, what happenedin the play, functionality of the robot, sug-gestions for improvement and the children’ssatisfaction with the play perceived by thestaff.
Furthermore, the interaction between the com-munication board and the robot is logged by thesystem, providing valuable information.Beside these evaluation tools there have also
been discussions with the designated staff at thecurrent pre-schools.
7http://childes.psy.cmu.edu/clan/
Figure 2: Talking Mats
4.3 Preliminary evaluation results fromthe activity diaries
According to the activity diaries, Lekbot wasused 56 times during releases 2–5; just below 10times each for the early releases, and 20 timeseach for releases 4 and 5. There is a great varia-tion in numbers of performed play sessions andin completed activity diaries, mainly due to ill-ness in children or staff, orthopedic surgery inone child and holidays. In the beginning therewas always the same peer, and only that one,attending the play sessions. Further on in theproject the staff chose to engage more peersfrom the pre-school. That means that sometimesthere was a different peer than originally andsometimes there was a group of peers interact-ing in the play. The support person attendingthe play sessions was always the same. She alsowas the one completing the activity diaries.
4.3.1 Functionality15 comments were given about the system
working well, where release 5 got the best scores.Problems with the system were reported 16times. Comments were given about rebootingthe system, loosing the commands, or problemswith activating them. Dissatisfaction with theactions of the Lekbot was reported 5 times,mainly about the delay between activating acommand and the activation of the robot. Therewere also reports of improved accessibility of thesystem, by finding a mobile piece of furniture
116
for the stand and by changing the angle of thedisplay.
4.3.2 InteractionThe project group chose not to give strict in-
structions on what to do in the play, just to leteveryone use the Lekbot at suitable level. Thus,there was a variation in complexity of the com-ments, as the headings in the activity diariesgave a structure of open questions. The col-lected, written comments were categorised in fivegroups; Preparations for the Lekbot play, Ex-plicit support from adult, Target child’s activityand perception of the play, Peer’s activity andperception of the play and Shared activity andperception of the play between target child andpeer(s). The three latter are reported togetherrelease by release.Preparation for the Lekbot play occurred
mainly for Per’s group, where he and his peersbuilt different tracks for the robot to follow. Ex-plicit support by adult is mentioned only forPer’s group, where the adult chose target pointfor the robot and she used the play for educa-tional matters regarding letter teaching. Shealso mediated between the children which im-proved their cooperation. In the final sessionsPer initiated turn taking after being urged bythe adult.
4.3.3 Activity and perceptionTarget child’s activity and perception of the
play is mentioned a lot, especially for Per andGreta. Most frequent among the comments arethose concerning Shared activity and perceptionof the play between target child and peer(s).
Release 2: Per initiates turn taking, reactsto the event followed by the activation of thecommand on the display, protests when his peerchoses “the wrong command”. Together they re-peatedly perform turn taking and use Per’s dig-ital communication device in the Lekbot activ-ity. Hans and his peers make a tunnel and thechildren give commands that make the robot gothrough it. Greta has high expectations on theplay before the session. Repeatedly she is unwill-ing to stop the play and she gives oral commentsto the activities of the robot.
Release 3: Per explores the commands andwhat happens when using them to answer thenewly implemented supplementary questions.Around Hans there is turn taking. Several chil-dren are playing together and the children mostfrequently choose the dance command. Gretais excited and unwilling to stop the play. Sheprotests when the adult makes the choice for therobot.
Release 4: Per shows the new commands forhis peer, and the children imitate the robot.Per and his original peer chose one new peereach. Interaction between the children takesplace through dancing and hand clapping. Hansplays with the robot together with adults fromoutside the preschool. Greta likes going back-wards, turning and hitting things with the robot.She starts telling her peer how to act by us-ing the commands on the display and her papercommunication chart. Her peer enjoys follow-ing Greta’s “instructions” and she likes dancing.There are repeated turn taking between themand they enjoy to cooperate getting the robot tomove from one spot to another.
Release 5: Per plays with the new commands,by himself. He finds strategies for the robot infinding food. When there are more than twochildren in the play, Per chooses to be the onecontrolling the display. He cooperates more –waits for his turn and shows better understand-ing for the other’s turn. All children repeatedlyuse communication charts and Blissymbolics toexpress themselves. They imitate the robot andthey act instead of it when it is out of order.In Hans’s group there is dancing and lookingfor food play. Turn taking takes place and allchildren want to participate in the Lekbot play.Greta decides whose turn it is to control therobot. Her peer likes the play of finding food.
4.3.4 SatisfactionStarting in release 3, the level of satisfaction
with the play session was noted in the activitydiary. The staff was asked to estimate how sat-isfied the target child and the peer were on ascale from 1 to 5, where 1 is the lowest and 5the highest. This was done every time at some
117
pre-schools and some times at others. The ten-dency is that the target children seem to be moresatisfied with the play than their peers from thestart of the play session. This is most protrud-ing regarding the oldest pair. At release 4 wherePer and his peer interact as a group for the firsttime, the scores suddenly are reversed so the Peris perceived to 3 on the satisfactory scale and thepeer(s) at 5. In release 5 the scores get a moreeven variation.
4.4 Video recordings
Most of the interviews with Talking Mats werevideo recorded. The full analysis will be donelater in the project. The analysis of the videorecordings of the robot interaction is an ongoingwork were three of the project members partic-ipate. This part of the work is time consumingand only minor sequences are transcribed andanalysed so far. Through micro analysis the finegrained interactional movements and the coop-eration between the children and the teacher ap-pears, as well as the joy of playing.Figure 3 contains a segment from the tran-
scription. The participants are Per, his peerSelma and his teacher Isa; and the Computerand the Robot. In the excerpt we can see howPer asks for Selma’s attention and with the helpof Isa and the communication map tells Selmato take her turn, which is to make a new com-mand for the robot to perform. Finally theyboth dance to the music.
4.5 Conclusion
All target children have enjoyed the Lekbot playfrom the beginning. The more commands andabilities the robot has received the more appre-ciated has the play become also by the peers.Improved play and interaction skills can be ob-served in varying degrees depending on the levelof each child. The Lekbot has been a nice andfun artefact for the children to gather round andit has given both the target children and theirpeers experiences of playing with each other.From Talking Mats interviews performed withPer and Greta it was revealed that they had noproblems handling the computer display or see-ing and hearing the display and the robot. Mak-
126 %gaze: Per looks at Selma127 %move: Selma is standing on her knees, sits downon her heels, keeps booths hands on her skirt128 %gaze: Selma looks toward the mirror on the wall129 %move: Per touches the left hand of Selma, keepshis arm stretched when Selma moves a bit131 %gaze: Isa looks at Per’s hand132 *Selma: ———————–133 %comment : Selma is singing while Per stretches to-ward her left hand134 %gesture: Isa draws the pointing map closer135 %gaze: Per looks down at the map136 %gaze: Selma looks down at the map137 *Per : ———————–138 %move: Selma stands up on her knee, departs on amovement forward139 *Isa: eh::: (0.3) your turn (0.3) Selma’s turn140 %gesture: Isa moves her finger back and forth overthe 6th picture on the map141 %gesture: Isa rests her finger at the picture, thenwithdraws it142 %gesture: Per points at the map143 %move: Selma moves toward the screen144 (2.1)145 %action: Selma makes a fast press at the screen146 %gaze: Per looks at the screen147 *Selma: dance: my king ———————–148 %move: Selma moves left with arms swinging, bendsforward, landing on hands and knees149 %action: Per looks at Selma, smiles150 *Computer : dance151 *Selma: mi:ine ñ: ñ: —(1.8)—152 *Robot : okay I gladly dance153 (1.0)154 *Robot : plays music 11 sec155 %comment : both children are dancing, Selma on herknees and Per sitting down
Figure 3: An example transcription segment, trans-lated to English
ing the same interview with Hans was not feasi-ble, though the project group experienced thathe seemed to deal pretty well with the system,although he needed a little more support thanthe two other children, who were able to controlthe toy autonomously. More results will be pre-sented when the video sequences are analysed,later on in the project.
5 Acknowledgements
We are grateful to 5 anonymous referees fortheir valuable comments. The Lekbot projectis financed by Vinnova, and Acapela has kindlyprovided us with speech synthesis.
118
ReferencesK. Arent and M. Wnuk. 2007. Remarks on be-
haviours programming of the interactive therapeu-tic robot Koala based on fuzzy logic techniques.In First KES International Symposium on Agentand Multi-Agent Systems: Technologies and Ap-plications, Wroclaw, Poland.
E. Berglund and M. Eriksson. 2000. Communicativedevelopment in Swedish children 16–28 monthsold: The Swedish early communicative develop-ment inventory – words and sentences. Scandina-vian Journal of Psychology, 41(2):133–144.
Jonas Beskow, Olov Engwall, Björn Granström, andPreben Wik. 2004. Design strategies for a virtuallanguage tutor. In INTERSPEECH 2004.
Dorothy Bishop, Eva Holmberg, and Eva Lundälv.1998. TROG: Test for Reception of Grammar(Swedish version). SIH Läromedel.
J. Brodin and P. Lindstrand. 2007. Perspektiv påIKT och lärande för barn, ungdomar och vuxnamed funktionshinder. Studentlitteratur.
Stina Ericsson. 2005. Information Enriched Con-stituents in Dialogue. Ph.D. thesis, University ofGothenburg, Gothenburg, Sweden.
M. Eriksson and E. Berglund. 1999. Swedish earlycommunicative development inventory – wordsand gestures. First Language, 19(55):55–90.
M. Granlund and C. Olsson. 1998. Familjen ochhabiliteringen. Stiftelsen ALA.
M. J. C. Hidecker, N. Paneth, P. Rosenbaum, R. D.Kent, J. Lillie, and B. Johnson. 2009. Develop-ment of the Communication Function Classifica-tion System (CFCS) for individuals with cerebralpalsy. Developmental Medicine and Child Neurol-ogy, 51(Supplement s2):48.
B. Knutsdotter Olofsson. 1992. I lekens värld.Almqvist och Wiksell.
H. Kozima, C. Nakagawa, and Y. Yasuda. 2007.Children-robot interaction: a pilot study in autismtherapy. Progress in Brain Research, 164:385–400.
Staffan Larsson. 2002. Issue-based Dialogue Man-agement. Ph.D. thesis, Department of Linguistics,University of Gothenburg, Sweden.
C.H. Lee, K. Kim, C. Breazeal, and R.W. Picard.2008. Shybot: Friend-stranger interaction for chil-dren living with autism. In CHI2008, Florence,Italy.
Peter Ljunglöf, Staffan Larsson, Katarina Mühlen-bock, and Gunilla Thunberg. 2009. TRIK: A talk-ing and drawing robot for children with commu-nication disabilities. In Nodalida’09: 17th NordicConference of Computational Linguistics. Shortpaper and demonstration.
Seymour Papert. 1993. Mindstorms: Children,Computers, and Powerful Ideas. Basic Books.
B. Robins, K. Dautenhahn, R. te Boekhorst, andC.L. Nehaniv. 2008. Behaviour delay and ex-pressiveness in child-robot interactions: a userstudy on interaction kinesics. In HRI’08, 3rdACM/IEEE International Conference on HumanRobot Interaction, Amsterdam, Netherlands.
J. Saldien, K. Goris, B. Verrelst, R. Van Ham, andD. Lefeber. 2006. ANTY: The development ofan intelligent huggable robot for hospitalized chil-dren. In CLAWAR, 9th International Conferenceon Climbing and Walking Robots, Brussels, Bel-gium.
Stephanie Seneff, Chao Wang, and Julia Zhang.2004. Spoken conversational interaction for lan-guage learning. In InSTIL/ICALL 2004 Sympo-sium on Computer Assisted Learning: NLP andSpeech Technologies in Advanced Language Learn-ing Systems.
E. Vallduví. 1992. The Informational Component.Garland.
119
Proceedings of the 2nd Workshop on Speech and Language Processing for Assistive Technologies, pages 120–127,Edinburgh, Scotland, UK, July 30, 2011. c©2011 Association for Computational Linguistics
Using lexical and corpus resources for augmenting the AAC lexicon
Katarina Heimann MühlenbockDept of Swedish LanguageUniversity of Gothenburg
Mats LundälvDart
Queen Silvia Children’s HospitalGothenburg
Abstract
A corpus of easy-to-read texts in combinationwith a base vocabulary pool for Swedish wasused in order to build a basic vocabulary. Thecoverage of these entries by symbols in an ex-isting AAC database was then assessed. Wefinally suggest a method for enriching the ex-pressive power of the AAC language by com-bining existing symbols and in this way illus-trate additional concepts.
1 Introduction
A considerable proportion of the population, among1.3 % of all individuals (Beukelman and Mirenda,2005) are affected by severe communication dis-orders, making them more or less unable to usewritten and/or spoken language. Different languagesupportive aids for these persons have evolved overthe years, mainly as graphical systems contain-ing symbols and pictures, simplified supportivesigning (derived from sign language vocabulary),or a combination of these, possibly comprisingspeech synthesis and speech recognition. All thesesupportive measures and methods are referred toas Augmentative and Alternative Communication(AAC).
A vocabulary comprising 20,878 lemma or baseforms from different sources was analysed in termsof frequency and dispersion. The primary issuein this study was to analyse to what extent theconcepts in the main AAC symbol databases mirrorthe vocabulary needed to produce and understandeveryday Swedish language. Another goal was toinvestigate the possibility of extending the AAC
symbol databases by combining separate basicwords from the vocabulary into compounds.
2 Background
A fundamental aspect for participation in the soci-ety is the possibility to acquire information and tocommunicate. For the majority of citizens, gettinginformation on every-day issues is hardly a task en-tailing any specific problems. There is, however,a substantial number of persons who have substan-tial difficulties to benefit from ordinary written andspoken sources, being dependent upon other modali-ties, either to express themselves, or as a support forinterpretation, or both. For this purpose, AAC re-sources in the shape of pictures and symbols havebeen designed for use in low-tech solutions suchas communication books and boards, and high-leveltechnologies such as computer programs and eye-tracking devices. AAC resources at hand are, how-ever, burdened by two major problems. First, man-ual production requires much effort and time. Newconcepts have to be identified and a uniform agree-ment has to be reached among different parties onhow to visually present the concept. Second, ac-cessibility in the sense of a consumer’s or devel-oper’s possibility and freedom to use available re-sources, is strongly restricted by distribution, copy-right and licensing issues. Different projects havebeen carried out with the goal to develop and im-plement some suggested open standards for syntac-tic and semantic encoding of AAC material. TheEuropean IST project WWAAC (World Wide Aug-mentative & Alternative Communication, 2004) was
120
a pan-european initiative to make the web more ac-cessible for a wide range of persons with languageand/or cognitive impairments.
An essential part of language lies within its ambi-guity on the lexical as well as structural level. Whenit comes to computerized processing, semantic vari-ation between word forms, morphological relation-ships within different word forms, and multiworditems claim specific handling, especially when en-riching an existing vocabulary with new entries. Infact, comparing wordlists and frequencies from dif-ferent sources is a task affected by a couple of com-plications. One problem encountered in a compara-tive study of word frequencies is how a word is de-fined, which in fact has been put under debate byfor instance Gardner (2007). In the present study,we consider the lemma, i.e. the look up form of aword, to be the key unit. The idea behind the use oflemma frequencies as units of study is that the hu-man mental or computational processing of lemmasand inflected forms profit from each other, which isin favour of a theory implying that a morphologicaldecomposition takes place for the recognition of in-flected forms.
Knowledge of the vocabulary is an essential partof both conveying and understanding messages, ver-bally as well as non-verbally. Together with the sys-tem of rules generating grammatical combinations,the words in the vocabulary contribute to the infiniteexpressive power of language. With a narrow vo-cabulary, the possible means to produce and achieveadequate information decreases. Researchers haveattempted to identify lists of words that could be in-cluded in a core vocabulary (Thorndike and Lorge,1944), (Spache, March 1953) and more specificallyfor people who use AAC (Balandin and Iacono,1998), (Banajee et al., 2003). There have also beenefforts to investigate how much of the vocabulary aperson needs to know in order to grasp the contentof written texts without having to struggle with iso-lated, unknown words (Hirsch and Nation, 1992). Inthe latter study, a list of around 2,000 high frequencywords of English, compiled by West (1953), wasused in order to investigate if knowledge of thesewords was actually sufficient for reading unsimpli-fied short novels. It was found that a person withthis restricted vocabulary was familiar with about90-92% of the total words. It is worth noting that
the word frequency counts here reflect the numberof times a word pertaining to a certain word familyoccurs in a text. The idea behind a word family isthat inflected and regulary derived forms of a knownbase word can also be considered as known words ifthe affixes are known. This implies that nouns, ad-verbs, verbs and adjectives sharing a common basewill be treated as one word, contrary to the lexico-graphical traditions (for Swedish), where the lemmaor base form is the conventional unit of study.
With this in mind, it follows that a database con-taining a core vocabulary of a language has to con-tain enough information for identification of differ-ent lexemes. For our purposes in this study, it wasalso necessary to add another source of informationin order to retrieve the semantic identifiers for sub-sequent illustration of different concepts into AACsymbols.
3 Experimental design
A corpus of easy-to-read texts and children’s fictionwas used in order to retrieve candidates for inclusioninto a database of basic Swedish. The hypothesis isthat by using a corpus of plain texts produced withthe aim of being easy to understand, we can deriveappropriate data for further statistical analysis ofwhich words or word forms are to be consideredas pertaining to a basic vocabulary. The candidatesretrieved by excerption of high-frequency lemmasfrom the corpus were subsequently compared tothe base-form words in a Swedish base vocabulary,where the lemmas obtaining the highest rank inboth sets were integrated into a database of corevocabulary. The AAC symbol coverage of thesedatabase entries was then assessed by addressing anexisting AAC symbol database. Finally, attemptswere made to expand the existing AAC vocabularythrough a semantic analysis of new words, simpleas well as compounds, and in that way make itpossible to illustrate new concepts.
4 Material
The material used comprise corpora as well as lex-ica. Some of the resources are freely available fromthe public domain, while other are used under spe-cific permissions.
121
4.1 AAC materialPictures and symbols aiding language and commu-nication have been developed over decades. Some ofthe symbol systems have a visual structure that sup-ports different parts of speech. For this study, theWidgit symbols library (Widgit Software, 2011) andvocabulary in Swedish (preliminary version 11) wasused, covering around 11,000 symbols and 64,000words (including synonyms and inflected forms).Some of the symbols are produced in order to illus-trate different concepts rather than isolated words,which to some extent had a negative impact on thecomparison of different wordlists. The focus of in-terest has been on content words, i.e. nouns, verbs,adjectives and adverbs, since the functional wordsnormally don’t appear as independent items. In to-tal, a wordlist of 20,907 entries was extracted, nor-mally the lemma form. Proper nouns and numberswere excluded in the study.
4.2 Corpora4.2.1 LäSBarT
The primary corpus material for this study is LäS-BarT, an acronym for Lättläst Svenska och Barnbok-stext ’Easy-to-read Swedish and Children’s fictionTexts’ (Mühlenbock, 2008). It is a specialized cor-pus of 1.3 million tokens, compiled with the objec-tive to mirror simple vocabulary and syntax. Themain text types include works from different do-mains and genres, such as fiction, official documentsfrom the government, parliament, county council,municipality and daily news. The common denomi-nator for all the texts is that they are all intended tobe read by persons that do not fully master everydaySwedish language.
The size of the corpus, 1.3 million tokens, wascompensated for by making text representativenessbe decisive during compilation. The supply of easy-to-read material is limited and subsequently, thevariation range is quite narrow. Contrary to manyother writing tasks, the production of easy-to-readtext is elicited by a specific need from the soci-ety and we cannot expect a large variety of genres.Three genres of easy-to-read texts were identifiedfor obtaining a representative sample, namely fic-tion, news and community information, which forthe target group of readers can be regarded as being
a balanced corpus.
4.2.2 SUC 2.0SUC 2.0 is a balanced corpus of 1 million words
in written Swedish, originating from the 1990’s. Itis designed according to the Brown corpus (Fran-cis and Kucera, 1979) and LOB corpus (Johanssonet al., 1978) principles, which means that it consistsof 500 samples of text with a length of about 2,000words each. The state-of-the-art markup language atthe time of compilation was SGML, and this anno-tation schema is kept also in the acctual, revised ver-sion. All entries are annotated with parts-of-speech,morphological analysis and lemma, or rather baseform. The corpus is also provided with a wide rangeof structural tags and functionally interpreted tags,according to the TEI standards Sperberg, (Consor-tium, TEI, 2007).
At the lexeme level, about 23% of the SUC corpusis covered by nouns, while verbs amounts to 17%,adjectives to 9%, proper nouns to 4%, adverbs to9%, prepositions 12%, conjunctions 8%, numbers2%, pronouns 10% and determiners to 6% of thetotal words. The total vocabulary has 69,371 baseforms.
4.3 Lexica4.3.1 LäSBarT wordlist
The wordlist obtained from the LäSBarT cor-pus, LäSBarT-listan (henceforward referred to asLBL) contains 22,041 lemmas in total, covering43,364 lexemes, proper nouns excluded. It containsinformation about lexical frequency, baseform,part-of-speech tag, and lemma/lexeme form. Thelemma/lexeme information tells us that a word likesticka has three different lemma/lexeme forms,namely sticka.1 for the noun sticka ’splinter;knitting needle’, and sticka.2 or sticka.3 for the twodifferent verb lexemes with the meanings ’prick,sting; put’ and ’knit’, respectively. This informationis necessary for further semantic disambiguation ofpolysemous words.
The overall part-of-speech distribution is listed inTable 1. In this study, 2,277 verbs, 14,856 nouns,2,715 adjectives and 1,030 adverbs were extractedfor further analysis.
122
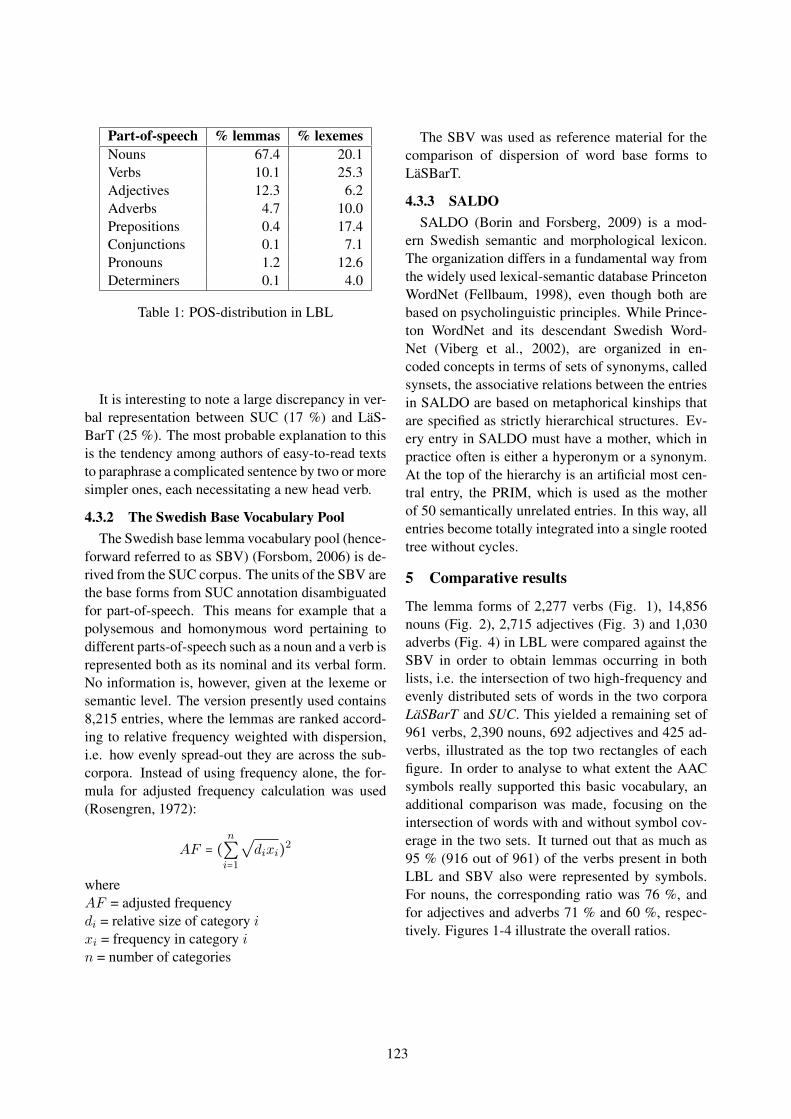
Part-of-speech % lemmas % lexemesNouns 67.4 20.1Verbs 10.1 25.3Adjectives 12.3 6.2Adverbs 4.7 10.0Prepositions 0.4 17.4Conjunctions 0.1 7.1Pronouns 1.2 12.6Determiners 0.1 4.0
Table 1: POS-distribution in LBL
It is interesting to note a large discrepancy in ver-bal representation between SUC (17 %) and LäS-BarT (25 %). The most probable explanation to thisis the tendency among authors of easy-to-read textsto paraphrase a complicated sentence by two or moresimpler ones, each necessitating a new head verb.
4.3.2 The Swedish Base Vocabulary PoolThe Swedish base lemma vocabulary pool (hence-
forward referred to as SBV) (Forsbom, 2006) is de-rived from the SUC corpus. The units of the SBV arethe base forms from SUC annotation disambiguatedfor part-of-speech. This means for example that apolysemous and homonymous word pertaining todifferent parts-of-speech such as a noun and a verb isrepresented both as its nominal and its verbal form.No information is, however, given at the lexeme orsemantic level. The version presently used contains8,215 entries, where the lemmas are ranked accord-ing to relative frequency weighted with dispersion,i.e. how evenly spread-out they are across the sub-corpora. Instead of using frequency alone, the for-mula for adjusted frequency calculation was used(Rosengren, 1972):
AF = (n
∑
i=1
√
dixi)2
whereAF = adjusted frequencydi = relative size of category ixi = frequency in category in = number of categories
The SBV was used as reference material for thecomparison of dispersion of word base forms toLäSBarT.
4.3.3 SALDOSALDO (Borin and Forsberg, 2009) is a mod-
ern Swedish semantic and morphological lexicon.The organization differs in a fundamental way fromthe widely used lexical-semantic database PrincetonWordNet (Fellbaum, 1998), even though both arebased on psycholinguistic principles. While Prince-ton WordNet and its descendant Swedish Word-Net (Viberg et al., 2002), are organized in en-coded concepts in terms of sets of synonyms, calledsynsets, the associative relations between the entriesin SALDO are based on metaphorical kinships thatare specified as strictly hierarchical structures. Ev-ery entry in SALDO must have a mother, which inpractice often is either a hyperonym or a synonym.At the top of the hierarchy is an artificial most cen-tral entry, the PRIM, which is used as the motherof 50 semantically unrelated entries. In this way, allentries become totally integrated into a single rootedtree without cycles.
5 Comparative results
The lemma forms of 2,277 verbs (Fig. 1), 14,856nouns (Fig. 2), 2,715 adjectives (Fig. 3) and 1,030adverbs (Fig. 4) in LBL were compared against theSBV in order to obtain lemmas occurring in bothlists, i.e. the intersection of two high-frequency andevenly distributed sets of words in the two corporaLäSBarT and SUC. This yielded a remaining set of961 verbs, 2,390 nouns, 692 adjectives and 425 ad-verbs, illustrated as the top two rectangles of eachfigure. In order to analyse to what extent the AACsymbols really supported this basic vocabulary, anadditional comparison was made, focusing on theintersection of words with and without symbol cov-erage in the two sets. It turned out that as much as95 % (916 out of 961) of the verbs present in bothLBL and SBV also were represented by symbols.For nouns, the corresponding ratio was 76 %, andfor adjectives and adverbs 71 % and 60 %, respec-tively. Figures 1-4 illustrate the overall ratios.
123
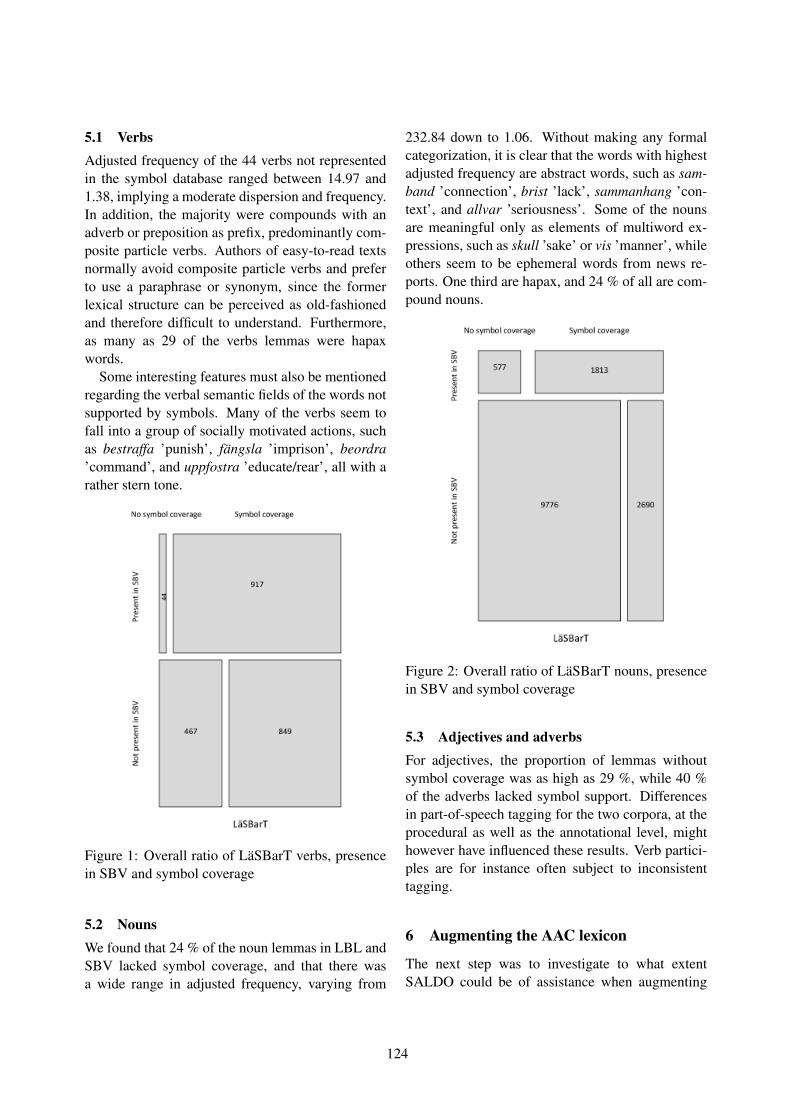
5.1 VerbsAdjusted frequency of the 44 verbs not representedin the symbol database ranged between 14.97 and1.38, implying a moderate dispersion and frequency.In addition, the majority were compounds with anadverb or preposition as prefix, predominantly com-posite particle verbs. Authors of easy-to-read textsnormally avoid composite particle verbs and preferto use a paraphrase or synonym, since the formerlexical structure can be perceived as old-fashionedand therefore difficult to understand. Furthermore,as many as 29 of the verbs lemmas were hapaxwords.
Some interesting features must also be mentionedregarding the verbal semantic fields of the words notsupported by symbols. Many of the verbs seem tofall into a group of socially motivated actions, suchas bestraffa ’punish’, fängsla ’imprison’, beordra’command’, and uppfostra ’educate/rear’, all with arather stern tone.
Figure 1: Overall ratio of LäSBarT verbs, presencein SBV and symbol coverage
5.2 NounsWe found that 24 % of the noun lemmas in LBL andSBV lacked symbol coverage, and that there wasa wide range in adjusted frequency, varying from
232.84 down to 1.06. Without making any formalcategorization, it is clear that the words with highestadjusted frequency are abstract words, such as sam-band ’connection’, brist ’lack’, sammanhang ’con-text’, and allvar ’seriousness’. Some of the nounsare meaningful only as elements of multiword ex-pressions, such as skull ’sake’ or vis ’manner’, whileothers seem to be ephemeral words from news re-ports. One third are hapax, and 24 % of all are com-pound nouns.
Figure 2: Overall ratio of LäSBarT nouns, presencein SBV and symbol coverage
5.3 Adjectives and adverbsFor adjectives, the proportion of lemmas withoutsymbol coverage was as high as 29 %, while 40 %of the adverbs lacked symbol support. Differencesin part-of-speech tagging for the two corpora, at theprocedural as well as the annotational level, mighthowever have influenced these results. Verb partici-ples are for instance often subject to inconsistenttagging.
6 Augmenting the AAC lexicon
The next step was to investigate to what extentSALDO could be of assistance when augmenting
124
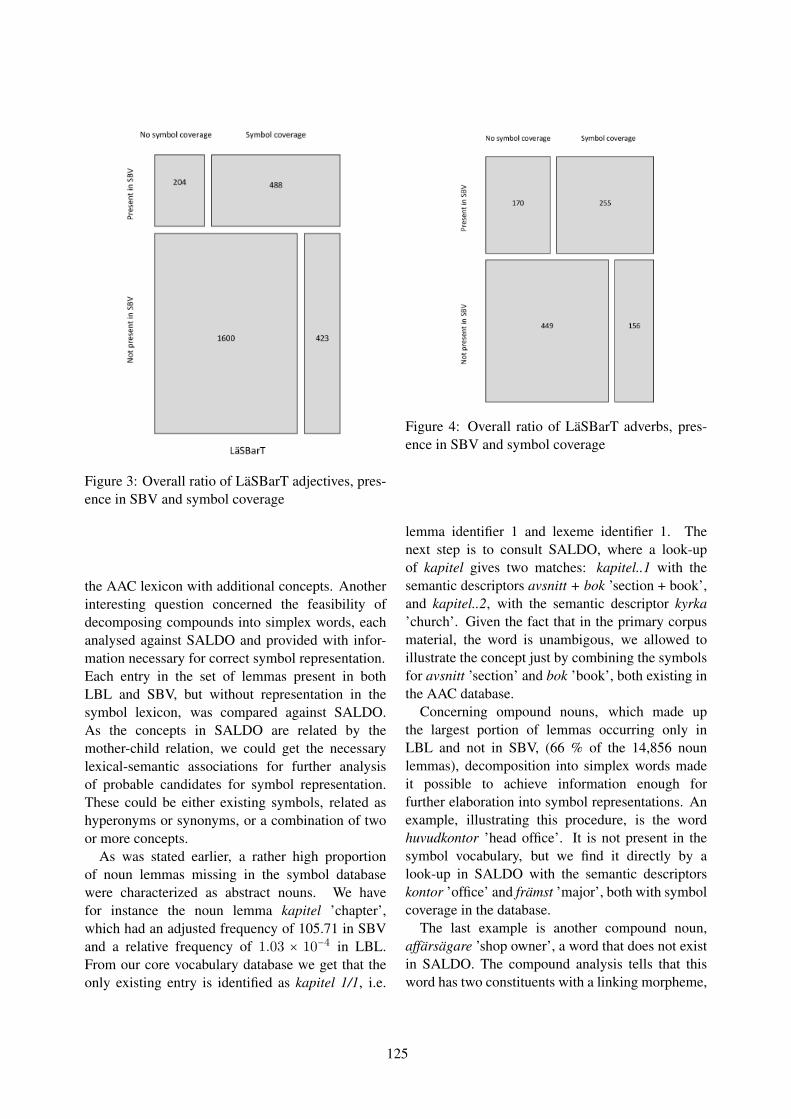
Figure 3: Overall ratio of LäSBarT adjectives, pres-ence in SBV and symbol coverage
the AAC lexicon with additional concepts. Anotherinteresting question concerned the feasibility ofdecomposing compounds into simplex words, eachanalysed against SALDO and provided with infor-mation necessary for correct symbol representation.Each entry in the set of lemmas present in bothLBL and SBV, but without representation in thesymbol lexicon, was compared against SALDO.As the concepts in SALDO are related by themother-child relation, we could get the necessarylexical-semantic associations for further analysisof probable candidates for symbol representation.These could be either existing symbols, related ashyperonyms or synonyms, or a combination of twoor more concepts.
As was stated earlier, a rather high proportionof noun lemmas missing in the symbol databasewere characterized as abstract nouns. We havefor instance the noun lemma kapitel ’chapter’,which had an adjusted frequency of 105.71 in SBVand a relative frequency of 1.03 × 10⁻⁴ in LBL.From our core vocabulary database we get that theonly existing entry is identified as kapitel 1/1, i.e.
Figure 4: Overall ratio of LäSBarT adverbs, pres-ence in SBV and symbol coverage
lemma identifier 1 and lexeme identifier 1. Thenext step is to consult SALDO, where a look-upof kapitel gives two matches: kapitel..1 with thesemantic descriptors avsnitt + bok ’section + book’,and kapitel..2, with the semantic descriptor kyrka’church’. Given the fact that in the primary corpusmaterial, the word is unambigous, we allowed toillustrate the concept just by combining the symbolsfor avsnitt ’section’ and bok ’book’, both existing inthe AAC database.
Concerning ompound nouns, which made upthe largest portion of lemmas occurring only inLBL and not in SBV, (66 % of the 14,856 nounlemmas), decomposition into simplex words madeit possible to achieve information enough forfurther elaboration into symbol representations. Anexample, illustrating this procedure, is the wordhuvudkontor ’head office’. It is not present in thesymbol vocabulary, but we find it directly by alook-up in SALDO with the semantic descriptorskontor ’office’ and främst ’major’, both with symbolcoverage in the database.
The last example is another compound noun,affärsägare ’shop owner’, a word that does not existin SALDO. The compound analysis tells that thisword has two constituents with a linking morpheme,
125
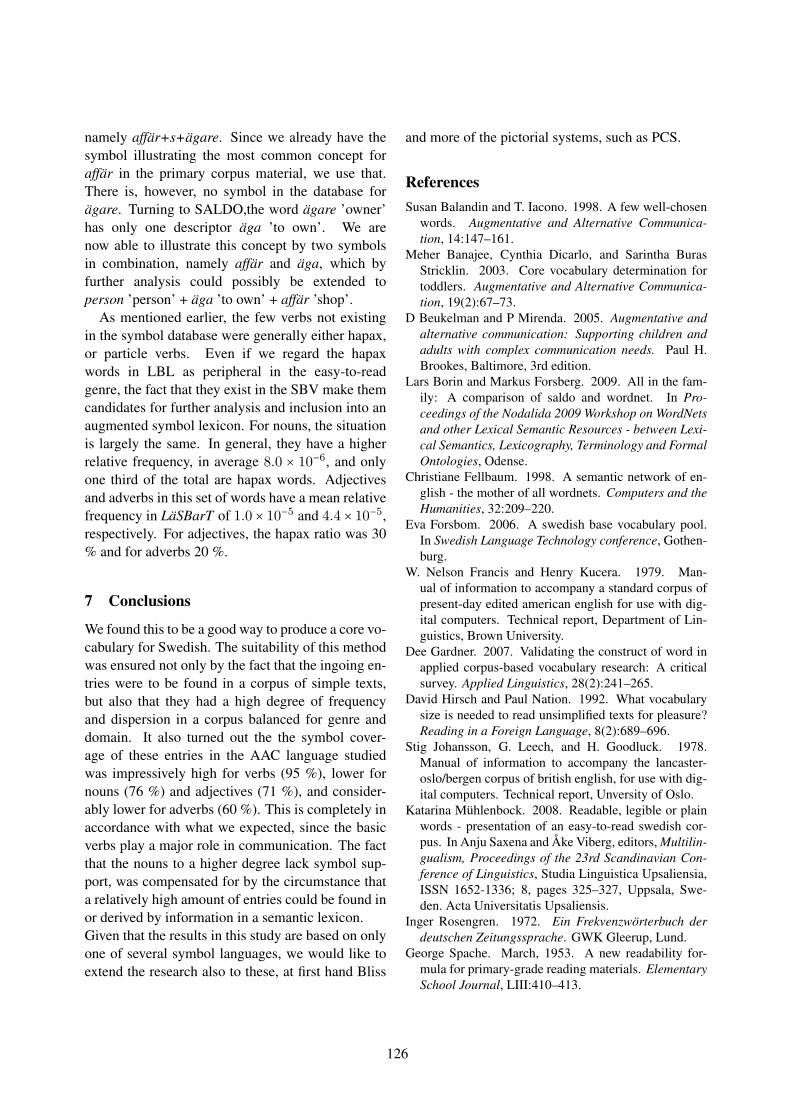
namely affär+s+ägare. Since we already have thesymbol illustrating the most common concept foraffär in the primary corpus material, we use that.There is, however, no symbol in the database forägare. Turning to SALDO,the word ägare ’owner’has only one descriptor äga ’to own’. We arenow able to illustrate this concept by two symbolsin combination, namely affär and äga, which byfurther analysis could possibly be extended toperson ’person’ + äga ’to own’ + affär ’shop’.
As mentioned earlier, the few verbs not existingin the symbol database were generally either hapax,or particle verbs. Even if we regard the hapaxwords in LBL as peripheral in the easy-to-readgenre, the fact that they exist in the SBV make themcandidates for further analysis and inclusion into anaugmented symbol lexicon. For nouns, the situationis largely the same. In general, they have a higherrelative frequency, in average 8.0 × 10⁻⁶, and onlyone third of the total are hapax words. Adjectivesand adverbs in this set of words have a mean relativefrequency in LäSBarT of 1.0 × 10⁻⁵ and 4.4 × 10⁻⁵,respectively. For adjectives, the hapax ratio was 30% and for adverbs 20 %.
7 Conclusions
We found this to be a good way to produce a core vo-cabulary for Swedish. The suitability of this methodwas ensured not only by the fact that the ingoing en-tries were to be found in a corpus of simple texts,but also that they had a high degree of frequencyand dispersion in a corpus balanced for genre anddomain. It also turned out the the symbol cover-age of these entries in the AAC language studiedwas impressively high for verbs (95 %), lower fornouns (76 %) and adjectives (71 %), and consider-ably lower for adverbs (60 %). This is completely inaccordance with what we expected, since the basicverbs play a major role in communication. The factthat the nouns to a higher degree lack symbol sup-port, was compensated for by the circumstance thata relatively high amount of entries could be found inor derived by information in a semantic lexicon.Given that the results in this study are based on onlyone of several symbol languages, we would like toextend the research also to these, at first hand Bliss
and more of the pictorial systems, such as PCS.
ReferencesSusan Balandin and T. Iacono. 1998. A few well-chosen
words. Augmentative and Alternative Communica-tion, 14:147–161.
Meher Banajee, Cynthia Dicarlo, and Sarintha BurasStricklin. 2003. Core vocabulary determination fortoddlers. Augmentative and Alternative Communica-tion, 19(2):67–73.
D Beukelman and P Mirenda. 2005. Augmentative andalternative communication: Supporting children andadults with complex communication needs. Paul H.Brookes, Baltimore, 3rd edition.
Lars Borin and Markus Forsberg. 2009. All in the fam-ily: A comparison of saldo and wordnet. In Pro-ceedings of the Nodalida 2009 Workshop on WordNetsand other Lexical Semantic Resources - between Lexi-cal Semantics, Lexicography, Terminology and FormalOntologies, Odense.
Christiane Fellbaum. 1998. A semantic network of en-glish - the mother of all wordnets. Computers and theHumanities, 32:209–220.
Eva Forsbom. 2006. A swedish base vocabulary pool.In Swedish Language Technology conference, Gothen-burg.
W. Nelson Francis and Henry Kucera. 1979. Man-ual of information to accompany a standard corpus ofpresent-day edited american english for use with dig-ital computers. Technical report, Department of Lin-guistics, Brown University.
Dee Gardner. 2007. Validating the construct of word inapplied corpus-based vocabulary research: A criticalsurvey. Applied Linguistics, 28(2):241–265.
David Hirsch and Paul Nation. 1992. What vocabularysize is needed to read unsimplified texts for pleasure?Reading in a Foreign Language, 8(2):689–696.
Stig Johansson, G. Leech, and H. Goodluck. 1978.Manual of information to accompany the lancaster-oslo/bergen corpus of british english, for use with dig-ital computers. Technical report, Unversity of Oslo.
Katarina Mühlenbock. 2008. Readable, legible or plainwords - presentation of an easy-to-read swedish cor-pus. In Anju Saxena and Åke Viberg, editors, Multilin-gualism, Proceedings of the 23rd Scandinavian Con-ference of Linguistics, Studia Linguistica Upsaliensia,ISSN 1652-1336; 8, pages 325–327, Uppsala, Swe-den. Acta Universitatis Upsaliensis.
Inger Rosengren. 1972. Ein Frekvenzwörterbuch derdeutschen Zeitungssprache. GWK Gleerup, Lund.
George Spache. March, 1953. A new readability for-mula for primary-grade reading materials. ElementarySchool Journal, LIII:410–413.
126
TEI Consortium. 2007. TEI P5: Guidelines for Elec-tronic Text Encoding and Interchange. TEI Consor-tium, p5 edition.
Edward L. Thorndike and I. Lorge. 1944. The teacher’sword book of 30,000 words. Columbia UniversityPress, New York.
Åke Viberg, K Lindmark, A Lindvall, and I Mellenius.2002. The swedish wordnet project. In Proceedingsof Euralex 2002, pages 407–412, Copenhagen Univer-sity.
M. West. 1953. A General Service List of English Words.Longman, London.
Widgit Software. 2011. Widgit homepage.http://www.widgit.com.
World Wide Augmentative & Alternative Communica-tion. 2004. Communication is not a privilege. Tech-nical report.
127
Proceedings of the 2nd Workshop on Speech and Language Processing for Assistive Technologies, pages 128–136,Edinburgh, Scotland, UK, July 30, 2011. c©2011 Association for Computational Linguistics
Experimental Identification of the Use of Hedges in the Simplification ofNumerical Expressions
Susana Bautista and Raquel Hervas and Pablo GervasUniversidad Complutense de Madrid, Spain
{raquelhb,subautis}@fdi.ucm.es, [email protected]
Richard Power and Sandra WilliamsDepartment of Computing, The Open University, Milton Keynes MK76AA, UK
{r.power,s.h.williams}@open.ac.uk
Abstract
Numerical information is very common inall kinds of documents from newspapers andmagazines to household bills and wage slips.However, many people find it difficult to un-derstand, particularly people with poor educa-tion and disabilities. Sometimes numerical in-formation is presented with hedges that mod-ify the meaning. A numerical hedge is a wordor phrase employed to indicate explicitly thatsome loss of precision has taken place (e.g.,“around”) and it may also indicate the di-rection of approximation (e.g., “more than”).This paper presents a study of the use of nu-merical hedges that is part of research inves-tigating the process of rewriting difficult nu-merical expressions in simpler ways. We car-ried out a survey in which experts in numer-acy were asked to simplify a range of pro-portion expressions and analysed the results toobtain guidelines for automating the simplifi-cation task.
1 Introduction
All public information services and documentsshould be accessible in such a way that makes themeasily understood by everybody, according to theUnited Nations (1994). Nowadays, a large percent-age of information expressed in daily news comesin the form of numerical expressions (statistics ofeconomy, demography data, etc). But many peoplehave problems with understanding such expressions-e.g., people with limited education or some kind ofmental disability.
Lack of ability to understand numerical informa-tion is an even greater problem than poor literacy.A U.K. Government Survey in 2003 estimated that6.8 million adults had insufficient numeracy skillsto perform simple everyday tasks such as payinghouse-hold bills and understanding wage slips, and23.8 million adults would be unable to achieve gradeC in the GCSE maths examination for 16 year-oldschool children (Williams et al., 2003).
A first possible approach to solve this impor-tant social problem is making numerical informa-tion accessible by rewriting difficult numerical ex-pressions using alternative wordings that are easierto understand. Some loss of precision could havepositive advantages for numerate people as well asless numerate. Such an approach would require aset of rewriting strategies yielding expressions thatare linguistically correct, easier to understand thanthe original, and as close as possible to the originalmeaning.
In rewriting, hedges play an important role. Forexample,“50.9%” could be rewritten as “just overhalf” using the hedge “just over”. In this kind ofsimplification, hedges indicate that the original num-ber has been approximated and, in some cases, alsothe direction of approximation.
This paper presents a preliminary study of the useof hedges when numerical expressions are simplifiedto make them more accessible. We have carried outa survey in which experts in numeracy were asked tosimplify a range of proportion expressions to obtainguidelines for developing the numerical expressionssimplification task automatically. As a first step to-wards more complex simplification strategies, we
128
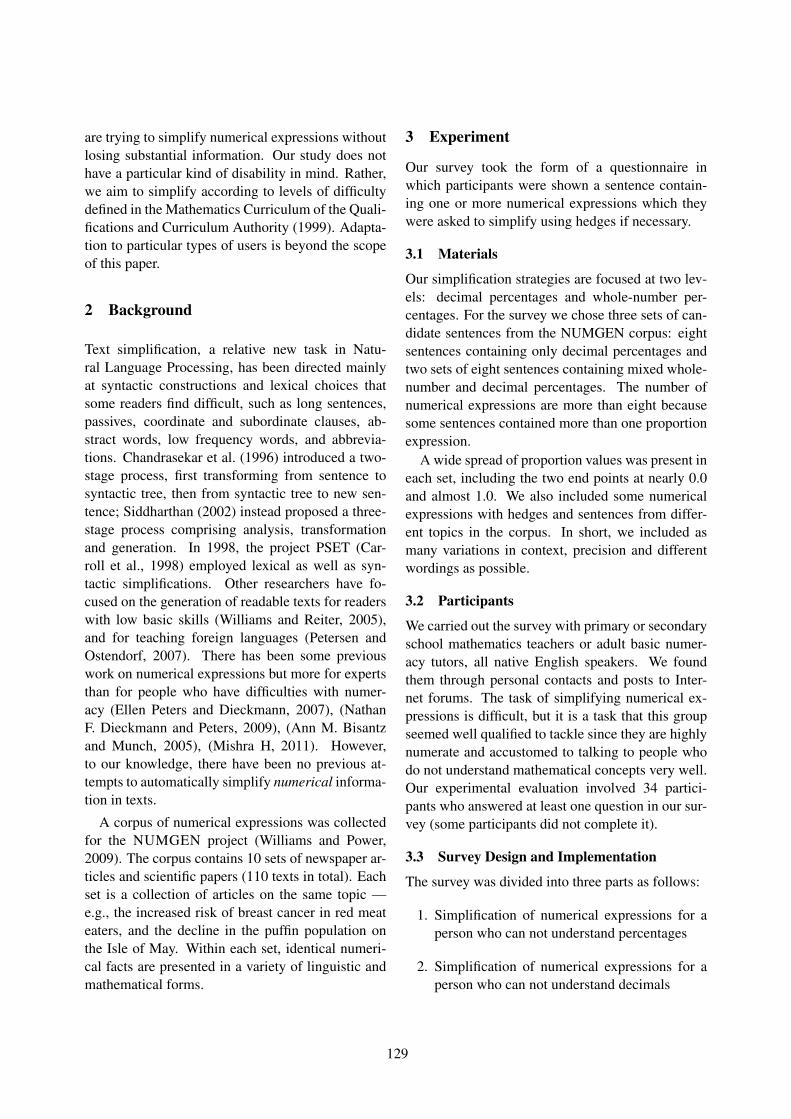
are trying to simplify numerical expressions withoutlosing substantial information. Our study does nothave a particular kind of disability in mind. Rather,we aim to simplify according to levels of difficultydefined in the Mathematics Curriculum of the Quali-fications and Curriculum Authority (1999). Adapta-tion to particular types of users is beyond the scopeof this paper.
2 Background
Text simplification, a relative new task in Natu-ral Language Processing, has been directed mainlyat syntactic constructions and lexical choices thatsome readers find difficult, such as long sentences,passives, coordinate and subordinate clauses, ab-stract words, low frequency words, and abbrevia-tions. Chandrasekar et al. (1996) introduced a two-stage process, first transforming from sentence tosyntactic tree, then from syntactic tree to new sen-tence; Siddharthan (2002) instead proposed a three-stage process comprising analysis, transformationand generation. In 1998, the project PSET (Car-roll et al., 1998) employed lexical as well as syn-tactic simplifications. Other researchers have fo-cused on the generation of readable texts for readerswith low basic skills (Williams and Reiter, 2005),and for teaching foreign languages (Petersen andOstendorf, 2007). There has been some previouswork on numerical expressions but more for expertsthan for people who have difficulties with numer-acy (Ellen Peters and Dieckmann, 2007), (NathanF. Dieckmann and Peters, 2009), (Ann M. Bisantzand Munch, 2005), (Mishra H, 2011). However,to our knowledge, there have been no previous at-tempts to automatically simplify numerical informa-tion in texts.
A corpus of numerical expressions was collectedfor the NUMGEN project (Williams and Power,2009). The corpus contains 10 sets of newspaper ar-ticles and scientific papers (110 texts in total). Eachset is a collection of articles on the same topic —e.g., the increased risk of breast cancer in red meateaters, and the decline in the puffin population onthe Isle of May. Within each set, identical numeri-cal facts are presented in a variety of linguistic andmathematical forms.
3 Experiment
Our survey took the form of a questionnaire inwhich participants were shown a sentence contain-ing one or more numerical expressions which theywere asked to simplify using hedges if necessary.
3.1 Materials
Our simplification strategies are focused at two lev-els: decimal percentages and whole-number per-centages. For the survey we chose three sets of can-didate sentences from the NUMGEN corpus: eightsentences containing only decimal percentages andtwo sets of eight sentences containing mixed whole-number and decimal percentages. The number ofnumerical expressions are more than eight becausesome sentences contained more than one proportionexpression.
A wide spread of proportion values was present ineach set, including the two end points at nearly 0.0and almost 1.0. We also included some numericalexpressions with hedges and sentences from differ-ent topics in the corpus. In short, we included asmany variations in context, precision and differentwordings as possible.
3.2 Participants
We carried out the survey with primary or secondaryschool mathematics teachers or adult basic numer-acy tutors, all native English speakers. We foundthem through personal contacts and posts to Inter-net forums. The task of simplifying numerical ex-pressions is difficult, but it is a task that this groupseemed well qualified to tackle since they are highlynumerate and accustomed to talking to people whodo not understand mathematical concepts very well.Our experimental evaluation involved 34 partici-pants who answered at least one question in our sur-vey (some participants did not complete it).
3.3 Survey Design and Implementation
The survey was divided into three parts as follows:
1. Simplification of numerical expressions for aperson who can not understand percentages
2. Simplification of numerical expressions for aperson who can not understand decimals
129
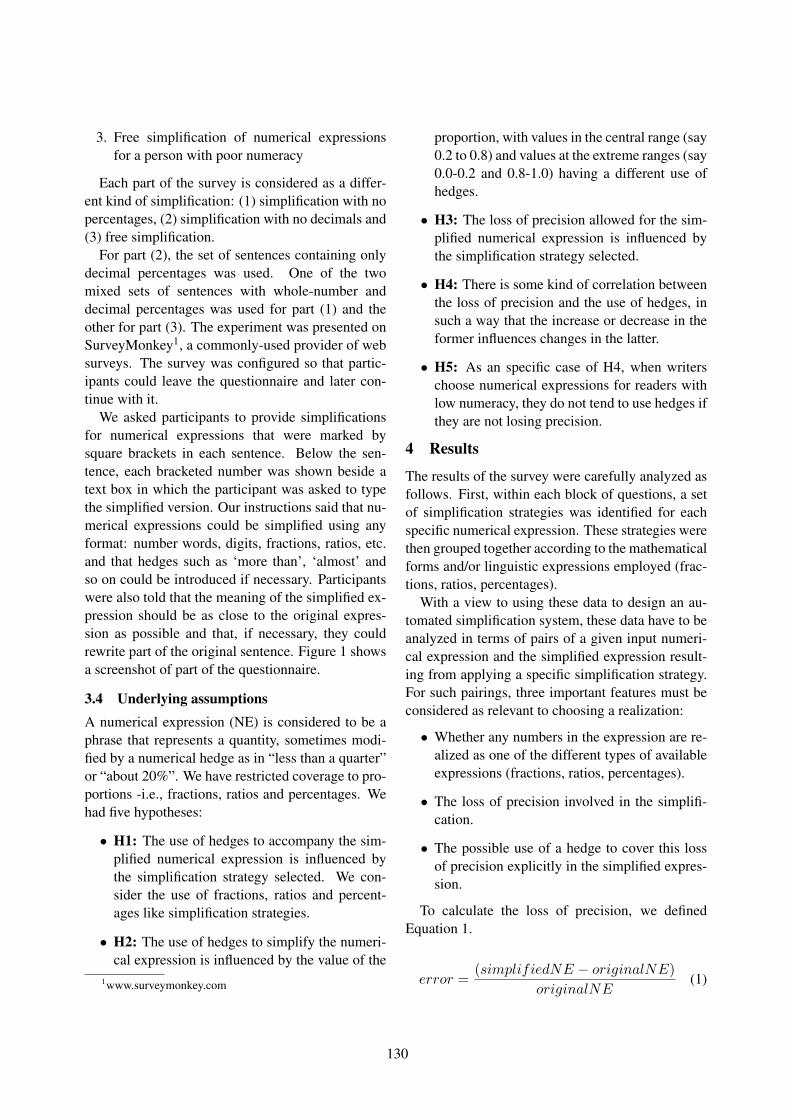
3. Free simplification of numerical expressionsfor a person with poor numeracy
Each part of the survey is considered as a differ-ent kind of simplification: (1) simplification with nopercentages, (2) simplification with no decimals and(3) free simplification.
For part (2), the set of sentences containing onlydecimal percentages was used. One of the twomixed sets of sentences with whole-number anddecimal percentages was used for part (1) and theother for part (3). The experiment was presented onSurveyMonkey1, a commonly-used provider of websurveys. The survey was configured so that partic-ipants could leave the questionnaire and later con-tinue with it.
We asked participants to provide simplificationsfor numerical expressions that were marked bysquare brackets in each sentence. Below the sen-tence, each bracketed number was shown beside atext box in which the participant was asked to typethe simplified version. Our instructions said that nu-merical expressions could be simplified using anyformat: number words, digits, fractions, ratios, etc.and that hedges such as ‘more than’, ‘almost’ andso on could be introduced if necessary. Participantswere also told that the meaning of the simplified ex-pression should be as close to the original expres-sion as possible and that, if necessary, they couldrewrite part of the original sentence. Figure 1 showsa screenshot of part of the questionnaire.
3.4 Underlying assumptionsA numerical expression (NE) is considered to be aphrase that represents a quantity, sometimes modi-fied by a numerical hedge as in “less than a quarter”or “about 20%”. We have restricted coverage to pro-portions -i.e., fractions, ratios and percentages. Wehad five hypotheses:
• H1: The use of hedges to accompany the sim-plified numerical expression is influenced bythe simplification strategy selected. We con-sider the use of fractions, ratios and percent-ages like simplification strategies.
• H2: The use of hedges to simplify the numeri-cal expression is influenced by the value of the
1www.surveymonkey.com
proportion, with values in the central range (say0.2 to 0.8) and values at the extreme ranges (say0.0-0.2 and 0.8-1.0) having a different use ofhedges.
• H3: The loss of precision allowed for the sim-plified numerical expression is influenced bythe simplification strategy selected.
• H4: There is some kind of correlation betweenthe loss of precision and the use of hedges, insuch a way that the increase or decrease in theformer influences changes in the latter.
• H5: As an specific case of H4, when writerschoose numerical expressions for readers withlow numeracy, they do not tend to use hedges ifthey are not losing precision.
4 Results
The results of the survey were carefully analyzed asfollows. First, within each block of questions, a setof simplification strategies was identified for eachspecific numerical expression. These strategies werethen grouped together according to the mathematicalforms and/or linguistic expressions employed (frac-tions, ratios, percentages).
With a view to using these data to design an au-tomated simplification system, these data have to beanalyzed in terms of pairs of a given input numeri-cal expression and the simplified expression result-ing from applying a specific simplification strategy.For such pairings, three important features must beconsidered as relevant to choosing a realization:
• Whether any numbers in the expression are re-alized as one of the different types of availableexpressions (fractions, ratios, percentages).
• The loss of precision involved in the simplifi-cation.
• The possible use of a hedge to cover this lossof precision explicitly in the simplified expres-sion.
To calculate the loss of precision, we definedEquation 1.
error =(simplifiedNE − originalNE)
originalNE(1)
130
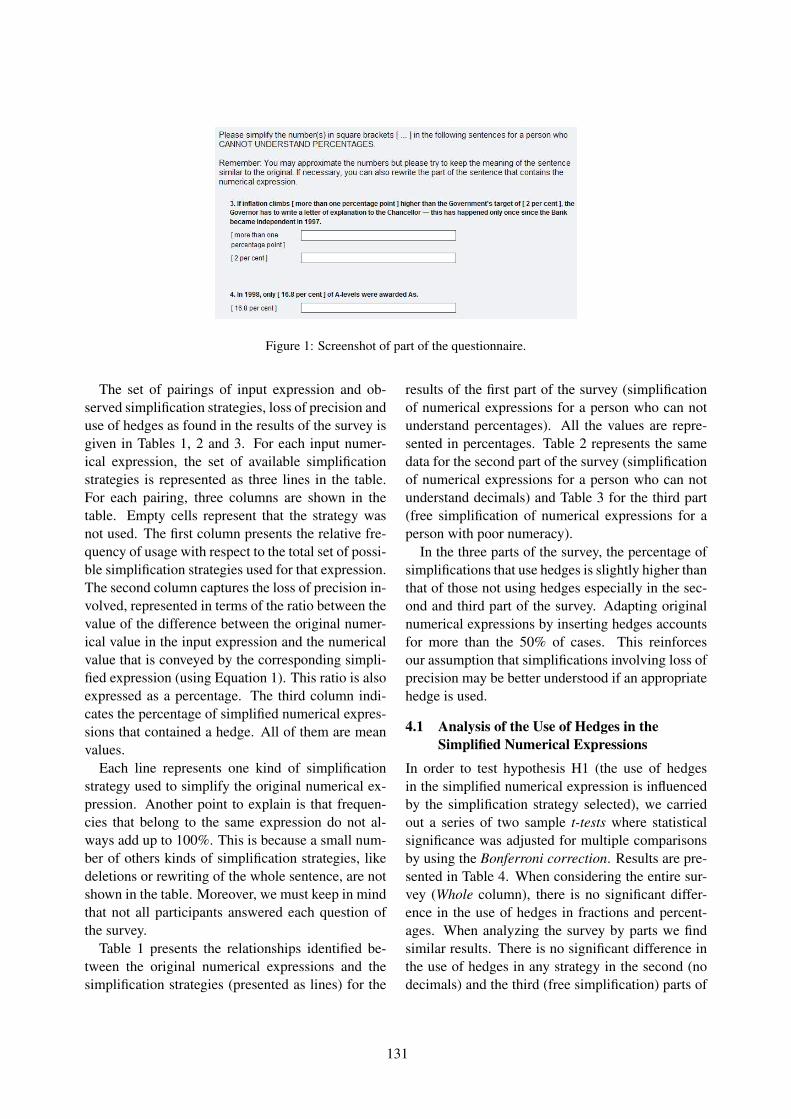
Figure 1: Screenshot of part of the questionnaire.
The set of pairings of input expression and ob-served simplification strategies, loss of precision anduse of hedges as found in the results of the survey isgiven in Tables 1, 2 and 3. For each input numer-ical expression, the set of available simplificationstrategies is represented as three lines in the table.For each pairing, three columns are shown in thetable. Empty cells represent that the strategy wasnot used. The first column presents the relative fre-quency of usage with respect to the total set of possi-ble simplification strategies used for that expression.The second column captures the loss of precision in-volved, represented in terms of the ratio between thevalue of the difference between the original numer-ical value in the input expression and the numericalvalue that is conveyed by the corresponding simpli-fied expression (using Equation 1). This ratio is alsoexpressed as a percentage. The third column indi-cates the percentage of simplified numerical expres-sions that contained a hedge. All of them are meanvalues.
Each line represents one kind of simplificationstrategy used to simplify the original numerical ex-pression. Another point to explain is that frequen-cies that belong to the same expression do not al-ways add up to 100%. This is because a small num-ber of others kinds of simplification strategies, likedeletions or rewriting of the whole sentence, are notshown in the table. Moreover, we must keep in mindthat not all participants answered each question ofthe survey.
Table 1 presents the relationships identified be-tween the original numerical expressions and thesimplification strategies (presented as lines) for the
results of the first part of the survey (simplificationof numerical expressions for a person who can notunderstand percentages). All the values are repre-sented in percentages. Table 2 represents the samedata for the second part of the survey (simplificationof numerical expressions for a person who can notunderstand decimals) and Table 3 for the third part(free simplification of numerical expressions for aperson with poor numeracy).
In the three parts of the survey, the percentage ofsimplifications that use hedges is slightly higher thanthat of those not using hedges especially in the sec-ond and third part of the survey. Adapting originalnumerical expressions by inserting hedges accountsfor more than the 50% of cases. This reinforcesour assumption that simplifications involving loss ofprecision may be better understood if an appropriatehedge is used.
4.1 Analysis of the Use of Hedges in theSimplified Numerical Expressions
In order to test hypothesis H1 (the use of hedgesin the simplified numerical expression is influencedby the simplification strategy selected), we carriedout a series of two sample t-tests where statisticalsignificance was adjusted for multiple comparisonsby using the Bonferroni correction. Results are pre-sented in Table 4. When considering the entire sur-vey (Whole column), there is no significant differ-ence in the use of hedges in fractions and percent-ages. When analyzing the survey by parts we findsimilar results. There is no significant difference inthe use of hedges in any strategy in the second (nodecimals) and the third (free simplification) parts of
131
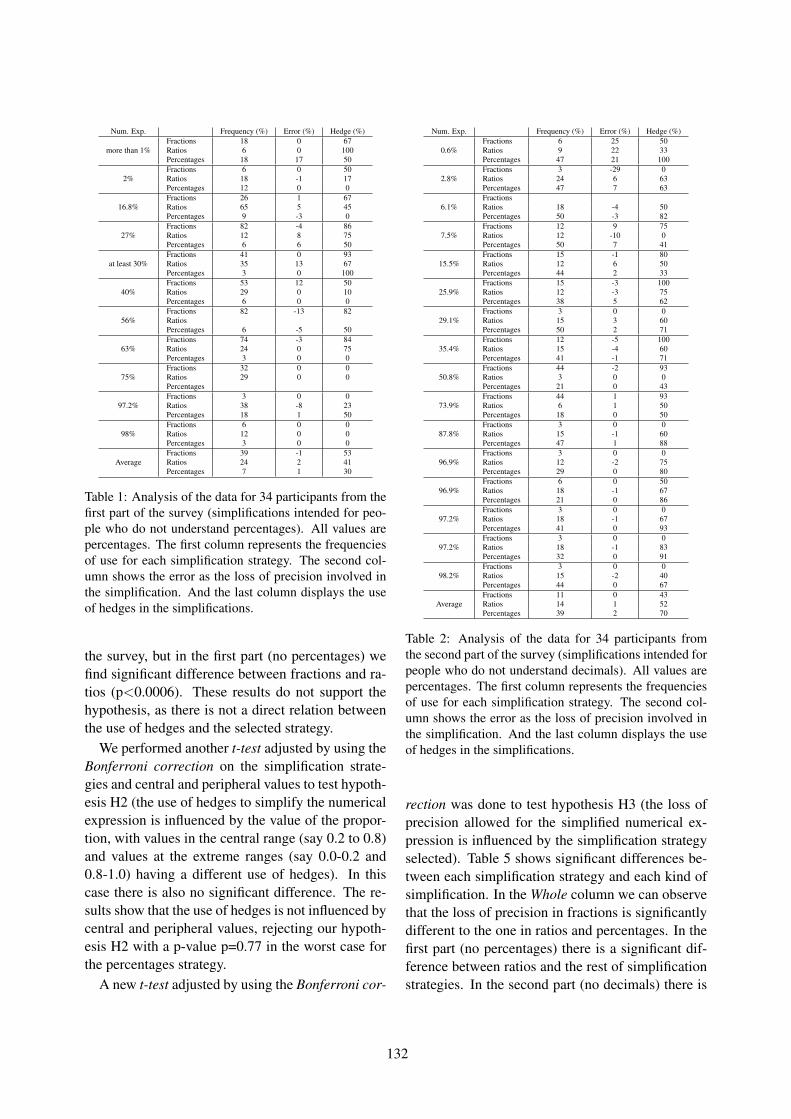
Num. Exp. Frequency (%) Error (%) Hedge (%)Fractions 18 0 67
more than 1% Ratios 6 0 100Percentages 18 17 50Fractions 6 0 50
2% Ratios 18 -1 17Percentages 12 0 0Fractions 26 1 67
16.8% Ratios 65 5 45Percentages 9 -3 0Fractions 82 -4 86
27% Ratios 12 8 75Percentages 6 6 50Fractions 41 0 93
at least 30% Ratios 35 13 67Percentages 3 0 100Fractions 53 12 50
40% Ratios 29 0 10Percentages 6 0 0Fractions 82 -13 82
56% RatiosPercentages 6 -5 50Fractions 74 -3 84
63% Ratios 24 0 75Percentages 3 0 0Fractions 32 0 0
75% Ratios 29 0 0PercentagesFractions 3 0 0
97.2% Ratios 38 -8 23Percentages 18 1 50Fractions 6 0 0
98% Ratios 12 0 0Percentages 3 0 0Fractions 39 -1 53
Average Ratios 24 2 41Percentages 7 1 30
Table 1: Analysis of the data for 34 participants from thefirst part of the survey (simplifications intended for peo-ple who do not understand percentages). All values arepercentages. The first column represents the frequenciesof use for each simplification strategy. The second col-umn shows the error as the loss of precision involved inthe simplification. And the last column displays the useof hedges in the simplifications.
the survey, but in the first part (no percentages) wefind significant difference between fractions and ra-tios (p<0.0006). These results do not support thehypothesis, as there is not a direct relation betweenthe use of hedges and the selected strategy.
We performed another t-test adjusted by using theBonferroni correction on the simplification strate-gies and central and peripheral values to test hypoth-esis H2 (the use of hedges to simplify the numericalexpression is influenced by the value of the propor-tion, with values in the central range (say 0.2 to 0.8)and values at the extreme ranges (say 0.0-0.2 and0.8-1.0) having a different use of hedges). In thiscase there is also no significant difference. The re-sults show that the use of hedges is not influenced bycentral and peripheral values, rejecting our hypoth-esis H2 with a p-value p=0.77 in the worst case forthe percentages strategy.
A new t-test adjusted by using the Bonferroni cor-
Num. Exp. Frequency (%) Error (%) Hedge (%)Fractions 6 25 50
0.6% Ratios 9 22 33Percentages 47 21 100Fractions 3 -29 0
2.8% Ratios 24 6 63Percentages 47 7 63Fractions
6.1% Ratios 18 -4 50Percentages 50 -3 82Fractions 12 9 75
7.5% Ratios 12 -10 0Percentages 50 7 41Fractions 15 -1 80
15.5% Ratios 12 6 50Percentages 44 2 33Fractions 15 -3 100
25.9% Ratios 12 -3 75Percentages 38 5 62Fractions 3 0 0
29.1% Ratios 15 3 60Percentages 50 2 71Fractions 12 -5 100
35.4% Ratios 15 -4 60Percentages 41 -1 71Fractions 44 -2 93
50.8% Ratios 3 0 0Percentages 21 0 43Fractions 44 1 93
73.9% Ratios 6 1 50Percentages 18 0 50Fractions 3 0 0
87.8% Ratios 15 -1 60Percentages 47 1 88Fractions 3 0 0
96.9% Ratios 12 -2 75Percentages 29 0 80Fractions 6 0 50
96.9% Ratios 18 -1 67Percentages 21 0 86Fractions 3 0 0
97.2% Ratios 18 -1 67Percentages 41 0 93Fractions 3 0 0
97.2% Ratios 18 -1 83Percentages 32 0 91Fractions 3 0 0
98.2% Ratios 15 -2 40Percentages 44 0 67Fractions 11 0 43
Average Ratios 14 1 52Percentages 39 2 70
Table 2: Analysis of the data for 34 participants fromthe second part of the survey (simplifications intended forpeople who do not understand decimals). All values arepercentages. The first column represents the frequenciesof use for each simplification strategy. The second col-umn shows the error as the loss of precision involved inthe simplification. And the last column displays the useof hedges in the simplifications.
rection was done to test hypothesis H3 (the loss ofprecision allowed for the simplified numerical ex-pression is influenced by the simplification strategyselected). Table 5 shows significant differences be-tween each simplification strategy and each kind ofsimplification. In the Whole column we can observethat the loss of precision in fractions is significantlydifferent to the one in ratios and percentages. In thefirst part (no percentages) there is a significant dif-ference between ratios and the rest of simplificationstrategies. In the second part (no decimals) there is
132
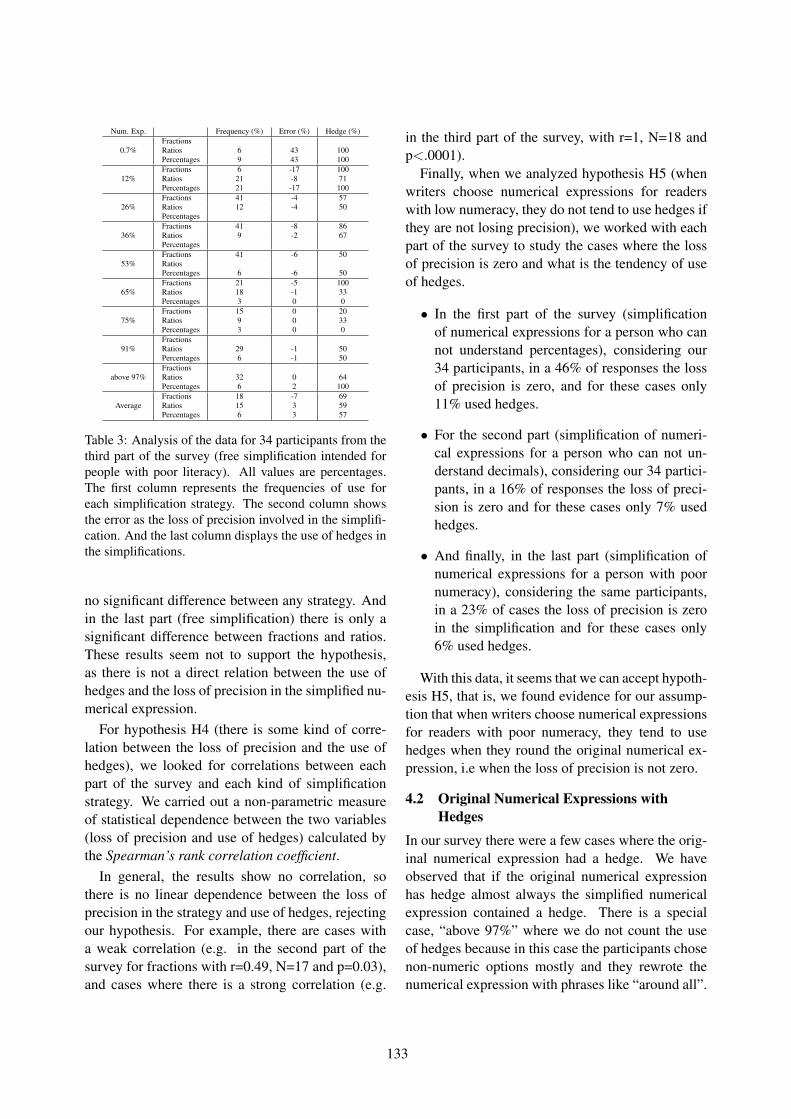
Num. Exp. Frequency (%) Error (%) Hedge (%)Fractions
0.7% Ratios 6 43 100Percentages 9 43 100Fractions 6 -17 100
12% Ratios 21 -8 71Percentages 21 -17 100Fractions 41 -4 57
26% Ratios 12 -4 50PercentagesFractions 41 -8 86
36% Ratios 9 -2 67PercentagesFractions 41 -6 50
53% RatiosPercentages 6 -6 50Fractions 21 -5 100
65% Ratios 18 -1 33Percentages 3 0 0Fractions 15 0 20
75% Ratios 9 0 33Percentages 3 0 0Fractions
91% Ratios 29 -1 50Percentages 6 -1 50Fractions
above 97% Ratios 32 0 64Percentages 6 2 100Fractions 18 -7 69
Average Ratios 15 3 59Percentages 6 3 57
Table 3: Analysis of the data for 34 participants from thethird part of the survey (free simplification intended forpeople with poor literacy). All values are percentages.The first column represents the frequencies of use foreach simplification strategy. The second column showsthe error as the loss of precision involved in the simplifi-cation. And the last column displays the use of hedges inthe simplifications.
no significant difference between any strategy. Andin the last part (free simplification) there is only asignificant difference between fractions and ratios.These results seem not to support the hypothesis,as there is not a direct relation between the use ofhedges and the loss of precision in the simplified nu-merical expression.
For hypothesis H4 (there is some kind of corre-lation between the loss of precision and the use ofhedges), we looked for correlations between eachpart of the survey and each kind of simplificationstrategy. We carried out a non-parametric measureof statistical dependence between the two variables(loss of precision and use of hedges) calculated bythe Spearman’s rank correlation coefficient.
In general, the results show no correlation, sothere is no linear dependence between the loss ofprecision in the strategy and use of hedges, rejectingour hypothesis. For example, there are cases witha weak correlation (e.g. in the second part of thesurvey for fractions with r=0.49, N=17 and p=0.03),and cases where there is a strong correlation (e.g.
in the third part of the survey, with r=1, N=18 andp<.0001).
Finally, when we analyzed hypothesis H5 (whenwriters choose numerical expressions for readerswith low numeracy, they do not tend to use hedges ifthey are not losing precision), we worked with eachpart of the survey to study the cases where the lossof precision is zero and what is the tendency of useof hedges.
• In the first part of the survey (simplificationof numerical expressions for a person who cannot understand percentages), considering our34 participants, in a 46% of responses the lossof precision is zero, and for these cases only11% used hedges.
• For the second part (simplification of numeri-cal expressions for a person who can not un-derstand decimals), considering our 34 partici-pants, in a 16% of responses the loss of preci-sion is zero and for these cases only 7% usedhedges.
• And finally, in the last part (simplification ofnumerical expressions for a person with poornumeracy), considering the same participants,in a 23% of cases the loss of precision is zeroin the simplification and for these cases only6% used hedges.
With this data, it seems that we can accept hypoth-esis H5, that is, we found evidence for our assump-tion that when writers choose numerical expressionsfor readers with poor numeracy, they tend to usehedges when they round the original numerical ex-pression, i.e when the loss of precision is not zero.
4.2 Original Numerical Expressions withHedges
In our survey there were a few cases where the orig-inal numerical expression had a hedge. We haveobserved that if the original numerical expressionhas hedge almost always the simplified numericalexpression contained a hedge. There is a specialcase, “above 97%” where we do not count the useof hedges because in this case the participants chosenon-numeric options mostly and they rewrote thenumerical expression with phrases like “around all”.
133
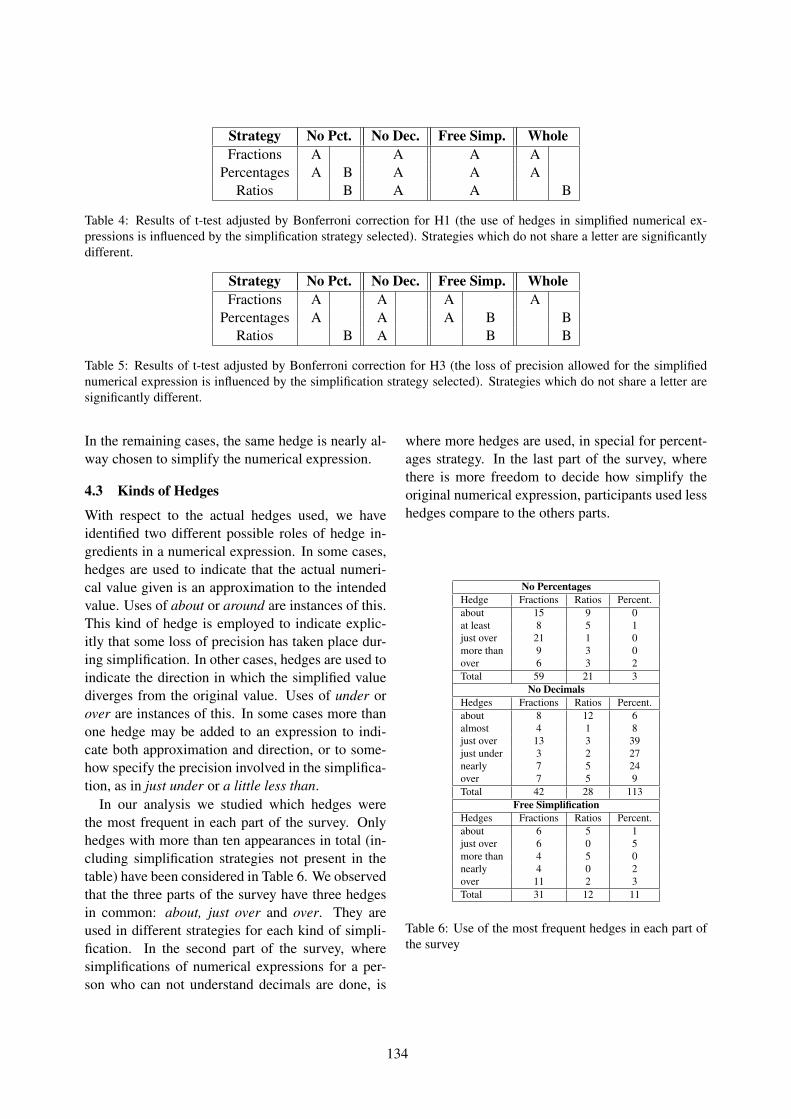
Strategy No Pct. No Dec. Free Simp. WholeFractions A A A A
Percentages A B A A ARatios B A A B
Table 4: Results of t-test adjusted by Bonferroni correction for H1 (the use of hedges in simplified numerical ex-pressions is influenced by the simplification strategy selected). Strategies which do not share a letter are significantlydifferent.
Strategy No Pct. No Dec. Free Simp. WholeFractions A A A A
Percentages A A A B BRatios B A B B
Table 5: Results of t-test adjusted by Bonferroni correction for H3 (the loss of precision allowed for the simplifiednumerical expression is influenced by the simplification strategy selected). Strategies which do not share a letter aresignificantly different.
In the remaining cases, the same hedge is nearly al-way chosen to simplify the numerical expression.
4.3 Kinds of Hedges
With respect to the actual hedges used, we haveidentified two different possible roles of hedge in-gredients in a numerical expression. In some cases,hedges are used to indicate that the actual numeri-cal value given is an approximation to the intendedvalue. Uses of about or around are instances of this.This kind of hedge is employed to indicate explic-itly that some loss of precision has taken place dur-ing simplification. In other cases, hedges are used toindicate the direction in which the simplified valuediverges from the original value. Uses of under orover are instances of this. In some cases more thanone hedge may be added to an expression to indi-cate both approximation and direction, or to some-how specify the precision involved in the simplifica-tion, as in just under or a little less than.
In our analysis we studied which hedges werethe most frequent in each part of the survey. Onlyhedges with more than ten appearances in total (in-cluding simplification strategies not present in thetable) have been considered in Table 6. We observedthat the three parts of the survey have three hedgesin common: about, just over and over. They areused in different strategies for each kind of simpli-fication. In the second part of the survey, wheresimplifications of numerical expressions for a per-son who can not understand decimals are done, is
where more hedges are used, in special for percent-ages strategy. In the last part of the survey, wherethere is more freedom to decide how simplify theoriginal numerical expression, participants used lesshedges compare to the others parts.
No PercentagesHedge Fractions Ratios Percent.about 15 9 0at least 8 5 1just over 21 1 0more than 9 3 0over 6 3 2Total 59 21 3
No DecimalsHedges Fractions Ratios Percent.about 8 12 6almost 4 1 8just over 13 3 39just under 3 2 27nearly 7 5 24over 7 5 9Total 42 28 113
Free SimplificationHedges Fractions Ratios Percent.about 6 5 1just over 6 0 5more than 4 5 0nearly 4 0 2over 11 2 3Total 31 12 11
Table 6: Use of the most frequent hedges in each part ofthe survey
134
5 Discussion
As can be seen in the results, the use of hedges tosimplify numerical expressions can be influenced bythree parameters. The first is the kind of simplifica-tion. Our survey was divided in three parts depend-ing on the mathematical knowledge of the final user.The second is the simplification strategy for choos-ing mathematical form (fractions, ratios, or percent-ages). In our data we observed some differences inthe usage of hedges with ratios and their usage withfractions and percentages (see Table 4). The last pa-rameter is the loss of precision that occurs when thenumerical expression is rounded. We investigatedthe use of hedges vs. loss of precision with differenttests hoping to define some dependencies, but therewas no clear correlation between them, and it wasonly when we tried a deeper analysis of strategiesand kind of simplifications that we found some cor-relations such as those we presented in Section 4.1.
When asked to simplify for people who do notunderstand percentages, or for people with poor nu-meracy, the participants use different simplificationstrategies and sometimes they use hedges to simplifythe original numerical expression. As some partic-ipants commented, not only are percentages mathe-matically sophisticated forms, but they may be usedin sophisticated ways in the text, often for exampledescribing rising and falling values, for which in-creases or decreases can themselves be described inpercentages terms. Such complex relationships arelikely to pose problems for people with poor numer-acy even if a suitable strategy can be found for sim-plifying the individual percentages. In some of theexamples with more than one numerical expressionbeing compared, some of the evaluators reported atendency to phrase them both according to a com-parable base. Thus we should consider the role ofcontext (the set of numerical expressions in a givensentence as a whole, and the meaning of the text) inestablishing what simplifications must be used.
6 Conclusions and Future Work
Through a survey administered to experts on nu-meracy, we have collected a wide range of exam-ples of appropriate simplifications of percentage ex-pressions. These examples of simplified expressionsgive us information about the use of hedges that our
participants carry out to adapt the original numer-ical expression to be understood by the final user.We investigated the loss of precision that occurs witheach hedge and the relation between the simplifica-tion strategy and the use of hedges.
Our aim is to use this data to guide the develop-ment of a system for automatically simplifying per-centages in texts. With the knowledge acquired fromour study we will improve our algorithm to simplifynumerical expressions. We could determinate fromthe simplification strategy, kind of simplification andthe loss of precision allowed, which will be the bestoption to adapt the original numerical expression tothe final user and if that option uses hedges to under-stand better the original numerical expression. As apart of our algorithm, we will have to look at inter-rater agreements for identifying appropriate hedges.
As future work, we plan to carry out another studyto determine a ranking of simplification strategiesfrom collecting a repertoire of rewriting strategiesused to simplify. This data should allow us to deter-mine whether common values are considered sim-pler and whether the value of the original expressioninfluences the chosen simplification strategy. So,given a numerical expression, we could choose whatsimplification strategy to apply and whether to inserta hedge. We could investigate whether the value ofthe original proportion also influences choices, de-pending on its correspondence with central or pe-ripheral values.
We have also collected a parallel corpus of numer-ical expressions (original vs. simplified version).This corpus will be shared with other researches soit can be used in different applications to improvethe readability of text. This could be a very use-ful resource because simplification of percentagesremains an interesting and non-trivial problem.
Acknowledgments
This research is funded by the Spanish Ministryof Education and Science (TIN2009-14659-C03-01Project), Universidad Complutense de Madrid andBanco Santander Central Hispano (GR58/08 Re-search Group Grant), and the FPI grant program.
135
ReferencesStephanie Schinzing Marsiglio Ann M. Bisantz and Jes-
sica Munch. 2005. Displaying uncertainty: Inves-tigating the effects of display format and specificity.Human Factors: The Journal of the Human Factorsand Ergonomics Society, 47(4):777.
J. Carroll, G. Minnen, Y. Canning, S. Devlin, and J. Tait.1998. Practical simplification of English newspapertext to assist aphasic readers. In AAAI-98 Workshop onIntegrating Artificial Intelligence and Assistive Tech-nology, Madison, Wisconsin.
Raman Chandrasekar, Christine Doran, and BangaloreSrinivas. 1996. Motivations and Methods for TextSimplification. In COLING, pages 1041–1044.
Paul Slovic Ellen Peters, Judith Hibbard and NathanDieckmann. 2007. Numeracy skill and the commu-nication, comprehension, and use of risk-benefit infor-mation. Health Affairs, 26(3):741–748.
Shiv B. Mishra H, Mishra A. 2011. In praise of vague-ness: malleability of vague information as a perfor-mance booster. Psychological Science, 22(6):733–8,April.
Paul Slovic Nathan F. Dieckmann and Ellen M. Peters.2009. The use of narrative evidence and explicit like-lihood by decisionmakers varying in numeracy. RiskAnalysis, 29(10).
The United Nations. 1994. Normas uniformes sobre laigualdad de oportunidades para las personas con dis-capacidad. Technical report.
Sarah E. Petersen and Mari Ostendorf. 2007. Text Sim-plification for Language Learners: A Corpus Analy-sis. Speech and Language Technology for Education(SLaTE).
Qualification and Curriculum Authority. 1999. Mathe-matics: the national curriculum for england. Depart-ment for Education and Employment, London.
Advaith Siddharthan. 2002. Resolving Attachment andClause Boundary Amgiguities for Simplifying Rela-tive Clause Constructs. In Proceedings of the StudentResearch Workshop, 40th Meeting of the Associationfor Computacional Linguistics.
Sandra Williams and Richard Power. 2009. Precisionand mathematical form in first and subsequent men-tions of numerical facts and their relation to documentstructure. In Proceedings of the 12th European Work-shop on Natural Language Generation, Athens.
Sandra Williams and Ehud Reiter. 2005. Generatingreadable texts for readers with low basic skills. InProceeding of the 10th European Workshop on Natu-ral Language Generation, pages 140–147, Aberdeen,Scotland.
Joel Williams, Sam Clemens, Karin Oleinikova, andKaren Tarvin. 2003. The Skills for Life survey: A
national needs and impact survey of literacy, numer-acy and ICT skills. Technical Report Research Report490, Department for Education and Skills.
136
Proceedings of the 2nd Workshop on Speech and Language Processing for Assistive Technologies, pages 137–147,Edinburgh, Scotland, UK, July 30, 2011. c©2011 Association for Computational Linguistics
Towards an on-demand Simple Portuguese Wikipedia
Arnaldo Candido Junior Ann CopestakeInstitute of Mathematics and Computer Sciences Computer Laboratory
University of São Paulo University of Cambridge arnaldoc at icmc.usp.br Ann.Copestake at cl.cam.ac.uk
Lucia Specia Sandra Maria AluísioResearch Group in Computational Linguistics Institute of Mathematics and Computer Sciences
University of Wolverhampton University of São Paulol.specia at wlv.ac.uk sandra at icmc.usp.br
Abstract
The Simple English Wikipedia provides a simplified version of Wikipedia's English articles for readers with special needs. However, there are fewer efforts to make information in Wikipedia in other languages accessible to a large audience. This work proposes the use of a syntactic simplification engine with high precision rules to automatically generate a Simple Portuguese Wikipedia on demand, based on user interactions with the main Portuguese Wikipedia. Our estimates indicated that a human can simplify about 28,000 occurrences of analysed patterns per million words, while our system can correctly simplify 22,200 occurrences, with estimated f-measure 77.2%.
1 Introduction
The Simple English Wikipedia1 is an effort to make information in Wikipedia2 accessible for less competent readers of English by using simple words and grammar. Examples of intended users include children and readers with special needs, such as users with learning disabilities and learners of English as a second language.
Simple English (or Plain English), used in this version of Wikipedia, is a result from the Plain English movement that occurred in Britain and the United States in the late 1970’s as a reaction to the unclear language used in government and business forms and documents. Some recommendations on how to write and organize information in Plain
1 http://simple.wikipedia.org/2 http://www.wikipedia.org/
Language (the set of guidelines to write simplified texts) are related to both syntax and lexical levels: use short sentences; avoid hidden verbs; use active voice; use concrete, short, simple words.
A number of resources, such as lists of common words3, are available for the English language to help users write in Simple English. These include lexical resources like the MRC Psycholinguistic Database4 which helps identify difficult words using psycholinguistic measures. However, resources as such do not exist for Portuguese. An exception is a small list of simple words compiled as part of the PorSimples project (Aluisio et al., 2008).
Although the guidelines from the Plain Language can in principle be applied for many languages and text genres, for Portuguese there are very few efforts using Plain Language to make information accessible to a large audience. To the best of our knowledge, the solution offered by Portugues Claro5 to help organizations produce European Portuguese (EP) documents in simple language is the only commercial option in such a direction. For Brazilian Portuguese (BP), a Brazilian Law (10098/2000) tries to ensure that content in e-Gov sites and services is written in simple and direct language in order to remove barriers in communication and to ensure citizens' rights to information and communication access. However, as it has been shown in Martins and Filgueiras (2007), content in such websites still needs considerable rewriting to follow the Plain Language guidelines.
A few efforts from the research community have recently resulted in natural language processing
3 http://simple.wiktionary.org/4 http://www2.let.vu.nl/resources/elw/resource/mrc.html5 http://www.portuguesclaro.pt/
137
systems to simplify and make Portuguese language clearer. ReEscreve (Barreiro and Cabral, 2009) is a multi-purpose paraphraser that helps users to simplify their EP texts by reducing its ambiguity, number of words and complexity. The current linguistic phenomena paraphrased are support verb constructions, which are replaced by stylistic variants. In the case of BP, the lack of simplification systems led to development of PorSimples project (Aluísio and Gasperin, 2010). This project uses simplification in different linguistic levels to provide simplified text to poor literacy readers.
For English, automatic text simplification has been exploited for helping readers with poor literacy (Max, 2006) and readers with other special needs, such as aphasic people (Devlin and Unthank, 2006; Carroll et al. 1999). It has also been used in bilingual education (Petersen, 2007) and for improving the accuracy of Natural Language Processing (NLP) tasks (Klebanov et al., 2004; Vickrey and Koller, 2008).
Given the general scarcity of human resources to manually simplify large content repositories such as Wikipedia, simplifying texts automatically can be the only feasible option. The Portuguese Wikipedia, for example, is the tenth largest Wikipedia (as of May 2011), with 683,215 articles and approximately 860,242 contributors6.
In this paper we propose a new rule-based syntactic simplification system to create a Simple Portuguese Wikipedia on demand, based on user interactions with the main Portuguese Wikipedia. We use a simplification engine to change passive into active voice and to break down and change the syntax of subordinate clauses. We focus on these operations because they are more difficult to process by readers with learning disabilities as compared to others such as coordination and complex noun phrases (Abedi et al., 2011; Jones et al., 2006; Chappell, 1985). User interaction with Wikipedia can be performed by a system like the Facilita7 (Watanabe et al., 2009), a browser plug-in developed in the PorSimples project to allow automatic adaptation (summarization and syntactic simplification) of any web page in BP.
This paper is organized as follows. Section 2 presents related work on syntactic simplification.
6 http://meta.wikimedia.org/wiki/List_of_Wikipedias#Grand Total7 http://nilc.icmc.usp.br/porsimples/facilita/
Section 3 presents the methodology to build and evaluate the simplification engine for BP. Section 4 presents the results of the engine evaluation. Section 5 presents an analysis on simplification issues and discusses possible improvements. Section 6 contains some final remarks.
2 Related work
Given the dependence of syntactic simplification on linguistic information, successful approaches are mostly based on rule-based systems. Approaches using operations learned from corpus have not shown to be able to perform complex operations such the splitting of sentences with relative clauses (Chandrasekar and Srinivas, 1997; Daelemans et al., 2004; Specia, 2010). On the other hand. the use of machine learning techniques to predict when to simplify a sentence, i.e. learning the properties of language that distinguish simple from normal texts, has achieved relative success (Napoles and Dredze, 2010). Therefore, most work on syntactic simplification still relies on rule-based systems to simplify a set of syntactic constructions. This is also the approach we follow in this paper. In what follows we review some relevant and work on syntactic simplification.
The seminal work of Chandrasekar and Srinivas (1997) investigated the induction of syntactic rules from a corpus annotated with part-of-speech tags augmented by agreement and subcategorization information. They extracted syntactic correspondences and generated rules aiming to speed up parsing and improving its accuracy, but not working on naturally occurring texts. Daelemans et al. (2004) compared both machine learning and rule-based approaches for the automatic generation of TV subtitles for hearing-impaired people. In their machine learning approach, a simplification model is learned from parallel corpora with TV programme transcripts and the associated subtitles. Their method used a memory-based learner and features such as words, lemmas, POS tags, chunk tags, relation tags and proper name tags, among others features (30 in total). However, this approach did not perform as well as the authors expected, making errors like removing sentence subjects or deleting a part of a multi-word unit. More recently, Specia (2010) presented a new approach for text simplification, based on the framework of Statistical Machine
138
Translation. Although the results are promising for lexical simplification, syntactic rewriting was not captured by the model to address long-distance operations, since syntactic information was not included into the framework.
Inui et al. (2003) proposed a rule-based system for text simplification aimed at deaf people. Using about one thousand manually created rules, the authors generate several paraphrases for each sentence and train a classifier to select the simpler ones. Promising results were obtained, although different types of errors on the paraphrase generation are encountered, such as problems with verb conjugation and regency. Our work aims at making Portuguese Wikipedia information accessible to a large audience and instead of generating several possible outputs we generate only one based on rules taken from a manual of simplification for BP.
Siddharthan (2006) proposed a syntactic simplification architecture that relies on shallow parsing. The general goal of the architecture is to make texts more accessible to a broader audience instead of targeting any particular application. The system simplifies apposition, relative clauses, coordination and subordination. Our method, on the other hand, relies on deep parsing (Bick, 2000) and focuses on changing passive to active voice and changing the syntax of relative clauses and subordinate sentences.
Max (2006) applied text simplification in the writing process by embedding the simplifier into a word processor. Although this system ensures accurate output, it requires manual choices. The suggested simplifications are ranked by a score of syntactic complexity and potential change of meaning. The writer then chooses their preferred simplification. Our method, on the other hand, offers the user only one simplification since it uses several rules to better capture each complex phenomenon.
Inspired by Siddharthan (2006), Jonnalagadda and Gonzalez (2009) present an approach to syntactic simplification addressing also the problem of accurately determining the grammatical correctness of the simplified sentences. They propose the combination of the number of null links and disjunct cost (the level of inappropriateness, caused by using less frequent rules in the linkage) from the cost vector returned
by a Link Grammar8 parser. Their motivation is to improve the performance of systems for extracting Protein-Protein Interactions automatically from biomedical articles by automatically simplifying sentences. Besides treating the syntactic phenomena described in Siddharthan (2006), they remove describing phrases occurring at the beginning of the sentences, like “These results suggest that” and “As reported previously”. While they focus on the scientific genre, our work is focused on the encyclopedic genre.
In order to obtain a text easier to understand by children, De Belder and Moens (2010) use the Stanford parser9 to select the following phenomena to syntactically simplify the sentences: appositions, relative clauses, prefix subordination and infix subordination and coordination. After sentence splitting, they try to apply the simplification rules again to both of the new sentences. However, they conclude that with the set of simplification rules used, it was not possible to reduce the reading difficulty for children and foresee the use of other techniques for this purpose, such as summarization and elaborations for difficult words.
3 Simplification engine
3.1 Engine development
The development of a syntactic simplification engine for a specific task and audience can be divided into five distinct phases: (a) target audience analysis; (b) review of complex syntactic phenomena for such an audience; (c) formulation of simplification guidelines; (d) refinement of rules based on evidence from corpora; and (e) programming and evaluation of rules.
In this paper we focus on the last two phases. We use the simplification guidelines from the PorSimples project, but these are based on grammar studies and corpora analysis for a different text genre (news). Therefore additional corpora evidence proved to be necessary. This resulted in the further refinement of the rules, covering different cases for each syntactic phenomenon.
The Simplification engine relies on the output of the Palavras Parser (Bick, 2000) to perform constituent tree transformations (for example, tree
8 http://www.abisource.com/projects/link-grammar/9 http://nlp.stanford.edu/software/lex-parser.shtml
139
splitting). Each node of a sentence tree is fed (breadth-first order) to the simplification algorithms, which can simplify the node (and its sub-tree) or skip it when the node does not meet the simplification prerequisites. Breadth-first order is chosen because several operations affect the root of a (sub)tree, while none of them affect leaves.
A development corpus containing examples of cases analysed for each syntactic phenomenon is used to test and refine the rules. The current version of the corpus has 156 sentences extracted from news text. The corpus includes negative and positive examples for each rule. Negative examples should not be simplified. They were inserted into the corpus to avoid unnecessary simplifications. Each rule is first tested against its own positive and negative examples. This test is called local test. After reaching a good precision on the local test, the rule is then tested against all the sentences in the corpus, global test. In the current corpus, the global test identified sentences correctly simplified by at least one rule (66%), sentences incorrectly simplified due to major errors in parsing/rules (7%) (ungrammatical sentences) and non-simplified sentences (27%). The last includes mainly negative examples, but also includes sentences not selected due to parsing errors, sentences from cases not yet implemented, and sentences from cases ignored due to ambiguity.
3.2 Passive voice
The default case for dealing with passive voice in our simplification engine is illustrated by the pair of original-simplified sentences in example10 (1). Sentences belonging to this case have a non-pronominal subject and a passive agent. Also, the predicator has two verbs, the verb to be followed by a verb in the past participle tense. The simplification consists in reordering the sentence components, turning the agent into subject (removing the by preposition), turning the subject into direct object and adjusting the predicator by removing the verb to be and re-inflecting the main verb. The new tense of the main verb is the same as the one of the to be verb and its number is defined according to the new subject.
10 Literal translations from Portuguese result in some sentences appearing ungrammatical in English.
O: As[The] transferências[transfers] foram[were:plural] feitas[made] pela[by the] empresa[company]. (1)
S: A[The] empresa[company] fez[made:sing] as[the] transferências[transfers].
Other correctly processed cases vary according the number of verbs (three or four), special subjects, and special agents. For cases comprising three or four verbs, the simplification rule must re-inflect11 two verbs (2) (one of them should agree with the subject and the other receives its tense from the verb to be). There are two cases of special subjects. In the first case, a hidden subject is turned into a pronominal direct object (3). In the second case, a pronominal subject must be transformed to oblique case pronoun and then to direct object. Special agents also represent two cases. In the first one, oblique case pronouns must be transformed before turning the agent into the subject. In the second case (4), a non-existent agent is turned into an undetermined subject (represented here by “they”).
O: A[The] porta[door] deveria[should] ter[have] sido[been] trancada[locked:fem] por[by] John.
(2)S: John deveria[should] ter[have]
trancado[locked:masc] a[the] porta[door].
O: [I] fui[was] encarregado[entrusted] por[by] minha[my] família[family].
(3)S: Minha[My] família[family]
encarregou[entrusted] me[me].
O: O[The] ladrão[thief] foi[was] pego[caught]. (4)S: [They] pegaram[caught] o[the] ladrão[thief].
Two cases are not processed because they are already considered easy enough: the syndetic voice and passive in non-root sentences. In those cases, the proposed simplification is generally less understandable than the original sentence. Sentences with split predicator (as in “the politician was very criticized by his electors”) are not processed for the time being, but should be incorporated in the pipeline in the future.
Table 1 presents the algorithm used to process the default case rule and verb case rules. Simplification rules are applied against all nodes in constituent tree, one node at a time, using breadth-first traversing.
11 Some reinflections may not be visible on example translation.
140
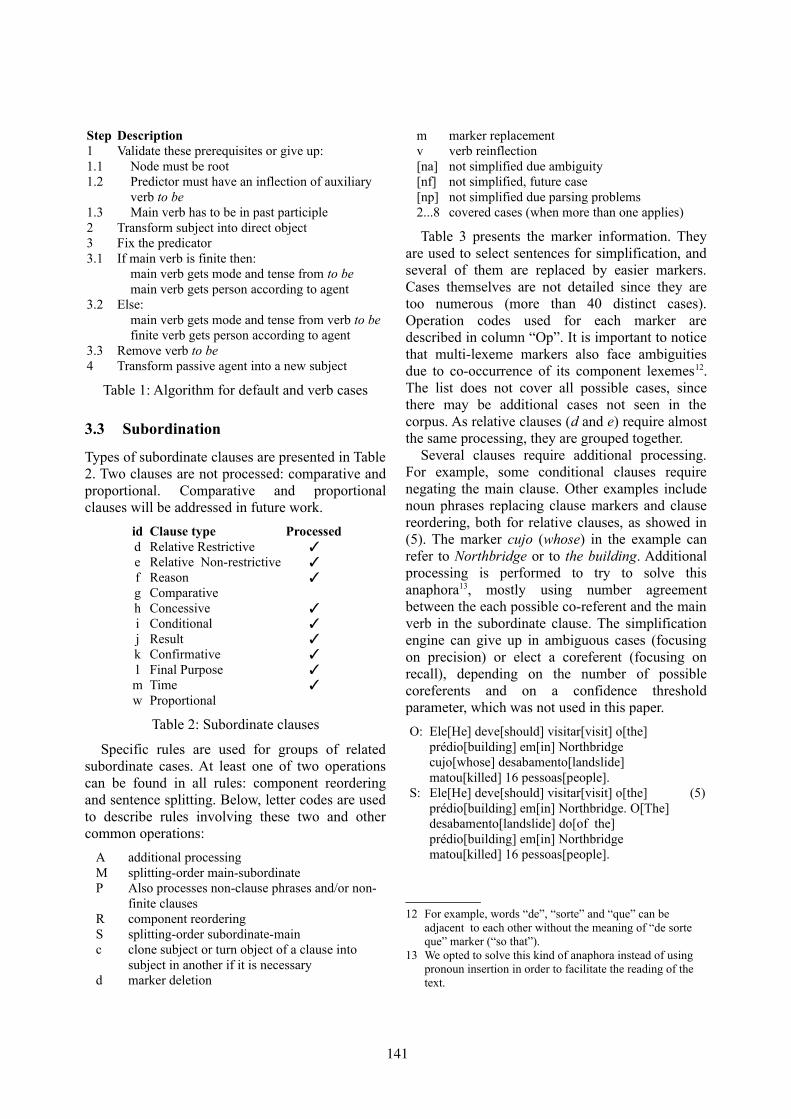
Step Description1 Validate these prerequisites or give up:1.1 Node must be root1.2 Predictor must have an inflection of auxiliary
verb to be1.3 Main verb has to be in past participle2 Transform subject into direct object3 Fix the predicator3.1 If main verb is finite then:
main verb gets mode and tense from to be main verb gets person according to agent
3.2 Else: main verb gets mode and tense from verb to be finite verb gets person according to agent
3.3 Remove verb to be4 Transform passive agent into a new subject
Table 1: Algorithm for default and verb cases
3.3 Subordination
Types of subordinate clauses are presented in Table 2. Two clauses are not processed: comparative and proportional. Comparative and proportional clauses will be addressed in future work.
id Clause type Processedd Relative Restrictive ✓e Relative Non-restrictive ✓f Reason ✓g Comparative h Concessive ✓i Conditional ✓j Result ✓k Confirmative ✓l Final Purpose ✓m Time ✓w Proportional
Table 2: Subordinate clauses
Specific rules are used for groups of related subordinate cases. At least one of two operations can be found in all rules: component reordering and sentence splitting. Below, letter codes are used to describe rules involving these two and other common operations:
A additional processingM splitting-order main-subordinate P Also processes non-clause phrases and/or non-
finite clausesR component reordering S splitting-order subordinate-main c clone subject or turn object of a clause into
subject in another if it is necessaryd marker deletion
m marker replacementv verb reinflection[na] not simplified due ambiguity[nf] not simplified, future case[np] not simplified due parsing problems2...8 covered cases (when more than one applies)
Table 3 presents the marker information. They are used to select sentences for simplification, and several of them are replaced by easier markers. Cases themselves are not detailed since they are too numerous (more than 40 distinct cases). Operation codes used for each marker are described in column “Op”. It is important to notice that multi-lexeme markers also face ambiguities due to co-occurrence of its component lexemes12. The list does not cover all possible cases, since there may be additional cases not seen in the corpus. As relative clauses (d and e) require almost the same processing, they are grouped together.
Several clauses require additional processing. For example, some conditional clauses require negating the main clause. Other examples include noun phrases replacing clause markers and clause reordering, both for relative clauses, as showed in (5). The marker cujo (whose) in the example can refer to Northbridge or to the building. Additional processing is performed to try to solve this anaphora13, mostly using number agreement between the each possible co-referent and the main verb in the subordinate clause. The simplification engine can give up in ambiguous cases (focusing on precision) or elect a coreferent (focusing on recall), depending on the number of possible coreferents and on a confidence threshold parameter, which was not used in this paper.
O: Ele[He] deve[should] visitar[visit] o[the] prédio[building] em[in] Northbridge cujo[whose] desabamento[landslide] matou[killed] 16 pessoas[people].
(5)S: Ele[He] deve[should] visitar[visit] o[the] prédio[building] em[in] Northbridge. O[The] desabamento[landslide] do[of the] prédio[building] em[in] Northbridge matou[killed] 16 pessoas[people].
12 For example, words “de”, “sorte” and “que” can be adjacent to each other without the meaning of “de sorte que” marker (“so that”).
13 We opted to solve this kind of anaphora instead of using pronoun insertion in order to facilitate the reading of the text.
141
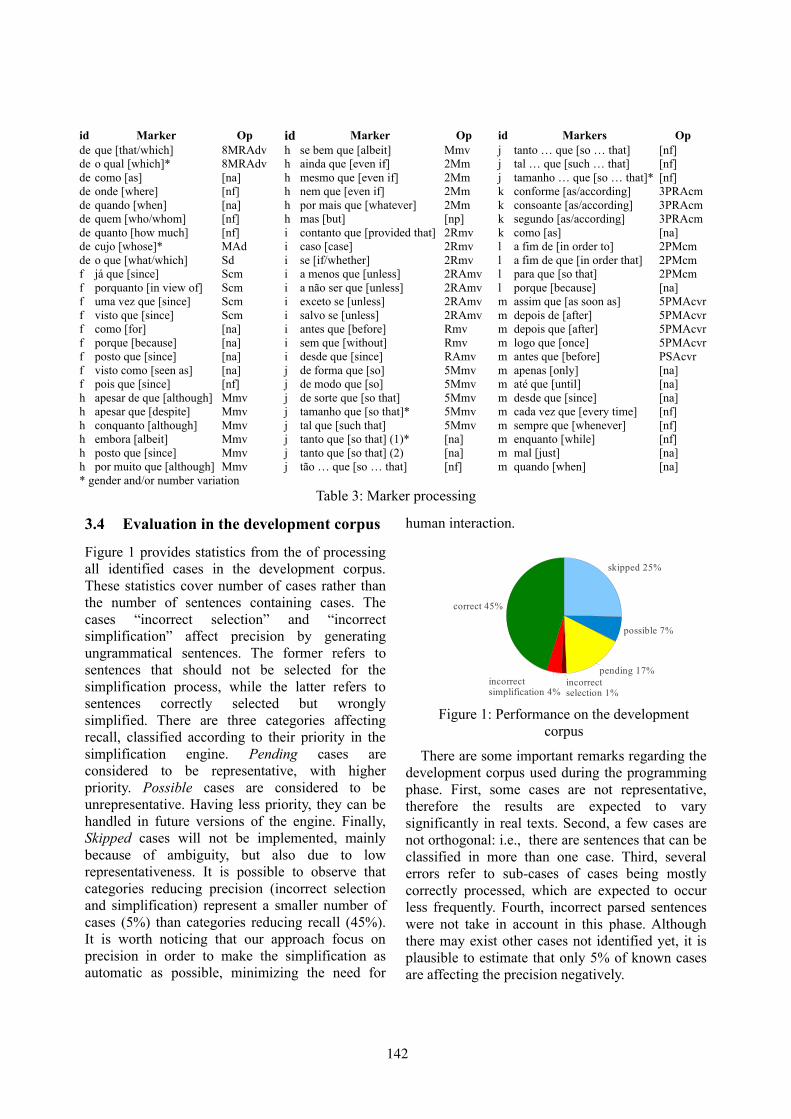
3.4 Evaluation in the development corpus
Figure 1 provides statistics from the of processing all identified cases in the development corpus. These statistics cover number of cases rather than the number of sentences containing cases. The cases “incorrect selection” and “incorrect simplification” affect precision by generating ungrammatical sentences. The former refers to sentences that should not be selected for the simplification process, while the latter refers to sentences correctly selected but wrongly simplified. There are three categories affecting recall, classified according to their priority in the simplification engine. Pending cases are considered to be representative, with higher priority. Possible cases are considered to be unrepresentative. Having less priority, they can be handled in future versions of the engine. Finally, Skipped cases will not be implemented, mainly because of ambiguity, but also due to low representativeness. It is possible to observe that categories reducing precision (incorrect selection and simplification) represent a smaller number of cases (5%) than categories reducing recall (45%). It is worth noticing that our approach focus on precision in order to make the simplification as automatic as possible, minimizing the need for
human interaction.
Figure 1: Performance on the development corpus
There are some important remarks regarding the development corpus used during the programming phase. First, some cases are not representative, therefore the results are expected to vary significantly in real texts. Second, a few cases are not orthogonal: i.e., there are sentences that can be classified in more than one case. Third, several errors refer to sub-cases of cases being mostly correctly processed, which are expected to occur less frequently. Fourth, incorrect parsed sentences were not take in account in this phase. Although there may exist other cases not identified yet, it is plausible to estimate that only 5% of known cases are affecting the precision negatively.
id Marker Op id Marker Op id Markers Opde que [that/which] 8MRAdv h se bem que [albeit] Mmv j tanto … que [so … that] [nf]de o qual [which]* 8MRAdv h ainda que [even if] 2Mm j tal … que [such … that] [nf]de como [as] [na] h mesmo que [even if] 2Mm j tamanho … que [so … that]* [nf]de onde [where] [nf] h nem que [even if] 2Mm k conforme [as/according] 3PRAcmde quando [when] [na] h por mais que [whatever] 2Mm k consoante [as/according] 3PRAcmde quem [who/whom] [nf] h mas [but] [np] k segundo [as/according] 3PRAcmde quanto [how much] [nf] i contanto que [provided that] 2Rmv k como [as] [na]de cujo [whose]* MAd i caso [case] 2Rmv l a fim de [in order to] 2PMcmde o que [what/which] Sd i se [if/whether] 2Rmv l a fim de que [in order that] 2PMcmf já que [since] Scm i a menos que [unless] 2RAmv l para que [so that] 2PMcmf porquanto [in view of] Scm i a não ser que [unless] 2RAmv l porque [because] [na]f uma vez que [since] Scm i exceto se [unless] 2RAmv m assim que [as soon as] 5PMAcvrf visto que [since] Scm i salvo se [unless] 2RAmv m depois de [after] 5PMAcvrf como [for] [na] i antes que [before] Rmv m depois que [after] 5PMAcvrf porque [because] [na] i sem que [without] Rmv m logo que [once] 5PMAcvrf posto que [since] [na] i desde que [since] RAmv m antes que [before] PSAcvrf visto como [seen as] [na] j de forma que [so] 5Mmv m apenas [only] [na]f pois que [since] [nf] j de modo que [so] 5Mmv m até que [until] [na]h apesar de que [although] Mmv j de sorte que [so that] 5Mmv m desde que [since] [na]h apesar que [despite] Mmv j tamanho que [so that]* 5Mmv m cada vez que [every time] [nf]h conquanto [although] Mmv j tal que [such that] 5Mmv m sempre que [whenever] [nf]h embora [albeit] Mmv j tanto que [so that] (1)* [na] m enquanto [while] [nf]h posto que [since] Mmv j tanto que [so that] (2) [na] m mal [just] [na]h por muito que [although] Mmv j tão … que [so … that] [nf] m quando [when] [na]* gender and/or number variation
Table 3: Marker processing
correct 45%
incorrectsimplification 4%
incorrectselection 1%
pending 17%
possible 7%
skipped 25%
142
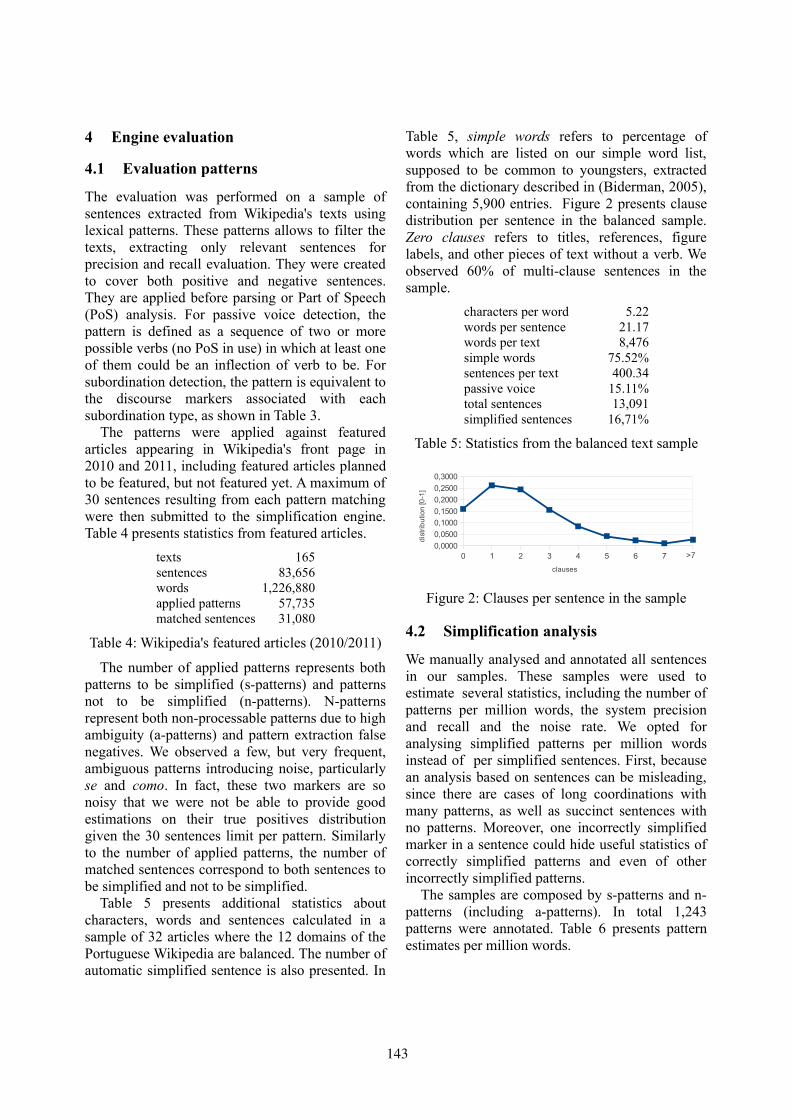
4 Engine evaluation
4.1 Evaluation patterns
The evaluation was performed on a sample of sentences extracted from Wikipedia's texts using lexical patterns. These patterns allows to filter the texts, extracting only relevant sentences for precision and recall evaluation. They were created to cover both positive and negative sentences. They are applied before parsing or Part of Speech (PoS) analysis. For passive voice detection, the pattern is defined as a sequence of two or more possible verbs (no PoS in use) in which at least one of them could be an inflection of verb to be. For subordination detection, the pattern is equivalent to the discourse markers associated with each subordination type, as shown in Table 3.
The patterns were applied against featured articles appearing in Wikipedia's front page in 2010 and 2011, including featured articles planned to be featured, but not featured yet. A maximum of 30 sentences resulting from each pattern matching were then submitted to the simplification engine. Table 4 presents statistics from featured articles.
texts 165sentences 83,656words 1,226,880applied patterns 57,735matched sentences 31,080
Table 4: Wikipedia's featured articles (2010/2011)
The number of applied patterns represents both patterns to be simplified (s-patterns) and patterns not to be simplified (n-patterns). N-patterns represent both non-processable patterns due to high ambiguity (a-patterns) and pattern extraction false negatives. We observed a few, but very frequent, ambiguous patterns introducing noise, particularly se and como. In fact, these two markers are so noisy that we were not be able to provide good estimations on their true positives distribution given the 30 sentences limit per pattern. Similarly to the number of applied patterns, the number of matched sentences correspond to both sentences to be simplified and not to be simplified.
Table 5 presents additional statistics about characters, words and sentences calculated in a sample of 32 articles where the 12 domains of the Portuguese Wikipedia are balanced. The number of automatic simplified sentence is also presented. In
Table 5, simple words refers to percentage of words which are listed on our simple word list, supposed to be common to youngsters, extracted from the dictionary described in (Biderman, 2005), containing 5,900 entries. Figure 2 presents clause distribution per sentence in the balanced sample. Zero clauses refers to titles, references, figure labels, and other pieces of text without a verb. We observed 60% of multi-clause sentences in the sample.
characters per word 5.22words per sentence 21.17words per text 8,476simple words 75.52%sentences per text 400.34passive voice 15.11%total sentences 13,091simplified sentences 16,71%
Table 5: Statistics from the balanced text sample
Figure 2: Clauses per sentence in the sample
4.2 Simplification analysis
We manually analysed and annotated all sentences in our samples. These samples were used to estimate several statistics, including the number of patterns per million words, the system precision and recall and the noise rate. We opted for analysing simplified patterns per million words instead of per simplified sentences. First, because an analysis based on sentences can be misleading, since there are cases of long coordinations with many patterns, as well as succinct sentences with no patterns. Moreover, one incorrectly simplified marker in a sentence could hide useful statistics of correctly simplified patterns and even of other incorrectly simplified patterns.
The samples are composed by s-patterns and n-patterns (including a-patterns). In total 1,243 patterns were annotated. Table 6 presents pattern estimates per million words.
0 1 2 3 4 5 6 7 80,0000
0,0500
0,1000
0,1500
0,2000
0,2500
0,3000
clauses
dist
rib
utio
n [0
-1]
>7
143
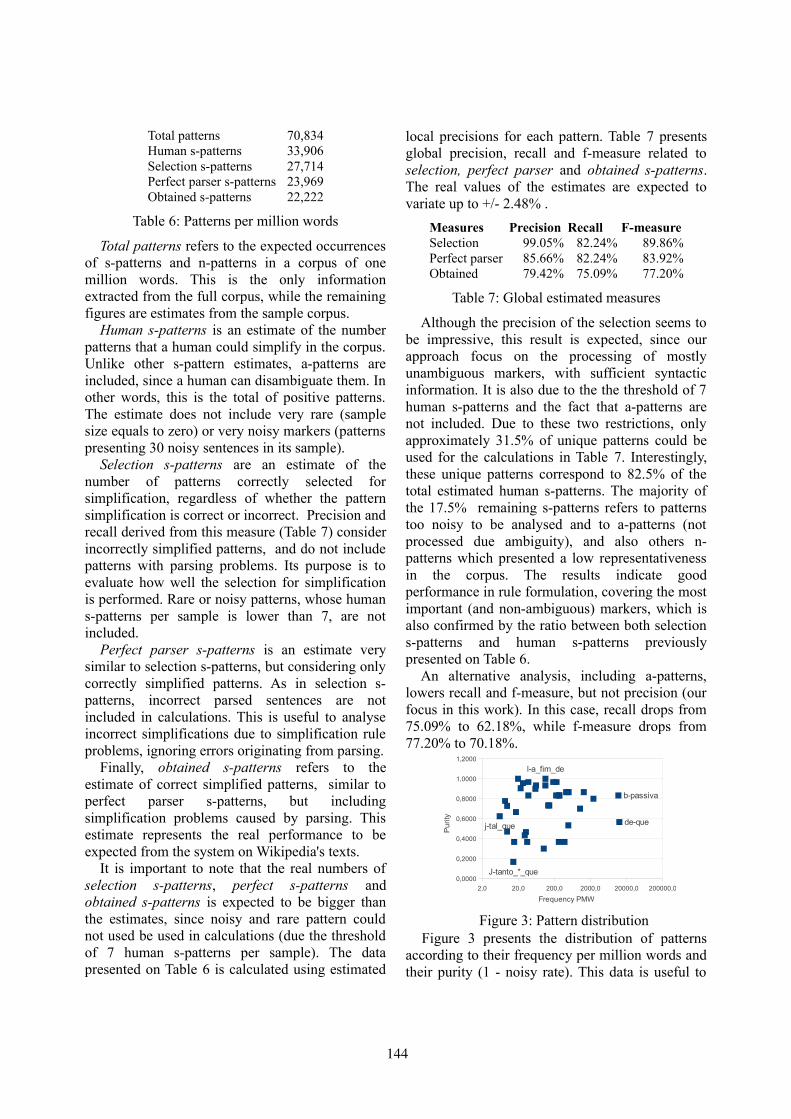
Total patterns 70,834Human s-patterns 33,906Selection s-patterns 27,714Perfect parser s-patterns 23,969Obtained s-patterns 22,222
Table 6: Patterns per million words
Total patterns refers to the expected occurrences of s-patterns and n-patterns in a corpus of one million words. This is the only information extracted from the full corpus, while the remaining figures are estimates from the sample corpus.
Human s-patterns is an estimate of the number patterns that a human could simplify in the corpus. Unlike other s-pattern estimates, a-patterns are included, since a human can disambiguate them. In other words, this is the total of positive patterns. The estimate does not include very rare (sample size equals to zero) or very noisy markers (patterns presenting 30 noisy sentences in its sample).
Selection s-patterns are an estimate of the number of patterns correctly selected for simplification, regardless of whether the pattern simplification is correct or incorrect. Precision and recall derived from this measure (Table 7) consider incorrectly simplified patterns, and do not include patterns with parsing problems. Its purpose is to evaluate how well the selection for simplification is performed. Rare or noisy patterns, whose human s-patterns per sample is lower than 7, are not included.
Perfect parser s-patterns is an estimate very similar to selection s-patterns, but considering only correctly simplified patterns. As in selection s-patterns, incorrect parsed sentences are not included in calculations. This is useful to analyse incorrect simplifications due to simplification rule problems, ignoring errors originating from parsing.
Finally, obtained s-patterns refers to the estimate of correct simplified patterns, similar to perfect parser s-patterns, but including simplification problems caused by parsing. This estimate represents the real performance to be expected from the system on Wikipedia's texts.
It is important to note that the real numbers of selection s-patterns, perfect s-patterns and obtained s-patterns is expected to be bigger than the estimates, since noisy and rare pattern could not used be used in calculations (due the threshold of 7 human s-patterns per sample). The data presented on Table 6 is calculated using estimated
local precisions for each pattern. Table 7 presents global precision, recall and f-measure related to selection, perfect parser and obtained s-patterns. The real values of the estimates are expected to variate up to +/- 2.48% .
Measures Precision Recall F-measureSelection 99.05% 82.24% 89.86%Perfect parser 85.66% 82.24% 83.92%Obtained 79.42% 75.09% 77.20%
Table 7: Global estimated measures
Although the precision of the selection seems to be impressive, this result is expected, since our approach focus on the processing of mostly unambiguous markers, with sufficient syntactic information. It is also due to the the threshold of 7 human s-patterns and the fact that a-patterns are not included. Due to these two restrictions, only approximately 31.5% of unique patterns could be used for the calculations in Table 7. Interestingly, these unique patterns correspond to 82.5% of the total estimated human s-patterns. The majority of the 17.5% remaining s-patterns refers to patterns too noisy to be analysed and to a-patterns (not processed due ambiguity), and also others n-patterns which presented a low representativeness in the corpus. The results indicate good performance in rule formulation, covering the most important (and non-ambiguous) markers, which is also confirmed by the ratio between both selection s-patterns and human s-patterns previously presented on Table 6.
An alternative analysis, including a-patterns, lowers recall and f-measure, but not precision (our focus in this work). In this case, recall drops from 75.09% to 62.18%, while f-measure drops from 77.20% to 70.18%.
Figure 3: Pattern distributionFigure 3 presents the distribution of patterns
according to their frequency per million words and their purity (1 - noisy rate). This data is useful to
2,0 20,0 200,0 2000,0 20000,0 200000,0
0,0000
0,2000
0,4000
0,6000
0,8000
1,0000
1,2000
b-passiva
de-que
l-a_fim_de
j-tal_que
J-tanto_*_que
Frequency PMW
Pu
rity
144
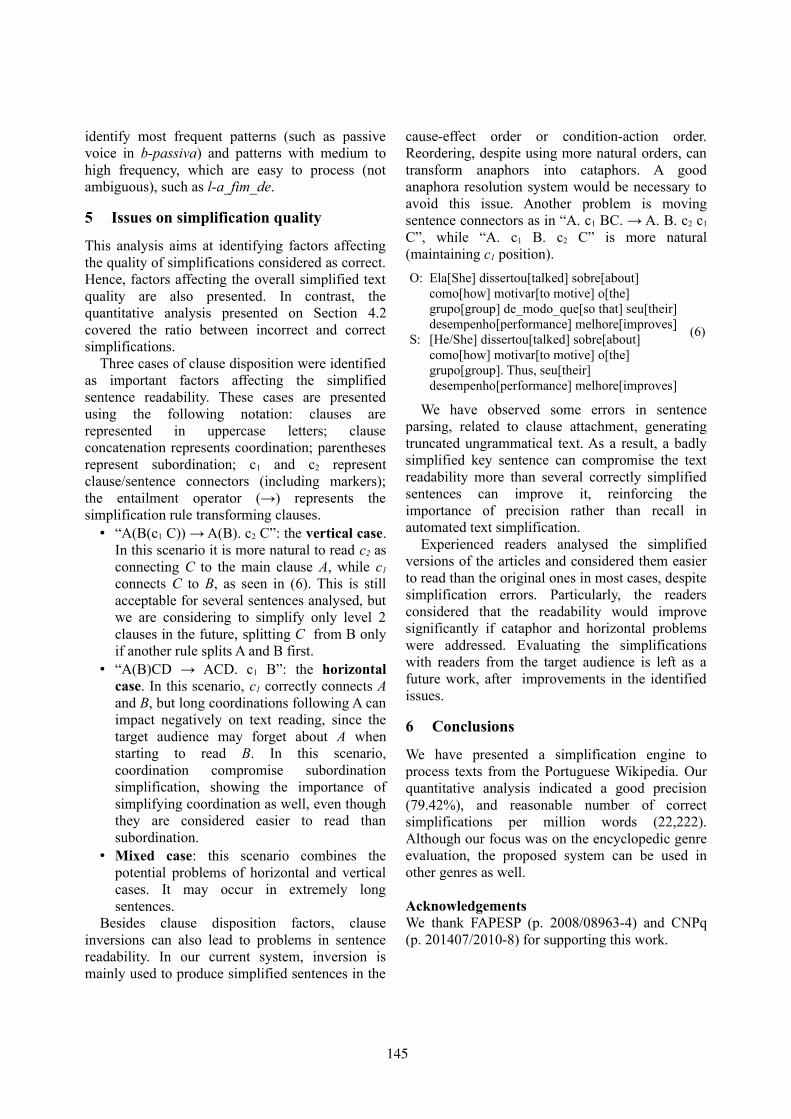
identify most frequent patterns (such as passive voice in b-passiva) and patterns with medium to high frequency, which are easy to process (not ambiguous), such as l-a_fim_de.
5 Issues on simplification quality
This analysis aims at identifying factors affecting the quality of simplifications considered as correct. Hence, factors affecting the overall simplified text quality are also presented. In contrast, the quantitative analysis presented on Section 4.2 covered the ratio between incorrect and correct simplifications.
Three cases of clause disposition were identified as important factors affecting the simplified sentence readability. These cases are presented using the following notation: clauses are represented in uppercase letters; clause concatenation represents coordination; parentheses represent subordination; c1 and c2 represent clause/sentence connectors (including markers); the entailment operator (→) represents the simplification rule transforming clauses.
• “A(B(c1 C)) → A(B). c2 C”: the vertical case. In this scenario it is more natural to read c2 as connecting C to the main clause A, while c1
connects C to B, as seen in (6). This is still acceptable for several sentences analysed, but we are considering to simplify only level 2 clauses in the future, splitting C from B only if another rule splits A and B first.
• “A(B)CD → ACD. c1 B”: the horizontal case. In this scenario, c1 correctly connects A and B, but long coordinations following A can impact negatively on text reading, since the target audience may forget about A when starting to read B. In this scenario, coordination compromise subordination simplification, showing the importance of simplifying coordination as well, even though they are considered easier to read than subordination.
• Mixed case: this scenario combines the potential problems of horizontal and vertical cases. It may occur in extremely long sentences.
Besides clause disposition factors, clause inversions can also lead to problems in sentence readability. In our current system, inversion is mainly used to produce simplified sentences in the
cause-effect order or condition-action order. Reordering, despite using more natural orders, can transform anaphors into cataphors. A good anaphora resolution system would be necessary to avoid this issue. Another problem is moving sentence connectors as in “A. c1 BC. → A. B. c2 c1
C”, while “A. c1 B. c2 C” is more natural (maintaining c1 position).
O: Ela[She] dissertou[talked] sobre[about] como[how] motivar[to motive] o[the] grupo[group] de_modo_que[so that] seu[their] desempenho[performance] melhore[improves]
(6)S: [He/She] dissertou[talked] sobre[about]
como[how] motivar[to motive] o[the] grupo[group]. Thus, seu[their] desempenho[performance] melhore[improves]
We have observed some errors in sentence parsing, related to clause attachment, generating truncated ungrammatical text. As a result, a badly simplified key sentence can compromise the text readability more than several correctly simplified sentences can improve it, reinforcing the importance of precision rather than recall in automated text simplification.
Experienced readers analysed the simplified versions of the articles and considered them easier to read than the original ones in most cases, despite simplification errors. Particularly, the readers considered that the readability would improve significantly if cataphor and horizontal problems were addressed. Evaluating the simplifications with readers from the target audience is left as a future work, after improvements in the identified issues.
6 Conclusions
We have presented a simplification engine to process texts from the Portuguese Wikipedia. Our quantitative analysis indicated a good precision (79.42%), and reasonable number of correct simplifications per million words (22,222). Although our focus was on the encyclopedic genre evaluation, the proposed system can be used in other genres as well.
AcknowledgementsWe thank FAPESP (p. 2008/08963-4) and CNPq (p. 201407/2010-8) for supporting this work.
145
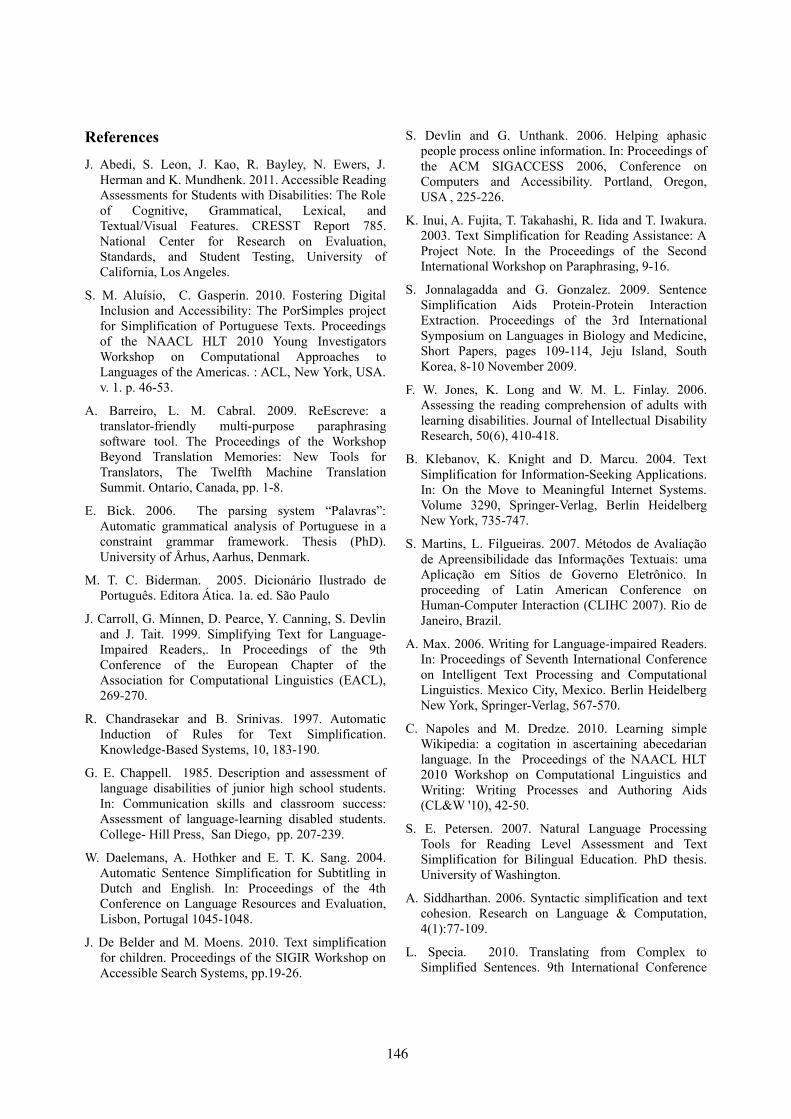
References
J. Abedi, S. Leon, J. Kao, R. Bayley, N. Ewers, J. Herman and K. Mundhenk. 2011. Accessible Reading Assessments for Students with Disabilities: The Role of Cognitive, Grammatical, Lexical, and Textual/Visual Features. CRESST Report 785. National Center for Research on Evaluation, Standards, and Student Testing, University of California, Los Angeles.
S. M. Aluísio, C. Gasperin. 2010. Fostering Digital Inclusion and Accessibility: The PorSimples project for Simplification of Portuguese Texts. Proceedings of the NAACL HLT 2010 Young Investigators Workshop on Computational Approaches to Languages of the Americas. : ACL, New York, USA. v. 1. p. 46-53.
A. Barreiro, L. M. Cabral. 2009. ReEscreve: a translator-friendly multi-purpose paraphrasing software tool. The Proceedings of the Workshop Beyond Translation Memories: New Tools for Translators, The Twelfth Machine Translation Summit. Ontario, Canada, pp. 1-8.
E. Bick. 2006. The parsing system “Palavras”: Automatic grammatical analysis of Portuguese in a constraint grammar framework. Thesis (PhD). University of Århus, Aarhus, Denmark.
M. T. C. Biderman. 2005. Dicionário Ilustrado de Português. Editora Ática. 1a. ed. São Paulo
J. Carroll, G. Minnen, D. Pearce, Y. Canning, S. Devlin and J. Tait. 1999. Simplifying Text for Language-Impaired Readers,. In Proceedings of the 9th Conference of the European Chapter of the Association for Computational Linguistics (EACL), 269-270.
R. Chandrasekar and B. Srinivas. 1997. Automatic Induction of Rules for Text Simplification. Knowledge-Based Systems, 10, 183-190.
G. E. Chappell. 1985. Description and assessment of language disabilities of junior high school students. In: Communication skills and classroom success: Assessment of language-learning disabled students. College- Hill Press, San Diego, pp. 207-239.
W. Daelemans, A. Hothker and E. T. K. Sang. 2004. Automatic Sentence Simplification for Subtitling in Dutch and English. In: Proceedings of the 4th Conference on Language Resources and Evaluation, Lisbon, Portugal 1045-1048.
J. De Belder and M. Moens. 2010. Text simplification for children. Proceedings of the SIGIR Workshop on Accessible Search Systems, pp.19-26.
S. Devlin and G. Unthank. 2006. Helping aphasic people process online information. In: Proceedings of the ACM SIGACCESS 2006, Conference on Computers and Accessibility. Portland, Oregon, USA , 225-226.
K. Inui, A. Fujita, T. Takahashi, R. Iida and T. Iwakura. 2003. Text Simplification for Reading Assistance: A Project Note. In the Proceedings of the Second International Workshop on Paraphrasing, 9-16.
S. Jonnalagadda and G. Gonzalez. 2009. Sentence Simplification Aids Protein-Protein Interaction Extraction. Proceedings of the 3rd International Symposium on Languages in Biology and Medicine, Short Papers, pages 109-114, Jeju Island, South Korea, 8-10 November 2009.
F. W. Jones, K. Long and W. M. L. Finlay. 2006. Assessing the reading comprehension of adults with learning disabilities. Journal of Intellectual Disability Research, 50(6), 410-418.
B. Klebanov, K. Knight and D. Marcu. 2004. Text Simplification for Information-Seeking Applications. In: On the Move to Meaningful Internet Systems. Volume 3290, Springer-Verlag, Berlin Heidelberg New York, 735-747.
S. Martins, L. Filgueiras. 2007. Métodos de Avaliação de Apreensibilidade das Informações Textuais: uma Aplicação em Sítios de Governo Eletrônico. In proceeding of Latin American Conference on Human-Computer Interaction (CLIHC 2007). Rio de Janeiro, Brazil.
A. Max. 2006. Writing for Language-impaired Readers. In: Proceedings of Seventh International Conference on Intelligent Text Processing and Computational Linguistics. Mexico City, Mexico. Berlin Heidelberg New York, Springer-Verlag, 567-570.
C. Napoles and M. Dredze. 2010. Learning simple Wikipedia: a cogitation in ascertaining abecedarian language. In the Proceedings of the NAACL HLT 2010 Workshop on Computational Linguistics and Writing: Writing Processes and Authoring Aids (CL&W '10), 42-50.
S. E. Petersen. 2007. Natural Language Processing Tools for Reading Level Assessment and Text Simplification for Bilingual Education. PhD thesis. University of Washington.
A. Siddharthan. 2006. Syntactic simplification and text cohesion. Research on Language & Computation, 4(1):77-109.
L. Specia. 2010. Translating from Complex to Simplified Sentences. 9th International Conference
146

on Computational Processing of the Portuguese Language. Lecture Notes in Artificial Intelligence, Vol. 6001, Springer, pp. 30-39.
D. Vickrey and D. Koller. 2008. Sentence Simplification for Semantic Role Labelling. In: Proceedings of the ACL-HLT. 344-352.
W. M. Watanabe, A. Candido Jr, V. R. Uzeda, R. P. M. Fortes, T. A. S. Pardo and S. M. Aluísio. 2009. Facilita: Reading Assistance for Low-literacy Readers. In: ACM International Conference on Design of Communication (SIGDOC 2009), volume 1, Bloomington, US, 29-36.
147
Proceedings of the 2nd Workshop on Speech and Language Processing for Assistive Technologies, pages 148–149,Edinburgh, Scotland, UK, July 30, 2011. c©2011 Association for Computational Linguistics
Workshop on Speech & Language Processing for Assistive Technologies
Demo Session
1 “How was School today...?” A Prototype
System that uses a Mobile Phone to Sup-port Personal Narrative for Children with Complex Communication
Rolf Black1, Annalu Waller1, Ehud Reiter2, Nava Tintarev2, Joseph Reddington2 (1University of Dundee, 2University of Aberdeen)
We will show a sensor based mobile phone proto-type that supports personal narrative for children with complex communication needs. We will demonstrate how the phone is used to capture voice recordings and information about location, people and objects using RFID tags and QR stick-ers. The challenging environment of a special school for prototype testing will be discussed using real life experiences.
2 The PhonicStick: Interactive access to sounds for people with Complex Com-munication Needs
Ha Trinh, Annalu Waller, Rolf Black, James Bennet (University of Dundee)
The PhonicStick is a new sound-based speech ge-nerating device which enables nonspeaking indi-viduals to access 42 English sounds and blend sounds into spoken words. The device can poten-tially be used both as a literacy learning tool and an interactive communication aid for people with literacy difficulties. We will discuss how NLP technologies, such as speech synthesis and predic-tive techniques, are utilised to improve the usabili-ty of the device.
3 Toby Churchill Ltd
David Mason1, James Bennet2
(1TLC, 2University of Dundee)
Lightwriter® SL40. We will show one of the new SL40 Connect mobile phone enabled Lightwri-ters®. Lightwriters® are portable text-to-speech devices with dual displays, one facing the user and a second out-facing display allowing natural face-to-face communication. They are operated by key-board and use a fast prediction system based on the user’s own vocabulary. A certain degree of literacy is required to operate a Lightwriter®.
Lightwriter® SL40 with PhonicStick. We will show an SL40 development unit that is running a version of Dundee University’s PhonicStick soft-ware. This project is an ongoing collaboration with the Assistive and Healthcare Technologies group in the School of Computing at Dundee.
VIVOCA. We will be describing a project with partners including the University of Sheffield and the Assistive Technology team at Barnsley District General Hospital. The project is developing and evaluating a novel device for supporting the com-munication needs of people with severe speech impairment that will address the limitations of the current technology. It builds on previous work by this team (funded by Neat) which has established user requirements and identified the technical de-velopments required. The device, a Voice Input Voice Output Communication Aid (or VIVOCA) will take as input the unintelligible disordered speech of the users.
148
4 SceneTalker: An Utterance-Based AAC System Prototype
Timothy Walsh1, Jan Bedrosian2, Linda Hoag3, Kathleen F. McCoy1 (1University of Delaware; 2Western Michigan Uni-versity, 3Kansas State University)
SceneTalker is a prototype utterance-based aug-mentative and alternative communication system that uses scripts (and scenes within scripts) to or-ganize prestored messages for highly routine goal-oriented public situations (such as going to a res-taurant). Many aspects of the system design are inspired by a series of experiments on using pres-tored utterances in public goal-oriented situations when the prestored message did not exactly match what the user wanted to say. In addition to the script structures, we show system messages that
are not anticipated to be perfect/complete for what is needed and strategies of use with stored messag-es that anticipate the communication partner’s follow-up to utterances (adjacency pairs).
5 SIGHT System
Charles Greenbacker1, Seniz Demir3, Peng Wu1, Sandra Carberry1, Stephanie Elzer2, Kathleen F. McCoy1 (1University of Delaware; 2Millersville University, 4Tübitak Bilgem, Turkey)
The SIGHT system is intended to give people with visual impairments access to information graphics (e.g., bar charts) found in popular media. The sys-tem generates a textual summary that provides the chart’s overall intended message and additional salient propositions conveyed by the graphic.
149

Author Index
Abad, Alberto, 1Almohimeed, Abdulaziz, 101Aluısio, Sandra Maria, 137
Bautista, Susana, 128Beckley, Russ, 43Bellur, Ashwin, 63Berman, Alexander, 110
Candido Jr, Arnaldo, 137Carberry, Sandra, 52Chester, Daniel, 52Claesson, Britt, 110Coles-Kemp, Lizzie, 32Copestake, Ann, 137
Damper, R.I., 101Dell’Orletta, Felice, 73Demir, Seniz, 52
Echevarry, Julian David, 84Elzer, Stephanie, 52Ericsson, Stina, 110
Farrajota, Luisa, 1Fonseca, Jose, 1Fowler, Andrew, 22Fried-Oken, Melanie, 22
G, Kasthuri, 63Gervas, Pablo, 128Gibbons, Christopher, 22Greenbacker, Charles, 52
Heimann Muhlenbock, Katarina, 120Hervas, Raquel, 128Hoffmann, Lisa, 94
Krishnan, Raghava, 63Kronlid, Fredrik, 110Kurian, Anila Susan, 63
Leal, Gabriela, 1Ljunglof, Peter, 110Lopez-Ludena, Veronica, 84Lucas-Cuesta, Juan Manuel, 84
Lufti, Syaheerah, 84Lundalv, Mats, 120
Madasamy, Nagarajan, 63Martınez-Gonzalez, Beatriz, 84Mattsson Muller, Ingrid, 110McCoy, Kathleen, 52McDonald, David, 52Montemagni, Simonetta, 73Murthy, Hema A., 63
Narayan, Badri, 63
Ottesjo, Cajsa, 110
Pavao Martins, Isabel, 1Pompili, Anna, 1Power, Richard, 128Prahallad, Kishore, 63
Reddington, Joseph, 32Roark, Brian, 22, 43Rudzicz, Frank, 11
San-Segundo, Ruben, 84Specia, Lucia, 137Sproat, Richard, 22
Trancoso, Isabel, 1
Venturi, Giulia, 73Vishwanath, Vinodh M., 63
Wald, Mike, 101Waller (editor), Annalu, 148Williams, Sandra, 128Wu, Peng, 52Wulfing, Jan-Oliver, 94
151