Embed Size (px)
Citation preview

Size Matters:Attracting New Immigrantsto Canadian Cities
Jennifer HyndmanSimon Fraser University
Nadine SchuurmanSimon Fraser University
Rob FiedlerSimon Fraser University
Montreal, Toronto, and Vancouver have attracted most new immigrants to Canada.Small and medium-sized cities in Canada are keen to share the wealth that new immigrants represent, and federal and provincial governments support a more evendistribution of settlement. As a result, the idea of attracting new immigrants tosmaller locations is apressingpolicy issue. This research weighs the characteristics ofplace that new immigrants consider on arrival. It uses findings from the Longitudinal Survey ofImmigrants to Canada (Statistics Canada, 2003) to construct an indexthat ranks five medium-sized cities in British Columbia in tenns of their potentialattractiveness to new immigrants. The index created proves robust and reliablefroma statistical viewpoint. The study confinns that immigrants are attracted to citieswherefriends andfamily orother immigrants live. Moreover, the increase in attractiveness ofa city is primarily related to its size. The index is an indicator ofthe rolethat population and the extantnumberofimmigrants in situ plays i.n determining theappeal ofsmaller cities. From a policy perspective, ifgovernments wish to Hspread thewealth" associated with immigration and an expanded labourforce, a proactive policy stance that enumerates and communicates the appeal afless prominent communities is vital. This is an importantfinding, and we offer policy options that accountfor the relationship ofpopulation size to immigrant retention.
La grande majorite des immigrants au Canada Sietablissent Cl Montreal, Cl TorontoDU Cl Vancouver. D'une part, Ies petites villes et celles de taille moyenne tiennent Clpartager les richesses decDulant de l'arrivee d'immigrants; d'autre part, les gouvernements federal et provinciaux appuient une repartition plus egale des nouveauximmigrants. En consequence, ['idee d'attirer Ies nouveaux immigrants vers de pluspetits centres s'avere une question strategique urgente. Cette recherche examine Ies
Key wordslMots..clefs: New immigrants to Canada/Nouveaux immigrants au Canada; Retention of immigrants/Retention des immigrants; Attractiveness of small cities/!'Attractivite despetites villes.
caracteristiques lites Cl l'elnplacement que les immigrants prennent en compte lorsde leur arrivee. En nous appuyant sur les resultats de l'Enquete longitudinale aupresdes immigrants au Canada (ELIC), nous creons un index d'attractivite qui €valuecinq villes de taille moyenne en Colombie britannique en fonction de la mesure danslaquelle les nouveaux immigrants sont susceptibles de les considerer interessantes.L'index s'est avere un outil statistique robuste etfiable. L'etude confinne que les immigrants sont attires vers les villes DU ils retrouvent « des amis et de la jamille » DU
d'autres groupes d'immigrants. De plus, le facteur d'attractivite d'une ville augmente principalement en fonction de sa taille. L'index constitue un indicateur durole quejouent la population et le nombre d'immigrants sur place dans l'attractivitedes petites villes. Dans une perspective strategique, si les gouvernements veulentdistribuer les richesses decoulant de 1'immigration et d'une main-d'oeuvre accrue, ilest crucial d'adopter une position de principe proactive qui valorise les communautes mains en vue et qui fait connaftre leurs attraits. Cette conclusion est importante, et nous offrons des possibilites d'action qui tiennent compte du lien entre lataiLLe de La popuLation et La retention des immigrants.
Immigrants to Canada select where they will settle on the basis of severalfactors including the presence of family and friends, employment opportunities, lifestyle, and climate. They tend to choose one of the three largestCanadian cities: Vancouver, Toronto, or Montreal. Federal and provincialgovernments, however, have preferences as to where immigrants shouldsettle. They employ various policy tools to encourage settlement in smallercities that are facing population decline or labour shortages. This article illustrates how immigrant concentration is related to the size of urban centres and the characteristics that larger populations afford. Although recognizing the desirability of immigrant settlement in medium-sized BritishColumbia cities by those who govern these cities and other levels of government, we analyse information about the actual settlement decisionsthat immigrants make when they come to Canada.
The study explores the desirability of five medium-sized cities in BritishColumbia by ranking them on the basis of a statistical index, which resultsin a specific "geography of desirability"from an immigrant perspective.Theindex is an expression of immigrants' preferences that can then be juxtaposed with the features of specific cities. The index is based on a number offactors, each weighted differently to reflect its importance in relation to immigrants'decision-making as documented in the findings of the Longitudinal Survey ofImmigrants to Canada (LSIC), Wave 1 (Statistics Canada, 2003).It draws on the LSIC data as a measure of immigrants' preferences. Werecognize that the LSIC does not reflect a definitive assessment of theselocations for settlement purposes; it does, however, serve as a reliable
indicator of relative desirability of the five cities based on past immigrants'choices.
The federal policy of regionalization, or immigrant dispersion, to smalland medium-sized cities outside MTV (Montreal, Toronto, Vancouver) isbeing considered at this time as policy-makers seek to spread the wealth ofimmigration. In exploring the attractiveness of these five British Columbiacities to immigrants, we do not endorse this policy or analyse its strengthsand weaknesses in any detail (Vatz-Laroussi & Walton-Roberts, 2005).Rather, we developed an index based on the five factors and examine themwith respect to five medium-sized centres in British Columbia. Not surprisingly, larger cities offer more features that attract immigrants, an observation that speaks to patterns of immigrant concentration.
The index necessarily uses city-level aggregates. Although some mayprotest that areas within cities are more useful units of analysis with respect to immigrant choice of settlement, we argue that new immigrants toCanada do make settlement choices at the city rather than the neighbourhood level. Once established in a city, immigrants may choose to moveto a different area, but such micro-differentiation is not characteristic ofnewcomers to Canada.The ISIC corroborates cities, rather than regions orneighbourhoods, as the basis for differentiation of settlement choice.
The article begins with a sketch of immigration patterns and policy inCanada at present and in the recent past. We then review the criteria forchoice of settlement location given by LSlC respondents. We use these criteria to develop the statistical index of desirability of smaller centres inBritish Columbia.The third section assesses the question ofwhether qualityof life or quality of livelihood is more important in immigrants' settlementdecisions. In the fourth section, we then explain Multi-Criteria Evaluation(MCE) and describe how we used this tool to generate the index. In thefifth section, we consider factors that were omitted from the study. Finally,we interpret the results based on the index and discuss their implications.
Immigration to Canada and British Columbia
The specific settlement patterns of immigrants to Canadian cities are related to the historical geographies of earlier immigration, contemporarygeopolitics, distance from source countries, economic performance of urban economies, and climate (Hiebert, 2000; Ray, 1998; Bourne, 1999). In2002 British Columbia attracted 150/0 of all immigrants to Canada, or 34,000people (Citizenship and Immigration Canada [CIC], 2003). Of those who
came to British COlul11bia that year, 87% chose to reside in Greater Vancouver, 2.2% chose Victoria, and 9.8% opted to settle in other locationsacross the province. This pattern reflects similar immigrant settlementpreferences over the past decade, during which 1.7.7% of immigrants toCanada landed in Vancouver. Clearly Vancouver is the immigrant city ofchoice in British Columbia: 41.3% of immigrants to Vancouver said theysettled there because of friends and family (Statistics Canada, 2003). If thepresence of a large foreign-born population defines cosmopolitanism,Vancouver is one of the most cosmopolitan cities in the world, with 37.5%of its population born outside the country.
Toronto, Vancouver, and Montreal are Canada's economic centres. Although job growth continues to occur disproportionately in these urbancentres, the paring back of the welfare state throu~hneoliberal policies atthe provincial and federal levels has reduced social and physical infrastructure in Canadian cities (feeple, 1995; Walton-Roberts, 2004). Critics of federal immigration policy have even argued that immigrant concentration inCanadian cities will lead to social tensions or public outbreaks of violence(Collacot, 2002), although these predictions have yet to materialize in theCanadian context.
As Walton...;Roberts (2004) observes, this Nproblem" of immigrationconcentration is largely framed by two perceptions. One is the demand forpopulation growth and skilled workers in areas outside the large metropolitan centres; and the other is the perception that the metropolitan areascannot manage rapid population growth combined with extensive ethnolinguistic and racial diversity. Walton-Roberts adds that a decline in immigrant economic integration, as measured by average immigrant earningsas a percentage of average Canadian-born earnings, has (too easily) beenread off as a decline in social and political integration. More research on thedecline in immigrant earnings shown in the 2001 Census is required, but itis premature to argue that this is a sign of increased immigrant segregationor declining participation in Canadian society.
Although still a relatively recent idea in Canada, plans to disperse immigrants geographically have been employed in the European context forsome time (Robinson, Andersson, & Musterd, 2003). European countries,however, tend to focus on asylum and refugee resettlement with respect todispersion policies, as most do not have the large-scale immigration recruitment programs for economic purposes found in Canada and theUnited States. Hence European governments tend to perceive dispersion(of asylum-seekers) as a share-the-burden proposition, rather than a
share-the-wealth opportunity. Asylum-seekers and refugees are thought tobe a humanitarian obligation and responsibility rather than part of an economic strategy to revitalize smaller cities that might be losing population.
In Canada, former Citizenship and Immigration Minister Denis Coderreargued that the government should admit the equivalent of 1% of theCanadian population per year, approximately 316,000 people. The Canadian government has shown interest in increasing the numbers of immigrants who settle outside major Canadian cities. To date, efforts to encourage immigrants to settle in smaller urban centres have met with limitedsuccess. It will be important to explore further how to attract immigrants tosmaller centres and persuade them to stay in order to reduce pressures onCanada's largest cities (erC,2001a).
Sherrell, Hyndman, and Preniqi (2004) show that employment opportunities and the presence of family and friends are important to successfulsettlement in smaller cities. The presence of family and friends providesvaluable support networks in the early stages ofsettlement, especially giventhe difficulties many immigrants and especially refugees face in earningsufficient income. This is highlighted by the deteriorating economic welfare of recent cohorts of immigrants to Canada. Recent immigrants face diminishing initial earnings. Notwithstanding Li's (2003) finding that catchup rates for immigrants arriving in the 19905 were faster than for thosewho arrived in the 1980s, low initial earnings put immigrants at a seriousdisadvantage until their earnings converge with the Canadian average. According to Li, the earnings gap between ilnmigrants and non-immigrantsin 1995 was $16,260 for immigrant men and $10,569 for immigrant women,compared with $6,368 and $5,342 respectively in 1981. So during the initialperiod, support from family and friends may be essential.
The number of immigrants settling outside the six largest census metropolitan areas (CMAs) has declined dramatically over three decades from30.40/0 during the 19705 to 22.3°"b during the 19805 to just 17.2% during the1990s, according to the Canadian censuses. Indeed when Vancouver wasincluded as a sixth city in the index ranking, it surpassed the score of eachof the other cities no matter how the variables were ranked. This findingreinforces the thesis that immigrants prefer large urban areas over smallerones. Insofar as immigration is seen as a share-the-wealth proposition,where immigrants are perceived to add value to particular locations throughtheir skills, employment offerings, tax contributions, and commul1ity participation (Cle, 2001b), the current settlement pattern of immigrants isseen as unsatisfactory to many local governments and businesses in British
Columbia cities because they are not attracting a proportional share ofnew immigrants.
We selected five medium-sized British Columbia cities for the study:Victoria, Kelowna, Prince George, Prince Rupert, and Nanaimo.These citiesrepresent a range of population sizes, coastal and inland locations, economic opportunities, and mild and more acute climatic conditions. Manyare the largest cities outside Vancouver. However, their selection does notreflect a judgement that they are the best or worst for immigrant settlement. Our aim is to develop a constructive assessment tool for all BritishColumbia cities and for prospective immigrants that highlights immigrants' preferences for specific locations, as documented in the first waveof the LSIC.
The Longitudinal Survey of Immigrants to Canada
Our study weighs and displays various characteristics of cities to rankwhich centres outside Greater Vancouver are most attractive to new immigrants. The variables used are based on emerging research about immigrants'preferred settlement locations. In particular, we use results from thefirst wave of data from the LSIC published by Statistics Canada (2003).1
LSIC results are used as the basis for weighting factors incorporated inthe index for two reasons.2 First, they represent a recent and reliable sampling of data that directly asks why immigrants choose to settle where theydo. Although other data may serve a similar purpose (i.e., the landed immigrant database or LIDS), they do not attempt to ascertain motivation perse. Second, the LSIC opens new avenues for comparison across provinces.Until no~ such in-depth research at a national scale was beyond the fundsand capacity of any researcher or government department. Medium-sizedcities in Ontario, for example, could be represented using the same rankingsystem as provided here.
We present our results with a note of caution: We have developed thisindex to represent certain values and characteristics of places that makethem attractive to immigrants.The ind.ex is by definition an incomplete indicator of selected factors that affect Ioeational decision-making by immigrants. It is by no means definitive and static over time. It does, however,attempt to create a policy-relevant basis for comparison across mediumsized centres in British Columbia, and potentially Canada, for policy analysis and planning. This method may be applied to other regions in Canada,especially regions with medium~sizedcities.
Attracting Newcomers: Quality of Life versus Quality of Livelihood
Economic immigrants to British Columbia are selected on the basis of theirofficial language abilities, skills, education, age, and experience. They tendto represent a relatively educated and privileged elite in their home countries and have certain expectations about the quality of life they can expectin Canada. People also immigrate to a new country to find employmentopportunities and remuneration that exceed those in their home countries. We refer to the potential to develop better employment conditions asimproved quality aflivelihood.
Bauder (2004) argues that recent immigrants to British Columbia whosettle in Victoria, Nanaimo, or Prince George tend to do better in thelabour market than those in Greater Vancouver and that their average incomes are higher in the smaller cities. Recent immigrant men averagedwell above $22,000 per annum outside Greater Vancouver, as opposed toonly $17,350 inVancouver. Recent immigrant women inVictoria earned almost $16/000 per year, whereas their counterparts in Vancouver made onaverage slightly more than $12,000.This suggests that quality of livelihood,once established, may well be better for new immigrants in cities outsideVancouver.
BauderJs (2004) study does not, however, include an analysis of labourforce participation by imlnigration class, which might show, for example,that a disproportionate number of family class immigrants settle in Vancouver whereas economic immigrants are most likely to settle outside theprovince's largest metropolis.The study does not control for visible-minority status and related group differences among immigrants, nor does it examine income patterns at the household level, which Ley (1999) suggestsmay vary significantly. ~t is possible that the earnings of whites in smallercities are being compared with those of non-whites in Greater Vancouver,or that higher individual incomes in smaller cities are offset by the ability togenerate higher household incomes in Greater Vancouver. Bauder's numbers do suggest that quality of livelihood for immigrants is on average better outside Vancouver than i11 Vancouver.
Quality of life, we contend, is quite different from quality of livelihood.One can debate at length the indicators to be included in such a category.Certainly the presence of family and/or friends in a given place, the qualityof education available for one's family (as well as the educa~ionalattainment of the community on average), climate, and the lifestyle associatedwith the city are all important considerations. Quality of life also incorporates many other factors, but these are idiosyncratic. For example, Florida
and Gertler (2003) argue that a thriving arts community (measured statistically as the number of artists, writers, and other "Bohemians") and a tolerant social character (measured in part by high numbers of immigrants)are the basis of a creative, competitive, vibrant urban economy. Bauder's(2004) study potentially corroborates Florida's (2002) analysis of the creative class: that the significant presence of immigrants among other variables is correlated with that of highly paid knowledge workers in the highend service sector. According to Florida, however, cities that rank highestin terms of creative economic strength, measured in part by large immigrant populations, also rank highest in income inequality. Florida's correlations are not based on any direct surveys or interviews with members ofthe creative class themselves. Rather, aggregate data are modelled in a waythat serves his argument. As Schuurman (2002) has argued, modelling isan iterative process in which the researcher tweaks the modei until It IS vaiidated by external indicators (which he or she seeks to model).
We use variables that according to LSIC are major factors for immigrants in deciding location. Where no data are available to measure thesevariables directly, we have created proxy measures as described in Appendix A. Settlement related to the presence of family and/or friends drivesimmigrants' decisions about where to settle throughout British Columbia(Walton-Roberts, 2004). Employment prospects are often tied to theseconnections, making it difficult to separate one criterion from one another.Immigrants also note that they are attracted to a city for its beauty and climate (Statistics Canada, 2003; Henin & Bennett, 2002). One's perceptionof affordable, quality housing might be another criterion, although wehave not included it in our index. Prospective immigrants might be attracted to a particular place by the presence of a symphony orchestra, theavailability of recreational facilities, or the number of parks. Education isalso a driving force behind parents' decisions to settle in a particular location (Waters, 2001). Each of these variables is incorporated into the final index using multi-criteria evaluation.
Multi-Criteria Evaluation (MCE):How is it Used to Create an Index?
The index is based on a technique used widely in the social sciences calledmulti-criteria evaluation (MCE). MCE is a tool that allows users to combine several criteria (attributes) in order to derive a suitability index forlocation of a spatial entity, or in this case to derive a choice of city for
immigration. The first step in MCE is to define the problem and relevantcriteria. Then each criterion is weighted depending on its relevance to thespatial solution (Satay, 1980).
The scoring remains a subjective process; its strength lies in the availability of scoring criteria commensurate with the goals of the analysis.High levels of relevance are associated with higher weights, which are inturn used to enhance the effect of that particular factor in the suitabilityequation. The value of MCE is that it allows the user to weight numerouscriteria in order to fine-tune the index (Jiallg & Eastmal1, 2003). Moreover,contradictory criteria can be used/ allowing the index to incorporate morethan one point ofview and still provide results. MCE is ofte11 used to assessthe suitability of particular locations in relation to one another. In this context, it is a stock geographic information systems (GIS) tool, although itsuse far exceeds geography (Schuurman, 2004). Sociologists, social epidemiologists, and urban planners are among the professionals who take advantage of the ability of MCE to integrate multiple-weighted criteria for rational (or political) decision-making.
The list of factors included in this project, like many developed for MCE,is not associated with absolute objective values. Rather, MCE attempts toaccommodate multiple perspectives, and the results of analysis vary depending on how factors al1d constraints are ranked in relation to each other(Satay, 1990). In this case, the incoming immigrants report how importanteach factor was to their choice of location, and the weighting in MCE reflectsthe relative importance of each factor.The final step is to combine all the information in order to develop a composite index of attraction to prospectiveimmigrants. This index will identify which medium-sized cities in BritishColumbia are most and least attractive potential sites of immigration basedon the findings ofWave 1 of the LSIC (Ruddick, 2004). Data for Wave 2 of theLSIC were collected between December 2002 and January 2004 and forWave 3 between November 2004 and October 2005.
The Index and its VariationsWe consider the index based on the LSIC findings the best indicator ofimmigrant decision-making in relation to settlement location. By calculating more than one index (we present 3 weightings, see Figure 1 for an explanation of the index calculation), our aim is to test the sensitivity of theLSIC index, that is, whether results change based on increased emphasis of(a) employment and business prospects; (b) presence of family and friends;(c) education (in the prospective place of settlement); and (d) lifestyle,taken here to refer broadly to climate and its implications for activities

Components2
IProvincial Exam Scores EJ, % Wdh Colk:ge Eel orHigberE]IAvail ofAdvanced EduaIlionEl
5.00 -; IAssessment ofClimate El
I% Immigrants 1971 - :ZOO~:El
IRecent Immigrant GrowthEJ~ IJob Growth 1996-:zoo1 8
4.50 I IUnemployment Rate (2001)8
Raw
Score ---.J4.00 ·1
FactorWeight
(x 0.391)
~__ 4.S8-1
(x 0.4(5)
WeightedScore
4.35
86.92
LSIC Index
Index Score l
Out of lOO
I Max Score is 5.00
Factors / 1.560
I Family & Friends BI Jobs & Business - B 1.870
I Education B ____0.610
I Lifestyle B ~~O.310 (x 0.061)
2 Factor components are evenly weighted within factors (components and factors are out of 5).
2 Factor components are evenly weighted within factors (components and factors are out of 5).
Livelihood IndexComponents2
I% Immigrants 1971-2001ElIRecent Immigrant GrowthElIJob Growth 1996·2001 OBIunempIOymenlRale(2001>8
IProvincial Exam Scores 8I% With College Ed.or~
IAvail. ofAdvancedEducaD<mEJ
4.S0~
5.00 -; IAssessment ofClimate El
4.S8-1
Raw
Score ---.J4.00-
1
FactorWeight
(x 0.330)
(x 0.500)
WeightedScore
Factors / 1.320
I Family & Friends Br:-:=:l 2.225I Jobs & Business ~
I Education r::;l____ (x 0.109)~ 0.500-------
I Lifestyle B ~(x 0.060)
0.300-----
4.37
87.48
Index Score'Out of 100
1 Max Score is 5.00
Figure 1. Sample index calculations.
based on Henin and Bennett (2002) and Walton-Roberts (2004). Dataanalysed to assess employment and business prospects and the presence offamily and friends (factors 1, 2, and 3) refer not only to the five cities, but tothe "universe"of all medium-sized cities in British Columbia (24 in total).3We do this to avoid skewing the results for the five selected cities by contextualizing them in a more realistic range ofvalues. This approach also allows one to assume that prospective immigrants choose not only fromamong the five study sites, but from all British Columbia cities outside theVancouver cel1SUS Inetropolitan area (CMA) ..
The LSIC IndexThe first index or ranking is based on the LSIC (Statistics Canada, 2003)findings that enumerate settlement factors for immigrants who establishthemselves outside the CMAs of Vancouver, Montreal, and Toronto. Economic immigrants to these cities cited the following as the main five motivations for moving there.
1. the presence of family and friends (35.60/0);2. job prospects (32.30/0);3. education prospects (12.1 %);4. lifestyle (5.60/0);5. business prospects (5.5%).
The index does not add up to 100% because the LSIC report (StatisticsCanada) published only the top five most important reasons for settlementlocation choice, which account for 91.1% of responses; we have re-scaledthe top five reasons to add up to 100%.
• The index combines job and business prospects (weighted at 41.5 %)to gauge employment-related prospects and measures them throughjob growth and unemployment rates (equally weighted).
• The presence of family and friends (weighted at 39.1 0/0) is measuredby a proxy that combines equally a measure of all immigrants whohave arrived since 1971 (at which time the Census registers the introduction of the points system into Canadian immigration policy)with the city's ranking as the destination for numbers of recent immigrants who arrived in British Columbia between 1996 and 2001.
• The education variable is a measure of three data points, eachweighted equally (at one third) for a total of 13.30/0 of the index: therank of proportion of population with university degrees; the rank of

the city against the four others on standardized test scores for highschool students in each city's secondary schools; and the presenceand degree of postsecondary education available in the city (Le.,university, university college, college).
• Lifestyle is perhaps the most subjective factor to measure and indicate. We weight it at 6.1 % in accordance with the LSIC findings. Weused climate as a proxy based on information gleaned from qualitative academic research (Hellin & Bennett, 2002; Walton-Roberts,2004) and on our interpretation of published LSIC results (in whichclimate plays a major role, 20°tb, in determining settlement in Vancouver).The ratings for climate were compiled from an informal survey of undergraduate students and necessarily include location bias.Tf chn111" 'hi' nt"'\+('\~ h("\".Hf'~"f''- ..hl)+ t"'~rru", it +hl" 11tf'\chrlo f~~+n.. le 1"'0_..... .., _-. 4a._~ _, _ " _" _.&., 'f _A.L .LA. L_ .&..&. "-I ..).L_ ~__ _ .....
moved, the index returns the same ranking for the five cities.
The Livelihood Index: Jobs and Business Prospects Weighted at 50%If securing a job somewhere is central to immigrant settlement there, thenlivelihood is a major variable in determining city ofsettlement (see Appendix B). For this index jobs and business prospects are weighted at 50%(compared with 41.5% for the LSIC index) with the quality oflife variables(presence of family and friends, education, and climate) making up theother 50%.
Index ofEqually Weighted VariablesIn order to illustrate the sensitivity of the index, we generated a map showing the five study sites as if each variable (presence of family and friends,job and business prospects, education, and lifestyle) mattered equally (seeAppendix B). This index does not reflect current research findings, but is il1ustrative of the robustness of the index.That is, there is little change in theranking of the cities regardless of the weighting of the variables selected.
Individual FactorsIn addition to the three indices generated, the four component factors areprovided separately for clarity (see Appendix B). Each assumes that a solevariable (e.g., education) is the 011ly C011sideration in terms of immigrants'choice in settlement location illustrating how cities rank based on the useof single variables in the decision-making process. For family-class immigrants, the presence of family and friends is likely to be the single greatest determining factor in selecting settlement locations. Thus the index
showing the presence of family and friends at 100% may be useful foranalysis pertaining to this group.
Missing from the Study
In creating any index or ranking, a number ofvariables are excluded. Someare simply not characteristics of the cities themselves, but are abstractqualities of a city's relationship, for example, to a larger centre like Vancouver. In this context, proximity to Vancouver is an important considerationthat is not integrated into the index" but one we discuss below. We have assumed that some variables not mentioned in the LSIC are secondary, notprimary considerations in relation to choice of settlement location. Webriefly discuss three such variables here to note their potential relevance tochoice of settlement location.
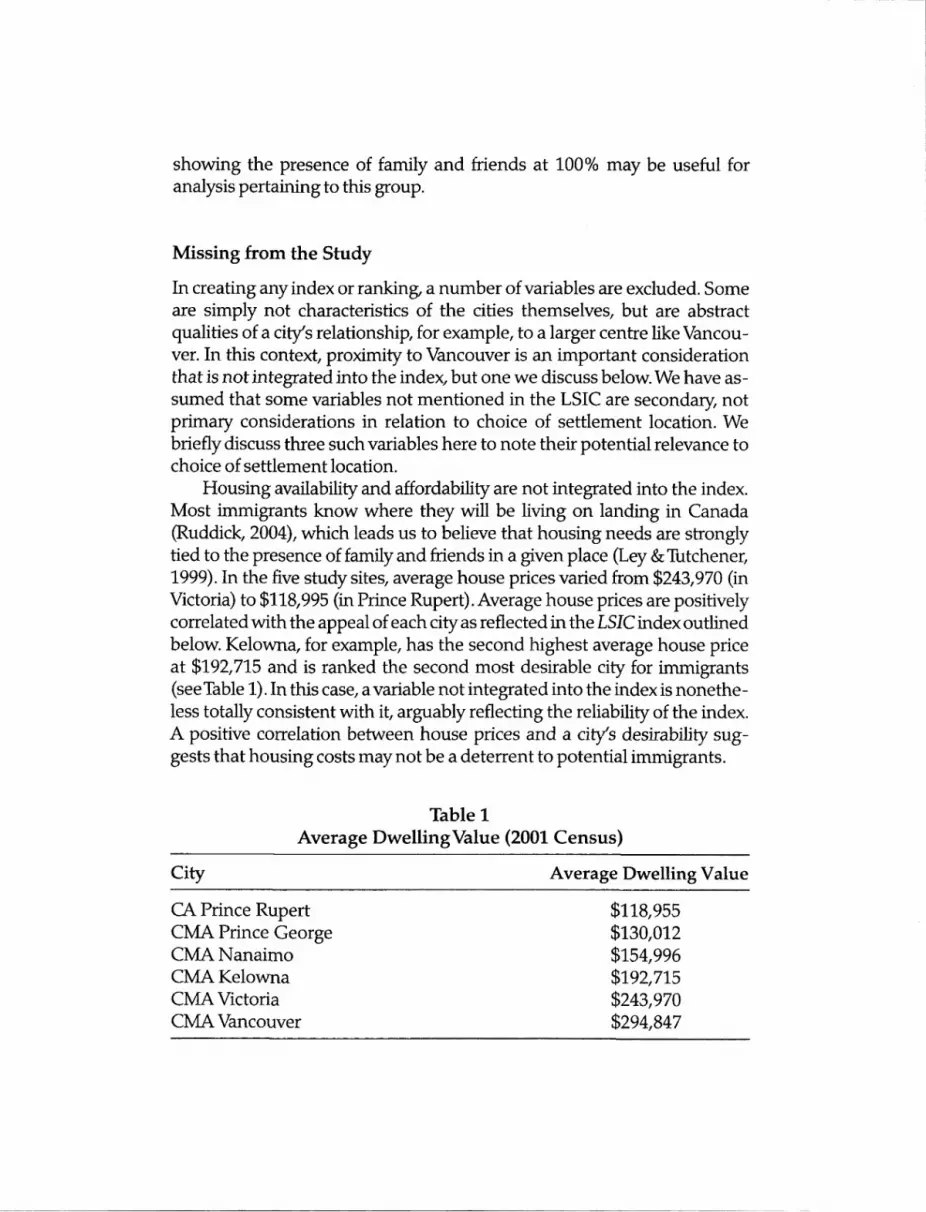
Housing availability and affordability are not integrated into the index.Most immigrants know where theywil! be living on landing in Canada(Ruddick, 2004), which leads us to believe that housing needs are stronglytied to the presence of family and friends in a given place (Ley & Tutchener,1999). In the five study sites, average house prices varied from. $243,970 (inVictoria) to $118,995 (in Prince Rupert). Average house prices are positivelycorrelated with the appeal ofeach city as reflected in the LSIC index outlinedbelow. Kelowna, for example, has the second highest average house priceat $192,715 and is ranked the second most desirable city for immigrants(seeTable 1). In this case, a variable not integrated into the index is nonetheless totally consistent with it, arguably reflecting the reliability of the index.A positive correlation between house prices and a city's desirability suggests that housing costs may not be a deterrent to potential immigrants.
Table 1Average DwellingValue (2001 Census)
City Average Dwelling Value
CA Prince RupertCMA Prince GeorgeCMANanaimoCMAKelownaCMA VictoriaCMA Vancouver
$118,955$130,012$154,996$192,715$243,970$294,847
Related to real estate markets is the relative location of each study siteto the province's largest city and economic centre, Greater Vancouver. Access to Greater Vancouver as a potential market, client, service provider,and so forth may well shape immigrants' choice of settlement location.Economic integration across geographical distance is facilitated by transport corridors and communications technology (Dicken, 2003). Three ofour study sites-Victoria, Nanaimo, and Kelowna-are more integrated inthis context than the others, Prince George and Prince Rupert. Victoria andNanaimo are separated from Vancouver by water, but are linked by multipIe convenient modes of transport. For example, an informal survey of thenumber of daily floatplane flights to Victoria and Nanaimo from Vancouversuggests a high-end mode (i.e", relatively expensive, for white collar workers) and high degree of integration: Victoria has 28 flights daily to Vancouver, and Nanaimo nine. Kelowna, on the other hand, offers a good, not asweather-dependent ground link (four hours by vehicle) that is relativelycheap, especially ifa business requires one to transport cargo from Vancouver to Kelowna.
A cursory exploration of transport links between 22 cities in British Columbia illustrates thatVancouver and Kelowna are the best connected withrespect to routes in and out of the city. If every city is a vertex or node andmajor highways are links, then Vancouver is served by three links, whilst amedium sized city such as Kamloops is served by six.The large discrepancyin the number of routes flowing into these cities is influenced as much bythe unique geography of the province as by size of settlement. Althoughconnectivity indices are useful determinants of size and connectivity inprovinces such as Ontario (e.g., Toronto is served by more roads thanPeterborough), it would be difficult to use a transport network as the soledeterminant of connectivity or size in British Columbia.
Potential for economic integration can be measured in a number ofother ways that include the availability of business services} fibre-optictelecommunications, and proximity of suppliers.The indices could includeweighting for connectivity that reflects economic integration with Vancouver or the largest city in any region. This would, however, require a muchmore systematic and in-depth qualitative study of what linkages mattermost and to whom. Such variables are likely to be far more relevant to entrepreneurs and business-class immigrants than professionals, assumingthat they find work in the occupation for which they are trained. Refugeeswho settle outside Vancouver, for example, are likely to be more concernedabout employment prospects in a given location than a ci1)ls degree ofeconomic integration with Vancouver and its road or air links.
Another dimension of settlement that has been largely ignored in theliterature on immigration (for an exception, see Hiebert, 2003) and is notincluded in the generation of the index is the proclivity of a given cityspopulation to welcome and accept new immigrants. Settlement servicesare likely to make a place more welcoming to new immigrants throughcounselling and interpretation services, host programs, and official languageinstruction by immigrant-specific agencies or as part of mainstream organizations such as schools, colleges, and hospitals.4 Many economic immigrants score highly on official language ability and do not necessarily availthemselves of as many settlement services as those who come in familyand refugee classes (Statistics Canada, 2003). The import~nceof such services will vary across immigrant classes and source countries.
Settlement is also facilitated in a better or worse fashion depending onthe host cities' attitudes to outsiders. This involves tolerance of ethnic orracial difference and acceptance of other nationalities, as most recent andcurrent immigrants to Canada and British Columbia are persons of colourfrom East and South Asia. Although a citys Chamber of Commerce or municipal council may wish to increase its labour force and population, it isunlikely to be successful in attracting immigrants if the attitudes of its residents and employers are not open to outsiders and their differences.Thus amissing element in our index is a systematic measurement of attitudes toward prospective immigrants in these cities of potential settlement. Hiebert's(2003) Vancouver community study illustrates the generally high levels ofsupport for immigrants to the city, with little variation across foreign-bornand native-born respondents. Vancouver is, however, a major metropoliswith a highly diverse and cosmopolitan population, as noted above. Although we cannot address this gap in current research here, we highlight itas a weakness in our own analysis and endorse the idea of research to document this dimension of settlement potential.
Results and Interpretation
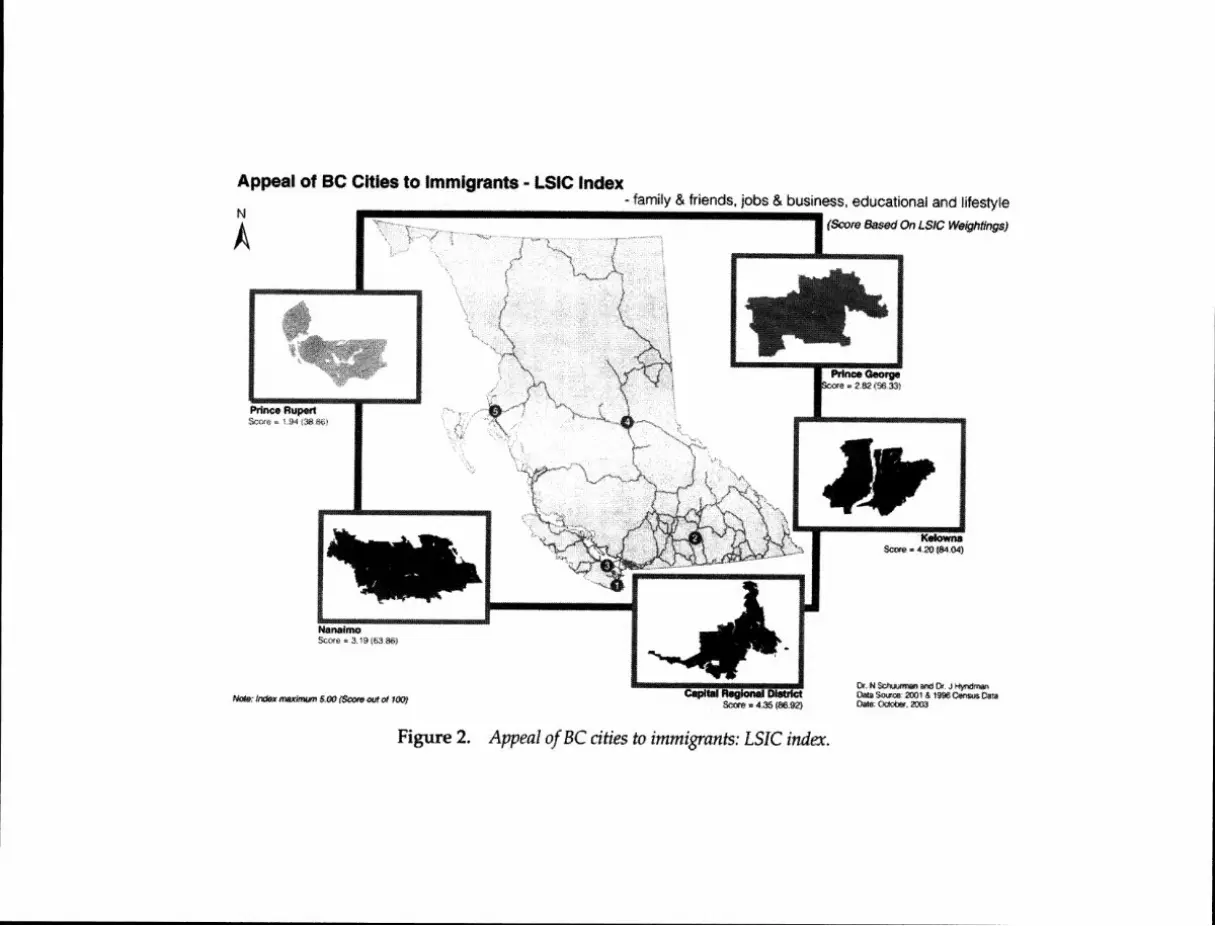
The results of each of iteration of the index are illustrated in Figure 2. Several preliminary conclusions that can be drawn from the analysis.
Our interpretation of the index is that population differences amongthe five study sites determine the ranking of individual cities: size matters.Population in a given place is indicative of service and amenities to someextent. In terms of CMA or CA population, Victoria has roughly 311,902(of 325,754 in the CRD) people compared with Kelowna's population of
K~
.Prince Ruped!,tl4 {~3in
Haul..SCClfe '* 3, 19 ~63Ji6J
Appeal of BC Cities to Immigrants .. LSIClndex .. familly & friends., jobs & business, educational and lifestyle---------112(Scor$ Based On LSIC Welghtings)
N
A
1WU<xt.~ ffUhm,lm 5JJO(SCCN <Wf ()f 1«)
Figure 2. Appea.l afBC cities to immigrants: LSICindex.
147,739, Nanaimo,s 85,664, Prince George's 85,035, and Prince Rupert's15,302. Larger city size is consistently correlated with attractiveness to immigrants based on the LSIC findings. The Capital Regional District (CRD),including Victoria and its environs, remains the most attractive mediumsized centre. Its larger population size is correlated with its attractiveness.Kelowna is the next most attractive city; again, its larger population correlates with its desirability. Nanaimo competes with Prince George for thirdplace despite its higher ranking on all but one indicator: job and businessprospects.
The index is not sensitive to varying weightings of the variables, becausevariables that make a centre attractive tend to aggregate (e.g., high presence of family and friends is likely to correspond to more likelihood of jobsand better business prospects in larger centres, which drives the likelihoodof better educational prospects).The availability of good job, business, andeducation prospects and the likelihood of family and friends being presenttend to increase with size.The LSIC did not explicitly ask respondents abouttheir preferred city size, but de facto the qualities that attract them to particular places tend to aggregate and concentrate in larger cities more thanin smaller centres.
The truism that geography matters is relevant here. The CRD aroundVictoria enjoys high levels of services and amenities for its size, includingrelative proximity to and integration with the province's largest urbanagglomeration. Settlements such as Prince Rupert and Prince George aresmaller, more geographically isolated, and climatically challenged, whichshapes their respective desirability to new immigrants. Variables that maybe positively correlated with larger settlement are therefore less likely toaccrue.
An index provides a ranking based on research, which points to theimportance of variables and on available data to approximate these variabIes. In this case, the LSIC (Statistics Canada, 2003) provides a basis forweighting factors identified as important to immigrants surveyed. Thesemethods have limitations. Despite our quantitative calculations that suggest that Kelowna is the second most attractive city to immigrants (outsideGreater Vancouver), qualitative research has shown that on-the-groundimmigrant experience of Kelowna is quite different. Walton-Roberts (2004)cites this interview excerpt.
F6: I have experienced a lot of racism in this town and even thoughI did experience racism in Edmonton when I came to Canada, butnot so much as I have in the last 6 years in this town.

Q: What kinds of things make you feel that way?
F6: I find that people are very paternalistic, condescending, and Ithink it's just the whole atmosphere. That's my personal opinion,I know some people think I'm crazy and that I'm overreacting, butI find this city very, the people are very different. (Non-Europeanwomen's focus group, Kelowna, October 2002) (p.19).
Similarly, Sherrell et al. (2004) cite interviews that highlight the economic mismatch between (industrial) immigrant skill sets and the servicesector jobs that dominate the Kelowna labour market.
rTnl Gi~k()Vr1 WP h~cI ~pvpn or P1P-ht rf~('torip~l_ Ttw~s rl vprvin-... ... ) v.. JIl .I
dustrial town ... there were big factories: 5000 people in one [fac-tory] [lOl-Kosovar-Vancouver]. Kelowna is tourist place, it isnot for engineers (Interview 109, Kosovar, Kelowna). The promotion of Kelowna like "Silicon Vineyard" is highly exaggerated.High-tech companies usually are small. Very small. And they areable to employ up to ten people. And no industry, no big manufacturing companies.... Here, generally, I believe it's mainly hospitality industry.... [The] highly promoted bridges.com ... does dovery well, but still not big enough to be big employer. [The] onlymanufacturer is Sunrype, [a] food processing kind ofcompany_ ButI'm afraid they don't need any high-tech personnel so far (Interview 108, Kosovar, Kelowna).
There are clear discrepancies between the quantitative index derivedhere and immigrants' perceptions on the ground. This project cannotground truth-or test the veracity of-the indices we have generated. Weacknowledge, however, that they represent part of the picture; in no waydo they account for the more subtle and subjective assessments of discrimination or employment suitability alluded to here. We use such indices asone step in a multi-methods approach to assessing the attractiveness ofmedium-sized cities in British Columbia and elsewhere.
Although the LSIC index is arguably the best for assessing the appealof smaller cities to prospective immigrants, the variation among the supplementary indices-weighting each of the variables at lOG%-is small.This strengthens the analytical value of the index and demonstrates its robust character. Nonetheless, we caution that other factors not included inthe index may also shape decisions about where to settle.
Conclusions
The most straightforvvard conclusion of this research is that the LSICbased index is robust and reliable from a statistical viewpoint. A numberof variables correlate with one another, especially family and friends andeconomic prospects. Two other variables, population and average housingprices, are strongly correlated with the results. Population size is a reliablesurrogate because weighted factors measure increases in absolute numbers rather than proportions, which ensures that larger centres will farebetter. Other Canadian research on the relationship of population size toimmigrant retention also points to higher retention rates in larger cities(Abu-Laban, Derwing, Krahn, Mulder, & Wilkinson, 1999; Krahn, Derwing,& Abu-Laban, 2003).
More broadly speaking, the study confirms that immigrants are attracted to cities with friends and family, including other immigrant groups.Large immigrant populations in cities likeToronto orVancouver are not accidental; they accrue because immigrants consistently choose to settle inareas where they find the people, livelihoods, and quality of life they seek.Opportunities in the fields of education and employrrient not surprisinglyexist in greater number in larger, more diversified urban centres. The logicis tautological: making a place attractive to immigrants requires an existingimmigrant population.
From a policy perspective, this circularity can be overcome only bystrong incentives. The LSIC results illustrate that immigrants prefer thefeatures correlated with· larger cities in the British Colombia context. Soextraordinarily attractive prospects are probably the only way that immigrants-who have the right to move within Canada-will voluntarilychoose smaller centres. One such draw might be a future option for familyunification not normally allowed under Canada's Immigrant and RefugeeProtection Act. Another might include offers of tax credits or exemptionsfrom provincial governments if new immigrants are willing to relocate inareas without dense immigrant populations. A more enforcement-orientedmeasure would be to use temporary work status instead of full immigration status to control settlement patterns by making admission to Canadaconditional on settlement in a specified smaller urban centre.
Further studies might evaluate clusters of smaller cities (e.g., Trail,Castlegar, Nelson) that constitute functional medium-sized cities whencoordinated as a unit. Results from such assessments may be more realisticand inclusive in appraising quality of life outside Canada's largest cities.Moreover, assessment of functional centres or corridors rather than formal

municipal bodies could allow cities to better represent their assets andvirtues in attracting immigrants. Such a strategy could enable a shift fromthe evaluation of existing appeal (as measured in this study) to a programthat allowed communities to engage actively in programs to attract immigration. Variables in a subsequent study based on functional centres mightinclude (a) degree of integration, including transportation and communication connectivity; (b) housing and rental prices (allowing smaller centresto score better); (c) proportion of immigrants in situ to total populationrather than a ratio of absolute numbers; and (d) recreational amenitiesand/or shopping opportunities (based on proxy variables such as presenceor absence of key stores) in addition to the existingvariables.
The index presented here is an indicator of the role that populationand the extant number of imm.igrants in situ plays in determining the appeal of smaller cities. From a policy perspective, if governments wish tospread the wealth associated with immigration and an expanded labourforce, a proactive policy stance that enumerates and communicates the appeal of less prominent communities is vital.
Acknowledgements
A version of this report was submitted to the BC Ministry of Community, Aboriginal andWomen's Services in November 2003. The authors thank Roy Chan for his research assistance.
Appendix AImmigration MCE: Methodology
FactorsFactors were determined based on Statistics Canada's (2003) release theLongitudinal Survey ofImmigrants to Canada. The sUIVey included data onthe"five most important reasons principal applicants in the economic classchoose to settle."The MCE used data from the results given for all other:CMAs or non-CMAs (other than Vancouver,Toronto, and Montreal).
Presence offamily and friends (interpreted as presence of relatively recent immigrants):
1. Total of all immigrants in each CMA or CA in British Columbia whoimmigrated from 1971 (first Census that points system took effect)to 2001 (SOOk weighting);
2. Growth in recent immigrants from 1996 to 2001 (Census 2001 recent immigrants-Census 1996 recent immigrants)/Census 1996recent immigrants *100). Note: recent immigrants are defined aspersons who have immigrated to Canada in the inter-census period, the five-year period between censuses (50% weighting)4
Job prospects and business prospects (Economic factors):1. Measured as the growth in employment from 1996 to 2001 (Census
2001 employed-·Census 1996 employed)/Census 1996 employed*100). Nate: employed refers to the number of persons 15 years oldand over who were in paid work (50% weighting);
2. The unemployment rate (Census 2001 data, 50% weighting).
Educational Prospects1. The availability of postsecondary educational institutes in each
CMA (university == 5, university college == 4, community college ==3,331/30/0 weighting).
2. Population with college diploma/certificate or university bachelor'sdegree or higher (33 1/3% weighting).
3. Grade 12 provincial exam scores (average determined from basicsubjects) (331/3% weighting).
Lifestyle1. Subjective assessment of most and least desirable climate (100%
weighting) .

ScoringTo create scores each factor was ranked into quintiles with five categories(20% of the data falls within each class). If the factor comprised subfactors,these were ranked using the same method and the average of the subfactors was used as the factor score.
WeightsMter scoring, each factor was multipliedby a weight. Several weights wereused to test the sensitivity of the MCE, but the variables are based on LSICfactors.
Weights from LSIC 2003-all other CMAs and non-CMAs: family andfriends (35.6%), job and business prospects (37.8%), education prospects(12.1%), and lifestyle (5.6%). The weig-hts derived from the LSIC do notadd up to 100% (91.1 %) as the LSIC report published only the top fivemost important reasons in settlement location choice (separately) forMontreal, Vancouver,Toronto, and all other CMAs and non-CMAs (Statistics Canada, 2003).
Note: Job prospects (32.3%) and business prospects (5.5%) were combined into a single factor.

AppendixBIndex and Individual Factor Results
Factors Components I Index Scores Victoria (CRD) Kelowna Nanaimo Prince George Prince Rupert
Family &% of CMAlCA Populaton Immigrants 1971-2001 5.00 3.00 4.00 2.00 5.00
FriendsRecent Immigrant % Growth 1996·2001 3.00 5.00 3.00 2.00 1.00Individual Factor Score lout of 5) 4.00 4.00 3.50 2.00 3.00
Jobs and Job Growth 1996-2001 4.00 4.00 3.00 5.00 1.00
BusinessUnemployment Rate (2001) 5.00 5.00 2.00 2.00 1.00Individual Factor Score (out of 5) 4.50 4.50 2.50 3.50 1.00
Provincial Exam Scores 3.75 4.25 3.25 2.75 2.25
Education% of Population with College Education or Higher 5.00 5.00 5.00 4.00 1.00Availability of Advanced Education institutions 5.00 4.00 4.00 5.00 2.00Individual Factor Score (out of 5) 4.58 4.42 4.08 3.92 1.75
I Lifestyle 'Individual Factor Score (out of 5) I 5.00 3.00 4.00 1.00 2.00 IFamily & Friends (weight =0.391) 1.56 1.56 1.37 0.78 1.17Job & Business Prospects (weight =0.415) 1.87 1.87 1.04 1.45 0.42
LSIC IndexEducation (weight =: 0.133) 0.61 0.59 0.54 0.52 0.23Lifestyte (weight =0.061) 0.31 0.18 0.24 0.06 0.12Total Index Score (out of 5.00) 4.35 4.20 3.19 2.82 1.94Out of 100 86.92 84.04 63.86 56.33 38.86
Family & Friends (weight = 0.330) 1.33 1.33 1.17 0.67 1.00Job & Business Prospects (weight =0.500) 2.25 2.25 1.25 1.75 0.50
Livelihood Education (weight = 0.109) 0.50 0.48 0.45 0.43 0.19Index Lifestyle (weight = 0.060) 0.30 0.18 0.24 0.06 0.12
Total Index Score (out of 5.00) 4.38 4.24 3.10 2.90 1.81Out of 100 87.63 84.87 62.01 58.06 36.20
Family & Friends (weight = 0.250) 1.00 1.00 0.88 0.50 0.75
Equal Job &Business Prospects (weight = 0.250) 1.13 1.13 0.63 0.88 0.25
WeightsEducation (weight = O.250) 1.15 1.10 1.02 0.98 0.44
IndexLifestyle (weight = 0.250) 1.25 0.75 1.00 0.25 0.50Total Index Score (out of 5.00) 4.52 3.98 3.52 2.60 1.94Out of 100 90.42 79.58 70.42 52.08 38.75

Notes
1. The LSIC data represent approximately 12,000 of 164,200 immigrants aged 15 and olderwho arrived in Canada oetween October 2000 and September 2001. Of those admitted to Canada,rou~hly 67% enter as economic-class immigrants (including both principal applicants and theirfamIlies), 27% enter as family-class immigrants, and just 6% enter as refugees. For a specific studyof the regionalization policy on government-assisted refugees, see Sherrell et al. (2004).
2. We did not analyse LSIC microdata. The weights used in the LSIC index are from resultspublished in the report Longitudinal Suroey ofImmigrants to Canada: Process, Progress and Prospects(Statistics Canada, 2003). The report's resufts indicate the quality level of estimates (based on aminimum sample size and the coefficient of variation) as acceptable, marginal, or unacceptable.Of the estimates used as weights in the LSIC index, all were considered acceptable. For further information about LSIC survey methodology see Statistics Canada (2003).
3. We have not included the statisticaloutput for these 24 cities, but contact [email protected] more information.
4. This project did not examine the provision of settlement services in the five study sites. Wedid note, however, that Prince Rupert is the only city without stream 1 settlement servicesf that is,an immigrant-specific agency that provides counselling and interpretation in the early stages ofsettlement.
References
Abu-Laban, B., DelWing, T., Krahn, H., Mulder, M., & Wilkinson, L. (1999). The settlement experiences ofrefugees in Alberta. Study preparedfor Citizenship and Immigration Canada (rev. ed.). Edmonton, AB: Prairie Centre of Excellence for Research on Immigration and Integration andPopulation Research Laboratory.
Bauder, H. (2004). Immigrants in urban labour markets: Place of birth and immigrant concentrations in British Columbia. Canadian Journal ofUrban Research, 12(2), 179-204.
Bourne, L.S. (1999). Migration, immi~ation, and socialsustainability: The recent Toronto experience incomparative context. Unpublished document, Centre of Excellence for Research on ImmigrationStudies (CERIS).
Collacot, M. (2002). Canada's immigration policy: The need for major reform. Public policy sourcesNo. 64. Vancouver, BC: Fraser Institute.
Citizenship and Immigration Canada (CIC). (2001a). Pursuing Canada's commitment to immigration: The imnligration plan for 2002. Ottawa: Minister of Public Works and Government ServicesCanada.
Citizenship and Immigration Canada (ele). (2001b). Towards a more balanced geographic distribution ofimmigrants, A special study by Strategic Planning, Policy and Research. Retrieved October12, 2003, from: http://www.cic.gc.ca/english/srr/pdf/res3fv.pdf.
Citizenship and Immigration Canada (CIC). (2003). Facts andfigures 2002: Immigration overview.Cat. No. MP43-333/2003-1E, ISBN 0-662-34188-0. Ottawa: Minister of Public Works andGovernment Services Canada.
Dicken, P. (2003). Global shift: Reshaping the global economic map in the 21st century. London; NewYork: Sage.
Florida, R. (2002). The rise ofthe creative class: And how ifs transformingwork, leisure, community andeveryday life. New York: Basic Books.
Florida, R., & Gertler, M. (2003). Cities: Talent's critical mass. Globe and Mail, January 3.Henin, B., & Bennett, M.R. (2002). Immi.gration to Canada's mid-sized cities: A study of Latin
Americans and Africans in Victoria, BC. Metropolis working paperseries, No. 02-22.Hiebert, D. (2000). The social geography of immigration and urbanization in Canada: A review
and interpretation. Working paper #00-12.Hiebert, D. (2003). Are immigrants welcome? Introducing the Vancouver Community Studies
Survey, RIIM workingpaper03-06, March.Krahn, H., Derwing, T.M., & Abu-Laban, B. (2003). The retention of newcomers in second-and
third tier cities in Canada. Working Paper No. WP #01-03. Edmonton, AB: Prairie Centre ofExcellence for Research on Immigration and Integration (PCERII).
Ley, D. (1999). Myths and meanings of immigration and the metropolis. Canadian Geographer,1(1),2-19.
Ley, D., & Tutchener, J. (1999). Immigration and metropolitan house prices in Canada. MetropolisWorking Paper Series, WP#99-09. Retrieved September 30, 2004, from: http://www.riim.metropolis.net/frameset_e.html.
Li, P. (2003). Initial earnings and catch-up capacity of immigrants. Canadian Public Policy, 29(3),319-337.
Ray, B. (1998). A comparative study of immigrant housing, neighbourhoods and social networks inToronto and Montreal. Ottawa: Canadian Mortgage and Housing Corporation.
Robinson, V., Andersson, R., & Musterd, S. (2003). Spreading the ~'burden"? A review ofpolicies todisperse asylum-seekers and refugees. Bristol, UK: Polity Press.
Ruddick, E. (2004, February). Longitudinal survey ofimmi~ants to Canada: Highlights from Wave 1,meeting of the working group for the enduringfederal role for research. Paper presented at SFUHarbour Centre, Vancouver.
Satay, T.J. (1980). The analytic hierarchy process. NewYork: McGraw-Hill.Saaty, T.J. (1990). How to make a decision: The analytic hierarchy process. European Journal of
Operational Research, 48, 9-26.Schuurman, N. (2002). Reconciling social constructivism and realism in GIS. ACME: An Inter
national E-Journalfor Critical Geowaphies, 1(1), 75-90.Schuurman, N. (2004). GIS: A short lntroduction. Oxford, UK: Blackwell.Sherrell, K., Hyndman, J., & Preniqi, F. (2004). Sharing the wealth, spreading the "burden"? The
settlement of Kosovar refugees in smaller BC cities. RIIM workingpaper #04-06.Statistics Canada. (2003). Longitudinal survey of immigrants to Canada: Process, progress, and
prospects. Catalogue No. 87-611-XIE, ISSN 1708-7740. Ottawa: Ministry of Industry.Teeple, G. (1995). Globalization and the decline ofsocial refann. Toronto, ON: Garamond Press.Vatz-Laroussi, M., & Walton-Roberts, M. (2005). Introduction. Canadian Ethnic Studies, 37, pp. 1-5.Walton-Roberts, M. (2004). Regional immigration and dispersal: Lessons from small and memum-
sized urban centres in British Columbia. RlIM working paper #04-03. Retrieved November 25,2005, from: http://riirn.metropolis.net/frameset_e.html.
Waters, J.L. (2001). Migration strategies and transnational families: Vancouver's satellite kids.RIIM working paper #01-10. Retrieved September 15, 2003, from: http://www.riim.metropolis.netNirtual%20Library/2001/wpOl1O.pdf.
Useful Links
Metropolis Canada (includes links to the various regional sites): http:/Icanada.metropolis.net/www.immigrantsandrefugees.ca
Citizensnip and Immigration Canada (eIe): http://www.cic.gc.ca/Statistics Canada (LSIC Reports): A Portrait ofEarly Settlement Experiences: http://www.statcan.ca/
english/freepub/89-614-XIE/89-614-XIE2005001.htmProcessf Progress and Prospects: http://www.statcan.caJenglish/freepub/89-611-XIE/index.htm


