Embed Size (px)
Citation preview
Single Technology Appraisal
Azacitidine for treating acute myeloid leukaemia with more than 30% bone
marrow blasts
Committee Papers
NATIONAL INSTITUTE FOR HEALTH AND CARE EXCELLENCE
SINGLE TECHNOLOGY APPRAISAL
Azacitidine for treating acute myeloid leukaemia with more than 30% bone marrow blasts [ID829]
Contents: 1. Pre-Meeting Briefing
2. Final Scope and Final Matrix of Consultees and Commentators
3. Company submission from Celgene
4. Clarification letters
NICE request to the company for clarification on their submission
Company response to NICE’s request for clarification
5. Patient group, professional group and NHS organisation submission from:
Leukaemia CARE
Association of Cancer Physicians, Royal College of Physicians and National Cancer Research Institute joint submission
Royal College of Pathologists Consultee organisations – in same order as on matrix
6. Expert statements from:
Dr M Dennis – clinical expert, nominated by Association of Cancer Physicians, Royal College of Physicians and National Cancer Research Institute
7. Evidence Review Group report prepared by Peninsula Technology Assessment Group • Evidence Review Group - addendum • Evidence Review Group - erratum
8. Evidence Review Group report – factual accuracy check
Any information supplied to NICE which has been marked as confidential, has been
redacted. All personal information has also been redacted.
CONFIDENTIAL
National Institute for Health and Care Excellence 1 of 42
Premeeting briefing – azacitidine for treating acute myeloid leukaemia with more than 30% bone marrow blasts
Issue date: February 2016
NATIONAL INSTITUTE FOR HEALTH AND CARE EXCELLENCE
Premeeting briefing
Azacitidine for treating acute myeloid leukaemia with more than 30% bone marrow
blasts [ID829]
This premeeting briefing presents:
the key evidence and views submitted by the company, the consultees and their
nominated clinical experts and patient experts and
the Evidence Review Group (ERG) report.
It highlights key issues for discussion at the first Appraisal Committee meeting and
should be read with the full supporting documents for this appraisal.
Please note that this document includes information from the ERG before the
company has checked the ERG report for factual inaccuracies.
Key issues for consideration
Clinical effectiveness
Which comparator or comparators are the most appropriate for azacitidine for
treating acute myeloid leukaemia with more than 30% bone marrow blasts in
people not suitable for haematopoietic stem cell transplantation?
The company presented clinical effectiveness evidence from AZA-AML-001
which compared azacitidine with a combined conventional care regimen (CCR).
The CCR comprised intensive chemotherapy with anthracycline and cytarabine
plus best supportive care (IC), low dose chemotherapy with cytarabine plus
best supportive care and best supportive care (BSC) alone.
CONFIDENTIAL
National Institute for Health and Care Excellence 2 of 42
Premeeting briefing – azacitidine for treating acute myeloid leukaemia with more than 30% bone marrow blasts
Issue date: February 2016
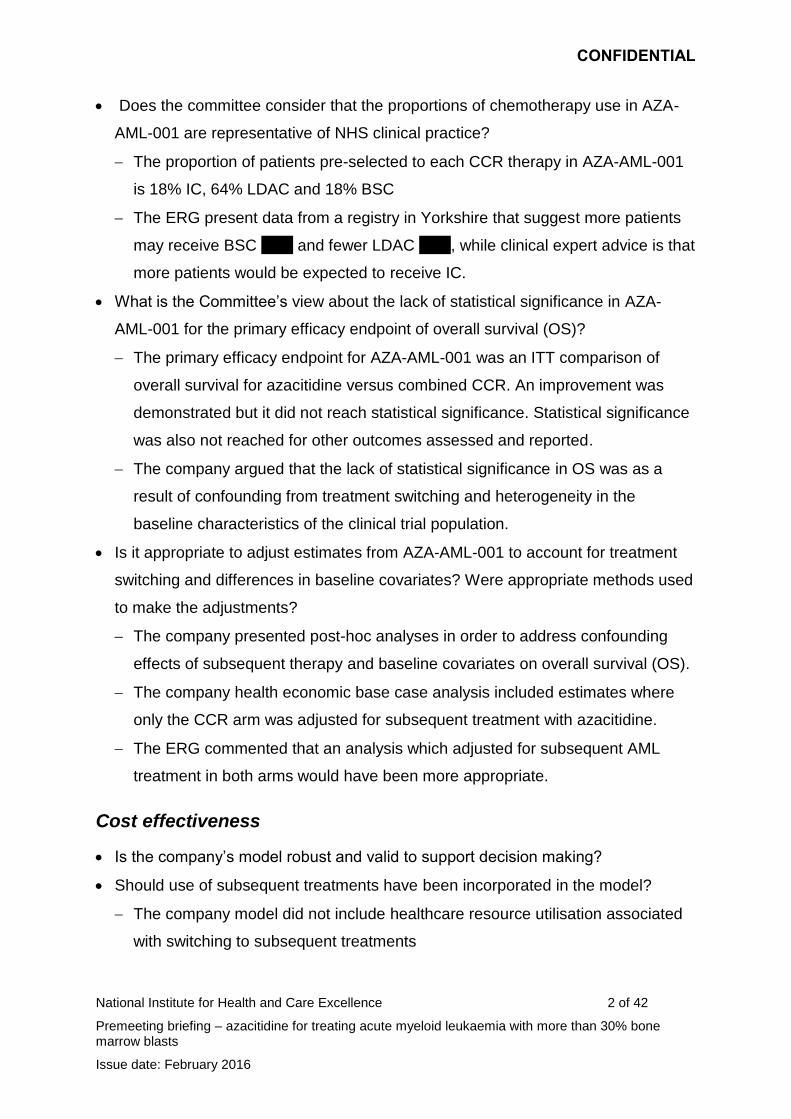
Does the committee consider that the proportions of chemotherapy use in AZA-
AML-001 are representative of NHS clinical practice?
The proportion of patients pre-selected to each CCR therapy in AZA-AML-001
is 18% IC, 64% LDAC and 18% BSC
The ERG present data from a registry in Yorkshire that suggest more patients
may receive BSC xxxx and fewer LDAC xxxx, while clinical expert advice is that
more patients would be expected to receive IC.
What is the Committee’s view about the lack of statistical significance in AZA-
AML-001 for the primary efficacy endpoint of overall survival (OS)?
The primary efficacy endpoint for AZA-AML-001 was an ITT comparison of
overall survival for azacitidine versus combined CCR. An improvement was
demonstrated but it did not reach statistical significance. Statistical significance
was also not reached for other outcomes assessed and reported.
The company argued that the lack of statistical significance in OS was as a
result of confounding from treatment switching and heterogeneity in the
baseline characteristics of the clinical trial population.
Is it appropriate to adjust estimates from AZA-AML-001 to account for treatment
switching and differences in baseline covariates? Were appropriate methods used
to make the adjustments?
The company presented post-hoc analyses in order to address confounding
effects of subsequent therapy and baseline covariates on overall survival (OS).
The company health economic base case analysis included estimates where
only the CCR arm was adjusted for subsequent treatment with azacitidine.
The ERG commented that an analysis which adjusted for subsequent AML
treatment in both arms would have been more appropriate.
Cost effectiveness
Is the company’s model robust and valid to support decision making?
Should use of subsequent treatments have been incorporated in the model?
The company model did not include healthcare resource utilisation associated
with switching to subsequent treatments
CONFIDENTIAL
National Institute for Health and Care Excellence 3 of 42
Premeeting briefing – azacitidine for treating acute myeloid leukaemia with more than 30% bone marrow blasts
Issue date: February 2016
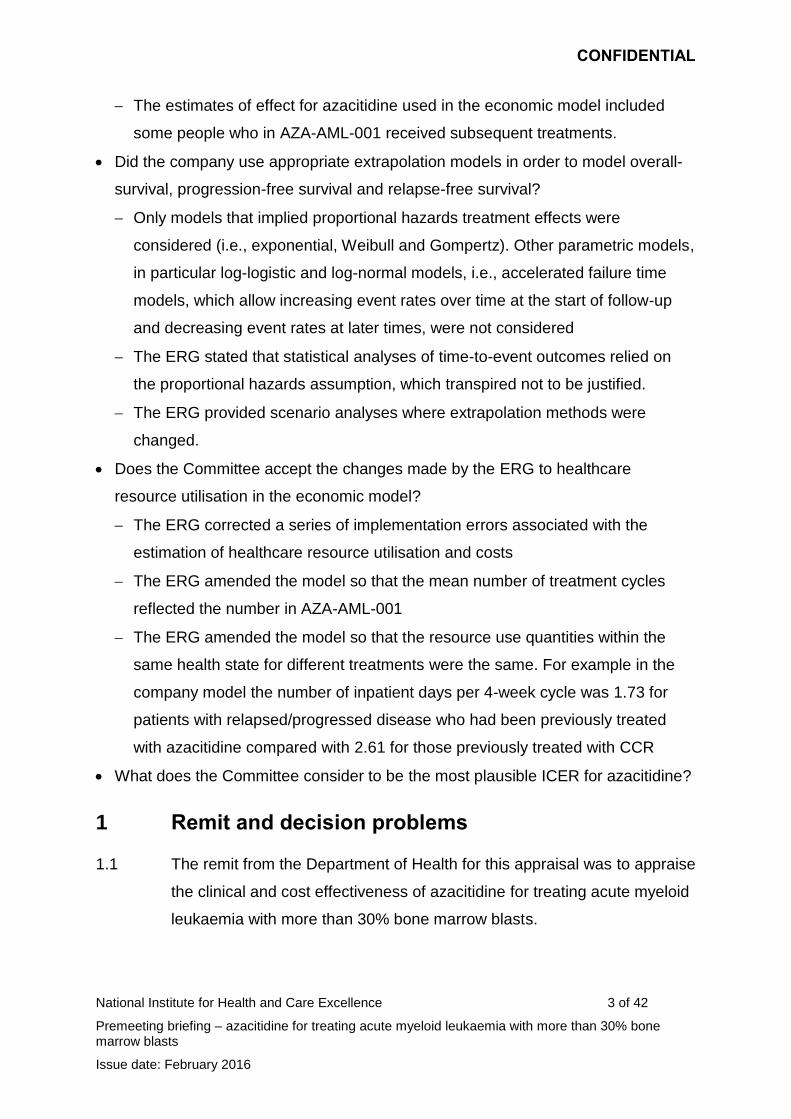
The estimates of effect for azacitidine used in the economic model included
some people who in AZA-AML-001 received subsequent treatments.
Did the company use appropriate extrapolation models in order to model overall-
survival, progression-free survival and relapse-free survival?
Only models that implied proportional hazards treatment effects were
considered (i.e., exponential, Weibull and Gompertz). Other parametric models,
in particular log-logistic and log-normal models, i.e., accelerated failure time
models, which allow increasing event rates over time at the start of follow-up
and decreasing event rates at later times, were not considered
The ERG stated that statistical analyses of time-to-event outcomes relied on
the proportional hazards assumption, which transpired not to be justified.
The ERG provided scenario analyses where extrapolation methods were
changed.
Does the Committee accept the changes made by the ERG to healthcare
resource utilisation in the economic model?
The ERG corrected a series of implementation errors associated with the
estimation of healthcare resource utilisation and costs
The ERG amended the model so that the mean number of treatment cycles
reflected the number in AZA-AML-001
The ERG amended the model so that the resource use quantities within the
same health state for different treatments were the same. For example in the
company model the number of inpatient days per 4-week cycle was 1.73 for
patients with relapsed/progressed disease who had been previously treated
with azacitidine compared with 2.61 for those previously treated with CCR
What does the Committee consider to be the most plausible ICER for azacitidine?
1 Remit and decision problems
1.1 The remit from the Department of Health for this appraisal was to appraise
the clinical and cost effectiveness of azacitidine for treating acute myeloid
leukaemia with more than 30% bone marrow blasts.
CONFIDENTIAL
National Institute for Health and Care Excellence 4 of 42
Premeeting briefing – azacitidine for treating acute myeloid leukaemia with more than 30% bone marrow blasts
Issue date: February 2016
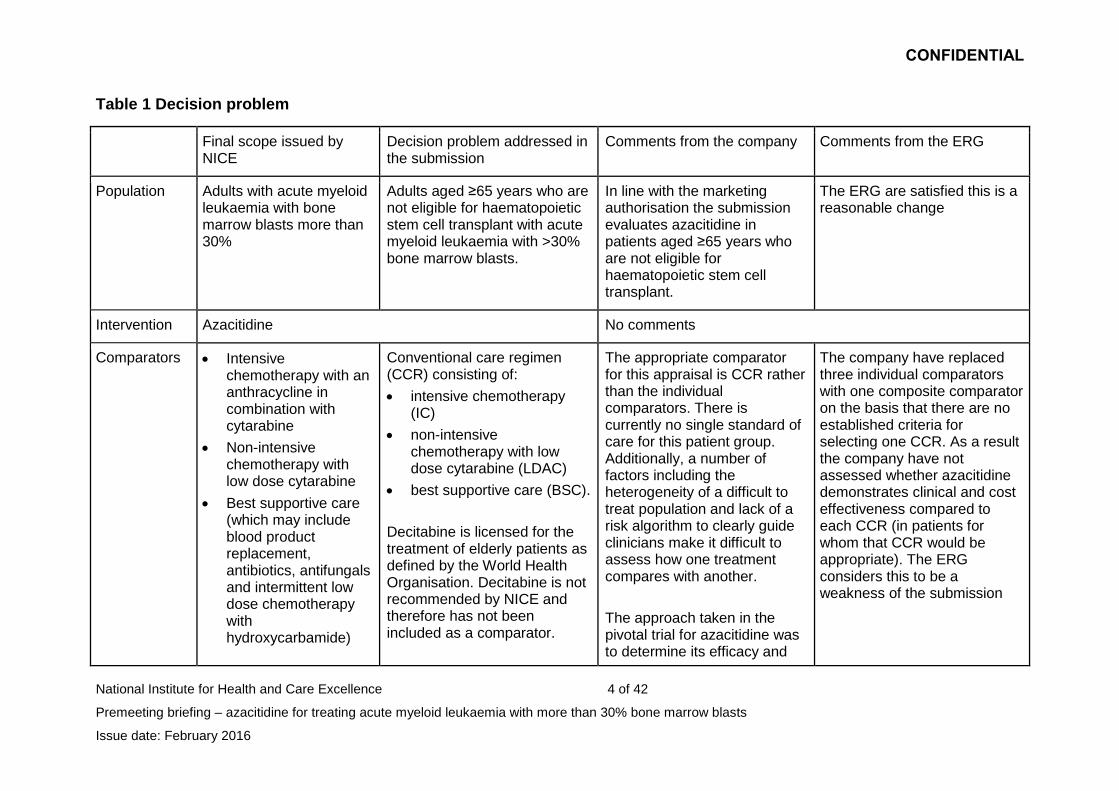
Table 1 Decision problem
Final scope issued by NICE
Decision problem addressed in the submission
Comments from the company Comments from the ERG
Population Adults with acute myeloid leukaemia with bone marrow blasts more than 30%
Adults aged ≥65 years who are not eligible for haematopoietic stem cell transplant with acute myeloid leukaemia with >30% bone marrow blasts.
In line with the marketing authorisation the submission evaluates azacitidine in patients aged ≥65 years who are not eligible for haematopoietic stem cell transplant.
The ERG are satisfied this is a reasonable change
Intervention Azacitidine No comments
Comparators Intensive chemotherapy with an anthracycline in combination with cytarabine
Non-intensive chemotherapy with low dose cytarabine
Best supportive care (which may include blood product replacement, antibiotics, antifungals and intermittent low dose chemotherapy with hydroxycarbamide)
Conventional care regimen (CCR) consisting of:
intensive chemotherapy (IC)
non-intensive chemotherapy with low dose cytarabine (LDAC)
best supportive care (BSC).
Decitabine is licensed for the treatment of elderly patients as defined by the World Health Organisation. Decitabine is not recommended by NICE and therefore has not been included as a comparator.
The appropriate comparator for this appraisal is CCR rather than the individual comparators. There is currently no single standard of care for this patient group. Additionally, a number of factors including the heterogeneity of a difficult to treat population and lack of a risk algorithm to clearly guide clinicians make it difficult to assess how one treatment compares with another.
The approach taken in the pivotal trial for azacitidine was to determine its efficacy and
The company have replaced three individual comparators with one composite comparator on the basis that there are no established criteria for selecting one CCR. As a result the company have not assessed whether azacitidine demonstrates clinical and cost effectiveness compared to each CCR (in patients for whom that CCR would be appropriate). The ERG considers this to be a weakness of the submission
CONFIDENTIAL
National Institute for Health and Care Excellence 5 of 42
Premeeting briefing – azacitidine for treating acute myeloid leukaemia with more than 30% bone marrow blasts
Issue date: February 2016
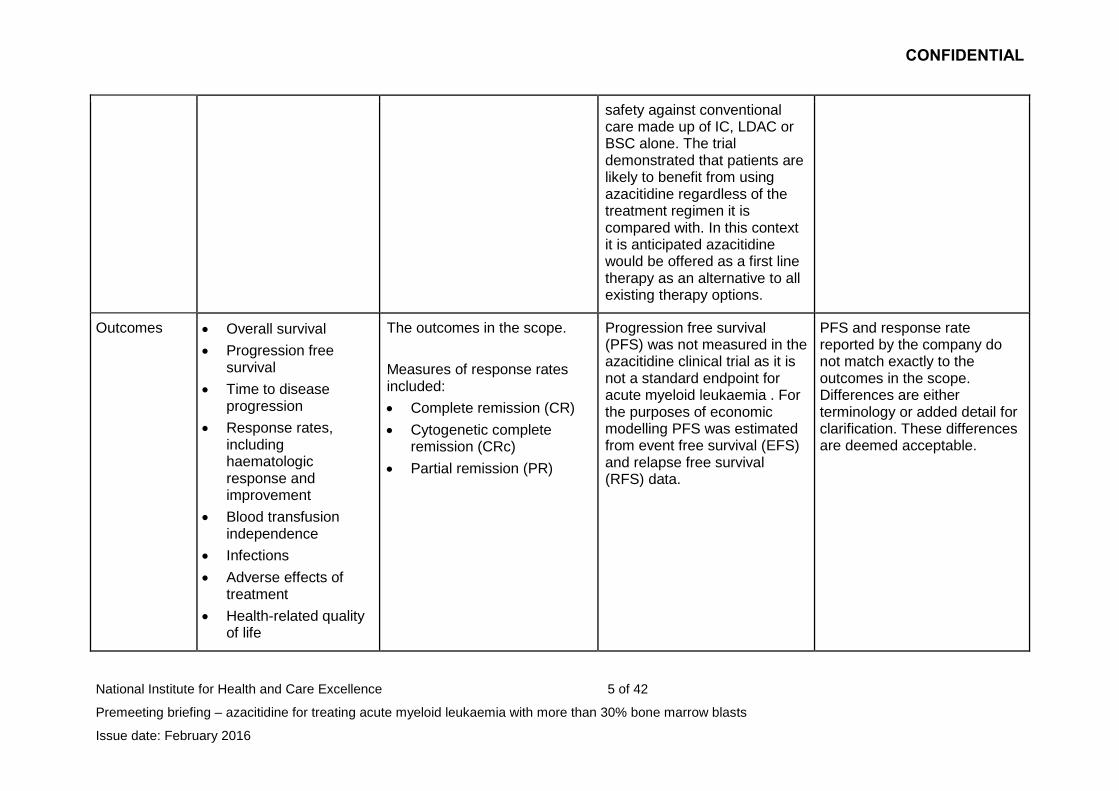
safety against conventional care made up of IC, LDAC or BSC alone. The trial demonstrated that patients are likely to benefit from using azacitidine regardless of the treatment regimen it is compared with. In this context it is anticipated azacitidine would be offered as a first line therapy as an alternative to all existing therapy options.
Outcomes Overall survival
Progression free survival
Time to disease progression
Response rates, including haematologic response and improvement
Blood transfusion independence
Infections
Adverse effects of treatment
Health-related quality of life
The outcomes in the scope.
Measures of response rates included:
Complete remission (CR)
Cytogenetic complete remission (CRc)
Partial remission (PR)
Progression free survival (PFS) was not measured in the azacitidine clinical trial as it is not a standard endpoint for acute myeloid leukaemia . For the purposes of economic modelling PFS was estimated from event free survival (EFS) and relapse free survival (RFS) data.
PFS and response rate reported by the company do not match exactly to the outcomes in the scope. Differences are either terminology or added detail for clarification. These differences are deemed acceptable.
CONFIDENTIAL
National Institute for Health and Care Excellence 6 of 42
Premeeting briefing – azacitidine for treating acute myeloid leukaemia with more than 30% bone marrow blasts
Issue date: February 2016
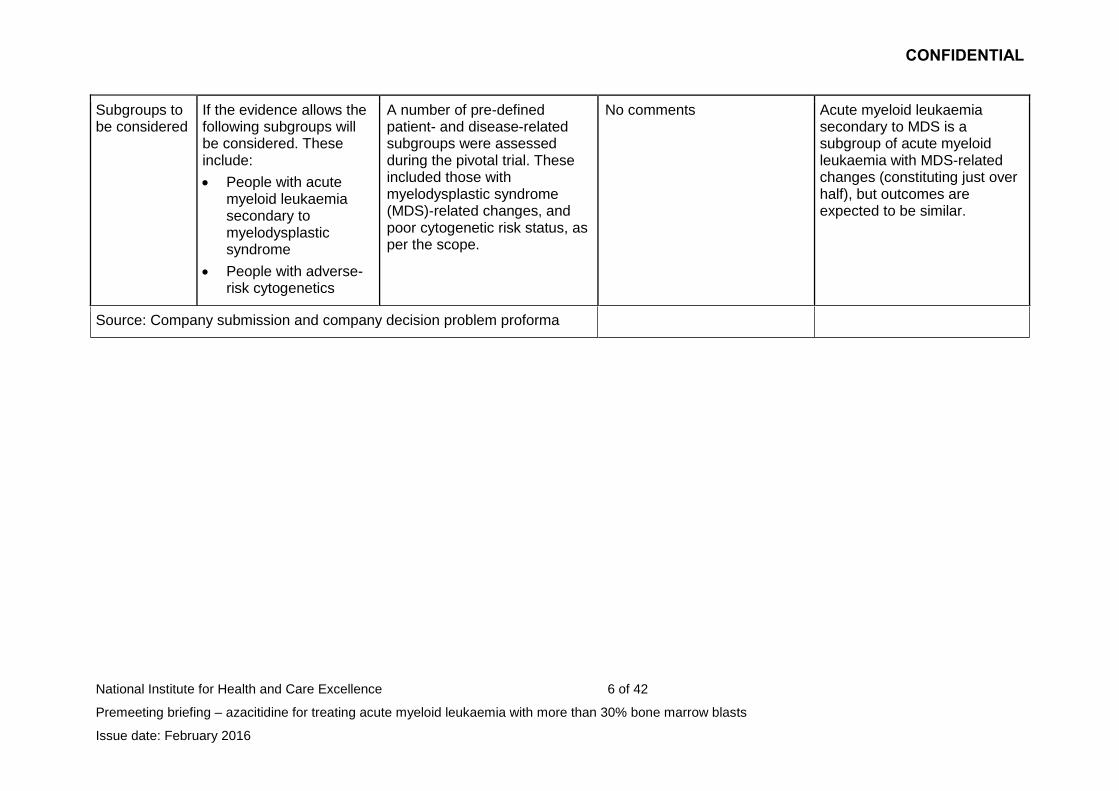
Subgroups to be considered
If the evidence allows the following subgroups will be considered. These include:
People with acute myeloid leukaemia secondary to myelodysplastic syndrome
People with adverse-risk cytogenetics
A number of pre-defined patient- and disease-related subgroups were assessed during the pivotal trial. These included those with myelodysplastic syndrome (MDS)-related changes, and poor cytogenetic risk status, as per the scope.
No comments Acute myeloid leukaemia secondary to MDS is a subgroup of acute myeloid leukaemia with MDS-related changes (constituting just over half), but outcomes are expected to be similar.
Source: Company submission and company decision problem proforma
CONFIDENTIAL
National Institute for Health and Care Excellence 7 of 42
Premeeting briefing – azacitidine for treating acute myeloid leukaemia with more than 30% bone marrow blasts
Issue date: February 2016
2 The technology and the treatment pathway
2.1 Azacitidine (Vidaza, Celgene) is administered subcutaneously at a
recommended dose of 75 mg/m2 per day for 7 days, followed by a rest
period of 21 days (28-day treatment cycles). The summary of product
characteristics recommends that patients should be treated for a minimum
of 6 cycles. In October 2015 azacitidine received a marketing
authorisation for treating ‘adult patients aged ≥65 years who are not
eligible for haematopoietic stem cell transplant with acute myeloid
leukaemia with >30% bone marrow blasts.’
2.2 Azacitidine also has a marketing authorisation for adults who are not
eligible for haematopoietic stem cell transplantation and have:
intermediate-2 and high-risk myelodysplastic syndromes (MDS)
according to the International Prognostic Scoring System (IPSS) or
chronic myelomonocytic leukaemia (CMML) with 10–29% marrow
blasts without myeloproliferative disorder or
acute myeloid leukaemia (AML) with 20–30% blasts and multilineage
dysplasia, according to the World Health Organization classification
These indications are subject to NICE technology appraisal guidance 218.
2.3 Acute myeloid leukaemia (AML) is a haematological bone marrow cancer
affecting the myeloid line of blood cells. In AML, myeloid stem cells in the
bone marrow produce immature blood cells (usually myeloblasts) which
do not develop fully and build up in the bone marrow. These immature
blood cells are not able to function properly and they reduce the ability of
the bone marrow to produce other cells the body needs. The World Health
Organisation (WHO) system requires involvement of at least 20% of blood
and/or bone marrow by myeloblasts for AML diagnosis. AML can develop
following myelodysplastic syndrome (MDS), or as a result of therapy (e.g.
cytotoxic therapy) or it can arise without previous associated disease or
treatment (primary AML). The company stated that around three quarters
CONFIDENTIAL
National Institute for Health and Care Excellence 8 of 42
Premeeting briefing – azacitidine for treating acute myeloid leukaemia with more than 30% bone marrow blasts
Issue date: February 2016
(73%) of all diagnoses occur in people over 60 years and that there are
approximately 1,777 new cases of AML annually.
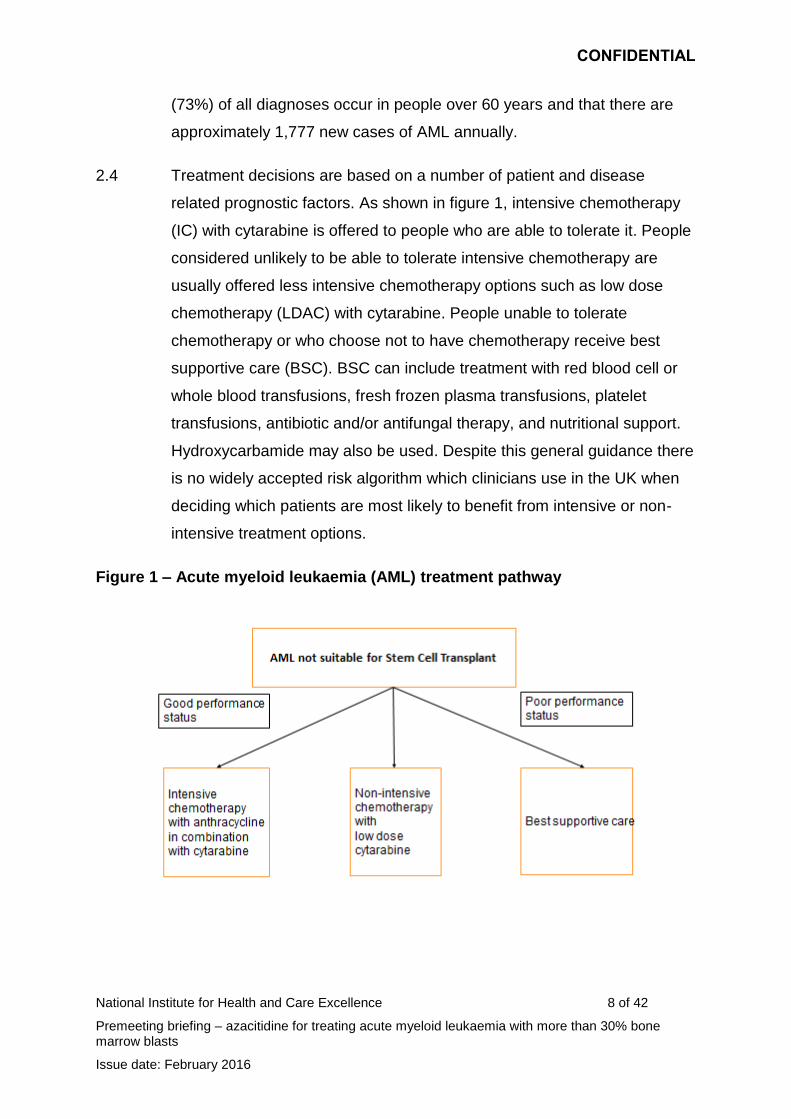
2.4 Treatment decisions are based on a number of patient and disease
related prognostic factors. As shown in figure 1, intensive chemotherapy
(IC) with cytarabine is offered to people who are able to tolerate it. People
considered unlikely to be able to tolerate intensive chemotherapy are
usually offered less intensive chemotherapy options such as low dose
chemotherapy (LDAC) with cytarabine. People unable to tolerate
chemotherapy or who choose not to have chemotherapy receive best
supportive care (BSC). BSC can include treatment with red blood cell or
whole blood transfusions, fresh frozen plasma transfusions, platelet
transfusions, antibiotic and/or antifungal therapy, and nutritional support.
Hydroxycarbamide may also be used. Despite this general guidance there
is no widely accepted risk algorithm which clinicians use in the UK when
deciding which patients are most likely to benefit from intensive or non-
intensive treatment options.
Figure 1 – Acute myeloid leukaemia (AML) treatment pathway
CONFIDENTIAL
National Institute for Health and Care Excellence 9 of 42
Premeeting briefing – azacitidine for treating acute myeloid leukaemia with more than 30% bone marrow blasts
Issue date: February 2016
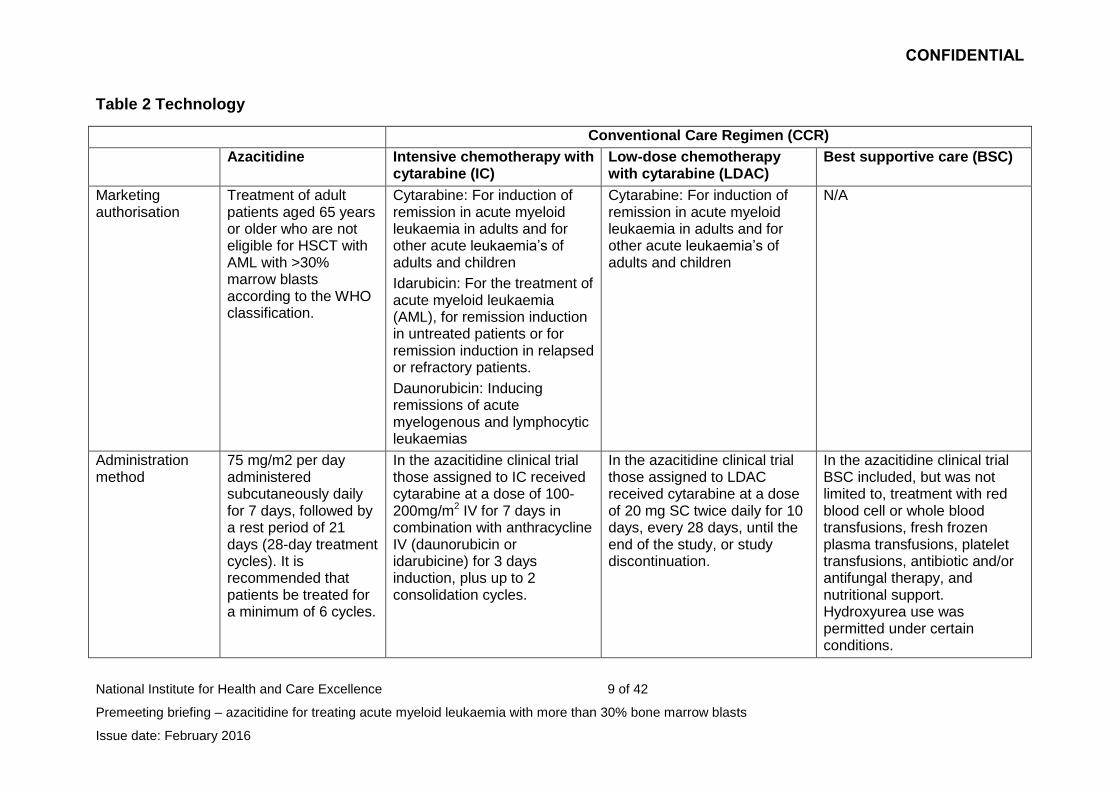
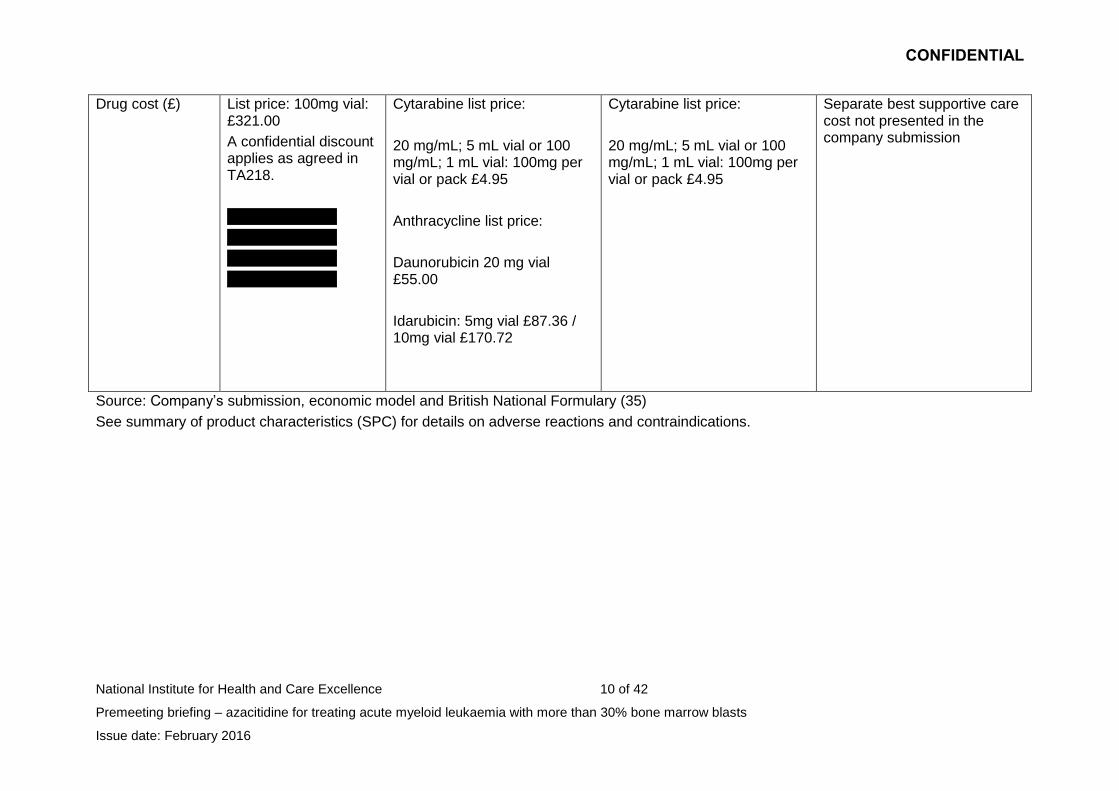
Table 2 Technology
Conventional Care Regimen (CCR)
Azacitidine Intensive chemotherapy with cytarabine (IC)
Low-dose chemotherapy with cytarabine (LDAC)
Best supportive care (BSC)
Marketing authorisation
Treatment of adult patients aged 65 years or older who are not eligible for HSCT with AML with >30% marrow blasts according to the WHO classification.
Cytarabine: For induction of remission in acute myeloid leukaemia in adults and for other acute leukaemia’s of adults and children
Idarubicin: For the treatment of acute myeloid leukaemia (AML), for remission induction in untreated patients or for remission induction in relapsed or refractory patients.
Daunorubicin: Inducing remissions of acute myelogenous and lymphocytic leukaemias
Cytarabine: For induction of remission in acute myeloid leukaemia in adults and for other acute leukaemia’s of adults and children
N/A
Administration method
75 mg/m2 per day administered subcutaneously daily for 7 days, followed by a rest period of 21 days (28-day treatment cycles). It is recommended that patients be treated for a minimum of 6 cycles.
In the azacitidine clinical trial those assigned to IC received cytarabine at a dose of 100-200mg/m2 IV for 7 days in combination with anthracycline IV (daunorubicin or idarubicine) for 3 days induction, plus up to 2 consolidation cycles.
In the azacitidine clinical trial those assigned to LDAC received cytarabine at a dose of 20 mg SC twice daily for 10 days, every 28 days, until the end of the study, or study discontinuation.
In the azacitidine clinical trial BSC included, but was not limited to, treatment with red blood cell or whole blood transfusions, fresh frozen plasma transfusions, platelet transfusions, antibiotic and/or antifungal therapy, and nutritional support. Hydroxyurea use was permitted under certain conditions.
CONFIDENTIAL
National Institute for Health and Care Excellence 10 of 42
Premeeting briefing – azacitidine for treating acute myeloid leukaemia with more than 30% bone marrow blasts
Issue date: February 2016
Drug cost (£) List price: 100mg vial: £321.00
A confidential discount applies as agreed in TA218.
xxxxxxxxxxxxxxx
xxxxxxxxxxxxxxx
xxxxxxxxxxxxxxx
xxxxxxxxxxxxxxx
Cytarabine list price:
20 mg/mL; 5 mL vial or 100 mg/mL; 1 mL vial: 100mg per vial or pack £4.95
Anthracycline list price:
Daunorubicin 20 mg vial £55.00
Idarubicin: 5mg vial £87.36 / 10mg vial £170.72
Cytarabine list price:
20 mg/mL; 5 mL vial or 100 mg/mL; 1 mL vial: 100mg per vial or pack £4.95
Separate best supportive care cost not presented in the company submission
Source: Company’s submission, economic model and British National Formulary (35)
See summary of product characteristics (SPC) for details on adverse reactions and contraindications.
CONFIDENTIAL
National Institute for Health and Care Excellence 11 of 42
Premeeting briefing – azacitidine for treating acute myeloid leukaemia with more than 30% bone marrow blasts
Issue date: February 2016
3 Comments from consultees
3.1 Consultees emphasised that the goal in treating acute myeloid leukaemia
(AML) is not to cure but to improve progression-free and overall survival.
They noted that in this population it is important to improve quality of life
including more tolerable side effects and improved symptom control.
Consultees noted that as around three quarters of all AML patients in the
UK are over 60 years old many patients are unable to tolerate aggressive
treatment options therefore treatment options are limited. Any
improvement in survival rates for a patient population with a poor
prognosis is welcome as AML is an aggressive fast developing cancer.
3.2 Consultees noted that no additional diagnostic or prognostic testing was
required as azacitidine was already in use for myelodysplastic syndrome
(MDS) and AML. They noted azacitidine was reasonably comparable in
administration and supportive care requirements to low dose
chemotherapy. Consultees noted the clinical trial conditions broadly reflect
that observed in clinical practice. Administration of azacitidine within the
key clinical trial consisted of 7 consecutive days of administration.
However, it was noted that in reality few day units are open at weekends
so on a worldwide basis this has led to the adoption of a ‘5+2+2’
schedule. Azacitidine would be administered from Monday to Friday then
again Monday and Tuesday to complete the 7 days of treatment.
3.3 One consultee noted that azacitidine provided a greater benefit when
compared with BSC rather than LDAC and that the subgroup of patients
with AML with MDS like features and adverse risk cytogenetics seemed to
obtain the most benefit.
CONFIDENTIAL
National Institute for Health and Care Excellence 12 of 42
Premeeting briefing – azacitidine for treating acute myeloid leukaemia with more than 30% bone marrow blasts
Issue date: February 2016
4 Clinical-effectiveness evidence
Overview of the clinical trials
4.1 The company conducted a systematic review of the literature to identify
studies evaluating the efficacy and safety of azacitidine and relevant
comparators. The company identified 1 phase III randomised controlled
trial, AZA-AML-001.
4.2 AZA-AML-001 was an international, multicentre, controlled, Phase 3 study
with an open-label, randomised, parallel-group design in 488 adults aged
65 years and above who had newly diagnosed AML with more than 30%
BM blasts and an ECOG performance status of 0-2 with adequate organ
function. Patients had to have newly diagnosed confirmed AML, AML
secondary to primary myelodysplastic disease (MDS) not treated with
azacitidine, decitabine or cytarabine, or AML secondary to exposure to
potentially leukaemogenic therapy (such as radiation therapy). The trial
excluded people previously treated with cytotoxic or biological treatment
for AML (except hydroxycarbamide). Patients were excluded if they had
received prior stem cell or bone marrow transplant. For full details of the
inclusion and exclusion criteria for AZA-AML-001 see page 47 of the
company submission.
4.3 Prior to randomisation patients were screened and assigned to one of
three conventional care regimens (CCRs). These were
intensive chemotherapy with anthracycline and cytarabine plus best
supportive care (IC)
low dose chemotherapy with cytarabine plus best supportive care
(LDAC)
best supportive care only (BSC).
4.4 Patients were then randomised to receive either azacitidine or the pre-
selected CCR. During the trial no crossover between any treatment
CONFIDENTIAL
National Institute for Health and Care Excellence 13 of 42
Premeeting briefing – azacitidine for treating acute myeloid leukaemia with more than 30% bone marrow blasts
Issue date: February 2016
groups was allowed and once randomised to a CCR patients could not
change to a different CCR. However, patients who discontinued study
treatment could receive subsequent AML therapy during study follow-up.
4.5 The primary outcome of the trial was overall survival (OS). The secondary
outcomes of the trial included 1-year OS rate, overall remission rate,
duration of remission, cytogenetic complete remission rate, partial
remission, stable disease, safety and tolerability, patient-reported quality
of life outcomes (using the EORTC-QLQ-30 questionnaire), measures of
healthcare resource utilisation and transfusion status.
ERG comments
4.6 The Evidence Review Group (ERG) commented that there were
limitations to the company’s systematic review searches and inclusion
criteria. However, the ERG concluded that the company did not appear to
have missed any evidence.
4.7 The ERG stated that the AZA-AML-001 pivotal trial was well-designed and
well conducted. They stated that although unavoidable, the open label
design of the trial increased the risk of bias. The ERG noted 4 key
concerns about the design of the trial:
The primary efficacy endpoint for the RCT was an ITT comparison of
overall survival for patients randomised to azacitidine versus patients
randomised to the combined CCR.
The trial was underpowered for the comparison of azacitidine to each
of the individual CCR arms. Additionally, the company anticipated the
selection of CCR to be 50:30:20 for IC:LDAC:BSC. The actual study
recruitment to CCR has the ratio 18:64:18.
The use of subsequent therapies following treatment assignment can
result in confounded estimates for the primary efficacy endpoint and
other endpoints.
CONFIDENTIAL
National Institute for Health and Care Excellence 14 of 42
Premeeting briefing – azacitidine for treating acute myeloid leukaemia with more than 30% bone marrow blasts
Issue date: February 2016
Statistical analyses of time-to-event outcomes relied on the
proportional hazards assumption, which the ERG considered not to be
justified.
Clinical trial results
AZA-AML-001
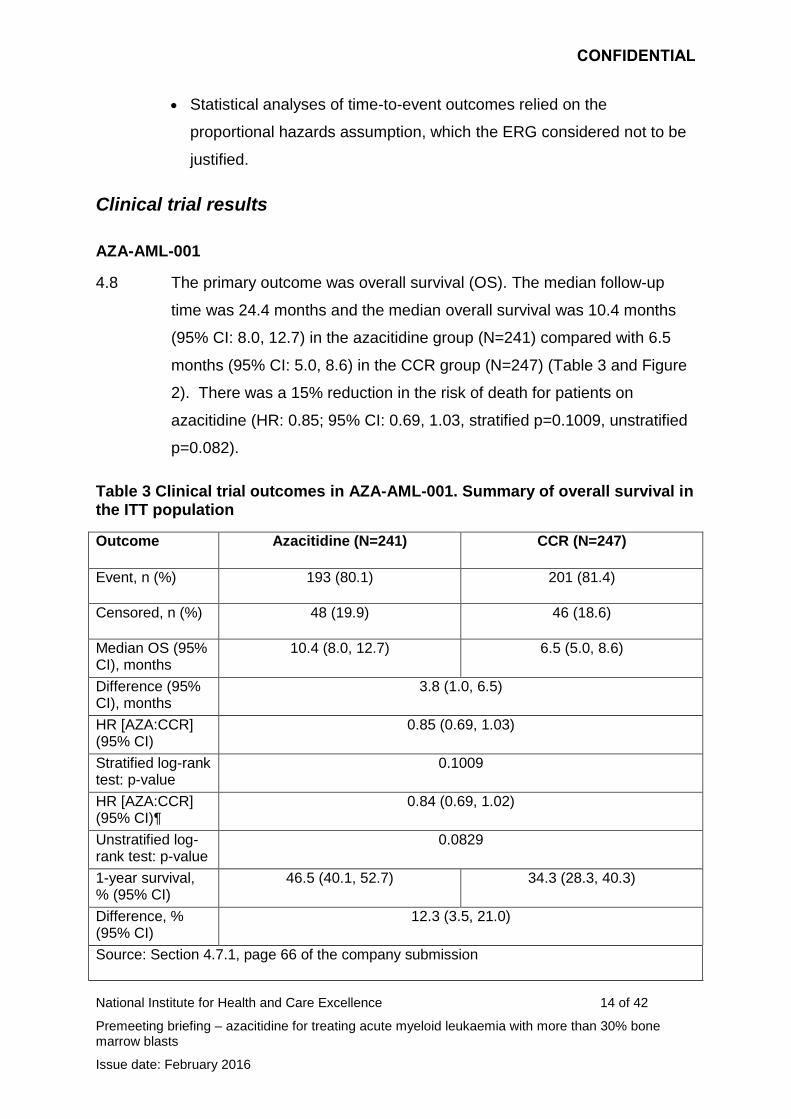
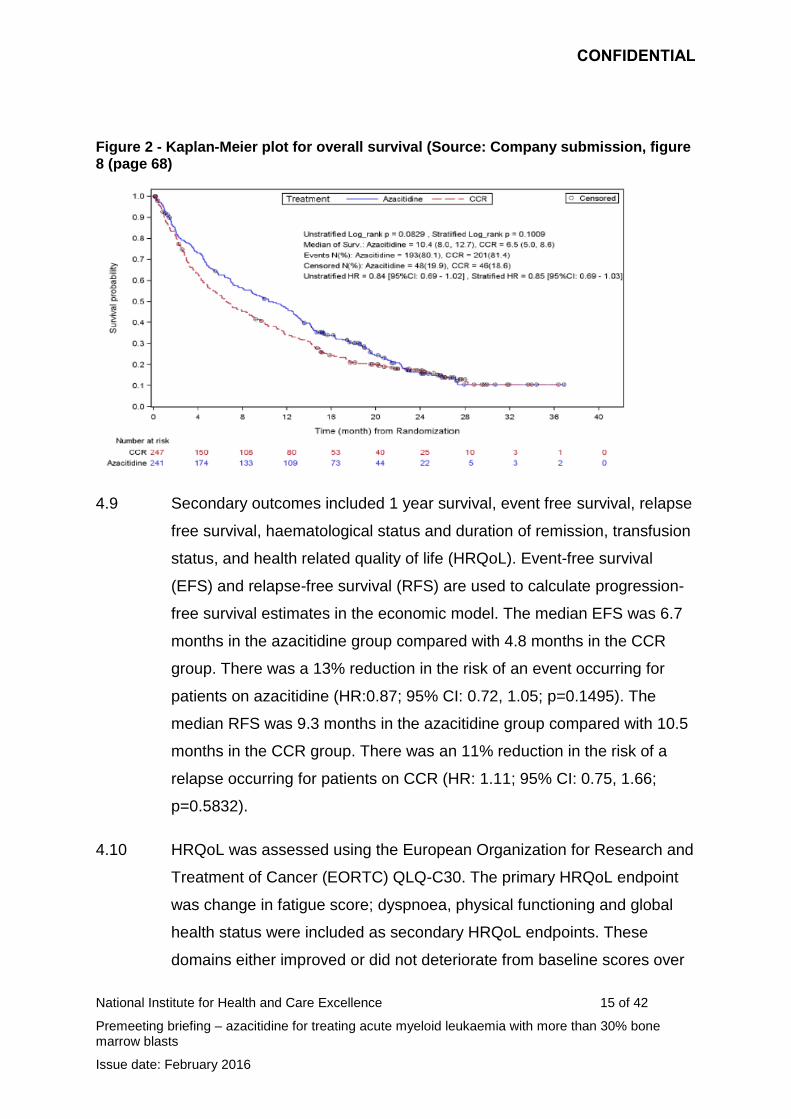
4.8 The primary outcome was overall survival (OS). The median follow-up
time was 24.4 months and the median overall survival was 10.4 months
(95% CI: 8.0, 12.7) in the azacitidine group (N=241) compared with 6.5
months (95% CI: 5.0, 8.6) in the CCR group (N=247) (Table 3 and Figure
2). There was a 15% reduction in the risk of death for patients on
azacitidine (HR: 0.85; 95% CI: 0.69, 1.03, stratified p=0.1009, unstratified
p=0.082).
Table 3 Clinical trial outcomes in AZA-AML-001. Summary of overall survival in the ITT population
Outcome Azacitidine (N=241) CCR (N=247)
Event, n (%) 193 (80.1) 201 (81.4)
Censored, n (%) 48 (19.9) 46 (18.6)
Median OS (95% CI), months
10.4 (8.0, 12.7) 6.5 (5.0, 8.6)
Difference (95% CI), months
3.8 (1.0, 6.5)
HR [AZA:CCR] (95% CI)
0.85 (0.69, 1.03)
Stratified log-rank test: p-value
0.1009
HR [AZA:CCR] (95% CI)¶
0.84 (0.69, 1.02)
Unstratified log-rank test: p-value
0.0829
1-year survival, % (95% CI)
46.5 (40.1, 52.7) 34.3 (28.3, 40.3)
Difference, % (95% CI)
12.3 (3.5, 21.0)
Source: Section 4.7.1, page 66 of the company submission
CONFIDENTIAL
National Institute for Health and Care Excellence 15 of 42
Premeeting briefing – azacitidine for treating acute myeloid leukaemia with more than 30% bone marrow blasts
Issue date: February 2016
Figure 2 - Kaplan-Meier plot for overall survival (Source: Company submission, figure 8 (page 68)
4.9 Secondary outcomes included 1 year survival, event free survival, relapse
free survival, haematological status and duration of remission, transfusion
status, and health related quality of life (HRQoL). Event-free survival
(EFS) and relapse-free survival (RFS) are used to calculate progression-
free survival estimates in the economic model. The median EFS was 6.7
months in the azacitidine group compared with 4.8 months in the CCR
group. There was a 13% reduction in the risk of an event occurring for
patients on azacitidine (HR:0.87; 95% CI: 0.72, 1.05; p=0.1495). The
median RFS was 9.3 months in the azacitidine group compared with 10.5
months in the CCR group. There was an 11% reduction in the risk of a
relapse occurring for patients on CCR (HR: 1.11; 95% CI: 0.75, 1.66;
p=0.5832).
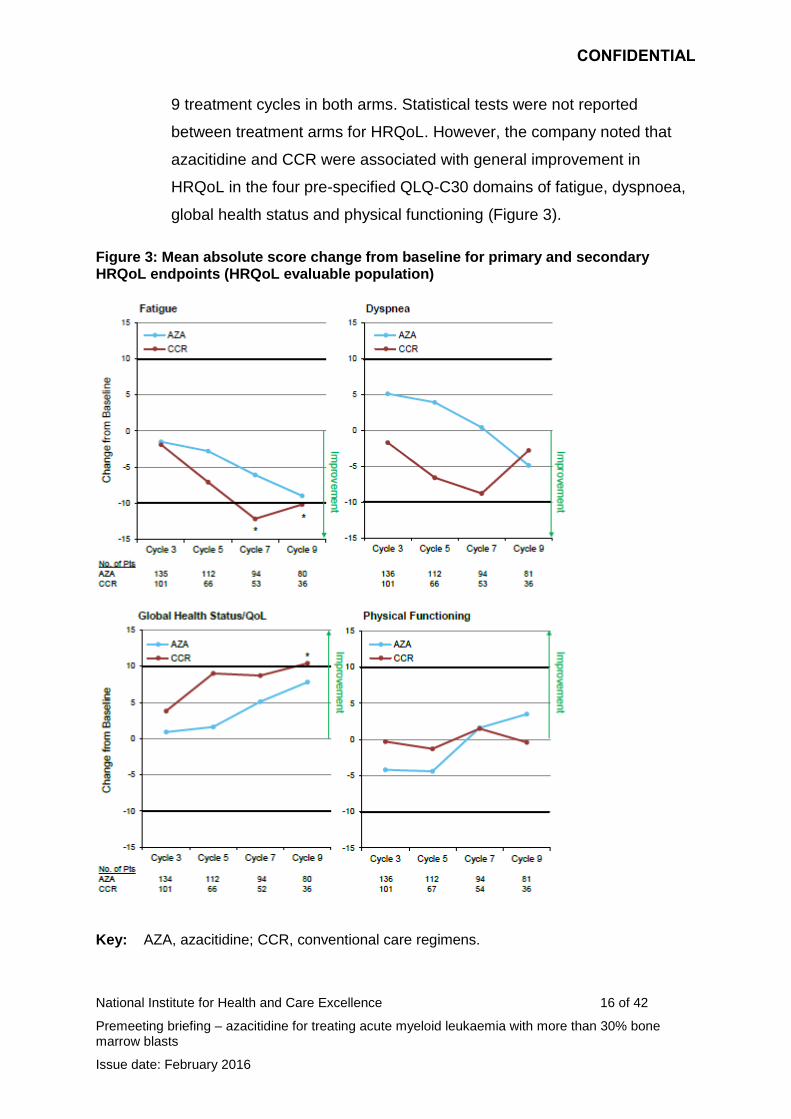
4.10 HRQoL was assessed using the European Organization for Research and
Treatment of Cancer (EORTC) QLQ-C30. The primary HRQoL endpoint
was change in fatigue score; dyspnoea, physical functioning and global
health status were included as secondary HRQoL endpoints. These
domains either improved or did not deteriorate from baseline scores over
CONFIDENTIAL
National Institute for Health and Care Excellence 16 of 42
Premeeting briefing – azacitidine for treating acute myeloid leukaemia with more than 30% bone marrow blasts
Issue date: February 2016
9 treatment cycles in both arms. Statistical tests were not reported
between treatment arms for HRQoL. However, the company noted that
azacitidine and CCR were associated with general improvement in
HRQoL in the four pre-specified QLQ-C30 domains of fatigue, dyspnoea,
global health status and physical functioning (Figure 3).
Figure 3: Mean absolute score change from baseline for primary and secondary HRQoL endpoints (HRQoL evaluable population)
Key: AZA, azacitidine; CCR, conventional care regimens.
CONFIDENTIAL
National Institute for Health and Care Excellence 17 of 42
Premeeting briefing – azacitidine for treating acute myeloid leukaemia with more than 30% bone marrow blasts
Issue date: February 2016
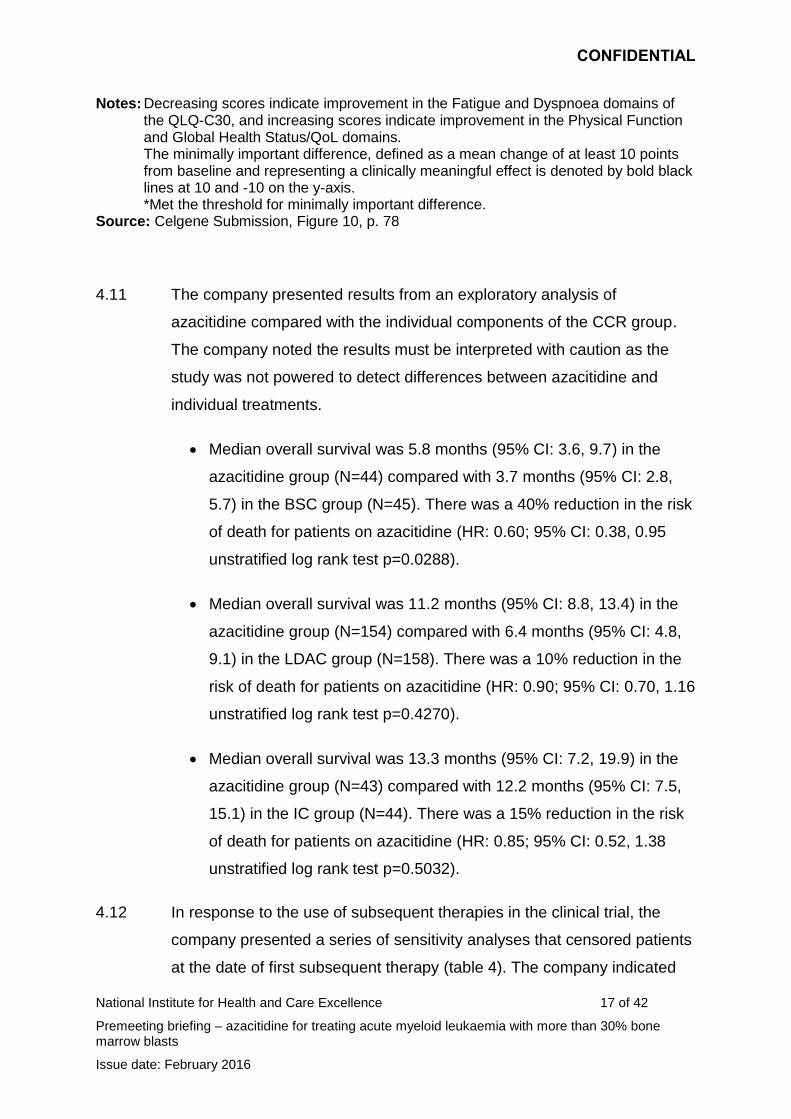
Notes: Decreasing scores indicate improvement in the Fatigue and Dyspnoea domains of the QLQ-C30, and increasing scores indicate improvement in the Physical Function and Global Health Status/QoL domains. The minimally important difference, defined as a mean change of at least 10 points from baseline and representing a clinically meaningful effect is denoted by bold black lines at 10 and -10 on the y-axis. *Met the threshold for minimally important difference.
Source: Celgene Submission, Figure 10, p. 78
4.11 The company presented results from an exploratory analysis of
azacitidine compared with the individual components of the CCR group.
The company noted the results must be interpreted with caution as the
study was not powered to detect differences between azacitidine and
individual treatments.
Median overall survival was 5.8 months (95% CI: 3.6, 9.7) in the
azacitidine group (N=44) compared with 3.7 months (95% CI: 2.8,
5.7) in the BSC group (N=45). There was a 40% reduction in the risk
of death for patients on azacitidine (HR: 0.60; 95% CI: 0.38, 0.95
unstratified log rank test p=0.0288).
Median overall survival was 11.2 months (95% CI: 8.8, 13.4) in the
azacitidine group (N=154) compared with 6.4 months (95% CI: 4.8,
9.1) in the LDAC group (N=158). There was a 10% reduction in the
risk of death for patients on azacitidine (HR: 0.90; 95% CI: 0.70, 1.16
unstratified log rank test p=0.4270).
Median overall survival was 13.3 months (95% CI: 7.2, 19.9) in the
azacitidine group (N=43) compared with 12.2 months (95% CI: 7.5,
15.1) in the IC group (N=44). There was a 15% reduction in the risk
of death for patients on azacitidine (HR: 0.85; 95% CI: 0.52, 1.38
unstratified log rank test p=0.5032).
4.12 In response to the use of subsequent therapies in the clinical trial, the
company presented a series of sensitivity analyses that censored patients
at the date of first subsequent therapy (table 4). The company indicated
CONFIDENTIAL
National Institute for Health and Care Excellence 18 of 42
Premeeting briefing – azacitidine for treating acute myeloid leukaemia with more than 30% bone marrow blasts
Issue date: February 2016
that these results suggested the subsequent therapies may be a
confounding factor in the analysis of treatment effect of azacitidine.
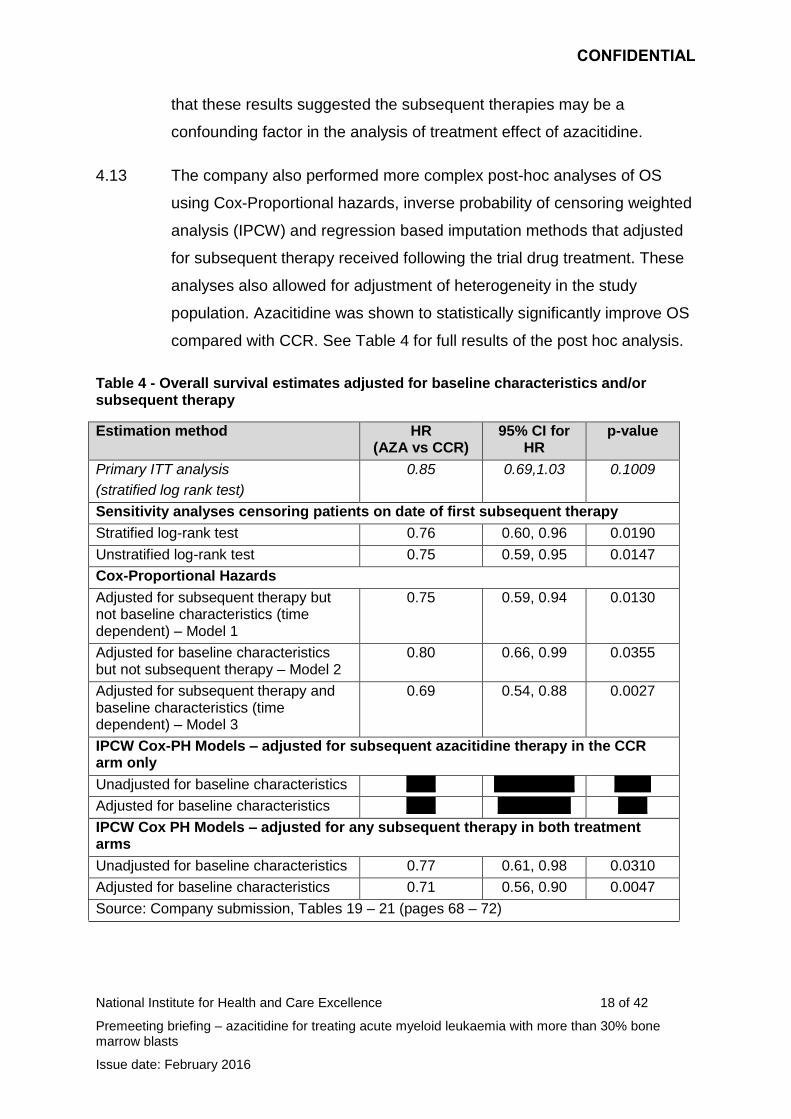
4.13 The company also performed more complex post-hoc analyses of OS
using Cox-Proportional hazards, inverse probability of censoring weighted
analysis (IPCW) and regression based imputation methods that adjusted
for subsequent therapy received following the trial drug treatment. These
analyses also allowed for adjustment of heterogeneity in the study
population. Azacitidine was shown to statistically significantly improve OS
compared with CCR. See Table 4 for full results of the post hoc analysis.
Table 4 - Overall survival estimates adjusted for baseline characteristics and/or subsequent therapy
Estimation method HR (AZA vs CCR)
95% CI for HR
p-value
Primary ITT analysis
(stratified log rank test)
0.85 0.69,1.03 0.1009
Sensitivity analyses censoring patients on date of first subsequent therapy
Stratified log-rank test 0.76 0.60, 0.96 0.0190
Unstratified log-rank test 0.75 0.59, 0.95 0.0147
Cox-Proportional Hazards
Adjusted for subsequent therapy but not baseline characteristics (time dependent) – Model 1
0.75 0.59, 0.94 0.0130
Adjusted for baseline characteristics but not subsequent therapy – Model 2
0.80 0.66, 0.99 0.0355
Adjusted for subsequent therapy and baseline characteristics (time dependent) – Model 3
0.69 0.54, 0.88 0.0027
IPCW Cox-PH Models – adjusted for subsequent azacitidine therapy in the CCR arm only
Unadjusted for baseline characteristics xxxx xxxxxxxxxxx xxxxx
Adjusted for baseline characteristics xxxx xxxxxxxxxx xxxx
IPCW Cox PH Models – adjusted for any subsequent therapy in both treatment arms
Unadjusted for baseline characteristics 0.77 0.61, 0.98 0.0310
Adjusted for baseline characteristics 0.71 0.56, 0.90 0.0047
Source: Company submission, Tables 19 – 21 (pages 68 – 72)
CONFIDENTIAL
National Institute for Health and Care Excellence 19 of 42
Premeeting briefing – azacitidine for treating acute myeloid leukaemia with more than 30% bone marrow blasts
Issue date: February 2016
4.14 The company concluded that treatment with azacitidine resulted in
clinically meaningful and statistically significant increases in overall
survival compared with CCR. The company noted that results from the
post-hoc analysis suggest that both baseline heterogeneity and
subsequent AML therapy may have confounded the primary endpoint of
OS. The company stated that after adjusting for these factors azacitidine
was associated with a statistically significant improvement in survival
benefit compared with CCR.
4.15 The company presented subgroup analyses for patients with poor-risk
cytogenetics and patients with MDS-related changes. The greatest OS
benefit was observed in patients with MDS-related changes. The median
OS in this sub-group was 12.7 months in the azacitidine group compared
with 6.3 months in the CCR group (HR: 0.69; 95% CI: 0.48, 0.98;
p=0.357). The median OS for people with a baseline cytogenetic risk
rated as poor was 6.4 months in the azacitidine group compared with 3.2
months in the CCR group (HR: 0.68; 95% CI: 0.58, 0.94; p=0.0185).
ERG comments
4.16 The ERG noted that in the ITT analysis of overall survival azacitidine was
not statistically significantly superior to the combined CCR. The ERG
commented that measures of haematologic response, duration of
remission and remission free survival were similar between azacitidine
and combined CCR. Considering the individual CCR arms, it appeared
(although limited statistical analysis was reported) that for some outcomes
azacitidine could be inferior to IC and LDAC. The ERG suggested that
although no statistical analyses were presented for the HRQOL data it
appears that HRQOL outcomes for CCR were better than for azacitidine.
4.17 The ERG commented on the company’s adjustments of OS as a result of
subsequent therapy. The ERG noted that that the submission lacked
clarity about what treatments analyses had adjusted for. The ERG stated
CONFIDENTIAL
National Institute for Health and Care Excellence 20 of 42
Premeeting briefing – azacitidine for treating acute myeloid leukaemia with more than 30% bone marrow blasts
Issue date: February 2016
that the more sophisticated adjustment methods appeared to make little
difference compared to the simpler censoring at switch methods.
4.18 The ERG noted that the company presented IPCW analysis where both
trial arms were adjusted for treatment switching and that this appeared to
adjust for any treatment switching. A further IPCW analysis was also
presented where only subsequent azacitidine use in the CCR arm was
adjusted for. The ERG stated that the analysis where both ams were
adjusted was more appropriate in instances where the mix of subsequent
treatments did not reflect that used in clinical practice. Further, in
completing the analysis that adjusted only for azacitidine use in the CCR
arm the company misinterpreted the NICE DSU technical support
document 16. The ERG noted that the IPCW analyses rested on
assumptions that they could not assess fully from the available clinical trial
data.
4.19 The ERG commented on the 3 Cox proportional hazards models of
survival. They noted that the different models show that adjusting or not
adjusting for baseline covariates appeared to be the single structural
factor to which estimate of relative effectiveness were most sensitive.
They stated that the results of the 3 models were all susceptible to bias.
The treatment effect in model 2 is likely to be biased from subsequent
treatment use, whereas the adjustments made in models 1 and 3 for
subsequent treatments assume that patients who switch have the same
prognosis as those that do not switch or that their prognoses differ but
they are evenly distributed across arms and that subsequent treatments
have the same average effect across arms conditional on prognosis.
Adverse effects of treatment
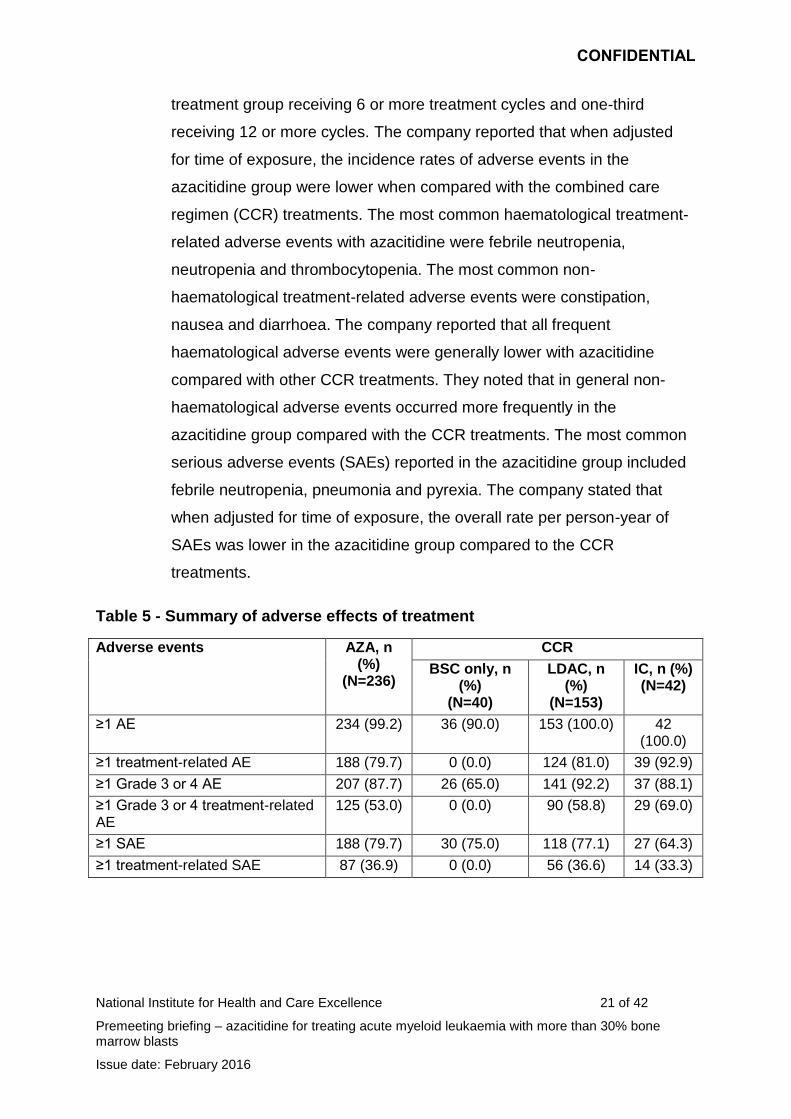
4.20 The company presented detailed adverse event data from AZA-AML-001
in section 4.12 (page 85 - 90) of its submission. These results are
summarised in Table 5. The company stated that azacitidine was
generally well tolerated, with more than 50% of people in the azacitidine
CONFIDENTIAL
National Institute for Health and Care Excellence 21 of 42
Premeeting briefing – azacitidine for treating acute myeloid leukaemia with more than 30% bone marrow blasts
Issue date: February 2016
treatment group receiving 6 or more treatment cycles and one-third
receiving 12 or more cycles. The company reported that when adjusted
for time of exposure, the incidence rates of adverse events in the
azacitidine group were lower when compared with the combined care
regimen (CCR) treatments. The most common haematological treatment-
related adverse events with azacitidine were febrile neutropenia,
neutropenia and thrombocytopenia. The most common non-
haematological treatment-related adverse events were constipation,
nausea and diarrhoea. The company reported that all frequent
haematological adverse events were generally lower with azacitidine
compared with other CCR treatments. They noted that in general non-
haematological adverse events occurred more frequently in the
azacitidine group compared with the CCR treatments. The most common
serious adverse events (SAEs) reported in the azacitidine group included
febrile neutropenia, pneumonia and pyrexia. The company stated that
when adjusted for time of exposure, the overall rate per person-year of
SAEs was lower in the azacitidine group compared to the CCR
treatments.
Table 5 - Summary of adverse effects of treatment
Adverse events AZA, n (%)
(N=236)
CCR
BSC only, n (%)
(N=40)
LDAC, n (%)
(N=153)
IC, n (%) (N=42)
≥1 AE 234 (99.2) 36 (90.0) 153 (100.0) 42 (100.0)
≥1 treatment-related AE 188 (79.7) 0 (0.0) 124 (81.0) 39 (92.9)
≥1 Grade 3 or 4 AE 207 (87.7) 26 (65.0) 141 (92.2) 37 (88.1)
≥1 Grade 3 or 4 treatment-related AE
125 (53.0) 0 (0.0) 90 (58.8) 29 (69.0)
≥1 SAE 188 (79.7) 30 (75.0) 118 (77.1) 27 (64.3)
≥1 treatment-related SAE 87 (36.9) 0 (0.0) 56 (36.6) 14 (33.3)
CONFIDENTIAL
National Institute for Health and Care Excellence 22 of 42
Premeeting briefing – azacitidine for treating acute myeloid leukaemia with more than 30% bone marrow blasts
Issue date: February 2016
ERG comments
4.21 The ERG noted that treatment related adverse events were common for
azacitidine, LDAC and IC but adverse events were less common for BSC.
CONFIDENTIAL
National Institute for Health and Care Excellence 23 of 42
Premeeting briefing – azacitidine for treating acute myeloid leukaemia with more than 30% bone marrow blasts
Issue date: February 2016
5 Cost-effectiveness evidence
Model structure
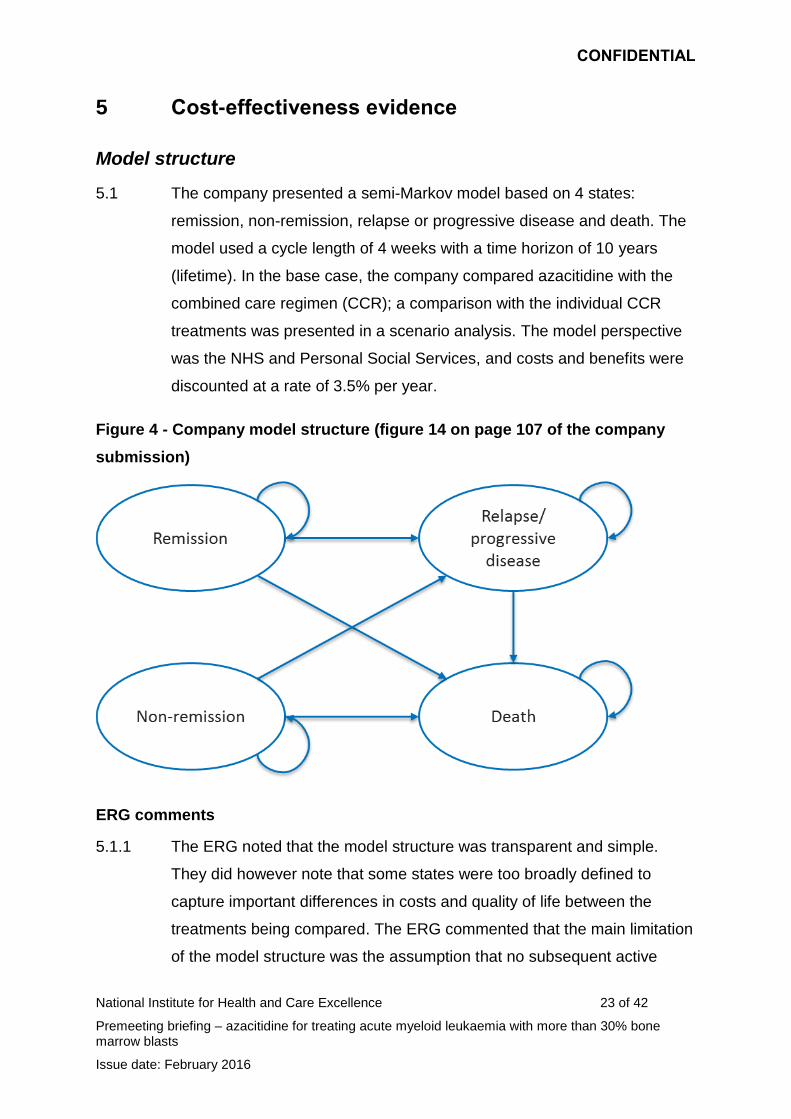
5.1 The company presented a semi-Markov model based on 4 states:
remission, non-remission, relapse or progressive disease and death. The
model used a cycle length of 4 weeks with a time horizon of 10 years
(lifetime). In the base case, the company compared azacitidine with the
combined care regimen (CCR); a comparison with the individual CCR
treatments was presented in a scenario analysis. The model perspective
was the NHS and Personal Social Services, and costs and benefits were
discounted at a rate of 3.5% per year.
Figure 4 - Company model structure (figure 14 on page 107 of the company
submission)
ERG comments
5.1.1 The ERG noted that the model structure was transparent and simple.
They did however note that some states were too broadly defined to
capture important differences in costs and quality of life between the
treatments being compared. The ERG commented that the main limitation
of the model structure was the assumption that no subsequent active
CONFIDENTIAL
National Institute for Health and Care Excellence 24 of 42
Premeeting briefing – azacitidine for treating acute myeloid leukaemia with more than 30% bone marrow blasts
Issue date: February 2016
treatment was given after the azacitidine or combined conventional care
regimen (CCR). They noted that the absence of any subsequent
treatment is inconsistent with the AZA-AML001 trial where a number of
subsequent treatments were used. Further it was inconsistent with the
approach taken by the company that used data from the AZA-AML001trial
that included treatment switching in the azacitidine arm. See section 5.3.2,
Table 29 (page 82) of the ERG Report for further information on the use of
subsequent therapies.
Model details
5.2 The model assumes that patients have completed the first cycle of
treatment (4 weeks) with either azacitidine or one of the combined care
regimens (CCR) and then either respond or do not respond to treatment.
Patients are then either in remission, non-remission or death. In
subsequent cycles, patients can remain in these states or transition to a
worse health state or die. The company estimated the proportion of
people in each health state for every 4 week cycle using relapse-free
survival, progression-free survival and overall survival curves. The model
also allows for analysis of patients based on suitability for intensive
chemotherapy (IC), low dose chemotherapy (LDAC) or best supportive
care (BSC). The model included subgroup analysis for patients with
cytogenetic risk and myelodysplasia-related changes.
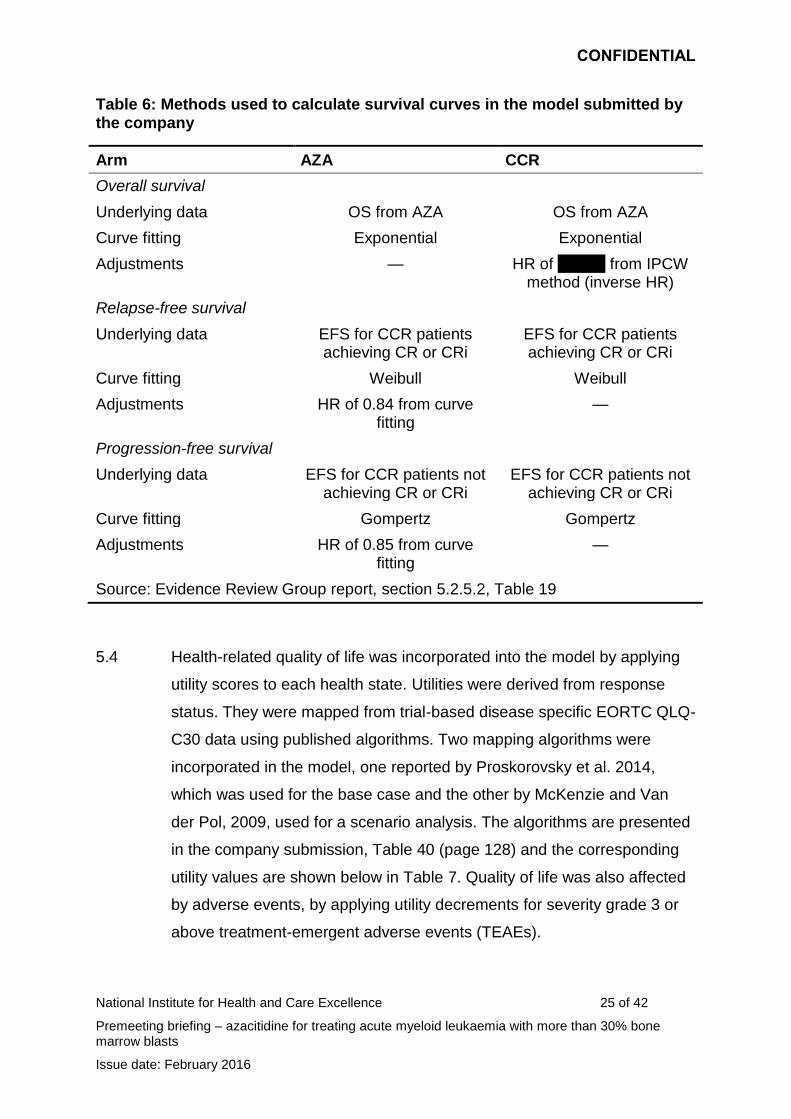
5.3 The company identified extrapolation models based on whether the
proportional hazards assumption was met, goodness of fit, clinical
plausibility, and internal and external validation. For the base case, overall
survival, progression-free survival and relapse-free survival were
extrapolated using the Exponential, Gompertz and Weibull respectively.
The company adjusted overall survival outcomes for treatment switching
using a range of different methodological options. Progression-free
survival and relapse-free survival were not adjusted for treatment
switching (Table 6).
CONFIDENTIAL
National Institute for Health and Care Excellence 25 of 42
Premeeting briefing – azacitidine for treating acute myeloid leukaemia with more than 30% bone marrow blasts
Issue date: February 2016
Table 6: Methods used to calculate survival curves in the model submitted by the company
Arm AZA CCR
Overall survival
Underlying data OS from AZA OS from AZA
Curve fitting Exponential Exponential
Adjustments — HR of xxxxxx from IPCW method (inverse HR)
Relapse-free survival
Underlying data EFS for CCR patients achieving CR or CRi
EFS for CCR patients achieving CR or CRi
Curve fitting Weibull Weibull
Adjustments HR of 0.84 from curve fitting
—
Progression-free survival
Underlying data EFS for CCR patients not achieving CR or CRi
EFS for CCR patients not achieving CR or CRi
Curve fitting Gompertz Gompertz
Adjustments HR of 0.85 from curve fitting
—
Source: Evidence Review Group report, section 5.2.5.2, Table 19
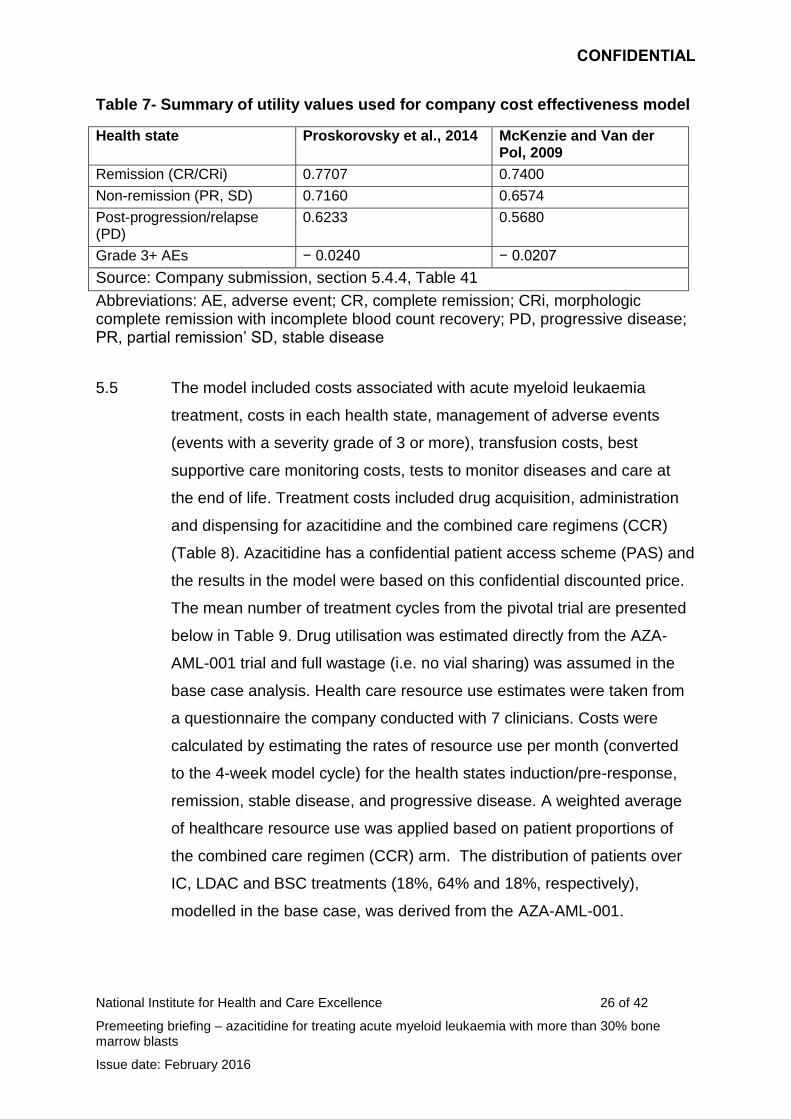
5.4 Health-related quality of life was incorporated into the model by applying
utility scores to each health state. Utilities were derived from response
status. They were mapped from trial-based disease specific EORTC QLQ-
C30 data using published algorithms. Two mapping algorithms were
incorporated in the model, one reported by Proskorovsky et al. 2014,
which was used for the base case and the other by McKenzie and Van
der Pol, 2009, used for a scenario analysis. The algorithms are presented
in the company submission, Table 40 (page 128) and the corresponding
utility values are shown below in Table 7. Quality of life was also affected
by adverse events, by applying utility decrements for severity grade 3 or
above treatment-emergent adverse events (TEAEs).
CONFIDENTIAL
National Institute for Health and Care Excellence 26 of 42
Premeeting briefing – azacitidine for treating acute myeloid leukaemia with more than 30% bone marrow blasts
Issue date: February 2016
Table 7- Summary of utility values used for company cost effectiveness model
Health state Proskorovsky et al., 2014 McKenzie and Van der Pol, 2009
Remission (CR/CRi) 0.7707 0.7400
Non-remission (PR, SD) 0.7160 0.6574
Post-progression/relapse (PD)
0.6233 0.5680
Grade 3+ AEs − 0.0240 − 0.0207
Source: Company submission, section 5.4.4, Table 41
Abbreviations: AE, adverse event; CR, complete remission; CRi, morphologic complete remission with incomplete blood count recovery; PD, progressive disease; PR, partial remission’ SD, stable disease
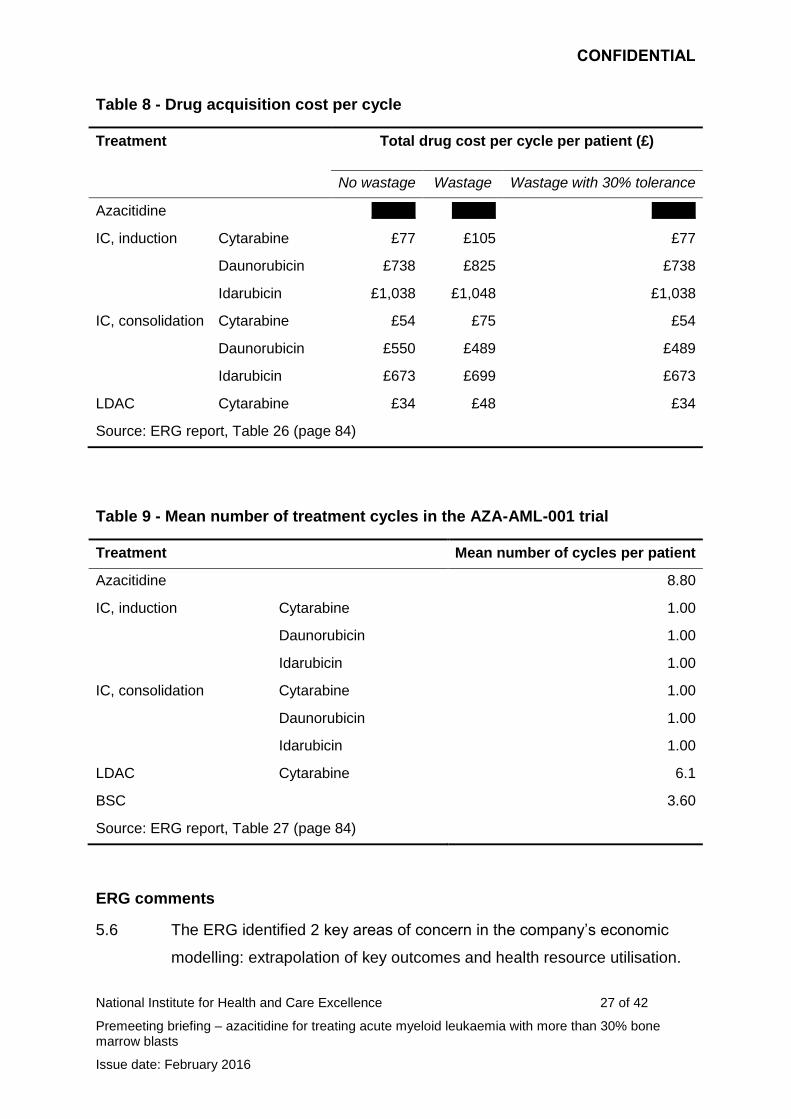
5.5 The model included costs associated with acute myeloid leukaemia
treatment, costs in each health state, management of adverse events
(events with a severity grade of 3 or more), transfusion costs, best
supportive care monitoring costs, tests to monitor diseases and care at
the end of life. Treatment costs included drug acquisition, administration
and dispensing for azacitidine and the combined care regimens (CCR)
(Table 8). Azacitidine has a confidential patient access scheme (PAS) and
the results in the model were based on this confidential discounted price.
The mean number of treatment cycles from the pivotal trial are presented
below in Table 9. Drug utilisation was estimated directly from the AZA-
AML-001 trial and full wastage (i.e. no vial sharing) was assumed in the
base case analysis. Health care resource use estimates were taken from
a questionnaire the company conducted with 7 clinicians. Costs were
calculated by estimating the rates of resource use per month (converted
to the 4-week model cycle) for the health states induction/pre-response,
remission, stable disease, and progressive disease. A weighted average
of healthcare resource use was applied based on patient proportions of
the combined care regimen (CCR) arm. The distribution of patients over
IC, LDAC and BSC treatments (18%, 64% and 18%, respectively),
modelled in the base case, was derived from the AZA-AML-001.
CONFIDENTIAL
National Institute for Health and Care Excellence 27 of 42
Premeeting briefing – azacitidine for treating acute myeloid leukaemia with more than 30% bone marrow blasts
Issue date: February 2016
Table 8 - Drug acquisition cost per cycle
Treatment Total drug cost per cycle per patient (£)
No wastage Wastage Wastage with 30% tolerance
Azacitidine xxxxxx xxxxxx xxxxxx
IC, induction Cytarabine £77 £105 £77
Daunorubicin £738 £825 £738
Idarubicin £1,038 £1,048 £1,038
IC, consolidation Cytarabine £54 £75 £54
Daunorubicin £550 £489 £489
Idarubicin £673 £699 £673
LDAC Cytarabine £34 £48 £34
Source: ERG report, Table 26 (page 84)
Table 9 - Mean number of treatment cycles in the AZA-AML-001 trial
Treatment Mean number of cycles per patient
Azacitidine 8.80
IC, induction Cytarabine 1.00
Daunorubicin 1.00
Idarubicin 1.00
IC, consolidation Cytarabine 1.00
Daunorubicin 1.00
Idarubicin 1.00
LDAC Cytarabine 6.1
BSC 3.60
Source: ERG report, Table 27 (page 84)
ERG comments
5.6 The ERG identified 2 key areas of concern in the company’s economic
modelling: extrapolation of key outcomes and health resource utilisation.
CONFIDENTIAL
National Institute for Health and Care Excellence 28 of 42
Premeeting briefing – azacitidine for treating acute myeloid leukaemia with more than 30% bone marrow blasts
Issue date: February 2016
The ERG also identified issues in relation to health related quality of life
estimates and costs of adverse events. However, the ERG considered
that these issues had only a minor effect on the results and were
secondary to the other issues identified.
5.7 The model assumed that no patients would receive active treatment
following discontinuation of first-line treatment. In the AZA-AML-001 trial
underpinning the analysis, 29% of participants received active second-line
treatment. Advice from clinical experts suggests that active second-line
treatment is considered for some patients in the NHS.
5.8 The model assumed proportional hazards for all time-to-event outcomes,
even though this was not supported for overall survival and relapse-free
survival by results from the AZA-AML-001 trial.
5.9 Overall survival in the AZA arm was not adjusted for subsequent active
treatment, resulting in an inconsistency between the modelled health
outcomes and costs, since only the costs of best supportive care were
modelled following azacitidine.
5.10 There were significant differences in the costs associated with the
relapsed and progressive disease state between the AZA and CCR arm,
even though patients in both arms are expected to be receiving BSC at
this point. The ERG noted that the biggest difference was in the number of
inpatient days in the relapsed and progressed disease state which were
1.73 for azacitidine versus 2.61 for CRR, the effect of this was that cost
differences accumulated at a rate of £628 per month despite all patients
being managed with BSC.
5.11 The mean number of cycles of treatment in the model didn’t reflect the
mean number of cycles of treatment in the AZA-AML-001 trial. In the
azacitidine arm the mean number of cycles of treatment was 5.6 instead
of 8.8. In the CCR arm IC was calculated as 2.61 instead of 2 (initiation
and consolidation), and LDAC was calculated as 4.4 when estimating
CONFIDENTIAL
National Institute for Health and Care Excellence 29 of 42
Premeeting briefing – azacitidine for treating acute myeloid leukaemia with more than 30% bone marrow blasts
Issue date: February 2016
drug acquisition costs and 5.3 when calculating the costs of drug
administration, tests and transfusion instead of 6.10.
Company's base-case results and sensitivity analysis
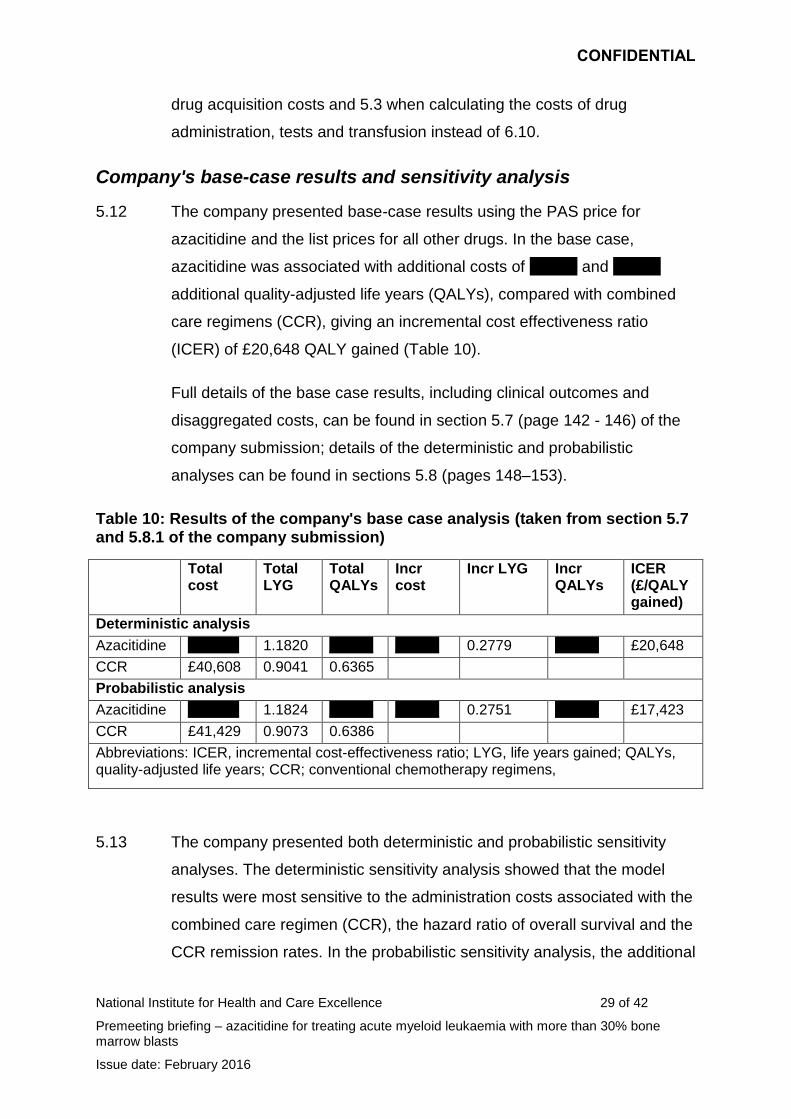
5.12 The company presented base-case results using the PAS price for
azacitidine and the list prices for all other drugs. In the base case,
azacitidine was associated with additional costs of xxxxxx and xxxxxx
additional quality-adjusted life years (QALYs), compared with combined
care regimens (CCR), giving an incremental cost effectiveness ratio
(ICER) of £20,648 QALY gained (Table 10).
Full details of the base case results, including clinical outcomes and
disaggregated costs, can be found in section 5.7 (page 142 - 146) of the
company submission; details of the deterministic and probabilistic
analyses can be found in sections 5.8 (pages 148–153).
Table 10: Results of the company's base case analysis (taken from section 5.7 and 5.8.1 of the company submission)
Total cost
Total LYG
Total QALYs
Incr cost
Incr LYG Incr QALYs
ICER (£/QALY gained)
Deterministic analysis
Azacitidine xxxxxxx 1.1820 xxxxxx xxxxxx 0.2779 xxxxxx £20,648
CCR £40,608 0.9041 0.6365
Probabilistic analysis
Azacitidine xxxxxxx 1.1824 xxxxxx xxxxxx 0.2751 xxxxxx £17,423
CCR £41,429 0.9073 0.6386
Abbreviations: ICER, incremental cost-effectiveness ratio; LYG, life years gained; QALYs, quality-adjusted life years; CCR; conventional chemotherapy regimens,
5.13 The company presented both deterministic and probabilistic sensitivity
analyses. The deterministic sensitivity analysis showed that the model
results were most sensitive to the administration costs associated with the
combined care regimen (CCR), the hazard ratio of overall survival and the
CCR remission rates. In the probabilistic sensitivity analysis, the additional
CONFIDENTIAL
National Institute for Health and Care Excellence 30 of 42
Premeeting briefing – azacitidine for treating acute myeloid leukaemia with more than 30% bone marrow blasts
Issue date: February 2016
costs associated with azacitidine increased by £752 compared with the
deterministic analysis and the additional QALYs increased by 0.0004; the
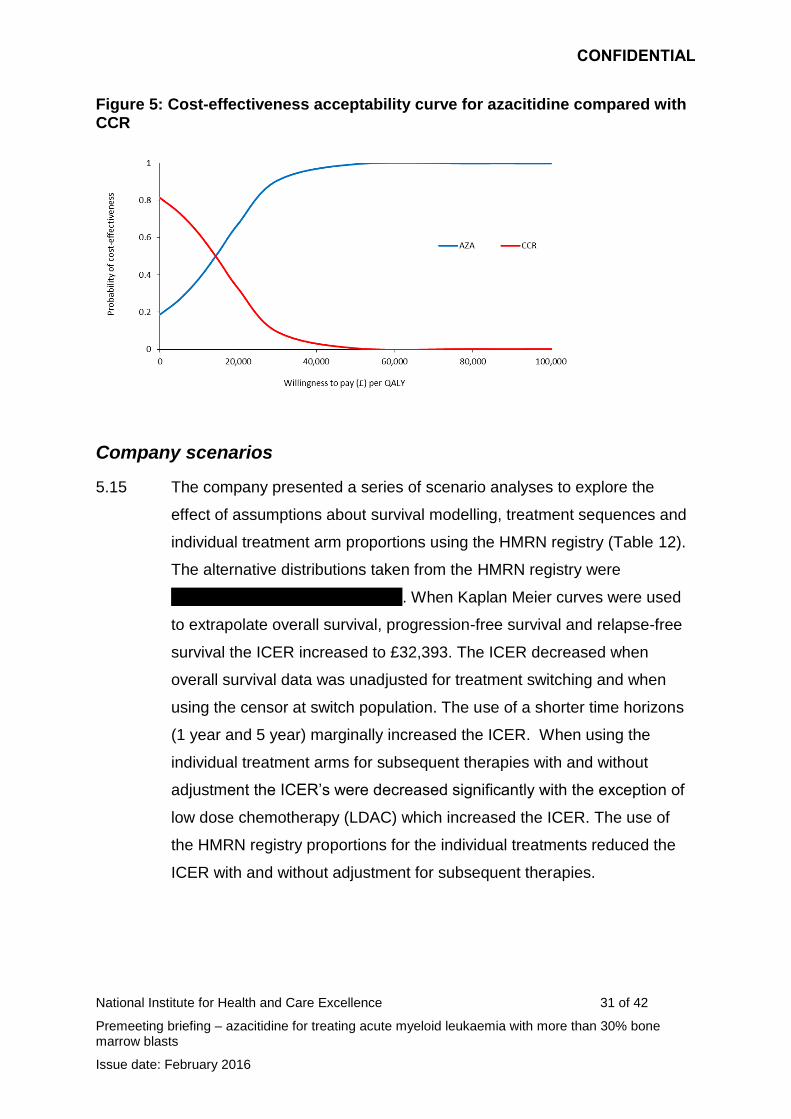
ICER therefore decreased to £17,423 per QALY gained (Table 10); the
probability of azacitidine being cost effective versus CCR at a threshold of
£20,000 is 69.9%. If the threshold is increased to £30,000 or £50,000 per
QALY, the probability of cost-effectiveness increases to 90.8% and 99.6%
respectively (Figure 6).
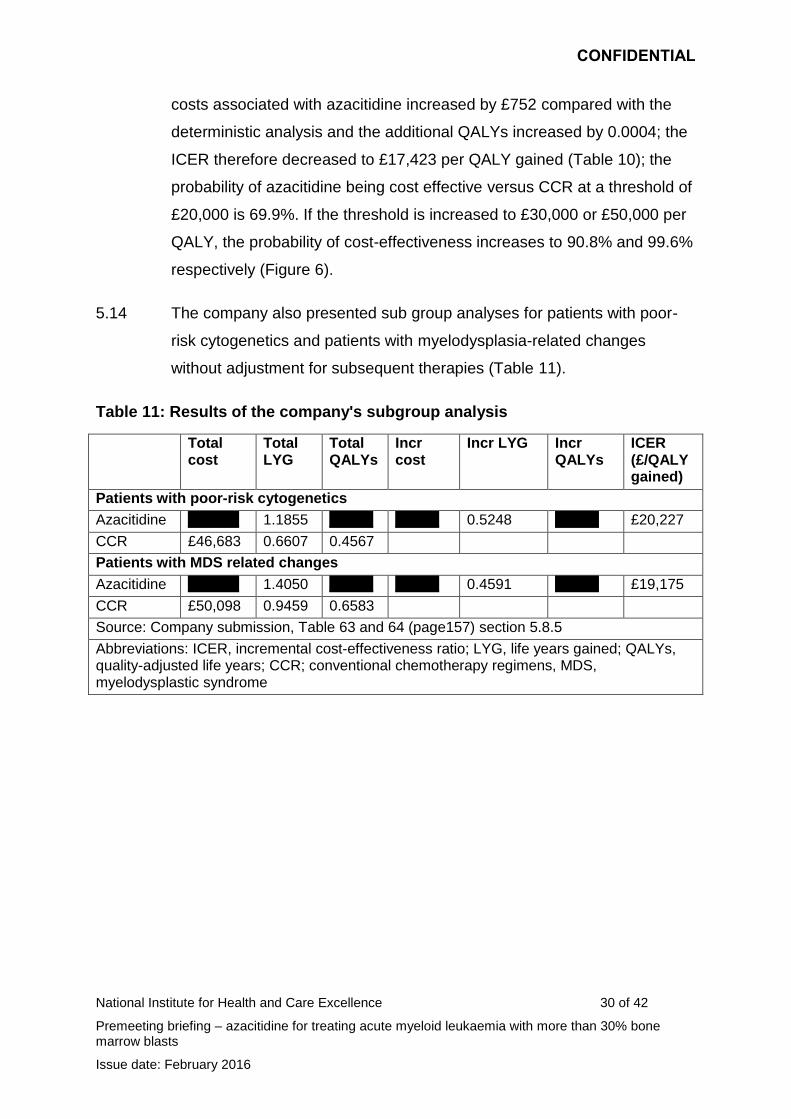
5.14 The company also presented sub group analyses for patients with poor-
risk cytogenetics and patients with myelodysplasia-related changes
without adjustment for subsequent therapies (Table 11).
Table 11: Results of the company's subgroup analysis
Total cost
Total LYG
Total QALYs
Incr cost
Incr LYG Incr QALYs
ICER (£/QALY gained)
Patients with poor-risk cytogenetics
Azacitidine xxxxxxx 1.1855 xxxxxx xxxxxx 0.5248 xxxxxx £20,227
CCR £46,683 0.6607 0.4567
Patients with MDS related changes
Azacitidine xxxxxxx 1.4050 xxxxxx xxxxxx 0.4591 xxxxxx £19,175
CCR £50,098 0.9459 0.6583
Source: Company submission, Table 63 and 64 (page157) section 5.8.5
Abbreviations: ICER, incremental cost-effectiveness ratio; LYG, life years gained; QALYs, quality-adjusted life years; CCR; conventional chemotherapy regimens, MDS, myelodysplastic syndrome
CONFIDENTIAL
National Institute for Health and Care Excellence 31 of 42
Premeeting briefing – azacitidine for treating acute myeloid leukaemia with more than 30% bone marrow blasts
Issue date: February 2016
Figure 5: Cost-effectiveness acceptability curve for azacitidine compared with CCR
Company scenarios
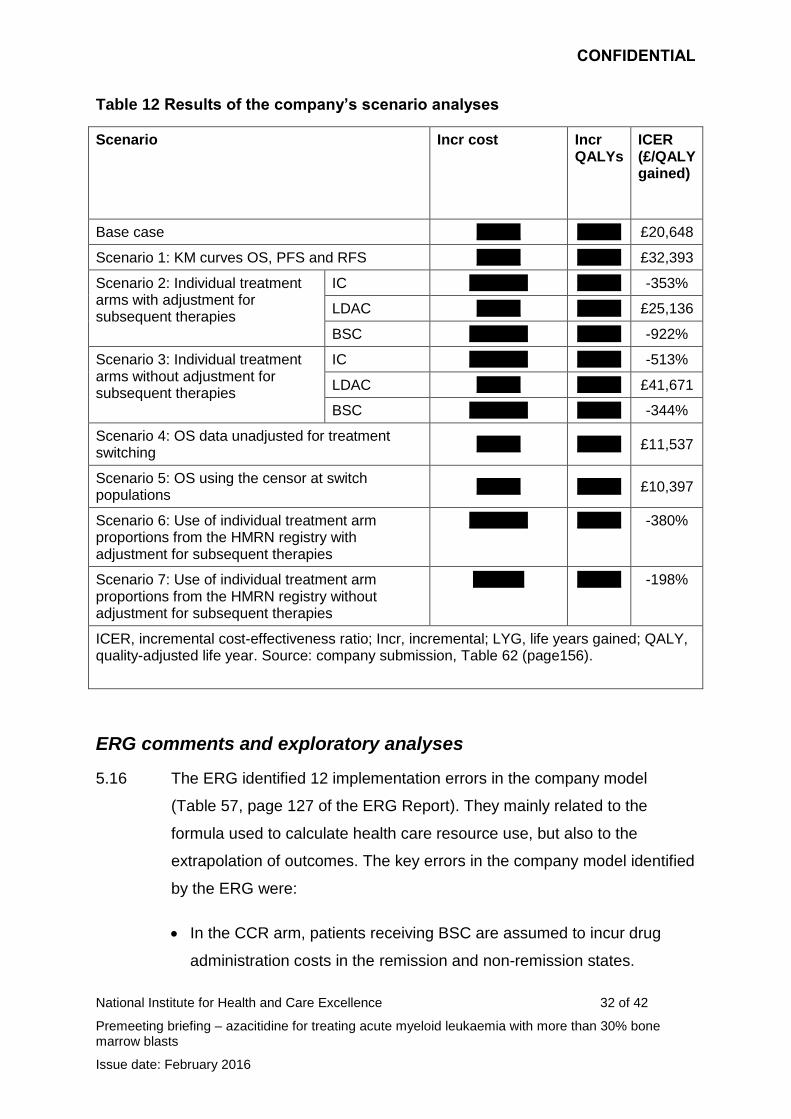
5.15 The company presented a series of scenario analyses to explore the
effect of assumptions about survival modelling, treatment sequences and
individual treatment arm proportions using the HMRN registry (Table 12).
The alternative distributions taken from the HMRN registry were
xxxxxxxxxxxxxxxxxxxxxxxxxxxxx. When Kaplan Meier curves were used
to extrapolate overall survival, progression-free survival and relapse-free
survival the ICER increased to £32,393. The ICER decreased when
overall survival data was unadjusted for treatment switching and when
using the censor at switch population. The use of a shorter time horizons
(1 year and 5 year) marginally increased the ICER. When using the
individual treatment arms for subsequent therapies with and without
adjustment the ICER’s were decreased significantly with the exception of
low dose chemotherapy (LDAC) which increased the ICER. The use of
the HMRN registry proportions for the individual treatments reduced the
ICER with and without adjustment for subsequent therapies.
CONFIDENTIAL
National Institute for Health and Care Excellence 32 of 42
Premeeting briefing – azacitidine for treating acute myeloid leukaemia with more than 30% bone marrow blasts
Issue date: February 2016
Table 12 Results of the company’s scenario analyses
Scenario Incr cost Incr QALYs
ICER (£/QALY gained)
Base case xxxxxx xxxxxx £20,648
Scenario 1: KM curves OS, PFS and RFS xxxxxx xxxxxx £32,393
Scenario 2: Individual treatment arms with adjustment for subsequent therapies
IC xxxxxxxx xxxxxx -353%
LDAC xxxxxx xxxxxx £25,136
BSC xxxxxxxx xxxxxx -922%
Scenario 3: Individual treatment arms without adjustment for subsequent therapies
IC xxxxxxxx xxxxxx -513%
LDAC xxxxxx xxxxxx £41,671
BSC xxxxxxxx xxxxxx -344%
Scenario 4: OS data unadjusted for treatment switching
xxxxxx xxxxxx £11,537
Scenario 5: OS using the censor at switch populations
xxxxxx xxxxxx £10,397
Scenario 6: Use of individual treatment arm proportions from the HMRN registry with adjustment for subsequent therapies
xxxxxxxx xxxxxx -380%
Scenario 7: Use of individual treatment arm proportions from the HMRN registry without adjustment for subsequent therapies
xxxxxxx xxxxxx -198%
ICER, incremental cost-effectiveness ratio; Incr, incremental; LYG, life years gained; QALY, quality-adjusted life year. Source: company submission, Table 62 (page156).
ERG comments and exploratory analyses
5.16 The ERG identified 12 implementation errors in the company model
(Table 57, page 127 of the ERG Report). They mainly related to the
formula used to calculate health care resource use, but also to the
extrapolation of outcomes. The key errors in the company model identified
by the ERG were:
In the CCR arm, patients receiving BSC are assumed to incur drug
administration costs in the remission and non-remission states.
CONFIDENTIAL
National Institute for Health and Care Excellence 33 of 42
Premeeting briefing – azacitidine for treating acute myeloid leukaemia with more than 30% bone marrow blasts
Issue date: February 2016
However, for other active treatments the costs of administering BSC
are not included after treatment discontinuation until
relapse/progression (increases ICER from £20,648 to £43,676).
In the azacitidine and CCR arms, costs of tests and transfusions are
not modelled for patients in the relapse/progressive disease state
(increases ICER from £20,648 to £37,381).
In the azacitidine and CCR arms, drug administration, monitoring tests
and transfusion costs are double-counted during the 1st model cycle
(increases ICER from £20,648 to £35,532).
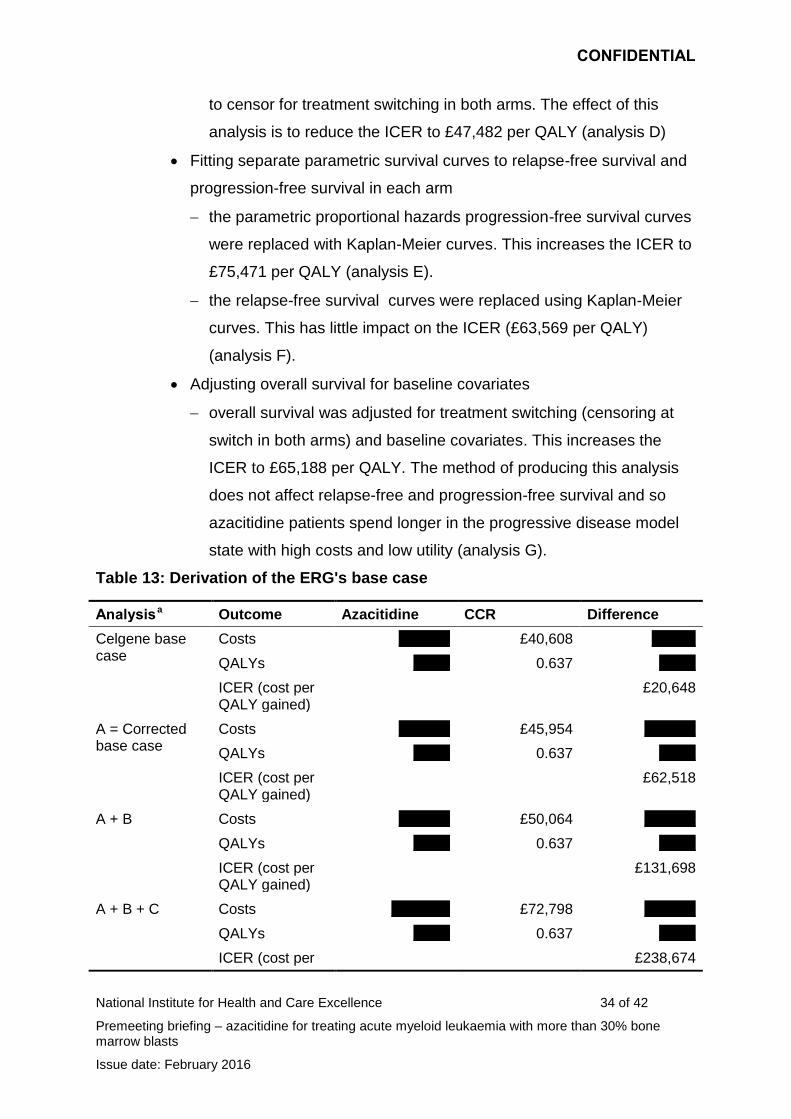
5.17 The cumulative effect of the 12 corrections was to increase the company
base case ICER from £20,648 to £62,518 (analysis A).
5.18 Having corrected the implementation errors the ERG then made a series
of changes to the parameter values to reflect current UK practice and to
make the model logic consistent (Table 59, page 4 of the ERG Report
addendum). The effect of each of the individual changes to the ICER from
analysis A is shown below. The cumulative effect of the changes is shown
in table 13.
Calibrating the number of treatment cycles
the mean number of treatment cycles was set to match the mean
number of cycles in AZA-AML-001. This increases the ICER to
£131,698 per QALY (analysis B);
Costs of relapsed and progressive disease
the costs of best supportive care for relapsed and progressive
disease were set to be equal across the arms. This increases the
ICER to £159,352 per QALY (analysis C);
Adjusting overall survival in both arms for subsequent active treatment
the method of modelling overall survival was changed to censoring
for treatment switching in both arms. Due to the model coding
modelling of relapse-free and progression-free survival also switches
CONFIDENTIAL
National Institute for Health and Care Excellence 34 of 42
Premeeting briefing – azacitidine for treating acute myeloid leukaemia with more than 30% bone marrow blasts
Issue date: February 2016
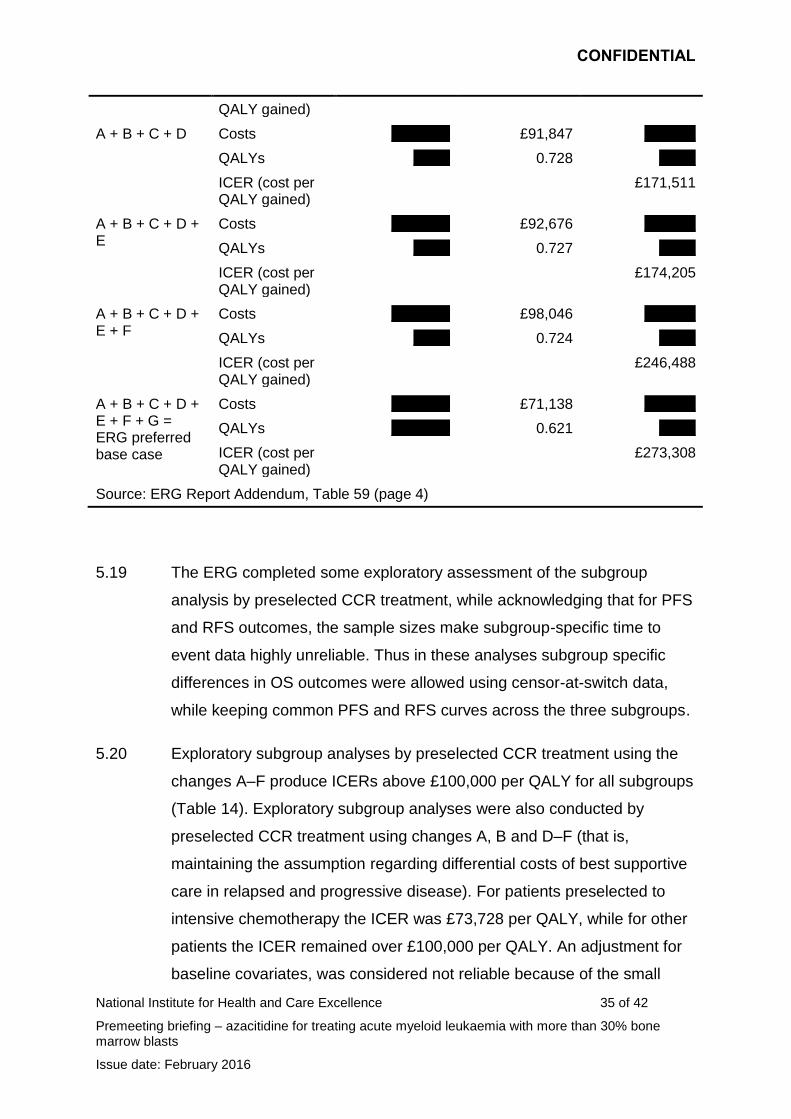
to censor for treatment switching in both arms. The effect of this
analysis is to reduce the ICER to £47,482 per QALY (analysis D)
Fitting separate parametric survival curves to relapse-free survival and
progression-free survival in each arm
the parametric proportional hazards progression-free survival curves
were replaced with Kaplan-Meier curves. This increases the ICER to
£75,471 per QALY (analysis E).
the relapse-free survival curves were replaced using Kaplan-Meier
curves. This has little impact on the ICER (£63,569 per QALY)
(analysis F).
Adjusting overall survival for baseline covariates
overall survival was adjusted for treatment switching (censoring at
switch in both arms) and baseline covariates. This increases the
ICER to £65,188 per QALY. The method of producing this analysis
does not affect relapse-free and progression-free survival and so
azacitidine patients spend longer in the progressive disease model
state with high costs and low utility (analysis G).
Table 13: Derivation of the ERG's base case
Analysis a Outcome Azacitidine CCR Difference
Celgene base case
Costs xxxxxxx £40,608 xxxxxx
QALYs xxxxx 0.637 xxxxx
ICER (cost per QALY gained)
£20,648
A = Corrected base case
Costs xxxxxxx £45,954 xxxxxxx
QALYs xxxxx 0.637 xxxxx
ICER (cost per QALY gained)
£62,518
A + B Costs xxxxxxx £50,064 xxxxxxx
QALYs xxxxx 0.637 xxxxx
ICER (cost per QALY gained)
£131,698
A + B + C Costs xxxxxxxx £72,798 xxxxxxx
QALYs xxxxx 0.637 xxxxx
ICER (cost per £238,674
CONFIDENTIAL
National Institute for Health and Care Excellence 35 of 42
Premeeting briefing – azacitidine for treating acute myeloid leukaemia with more than 30% bone marrow blasts
Issue date: February 2016
QALY gained)
A + B + C + D Costs xxxxxxxx £91,847 xxxxxxx
QALYs xxxxx 0.728 xxxxx
ICER (cost per QALY gained)
£171,511
A + B + C + D + E
Costs xxxxxxxx £92,676 xxxxxxx
QALYs xxxxx 0.727 xxxxx
ICER (cost per QALY gained)
£174,205
A + B + C + D + E + F
Costs xxxxxxxx £98,046 xxxxxxx
QALYs xxxxx 0.724 xxxxx
ICER (cost per QALY gained)
£246,488
A + B + C + D + E + F + G = ERG preferred base case
Costs xxxxxxxx £71,138 xxxxxxx
QALYs xxxxxxxx 0.621 xxxxx
ICER (cost per QALY gained)
£273,308
Source: ERG Report Addendum, Table 59 (page 4)
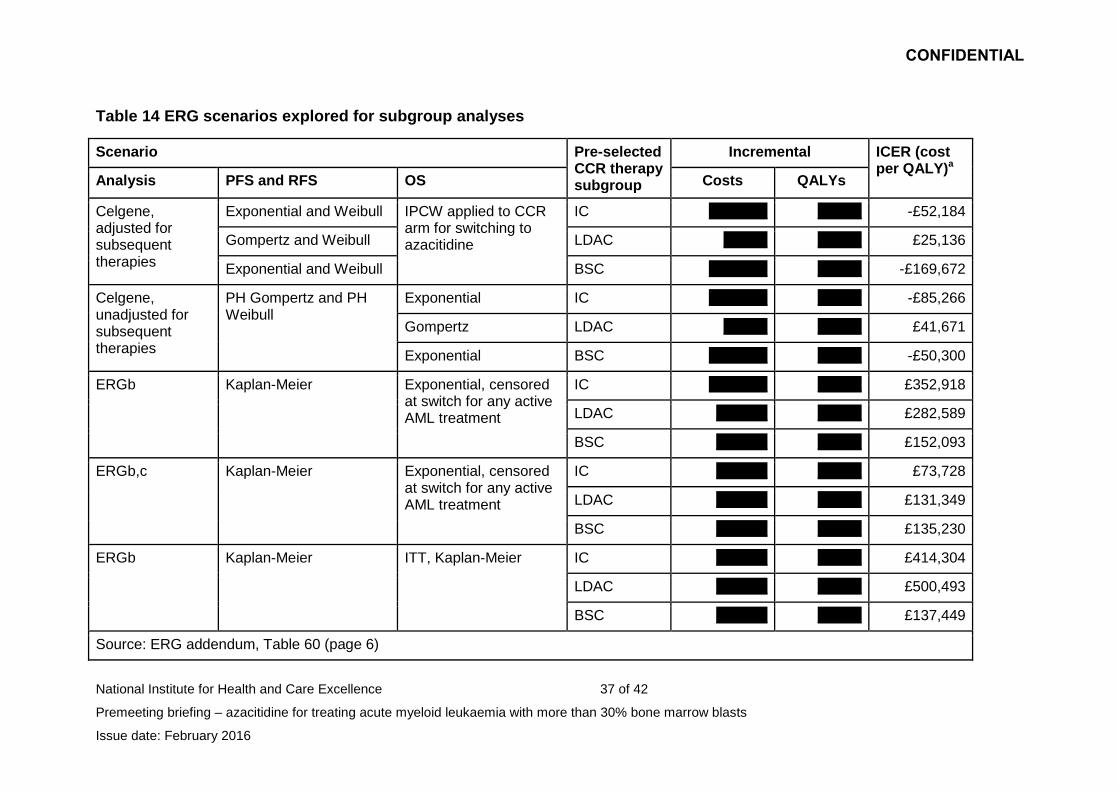
5.19 The ERG completed some exploratory assessment of the subgroup
analysis by preselected CCR treatment, while acknowledging that for PFS
and RFS outcomes, the sample sizes make subgroup-specific time to
event data highly unreliable. Thus in these analyses subgroup specific
differences in OS outcomes were allowed using censor-at-switch data,
while keeping common PFS and RFS curves across the three subgroups.
5.20 Exploratory subgroup analyses by preselected CCR treatment using the
changes A–F produce ICERs above £100,000 per QALY for all subgroups
(Table 14). Exploratory subgroup analyses were also conducted by
preselected CCR treatment using changes A, B and D–F (that is,
maintaining the assumption regarding differential costs of best supportive
care in relapsed and progressive disease). For patients preselected to
intensive chemotherapy the ICER was £73,728 per QALY, while for other
patients the ICER remained over £100,000 per QALY. An adjustment for
baseline covariates, was considered not reliable because of the small
CONFIDENTIAL
National Institute for Health and Care Excellence 36 of 42
Premeeting briefing – azacitidine for treating acute myeloid leukaemia with more than 30% bone marrow blasts
Issue date: February 2016
sample sizes within each group, but would be expected to increase the
ICERs.
CONFIDENTIAL
National Institute for Health and Care Excellence 37 of 42
Premeeting briefing – azacitidine for treating acute myeloid leukaemia with more than 30% bone marrow blasts
Issue date: February 2016
Table 14 ERG scenarios explored for subgroup analyses
Scenario Pre-selected CCR therapy subgroup
Incremental ICER (cost per QALY)a
Analysis PFS and RFS OS Costs QALYs
Celgene, adjusted for subsequent therapies
Exponential and Weibull IPCW applied to CCR arm for switching to azacitidine
IC xxxxxxxx xxxxxx -£52,184
Gompertz and Weibull LDAC xxxxxx xxxxxx £25,136
Exponential and Weibull BSC xxxxxxxx xxxxxx -£169,672
Celgene, unadjusted for subsequent therapies
PH Gompertz and PH Weibull
Exponential IC xxxxxxxx xxxxxx -£85,266
Gompertz LDAC xxxxxx xxxxxx £41,671
Exponential BSC xxxxxxxx xxxxxx -£50,300
ERGb Kaplan-Meier Exponential, censored at switch for any active AML treatment
IC xxxxxxxx xxxxxx £352,918
LDAC xxxxxxx xxxxxx £282,589
BSC xxxxxxx xxxxxx £152,093
ERGb,c Kaplan-Meier Exponential, censored at switch for any active AML treatment
IC xxxxxxx xxxxxx £73,728
LDAC xxxxxxx xxxxxx £131,349
BSC xxxxxxx xxxxxx £135,230
ERGb Kaplan-Meier ITT, Kaplan-Meier IC xxxxxxx xxxxxx £414,304
LDAC xxxxxxx xxxxxx £500,493
BSC xxxxxxx xxxxxx £137,449
Source: ERG addendum, Table 60 (page 6)
CONFIDENTIAL
National Institute for Health and Care Excellence 38 of 42
Premeeting briefing – azacitidine for treating acute myeloid leukaemia with more than 30% bone marrow blasts
Issue date: February 2016
Notes: a, Negative ICERs indicate azacitidine is dominant; b, Includes corrections and changes as described in Table 59 except for component ‘G’ (i.e., not including adjustment for baseline covariates); c, Not including component ‘C’ (i.e., retaining Celgene’s estimates for costs in Relapse/PD)
CONFIDENTIAL
National Institute for Health and Care Excellence 39 of 42
Premeeting briefing – azacitidine for treating acute myeloid leukaemia with more than 30% bone marrow blasts
Issue date: February 2016
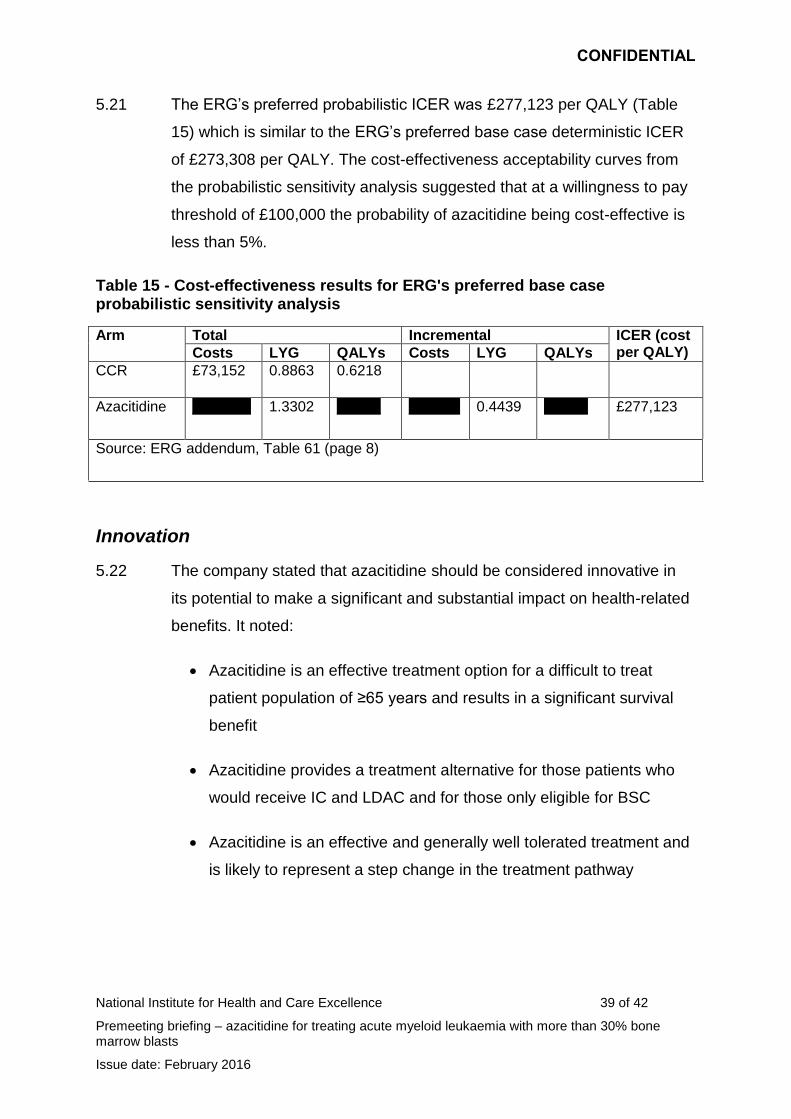
5.21 The ERG’s preferred probabilistic ICER was £277,123 per QALY (Table
15) which is similar to the ERG’s preferred base case deterministic ICER
of £273,308 per QALY. The cost-effectiveness acceptability curves from
the probabilistic sensitivity analysis suggested that at a willingness to pay
threshold of £100,000 the probability of azacitidine being cost-effective is
less than 5%.
Table 15 - Cost-effectiveness results for ERG's preferred base case probabilistic sensitivity analysis
Arm Total Incremental ICER (cost per QALY) Costs LYG QALYs Costs LYG QALYs
CCR £73,152 0.8863 0.6218
Azacitidine xxxxxxxx 1.3302 xxxxxx xxxxxxx 0.4439 xxxxxx £277,123
Source: ERG addendum, Table 61 (page 8)
Innovation
5.22 The company stated that azacitidine should be considered innovative in
its potential to make a significant and substantial impact on health-related
benefits. It noted:
Azacitidine is an effective treatment option for a difficult to treat
patient population of ≥65 years and results in a significant survival
benefit
Azacitidine provides a treatment alternative for those patients who
would receive IC and LDAC and for those only eligible for BSC
Azacitidine is an effective and generally well tolerated treatment and
is likely to represent a step change in the treatment pathway
CONFIDENTIAL
National Institute for Health and Care Excellence 40 of 42
Premeeting briefing – azacitidine for treating acute myeloid leukaemia with more than 30% bone marrow blasts
Issue date: February 2016
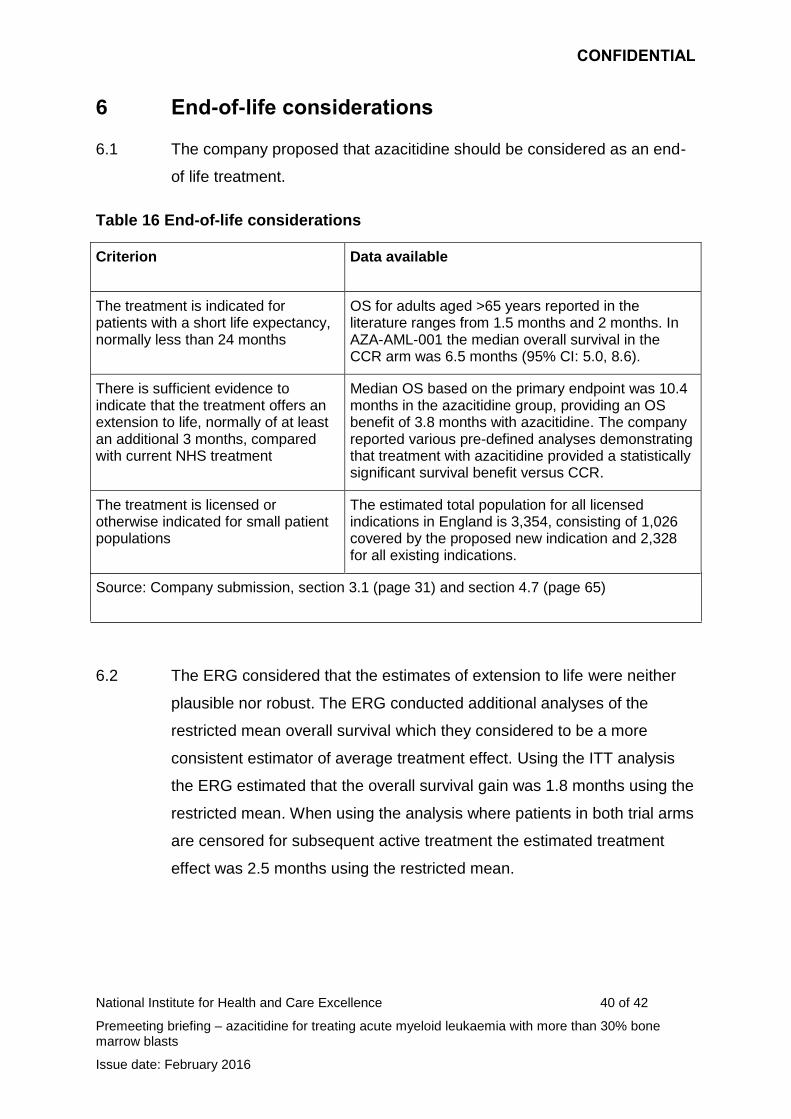
6 End-of-life considerations
6.1 The company proposed that azacitidine should be considered as an end-
of life treatment.
Table 16 End-of-life considerations
Criterion Data available
The treatment is indicated for patients with a short life expectancy, normally less than 24 months
OS for adults aged >65 years reported in the literature ranges from 1.5 months and 2 months. In AZA-AML-001 the median overall survival in the CCR arm was 6.5 months (95% CI: 5.0, 8.6).
There is sufficient evidence to indicate that the treatment offers an extension to life, normally of at least an additional 3 months, compared with current NHS treatment
Median OS based on the primary endpoint was 10.4 months in the azacitidine group, providing an OS benefit of 3.8 months with azacitidine. The company reported various pre-defined analyses demonstrating that treatment with azacitidine provided a statistically significant survival benefit versus CCR.
The treatment is licensed or otherwise indicated for small patient populations
The estimated total population for all licensed indications in England is 3,354, consisting of 1,026 covered by the proposed new indication and 2,328 for all existing indications.
Source: Company submission, section 3.1 (page 31) and section 4.7 (page 65)
6.2 The ERG considered that the estimates of extension to life were neither
plausible nor robust. The ERG conducted additional analyses of the
restricted mean overall survival which they considered to be a more
consistent estimator of average treatment effect. Using the ITT analysis
the ERG estimated that the overall survival gain was 1.8 months using the
restricted mean. When using the analysis where patients in both trial arms
are censored for subsequent active treatment the estimated treatment
effect was 2.5 months using the restricted mean.
CONFIDENTIAL
National Institute for Health and Care Excellence 41 of 42
Premeeting briefing – azacitidine for treating acute myeloid leukaemia with more than 30% bone marrow blasts
Issue date: February 2016
7 Equality issues
7.1 No equality issues were raised during consultation. The company
requested to amend the proposed remit in line with wording of marketing
authorisation which specified an age cut-off of ‘65 years or more’. As
NICE has an obligation towards people protected by the equality
legislation; it was decided that age restriction should not be specified in
the remit or scope.
8 Authors
Stuart Wood
Technical Lead(s)
Zoe Garrett
Technical Adviser
with input from the Lead Team (Professor Peter Crome, Claire Rothery and Dr Judith
Wardle).
CONFIDENTIAL
National Institute for Health and Care Excellence 42 of 42
Premeeting briefing – azacitidine for treating acute myeloid leukaemia with more than 30% bone marrow blasts
Issue date: February 2016
Appendix A: Clinical efficacy section of the draft European
public assessment report
http://www.ema.europa.eu/docs/en_GB/document_library/EPAR_-
_Summary_for_the_public/human/000978/WC500050240.pdf
Appendix B
National Institute for Health and Care Excellence Final scope for the appraisal of azacitidine for treating acute myeloid leukaemia with more than 30% bone marrow blasts Issue Date: September 2015 Page 1 of 4
NATIONAL INSTITUTE FOR HEALTH AND CARE EXCELLENCE
SingleTechnology Appraisal
Azacitidine for treating acute myeloid leukaemia with more than 30% bone marrow blasts
Final scope
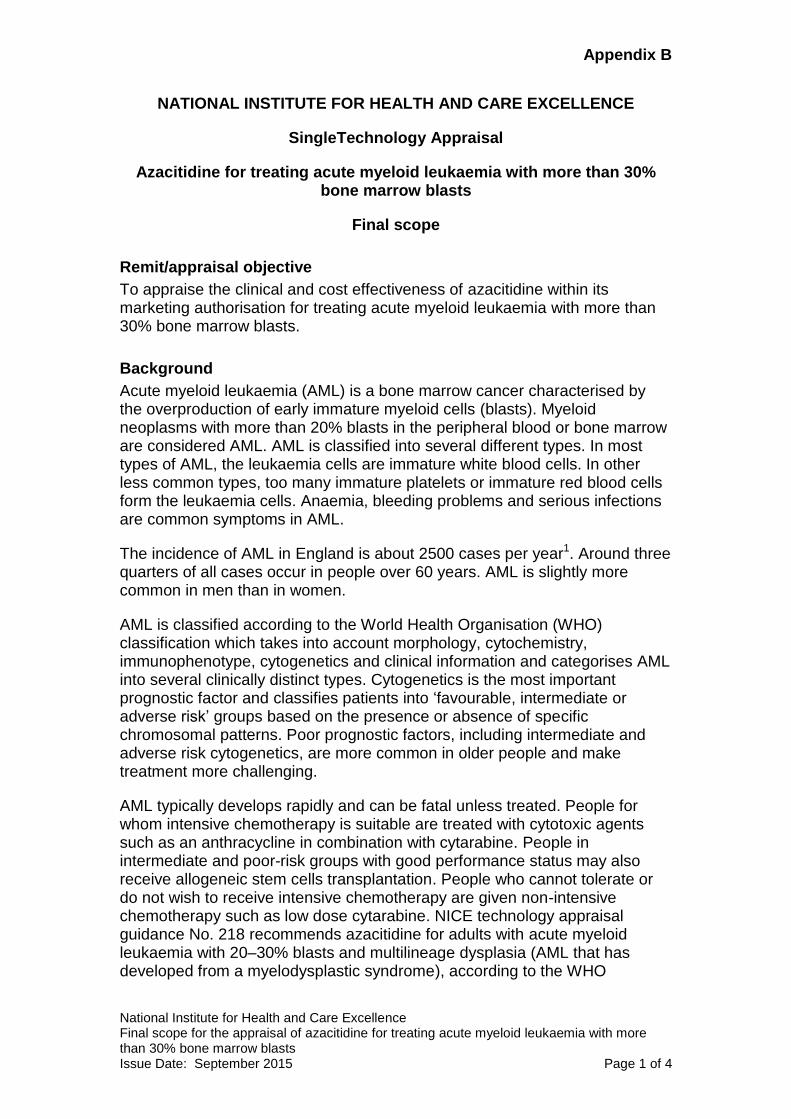
Remit/appraisal objective
To appraise the clinical and cost effectiveness of azacitidine within its marketing authorisation for treating acute myeloid leukaemia with more than 30% bone marrow blasts.
Background
Acute myeloid leukaemia (AML) is a bone marrow cancer characterised by the overproduction of early immature myeloid cells (blasts). Myeloid neoplasms with more than 20% blasts in the peripheral blood or bone marrow are considered AML. AML is classified into several different types. In most types of AML, the leukaemia cells are immature white blood cells. In other less common types, too many immature platelets or immature red blood cells form the leukaemia cells. Anaemia, bleeding problems and serious infections are common symptoms in AML.
The incidence of AML in England is about 2500 cases per year1. Around three quarters of all cases occur in people over 60 years. AML is slightly more common in men than in women.
AML is classified according to the World Health Organisation (WHO) classification which takes into account morphology, cytochemistry, immunophenotype, cytogenetics and clinical information and categorises AML into several clinically distinct types. Cytogenetics is the most important prognostic factor and classifies patients into ‘favourable, intermediate or adverse risk’ groups based on the presence or absence of specific chromosomal patterns. Poor prognostic factors, including intermediate and adverse risk cytogenetics, are more common in older people and make treatment more challenging.
AML typically develops rapidly and can be fatal unless treated. People for whom intensive chemotherapy is suitable are treated with cytotoxic agents such as an anthracycline in combination with cytarabine. People in intermediate and poor-risk groups with good performance status may also receive allogeneic stem cells transplantation. People who cannot tolerate or do not wish to receive intensive chemotherapy are given non-intensive chemotherapy such as low dose cytarabine. NICE technology appraisal guidance No. 218 recommends azacitidine for adults with acute myeloid leukaemia with 20–30% blasts and multilineage dysplasia (AML that has developed from a myelodysplastic syndrome), according to the WHO
Appendix B
National Institute for Health and Care Excellence Final scope for the appraisal of azacitidine for treating acute myeloid leukaemia with more than 30% bone marrow blasts Issue Date: September 2015 Page 2 of 4
classification and who cannot have haematopoietic stem cell transplantation. Other aspects of care include blood product replacement for anaemia and thrombocytopenia, antibiotics and antifungals for infections and intermittent low dose chemotherapy with hydroxycarbamide to keep the peripheral blood blast count low.
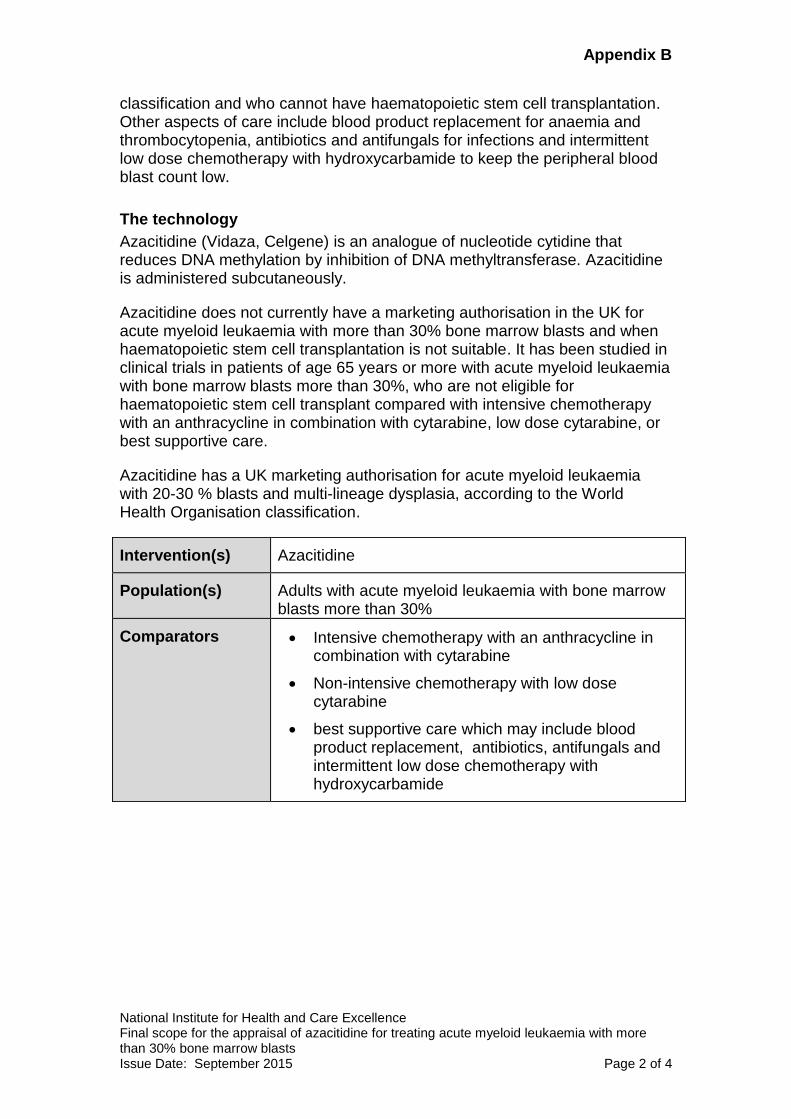
The technology
Azacitidine (Vidaza, Celgene) is an analogue of nucleotide cytidine that reduces DNA methylation by inhibition of DNA methyltransferase. Azacitidine is administered subcutaneously.
Azacitidine does not currently have a marketing authorisation in the UK for acute myeloid leukaemia with more than 30% bone marrow blasts and when haematopoietic stem cell transplantation is not suitable. It has been studied in clinical trials in patients of age 65 years or more with acute myeloid leukaemia with bone marrow blasts more than 30%, who are not eligible for haematopoietic stem cell transplant compared with intensive chemotherapy with an anthracycline in combination with cytarabine, low dose cytarabine, or best supportive care.
Azacitidine has a UK marketing authorisation for acute myeloid leukaemia with 20-30 % blasts and multi-lineage dysplasia, according to the World Health Organisation classification.
Intervention(s) Azacitidine
Population(s) Adults with acute myeloid leukaemia with bone marrow blasts more than 30%
Comparators Intensive chemotherapy with an anthracycline in combination with cytarabine
Non-intensive chemotherapy with low dose cytarabine
best supportive care which may include blood product replacement, antibiotics, antifungals and intermittent low dose chemotherapy with hydroxycarbamide
Appendix B
National Institute for Health and Care Excellence Final scope for the appraisal of azacitidine for treating acute myeloid leukaemia with more than 30% bone marrow blasts Issue Date: September 2015 Page 3 of 4
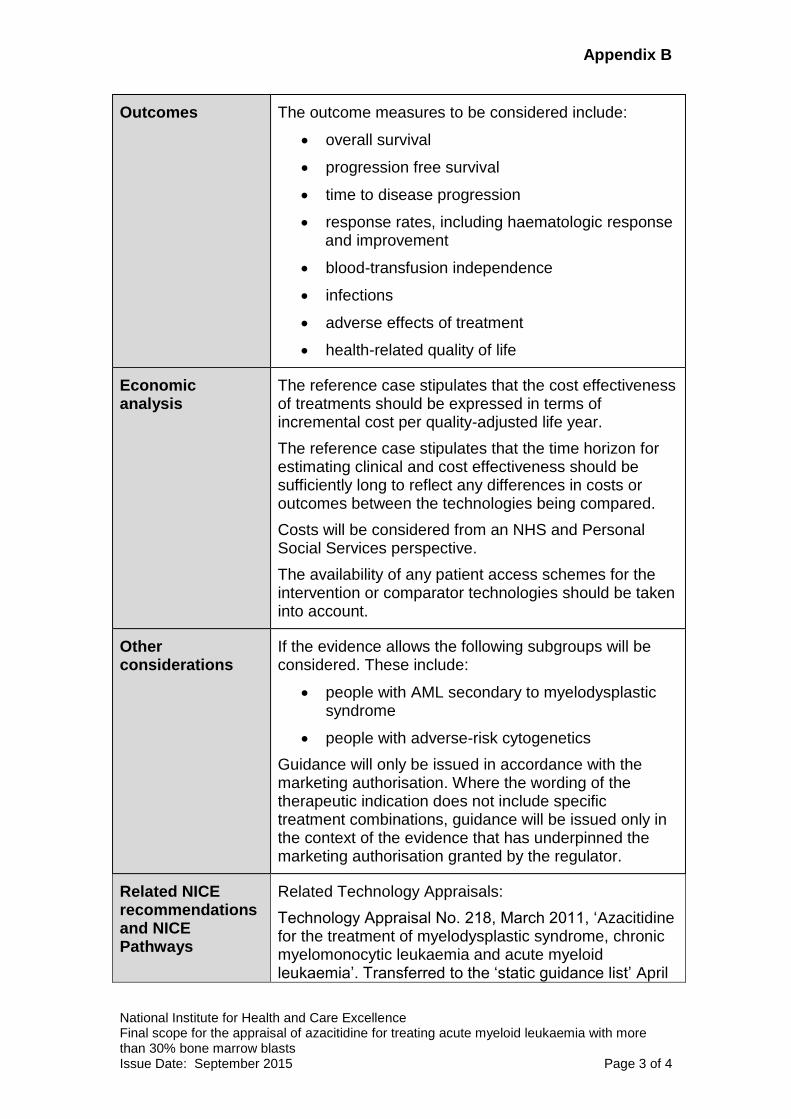
Outcomes The outcome measures to be considered include:
overall survival
progression free survival
time to disease progression
response rates, including haematologic response and improvement
blood-transfusion independence
infections
adverse effects of treatment
health-related quality of life
Economic analysis
The reference case stipulates that the cost effectiveness of treatments should be expressed in terms of incremental cost per quality-adjusted life year.
The reference case stipulates that the time horizon for estimating clinical and cost effectiveness should be sufficiently long to reflect any differences in costs or outcomes between the technologies being compared.
Costs will be considered from an NHS and Personal Social Services perspective.
The availability of any patient access schemes for the intervention or comparator technologies should be taken into account.
Other considerations
If the evidence allows the following subgroups will be considered. These include:
people with AML secondary to myelodysplastic syndrome
people with adverse-risk cytogenetics
Guidance will only be issued in accordance with the marketing authorisation. Where the wording of the therapeutic indication does not include specific treatment combinations, guidance will be issued only in the context of the evidence that has underpinned the marketing authorisation granted by the regulator.
Related NICE recommendations and NICE Pathways
Related Technology Appraisals:
Technology Appraisal No. 218, March 2011, ‘Azacitidine for the treatment of myelodysplastic syndrome, chronic myelomonocytic leukaemia and acute myeloid leukaemia’. Transferred to the ‘static guidance list’ April
Appendix B
National Institute for Health and Care Excellence Final scope for the appraisal of azacitidine for treating acute myeloid leukaemia with more than 30% bone marrow blasts Issue Date: September 2015 Page 4 of 4
2014 Technology Appraisal No. 270, December 2012, Decitabine for the treatment of acute myeloid leukaemia (terminated appraisal).
Related Cancer Service Guidance:
Guidance on Cancer Services, CSGHO, October 2003, ‘Improving outcomes in haematological cancers’
Related NICE Pathways:
NICE Pathway: Blood and bone marrow cancers, Pathway last updated: June 2015, http://pathways.nice.org.uk/pathways/blood-and-bone-marrow-cancers
Related National Policy
Blood and marrow transplantation services (all ages), Chapter 29, Manual for Prescribed Specialised Services 2013/14 http://www.england.nhs.uk/wp-content/uploads/2014/01/pss-manual.pdf
Department of Health, NHS Outcomes Framework 2014-2015, Nov 2013. Domains 1 and 2 https://www.gov.uk/government/uploads/system/uploads/attachment_data/file/256456/NHS_outcomes.pdf
Reference:
1. Cancer Research UK, 2014, Acute myeloid leukaemia (AML) incidence statistics (accessed on 14/09/2015)
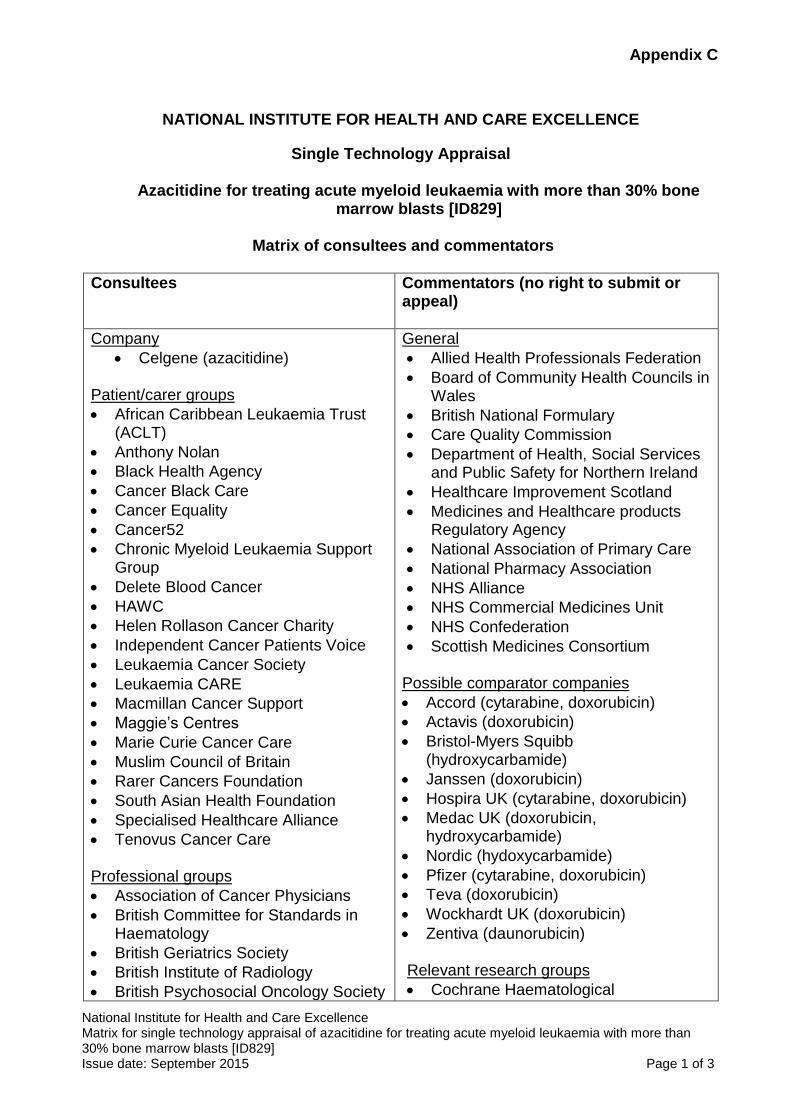
Appendix C
National Institute for Health and Care Excellence Matrix for single technology appraisal of azacitidine for treating acute myeloid leukaemia with more than 30% bone marrow blasts [ID829] Issue date: September 2015 Page 1 of 3
NATIONAL INSTITUTE FOR HEALTH AND CARE EXCELLENCE
Single Technology Appraisal
Azacitidine for treating acute myeloid leukaemia with more than 30% bone marrow blasts [ID829]
Matrix of consultees and commentators
Consultees Commentators (no right to submit or appeal)
Company
Celgene (azacitidine)
Patient/carer groups
African Caribbean Leukaemia Trust (ACLT)
Anthony Nolan
Black Health Agency
Cancer Black Care
Cancer Equality
Cancer52
Chronic Myeloid Leukaemia Support Group
Delete Blood Cancer
HAWC
Helen Rollason Cancer Charity
Independent Cancer Patients Voice
Leukaemia Cancer Society
Leukaemia CARE
Macmillan Cancer Support
Maggie’s Centres
Marie Curie Cancer Care
Muslim Council of Britain
Rarer Cancers Foundation
South Asian Health Foundation
Specialised Healthcare Alliance
Tenovus Cancer Care
Professional groups
Association of Cancer Physicians
British Committee for Standards in Haematology
British Geriatrics Society
British Institute of Radiology
British Psychosocial Oncology Society
General
Allied Health Professionals Federation
Board of Community Health Councils in Wales
British National Formulary
Care Quality Commission
Department of Health, Social Services and Public Safety for Northern Ireland
Healthcare Improvement Scotland
Medicines and Healthcare products Regulatory Agency
National Association of Primary Care
National Pharmacy Association
NHS Alliance
NHS Commercial Medicines Unit
NHS Confederation
Scottish Medicines Consortium Possible comparator companies
Accord (cytarabine, doxorubicin)
Actavis (doxorubicin)
Bristol-Myers Squibb (hydroxycarbamide)
Janssen (doxorubicin)
Hospira UK (cytarabine, doxorubicin)
Medac UK (doxorubicin, hydroxycarbamide)
Nordic (hydoxycarbamide)
Pfizer (cytarabine, doxorubicin)
Teva (doxorubicin)
Wockhardt UK (doxorubicin)
Zentiva (daunorubicin)
Relevant research groups
Cochrane Haematological
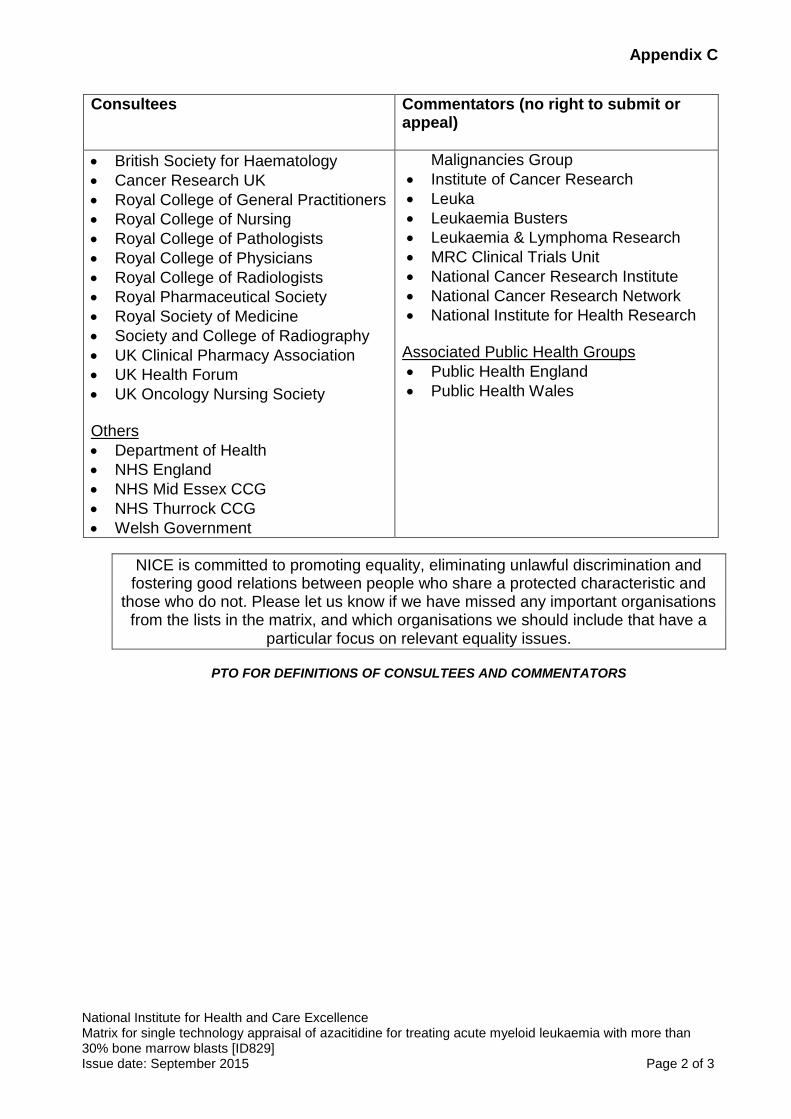
Appendix C
National Institute for Health and Care Excellence Matrix for single technology appraisal of azacitidine for treating acute myeloid leukaemia with more than 30% bone marrow blasts [ID829] Issue date: September 2015 Page 2 of 3
Consultees Commentators (no right to submit or appeal)
British Society for Haematology
Cancer Research UK
Royal College of General Practitioners
Royal College of Nursing
Royal College of Pathologists
Royal College of Physicians
Royal College of Radiologists
Royal Pharmaceutical Society
Royal Society of Medicine
Society and College of Radiography
UK Clinical Pharmacy Association
UK Health Forum
UK Oncology Nursing Society Others
Department of Health
NHS England
NHS Mid Essex CCG
NHS Thurrock CCG
Welsh Government
Malignancies Group
Institute of Cancer Research
Leuka
Leukaemia Busters
Leukaemia & Lymphoma Research
MRC Clinical Trials Unit
National Cancer Research Institute
National Cancer Research Network
National Institute for Health Research Associated Public Health Groups
Public Health England
Public Health Wales
NICE is committed to promoting equality, eliminating unlawful discrimination and fostering good relations between people who share a protected characteristic and
those who do not. Please let us know if we have missed any important organisations from the lists in the matrix, and which organisations we should include that have a
particular focus on relevant equality issues.
PTO FOR DEFINITIONS OF CONSULTEES AND COMMENTATORS
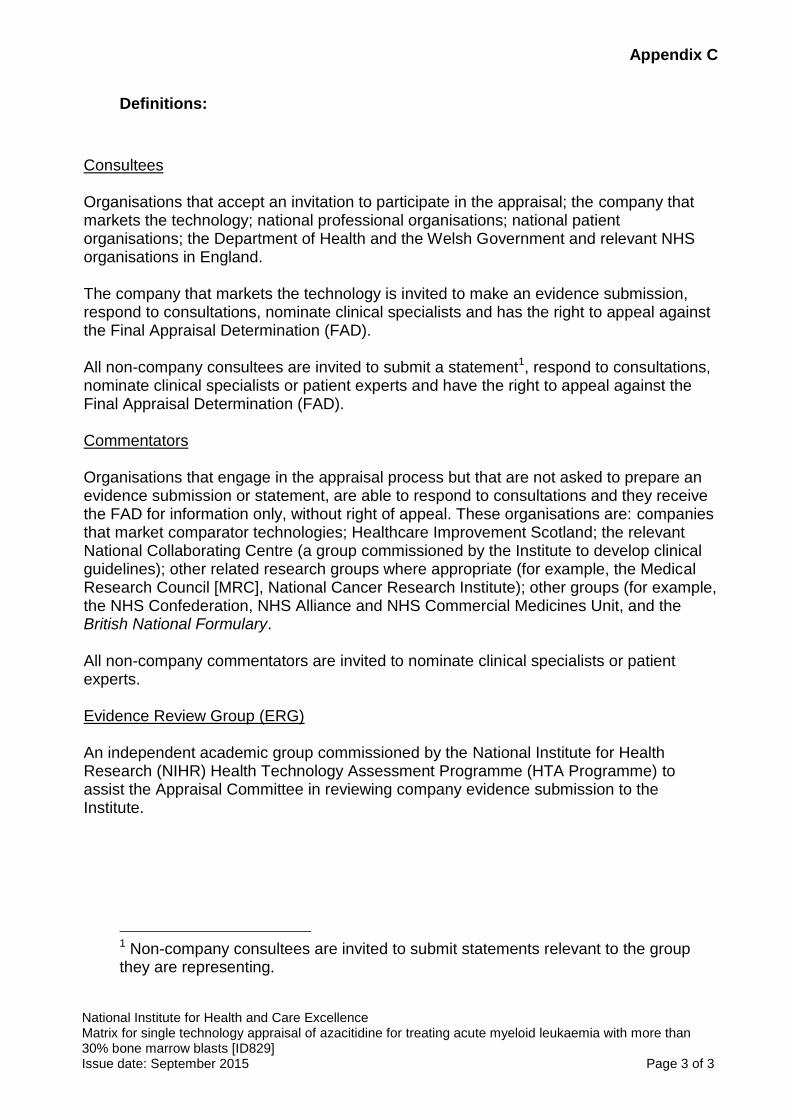
Appendix C
National Institute for Health and Care Excellence Matrix for single technology appraisal of azacitidine for treating acute myeloid leukaemia with more than 30% bone marrow blasts [ID829] Issue date: September 2015 Page 3 of 3
Definitions:
Consultees Organisations that accept an invitation to participate in the appraisal; the company that markets the technology; national professional organisations; national patient organisations; the Department of Health and the Welsh Government and relevant NHS organisations in England. The company that markets the technology is invited to make an evidence submission, respond to consultations, nominate clinical specialists and has the right to appeal against the Final Appraisal Determination (FAD). All non-company consultees are invited to submit a statement1, respond to consultations, nominate clinical specialists or patient experts and have the right to appeal against the Final Appraisal Determination (FAD). Commentators Organisations that engage in the appraisal process but that are not asked to prepare an evidence submission or statement, are able to respond to consultations and they receive the FAD for information only, without right of appeal. These organisations are: companies that market comparator technologies; Healthcare Improvement Scotland; the relevant National Collaborating Centre (a group commissioned by the Institute to develop clinical guidelines); other related research groups where appropriate (for example, the Medical Research Council [MRC], National Cancer Research Institute); other groups (for example, the NHS Confederation, NHS Alliance and NHS Commercial Medicines Unit, and the British National Formulary. All non-company commentators are invited to nominate clinical specialists or patient experts. Evidence Review Group (ERG) An independent academic group commissioned by the National Institute for Health Research (NIHR) Health Technology Assessment Programme (HTA Programme) to assist the Appraisal Committee in reviewing company evidence submission to the Institute.
1 Non-company consultees are invited to submit statements relevant to the group they are representing.
Company evidence submission template for azacitidine [ID829] 1
NATIONAL INSTITUTE FOR HEALTH AND
CARE EXCELLENCE
Single technology appraisal (STA)
Leukaemia (acute myeloid, over 30% blasts)
– azacitidine [ID829]
Company evidence submission
25th November 2015
File name Version Contains confidential information
Date
Azacitidine AML NICE STA Final CIC AIC Marked
1 Yes 25/11/15
Company evidence submission template for azacitidine [ID829] 2
Instructions for companies
This is the template for submission of evidence to the National Institute for Health and
Care Excellence (NICE) as part of the single technology appraisal (STA) process. Please
note that the information requirements for submissions are summarised in this template;
full details of the requirements for pharmaceuticals and devices are in the user guide.
This submission must not be longer than 250 pages, excluding appendices and the
pages covered by this template.
Companies making evidence submissions to NICE should also refer to the NICE guide to
the methods of technology appraisal and the NICE guide to the processes of technology
appraisal.
Company evidence submission for azacitidine [ID829] 3
Contents
Instructions for companies ............................................................................................... 2
Contents .......................................................................................................................... 3
List of Tables ................................................................................................................... 5
List of Figures .................................................................................................................. 7
Abbreviations .................................................................................................................. 9
1 Executive summary ........................................................................................... 11
1.1 Statement of the decision problem .................................................................. 12
1.2 Description of the technology being appraised ................................................ 16
1.3 Summary of the clinical effectiveness analysis ................................................ 17
1.4 Summary of the cost-effectiveness analysis .................................................... 20
2 The technology .................................................................................................. 23
2.1 Description of the technology .......................................................................... 23
2.2 Marketing authorisation/CE marking and health technology assessment ........ 25
2.3 Administration and costs of the technology ..................................................... 28
2.4 Changes in service provision and management .............................................. 29
2.5 Innovation ....................................................................................................... 30
3 Health condition and position of the technology in the treatment pathway ......... 31
3.1 Disease overview ............................................................................................ 31
3.2 Burden to patients, carers and society ............................................................ 32
3.3 Clinical pathway of care .................................................................................. 33
3.4 Life expectancy ............................................................................................... 34
3.5 Relevant NICE guidance, pathways or commissioning guides ........................ 34
3.6 Clinical guidelines ........................................................................................... 35
3.7 Issues relating to current clinical practice ........................................................ 37
3.8 Equality ........................................................................................................... 38
4 Clinical effectiveness ......................................................................................... 39
4.1 Identification and selection of relevant studies................................................. 39
4.2 List of relevant randomised controlled trials ..................................................... 43
4.3 Summary of methodology of the relevant randomised controlled trials ............ 43
4.4 Statistical analysis and definition of study groups in the relevant randomised controlled trials ................................................................................................ 53
4.5 Participant flow in the relevant randomised controlled trials ............................ 56
4.6 Quality assessment of the relevant randomised controlled trials ..................... 64
4.7 Clinical effectiveness results (AZA-AML-001) .................................................. 65
4.8 Subgroup analysis ........................................................................................... 78
4.9 Meta-analysis .................................................................................................. 80
Company evidence submission for azacitidine [ID829] 4
4.10 Indirect and mixed treatment comparisons ...................................................... 80
4.11 Non-randomised and non-controlled evidence ................................................ 80
4.12 Adverse reactions ........................................................................................... 85
4.13 Interpretation of clinical effectiveness and safety evidence ............................. 91
4.14 Ongoing studies .............................................................................................. 98
5 Cost effectiveness ............................................................................................. 99
5.1 Published cost-effectiveness studies ............................................................... 99
5.2 De novo analysis ........................................................................................... 106
5.3 Clinical parameters and variables.................................................................. 109
5.4 Measurement and valuation of health effects ................................................ 127
5.5 Cost and healthcare resource use identification, measurement and valuation ...................................................................................................................... 129
5.6 Summary of base-case de novo analysis inputs and assumptions ................ 138
5.7 Base-case results .......................................................................................... 141
5.8 Sensitivity analyses ....................................................................................... 146
5.9 Validation ...................................................................................................... 157
5.10 Interpretation and conclusions of economic evidence.................................... 158
6 Assessment of factors relevant to the NHS and other parties .......................... 160
7 References ...................................................................................................... 165
8 Appendices ...................................................................................................... 173
Company evidence submission for azacitidine [ID829] 5
List of Tables
Table 1: The decision problem ...................................................................................... 13
Table 2: Technology being appraised ............................................................................ 16
Table 3: Summary of variables applied in the economic model ..................................... 20
Table 4: Incremental cost-effectiveness results ............................................................. 22
Table 5: Regulatory approval of azacitidine outside the UK ........................................... 27
Table 6: Costs of the technology being appraised ......................................................... 28
Table 7: Scope of the literature review: PICOS criteria for study inclusion ..................... 39
Table 8: Studies identified in systematic review ............................................................. 42
Table 9: List of relevant RCTs ....................................................................................... 43
Table 10: Inclusion and exclusion criteria ...................................................................... 47
Table 11: Outcomes investigated in AZA-AML-001 ....................................................... 50
Table 12: Response categories and definitions ............................................................. 52
Table 13: Criteria leading to exclusion from the evaluable population ........................... 53
Table 14: Analysis populations ...................................................................................... 59
Table 15: Demographics of participants in the RCT across randomised groups (ITT) ... 59
Table 16: Disease characteristics and prior therapies (ITT) ........................................... 61
Table 17: Quality assessment results for parallel group RCTs ...................................... 64
Table 18: Summary of overall survival in the ITT population .......................................... 66
Table 19: Summary of sensitivity analyses on overall survival (ITT) .............................. 68
Table 20: Summary of time to death within CCR selection (ITT).................................... 69
Table 21: Post-hoc overall survival estimates adjusted for baseline characteristics and/or subsequent therapy ....................................................................................................... 70
Table 22: Secondary endpoints: azacitidine versus CCR .............................................. 72
Table 23: Secondary endpoints – investigators pre-selection ........................................ 73
Table 24: HRQoL assessment rates .............................................................................. 77
Table 25: Baseline and treatment characteristics of patients from the AAR (BM blasts >30% and WBC <15G/L) and the AML-001 trial ............................................................ 82
Table 26: Summary of adverse events .......................................................................... 86
Table 27: Summary of adverse events occurring in >10% of subjects in the azacitidine treatment group ............................................................................................................. 87
Table 28: End-of-life criteria .......................................................................................... 97
Table 29: Summary of included cost-effectiveness evaluations ................................... 102
Table 30: Features of the de novo analysis ................................................................. 108
Table 31: Response rates by arm in the AZA-AML-001 trial ........................................ 109
Table 32: Hazard ratios for OS: azacitidine vs CCR .................................................... 111
Table 33: Hazard ratios azacitidine for RFS: vs CCR .................................................. 114
Table 34: Hazard ratios azacitidine for PFS: vs CCR .................................................. 116
Company evidence submission for azacitidine [ID829] 6
Table 35: Goodness of fit for OS, RFS, and PFS parametric functions (ITT data) ....... 120
Table 36: Goodness of fit for OS, RFS, and PFS parametric functions without adjustment for cross-over (censor-at-switch data) ......................................................................... 121
Table 37: Covariates used in the IPCW method .......................................................... 125
Table 38: Results of the IPCW models ........................................................................ 126
Table 39: Comparison of survival for CCR between primary efficacy and IPCW HR-adjusted analyses ....................................................................................................... 127
Table 40: Mapping algorithms from EORTC QLQ-C30 to EQ-5D ................................ 127
Table 41: Summary of utility values for cost-effectiveness analysis ............................. 129
Table 42: Drug utilisation per cycle (4 weeks) ............................................................. 130
Table 43: Drug acquisition unit costs (£) ...................................................................... 131
Table 44: Drug acquisition cost per cycle .................................................................... 131
Table 45: Mean number of treatment cycles in the AZA-AML-001 trial ........................ 132
Table 46: HCRU (frequency per cycle) for each health state. ...................................... 133
Table 47: HCRU (mean time in minutes per frequency) for each health state .............. 134
Table 48: Unit costs for each item of HCRU ................................................................ 135
Table 49: HCRU (number of tests per cycle) for drug monitoring tests ........................ 136
Table 50: Unit Costs for drug monitoring tests ............................................................. 136
Table 51: Unit costs and resource use (number of transfusions per cycle) of transfusions .................................................................................................................................... 137
Table 52: Costs of managing adverse events (≥ grade 3) ............................................ 138
Table 53: Summary of variables applied in the economic model ................................. 138
Table 54: Assumptions used in the economic model ................................................... 140
Table 55: Base-case results ........................................................................................ 142
Table 56: Summary of QALY gain by health state ....................................................... 145
Table 57: Summary of Costs by health state ............................................................... 146
Table 58: Summary of predicted resource use by category of cost .............................. 146
Table 59: Probabilistic distributions for model parameters ........................................... 147
Table 60: PSA results ................................................................................................. 148
Table 61: DSA results ................................................................................................. 152
Table 62: Results of the scenario analyses ................................................................. 154
Table 63: Results for patients with poor-risk cytogenetics (without adjustment for subsequent therapies) ................................................................................................. 156
Table 64: Results for patients with MDS related Changes (without adjustment for subsequent therapies) ................................................................................................. 156
Table 65: Checklist used to check the model inputs and results .................................. 157
Table 66: Eligible Population for the full marketing authorisation ................................. 160
Table 67: Subgroup Population with poor risk cytogenetics ......................................... 160
Table 68: Subgroup Population with MDS related changes ......................................... 161
Company evidence submission for azacitidine [ID829] 7
Table 69: Budget Impact for the full marketing authorisation ....................................... 162
Table 70: Budget Impact for the Subgroup Population with poor risk cytogenetics ...... 163
Table 71: Budget Impact for the Subgroup Population with MDS related changes ...... 163
List of Figures
Figure 1: Model Structure .............................................................................................. 22
Figure 2: Proposed azacitidine mechanism of action ..................................................... 24
Figure 3: Management of newly-diagnosed AML aged 60 years or more, NCCN guidelines ...................................................................................................................... 37
Figure 4: PRISMA study flow diagram ........................................................................... 42
Figure 5: Study design .................................................................................................. 45
Figure 6: Randomisation ............................................................................................... 47
Figure 7: CONSORT diagram for AZA-AML-001 ........................................................... 58
Figure 8: Kaplan-Meier plot of overall survival ............................................................... 66
Figure 9: Kaplan-Meier plot of overall survival censored for first subsequent AML therapy ...................................................................................................................................... 68
Figure 10: Mean absolute score change from baseline for primary and secondary HRQoL endpoints (HRQoL evaluable population) ......................................................... 78
Figure 11: Overall survival by patient related- or disease-related prognostic factor: azacitidine versus CCR ................................................................................................. 80
Figure 12: Kaplan-Meier curve showing the median OS of patients treated with first-line azacitidine in the AAR who fulfilled the BM blast percentage and WBC count entry criteria of AML-001 with A) AML; B) AML-MRC; C) AML and poor-risk cytogenetics ..... 84
Figure 13: Schematic for the systematic review of cost-effectiveness evidence .......... 100
Figure 14: Model Structure .......................................................................................... 107
Figure 15: Log-log plot for OS ..................................................................................... 111
Figure 16: KM curves for RFS ..................................................................................... 112
Figure 17: Log-log plot for RFS ................................................................................... 113
Figure 18: KM curves for PFS ..................................................................................... 115
Figure 19: Log-log plot for PFS.................................................................................... 115
Figure 20: OS after adjustment for cross-over (base-case) ......................................... 117
Figure 21: RFS after adjustment for cross-over (base-case) ....................................... 117
Figure 22: PFS after adjustment for cross-over (base-case) ........................................ 118
Figure 23: OS, PFS, and RFS without adjustment for cross-over (ITT data) ................ 119
Figure 24: OS, PFS, and RFS without adjustment for cross-over (censor-at-switch data) .................................................................................................................................... 120
Figure 25: Kaplan–Meier plot of observed azacitidine and IPCW HR-adjusted CCR data .................................................................................................................................... 127
Figure 26: Markov Trace - RFS ................................................................................... 143
Company evidence submission for azacitidine [ID829] 8
Figure 27: Markov Trace - PFS ................................................................................... 143
Figure 28: Markov Trace - OS ..................................................................................... 144
Figure 29: Markov Trace - azacitidine ......................................................................... 144
Figure 30: Markov Trace - CCR................................................................................... 145
Figure 31: Cost-effectiveness Plane – Incremental Costs vs. Incremental QALYs ...... 149
Figure 32: Cost-effectiveness Plane – Incremental Costs vs. Incremental LYs ............ 149
Figure 33: Cost-effectiveness Acceptability Curve ....................................................... 150
Figure 34: Tornado Diagram for DSA .......................................................................... 151
Figure 35: Comparison of CCR OS data to HMRN ...................................................... 158
Figure 36: Comparison of CCR OS data for patients with poor-risk cytogenetics to HMRN .................................................................................................................................... 158
Company evidence submission for azacitidine [ID829] 9
Abbreviations
AAR Austrian Azacitidine Registry
AE Adverse event
AML Acute myeloid leukaemia
ANC Absolute neutrophil count
APL Acute promyelocytic leukaemia
BID Twice daily
BM Bone marrow
BSC Best supportive care
CCR Conventional care regimens
CI Confidence interval
CMML Chronic myelomonocytic leukaemia
CNS Central nervous system
CR Complete remission
CRc Cytogenetic complete remission
CRi Complete remission with incomplete blood count recovery
DNA Deoxyribonucleic acid
ECOG Eastern Cooperative Oncology Group
EFS Event-free survival
EORTC European Organization for Research and Treatment on Cancer
EU European Union
HR Hazard ratio
HRQoL Health-related quality of life
HCRU Healthcare resource utilisation
HSCT Haematopoietic stem cell transplantation
IC Intensive chemotherapy
IPCW Inverse probability of censoring weighted
ITT Intent-to-treat
IV Intravenous
IVRS Interactive Voice Response System
IWG International Working Group
KM Kaplan Meier
LDAC Low-dose cytarabine
MDS Myelodysplastic syndromes
miRNA Micro-ribonucleic acid
mITT Modified intent-to-treat
NYHA New York Heart Association
OS Overall survival
Company evidence submission for azacitidine [ID829] 10
PH Proportional hazards
PR Partial remission
PRISMA Preferred Reporting Items for Systematic Reviews and Meta-Analyses
PRO Patient-reported outcomes
QLQ Quality of life questionnaire
RBC Red blood cell
RCT Randomised controlled trial
RFS Relapse-free survival
SAE Serious adverse event
SC Subcutaneous(ly)
SD Standard deviation
SNP Single nucleotide polymorphism
WBC White blood cell
WHO World Health Organization
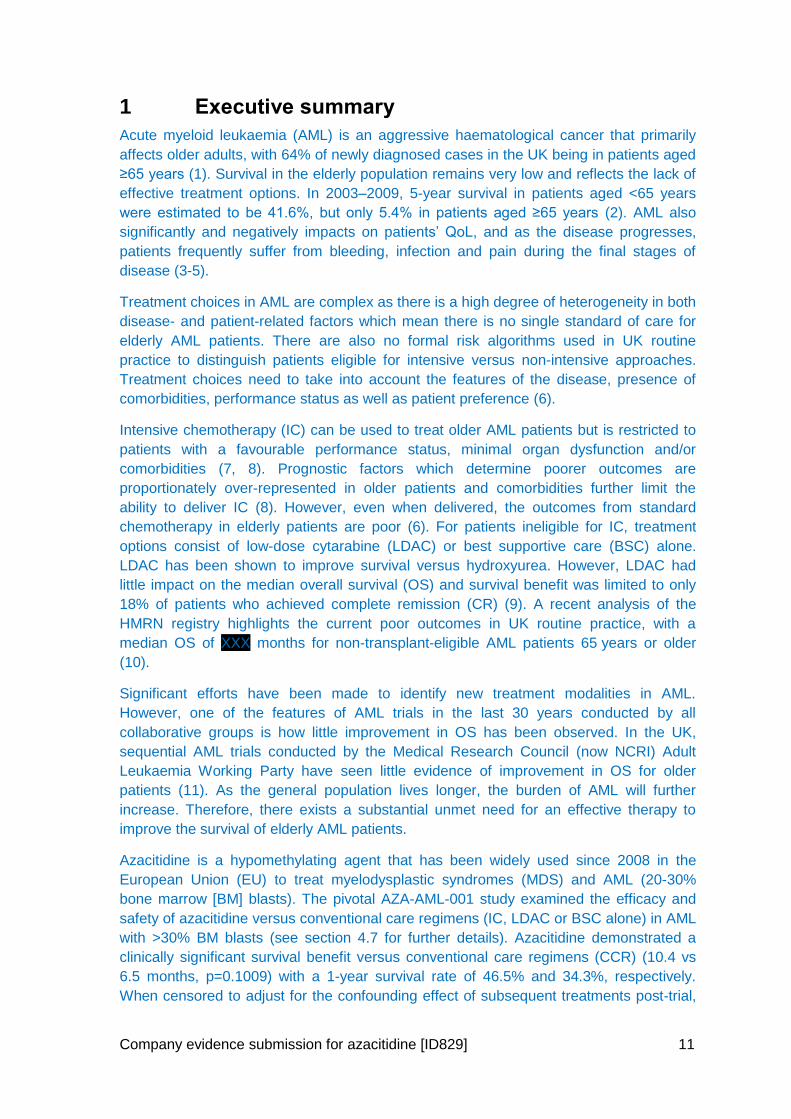
Company evidence submission for azacitidine [ID829] 11
1 Executive summary
Acute myeloid leukaemia (AML) is an aggressive haematological cancer that primarily
affects older adults, with 64% of newly diagnosed cases in the UK being in patients aged
≥65 years (1). Survival in the elderly population remains very low and reflects the lack of
effective treatment options. In 2003–2009, 5-year survival in patients aged <65 years
were estimated to be 41.6%, but only 5.4% in patients aged ≥65 years (2). AML also
significantly and negatively impacts on patients’ QoL, and as the disease progresses,
patients frequently suffer from bleeding, infection and pain during the final stages of
disease (3-5).
Treatment choices in AML are complex as there is a high degree of heterogeneity in both
disease- and patient-related factors which mean there is no single standard of care for
elderly AML patients. There are also no formal risk algorithms used in UK routine
practice to distinguish patients eligible for intensive versus non-intensive approaches.
Treatment choices need to take into account the features of the disease, presence of
comorbidities, performance status as well as patient preference (6).
Intensive chemotherapy (IC) can be used to treat older AML patients but is restricted to
patients with a favourable performance status, minimal organ dysfunction and/or
comorbidities (7, 8). Prognostic factors which determine poorer outcomes are
proportionately over-represented in older patients and comorbidities further limit the
ability to deliver IC (8). However, even when delivered, the outcomes from standard
chemotherapy in elderly patients are poor (6). For patients ineligible for IC, treatment
options consist of low-dose cytarabine (LDAC) or best supportive care (BSC) alone.
LDAC has been shown to improve survival versus hydroxyurea. However, LDAC had
little impact on the median overall survival (OS) and survival benefit was limited to only
18% of patients who achieved complete remission (CR) (9). A recent analysis of the
HMRN registry highlights the current poor outcomes in UK routine practice, with a
median OS of XXX months for non-transplant-eligible AML patients 65 years or older
(10).
Significant efforts have been made to identify new treatment modalities in AML.
However, one of the features of AML trials in the last 30 years conducted by all
collaborative groups is how little improvement in OS has been observed. In the UK,
sequential AML trials conducted by the Medical Research Council (now NCRI) Adult
Leukaemia Working Party have seen little evidence of improvement in OS for older
patients (11). As the general population lives longer, the burden of AML will further
increase. Therefore, there exists a substantial unmet need for an effective therapy to
improve the survival of elderly AML patients.
Azacitidine is a hypomethylating agent that has been widely used since 2008 in the
European Union (EU) to treat myelodysplastic syndromes (MDS) and AML (20-30%
bone marrow [BM] blasts). The pivotal AZA-AML-001 study examined the efficacy and
safety of azacitidine versus conventional care regimens (IC, LDAC or BSC alone) in AML
with >30% BM blasts (see section 4.7 for further details). Azacitidine demonstrated a
clinically significant survival benefit versus conventional care regimens (CCR) (10.4 vs
6.5 months, p=0.1009) with a 1-year survival rate of 46.5% and 34.3%, respectively.
When censored to adjust for the confounding effect of subsequent treatments post-trial,
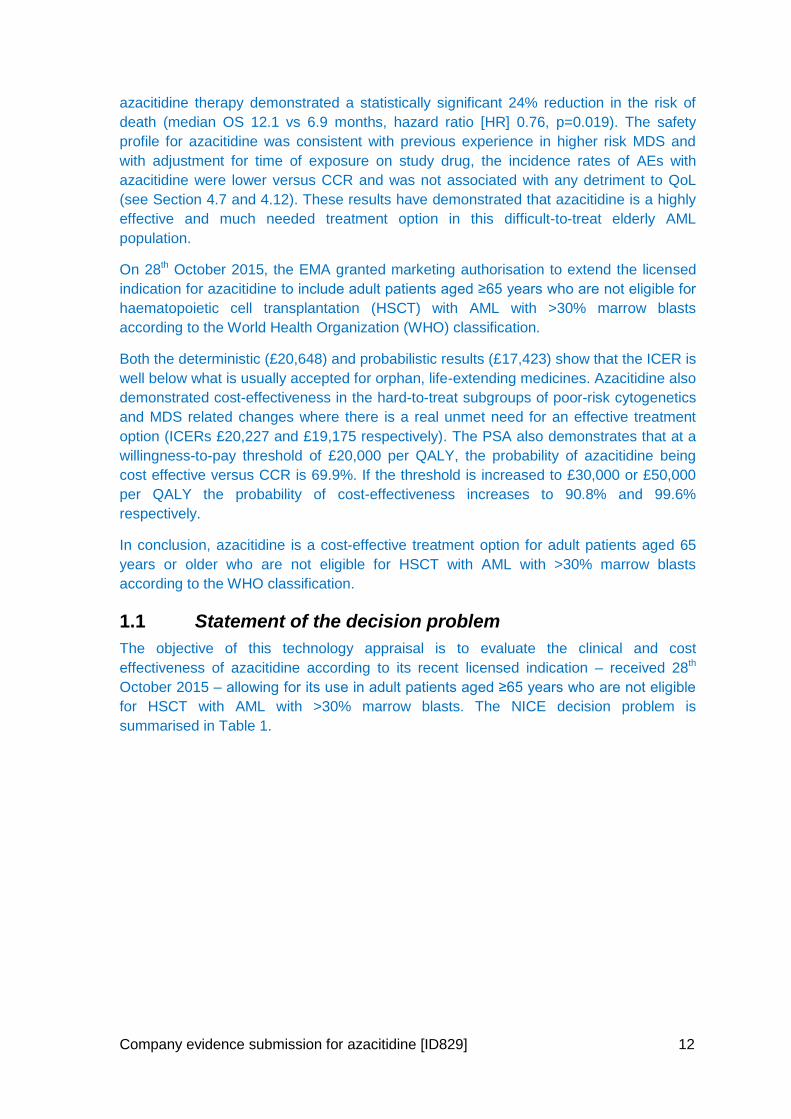
Company evidence submission for azacitidine [ID829] 12
azacitidine therapy demonstrated a statistically significant 24% reduction in the risk of
death (median OS 12.1 vs 6.9 months, hazard ratio [HR] 0.76, p=0.019). The safety
profile for azacitidine was consistent with previous experience in higher risk MDS and
with adjustment for time of exposure on study drug, the incidence rates of AEs with
azacitidine were lower versus CCR and was not associated with any detriment to QoL
(see Section 4.7 and 4.12). These results have demonstrated that azacitidine is a highly
effective and much needed treatment option in this difficult-to-treat elderly AML
population.
On 28th October 2015, the EMA granted marketing authorisation to extend the licensed
indication for azacitidine to include adult patients aged ≥65 years who are not eligible for
haematopoietic cell transplantation (HSCT) with AML with >30% marrow blasts
according to the World Health Organization (WHO) classification.
Both the deterministic (£20,648) and probabilistic results (£17,423) show that the ICER is
well below what is usually accepted for orphan, life-extending medicines. Azacitidine also
demonstrated cost-effectiveness in the hard-to-treat subgroups of poor-risk cytogenetics
and MDS related changes where there is a real unmet need for an effective treatment
option (ICERs £20,227 and £19,175 respectively). The PSA also demonstrates that at a
willingness-to-pay threshold of £20,000 per QALY, the probability of azacitidine being
cost effective versus CCR is 69.9%. If the threshold is increased to £30,000 or £50,000
per QALY the probability of cost-effectiveness increases to 90.8% and 99.6%
respectively.
In conclusion, azacitidine is a cost-effective treatment option for adult patients aged 65
years or older who are not eligible for HSCT with AML with >30% marrow blasts
according to the WHO classification.
1.1 Statement of the decision problem
The objective of this technology appraisal is to evaluate the clinical and cost
effectiveness of azacitidine according to its recent licensed indication – received 28th
October 2015 – allowing for its use in adult patients aged ≥65 years who are not eligible
for HSCT with AML with >30% marrow blasts. The NICE decision problem is
summarised in Table 1.
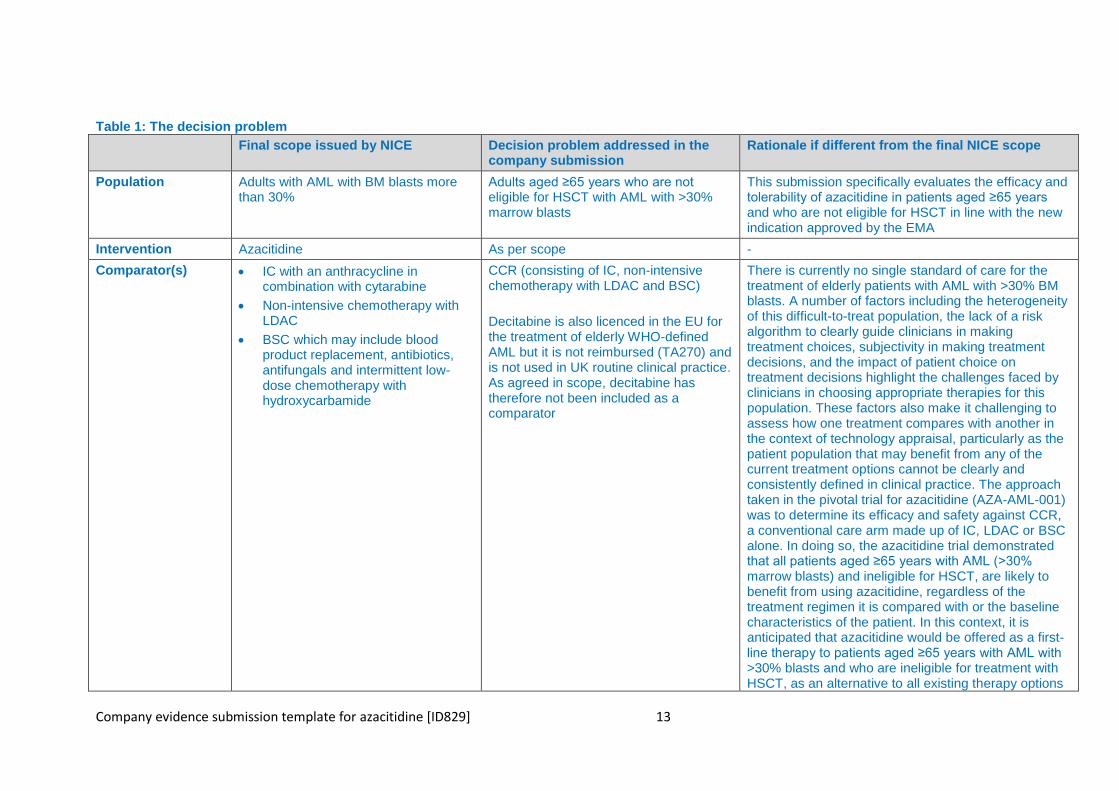
Company evidence submission template for azacitidine [ID829] 13
Table 1: The decision problem
Final scope issued by NICE Decision problem addressed in the company submission
Rationale if different from the final NICE scope
Population Adults with AML with BM blasts more than 30%
Adults aged ≥65 years who are not eligible for HSCT with AML with >30% marrow blasts
This submission specifically evaluates the efficacy and tolerability of azacitidine in patients aged ≥65 years and who are not eligible for HSCT in line with the new indication approved by the EMA
Intervention Azacitidine As per scope -
Comparator(s) IC with an anthracycline in combination with cytarabine
Non-intensive chemotherapy with LDAC
BSC which may include blood product replacement, antibiotics, antifungals and intermittent low-dose chemotherapy with hydroxycarbamide
CCR (consisting of IC, non-intensive chemotherapy with LDAC and BSC)
Decitabine is also licenced in the EU for the treatment of elderly WHO-defined AML but it is not reimbursed (TA270) and is not used in UK routine clinical practice. As agreed in scope, decitabine has therefore not been included as a comparator
There is currently no single standard of care for the treatment of elderly patients with AML with >30% BM blasts. A number of factors including the heterogeneity of this difficult-to-treat population, the lack of a risk algorithm to clearly guide clinicians in making treatment choices, subjectivity in making treatment decisions, and the impact of patient choice on treatment decisions highlight the challenges faced by clinicians in choosing appropriate therapies for this population. These factors also make it challenging to assess how one treatment compares with another in the context of technology appraisal, particularly as the patient population that may benefit from any of the current treatment options cannot be clearly and consistently defined in clinical practice. The approach taken in the pivotal trial for azacitidine (AZA-AML-001) was to determine its efficacy and safety against CCR, a conventional care arm made up of IC, LDAC or BSC alone. In doing so, the azacitidine trial demonstrated that all patients aged ≥65 years with AML (>30% marrow blasts) and ineligible for HSCT, are likely to benefit from using azacitidine, regardless of the treatment regimen it is compared with or the baseline characteristics of the patient. In this context, it is anticipated that azacitidine would be offered as a first-line therapy to patients aged ≥65 years with AML with >30% blasts and who are ineligible for treatment with HSCT, as an alternative to all existing therapy options
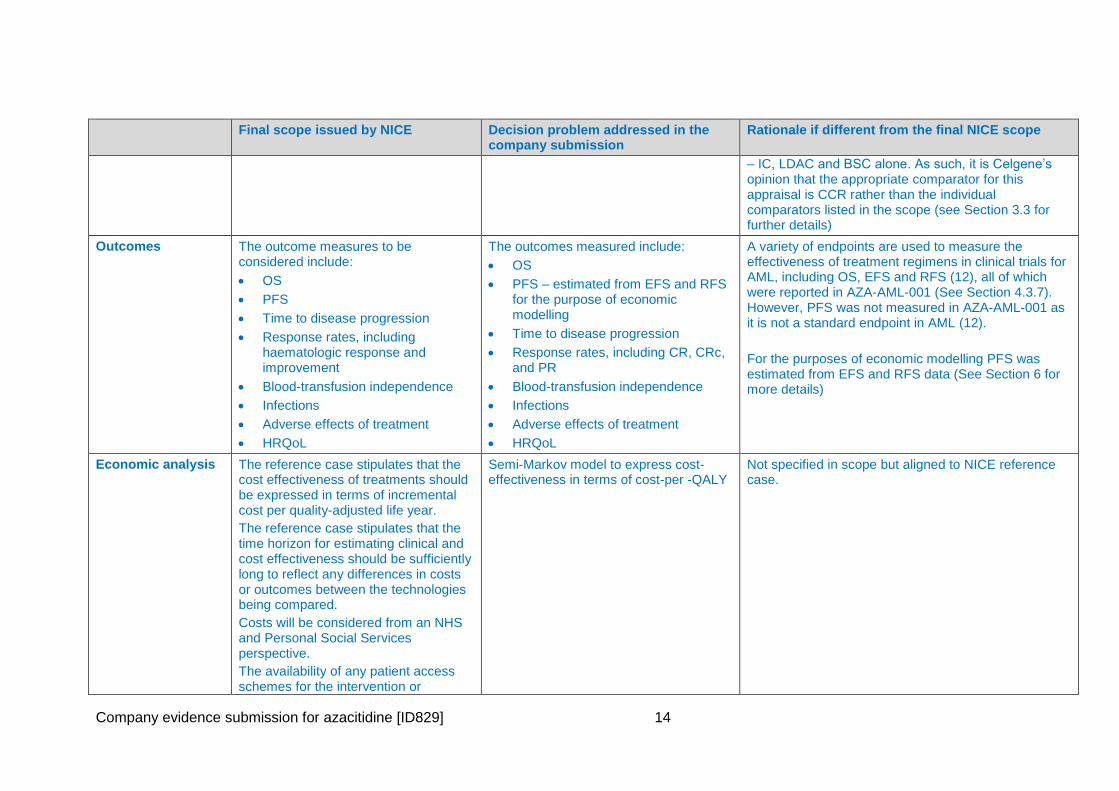
Company evidence submission for azacitidine [ID829] 14
Final scope issued by NICE Decision problem addressed in the company submission
Rationale if different from the final NICE scope
– IC, LDAC and BSC alone. As such, it is Celgene’s opinion that the appropriate comparator for this appraisal is CCR rather than the individual comparators listed in the scope (see Section 3.3 for further details)
Outcomes The outcome measures to be considered include:
OS
PFS
Time to disease progression
Response rates, including haematologic response and improvement
Blood-transfusion independence
Infections
Adverse effects of treatment
HRQoL
The outcomes measured include:
OS
PFS – estimated from EFS and RFS for the purpose of economic modelling
Time to disease progression
Response rates, including CR, CRc, and PR
Blood-transfusion independence
Infections
Adverse effects of treatment
HRQoL
A variety of endpoints are used to measure the effectiveness of treatment regimens in clinical trials for AML, including OS, EFS and RFS (12), all of which were reported in AZA-AML-001 (See Section 4.3.7). However, PFS was not measured in AZA-AML-001 as it is not a standard endpoint in AML (12).
For the purposes of economic modelling PFS was estimated from EFS and RFS data (See Section 6 for more details)
Economic analysis The reference case stipulates that the cost effectiveness of treatments should be expressed in terms of incremental cost per quality-adjusted life year.
The reference case stipulates that the time horizon for estimating clinical and cost effectiveness should be sufficiently long to reflect any differences in costs or outcomes between the technologies being compared.
Costs will be considered from an NHS and Personal Social Services perspective.
The availability of any patient access schemes for the intervention or
Semi-Markov model to express cost-effectiveness in terms of cost-per -QALY
Not specified in scope but aligned to NICE reference case.
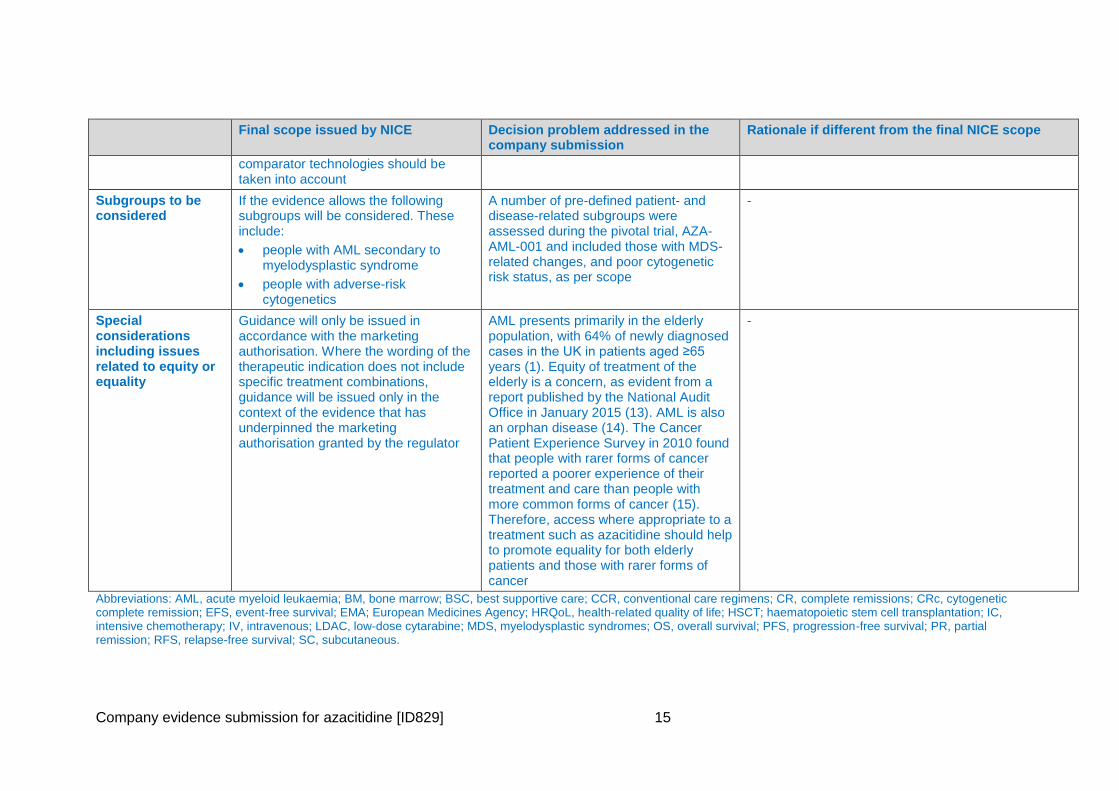
Company evidence submission for azacitidine [ID829] 15
Final scope issued by NICE Decision problem addressed in the company submission
Rationale if different from the final NICE scope
comparator technologies should be taken into account
Subgroups to be considered
If the evidence allows the following subgroups will be considered. These include:
people with AML secondary to myelodysplastic syndrome
people with adverse-risk cytogenetics
A number of pre-defined patient- and disease-related subgroups were assessed during the pivotal trial, AZA-AML-001 and included those with MDS-related changes, and poor cytogenetic risk status, as per scope
-
Special considerations including issues related to equity or equality
Guidance will only be issued in accordance with the marketing authorisation. Where the wording of the therapeutic indication does not include specific treatment combinations, guidance will be issued only in the context of the evidence that has underpinned the marketing authorisation granted by the regulator
AML presents primarily in the elderly population, with 64% of newly diagnosed cases in the UK in patients aged ≥65 years (1). Equity of treatment of the elderly is a concern, as evident from a report published by the National Audit Office in January 2015 (13). AML is also an orphan disease (14). The Cancer Patient Experience Survey in 2010 found that people with rarer forms of cancer reported a poorer experience of their treatment and care than people with more common forms of cancer (15). Therefore, access where appropriate to a treatment such as azacitidine should help to promote equality for both elderly patients and those with rarer forms of cancer
-
Abbreviations: AML, acute myeloid leukaemia; BM, bone marrow; BSC, best supportive care; CCR, conventional care regimens; CR, complete remissions; CRc, cytogenetic complete remission; EFS, event-free survival; EMA; European Medicines Agency; HRQoL, health-related quality of life; HSCT; haematopoietic stem cell transplantation; IC, intensive chemotherapy; IV, intravenous; LDAC, low-dose cytarabine; MDS, myelodysplastic syndromes; OS, overall survival; PFS, progression-free survival; PR, partial remission; RFS, relapse-free survival; SC, subcutaneous.
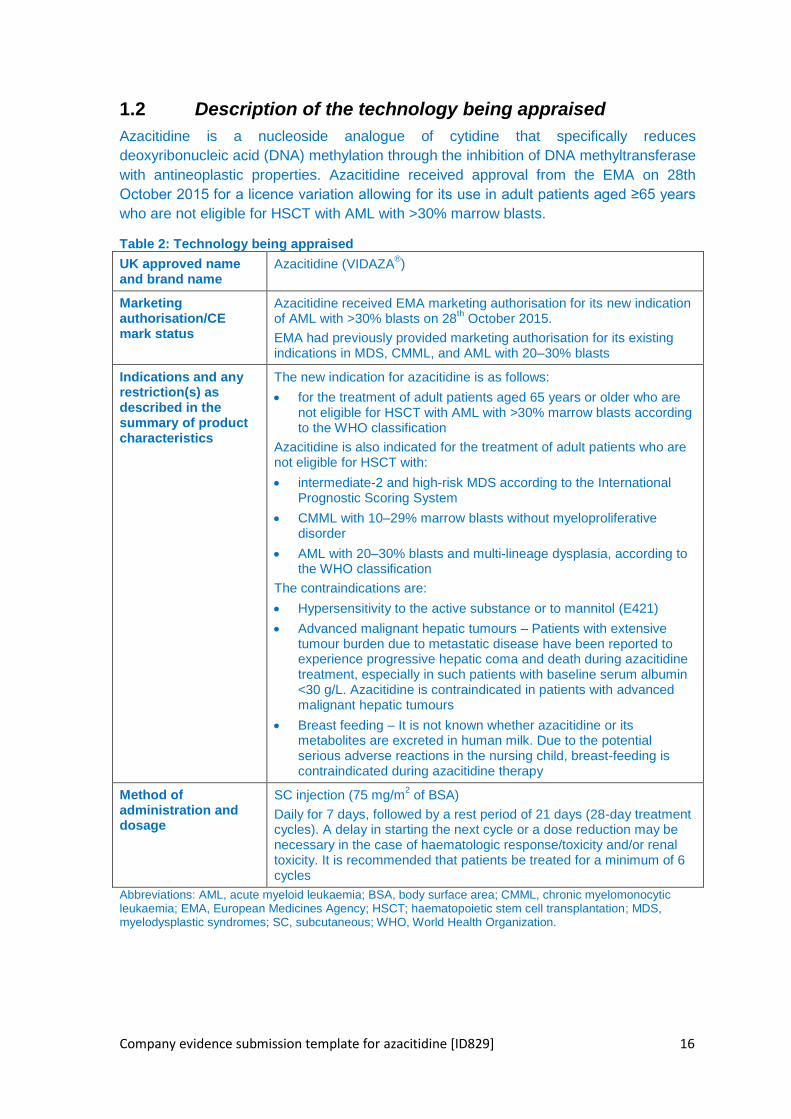
Company evidence submission template for azacitidine [ID829] 16
1.2 Description of the technology being appraised
Azacitidine is a nucleoside analogue of cytidine that specifically reduces
deoxyribonucleic acid (DNA) methylation through the inhibition of DNA methyltransferase
with antineoplastic properties. Azacitidine received approval from the EMA on 28th
October 2015 for a licence variation allowing for its use in adult patients aged ≥65 years
who are not eligible for HSCT with AML with >30% marrow blasts.
Table 2: Technology being appraised
UK approved name and brand name
Azacitidine (VIDAZA®)
Marketing authorisation/CE mark status
Azacitidine received EMA marketing authorisation for its new indication of AML with >30% blasts on 28
th October 2015.
EMA had previously provided marketing authorisation for its existing indications in MDS, CMML, and AML with 20–30% blasts
Indications and any restriction(s) as described in the summary of product characteristics
The new indication for azacitidine is as follows:
for the treatment of adult patients aged 65 years or older who are not eligible for HSCT with AML with >30% marrow blasts according to the WHO classification
Azacitidine is also indicated for the treatment of adult patients who are not eligible for HSCT with:
intermediate-2 and high-risk MDS according to the International Prognostic Scoring System
CMML with 10–29% marrow blasts without myeloproliferative disorder
AML with 20–30% blasts and multi-lineage dysplasia, according to the WHO classification
The contraindications are:
Hypersensitivity to the active substance or to mannitol (E421)
Advanced malignant hepatic tumours – Patients with extensive tumour burden due to metastatic disease have been reported to experience progressive hepatic coma and death during azacitidine treatment, especially in such patients with baseline serum albumin <30 g/L. Azacitidine is contraindicated in patients with advanced malignant hepatic tumours
Breast feeding – It is not known whether azacitidine or its metabolites are excreted in human milk. Due to the potential serious adverse reactions in the nursing child, breast-feeding is contraindicated during azacitidine therapy
Method of administration and dosage
SC injection (75 mg/m2 of BSA)
Daily for 7 days, followed by a rest period of 21 days (28-day treatment cycles). A delay in starting the next cycle or a dose reduction may be necessary in the case of haematologic response/toxicity and/or renal toxicity. It is recommended that patients be treated for a minimum of 6 cycles
Abbreviations: AML, acute myeloid leukaemia; BSA, body surface area; CMML, chronic myelomonocytic leukaemia; EMA, European Medicines Agency; HSCT; haematopoietic stem cell transplantation; MDS, myelodysplastic syndromes; SC, subcutaneous; WHO, World Health Organization.
Company evidence submission for azacitidine [ID829] 17
1.3 Summary of the clinical effectiveness analysis
Evidence supporting the efficacy and safety of azacitidine comes from a single pivotal
regulatory trial, AZA-AML-001. The trial was a large (n=488), international, multicentre,
controlled Phase 3 study with an open-label, randomised, parallel-group design, which
evaluated the efficacy and tolerability of azacitidine versus CCR (consisting of IC, LDAC
or BSC alone) for the treatment of elderly patients (aged ≥65 years) with AML with >30%
BM blasts who are ineligible for HSCT. The body of evidence from this study
demonstrates that azacitidine provides an effective and tolerable treatment option in this
difficult-to-treat patient population, and can be considered a highly effective option for
elderly patients with complex patient- and disease-related prognostic factors.
1.3.1 Efficacy demonstrated in AZA-AML-001
In summary, AZA-AML-001 showed the following:
Azacitidine treatment reduced the risk of death by 15% (HR: 0.85; 95% confidence
interval [CI]: 0.69, 1.03, stratified p=0.1009, unstratified p=0.082), with a median OS
of 10.4 months compared with 6.5 months for CCR (primary endpoint).
Although the log-rank test did not reach statistical significance, a clinically significant
improvement in OS of 3.8 months was observed. The median OS of 10.4 months
represents the largest OS benefit seen with a low-intensity therapy in elderly AML
(16).
The 1-year survival estimate was 46.5% in the azacitidine arm, with a clinically
meaningful benefit of 12.3% over the CCR arm. This is the greatest 1-year survival
reported in an elderly population of patients with AML to date (9, 17-23).
When censoring subjects for first subsequent AML therapy, risk of death was
statistically significantly reduced by 24% (HR: 0.76; 95% CI: 0.60, 0.96, stratified
p=0.019, median OS 12.1 months vs. 6.9 months), demonstrating that subsequent
AML therapy has a significant impact on the results, leading to an underestimation of
the effect of azacitidine.
Post-hoc Cox proportional hazards (PH) and inverse probability of censoring weighted
(IPCW)-adjusted Cox PH analyses support these results, demonstrating that when
subsequent therapy and baseline prognostic factors are adjusted for, azacitidine has
a statistically significant survival benefit (Cox PH analyses: risk of death reduced by
25–31%, all p<0.05; CCR-adjusted IPCW Cox PH analyses: risk of death reduced by
19–25%, all p<0.05).
In pre-defined exploratory analyses assessing the individual treatment components of
the CCR group, median OS was greater for azacitidine compared with LDAC
(11.2 months vs. 6.4 months, respectively, p=0.4270), IC (13.2 months vs. 12.2
months, respectively, p=0.5032), and BSC only (5.8 months vs. 3.7 months,
respectively, p=0.0288). These results must be interpreted with caution as the study
was not powered to detect differences between azacitidine and individual treatments.
Pre-defined univariate sub-group analyses showed favourable trends in survival in
favour of azacitidine versus CCR across all sub-groups (HR<1), including baseline
patient- and disease-related prognostic factors.
Measures of haematologic response, duration of remission, and relapse-free survival
(RFS) were similar between the azacitidine and CCR treatment arms.
Company evidence submission for azacitidine [ID829] 18
Although CR rates were similar between azacitidine and CCR (20% vs 22%), a CR
was not pre-requisite for OS benefit with azacitidine. In a post-hoc analysis of patients
who did not obtain a CR, median OS was significantly longer for azacitidine vs CCR
(6.9 vs 4.2 months; HR 0.77, p=0.017) with estimated 1-year survival of 33.8% vs
20.4%, respectively.
A trend for improved event-free survival (EFS) in favour of the azacitidine group
compared with CCR was also observed, and azacitidine was associated with an
overall benefit in achieving both red blood cell (RBC) (38.5% vs 27.6%) and platelet
transfusion (40.6% vs 29.3%) independence.
There was no meaningful deterioration in health-related quality of life (HRQoL)
associated with prolongation of OS in the azacitidine group during treatment. Further,
azacitidine and CCR were associated with general improvement in HRQoL in the four
pre-specified HRQoL questionnaire (EORTC QLQ-C30) domains of fatigue,
dyspnoea, global health status and physical functioning.
1.3.2 Safety profile
In AZA-AML-001 azacitidine was generally well tolerated, with more than 50% of
subjects in the azacitidine treatment group receiving six or more treatment cycles, and
one-third receiving 12 or more cycles.
As expected, and considering the underlying disease and the known pharmacology of
azacitidine, the most common AEs in the azacitidine arm were constipation (41.9%),
nausea (39.8%), pyrexia (37.7%), diarrhoea (36.9%), febrile neutropenia (32.2%),
neutropenia (30.1%), and thrombocytopenia (27.1%). The most frequent serious adverse
events (SAEs) reported in the azacitidine group included febrile neutropenia (25.0%),
pneumonia (20.3%), AML (11.0%), and pyrexia (10.6%).
Azacitidine has been marketed and widely used in adults with MDS and AML in the EU
since 2008 and the favourable tolerability profile of azacitidine observed in AZA-AML-001
is consistent with that previously observed and reported with azacitidine in these existing
indications (24, 25). Given the imbalances in treatment duration between the treatment
groups, when adjusting for duration of exposure, the incidence rates for the majority of
AEs were either similar or lower in azacitidine-treated subjects compared to the
individual CCR groups, with no additional risks observed over these currently used
regimens. These results indicate that azacitidine has a favourable safety profile in the
treatment of elderly patients with AML.
1.3.3 Strengths and limitations of the evidence base
Study AZA-AML-001 was conducted at 98 sites across 18 countries, including 5 sites in
the UK and provides the pivotal evidence supporting the regulatory approval of
azacitidine for the treatment of AML with BM blasts >30% in elderly patients who are
ineligible for HSCT. The study successfully addresses the decision problem, providing
evidence in the appropriate population versus a range of treatments currently used in
clinical practice – defined as CCR – and reporting a number of efficacy, safety and
quality of life endpoints.
Company evidence submission for azacitidine [ID829] 19
The primary endpoint of OS is considered the most reliable endpoint for cancer studies,
as it is an objective and direct measure of the treatment benefit that is most clinically
meaningful to this patient population.
The patient population is representative of the population covered by the licence and the
population that would be treated in clinical practice. Due to the nature of the disease and
the age of the patients, this population is highly heterogeneous with a number of adverse
disease- and patient-related prognostic factors associated with it. In study AZA-AML-001
>20% of patients had an Eastern Cooperative Oncology Group (ECOG) performance
status of 2, >50% had poor cytogenetic risk and/or MDS-related changes, and >50%
were aged ≥75 years. This high degree of heterogeneity means that there is no standard
of care for elderly patients with AML and there is no widely accepted risk algorithm which
clinicians use when deciding which patients are most likely to benefit from intensive or
non-intensive treatment options. Treatment decisions remain complex and subjective
based on the judgement of the individual clinician (26, 27), and patient choice/motivation
can supersede any clinical attempt to determine eligibility for various treatment options
(23).
To overcome these difficulties, study AZA-AML-001 was powered to compare the
efficacy and tolerability of azacitidine versus a composite comparator, CCR, combining
all patients, irrespective of treatment regimen and prognostic patient- and disease-
related factors, into one patient population. This approach of comparing with a composite
comparator has been recognised and accepted by NICE in its previous appraisal of
azacitidine (TA218) (28), as well as in other disease areas (e.g. TA254 in relapsing
remitting multiple sclerosis) (29).
Limitations of the evidence supporting azacitidine stem largely from factors inherent in
cancer trials, such as the impact of subsequent therapies on the results, as well as the
heterogeneity of the AML patient population treated. The lack of statistical significance
observed in the primary OS analysis in AZA-AML-001 may reflect the convergence of the
survival curves beyond 22 months which is expected for a condition without a cure and a
poor prognosis, and the choice of a non-parametric statistical test (log-rank test) in line
with many clinical trials. This is likely to have led to an underestimation in the treatment
effect of azacitidine. Furthermore, possible imbalances in subsequent therapy between
treatment arms are recognised as a problem in cancer trials which use OS as a primary
endpoint (30). When censoring patients who received a subsequent AML therapy, a
statistically significant reduction in the risk of death was observed with azacitidine
treatment versus CCR (OS: 12.1 vs. 6.9 months, respectively; p=0.019).
In addition, univariate analysis demonstrated the heterogeneity inherent in the elderly
AML population, with a median OS between subgroups ranging from 4.8 months to
17 months (in the azacitidine arm). However, azacitidine provides a consistent survival
benefit across all subgroups (HR for OS<1), with the strongest effect (HR≤0.71) seen in
patients with MDS-related changes, prior MDS and poor risk cytogenetics. Cox-PH and
IPCW-adjusted Cox PH analyses which adjusted for subsequent therapies and
prognostic factors elicited a statistically significant reduction in the overall risk of death
with azacitidine when compared with CCR.
Therefore, while the primary endpoint of the trial was not met, the study successfully
demonstrated that there were a number of confounding factors which led to the
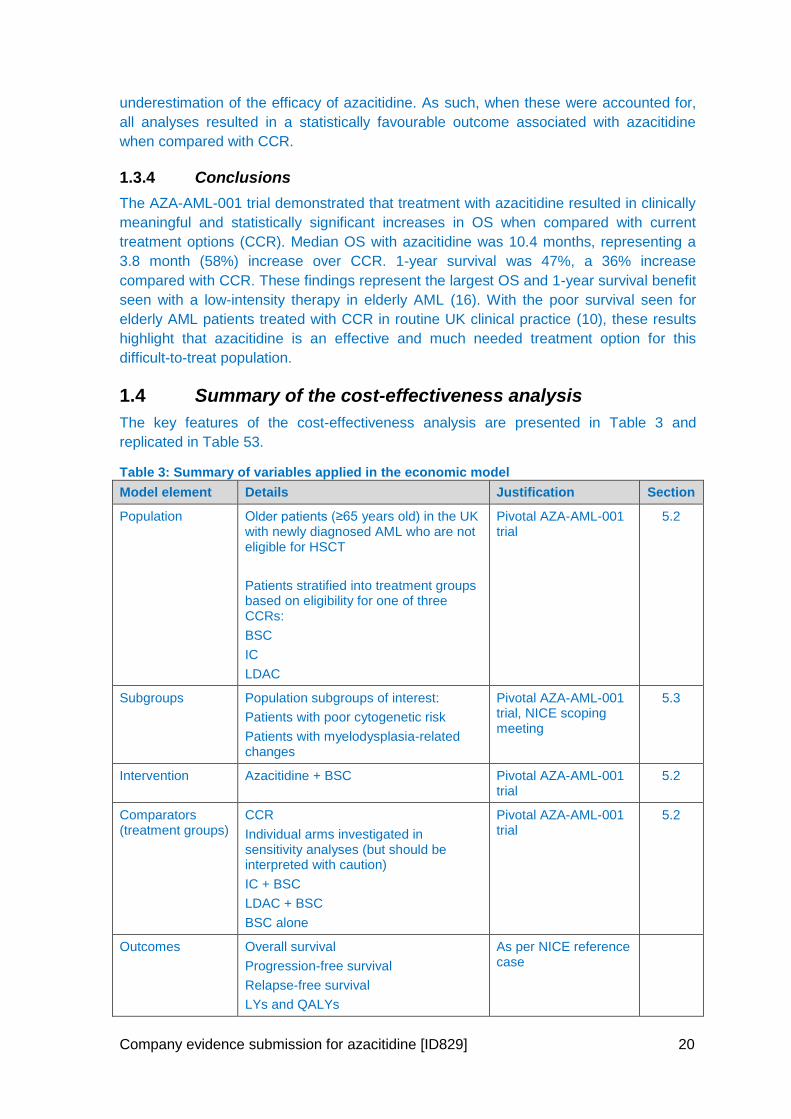
Company evidence submission for azacitidine [ID829] 20
underestimation of the efficacy of azacitidine. As such, when these were accounted for,
all analyses resulted in a statistically favourable outcome associated with azacitidine
when compared with CCR.
1.3.4 Conclusions
The AZA-AML-001 trial demonstrated that treatment with azacitidine resulted in clinically
meaningful and statistically significant increases in OS when compared with current
treatment options (CCR). Median OS with azacitidine was 10.4 months, representing a
3.8 month (58%) increase over CCR. 1-year survival was 47%, a 36% increase
compared with CCR. These findings represent the largest OS and 1-year survival benefit
seen with a low-intensity therapy in elderly AML (16). With the poor survival seen for
elderly AML patients treated with CCR in routine UK clinical practice (10), these results
highlight that azacitidine is an effective and much needed treatment option for this
difficult-to-treat population.
1.4 Summary of the cost-effectiveness analysis
The key features of the cost-effectiveness analysis are presented in Table 3 and
replicated in Table 53.
Table 3: Summary of variables applied in the economic model
Model element Details Justification Section
Population Older patients (≥65 years old) in the UK with newly diagnosed AML who are not eligible for HSCT
Patients stratified into treatment groups based on eligibility for one of three CCRs:
BSC
IC
LDAC
Pivotal AZA-AML-001 trial
5.2
Subgroups Population subgroups of interest:
Patients with poor cytogenetic risk
Patients with myelodysplasia-related changes
Pivotal AZA-AML-001 trial, NICE scoping meeting
5.3
Intervention Azacitidine + BSC Pivotal AZA-AML-001 trial
5.2
Comparators (treatment groups)
CCR
Individual arms investigated in sensitivity analyses (but should be interpreted with caution)
IC + BSC
LDAC + BSC
BSC alone
Pivotal AZA-AML-001 trial
5.2
Outcomes Overall survival
Progression-free survival
Relapse-free survival
LYs and QALYs
As per NICE reference case
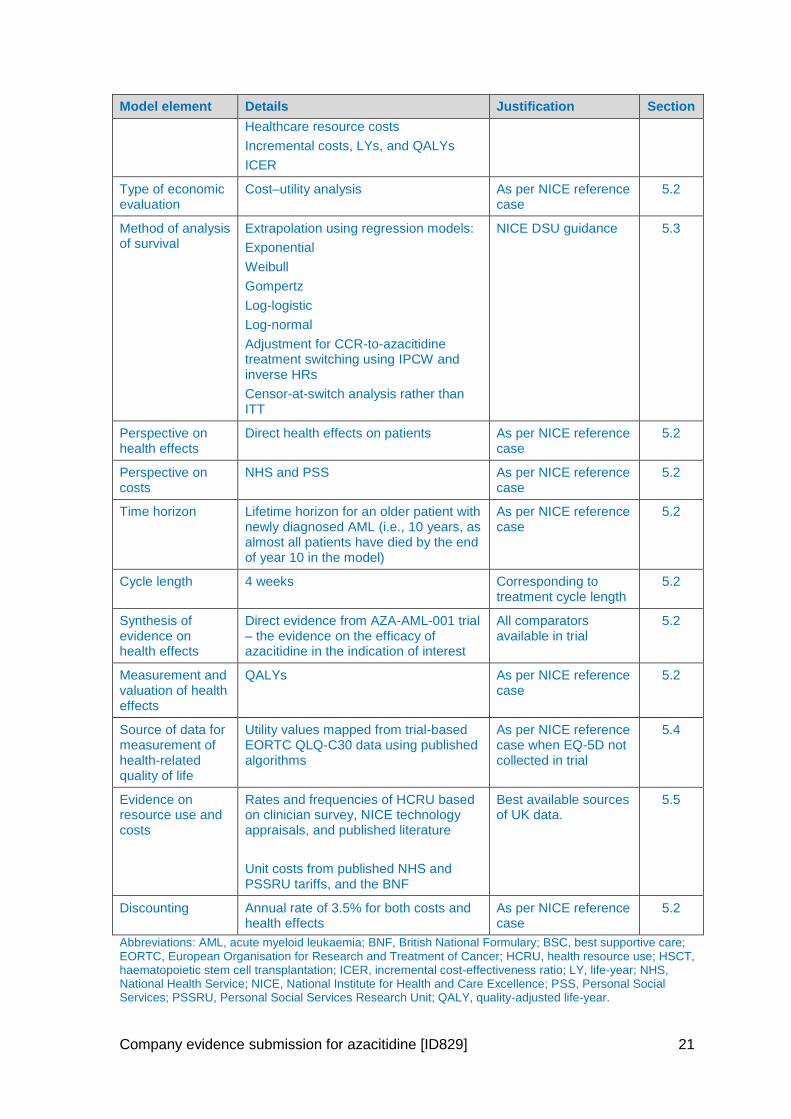
Company evidence submission for azacitidine [ID829] 21
Model element Details Justification Section
Healthcare resource costs
Incremental costs, LYs, and QALYs
ICER
Type of economic evaluation
Cost–utility analysis As per NICE reference case
5.2
Method of analysis of survival
Extrapolation using regression models:
Exponential
Weibull
Gompertz
Log-logistic
Log-normal
Adjustment for CCR-to-azacitidine treatment switching using IPCW and inverse HRs
Censor-at-switch analysis rather than ITT
NICE DSU guidance 5.3
Perspective on health effects
Direct health effects on patients As per NICE reference case
5.2
Perspective on costs
NHS and PSS As per NICE reference case
5.2
Time horizon Lifetime horizon for an older patient with newly diagnosed AML (i.e., 10 years, as almost all patients have died by the end of year 10 in the model)
As per NICE reference case
5.2
Cycle length 4 weeks Corresponding to treatment cycle length
5.2
Synthesis of evidence on health effects
Direct evidence from AZA-AML-001 trial – the evidence on the efficacy of azacitidine in the indication of interest
All comparators available in trial
5.2
Measurement and valuation of health effects
QALYs As per NICE reference case
5.2
Source of data for measurement of health-related quality of life
Utility values mapped from trial-based EORTC QLQ-C30 data using published algorithms
As per NICE reference case when EQ-5D not collected in trial
5.4
Evidence on resource use and costs
Rates and frequencies of HCRU based on clinician survey, NICE technology appraisals, and published literature
Unit costs from published NHS and PSSRU tariffs, and the BNF
Best available sources of UK data.
5.5
Discounting Annual rate of 3.5% for both costs and health effects
As per NICE reference case
5.2
Abbreviations: AML, acute myeloid leukaemia; BNF, British National Formulary; BSC, best supportive care; EORTC, European Organisation for Research and Treatment of Cancer; HCRU, health resource use; HSCT, haematopoietic stem cell transplantation; ICER, incremental cost-effectiveness ratio; LY, life-year; NHS, National Health Service; NICE, National Institute for Health and Care Excellence; PSS, Personal Social Services; PSSRU, Personal Social Services Research Unit; QALY, quality-adjusted life-year.
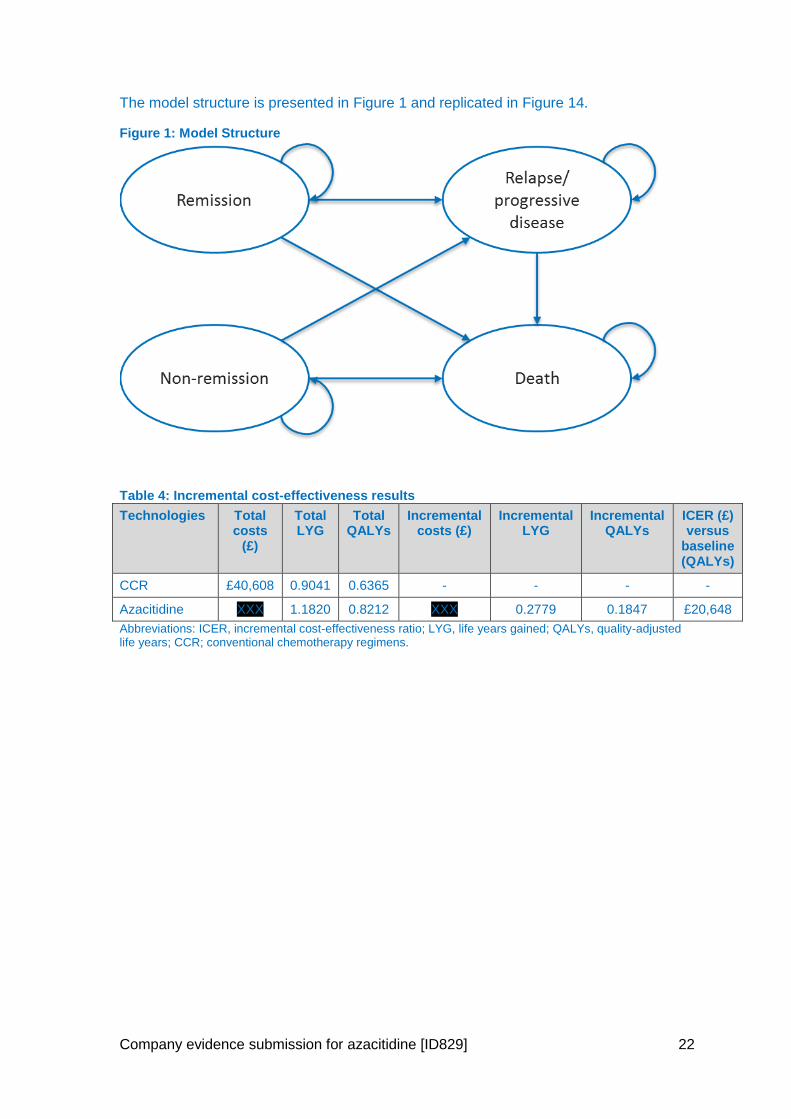
Company evidence submission for azacitidine [ID829] 22
The model structure is presented in Figure 1 and replicated in Figure 14.
Figure 1: Model Structure
Table 4: Incremental cost-effectiveness results
Technologies Total costs
(£)
Total LYG
Total QALYs
Incremental costs (£)
Incremental LYG
Incremental QALYs
ICER (£) versus
baseline (QALYs)
CCR £40,608 0.9041 0.6365 - - - -
Azacitidine XXX 1.1820 0.8212 XXX 0.2779 0.1847 £20,648
Abbreviations: ICER, incremental cost-effectiveness ratio; LYG, life years gained; QALYs, quality-adjusted life years; CCR; conventional chemotherapy regimens.
Company evidence submission for azacitidine [ID829] 23
2 The technology
2.1 Description of the technology
Brand name: VIDAZA®
UK approved name: Azacitidine
Therapeutic class: Epigenetic therapy and pyrimidine analogue
Mechanism of action: Azacitidine is a nucleoside analogue of natural occurring cytidine
(31). The mechanism of action of azacitidine is not currently fully understood, but it is
believed to exert its antineoplastic effects by multiple mechanisms, including (SmPC,
Appendix 1):
1. hypomethylation of DNA and
2. cytotoxicity on abnormal haematopoietic cells in the BM
As shown in Figure 2, in AML, blast cells undergo abnormal DNA hypermethylation,
leading to the silencing of tumour suppressing genes, with a resulting loss of cell
differentiation, increased proliferation, and a reduction in cell death (32). During cell
division, azacitidine becomes incorporated into DNA in place of cytidine. Azacitidine
cannot be methylated by DNA methyltransferase and the enzyme becomes permanently
attached to the DNA (33). This abnormal DNA-protein adduct is recognised by the cell
and is subsequently degraded by the proteasomal degradation pathway, leading to a
further reduction in DNA methylation (33). Reducing DNA methylation leads to the re-
expression of silenced tumour-suppressor genes (34), and the restoration of cancer-
suppressing functions to cancer cells (31).
The cytotoxic effects of azacitidine may result from multiple mechanisms, including
inhibition of DNA, RNA and protein synthesis, incorporation into RNA and DNA, and
activation of DNA damage pathways (SmPC, Appendix 1).
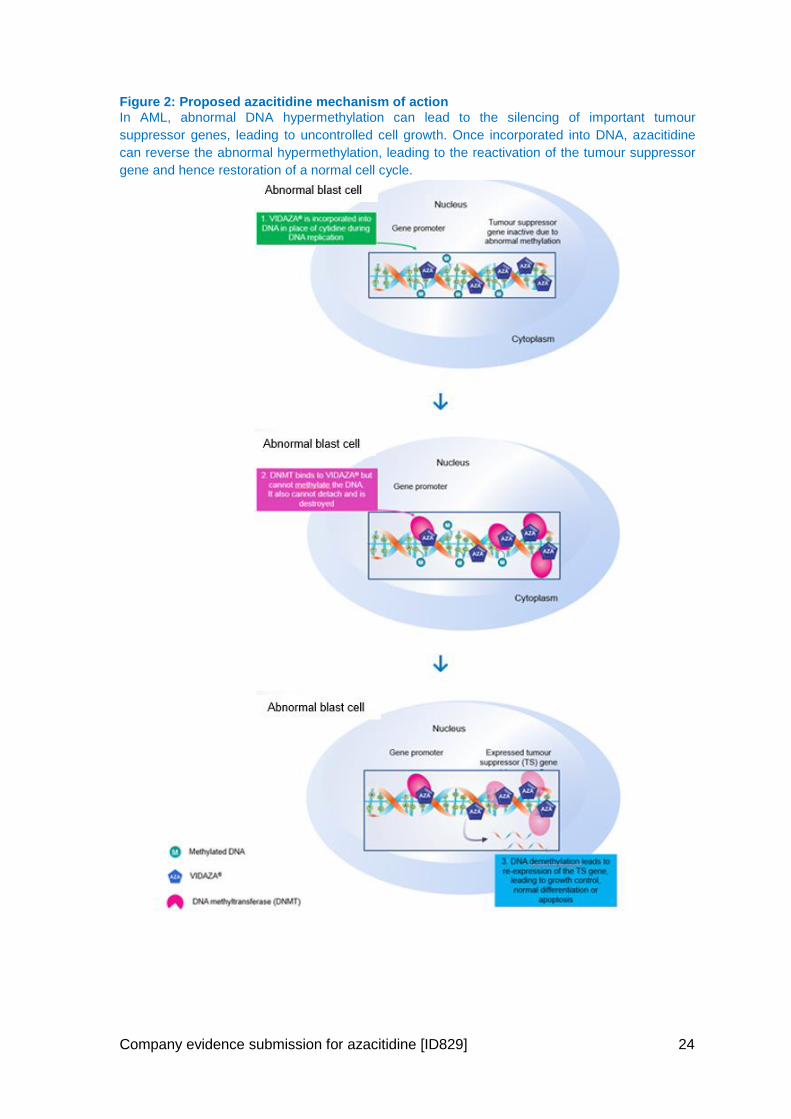
Company evidence submission for azacitidine [ID829] 24
Figure 2: Proposed azacitidine mechanism of action
In AML, abnormal DNA hypermethylation can lead to the silencing of important tumour
suppressor genes, leading to uncontrolled cell growth. Once incorporated into DNA, azacitidine
can reverse the abnormal hypermethylation, leading to the reactivation of the tumour suppressor
gene and hence restoration of a normal cell cycle.
Company evidence submission for azacitidine [ID829] 25
2.2 Marketing authorisation/CE marking and health technology assessment
2.2.1 Marketing authorisation/CE marking
For the new indication considered in this submission:
Regulatory submission to EMA: 23rd December 2014
CHMP positive opinion: 24th September 2015
Marketing authorisation: 28th October 2015
2.2.2 Indication(s) in the UK
The new indication is as follows:
Azacitidine is indicated for the treatment of adult patients aged 65 years or older who
are not eligible for HSCT with AML with >30% marrow blasts according to the WHO
classification
Azacitidine is also indicated for the treatment of:
intermediate-2 and high-risk myelodysplastic syndromes (MDS) according to the
International Prognostic Scoring System,
chronic myelomonocytic leukaemia with 10–29% marrow blasts without
myeloproliferative disorder,
acute myeloid leukaemia (AML) with 20–30% blasts and multi-lineage dysplasia,
according to the World Health Organization (WHO) classification.
2.2.3 Restrictions or contraindications
The contraindications listed in the SmPC are:
Hypersensitivity to the active substance or to mannitol (E421)
Advanced malignant hepatic tumours – Patients with extensive tumour burden due to
metastatic disease have been reported to experience progressive hepatic coma and
death during azacitidine treatment, especially in such patients with baseline serum
albumin <30 g/L. Azacitidine is contraindicated in patients with advanced malignant
hepatic tumours.
Breast feeding – It is not known whether azacitidine or its metabolites are excreted in
human milk. Due to the potential serious adverse reactions in the nursing child,
breast-feeding is contraindicated during azacitidine therapy.
2.2.4 SmPC/Information for use and (Draft) assessment report
SmPC and EPAR are provided in Appendix 1.
2.2.5 Main issues discussed by regulatory authorities
During the regulatory process for azacitidine, three main issues were raised by the
CHMP and were subsequently addressed by Celgene.
Company evidence submission for azacitidine [ID829] 26
1. Failure to meet the primary endpoint of the International, multi-centre, open-label, randomised controlled Phase 3 trial (AZA-AML-001).
The CHMP considered the requirement for additional information about the
heterogeneity of the patient population and the influence of such on the primary endpoint
of OS, given that the primary endpoint of the study was not met. Celgene provided
evidence that supported the notion that failure of the primary endpoint was due to an
imbalance in patients’ baseline characteristics/prognostic factors, and the impact of
subsequent therapies. These resulted in an under-estimation of the true treatment effect
of azacitidine versus CCR in elderly patients with AML. The impact of subsequent
therapies has been recognised as a problem in cancer trials which use OS as a primary
endpoint (30).
Celgene conveyed to the CHMP:
the complex interaction of baseline prognostic factors that vary between subjects and
influences treatment decisions and outcomes, and that the interaction of these factors
change as a patient’s disease progresses.
that there was a statistically significant survival benefit in favour of azacitidine when
adjustments were made for the imbalance in baseline prognostic factors
that the subsequent therapies patients received had a significant confounding effect
on the primary (survival) analysis.
2. Inconsistent overall survival results across CCR subpopulations
The CHMP considered the OS results across the CCR subpopulations were inconsistent
and that this is of relevance considering the large heterogeneity of the study population.
The CHMP asked for data on the patients’ baseline characteristics, subsequent
therapies, and safety profiles for each treatment group to be supplied. In addition,
Celgene were asked to explain how these factors impacted the individual treatment
groups and the survival outcomes from the overall CCR population. Celgene also
provided a benefit/risk assessment for each treatment group and discussed the impact of
this on the overall CCR population.
Celgene demonstrated that:
data relating to each of the treatment groups were consistent with that observed in the
literature which further confirmed the observed heterogeneity within each group
the impact of subsequent therapy was deemed to have a significant influence on the
survival estimates and was consistent with that reported in the CCR population
survival estimates within each treatment group were consistent with the distribution of
baseline patient- and disease related prognostic factors. For example, subjects in the
BSC only group had the shortest OS, while subjects in the IC group had the longest
OS
the safety profile of azacitidine within each treatment group was consistent with the
established profile of azacitidine.
3. Clinical benefit
The CHMP requested that Celgene further discussed the extent that azacitidine
produces an additional benefit relative to existing therapy. Celgene explained that the
Company evidence submission for azacitidine [ID829] 27
new indication addresses an unmet medical need at a different stage of the disease in a
population with a greater incidence of poor prognostic factors and reduced survival
outcomes. The CHMP had previously concluded that an additional 1-year market
exclusivity could be granted for the new indication providing that azacitidine
demonstrated superiority in terms of benefit-risk over existing therapies in this
population. A one year marketing protection was subsequently approved by the
European Commission.
2.2.6 Anticipated date of availability in the UK
Azacitidine was launched on 17th December 2008 for the treatment of adult patients who
are not eligible for HSCT with:
intermediate-2 and high-risk MDS
chronic myelomonocytic leukaemia with 10–29% BM blasts without myeloproliferative
disorder
AML with 20–30% BM blasts and multi-lineage dysplasia
The UK launch for the new indication in AML >30% marrow blasts is planned for
25th January 2016.
2.2.7 Regulatory approval outside the UK
Table 5: Regulatory approval of azacitidine outside the UK
Indication Locations
AML with ≥30% blasts 28 EU states, Iceland, Norway, Liechtenstein and Mexico
Marketing authorisation is currently being sought in Switzerland, South Korea and Brazil
INT-2 and high risk MDS, CMML and AML with 20–30% blasts
28 European Union states, Iceland, Norway, Liechtenstein, Montenegro, Saudi Arabia, Oman, Macedonia, Bosnia and Herzegovina, Qatar, Serbia, Jordan, Vietnam, Syria, Morocco, El Salvador, Costa Rica, Nicaragua, Tunisia, Uruguay, Panama, Ecuador, Honduras, Columbia, Peru, New Zealand, Singapore, Guatemala, Russia, Chile, Dominican Republic, Malaysia, Bolivia and Australia
INT-2 and high risk MDS Mexico
MDS Japan
High-risk MDS Switzerland and Turkey
INT-2 and high risk MDS, and AML
Canada
RA or RARS, RAEB, RAEB-T, and myelomonocytic leukaemia
USA, South Korea, Israel, Lebanon, Hong Kong, Thailand, Argentina, Macau and South Africa
RAEB, RAEB-T, and myelomonocytic leukaemia
Brazil and Taiwan
Abbreviations: AML, acute myeloid leukaemia; CMML, chronic myelomonocytic leukaemia; EU, European union; INT-2, intermediate-2; MDS, myelodysplastic syndromes, RA, refractory anaemia; RARS, refractory anaemia with ringed sideroblasts; RAEB, refractory anaemia with excess blasts; RAEB-T, refractory anaemia with excess blasts in transformation.
Company evidence submission for azacitidine [ID829] 28
2.2.8 Ongoing HTAs in the rest of the UK
A submission to the SMC is currently planned for the 1st February 2016, and a
submission to the AWMSG has been ruled out after submission of a Form A due to
meeting exclusion criteria number 2 for AWMSG.
2.3 Administration and costs of the technology
Table 6: Costs of the technology being appraised
Cost Source
Pharmaceutical formulation
Powder for suspension for injection.
White lyophilised powder.
Each vial contains 100 mg azacitidine. After reconstitution, each mL of suspension contains 25 mg azacitidine.
SmPC
Acquisition cost (excluding VAT)
†
List price: 100 mg vial: £321.00
Please note, a confidential discount applies as agreed in TA218.
BNF (35)
TA218 (28)
Method of administration
Subcutaneous injection SmPC
Doses Azacitidine is available as 100 mg vials SmPC
Dosing frequency
Daily for 7 days, followed by a rest period of 21 days (28-day treatment cycles). A delay in starting the next cycle or a dose reduction may be necessary in the case of haematologic response/toxicity and/or renal toxicity
SmPC
Average length of a course of treatment
It is recommended that each patient should be treated with a minimum of six cycles. Treatment should be continued for as long as the patient continues to benefit, or until disease progression.
In the AZA-AML-001 trial patients received a median of 6 cycles of treatment in the azacitidine (min, max: 1, 28)
SmPC
AZA-AML-001 (36)
Average cost of a course of treatment
XXX (Calculated from health economic model, using dosing from the AZA-AML-001 study and patients staying on treatment.
Anticipated average interval between courses of treatments
Not applicable SmPC
Anticipated number of repeat courses of treatments
None specified. Treatment is ongoing until the patient no longer benefits from treatment or until disease progression.
SmPC
Dose adjustments
Dose modifications and interruptions are specified within the SmPC for patients experiencing haematological and/or renal toxicity.
Please see Section 4.2 of the SmPC for further information
SmPC
Company evidence submission for azacitidine [ID829] 29
Cost Source
Anticipated care setting
Azacitidine treatment should be initiated and monitored under the supervision of a physician experienced in the use of chemotherapeutic agents.
Abbreviations: SmPC, Summary of Product Characteristics. † Based on the reported list price on 27/10/15.
2.3.1 Patient access scheme
A PAS was agreed as part of TA218 (28) to be applied to all current and future
indications. As such this PAS applies to the new indication of azacitidine considered in
this submission.
2.4 Changes in service provision and management
2.4.1 Additional test/investigations
As seen in Table 49, azacitidine is associated with comparable monitoring requirements
to CCR.
No additional tests or monitoring are required for azacitidine beyond those that are
already part of current clinical practice. Therefore, it is anticipated that no additional NHS
resources will be required.
2.4.2 Main resource use to the NHS associated with the technology
Azacitidine is administered subcutaneously for seven consecutive days during each 28-
day cycle of treatment. As is standard practice for anticancer therapy, azacitidine should
be initiated and monitored under the supervision of a physician experienced in the use of
chemotherapeutic agents. Prior to and during treatment, patients should be monitored for
haematologic response/toxicity and renal toxicities. Liver function tests, serum creatinine
and serum bicarbonate should be determined prior to initiation of therapy and prior to
each treatment cycle. Additionally, complete blood counts are required prior to initiation
of therapy and as required to monitor response and toxicity. As a minimum, complete
blood counts should be performed prior to each treatment cycle.
Monitoring of renal function is recommended in elderly patients, and is required in
patients with renal impairment. In addition, patients with severe hepatic organ
impairment should be carefully monitored for AEs.
As stated above, no additional tests or monitoring are required for azacitidine beyond
those that are already part of current clinical practice. Therefore, it is anticipated that no
additional NHS resources will be required. When compared to CCR, Table 46 shows that
azacitidine requires comparable resource use. However, during induction (or early
treatment), azacitidine requires considerably less inpatient days. This is mainly due to
the fact that IC patients are hospitalised for a long period of time whilst receiving
induction treatment.
2.4.3 Additional infrastructure requirements
Azacitidine is currently used in the NHS to treat patients with intermediate-2 and high-
risk MDS, chronic myelomonocytic leukaemia (CMML) with 10–29% BM blasts without
Company evidence submission for azacitidine [ID829] 30
myeloproliferative disorder, and AML with 20–30% BM blasts and multi-lineage
dysplasia. As such no additional NHS infrastructure is required to accommodate
azacitidine.
2.4.4 Patient monitoring requirements
The level of monitoring required for azacitidine is consistent with other treatments
prescribed for AML. For an overview of the monitoring requirements associated with
treatment with azacitidine, see Section 2.4.2.
2.4.5 Need for concomitant therapies
As per Section 4.2 of the SmPC, patients receiving treatment with azacitidine should be
pre-medicated with anti-emetics to minimise nausea and vomiting. In addition,
subcutaneous adverse reactions such as injection site rash/inflammation/pruritus, rash,
erythema and skin lesion may require management with concomitant medicinal products,
such as antihistamines, corticosteroids and non-steroidal anti-inflammatory medicinal
products.
2.5 Innovation
Azacitidine represents a novel treatment option for this difficult to treat patient population,
and results in a significant survival benefit when compared with other relevant
treatments. In the pivotal azacitidine trial, AZA-AML-001, the observed median OS of
10.4 months – a 3.8 month (58%) increase over CCR – and 1-year survival of 47% – a
36% increase over CCR– represent the largest OS and 1-year survival benefit seen with
a low-intensity therapy in elderly AML (16).
As well as providing an alternative treatment option for patients who would typically
receive low-dose chemotherapy or IC, azacitidine represents a valuable treatment option
for patients who would typically only be eligible for BSC. In this population, treatment
with azacitidine resulted in a median OS of 5.8 months; representing a clinically
significant improvement in OS benefit. Therefore, azacitidine offers an effective and
tolerable treatment option for elderly patients with AML and is likely to represent a step-
change in the treatment pathway for patients with the worst prognostic factors.
Treatment options for elderly patients with AML are limited and survival is poor. A recent
analysis of the HMRN registry highlights the current poor outcomes in UK routine
practice, with a median OS of XXX months for non-transplant-eligible AML patients
65 years or older (10). Therefore, there is a clear unmet need to improve treatment
options and survival outcomes in the population aged 65 years and over (2). This was
acknowledged by a National Audit Office report in 2015 which reported that despite
improvements over recent years there remains considerable scope to improve outcomes
for cancer patients, and that outcomes and access are generally poorer for the elderly
population (13).
Company evidence submission template for azacitidine [ID829] 31
3 Health condition and position of the technology in the treatment pathway
3.1 Disease overview
AML is the most frequent form of leukaemia, accounting for approximately 25% of all
leukaemia cases in adults in the Western world (37). It is an aggressive, clonal myeloid
neoplasm with maturation arrest of myelopoiesis, leading to an accumulation of
myeloblasts in the BM and/or blood. AML is a life threatening disease that primarily
affects older adults. In the UK between 2009 and 2011, an average of 40% of cases
were diagnosed in men and women aged 75 years and over, and almost three quarters
of cases (73%) were diagnosed in those aged 60 and over (1). The median age of
diagnosis is between 65 and 72 years for the entire population, and 78 years when
evaluating the population who are aged over 65 years (7, 9, 38-41).
The annual incidence rate of AML in England has been estimated to be 4.1 per 100,000
(42)). The incidence increases dramatically with older age, rising to 18.35 per 100,000 in
people aged 65 years and over (42), equating to approximately 1,777 new cases of AML
in this patient group in England annually (42-44) (see Section 4.13.2 for derivation of
figures).
AML can arise de novo (primary AML), through transformation of existing
myelodysplasia, or be secondary to previous therapy (e.g. cytotoxic chemotherapy). It is
currently estimated that up to 30% of patients with MDS will progress to develop AML,
with the disease often being refractory to current therapies (45). Pre-existing
myelodysplastic or myeloproliferative disorders are common in elderly patients with AML,
occurring in 24% to 40% of cases (46), whereas therapy-related AML accounts for
approximately 5–10% of all cases (47). The prognosis for patients with MDS-related
changes and/or therapy-related AML is considerably worse than that for patients with
primary AML (48).
The clinical signs and symptoms of AML are diverse and non-specific, but they are
usually directly attributable to the leukaemic infiltration of the BM, with resultant
cytopenias (reduction in blood cell counts). Typically, patients present with signs and
symptoms of fatigue, haemorrhage, and/or infections and fever due to reductions in
RBCs, platelets, and WBCs (48). The corresponding impact on physical and
psychological aspects of quality of life is significant and increases over the course of the
condition (3).
Diagnosis of AML requires the examination of peripheral blood and BM specimens, using
morphology, cytochemistry, immunophenotyping, cytogenetics, and molecular genetics.
According to the WHO classification of myeloid neoplasms, a myeloid neoplasm with
≥20% blasts in the peripheral blood or BM is considered to be AML when occurring de
novo, evolution to AML when it occurs with previous diagnosis of MDS or
myelodysplastic/myeloproliferative neoplasm (49).
Treatment of AML is complex, and can consist of HSCT, IC, low-dose chemotherapy
(e.g. LDAC), azacitidine (existing indication for patients with 20–30% BM blasts) or BSC.
Clinical guidelines for the treatment of elderly patients with AML vary depending on a
Company evidence submission for azacitidine [ID829] 32
variety of disease- and patient-related prognostic factors, with no pre-defined NICE
clinical guidelines available for the treatment of AML.
Significant efforts have been made to identify new treatment modalities in AML.
However, one of the features of AML trials in the last 30 years conducted by all
collaborative groups is how little improvement in OS has been observed. In the UK,
sequential AML trials conducted by the Medical Research Council (now NCRI) Adult
Leukaemia Working Party has seen little evidence of improvement in OS for older
patients (11).
3.2 Burden to patients, carers and society
Survival in patients with AML is highly dependent on a variety of patient- and disease-
related prognostic factors, including increased age, reduced performance status,
comorbidities, vulnerability, frailty, and genetic factors (7, 50-52). As such, elderly
patients with AML face a significantly reduced chance of survival due to the combination
of adverse prognostic factors. This, together with the lower likelihood of response to
treatment, makes the treatment of elderly patients particularly difficult (53, 54). Over the
past 30 years, limited improvement in the survival outcome of elderly AML patients have
been observed. Between 2003 and 2009, 5-year survival estimates in patients aged <65
years were 41.6%. In patients aged ≥65 years only 5.4% of patients were estimated to
be alive (2).
To date, the treatment option with the most favourable outcome for elderly AML patients
is IC. However, in elderly patients, IC has been associated with unsatisfactory results
due to the low rates of complete remission, duration of remission, disease-free survival,
and increased risk of induction-related mortality (7). The combination of poor survival
outcomes and limited treatment options also presents a significant emotional burden to
elderly patients with AML.
When compared with the general population, patients with AML experience a significant
reduction in physical functioning (as determined via the physical component domain of
quality of life assessments), and experience a higher incidence of depression (3).
Furthermore, quality of life deteriorates over time, with a significant reduction observed
as early as 2 weeks after AML diagnosis (3). Patients with AML can also experience
appetite loss and fatigue; both having a negative impact on overall measures of quality of
life (4). The burden of the disease continues until death, with patients frequently suffering
from open bleeding, infection, and pain during the final stages of the disease (5). The
impact is far reaching with caregivers, including family or friends, often having to deal
with numerous and concurrent stressful events, and often suffering negative
psychological, behavioural and physiological effects on their daily lives and their health
(55).
While the emotional and physical burden of the disease has been widely reported, it is
difficult to determine the full economic burden of AML due to the nature of the disease
(for example the variety of treatments used and observed variations in rates of remission
and relapse observed), and published data are limited. For example, one study
estimated the 5-year per-patient cost of medical treatment from the UK NHS perspective
to vary between £8,170 and £81,636 (56). This study highlighted that the costs for
medical treatment can vary significantly, and reflects the complex nature and
Company evidence submission for azacitidine [ID829] 33
heterogeneity of the disease, as well as how the disease is treated. In the Netherlands
the direct lifetime per-patient cost for patients with AML have been estimated at
€151,827 (2001 values), with 50% of costs attributed to induction and consolidation
therapy, and 20% to relapse (57). Therefore, while AML affects a relatively small
proportion of the population, the costs associated with its management can be
substantial.
3.3 Clinical pathway of care
Due to the heterogeneity of disease, there is no standard of care for elderly patients with
AML, resulting in complex treatment guidelines (6, 8, 58, 59). Despite differences
between published treatment guidelines, there is a general consensus that treatment
decisions should be based on a number of patient- and disease-related prognostic
factors. Patients with favourable prognostic factors are more likely to be assessed as “fit”
to receive treatment with IC while patients with unfavourable prognostic factors, such as
increased age, poor performance and/or cytogenetic risk status, and increased
comorbidities are typically deemed unfit for treatment with IC. As such, these patients
are usually offered less intensive chemotherapy options, such as LDAC and those
unable to tolerate chemotherapy or who chose not to receive LDAC should receive BSC
only.
Despite this general guidance there is no widely accepted risk algorithm which clinicians
use in the UK when deciding which patients are most likely to benefit from intensive or
non-intensive treatment options. A recent review further demonstrated the lack of
structure when making treatment decisions, concluding that decisions remain complex
and selection is subjective based on the clinician’s judgement (26). Patient choice was
also found to be a confounding factor, accounting for approximately 8% of treatment
decisions, irrespective of the clinicians’ recommendation (23).
Difficulty in classifying patients as “fit” or “unfit” for IC has been further highlighted in the
National Cancer Research Institute AML and high risk MDS studies (27). Since intensive
treatment may well be shortening life for some, there is the issue of which patients
should be treated with an intensive approach and who should not. In the UK, older AML
patients can currently be entered into one of two national studies. AML18 (formerly
AML16) is for patients who are considered fit for an intensive approach whereas patients
who are not considered fit for an intensive treatment approach will be eligible for the
NCRI/LLR LI-1 Trial. Neither study protocol provides an objective measure of ‘fit’ vs
‘unfit’ and so eligibility is subjective and is determined by investigator and patient.
The heterogeneity of this difficult-to-treat population, the lack of a risk algorithm to clearly
guide clinicians, subjectivity in making treatment decisions, and the impact of patient
choice highlight the challenges faced by clinicians in treating this population effectively.
These factors also make it extremely challenging to assess how one treatment compares
with another in the context of technology appraisal, particularly as the patient population
that may benefit from any of the current treatment options cannot be clearly and
consistently defined in clinical practice. The approach taken in the pivotal trial for
azacitidine (AZA-AML-001) was to determine its efficacy and safety against CCR, a
conventional care arm made up of IC, LDAC or BSC alone. In doing so, the trial
demonstrates that all patients aged ≥65 years with AML (>30% marrow blasts) and
Company evidence submission for azacitidine [ID829] 34
ineligible for HSCT, are likely to benefit from using azacitidine, regardless of the
treatment regimen it is compared with or the baseline characteristics of the patient (See
section 4.7 and 4.8 for trial results). In this context, it is anticipated that azacitidine would
be offered as a first-line therapy to patients aged ≥65 years with AML with >30% blasts
and who are ineligible for treatment with HSCT, as an alternative to all existing therapy
options – IC, LDAC and BSC alone.
3.4 Life expectancy
AML is a heterogeneous disease in terms of response to treatment and OS. Prognostic
factors that contribute to this heterogeneity can be patient-related (such as increased
age, reduced performance status, comorbidities, vulnerability, or frailty) or disease-
related (such as genetic factors, adverse cytogenetics, somatic mutations, or whether
the patient has MDS-related changes) (50-52).
Survival is highly age dependent with survival rates being significantly lower in older
patients (7). The median OS of elderly patients with AML in population-based studies
has remained unchanged since 1995 at 1.5 to 3 months (60, 61). Furthermore, a recent
analysis of the HMRN registry highlights the current poor outcomes in UK routine
practice, with a median OS of XXX months for non-transplant-eligible AML patients 65
years or older treated with CCR (10). There is also a clear disparity in 5-year survival
rates between AML patients of different ages. Between 2003 and 2009, 5-year survival
rates for patients <65 years of age was 41.6%, but just 5.4% in patients ≥65 years of age
(2). In contrast, the life expectancy of people in the general population once they have
reached 75 years of age is a further 10.6 years (males) and 12.9 years (females) (62).
Therefore, AML represents a challenging disease to treat, and results in a significant
reduction in patient’s life expectancy.
Azacitidine has designated orphan status across all of its licensed indications including
AML, MDS and CMML. At the time of designation by the EMA, AML affected less than 2
people in 10,000 per year and MDS affected between 1.1 and 3 in 10,000 people in the
EU. N.B. At the time of orphan medicine designation, CMML was classified as a type of
MDS.
Current estimates in England suggest that there are 1,777 new cases of AML each year
in people aged 65 and over (42-44). When the additional criteria of ineligibility for HSCT
and >30% marrow blasts are taken into account the actual number of elderly patients
eligible for treatment with azacitidine under the new indication is estimated to be 1,158
(See Section 4.13.2 for further details).
In addition, it is estimated that around 2,328 adult patients would be eligible for treatment
with azacitidine in England for all other licensed indications (MDS, CMML and AML with
20–30% blasts) (See Section 4.13.2 for further details).
3.5 Relevant NICE guidance, pathways or commissioning guides
Azacitidine was approved by NICE in 2011 within its existing indication for MDS, CMML
and AML. In this appraisal (TA218) NICE recommended azacitidine as a treatment
option for adults who are not eligible for HSCT and have AML with 20–30% blasts and
Company evidence submission for azacitidine [ID829] 35
multilineage dysplasia, according to the WHO classification (28). The full wording of the
guidance is provided below. No further technology appraisals or clinical guidelines have
been published by NICE for AML.
AML is included in the NICE pathway for blood and bone cancers (63). However, the
pathway provides no further recommendations on managing patients with AML beyond
those provided in TA218.
NICE TA218 (28)
Azacitidine is recommended as a treatment option for adults who are not eligible for
HSCT and have:
intermediate-2 and high-risk myelodysplastic syndromes according to the International
Prognostic Scoring System or
Chronic myelomonocytic leukaemia with 10–29% marrow blasts without
myeloproliferative disorder or
AML with 20–30% blasts and multilineage dysplasia, according to the WHO
classification and
if the manufacturer provides azacitidine with the discount agreed as part of the patient
access scheme.
3.6 Clinical guidelines
Treatment choices need to take into account the features of the disease, presence of
comorbidities, performance status as well as patient preference (6). A number of
guidelines provide recommendations on the treatment of elderly patients with AML,
including the British Committee for Standards in Haematology (6), the European
Leukaemia Net (8), the European Society for Medicinal Oncology (58), and the US
National Comprehensive Cancer Network (59). These guidelines recommend that
treatment should be driven by patient-related prognostic factors such as age,
performance status, comorbidities (cardiovascular, cerebrovascular, pulmonary, hepatic,
or renal dysfunction) and adverse disease-related prognostic factors, including
unfavourable cytogenetics/molecular markers, therapy-related AML, or prior MDS.
Treatment choices will depend on the balance of patient- and disease-related prognostic
factors and currently include IC ± HSCT, low-dose chemotherapy (e.g. LDAC), or BSC
alone (8). HSCT however is rarely used in patients older than 65 years of age (64).
UK clinical guidelines
In guidelines published by the British Committee for standards in Haematology in 2006
(6), elderly patients with AML (defined as >60 years of age) who could tolerate IC were
recommended to participate in the NCRI clinical trial, or if they were not eligible or
refused to participate in the clinical trial, then treatment with standard IC (daunorubicin
and cytarabine) was recommended. Treatment with LDAC was recommended for
patients who opted for non-intensive chemotherapy, and BSC was recommended for all
patients who were deemed unfit to tolerate chemotherapy. These UK guidelines predate
the introduction of azacitidine for its existing indication of AML with 20-30% BM blasts,
and have not been updated since 2006.
Company evidence submission for azacitidine [ID829] 36
European clinical guidelines
European Leukaemia NET guidelines from 2010 provide treatment and management
recommendations in elderly patients (defined as ≥60 years of age) with AML (8). The
guidelines make specific recommendations for patients aged between 60 and 75 years
of age, and for those aged ≥75 years.
For patients <75 years of age with good performance status (performance status<2)
and no comorbidities, IC provides a favourable chance of achieving CR. The degree
of cytogenetic risk will influence the acceptability of giving IC, and patients who have
adverse cytogenetic risk, even those with good performance status and lacking
comorbidities, may consider alternative treatments, such as investigational or low-
intensity treatments. At the time azacitidine and decitabine were among the
investigational hypomethylating products considered as being appropriate for use.
For patients over 75 years of age (and probably ≥65 years) with performance status
≥2, comorbidities or organ dysfunction, IC should not be considered as these patients
tend not to receive benefit from conventional chemotherapy. These patients may be
considered for alternative therapies including a low-intensity dosing regimen such as
LDAC, although evidence showed mortality was still high and there was no benefit of
LDAC in patients with adverse cytogenetics. At that time it was recognised that other
alternative options were necessary and these guidelines also recommend
investigational products which at that time included azacitidine or decitabine.
More recently, guidelines published by the European Society for Medical Oncology in
2013, support the notion that treatment should be based on a number of prognostic
factors, such as age, cytogenetics, molecular genetics, and comorbidity (65). The
guidelines state that patients aged ≥60 years are more susceptible to treatment-related
complications, and that elderly patients and patients with significant comorbidity are often
not eligible for IC. Therefore, these patient populations should be offered BSC or
palliative systemic treatment, such LDAC or azacitidine.
US clinical guidelines
The US 2015 National Comprehensive Cancer Network guidelines (59) have specific
recommendations for newly diagnosed, older AML patients (defined as ≥60 years old).
As shown Figure 3 older AML patients with an ECOG performance status of 0 to 2, with
or without adverse features may be managed with a clinical trial, IC or low intensity
therapy (including LDAC and azacitidine). For patients with an ECOG performance
status >2 or significant comorbidities, patients are more likely to experience toxicity and
less are likely to benefit from IC, so it is reasonable to offer a clinical trial, low-intensity
therapies or supportive care alone. Azacitidine is therefore a recommended treatment
option for both IC-eligible and IC-ineligible older AML patients.
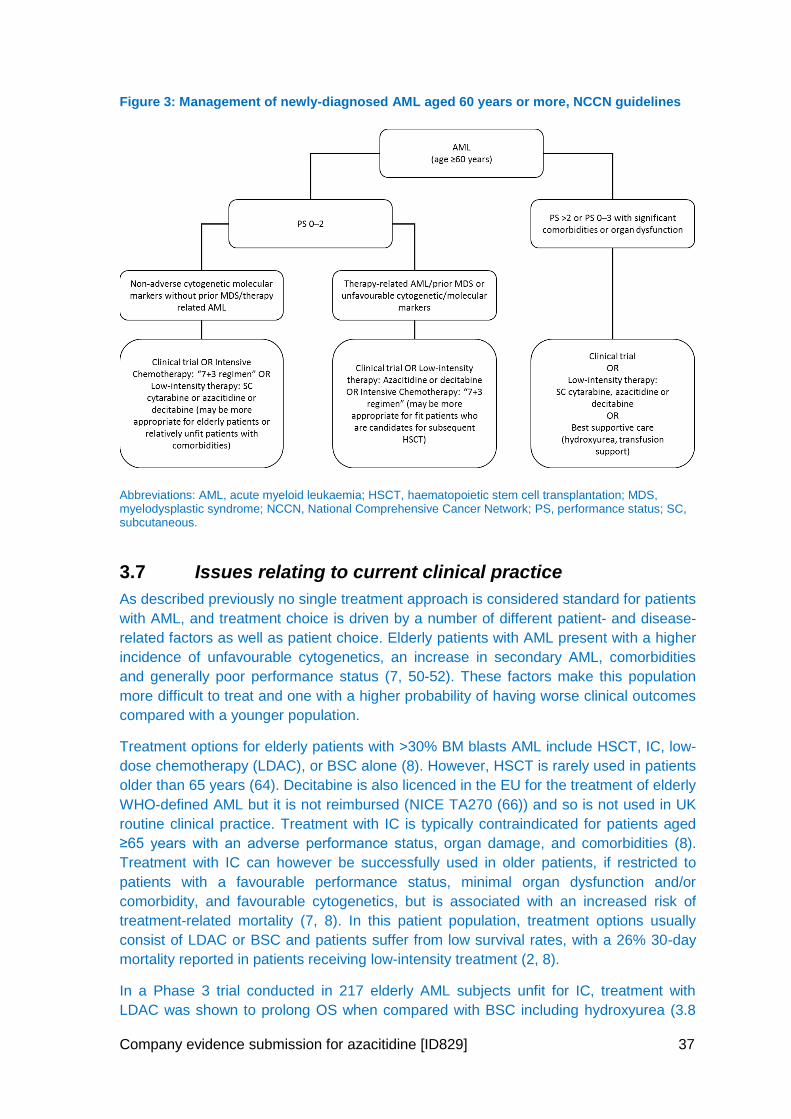
Company evidence submission for azacitidine [ID829] 37
Figure 3: Management of newly-diagnosed AML aged 60 years or more, NCCN guidelines
Abbreviations: AML, acute myeloid leukaemia; HSCT, haematopoietic stem cell transplantation; MDS, myelodysplastic syndrome; NCCN, National Comprehensive Cancer Network; PS, performance status; SC, subcutaneous.
3.7 Issues relating to current clinical practice
As described previously no single treatment approach is considered standard for patients
with AML, and treatment choice is driven by a number of different patient- and disease-
related factors as well as patient choice. Elderly patients with AML present with a higher
incidence of unfavourable cytogenetics, an increase in secondary AML, comorbidities
and generally poor performance status (7, 50-52). These factors make this population
more difficult to treat and one with a higher probability of having worse clinical outcomes
compared with a younger population.
Treatment options for elderly patients with >30% BM blasts AML include HSCT, IC, low-
dose chemotherapy (LDAC), or BSC alone (8). However, HSCT is rarely used in patients
older than 65 years (64). Decitabine is also licenced in the EU for the treatment of elderly
WHO-defined AML but it is not reimbursed (NICE TA270 (66)) and so is not used in UK
routine clinical practice. Treatment with IC is typically contraindicated for patients aged
≥65 years with an adverse performance status, organ damage, and comorbidities (8).
Treatment with IC can however be successfully used in older patients, if restricted to
patients with a favourable performance status, minimal organ dysfunction and/or
comorbidity, and favourable cytogenetics, but is associated with an increased risk of
treatment-related mortality (7, 8). In this patient population, treatment options usually
consist of LDAC or BSC and patients suffer from low survival rates, with a 26% 30-day
mortality reported in patients receiving low-intensity treatment (2, 8).
In a Phase 3 trial conducted in 217 elderly AML subjects unfit for IC, treatment with
LDAC was shown to prolong OS when compared with BSC including hydroxyurea (3.8
Company evidence submission for azacitidine [ID829] 38
months versus 2.5 months, respectively) (9). However, long-term outcomes were poor,
with only 25% of the subjects alive at 1 year (67). In addition, treatment with LDAC had
no OS benefit in elderly patients with adverse cytogenetics, with an estimated survival of
just 2 months.
In spite of significant efforts to identify new treatment modalities in AML, little
improvement has been observed in the last 30 years in AML trials conducted by all
collaborative groups; in the UK, sequential AML trials conducted by the Medical
Research Council (now NCRI) Adult Leukaemia Working Party has seen little evidence
of improvement in OS for older patients (11) and 5-year survival rates for patients aged
≥65 years are just 5.4%, compared with 41.6% for younger patients (aged <65 years)
(2).
As such, there still exists a need for an effective therapy to improve the survival benefit
and reduce the burden of disease in the elderly AML population, particularly those where
existing therapeutic options are of limited value.
3.8 Equality
AML presents primarily in the elderly population, with 64% of newly diagnosed cases in
the UK in patients aged ≥65 years (1). Equity of treatment of the elderly is a concern, as
evident from a report published by the National Audit Office in January 2015 (13). AML is
also an orphan disease (14). The Cancer Patient Experience Survey in 2010 found that
people with rarer forms of cancer reported a poorer experience of their treatment and
care than people with more common forms of cancer (15). Therefore, access where
appropriate to a treatment such as azacitidine should help to promote equality for both
elderly patients and those with rarer forms of cancer.
Company evidence submission for azacitidine [ID829] 39
4 Clinical effectiveness
4.1 Identification and selection of relevant studies
A systematic review was conducted to retrieve relevant clinical data from the published
literature regarding the efficacy and safety of azacitidine, as well as relevant
comparators, for subjects aged 65 years or over with AML with >30% BM blasts and who
were not eligible for HSCT. The systematic review was designed to capture evidence in
a broader population than that defined in the appraisal scope of relevance to the licenced
indication for azacitidine, and included patients aged ≥55 years and with AML >20% BM
blasts. Evidence specifically addressing the population considered in the scope and
relevant to the licenced indication for azacitidine was then selected for inclusion in the
submission.
4.1.1 Search strategy
Relevant studies were identified through a search of the following databases: Medline,
Embase, and Cochrane Central Register of Controlled Trials (search strategies are
presented in Appendix 2). Searches were initially run on 5th February 2015 and rerun on
20th November 2015 to identify additional studies published since the initial search. In
addition, the conference proceedings from European Hematology Association (EHA)
Annual Congress, American Society of Hematology (ASH) Annual Conference, and the
British Society for Haematology (BSH) Annual Scientific Meeting were searched between
January 2013 and April 2015. Finally, clinicaltrials.gov was searched for relevant,
unpublished studies
4.1.2 Study selection
The systematic literature search was performed using a predefined search strategy to
identify eligible studies. Selection of studies for inclusion was determined using the
PICOS criteria in Table 7.
Two investigators independently reviewed all abstracts identified in the literature search.
Abstracts were compared against eligibility criteria and if deemed eligible for inclusion,
they were advanced to full-text screening. The same two investigators independently
reviewed relevant full-text articles. Articles deemed eligible at this stage were included in
the systematic literature review and, where possible, analyses. Discrepancies between
investigators were resolved by involving a third investigator and coming to a consensus.
In the event that there were multiple publications for a single trial, only those publications
providing the most recent data or any other relevant data for the analyses were selected
for inclusion.
Table 7: Scope of the literature review: PICOS criteria for study inclusion
Criteria Definition
Population Older adult AML patients† with peripheral blood or BM leukaemic myeloblasts
>20%, who either:
Are newly diagnosed with AML
Have developed AML secondary to “preleukaemic” blood disorders such as MDS or myeloproliferative disease
Have developed AML secondary to exposure to leukaemogenic therapy
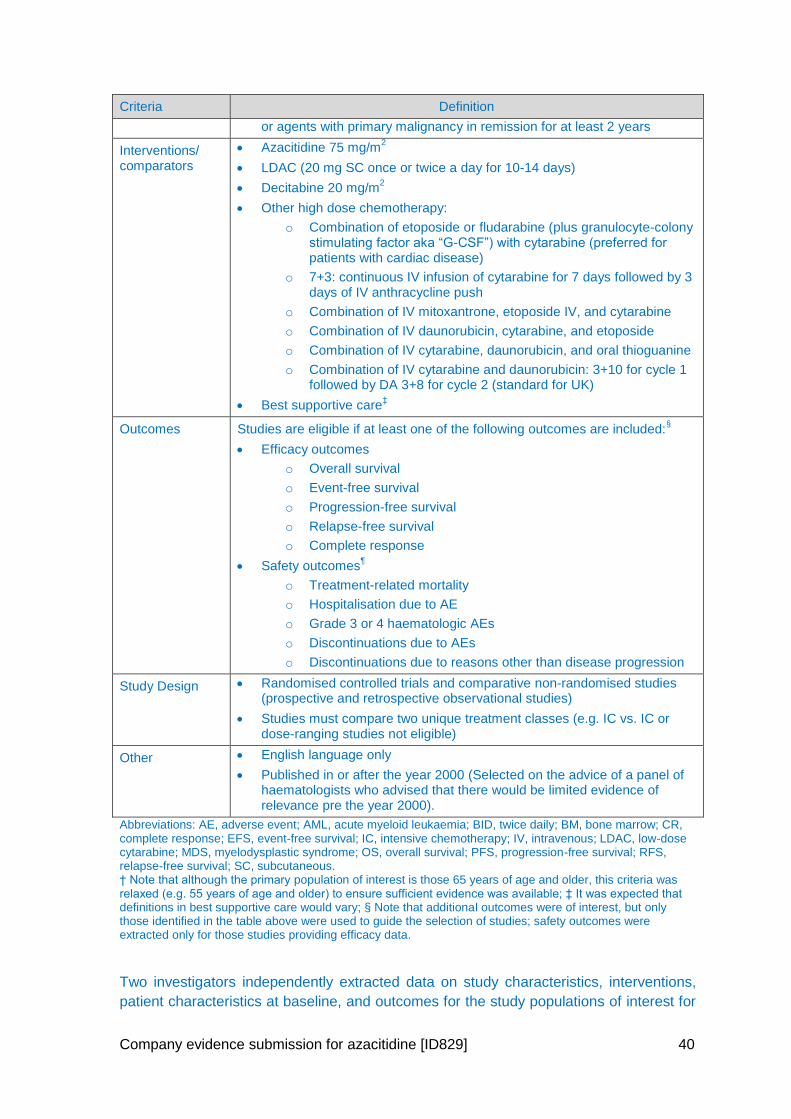
Company evidence submission for azacitidine [ID829] 40
Criteria Definition
or agents with primary malignancy in remission for at least 2 years
Interventions/ comparators
Azacitidine 75 mg/m2
LDAC (20 mg SC once or twice a day for 10-14 days)
Decitabine 20 mg/m2
Other high dose chemotherapy:
o Combination of etoposide or fludarabine (plus granulocyte-colony stimulating factor aka “G-CSF”) with cytarabine (preferred for patients with cardiac disease)
o 7+3: continuous IV infusion of cytarabine for 7 days followed by 3 days of IV anthracycline push
o Combination of IV mitoxantrone, etoposide IV, and cytarabine
o Combination of IV daunorubicin, cytarabine, and etoposide
o Combination of IV cytarabine, daunorubicin, and oral thioguanine
o Combination of IV cytarabine and daunorubicin: 3+10 for cycle 1 followed by DA 3+8 for cycle 2 (standard for UK)
Best supportive care‡
Outcomes Studies are eligible if at least one of the following outcomes are included:§
Efficacy outcomes
o Overall survival
o Event-free survival
o Progression-free survival
o Relapse-free survival
o Complete response
Safety outcomes¶
o Treatment-related mortality
o Hospitalisation due to AE
o Grade 3 or 4 haematologic AEs
o Discontinuations due to AEs
o Discontinuations due to reasons other than disease progression
Study Design Randomised controlled trials and comparative non-randomised studies (prospective and retrospective observational studies)
Studies must compare two unique treatment classes (e.g. IC vs. IC or dose-ranging studies not eligible)
Other English language only
Published in or after the year 2000 (Selected on the advice of a panel of haematologists who advised that there would be limited evidence of relevance pre the year 2000).
Abbreviations: AE, adverse event; AML, acute myeloid leukaemia; BID, twice daily; BM, bone marrow; CR, complete response; EFS, event-free survival; IC, intensive chemotherapy; IV, intravenous; LDAC, low-dose cytarabine; MDS, myelodysplastic syndrome; OS, overall survival; PFS, progression-free survival; RFS, relapse-free survival; SC, subcutaneous. † Note that although the primary population of interest is those 65 years of age and older, this criteria was relaxed (e.g. 55 years of age and older) to ensure sufficient evidence was available; ‡ It was expected that definitions in best supportive care would vary; § Note that additional outcomes were of interest, but only those identified in the table above were used to guide the selection of studies; safety outcomes were extracted only for those studies providing efficacy data.
Two investigators independently extracted data on study characteristics, interventions,
patient characteristics at baseline, and outcomes for the study populations of interest for
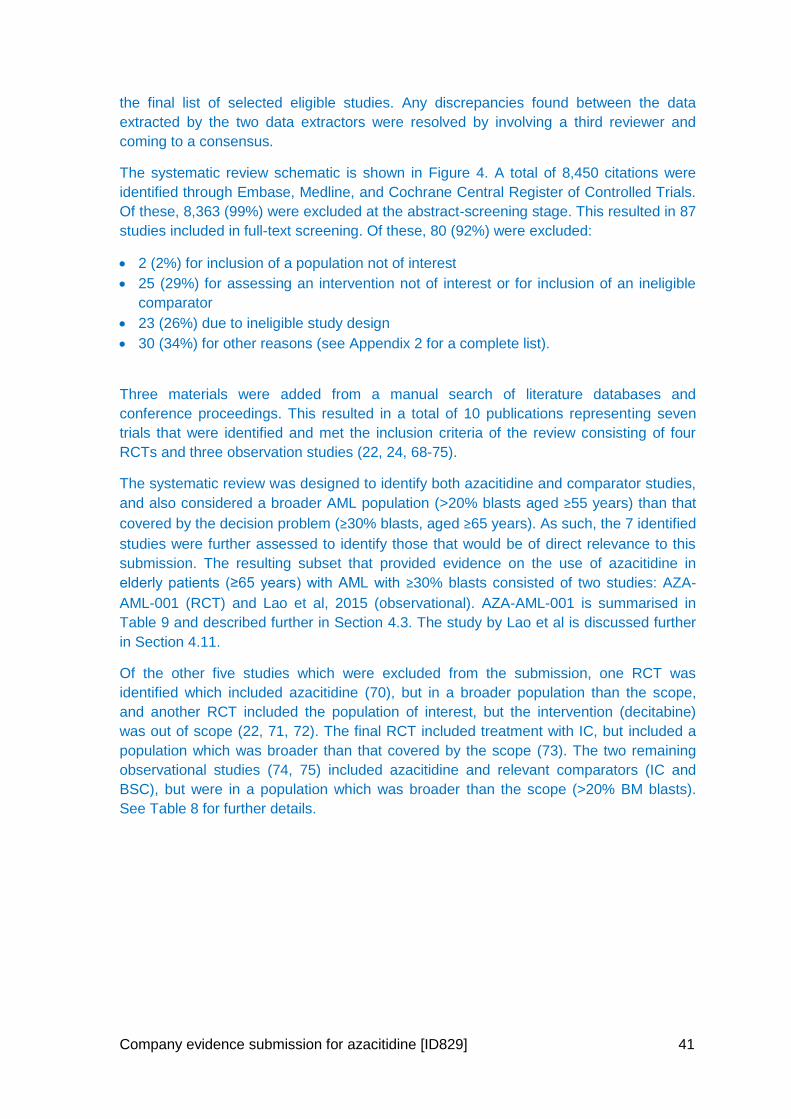
Company evidence submission for azacitidine [ID829] 41
the final list of selected eligible studies. Any discrepancies found between the data
extracted by the two data extractors were resolved by involving a third reviewer and
coming to a consensus.
The systematic review schematic is shown in Figure 4. A total of 8,450 citations were
identified through Embase, Medline, and Cochrane Central Register of Controlled Trials.
Of these, 8,363 (99%) were excluded at the abstract-screening stage. This resulted in 87
studies included in full-text screening. Of these, 80 (92%) were excluded:
2 (2%) for inclusion of a population not of interest
25 (29%) for assessing an intervention not of interest or for inclusion of an ineligible
comparator
23 (26%) due to ineligible study design
30 (34%) for other reasons (see Appendix 2 for a complete list).
Three materials were added from a manual search of literature databases and
conference proceedings. This resulted in a total of 10 publications representing seven
trials that were identified and met the inclusion criteria of the review consisting of four
RCTs and three observation studies (22, 24, 68-75).
The systematic review was designed to identify both azacitidine and comparator studies,
and also considered a broader AML population (>20% blasts aged ≥55 years) than that
covered by the decision problem (≥30% blasts, aged ≥65 years). As such, the 7 identified
studies were further assessed to identify those that would be of direct relevance to this
submission. The resulting subset that provided evidence on the use of azacitidine in
elderly patients (≥65 years) with AML with ≥30% blasts consisted of two studies: AZA-
AML-001 (RCT) and Lao et al, 2015 (observational). AZA-AML-001 is summarised in
Table 9 and described further in Section 4.3. The study by Lao et al is discussed further
in Section 4.11.
Of the other five studies which were excluded from the submission, one RCT was
identified which included azacitidine (70), but in a broader population than the scope,
and another RCT included the population of interest, but the intervention (decitabine)
was out of scope (22, 71, 72). The final RCT included treatment with IC, but included a
population which was broader than that covered by the scope (73). The two remaining
observational studies (74, 75) included azacitidine and relevant comparators (IC and
BSC), but were in a population which was broader than the scope (>20% BM blasts).
See Table 8 for further details.
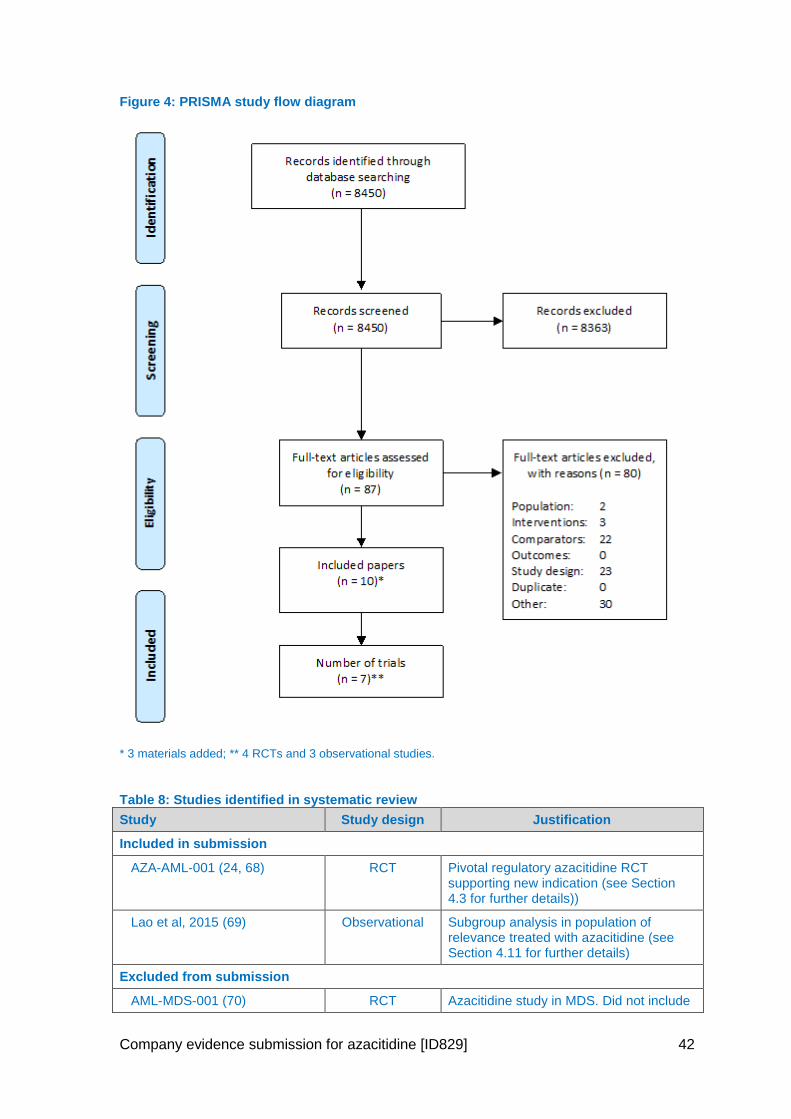
Company evidence submission for azacitidine [ID829] 42
Figure 4: PRISMA study flow diagram
* 3 materials added; ** 4 RCTs and 3 observational studies.
Table 8: Studies identified in systematic review
Study Study design Justification
Included in submission
AZA-AML-001 (24, 68) RCT Pivotal regulatory azacitidine RCT supporting new indication (see Section 4.3 for further details))
Lao et al, 2015 (69) Observational Subgroup analysis in population of relevance treated with azacitidine (see Section 4.11 for further details)
Excluded from submission
AML-MDS-001 (70) RCT Azacitidine study in MDS. Did not include
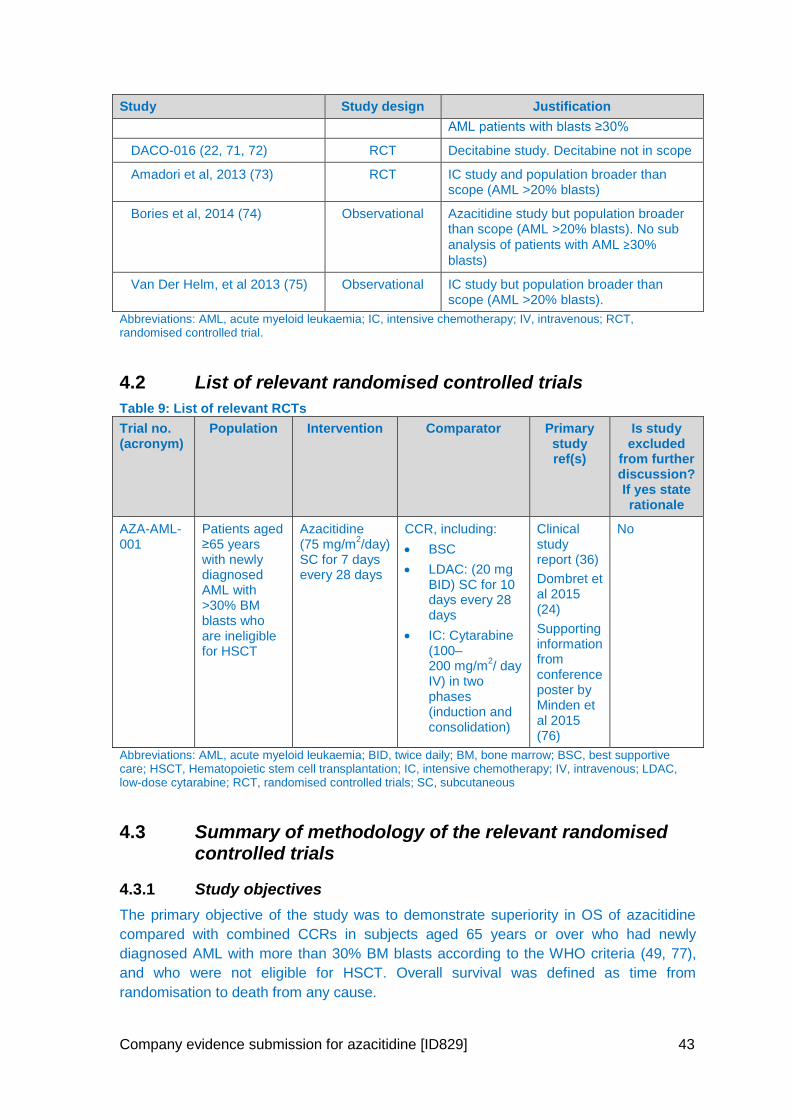
Company evidence submission for azacitidine [ID829] 43
Study Study design Justification
AML patients with blasts ≥30%
DACO-016 (22, 71, 72) RCT Decitabine study. Decitabine not in scope
Amadori et al, 2013 (73) RCT IC study and population broader than scope (AML >20% blasts)
Bories et al, 2014 (74) Observational Azacitidine study but population broader than scope (AML >20% blasts). No sub
analysis of patients with AML ≥30%
blasts)
Van Der Helm, et al 2013 (75) Observational IC study but population broader than scope (AML >20% blasts).
Abbreviations: AML, acute myeloid leukaemia; IC, intensive chemotherapy; IV, intravenous; RCT, randomised controlled trial.
4.2 List of relevant randomised controlled trials
Table 9: List of relevant RCTs
Trial no. (acronym)
Population Intervention Comparator Primary study ref(s)
Is study excluded
from further discussion? If yes state rationale
AZA-AML-001
Patients aged ≥65 years with newly diagnosed AML with >30% BM blasts who are ineligible for HSCT
Azacitidine (75 mg/m
2/day)
SC for 7 days every 28 days
CCR, including:
BSC
LDAC: (20 mg BID) SC for 10 days every 28 days
IC: Cytarabine (100–200 mg/m
2/ day
IV) in two phases (induction and consolidation)
Clinical study report (36)
Dombret et al 2015 (24)
Supporting information from conference poster by Minden et al 2015 (76)
No
Abbreviations: AML, acute myeloid leukaemia; BID, twice daily; BM, bone marrow; BSC, best supportive care; HSCT, Hematopoietic stem cell transplantation; IC, intensive chemotherapy; IV, intravenous; LDAC, low-dose cytarabine; RCT, randomised controlled trials; SC, subcutaneous
4.3 Summary of methodology of the relevant randomised controlled trials
4.3.1 Study objectives
The primary objective of the study was to demonstrate superiority in OS of azacitidine
compared with combined CCRs in subjects aged 65 years or over who had newly
diagnosed AML with more than 30% BM blasts according to the WHO criteria (49, 77),
and who were not eligible for HSCT. Overall survival was defined as time from
randomisation to death from any cause.
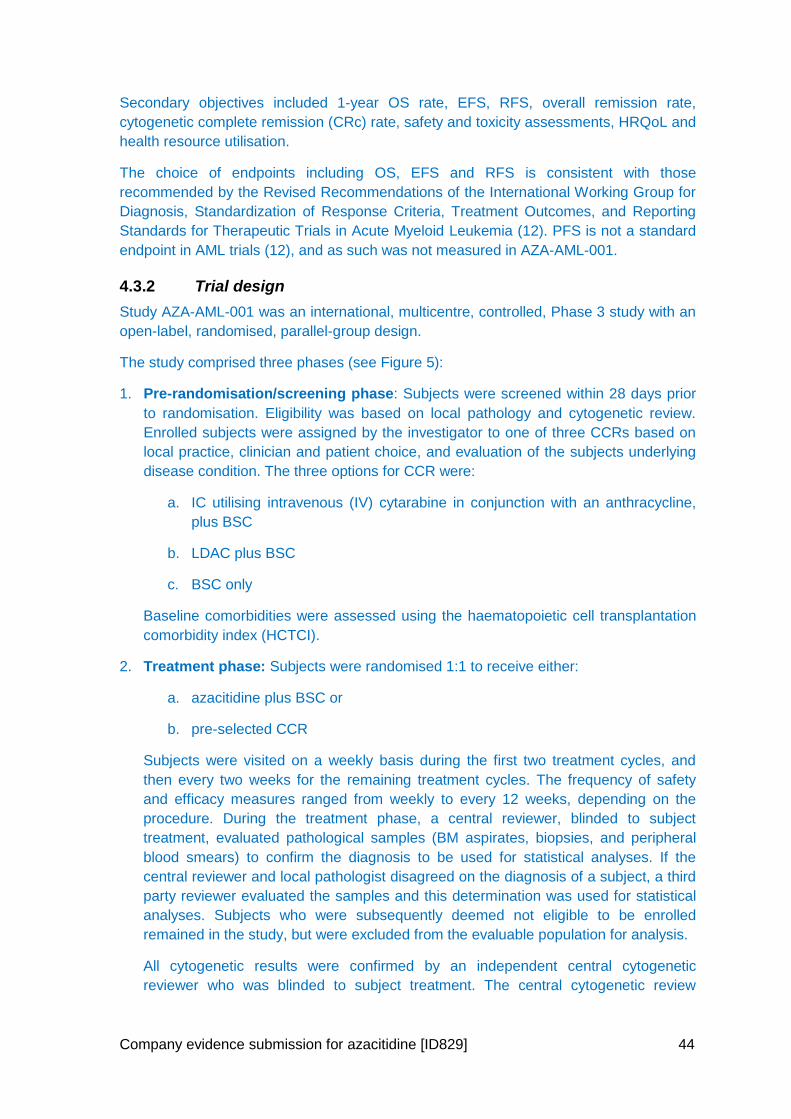
Company evidence submission for azacitidine [ID829] 44
Secondary objectives included 1-year OS rate, EFS, RFS, overall remission rate,
cytogenetic complete remission (CRc) rate, safety and toxicity assessments, HRQoL and
health resource utilisation.
The choice of endpoints including OS, EFS and RFS is consistent with those
recommended by the Revised Recommendations of the International Working Group for
Diagnosis, Standardization of Response Criteria, Treatment Outcomes, and Reporting
Standards for Therapeutic Trials in Acute Myeloid Leukemia (12). PFS is not a standard
endpoint in AML trials (12), and as such was not measured in AZA-AML-001.
4.3.2 Trial design
Study AZA-AML-001 was an international, multicentre, controlled, Phase 3 study with an
open-label, randomised, parallel-group design.
The study comprised three phases (see Figure 5):
1. Pre-randomisation/screening phase: Subjects were screened within 28 days prior
to randomisation. Eligibility was based on local pathology and cytogenetic review.
Enrolled subjects were assigned by the investigator to one of three CCRs based on
local practice, clinician and patient choice, and evaluation of the subjects underlying
disease condition. The three options for CCR were:
a. IC utilising intravenous (IV) cytarabine in conjunction with an anthracycline,
plus BSC
b. LDAC plus BSC
c. BSC only
Baseline comorbidities were assessed using the haematopoietic cell transplantation
comorbidity index (HCTCI).
2. Treatment phase: Subjects were randomised 1:1 to receive either:
a. azacitidine plus BSC or
b. pre-selected CCR
Subjects were visited on a weekly basis during the first two treatment cycles, and
then every two weeks for the remaining treatment cycles. The frequency of safety
and efficacy measures ranged from weekly to every 12 weeks, depending on the
procedure. During the treatment phase, a central reviewer, blinded to subject
treatment, evaluated pathological samples (BM aspirates, biopsies, and peripheral
blood smears) to confirm the diagnosis to be used for statistical analyses. If the
central reviewer and local pathologist disagreed on the diagnosis of a subject, a third
party reviewer evaluated the samples and this determination was used for statistical
analyses. Subjects who were subsequently deemed not eligible to be enrolled
remained in the study, but were excluded from the evaluable population for analysis.
All cytogenetic results were confirmed by an independent central cytogenetic
reviewer who was blinded to subject treatment. The central cytogenetic review
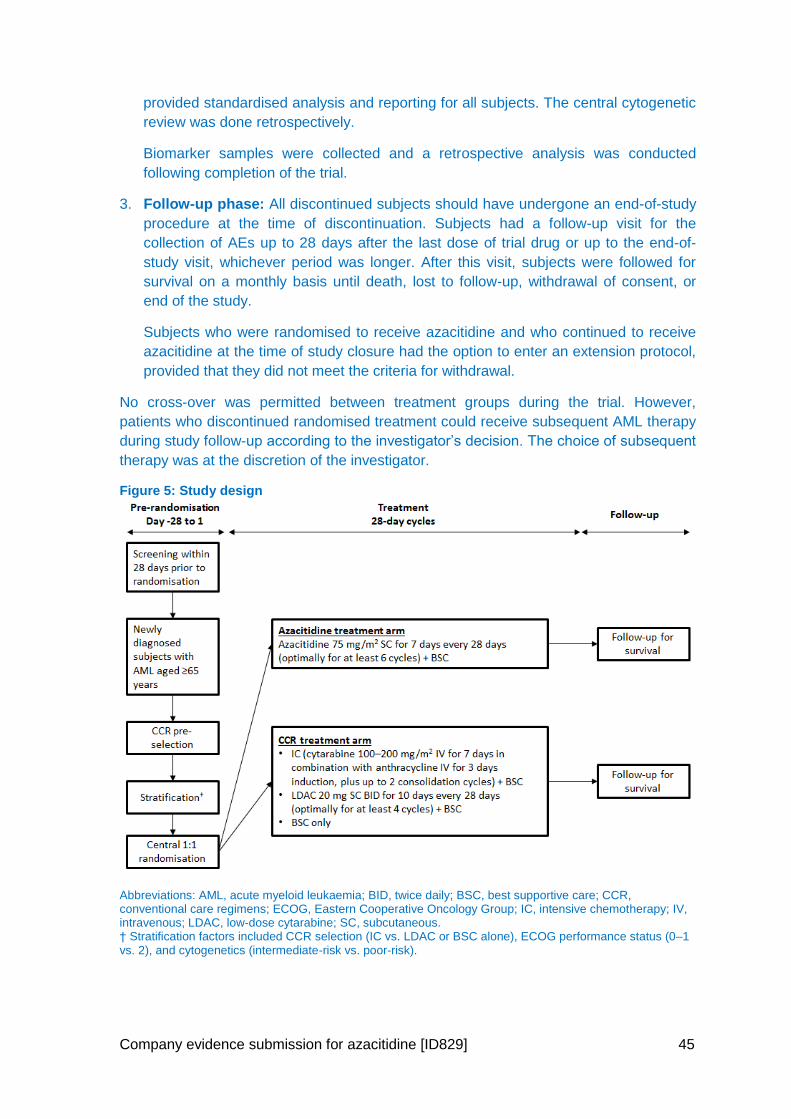
Company evidence submission for azacitidine [ID829] 45
provided standardised analysis and reporting for all subjects. The central cytogenetic
review was done retrospectively.
Biomarker samples were collected and a retrospective analysis was conducted
following completion of the trial.
3. Follow-up phase: All discontinued subjects should have undergone an end-of-study
procedure at the time of discontinuation. Subjects had a follow-up visit for the
collection of AEs up to 28 days after the last dose of trial drug or up to the end-of-
study visit, whichever period was longer. After this visit, subjects were followed for
survival on a monthly basis until death, lost to follow-up, withdrawal of consent, or
end of the study.
Subjects who were randomised to receive azacitidine and who continued to receive
azacitidine at the time of study closure had the option to enter an extension protocol,
provided that they did not meet the criteria for withdrawal.
No cross-over was permitted between treatment groups during the trial. However,
patients who discontinued randomised treatment could receive subsequent AML therapy
during study follow-up according to the investigator’s decision. The choice of subsequent
therapy was at the discretion of the investigator.
Figure 5: Study design
Abbreviations: AML, acute myeloid leukaemia; BID, twice daily; BSC, best supportive care; CCR, conventional care regimens; ECOG, Eastern Cooperative Oncology Group; IC, intensive chemotherapy; IV, intravenous; LDAC, low-dose cytarabine; SC, subcutaneous. † Stratification factors included CCR selection (IC vs. LDAC or BSC alone), ECOG performance status (0–1 vs. 2), and cytogenetics (intermediate-risk vs. poor-risk).
Company evidence submission for azacitidine [ID829] 46
4.3.2.1 Study duration
The expected duration of the study was 31 months. This time frame consisted of a 19-
month subject enrolment period, followed by 12 months of subject treatment and
observation. The study was planned to conclude 12 months after the last subject was
randomised.
4.3.2.2 Randomisation
Subjects were randomised in a 1:1 ratio to receive either azacitidine or pre-selected CCR
using an interactive voice recognition system (see Figure 6). A stratified, blocked
randomisation schedule was implemented. The random treatment assignment was
concealed so that investigators and subjects did not know in advance the next treatment
assignment. Subjects were stratified by CCR selection (IC versus LDAC or BSC), ECOG
performance status at baseline (0–1 versus 2), and cytogenetics (intermediate-risk
versus poor-risk). No crossover between any of the treatment groups was permitted.
Once randomised and assigned to receive one of the CCR options, a subject was not to
be transferred to another treatment option within conventional care and was not to be
transferred to the azacitidine treatment arm at any time during study, or treated with
azacitidine following discontinuation from the originally assigned therapy, for the entire
study duration. However, subjects could continue to receive the randomised study
treatment for as long as was appropriate within the study duration.
4.3.2.3 Blinding
This was an open-label study. Blinding of study treatment was not feasible due to
multiple comparators and routes of administration, which included intravenous infusion
and subcutaneous injection over differing time periods depending on the treatment (See
Section 4.3.5 for posology details). However, all central reviewers (pathology and
cytogenetic) were blinded to subject treatment assignment. Evaluations by central review
were used for the statistical efficacy analyses. The Independent Review Committee
which reviewed and confirmed the International Working Group responses and durations
was blinded to treatment, investigative site, and subject identifier.
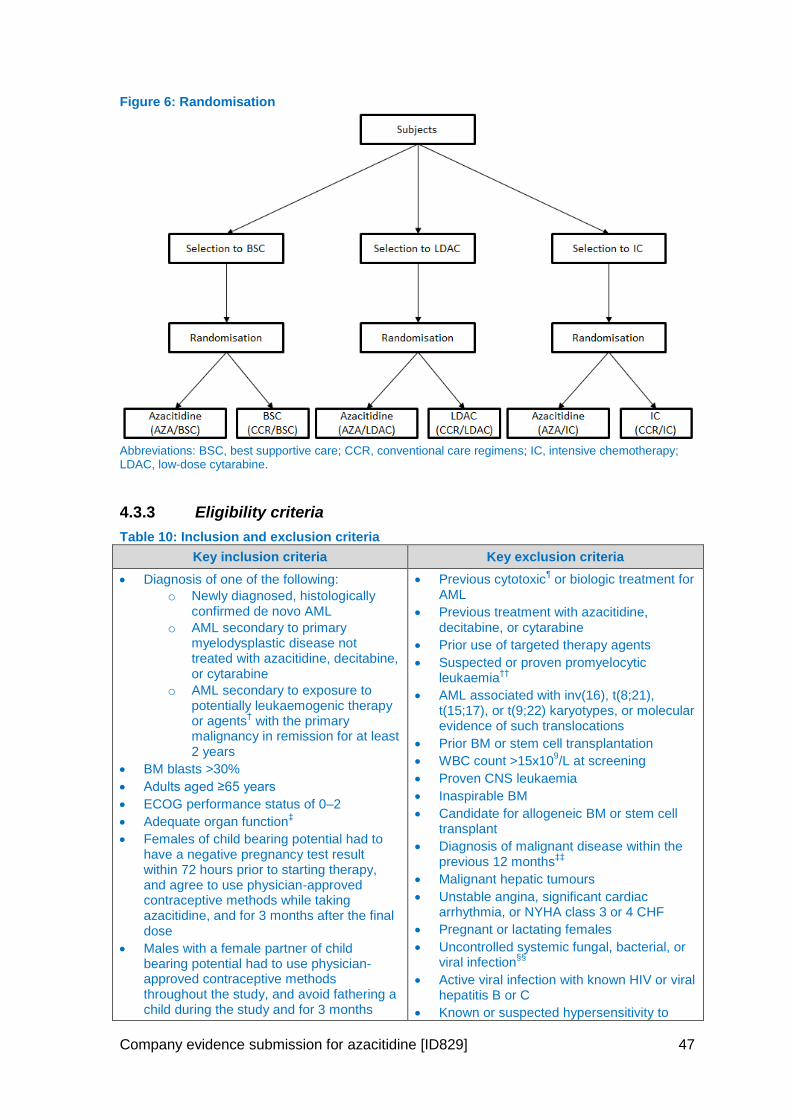
Company evidence submission for azacitidine [ID829] 47
Figure 6: Randomisation
Abbreviations: BSC, best supportive care; CCR, conventional care regimens; IC, intensive chemotherapy; LDAC, low-dose cytarabine.
4.3.3 Eligibility criteria
Table 10: Inclusion and exclusion criteria
Key inclusion criteria Key exclusion criteria
Diagnosis of one of the following:
o Newly diagnosed, histologically confirmed de novo AML
o AML secondary to primary myelodysplastic disease not treated with azacitidine, decitabine, or cytarabine
o AML secondary to exposure to potentially leukaemogenic therapy or agents
† with the primary
malignancy in remission for at least 2 years
BM blasts >30%
Adults aged ≥65 years
ECOG performance status of 0–2
Adequate organ function‡
Females of child bearing potential had to have a negative pregnancy test result within 72 hours prior to starting therapy, and agree to use physician-approved contraceptive methods while taking azacitidine, and for 3 months after the final dose
Males with a female partner of child bearing potential had to use physician-approved contraceptive methods throughout the study, and avoid fathering a child during the study and for 3 months
Previous cytotoxic¶ or biologic treatment for
AML
Previous treatment with azacitidine, decitabine, or cytarabine
Prior use of targeted therapy agents
Suspected or proven promyelocytic leukaemia
††
AML associated with inv(16), t(8;21), t(15;17), or t(9;22) karyotypes, or molecular evidence of such translocations
Prior BM or stem cell transplantation
WBC count >15x109/L at screening
Proven CNS leukaemia
Inaspirable BM
Candidate for allogeneic BM or stem cell transplant
Diagnosis of malignant disease within the previous 12 months
‡‡
Malignant hepatic tumours
Unstable angina, significant cardiac arrhythmia, or NYHA class 3 or 4 CHF
Pregnant or lactating females
Uncontrolled systemic fungal, bacterial, or viral infection
§§
Active viral infection with known HIV or viral hepatitis B or C
Known or suspected hypersensitivity to
Company evidence submission for azacitidine [ID829] 48
Key inclusion criteria Key exclusion criteria
after the final dose§
Able to adhere to study protocol
azacitidine or mannitol
Use of any experimental drug or therapy within 28 days prior to day 1 of cycle 1
Unwilling or unable to complete PRO assessments without assistance or minimal assistance
Any condition, including laboratory abnormalities, which would place the subject at an unacceptable risk
Any significant medical condition, including the presence of laboratory abnormalities, or psychiatric illness which would interfere with subject participation
Any condition that confounded the ability to interpret data from the study
Abbreviations: AML, acute myeloid leukaemia; BM, bone marrow; CHF, congestive heart failure; CNS, central nervous system; ECOG, Eastern Cooperative Oncology Group; HIV, human immunodeficiency virus; NYHA, New York Heart Association; PRO, patient-reported outcomes; WBC, white blood cells. †Such as radiation therapy, alkylating agents, and topoisomerase II inhibitors; ‡ defined as serum bilirubin ≤1.5 times the upper limit of normal, serum aspartate aminotransferase and alanine aminotransferase ≤2.5 times the upper limit of normal, and serum creatinine ≤1.5 times the upper limit of normal; § 6 months in Canada for male subjects; ¶ excluding hydroxyurea which was permitted up to 2 weeks prior to the screening haematology sample; †† based on morphology, immunophenotype, molecular assay, karyotype, or AML with previous haematologic disorder such as chronic myelogenous leukaemia or myeloproliferative neoplasms; ‡‡ excluding basal cell carcinoma of the skin without complications, in-situ carcinoma of the cervix or breast, or other local malignancy excised or irradiated with a high probability of cure; §§ defined as ongoing signs/symptoms related to the infection without improvement despite appropriate treatment.
4.3.4 Location
Screening was conducted in 107 investigational sites, of which, 98 sites randomised at
least one patient across 18 countries in different geographic regions. Locations included:
Asia (12 sites); Australia (6 sites); the US/Canada (12 sites); Eastern Europe (12 sites);
and Western Europe and Israel (56 sites). These included 5 sites in the UK which in total
randomised 26 patients: Oxford (n=4), Bournemouth (n=1), St Bartholomew’s (n=13),
King’s College (n=4) and Wolverhampton (n=4).
4.3.5 Trial drugs
The trial drug was azacitidine and the comparators were combined CCR, including IC +
BSC, LDAC + BSC, or BSC only. Full details of the trial drugs and treatment regimen are
given below.
Azacitidine: All subjects randomised to receive azacitidine were to receive
75 mg/m2/day by subcutaneously (SC) for 7 days every 28 days until the end of the
study, or study discontinuation. In addition, subjects were eligible to receive BSC as
required.
IC: All subjects who were randomised to the combined CCR arm and were assigned
IC were to be treated with an induction treatment regimen (cycle 1) followed by a
maximum of two consolidation cycles (cycles 2 and 3). In addition, subjects were
eligible to receive BSC as required.
o Induction therapy (cycle 1) – Cytarabine was administered at a dose of 100–
200 mg/m2/day via continuous IV infusion for a total of 7 days. Anthracycline was
Company evidence submission for azacitidine [ID829] 49
given in combination with cytarabine on days 1, 2 and 3 (daunorubicin [45–
60 mg/m2/day] or idarubicin [9–12 mg/m2/day]).
o Consolidation therapy (cycles 2 and 3) – Subjects who attained a CR, complete
remission with incomplete blood count recovery (CRi), or partial remission (PR)
according to the AML response criteria (Appendix 3) were eligible to receive
between one and two cycles of consolidation therapy. Cytarabine was
administered at a dose of 100–200 mg/m2/day via continuous IV infusion for 3–7
days. The anthracycline of choice was identical to that administered during cycle 1
and was administered via IV on days 1 and 2. Consolidation therapy was started
between day 28 and 70 from commencement of induction therapy, and the second
consolidation therapy, if given, was started between day 28 and 70 from
commencement of the first consolidation therapy. Any subject who failed to attain a
CR, CRi, or PR following the induction therapy was removed from the treatment
phase and entered the follow-up phase of the study.
LDAC: Subjects randomised to the CCR arm and assigned to LDAC were to receive
cytarabine at a dose of 20 mg SC twice daily (BID) for 10 days, every 28 days, until
the end of the study, or study discontinuation. In addition, subjects were eligible to
receive BSC as required.
BSC: All subjects who were randomised to the combined CCR treatment arm and
were assigned BSC received any supportive care needed until the end of study. BSC
included, but was not limited to, treatment with red blood cell or whole blood
transfusions, fresh frozen plasma transfusions, platelet transfusions, antibiotic and/or
antifungal therapy, and nutritional support. Hydroxyurea use was permitted under
certain conditions (see Section 4.3.6). Best supportive care excluded cancer surgery,
immunotherapy, biologic therapy, radiotherapy, anticancer hormonal therapy, and
systemic chemotherapy where the goal was to eradicate or slow the progression of
the disease.
4.3.6 Prior and concomitant therapy
Concomitant medications were to be kept to a minimum during the study. However,
medications which were deemed to be necessary for the subject’s welfare and were
unlikely to interfere with the trial drugs were given at the discretion of the investigator.
The use of hydroxyurea was permitted up to 2 weeks prior to the screening of the
haematology sample. During the screening period, hydroxyurea could be given until
72 hours prior to the start of study therapy. Following the start of study therapy,
transient hydroxyurea use was permitted in all treatment arms as a component of
BSC. Subjects in the azacitidine treatment arm were not permitted to be given
hydroxyurea within the 72 hours prior to and after azacitidine administration.
Serotonin receptor antagonists were administered as an antiemetic approximately
30 minutes prior to administration of azacitidine. Additional doses were administered if
required.
Blood product support (red blood cells and platelets) were administered according to
institutional standards.
Myeloid growth factors could be given per investigator discretion only for the
treatment of neutropenic infections, prophylactically during IC treatment, or in subjects
with two or more previous episodes of neutropenic infection who were at risk of
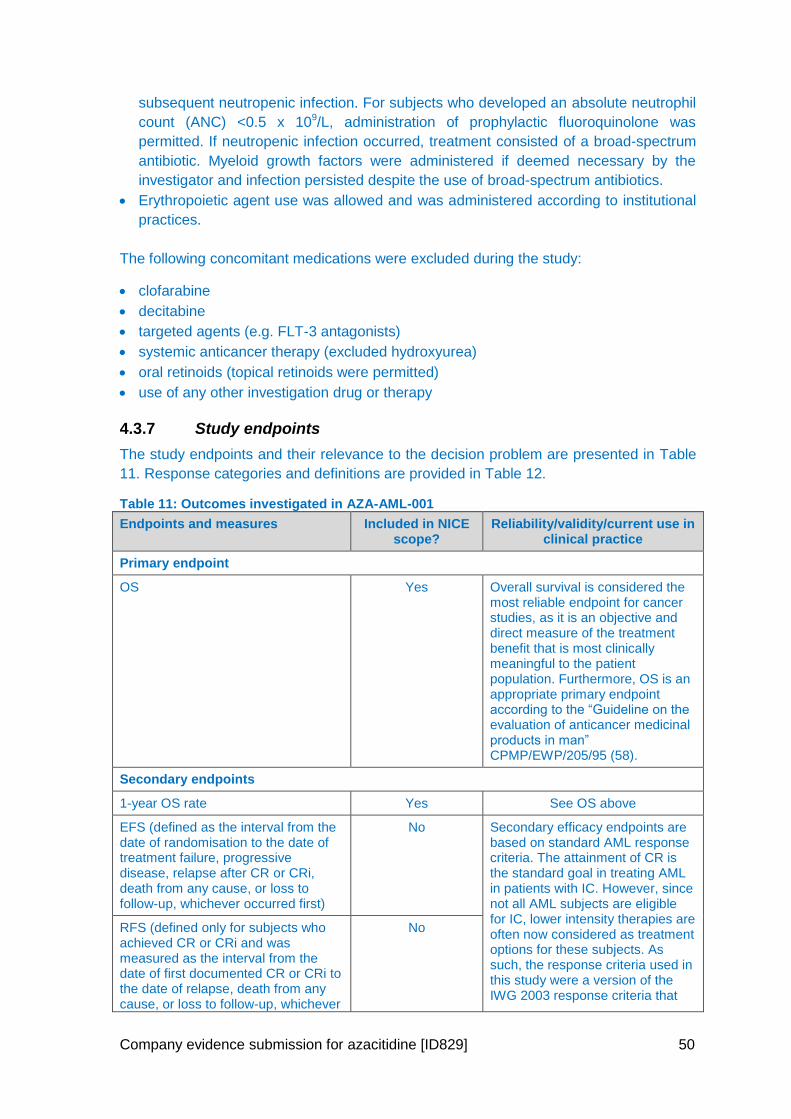
Company evidence submission for azacitidine [ID829] 50
subsequent neutropenic infection. For subjects who developed an absolute neutrophil
count (ANC) <0.5 x 10⁹/L, administration of prophylactic fluoroquinolone was
permitted. If neutropenic infection occurred, treatment consisted of a broad-spectrum
antibiotic. Myeloid growth factors were administered if deemed necessary by the
investigator and infection persisted despite the use of broad-spectrum antibiotics.
Erythropoietic agent use was allowed and was administered according to institutional
practices.
The following concomitant medications were excluded during the study:
clofarabine
decitabine
targeted agents (e.g. FLT-3 antagonists)
systemic anticancer therapy (excluded hydroxyurea)
oral retinoids (topical retinoids were permitted)
use of any other investigation drug or therapy
4.3.7 Study endpoints
The study endpoints and their relevance to the decision problem are presented in Table
11. Response categories and definitions are provided in Table 12.
Table 11: Outcomes investigated in AZA-AML-001
Endpoints and measures Included in NICE scope?
Reliability/validity/current use in clinical practice
Primary endpoint
OS Yes Overall survival is considered the most reliable endpoint for cancer studies, as it is an objective and direct measure of the treatment benefit that is most clinically meaningful to the patient population. Furthermore, OS is an appropriate primary endpoint according to the “Guideline on the evaluation of anticancer medicinal products in man” CPMP/EWP/205/95 (58).
Secondary endpoints
1-year OS rate Yes See OS above
EFS (defined as the interval from the date of randomisation to the date of treatment failure, progressive disease, relapse after CR or CRi, death from any cause, or loss to follow-up, whichever occurred first)
No Secondary efficacy endpoints are based on standard AML response criteria. The attainment of CR is the standard goal in treating AML in patients with IC. However, since not all AML subjects are eligible for IC, lower intensity therapies are often now considered as treatment options for these subjects. As such, the response criteria used in this study were a version of the IWG 2003 response criteria that
RFS (defined only for subjects who achieved CR or CRi and was measured as the interval from the date of first documented CR or CRi to the date of relapse, death from any cause, or loss to follow-up, whichever
No
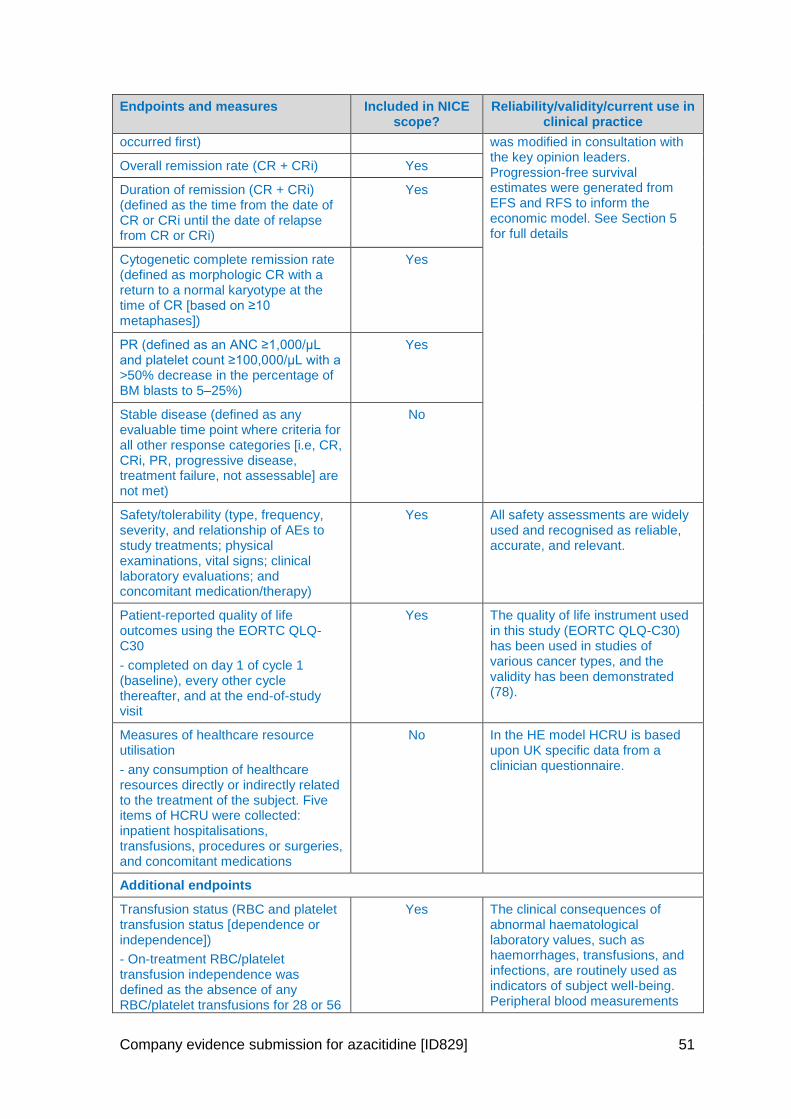
Company evidence submission for azacitidine [ID829] 51
Endpoints and measures Included in NICE scope?
Reliability/validity/current use in clinical practice
occurred first) was modified in consultation with the key opinion leaders. Progression-free survival estimates were generated from EFS and RFS to inform the economic model. See Section 5 for full details
Overall remission rate (CR + CRi) Yes
Duration of remission (CR + CRi) (defined as the time from the date of CR or CRi until the date of relapse from CR or CRi)
Yes
Cytogenetic complete remission rate (defined as morphologic CR with a return to a normal karyotype at the time of CR [based on ≥10 metaphases])
Yes
PR (defined as an ANC ≥1,000/μL and platelet count ≥100,000/μL with a >50% decrease in the percentage of BM blasts to 5–25%)
Yes
Stable disease (defined as any evaluable time point where criteria for all other response categories [i.e, CR, CRi, PR, progressive disease, treatment failure, not assessable] are not met)
No
Safety/tolerability (type, frequency, severity, and relationship of AEs to study treatments; physical examinations, vital signs; clinical laboratory evaluations; and concomitant medication/therapy)
Yes All safety assessments are widely used and recognised as reliable, accurate, and relevant.
Patient-reported quality of life outcomes using the EORTC QLQ-C30
- completed on day 1 of cycle 1 (baseline), every other cycle thereafter, and at the end-of-study visit
Yes The quality of life instrument used in this study (EORTC QLQ-C30) has been used in studies of various cancer types, and the validity has been demonstrated (78).
Measures of healthcare resource utilisation
- any consumption of healthcare resources directly or indirectly related to the treatment of the subject. Five items of HCRU were collected: inpatient hospitalisations, transfusions, procedures or surgeries, and concomitant medications
No In the HE model HCRU is based upon UK specific data from a clinician questionnaire.
Additional endpoints
Transfusion status (RBC and platelet transfusion status [dependence or independence])
- On-treatment RBC/platelet transfusion independence was defined as the absence of any RBC/platelet transfusions for 28 or 56
Yes The clinical consequences of abnormal haematological laboratory values, such as haemorrhages, transfusions, and infections, are routinely used as indicators of subject well-being. Peripheral blood measurements
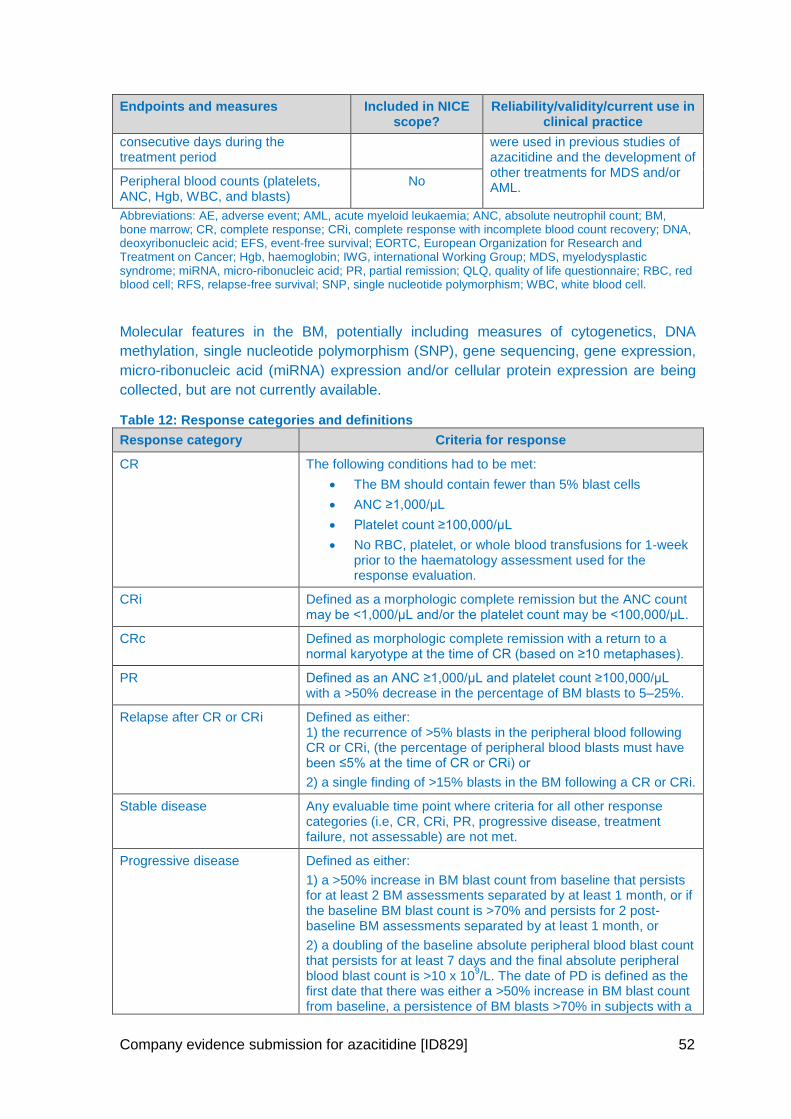
Company evidence submission for azacitidine [ID829] 52
Endpoints and measures Included in NICE scope?
Reliability/validity/current use in clinical practice
consecutive days during the treatment period
were used in previous studies of azacitidine and the development of other treatments for MDS and/or AML.
Peripheral blood counts (platelets, ANC, Hgb, WBC, and blasts)
No
Abbreviations: AE, adverse event; AML, acute myeloid leukaemia; ANC, absolute neutrophil count; BM, bone marrow; CR, complete response; CRi, complete response with incomplete blood count recovery; DNA, deoxyribonucleic acid; EFS, event-free survival; EORTC, European Organization for Research and Treatment on Cancer; Hgb, haemoglobin; IWG, international Working Group; MDS, myelodysplastic syndrome; miRNA, micro-ribonucleic acid; PR, partial remission; QLQ, quality of life questionnaire; RBC, red blood cell; RFS, relapse-free survival; SNP, single nucleotide polymorphism; WBC, white blood cell.
Molecular features in the BM, potentially including measures of cytogenetics, DNA
methylation, single nucleotide polymorphism (SNP), gene sequencing, gene expression,
micro-ribonucleic acid (miRNA) expression and/or cellular protein expression are being
collected, but are not currently available.
Table 12: Response categories and definitions
Response category Criteria for response
CR The following conditions had to be met:
The BM should contain fewer than 5% blast cells
ANC ≥1,000/μL
Platelet count ≥100,000/μL
No RBC, platelet, or whole blood transfusions for 1-week prior to the haematology assessment used for the response evaluation.
CRi Defined as a morphologic complete remission but the ANC count may be <1,000/μL and/or the platelet count may be <100,000/μL.
CRc Defined as morphologic complete remission with a return to a normal karyotype at the time of CR (based on ≥10 metaphases).
PR Defined as an ANC ≥1,000/μL and platelet count ≥100,000/μL with a >50% decrease in the percentage of BM blasts to 5–25%.
Relapse after CR or CRi Defined as either: 1) the recurrence of >5% blasts in the peripheral blood following CR or CRi, (the percentage of peripheral blood blasts must have been ≤5% at the time of CR or CRi) or
2) a single finding of >15% blasts in the BM following a CR or CRi.
Stable disease Any evaluable time point where criteria for all other response categories (i.e, CR, CRi, PR, progressive disease, treatment failure, not assessable) are not met.
Progressive disease Defined as either:
1) a >50% increase in BM blast count from baseline that persists for at least 2 BM assessments separated by at least 1 month, or if the baseline BM blast count is >70% and persists for 2 post-baseline BM assessments separated by at least 1 month, or
2) a doubling of the baseline absolute peripheral blood blast count that persists for at least 7 days and the final absolute peripheral blood blast count is >10 x 10
9/L. The date of PD is defined as the
first date that there was either a >50% increase in BM blast count from baseline, a persistence of BM blasts >70% in subjects with a
Company evidence submission for azacitidine [ID829] 53
Response category Criteria for response
baseline BM blast count of >70%, or a doubling of the peripheral blood blast count.
Treatment failure Defined as death during cycle 1 or within 28 days of the last dose and prior to day 1 of cycle 2.
Abbreviations: ANC, absolute neutrophil count; BM, bone marrow; CR, complete remission; CRc, cytogenetic complete remission; CRi, complete remission with incomplete blood count recovery; PR, partial remission, RBC, red blood cell.
4.4 Statistical analysis and definition of study groups in the relevant randomised controlled trials
4.4.1 Analysis populations
Intent-to-treat population: all subjects who were randomised, independent of whether
or not they received study treatment. The intent-to-treat (ITT) population was used for
the analysis of the primary and secondary efficacy endpoints. Subjects in the ITT
population were analysed as randomised.
Evaluable population: all subjects who had at least 1 efficacy assessment performed,
did not meet any of the exclusion criteria (see Table 13), and had received a minimum of
one cycle of treatment (or 28 days of treatment with blood products or antibiotics as
needed) were considered to be in the evaluable population.
Modified ITT population: ITT subjects who received at least 1 dose of study medication
and had a diagnosis of AML with >30% blasts confirmed by retrospective central review
of an evaluable BM aspirate.
HRQoL evaluable population: all randomised subjects who completed the baseline
HRQoL assessment (day 1) and had at least one follow-up assessment.
Safety population: all randomised subjects who had received at least one dose of trial
drug and had at least one post-dose safety assessment. Subjects who were randomised
to BSC within the CCR group were considered to be included in the safety population is
that had at least one post-randomised safety assessment. Drug exposure and all safety
analyses were based on the safety population. All subjects were analysed according to
the initial treatment they received.
Table 13: Criteria leading to exclusion from the evaluable population
Criteria
AML diagnosis not confirmed by central review
Cytogenetic risk stratification category not confirmed by central review
Randomised in error (had at least 1 inclusion or exclusion criteria violation)
Did not receive at least 1 cycle of randomised study medication
Initial treatment given was not treatment assigned in randomisation
Did not have at least 1 post-randomisation efficacy assessment performed
Received protocol prohibited concomitant therapy
Azacitidine was not administered after reconstitution within the protocol defined timeframe for > 1/3 of days dosed
Study medication compliance was <80% or >120%
Company evidence submission for azacitidine [ID829] 54
4.4.2 Primary hypothesis
The null hypothesis for the primary efficacy endpoint was that the OS distributions
between the azacitidine and CCR treatment groups were equivalent.
All hypothesis testing were carried out at the 5% (2-sided) significance level and
designed to evaluate the superiority of azacitidine relative to CCR. Secondary endpoints
were not adjusted for multiplicity.
4.4.3 Determination of sample size
The equality of OS curves was to be compared between the azacitidine and combined
CCR groups using a stratified log-rank test. The planned sample size was approximately
480 subjects (240 per treatment arm), calculated on the assumption of a median OS of
10.5 months in the azacitidine arm and 7.5 months in the combined CCR arm (40%
improvement), with a dropout rate of 1% from both treatment groups. The investigator
selection of CCR was anticipated to be 50%, 30%, and 20% of subjects to the IC, LDAC,
and BSC groups, respectively. This design required 374 deaths to allow the
demonstration of a statistically significant difference in OS at a one-sided significance
level of 0.025 with at least 90% power to detect a constant HR of 0.71.
Power calculations were based on comparisons made between the azacitidine group
and the CCR group. The study was not prospectively powered to statistically compare
the individual CCR treatment selections.
The final analysis, planned after 374 events had been observed, was expected
approximately 31 months following randomisation of the first subject into the study.
4.4.4 Primary efficacy analysis
The primary efficacy analysis was performed using the ITT population. The analysis of
the primary efficacy endpoint was conducted using an unstratified log-rank rest and a
stratified log-rank test (stratified by CCR selection, ECOG performance status, and
cytogenetic risk status). The Kaplan Meier (KM) method was used to estimate the
survival distribution functions for each treatment group. KM estimates for median OS,
25th and 75th percentiles, and associated two-sided 95% CIs were summarised for each
treatment group (both unadjusted for the stratification variables and within strata).
Additionally, the numerical difference and associated 95% CI in the median, and the 25th
and 75th percentiles between the two treatment groups (azacitidine vs. CCR) were
presented for the unstratified KM estimates.
Cox proportional hazards models (unstratified and stratified) were used to estimate the
hazard rate ratio and the corresponding 95% CI for azacitidine vs CCR.
Surviving subjects were censored upon study discontinuation (loss to follow-up,
withdrawal of consent) or at the end of the post-study follow-up.
4.4.4.1 Sensitivity analysis
The following sensitivity analyses were performed.
Company evidence submission for azacitidine [ID829] 55
Using the evaluable population
The primary efficacy analysis was repeated using the evaluable population.
Analyses to evaluate any impact of subjects receiving other cancer therapy after study therapy
Censoring for the use of any subsequent therapy for AML
Subjects who received follow-up therapy for AML following discontinuation from trial
drug were censored from the date on which the first subsequent therapy was started.
The modified time-to-death endpoint was based on the ITT population and analysed
as per primary analysis of the primary endpoint.
4.4.4.2 Exploratory analyses
In support of the primary analysis, the following analyses were conducted on the ITT
population using the same methods as the primary analysis, without stratification:
azacitidine versus BSC only among subjects pre-selected to BSC only
azacitidine versus LDAC among subjects pre-selected to LDAC
azacitidine versus IC among subjects pre-selected to IC
4.4.4.3 Post-hoc analyses
Impact of subsequent therapy and/or baseline characteristics
In post-hoc multivariate efficacy analyses OS with azacitidine compared with CCR was
estimated by using Cox proportional hazards models to adjust for variables that were
preselected on the basis of their known potential to influence outcomes because of
confounding and/or heterogeneity. These Cox models were adjusted for (1) covariates
for subsequent therapy (time-varying; yes or no) and treatment-by-subsequent-therapy
(time-varying) interaction, (2) selected baseline demographic and disease covariates
known to influence prognosis (e.g. cytogenetic risk), and (3) all covariates in models (1)
and (2). HRs, 95% CIs, and p values were estimated.
In addition, the influence of subsequent therapy on median OS was evaluated by using
an IPCW adjusted Cox PH model. The IPCW approach computes adjusted HR estimates
which allow for a correction for dependent censoring (79). This approach allows for the
detection of improved survival that the standard ITT comparison fails to detect when a
large proportion of the subjects receive subsequent therapy.
For regulatory purposes, an initial IPCW analysis was undertaken in which both
treatment arms were adjusted. A further IPCW analysis was conducted in line with the
NICE DSU TSD16 in which adjustments were only made to the comparator treatment
arm (CCR) (80).
Impact of subsequent therapy on overall survival
To further explore the impact on OS of subsequent therapies, estimates of OS for
azacitidine versus CCR were also generated for subjects who did not receive any
subsequent therapy and for those subjects who received any subsequent therapy.
Company evidence submission for azacitidine [ID829] 56
Modified intent-to-treat population
Considering the criteria used to select the evaluable population were very restrictive, a
post-hoc analysis for the OS endpoint was conducted in a modified ITT (mITT)
population, with less extensive criteria than for the evaluable population.
4.4.5 Secondary efficacy analysis
All secondary endpoints were analysed using the ITT population, except for HRQoL and
healthcare resource utilisation (HCRU). Analyses for both HRQoL and HCRU were
conducted using a HRQoL evaluable population, defined as all randomised subjects who
completed the baseline HRQoL assessment (day 1) and had at least one follow-up
assessment.
Kaplan-Meier methods were used to estimate the 1-year survival probabilities for time to
death from any cause and death probabilities at 30 and 60 days.
Time-to-event endpoints (EFS and RFS) were analysed using the same methods as the
primary efficacy analysis, but without stratification. For EFS, subjects who were alive and
event-free were censored at the date of their last response assessment, and for RFS,
subjects who were in continuous CR or CRi were censored at the date of their last
response assessment.
Haematologic status was explored by examining the percentage of responders, defined
as CR and CRi, and the duration of remission, CRc, peripheral blood counts, and
transfusion requirements. All responses were based on the modified International
Working Group (IWG) response criteria for AML, and are defined in Table 12.
For duration of remission, subjects who were lost to follow-up or were alive at follow-up
without documented relapse were censored at the date of their last response
assessment. Summary statistics included KM estimates of median duration of remission,
and 1-year cumulative incidence of relapse for each treatment group.
For transfusion status, subjects who maintained red blood cell/platelet transfusion
independence to the end of the treatment period were censored at the date of treatment
discontinuation or death, whichever was sooner. Duration of transfusion independence
was estimated and summarised using KM methods.
For HRQoL analyses, the mean change from baseline for each domain at each time
point was compared with the minimal important difference to determine whether the
change was clinically meaningful. A mean change of at least 10 points on the
standardised domain scores was required to be considered meaningful (81).
All reported log-rank or Fisher’s exact test p values for secondary endpoints are nominal.
4.5 Participant flow in the relevant randomised controlled trials
4.5.1 Patient disposition
In total, 488 subjects were randomised. Of these, 241 subjects were randomised to
receive azacitidine, and 247 subjects were randomised to receive conventional care
treatment.
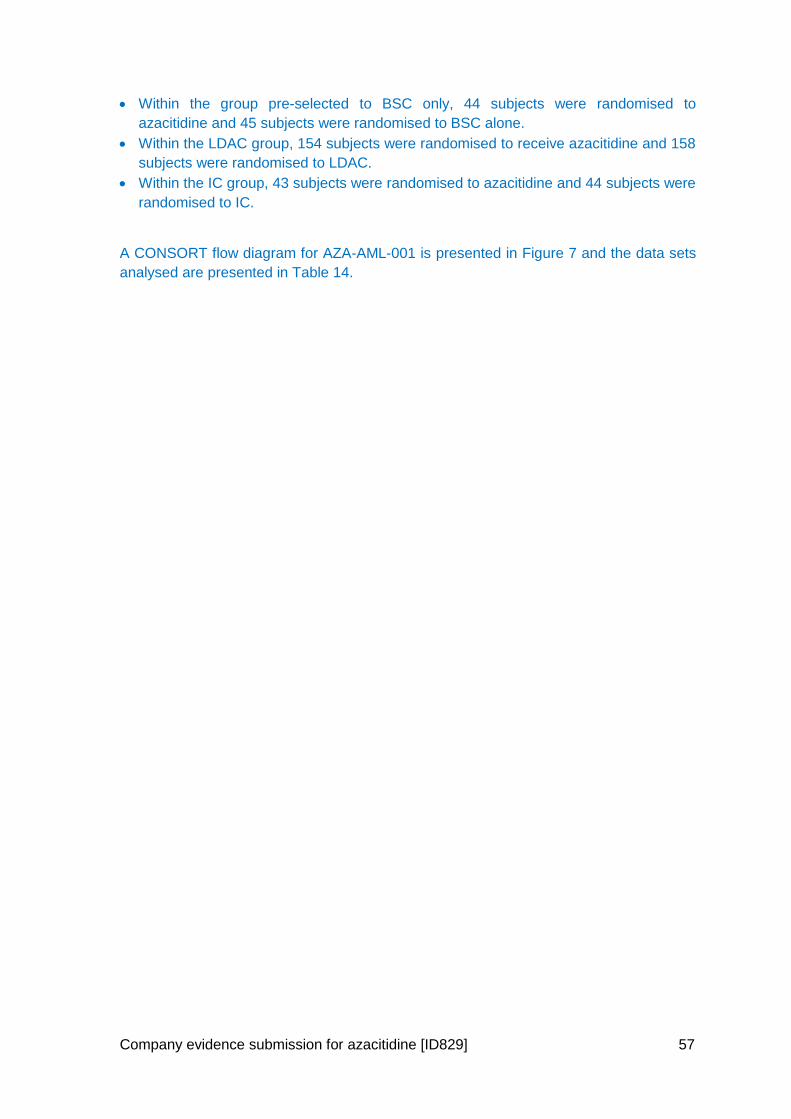
Company evidence submission for azacitidine [ID829] 57
Within the group pre-selected to BSC only, 44 subjects were randomised to
azacitidine and 45 subjects were randomised to BSC alone.
Within the LDAC group, 154 subjects were randomised to receive azacitidine and 158
subjects were randomised to LDAC.
Within the IC group, 43 subjects were randomised to azacitidine and 44 subjects were
randomised to IC.
A CONSORT flow diagram for AZA-AML-001 is presented in Figure 7 and the data sets
analysed are presented in Table 14.
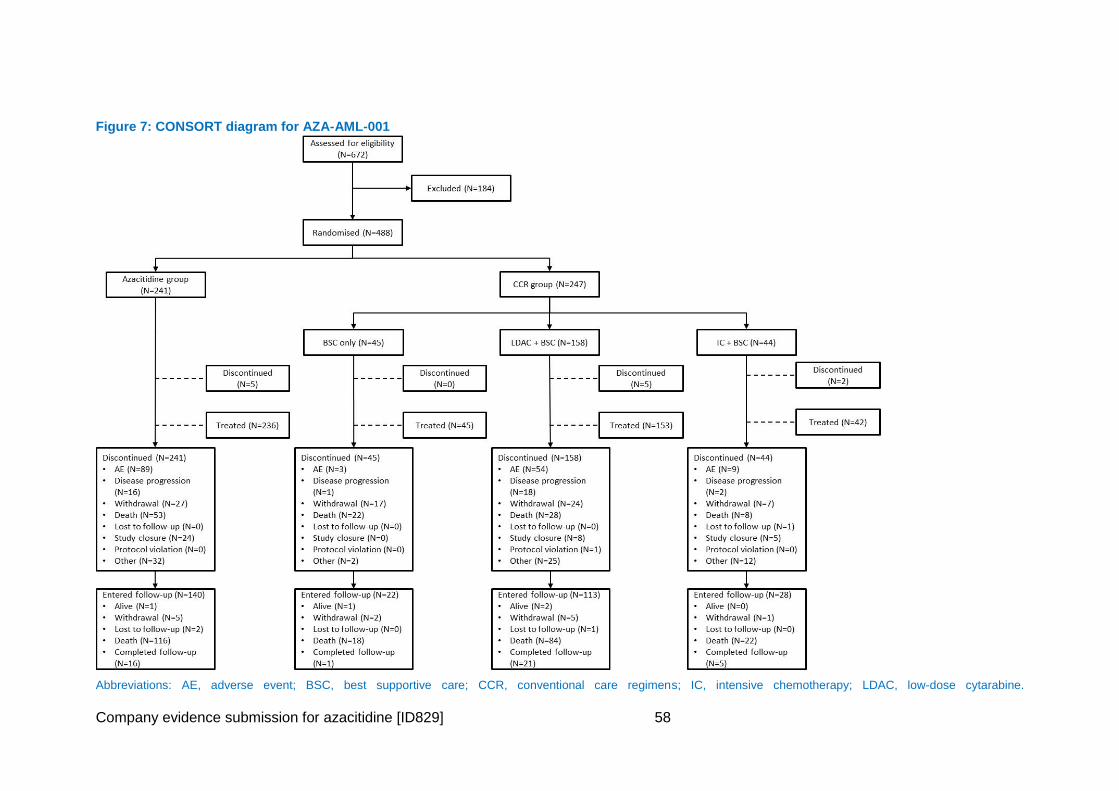
Company evidence submission for azacitidine [ID829] 58
Figure 7: CONSORT diagram for AZA-AML-001
Abbreviations: AE, adverse event; BSC, best supportive care; CCR, conventional care regimens; IC, intensive chemotherapy; LDAC, low-dose cytarabine.
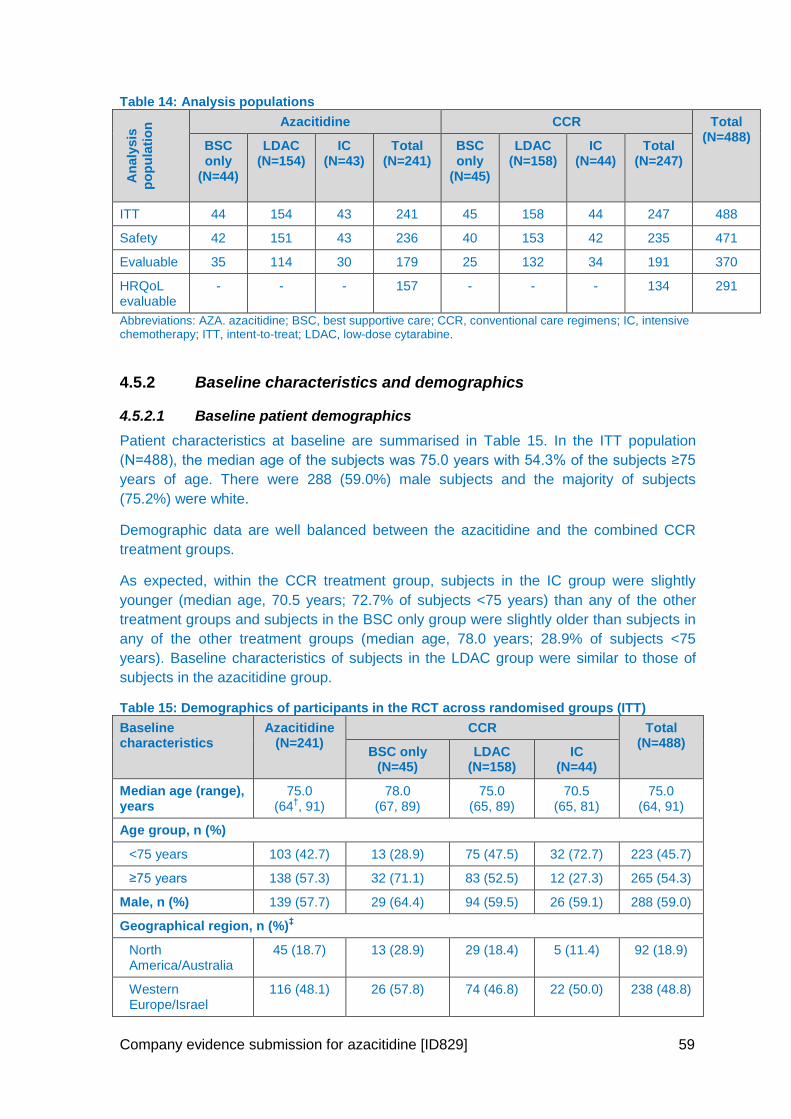
Company evidence submission for azacitidine [ID829] 59
Table 14: Analysis populations
An
aly
sis
po
pu
lati
on
Azacitidine CCR Total (N=488)
BSC only
(N=44)
LDAC (N=154)
IC (N=43)
Total (N=241)
BSC only
(N=45)
LDAC (N=158)
IC (N=44)
Total (N=247)
ITT 44 154 43 241 45 158 44 247 488
Safety 42 151 43 236 40 153 42 235 471
Evaluable 35 114 30 179 25 132 34 191 370
HRQoL evaluable
- - - 157 - - - 134 291
Abbreviations: AZA. azacitidine; BSC, best supportive care; CCR, conventional care regimens; IC, intensive chemotherapy; ITT, intent-to-treat; LDAC, low-dose cytarabine.
4.5.2 Baseline characteristics and demographics
4.5.2.1 Baseline patient demographics
Patient characteristics at baseline are summarised in Table 15. In the ITT population
(N=488), the median age of the subjects was 75.0 years with 54.3% of the subjects ≥75
years of age. There were 288 (59.0%) male subjects and the majority of subjects
(75.2%) were white.
Demographic data are well balanced between the azacitidine and the combined CCR
treatment groups.
As expected, within the CCR treatment group, subjects in the IC group were slightly
younger (median age, 70.5 years; 72.7% of subjects <75 years) than any of the other
treatment groups and subjects in the BSC only group were slightly older than subjects in
any of the other treatment groups (median age, 78.0 years; 28.9% of subjects <75
years). Baseline characteristics of subjects in the LDAC group were similar to those of
subjects in the azacitidine group.
Table 15: Demographics of participants in the RCT across randomised groups (ITT)
Baseline characteristics
Azacitidine (N=241)
CCR Total (N=488)
BSC only (N=45)
LDAC (N=158)
IC (N=44)
Median age (range), years
75.0 (64
†, 91)
78.0 (67, 89)
75.0 (65, 89)
70.5 (65, 81)
75.0 (64, 91)
Age group, n (%)
<75 years 103 (42.7) 13 (28.9) 75 (47.5) 32 (72.7) 223 (45.7)
≥75 years 138 (57.3) 32 (71.1) 83 (52.5) 12 (27.3) 265 (54.3)
Male, n (%) 139 (57.7) 29 (64.4) 94 (59.5) 26 (59.1) 288 (59.0)
Geographical region, n (%)‡
North America/Australia
45 (18.7) 13 (28.9) 29 (18.4) 5 (11.4) 92 (18.9)
Western Europe/Israel
116 (48.1) 26 (57.8) 74 (46.8) 22 (50.0) 238 (48.8)
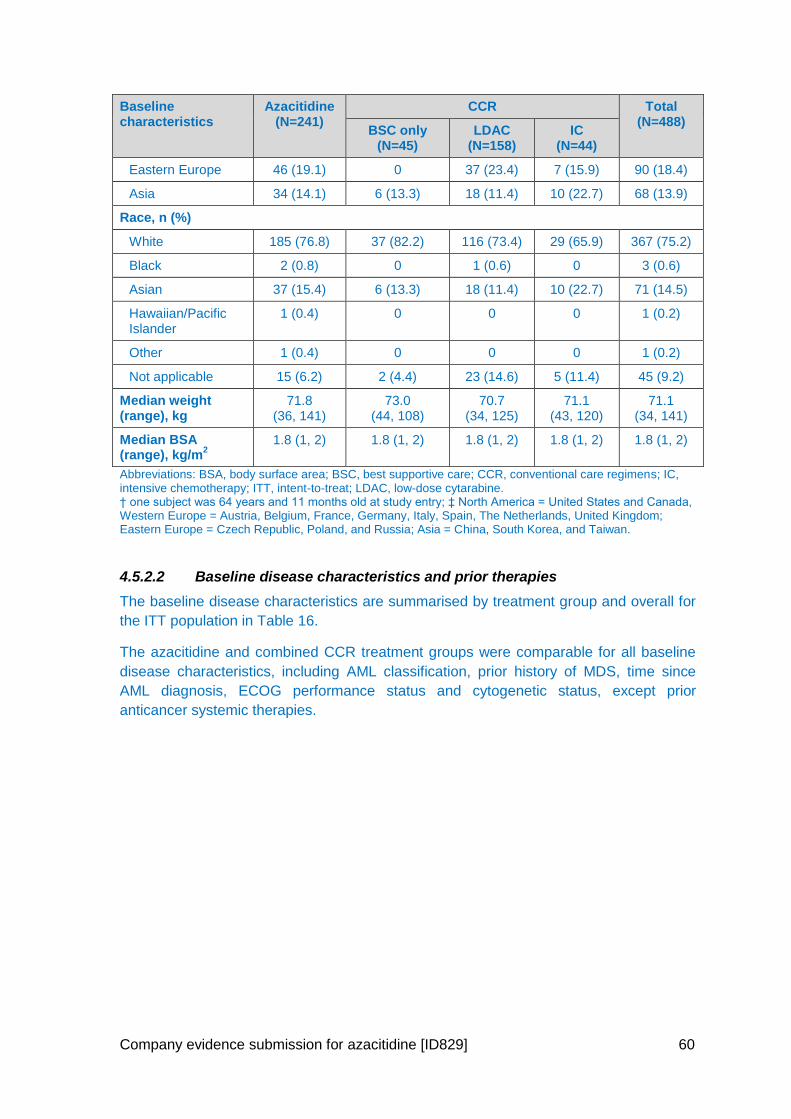
Company evidence submission for azacitidine [ID829] 60
Baseline characteristics
Azacitidine (N=241)
CCR Total (N=488)
BSC only (N=45)
LDAC (N=158)
IC (N=44)
Eastern Europe 46 (19.1) 0 37 (23.4) 7 (15.9) 90 (18.4)
Asia 34 (14.1) 6 (13.3) 18 (11.4) 10 (22.7) 68 (13.9)
Race, n (%)
White 185 (76.8) 37 (82.2) 116 (73.4) 29 (65.9) 367 (75.2)
Black 2 (0.8) 0 1 (0.6) 0 3 (0.6)
Asian 37 (15.4) 6 (13.3) 18 (11.4) 10 (22.7) 71 (14.5)
Hawaiian/Pacific Islander
1 (0.4) 0 0 0 1 (0.2)
Other 1 (0.4) 0 0 0 1 (0.2)
Not applicable 15 (6.2) 2 (4.4) 23 (14.6) 5 (11.4) 45 (9.2)
Median weight (range), kg
71.8 (36, 141)
73.0 (44, 108)
70.7 (34, 125)
71.1 (43, 120)
71.1 (34, 141)
Median BSA (range), kg/m
2
1.8 (1, 2) 1.8 (1, 2) 1.8 (1, 2) 1.8 (1, 2) 1.8 (1, 2)
Abbreviations: BSA, body surface area; BSC, best supportive care; CCR, conventional care regimens; IC, intensive chemotherapy; ITT, intent-to-treat; LDAC, low-dose cytarabine. † one subject was 64 years and 11 months old at study entry; ‡ North America = United States and Canada, Western Europe = Austria, Belgium, France, Germany, Italy, Spain, The Netherlands, United Kingdom; Eastern Europe = Czech Republic, Poland, and Russia; Asia = China, South Korea, and Taiwan.
4.5.2.2 Baseline disease characteristics and prior therapies
The baseline disease characteristics are summarised by treatment group and overall for
the ITT population in Table 16.
The azacitidine and combined CCR treatment groups were comparable for all baseline
disease characteristics, including AML classification, prior history of MDS, time since
AML diagnosis, ECOG performance status and cytogenetic status, except prior
anticancer systemic therapies.
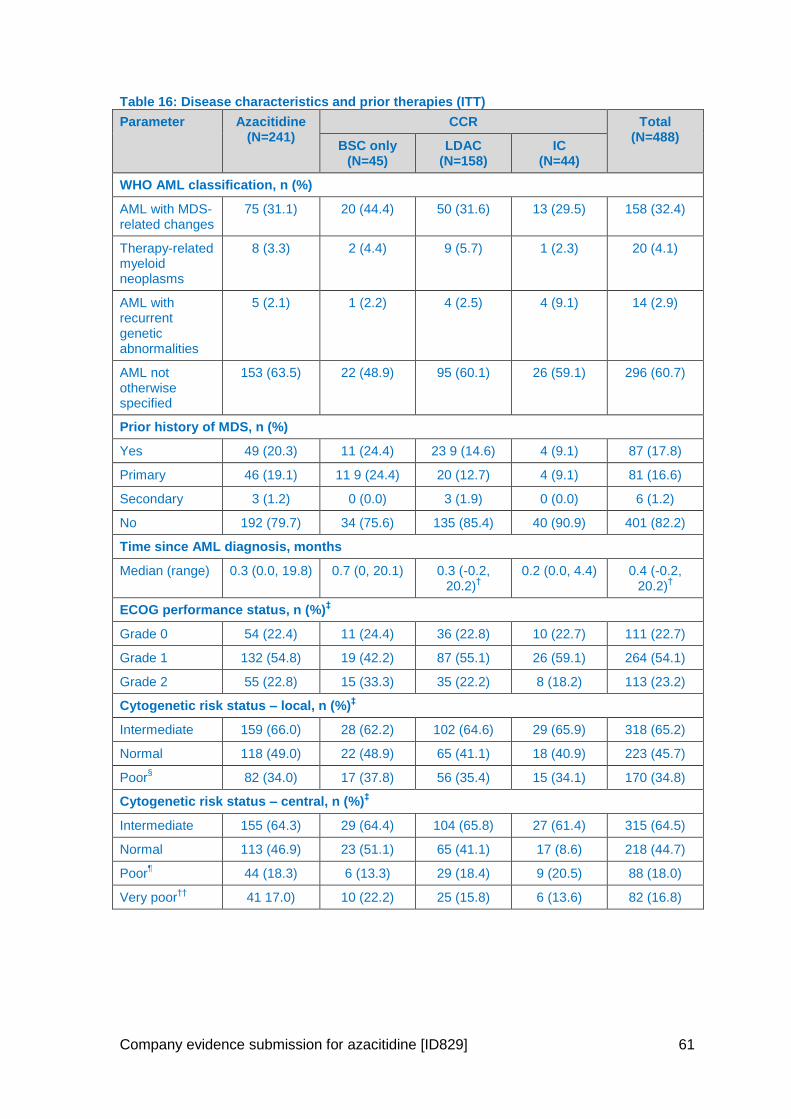
Company evidence submission for azacitidine [ID829] 61
Table 16: Disease characteristics and prior therapies (ITT)
Parameter Azacitidine (N=241)
CCR Total (N=488)
BSC only (N=45)
LDAC (N=158)
IC (N=44)
WHO AML classification, n (%)
AML with MDS-related changes
75 (31.1) 20 (44.4) 50 (31.6) 13 (29.5) 158 (32.4)
Therapy-related myeloid neoplasms
8 (3.3) 2 (4.4) 9 (5.7) 1 (2.3) 20 (4.1)
AML with recurrent genetic abnormalities
5 (2.1) 1 (2.2) 4 (2.5) 4 (9.1) 14 (2.9)
AML not otherwise specified
153 (63.5) 22 (48.9) 95 (60.1) 26 (59.1) 296 (60.7)
Prior history of MDS, n (%)
Yes 49 (20.3) 11 (24.4) 23 9 (14.6) 4 (9.1) 87 (17.8)
Primary 46 (19.1) 11 9 (24.4) 20 (12.7) 4 (9.1) 81 (16.6)
Secondary 3 (1.2) 0 (0.0) 3 (1.9) 0 (0.0) 6 (1.2)
No 192 (79.7) 34 (75.6) 135 (85.4) 40 (90.9) 401 (82.2)
Time since AML diagnosis, months
Median (range) 0.3 (0.0, 19.8) 0.7 (0, 20.1) 0.3 (-0.2, 20.2)
† 0.2 (0.0, 4.4) 0.4 (-0.2,
20.2)†
ECOG performance status, n (%)‡
Grade 0 54 (22.4) 11 (24.4) 36 (22.8) 10 (22.7) 111 (22.7)
Grade 1 132 (54.8) 19 (42.2) 87 (55.1) 26 (59.1) 264 (54.1)
Grade 2 55 (22.8) 15 (33.3) 35 (22.2) 8 (18.2) 113 (23.2)
Cytogenetic risk status – local, n (%)‡
Intermediate 159 (66.0) 28 (62.2) 102 (64.6) 29 (65.9) 318 (65.2)
Normal 118 (49.0) 22 (48.9) 65 (41.1) 18 (40.9) 223 (45.7)
Poor§
82 (34.0) 17 (37.8) 56 (35.4) 15 (34.1) 170 (34.8)
Cytogenetic risk status – central, n (%)‡
Intermediate 155 (64.3) 29 (64.4) 104 (65.8) 27 (61.4) 315 (64.5)
Normal 113 (46.9) 23 (51.1) 65 (41.1) 17 (8.6) 218 (44.7)
Poor¶
44 (18.3) 6 (13.3) 29 (18.4) 9 (20.5) 88 (18.0)
Very poor††
41 17.0) 10 (22.2) 25 (15.8) 6 (13.6) 82 (16.8)
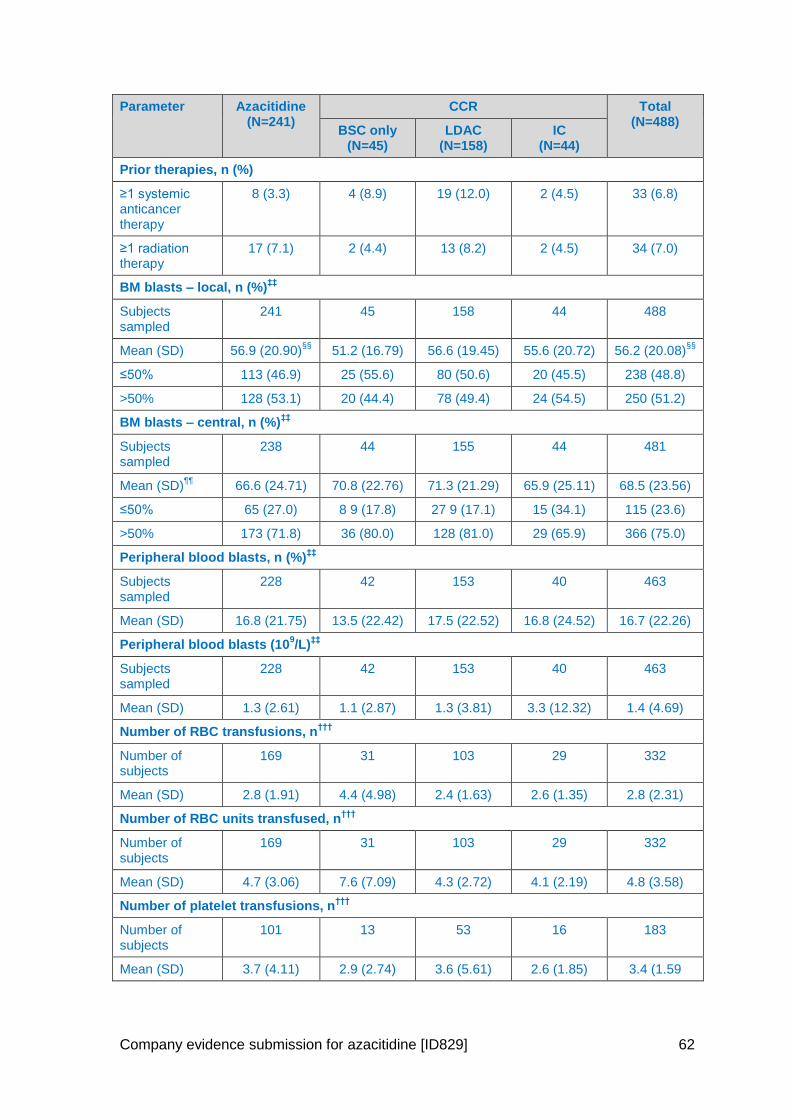
Company evidence submission for azacitidine [ID829] 62
Parameter Azacitidine (N=241)
CCR Total (N=488)
BSC only (N=45)
LDAC (N=158)
IC (N=44)
Prior therapies, n (%)
≥1 systemic anticancer therapy
8 (3.3) 4 (8.9) 19 (12.0) 2 (4.5) 33 (6.8)
≥1 radiation therapy
17 (7.1) 2 (4.4) 13 (8.2) 2 (4.5) 34 (7.0)
BM blasts – local, n (%)‡‡
Subjects sampled
241 45 158 44 488
Mean (SD) 56.9 (20.90)§§
51.2 (16.79) 56.6 (19.45) 55.6 (20.72) 56.2 (20.08)§§
≤50% 113 (46.9) 25 (55.6) 80 (50.6) 20 (45.5) 238 (48.8)
>50% 128 (53.1) 20 (44.4) 78 (49.4) 24 (54.5) 250 (51.2)
BM blasts – central, n (%)‡‡
Subjects sampled
238 44 155 44 481
Mean (SD)¶¶
66.6 (24.71) 70.8 (22.76) 71.3 (21.29) 65.9 (25.11) 68.5 (23.56)
≤50% 65 (27.0) 8 9 (17.8) 27 9 (17.1) 15 (34.1) 115 (23.6)
>50% 173 (71.8) 36 (80.0) 128 (81.0) 29 (65.9) 366 (75.0)
Peripheral blood blasts, n (%)‡‡
Subjects sampled
228 42 153 40 463
Mean (SD) 16.8 (21.75) 13.5 (22.42) 17.5 (22.52) 16.8 (24.52) 16.7 (22.26)
Peripheral blood blasts (109/L)
‡‡
Subjects sampled
228 42 153 40 463
Mean (SD) 1.3 (2.61) 1.1 (2.87) 1.3 (3.81) 3.3 (12.32) 1.4 (4.69)
Number of RBC transfusions, n†††
Number of subjects
169 31 103 29 332
Mean (SD) 2.8 (1.91) 4.4 (4.98) 2.4 (1.63) 2.6 (1.35) 2.8 (2.31)
Number of RBC units transfused, n†††
Number of subjects
169 31 103 29 332
Mean (SD) 4.7 (3.06) 7.6 (7.09) 4.3 (2.72) 4.1 (2.19) 4.8 (3.58)
Number of platelet transfusions, n†††
Number of subjects
101 13 53 16 183
Mean (SD) 3.7 (4.11) 2.9 (2.74) 3.6 (5.61) 2.6 (1.85) 3.4 (1.59
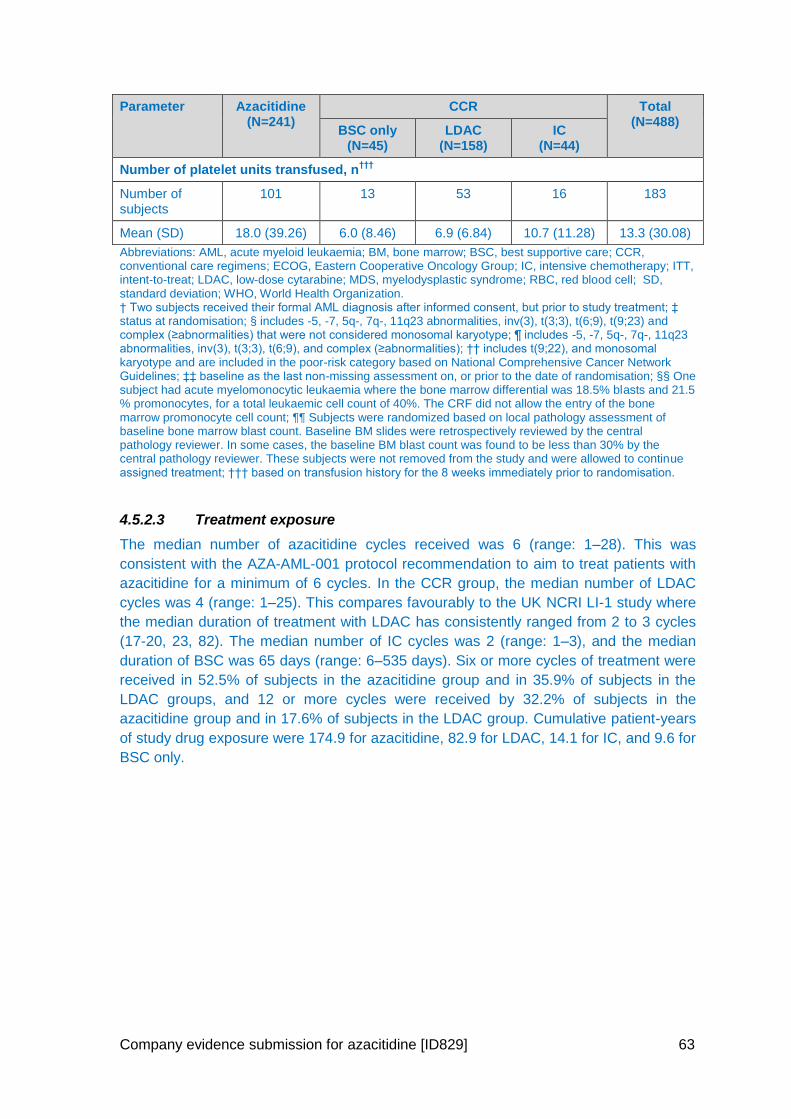
Company evidence submission for azacitidine [ID829] 63
Parameter Azacitidine (N=241)
CCR Total (N=488)
BSC only (N=45)
LDAC (N=158)
IC (N=44)
Number of platelet units transfused, n†††
Number of subjects
101 13 53 16 183
Mean (SD) 18.0 (39.26) 6.0 (8.46) 6.9 (6.84) 10.7 (11.28) 13.3 (30.08)
Abbreviations: AML, acute myeloid leukaemia; BM, bone marrow; BSC, best supportive care; CCR, conventional care regimens; ECOG, Eastern Cooperative Oncology Group; IC, intensive chemotherapy; ITT, intent-to-treat; LDAC, low-dose cytarabine; MDS, myelodysplastic syndrome; RBC, red blood cell; SD, standard deviation; WHO, World Health Organization. † Two subjects received their formal AML diagnosis after informed consent, but prior to study treatment; ‡ status at randomisation; § includes -5, -7, 5q-, 7q-, 11q23 abnormalities, inv(3), t(3;3), t(6;9), t(9;23) and complex (≥abnormalities) that were not considered monosomal karyotype; ¶ includes -5, -7, 5q-, 7q-, 11q23 abnormalities, inv(3), t(3;3), t(6;9), and complex (≥abnormalities); †† includes t(9;22), and monosomal karyotype and are included in the poor-risk category based on National Comprehensive Cancer Network Guidelines; ‡‡ baseline as the last non-missing assessment on, or prior to the date of randomisation; §§ One subject had acute myelomonocytic leukaemia where the bone marrow differential was 18.5% blasts and 21.5 % promonocytes, for a total leukaemic cell count of 40%. The CRF did not allow the entry of the bone marrow promonocyte cell count; ¶¶ Subjects were randomized based on local pathology assessment of baseline bone marrow blast count. Baseline BM slides were retrospectively reviewed by the central pathology reviewer. In some cases, the baseline BM blast count was found to be less than 30% by the central pathology reviewer. These subjects were not removed from the study and were allowed to continue assigned treatment; ††† based on transfusion history for the 8 weeks immediately prior to randomisation.
4.5.2.3 Treatment exposure
The median number of azacitidine cycles received was 6 (range: 1–28). This was
consistent with the AZA-AML-001 protocol recommendation to aim to treat patients with
azacitidine for a minimum of 6 cycles. In the CCR group, the median number of LDAC
cycles was 4 (range: 1–25). This compares favourably to the UK NCRI LI-1 study where
the median duration of treatment with LDAC has consistently ranged from 2 to 3 cycles
(17-20, 23, 82). The median number of IC cycles was 2 (range: 1–3), and the median
duration of BSC was 65 days (range: 6–535 days). Six or more cycles of treatment were
received in 52.5% of subjects in the azacitidine group and in 35.9% of subjects in the
LDAC groups, and 12 or more cycles were received by 32.2% of subjects in the
azacitidine group and in 17.6% of subjects in the LDAC group. Cumulative patient-years
of study drug exposure were 174.9 for azacitidine, 82.9 for LDAC, 14.1 for IC, and 9.6 for
BSC only.
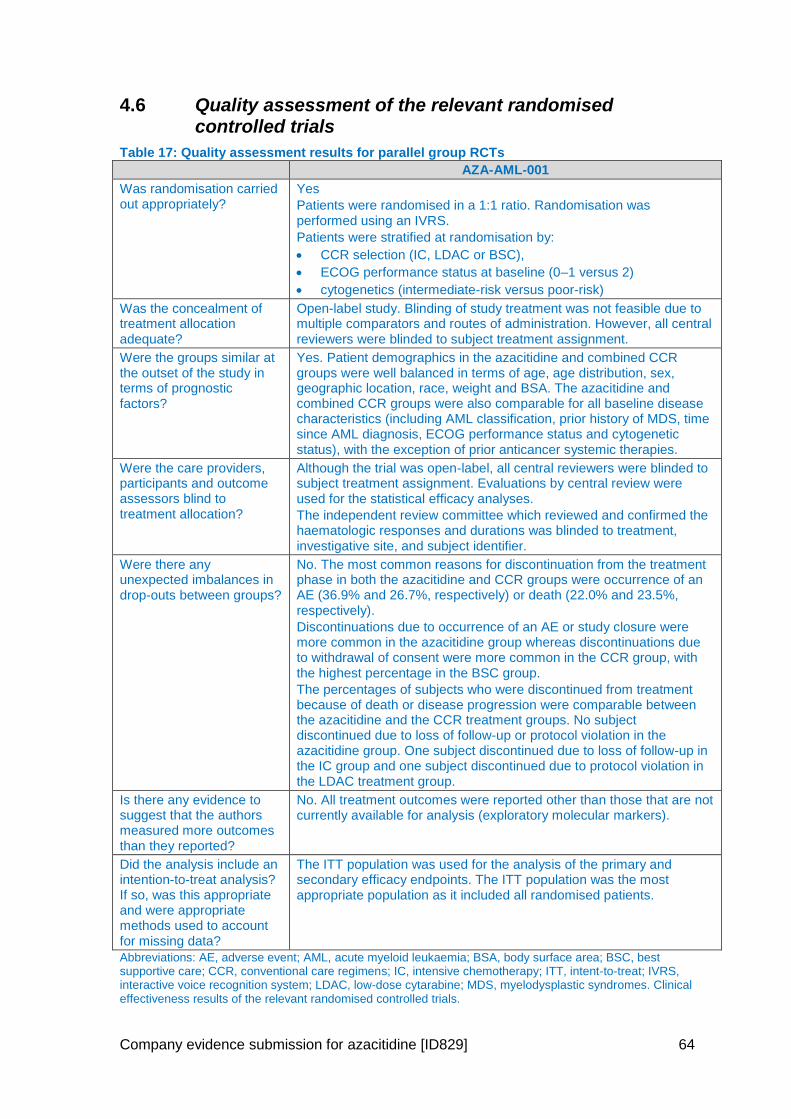
Company evidence submission for azacitidine [ID829] 64
4.6 Quality assessment of the relevant randomised controlled trials
Table 17: Quality assessment results for parallel group RCTs
AZA-AML-001
Was randomisation carried out appropriately?
Yes
Patients were randomised in a 1:1 ratio. Randomisation was performed using an IVRS.
Patients were stratified at randomisation by:
CCR selection (IC, LDAC or BSC),
ECOG performance status at baseline (0–1 versus 2)
cytogenetics (intermediate-risk versus poor-risk)
Was the concealment of treatment allocation adequate?
Open-label study. Blinding of study treatment was not feasible due to multiple comparators and routes of administration. However, all central reviewers were blinded to subject treatment assignment.
Were the groups similar at the outset of the study in terms of prognostic factors?
Yes. Patient demographics in the azacitidine and combined CCR groups were well balanced in terms of age, age distribution, sex, geographic location, race, weight and BSA. The azacitidine and combined CCR groups were also comparable for all baseline disease characteristics (including AML classification, prior history of MDS, time since AML diagnosis, ECOG performance status and cytogenetic status), with the exception of prior anticancer systemic therapies.
Were the care providers, participants and outcome assessors blind to treatment allocation?
Although the trial was open-label, all central reviewers were blinded to subject treatment assignment. Evaluations by central review were used for the statistical efficacy analyses.
The independent review committee which reviewed and confirmed the haematologic responses and durations was blinded to treatment, investigative site, and subject identifier.
Were there any unexpected imbalances in drop-outs between groups?
No. The most common reasons for discontinuation from the treatment phase in both the azacitidine and CCR groups were occurrence of an AE (36.9% and 26.7%, respectively) or death (22.0% and 23.5%, respectively).
Discontinuations due to occurrence of an AE or study closure were more common in the azacitidine group whereas discontinuations due to withdrawal of consent were more common in the CCR group, with the highest percentage in the BSC group.
The percentages of subjects who were discontinued from treatment because of death or disease progression were comparable between the azacitidine and the CCR treatment groups. No subject discontinued due to loss of follow-up or protocol violation in the azacitidine group. One subject discontinued due to loss of follow-up in the IC group and one subject discontinued due to protocol violation in the LDAC treatment group.
Is there any evidence to suggest that the authors measured more outcomes than they reported?
No. All treatment outcomes were reported other than those that are not currently available for analysis (exploratory molecular markers).
Did the analysis include an intention-to-treat analysis? If so, was this appropriate and were appropriate methods used to account for missing data?
The ITT population was used for the analysis of the primary and secondary efficacy endpoints. The ITT population was the most appropriate population as it included all randomised patients.
Abbreviations: AE, adverse event; AML, acute myeloid leukaemia; BSA, body surface area; BSC, best supportive care; CCR, conventional care regimens; IC, intensive chemotherapy; ITT, intent-to-treat; IVRS, interactive voice recognition system; LDAC, low-dose cytarabine; MDS, myelodysplastic syndromes. Clinical effectiveness results of the relevant randomised controlled trials.
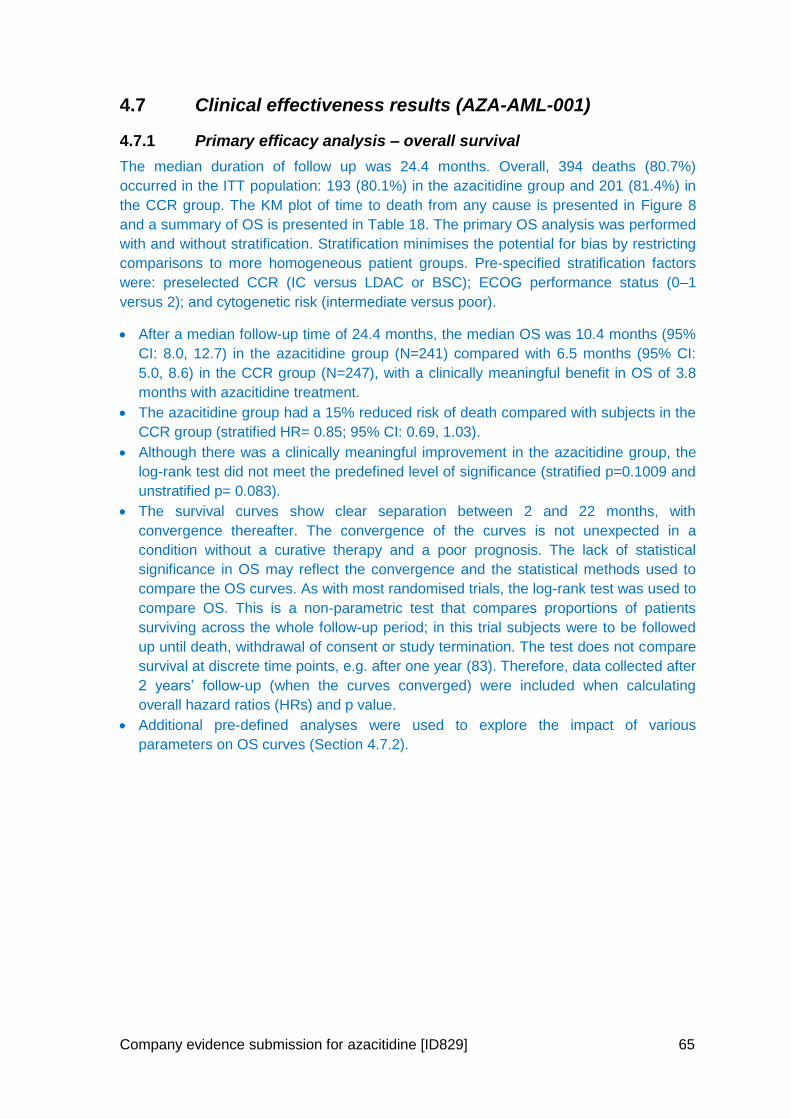
Company evidence submission for azacitidine [ID829] 65
4.7 Clinical effectiveness results (AZA-AML-001)
4.7.1 Primary efficacy analysis – overall survival
The median duration of follow up was 24.4 months. Overall, 394 deaths (80.7%)
occurred in the ITT population: 193 (80.1%) in the azacitidine group and 201 (81.4%) in
the CCR group. The KM plot of time to death from any cause is presented in Figure 8
and a summary of OS is presented in Table 18. The primary OS analysis was performed
with and without stratification. Stratification minimises the potential for bias by restricting
comparisons to more homogeneous patient groups. Pre-specified stratification factors
were: preselected CCR (IC versus LDAC or BSC); ECOG performance status (0–1
versus 2); and cytogenetic risk (intermediate versus poor).
After a median follow-up time of 24.4 months, the median OS was 10.4 months (95%
CI: 8.0, 12.7) in the azacitidine group (N=241) compared with 6.5 months (95% CI:
5.0, 8.6) in the CCR group (N=247), with a clinically meaningful benefit in OS of 3.8
months with azacitidine treatment.
The azacitidine group had a 15% reduced risk of death compared with subjects in the
CCR group (stratified HR= 0.85; 95% CI: 0.69, 1.03).
Although there was a clinically meaningful improvement in the azacitidine group, the
log-rank test did not meet the predefined level of significance (stratified p=0.1009 and
unstratified p= 0.083).
The survival curves show clear separation between 2 and 22 months, with
convergence thereafter. The convergence of the curves is not unexpected in a
condition without a curative therapy and a poor prognosis. The lack of statistical
significance in OS may reflect the convergence and the statistical methods used to
compare the OS curves. As with most randomised trials, the log-rank test was used to
compare OS. This is a non-parametric test that compares proportions of patients
surviving across the whole follow-up period; in this trial subjects were to be followed
up until death, withdrawal of consent or study termination. The test does not compare
survival at discrete time points, e.g. after one year (83). Therefore, data collected after
2 years’ follow-up (when the curves converged) were included when calculating
overall hazard ratios (HRs) and p value.
Additional pre-defined analyses were used to explore the impact of various
parameters on OS curves (Section 4.7.2).
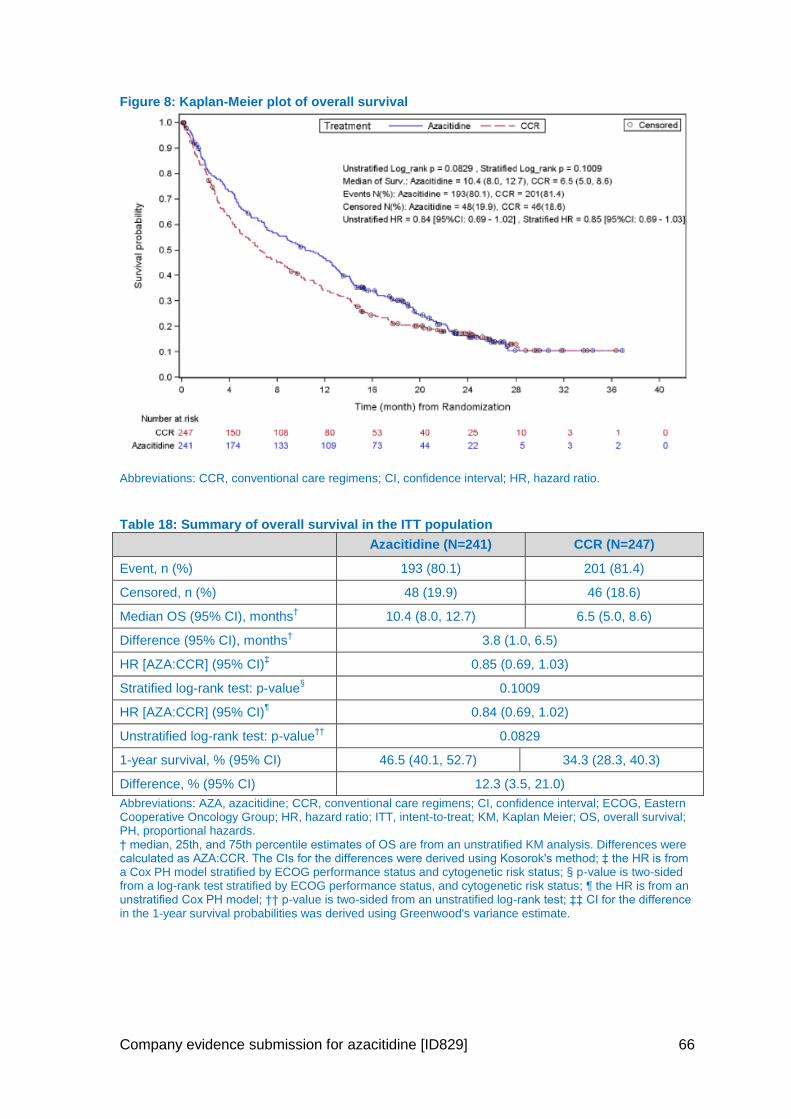
Company evidence submission for azacitidine [ID829] 66
Figure 8: Kaplan-Meier plot of overall survival
Abbreviations: CCR, conventional care regimens; CI, confidence interval; HR, hazard ratio.
Table 18: Summary of overall survival in the ITT population
Azacitidine (N=241) CCR (N=247)
Event, n (%) 193 (80.1) 201 (81.4)
Censored, n (%) 48 (19.9) 46 (18.6)
Median OS (95% CI), months† 10.4 (8.0, 12.7) 6.5 (5.0, 8.6)
Difference (95% CI), months† 3.8 (1.0, 6.5)
HR [AZA:CCR] (95% CI)‡ 0.85 (0.69, 1.03)
Stratified log-rank test: p-value§ 0.1009
HR [AZA:CCR] (95% CI)¶ 0.84 (0.69, 1.02)
Unstratified log-rank test: p-value††
0.0829
1-year survival, % (95% CI) 46.5 (40.1, 52.7) 34.3 (28.3, 40.3)
Difference, % (95% CI) 12.3 (3.5, 21.0)
Abbreviations: AZA, azacitidine; CCR, conventional care regimens; CI, confidence interval; ECOG, Eastern Cooperative Oncology Group; HR, hazard ratio; ITT, intent-to-treat; KM, Kaplan Meier; OS, overall survival; PH, proportional hazards. † median, 25th, and 75th percentile estimates of OS are from an unstratified KM analysis. Differences were calculated as AZA:CCR. The CIs for the differences were derived using Kosorok's method; ‡ the HR is from a Cox PH model stratified by ECOG performance status and cytogenetic risk status; § p-value is two-sided from a log-rank test stratified by ECOG performance status, and cytogenetic risk status; ¶ the HR is from an unstratified Cox PH model; †† p-value is two-sided from an unstratified log-rank test; ‡‡ CI for the difference in the 1-year survival probabilities was derived using Greenwood's variance estimate.
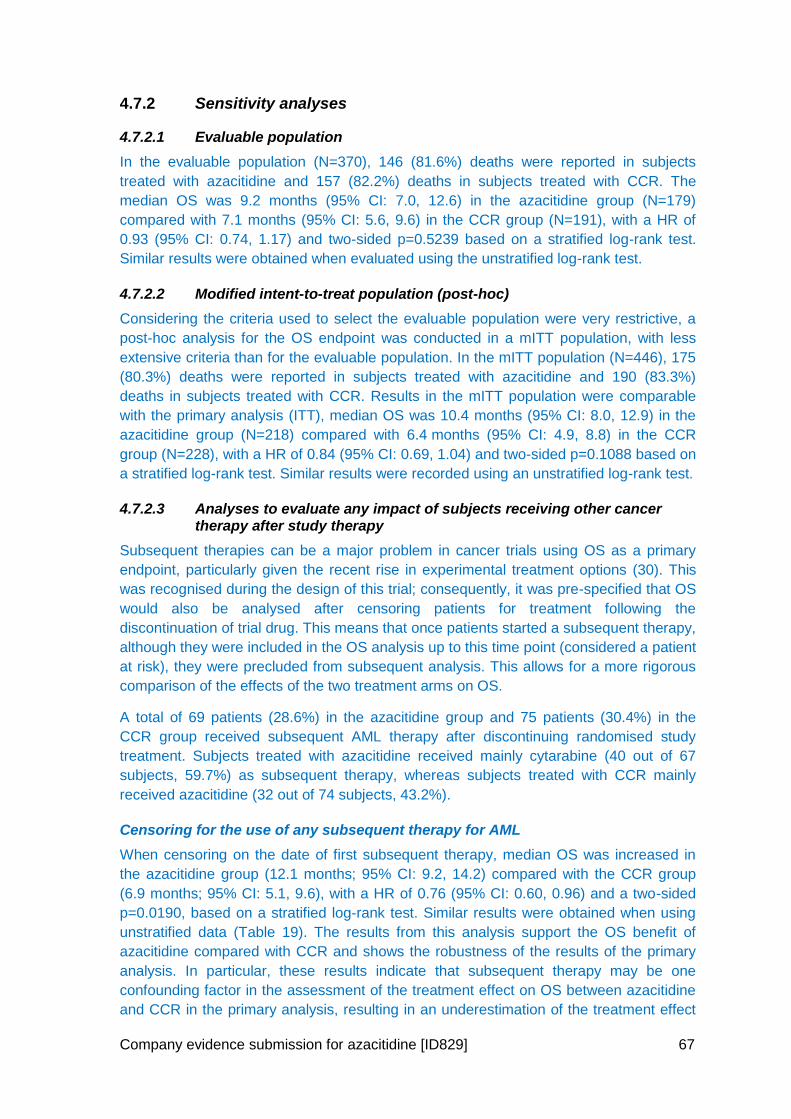
Company evidence submission for azacitidine [ID829] 67
4.7.2 Sensitivity analyses
4.7.2.1 Evaluable population
In the evaluable population (N=370), 146 (81.6%) deaths were reported in subjects
treated with azacitidine and 157 (82.2%) deaths in subjects treated with CCR. The
median OS was 9.2 months (95% CI: 7.0, 12.6) in the azacitidine group (N=179)
compared with 7.1 months (95% CI: 5.6, 9.6) in the CCR group (N=191), with a HR of
0.93 (95% CI: 0.74, 1.17) and two-sided p=0.5239 based on a stratified log-rank test.
Similar results were obtained when evaluated using the unstratified log-rank test.
4.7.2.2 Modified intent-to-treat population (post-hoc)
Considering the criteria used to select the evaluable population were very restrictive, a
post-hoc analysis for the OS endpoint was conducted in a mITT population, with less
extensive criteria than for the evaluable population. In the mITT population (N=446), 175
(80.3%) deaths were reported in subjects treated with azacitidine and 190 (83.3%)
deaths in subjects treated with CCR. Results in the mITT population were comparable
with the primary analysis (ITT), median OS was 10.4 months (95% CI: 8.0, 12.9) in the
azacitidine group (N=218) compared with 6.4 months (95% CI: 4.9, 8.8) in the CCR
group (N=228), with a HR of 0.84 (95% CI: 0.69, 1.04) and two-sided p=0.1088 based on
a stratified log-rank test. Similar results were recorded using an unstratified log-rank test.
4.7.2.3 Analyses to evaluate any impact of subjects receiving other cancer therapy after study therapy
Subsequent therapies can be a major problem in cancer trials using OS as a primary
endpoint, particularly given the recent rise in experimental treatment options (30). This
was recognised during the design of this trial; consequently, it was pre-specified that OS
would also be analysed after censoring patients for treatment following the
discontinuation of trial drug. This means that once patients started a subsequent therapy,
although they were included in the OS analysis up to this time point (considered a patient
at risk), they were precluded from subsequent analysis. This allows for a more rigorous
comparison of the effects of the two treatment arms on OS.
A total of 69 patients (28.6%) in the azacitidine group and 75 patients (30.4%) in the
CCR group received subsequent AML therapy after discontinuing randomised study
treatment. Subjects treated with azacitidine received mainly cytarabine (40 out of 67
subjects, 59.7%) as subsequent therapy, whereas subjects treated with CCR mainly
received azacitidine (32 out of 74 subjects, 43.2%).
Censoring for the use of any subsequent therapy for AML
When censoring on the date of first subsequent therapy, median OS was increased in
the azacitidine group (12.1 months; 95% CI: 9.2, 14.2) compared with the CCR group
(6.9 months; 95% CI: 5.1, 9.6), with a HR of 0.76 (95% CI: 0.60, 0.96) and a two-sided
p=0.0190, based on a stratified log-rank test. Similar results were obtained when using
unstratified data (Table 19). The results from this analysis support the OS benefit of
azacitidine compared with CCR and shows the robustness of the results of the primary
analysis. In particular, these results indicate that subsequent therapy may be one
confounding factor in the assessment of the treatment effect on OS between azacitidine
and CCR in the primary analysis, resulting in an underestimation of the treatment effect
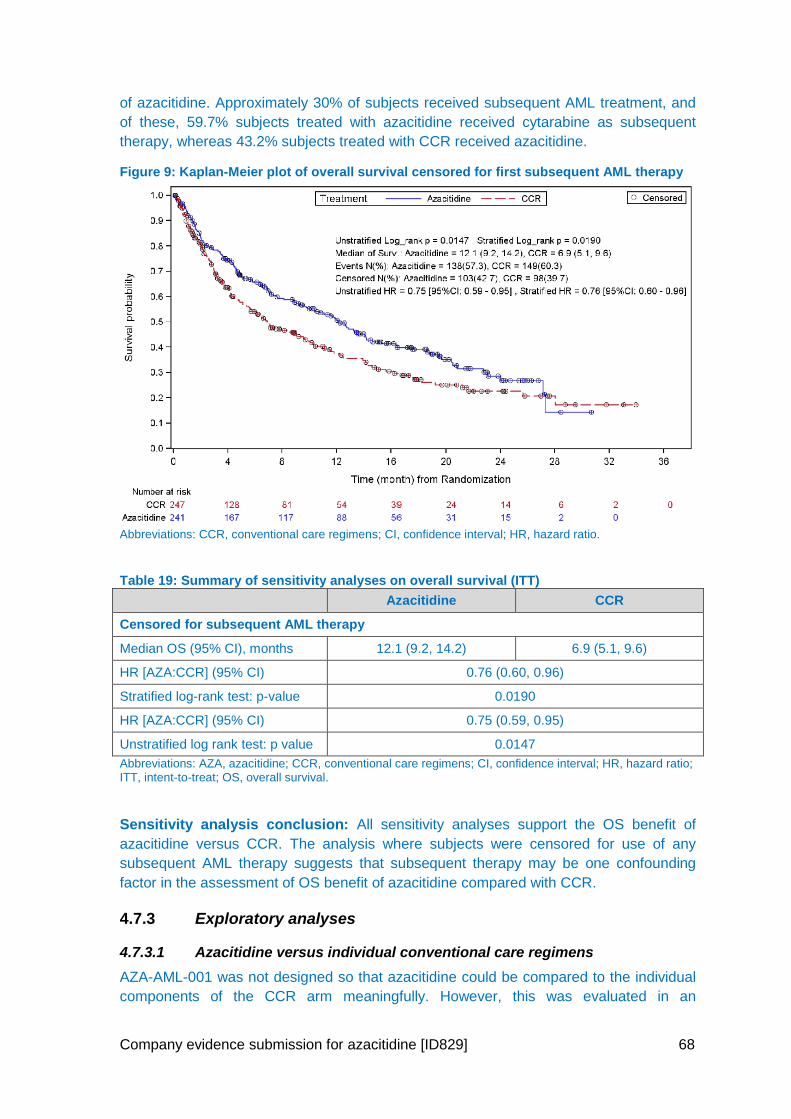
Company evidence submission for azacitidine [ID829] 68
of azacitidine. Approximately 30% of subjects received subsequent AML treatment, and
of these, 59.7% subjects treated with azacitidine received cytarabine as subsequent
therapy, whereas 43.2% subjects treated with CCR received azacitidine.
Figure 9: Kaplan-Meier plot of overall survival censored for first subsequent AML therapy
Abbreviations: CCR, conventional care regimens; CI, confidence interval; HR, hazard ratio.
Table 19: Summary of sensitivity analyses on overall survival (ITT)
Azacitidine CCR
Censored for subsequent AML therapy
Median OS (95% CI), months 12.1 (9.2, 14.2) 6.9 (5.1, 9.6)
HR [AZA:CCR] (95% CI) 0.76 (0.60, 0.96)
Stratified log-rank test: p-value 0.0190
HR [AZA:CCR] (95% CI) 0.75 (0.59, 0.95)
Unstratified log rank test: p value 0.0147
Abbreviations: AZA, azacitidine; CCR, conventional care regimens; CI, confidence interval; HR, hazard ratio; ITT, intent-to-treat; OS, overall survival.
Sensitivity analysis conclusion: All sensitivity analyses support the OS benefit of
azacitidine versus CCR. The analysis where subjects were censored for use of any
subsequent AML therapy suggests that subsequent therapy may be one confounding
factor in the assessment of OS benefit of azacitidine compared with CCR.
4.7.3 Exploratory analyses
4.7.3.1 Azacitidine versus individual conventional care regimens
AZA-AML-001 was not designed so that azacitidine could be compared to the individual
components of the CCR arm meaningfully. However, this was evaluated in an
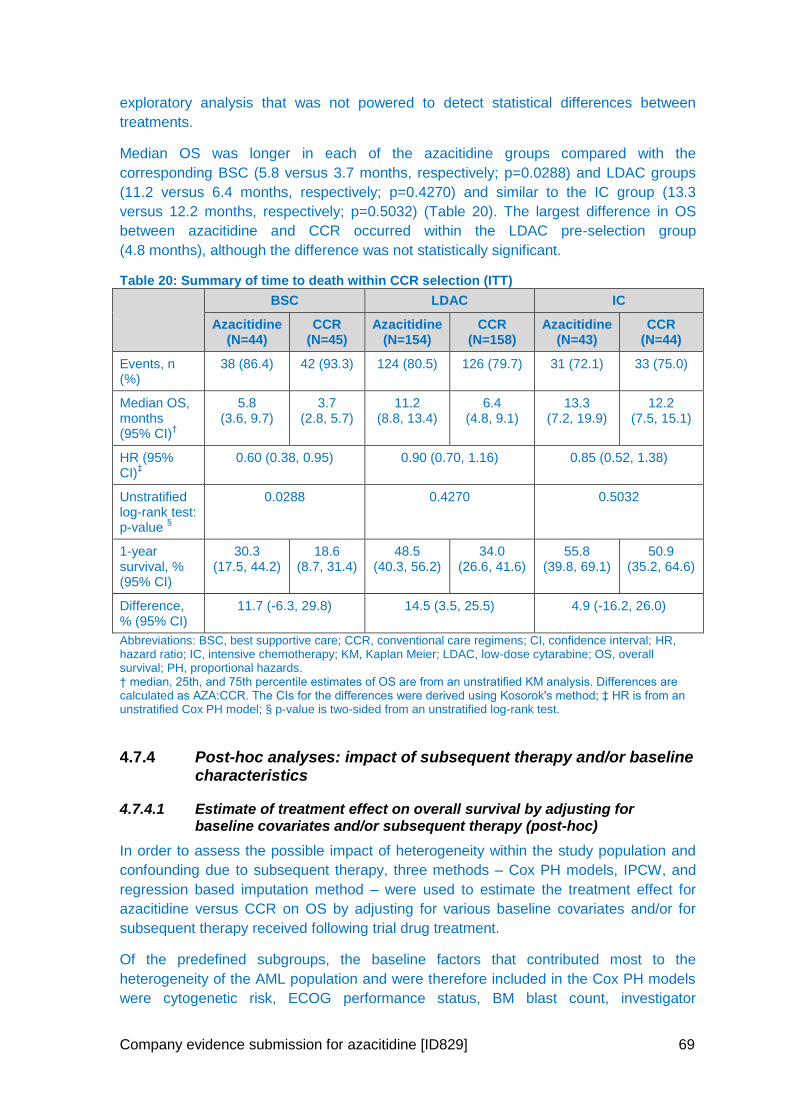
Company evidence submission for azacitidine [ID829] 69
exploratory analysis that was not powered to detect statistical differences between
treatments.
Median OS was longer in each of the azacitidine groups compared with the
corresponding BSC (5.8 versus 3.7 months, respectively; p=0.0288) and LDAC groups
(11.2 versus 6.4 months, respectively; p=0.4270) and similar to the IC group (13.3
versus 12.2 months, respectively; p=0.5032) (Table 20). The largest difference in OS
between azacitidine and CCR occurred within the LDAC pre-selection group
(4.8 months), although the difference was not statistically significant.
Table 20: Summary of time to death within CCR selection (ITT)
BSC LDAC IC
Azacitidine (N=44)
CCR (N=45)
Azacitidine (N=154)
CCR (N=158)
Azacitidine (N=43)
CCR (N=44)
Events, n (%)
38 (86.4) 42 (93.3) 124 (80.5) 126 (79.7) 31 (72.1) 33 (75.0)
Median OS, months (95% CI)
†
5.8 (3.6, 9.7)
3.7 (2.8, 5.7)
11.2 (8.8, 13.4)
6.4 (4.8, 9.1)
13.3 (7.2, 19.9)
12.2 (7.5, 15.1)
HR (95% CI)
‡ 0.60 (0.38, 0.95) 0.90 (0.70, 1.16) 0.85 (0.52, 1.38)
Unstratified log-rank test: p-value
§
0.0288 0.4270 0.5032
1-year survival, % (95% CI)
30.3 (17.5, 44.2)
18.6 (8.7, 31.4)
48.5 (40.3, 56.2)
34.0 (26.6, 41.6)
55.8 (39.8, 69.1)
50.9 (35.2, 64.6)
Difference, % (95% CI)
11.7 (-6.3, 29.8) 14.5 (3.5, 25.5) 4.9 (-16.2, 26.0)
Abbreviations: BSC, best supportive care; CCR, conventional care regimens; CI, confidence interval; HR, hazard ratio; IC, intensive chemotherapy; KM, Kaplan Meier; LDAC, low-dose cytarabine; OS, overall survival; PH, proportional hazards. † median, 25th, and 75th percentile estimates of OS are from an unstratified KM analysis. Differences are calculated as AZA:CCR. The CIs for the differences were derived using Kosorok's method; ‡ HR is from an unstratified Cox PH model; § p-value is two-sided from an unstratified log-rank test.
4.7.4 Post-hoc analyses: impact of subsequent therapy and/or baseline characteristics
4.7.4.1 Estimate of treatment effect on overall survival by adjusting for baseline covariates and/or subsequent therapy (post-hoc)
In order to assess the possible impact of heterogeneity within the study population and
confounding due to subsequent therapy, three methods – Cox PH models, IPCW, and
regression based imputation method – were used to estimate the treatment effect for
azacitidine versus CCR on OS by adjusting for various baseline covariates and/or for
subsequent therapy received following trial drug treatment.
Of the predefined subgroups, the baseline factors that contributed most to the
heterogeneity of the AML population and were therefore included in the Cox PH models
were cytogenetic risk, ECOG performance status, BM blast count, investigator
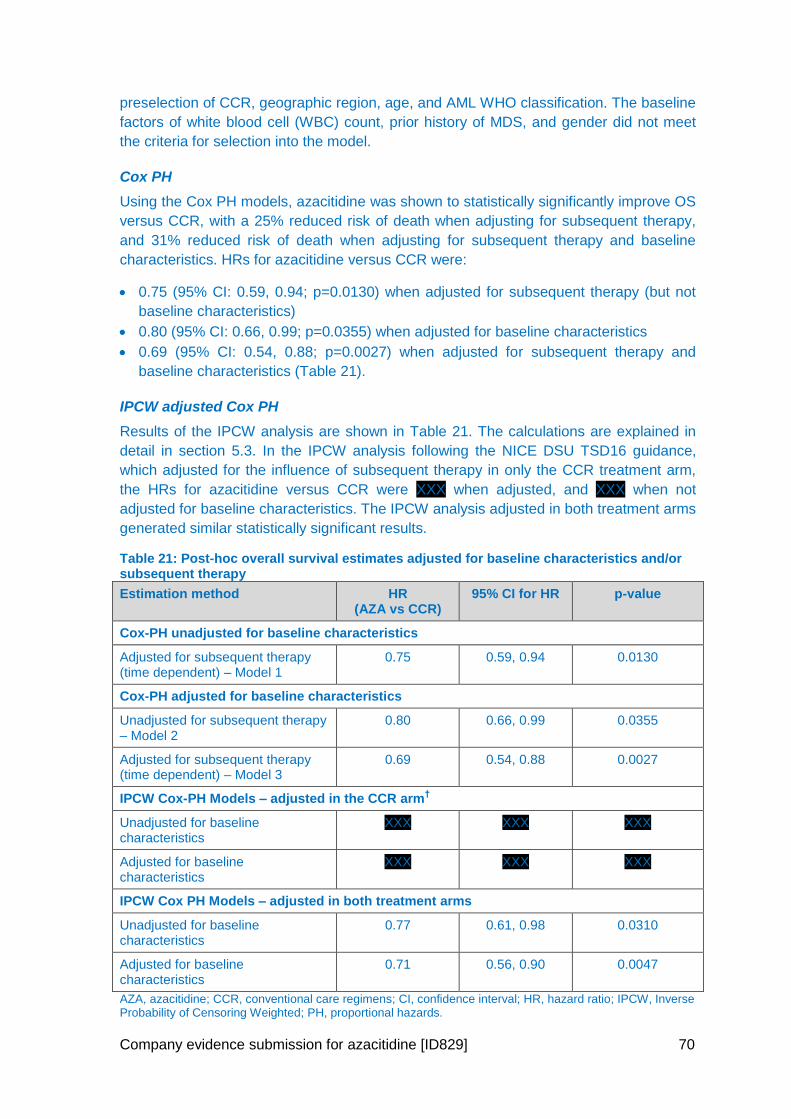
Company evidence submission for azacitidine [ID829] 70
preselection of CCR, geographic region, age, and AML WHO classification. The baseline
factors of white blood cell (WBC) count, prior history of MDS, and gender did not meet
the criteria for selection into the model.
Cox PH
Using the Cox PH models, azacitidine was shown to statistically significantly improve OS
versus CCR, with a 25% reduced risk of death when adjusting for subsequent therapy,
and 31% reduced risk of death when adjusting for subsequent therapy and baseline
characteristics. HRs for azacitidine versus CCR were:
0.75 (95% CI: 0.59, 0.94; p=0.0130) when adjusted for subsequent therapy (but not
baseline characteristics)
0.80 (95% CI: 0.66, 0.99; p=0.0355) when adjusted for baseline characteristics
0.69 (95% CI: 0.54, 0.88; p=0.0027) when adjusted for subsequent therapy and
baseline characteristics (Table 21).
IPCW adjusted Cox PH
Results of the IPCW analysis are shown in Table 21. The calculations are explained in
detail in section 5.3. In the IPCW analysis following the NICE DSU TSD16 guidance,
which adjusted for the influence of subsequent therapy in only the CCR treatment arm,
the HRs for azacitidine versus CCR were XXX when adjusted, and XXX when not
adjusted for baseline characteristics. The IPCW analysis adjusted in both treatment arms
generated similar statistically significant results.
Table 21: Post-hoc overall survival estimates adjusted for baseline characteristics and/or subsequent therapy
Estimation method HR (AZA vs CCR)
95% CI for HR p-value
Cox-PH unadjusted for baseline characteristics
Adjusted for subsequent therapy (time dependent) – Model 1
0.75 0.59, 0.94 0.0130
Cox-PH adjusted for baseline characteristics
Unadjusted for subsequent therapy – Model 2
0.80 0.66, 0.99 0.0355
Adjusted for subsequent therapy (time dependent) – Model 3
0.69 0.54, 0.88 0.0027
IPCW Cox-PH Models – adjusted in the CCR arm†
Unadjusted for baseline characteristics
XXX XXX XXX
Adjusted for baseline characteristics
XXX XXX XXX
IPCW Cox PH Models – adjusted in both treatment arms
Unadjusted for baseline characteristics
0.77 0.61, 0.98 0.0310
Adjusted for baseline characteristics
0.71 0.56, 0.90 0.0047
AZA, azacitidine; CCR, conventional care regimens; CI, confidence interval; HR, hazard ratio; IPCW, Inverse Probability of Censoring Weighted; PH, proportional hazards.
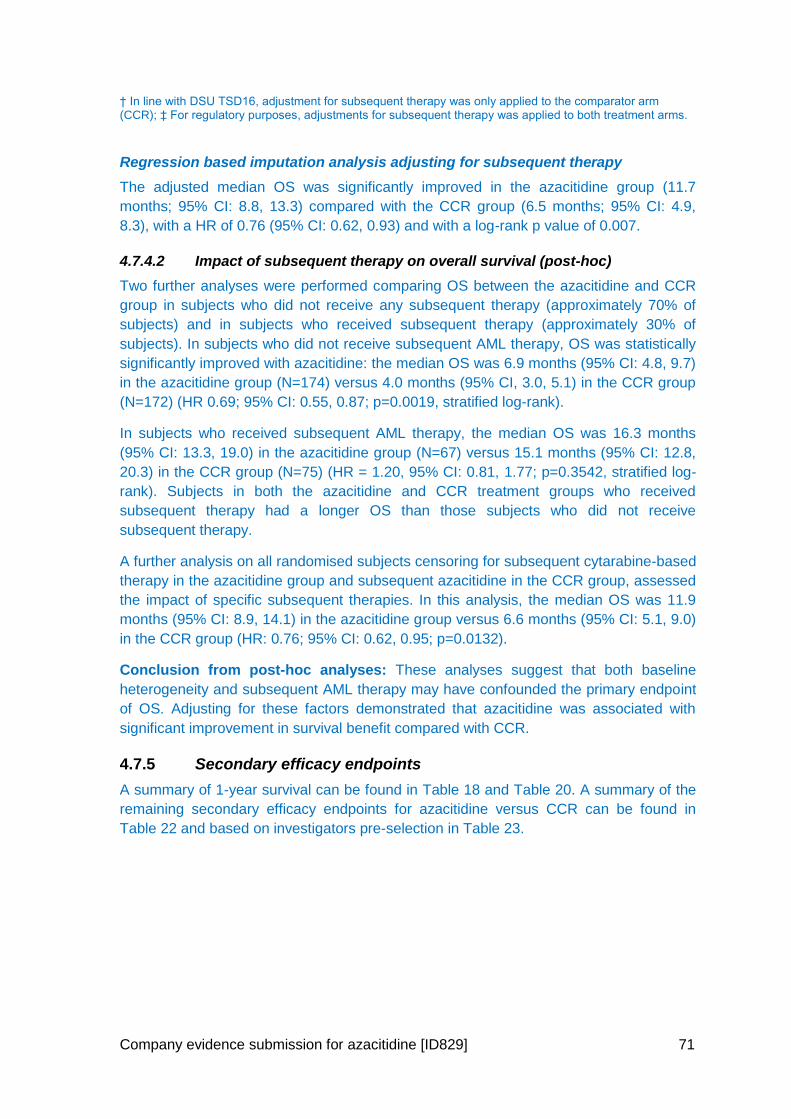
Company evidence submission for azacitidine [ID829] 71
† In line with DSU TSD16, adjustment for subsequent therapy was only applied to the comparator arm (CCR); ‡ For regulatory purposes, adjustments for subsequent therapy was applied to both treatment arms.
Regression based imputation analysis adjusting for subsequent therapy
The adjusted median OS was significantly improved in the azacitidine group (11.7
months; 95% CI: 8.8, 13.3) compared with the CCR group (6.5 months; 95% CI: 4.9,
8.3), with a HR of 0.76 (95% CI: 0.62, 0.93) and with a log-rank p value of 0.007.
4.7.4.2 Impact of subsequent therapy on overall survival (post-hoc)
Two further analyses were performed comparing OS between the azacitidine and CCR
group in subjects who did not receive any subsequent therapy (approximately 70% of
subjects) and in subjects who received subsequent therapy (approximately 30% of
subjects). In subjects who did not receive subsequent AML therapy, OS was statistically
significantly improved with azacitidine: the median OS was 6.9 months (95% CI: 4.8, 9.7)
in the azacitidine group (N=174) versus 4.0 months (95% CI, 3.0, 5.1) in the CCR group
(N=172) (HR 0.69; 95% CI: 0.55, 0.87; p=0.0019, stratified log-rank).
In subjects who received subsequent AML therapy, the median OS was 16.3 months
(95% CI: 13.3, 19.0) in the azacitidine group (N=67) versus 15.1 months (95% CI: 12.8,
20.3) in the CCR group (N=75) (HR = 1.20, 95% CI: 0.81, 1.77; p=0.3542, stratified log-
rank). Subjects in both the azacitidine and CCR treatment groups who received
subsequent therapy had a longer OS than those subjects who did not receive
subsequent therapy.
A further analysis on all randomised subjects censoring for subsequent cytarabine-based
therapy in the azacitidine group and subsequent azacitidine in the CCR group, assessed
the impact of specific subsequent therapies. In this analysis, the median OS was 11.9
months (95% CI: 8.9, 14.1) in the azacitidine group versus 6.6 months (95% CI: 5.1, 9.0)
in the CCR group (HR: 0.76; 95% CI: 0.62, 0.95; p=0.0132).
Conclusion from post-hoc analyses: These analyses suggest that both baseline
heterogeneity and subsequent AML therapy may have confounded the primary endpoint
of OS. Adjusting for these factors demonstrated that azacitidine was associated with
significant improvement in survival benefit compared with CCR.
4.7.5 Secondary efficacy endpoints
A summary of 1-year survival can be found in Table 18 and Table 20. A summary of the
remaining secondary efficacy endpoints for azacitidine versus CCR can be found in
Table 22 and based on investigators pre-selection in Table 23.
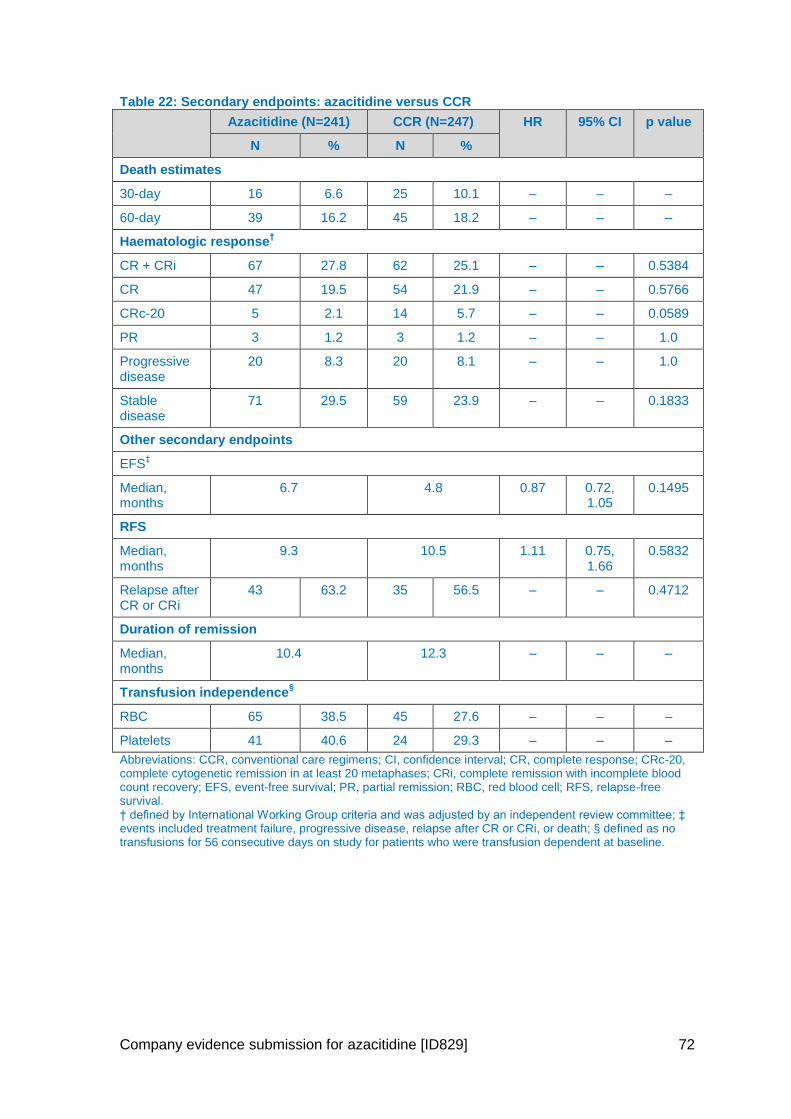
Company evidence submission for azacitidine [ID829] 72
Table 22: Secondary endpoints: azacitidine versus CCR
Azacitidine (N=241) CCR (N=247) HR 95% CI p value
N % N %
Death estimates
30-day 16 6.6 25 10.1 – – –
60-day 39 16.2 45 18.2 – – –
Haematologic response†
CR + CRi 67 27.8 62 25.1 – – 0.5384
CR 47 19.5 54 21.9 – – 0.5766
CRc-20 5 2.1 14 5.7 – – 0.0589
PR 3 1.2 3 1.2 – – 1.0
Progressive disease
20 8.3 20 8.1 – – 1.0
Stable disease
71 29.5 59 23.9 – – 0.1833
Other secondary endpoints
EFS‡
Median, months
6.7 4.8 0.87 0.72, 1.05
0.1495
RFS
Median, months
9.3 10.5 1.11 0.75, 1.66
0.5832
Relapse after CR or CRi
43 63.2 35 56.5 – – 0.4712
Duration of remission
Median, months
10.4 12.3 – – –
Transfusion independence§
RBC 65 38.5 45 27.6 – – –
Platelets 41 40.6 24 29.3 – – –
Abbreviations: CCR, conventional care regimens; CI, confidence interval; CR, complete response; CRc-20, complete cytogenetic remission in at least 20 metaphases; CRi, complete remission with incomplete blood count recovery; EFS, event-free survival; PR, partial remission; RBC, red blood cell; RFS, relapse-free survival. † defined by International Working Group criteria and was adjusted by an independent review committee; ‡ events included treatment failure, progressive disease, relapse after CR or CRi, or death; § defined as no transfusions for 56 consecutive days on study for patients who were transfusion dependent at baseline.
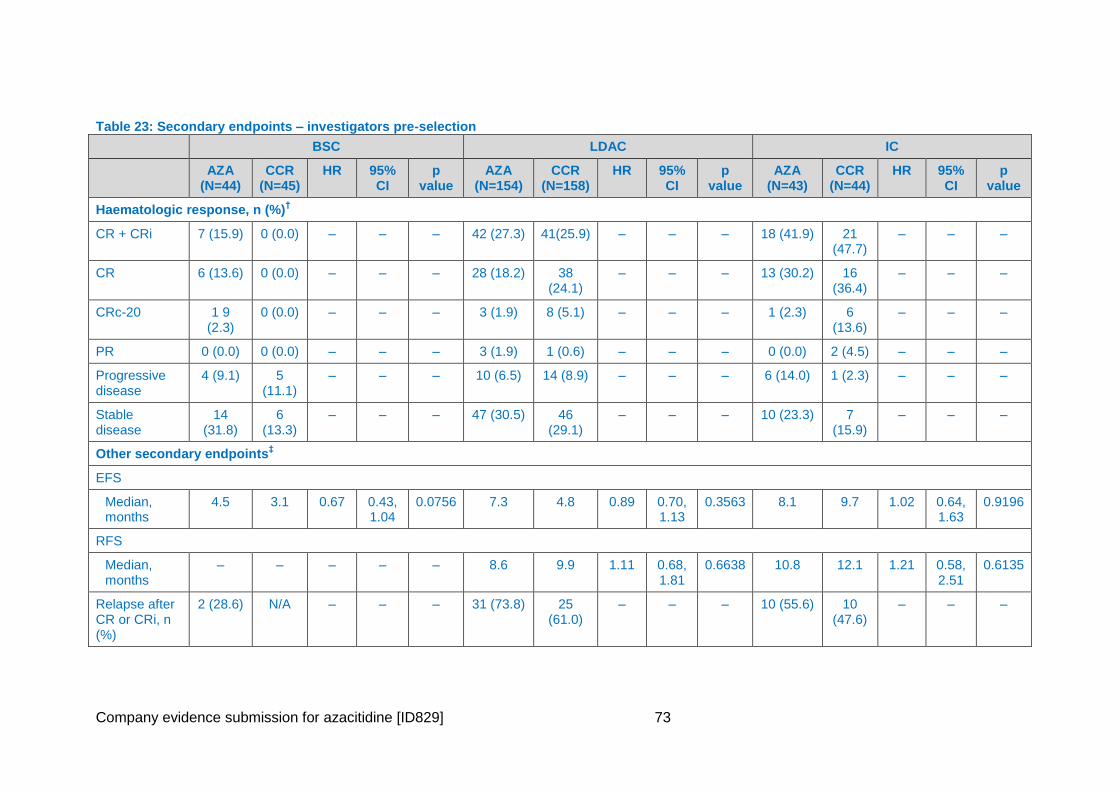
Company evidence submission for azacitidine [ID829] 73
Table 23: Secondary endpoints – investigators pre-selection
BSC LDAC IC
AZA (N=44)
CCR (N=45)
HR 95% CI
p value
AZA (N=154)
CCR (N=158)
HR 95% CI
p value
AZA (N=43)
CCR (N=44)
HR 95% CI
p value
Haematologic response, n (%)†
CR + CRi 7 (15.9) 0 (0.0) – – – 42 (27.3) 41(25.9) – – – 18 (41.9) 21 (47.7)
– – –
CR 6 (13.6) 0 (0.0) – – – 28 (18.2) 38 (24.1)
– – – 13 (30.2) 16 (36.4)
– – –
CRc-20 1 9 (2.3)
0 (0.0) – – – 3 (1.9) 8 (5.1) – – – 1 (2.3) 6 (13.6)
– – –
PR 0 (0.0) 0 (0.0) – – – 3 (1.9) 1 (0.6) – – – 0 (0.0) 2 (4.5) – – –
Progressive disease
4 (9.1) 5 (11.1)
– – – 10 (6.5) 14 (8.9) – – – 6 (14.0) 1 (2.3) – – –
Stable disease
14 (31.8)
6 (13.3)
– – – 47 (30.5) 46 (29.1)
– – – 10 (23.3) 7 (15.9)
– – –
Other secondary endpoints‡
EFS
Median, months
4.5 3.1 0.67 0.43, 1.04
0.0756 7.3 4.8 0.89 0.70, 1.13
0.3563 8.1 9.7 1.02 0.64, 1.63
0.9196
RFS
Median, months
– – – – – 8.6 9.9 1.11 0.68, 1.81
0.6638 10.8 12.1 1.21 0.58, 2.51
0.6135
Relapse after CR or CRi, n (%)
2 (28.6) N/A – – – 31 (73.8) 25 (61.0)
– – – 10 (55.6) 10 (47.6)
– – –
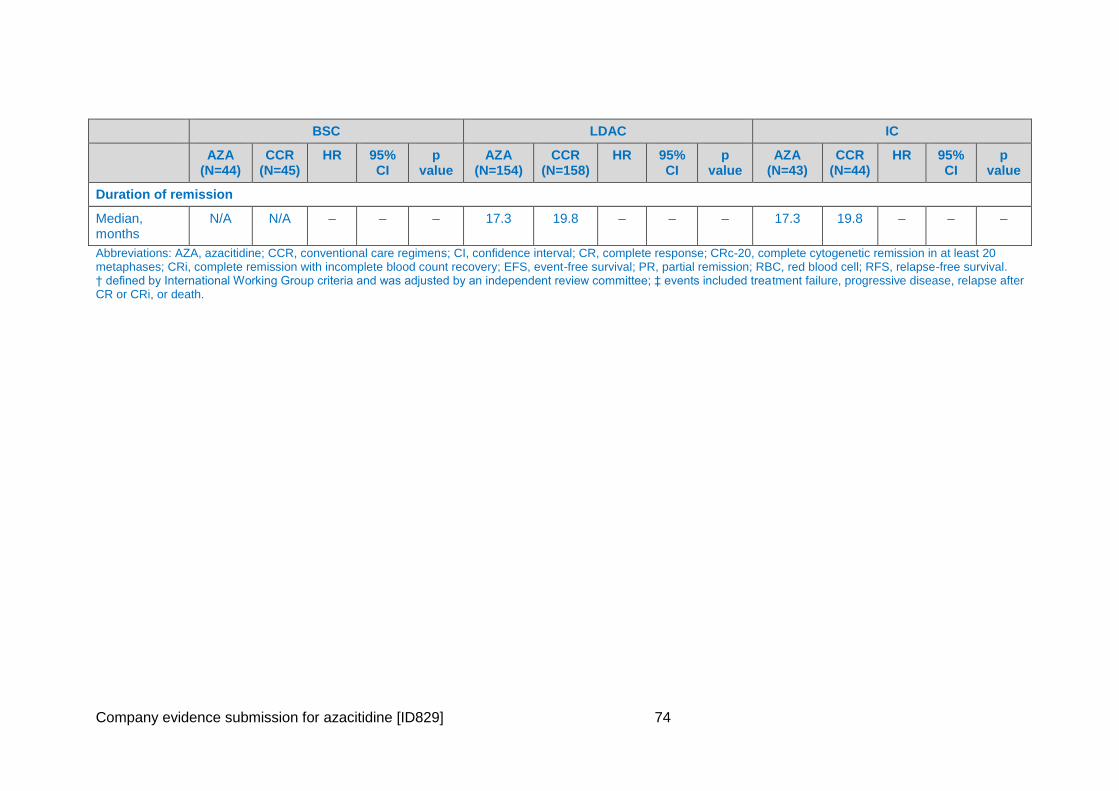
Company evidence submission for azacitidine [ID829] 74
BSC LDAC IC
AZA (N=44)
CCR (N=45)
HR 95% CI
p value
AZA (N=154)
CCR (N=158)
HR 95% CI
p value
AZA (N=43)
CCR (N=44)
HR 95% CI
p value
Duration of remission
Median, months
N/A N/A – – – 17.3 19.8 – – – 17.3 19.8 – – –
Abbreviations: AZA, azacitidine; CCR, conventional care regimens; CI, confidence interval; CR, complete response; CRc-20, complete cytogenetic remission in at least 20 metaphases; CRi, complete remission with incomplete blood count recovery; EFS, event-free survival; PR, partial remission; RBC, red blood cell; RFS, relapse-free survival. † defined by International Working Group criteria and was adjusted by an independent review committee; ‡ events included treatment failure, progressive disease, relapse after CR or CRi, or death.
Company evidence submission for azacitidine [ID829] 75
4.7.5.1 1-year survival
Azacitidine improved 1-year survival compared with CCR (46.5% vs. 34.3%,
respectively), resulting in a clinically meaningful difference of 12.3% in favour of
azacitidine (95% CI: 3.5, 21.0).
1-year survival was also improved for azacitidine when compared with each of the CCR
therapies (within investigator pre-selection) (BSC only: 30.3% vs. 18.6%, LDAC: 48.5%
vs. 34.0%, and IC: 55.8% vs. 50.9%, respectively), and in a post-hoc analysis, when
compared with BSC plus LDAC (within investigator pre-selection) (44.5% vs. 30.6%,
respectively).
Results for azacitidine versus CCR were similar in the evaluable population (44.2% vs.
36.8%, respectively), in the mITT population (46.9% vs 34.6%, respectively), and in the
post-hoc regression-based imputation analysis (48.3% vs. 33.4%, respectively).
When excluding subjects where their best response was a CR, the 1-year survival
estimate was 33.8% in the azacitidine group and 20.4% in the CCR group.
All analyses, pre-specified or post-hoc, showed a consistent 1-year survival benefit in favour
of azacitidine when compared with CCR.
4.7.5.2 30-day and 60-day death estimates
The 30-day and 60-day KM death estimates were 6.6% and 16.3%, respectively in the
azacitidine group and 10.3% and 18.6%, respectively in the CCR group.
4.7.5.3 Event-free survival
Overall, 212 (88.0%) events (defined as treatment failure, progressive disease, relapse after
CR or CRi, death from any cause, or loss to follow-up) were reported in subjects treated with
azacitidine and 216 (87.4%) events in subjects treated with CCR.
There was a trend for improved EFS with azacitidine when compared with CCR. The median
EFS was 6.7 months in the azacitidine treatment group and 4.8 months in the CCR
treatment group (HR: 0.87; 95% CI: 0.72, 1.05; p=0.1495).
When considering investigator pre-selection, median EFS was:
4.5 months for azacitidine (BSC pre-selected) and 3.1 months for BSC (HR: 0.67; 95%
CI: 0.43, 1.04; p=0.0756)
7.3 months for azacitidine (LDAC pre-selected) and 4.8 months for LDAC (HR: 0.89; 95%
CI: 0.70, 1.13; p=0.3563)
8.1 months for azacitidine (IC pre-selected) and 9.7 months for IC (HR: 1.02; 95% CI:
0.64, 1.63; p=0.9196)
4.7.5.4 Relapse-free survival
In subjects with CR or CRi, 53 (79.1%) events (relapse or death from any cause) were
reported in the azacitidine arm and 47 (75.8%) events in the CCR arm.
No difference was observed for RFS between treatment groups; median RFS was 9.3
months in the azacitidine group compared with 10.5 months in the CCR group (HR: 1.11;
95% CI: 0.75, 1.66; p=0.5832).
Company evidence submission for azacitidine [ID829] 76
When considering investigator pre-selection:
No subjects pre-selected and randomised to BSC achieved a CR or CRi.
Median RFS was 8.6 months for azacitidine (LDAC pre-selected) compared with 9.9
months for LDAC (HR: 1.11; 95% CI: 0.68, 1.81; p=0.6638).
Median RFS was 10.8 months for azacitidine (IC pre-selected) compared with
12.1 months for IC (HR: 1.21; 95% CI: 0.58, 2.51; p=0.6135).
4.7.5.5 Haematologic response and duration of remission
Overall response rates (CR+CRi) were comparable between treatment groups (27.8% in the
azacitidine group vs 25.1% in the CCR group), as were rates of CR, PR, stable disease,
progressive disease and cytogenetic complete remission (Table 22). In subjects who
achieved a CR or CRi, the median duration of remission was 10.4 months for the azacitidine
subjects and 12.3 months for CCR subjects. The rate of relapse after CR or CRi was 64.2%
in the azacitidine group and 56.5% subjects in the CCR group. The 1-year cumulative
relapse estimate was 52.2% in the azacitidine group versus 46.6% in the CCR treatment
group.
In the individual components of the CCR arm, the rate of CR/CRi was: 15.9% vs 0% for
azacitidine vs. BSC, respectively; 27.3% vs 25.9% for azacitidine vs. LDAC, respectively;
41.9% vs. 47.7% for azacitidine vs. IC, respectively (Table 23).
4.7.5.6 Overall survival according to haematologic response (post-hoc)
When excluding subjects who achieved a CR (47 and 54 patients in the azacitidine and CCR
arms, respectively), median OS in the azacitidine group was 6.9 months compared with 4.2
months in the CCR group (HR: 0.76; 95% CI: 0.61, 0.94, p=0.017). When excluding subjects
with a best response of CR, CRi, and PR, the median OS was 5.5 months in the azacitidine
groups versus 4.0 months in the CCR group (HR: 0.86; 95% CI: 0.69, 1.07).
4.7.5.7 Transfusion status
A higher proportion of patients in the azacitidine treatment group who were transfusion
dependent at baseline achieved RBC transfusion independence during treatment compared
with CCR (38.5% vs. 27.6%, respectively). Similar results were obtained in those who were
transfusion dependent at baseline and became platelet transfusion independent during
treatment (40.6% vs. 29.3%, respectively).
With comparable baseline rates of RBC transfusion dependence, the total number of
subjects who remained or became independent of transfusions while on treatment was 105
(43.6%) in the azacitidine group and 76 (30.8%) in the CCR group. With slightly higher
baseline rates of platelet transfusion dependence in the azacitidine group (41.9% versus
33.2%), the total number of subjects who remained or became independent of platelet
transfusions was 142 (58.9%) in the azacitidine group and 106 (42.9%) in the CCR group.
There were a greater proportion of subjects in the azacitidine group versus those receiving
BSC only or IC who were RBC transfusion dependent at baseline and became transfusion
independent during treatment. Similar analysis evaluating platelet transfusion dependence
showed a greater proportion of subjects receiving azacitidine versus those receiving BSC
only or LDAC who were transfusion dependent at baseline became platelet transfusion
independent during treatment.
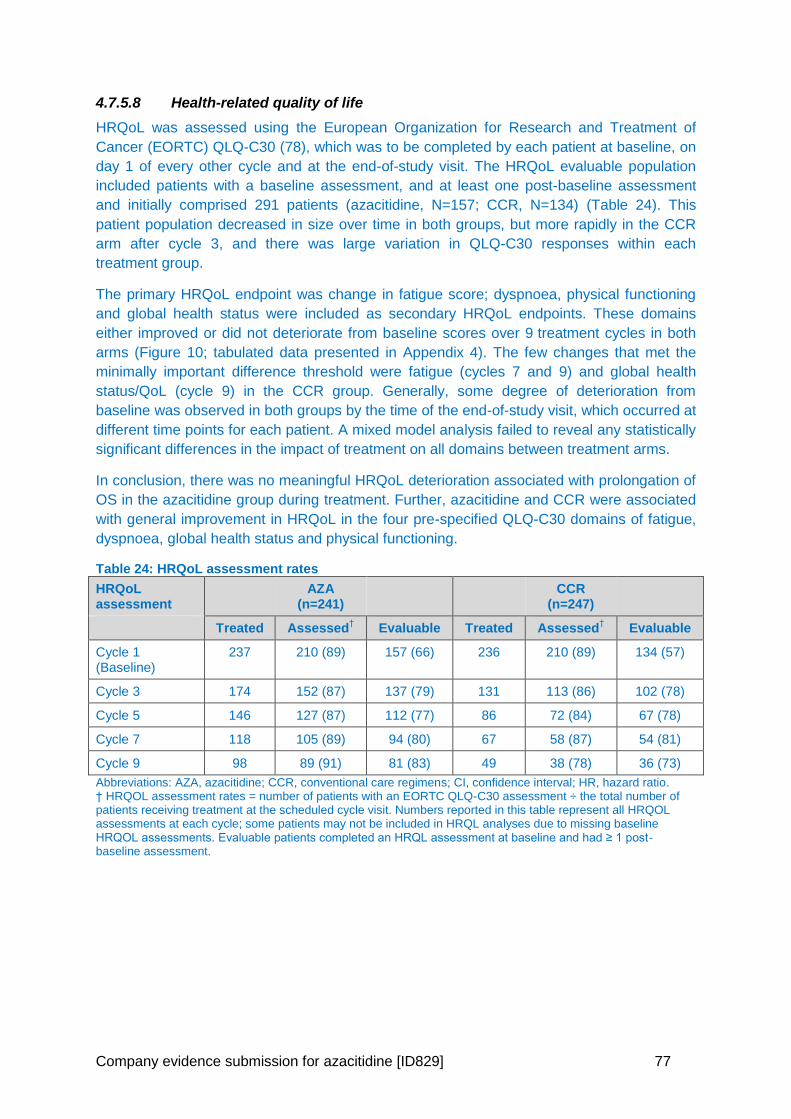
Company evidence submission for azacitidine [ID829] 77
4.7.5.8 Health-related quality of life
HRQoL was assessed using the European Organization for Research and Treatment of
Cancer (EORTC) QLQ-C30 (78), which was to be completed by each patient at baseline, on
day 1 of every other cycle and at the end-of-study visit. The HRQoL evaluable population
included patients with a baseline assessment, and at least one post-baseline assessment
and initially comprised 291 patients (azacitidine, N=157; CCR, N=134) (Table 24). This
patient population decreased in size over time in both groups, but more rapidly in the CCR
arm after cycle 3, and there was large variation in QLQ-C30 responses within each
treatment group.
The primary HRQoL endpoint was change in fatigue score; dyspnoea, physical functioning
and global health status were included as secondary HRQoL endpoints. These domains
either improved or did not deteriorate from baseline scores over 9 treatment cycles in both
arms (Figure 10; tabulated data presented in Appendix 4). The few changes that met the
minimally important difference threshold were fatigue (cycles 7 and 9) and global health
status/QoL (cycle 9) in the CCR group. Generally, some degree of deterioration from
baseline was observed in both groups by the time of the end-of-study visit, which occurred at
different time points for each patient. A mixed model analysis failed to reveal any statistically
significant differences in the impact of treatment on all domains between treatment arms.
In conclusion, there was no meaningful HRQoL deterioration associated with prolongation of
OS in the azacitidine group during treatment. Further, azacitidine and CCR were associated
with general improvement in HRQoL in the four pre-specified QLQ-C30 domains of fatigue,
dyspnoea, global health status and physical functioning.
Table 24: HRQoL assessment rates
HRQoL assessment
AZA (n=241)
CCR (n=247)
Treated Assessed† Evaluable Treated Assessed
† Evaluable
Cycle 1 (Baseline)
237 210 (89) 157 (66) 236 210 (89) 134 (57)
Cycle 3 174 152 (87) 137 (79) 131 113 (86) 102 (78)
Cycle 5 146 127 (87) 112 (77) 86 72 (84) 67 (78)
Cycle 7 118 105 (89) 94 (80) 67 58 (87) 54 (81)
Cycle 9 98 89 (91) 81 (83) 49 38 (78) 36 (73)
Abbreviations: AZA, azacitidine; CCR, conventional care regimens; CI, confidence interval; HR, hazard ratio. † HRQOL assessment rates = number of patients with an EORTC QLQ-C30 assessment ÷ the total number of patients receiving treatment at the scheduled cycle visit. Numbers reported in this table represent all HRQOL assessments at each cycle; some patients may not be included in HRQL analyses due to missing baseline HRQOL assessments. Evaluable patients completed an HRQL assessment at baseline and had ≥ 1 post-baseline assessment.
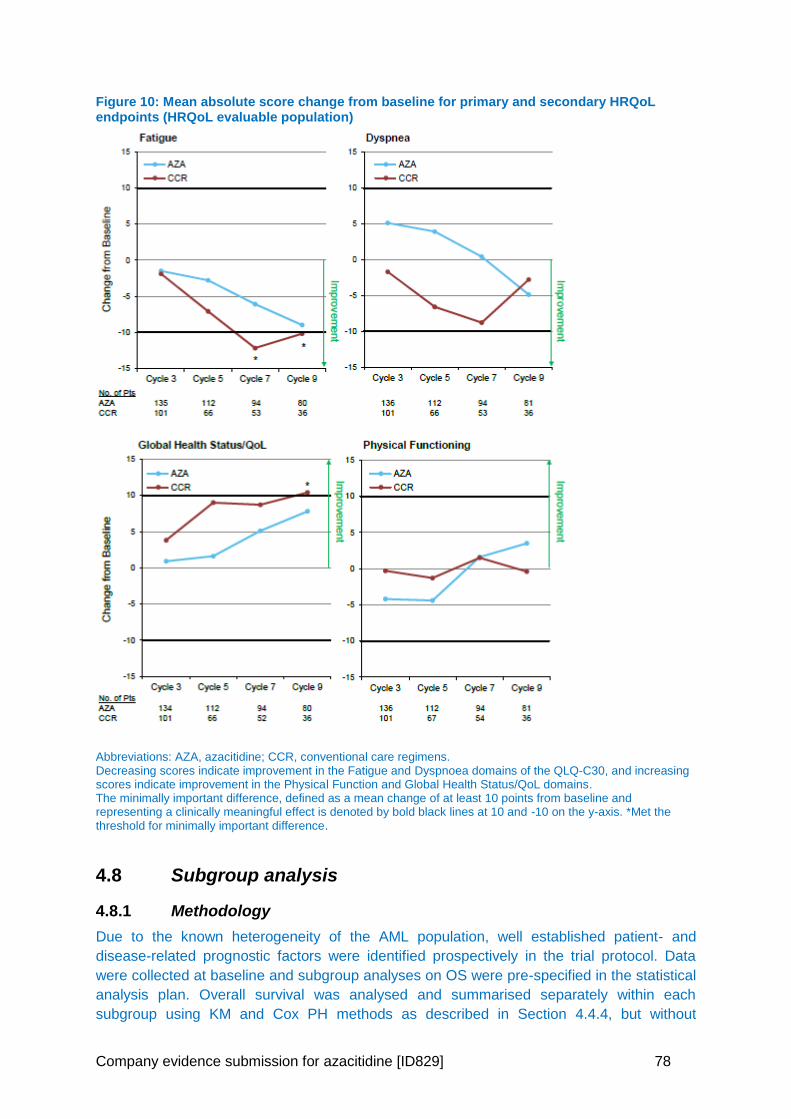
Company evidence submission for azacitidine [ID829] 78
Figure 10: Mean absolute score change from baseline for primary and secondary HRQoL endpoints (HRQoL evaluable population)
Abbreviations: AZA, azacitidine; CCR, conventional care regimens. Decreasing scores indicate improvement in the Fatigue and Dyspnoea domains of the QLQ-C30, and increasing scores indicate improvement in the Physical Function and Global Health Status/QoL domains. The minimally important difference, defined as a mean change of at least 10 points from baseline and representing a clinically meaningful effect is denoted by bold black lines at 10 and -10 on the y-axis. *Met the threshold for minimally important difference.
4.8 Subgroup analysis
4.8.1 Methodology
Due to the known heterogeneity of the AML population, well established patient- and
disease-related prognostic factors were identified prospectively in the trial protocol. Data
were collected at baseline and subgroup analyses on OS were pre-specified in the statistical
analysis plan. Overall survival was analysed and summarised separately within each
subgroup using KM and Cox PH methods as described in Section 4.4.4, but without
Company evidence submission for azacitidine [ID829] 79
stratification. Variables included in the analysis which are of relevance to the decision
problem were baseline cytogenetic risk status and WHO classification of AML. The full list of
variables included in the univariate analysis were:
Age group (<75 and ≥75 years old)
Gender
Race (White, Asian, others)
ECOG performance status (0–1, 2)
Baseline cytogenetic risk status (intermediate or poor)
Geographic region (North America [US and Canada]/Australia, Western Europe
[Germany, Italy, France, United Kingdom, Spain, Austria, Belgium, The Netherlands]/
Israel, Eastern Europe [Poland, Russia, and Czech Republic], Asia [China, South Korea,
and Taiwan]
WHO classification (AML with recurrent genetic abnormalities, AML with MDS-related
changes, therapy-related myeloid neoplasms, and AML not otherwise specified)
Baseline WBC count (≤5x10⁹/L or >5x10⁹/L)
Baseline percentage BM blasts (≤50% or >50%)
Prior history of MDS (yes or no)
4.8.2 Results
Figure 11 shows the results of the univariate analysis, illustrating the HR for each patient-
related or disease-related prognostic factor. There was a consistent trend in OS benefit
across all pre-specified subgroups in favour of azacitidine. The strongest effect was seen in
patients with MDS-related changes, and in those with a baseline cytogenetic risk rated as
poor. In subjects with MDS-related changes, the median OS was 12.7 months in those
receiving azacitidine and 6.3 months in those receiving CCR (HR: 0.69; 95% CI: 0.48, 0.98;
p=0.0.357). In subjects with a baseline cytogenetic risk rated as poor, the median OS was
6.4 months in those receiving azacitidine and 3.2 months in those receiving CCR (HR: 0.68;
95% CI: 0.68, 0.94; p=0.0185). There was also a statistically significant effect of age,
gender, and race.
Tabulated results for all sub-groups are available in Appendix 5.
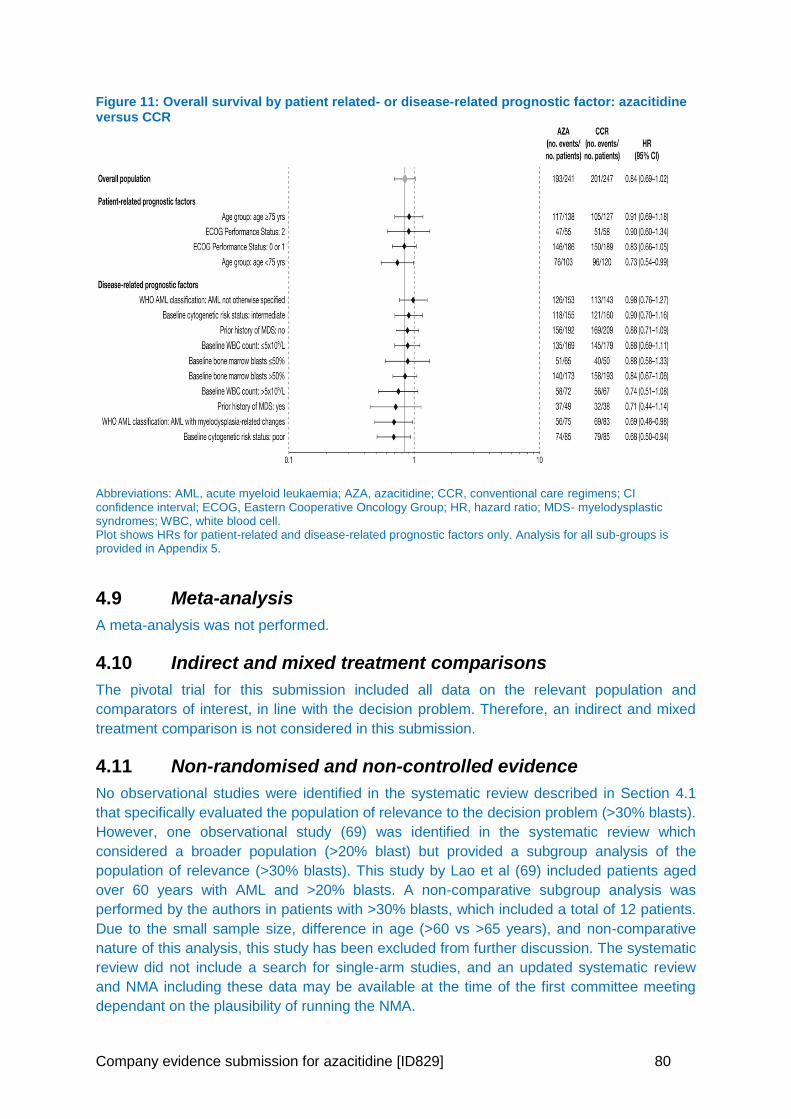
Company evidence submission for azacitidine [ID829] 80
Figure 11: Overall survival by patient related- or disease-related prognostic factor: azacitidine versus CCR
Abbreviations: AML, acute myeloid leukaemia; AZA, azacitidine; CCR, conventional care regimens; CI confidence interval; ECOG, Eastern Cooperative Oncology Group; HR, hazard ratio; MDS- myelodysplastic syndromes; WBC, white blood cell. Plot shows HRs for patient-related and disease-related prognostic factors only. Analysis for all sub-groups is provided in Appendix 5.
4.9 Meta-analysis
A meta-analysis was not performed.
4.10 Indirect and mixed treatment comparisons
The pivotal trial for this submission included all data on the relevant population and
comparators of interest, in line with the decision problem. Therefore, an indirect and mixed
treatment comparison is not considered in this submission.
4.11 Non-randomised and non-controlled evidence
No observational studies were identified in the systematic review described in Section 4.1
that specifically evaluated the population of relevance to the decision problem (>30% blasts).
However, one observational study (69) was identified in the systematic review which
considered a broader population (>20% blast) but provided a subgroup analysis of the
population of relevance (>30% blasts). This study by Lao et al (69) included patients aged
over 60 years with AML and >20% blasts. A non-comparative subgroup analysis was
performed by the authors in patients with >30% blasts, which included a total of 12 patients.
Due to the small sample size, difference in age (>60 vs >65 years), and non-comparative
nature of this analysis, this study has been excluded from further discussion. The systematic
review did not include a search for single-arm studies, and an updated systematic review
and NMA including these data may be available at the time of the first committee meeting
dependant on the plausibility of running the NMA.
Company evidence submission for azacitidine [ID829] 81
4.11.1 Single arm registries
Although single arm registries were excluded from the systematic review, there are several
‘real-world’ azacitidine AML registries that are of importance to this submission. The
possibility of conducting a matched-adjusted indirect comparison to utilise the single-arm
data is currently being explored and may be available at time of first Committee Meeting.
4.11.1.1 Austrian Azacitidine Registry
The largest study examining the effectiveness and safety of azacitidine in AML is the
Austrian Azacitidine Registry (AAR; NCT01595295). This was initiated to gain a
comprehensive view of the use, safety and efficacy of azacitidine in patients with AML in a
‘real world’ clinical practice setting. No formal exclusion criteria existed, as the aim was to
include all WHO-AML patients treated with azacitidine, irrespective of age, comorbidities,
and/or previous lines of treatment (25, 84).
The patient population was elderly with a number of comorbidities. The median age was
73 years, with 43% ≥75 years, 79% had ≥1 comorbidity, 54% had received prior disease
modifying treatment and 24% had an ECOG performance status of ≥2. This cohort
included 172 patients with >30% BM blasts.
Patients received a median of 4 cycles (range 1-37) and overall response to treatment,
defined as complete response, marrow complete response, partial response and
haematological improvement, was documented in 48% of the total ITT cohort and in 72%
of patients evaluable.
Median OS was 9.6 months (95% CI: 8.53, 10.7) from initiation of treatment with
azacitidine in the entire cohort. A clinically relevant OS benefit was observed with any
form of disease stabilisation (marrow stable disease [8.1 months], haematological
improvement [9.7 months] or a combination thereof [18.9 months]) as compared to
patients without response and/ or without disease stabilization (3.2 months). Median
progression-free survival in responding patients was 9.1 months (95% CI: 0.9, 39.9).
Median OS was 16.1 months for responders and 3.7 months for non-responders.
Baseline age </≥75, age </≥80, WBC count </≥30 G/l or BM blast count ≤30/>30% did not
impact on OS. Azacitidine treatment schedule (5 days vs 7 days) also did not impact on
OS (8.9 vs 9.7 months, p=0.677).
The authors’ concluded that azacitidine is safe and effective in elderly, comorbid AML
patients treated in an everyday life setting, irrespective of BM blast count (25).
A recent updated analysis of the AAR assessed the efficacy and safety of 1st line azacitidine
therapy in 95 patients who fulfilled the BM blast percentage and WBC count entry criteria of
the AZA-AML-001 trial (BM blasts >30% and WBC <15G/L) (85).
Baseline patient and disease characteristics were similar (Table 25). Patient status at
data cut-off, reasons for azacitidine discontinuation and treatment characteristics were
also similar: median number of azacitidine cycles was 5 (1–51) and 6 (1–28), respectively
(Table 25).
Patient outcomes in terms of overall response according to International Working Group
criteria (31.5% vs 29.0%), red blood cell (42.1% vs 38.5%) and platelet transfusion
independence (34.5% vs 40.6%) did not differ significantly between the AAR and the
AML-001 trial. Event-free survival was 5.5 months (range: 0–35.3) vs 6.7 months (range:
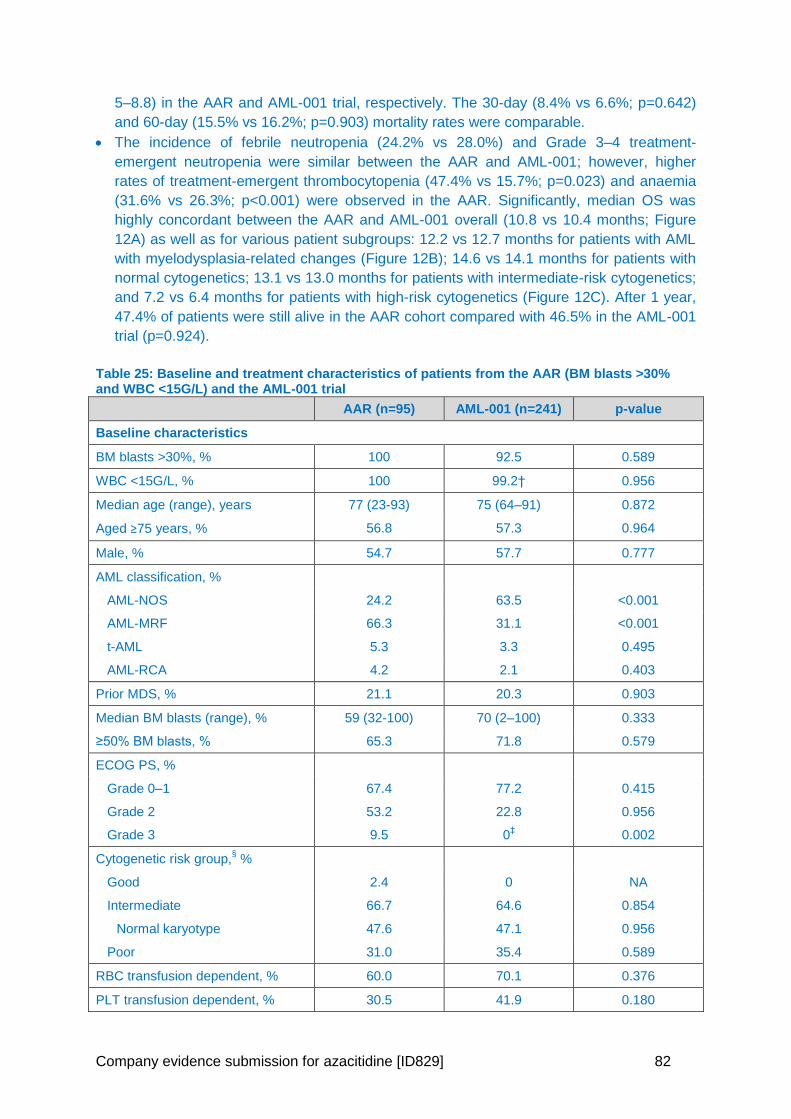
Company evidence submission for azacitidine [ID829] 82
5–8.8) in the AAR and AML-001 trial, respectively. The 30-day (8.4% vs 6.6%; p=0.642)
and 60-day (15.5% vs 16.2%; p=0.903) mortality rates were comparable.
The incidence of febrile neutropenia (24.2% vs 28.0%) and Grade 3–4 treatment-
emergent neutropenia were similar between the AAR and AML-001; however, higher
rates of treatment-emergent thrombocytopenia (47.4% vs 15.7%; p=0.023) and anaemia
(31.6% vs 26.3%; p<0.001) were observed in the AAR. Significantly, median OS was
highly concordant between the AAR and AML-001 overall (10.8 vs 10.4 months; Figure
12A) as well as for various patient subgroups: 12.2 vs 12.7 months for patients with AML
with myelodysplasia-related changes (Figure 12B); 14.6 vs 14.1 months for patients with
normal cytogenetics; 13.1 vs 13.0 months for patients with intermediate-risk cytogenetics;
and 7.2 vs 6.4 months for patients with high-risk cytogenetics (Figure 12C). After 1 year,
47.4% of patients were still alive in the AAR cohort compared with 46.5% in the AML-001
trial (p=0.924).
Table 25: Baseline and treatment characteristics of patients from the AAR (BM blasts >30% and WBC <15G/L) and the AML-001 trial
AAR (n=95) AML-001 (n=241) p-value
Baseline characteristics
BM blasts >30%, % 100 92.5 0.589
WBC <15G/L, % 100 99.2† 0.956
Median age (range), years 77 (23-93) 75 (64–91) 0.872
Aged ≥75 years, % 56.8 57.3 0.964
Male, % 54.7 57.7 0.777
AML classification, %
AML-NOS 24.2 63.5 <0.001
AML-MRF 66.3 31.1 <0.001
t-AML 5.3 3.3 0.495
AML-RCA 4.2 2.1 0.403
Prior MDS, % 21.1 20.3 0.903
Median BM blasts (range), % 59 (32-100) 70 (2–100) 0.333
≥50% BM blasts, % 65.3 71.8 0.579
ECOG PS, %
Grade 0–1 67.4 77.2 0.415
Grade 2 53.2 22.8 0.956
Grade 3 9.5 0‡
0.002
Cytogenetic risk group,§ %
Good 2.4 0 NA
Intermediate 66.7 64.6 0.854
Normal karyotype 47.6 47.1 0.956
Poor 31.0 35.4 0.589
RBC transfusion dependent, % 60.0 70.1 0.376
PLT transfusion dependent, % 30.5 41.9 0.180
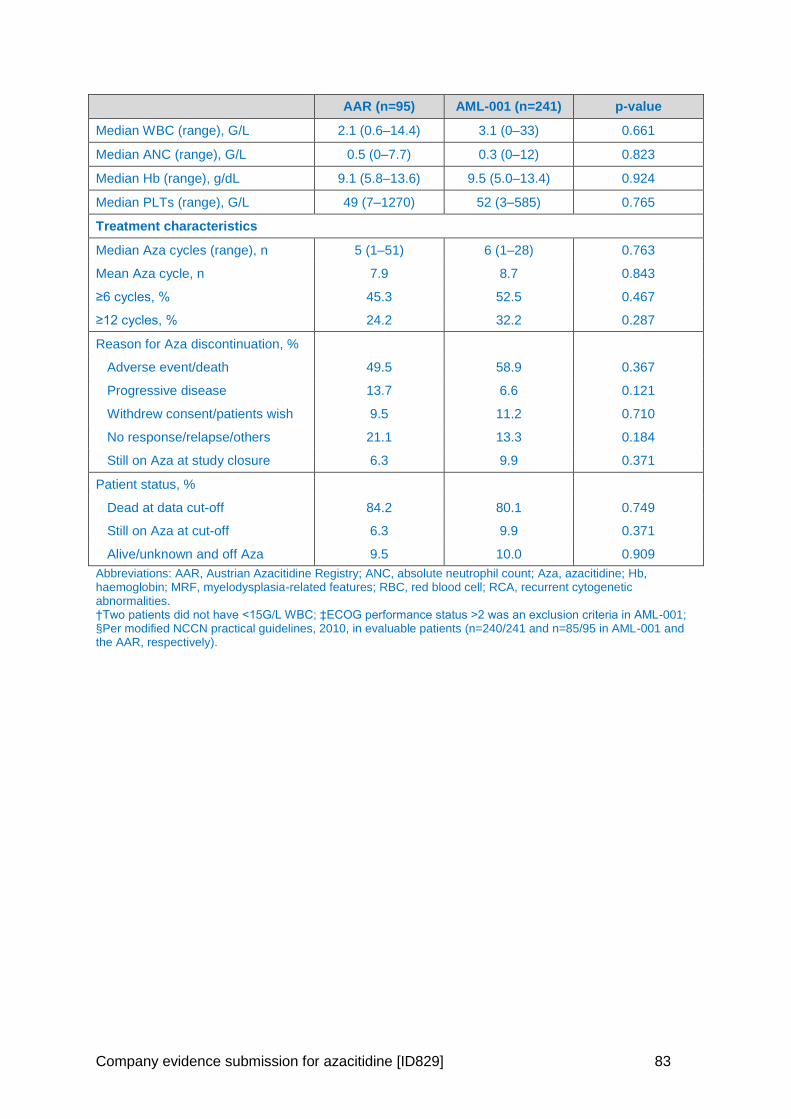
Company evidence submission for azacitidine [ID829] 83
AAR (n=95) AML-001 (n=241) p-value
Median WBC (range), G/L 2.1 (0.6–14.4) 3.1 (0–33) 0.661
Median ANC (range), G/L 0.5 (0–7.7) 0.3 (0–12) 0.823
Median Hb (range), g/dL 9.1 (5.8–13.6) 9.5 (5.0–13.4) 0.924
Median PLTs (range), G/L 49 (7–1270) 52 (3–585) 0.765
Treatment characteristics
Median Aza cycles (range), n 5 (1–51) 6 (1–28) 0.763
Mean Aza cycle, n 7.9 8.7 0.843
≥6 cycles, % 45.3 52.5 0.467
≥12 cycles, % 24.2 32.2 0.287
Reason for Aza discontinuation, %
Adverse event/death 49.5 58.9 0.367
Progressive disease 13.7 6.6 0.121
Withdrew consent/patients wish 9.5 11.2 0.710
No response/relapse/others 21.1 13.3 0.184
Still on Aza at study closure 6.3 9.9 0.371
Patient status, %
Dead at data cut-off 84.2 80.1 0.749
Still on Aza at cut-off 6.3 9.9 0.371
Alive/unknown and off Aza 9.5 10.0 0.909
Abbreviations: AAR, Austrian Azacitidine Registry; ANC, absolute neutrophil count; Aza, azacitidine; Hb, haemoglobin; MRF, myelodysplasia-related features; RBC, red blood cell; RCA, recurrent cytogenetic abnormalities. †Two patients did not have <15G/L WBC; ‡ECOG performance status >2 was an exclusion criteria in AML-001; §Per modified NCCN practical guidelines, 2010, in evaluable patients (n=240/241 and n=85/95 in AML-001 and the AAR, respectively).
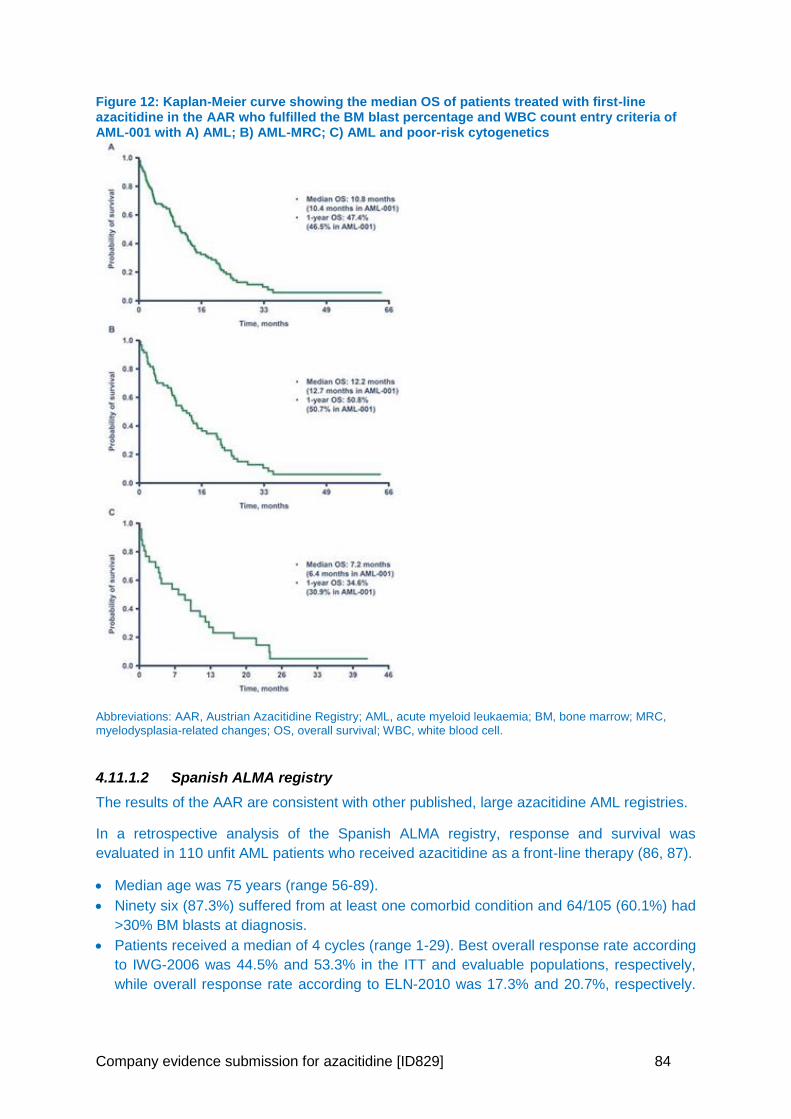
Company evidence submission for azacitidine [ID829] 84
Figure 12: Kaplan-Meier curve showing the median OS of patients treated with first-line azacitidine in the AAR who fulfilled the BM blast percentage and WBC count entry criteria of AML-001 with A) AML; B) AML-MRC; C) AML and poor-risk cytogenetics
Abbreviations: AAR, Austrian Azacitidine Registry; AML, acute myeloid leukaemia; BM, bone marrow; MRC, myelodysplasia-related changes; OS, overall survival; WBC, white blood cell.
4.11.1.2 Spanish ALMA registry
The results of the AAR are consistent with other published, large azacitidine AML registries.
In a retrospective analysis of the Spanish ALMA registry, response and survival was
evaluated in 110 unfit AML patients who received azacitidine as a front-line therapy (86, 87).
Median age was 75 years (range 56-89).
Ninety six (87.3%) suffered from at least one comorbid condition and 64/105 (60.1%) had
>30% BM blasts at diagnosis.
Patients received a median of 4 cycles (range 1-29). Best overall response rate according
to IWG-2006 was 44.5% and 53.3% in the ITT and evaluable populations, respectively,
while overall response rate according to ELN-2010 was 17.3% and 20.7%, respectively.
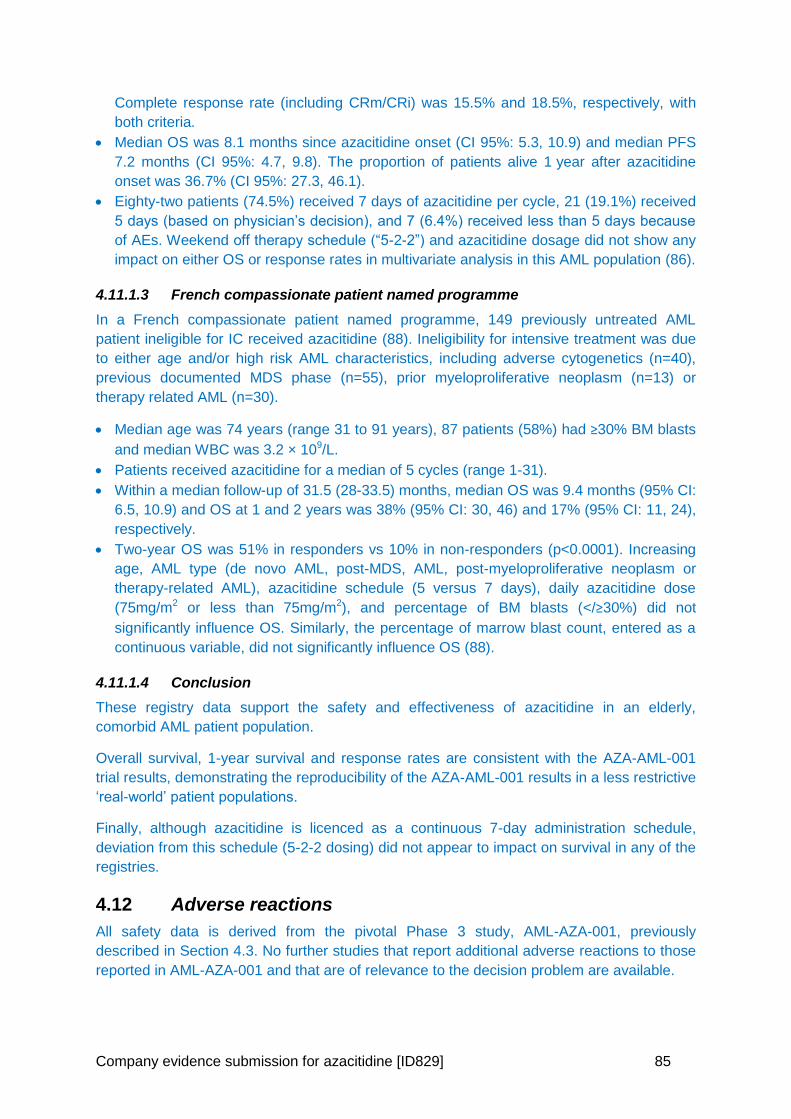
Company evidence submission for azacitidine [ID829] 85
Complete response rate (including CRm/CRi) was 15.5% and 18.5%, respectively, with
both criteria.
Median OS was 8.1 months since azacitidine onset (CI 95%: 5.3, 10.9) and median PFS
7.2 months (CI 95%: 4.7, 9.8). The proportion of patients alive 1 year after azacitidine
onset was 36.7% (CI 95%: 27.3, 46.1).
Eighty-two patients (74.5%) received 7 days of azacitidine per cycle, 21 (19.1%) received
5 days (based on physician’s decision), and 7 (6.4%) received less than 5 days because
of AEs. Weekend off therapy schedule (“5-2-2”) and azacitidine dosage did not show any
impact on either OS or response rates in multivariate analysis in this AML population (86).
4.11.1.3 French compassionate patient named programme
In a French compassionate patient named programme, 149 previously untreated AML
patient ineligible for IC received azacitidine (88). Ineligibility for intensive treatment was due
to either age and/or high risk AML characteristics, including adverse cytogenetics (n=40),
previous documented MDS phase (n=55), prior myeloproliferative neoplasm (n=13) or
therapy related AML (n=30).
Median age was 74 years (range 31 to 91 years), 87 patients (58%) had ≥30% BM blasts
and median WBC was 3.2 × 10⁹/L.
Patients received azacitidine for a median of 5 cycles (range 1-31).
Within a median follow-up of 31.5 (28-33.5) months, median OS was 9.4 months (95% CI:
6.5, 10.9) and OS at 1 and 2 years was 38% (95% CI: 30, 46) and 17% (95% CI: 11, 24),
respectively.
Two-year OS was 51% in responders vs 10% in non-responders (p<0.0001). Increasing
age, AML type (de novo AML, post-MDS, AML, post-myeloproliferative neoplasm or
therapy-related AML), azacitidine schedule (5 versus 7 days), daily azacitidine dose
(75mg/m2 or less than 75mg/m2), and percentage of BM blasts (</≥30%) did not
significantly influence OS. Similarly, the percentage of marrow blast count, entered as a
continuous variable, did not significantly influence OS (88).
4.11.1.4 Conclusion
These registry data support the safety and effectiveness of azacitidine in an elderly,
comorbid AML patient population.
Overall survival, 1-year survival and response rates are consistent with the AZA-AML-001
trial results, demonstrating the reproducibility of the AZA-AML-001 results in a less restrictive
‘real-world’ patient populations.
Finally, although azacitidine is licenced as a continuous 7-day administration schedule,
deviation from this schedule (5-2-2 dosing) did not appear to impact on survival in any of the
registries.
4.12 Adverse reactions
All safety data is derived from the pivotal Phase 3 study, AML-AZA-001, previously
described in Section 4.3. No further studies that report additional adverse reactions to those
reported in AML-AZA-001 and that are of relevance to the decision problem are available.
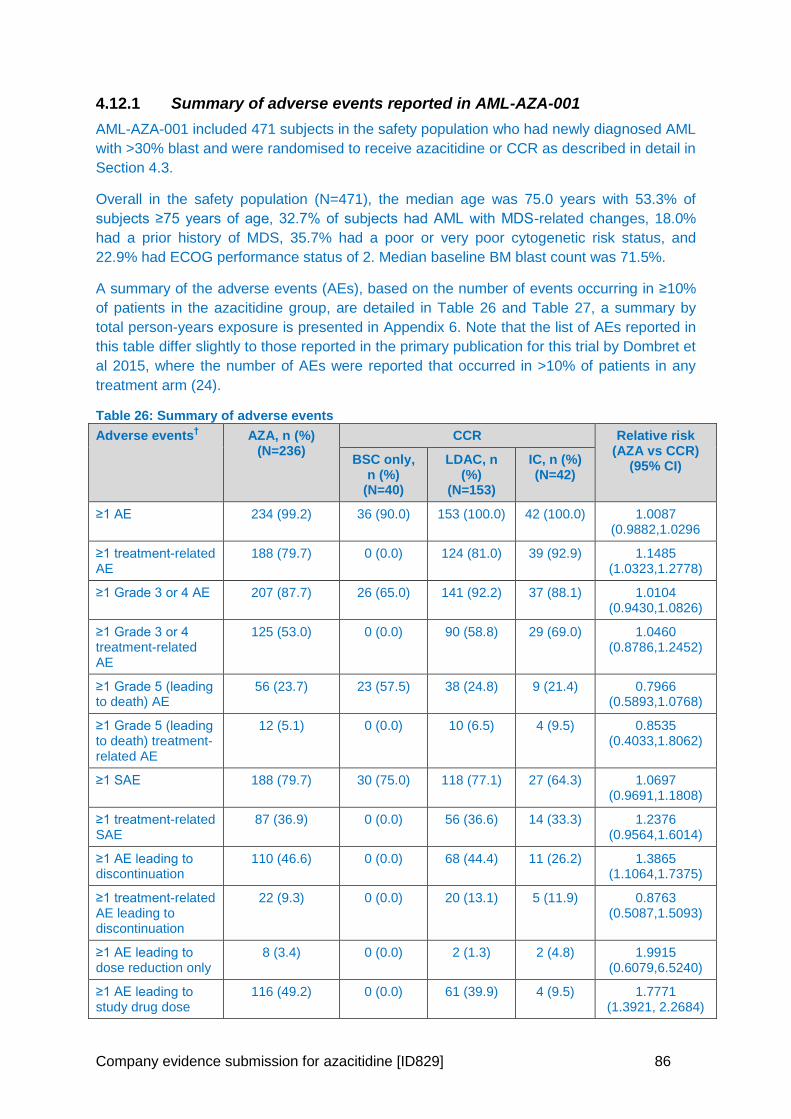
Company evidence submission for azacitidine [ID829] 86
4.12.1 Summary of adverse events reported in AML-AZA-001
AML-AZA-001 included 471 subjects in the safety population who had newly diagnosed AML
with >30% blast and were randomised to receive azacitidine or CCR as described in detail in
Section 4.3.
Overall in the safety population (N=471), the median age was 75.0 years with 53.3% of
subjects ≥75 years of age, 32.7% of subjects had AML with MDS-related changes, 18.0%
had a prior history of MDS, 35.7% had a poor or very poor cytogenetic risk status, and
22.9% had ECOG performance status of 2. Median baseline BM blast count was 71.5%.
A summary of the adverse events (AEs), based on the number of events occurring in ≥10%
of patients in the azacitidine group, are detailed in Table 26 and Table 27, a summary by
total person-years exposure is presented in Appendix 6. Note that the list of AEs reported in
this table differ slightly to those reported in the primary publication for this trial by Dombret et
al 2015, where the number of AEs were reported that occurred in >10% of patients in any
treatment arm (24).
Table 26: Summary of adverse events
Adverse events† AZA, n (%)
(N=236) CCR Relative risk
(AZA vs CCR) (95% CI)
BSC only, n (%)
(N=40)
LDAC, n (%)
(N=153)
IC, n (%) (N=42)
≥1 AE 234 (99.2) 36 (90.0) 153 (100.0) 42 (100.0) 1.0087 (0.9882,1.0296
≥1 treatment-related AE
188 (79.7) 0 (0.0) 124 (81.0) 39 (92.9) 1.1485 (1.0323,1.2778)
≥1 Grade 3 or 4 AE 207 (87.7) 26 (65.0) 141 (92.2) 37 (88.1) 1.0104 (0.9430,1.0826)
≥1 Grade 3 or 4 treatment-related AE
125 (53.0) 0 (0.0) 90 (58.8) 29 (69.0) 1.0460 (0.8786,1.2452)
≥1 Grade 5 (leading to death) AE
56 (23.7) 23 (57.5) 38 (24.8) 9 (21.4) 0.7966 (0.5893,1.0768)
≥1 Grade 5 (leading to death) treatment-related AE
12 (5.1) 0 (0.0) 10 (6.5) 4 (9.5) 0.8535 (0.4033,1.8062)
≥1 SAE 188 (79.7) 30 (75.0) 118 (77.1) 27 (64.3) 1.0697 (0.9691,1.1808)
≥1 treatment-related SAE
87 (36.9) 0 (0.0) 56 (36.6) 14 (33.3) 1.2376 (0.9564,1.6014)
≥1 AE leading to discontinuation
110 (46.6) 0 (0.0) 68 (44.4) 11 (26.2) 1.3865 (1.1064,1.7375)
≥1 treatment-related AE leading to discontinuation
22 (9.3) 0 (0.0) 20 (13.1) 5 (11.9) 0.8763 (0.5087,1.5093)
≥1 AE leading to dose reduction only
8 (3.4) 0 (0.0) 2 (1.3) 2 (4.8) 1.9915 (0.6079,6.5240)
≥1 AE leading to study drug dose
116 (49.2) 0 (0.0) 61 (39.9) 4 (9.5) 1.7771 (1.3921, 2.2684)
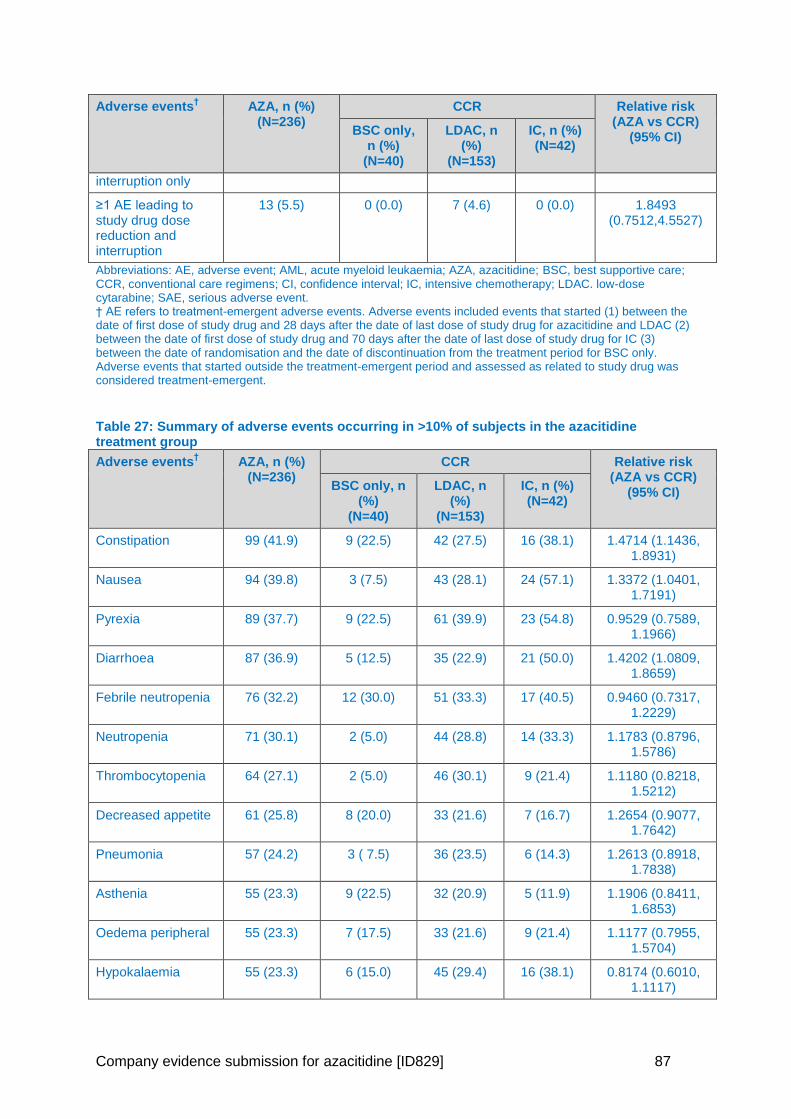
Company evidence submission for azacitidine [ID829] 87
Adverse events† AZA, n (%)
(N=236) CCR Relative risk
(AZA vs CCR) (95% CI)
BSC only, n (%)
(N=40)
LDAC, n (%)
(N=153)
IC, n (%) (N=42)
interruption only
≥1 AE leading to study drug dose reduction and interruption
13 (5.5) 0 (0.0) 7 (4.6) 0 (0.0) 1.8493 (0.7512,4.5527)
Abbreviations: AE, adverse event; AML, acute myeloid leukaemia; AZA, azacitidine; BSC, best supportive care; CCR, conventional care regimens; CI, confidence interval; IC, intensive chemotherapy; LDAC. low-dose cytarabine; SAE, serious adverse event. † AE refers to treatment-emergent adverse events. Adverse events included events that started (1) between the date of first dose of study drug and 28 days after the date of last dose of study drug for azacitidine and LDAC (2) between the date of first dose of study drug and 70 days after the date of last dose of study drug for IC (3) between the date of randomisation and the date of discontinuation from the treatment period for BSC only. Adverse events that started outside the treatment-emergent period and assessed as related to study drug was considered treatment-emergent.
Table 27: Summary of adverse events occurring in >10% of subjects in the azacitidine treatment group
Adverse events† AZA, n (%)
(N=236) CCR Relative risk
(AZA vs CCR) (95% CI)
BSC only, n (%)
(N=40)
LDAC, n (%)
(N=153)
IC, n (%) (N=42)
Constipation 99 (41.9) 9 (22.5) 42 (27.5) 16 (38.1) 1.4714 (1.1436, 1.8931)
Nausea 94 (39.8) 3 (7.5) 43 (28.1) 24 (57.1) 1.3372 (1.0401, 1.7191)
Pyrexia 89 (37.7) 9 (22.5) 61 (39.9) 23 (54.8) 0.9529 (0.7589, 1.1966)
Diarrhoea 87 (36.9) 5 (12.5) 35 (22.9) 21 (50.0) 1.4202 (1.0809, 1.8659)
Febrile neutropenia 76 (32.2) 12 (30.0) 51 (33.3) 17 (40.5) 0.9460 (0.7317, 1.2229)
Neutropenia 71 (30.1) 2 (5.0) 44 (28.8) 14 (33.3) 1.1783 (0.8796, 1.5786)
Thrombocytopenia 64 (27.1) 2 (5.0) 46 (30.1) 9 (21.4) 1.1180 (0.8218, 1.5212)
Decreased appetite 61 (25.8) 8 (20.0) 33 (21.6) 7 (16.7) 1.2654 (0.9077, 1.7642)
Pneumonia 57 (24.2) 3 ( 7.5) 36 (23.5) 6 (14.3) 1.2613 (0.8918, 1.7838)
Asthenia 55 (23.3) 9 (22.5) 32 (20.9) 5 (11.9) 1.1906 (0.8411, 1.6853)
Oedema peripheral 55 (23.3) 7 (17.5) 33 (21.6) 9 (21.4) 1.1177 (0.7955, 1.5704)
Hypokalaemia 55 (23.3) 6 (15.0) 45 (29.4) 16 (38.1) 0.8174 (0.6010, 1.1117)
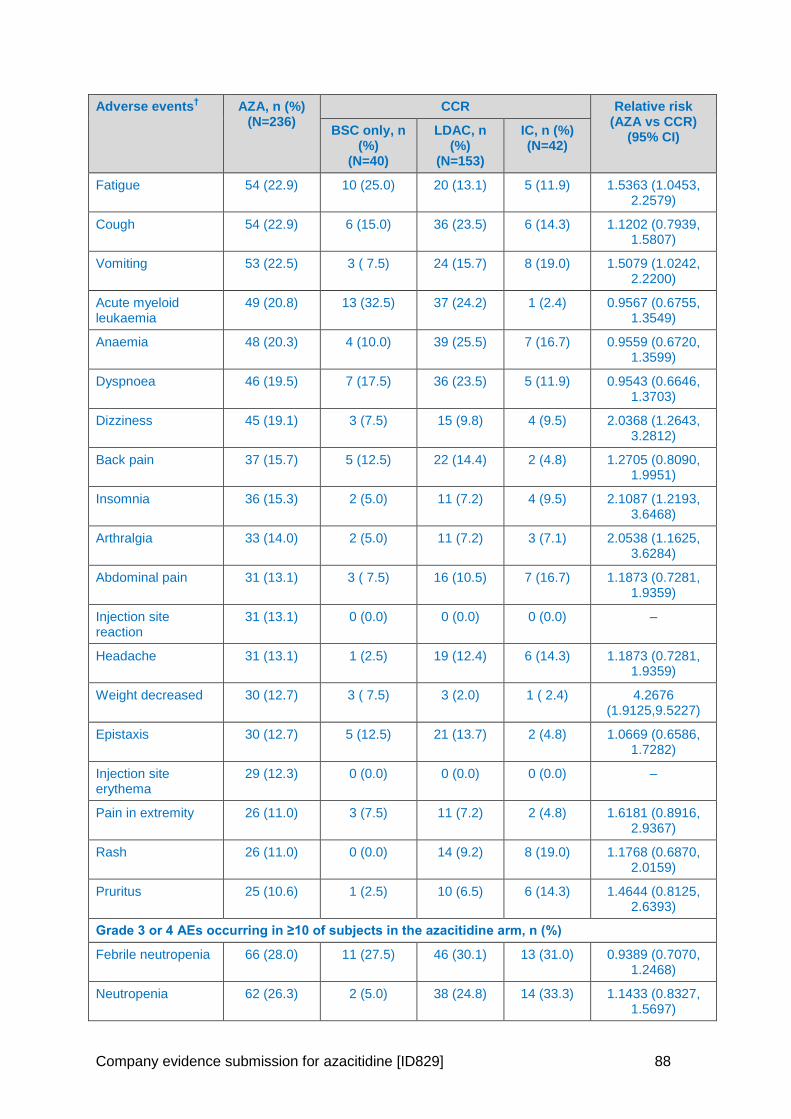
Company evidence submission for azacitidine [ID829] 88
Adverse events† AZA, n (%)
(N=236) CCR Relative risk
(AZA vs CCR) (95% CI)
BSC only, n (%)
(N=40)
LDAC, n (%)
(N=153)
IC, n (%) (N=42)
Fatigue 54 (22.9) 10 (25.0) 20 (13.1) 5 (11.9) 1.5363 (1.0453, 2.2579)
Cough 54 (22.9) 6 (15.0) 36 (23.5) 6 (14.3) 1.1202 (0.7939, 1.5807)
Vomiting 53 (22.5) 3 ( 7.5) 24 (15.7) 8 (19.0) 1.5079 (1.0242, 2.2200)
Acute myeloid leukaemia
49 (20.8) 13 (32.5) 37 (24.2) 1 (2.4) 0.9567 (0.6755, 1.3549)
Anaemia 48 (20.3) 4 (10.0) 39 (25.5) 7 (16.7) 0.9559 (0.6720, 1.3599)
Dyspnoea 46 (19.5) 7 (17.5) 36 (23.5) 5 (11.9) 0.9543 (0.6646, 1.3703)
Dizziness 45 (19.1) 3 (7.5) 15 (9.8) 4 (9.5) 2.0368 (1.2643, 3.2812)
Back pain 37 (15.7) 5 (12.5) 22 (14.4) 2 (4.8) 1.2705 (0.8090, 1.9951)
Insomnia 36 (15.3) 2 (5.0) 11 (7.2) 4 (9.5) 2.1087 (1.2193, 3.6468)
Arthralgia 33 (14.0) 2 (5.0) 11 (7.2) 3 (7.1) 2.0538 (1.1625, 3.6284)
Abdominal pain 31 (13.1) 3 ( 7.5) 16 (10.5) 7 (16.7) 1.1873 (0.7281, 1.9359)
Injection site reaction
31 (13.1) 0 (0.0) 0 (0.0) 0 (0.0) –
Headache 31 (13.1) 1 (2.5) 19 (12.4) 6 (14.3) 1.1873 (0.7281, 1.9359)
Weight decreased 30 (12.7) 3 ( 7.5) 3 (2.0) 1 ( 2.4) 4.2676 (1.9125,9.5227)
Epistaxis 30 (12.7) 5 (12.5) 21 (13.7) 2 (4.8) 1.0669 (0.6586, 1.7282)
Injection site erythema
29 (12.3) 0 (0.0) 0 (0.0) 0 (0.0) –
Pain in extremity 26 (11.0) 3 (7.5) 11 (7.2) 2 (4.8) 1.6181 (0.8916, 2.9367)
Rash 26 (11.0) 0 (0.0) 14 (9.2) 8 (19.0) 1.1768 (0.6870, 2.0159)
Pruritus 25 (10.6) 1 (2.5) 10 (6.5) 6 (14.3) 1.4644 (0.8125, 2.6393)
Grade 3 or 4 AEs occurring in ≥10 of subjects in the azacitidine arm, n (%)
Febrile neutropenia 66 (28.0) 11 (27.5) 46 (30.1) 13 (31.0) 0.9389 (0.7070, 1.2468)
Neutropenia 62 (26.3) 2 (5.0) 38 (24.8) 14 (33.3) 1.1433 (0.8327, 1.5697)
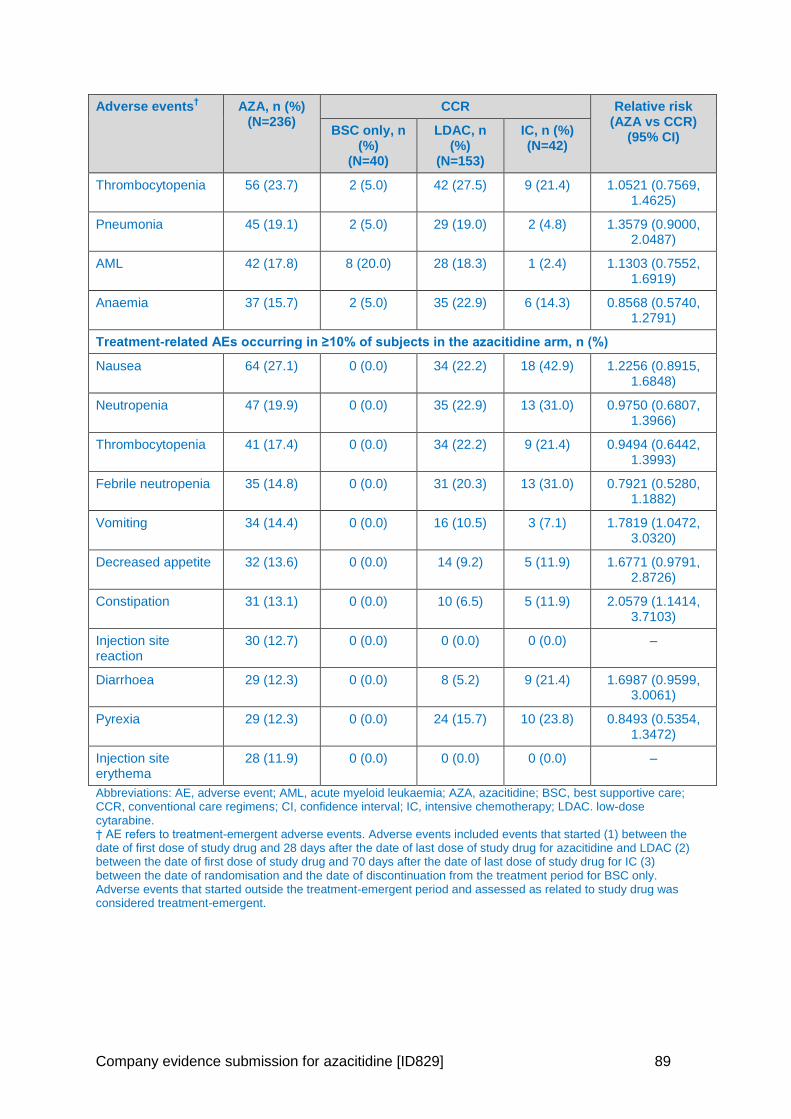
Company evidence submission for azacitidine [ID829] 89
Adverse events† AZA, n (%)
(N=236) CCR Relative risk
(AZA vs CCR) (95% CI)
BSC only, n (%)
(N=40)
LDAC, n (%)
(N=153)
IC, n (%) (N=42)
Thrombocytopenia 56 (23.7) 2 (5.0) 42 (27.5) 9 (21.4) 1.0521 (0.7569, 1.4625)
Pneumonia 45 (19.1) 2 (5.0) 29 (19.0) 2 (4.8) 1.3579 (0.9000, 2.0487)
AML 42 (17.8) 8 (20.0) 28 (18.3) 1 (2.4) 1.1303 (0.7552, 1.6919)
Anaemia 37 (15.7) 2 (5.0) 35 (22.9) 6 (14.3) 0.8568 (0.5740, 1.2791)
Treatment-related AEs occurring in ≥10% of subjects in the azacitidine arm, n (%)
Nausea 64 (27.1) 0 (0.0) 34 (22.2) 18 (42.9) 1.2256 (0.8915, 1.6848)
Neutropenia 47 (19.9) 0 (0.0) 35 (22.9) 13 (31.0) 0.9750 (0.6807, 1.3966)
Thrombocytopenia 41 (17.4) 0 (0.0) 34 (22.2) 9 (21.4) 0.9494 (0.6442, 1.3993)
Febrile neutropenia 35 (14.8) 0 (0.0) 31 (20.3) 13 (31.0) 0.7921 (0.5280, 1.1882)
Vomiting 34 (14.4) 0 (0.0) 16 (10.5) 3 (7.1) 1.7819 (1.0472, 3.0320)
Decreased appetite 32 (13.6) 0 (0.0) 14 (9.2) 5 (11.9) 1.6771 (0.9791, 2.8726)
Constipation 31 (13.1) 0 (0.0) 10 (6.5) 5 (11.9) 2.0579 (1.1414, 3.7103)
Injection site reaction
30 (12.7) 0 (0.0) 0 (0.0) 0 (0.0) –
Diarrhoea 29 (12.3) 0 (0.0) 8 (5.2) 9 (21.4) 1.6987 (0.9599, 3.0061)
Pyrexia 29 (12.3) 0 (0.0) 24 (15.7) 10 (23.8) 0.8493 (0.5354, 1.3472)
Injection site erythema
28 (11.9) 0 (0.0) 0 (0.0) 0 (0.0) –
Abbreviations: AE, adverse event; AML, acute myeloid leukaemia; AZA, azacitidine; BSC, best supportive care; CCR, conventional care regimens; CI, confidence interval; IC, intensive chemotherapy; LDAC. low-dose cytarabine. † AE refers to treatment-emergent adverse events. Adverse events included events that started (1) between the date of first dose of study drug and 28 days after the date of last dose of study drug for azacitidine and LDAC (2) between the date of first dose of study drug and 70 days after the date of last dose of study drug for IC (3) between the date of randomisation and the date of discontinuation from the treatment period for BSC only. Adverse events that started outside the treatment-emergent period and assessed as related to study drug was considered treatment-emergent.
Company evidence submission for azacitidine [ID829] 90
4.12.2 Safety overview
In general, in AZA-AML-001, azacitidine was generally well tolerated, with more than 50% of
subjects in the azacitidine treatment group receiving 6 or more treatment cycles and one-
third receiving 12 or more cycles.
As expected, and considering the underlying disease and the known pharmacology of the
treatments used in the study, AEs were most frequently reported from four system organ
classes: general disorders and administration site conditions; gastrointestinal disorders;
infections and infestations; blood and lymphatic system disorders. When adjusted for time of
exposure, the incidence rates in these classes were lower in the azacitidine treatment group
versus the other treatment groups. In addition, the frequency of AEs leading to study drug
discontinuation was low and similar between treatment groups.
The most common haematological AEs reported in the azacitidine group were febrile
neutropenia (32.2%), neutropenia (30.1%), and thrombocytopenia (27.1%). Neutropenia and
thrombocytopenia occurred more frequently in the azacitidine group compared with the BSC
only group. Neutropenia and febrile neutropenia were similar between azacitidine and LDAC,
whereas thrombocytopenia was more frequent for LDAC. Neutropenia and febrile
neutropenia were more frequent in the IC group compared with the other treatment groups.
Adjusting for exposure time, all frequent haematological AEs, including Grade 3 or 4 AEs,
were generally lower with azacitidine compared with other CCR treatments.
The most common non-haematological AEs reported in the azacitidine group were
gastrointestinal toxicities such as constipation (41.9%), nausea (39.8%), and diarrhoea
(36.9%), and general disorders, such as pyrexia (37.7%). Nausea and diarrhoea occurred
more frequently in the azacitidine group than in the BSC only and LDAC groups.
Constipation in the azacitidine group was more frequent than in the IC group. When
adjusting for time of exposure, the incidence rates of gastrointestinal events (constipation,
nausea, and diarrhoea) were equivalent between the azacitidine group and the LDAC group
and lower than the IC group.
The most common SAE reported in azacitidine-treated subjects included febrile neutropenia
(25.0%), pneumonia (20.3%), AML (11.0%), and pyrexia (10.6%). Similar trends were
observed in LDAC-treated subjects. The percentage of subjects with SAEs was lower in the
IC group, with the most frequently reported SAEs being febrile neutropenia (16.7%). In the
BSC only group, the most frequently reported SAEs were AML (30.0%), febrile neutropenia
(30.0%), and cellulitis (10.0%). When adjusted for time of exposure, the overall rate per
person-year of SAEs was lower in the azacitidine group compared to the three other
treatment groups.
The majority of deaths in the azacitidine group occurred during the post-treatment period
(54.8%) with 23.2% of deaths occurring on-treatment. Similar death rates were reported in
the three active treatment groups. The rate of on-treatment death was 2-fold higher in the
BSC only group. The cause of on- and post-treatment death was consistent with the
manifestations of AML and/or underlying disease of an elderly population.
Haematology data were consistent with the reduction in haematologic AEs over time and
revealed a trend toward normalisation for haemoglobin and platelets over time. The
laboratory shift data demonstrated that azacitidine had a haematological profile that was
either comparable to or better than that for LDAC and IC.
Company evidence submission for azacitidine [ID829] 91
In conclusion, azacitidine has been marketed and widely used for MDS and AML in the EU
since 2008, and the safety profile observed with azacitidine in AZA-AML-001 was consistent
with that previously observed and reported with azacitidine in its existing approved
indications. When normalising for treatment exposure, azacitidine tends to have a favourable
safety profile compared with the CCR treatment groups with no additional risks over
currently used regimens.
4.13 Interpretation of clinical effectiveness and safety evidence
4.13.1 Principal (interim) findings from the clinical evidence highlighting the clinical benefits and harms of the technology
Summary
Azacitidine significantly improved patients’ overall survival (12.1 months vs.
6.9 months; p=0.019) after censoring for the first subsequent AML therapy in
patients aged ≥65 years with AML in the AZA-AML-001 study
Azacitidine significantly improved 1-year survival versus CCR (46.5% vs 34.3%,
difference 12.3%)
The AZA-AML-001 findings represent the largest OS and 1-year survival benefit
seen in low intensity therapy in elderly AML and are consistent with real world
registry data
AZA-AML-001 shows that azacitidine is highly effective and well-tolerated and
has no detrimental effect on QoL. It is therefore a much needed treatment
option for elderly patients with AML
Key efficacy findings from AZA-AML-001
The AZA-AML-001 Phase 3 study evaluated the safety and efficacy of azacitidine versus
CCR for the treatment of elderly patients (aged ≥65 years) with AML with >30% BM blasts
who are ineligible for HSCT. AZA-AML-001 was a large (n=488), high-quality, international,
multicentre, controlled study with an open-label, randomised, parallel-group design.
Survival benefits of azacitidine versus CCR (overall population)
AZA-AML-001 demonstrated a 15% reduction in the risk of death for patients on
azacitidine was observed (HR: 0.85; 95% CI: 0.69, 1.03, stratified p=0.1009, unstratified
p=0.082). The median OS was 10.4 months compared with 6.5 months for CCR (an
improvement of 3.8 months).
Although the log-rank test did not reach the pre-defined significance level, there was still
a clinically significant improvement in OS of 3.8 months. These findings represent the
largest median survival benefit seen with a low intensity therapy in elderly AML (16).
Survival benefits of azacitidine versus CCR (censored/adjusted analyses)
After censoring subjects for first subsequent AML therapy, a statistically significant 24%
reduction in the risk of death was observed with azacitidine treatment (HR: 0.76; 95% CI:
0.60, 0.96, stratified p=0.019, median OS 12.1 months vs. 6.9 months), demonstrating
that subsequent AML therapy has a significant impact on survival.
Post-hoc Cox PH and IPCW-adjusted Cox PH analyses support these results and show
that both subsequent therapy and prognostic factors impact the results.
Company evidence submission for azacitidine [ID829] 92
o In Cox PH analyses, when adjusting for subsequent therapy, baseline prognostic
factors or both, the risk of death was statistically significantly reduced by 25%–31%
with azacitidine treatment versus CCR (all p<0.05). In the CCR-adjusted IPCW Cox
PH analyses (in line with NICE DSU TSD16 guidance (80)), the risk of death was
statistically significantly reduced by XXX with azacitidine treatment versus CCR XXX
1-year survival
The 1-year survival estimate was 46.5% in the azacitidine treatment group and 34.3% in
the CCR treatment group, representing a clinically meaningful difference of 12.3% in
favour of azacitidine. Consistent with this analysis, when censoring for subsequent
therapy, the 1-year survival difference was 13.0%. This is the greatest 1-year survival
reported in an elderly population of patients with AML (9, 17-23).
Survival benefits of azacitidine versus LDAC, IC and BSC
In pre-defined exploratory analyses of azacitidine versus the individual components of the
CCR group, median OS was greater for azacitidine versus LDAC and IC (LDAC:
11.2 months versus 6.4 months, respectively; IC: 13.2 months versus 12.2 months,
respectively), and a statistically significant improvement was observed between the
azacitidine group and the BSC only group (5.8 months versus 3.7 months, respectively,
p=0.0288). However, these results must be interpreted with caution as the study was not
powered to detect differences between azacitidine and individual treatments.
Survival benefits of azacitidine in patient sub-groups (poor-risk cytogenetics and AML patients with MDS-related changes)
Pre-defined univariate subgroup analyses showed a consistent trend in survival benefit
for azacitidine versus CCR across all subgroups (HR for OS<1), including baseline
patient- and disease-related prognostic factors.
The strongest effect (HR≤0.71) was seen in patients with MDS-related changes, prior
MDS and poor risk cytogenetics.
Additional benefits of azacitidine versus CCR (overall population)
In terms of other efficacy assessments, measures of haematologic response, duration of
remission, and RFS were similar between the azacitidine and CCR treatment arms.
In patients who did not obtain a CR, median OS was significantly longer for azacitidine
versus CCR (6.9 vs 4.2 months; HR 0.77, p=0.017) with an estimated 1-year survival of
33.8% vs 20.4%, respectively. Similar observations have been made in both AML (25)
and higher risk MDS (89). Therefore, attainment of a CR does not appear to be a
prerequisite for a survival benefit with azacitidine.
A trend for improved EFS in favour of the azacitidine group compared with CCR was
however observed, and azacitidine was associated with an overall benefit in both RBC
and platelet transfusion dependence.
Efficacy conclusion
In summary, treatment with azacitidine resulted in clinically meaningful and statistically
significant increases in OS in a number of different analyses, with associated
improvements in haematologic endpoints. As shown in Section 4.11.1, similar results for
OS, 1-year survival and response rates have been observed in ‘real-world’ registries with
Company evidence submission for azacitidine [ID829] 93
less-stringent inclusion criteria, demonstrating the reproducibility of the AZA-AML-001
results. These analyses demonstrate that azacitidine is a highly effective and much
needed treatment option in this difficult-to-treat elderly AML population.
Patient-reported outcomes
There was no meaningful HRQoL deterioration associated with prolongation of OS in the
azacitidine group during treatment. Further, azacitidine and CCR were associated with
general improvement in HRQoL in the four pre-specified QLQ-C30 domains of fatigue,
dyspnoea, global health status and physical functioning.
Safety & tolerability
Adverse events for azacitidine
As expected, and considering the underlying disease and the known pharmacology of
the treatments used in the study, AEs were most frequently reported from four system
organ classes: general disorders and administration site conditions; gastrointestinal
disorders; infections and infestations; blood and lymphatic system disorders.
Overall, when adjusted for the time of exposure to study drug, the incidence rates were
lower in these classes in the azacitidine group when compared with all other individual
treatment groups. Additionally, the frequency of AEs leading to study drug
discontinuation was low and similar between all treatment groups.
The most common haematological AEs reported in the azacitidine group were febrile
neutropenia (32%), neutropenia (30%), and thrombocytopenia (27%) and the most
common non-haematological AEs were gastrointestinal toxicities such as constipation
(42%), nausea (40%), and diarrhoea (37%), and general disorders such as pyrexia
(38%).
The most frequent SAEs reported in the azacitidine group included febrile neutropenia
(25%), pneumonia (20%), AML (11%), and pyrexia (11%).
Adverse events for azacitidine adjusted for time of exposure
When adjusted for time of exposure:
all frequent haematological AEs, including Grade 3 and 4 AEs, were generally lower in
the azacitidine groups when compared with other CCR treatments
incidence rates of gastrointestinal events were equivalent between the azacitidine group
and the LDAC group, and lower than the IC group
overall rate per person-year of SAEs was lower in the azacitidine group compared with
other CCR treatments.
Rates of on-treatment and post-treatment death
Similar death rates were reported in the three active treatment groups, and the rate of on-
treatment death was 2-fold higher in the BSC only group. The cause of both on- and post-
treatment death was consistent with the manifestations of AML and/or underlying disease
of the elderly.
Company evidence submission for azacitidine [ID829] 94
Duration of treatment
Azacitidine was generally well tolerated, with more than 50% of subjects in the
azacitidine treatment group receiving six of more treatment cycles, and one-third
receiving 12 or more cycles.
The median duration of treatment for azacitidine (164.5 days) was longer than the
median duration observed for BSC only (65.0 days), LDAC (98.0 days), or IC (55.5 days)
treatment groups.
Safety conclusion
In conclusion, azacitidine has been marketed and widely used for MDS and AML in the
EU since 2008, the favourable tolerability profile of azacitidine in older patients with AML
is consistent with that previously observed and reported with azacitidine in its existing
approved indications (24, 25). Given the imbalances in treatment duration between the
treatment groups, when adjusting for duration of exposure, the incidence rates for the
majority of AEs were either similar or lower in azacitidine-treated subjects compared to
the individual CCR groups, with no additional risks observed over currently used
regimens. These results indicate that azacitidine has a favourable safety profile in the
treatment of elderly patients with AML.
4.13.2 Strengths and limitations of the clinical evidence base for the technology
Strengths
1. Design features of the AZA-AML-001 study
Study AZA-AML-001 is a high quality Phase 3 RCT which provides the pivotal
evidence supporting the regulatory approval of azacitidine for the treatment of AML
with BM blasts >30% in elderly patients who are ineligible for HSCT. The study
successfully addresses the decision problem, providing evidence in the appropriate
population versus a range of treatments currently used in clinical practice – defined
as CCR – and reporting a number of efficacy, safety and quality of life endpoints.
The primary endpoint of OS is considered the most reliable endpoint for cancer
studies, as it is an objective and direct measure of the treatment benefit that is most
clinically meaningful to this patient population (see Section 4.3.7).
2. Representativeness of patient population & generalisability to UK clinical practice
The patient population recruited to the study is representative of patients included in
the licensed indication and the population that would be treated in routine clinical
practice in the UK. Similar to patients in routine practice, AZA-AML-001 had a highly
heterogeneous population with a high number of poor prognostic features. This
included a median BM blast count of ~70%, 32% with a diagnosis of AML-MRC,
35% poor risk cytogenetics, median age of 75 years and >20% of patients had an
ECOG performance status of 2.
When comparing AZA-AML-001 to the HMRN registry (10), it can be seen that the
median age (75 years AZA-AML-001 vs 78.7 years HMRN) and frequency of poor
risk cytogenetics (35% AZA-AML-001 vs 33.9% HMRN) were similar. However,
Company evidence submission for azacitidine [ID829] 95
there was an increased proportion of AML-MRC in the AZA-AML-001 study (32%
AZA-AML-001 vs 12.1% HMRN).
In the HRMN, there is a different proportional uptake of CCR regimens (XXX We
hypothesise this is due to WBC cut off in the trial (impact on the cost-effectiveness
is explored in the sensitivity analyses in section 5.8).
3. Appropriateness of the composite comparator in the context of UK clinical practice
As discussed in detail in section 3.3, the observed heterogeneity means that there
is no standard of care for elderly patients with AML. As such, complex treatment
guidelines (6, 8, 59, 65) have been developed and there is no widely accepted risk
algorithm that clinicians use when deciding which patients are most likely to benefit
from intensive or non-intensive treatment options.
To overcome these difficulties, study AZA-AML-001 was powered to compare the
efficacy and tolerability of azacitidine versus a composite comparator, CCR,
combining all patients, irrespective of treatment regimen, into one patient
population. This approach of comparing with a composite comparator has been
recognised and accepted by NICE in its previous appraisal of azacitidine (TA218)
(28), as well as in other disease areas (e.g. TA254 in relapsing remitting multiple
sclerosis) (29). Given the difficulties described above CCR is the most appropriate
comparator when assessing the efficacy of azacitidine in this difficult-to-treat patient
population.
4. Value of clinical outcomes observed with azacitidine
Outcomes for elderly AML patients treated with CCR are very poor and therefore
there is an urgent unmet need for new treatment options. AZA-AML-001 has shown
the highest median OS (10.4 months, a 58% increase vs CCR) and 1-year survival
(47%, a 36% increase vs CCR) benefit for a non-intensive therapy in an elderly
AML population and has demonstrated that azacitidine can provide a highly
effective and well-tolerated treatment option for this complex and difficult-to-treat
patient population.
Limitations
1. Absence of statistical significance for the primary endpoint of OS in the AZA-AML-001 study
While the primary endpoint demonstrated a clinically meaningful increase in OS of
3.8 months in the azacitidine treatment group versus the CCR treatment group, the
log-rank test failed to reach the pre-defined significance level.
The convergence of the survival curves observed after month 22 is not unexpected
in a condition without a curative therapy and a poor prognosis.
The lack of statistical significance achieved in the primary OS analysis may reflect
the convergence and the statistical methods used to compare the OS curves. In line
with the majority of clinical trials, the log-rank test was used to compare OS.
However, this is a non-parametric test which compares the survival across the
entire follow-up period. Using this test is likely to have led to an underestimation in
the survival difference between treatments in cases where patients are followed up
until death, withdrawal of consent, or study termination. The test does not compare
Company evidence submission for azacitidine [ID829] 96
survival at discrete time points, and therefore data after two years – when the
curves converged – were included when calculating overall HRs and significance
levels (83).
Furthermore, possible imbalances in subsequent therapy between treatment arms
is recognised as a problem in cancer trials which use OS as a primary endpoint
(30).
To allow for a more rigorous comparison of the effects of the two treatment arms on
OS, the study included a pre-specified analysis where patients were censored upon
discontinuation of study drug and initiation of subsequent therapy. This means that
patients were included in OS calculations up until starting treatment with
subsequent therapy, at which point they were precluded from further analysis. In
total, 69 (28.6%) subjects in the azacitidine group and 75 (30.4%) subjects in the
CCR group received subsequent AML therapy after discontinuing study treatment.
The results from this analysis demonstrated a statistically significant reduction in the
risk of death with azacitidine treatment versus CCR (OS: 12.1 vs. 6.9 months,
respectively; p=0.019). Furthermore, when evaluating 1-year survival – a time point
at which subsequent therapy is less likely to have an impact – there was a
significant increase associated with azacitidine which was consistent with the
results observed when censoring for subsequent therapy.
2. Effect of prognostic factors on observed survival outcomes from the AZA-AML-001 study
A variety of patient- and disease-related prognostic factors are likely to influence
survival outcomes. The impact of the heterogeneity of the elderly AML population
was examined in univariate and multivariate analyses.
Univariate analysis demonstrated the heterogeneity of the elderly AML
population, with a median OS between subgroups ranging from 4.8 months to
17 months (in the azacitidine arm).
In all subgroups there was a consistent trend in survival benefit associated with
azacitidine treatment (HR for OS<1), and the strongest effect (HR≤0.71) was
seen in patients with MDS-related changes, prior MDS and poor risk
cytogenetics. As expected, survival was better in younger patients (<75 years)
and in patients with a better performance status (ECOG performance status 0 or
1).
Two IPCW-adjusted Cox PH analyses were undertaken to adjust for baseline
patient- and disease-related covariates and the impact of subsequent therapy. A
regulatory-preferred analysis was conducted where adjustments were made to
both treatment arms, and a NICE-preferred analysis was conducted where
adjustments were made only to the CCR treatment arm. Both analyses revealed
a statistically significant survival benefit with azacitidine versus CCR (regulatory-
preferred: HR: 0.71; p=0.0047 and NICE-preferred: HR: 0.75; p=0.01). The
outcomes of these analyses indicate that treatment with azacitidine results in a
statistically significant reduction in the overall risk of death when compared with
CCR.
While the primary endpoint of the trial was not met, the study successfully
demonstrated that there were a number of confounding factors which led to the
underestimation of the efficacy of azacitidine. As such, when these were accounted
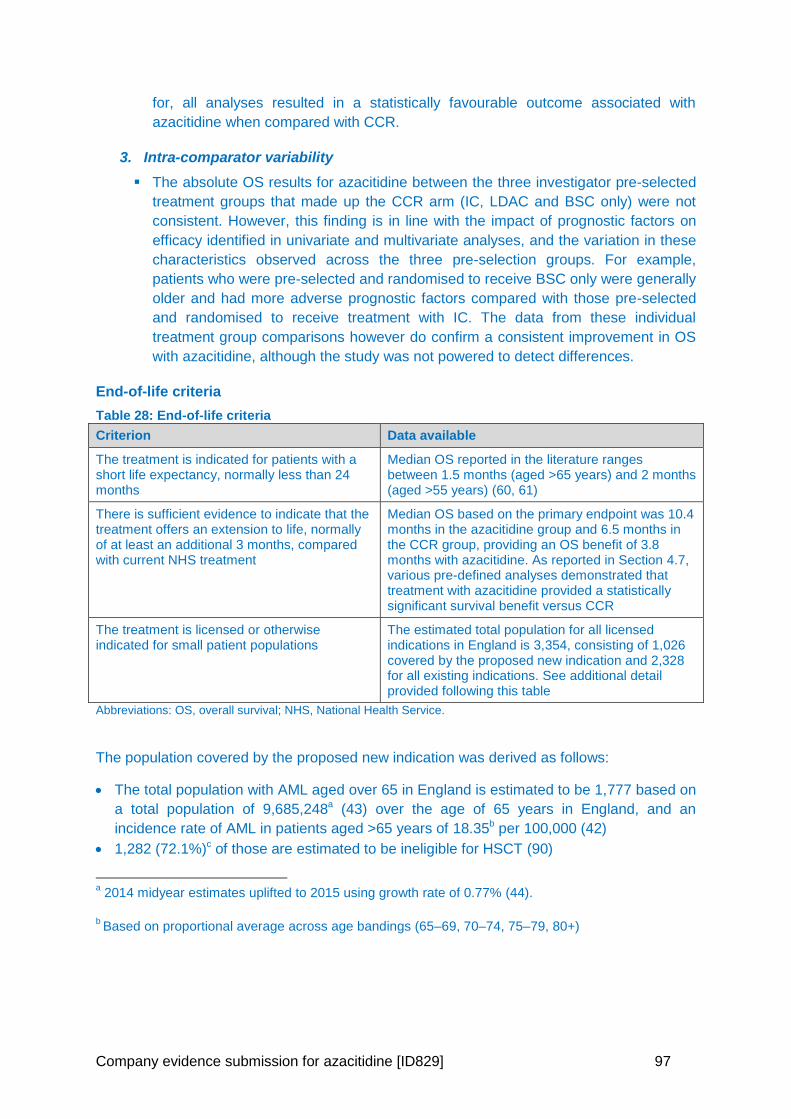
Company evidence submission for azacitidine [ID829] 97
for, all analyses resulted in a statistically favourable outcome associated with
azacitidine when compared with CCR.
3. Intra-comparator variability
The absolute OS results for azacitidine between the three investigator pre-selected
treatment groups that made up the CCR arm (IC, LDAC and BSC only) were not
consistent. However, this finding is in line with the impact of prognostic factors on
efficacy identified in univariate and multivariate analyses, and the variation in these
characteristics observed across the three pre-selection groups. For example,
patients who were pre-selected and randomised to receive BSC only were generally
older and had more adverse prognostic factors compared with those pre-selected
and randomised to receive treatment with IC. The data from these individual
treatment group comparisons however do confirm a consistent improvement in OS
with azacitidine, although the study was not powered to detect differences.
End-of-life criteria
Table 28: End-of-life criteria
Criterion Data available
The treatment is indicated for patients with a short life expectancy, normally less than 24 months
Median OS reported in the literature ranges between 1.5 months (aged >65 years) and 2 months (aged >55 years) (60, 61)
There is sufficient evidence to indicate that the treatment offers an extension to life, normally of at least an additional 3 months, compared with current NHS treatment
Median OS based on the primary endpoint was 10.4 months in the azacitidine group and 6.5 months in the CCR group, providing an OS benefit of 3.8 months with azacitidine. As reported in Section 4.7, various pre-defined analyses demonstrated that treatment with azacitidine provided a statistically significant survival benefit versus CCR
The treatment is licensed or otherwise indicated for small patient populations
The estimated total population for all licensed indications in England is 3,354, consisting of 1,026 covered by the proposed new indication and 2,328 for all existing indications. See additional detail provided following this table
Abbreviations: OS, overall survival; NHS, National Health Service.
The population covered by the proposed new indication was derived as follows:
The total population with AML aged over 65 in England is estimated to be 1,777 based on
a total population of 9,685,248a (43) over the age of 65 years in England, and an
incidence rate of AML in patients aged >65 years of 18.35b per 100,000 (42)
1,282 (72.1%)c of those are estimated to be ineligible for HSCT (90)
a 2014 midyear estimates uplifted to 2015 using growth rate of 0.77% (44).
b Based on proportional average across age bandings (65–69, 70–74, 75–79, 80+)
Company evidence submission for azacitidine [ID829] 98
Of these, 1,026 (80%) are estimated to have BM blasts >30% (91)
The population for all other licensed indications was derived as follows:
The total population with MDS (including patients with chronic mylomonocytic leukaemia
and AML with 20–30% blasts) in adults (>18 years) in England is estimated to be 10,298
based on a total population of 55,155,788a (43), and an incidence rate of MDS in patients
aged >18 years of 18.67d per 100,000 (42)
2,451 (23.8%)e of those are estimated to have intermediate-2 and high-risk MDS (92-94)
2,328 (95%) of those are estimated to be ineligible for HSCT (95)
4.14 Ongoing studies
In adults with AML with BM blasts >30%, there are no completed or ongoing company-
sponsored studies from which new evidence will become available in the next 12 months.
c Population estimated from total of 495 patients eligible for HSCT in England in 2013.
d Based on proportional average across 5-year age bandings (20–24 to 80+)
e Based on a proportional average.
Company evidence submission for azacitidine [ID829] 99
5 Cost effectiveness
5.1 Published cost-effectiveness studies
5.1.1 Identification of studies
A systematic review was conducted to identify cost-effectiveness studies from the published
literature relevant to the decision problem.
The following electronic databases were searched on the 19th October 2015: Ovid
MEDLINE, Ovid MEDLINE In-Process and Other Non-Indexed Citations, EMBASE (Ovid),
NHS EED (Ovid, as part of the Cochrane Library), HTA (Ovid, as part of the Cochrane
Library) and Econlit (Ovid).
Electronic searches were supplemented by hand searching the following sources: reference
lists of included publications, conference proceedings, the Cost-Effectiveness Analysis
(CEA) Registry, the WHO International Clinical Trials Registry Platform (ICTRP), the HTA
database of the International Network of Agencies for Health Technology Assessment
(INAHTA), the NIHR HTA website, the Research Papers in Economics (RePEc) website,
and previous NICE HTA submissions in the relevant disease. Any relevant abstracts
identified through the electronic database search or supplementary hand searching were
checked for available associated posters.
In total, 365 citations were identified through the electronic database searches. Upon the
removal of duplicates, 334 titles and abstracts were screened for relevance according to
eligibility criteria described in Appendix 7. Following exclusion of 286 citations, the full texts
of 48 publications were reviewed, of which 40 were excluded, resulting in eight relevant
papers for final inclusion (Figure 13).
No additional relevant studies were identified via hand searching.
Full details of the search, including search terms, details of the included studies and of the
studies excluded on full paper review are provided in Appendix 7.
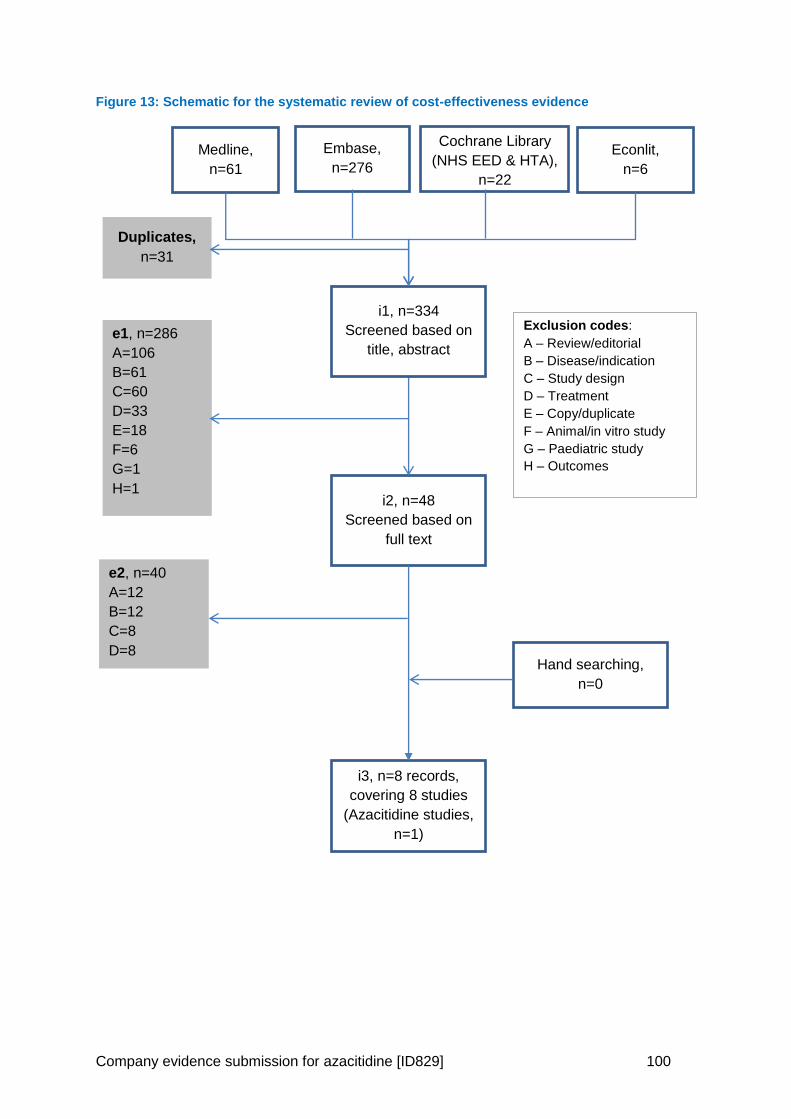
Company evidence submission for azacitidine [ID829] 100
Figure 13: Schematic for the systematic review of cost-effectiveness evidence
Medline,
n=61
e1, n=286
A=106
B=61
C=60
D=33
E=18
F=6
G=1
H=1 i2, n=48
Screened based on
full text
i3, n=8 records,
covering 8 studies
(Azacitidine studies,
n=1)
Embase,
n=276 Econlit,
n=6
i1, n=334
Screened based on
title, abstract
Duplicates,
n=31
e2, n=40
A=12
B=12
C=8
D=8
Exclusion codes: A – Review/editorial B – Disease/indication C – Study design D – Treatment E – Copy/duplicate F – Animal/in vitro study G – Paediatric study H – Outcomes
Hand searching,
n=0
Cochrane Library
(NHS EED & HTA),
n=22
Company evidence submission for azacitidine [ID829] 101
5.1.2 Description of identified studies
Of the eight studies identified for inclusion, four were full publications (96-99), and four were
abstracts (100-103), of which one had an available associated poster (103). Countries from
which the economic data were derived included: the US (n=4) (99, 100, 102, 103); France
(n=1) (96); Russia (n=1) (101); China (n=1) (97); and Italy (n=1) (98). No UK-based studies
were identified.
Of the eight studies identified, three were cost-utility analyses that evaluated currently
available pharmacological interventions in an active comparator setting, and reported an
ICER (100, 102, 103); these studies are deemed to be most relevant to decision making in
England, however, one was a poster and two were abstracts only and thus reported limited
information regarding study methodology. The remaining five studies were cost-
effectiveness analyses: four studies reported costs per LYG (96, 97, 99, 101), and two
reported costs per complete remission (98, 99).
All of the included studies considered the treatment of patients with AML; in two studies, the
FAB classification system was used to diagnose patients, and therefore it is assumed that
patients had >30% blasts (96, 97). However, it was unclear in six studies if patients had
>30% blasts due to a lack of reporting (98-103). One study considered only patients with
acute promyelocytic leukaemia (APL) (103). The interventions investigated in the studies
included: azacitidine vs low-dose cytarabine (Ara-C) (101); decitabine vs conventional
induction chemotherapy with Ara-C and daunorubicin (100); chemotherapy vs
autologous/allogeneic bone marrow transplantation (96); high-dose Ara-C vs daunorubicin
(97); idarubicin vs daunorubicin (both in combination with Ara-C) (98, 99); chemotherapy vs
allogeneic haematopoietic cell transplantation (102); and arsenic trioxide vs Ara-C in
combination with chemotherapy vs idarubicin (103).
With regard to the model structures used, two studies constructed Markov models (100,
103), two studies used decision trees/analyses (98, 102), and four studies did not specify the
model type used (96, 97, 99, 101). The analysis perspective was clearly reported in only one
study and this was from the US third party payer perspective (103). In two studies, a payer
perspective was assumed (96, 98). The time horizon was reported in three studies (100,
102, 103), and ranged from 1 year (100) to 55 years (103). Health states considered in the
models included: healthy (100), death (100, 103), active disease (100), AML in remission on
conventional induction chemotherapy (100), AML in remission on decitabine or high-dose
Ara-C (100), AML on active treatment with conventional induction chemotherapy or
decitabine (100), complete remission (98), partial remission (98), resistance (98), 1st-line
stable disease (103), 2nd-line stable disease (103), and 2nd-line disease event (103).
The eight included studies are summarised in Table 29.
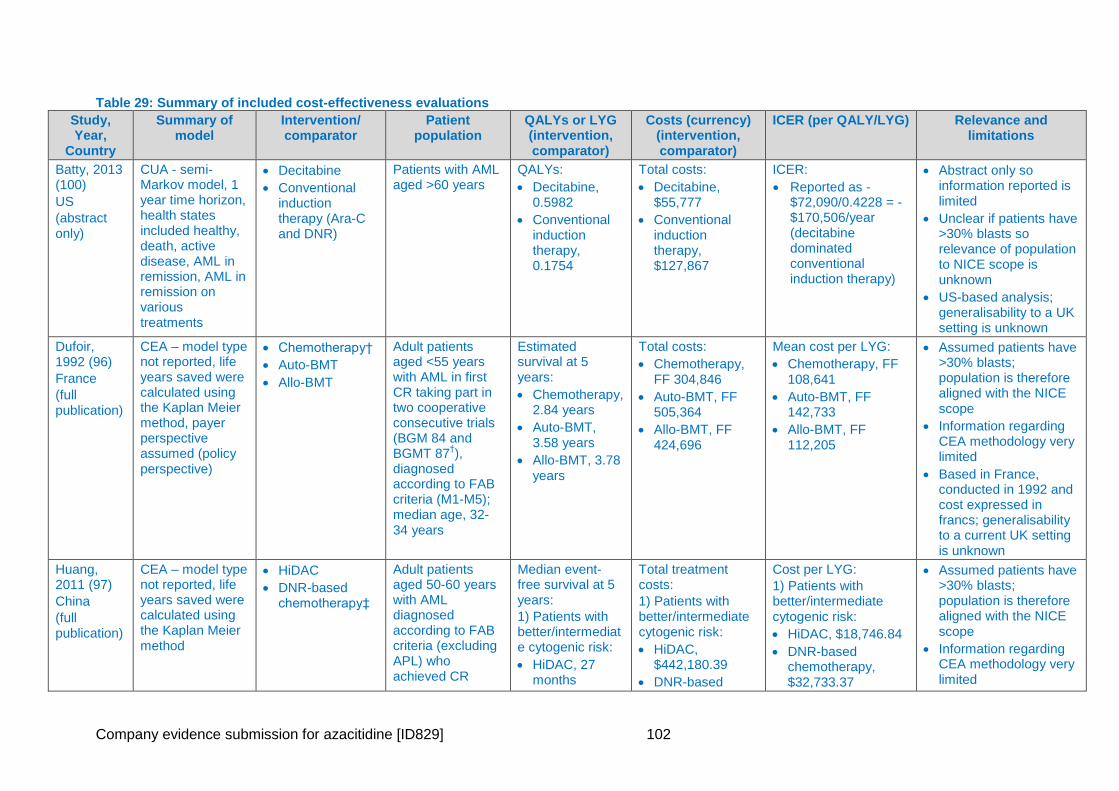
Company evidence submission for azacitidine [ID829] 102
Table 29: Summary of included cost-effectiveness evaluations
Study, Year,
Country
Summary of model
Intervention/ comparator
Patient population
QALYs or LYG (intervention, comparator)
Costs (currency) (intervention, comparator)
ICER (per QALY/LYG) Relevance and limitations
Batty, 2013 (100)
US
(abstract only)
CUA - semi-Markov model, 1 year time horizon, health states included healthy, death, active disease, AML in remission, AML in remission on various treatments
Decitabine
Conventional induction therapy (Ara-C and DNR)
Patients with AML aged >60 years
QALYs:
Decitabine, 0.5982
Conventional induction therapy, 0.1754
Total costs:
Decitabine, $55,777
Conventional induction therapy, $127,867
ICER:
Reported as -$72,090/0.4228 = -$170,506/year (decitabine dominated conventional induction therapy)
Abstract only so information reported is limited
Unclear if patients have >30% blasts so relevance of population to NICE scope is unknown
US-based analysis; generalisability to a UK setting is unknown
Dufoir, 1992 (96)
France
(full publication)
CEA – model type not reported, life years saved were calculated using the Kaplan Meier method, payer perspective assumed (policy perspective)
Chemotherapy†
Auto-BMT
Allo-BMT
Adult patients aged <55 years with AML in first CR taking part in two cooperative consecutive trials (BGM 84 and BGMT 87
†),
diagnosed according to FAB criteria (M1-M5); median age, 32-34 years
Estimated survival at 5 years:
Chemotherapy, 2.84 years
Auto-BMT, 3.58 years
Allo-BMT, 3.78 years
Total costs:
Chemotherapy, FF 304,846
Auto-BMT, FF 505,364
Allo-BMT, FF 424,696
Mean cost per LYG:
Chemotherapy, FF 108,641
Auto-BMT, FF 142,733
Allo-BMT, FF 112,205
Assumed patients have >30% blasts; population is therefore aligned with the NICE scope
Information regarding CEA methodology very limited
Based in France, conducted in 1992 and cost expressed in francs; generalisability to a current UK setting is unknown
Huang, 2011 (97)
China
(full publication)
CEA – model type not reported, life years saved were calculated using the Kaplan Meier method
HiDAC
DNR-based chemotherapy‡
Adult patients aged 50-60 years with AML diagnosed according to FAB criteria (excluding APL) who achieved CR
Median event-free survival at 5 years:
1) Patients with better/intermediate cytogenic risk:
HiDAC, 27 months
Total treatment costs:
1) Patients with better/intermediate cytogenic risk:
HiDAC, $442,180.39
DNR-based
Cost per LYG:
1) Patients with better/intermediate cytogenic risk:
HiDAC, $18,746.84
DNR-based chemotherapy, $32,733.37
Assumed patients have >30% blasts; population is therefore aligned with the NICE scope
Information regarding CEA methodology very limited
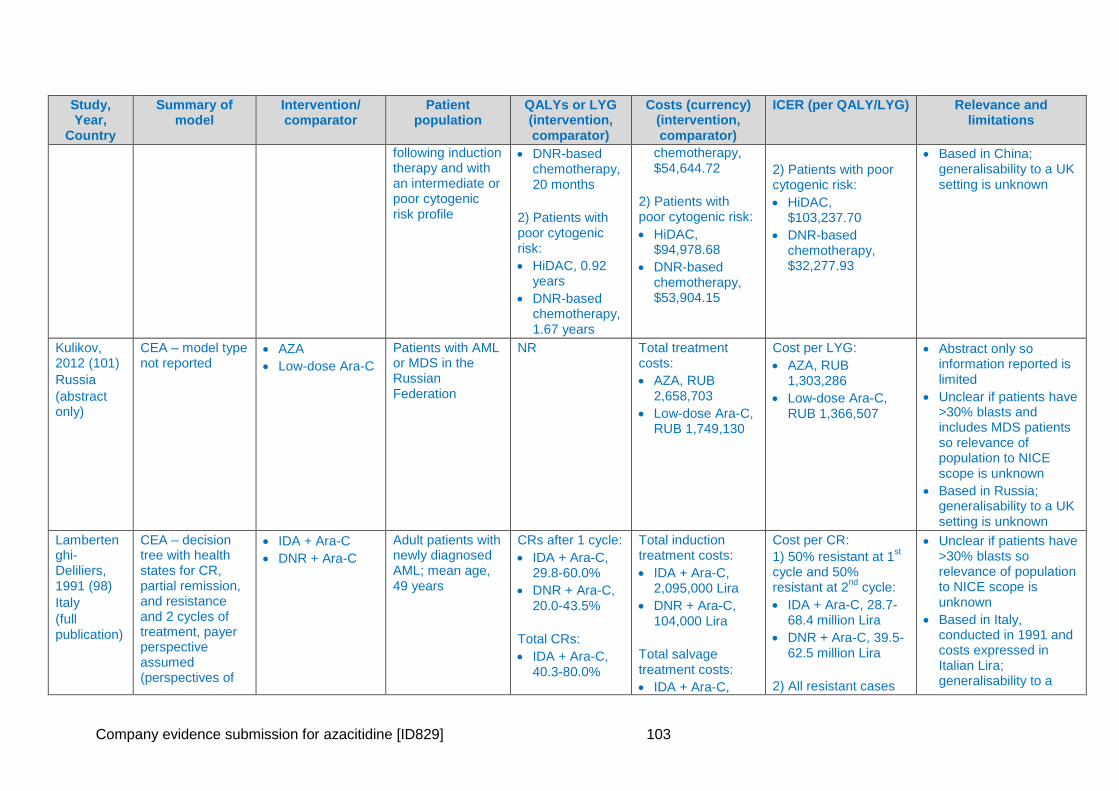
Company evidence submission for azacitidine [ID829] 103
Study, Year,
Country
Summary of model
Intervention/ comparator
Patient population
QALYs or LYG (intervention, comparator)
Costs (currency) (intervention, comparator)
ICER (per QALY/LYG) Relevance and limitations
following induction therapy and with an intermediate or poor cytogenic risk profile
DNR-based chemotherapy, 20 months
2) Patients with poor cytogenic risk:
HiDAC, 0.92 years
DNR-based chemotherapy, 1.67 years
chemotherapy, $54,644.72
2) Patients with poor cytogenic risk:
HiDAC, $94,978.68
DNR-based chemotherapy, $53,904.15
2) Patients with poor cytogenic risk:
HiDAC, $103,237.70
DNR-based chemotherapy, $32,277.93
Based in China; generalisability to a UK setting is unknown
Kulikov, 2012 (101)
Russia
(abstract only)
CEA – model type not reported
AZA
Low-dose Ara-C
Patients with AML or MDS in the Russian Federation
NR Total treatment costs:
AZA, RUB 2,658,703
Low-dose Ara-C, RUB 1,749,130
Cost per LYG:
AZA, RUB 1,303,286
Low-dose Ara-C, RUB 1,366,507
Abstract only so information reported is limited
Unclear if patients have >30% blasts and includes MDS patients so relevance of population to NICE scope is unknown
Based in Russia; generalisability to a UK setting is unknown
Lambertenghi-Deliliers, 1991 (98)
Italy
(full publication)
CEA – decision tree with health states for CR, partial remission, and resistance and 2 cycles of treatment, payer perspective assumed (perspectives of
IDA + Ara-C
DNR + Ara-C
Adult patients with newly diagnosed AML; mean age, 49 years
CRs after 1 cycle:
IDA + Ara-C, 29.8-60.0%
DNR + Ara-C, 20.0-43.5%
Total CRs:
IDA + Ara-C, 40.3-80.0%
Total induction treatment costs:
IDA + Ara-C, 2,095,000 Lira
DNR + Ara-C, 104,000 Lira
Total salvage treatment costs:
IDA + Ara-C,
Cost per CR:
1) 50% resistant at 1st
cycle and 50% resistant at 2
nd cycle:
IDA + Ara-C, 28.7-68.4 million Lira
DNR + Ara-C, 39.5-62.5 million Lira
2) All resistant cases
Unclear if patients have >30% blasts so relevance of population to NICE scope is unknown
Based in Italy, conducted in 1991 and costs expressed in Italian Lira; generalisability to a
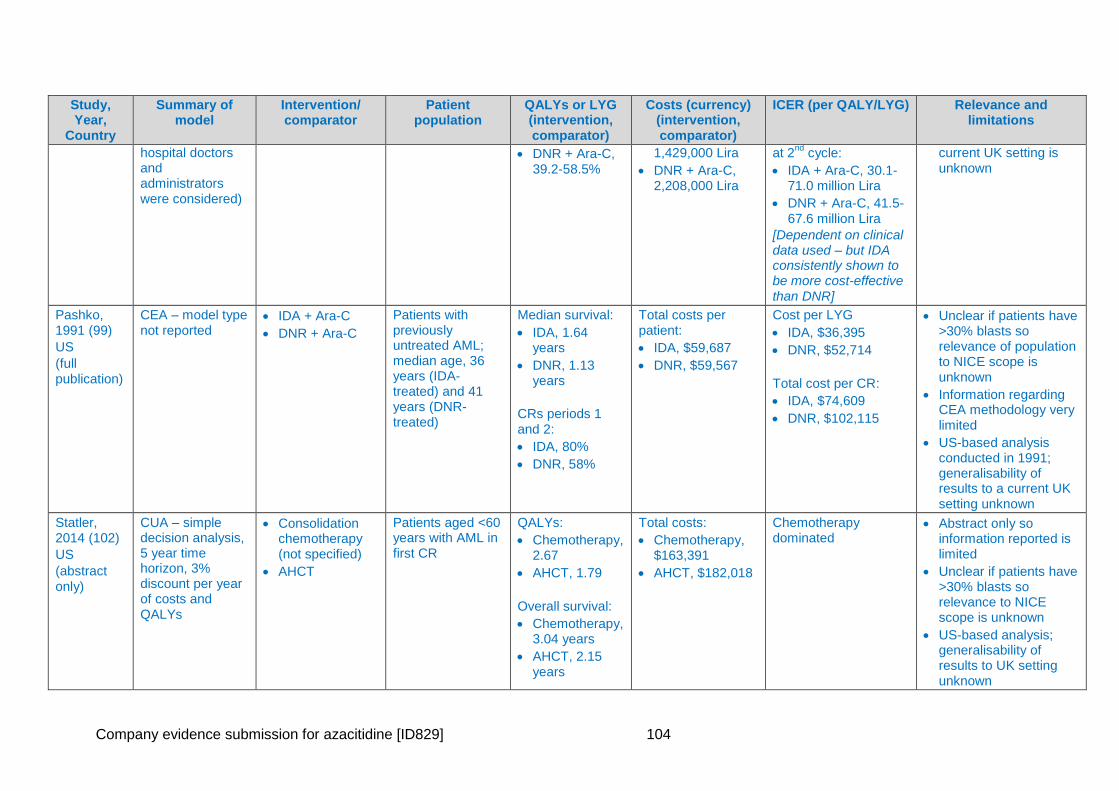
Company evidence submission for azacitidine [ID829] 104
Study, Year,
Country
Summary of model
Intervention/ comparator
Patient population
QALYs or LYG (intervention, comparator)
Costs (currency) (intervention, comparator)
ICER (per QALY/LYG) Relevance and limitations
hospital doctors and administrators were considered)
DNR + Ara-C, 39.2-58.5%
1,429,000 Lira
DNR + Ara-C, 2,208,000 Lira
at 2nd
cycle:
IDA + Ara-C, 30.1-71.0 million Lira
DNR + Ara-C, 41.5-67.6 million Lira
[Dependent on clinical data used – but IDA consistently shown to be more cost-effective than DNR]
current UK setting is unknown
Pashko, 1991 (99)
US
(full publication)
CEA – model type not reported
IDA + Ara-C
DNR + Ara-C
Patients with previously untreated AML; median age, 36 years (IDA-treated) and 41 years (DNR-treated)
Median survival:
IDA, 1.64 years
DNR, 1.13 years
CRs periods 1 and 2:
IDA, 80%
DNR, 58%
Total costs per patient:
IDA, $59,687
DNR, $59,567
Cost per LYG
IDA, $36,395
DNR, $52,714
Total cost per CR:
IDA, $74,609
DNR, $102,115
Unclear if patients have >30% blasts so relevance of population to NICE scope is unknown
Information regarding CEA methodology very limited
US-based analysis conducted in 1991; generalisability of results to a current UK setting unknown
Statler, 2014 (102)
US
(abstract only)
CUA – simple decision analysis, 5 year time horizon, 3% discount per year of costs and QALYs
Consolidation chemotherapy (not specified)
AHCT
Patients aged <60 years with AML in first CR
QALYs:
Chemotherapy, 2.67
AHCT, 1.79
Overall survival:
Chemotherapy, 3.04 years
AHCT, 2.15 years
Total costs:
Chemotherapy, $163,391
AHCT, $182,018
Chemotherapy dominated
Abstract only so information reported is limited
Unclear if patients have >30% blasts so relevance to NICE scope is unknown
US-based analysis; generalisability of results to UK setting unknown
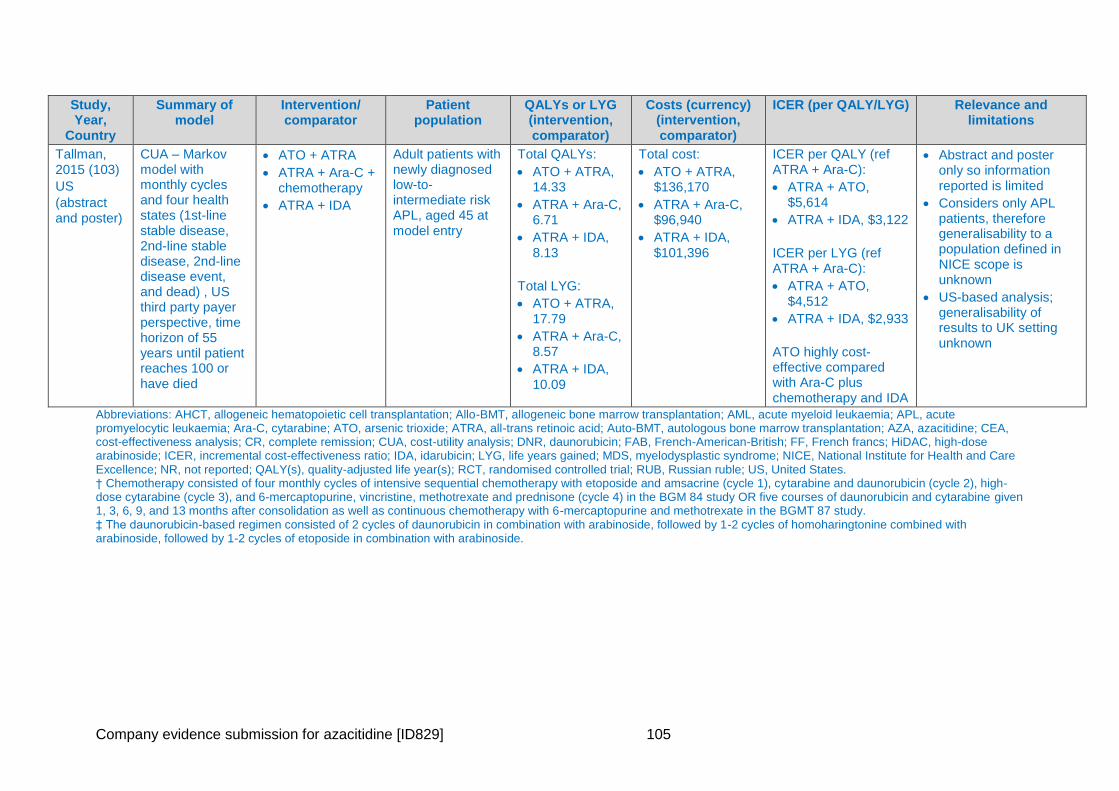
Company evidence submission for azacitidine [ID829] 105
Study, Year,
Country
Summary of model
Intervention/ comparator
Patient population
QALYs or LYG (intervention, comparator)
Costs (currency) (intervention, comparator)
ICER (per QALY/LYG) Relevance and limitations
Tallman, 2015 (103)
US
(abstract and poster)
CUA – Markov model with monthly cycles and four health states (1st-line stable disease, 2nd-line stable disease, 2nd-line disease event, and dead) , US third party payer perspective, time horizon of 55 years until patient reaches 100 or have died
ATO + ATRA
ATRA + Ara-C + chemotherapy
ATRA + IDA
Adult patients with newly diagnosed low-to-intermediate risk APL, aged 45 at model entry
Total QALYs:
ATO + ATRA, 14.33
ATRA + Ara-C, 6.71
ATRA + IDA, 8.13
Total LYG:
ATO + ATRA, 17.79
ATRA + Ara-C, 8.57
ATRA + IDA, 10.09
Total cost:
ATO + ATRA, $136,170
ATRA + Ara-C, $96,940
ATRA + IDA, $101,396
ICER per QALY (ref ATRA + Ara-C):
ATRA + ATO, $5,614
ATRA + IDA, $3,122
ICER per LYG (ref ATRA + Ara-C):
ATRA + ATO, $4,512
ATRA + IDA, $2,933
ATO highly cost-effective compared with Ara-C plus chemotherapy and IDA
Abstract and poster only so information reported is limited
Considers only APL patients, therefore generalisability to a population defined in NICE scope is unknown
US-based analysis; generalisability of results to UK setting unknown
Abbreviations: AHCT, allogeneic hematopoietic cell transplantation; Allo-BMT, allogeneic bone marrow transplantation; AML, acute myeloid leukaemia; APL, acute promyelocytic leukaemia; Ara-C, cytarabine; ATO, arsenic trioxide; ATRA, all-trans retinoic acid; Auto-BMT, autologous bone marrow transplantation; AZA, azacitidine; CEA, cost-effectiveness analysis; CR, complete remission; CUA, cost-utility analysis; DNR, daunorubicin; FAB, French-American-British; FF, French francs; HiDAC, high-dose arabinoside; ICER, incremental cost-effectiveness ratio; IDA, idarubicin; LYG, life years gained; MDS, myelodysplastic syndrome; NICE, National Institute for Health and Care Excellence; NR, not reported; QALY(s), quality-adjusted life year(s); RCT, randomised controlled trial; RUB, Russian ruble; US, United States. † Chemotherapy consisted of four monthly cycles of intensive sequential chemotherapy with etoposide and amsacrine (cycle 1), cytarabine and daunorubicin (cycle 2), high-dose cytarabine (cycle 3), and 6-mercaptopurine, vincristine, methotrexate and prednisone (cycle 4) in the BGM 84 study OR five courses of daunorubicin and cytarabine given 1, 3, 6, 9, and 13 months after consolidation as well as continuous chemotherapy with 6-mercaptopurine and methotrexate in the BGMT 87 study. ‡ The daunorubicin-based regimen consisted of 2 cycles of daunorubicin in combination with arabinoside, followed by 1-2 cycles of homoharingtonine combined with arabinoside, followed by 1-2 cycles of etoposide in combination with arabinoside.
Company evidence submission for azacitidine [ID829] 106
5.1.3 Quality assessment of identified studies
Quality assessments of the full text studies are provided in Appendix 8. Identified abstracts
and posters were not quality assessed due to the limited reporting of the methodology used.
5.2 De novo analysis
The cost-effectiveness model was developed according to methods guidance published by
NICE (104) and the NICE Decision Support Unit (DSU) (105-107) and international good
research practices for modelling (108, 109), to ensure that the analysis was as
methodologically rigorous as possible.
5.2.1 Patient population
The population in the model is the AZA-AML-001 trial population and is in line with the target
indication: older patients with newly diagnosed AML and more than 30% bone marrow blasts
who are not eligible for HSCT. The starting age in the model was 75 years and patients were
assumed to have a body surface area (BSA) of 1.80 m2, based on the mean age and BSA of
patients in the AZA-AML-001 trial.
The distribution of patients receiving IC (18%), LDAC (64%), and BSC (18%) is slightly
different to patients in UK clinical practice from the Haematological Malignancies Research
Network (HMRN) data from Northern England (10). HMRN is a collaboration between
researchers in the Epidemiology & Statistics Group (ECSG) at the University of York, a
unified Clinical Network operating across 14 hospitals, and an integrated Haematological
Malignancy Diagnostic Service at St James’s Hospital in Leeds (110). The HMRN data
shows that of the patients receiving the treatment options of interest, XXX. More patients in
this registry received BSC and fewer LDAC than in AZA-AML-001. To access the impact of
this difference, a weighted average ICER based upon this treatment distribution and
calculated from the individual treatment arms in AZA-AML-001 (as undertaken by the DSU in
TA218 (28)) is presented as a scenario analysis in section 5.8.
This report focuses on this overall study population (CCR). This is because, as explained in
section 3.3 above, there is no clinical consensus on a criteria which makes an individual
eligible to receive IC, LDAC, or just BSC. Clinical decisions are based on upon the expert
judgement of the treating physician and the preferences of the patient and their individual
needs.
The model also allows analysis of patients based on eligibility for IC, LDAC, or BSC,
cytogenetic risk (intermediate and poor), and myelodysplasia-related changes. Subgroups
on cytogenetic risk and myelodysplasia-related changes were chosen based upon a current
unmet need for an effective option for patients presenting with these characteristics and the
observed significant (P-values < 0.05) OS benefit of azacitidine over CCR in the AZA-AML-
001 trial in these subgroups. The results from alternative and subgroup analysis are
presented in in section 5.8 below.
5.2.2 Model structure
A semi-Markov model was developed based on the design of the AZA-AML-001 study and a
targeted literature review of clinical guidelines and economic models for AML in the
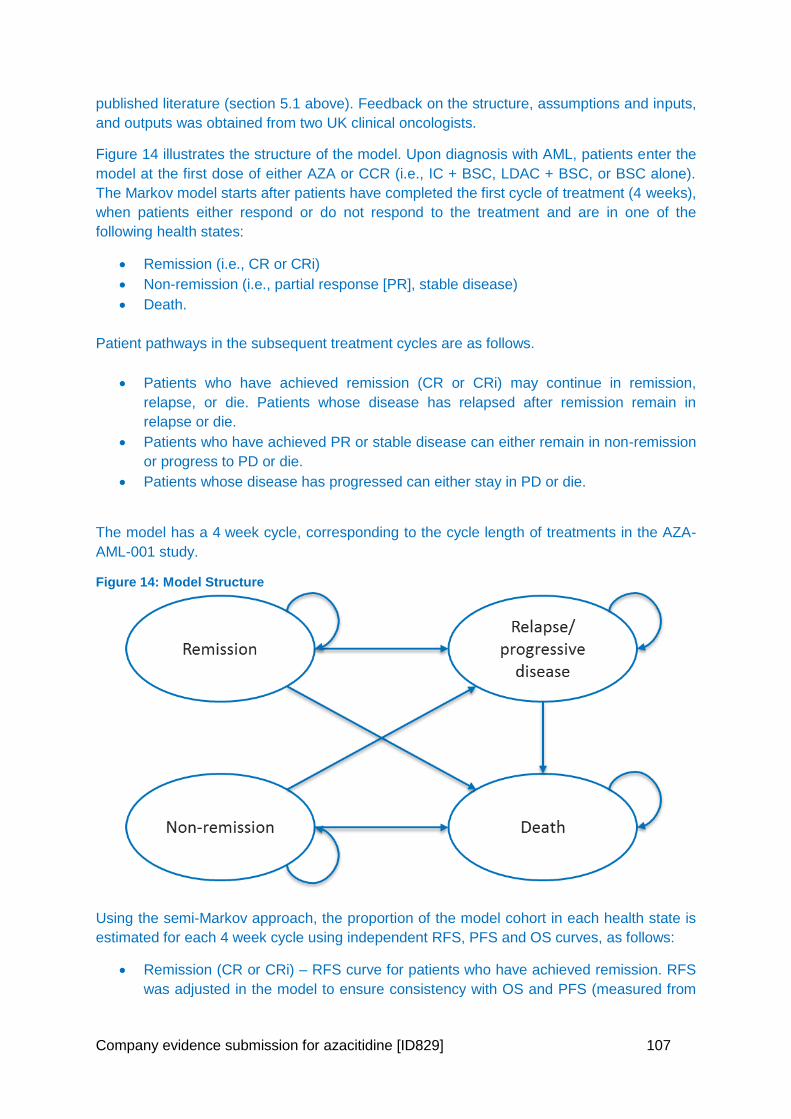
Company evidence submission for azacitidine [ID829] 107
published literature (section 5.1 above). Feedback on the structure, assumptions and inputs,
and outputs was obtained from two UK clinical oncologists.
Figure 14 illustrates the structure of the model. Upon diagnosis with AML, patients enter the
model at the first dose of either AZA or CCR (i.e., IC + BSC, LDAC + BSC, or BSC alone).
The Markov model starts after patients have completed the first cycle of treatment (4 weeks),
when patients either respond or do not respond to the treatment and are in one of the
following health states:
Remission (i.e., CR or CRi)
Non-remission (i.e., partial response [PR], stable disease)
Death.
Patient pathways in the subsequent treatment cycles are as follows.
Patients who have achieved remission (CR or CRi) may continue in remission,
relapse, or die. Patients whose disease has relapsed after remission remain in
relapse or die.
Patients who have achieved PR or stable disease can either remain in non-remission
or progress to PD or die.
Patients whose disease has progressed can either stay in PD or die.
The model has a 4 week cycle, corresponding to the cycle length of treatments in the AZA-
AML-001 study.
Figure 14: Model Structure
Using the semi-Markov approach, the proportion of the model cohort in each health state is
estimated for each 4 week cycle using independent RFS, PFS and OS curves, as follows:
Remission (CR or CRi) – RFS curve for patients who have achieved remission. RFS
was adjusted in the model to ensure consistency with OS and PFS (measured from
Company evidence submission for azacitidine [ID829] 108
randomisation to event, whereas in AZA-AML-001, RFS is measured from the first
response to relapse).
Non-remission (PR or SD) – PFS curve for patients who have achieved PR or SD
PD or relapse – difference between the OS, RFS, and PFS curves
Death – complement of the OS curve.
Table 30: Features of the de novo analysis
Factor Chosen values Justification
Time horizon Lifetime horizon for an older patient with newly diagnosed AML (i.e., 10 years, as almost all patients have died by the end of year 10 in the model)
As per NICE reference case
Were health effects measured in QALYs; if not, what was used?
Yes. QALYs.
Utility values mapped from trial-based EORTC QLQ-C30 data using published algorithms (see section 5.4 below)
As per NICE reference case
Discount of 3.5% for utilities and costs
Yes. As per NICE reference case
Perspective (NHS/PSS) NHS/PSS As per NICE reference case
PSS, personal social services; QALYs, quality-adjusted life years
5.2.3 Intervention technology and comparators
The model is based directly on evidence from the AZA-AML-001 trial. As described in
section 1.3 above, investigators assigned patients to one of three CCRs before
randomization to AZA or individual CCR regimen. The main comparator for the economic
evaluation is CCR as defined in the trial. The individual components of CCR were:
IC:
o Induction therapy – Cytarabine was administered at a dose of 100–
200 mg/m2/day via continuous IV infusion for a total of 7 days. Anthracycline
was given in combination with cytarabine for 7 days.
o Consolidation - Two consolidation cycles for those who responded to the
treatment, followed by BSC. Those who do not respond to induction therapy
receive BSC.
LDAC: Cytarabine at a dose of 20 mg SC BID for 10 days, every 28 days, until
disease progression or unacceptable toxicity; patients then receive BSC.
BSC: Including but is not limited to red cell or whole blood transfusions, fresh frozen
plasma transfusions, platelet transfusions, antibiotic and/or antifungal therapy, and
nutritional support). This is continued until death.
o The same BSC is assumed to apply to all patients who have stopped active
treatment on AZA, IC or LDAC
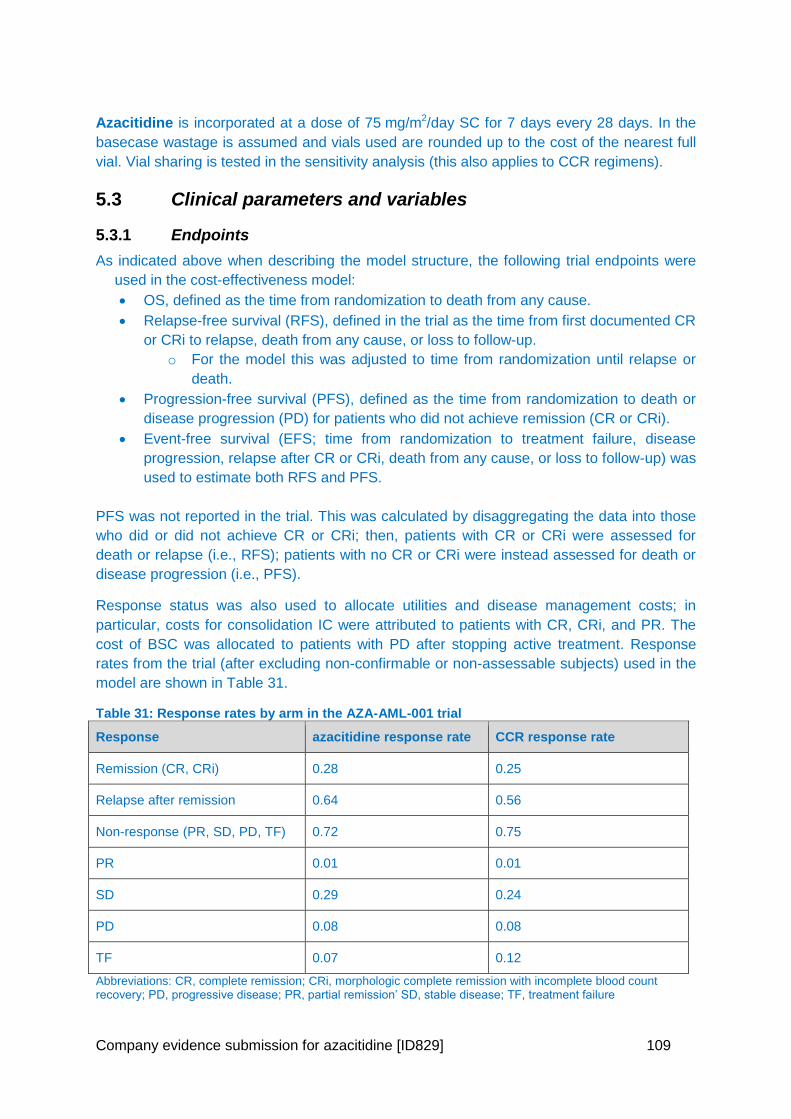
Company evidence submission for azacitidine [ID829] 109
Azacitidine is incorporated at a dose of 75 mg/m2/day SC for 7 days every 28 days. In the
basecase wastage is assumed and vials used are rounded up to the cost of the nearest full
vial. Vial sharing is tested in the sensitivity analysis (this also applies to CCR regimens).
5.3 Clinical parameters and variables
5.3.1 Endpoints
As indicated above when describing the model structure, the following trial endpoints were
used in the cost-effectiveness model:
OS, defined as the time from randomization to death from any cause.
Relapse-free survival (RFS), defined in the trial as the time from first documented CR
or CRi to relapse, death from any cause, or loss to follow-up.
o For the model this was adjusted to time from randomization until relapse or
death.
Progression-free survival (PFS), defined as the time from randomization to death or
disease progression (PD) for patients who did not achieve remission (CR or CRi).
Event-free survival (EFS; time from randomization to treatment failure, disease
progression, relapse after CR or CRi, death from any cause, or loss to follow-up) was
used to estimate both RFS and PFS.
PFS was not reported in the trial. This was calculated by disaggregating the data into those
who did or did not achieve CR or CRi; then, patients with CR or CRi were assessed for
death or relapse (i.e., RFS); patients with no CR or CRi were instead assessed for death or
disease progression (i.e., PFS).
Response status was also used to allocate utilities and disease management costs; in
particular, costs for consolidation IC were attributed to patients with CR, CRi, and PR. The
cost of BSC was allocated to patients with PD after stopping active treatment. Response
rates from the trial (after excluding non-confirmable or non-assessable subjects) used in the
model are shown in Table 31.
Table 31: Response rates by arm in the AZA-AML-001 trial
Response azacitidine response rate CCR response rate
Remission (CR, CRi) 0.28 0.25
Relapse after remission 0.64 0.56
Non-response (PR, SD, PD, TF) 0.72 0.75
PR 0.01 0.01
SD 0.29 0.24
PD 0.08 0.08
TF 0.07 0.12
Abbreviations: CR, complete remission; CRi, morphologic complete remission with incomplete blood count recovery; PD, progressive disease; PR, partial remission’ SD, stable disease; TF, treatment failure
Company evidence submission for azacitidine [ID829] 110
5.3.2 Extrapolation of data and curve fitting
A variety of methods can be used to assess the suitability of parametric survival models,
which involves fitting and testing a range of survival models and comparing internal validity
(goodness of fit to the observed trial data) and external validity (the plausibility of
extrapolated portions). We used the survival model selection process algorithm
recommended by the NICE DSU TSD14 (106) which involves the following steps:
examination of the log-cumulative hazard plot for each model
testing the proportional hazards assumptions
comparison of model fit in order to select the most appropriate model taking into account
the completeness of the survival data based on:
visual inspection
Akaike/Bayesian information criterion (AIC/BIC)
log-log plots
Cox regressions
clinical validation.
Relative efficacy is commonly used to establish differences between treatments when
proportional hazards (PH) are applicable. Details are described for the extrapolation of OS in
all patients below. The results of survival analysis for treatment group by pre-selected CCR
treatment are presented in Appendix 9 and presented as sensitivity analyses (results based
upon the individual treatment arms, should be considered however due the limitations
explained throughout this document).
The following curve fits are used in the base-case:
OS: Exponential
RFS: Weibull
PFS: Gompertz
5.3.3 Fitting of Curves
1. OS
The Kaplan-Meier (KM) OS estimates from the AZA-AML-001 trial are shown in Figure 8.
The curves start to separate after 3 months; the difference between the curves is greatest at
about 13 months and then become smaller until the two curves cross at month 25. At month
40, about 10% of patients remained alive.
Using the model selection algorithm described above, the log-log plots of –ln(-ln(S)) vs ln(t),
where S is survival (OS, RFS, and PFS, respectively) and t is time in months, are first plotted
for OS, as shown in Figure 15. The curves are relatively straight and parallel, indicating that
proportional hazards hold; moreover, a Cox regression run with an interaction between
treatment group and ln(time) showed no statistically significant effect of the interaction (p-
value of 0.133), also supporting the use of HRs.
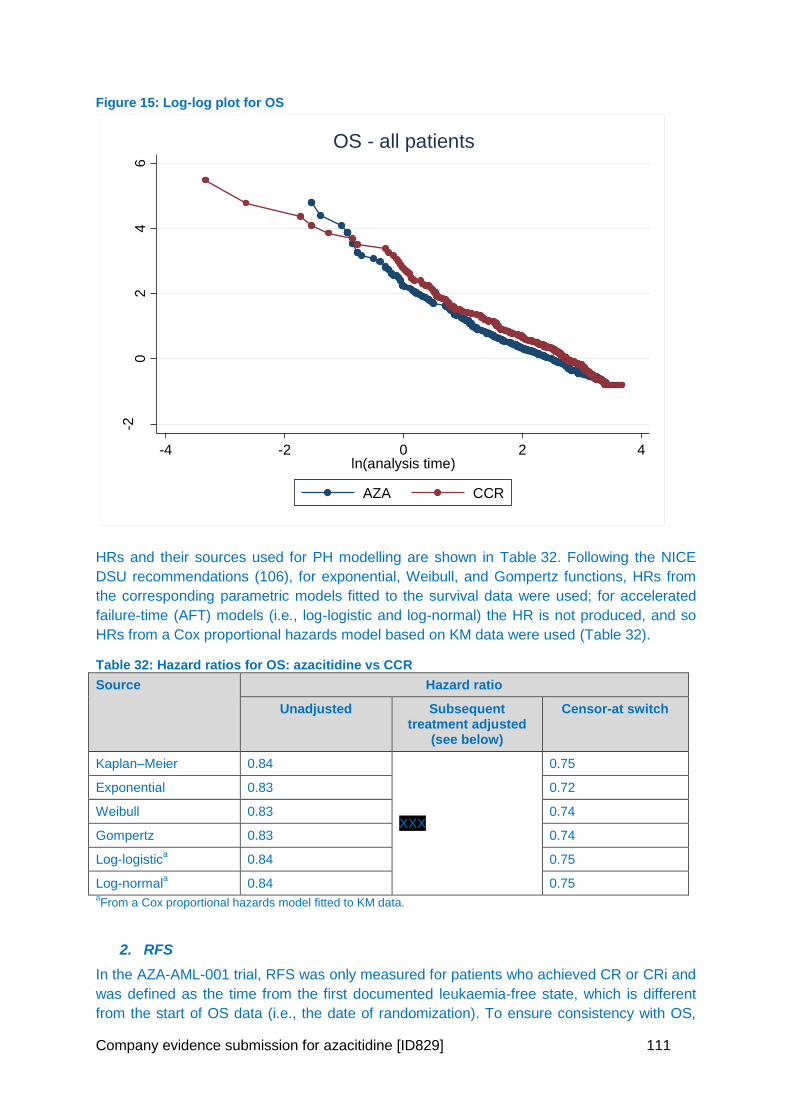
Company evidence submission for azacitidine [ID829] 111
Figure 15: Log-log plot for OS
HRs and their sources used for PH modelling are shown in Table 32. Following the NICE
DSU recommendations (106), for exponential, Weibull, and Gompertz functions, HRs from
the corresponding parametric models fitted to the survival data were used; for accelerated
failure-time (AFT) models (i.e., log-logistic and log-normal) the HR is not produced, and so
HRs from a Cox proportional hazards model based on KM data were used (Table 32).
Table 32: Hazard ratios for OS: azacitidine vs CCR
Source Hazard ratio
Unadjusted Subsequent treatment adjusted
(see below)
Censor-at switch
Kaplan–Meier 0.84
XXX
0.75
Exponential 0.83 0.72
Weibull 0.83 0.74
Gompertz 0.83 0.74
Log-logistica 0.84 0.75
Log-normala 0.84 0.75
aFrom a Cox proportional hazards model fitted to KM data.
2. RFS
In the AZA-AML-001 trial, RFS was only measured for patients who achieved CR or CRi and
was defined as the time from the first documented leukaemia-free state, which is different
from the start of OS data (i.e., the date of randomization). To ensure consistency with OS,
-20
24
6
-ln[-
ln(S
urv
ival P
roba
bili
ty)]
-4 -2 0 2 4ln(analysis time)
AZA CCR
OS - all patients
Company evidence submission for azacitidine [ID829] 112
RFS was redefined in the model as the time from randomization to relapse, death from any
cause, or loss to follow-up, whichever occurred first, censoring for subjects alive in
continuous CR/CRi. It was noted that all relapses after CR/CRi occurred before other events
amongst patients who achieved CR/CRi.Figure 16 shows the KM estimates for RFS from the
AZA-AML-001 trial; the curves cross after 20 months. Figure 17 shows the log-log plot for
RFS hazards; unlike OS and PFS, these indicate that the PH assumption is weak, and a Cox
regression run with an interaction between treatment group and ln(time) showed a
statistically significant effect of the interaction (p-value of 0.011); however, the PH
assumption overall has been retained for consistency. HRs are also used still for RFS in the
model because the shape of the RFS curves, both overall and for treatment groups and
subgroups, are not well suited for independent regression models (for illustration of this:
there is no indication visually that independent regression models would better characterise
observed RFS for extrapolation).Table 33 shows the HRs used in the model.
Figure 16: KM curves for RFS
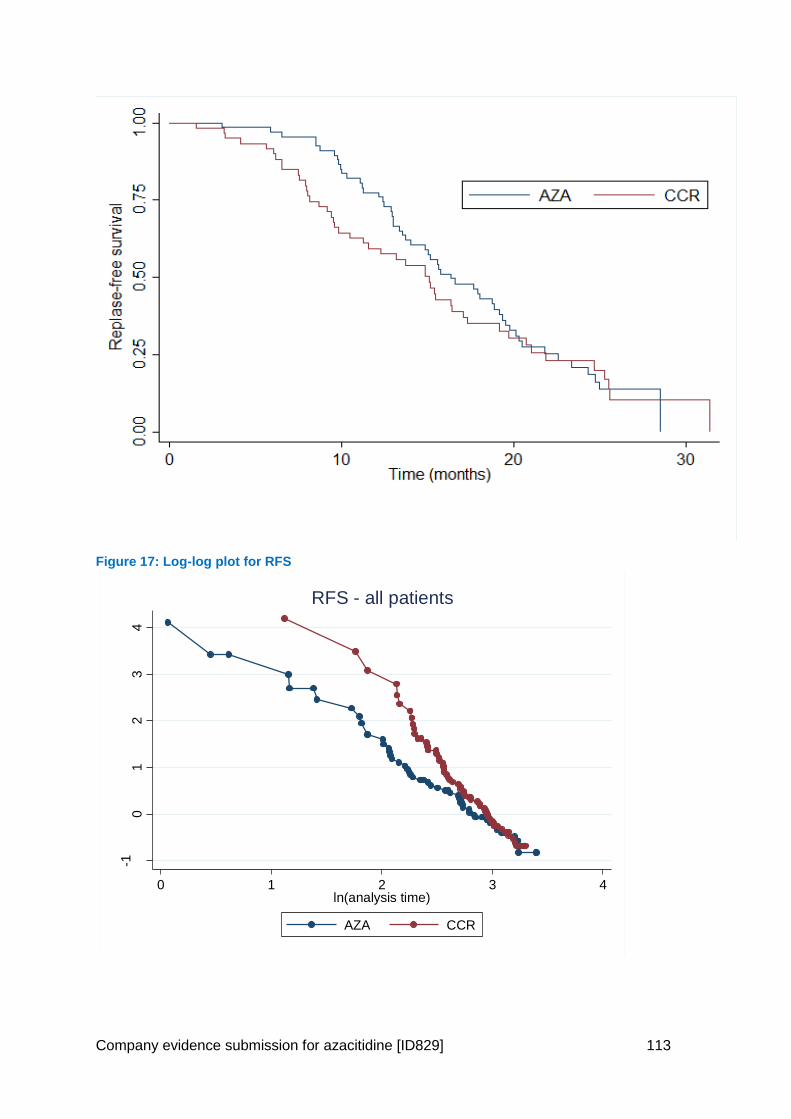
Company evidence submission for azacitidine [ID829] 113
Figure 17: Log-log plot for RFS
-10
12
34
-ln[-
ln(S
urv
ival P
roba
bili
ty)]
0 1 2 3 4ln(analysis time)
AZA CCR
RFS - all patients
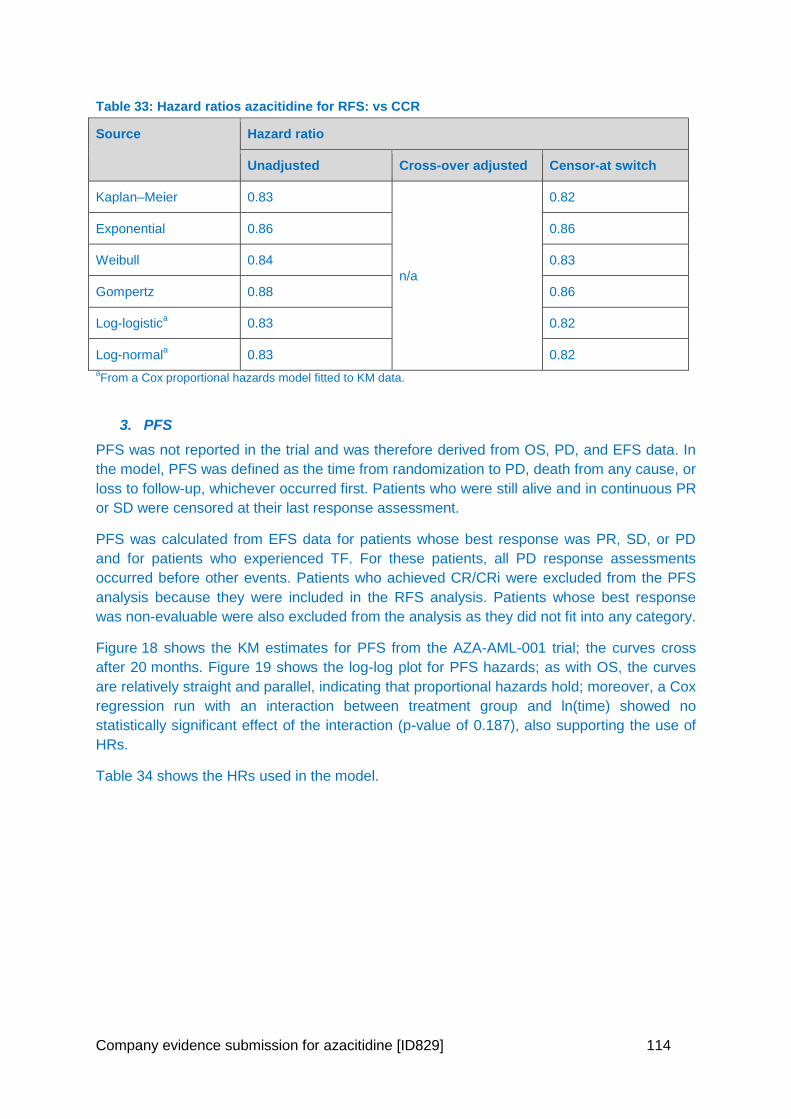
Company evidence submission for azacitidine [ID829] 114
Table 33: Hazard ratios azacitidine for RFS: vs CCR
Source Hazard ratio
Unadjusted Cross-over adjusted Censor-at switch
Kaplan–Meier 0.83
n/a
0.82
Exponential 0.86 0.86
Weibull 0.84 0.83
Gompertz 0.88 0.86
Log-logistica 0.83 0.82
Log-normala 0.83 0.82
aFrom a Cox proportional hazards model fitted to KM data.
3. PFS
PFS was not reported in the trial and was therefore derived from OS, PD, and EFS data. In
the model, PFS was defined as the time from randomization to PD, death from any cause, or
loss to follow-up, whichever occurred first. Patients who were still alive and in continuous PR
or SD were censored at their last response assessment.
PFS was calculated from EFS data for patients whose best response was PR, SD, or PD
and for patients who experienced TF. For these patients, all PD response assessments
occurred before other events. Patients who achieved CR/CRi were excluded from the PFS
analysis because they were included in the RFS analysis. Patients whose best response
was non-evaluable were also excluded from the analysis as they did not fit into any category.
Figure 18 shows the KM estimates for PFS from the AZA-AML-001 trial; the curves cross
after 20 months. Figure 19 shows the log-log plot for PFS hazards; as with OS, the curves
are relatively straight and parallel, indicating that proportional hazards hold; moreover, a Cox
regression run with an interaction between treatment group and ln(time) showed no
statistically significant effect of the interaction (p-value of 0.187), also supporting the use of
HRs.
Table 34 shows the HRs used in the model.
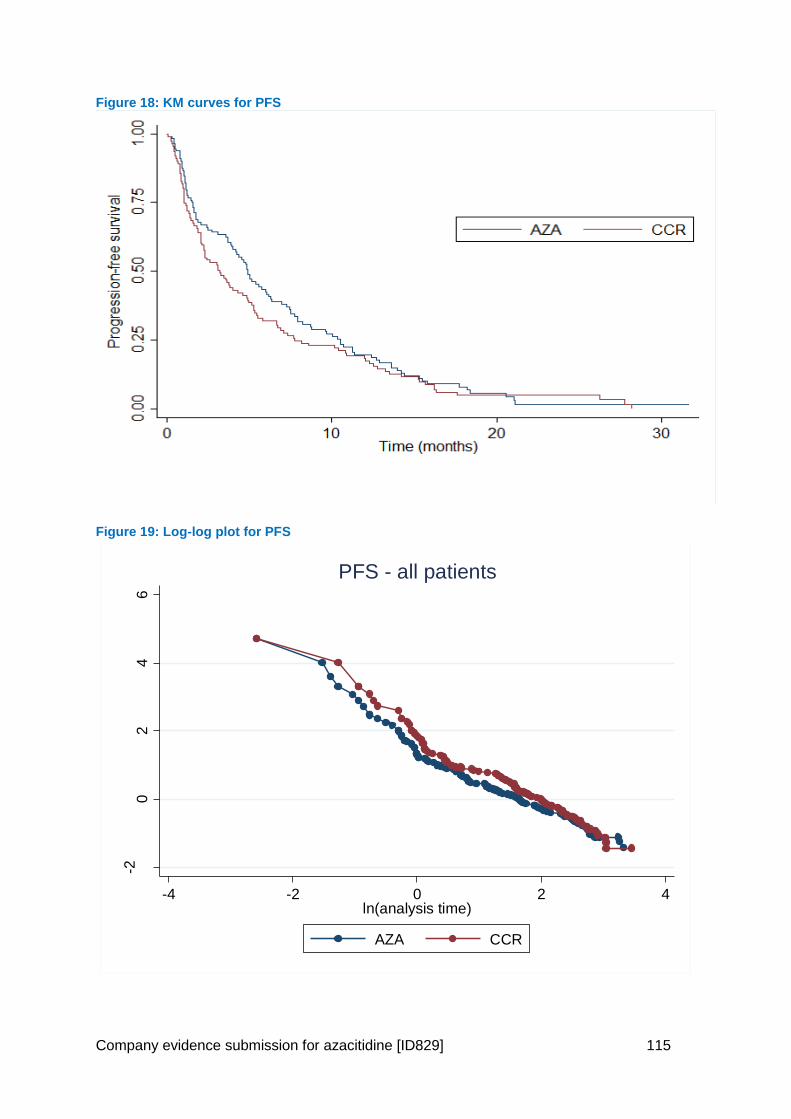
Company evidence submission for azacitidine [ID829] 115
Figure 18: KM curves for PFS
Figure 19: Log-log plot for PFS
-20
24
6
-ln[-
ln(S
urv
ival P
roba
bili
ty)]
-4 -2 0 2 4ln(analysis time)
AZA CCR
PFS - all patients
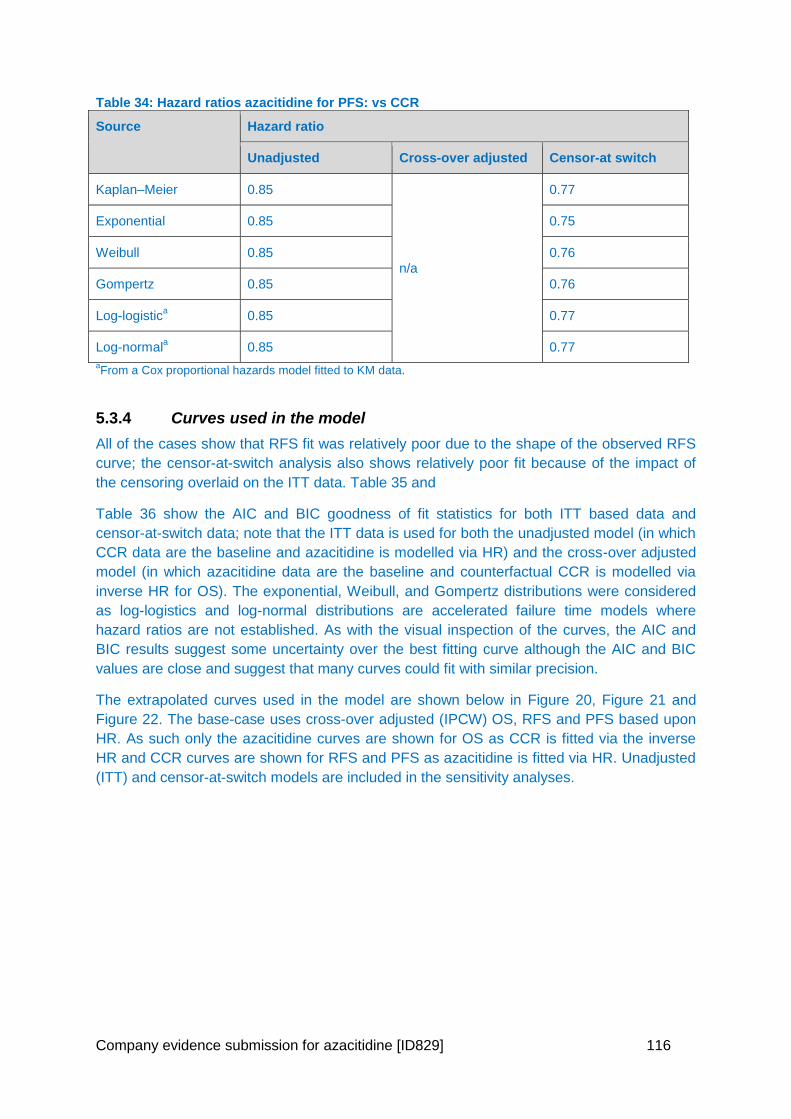
Company evidence submission for azacitidine [ID829] 116
Table 34: Hazard ratios azacitidine for PFS: vs CCR
Source Hazard ratio
Unadjusted Cross-over adjusted Censor-at switch
Kaplan–Meier 0.85
n/a
0.77
Exponential 0.85 0.75
Weibull 0.85 0.76
Gompertz 0.85 0.76
Log-logistica 0.85 0.77
Log-normala 0.85 0.77
aFrom a Cox proportional hazards model fitted to KM data.
5.3.4 Curves used in the model
All of the cases show that RFS fit was relatively poor due to the shape of the observed RFS
curve; the censor-at-switch analysis also shows relatively poor fit because of the impact of
the censoring overlaid on the ITT data. Table 35 and
Table 36 show the AIC and BIC goodness of fit statistics for both ITT based data and
censor-at-switch data; note that the ITT data is used for both the unadjusted model (in which
CCR data are the baseline and azacitidine is modelled via HR) and the cross-over adjusted
model (in which azacitidine data are the baseline and counterfactual CCR is modelled via
inverse HR for OS). The exponential, Weibull, and Gompertz distributions were considered
as log-logistics and log-normal distributions are accelerated failure time models where
hazard ratios are not established. As with the visual inspection of the curves, the AIC and
BIC results suggest some uncertainty over the best fitting curve although the AIC and BIC
values are close and suggest that many curves could fit with similar precision.
The extrapolated curves used in the model are shown below in Figure 20, Figure 21 and
Figure 22. The base-case uses cross-over adjusted (IPCW) OS, RFS and PFS based upon
HR. As such only the azacitidine curves are shown for OS as CCR is fitted via the inverse
HR and CCR curves are shown for RFS and PFS as azacitidine is fitted via HR. Unadjusted
(ITT) and censor-at-switch models are included in the sensitivity analyses.
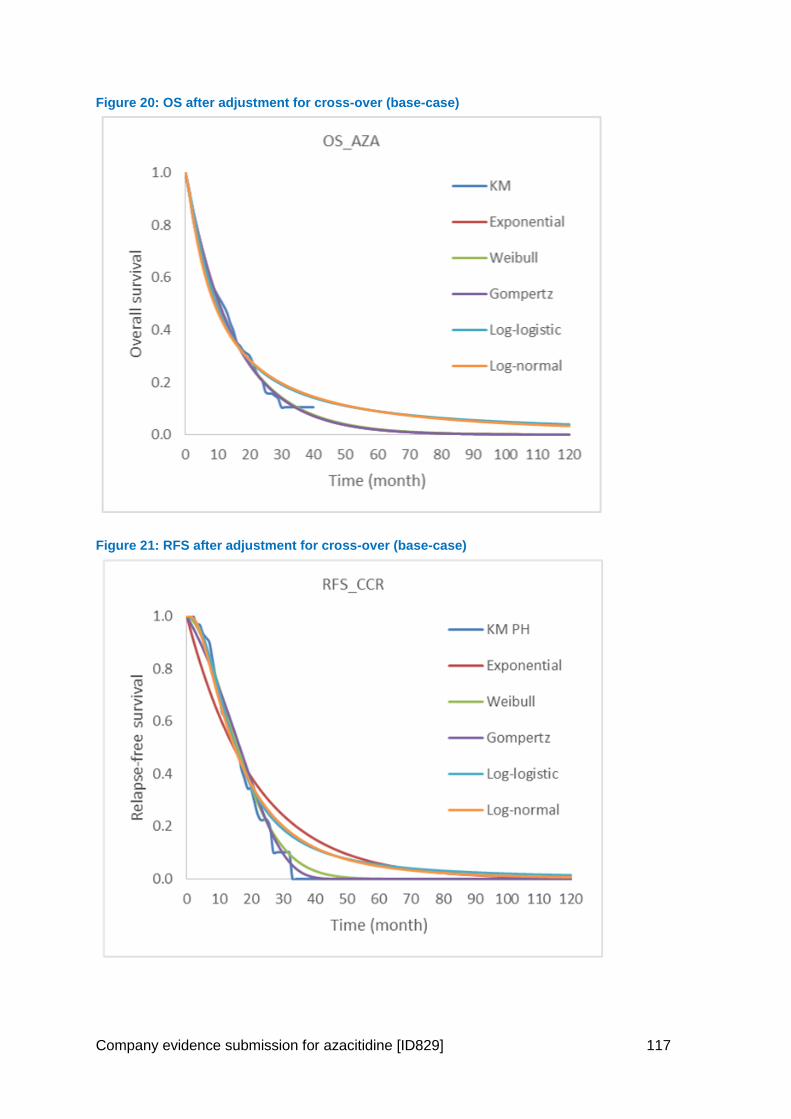
Company evidence submission for azacitidine [ID829] 117
Figure 20: OS after adjustment for cross-over (base-case)
Figure 21: RFS after adjustment for cross-over (base-case)
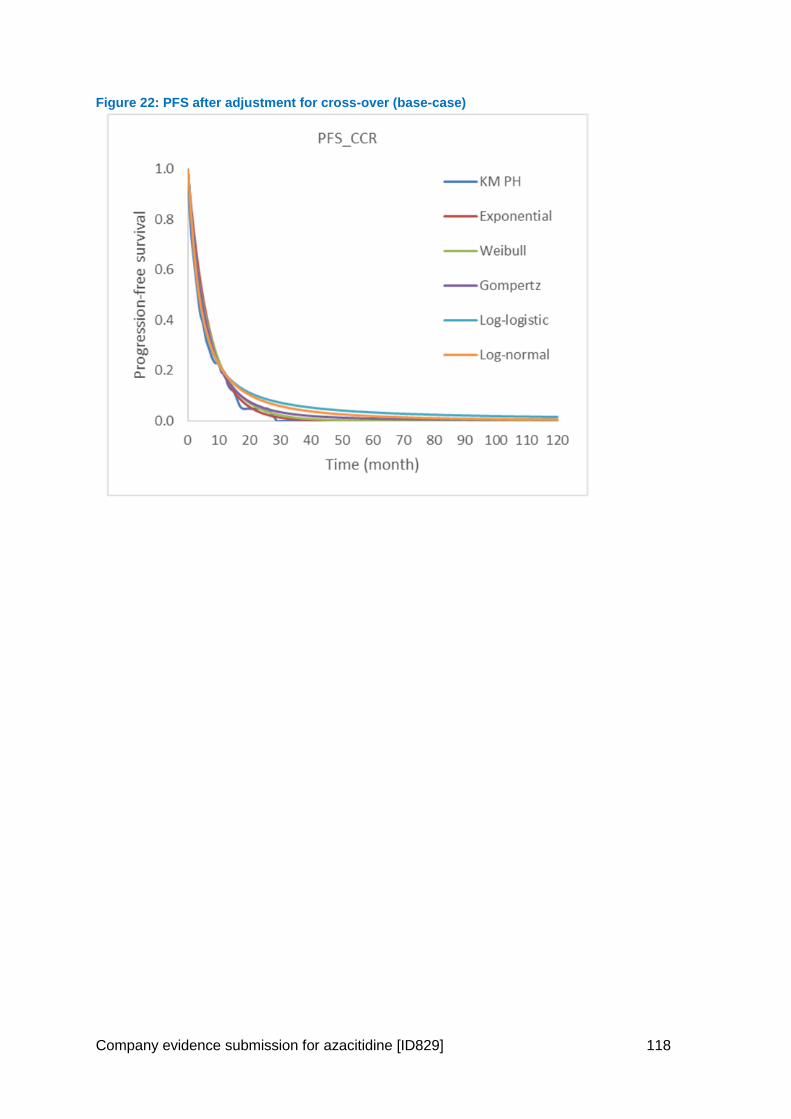
Company evidence submission for azacitidine [ID829] 118
Figure 22: PFS after adjustment for cross-over (base-case)
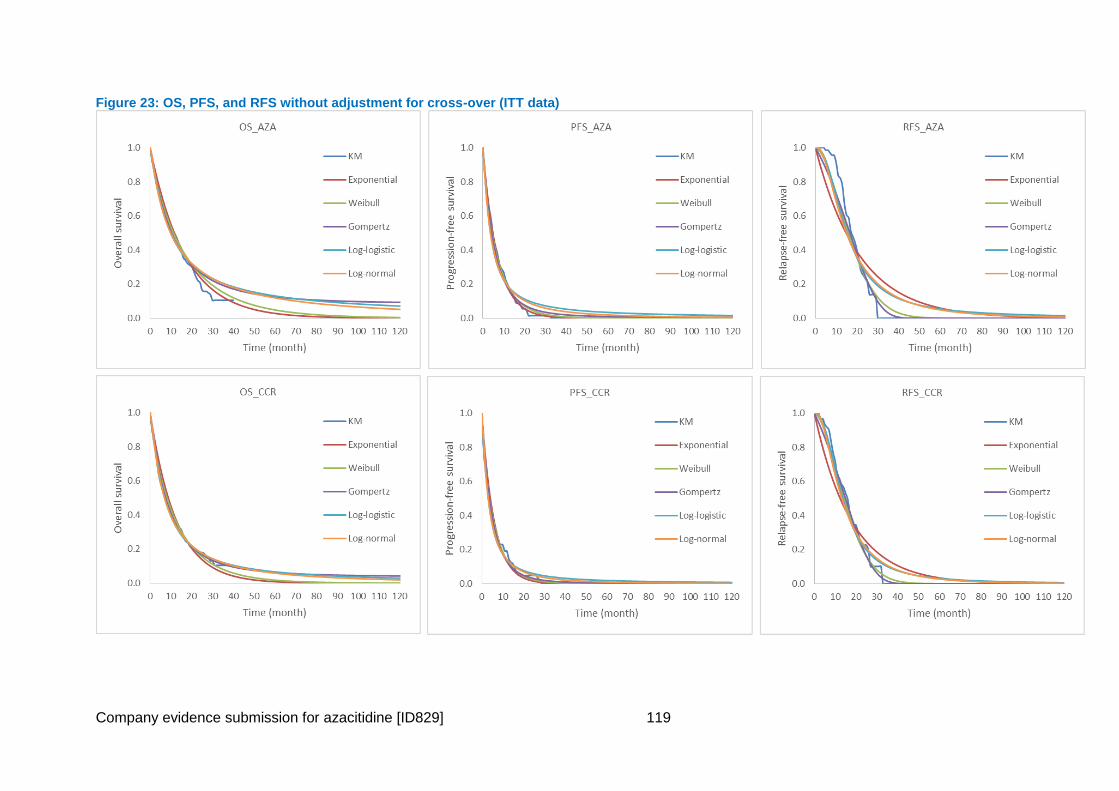
Company evidence submission for azacitidine [ID829] 119
Figure 23: OS, PFS, and RFS without adjustment for cross-over (ITT data)
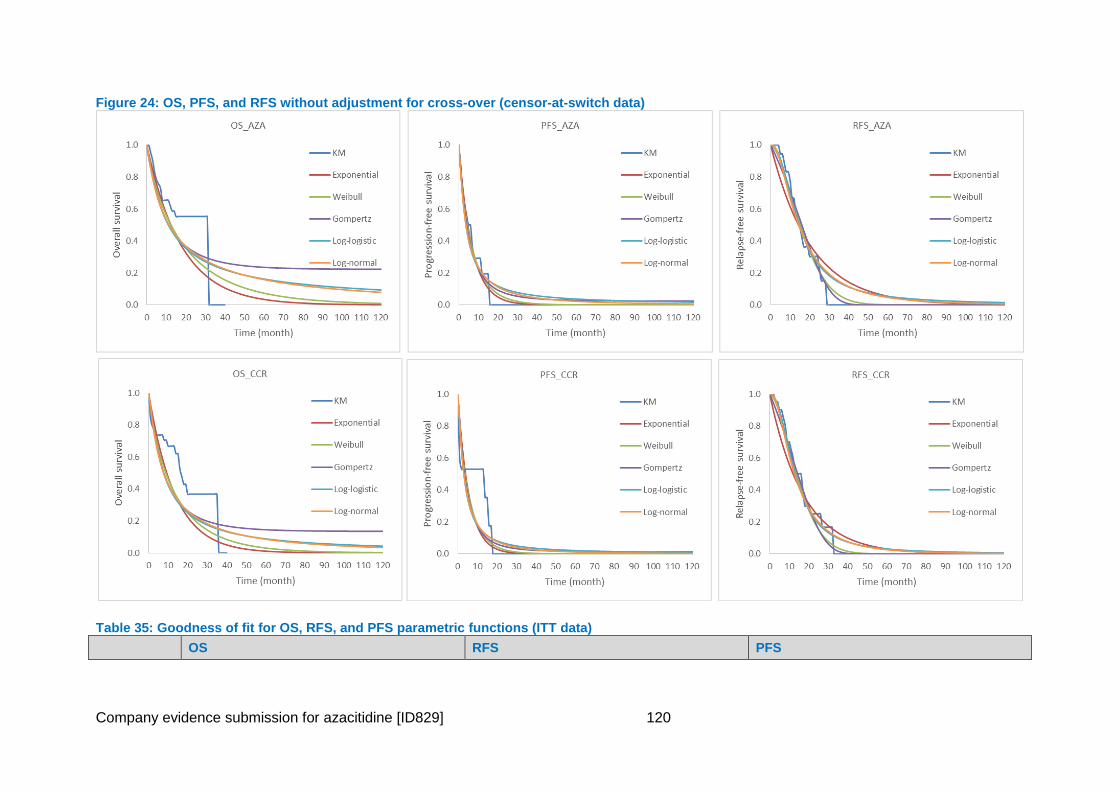
Company evidence submission for azacitidine [ID829] 120
Figure 24: OS, PFS, and RFS without adjustment for cross-over (censor-at-switch data)
Table 35: Goodness of fit for OS, RFS, and PFS parametric functions (ITT data)
OS RFS PFS
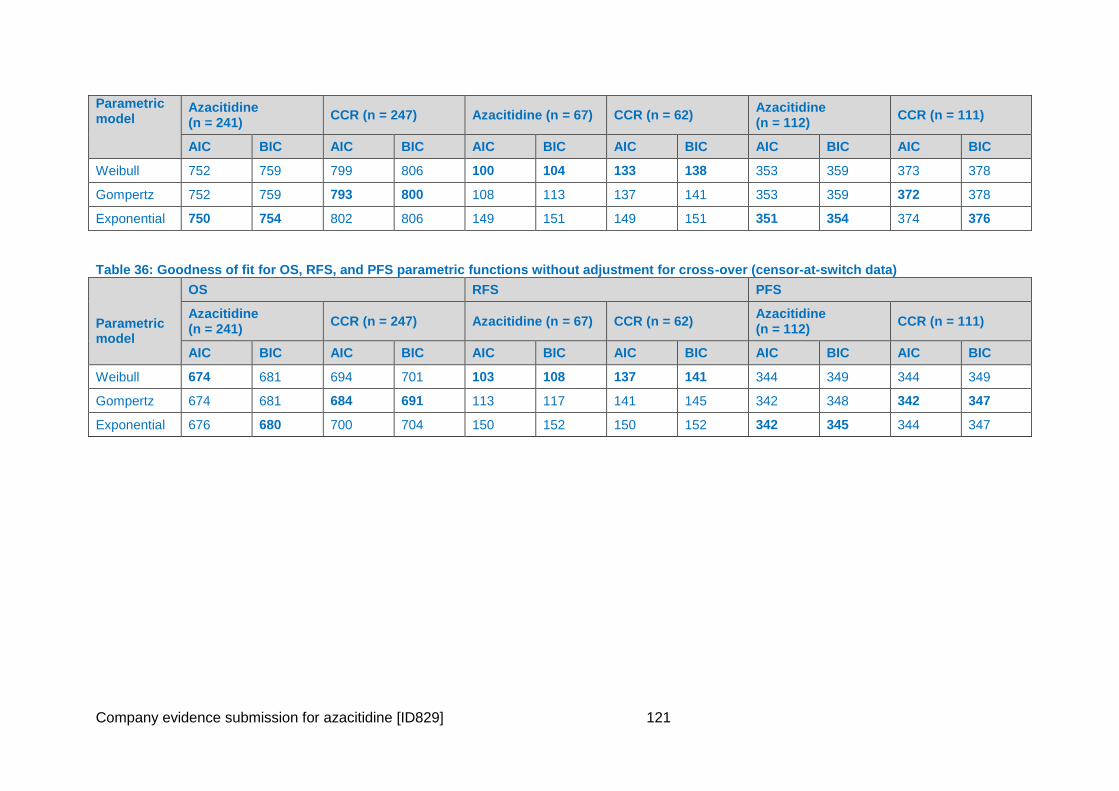
Company evidence submission for azacitidine [ID829] 121
Parametric model
Azacitidine (n = 241)
CCR (n = 247) Azacitidine (n = 67) CCR (n = 62) Azacitidine (n = 112)
CCR (n = 111)
AIC BIC AIC BIC AIC BIC AIC BIC AIC BIC AIC BIC
Weibull 752 759 799 806 100 104 133 138 353 359 373 378
Gompertz 752 759 793 800 108 113 137 141 353 359 372 378
Exponential 750 754 802 806 149 151 149 151 351 354 374 376
Table 36: Goodness of fit for OS, RFS, and PFS parametric functions without adjustment for cross-over (censor-at-switch data)
Parametric model
OS RFS PFS
Azacitidine (n = 241)
CCR (n = 247) Azacitidine (n = 67) CCR (n = 62) Azacitidine (n = 112)
CCR (n = 111)
AIC BIC AIC BIC AIC BIC AIC BIC AIC BIC AIC BIC
Weibull 674 681 694 701 103 108 137 141 344 349 344 349
Gompertz 674 681 684 691 113 117 141 145 342 348 342 347
Exponential 676 680 700 704 150 152 150 152 342 345 344 347
Company evidence submission for azacitidine [ID829] 122
5.3.5 Subsequent Treatment Adjustment
1. Selection of models
In the AZA-AML-001 trial a total of 67 of the 241 AZA patients received AML therapy after
azacitidine, and 75 patients of the 247 CCR patients received AML therapy after CCR. The
results of the pre-specified censor-at-switch analysis indicated that subsequent therapies
could be affecting the OS results. To remedy this, a number of alternative methods for
adjusting for treatment switching were explored. Following the NICE DSU TSD16 (80), the
IPCW, Rank Preserving Structural Failure Time Model (RPSFTM) and Iterative Parameter
Estimation (IPE) were estimated and tested for applicability.
The analysis was undertaken by a third party (PRMA Consulting) and involved replicating
the protocol-defined analyses conducted by Celgene (primary efficacy analysis and censor-
at-switch analysis), and additional analyses that adjust for treatment switching (IPCW,
RPSFT and IPE). SAS v.9.3 software was used for replication of the primary efficacy and
censor-at-switch analyses and for the IPCW method, but Stata v.14 was used for the
remaining analyses because the RPSFT and IPE methods are not implemented in SAS. The
SAS and STATA codes are available in Error! Reference source not found..
All analyses were based on the ITT population. Patients were assigned to cycles where the
start date of each treatment cycle was calculated based on study drug exposure records for
each patient, except those who received BSC only. The start date of the first cycle was the
earliest date that the patient received any study drug or the date of randomization for
patients receiving BSC only. The full report is available in Error! Reference source not
found..
The analyses adjusted for crossover, which accounted only for switching from CCR to
azacitidine, produced the following results:
IPCW method: adjusted XXX, unadjusted XXX median OS of XXX months for CCR.
RPSFT method: adjusted HR XXX median OS of XXX months for CCR based on
counterfactual data and XXX months based on the inverse-HR.
IPE method using an exponential distribution: adjusted HR XXX median OS of
6.49 months for CCR based on counterfactual data and XXX months based on the
inverse-HR.
The two-stage method was not used because there was insufficient time-varying data to
identify the “second baseline” that the method requires.
The IPCW was selected as the most realistic model (as presented in section 4.7.4.1).
However, this analysis does have some limitations. The IPCW method has an underlying
assumption that there are no unmeasured confounders; that is, all factors that might affect
treatment switching are observed, measured, and included. In reality this is never truly the
case. Every effort was made to include all relevant baseline and time-varying covariates so
that no important predictors of switching are missing; the covariates were also validated by a
clinical expert. However, there might be other covariates that might have an impact on
switching and were not captured. A further limitation of the IPCW approach is that it does not
produce counterfactual survival data directly; in order to use adjusted CCR data in
Company evidence submission for azacitidine [ID829] 123
subsequent survival analysis and economic modeling, counterfactual data are required. The
survivor function approach, in which the CCR hazard function is calculated using the
observed azacitidine hazard function and using the inverse of the IPCW-adjusted HR,
changed the shape of the CCR survival curve relative to the observed data. On the face of it,
this is problematic – as well as altering the shape of the CCR survival curve, the method
forces hazards to be proportional – but it must be acknowledged that the purpose of the
analyses is to produce counterfactual data, which may result in counterfactual hazard
functions (i.e., different KM curve shapes) and not just counterfactual hazards from curves
whose shapes do not change.
These limits notwithstanding, the IPCW method and results are stronger than the
alternatives. The use of RPSFT and IPE methods have an underlying assumption of a
common treatment effect for patients who started treatment with azacitidine and for those
who switched to azacitidine. This assumption does not hold in this case: differences in
prognosis between the two groups are likely to lead to a different benefit from delayed
versus immediate treatment; CCR itself, particularly LDAC and IC, is also an active
treatment, so the prognosis of a patient switching from CCR will not be the same as for a
patient receiving azacitidine from the start of the study.
The similarity of the results for the IPE and RPSFT analyses is likely because of violation of
the key assumption, that treatment benefit in terms of OS is the same regardless of whether
a patient began on azacitidine or switched; this assumption is hard to justify given the
prognosis for with AML in the trial. The assumption cannot be tested in an unbiased test (i.e.,
the basis of the test is that patients who switched to the treatment are endogenously more or
less likely to benefit, which prevents an unbiased test).
Censor-at-switch analysis is prone to selection bias, and the primary efficacy analysis (not
accounting for switching) is inappropriate. The approach taken here methodically moved
through the available methods.
Finally, subgroup adjustment was not feasible because of limited data on switching;
however, a clinical expert consulted during this analysis stated that questions can be raised
about the clinical generalizability of the results in subgroups, because clinicians can identify
potential switching candidates based on observed performance, and recommended focusing
on the adjusted data for overall patients.
Although there is uncertainty related to how the counterfactual CCR data must be
constructed for the IPCW analysis, and the requirements for an assumption of no
unmeasured confounding to hold, the assumptions underlying the IPCW method are the best
supported by the data in this instance.
2. The IPCW model - Methods
A regression model is developed to estimate the probability of remaining uncensored, where
in this case uncensored is defined as the CCR patient receiving no subsequent azacitidine
therapy. This is then used to generate and adjust HR estimates for the difference in OS
between the two treatments.
Weights relate to the probability of remaining uncensored, or having no subsequent use of
azacitidine. Study patients with a low probability of remaining uncensored but who in fact
remained uncensored have greater weight in the analyses than those who had a higher
Company evidence submission for azacitidine [ID829] 124
probability of remaining uncensored. This is because such patients are a closer proximate
match (i.e., comparing low-probability patients who are censored with low-probability
patients who remain uncensored is the closest approximate comparison, and so these
patients have more weight in the analysis). The basic assumption that needs to be met by
applying this method is that there are no unmeasured confounders (80).This means that all
relevant baseline and time-varying covariates should be correctly specified and collected,
and no important predictors of switching are missing.
Patients who switch treatments are artificially censored at the time of switching, and
observations for the remaining patients are weighted to adjust for censored patients. A
pooled logistic model is constructed to predict the probabilities of remaining uncensored-by
informative censoring (crossover) at each measurement point and must include all baseline
or post-randomization variables that predict both treatment switching and outcome. Briefly,
the procedure for estimation using IPCW is as follows (79, 111):
1. Panel data are created for the pooled logistic models. The follow-up period is
partitioned into intervals based on follow-up measurement points (visit dates). At
each measurement point, time-dependent variables that could predict treatment
discontinuation, switching, and OS are assessed for all patients.
2. The probability of remaining uncensored is calculated. A logistic regression model is
fitted to predict participation at each measurement (remaining uncensored) for each
subject. The probability of remaining uncensored using baseline risk factors of
interest (E) is estimated, as is the probability P of remaining uncensored using both
baseline risk factors of interest (E) and time-dependent covariates (Z). The results of
this modeling process are summarized to describe the factors associated with
participation at each procedure.
3. IPCWs are calculated: the inverse probability weight for remaining uncensored (1/P)
will consist of the probability for remaining uncensored estimated in step 2, using
both covariates E and Z. This inverse probability is stabilized by multiplying it by the
probability for remaining uncensored using covariates.
4. A standard Cox regression (i.e., in accordance with estimation with no crossover) is
fitted for the current outcome using 1/P as weights. The set of covariates E and any
other appropriate adjustment covariates for that outcome may also be included in a
parametric regression approach. The weighted Cox regression is fitted using
stabilized weights (S/P). Standard errors are corrected using sandwich estimation or
bootstrapping methods.
5. An unweighted version of the Cox regression is fitted for comparison. The same
models are fitted as in step 3 but without any sampling weights.
Preliminary reviews of the data suggested that subsequent use of azacitidine often closely
followed relapse or progression. The model constructed had relatively short time periods
(15 days) in order to capture this association. This model was constructed using the status of
patients at 15 day time points. The last time period for each study subject usually contained
less than 15 days.
The “numerator” model in the pooled logistic model consisted of baseline factors and the
“denominator” model consisted of baseline factors and time-varying covariates. This method
Company evidence submission for azacitidine [ID829] 125
provides an estimate of the adjusted HR of survival for the CCR arm in relation to the
azacitidine arm but does not generate an estimate of the survival distribution (i.e., does not
produce a KM curve). However, a crude estimate of the survival distribution can be obtained
by applying the estimated HR to the azacitidine KM curve; this will result in an estimated
CCR survival curve with a similar profile (shape) to the azacitidine curve. Similarly, the
converse of the HR can be used as an estimate of the median of the adjusted survival
distribution for CCR – the actual estimated values are indicative only and will reflect the
estimated distribution based on the distribution of the azacitidine KM curve (112).
Baseline characteristics and time-varying variables were captured during the trial and were
used in step 2 of the IPCW method in order to estimate the probabilities of remaining
uncensored or having no subsequent use of azacitidine. These variables were assessed by
a clinician to establish which factors would be considered relevant and appropriate for use in
the crossover analysis models, and whether any of the laboratory variables collected at each
visit were relevant for analysis of survival data, either as factors that influence the change in
treatment or as factors that could affect the estimate of survival.
Statistical tests were then conducted to assess whether there were any statistically
significant differences between CCR patients who switch and CCR patients who do not
switch for the list of potential covariates to be included in the model. Means and standard
deviations were calculated for numerical variables and counts and percentages for
categorical variables for all patients, but also separately for patients who were censored or
died. P values were determined using chi-square test for categorical variables and Student’s
t-test for numerical variables.
The covariates included initially in the model, are presented in Table 37. These were
summarized by basic summary statistics (number and percentages for categorical variables
and means and standard deviations for numerical variables).
Table 37: Covariates used in the IPCW method
Type of variable Variable
Non time-varying covariates
Demographic characteristics Age at informed consent (continuous)
Age (<75 years, ≥75 years)
Sex (male or female)
Geographic region (North America/Australia, Western Europe/Israel, Eastern Europe, or Asia)
Race (Asian, Black or African American, White, Native Hawaiian or other Pacific islander, other, n/a)
Clinical characteristics ECOG performance status at randomization (0–1, 2)
AML classification (newly diagnosed, histologically confirmed de novo AML; AML secondary to prior myelodysplastic disease not treated with azacitidine, decitabine, or cytarabine; AML secondary to exposure to potentially leukemogenic therapies or agents with the primary malignancy in remission for at least 2 years)
Time since initial AML diagnosis to randomization (< median; ≥ median) (derived from time since initial diagnosis and date of signed informed
Company evidence submission for azacitidine [ID829] 126
Type of variable Variable
consent)
Baseline comorbidity score
Prior history of myelodysplastic syndromes (yes or no)
Cytogenetic risk status (intermediate risk, poor risk)
Study design Pre-randomization CCR assignment (BSC, low-dose cytarabine, intensive chemotherapy)
International working group response assessment
Laboratory variables Percentage bone marrow blasts (continuous) according to central review
Time-varying covariates
Laboratory variables WBC count
Hemoglobin
Platelet count
ANC
RBC transfusion status (independent or dependent)
Platelet transfusion status (independent or dependent)
Adverse events Occurrence of a grade 3/4 adverse event since last visit (yes/no)
Other Time since last visit (in months; included at each visit)
Abbreviations: ANC, absolute neutrophil count; ECOG, Eastern Cooperative Oncology Group; RBC, red blood cell; WBC, white blood cell
3. The IPCW model - Results
A Cox regression was approximated by using a pooled logistic model that included weighting
by the stabilized weights and adjustment for the repeated study subject observations. An
unadjusted HR of XXX was estimated for the model with 15 day time periods. As shown in
Table 38, after adjustment for baseline factors, the HR was reduced to XXX (further details
are provided in Error! Reference source not found..
Table 38: Results of the IPCW models
Model HR (95% CI) P valuea
Unadjusted XXX XXX
Adjusted XXX XXX aP value calculated using a log-rank test
However, the IPCW method provides a KM curve associated with the counterfactual data,
without itself being counterfactual data. There are various methods for producing
counterfactual data. The method used here is the “survivor function” approach presented by
Latimer and colleagues (113), and involves producing a counterfactual KM curve by
multiplying the azacitidine hazard function (which does not require adjustment and is
presumed to be unbiased by treatment switching) by the inverse of the IPCW-adjusted HR.
Using the IPCW adjusted HR of XXX, this produces the observed azacitidine and
counterfactual CCR data shown in Figure 25 and Table 39. Note that, because the
construction of the counterfactual data alters the shape of the CCR curve to Figure 25.
Company evidence submission for azacitidine [ID829] 127
Table 39 shows that this results in an increase in the median OS, but a decrease in the
mean OS.
Figure 25: Kaplan–Meier plot of observed azacitidine and IPCW HR-adjusted CCR data
XXX
Table 39: Comparison of survival for CCR between primary efficacy and IPCW HR-adjusted analyses
Analysis Median OS (95% CI) Restricted mean OSa (95% CI)
Primary efficacy 6.49 (4.93, 8.54) 11.14 (9.26, 13.16)
IPCW XXX XXX
aRestricted mean is the mean survival within the follow-up period (24.4 months)
In the model, the cross-over adjusted hazard ratio of XXX was applied to the CCR data
using the inverse. That is, trial-based, extrapolated azacitidine data is used as the reference
and counterfactual CCR data is generated using inverse HRs. The implementation was
conducted for all five parametric functions used to extrapolate azacitidine survival.
5.4 Measurement and valuation of health effects
5.4.1 Health-related quality-of-life data from clinical trials
5.4.1.1 Mapping
PubMed and the latest HERC database were searched to identify algorithms to map from
the EORTC QLQ-C30 to EQ-5D. The HERC database lists published studies of mapping
algorithms that estimate EQ-5D Health State Utility Values (HSUVs) from other HRQL
measures and reports the algorithm in sufficient detail to allow other researchers to estimate
utilities from other data. Ten studies that mapped between the EORTC QLQ-C30 and EQ-5D
in various cancers were identified, but none in AML or haematology.
Many of the reported mapping algorithms are not applicable to other samples: the mapping
function is not always provided fully for other researchers to use, the samples may have
been too small, or the methodology may have produced unreliable predictions.
The mapping algorithm reported by McKenzie and Van der Pol, 2009 (114) and
Proskorovsky et al., 2014 (115) were selected, based on their previous use in HTA, the large
sample of older cancer patients in the UK, the good performance of the model, and its
external validation by Longworth et al., 2014 (116). The more recent algorithms by
Proskorovsky et al., 2014 were used to derive HSUVs for the base case; HSUVs based on
the algorithm by McKenzie and van der Pol, 2009 were used in scenario analysis. The
mapping algorithms are presented in Table 40.
Table 40: Mapping algorithms from EORTC QLQ-C30 to EQ-5D
EORTC QLQ-C30 McKenzie and Van der Pol, 2009
Proskorovsky et al., 2014
Full model Trimmed model
Constant 0.2376 0.1554 0.23004
Company evidence submission for azacitidine [ID829] 128
EORTC QLQ-C30 McKenzie and Van der Pol, 2009
Proskorovsky et al., 2014
Full model Trimmed model
Global health status 0.0016* 0.00198* 0.00191
Physical functioning 0.0004 0.00463* 0.00478
Role functioning 0.0022* 0.00058079 NS
Emotional functioning 0.0028* 0.00141* 0.00136
Cognitive functioning 0.0009* −0.00048664 NS
Social functioning 0.0002 0.00059878 NS
Fatigue −0.0021* 0.00016137 NS
Nausea/vomiting −0.0005 0.00041262 NS
Pain −0.0024* −0.00249* −0.00249
Dyspnoea 0.0004 0.00060165 NS
Insomnia 0.00004 0.00082466 NS
Appetite loss 0.0003 −0.00037029 NS
Constipation 0.0001 −0.00050445 NS
Diarrhoea −0.0003 - -
Financial problems −0.0006 0.00079559 NS
Adjusted R2 0.611 0.6956 0.6941
RMSE indices - 0.165 0.165
No of patients (country) 199 (UK) 154 (UK and Germany)
Disease Inoperable oesophageal cancer
Multiple myeloma
Validation External validation with breast cancer
No external validation
RMSE, root mean square error; NS, not significant
Mapping was based on subgroups of patients with EORTC QLQ-C30 values.
Utility for remission with CR or CRi was mapped patients who achieved CR or CRi.
Utility for non-remission with PR or SD was mapped from patients who achieved PR or
SD.
Utility for PD was mapped from the final observed data before progression as a proxy for
progression.
Utility for post-relapse after remission is assumed to be the same as for PD.
The resulting mapped HSUVs are presented in Table 41 below.
5.4.2 Health-related quality-of-life studies
As explained above, targeted searches were run and identified two studies which have been
used to inform the HSUVs used in the model. More details on the McKenzie and Van der
Pol, 2009 and Proskorovsky et al., 2014 studies are presented above.
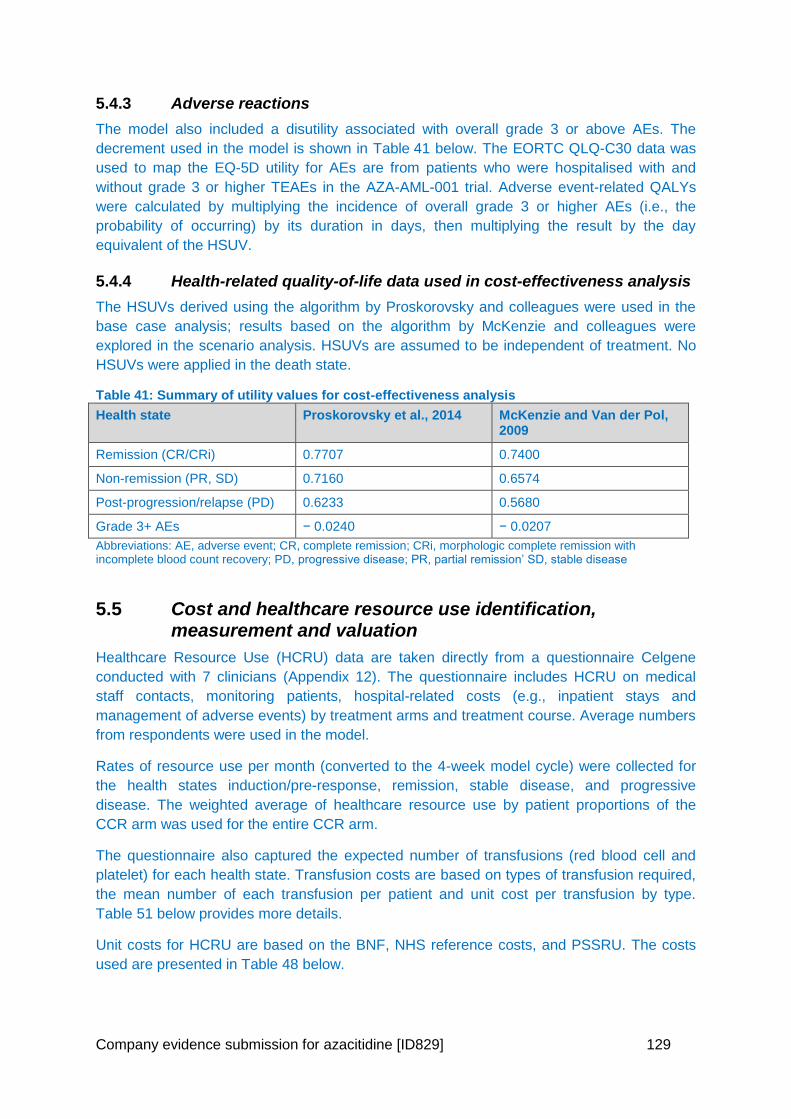
Company evidence submission for azacitidine [ID829] 129
5.4.3 Adverse reactions
The model also included a disutility associated with overall grade 3 or above AEs. The
decrement used in the model is shown in Table 41 below. The EORTC QLQ-C30 data was
used to map the EQ-5D utility for AEs are from patients who were hospitalised with and
without grade 3 or higher TEAEs in the AZA-AML-001 trial. Adverse event-related QALYs
were calculated by multiplying the incidence of overall grade 3 or higher AEs (i.e., the
probability of occurring) by its duration in days, then multiplying the result by the day
equivalent of the HSUV.
5.4.4 Health-related quality-of-life data used in cost-effectiveness analysis
The HSUVs derived using the algorithm by Proskorovsky and colleagues were used in the
base case analysis; results based on the algorithm by McKenzie and colleagues were
explored in the scenario analysis. HSUVs are assumed to be independent of treatment. No
HSUVs were applied in the death state.
Table 41: Summary of utility values for cost-effectiveness analysis
Health state Proskorovsky et al., 2014 McKenzie and Van der Pol, 2009
Remission (CR/CRi) 0.7707 0.7400
Non-remission (PR, SD) 0.7160 0.6574
Post-progression/relapse (PD) 0.6233 0.5680
Grade 3+ AEs − 0.0240 − 0.0207
Abbreviations: AE, adverse event; CR, complete remission; CRi, morphologic complete remission with incomplete blood count recovery; PD, progressive disease; PR, partial remission’ SD, stable disease
5.5 Cost and healthcare resource use identification, measurement and valuation
Healthcare Resource Use (HCRU) data are taken directly from a questionnaire Celgene
conducted with 7 clinicians (Appendix 12). The questionnaire includes HCRU on medical
staff contacts, monitoring patients, hospital-related costs (e.g., inpatient stays and
management of adverse events) by treatment arms and treatment course. Average numbers
from respondents were used in the model.
Rates of resource use per month (converted to the 4-week model cycle) were collected for
the health states induction/pre-response, remission, stable disease, and progressive
disease. The weighted average of healthcare resource use by patient proportions of the
CCR arm was used for the entire CCR arm.
The questionnaire also captured the expected number of transfusions (red blood cell and
platelet) for each health state. Transfusion costs are based on types of transfusion required,
the mean number of each transfusion per patient and unit cost per transfusion by type.
Table 51 below provides more details.
Unit costs for HCRU are based on the BNF, NHS reference costs, and PSSRU. The costs
used are presented in Table 48 below.
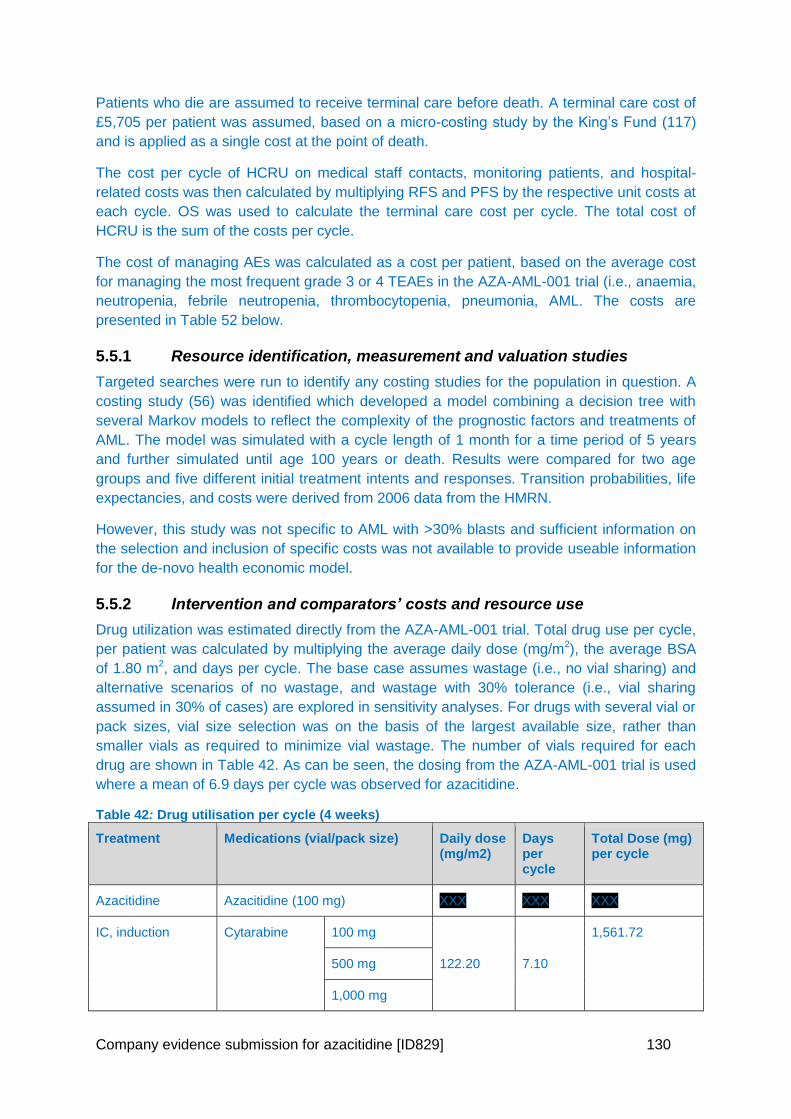
Company evidence submission for azacitidine [ID829] 130
Patients who die are assumed to receive terminal care before death. A terminal care cost of
£5,705 per patient was assumed, based on a micro-costing study by the King’s Fund (117)
and is applied as a single cost at the point of death.
The cost per cycle of HCRU on medical staff contacts, monitoring patients, and hospital-
related costs was then calculated by multiplying RFS and PFS by the respective unit costs at
each cycle. OS was used to calculate the terminal care cost per cycle. The total cost of
HCRU is the sum of the costs per cycle.
The cost of managing AEs was calculated as a cost per patient, based on the average cost
for managing the most frequent grade 3 or 4 TEAEs in the AZA-AML-001 trial (i.e., anaemia,
neutropenia, febrile neutropenia, thrombocytopenia, pneumonia, AML. The costs are
presented in Table 52 below.
5.5.1 Resource identification, measurement and valuation studies
Targeted searches were run to identify any costing studies for the population in question. A
costing study (56) was identified which developed a model combining a decision tree with
several Markov models to reflect the complexity of the prognostic factors and treatments of
AML. The model was simulated with a cycle length of 1 month for a time period of 5 years
and further simulated until age 100 years or death. Results were compared for two age
groups and five different initial treatment intents and responses. Transition probabilities, life
expectancies, and costs were derived from 2006 data from the HMRN.
However, this study was not specific to AML with >30% blasts and sufficient information on
the selection and inclusion of specific costs was not available to provide useable information
for the de-novo health economic model.
5.5.2 Intervention and comparators’ costs and resource use
Drug utilization was estimated directly from the AZA-AML-001 trial. Total drug use per cycle,
per patient was calculated by multiplying the average daily dose (mg/m2), the average BSA
of 1.80 m2, and days per cycle. The base case assumes wastage (i.e., no vial sharing) and
alternative scenarios of no wastage, and wastage with 30% tolerance (i.e., vial sharing
assumed in 30% of cases) are explored in sensitivity analyses. For drugs with several vial or
pack sizes, vial size selection was on the basis of the largest available size, rather than
smaller vials as required to minimize vial wastage. The number of vials required for each
drug are shown in Table 42. As can be seen, the dosing from the AZA-AML-001 trial is used
where a mean of 6.9 days per cycle was observed for azacitidine.
Table 42: Drug utilisation per cycle (4 weeks)
Treatment Medications (vial/pack size)
Daily dose (mg/m2)
Days per cycle
Total Dose (mg) per cycle
Azacitidine Azacitidine (100 mg) XXX XXX XXX
IC, induction Cytarabine 100 mg
122.20 7.10
1,561.72
500 mg
1,000 mg
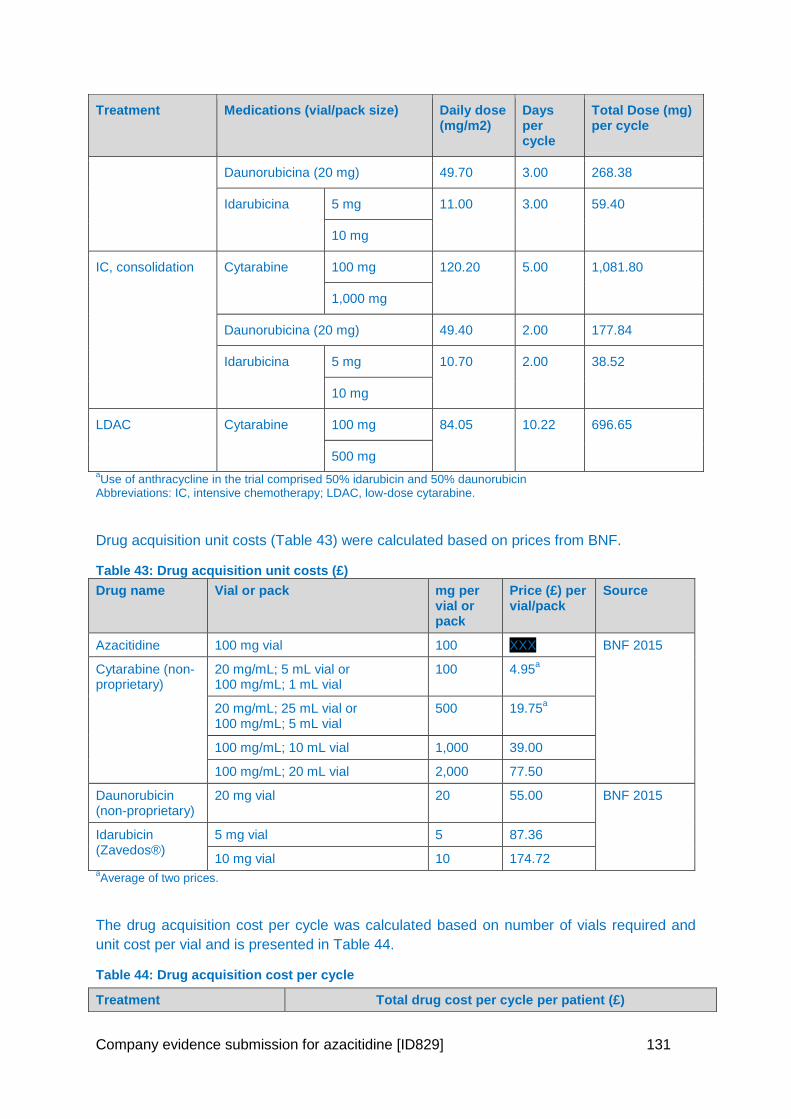
Company evidence submission for azacitidine [ID829] 131
Treatment Medications (vial/pack size)
Daily dose (mg/m2)
Days per cycle
Total Dose (mg) per cycle
Daunorubicina (20 mg) 49.70 3.00 268.38
Idarubicina 5 mg 11.00 3.00 59.40
10 mg
IC, consolidation Cytarabine 100 mg 120.20 5.00 1,081.80
1,000 mg
Daunorubicina (20 mg) 49.40 2.00 177.84
Idarubicina 5 mg 10.70 2.00 38.52
10 mg
LDAC Cytarabine 100 mg 84.05 10.22 696.65
500 mg
aUse of anthracycline in the trial comprised 50% idarubicin and 50% daunorubicin
Abbreviations: IC, intensive chemotherapy; LDAC, low-dose cytarabine.
Drug acquisition unit costs (Table 43) were calculated based on prices from BNF.
Table 43: Drug acquisition unit costs (£)
Drug name Vial or pack mg per vial or pack
Price (£) per vial/pack
Source
Azacitidine 100 mg vial 100 XXX BNF 2015
Cytarabine (non-proprietary)
20 mg/mL; 5 mL vial or 100 mg/mL; 1 mL vial
100 4.95a
20 mg/mL; 25 mL vial or 100 mg/mL; 5 mL vial
500 19.75a
100 mg/mL; 10 mL vial 1,000 39.00
100 mg/mL; 20 mL vial 2,000 77.50
Daunorubicin (non-proprietary)
20 mg vial 20 55.00 BNF 2015
Idarubicin (Zavedos®)
5 mg vial 5 87.36
10 mg vial 10 174.72 aAverage of two prices.
The drug acquisition cost per cycle was calculated based on number of vials required and
unit cost per vial and is presented in Table 44.
Table 44: Drug acquisition cost per cycle
Treatment Total drug cost per cycle per patient (£)
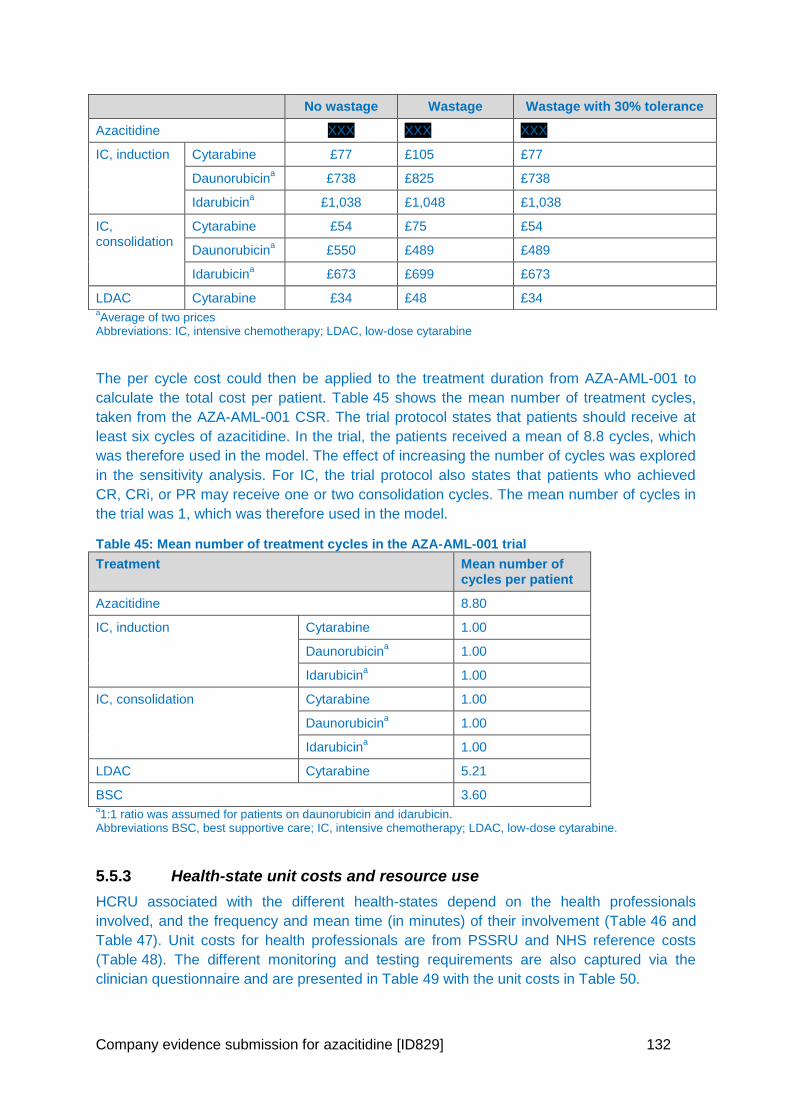
Company evidence submission for azacitidine [ID829] 132
aAverage of two prices
Abbreviations: IC, intensive chemotherapy; LDAC, low-dose cytarabine
The per cycle cost could then be applied to the treatment duration from AZA-AML-001 to
calculate the total cost per patient. Table 45 shows the mean number of treatment cycles,
taken from the AZA-AML-001 CSR. The trial protocol states that patients should receive at
least six cycles of azacitidine. In the trial, the patients received a mean of 8.8 cycles, which
was therefore used in the model. The effect of increasing the number of cycles was explored
in the sensitivity analysis. For IC, the trial protocol also states that patients who achieved
CR, CRi, or PR may receive one or two consolidation cycles. The mean number of cycles in
the trial was 1, which was therefore used in the model.
Table 45: Mean number of treatment cycles in the AZA-AML-001 trial
Treatment Mean number of cycles per patient
Azacitidine 8.80
IC, induction Cytarabine 1.00
Daunorubicina 1.00
Idarubicina 1.00
IC, consolidation Cytarabine 1.00
Daunorubicina 1.00
Idarubicina 1.00
LDAC Cytarabine 5.21
BSC 3.60 a1:1 ratio was assumed for patients on daunorubicin and idarubicin.
Abbreviations BSC, best supportive care; IC, intensive chemotherapy; LDAC, low-dose cytarabine.
5.5.3 Health-state unit costs and resource use
HCRU associated with the different health-states depend on the health professionals
involved, and the frequency and mean time (in minutes) of their involvement (Table 46 and
Table 47). Unit costs for health professionals are from PSSRU and NHS reference costs
(Table 48). The different monitoring and testing requirements are also captured via the
clinician questionnaire and are presented in Table 49 with the unit costs in Table 50.
No wastage Wastage Wastage with 30% tolerance
Azacitidine XXX XXX XXX
IC, induction Cytarabine £77 £105 £77
Daunorubicina £738 £825 £738
Idarubicina £1,038 £1,048 £1,038
IC, consolidation
Cytarabine £54 £75 £54
Daunorubicina £550 £489 £489
Idarubicina £673 £699 £673
LDAC Cytarabine £34 £48 £34
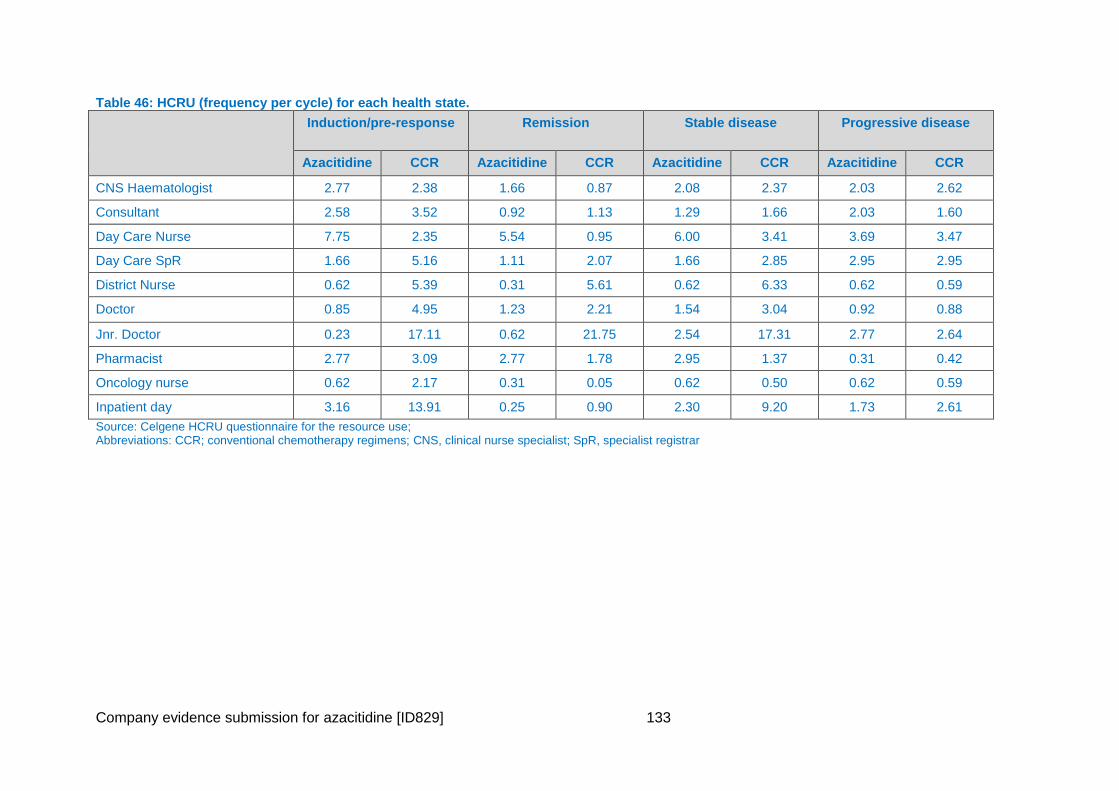
Company evidence submission for azacitidine [ID829] 133
Table 46: HCRU (frequency per cycle) for each health state.
Induction/pre-response Remission Stable disease Progressive disease
Azacitidine CCR Azacitidine CCR Azacitidine CCR Azacitidine CCR
CNS Haematologist 2.77 2.38 1.66 0.87 2.08 2.37 2.03 2.62
Consultant 2.58 3.52 0.92 1.13 1.29 1.66 2.03 1.60
Day Care Nurse 7.75 2.35 5.54 0.95 6.00 3.41 3.69 3.47
Day Care SpR 1.66 5.16 1.11 2.07 1.66 2.85 2.95 2.95
District Nurse 0.62 5.39 0.31 5.61 0.62 6.33 0.62 0.59
Doctor 0.85 4.95 1.23 2.21 1.54 3.04 0.92 0.88
Jnr. Doctor 0.23 17.11 0.62 21.75 2.54 17.31 2.77 2.64
Pharmacist 2.77 3.09 2.77 1.78 2.95 1.37 0.31 0.42
Oncology nurse 0.62 2.17 0.31 0.05 0.62 0.50 0.62 0.59
Inpatient day 3.16 13.91 0.25 0.90 2.30 9.20 1.73 2.61
Source: Celgene HCRU questionnaire for the resource use; Abbreviations: CCR; conventional chemotherapy regimens; CNS, clinical nurse specialist; SpR, specialist registrar
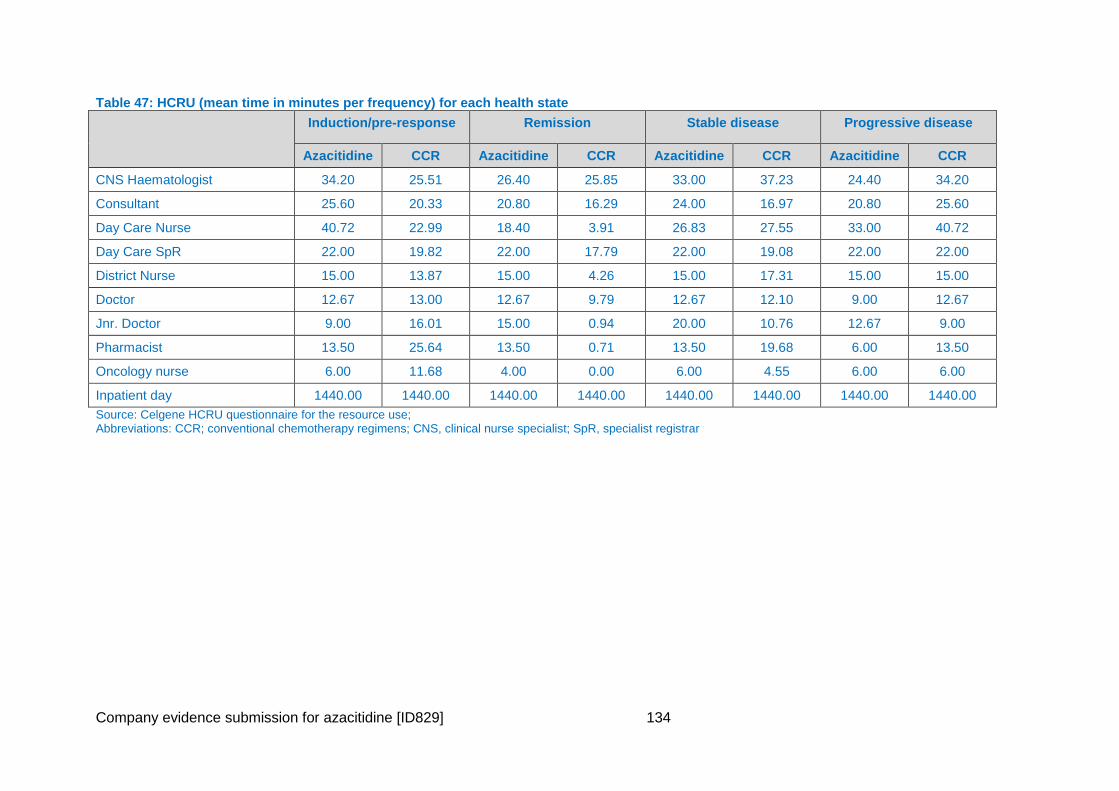
Company evidence submission for azacitidine [ID829] 134
Table 47: HCRU (mean time in minutes per frequency) for each health state
Induction/pre-response Remission Stable disease Progressive disease
Azacitidine CCR Azacitidine CCR Azacitidine CCR Azacitidine CCR
CNS Haematologist 34.20 25.51 26.40 25.85 33.00 37.23 24.40 34.20
Consultant 25.60 20.33 20.80 16.29 24.00 16.97 20.80 25.60
Day Care Nurse 40.72 22.99 18.40 3.91 26.83 27.55 33.00 40.72
Day Care SpR 22.00 19.82 22.00 17.79 22.00 19.08 22.00 22.00
District Nurse 15.00 13.87 15.00 4.26 15.00 17.31 15.00 15.00
Doctor 12.67 13.00 12.67 9.79 12.67 12.10 9.00 12.67
Jnr. Doctor 9.00 16.01 15.00 0.94 20.00 10.76 12.67 9.00
Pharmacist 13.50 25.64 13.50 0.71 13.50 19.68 6.00 13.50
Oncology nurse 6.00 11.68 4.00 0.00 6.00 4.55 6.00 6.00
Inpatient day 1440.00 1440.00 1440.00 1440.00 1440.00 1440.00 1440.00 1440.00
Source: Celgene HCRU questionnaire for the resource use; Abbreviations: CCR; conventional chemotherapy regimens; CNS, clinical nurse specialist; SpR, specialist registrar
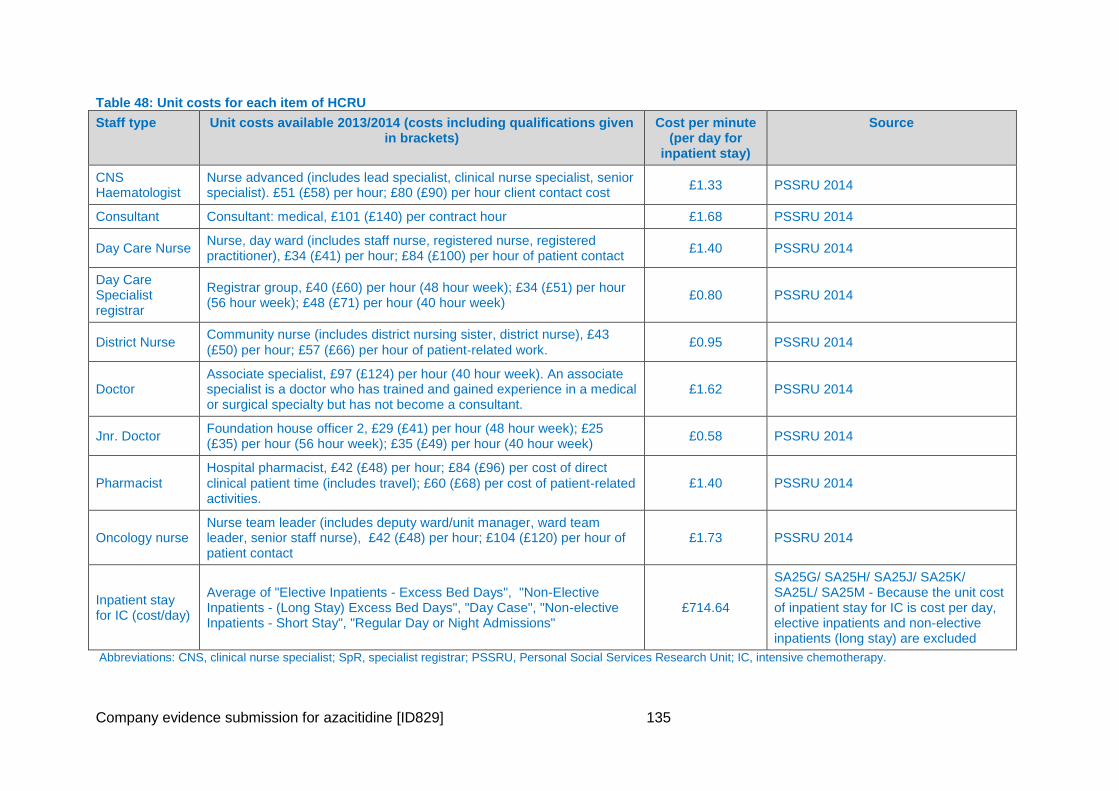
Company evidence submission for azacitidine [ID829] 135
Table 48: Unit costs for each item of HCRU
Staff type Unit costs available 2013/2014 (costs including qualifications given in brackets)
Cost per minute (per day for
inpatient stay)
Source
CNS Haematologist
Nurse advanced (includes lead specialist, clinical nurse specialist, senior specialist). £51 (£58) per hour; £80 (£90) per hour client contact cost
£1.33 PSSRU 2014
Consultant Consultant: medical, £101 (£140) per contract hour £1.68 PSSRU 2014
Day Care Nurse Nurse, day ward (includes staff nurse, registered nurse, registered practitioner), £34 (£41) per hour; £84 (£100) per hour of patient contact
£1.40 PSSRU 2014
Day Care Specialist registrar
Registrar group, £40 (£60) per hour (48 hour week); £34 (£51) per hour (56 hour week); £48 (£71) per hour (40 hour week)
£0.80 PSSRU 2014
District Nurse Community nurse (includes district nursing sister, district nurse), £43
(£50) per hour; £57 (£66) per hour of patient‐related work. £0.95 PSSRU 2014
Doctor Associate specialist, £97 (£124) per hour (40 hour week). An associate specialist is a doctor who has trained and gained experience in a medical or surgical specialty but has not become a consultant.
£1.62 PSSRU 2014
Jnr. Doctor Foundation house officer 2, £29 (£41) per hour (48 hour week); £25 (£35) per hour (56 hour week); £35 (£49) per hour (40 hour week)
£0.58 PSSRU 2014
Pharmacist Hospital pharmacist, £42 (£48) per hour; £84 (£96) per cost of direct
clinical patient time (includes travel); £60 (£68) per cost of patient‐related activities.
£1.40 PSSRU 2014
Oncology nurse Nurse team leader (includes deputy ward/unit manager, ward team leader, senior staff nurse), £42 (£48) per hour; £104 (£120) per hour of patient contact
£1.73 PSSRU 2014
Inpatient stay for IC (cost/day)
Average of "Elective Inpatients - Excess Bed Days", "Non-Elective Inpatients - (Long Stay) Excess Bed Days", "Day Case", "Non-elective Inpatients - Short Stay", "Regular Day or Night Admissions"
£714.64
SA25G/ SA25H/ SA25J/ SA25K/ SA25L/ SA25M - Because the unit cost of inpatient stay for IC is cost per day, elective inpatients and non-elective inpatients (long stay) are excluded
Abbreviations: CNS, clinical nurse specialist; SpR, specialist registrar; PSSRU, Personal Social Services Research Unit; IC, intensive chemotherapy.
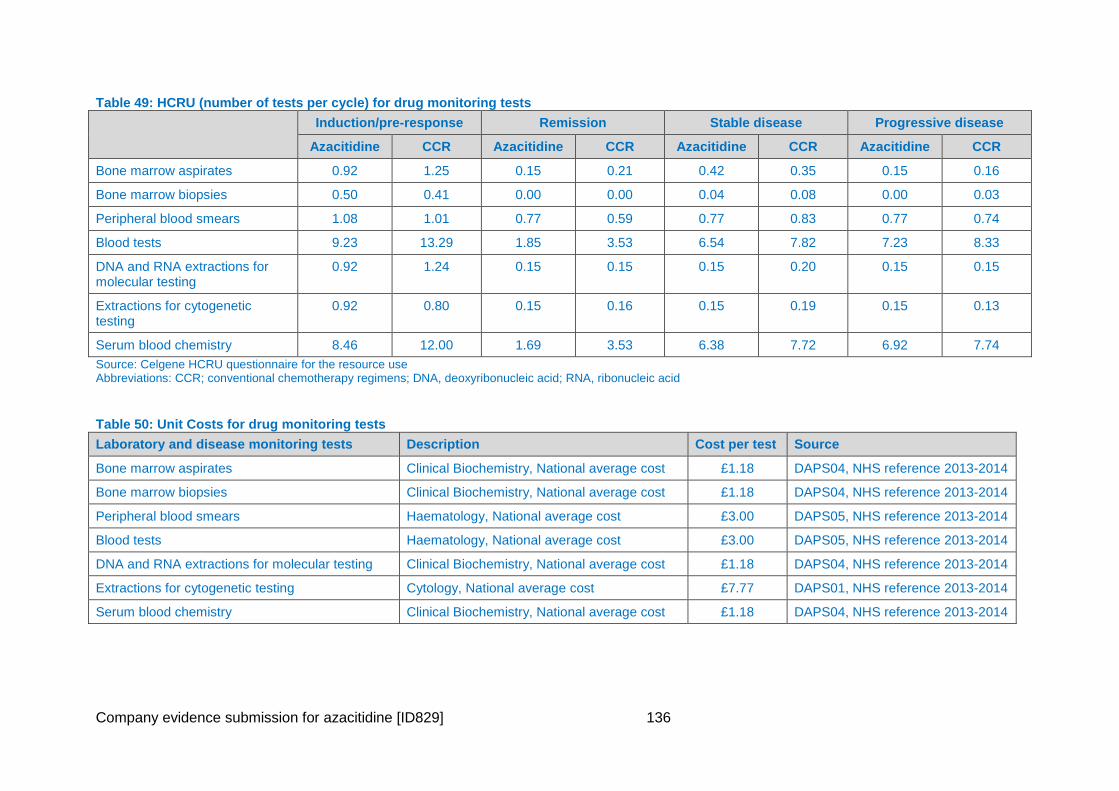
Company evidence submission for azacitidine [ID829] 136
Table 49: HCRU (number of tests per cycle) for drug monitoring tests
Induction/pre-response Remission Stable disease Progressive disease
Azacitidine CCR Azacitidine CCR Azacitidine CCR Azacitidine CCR
Bone marrow aspirates 0.92 1.25 0.15 0.21 0.42 0.35 0.15 0.16
Bone marrow biopsies 0.50 0.41 0.00 0.00 0.04 0.08 0.00 0.03
Peripheral blood smears 1.08 1.01 0.77 0.59 0.77 0.83 0.77 0.74
Blood tests 9.23 13.29 1.85 3.53 6.54 7.82 7.23 8.33
DNA and RNA extractions for molecular testing
0.92 1.24 0.15 0.15 0.15 0.20 0.15 0.15
Extractions for cytogenetic testing
0.92 0.80 0.15 0.16 0.15 0.19 0.15 0.13
Serum blood chemistry 8.46 12.00 1.69 3.53 6.38 7.72 6.92 7.74
Source: Celgene HCRU questionnaire for the resource use Abbreviations: CCR; conventional chemotherapy regimens; DNA, deoxyribonucleic acid; RNA, ribonucleic acid
Table 50: Unit Costs for drug monitoring tests
Laboratory and disease monitoring tests Description Cost per test Source
Bone marrow aspirates Clinical Biochemistry, National average cost £1.18 DAPS04, NHS reference 2013-2014
Bone marrow biopsies Clinical Biochemistry, National average cost £1.18 DAPS04, NHS reference 2013-2014
Peripheral blood smears Haematology, National average cost £3.00 DAPS05, NHS reference 2013-2014
Blood tests Haematology, National average cost £3.00 DAPS05, NHS reference 2013-2014
DNA and RNA extractions for molecular testing Clinical Biochemistry, National average cost £1.18 DAPS04, NHS reference 2013-2014
Extractions for cytogenetic testing Cytology, National average cost £7.77 DAPS01, NHS reference 2013-2014
Serum blood chemistry Clinical Biochemistry, National average cost £1.18 DAPS04, NHS reference 2013-2014
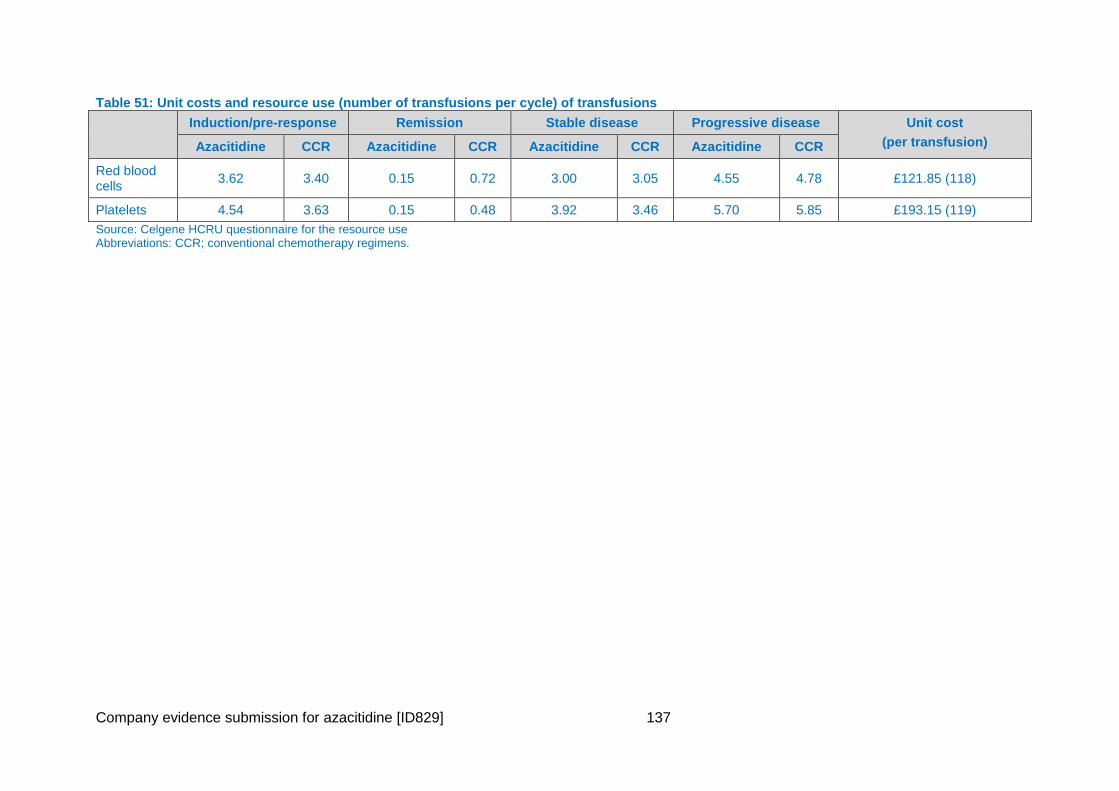
Company evidence submission for azacitidine [ID829] 137
Table 51: Unit costs and resource use (number of transfusions per cycle) of transfusions
Induction/pre-response Remission Stable disease Progressive disease Unit cost
(per transfusion) Azacitidine CCR Azacitidine CCR Azacitidine CCR Azacitidine CCR
Red blood cells
3.62 3.40 0.15 0.72 3.00 3.05 4.55 4.78 £121.85 (118)
Platelets 4.54 3.63 0.15 0.48 3.92 3.46 5.70 5.85 £193.15 (119)
Source: Celgene HCRU questionnaire for the resource use Abbreviations: CCR; conventional chemotherapy regimens.
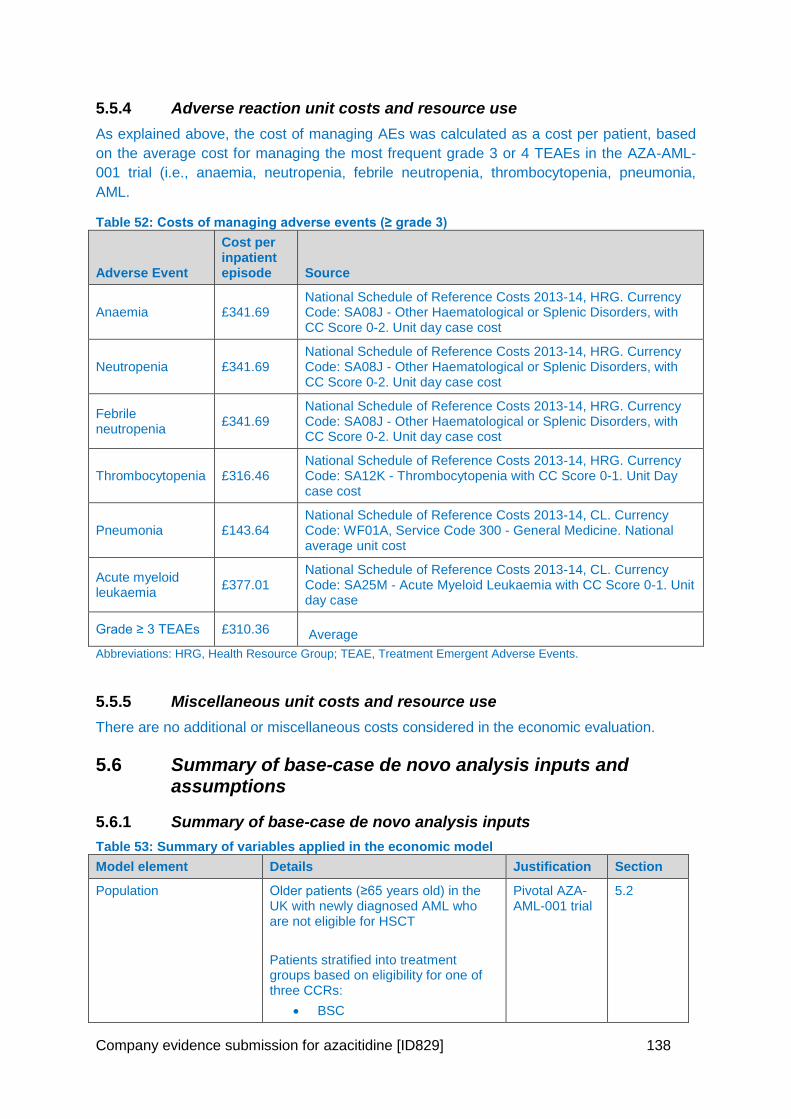
Company evidence submission for azacitidine [ID829] 138
5.5.4 Adverse reaction unit costs and resource use
As explained above, the cost of managing AEs was calculated as a cost per patient, based
on the average cost for managing the most frequent grade 3 or 4 TEAEs in the AZA-AML-
001 trial (i.e., anaemia, neutropenia, febrile neutropenia, thrombocytopenia, pneumonia,
AML.
Table 52: Costs of managing adverse events (≥ grade 3)
Adverse Event
Cost per inpatient episode Source
Anaemia £341.69 National Schedule of Reference Costs 2013-14, HRG. Currency Code: SA08J - Other Haematological or Splenic Disorders, with CC Score 0-2. Unit day case cost
Neutropenia £341.69 National Schedule of Reference Costs 2013-14, HRG. Currency Code: SA08J - Other Haematological or Splenic Disorders, with CC Score 0-2. Unit day case cost
Febrile neutropenia
£341.69 National Schedule of Reference Costs 2013-14, HRG. Currency Code: SA08J - Other Haematological or Splenic Disorders, with CC Score 0-2. Unit day case cost
Thrombocytopenia £316.46 National Schedule of Reference Costs 2013-14, HRG. Currency Code: SA12K - Thrombocytopenia with CC Score 0-1. Unit Day case cost
Pneumonia £143.64 National Schedule of Reference Costs 2013-14, CL. Currency Code: WF01A, Service Code 300 - General Medicine. National average unit cost
Acute myeloid leukaemia
£377.01 National Schedule of Reference Costs 2013-14, CL. Currency Code: SA25M - Acute Myeloid Leukaemia with CC Score 0-1. Unit day case
Grade ≥ 3 TEAEs £310.36 Average
Abbreviations: HRG, Health Resource Group; TEAE, Treatment Emergent Adverse Events.
5.5.5 Miscellaneous unit costs and resource use
There are no additional or miscellaneous costs considered in the economic evaluation.
5.6 Summary of base-case de novo analysis inputs and assumptions
5.6.1 Summary of base-case de novo analysis inputs
Table 53: Summary of variables applied in the economic model
Model element Details Justification Section
Population Older patients (≥65 years old) in the UK with newly diagnosed AML who are not eligible for HSCT
Patients stratified into treatment groups based on eligibility for one of three CCRs:
BSC
Pivotal AZA-AML-001 trial
5.2
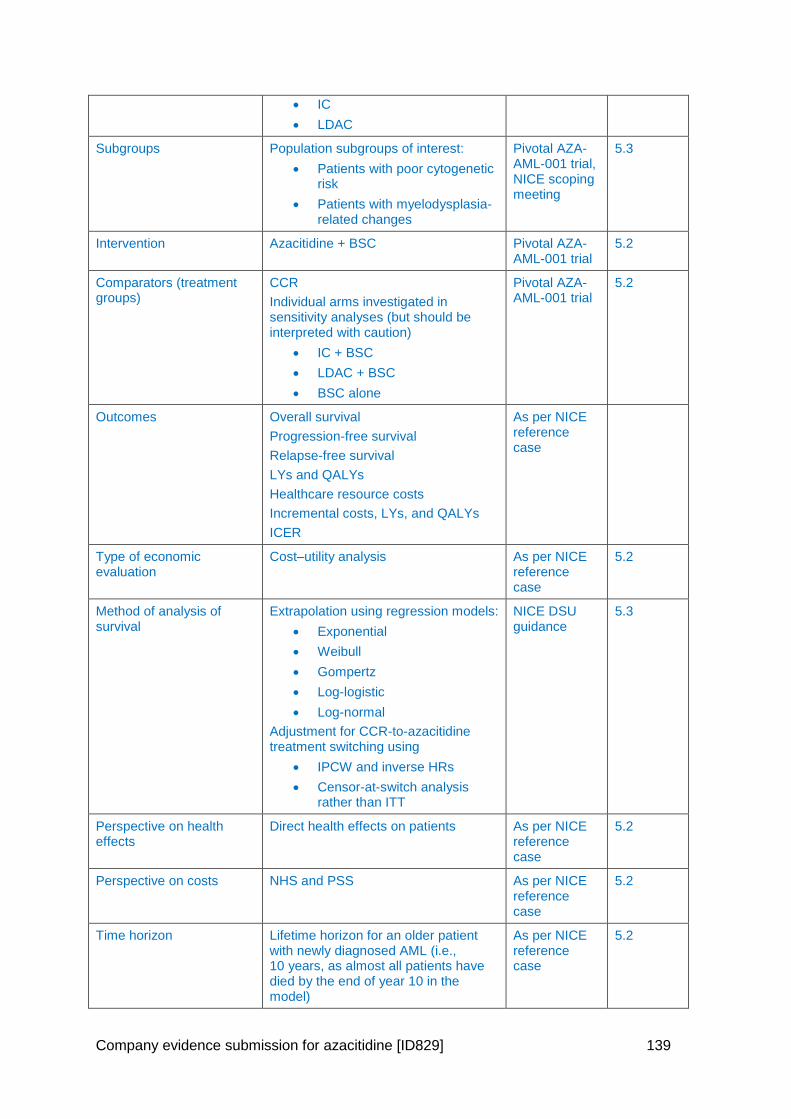
Company evidence submission for azacitidine [ID829] 139
IC
LDAC
Subgroups Population subgroups of interest:
Patients with poor cytogenetic risk
Patients with myelodysplasia-related changes
Pivotal AZA-AML-001 trial, NICE scoping meeting
5.3
Intervention Azacitidine + BSC Pivotal AZA-AML-001 trial
5.2
Comparators (treatment groups)
CCR
Individual arms investigated in sensitivity analyses (but should be interpreted with caution)
IC + BSC
LDAC + BSC
BSC alone
Pivotal AZA-AML-001 trial
5.2
Outcomes Overall survival
Progression-free survival
Relapse-free survival
LYs and QALYs
Healthcare resource costs
Incremental costs, LYs, and QALYs
ICER
As per NICE reference case
Type of economic evaluation
Cost–utility analysis As per NICE reference case
5.2
Method of analysis of survival
Extrapolation using regression models:
Exponential
Weibull
Gompertz
Log-logistic
Log-normal
Adjustment for CCR-to-azacitidine treatment switching using
IPCW and inverse HRs
Censor-at-switch analysis rather than ITT
NICE DSU guidance
5.3
Perspective on health effects
Direct health effects on patients As per NICE reference case
5.2
Perspective on costs NHS and PSS As per NICE reference case
5.2
Time horizon Lifetime horizon for an older patient with newly diagnosed AML (i.e., 10 years, as almost all patients have died by the end of year 10 in the model)
As per NICE reference case
5.2
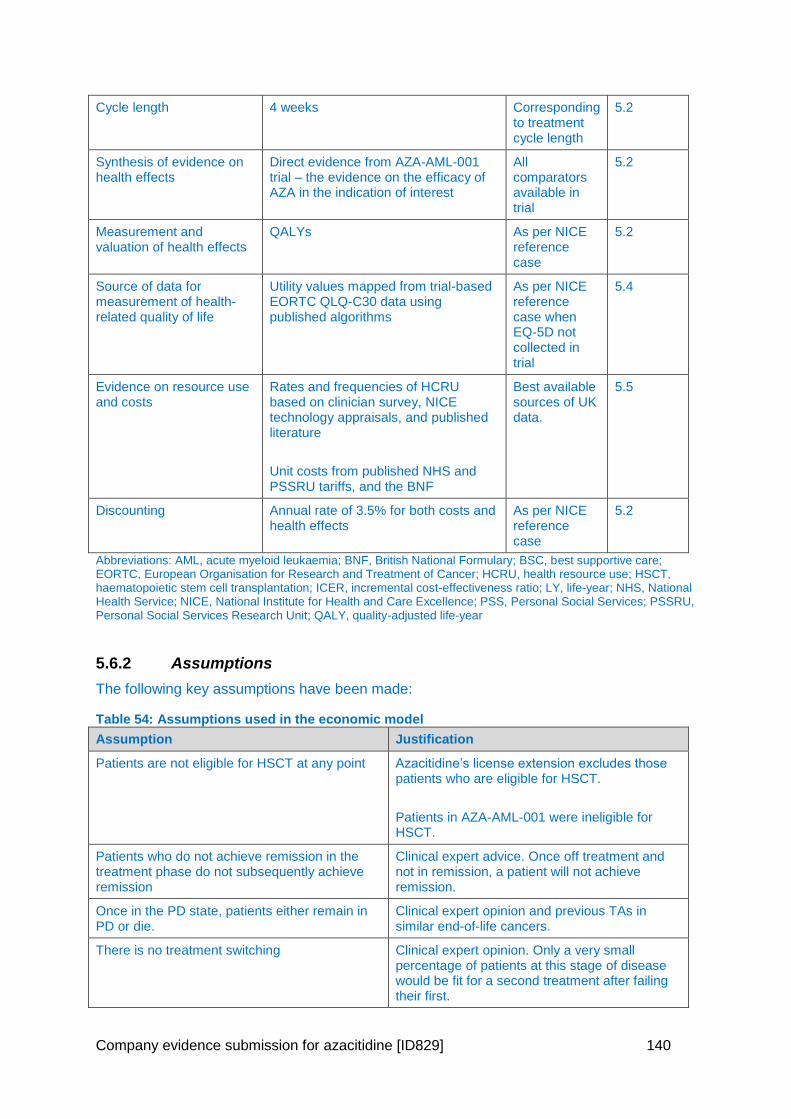
Company evidence submission for azacitidine [ID829] 140
Cycle length 4 weeks Corresponding to treatment cycle length
5.2
Synthesis of evidence on health effects
Direct evidence from AZA-AML-001 trial – the evidence on the efficacy of AZA in the indication of interest
All comparators available in trial
5.2
Measurement and valuation of health effects
QALYs As per NICE reference case
5.2
Source of data for measurement of health-related quality of life
Utility values mapped from trial-based EORTC QLQ-C30 data using published algorithms
As per NICE reference case when EQ-5D not collected in trial
5.4
Evidence on resource use and costs
Rates and frequencies of HCRU based on clinician survey, NICE technology appraisals, and published literature
Unit costs from published NHS and PSSRU tariffs, and the BNF
Best available sources of UK data.
5.5
Discounting Annual rate of 3.5% for both costs and health effects
As per NICE reference case
5.2
Abbreviations: AML, acute myeloid leukaemia; BNF, British National Formulary; BSC, best supportive care; EORTC, European Organisation for Research and Treatment of Cancer; HCRU, health resource use; HSCT, haematopoietic stem cell transplantation; ICER, incremental cost-effectiveness ratio; LY, life-year; NHS, National Health Service; NICE, National Institute for Health and Care Excellence; PSS, Personal Social Services; PSSRU, Personal Social Services Research Unit; QALY, quality-adjusted life-year
5.6.2 Assumptions
The following key assumptions have been made:
Table 54: Assumptions used in the economic model
Assumption Justification
Patients are not eligible for HSCT at any point Azacitidine’s license extension excludes those patients who are eligible for HSCT.
Patients in AZA-AML-001 were ineligible for HSCT.
Patients who do not achieve remission in the treatment phase do not subsequently achieve remission
Clinical expert advice. Once off treatment and not in remission, a patient will not achieve remission.
Once in the PD state, patients either remain in PD or die.
Clinical expert opinion and previous TAs in similar end-of-life cancers.
There is no treatment switching Clinical expert opinion. Only a very small percentage of patients at this stage of disease would be fit for a second treatment after failing their first.
Company evidence submission for azacitidine [ID829] 141
Assumption Justification
In any cycle, patients can only be in one of the health states
Markov model Structure
Abbreviations: HSCT, haematopoietic stem cell transplantation; BSC, best supportive care; TAs, technology appraisals; PD, progressive disease.
5.7 Base-case results
5.7.1 Base-case incremental cost effectiveness analysis results
The base-case results are presented in Table 55 below.
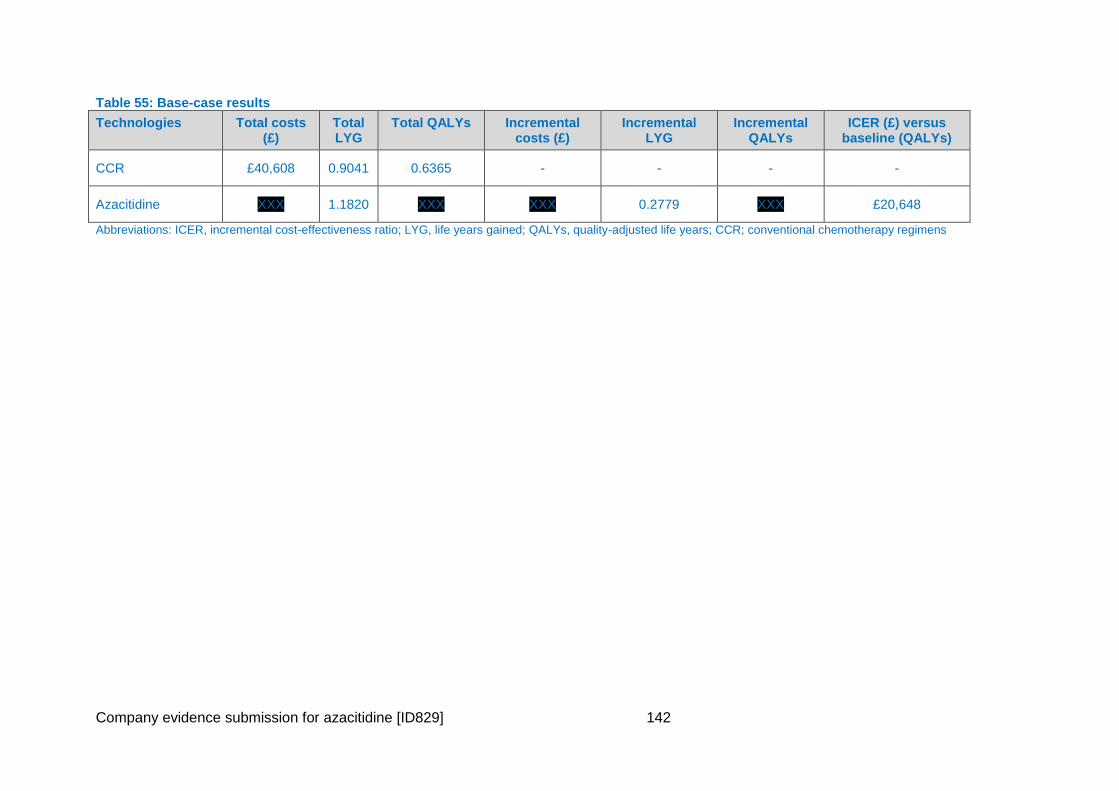
Company evidence submission for azacitidine [ID829] 142
Table 55: Base-case results
Technologies Total costs (£)
Total LYG
Total QALYs Incremental costs (£)
Incremental LYG
Incremental QALYs
ICER (£) versus baseline (QALYs)
CCR £40,608 0.9041 0.6365 - - - -
Azacitidine XXX 1.1820 XXX XXX 0.2779 XXX £20,648
Abbreviations: ICER, incremental cost-effectiveness ratio; LYG, life years gained; QALYs, quality-adjusted life years; CCR; conventional chemotherapy regimens
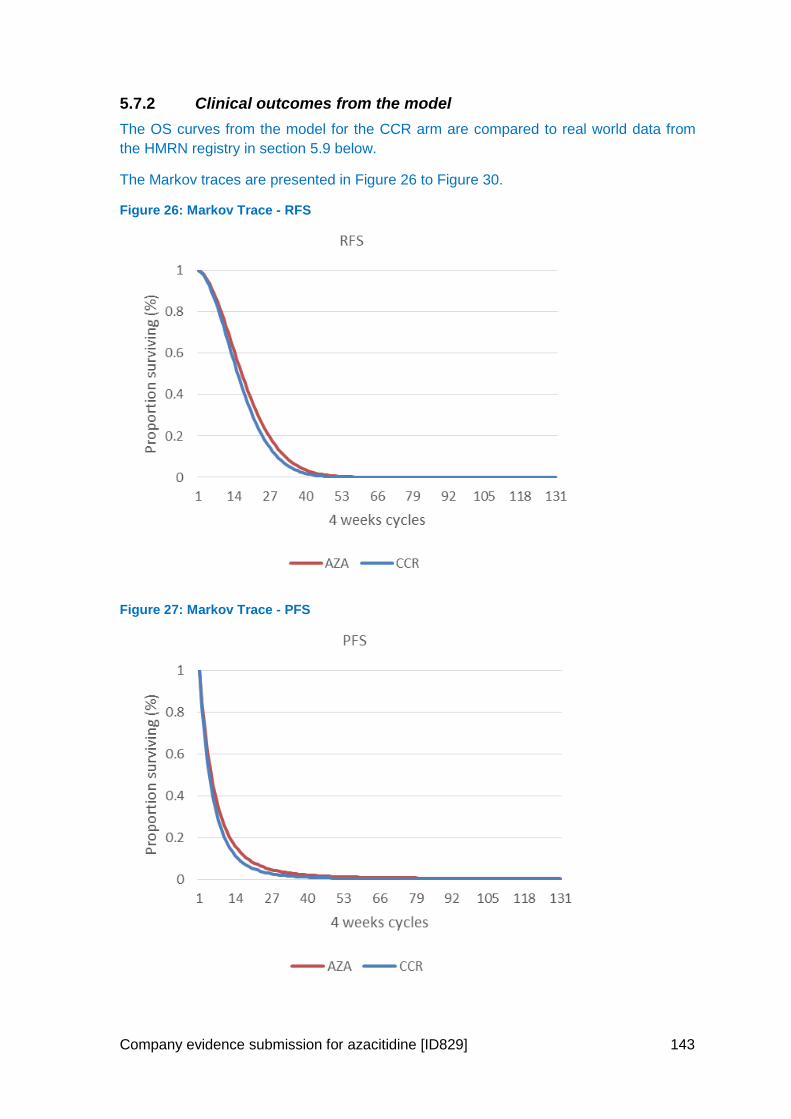
Company evidence submission for azacitidine [ID829] 143
5.7.2 Clinical outcomes from the model
The OS curves from the model for the CCR arm are compared to real world data from
the HMRN registry in section 5.9 below.
The Markov traces are presented in Figure 26 to Figure 30.
Figure 26: Markov Trace - RFS
Figure 27: Markov Trace - PFS
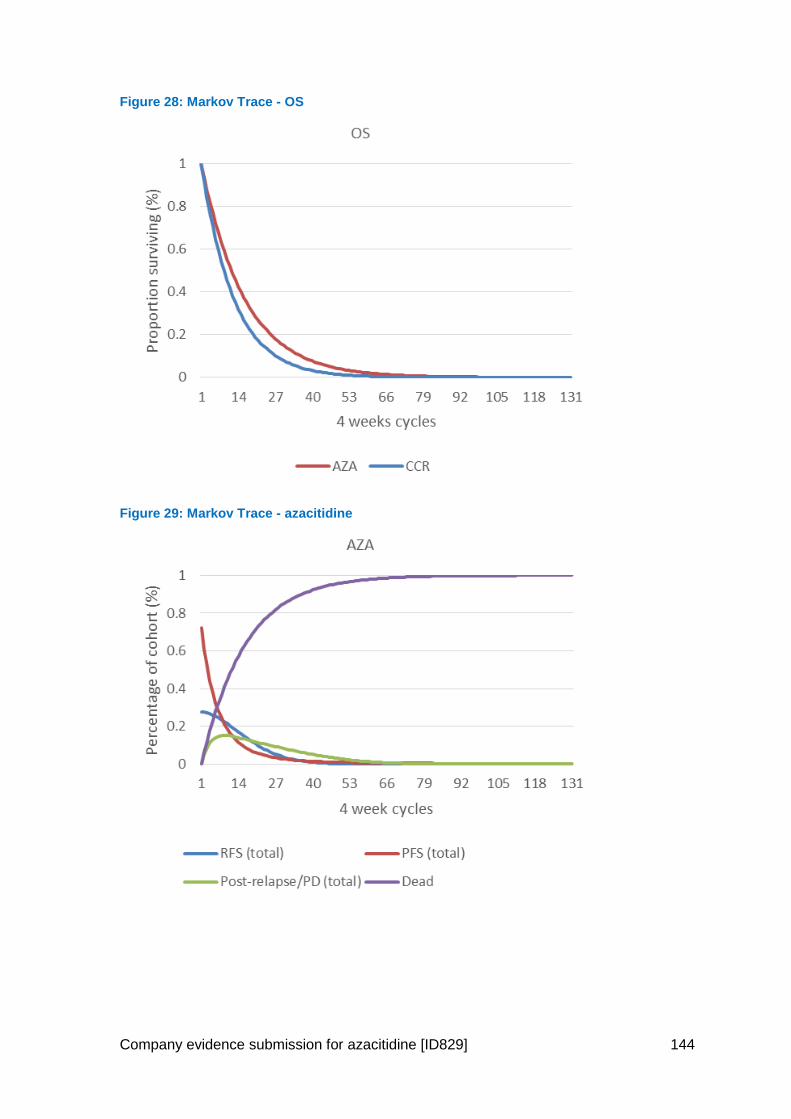
Company evidence submission for azacitidine [ID829] 144
Figure 28: Markov Trace - OS
Figure 29: Markov Trace - azacitidine
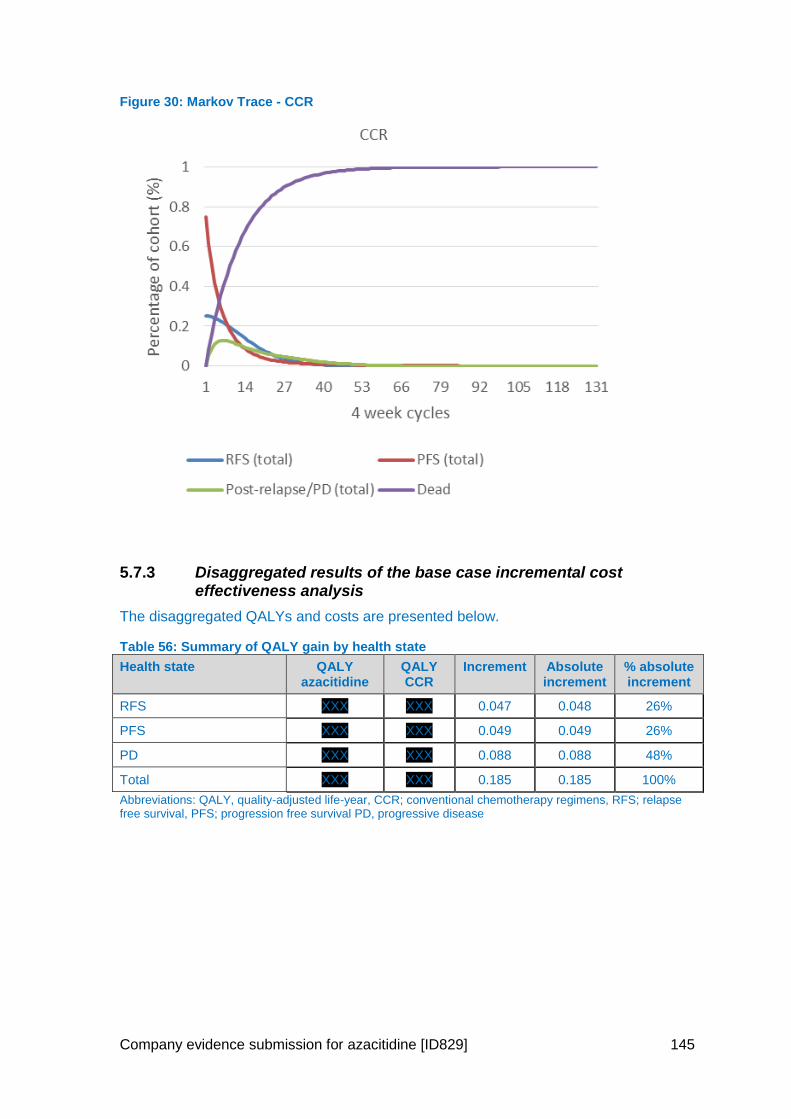
Company evidence submission for azacitidine [ID829] 145
Figure 30: Markov Trace - CCR
5.7.3 Disaggregated results of the base case incremental cost effectiveness analysis
The disaggregated QALYs and costs are presented below.
Table 56: Summary of QALY gain by health state
Health state QALY azacitidine
QALY CCR
Increment Absolute increment
% absolute increment
RFS XXX XXX 0.047 0.048 26%
PFS XXX XXX 0.049 0.049 26%
PD XXX XXX 0.088 0.088 48%
Total XXX XXX 0.185 0.185 100%
Abbreviations: QALY, quality-adjusted life-year, CCR; conventional chemotherapy regimens, RFS; relapse free survival, PFS; progression free survival PD, progressive disease
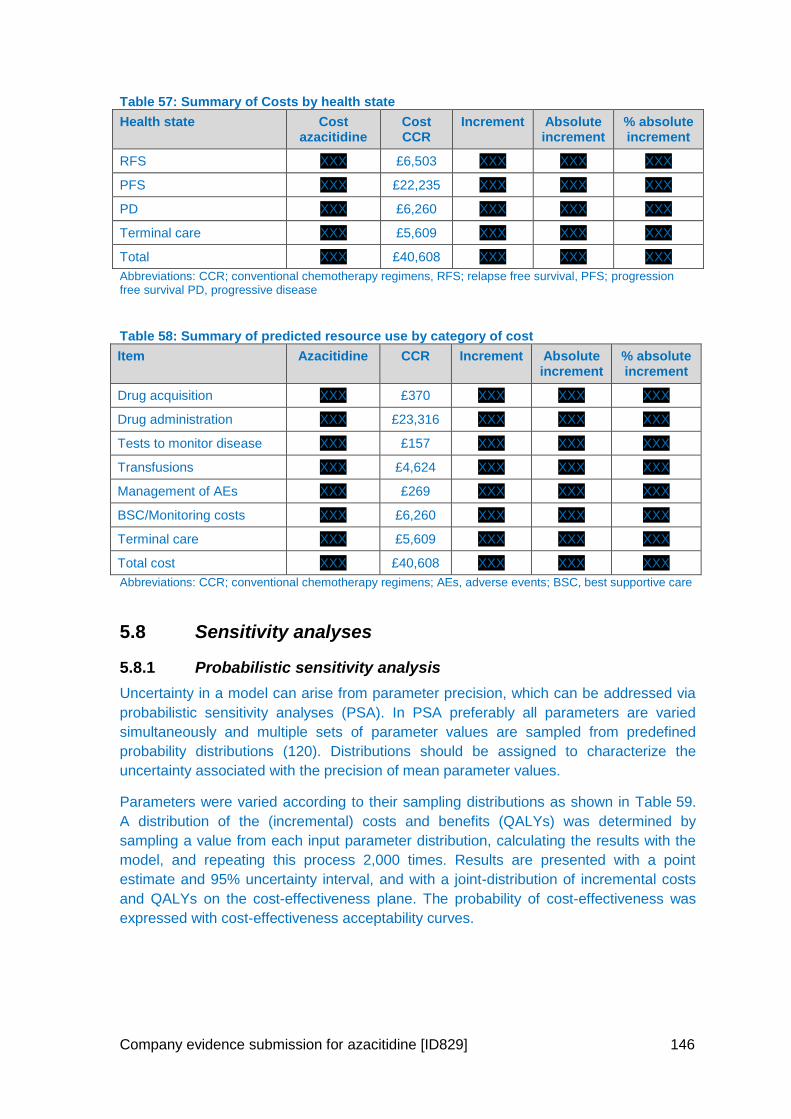
Company evidence submission for azacitidine [ID829] 146
Table 57: Summary of Costs by health state
Health state Cost azacitidine
Cost CCR
Increment Absolute increment
% absolute increment
RFS XXX £6,503 XXX XXX XXX
PFS XXX £22,235 XXX XXX XXX
PD XXX £6,260 XXX XXX XXX
Terminal care XXX £5,609 XXX XXX XXX
Total XXX £40,608 XXX XXX XXX
Abbreviations: CCR; conventional chemotherapy regimens, RFS; relapse free survival, PFS; progression free survival PD, progressive disease
Table 58: Summary of predicted resource use by category of cost
Item Azacitidine CCR Increment Absolute increment
% absolute increment
Drug acquisition XXX £370 XXX XXX XXX
Drug administration XXX £23,316 XXX XXX XXX
Tests to monitor disease XXX £157 XXX XXX XXX
Transfusions XXX £4,624 XXX XXX XXX
Management of AEs XXX £269 XXX XXX XXX
BSC/Monitoring costs XXX £6,260 XXX XXX XXX
Terminal care XXX £5,609 XXX XXX XXX
Total cost XXX £40,608 XXX XXX XXX
Abbreviations: CCR; conventional chemotherapy regimens; AEs, adverse events; BSC, best supportive care
5.8 Sensitivity analyses
5.8.1 Probabilistic sensitivity analysis
Uncertainty in a model can arise from parameter precision, which can be addressed via
probabilistic sensitivity analyses (PSA). In PSA preferably all parameters are varied
simultaneously and multiple sets of parameter values are sampled from predefined
probability distributions (120). Distributions should be assigned to characterize the
uncertainty associated with the precision of mean parameter values.
Parameters were varied according to their sampling distributions as shown in Table 59.
A distribution of the (incremental) costs and benefits (QALYs) was determined by
sampling a value from each input parameter distribution, calculating the results with the
model, and repeating this process 2,000 times. Results are presented with a point
estimate and 95% uncertainty interval, and with a joint-distribution of incremental costs
and QALYs on the cost-effectiveness plane. The probability of cost-effectiveness was
expressed with cost-effectiveness acceptability curves.
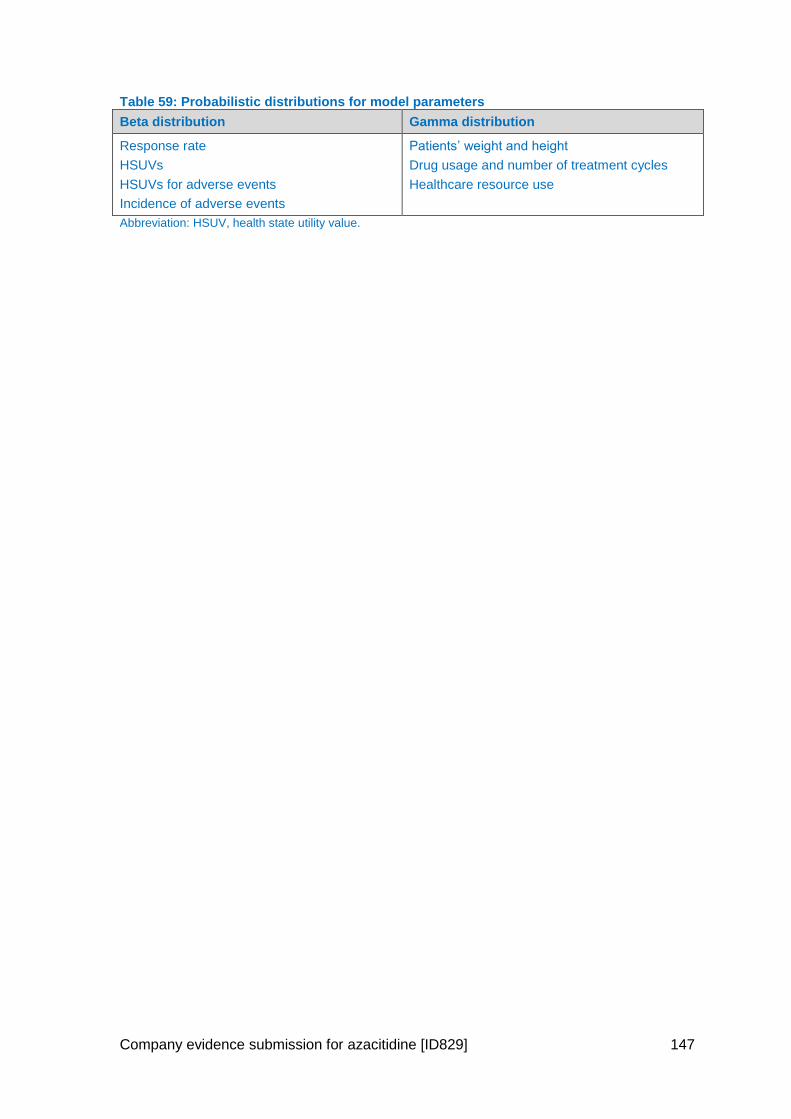
Company evidence submission for azacitidine [ID829] 147
Table 59: Probabilistic distributions for model parameters
Beta distribution Gamma distribution
Response rate
HSUVs
HSUVs for adverse events
Incidence of adverse events
Patients’ weight and height
Drug usage and number of treatment cycles
Healthcare resource use
Abbreviation: HSUV, health state utility value.
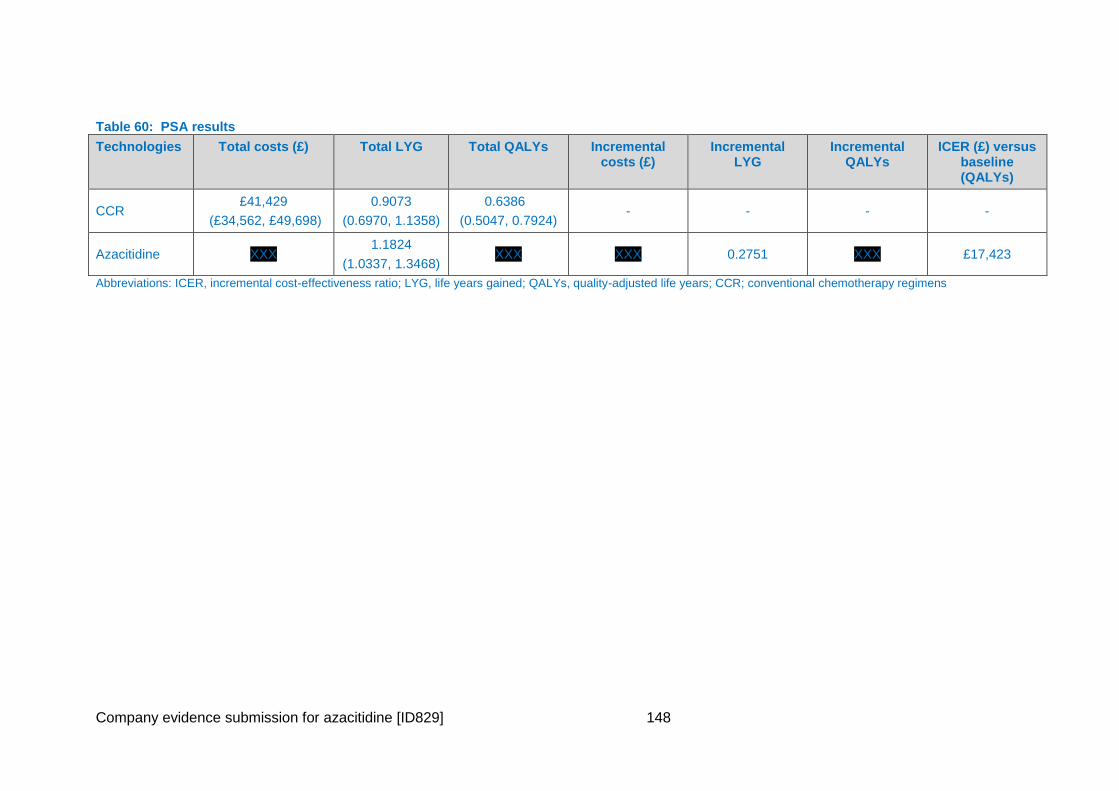
Company evidence submission for azacitidine [ID829] 148
Table 60: PSA results
Technologies Total costs (£) Total LYG Total QALYs Incremental costs (£)
Incremental LYG
Incremental QALYs
ICER (£) versus baseline (QALYs)
CCR £41,429
(£34,562, £49,698)
0.9073
(0.6970, 1.1358)
0.6386
(0.5047, 0.7924) - - - -
Azacitidine XXX 1.1824
(1.0337, 1.3468) XXX XXX 0.2751 XXX £17,423
Abbreviations: ICER, incremental cost-effectiveness ratio; LYG, life years gained; QALYs, quality-adjusted life years; CCR; conventional chemotherapy regimens
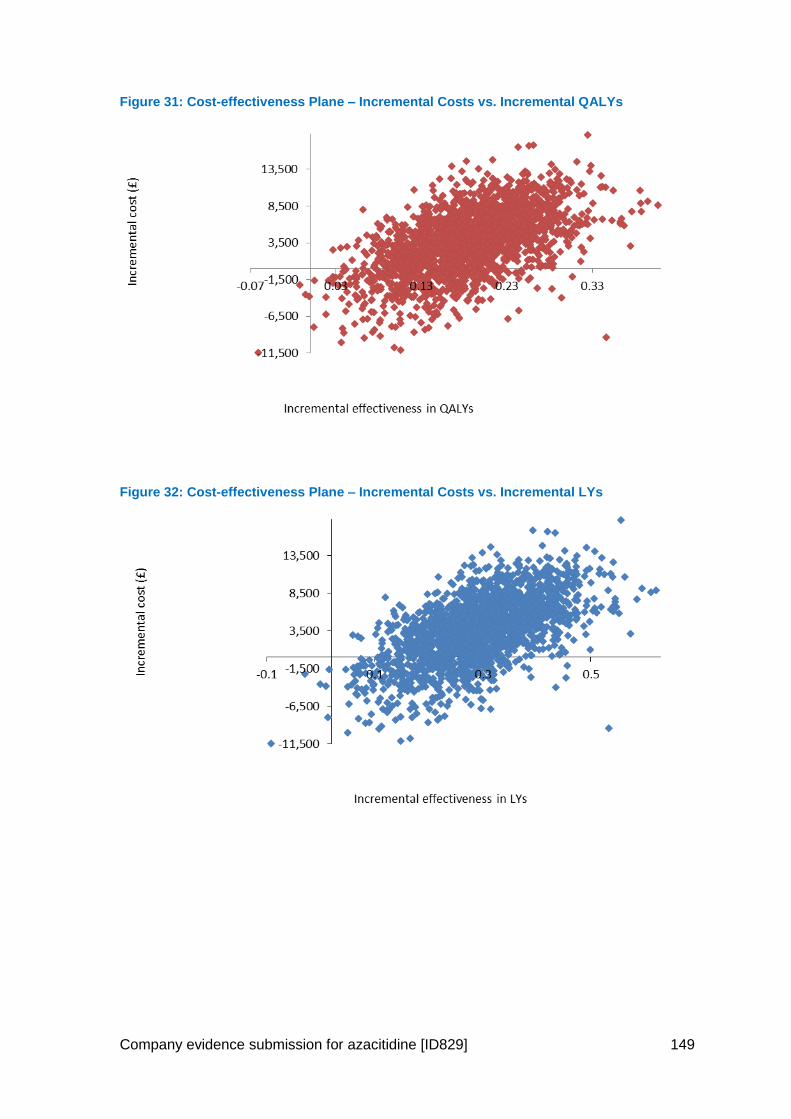
Company evidence submission for azacitidine [ID829] 149
Figure 31: Cost-effectiveness Plane – Incremental Costs vs. Incremental QALYs
Figure 32: Cost-effectiveness Plane – Incremental Costs vs. Incremental LYs
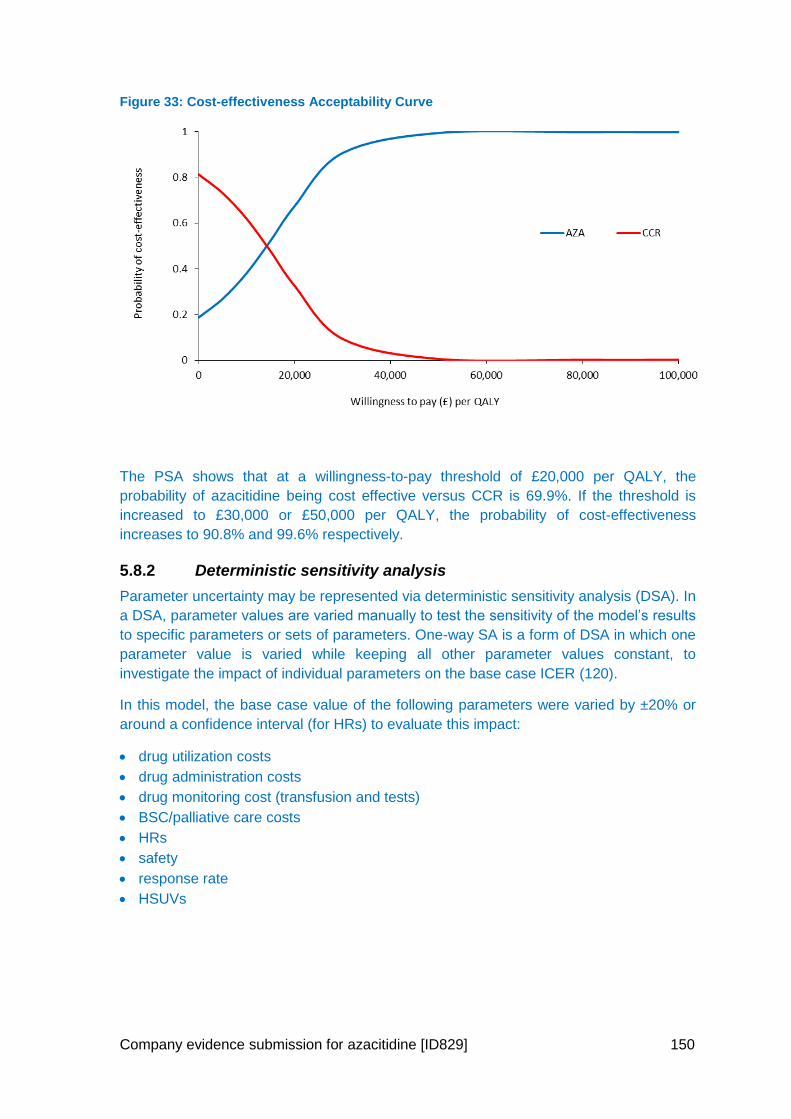
Company evidence submission for azacitidine [ID829] 150
Figure 33: Cost-effectiveness Acceptability Curve
The PSA shows that at a willingness-to-pay threshold of £20,000 per QALY, the
probability of azacitidine being cost effective versus CCR is 69.9%. If the threshold is
increased to £30,000 or £50,000 per QALY, the probability of cost-effectiveness
increases to 90.8% and 99.6% respectively.
5.8.2 Deterministic sensitivity analysis
Parameter uncertainty may be represented via deterministic sensitivity analysis (DSA). In
a DSA, parameter values are varied manually to test the sensitivity of the model’s results
to specific parameters or sets of parameters. One-way SA is a form of DSA in which one
parameter value is varied while keeping all other parameter values constant, to
investigate the impact of individual parameters on the base case ICER (120).
In this model, the base case value of the following parameters were varied by ±20% or
around a confidence interval (for HRs) to evaluate this impact:
drug utilization costs
drug administration costs
drug monitoring cost (transfusion and tests)
BSC/palliative care costs
HRs
safety
response rate
HSUVs
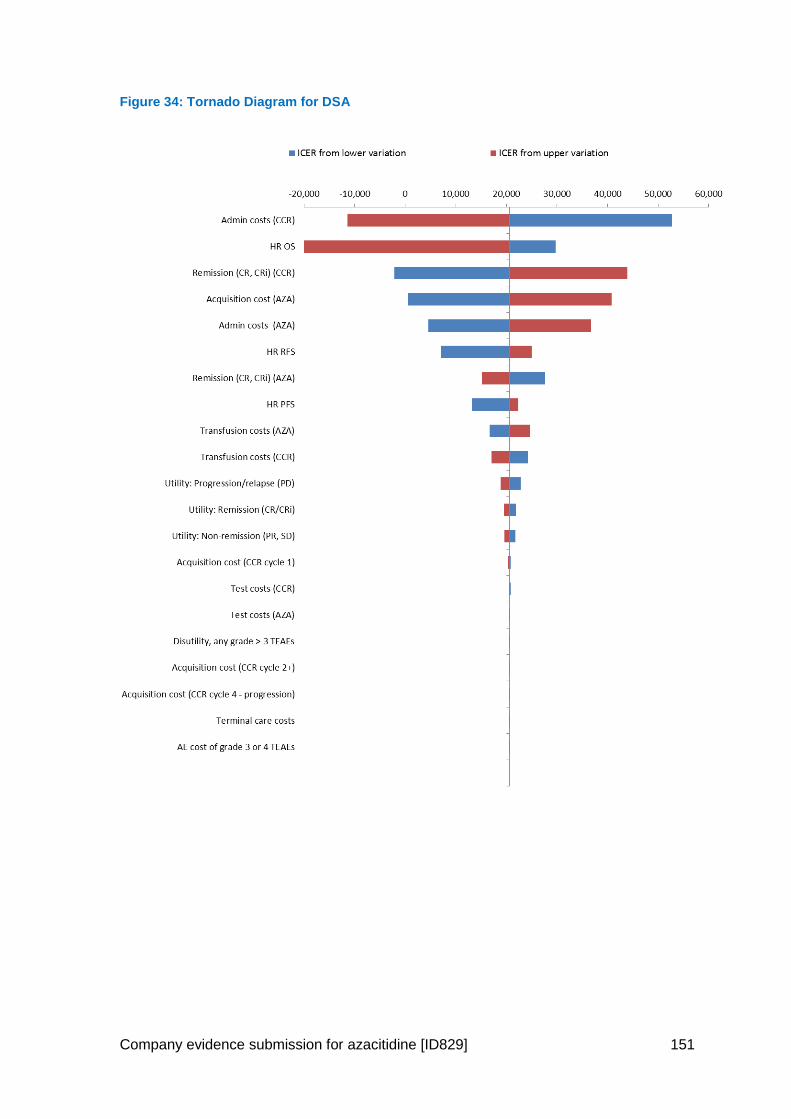
Company evidence submission for azacitidine [ID829] 151
Figure 34: Tornado Diagram for DSA
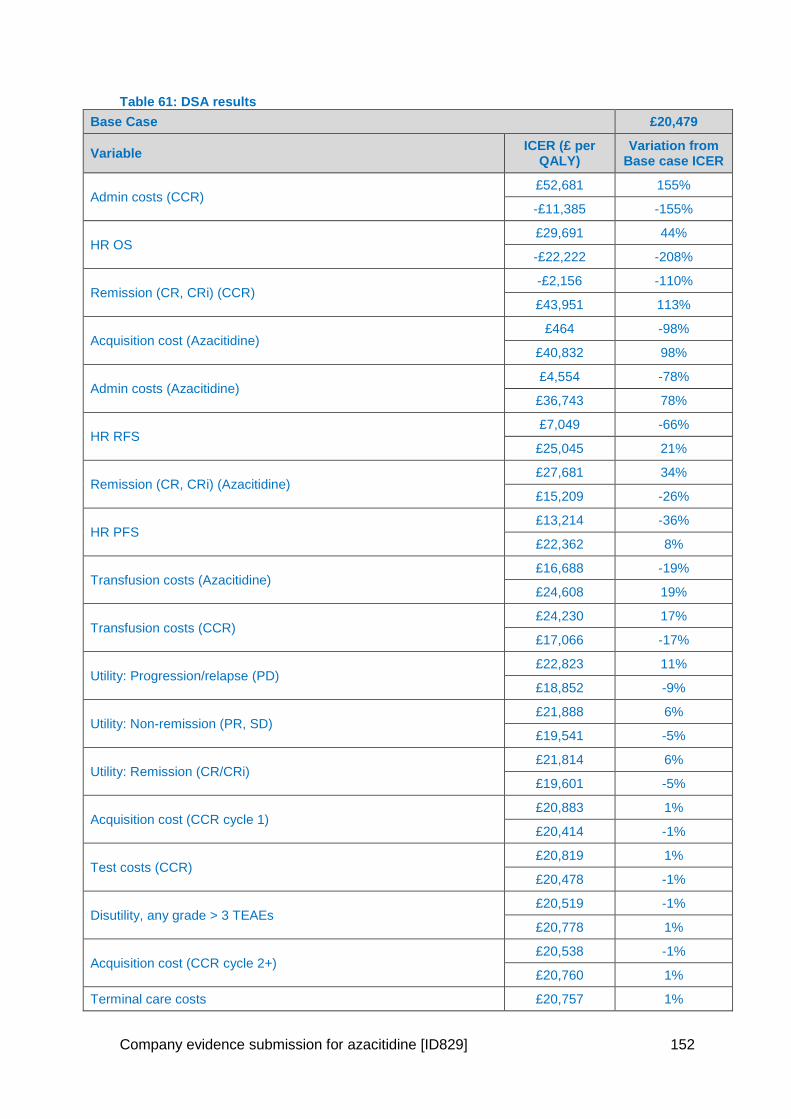
Company evidence submission for azacitidine [ID829] 152
Table 61: DSA results
Base Case £20,479
Variable ICER (£ per
QALY) Variation from
Base case ICER
Admin costs (CCR) £52,681 155%
-£11,385 -155%
HR OS £29,691 44%
-£22,222 -208%
Remission (CR, CRi) (CCR) -£2,156 -110%
£43,951 113%
Acquisition cost (Azacitidine) £464 -98%
£40,832 98%
Admin costs (Azacitidine) £4,554 -78%
£36,743 78%
HR RFS £7,049 -66%
£25,045 21%
Remission (CR, CRi) (Azacitidine) £27,681 34%
£15,209 -26%
HR PFS £13,214 -36%
£22,362 8%
Transfusion costs (Azacitidine) £16,688 -19%
£24,608 19%
Transfusion costs (CCR) £24,230 17%
£17,066 -17%
Utility: Progression/relapse (PD) £22,823 11%
£18,852 -9%
Utility: Non-remission (PR, SD) £21,888 6%
£19,541 -5%
Utility: Remission (CR/CRi) £21,814 6%
£19,601 -5%
Acquisition cost (CCR cycle 1) £20,883 1%
£20,414 -1%
Test costs (CCR) £20,819 1%
£20,478 -1%
Disutility, any grade > 3 TEAEs £20,519 -1%
£20,778 1%
Acquisition cost (CCR cycle 2+) £20,538 -1%
£20,760 1%
Terminal care costs £20,757 1%
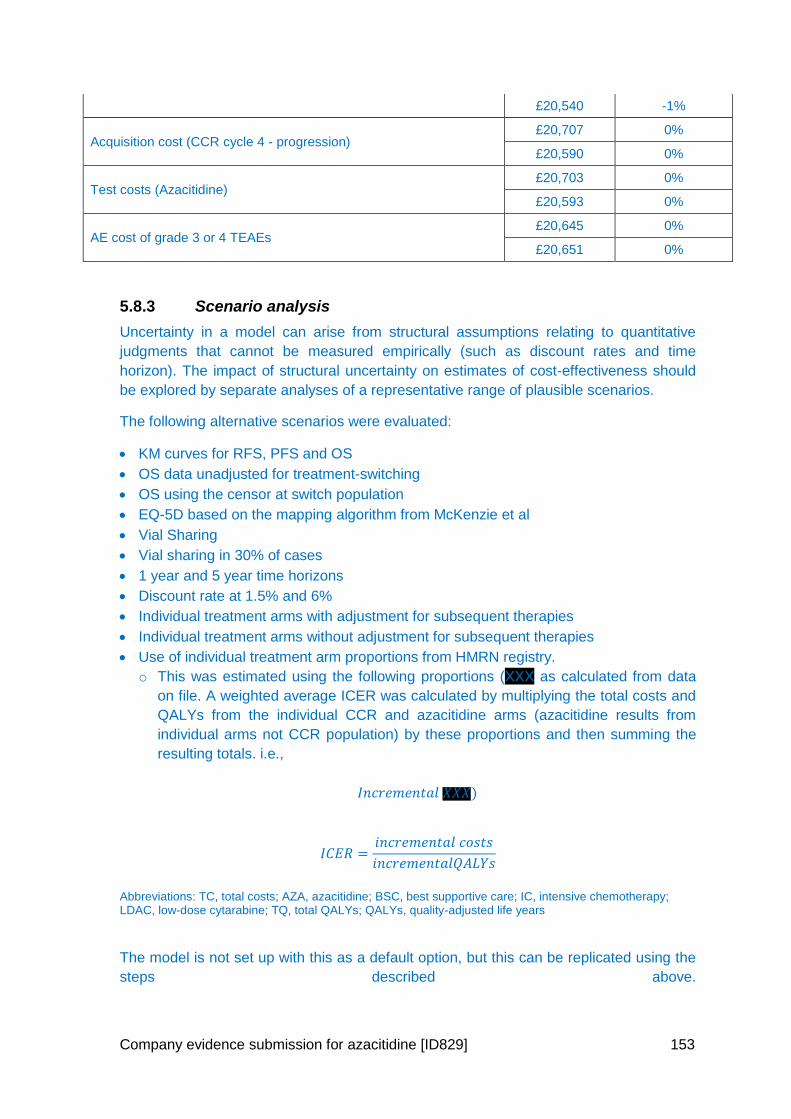
Company evidence submission for azacitidine [ID829] 153
£20,540 -1%
Acquisition cost (CCR cycle 4 - progression) £20,707 0%
£20,590 0%
Test costs (Azacitidine) £20,703 0%
£20,593 0%
AE cost of grade 3 or 4 TEAEs £20,645 0%
£20,651 0%
5.8.3 Scenario analysis
Uncertainty in a model can arise from structural assumptions relating to quantitative
judgments that cannot be measured empirically (such as discount rates and time
horizon). The impact of structural uncertainty on estimates of cost-effectiveness should
be explored by separate analyses of a representative range of plausible scenarios.
The following alternative scenarios were evaluated:
KM curves for RFS, PFS and OS
OS data unadjusted for treatment-switching
OS using the censor at switch population
EQ-5D based on the mapping algorithm from McKenzie et al
Vial Sharing
Vial sharing in 30% of cases
1 year and 5 year time horizons
Discount rate at 1.5% and 6%
Individual treatment arms with adjustment for subsequent therapies
Individual treatment arms without adjustment for subsequent therapies
Use of individual treatment arm proportions from HMRN registry.
o This was estimated using the following proportions (XXX as calculated from data
on file. A weighted average ICER was calculated by multiplying the total costs and
QALYs from the individual CCR and azacitidine arms (azacitidine results from
individual arms not CCR population) by these proportions and then summing the
resulting totals. i.e.,
𝐼𝑛𝑐𝑟𝑒𝑚𝑒𝑛𝑡𝑎𝑙 𝑋𝑋𝑋)
𝐼𝐶𝐸𝑅 =𝑖𝑛𝑐𝑟𝑒𝑚𝑒𝑛𝑡𝑎𝑙 𝑐𝑜𝑠𝑡𝑠
𝑖𝑛𝑐𝑟𝑒𝑚𝑒𝑛𝑡𝑎𝑙𝑄𝐴𝐿𝑌𝑠
Abbreviations: TC, total costs; AZA, azacitidine; BSC, best supportive care; IC, intensive chemotherapy; LDAC, low-dose cytarabine; TQ, total QALYs; QALYs, quality-adjusted life years
The model is not set up with this as a default option, but this can be replicated using the
steps described above.
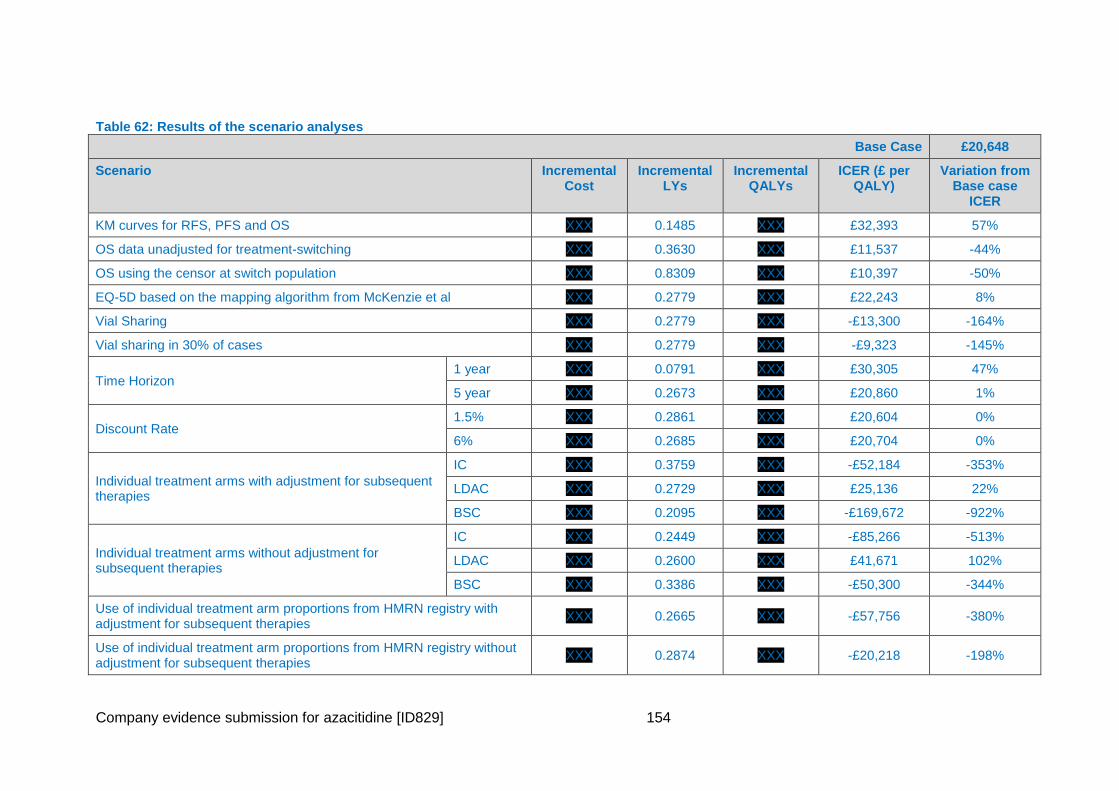
Company evidence submission for azacitidine [ID829] 154
Table 62: Results of the scenario analyses
Base Case £20,648
Scenario Incremental Cost
Incremental LYs
Incremental QALYs
ICER (£ per QALY)
Variation from Base case
ICER
KM curves for RFS, PFS and OS XXX 0.1485 XXX £32,393 57%
OS data unadjusted for treatment-switching XXX 0.3630 XXX £11,537 -44%
OS using the censor at switch population XXX 0.8309 XXX £10,397 -50%
EQ-5D based on the mapping algorithm from McKenzie et al XXX 0.2779 XXX £22,243 8%
Vial Sharing XXX 0.2779 XXX -£13,300 -164%
Vial sharing in 30% of cases XXX 0.2779 XXX -£9,323 -145%
Time Horizon 1 year XXX 0.0791 XXX £30,305 47%
5 year XXX 0.2673 XXX £20,860 1%
Discount Rate 1.5% XXX 0.2861 XXX £20,604 0%
6% XXX 0.2685 XXX £20,704 0%
Individual treatment arms with adjustment for subsequent therapies
IC XXX 0.3759 XXX -£52,184 -353%
LDAC XXX 0.2729 XXX £25,136 22%
BSC XXX 0.2095 XXX -£169,672 -922%
Individual treatment arms without adjustment for subsequent therapies
IC XXX 0.2449 XXX -£85,266 -513%
LDAC XXX 0.2600 XXX £41,671 102%
BSC XXX 0.3386 XXX -£50,300 -344%
Use of individual treatment arm proportions from HMRN registry with adjustment for subsequent therapies
XXX 0.2665 XXX -£57,756 -380%
Use of individual treatment arm proportions from HMRN registry without adjustment for subsequent therapies
XXX 0.2874 XXX -£20,218 -198%
Company evidence submission for azacitidine [ID829] 155
5.8.4 Summary of sensitivity analyses results
PSA results are slightly lower than the deterministic ICER with reasonable variation in
the incremental costs, incremental QALYs, and ICERs overall and all of the parameters
converge.
Deterministic sensitivity analyses showed that the greatest uncertainty is around CCR
administration costs, HR for OS, CCR remission rates, AZA acquisition and
administration costs, and the HR for RFS – i.e., factors generally tied to the difference in
total costs between AZA and CCR.
Alternative scenarios were also tested to investigate the uncertainty around the model
structure and assumptions. Vial sharing assumptions had the greatest effect on cost-
effectiveness producing dominant ICERs. Using Kaplan-Meier curves without
extrapolation also had a noticeable impact, increasing the ICER to £32,393. Use of a
shorter time horizon (1 year) also increased the ICER to £54,376.
All but one of the sensitivity analyses produced ICERs below £50,000 per QALY. This
was only crossed when the administration costs of CCR were reduced by 20% (ICER
£52,681).
5.8.5 Subgroup analysis
The results of the two subgroups (patients with poor-risk cytogenetics and patients with
MDS related changes) are presented below. As subsequent-treatment adjustment was
not possible for these subgroups, results are presented without adjustment.
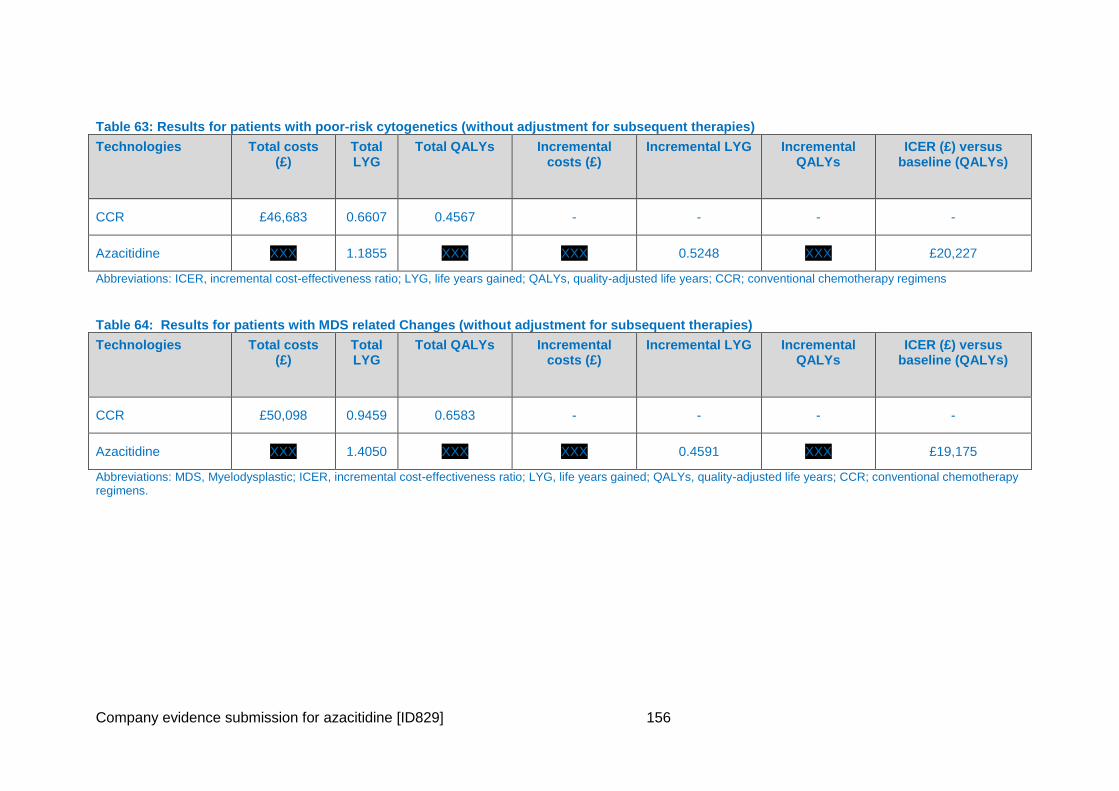
Company evidence submission for azacitidine [ID829] 156
Table 63: Results for patients with poor-risk cytogenetics (without adjustment for subsequent therapies)
Technologies Total costs (£)
Total LYG
Total QALYs Incremental costs (£)
Incremental LYG Incremental QALYs
ICER (£) versus baseline (QALYs)
CCR £46,683 0.6607 0.4567 - - - -
Azacitidine XXX 1.1855 XXX XXX 0.5248 XXX £20,227
Abbreviations: ICER, incremental cost-effectiveness ratio; LYG, life years gained; QALYs, quality-adjusted life years; CCR; conventional chemotherapy regimens
Table 64: Results for patients with MDS related Changes (without adjustment for subsequent therapies)
Technologies Total costs (£)
Total LYG
Total QALYs Incremental costs (£)
Incremental LYG Incremental QALYs
ICER (£) versus baseline (QALYs)
CCR £50,098 0.9459 0.6583 - - - -
Azacitidine XXX 1.4050 XXX XXX 0.4591 XXX £19,175
Abbreviations: MDS, Myelodysplastic; ICER, incremental cost-effectiveness ratio; LYG, life years gained; QALYs, quality-adjusted life years; CCR; conventional chemotherapy regimens.
Company evidence submission for azacitidine [ID829] 157
5.9 Validation
The model was validated through a multistep process to verify the structure and
underlying modelling and economic assumptions; this was followed by verification of all
numerical data included in the model and mark-up of the reference publication.
5.9.1 Validation of assumptions
The model structure and underlying assumptions were assessed at four levels.
An internal clinical validation was performed by PRMA Consulting’s Senior Medical
Director, Professor Deborah Saltman.
PRMA Consulting’s senior management and expert health economists performed an
internal validation.
The validity of the model was confirmed by XXX, an external technical advisor with
extensive experience of NICE HTAs.
Externally, two UK clinical oncologists validated the model structure and key
assumptions; one of them also validated HCRU inputs (types of HCRU involved) and
model outputs on effectiveness.
The model was also reviewed by the Celgene team.
5.9.2 Internal model validation
Internal validation involved checking the model for face validity (plausibility) and technical
validity (verification).
The model developers used a checklist to ensure that the model generates accurate
results and that these are consistent with input data and robust to extreme values. The
checks are documented in Table 65.
A health economist who was not involved in development of the cost-effectiveness
analysis checked the formulas.
Table 65: Checklist used to check the model inputs and results
Check Purpose
Set discount rate to 0 To confirm that discounted and non-discounted results are equal
Set main HSUVs to 0 To confirm that QALYs are zero, or can be explained by utility decrements associated with adverse events
Set all HSUVs to 1 To confirm that LYs are equal to QALYs, or that any difference can be explained by utility decrements associated with adverse events
Set drug costs to 0 To confirm that drug costs are zero
Set admin costs to 0 To confirm that administration costs are zero
Set all non-drug costs to 0 To confirm that non-drug costs are zero
Manually confirm tornado diagram calculations by changing user-
To confirm that that tornado diagram calculations are correct
Company evidence submission for azacitidine [ID829] 158
Check Purpose
altered cells
Abbreviations: HSUV, health state utility value; LY, life-year; QALY, quality-adjusted life-year.
5.9.3 Validation of model outcomes
The overall survival from the model for the CCR arm has been compared to UK specific
real world data from the HMRN registry (data on file). Figure 35 provides a comparison
for all patients and Figure 36 for those patients with poor-risk cytogenetics.
Figure 35: Comparison of CCR OS data to HMRN
XXX
Figure 36: Comparison of CCR OS data for patients with poor-risk cytogenetics to HMRN XXX
It can be seen that the model predicts slightly better outcomes than have been seen for
patients treated with CCR in UK clinical practice. When adjustment is made for
subsequent therapies, the survival curves move closer to that seen in the real world. This
further emphasises that CCR survival in AZA-AML-001 could have benefited from
patients switching treatment to receive azacitidine which they currently cannot do in
clinical practice in the UK.
The similar curve shapes suggest the model is replicating real life experience plausibly
and that the results of AZA-AML-001 can be interpreted with a degree of comfort once
adjustments have been made for subsequent treatments.
5.10 Interpretation and conclusions of economic evidence
The model has a number of strengths and weakness which should be considered when
interpreting the results.
5.10.1 Strengths
The model was developed according to published methodological guidance and includes
advanced modelling techniques. All model inputs have been based on the AZA-AML-001
trial, published sources (such as NHS reference costs), or inputs from key opinion
leaders.
The model is user-friendly, transparent, and flexible. It allows the user to compare
azacitidine and CCR in the overall population, or individually by preselected CCR. The
model has built-in functionalities to run a range of sensitivity analyses including one-way
SA via variation of key inputs, PSA, and alternative scenario analyses.
The model structure, clinical assumptions underlying the model, and model outputs for
effectiveness have been validated by two UK clinicians with input from a further 7 UK
clinicians.
Company evidence submission for azacitidine [ID829] 159
5.10.2 Limitations
Although a systematic approach to survival modelling approach was taken, and a range
of sensitivity analyses have addressed the uncertainty in model parameters and
structure, the results should be treated with caution because of some limitations.
The impact of disutility of AEs may have been underestimated because it was based on
grade 3 or worse AEs, although this is a common assumption in oncology modelling, and
should reflect impactful AEs.
HCRU and costs are comprised of a combination of trial data, published unit costs, and a
survey of clinicians with experience treating patients with AML; the latter is an uncertain
source of input data mainly because azacitidine itself is not a part of usual clinical
practice to treat AML >30% blasts in England and Wales. However, in the absence of
trial-based or observational data on HCRU, it is considered to be a representative
dataset for England and Wales.
Finally, comparison is limited across types of survival analysis, treatment groups for IC,
LDAC, and BSC, and subgroups for cytogenetic risk and myelodysplasia-related
changes by the fact that HRs adjusted for subsequent treatments are only able to be
estimated for the overall patient population, not subgroups or other treatment groups and
it has been shown above that it is important to adjust the OS results of AZA-AML-001 for
the impact of subsequent treatments.
5.10.3 Conclusion
One-way Sensitivity analysis has shown that the ICER is most sensitive to the
administration costs, assumptions on vial sharing and to rates of remission – i.e., to
factors linked to the difference in total costs between AZA and CCR. However, the
majority of sensitivity analyses tested produced ICERs around £30,000 per QALY and
very few rose above £50,000 per QALY.
Both the deterministic (£20,648) and probabilistic results (£17,423) show that the ICER is
well below what is usually accepted for Orphan, life-extending medicines and azacitidine
also demonstrated cost-effectiveness in the hard-to-treat subgroups of poor-risk
cytogenetics and MDS related changes where there is a real unmet need for an effective
treatment option (ICERs £20,227 and £19,175 respectively). The PSA also demonstrates
that at a willingness-to-pay threshold of £20,000 per QALY, the probability of azacitidine
being cost effective versus CCR is 69.9%. If the threshold is increased to £30,000 or
£50,000 per QALY, the probability of cost-effectiveness increases to 90.8% and 99.6%
respectively.
Azacitidine should be reimbursed for the treatment of adult patients aged 65 years or
older who are not eligible for HSCT with AML with >30% marrow blasts according to the
WHO classification.
Company evidence submission for azacitidine [ID829] 160
6 Assessment of factors relevant to the NHS and other parties
6.1 The purpose of this section is to provide an analysis of any factors relevant to the NHS and other parties that may fall outside the remit of the assessments of clinical and cost effectiveness. This will allow subsequent evaluation of the budget impact analysis. Such factors might include issues relating to service organisation and provision, resource allocation and equity, societal or ethical issues, plus any impact on patients or carers.
Provide the information specified in sections 6.2–6.10.
6.2 State how many people are eligible for treatment in England. Present results for the full marketing authorisation or CE marking and for any subgroups considered. Also present results for the subsequent 5 years.
Table 66: Eligible Population for the full marketing authorisation
Year 2016 2017 2018 2019 2020
Population aged over 65 9,685,248 9,759,824 9,834,975 9,910,704 9,987,016
Prevalent population - - - - -
Incident population 1,777 1,791 1,805 1,819 1,833
Incident population less those eligible for HSCT (from 2013)
1,282 1,296 1,310 1,324 1,338
AML ineligible for HSCT cases with blasts > 30% (80%)
1,026 1,037 1,048 1,059 1,070
Abreviations: HSCT, haematopoietic stem cell transplantation; AML, Acute Myeloid Leukaemia
Table 67: Subgroup Population with poor risk cytogenetics
Year 2016 2017 2018 2019 2020
Population 9,685,248 9,759,824 9,834,975 9,910,704 9,987,016
Prevalent population - - - - -
Incident population 1,777 1,791 1,805 1,819 1,833
Incident population less those eligible for HSCT (from 2013)
1,282 1,296 1,310 1,324 1,338
Population with poor risk cytogenetics (34.8%)
446 451 456 461 465
AML ineligible for HSCT cases with blasts > 30% (80%)
357 361 365 368 372
Abreviations: HSCT, haematopoietic stem cell transplantation; AML, Acute Myeloid Leukaemia
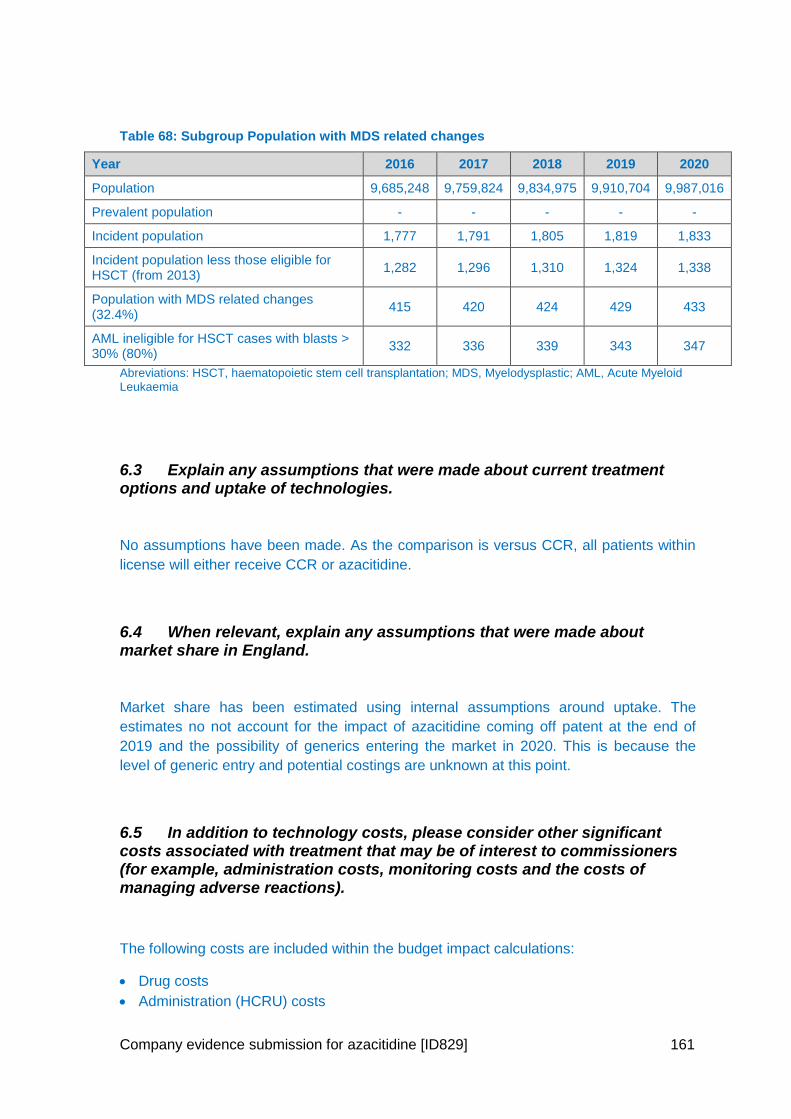
Company evidence submission for azacitidine [ID829] 161
Table 68: Subgroup Population with MDS related changes
Year 2016 2017 2018 2019 2020
Population 9,685,248 9,759,824 9,834,975 9,910,704 9,987,016
Prevalent population - - - - -
Incident population 1,777 1,791 1,805 1,819 1,833
Incident population less those eligible for HSCT (from 2013)
1,282 1,296 1,310 1,324 1,338
Population with MDS related changes (32.4%)
415 420 424 429 433
AML ineligible for HSCT cases with blasts > 30% (80%)
332 336 339 343 347
Abreviations: HSCT, haematopoietic stem cell transplantation; MDS, Myelodysplastic; AML, Acute Myeloid Leukaemia
6.3 Explain any assumptions that were made about current treatment options and uptake of technologies.
No assumptions have been made. As the comparison is versus CCR, all patients within
license will either receive CCR or azacitidine.
6.4 When relevant, explain any assumptions that were made about market share in England.
Market share has been estimated using internal assumptions around uptake. The
estimates no not account for the impact of azacitidine coming off patent at the end of
2019 and the possibility of generics entering the market in 2020. This is because the
level of generic entry and potential costings are unknown at this point.
6.5 In addition to technology costs, please consider other significant costs associated with treatment that may be of interest to commissioners (for example, administration costs, monitoring costs and the costs of managing adverse reactions).
The following costs are included within the budget impact calculations:
Drug costs
Administration (HCRU) costs
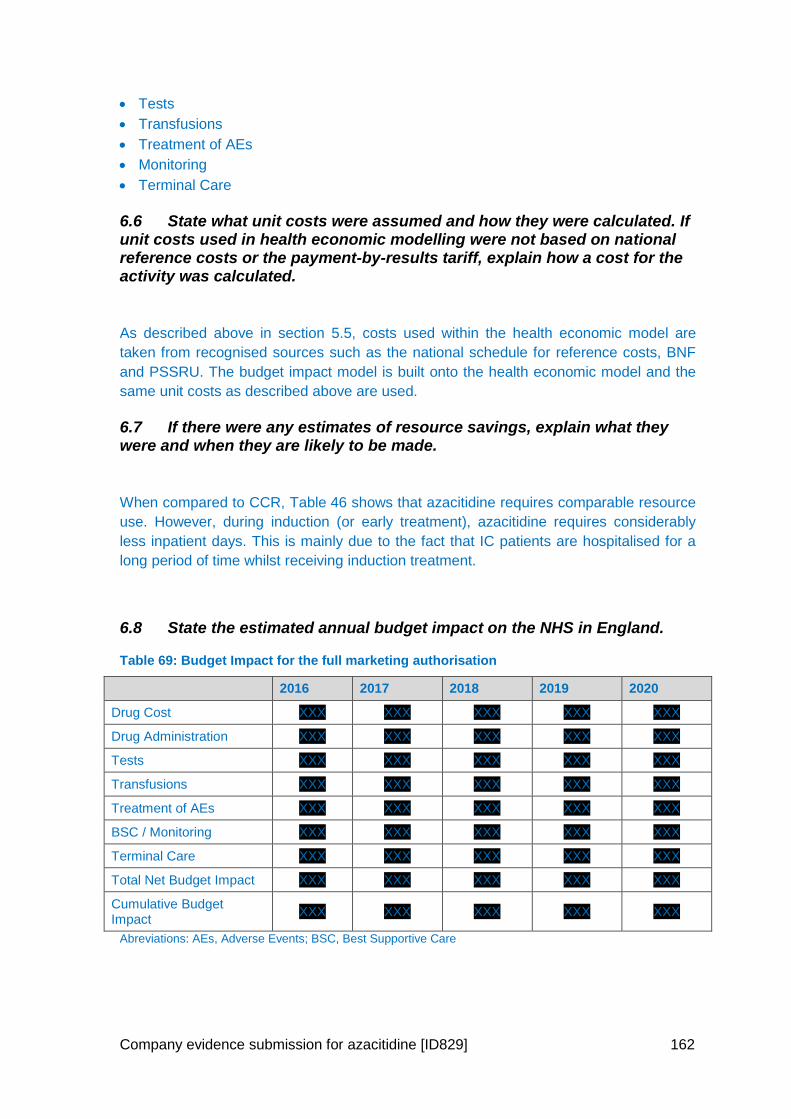
Company evidence submission for azacitidine [ID829] 162
Tests
Transfusions
Treatment of AEs
Monitoring
Terminal Care
6.6 State what unit costs were assumed and how they were calculated. If unit costs used in health economic modelling were not based on national reference costs or the payment-by-results tariff, explain how a cost for the activity was calculated.
As described above in section 5.5, costs used within the health economic model are
taken from recognised sources such as the national schedule for reference costs, BNF
and PSSRU. The budget impact model is built onto the health economic model and the
same unit costs as described above are used.
6.7 If there were any estimates of resource savings, explain what they were and when they are likely to be made.
When compared to CCR, Table 46 shows that azacitidine requires comparable resource
use. However, during induction (or early treatment), azacitidine requires considerably
less inpatient days. This is mainly due to the fact that IC patients are hospitalised for a
long period of time whilst receiving induction treatment.
6.8 State the estimated annual budget impact on the NHS in England.
Table 69: Budget Impact for the full marketing authorisation
2016 2017 2018 2019 2020
Drug Cost XXX XXX XXX XXX XXX
Drug Administration XXX XXX XXX XXX XXX
Tests XXX XXX XXX XXX XXX
Transfusions XXX XXX XXX XXX XXX
Treatment of AEs XXX XXX XXX XXX XXX
BSC / Monitoring XXX XXX XXX XXX XXX
Terminal Care XXX XXX XXX XXX XXX
Total Net Budget Impact XXX XXX XXX XXX XXX
Cumulative Budget Impact
XXX XXX XXX XXX XXX
Abreviations: AEs, Adverse Events; BSC, Best Supportive Care
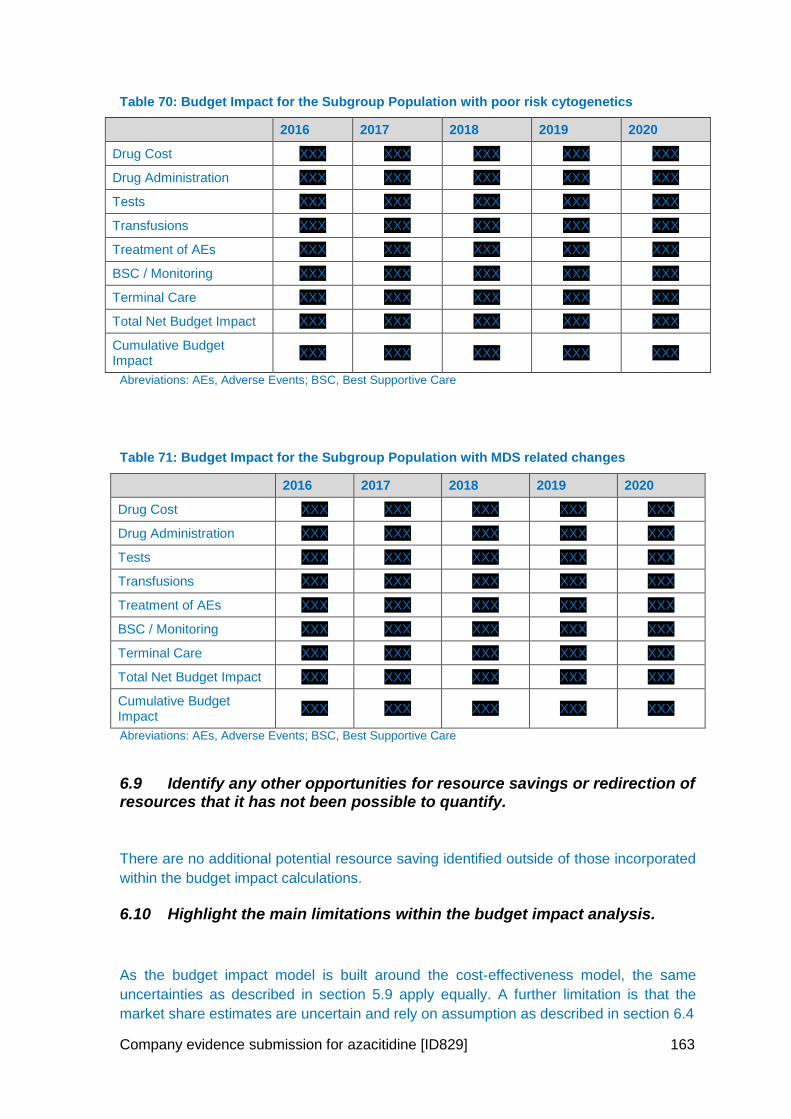
Company evidence submission for azacitidine [ID829] 163
Table 70: Budget Impact for the Subgroup Population with poor risk cytogenetics
2016 2017 2018 2019 2020
Drug Cost XXX XXX XXX XXX XXX
Drug Administration XXX XXX XXX XXX XXX
Tests XXX XXX XXX XXX XXX
Transfusions XXX XXX XXX XXX XXX
Treatment of AEs XXX XXX XXX XXX XXX
BSC / Monitoring XXX XXX XXX XXX XXX
Terminal Care XXX XXX XXX XXX XXX
Total Net Budget Impact XXX XXX XXX XXX XXX
Cumulative Budget Impact
XXX XXX XXX XXX XXX
Abreviations: AEs, Adverse Events; BSC, Best Supportive Care
Table 71: Budget Impact for the Subgroup Population with MDS related changes
2016 2017 2018 2019 2020
Drug Cost XXX XXX XXX XXX XXX
Drug Administration XXX XXX XXX XXX XXX
Tests XXX XXX XXX XXX XXX
Transfusions XXX XXX XXX XXX XXX
Treatment of AEs XXX XXX XXX XXX XXX
BSC / Monitoring XXX XXX XXX XXX XXX
Terminal Care XXX XXX XXX XXX XXX
Total Net Budget Impact XXX XXX XXX XXX XXX
Cumulative Budget Impact
XXX XXX XXX XXX XXX
Abreviations: AEs, Adverse Events; BSC, Best Supportive Care
6.9 Identify any other opportunities for resource savings or redirection of resources that it has not been possible to quantify.
There are no additional potential resource saving identified outside of those incorporated
within the budget impact calculations.
6.10 Highlight the main limitations within the budget impact analysis.
As the budget impact model is built around the cost-effectiveness model, the same
uncertainties as described in section 5.9 apply equally. A further limitation is that the
market share estimates are uncertain and rely on assumption as described in section 6.4

Company evidence submission for azacitidine [ID829] 164
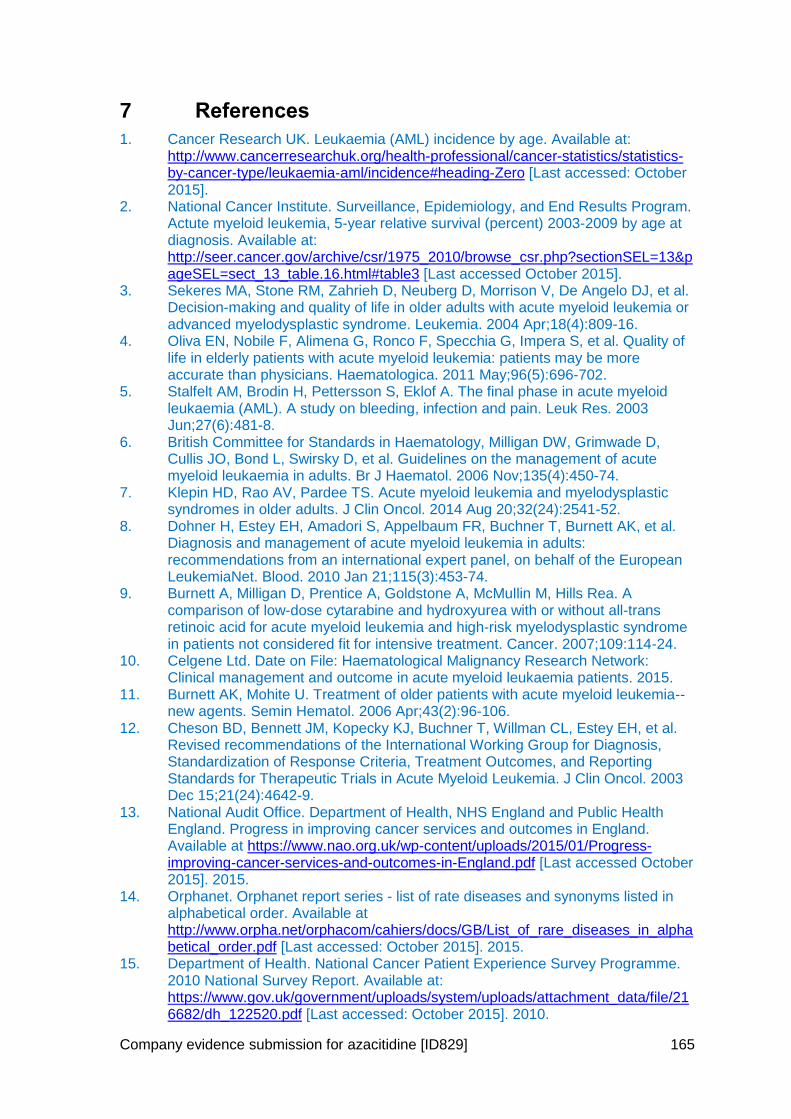
Company evidence submission for azacitidine [ID829] 165
7 References
1. Cancer Research UK. Leukaemia (AML) incidence by age. Available at: http://www.cancerresearchuk.org/health-professional/cancer-statistics/statistics-by-cancer-type/leukaemia-aml/incidence#heading-Zero [Last accessed: October 2015].
2. National Cancer Institute. Surveillance, Epidemiology, and End Results Program. Actute myeloid leukemia, 5-year relative survival (percent) 2003-2009 by age at diagnosis. Available at: http://seer.cancer.gov/archive/csr/1975_2010/browse_csr.php?sectionSEL=13&pageSEL=sect_13_table.16.html#table3 [Last accessed October 2015].
3. Sekeres MA, Stone RM, Zahrieh D, Neuberg D, Morrison V, De Angelo DJ, et al. Decision-making and quality of life in older adults with acute myeloid leukemia or advanced myelodysplastic syndrome. Leukemia. 2004 Apr;18(4):809-16.
4. Oliva EN, Nobile F, Alimena G, Ronco F, Specchia G, Impera S, et al. Quality of life in elderly patients with acute myeloid leukemia: patients may be more accurate than physicians. Haematologica. 2011 May;96(5):696-702.
5. Stalfelt AM, Brodin H, Pettersson S, Eklof A. The final phase in acute myeloid leukaemia (AML). A study on bleeding, infection and pain. Leuk Res. 2003 Jun;27(6):481-8.
6. British Committee for Standards in Haematology, Milligan DW, Grimwade D, Cullis JO, Bond L, Swirsky D, et al. Guidelines on the management of acute myeloid leukaemia in adults. Br J Haematol. 2006 Nov;135(4):450-74.
7. Klepin HD, Rao AV, Pardee TS. Acute myeloid leukemia and myelodysplastic syndromes in older adults. J Clin Oncol. 2014 Aug 20;32(24):2541-52.
8. Dohner H, Estey EH, Amadori S, Appelbaum FR, Buchner T, Burnett AK, et al. Diagnosis and management of acute myeloid leukemia in adults: recommendations from an international expert panel, on behalf of the European LeukemiaNet. Blood. 2010 Jan 21;115(3):453-74.
9. Burnett A, Milligan D, Prentice A, Goldstone A, McMullin M, Hills Rea. A comparison of low-dose cytarabine and hydroxyurea with or without all-trans retinoic acid for acute myeloid leukemia and high-risk myelodysplastic syndrome in patients not considered fit for intensive treatment. Cancer. 2007;109:114-24.
10. Celgene Ltd. Date on File: Haematological Malignancy Research Network: Clinical management and outcome in acute myeloid leukaemia patients. 2015.
11. Burnett AK, Mohite U. Treatment of older patients with acute myeloid leukemia--new agents. Semin Hematol. 2006 Apr;43(2):96-106.
12. Cheson BD, Bennett JM, Kopecky KJ, Buchner T, Willman CL, Estey EH, et al. Revised recommendations of the International Working Group for Diagnosis, Standardization of Response Criteria, Treatment Outcomes, and Reporting Standards for Therapeutic Trials in Acute Myeloid Leukemia. J Clin Oncol. 2003 Dec 15;21(24):4642-9.
13. National Audit Office. Department of Health, NHS England and Public Health England. Progress in improving cancer services and outcomes in England. Available at https://www.nao.org.uk/wp-content/uploads/2015/01/Progress-improving-cancer-services-and-outcomes-in-England.pdf [Last accessed October 2015]. 2015.
14. Orphanet. Orphanet report series - list of rate diseases and synonyms listed in alphabetical order. Available at http://www.orpha.net/orphacom/cahiers/docs/GB/List_of_rare_diseases_in_alphabetical_order.pdf [Last accessed: October 2015]. 2015.
15. Department of Health. National Cancer Patient Experience Survey Programme. 2010 National Survey Report. Available at: https://www.gov.uk/government/uploads/system/uploads/attachment_data/file/216682/dh_122520.pdf [Last accessed: October 2015]. 2010.
Company evidence submission for azacitidine [ID829] 166
16. Dombret H, et al. Results of a Phase 3 multicenter, randomized, open-label study of azacitidine vs conventional care regimens in older patients with newly diagnosed acute myeloid leukemia. Haematologica. 2014;99:LB2433.
17. Burnett AK, Hills RK, Hunter AE, Milligan D, Kell WJ, Wheatley K, et al. The addition of gemtuzumab ozogamicin to low-dose Ara-C improves remission rate but does not significantly prolong survival in older patients with acute myeloid leukaemia: results from the LRF AML14 and NCRI AML16 pick-a-winner comparison. Leukemia. 2013 Jan;27(1):75-81.
18. Burnett AK, Russell N, Hills RK, Panoskaltsis N, Khwaja A, Hemmaway C, et al. A randomised comparison of the novel nucleoside analogue sapacitabine with low-dose cytarabine in older patients with acute myeloid leukaemia. Leukemia. 2015 Jun;29(6):1312-9.
19. Burnett AK, Russell NH, Culligan D, Cavanagh J, Kell J, Wheatley K, et al. The addition of the farnesyl transferase inhibitor, tipifarnib, to low dose cytarabine does not improve outcome for older patients with AML. Br J Haematol. 2012 Aug;158(4):519-22.
20. Dennis M, Russell N, Hills RK, Hemmaway C, Panoskaltsis N, McMullin MF, et al. Vosaroxin and vosaroxin plus low-dose Ara-C (LDAC) vs low-dose Ara-C alone in older patients with acute myeloid leukemia. Blood. 2015 May 7;125(19):2923-32.
21. Harousseau JL, Martinelli G, Jedrzejczak WW, Brandwein JM, Bordessoule D, Masszi T, et al. A randomized phase 3 study of tipifarnib compared with best supportive care, including hydroxyurea, in the treatment of newly diagnosed acute myeloid leukemia in patients 70 years or older. Blood. 2009 Aug 6;114(6):1166-73.
22. Kantarjian HM, Thomas XG, Dmoszynska A, Wierzbowska A, Mazur G, Mayer J, et al. Multicenter, randomized, open-label, phase III trial of decitabine versus patient choice, with physician advice, of either supportive care or low-dose cytarabine for the treatment of older patients with newly diagnosed acute myeloid leukemia. J Clin Oncol. 2012 Jul 20;30(21):2670-7.
23. Burnett AK, Russell NH, Hunter AE, Milligan D, Knapper S, Wheatley K, et al. Clofarabine doubles the response rate in older patients with acute myeloid leukemia but does not improve survival. Blood. 2013 Aug 22;122(8):1384-94.
24. Dombret H, Seymour JF, Butrym A, Wierzbowska A, Selleslag D, Jang JH, et al. International phase 3 study of azacitidine vs conventional care regimens in older patients with newly diagnosed AML with >30% blasts. Blood. 2015 Jul 16;126(3):291-9.
25. Pleyer L, Burgstaller S, Girschikofsky M, Linkesch W, Stauder R, Pfeilstocker M, et al. Azacitidine in 302 patients with WHO-defined acute myeloid leukemia: results from the Austrian Azacitidine Registry of the AGMT-Study Group. Ann Hematol. 2014 Nov;93(11):1825-38.
26. Ossenkoppele G, Lowenberg B. How I treat the older patient with acute myeloid leukemia. Blood. 2015;125(5):767-74.
27. National Cancer Research Institute. A programme of development for older patients with acute myeloid leukaemia and high risk myelodysplastic syndrome (trial reference ISRCTN 11036523). 2006.
28. National Institute for Health and Care Excellence. TA218. Azacitidine for the treatment of myelodysplastic syndromes, chronic myelomonocytic leukaemia and acute myeloid leukaemia. Available at: http://www.nice.org.uk/guidance/ta218/resources/azacitidine-for-the-treatment-of-myelodysplastic-syndromes-chronic-myelomonocytic-leukaemia-and-acute-myeloid-leukaemia-82600256379589 [Last accessed: October 2015]. 2011.
29. National Institute for Health and Care Excellence. TA254. Fingolimod for the treatment of highly active relapsing–remitting multiple sclerosis. Available at: http://www.nice.org.uk/Guidance/TA254 [Last accessed: November 2015]. 2012.
Company evidence submission for azacitidine [ID829] 167
30. Korn E, Freidlin B, Abrams J. Overall survival as the outcome for randomised clinical trials with effective subsequent therapies. Journal of Clinical Oncology. 2011;29:4642-9.
31. Kaminskas E, Farrell AT, Wang YC, Sridhara R, Pazdur R. FDA drug approval summary: azacitidine (5-azacytidine, Vidaza) for injectable suspension. Oncologist. 2005 Mar;10(3):176-82.
32. Esteller M. Epigenetics in cancer. N Engl J Med. 2008 Mar 13;358(11):1148-59. 33. Yoo CB, Jones PA. Epigenetic therapy of cancer: past, present and future. Nat
Rev Drug Discov. 2006 Jan;5(1):37-50. 34. Raj K, Mufti GJ. Azacytidine (Vidaza(R)) in the treatment of myelodysplastic
syndromes. Ther Clin Risk Manag. 2006 Dec;2(4):377-88. 35. Joint Formulary Committee. British National Formulary 69. The authority on the
selection and use of medicines. 2015:588. 36. Celgene Corporation. Clincal Study Report: AZA-AML-001 A phase 3,
multicenter, randomized, open-label, study of azacitidine (Vidaza) versus conventional care regimens for the treatment of older subjects with newly diagnosed acute myeloid leukemia. 2014.
37. Deschler B, Lubbert M. Acute myeloid leukemia: epidemiology and etiology. Cancer. 2006 Nov 1;107(9):2099-107.
38. Juliusson G, Lazarevic V, Horstedt AS, Hagberg O, Hoglund M, Swedish Acute Leukemia Registry G. Acute myeloid leukemia in the real world: why population-based registries are needed. Blood. 2012 Apr 26;119(17):3890-9.
39. Lang K, Earle CC, Foster T, Dixon D, Van Gool R, Menzin J. Trends in the treatment of acute myeloid leukaemia in the elderly. Drugs Aging. 2005;22(11):943-55.
40. Oran B, Weisdorf DJ. Survival for older patients with acute myeloid leukemia: a population-based study. Haematologica. 2012 Dec;97(12):1916-24.
41. Meyers J, Yu Y, Kaye JA, Davis KL. Medicare fee-for-service enrollees with primary acute myeloid leukemia: an analysis of treatment patterns, survival, and healthcare resource utilization and costs. Appl Health Econ Health Policy. 2013 Jun;11(3):275-86.
42. Haematological Malignancy Research Network. Incidence. Available at: https://www.hmrn.org/statistics/incidence [Last accessed: November 2015].
43. Office for National Statistics. Population Estimates for UK, England and Wales, Scotland and Northern Ireland, Mid-2014. Available at: http://ons.gov.uk/ons/publications/re-reference-tables.html?edition=tcm%3A77-368259 [Last accessed: November 2015]. 2015.
44. Office for National Statistics. Mid-year population estimates for the UK 2014. Available at: http://ons.gov.uk/ons/rel/pop-estimate/population-estimates-for-uk--england-and-wales--scotland-and-northern-ireland/mid-2014/mid-year-population-estimates-for-the-uk-2014.html [Last accessed: November 2015]. 2015.
45. Edlin R, Connock M, Tubeuf S, Round J, Fry-Smith A, Hyde C, et al. Azacitidine for the treatment of myelodysplastic syndrome, chronic myelomonocytic leukaemia and acute myeloid leukaemia. Health Technol Assess. 2010 May;14 Suppl 1:69-74.
46. Gajewski JL, Ho WG, Nimer SD, Hirji KF, Gekelman L, Jacobs AD, et al. Efficacy of intensive chemotherapy for acute myelogenous leukemia associated with a preleukemic syndrome. J Clin Oncol. 1989 Nov;7(11):1637-45.
47. Leone G, Mele L, Pulsoni A, Equitani F, Pagano L. The incidence of secondary leukemias. Haematologica. 1999 Oct;84(10):937-45.
48. Lowenberg B, Downing JR, Burnett A. Acute myeloid leukemia. N Engl J Med. 1999 Sep 30;341(14):1051-62.
49. Vardiman JW, Thiele J, Arber DA, Brunning RD, Borowitz MJ, Porwit A, et al. The 2008 revision of the World Health Organization (WHO) classification of myeloid
Company evidence submission for azacitidine [ID829] 168
neoplasms and acute leukemia: rationale and important changes. Blood. 2009 Jul 30;114(5):937-51.
50. Vey N. Targeting age-related changes in the biology of acute myeloid leukemia: is the patient seeing the progress? Interdiscip Top Gerontol. 2013;38:73-84.
51. Sherman AE, Motyckova G, Fega KR, Deangelo DJ, Abel GA, Steensma D, et al. Geriatric assessment in older patients with acute myeloid leukemia: a retrospective study of associated treatment and outcomes. Leuk Res. 2013 Sep;37(9):998-1003.
52. Klepin HD, Geiger AM, Tooze JA, Kritchevsky SB, Williamson JD, Pardee TS, et al. Geriatric assessment predicts survival for older adults receiving induction chemotherapy for acute myelogenous leukemia. Blood. 2013 May 23;121(21):4287-94.
53. Appelbaum FR, Gundacker H, Head DR, Slovak ML, Willman CL, Godwin JE, et al. Age and acute myeloid leukemia. Blood. 2006 May 1;107(9):3481-5.
54. Erba H. Has there been progress in the treatment of older patients with acute myeloid leukemia? Best Pract Res Clin Haematol. 2010;23(4):495-501.
55. Bevans M, Sternberg EM. Caregiving burden, stress, and health effects among family caregivers of adult cancer patients. JAMA. 2012 Jan 25;307(4):398-403.
56. Wang HI, Aas E, Howell D, Roman E, Patmore R, Jack A, et al. Long-term medical costs and life expectancy of acute myeloid leukemia: a probabilistic decision model. Value Health. 2014 Mar;17(2):205-14.
57. Redaelli A, Botteman MF, Stephens JM, Brandt S, Pashos CL. Economic burden of acute myeloid leukemia: a literature review. Cancer Treat Rev. 2004 May;30(3):237-47.
58. European Medicines Agency. Guideline on the evaluation of anticancer medicinal products in man CPMP/EWP/205/95/Rev.3/Corr.2. 2006.
59. National Comprehensive Cancer Network. NCCN guidelines version 1.2015 acute myeloid leukemia. 2015.
60. Taylor PR, Reid MM, Stark AN, Bown N, Hamilton PJ, Proctor SJ. De novo acute myeloid leukaemia in patients over 55-years-old: a population-based study of incidence, treatment and outcome. Northern Region Haematology Group. Leukemia. 1995 Feb;9(2):231-7.
61. Medeiros B, Satram-Hoang S, Hurst D, Hoang K, Momin F, Reyes C. Big data analysis of treatment patterns and outcomes among elderly acute myeloid leukemia patients in the United States. Ann Hematol. 2015;94:1127-38.
62. Juliusson G, Antunovic P, Derolf A, Lehmann S, Mollgard L, Stockelberg D, et al. Age and acute myeloid leukemia: real world data on decision to treat and outcomes from the Swedish Acute Leukemia Registry. Blood. 2009 Apr 30;113(18):4179-87.
63. National Institute for Health and Care Excellence. NICE pathways. Leukaemia. Available at: http://pathways.nice.org.uk/pathways/blood-and-bone-marrow-cancers/leukaemia#content=view-index&path=view%3A/pathways/blood-and-bone-marrow-cancers/leukaemia.xml [Last accessed: November 2015]. 2015.
64. Estey E, de Lima M, Tibes R, Pierce S, Kantarjian H, Champlin R, et al. Prospective feasibility analysis of reduced-intensity conditioning (RIC) regimens for hematopoietic stem cell transplantation (HSCT) in elderly patients with acute myeloid leukemia (AML) and high-risk myelodysplastic syndrome (MDS). Blood. 2007 Feb 15;109(4):1395-400.
65. Fey MF, Buske C, Group EGW. Acute myeloblastic leukaemias in adult patients: ESMO Clinical Practice Guidelines for diagnosis, treatment and follow-up. Ann Oncol. 2013 Oct;24 Suppl 6:vi138-43.
66. National Institute for Health and Care Excellence. TA270. Decitabine for the treatment of acute myeloid leukaemia (terminated appraisal). Available at: http://www.nice.org.uk/guidance/ta270 [Last accessed: November 2015]. 2012.
Company evidence submission for azacitidine [ID829] 169
67. Kantarjian HM. Therapy for elderly patients with acute myeloid leukemia: a problem in search of solutions. Cancer. 2007 Mar 15;109(6):1007-10.
68. Dohner H, Selleslag D, Cavenagh J, et al. Overall survival and clinical outcomes in older patients with acute myeloid leukemia treated with azacitidine or intensive chemotherapy in the AZA-AML-001 study. Paper presented at: Congress of the European Hematology Association 2015; Vienna, Austria. 2015.
69. Lao Z, Yiu R, Wong GC, Ho A. Treatment of elderly patients with acute myeloid leukemia with azacitidine results in fewer hospitalization days and infective complications but similar survival compared with intensive chemotherapy. Asia Pac J Clin Oncol. 2015 Mar;11(1):54-61.
70. Fenaux P, Mufti GJ, Hellstrom-Lindberg E, Santini V, Gattermann N, Germing U, et al. Azacitidine prolongs overall survival compared with conventional care regimens in elderly patients with low bone marrow blast count acute myeloid leukemia. J Clin Oncol. 2010 Feb 1;28(4):562-9.
71. Kadia TM, Thomas XG, Dmoszynska A, Wierzbowska A, Minden M, Arthur C, et al. Decitabine improves outcomes in older patients with acute myeloid leukemia and higher blast counts. Am J Hematol. 2015 Jul;90(7):E139-41.
72. Thomas XG, Arthur C, Delaunay J, Jones M, Berrak E, Kantarjian HM. A post hoc sensitivity analysis of survival probabilities in a multinational phase III trial of decitabine in older patients with newly diagnosed acute myeloid leukemia. Clin Lymphoma Myeloma Leuk. 2014 Feb;14(1):68-72.
73. Amadori S, Suciu S, Stasi R, Salih HR, Selleslag D, Muus P, et al. Sequential combination of gemtuzumab ozogamicin and standard chemotherapy in older patients with newly diagnosed acute myeloid leukemia: results of a randomized phase III trial by the EORTC and GIMEMA consortium (AML-17). J Clin Oncol. 2013 Dec 10;31(35):4424-30.
74. Bories P, Bertoli S, Berard E, Laurent J, Duchayne E, Sarry A, et al. Intensive chemotherapy, azacitidine, or supportive care in older acute myeloid leukemia patients: an analysis from a regional healthcare network. Am J Hematol. 2014 Dec;89(12):E244-52.
75. van der Helm LH, Scheepers ER, Veeger NJ, Daenen SM, Mulder AB, van den Berg E, et al. Azacitidine might be beneficial in a subgroup of older AML patients compared to intensive chemotherapy: a single centre retrospective study of 227 consecutive patients. J Hematol Oncol. 2013;6:29.
76. Minden MD, Dombret H, Seymour JF, Stone RM, Alibhai S, Nixone A, et al. The effect of azacitidine on health-related quality of life in older patients with newly diagnosed acute myeloid leukemia: Results from the AZA-AML-001 trial. Presented at the 20th Congress of the European Hematology Association (EHA); June 11-14, 2015; Vienna, Austria.
77. Vardiman JW, Harris NL, Brunning RD. The World Health Organization (WHO) classification of the myeloid neoplasms. Blood. 2002 Oct 1;100(7):2292-302.
78. Aaronson NK, Ahmedzai S, Bergman B, Bullinger M, Cull A, Duez NJ, et al. The European Organization for Research and Treatment of Cancer QLQ-C30: a quality-of-life instrument for use in international clinical trials in oncology. J Natl Cancer Inst. 1993 Mar 3;85(5):365-76.
79. Robins JM, Finkelstein DM. Correcting for noncompliance and dependent censoring in an AIDS Clinical Trial with inverse probability of censoring weighted (IPCW) log-rank tests. Biometrics. 2000 Sep;56(3):779-88.
80. Latimer N, Abrams K. NICE DSU Technical Support Document 16: Adjusting survival time estimates in the presence of treatment switching. Available at: http://www.nicedsu.org.uk/TSD16_Treatment_Switching.pdf [Last accessed: November 2015]. 2014.
81. Osoba D, Rodrigues G, Myles J, Zee B, Pater J. Interpreting the significance of changes in health-related quality-of-life scores. J Clin Oncol. 1998 Jan;16(1):139-44.
Company evidence submission for azacitidine [ID829] 170
82. Burnett AK, Hills RK, Hunter A, Milligan D, Kell J, Wheatley K, et al. The addition of arsenic trioxide to low-dose Ara-C in older patients with AML does not improve outcome. Leukemia. 2011 Jul;25(7):1122-7.
83. Bland JM, Altman DG. The logrank test. BMJ. 2004 May 1;328(7447):1073. 84. Pleyer L, Stauder R, Burgstaller S, Schreder M, Tinchon C, Pfeilstocker M, et al.
Azacitidine in patients with WHO-defined AML - results of 155 patients from the Austrian Azacitidine Registry of the AGMT-Study Group. J Hematol Oncol. 2013;6:32.
85. Pleyer L, Burgstaller S, Stauder R, Girschikofsky M, Sill H, Schlick K, et al. Azacitidine in acute myeloid leukemia with >30% bone marrow blasts and <15 g/l white blood cell count: Results from the Austrian azacitidine registry of the AGMT study group versus randomized controlled phase III clinical trial data. Presented at 57th Annual Meeting & Exposition, American Society of Haematology, Orlando, FL, December 5-8, 2015. 2015.
86. Ramos F, Thepot S, Pleyer L, Maurillo L, Itzykson R, Bargay J, et al. Azacitidine frontline therapy for unfit acute myeloid leukemia patients: clinical use and outcome prediction. Leuk Res. 2015 Mar;39(3):296-306.
87. Ramos F, Martinez-Robles V, Bargay J, Deben G, Garrido A, Serrano J, et al. Azacitidine as front-line therapy in AML: Results from Spanish National Registry. Alma Study Investigators. Presented at 54th Annual Meeting & Exposition, American Society of Haematology, Atlanta, GAL, December 8-11, 2012. 2012.
88. Thepot S, Itzykson R, Seegers V, Recher C, Raffoux E, Quesnel B, et al. Azacitidine in untreated acute myeloid leukemia: a report on 149 patients. Am J Hematol. 2014 Apr;89(4):410-6.
89. Gore SD, Fenaux P, Santini V, Bennett JM, Silverman LR, Seymour JF, et al. A multivariate analysis of the relationship between response and survival among patients with higher-risk myelodysplastic syndromes treated within azacitidine or conventional care regimens in the randomized AZA-001 trial. Haematologica. 2013 Jul;98(7):1067-72.
90. British Society of Blood and Marrow Transplantation. 2013 Activity: 2013 UK & ROI Transplant Table Indications. Available at: http://bsbmt.org/2013-activity/ [Last accessed: November 2015].
91. Celgene Ltd. Date on File: Celgene advisory board. 92. Greenberg P, Cox C, LeBeau MM, Fenaux P, Morel P, Sanz G, et al.
International scoring system for evaluating prognosis in myelodysplastic syndromes. Blood. 1997 Mar 15;89(6):2079-88.
93. Greenberg PL, Tuechler H, Schanz J, Sanz G, Garcia-Manero G, Sole F, et al. Revised international prognostic scoring system for myelodysplastic syndromes. Blood. 2012 Sep 20;120(12):2454-65.
94. Ambaglio I, Travaglino E, Della Porta M, Pascutto C, Ubezio M, Invernizzi R, et al. The impact of the degree of anemia on survival of patients with myelodysplastic syndrome. A basis for prognostic assessment and clinical decision making. Poster presented at EHA. Poster number: 310-P. 2010.
95. Celgene Ltd. Data on File: Celgene MDS patient chart study (UK). 96. Dufoir T, Saux MC, Terraza B, Marit G, Guessard S, Foulon G, et al.
Comparative cost of allogeneic or autologous bone marrow transplantation and chemotherapy in patients with acute myeloid leukaemia in first remission. Bone Marrow Transplantation. 1992;10(4):323-9.
97. Huang BT, Wang Y, Du QF, Yang J, Yu J, Zeng QC, et al. Analysis of efficacy and cost-effectiveness of high-dose arabinoside versus daunorubicin chemotherapy in older adult patients with acute myeloid leukemia by cytogenetic risk profile: Retrospective review from China. International Journal of Hematology. 2011 April;93(4):474-81.
Company evidence submission for azacitidine [ID829] 171
98. Lambertenghi-Deliliers G, Oriani A, Pioltelli P, Pogliani EM, Capri S. Cost-effectiveness analysis of induction regimens containing anthracyclines in adult acute myelogenous leukemia. Leukemia and Lymphoma. 1991;5(1):33-41.
99. Pashko S, Jacobs J, Santorsa J. The cost-effectiveness of idarubicin/cytosine arabinoside versus daunorubicin/cytosine arabinoside in the treatment of adults with acute myeloid leukemia. Clinical Therapeutics. 1991 May-Jun;13(3):353-60.
100. Batty N, Wiles S, Kabalan M, Sharma R, Shatzel J, Pang J, et al. Decitabine is more cost effective than standard conventional induction therapy in elderly acute myeloid leukemia patients. Blood. 2013 21 Oct;122 (21).
101. Kulikov A, Yagudina R, Misikova B. Pharmacoeconomic evaluation of acute myeloid leukemia and mds syndromes (intermediate and high risk) treatment with azacitidine in the russian federation. Value in Health. 2012 November;15 (7):A423.
102. Statler A, Singer M, Advani AS. A cost-effectiveness analysis evaluating allogeneic hematopoietic cell transplantation (AHCT) versus consolidation chemotherapy for the treatment of acute myeloid leukemia (AML) in first complete remission. Journal of Clinical Oncology. 2014 20 May;1).
103. Tallman M, Lo-Coco F, Barnes G, Kruse M, Wildner R, Martin M, et al. Cost-effectiveness analysis of arsenic trioxide for the treatment of in patients with acute promyelocytic leukemia. Value in Health. 2015 May;18 (3):A202.
104. National Institute for Health and Care Excellence. Guide to the methods of technology appraisal. http://publications.nice.org.uk/pmg9. 2013.
105. Kaltenthaler E, Tappenden P, Paisley S, Squires H. NICE DSU technical support document 13: identifying and reviewing evidence to inform the conceptualisation and population of cost-effectiveness models. 2011.
106. Latimer N. NICE DSU Technical Support Document 14: Undertaking survival analysis for economic evaluations alongside clinical trials - extrapolation with patient-level data. 2011.
107. Papaioannou D, Brazier J, Paisley S. NICE DSU technical support document 9: the identification, review, and synthesis of health state utility values from the literature. 2010.
108. Caro JJ, Briggs AH, Siebert U, Kuntz KM, Force I-SMGRPT. Modeling good research practices--overview: a report of the ISPOR-SMDM Modeling Good Research Practices Task Force-1. Med Decis Making. 2012 Sep-Oct;32(5):667-77.
109. Eddy DM, Hollingworth W, Caro JJ, Tsevat J, McDonald KM, Wong JB, et al. Model transparency and validation: a report of the ISPOR-SMDM Modeling Good Research Practices Task Force-7. Med Decis Making. 2012 Sep-Oct;32(5):733-43.
110. https://www.hmrn.org/about/info accessed on: 14/11/15. 111. Cole SR, Hernan MA. Adjusted survival curves with inverse probability weights.
Comput Methods Programs Biomed. 2004 Jul;75(1):45-9. 112. Davies A, Briggs A, Schneider J, Levy A, Ebeid O, al e. The Ends Justify the
Mean: Outcome Measures for Estimating the Value of New Cancer Therapies. 2012.
113. Latimer NR, Abrams KR, Lambert PC, Crowther MJ, Wailoo AJ, Morden JP, et al. Adjusting survival time estimates to account for treatment switching in randomized controlled trials--an economic evaluation context: methods, limitations, and recommendations. Med Decis Making. 2014 Apr;34(3):387-402.
114. McKenzie L, van der Pol M. Mapping the EORTC QLQ C-30 onto the EQ-5D instrument: the potential to estimate QALYs without generic preference data. Value Health. 2009 Jan-Feb;12(1):167-71.
115. Proskorovsky I, Lewis P, Williams CD, Jordan K, Kyriakou C, Ishak J, et al. Mapping EORTC QLQ-C30 and QLQ-MY20 to EQ-5D in patients with multiple myeloma. Health Qual Life Outcomes. 2014;12:35.
Company evidence submission for azacitidine [ID829] 172
116. Longworth L, Yang Y, Young T, Mulhern B, Hernandez Alava M, Mukuria C, et al. Use of generic and condition-specific measures of health-related quality of life in NICE decision-making: a systematic review, statistical modelling and survey. Health Technol Assess. 2014 Feb;18(9):1-224.
117. Addicott R, Dewar S. Improving choice at end of life. King's Fund. Accessed on: 05/09/15 http://www.kingsfund.org.uk/sites/files/kf/improving-choice-end-of-life-descriptive-analysis-impact-costs-marie-curie-choice-programme-lincolnshire-rachael-addicot-steve-dewar-april-2008.pdf. 2008.
118. NHS Blood and Transplant. Price List 2015/16; Code BC001; http://hospital.blood.co.uk/media/27457/price_list_2015-16.pdf, accessed on: 15/11/15.
119. NHS Blood and Transplant. Price List 2015/16; Code BC04; http://hospital.blood.co.uk/media/27457/price_list_2015-16.pdf, accessed on: 15/11/15.
120. Briggs AH, Weinstein MC, Fenwick EA, Karnon J, Sculpher MJ, Paltiel AD, et al. Model parameter estimation and uncertainty analysis: a report of the ISPOR-SMDM Modeling Good Research Practices Task Force Working Group-6. Med Decis Making. 2012 Sep-Oct;32(5):722-32.
Company evidence submission for azacitidine [ID829] 173
8 Appendices
[List the titles of the appendices here. All appendices should be provided as separate
documents to the main submission.]
Abacus guidance: see separate appendices template to help complete appendices as
appropriate
Appendix 1: SmPC and EPAR
Appendix 2: Search strategy for relevant studies
Appendix 3: AWG 2003 response criteria
Appendix 4: HRQoL results from AZA-AML-001
Appendix 5: Subgroup analyses from AZA-AML-001
Appendix 6: Adverse reactions by patient exposure from AZA-AML-001
Appendix 7: Search strategy for cost-effectiveness studies
Appendix 8: Quality assessment of cost-effectiveness studies
Appendix 9: Extrapolation of data
XXX
Appendix 10: HCRU questionnaire
Level 1A City Tower
Manchester M1 4BT
United Kingdom
+44 (0)300 323 0140
www.nice.org.uk
Single technology appraisal
Leukaemia (acute myeloid, over 30% blasts) – azacitidine [ID829]
Dear [Insert name],
The Evidence Review Group, the Peninsula Technology Assessment Group (PenTAG), and
the technical team at NICE have looked at the submission received on 25th November 2015
from Celgene. In general they felt that it is well presented and clear. However, the ERG and
the NICE technical team would like further clarification on the clinical and cost effectiveness
data (see questions listed at end of letter).
The ERG and the technical team at NICE will be addressing these issues in their reports.
Please provide your written response to the clarification questions by 5pm on 8th January
2016. Your response and any supporting documents should be uploaded to NICE
Docs/Appraisals [embed NICE DOCS LINK].
Two versions of your written response should be submitted; one with academic/commercial-
in-confidence information clearly marked and one with this information removed.
Please underline all confidential information, and separately highlight information that is
submitted as commercial in confidence in turquoise, and all information submitted as
academic in confidence in yellow.
If you present data that are not already referenced in the main body of your submission and
that are academic/commercial in confidence, please complete the attached checklist for
confidential information.
Please do not embed documents (PDFs or spreadsheets) in your response because this
may result in them being lost or unreadable.
If you have any queries on the technical issues raised in this letter, please contact Nicola
Hay, Technical Adviser ([email protected]). Any procedural questions should be
addressed to Stephanie Yates, Project Manager ([email protected]).
Yours sincerely
Nicola Hay
Technical Adviser
On behalf of
Dr Frances Sutcliffe
Level 1A City Tower
Manchester M1 4BT
United Kingdom
+44 (0)300 323 0140
www.nice.org.uk
Associate Director – Appraisals
Centre for Health Technology Evaluation
Encl. checklist for confidential information
Section A: Clarification on clinical effectiveness data
A1. Priority question: Patient level transcripts have been received. Please provide a
data dictionary for the variables in the data files ID829 azacitidine AML 3245
trial data 141215 SY [CIC].dta, ID829 azacitidine AML os_blxt 141215
SY [CIC].dta, and ID829 azcitidine AML wgtanalaealt 141215 SY
[CICC].dta.
Literature searching
A2. Please clarify the host platform through which EMBASE was searched? If it was not
OVID, please separate out the MEDLINE searches from the EMBASE search,
thereby providing MEDLINE OVID searches in one annex and the EMBASE search
in another.
A3. Priority Question: The literature searches exclude studies reporting meta-analyses
or systematic reviews. Please provide the rationale for this decision.
A4. Page 41 of the company submission states that ‘three materials were added from a
manual search of literature databases and conference proceedings.’
a. Please provide the complete citations for the materials that were added.
b. Please clarify which literature databases were searched manually.
A5. Page 85 of the company submission states that 'no further studies that report
additional adverse reactions… and that are of relevance to the decision problem are
available.'
a. Please clarify if separate literature searches been undertaken to identify
studies reporting adverse effects.
b. If a separate literature search has been undertaken, please provide the
search strategies and a table of studies excluded.
c. If no separate searches were undertaken, please provide further commentary
to support the statement that ‘no further studies that report additional adverse
events …that are of relevance to the decision problem are available.’
Level 1A City Tower
Manchester M1 4BT
United Kingdom
+44 (0)300 323 0140
www.nice.org.uk
A6. Page 98 of the company submission states that ‘there are no completed or ongoing
company-sponsored studies from which new evidence will become available in the
next 12 months.’ Please confirm whether there are any such studies from which new
evidence will become available beyond 12 months.
A7. Please provide full citations for the 15 studies excluded as they were published pre-
2000 (Appendix 2.4, Table 1).
AZA-AML-001 trial
Methods
A8. Page 54 of the company’s submission: Please clarify why the sample size
calculations assumed a split of 50:30:20 for intensive chemotherapy: low-dose
cytarabine: best supportive care.
A9. Please confirm whether loss to follow-up was treated as an event rather than
censored for relapse-free survival, event- free survival (Table 11, page 50 of the
company’s submission) and progression-free survival (page 112 of the company’s
submission).Please provide justification as to why loss to follow-up was treated as
an event if applicable.
A10. Please clarify why event-free survival, relapse-free survival and progression-free
survival were not adjusted for treatment switching.
A11. Last row of Table 17, (page 64 of the company’s submission) ‘Did the analysis
include an intention-to-treat analysis? If so, was this appropriate and were
appropriate methods used to account for missing data?’ In response to the question,
it is stated that ‘the ITT population was the most appropriate population as it
included all randomised patients.’ Please clarify how missing data were dealt with in
the analysis of primary and secondary outcomes, including the post-hoc analysis to
adjust for treatment switching.
A12. Section 4.7.4, pages 69-71 of the company’s submission:
a. Please clarify how covariates were selected for the analyses.
b. Please clarify why no time-varying covariates (e.g. bone marrow or peripheral
blood blast count) were included in the propensity score for the Inverse
probability of censoring weighted method.
A13. Section 4.7.4.1, pages 65-66 of the company’s submission: Please provide a
description of the methods used to perform the regression-based imputation analysis
adjusting for subsequent therapy.
Level 1A City Tower
Manchester M1 4BT
United Kingdom
+44 (0)300 323 0140
www.nice.org.uk
A14. Section 4.7.5.8, Health-related quality of life, page 77 of the company’s submission:
states that ‘A mixed model analysis failed to reveal any statistically significant
differences in the impact of treatment on all domains between treatment arms.’
Please clarify what statistical distribution was used for this analysis, any if there were
any stratification and fixed and time-varying covariate adjustment and adjustment for
differential drop-out across treatment arms.
A15. Please provide a table giving the counts and incidence rates for each treatment arm
of the AZA-AML-001 trial (azacitidine, intensive chemotherapy, low-dose cytarabine,
best supportive care) of the grade ≥3 treatment related adverse events that occurred
in >10% of patients in any treatment arm.
Results
A16. Please state the number of UK patients (26 in total) randomised to azacitidine,
intensive chemotherapy, low-dose cytarabine, and best supportive care.
A17. Table 16, page 61 of the company submission: Please provide a corrected version of
Table 16 (The numbers in ‘Cytogenetic risk status – local/central’ do not appear to
sum to the number of patients randomised [unless ‘Normal’ patients are excluded –
perhaps these should be indicated as a subset of ‘Intermediate’?]). There also
appears to be some inaccuracies in the ‘Prior history of MDS’ when compared with
Dombret et al. 2015 and the AZA-AML-001 clinical study report.
A18. Table 22, page 72 of the company’s submission: Please confirm whether the
proportion of patients randomised to azacitidine experiencing relapse after complete
remission or complete remission with incomplete blood count recovery is 63.2% or
64.2% (as per Dombret et al. 2015 and the AZA-AML-001 clinical study report).
A19. Please confirm whether the age range of patients randomised to low-dose
cytarabine is 65–89 years (as per page 59 of the company submission) or 65–88
years (as per Dombret et al. 2015 and the AZA-AML-001 clinical study report).
A20. Please complete the table below for event-free survival and relapse-free survival..
For each treatment arm (azacitidine [AZA], intensive chemotherapy [IC], low-dose
cytarabine [LDAC], best supportive care [BSC]). Please provide a tabulation of the
count of each event type (at the latest snapshot), for example for relapse-free
survival.
Arm AZA CCR
IC LDAC BSC
Relapse XX XX XX XX
Death from any
cause
XX XX XX XX
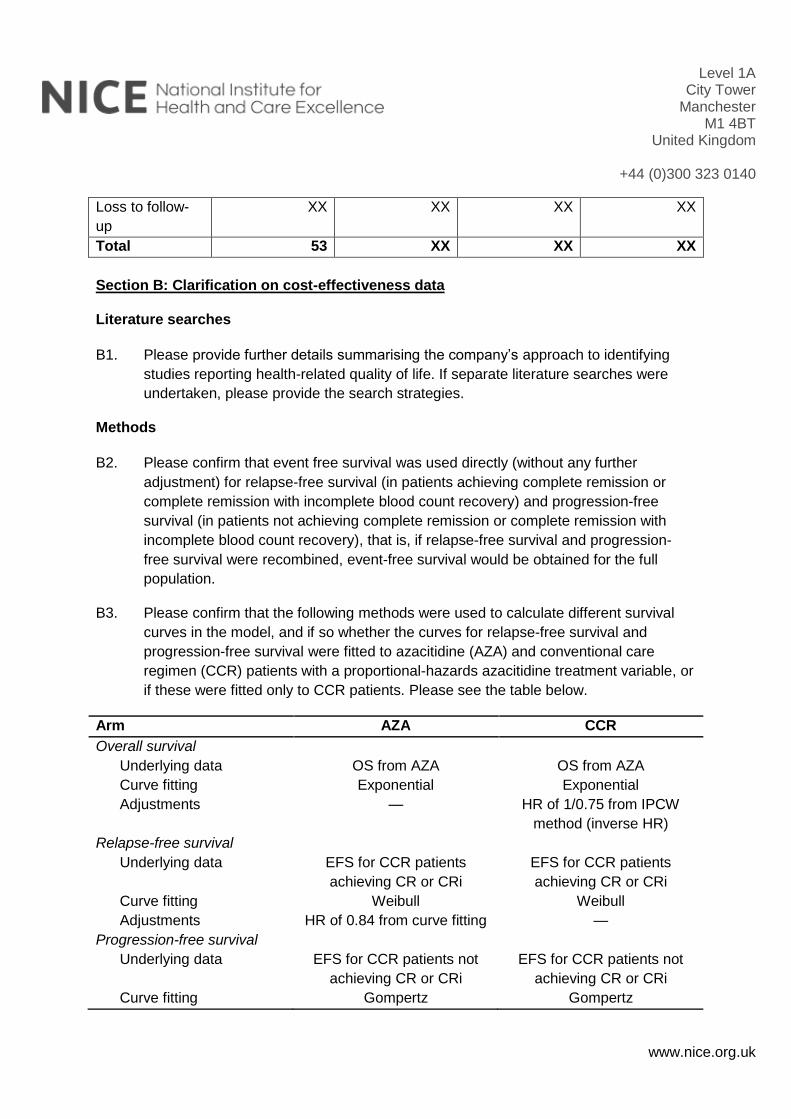
Level 1A City Tower
Manchester M1 4BT
United Kingdom
+44 (0)300 323 0140
www.nice.org.uk
Loss to follow-
up
XX XX XX XX
Total 53 XX XX XX
Section B: Clarification on cost-effectiveness data
Literature searches
B1. Please provide further details summarising the company’s approach to identifying
studies reporting health-related quality of life. If separate literature searches were
undertaken, please provide the search strategies.
Methods
B2. Please confirm that event free survival was used directly (without any further
adjustment) for relapse-free survival (in patients achieving complete remission or
complete remission with incomplete blood count recovery) and progression-free
survival (in patients not achieving complete remission or complete remission with
incomplete blood count recovery), that is, if relapse-free survival and progression-
free survival were recombined, event-free survival would be obtained for the full
population.
B3. Please confirm that the following methods were used to calculate different survival
curves in the model, and if so whether the curves for relapse-free survival and
progression-free survival were fitted to azacitidine (AZA) and conventional care
regimen (CCR) patients with a proportional-hazards azacitidine treatment variable, or
if these were fitted only to CCR patients. Please see the table below.
Arm AZA CCR
Overall survival
Underlying data OS from AZA OS from AZA
Curve fitting Exponential Exponential
Adjustments — HR of 1/0.75 from IPCW
method (inverse HR)
Relapse-free survival
Underlying data EFS for CCR patients
achieving CR or CRi
EFS for CCR patients
achieving CR or CRi
Curve fitting Weibull Weibull
Adjustments HR of 0.84 from curve fitting —
Progression-free survival
Underlying data EFS for CCR patients not
achieving CR or CRi
EFS for CCR patients not
achieving CR or CRi
Curve fitting Gompertz Gompertz
Level 1A City Tower
Manchester M1 4BT
United Kingdom
+44 (0)300 323 0140
www.nice.org.uk
Adjustments HR of 0.85 from curve fitting —
B4. Page 112 of the company’s submission: Please clarify whether the results using the
Iterative Parameter Estimation (IPE) method are correct, as there appears to be
some disparity between these results and the results in Appendix 11 and other
sources.
B5. Priority question: Please provide a copy of the Statistical Analysis Plan cited in
Appendix 11 of the company’s submission.
B6. Page 123 of the company’s submission states that ‘subgroup adjustment was not
feasible because of limited data on switching; however, a clinical expert consulted
during this analysis stated that questions can be raised about the clinical
generalizability of the results in subgroups, because clinicians can identify potential
switching candidates based on observed performance, and recommended focusing
on the adjusted data for overall patients.’
a. Please clarify what baseline patient characteristics were used to define the
subgroups and why particular baseline characteristics were chosen.
b. Please provide further details on the reasons why the results of the subgroup
analysis were not considered to be clinically generalizable.
c. Please provide details of the number of patients who switched treatments and
the number who did not.
B7. Table 37, page 125 of the company’s submission. Please clarify whether the
information about covariates used in the Inverse probability of censoring weighted
analysis in Table 37 is correct as there appears to be discrepancies between Table
37 and Table 14 of Appendix 11.
B8. Page 130 of the company’s submission: Please explain why the adverse events
which are costed on page 130 of the company’s submission appear to differ from the
adverse events for which disutilities are measured (page 129 of the company’s
submission).
B9. Please explain what the ‘Acute myeloid leukaemia’ adverse event refers to, and what
the cost represents.
B10. Priority question: Please explain how mean treatment duration for azacitidine from
the AZA-AML-001 trial was applied in the model. Please confirm that the model only
includes costs for 8 cycles of treatment although 32% of patients were still receiving
azacitidine after 12 cycles.
1
Single technology appraisal
Leukaemia (acute myeloid, over 30% blasts) – azacitidine [ID829]
Dear Matthew,
The Evidence Review Group, the Peninsula Technology Assessment Group (PenTAG),
and the technical team at NICE have looked at the submission received on 25th
November 2015 from Celgene. In general they felt that it is well presented and clear.
However, the ERG and the NICE technical team would like further clarification on the
clinical and cost effectiveness data (see questions listed at end of letter).
The ERG and the technical team at NICE will be addressing these issues in their
reports.
Please provide your written response to the clarification questions by 5pm on Friday 8
January 2016. Your response and any supporting documents should be uploaded to
NICE Docs/Appraisals.
Two versions of your written response should be submitted; one with
academic/commercial-in-confidence information clearly marked and one with this
information removed.
Please underline all confidential information, and separately highlight information that is
submitted as commercial in confidence in turquoise, and all information submitted as
academic in confidence in yellow.
If you present data that are not already referenced in the main body of your submission
and that are academic/commercial in confidence, please complete the attached checklist
for confidential information.
Please do not embed documents (PDFs or spreadsheets) in your response because this
may result in them being lost or unreadable.
If you have any queries on the technical issues raised in this letter, please contact Nicola
Hay, Technical Adviser ([email protected]). Any procedural questions should be
addressed to Stephanie Yates, Project Manager ([email protected]).
Yours sincerely
Nicola Hay
Technical Adviser
On behalf of
Dr Frances Sutcliffe
2
Associate Director – Appraisals
Centre for Health Technology Evaluation
Encl. checklist for confidential information
Section A: Clarification on clinical effectiveness data
A1. Priority question: Patient level transcripts have been received. Please provide a data
dictionary for the variables in the data files ID829 azacitidine AML 3245 trial
data 141215 SY [CIC].dta, ID829 azacitidine AML os_blxt 141215 SY
[CIC].dta, and ID829 azcitidine AML wgtanalaealt 141215 SY [CICC].dta.
See separate Excel file “Azacitidine AML trial data dictionary.xlsx”
Literature searching
A2. Please clarify the host platform through which EMBASE was searched? If it was not
OVID, please separate out the MEDLINE searches from the EMBASE search, thereby
providing MEDLINE OVID searches in one annex and the EMBASE search in another.
All searches were executed through OVID.
A3. Priority Question: The literature searches exclude studies reporting meta-analyses or
systematic reviews. Please provide the rationale for this decision.
The purpose of the systematic literature review was to identify all relevant RCT data that
can be used to estimate comparative efficacy and safety of the treatments of interest.
Although systematic reviews and meta-analyses can provide valuable data, these are
not original (primary) data. Further, these reviews should only include studies already
identified by the search strategy. As such, there was not a need to include meta-
analyses or systematic reviews.
A4. Page 41 of the company submission states that ‘three materials were added from a
manual search of literature databases and conference proceedings.’
a. Please provide the complete citations for the materials that were added.
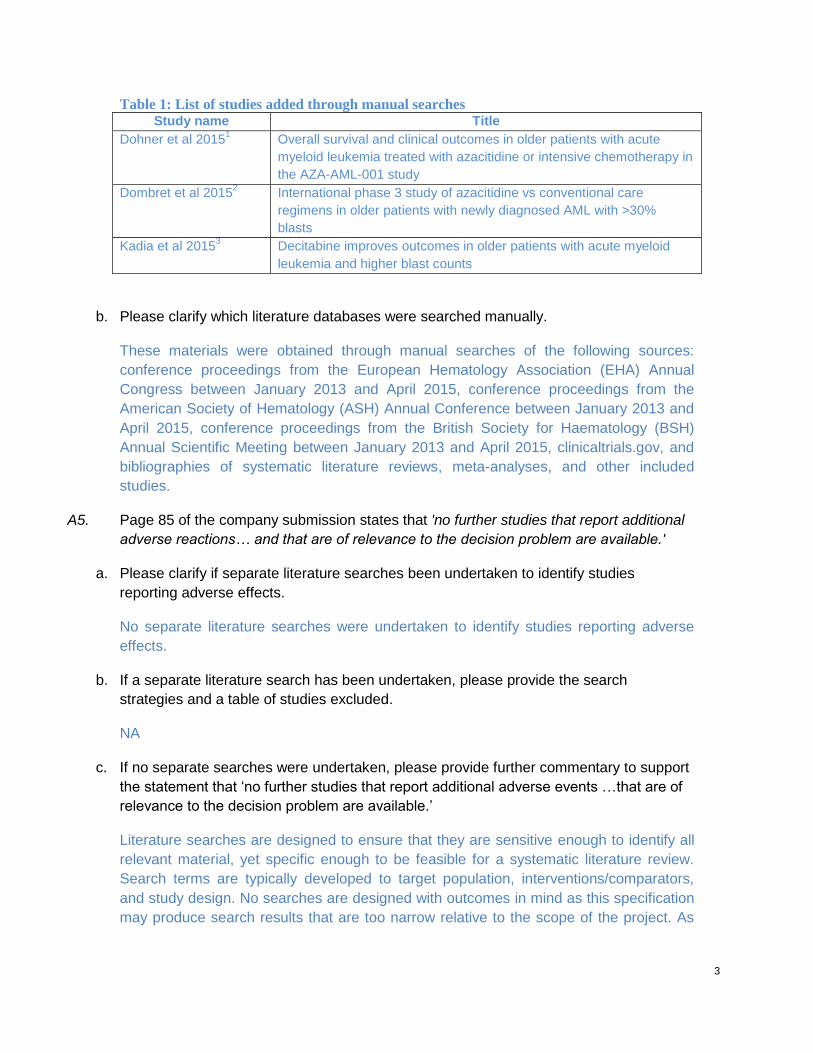
3
Table 1: List of studies added through manual searches Study name Title
Dohner et al 20151 Overall survival and clinical outcomes in older patients with acute
myeloid leukemia treated with azacitidine or intensive chemotherapy in
the AZA-AML-001 study
Dombret et al 20152 International phase 3 study of azacitidine vs conventional care
regimens in older patients with newly diagnosed AML with >30%
blasts
Kadia et al 20153 Decitabine improves outcomes in older patients with acute myeloid
leukemia and higher blast counts
b. Please clarify which literature databases were searched manually.
These materials were obtained through manual searches of the following sources:
conference proceedings from the European Hematology Association (EHA) Annual
Congress between January 2013 and April 2015, conference proceedings from the
American Society of Hematology (ASH) Annual Conference between January 2013 and
April 2015, conference proceedings from the British Society for Haematology (BSH)
Annual Scientific Meeting between January 2013 and April 2015, clinicaltrials.gov, and
bibliographies of systematic literature reviews, meta-analyses, and other included
studies.
A5. Page 85 of the company submission states that 'no further studies that report additional
adverse reactions… and that are of relevance to the decision problem are available.'
a. Please clarify if separate literature searches been undertaken to identify studies
reporting adverse effects.
No separate literature searches were undertaken to identify studies reporting adverse
effects.
b. If a separate literature search has been undertaken, please provide the search
strategies and a table of studies excluded.
NA
c. If no separate searches were undertaken, please provide further commentary to support
the statement that ‘no further studies that report additional adverse events …that are of
relevance to the decision problem are available.’
Literature searches are designed to ensure that they are sensitive enough to identify all
relevant material, yet specific enough to be feasible for a systematic literature review.
Search terms are typically developed to target population, interventions/comparators,
and study design. No searches are designed with outcomes in mind as this specification
may produce search results that are too narrow relative to the scope of the project. As
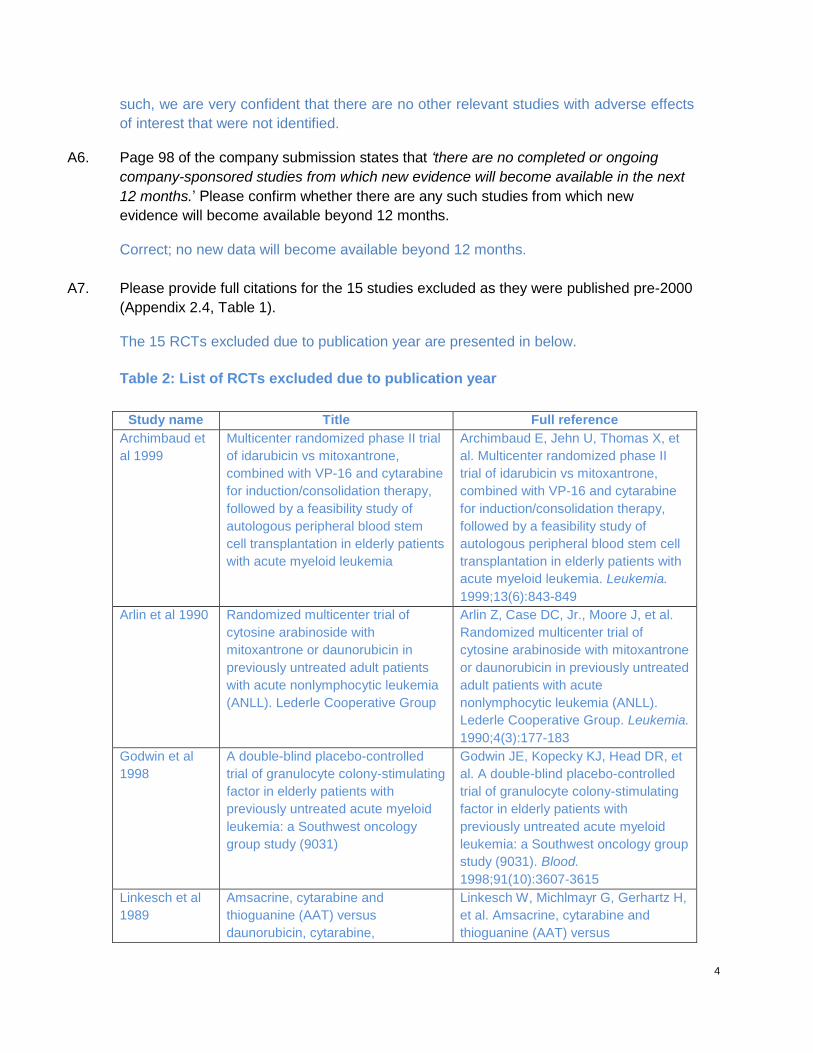
4
such, we are very confident that there are no other relevant studies with adverse effects
of interest that were not identified.
A6. Page 98 of the company submission states that ‘there are no completed or ongoing
company-sponsored studies from which new evidence will become available in the next
12 months.’ Please confirm whether there are any such studies from which new
evidence will become available beyond 12 months.
Correct; no new data will become available beyond 12 months.
A7. Please provide full citations for the 15 studies excluded as they were published pre-2000
(Appendix 2.4, Table 1).
The 15 RCTs excluded due to publication year are presented in below.
Table 2: List of RCTs excluded due to publication year
Study name Title Full reference
Archimbaud et
al 1999
Multicenter randomized phase II trial
of idarubicin vs mitoxantrone,
combined with VP-16 and cytarabine
for induction/consolidation therapy,
followed by a feasibility study of
autologous peripheral blood stem
cell transplantation in elderly patients
with acute myeloid leukemia
Archimbaud E, Jehn U, Thomas X, et
al. Multicenter randomized phase II
trial of idarubicin vs mitoxantrone,
combined with VP-16 and cytarabine
for induction/consolidation therapy,
followed by a feasibility study of
autologous peripheral blood stem cell
transplantation in elderly patients with
acute myeloid leukemia. Leukemia.
1999;13(6):843-849
Arlin et al 1990 Randomized multicenter trial of
cytosine arabinoside with
mitoxantrone or daunorubicin in
previously untreated adult patients
with acute nonlymphocytic leukemia
(ANLL). Lederle Cooperative Group
Arlin Z, Case DC, Jr., Moore J, et al.
Randomized multicenter trial of
cytosine arabinoside with mitoxantrone
or daunorubicin in previously untreated
adult patients with acute
nonlymphocytic leukemia (ANLL).
Lederle Cooperative Group. Leukemia.
1990;4(3):177-183
Godwin et al
1998
A double-blind placebo-controlled
trial of granulocyte colony-stimulating
factor in elderly patients with
previously untreated acute myeloid
leukemia: a Southwest oncology
group study (9031)
Godwin JE, Kopecky KJ, Head DR, et
al. A double-blind placebo-controlled
trial of granulocyte colony-stimulating
factor in elderly patients with
previously untreated acute myeloid
leukemia: a Southwest oncology group
study (9031). Blood.
1998;91(10):3607-3615
Linkesch et al
1989
Amsacrine, cytarabine and
thioguanine (AAT) versus
daunorubicin, cytarabine,
Linkesch W, Michlmayr G, Gerhartz H,
et al. Amsacrine, cytarabine and
thioguanine (AAT) versus
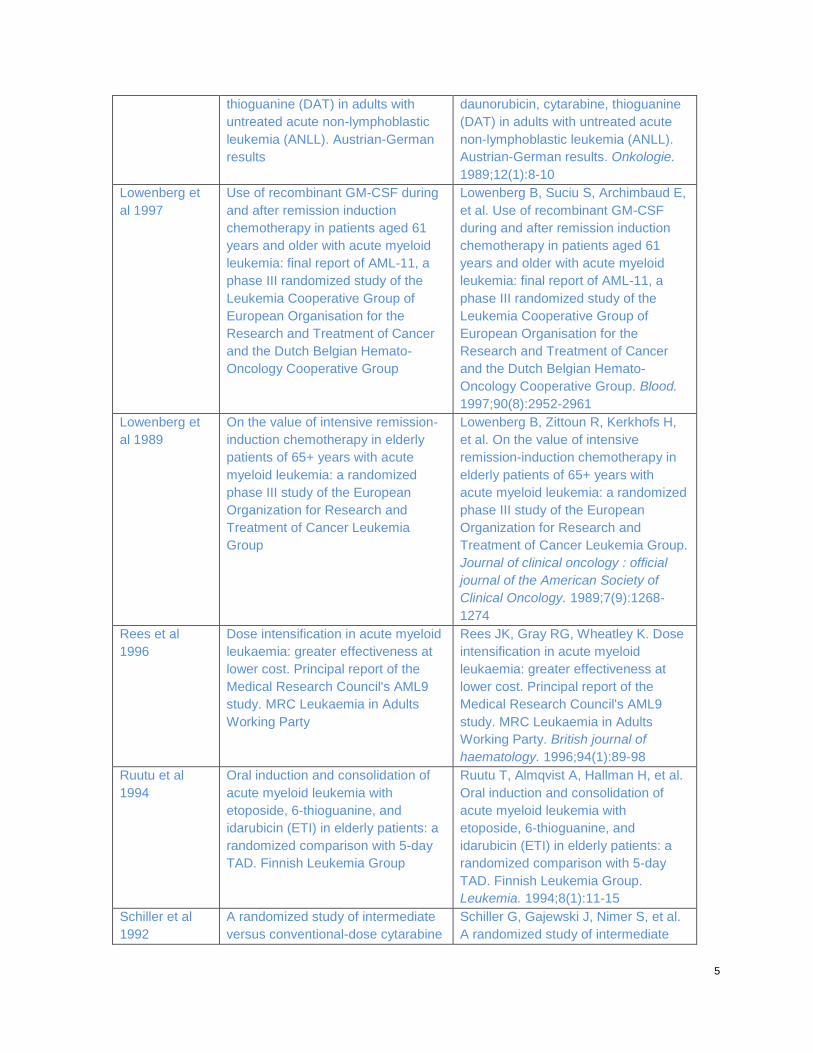
5
thioguanine (DAT) in adults with
untreated acute non-lymphoblastic
leukemia (ANLL). Austrian-German
results
daunorubicin, cytarabine, thioguanine
(DAT) in adults with untreated acute
non-lymphoblastic leukemia (ANLL).
Austrian-German results. Onkologie.
1989;12(1):8-10
Lowenberg et
al 1997
Use of recombinant GM-CSF during
and after remission induction
chemotherapy in patients aged 61
years and older with acute myeloid
leukemia: final report of AML-11, a
phase III randomized study of the
Leukemia Cooperative Group of
European Organisation for the
Research and Treatment of Cancer
and the Dutch Belgian Hemato-
Oncology Cooperative Group
Lowenberg B, Suciu S, Archimbaud E,
et al. Use of recombinant GM-CSF
during and after remission induction
chemotherapy in patients aged 61
years and older with acute myeloid
leukemia: final report of AML-11, a
phase III randomized study of the
Leukemia Cooperative Group of
European Organisation for the
Research and Treatment of Cancer
and the Dutch Belgian Hemato-
Oncology Cooperative Group. Blood.
1997;90(8):2952-2961
Lowenberg et
al 1989
On the value of intensive remission-
induction chemotherapy in elderly
patients of 65+ years with acute
myeloid leukemia: a randomized
phase III study of the European
Organization for Research and
Treatment of Cancer Leukemia
Group
Lowenberg B, Zittoun R, Kerkhofs H,
et al. On the value of intensive
remission-induction chemotherapy in
elderly patients of 65+ years with
acute myeloid leukemia: a randomized
phase III study of the European
Organization for Research and
Treatment of Cancer Leukemia Group.
Journal of clinical oncology : official
journal of the American Society of
Clinical Oncology. 1989;7(9):1268-
1274
Rees et al
1996
Dose intensification in acute myeloid
leukaemia: greater effectiveness at
lower cost. Principal report of the
Medical Research Council's AML9
study. MRC Leukaemia in Adults
Working Party
Rees JK, Gray RG, Wheatley K. Dose
intensification in acute myeloid
leukaemia: greater effectiveness at
lower cost. Principal report of the
Medical Research Council's AML9
study. MRC Leukaemia in Adults
Working Party. British journal of
haematology. 1996;94(1):89-98
Ruutu et al
1994
Oral induction and consolidation of
acute myeloid leukemia with
etoposide, 6-thioguanine, and
idarubicin (ETI) in elderly patients: a
randomized comparison with 5-day
TAD. Finnish Leukemia Group
Ruutu T, Almqvist A, Hallman H, et al.
Oral induction and consolidation of
acute myeloid leukemia with
etoposide, 6-thioguanine, and
idarubicin (ETI) in elderly patients: a
randomized comparison with 5-day
TAD. Finnish Leukemia Group.
Leukemia. 1994;8(1):11-15
Schiller et al
1992
A randomized study of intermediate
versus conventional-dose cytarabine
Schiller G, Gajewski J, Nimer S, et al.
A randomized study of intermediate
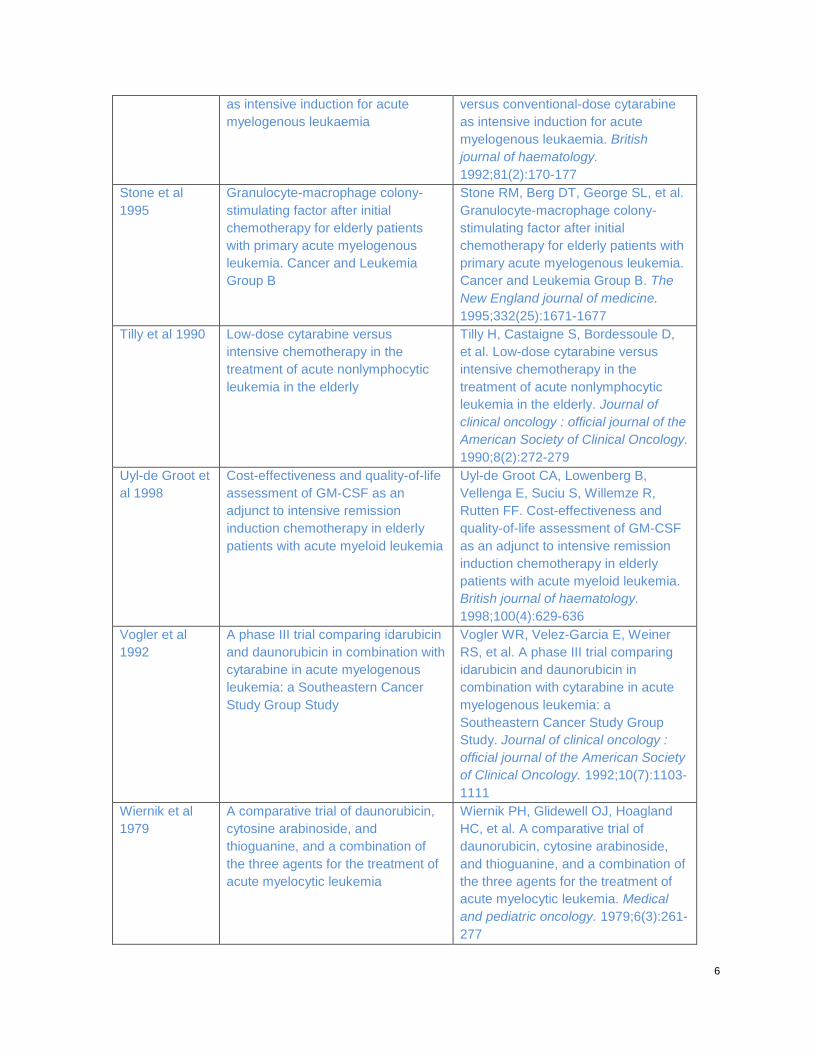
6
as intensive induction for acute
myelogenous leukaemia
versus conventional-dose cytarabine
as intensive induction for acute
myelogenous leukaemia. British
journal of haematology.
1992;81(2):170-177
Stone et al
1995
Granulocyte-macrophage colony-
stimulating factor after initial
chemotherapy for elderly patients
with primary acute myelogenous
leukemia. Cancer and Leukemia
Group B
Stone RM, Berg DT, George SL, et al.
Granulocyte-macrophage colony-
stimulating factor after initial
chemotherapy for elderly patients with
primary acute myelogenous leukemia.
Cancer and Leukemia Group B. The
New England journal of medicine.
1995;332(25):1671-1677
Tilly et al 1990 Low-dose cytarabine versus
intensive chemotherapy in the
treatment of acute nonlymphocytic
leukemia in the elderly
Tilly H, Castaigne S, Bordessoule D,
et al. Low-dose cytarabine versus
intensive chemotherapy in the
treatment of acute nonlymphocytic
leukemia in the elderly. Journal of
clinical oncology : official journal of the
American Society of Clinical Oncology.
1990;8(2):272-279
Uyl-de Groot et
al 1998
Cost-effectiveness and quality-of-life
assessment of GM-CSF as an
adjunct to intensive remission
induction chemotherapy in elderly
patients with acute myeloid leukemia
Uyl-de Groot CA, Lowenberg B,
Vellenga E, Suciu S, Willemze R,
Rutten FF. Cost-effectiveness and
quality-of-life assessment of GM-CSF
as an adjunct to intensive remission
induction chemotherapy in elderly
patients with acute myeloid leukemia.
British journal of haematology.
1998;100(4):629-636
Vogler et al
1992
A phase III trial comparing idarubicin
and daunorubicin in combination with
cytarabine in acute myelogenous
leukemia: a Southeastern Cancer
Study Group Study
Vogler WR, Velez-Garcia E, Weiner
RS, et al. A phase III trial comparing
idarubicin and daunorubicin in
combination with cytarabine in acute
myelogenous leukemia: a
Southeastern Cancer Study Group
Study. Journal of clinical oncology :
official journal of the American Society
of Clinical Oncology. 1992;10(7):1103-
1111
Wiernik et al
1979
A comparative trial of daunorubicin,
cytosine arabinoside, and
thioguanine, and a combination of
the three agents for the treatment of
acute myelocytic leukemia
Wiernik PH, Glidewell OJ, Hoagland
HC, et al. A comparative trial of
daunorubicin, cytosine arabinoside,
and thioguanine, and a combination of
the three agents for the treatment of
acute myelocytic leukemia. Medical
and pediatric oncology. 1979;6(3):261-
277
7
Witz et al 1998 A placebo-controlled study of
recombinant human granulocyte-
macrophage colony-stimulating
factor administered during and after
induction treatment for de novo
acute myelogenous leukemia in
elderly patients. Groupe Ouest Est
Leucemies Aigues Myeloblastiques
(GOELAM)
Witz F, Sadoun A, Perrin MC, et al. A
placebo-controlled study of
recombinant human granulocyte-
macrophage colony-stimulating factor
administered during and after
induction treatment for de novo acute
myelogenous leukemia in elderly
patients. Groupe Ouest Est Leucemies
Aigues Myeloblastiques (GOELAM).
Blood. 1998;91(8):2722-2730
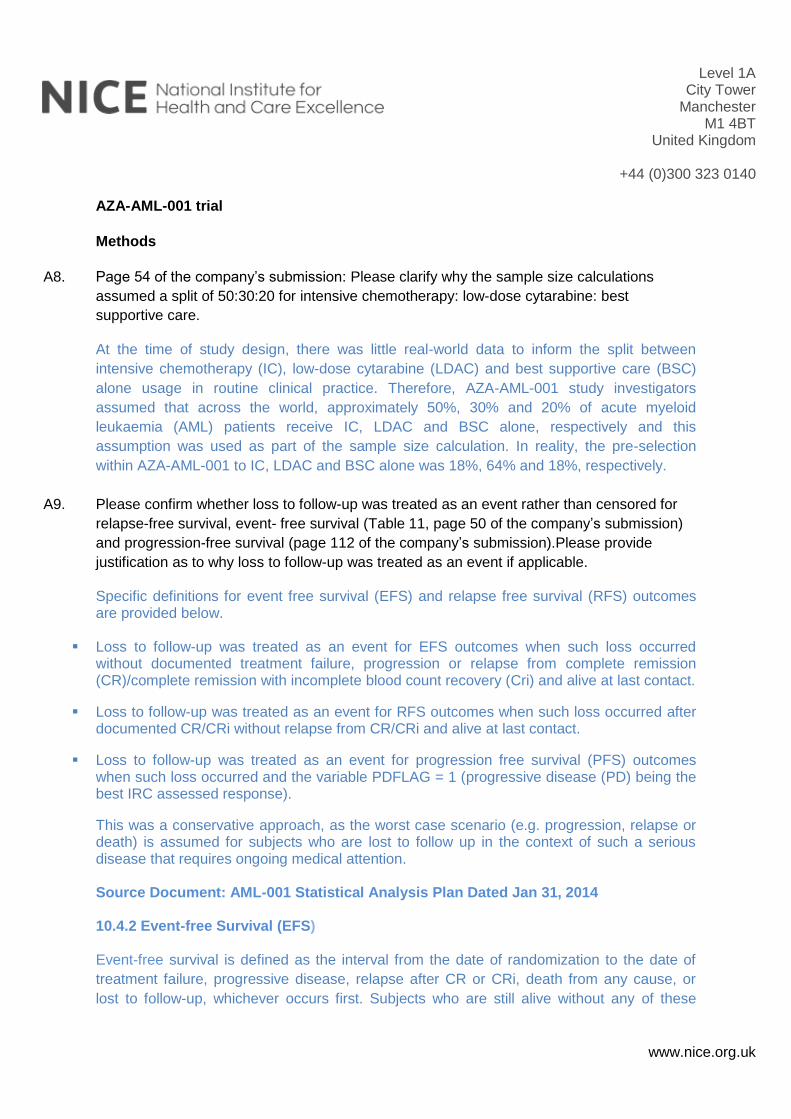
Level 1A City Tower
Manchester M1 4BT
United Kingdom
+44 (0)300 323 0140
www.nice.org.uk
AZA-AML-001 trial
Methods
A8. Page 54 of the company’s submission: Please clarify why the sample size calculations
assumed a split of 50:30:20 for intensive chemotherapy: low-dose cytarabine: best
supportive care.
At the time of study design, there was little real-world data to inform the split between
intensive chemotherapy (IC), low-dose cytarabine (LDAC) and best supportive care (BSC)
alone usage in routine clinical practice. Therefore, AZA-AML-001 study investigators
assumed that across the world, approximately 50%, 30% and 20% of acute myeloid
leukaemia (AML) patients receive IC, LDAC and BSC alone, respectively and this
assumption was used as part of the sample size calculation. In reality, the pre-selection
within AZA-AML-001 to IC, LDAC and BSC alone was 18%, 64% and 18%, respectively.
A9. Please confirm whether loss to follow-up was treated as an event rather than censored for
relapse-free survival, event- free survival (Table 11, page 50 of the company’s submission)
and progression-free survival (page 112 of the company’s submission).Please provide
justification as to why loss to follow-up was treated as an event if applicable.
Specific definitions for event free survival (EFS) and relapse free survival (RFS) outcomes are provided below.
Loss to follow-up was treated as an event for EFS outcomes when such loss occurred without documented treatment failure, progression or relapse from complete remission (CR)/complete remission with incomplete blood count recovery (Cri) and alive at last contact.
Loss to follow-up was treated as an event for RFS outcomes when such loss occurred after documented CR/CRi without relapse from CR/CRi and alive at last contact.
Loss to follow-up was treated as an event for progression free survival (PFS) outcomes when such loss occurred and the variable PDFLAG = 1 (progressive disease (PD) being the best IRC assessed response).
This was a conservative approach, as the worst case scenario (e.g. progression, relapse or death) is assumed for subjects who are lost to follow up in the context of such a serious disease that requires ongoing medical attention. Source Document: AML-001 Statistical Analysis Plan Dated Jan 31, 2014 10.4.2 Event-free Survival (EFS) Event-free survival is defined as the interval from the date of randomization to the date of
treatment failure, progressive disease, relapse after CR or CRi, death from any cause, or
lost to follow-up, whichever occurs first. Subjects who are still alive without any of these
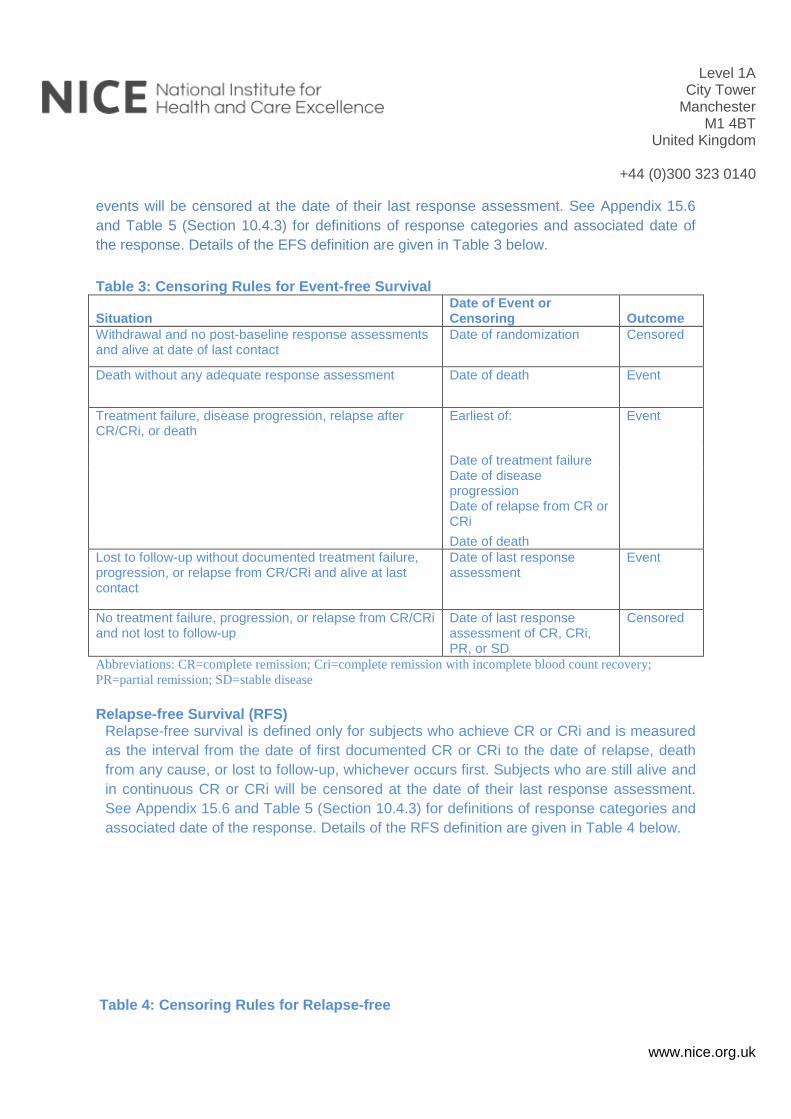
Level 1A City Tower
Manchester M1 4BT
United Kingdom
+44 (0)300 323 0140
www.nice.org.uk
events will be censored at the date of their last response assessment. See Appendix 15.6
and Table 5 (Section 10.4.3) for definitions of response categories and associated date of
the response. Details of the EFS definition are given in Table 3 below.
Table 3: Censoring Rules for Event-free Survival
Situation Date of Event or Censoring Outcome
Withdrawal and no post-baseline response assessments and alive at date of last contact
Date of randomization Censored
Death without any adequate response assessment Date of death Event
Treatment failure, disease progression, relapse after CR/CRi, or death
Earliest of: Event
Date of treatment failure Date of disease
progression
Date of relapse from CR or CRi
Date of death
Lost to follow-up without documented treatment failure, progression, or relapse from CR/CRi and alive at last contact
Date of last response assessment
Event
No treatment failure, progression, or relapse from CR/CRi and not lost to follow-up
Date of last response assessment of CR, CRi, PR, or SD
Censored
Abbreviations: CR=complete remission; Cri=complete remission with incomplete blood count recovery;
PR=partial remission; SD=stable disease
Relapse-free Survival (RFS)
Relapse-free survival is defined only for subjects who achieve CR or CRi and is measured
as the interval from the date of first documented CR or CRi to the date of relapse, death
from any cause, or lost to follow-up, whichever occurs first. Subjects who are still alive and
in continuous CR or CRi will be censored at the date of their last response assessment.
See Appendix 15.6 and Table 5 (Section 10.4.3) for definitions of response categories and
associated date of the response. Details of the RFS definition are given in Table 4 below.
Table 4: Censoring Rules for Relapse-free
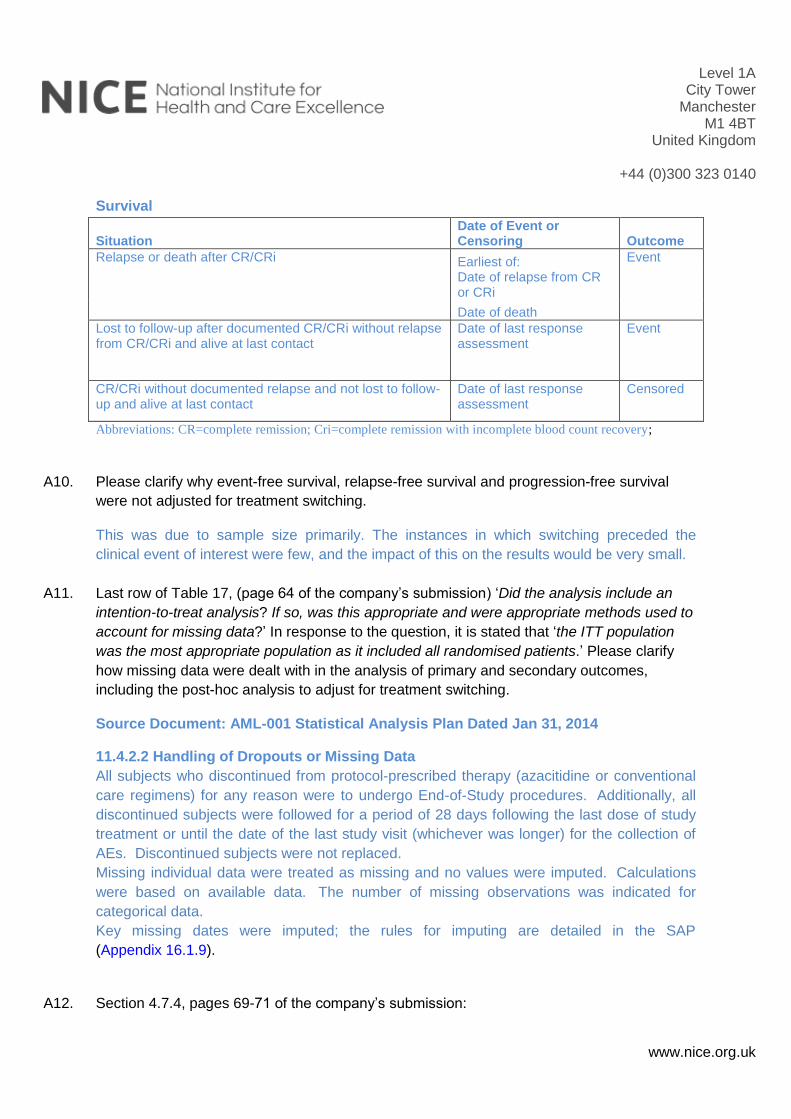
Level 1A City Tower
Manchester M1 4BT
United Kingdom
+44 (0)300 323 0140
www.nice.org.uk
Survival
Situation Date of Event or Censoring Outcome
Relapse or death after CR/CRi Earliest of: Event
Date of relapse from CR or CRi
Date of death
Lost to follow-up after documented CR/CRi without relapse from CR/CRi and alive at last contact
Date of last response assessment
Event
CR/CRi without documented relapse and not lost to follow-up and alive at last contact
Date of last response assessment
Censored
Abbreviations: CR=complete remission; Cri=complete remission with incomplete blood count recovery;
A10. Please clarify why event-free survival, relapse-free survival and progression-free survival
were not adjusted for treatment switching.
This was due to sample size primarily. The instances in which switching preceded the
clinical event of interest were few, and the impact of this on the results would be very small.
A11. Last row of Table 17, (page 64 of the company’s submission) ‘Did the analysis include an
intention-to-treat analysis? If so, was this appropriate and were appropriate methods used to
account for missing data?’ In response to the question, it is stated that ‘the ITT population
was the most appropriate population as it included all randomised patients.’ Please clarify
how missing data were dealt with in the analysis of primary and secondary outcomes,
including the post-hoc analysis to adjust for treatment switching.
Source Document: AML-001 Statistical Analysis Plan Dated Jan 31, 2014
11.4.2.2 Handling of Dropouts or Missing Data
All subjects who discontinued from protocol-prescribed therapy (azacitidine or conventional
care regimens) for any reason were to undergo End-of-Study procedures. Additionally, all
discontinued subjects were followed for a period of 28 days following the last dose of study
treatment or until the date of the last study visit (whichever was longer) for the collection of
AEs. Discontinued subjects were not replaced.
Missing individual data were treated as missing and no values were imputed. Calculations
were based on available data. The number of missing observations was indicated for
categorical data.
Key missing dates were imputed; the rules for imputing are detailed in the SAP
(Appendix 16.1.9).
A12. Section 4.7.4, pages 69-71 of the company’s submission:
Level 1A City Tower
Manchester M1 4BT
United Kingdom
+44 (0)300 323 0140
www.nice.org.uk
a. Please clarify how covariates were selected for the analyses.
Covariates were prospectively identified for the crossover analysis in the trial data and
confirmed with a UK-based clinician who is actively treating patients in this indication.
Following their feedback, covariates were appropriately included in the analysis according to
whether or not they were also time-varying in the trial data.
b. Please clarify why no time-varying covariates (e.g. bone marrow or peripheral blood blast
count) were included in the propensity score for the Inverse probability of censoring
weighted method.
In line with question B7 below: Table 14 of Appendix 11 captures covariates ultimately
included in the model, based on tests of statistically significant differences in covariates
between the treatment and also with a view to targeting parsimony in the model.
A13. Section 4.7.4.1, pages 65-66 of the company’s submission: Please provide a description of
the methods used to perform the regression-based imputation analysis adjusting for
subsequent therapy.
The following text from the statistical analysis plan for post-hoc analyses of primary efficacy
endpoints describes the approach taken.
2.3 Regression based imputation method
A regression based imputation procedure has been proposed by Luo et al (ref 4 in SAP) that
allows for inferences about the treatment effect in the presence of confounding due to
additional therapy received subsequent to the randomized study treatment. This method
provides an accurate estimate of the treatment effect by removing the confounding effects of
additional subsequent therapy. This method provides adjusted estimates of the Kaplan Meier
(KM) survival curves, which allows for comparisons using log-rank test and the calculation of
an adjusted HR and associated confidence intervals.
A more detailed description of the methodology followed to perform the regression-based
imputation are discussed in Appendix 5.1 of the Statistical Methods Addendum (provided
separately).
A14. Section 4.7.5.8, Health-related quality of life, page 77 of the company’s submission: states
that ‘A mixed model analysis failed to reveal any statistically significant differences in the
impact of treatment on all domains between treatment arms.’ Please clarify what statistical
distribution was used for this analysis, any if there were any stratification and fixed and time-
varying covariate adjustment and adjustment for differential drop-out across treatment arms.

Level 1A City Tower
Manchester M1 4BT
United Kingdom
+44 (0)300 323 0140
www.nice.org.uk
A mixed effect model repeat measurement (MMRM) model was developed for the EORTC
QLQ-C30 Fatigue domain with the inclusion of a fixed-effect covariate indicating whether a
transfusion had taken place up to 5 days before health related quality of life (HRQL)
assessment. This analysis was undertaken because blood transfusions are likely to affect
fatigue, but this relationship would not have been explored by previous analyses.
Additional MMRM models were developed for the secondary HRQL domains (Dyspnea,
Physical Functioning and Global Health Status/ quality of life (QoL)) that included RBC or
platelet transfusion up to 5 days before the HRQL assessment as a factor.
The statement ‘A mixed model analysis failed to reveal any statistically significant
differences in the impact of treatment on all domains between treatment arms’ references
the post-hoc MMRM analysis controlling for the impact of red blood cell (RBC) or platelet
transfusion received up to 5 days before HRQoL assessment. It was hypothesized by the
clinical study team that transfusions administered shortly before HRQoL assessment may
have an effect on fatigue. and this effect would not have been captured in the initial model.
The results of the MMRM analysis for the Fatigue domain without this additional covariate
were significant in favour of CCR. No significant differences were observed for the
secondary domains. Full presentation of both results can be located in the CSR section
11.4.1.2.10.7.
All MMRM analyses were based on the assumption that data are missing at random. A
post-hoc sensitivity analysis utilizing a pattern-mixture model was conducted to explore the
impact of the missing-at-random assumption. Results of this analysis aligned with the
MMRM results for Physical Functioning, Dyspnea and Global Health Status/QoL, with no
differences between treatment groups at p<0.05, while results favoured CCR for the Fatigue
domain (P=0.025).
A15. Please provide a table giving the counts and incidence rates for each treatment arm of the
AZA-AML-001 trial (azacitidine, intensive chemotherapy, low-dose cytarabine, best
supportive care) of the grade ≥3 treatment related adverse events that occurred in >10% of
patients in any treatment arm.
Table 5: Incidence rates for each treatment arm of the AZA-AML-001 trial Individual CCR arms
Azacitidine
(n=236)
BSC only
(n=40)
LDAC
(n=153)
IC
(n=42)
Preferred term No. % No. % No. % No. %
Febrile
neutropenia
66 28.0 11 27.5 46 30.1 13 31.0
Neutropenia 62 26.3 2 5.0 38 24.8 14 33.3
Thrombocytopenia 56 23.7 2 5.0 42 27.5 9 21.4
Pneumonia 45 19.1 2 5.0 29 19.0 2 4.8
Anaemia 37 15.7 2 5.0 35 22.9 6 14.3
Leukopenia 16 6.8 0 0 13 8.5 6 14.3
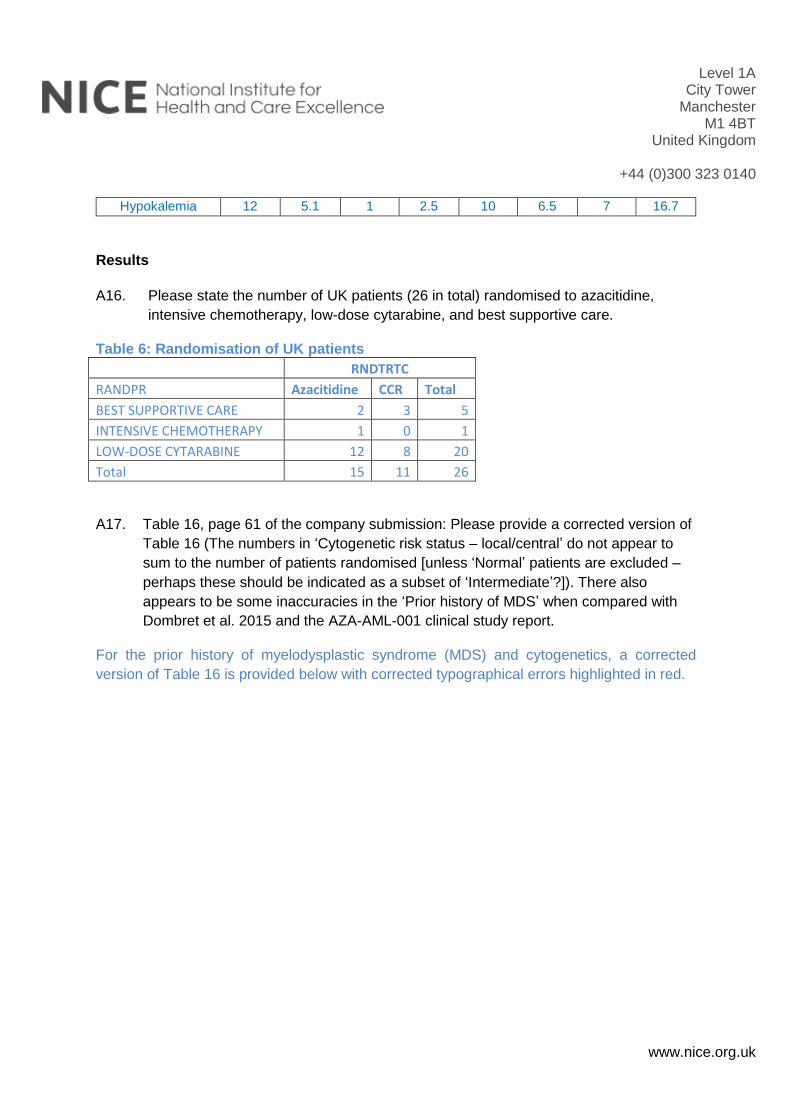
Level 1A City Tower
Manchester M1 4BT
United Kingdom
+44 (0)300 323 0140
www.nice.org.uk
Hypokalemia 12 5.1 1 2.5 10 6.5 7 16.7
Results
A16. Please state the number of UK patients (26 in total) randomised to azacitidine,
intensive chemotherapy, low-dose cytarabine, and best supportive care.
Table 6: Randomisation of UK patients
RNDTRTC
RANDPR Azacitidine CCR Total
BEST SUPPORTIVE CARE 2 3 5
INTENSIVE CHEMOTHERAPY 1 0 1
LOW-DOSE CYTARABINE 12 8 20
Total 15 11 26
A17. Table 16, page 61 of the company submission: Please provide a corrected version of
Table 16 (The numbers in ‘Cytogenetic risk status – local/central’ do not appear to
sum to the number of patients randomised [unless ‘Normal’ patients are excluded –
perhaps these should be indicated as a subset of ‘Intermediate’?]). There also
appears to be some inaccuracies in the ‘Prior history of MDS’ when compared with
Dombret et al. 2015 and the AZA-AML-001 clinical study report.
For the prior history of myelodysplastic syndrome (MDS) and cytogenetics, a corrected
version of Table 16 is provided below with corrected typographical errors highlighted in red.
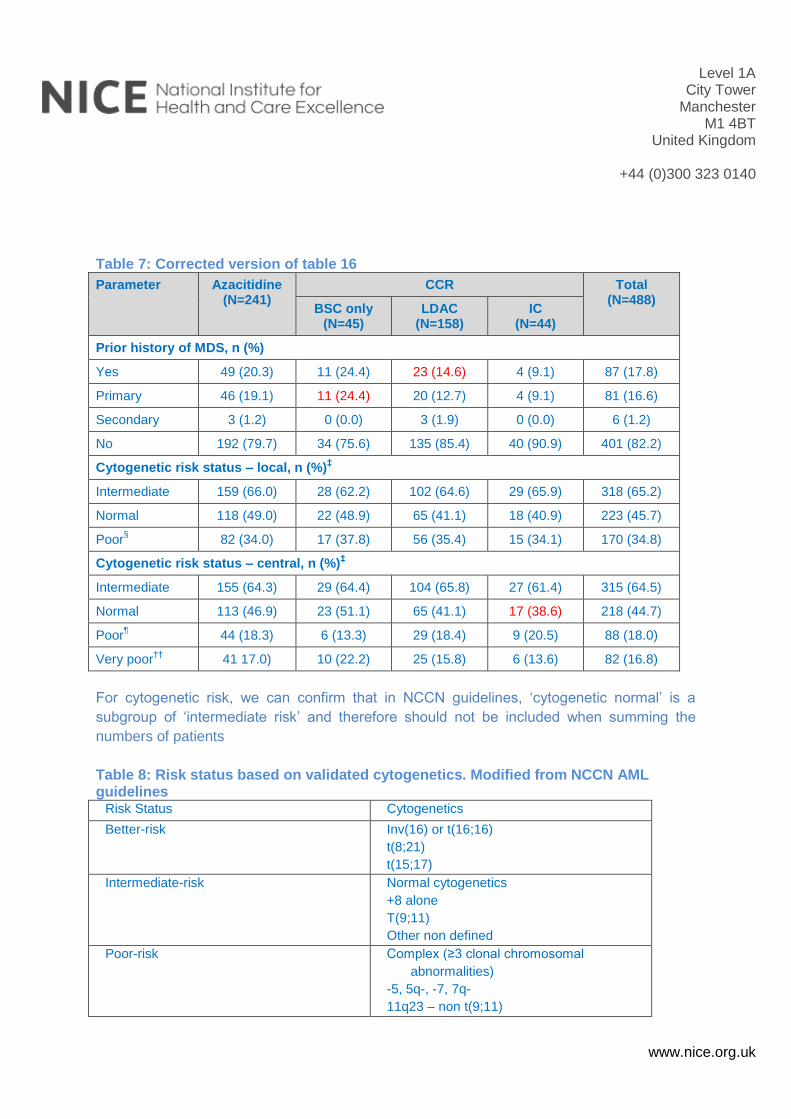
Level 1A City Tower
Manchester M1 4BT
United Kingdom
+44 (0)300 323 0140
www.nice.org.uk
Table 7: Corrected version of table 16
Parameter Azacitidine (N=241)
CCR Total (N=488)
BSC only (N=45)
LDAC (N=158)
IC (N=44)
Prior history of MDS, n (%)
Yes 49 (20.3) 11 (24.4) 23 (14.6) 4 (9.1) 87 (17.8)
Primary 46 (19.1) 11 (24.4) 20 (12.7) 4 (9.1) 81 (16.6)
Secondary 3 (1.2) 0 (0.0) 3 (1.9) 0 (0.0) 6 (1.2)
No 192 (79.7) 34 (75.6) 135 (85.4) 40 (90.9) 401 (82.2)
Cytogenetic risk status – local, n (%)‡
Intermediate 159 (66.0) 28 (62.2) 102 (64.6) 29 (65.9) 318 (65.2)
Normal 118 (49.0) 22 (48.9) 65 (41.1) 18 (40.9) 223 (45.7)
Poor§
82 (34.0) 17 (37.8) 56 (35.4) 15 (34.1) 170 (34.8)
Cytogenetic risk status – central, n (%)‡
Intermediate 155 (64.3) 29 (64.4) 104 (65.8) 27 (61.4) 315 (64.5)
Normal 113 (46.9) 23 (51.1) 65 (41.1) 17 (38.6) 218 (44.7)
Poor¶
44 (18.3) 6 (13.3) 29 (18.4) 9 (20.5) 88 (18.0)
Very poor††
41 17.0) 10 (22.2) 25 (15.8) 6 (13.6) 82 (16.8)
For cytogenetic risk, we can confirm that in NCCN guidelines, ‘cytogenetic normal’ is a
subgroup of ‘intermediate risk’ and therefore should not be included when summing the
numbers of patients
Table 8: Risk status based on validated cytogenetics. Modified from NCCN AML guidelines
Risk Status Cytogenetics
Better-risk Inv(16) or t(16;16)
t(8;21)
t(15;17)
Intermediate-risk Normal cytogenetics
+8 alone
T(9;11)
Other non defined
Poor-risk Complex (≥3 clonal chromosomal
abnormalities)
-5, 5q-, -7, 7q-
11q23 – non t(9;11)
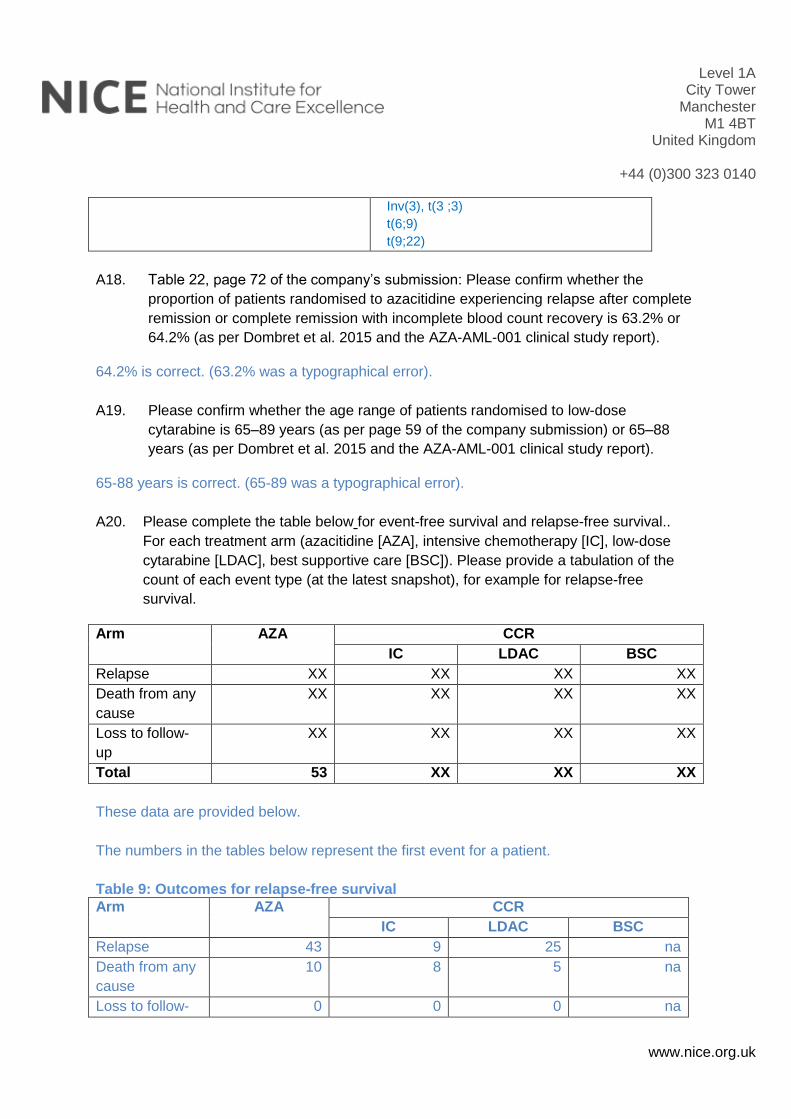
Level 1A City Tower
Manchester M1 4BT
United Kingdom
+44 (0)300 323 0140
www.nice.org.uk
Inv(3), t(3 ;3)
t(6;9)
t(9;22)
A18. Table 22, page 72 of the company’s submission: Please confirm whether the
proportion of patients randomised to azacitidine experiencing relapse after complete
remission or complete remission with incomplete blood count recovery is 63.2% or
64.2% (as per Dombret et al. 2015 and the AZA-AML-001 clinical study report).
64.2% is correct. (63.2% was a typographical error).
A19. Please confirm whether the age range of patients randomised to low-dose
cytarabine is 65–89 years (as per page 59 of the company submission) or 65–88
years (as per Dombret et al. 2015 and the AZA-AML-001 clinical study report).
65-88 years is correct. (65-89 was a typographical error).
A20. Please complete the table below for event-free survival and relapse-free survival..
For each treatment arm (azacitidine [AZA], intensive chemotherapy [IC], low-dose
cytarabine [LDAC], best supportive care [BSC]). Please provide a tabulation of the
count of each event type (at the latest snapshot), for example for relapse-free
survival.
Arm AZA CCR
IC LDAC BSC
Relapse XX XX XX XX
Death from any
cause
XX XX XX XX
Loss to follow-
up
XX XX XX XX
Total 53 XX XX XX
These data are provided below.
The numbers in the tables below represent the first event for a patient.
Table 9: Outcomes for relapse-free survival
Arm AZA CCR
IC LDAC BSC
Relapse 43 9 25 na
Death from any
cause
10 8 5 na
Loss to follow- 0 0 0 na
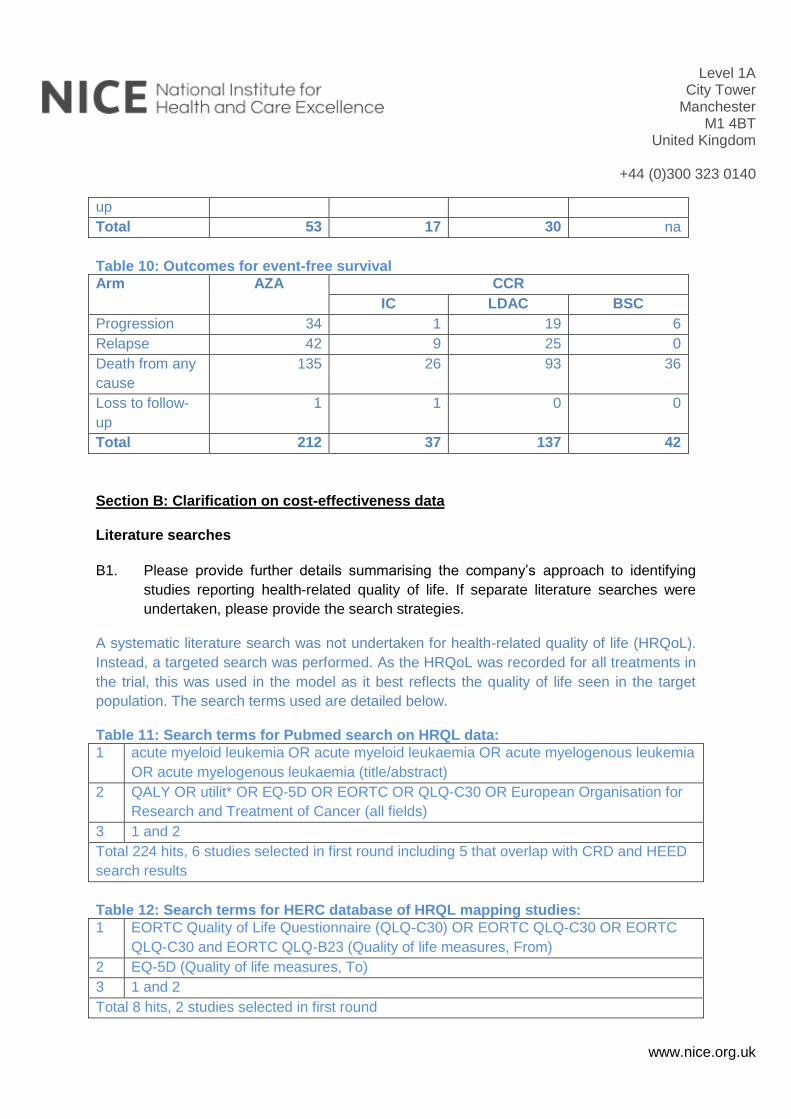
Level 1A City Tower
Manchester M1 4BT
United Kingdom
+44 (0)300 323 0140
www.nice.org.uk
up
Total 53 17 30 na
Table 10: Outcomes for event-free survival
Arm AZA CCR
IC LDAC BSC
Progression 34 1 19 6
Relapse 42 9 25 0
Death from any
cause
135 26 93 36
Loss to follow-
up
1 1 0 0
Total 212 37 137 42
Section B: Clarification on cost-effectiveness data
Literature searches
B1. Please provide further details summarising the company’s approach to identifying
studies reporting health-related quality of life. If separate literature searches were
undertaken, please provide the search strategies.
A systematic literature search was not undertaken for health-related quality of life (HRQoL).
Instead, a targeted search was performed. As the HRQoL was recorded for all treatments in
the trial, this was used in the model as it best reflects the quality of life seen in the target
population. The search terms used are detailed below.
Table 11: Search terms for Pubmed search on HRQL data:
1 acute myeloid leukemia OR acute myeloid leukaemia OR acute myelogenous leukemia
OR acute myelogenous leukaemia (title/abstract)
2 QALY OR utilit* OR EQ-5D OR EORTC OR QLQ-C30 OR European Organisation for
Research and Treatment of Cancer (all fields)
3 1 and 2
Total 224 hits, 6 studies selected in first round including 5 that overlap with CRD and HEED
search results
Table 12: Search terms for HERC database of HRQL mapping studies:
1 EORTC Quality of Life Questionnaire (QLQ-C30) OR EORTC QLQ-C30 OR EORTC
QLQ-C30 and EORTC QLQ-B23 (Quality of life measures, From)
2 EQ-5D (Quality of life measures, To)
3 1 and 2
Total 8 hits, 2 studies selected in first round
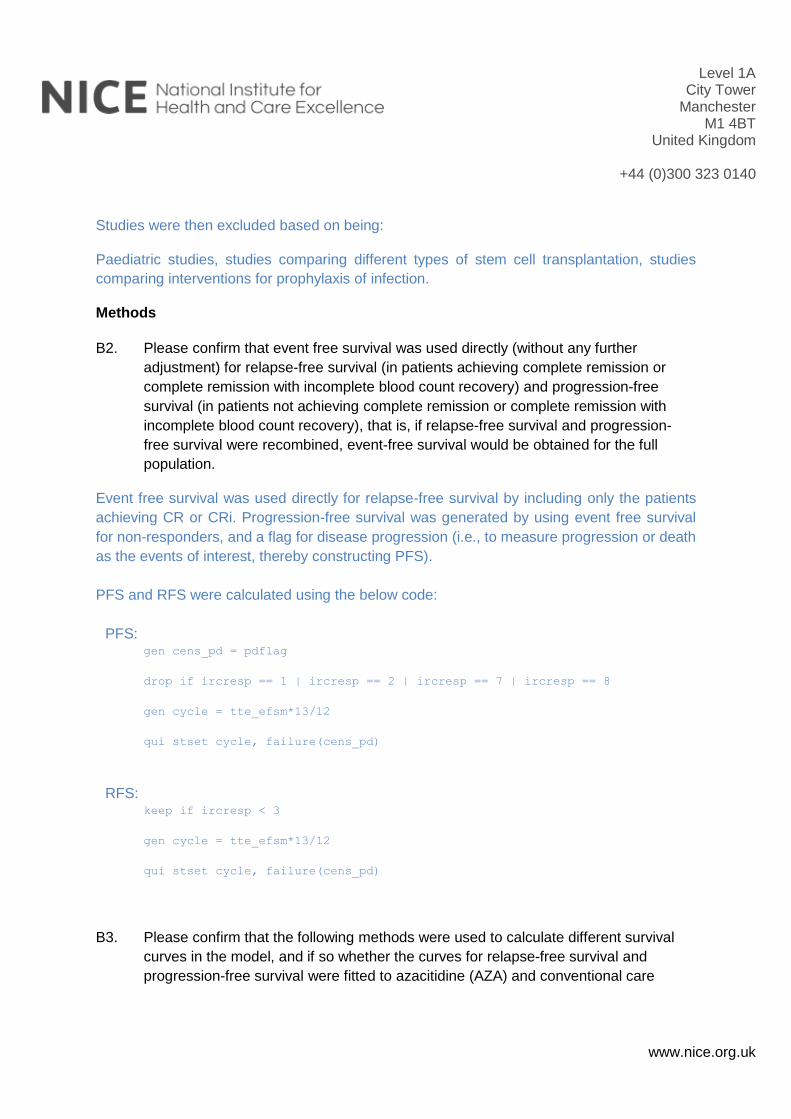
Level 1A City Tower
Manchester M1 4BT
United Kingdom
+44 (0)300 323 0140
www.nice.org.uk
Studies were then excluded based on being:
Paediatric studies, studies comparing different types of stem cell transplantation, studies
comparing interventions for prophylaxis of infection.
Methods
B2. Please confirm that event free survival was used directly (without any further
adjustment) for relapse-free survival (in patients achieving complete remission or
complete remission with incomplete blood count recovery) and progression-free
survival (in patients not achieving complete remission or complete remission with
incomplete blood count recovery), that is, if relapse-free survival and progression-
free survival were recombined, event-free survival would be obtained for the full
population.
Event free survival was used directly for relapse-free survival by including only the patients
achieving CR or CRi. Progression-free survival was generated by using event free survival
for non-responders, and a flag for disease progression (i.e., to measure progression or death
as the events of interest, thereby constructing PFS).
PFS and RFS were calculated using the below code:
PFS: gen cens_pd = pdflag
drop if ircresp == 1 | ircresp == 2 | ircresp == 7 | ircresp == 8
gen cycle = tte_efsm*13/12
qui stset cycle, failure(cens_pd)
RFS: keep if ircresp < 3
gen cycle = tte_efsm*13/12
qui stset cycle, failure(cens_pd)
B3. Please confirm that the following methods were used to calculate different survival
curves in the model, and if so whether the curves for relapse-free survival and
progression-free survival were fitted to azacitidine (AZA) and conventional care
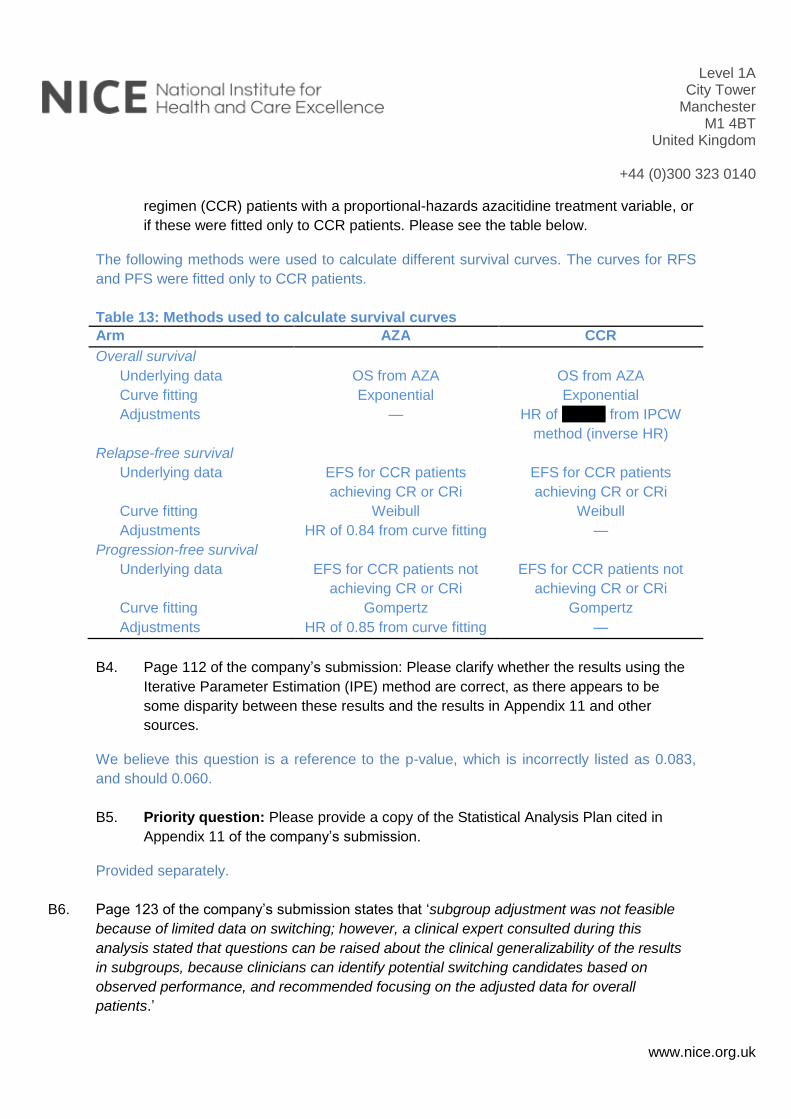
Level 1A City Tower
Manchester M1 4BT
United Kingdom
+44 (0)300 323 0140
www.nice.org.uk
regimen (CCR) patients with a proportional-hazards azacitidine treatment variable, or
if these were fitted only to CCR patients. Please see the table below.
The following methods were used to calculate different survival curves. The curves for RFS
and PFS were fitted only to CCR patients.
Table 13: Methods used to calculate survival curves
Arm AZA CCR
Overall survival
Underlying data OS from AZA OS from AZA
Curve fitting Exponential Exponential
Adjustments — HR of xxxxxx from IPCW
method (inverse HR)
Relapse-free survival
Underlying data EFS for CCR patients
achieving CR or CRi
EFS for CCR patients
achieving CR or CRi
Curve fitting Weibull Weibull
Adjustments HR of 0.84 from curve fitting —
Progression-free survival
Underlying data EFS for CCR patients not
achieving CR or CRi
EFS for CCR patients not
achieving CR or CRi
Curve fitting Gompertz Gompertz
Adjustments HR of 0.85 from curve fitting —
B4. Page 112 of the company’s submission: Please clarify whether the results using the
Iterative Parameter Estimation (IPE) method are correct, as there appears to be
some disparity between these results and the results in Appendix 11 and other
sources.
We believe this question is a reference to the p-value, which is incorrectly listed as 0.083,
and should 0.060.
B5. Priority question: Please provide a copy of the Statistical Analysis Plan cited in
Appendix 11 of the company’s submission.
Provided separately.
B6. Page 123 of the company’s submission states that ‘subgroup adjustment was not feasible
because of limited data on switching; however, a clinical expert consulted during this
analysis stated that questions can be raised about the clinical generalizability of the results
in subgroups, because clinicians can identify potential switching candidates based on
observed performance, and recommended focusing on the adjusted data for overall
patients.’
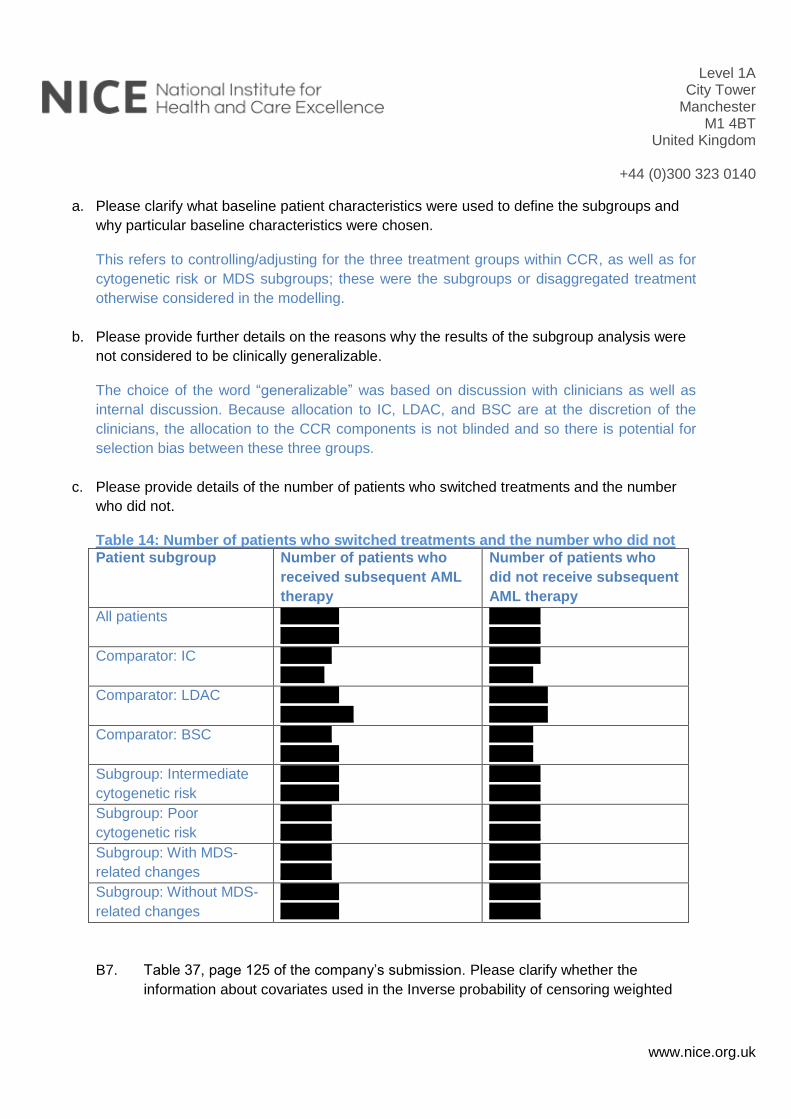
Level 1A City Tower
Manchester M1 4BT
United Kingdom
+44 (0)300 323 0140
www.nice.org.uk
a. Please clarify what baseline patient characteristics were used to define the subgroups and
why particular baseline characteristics were chosen.
This refers to controlling/adjusting for the three treatment groups within CCR, as well as for
cytogenetic risk or MDS subgroups; these were the subgroups or disaggregated treatment
otherwise considered in the modelling.
b. Please provide further details on the reasons why the results of the subgroup analysis were
not considered to be clinically generalizable.
The choice of the word “generalizable” was based on discussion with clinicians as well as
internal discussion. Because allocation to IC, LDAC, and BSC are at the discretion of the
clinicians, the allocation to the CCR components is not blinded and so there is potential for
selection bias between these three groups.
c. Please provide details of the number of patients who switched treatments and the number
who did not.
Table 14: Number of patients who switched treatments and the number who did not
Patient subgroup Number of patients who
received subsequent AML
therapy
Number of patients who
did not receive subsequent
AML therapy
All patients xxxxxxxx
xxxxxxxx
xxxxxxx
xxxxxxx
Comparator: IC xxxxxxx
xxxxxx
xxxxxxx
xxxxxx
Comparator: LDAC xxxxxxxx
xxxxxxxxxx
xxxxxxxx
xxxxxxxx
Comparator: BSC xxxxxxx
xxxxxxxx
xxxxxx
xxxxxx
Subgroup: Intermediate
cytogenetic risk
xxxxxxxx
xxxxxxxx
xxxxxxx
xxxxxxx
Subgroup: Poor
cytogenetic risk
xxxxxxx
xxxxxxx
xxxxxxx
xxxxxxx
Subgroup: With MDS-
related changes
xxxxxxx
xxxxxxx
xxxxxxx
xxxxxxx
Subgroup: Without MDS-
related changes
xxxxxxxx
xxxxxxxx
xxxxxxx
xxxxxxx
B7. Table 37, page 125 of the company’s submission. Please clarify whether the
information about covariates used in the Inverse probability of censoring weighted
Level 1A City Tower
Manchester M1 4BT
United Kingdom
+44 (0)300 323 0140
www.nice.org.uk
analysis in Table 37 is correct as there appears to be discrepancies between Table
37 and Table 14 of Appendix 11.
Table 37 has all covariates that were considered for the Inverse probability of censoring
weighted (IPCW). Then whether there were any statistically significant differences between
CCR patients who switch and CCR patients who do not switch were used to narrow this to
the list of covariates to be included in the model, seen in Table 14.
B8. Page 130 of the company’s submission: Please explain why the adverse events
which are costed on page 130 of the company’s submission appear to differ from the
adverse events for which disutilities are measured (page 129 of the company’s
submission).
HRQL analysis from the trial was more restricted in terms of measuring and mapping from
EORTC QLQ-C30 scores during an AE in the trial; costing on the other hand used rates of
AEs, disaggregated by type, from the main clinical study report, and hence were more
detailed.
Thus, in the model, AE disutilities are a single figure that are aggregated at the trial-analysis
level; AE costs on the other hand are aggregated within the model itself, calculated from
rates and unit costs for AEs.
B9. Please explain what the ‘Acute myeloid leukaemia’ adverse event refers to, and what
the cost represents.
The AE preferred term (PT) “acute myeloid leukaemia” includes the verbatim term
“worsening AML” reported by the investigator. If a subject’s disease worsened during the
study treatment period but did not meet the protocol-defined criteria for progressive disease
(PD), the PI reported an AE of “worsening AML.” Specific to the intensive chemotherapy
treatment group, if a subject did not achieve CR, CRi, or PR after induction therapy, the
subject was to be discontinued from the treatment period, per protocol. If intensive
chemotherapy subjects achieved a response following treatment, they were to remain in the
treatment period until they met the criteria for relapse after CR/CRi or were removed for
some other reason. Therefore, there was little opportunity to have an AE or worsening AML
in the intensive chemotherapy group. However a subject could have achieved a response of
CR/CRi and then worsened, without meeting the relapse definition and then had an AE of
worsening AML reported.
AML AE cost is directly from National Schedule of Reference Costs 2013-14, CL. The
currency Code: SA25M - Acute Myeloid Leukaemia with CC Score 0-1. The cost represents
“Unit day case”.
Level 1A City Tower
Manchester M1 4BT
United Kingdom
+44 (0)300 323 0140
www.nice.org.uk
B10. Priority question: Please explain how mean treatment duration for azacitidine from
the AZA-AML-001 trial was applied in the model. Please confirm that the model only
includes costs for 8 cycles of treatment although 32% of patients were still receiving
azacitidine after 12 cycles.
The model uses mean number of cycles per patient (8) to calculate treatment costs. This is
on the basis of a time-threshold in terms of cycles based on the mean, but does not account
for the distribution around the mean duration and hence the right-hand tail to this distribution,
after 8.8 cycles, is not used.
Additional question:
The company has provided the (Stata) dataset used for the final inverse-probability of
censoring weights (IPCW) analysis of overall survival (OS), with follow-up divided into 15-
day periods. The company has not, however, provided the (SAS) dataset used to estimate
the censoring weights used in the analysis. Could the company please provide the dataset
(and accompanying data dictionary) used to estimate the IPCW weights. In Appendix 10 of
the company submission, these are the datasets required to run the SAS code under ‘*
alternate scenario - reduced periods’ (please note that despite the name this is used in their
base case analyses).
SAS files are provided separately. The data dictionary provided separately in response to
question A1 can be used.
Appendix G – patient/carer organisation submission template
National Institute for Health and Care Excellence Page 1 of 10
Patient/carer organisation submission template (STA)
NATIONAL INSTITUTE FOR HEALTH AND CARE EXCELLENCE
Patient/carer organisation submission (STA)
Azacitidine for treating acute myeloid leukaemia with more than 30% bone marrow blasts
Thank you for agreeing to give us your views on this treatment that is being appraised by NICE and how it could be used in the NHS. Patients, carers and patient organisations can provide a unique perspective on conditions and their treatment that is not typically available from other sources. We are interested in hearing about:
the experience of having the condition or caring for someone with the condition
the experience of receiving NHS care for the condition
the experience of having specific treatments for the condition
the outcomes of treatment that are important to patients or carers (which might differ from those measured in clinical studies, and including health-related quality of life)
the acceptability of different treatments and how they are given
expectations about the risks and benefits of the treatment.
To help you give your views, we have provided a questionnaire. You do not have to answer every question — the questions are there as prompts to guide you. The length of your response should not normally exceed 10 pages.
1. About you and your organisation
Your name: xxxx xxxxxxxxxxxxxxxxx
Name of your organisation: Leukaemia CARE
Your position in the organisation: xxxx xx xxxxxxxxx xxx xxxxxxxx
Brief description of the organisation:
Leukaemia CARE is a national blood cancer support charity – founded in
1967 and first registered with the Charity Commission in 1969. We are
dedicated to ensuring that anyone affected by blood cancer receives the right
information, advice and support.
We support people affected by leukaemia, lymphoma; Hodgkin lymphoma;
non-Hodgkin lymphoma; multiple myeloma; myelodysplastic syndromes;
Appendix G – patient/carer organisation submission template
National Institute for Health and Care Excellence Page 2 of 10
Patient/carer organisation submission template (STA)
myeloproliferative neoplasms and aplastic anaemia. Our current membership
database stands at approximately 18,500. This includes patients, carers,
healthcare professionals etc.
Leukaemia CARE offers this care and support through our head office, based
in Worcester and a network of volunteers throughout the United Kingdom.
Support is offered over seven key areas:
o 24-hour CARE Line
o Live chat (currently office hours only)
o Support groups
o Patient and carer conferences
o One-to-one phone buddy support
o Cancer campaigning and patient advocacy
o Information and booklets
Since its inception over 25 years ago our CARE-Line has taken many
thousands of calls from patients, their carers, family and friends. Our website
provides extensive information on all aspects of the blood cancer journey,
running from diagnosis to what happens when treatment stops and includes
emotional effects of a blood cancer and help for those caring for a patient. Our
focus is purely on information and support for everyone affected by a
diagnosis of blood cancer. See http://www.leukaemiacare.org.uk
Leukaemia CARE also works with other charities and policy/decision makers
to campaign for the rights of all patients affected by a blood cancer to have
access to and receive the best possible treatment and care when they need it.
Organisational Funding:
Over 85% of our total funding comes from our own fundraising activities and
those of our volunteers. This includes a wide range of activities – such as
legacies, community events, marathons, recycling campaigns etc.
Leukaemia CARE also receives funding from a wide range of pharmaceutical
companies, but in total those funds do not exceed 15% of our total income.
Any funds received from the pharmaceutical industry are received and
dispersed in accordance with the ABPI Code of Practice and the Leukaemia
Appendix G – patient/carer organisation submission template
National Institute for Health and Care Excellence Page 3 of 10
Patient/carer organisation submission template (STA)
CARE Code of Practice. Our Code of Practice is a commitment undertaken
voluntarily by Leukaemia CARE to adhere to specific policies that regulate our
involvement with the pharmaceutical industry.
A copy of our code of practice is available at:
http://www.leukaemiacare.org.uk/code-of-practice
(For example: who funds the organisation? How many members does the
organisation have?)
We are asking for your collective view as an organisation and will be asking
patient experts for their individual input separately. If you have the condition,
or care for someone with the condition, you may wish to complete a patient
expert questionnaire to give your individual views as well.
Links with, or funding from the tobacco industry - please declare any direct or indirect links to, and receipt of funding from the tobacco industry:
N/A
2. Living with the condition
What is it like to live with the condition or what do carers experience when caring for someone with the condition?
Acute myeloid leukaemia (AML) is a form of blood cancer, which affects the
white blood cells known as myeloid cells. It is a rapidly progressing form of
leukaemia. Approximately 2,500 people are diagnosed in England each year.
AML, like most forms of cancer, is more common in older people with around
three quarters of all patients in the UK with AML are over sixty years old. As
such, the majority of AML patients will have co-morbidities that affect their
fitness which could make their treatment options more limited.
Patients can be diagnosed with primary AML but it is also possible for
myelodysplastic syndromes (MDS) and myeloproliferative neoplasms (MPNs)
to develop into secondary AML. Patients whose condition has progressed to
AML are often associated with resistance to standard chemotherapies and
have a poorer overall prognosis. Additionally, poor prognostic factors are
Appendix G – patient/carer organisation submission template
National Institute for Health and Care Excellence Page 4 of 10
Patient/carer organisation submission template (STA)
more common in older patients, also making treatment particularly
challenging.
The most common signs or symptoms of AML are anaemia (which causes
fatigue and breathlessness), low platelet counts (which cause bruising and
bleeding) and low white cell count (which causes persistent infections and
fever). Less common symptoms include bone pain, enlarged spleen and/or
enlarged lymph nodes. Patients can experience some or all of these
symptoms and they have a huge impact on their quality of life.
As shown in the recently updated NCIN report “Routes to Diagnosis”, 53% of
AML patients are diagnosed following an emergency presentation. This
compares to 30.5% for blood cancers and 22% for cancers generally. The
acute nature of the disease, which is rapidly progressing and has an
extremely poor prognosis, is a key factor in the late diagnosis of this disease.
People diagnosed with AML have a 47% chance of surviving for 6 months,
34% chance of surviving for 12 months and only 19% of surviving for 36
months or more.
With most patients diagnosed following emergency presentation and the
extremely poor prognosis expected, being diagnosed with AML can be
extremely traumatic, shocking and scary. Following diagnosis some patients
may experience feelings of disbelief, denial, anger, fear, blame, guilt, isolation
and depression.
Due to the extremely poor prognosis of patients with AML, it will not affect
patients in isolation but can cause a “ripple”, affecting a patient’s family and
friends. As most patients will die within a year of diagnosis, the emotional
impact on the family and friends can often be profound. As such, any
improvements in patients’ outcomes and quality of life will also have a wider
impact on the lives of their family and friends.
3. Current practice in treating the condition
Which treatment outcomes are important to patients or carers? (That is,
what would patients or carers like treatment to achieve?) Which of these
Appendix G – patient/carer organisation submission template
National Institute for Health and Care Excellence Page 5 of 10
Patient/carer organisation submission template (STA)
are most important? If possible, please explain why.
Whilst it is difficult to make generalised statements concerning patient’s
wishes, it must generally be accepted that the most important treatment
outcomes are:
Survival (progression-free and overall)
Durable responses to treatment
Quality of Life – including more tolerable side effects and improved
symptom control
Active treatment (rather than Best Supportive Care)
What is your organisation’s experience of currently available NHS care and of specific treatments for the condition? How acceptable are these treatments and which are preferred and why?
As previously mentioned, around three quarters of all AML patients in the UK
are over sixty years old. Due to this many AML patients have co-morbidities
that may affect their health and fitness. As such, patients are often unable to
tolerate aggressive treatment options which would usually give them the best
chance of prolonged survival. For most patients, treatment options are
therefore limited.
In this setting, the treatment usually recommended is a low dose
chemotherapy (cytarabine and hydroxyurea). This treatment often
offers a limited benefit, but can encourage haematological remissions
in a small proportion of patients.
An additional (or alternative) treatment option for patients in this setting
is best supportive care which focuses on treating any symptoms or
complications of the disease, keeping the patient as comfortable as
possible. Whilst it is currently sometimes the only available option for
patients, it is not actively treating the AML.
For patients who are younger, or have no other health issues, intensive
chemotherapy is the recommended treatment option. However for most
Appendix G – patient/carer organisation submission template
National Institute for Health and Care Excellence Page 6 of 10
Patient/carer organisation submission template (STA)
patients within the proposed patient group, this is not an appropriate
treatment option as it is reserved for patients who are well enough to
tolerate the treatment.
AML is an aggressive, fast developing cancer with a poor prognosis. As
previously mentioned, the survival rates for patients with AML are very low
and have barely improved for over 40 years. Following diagnosis, most
patients will die within a year, which demonstrates the desperate need for
improvements in treatment for these patients.
4. What do patients or carers consider to be the
advantages of the treatment being appraised?
Benefits of a treatment might include its effect on:
the course and/or outcome of the condition
physical symptoms
pain
level of disability
mental health
quality of life (such as lifestyle and work)
other people (for example, family, friends and employers)
ease of use (for example, tablets rather than injection)
where the treatment has to be used (for example, at home rather than in hospital)
any other issues not listed above
Please list the benefits/advantages that patients or carers expect to gain from using the treatment being appraised over other NHS treatments in England.
During clinical trials azacitidine appears to demonstrate an improved
overall survival. Any potential improvement in survival rates in a patient
population with such a poor prognosis is extremely welcome.
Improved quality of life
Appendix G – patient/carer organisation submission template
National Institute for Health and Care Excellence Page 7 of 10
Patient/carer organisation submission template (STA)
Azacitidine appears to be a more tolerable treatment option,
demonstrating fewer adverse effects.
Remains an effective treatment option in hard to treat patients with
poor risk cytogenetics and those with myelodysplasia-related changes.
Azacitidine is superior to best supportive care, which confirms that
active treatment should be considered for older AML patients.
Fewer hospitalisation days
Transfusion independency
Patients without a complete response to azacitidine still encountered a
significant benefit compared to alternative therapies.
Additional option following currently available alternative treatments
If you know of any differences in opinion between patients or carers about the benefits of the treatment being appraised, please tell us about them.
N/A
5. What do patients and/or carers consider to be the
disadvantages of the treatment being appraised?
Disadvantages of a treatment might include:
aspects of the condition that the treatment cannot help with or might make worse
difficulties in taking or using the treatment (for example, injection rather than tablets)
side effects (for example, type or number of problems, how often, for how long, how severe. Please describe which side effects patients might be willing to accept or tolerate and which would be difficult to accept or tolerate)
where the treatment has to be used (for example, in hospital rather than at home)
impact on others (for example, family, friends and employers)
financial impact on the patient and/or their family (for example, the cost of travel to hospital or paying a carer)
Appendix G – patient/carer organisation submission template
National Institute for Health and Care Excellence Page 8 of 10
Patient/carer organisation submission template (STA)
any other issues not listed above
Please list any concerns patients or carers have about current NHS treatments in England.
See above.
Please list any concerns patients or carers have about the treatment being appraised.
Patients taking azacitidine encountered adverse effects such as
nausea, neutropenia and thrombocytopenia (although many of these
compare more favourably than the alternative options).
If you know of any differences in opinion between patients or carers about the disadvantages of the treatment being appraised, please tell us about them.
N/A
6. Patient population
Are there any groups of patients who might benefit more from the treatment than others? If so, please describe them and explain why.
This treatment may be of particular benefit for less fit or frailer patients
who are unable to tolerate the more aggressive treatment options, as
there is little option for alternative therapies.
Potential particular benefit for patients with poor-risk cytogenetics and
poor prognostic factors (as their alternatives are limited).
Are there any groups of patients who might benefit less from the treatment than others? If so, please describe them and explain why.
N/A
7. Research evidence on patient or carer views of the
treatment
Is your organisation familiar with the published research literature for the treatment?
Yes ☐ No
Appendix G – patient/carer organisation submission template
National Institute for Health and Care Excellence Page 9 of 10
Patient/carer organisation submission template (STA)
8. Equality
NICE is committed to promoting equality of opportunity, eliminating unlawful discrimination and fostering good relations between people with particular protected characteristics and others. Protected characteristics are: age; being or becoming a transsexual person; being married or in a civil partnership; being pregnant or having a child; disability; race including colour, nationality, ethnic or national origin; religion, belief or lack of religion/belief; sex; sexual orientation.
Please let us know if you think that recommendations from this appraisal could have an adverse impact on any particular groups of people, such as:
excluding from full consideration any people protected by the equality legislation who fall within the patient population for which the treatment is/will be licensed;
having a different impact on people protected by the equality legislation than on the wider population, e.g. by making it more difficult in practice for a specific group to access the treatment;
any adverse impact on people with a particular disability or disabilities.
Please let us know if you think that there are any potential equality issues that should be considered in this appraisal.
Are there groups of patients who would have difficulties using the treatment or currently available treatments? Please tell us what evidence you think would help the Committee to identify and consider such impacts.
9. Other issues
Do you consider the treatment to be innovative?
Yes ☐ No
If yes, please explain what makes it significantly different from other treatments for the condition.
We consider azacitidine to be innovative as it is the only AML treatment that
has demonstrated an improved overall survival rate in older patients with
poor-risk cytogenetics.
Are there any other issues that you would like the Appraisal Committee to consider?
Appendix G – patient/carer organisation submission template
National Institute for Health and Care Excellence Page 10 of 10
Patient/carer organisation submission template (STA)
10. Key messages
In no more than 5 bullet points, please summarise the key messages of your submission.
AML is a fast progressing form of leukaemia that typically affects patients
over 65. It can have a fundamental impact on the physical and emotional
health of patients and their family and friends.
Common symptoms of AML are anaemia (which causes fatigue and
breathlessness), low platelet counts (which causes bruising and bleeding)
and low white cell count (which causes persistent infections and fever). The
symptoms can have a profound impact on the quality of life of the patient.
As 53% of AML diagnoses are in an emergency presentation, when most
patients are diagnosed, the condition has already progressed significantly.
Patient prognosis following diagnosis is generally very poor, with one year
survival rates of only 34%.
It is a difficult to treat disease, especially when patients are unable to
receive more intensive treatment options. For patients within this
population, who are often unable to tolerate intensive chemotherapy
options, there are very limited treatments available. Currently available
options include low-dose chemotherapy and best supportive care, with
limited efficacy. There is a clear need for more tolerable, effective
treatments for patients in this setting in order to improve overall survival
rates.
Azacitidine seems to be a promising treatment option, in an area where
there are fewer options and low overall survival rates. It seems to be
especially beneficial for older patients and those with poor prognosis (e.g.
poor-risk cytogenetics or myelodysplasia-related changes).
Appendix G - professional organisation submission template
NATIONAL INSTITUTE FOR HEALTH AND CARE EXCELLENCE
Single Technology Appraisal (STA)
Azacitidine for treating acute myeloid leukaemia with more than 30% bone marrow blasts
1
Thank you for agreeing to make a submission on your organisation’s view of the technology and the way it should be used in the NHS. Healthcare professionals can provide a unique perspective on the technology within the context of current clinical practice which is not typically available from the published literature. To help you in making your submission, we have provided a template. The questions are there as prompts to guide you. It is not essential that you answer all of them. Please do not exceed the 8-page limit.
About you Your name: XX XXXXXX XXXXXXX, submitting on behalf of: Name of your organisation: NCRI-RCP-ACP
Links with, or funding from the tobacco industry - please declare any direct or indirect links to, and receipt of funding from the tobacco industry: None to declare
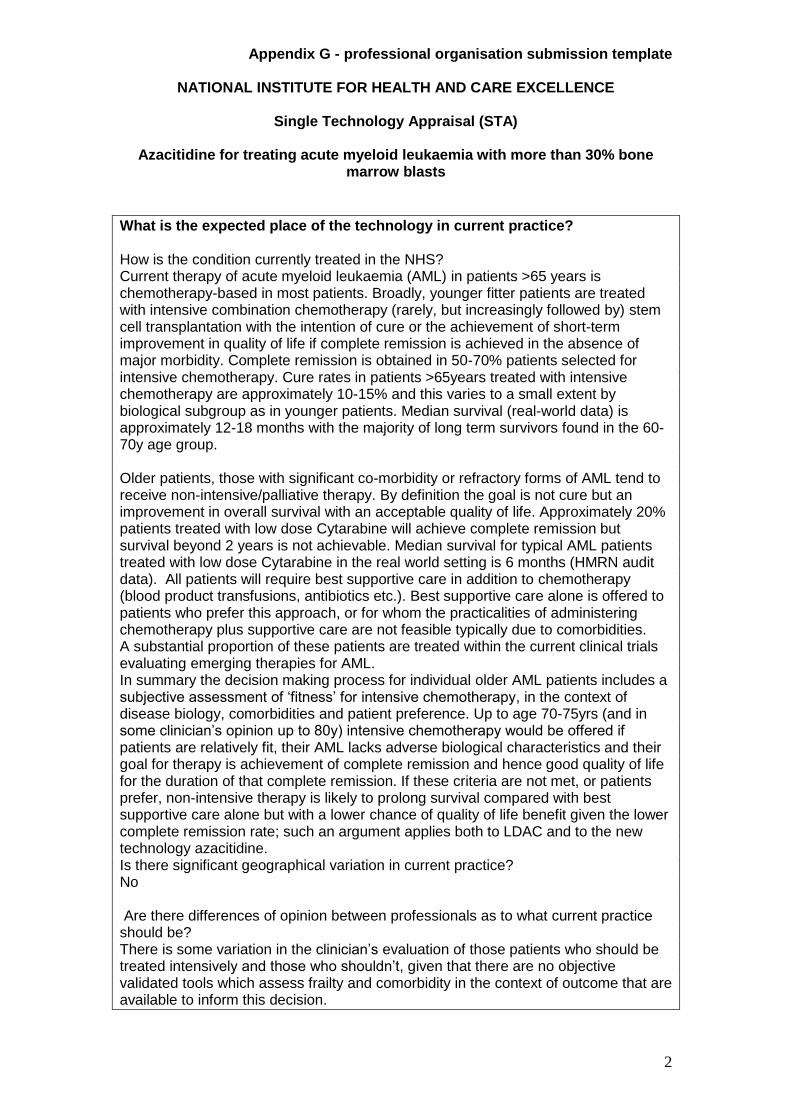
Appendix G - professional organisation submission template
NATIONAL INSTITUTE FOR HEALTH AND CARE EXCELLENCE
Single Technology Appraisal (STA)
Azacitidine for treating acute myeloid leukaemia with more than 30% bone marrow blasts
2
What is the expected place of the technology in current practice? How is the condition currently treated in the NHS? Current therapy of acute myeloid leukaemia (AML) in patients >65 years is chemotherapy-based in most patients. Broadly, younger fitter patients are treated with intensive combination chemotherapy (rarely, but increasingly followed by) stem cell transplantation with the intention of cure or the achievement of short-term improvement in quality of life if complete remission is achieved in the absence of major morbidity. Complete remission is obtained in 50-70% patients selected for intensive chemotherapy. Cure rates in patients >65years treated with intensive chemotherapy are approximately 10-15% and this varies to a small extent by biological subgroup as in younger patients. Median survival (real-world data) is approximately 12-18 months with the majority of long term survivors found in the 60-70y age group. Older patients, those with significant co-morbidity or refractory forms of AML tend to receive non-intensive/palliative therapy. By definition the goal is not cure but an improvement in overall survival with an acceptable quality of life. Approximately 20% patients treated with low dose Cytarabine will achieve complete remission but survival beyond 2 years is not achievable. Median survival for typical AML patients treated with low dose Cytarabine in the real world setting is 6 months (HMRN audit data). All patients will require best supportive care in addition to chemotherapy (blood product transfusions, antibiotics etc.). Best supportive care alone is offered to patients who prefer this approach, or for whom the practicalities of administering chemotherapy plus supportive care are not feasible typically due to comorbidities. A substantial proportion of these patients are treated within the current clinical trials evaluating emerging therapies for AML. In summary the decision making process for individual older AML patients includes a subjective assessment of ‘fitness’ for intensive chemotherapy, in the context of disease biology, comorbidities and patient preference. Up to age 70-75yrs (and in some clinician’s opinion up to 80y) intensive chemotherapy would be offered if patients are relatively fit, their AML lacks adverse biological characteristics and their goal for therapy is achievement of complete remission and hence good quality of life for the duration of that complete remission. If these criteria are not met, or patients prefer, non-intensive therapy is likely to prolong survival compared with best supportive care alone but with a lower chance of quality of life benefit given the lower complete remission rate; such an argument applies both to LDAC and to the new technology azacitidine. Is there significant geographical variation in current practice? No Are there differences of opinion between professionals as to what current practice should be? There is some variation in the clinician’s evaluation of those patients who should be treated intensively and those who shouldn’t, given that there are no objective validated tools which assess frailty and comorbidity in the context of outcome that are available to inform this decision.
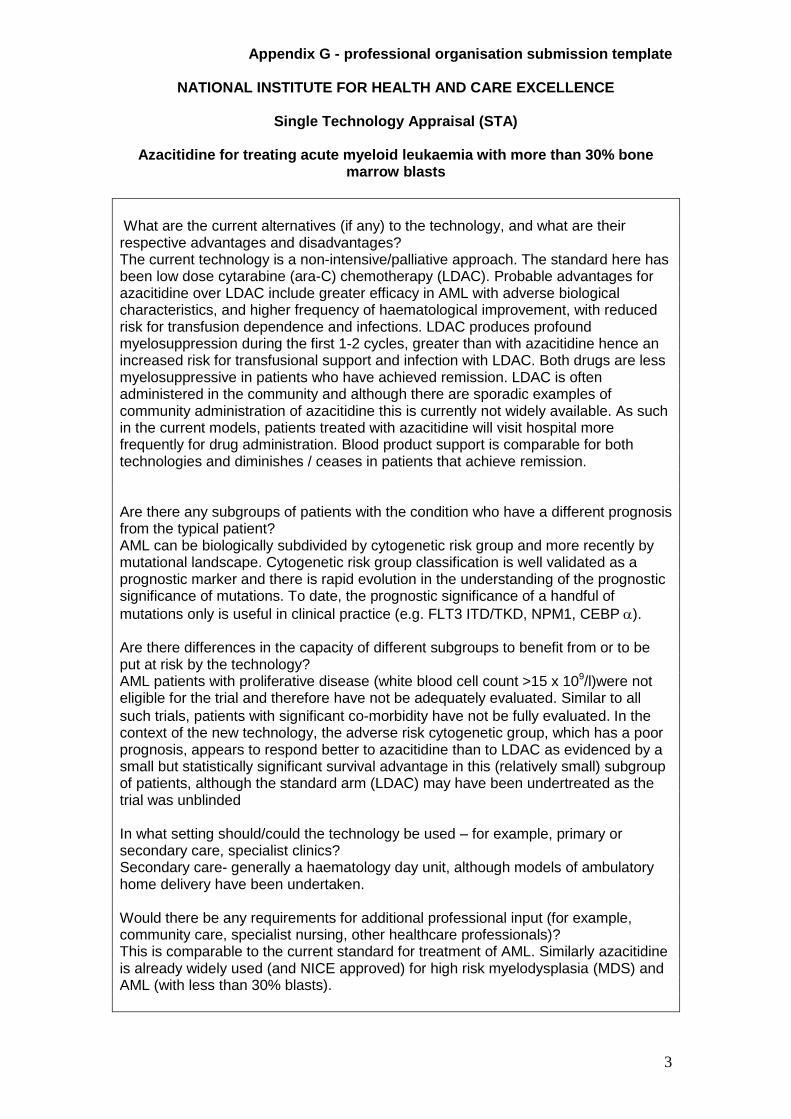
Appendix G - professional organisation submission template
NATIONAL INSTITUTE FOR HEALTH AND CARE EXCELLENCE
Single Technology Appraisal (STA)
Azacitidine for treating acute myeloid leukaemia with more than 30% bone marrow blasts
3
What are the current alternatives (if any) to the technology, and what are their respective advantages and disadvantages? The current technology is a non-intensive/palliative approach. The standard here has been low dose cytarabine (ara-C) chemotherapy (LDAC). Probable advantages for azacitidine over LDAC include greater efficacy in AML with adverse biological characteristics, and higher frequency of haematological improvement, with reduced risk for transfusion dependence and infections. LDAC produces profound myelosuppression during the first 1-2 cycles, greater than with azacitidine hence an increased risk for transfusional support and infection with LDAC. Both drugs are less myelosuppressive in patients who have achieved remission. LDAC is often administered in the community and although there are sporadic examples of community administration of azacitidine this is currently not widely available. As such in the current models, patients treated with azacitidine will visit hospital more frequently for drug administration. Blood product support is comparable for both technologies and diminishes / ceases in patients that achieve remission. Are there any subgroups of patients with the condition who have a different prognosis from the typical patient? AML can be biologically subdivided by cytogenetic risk group and more recently by mutational landscape. Cytogenetic risk group classification is well validated as a prognostic marker and there is rapid evolution in the understanding of the prognostic significance of mutations. To date, the prognostic significance of a handful of
mutations only is useful in clinical practice (e.g. FLT3 ITD/TKD, NPM1, CEBP). Are there differences in the capacity of different subgroups to benefit from or to be put at risk by the technology? AML patients with proliferative disease (white blood cell count >15 x 109/l)were not eligible for the trial and therefore have not be adequately evaluated. Similar to all
such trials, patients with significant co-morbidity have not be fully evaluated.In the context of the new technology, the adverse risk cytogenetic group, which has a poor prognosis, appears to respond better to azacitidine than to LDAC as evidenced by a small but statistically significant survival advantage in this (relatively small) subgroup of patients, although the standard arm (LDAC) may have been undertreated as the trial was unblinded In what setting should/could the technology be used – for example, primary or secondary care, specialist clinics? Secondary care- generally a haematology day unit, although models of ambulatory home delivery have been undertaken. Would there be any requirements for additional professional input (for example, community care, specialist nursing, other healthcare professionals)? This is comparable to the current standard for treatment of AML. Similarly azacitidine is already widely used (and NICE approved) for high risk myelodysplasia (MDS) and AML (with less than 30% blasts).
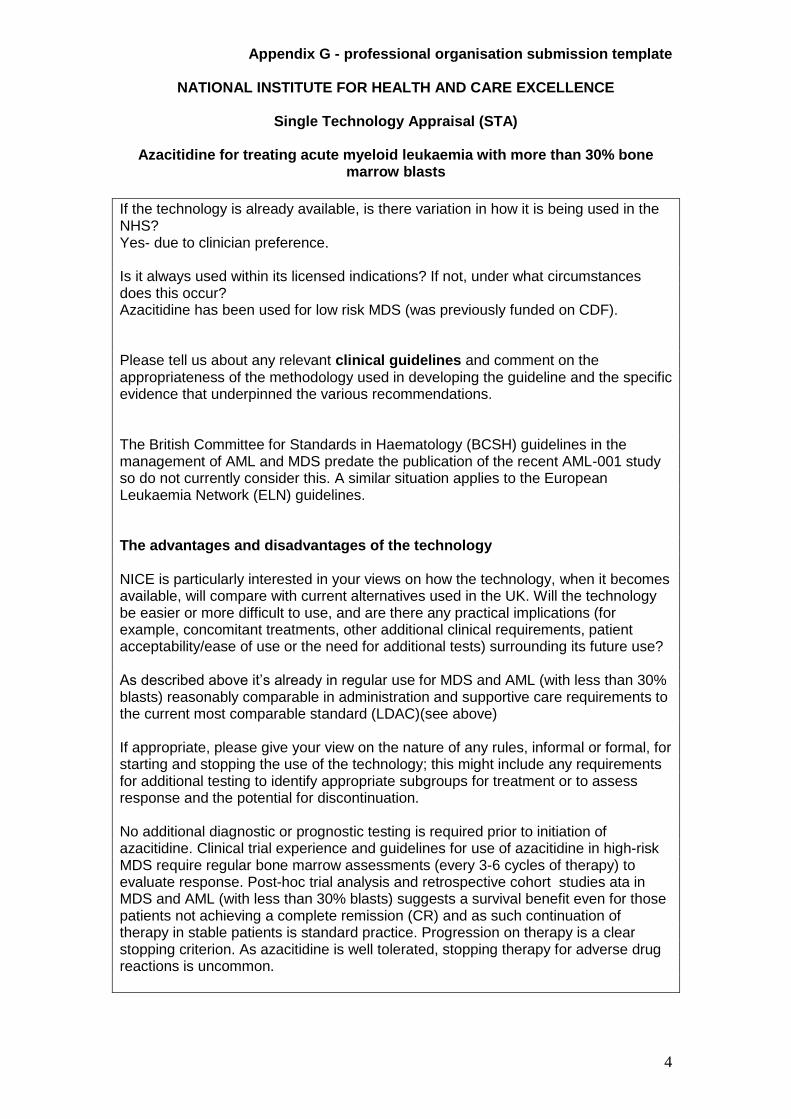
Appendix G - professional organisation submission template
NATIONAL INSTITUTE FOR HEALTH AND CARE EXCELLENCE
Single Technology Appraisal (STA)
Azacitidine for treating acute myeloid leukaemia with more than 30% bone marrow blasts
4
If the technology is already available, is there variation in how it is being used in the NHS? Yes- due to clinician preference. Is it always used within its licensed indications? If not, under what circumstances does this occur? Azacitidine has been used for low risk MDS (was previously funded on CDF). Please tell us about any relevant clinical guidelines and comment on the appropriateness of the methodology used in developing the guideline and the specific evidence that underpinned the various recommendations. The British Committee for Standards in Haematology (BCSH) guidelines in the management of AML and MDS predate the publication of the recent AML-001 study so do not currently consider this. A similar situation applies to the European Leukaemia Network (ELN) guidelines. The advantages and disadvantages of the technology NICE is particularly interested in your views on how the technology, when it becomes available, will compare with current alternatives used in the UK. Will the technology be easier or more difficult to use, and are there any practical implications (for example, concomitant treatments, other additional clinical requirements, patient acceptability/ease of use or the need for additional tests) surrounding its future use? As described above it’s already in regular use for MDS and AML (with less than 30% blasts) reasonably comparable in administration and supportive care requirements to the current most comparable standard (LDAC)(see above) If appropriate, please give your view on the nature of any rules, informal or formal, for starting and stopping the use of the technology; this might include any requirements for additional testing to identify appropriate subgroups for treatment or to assess response and the potential for discontinuation. No additional diagnostic or prognostic testing is required prior to initiation of azacitidine. Clinical trial experience and guidelines for use of azacitidine in high-risk MDS require regular bone marrow assessments (every 3-6 cycles of therapy) to evaluate response. Post-hoc trial analysis and retrospective cohort studies ata in MDS and AML (with less than 30% blasts) suggests a survival benefit even for those patients not achieving a complete remission (CR) and as such continuation of therapy in stable patients is standard practice. Progression on therapy is a clear stopping criterion. As azacitidine is well tolerated, stopping therapy for adverse drug reactions is uncommon.
Appendix G - professional organisation submission template
NATIONAL INSTITUTE FOR HEALTH AND CARE EXCELLENCE
Single Technology Appraisal (STA)
Azacitidine for treating acute myeloid leukaemia with more than 30% bone marrow blasts
5
If you are familiar with the evidence base for the technology, please comment on whether the use of the technology under clinical trial conditions reflects that observed in clinical practice. Broadly yes- with the caveat as with all such clinical trials that the exclusion/inclusion criteria inevitably does not wholly represent the patient population. Do the circumstances in which the trials were conducted reflect current UK practice, and if not, how could the results be extrapolated to a UK setting? They do and UK sites participated in the study. One significant variation is however that administration of azacitidine within the trial consisted of 7 consecutive days of administration- in reality few day units are open at weekends so on a worldwide basis this has led to the adoption of a ‘5+2+2’ schedule- where it is administered mon-fri then again on mon/tue to complete the seven days- there is less data here, but responses appear to be comparable. What, in your view, are the most important outcomes, and were they measured in the trials? Overall survival, response rate, safety assessments and quality of life. Yes but as is often the case, compliance with PRO completion reduced precipitously with time. As such it is difficult to interpret these data and of some interest that the only clinically significant benefits for QoL (with many caveats) were seen in the CCR arm. No decrement in QoL was apparently observed in the azacitidine arm. If surrogate measures of outcome were used, do they adequately predict long-term outcomes? N/A What is the relative significance of any side effects or adverse reactions? Generally well tolerated, with fewer adverse events compared to current standard therapies. In what ways do these affect the management of the condition and the patient’s quality of life? Ongoing supportive care requirements- potentially reduced from from current standard (LDAC). QoL - see above. Are there any adverse effects that were not apparent in clinical trials but have come to light subsequently during routine clinical practice? Not at a significant rate to my knowledge.
Appendix G - professional organisation submission template
NATIONAL INSTITUTE FOR HEALTH AND CARE EXCELLENCE
Single Technology Appraisal (STA)
Azacitidine for treating acute myeloid leukaemia with more than 30% bone marrow blasts
6
Any additional sources of evidence Can you provide information about any relevant evidence that might not be found by a technology-focused systematic review of the available trial evidence? This could be information on recent and informal unpublished evidence, or information from registries and other nationally coordinated clinical audits. Any such information must include sufficient detail to allow a judgement to be made as to the quality of the evidence and to allow potential sources of bias to be determined. The audits and registries I’m aware of have been published. Implementation issues The NHS is required by the Department of Health to provide funding and resources for medicines and treatments that have been recommended by NICE technology appraisal guidance. This provision has to be made within 3 months from the date of publication of the guidance. If the technology is unlikely to be available in sufficient quantity, or the staff and facilities to fulfil the general nature of the guidance cannot be put in place within 3 months, NICE may advise the Department of Health to vary this direction. Please note that NICE cannot suggest such a variation on the basis of budgetary constraints alone. How would possible NICE guidance on this technology affect the delivery of care for patients with this condition? Would NHS staff need extra education and training? Would any additional resources be required (for example, facilities or equipment)? Could be implemented with limited impact. This is a relatively rare disease and the technology would largely be replacing an alternative in units who are already very experienced in azacitidine therapy. This would require a non-licensed dosing schedule to be used as outlined above (5+2+2) In view of the short half-life many units require patients to attend their day units for daily administration- a home administration service is available in some areas of England and can provide much greater convenience for patients. Equality NICE is committed to promoting equality of opportunity, eliminating unlawful discrimination and fostering good relations between people with particular protected characteristics and others. Please let us know if you think that this appraisal: - could exclude from full consideration any people protected by the equality legislation who fall within the patient population for which [the treatment(s)] is/are/will be licensed;
Appendix G - professional organisation submission template
NATIONAL INSTITUTE FOR HEALTH AND CARE EXCELLENCE
Single Technology Appraisal (STA)
Azacitidine for treating acute myeloid leukaemia with more than 30% bone marrow blasts
7
- could lead to recommendations that have a different impact on people protected by the equality legislation than on the wider population, e.g. by making it more difficult in practice for a specific group to access the technology; - could lead to recommendations that have any adverse impact on people with a particular disability or disabilities. Please tell us what evidence should be obtained to enable the Committee to identify and consider such impacts. I don’t believe there would be such impact.
Appendix G - professional organisation submission template
NATIONAL INSTITUTE FOR HEALTH AND CARE EXCELLENCE
Single Technology Appraisal (STA)
Azacitidine for treating acute myeloid leukaemia with more than 30% bone marrow blasts
1
Thank you for agreeing to make a submission on your organisation’s view of the technology and the way it should be used in the NHS. Healthcare professionals can provide a unique perspective on the technology within the context of current clinical practice which is not typically available from the published literature. To help you in making your submission, we have provided a template. The questions are there as prompts to guide you. It is not essential that you answer all of them. Please do not exceed the 8-page limit.
About you XXXX XXXXX XXXXXXX Your name: Name of your organisation: RCPath Are you (tick all that apply):
a specialist in the treatment of people with the condition for which NICE is considering this technology?
- - a specialist in the clinical evidence base that is to support the technology (e.g.
involved in clinical trials for the technology)? -
Links with, or funding from the tobacco industry - please declare any direct or
indirect links to, and receipt of funding from the tobacco industry:
Appendix G - professional organisation submission template
NATIONAL INSTITUTE FOR HEALTH AND CARE EXCELLENCE
Single Technology Appraisal (STA)
Azacitidine for treating acute myeloid leukaemia with more than 30% bone marrow blasts
2
What is the expected place of the technology in current practice? How is the condition currently treated in the NHS? Is there significant geographical variation in current practice? Are there differences of opinion between professionals as to what current practice should be? What are the current alternatives (if any) to the technology, and what are their respective advantages and disadvantages? AML in the majority of patients aged 60-70 yrs is treated with intensive chemotherapy with the aim of achieving a complete remission, many of these patients will be considered for BMT. Allo transplant has been shown to improve survival in patients aged 60 – 70 years. Patients over 70 are also frequently treated with intensive therapy if considered fit but older frailer patients may be offered non-intensive therapies such as LDAC or if elderly and v frail with supportive care of transfusions and prophylactic antibiotics (BSC). This is the group of patients where the technology may benefit. The judgement of whether a patient is fit for intensive therapy is clinically based and there may be some variation in practice. There are useful ELN guidelines on the treatment of AML. A substantial proportion of these patients are treated within the current clinical trials evaluating emerging therapies for AML. Are there any subgroups of patients with the condition who have a different prognosis from the typical patient? Are there differences in the capacity of different subgroups to benefit from or to be put at risk by the technology? The current technology is a non-intensive/palliative approach for older patients not fit for intensive therapy. The standard here has been low dose cytarabine (ara-C) chemotherapy (LDAC). Azacitidine is comparable in tolerability and response rates in terms of remission induction. Azacitidine (AZA) may have a greater response rate in the sub group of patients who have an adverse cytogenetic karyotype In what setting should/could the technology be used – for example, primary or secondary care, specialist clinics? Would there be any requirements for additional professional input (for example, community care, specialist nursing, other healthcare professionals)? Secondary Care though some patients may receive home delivered care If the technology is already available, is there variation in how it is being used in the NHS? Is it always used within its licensed indications? If not, under what circumstances does this occur? Yes it is available and widely used for patients with MDS and selected low blast count AML. It has been also used in the relapsed setting as many older AML patients relapse as an MDS
Appendix G - professional organisation submission template
NATIONAL INSTITUTE FOR HEALTH AND CARE EXCELLENCE
Single Technology Appraisal (STA)
Azacitidine for treating acute myeloid leukaemia with more than 30% bone marrow blasts
3
Please tell us about any relevant clinical guidelines and comment on the appropriateness of the methodology used in developing the guideline and the specific evidence that underpinned the various recommendations. Mentioned above. The UK guidelines in this area are older and do not mention this technology The advantages and disadvantages of the technology NICE is particularly interested in your views on how the technology, when it becomes available, will compare with current alternatives used in the UK. Will the technology be easier or more difficult to use, and are there any practical implications (for example, concomitant treatments, other additional clinical requirements, patient acceptability/ease of use or the need for additional tests) surrounding its future use? As described above it’s already in regular use for MDS and AML (with less than 20% blasts) Its use is reasonably comparable in administration and supportive care requirements to the current most comparable standard (LDAC) If appropriate, please give your view on the nature of any rules, informal or formal, for starting and stopping the use of the technology; this might include any requirements for additional testing to identify appropriate subgroups for treatment or to assess response and the potential for discontinuation. Most patients are assessed after 4 cycles of therapy with a bone marrow to assess their response and a decision made as to whether continue therapy or not. If you are familiar with the evidence base for the technology, please comment on whether the use of the technology under clinical trial conditions reflects that observed in clinical practice. Do the circumstances in which the trials were conducted reflect current UK practice, and if not, how could the results be extrapolated to a UK setting? What, in your view, are the most important outcomes, and were they measured in the trials? If surrogate measures of outcome were used, do they adequately predict long-term outcomes? Certain patients with AML were excluded from the trial if they had a high WCC. There is little evidence that this proliferative type of AML responds well to this technology. Overall the benefit from Azacytidine seemed strongest against BSC rather than LDAC and subgroups with AML with MDS like features and adverse risk cytogenetics seemed to benefit most What is the relative significance of any side effects or adverse reactions? In what ways do these affect the management of the condition and the patient’s quality of
Appendix G - professional organisation submission template
NATIONAL INSTITUTE FOR HEALTH AND CARE EXCELLENCE
Single Technology Appraisal (STA)
Azacitidine for treating acute myeloid leukaemia with more than 30% bone marrow blasts
4
life? Are there any adverse effects that were not apparent in clinical trials but have come to light subsequently during routine clinical practice? These are manageable Any additional sources of evidence Can you provide information about any relevant evidence that might not be found by a technology-focused systematic review of the available trial evidence? This could be information on recent and informal unpublished evidence, or information from registries and other nationally coordinated clinical audits. Any such information must include sufficient detail to allow a judgement to be made as to the quality of the evidence and to allow potential sources of bias to be determined. Implementation issues The NHS is required by the Department of Health to provide funding and resources for medicines and treatments that have been recommended by NICE technology appraisal guidance. This provision has to be made within 3 months from the date of publication of the guidance. If the technology is unlikely to be available in sufficient quantity, or the staff and facilities to fulfil the general nature of the guidance cannot be put in place within 3 months, NICE may advise the Department of Health to vary this direction. Please note that NICE cannot suggest such a variation on the basis of budgetary constraints alone. How would possible NICE guidance on this technology affect the delivery of care for patients with this condition? Would NHS staff need extra education and training? Would any additional resources be required (for example, facilities or equipment)?
Appendix G - professional organisation submission template
NATIONAL INSTITUTE FOR HEALTH AND CARE EXCELLENCE
Single Technology Appraisal (STA)
Azacitidine for treating acute myeloid leukaemia with more than 30% bone marrow blasts
5
Equality NICE is committed to promoting equality of opportunity, eliminating unlawful discrimination and fostering good relations between people with particular protected characteristics and others. Please let us know if you think that this appraisal: - could exclude from full consideration any people protected by the equality legislation who fall within the patient population for which [the treatment(s)] is/are/will be licensed; - could lead to recommendations that have a different impact on people protected by the equality legislation than on the wider population, e.g. by making it more difficult in practice for a specific group to access the technology; - could lead to recommendations that have any adverse impact on people with a particular disability or disabilities. Please tell us what evidence should be obtained to enable the Committee to identify and consider such impacts.
Page 1 of 145
Produced by Peninsula Technology Assessment Group (PenTAG) University of Exeter St Luke’s Campus, Heavitree Road, Exeter, EX1 2LU
Authors Ruben Mujica Mota,1 Senior Lecturer
Jo Varley-Campbell,1 Associate Research Fellow
Irina Tikhonova,1 Associate Research Fellow
Chris Cooper,1 Senior Information Specialist
Martin Hoyle,1 Associate Professor
Claudius Rudin,2 Consultant Haematologist
Tristan Snowsill,1 Research Fellow
1 Peninsula Technology Assessment Group (PenTAG), Exeter, UK
2 Royal Devon and Exeter NHS Foundation Trust, Exeter, UK
Correspondence to Ruben Mujica Mota, South Cloisters, St Luke’s Campus, Heavitree Road, Exeter, EX1 2LU
Date completed 10/02/2016
Source of funding This report was commissioned by the NIHR HTA Programme as project number 15/64/10.
Declared competing interests of the authors
None
Acknowledgments We acknowledge the excellent administrative support of Sue Whiffin and Jenny Lowe (both of University of Exeter). We also acknowledge support and guidance given by Mary Bond (University of Exeter) relating to the critique of the company’s clinical evidence.
Rider on responsibility for report
The views expressed in this report are those of the authors and not necessarily those of the NIHR HTA Programme. Any errors are the responsibility of the authors.
This report should be referenced as follows:
Mujica Mota R, Varley-Campbell J, Tikhonova I, Cooper C, Hoyle M, Rudin C, Snowsill T. Azacitidine for treating acute myeloid leukaemia with more than 30% bone marrow blasts: A Single Technology Appraisal. Peninsula Technology Assessment Group (PenTAG), 2016.
Azacitidine for treating acute myeloid
leukaemia with more than 30% bone
marrow blasts
A Single Technology Appraisal
Page 2 of 145
Contributions of authors
Ruben Mujica Mota
Led the critique of the review of economic evaluation studies, the critique of the economic model and subsequent treatment adjustment. Wrote the respective sections of these contributions.
Jo Varley-Campbell
Led the critique of the company’s decision problem and clinical effectiveness evidence. Wrote the Decision problem and Clinical effectiveness chapters. Contributed to the writing and editing of the report.
Irina Tikhonova
Contributed to the critique of the company’s economic model and to the writing and editing of the Cost-effectiveness chapter.
Chris Cooper Led the critique of the company’s literature searching for this submission. Wrote the review of the literature searches for the report. Contributed to the writing and editing of the report.
Martin Hoyle Provided occasional advice on the critique of the economic evaluation, commented on drafts of the report and is the guarantor of the report.
Claudius Rudin
Provided clinical advice on acute myeloid leukaemia and its management within the NHS. Reviewed and revised a draft version of the report.
Tristan Snowsill
Contributed to the critique of the company’s clinical and cost-effectiveness evidence. Wrote the Summary, Background, End of Life and Overall conclusions sections. Compiled the report. Provided overall project management.
Page 3 of 145
Contents
Contents ............................................................................................................................... 3
List of tables .......................................................................................................................... 6
List of figures ........................................................................................................................ 8
Abbreviations ........................................................................................................................ 9
1 Summary ..................................................................................................................... 12
1.1 Critique of the decision problem in the company submission ................................ 12
1.2 Summary of clinical effectiveness evidence submitted by the company ................ 12
1.3 Summary of the ERG’s critique of the clinical effectiveness evidence submitted ... 13
1.4 Summary of cost-effectiveness evidence submitted by the company .................... 13
1.4.1 Company’s systematic review of economic evaluations ................................. 13
1.4.2 Company’s submitted economic evaluation ................................................... 13
1.5 Summary of the ERG’s critique of the cost-effectiveness evidence submitted ....... 15
1.6 ERG commentary on the robustness of evidence submitted by the company ....... 15
1.6.1 Strengths ....................................................................................................... 15
1.6.2 Weaknesses and areas of uncertainty ........................................................... 16
1.7 Summary of exploratory and sensitivity analyses undertaken by the ERG ............ 17
2 Background .................................................................................................................. 18
2.1 Critique of company’s description of underlying health problem ............................ 18
2.1.1 Epidemiology ................................................................................................. 18
2.1.2 Diagnosis ....................................................................................................... 19
2.1.3 Prognostic markers and risk factors ............................................................... 19
2.1.4 Burden and impact on quality of life ............................................................... 20
2.2 Critique of company’s overview of current service provision ................................. 21
3 Critique of company’s definition of the decision problem .............................................. 23
3.1 Population ............................................................................................................. 25
3.1.1 Subgroups to be considered .......................................................................... 25
3.2 Intervention ........................................................................................................... 25
3.3 Comparators ......................................................................................................... 26
3.4 Outcomes ............................................................................................................. 27
3.5 Other relevant factors ........................................................................................... 27
4 Clinical effectiveness ................................................................................................... 28
4.1 Critique of the methods of review(s) ...................................................................... 28
Page 4 of 145
4.1.1 Searches ....................................................................................................... 28
4.1.2 Inclusion criteria ............................................................................................. 29
4.1.3 Data extraction ............................................................................................... 34
4.1.4 Quality assessment........................................................................................ 34
4.1.5 Evidence synthesis ........................................................................................ 37
4.2 Critique of the trials of the technology of interest, their analysis and interpretation 37
4.2.1 Methods ......................................................................................................... 37
4.2.2 Results........................................................................................................... 45
4.2.3 Interpretation.................................................................................................. 58
4.3 Adjustments of overall survival estimates for subsequent therapy ......................... 59
4.3.1 Cox proportional hazards models ................................................................... 60
4.3.2 Inverse probability of censoring weights (IPCW) method ............................... 61
4.3.3 Other analyses ............................................................................................... 63
4.3.4 Summary and additional issues ..................................................................... 63
4.4 Critique of trials identified and included and of the indirect comparison and/or
multiple treatment comparison ......................................................................................... 66
4.5 Critique of other evidence sources ........................................................................ 66
4.5.1 Non-randomised evidence ............................................................................. 66
4.5.2 Registry data.................................................................................................. 66
4.6 Conclusions of the clinical effectiveness section ................................................... 66
5 Cost-effectiveness ....................................................................................................... 67
5.1 ERG comment on company’s review of cost-effectiveness evidence .................... 67
5.1.1 Objective ........................................................................................................ 67
5.1.2 Search strategies ........................................................................................... 67
5.1.3 Inclusion criteria ............................................................................................. 68
5.1.4 Results........................................................................................................... 68
5.1.5 Conclusions ................................................................................................... 69
5.2 Summary of company’s submitted economic evaluation ....................................... 69
5.2.1 Model structure .............................................................................................. 69
5.2.2 Population ...................................................................................................... 71
5.2.3 Interventions and comparators ....................................................................... 72
5.2.4 Perspective, time horizon and discounting ..................................................... 73
5.2.5 Treatment effectiveness and extrapolation ..................................................... 73
5.2.6 Health-related quality of life ............................................................................ 82
5.2.7 Resources and costs ..................................................................................... 83
5.2.8 Cost-effectiveness results .............................................................................. 90
Page 5 of 145
5.2.9 Sensitivity analyses........................................................................................ 92
5.2.10 Model validation and face validity check ........................................................ 96
5.3 Critique of company’s submitted economic evaluation by the ERG ....................... 99
5.3.1 Critical appraisal checklists ............................................................................ 99
5.3.2 Model structure ............................................................................................ 104
5.3.3 Population .................................................................................................... 106
5.3.4 Interventions and comparators ..................................................................... 106
5.3.5 Perspective, time horizon and discounting ................................................... 107
5.3.6 Treatment effectiveness and extrapolation ................................................... 107
5.3.7 Health-related quality of life .......................................................................... 120
5.3.8 Resources and costs ................................................................................... 122
5.3.9 Cost-effectiveness results ............................................................................ 123
5.3.10 Sensitivity analyses...................................................................................... 124
5.3.11 Model validation and face validity check ...................................................... 126
5.4 Exploratory and sensitivity analyses undertaken by the ERG .............................. 127
5.4.1 Corrected base case .................................................................................... 127
5.4.2 ERG preferred base case ............................................................................ 127
5.4.3 Exploratory analyses .................................................................................... 128
5.5 Conclusions of the cost-effectiveness section ..................................................... 129
6 Impact on the ICER of additional clinical and economic analyses undertaken by the
ERG .................................................................................................................................. 130
6.1 Exploratory analyses ........................................................................................... 132
6.2 Univariate sensitivity analyses ............................................................................ 133
6.3 Probabilistic sensitivity analysis .......................................................................... 134
7 End of life ................................................................................................................... 136
8 Overall conclusions .................................................................................................... 138
8.1 Implications for research ..................................................................................... 138
8.1.1 Clinical effectiveness ................................................................................... 138
8.1.2 Health-related quality of life (HRQoL) .......................................................... 139
8.1.3 Healthcare resource use .............................................................................. 139
References ....................................................................................................................... 140
List of appendices ............................................................................................................. 145
Page 6 of 145
List of tables
Table 1: Summary table of decision problem critique .......................................................... 24
Table 2: Scope of the literature review: PICOS criteria for study inclusion .......................... 30
Table 3: Critical appraisal of AZA-AML-001 ........................................................................ 35
Table 4: Treatment protocol ................................................................................................ 38
Table 5: Concomitant medications in/excluded ................................................................... 39
Table 6: Eligibility Criteria .................................................................................................... 40
Table 7: Study endpoints .................................................................................................... 41
Table 8: Analysis Population ............................................................................................... 43
Table 9: Population distribution for analysis ........................................................................ 46
Table 10: Summary of overall survival in the ITT population ............................................... 48
Table 11: Secondary endpoints: azacitidine versus CCR .................................................... 49
Table 12: Secondary endpoints – according to investigator pre-selection: haematologic
response ................................................................................................................. 52
Table 13: Secondary endpoints – according to investigator pre-selection: other secondary
outcomes ................................................................................................................. 53
Table 14: HRQoL assessment rates ................................................................................... 54
Table 15: Summary of adverse events ................................................................................ 57
Table 16: Grade 3 to 4 Treatment emergent adverse events occurring in ≥10% of patients in
any treatment group ................................................................................................ 58
Table 17: Key assumptions in Celgene's economic model .................................................. 71
Table 18: Censoring rules for event-free survival ................................................................ 74
Table 19: Censoring rules for relapse-free survival ............................................................. 75
Table 20: Response rates in the AZA-AML-001 trial ........................................................... 75
Table 21: Covariates used in the company's IPCW analysis ............................................... 80
Table 22: Methods used to calculate survival curves in the model submitted by Celgene ... 82
Table 23: Summary of utility values for Celgene’s economic evaluation .............................. 83
Table 24: Drug utilisation per cycle (4 weeks) for no wastage scenario ............................... 84
Table 25: Drug acquisition unit costs ................................................................................... 84
Table 26: Drug acquisition cost per cycle ............................................................................ 85
Table 27: Mean number of treatment cycles in the AZA-AML-001 trial ................................ 85
Table 28: Unit costs for each item of healthcare resource use ............................................ 86
Table 29: Healthcare resource use (frequency per cycle) for each health state................... 87
Page 7 of 145
Table 30: Healthcare resource use (mean time in minutes per frequency) for each health
state ........................................................................................................................ 87
Table 31: Healthcare resource use (number of tests per cycle) for drug monitoring tests .... 88
Table 32: Unit costs for drug monitoring tests ..................................................................... 88
Table 33: Unit cost and resource use (number of transfusions per cycle) of transfusions .... 89
Table 34: Costs of managing adverse events (≥ grade 3) ................................................... 89
Table 35: Base case results of the company's model .......................................................... 90
Table 36: Health outcomes (QALYs) by health state in the company's model ..................... 90
Table 37: Costs by health state in the company's model ..................................................... 90
Table 38: Costs by component in the company's model ...................................................... 91
Table 39: Results for patients with poor-risk cytogenetics ................................................... 91
Table 40: Results for patients with MDS related changes ................................................... 91
Table 41: Distributions used in the company’s probabilistic sensitivity analysis ................... 94
Table 42: Results of the company's submitted probabilistic sensitivity analysis ................... 94
Table 43: Results of the company's scenario analyses ....................................................... 96
Table 44: Checklist used to check the model inputs and results .......................................... 97
Table 45: NICE reference case ........................................................................................... 99
Table 46: Drummond checklist65 ....................................................................................... 101
Table 47: Philips checklist66 .............................................................................................. 102
Table 48: Subsequent therapies used in AZA-AML-001 by randomly allocated therapy .... 105
Table 49: Goodness of fit for OS, RFS, and PFS parametric functions (ITT data) ............. 108
Table 50: Goodness of fit for OS, RFS, and PFS parametric functions (censor-at-switch
data) ...................................................................................................................... 109
Table 51: Results of the IPCW models .............................................................................. 113
Table 52: List of covariates used for calculating stabilised weights in the IPCW model ..... 113
Table 53: Goodness of fit and test statistics for OS parametric functions (patients censored
at switch for any subsequent therapy in both arms) ............................................... 117
Table 54: Number of patients who switched treatments in AZA-AML-001 ......................... 119
Table 55: Summary of QALYs by health state in company base case ............................... 124
Table 56: Summary of costs by health state in company base case .................................. 124
Table 57: Corrections to the implementation of Celgene's model ...................................... 127
Table 58: Corrected base case and elements of ERG preferred base case ...................... 131
Table 59: Derivation of the ERG's preferred base case ..................................................... 132
Table 60: Scenarios explored for subgroup analysis explored by ERG ............................. 133
Table 61: Cost-effectiveness results for ERG’s preferred base case probabilistic sensitivity
analysis ................................................................................................................. 135
Table 62: Assessment of end-of-life criteria ...................................................................... 136
Page 8 of 145
List of figures
Figure 1: PRISMA study flow diagram ................................................................................. 33
Figure 2: Kaplan-Meier plot of overall survival ..................................................................... 47
Figure 3: Kaplan-Meier plot of event-free survival ............................................................... 50
Figure 4: Kaplan-Meier plot of relapse-free survival ............................................................ 51
Figure 5: Kaplan-Meier plot of progression-free survival ..................................................... 52
Figure 6: Mean absolute score change from baseline for primary and secondary HRQoL
endpoints (HRQoL evaluable population) ................................................................ 55
Figure 7: Overall survival in AZA-AML-001 based on intention-to-treat population .............. 61
Figure 8: Overall survival in AZA-AML-001 following adjustment of the CCR arm for
subsequent treatment with azacitidine using the IPCW method ............................... 62
Figure 9: Structure of the model submitted by Celgene ....................................................... 70
Figure 10: Overall survival used in the company's submitted model .................................... 76
Figure 11: Relapse-free survival used in the company's submitted model ........................... 77
Figure 12: Progression-free survival used in the company's submitted model ..................... 77
Figure 13: Tornado diagram of company’s deterministic sensitivity analyses ...................... 93
Figure 14: Cost-effectiveness acceptability curves in the company's probabilistic sensitivity
analysis ................................................................................................................... 95
Figure 15: Comparison of CCR overall survival predictions to Haematological Malignancy
Research Network data ........................................................................................... 98
Figure 16: Comparison of CCR overall survival predictions for patients with poor-risk
cytogenetics to Haematological Malignancy Research Network data ...................... 98
Figure 17: Kaplan-Meier estimate of relapse-free survival in AZA-AML-001 ...................... 109
Figure 18: Kaplan-Meier estimate of progression-free survival in AZA-AML-001 ............... 110
Figure 19: Survival curves used in Celgene’s base case (Y-axis in logarithmic scale)....... 111
Figure 20: Overall survival curves in AZA-AML-001 following adjustment of the CCR arm for
subsequent treatment with azacitidine using the IPCW method ............................. 114
Figure 21: Overall survival from AZA-AML-001 adjusted using hazard ratio from the IPCW
method .................................................................................................................. 115
Figure 22: Overall survival in AZA-AML-001 – ITT Kaplan-Meier data and adjusted
exponential model fitted to censor-at-switch (any AML therapy) data .................... 118
Figure 23: Tornado diagram of ERG’s preferred base case deterministic analysis ............ 134
Figure 24: Cost-effectiveness acceptability curves from ERG’s preferred base case
probabilistic sensitivity analysis ............................................................................. 135
Page 9 of 145
Abbreviations
AE Adverse event
AIC Akaike information criterion
AML Acute myeloid leukaemia
ANC Absolute neutrophil count
AZA Azacitidine
BIC Bayesian information criterion
BM Bone marrow
BNF British National Formulary
BSC Best supportive care
CCR Conventional care regimens
CI Confidence interval
CMML Chronic myelomonocytic leukaemia
CNS Clinical nurse specialist
CR Complete remission
CRc Cytogenetic complete remission
CRi Complete remission with incomplete blood count recovery
DNA Deoxyribonucleic acid
ECOG Eastern Cooperative Oncology Group
EFS Event-free survival
EORTC European Organization for Research and Treatment on Cancer
EQ-5D EuroQol five dimensions questionnaire
ERG Evidence Review Group
HMRN Haematological Malignancy Research Network
HR Hazard ratio
Page 10 of 145
HRQoL Health-related quality of life
HCRU Healthcare resource utilisation
HSCT Haematopoietic stem cell transplantation
IC Intensive chemotherapy
ICER Incremental cost-effectiveness ratio
IPCW Inverse probability of censoring weighting
IPE Iterative parameter estimation
ITT Intent-to-treat
IV Intravenous
IVRS Interactive Voice Response System
IWG International Working Group
KM Kaplan Meier
LDAC Low-dose cytarabine
LYG Life years gained
MDS Myelodysplastic syndromes
NICE National Institute for Health and Care Excellence
OS Overall survival
PAS Patient Access Scheme
PD Progressive disease
PFS Progression-free survival
PH Proportional hazards
PR Partial remission
PRISMA Preferred Reporting Items for Systematic Reviews and Meta-Analyses
PRO Patient-reported outcomes
PS Performance status
PSA Probabilistic sensitivity analysis
PSSRU Personal Social Services Research Unit
Page 11 of 145
QALY Quality-adjusted life year
QLQ Quality of life questionnaire
RBC Red blood cell
RCT Randomised controlled trial
RFS Relapse-free survival
RPSFTM Rank preserving structural failure time model
SAE Serious adverse event
SC Subcutaneous(ly)
SD Stable disease
SF-12 Short-form 12 questionnaire
WBC White blood cell
WHO World Health Organization
Page 12 of 145
1 Summary
1.1 Critique of the decision problem in the company submission
The company narrowed the population from adults with acute myeloid leukaemia (AML) and
bone marrow blasts more than 30% (as per the NICE Scope) to adults aged ≥65 years who
are not eligible for haematopoietic stem cell transplantation with AML and bone marrow
blasts more than 30% to adults. This change was to coincide with the European Medicines
Agency marketing authorisation for azacitidine and was deemed a reasonable change by the
ERG.
The intervention in the decision problem was azacitidine, as in the NICE Scope.
The comparator(s) in the decision problem were different from the NICE Scope. The
company replaced three individual comparators (intensive chemotherapy [IC], non-intensive
chemotherapy with low dose cytarabine [LDAC] and best supportive care [BSC]) with one
composite comparator (conventional care regimen; CCR) on the basis that there are no
established criteria for selecting one CCR. As a result, the company has not assessed
whether azacitidine demonstrated clinical and/or cost-effectiveness versus each of the CCR
comparators. The ERG considered this to be a weakness of the submission.
The company reported the same outcomes to that of the NICE Scope.
The NICE Scope asked for evidence, if available, on the following subgroups: people with
AML secondary to myelodysplastic syndrome (MDS) and people with adverse-risk
cytogenetics. The company reported that these subgroups were assessed. Although the
submission looked at the subgroup of AML with MDS-related changes (which is a broader
subgroup than AML secondary to MDS), these other considerations were deemed
acceptable by the ERG.
1.2 Summary of clinical effectiveness evidence submitted by the
company
The primary focus of the company’s submission was the RCT AZA-AML-001. Patients were
randomised to azacitidine (N=241) or to a conventional care regimen (N=247; BSC=45,
LDAC=158, IC=44). Baseline characteristics were reported as being balanced between
arms. Outcome results were as follows:
Overall survival
Azacitidine was numerically superior to CCR in prolonging survival of adults ≥65 years with
AML with >30% bone marrow blasts but statistical significance was not reached. Median
duration of follow up was 24.5 months. By the study end, there were 193 deaths (80.7%)
following treatment with azacitidine and 201 deaths (81.4%) following CCR treatment.
Secondary endpoints
1-year survival rates were 46.5% for azacitidine compared to 34.3% in the CCR arm
(difference 12.3 %; 95% CI: 3.5, 21.0).
Measures of haematologic response, duration of remission and remission free survival were
similar between treatment arms when CCR was combined. When CCR was not combined, it
Page 13 of 145
appeared that IC was numerically superior to azacitidine for these outcomes, although the
study was not powered to detect any such differences.
No statistical analyses were presented for the health-related quality of life (HRQoL) data.
Appearances from the figures suggest that CCR was favourable to azacitidine.
Adverse events
Treatment related AEs were common for both azacitidine, LDAC and IC. Unsurprisingly, AEs
were less common for BSC.
1.3 Summary of the ERG’s critique of the clinical effectiveness
evidence submitted
The company presented a poorly constructed systematic review of the literature. Their
searches were weak and their inclusion criteria were both over- and under-exclusive.
Ultimately however, the ERG concluded that the company did not miss any evidence.
The primary focus of the company’s submission was the RCT AZA-AML-001. This was
generally an appropriately-designed RCT, although it was underpowered for comparisons of
azacitidine to each of the CCR arms. It is not clear whether the proportion of patients pre-
selected to each CCR therapy in the RCT (18% IC, 64% LDAC and 18% BSC) are
representative of NHS clinical practice; data from a registry in Yorkshire suggests more
patients may receive BSC xxxxx and fewer LDAC xxxxx, while clinical expert advice is that
more patients would be expected to receive IC. The use of subsequent therapies following
treatment assignment was permitted, and this was a limitation to the study design as it
resulted in confounded estimates for the primary efficacy endpoint and other endpoints.
The open-label design of the trial, although unavoidable as the treatments generally require
different levels of medical intervention, increases the risk of bias.
Statistical analyses of time-to-event outcomes relied on the proportional hazards
assumption, which transpired not to be justified.
1.4 Summary of cost-effectiveness evidence submitted by the
company
1.4.1 Company’s systematic review of economic evaluations
The company conducted a systematic review of economic evaluations, which did not find
any pre-existing studies adequately addressing the decision problem.
1.4.2 Company’s submitted economic evaluation
1.4.2.1 Methods
The company presented a model-based economic evaluation to address the decision
problem.
A semi-Markov (survival partition) model was used with four health states: Remission, Stable
disease, Relapse/Post-progression and Death. Patients achieving remission started the
model in the Remission state, while patients not achieving remission started in the Stable
disease state. A model cycle length of four weeks was used, and a time horizon of ten years
Page 14 of 145
was used. Outputs of the model (costs, life years and quality-adjusted life years [QALYs])
were discounted at 3.5% per annum.
Two treatment arms were modelled. The azacitidine (AZA) arm modelled treatment with
azacitidine until discontinued, followed by BSC. The CCR arm modelled a mixture of
conventional treatments (IC, LDAC and BSC), with IC and LDAC followed by BSC after
discontinuation.
Overall survival, relapse-free survival and progression-free survival curves were constructed
by fitting parametric survival models to data from the AZA-AML-001 trial. The treatment
effect was modelled using proportional hazards for all survival curves. A model selection
process was followed, which resulted in the selection of an exponential survival model for
overall survival, a Weibull model for relapse-free survival and a Gompertz model for
progression-free survival. Hazard ratios of 0.84 and 0.85 were used for relapse-free and
progression-free survival respectively, while a hazard ratio of xxxx was used for overall
survival based on an analysis adjusting for subsequent treatment with azacitidine in patients
randomised to CCR.
Health state utility values were estimated by mapping EORTC QLQ-30 data collected in the
AZA-AML-001 trial to EQ-5D utility values, and were not modelled as varying according to
treatment given. The impact of adverse events on health-related quality of life was also
directly modelled by treatment.
Costs were modelled from the NHS and personal social services perspective. Drug
acquisition costs were estimated using the average daily dose in AZA-AML-001 and list
prices (British National Formulary; BNF), with a confidential patient access scheme (PAS)
discount of xxx applied to the cost of azacitidine. In the base case full wastage was assumed
(i.e., no vial sharing across days or across patients). Patients were assumed to receive the
relevant first-line treatment until relapse or progression. Drug administration, medical
management, diagnostic test and transfusion resource use were estimated through a survey
of clinicians conducted by the company. The PSSRU Unit cost of health and social care and
the NHS reference costs were used to estimate unit costs. Costs of adverse events were
also modelled.
Univariate and probabilistic sensitivity analyses were conducted to explore uncertainty in the
incremental cost-effectiveness ratio (ICER) and to identify parameters to which the model
was sensitive. Scenario analyses were also conducted.
1.4.2.2 Results
In the company’s base case analysis, treatment with CCR resulted in 0.6365 QALYs and
£40,608 cost, while treatment with azacitidine resulted in xxxxxx QALYs xxxxxxxxx and
xxxxxxx cost xxxxxxxxx, with a corresponding ICER of £20,648 per QALY.
Azacitidine was predicted to provide QALY gains across all health states, and was predicted
to result in increased costs in the Remission and in Relapse/Progressive disease health
states, partially compensated for by savings in the Stable disease health state.
Drug acquisition costs were the largest cost component in the AZA arm xxxxxxxx more
costly than in the CCR arm), while drug administration costs were the largest cost
component in the CCR arm xxxxxxxx more costly than in the AZA arm). Other costs were
largely similar between the two arms.
Page 15 of 145
In their probabilistic sensitivity analysis, incremental QALYs were similar to the deterministic
analysis, while incremental costs were marginally lower. The resulting ICER for azacitidine
was £17,423 per QALY. At cost-effectiveness thresholds of £20,000, £30,000 and £50,000
per QALY, azacitidine was cost-effective versus CCR in 69.9%, 90.8% and 99.6% of
iterations respectively.
Univariate sensitivity analyses identified that the results were sensitive to a number of
parameters, with administration costs in the CCR arm, the hazard ratio for overall survival,
the remission rates in the CCR arm and the acquisition and administration costs in the AZA
arm as the five parameters to which the model was most sensitive.
One notable scenario analysis showed that when overall survival in the CCR arm was not
adjusted for subsequent treatment, this resulted in improved cost-effectiveness of azacitidine
(£11,537 per QALY).
1.5 Summary of the ERG’s critique of the cost-effectiveness evidence
submitted
The ERG identified several issues with the company’s submitted economic evaluation.
The model assumed that no patients would receive active treatment following
discontinuation of first-line treatment. However, in the AZA-AML-001 trial underpinning the
analysis, 29% of participants received active second-line treatment. Advice from clinical
experts suggests that active second-line treatment is considered for some patients in the
NHS.
The model assumed proportional hazards for all time-to-event outcomes, even though this
was not supported for overall survival and relapse-free survival by results from the AZA-
AML-001 trial.
Overall survival in the AZA arm was not adjusted for subsequent active treatment, resulting
in an inconsistency between the modelled health outcomes and costs, since only the costs
of best supportive care were modelled following azacitidine.
Implementation issues were identified in the model. The most significant of these was an
error in the calculation of the duration of first-line treatment which resulted in an
underestimate of the drug acquisition and administration costs in both arms.
The ERG also identified that there were significant differences in the cost associated with the
Relapse/progressive disease state between the AZA and CCR arm, even though all patients
(in both arms) are expected to be receiving BSC at this point.
1.6 ERG commentary on the robustness of evidence submitted by the
company
1.6.1 Strengths
The company’s submission was based on a recent and relevant RCT (AZA-AML-001) with
the following strengths:
Multicentre RCT conducted across multiple countries, including countries in Western
Europe;
Page 16 of 145
Sufficient follow-up for mature estimates of survival outcomes, including overall
survival;
Appropriate dosing in the intervention and comparator arms;
Appropriate randomisation, including concealment of allocation prior to randomisation
and stratified blocking on key prognostic variables;
Appropriate and relevant outcomes measured.
The company’s submitted economic evaluation had the following strengths:
Simple and transparent overall model structure;
Inclusion of relevant costs from an NHS and personal social services perspective;
Suitable cycle length and time horizon;
Transparent process for fitting survival models;
Utility values suitably mapped from health-related quality of life measurements from
AZA-AML-001;
Probabilistic sensitivity analysis to estimate the importance of parameter uncertainty
in the decision problem.
1.6.2 Weaknesses and areas of uncertainty
The decision problem addressed by the company’s submission had a key weakness that
instead of individual conventional care regimens as comparators (as in the NICE Scope), a
combined comparator was used.
The company’s systematic review of clinical effectiveness evidence was hampered by poorly
designed and reported searches.
The pivotal trial (AZA-AML-001) had the following weaknesses:
Underpowered for comparisons between azacitidine and individual conventional care
regimens;
Significant proportion of patients used subsequent active treatments, including
treatments not currently used in the NHS, and these were not balanced between
treatment arms;
Limited proportion of patients allocated intensive chemotherapy as their conventional
care regimen compared to expectation of routine clinical practice according to clinical
experts;
Open-label design increases the risk of bias;
Statistical analyses relying on proportional hazards assumption which is not justified.
The company’s submitted economic evaluation had the following weaknesses:
Inconsistency between the treatments costed post-discontinuation (BSC only) and
the subsequent treatments reflected in overall survival estimates (AZA: active
treatments; CCR, active treatments except azacitidine);
Page 17 of 145
Inappropriate proportional hazards assumption for overall survival and relapse-free
survival outcomes;
Implementation errors, including a significant underestimate of treatment duration in
both arms;
Inadequate exploration of structural uncertainty;
Significantly greater costs after relapse/progression in the CCR arm despite patients
in both arms receiving BSC only in this state.
The following areas of uncertainty remain:
The overall survival benefit demonstrated in AZA-AML-001 did not reach statistical
significance in pre-planned analyses, yet it is interpreted nevertheless as a positive
result;
It is not clear to what extent azacitidine is a clinically effective and cost-effective
alternative to IC, LDAC and BSC as individual comparators.
1.7 Summary of exploratory and sensitivity analyses undertaken by the
ERG
The ERG preferred base case ICER is £169,606 per QALY, compared to the company’s
base case ICER of £20,648 per QALY. The reasons for the increased ICER are:
Corrections to errors in model formulae (increases ICER from £20,648 to £62,518
per QALY);
Increased costs in the AZA and CCR arms due to correcting the implementation of
treatment duration in the model (increases ICER from £62,518 to £131,698 per
QALY);
Equalised costs in the Relapse/progressive disease health state across the model
(increases ICER from £131,698 to £238,674 per QALY);
Overall survival in both arms adjusted for subsequent active treatment (reduces
ICER from £238,674 to £171,511 per QALY);
Relapse-free survival Kaplan-Meier curves used for AZA and CCR arms (increases
ICER from £171,511 to £174,205 per QALY);
Progression-free survival Kaplan-Meier curves used for AZA and CCR arms
(increases ICER from £174,205 to £246,488 per QALY);
Adjusting overall survival for baseline covariates (reduces ICER from £246,488 to
£169,606 per QALY).
Page 18 of 145
2 Background
2.1 Critique of company’s description of underlying health problem
Celgene describe acute myeloid leukaemia (AML) as ‘an aggressive, clonal myeloid
neoplasm with maturation arrest of myelopoiesis, leading to an accumulation of myeloblasts
in the [bone marrow (BM)] and/or blood.’ (Source: Celgene submission, Section 3.1, p. 31).
AML is a haematological cancer affecting the myeloid line of blood cells. In AML, myeloid
stem cells in the bone marrow produce immature blood cells (usually myeloblasts) which do
not develop fully and build up in the bone marrow. These immature blood cells are not able
to function properly and they reduce the ability of the bone marrow to produce other cells the
body needs.
AML can develop following myelodysplastic syndrome (MDS), or can develop as a result of
therapy (e.g., cytotoxic therapy), or can arise without previous associated disease or
treatment (primary AML).
The World Health Organisation (WHO) system requires involvement of at least 20% of blood
and/or bone marrow by myeloblasts for AML diagnosis, and is also used to classify AML into
subtypes to aid clinical decision making and prognosis.
Celgene describe the following signs and symptoms of AML (Source: Celgene submission,
Section 3.1, p. 31):
The clinical signs and symptoms of AML are diverse and non-specific, but they are
usually directly attributable to the leukaemic infiltration of the [bone marrow], with
resultant cytopenias (reduction in blood cell counts). Typically, patients present with
signs and symptoms of fatigue, haemorrhage, and/or infections and fever due to
reductions in [red blood cells], platelets, and [white blood cells].1 The corresponding
impact on physical and psychological aspects of quality of life is significant and
increases over the course of the condition.2
The ERG believes the description given is appropriate.
2.1.1 Epidemiology
Celgene give the following estimates of the incidence of AML (Source: Celgene submission,
Section 3.1, p. 31):
AML is the most frequent form of leukaemia, accounting for approximately 25% of all
leukaemia cases in adults in the Western world.3 […] In the UK between 2009 and
2011, an average of 40% of cases were diagnosed in men and women aged 75
years and over, and almost three quarters of cases (73%) were diagnosed in those
aged 60 and over.4 The median age of diagnosis is between 65 and 72 years for the
entire population, and 78 years when evaluating the population who are aged over 65
years.5-10
The annual incidence rate of AML in England has been estimated to be 4.1 per
100,000.11 The incidence increases dramatically with older age, rising to 18.35 per
Page 19 of 145
100,000 in people aged 65 years and over,11 equating to approximately 1,777 new
cases of AML in this patient group in England annually.11-13
The incidence statistics provided by Celgene appear to be well-sourced, but we estimate a
marginally lower number of new cases in adults aged over 65 per year in England (1,610
versus 1,777) using the same datasets but a different method (applying the different age-
specific rates to the relevant population estimates and aggregating afterwards rather than
applying an aggregated rate to an aggregate population estimate). This also corresponds to
a marginally lower incidence rate for the over-65s of 16.88 per 100,000 (rather than 18.35).
2.1.2 Diagnosis
Diagnostic criteria are given by Celgene (Source: Celgene submission, Section 3.1, p. 31):
Diagnosis of AML requires the examination of peripheral blood and BM specimens,
using morphology, cytochemistry, immunophenotyping, cytogenetics, and molecular
genetics. According to the WHO classification of myeloid neoplasms, a myeloid
neoplasm with ≥20% blasts in the peripheral blood or BM is considered to be AML
when occurring de novo, evolution to AML when it occurs with previous diagnosis of
MDS or myelodysplastic/myeloproliferative neoplasm.14
An abnormal result on a complete blood count is a typical finding prior to a diagnosis of AML.
An excess of white blood cells is commonly seen, and counts for platelets and/or red blood
cells may be reduced.
2.1.3 Prognostic markers and risk factors
Celgene have provided general information on survival in AML (Source: Celgene
submission, Section 3.4, p. 34):
AML is a heterogeneous disease in terms of response to treatment and OS.
Prognostic factors that contribute to this heterogeneity can be patient-related (such
as increased age, reduced performance status, comorbidities, vulnerability, or frailty)
or disease-related (such as genetic factors, adverse cytogenetics, somatic mutations,
or whether the patient has MDS-related changes).15-17
Survival is highly age dependent with survival rates being significantly lower in older
patients.5 The median [overall survival (OS)] of elderly patients with AML in
population-based studies has remained unchanged since 1995 at 1.5 to 3 months.18,
19 Furthermore, a recent analysis of the [Haematological Malignancy Research
Network] HMRN registry highlights the current poor outcomes in UK routine practice,
with a median OS of xxx months for non-transplant-eligible AML patients 65 years or
older treated with [conventional care regimens (CCR)].20 There is also a clear
disparity in 5-year survival rates between AML patients of different ages. Between
2003 and 2009, 5-year survival rates for patients <65 years of age was 41.6%, but
just 5.4% in patients ≥65 years of age.21 In contrast, the life expectancy of people in
the general population once they have reached 75 years of age is a further 10.6
years (males) and 12.9 years (females).22 Therefore, AML represents a challenging
disease to treat, and results in a significant reduction in patient’s life expectancy.
Page 20 of 145
Age and cytogenetics appear to be the most important prognostic factors. The NICE Scope
identified two subgroups to be considered if evidence allowed, these were: people with AML
secondary to myelodysplastic syndrome, and people with adverse-risk cytogenetics.
AML secondary to myelodysplastic syndrome is associated with reduced likelihood of
treatment response and therefore with worse prognosis.9
Cytogenetics are generally classified as being favourable, intermediate or poor, with survival
differing markedly between these groups. In a recent analysis of patients enrolled in the
Cancer and Leukaemia Group B first-line trials, median (overall) survival for patients aged
over 60 was 1.6 years for individuals in the favourable group (based on cytogenetics and
molecular genetics), 0.9 years for individuals in the intermediate groups, and 0.5 years for
individuals in the adverse groups.23
2.1.4 Burden and impact on quality of life
Celgene note the following in relation to the impact on the quality of life of the patient
(Source: Celgene submission, Section 3.2, p. 32):
When compared with the general population, patients with AML experience a
significant reduction in physical functioning (as determined via the physical
component domain of quality of life assessments), and experience a higher incidence
of depression.2 Furthermore, quality of life deteriorates over time, with a significant
reduction observed as early as 2 weeks after AML diagnosis.2 Patients with AML can
also experience appetite loss and fatigue; both having a negative impact on overall
measures of quality of life.24 The burden of the disease continues until death, with
patients frequently suffering from open bleeding, infection, and pain during the final
stages of the disease.25
The ERG note that the study by Sekeres et al.2 found similar SF-12 mental component
scores for AML patients as population norms, which should be considered alongside the
finding of a higher incidence of depression. Other than this the description is appropriate and
relevant.
Celgene also note the potential impact on caregivers (Source: Celgene submission, Section
3.2, p. 32):
The impact is far reaching with caregivers, including family or friends, often having to
deal with numerous and concurrent stressful events, and often suffering negative
psychological, behavioural and physiological effects on their daily lives and their
health.26
The ERG note that the publication by Bevans and Sternberg26 cited by the company is a
case study of a single individual with AML secondary to MDS, who also received HSCT. The
ERG considers that this does not constitute high-quality evidence of an impact on
caregivers, although the ERG does not dispute that such impacts may exist.
Page 21 of 145
2.2 Critique of company’s overview of current service provision
The company gives the following overview of the clinical pathway of care for elderly patients
with AML – the company’s decision problem focuses on elderly patients as opposed to all
adults, see Section 3 (p. 23) – (Source: Celgene submission, Section 3.3, p. 33):
Due to the heterogeneity of disease, there is no standard of care for elderly patients
with AML, resulting in complex treatment guidelines.27-30 Despite differences between
published treatment guidelines, there is a general consensus that treatment
decisions should be based on a number of patient- and disease-related prognostic
factors. Patients with favourable prognostic factors are more likely to be assessed as
“fit” to receive treatment with IC while patients with unfavourable prognostic factors,
such as increased age, poor performance and/or cytogenetic risk status, and
increased comorbidities are typically deemed unfit for treatment with IC. As such,
these patients are usually offered less intensive chemotherapy options, such as
LDAC and those unable to tolerate chemotherapy or who chose not to receive LDAC
should receive BSC only.
Despite this general guidance there is no widely accepted risk algorithm which
clinicians use in the UK when deciding which patients are most likely to benefit from
intensive or non-intensive treatment options. A recent review further demonstrated
the lack of structure when making treatment decisions, concluding that decisions
remain complex and selection is subjective based on the clinician’s judgement.31
Patient choice was also found to be a confounding factor, accounting for
approximately 8% of treatment decisions, irrespective of the clinicians’
recommendation.32
The company also provide the following information in relation to current service provision
(Source: Celgene submission, Section 3.7, p. 37):
Treatment options for elderly patients with >30% BM blasts AML include HSCT, IC,
low-dose chemotherapy (LDAC), or BSC alone.28 However, HSCT is rarely used in
patients older than 65 years.33 Decitabine is also licenced in the EU for the treatment
of elderly WHO-defined AML but it is not reimbursed (NICE TA27034) and so is not
used in UK routine clinical practice. Treatment with IC is typically contraindicated for
patients aged ≥65 years with an adverse performance status, organ damage, and
comorbidities.28 Treatment with IC can however be successfully used in older
patients, if restricted to patients with a favourable performance status, minimal organ
dysfunction and/or comorbidity, and favourable cytogenetics, but is associated with
an increased risk of treatment-related mortality.5, 28 In this patient population,
treatment options usually consist of LDAC or BSC and patients suffer from low
survival rates, with a 26% 30-day mortality reported in patients receiving low-intensity
treatment.21, 28
The ERG note that a Swedish registry study covering 98% of Swedish patients diagnosed
with AML by the French-American-British criteria (requiring at least 30% bone marrow
blasts) found that 55% of patients aged at least 65 years with ECOG PS 0–2 were reported
Page 22 of 145
fit for intensive chemotherapy, and 45% of patients aged at least 65 years of any ECOG
PS.22
Our clinical expert (CR) advised that IC is administered in an inpatient setting, while LDAC
may be self-administered at home. Azacitidine would most likely be administered as a
regular day case in the NHS, which presents the problem of administering azacitidine on
seven consecutive days since many day case units do not currently operate over the
weekend. Patients treated with azacitidine would normally attend for five consecutive days
(Monday to Friday) and then two consecutive days after a weekend break (Monday and
Tuesday). Prevailing clinical opinion is that this schedule is non-inferior to administration
over seven consecutive days. Patients treated with best supportive care may be admitted at
times to treat certain complications (e.g., infection). A UK study recently found that of
patients with one of three haematological malignancies (AML, diffuse large B-cell lymphoma
and myeloma), 74% died in hospital, 15% at home, and the remainder in a hospice or
nursing home.35
The ERG believes that these descriptions are appropriate and relevant to the company’s
chosen decision problem (see Section 3, p. 23).

Page 23 of 145
3 Critique of company’s definition of the decision problem
The company presented their decision problem within the Executive Summary chapter,
under the subheading ‘statement of the decision problem’ (Celgene submission, Section 1.1,
p. 12–16). A summary table of the NICE Scope,36 the company’s decision problem and the
ERG’s critique is presented below (Table 1). Further comments to the decision problem
follow the table.
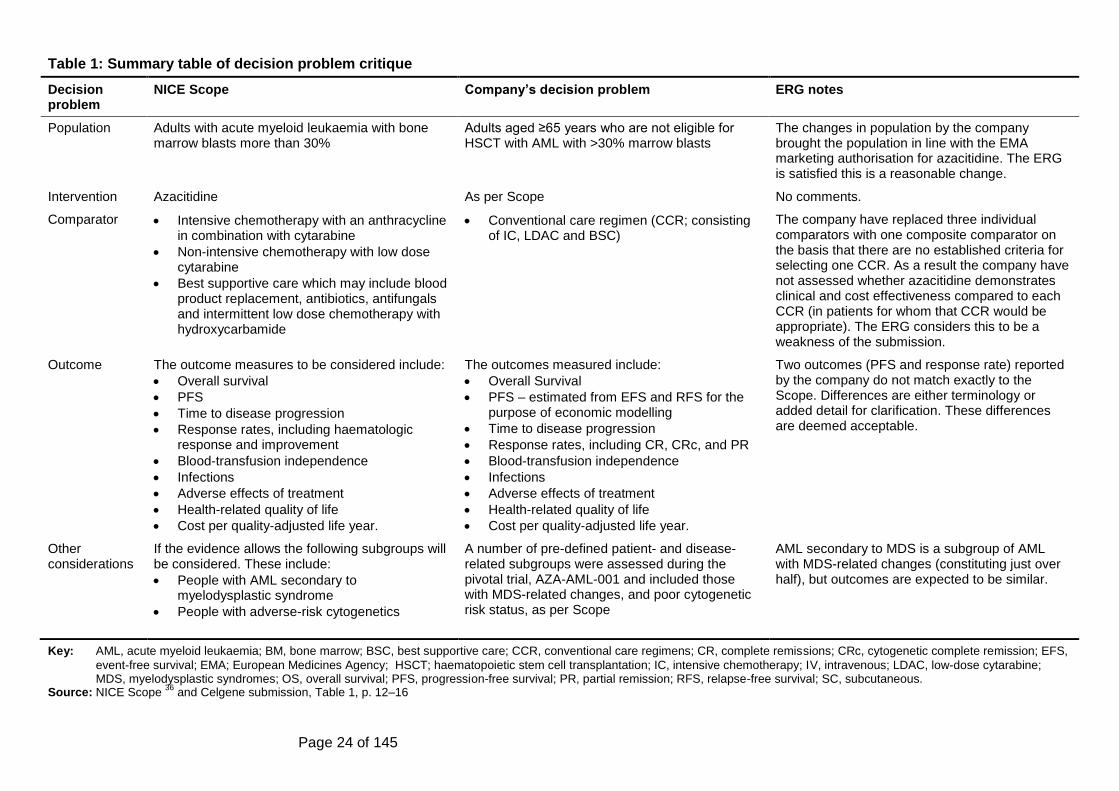
Page 24 of 145
Table 1: Summary table of decision problem critique
Decision problem
NICE Scope Company’s decision problem ERG notes
Population Adults with acute myeloid leukaemia with bone marrow blasts more than 30%
Adults aged ≥65 years who are not eligible for HSCT with AML with >30% marrow blasts
The changes in population by the company brought the population in line with the EMA marketing authorisation for azacitidine. The ERG is satisfied this is a reasonable change.
Intervention Azacitidine As per Scope No comments.
Comparator Intensive chemotherapy with an anthracycline in combination with cytarabine
Non-intensive chemotherapy with low dose cytarabine
Best supportive care which may include blood product replacement, antibiotics, antifungals and intermittent low dose chemotherapy with hydroxycarbamide
Conventional care regimen (CCR; consisting of IC, LDAC and BSC)
The company have replaced three individual comparators with one composite comparator on the basis that there are no established criteria for selecting one CCR. As a result the company have not assessed whether azacitidine demonstrates clinical and cost effectiveness compared to each CCR (in patients for whom that CCR would be appropriate). The ERG considers this to be a weakness of the submission.
Outcome The outcome measures to be considered include:
Overall survival
PFS
Time to disease progression
Response rates, including haematologic response and improvement
Blood-transfusion independence
Infections
Adverse effects of treatment
Health-related quality of life
Cost per quality-adjusted life year.
The outcomes measured include:
Overall Survival
PFS – estimated from EFS and RFS for the purpose of economic modelling
Time to disease progression
Response rates, including CR, CRc, and PR
Blood-transfusion independence
Infections
Adverse effects of treatment
Health-related quality of life
Cost per quality-adjusted life year.
Two outcomes (PFS and response rate) reported by the company do not match exactly to the Scope. Differences are either terminology or added detail for clarification. These differences are deemed acceptable.
Other considerations
If the evidence allows the following subgroups will be considered. These include:
People with AML secondary to myelodysplastic syndrome
People with adverse-risk cytogenetics
A number of pre-defined patient- and disease-related subgroups were assessed during the pivotal trial, AZA-AML-001 and included those with MDS-related changes, and poor cytogenetic risk status, as per Scope
AML secondary to MDS is a subgroup of AML with MDS-related changes (constituting just over half), but outcomes are expected to be similar.
Key: AML, acute myeloid leukaemia; BM, bone marrow; BSC, best supportive care; CCR, conventional care regimens; CR, complete remissions; CRc, cytogenetic complete remission; EFS,
event-free survival; EMA; European Medicines Agency; HSCT; haematopoietic stem cell transplantation; IC, intensive chemotherapy; IV, intravenous; LDAC, low-dose cytarabine; MDS, myelodysplastic syndromes; OS, overall survival; PFS, progression-free survival; PR, partial remission; RFS, relapse-free survival; SC, subcutaneous.
Source: NICE Scope 36
and Celgene submission, Table 1, p. 12–16
Page 25 of 145
3.1 Population
The population in the company’s submission did not match for age and eligibility (adults
aged ≥65 years who are not eligible for haematopoietic stem cell transplantation), to the
population specified in the NICE Scope (adults).36 Celgene justify this inconsistency by
stating that:
This submission specifically evaluates the efficacy and tolerability of azacitidine in
patients aged ≥65 years and who are not eligible for HSCT in line with the new
indication approved by the EMA.
The European Medicines Agency (EMA) indication for azacitidine has been expanded, and
now includes: “Treatment of adult patients aged 65 years or older who are not eligible for
HSCT with AML with >30% marrow blasts according to the WHO classification.” Therefore,
the population reported by the company matches the EMA marketing authorisation for
azacitidine but does not match the NICE Scope. Overall we agree that the population
considered by the company’s submission is appropriate based on it matching the EMA
indication.
3.1.1 Subgroups to be considered
The NICE Scope states that if evidence allows, the following subgroups should be
considered:
People with AML secondary to myelodysplastic syndrome;
People with adverse-risk cytogenetics.
The company’s decision problem suggests that pre-defined subgroups were assessed in the
pivotal trial, including those with MDS-related changes and those with poor cytogenetic risk
status. The ERG note that AML with MDS-related changes is a broader category including
AML secondary to MDS, and that in the pivotal trial there were 158 patients with MDS-
related changes but only 87 patients with prior MDS.37 Nevertheless, the prognosis of AML
with MDS-related changes is likely to be similar to the prognosis of AML secondary to MDS.
3.2 Intervention
The company’s decision problem specified the intervention as ‘azacitidine’, which matches
the NICE Scope.36
The NICE Scope describes azacitidine as follows; ‘Azacitidine (Vidaza, Celgene) is an
analogue of nucleotide cytidine that reduces DNA methylation by inhibition of DNA
methyltransferase. Azacitidine is administered subcutaneously.’
The EMA recommend the following for administering azacitidine:
The recommended starting dose of Vidaza is 75 mg per square metre body surface
area (calculated using the patient’s height and weight). It is given as an injection
under the skin… …every day for one week, followed by three weeks with no
treatment. This four-week period is one ‘cycle’. Treatment continues for at least six
cycles and then for as long as it benefits the patient. The liver, kidneys and blood
should be checked before each cycle. If the blood counts fall too low or if the patient
Page 26 of 145
develops kidney problems, the next treatment cycle should be delayed or a lower
dose should be used. Patients who have severe liver problems should be carefully
monitored for side effects, but Vidaza must not be used in patients with advanced
liver cancer.
Our clinical advisor (CR) commented that they would typically administer azacitidine for five
days (Monday to Friday), and then administer the remaining two days on Monday and
Tuesday of the following week, as this is more convenient for the patients and the day case
setup at the hospital.
3.3 Comparators
The comparators in the submission do not match those in the Scope.36 There is more detail
given by the Scope, regarding component treatments, than by the company who just report
the overarching term for the comparator. The company also refer to decitabine, a treatment
that was included in the NICE Draft Scope as a form of non-intensive chemotherapy.
Decitabine has marketing authorisation in the UK but has not received a positive NICE
recommendation following termination of NICE technology appraisal 270.34 The company
note that decitabine was removed for the Final Scope and do not include it in their decision
problem.
The comparator in the company submission is a composite comparator, containing the
comparators as identified in the Scope. This comparator is referred to as Conventional Care
Regimen (CCR). Further details on dosing schedules for the CCR are as follows:
Intensive Chemotherapy (IC): generally consists of cytarabine 100-200 mg/m2 per
day by continuous intravenous infusion for 7 days, plus three days of either
daunorubicin 45-60 mg/m2 per day or idarubicin 9-12 mg/m2 per day for one cycle,
followed by up to two consolidation cycles.28 Our clinical expert commented that
there are various different schedules for the administration of the IC treatment;
however these differing combinations are unlikely to alter the clinical effectiveness of
the drugs.
LDAC: subcutaneously, 20 mg twice per day for 10 days.28 This dosing practice was
considered routine by our clinical expert.
BSC: typically BSC will consist of prophylactic anti-infectious treatment (including
fungal and antibiotic prophylaxis) and transfusion support (platelet, red blood cell and
granulocyte transfusion).28 This dosing practice was considered routine by our clinical
expert.
Our clinical advisor (CR) commented that most patients are offered IC even if they ultimately
receive an alternative treatment.
The ERG considers it a weakness to use a combined comparator in the decision problem,
since it is possible that azacitidine could be effective and cost-effective (at a chosen cost-
effectiveness threshold) versus some individual comparators but not others, but this would
be obscured. This could result in either: azacitidine being used in patients when it would
have been better for them and/or a better use of limited NHS resources for an alternative
treatment to be used; or, azacitidine not being used in patients when it would have been
better for the patient and/or a better use of limited NHS resources.
Page 27 of 145
3.4 Outcomes
The outcomes in the company submission match those in the Scope. However, they have
made the following amendments to progression free survival and response rate:
Progression free survival (PFS) - estimated from event-free survival (EFS) and
relapse-free survival (RFS) for the purpose of economic modelling.
Response rate – including complete remission, cytogenetic complete remission and
partial remission.
The company justify the alterations to PFS, by suggesting that PFS is not a standard
endpoint for AML. Our clinical advisor (CR) believes that estimating PFS from EFS and RFS
would be an appropriate alternative measure.
For the measure of response rate, the Scope specified response rate, including
haematologic response and improvement, whereas the company reports that the outcome
response rate included complete remission, cytogenetic complete remission and partial
remission. These are only terminological differences.
3.5 Other relevant factors
In response to special considerations relating to equity and equality, the company make the
following statement within their decision problem. The ERG has no comments on their
statement.
AML presents primarily in the elderly population, with 64% of newly diagnosed cases
in the UK in patients aged ≥65 years.4 Equity of treatment of the elderly is a concern,
as evident from a report published by the National Audit Office in January 2015.38
AML is also an orphan disease.39 The Cancer Patient Experience Survey in 2010
found that people with rarer forms of cancer reported a poorer experience of their
treatment and care than people with more common forms of cancer.40 Therefore,
access where appropriate to a treatment such as azacitidine should help to promote
equality for both elderly patients and those with rarer forms of cancer.
Page 28 of 145
4 Clinical effectiveness
4.1 Critique of the methods of review(s)
4.1.1 Searches
Celgene presented a literature search protocol to support its review of clinical effectiveness.
This protocol included systematic searches of key biomedical databases using a literature
search strategy, hand-searching of conference abstracts, and a search of ClinicalTrials.gov.
The literature search was last updated in November 2015.
The bibliographic database searching used a search strategy that took the following form:
1. (controlled index terms for acute granulocytic, acute myeloblastic, acute
myelomonocytic, acute monocytic or acute megakaryocytic leukemia or
erythroleukemia or promyelocytic) and
2. (controlled index terms for Azacitidine, cytarabine, gemcitabine, deoxycytidine,
etoposide, etopofos, fludarabine, anthracycline, mitoxantrone, daunorubicin or
tioguanine or best supported care) and
3. (a range of search terms for study design (RCTs and observational), limits to remove
studies conducted on animals and studies published in languages other than English.
Systematic reviews and meta-analysis were also excluded from identification. The
searches were date limited 2000 to current).
The search strategy was applied in the following bibliographic databases: MEDLINE (OVID),
EMBASE (OVID) and Cochrane CENTRAL (OVID).
The following conference proceedings were hand-searched: European Haematology
Association (EHA) Annual Congress, American Society of Haematology (ASH) Annual
Conference, and the British Society for Haematology (BSH) Annual Scientific Meeting
between January 2013 and April 2015. Finally, ClinicalTrials.gov was searched for relevant,
unpublished studies.
The ERG believes the literature searching for clinical effectiveness studies was poorly
conducted and reported.
The literature search strategies provided rely entirely on controlled indexing search terms.
Free-text search terms for acute myeloid leuk(a)emia or AML (as used in the submission of
cost-effectiveness literature searching) have been omitted. This is inappropriate for two
reasons:
1. The searches (as presented) will only return studies that have been indexed. Newly
published studies (or additional trial outcome data), or relevant studies published
ahead of print, will likely be excluded from these searches as, whilst studies are
uploaded to bibliographic databases on receipt, there is a delay between a study
being published and then indexed. This point affects the currency of the literature
searches and introduces bias into the identification of studies.
2. Any studies that have been incorrectly indexed but are of relevance to the decision
problem would be missed by these searches. The inclusion of free-text terms for
Page 29 of 145
AML, for example, would address this risk. This point affects the sensitivity of the
literature search, which is poor.
The search strategy excludes the identification of systematic reviews and meta-analyses. In
clarification, the manufacturer stated that the bibliographies of systematic literature reviews,
meta-analyses and other included studies were used as a search strategy to identify further
studies. As systematic reviews and meta-analyses were excluded from bibliographic
searching it is not clear how they were identified and therefore how this particular search
was actually conducted. This affects the replicability of the literature searching.
The literature searching is difficult to validate and it has been poorly reported.
The literature search strategies for MEDLINE and EMBASE have been combined and
reported as if one search. This makes it difficult to validate and repeat the literature search
used in MEDLINE as the EMBASE search strategy has been used and presented as the
base search. Furthermore, the combination, and practicable use of study design literature
search filters, is poorly considered when balanced against the decision problem of the
review. This affects the transparency of the literature searching.
In view of these points, the ERG has undertaken its own scoping searches to ensure that no
phase III RCTs have been missed by this review. Whilst basic scoping searches have not
identified any additional studies, the ERG has been unable to validate aspects of this search,
and the overall quality of the approach to literature searching is sufficiently poor, that it raises
questions if it is truly fit for purpose.
4.1.1.1 Adverse events
Celgene did not undertake separate literature searches to identify studies reporting adverse
events. In their submission, Celgene stated that (Source: Celgene submission, Section 4.12,
p. 85):
No further studies that report additional adverse events …that are of relevance to the
decision problem are available
In clarification, Celgene confirmed that no separate literature searches to identify studies
reporting adverse events were undertaken, stating that their literature searches were not
limited by adverse event outcomes. Whilst it is true that Celgene’s literature searches were
not limited by outcomes, Celgene’s literature searches were limited by study design. It is
therefore possible that studies reporting adverse events may have been missed.
4.1.2 Inclusion criteria
Celgene’s inclusion criteria are given below (Table 2) with an additional column added to the
right of the table, taken from the Scope36 for reference and comparison. Comments about
the differences in inclusion criteria are outlined below the table.
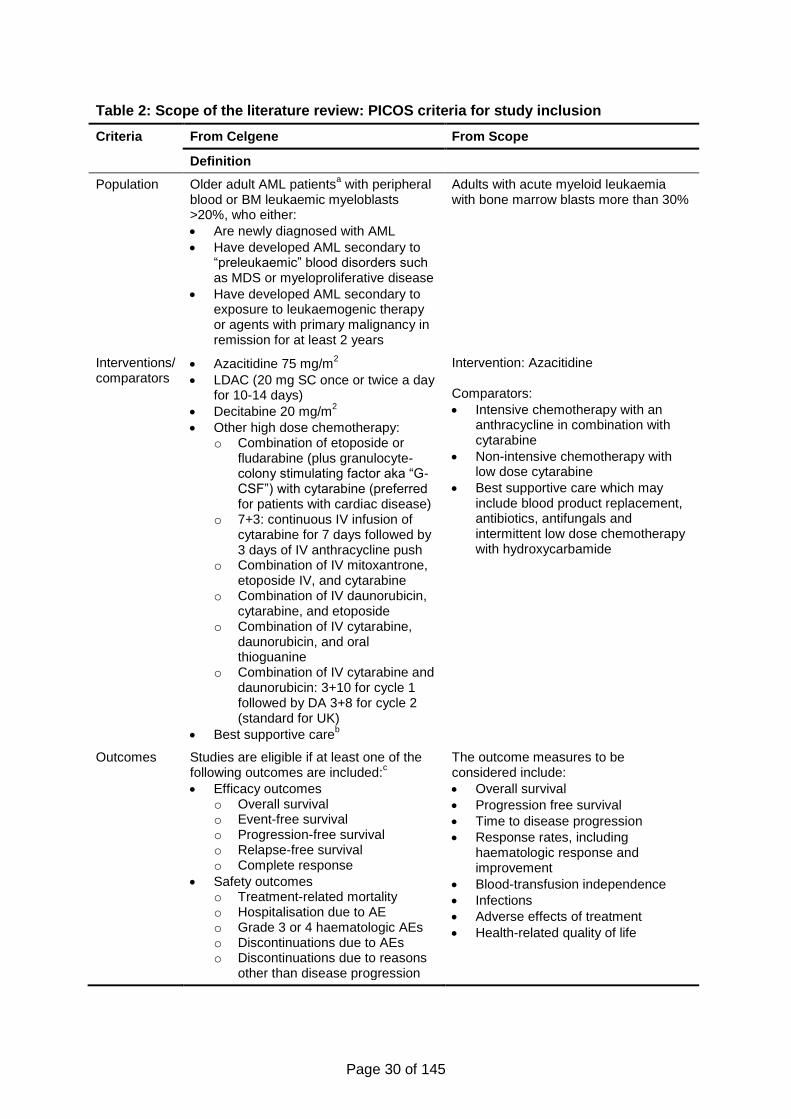
Page 30 of 145
Table 2: Scope of the literature review: PICOS criteria for study inclusion
Criteria From Celgene From Scope
Definition
Population Older adult AML patientsa with peripheral
blood or BM leukaemic myeloblasts >20%, who either:
Are newly diagnosed with AML
Have developed AML secondary to “preleukaemic” blood disorders such as MDS or myeloproliferative disease
Have developed AML secondary to exposure to leukaemogenic therapy or agents with primary malignancy in remission for at least 2 years
Adults with acute myeloid leukaemia with bone marrow blasts more than 30%
Interventions/ comparators
Azacitidine 75 mg/m2
LDAC (20 mg SC once or twice a day for 10-14 days)
Decitabine 20 mg/m2
Other high dose chemotherapy: o Combination of etoposide or
fludarabine (plus granulocyte-colony stimulating factor aka “G-CSF”) with cytarabine (preferred for patients with cardiac disease)
o 7+3: continuous IV infusion of cytarabine for 7 days followed by 3 days of IV anthracycline push
o Combination of IV mitoxantrone, etoposide IV, and cytarabine
o Combination of IV daunorubicin, cytarabine, and etoposide
o Combination of IV cytarabine, daunorubicin, and oral thioguanine
o Combination of IV cytarabine and daunorubicin: 3+10 for cycle 1 followed by DA 3+8 for cycle 2 (standard for UK)
Best supportive careb
Intervention: Azacitidine Comparators:
Intensive chemotherapy with an anthracycline in combination with cytarabine
Non-intensive chemotherapy with low dose cytarabine
Best supportive care which may include blood product replacement, antibiotics, antifungals and intermittent low dose chemotherapy with hydroxycarbamide
Outcomes Studies are eligible if at least one of the following outcomes are included:
c
Efficacy outcomes o Overall survival o Event-free survival o Progression-free survival o Relapse-free survival o Complete response
Safety outcomes o Treatment-related mortality o Hospitalisation due to AE o Grade 3 or 4 haematologic AEs o Discontinuations due to AEs o Discontinuations due to reasons
other than disease progression
The outcome measures to be considered include:
Overall survival
Progression free survival
Time to disease progression
Response rates, including haematologic response and improvement
Blood-transfusion independence
Infections
Adverse effects of treatment
Health-related quality of life
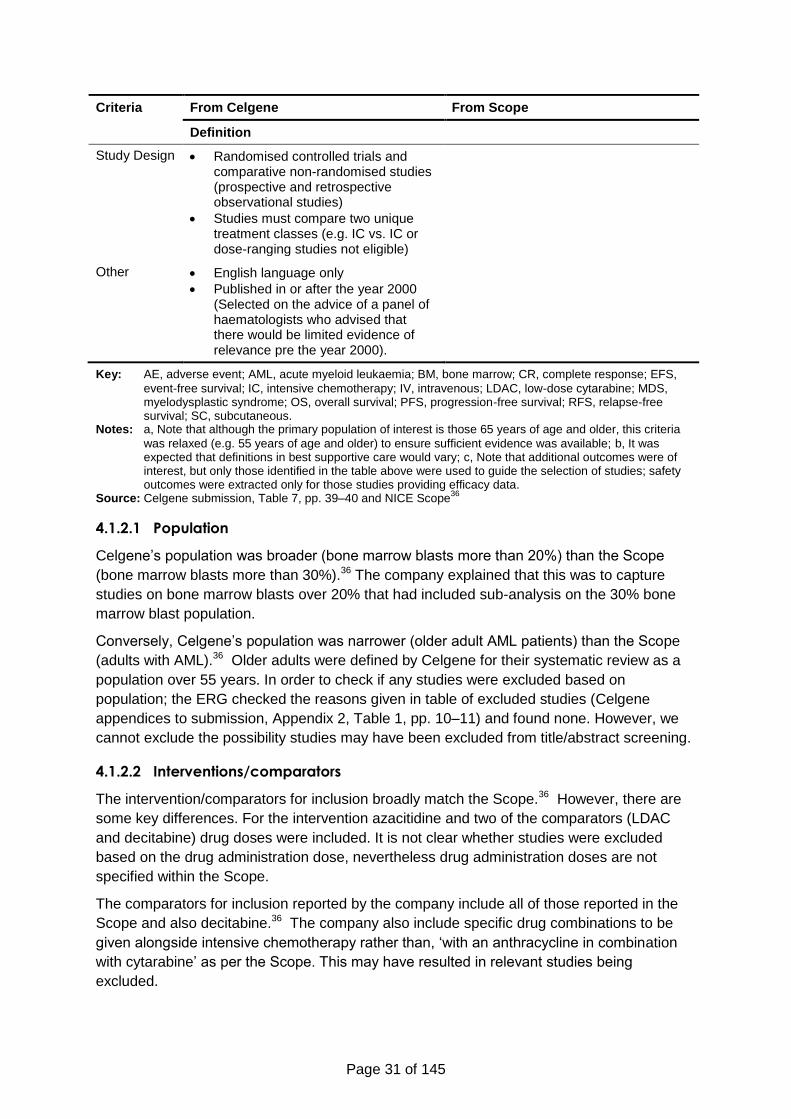
Page 31 of 145
Criteria From Celgene From Scope
Definition
Study Design Randomised controlled trials and comparative non-randomised studies (prospective and retrospective observational studies)
Studies must compare two unique treatment classes (e.g. IC vs. IC or dose-ranging studies not eligible)
Other English language only
Published in or after the year 2000 (Selected on the advice of a panel of haematologists who advised that there would be limited evidence of relevance pre the year 2000).
Key: AE, adverse event; AML, acute myeloid leukaemia; BM, bone marrow; CR, complete response; EFS,
event-free survival; IC, intensive chemotherapy; IV, intravenous; LDAC, low-dose cytarabine; MDS, myelodysplastic syndrome; OS, overall survival; PFS, progression-free survival; RFS, relapse-free survival; SC, subcutaneous.
Notes: a, Note that although the primary population of interest is those 65 years of age and older, this criteria
was relaxed (e.g. 55 years of age and older) to ensure sufficient evidence was available; b, It was expected that definitions in best supportive care would vary; c, Note that additional outcomes were of interest, but only those identified in the table above were used to guide the selection of studies; safety outcomes were extracted only for those studies providing efficacy data.
Source: Celgene submission, Table 7, pp. 39–40 and NICE Scope36
4.1.2.1 Population
Celgene’s population was broader (bone marrow blasts more than 20%) than the Scope
(bone marrow blasts more than 30%).36 The company explained that this was to capture
studies on bone marrow blasts over 20% that had included sub-analysis on the 30% bone
marrow blast population.
Conversely, Celgene’s population was narrower (older adult AML patients) than the Scope
(adults with AML).36 Older adults were defined by Celgene for their systematic review as a
population over 55 years. In order to check if any studies were excluded based on
population; the ERG checked the reasons given in table of excluded studies (Celgene
appendices to submission, Appendix 2, Table 1, pp. 10–11) and found none. However, we
cannot exclude the possibility studies may have been excluded from title/abstract screening.
4.1.2.2 Interventions/comparators
The intervention/comparators for inclusion broadly match the Scope.36 However, there are
some key differences. For the intervention azacitidine and two of the comparators (LDAC
and decitabine) drug doses were included. It is not clear whether studies were excluded
based on the drug administration dose, nevertheless drug administration doses are not
specified within the Scope.
The comparators for inclusion reported by the company include all of those reported in the
Scope and also decitabine.36 The company also include specific drug combinations to be
given alongside intensive chemotherapy rather than, ‘with an anthracycline in combination
with cytarabine’ as per the Scope. This may have resulted in relevant studies being
excluded.
Page 32 of 145
4.1.2.3 Outcomes
The outcomes overall survival, progression-free survival match the Scope.36 However,
event-free survival, relapse-free survival and complete response are not within the Scope.
Other outcomes within the Scope, but not in the inclusion table submitted by the company
include: time to disease progression; response rates, including haematologic response and
improvement; blood transfusion independence; infections; adverse effects of treatment and
health related quality of life. In order to check if any studies were excluded based on
outcomes; the ERG checked the reasons given in table of excluded studies (Celgene
appendices to submission, Appendix 2, Table 1, p. 10–11) and found none. However, we
cannot exclude the possibility studies may have been excluded from title/abstract screening.
4.1.2.4 Study Design
The Scope did not restrict study design. However, the NICE reference case guide to the
methods of technology appraisal 2013 (Chapter 5.2.3)41 recommends studies should be
restricted to RCTs and when they are not available, non RCTs. Studies included in the
company submission were RCTs, observational studies and information from registries. We
are satisfied the study designs meet the reference case.
4.1.2.5 Other
Celgene applied an English language restriction to their systematic review. Language was
not given as a reason for exclusion from full-text screening (Celgene appendices to
submission, Appendix 2, Table 1, p. 10–11). However, we cannot exclude the possibility
studies may have been excluded from title/abstract screening.
Another restriction was to exclude studies published before 2000. The decision to restrict the
studies to only include studies post-2000 was (Source: Celgene submission, Section 4.1.2,
p. 40):
Selected on the advice of a panel of haematologists who advised that there would be
limited evidence of relevance pre the year 2000
The ERG notes that azacitidine was used for primarily haematologic malignancies in the
1960s-1980s.42-44 Consequently, studies excluded based on date limitation could add
relevant information for the use of azacitidine in treating AML. Reference citations for the 15
RCT studies reported as excluded based on publication date (Celgene appendices to
submission, Appendix 2, Table 1, p. 10–11) were requested and subsequently examined.
None of the 15 studies would have been eligible for inclusion in this submission.
4.1.2.6 Study selection
Celgene’s submission explains the process used in study selection (i.e., that two
researchers independently reviewed the abstracts and the full-texts of studies, that
discrepancies between investigators were resolved by involving a third investigator and
coming to a consensus). These are standard procedures for systematic reviews.41
From the 8,450 citations the company identified from their searches, 8,363 citations were
excluded and 87 were taken to full-text screening at the abstract screening stage. From the
full-text screening, 80 citations were excluded with reasons for exclusion provided (Celgene
appendices to submission, Appendix 2, Table 1, pp. 10–11). The company go on to explain
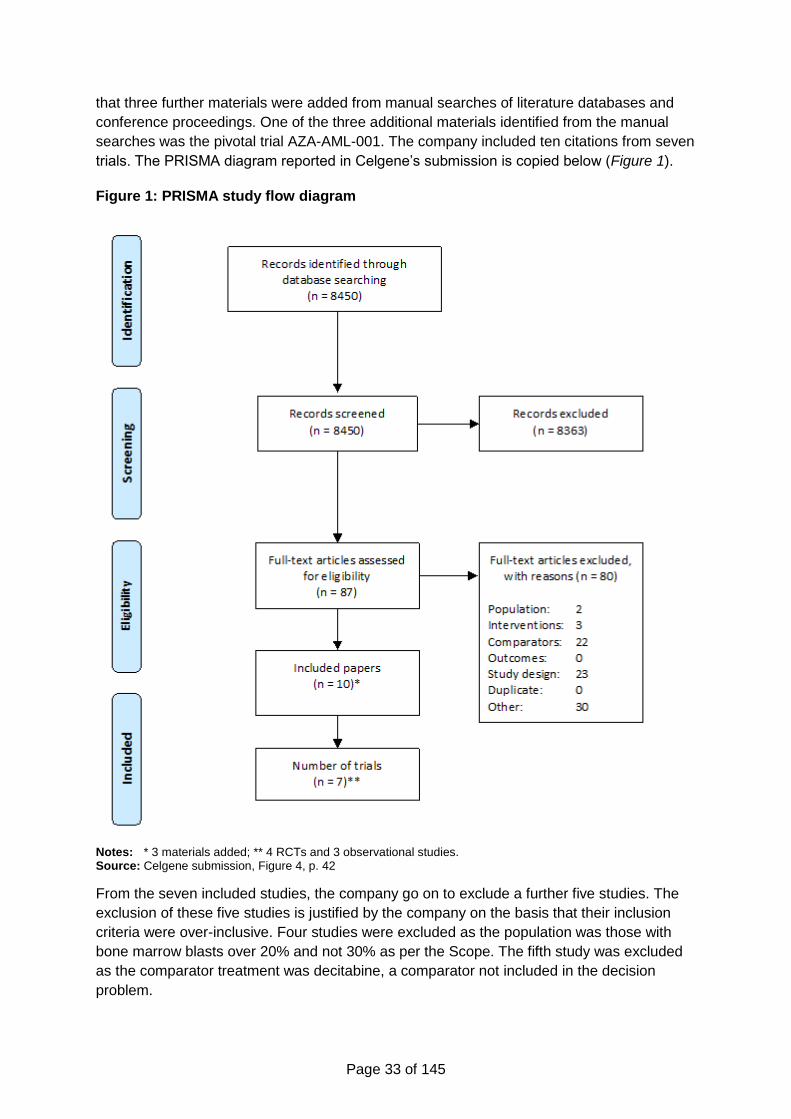
Page 33 of 145
that three further materials were added from manual searches of literature databases and
conference proceedings. One of the three additional materials identified from the manual
searches was the pivotal trial AZA-AML-001. The company included ten citations from seven
trials. The PRISMA diagram reported in Celgene’s submission is copied below (Figure 1).
Figure 1: PRISMA study flow diagram
Notes: * 3 materials added; ** 4 RCTs and 3 observational studies. Source: Celgene submission, Figure 4, p. 42
From the seven included studies, the company go on to exclude a further five studies. The
exclusion of these five studies is justified by the company on the basis that their inclusion
criteria were over-inclusive. Four studies were excluded as the population was those with
bone marrow blasts over 20% and not 30% as per the Scope. The fifth study was excluded
as the comparator treatment was decitabine, a comparator not included in the decision
problem.
Page 34 of 145
The remaining two studies were an RCT by Dombret et al. 2015.45 and an observational
study by Lao et al. 2015.46 The main focus of the submission was the RCT study by Dombret
et al. (AZA-AML-001). The company also refer to registry data from three countries (Austria,
Spain and France) within their submission.
4.1.3 Data extraction
The submission explains the process of data extraction used, which is in line with the
standard review process (Source: Celgene submission, Section 4.1.2, p. 40)
Two investigators independently extracted data on study characteristics,
interventions, patient characteristics at baseline, and outcomes for the study
populations of interest for the final list of selected eligible studies. Any discrepancies
found between the data extracted by the two data extractors were resolved by
involving a third reviewer and coming to a consensus.
The ERG notes that in relation to the pivotal RCT by Dombret et al.,45 all the typical data
(including but not limited to: participant inclusion criteria, baseline characteristics, methods,
primary and secondary study outcomes and adverse events) has been extracted from the
paper, but that there were several typographic errors in the extracted data reported in their
submission. The ERG has referred to the original publication and the clinical study report for
AZA-AML-00137 to resolve discrepancies where they have been identified.
4.1.4 Quality assessment
Details of the company’s critical appraisal of the RCT AZA-AML-001,45 alongside our
critique, can be seen below in Table 3. The critical appraisal appears (since no reference is
given to the tool used) to have been performed by the company using the CRD assessment
criteria for risk of bias in RCTs. However, they have slightly adjusted the wording of the
questions, as they do not match exactly. The meanings behind the questions remain the
same.
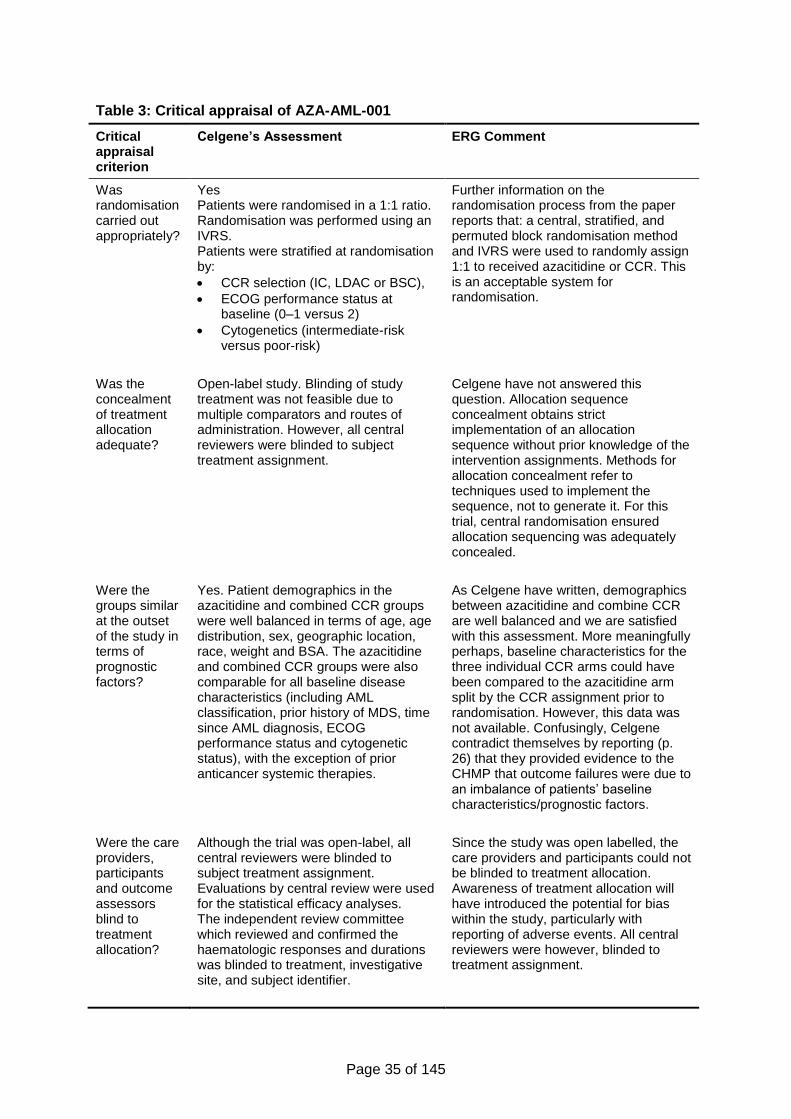
Page 35 of 145
Table 3: Critical appraisal of AZA-AML-001
Critical appraisal criterion
Celgene’s Assessment ERG Comment
Was randomisation carried out appropriately?
Yes Patients were randomised in a 1:1 ratio. Randomisation was performed using an IVRS. Patients were stratified at randomisation by:
CCR selection (IC, LDAC or BSC),
ECOG performance status at baseline (0–1 versus 2)
Cytogenetics (intermediate-risk versus poor-risk)
Further information on the randomisation process from the paper reports that: a central, stratified, and permuted block randomisation method and IVRS were used to randomly assign 1:1 to received azacitidine or CCR. This is an acceptable system for randomisation.
Was the concealment of treatment allocation adequate?
Open-label study. Blinding of study treatment was not feasible due to multiple comparators and routes of administration. However, all central reviewers were blinded to subject treatment assignment.
Celgene have not answered this question. Allocation sequence concealment obtains strict implementation of an allocation sequence without prior knowledge of the intervention assignments. Methods for allocation concealment refer to techniques used to implement the sequence, not to generate it. For this trial, central randomisation ensured allocation sequencing was adequately concealed.
Were the groups similar at the outset of the study in terms of prognostic factors?
Yes. Patient demographics in the azacitidine and combined CCR groups were well balanced in terms of age, age distribution, sex, geographic location, race, weight and BSA. The azacitidine and combined CCR groups were also comparable for all baseline disease characteristics (including AML classification, prior history of MDS, time since AML diagnosis, ECOG performance status and cytogenetic status), with the exception of prior anticancer systemic therapies.
As Celgene have written, demographics between azacitidine and combine CCR are well balanced and we are satisfied with this assessment. More meaningfully perhaps, baseline characteristics for the three individual CCR arms could have been compared to the azacitidine arm split by the CCR assignment prior to randomisation. However, this data was not available. Confusingly, Celgene contradict themselves by reporting (p. 26) that they provided evidence to the CHMP that outcome failures were due to an imbalance of patients’ baseline characteristics/prognostic factors.
Were the care providers, participants and outcome assessors blind to treatment allocation?
Although the trial was open-label, all central reviewers were blinded to subject treatment assignment. Evaluations by central review were used for the statistical efficacy analyses. The independent review committee which reviewed and confirmed the haematologic responses and durations was blinded to treatment, investigative site, and subject identifier.
Since the study was open labelled, the care providers and participants could not be blinded to treatment allocation. Awareness of treatment allocation will have introduced the potential for bias within the study, particularly with reporting of adverse events. All central reviewers were however, blinded to treatment assignment.
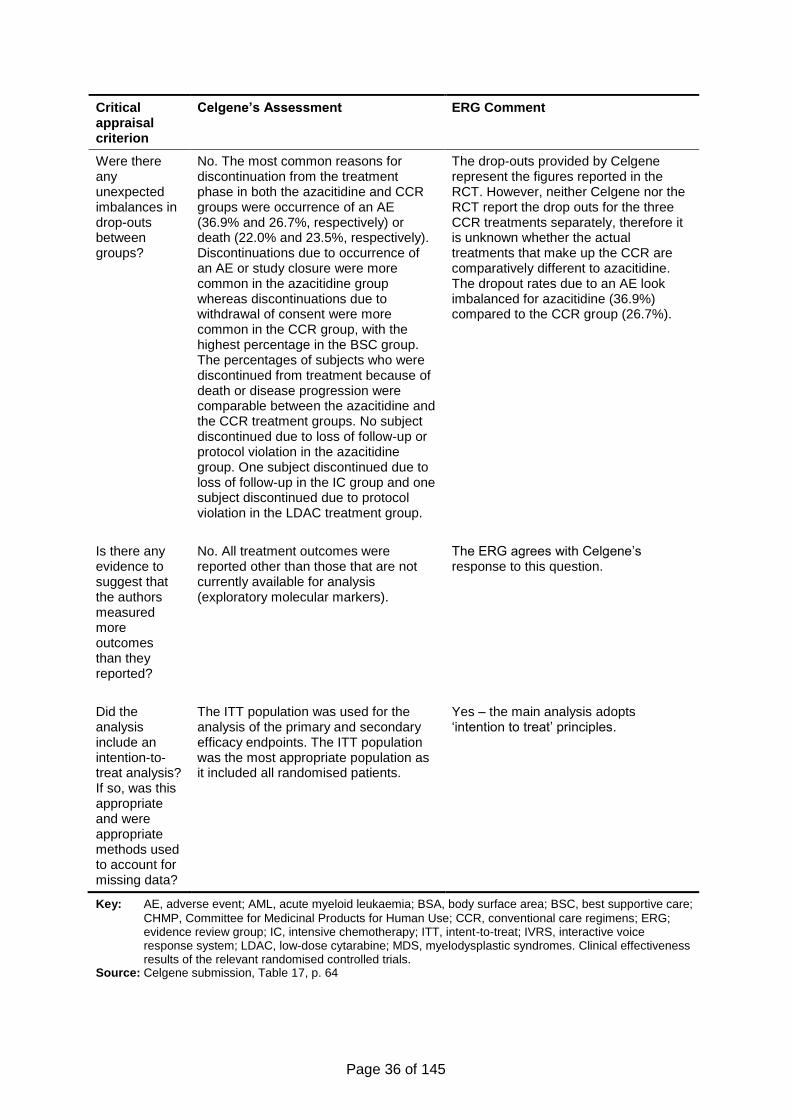
Page 36 of 145
Critical appraisal criterion
Celgene’s Assessment ERG Comment
Were there any unexpected imbalances in drop-outs between groups?
No. The most common reasons for discontinuation from the treatment phase in both the azacitidine and CCR groups were occurrence of an AE (36.9% and 26.7%, respectively) or death (22.0% and 23.5%, respectively). Discontinuations due to occurrence of an AE or study closure were more common in the azacitidine group whereas discontinuations due to withdrawal of consent were more common in the CCR group, with the highest percentage in the BSC group. The percentages of subjects who were discontinued from treatment because of death or disease progression were comparable between the azacitidine and the CCR treatment groups. No subject discontinued due to loss of follow-up or protocol violation in the azacitidine group. One subject discontinued due to loss of follow-up in the IC group and one subject discontinued due to protocol violation in the LDAC treatment group.
The drop-outs provided by Celgene represent the figures reported in the RCT. However, neither Celgene nor the RCT report the drop outs for the three CCR treatments separately, therefore it is unknown whether the actual treatments that make up the CCR are comparatively different to azacitidine. The dropout rates due to an AE look imbalanced for azacitidine (36.9%) compared to the CCR group (26.7%).
Is there any evidence to suggest that the authors measured more outcomes than they reported?
No. All treatment outcomes were reported other than those that are not currently available for analysis (exploratory molecular markers).
The ERG agrees with Celgene’s response to this question.
Did the analysis include an intention-to-treat analysis? If so, was this appropriate and were appropriate methods used to account for missing data?
The ITT population was used for the analysis of the primary and secondary efficacy endpoints. The ITT population was the most appropriate population as it included all randomised patients.
Yes – the main analysis adopts ‘intention to treat’ principles.
Key: AE, adverse event; AML, acute myeloid leukaemia; BSA, body surface area; BSC, best supportive care;
CHMP, Committee for Medicinal Products for Human Use; CCR, conventional care regimens; ERG; evidence review group; IC, intensive chemotherapy; ITT, intent-to-treat; IVRS, interactive voice response system; LDAC, low-dose cytarabine; MDS, myelodysplastic syndromes. Clinical effectiveness results of the relevant randomised controlled trials.
Source: Celgene submission, Table 17, p. 64
Page 37 of 145
4.1.5 Evidence synthesis
From the searches, one RCT was identified. Therefore synthesis of the evidence was not
required.
4.2 Critique of the trials of the technology of interest, their analysis and
interpretation
4.2.1 Methods
The single RCT (study name AZA-AML-001; main publication by Dombret et al. 201545)
identified was presented in detail within the submission.
4.2.1.1 Study objectives
The company submission reports the study objectives as follows (Source: Celgene
submission, Section 4.3.1, p. 43):
The primary objective of the study was to demonstrate superiority in OS of
azacitidine compared with combined CCRs in subjects aged 65 years or over who
had newly diagnosed AML with more than 30% BM blasts according to the WHO
criteria,14, 47 and who were not eligible for haematopoietic stem cell transplantation.
Overall survival was defined as time from randomisation to death from any cause.
Secondary objectives included 1-year OS rate, EFS, RFS, overall remission rate,
cytogenetic complete remission (CRc) rate, safety and toxicity assessments, HRQoL and
health resource utilisation.
The primary objective concurs with the primary outcome; an outcome specified within the
NICE Scope.36 The secondary objectives correspond in parts to the outcomes from the
Scope. The differences are the same as those already discussed in Section 4.1.2.3 (page
32).
4.2.1.2 Study design and treatment
The study AZA-AML-001 was a multicentre (over 18 countries), randomised, open-label,
parallel-group study.
Before randomisation, the most appropriate CCR (IC, LDAC or BSC) was determined by
investigators on the basis of age, Eastern Cooperative Oncology Group Performance Status
(ECOG PS), comorbidities and regional guidelines and/or institutional practice. Once the
CCR had been chosen, a central, stratified, and permuted block randomisation method and
interactive voice response system was used to randomly assign 1:1 to receive azacitidine
with BSC or the pre-selected CCR. The random treatment assignment was concealed so
that investigators and subjects did not know in advance the next treatment assignment.
Following randomisation and drug administration, follow-up appointments were scheduled
once per week during the first two treatment cycles, then every other week thereafter. The
frequency of safety and efficacy measures ranged from weekly to every 12 weeks,
depending on the procedure. Drug administration and data collection protocols are outlined
in Table 4.
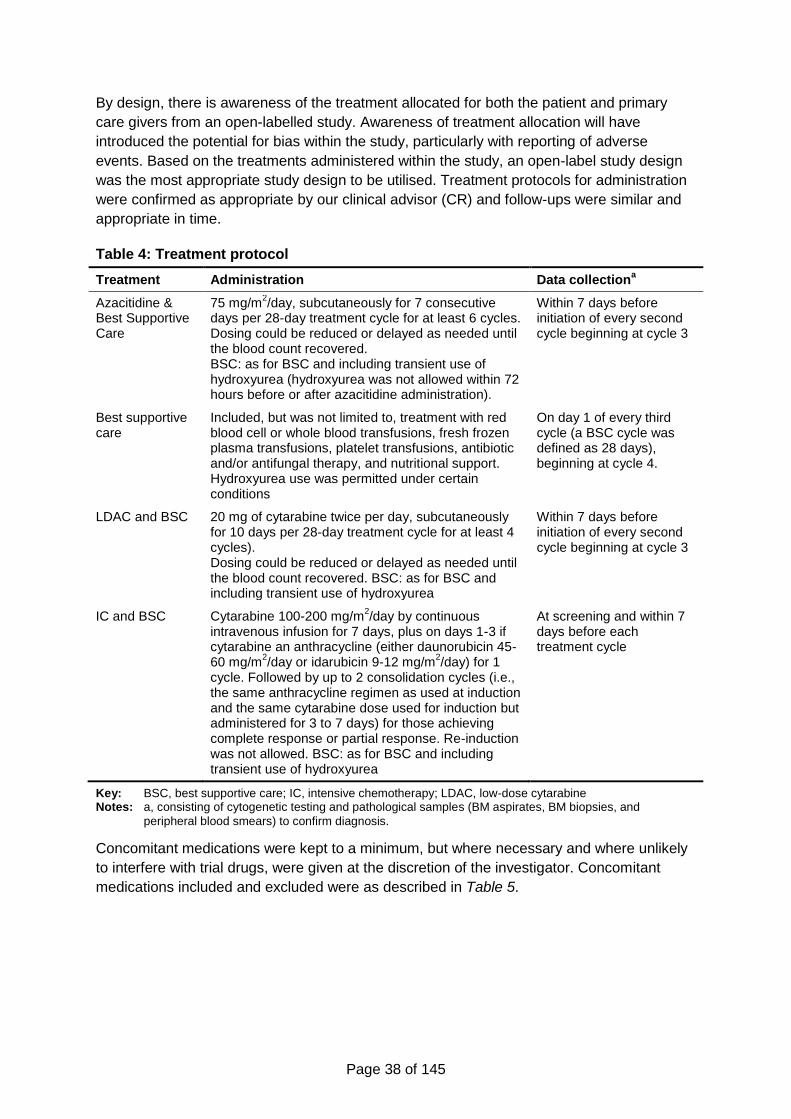
Page 38 of 145
By design, there is awareness of the treatment allocated for both the patient and primary
care givers from an open-labelled study. Awareness of treatment allocation will have
introduced the potential for bias within the study, particularly with reporting of adverse
events. Based on the treatments administered within the study, an open-label study design
was the most appropriate study design to be utilised. Treatment protocols for administration
were confirmed as appropriate by our clinical advisor (CR) and follow-ups were similar and
appropriate in time.
Table 4: Treatment protocol
Treatment Administration Data collectiona
Azacitidine & Best Supportive Care
75 mg/m2/day, subcutaneously for 7 consecutive
days per 28-day treatment cycle for at least 6 cycles. Dosing could be reduced or delayed as needed until the blood count recovered. BSC: as for BSC and including transient use of hydroxyurea (hydroxyurea was not allowed within 72 hours before or after azacitidine administration).
Within 7 days before initiation of every second cycle beginning at cycle 3
Best supportive care
Included, but was not limited to, treatment with red blood cell or whole blood transfusions, fresh frozen plasma transfusions, platelet transfusions, antibiotic and/or antifungal therapy, and nutritional support. Hydroxyurea use was permitted under certain conditions
On day 1 of every third cycle (a BSC cycle was defined as 28 days), beginning at cycle 4.
LDAC and BSC 20 mg of cytarabine twice per day, subcutaneously for 10 days per 28-day treatment cycle for at least 4 cycles). Dosing could be reduced or delayed as needed until the blood count recovered. BSC: as for BSC and including transient use of hydroxyurea
Within 7 days before initiation of every second cycle beginning at cycle 3
IC and BSC Cytarabine 100-200 mg/m2/day by continuous
intravenous infusion for 7 days, plus on days 1-3 if cytarabine an anthracycline (either daunorubicin 45-60 mg/m
2/day or idarubicin 9-12 mg/m
2/day) for 1
cycle. Followed by up to 2 consolidation cycles (i.e., the same anthracycline regimen as used at induction and the same cytarabine dose used for induction but administered for 3 to 7 days) for those achieving complete response or partial response. Re-induction was not allowed. BSC: as for BSC and including transient use of hydroxyurea
At screening and within 7 days before each treatment cycle
Key: BSC, best supportive care; IC, intensive chemotherapy; LDAC, low-dose cytarabine Notes: a, consisting of cytogenetic testing and pathological samples (BM aspirates, BM biopsies, and
peripheral blood smears) to confirm diagnosis.
Concomitant medications were kept to a minimum, but where necessary and where unlikely
to interfere with trial drugs, were given at the discretion of the investigator. Concomitant
medications included and excluded were as described in Table 5.
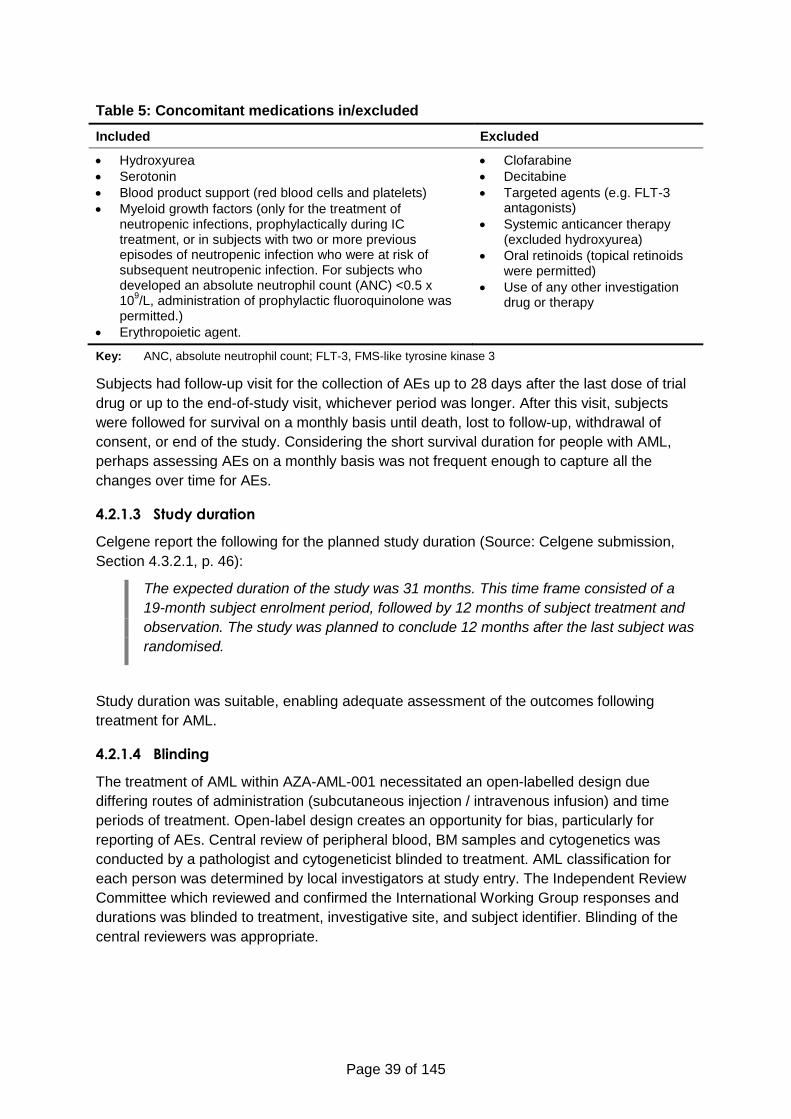
Page 39 of 145
Table 5: Concomitant medications in/excluded
Included Excluded
Hydroxyurea
Serotonin
Blood product support (red blood cells and platelets)
Myeloid growth factors (only for the treatment of neutropenic infections, prophylactically during IC treatment, or in subjects with two or more previous episodes of neutropenic infection who were at risk of subsequent neutropenic infection. For subjects who developed an absolute neutrophil count (ANC) <0.5 x 10
9/L, administration of prophylactic fluoroquinolone was
permitted.)
Erythropoietic agent.
Clofarabine
Decitabine
Targeted agents (e.g. FLT-3 antagonists)
Systemic anticancer therapy (excluded hydroxyurea)
Oral retinoids (topical retinoids were permitted)
Use of any other investigation drug or therapy
Key: ANC, absolute neutrophil count; FLT-3, FMS-like tyrosine kinase 3
Subjects had follow-up visit for the collection of AEs up to 28 days after the last dose of trial
drug or up to the end-of-study visit, whichever period was longer. After this visit, subjects
were followed for survival on a monthly basis until death, lost to follow-up, withdrawal of
consent, or end of the study. Considering the short survival duration for people with AML,
perhaps assessing AEs on a monthly basis was not frequent enough to capture all the
changes over time for AEs.
4.2.1.3 Study duration
Celgene report the following for the planned study duration (Source: Celgene submission,
Section 4.3.2.1, p. 46):
The expected duration of the study was 31 months. This time frame consisted of a
19-month subject enrolment period, followed by 12 months of subject treatment and
observation. The study was planned to conclude 12 months after the last subject was
randomised.
Study duration was suitable, enabling adequate assessment of the outcomes following
treatment for AML.
4.2.1.4 Blinding
The treatment of AML within AZA-AML-001 necessitated an open-labelled design due
differing routes of administration (subcutaneous injection / intravenous infusion) and time
periods of treatment. Open-label design creates an opportunity for bias, particularly for
reporting of AEs. Central review of peripheral blood, BM samples and cytogenetics was
conducted by a pathologist and cytogeneticist blinded to treatment. AML classification for
each person was determined by local investigators at study entry. The Independent Review
Committee which reviewed and confirmed the International Working Group responses and
durations was blinded to treatment, investigative site, and subject identifier. Blinding of the
central reviewers was appropriate.
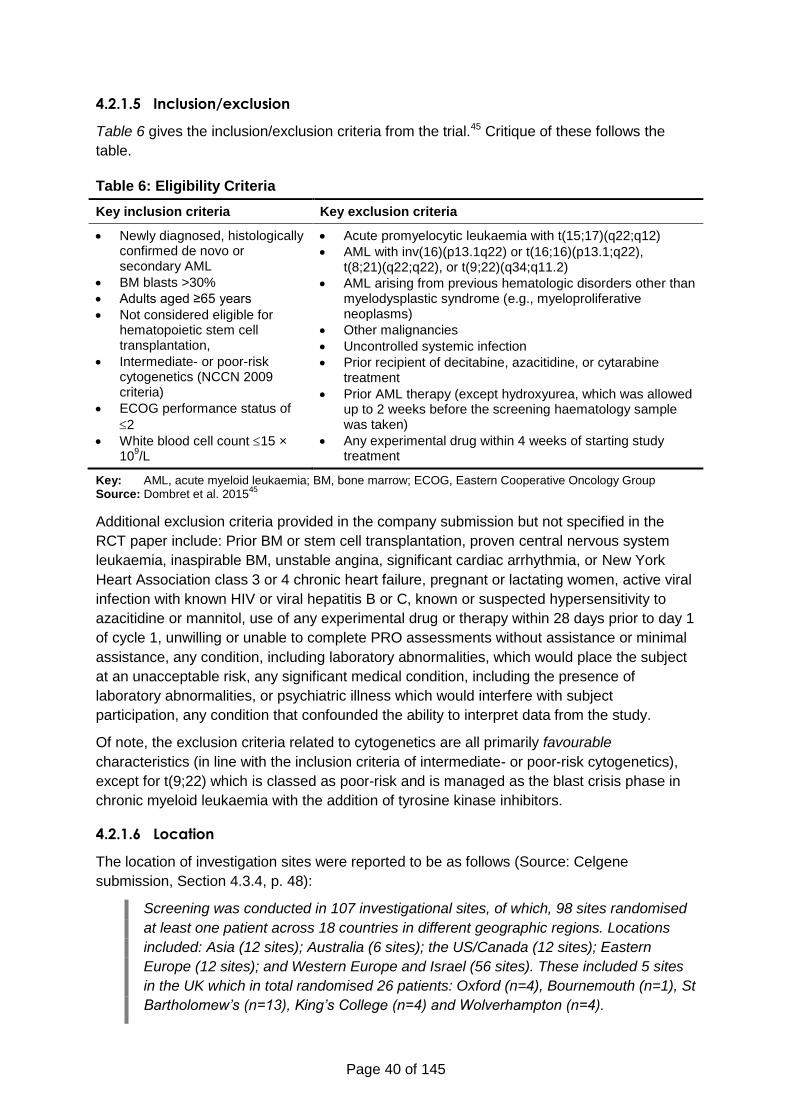
Page 40 of 145
4.2.1.5 Inclusion/exclusion
Table 6 gives the inclusion/exclusion criteria from the trial.45 Critique of these follows the
table.
Table 6: Eligibility Criteria
Key inclusion criteria Key exclusion criteria
Newly diagnosed, histologically confirmed de novo or secondary AML
BM blasts >30%
Adults aged ≥65 years
Not considered eligible for hematopoietic stem cell transplantation,
Intermediate- or poor-risk cytogenetics (NCCN 2009 criteria)
ECOG performance status of
2
White blood cell count 15 × 10
9/L
Acute promyelocytic leukaemia with t(15;17)(q22;q12)
AML with inv(16)(p13.1q22) or t(16;16)(p13.1;q22), t(8;21)(q22;q22), or t(9;22)(q34;q11.2)
AML arising from previous hematologic disorders other than myelodysplastic syndrome (e.g., myeloproliferative neoplasms)
Other malignancies
Uncontrolled systemic infection
Prior recipient of decitabine, azacitidine, or cytarabine treatment
Prior AML therapy (except hydroxyurea, which was allowed up to 2 weeks before the screening haematology sample was taken)
Any experimental drug within 4 weeks of starting study treatment
Key: AML, acute myeloid leukaemia; BM, bone marrow; ECOG, Eastern Cooperative Oncology Group Source: Dombret et al. 2015
45
Additional exclusion criteria provided in the company submission but not specified in the
RCT paper include: Prior BM or stem cell transplantation, proven central nervous system
leukaemia, inaspirable BM, unstable angina, significant cardiac arrhythmia, or New York
Heart Association class 3 or 4 chronic heart failure, pregnant or lactating women, active viral
infection with known HIV or viral hepatitis B or C, known or suspected hypersensitivity to
azacitidine or mannitol, use of any experimental drug or therapy within 28 days prior to day 1
of cycle 1, unwilling or unable to complete PRO assessments without assistance or minimal
assistance, any condition, including laboratory abnormalities, which would place the subject
at an unacceptable risk, any significant medical condition, including the presence of
laboratory abnormalities, or psychiatric illness which would interfere with subject
participation, any condition that confounded the ability to interpret data from the study.
Of note, the exclusion criteria related to cytogenetics are all primarily favourable
characteristics (in line with the inclusion criteria of intermediate- or poor-risk cytogenetics),
except for t(9;22) which is classed as poor-risk and is managed as the blast crisis phase in
chronic myeloid leukaemia with the addition of tyrosine kinase inhibitors.
4.2.1.6 Location
The location of investigation sites were reported to be as follows (Source: Celgene
submission, Section 4.3.4, p. 48):
Screening was conducted in 107 investigational sites, of which, 98 sites randomised
at least one patient across 18 countries in different geographic regions. Locations
included: Asia (12 sites); Australia (6 sites); the US/Canada (12 sites); Eastern
Europe (12 sites); and Western Europe and Israel (56 sites). These included 5 sites
in the UK which in total randomised 26 patients: Oxford (n=4), Bournemouth (n=1), St
Bartholomew’s (n=13), King’s College (n=4) and Wolverhampton (n=4).
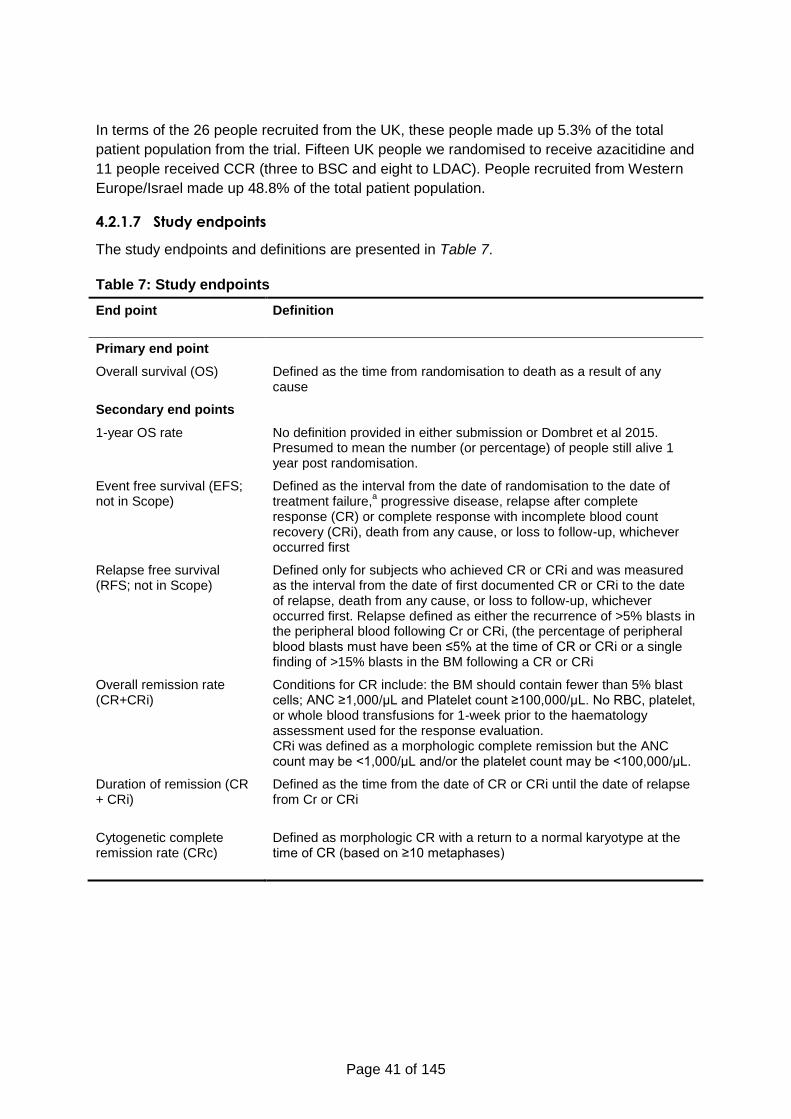
Page 41 of 145
In terms of the 26 people recruited from the UK, these people made up 5.3% of the total
patient population from the trial. Fifteen UK people we randomised to receive azacitidine and
11 people received CCR (three to BSC and eight to LDAC). People recruited from Western
Europe/Israel made up 48.8% of the total patient population.
4.2.1.7 Study endpoints
The study endpoints and definitions are presented in Table 7.
Table 7: Study endpoints
End point
Definition
Primary end point
Overall survival (OS) Defined as the time from randomisation to death as a result of any cause
Secondary end points
1-year OS rate No definition provided in either submission or Dombret et al 2015. Presumed to mean the number (or percentage) of people still alive 1 year post randomisation.
Event free survival (EFS; not in Scope)
Defined as the interval from the date of randomisation to the date of treatment failure,
a progressive disease, relapse after complete
response (CR) or complete response with incomplete blood count recovery (CRi), death from any cause, or loss to follow-up, whichever occurred first
Relapse free survival (RFS; not in Scope)
Defined only for subjects who achieved CR or CRi and was measured as the interval from the date of first documented CR or CRi to the date of relapse, death from any cause, or loss to follow-up, whichever occurred first. Relapse defined as either the recurrence of >5% blasts in the peripheral blood following Cr or CRi, (the percentage of peripheral blood blasts must have been ≤5% at the time of CR or CRi or a single finding of >15% blasts in the BM following a CR or CRi
Overall remission rate (CR+CRi)
Conditions for CR include: the BM should contain fewer than 5% blast cells; ANC ≥1,000/μL and Platelet count ≥100,000/μL. No RBC, platelet, or whole blood transfusions for 1-week prior to the haematology assessment used for the response evaluation. CRi was defined as a morphologic complete remission but the ANC count may be <1,000/μL and/or the platelet count may be <100,000/μL.
Duration of remission (CR + CRi)
Defined as the time from the date of CR or CRi until the date of relapse from Cr or CRi
Cytogenetic complete remission rate (CRc)
Defined as morphologic CR with a return to a normal karyotype at the time of CR (based on ≥10 metaphases)
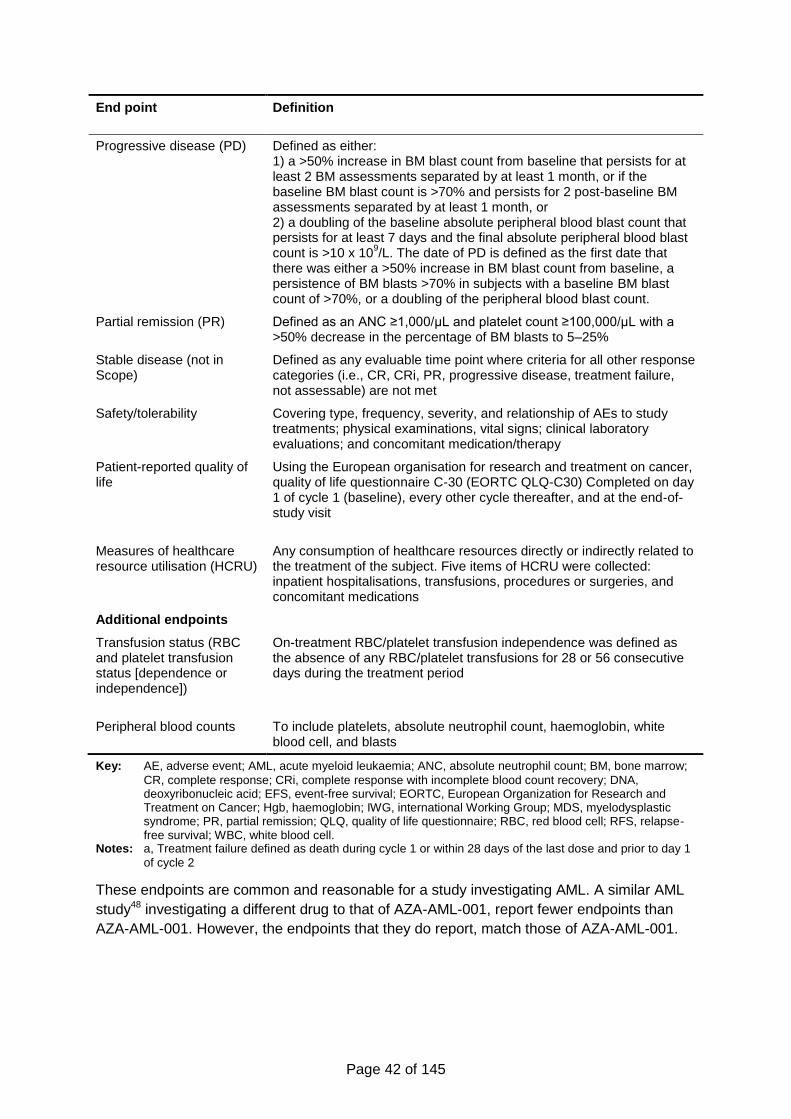
Page 42 of 145
End point
Definition
Progressive disease (PD) Defined as either: 1) a >50% increase in BM blast count from baseline that persists for at least 2 BM assessments separated by at least 1 month, or if the baseline BM blast count is >70% and persists for 2 post-baseline BM assessments separated by at least 1 month, or 2) a doubling of the baseline absolute peripheral blood blast count that persists for at least 7 days and the final absolute peripheral blood blast count is >10 x 10
9/L. The date of PD is defined as the first date that
there was either a >50% increase in BM blast count from baseline, a persistence of BM blasts >70% in subjects with a baseline BM blast count of >70%, or a doubling of the peripheral blood blast count.
Partial remission (PR)
Defined as an ANC ≥1,000/μL and platelet count ≥100,000/μL with a >50% decrease in the percentage of BM blasts to 5–25%
Stable disease (not in Scope)
Defined as any evaluable time point where criteria for all other response categories (i.e., CR, CRi, PR, progressive disease, treatment failure, not assessable) are not met
Safety/tolerability
Covering type, frequency, severity, and relationship of AEs to study treatments; physical examinations, vital signs; clinical laboratory evaluations; and concomitant medication/therapy
Patient-reported quality of life
Using the European organisation for research and treatment on cancer, quality of life questionnaire C-30 (EORTC QLQ-C30) Completed on day 1 of cycle 1 (baseline), every other cycle thereafter, and at the end-of-study visit
Measures of healthcare resource utilisation (HCRU)
Any consumption of healthcare resources directly or indirectly related to the treatment of the subject. Five items of HCRU were collected: inpatient hospitalisations, transfusions, procedures or surgeries, and concomitant medications
Additional endpoints
Transfusion status (RBC and platelet transfusion status [dependence or independence])
On-treatment RBC/platelet transfusion independence was defined as the absence of any RBC/platelet transfusions for 28 or 56 consecutive days during the treatment period
Peripheral blood counts To include platelets, absolute neutrophil count, haemoglobin, white blood cell, and blasts
Key: AE, adverse event; AML, acute myeloid leukaemia; ANC, absolute neutrophil count; BM, bone marrow;
CR, complete response; CRi, complete response with incomplete blood count recovery; DNA, deoxyribonucleic acid; EFS, event-free survival; EORTC, European Organization for Research and Treatment on Cancer; Hgb, haemoglobin; IWG, international Working Group; MDS, myelodysplastic syndrome; PR, partial remission; QLQ, quality of life questionnaire; RBC, red blood cell; RFS, relapse-free survival; WBC, white blood cell.
Notes: a, Treatment failure defined as death during cycle 1 or within 28 days of the last dose and prior to day 1
of cycle 2
These endpoints are common and reasonable for a study investigating AML. A similar AML
study48 investigating a different drug to that of AZA-AML-001, report fewer endpoints than
AZA-AML-001. However, the endpoints that they do report, match those of AZA-AML-001.
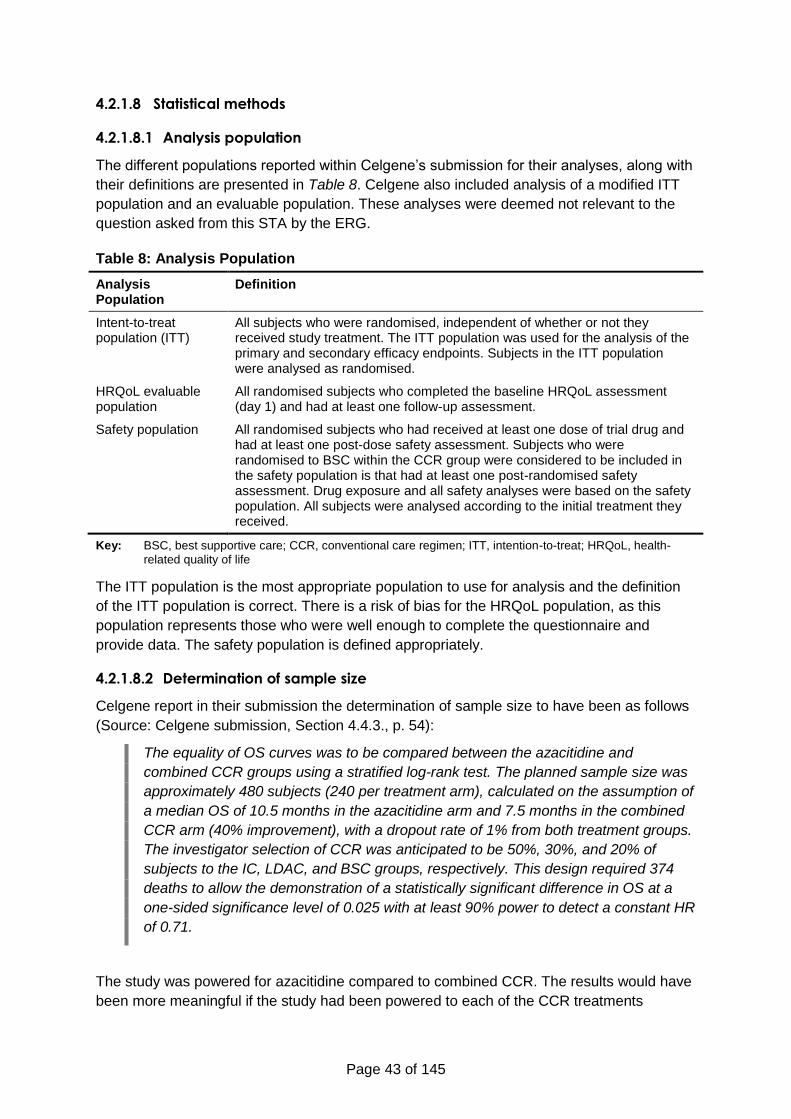
Page 43 of 145
4.2.1.8 Statistical methods
4.2.1.8.1 Analysis population
The different populations reported within Celgene’s submission for their analyses, along with
their definitions are presented in Table 8. Celgene also included analysis of a modified ITT
population and an evaluable population. These analyses were deemed not relevant to the
question asked from this STA by the ERG.
Table 8: Analysis Population
Analysis Population
Definition
Intent-to-treat population (ITT)
All subjects who were randomised, independent of whether or not they received study treatment. The ITT population was used for the analysis of the primary and secondary efficacy endpoints. Subjects in the ITT population were analysed as randomised.
HRQoL evaluable population
All randomised subjects who completed the baseline HRQoL assessment (day 1) and had at least one follow-up assessment.
Safety population All randomised subjects who had received at least one dose of trial drug and had at least one post-dose safety assessment. Subjects who were randomised to BSC within the CCR group were considered to be included in the safety population is that had at least one post-randomised safety assessment. Drug exposure and all safety analyses were based on the safety population. All subjects were analysed according to the initial treatment they received.
Key: BSC, best supportive care; CCR, conventional care regimen; ITT, intention-to-treat; HRQoL, health-
related quality of life
The ITT population is the most appropriate population to use for analysis and the definition
of the ITT population is correct. There is a risk of bias for the HRQoL population, as this
population represents those who were well enough to complete the questionnaire and
provide data. The safety population is defined appropriately.
4.2.1.8.2 Determination of sample size
Celgene report in their submission the determination of sample size to have been as follows
(Source: Celgene submission, Section 4.4.3., p. 54):
The equality of OS curves was to be compared between the azacitidine and
combined CCR groups using a stratified log-rank test. The planned sample size was
approximately 480 subjects (240 per treatment arm), calculated on the assumption of
a median OS of 10.5 months in the azacitidine arm and 7.5 months in the combined
CCR arm (40% improvement), with a dropout rate of 1% from both treatment groups.
The investigator selection of CCR was anticipated to be 50%, 30%, and 20% of
subjects to the IC, LDAC, and BSC groups, respectively. This design required 374
deaths to allow the demonstration of a statistically significant difference in OS at a
one-sided significance level of 0.025 with at least 90% power to detect a constant HR
of 0.71.
The study was powered for azacitidine compared to combined CCR. The results would have
been more meaningful if the study had been powered to each of the CCR treatments
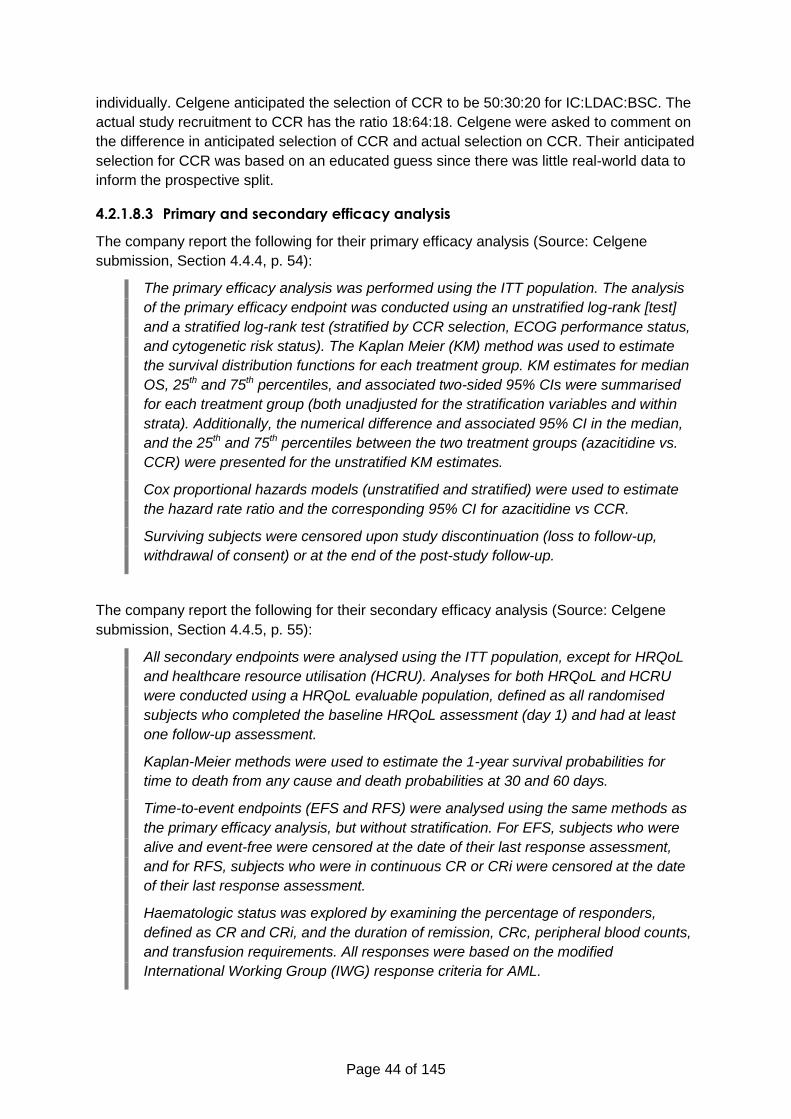
Page 44 of 145
individually. Celgene anticipated the selection of CCR to be 50:30:20 for IC:LDAC:BSC. The
actual study recruitment to CCR has the ratio 18:64:18. Celgene were asked to comment on
the difference in anticipated selection of CCR and actual selection on CCR. Their anticipated
selection for CCR was based on an educated guess since there was little real-world data to
inform the prospective split.
4.2.1.8.3 Primary and secondary efficacy analysis
The company report the following for their primary efficacy analysis (Source: Celgene
submission, Section 4.4.4, p. 54):
The primary efficacy analysis was performed using the ITT population. The analysis
of the primary efficacy endpoint was conducted using an unstratified log-rank [test]
and a stratified log-rank test (stratified by CCR selection, ECOG performance status,
and cytogenetic risk status). The Kaplan Meier (KM) method was used to estimate
the survival distribution functions for each treatment group. KM estimates for median
OS, 25th and 75th percentiles, and associated two-sided 95% CIs were summarised
for each treatment group (both unadjusted for the stratification variables and within
strata). Additionally, the numerical difference and associated 95% CI in the median,
and the 25th and 75th percentiles between the two treatment groups (azacitidine vs.
CCR) were presented for the unstratified KM estimates.
Cox proportional hazards models (unstratified and stratified) were used to estimate
the hazard rate ratio and the corresponding 95% CI for azacitidine vs CCR.
Surviving subjects were censored upon study discontinuation (loss to follow-up,
withdrawal of consent) or at the end of the post-study follow-up.
The company report the following for their secondary efficacy analysis (Source: Celgene
submission, Section 4.4.5, p. 55):
All secondary endpoints were analysed using the ITT population, except for HRQoL
and healthcare resource utilisation (HCRU). Analyses for both HRQoL and HCRU
were conducted using a HRQoL evaluable population, defined as all randomised
subjects who completed the baseline HRQoL assessment (day 1) and had at least
one follow-up assessment.
Kaplan-Meier methods were used to estimate the 1-year survival probabilities for
time to death from any cause and death probabilities at 30 and 60 days.
Time-to-event endpoints (EFS and RFS) were analysed using the same methods as
the primary efficacy analysis, but without stratification. For EFS, subjects who were
alive and event-free were censored at the date of their last response assessment,
and for RFS, subjects who were in continuous CR or CRi were censored at the date
of their last response assessment.
Haematologic status was explored by examining the percentage of responders,
defined as CR and CRi, and the duration of remission, CRc, peripheral blood counts,
and transfusion requirements. All responses were based on the modified
International Working Group (IWG) response criteria for AML.
Page 45 of 145
For duration of remission, subjects who were lost to follow-up or were alive at follow-
up without documented relapse were censored at the date of their last response
assessment. Summary statistics included KM estimates of median duration of
remission, and 1-year cumulative incidence of relapse for each treatment group.
For transfusion status, subjects who maintained red blood cell/platelet transfusion
independence to the end of the treatment period were censored at the date of
treatment discontinuation or death, whichever was sooner. Duration of transfusion
independence was estimated and summarised using KM methods.
For HRQoL analyses, the mean change from baseline for each domain at each time
point was compared with the minimal important difference to determine whether the
change was clinically meaningful. A mean change of at least 10 points on the
standardised domain scores was required to be considered meaningful.49
All reported log-rank or Fisher’s exact test p values for secondary endpoints are
nominal.
The majority of the statistical methods used in the trial to analyse time-to-event data (and in
particular, the primary efficacy outcome, overall survival) assume proportional hazards or
have reduced efficiency in the presence of non-proportional hazards. There is no justification
given for expecting this assumption to hold, and considering the results (e.g., Figure 2, page
47) this assumption was not reasonable.
In the presence of non-proportional hazards, appropriate alternatives to the log-rank test
employed in the trial would be the Wilcoxon–Breslow–Gehan and Peto–Peto–Prentice tests
(the choice between these based on the assessment of there being any differences in
censoring patterns). In the presence of non-proportional hazards, there is no simple
alternative to using a hazard ratio, but statistics such as the difference in restricted mean
survival could be meaningful.
Using both stratified and unstratified tests is not directly justified. Overstratification can lead
to loss of information, but unstratified tests are not appropriate when there is heterogeneity
between strata.50 Given the variables used for stratification are considered prognostic
indicators, this suggests that the stratified analyses are more appropriate. Furthermore, the
set of variables used for stratification was reduced in the event that stratification with the full
set of variables would lead to individual strata with fewer than 16 patients, which should
have reduced the risk of overstratification.
The ERG considers the censoring events loss to follow-up and withdrawal of consent may
be informative for overall survival (which would violate the necessary assumptions for
Kaplan–Meier analyses) but the most common reason for censoring was the patient being
alive at the time of study closure,37 so this is unlikely to have significantly impacted on
results.
4.2.2 Results
4.2.2.1 Population distribution
In total, 488 people were randomised. Of these, 241 subjects were randomised to receive
azacitidine, and 247 people were randomised to receive conventional care treatment. The
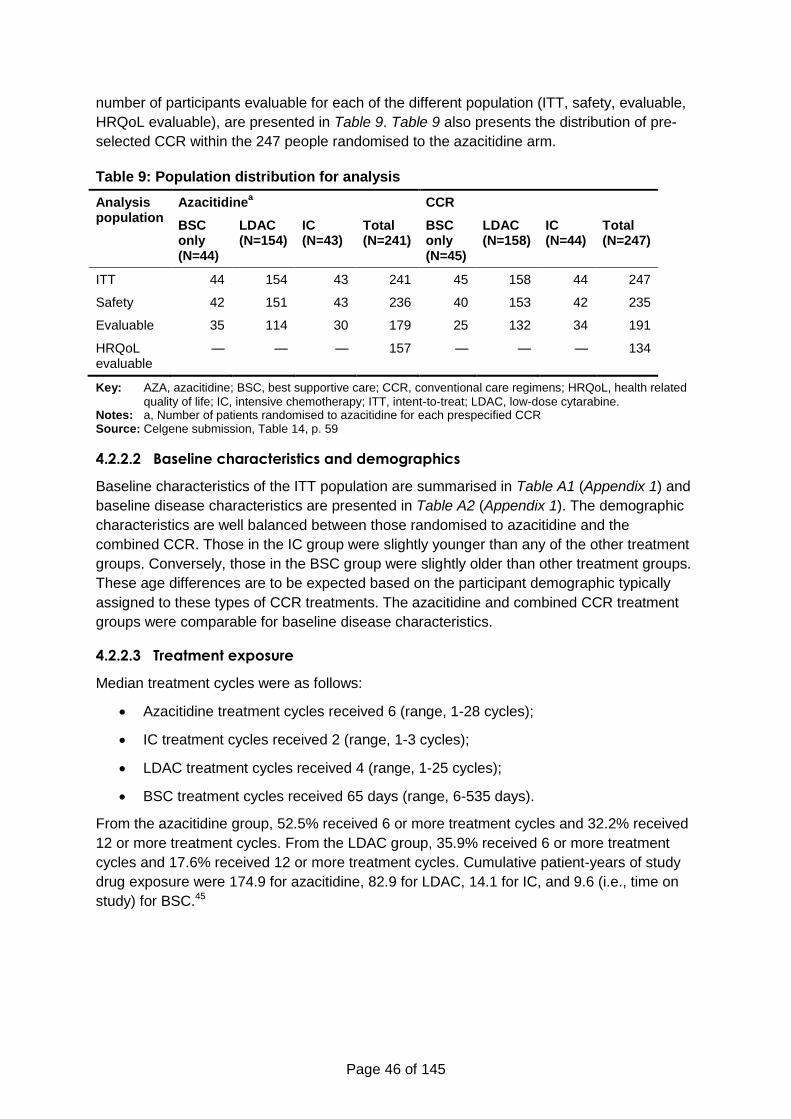
Page 46 of 145
number of participants evaluable for each of the different population (ITT, safety, evaluable,
HRQoL evaluable), are presented in Table 9. Table 9 also presents the distribution of pre-
selected CCR within the 247 people randomised to the azacitidine arm.
Table 9: Population distribution for analysis
Analysis population
Azacitidinea CCR
BSC only (N=44)
LDAC (N=154)
IC (N=43)
Total (N=241)
BSC only (N=45)
LDAC (N=158)
IC (N=44)
Total (N=247)
ITT 44 154 43 241 45 158 44 247
Safety 42 151 43 236 40 153 42 235
Evaluable 35 114 30 179 25 132 34 191
HRQoL evaluable
— — — 157 — — — 134
Key: AZA, azacitidine; BSC, best supportive care; CCR, conventional care regimens; HRQoL, health related
quality of life; IC, intensive chemotherapy; ITT, intent-to-treat; LDAC, low-dose cytarabine. Notes: a, Number of patients randomised to azacitidine for each prespecified CCR Source: Celgene submission, Table 14, p. 59
4.2.2.2 Baseline characteristics and demographics
Baseline characteristics of the ITT population are summarised in Table A1 (Appendix 1) and
baseline disease characteristics are presented in Table A2 (Appendix 1). The demographic
characteristics are well balanced between those randomised to azacitidine and the
combined CCR. Those in the IC group were slightly younger than any of the other treatment
groups. Conversely, those in the BSC group were slightly older than other treatment groups.
These age differences are to be expected based on the participant demographic typically
assigned to these types of CCR treatments. The azacitidine and combined CCR treatment
groups were comparable for baseline disease characteristics.
4.2.2.3 Treatment exposure
Median treatment cycles were as follows:
Azacitidine treatment cycles received 6 (range, 1-28 cycles);
IC treatment cycles received 2 (range, 1-3 cycles);
LDAC treatment cycles received 4 (range, 1-25 cycles);
BSC treatment cycles received 65 days (range, 6-535 days).
From the azacitidine group, 52.5% received 6 or more treatment cycles and 32.2% received
12 or more treatment cycles. From the LDAC group, 35.9% received 6 or more treatment
cycles and 17.6% received 12 or more treatment cycles. Cumulative patient-years of study
drug exposure were 174.9 for azacitidine, 82.9 for LDAC, 14.1 for IC, and 9.6 (i.e., time on
study) for BSC.45
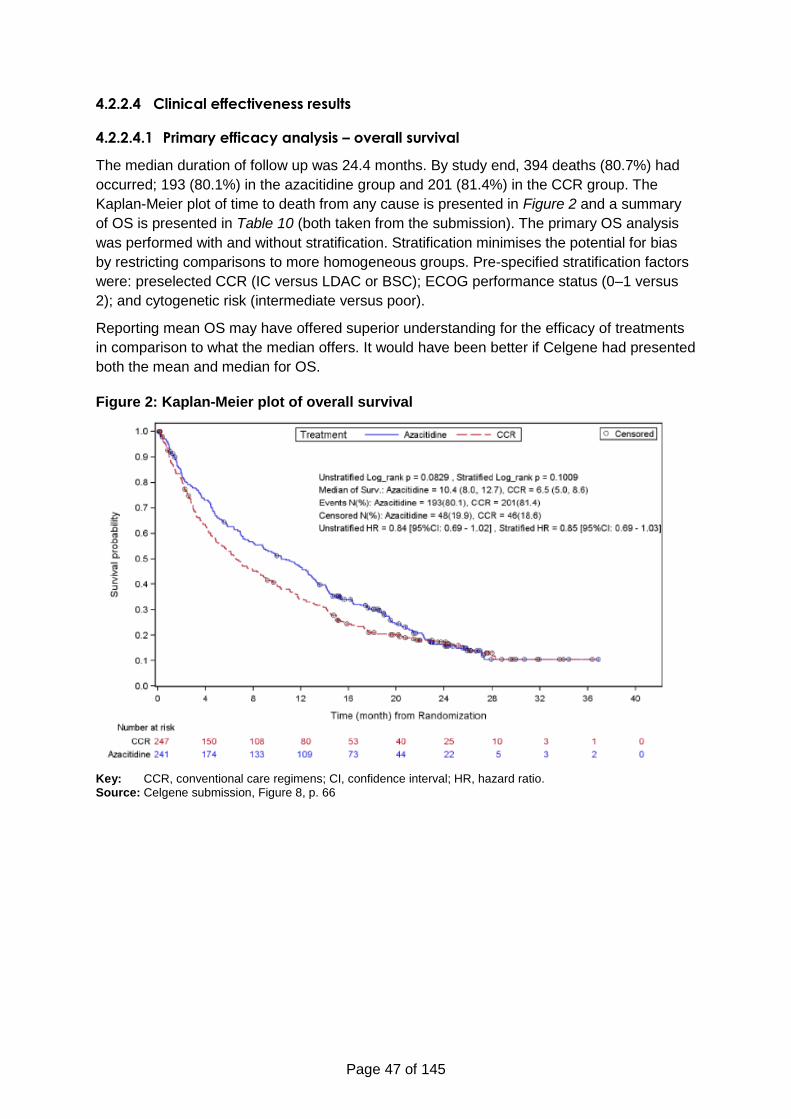
Page 47 of 145
4.2.2.4 Clinical effectiveness results
4.2.2.4.1 Primary efficacy analysis – overall survival
The median duration of follow up was 24.4 months. By study end, 394 deaths (80.7%) had
occurred; 193 (80.1%) in the azacitidine group and 201 (81.4%) in the CCR group. The
Kaplan-Meier plot of time to death from any cause is presented in Figure 2 and a summary
of OS is presented in Table 10 (both taken from the submission). The primary OS analysis
was performed with and without stratification. Stratification minimises the potential for bias
by restricting comparisons to more homogeneous groups. Pre-specified stratification factors
were: preselected CCR (IC versus LDAC or BSC); ECOG performance status (0–1 versus
2); and cytogenetic risk (intermediate versus poor).
Reporting mean OS may have offered superior understanding for the efficacy of treatments
in comparison to what the median offers. It would have been better if Celgene had presented
both the mean and median for OS.
Figure 2: Kaplan-Meier plot of overall survival
Key: CCR, conventional care regimens; CI, confidence interval; HR, hazard ratio. Source: Celgene submission, Figure 8, p. 66
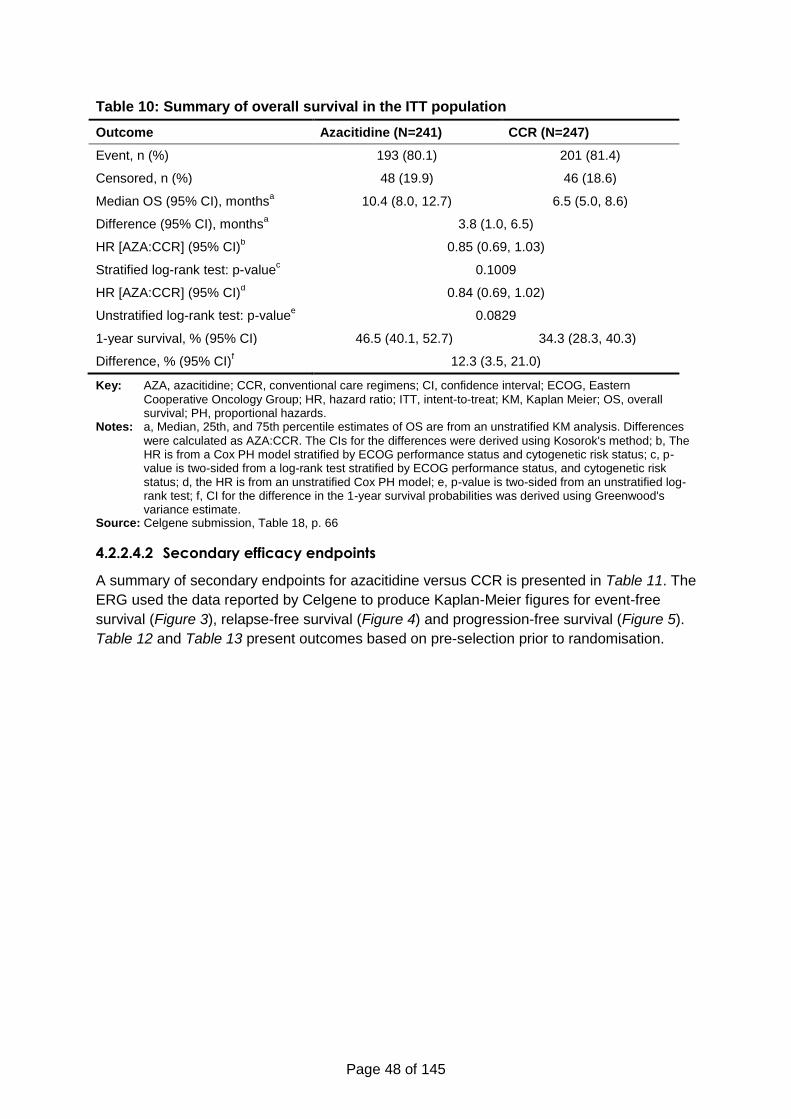
Page 48 of 145
Table 10: Summary of overall survival in the ITT population
Outcome Azacitidine (N=241) CCR (N=247)
Event, n (%) 193 (80.1) 201 (81.4)
Censored, n (%) 48 (19.9) 46 (18.6)
Median OS (95% CI), monthsa 10.4 (8.0, 12.7) 6.5 (5.0, 8.6)
Difference (95% CI), monthsa 3.8 (1.0, 6.5)
HR [AZA:CCR] (95% CI)b 0.85 (0.69, 1.03)
Stratified log-rank test: p-valuec 0.1009
HR [AZA:CCR] (95% CI)d 0.84 (0.69, 1.02)
Unstratified log-rank test: p-valuee 0.0829
1-year survival, % (95% CI) 46.5 (40.1, 52.7) 34.3 (28.3, 40.3)
Difference, % (95% CI)f 12.3 (3.5, 21.0)
Key: AZA, azacitidine; CCR, conventional care regimens; CI, confidence interval; ECOG, Eastern
Cooperative Oncology Group; HR, hazard ratio; ITT, intent-to-treat; KM, Kaplan Meier; OS, overall survival; PH, proportional hazards.
Notes: a, Median, 25th, and 75th percentile estimates of OS are from an unstratified KM analysis. Differences
were calculated as AZA:CCR. The CIs for the differences were derived using Kosorok's method; b, The HR is from a Cox PH model stratified by ECOG performance status and cytogenetic risk status; c, p-value is two-sided from a log-rank test stratified by ECOG performance status, and cytogenetic risk status; d, the HR is from an unstratified Cox PH model; e, p-value is two-sided from an unstratified log-rank test; f, CI for the difference in the 1-year survival probabilities was derived using Greenwood's variance estimate.
Source: Celgene submission, Table 18, p. 66
4.2.2.4.2 Secondary efficacy endpoints
A summary of secondary endpoints for azacitidine versus CCR is presented in Table 11. The
ERG used the data reported by Celgene to produce Kaplan-Meier figures for event-free
survival (Figure 3), relapse-free survival (Figure 4) and progression-free survival (Figure 5).
Table 12 and Table 13 present outcomes based on pre-selection prior to randomisation.
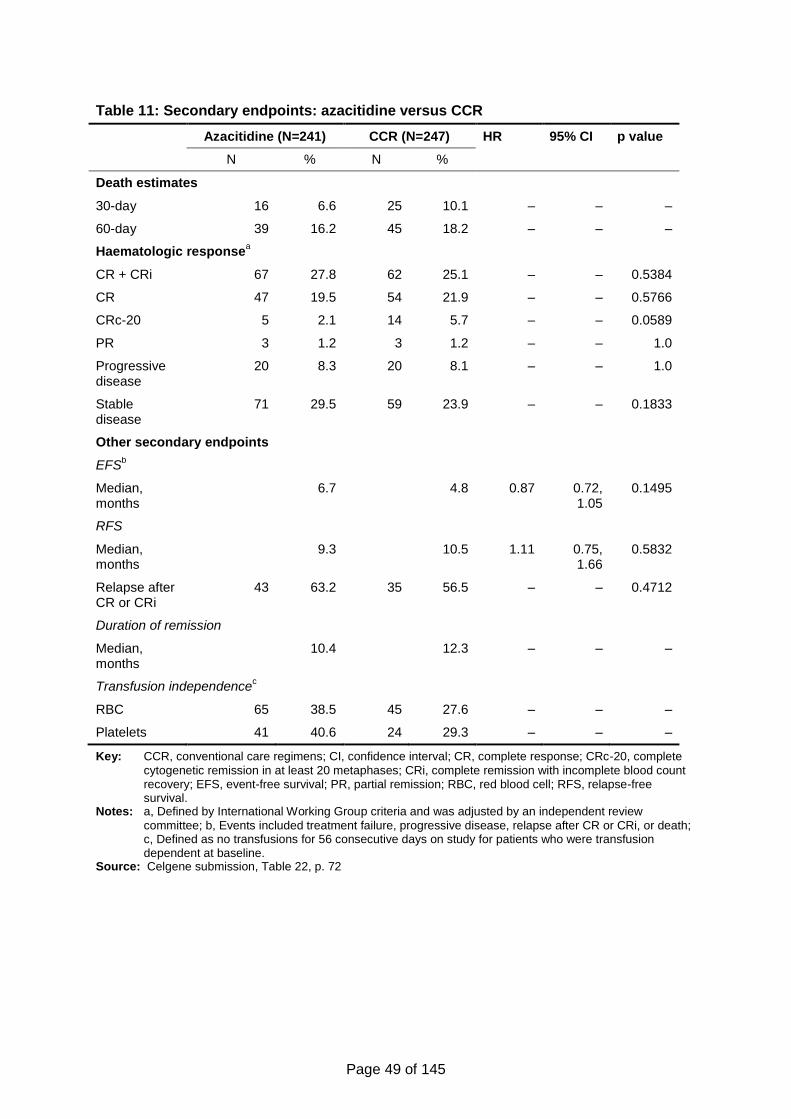
Page 49 of 145
Table 11: Secondary endpoints: azacitidine versus CCR
Azacitidine (N=241) CCR (N=247) HR 95% CI p value
N % N %
Death estimates
30-day 16 6.6 25 10.1 – – –
60-day 39 16.2 45 18.2 – – –
Haematologic responsea
CR + CRi 67 27.8 62 25.1 – – 0.5384
CR 47 19.5 54 21.9 – – 0.5766
CRc-20 5 2.1 14 5.7 – – 0.0589
PR 3 1.2 3 1.2 – – 1.0
Progressive disease
20 8.3 20 8.1 – – 1.0
Stable disease
71 29.5 59 23.9 – – 0.1833
Other secondary endpoints
EFSb
Median, months
6.7 4.8 0.87 0.72, 1.05
0.1495
RFS
Median, months
9.3 10.5 1.11 0.75, 1.66
0.5832
Relapse after CR or CRi
43 63.2 35 56.5 – – 0.4712
Duration of remission
Median, months
10.4 12.3 – – –
Transfusion independencec
RBC 65 38.5 45 27.6 – – –
Platelets 41 40.6 24 29.3 – – –
Key: CCR, conventional care regimens; CI, confidence interval; CR, complete response; CRc-20, complete
cytogenetic remission in at least 20 metaphases; CRi, complete remission with incomplete blood count recovery; EFS, event-free survival; PR, partial remission; RBC, red blood cell; RFS, relapse-free survival.
Notes: a, Defined by International Working Group criteria and was adjusted by an independent review
committee; b, Events included treatment failure, progressive disease, relapse after CR or CRi, or death; c, Defined as no transfusions for 56 consecutive days on study for patients who were transfusion dependent at baseline.
Source: Celgene submission, Table 22, p. 72
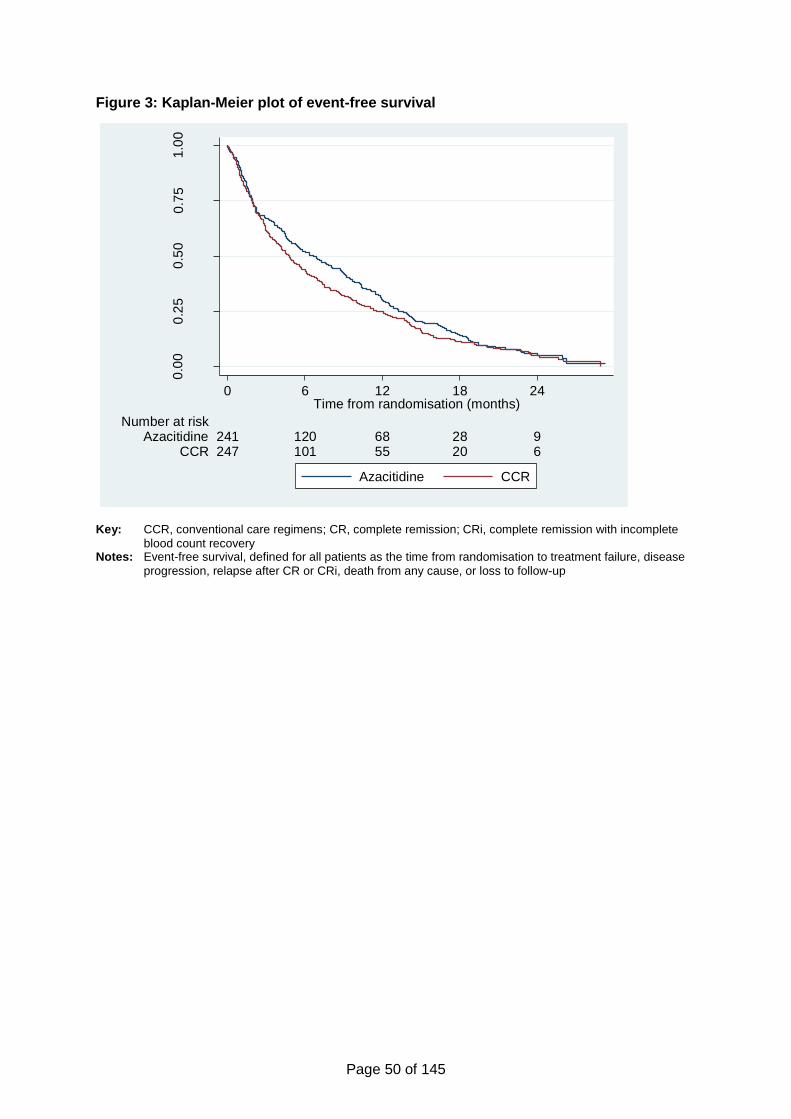
Page 50 of 145
Figure 3: Kaplan-Meier plot of event-free survival
Key: CCR, conventional care regimens; CR, complete remission; CRi, complete remission with incomplete
blood count recovery Notes: Event-free survival, defined for all patients as the time from randomisation to treatment failure, disease
progression, relapse after CR or CRi, death from any cause, or loss to follow-up
0.0
00
.25
0.5
00
.75
1.0
0
Eve
nt-
fre
e s
urv
ival
247 101 55 20 6CCR241 120 68 28 9Azacitidine
Number at risk
0 6 12 18 24Time from randomisation (months)
Azacitidine CCR
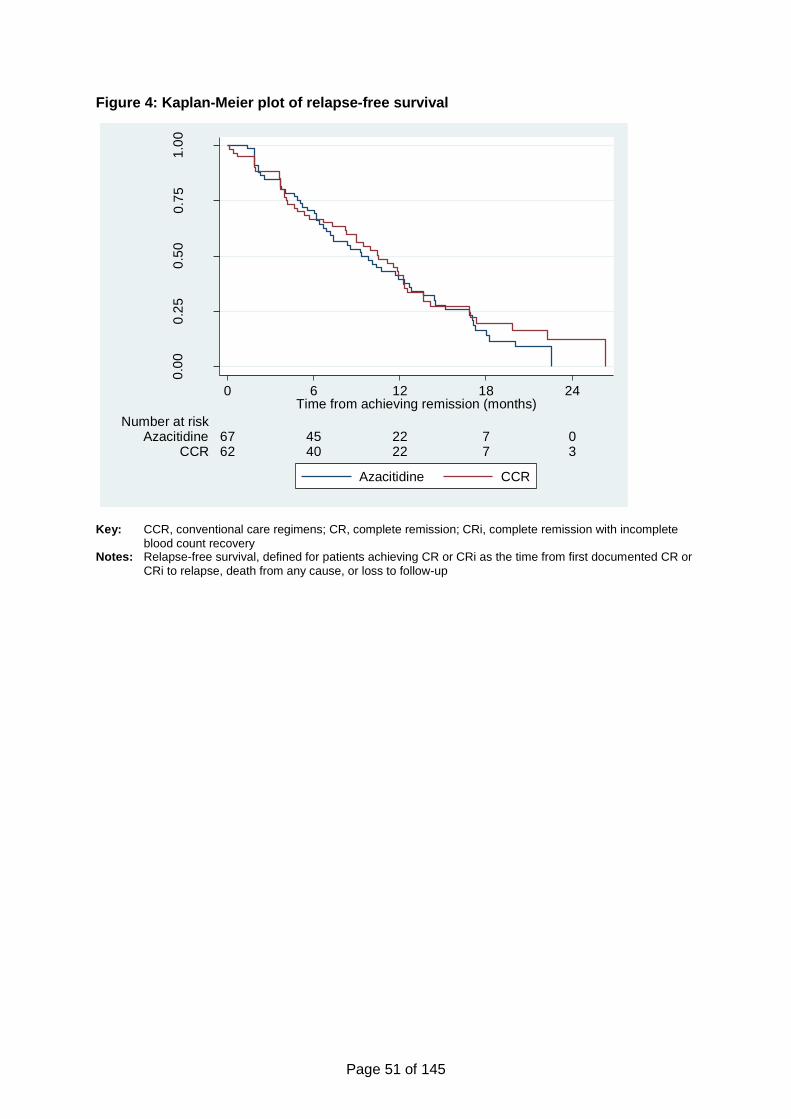
Page 51 of 145
Figure 4: Kaplan-Meier plot of relapse-free survival
Key: CCR, conventional care regimens; CR, complete remission; CRi, complete remission with incomplete
blood count recovery Notes: Relapse-free survival, defined for patients achieving CR or CRi as the time from first documented CR or
CRi to relapse, death from any cause, or loss to follow-up
0.0
00
.25
0.5
00
.75
1.0
0
Rela
pse-f
ree
su
rviv
al
62 40 22 7 3CCR67 45 22 7 0Azacitidine
Number at risk
0 6 12 18 24Time from achieving remission (months)
Azacitidine CCR
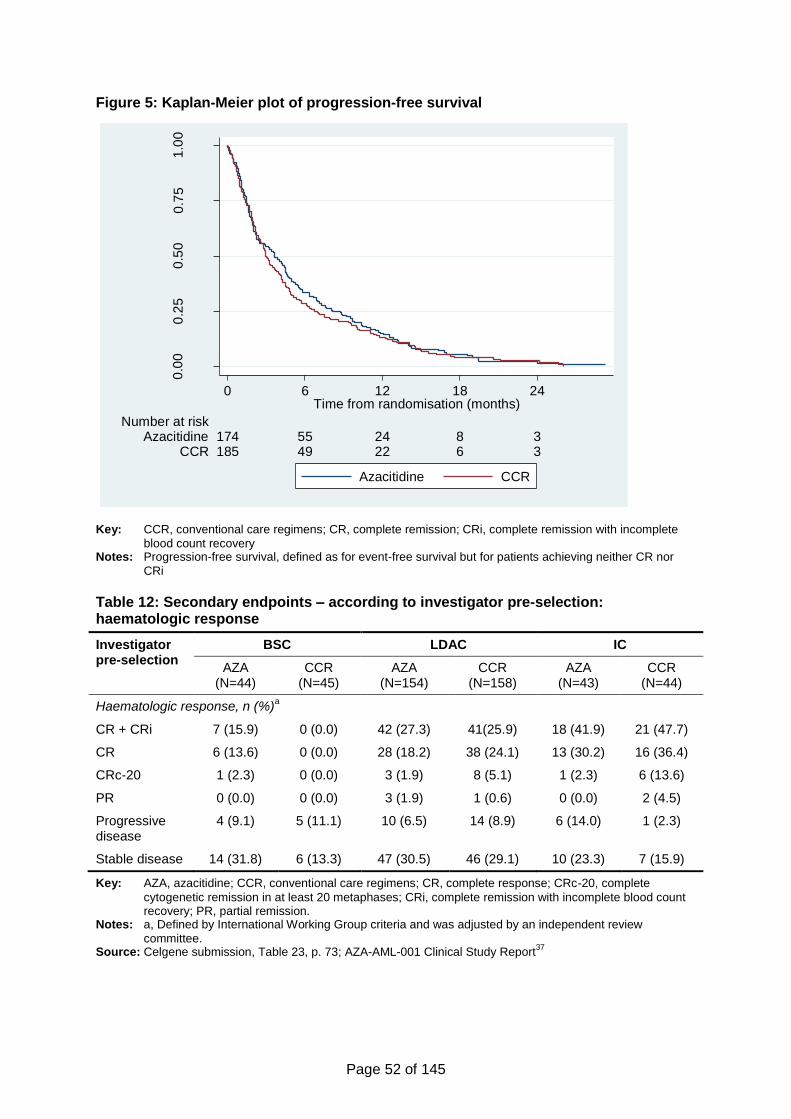
Page 52 of 145
Figure 5: Kaplan-Meier plot of progression-free survival
Key: CCR, conventional care regimens; CR, complete remission; CRi, complete remission with incomplete
blood count recovery Notes: Progression-free survival, defined as for event-free survival but for patients achieving neither CR nor
CRi
Table 12: Secondary endpoints – according to investigator pre-selection: haematologic response
Investigator pre-selection
BSC LDAC IC
AZA (N=44)
CCR (N=45)
AZA (N=154)
CCR (N=158)
AZA (N=43)
CCR (N=44)
Haematologic response, n (%)a
CR + CRi 7 (15.9) 0 (0.0) 42 (27.3) 41(25.9) 18 (41.9) 21 (47.7)
CR 6 (13.6) 0 (0.0) 28 (18.2) 38 (24.1) 13 (30.2) 16 (36.4)
CRc-20 1 (2.3) 0 (0.0) 3 (1.9) 8 (5.1) 1 (2.3) 6 (13.6)
PR 0 (0.0) 0 (0.0) 3 (1.9) 1 (0.6) 0 (0.0) 2 (4.5)
Progressive disease
4 (9.1) 5 (11.1) 10 (6.5) 14 (8.9) 6 (14.0) 1 (2.3)
Stable disease 14 (31.8) 6 (13.3) 47 (30.5) 46 (29.1) 10 (23.3) 7 (15.9)
Key: AZA, azacitidine; CCR, conventional care regimens; CR, complete response; CRc-20, complete
cytogenetic remission in at least 20 metaphases; CRi, complete remission with incomplete blood count recovery; PR, partial remission.
Notes: a, Defined by International Working Group criteria and was adjusted by an independent review
committee. Source: Celgene submission, Table 23, p. 73; AZA-AML-001 Clinical Study Report
37
0.0
00
.25
0.5
00
.75
1.0
0
Pro
gre
ssio
n-f
ree
su
rviv
al
185 49 22 6 3CCR174 55 24 8 3Azacitidine
Number at risk
0 6 12 18 24Time from randomisation (months)
Azacitidine CCR
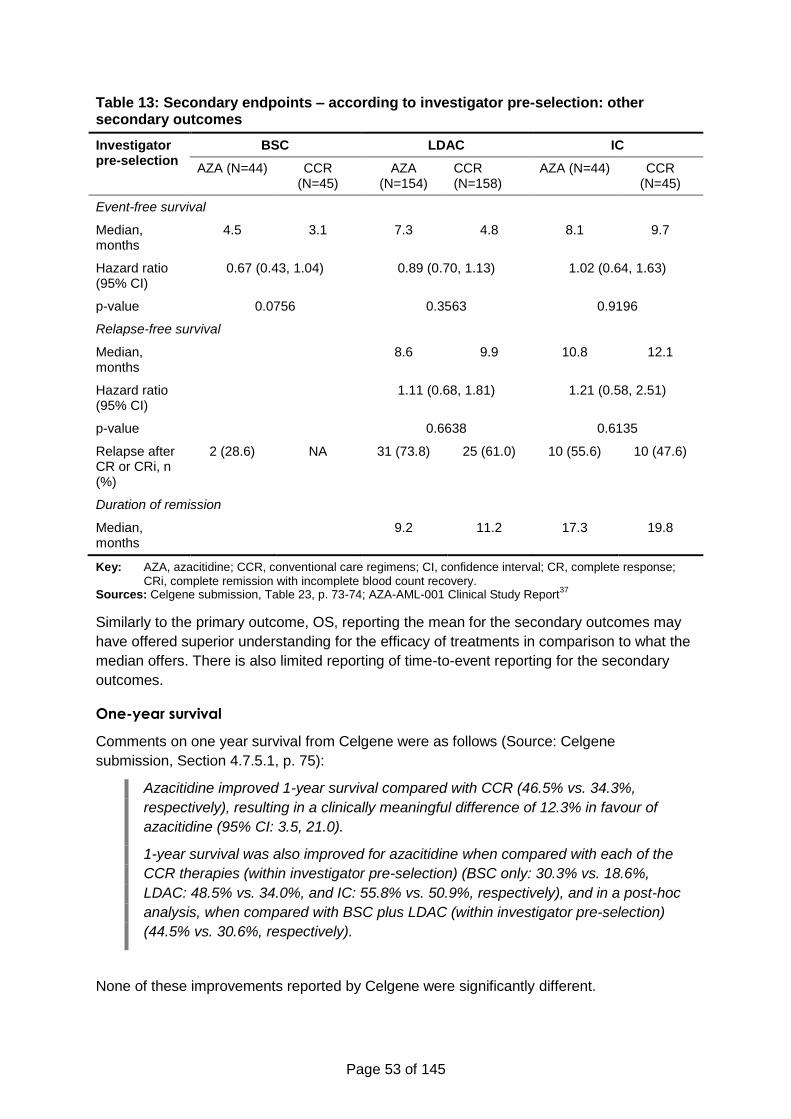
Page 53 of 145
Table 13: Secondary endpoints – according to investigator pre-selection: other secondary outcomes
Investigator pre-selection
BSC LDAC IC
AZA (N=44) CCR (N=45)
AZA (N=154)
CCR (N=158)
AZA (N=44) CCR (N=45)
Event-free survival
Median, months
4.5 3.1 7.3 4.8 8.1 9.7
Hazard ratio (95% CI)
0.67 (0.43, 1.04) 0.89 (0.70, 1.13) 1.02 (0.64, 1.63)
p-value 0.0756 0.3563 0.9196
Relapse-free survival
Median, months
8.6 9.9 10.8 12.1
Hazard ratio (95% CI)
1.11 (0.68, 1.81) 1.21 (0.58, 2.51)
p-value 0.6638 0.6135
Relapse after CR or CRi, n (%)
2 (28.6) NA 31 (73.8) 25 (61.0) 10 (55.6) 10 (47.6)
Duration of remission
Median, months
9.2 11.2 17.3 19.8
Key: AZA, azacitidine; CCR, conventional care regimens; CI, confidence interval; CR, complete response;
CRi, complete remission with incomplete blood count recovery. Sources: Celgene submission, Table 23, p. 73-74; AZA-AML-001 Clinical Study Report
37
Similarly to the primary outcome, OS, reporting the mean for the secondary outcomes may
have offered superior understanding for the efficacy of treatments in comparison to what the
median offers. There is also limited reporting of time-to-event reporting for the secondary
outcomes.
One-year survival
Comments on one year survival from Celgene were as follows (Source: Celgene
submission, Section 4.7.5.1, p. 75):
Azacitidine improved 1-year survival compared with CCR (46.5% vs. 34.3%,
respectively), resulting in a clinically meaningful difference of 12.3% in favour of
azacitidine (95% CI: 3.5, 21.0).
1-year survival was also improved for azacitidine when compared with each of the
CCR therapies (within investigator pre-selection) (BSC only: 30.3% vs. 18.6%,
LDAC: 48.5% vs. 34.0%, and IC: 55.8% vs. 50.9%, respectively), and in a post-hoc
analysis, when compared with BSC plus LDAC (within investigator pre-selection)
(44.5% vs. 30.6%, respectively).
None of these improvements reported by Celgene were significantly different.
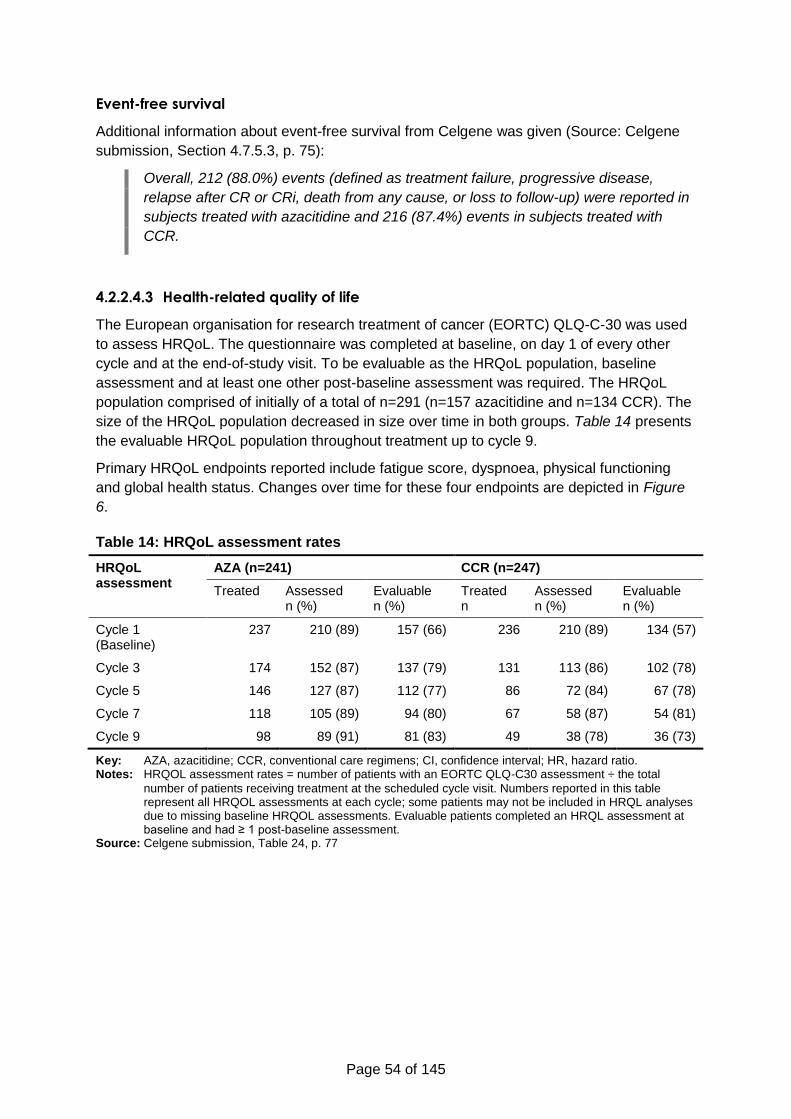
Page 54 of 145
Event-free survival
Additional information about event-free survival from Celgene was given (Source: Celgene
submission, Section 4.7.5.3, p. 75):
Overall, 212 (88.0%) events (defined as treatment failure, progressive disease,
relapse after CR or CRi, death from any cause, or loss to follow-up) were reported in
subjects treated with azacitidine and 216 (87.4%) events in subjects treated with
CCR.
4.2.2.4.3 Health-related quality of life
The European organisation for research treatment of cancer (EORTC) QLQ-C-30 was used
to assess HRQoL. The questionnaire was completed at baseline, on day 1 of every other
cycle and at the end-of-study visit. To be evaluable as the HRQoL population, baseline
assessment and at least one other post-baseline assessment was required. The HRQoL
population comprised of initially of a total of n=291 (n=157 azacitidine and n=134 CCR). The
size of the HRQoL population decreased in size over time in both groups. Table 14 presents
the evaluable HRQoL population throughout treatment up to cycle 9.
Primary HRQoL endpoints reported include fatigue score, dyspnoea, physical functioning
and global health status. Changes over time for these four endpoints are depicted in Figure
6.
Table 14: HRQoL assessment rates
HRQoL assessment
AZA (n=241) CCR (n=247)
Treated Assessed
n (%) Evaluable n (%)
Treated n
Assessed
n (%) Evaluable n (%)
Cycle 1 (Baseline)
237 210 (89) 157 (66) 236 210 (89) 134 (57)
Cycle 3 174 152 (87) 137 (79) 131 113 (86) 102 (78)
Cycle 5 146 127 (87) 112 (77) 86 72 (84) 67 (78)
Cycle 7 118 105 (89) 94 (80) 67 58 (87) 54 (81)
Cycle 9 98 89 (91) 81 (83) 49 38 (78) 36 (73)
Key: AZA, azacitidine; CCR, conventional care regimens; CI, confidence interval; HR, hazard ratio. Notes: HRQOL assessment rates = number of patients with an EORTC QLQ-C30 assessment ÷ the total
number of patients receiving treatment at the scheduled cycle visit. Numbers reported in this table represent all HRQOL assessments at each cycle; some patients may not be included in HRQL analyses due to missing baseline HRQOL assessments. Evaluable patients completed an HRQL assessment at baseline and had ≥ 1 post-baseline assessment.
Source: Celgene submission, Table 24, p. 77
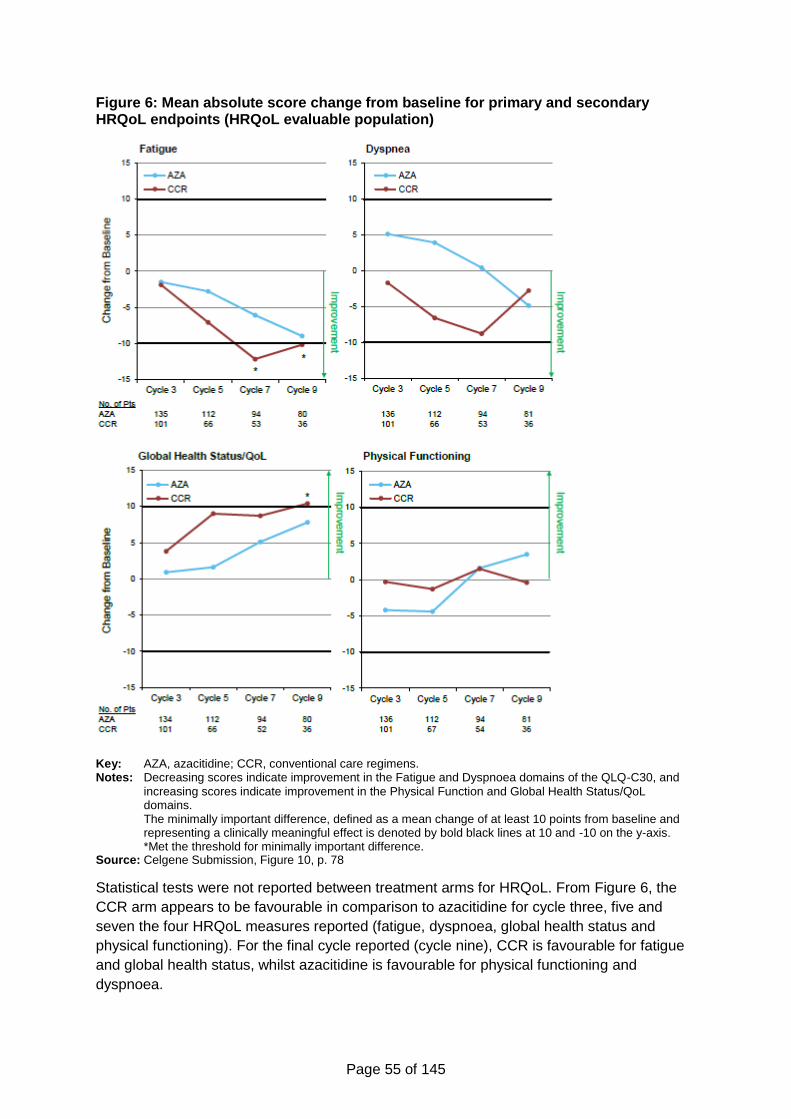
Page 55 of 145
Figure 6: Mean absolute score change from baseline for primary and secondary HRQoL endpoints (HRQoL evaluable population)
Key: AZA, azacitidine; CCR, conventional care regimens. Notes: Decreasing scores indicate improvement in the Fatigue and Dyspnoea domains of the QLQ-C30, and
increasing scores indicate improvement in the Physical Function and Global Health Status/QoL domains. The minimally important difference, defined as a mean change of at least 10 points from baseline and representing a clinically meaningful effect is denoted by bold black lines at 10 and -10 on the y-axis. *Met the threshold for minimally important difference.
Source: Celgene Submission, Figure 10, p. 78
Statistical tests were not reported between treatment arms for HRQoL. From Figure 6, the
CCR arm appears to be favourable in comparison to azacitidine for cycle three, five and
seven the four HRQoL measures reported (fatigue, dyspnoea, global health status and
physical functioning). For the final cycle reported (cycle nine), CCR is favourable for fatigue
and global health status, whilst azacitidine is favourable for physical functioning and
dyspnoea.
Page 56 of 145
There are two significant critiques of the HRQoL analyses by Celgene:
Assessments are made at the start of each cycle, after a significant recovery period
for patients after treatment;
A significant number of patients (197 patients, 40%) are not represented in the
HRQoL assessment at any time point as they did not have a baseline assessment
(14%) and/or lacked a post-baseline assessment; these patients are likely to have
been more ill (lower HRQoL) than the patients who were assessed and evaluable.
4.2.2.4.4 Adverse events
AML-AZA-001 included 471 subjects in the safety population who had newly diagnosed AML
with >30% blasts and were randomised to receive azacitidine or CCR. The median age of
the safety population was 75.0 years with 53.3% of subjects ≥75 years of age, 32.7% of
subjects had AML with MDS-related changes, 18.0% had a prior history of MDS, 35.7% had
a poor or very poor cytogenetic risk status, and 22.9% had ECOG performance status of 2.
Median baseline BM blast count was 71.5%.
A summary for adverse events (AEs) is presented in Table 15. Table 16 reports the
incidences of AEs for > 10 % of people in any treatment arm. Tables A3, A4 and A5
(Appendix 1) presents AEs for both treatment arms, based on the number of events
occurring in ≥10% of people in the azacitidine group.
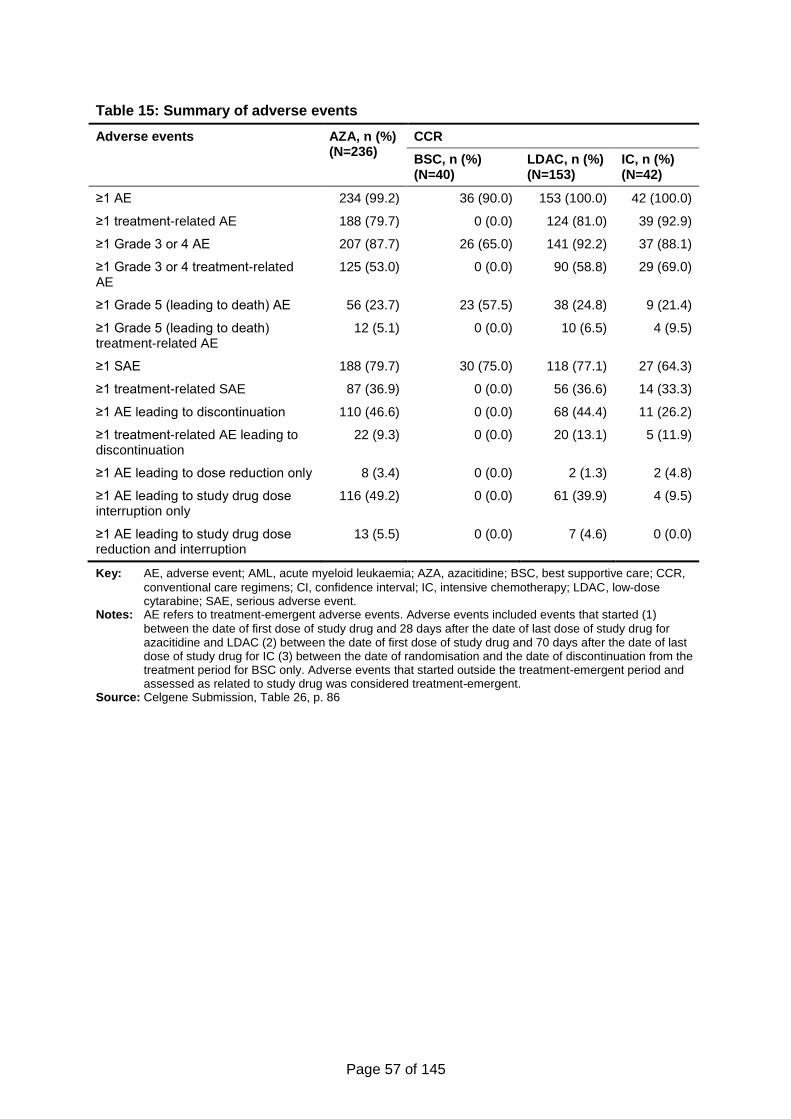
Page 57 of 145
Table 15: Summary of adverse events
Adverse events AZA, n (%) (N=236)
CCR
BSC, n (%) (N=40)
LDAC, n (%) (N=153)
IC, n (%) (N=42)
≥1 AE 234 (99.2) 36 (90.0) 153 (100.0) 42 (100.0)
≥1 treatment-related AE 188 (79.7) 0 (0.0) 124 (81.0) 39 (92.9)
≥1 Grade 3 or 4 AE 207 (87.7) 26 (65.0) 141 (92.2) 37 (88.1)
≥1 Grade 3 or 4 treatment-related AE
125 (53.0) 0 (0.0) 90 (58.8) 29 (69.0)
≥1 Grade 5 (leading to death) AE 56 (23.7) 23 (57.5) 38 (24.8) 9 (21.4)
≥1 Grade 5 (leading to death) treatment-related AE
12 (5.1) 0 (0.0) 10 (6.5) 4 (9.5)
≥1 SAE 188 (79.7) 30 (75.0) 118 (77.1) 27 (64.3)
≥1 treatment-related SAE 87 (36.9) 0 (0.0) 56 (36.6) 14 (33.3)
≥1 AE leading to discontinuation 110 (46.6) 0 (0.0) 68 (44.4) 11 (26.2)
≥1 treatment-related AE leading to discontinuation
22 (9.3) 0 (0.0) 20 (13.1) 5 (11.9)
≥1 AE leading to dose reduction only 8 (3.4) 0 (0.0) 2 (1.3) 2 (4.8)
≥1 AE leading to study drug dose interruption only
116 (49.2) 0 (0.0) 61 (39.9) 4 (9.5)
≥1 AE leading to study drug dose reduction and interruption
13 (5.5) 0 (0.0) 7 (4.6) 0 (0.0)
Key: AE, adverse event; AML, acute myeloid leukaemia; AZA, azacitidine; BSC, best supportive care; CCR,
conventional care regimens; CI, confidence interval; IC, intensive chemotherapy; LDAC, low-dose cytarabine; SAE, serious adverse event.
Notes: AE refers to treatment-emergent adverse events. Adverse events included events that started (1)
between the date of first dose of study drug and 28 days after the date of last dose of study drug for azacitidine and LDAC (2) between the date of first dose of study drug and 70 days after the date of last dose of study drug for IC (3) between the date of randomisation and the date of discontinuation from the treatment period for BSC only. Adverse events that started outside the treatment-emergent period and assessed as related to study drug was considered treatment-emergent.
Source: Celgene Submission, Table 26, p. 86
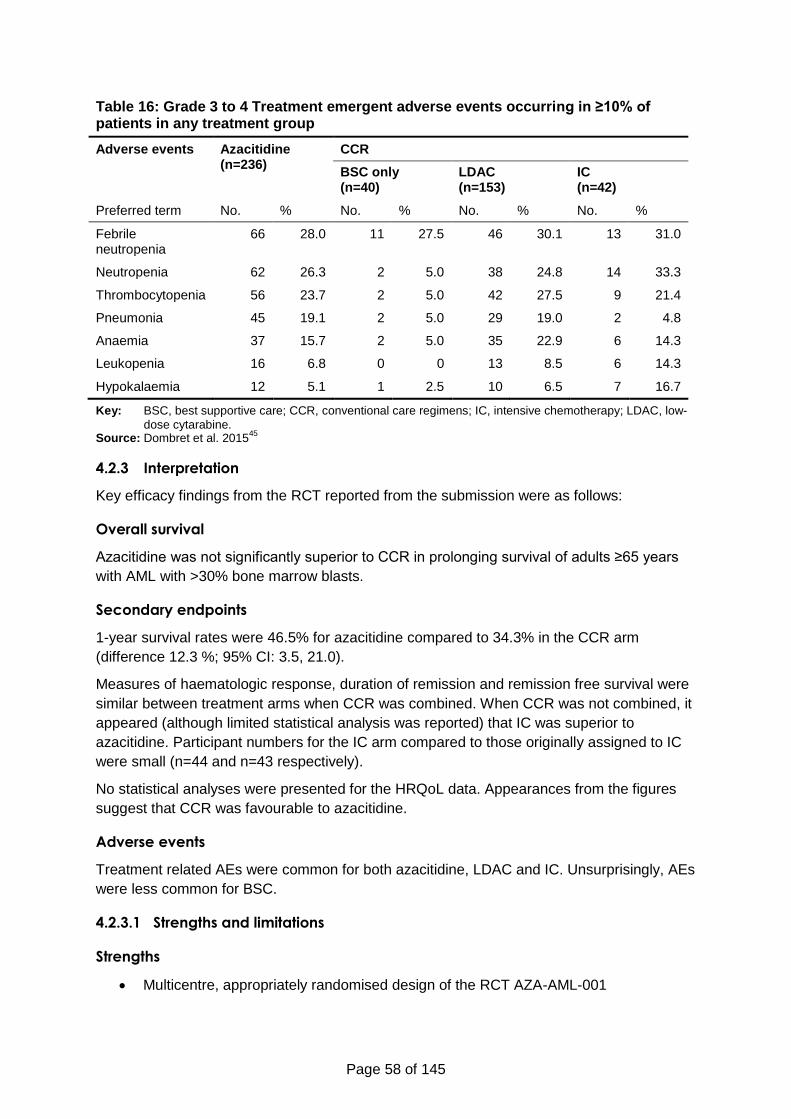
Page 58 of 145
Table 16: Grade 3 to 4 Treatment emergent adverse events occurring in ≥10% of patients in any treatment group
Adverse events Azacitidine (n=236)
CCR
BSC only (n=40)
LDAC (n=153)
IC (n=42)
Preferred term No. % No. % No. % No. %
Febrile neutropenia
66 28.0 11 27.5 46 30.1 13 31.0
Neutropenia 62 26.3 2 5.0 38 24.8 14 33.3
Thrombocytopenia 56 23.7 2 5.0 42 27.5 9 21.4
Pneumonia 45 19.1 2 5.0 29 19.0 2 4.8
Anaemia 37 15.7 2 5.0 35 22.9 6 14.3
Leukopenia 16 6.8 0 0 13 8.5 6 14.3
Hypokalaemia 12 5.1 1 2.5 10 6.5 7 16.7
Key: BSC, best supportive care; CCR, conventional care regimens; IC, intensive chemotherapy; LDAC, low-
dose cytarabine. Source: Dombret et al. 2015
45
4.2.3 Interpretation
Key efficacy findings from the RCT reported from the submission were as follows:
Overall survival
Azacitidine was not significantly superior to CCR in prolonging survival of adults ≥65 years
with AML with >30% bone marrow blasts.
Secondary endpoints
1-year survival rates were 46.5% for azacitidine compared to 34.3% in the CCR arm
(difference 12.3 %; 95% CI: 3.5, 21.0).
Measures of haematologic response, duration of remission and remission free survival were
similar between treatment arms when CCR was combined. When CCR was not combined, it
appeared (although limited statistical analysis was reported) that IC was superior to
azacitidine. Participant numbers for the IC arm compared to those originally assigned to IC
were small (n=44 and n=43 respectively).
No statistical analyses were presented for the HRQoL data. Appearances from the figures
suggest that CCR was favourable to azacitidine.
Adverse events
Treatment related AEs were common for both azacitidine, LDAC and IC. Unsurprisingly, AEs
were less common for BSC.
4.2.3.1 Strengths and limitations
Strengths
Multicentre, appropriately randomised design of the RCT AZA-AML-001
Page 59 of 145
The population recruited to AZA-AML-001 was representative of the typical UK
patient population
The appropriate CCR regimes used as a comparator in AZA-AML-001 compared to
UK standard practices
Limitations
Underpowered for individual CCR arms
The open-label design introduces the risk of bias
The use of subsequent therapies following treatment assignment, some of which are
not used in routine NHS practice, and which were not balanced across treatment
arms
Limited reporting of time-to-treat outcomes (except for OS)
Use of statistical analyses which have reduced efficiency when proportional hazard
assumptions are not met
4.3 Adjustments of overall survival estimates for subsequent therapy
In order to address confounding effects of subsequent therapy on overall survival (OS), the
company’s submission presents post-hoc analyses that adjust for subsequent therapy use.
Among these, the analyses that censored data at the start of subsequent therapy and
weighted the remaining data by the inverse of the probability of not being censored, i.e., the
inverse probability of censoring weights (IPCW) method, play the most prominent role in the
submission. Other methods of adjustment of OS treatment effects were considered
elsewhere in the submission (Celgene submission, Section 5.3.5, p. 122), such as the Rank
Preserving Structural Failure Time Model (RPSFTM) and the Iterative Parameter Estimation
(IPE), but these were considered inferior to the IPCW.
The company presented estimates of relative effects for two sets of IPCW analyses. In the
first set of analyses, adjustment for subsequent treatment was applied to both trial arms (i.e.,
azacitidine and CCR). In the second set of analyses, adjustment for subsequent treatment
with azacitidine was applied to the CCR arm.
Celgene adopted the results of the second set for its health economic base case analysis.
The company justified this choice on the basis of methodological guidelines (Source:
Celgene submission, Section 4.4.4.3, p. 55):
For regulatory purposes, an initial IPCW analysis was undertaken in which both
treatment arms were adjusted. A further IPCW analysis was conducted in line with
the NICE DSU TSD16 in which adjustments were only made to the comparator
treatment arm (CCR).51
This reasoning led Celgene to devote little space in its submission to describe the first set of
IPCW analyses, which adjusted for subsequent therapy in both arms, and to focus on
detailing the second IPCW analysis, which only adjusted for subsequent azacitidine use in
the CCR arm.
Page 60 of 145
The ERG believes the first set of analyses, which adjust for subsequent AML treatment in
both trial arms, should have been used for the base case economic analysis instead of the
IPCW analysis adjusting for azacitidine use in CCR. The ERG believes the company are
mistaken in their interpretation of the methodological guidelines. The NICE DSU TSD16
illustrates the application of IPCW to estimate treatment effects in a hypothetical context
where a policy choice needs to be made among two states of the world, one where a new,
experimental treatment is available to patients and the alternative state where such
treatment is not available, and the evidence comes from an RCT where some control
patients switch to the experimental treatment after randomisation. IPCW adjustment (or
indeed adjustment by any other suitable method for that matter) of outcome data in the
control arm would then be warranted. In this example no IPCW adjustment was made in the
experimental arm because it was assumed that the mix of subsequent therapies used by
patients in that arm is representative of patterns of care in the state of the world where the
experimental treatment is made available. In contrast, as acknowledged in the NICE DSU
TSD16, if the mix of subsequent therapies in any trial arm (whether is the experimental or
control) is not representative of patterns of care in the state of the world of interest to the
decision problem, then adjustment for those subsequent treatments is needed.
Therefore, in the case where, as the cost-effectiveness model submitted by Celgene for this
appraisal implies (see Section 5), the decision problem involves the evaluation of two
alternative states of the world where no subsequent active treatment is available, then
adjustment of outcomes for active treatment switching in both trial arms is warranted.
Whether the premise that no subsequent active treatment would be available to UK patients
in routine practice is correct may of course be questioned (see Section 5 for clinical expert
opinion on this issue obtained by the ERG for this appraisal), but the point here is that
applying IPCW adjustment for subsequent treatment to the outcome data of the CCR but not
the azacitidine arm in the AZA-AML-001 trial is inconsistent with the economic model which
the OS IPCW analysis was designed to inform.
Since OS differences between the two arms in AZA-AML-001 narrowed over time and the
statistically insignificant ITT findings in OS were reversed when data were censored at
subsequent AML treatment initiation (Celgene submission, Section 4.7.2.3, pp. 67–68),
Celgene undertook further post-hoc analyses to adjust for imbalance in the use of
subsequent treatment and baseline covariates across trial arms. The following methods
were explored.
4.3.1 Cox proportional hazards models
Three post-hoc Cox proportional hazards models of survival were considered in the clinical
effectiveness submission, although were not part of scenarios investigated in the economic
submission:
Model 1 was a function of a time varying indicator of subsequent treatment (as a
main effect and interacted with treatment allocation);
Model 2 was a function of baseline covariates alone;
Model 3 included covariates in Models 1 and 2.
Model 3 produced a large treatment effect estimate (HR 0.69, 95% CI: 0.54, 0.88;
p=0.0027). However, this estimate and those from the other two post-hoc Cox proportional
hazards models are susceptible to bias.
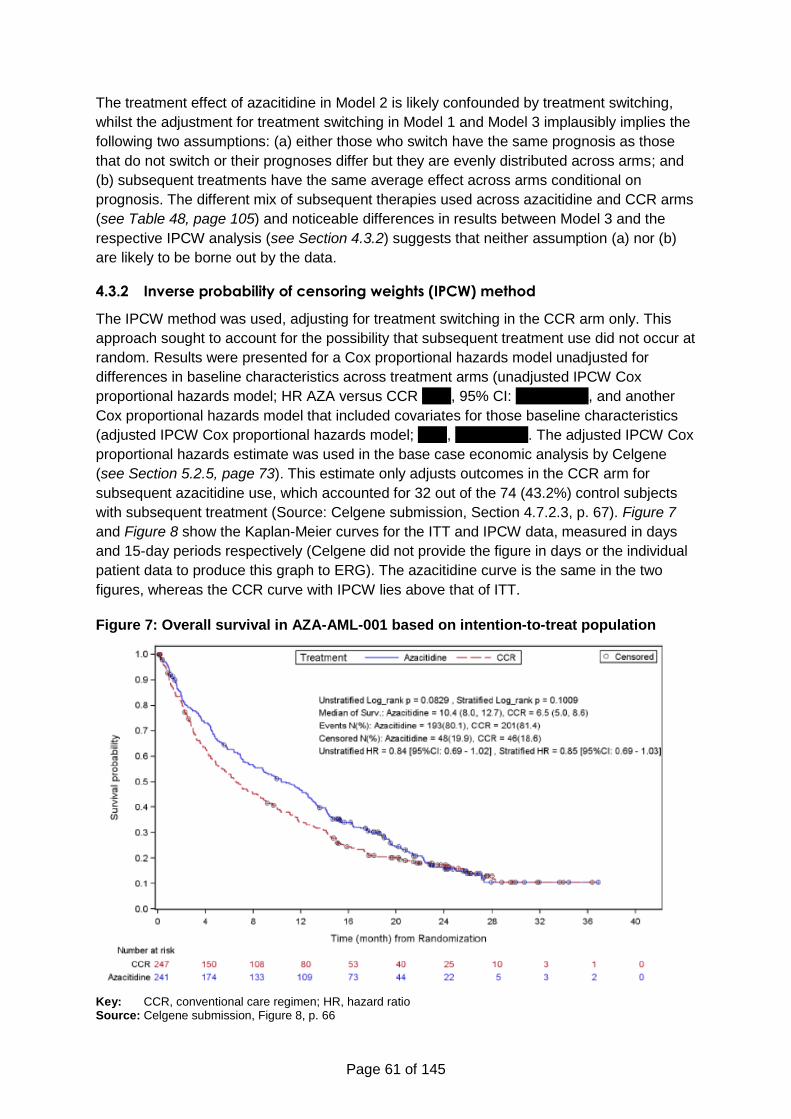
Page 61 of 145
The treatment effect of azacitidine in Model 2 is likely confounded by treatment switching,
whilst the adjustment for treatment switching in Model 1 and Model 3 implausibly implies the
following two assumptions: (a) either those who switch have the same prognosis as those
that do not switch or their prognoses differ but they are evenly distributed across arms; and
(b) subsequent treatments have the same average effect across arms conditional on
prognosis. The different mix of subsequent therapies used across azacitidine and CCR arms
(see Table 48, page 105) and noticeable differences in results between Model 3 and the
respective IPCW analysis (see Section 4.3.2) suggests that neither assumption (a) nor (b)
are likely to be borne out by the data.
4.3.2 Inverse probability of censoring weights (IPCW) method
The IPCW method was used, adjusting for treatment switching in the CCR arm only. This
approach sought to account for the possibility that subsequent treatment use did not occur at
random. Results were presented for a Cox proportional hazards model unadjusted for
differences in baseline characteristics across treatment arms (unadjusted IPCW Cox
proportional hazards model; HR AZA versus CCR xxxx, 95% CI: xxxxxxxxxx, and another
Cox proportional hazards model that included covariates for those baseline characteristics
(adjusted IPCW Cox proportional hazards model; xxxx, xxxxxxxxxx. The adjusted IPCW Cox
proportional hazards estimate was used in the base case economic analysis by Celgene
(see Section 5.2.5, page 73). This estimate only adjusts outcomes in the CCR arm for
subsequent azacitidine use, which accounted for 32 out of the 74 (43.2%) control subjects
with subsequent treatment (Source: Celgene submission, Section 4.7.2.3, p. 67). Figure 7
and Figure 8 show the Kaplan-Meier curves for the ITT and IPCW data, measured in days
and 15-day periods respectively (Celgene did not provide the figure in days or the individual
patient data to produce this graph to ERG). The azacitidine curve is the same in the two
figures, whereas the CCR curve with IPCW lies above that of ITT.
Figure 7: Overall survival in AZA-AML-001 based on intention-to-treat population
Key: CCR, conventional care regimen; HR, hazard ratio Source: Celgene submission, Figure 8, p. 66
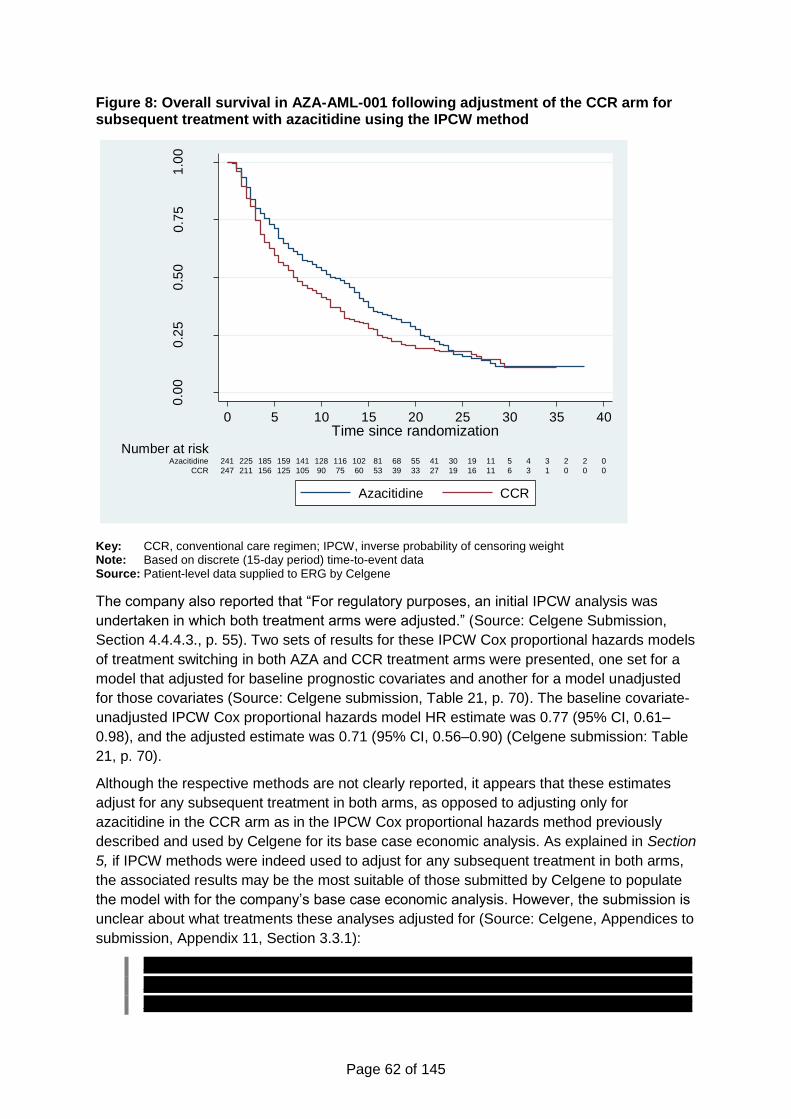
Page 62 of 145
Figure 8: Overall survival in AZA-AML-001 following adjustment of the CCR arm for subsequent treatment with azacitidine using the IPCW method
Key: CCR, conventional care regimen; IPCW, inverse probability of censoring weight Note: Based on discrete (15-day period) time-to-event data Source: Patient-level data supplied to ERG by Celgene
The company also reported that “For regulatory purposes, an initial IPCW analysis was
undertaken in which both treatment arms were adjusted.” (Source: Celgene Submission,
Section 4.4.4.3., p. 55). Two sets of results for these IPCW Cox proportional hazards models
of treatment switching in both AZA and CCR treatment arms were presented, one set for a
model that adjusted for baseline prognostic covariates and another for a model unadjusted
for those covariates (Source: Celgene submission, Table 21, p. 70). The baseline covariate-
unadjusted IPCW Cox proportional hazards model HR estimate was 0.77 (95% CI, 0.61–
0.98), and the adjusted estimate was 0.71 (95% CI, 0.56–0.90) (Celgene submission: Table
21, p. 70).
Although the respective methods are not clearly reported, it appears that these estimates
adjust for any subsequent treatment in both arms, as opposed to adjusting only for
azacitidine in the CCR arm as in the IPCW Cox proportional hazards method previously
described and used by Celgene for its base case economic analysis. As explained in Section
5, if IPCW methods were indeed used to adjust for any subsequent treatment in both arms,
the associated results may be the most suitable of those submitted by Celgene to populate
the model with for the company’s base case economic analysis. However, the submission is
unclear about what treatments these analyses adjusted for (Source: Celgene, Appendices to
submission, Appendix 11, Section 3.3.1):
xxxxxxxxxxxxxxxxxxxxxxxxxxxxxxxxxxxxxxxxxxxxxxxxxxxxxxxxxxxxxxxxxxxxxxxxxxx
xxxxxxxxxxxxxxxxxxxxxxxxxxxxxxxxxxxxxxxxxxxxxxxxxxxxxxxxxxxxxxxxxxxxxxxxxxx
xxxxxxxxxxxxxxxxxxxxxxxxxxxxxxxxxxxxxxxxxxxxxxxxxxxxxxxxxxxxxxxxxxxxxxxxxxx
0.0
00
.25
0.5
00
.75
1.0
0
Pro
po
rtio
n s
urv
ivin
g o
vera
ll
247 211 156 125 105 90 75 60 53 39 33 27 19 16 11 6 3 1 0 0 0CCR
241 225 185 159 141 128 116 102 81 68 55 41 30 19 11 5 4 3 2 2 0Azacitidine
Number at risk
0 5 1510 20 25 30 35 40Time since randomization
Azacitidine CCR
Page 63 of 145
xxxxxxxxxxxxxxxxxxxxxxxxxxxxxxxxxxxxxxxxxxxxxxxxxxxxxxxxxxxxxxxxxxxxxxxxxxx
xxxxxxxxxxxxxxxxxxxxxxxxxxxxxxxxxxxxxxxxxxxxxxxxxxxxxxxxxxxxxxxxxxxxxxxxxxx
xxxxxxxxxxxxxxxxxxxxxxxxxxxxxxxxxxxxxxxxxxxxxxxxxxxxxxxxxxxxxxxxxxxxxxxxxxx
xxxxxxxxxxxxxxxxxxxxxxxxxxxxxxxxxxxxxxxxxxxxxxxxxxxxxxxxxxxxxxxxxxxxxxxxxxx
xxxxxxxxxxxxxxxxxxxxxxxxxxxxxxxxxxxxxxxxxxxxxxxxxxxxxxxxxxxxxxxxxxxxxxxxxxx
xxxxxxxxxxxxxxxxxxxxxxxxxxxxxxxxxxxxxxxxxxxxxxxxxxxxxxxxxxxxxxxxxxxxxxxxxxx
xxxxxxxxxxxxxxxxxxxxxxxxxxxxxxxxxxxxxxxxxxxxxxxxxxxxxxxxxxxxxxxxxxxxxxxxxxx
xxxxxxxxxxxxxxxxxxxxxxxxxxxxxxxxxxxxxxxxxxxxxxxxxxxxxxxxxxxxxxxxxxxxxxxxxxx
xxxxxxxxxxxxxxxxxxxxxxxxxxxxxxxxxxxxxxxxxxxxxxxxxxxxxxxxxxxxxxxxxxxxxxxxxxx
xxxxxxxxxxxxxxxxxxxxxxxxxxxxxxxxxxxxxxxxxxxxxxxxxxxxxxxxxxxxxx.
In AZA-AML-001, azacitidine was not the only subsequent treatment for AML used in the
CCR arm, and there were also active treatments after azacitidine in the azacitidine arm (see
Table 48, page 105).
4.3.3 Other analyses
Other analyses submitted by the company separately analysed patients who did and did not
receive any subsequent therapy. These analyses are by their nature of limited use in
informing assessments of relative effectiveness, because the differences in outcomes
between those two groups of patients are likely to confound the effect of treatment with
individual variation in the propensity to receive treatment, and are not reviewed further.
Another set of treatment effect estimates were reported for an analysis that censored
subsequent cytarabine-based therapy in the azacitidine group and subsequent azacitidine in
the CCR group (HR xxxx; 95% CI: xxxxxxxxx). These results are more in line with the
assumptions of Celgene’s economic model, which assumes no subsequent active treatment
after treatment failure is used in the azacitidine and CCR groups. However, as reported by
the Celgene submission, cytarabine accounted only for 40 (59.7%) of the 67 subjects who
received subsequent treatment in the azacitidine group (Celgene submission, Section
4.7.2.3, p. 67).
Another analysis used an imputation method to adjust for treatment switching (Celgene Post
hoc statistical methods addendum AZA-AML-001), but since little information was provided
on the methods and the results of this analysis played no subsequent role in the submission,
we do not discuss these further.
4.3.4 Summary and additional issues
Comparing HR estimates between the baseline covariate-unadjusted IPCW PH, 0.77 (95%
CI: 0.61–0.98) (Celgene submission, Table 21, p. 70), and the unstratified HR (ITT)
censoring at switch to AML therapy, 0.75 (95% CI: 0.59–0.95) (Celgene submission, Table
19, p. 68), suggests sophisticated methods of adjustment for subsequent treatment use that
account for censoring not-at-random (e.g., IPCW) make little difference versus simple
methods that assume censoring at random.
Further, similar HR estimates were found with IPCW Cox proportional hazards versus simply
estimating Cox proportional hazards treatment effects without subsequent therapy-related
censoring and a time-varying covariate indicator of subsequent therapy interacted with
randomly allocated therapy (0.71 versus 0.69).
Page 64 of 145
Adjusting versus not adjusting for baseline covariates appears to be the single structural
factor to which estimates of relative effectiveness are most sensitive, as evidenced by the
difference in HR estimates between Cox proportional hazards Model 1 versus Model 3 (0.75
versus 0.69) and the corresponding estimates with IPCW applied to both trial arms (0.77
versus 0.71).
The wide range of HR estimates reported by the company relies on the assumption of
constant proportional hazards, which was statistically tested for the Cox but not for the IPCW
approaches. No reasons for the absence of tests of the proportional hazards assumption in
the IPCW analyses were presented in the submission. The methods description presented in
the cost-effectiveness section of the Celgene submission suggests these tests were not
performed and does not provide reasons for this omission (see Section 5.3 for our critique of
methods presented in the cost-effectiveness section of the Celgene submission).
In Figure A1 (Appendix 2) we present log-log plots for the IPCW analysis adjusting for
azacitidine use in the CCR arm only (the corresponding data for the IPCW analysis adjusting
both the azacitidine and CCR arm for subsequent AML therapy use were not provided by the
company). This suggests that the proportional hazards assumption (i.e., curves being
parallel) is unlikely to hold after month 20. Statistical test of this assumption using
Schoenfeld residuals also rejects the assumption (X²=5.82; p=0.016).
As explained in Section 5.3.6.2 (page 111), the IPCW method applied by Celgene consisted
of two parts, first a regression analysis to predict the probability of a CCR patient not
receiving subsequent treatment at each follow-up point (every 15-days), as a function of
fixed baseline covariates and time-varying covariates that affect both the likelihood of
treatment switching and overall survival outcomes. In a second step the survival time of CCR
individuals who switched to azacitidine are censored at the time of switching and the inverse
of the predicted probability of switching corresponding to uncensored CCR individuals at a
given follow-up point is used as sampling weight to account for the unobserved outcomes of
censored individuals in the counterfactual situation that they had not switched treatment.
This method thus intends to estimate the outcomes that would have been observed in the
CCR sample had no patients switched to azacitidine, and does so by adjusting for non-
random censoring (i.e., treatment switching) using a predictive model for subsequent
treatment.
The validity of overall survival IPCW estimates (and resulting hazard ratios) depends on the
AZA-AML-001 data conforming to two key assumptions.
The first key assumption (referred to as the exchangeability assumption) dictates that after
controlling for the measured predictors common to survival and subsequent azacitidine use,
subsequent azacitidine users have the same survival prognosis as those who remain in
CCR. As discussed elsewhere, this assumption only holds under the following three
conditions:
All common predictors are appropriately measured and accounted for in the analysis;
The sample of patients available at all follow-up times is sufficiently large to ensure
that the probability of not switching is positive for every combination of values
observed for the common predictors over the whole sequence of follow-up points
(i.e., the positivity condition, Cole and Hernan 200852);
Page 65 of 145
The common predictors cannot perfectly or nearly perfectly predict survival or
switching to azacitidine.
Thus, small sample size or perfect common predictors violate the exchangeability
assumption because the survival outcomes of uncensored CCR patients would not be
representative of censored individuals, who switched to azacitidine, even if all common
confounders were appropriately measured and included in the analysis.53 This problem is
thus aggravated by small sample sizes, highly stratified data due to a large set of predictors
used to estimate weights, and continuous predictors can generate random non-positivity.
The second assumption is that the functional forms in which the common predictors enter
the switching prediction model is correctly specified, so that exchangeability is maximised by
controlling for selection bias while maintaining positivity.52
While the ERG could replicate the IPCW hazard ratio estimates reported by Celgene using
individual patient data provided by the company, it was not provided the data to replicate the
estimation of IPCW weights, which were estimated in SAS (Celgene appendices to
submission, Appendix 10). This limited the ability to assess whether the assumptions implied
by the IPCW method are consistent with the data from AZA-AML-001. Further details are
provided in Section 5.3.6.2 (page 111).
Celgene notes that besides the limitations inherent in the IPCW, there was an additional
limitation (Source: Celgene Post hoc statistical methods addendum AZA-AML-001, pp. 6–7):
An additional limitation of the post-randomization data in the current study was that
for subjects who did not receive subsequent therapy, the last visit interval extended
from the last assessment done at the time of discontinuation from the treatment
phase of the study to the time of censoring (study closure or lost to follow-up) or
death. If the subject was alive and in the survival follow-up phase for a long period of
time then the gap between treatment discontinuation and death or censoring could
be quite long and represents a time interval during which no additional clinical
information was collected or available.
This issue is a potentially important one for the company’s IPCW analyses, because it
suggests that an unknown proportion of patients might have received unrecorded
subsequent therapy, for which survival outcomes remained unadjusted for. For the IPCW
analysis that adjusted only outcomes of CCR arm, this implies that the benefit of azacitidine
may be underestimated. In contrast, in the IPCW analysis that adjusted survival outcomes of
both trial arms, if patients with improved survival prognosis were to be more likely to have
received subsequent therapy during the period of unrecorded clinical management activity it
is possible that unrecorded treatment switching may have produced a larger omitted variable
bias in overall survival outcomes of azacitidine than CCR, and that the survival benefits of
azacitidine may be overestimated.
The implications of these issues are covered further in Section 5 that discusses the cost-
effectiveness analysis submitted by Celgene.
Page 66 of 145
4.4 Critique of trials identified and included and of the indirect
comparison and/or multiple treatment comparison
As one RCT was identified from the searches and screening,45 indirect comparisons and/or
multiple treatment comparisons could not be made and were not presented by the company.
4.5 Critique of other evidence sources
Celgene provided four further sources (one non-RCT and three trial registries) of evidence
within their submission.
4.5.1 Non-randomised evidence
The single non-RCT relevant to the decision problem identified by Celgene was by Lao et
al.46 This was a study which included a broader population of >20% blasts, however they
provided sub-analysis for the population with >30% blasts. Celgene do not report any of the
findings from this study as they claim the number of people with >30% blasts was small
(n=12 for azacitidine group versus n=8 for the IC group versus n=22 for BSC group). From
exploring the Lao et al. study, there is no evidence reported that compares any outcomes
between the azacitidine group and either IC or BSC for those with >30% blasts. There is
evidence comparing <30% and 30% or higher BM blasts in the azacitidine arm.
4.5.2 Registry data
The company report registry data from three countries: Austria, Spain and France. They
hoped to conduct matched-adjusted indirect comparison using single-arm data. None of the
published registry data (Austrian azacitidine registry (NCT01595295); Spanish AMLA
registry and French compassionate patient named programme) provided information on the
population with >30% bone marrow blasts, a population requirements for the Scope for this
report.
4.6 Conclusions of the clinical effectiveness section
In spite of poorly designed and reported searches, the company submission identified a
single RCT trial (AZA-AML-001) that matched the decision problem. Information from this
study was reported in detail. The RCT was well conducted, although underpowered for each
of the CCR arms.
The primary efficacy endpoint for the RCT was an ITT comparison of overall survival for
patients randomised to azacitidine versus patients randomised to CCR. An improvement
was demonstrated but it did not reach statistical significance. Statistical significance was
also not reached for other outcomes assessed and reported. There was some evidence,
though not statistically significant due to underpowering, that azacitidine was inferior to
LDAC and IC on a number of outcomes, including response rate and relapse-free survival,
although azacitidine appeared to be superior in relation to overall survival.
Post-hoc analyses were presented where overall survival outcomes were adjusted for
subsequent treatment in CCR, where a significant improvement with azacitidine was found.
However, these analyses were hampered by the fact that they relied on the assumption that
treatment effects displayed a proportional hazards pattern, which was not statistically tested
in the analysis sample.
Page 67 of 145
5 Cost-effectiveness
5.1 ERG comment on company’s review of cost-effectiveness
evidence
5.1.1 Objective
The company conducted a systematic review to identify cost-effectiveness studies from the
published literature relevant to the decision problem (see Section 3, page 23).
5.1.2 Search strategies
5.1.2.1 Economic evaluations
The company presented a literature search protocol to support its review of cost
effectiveness. This protocol included systematic searches of key biomedical databases using
a literature search strategy combined with hand-searching of conference abstracts and
included studies. The literature searching was last updated in October 2015.
The bibliographic database searching used a search strategy that took the following form:
1. (search terms for acute myeloid leukaemia/leukaemia); and
2. (search terms for Azacitidine, cytarabine, clofarabine, daunorubicin, etoposide,
fludarabine, idarubicin, mitoxantrone, mercaptopurine, amsacrine, cytotoxic or
anthracycline or supportive or conventional care or chemotherapy or antineoplastic
agent); and
3. (search terms to identify cost analysis, studies reporting economic evaluations or cost
parameters).
This search strategy was applied in: MEDLINE and EMBASE (both via OVID), NHS EEDs
and the HTA library (via the Cochrane Library: OVID interface) and Econlit (OVID).
The following conference proceedings were hand-searched between 2013 and 2015
inclusive:
International Society for Pharmacoeconomics and Outcomes Research (ISPOR) -
European, International, Asia-Pac, and Latin American
American Society of Clinical Oncology (ASCO)
European Society for Medical Oncology (ESMO)
Tufts Cost-effectiveness Analysis (CEA) registry
WHO International Clinical Trials Registry Platform (ICTRP)
HTA Database of the International Network of Agencies for Health Technology
Assessment (INAHTA)
NIHR HTA website
Research Papers in Economics (RePEc) website
NICE website.
Page 68 of 145
The ERG accepts that these literature searches were fit for purpose.
5.1.2.2 Health-related quality of life
Celgene did not record a systematic search for studies reporting HRQoL in their original
submission. In response to a question for clarification, Celgene confirmed that they had
undertaken a targeted systematic search. This literature search was undertaken in PubMed
and the HERC database and takes population search terms combined with search terms for:
QALY or utlilit* (search term is truncated) or EQ-5D. The ERG has been able to replicate
and validate this search.
Celgene noted further that HRQoL was recorded for all treatments in the trial that supports
their submission. Celgene have therefore used this data to parameterise their model arguing
that it best reflects the quality of life seen in the target population. Given the inherent
difficulty of measuring HRQoL outcomes in oncology trials and in particular in this clinical
area, ERG believes that Celgene is likely to have identified the best available source of
evidence on these outcomes relevant to this assessment.
5.1.3 Inclusion criteria
The review included cost-utility studies in the English language, or English abstracts of
studies from studies written in other languages, relating to adults (>18 years) with AML with
>30% blasts. In terms of treatments, included studies had to investigate azacitidine
(intervention) and comparators of including intensive or non-intensive low-dose
chemotherapy, including:
Cytarabine (Ara C)
Clofarabine (Evoltra®)
Daunorubicin (daunomycin)
Etoposide (Etopophos®, Vepesid®)
Fludarabine (Fludara®)
Idarubucin (Zavedos®)
Mercaptopurine (Xaluprine®)
Mitoxantrone
Amsacrine
Hydroxycarbamide (Hydrea)
or best supportive care (BSC).
All of these criteria were within the NICE Scope.
5.1.4 Results
Of 334 titles identified by the company’s searches, forty eight studies were candidates for
inclusion based on abstract and title content and its full text screened for possible inclusion.
Forty studies were excluded after screening their full text, mostly due to the patient
population investigated; six studies were excluded due to the study design being limited to
Page 69 of 145
costs only rather than cost-effectiveness analysis. The remaining eight studies were included
in the review.
Of the eight reviewed studies four were published abstracts and the remaining four were full
journal article publications. Two of the full publications reported studies in populations within
the NICE score of AML with >30% blasts, one was a study conducted in France,54 and
another was a study conducted in China.55 The company performed quality assessment of
the four full publications only, since abstract publication reported insufficient information to
be assessed.
Although Celgene did not discuss the results of their quality assessment of the four included
full publications, the quality checklist (Celgene appendices to submission, Appendix 8)
makes clear that the studies were of very poor quality in terms of design, since no study was
designed as an incremental cost-utility analysis, details of modelling methods required to
extrapolate outcomes from short term efficacy studies to capture all important costs and
benefits were not provided, and the degree of uncertainty in estimates was not measured.
None of the studies were conducted in the UK and the one European study identified did not
provide adequate methodological evidence to be of use to this assessment.
Only one of the reviewed studies evaluated azacitidine (versus LDAC). This was a study
conducted in Russia that reported that azacitidine resulted in RUB 909,573 ($32,261 at 2012
PPP; source: OECD http://www.oecd-ilibrary.org/economics/purchasing-power-parities-for-
gdp-2013-1_ppp-gdp-table-2013-1-en) extra costs and 0.76 additional life years per patient
than LDAC, for an incremental cost per life year gained of RUB 1,196,808 (£42,449), but
since it was published as an abstract56 it provided limited information (ICER calculations
made by ERG from information reported in the publication). Further, its relevance to the
NICE decision problem is ambiguous since it is not clear whether patients had >30% blasts,
and it included MDS patients. Moreover, these results did not take account of HRQoL
outcomes and the costs results may not be transferable due to differences in relative prices
between UK and Russia.
5.1.5 Conclusions
Although no conclusions were provided by the submitted review, ERG concludes that the
quality of the evidence is poor and in any case unlikely to be relevant to the present
assessment.
5.2 Summary of company’s submitted economic evaluation
5.2.1 Model structure
A semi-Markov model, proposed by Celgene, is based on AZA-AML-001 study, a literature
review of clinical guidelines and economic models for AML, and advice from two UK clinical
oncologists. The structure of the model is described in the submission (Celgene submission,
Section 5.5.5, pp. 106–108) and shown in Figure 9 below.
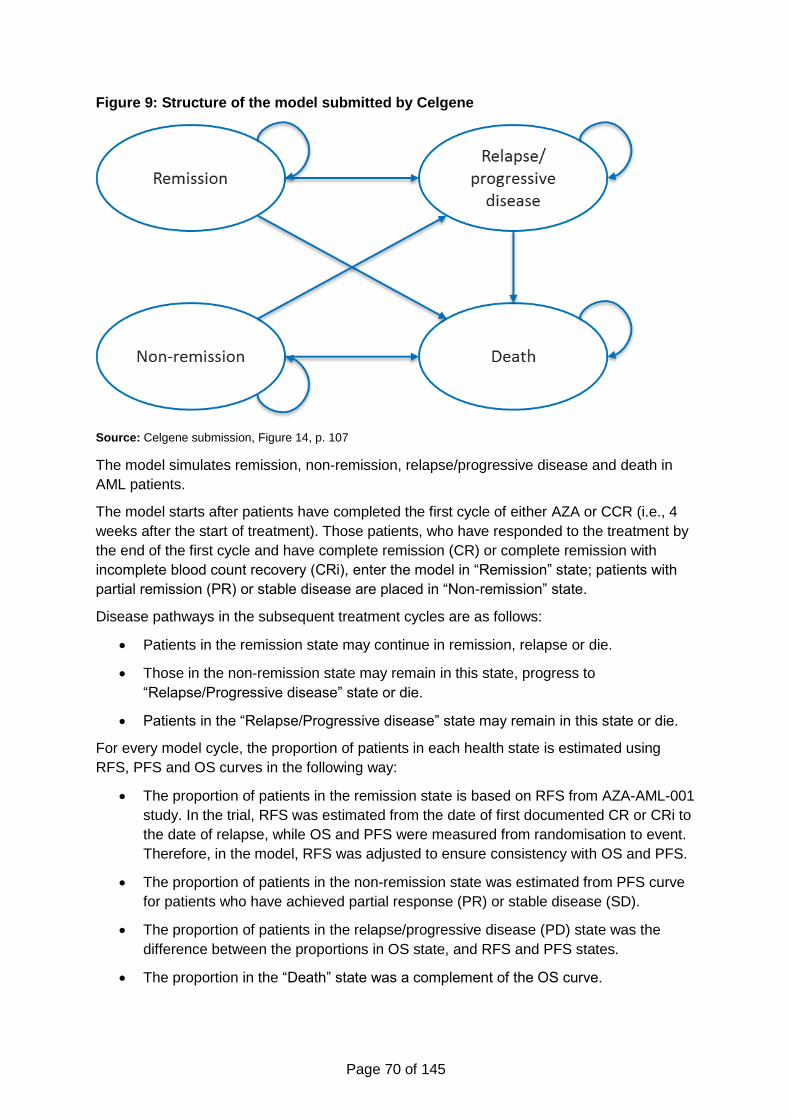
Page 70 of 145
Figure 9: Structure of the model submitted by Celgene
Source: Celgene submission, Figure 14, p. 107
The model simulates remission, non-remission, relapse/progressive disease and death in
AML patients.
The model starts after patients have completed the first cycle of either AZA or CCR (i.e., 4
weeks after the start of treatment). Those patients, who have responded to the treatment by
the end of the first cycle and have complete remission (CR) or complete remission with
incomplete blood count recovery (CRi), enter the model in “Remission” state; patients with
partial remission (PR) or stable disease are placed in “Non-remission” state.
Disease pathways in the subsequent treatment cycles are as follows:
Patients in the remission state may continue in remission, relapse or die.
Those in the non-remission state may remain in this state, progress to
“Relapse/Progressive disease” state or die.
Patients in the “Relapse/Progressive disease” state may remain in this state or die.
For every model cycle, the proportion of patients in each health state is estimated using
RFS, PFS and OS curves in the following way:
The proportion of patients in the remission state is based on RFS from AZA-AML-001
study. In the trial, RFS was estimated from the date of first documented CR or CRi to
the date of relapse, while OS and PFS were measured from randomisation to event.
Therefore, in the model, RFS was adjusted to ensure consistency with OS and PFS.
The proportion of patients in the non-remission state was estimated from PFS curve
for patients who have achieved partial response (PR) or stable disease (SD).
The proportion of patients in the relapse/progressive disease (PD) state was the
difference between the proportions in OS state, and RFS and PFS states.
The proportion in the “Death” state was a complement of the OS curve.
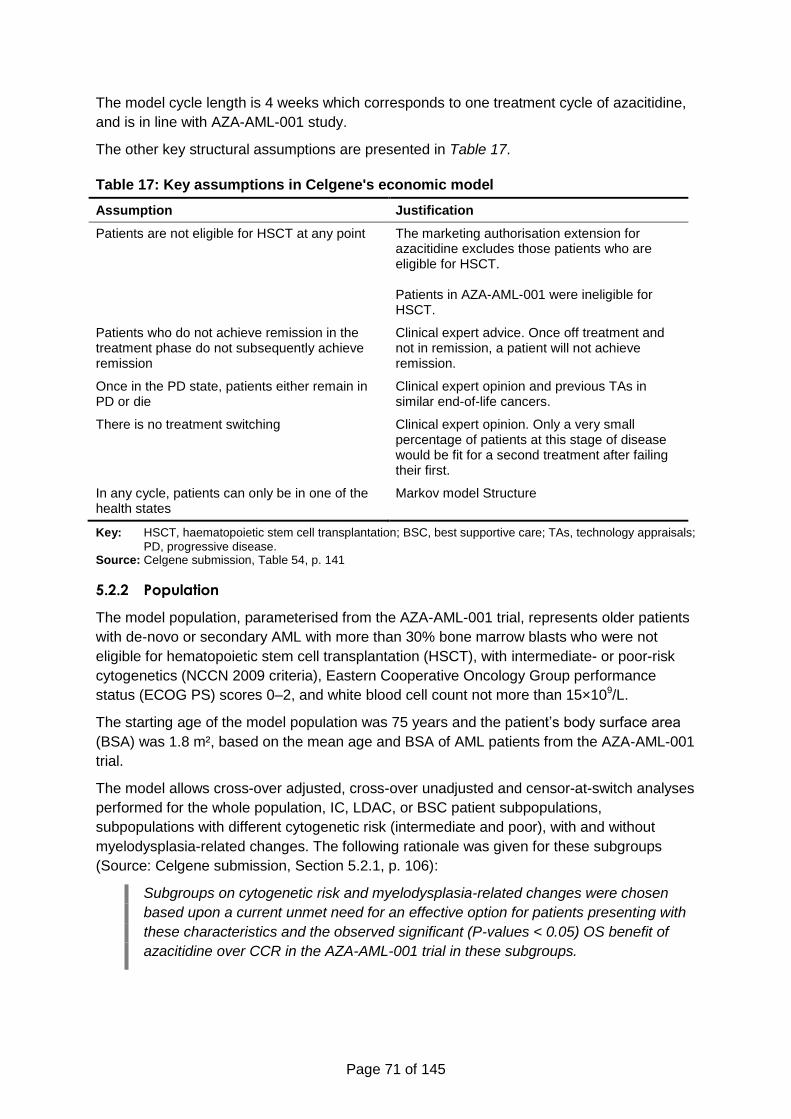
Page 71 of 145
The model cycle length is 4 weeks which corresponds to one treatment cycle of azacitidine,
and is in line with AZA-AML-001 study.
The other key structural assumptions are presented in Table 17.
Table 17: Key assumptions in Celgene's economic model
Assumption Justification
Patients are not eligible for HSCT at any point The marketing authorisation extension for azacitidine excludes those patients who are eligible for HSCT. Patients in AZA-AML-001 were ineligible for HSCT.
Patients who do not achieve remission in the treatment phase do not subsequently achieve remission
Clinical expert advice. Once off treatment and not in remission, a patient will not achieve remission.
Once in the PD state, patients either remain in PD or die
Clinical expert opinion and previous TAs in similar end-of-life cancers.
There is no treatment switching Clinical expert opinion. Only a very small percentage of patients at this stage of disease would be fit for a second treatment after failing their first.
In any cycle, patients can only be in one of the health states
Markov model Structure
Key: HSCT, haematopoietic stem cell transplantation; BSC, best supportive care; TAs, technology appraisals;
PD, progressive disease. Source: Celgene submission, Table 54, p. 141
5.2.2 Population
The model population, parameterised from the AZA-AML-001 trial, represents older patients
with de-novo or secondary AML with more than 30% bone marrow blasts who were not
eligible for hematopoietic stem cell transplantation (HSCT), with intermediate- or poor-risk
cytogenetics (NCCN 2009 criteria), Eastern Cooperative Oncology Group performance
status (ECOG PS) scores 0–2, and white blood cell count not more than 15×109/L.
The starting age of the model population was 75 years and the patient’s body surface area
(BSA) was 1.8 m², based on the mean age and BSA of AML patients from the AZA-AML-001
trial.
The model allows cross-over adjusted, cross-over unadjusted and censor-at-switch analyses
performed for the whole population, IC, LDAC, or BSC patient subpopulations,
subpopulations with different cytogenetic risk (intermediate and poor), with and without
myelodysplasia-related changes. The following rationale was given for these subgroups
(Source: Celgene submission, Section 5.2.1, p. 106):
Subgroups on cytogenetic risk and myelodysplasia-related changes were chosen
based upon a current unmet need for an effective option for patients presenting with
these characteristics and the observed significant (P-values < 0.05) OS benefit of
azacitidine over CCR in the AZA-AML-001 trial in these subgroups.
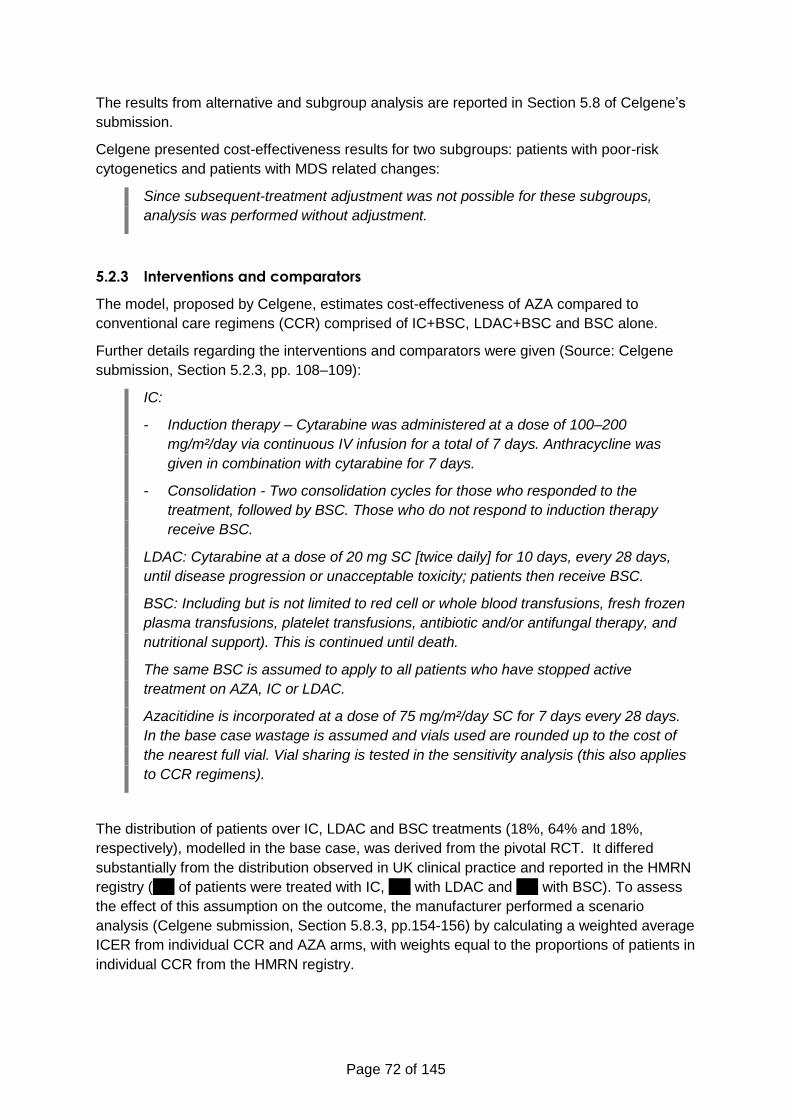
Page 72 of 145
The results from alternative and subgroup analysis are reported in Section 5.8 of Celgene’s
submission.
Celgene presented cost-effectiveness results for two subgroups: patients with poor-risk
cytogenetics and patients with MDS related changes:
Since subsequent-treatment adjustment was not possible for these subgroups,
analysis was performed without adjustment.
5.2.3 Interventions and comparators
The model, proposed by Celgene, estimates cost-effectiveness of AZA compared to
conventional care regimens (CCR) comprised of IC+BSC, LDAC+BSC and BSC alone.
Further details regarding the interventions and comparators were given (Source: Celgene
submission, Section 5.2.3, pp. 108–109):
IC:
- Induction therapy – Cytarabine was administered at a dose of 100–200
mg/m²/day via continuous IV infusion for a total of 7 days. Anthracycline was
given in combination with cytarabine for 7 days.
- Consolidation - Two consolidation cycles for those who responded to the
treatment, followed by BSC. Those who do not respond to induction therapy
receive BSC.
LDAC: Cytarabine at a dose of 20 mg SC [twice daily] for 10 days, every 28 days,
until disease progression or unacceptable toxicity; patients then receive BSC.
BSC: Including but is not limited to red cell or whole blood transfusions, fresh frozen
plasma transfusions, platelet transfusions, antibiotic and/or antifungal therapy, and
nutritional support). This is continued until death.
The same BSC is assumed to apply to all patients who have stopped active
treatment on AZA, IC or LDAC.
Azacitidine is incorporated at a dose of 75 mg/m²/day SC for 7 days every 28 days.
In the base case wastage is assumed and vials used are rounded up to the cost of
the nearest full vial. Vial sharing is tested in the sensitivity analysis (this also applies
to CCR regimens).
The distribution of patients over IC, LDAC and BSC treatments (18%, 64% and 18%,
respectively), modelled in the base case, was derived from the pivotal RCT. It differed
substantially from the distribution observed in UK clinical practice and reported in the HMRN
registry (xxx of patients were treated with IC, xxx with LDAC and xxx with BSC). To assess
the effect of this assumption on the outcome, the manufacturer performed a scenario
analysis (Celgene submission, Section 5.8.3, pp.154-156) by calculating a weighted average
ICER from individual CCR and AZA arms, with weights equal to the proportions of patients in
individual CCR from the HMRN registry.
Page 73 of 145
5.2.4 Perspective, time horizon and discounting
In the model, the perspective on costs was NHS and personal social services perspectives,
and the perspective on health effects was direct health effects on patients, in accordance
with the NICE reference case.
The model time horizon was 10-years, which was considered the life-time horizon of the
patient population in question.
For utilities and costs, the manufacturer used the discount rate of 3.5%, in line with the NICE
reference case. In addition, the model allows analyses with the discount rates of 1.5% and
6%.
5.2.5 Treatment effectiveness and extrapolation
Treatment effectiveness was estimated from the AZA-AML-001 trial and post-hoc analyses
conducted on the data collected.
The economic model used the following clinical endpoints:
Overall survival (OS), defined as the time from randomization to death from any
cause;
Relapse-free survival (RFS), the time from first documented CR or CRi to relapse,
death from any cause, or loss to follow-up (for the model this was adjusted to time
from randomization until relapse or death);
Progression-free survival (PFS), defined as the time from randomization to death or
disease progression (PD) for patients who did not achieve remission (CR or CRi);
Event-free survival (EFS), defined as the time from randomization to treatment
failure, disease progression, relapse after CR or CRi, death from any cause, or loss
to follow-up).
EFS was employed to estimate both RFS and PFS, which were obtained (Source: Celgene
submission, Section 5.3.1., p. 109):
[…] by disaggregating the data into those who did or did not achieve CR or CRi; then,
patients with CR or CRi were assessed for death or relapse (i.e., RFS); patients with
no CR or CRi were instead assessed for death or disease progression (i.e., PFS).
Response status was also used to allocate utilities and disease management costs;
in particular, costs for consolidation IC were attributed to patients with CR, CRi, and
PR. The cost of BSC was allocated to patients with PD after stopping active
treatment.
In response to an ERG question for clarification regarding the treatment of loss to follow-up,
Celgene provided further information:
Specific definitions for event free survival (EFS) and relapse free survival (RFS)
outcomes are provided below:
- Loss to follow-up was treated as an event for EFS outcomes when such loss
occurred without documented treatment failure, progression or relapse from
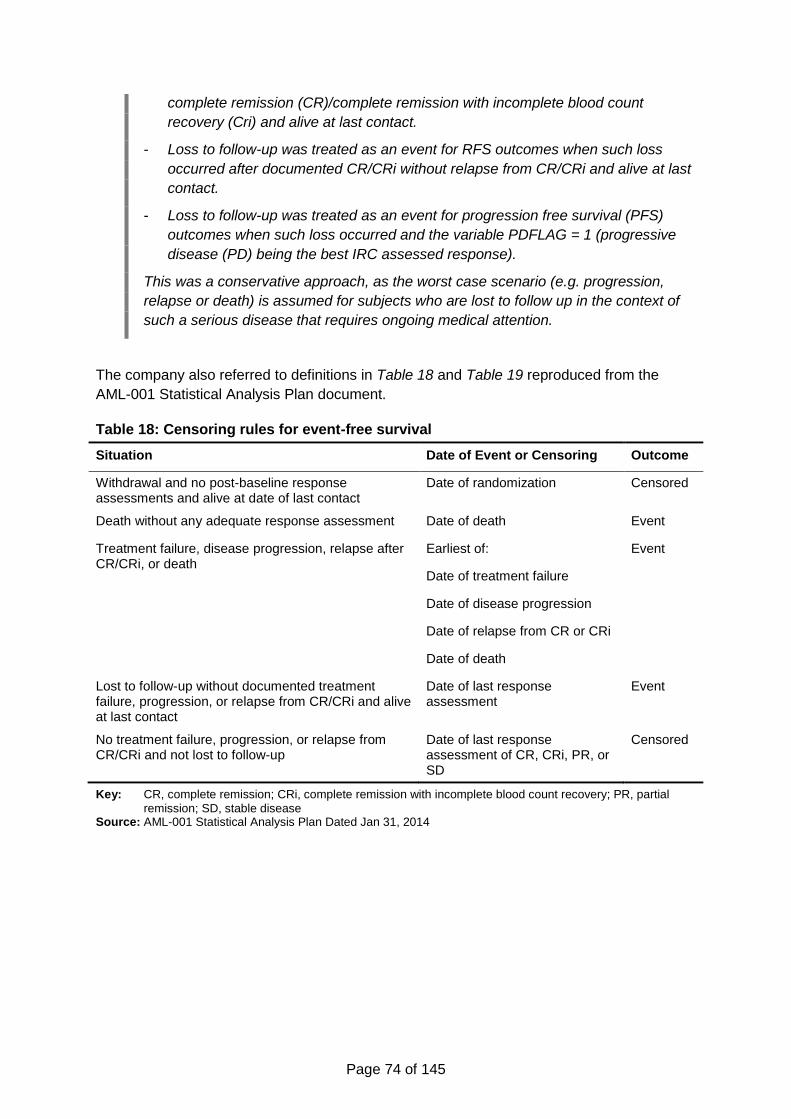
Page 74 of 145
complete remission (CR)/complete remission with incomplete blood count
recovery (Cri) and alive at last contact.
- Loss to follow-up was treated as an event for RFS outcomes when such loss
occurred after documented CR/CRi without relapse from CR/CRi and alive at last
contact.
- Loss to follow-up was treated as an event for progression free survival (PFS)
outcomes when such loss occurred and the variable PDFLAG = 1 (progressive
disease (PD) being the best IRC assessed response).
This was a conservative approach, as the worst case scenario (e.g. progression,
relapse or death) is assumed for subjects who are lost to follow up in the context of
such a serious disease that requires ongoing medical attention.
The company also referred to definitions in Table 18 and Table 19 reproduced from the
AML-001 Statistical Analysis Plan document.
Table 18: Censoring rules for event-free survival
Situation Date of Event or Censoring Outcome
Withdrawal and no post-baseline response assessments and alive at date of last contact
Date of randomization Censored
Death without any adequate response assessment Date of death Event
Treatment failure, disease progression, relapse after CR/CRi, or death
Earliest of: Event
Date of treatment failure
Date of disease progression
Date of relapse from CR or CRi
Date of death
Lost to follow-up without documented treatment failure, progression, or relapse from CR/CRi and alive at last contact
Date of last response assessment
Event
No treatment failure, progression, or relapse from CR/CRi and not lost to follow-up
Date of last response assessment of CR, CRi, PR, or SD
Censored
Key: CR, complete remission; CRi, complete remission with incomplete blood count recovery; PR, partial
remission; SD, stable disease Source: AML-001 Statistical Analysis Plan Dated Jan 31, 2014
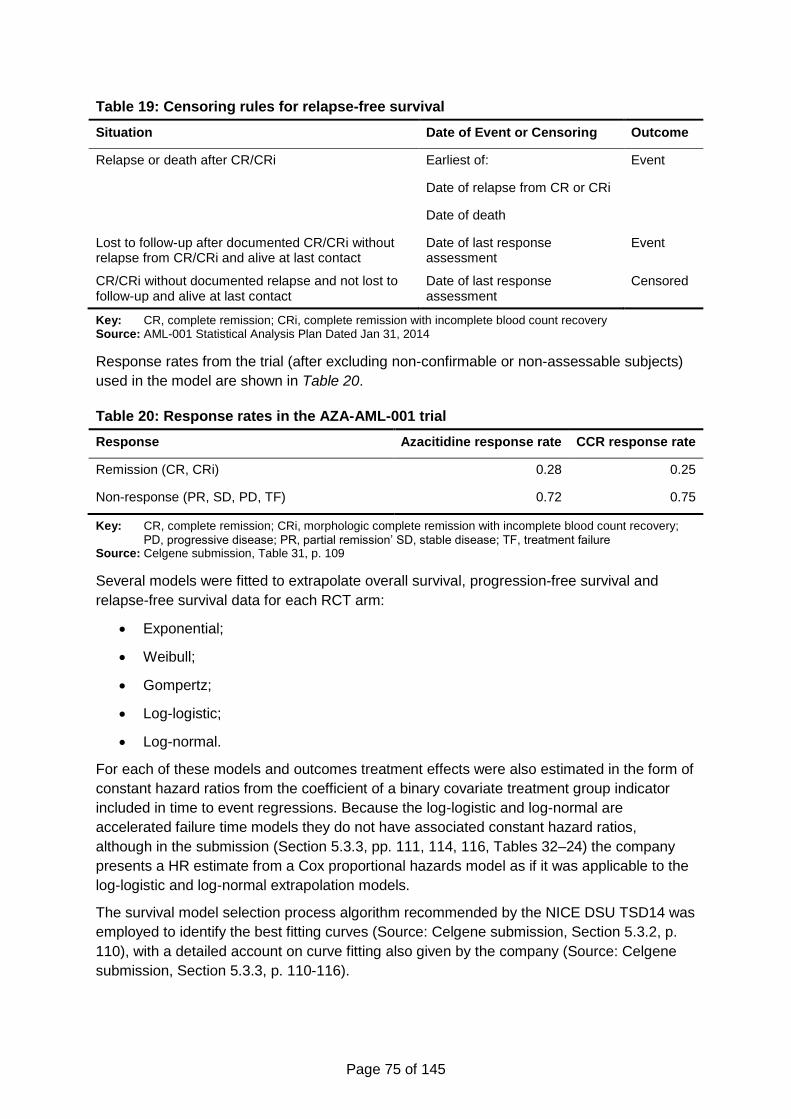
Page 75 of 145
Table 19: Censoring rules for relapse-free survival
Situation Date of Event or Censoring Outcome
Relapse or death after CR/CRi Earliest of: Event
Date of relapse from CR or CRi
Date of death
Lost to follow-up after documented CR/CRi without relapse from CR/CRi and alive at last contact
Date of last response assessment
Event
CR/CRi without documented relapse and not lost to follow-up and alive at last contact
Date of last response assessment
Censored
Key: CR, complete remission; CRi, complete remission with incomplete blood count recovery Source: AML-001 Statistical Analysis Plan Dated Jan 31, 2014
Response rates from the trial (after excluding non-confirmable or non-assessable subjects)
used in the model are shown in Table 20.
Table 20: Response rates in the AZA-AML-001 trial
Response Azacitidine response rate CCR response rate
Remission (CR, CRi) 0.28 0.25
Non-response (PR, SD, PD, TF) 0.72 0.75
Key: CR, complete remission; CRi, morphologic complete remission with incomplete blood count recovery;
PD, progressive disease; PR, partial remission’ SD, stable disease; TF, treatment failure Source: Celgene submission, Table 31, p. 109
Several models were fitted to extrapolate overall survival, progression-free survival and
relapse-free survival data for each RCT arm:
Exponential;
Weibull;
Gompertz;
Log-logistic;
Log-normal.
For each of these models and outcomes treatment effects were also estimated in the form of
constant hazard ratios from the coefficient of a binary covariate treatment group indicator
included in time to event regressions. Because the log-logistic and log-normal are
accelerated failure time models they do not have associated constant hazard ratios,
although in the submission (Section 5.3.3, pp. 111, 114, 116, Tables 32–24) the company
presents a HR estimate from a Cox proportional hazards model as if it was applicable to the
log-logistic and log-normal extrapolation models.
The survival model selection process algorithm recommended by the NICE DSU TSD14 was
employed to identify the best fitting curves (Source: Celgene submission, Section 5.3.2, p.
110), with a detailed account on curve fitting also given by the company (Source: Celgene
submission, Section 5.3.3, p. 110-116).
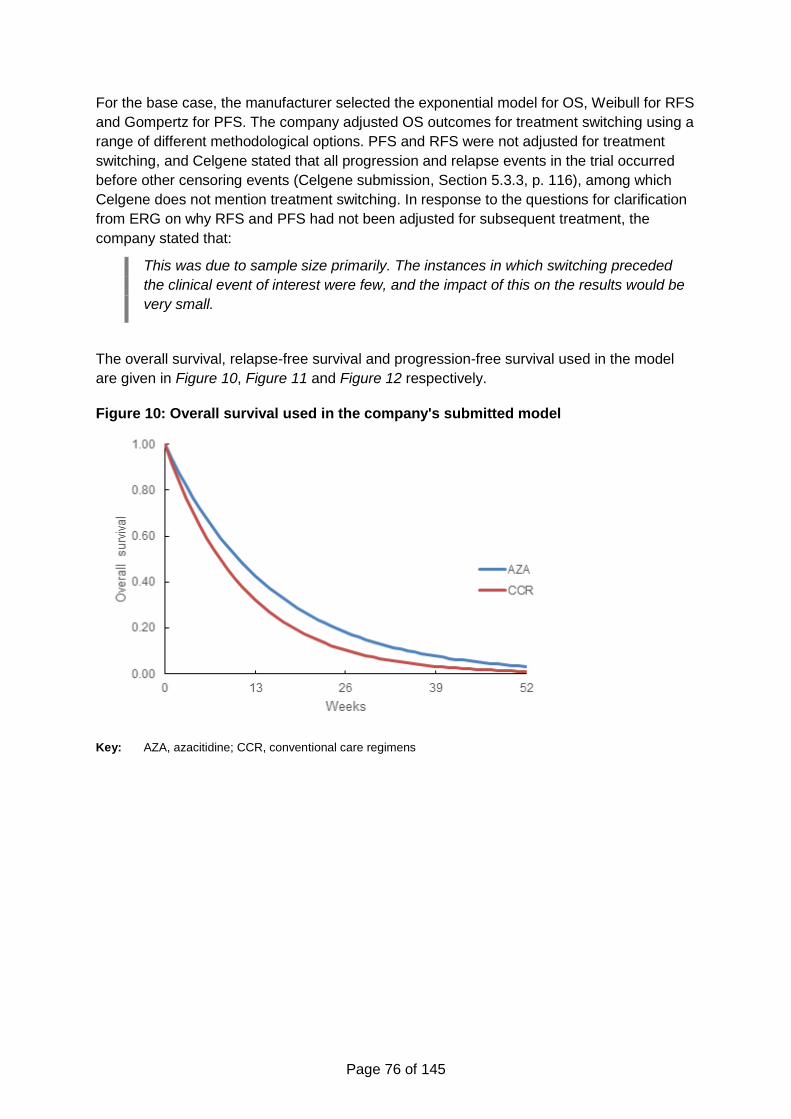
Page 76 of 145
For the base case, the manufacturer selected the exponential model for OS, Weibull for RFS
and Gompertz for PFS. The company adjusted OS outcomes for treatment switching using a
range of different methodological options. PFS and RFS were not adjusted for treatment
switching, and Celgene stated that all progression and relapse events in the trial occurred
before other censoring events (Celgene submission, Section 5.3.3, p. 116), among which
Celgene does not mention treatment switching. In response to the questions for clarification
from ERG on why RFS and PFS had not been adjusted for subsequent treatment, the
company stated that:
This was due to sample size primarily. The instances in which switching preceded
the clinical event of interest were few, and the impact of this on the results would be
very small.
The overall survival, relapse-free survival and progression-free survival used in the model
are given in Figure 10, Figure 11 and Figure 12 respectively.
Figure 10: Overall survival used in the company's submitted model
Key: AZA, azacitidine; CCR, conventional care regimens
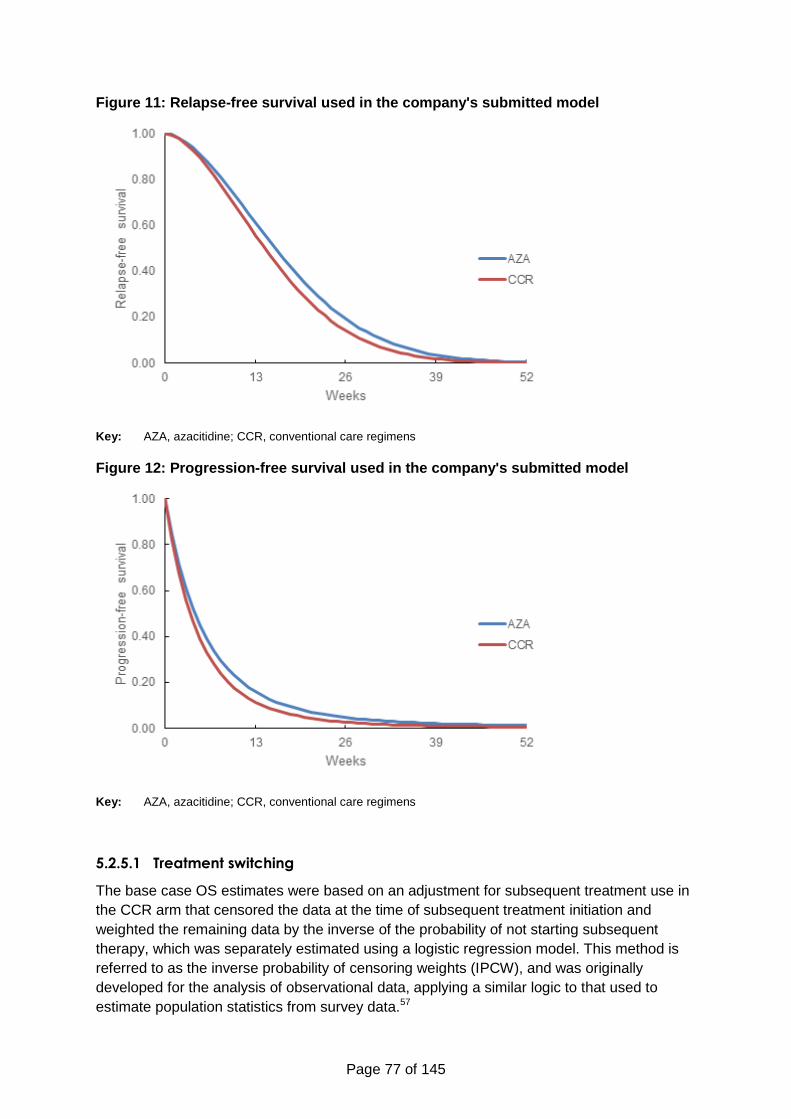
Page 77 of 145
Figure 11: Relapse-free survival used in the company's submitted model
Key: AZA, azacitidine; CCR, conventional care regimens
Figure 12: Progression-free survival used in the company's submitted model
Key: AZA, azacitidine; CCR, conventional care regimens
5.2.5.1 Treatment switching
The base case OS estimates were based on an adjustment for subsequent treatment use in
the CCR arm that censored the data at the time of subsequent treatment initiation and
weighted the remaining data by the inverse of the probability of not starting subsequent
therapy, which was separately estimated using a logistic regression model. This method is
referred to as the inverse probability of censoring weights (IPCW), and was originally
developed for the analysis of observational data, applying a similar logic to that used to
estimate population statistics from survey data.57
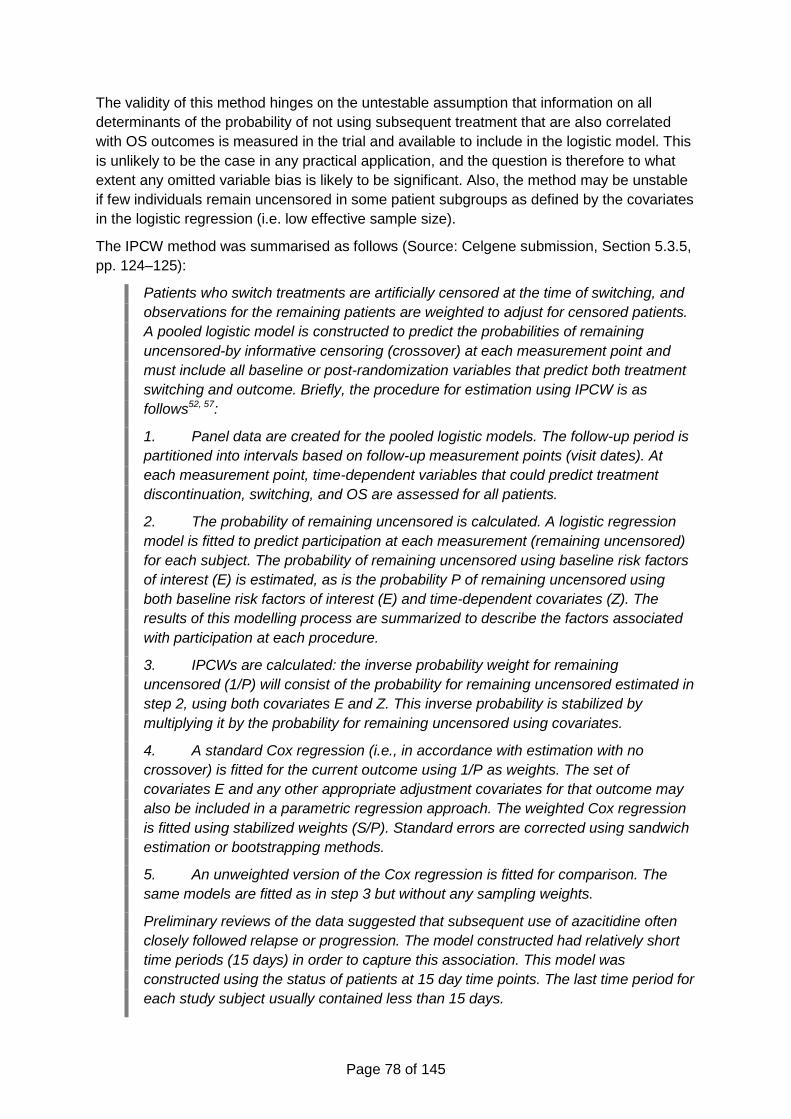
Page 78 of 145
The validity of this method hinges on the untestable assumption that information on all
determinants of the probability of not using subsequent treatment that are also correlated
with OS outcomes is measured in the trial and available to include in the logistic model. This
is unlikely to be the case in any practical application, and the question is therefore to what
extent any omitted variable bias is likely to be significant. Also, the method may be unstable
if few individuals remain uncensored in some patient subgroups as defined by the covariates
in the logistic regression (i.e. low effective sample size).
The IPCW method was summarised as follows (Source: Celgene submission, Section 5.3.5,
pp. 124–125):
Patients who switch treatments are artificially censored at the time of switching, and
observations for the remaining patients are weighted to adjust for censored patients.
A pooled logistic model is constructed to predict the probabilities of remaining
uncensored-by informative censoring (crossover) at each measurement point and
must include all baseline or post-randomization variables that predict both treatment
switching and outcome. Briefly, the procedure for estimation using IPCW is as
follows52, 57:
1. Panel data are created for the pooled logistic models. The follow-up period is
partitioned into intervals based on follow-up measurement points (visit dates). At
each measurement point, time-dependent variables that could predict treatment
discontinuation, switching, and OS are assessed for all patients.
2. The probability of remaining uncensored is calculated. A logistic regression
model is fitted to predict participation at each measurement (remaining uncensored)
for each subject. The probability of remaining uncensored using baseline risk factors
of interest (E) is estimated, as is the probability P of remaining uncensored using
both baseline risk factors of interest (E) and time-dependent covariates (Z). The
results of this modelling process are summarized to describe the factors associated
with participation at each procedure.
3. IPCWs are calculated: the inverse probability weight for remaining
uncensored (1/P) will consist of the probability for remaining uncensored estimated in
step 2, using both covariates E and Z. This inverse probability is stabilized by
multiplying it by the probability for remaining uncensored using covariates.
4. A standard Cox regression (i.e., in accordance with estimation with no
crossover) is fitted for the current outcome using 1/P as weights. The set of
covariates E and any other appropriate adjustment covariates for that outcome may
also be included in a parametric regression approach. The weighted Cox regression
is fitted using stabilized weights (S/P). Standard errors are corrected using sandwich
estimation or bootstrapping methods.
5. An unweighted version of the Cox regression is fitted for comparison. The
same models are fitted as in step 3 but without any sampling weights.
Preliminary reviews of the data suggested that subsequent use of azacitidine often
closely followed relapse or progression. The model constructed had relatively short
time periods (15 days) in order to capture this association. This model was
constructed using the status of patients at 15 day time points. The last time period for
each study subject usually contained less than 15 days.
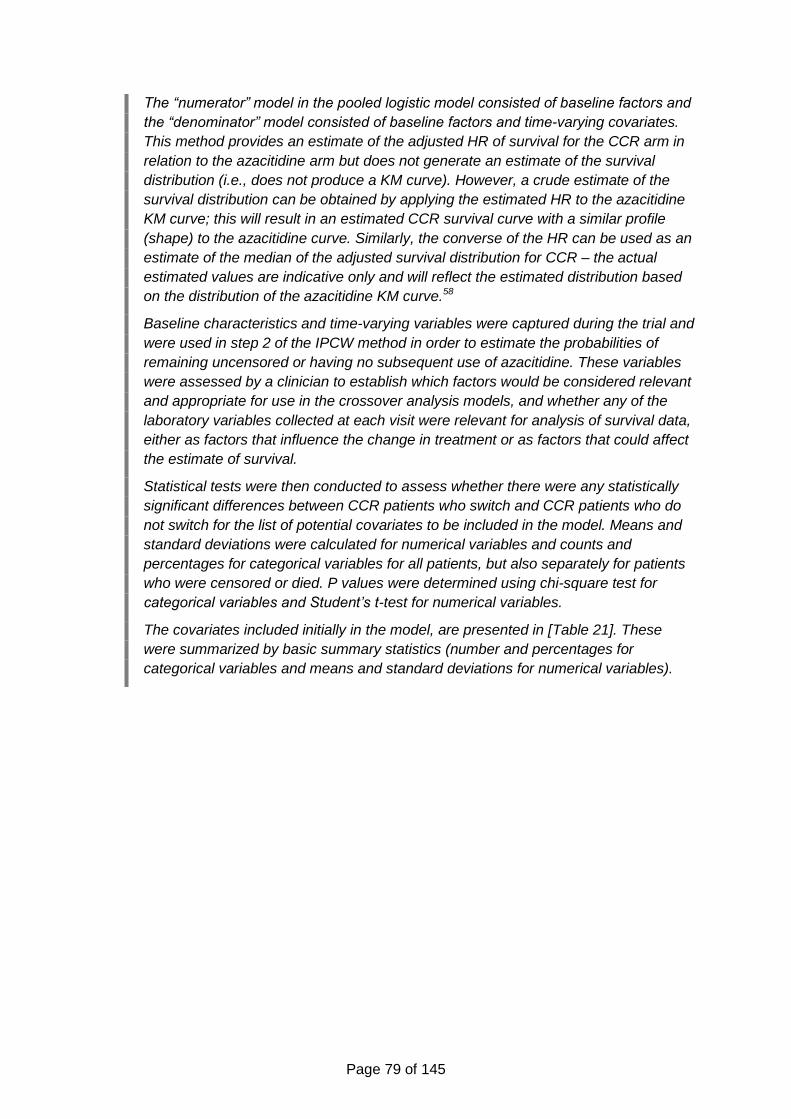
Page 79 of 145
The “numerator” model in the pooled logistic model consisted of baseline factors and
the “denominator” model consisted of baseline factors and time-varying covariates.
This method provides an estimate of the adjusted HR of survival for the CCR arm in
relation to the azacitidine arm but does not generate an estimate of the survival
distribution (i.e., does not produce a KM curve). However, a crude estimate of the
survival distribution can be obtained by applying the estimated HR to the azacitidine
KM curve; this will result in an estimated CCR survival curve with a similar profile
(shape) to the azacitidine curve. Similarly, the converse of the HR can be used as an
estimate of the median of the adjusted survival distribution for CCR – the actual
estimated values are indicative only and will reflect the estimated distribution based
on the distribution of the azacitidine KM curve.58
Baseline characteristics and time-varying variables were captured during the trial and
were used in step 2 of the IPCW method in order to estimate the probabilities of
remaining uncensored or having no subsequent use of azacitidine. These variables
were assessed by a clinician to establish which factors would be considered relevant
and appropriate for use in the crossover analysis models, and whether any of the
laboratory variables collected at each visit were relevant for analysis of survival data,
either as factors that influence the change in treatment or as factors that could affect
the estimate of survival.
Statistical tests were then conducted to assess whether there were any statistically
significant differences between CCR patients who switch and CCR patients who do
not switch for the list of potential covariates to be included in the model. Means and
standard deviations were calculated for numerical variables and counts and
percentages for categorical variables for all patients, but also separately for patients
who were censored or died. P values were determined using chi-square test for
categorical variables and Student’s t-test for numerical variables.
The covariates included initially in the model, are presented in [Table 21]. These
were summarized by basic summary statistics (number and percentages for
categorical variables and means and standard deviations for numerical variables).
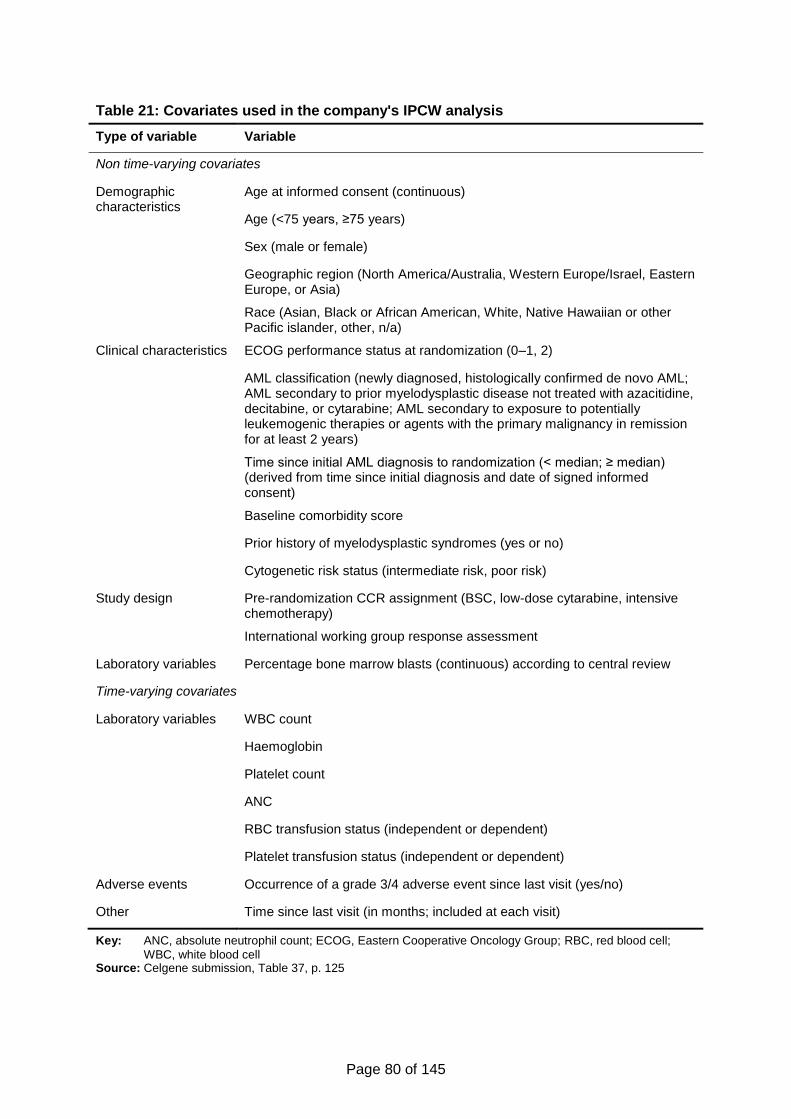
Page 80 of 145
Table 21: Covariates used in the company's IPCW analysis
Type of variable Variable
Non time-varying covariates
Demographic characteristics
Age at informed consent (continuous)
Age (<75 years, ≥75 years)
Sex (male or female)
Geographic region (North America/Australia, Western Europe/Israel, Eastern Europe, or Asia)
Race (Asian, Black or African American, White, Native Hawaiian or other Pacific islander, other, n/a)
Clinical characteristics ECOG performance status at randomization (0–1, 2)
AML classification (newly diagnosed, histologically confirmed de novo AML; AML secondary to prior myelodysplastic disease not treated with azacitidine, decitabine, or cytarabine; AML secondary to exposure to potentially leukemogenic therapies or agents with the primary malignancy in remission for at least 2 years)
Time since initial AML diagnosis to randomization (< median; ≥ median) (derived from time since initial diagnosis and date of signed informed consent)
Baseline comorbidity score
Prior history of myelodysplastic syndromes (yes or no)
Cytogenetic risk status (intermediate risk, poor risk)
Study design Pre-randomization CCR assignment (BSC, low-dose cytarabine, intensive chemotherapy)
International working group response assessment
Laboratory variables Percentage bone marrow blasts (continuous) according to central review
Time-varying covariates
Laboratory variables WBC count
Haemoglobin
Platelet count
ANC
RBC transfusion status (independent or dependent)
Platelet transfusion status (independent or dependent)
Adverse events Occurrence of a grade 3/4 adverse event since last visit (yes/no)
Other Time since last visit (in months; included at each visit)
Key: ANC, absolute neutrophil count; ECOG, Eastern Cooperative Oncology Group; RBC, red blood cell;
WBC, white blood cell Source: Celgene submission, Table 37, p. 125
Page 81 of 145
In relation to the statement that “this method provides an estimate of the adjusted HR of
survival for the CCR arm in relation to the azacitidine arm but does not generate an estimate
of the survival distribution (i.e., does not produce a KM curve),” the ERG notes that this
statement is incorrect, because survival curves for both trials arm may be generated from
the IPCW analysis. The respective figure is produced by ERG in Figure 8 (page 62) using
individual patient data provided by Celgene.
ERG also consulted clinical experts on whether there were any variables missing from Table
21 that may be considered to predict or explain the use of subsequent therapy and at the
same time be associated with survival prognosis. The clinical experts did not suggest any
additional variables.
In arriving at their preferred base case method the company also considered other
approaches, including not adjusting for treatment switching, censoring at switch, and the
Rank Preserving Structural Failure Time Model (RPSFTM) and the Iterative Parameter
Estimation (IPE). Celgene considered the RPSTFM and IPE approaches as involving a
fundamental assumption (i.e., that the treatment effect of azacitidine is the same for patients
who received it as initially randomly allocated therapy as for patients who received it as
subsequent treatment) that is unlikely to be valid. The company stated (Source: Celgene
submission, Section 5.3.5, p. 123):
These limits notwithstanding, the IPCW method and results are stronger than the
alternatives. The use of RPSFT and IPE methods has an underlying assumption of a
common treatment effect for patients who started treatment with azacitidine and for
those who switched to azacitidine. This assumption does not hold in this case:
differences in prognosis between the two groups are likely to lead to a different
benefit from delayed versus immediate treatment; CCR itself, particularly LDAC and
IC, is also an active treatment, so the prognosis of a patient switching from CCR will
not be the same as for a patient receiving azacitidine from the start of the study.
The similarity of the results for the IPE and RPSFT analyses is likely because of
violation of the key assumption, that treatment benefit in terms of OS is the same
regardless of whether a patient began on azacitidine or switched; this assumption is
hard to justify given the prognosis for with AML in the trial.
In addition, Celgene reported the attempt to use of two-stage methods,51 which could not be
implemented due to insufficient numbers of subsequent treatment users in the CCR arm and
recorded data (Source: Celgene appendices to submission, Appendix 11, Section 4.7).
Similarly to the IPCW method, the censor-at-switch method dropped the data after the start
of azacitidine in the CCR trial arm, but unlike IPCW it did not apply any adjustment to the
remaining data for the differences in probability of censoring (azacitidine) across CCR arm
patients. Thus, to the extent that the estimates from the two methods differ (provided IPCW
is validly in this application), would suggest that azacitidine was not given to CCR patients at
random (as one would expect). As it transpires, Celgene reported hazard ratio estimates
from Cox proportional hazards models of xxxx for both the IPCW and censor-at-switch
methods, suggesting that adjusting for non-random subsequent therapy use is not important
in this case (see also the critique of treatment switching in the clinical effectiveness Section
4.3).
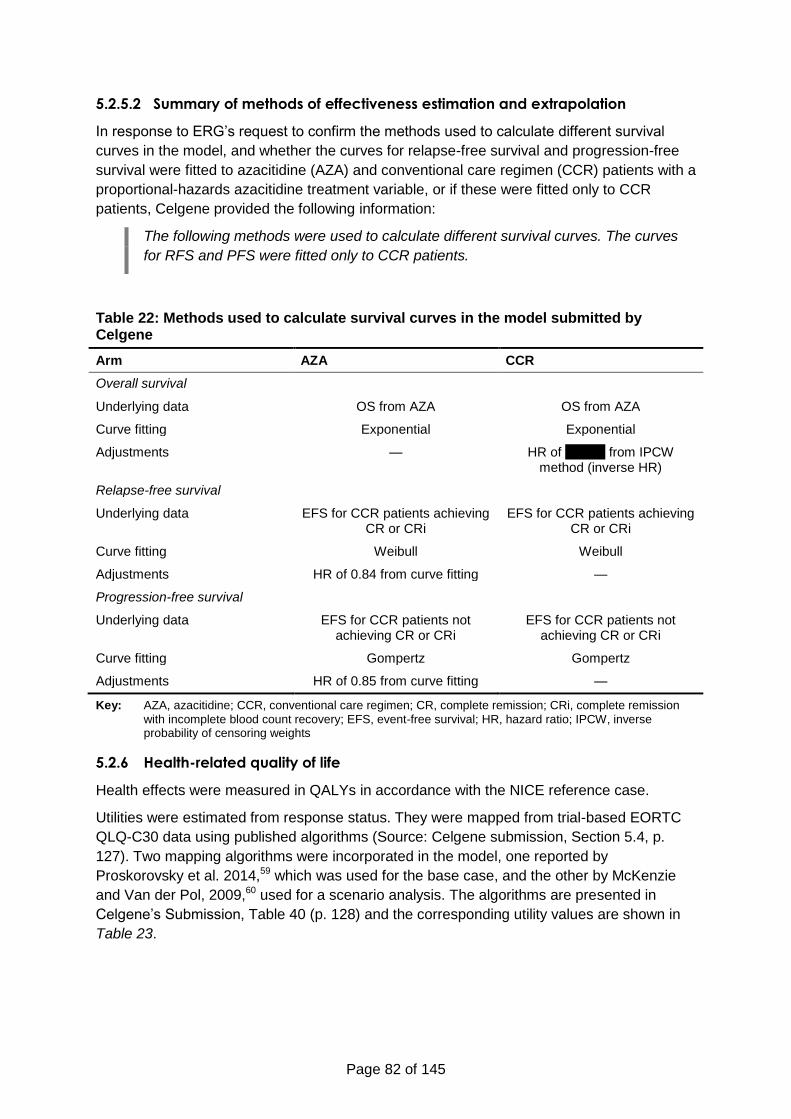
Page 82 of 145
5.2.5.2 Summary of methods of effectiveness estimation and extrapolation
In response to ERG’s request to confirm the methods used to calculate different survival
curves in the model, and whether the curves for relapse-free survival and progression-free
survival were fitted to azacitidine (AZA) and conventional care regimen (CCR) patients with a
proportional-hazards azacitidine treatment variable, or if these were fitted only to CCR
patients, Celgene provided the following information:
The following methods were used to calculate different survival curves. The curves
for RFS and PFS were fitted only to CCR patients.
Table 22: Methods used to calculate survival curves in the model submitted by Celgene
Arm AZA CCR
Overall survival
Underlying data OS from AZA OS from AZA
Curve fitting Exponential Exponential
Adjustments — HR of xxxxxx from IPCW method (inverse HR)
Relapse-free survival
Underlying data EFS for CCR patients achieving CR or CRi
EFS for CCR patients achieving CR or CRi
Curve fitting Weibull Weibull
Adjustments HR of 0.84 from curve fitting —
Progression-free survival
Underlying data EFS for CCR patients not achieving CR or CRi
EFS for CCR patients not achieving CR or CRi
Curve fitting Gompertz Gompertz
Adjustments HR of 0.85 from curve fitting —
Key: AZA, azacitidine; CCR, conventional care regimen; CR, complete remission; CRi, complete remission
with incomplete blood count recovery; EFS, event-free survival; HR, hazard ratio; IPCW, inverse probability of censoring weights
5.2.6 Health-related quality of life
Health effects were measured in QALYs in accordance with the NICE reference case.
Utilities were estimated from response status. They were mapped from trial-based EORTC
QLQ-C30 data using published algorithms (Source: Celgene submission, Section 5.4, p.
127). Two mapping algorithms were incorporated in the model, one reported by
Proskorovsky et al. 2014,59 which was used for the base case, and the other by McKenzie
and Van der Pol, 2009,60 used for a scenario analysis. The algorithms are presented in
Celgene’s Submission, Table 40 (p. 128) and the corresponding utility values are shown in
Table 23.
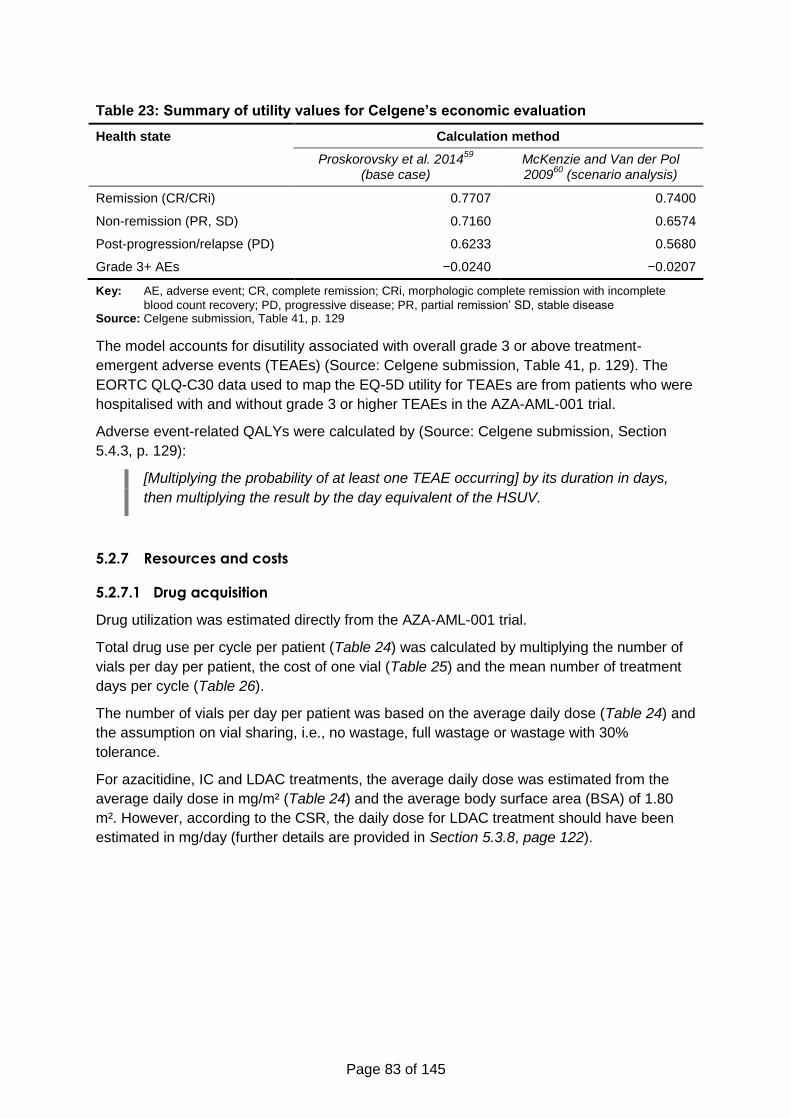
Page 83 of 145
Table 23: Summary of utility values for Celgene’s economic evaluation
Health state Calculation method
Proskorovsky et al. 201459
(base case)
McKenzie and Van der Pol 2009
60 (scenario analysis)
Remission (CR/CRi) 0.7707 0.7400
Non-remission (PR, SD) 0.7160 0.6574
Post-progression/relapse (PD) 0.6233 0.5680
Grade 3+ AEs −0.0240 −0.0207
Key: AE, adverse event; CR, complete remission; CRi, morphologic complete remission with incomplete
blood count recovery; PD, progressive disease; PR, partial remission’ SD, stable disease Source: Celgene submission, Table 41, p. 129
The model accounts for disutility associated with overall grade 3 or above treatment-
emergent adverse events (TEAEs) (Source: Celgene submission, Table 41, p. 129). The
EORTC QLQ-C30 data used to map the EQ-5D utility for TEAEs are from patients who were
hospitalised with and without grade 3 or higher TEAEs in the AZA-AML-001 trial.
Adverse event-related QALYs were calculated by (Source: Celgene submission, Section
5.4.3, p. 129):
[Multiplying the probability of at least one TEAE occurring] by its duration in days,
then multiplying the result by the day equivalent of the HSUV.
5.2.7 Resources and costs
5.2.7.1 Drug acquisition
Drug utilization was estimated directly from the AZA-AML-001 trial.
Total drug use per cycle per patient (Table 24) was calculated by multiplying the number of
vials per day per patient, the cost of one vial (Table 25) and the mean number of treatment
days per cycle (Table 26).
The number of vials per day per patient was based on the average daily dose (Table 24) and
the assumption on vial sharing, i.e., no wastage, full wastage or wastage with 30%
tolerance.
For azacitidine, IC and LDAC treatments, the average daily dose was estimated from the
average daily dose in mg/m² (Table 24) and the average body surface area (BSA) of 1.80
m². However, according to the CSR, the daily dose for LDAC treatment should have been
estimated in mg/day (further details are provided in Section 5.3.8, page 122).
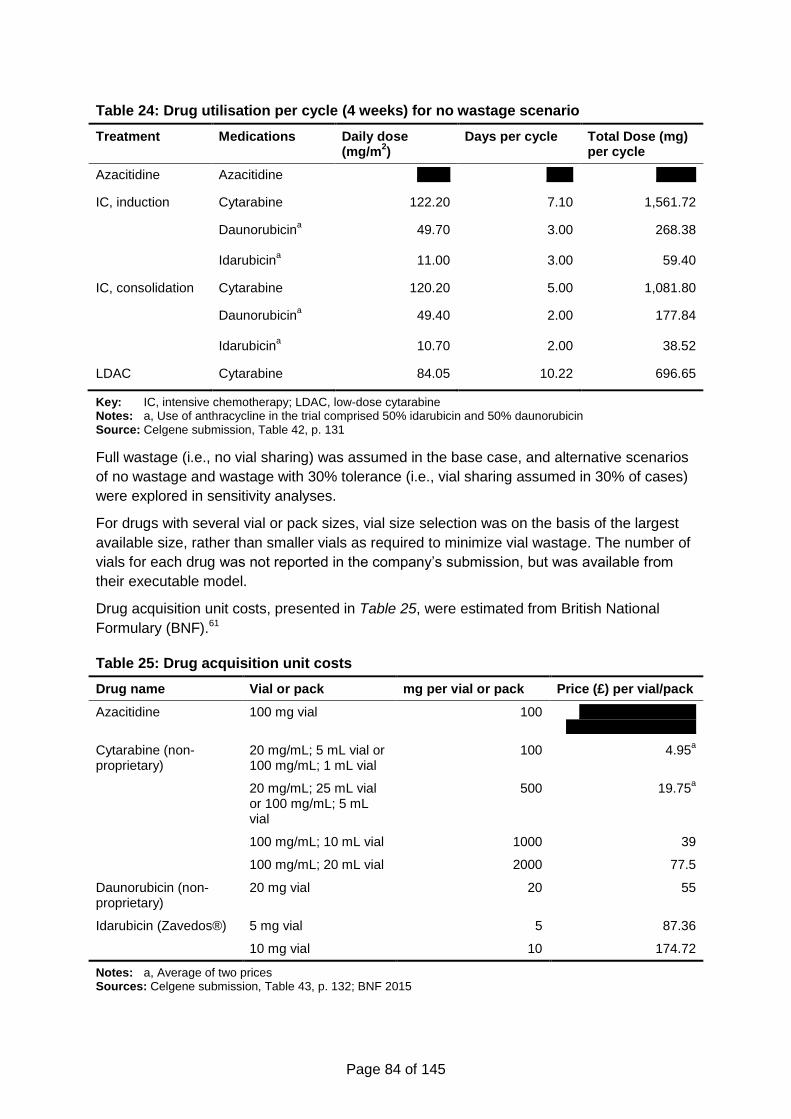
Page 84 of 145
Table 24: Drug utilisation per cycle (4 weeks) for no wastage scenario
Treatment Medications Daily dose (mg/m
2)
Days per cycle Total Dose (mg) per cycle
Azacitidine Azacitidine xxxxx xxxx xxxxxx
IC, induction Cytarabine 122.20 7.10 1,561.72
Daunorubicina 49.70 3.00 268.38
Idarubicina
11.00 3.00 59.40
IC, consolidation Cytarabine 120.20 5.00 1,081.80
Daunorubicina 49.40 2.00 177.84
Idarubicina 10.70 2.00 38.52
LDAC Cytarabine 84.05 10.22 696.65
Key: IC, intensive chemotherapy; LDAC, low-dose cytarabine Notes: a, Use of anthracycline in the trial comprised 50% idarubicin and 50% daunorubicin Source: Celgene submission, Table 42, p. 131
Full wastage (i.e., no vial sharing) was assumed in the base case, and alternative scenarios
of no wastage and wastage with 30% tolerance (i.e., vial sharing assumed in 30% of cases)
were explored in sensitivity analyses.
For drugs with several vial or pack sizes, vial size selection was on the basis of the largest
available size, rather than smaller vials as required to minimize vial wastage. The number of
vials for each drug was not reported in the company’s submission, but was available from
their executable model.
Drug acquisition unit costs, presented in Table 25, were estimated from British National
Formulary (BNF).61
Table 25: Drug acquisition unit costs
Drug name Vial or pack mg per vial or pack Price (£) per vial/pack
Azacitidine 100 mg vial 100 xxxxxxxxxxx xxxxxx xxxxxxxxxxxxxxxxxxx]
Cytarabine (non-proprietary)
20 mg/mL; 5 mL vial or 100 mg/mL; 1 mL vial
100 4.95a
20 mg/mL; 25 mL vial or 100 mg/mL; 5 mL vial
500 19.75a
100 mg/mL; 10 mL vial 1000 39
100 mg/mL; 20 mL vial 2000 77.5
Daunorubicin (non-proprietary)
20 mg vial 20 55
Idarubicin (Zavedos®) 5 mg vial 5 87.36
10 mg vial 10 174.72
Notes: a, Average of two prices Sources: Celgene submission, Table 43, p. 132; BNF 2015
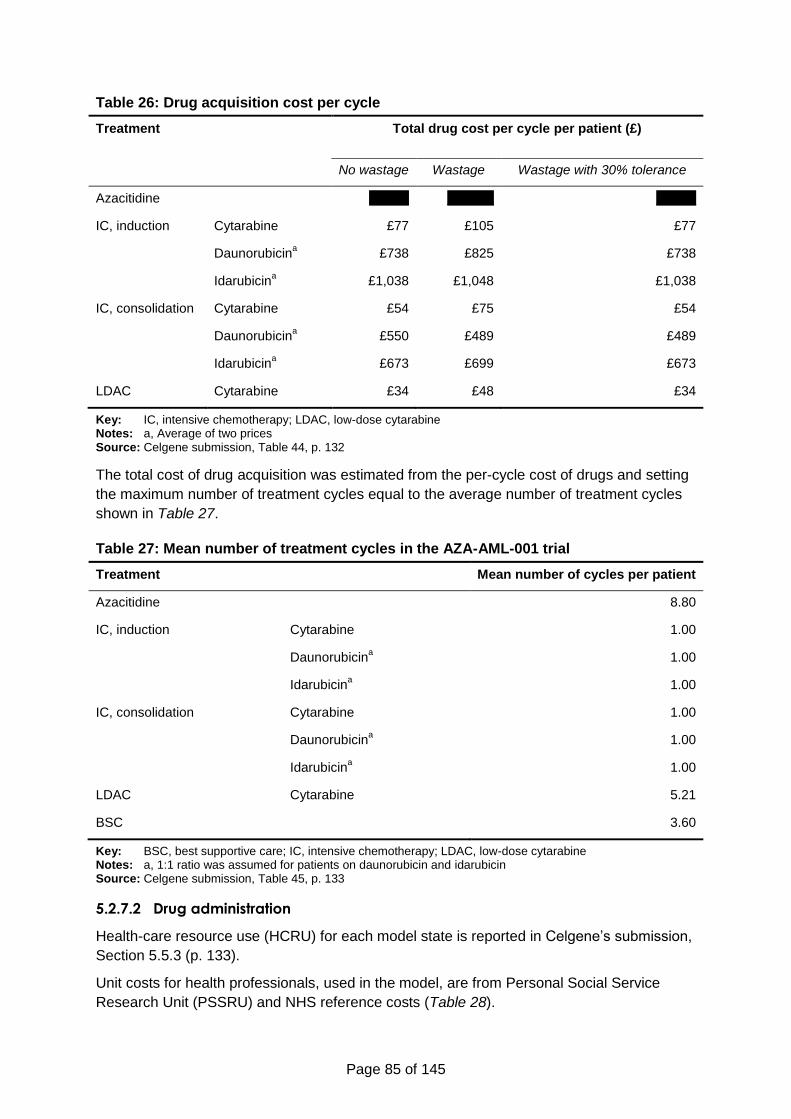
Page 85 of 145
Table 26: Drug acquisition cost per cycle
Treatment Total drug cost per cycle per patient (£)
No wastage Wastage Wastage with 30% tolerance
Azacitidine xxxxxx xxxxxxx xxxxxx
IC, induction Cytarabine £77 £105 £77
Daunorubicina £738 £825 £738
Idarubicina £1,038 £1,048 £1,038
IC, consolidation Cytarabine £54 £75 £54
Daunorubicina £550 £489 £489
Idarubicina £673 £699 £673
LDAC Cytarabine £34 £48 £34
Key: IC, intensive chemotherapy; LDAC, low-dose cytarabine Notes: a, Average of two prices Source: Celgene submission, Table 44, p. 132
The total cost of drug acquisition was estimated from the per-cycle cost of drugs and setting
the maximum number of treatment cycles equal to the average number of treatment cycles
shown in Table 27.
Table 27: Mean number of treatment cycles in the AZA-AML-001 trial
Treatment Mean number of cycles per patient
Azacitidine 8.80
IC, induction Cytarabine 1.00
Daunorubicina 1.00
Idarubicina 1.00
IC, consolidation Cytarabine 1.00
Daunorubicina 1.00
Idarubicina 1.00
LDAC Cytarabine 5.21
BSC 3.60
Key: BSC, best supportive care; IC, intensive chemotherapy; LDAC, low-dose cytarabine Notes: a, 1:1 ratio was assumed for patients on daunorubicin and idarubicin Source: Celgene submission, Table 45, p. 133
5.2.7.2 Drug administration
Health-care resource use (HCRU) for each model state is reported in Celgene’s submission,
Section 5.5.3 (p. 133).
Unit costs for health professionals, used in the model, are from Personal Social Service
Research Unit (PSSRU) and NHS reference costs (Table 28).
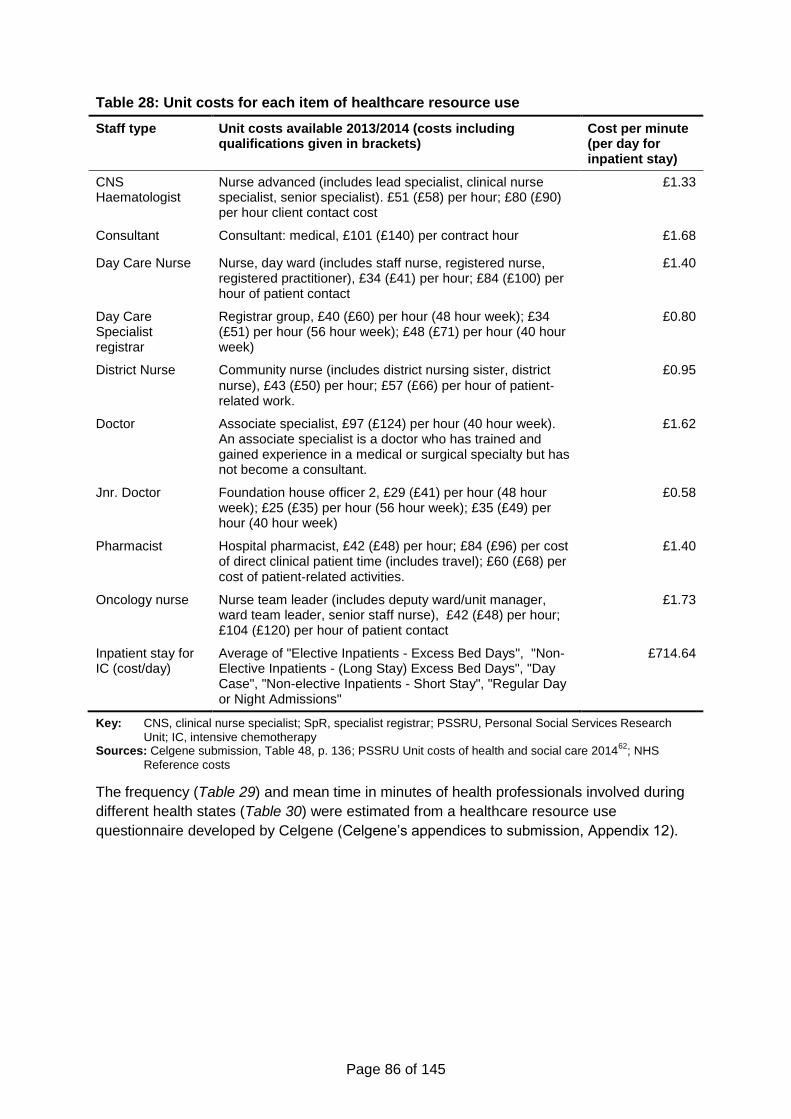
Page 86 of 145
Table 28: Unit costs for each item of healthcare resource use
Staff type Unit costs available 2013/2014 (costs including qualifications given in brackets)
Cost per minute (per day for inpatient stay)
CNS Haematologist
Nurse advanced (includes lead specialist, clinical nurse specialist, senior specialist). £51 (£58) per hour; £80 (£90) per hour client contact cost
£1.33
Consultant Consultant: medical, £101 (£140) per contract hour £1.68
Day Care Nurse Nurse, day ward (includes staff nurse, registered nurse, registered practitioner), £34 (£41) per hour; £84 (£100) per hour of patient contact
£1.40
Day Care Specialist registrar
Registrar group, £40 (£60) per hour (48 hour week); £34 (£51) per hour (56 hour week); £48 (£71) per hour (40 hour week)
£0.80
District Nurse Community nurse (includes district nursing sister, district
nurse), £43 (£50) per hour; £57 (£66) per hour of patient‐related work.
£0.95
Doctor Associate specialist, £97 (£124) per hour (40 hour week). An associate specialist is a doctor who has trained and gained experience in a medical or surgical specialty but has not become a consultant.
£1.62
Jnr. Doctor Foundation house officer 2, £29 (£41) per hour (48 hour week); £25 (£35) per hour (56 hour week); £35 (£49) per hour (40 hour week)
£0.58
Pharmacist Hospital pharmacist, £42 (£48) per hour; £84 (£96) per cost of direct clinical patient time (includes travel); £60 (£68) per cost of patient‐related activities.
£1.40
Oncology nurse Nurse team leader (includes deputy ward/unit manager, ward team leader, senior staff nurse), £42 (£48) per hour; £104 (£120) per hour of patient contact
£1.73
Inpatient stay for IC (cost/day)
Average of "Elective Inpatients - Excess Bed Days", "Non-Elective Inpatients - (Long Stay) Excess Bed Days", "Day Case", "Non-elective Inpatients - Short Stay", "Regular Day or Night Admissions"
£714.64
Key: CNS, clinical nurse specialist; SpR, specialist registrar; PSSRU, Personal Social Services Research
Unit; IC, intensive chemotherapy Sources: Celgene submission, Table 48, p. 136; PSSRU Unit costs of health and social care 2014
62; NHS
Reference costs
The frequency (Table 29) and mean time in minutes of health professionals involved during
different health states (Table 30) were estimated from a healthcare resource use
questionnaire developed by Celgene (Celgene’s appendices to submission, Appendix 12).
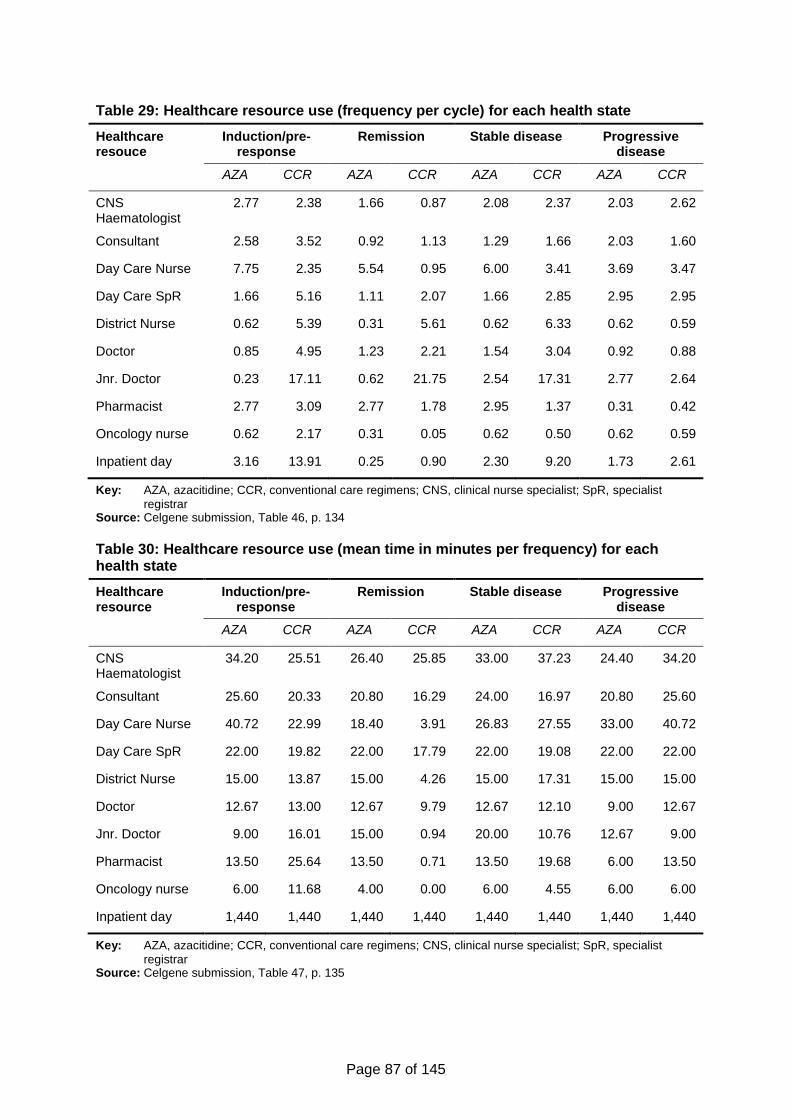
Page 87 of 145
Table 29: Healthcare resource use (frequency per cycle) for each health state
Healthcare resouce
Induction/pre-response
Remission Stable disease Progressive disease
AZA CCR AZA CCR AZA CCR AZA CCR
CNS Haematologist
2.77 2.38 1.66 0.87 2.08 2.37 2.03 2.62
Consultant 2.58 3.52 0.92 1.13 1.29 1.66 2.03 1.60
Day Care Nurse 7.75 2.35 5.54 0.95 6.00 3.41 3.69 3.47
Day Care SpR 1.66 5.16 1.11 2.07 1.66 2.85 2.95 2.95
District Nurse 0.62 5.39 0.31 5.61 0.62 6.33 0.62 0.59
Doctor 0.85 4.95 1.23 2.21 1.54 3.04 0.92 0.88
Jnr. Doctor 0.23 17.11 0.62 21.75 2.54 17.31 2.77 2.64
Pharmacist 2.77 3.09 2.77 1.78 2.95 1.37 0.31 0.42
Oncology nurse 0.62 2.17 0.31 0.05 0.62 0.50 0.62 0.59
Inpatient day 3.16 13.91 0.25 0.90 2.30 9.20 1.73 2.61
Key: AZA, azacitidine; CCR, conventional care regimens; CNS, clinical nurse specialist; SpR, specialist
registrar Source: Celgene submission, Table 46, p. 134
Table 30: Healthcare resource use (mean time in minutes per frequency) for each health state
Healthcare resource
Induction/pre-response
Remission Stable disease Progressive disease
AZA CCR AZA CCR AZA CCR AZA CCR
CNS Haematologist
34.20 25.51 26.40 25.85 33.00 37.23 24.40 34.20
Consultant 25.60 20.33 20.80 16.29 24.00 16.97 20.80 25.60
Day Care Nurse 40.72 22.99 18.40 3.91 26.83 27.55 33.00 40.72
Day Care SpR 22.00 19.82 22.00 17.79 22.00 19.08 22.00 22.00
District Nurse 15.00 13.87 15.00 4.26 15.00 17.31 15.00 15.00
Doctor 12.67 13.00 12.67 9.79 12.67 12.10 9.00 12.67
Jnr. Doctor 9.00 16.01 15.00 0.94 20.00 10.76 12.67 9.00
Pharmacist 13.50 25.64 13.50 0.71 13.50 19.68 6.00 13.50
Oncology nurse 6.00 11.68 4.00 0.00 6.00 4.55 6.00 6.00
Inpatient day 1,440 1,440 1,440 1,440 1,440 1,440 1,440 1,440
Key: AZA, azacitidine; CCR, conventional care regimens; CNS, clinical nurse specialist; SpR, specialist
registrar Source: Celgene submission, Table 47, p. 135
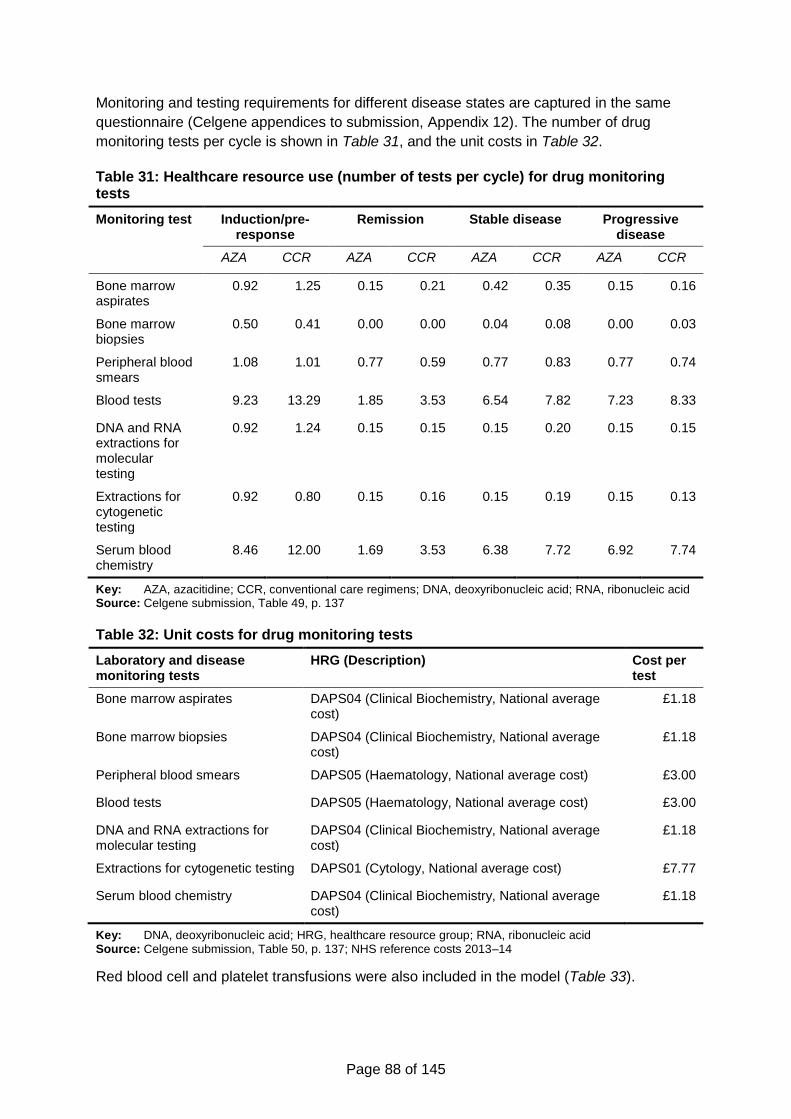
Page 88 of 145
Monitoring and testing requirements for different disease states are captured in the same
questionnaire (Celgene appendices to submission, Appendix 12). The number of drug
monitoring tests per cycle is shown in Table 31, and the unit costs in Table 32.
Table 31: Healthcare resource use (number of tests per cycle) for drug monitoring tests
Monitoring test Induction/pre-response
Remission Stable disease Progressive disease
AZA CCR AZA CCR AZA CCR AZA CCR
Bone marrow aspirates
0.92 1.25 0.15 0.21 0.42 0.35 0.15 0.16
Bone marrow biopsies
0.50 0.41 0.00 0.00 0.04 0.08 0.00 0.03
Peripheral blood smears
1.08 1.01 0.77 0.59 0.77 0.83 0.77 0.74
Blood tests 9.23 13.29 1.85 3.53 6.54 7.82 7.23 8.33
DNA and RNA extractions for molecular testing
0.92 1.24 0.15 0.15 0.15 0.20 0.15 0.15
Extractions for cytogenetic testing
0.92 0.80 0.15 0.16 0.15 0.19 0.15 0.13
Serum blood chemistry
8.46 12.00 1.69 3.53 6.38 7.72 6.92 7.74
Key: AZA, azacitidine; CCR, conventional care regimens; DNA, deoxyribonucleic acid; RNA, ribonucleic acid Source: Celgene submission, Table 49, p. 137
Table 32: Unit costs for drug monitoring tests
Laboratory and disease monitoring tests
HRG (Description) Cost per test
Bone marrow aspirates DAPS04 (Clinical Biochemistry, National average cost)
£1.18
Bone marrow biopsies DAPS04 (Clinical Biochemistry, National average cost)
£1.18
Peripheral blood smears DAPS05 (Haematology, National average cost) £3.00
Blood tests DAPS05 (Haematology, National average cost) £3.00
DNA and RNA extractions for molecular testing
DAPS04 (Clinical Biochemistry, National average cost)
£1.18
Extractions for cytogenetic testing DAPS01 (Cytology, National average cost) £7.77
Serum blood chemistry DAPS04 (Clinical Biochemistry, National average cost)
£1.18
Key: DNA, deoxyribonucleic acid; HRG, healthcare resource group; RNA, ribonucleic acid Source: Celgene submission, Table 50, p. 137; NHS reference costs 2013–14
Red blood cell and platelet transfusions were also included in the model (Table 33).
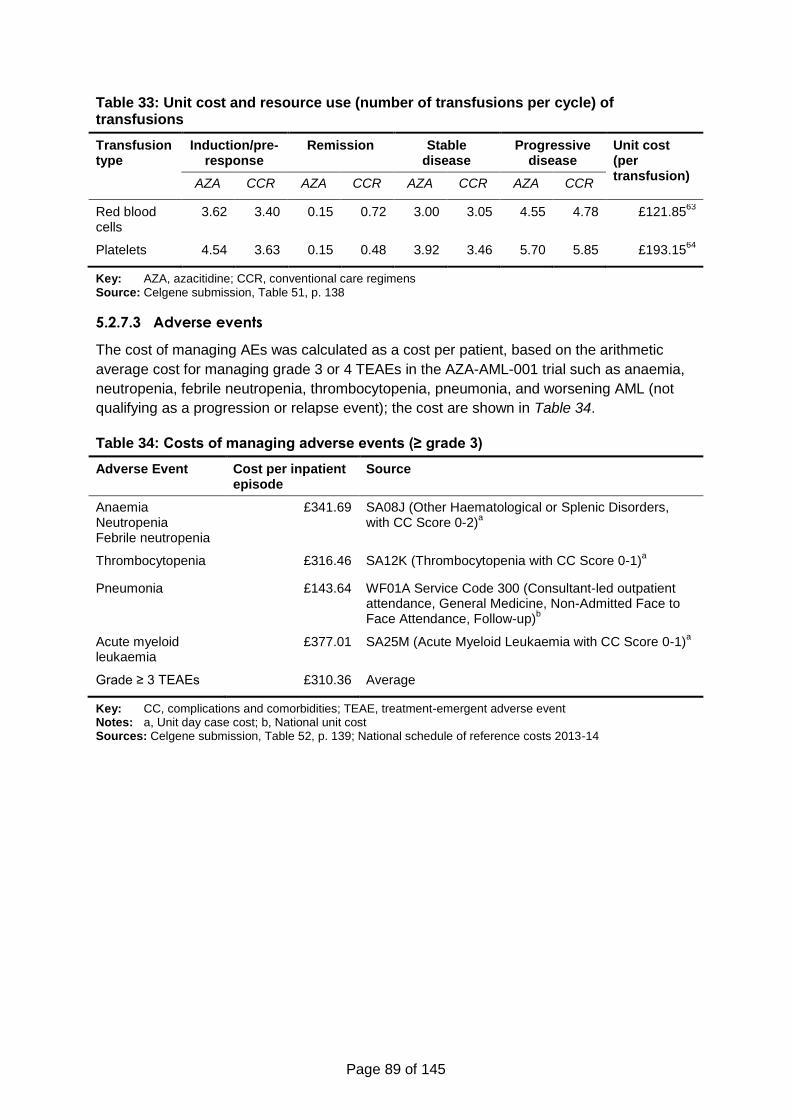
Page 89 of 145
Table 33: Unit cost and resource use (number of transfusions per cycle) of transfusions
Transfusion type
Induction/pre-response
Remission Stable disease
Progressive disease
Unit cost (per transfusion)
AZA CCR AZA CCR AZA CCR AZA CCR
Red blood cells
3.62 3.40 0.15 0.72 3.00 3.05 4.55 4.78 £121.8563
Platelets 4.54 3.63 0.15 0.48 3.92 3.46 5.70 5.85 £193.1564
Key: AZA, azacitidine; CCR, conventional care regimens Source: Celgene submission, Table 51, p. 138
5.2.7.3 Adverse events
The cost of managing AEs was calculated as a cost per patient, based on the arithmetic
average cost for managing grade 3 or 4 TEAEs in the AZA-AML-001 trial such as anaemia,
neutropenia, febrile neutropenia, thrombocytopenia, pneumonia, and worsening AML (not
qualifying as a progression or relapse event); the cost are shown in Table 34.
Table 34: Costs of managing adverse events (≥ grade 3)
Adverse Event Cost per inpatient episode
Source
Anaemia Neutropenia Febrile neutropenia
£341.69 SA08J (Other Haematological or Splenic Disorders, with CC Score 0-2)
a
Thrombocytopenia £316.46 SA12K (Thrombocytopenia with CC Score 0-1)a
Pneumonia £143.64 WF01A Service Code 300 (Consultant-led outpatient attendance, General Medicine, Non-Admitted Face to Face Attendance, Follow-up)
b
Acute myeloid leukaemia
£377.01 SA25M (Acute Myeloid Leukaemia with CC Score 0-1)a
Grade ≥ 3 TEAEs £310.36 Average
Key: CC, complications and comorbidities; TEAE, treatment-emergent adverse event Notes: a, Unit day case cost; b, National unit cost Sources: Celgene submission, Table 52, p. 139; National schedule of reference costs 2013-14
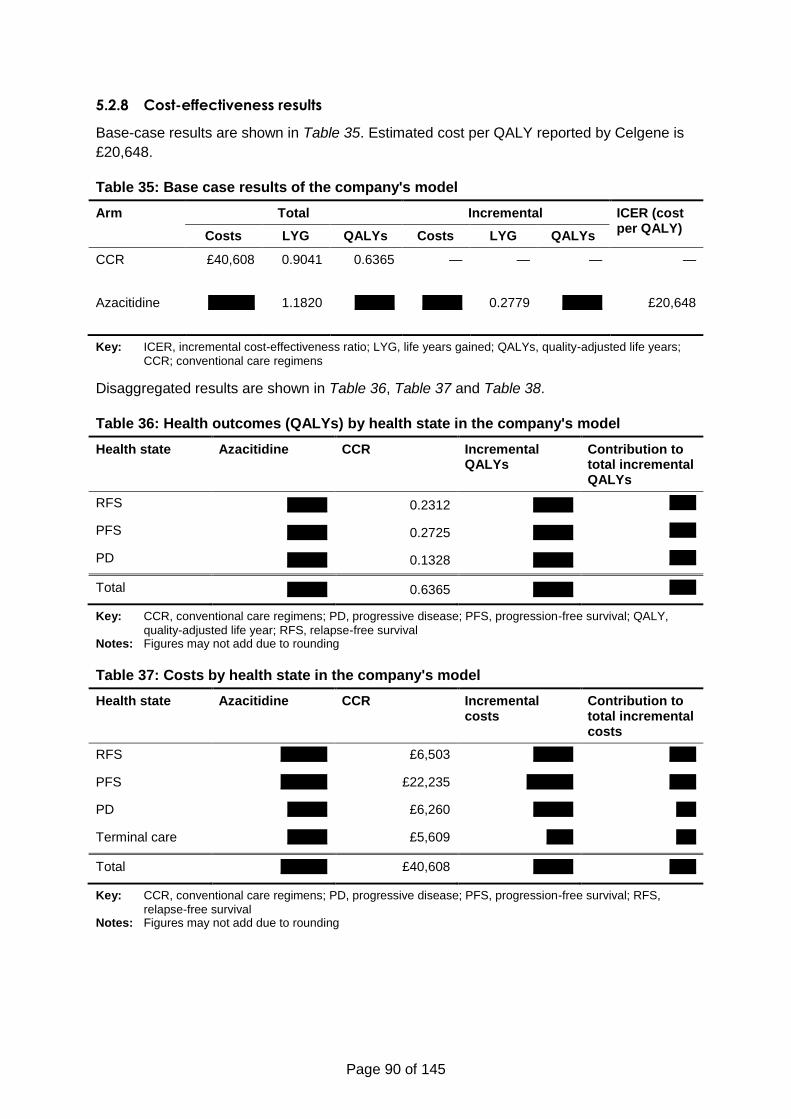
Page 90 of 145
5.2.8 Cost-effectiveness results
Base-case results are shown in Table 35. Estimated cost per QALY reported by Celgene is
£20,648.
Table 35: Base case results of the company's model
Arm Total Incremental ICER (cost per QALY)
Costs LYG QALYs Costs LYG QALYs
CCR £40,608 0.9041 0.6365 — — — —
Azacitidine xxxxxxx 1.1820 xxxxxx xxxxxx 0.2779 xxxxxx £20,648
Key: ICER, incremental cost-effectiveness ratio; LYG, life years gained; QALYs, quality-adjusted life years;
CCR; conventional care regimens
Disaggregated results are shown in Table 36, Table 37 and Table 38.
Table 36: Health outcomes (QALYs) by health state in the company's model
Health state Azacitidine CCR Incremental QALYs
Contribution to total incremental QALYs
RFS xxxxxx 0.2312 xxxxxx xxxx
PFS xxxxxx 0.2725 xxxxxx xxxx
PD xxxxxx 0.1328 xxxxxx xxxx
Total xxxxxx 0.6365 xxxxxx xxxx
Key: CCR, conventional care regimens; PD, progressive disease; PFS, progression-free survival; QALY,
quality-adjusted life year; RFS, relapse-free survival Notes: Figures may not add due to rounding
Table 37: Costs by health state in the company's model
Health state Azacitidine CCR Incremental costs
Contribution to total incremental costs
RFS xxxxxxx £6,503 xxxxxx xxxx
PFS xxxxxxx £22,235 xxxxxxx xxxx
PD xxxxxx £6,260 xxxxxx xxx
Terminal care xxxxxx £5,609 xxxx xxx
Total xxxxxxx £40,608 xxxxxx xxxx
Key: CCR, conventional care regimens; PD, progressive disease; PFS, progression-free survival; RFS,
relapse-free survival Notes: Figures may not add due to rounding
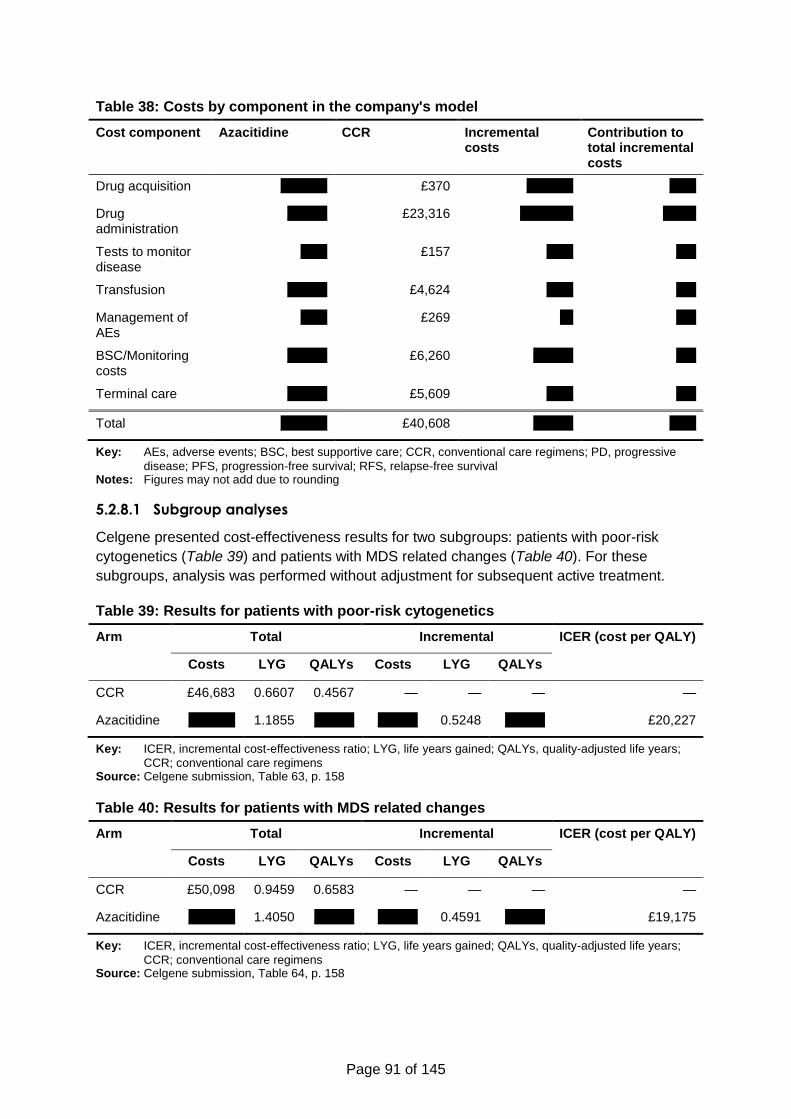
Page 91 of 145
Table 38: Costs by component in the company's model
Cost component Azacitidine CCR Incremental costs
Contribution to total incremental costs
Drug acquisition xxxxxxx £370 xxxxxxx xxxx
Drug administration
xxxxxx £23,316 xxxxxxxx xxxxx
Tests to monitor disease
xxxx £157 xxxx xxx
Transfusion xxxxxx £4,624 xxxx xxx
Management of AEs
xxxx £269 xx xxx
BSC/Monitoring costs
xxxxxx £6,260 xxxxxx xxx
Terminal care xxxxxx £5,609 xxxx xxx
Total xxxxxxx £40,608 xxxxxx xxxx
Key: AEs, adverse events; BSC, best supportive care; CCR, conventional care regimens; PD, progressive
disease; PFS, progression-free survival; RFS, relapse-free survival Notes: Figures may not add due to rounding
5.2.8.1 Subgroup analyses
Celgene presented cost-effectiveness results for two subgroups: patients with poor-risk
cytogenetics (Table 39) and patients with MDS related changes (Table 40). For these
subgroups, analysis was performed without adjustment for subsequent active treatment.
Table 39: Results for patients with poor-risk cytogenetics
Arm Total Incremental ICER (cost per QALY)
Costs LYG QALYs Costs LYG QALYs
CCR £46,683 0.6607 0.4567 — — — —
Azacitidine xxxxxxx 1.1855 xxxxxx xxxxxx 0.5248 xxxxxx £20,227
Key: ICER, incremental cost-effectiveness ratio; LYG, life years gained; QALYs, quality-adjusted life years;
CCR; conventional care regimens Source: Celgene submission, Table 63, p. 158
Table 40: Results for patients with MDS related changes
Arm Total Incremental ICER (cost per QALY)
Costs LYG QALYs Costs LYG QALYs
CCR £50,098 0.9459 0.6583 — — — —
Azacitidine xxxxxxx 1.4050 xxxxxx xxxxxx 0.4591 xxxxxx £19,175
Key: ICER, incremental cost-effectiveness ratio; LYG, life years gained; QALYs, quality-adjusted life years;
CCR; conventional care regimens Source: Celgene submission, Table 64, p. 158
Page 92 of 145
5.2.9 Sensitivity analyses
Celgene performed deterministic and probabilistic sensitivity analyses to estimate the effect
of uncertainty in model parameters on the ICER.
5.2.9.1 Univariate sensitivity analyses
One-way SA is a form of deterministic sensitivity analysis in which one parameter value is
varied while keeping all other parameter values constant, to investigate the impact of
individual parameters on the base case ICER.
In the model, the base case values of the following parameters were varied by ±20% or
around a confidence interval (for HRs) to evaluate this impact:
Drug utilization costs;
Drug administration costs;
Drug monitoring cost (transfusion and tests);
BSC/palliative care costs;
HRs;
Safety;
Response rate;
Health state utility values.
A tornado diagram demonstrating the results of the univariate sensitivity analyses is shown
in Figure 13.
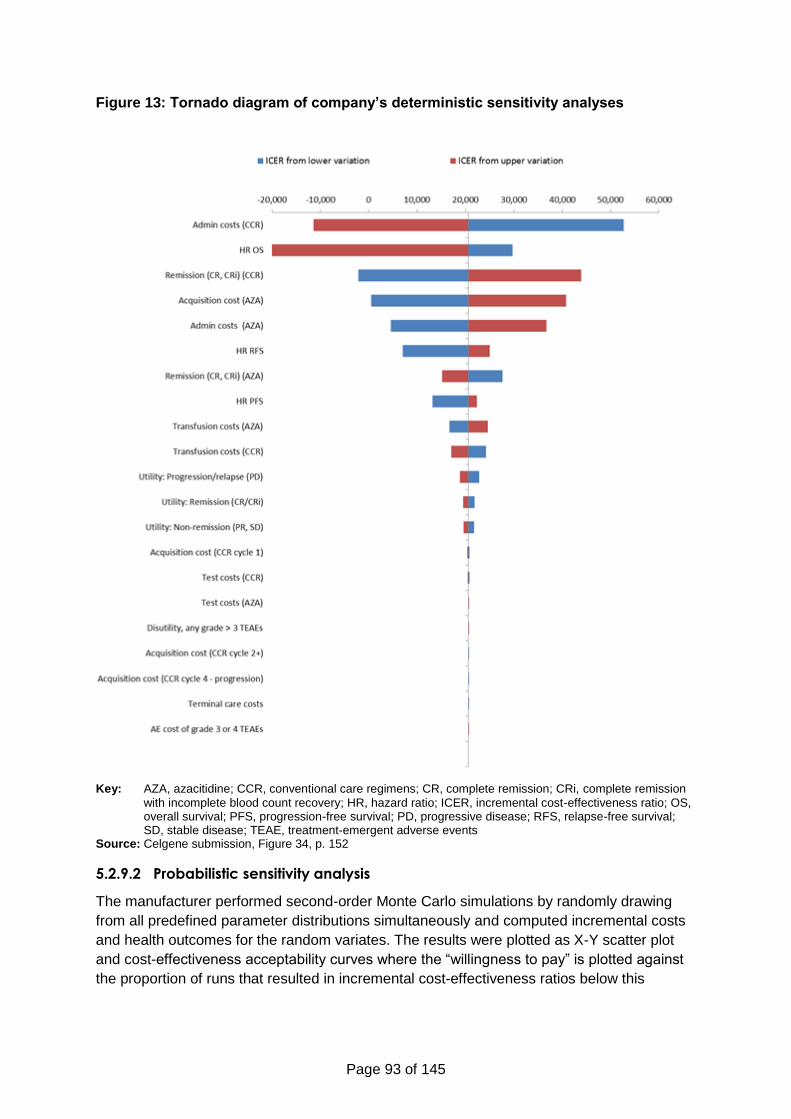
Page 93 of 145
Figure 13: Tornado diagram of company’s deterministic sensitivity analyses
Key: AZA, azacitidine; CCR, conventional care regimens; CR, complete remission; CRi, complete remission
with incomplete blood count recovery; HR, hazard ratio; ICER, incremental cost-effectiveness ratio; OS, overall survival; PFS, progression-free survival; PD, progressive disease; RFS, relapse-free survival; SD, stable disease; TEAE, treatment-emergent adverse events
Source: Celgene submission, Figure 34, p. 152
5.2.9.2 Probabilistic sensitivity analysis
The manufacturer performed second-order Monte Carlo simulations by randomly drawing
from all predefined parameter distributions simultaneously and computed incremental costs
and health outcomes for the random variates. The results were plotted as X-Y scatter plot
and cost-effectiveness acceptability curves where the “willingness to pay” is plotted against
the proportion of runs that resulted in incremental cost-effectiveness ratios below this
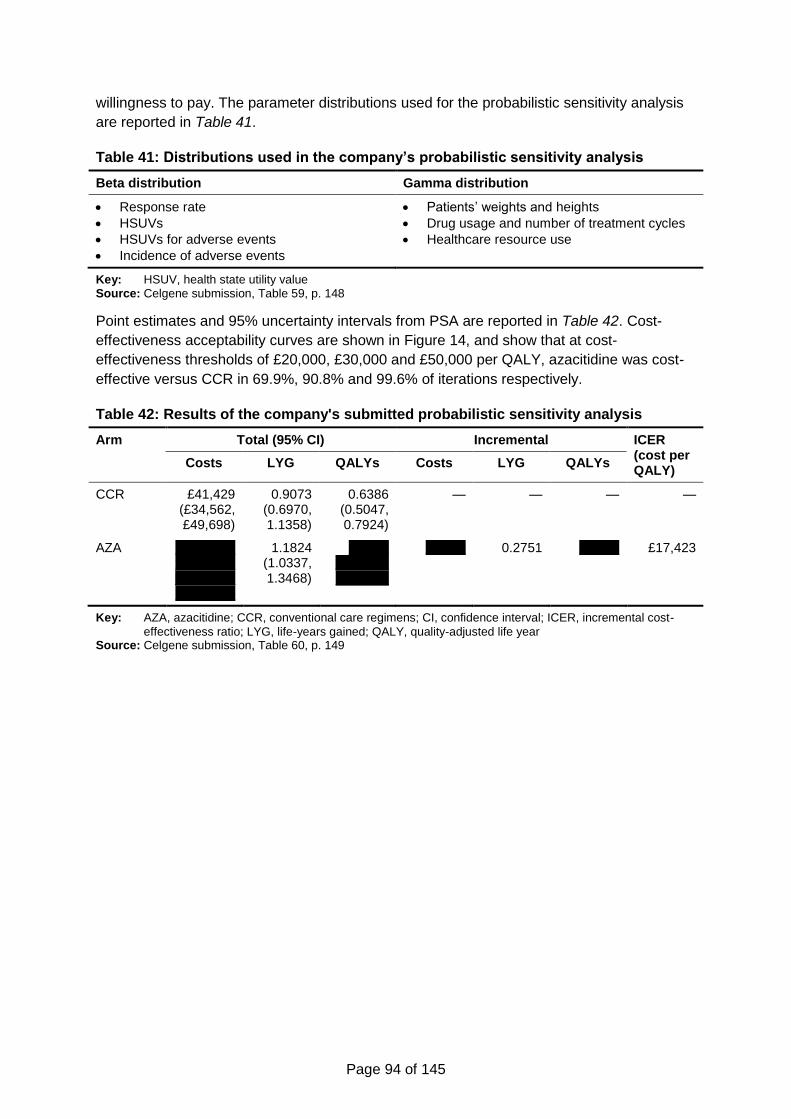
Page 94 of 145
willingness to pay. The parameter distributions used for the probabilistic sensitivity analysis
are reported in Table 41.
Table 41: Distributions used in the company’s probabilistic sensitivity analysis
Beta distribution Gamma distribution
Response rate
HSUVs
HSUVs for adverse events
Incidence of adverse events
Patients’ weights and heights
Drug usage and number of treatment cycles
Healthcare resource use
Key: HSUV, health state utility value Source: Celgene submission, Table 59, p. 148
Point estimates and 95% uncertainty intervals from PSA are reported in Table 42. Cost-
effectiveness acceptability curves are shown in Figure 14, and show that at cost-
effectiveness thresholds of £20,000, £30,000 and £50,000 per QALY, azacitidine was cost-
effective versus CCR in 69.9%, 90.8% and 99.6% of iterations respectively.
Table 42: Results of the company's submitted probabilistic sensitivity analysis
Arm Total (95% CI) Incremental ICER (cost per QALY)
Costs LYG QALYs Costs LYG QALYs
CCR £41,429 (£34,562, £49,698)
0.9073 (0.6970, 1.1358)
0.6386 (0.5047, 0.7924)
— — — —
AZA xxxxxxxxxxxxxxxxxx xxxxxxxxx xxxxxxxxx
1.1824 (1.0337, 1.3468)
xxxxxx xxxxxxxx xxxxxxxx
xxxxxx 0.2751 xxxxxx £17,423
Key: AZA, azacitidine; CCR, conventional care regimens; CI, confidence interval; ICER, incremental cost-
effectiveness ratio; LYG, life-years gained; QALY, quality-adjusted life year Source: Celgene submission, Table 60, p. 149
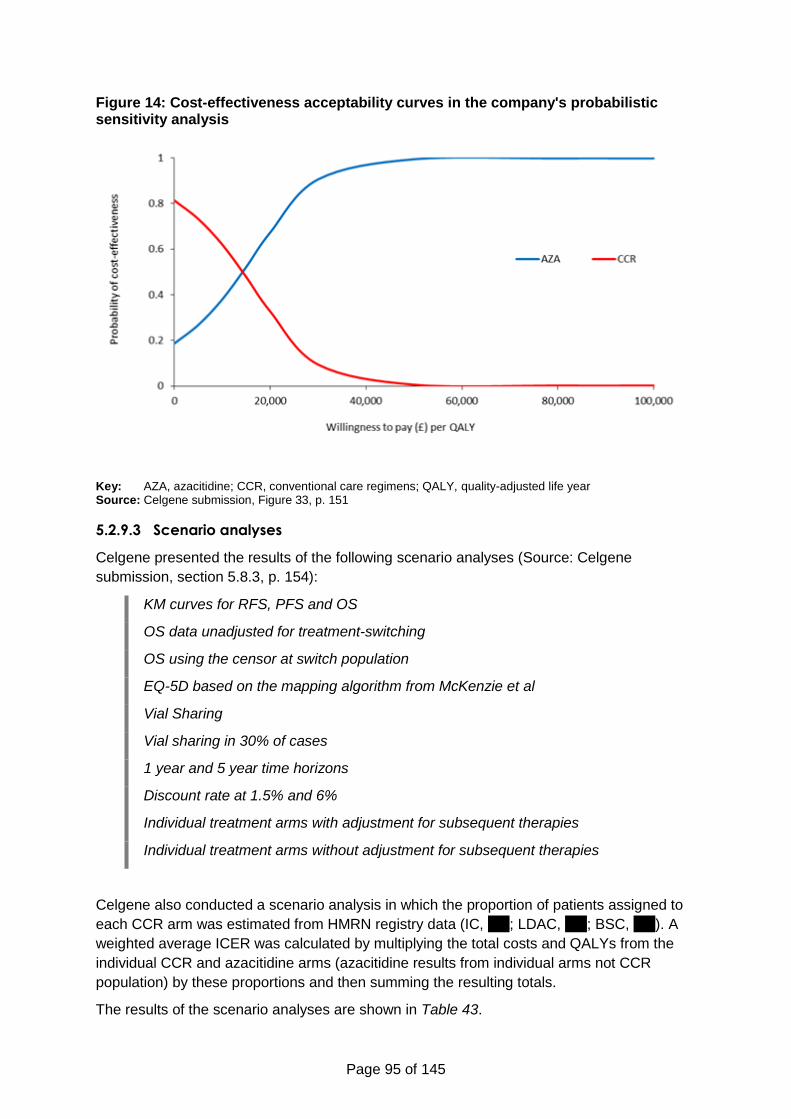
Page 95 of 145
Figure 14: Cost-effectiveness acceptability curves in the company's probabilistic sensitivity analysis
Key: AZA, azacitidine; CCR, conventional care regimens; QALY, quality-adjusted life year Source: Celgene submission, Figure 33, p. 151
5.2.9.3 Scenario analyses
Celgene presented the results of the following scenario analyses (Source: Celgene
submission, section 5.8.3, p. 154):
KM curves for RFS, PFS and OS
OS data unadjusted for treatment-switching
OS using the censor at switch population
EQ-5D based on the mapping algorithm from McKenzie et al
Vial Sharing
Vial sharing in 30% of cases
1 year and 5 year time horizons
Discount rate at 1.5% and 6%
Individual treatment arms with adjustment for subsequent therapies
Individual treatment arms without adjustment for subsequent therapies
Celgene also conducted a scenario analysis in which the proportion of patients assigned to
each CCR arm was estimated from HMRN registry data (IC, xxx; LDAC, xxx; BSC, xxx). A
weighted average ICER was calculated by multiplying the total costs and QALYs from the
individual CCR and azacitidine arms (azacitidine results from individual arms not CCR
population) by these proportions and then summing the resulting totals.
The results of the scenario analyses are shown in Table 43.
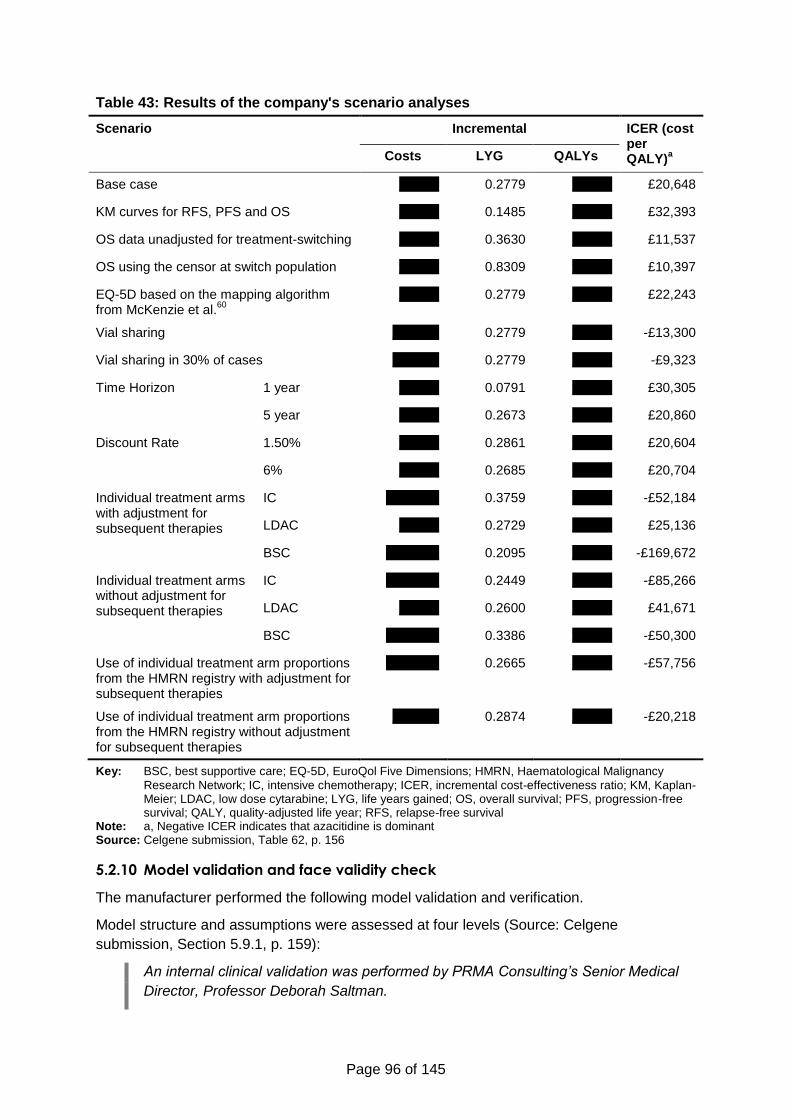
Page 96 of 145
Table 43: Results of the company's scenario analyses
Scenario Incremental ICER (cost per QALY)
a Costs LYG QALYs
Base case xxxxxx 0.2779 xxxxxx £20,648
KM curves for RFS, PFS and OS xxxxxx 0.1485 xxxxxx £32,393
OS data unadjusted for treatment-switching xxxxxx 0.3630 xxxxxx £11,537
OS using the censor at switch population xxxxxx 0.8309 xxxxxx £10,397
EQ-5D based on the mapping algorithm from McKenzie et al.
60
xxxxxx 0.2779 xxxxxx £22,243
Vial sharing xxxxxxx 0.2779 xxxxxx -£13,300
Vial sharing in 30% of cases xxxxxxx 0.2779 xxxxxx -£9,323
Time Horizon 1 year xxxxxx 0.0791 xxxxxx £30,305
5 year xxxxxx 0.2673 xxxxxx £20,860
Discount Rate 1.50% xxxxxx 0.2861 xxxxxx £20,604
6% xxxxxx 0.2685 xxxxxx £20,704
Individual treatment arms with adjustment for subsequent therapies
IC xxxxxxxx 0.3759 xxxxxx -£52,184
LDAC xxxxxx 0.2729 xxxxxx £25,136
BSC xxxxxxxx 0.2095 xxxxxx -£169,672
Individual treatment arms without adjustment for subsequent therapies
IC xxxxxxxx 0.2449 xxxxxx -£85,266
LDAC xxxxxx 0.2600 xxxxxx £41,671
BSC xxxxxxxx 0.3386 xxxxxx -£50,300
Use of individual treatment arm proportions from the HMRN registry with adjustment for subsequent therapies
xxxxxxxx 0.2665 xxxxxx -£57,756
Use of individual treatment arm proportions from the HMRN registry without adjustment for subsequent therapies
xxxxxxx 0.2874 xxxxxx -£20,218
Key: BSC, best supportive care; EQ-5D, EuroQol Five Dimensions; HMRN, Haematological Malignancy
Research Network; IC, intensive chemotherapy; ICER, incremental cost-effectiveness ratio; KM, Kaplan-Meier; LDAC, low dose cytarabine; LYG, life years gained; OS, overall survival; PFS, progression-free survival; QALY, quality-adjusted life year; RFS, relapse-free survival
Note: a, Negative ICER indicates that azacitidine is dominant Source: Celgene submission, Table 62, p. 156
5.2.10 Model validation and face validity check
The manufacturer performed the following model validation and verification.
Model structure and assumptions were assessed at four levels (Source: Celgene
submission, Section 5.9.1, p. 159):
An internal clinical validation was performed by PRMA Consulting’s Senior Medical
Director, Professor Deborah Saltman.
Page 97 of 145
PRMA Consulting’s senior management and expert health economists performed an
internal validation.
The validity of the model was confirmed by Professor Stephen Palmer, an external
technical advisor with extensive experience of NICE HTAs.
Externally, two UK clinical oncologists validated the model structure and key
assumptions; one of them also validated HCRU inputs (types of HCRU involved) and
model outputs on effectiveness.
The model was also reviewed by the Celgene team.
Technical validity was ensured by performing model checks reported in Table 44.
Table 44: Checklist used to check the model inputs and results
Check Purpose
Set discount rate to 0 To confirm that discounted and non-discounted results are equal
Set main HSUVs to 0 To confirm that QALYs are zero, or can be explained by utility decrements associated with adverse events
Set all HSUVs to 1 To confirm that LYs are equal to QALYs, or that any difference can be explained by utility decrements associated with adverse events
Set drug costs to 0 To confirm that drug costs are zero
Set admin costs to 0 To confirm that administration costs are zero
Set all non-drug costs to 0 To confirm that non-drug costs are zero
Manually confirm tornado diagram calculations by changing user-altered cells
To confirm that that tornado diagram calculations are correct
Key: HSUV, health state utility value; LY, life-year; QALY, quality-adjusted life-year Source: Celgene submission, Table 65, p. 159
The OS for patients in CCR arm, predicted by the model, has been compared to UK real
world data from the HMRN registry. Figure 15 provides a comparison for all patients and
Figure 16 for those patients with poor-risk cytogenetics. Celgene’s submission states
(Source: Celgene Submission, Section 5.9.3., p.160-161):
It can be seen that the model predicts slightly better outcomes than have been seen
for patients treated with CCR in UK clinical practice. When adjustment is made for
subsequent therapies, the survival curves move closer to that seen in the real world.
This further emphasises that CCR survival in AZA-AML-001 could have benefited
from patients switching treatment to receive azacitidine which they currently cannot
do in clinical practice in the UK. The similar curve shapes suggest the model is
replicating real life experience plausibly and that the results of AZA-AML-001 can be
interpreted with a degree of comfort once adjustments have been made for
subsequent treatments.
Page 98 of 145
Figure 15: Comparison of CCR overall survival predictions to Haematological Malignancy Research Network data
Key: CCR, conventional care regimens; HMRN, Haematological Malignancy Research Network Source: Celgene submission, Figure 35, p. 160
Figure 16: Comparison of CCR overall survival predictions for patients with poor-risk cytogenetics to Haematological Malignancy Research Network data
Key: CCR, conventional care regimens; HMRN, Haematological Malignancy Research Network Source: Celgene submission, Figure 36, p. 161
Page 99 of 145
5.3 Critique of company’s submitted economic evaluation by the ERG
5.3.1 Critical appraisal checklists
Table 45: NICE reference case
NICE reference case requirement Meets criteria?
Reviewer comment
Defining the decision problem
The Scope developed by NICE
Y
Comparator Therapies routinely used in the NHS, including technologies regarded as current best practice
U The ERG believe that subsequent treatments after initial treatment with azacitidine, IC and LDAC should have been allowed in the model, which assumed that the no subsequent AML treatment was given and patients were managed by BSC instead.
Perspective on outcomes
All health effects on individuals
Y
Perspective on costs
NHS and PSS Y
Type of economic evaluation
Incremental Cost-utility analysis
Y
Time horizon Lifetime Y At the mean age, 75, of patients at the start of the effectiveness study and economic model the 10-year horizon used in the analysis covers most patients’ remaining lifetime.
Synthesis of evidence on health effects
Based on a single study U Based on evidence from a single trial (AZA-AML-001) since systematic review of clinical effectiveness found no relevant studies. The searches for the systematic review were judged to be poorly designed and reported.
Measuring and valuing health effects
QALYs Y
Source of data for measurement of HRQL
Reported directly by patients and/or carers
Y Based on data collected with a disease specific questionnaire (EORTC-Q30) from a single trial (AZA-AML-001)
Source of preference data for valuation of changes in HRQL
Representative sample of the public
Y EQ-5D survey mapped from disease specific single trial data using a published mapping algorithm
Page 100 of 145
NICE reference case requirement Meets criteria?
Reviewer comment
Evidence on resource use and costs
Y Unit costs reflect the perspective adopted. However, resource use was based on experts’ opinion on expected quantities of resource utilisation by disease state and initial treatment; it is unclear why those quantities are different across initial arms in the progressive disease state when all patients are assumed to receive best supportive care only.
Discount rate 3.5% p.a. for costs and health effects
Y
Equity weighting An additional QALY has the same weight regardless of the other characteristics of the individuals receiving the health benefit
Y
Key: BSC, best supportive care; HRQL, health-related quality of life; IC, intensive chemotherapy; LDAC, low-
dose cytarabine; N, no; p.a., per annum; QALY, quality-adjusted life year; U, unclear; Y, yes
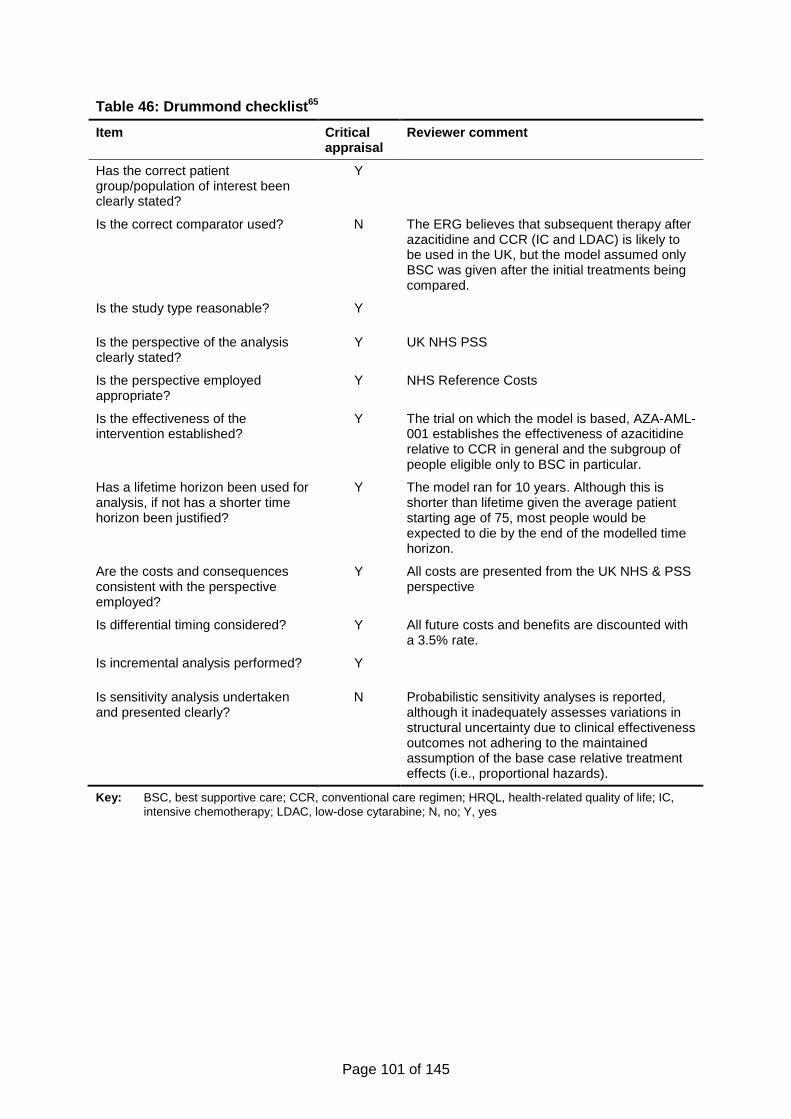
Page 101 of 145
Table 46: Drummond checklist65
Item Critical appraisal
Reviewer comment
Has the correct patient group/population of interest been clearly stated?
Y
Is the correct comparator used? N The ERG believes that subsequent therapy after azacitidine and CCR (IC and LDAC) is likely to be used in the UK, but the model assumed only BSC was given after the initial treatments being compared.
Is the study type reasonable? Y
Is the perspective of the analysis clearly stated?
Y UK NHS PSS
Is the perspective employed appropriate?
Y NHS Reference Costs
Is the effectiveness of the intervention established?
Y The trial on which the model is based, AZA-AML-001 establishes the effectiveness of azacitidine relative to CCR in general and the subgroup of people eligible only to BSC in particular.
Has a lifetime horizon been used for analysis, if not has a shorter time horizon been justified?
Y The model ran for 10 years. Although this is shorter than lifetime given the average patient starting age of 75, most people would be expected to die by the end of the modelled time horizon.
Are the costs and consequences consistent with the perspective employed?
Y All costs are presented from the UK NHS & PSS perspective
Is differential timing considered? Y All future costs and benefits are discounted with a 3.5% rate.
Is incremental analysis performed? Y
Is sensitivity analysis undertaken and presented clearly?
N Probabilistic sensitivity analyses is reported, although it inadequately assesses variations in structural uncertainty due to clinical effectiveness outcomes not adhering to the maintained assumption of the base case relative treatment effects (i.e., proportional hazards).
Key: BSC, best supportive care; CCR, conventional care regimen; HRQL, health-related quality of life; IC,
intensive chemotherapy; LDAC, low-dose cytarabine; N, no; Y, yes
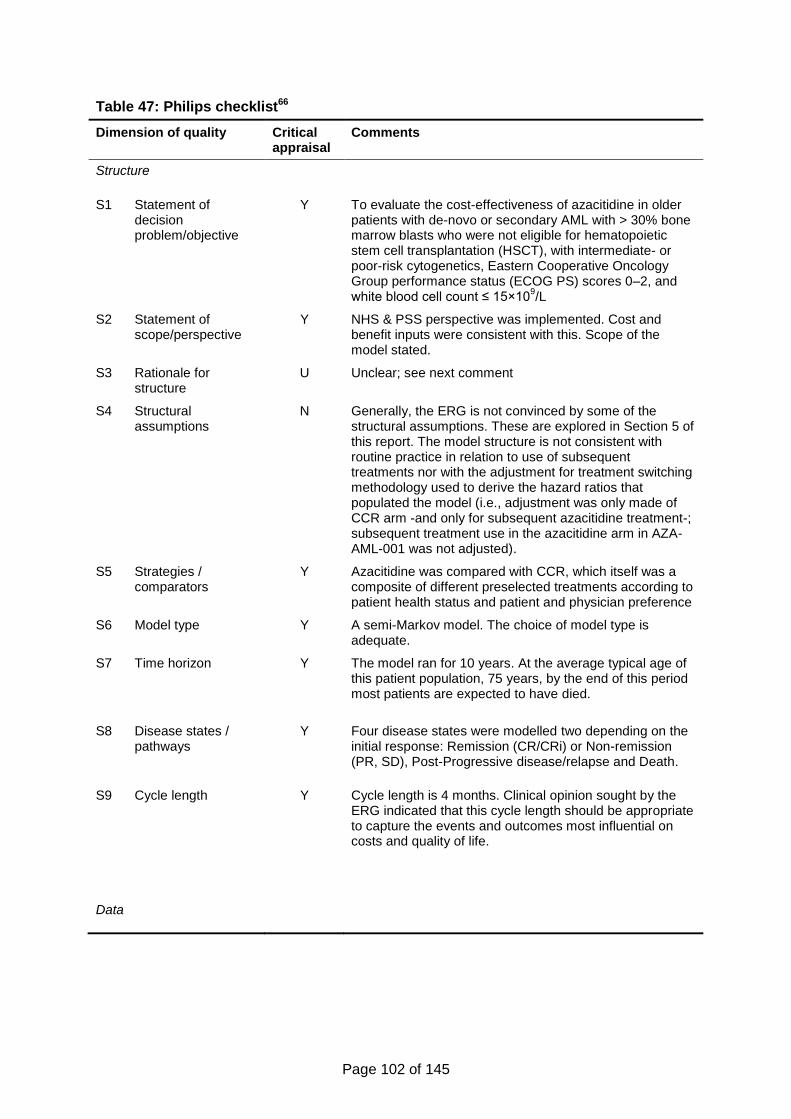
Page 102 of 145
Table 47: Philips checklist66
Dimension of quality Critical appraisal
Comments
Structure
S1 Statement of decision problem/objective
Y To evaluate the cost-effectiveness of azacitidine in older patients with de-novo or secondary AML with > 30% bone marrow blasts who were not eligible for hematopoietic stem cell transplantation (HSCT), with intermediate- or poor-risk cytogenetics, Eastern Cooperative Oncology Group performance status (ECOG PS) scores 0–2, and white blood cell count ≤ 15×10
9/L
S2 Statement of scope/perspective
Y NHS & PSS perspective was implemented. Cost and benefit inputs were consistent with this. Scope of the model stated.
S3 Rationale for structure
U Unclear; see next comment
S4 Structural assumptions
N Generally, the ERG is not convinced by some of the structural assumptions. These are explored in Section 5 of this report. The model structure is not consistent with routine practice in relation to use of subsequent treatments nor with the adjustment for treatment switching methodology used to derive the hazard ratios that populated the model (i.e., adjustment was only made of CCR arm -and only for subsequent azacitidine treatment-; subsequent treatment use in the azacitidine arm in AZA-AML-001 was not adjusted).
S5 Strategies / comparators
Y Azacitidine was compared with CCR, which itself was a composite of different preselected treatments according to patient health status and patient and physician preference
S6 Model type Y A semi-Markov model. The choice of model type is adequate.
S7 Time horizon Y The model ran for 10 years. At the average typical age of this patient population, 75 years, by the end of this period most patients are expected to have died.
S8 Disease states / pathways
Y Four disease states were modelled two depending on the initial response: Remission (CR/CRi) or Non-remission (PR, SD), Post-Progressive disease/relapse and Death.
S9 Cycle length Y Cycle length is 4 months. Clinical opinion sought by the ERG indicated that this cycle length should be appropriate to capture the events and outcomes most influential on costs and quality of life.
Data
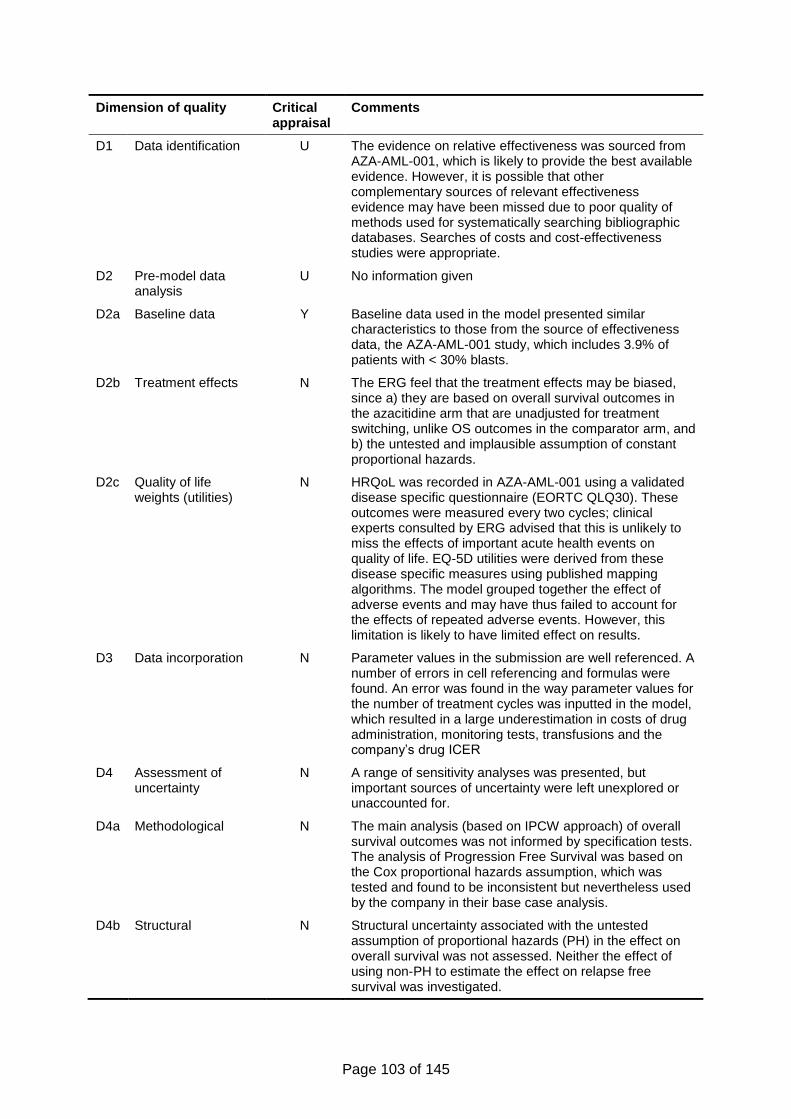
Page 103 of 145
Dimension of quality Critical appraisal
Comments
D1 Data identification U The evidence on relative effectiveness was sourced from AZA-AML-001, which is likely to provide the best available evidence. However, it is possible that other complementary sources of relevant effectiveness evidence may have been missed due to poor quality of methods used for systematically searching bibliographic databases. Searches of costs and cost-effectiveness studies were appropriate.
D2 Pre-model data analysis
U No information given
D2a Baseline data Y Baseline data used in the model presented similar characteristics to those from the source of effectiveness data, the AZA-AML-001 study, which includes 3.9% of patients with < 30% blasts.
D2b Treatment effects N The ERG feel that the treatment effects may be biased, since a) they are based on overall survival outcomes in the azacitidine arm that are unadjusted for treatment switching, unlike OS outcomes in the comparator arm, and b) the untested and implausible assumption of constant proportional hazards.
D2c Quality of life weights (utilities)
N HRQoL was recorded in AZA-AML-001 using a validated disease specific questionnaire (EORTC QLQ30). These outcomes were measured every two cycles; clinical experts consulted by ERG advised that this is unlikely to miss the effects of important acute health events on quality of life. EQ-5D utilities were derived from these disease specific measures using published mapping algorithms. The model grouped together the effect of adverse events and may have thus failed to account for the effects of repeated adverse events. However, this limitation is likely to have limited effect on results.
D3 Data incorporation N Parameter values in the submission are well referenced. A number of errors in cell referencing and formulas were found. An error was found in the way parameter values for the number of treatment cycles was inputted in the model, which resulted in a large underestimation in costs of drug administration, monitoring tests, transfusions and the company’s drug ICER
D4 Assessment of uncertainty
N A range of sensitivity analyses was presented, but important sources of uncertainty were left unexplored or unaccounted for.
D4a Methodological N The main analysis (based on IPCW approach) of overall survival outcomes was not informed by specification tests. The analysis of Progression Free Survival was based on the Cox proportional hazards assumption, which was tested and found to be inconsistent but nevertheless used by the company in their base case analysis.
D4b Structural N Structural uncertainty associated with the untested assumption of proportional hazards (PH) in the effect on overall survival was not assessed. Neither the effect of using non-PH to estimate the effect on relapse free survival was investigated.
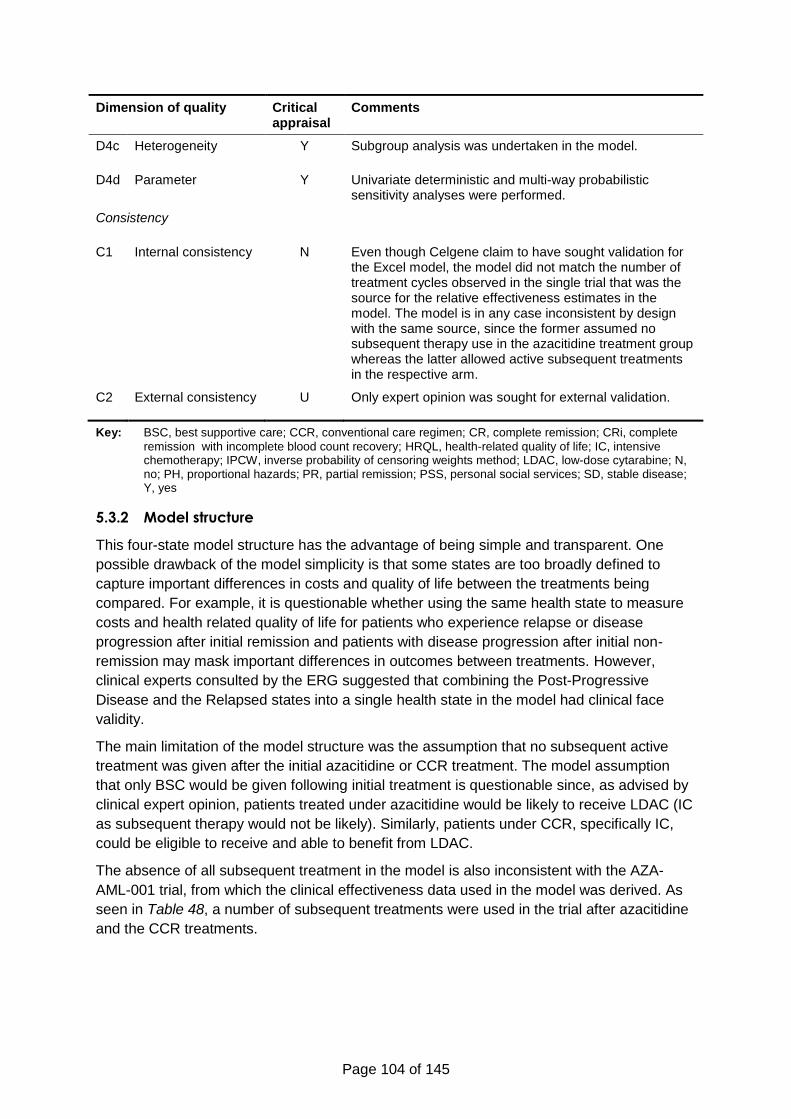
Page 104 of 145
Dimension of quality Critical appraisal
Comments
D4c Heterogeneity Y Subgroup analysis was undertaken in the model.
D4d Parameter Y Univariate deterministic and multi-way probabilistic sensitivity analyses were performed.
Consistency
C1 Internal consistency N Even though Celgene claim to have sought validation for the Excel model, the model did not match the number of treatment cycles observed in the single trial that was the source for the relative effectiveness estimates in the model. The model is in any case inconsistent by design with the same source, since the former assumed no subsequent therapy use in the azacitidine treatment group whereas the latter allowed active subsequent treatments in the respective arm.
C2 External consistency U Only expert opinion was sought for external validation.
Key: BSC, best supportive care; CCR, conventional care regimen; CR, complete remission; CRi, complete
remission with incomplete blood count recovery; HRQL, health-related quality of life; IC, intensive chemotherapy; IPCW, inverse probability of censoring weights method; LDAC, low-dose cytarabine; N, no; PH, proportional hazards; PR, partial remission; PSS, personal social services; SD, stable disease; Y, yes
5.3.2 Model structure
This four-state model structure has the advantage of being simple and transparent. One
possible drawback of the model simplicity is that some states are too broadly defined to
capture important differences in costs and quality of life between the treatments being
compared. For example, it is questionable whether using the same health state to measure
costs and health related quality of life for patients who experience relapse or disease
progression after initial remission and patients with disease progression after initial non-
remission may mask important differences in outcomes between treatments. However,
clinical experts consulted by the ERG suggested that combining the Post-Progressive
Disease and the Relapsed states into a single health state in the model had clinical face
validity.
The main limitation of the model structure was the assumption that no subsequent active
treatment was given after the initial azacitidine or CCR treatment. The model assumption
that only BSC would be given following initial treatment is questionable since, as advised by
clinical expert opinion, patients treated under azacitidine would be likely to receive LDAC (IC
as subsequent therapy would not be likely). Similarly, patients under CCR, specifically IC,
could be eligible to receive and able to benefit from LDAC.
The absence of all subsequent treatment in the model is also inconsistent with the AZA-
AML-001 trial, from which the clinical effectiveness data used in the model was derived. As
seen in Table 48, a number of subsequent treatments were used in the trial after azacitidine
and the CCR treatments.
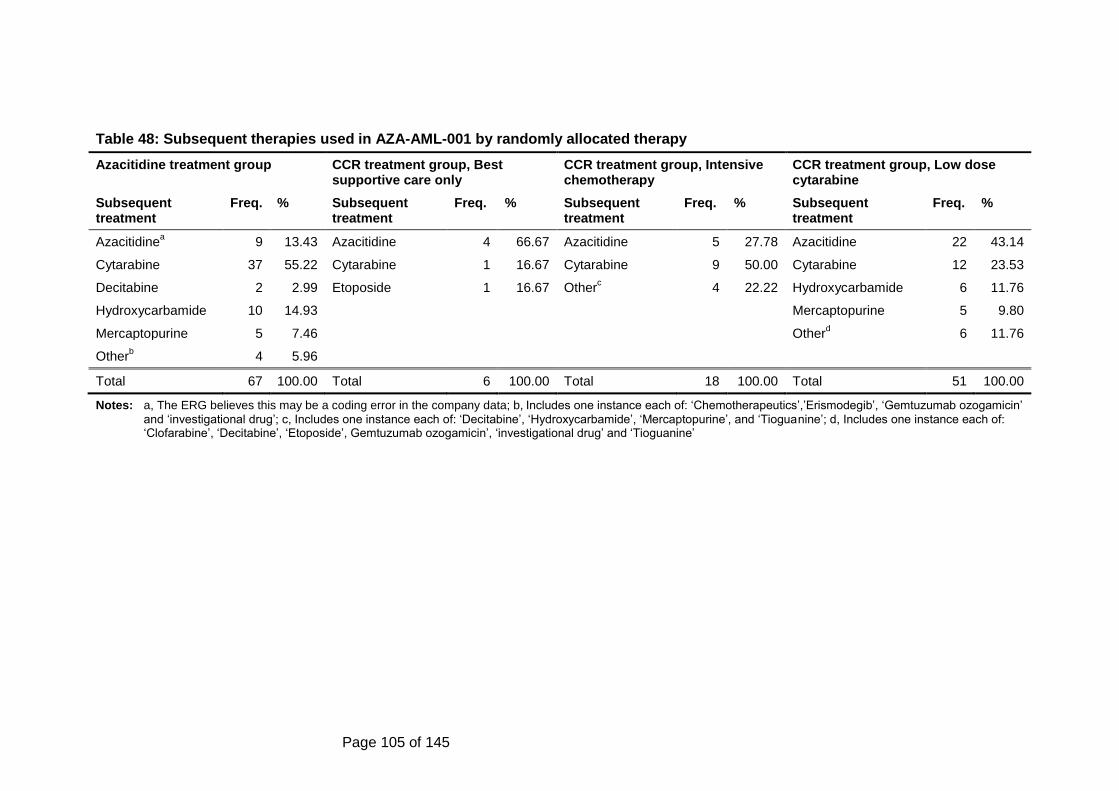
Page 105 of 145
Table 48: Subsequent therapies used in AZA-AML-001 by randomly allocated therapy
Azacitidine treatment group CCR treatment group, Best supportive care only
CCR treatment group, Intensive chemotherapy
CCR treatment group, Low dose cytarabine
Subsequent treatment
Freq. % Subsequent treatment
Freq. % Subsequent treatment
Freq. % Subsequent treatment
Freq. %
Azacitidinea 9 13.43 Azacitidine 4 66.67 Azacitidine 5 27.78 Azacitidine 22 43.14
Cytarabine 37 55.22 Cytarabine 1 16.67 Cytarabine 9 50.00 Cytarabine 12 23.53
Decitabine 2 2.99 Etoposide
1 16.67 Otherc
4 22.22 Hydroxycarbamide 6 11.76
Hydroxycarbamide 10 14.93 Mercaptopurine 5 9.80
Mercaptopurine 5 7.46 Otherd
6 11.76
Otherb
4 5.96
Total 67 100.00 Total 6 100.00 Total 18 100.00 Total 51 100.00
Notes:
a, The ERG believes this may be a coding error in the company data; b, Includes one instance each of: ‘Chemotherapeutics’,’Erismodegib’, ‘Gemtuzumab ozogamicin’
and ‘investigational drug’; c, Includes one instance each of: ‘Decitabine’, ‘Hydroxycarbamide’, ‘Mercaptopurine’, and ‘Tioguanine’; d, Includes one instance each of: ‘Clofarabine’, ‘Decitabine’, ‘Etoposide’, Gemtuzumab ozogamicin’, ‘investigational drug’ and ‘Tioguanine’
Page 106 of 145
5.3.3 Population
The model considered in the base case a cohort of patients with mean age 75, 59% of whom
are male, weighing 71 kg and with a Body Surface Area of 1.80 m². In terms of the pre-
selected CCR treatments, the distribution used was that of AZA-AML-001 (BSC, 18%;
LDAC, 64%; IC, 18%) but results from sensitivity analyses using the alternative distribution
in the HMRN registry (BSC, xxx; LDAC, xxx; IC, xxx) were also submitted for this
assessment. The clinical experts consulted by the ERG advised that the distribution of
patients amongst CCR treatments in these registry data was different to their local practice
but they thought it plausible that the registry data reflected routine UK practice and they had
no alternative data.
A footnote to Table 1 of the study report by Dombret et al. 2015,45 states that “Patients were
randomly assigned on the basis of local pathology assessment of baseline BM blast count,
which was subsequently reviewed by the central pathologist; in a small number of cases,
baseline blast count was <30% upon central review.” In the data provided by Celgene,
baseline blast count data were grouped in bands, 0 to 5%, 5 to <25%, 25 to <50%, and 50-
100%, and 3.9% (19/488) of the sample had baseline blast count <25%.
5.3.4 Interventions and comparators
The specification of evaluated treatments was consistent with randomly allocated treatments
specified in AZA-AML-001. The number of cycles of treatment and the doses were intended
to mirror those in the trial. However, the way parameter values for the number of treatment
cycles were implemented in the model was incorrect, resulting in a mean number of
treatment cycles in the azacitidine group of 5.6 instead of the intended 8.8, in the CCR group
IC of 1.86 instead of 2 (initiation and consolidation) and 4.4 when estimating drug acquisition
costs and 5.3 when calculating the costs of drug administration, tests and transfusion
instead of 6.10 in the CCR group LDAC.
In addition, the description of the CCR IC regimen in the economic section of the submission
(Section 5.2.3, p. 72), states that one-cycle of induction with IC was followed by “two
consolidation cycles for those who responded to the treatment, followed by BSC. Those who
do not respond to induction therapy receive BSC”. In effect, the model applied costs for up to
two consolidation cycles to the group of patients who achieved CR/CRi after induction and
did not relapse (i.e., were in Remission) and to the group of those who did not achieve
CR/CRi after induction but whose disease did not progress (i.e. were in non-Remission).
As discussed before, subsequent therapies were not allowed in the model, despite their use
in AZA-AML-001. It is possible that the use of subsequent treatments in the trial may have
resulted in a number of treatment cycles that may not correspond with the number of
treatment cycles that would be expected in a situation such as that modelled by Celgene,
where subsequent therapy is unavailable.
In any case it is questionable that the sequence of treatments studied in the model (i.e., AZA
followed by BSC and CCR followed by BSC) is realistic and the relative effectiveness
parameter values used in the model themselves reflect a treatment pathway different to that
of the model, especially for the azacitidine intervention, whose estimated relative survival
effectiveness was not adjusted for the effects of subsequent treatments in the RCT data
source as discussed in Section 5.3.6.
Page 107 of 145
5.3.5 Perspective, time horizon and discounting
The NHS and PSS perspective was used, in line with the NICE reference case. Given the
mean age of the modelled cohort and the limited life expectancy of its patient population, the
10-year time horizon is likely to capture practically all important differences in costs and
health benefits as almost all patients would have died within such period. Discounting was
also applied to costs and QALYs as in the NICE reference case.
5.3.6 Treatment effectiveness and extrapolation
5.3.6.1 Extrapolation of overall, progression-free and relapse-free survival and
effectiveness estimates of progression-free and relapse-free survival
The choice of parametric curves for extrapolation of OS, PFS and RFS, was based on a
comparison of goodness of fit statistics associated with the candidate parametric models.
However, only models that implied proportional hazards treatment effects were considered
(i.e., exponential, Weibull and Gompertz). Other parametric models, in particular log-logistic
and log-normal models, i.e., accelerated failure time models, which allow increasing event
rates over time at the start of follow-up and decreasing event rates at later times, were not
considered.
According to the submission, Celgene’s decision only to consider PH models found support
in the statistical tests of the assumption for the OS and PFS, but not in the tests results of
RFS data. The company states that (Source: Celgene submission, Section 5.3.3, p. 112):
Figure 17 [of the company’s submission] shows the log-log plot for RFS hazards;
unlike OS and PFS, these indicate that the PH assumption is weak, and a Cox
regression run with an interaction between treatment group and ln(time) showed a
statistically significant effect of the interaction (p-value of 0.011); however, the PH
assumption overall has been retained for consistency.
It is unclear what consistency means in this statement, but it appears the PH assumption
was imposed in the extrapolation and estimation of treatment effects on relapse because PH
was not rejected in the analysis of OS and PFS, which is a methodology that is likely to be
flawed.
The submission elaborates on the company’s methodological practice stating that “HRs are
also used still for RFS in the model because the shape of the RFS curves, both overall and
for treatment groups and subgroups, are not well suited for independent regression models
(for illustration of this: there is no indication visually that independent regression models
would better characterise observed RFS for extrapolation)”. It is unclear what this statement
tries to convey. In any case, Celgene had better options to their chosen biased approach.
The company could have fitted a separate curve to the RFS data of each trial arm, instead of
forcing a common parametric shape on those curves. Also more flexible models could have
been estimated than those supporting the proportional hazard assumption, which although
convenient was not indispensable in this or any similar analysis.
The analysis of OS in the submission is also flawed. Although the company reported results
of a statistical test (for statistically significant interaction of the treatment group variable and
the logarithm of time) and visual inspection of log-log plots that supported the PH
assumption, these diagnostic checks were only applied to data that was unadjusted for
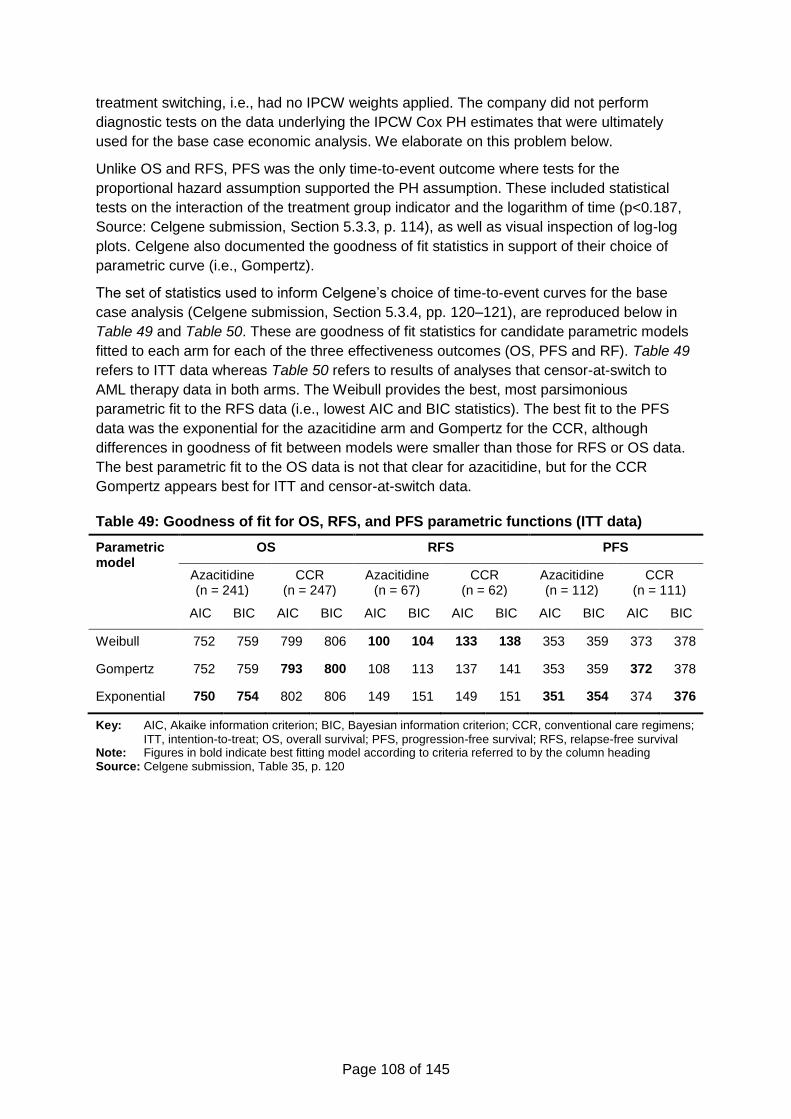
Page 108 of 145
treatment switching, i.e., had no IPCW weights applied. The company did not perform
diagnostic tests on the data underlying the IPCW Cox PH estimates that were ultimately
used for the base case economic analysis. We elaborate on this problem below.
Unlike OS and RFS, PFS was the only time-to-event outcome where tests for the
proportional hazard assumption supported the PH assumption. These included statistical
tests on the interaction of the treatment group indicator and the logarithm of time (p<0.187,
Source: Celgene submission, Section 5.3.3, p. 114), as well as visual inspection of log-log
plots. Celgene also documented the goodness of fit statistics in support of their choice of
parametric curve (i.e., Gompertz).
The set of statistics used to inform Celgene’s choice of time-to-event curves for the base
case analysis (Celgene submission, Section 5.3.4, pp. 120–121), are reproduced below in
Table 49 and Table 50. These are goodness of fit statistics for candidate parametric models
fitted to each arm for each of the three effectiveness outcomes (OS, PFS and RF). Table 49
refers to ITT data whereas Table 50 refers to results of analyses that censor-at-switch to
AML therapy data in both arms. The Weibull provides the best, most parsimonious
parametric fit to the RFS data (i.e., lowest AIC and BIC statistics). The best fit to the PFS
data was the exponential for the azacitidine arm and Gompertz for the CCR, although
differences in goodness of fit between models were smaller than those for RFS or OS data.
The best parametric fit to the OS data is not that clear for azacitidine, but for the CCR
Gompertz appears best for ITT and censor-at-switch data.
Table 49: Goodness of fit for OS, RFS, and PFS parametric functions (ITT data)
Parametric model
OS RFS PFS
Azacitidine (n = 241)
CCR (n = 247)
Azacitidine (n = 67)
CCR (n = 62)
Azacitidine (n = 112)
CCR (n = 111)
AIC BIC AIC BIC AIC BIC AIC BIC AIC BIC AIC BIC
Weibull 752 759 799 806 100 104 133 138 353 359 373 378
Gompertz 752 759 793 800 108 113 137 141 353 359 372 378
Exponential 750 754 802 806 149 151 149 151 351 354 374 376
Key: AIC, Akaike information criterion; BIC, Bayesian information criterion; CCR, conventional care regimens;
ITT, intention-to-treat; OS, overall survival; PFS, progression-free survival; RFS, relapse-free survival Note: Figures in bold indicate best fitting model according to criteria referred to by the column heading Source: Celgene submission, Table 35, p. 120
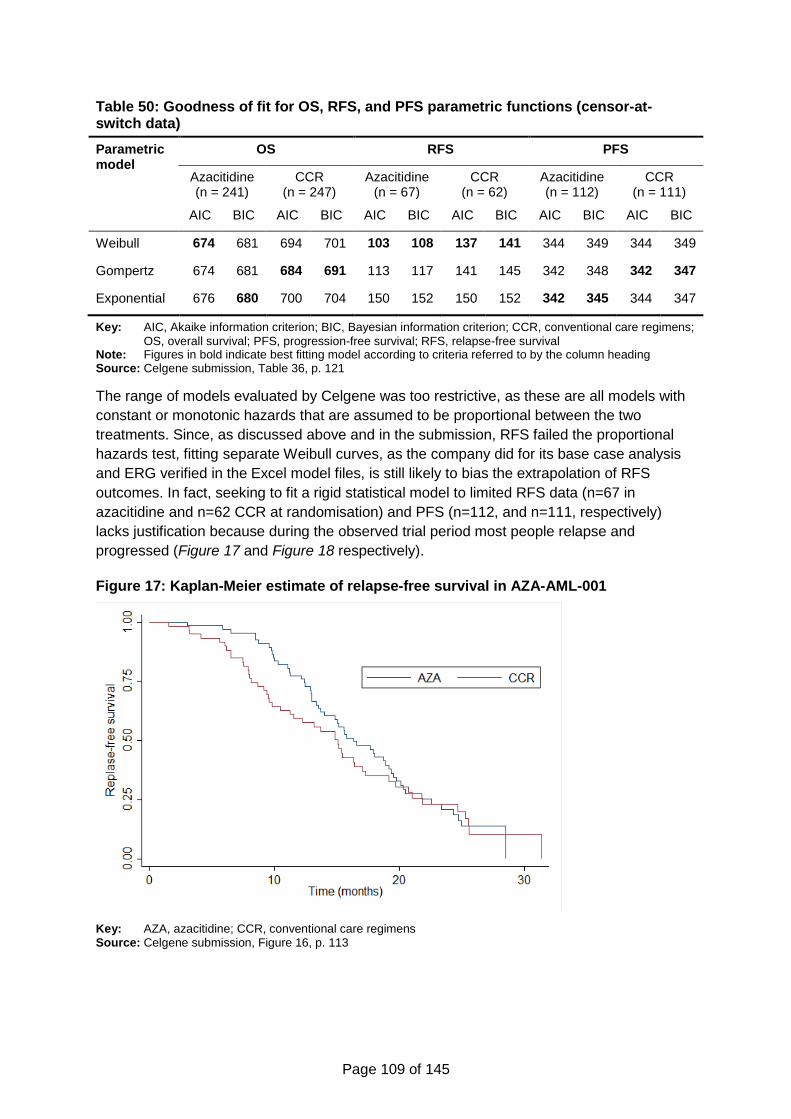
Page 109 of 145
Table 50: Goodness of fit for OS, RFS, and PFS parametric functions (censor-at-switch data)
Parametric model
OS RFS PFS
Azacitidine (n = 241)
CCR (n = 247)
Azacitidine (n = 67)
CCR (n = 62)
Azacitidine (n = 112)
CCR (n = 111)
AIC BIC AIC BIC AIC BIC AIC BIC AIC BIC AIC BIC
Weibull 674 681 694 701 103 108 137 141 344 349 344 349
Gompertz 674 681 684 691 113 117 141 145 342 348 342 347
Exponential 676 680 700 704 150 152 150 152 342 345 344 347
Key: AIC, Akaike information criterion; BIC, Bayesian information criterion; CCR, conventional care regimens;
OS, overall survival; PFS, progression-free survival; RFS, relapse-free survival Note: Figures in bold indicate best fitting model according to criteria referred to by the column heading Source: Celgene submission, Table 36, p. 121
The range of models evaluated by Celgene was too restrictive, as these are all models with
constant or monotonic hazards that are assumed to be proportional between the two
treatments. Since, as discussed above and in the submission, RFS failed the proportional
hazards test, fitting separate Weibull curves, as the company did for its base case analysis
and ERG verified in the Excel model files, is still likely to bias the extrapolation of RFS
outcomes. In fact, seeking to fit a rigid statistical model to limited RFS data (n=67 in
azacitidine and n=62 CCR at randomisation) and PFS (n=112, and n=111, respectively)
lacks justification because during the observed trial period most people relapse and
progressed (Figure 17 and Figure 18 respectively).
Figure 17: Kaplan-Meier estimate of relapse-free survival in AZA-AML-001
Key: AZA, azacitidine; CCR, conventional care regimens Source: Celgene submission, Figure 16, p. 113
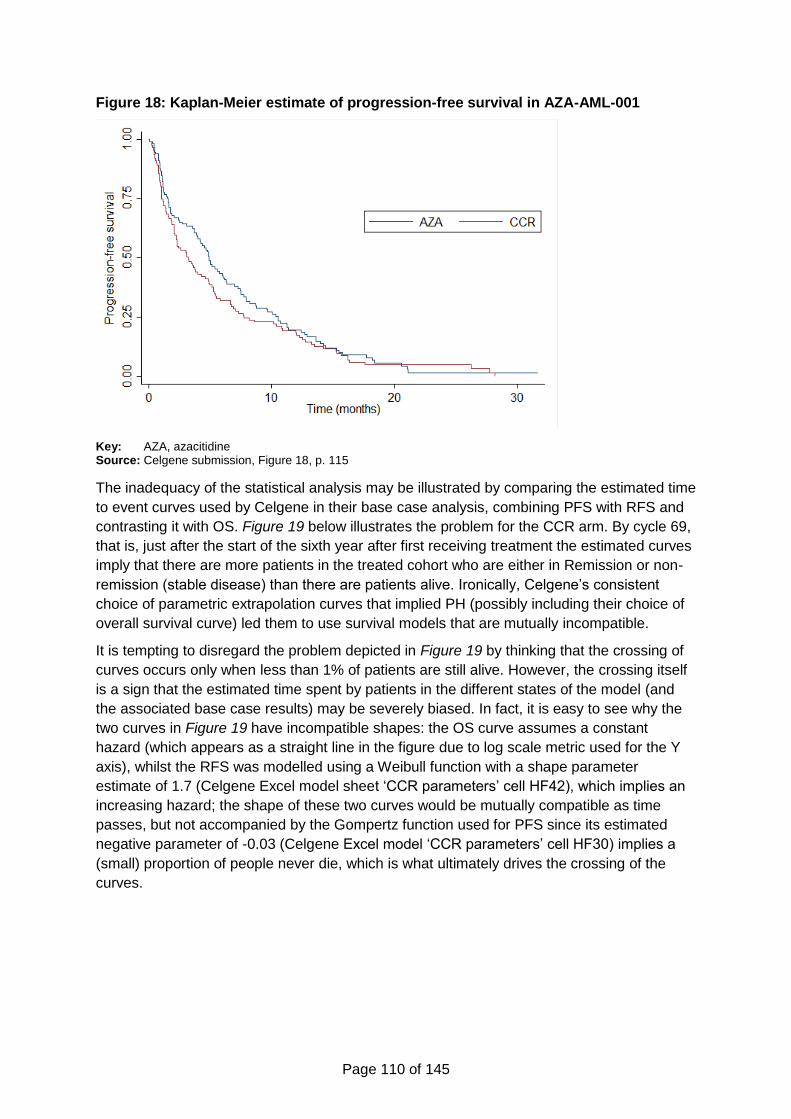
Page 110 of 145
Figure 18: Kaplan-Meier estimate of progression-free survival in AZA-AML-001
Key: AZA, azacitidine Source: Celgene submission, Figure 18, p. 115
The inadequacy of the statistical analysis may be illustrated by comparing the estimated time
to event curves used by Celgene in their base case analysis, combining PFS with RFS and
contrasting it with OS. Figure 19 below illustrates the problem for the CCR arm. By cycle 69,
that is, just after the start of the sixth year after first receiving treatment the estimated curves
imply that there are more patients in the treated cohort who are either in Remission or non-
remission (stable disease) than there are patients alive. Ironically, Celgene’s consistent
choice of parametric extrapolation curves that implied PH (possibly including their choice of
overall survival curve) led them to use survival models that are mutually incompatible.
It is tempting to disregard the problem depicted in Figure 19 by thinking that the crossing of
curves occurs only when less than 1% of patients are still alive. However, the crossing itself
is a sign that the estimated time spent by patients in the different states of the model (and
the associated base case results) may be severely biased. In fact, it is easy to see why the
two curves in Figure 19 have incompatible shapes: the OS curve assumes a constant
hazard (which appears as a straight line in the figure due to log scale metric used for the Y
axis), whilst the RFS was modelled using a Weibull function with a shape parameter
estimate of 1.7 (Celgene Excel model sheet ‘CCR parameters’ cell HF42), which implies an
increasing hazard; the shape of these two curves would be mutually compatible as time
passes, but not accompanied by the Gompertz function used for PFS since its estimated
negative parameter of -0.03 (Celgene Excel model ‘CCR parameters’ cell HF30) implies a
(small) proportion of people never die, which is what ultimately drives the crossing of the
curves.
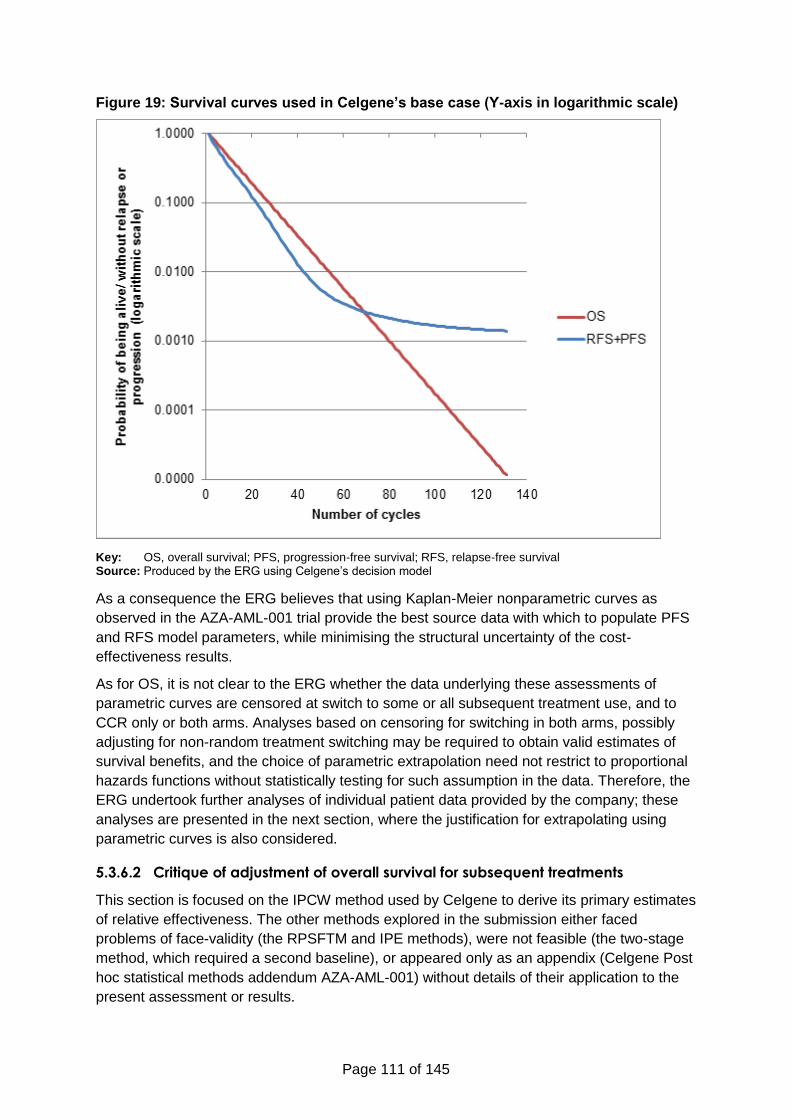
Page 111 of 145
Figure 19: Survival curves used in Celgene’s base case (Y-axis in logarithmic scale)
Key: OS, overall survival; PFS, progression-free survival; RFS, relapse-free survival Source: Produced by the ERG using Celgene’s decision model
As a consequence the ERG believes that using Kaplan-Meier nonparametric curves as
observed in the AZA-AML-001 trial provide the best source data with which to populate PFS
and RFS model parameters, while minimising the structural uncertainty of the cost-
effectiveness results.
As for OS, it is not clear to the ERG whether the data underlying these assessments of
parametric curves are censored at switch to some or all subsequent treatment use, and to
CCR only or both arms. Analyses based on censoring for switching in both arms, possibly
adjusting for non-random treatment switching may be required to obtain valid estimates of
survival benefits, and the choice of parametric extrapolation need not restrict to proportional
hazards functions without statistically testing for such assumption in the data. Therefore, the
ERG undertook further analyses of individual patient data provided by the company; these
analyses are presented in the next section, where the justification for extrapolating using
parametric curves is also considered.
5.3.6.2 Critique of adjustment of overall survival for subsequent treatments
This section is focused on the IPCW method used by Celgene to derive its primary estimates
of relative effectiveness. The other methods explored in the submission either faced
problems of face-validity (the RPSFTM and IPE methods), were not feasible (the two-stage
method, which required a second baseline), or appeared only as an appendix (Celgene Post
hoc statistical methods addendum AZA-AML-001) without details of their application to the
present assessment or results.
Page 112 of 145
As discussed in Section 5.2.5.1 (page 77), the validity of the IPCW method, which originated
in the literature of causal effects estimation using observational data, is limited by its
requirement that data for all relevant confounders related to treatment switching and
mortality are included in the analysis, and tends to perform poorly in small samples or
applications with rare events. In an RCT context where the method could take advantage of
high quality prognostic information to adjust for observed confounding in treatment switching,
the IPCW method is hampered by the small size of available samples of patient data.
Consequently, IPCW was not used by Celgene to estimate OS effectiveness by CCR
preselected therapy.
Indeed, the company stated (Source: Celgene submission, Section 5.3.5, p. 123):
subgroup adjustment was not feasible because of limited data on switching; however,
a clinical expert consulted during this analysis stated that questions can be raised
about the clinical generalizability of the results in subgroups [This refers to
controlling/adjusting for the three treatment groups within CCR, as well as for
cytogenetic risk or MDS subgroups, as clarified by Celgene in response to questions
by ERG], because clinicians can identify potential switching candidates based on
observed performance, and recommended focusing on the adjusted data for overall
patients.
Similarly, in response to the request by ERG to clarify the reason for not adjusting event-free
survival, relapse-free survival and progression-free survival for treatment switching, the
company answered that “This was due to sample size primarily. The instances in which
switching preceded the clinical event of interest were few, and the impact of this on the
results would be very small.”
Celgene provided the ERG with the individual patient data for replicating the IPCW
estimation of the Cox proportional hazard ratios used in the company’s base case cost-
effectiveness analysis. ERG was able to replicate those results (Table 51). The ERG was
unable, however, to replicate the estimation of IPCW weights, which were provided by the
company but without the dataset used to estimate them. Thus the ERG can only comment
on the quality of the analyses of OS with the IPCW weights as given, without being able to
assess whether the statistical model used to estimate these weights is of good quality. This
is a relevant issue given the relatively small sample available for analysis and the large
number of groups of patients as defined by the covariates used in the IPCW model, which
according to the SAS code (Celgene appendices to submission, Appendix 10) and Table 52,
included four binary and one three-level fixed baseline variables, three binary time-varying
covariates, and one variable indicating the 76 15-day periods of observation, for a total of 24
× 31 × 22 = 192 possible subgroups at each of the 76 follow-up times. It is unlikely that the
validating condition (see Section 4.3.2, p. 61) of there being a positive probability of not
being censored at each and every follow-up point and for every combination of values
observed for the covariates in the IPCW model, might have been met in this sample, and this
became less likely as time passed in the trial.
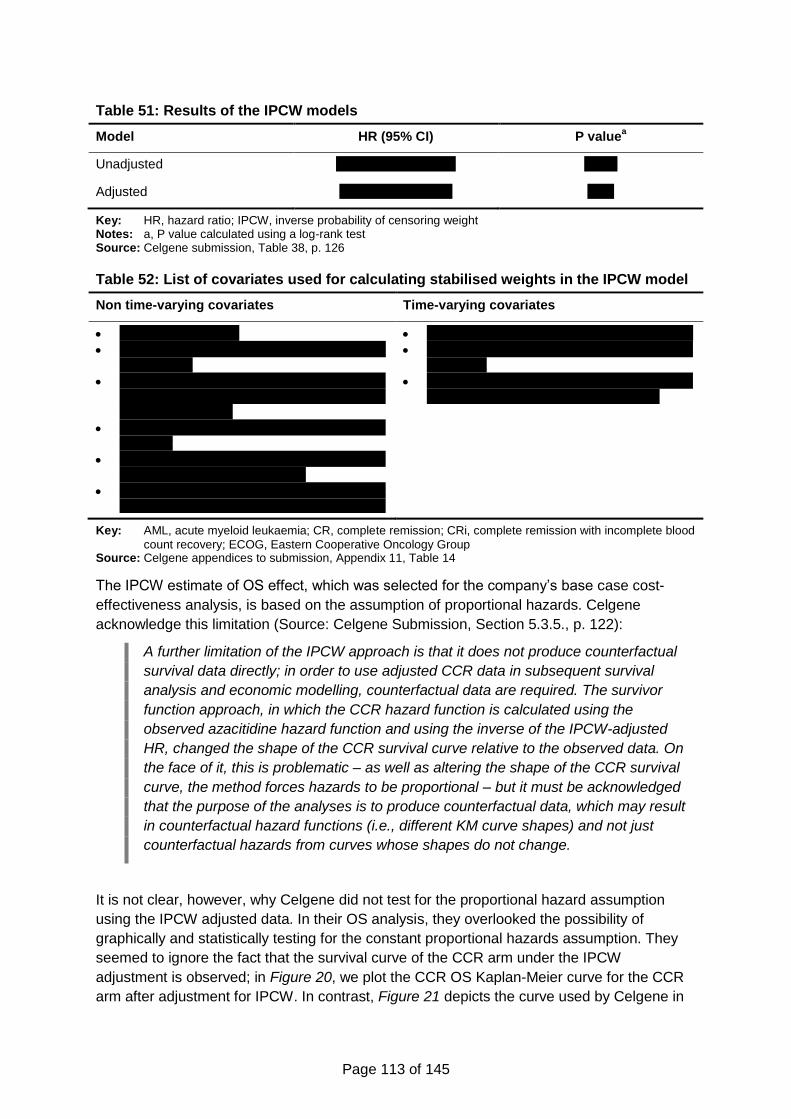
Page 113 of 145
Table 51: Results of the IPCW models
Model HR (95% CI) P valuea
Unadjusted xxxxxxxxxxxxxxxxxx xxxxx
Adjusted xxxxxxxxxxxxxxxxx xxxx
Key: HR, hazard ratio; IPCW, inverse probability of censoring weight Notes: a, P value calculated using a log-rank test Source: Celgene submission, Table 38, p. 126
Table 52: List of covariates used for calculating stabilised weights in the IPCW model
Non time-varying covariates Time-varying covariates
xxxxxxxxxxxxxxxxxx
xxxxxxxxxxxxxxxxxxxxxxxxxxxxxxxxxxxxxxxx xxxxxxxxxxx
xxxxxxxxxxxxxxxxxxxxxxxxxxxxxxxxxxxxxxxxxxxxxxxxxxxxxxxxxxxxxxxxxxxxxxxxxxxxxxxxxxxxxxxxxxxxxxxxx
xxxxxxxxxxxxxxxxxxxxxxxxxxxxxxxxxxxxxxxxxxxxxxxx
xxxxxxxxxxxxxxxxxxxxxxxxxxxxxxxxxxxxxxxxxxxxxxxxxxxxxxxxxxxxxxxxxxxx
xxxxxxxxxxxxxxxxxxxxxxxxxxxxxxxxxxxxxxxxxxxxxxxxxxxxxxxxxxxxxxxxxxxxxxxxxxxxxxxx
xxxxxxxxxxxxxxxxxxxxxxxxxxxxxxxxxxxxxxxx
xxxxxxxxxxxxxxxxxxxxxxxxxxxxxxxxxxxxxxxxxxxxxxxxx
xxxxxxxxxxxxxxxxxxxxxxxxxxxxxxxxxxxxxxxxxxxxxxxxxxxxxxxxxxxxxxxxxxxxxxxxxxx
Key: AML, acute myeloid leukaemia; CR, complete remission; CRi, complete remission with incomplete blood
count recovery; ECOG, Eastern Cooperative Oncology Group Source: Celgene appendices to submission, Appendix 11, Table 14
The IPCW estimate of OS effect, which was selected for the company’s base case cost-
effectiveness analysis, is based on the assumption of proportional hazards. Celgene
acknowledge this limitation (Source: Celgene Submission, Section 5.3.5., p. 122):
A further limitation of the IPCW approach is that it does not produce counterfactual
survival data directly; in order to use adjusted CCR data in subsequent survival
analysis and economic modelling, counterfactual data are required. The survivor
function approach, in which the CCR hazard function is calculated using the
observed azacitidine hazard function and using the inverse of the IPCW-adjusted
HR, changed the shape of the CCR survival curve relative to the observed data. On
the face of it, this is problematic – as well as altering the shape of the CCR survival
curve, the method forces hazards to be proportional – but it must be acknowledged
that the purpose of the analyses is to produce counterfactual data, which may result
in counterfactual hazard functions (i.e., different KM curve shapes) and not just
counterfactual hazards from curves whose shapes do not change.
It is not clear, however, why Celgene did not test for the proportional hazard assumption
using the IPCW adjusted data. In their OS analysis, they overlooked the possibility of
graphically and statistically testing for the constant proportional hazards assumption. They
seemed to ignore the fact that the survival curve of the CCR arm under the IPCW
adjustment is observed; in Figure 20, we plot the CCR OS Kaplan-Meier curve for the CCR
arm after adjustment for IPCW. In contrast, Figure 21 depicts the curve used by Celgene in
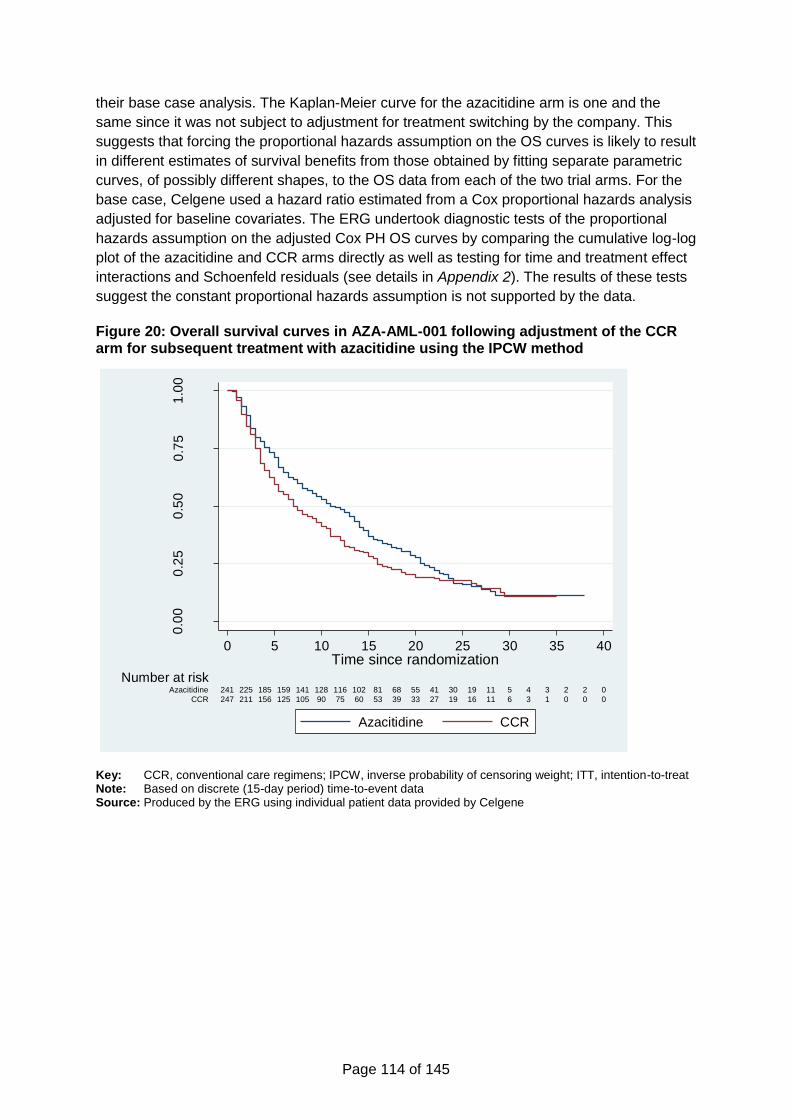
Page 114 of 145
their base case analysis. The Kaplan-Meier curve for the azacitidine arm is one and the
same since it was not subject to adjustment for treatment switching by the company. This
suggests that forcing the proportional hazards assumption on the OS curves is likely to result
in different estimates of survival benefits from those obtained by fitting separate parametric
curves, of possibly different shapes, to the OS data from each of the two trial arms. For the
base case, Celgene used a hazard ratio estimated from a Cox proportional hazards analysis
adjusted for baseline covariates. The ERG undertook diagnostic tests of the proportional
hazards assumption on the adjusted Cox PH OS curves by comparing the cumulative log-log
plot of the azacitidine and CCR arms directly as well as testing for time and treatment effect
interactions and Schoenfeld residuals (see details in Appendix 2). The results of these tests
suggest the constant proportional hazards assumption is not supported by the data.
Figure 20: Overall survival curves in AZA-AML-001 following adjustment of the CCR arm for subsequent treatment with azacitidine using the IPCW method
Key: CCR, conventional care regimens; IPCW, inverse probability of censoring weight; ITT, intention-to-treat Note: Based on discrete (15-day period) time-to-event data Source: Produced by the ERG using individual patient data provided by Celgene
0.0
00
.25
0.5
00
.75
1.0
0
Pro
po
rtio
n s
urv
ivin
g o
vera
ll
247 211 156 125 105 90 75 60 53 39 33 27 19 16 11 6 3 1 0 0 0CCR
241 225 185 159 141 128 116 102 81 68 55 41 30 19 11 5 4 3 2 2 0Azacitidine
Number at risk
0 5 1510 20 25 30 35 40Time since randomization
Azacitidine CCR
Page 115 of 145
Figure 21: Overall survival from AZA-AML-001 adjusted using hazard ratio from the IPCW method
Key: CCR, conventional care regimens; HR, hazard ratio; IPCW, inverse probability of censoring weight Source: Celgene submission, Figure 25, p. 127
Celgene stated that progression and relapse events in the trial occurred before other
censoring events and few cases of progression and relapse occurred after subsequent
therapy use in CCR (Source: Celgene responses to NICE questions for clarification). This
suggests that adjustment of PFS and RFS using the IPCW method would not have been
practicable due to very small numbers, but the company could have applied simple
censoring at switch adjustments on curves to verify that indeed subsequent therapy use was
not important for the results, as the company suggests.
In any case, these adjustments for treatment switching are inconsistent with the economic
model for which they were intended. The Celgene model assumes no subsequent therapy
use was available after either azacitidine or CCR (Celgene submission, Section 5.6.2, p.
161). In contrast, the clinical effectiveness analyses conducted by Celgene only adjusted for
subsequent treatment with azacitidine in CCR arm, thus ignoring the use of subsequent
treatments in the azacitidine arm of AZA-AML-001 (the source of the clinical effectiveness
data), as well as any active subsequent treatments other than azacitidine used in the CCR
arm.
In defence of their methodology, Celgene referred to the methodological recommendations
in the NICE DSU TSD1651 as indicating that the NICE preferred approach is to adjust
treatment switching in the comparator (CCR arm) but not the intervention (azacitidine arm).
As discussed in Section 4.3 (page 59), this is an incorrect interpretation of NICE DSU
TSD16, which clearly recommends that in situations where, as in the present case, the
decision problem involves the evaluation of two alternative states of the world where no
subsequent active treatment is available, then adjustment of outcomes for active treatment
switching in both trial arms is warranted. Whether the assumption that no subsequent active
treatment would be available to UK patients in routine practice is plausible may of course be
questioned, but the point here is that applying IPCW adjustment for subsequent treatment to
Page 116 of 145
the outcome data of the CCR but not the azacitidine arm in the AZA-AML-001 trial is
inconsistent with the economic model which the overall survival IPCW analysis was
designed to inform.
To remedy the contradiction between the model structure, on the one hand, and the
methodology underlying the OS treatment effect estimates, on the other, two options were
available to the ERG. One was to correct the model to include the costs of subsequent
treatments used in the AZA-AML-001 and left unadjusted for in the statistical analysis that
produced the base case OS treatment effect estimates. This option was not feasible
because the required data on the dates of start and end of subsequent treatments as well as
treatment dosages and frequencies of administration were not available to ERG. The
alternative of adjusting the estimates of relative effectiveness for subsequent AML treatment
use in both arms of AZA-AML-001 was feasible, since the company provided results of such
analysis using IPCW (Celgene submission, Table 21, p. 70). A limitation of this option was
that statistical tests to validate these analyses were not reported, and the Kaplan-Meier or
individual patient data required to perform them were not available to ERG either (not all the
required data were available in the individual patient data that Celgene provided for ERG
use). Ideally, testing for the Cox PH assumption would be performed and, if rejected,
treatment effects estimated using a different model.
The only option available to ERG was to base the test of the proportional hazards
assumption on OS data censored-at-switch, which had similar Kaplan-Meier plots as the OS
IPCW weighted data in the CCR arm, and resulted in small differences in hazard ratio
estimates (Celgene appendices to submission, Appendix 11). The data provided by Celgene
did not allow ERG to extend the IPCW analysis to adjust for subsequent AML therapy to
both treatment groups. However, the company provided the data to perform censor-at-switch
analysis for any subsequent AML therapy use in both trial arms, as well as testing for the
proportional hazards assumption in the data. Fitting a range of parametric curves including
proportional (exponential, Weibull, Gompertz, Bathtub) and non-proportional hazard
parametric models (log-normal and log-logistic) to OS data from each trial arm separately
resulted in the following goodness of fit statistics and test statistics for nested models (i.e.,
whether the simple exponential model could be supported by the results of more complex
proportional hazards models).
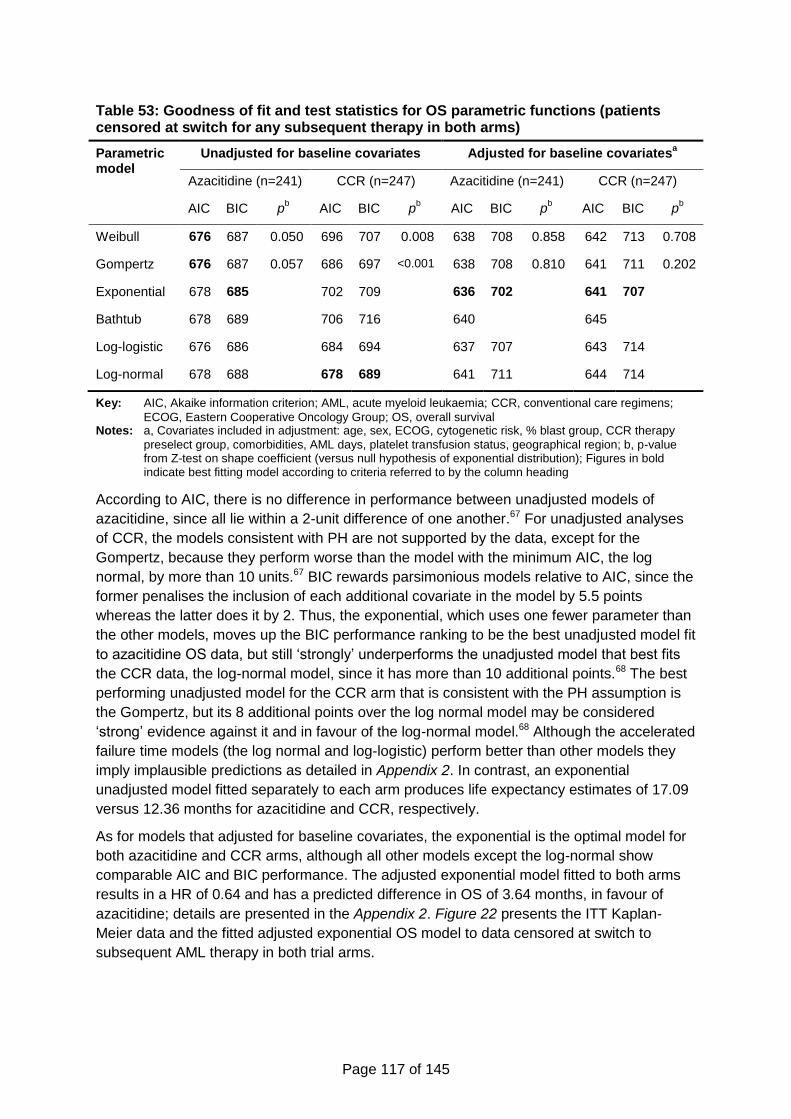
Page 117 of 145
Table 53: Goodness of fit and test statistics for OS parametric functions (patients censored at switch for any subsequent therapy in both arms)
Parametric model
Unadjusted for baseline covariates Adjusted for baseline covariatesa
Azacitidine (n=241) CCR (n=247) Azacitidine (n=241) CCR (n=247)
AIC BIC pb AIC BIC p
b AIC BIC p
b AIC BIC p
b
Weibull 676 687 0.050 696 707 0.008 638 708 0.858 642 713 0.708
Gompertz 676 687 0.057 686 697 <0.001 638 708 0.810 641 711 0.202
Exponential 678 685 702 709 636 702 641 707
Bathtub 678 689 706 716 640 645
Log-logistic 676 686 684 694 637 707 643 714
Log-normal 678 688 678 689 641 711 644 714
Key: AIC, Akaike information criterion; AML, acute myeloid leukaemia; CCR, conventional care regimens;
ECOG, Eastern Cooperative Oncology Group; OS, overall survival Notes: a, Covariates included in adjustment: age, sex, ECOG, cytogenetic risk, % blast group, CCR therapy
preselect group, comorbidities, AML days, platelet transfusion status, geographical region; b, p-value from Z-test on shape coefficient (versus null hypothesis of exponential distribution); Figures in bold indicate best fitting model according to criteria referred to by the column heading
According to AIC, there is no difference in performance between unadjusted models of
azacitidine, since all lie within a 2-unit difference of one another.67 For unadjusted analyses
of CCR, the models consistent with PH are not supported by the data, except for the
Gompertz, because they perform worse than the model with the minimum AIC, the log
normal, by more than 10 units.67 BIC rewards parsimonious models relative to AIC, since the
former penalises the inclusion of each additional covariate in the model by 5.5 points
whereas the latter does it by 2. Thus, the exponential, which uses one fewer parameter than
the other models, moves up the BIC performance ranking to be the best unadjusted model fit
to azacitidine OS data, but still ‘strongly’ underperforms the unadjusted model that best fits
the CCR data, the log-normal model, since it has more than 10 additional points.68 The best
performing unadjusted model for the CCR arm that is consistent with the PH assumption is
the Gompertz, but its 8 additional points over the log normal model may be considered
‘strong’ evidence against it and in favour of the log-normal model.68 Although the accelerated
failure time models (the log normal and log-logistic) perform better than other models they
imply implausible predictions as detailed in Appendix 2. In contrast, an exponential
unadjusted model fitted separately to each arm produces life expectancy estimates of 17.09
versus 12.36 months for azacitidine and CCR, respectively.
As for models that adjusted for baseline covariates, the exponential is the optimal model for
both azacitidine and CCR arms, although all other models except the log-normal show
comparable AIC and BIC performance. The adjusted exponential model fitted to both arms
results in a HR of 0.64 and has a predicted difference in OS of 3.64 months, in favour of
azacitidine; details are presented in the Appendix 2. Figure 22 presents the ITT Kaplan-
Meier data and the fitted adjusted exponential OS model to data censored at switch to
subsequent AML therapy in both trial arms.
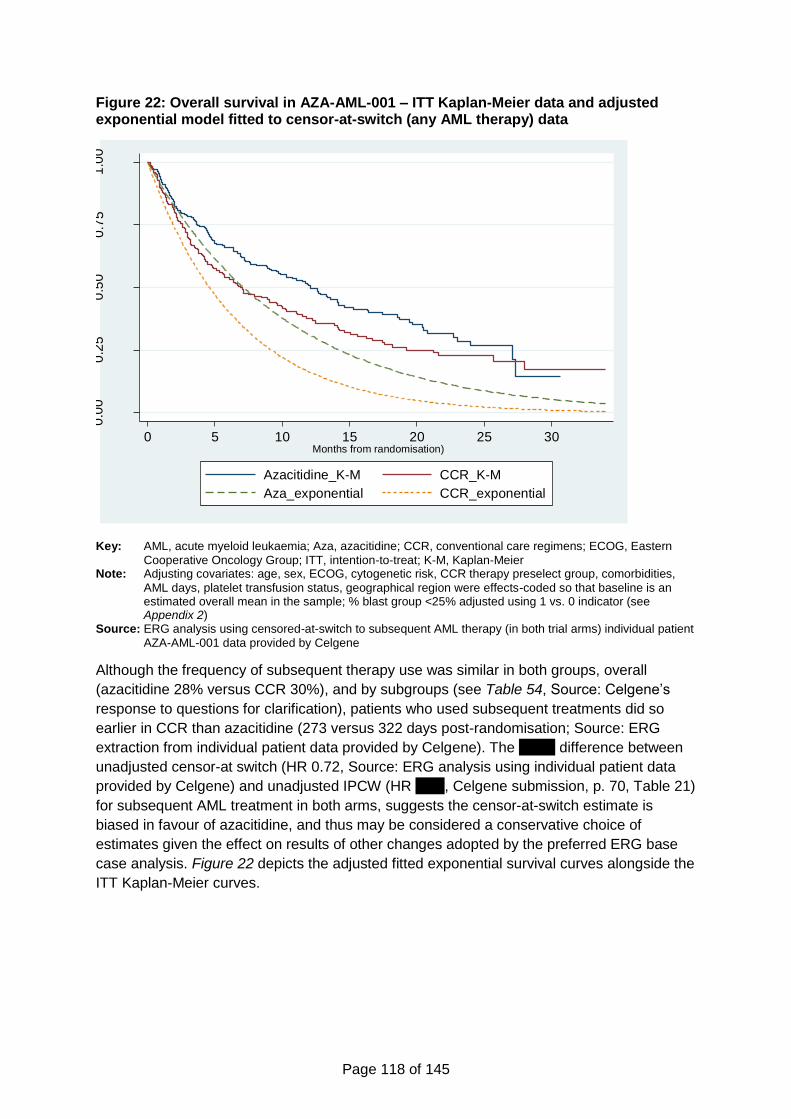
Page 118 of 145
Figure 22: Overall survival in AZA-AML-001 – ITT Kaplan-Meier data and adjusted exponential model fitted to censor-at-switch (any AML therapy) data
Key: AML, acute myeloid leukaemia; Aza, azacitidine; CCR, conventional care regimens; ECOG, Eastern
Cooperative Oncology Group; ITT, intention-to-treat; K-M, Kaplan-Meier Note: Adjusting covariates: age, sex, ECOG, cytogenetic risk, CCR therapy preselect group, comorbidities,
AML days, platelet transfusion status, geographical region were effects-coded so that baseline is an estimated overall mean in the sample; % blast group <25% adjusted using 1 vs. 0 indicator (see Appendix 2)
Source: ERG analysis using censored-at-switch to subsequent AML therapy (in both trial arms) individual patient
AZA-AML-001 data provided by Celgene
Although the frequency of subsequent therapy use was similar in both groups, overall
(azacitidine 28% versus CCR 30%), and by subgroups (see Table 54, Source: Celgene’s
response to questions for clarification), patients who used subsequent treatments did so
earlier in CCR than azacitidine (273 versus 322 days post-randomisation; Source: ERG
extraction from individual patient data provided by Celgene). The xxxxx difference between
unadjusted censor-at switch (HR 0.72, Source: ERG analysis using individual patient data
provided by Celgene) and unadjusted IPCW (HR xxxx, Celgene submission, p. 70, Table 21)
for subsequent AML treatment in both arms, suggests the censor-at-switch estimate is
biased in favour of azacitidine, and thus may be considered a conservative choice of
estimates given the effect on results of other changes adopted by the preferred ERG base
case analysis. Figure 22 depicts the adjusted fitted exponential survival curves alongside the
ITT Kaplan-Meier curves.
0.0
00
.25
0.5
00
.75
1.0
0
0 5 10 15 20 25 30Months from randomisation)
Azacitidine_K-M CCR_K-M
Aza_exponential CCR_exponential
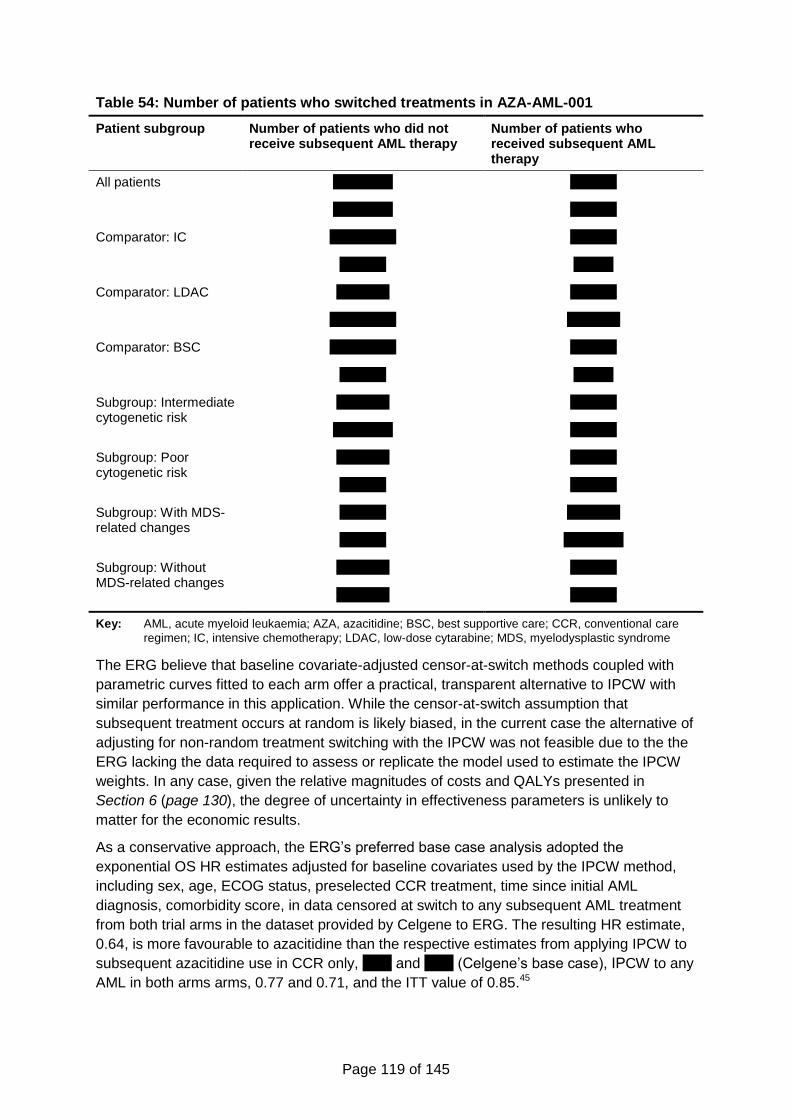
Page 119 of 145
Table 54: Number of patients who switched treatments in AZA-AML-001
Patient subgroup Number of patients who did not receive subsequent AML therapy
Number of patients who received subsequent AML therapy
All patients xxxxxxxxx xxxxxxx
xxxxxxxxx xxxxxxx
Comparator: IC xxxxxxxxxx xxxxxxx
xxxxxxx xxxxxx
Comparator: LDAC xxxxxxxx xxxxxxx
xxxxxxxxxx xxxxxxxx
Comparator: BSC xxxxxxxxxx xxxxxxx
xxxxxxx xxxxxx
Subgroup: Intermediate cytogenetic risk
xxxxxxxx xxxxxxx
xxxxxxxxx xxxxxxx
Subgroup: Poor cytogenetic risk
xxxxxxxx xxxxxxx
xxxxxxx xxxxxxx
Subgroup: With MDS-related changes
xxxxxxx xxxxxxxx
xxxxxxx xxxxxxxxx
Subgroup: Without MDS-related changes
xxxxxxxx xxxxxxx
xxxxxxxx xxxxxxx
Key: AML, acute myeloid leukaemia; AZA, azacitidine; BSC, best supportive care; CCR, conventional care
regimen; IC, intensive chemotherapy; LDAC, low-dose cytarabine; MDS, myelodysplastic syndrome
The ERG believe that baseline covariate-adjusted censor-at-switch methods coupled with
parametric curves fitted to each arm offer a practical, transparent alternative to IPCW with
similar performance in this application. While the censor-at-switch assumption that
subsequent treatment occurs at random is likely biased, in the current case the alternative of
adjusting for non-random treatment switching with the IPCW was not feasible due to the the
ERG lacking the data required to assess or replicate the model used to estimate the IPCW
weights. In any case, given the relative magnitudes of costs and QALYs presented in
Section 6 (page 130), the degree of uncertainty in effectiveness parameters is unlikely to
matter for the economic results.
As a conservative approach, the ERG’s preferred base case analysis adopted the
exponential OS HR estimates adjusted for baseline covariates used by the IPCW method,
including sex, age, ECOG status, preselected CCR treatment, time since initial AML
diagnosis, comorbidity score, in data censored at switch to any subsequent AML treatment
from both trial arms in the dataset provided by Celgene to ERG. The resulting HR estimate,
0.64, is more favourable to azacitidine than the respective estimates from applying IPCW to
subsequent azacitidine use in CCR only, xxxx and xxxx (Celgene’s base case), IPCW to any
AML in both arms arms, 0.77 and 0.71, and the ITT value of 0.85.45
Page 120 of 145
It must be noted that the adjusted censored at switch analysis performed by the ERG in
obtaining its preferred estimate of OS effectiveness was not extended to subgroup analyses,
since the small sample is likely to lead to bias due to overfitting when adjusting for baseline
covariates. The subgroup analyses were thus based on the original censor-at switch
exponential OS curves estimates used by the company in their model.
5.3.7 Health-related quality of life
A number of problems were found with the assessment of health related quality of life in the
economic analysis. However, based on univariate sensitivity analyses presented by Celgene
and conducted by ERG, the bias originating from this element of the model has an
insignificant influence on the ICER.
In line with RCT studies in this field, health related quality of life was measured at the start of
every other cycle in AZA-AML-001 using a disease specific HRQoL measure, the EORTC
QLQ-C30. Since EQ-5D outcomes were not measured in the trial, peer-reviewed mapping
algorithms were identified and used by Celgene in accordance with NICE methodological
guidance.41
Three potential limitations of this analysis were identified by ERG. One related to the
possibility that because HRQoL was measured every 56 days in AZA-AML-001, the effects
of some important acute adverse clinical events, especially treatment-related ones, may
have been missed by the data collection. Advice sought from clinical experts suggests that
no obvious important events would have been expected to be missed by the quality of life
study supporting the Celgene submission.
Another potential issue was missing data. Celgene reported that longitudinal statistical
analysis using mixed methods were employed to assess HRQoL (Celgene Submission,
Section 4.7.5.8, p. 77), and in response to clarification questions by ERG, the company
stated that:
A mixed effect model repeat measurement (MMRM) model was developed for the
EORTC QLQ-C30 Fatigue domain with the inclusion of a fixed-effect covariate
indicating whether a transfusion had taken place up to 5 days before health related
quality of life (HRQL) assessment. This analysis was undertaken because blood
transfusions are likely to affect fatigue, but this relationship would not have been
explored by previous analyses.
Additional MMRM models were developed for the secondary HRQL domains
(Dyspnoea, Physical Functioning and Global Health Status/ quality of life (QoL)) that
included RBC or platelet transfusion up to 5 days before the HRQL assessment as a
factor.
The statement ‘A mixed model analysis failed to reveal any statistically significant
differences in the impact of treatment on all domains between treatment arms’
references the post-hoc MMRM analysis controlling for the impact of red blood cell
(RBC) or platelet transfusion received up to 5 days before HRQoL assessment. It
was hypothesized by the clinical study team that transfusions administered shortly
before HRQoL assessment may have an effect on fatigue, and this effect would not
have been captured in the initial model. The results of the MMRM analysis for the
Fatigue domain without this additional covariate were significant in favour of CCR.
Page 121 of 145
No significant differences were observed for the secondary domains. Full
presentation of both results can be located in the CSR section 11.4.1.2.10.7.
All MMRM analyses were based on the assumption that data are missing at random.
A post-hoc sensitivity analysis utilizing a pattern-mixture model was conducted to
explore the impact of the missing-at-random assumption. Results of this analysis
aligned with the MMRM results for Physical Functioning, Dyspnoea and Global
Health Status/QoL, with no differences between treatment groups at p<0.05, while
results favoured CCR for the Fatigue domain (P=0.025).
The ERG is satisfied that the statistical analyses of HRQoL conducted by Celgene were
thorough and conducted following best methodological practice. As is typical with patient
reported outcome studies conducted alongside RCT in this clinical area, missing data is a
problem due to the high drop-out rates and item non-response, and analytical methods
employed by Celgene have tried to address it. However, the results of this analysis were
crudely applied in the cost-effectiveness model, as explained next.
The third limitation was the way the effect of adverse events was implemented in the model,
which treated disutility effects of adverse events differently from their cost impacts. The ERG
asked the company to explain why the adverse events which are costed on page 130 of the
company’s submission appear to differ from the adverse events for which disutilities are
measured (page 129 of the company’s submission). The company replied:
HRQL analysis from the trial was more restricted in terms of measuring and mapping
from EORTC QLQ-C30 scores during an AE in the trial; costing on the other hand
used rates of AEs, disaggregated by type, from the main clinical study report, and
hence were more detailed.
Thus, in the model, AE disutilities are a single figure that are aggregated at the trial-
analysis level; AE costs on the other hand are aggregated within the model itself,
calculated from rates and unit costs for AEs.
The QALY impact of AEs was modelled as the probability of at least one TEAE of Grade > 3
per 100 person-years multiplied by the utility of grade > 3 TEAEs. In the model, the effect of
AEs on QALYs in azacitidine have been modelled for a maximum of 8.8 treatment cycles,
which is effectively less than the mean 8.8 in the trial, while for CCR as a whole they were
counted for a maximum number of cycles of 5.1 which is more than the mean number of 2
cycles with IC. These calculations are likely to overestimate the additional costs of CCR
relative to azacitidine but this bias had a small effect on the results given other issues
identified by the ERG in the model.
These features of the model are likely to lead to bias in estimating the costs and QALYs
differences between the azacitidine and CCR treatment groups, as they conflated different
types of adverse events and inaccurately measured repeated or continued episodes of AEs.
Page 122 of 145
5.3.8 Resources and costs
5.3.8.1 Drug costs
The ERG identified some errors in the calculation of drug costs. The most important error
was that the model incorrectly applied the mean number of cycles reported in the trial.45 In
order to obtain the mean 8.8 number of azacitidine cycles, a maximum number of 19 cycles
needs to be set given the distribution of the modelled cohort between the Remission and
Non-remission states (the proportion of cohort members in the relapse/PD state and Death
states do not consume azacitidine medication). Instead Celgene applied a maximum of 8.8
(rounded down to the closest integer, 8) number of treatment cycles effectively accounting
for a mean number of azacitidine cycles in the model less than 6 as opposed to the intended
8.8. Likewise the correct maximum number of cycles for LDAC in CCR is 10 cycles (the 1.6
cycles used for IC in CCR modelled by Celgene is practically correct). In correcting the
probabilistic sensitivity analysis ERG chose SE 3 for azacitidine, 1 LDAC and (0.06 for IC as
used by Celgene’s base case is correct), to calibrate the respective model outputs to the
reported figures for mean minus one standard error in the number of cycles reported by
Dombret et al. 2015.45 As documented below, correcting this error of implementation to
calibrate the model outputs with the summary statistic reported by the trial increases the
ICER from a level around £20,000 to £84,000 per QALY gained.
A mistake was also found in the calculation of dosing. Celgene incorrectly estimated daily
dose of cytarabine (‘HRU_costs’!C115:C117) assuming mg/m² instead of using mg/day as in
the CSR. However, this error does not affect acquisition costs, since the inflated dose is still
less than the size of a vial, but has a small effect on ICERs for the ‘no wastage’ analyses.
More importantly, the costs of drug acquisition and administration, monitoring tests, and
transfusions in CCR were based on a formula with reference to the azacitidine number of
cycles (8.8) instead of the number of cycles of CCR treatments (2 cycles, 1 initiation and 1
consolidation cycle in IC, and 6.1 in LDAC).
The ERG also corrected an error in how the model calculated the costs of drug
administration, monitoring tests and transfusions in the first (induction/pre-response) cycle
for both azacitidine (Model AZA sheet AB23:AD23 and Model CCR sheet AB23:AD23). In
the first cycle, the model accounts for costs of two cycles for these costs, unlike for drug
acquisition costs (AA23 in Model CCR and Model AZA sheets), which only accounts for the
initial cycle. This has the effect of loading the costs of two cycles of treatment to all patients,
since the survival curves in the model assume all are alive and under treatment while
awaiting the initial evaluation of response. For IC this implies one induction cycle and one
consolidating cycle thus overestimating the mean number of consolidation cycles reported in
the trial of 1.45
5.3.8.2 Health resource utilisation and unit costs
The quantities of resource use for medical staff costs, drug monitoring tests and outpatient
procedures (including transfusions), and inpatient hospitalisations by health state and initial
treatment (azacitidine, IC, LDAC or BSC) were derived from expert opinion. Apart from drug
monitoring testing and outpatient procedures during Remission and Non-remission phases
(i.e., while the initial treatments are being administered or when treatment has recently been
withdrawn or concluded), it is not clear the rationale for having different resource use
quantities within the same health state for the different treatments being compared. Models
Page 123 of 145
of health state transitions that use generic health states, where health status entirely
determines health related quality of life and costs and where treatment is irrelevant (apart
from explicit treatment-related events), are more transparent and arguably robust to bias. In
terms of resource use none of the health states are generic, and only adverse events-related
costs are independent of initial treatment.
Without a clear clinical rationale, asking expert opinion about costs in the
Relapse/progressive disease phase contingent on initial treatment, despite the model
assumption that all patients in this phase are managed under BSC only, is susceptible to
framing bias in surveyed responses. This issue is apparent in the health resource use
questionnaire used by Celgene and presented in its submission Appendix 12. Furthermore,
in this model, variation of costs in Relapse/progressive disease across initial treatments are
not accompanied by a corresponding variation in utilities, which implies resources are being
used without noticeable effects on quality of life.
Most notably in the differences in resource use quantities is the amount of inpatient days per
4-week cycle of 1.73 in azacitidine versus 2.61 in CCR (Celgene Submission, Table 46, p.
134). At the Intensive Care per inpatient day cost used by Celgene of £714, inpatient costs
differences between groups accumulate at a rate of £628 per month per patient in
Relapse/PD. The CCR per cycle inpatient days figure breakdown by treatment is, as
presented in the Excel model file, 1.66, 0.95 and 0.00, for IC, LDAC and BSC (sheet ‘Default
values’ cells I283, M283, Q283). While heterogeneity by pre-selected CCR therapy is to be
expected it is unclear why the weighted average across subgroups should differ between
azacitidine and CCR in Relapse/PD managed with BSC.
The ERG believes that costs in the Relapse/PD phase should be equal across treatment
arms and pre-selected therapy arms, which significantly increases the ICER for azacitidine
versus CCR. Appendix 3 presents the costs per cycle in PD/Relapse under BSC, which were
applied to the PD/Relapse state across all arms and therapies within CCR to reflect the
assumption that all patients are in the same health state and managed equally.
Another limitation was that the costs of managing AEs in patients from azacitidine and CCR
groups were estimated as the product of the probability of at least one TEAE of Grade > 3
per 100 person-years and the average cost of managing grade 3 or 4 TEAEs observed in
the AZA-AML-001 trial. The average cost was calculated as arithmetic average of the
treatment costs of anaemia, neutropenia, febrile neutropenia, thrombocytopenia, pneumonia
and worsening AML. Furthermore, it was assumed that the most frequent TEAEs of grade 3
or 4 and their incidence rates in azacitidine and CCR groups are the same.
In the executable model, the costs of managing AEs in azacitidine and CCR patients have
only been accounted as a one-off initial cost, which is at odds with the way the associated
quality of life effects were implemented in the model (see Section 5.3.7).
5.3.9 Cost-effectiveness results
The deterministic base case ICER presented by Celgene is £20,648 per QALY. Comparison
of Tables 56 on QALYs and 57 on Costs results in the submission, (Celgene Submission,
Tables 56 and 57, p. 146-147), reproduced below, points to RFS and Relapse/PD as the
phases in the model where the largest outcome differences between treatment groups
appear. While in the RFS phase azacitidine is associated with a xxx increase in utilities over
CCR that is accompanied by a xxxx increment in costs. As for the Relapse/PD phase these
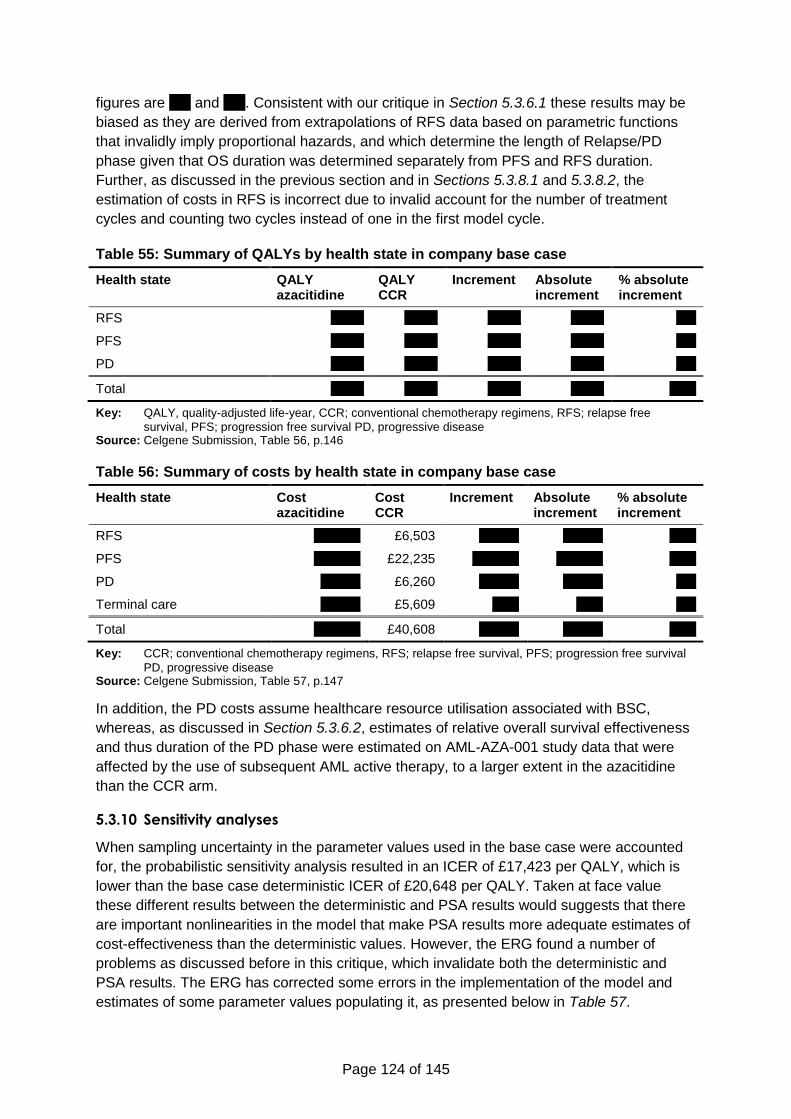
Page 124 of 145
figures are xxx and xxx. Consistent with our critique in Section 5.3.6.1 these results may be
biased as they are derived from extrapolations of RFS data based on parametric functions
that invalidly imply proportional hazards, and which determine the length of Relapse/PD
phase given that OS duration was determined separately from PFS and RFS duration.
Further, as discussed in the previous section and in Sections 5.3.8.1 and 5.3.8.2, the
estimation of costs in RFS is incorrect due to invalid account for the number of treatment
cycles and counting two cycles instead of one in the first model cycle.
Table 55: Summary of QALYs by health state in company base case
Health state QALY azacitidine
QALY CCR
Increment Absolute increment
% absolute increment
RFS xxxxx 0.231 xxxxx xxxxx xxx
PFS xxxxx 0.273 xxxxx xxxxx xxx
PD xxxxx 0.133 xxxxx xxxxx xxx
Total xxxxx 0.637 xxxxx xxxxx xxxx
Key: QALY, quality-adjusted life-year, CCR; conventional chemotherapy regimens, RFS; relapse free
survival, PFS; progression free survival PD, progressive disease Source: Celgene Submission, Table 56, p.146
Table 56: Summary of costs by health state in company base case
Health state Cost azacitidine
Cost CCR
Increment Absolute increment
% absolute increment
RFS xxxxxxx £6,503 xxxxxx xxxxxx xxxx
PFS xxxxxxx £22,235 xxxxxxx xxxxxxx xxxx
PD xxxxxx £6,260 xxxxxx xxxxxx xxx
Terminal care xxxxxx £5,609 xxxx xxxx xxx
Total xxxxxxx £40,608 xxxxxx xxxxxx xxxx
Key: CCR; conventional chemotherapy regimens, RFS; relapse free survival, PFS; progression free survival
PD, progressive disease Source: Celgene Submission, Table 57, p.147
In addition, the PD costs assume healthcare resource utilisation associated with BSC,
whereas, as discussed in Section 5.3.6.2, estimates of relative overall survival effectiveness
and thus duration of the PD phase were estimated on AML-AZA-001 study data that were
affected by the use of subsequent AML active therapy, to a larger extent in the azacitidine
than the CCR arm.
5.3.10 Sensitivity analyses
When sampling uncertainty in the parameter values used in the base case were accounted
for, the probabilistic sensitivity analysis resulted in an ICER of £17,423 per QALY, which is
lower than the base case deterministic ICER of £20,648 per QALY. Taken at face value
these different results between the deterministic and PSA results would suggests that there
are important nonlinearities in the model that make PSA results more adequate estimates of
cost-effectiveness than the deterministic values. However, the ERG found a number of
problems as discussed before in this critique, which invalidate both the deterministic and
PSA results. The ERG has corrected some errors in the implementation of the model and
estimates of some parameter values populating it, as presented below in Table 57.
Page 125 of 145
Despite the limitations identified in the model from which Celgene derived their base case
cost-effectiveness results, its analysis of the most influential individual parameter values
provides guidance as to which elements may need special consideration in assessing the
validity of results. As described in Section 5.2.9.1 (page 92), ICER results are most sensitive
to variation in the costs of drug administration in CCR, followed by the hazard ratio of OS,
with acquisition costs of AZA, administration costs of AZA and the HR of RFS being the
fourth, fifth and sixth most influential parameters. In these parameters ERG found flaws
either in model implementation or parameter estimation, as discussed above. To illustrate
the importance of this, Celgene reports that a 20% increase in the value of these parameters
is associated with an increase of their base case results of 155%, 44%, 113%, 98% and
78% (Celgene submission, Table 61, p. 153).
Of particular interest is the subgroup analysis of patients who would be candidates for LDAC
under the control situation. In this group Celgene’s scenario analysis is reported to result in
an ICER of £25,136 per QALY with IPCW adjustment for treatment switching in the control
arm. However, some 28% of the azacitidine arm subjects received subsequent active
treatment but their health outcomes and costs were not adjusted for the effect of subsequent
lines of treatment. This caveat is also relevant for the comparison of patients pre-selected for
BSC and for IC controls, where according to results presented by Celgene, azacitidine
generates more QALYs and has lower costs relative to BSC and IC. However, as explained
next, the results of this subgroup analyses did not collectively pass a fundamental validation
test.
Celgene provides the results of a scenario where the distribution of patients by pre-selected
CCR treatment is that observed in clinical practice from HMRN registry data (xxx IC, xxx
LDAC, xxx BSC) instead of the original trial case mix (18%, 64% and 18%, respectively).
The ICERs change from £20,648 to -£57,756 per QALY, i.e., to the result that azacitidine is
both more effective and less costly than CCR. Although an improvement in cost-
effectiveness of azacitidine is to be expected when applying a distribution of the patient
population with a larger proportion of patients in poorer health condition and thus eligible to
receive BSC under CCR, as in AZA-AML-001 the largest detectable difference was found
precisely in those patients, these are unexpectedly large results. ERG replicated these
results to a small degree of discrepancy (-£57,968 versus -£57,656 per QALY), using the
weighted average method described by Celgene in its submission (Celgene submission,
Section 5.8.3, p. 155). However when ERG tried to replicate the base case results using the
same method we obtained and ICER of -£17,960 per QALY (azacitidine dominant), quite a
different result from the base case model result of £20,648 per QALY. This suggests that the
method used by Celgene to calculate an alternative ICER based on HMRN data may not be
compared with that used in the base case. It must be noted that this discrepancy is despite
both the subgroup analysis by CCR pre-selected treatment and the analysis of the overall
sample using the same OS effectiveness estimates, i.e., the exponential extrapolation using
the adjusted IPCW HR estimate of xxxx.
The inability to replicate the base case results using the weighted average method described
in the Celgene submission poses a severe limitation to ERG’s ability to correct the most
important flaws of the model submitted by Celgene. This is because the error incurred by the
company in implementing the number of treatment cycles described in Section 5.3.8.1 (page
122) may only be corrected, within their model, by separately calculating costs and QALYs
for each CCR pre-selected treatment subgroup and combining results using weighted
Page 126 of 145
averages of costs and of QALYs using the patient distributions in AZA-AML-001, in the same
way as the company did for their sensitivity analysis of the HMRN patient population. Our
corrected results presented in Section 6 (page 130) are subject to this caveat.
5.3.11 Model validation and face validity check
5.3.11.1 Internal validity
We conducted two assessments of internal validity of the model submitted by Celgene. First,
we compared the mean number of treatment cycles produced by the model in the azacitidine
arm with the reported mean number of cycles in AZA-AML-001.45 As discussed in Section
5.3.8.1 we found that the model underestimated the mean number of treatment cycles, and
this was due to an error of implementation in that the maximum number of treatment cycles
allowed by the model was 8 (after rounding 8.8 to the lowest integer), thus overlooking the
fact that a proportion of the modelled cohort would have made a transition to Relapse/PD
and therefore be receiving no treatment within those first 8 cycles. Similar but more severe
underestimation problems applied to the active treatments in the CCR arm.
The second validity check compared the overall survival outputs from the model with the
respective outcome in the original trial report, for the azacitidine arm. In this case the model
overestimated the observed data; the median overall survival was approximately 11.5 in the
model base case (exponential distribution) versus 10.4 months in the Kaplan-Meier OS
curve in AZA-AML-001 (Figure 1A of Dombret et al. 201545). Incidentally, the model output
was closer to the median OS obtained by censoring data at switch to subsequent AML
therapy, i.e., 12.1 months (Figure 1B of Dombret et al. 201545).
5.3.11.2 Model implementation checks
We conducted a list of model checks, including black-box tests (varying inputs and checking
for the anticipated impact on outputs) and checking individual formulae in the model. We
highlight below problems identified by this and a subsequent process that sought to replicate
model results in the submission.
In calculating the costs of drug administration, monitoring tests and transfusions
corresponding to stable disease (“Model CCR” and “Model AZA” columns AB:AD), the
company subtracted a portion of these costs equal either to the differences between the
proportion of patients in the modelled cohort who were in Non-remission and the proportion
of patients who were in remission at each cycle, or to zero, whichever of the two quantities
was higher. This was found to have no rational basis and was not explained nor described in
the submission.
The model was also subject to verification tests, where individual parameters’ values in the
model were varied and results compared to a priori expectations. Further, the ERG identified
an error in the formulae referencing the Kaplan-Meier curves for PFS and RFS in the “KM”
worksheet (DD:DI columns). This is correction was important in the light of ERG’s preference
for using Kaplan-Meier time to event curves to model the evolution in these outcomes, as
described in the next section.
Page 127 of 145
5.4 Exploratory and sensitivity analyses undertaken by the ERG
5.4.1 Corrected base case
The ERG identified a number of implementation errors in the model submitted by Celgene
and corrected them, as shown in Table 57.
Table 57: Corrections to the implementation of Celgene's model
Celgene’s model ERG’s corrections
The costs of drug administration, tests and transfusions in LDAC patients were estimated for 8 model cycles, as for azacitidine, instead of 6.1 cycles reported in the submission (AB, AC and AD in ‘Model CCR’).
Corrected to incorporate changes in the mean number of treatment cycles for LDAC patients
Transfusion costs pre-response in CCR arm were modelled using the corresponding costs for azacitidine group (‘Model CCR’!AD23)
Corrected
Transfusion costs in cycles 2+ in CCR arm were modelled incorrectly: the cost of transfusion in remission state was assumed to be equal to the transfusion costs in patients with stable disease (‘Model CCR’!AD24:153).
Corrected
Cytarabine daily dose for LDAC assumed mg/m² (resulting in 71.82 mg/day) instead of 39.9 mg/day reported in CSR. However, it has no effect on costs in the base case and has a minimal effect on ICER in scenario analyses for no wastage and wastage with 30% tolerance (‘HRU costs’!C115:117).
39.9 mg/day of cytarabine in LDAC patients
Kaplan-Meier OS, PFS and RFS curves for the overall sample were incorrectly referenced to the IC curves in the KM worksheet (DD:DI columns)
Corrected
Costs of tests and transfusions in PD state were not modelled by Celgene
Corrected
Celgene assume the drug administration costs for IC patients after cycle 3
Corrected
“BSC only” patients are assumed to incur drug administration costs Corrected
Wastage with 30% tolerance was coded incorrectly Corrected
The number of treatment cycles for which drug administration, monitoring tests and transfusions costs were accounted was two in the first treatment cycle (AB23, AC23 and AD23 in Model AZA and Model CCR), in contrast to drug acquisition costs for which only one cycle was accounted in the first cycle (AA23 in Model AZA and Model CCR sheets).
Corrected
Key: CCR, conventional care regimen; CSR, clinical study report; ERG, Evidence Review Group; ICER,
incremental cost-effectiveness ratio; LDAC, low-dose cytarabine; OS, overall survival; PFS, progression-free survival; RFS, relapse-free survival
5.4.2 ERG preferred base case
The corrections to the implementation were followed by a series of changes made to the
model parameter values to reflect what ERG considers the best values to reflect current UK
practice and model logic. The results of these changes are presented as a sequence of
cumulative changes in Section 6.
Page 128 of 145
5.4.2.1 Calibrating the number of treatment cycles
The maximum number of treatment cycles of azacitidine treatment was set to 19, in order to
match the 8.80 mean number of cycles in the respective arm of AZA-AML-001.45 Similarly
the maximum number of treatment cycles of LDAC was set to 10 to match the respective
mean reported in the trial of 6.1 cycles of treatment. The IC was set to a maximum of two
cycles as specified in the trial protocol and reported in the submission.
5.4.2.2 Equalising costs of relapse and progressive disease across treatments
The frequency and amount of use of medical staff, monitoring and outpatient procedures and
hospitalisations used by patients managed under BSC in the progressive disease/relapse
state as estimated from clinical opinion surveyed by Celgene was applied to IC and LDAC
preselected CCR patients and azacitidine patients that were in the progressive disease or
relapse health state. Appendix 3 details the costs used in PD/Relapse by ERG for its
preferred base case analysis.
5.4.2.3 Adjusting overall survival in both arms for subsequent active treatment
The ERG set the OS curves to the Censor At Switch analysis mode in Celgene’s model,
keeping the exponential functional form adopted in Celgene’s base-case. This choice was
associated with a hazard ratio of 0.72, which corresponded to the analysis that was
unadjusted for baseline covariates. Given the high ICERs that were obtained after the
preceding revisions in Sections 5.4.2.1 and 5.4.2.2, the effect of adopting the smaller hazard
that resulted from censored at switch analysis that adjusted for baseline covariates was
investigated in exploratory analyses.
5.4.2.4 Fitting separate parametric survival curves to relapse-free survival and
progression-free survival in each arm
Since finding the optimal fitting functional form for RFS and PFS is highly uncertain as
discussed in this report, the ERG adopted the observed non-parametric Kaplan-Meier curves
from the trial for these outcomes. The rationale for this choice is further strengthened by the
fact that the Kaplan-Meier curves are almost completely observed by the end of the
observation period at 37 months and extrapolation is not necessary. Neither is it obvious that
adjusting those survival curves for any observed confounders is practicable or indeed
desirable.
5.4.2.5 Adjusting overall survival for baseline covariates
The effect of using the OS hazard ratio estimate of 0.64 from the exponential model adjusted
for baseline covariates, which found support in statistical tests conducted by the ERG, was
investigated.
5.4.3 Exploratory analyses
The ERG sought to perform some exploratory assessment of the subgroup analysis by
preselected CCR treatment, while acknowledging that for PFS and RFS outcomes, the
sample sizes make subgroup-specific time to event data highly unreliable. Thus in these
analyses subgroup specific differences in OS outcomes were allowed using censor-at-switch
data, while keeping common PFS and RFS curves across the three subgroups.
Page 129 of 145
5.5 Conclusions of the cost-effectiveness section
The ERG identified several issues with the company’s submitted economic evaluation.
The model assumed that no patients would receive active treatment following
discontinuation of first-line treatment. In the AZA-AML-001 trial underpinning the analysis,
29% of participants received active second-line treatment. Advice from clinical experts
suggests that active second-line treatment is considered for some patients in the NHS.
The model assumed proportional hazards for all time-to-event outcomes, even though this
was not supported for overall survival and relapse-free survival by results from the AZA-
AML-001 trial.
Overall survival in the AZA arm was not adjusted for subsequent active treatment, resulting
in an inconsistency between the modelled health outcomes and costs, since only the costs
of best supportive care were modelled following azacitidine.
Implementation issues were identified in the model. The most significant of these was an
error in the calculation of the duration of first-line treatment which resulted in an
underestimate of the drug acquisition and administration costs in both arms.
The ERG also identified that there were significant differences in the cost associated with the
Relapse/progressive disease state between the AZA and CCR arm, even though all patients
(in both arms) are expected to be receiving BSC at this point.
Page 130 of 145
6 Impact on the ICER of additional clinical and economic
analyses undertaken by the ERG
The ERG’s preferred base case ICER is £169,606 per QALY (see Table 58 and Table 59).
Corrections to implementation errors in the model increased the ICER from the base case
£20,648 to £62,518 per QALY (analysis A).
Analyses B to G are the additional changes made to reach the ERG’s preferred base case.
Of these, two independently lead to significant increases in the ICER: calibrating the number
of treatment cycles to match the mean number of cycles in AZA-AML-00145 increases the
ICER to £131,698 per QALY; setting the costs of relapse/progressive disease equal across
the arms increases the ICER to £159,352 per QALY. Two independently lead to reductions
in the ICER: adjusting overall survival for treatment switching in both arms reduces the ICER
to £47,482 per QALY; adjusting overall survival for baseline covariates reduces the ICER to
£39,145 per QALY. Using Kaplan-Meier relapse-free survival has little impact on the ICER
(£63,569 per QALY). Using Kaplan-Meier progression-free survival increases the ICER to
£75,471 per QALY.
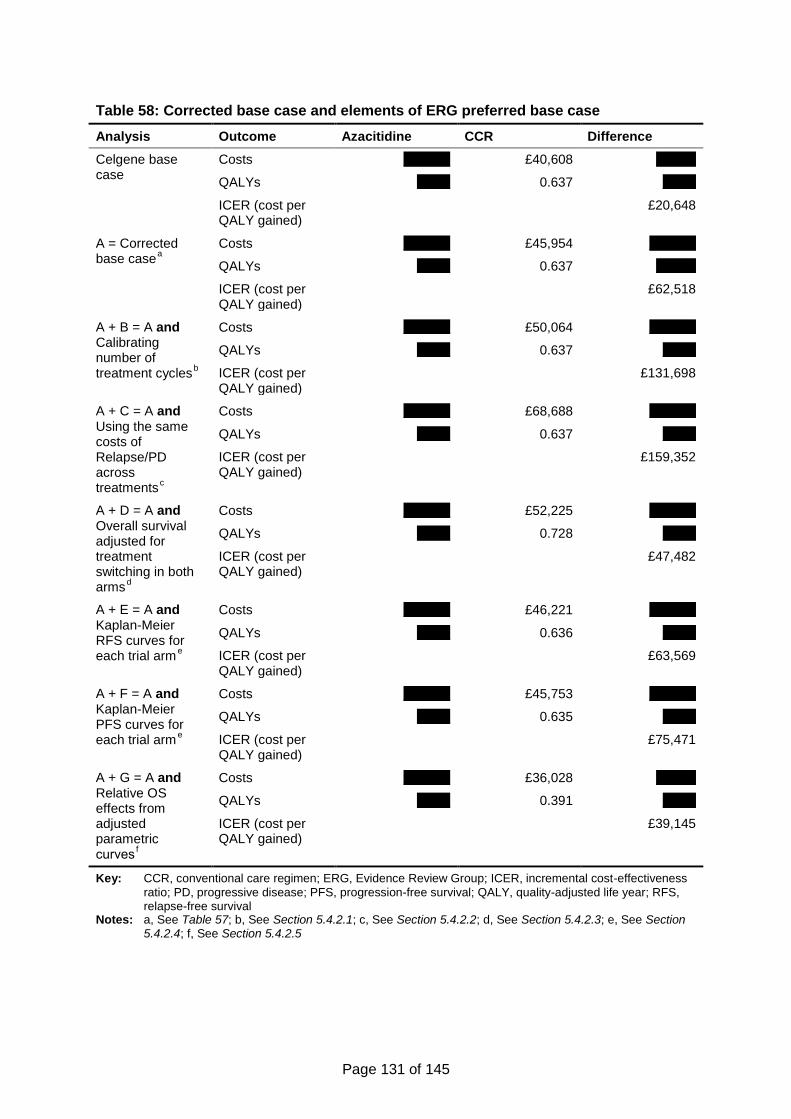
Page 131 of 145
Table 58: Corrected base case and elements of ERG preferred base case
Analysis Outcome Azacitidine CCR Difference
Celgene base case
Costs xxxxxxx £40,608 xxxxxx
QALYs xxxxx 0.637 xxxxx
ICER (cost per QALY gained)
£20,648
A = Corrected base case
a
Costs xxxxxxx £45,954 xxxxxxx
QALYs xxxxx 0.637 xxxxxx
ICER (cost per QALY gained)
£62,518
A + B = A and Calibrating number of treatment cycles
b
Costs xxxxxxx £50,064 xxxxxxx
QALYs xxxxx 0.637 xxxxx
ICER (cost per QALY gained)
£131,698
A + C = A and Using the same costs of Relapse/PD across treatments
c
Costs xxxxxxx £68,688 xxxxxxx
QALYs xxxxx 0.637 xxxxx
ICER (cost per QALY gained)
£159,352
A + D = A and Overall survival adjusted for treatment switching in both arms
d
Costs xxxxxxx £52,225 xxxxxxx
QALYs xxxxx 0.728 xxxxx
ICER (cost per QALY gained)
£47,482
A + E = A and Kaplan-Meier RFS curves for each trial arm
e
Costs xxxxxxx £46,221 xxxxxxx
QALYs xxxxx 0.636 xxxxx
ICER (cost per QALY gained)
£63,569
A + F = A and Kaplan-Meier PFS curves for each trial arm
e
Costs xxxxxxx £45,753 xxxxxxx
QALYs xxxxx 0.635 xxxxx
ICER (cost per QALY gained)
£75,471
A + G = A and Relative OS effects from adjusted parametric curves
f
Costs xxxxxxx £36,028 xxxxxx
QALYs xxxxx 0.391 xxxxx
ICER (cost per QALY gained)
£39,145
Key: CCR, conventional care regimen; ERG, Evidence Review Group; ICER, incremental cost-effectiveness
ratio; PD, progressive disease; PFS, progression-free survival; QALY, quality-adjusted life year; RFS, relapse-free survival
Notes: a, See Table 57; b, See Section 5.4.2.1; c, See Section 5.4.2.2; d, See Section 5.4.2.3; e, See Section 5.4.2.4; f, See Section 5.4.2.5
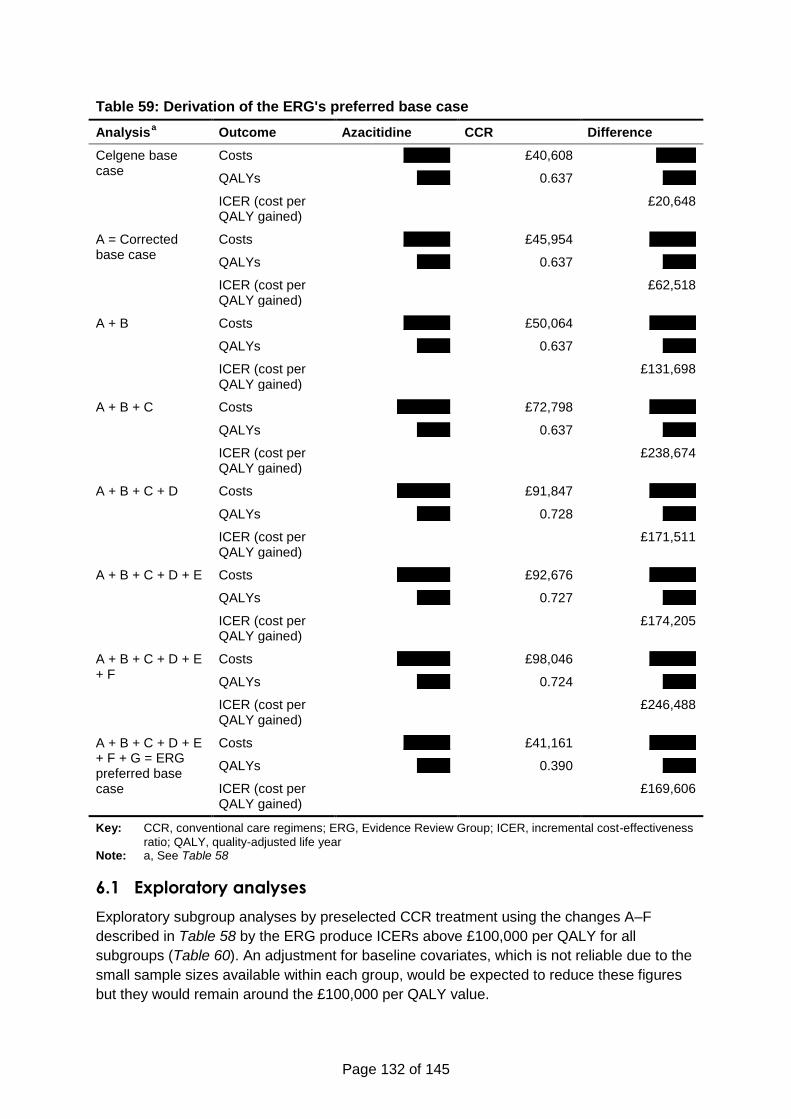
Page 132 of 145
Table 59: Derivation of the ERG's preferred base case
Analysis a Outcome Azacitidine CCR Difference
Celgene base case
Costs xxxxxxx £40,608 xxxxxx
QALYs xxxxx 0.637 xxxxx
ICER (cost per QALY gained)
£20,648
A = Corrected base case
Costs xxxxxxx £45,954 xxxxxxx
QALYs xxxxx 0.637 xxxxx
ICER (cost per QALY gained)
£62,518
A + B Costs xxxxxxx £50,064 xxxxxxx
QALYs xxxxx 0.637 xxxxx
ICER (cost per QALY gained)
£131,698
A + B + C Costs xxxxxxxx £72,798 xxxxxxx
QALYs xxxxx 0.637 xxxxx
ICER (cost per QALY gained)
£238,674
A + B + C + D Costs xxxxxxxx £91,847 xxxxxxx
QALYs xxxxx 0.728 xxxxx
ICER (cost per QALY gained)
£171,511
A + B + C + D + E Costs xxxxxxxx £92,676 xxxxxxx
QALYs xxxxx 0.727 xxxxx
ICER (cost per QALY gained)
£174,205
A + B + C + D + E + F
Costs xxxxxxxx £98,046 xxxxxxx
QALYs xxxxx 0.724 xxxxx
ICER (cost per QALY gained)
£246,488
A + B + C + D + E + F + G = ERG preferred base case
Costs xxxxxxx £41,161 xxxxxxx
QALYs xxxxx 0.390 xxxxx
ICER (cost per QALY gained)
£169,606
Key: CCR, conventional care regimens; ERG, Evidence Review Group; ICER, incremental cost-effectiveness
ratio; QALY, quality-adjusted life year Note: a, See Table 58
6.1 Exploratory analyses
Exploratory subgroup analyses by preselected CCR treatment using the changes A–F
described in Table 58 by the ERG produce ICERs above £100,000 per QALY for all
subgroups (Table 60). An adjustment for baseline covariates, which is not reliable due to the
small sample sizes available within each group, would be expected to reduce these figures
but they would remain around the £100,000 per QALY value.
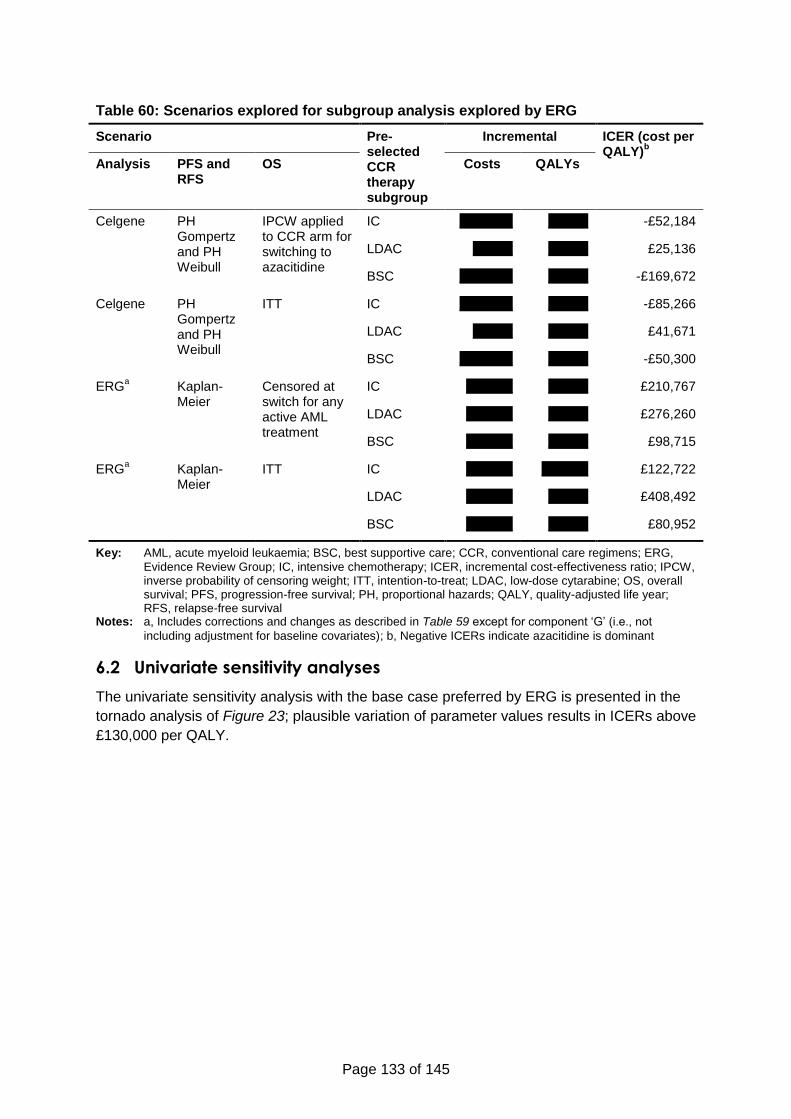
Page 133 of 145
Table 60: Scenarios explored for subgroup analysis explored by ERG
Scenario Pre-selected CCR therapy subgroup
Incremental ICER (cost per QALY)
b
Analysis PFS and RFS
OS Costs QALYs
Celgene PH Gompertz and PH Weibull
IPCW applied to CCR arm for switching to azacitidine
IC xxxxxxxx xxxxxx -£52,184
LDAC xxxxxx xxxxxx £25,136
BSC xxxxxxxx xxxxxx -£169,672
Celgene PH Gompertz and PH Weibull
ITT IC xxxxxxxx xxxxxx -£85,266
LDAC xxxxxx xxxxxx £41,671
BSC xxxxxxxx xxxxxx -£50,300
ERGa Kaplan-
Meier Censored at switch for any active AML treatment
IC xxxxxxx xxxxxx £210,767
LDAC xxxxxxx xxxxxx £276,260
BSC xxxxxxx xxxxxx £98,715
ERGa Kaplan-
Meier ITT IC xxxxxxx xxxxxxx £122,722
LDAC xxxxxxx xxxxxx £408,492
BSC xxxxxxx xxxxxx £80,952
Key: AML, acute myeloid leukaemia; BSC, best supportive care; CCR, conventional care regimens; ERG,
Evidence Review Group; IC, intensive chemotherapy; ICER, incremental cost-effectiveness ratio; IPCW, inverse probability of censoring weight; ITT, intention-to-treat; LDAC, low-dose cytarabine; OS, overall survival; PFS, progression-free survival; PH, proportional hazards; QALY, quality-adjusted life year; RFS, relapse-free survival
Notes: a, Includes corrections and changes as described in Table 59 except for component ‘G’ (i.e., not
including adjustment for baseline covariates); b, Negative ICERs indicate azacitidine is dominant
6.2 Univariate sensitivity analyses
The univariate sensitivity analysis with the base case preferred by ERG is presented in the
tornado analysis of Figure 23; plausible variation of parameter values results in ICERs above
£130,000 per QALY.
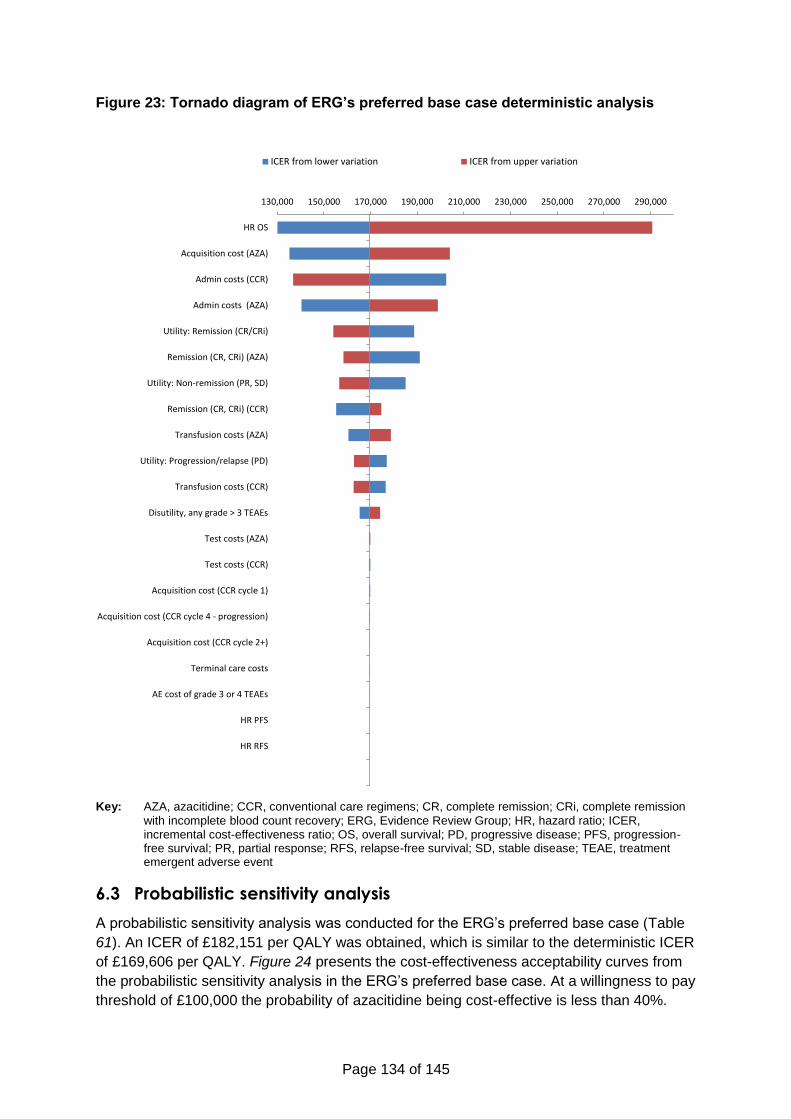
Page 134 of 145
Figure 23: Tornado diagram of ERG’s preferred base case deterministic analysis
Key: AZA, azacitidine; CCR, conventional care regimens; CR, complete remission; CRi, complete remission
with incomplete blood count recovery; ERG, Evidence Review Group; HR, hazard ratio; ICER, incremental cost-effectiveness ratio; OS, overall survival; PD, progressive disease; PFS, progression-free survival; PR, partial response; RFS, relapse-free survival; SD, stable disease; TEAE, treatment emergent adverse event
6.3 Probabilistic sensitivity analysis
A probabilistic sensitivity analysis was conducted for the ERG’s preferred base case (Table
61). An ICER of £182,151 per QALY was obtained, which is similar to the deterministic ICER
of £169,606 per QALY. Figure 24 presents the cost-effectiveness acceptability curves from
the probabilistic sensitivity analysis in the ERG’s preferred base case. At a willingness to pay
threshold of £100,000 the probability of azacitidine being cost-effective is less than 40%.
130,000 150,000 170,000 190,000 210,000 230,000 250,000 270,000 290,000
HR OS
Acquisition cost (AZA)
Admin costs (CCR)
Admin costs (AZA)
Utility: Remission (CR/CRi)
Remission (CR, CRi) (AZA)
Utility: Non-remission (PR, SD)
Remission (CR, CRi) (CCR)
Transfusion costs (AZA)
Utility: Progression/relapse (PD)
Transfusion costs (CCR)
Disutility, any grade > 3 TEAEs
Test costs (AZA)
Test costs (CCR)
Acquisition cost (CCR cycle 1)
Acquisition cost (CCR cycle 4 - progression)
Acquisition cost (CCR cycle 2+)
Terminal care costs
AE cost of grade 3 or 4 TEAEs
HR PFS
HR RFS
ICER from lower variation ICER from upper variation
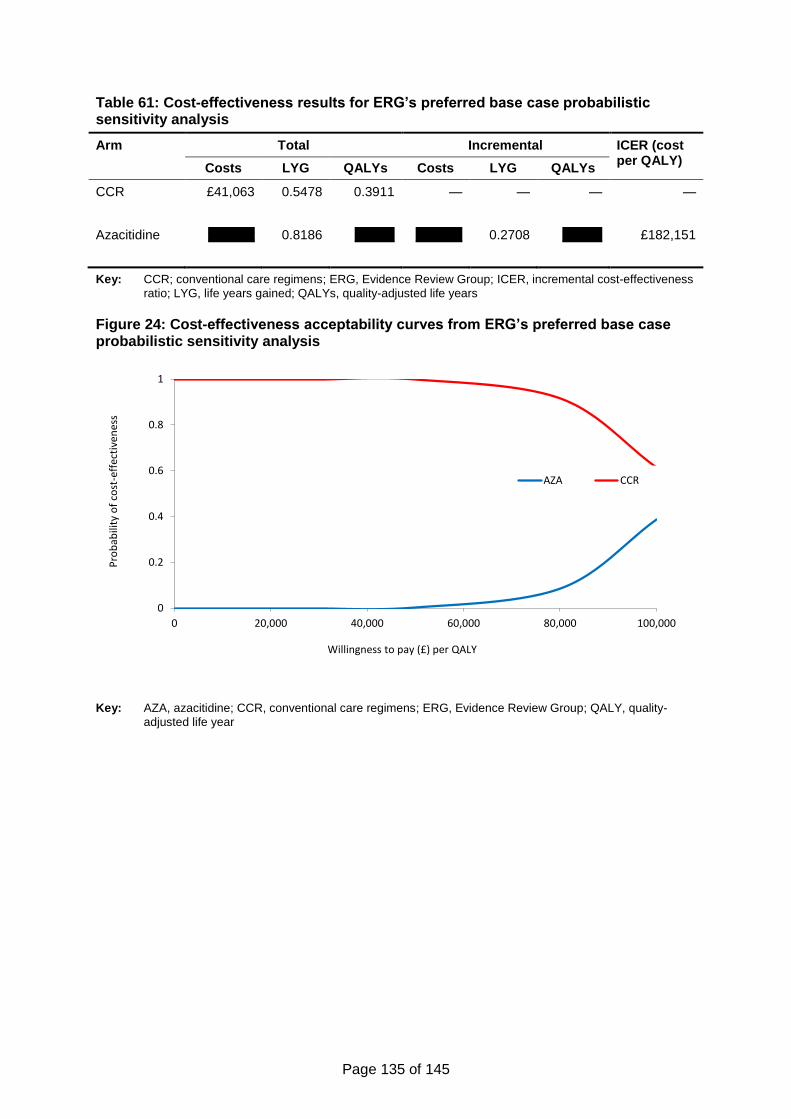
Page 135 of 145
Table 61: Cost-effectiveness results for ERG’s preferred base case probabilistic sensitivity analysis
Arm Total Incremental ICER (cost per QALY)
Costs LYG QALYs Costs LYG QALYs
CCR £41,063 0.5478 0.3911 — — — —
Azacitidine xxxxxxx 0.8186 xxxxxx xxxxxxx 0.2708 xxxxxx £182,151
Key: CCR; conventional care regimens; ERG, Evidence Review Group; ICER, incremental cost-effectiveness
ratio; LYG, life years gained; QALYs, quality-adjusted life years
Figure 24: Cost-effectiveness acceptability curves from ERG’s preferred base case probabilistic sensitivity analysis
Key: AZA, azacitidine; CCR, conventional care regimens; ERG, Evidence Review Group; QALY, quality-
adjusted life year
0
0.2
0.4
0.6
0.8
1
0 20,000 40,000 60,000 80,000 100,000
Pro
bab
ility
of
cost
-eff
ecti
ven
ess
Willingness to pay (£) per QALY
AZA CCR
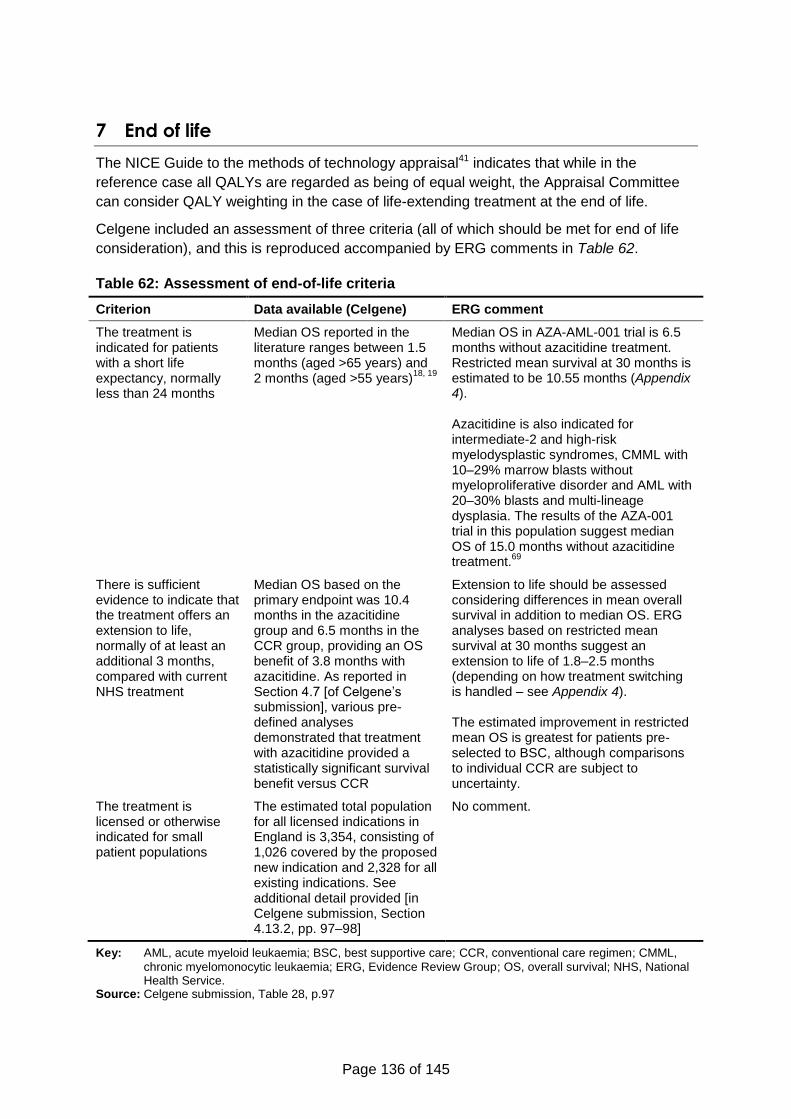
Page 136 of 145
7 End of life
The NICE Guide to the methods of technology appraisal41 indicates that while in the
reference case all QALYs are regarded as being of equal weight, the Appraisal Committee
can consider QALY weighting in the case of life-extending treatment at the end of life.
Celgene included an assessment of three criteria (all of which should be met for end of life
consideration), and this is reproduced accompanied by ERG comments in Table 62.
Table 62: Assessment of end-of-life criteria
Criterion Data available (Celgene) ERG comment
The treatment is indicated for patients with a short life expectancy, normally less than 24 months
Median OS reported in the literature ranges between 1.5 months (aged >65 years) and 2 months (aged >55 years)
18, 19
Median OS in AZA-AML-001 trial is 6.5 months without azacitidine treatment. Restricted mean survival at 30 months is estimated to be 10.55 months (Appendix 4). Azacitidine is also indicated for intermediate-2 and high-risk myelodysplastic syndromes, CMML with 10–29% marrow blasts without myeloproliferative disorder and AML with 20–30% blasts and multi-lineage dysplasia. The results of the AZA-001 trial in this population suggest median OS of 15.0 months without azacitidine treatment.
69
There is sufficient evidence to indicate that the treatment offers an extension to life, normally of at least an additional 3 months, compared with current NHS treatment
Median OS based on the primary endpoint was 10.4 months in the azacitidine group and 6.5 months in the CCR group, providing an OS benefit of 3.8 months with azacitidine. As reported in Section 4.7 [of Celgene’s submission], various pre-defined analyses demonstrated that treatment with azacitidine provided a statistically significant survival benefit versus CCR
Extension to life should be assessed considering differences in mean overall survival in addition to median OS. ERG analyses based on restricted mean survival at 30 months suggest an extension to life of 1.8–2.5 months (depending on how treatment switching is handled – see Appendix 4). The estimated improvement in restricted mean OS is greatest for patients pre-selected to BSC, although comparisons to individual CCR are subject to uncertainty.
The treatment is licensed or otherwise indicated for small patient populations
The estimated total population for all licensed indications in England is 3,354, consisting of 1,026 covered by the proposed new indication and 2,328 for all existing indications. See additional detail provided [in Celgene submission, Section 4.13.2, pp. 97–98]
No comment.
Key: AML, acute myeloid leukaemia; BSC, best supportive care; CCR, conventional care regimen; CMML,
chronic myelomonocytic leukaemia; ERG, Evidence Review Group; OS, overall survival; NHS, National Health Service.
Source: Celgene submission, Table 28, p.97
Page 137 of 145
The NICE guide also indicates that the Committee will need to be satisfied that the estimates
of the extension to life are robust, and that the assumptions used in the reference case
economic modelling are plausible, objective and robust.
The ERG considers that the estimates of extension to life are not robust. The company’s
estimate based on median overall survival difference is not robust as it is does not reflect the
convergence of survival curves seen in AZA-AML-001. Overall survival benefit was also the
primary endpoint of AZA-AML-001 and this did not reach statistical significance. Estimates of
overall survival are affected by adjustments for baseline imbalances and for subsequent
active treatment.
The ERG conducted additional analyses of the restricted mean overall survival at 30 months
(see Appendix 4) and found that the survival gain was less than three months on average for
azacitidine versus CCR.
The ERG also considers that the assumptions used in the company’s economic modelling
were not plausible or robust. In Section 6 (page 130) the ERG show the results of correcting
these assumptions and implementation errors. The ERG’s preferred base case ICER is
considered to be more plausible, objective and robust.
Page 138 of 145
8 Overall conclusions
The ERG believes that by limiting the comparators in the decision problem to a combined
CCR comparator, there is the possibility of azacitidine being recommended or not
recommended inappropriately for certain patients (according to the most appropriate CCR
for them). Although it is claimed that these patients cannot be reliably and objectively
identified, they are at least sufficiently identifiable for CCR regimens to be assigned both in
routine clinical practice and in the pivotal RCT. In the absence of high-quality clinical
effectiveness data on the clinical value of azacitidine versus individual conventional care
regimens, clinical decision making may be made more challenging if azacitidine is
recommended for all elderly AML patients with >30% blasts.
Of the key changes made to the economic model by the ERG in arriving at their preferred
base case (ICER £169,606 per QALY), the following might be considered to be differences
of opinion between the company and the ERG:
Adjustment of overall survival in the azacitidine and CCR arms for subsequent active
treatment – the company only adjusted survival in the CCR arm (for subsequent
treatment with azacitidine), while the ERG has adjusted survival in both arms for any
active treatment for AML;
Equalising costs per month spent in the Relapse/progressive disease state – the
company assumed significant incremental costs in the CCR arm despite all patients
in the model receiving best supportive care only in this state; their assumption is
based on a questionnaire-based survey of clinicians, but expert opinion solicited by
the ERG does not support this assumption;
Replacing parametric survival models for relapse-free and progression-free survival
with Kaplan-Meier curves to avoid imposing a proportional hazards assumption – the
company used a proportional hazards assumption “for consistency” although they
acknowledged it was in contradiction of the data.
The ERG considers that the changes made to the modelled treatment duration cannot be
considered matters of opinion and are corrections to implementation errors. After correcting
solely for these implementation issues, an ICER of £131,698 per QALY was obtained.
The base case analysis preferred by the ERG has the limitation that the sum of the cohort
proportions in PFS and RFS exceeds the proportion alive by the third cycle in the model.
Celgene included an adjustment in the model to eliminate such anomalies, but nevertheless
this remains a deficiency of the model structure. The ERG has not attempted to correct this,
due to the difficulties of fitting plausible parametric models to the PFS and RFS data (as
discussed in this critique) and adjusting for baseline covariates, given the small samples
available for analysis.
8.1 Implications for research
8.1.1 Clinical effectiveness
Further research is needed to establish the effectiveness of azacitidine in elderly AML
patients with >30% blasts. This research should be powered to detect clinically meaningful
improvements in survival between azacitidine and individual conventional care regimens.
Page 139 of 145
The statistical analyses planned for the research should account for the likelihood of non-
proportional hazards and for treatment switching, with adequate data collection to support
multiple plausible statistical models.
8.1.2 Health-related quality of life (HRQoL)
This research should also collect HRQoL data measured using a generic (as opposed to
condition-specific) and validated instrument, which allow outcomes to be valued using
preferences from the general public (preferably EQ-5D) and is preferred for economic
analyses. Significant efforts should be made to collect HRQoL data across all patients and
across all time points to reflect the full range of quality of life experienced by patients.
8.1.3 Healthcare resource use
Further research (likely separate from the research above) is required to accurately estimate
healthcare resource use in elderly AML patients with >30% blasts within the NHS. For
conventional care regimens this should be based on routine clinical practice. For azacitidine,
this may involve a pilot study, or, if azacitidine receives a positive recommendation from
NICE, prospective collection of healthcare resource use data, and collection of data relating
to the most clinically appropriate alternative treatment for each patient.
Page 140 of 145
References
1. Lowenberg B, Downing JR, Burnett A. Acute myeloid leukemia. N Engl J Med. 1999;341(14):1051-62.
2. Sekeres MA, Stone RM, Zahrieh D, Neuberg D, Morrison V, De Angelo DJ, et al. Decision-making and quality of life in older adults with acute myeloid leukemia or advanced myelodysplastic syndrome. Leukemia. 2004;18(4):809-16.
3. Deschler B, Lubbert M. Acute myeloid leukemia: epidemiology and etiology. Cancer. 2006;107(9):2099-107.
4. Cancer Research UK. Leukaemia (AML) incidence by age. Available at: http://www.cancerresearchuk.org/health-professional/cancer-statistics/statistics-by-cancer-type/leukaemia-aml/incidence#heading-Zero [Last accessed: October 2015].
5. Klepin HD, Rao AV, Pardee TS. Acute myeloid leukemia and myelodysplastic syndromes in older adults. J Clin Oncol. 2014;32(24):2541-52.
6. Burnett A, Milligan D, Prentice A, Goldstone A, McMullin M, Hills Rea. A comparison of low-dose cytarabine and hydroxyurea with or without all-trans retinoic acid for acute myeloid leukemia and high-risk myelodysplastic syndrome in patients not considered fit for intensive treatment. Cancer. 2007;109:114-24.
7. Juliusson G, Lazarevic V, Horstedt AS, Hagberg O, Hoglund M, Swedish Acute Leukemia Registry G. Acute myeloid leukemia in the real world: why population-based registries are needed. Blood. 2012;119(17):3890-9.
8. Lang K, Earle CC, Foster T, Dixon D, Van Gool R, Menzin J. Trends in the treatment of acute myeloid leukaemia in the elderly. Drugs Aging. 2005;22(11):943-55.
9. Oran B, Weisdorf DJ. Survival for older patients with acute myeloid leukemia: a population-based study. Haematologica. 2012;97(12):1916-24.
10. Meyers J, Yu Y, Kaye JA, Davis KL. Medicare fee-for-service enrollees with primary acute myeloid leukemia: an analysis of treatment patterns, survival, and healthcare resource utilization and costs. Appl Health Econ Health Policy. 2013;11(3):275-86.
11. Haematological Malignancy Research Network. Incidence. Available at: https://www.hmrn.org/statistics/incidence [Last accessed: November 2015].
12. Office for National Statistics. Population Estimates for UK, England and Wales, Scotland and Northern Ireland, Mid-2014. Available at: http://ons.gov.uk/ons/publications/re-reference-tables.html?edition=tcm%3A77-368259 [Last accessed: November 2015]. 2015.
13. Office for National Statistics. Mid-year population estimates for the UK 2014. Available at: http://ons.gov.uk/ons/rel/pop-estimate/population-estimates-for-uk--england-and-wales--scotland-and-northern-ireland/mid-2014/mid-year-population-estimates-for-the-uk-2014.html [Last accessed: November 2015]. 2015.
14. Vardiman JW, Thiele J, Arber DA, Brunning RD, Borowitz MJ, Porwit A, et al. The 2008 revision of the World Health Organization (WHO) classification of myeloid neoplasms and acute leukemia: rationale and important changes. Blood. 2009;114(5):937-51.
15. Vey N. Targeting age-related changes in the biology of acute myeloid leukemia: is the patient seeing the progress? Interdiscip Top Gerontol. 2013;38:73-84.
Page 141 of 145
16. Sherman AE, Motyckova G, Fega KR, Deangelo DJ, Abel GA, Steensma D, et al. Geriatric assessment in older patients with acute myeloid leukemia: a retrospective study of associated treatment and outcomes. Leuk Res. 2013;37(9):998-1003.
17. Klepin HD, Geiger AM, Tooze JA, Kritchevsky SB, Williamson JD, Pardee TS, et al. Geriatric assessment predicts survival for older adults receiving induction chemotherapy for acute myelogenous leukemia. Blood. 2013;121(21):4287-94.
18. Taylor PR, Reid MM, Stark AN, Bown N, Hamilton PJ, Proctor SJ. De novo acute myeloid leukaemia in patients over 55-years-old: a population-based study of incidence, treatment and outcome. Northern Region Haematology Group. Leukemia. 1995;9(2):231-7.
19. Medeiros B, Satram-Hoang S, Hurst D, Hoang K, Momin F, Reyes C. Big data analysis of treatment patterns and outcomes among elderly acute myeloid leukemia patients in the United States. Ann Hematol. 2015;94:1127-38.
20. Celgene Ltd. Date on File: Haematological Malignancy Research Network: Clinical management and outcome in acute myeloid leukaemia patients. 2015.
21. National Cancer Institute. Surveillance, Epidemiology, and End Results Program. Actute myeloid leukemia, 5-year relative survival (percent) 2003-2009 by age at diagnosis. Available at: http://seer.cancer.gov/archive/csr/1975_2010/browse_csr.php?sectionSEL=13&pageSEL=sect_13_table.16.html#table3 [Last accessed October 2015].
22. Juliusson G, Antunovic P, Derolf A, Lehmann S, Mollgard L, Stockelberg D, et al. Age and acute myeloid leukemia: real world data on decision to treat and outcomes from the Swedish Acute Leukemia Registry. Blood. 2009;113(18):4179-87.
23. Mrozek K, Marcucci G, Nicolet D, Maharry KS, Becker H, Whitman SP, et al. Prognostic significance of the European LeukemiaNet standardized system for reporting cytogenetic and molecular alterations in adults with acute myeloid leukemia. J Clin Oncol. 2012;30(36):4515-23.
24. Oliva EN, Nobile F, Alimena G, Ronco F, Specchia G, Impera S, et al. Quality of life in elderly patients with acute myeloid leukemia: patients may be more accurate than physicians. Haematologica. 2011;96(5):696-702.
25. Stalfelt AM, Brodin H, Pettersson S, Eklof A. The final phase in acute myeloid leukaemia (AML). A study on bleeding, infection and pain. Leuk Res. 2003;27(6):481-8.
26. Bevans M, Sternberg EM. Caregiving burden, stress, and health effects among family caregivers of adult cancer patients. JAMA. 2012;307(4):398-403.
27. British Committee for Standards in Haematology, Milligan DW, Grimwade D, Cullis JO, Bond L, Swirsky D, et al. Guidelines on the management of acute myeloid leukaemia in adults. Br J Haematol. 2006;135(4):450-74.
28. Dohner H, Estey EH, Amadori S, Appelbaum FR, Buchner T, Burnett AK, et al. Diagnosis and management of acute myeloid leukemia in adults: recommendations from an international expert panel, on behalf of the European LeukemiaNet. Blood. 2010;115(3):453-74.
29. European Medicines Agency. Guideline on the evaluation of anticancer medicinal products in man CPMP/EWP/205/95/Rev.3/Corr.2. 2006.
30. National Comprehensive Cancer Network. NCCN guidelines version 1.2015 acute myeloid leukemia. 2015.
31. Ossenkoppele G, Lowenberg B. How I treat the older patient with acute myeloid leukemia. Blood. 2015;125(5):767-74.
Page 142 of 145
32. Burnett AK, Russell NH, Hunter AE, Milligan D, Knapper S, Wheatley K, et al. Clofarabine doubles the response rate in older patients with acute myeloid leukemia but does not improve survival. Blood. 2013;122(8):1384-94.
33. Estey E, de Lima M, Tibes R, Pierce S, Kantarjian H, Champlin R, et al. Prospective feasibility analysis of reduced-intensity conditioning (RIC) regimens for hematopoietic stem cell transplantation (HSCT) in elderly patients with acute myeloid leukemia (AML) and high-risk myelodysplastic syndrome (MDS). Blood. 2007;109(4):1395-400.
34. National Institute for Health and Care Excellence. TA270. Decitabine for the treatment of acute myeloid leukaemia (terminated appraisal). Available at: http://www.nice.org.uk/guidance/ta270 [Last accessed: November 2015]. 2012.
35. Howell DA, Wang HI, Roman E, Smith AG, Patmore R, Johnson MJ, et al. Variations in specialist palliative care referrals: findings from a population-based patient cohort of acute myeloid leukaemia, diffuse large B-cell lymphoma and myeloma. BMJ supportive & palliative care. 2015;5(5):496-502.
36. National Institute for Health and Care Excellence. Final Scope: Azacitidine for treating acute myeloid leukaemia with more than 30% bone marrow blasts. 2014.
37. Celgene Corporation. Clincal Study Report: AZA-AML-001 A phase 3, multicenter, randomized, open-label, study of azacitidine (Vidaza) versus conventional care regimens for the treatment of older subjects with newly diagnosed acute myeloid leukemia. 2014.
38. National Audit Office. Department of Health, NHS England and Public Health England. Progress in improving cancer services and outcomes in England. Available at https://www.nao.org.uk/wp-content/uploads/2015/01/Progress-improving-cancer-services-and-outcomes-in-England.pdf [Last accessed October 2015]. 2015.
39. Orphanet. Orphanet report series - list of rate diseases and synonyms listed in alphabetical order. Available at http://www.orpha.net/orphacom/cahiers/docs/GB/List_of_rare_diseases_in_alphabetical_order.pdf [Last accessed: October 2015]. 2015.
40. Department of Health. National Cancer Patient Experience Survey Programme. 2010 National Survey Report. Available at: https://www.gov.uk/government/uploads/system/uploads/attachment_data/file/216682/dh_122520.pdf [Last accessed: October 2015]. 2010.
41. National Institute for Health and Care Excellence. Guide to the methods of technology appraisal. http://publications.nice.org.uk/pmg9. 2013.
42. Karon M, Sieger L, Leimbrock S, Finklestein JZ, Nesbit ME, Swaney JJ. 5-Azacytidine: a new active agent for the treatment of acute leukemia. Blood. 1973;42(3):359-65.
43. Vogler WR, Miller DS, Keller JW. 5-Azacytidine (NSC 102816): a new drug for the treatment of myeloblastic leukemia. Blood. 1976;48(3):331-7.
44. McCormack SE, Warlick ED. Epigenetic approaches in the treatment of myelodysplastic syndromes: clinical utility of azacitidine. OncoTargets and therapy. 2010;3:157-65.
45. Dombret H, Seymour JF, Butrym A, Wierzbowska A, Selleslag D, Jang JH, et al. International phase 3 study of azacitidine vs conventional care regimens in older patients with newly diagnosed AML with >30% blasts. Blood. 2015;126(3):291-9.
46. Lao Z, Yiu R, Wong GC, Ho A. Treatment of elderly patients with acute myeloid leukemia with azacitidine results in fewer hospitalization days and infective
Page 143 of 145
complications but similar survival compared with intensive chemotherapy. Asia-Pacific journal of clinical oncology. 2015;11(1):54-61.
47. Vardiman JW, Harris NL, Brunning RD. The World Health Organization (WHO) classification of the myeloid neoplasms. Blood. 2002;100(7):2292-302.
48. Kantarjian HM, Thomas XG, Dmoszynska A, Wierzbowska A, Mazur G, Mayer J, et al. Multicenter, randomized, open-label, phase III trial of decitabine versus patient choice, with physician advice, of either supportive care or low-dose cytarabine for the treatment of older patients with newly diagnosed acute myeloid leukemia. J Clin Oncol. 2012;30(21):2670-7.
49. Osoba D, Rodrigues G, Myles J, Zee B, Pater J. Interpreting the significance of changes in health-related quality-of-life scores. J Clin Oncol. 1998;16(1):139-44.
50. Feng C, Wang H, Tu XM. Power Loss of Stratified Log-Rank Test in Homogeneous Samples. International Journal of Quality, Statistics, and Reliability. 2010;2010:4.
51. Latimer N, Abrams K. NICE DSU Technical Support Document 16: Adjusting survival time estimates in the presence of treatment switching. Available at: http://www.nicedsu.org.uk/TSD16_Treatment_Switching.pdf [Last accessed: November 2015]. 2014.
52. Cole SR, Hernan MA. Adjusted survival curves with inverse probability weights. Comput Methods Programs Biomed. 2004;75(1):45-9.
53. Howe CJ, Cole SR, Chmiel JS, Munoz A. Limitations of Inverse Probability-of-Censoring Weights in Estimating Survival in the Presence of Strong Selection Bias American Journal of Epidemiology. 2011;173(5):569-77.
54. Dufoir T, Saux MC, Terraza B, Marit G, Guessard S, Foulon G, et al. Comparative cost of allogeneic or autologous bone marrow transplantation and chemotherapy in patients with acute myeloid leukaemia in first remission. Bone Marrow Transplantation. 1992;10(4):323-9.
55. Huang BT, Wang Y, Du QF, Yang J, Yu J, Zeng QC, et al. Analysis of efficacy and cost-effectiveness of high-dose arabinoside versus daunorubicin chemotherapy in older adult patients with acute myeloid leukemia by cytogenetic risk profile: Retrospective review from China. International Journal of Hematology. 2011;93(4):474-81.
56. Kulikov A, Yagudina R, Misikova B. Pharmacoeconomic evaluation of acute myeloid leukemia and mds syndromes (intermediate and high risk) treatment with azacitidine in the russian federation. Value in Health. 2012;15 (7):A423.
57. Robins JM, Finkelstein DM. Correcting for noncompliance and dependent censoring in an AIDS Clinical Trial with inverse probability of censoring weighted (IPCW) log-rank tests. Biometrics. 2000;56(3):779-88.
58. Davies A, Briggs A, Schneider J, Levy A, Ebeid O, al e. The Ends Justify the Mean: Outcome Measures for Estimating the Value of New Cancer Therapies. 2012.
59. Proskorovsky I, Lewis P, Williams CD, Jordan K, Kyriakou C, Ishak J, et al. Mapping EORTC QLQ-C30 and QLQ-MY20 to EQ-5D in patients with multiple myeloma. Health Qual Life Outcomes. 2014;12:35.
60. McKenzie L, van der Pol M. Mapping the EORTC QLQ C-30 onto the EQ-5D instrument: the potential to estimate QALYs without generic preference data. Value Health. 2009;12(1):167-71.
61. Joint Formulary Committee. British National Formulary 69. The authority on the selection and use of medicines. 2015:588.
Page 144 of 145
62. Curtis L. Unit costs of health and social care. Canterbury: Personal Social Services Research Unit (PSSRU); 2014.
63. NHS Blood and Transplant. Price List 2015/16; Code BC001; http://hospital.blood.co.uk/media/27457/price_list_2015-16.pdf, accessed on: 15/11/15.
64. NHS Blood and Transplant. Price List 2015/16; Code BC04; http://hospital.blood.co.uk/media/27457/price_list_2015-16.pdf, accessed on: 15/11/15.
65. Drummond MF, Jefferson TO. Guidelines for authors and peer reviewers of economic submissions to the BMJ. The BMJ Economic Evaluation Working Party. Bmj. 1996;313(7052):275-83.
66. Philips Z, Ginnelly L, Sculpher M, Claxton K, Golder S, Riemsma R, et al. Review of guidelines for good practice in decision-analytic modelling in health technology assessment. Health Technol Assess. 2004;8(36):iii-iv, ix-xi, 1-158.
67. Burnham KP, Anderson DR. Multimodel inference - understanding AIC and BIC in model selection. Sociol Method Res. 2004;33(2):261-304.
68. Kass RE, Wasserman L. A Reference Bayesian Test for Nested Hypotheses and Its Relationship to the Schwarz Criterion. J Am Stat Assoc. 1995;90(431):928-34.
69. Fenaux P, Mufti GJ, Hellstrom-Lindberg E, Santini V, Finelli C, Giagounidis A, et al. Efficacy of azacitidine compared with that of conventional care regimens in the treatment of higher-risk myelodysplastic syndromes: a randomised, open-label, phase III study. The Lancet Oncology. 2009;10(3):223-32.
Page 145 of 145
List of appendices
Appendix 1: Additional clinical effectiveness results from AZA-AML-001
Appendix 2: Statistical analysis of individual patient data for overall survival in AZA-AML-001
Appendix 3: Resource use values applied by ERG to Relapse/PD phase across all arms for calculating their preferred base case analysis
Appendix 4: Estimation of restricted mean overall survival in AZA-AML-001
Azacitidine for treating acute myeloid
leukaemia with more than 30% bone marrow
blasts
Addendum
This addendum updates and replaces Section 6 “Impact on the ICER of additional clinical
and economic analyses undertaken by the ERG”.
An error was identified in the ERG’s estimate of the baseline overall survival curve adjusted
for baseline covariates. This has been corrected and the effect on the results has been
reflected in the new Section 6. The ERG has also made certain clarifications within the
section and has conducted additional exploratory analyses.
6 Impact on the ICER of additional clinical and economic
analyses undertaken by the ERG
The ERG’s preferred base case ICER is £273,308 per QALY (see Table 58 and Table 59).
Corrections to implementation errors in the model increased the ICER from the base case
£20,648 to £62,518 per QALY (analysis A).
Analyses B to G are the additional changes made to reach the ERG’s preferred base case.
Of these, two independently lead to significant increases in the ICER: calibrating the number
of treatment cycles to match the mean number of cycles in AZA-AML-00145 increases the
ICER to £131,698 per QALY (analysis B); setting the costs of relapse/progressive disease
equal across the arms increases the ICER to £159,352 per QALY (analysis C).
The primary focus of analysis D is to change the way overall survival is modelled by
censoring for treatment switching in both arms. As a side effect (due to the model wiring) this
also results in changes to the modelling of relapse-free and progression-free survival, again
to censor for treatment switching in both arms. The effect of this analysis is to reduce the
ICER to £47,482 per QALY.
Analysis E replaces the parametric proportional hazards progression-free survival curves
with Kaplan-Meier curves and increases the ICER to £75,471 per QALY.
Using Kaplan-Meier curves for relapse-free survival (analysis F) has little impact on the
ICER (£63,569 per QALY).
Adjusting overall survival for treatment switching (censoring at switch in both arms) and
baseline covariates (analysis G) increases the ICER to £65,188 per QALY. The reason the
ICER for analysis G is higher than the ICER for analysis D is that analysis G does not have
the side effects on relapse-free and progression-free survival and so azacitidine patients
spend longer in the progressive disease model state with high costs and low utility.
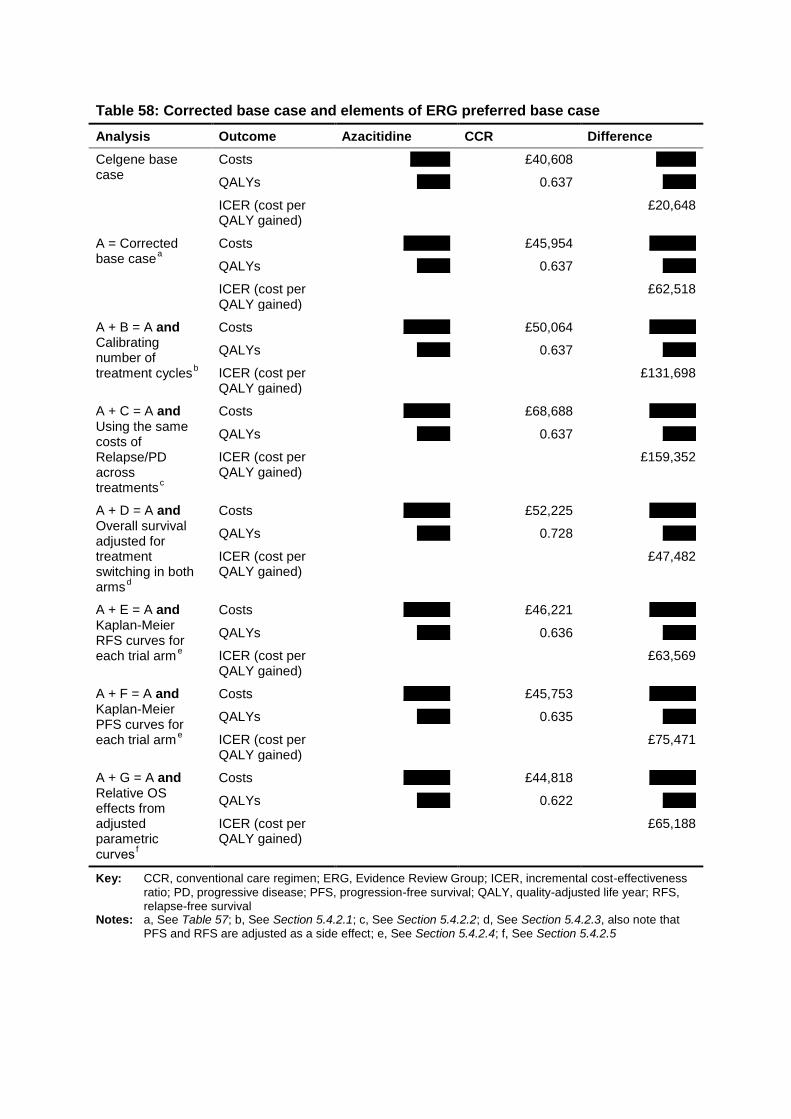
Table 58: Corrected base case and elements of ERG preferred base case
Analysis Outcome Azacitidine CCR Difference
Celgene base case
Costs xxxxxx £40,608 xxxxxx
QALYs xxxxx 0.637 xxxxx
ICER (cost per QALY gained)
£20,648
A = Corrected base case
a
Costs xxxxxxx £45,954 xxxxxxx
QALYs xxxxx 0.637 xxxxx
ICER (cost per QALY gained)
£62,518
A + B = A and Calibrating number of treatment cycles
b
Costs xxxxxxx £50,064 xxxxxxx
QALYs xxxxx 0.637 xxxxx
ICER (cost per QALY gained)
£131,698
A + C = A and Using the same costs of Relapse/PD across treatments
c
Costs xxxxxxx £68,688 xxxxxxx
QALYs xxxxx 0.637 xxxxx
ICER (cost per QALY gained)
£159,352
A + D = A and Overall survival adjusted for treatment switching in both arms
d
Costs xxxxxxx £52,225 xxxxxxx
QALYs xxxxx 0.728 xxxxx
ICER (cost per QALY gained)
£47,482
A + E = A and Kaplan-Meier RFS curves for each trial arm
e
Costs xxxxxxx £46,221 xxxxxxx
QALYs xxxxx 0.636 xxxxx
ICER (cost per QALY gained)
£63,569
A + F = A and Kaplan-Meier PFS curves for each trial arm
e
Costs xxxxxxx £45,753 xxxxxxx
QALYs xxxxx 0.635 xxxxx
ICER (cost per QALY gained)
£75,471
A + G = A and Relative OS effects from adjusted parametric curves
f
Costs xxxxxxx £44,818 xxxxxxx
QALYs xxxxx 0.622 xxxxx
ICER (cost per QALY gained)
£65,188
Key: CCR, conventional care regimen; ERG, Evidence Review Group; ICER, incremental cost-effectiveness
ratio; PD, progressive disease; PFS, progression-free survival; QALY, quality-adjusted life year; RFS, relapse-free survival
Notes: a, See Table 57; b, See Section 5.4.2.1; c, See Section 5.4.2.2; d, See Section 5.4.2.3, also note that PFS and RFS are adjusted as a side effect; e, See Section 5.4.2.4; f, See Section 5.4.2.5
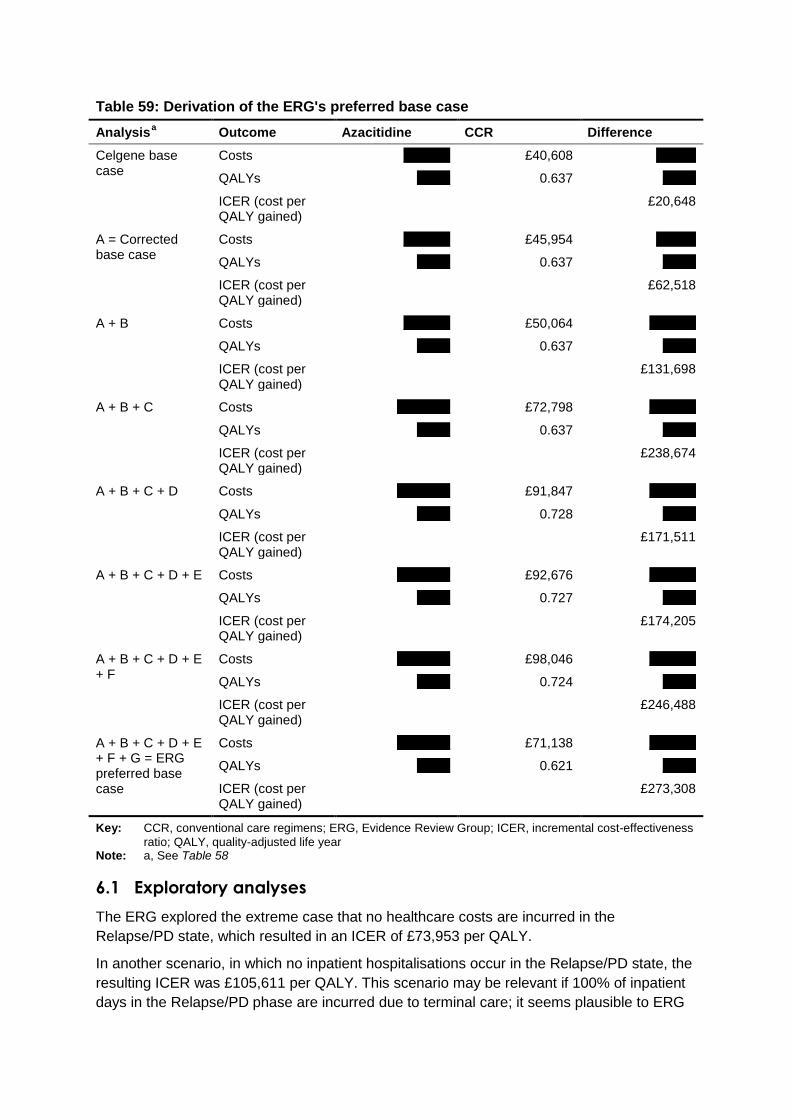
Table 59: Derivation of the ERG's preferred base case
Analysis a Outcome Azacitidine CCR Difference
Celgene base case
Costs xxxxxxx £40,608 xxxxxx
QALYs xxxxx 0.637 xxxxx
ICER (cost per QALY gained)
£20,648
A = Corrected base case
Costs xxxxxxx £45,954 xxxxxx
QALYs xxxxx 0.637 xxxxx
ICER (cost per QALY gained)
£62,518
A + B Costs xxxxxxx £50,064 xxxxxxx
QALYs xxxxx 0.637 xxxxx
ICER (cost per QALY gained)
£131,698
A + B + C Costs xxxxxxxx £72,798 xxxxxxx
QALYs xxxxx 0.637 xxxxx
ICER (cost per QALY gained)
£238,674
A + B + C + D Costs xxxxxxxx £91,847 xxxxxxx
QALYs xxxxx 0.728 xxxxx
ICER (cost per QALY gained)
£171,511
A + B + C + D + E Costs xxxxxxxx £92,676 xxxxxxx
QALYs xxxxx 0.727 xxxxx
ICER (cost per QALY gained)
£174,205
A + B + C + D + E + F
Costs xxxxxxxx £98,046 xxxxxxx
QALYs xxxxx 0.724 xxxxx
ICER (cost per QALY gained)
£246,488
A + B + C + D + E + F + G = ERG preferred base case
Costs xxxxxxxx £71,138 xxxxxxx
QALYs xxxxx 0.621 xxxxx
ICER (cost per QALY gained)
£273,308
Key: CCR, conventional care regimens; ERG, Evidence Review Group; ICER, incremental cost-effectiveness
ratio; QALY, quality-adjusted life year Note: a, See Table 58
6.1 Exploratory analyses
The ERG explored the extreme case that no healthcare costs are incurred in the
Relapse/PD state, which resulted in an ICER of £73,953 per QALY.
In another scenario, in which no inpatient hospitalisations occur in the Relapse/PD state, the
resulting ICER was £105,611 per QALY. This scenario may be relevant if 100% of inpatient
days in the Relapse/PD phase are incurred due to terminal care; it seems plausible to ERG
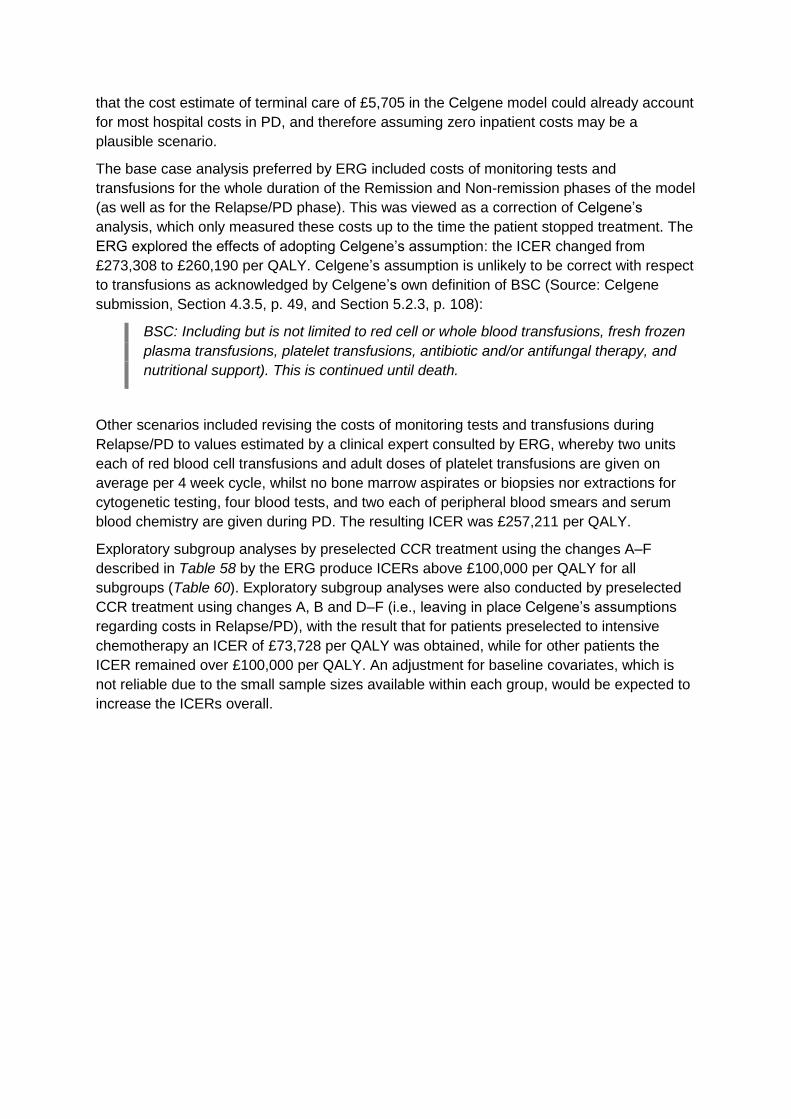
that the cost estimate of terminal care of £5,705 in the Celgene model could already account
for most hospital costs in PD, and therefore assuming zero inpatient costs may be a
plausible scenario.
The base case analysis preferred by ERG included costs of monitoring tests and
transfusions for the whole duration of the Remission and Non-remission phases of the model
(as well as for the Relapse/PD phase). This was viewed as a correction of Celgene’s
analysis, which only measured these costs up to the time the patient stopped treatment. The
ERG explored the effects of adopting Celgene’s assumption: the ICER changed from
£273,308 to £260,190 per QALY. Celgene’s assumption is unlikely to be correct with respect
to transfusions as acknowledged by Celgene’s own definition of BSC (Source: Celgene
submission, Section 4.3.5, p. 49, and Section 5.2.3, p. 108):
BSC: Including but is not limited to red cell or whole blood transfusions, fresh frozen
plasma transfusions, platelet transfusions, antibiotic and/or antifungal therapy, and
nutritional support). This is continued until death.
Other scenarios included revising the costs of monitoring tests and transfusions during
Relapse/PD to values estimated by a clinical expert consulted by ERG, whereby two units
each of red blood cell transfusions and adult doses of platelet transfusions are given on
average per 4 week cycle, whilst no bone marrow aspirates or biopsies nor extractions for
cytogenetic testing, four blood tests, and two each of peripheral blood smears and serum
blood chemistry are given during PD. The resulting ICER was £257,211 per QALY.
Exploratory subgroup analyses by preselected CCR treatment using the changes A–F
described in Table 58 by the ERG produce ICERs above £100,000 per QALY for all
subgroups (Table 60). Exploratory subgroup analyses were also conducted by preselected
CCR treatment using changes A, B and D–F (i.e., leaving in place Celgene’s assumptions
regarding costs in Relapse/PD), with the result that for patients preselected to intensive
chemotherapy an ICER of £73,728 per QALY was obtained, while for other patients the
ICER remained over £100,000 per QALY. An adjustment for baseline covariates, which is
not reliable due to the small sample sizes available within each group, would be expected to
increase the ICERs overall.
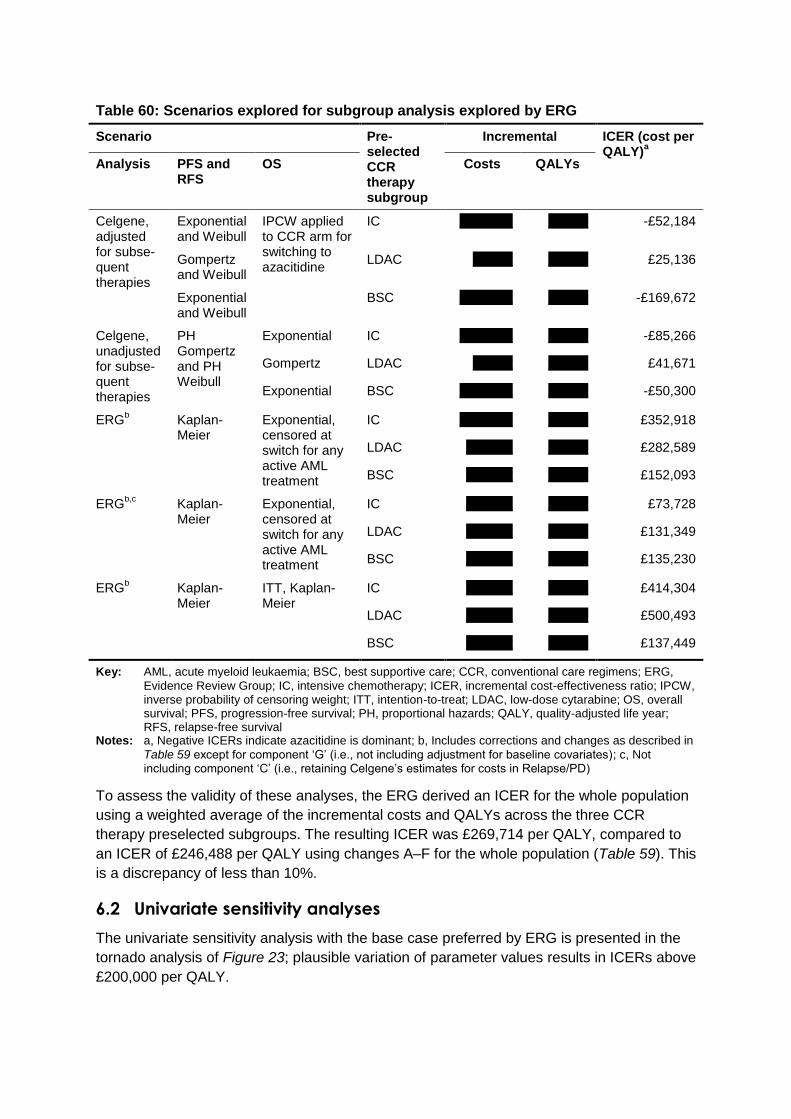
Table 60: Scenarios explored for subgroup analysis explored by ERG
Scenario Pre-selected CCR therapy subgroup
Incremental ICER (cost per QALY)
a
Analysis PFS and RFS
OS Costs QALYs
Celgene, adjusted for subse-quent therapies
Exponential and Weibull
IPCW applied to CCR arm for switching to azacitidine
IC xxxxxxxx xxxxxx -£52,184
Gompertz and Weibull
LDAC xxxxxx xxxxxx £25,136
Exponential and Weibull
BSC xxxxxxxx xxxxxx -£169,672
Celgene, unadjusted for subse-quent therapies
PH Gompertz and PH Weibull
Exponential IC xxxxxxxx xxxxxx -£85,266
Gompertz LDAC xxxxxx xxxxxx £41,671
Exponential BSC xxxxxxxx xxxxxx -£50,300
ERGb Kaplan-
Meier Exponential, censored at switch for any active AML treatment
IC xxxxxxxx xxxxxx £352,918
LDAC xxxxxxx xxxxxx £282,589
BSC xxxxxxx xxxxxx £152,093
ERGb,c
Kaplan-Meier
Exponential, censored at switch for any active AML treatment
IC xxxxxxx xxxxxx £73,728
LDAC xxxxxxx xxxxxx £131,349
BSC xxxxxxx xxxxxx £135,230
ERGb Kaplan-
Meier ITT, Kaplan-Meier
IC xxxxxxx xxxxxx £414,304
LDAC xxxxxxx xxxxxx £500,493
BSC xxxxxxx xxxxxx £137,449
Key: AML, acute myeloid leukaemia; BSC, best supportive care; CCR, conventional care regimens; ERG,
Evidence Review Group; IC, intensive chemotherapy; ICER, incremental cost-effectiveness ratio; IPCW, inverse probability of censoring weight; ITT, intention-to-treat; LDAC, low-dose cytarabine; OS, overall survival; PFS, progression-free survival; PH, proportional hazards; QALY, quality-adjusted life year; RFS, relapse-free survival
Notes: a, Negative ICERs indicate azacitidine is dominant; b, Includes corrections and changes as described in
Table 59 except for component ‘G’ (i.e., not including adjustment for baseline covariates); c, Not including component ‘C’ (i.e., retaining Celgene’s estimates for costs in Relapse/PD)
To assess the validity of these analyses, the ERG derived an ICER for the whole population
using a weighted average of the incremental costs and QALYs across the three CCR
therapy preselected subgroups. The resulting ICER was £269,714 per QALY, compared to
an ICER of £246,488 per QALY using changes A–F for the whole population (Table 59). This
is a discrepancy of less than 10%.
6.2 Univariate sensitivity analyses
The univariate sensitivity analysis with the base case preferred by ERG is presented in the
tornado analysis of Figure 23; plausible variation of parameter values results in ICERs above
£200,000 per QALY.
Figure 23: Tornado diagram of ERG’s preferred base case deterministic analysis
Key: AZA, azacitidine; CCR, conventional care regimens; CR, complete remission; CRi, complete remission
with incomplete blood count recovery; ERG, Evidence Review Group; HR, hazard ratio; ICER, incremental cost-effectiveness ratio; OS, overall survival; PD, progressive disease; PFS, progression-free survival; PR, partial response; RFS, relapse-free survival; SD, stable disease; TEAE, treatment emergent adverse event
6.3 Probabilistic sensitivity analysis
A probabilistic sensitivity analysis was conducted for the ERG’s preferred base case (Table
61). An ICER of £277,123 per QALY was obtained, which is similar to the deterministic ICER
of £273,308 per QALY. Figure 24 presents the cost-effectiveness acceptability curves from
the probabilistic sensitivity analysis in the ERG’s preferred base case. At a willingness to pay
threshold of £100,000 the probability of azacitidine being cost-effective is less than 5%.
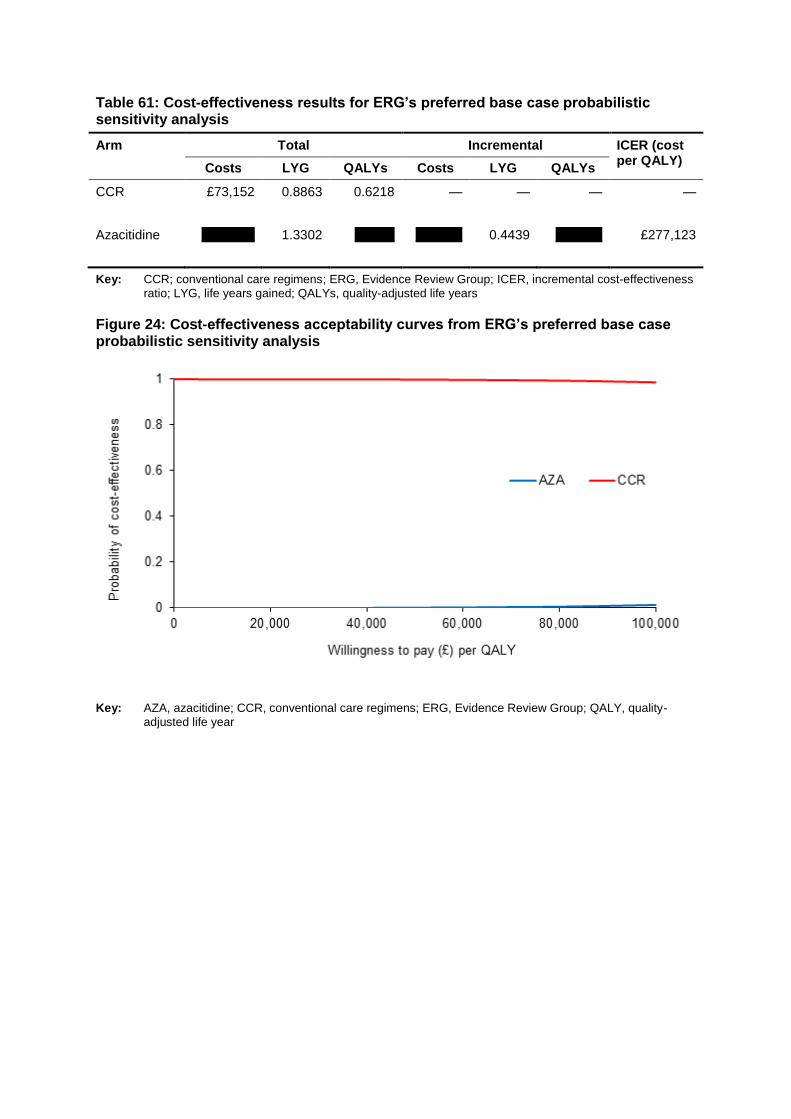
Table 61: Cost-effectiveness results for ERG’s preferred base case probabilistic sensitivity analysis
Arm Total Incremental ICER (cost per QALY)
Costs LYG QALYs Costs LYG QALYs
CCR £73,152 0.8863 0.6218 — — — —
Azacitidine xxxxxxxx 1.3302 xxxxxx xxxxxxx 0.4439 xxxxxxx £277,123
Key: CCR; conventional care regimens; ERG, Evidence Review Group; ICER, incremental cost-effectiveness
ratio; LYG, life years gained; QALYs, quality-adjusted life years
Figure 24: Cost-effectiveness acceptability curves from ERG’s preferred base case probabilistic sensitivity analysis
Key: AZA, azacitidine; CCR, conventional care regimens; ERG, Evidence Review Group; QALY, quality-
adjusted life year
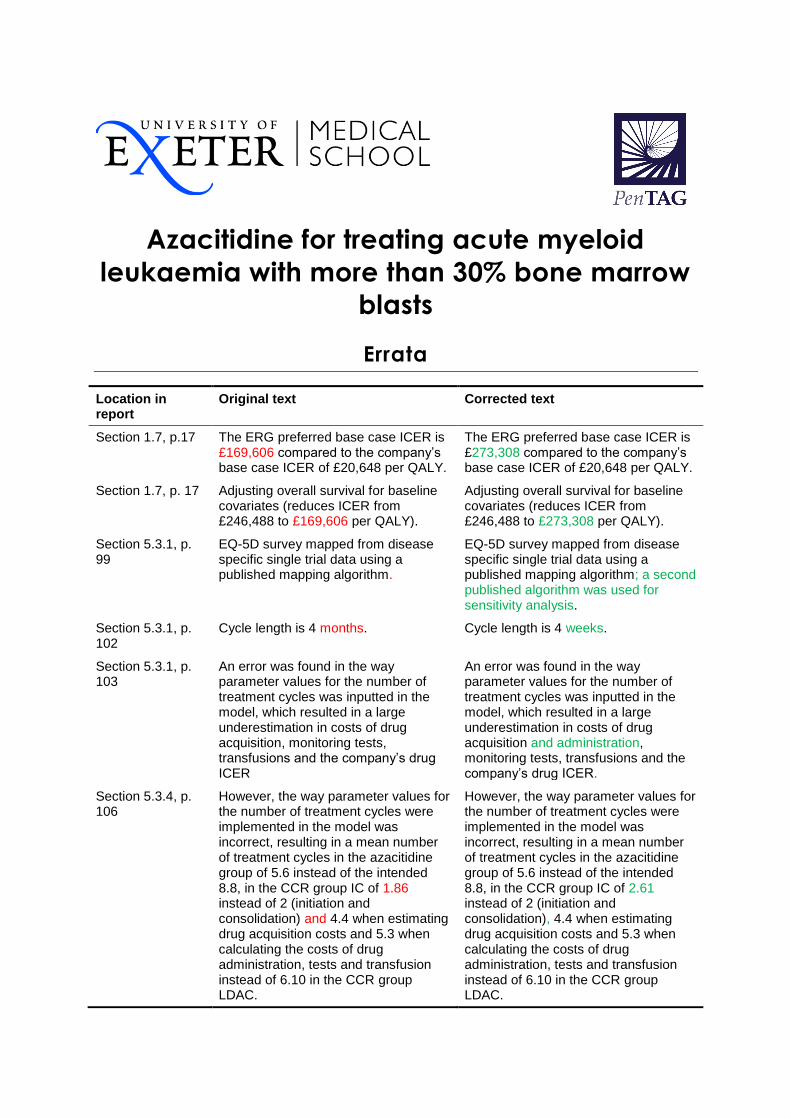
Azacitidine for treating acute myeloid
leukaemia with more than 30% bone marrow
blasts
Errata
Location in report
Original text Corrected text
Section 1.7, p.17 The ERG preferred base case ICER is £169,606 compared to the company’s base case ICER of £20,648 per QALY.
The ERG preferred base case ICER is £273,308 compared to the company’s base case ICER of £20,648 per QALY.
Section 1.7, p. 17 Adjusting overall survival for baseline covariates (reduces ICER from £246,488 to £169,606 per QALY).
Adjusting overall survival for baseline covariates (reduces ICER from £246,488 to £273,308 per QALY).
Section 5.3.1, p. 99
EQ-5D survey mapped from disease specific single trial data using a published mapping algorithm.
EQ-5D survey mapped from disease specific single trial data using a published mapping algorithm; a second published algorithm was used for sensitivity analysis.
Section 5.3.1, p. 102
Cycle length is 4 months. Cycle length is 4 weeks.
Section 5.3.1, p. 103
An error was found in the way parameter values for the number of treatment cycles was inputted in the model, which resulted in a large underestimation in costs of drug acquisition, monitoring tests, transfusions and the company’s drug ICER
An error was found in the way parameter values for the number of treatment cycles was inputted in the model, which resulted in a large underestimation in costs of drug acquisition and administration, monitoring tests, transfusions and the company’s drug ICER.
Section 5.3.4, p. 106
However, the way parameter values for the number of treatment cycles were implemented in the model was incorrect, resulting in a mean number of treatment cycles in the azacitidine group of 5.6 instead of the intended 8.8, in the CCR group IC of 1.86 instead of 2 (initiation and consolidation) and 4.4 when estimating drug acquisition costs and 5.3 when calculating the costs of drug administration, tests and transfusion instead of 6.10 in the CCR group LDAC.
However, the way parameter values for the number of treatment cycles were implemented in the model was incorrect, resulting in a mean number of treatment cycles in the azacitidine group of 5.6 instead of the intended 8.8, in the CCR group IC of 2.61 instead of 2 (initiation and consolidation), 4.4 when estimating drug acquisition costs and 5.3 when calculating the costs of drug administration, tests and transfusion instead of 6.10 in the CCR group LDAC.
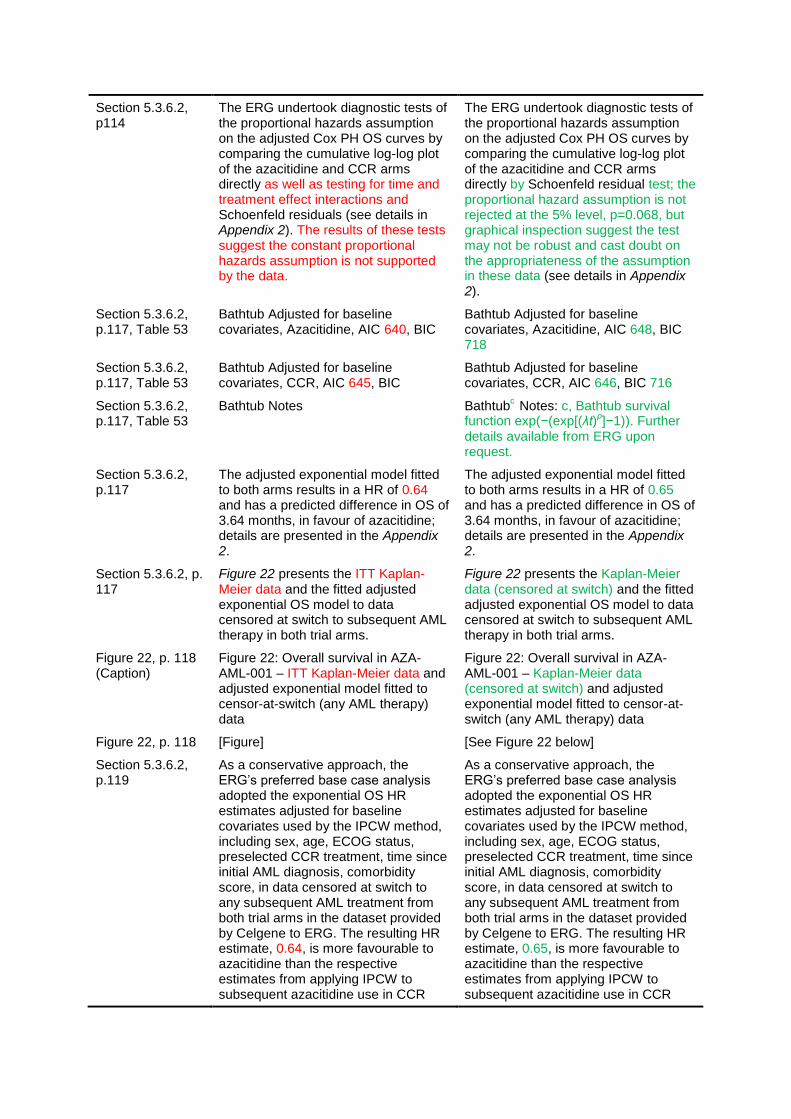
Section 5.3.6.2, p114
The ERG undertook diagnostic tests of the proportional hazards assumption on the adjusted Cox PH OS curves by comparing the cumulative log-log plot of the azacitidine and CCR arms directly as well as testing for time and treatment effect interactions and Schoenfeld residuals (see details in Appendix 2). The results of these tests suggest the constant proportional hazards assumption is not supported by the data.
The ERG undertook diagnostic tests of the proportional hazards assumption on the adjusted Cox PH OS curves by comparing the cumulative log-log plot of the azacitidine and CCR arms directly by Schoenfeld residual test; the proportional hazard assumption is not rejected at the 5% level, p=0.068, but graphical inspection suggest the test may not be robust and cast doubt on the appropriateness of the assumption in these data (see details in Appendix 2).
Section 5.3.6.2, p.117, Table 53
Bathtub Adjusted for baseline covariates, Azacitidine, AIC 640, BIC
Bathtub Adjusted for baseline covariates, Azacitidine, AIC 648, BIC 718
Section 5.3.6.2, p.117, Table 53
Bathtub Adjusted for baseline covariates, CCR, AIC 645, BIC
Bathtub Adjusted for baseline covariates, CCR, AIC 646, BIC 716
Section 5.3.6.2, p.117, Table 53
Bathtub Notes Bathtubc
Notes: c, Bathtub survival function exp(−(exp[(λt)
ρ]−1)). Further
details available from ERG upon request.
Section 5.3.6.2, p.117
The adjusted exponential model fitted to both arms results in a HR of 0.64 and has a predicted difference in OS of 3.64 months, in favour of azacitidine; details are presented in the Appendix 2.
The adjusted exponential model fitted to both arms results in a HR of 0.65 and has a predicted difference in OS of 3.64 months, in favour of azacitidine; details are presented in the Appendix 2.
Section 5.3.6.2, p. 117
Figure 22 presents the ITT Kaplan-Meier data and the fitted adjusted exponential OS model to data censored at switch to subsequent AML therapy in both trial arms.
Figure 22 presents the Kaplan-Meier data (censored at switch) and the fitted adjusted exponential OS model to data censored at switch to subsequent AML therapy in both trial arms.
Figure 22, p. 118 (Caption)
Figure 22: Overall survival in AZA-AML-001 – ITT Kaplan-Meier data and adjusted exponential model fitted to censor-at-switch (any AML therapy) data
Figure 22: Overall survival in AZA-AML-001 – Kaplan-Meier data (censored at switch) and adjusted exponential model fitted to censor-at-switch (any AML therapy) data
Figure 22, p. 118 [Figure] [See Figure 22 below]
Section 5.3.6.2, p.119
As a conservative approach, the ERG’s preferred base case analysis adopted the exponential OS HR estimates adjusted for baseline covariates used by the IPCW method, including sex, age, ECOG status, preselected CCR treatment, time since initial AML diagnosis, comorbidity score, in data censored at switch to any subsequent AML treatment from both trial arms in the dataset provided by Celgene to ERG. The resulting HR estimate, 0.64, is more favourable to azacitidine than the respective estimates from applying IPCW to subsequent azacitidine use in CCR
As a conservative approach, the ERG’s preferred base case analysis adopted the exponential OS HR estimates adjusted for baseline covariates used by the IPCW method, including sex, age, ECOG status, preselected CCR treatment, time since initial AML diagnosis, comorbidity score, in data censored at switch to any subsequent AML treatment from both trial arms in the dataset provided by Celgene to ERG. The resulting HR estimate, 0.65, is more favourable to azacitidine than the respective estimates from applying IPCW to subsequent azacitidine use in CCR
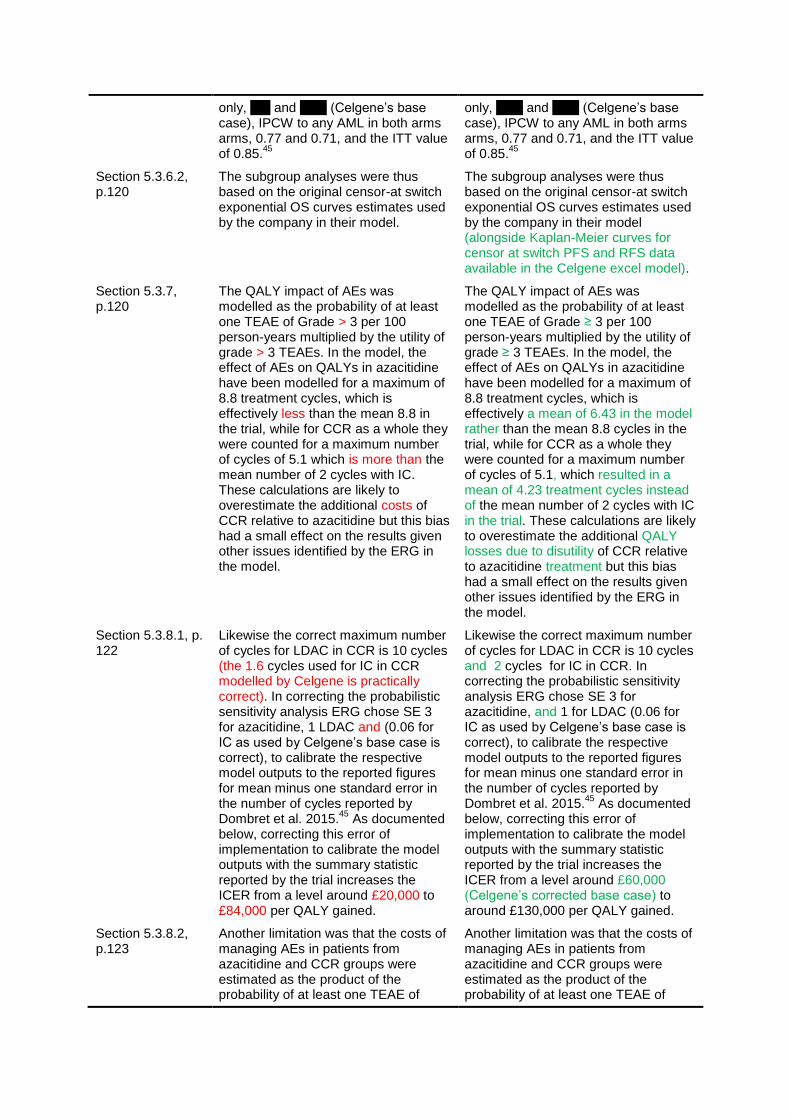
only, xxx and xxxx (Celgene’s base case), IPCW to any AML in both arms arms, 0.77 and 0.71, and the ITT value of 0.85.
45
only, xxxx and xxxx (Celgene’s base case), IPCW to any AML in both arms arms, 0.77 and 0.71, and the ITT value of 0.85.
45
Section 5.3.6.2, p.120
The subgroup analyses were thus based on the original censor-at switch exponential OS curves estimates used by the company in their model.
The subgroup analyses were thus based on the original censor-at switch exponential OS curves estimates used by the company in their model (alongside Kaplan-Meier curves for censor at switch PFS and RFS data available in the Celgene excel model).
Section 5.3.7, p.120
The QALY impact of AEs was modelled as the probability of at least one TEAE of Grade > 3 per 100 person-years multiplied by the utility of grade > 3 TEAEs. In the model, the effect of AEs on QALYs in azacitidine have been modelled for a maximum of 8.8 treatment cycles, which is effectively less than the mean 8.8 in the trial, while for CCR as a whole they were counted for a maximum number of cycles of 5.1 which is more than the mean number of 2 cycles with IC. These calculations are likely to overestimate the additional costs of CCR relative to azacitidine but this bias had a small effect on the results given other issues identified by the ERG in the model.
The QALY impact of AEs was modelled as the probability of at least one TEAE of Grade ≥ 3 per 100 person-years multiplied by the utility of grade ≥ 3 TEAEs. In the model, the effect of AEs on QALYs in azacitidine have been modelled for a maximum of 8.8 treatment cycles, which is effectively a mean of 6.43 in the model rather than the mean 8.8 cycles in the trial, while for CCR as a whole they were counted for a maximum number of cycles of 5.1, which resulted in a mean of 4.23 treatment cycles instead of the mean number of 2 cycles with IC in the trial. These calculations are likely to overestimate the additional QALY losses due to disutility of CCR relative to azacitidine treatment but this bias had a small effect on the results given other issues identified by the ERG in the model.
Section 5.3.8.1, p. 122
Likewise the correct maximum number of cycles for LDAC in CCR is 10 cycles (the 1.6 cycles used for IC in CCR modelled by Celgene is practically correct). In correcting the probabilistic sensitivity analysis ERG chose SE 3 for azacitidine, 1 LDAC and (0.06 for IC as used by Celgene’s base case is correct), to calibrate the respective model outputs to the reported figures for mean minus one standard error in the number of cycles reported by Dombret et al. 2015.
45 As documented
below, correcting this error of implementation to calibrate the model outputs with the summary statistic reported by the trial increases the ICER from a level around £20,000 to £84,000 per QALY gained.
Likewise the correct maximum number of cycles for LDAC in CCR is 10 cycles and 2 cycles for IC in CCR. In correcting the probabilistic sensitivity analysis ERG chose SE 3 for azacitidine, and 1 for LDAC (0.06 for IC as used by Celgene’s base case is correct), to calibrate the respective model outputs to the reported figures for mean minus one standard error in the number of cycles reported by Dombret et al. 2015.
45 As documented
below, correcting this error of implementation to calibrate the model outputs with the summary statistic reported by the trial increases the ICER from a level around £60,000 (Celgene’s corrected base case) to around £130,000 per QALY gained.
Section 5.3.8.2, p.123
Another limitation was that the costs of managing AEs in patients from azacitidine and CCR groups were estimated as the product of the probability of at least one TEAE of
Another limitation was that the costs of managing AEs in patients from azacitidine and CCR groups were estimated as the product of the probability of at least one TEAE of
Grade > 3 per 100 person-years and the average cost of managing grade 3 or 4 TEAEs observed in the AZA-AML-001 trial.
Grade ≥ 3 per 100 person-years and the average cost of managing grade 3 or 4 TEAEs observed in the AZA-AML-001 trial.
Section 5.3.10, p. 126
Our corrected results presented in Section 6 (page 130) are subject to this caveat.
However, the ERG corrected base case results presented in Section 6 (page130) were found to be replicable by the weighted average method within a 5-10% margin of error.
Section 5.4.2.3, p.128
The ERG set the OS curves to the Censor At Switch analysis mode in Celgene’s model, keeping the exponential functional form adopted in Celgene’s base-case. This choice was associated with a hazard ratio of 0.72, which corresponded to the analysis that was unadjusted for baseline covariates. Given the high ICERs that were obtained after the preceding revisions in Sections 5.4.2.1 and 5.4.2.2, the effect of adopting the smaller hazard that resulted from censored at switch analysis that adjusted for baseline covariates was investigated in exploratory analyses.
The ERG set the OS curves to the Censor At Switch analysis mode in Celgene’s model, keeping the exponential functional form adopted in Celgene’s base-case. This choice was associated with a hazard ratio of 0.72, which corresponded to the analysis that was unadjusted for baseline covariates. In addition, the Censor At Switch analysis in the Celgene model alters the estimates of relative effects of azacitidine on PFS and RFS, from the Celgene base case HR values of 0.84 and 0.85 to 0.83 and 0.76, respectively. Given the high ICERs that were obtained after the preceding revisions in Sections 5.4.2.1 and 5.4.2.2, the effect of adopting the smaller hazard that resulted from censored at switch analysis that adjusted for baseline covariates was investigated in separate exploratory analyses.
Secton 5.4.2.5, p. 128
The effect of using the OS hazard ratio estimate of 0.64 from the exponential model adjusted for baseline covariates, which found support in statistical tests conducted by the ERG, was investigated.
The effect of using the OS hazard ratio estimate of 0.65 from the exponential model adjusted for baseline covariates, which found support in statistical tests conducted by the ERG, was investigated.
Section 5.4.3, p. 128
The ERG sought to perform some exploratory assessment of the subgroup analysis by preselected CCR treatment, while acknowledging that for PFS and RFS outcomes, the sample sizes make subgroup-specific time to event data highly unreliable. Thus in these analyses subgroup specific differences in OS outcomes were allowed using censor-at-switch data, while keeping common PFS and RFS curves across the three subgroups.
Since resource use data in the Celgene model was obtained from a survey of clinical experts’ estimates, and because the ERG’s preferred cost estimates for Relapse/PD were those estimated by Celgene’s experts for the BSC (i.e. the most costly) subgroup during Relapse/PD, the effect of uncertainty from these values on the ICER was explored in extreme scenarios where costs of Relapse/PD were zero and, separately, where no inpatient costs were incurred (apart from what is already included in the model ‘Terminal care’ costs). In its preferred base case analysis, Celgene measured costs of monitoring tests and transfusions only while patients were on azacitidine, LDAC or
IC. The ERG instead included costs for these items for the duration of the patients in Remission and Non-Remission states as well as during Relapse/ Progressive Disease. The ERG explored the effects of adopting Celgene’s assumption that no such costs would occur after treatment active treatment stopped. Other scenarios included revising the costs of monitoring tests and transfusions during Relapse/PD to values estimated by a clinical expert consulted by the ERG, whereby two units each of red blood cell transfusions and adult doses of platelet transfusions are given on average per 4 week cycle, whilst no bone marrow aspirates or biopsies nor extractions for cytogenetic testing, four blood tests, and two each of peripheral blood smears and serum blood chemistry are given during PD. In addition, the ERG sought to perform some exploratory assessment of the subgroup analysis by preselected CCR treatment, while acknowledging that for PFS and RFS outcomes, the sample sizes make subgroup-specific time to event data highly unreliable. In these analyses subgroup specific differences in OS, PFS, and RFS outcomes were allowed using censor-at-switch data, using the exponential (OS) and Kaplan-Meier (PFS and RFS) curves provided by Celgene in the Excel model for each arm in the three subgroups.
Section 6, pp. 130–136
[Section 6 and all included tables (58 to 61) and figures (23 and 24) superseded by the ERG Addendum following correction of an error in the final stage of the
derivation of the ERG preferred base case]
Section 8, p. 138 Of the key changes made to the economic model by the ERG in arriving at their preferred base case (ICER £169,606 per QALY), the following might be considered to be differences of opinion between the company and the ERG:
Of the key changes made to the economic model by the ERG in arriving at their preferred base case (ICER £273,308 per QALY), the following might be considered to be differences of opinion between the company and the ERG:
Section 8, p. 138 The base case analysis preferred by the ERG has the limitation that the sum of the cohort proportions in PFS and RFS exceeds the proportion alive by the third cycle in the model. Celgene included an adjustment in the model to eliminate such anomalies, but nevertheless this remains a deficiency of the model structure. The ERG has not attempted to correct this, due to the
[This is no longer the case after correcting the error in estimating the ERG’s adjusted exponential OS baseline hazard; Appendix has been corrected below]
difficulties of fitting plausible parametric models to the PFS and RFS data (as discussed in this critique) and adjusting for baseline covariates, given the small samples available for analysis.
Appendix 2, Figure A1 (caption)
Figure A1: Log-log plots of OS probability adjusted for subsequent azacitidine use in the CCR arm using the IPCW method – unadjusted for baseline covariates
Figure A1: Log-log plots of OS probability adjusted for subsequent azacitidine use in the CCR arm using the IPCW method – adjusted for baseline covariates
Appendix 2, Figure A1, footnotes
Note: Not adjusted for differences in baseline covariates
[Note deleted]
Appendix 2, Figure A1
[Figure] [See Figure A1 below]
Appendix 2, Section A2.1
Append following subsection: A2.1.2 Schoenfeld residual plots Figure A2: Schoenfeld residual plots and local polynomial regression, adjusted for subsequent azacitidine use in the CCR arm – adjusted for baseline covariates [Figure A2] Key: CCR, conventional care regimens Source: ERG analysis using individual patient data provided by Celgene
Appendices 2–4 [Figure numbering] [Renumber figures]
Appendix 2, Section A2.4
Model estimated using effects coding to obtain average baseline. Mean time to death Azacitidine = 0.0973354
-1 =
10.27 months; CCR =(1.549388×0.0973354)
-1 = 6.63
months (HR azacitidine vs. CCR = 1.549388
-1 = 0.6454162)
Model estimated using effects coding to obtain average baseline. Mean time to death Azacitidine = 0.058019
-1 =
17.24 months; CCR =(1.549388×0.058019)
-1 = 11.12
months (HR azacitidine vs. CCR = 1.549388
-1 = 0.6454162)
Appendix 2, Section A2.4
This model adjusted for baseline covariates sex, age, ECOG, cytogenetic risk, CCR preselected treatment, comorbidity group, AML days, platelet transfusion status, geographical region, used in Celgene’s IPCW analysis (fixed covariates), using effects-coding, in order to estimate the average baseline (intercept) coefficient in the sample. Blast group was not effects-coded but included in order to adjust for blast group <25 (blastgrp2 indicates 5-24% blasts; blastgrp4 indicates blastgrp<5%), so that estimated baseline coefficient of 0.0973354 is average in sample with blasts≥25% group.
This model adjusted for baseline covariates sex, age, ECOG, cytogenetic risk, CCR preselected treatment, comorbidity group, AML days, platelet transfusion status, geographical region, used in Celgene’s IPCW analysis (fixed covariates). The predicted baseline hazard rate was obtained by evaluating the estimated equation and mean valued of the covariates for the whole. Blast group was not evaluated at 0 in order to adjust for blast group <25 (blastgrp2 indicates 5-24% blasts; blastgrp4 indicates blastgrp<5%), so that estimated baseline coefficient of 0.058019 is average in sample with blasts≥25% group.

Appendix 2, Section A2.4
[Stata output from streg command] [Stata output as shown below]
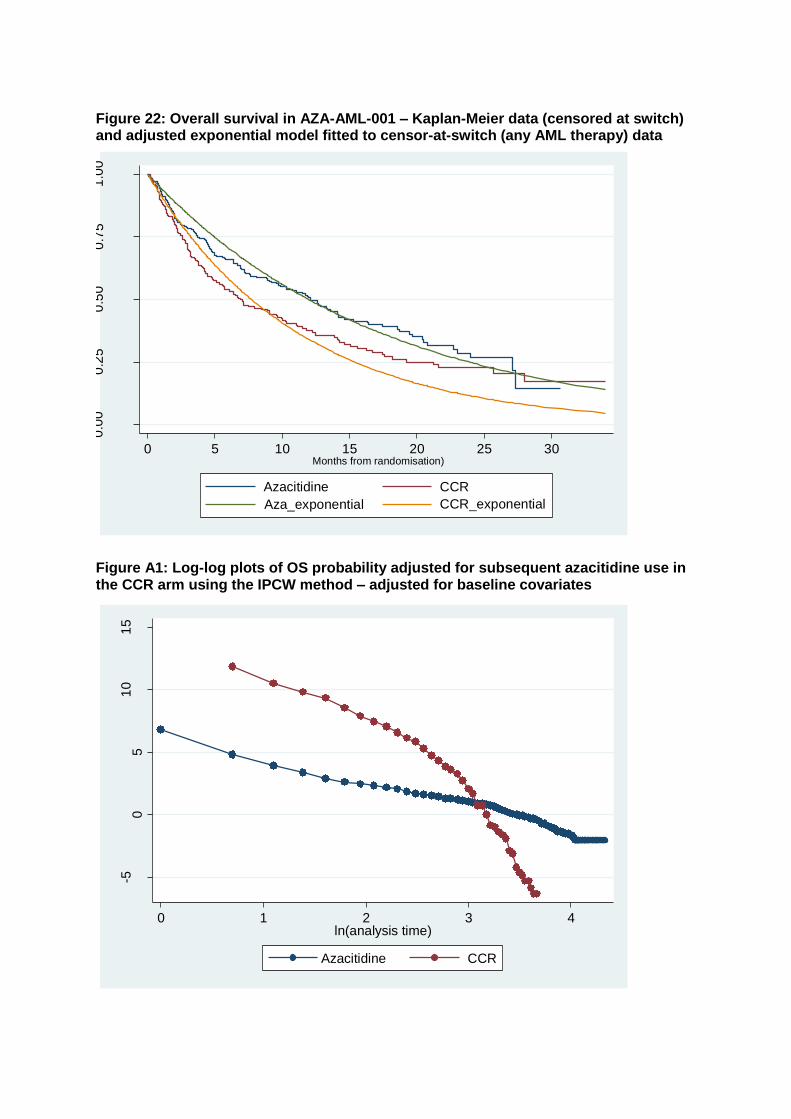
Figure 22: Overall survival in AZA-AML-001 – Kaplan-Meier data (censored at switch) and adjusted exponential model fitted to censor-at-switch (any AML therapy) data
Figure A1: Log-log plots of OS probability adjusted for subsequent azacitidine use in the CCR arm using the IPCW method – adjusted for baseline covariates
0.0
00
.25
0.5
00
.75
1.0
0
0 5 10 15 20 25 30Months from randomisation)
Azacitidine CCR
Aza_exponential CCR_exponential
-50
51
01
5
-ln[-
ln(S
urv
ival P
roba
bili
ty)]
0 1 2 3 4ln(analysis time)
Azacitidine CCR
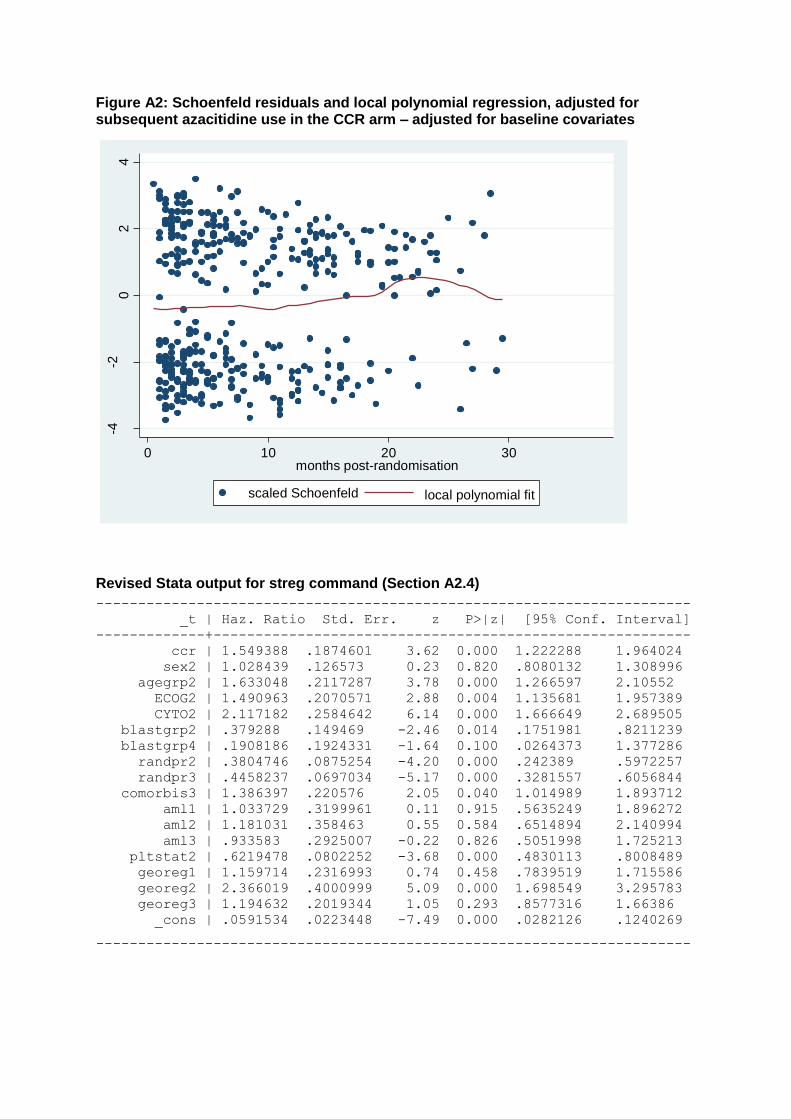
Figure A2: Schoenfeld residuals and local polynomial regression, adjusted for subsequent azacitidine use in the CCR arm – adjusted for baseline covariates
Revised Stata output for streg command (Section A2.4)
-----------------------------------------------------------------------
_t | Haz. Ratio Std. Err. z P>|z| [95% Conf. Interval]
-------------+---------------------------------------------------------
ccr | 1.549388 .1874601 3.62 0.000 1.222288 1.964024
sex2 | 1.028439 .126573 0.23 0.820 .8080132 1.308996
agegrp2 | 1.633048 .2117287 3.78 0.000 1.266597 2.10552
ECOG2 | 1.490963 .2070571 2.88 0.004 1.135681 1.957389
CYTO2 | 2.117182 .2584642 6.14 0.000 1.666649 2.689505
blastgrp2 | .379288 .149469 -2.46 0.014 .1751981 .8211239
blastgrp4 | .1908186 .1924331 -1.64 0.100 .0264373 1.377286
randpr2 | .3804746 .0875254 -4.20 0.000 .242389 .5972257
randpr3 | .4458237 .0697034 -5.17 0.000 .3281557 .6056844
comorbis3 | 1.386397 .220576 2.05 0.040 1.014989 1.893712
aml1 | 1.033729 .3199961 0.11 0.915 .5635249 1.896272
aml2 | 1.181031 .358463 0.55 0.584 .6514894 2.140994
aml3 | .933583 .2925007 -0.22 0.826 .5051998 1.725213
pltstat2 | .6219478 .0802252 -3.68 0.000 .4830113 .8008489
georeg1 | 1.159714 .2316993 0.74 0.458 .7839519 1.715586
georeg2 | 2.366019 .4000999 5.09 0.000 1.698549 3.295783
georeg3 | 1.194632 .2019344 1.05 0.293 .8577316 1.66386
_cons | .0591534 .0223448 -7.49 0.000 .0282126 .1240269
-----------------------------------------------------------------------
-4-2
02
4
0 10 20 30months post-randomisation
scaled Schoenfeld local polynomial fit
National Institute for Health and Care Excellence
Centre for Health Technology Evaluation
Pro-forma Response
ERG report
Azacitidine for treating acute myeloid leukaemia with more than 30% bone marrow blasts [ID829]
You are asked to check the ERG report from Peninsula Technology Assessment Group (PenTAG) to ensure there are no factual inaccuracies contained within it. If you do identify any factual inaccuracies you must inform NICE by 5pm, Friday 19 February 2016 (changed to Wednesday 24
th February 2016) using the
below proforma comments table. All factual errors will be highlighted in a report and presented to the Appraisal Committee and will subsequently be published on the NICE website with the Evaluation report. The proforma document should act as a method of detailing any inaccuracies found and how and why they should be corrected.
Issue 1 Use of CCR as a comparator; not investigating individual treatments
Description of problem Description of proposed amendment
Justification for amendment ERG response
Throughout the report (example Table 1, pg. 24), the ERG have
It should be stated that: Stating that the company have not assessed whether azacitidine
The company have not adequately assessed whether azacitidine
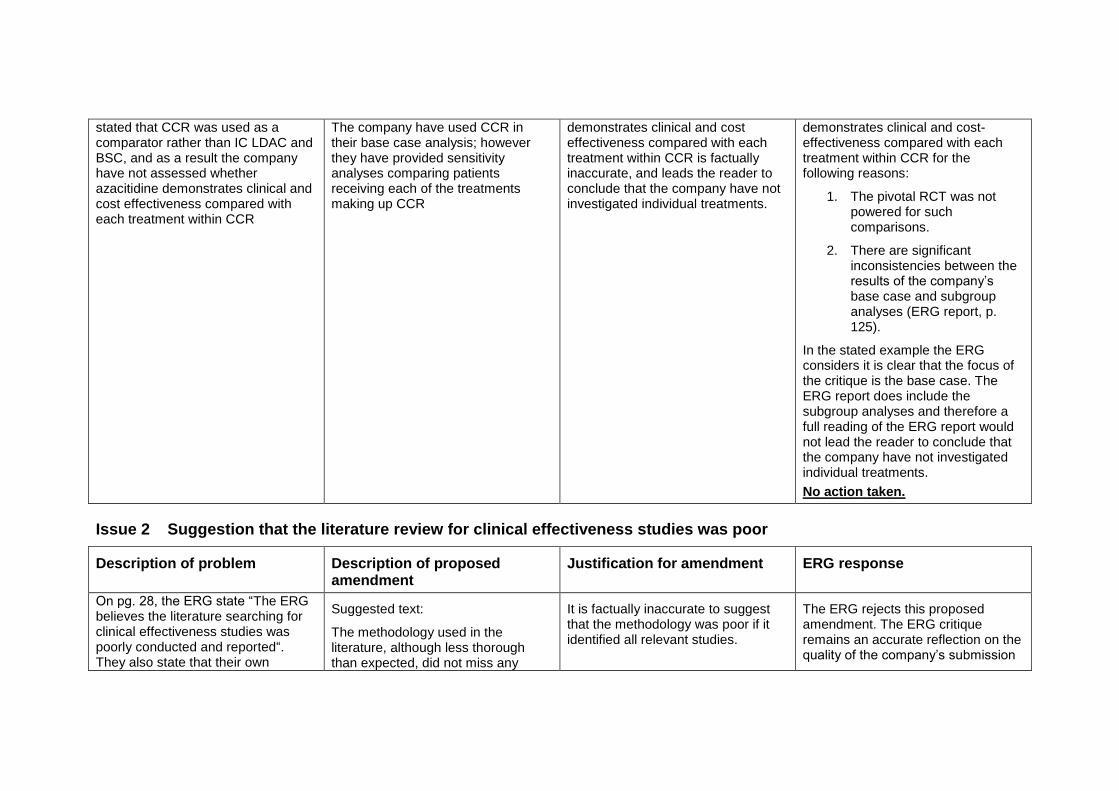
stated that CCR was used as a comparator rather than IC LDAC and BSC, and as a result the company have not assessed whether azacitidine demonstrates clinical and cost effectiveness compared with each treatment within CCR
The company have used CCR in their base case analysis; however they have provided sensitivity analyses comparing patients receiving each of the treatments making up CCR
demonstrates clinical and cost effectiveness compared with each treatment within CCR is factually inaccurate, and leads the reader to conclude that the company have not investigated individual treatments.
demonstrates clinical and cost-effectiveness compared with each treatment within CCR for the following reasons:
1. The pivotal RCT was not powered for such comparisons.
2. There are significant inconsistencies between the results of the company’s base case and subgroup analyses (ERG report, p. 125).
In the stated example the ERG considers it is clear that the focus of the critique is the base case. The ERG report does include the subgroup analyses and therefore a full reading of the ERG report would not lead the reader to conclude that the company have not investigated individual treatments.
No action taken.
Issue 2 Suggestion that the literature review for clinical effectiveness studies was poor
Description of problem Description of proposed amendment
Justification for amendment ERG response
On pg. 28, the ERG state “The ERG believes the literature searching for clinical effectiveness studies was poorly conducted and reported“. They also state that their own
Suggested text:
The methodology used in the literature, although less thorough than expected, did not miss any
It is factually inaccurate to suggest that the methodology was poor if it identified all relevant studies.
The ERG rejects this proposed amendment. The ERG critique remains an accurate reflection on the quality of the company’s submission
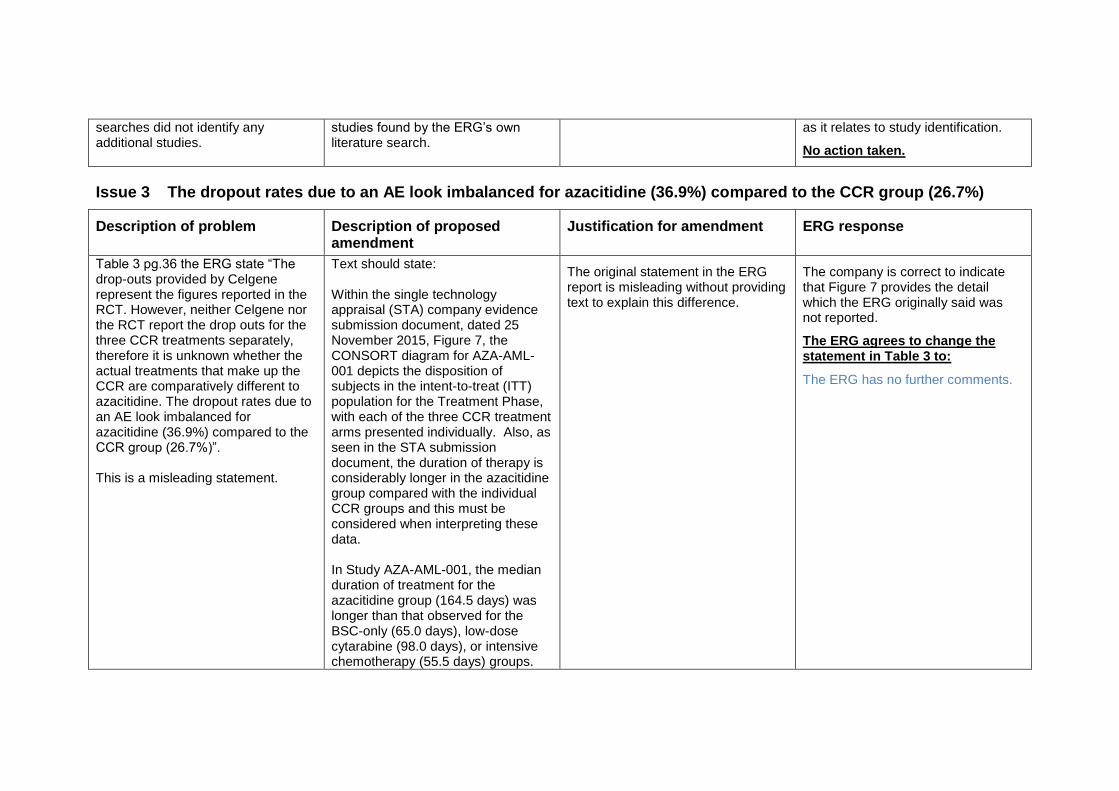
searches did not identify any additional studies.
studies found by the ERG’s own literature search.
as it relates to study identification.
No action taken.
Issue 3 The dropout rates due to an AE look imbalanced for azacitidine (36.9%) compared to the CCR group (26.7%)
Description of problem Description of proposed amendment
Justification for amendment ERG response
Table 3 pg.36 the ERG state “The drop-outs provided by Celgene represent the figures reported in the RCT. However, neither Celgene nor the RCT report the drop outs for the three CCR treatments separately, therefore it is unknown whether the actual treatments that make up the CCR are comparatively different to azacitidine. The dropout rates due to an AE look imbalanced for azacitidine (36.9%) compared to the CCR group (26.7%)”. This is a misleading statement.
Text should state: Within the single technology appraisal (STA) company evidence submission document, dated 25 November 2015, Figure 7, the CONSORT diagram for AZA-AML-001 depicts the disposition of subjects in the intent-to-treat (ITT) population for the Treatment Phase, with each of the three CCR treatment arms presented individually. Also, as seen in the STA submission document, the duration of therapy is considerably longer in the azacitidine group compared with the individual CCR groups and this must be considered when interpreting these data. In Study AZA-AML-001, the median duration of treatment for the azacitidine group (164.5 days) was longer than that observed for the BSC-only (65.0 days), low-dose cytarabine (98.0 days), or intensive chemotherapy (55.5 days) groups.
The original statement in the ERG report is misleading without providing text to explain this difference.
The company is correct to indicate that Figure 7 provides the detail which the ERG originally said was not reported.
The ERG agrees to change the statement in Table 3 to:
The ERG has no further comments.
The total treatment exposure expressed in person-years was higher in the azacitidine group (174.9) than in the other groups (82.9, 14.1, and 9.6 for low-dose cytarabine, intensive chemotherapy, and BSC-only groups, respectively).
Issue 4 Statement that none of the published registry data provided information on the population with >30% blasts
Description of problem Description of proposed amendment
Justification for amendment ERG response
On page 66 of the ERG report, it is stated that “None of the published registry data (Austrian azacitidine registry (NCT01595295); Spanish AMLA registry and French compassionate patient named programme) provided information on the population with >30% bone marrow blasts, a population requirements for the Scope for this report.“
This statement should be removed. The registry data discussed do include information on patients with >30% bone marrow blasts; therefore the ERG’s statement is factually inaccurate.
The ERG’s intended meaning was that results pertaining only to the subpopulation with >30% blasts was not presented (not that patients with >30% blasts were not represented at all). However, the ERG acknowledges that results were presented for a relevant subpopulation from the Austrian Azacitidine Registry.
The ERG agrees to replace the paragraph with the following:
Both the Spanish AMLA registry and French compassionate patient named programme failed to provide outcomes for the specific population with >30% bone marrow blasts. Instead only the proportion of patients with >30% bone marrow

blasts was reported. Outcomes were reported combined irrespective of bone marrow blast status.
The Austrian azacitidine registry (AAR, NCT01595295) report outcomes for the total patient population irrespective of bone marrow blasts status. In addition, they also report outcomes for those with >30% bone marrow blasts and a WBC <15g/L receiving azacitidine and compare baseline and treatment characteristics for these patients to the azacitidine arm of the AZA-AML-001 trial. Baseline and treatment characteristics were similar between the two groups of patients receiving azacitidine except for the following differences:
Baseline characteristics for AML classification: AML-NOS was higher (63.5 %) in the AZA-AML-001 trial than the AAR (24.2%) and for AML-MRF, the AAR reported higher proportions (66.3%) than the AZA-AML-001 trial (31.1%).
Outcomes appear to be similar for the registry and the AZA-AML-001 trial.
For AE, treatment-emergent thrombocytopenia and anaemia both had significantly higher (47.4% and 31.6% respectively) incidences in the
Austrian azacitidine registry than from the AZA-AML-001 trial (15.7% and 26.3% respectively).
Issue 5 Statement that the ERG’s preferred base case equalises the costs in the relapse/progressive disease health state across the model
Description of problem Description of proposed amendment
Justification for amendment ERG response
Throughout the report, the ERG make reference to their preferred base case of setting relapse/PD health state costs to be equal across the model. For example on pg.15 they say “The ERG also identified that there were significant differences in the cost associated with the Relapse/progressive disease state between the AZA and CCR arm, even though all patients (in both arms) are expected to be receiving BSC at this point.” This is further detailed in section 5.3.8.2 on pages 122-123.
In Appendix 3 of the ERG report, the ERG state that they have applied the data for the BSC cohort to all cohorts within the relapse/PD state.
The ERG also state that it is questionable that the sequence of treatments studied in the model i.e., AZA followed by BSC and CCR
A statement should be added by the ERG in relation to their preferred base case, that setting setting relapse/PD health state costs to be equal across the model is not reflective of the AZA-AML-001 trial, the conclusions drawn by the clinical questionnaire designed to elicit resource use (from 7 UK clinicians), or the clinical opinion given to the ERG.
In addition, it should be noted that applying the BSC cohort data to all cohorts in the relapse/PD state is inappropriate and not representative of clinical practice.
There is inconsistent messaging from the ERG; one message of setting relapse/PD health state costs to be equal across the model, and the other than patients would receive active treatment after 1
st line.
The combination of the AZA-AML-001 trial, the conclusions drawn by the clinical questionnaire designed to elicit resource use (from 7 UK clinicians), as well as clinical opinion given to the ERG, suggests that patient resource use is likely to vary after 1
st line treatment.
Applying the BSC cohort data to all cohorts in the relapse/PD state is inappropriate and not representative of clinical practice.
The proposed statements are not appropriate.
The ERG had to work within the limitations of the structure of the Celgene model. The ERG’s limited aim was to correct the OS effectiveness parameter values in Celgene’s model to make them consistent with the model’s assumption that no subsequent active therapy would be used in AZA or CCR after 1st line treatment; see Celgene submission, Section 5.6.2., Table 54, p. 141 “Assumption: There is no treatment switching. Justification Clinical expert opinion. Only a very small percentage of patients at this stage of disease would be fit for a second treatment after failing their first.”
ERG’s corrections do not imply endorsement of Celgene’s assumptions. The model should have
followed by BSC) is realistic, suggesting subsequent therapy may be given in clinical practice (as was seen in the AZA-AML-001 trial). In addition, the ERG states (pg. 129) “Advice from clinical experts suggests that active second-line treatment is considered for some patients in the NHS”.
allowed for the cost and effects of subsequent treatments used in the trial which would also be used in routine NHS practice, by modelling second line treatment. However, Celgene’s model assumed that no such treatment was available after relapse/PD. As stated in ERG’s report, Section 5.3.6.2, p. 116.
“To remedy the contradiction between the model structure, on the one hand, and the methodology underlying the OS treatment effect estimates, on the other, two options were available to the ERG. One was to correct the model to include the costs of subsequent treatments used in the AZA-AML-001 and left unadjusted for in the statistical analysis that produced the base case OS treatment effect estimates. This option was not feasible because the required data on the dates of start and end of subsequent treatments as well as treatment dosages and frequencies of administration were not available to ERG.”
Note that setting relapse/PD costs to be equal across the model was simply done for consistency with the model assumptions; i.e. Celgene assume that patients in this state are all managed by BSC and it was not clear why there should be differences in costs by initial treatment (i.e. AZA
vs CCR). Different costs may apply to the relapse/PD phase (and ERG presented results of varying these), but claiming that costs should be different between cohorts is questionable given the lack of data and difficulties of defining these CCR preselected subgroups a priori. Further, Celgene did not provide any evidence in its submission that the resource use survey addressed the role of the specific subsequent treatments used in AZA-AML-001.
No action taken.
Issue 6 Statement that combined PFS and RFS curves cross OS curve at cycle 69
Description of problem Description of proposed amendment
Justification for amendment ERG response
On page 110, the ERG state “The inadequacy of the statistical analysis may be illustrated by comparing the estimated time to event curves used by Celgene in their base case analysis, combining PFS with RFS and contrasting it with OS. Error! Reference source not found. below illustrates the problem for the CCR arm. By cycle 69, that is, just after the start of the sixth year after first receiving treatment the estimated curves imply that there are more
This statement should be removed. This is factually inaccurate. Having checked the model, the curves do not cross. A possible reason for the ERG’s interpretation may be that they have compared the wrong settings: RFS and PFS in columns H and I of the Model worksheets can exceed OS in column J because they are comprised from different denominators: in fact, OS from column J must be compared with
The ERG stands by its comment.
The ERG confirms it has considered the appropriate columns. The reason these curves, as implemented in the Excel model, do not cross is that in the Excel model Celgene applied an adjustment so that when crossing would have occurred the survival probabilities distributed the OS time proportionately to PFS and RFS; e.g. in Celgene Model AZA sheet cell L23 the formula is:
patients in the treated cohort who are either in Remission or non-remission (stable disease) than there are patients alive.”
RFS and PFS from columns K and L, respectively.
= IF((RFS*'PSA inputs'!$D$22+PFS*'PSA inputs'!$D$24)>OS,OS*'PSA inputs'!$D$22/('PSA inputs'!$D$22+'PSA inputs'!$D$24),RFS*'PSA inputs'!$D$22).
This correction avoids having PFS + RFS larger than OS, but does not address concerns about the validity of Celgene’s chosen parametric survival curves for assigning time to Remission and Non-remission versus relapse/PD states in the model.
No action taken.
Issue 7 The use of censor at switch analyses
Description of problem Description of proposed amendment
Justification for amendment ERG response
On pages 116 to 120, the ERG describe using censor at switch methodology to model the OS. They acknowledge that they did this because they were not able to perform the IPCW analysis to adjust for subsequent therapy for both treatment groups.
The ERG also acknowledge that (pg. 129) “Advice from clinical experts
It should be noted along with the ERG’s preferred base case ICER that the methodology used for modelling OS is not optimal, and does not fit with the AZA-AML-001 trial, the conclusions drawn by the clinical questionnaire designed to elicit resource use (from 7 UK clinicians), as well as clinical opinion given to the ERG, all of which suggest patients could receive
The ERG’s base case ICER is misleading without acknowledging the limitations of the OS modelling whenever the base case is mentioned.
The ERG’s preferred base case is the best possible use of the available data given Celgene’s model logic. It does not represent ERG’s view of what UK routine practice is or an endorsement of Celgene’s structural assumptions, whose correction was beyond the scope of ERG’s STA review as defined by NICE. We acknowledge this in ERG report Section 5.3.6.2, p. 117: “Whether the
suggests that active second-line treatment is considered for some patients in the NHS”
subsequent therapy. assumption that no subsequent active treatment would be available to UK patients in routine practice is plausible may of course be questioned, but the point here is that applying IPCW adjustment for subsequent treatment to the outcome data of the CCR but not the azacitidine arm in the AZA-AML-001 trial is inconsistent with the economic model which the overall survival IPCW analysis was designed to inform.”
Please also see our response to Issue 6.
No action taken.
Issue 8 OS modelling methods and results are unrealistic and misleading
Description of problem Description of proposed amendment
Justification for amendment ERG response
The ERG describes their preferred base case for OS modelling (pg. 116-120), as well as the use of KM data for PFS and RFS (pg. 128).
The ERG state the uncertainty around the PH assumption for OS (pg.114).
The ERG’s methodology uses a censor-at-switch analysis and does
It should be noted in the report that the ERG’s preferred base case is unrealistic as it:
- Extends OS but uses KM data for PFS and RFS leading to clinical implausibility. In addition, it can be seen that, even in isolation, the KM data for PFS and RFS is not
Given the ERG’s stated uncertainty around the PH assumption with OS, the clinical implausibility of the ERG’s modelling of OS in relation to PFS and RFS, removing subsequent therapy and the way the changes in the ERG’s base case interact with each other, the ERG’s methodology is misleading.
Stating the ERG preferred base case
The ERG disagrees with Celgene’s view. In response to each point in proposed amendments:
ERG chose KM curves for PFS and RFS because they are a) as observed in the trial and b) non-parametric, i.e. free from risk of bias in fitting a parametric curve, which Celgene’s own analysis identified as an issue. The resulting PFS and RFS
not allow for any subsequent therapy; this does not represent the view of the clinical expert consulted by the ERG, the data from the AZA-AML-001 trial or the clinician questionnaire used to calculate HRU by the Company.
Pg. 118 of ERG report: text states that their OS modelling is “conservative” i.e. it is unrealistically increases the ICER, because it is biased in favour of AZA for OS.
PFS and RFS are not increased (ERG uses KM data in their base case).
The ERG’s modelling of OS interacts with two other influential ERG changes 1. Scenario “E”, the use of KM data only for RFS and PFS (which we have shown is inappropriate), and 2. Scenario “B”, the calibration of relapse/PD HRU and costs. The unrealistic combination of these changes is misleading.
appropriate
- Pushes patients into the PD disease state for longer which combines with other ERG changes such as equalised costs and HRU across all PD for both arms thus biasing against azacitidine
- Suggests no subsequent therapy is received after 1
st
line therapy despite consistent evidence that this is unrealistic
without acknowledging its limitations and implausibility clearly is misleading to the reader.
data may have been affected by the use of subsequent therapies although it appears that at least for CCR arm subsequent azacitidine use occurred in few instances and their effect was negligible (this was confirmed by Celgene’s response to ERG’s questions for clarification).
Acknowledging that the ERG’s preferred base-case analysis results in a longer incremental period in relapse/PD under azacitidine than those of Celgene’s base case, ERG have undertaken considerable sensitivity analyses. All of these show that the ICER is >£70,000 per QALY even when relapse/PD costs are zero.
Please see our response to Issues 5 & 7.
No action taken.
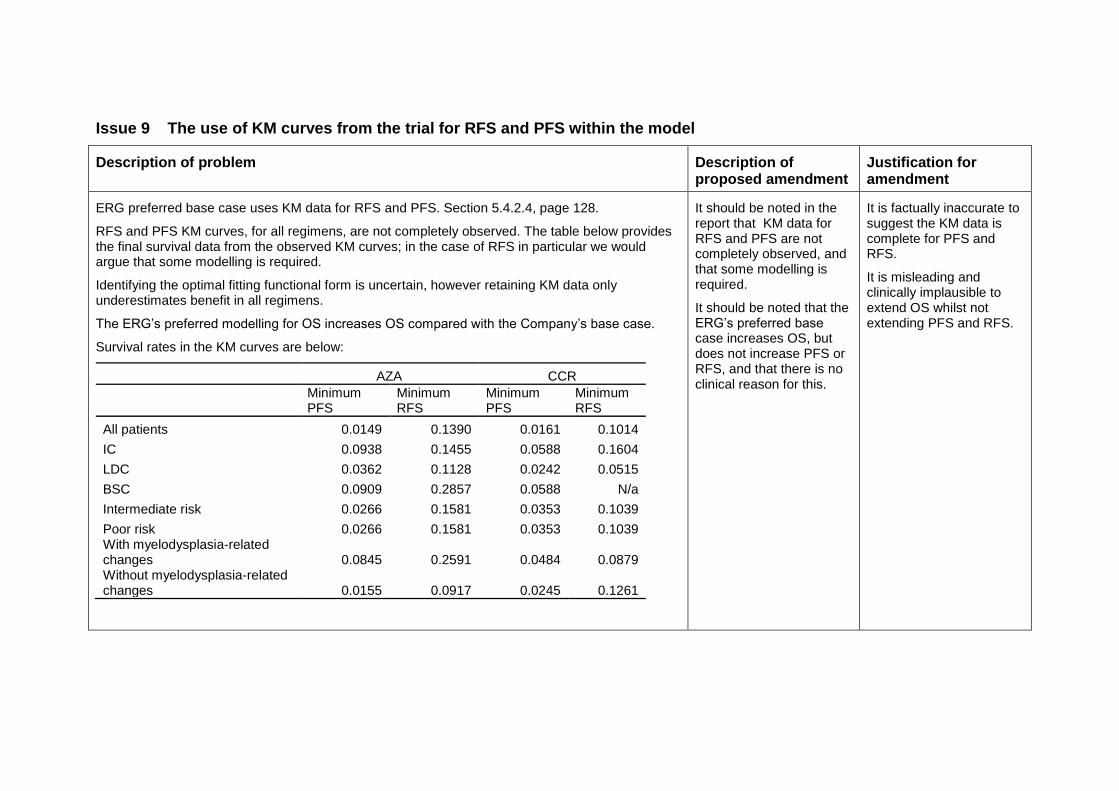
Issue 9 The use of KM curves from the trial for RFS and PFS within the model
Description of problem Description of proposed amendment
Justification for amendment
ERG preferred base case uses KM data for RFS and PFS. Section 5.4.2.4, page 128.
RFS and PFS KM curves, for all regimens, are not completely observed. The table below provides the final survival data from the observed KM curves; in the case of RFS in particular we would argue that some modelling is required.
Identifying the optimal fitting functional form is uncertain, however retaining KM data only underestimates benefit in all regimens.
The ERG’s preferred modelling for OS increases OS compared with the Company’s base case.
Survival rates in the KM curves are below:
AZA CCR
Minimum PFS
Minimum RFS
Minimum PFS
Minimum RFS
All patients 0.0149 0.1390 0.0161 0.1014
IC 0.0938 0.1455 0.0588 0.1604
LDC 0.0362 0.1128 0.0242 0.0515
BSC 0.0909 0.2857 0.0588 N/a
Intermediate risk 0.0266 0.1581 0.0353 0.1039
Poor risk 0.0266 0.1581 0.0353 0.1039 With myelodysplasia-related changes 0.0845 0.2591 0.0484 0.0879 Without myelodysplasia-related changes 0.0155 0.0917 0.0245 0.1261
It should be noted in the report that KM data for RFS and PFS are not completely observed, and that some modelling is required.
It should be noted that the ERG’s preferred base case increases OS, but does not increase PFS or RFS, and that there is no clinical reason for this.
It is factually inaccurate to suggest the KM data is complete for PFS and RFS.
It is misleading and clinically implausible to extend OS whilst not extending PFS and RFS.
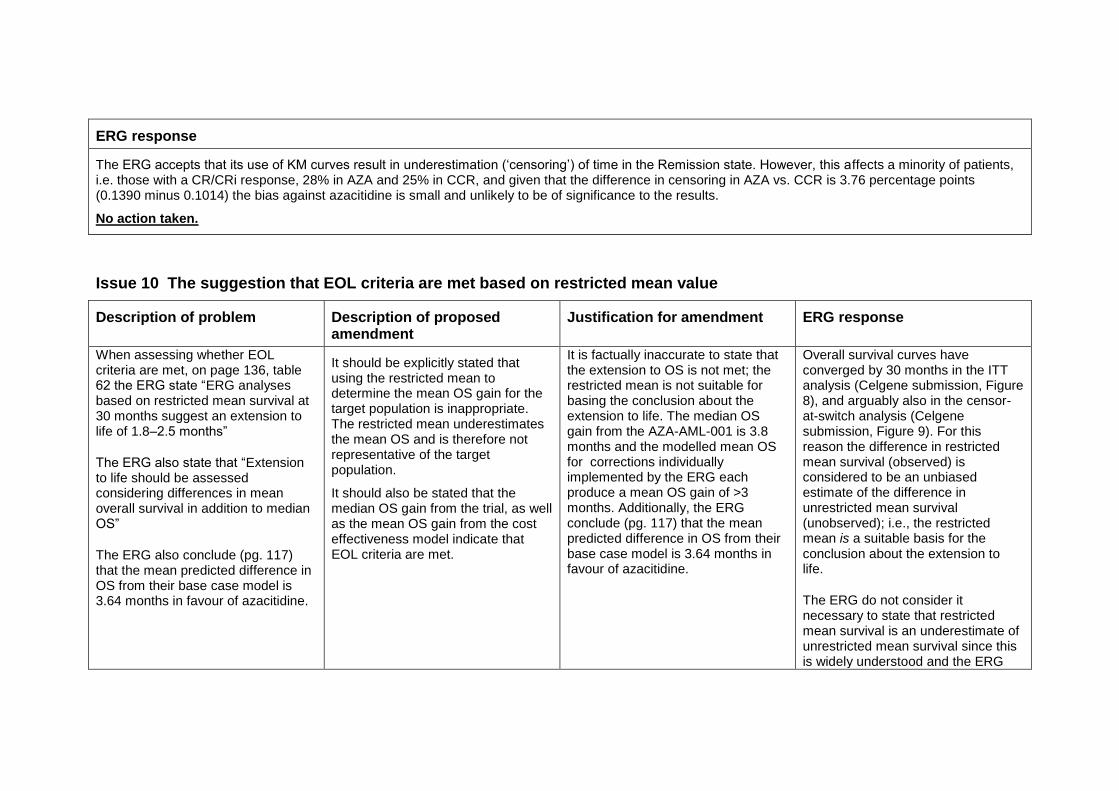
ERG response
The ERG accepts that its use of KM curves result in underestimation (‘censoring’) of time in the Remission state. However, this affects a minority of patients, i.e. those with a CR/CRi response, 28% in AZA and 25% in CCR, and given that the difference in censoring in AZA vs. CCR is 3.76 percentage points (0.1390 minus 0.1014) the bias against azacitidine is small and unlikely to be of significance to the results.
No action taken.
Issue 10 The suggestion that EOL criteria are met based on restricted mean value
Description of problem Description of proposed amendment
Justification for amendment ERG response
When assessing whether EOL criteria are met, on page 136, table 62 the ERG state “ERG analyses based on restricted mean survival at 30 months suggest an extension to life of 1.8–2.5 months”
The ERG also state that “Extension to life should be assessed considering differences in mean overall survival in addition to median OS”
The ERG also conclude (pg. 117) that the mean predicted difference in OS from their base case model is 3.64 months in favour of azacitidine.
It should be explicitly stated that using the restricted mean to determine the mean OS gain for the target population is inappropriate. The restricted mean underestimates the mean OS and is therefore not representative of the target population.
It should also be stated that the median OS gain from the trial, as well as the mean OS gain from the cost effectiveness model indicate that EOL criteria are met.
It is factually inaccurate to state that the extension to OS is not met; the restricted mean is not suitable for basing the conclusion about the extension to life. The median OS gain from the AZA-AML-001 is 3.8 months and the modelled mean OS for corrections individually implemented by the ERG each produce a mean OS gain of >3 months. Additionally, the ERG conclude (pg. 117) that the mean predicted difference in OS from their base case model is 3.64 months in favour of azacitidine.
Overall survival curves have converged by 30 months in the ITT analysis (Celgene submission, Figure 8), and arguably also in the censor-at-switch analysis (Celgene submission, Figure 9). For this reason the difference in restricted mean survival (observed) is considered to be an unbiased estimate of the difference in unrestricted mean survival (unobserved); i.e., the restricted mean is a suitable basis for the conclusion about the extension to life.
The ERG do not consider it necessary to state that restricted mean survival is an underestimate of unrestricted mean survival since this is widely understood and the ERG
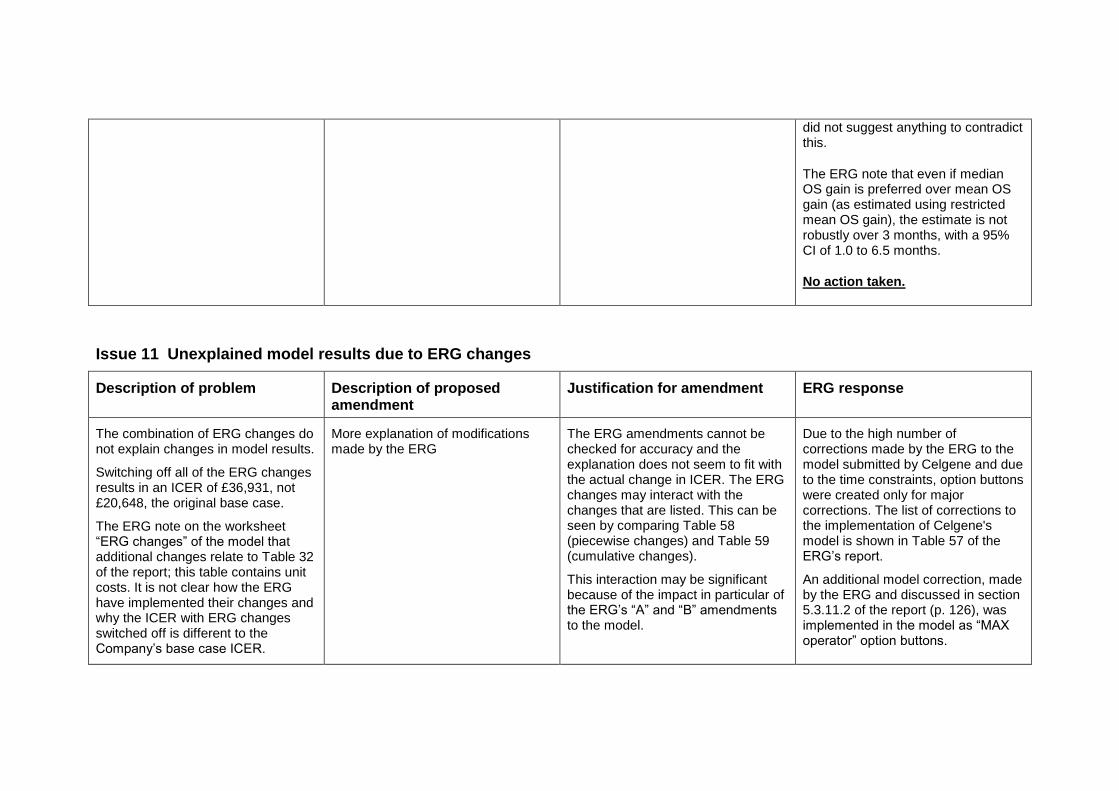
did not suggest anything to contradict this.
The ERG note that even if median OS gain is preferred over mean OS gain (as estimated using restricted mean OS gain), the estimate is not robustly over 3 months, with a 95% CI of 1.0 to 6.5 months.
No action taken.
Issue 11 Unexplained model results due to ERG changes
Description of problem Description of proposed amendment
Justification for amendment ERG response
The combination of ERG changes do not explain changes in model results.
Switching off all of the ERG changes results in an ICER of £36,931, not £20,648, the original base case.
The ERG note on the worksheet “ERG changes” of the model that additional changes relate to Table 32 of the report; this table contains unit costs. It is not clear how the ERG have implemented their changes and why the ICER with ERG changes switched off is different to the Company’s base case ICER.
More explanation of modifications made by the ERG
The ERG amendments cannot be checked for accuracy and the explanation does not seem to fit with the actual change in ICER. The ERG changes may interact with the changes that are listed. This can be seen by comparing Table 58 (piecewise changes) and Table 59 (cumulative changes).
This interaction may be significant because of the impact in particular of the ERG’s “A” and “B” amendments to the model.
Due to the high number of corrections made by the ERG to the model submitted by Celgene and due to the time constraints, option buttons were created only for major corrections. The list of corrections to the implementation of Celgene's model is shown in Table 57 of the ERG’s report.
An additional model correction, made by the ERG and discussed in section 5.3.11.2 of the report (p. 126), was implemented in the model as “MAX operator” option buttons.

The duration of monitoring tests and transfusions implemented in the ERG’s base case is described in section 6.1 (p. 134) of our report:
“The base case analysis preferred by ERG included costs of monitoring tests and transfusions for the whole duration of the Remission and Non-remission phases of the model (as well as for the Relapse/PD phase).”
In the executable model, all corrected cells are highlighted in yellow.
Action: ERG have produced a full listing of corrections to Celgene’s model (below)
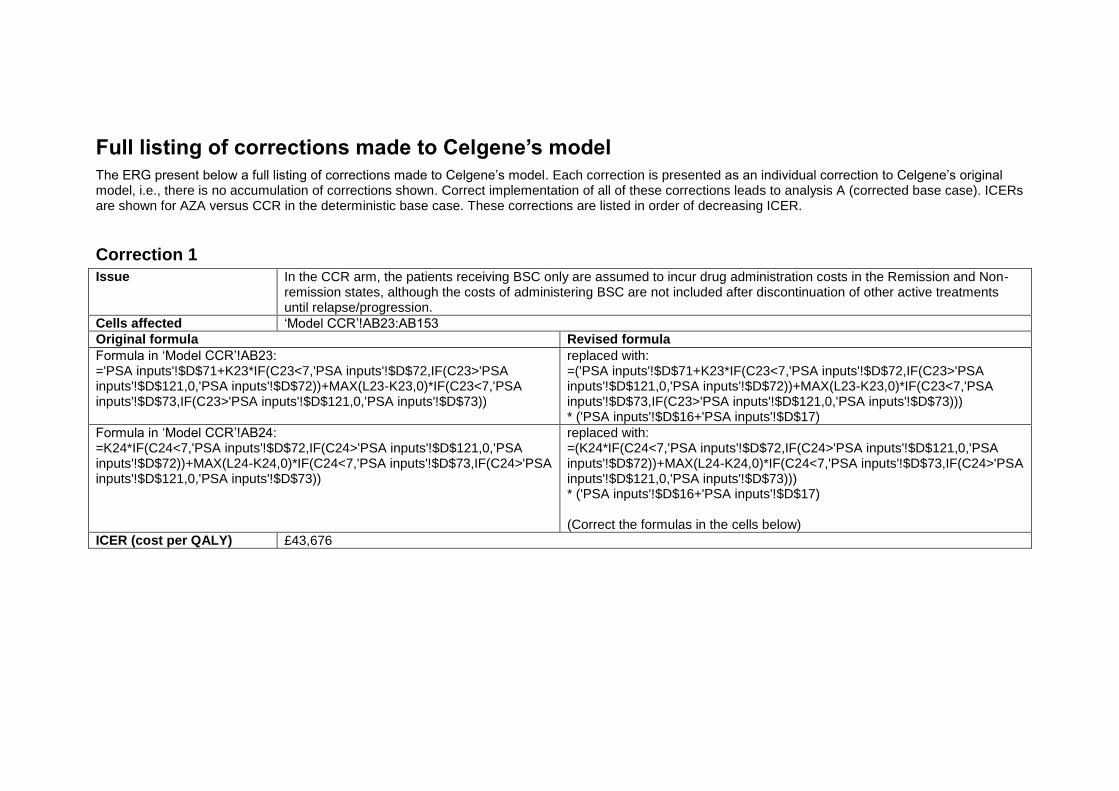
Full listing of corrections made to Celgene’s model
The ERG present below a full listing of corrections made to Celgene’s model. Each correction is presented as an individual correction to Celgene’s original model, i.e., there is no accumulation of corrections shown. Correct implementation of all of these corrections leads to analysis A (corrected base case). ICERs are shown for AZA versus CCR in the deterministic base case. These corrections are listed in order of decreasing ICER.
Correction 1
Issue In the CCR arm, the patients receiving BSC only are assumed to incur drug administration costs in the Remission and Non-remission states, although the costs of administering BSC are not included after discontinuation of other active treatments until relapse/progression.
Cells affected ‘Model CCR’!AB23:AB153
Original formula Revised formula
Formula in ‘Model CCR’!AB23: ='PSA inputs'!$D$71+K23*IF(C23<7,'PSA inputs'!$D$72,IF(C23>'PSA inputs'!$D$121,0,'PSA inputs'!$D$72))+MAX(L23-K23,0)*IF(C23<7,'PSA inputs'!$D$73,IF(C23>'PSA inputs'!$D$121,0,'PSA inputs'!$D$73))
replaced with: =('PSA inputs'!$D$71+K23*IF(C23<7,'PSA inputs'!$D$72,IF(C23>'PSA inputs'!$D$121,0,'PSA inputs'!$D$72))+MAX(L23-K23,0)*IF(C23<7,'PSA inputs'!$D$73,IF(C23>'PSA inputs'!$D$121,0,'PSA inputs'!$D$73))) * ('PSA inputs'!$D$16+'PSA inputs'!$D$17)
Formula in ‘Model CCR’!AB24: =K24*IF(C24<7,'PSA inputs'!$D$72,IF(C24>'PSA inputs'!$D$121,0,'PSA inputs'!$D$72))+MAX(L24-K24,0)*IF(C24<7,'PSA inputs'!$D$73,IF(C24>'PSA inputs'!$D$121,0,'PSA inputs'!$D$73))
replaced with: =(K24*IF(C24<7,'PSA inputs'!$D$72,IF(C24>'PSA inputs'!$D$121,0,'PSA inputs'!$D$72))+MAX(L24-K24,0)*IF(C24<7,'PSA inputs'!$D$73,IF(C24>'PSA inputs'!$D$121,0,'PSA inputs'!$D$73))) * ('PSA inputs'!$D$16+'PSA inputs'!$D$17) (Correct the formulas in the cells below)
ICER (cost per QALY) £43,676
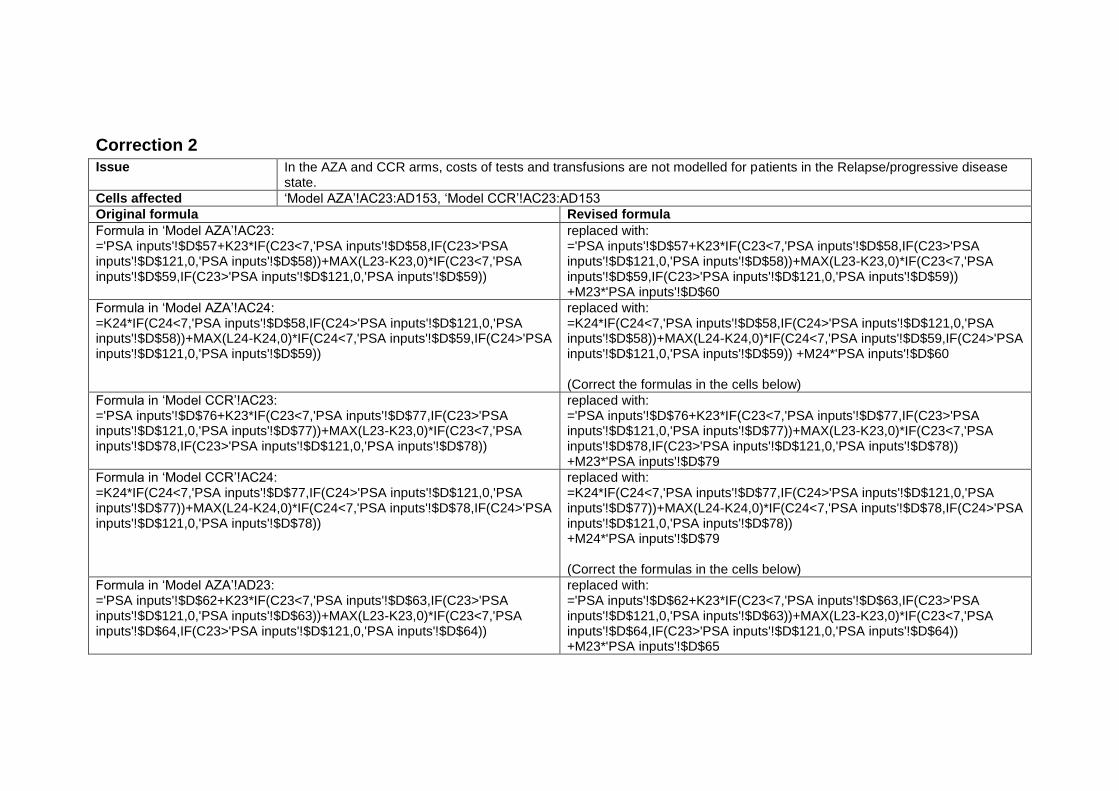
Correction 2
Issue In the AZA and CCR arms, costs of tests and transfusions are not modelled for patients in the Relapse/progressive disease state.
Cells affected ‘Model AZA’!AC23:AD153, ‘Model CCR’!AC23:AD153
Original formula Revised formula
Formula in ‘Model AZA’!AC23: ='PSA inputs'!$D$57+K23*IF(C23<7,'PSA inputs'!$D$58,IF(C23>'PSA inputs'!$D$121,0,'PSA inputs'!$D$58))+MAX(L23-K23,0)*IF(C23<7,'PSA inputs'!$D$59,IF(C23>'PSA inputs'!$D$121,0,'PSA inputs'!$D$59))
replaced with: ='PSA inputs'!$D$57+K23*IF(C23<7,'PSA inputs'!$D$58,IF(C23>'PSA inputs'!$D$121,0,'PSA inputs'!$D$58))+MAX(L23-K23,0)*IF(C23<7,'PSA inputs'!$D$59,IF(C23>'PSA inputs'!$D$121,0,'PSA inputs'!$D$59)) +M23*'PSA inputs'!$D$60
Formula in ‘Model AZA’!AC24: =K24*IF(C24<7,'PSA inputs'!$D$58,IF(C24>'PSA inputs'!$D$121,0,'PSA inputs'!$D$58))+MAX(L24-K24,0)*IF(C24<7,'PSA inputs'!$D$59,IF(C24>'PSA inputs'!$D$121,0,'PSA inputs'!$D$59))
replaced with: =K24*IF(C24<7,'PSA inputs'!$D$58,IF(C24>'PSA inputs'!$D$121,0,'PSA inputs'!$D$58))+MAX(L24-K24,0)*IF(C24<7,'PSA inputs'!$D$59,IF(C24>'PSA inputs'!$D$121,0,'PSA inputs'!$D$59)) +M24*'PSA inputs'!$D$60 (Correct the formulas in the cells below)
Formula in ‘Model CCR’!AC23: ='PSA inputs'!$D$76+K23*IF(C23<7,'PSA inputs'!$D$77,IF(C23>'PSA inputs'!$D$121,0,'PSA inputs'!$D$77))+MAX(L23-K23,0)*IF(C23<7,'PSA inputs'!$D$78,IF(C23>'PSA inputs'!$D$121,0,'PSA inputs'!$D$78))
replaced with: ='PSA inputs'!$D$76+K23*IF(C23<7,'PSA inputs'!$D$77,IF(C23>'PSA inputs'!$D$121,0,'PSA inputs'!$D$77))+MAX(L23-K23,0)*IF(C23<7,'PSA inputs'!$D$78,IF(C23>'PSA inputs'!$D$121,0,'PSA inputs'!$D$78)) +M23*'PSA inputs'!$D$79
Formula in ‘Model CCR’!AC24: =K24*IF(C24<7,'PSA inputs'!$D$77,IF(C24>'PSA inputs'!$D$121,0,'PSA inputs'!$D$77))+MAX(L24-K24,0)*IF(C24<7,'PSA inputs'!$D$78,IF(C24>'PSA inputs'!$D$121,0,'PSA inputs'!$D$78))
replaced with: =K24*IF(C24<7,'PSA inputs'!$D$77,IF(C24>'PSA inputs'!$D$121,0,'PSA inputs'!$D$77))+MAX(L24-K24,0)*IF(C24<7,'PSA inputs'!$D$78,IF(C24>'PSA inputs'!$D$121,0,'PSA inputs'!$D$78)) +M24*'PSA inputs'!$D$79 (Correct the formulas in the cells below)
Formula in ‘Model AZA’!AD23: ='PSA inputs'!$D$62+K23*IF(C23<7,'PSA inputs'!$D$63,IF(C23>'PSA inputs'!$D$121,0,'PSA inputs'!$D$63))+MAX(L23-K23,0)*IF(C23<7,'PSA inputs'!$D$64,IF(C23>'PSA inputs'!$D$121,0,'PSA inputs'!$D$64))
replaced with: ='PSA inputs'!$D$62+K23*IF(C23<7,'PSA inputs'!$D$63,IF(C23>'PSA inputs'!$D$121,0,'PSA inputs'!$D$63))+MAX(L23-K23,0)*IF(C23<7,'PSA inputs'!$D$64,IF(C23>'PSA inputs'!$D$121,0,'PSA inputs'!$D$64)) +M23*'PSA inputs'!$D$65
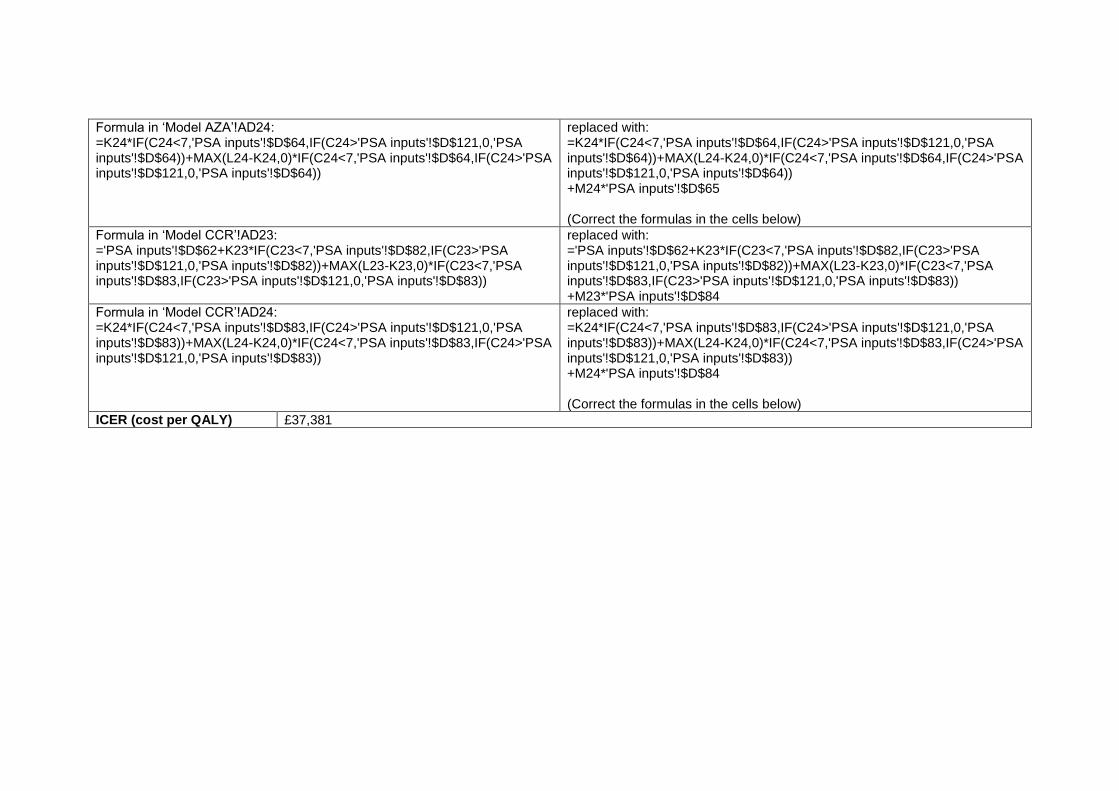
Formula in ‘Model AZA’!AD24: =K24*IF(C24<7,'PSA inputs'!$D$64,IF(C24>'PSA inputs'!$D$121,0,'PSA inputs'!$D$64))+MAX(L24-K24,0)*IF(C24<7,'PSA inputs'!$D$64,IF(C24>'PSA inputs'!$D$121,0,'PSA inputs'!$D$64))
replaced with: =K24*IF(C24<7,'PSA inputs'!$D$64,IF(C24>'PSA inputs'!$D$121,0,'PSA inputs'!$D$64))+MAX(L24-K24,0)*IF(C24<7,'PSA inputs'!$D$64,IF(C24>'PSA inputs'!$D$121,0,'PSA inputs'!$D$64)) +M24*'PSA inputs'!$D$65 (Correct the formulas in the cells below)
Formula in ‘Model CCR’!AD23: ='PSA inputs'!$D$62+K23*IF(C23<7,'PSA inputs'!$D$82,IF(C23>'PSA inputs'!$D$121,0,'PSA inputs'!$D$82))+MAX(L23-K23,0)*IF(C23<7,'PSA inputs'!$D$83,IF(C23>'PSA inputs'!$D$121,0,'PSA inputs'!$D$83))
replaced with: ='PSA inputs'!$D$62+K23*IF(C23<7,'PSA inputs'!$D$82,IF(C23>'PSA inputs'!$D$121,0,'PSA inputs'!$D$82))+MAX(L23-K23,0)*IF(C23<7,'PSA inputs'!$D$83,IF(C23>'PSA inputs'!$D$121,0,'PSA inputs'!$D$83)) +M23*'PSA inputs'!$D$84
Formula in ‘Model CCR’!AD24: =K24*IF(C24<7,'PSA inputs'!$D$83,IF(C24>'PSA inputs'!$D$121,0,'PSA inputs'!$D$83))+MAX(L24-K24,0)*IF(C24<7,'PSA inputs'!$D$83,IF(C24>'PSA inputs'!$D$121,0,'PSA inputs'!$D$83))
replaced with: =K24*IF(C24<7,'PSA inputs'!$D$83,IF(C24>'PSA inputs'!$D$121,0,'PSA inputs'!$D$83))+MAX(L24-K24,0)*IF(C24<7,'PSA inputs'!$D$83,IF(C24>'PSA inputs'!$D$121,0,'PSA inputs'!$D$83)) +M24*'PSA inputs'!$D$84 (Correct the formulas in the cells below)
ICER (cost per QALY) £37,381
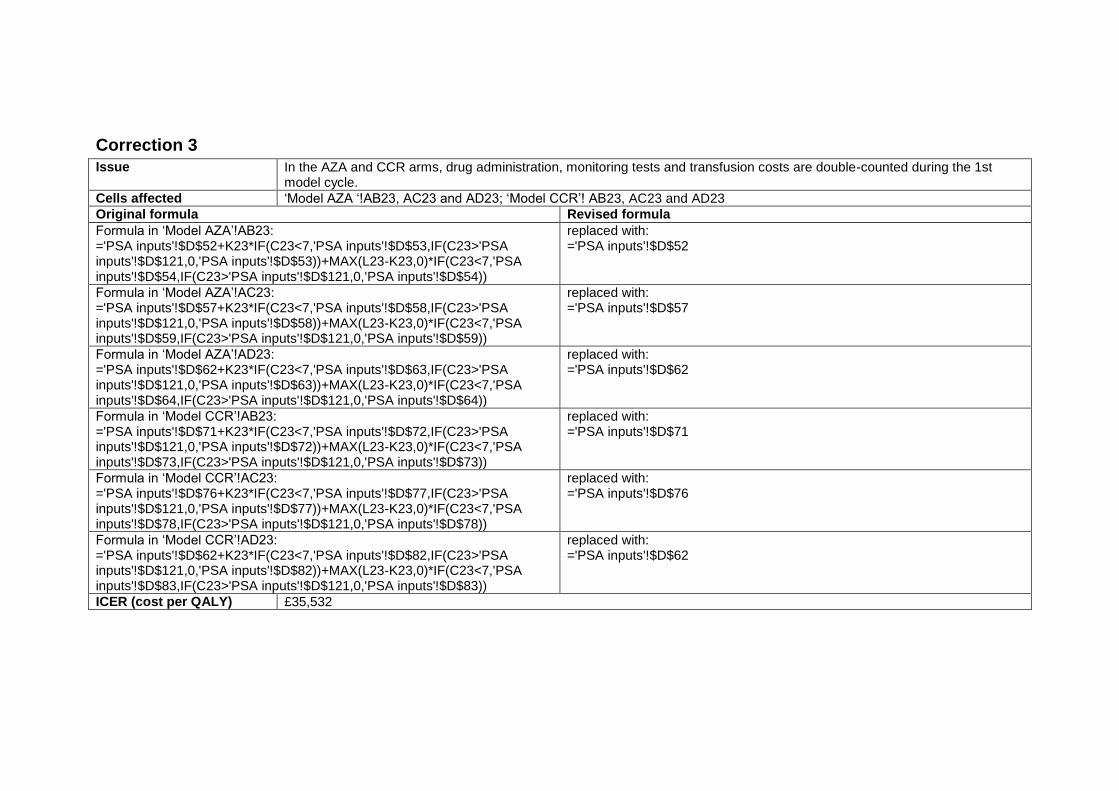
Correction 3
Issue In the AZA and CCR arms, drug administration, monitoring tests and transfusion costs are double-counted during the 1st model cycle.
Cells affected ‘Model AZA ‘!AB23, AC23 and AD23; ‘Model CCR’! AB23, AC23 and AD23
Original formula Revised formula
Formula in ‘Model AZA’!AB23: ='PSA inputs'!$D$52+K23*IF(C23<7,'PSA inputs'!$D$53,IF(C23>'PSA inputs'!$D$121,0,'PSA inputs'!$D$53))+MAX(L23-K23,0)*IF(C23<7,'PSA inputs'!$D$54,IF(C23>'PSA inputs'!$D$121,0,'PSA inputs'!$D$54))
replaced with: ='PSA inputs'!$D$52
Formula in ‘Model AZA’!AC23: ='PSA inputs'!$D$57+K23*IF(C23<7,'PSA inputs'!$D$58,IF(C23>'PSA inputs'!$D$121,0,'PSA inputs'!$D$58))+MAX(L23-K23,0)*IF(C23<7,'PSA inputs'!$D$59,IF(C23>'PSA inputs'!$D$121,0,'PSA inputs'!$D$59))
replaced with: ='PSA inputs'!$D$57
Formula in ‘Model AZA’!AD23: ='PSA inputs'!$D$62+K23*IF(C23<7,'PSA inputs'!$D$63,IF(C23>'PSA inputs'!$D$121,0,'PSA inputs'!$D$63))+MAX(L23-K23,0)*IF(C23<7,'PSA inputs'!$D$64,IF(C23>'PSA inputs'!$D$121,0,'PSA inputs'!$D$64))
replaced with: ='PSA inputs'!$D$62
Formula in ‘Model CCR’!AB23: ='PSA inputs'!$D$71+K23*IF(C23<7,'PSA inputs'!$D$72,IF(C23>'PSA inputs'!$D$121,0,'PSA inputs'!$D$72))+MAX(L23-K23,0)*IF(C23<7,'PSA inputs'!$D$73,IF(C23>'PSA inputs'!$D$121,0,'PSA inputs'!$D$73))
replaced with: ='PSA inputs'!$D$71
Formula in ‘Model CCR’!AC23: ='PSA inputs'!$D$76+K23*IF(C23<7,'PSA inputs'!$D$77,IF(C23>'PSA inputs'!$D$121,0,'PSA inputs'!$D$77))+MAX(L23-K23,0)*IF(C23<7,'PSA inputs'!$D$78,IF(C23>'PSA inputs'!$D$121,0,'PSA inputs'!$D$78))
replaced with: ='PSA inputs'!$D$76
Formula in ‘Model CCR’!AD23: ='PSA inputs'!$D$62+K23*IF(C23<7,'PSA inputs'!$D$82,IF(C23>'PSA inputs'!$D$121,0,'PSA inputs'!$D$82))+MAX(L23-K23,0)*IF(C23<7,'PSA inputs'!$D$83,IF(C23>'PSA inputs'!$D$121,0,'PSA inputs'!$D$83))
replaced with: ='PSA inputs'!$D$62
ICER (cost per QALY) £35,532
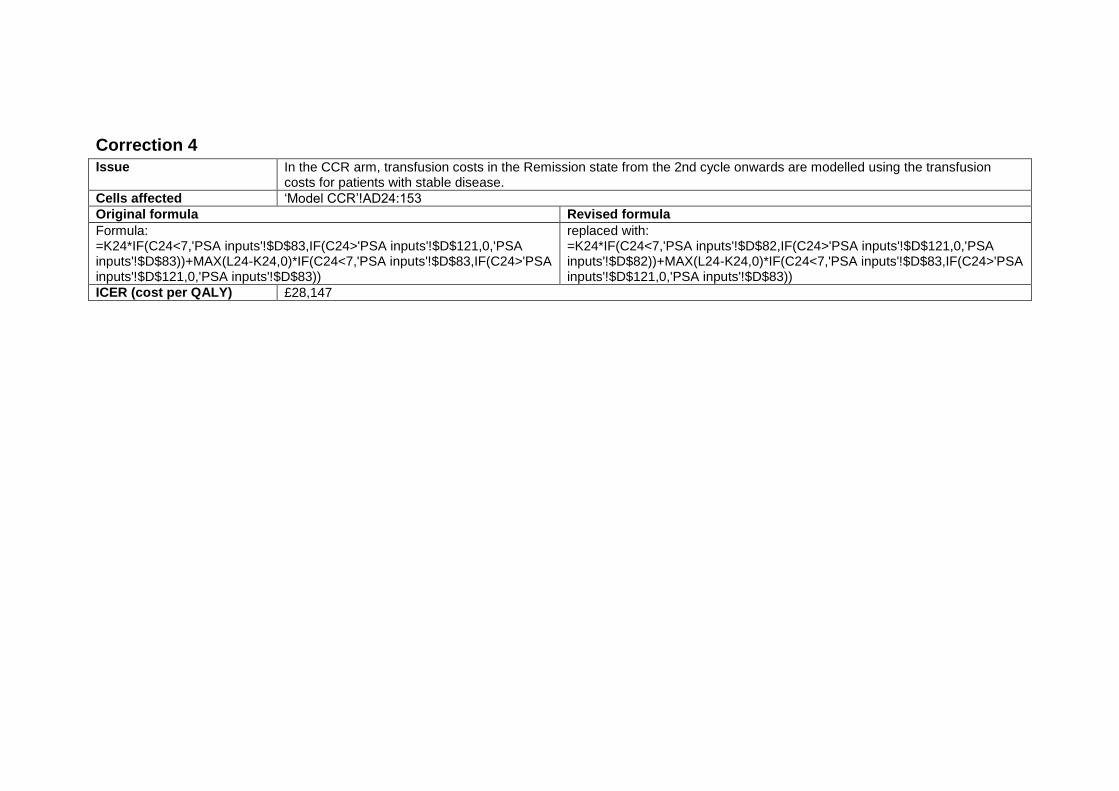
Correction 4
Issue In the CCR arm, transfusion costs in the Remission state from the 2nd cycle onwards are modelled using the transfusion costs for patients with stable disease.
Cells affected ‘Model CCR’!AD24:153
Original formula Revised formula
Formula: =K24*IF(C24<7,'PSA inputs'!$D$83,IF(C24>'PSA inputs'!$D$121,0,'PSA inputs'!$D$83))+MAX(L24-K24,0)*IF(C24<7,'PSA inputs'!$D$83,IF(C24>'PSA inputs'!$D$121,0,'PSA inputs'!$D$83))
replaced with: =K24*IF(C24<7,'PSA inputs'!$D$82,IF(C24>'PSA inputs'!$D$121,0,'PSA inputs'!$D$82))+MAX(L24-K24,0)*IF(C24<7,'PSA inputs'!$D$83,IF(C24>'PSA inputs'!$D$121,0,'PSA inputs'!$D$83))
ICER (cost per QALY) £28,147
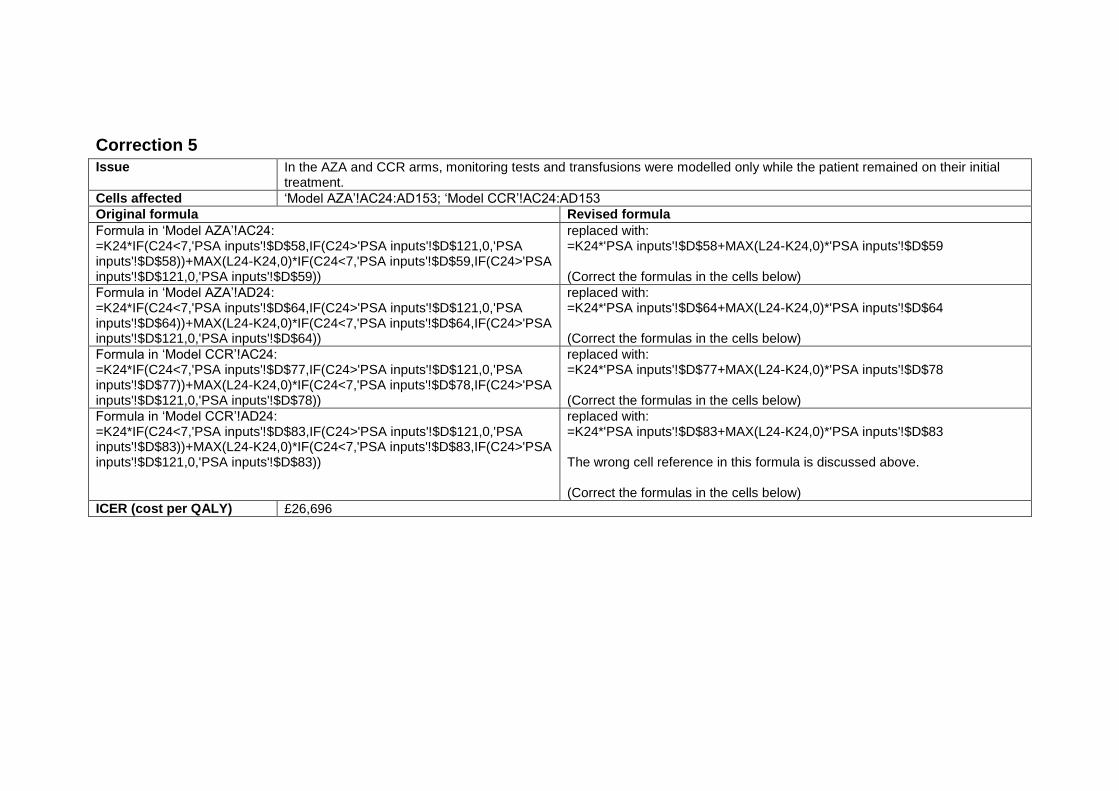
Correction 5
Issue In the AZA and CCR arms, monitoring tests and transfusions were modelled only while the patient remained on their initial treatment.
Cells affected ‘Model AZA’!AC24:AD153; ‘Model CCR’!AC24:AD153
Original formula Revised formula
Formula in ‘Model AZA’!AC24: =K24*IF(C24<7,'PSA inputs'!$D$58,IF(C24>'PSA inputs'!$D$121,0,'PSA inputs'!$D$58))+MAX(L24-K24,0)*IF(C24<7,'PSA inputs'!$D$59,IF(C24>'PSA inputs'!$D$121,0,'PSA inputs'!$D$59))
replaced with: =K24*'PSA inputs'!$D$58+MAX(L24-K24,0)*'PSA inputs'!$D$59 (Correct the formulas in the cells below)
Formula in ‘Model AZA’!AD24: =K24*IF(C24<7,'PSA inputs'!$D$64,IF(C24>'PSA inputs'!$D$121,0,'PSA inputs'!$D$64))+MAX(L24-K24,0)*IF(C24<7,'PSA inputs'!$D$64,IF(C24>'PSA inputs'!$D$121,0,'PSA inputs'!$D$64))
replaced with: =K24*'PSA inputs'!$D$64+MAX(L24-K24,0)*'PSA inputs'!$D$64 (Correct the formulas in the cells below)
Formula in ‘Model CCR’!AC24: =K24*IF(C24<7,'PSA inputs'!$D$77,IF(C24>'PSA inputs'!$D$121,0,'PSA inputs'!$D$77))+MAX(L24-K24,0)*IF(C24<7,'PSA inputs'!$D$78,IF(C24>'PSA inputs'!$D$121,0,'PSA inputs'!$D$78))
replaced with: =K24*'PSA inputs'!$D$77+MAX(L24-K24,0)*'PSA inputs'!$D$78 (Correct the formulas in the cells below)
Formula in ‘Model CCR’!AD24: =K24*IF(C24<7,'PSA inputs'!$D$83,IF(C24>'PSA inputs'!$D$121,0,'PSA inputs'!$D$83))+MAX(L24-K24,0)*IF(C24<7,'PSA inputs'!$D$83,IF(C24>'PSA inputs'!$D$121,0,'PSA inputs'!$D$83))
replaced with: =K24*'PSA inputs'!$D$83+MAX(L24-K24,0)*'PSA inputs'!$D$83 The wrong cell reference in this formula is discussed above. (Correct the formulas in the cells below)
ICER (cost per QALY) £26,696
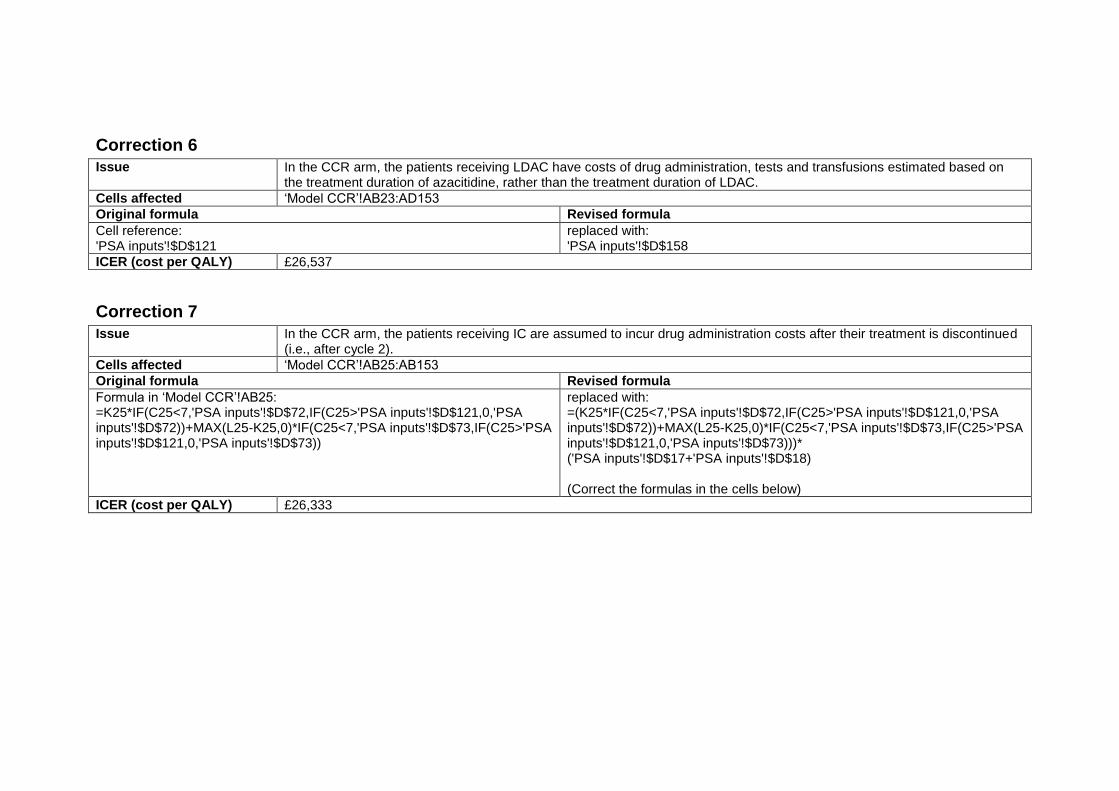
Correction 6
Issue In the CCR arm, the patients receiving LDAC have costs of drug administration, tests and transfusions estimated based on the treatment duration of azacitidine, rather than the treatment duration of LDAC.
Cells affected ‘Model CCR’!AB23:AD153
Original formula Revised formula
Cell reference: 'PSA inputs'!$D$121
replaced with: 'PSA inputs'!$D$158
ICER (cost per QALY) £26,537
Correction 7
Issue In the CCR arm, the patients receiving IC are assumed to incur drug administration costs after their treatment is discontinued (i.e., after cycle 2).
Cells affected ‘Model CCR’!AB25:AB153
Original formula Revised formula
Formula in ‘Model CCR’!AB25: =K25*IF(C25<7,'PSA inputs'!$D$72,IF(C25>'PSA inputs'!$D$121,0,'PSA inputs'!$D$72))+MAX(L25-K25,0)*IF(C25<7,'PSA inputs'!$D$73,IF(C25>'PSA inputs'!$D$121,0,'PSA inputs'!$D$73))
replaced with: =(K25*IF(C25<7,'PSA inputs'!$D$72,IF(C25>'PSA inputs'!$D$121,0,'PSA inputs'!$D$72))+MAX(L25-K25,0)*IF(C25<7,'PSA inputs'!$D$73,IF(C25>'PSA inputs'!$D$121,0,'PSA inputs'!$D$73)))* ('PSA inputs'!$D$17+'PSA inputs'!$D$18) (Correct the formulas in the cells below)
ICER (cost per QALY) £26,333
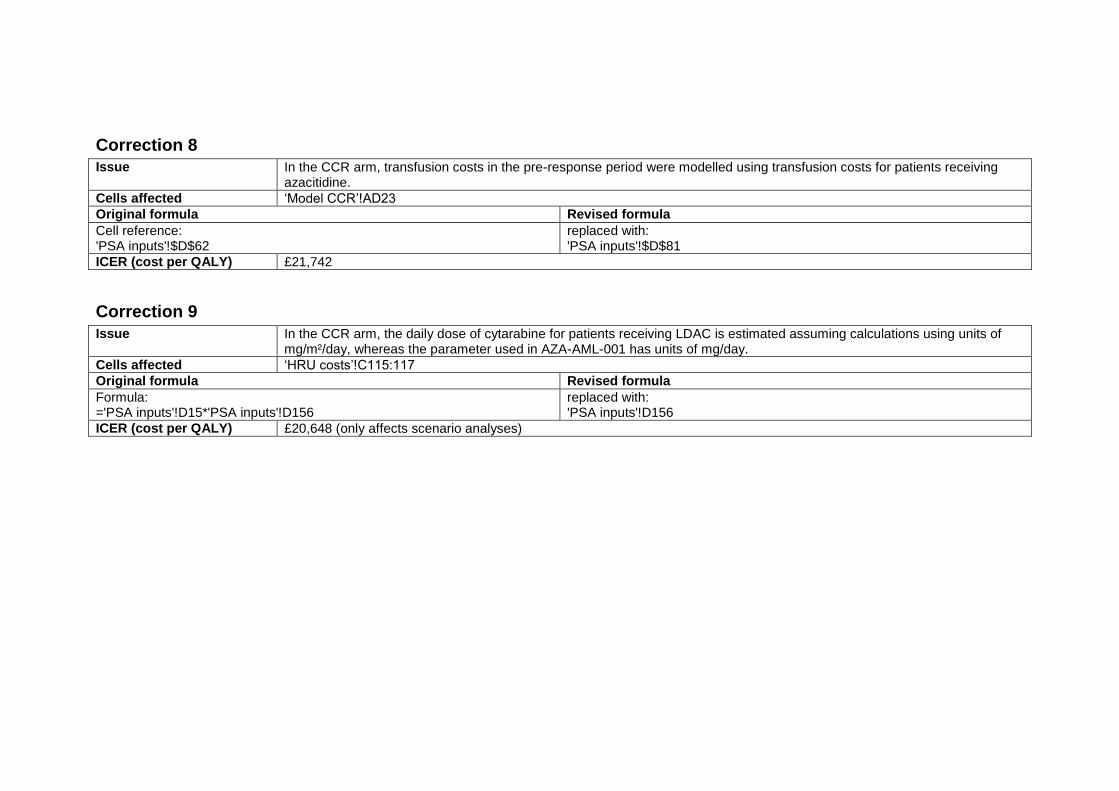
Correction 8
Issue In the CCR arm, transfusion costs in the pre-response period were modelled using transfusion costs for patients receiving azacitidine.
Cells affected ‘Model CCR’!AD23
Original formula Revised formula
Cell reference: 'PSA inputs'!$D$62
replaced with: 'PSA inputs'!$D$81
ICER (cost per QALY) £21,742
Correction 9
Issue In the CCR arm, the daily dose of cytarabine for patients receiving LDAC is estimated assuming calculations using units of mg/m²/day, whereas the parameter used in AZA-AML-001 has units of mg/day.
Cells affected ‘HRU costs’!C115:117
Original formula Revised formula
Formula: ='PSA inputs'!D15*'PSA inputs'!D156
replaced with: 'PSA inputs'!D156
ICER (cost per QALY) £20,648 (only affects scenario analyses)
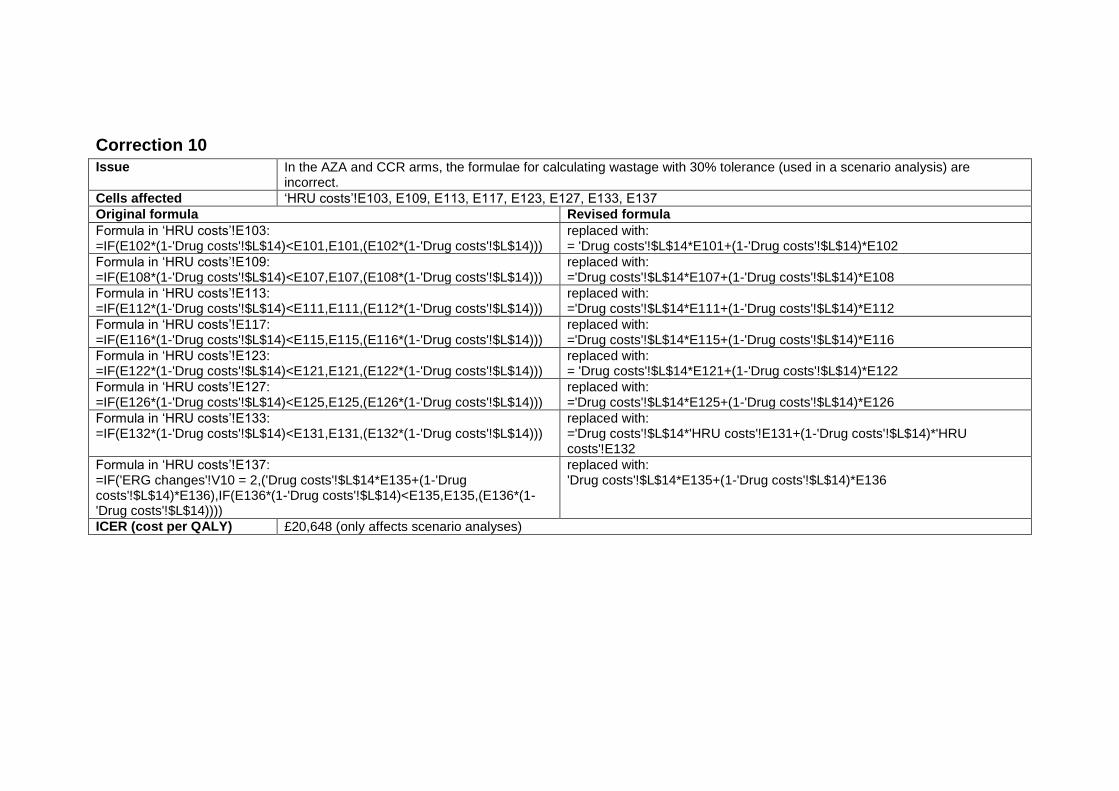
Correction 10
Issue In the AZA and CCR arms, the formulae for calculating wastage with 30% tolerance (used in a scenario analysis) are incorrect.
Cells affected ‘HRU costs’!E103, E109, E113, E117, E123, E127, E133, E137
Original formula Revised formula
Formula in ‘HRU costs’!E103: =IF(E102*(1-'Drug costs'!$L$14)<E101,E101,(E102*(1-'Drug costs'!$L$14)))
replaced with: = 'Drug costs'!$L$14*E101+(1-'Drug costs'!$L$14)*E102
Formula in ‘HRU costs’!E109: =IF(E108*(1-'Drug costs'!$L$14)<E107,E107,(E108*(1-'Drug costs'!$L$14)))
replaced with: ='Drug costs'!$L$14*E107+(1-'Drug costs'!$L$14)*E108
Formula in ‘HRU costs’!E113: =IF(E112*(1-'Drug costs'!$L$14)<E111,E111,(E112*(1-'Drug costs'!$L$14)))
replaced with: ='Drug costs'!$L$14*E111+(1-'Drug costs'!$L$14)*E112
Formula in ‘HRU costs’!E117: =IF(E116*(1-'Drug costs'!$L$14)<E115,E115,(E116*(1-'Drug costs'!$L$14)))
replaced with: ='Drug costs'!$L$14*E115+(1-'Drug costs'!$L$14)*E116
Formula in ‘HRU costs’!E123: =IF(E122*(1-'Drug costs'!$L$14)<E121,E121,(E122*(1-'Drug costs'!$L$14)))
replaced with: = 'Drug costs'!$L$14*E121+(1-'Drug costs'!$L$14)*E122
Formula in ‘HRU costs’!E127: =IF(E126*(1-'Drug costs'!$L$14)<E125,E125,(E126*(1-'Drug costs'!$L$14)))
replaced with: ='Drug costs'!$L$14*E125+(1-'Drug costs'!$L$14)*E126
Formula in ‘HRU costs’!E133: =IF(E132*(1-'Drug costs'!$L$14)<E131,E131,(E132*(1-'Drug costs'!$L$14)))
replaced with: ='Drug costs'!$L$14*'HRU costs'!E131+(1-'Drug costs'!$L$14)*'HRU costs'!E132
Formula in ‘HRU costs’!E137: =IF('ERG changes'!V10 = 2,('Drug costs'!$L$14*E135+(1-'Drug costs'!$L$14)*E136),IF(E136*(1-'Drug costs'!$L$14)<E135,E135,(E136*(1-'Drug costs'!$L$14))))
replaced with: 'Drug costs'!$L$14*E135+(1-'Drug costs'!$L$14)*E136
ICER (cost per QALY) £20,648 (only affects scenario analyses)
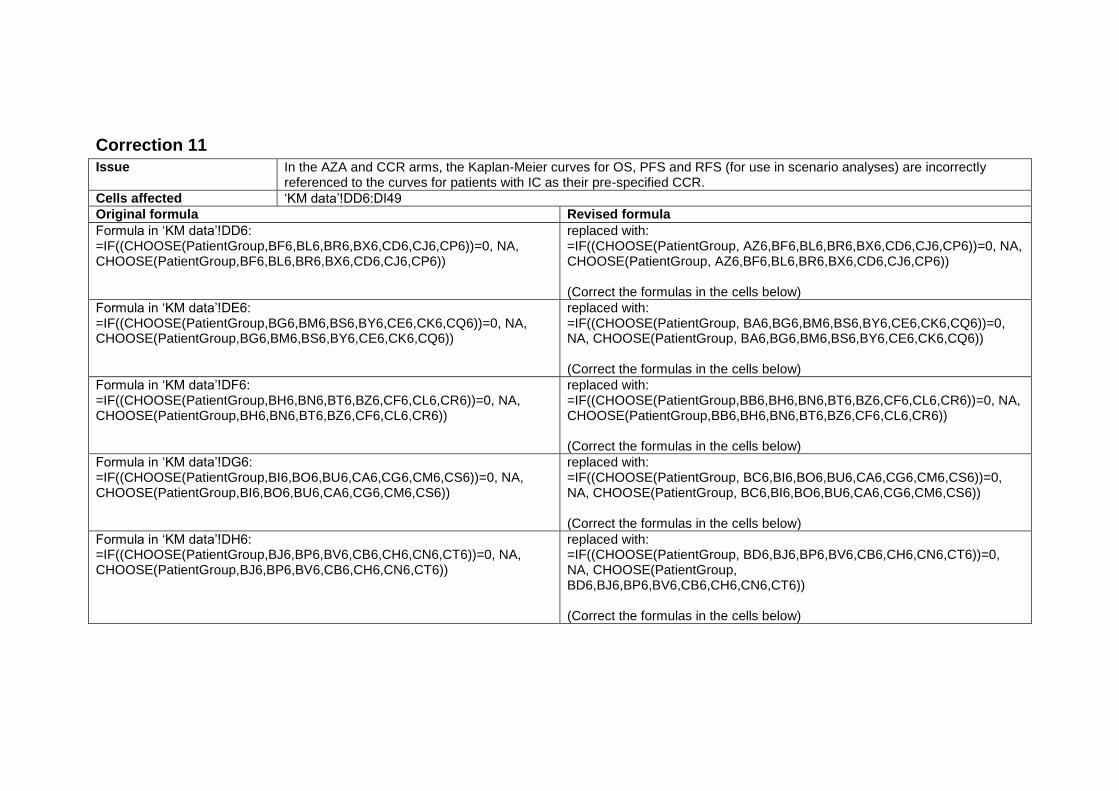
Correction 11
Issue In the AZA and CCR arms, the Kaplan-Meier curves for OS, PFS and RFS (for use in scenario analyses) are incorrectly referenced to the curves for patients with IC as their pre-specified CCR.
Cells affected ‘KM data’!DD6:DI49
Original formula Revised formula
Formula in ‘KM data’!DD6: =IF((CHOOSE(PatientGroup,BF6,BL6,BR6,BX6,CD6,CJ6,CP6))=0, NA, CHOOSE(PatientGroup,BF6,BL6,BR6,BX6,CD6,CJ6,CP6))
replaced with: =IF((CHOOSE(PatientGroup, AZ6,BF6,BL6,BR6,BX6,CD6,CJ6,CP6))=0, NA, CHOOSE(PatientGroup, AZ6,BF6,BL6,BR6,BX6,CD6,CJ6,CP6)) (Correct the formulas in the cells below)
Formula in ‘KM data’!DE6: =IF((CHOOSE(PatientGroup,BG6,BM6,BS6,BY6,CE6,CK6,CQ6))=0, NA, CHOOSE(PatientGroup,BG6,BM6,BS6,BY6,CE6,CK6,CQ6))
replaced with: =IF((CHOOSE(PatientGroup, BA6,BG6,BM6,BS6,BY6,CE6,CK6,CQ6))=0, NA, CHOOSE(PatientGroup, BA6,BG6,BM6,BS6,BY6,CE6,CK6,CQ6)) (Correct the formulas in the cells below)
Formula in ‘KM data’!DF6: =IF((CHOOSE(PatientGroup,BH6,BN6,BT6,BZ6,CF6,CL6,CR6))=0, NA, CHOOSE(PatientGroup,BH6,BN6,BT6,BZ6,CF6,CL6,CR6))
replaced with: =IF((CHOOSE(PatientGroup,BB6,BH6,BN6,BT6,BZ6,CF6,CL6,CR6))=0, NA, CHOOSE(PatientGroup,BB6,BH6,BN6,BT6,BZ6,CF6,CL6,CR6)) (Correct the formulas in the cells below)
Formula in ‘KM data’!DG6: =IF((CHOOSE(PatientGroup,BI6,BO6,BU6,CA6,CG6,CM6,CS6))=0, NA, CHOOSE(PatientGroup,BI6,BO6,BU6,CA6,CG6,CM6,CS6))
replaced with: =IF((CHOOSE(PatientGroup, BC6,BI6,BO6,BU6,CA6,CG6,CM6,CS6))=0, NA, CHOOSE(PatientGroup, BC6,BI6,BO6,BU6,CA6,CG6,CM6,CS6)) (Correct the formulas in the cells below)
Formula in ‘KM data’!DH6: =IF((CHOOSE(PatientGroup,BJ6,BP6,BV6,CB6,CH6,CN6,CT6))=0, NA, CHOOSE(PatientGroup,BJ6,BP6,BV6,CB6,CH6,CN6,CT6))
replaced with: =IF((CHOOSE(PatientGroup, BD6,BJ6,BP6,BV6,CB6,CH6,CN6,CT6))=0, NA, CHOOSE(PatientGroup, BD6,BJ6,BP6,BV6,CB6,CH6,CN6,CT6)) (Correct the formulas in the cells below)
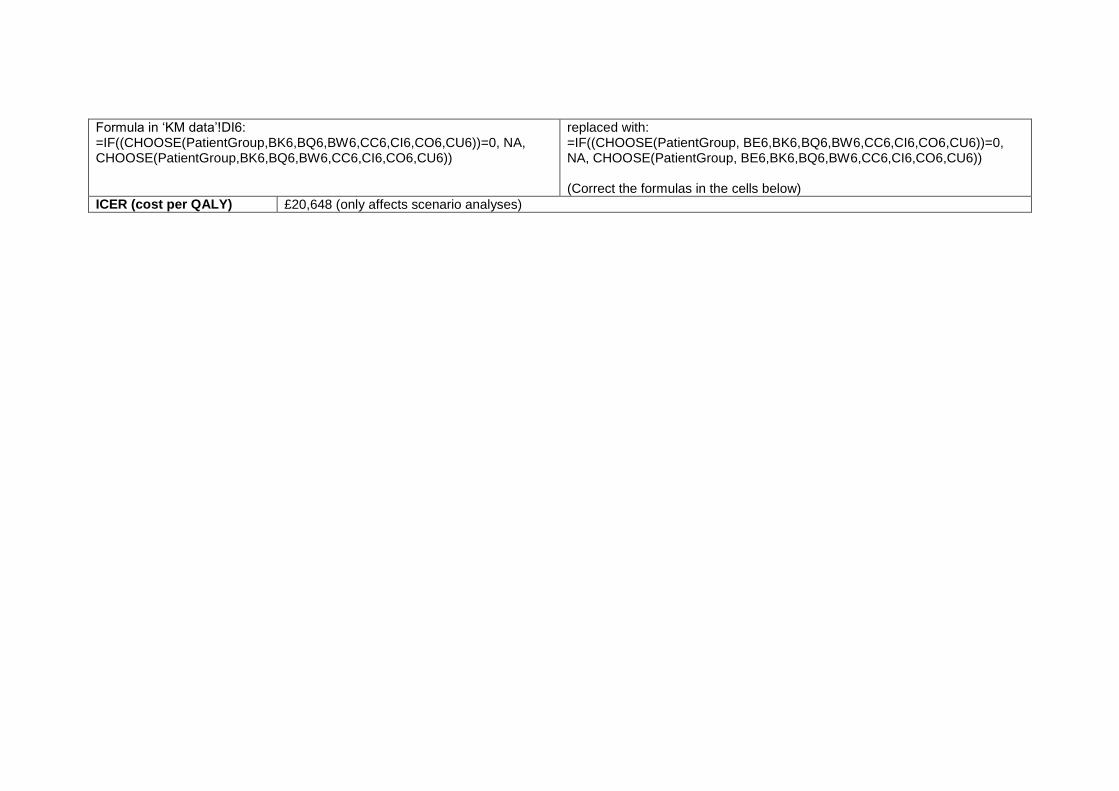
Formula in ‘KM data’!DI6: =IF((CHOOSE(PatientGroup,BK6,BQ6,BW6,CC6,CI6,CO6,CU6))=0, NA, CHOOSE(PatientGroup,BK6,BQ6,BW6,CC6,CI6,CO6,CU6))
replaced with: =IF((CHOOSE(PatientGroup, BE6,BK6,BQ6,BW6,CC6,CI6,CO6,CU6))=0, NA, CHOOSE(PatientGroup, BE6,BK6,BQ6,BW6,CC6,CI6,CO6,CU6)) (Correct the formulas in the cells below)
ICER (cost per QALY) £20,648 (only affects scenario analyses)
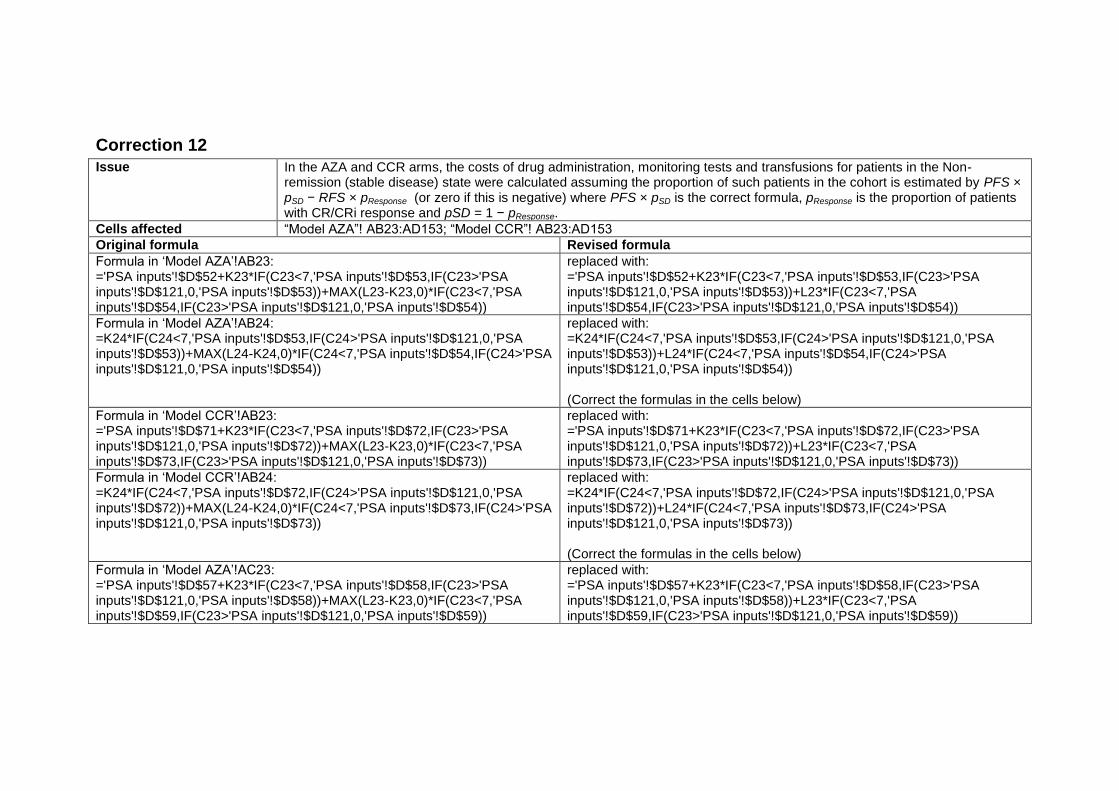
Correction 12
Issue In the AZA and CCR arms, the costs of drug administration, monitoring tests and transfusions for patients in the Non-remission (stable disease) state were calculated assuming the proportion of such patients in the cohort is estimated by PFS × pSD − RFS × pResponse (or zero if this is negative) where PFS × pSD is the correct formula, pResponse is the proportion of patients with CR/CRi response and pSD = 1 − pResponse.
Cells affected “Model AZA”! AB23:AD153; “Model CCR”! AB23:AD153
Original formula Revised formula
Formula in ‘Model AZA’!AB23: ='PSA inputs'!$D$52+K23*IF(C23<7,'PSA inputs'!$D$53,IF(C23>'PSA inputs'!$D$121,0,'PSA inputs'!$D$53))+MAX(L23-K23,0)*IF(C23<7,'PSA inputs'!$D$54,IF(C23>'PSA inputs'!$D$121,0,'PSA inputs'!$D$54))
replaced with: ='PSA inputs'!$D$52+K23*IF(C23<7,'PSA inputs'!$D$53,IF(C23>'PSA inputs'!$D$121,0,'PSA inputs'!$D$53))+L23*IF(C23<7,'PSA inputs'!$D$54,IF(C23>'PSA inputs'!$D$121,0,'PSA inputs'!$D$54))
Formula in ‘Model AZA’!AB24: =K24*IF(C24<7,'PSA inputs'!$D$53,IF(C24>'PSA inputs'!$D$121,0,'PSA inputs'!$D$53))+MAX(L24-K24,0)*IF(C24<7,'PSA inputs'!$D$54,IF(C24>'PSA inputs'!$D$121,0,'PSA inputs'!$D$54))
replaced with: =K24*IF(C24<7,'PSA inputs'!$D$53,IF(C24>'PSA inputs'!$D$121,0,'PSA inputs'!$D$53))+L24*IF(C24<7,'PSA inputs'!$D$54,IF(C24>'PSA inputs'!$D$121,0,'PSA inputs'!$D$54)) (Correct the formulas in the cells below)
Formula in ‘Model CCR’!AB23: ='PSA inputs'!$D$71+K23*IF(C23<7,'PSA inputs'!$D$72,IF(C23>'PSA inputs'!$D$121,0,'PSA inputs'!$D$72))+MAX(L23-K23,0)*IF(C23<7,'PSA inputs'!$D$73,IF(C23>'PSA inputs'!$D$121,0,'PSA inputs'!$D$73))
replaced with: ='PSA inputs'!$D$71+K23*IF(C23<7,'PSA inputs'!$D$72,IF(C23>'PSA inputs'!$D$121,0,'PSA inputs'!$D$72))+L23*IF(C23<7,'PSA inputs'!$D$73,IF(C23>'PSA inputs'!$D$121,0,'PSA inputs'!$D$73))
Formula in ‘Model CCR’!AB24: =K24*IF(C24<7,'PSA inputs'!$D$72,IF(C24>'PSA inputs'!$D$121,0,'PSA inputs'!$D$72))+MAX(L24-K24,0)*IF(C24<7,'PSA inputs'!$D$73,IF(C24>'PSA inputs'!$D$121,0,'PSA inputs'!$D$73))
replaced with: =K24*IF(C24<7,'PSA inputs'!$D$72,IF(C24>'PSA inputs'!$D$121,0,'PSA inputs'!$D$72))+L24*IF(C24<7,'PSA inputs'!$D$73,IF(C24>'PSA inputs'!$D$121,0,'PSA inputs'!$D$73)) (Correct the formulas in the cells below)
Formula in ‘Model AZA’!AC23: ='PSA inputs'!$D$57+K23*IF(C23<7,'PSA inputs'!$D$58,IF(C23>'PSA inputs'!$D$121,0,'PSA inputs'!$D$58))+MAX(L23-K23,0)*IF(C23<7,'PSA inputs'!$D$59,IF(C23>'PSA inputs'!$D$121,0,'PSA inputs'!$D$59))
replaced with: ='PSA inputs'!$D$57+K23*IF(C23<7,'PSA inputs'!$D$58,IF(C23>'PSA inputs'!$D$121,0,'PSA inputs'!$D$58))+L23*IF(C23<7,'PSA inputs'!$D$59,IF(C23>'PSA inputs'!$D$121,0,'PSA inputs'!$D$59))
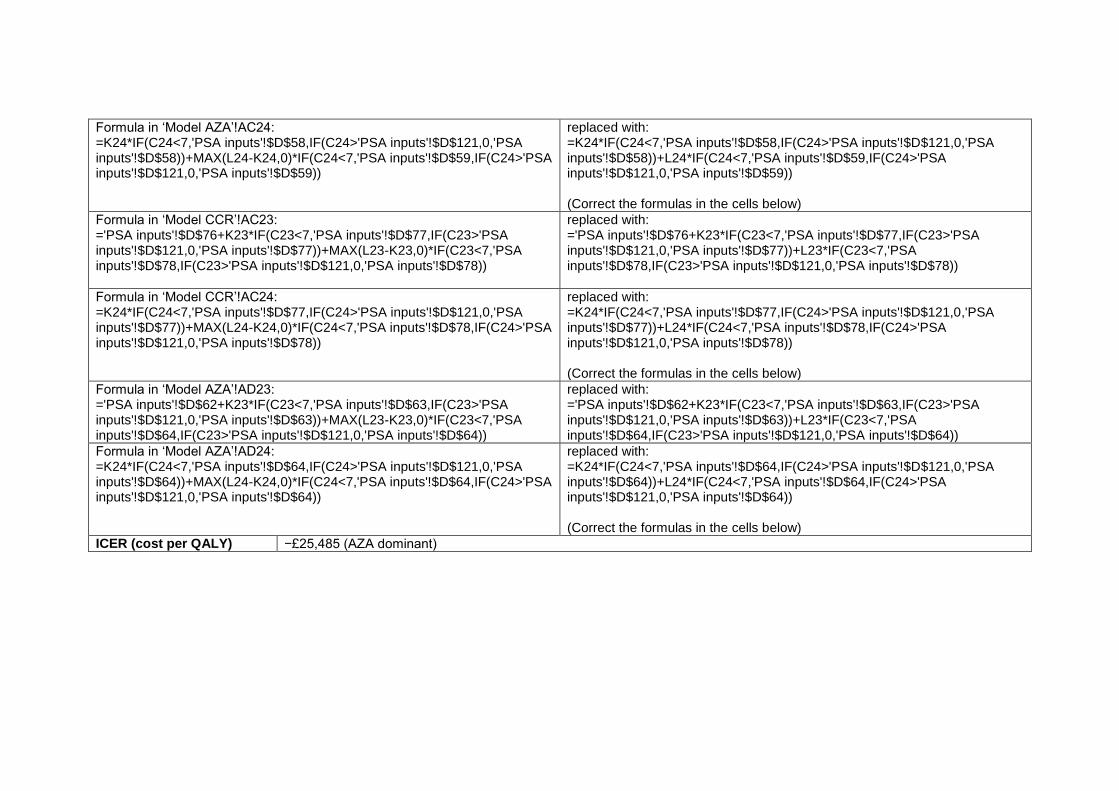
Formula in ‘Model AZA’!AC24: =K24*IF(C24<7,'PSA inputs'!$D$58,IF(C24>'PSA inputs'!$D$121,0,'PSA inputs'!$D$58))+MAX(L24-K24,0)*IF(C24<7,'PSA inputs'!$D$59,IF(C24>'PSA inputs'!$D$121,0,'PSA inputs'!$D$59))
replaced with: =K24*IF(C24<7,'PSA inputs'!$D$58,IF(C24>'PSA inputs'!$D$121,0,'PSA inputs'!$D$58))+L24*IF(C24<7,'PSA inputs'!$D$59,IF(C24>'PSA inputs'!$D$121,0,'PSA inputs'!$D$59)) (Correct the formulas in the cells below)
Formula in ‘Model CCR’!AC23: ='PSA inputs'!$D$76+K23*IF(C23<7,'PSA inputs'!$D$77,IF(C23>'PSA inputs'!$D$121,0,'PSA inputs'!$D$77))+MAX(L23-K23,0)*IF(C23<7,'PSA inputs'!$D$78,IF(C23>'PSA inputs'!$D$121,0,'PSA inputs'!$D$78))
replaced with: ='PSA inputs'!$D$76+K23*IF(C23<7,'PSA inputs'!$D$77,IF(C23>'PSA inputs'!$D$121,0,'PSA inputs'!$D$77))+L23*IF(C23<7,'PSA inputs'!$D$78,IF(C23>'PSA inputs'!$D$121,0,'PSA inputs'!$D$78))
Formula in ‘Model CCR’!AC24: =K24*IF(C24<7,'PSA inputs'!$D$77,IF(C24>'PSA inputs'!$D$121,0,'PSA inputs'!$D$77))+MAX(L24-K24,0)*IF(C24<7,'PSA inputs'!$D$78,IF(C24>'PSA inputs'!$D$121,0,'PSA inputs'!$D$78))
replaced with: =K24*IF(C24<7,'PSA inputs'!$D$77,IF(C24>'PSA inputs'!$D$121,0,'PSA inputs'!$D$77))+L24*IF(C24<7,'PSA inputs'!$D$78,IF(C24>'PSA inputs'!$D$121,0,'PSA inputs'!$D$78)) (Correct the formulas in the cells below)
Formula in ‘Model AZA’!AD23: ='PSA inputs'!$D$62+K23*IF(C23<7,'PSA inputs'!$D$63,IF(C23>'PSA inputs'!$D$121,0,'PSA inputs'!$D$63))+MAX(L23-K23,0)*IF(C23<7,'PSA inputs'!$D$64,IF(C23>'PSA inputs'!$D$121,0,'PSA inputs'!$D$64))
replaced with: ='PSA inputs'!$D$62+K23*IF(C23<7,'PSA inputs'!$D$63,IF(C23>'PSA inputs'!$D$121,0,'PSA inputs'!$D$63))+L23*IF(C23<7,'PSA inputs'!$D$64,IF(C23>'PSA inputs'!$D$121,0,'PSA inputs'!$D$64))
Formula in ‘Model AZA’!AD24: =K24*IF(C24<7,'PSA inputs'!$D$64,IF(C24>'PSA inputs'!$D$121,0,'PSA inputs'!$D$64))+MAX(L24-K24,0)*IF(C24<7,'PSA inputs'!$D$64,IF(C24>'PSA inputs'!$D$121,0,'PSA inputs'!$D$64))
replaced with: =K24*IF(C24<7,'PSA inputs'!$D$64,IF(C24>'PSA inputs'!$D$121,0,'PSA inputs'!$D$64))+L24*IF(C24<7,'PSA inputs'!$D$64,IF(C24>'PSA inputs'!$D$121,0,'PSA inputs'!$D$64)) (Correct the formulas in the cells below)
ICER (cost per QALY) −£25,485 (AZA dominant)