Embed Size (px)
Citation preview
Engineering Structures 30 (2008) 804–820www.elsevier.com/locate/engstruct
Simplified pushover-based vulnerability analysis for large-scale assessmentof RC buildings
Barbara Borzia,∗, Rui Pinhob, Helen Crowleya
a Eucentre, European Centre for Training and Research in Earthquake Engineering, Via Ferrata 1, Pavia, Italyb Universita degli Studi di Pavia, Italy
Received 12 September 2006; received in revised form 28 May 2007; accepted 29 May 2007Available online 2 July 2007
Abstract
Analytical methods for large-scale assessment of the seismic vulnerability of RC buildings have only recently become feasible due to acombination of advancements in the field of seismic hazard assessment and structural response analysis. In many of the original procedures todefine analytical vulnerability curves, nonlinear time-history analyses of prototype structures with randomly varying structural characteristics werecarried out for a set of representative earthquakes. However, running nonlinear dynamic analyses for a large number of structures is extremelytime consuming and alternative methods have thus been sought. The method presented in this paper defines the nonlinear behaviour of a randompopulation of buildings through a simplified pushover and displacement-based procedure. Displacement capacity limits are identified on thepushover curve and these limits are compared with the displacement demand from a response spectrum for each building in the random population,thus leading to the generation of vulnerability curves.c© 2007 Elsevier Ltd. All rights reserved.
Keywords: Loss estimation; Vulnerability assessment; Vulnerability curves; Simplified pushover; RC structures
1. Introduction
Seismic vulnerability is a measure of how prone a buildingis to damage for a given severity of the ground shaking. Theaim of much of the research work dedicated to this subject is togive a mathematical formulation to the vulnerability. The twomost largely utilised formulations to describe the vulnerabilityare damage probability matrices and vulnerability curves. Avulnerability curve describes the conditional probability ofexceeding a certain damage limit state in terms of the selectedintensity of the ground motion. The same probability in discreteterms is a component of a damage probability matrix. Theconditional probability is expressed as
Pik = P[D ≥ di | S = sk] (1)
where Pik is the probability that the damage state di will beachieved or exceeded for a ground motion severity sk , and D
∗ Corresponding author.E-mail address: [email protected] (B. Borzi).
0141-0296/$ - see front matter c© 2007 Elsevier Ltd. All rights reserved.doi:10.1016/j.engstruct.2007.05.021
and S are the variables representing the damage and the severityof the input motion, respectively.
In this paper a Simplified Pushover-Based EarthquakeLoss Assessment method (SP-BELA) for the definition ofvulnerability curves is presented. Conceptually, the methodmay be applied to any structural typology; however, herein itis employed to study the vulnerability of Reinforced Concrete(RC) bare frame buildings not designed for seismic loads,representative of the “as built” in Mediterranean countries.The effect of infill walls will be the subject of furtherdevelopments of the methodology. The input motion severity isdescribed through the peak ground acceleration (PGA) as thisis consistent with the parameter commonly used for seismiczonation in current design codes. Displacement responsespectra anchored to the PGA are also utilised, thus allowingthe relationship between the frequency content of the groundmotion and the period of vibration of different classes of RCbuildings to be taken into account.
This paper begins with a brief literature review of analyticalmethods available for vulnerability assessment in order tolocate the proposed methodology within the framework of

B. Borzi et al. / Engineering Structures 30 (2008) 804–820 805
Fig. 1. Flowchart to describe the components of the calculation of analytical vulnerability curves [adapted from Dumova-Jovanoska [12]].
current probabilistic mechanics-based assessment procedures.The details of the derivation of the methodology are thenpresented and finally the output of the methodology is validatedthrough comparisons with other methods, both in terms ofthe nonlinear response of RC structures and the vulnerabilitypredictions for increased levels of PGA.
2. Brief review of analytical methods for vulnerabilityassessment
Analytical methods for large-scale assessment of the seismicvulnerability of RC buildings have only recently becomefeasible due to a combination of advancements in the fieldof seismic hazard assessment and structural response analysis.In the past, empirical methods based on the observed damagedata of buildings in terms of macroseismic intensity werepopular because they allowed the data to be convolvedwith seismic hazard maps, which were also in terms ofmacroseismic intensity. However, recent developments inprobabilistic seismic hazard assessment have led to theproduction of seismic hazard maps in terms of peak groundacceleration (PGA) and spectral ordinates, allowing methodswhich correlate the damage of the building stock to these inputparameters to be proposed (the reader is referred to the work ofCalvi et al. [4] for a more detailed review of the evolution ofloss assessment over the past 30 years).
Analytical vulnerability assessment approaches tend tofeature, with respect to empirical methods, slightly moredetailed and transparent vulnerability assessment algorithmswith direct physical meaning, that not only allow detailedsensitivity studies to be undertaken, but also cater for morestraightforward calibration to various characteristics of buildingstock and hazard. Such characteristics place this type of lossassessment methods in an ideal position for employment inparametric studies that aim at the definition/calibration of urban
planning, retrofitting, insurance and other similar policies orinitiatives.
The flowchart presented in Fig. 1 shows the componentsgenerally included in the analytical derivation of vulnerabilitycurves for the seismic assessment of buildings. One of themain differences between analytical methods arises in thecomputational modelling of the structural behaviour and inparticular the procedure used to define the nonlinear responseof the structure to a given ground motion input. In manyof the original procedures to define analytical vulnerabilitycurves, nonlinear time-history analyses of prototype structureswith randomly varying structural characteristics were carriedout for a set of representative earthquakes [e.g. Singhal andKiremidjian [33]; Masi [22]]. This procedure has also beenapplied in hybrid methods which combine analytical resultswith post-earthquake observed damage data [e.g. Kappos et al.[18]]. However, running nonlinear dynamic analyses for alarge number of structures is extremely time consuming andalternative methods have thus been sought.
2.1. Capacity spectrum-based methods
The Capacity Spectrum Method of ATC-40 [1] is onealternative to nonlinear time-history analysis and it wasoriginally applied in the HAZUS methodology for earthquakeloss estimation [13,14]. The performance point of a buildingtype under a particular ground-shaking scenario (or PESH) isfound from the intersection of an acceleration–displacementspectrum, representing the ground motion, and a capacity curve(pushover curve converted to plots of spectral accelerationversus spectral displacement), representing the horizontaldisplacement of the structure under increasing lateral load[e.g. Kircher et al. [19]] (see Fig. 2). In HAZUS, the capacitycurves have been defined using nonlinear pushover analysisof typical US prototype structures (with the variability in

806 B. Borzi et al. / Engineering Structures 30 (2008) 804–820
Fig. 2. Capacity Spectrum Method, as applied in HAZUS [13,14].
this curve assigned through a combination of performancedata, earthquake field data, expert opinion and judgement),whilst adaptive pushover analyses of buildings with randomstructural characteristics have been used by Rossetto andElnashai [31]. As mentioned previously, the procedure to definethe nonlinear capacity of reinforced concrete structures canmake a large difference to the computational effort and thussimplified methods used to define the capacity are preferred. Asimplified method can also be more easily adapted for differentconstruction characteristics, thus allowing the vulnerabilityassessment component of a risk or loss model to be easilycalibrated to the country or region under consideration.
Giovinazzi [15] presents a mechanical procedure for therisk assessment of reinforced concrete frames that usesbilinear capacity curves which are derived using the equationsand parameters available in seismic design codes. The baseshear coefficient (which can be related to the yield spectralacceleration) is generally a function of seismic zone, soilconditions, building dynamic response, structural type andbuilding importance, all of which can be obtained from thecode. The yield spectral displacement is a function of theyield spectral acceleration and the yield period of vibration, thelatter being calculated using the simple formulae available inseismic design codes which usually give the period in termsof the building height. The ultimate spectral displacementis a function of the yield displacement and the buildingductility capacity, which has been assumed to be 2.5 forreinforced concrete buildings that have not been seismicallydesigned; otherwise, it can be derived using the behaviourfactor specified in the code. The use of seismic design codesto calculate simplified pushover curves of the building stockis a cost-effective method for calibrating the vulnerability ofbuildings designed to different design codes. However, code-based definitions of the yield period of vibration and base shearcapacity of RC structures could differ greatly from the actualproperties of the building stock [see e.g. Crowley [7]] and inmany countries the existing building stock has been constructedwithout even conforming to any seismic design code.
2.2. Mechanics-based methods
Cosenza et al. [6] present a mechanics-based approach forthe assessment of reinforced concrete buildings that is based
on the formation of collapse mechanisms. The building framesystem is idealised as a generic three-dimensional line modeland beams and columns are dimensioned and detailed for thebuilding code that was in force at the time of construction.For each element, member moment–rotation behaviour isdefined in terms of yield moment, yield curvature and ultimatecurvature capacity. The ultimate base shear capacity, Vb,i , ofeach simulated building is determined using a plastic analysisapproach; it is assumed that building capacity corresponds tothe development of a pre-defined plastic mechanism (Fig. 3),and that seismic forces may be represented by a lineardistribution over the height of the building.
The ultimate roof displacement ∆u,i is determined as afunction of the ultimate rotation, θu , of the structural elementswhilst the global seismic behaviour is represented by a collapsemultiplier λb,i (base shear Vb,i divided by seismic weight, W )and the corresponding lateral (driftu)i (roof displacementdivided by building height). The seismic response is evaluatedfor 3nz mechanisms, where nz represents the number ofstoreys; the seismic capacity corresponds to the lowestcollapse multiplier of all the considered mechanisms andthe associated drift. The seismic capacity of buildingstock will vary from the generic building due to differentmorphologic/geometric/structural configurations and materialproperties. Hence a number of building models are generatedbased on the probabilistic distribution of the structuralparameters. A Monte Carlo simulation technique is appliedto calculate “probabilistic capacity curves” which expressthe probability of having a capacity lower than the assignedthreshold value. A clear framework for the treatment ofuncertainty in the geometric and material properties in anurban environment is thus accounted for in the method.However, the main disadvantages of the procedure are that onlythe collapse limit state is currently considered and no clearindication is given on how the capacity should be convolvedwith the demand to calculate the probability of exceedinggiven limit states. However, recent developments have beenmade to compensate for some of these shortcomings and themethodology has been placed in a risk assessment framework[see Iervolino et al. [17]].
2.3. Displacement-based methods
Alternative methods to define the nonlinear behaviour ofreinforced concrete buildings have been proposed which donot require the derivation of pushover curves, but instead thenonlinear displacement capacity and period of vibration of asingle degree of freedom equivalent system are defined, withoutrequiring the base shear capacity of the structure to be explicitlycalculated [e.g. Calvi [3]]. The procedure proposed by Calvi[3] utilised the principles of the Direct Displacement-BasedDesign method [e.g. Priestley [28]], wherein a multi-degree-of-freedom (MDOF) structure is modelled as a single DOF systemand different displacement profiles are accounted for accordingto the failure mechanism (or displacement profile) at a givenlimit state, using the geometric and material properties of thestructures within a building class. The approach is particularly

B. Borzi et al. / Engineering Structures 30 (2008) 804–820 807
Fig. 3. Analysed collapse mechanisms [6].
suitable for loss estimation studies, since, in addition to thedirect customisation to any given building stock characteristics,it is computationally efficient, thus allowing extensive andrepetitive parametric studies to be carried out in a cost-effectivemanner.
The methodology proposed by Calvi [3] has subsequentlybeen developed for reinforced concrete buildings by Pinho et al.[25] and Crowley et al. [10], leading to the Displacement-Based Earthquake Loss Assessment (DBELA) procedure.The displacement capacity at three different limit states areconsidered in DBELA based on the sectional strains in thesteel and concrete at yield, significant damage and collapse. Thedisplacement capacity of column-sway (soft-storey) and beam-sway (distributed damage) failure mechanisms are considered;the division of the building stock into different responsemechanisms is based on the construction year and evidenceof a weak ground floor storey. Many buildings built beforethe inclusion of sound seismic design philosophy (i.e. capacitydesign) into a country’s seismic design code and those with aweak ground floor storey (as compared to the upper floors) willgenerally adopt a soft-storey (column-sway) mechanism.
In DBELA, the structural displacement capacity ofreinforced concrete members/structures is derived fromstructural mechanics principles; beginning with the yield strainof the reinforcing steel and the geometry of the beam andcolumn sections in the building class, the yield curvaturecan be defined using the relationships suggested by Priestley[28]. These beam and column yield curvatures are thenmultiplied by empirical coefficients to account for shear andjoint deformation to obtain a formula for chord rotation. Thischord rotation is equated to base rotation and multiplied bythe height of the equivalent SDOF system to produce theyield displacement capacity. Post-yield displacement capacityformulae are derived by adding a plastic displacementcomponent to the yield displacement, calculated by multiplyingtogether the limit state plastic section curvature, the plastichinge length, and the height or length of the yielding member.The displacement capacity equations, which are thus functionsof the geometrical and material properties and the height ofthe building class, are transformed into functions of periodthrough the substitution of an equation relating the height ofa structure to its limit state period [8,9]. A direct comparison isthus possible at any period between the displacement capacityof a building class and the displacement demand predicted froma response spectrum (Fig. 4).
The probability that the demand imposed by an earthquake isgreater than the capacity of the building class, and thus ‘failure’occurs, is given by the classical time-invariant reliability
Fig. 4. An illustrative description of the deterministic comparison of limit state(LS) displacement capacity and displacement demand in DBELA.
formula [e.g. Pinto et al. [26]]:
P f =
∫∞
0[1 − FD(α)] fSC (α)dα (2)
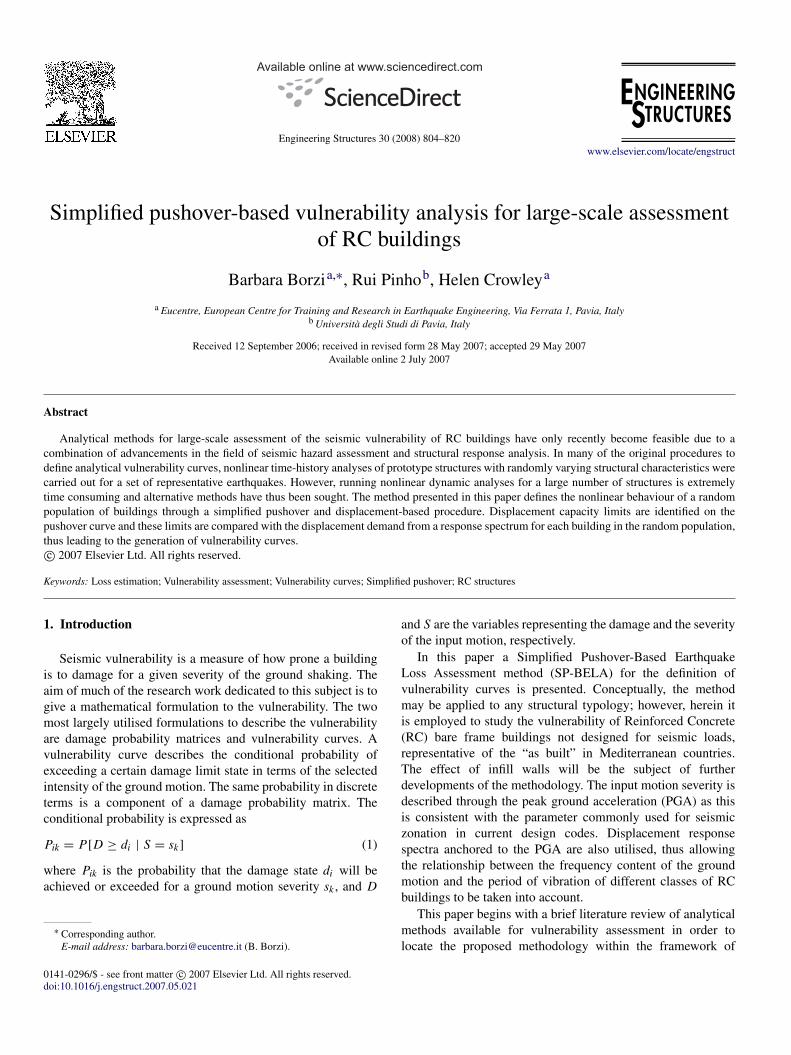
where FD(α) is the cumulative distribution function (CDF) ofthe demand (obtained from the median displacement demandand the logarithmic standard deviation at a given period)and fsc(α) is the probability density function (PDF) of thecapacity, defined in terms of a particular damage parameter(α). The PDF of the capacity is modelled in DBELA usinga joint probability density function (JPDF) of displacementcapacity and period (Fig. 5(c)) based on the variability of avector of random variables that are present in the equationsfor displacement capacity, conditioned to period (Fig. 5(a)) andperiod of vibration (Fig. 5(b)).
3. Simplified pushover-based method
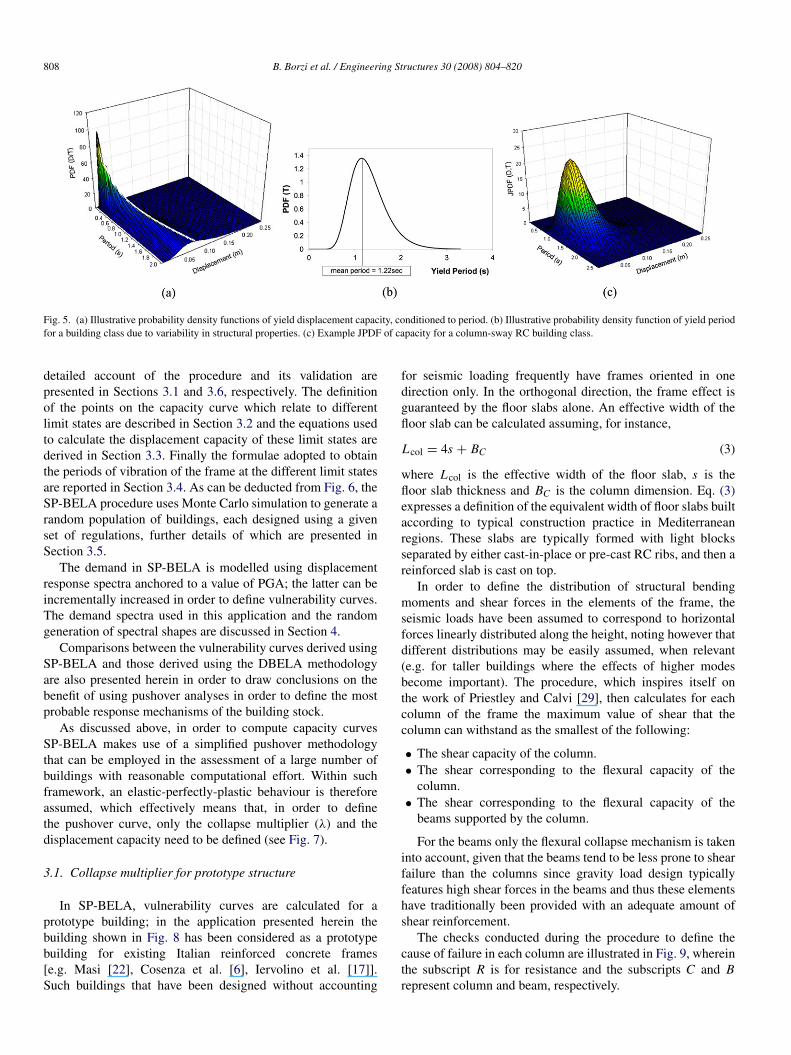
The Simplified Pushover-Based Earthquake Loss Assess-ment (SP-BELA) method presented in this paper combines thedefinition of a pushover curve using a simplified mechanics-based procedure (similar to that proposed by Cosenza et al. [6])to define the base shear capacity of the building stock, with adisplacement-based framework similar to that in DBELA, suchthat the vulnerability of building classes at different limit statescan be obtained. The steps of the methodology are illustrated inFig. 6.
The main component of the methodology involves thedefinition of the capacity of a population of buildings basedon a prototype structure, which is carried out using simplifiedpushover analysis to obtain the collapse multiplier (λ). A
808 B. Borzi et al. / Engineering Structures 30 (2008) 804–820
Fig. 5. (a) Illustrative probability density functions of yield displacement capacity, conditioned to period. (b) Illustrative probability density function of yield periodfor a building class due to variability in structural properties. (c) Example JPDF of capacity for a column-sway RC building class.
detailed account of the procedure and its validation arepresented in Sections 3.1 and 3.6, respectively. The definitionof the points on the capacity curve which relate to differentlimit states are described in Section 3.2 and the equations usedto calculate the displacement capacity of these limit states arederived in Section 3.3. Finally the formulae adopted to obtainthe periods of vibration of the frame at the different limit statesare reported in Section 3.4. As can be deducted from Fig. 6, theSP-BELA procedure uses Monte Carlo simulation to generate arandom population of buildings, each designed using a givenset of regulations, further details of which are presented inSection 3.5.
The demand in SP-BELA is modelled using displacementresponse spectra anchored to a value of PGA; the latter can beincrementally increased in order to define vulnerability curves.The demand spectra used in this application and the randomgeneration of spectral shapes are discussed in Section 4.
Comparisons between the vulnerability curves derived usingSP-BELA and those derived using the DBELA methodologyare also presented herein in order to draw conclusions on thebenefit of using pushover analyses in order to define the mostprobable response mechanisms of the building stock.
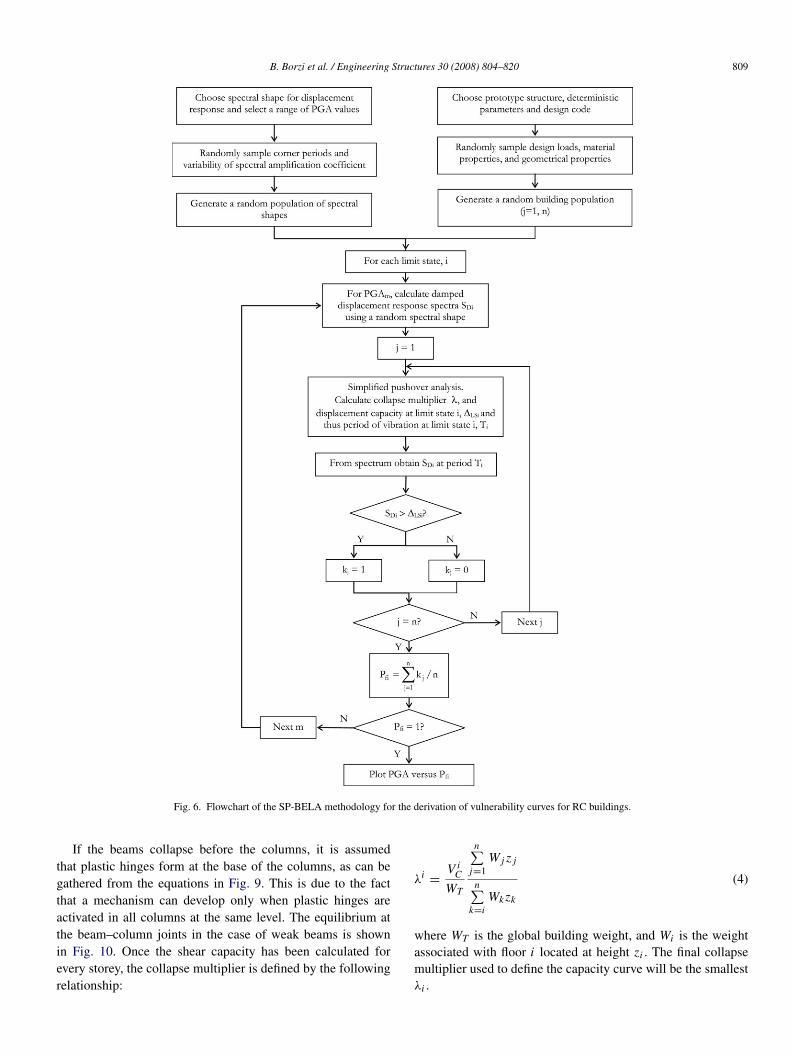
As discussed above, in order to compute capacity curvesSP-BELA makes use of a simplified pushover methodologythat can be employed in the assessment of a large number ofbuildings with reasonable computational effort. Within suchframework, an elastic-perfectly-plastic behaviour is thereforeassumed, which effectively means that, in order to definethe pushover curve, only the collapse multiplier (λ) and thedisplacement capacity need to be defined (see Fig. 7).
3.1. Collapse multiplier for prototype structure
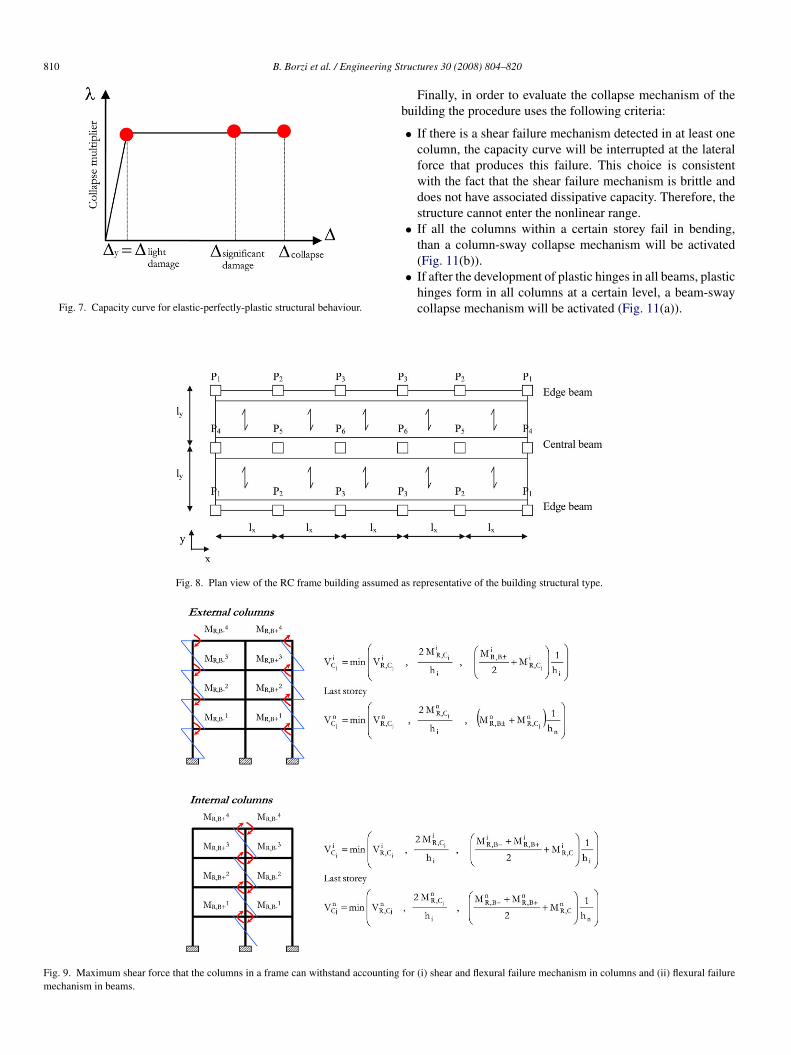
In SP-BELA, vulnerability curves are calculated for aprototype building; in the application presented herein thebuilding shown in Fig. 8 has been considered as a prototypebuilding for existing Italian reinforced concrete frames[e.g. Masi [22], Cosenza et al. [6], Iervolino et al. [17]].Such buildings that have been designed without accounting
for seismic loading frequently have frames oriented in onedirection only. In the orthogonal direction, the frame effect isguaranteed by the floor slabs alone. An effective width of thefloor slab can be calculated assuming, for instance,
Lcol = 4s + BC (3)
where Lcol is the effective width of the floor slab, s is thefloor slab thickness and BC is the column dimension. Eq. (3)expresses a definition of the equivalent width of floor slabs builtaccording to typical construction practice in Mediterraneanregions. These slabs are typically formed with light blocksseparated by either cast-in-place or pre-cast RC ribs, and then areinforced slab is cast on top.
In order to define the distribution of structural bendingmoments and shear forces in the elements of the frame, theseismic loads have been assumed to correspond to horizontalforces linearly distributed along the height, noting however thatdifferent distributions may be easily assumed, when relevant(e.g. for taller buildings where the effects of higher modesbecome important). The procedure, which inspires itself onthe work of Priestley and Calvi [29], then calculates for eachcolumn of the frame the maximum value of shear that thecolumn can withstand as the smallest of the following:
• The shear capacity of the column.• The shear corresponding to the flexural capacity of the
column.• The shear corresponding to the flexural capacity of the
beams supported by the column.
For the beams only the flexural collapse mechanism is takeninto account, given that the beams tend to be less prone to shearfailure than the columns since gravity load design typicallyfeatures high shear forces in the beams and thus these elementshave traditionally been provided with an adequate amount ofshear reinforcement.
The checks conducted during the procedure to define thecause of failure in each column are illustrated in Fig. 9, whereinthe subscript R is for resistance and the subscripts C and Brepresent column and beam, respectively.
B. Borzi et al. / Engineering Structures 30 (2008) 804–820 809
Fig. 6. Flowchart of the SP-BELA methodology for the derivation of vulnerability curves for RC buildings.
If the beams collapse before the columns, it is assumedthat plastic hinges form at the base of the columns, as can begathered from the equations in Fig. 9. This is due to the factthat a mechanism can develop only when plastic hinges areactivated in all columns at the same level. The equilibrium atthe beam–column joints in the case of weak beams is shownin Fig. 10. Once the shear capacity has been calculated forevery storey, the collapse multiplier is defined by the followingrelationship:
λi=
V iC
WT
n∑j=1
W j z j
n∑k=i
Wk zk
(4)
where WT is the global building weight, and Wi is the weightassociated with floor i located at height zi . The final collapsemultiplier used to define the capacity curve will be the smallestλi .
810 B. Borzi et al. / Engineering Structures 30 (2008) 804–820
Fig. 7. Capacity curve for elastic-perfectly-plastic structural behaviour.
Fig. 8. Plan view of the RC frame building assumed as representative of the building structural type.
Fig. 9. Maximum shear force that the columns in a frame can withstand accounting for (i) shear and flexural failure mechanism in columns and (ii) flexural failuremechanism in beams.
Finally, in order to evaluate the collapse mechanism of thebuilding the procedure uses the following criteria:
• If there is a shear failure mechanism detected in at least onecolumn, the capacity curve will be interrupted at the lateralforce that produces this failure. This choice is consistentwith the fact that the shear failure mechanism is brittle anddoes not have associated dissipative capacity. Therefore, thestructure cannot enter the nonlinear range.
• If all the columns within a certain storey fail in bending,than a column-sway collapse mechanism will be activated(Fig. 11(b)).
• If after the development of plastic hinges in all beams, plastichinges form in all columns at a certain level, a beam-swaycollapse mechanism will be activated (Fig. 11(a)).

B. Borzi et al. / Engineering Structures 30 (2008) 804–820 811
Fig. 10. Equilibrium at the joint in the case of weak beams.
Fig. 11. Possible collapse mechanisms for a frame (a) beam-sway collapsemechanism, (b) column-sway collapse mechanism.
There could be a situation in which at the storeycorresponding to the smallest λi some of the columns arestronger than the beams, or vice versa. Therefore, it cannot beclearly identified whether a beam or a column-sway mechanismwill be activated. The analyses undertaken to validate the SP-BELA procedure (described in Section 3.5) have shown that insuch cases the collapse mechanism is an average between thecolumn and the beam-sway.
3.2. Limit state definition
On the capacity curve, the displacement capacity can berelated to damage conditions which are identifiable throughLimit States (LS). Three limit state conditions have beentaken into account: light damage, significant damage andcollapse. The light damage limit condition refers to thesituation where the building can be used after the earthquakewithout the need for repair and/or strengthening. Since thiscondition relates to a building which can be used after anearthquake, both the structural and non-structural damage aretaken into account. The subdivision between structural andnon-structural damage is particularly relevant for RC framebuildings because they have the capability to deform withoutsuffering structural damage beyond the initiation of non-structural damage. If a building deforms beyond the significantdamage limit state it cannot be used after the earthquakewithout strengthening. Furthermore, at this level of damage itmight not be economically advantageous to repair the building.If the collapse limit condition is achieved, the building becomesunsafe for its occupants as it is no longer capable of sustainingany further lateral force nor the gravity loads for which it hasbeen designed.
To quantify whether a structural element achieves a limitcondition the chord rotation in the columns of the storey wherethe collapse mechanism is activated is compared with limitrotation capacities defined as follows:
• Non-structural light damage limit state (NSLD): inter-storey rotation capacity between 0.1% and 0.3% for drift-sensitive partition walls [3].
• Light damage structural limit state (LS1): The rotationcapacity is limited by the chord rotation corresponding toyielding Θy [24,5]:
Θy = φyLV
3+ 0.0013
(1 + 1.5
h
LV
)+ 0.13φy
db fy√
fc(5)
where φy is the yield curvature of the section, h is the sectionheight, db is the longitudinal bar diameter, fy and fc are theresistance of steel and concrete in MPa, respectively, and LVis the shear span (equal to the ratio between bending momentand shear). For columns, a double bending distribution iscommonly assumed, and hence LV is half of the interstoreyheight.
The yield curvature is calculated according to therelationship proposed by Priestley [27]:
φy = 2.14εy
h(6)
where εy is the yield strain of the longitudinal rebars.• Significant damage limit state (LS2): The chord rotation
capacity is limited to 3/4 of the ultimate rotation capacityΘu [24,5]:
Θu =1γel
(Θy +
(φu − φy
)Lpl
(1 −
0.5Lpl
LV
))(7)
where γel is 1.5 for the primary structural elements and 1 forall others, φu is the ultimate curvature and Lpl is the plastichinge length. The plastic hinge length can be calculated as
Lpl = 0.1LV + 0.17h + 0.24db fy√
fc, (8)
whilst the ultimate curvature is assumed to be
φu =εcu + εsu
h(9)
where εcu and εsu are the ultimate concrete and steel strains,respectively. Calvi [3] suggested the following ranges for theultimate strain capacity:
εcu = 0.5%–1%; εsu = 1.5%–3% for poorly confinedRC elements, and
εcu = 1%–2%; εsu = 4%–6% for well confined RCelements.
The values for poorly confined elements are assumed inthis application as the buildings are considered to be pre-code and thus contain insufficient levels of confinement.
• Collapse limit condition (LS3): The chord rotation capacityis limited to the ultimate rotation capacity Θu (Eq. (7)).
3.3. Displacement capacity
The displacement capacity for each LS of interest is thedisplacement at the centre of mass of the building, being defined

812 B. Borzi et al. / Engineering Structures 30 (2008) 804–820
Fig. 12. Deformed shape for (left) beam-sway and (right) column-sway collapse mechanisms activated above the first floor. The black line represents the elasticdeformed shape and the grey line the post-yield mechanism.
on the basis of the limit conditions described in the previoussection and the deformed shape associated to the failuremechanism. As discussed previously, the limit conditions aregiven in terms of chord rotations that, for columns, correspondto the interstorey drift. To define the displacement capacityon the pushover curve corresponding to the interstorey drift,the height of an equivalent SDOF system has to be evaluated.According to Priestley [27], a coefficient κ1 to be applied to thetotal building height is introduced:
κ1 = 0.64 for n ≤ 4
κ1 = 0.64 − 0.0125(n − 4) for 4 < n < 20
κ1 = 0.44 for n ≥ 20
(10)
where n is the number of storeys of the building. Althoughthe equations above refer to the global collapse mechanismactivated at foundation level, in this first application they havebeen considered adequate for other types of failure mechanism.
A linear deformed shape is assumed within the elasticrange. Therefore, the displacement capacity associated to lightstructural damage (LS1), which corresponds on the pushovercurve to the yielding point, is given by
∆SL1 = κ1 HT Θy (11)
where HT is the global building height.Given that the interstorey rotation that produces damage
to non-structural elements is usually smaller than Θy , thedisplacement capacity corresponding to the non-structural lightdamage limit condition is also calculated for a linear deformedshape along the height:
∆NSLD = κ1 HT ΘNSLD. (12)
In the post-elastic range the deformed shape is assumed asshown in Fig. 12 for beam-sway and column-sway mechanisms.When the beam-sway collapse mechanism is activated, theprocedure accounts for the centre of mass moving up towardsthe centre of mass of the part of the building that is involvedin the collapse mechanism. Hence, Eqs. (13) and (14) definethe displacement capacity for global and soft storey failuremechanisms, respectively:
∆LSi = ∆LS1H∗
k
κ1 HT+ (ΘLSi − Θy)Hk (13)
∆LSi = ∆LS1 + (ΘLSi − Θy) h p (14)
Fig. 13. Relationship between elastic and equivalent period of vibration forlimit state i .
where i is equal to 2 or 3 for the significant damage and collapselimit states, respectively, h p is the interstorey height and Hkis the equivalent height of the part of the building above theactivation of the global collapse failure mechanism and H∗
k isHk plus the height to activation of the mechanism.
3.4. Periods of vibration
For the structural limit states the vibration periods of theequivalent SDOF system correspond to the secant stiffness (seeFig. 13); hence the relationship between the elastic period ofvibration and the one corresponding to a limit state i is givenby the following relationship and shown in Fig. 13.
TLSi = TLSy√
µLSi (15)
where TLSy corresponds to the period at yield, hence dulyaccounting for the cracking of the frames (see [8,9]).
For the non-structural light damage limit state condition,however, and since the latter is associated with small rotationsthat do not produce crack spreading, the elastic period ofvibration calculated according to Eq. (15), from Eurocode 8 [5]is assumed instead.
TSL = 0 .075H3/4T . (16)
3.5. Validation of simplified pushover curves
In order to assess the adequacy of using the proposedsimplified procedure in the computation of simplified pushovercurves, comparisons with results obtained from Finite Element(FE) analyses have been carried out. The latter have beenconducted with SeismoStruct [32], a fibre-element basedprogram for seismic analysis of framed structures, which can befreely downloaded from the Internet. The program is capable of

B. Borzi et al. / Engineering Structures 30 (2008) 804–820 813
Fig. 14. Comparison between simplified and FE analyses: (a) the x-direction and (b) the y-direction.
predicting the large displacement behaviour and the collapseload of framed structures under static or dynamic loading,duly accounting for geometric nonlinearities and materialinelasticity. Its accuracy in predicting the seismic response ofreinforced concrete structures has been demonstrated throughcomparisons with experimental results derived from pseudo-dynamic tests carried out on large-scale models [e.g. Lopez-Menjivar [20]; Casarotti et al. [2]].
A six-storey building designed according to the 1992 Italiandesign code [11] considering gravity loads only has been usedin this brief validation study. The building has the same plan asthe one assumed to generate the vulnerability curves (Fig. 8).The span dimensions in the x- and y-directions are 5 m and 6 m,respectively. It has been loaded with a triangular distribution oflateral forces, and the collapse multiplier λ has been computedas described in Section 3.1. The displacement capacities havebeen calculated according to Calvi [3] using formulae based onthe curvature capacity of the sections where the formation ofplastic hinges is predicted because these relationships do notaccount for joint deformability, which is, on the other hand,taken into account by the chord rotation formulae presented inSection 3.2.
Fig. 14(a) shows the comparison between the simplifiedand the FE analyses for lateral forces applied along the x-direction of the RC frames. Both the FE and the simplified codedeveloped in this work predict the activation of a soft-storeymechanism between the fourth floor and the fifth floor: thus, thecomparison between the obtained results is very satisfactory.Fig. 14(b) shows the comparison for seismic forces actingalong the y-direction of the floor slabs. The simplified analysispredicts the activation of a global collapse mechanism withthe formation of plastic hinges at the base of the columnsin the third storey. The FE analysis shows that the damageis distributed over the first four storeys of the building. Inthis case the collapse mechanism is not well identified. Thisis due to the fact that for the analysed case the collapsemultipliers at each storey are very similar. Therefore, a smallvariation in the distribution of internal actions can lead to aninaccurate identification of the failure mechanism. However,the comparison between the obtained global results is stillsatisfactory.
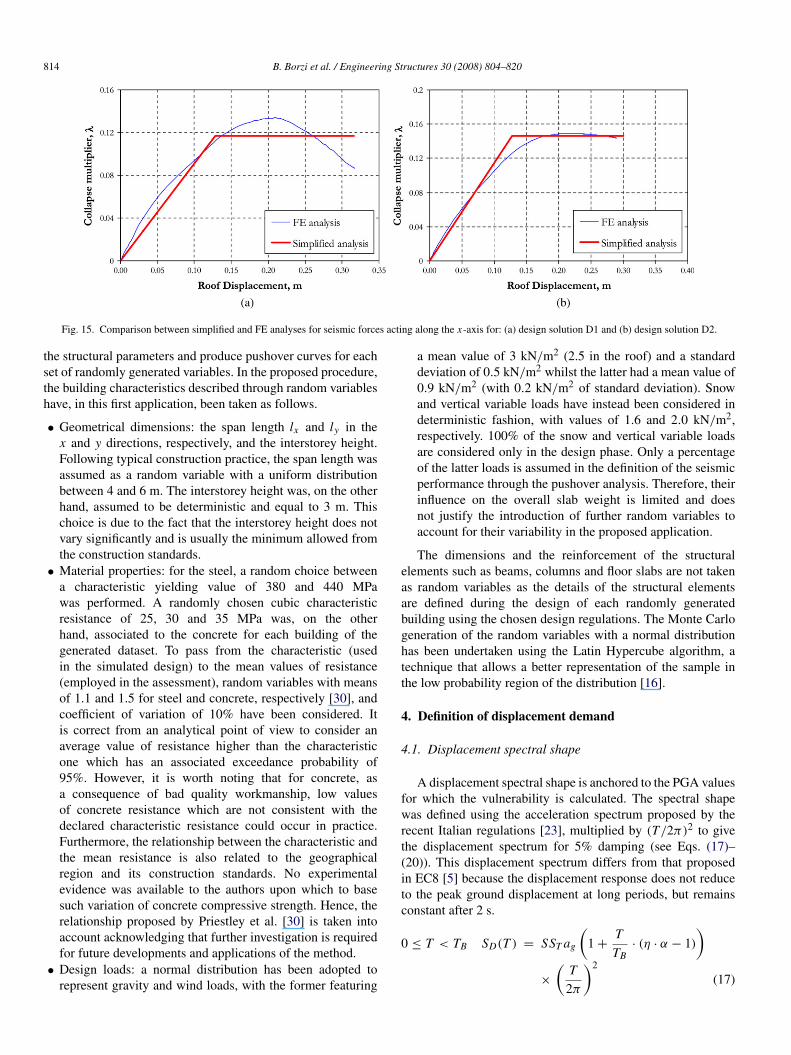
With the aim of further checking the simplified pushoveralgorithm used in the generation of vulnerability curves, somealternative design solutions have been tested: D1—columnsections and reinforcement decreased from the first to the thirdfloor levels (and then kept constant in the remaining storeys),D2—column sections and reinforcement determined for theground storey kept constant throughout the entire buildingheight.
For the two aforementioned design solutions only the resultsof the pushover analysis in the x-direction are shown. Forthe design solution D1 both the simplified and FE pushoveranalysis predict a mixed mechanism between global and softstorey at the second storey and the comparison of the pushovercurves is good, as demonstrated in Fig. 15(a). The case ofcolumns having the same section and reinforcement along thebuilding height is shown in Fig. 15(b). The simplified analysispredicts a mixed mechanism between global and soft storey atthe second storey. On the other hand the FE analysis showsthat the damage tends to be concentrated at the first storey.This difference is due to the fact that the collapse multiplierspredicted by the simplified analysis at the first and secondstoreys are 0.147 and 0.146, respectively. Therefore, simplifiedanalyses in cases like this cannot predict the failure mechanismwith a high level of confidence. Still, as shown in Fig. 15(b),the pushover curve is well predicted.
In conclusion, it is possible to state that the simplifiedprocedure is able to capture the collapse multiplier. Somedifferences might be due to an inaccurate identification ofthe collapse mechanism which will affect the prediction ofdisplacements. This condition can occur when the collapsemultipliers at the various floors are similar. Therefore, a smallvariation in the distribution of forces with respect to thepredicted ones might lead to different collapse mechanisms. Inany case, a good correspondence between the approximate andaccurate pushover curve has been observed.
3.6. Random variables to describe uncertainty in buildingcharacteristics
In order to derive vulnerability curves using this type ofanalytical procedure, it is necessary to randomly characterise
814 B. Borzi et al. / Engineering Structures 30 (2008) 804–820
Fig. 15. Comparison between simplified and FE analyses for seismic forces acting along the x-axis for: (a) design solution D1 and (b) design solution D2.
the structural parameters and produce pushover curves for eachset of randomly generated variables. In the proposed procedure,the building characteristics described through random variableshave, in this first application, been taken as follows.
• Geometrical dimensions: the span length lx and ly in thex and y directions, respectively, and the interstorey height.Following typical construction practice, the span length wasassumed as a random variable with a uniform distributionbetween 4 and 6 m. The interstorey height was, on the otherhand, assumed to be deterministic and equal to 3 m. Thischoice is due to the fact that the interstorey height does notvary significantly and is usually the minimum allowed fromthe construction standards.
• Material properties: for the steel, a random choice betweena characteristic yielding value of 380 and 440 MPawas performed. A randomly chosen cubic characteristicresistance of 25, 30 and 35 MPa was, on the otherhand, associated to the concrete for each building of thegenerated dataset. To pass from the characteristic (usedin the simulated design) to the mean values of resistance(employed in the assessment), random variables with meansof 1.1 and 1.5 for steel and concrete, respectively [30], andcoefficient of variation of 10% have been considered. Itis correct from an analytical point of view to consider anaverage value of resistance higher than the characteristicone which has an associated exceedance probability of95%. However, it is worth noting that for concrete, asa consequence of bad quality workmanship, low valuesof concrete resistance which are not consistent with thedeclared characteristic resistance could occur in practice.Furthermore, the relationship between the characteristic andthe mean resistance is also related to the geographicalregion and its construction standards. No experimentalevidence was available to the authors upon which to basesuch variation of concrete compressive strength. Hence, therelationship proposed by Priestley et al. [30] is taken intoaccount acknowledging that further investigation is requiredfor future developments and applications of the method.
• Design loads: a normal distribution has been adopted torepresent gravity and wind loads, with the former featuring
a mean value of 3 kN/m2 (2.5 in the roof) and a standarddeviation of 0.5 kN/m2 whilst the latter had a mean value of0.9 kN/m2 (with 0.2 kN/m2 of standard deviation). Snowand vertical variable loads have instead been considered indeterministic fashion, with values of 1.6 and 2.0 kN/m2,respectively. 100% of the snow and vertical variable loadsare considered only in the design phase. Only a percentageof the latter loads is assumed in the definition of the seismicperformance through the pushover analysis. Therefore, theirinfluence on the overall slab weight is limited and doesnot justify the introduction of further random variables toaccount for their variability in the proposed application.
The dimensions and the reinforcement of the structuralelements such as beams, columns and floor slabs are not takenas random variables as the details of the structural elementsare defined during the design of each randomly generatedbuilding using the chosen design regulations. The Monte Carlogeneration of the random variables with a normal distributionhas been undertaken using the Latin Hypercube algorithm, atechnique that allows a better representation of the sample inthe low probability region of the distribution [16].
4. Definition of displacement demand
4.1. Displacement spectral shape
A displacement spectral shape is anchored to the PGA valuesfor which the vulnerability is calculated. The spectral shapewas defined using the acceleration spectrum proposed by therecent Italian regulations [23], multiplied by (T/2π)2 to givethe displacement spectrum for 5% damping (see Eqs. (17)–(20)). This displacement spectrum differs from that proposedin EC8 [5] because the displacement response does not reduceto the peak ground displacement at long periods, but remainsconstant after 2 s.
0 ≤ T < TB SD(T ) = SST ag
(1 +
T
TB· (η · α − 1)
)×
(T
2π
)2
(17)
B. Borzi et al. / Engineering Structures 30 (2008) 804–820 815
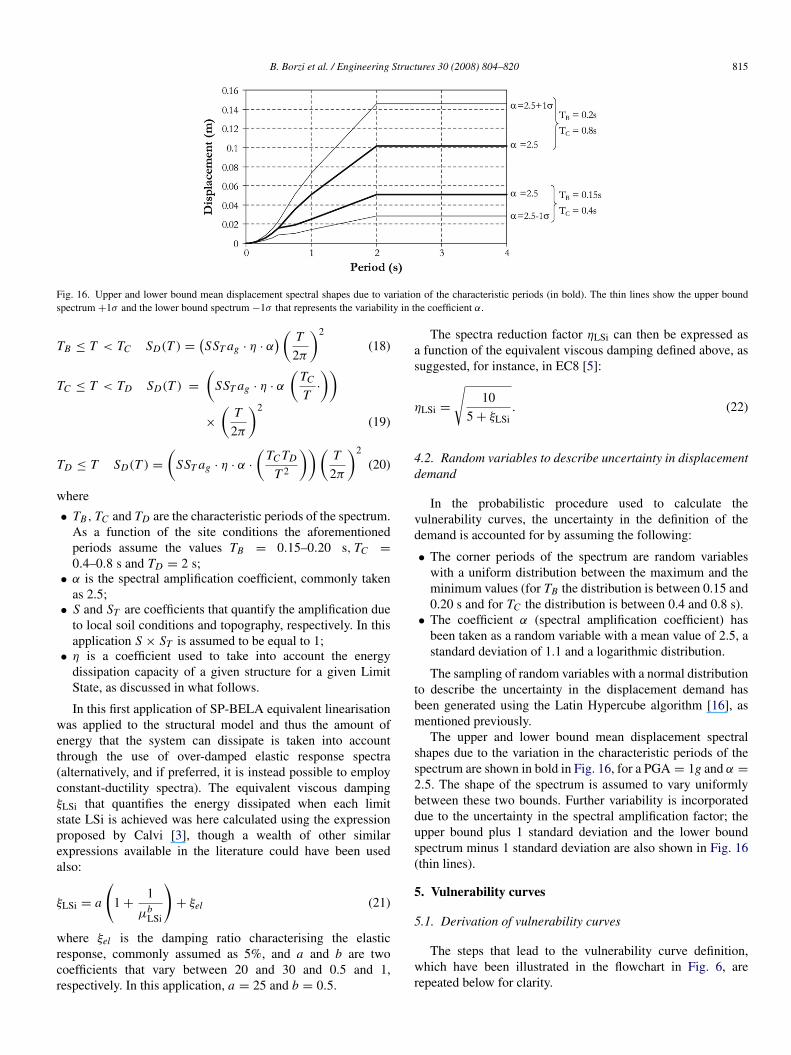
Fig. 16. Upper and lower bound mean displacement spectral shapes due to variation of the characteristic periods (in bold). The thin lines show the upper boundspectrum +1σ and the lower bound spectrum −1σ that represents the variability in the coefficient α.
TB ≤ T < TC SD(T ) =(SST ag · η · α
) ( T
2π
)2
(18)
TC ≤ T < TD SD(T ) =
(SST ag · η · α
(TC
T·
))×
(T
2π
)2
(19)
TD ≤ T SD(T ) =
(SST ag · η · α ·
(TC TD
T 2
))(T
2π
)2
(20)
where
• TB, TC and TD are the characteristic periods of the spectrum.As a function of the site conditions the aforementionedperiods assume the values TB = 0.15–0.20 s, TC =
0.4–0.8 s and TD = 2 s;• α is the spectral amplification coefficient, commonly taken
as 2.5;• S and ST are coefficients that quantify the amplification due
to local soil conditions and topography, respectively. In thisapplication S × ST is assumed to be equal to 1;
• η is a coefficient used to take into account the energydissipation capacity of a given structure for a given LimitState, as discussed in what follows.
In this first application of SP-BELA equivalent linearisationwas applied to the structural model and thus the amount ofenergy that the system can dissipate is taken into accountthrough the use of over-damped elastic response spectra(alternatively, and if preferred, it is instead possible to employconstant-ductility spectra). The equivalent viscous dampingξLSi that quantifies the energy dissipated when each limitstate LSi is achieved was here calculated using the expressionproposed by Calvi [3], though a wealth of other similarexpressions available in the literature could have been usedalso:
ξLSi = a
(1 +
1
µbLSi
)+ ξel (21)
where ξel is the damping ratio characterising the elasticresponse, commonly assumed as 5%, and a and b are twocoefficients that vary between 20 and 30 and 0.5 and 1,respectively. In this application, a = 25 and b = 0.5.
The spectra reduction factor ηLSi can then be expressed asa function of the equivalent viscous damping defined above, assuggested, for instance, in EC8 [5]:
ηLSi =
√10
5 + ξLSi. (22)
4.2. Random variables to describe uncertainty in displacementdemand
In the probabilistic procedure used to calculate thevulnerability curves, the uncertainty in the definition of thedemand is accounted for by assuming the following:
• The corner periods of the spectrum are random variableswith a uniform distribution between the maximum and theminimum values (for TB the distribution is between 0.15 and0.20 s and for TC the distribution is between 0.4 and 0.8 s).
• The coefficient α (spectral amplification coefficient) hasbeen taken as a random variable with a mean value of 2.5, astandard deviation of 1.1 and a logarithmic distribution.
The sampling of random variables with a normal distributionto describe the uncertainty in the displacement demand hasbeen generated using the Latin Hypercube algorithm [16], asmentioned previously.
The upper and lower bound mean displacement spectralshapes due to the variation in the characteristic periods of thespectrum are shown in bold in Fig. 16, for a PGA = 1g and α =
2.5. The shape of the spectrum is assumed to vary uniformlybetween these two bounds. Further variability is incorporateddue to the uncertainty in the spectral amplification factor; theupper bound plus 1 standard deviation and the lower boundspectrum minus 1 standard deviation are also shown in Fig. 16(thin lines).
5. Vulnerability curves
5.1. Derivation of vulnerability curves
The steps that lead to the vulnerability curve definition,which have been illustrated in the flowchart in Fig. 6, arerepeated below for clarity.
816 B. Borzi et al. / Engineering Structures 30 (2008) 804–820
1. Definition of a building sample through Monte Carlogeneration: the structural type is identified by a buildingwhich does not have deterministic properties, but isdescribed through random variables, as presented inSection 3.6.
2. Definition of building capacity through a pushover curve foreach component of the building dataset. On the pushovercurve, the displacement values which define the achievementof selected limit conditions are identified, as presented inSection 3.3, whilst the limit state periods of vibration arecalculated as discussed in Section 3.4.
3. Definition of the displacement demand: a displacementspectral shape is anchored to each value of PGA for whichthe vulnerability is calculated, as described in Section 4.
4. Comparison between demand and capacity to define theproportion of buildings of the dataset that survive theconsidered limit conditions.
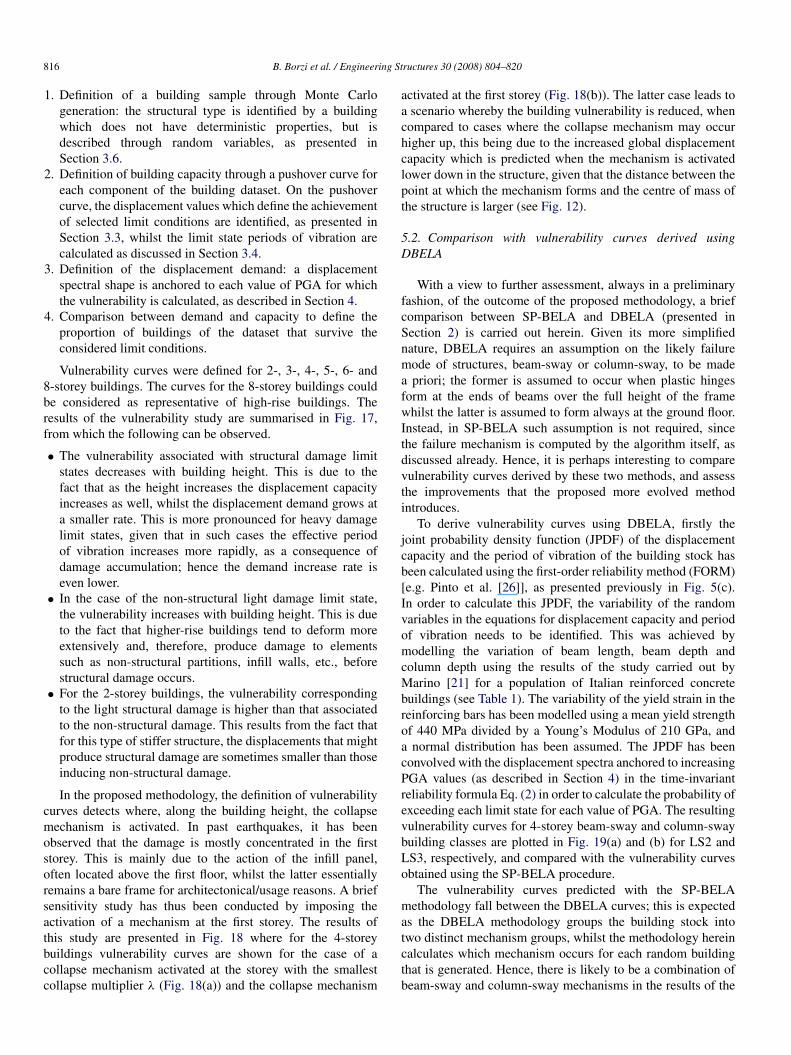
Vulnerability curves were defined for 2-, 3-, 4-, 5-, 6- and8-storey buildings. The curves for the 8-storey buildings couldbe considered as representative of high-rise buildings. Theresults of the vulnerability study are summarised in Fig. 17,from which the following can be observed.
• The vulnerability associated with structural damage limitstates decreases with building height. This is due to thefact that as the height increases the displacement capacityincreases as well, whilst the displacement demand grows ata smaller rate. This is more pronounced for heavy damagelimit states, given that in such cases the effective periodof vibration increases more rapidly, as a consequence ofdamage accumulation; hence the demand increase rate iseven lower.
• In the case of the non-structural light damage limit state,the vulnerability increases with building height. This is dueto the fact that higher-rise buildings tend to deform moreextensively and, therefore, produce damage to elementssuch as non-structural partitions, infill walls, etc., beforestructural damage occurs.
• For the 2-storey buildings, the vulnerability correspondingto the light structural damage is higher than that associatedto the non-structural damage. This results from the fact thatfor this type of stiffer structure, the displacements that mightproduce structural damage are sometimes smaller than thoseinducing non-structural damage.
In the proposed methodology, the definition of vulnerabilitycurves detects where, along the building height, the collapsemechanism is activated. In past earthquakes, it has beenobserved that the damage is mostly concentrated in the firststorey. This is mainly due to the action of the infill panel,often located above the first floor, whilst the latter essentiallyremains a bare frame for architectonical/usage reasons. A briefsensitivity study has thus been conducted by imposing theactivation of a mechanism at the first storey. The results ofthis study are presented in Fig. 18 where for the 4-storeybuildings vulnerability curves are shown for the case of acollapse mechanism activated at the storey with the smallestcollapse multiplier λ (Fig. 18(a)) and the collapse mechanism
activated at the first storey (Fig. 18(b)). The latter case leads toa scenario whereby the building vulnerability is reduced, whencompared to cases where the collapse mechanism may occurhigher up, this being due to the increased global displacementcapacity which is predicted when the mechanism is activatedlower down in the structure, given that the distance between thepoint at which the mechanism forms and the centre of mass ofthe structure is larger (see Fig. 12).
5.2. Comparison with vulnerability curves derived usingDBELA
With a view to further assessment, always in a preliminaryfashion, of the outcome of the proposed methodology, a briefcomparison between SP-BELA and DBELA (presented inSection 2) is carried out herein. Given its more simplifiednature, DBELA requires an assumption on the likely failuremode of structures, beam-sway or column-sway, to be madea priori; the former is assumed to occur when plastic hingesform at the ends of beams over the full height of the framewhilst the latter is assumed to form always at the ground floor.Instead, in SP-BELA such assumption is not required, sincethe failure mechanism is computed by the algorithm itself, asdiscussed already. Hence, it is perhaps interesting to comparevulnerability curves derived by these two methods, and assessthe improvements that the proposed more evolved methodintroduces.
To derive vulnerability curves using DBELA, firstly thejoint probability density function (JPDF) of the displacementcapacity and the period of vibration of the building stock hasbeen calculated using the first-order reliability method (FORM)[e.g. Pinto et al. [26]], as presented previously in Fig. 5(c).In order to calculate this JPDF, the variability of the randomvariables in the equations for displacement capacity and periodof vibration needs to be identified. This was achieved bymodelling the variation of beam length, beam depth andcolumn depth using the results of the study carried out byMarino [21] for a population of Italian reinforced concretebuildings (see Table 1). The variability of the yield strain in thereinforcing bars has been modelled using a mean yield strengthof 440 MPa divided by a Young’s Modulus of 210 GPa, anda normal distribution has been assumed. The JPDF has beenconvolved with the displacement spectra anchored to increasingPGA values (as described in Section 4) in the time-invariantreliability formula Eq. (2) in order to calculate the probability ofexceeding each limit state for each value of PGA. The resultingvulnerability curves for 4-storey beam-sway and column-swaybuilding classes are plotted in Fig. 19(a) and (b) for LS2 andLS3, respectively, and compared with the vulnerability curvesobtained using the SP-BELA procedure.
The vulnerability curves predicted with the SP-BELAmethodology fall between the DBELA curves; this is expectedas the DBELA methodology groups the building stock intotwo distinct mechanism groups, whilst the methodology hereincalculates which mechanism occurs for each random buildingthat is generated. Hence, there is likely to be a combination ofbeam-sway and column-sway mechanisms in the results of the
B. Borzi et al. / Engineering Structures 30 (2008) 804–820 817
Fig. 17. Exemplificative vulnerability curves derived with the proposed method.
Table 1Random variables which describe the structural characteristics of Italian RC buildings
Structural parameter µ σ Distribution
Yield strain of reinforcing bars 0.0021 0.00021 NormalBeam length 5.0 m 1.0 m NormalBeam depth 0.34 m 0.07 m LognormalColumn depth 0.38 m 0.11 m LognormalStorey height 3.0 m . . . Deterministic value

818 B. Borzi et al. / Engineering Structures 30 (2008) 804–820
Fig. 18. Post-yield vulnerability curves for a 4-storey building assuming (a) collapse mechanism activated at the level with the smallest λi (b) collapse mechanismactivated at the first level.
Fig. 19. Vulnerability curves for 4-storey buildings (assuming collapse mechanism activated at the first level) using the SP-BELA method, compared with theDBELA vulnerability curves for a column-sway and a beam-sway mechanism for (a) Limit State 2 and (b) Limit State 3 conditions.
SP-BELA procedure because not all of the random buildingswill fail in the same manner. The DBELA methodologyrequires a combination of the beam-sway and column-swaycurves depending on the proportions of the building stockwhich are assumed to fall into either of these two groups;however, such assumptions are not necessary with the SP-BELA procedure and the proportion of each mechanism isimplicitly accounted for in the generation of the vulnerabilitycurves. It is reassuring to note that the SP-BELA curve iscloser to the DBELA column-sway curve than the beam-swaycurve as the buildings considered herein have not been designedconsidering capacity design principles and thus the formationof plastic hinges in the columns, as opposed to the beams, isexpected.
5.3. Vulnerability curves based on the lognormal distribution
The possibility of using a mathematically described curveinstead of a curve given by points can be an advantage inapplications related to the calculation of seismic risk as theyare easier to implement in software packages. The lognormaldistribution is the most widely used distribution in vulnerabilitystudies for the mathematical representation of vulnerabilitycurves. The curves calculated in the SP-BELA method have
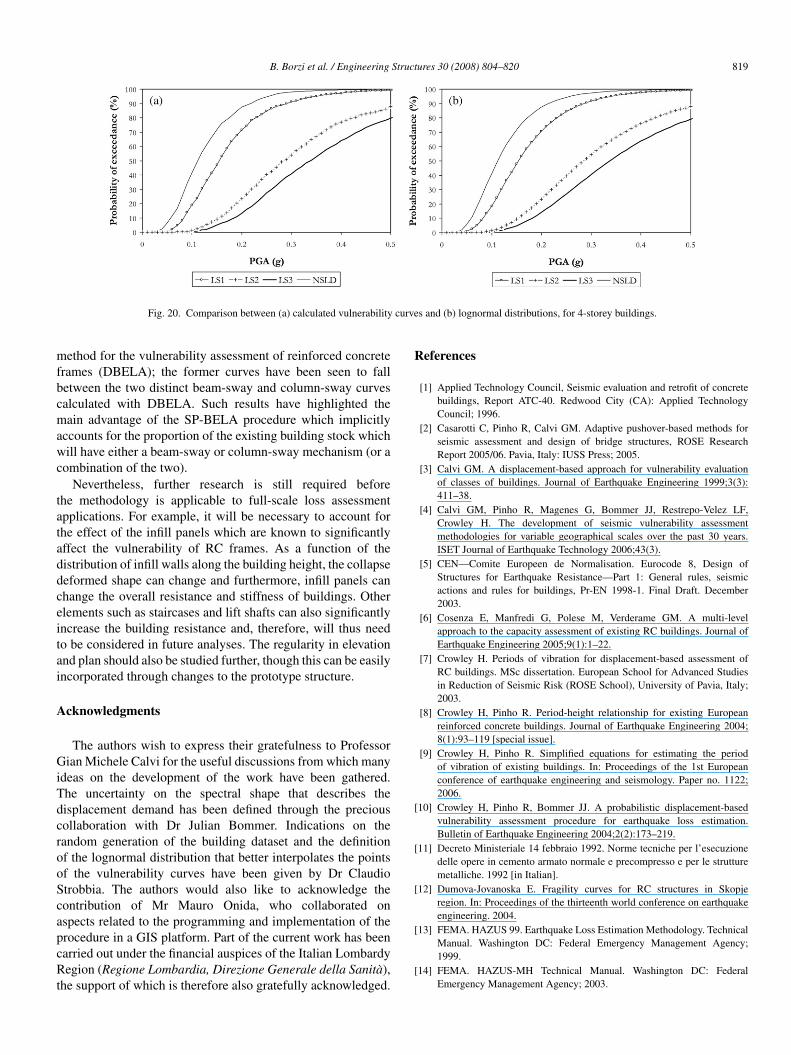
been fitted with a lognormal distribution obtained through anonlinear regression procedure and the agreement between thecurves is good, as shown in Fig. 20 for the example case of4-storey buildings.
6. Conclusions
A simplified pushover-based method for the definition ofvulnerability curves is presented in this paper. To illustratethe rationale and inner workings of the methodology, curveshave been calculated for RC frame buildings designed forgravity loads alone. The building capacity has been definedthough a pushover curve, which is a valuable tool nowadaysand is proposed in modern seismic design codes to capture theglobal performance of a building subject to earthquake loadswith a reasonable level of computational effort. However, asimplified approach to the definition of pushover curves hasbeen adopted such that the analysis of hundreds of randomlygenerated frames can be undertaken within a reasonable timespan. The definition of whether or not a building survives alimit condition is based on displacements, which are known tobe well correlated with building damage.
The vulnerability curves predicted with the SP-BELAprocedure have been compared with a fully displacement-based
B. Borzi et al. / Engineering Structures 30 (2008) 804–820 819
Fig. 20. Comparison between (a) calculated vulnerability curves and (b) lognormal distributions, for 4-storey buildings.
method for the vulnerability assessment of reinforced concreteframes (DBELA); the former curves have been seen to fallbetween the two distinct beam-sway and column-sway curvescalculated with DBELA. Such results have highlighted themain advantage of the SP-BELA procedure which implicitlyaccounts for the proportion of the existing building stock whichwill have either a beam-sway or column-sway mechanism (or acombination of the two).
Nevertheless, further research is still required beforethe methodology is applicable to full-scale loss assessmentapplications. For example, it will be necessary to account forthe effect of the infill panels which are known to significantlyaffect the vulnerability of RC frames. As a function of thedistribution of infill walls along the building height, the collapsedeformed shape can change and furthermore, infill panels canchange the overall resistance and stiffness of buildings. Otherelements such as staircases and lift shafts can also significantlyincrease the building resistance and, therefore, will thus needto be considered in future analyses. The regularity in elevationand plan should also be studied further, though this can be easilyincorporated through changes to the prototype structure.
Acknowledgments
The authors wish to express their gratefulness to ProfessorGian Michele Calvi for the useful discussions from which manyideas on the development of the work have been gathered.The uncertainty on the spectral shape that describes thedisplacement demand has been defined through the preciouscollaboration with Dr Julian Bommer. Indications on therandom generation of the building dataset and the definitionof the lognormal distribution that better interpolates the pointsof the vulnerability curves have been given by Dr ClaudioStrobbia. The authors would also like to acknowledge thecontribution of Mr Mauro Onida, who collaborated onaspects related to the programming and implementation of theprocedure in a GIS platform. Part of the current work has beencarried out under the financial auspices of the Italian LombardyRegion (Regione Lombardia, Direzione Generale della Sanita),the support of which is therefore also gratefully acknowledged.
References
[1] Applied Technology Council, Seismic evaluation and retrofit of concretebuildings, Report ATC-40. Redwood City (CA): Applied TechnologyCouncil; 1996.
[2] Casarotti C, Pinho R, Calvi GM. Adaptive pushover-based methods forseismic assessment and design of bridge structures, ROSE ResearchReport 2005/06. Pavia, Italy: IUSS Press; 2005.
[3] Calvi GM. A displacement-based approach for vulnerability evaluationof classes of buildings. Journal of Earthquake Engineering 1999;3(3):411–38.
[4] Calvi GM, Pinho R, Magenes G, Bommer JJ, Restrepo-Velez LF,Crowley H. The development of seismic vulnerability assessmentmethodologies for variable geographical scales over the past 30 years.ISET Journal of Earthquake Technology 2006;43(3).
[5] CEN—Comite Europeen de Normalisation. Eurocode 8, Design ofStructures for Earthquake Resistance—Part 1: General rules, seismicactions and rules for buildings, Pr-EN 1998-1. Final Draft. December2003.
[6] Cosenza E, Manfredi G, Polese M, Verderame GM. A multi-levelapproach to the capacity assessment of existing RC buildings. Journal ofEarthquake Engineering 2005;9(1):1–22.
[7] Crowley H. Periods of vibration for displacement-based assessment ofRC buildings. MSc dissertation. European School for Advanced Studiesin Reduction of Seismic Risk (ROSE School), University of Pavia, Italy;2003.
[8] Crowley H, Pinho R. Period-height relationship for existing Europeanreinforced concrete buildings. Journal of Earthquake Engineering 2004;8(1):93–119 [special issue].
[9] Crowley H, Pinho R. Simplified equations for estimating the periodof vibration of existing buildings. In: Proceedings of the 1st Europeanconference of earthquake engineering and seismology. Paper no. 1122;2006.
[10] Crowley H, Pinho R, Bommer JJ. A probabilistic displacement-basedvulnerability assessment procedure for earthquake loss estimation.Bulletin of Earthquake Engineering 2004;2(2):173–219.
[11] Decreto Ministeriale 14 febbraio 1992. Norme tecniche per l’esecuzionedelle opere in cemento armato normale e precompresso e per le strutturemetalliche. 1992 [in Italian].
[12] Dumova-Jovanoska E. Fragility curves for RC structures in Skopjeregion. In: Proceedings of the thirteenth world conference on earthquakeengineering. 2004.
[13] FEMA. HAZUS 99. Earthquake Loss Estimation Methodology. TechnicalManual. Washington DC: Federal Emergency Management Agency;1999.
[14] FEMA. HAZUS-MH Technical Manual. Washington DC: FederalEmergency Management Agency; 2003.
820 B. Borzi et al. / Engineering Structures 30 (2008) 804–820
[15] Giovinazzi S. The vulnerability assessment and the damage scenarioin seismic risk analysis. PhD thesis. Technical University Carolo-Wilhelmina at Braunschweig and University of Florence. 2005.
[16] Helton LC, Davis FJ. Latin Hypercube sampling and the propagation ofuncertainty in analysis of complex systems. Reliability Engineering &System Safety 2003;81:23–69.
[17] Iervolino I, Manfredi G, Polese M, Verderame GM, Fabbrocino G.Seismic risk for Italian type R.C. buildings. In: Proceedings of the 1stEuropean conference on earthquake engineering and seismology, Paperno. 567. 2006.
[18] Kappos AJ, Pitilakis K, Stylianidis KC. Cost-benefit analysis forthe seismic rehabilitation of buildings in Thessaloniki, based on ahybrid method of vulnerability assessment. In: Proceedings of the 5thinternational conference on seismic zonation, vol. 1. 1996, pp. 406–13.
[19] Kircher CA, Nassar AA, Kustu O, Holmes WT. Development of buildingdamage functions for earthquake loss estimation. Earthquake Spectra1997;13(4):663–82.
[20] Lopez-Menjivar MA. Verification of a displacement-based AdaptivePushover method for assessment of 2-D Reinforced Concrete Buildings.PhD thesis. Italy: European School for Advances Studies in Reduction ofSeismic Risk (ROSE School), University of Pavia; 2004.
[21] Marino S. Rilievo ed elaborazione statistiche delle caratteristiche diedifici esistenti in cemento armato ai fini della valutazione di scenari didanno. Undergraduate thesis. Italy: Department of Structural Mechanics,University of Pavia; 2005 [in Italian].
[22] Masi A. Seismic vulnerability assessment of gravity load designed R/Cframes. Bulletin of Earthquake Engineering 2004;1(3):371–95.
[23] Ordinanza del Presidente del Consiglio dei Ministri n, 3274 del 20 Marzo
2003. Primi elementi in materia di criteri generali per la classificazionesismica del territorio nazionale e di normative tecniche per le costruzioniin zona sismica. GU n, 72 del 8-5-2003. 2003 [in Italian].
[24] Panagiotakos T, Fardis MN. Deformation of R.C. members at yieldingand ultimate. ACI Structural Journal 2001;98:135–48.
[25] Pinho R, Bommer JJ, Glaister S. A simplified approach to displacement-based earthquake loss estimation analysis. In: Proceeding of the 12thEuropean conference on earthquake engineering. Paper no. 738. 2002.
[26] Pinto PE, Giannini R, Franchin P. Methods for seismic reliability analysisof structures. Pavia (Italy): IUSS Press; 2004.
[27] Priestley MJN. Displacement-based seismic assessment of reinforcedconcrete buildings. Journal of Earthquake Engineering 1997;1:157–92.
[28] Priestley MJN. Myths and fallacies in earthquake engineering—revisited.In: The Mallet Milne Lecture. Pavia (Italy): IUSS Press; 2003.
[29] Priestley MJN, Calvi GM. Towards a capacity design assessmentprocedure for reinforced concrete frames. Earthquake Spectra 1991;7(3):413–37.
[30] Priestley MJN, Seible F, Calvi GM. Seismic design and retrofit of bridges.John Wiley & Sons, Inc.; 1996.
[31] Rossetto T, Elnashai A. A new analytical procedure for the derivation ofdisplacement-based vulnerability curves for populations of RC structures.Engineering Structures 2005;7(3):397–409.
[32] SeismoSoft. SeismoStruct—A computer program for static and dynamicanalysis for framed structures. Available from URL: www.seismosoft.com(online). 2007.
[33] Singhal A, Kiremidjian AS. Method for probabilistic evaluation ofseismic structural damage. Journal of Structural Engineering, ASCE1996;122(12):1459–67.


