Embed Size (px)
Citation preview
www.elsevier.com/locate/rse
Remote Sensing of Environm
Simple reflectance indices track heat and water stress-induced changes in
steady-state chlorophyll fluorescence at the canopy scale
S.Z. Dobrowski a,*, J.C. Pushnik b, P.J. Zarco-Tejada c, S.L. Ustin a
aCenter for Spatial Technologies and Remote Sensing, University of California, Davis, Davis, CA, USAbDepartment of Biological Sciences, California State University, Chico, Chico, CA, USA
cInstituto de Agricultura Sostenible (IAS), Consejo Superior de Investigaciones Cientıficas (CSIC), Cordoba, Spain
Received 2 March 2005; received in revised form 28 April 2005; accepted 22 May 2005
Abstract
Non-invasive remote sensing techniques for monitoring plant stress and photosynthetic status have received much attention. The majority
of published vegetation indices are not sensitive to rapid changes in plant photosynthetic status brought on by common environmental
stressors such as diurnal fluxes in irradiance and heat. This is due to the fact that most vegetation indices have no direct link to photosynthetic
functioning beyond their sensitivity to canopy structure and pigment concentration changes. In contrast, this study makes progress on a more
direct link between passive reflectance measurements and plant physiological status through an understanding of photochemical quenching
(qP) and non-photochemical quenching processes. This is accomplished through the characterization of steady-state fluorescence (Fs) and its
influence on apparent reflectance in the red-edge spectral region. A series of experiments were conducted under controlled environmental
conditions, linking passive reflectance measurements of a grapevine canopy (Vitis vinifera L. cv. Cabernet Sauvignon) to leaf level estimates
of CO2 assimilation (A), stomatal conductance (g), qP, and Fs. Plant stress was induced by imposing a diurnal heat stress and recovery event
and by withholding water from the plant canopy over the course of the experiment. We outlined evidence for a link between Fs and
photosynthetic status, identified the Fs signal in passive remote sensing reflectance data, and related reflectance-derived estimates of Fs to
plant photosynthetic status. These results provide evidence that simple reflectance indices calculated in the red-edge spectral region can track
temperature and water-induced changes in Fs and, consequently, provide a rapid assessment of plant stress that is directly linked to plant
physiological processes.
D 2005 Elsevier Inc. All rights reserved.
Keywords: Plant stress monitoring; Chlorophyll fluorescence; Remote sensing; Photochemical quenching; Non-photochemical quenching; Grapevines
1. Introduction
Much effort has been devoted to developing non-
invasive remote sensing techniques for monitoring plant
stress and photosynthetic status. Most remotely sensed
vegetation indices are used for characterizing the amount
and spatial distribution of vegetation (Baret & Guyot, 1991;
Price, 1992). Vegetation indices have also been used to
estimate potential levels of canopy photosynthesis and net
primary productivity with mixed success (Choudhury, 2001;
0034-4257/$ - see front matter D 2005 Elsevier Inc. All rights reserved.
doi:10.1016/j.rse.2005.05.006
* Corresponding author. Tel.: +1 530 752 5092.
E-mail address: [email protected] (S.Z. Dobrowski).
Gamon et al., 1995; Verma et al., 1993). Nevertheless, the
majority of published vegetation indices are not sensitive to
rapid changes in plant photosynthetic status brought on by
common environmental stressors such as diurnal fluxes in
irradiance and heat. This is due to the fact that most
vegetation indices have no direct link to photosynthetic
functioning beyond their sensitivity to canopy structure
(e.g., leaf angle) and pigment concentrations. Consequently,
measurements of canopy reflectance have proven less useful
for real-time monitoring of plant photosynthesis and/or
water status at the whole plant level (Gamon et al., 1990;
Penuelas et al., 1995).
One exception to this involves remote estimates of the
xanthophyll cycle captured by the photochemical reflec-
ent 97 (2005) 403 – 414
S.Z. Dobrowski et al. / Remote Sensing of Environment 97 (2005) 403–414404
tance index (PRI) (Gamon et al., 1990, 1992, 1995, 1997).
The PRI has been linked to the status of the epoxidation
state of xanthophyll pigments, one of the components of the
non-photochemical de-excitation pathway (Demmig-Adams
& Adams, 1992). The PRI is intended for estimating
changes in xanthophyll cycle pigments as they vary due to
changes in photosynthetic light use efficiency (Gamon et al.,
1992, 1997; Penuelas et al., 1995, 1997). The PRI is one of
the few spectral indices which has been shown to be
sensitive to rapid changes in plant photosynthetic status
(Gamon et al., 1990, 1992, 1997; Penuelas et al., 1997).
A similar avenue of research gaining both past and
recent attention is the study of chlorophyll fluorescence
(CF) as a means for the remote estimation of plant
physiological status. CF is a protective process by which
plants dissipate energy that is in excess of photosynthetic
demands. CF is emitted primarily from chlorophyll a of
the antennae system of photosystem 2 (PS II). Any
physiological process that influences the function of
photosystem II and other photosystem de-excitation path-
ways will have an effect on CF. There are two main
controls on the relaxation pathways: (i) the redox state of
plastoquinone, the primary stable electron acceptor of PSII,
which determines the level of quenching by photochemis-
try (qP); and (ii) the changes in non-photochemical
quenching processes, which are light-induced protective
processes that result in the de-excitation of the chlorophyll
singlet to the ground state with the production of heat
(Johnson et al., 1994; Muller et al., 2001; Pospisil, 1997).
CF, qP, and non-photochemical quenching all have rate
constants associated with them and any process that
increases the rate constants of the other de-excitation
pathways will decrease CF intensity (Bjorkman & Dem-
mig-Adams, 1994; Demmig-Adams & Adams, 1992).
CF intensity can vary over time as a function of the
photosynthetic activity of the plant tissue being measured.
This relationship was initially described by Kautzky
(Kautzky & Hirsch, 1931) and has garnered much attention
from plant physiologists who have used leaf level CF
measurements as a non-invasive plant monitoring tool for
many years. More specifically, leaf level CF measurements
utilizing a class of instruments known as pulse amplitude
modulating fluorometers have been used with varying
degrees of success to estimate plant stress, quantum yield,
PS II efficiency, and electron transport rates. CF measure-
ment, interpretation, and relation to photosynthesis and
plant physiological status have been the subject of several
detailed reviews (Larcher, 1994; Lazar, 1999; Lichtenthaler,
1992).
In addition to leaf level measurements, CF can be
measured for entire leaves and plants. Fluorescence
imaging, as it is commonly referred to, is conducted using
laser or flash lamps to induce CF. Concurrently, spectral or
imaging sensors are used to measure the CF signal for
entire leaves, groups of leaves, or entire plants depending
on the sensor type and configuration. These types of
measurement systems have been shown to be effective for
non-destructive monitoring of plant stress and functioning
at near distances and far distances (for reviews, see
Buschmann et al., 2000; Lang et al., 1996). Unfortunately,
the application of these techniques to larger spatial scales is
limited primarily by the small spatial extent of the laser
induction pulse as well as incomplete coverage in the
spatial domain.
An area of active CF research is exploring the link
between steady-state fluorescence (Fs) and plant photo-
synthetic status. Fs is the fluorescence emitted under
constant illumination without saturating flashes. Flexas et
al. (1999, 2000, 2002a) showed that Fs exhibits a strong
positive correlation with diurnal variations in H2O stomatal
conductance ( g), and to a lesser extent, CO2 assimilation
(A) influenced by variable irradiance conditions and water
stress. Their findings are promising in that Fs can be
monitored directly without the use of laser induction pulses
or saturation flashes. This provides an avenue for long-term
plant stress monitoring using passive remote sensing
strategies. Concurrent to these findings, a small but growing
body of research has found support for the potential of
identifying the Fs signal in reflectance data from passive
platforms at near and far distances. This is further expanded
below.
1.1. CF emission spectra
Understanding the spectral characteristics of Fs is critical
if remote estimates of its properties are attempted. The
emission spectra of chlorophyll fluorescence is character-
ized by two bands spanning the range between 600 nm and
800 nm but with maxima at 690 nm (F690) and 740 nm
(F740) (Buschmann et al., 2000). The intensity, shape, and
position of these emission bands are affected by a number of
factors. Gitelson et al. (1998) showed that a significant
portion of the shape of the CF emission spectra of PS II can
be explained by re-absorption processes due to chlorophyll
pigments. The re-absorption of fluorescence emission is
greatest at F690 because this emission peak overlaps the in
vivo chlorophyll a, and to a lesser extent, chlorophyll b
absorption maxima located in this region of the spectrum.
This suggests that the F690 intensity is sensitive to
chlorophyll concentration of the leaf tissue as was demon-
strated by a number of investigators (Gitelson et al., 1998,
1999). In contrast, F740 is minimally affected by chlorophyll
concentration, and thus, the ratio F690/ F740 has been shown
to be inversely related to chlorophyll content (Gitelson et
al., 1998; Lichtenthaler et al., 1998).
1.2. Fs and remote sensing
The remote detection of Fs in vegetation using passive
remote sensing techniques is in a nascent state. Early on,
investigators showed that Fs was related to water stress and
photosynthetic function using a Fraunhofer line discrim-
S.Z. Dobrowski et al. / Remote Sensing of Environment 97 (2005) 403–414 405
inator (Carter et al., 1990, 1996; McFarlane et al., 1980).
Buschmann and Lichtenhaler (1988) found evidence for the
superposition of a Fs signal on leaf apparent reflectance
signatures. Subsequently, Zarco-Tejada et al. (2000a,2000b)
demonstrated that the Fs signal could be detected in
apparent reflectance data at both the leaf and canopy level
using time-decay experiments and induction with long-pass
filters in the laboratory. Furthermore, Zarco-Tejada et al.
(2003a) showed that the Fs signal could be identified at the
canopy scale using spectral subtraction and derivative
reflectance-based optical indices under controlled environ-
ment conditions. More recently, studies have demonstrated
evidence for Fs in-filling of the 760-nm atmospheric oxygen
absorption band detectable in the radiance spectra of field
instruments (Evain et al., 2004; Moya et al., 2004).
Despite these initial results, little work has been
conducted that demonstrates a strong link between reflec-
tance based Fs measurements at the canopy level and plant
physiological status. This study explores the link between
canopy-level reflectance-derived Fs measurements, and
plant physiological status. The goals are (1) outline evidence
for a link between Fs and photosynthetic status; (2) identify
the Fs signal in passive remote sensing reflectance data; and
(3) relate reflectance-derived estimates of Fs to plant
photosynthetic status. These steps are critical if Fs measure-
ments are to be used strategically for plant monitoring and if
these techniques are scalable to larger stand and landscape
levels.
2. Materials and methods
2.1. Plant materials and controlled environment
The experiment was conducted on 3-year-old grape-
vines of Vitis vinifera L. cv. Cabernet Sauvignon potted in
1-L containers. Nine plants were used in the experiment to
create a vegetation canopy approximately 1 m�1 m in
size (herein referred to as the Fcanopy_). The plants were
grown under favorable conditions in a potting mixture
containing 40% peat, 30% sand, and 30% vermiculite, at
an outdoor facility under 30% shade cloth prior to the
experiment. On the morning the experiment began, the
plants were moved into a controlled environment facility
and placed in a growth chamber (Conviron PGV36,Con-
trolled Environments Ltd., Winnipeg, MN, Canada) in
which temperature and moisture stress could be induced in
the canopy under constant light conditions. The growth
chamber area was 3.3 m2, with dimensions of 2.4 m�2.2
m�2.0 m height. Photosynthetically active radiation
(PAR) was measured in the CEF with a quantum sensor
(LI-190SA, Li-Cor, Inc., Lincoln, NE, USA), yielding 700
Amol photons m�2 s�1 at the canopy surface. A balanced
spectrum was provided using three types of light sources
in the chamber: metal halide, high-pressure sodium, and
incandescent lamps.
2.2. Experiment
Several trials were conducted to test for instrument
capabilities and spectral calibration and measurement
protocol design. The actual experiment was conducted in
October 2002 over a 4-day period. Just prior to being placed
in the growth chamber, the canopy was fully watered to field
capacity. Subsequently, seven fully expanded leaves from
separate plants in the upper portion of the canopy were
selected and labeled. A light response curve was conducted
on each leaf in order to pick a representative leaf for gas-
exchange and fluorescence measurements over the course of
the experiment.
The canopy was placed in the fully illuminated growth
chamber. The light treatment was maintained from 1030 to
1930 h each day over the course of the 4-day experiment.
Photosynthetic response was varied in the growth chamber
over an 8-h period by ramping the temperature from 23 -Cat the start of each day (1100 h) to 43 -C in the middle of the
day (1530 h), followed by a recovery to initial conditions of
23 -C at the end of the day (1830 h). This diurnal
temperature profile was implemented over a 3-day course.
On day 4, the temperature was ramped up to 30 -C at 1330 h
and held constant for the remainder of the light period in
order to prevent heat stress from being induced. Addition-
ally, water stress was induced over the course of the
experiment by withholding water from the canopy for the
first 3 days. The canopy was fully watered to field capacity
at 1530 h on day 3 and was watered at again the beginning
of day 4 in order to ensure that the canopy did not
experience a water deficit.
2.3. Gas exchange and fluorescence measurements
Simultaneous measurements of gas-exchange and Fs
were made over the 4-day experiment using an infrared gas
analyzer (LI-Cor 6400 IRGA with an integrated 6400-40
leaf chamber fluorometer, Li-Cor, Inc., Lincoln, NE, USA).
Over the course of the experiment, gas-exchange measure-
ments including CO2 assimilation rate (A), stomatal
conductance ( g), and related parameters were made every
10 min. A suite of CF measurements including Fs, DF/Fm’,
and qP were made every 20 min on the leaf exhibiting an
average assimilation response as determined from the light
response curve results. The leaf chamber was configured to
track the temperature, humidity, and illumination conditions
of the growth chamber. CO2 levels were held fixed at 430
ppm within the leaf chamber corresponding to the average
concentration in the growth chamber. Fluorescence param-
eters were set following recommended values published in
the LICOR 6400 manual (LICOR Biosciences, Inc.,
Lincoln, NE) for light-adapted leaves. Saturation pulses of
approximately 8000 Amol photons m�2 s�1 with a 0.8-s
duration were applied in order to saturate the PS II reaction
centers for estimating Fm’. Additionally, the Fdark pulse_routine was performed in order to estimate Fo’. This is
0 200 400 600 800 1000 1200
A (
µmol
m-2s-1
)
-2
0
2
4
6
8
10
12
Leaf 1Leaf 2Leaf 3Leaf 4Leaf 5Leaf 6Leaf 7
PPFD (µmol m-2s-1)
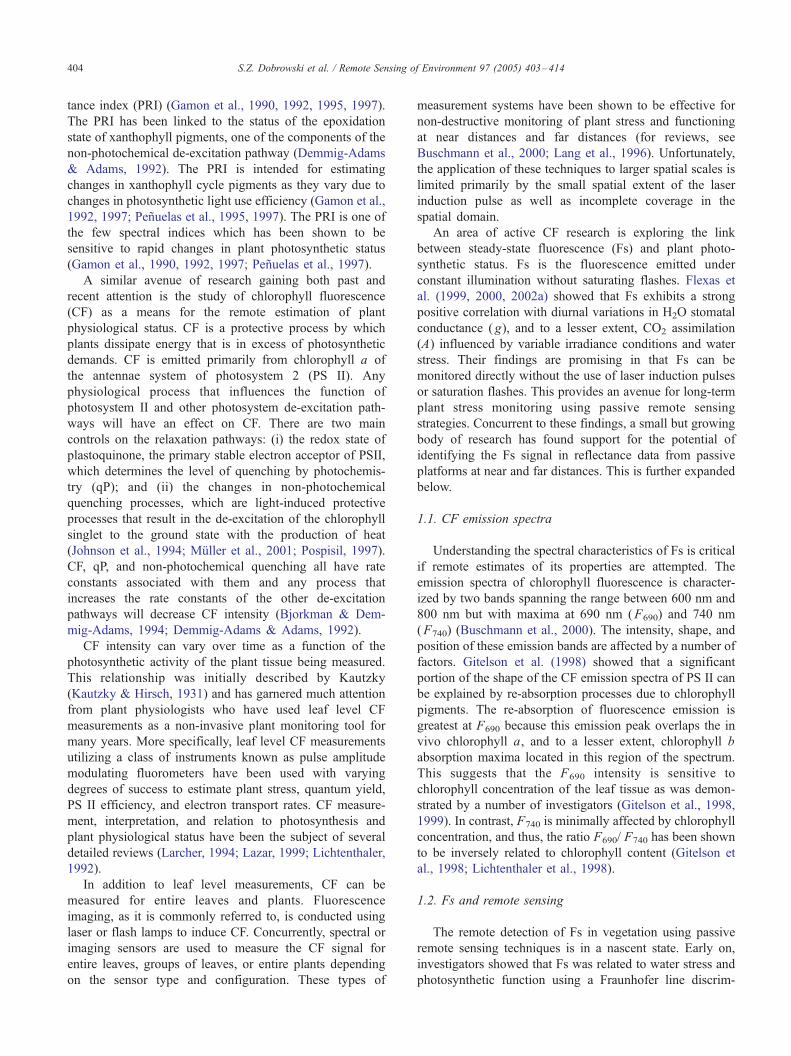
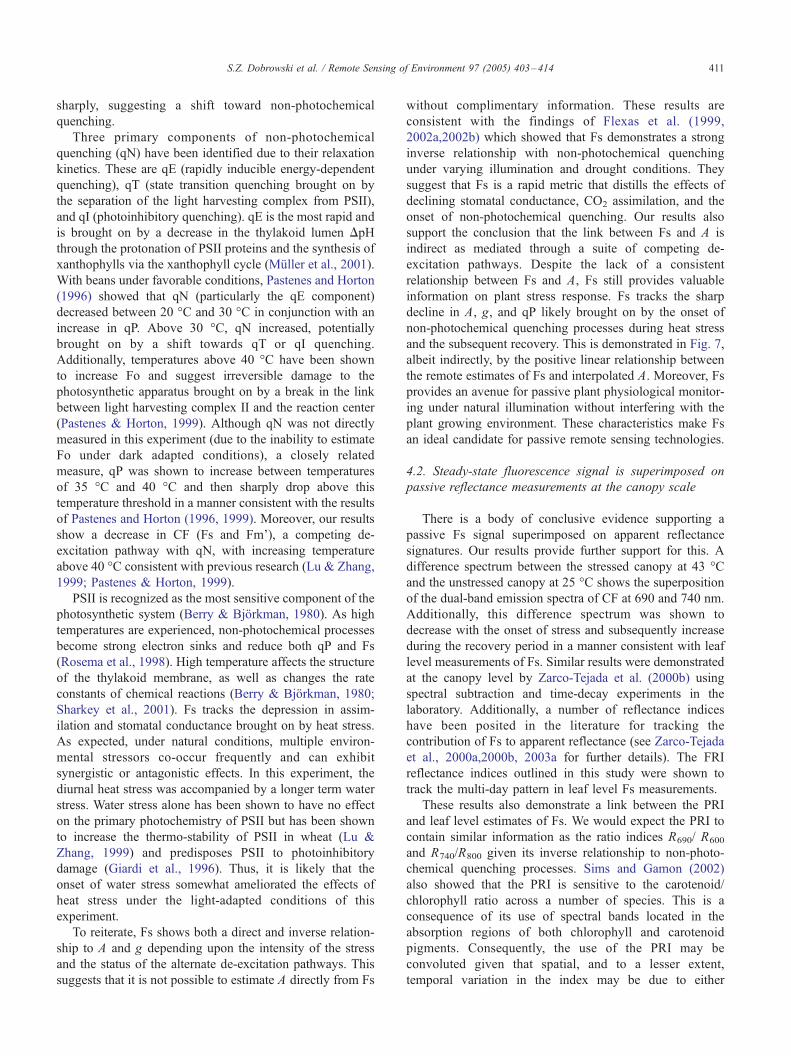
Fig. 1. Light response curves for seven fully expanded leaves from separate
plants in the upper portion of the experimental canopy. Leaf 3 was chosen
for use in all subsequent fluorescence and gas-exchange measurements.
S.Z. Dobrowski et al. / Remote Sensing of Environment 97 (2005) 403–414406
accomplished by preferentially exciting PSI with far-red
light, causing electrons to drain from PSII (see Licor manual
for further details). Given Fo’, Fm’, and Fs, the fraction of
absorbed PS II photons used in photochemistry (DF/Fm’) as
well as photochemical quenching (qP) were estimated using
the built in LICOR fluorometer functions following
published equations (van Kooten & Snel, 1990).
2.4. Leaf water potential and chlorophyll measurements
Pre-dawn leaf water potential measurements were
conducted just prior to the beginning of the experiment,
at the height of water stress (day 3 prior to watering), and
at the end of the experiment using a pressure bomb. Five
fully expanded leaves were collected from the canopy
outside of the field of view of the spectrometer (see
Spectral measurements below) at each sampling period in
order to quantify the effect of the water stress. Addition-
ally, chlorophyll samples were taken at the beginning and
end of the experiment in order to track any potential
degradation of chlorophyll over the course of the experi-
ment. The seven leaves labeled for the light response
curves were used to excise two, 2.3-cm-diameter circles
per leaf, which were subsequently used for extraction of
chlorophyll using 5 ml of N,N-dimethylformamide (Spec-
tral-analysis grade, Fisher). 3 ml of supernatant were
centrifuged at 3000�g, placed in a cuvette and the
absorbance was measured at 663.8 nm, 646.8 nm, and
480 nm with a spectrophotometer diode array (Hewlett
Packard 8452A). Chlorophyll a and chlorophyll b concen-
trations were calculated using the extinction coefficients
derived by Wellburn (1994).
2.5. Spectral measurements
The growth chamber was equipped with a spectrometer
(ASD FieldSpec Pro, Analytical Spectral Devices, Inc.,
Boulder, CO, USA) measuring the 350–2500-nm spectral
region. The instrument has a spectral resolution of 3 nm at
700 nm and a sampling interval of 1.4 nm between 350 and
1050 nm. A 200-Am-diameter single-mode fiber optic was
used for data collection with an angular field of view of 25-.The fiber optic was placed 0.72 m from the vegetation
canopy, resulting in a circular field of view (FOV) of 0.32 m
in diameter at the top of the vegetation canopy. The
porometer leaf chamber was located outside the FOV of
the fiber optic.
Spectral measurements were conducted every half hour
over the course of the experiment without disturbing the
vine canopy. A 0.7�0.7-m BaSO4 calibration panel was
used for calculation of reflectance with every spectral
measurement. Each vegetation and panel radiance measure-
ment was the average of 50 scans. Additionally, a dark
current correction was collected with every spectral meas-
urement in order to account for instrument noise. This
protocol ensured accurate reflectance measurements, inde-
pendent of the temperature change occurring inside the
growth chamber. A Savitzky–Golay third-order polynomial
least-square function of 20 nm was used to smooth the
signal between 350 nm and 1050 nm (Savitzky & Golay,
1964). Further details about the spectrometer configuration
can be found in (Zarco-Tejada et al., 2003a).
2.6. Determining the effect of Fs on canopy reflectance
Two methods were used to quantify the fluorescence
emission signal superimposed on the canopy reflectance.
The first method involves calculating the reflectance
difference between times in which fluorescence emissions
vary due to the heat and water stress induced in the
experiment. This method identifies the reflectance change
between two times due to fluorescence (Zarco-Tejada et
al., 2000a,2000b). The second method, and the focus of
this study, is based on optical indices calculated from
wavelengths affected by fluorescence emission (bands in
the spectral region between 650 and 770 nm with emission
peaks at 690 nm and 740 nm) normalized by wavelengths
not affected by CF emission (e.g., 600 nm, 800 nm).
Several optical indices of this type have been reported in
the literature, such as the curvature index (R675IR690)/R6832
and ratio indices such as R750/R800, R685/R655, R690/R655
(Zarco-Tejada et al., 2000a,2000b, 2003a).
2.7. Statistical analysis
Reflectance measurements were made at different times
than the fluorescence and gas-exchange measurements.
Therefore, a smoothing spline was fit to the data to
interpolate fluorescence and gas-exchange measurements
taken every 20 min and 10 min, respectively, to the 30-min
interval of the reflectance measurements. The smoothed
values were used to subsequently determine the correlation
between these metrics. The smoothing parameter (analogous
S.Z. Dobrowski et al. / Remote Sensing of Environment 97 (2005) 403–414 407
to the degrees of freedom) was automatically selected using
a cross-validation process (for further details, see Chambers
& Hastie, 1992) to maximize fidelity to the original data.
Consequently, the degrees of freedom for each smoothing
operation varied depending on the characteristics of the
data. All statistical analyses were done using Splus statistics
software (Insightful.corp).
3. Results
3.1. Gas-exchange and fluorescence measurements
Light response curves for seven fully expanded leaves
from separate plants in the experimental canopy are shown
in Fig. 1. Assimilation rates approached their maxima at the
ambient PPFD value of 700 Amol m�2 s�1 and varied
between 5 and 10 Amol CO2 m�2 s�1. Leaf 3 was chosen
for all subsequent gas-exchange and fluorescence measure-
g (
mo
l m- 2
s-1)
0.00
0.02
0.04
0.06
0.08
0.10
11:0
0:00
14:0
0:00
17:0
0:00
Tem
p (o C
)
20253035404550
11:0
0:00
14:0
0:00
17:0
0:00
A (
µmol
-2s-1
)
0
2
4
6
8
qP
(re
lativ
e un
its)
0.350.400.450.500.550.600.650.70
Fs
(re
lativ
e u
nits
)
400
600
800
1000
1200
11:0
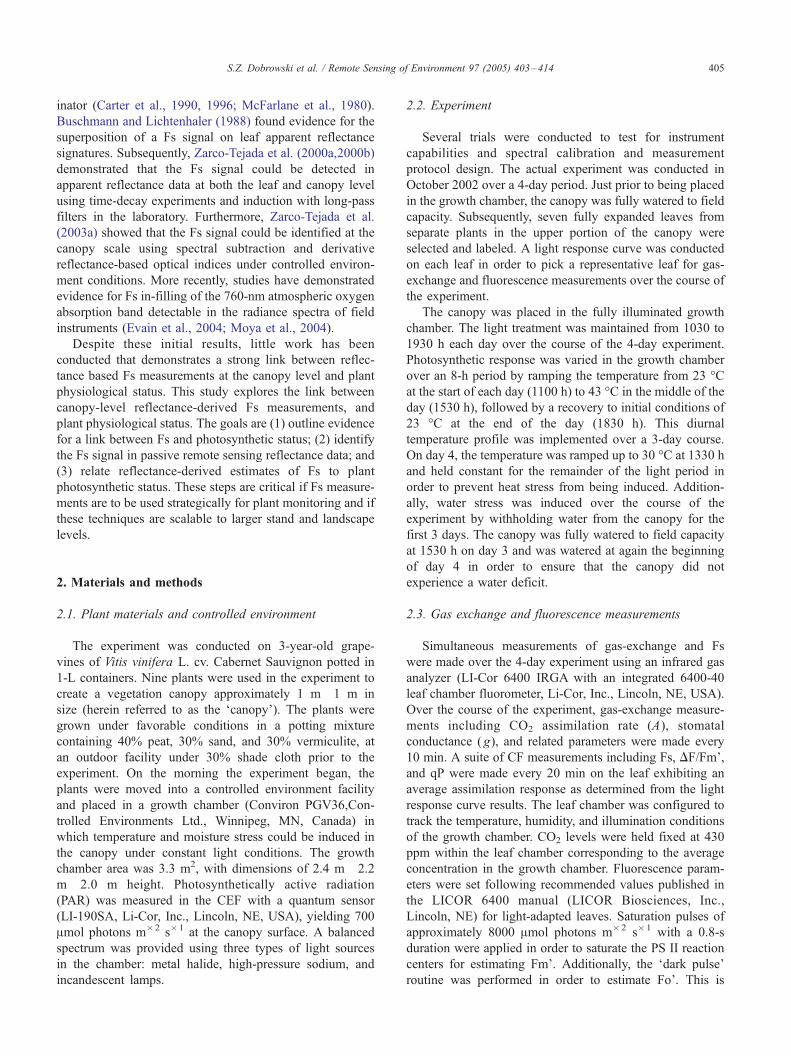
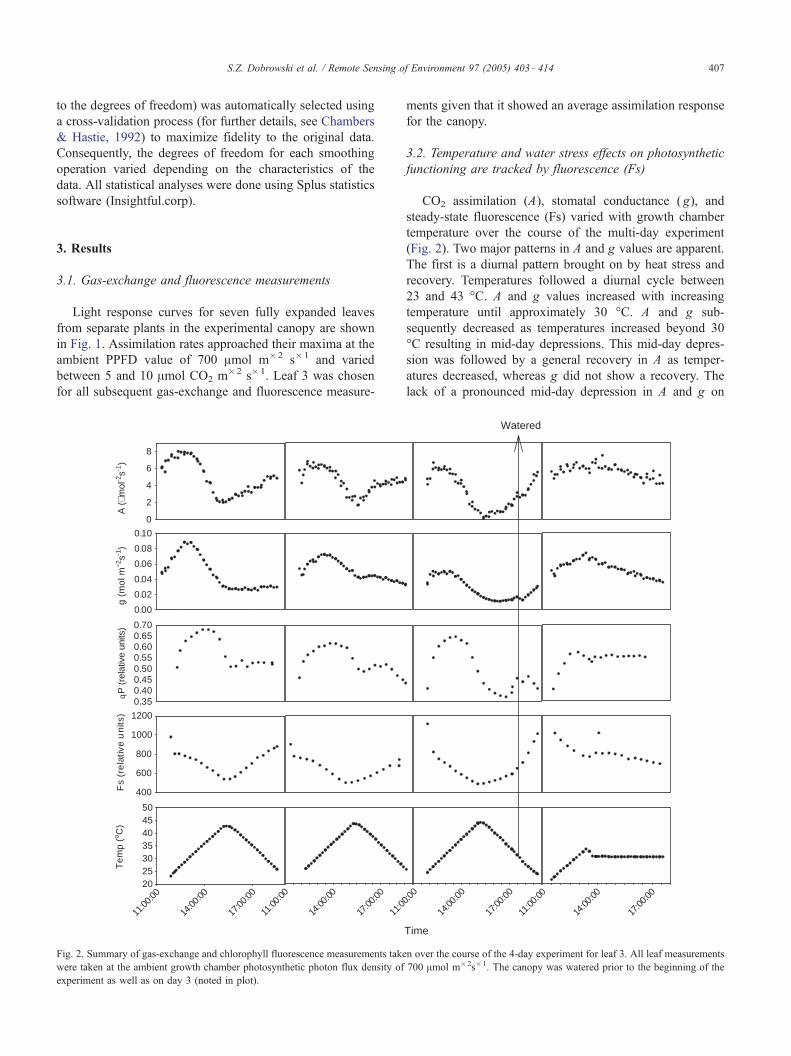
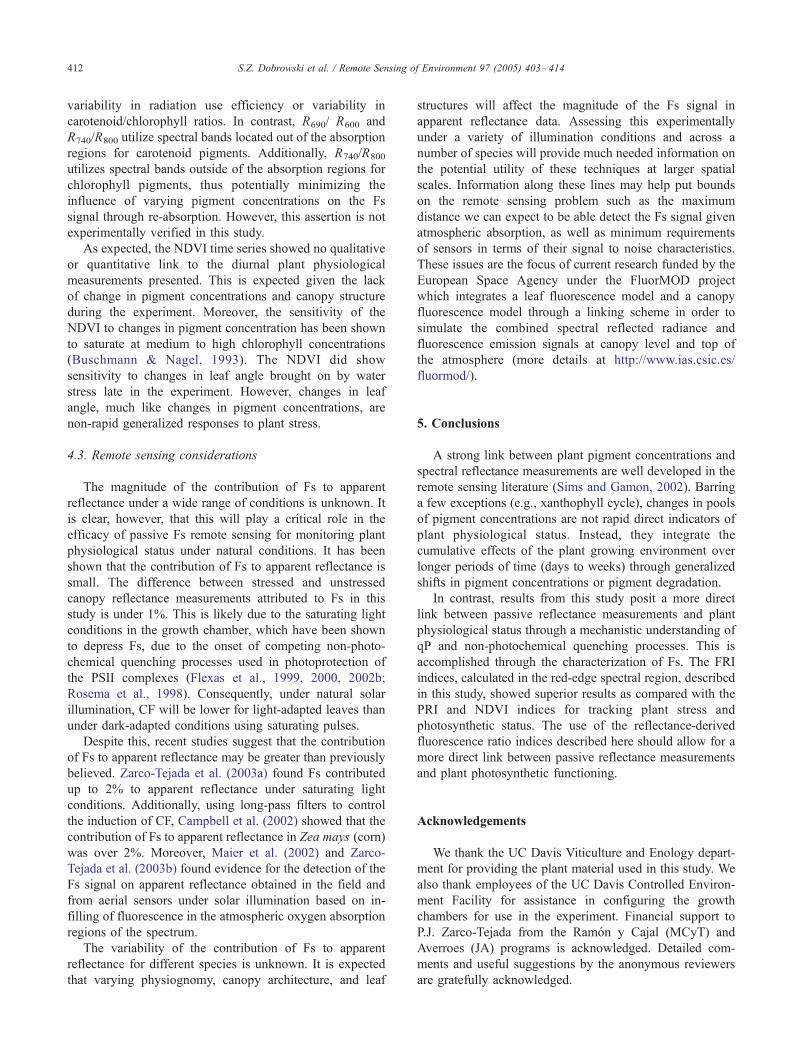
Fig. 2. Summary of gas-exchange and chlorophyll fluorescence measurements take
were taken at the ambient growth chamber photosynthetic photon flux density of
experiment as well as on day 3 (noted in plot).
ments given that it showed an average assimilation response
for the canopy.
3.2. Temperature and water stress effects on photosynthetic
functioning are tracked by fluorescence (Fs)
CO2 assimilation (A), stomatal conductance ( g), and
steady-state fluorescence (Fs) varied with growth chamber
temperature over the course of the multi-day experiment
(Fig. 2). Two major patterns in A and g values are apparent.
The first is a diurnal pattern brought on by heat stress and
recovery. Temperatures followed a diurnal cycle between
23 and 43 -C. A and g values increased with increasing
temperature until approximately 30 -C. A and g sub-
sequently decreased as temperatures increased beyond 30
-C resulting in mid-day depressions. This mid-day depres-
sion was followed by a general recovery in A as temper-
atures decreased, whereas g did not show a recovery. The
lack of a pronounced mid-day depression in A and g on
Time
0:00
14:0
0:00
17:0
0:00
11:0
0:00
14:0
0:00
17:0
0:00
Watered
n over the course of the 4-day experiment for leaf 3. All leaf measurements
700 Amol m�2s�1. The canopy was watered prior to the beginning of the
Wavelength (nm)600 650 700 750 800
Ref
lect
ance
0.0
0.1
0.2
0.3
0.4
0.5
Ref
lect
ance
Diff
eren
ce
0.000
0.002
0.004
0.006
0.008
12:00 Day 115:30 Day 1Difference
740 nm
690 nm
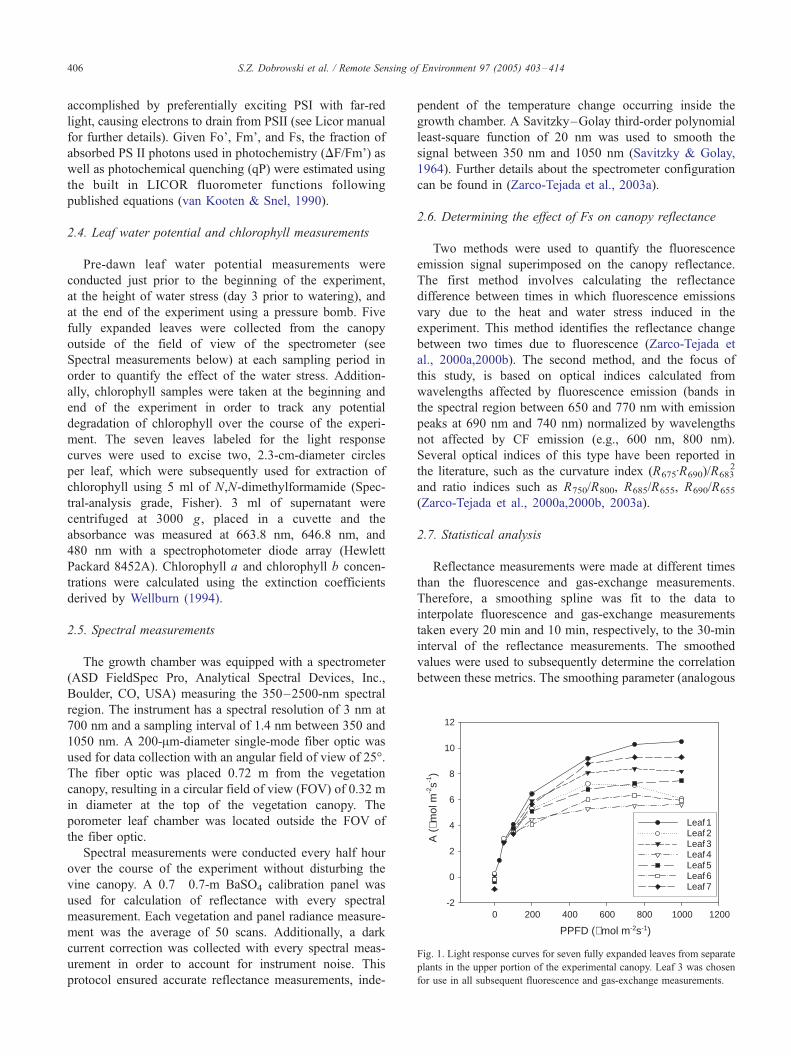
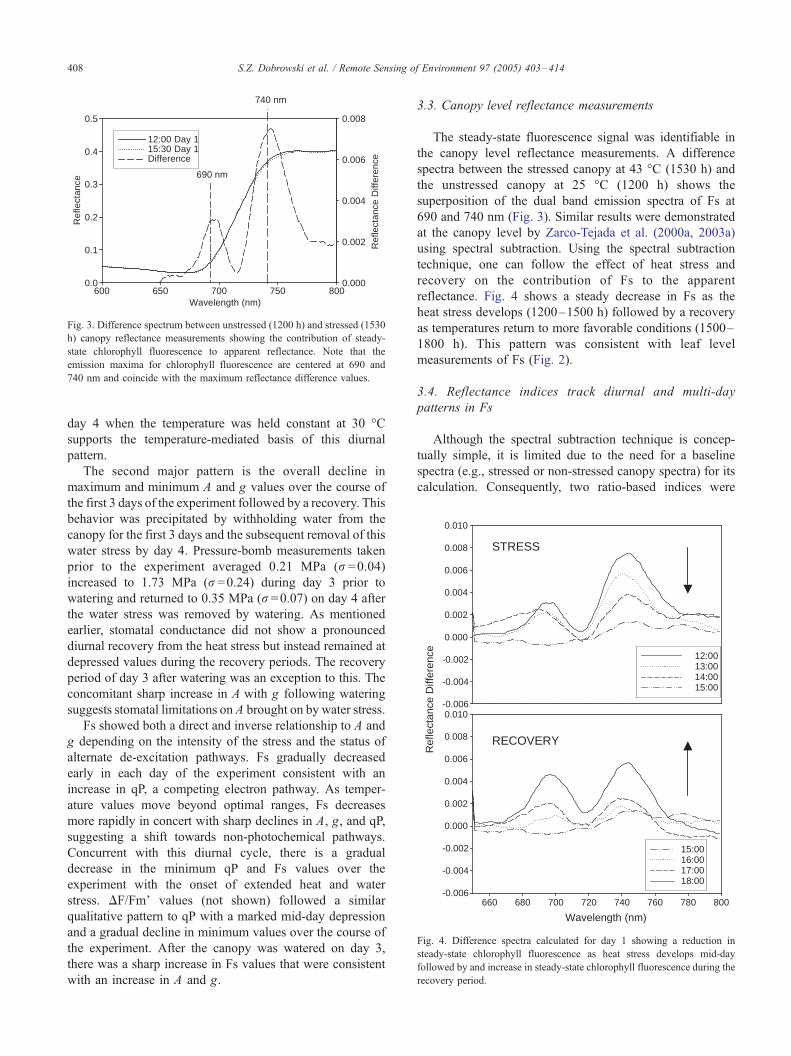
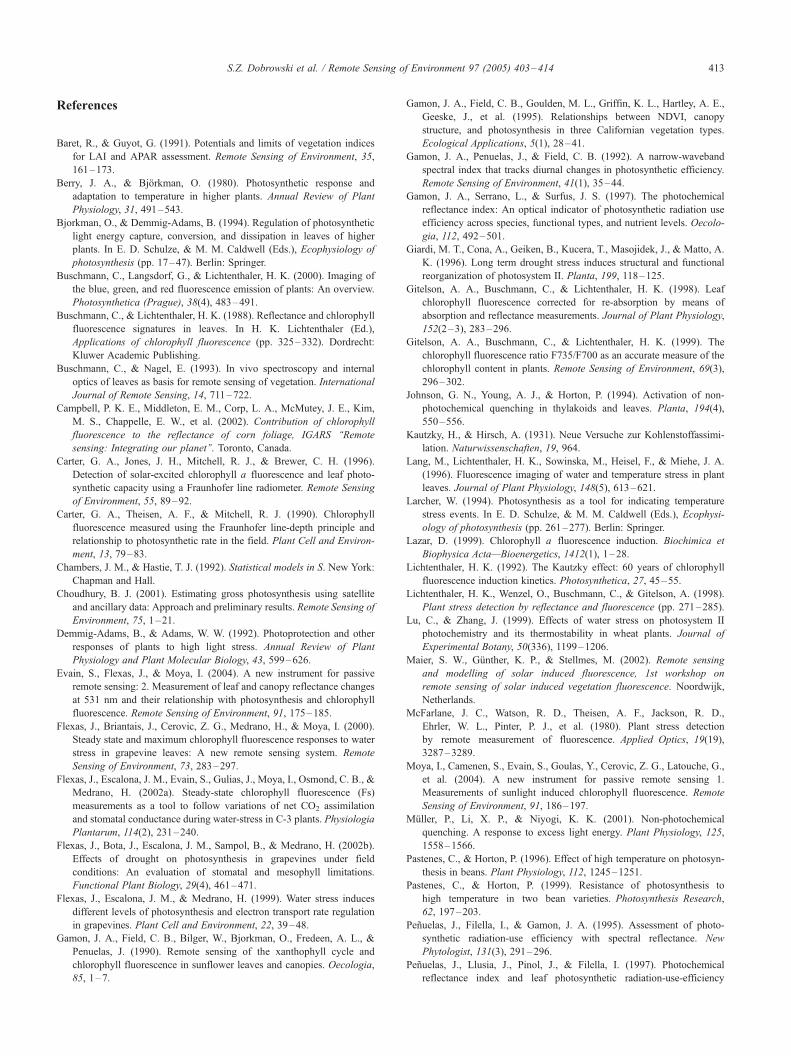
Fig. 3. Difference spectrum between unstressed (1200 h) and stressed (1530
h) canopy reflectance measurements showing the contribution of steady-
state chlorophyll fluorescence to apparent reflectance. Note that the
emission maxima for chlorophyll fluorescence are centered at 690 and
740 nm and coincide with the maximum reflectance difference values.
Ref
lect
ance
Diff
eren
ce
-0.006
-0.004
-0.002
0.000
0.002
0.004
0.006
0.008
0.010
12:00 13:00 14:00 15:00
Wavelength (nm)
660 680 700 720 740 760 780 800-0.006
-0.004
-0.002
0.000
0.002
0.004
0.006
0.008
0.010
15:0016:0017:0018:00
STRESS
RECOVERY
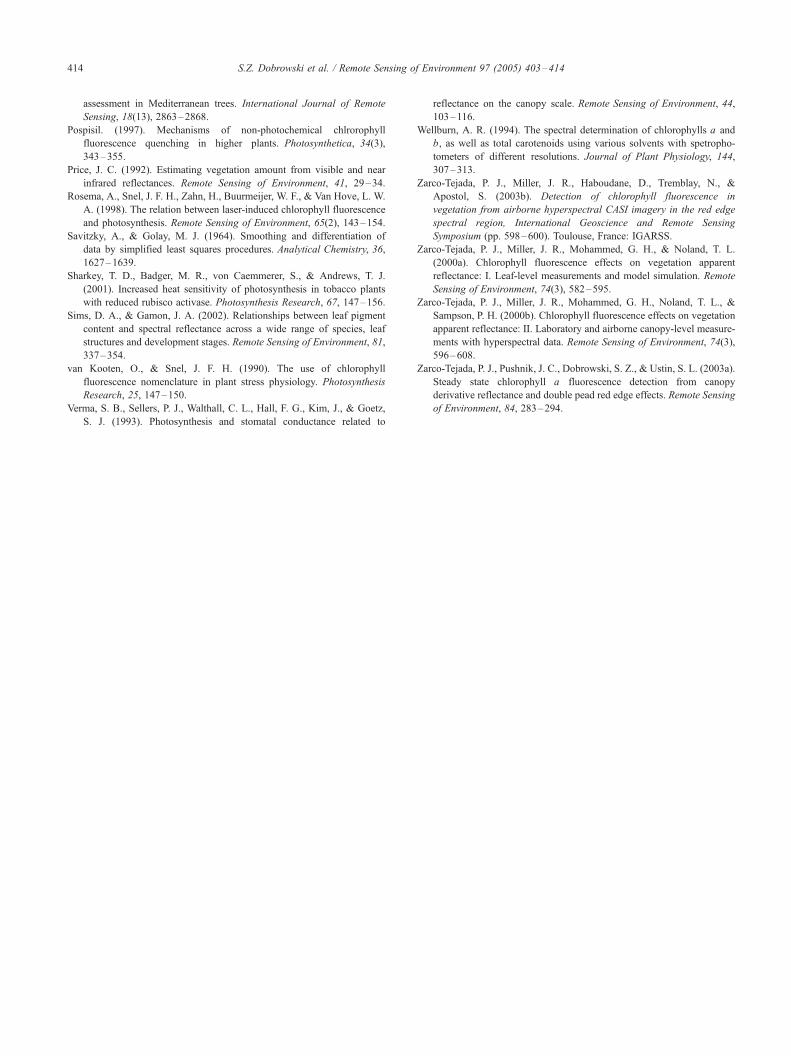
Fig. 4. Difference spectra calculated for day 1 showing a reduction in
steady-state chlorophyll fluorescence as heat stress develops mid-day
followed by and increase in steady-state chlorophyll fluorescence during the
recovery period.
S.Z. Dobrowski et al. / Remote Sensing of Environment 97 (2005) 403–414408
day 4 when the temperature was held constant at 30 -Csupports the temperature-mediated basis of this diurnal
pattern.
The second major pattern is the overall decline in
maximum and minimum A and g values over the course of
the first 3 days of the experiment followed by a recovery. This
behavior was precipitated by withholding water from the
canopy for the first 3 days and the subsequent removal of this
water stress by day 4. Pressure-bomb measurements taken
prior to the experiment averaged 0.21 MPa (r =0.04)
increased to 1.73 MPa (r =0.24) during day 3 prior to
watering and returned to 0.35 MPa (r =0.07) on day 4 after
the water stress was removed by watering. As mentioned
earlier, stomatal conductance did not show a pronounced
diurnal recovery from the heat stress but instead remained at
depressed values during the recovery periods. The recovery
period of day 3 after watering was an exception to this. The
concomitant sharp increase in A with g following watering
suggests stomatal limitations on A brought on by water stress.
Fs showed both a direct and inverse relationship to A and
g depending on the intensity of the stress and the status of
alternate de-excitation pathways. Fs gradually decreased
early in each day of the experiment consistent with an
increase in qP, a competing electron pathway. As temper-
ature values move beyond optimal ranges, Fs decreases
more rapidly in concert with sharp declines in A, g, and qP,
suggesting a shift towards non-photochemical pathways.
Concurrent with this diurnal cycle, there is a gradual
decrease in the minimum qP and Fs values over the
experiment with the onset of extended heat and water
stress. DF/Fm’ values (not shown) followed a similar
qualitative pattern to qP with a marked mid-day depression
and a gradual decline in minimum values over the course of
the experiment. After the canopy was watered on day 3,
there was a sharp increase in Fs values that were consistent
with an increase in A and g.
3.3. Canopy level reflectance measurements
The steady-state fluorescence signal was identifiable in
the canopy level reflectance measurements. A difference
spectra between the stressed canopy at 43 -C (1530 h) and
the unstressed canopy at 25 -C (1200 h) shows the
superposition of the dual band emission spectra of Fs at
690 and 740 nm (Fig. 3). Similar results were demonstrated
at the canopy level by Zarco-Tejada et al. (2000a, 2003a)
using spectral subtraction. Using the spectral subtraction
technique, one can follow the effect of heat stress and
recovery on the contribution of Fs to the apparent
reflectance. Fig. 4 shows a steady decrease in Fs as the
heat stress develops (1200–1500 h) followed by a recovery
as temperatures return to more favorable conditions (1500–
1800 h). This pattern was consistent with leaf level
measurements of Fs (Fig. 2).
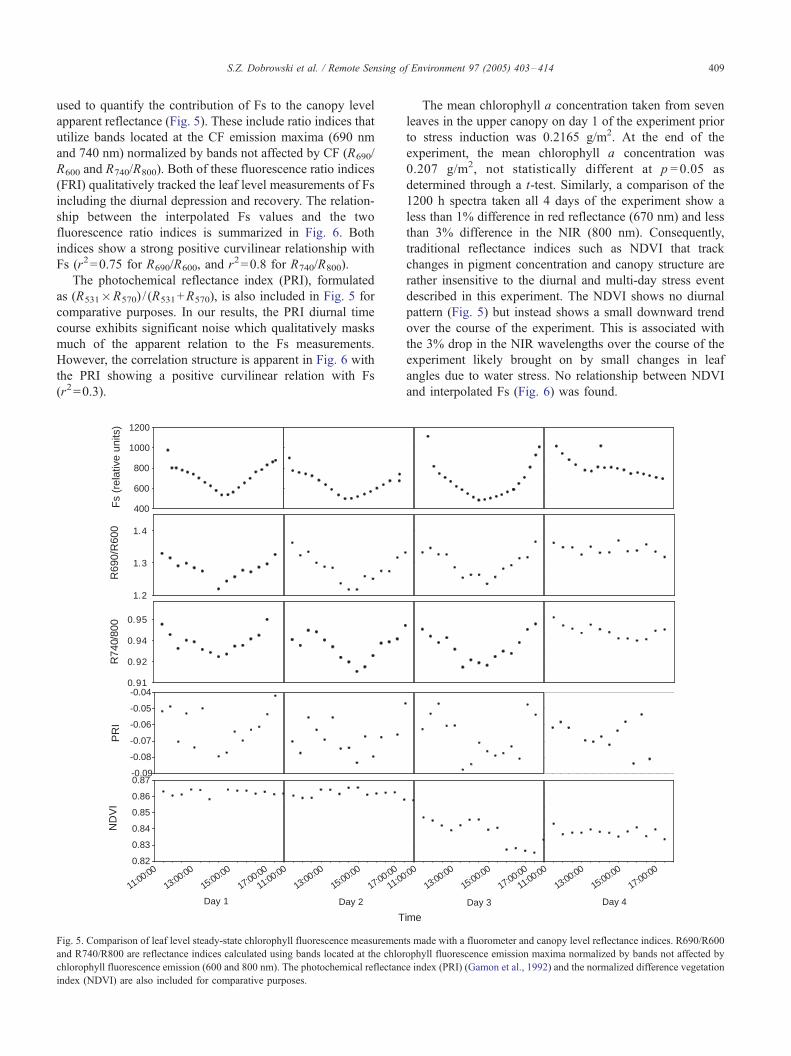
3.4. Reflectance indices track diurnal and multi-day
patterns in Fs
Although the spectral subtraction technique is concep-
tually simple, it is limited due to the need for a baseline
spectra (e.g., stressed or non-stressed canopy spectra) for its
calculation. Consequently, two ratio-based indices were
S.Z. Dobrowski et al. / Remote Sensing of Environment 97 (2005) 403–414 409
used to quantify the contribution of Fs to the canopy level
apparent reflectance (Fig. 5). These include ratio indices that
utilize bands located at the CF emission maxima (690 nm
and 740 nm) normalized by bands not affected by CF (R690/
R600 and R740/R800). Both of these fluorescence ratio indices
(FRI) qualitatively tracked the leaf level measurements of Fs
including the diurnal depression and recovery. The relation-
ship between the interpolated Fs values and the two
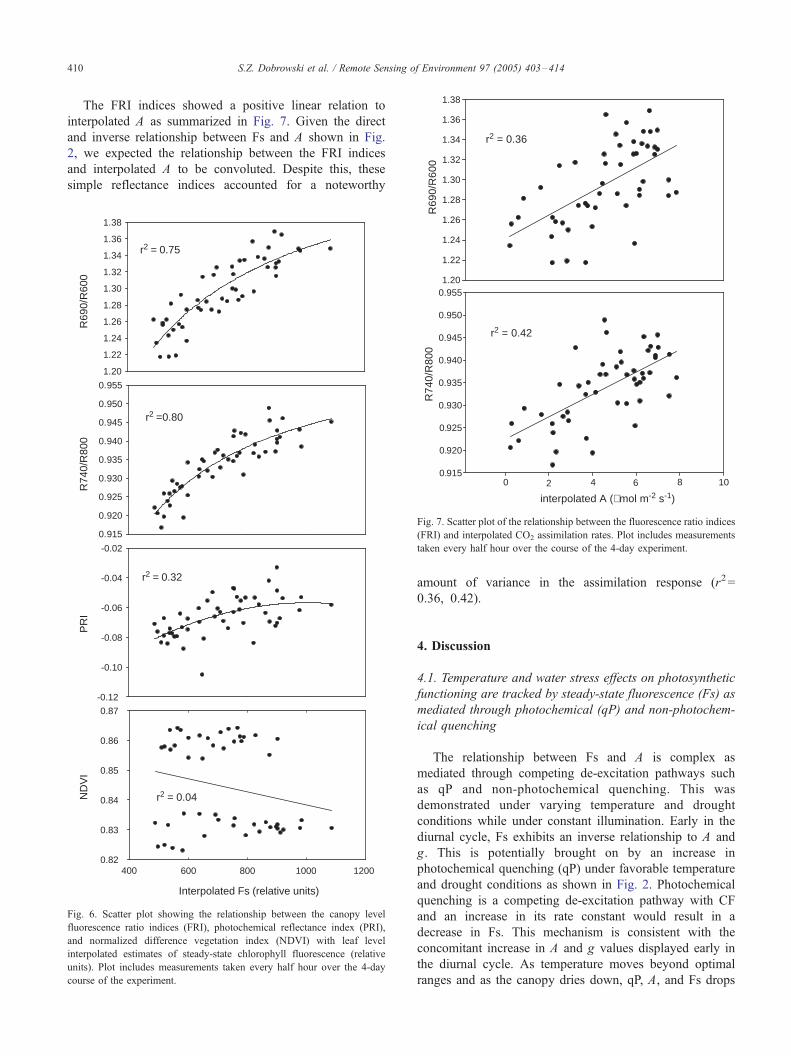
fluorescence ratio indices is summarized in Fig. 6. Both
indices show a strong positive curvilinear relationship with
Fs (r2=0.75 for R690/R600, and r2=0.8 for R740/R800).
The photochemical reflectance index (PRI), formulated
as (R531�R570) / (R531+R570), is also included in Fig. 5 for
comparative purposes. In our results, the PRI diurnal time
course exhibits significant noise which qualitatively masks
much of the apparent relation to the Fs measurements.
However, the correlation structure is apparent in Fig. 6 with
the PRI showing a positive curvilinear relation with Fs
(r2=0.3).
T
Day 1 Day 2
R69
0/R
600
1.2
1.3
1.4
PR
I
-0.09
-0.08
-0.07
-0.06
-0.05
-0.04
R74
0/80
0
0.91
0.92
0.94
0.95
Fs
(rel
ativ
e un
its)
400
600
800
1000
1200
11:00:00
13:00:00
15:00:00
17:00:00
ND
VI
0.82
0.83
0.84
0.85
0.86
0.87
11:00:00
13:00:00
15:00:00
17:00:00
11:0
Fig. 5. Comparison of leaf level steady-state chlorophyll fluorescence measuremen
and R740/R800 are reflectance indices calculated using bands located at the chlor
chlorophyll fluorescence emission (600 and 800 nm). The photochemical reflectanc
index (NDVI) are also included for comparative purposes.
The mean chlorophyll a concentration taken from seven
leaves in the upper canopy on day 1 of the experiment prior
to stress induction was 0.2165 g/m2. At the end of the
experiment, the mean chlorophyll a concentration was
0.207 g/m2, not statistically different at p =0.05 as
determined through a t-test. Similarly, a comparison of the
1200 h spectra taken all 4 days of the experiment show a
less than 1% difference in red reflectance (670 nm) and less
than 3% difference in the NIR (800 nm). Consequently,
traditional reflectance indices such as NDVI that track
changes in pigment concentration and canopy structure are
rather insensitive to the diurnal and multi-day stress event
described in this experiment. The NDVI shows no diurnal
pattern (Fig. 5) but instead shows a small downward trend
over the course of the experiment. This is associated with
the 3% drop in the NIR wavelengths over the course of the
experiment likely brought on by small changes in leaf
angles due to water stress. No relationship between NDVI
and interpolated Fs (Fig. 6) was found.
ime
Day 3 Day 4
0:00
13:00:00
15:00:00
17:00:00
11:00:00
13:00:00
15:00:00
17:00:00
ts made with a fluorometer and canopy level reflectance indices. R690/R600
ophyll fluorescence emission maxima normalized by bands not affected by
e index (PRI) (Gamon et al., 1992) and the normalized difference vegetation
0/R
600
1.30
1.32
1.34
1.36
1.38
r2 = 0.36
S.Z. Dobrowski et al. / Remote Sensing of Environment 97 (2005) 403–414410
The FRI indices showed a positive linear relation to
interpolated A as summarized in Fig. 7. Given the direct
and inverse relationship between Fs and A shown in Fig.
2, we expected the relationship between the FRI indices
and interpolated A to be convoluted. Despite this, these
simple reflectance indices accounted for a noteworthy
R69
0/R
600
1.20
1.22
1.24
1.26
1.28
1.30
1.32
1.34
1.36
1.38
r2 = 0.75
R74
0/R
800
0.915
0.920
0.925
0.930
0.935
0.940
0.945
0.950
0.955
r2 =0.80
PR
I
-0.12
-0.10
-0.08
-0.06
-0.04
-0.02
r2 = 0.32
Interpolated Fs (relative units)
400 600 800 1000 1200
ND
VI
0.82
0.83
0.84
0.85
0.86
0.87
r2 = 0.04
Fig. 6. Scatter plot showing the relationship between the canopy level
fluorescence ratio indices (FRI), photochemical reflectance index (PRI),
and normalized difference vegetation index (NDVI) with leaf level
interpolated estimates of steady-state chlorophyll fluorescence (relative
units). Plot includes measurements taken every half hour over the 4-day
course of the experiment.
interpolated A (µmol m-2 s-1)
0 2 4 6 8 10
R74
0/R
800
0.915
0.920
0.925
0.930
0.935
0.940
0.945
0.950
0.955
R69
1.20
1.22
1.24
1.26
1.28
r2 = 0.42
Fig. 7. Scatter plot of the relationship between the fluorescence ratio indices
(FRI) and interpolated CO2 assimilation rates. Plot includes measurements
taken every half hour over the course of the 4-day experiment.
amount of variance in the assimilation response (r2=
0.36, 0.42).
4. Discussion
4.1. Temperature and water stress effects on photosynthetic
functioning are tracked by steady-state fluorescence (Fs) as
mediated through photochemical (qP) and non-photochem-
ical quenching
The relationship between Fs and A is complex as
mediated through competing de-excitation pathways such
as qP and non-photochemical quenching. This was
demonstrated under varying temperature and drought
conditions while under constant illumination. Early in the
diurnal cycle, Fs exhibits an inverse relationship to A and
g. This is potentially brought on by an increase in
photochemical quenching (qP) under favorable temperature
and drought conditions as shown in Fig. 2. Photochemical
quenching is a competing de-excitation pathway with CF
and an increase in its rate constant would result in a
decrease in Fs. This mechanism is consistent with the
concomitant increase in A and g values displayed early in
the diurnal cycle. As temperature moves beyond optimal
ranges and as the canopy dries down, qP, A, and Fs drops
S.Z. Dobrowski et al. / Remote Sensing of Environment 97 (2005) 403–414 411
sharply, suggesting a shift toward non-photochemical
quenching.
Three primary components of non-photochemical
quenching (qN) have been identified due to their relaxation
kinetics. These are qE (rapidly inducible energy-dependent
quenching), qT (state transition quenching brought on by
the separation of the light harvesting complex from PSII),
and qI (photoinhibitory quenching). qE is the most rapid and
is brought on by a decrease in the thylakoid lumen DpH
through the protonation of PSII proteins and the synthesis of
xanthophylls via the xanthophyll cycle (Muller et al., 2001).
With beans under favorable conditions, Pastenes and Horton
(1996) showed that qN (particularly the qE component)
decreased between 20 -C and 30 -C in conjunction with an
increase in qP. Above 30 -C, qN increased, potentially
brought on by a shift towards qT or qI quenching.
Additionally, temperatures above 40 -C have been shown
to increase Fo and suggest irreversible damage to the
photosynthetic apparatus brought on by a break in the link
between light harvesting complex II and the reaction center
(Pastenes & Horton, 1999). Although qN was not directly
measured in this experiment (due to the inability to estimate
Fo under dark adapted conditions), a closely related
measure, qP was shown to increase between temperatures
of 35 -C and 40 -C and then sharply drop above this
temperature threshold in a manner consistent with the results
of Pastenes and Horton (1996, 1999). Moreover, our results
show a decrease in CF (Fs and Fm’), a competing de-
excitation pathway with qN, with increasing temperature
above 40 -C consistent with previous research (Lu & Zhang,
1999; Pastenes & Horton, 1999).
PSII is recognized as the most sensitive component of the
photosynthetic system (Berry & Bjorkman, 1980). As high
temperatures are experienced, non-photochemical processes
become strong electron sinks and reduce both qP and Fs
(Rosema et al., 1998). High temperature affects the structure
of the thylakoid membrane, as well as changes the rate
constants of chemical reactions (Berry & Bjorkman, 1980;
Sharkey et al., 2001). Fs tracks the depression in assim-
ilation and stomatal conductance brought on by heat stress.
As expected, under natural conditions, multiple environ-
mental stressors co-occur frequently and can exhibit
synergistic or antagonistic effects. In this experiment, the
diurnal heat stress was accompanied by a longer term water
stress. Water stress alone has been shown to have no effect
on the primary photochemistry of PSII but has been shown
to increase the thermo-stability of PSII in wheat (Lu &
Zhang, 1999) and predisposes PSII to photoinhibitory
damage (Giardi et al., 1996). Thus, it is likely that the
onset of water stress somewhat ameliorated the effects of
heat stress under the light-adapted conditions of this
experiment.
To reiterate, Fs shows both a direct and inverse relation-
ship to A and g depending upon the intensity of the stress
and the status of the alternate de-excitation pathways. This
suggests that it is not possible to estimate A directly from Fs
without complimentary information. These results are
consistent with the findings of Flexas et al. (1999,
2002a,2002b) which showed that Fs demonstrates a strong
inverse relationship with non-photochemical quenching
under varying illumination and drought conditions. They
suggest that Fs is a rapid metric that distills the effects of
declining stomatal conductance, CO2 assimilation, and the
onset of non-photochemical quenching. Our results also
support the conclusion that the link between Fs and A is
indirect as mediated through a suite of competing de-
excitation pathways. Despite the lack of a consistent
relationship between Fs and A, Fs still provides valuable
information on plant stress response. Fs tracks the sharp
decline in A, g, and qP likely brought on by the onset of
non-photochemical quenching processes during heat stress
and the subsequent recovery. This is demonstrated in Fig. 7,
albeit indirectly, by the positive linear relationship between
the remote estimates of Fs and interpolated A. Moreover, Fs
provides an avenue for passive plant physiological monitor-
ing under natural illumination without interfering with the
plant growing environment. These characteristics make Fs
an ideal candidate for passive remote sensing technologies.
4.2. Steady-state fluorescence signal is superimposed on
passive reflectance measurements at the canopy scale
There is a body of conclusive evidence supporting a
passive Fs signal superimposed on apparent reflectance
signatures. Our results provide further support for this. A
difference spectrum between the stressed canopy at 43 -Cand the unstressed canopy at 25 -C shows the superposition
of the dual-band emission spectra of CF at 690 and 740 nm.
Additionally, this difference spectrum was shown to
decrease with the onset of stress and subsequently increase
during the recovery period in a manner consistent with leaf
level measurements of Fs. Similar results were demonstrated
at the canopy level by Zarco-Tejada et al. (2000b) using
spectral subtraction and time-decay experiments in the
laboratory. Additionally, a number of reflectance indices
have been posited in the literature for tracking the
contribution of Fs to apparent reflectance (see Zarco-Tejada
et al., 2000a,2000b, 2003a for further details). The FRI
reflectance indices outlined in this study were shown to
track the multi-day pattern in leaf level Fs measurements.
These results also demonstrate a link between the PRI
and leaf level estimates of Fs. We would expect the PRI to
contain similar information as the ratio indices R690/ R600
and R740/R800 given its inverse relationship to non-photo-
chemical quenching processes. Sims and Gamon (2002)
also showed that the PRI is sensitive to the carotenoid/
chlorophyll ratio across a number of species. This is a
consequence of its use of spectral bands located in the
absorption regions of both chlorophyll and carotenoid
pigments. Consequently, the use of the PRI may be
convoluted given that spatial, and to a lesser extent,
temporal variation in the index may be due to either
S.Z. Dobrowski et al. / Remote Sensing of Environment 97 (2005) 403–414412
variability in radiation use efficiency or variability in
carotenoid/chlorophyll ratios. In contrast, R690/ R600 and
R740/R800 utilize spectral bands located out of the absorption
regions for carotenoid pigments. Additionally, R740/R800
utilizes spectral bands outside of the absorption regions for
chlorophyll pigments, thus potentially minimizing the
influence of varying pigment concentrations on the Fs
signal through re-absorption. However, this assertion is not
experimentally verified in this study.
As expected, the NDVI time series showed no qualitative
or quantitative link to the diurnal plant physiological
measurements presented. This is expected given the lack
of change in pigment concentrations and canopy structure
during the experiment. Moreover, the sensitivity of the
NDVI to changes in pigment concentration has been shown
to saturate at medium to high chlorophyll concentrations
(Buschmann & Nagel, 1993). The NDVI did show
sensitivity to changes in leaf angle brought on by water
stress late in the experiment. However, changes in leaf
angle, much like changes in pigment concentrations, are
non-rapid generalized responses to plant stress.
4.3. Remote sensing considerations
The magnitude of the contribution of Fs to apparent
reflectance under a wide range of conditions is unknown. It
is clear, however, that this will play a critical role in the
efficacy of passive Fs remote sensing for monitoring plant
physiological status under natural conditions. It has been
shown that the contribution of Fs to apparent reflectance is
small. The difference between stressed and unstressed
canopy reflectance measurements attributed to Fs in this
study is under 1%. This is likely due to the saturating light
conditions in the growth chamber, which have been shown
to depress Fs, due to the onset of competing non-photo-
chemical quenching processes used in photoprotection of
the PSII complexes (Flexas et al., 1999, 2000, 2002b;
Rosema et al., 1998). Consequently, under natural solar
illumination, CF will be lower for light-adapted leaves than
under dark-adapted conditions using saturating pulses.
Despite this, recent studies suggest that the contribution
of Fs to apparent reflectance may be greater than previously
believed. Zarco-Tejada et al. (2003a) found Fs contributed
up to 2% to apparent reflectance under saturating light
conditions. Additionally, using long-pass filters to control
the induction of CF, Campbell et al. (2002) showed that the
contribution of Fs to apparent reflectance in Zea mays (corn)
was over 2%. Moreover, Maier et al. (2002) and Zarco-
Tejada et al. (2003b) found evidence for the detection of the
Fs signal on apparent reflectance obtained in the field and
from aerial sensors under solar illumination based on in-
filling of fluorescence in the atmospheric oxygen absorption
regions of the spectrum.
The variability of the contribution of Fs to apparent
reflectance for different species is unknown. It is expected
that varying physiognomy, canopy architecture, and leaf
structures will affect the magnitude of the Fs signal in
apparent reflectance data. Assessing this experimentally
under a variety of illumination conditions and across a
number of species will provide much needed information on
the potential utility of these techniques at larger spatial
scales. Information along these lines may help put bounds
on the remote sensing problem such as the maximum
distance we can expect to be able detect the Fs signal given
atmospheric absorption, as well as minimum requirements
of sensors in terms of their signal to noise characteristics.
These issues are the focus of current research funded by the
European Space Agency under the FluorMOD project
which integrates a leaf fluorescence model and a canopy
fluorescence model through a linking scheme in order to
simulate the combined spectral reflected radiance and
fluorescence emission signals at canopy level and top of
the atmosphere (more details at http://www.ias.csic.es/
fluormod/).
5. Conclusions
A strong link between plant pigment concentrations and
spectral reflectance measurements are well developed in the
remote sensing literature (Sims and Gamon, 2002). Barring
a few exceptions (e.g., xanthophyll cycle), changes in pools
of pigment concentrations are not rapid direct indicators of
plant physiological status. Instead, they integrate the
cumulative effects of the plant growing environment over
longer periods of time (days to weeks) through generalized
shifts in pigment concentrations or pigment degradation.
In contrast, results from this study posit a more direct
link between passive reflectance measurements and plant
physiological status through a mechanistic understanding of
qP and non-photochemical quenching processes. This is
accomplished through the characterization of Fs. The FRI
indices, calculated in the red-edge spectral region, described
in this study, showed superior results as compared with the
PRI and NDVI indices for tracking plant stress and
photosynthetic status. The use of the reflectance-derived
fluorescence ratio indices described here should allow for a
more direct link between passive reflectance measurements
and plant photosynthetic functioning.
Acknowledgements
We thank the UC Davis Viticulture and Enology depart-
ment for providing the plant material used in this study. We
also thank employees of the UC Davis Controlled Environ-
ment Facility for assistance in configuring the growth
chambers for use in the experiment. Financial support to
P.J. Zarco-Tejada from the Ramon y Cajal (MCyT) and
Averroes (JA) programs is acknowledged. Detailed com-
ments and useful suggestions by the anonymous reviewers
are gratefully acknowledged.
S.Z. Dobrowski et al. / Remote Sensing of Environment 97 (2005) 403–414 413
References
Baret, R., & Guyot, G. (1991). Potentials and limits of vegetation indices
for LAI and APAR assessment. Remote Sensing of Environment, 35,
161–173.
Berry, J. A., & Bjorkman, O. (1980). Photosynthetic response and
adaptation to temperature in higher plants. Annual Review of Plant
Physiology, 31, 491–543.
Bjorkman, O., & Demmig-Adams, B. (1994). Regulation of photosynthetic
light energy capture, conversion, and dissipation in leaves of higher
plants. In E. D. Schulze, & M. M. Caldwell (Eds.), Ecophysiology of
photosynthesis (pp. 17–47). Berlin’ Springer.
Buschmann, C., Langsdorf, G., & Lichtenthaler, H. K. (2000). Imaging of
the blue, green, and red fluorescence emission of plants: An overview.
Photosynthetica (Prague), 38(4), 483–491.
Buschmann, C., & Lichtenthaler, H. K. (1988). Reflectance and chlorophyll
fluorescence signatures in leaves. In H. K. Lichtenthaler (Ed.),
Applications of chlorophyll fluorescence (pp. 325–332). Dordrecht’
Kluwer Academic Publishing.
Buschmann, C., & Nagel, E. (1993). In vivo spectroscopy and internal
optics of leaves as basis for remote sensing of vegetation. International
Journal of Remote Sensing, 14, 711–722.
Campbell, P. K. E., Middleton, E. M., Corp, L. A., McMutey, J. E., Kim,
M. S., Chappelle, E. W., et al. (2002). Contribution of chlorophyll
fluorescence to the reflectance of corn foliage, IGARS ‘‘Remote
sensing: Integrating our planet’’. Toronto, Canada.
Carter, G. A., Jones, J. H., Mitchell, R. J., & Brewer, C. H. (1996).
Detection of solar-excited chlorophyll a fluorescence and leaf photo-
synthetic capacity using a Fraunhofer line radiometer. Remote Sensing
of Environment, 55, 89–92.
Carter, G. A., Theisen, A. F., & Mitchell, R. J. (1990). Chlorophyll
fluorescence measured using the Fraunhofer line-depth principle and
relationship to photosynthetic rate in the field. Plant Cell and Environ-
ment, 13, 79–83.
Chambers, J. M., & Hastie, T. J. (1992). Statistical models in S. New York’
Chapman and Hall.
Choudhury, B. J. (2001). Estimating gross photosynthesis using satellite
and ancillary data: Approach and preliminary results. Remote Sensing of
Environment, 75, 1–21.
Demmig-Adams, B., & Adams, W. W. (1992). Photoprotection and other
responses of plants to high light stress. Annual Review of Plant
Physiology and Plant Molecular Biology, 43, 599–626.
Evain, S., Flexas, J., & Moya, I. (2004). A new instrument for passive
remote sensing: 2. Measurement of leaf and canopy reflectance changes
at 531 nm and their relationship with photosynthesis and chlorophyll
fluorescence. Remote Sensing of Environment, 91, 175–185.
Flexas, J., Briantais, J., Cerovic, Z. G., Medrano, H., & Moya, I. (2000).
Steady state and maximum chlorophyll fluorescence responses to water
stress in grapevine leaves: A new remote sensing system. Remote
Sensing of Environment, 73, 283–297.
Flexas, J., Escalona, J. M., Evain, S., Gulias, J., Moya, I., Osmond, C. B., &
Medrano, H. (2002a). Steady-state chlorophyll fluorescence (Fs)
measurements as a tool to follow variations of net CO2 assimilation
and stomatal conductance during water-stress in C-3 plants. Physiologia
Plantarum, 114(2), 231–240.
Flexas, J., Bota, J., Escalona, J. M., Sampol, B., & Medrano, H. (2002b).
Effects of drought on photosynthesis in grapevines under field
conditions: An evaluation of stomatal and mesophyll limitations.
Functional Plant Biology, 29(4), 461–471.
Flexas, J., Escalona, J. M., & Medrano, H. (1999). Water stress induces
different levels of photosynthesis and electron transport rate regulation
in grapevines. Plant Cell and Environment, 22, 39–48.
Gamon, J. A., Field, C. B., Bilger, W., Bjorkman, O., Fredeen, A. L., &
Penuelas, J. (1990). Remote sensing of the xanthophyll cycle and
chlorophyll fluorescence in sunflower leaves and canopies. Oecologia,
85, 1–7.
Gamon, J. A., Field, C. B., Goulden, M. L., Griffin, K. L., Hartley, A. E.,
Geeske, J., et al. (1995). Relationships between NDVI, canopy
structure, and photosynthesis in three Californian vegetation types.
Ecological Applications, 5(1), 28–41.
Gamon, J. A., Penuelas, J., & Field, C. B. (1992). A narrow-waveband
spectral index that tracks diurnal changes in photosynthetic efficiency.
Remote Sensing of Environment, 41(1), 35–44.
Gamon, J. A., Serrano, L., & Surfus, J. S. (1997). The photochemical
reflectance index: An optical indicator of photosynthetic radiation use
efficiency across species, functional types, and nutrient levels. Oecolo-
gia, 112, 492–501.
Giardi, M. T., Cona, A., Geiken, B., Kucera, T., Masojidek, J., & Matto, A.
K. (1996). Long term drought stress induces structural and functional
reorganization of photosystem II. Planta, 199, 118–125.
Gitelson, A. A., Buschmann, C., & Lichtenthaler, H. K. (1998). Leaf
chlorophyll fluorescence corrected for re-absorption by means of
absorption and reflectance measurements. Journal of Plant Physiology,
152(2–3), 283–296.
Gitelson, A. A., Buschmann, C., & Lichtenthaler, H. K. (1999). The
chlorophyll fluorescence ratio F735/F700 as an accurate measure of the
chlorophyll content in plants. Remote Sensing of Environment, 69(3),
296–302.
Johnson, G. N., Young, A. J., & Horton, P. (1994). Activation of non-
photochemical quenching in thylakoids and leaves. Planta, 194(4),
550–556.
Kautzky, H., & Hirsch, A. (1931). Neue Versuche zur Kohlenstoffassimi-
lation. Naturwissenschaften, 19, 964.
Lang, M., Lichtenthaler, H. K., Sowinska, M., Heisel, F., & Miehe, J. A.
(1996). Fluorescence imaging of water and temperature stress in plant
leaves. Journal of Plant Physiology, 148(5), 613–621.
Larcher, W. (1994). Photosynthesis as a tool for indicating temperature
stress events. In E. D. Schulze, & M. M. Caldwell (Eds.), Ecophysi-
ology of photosynthesis (pp. 261–277). Berlin’ Springer.Lazar, D. (1999). Chlorophyll a fluorescence induction. Biochimica et
Biophysica Acta—Bioenergetics, 1412(1), 1–28.
Lichtenthaler, H. K. (1992). The Kautzky effect: 60 years of chlorophyll
fluorescence induction kinetics. Photosynthetica, 27, 45–55.
Lichtenthaler, H. K., Wenzel, O., Buschmann, C., & Gitelson, A. (1998).
Plant stress detection by reflectance and fluorescence (pp. 271–285).
Lu, C., & Zhang, J. (1999). Effects of water stress on photosystem II
photochemistry and its thermostability in wheat plants. Journal of
Experimental Botany, 50(336), 1199–1206.
Maier, S. W., Gunther, K. P., & Stellmes, M. (2002). Remote sensing
and modelling of solar induced fluorescence, 1st workshop on
remote sensing of solar induced vegetation fluorescence. Noordwijk,
Netherlands.
McFarlane, J. C., Watson, R. D., Theisen, A. F., Jackson, R. D.,
Ehrler, W. L., Pinter, P. J., et al. (1980). Plant stress detection
by remote measurement of fluorescence. Applied Optics, 19(19),
3287–3289.
Moya, I., Camenen, S., Evain, S., Goulas, Y., Cerovic, Z. G., Latouche, G.,
et al. (2004). A new instrument for passive remote sensing 1.
Measurements of sunlight induced chlorophyll fluorescence. Remote
Sensing of Environment, 91, 186–197.
Muller, P., Li, X. P., & Niyogi, K. K. (2001). Non-photochemical
quenching. A response to excess light energy. Plant Physiology, 125,
1558–1566.
Pastenes, C., & Horton, P. (1996). Effect of high temperature on photosyn-
thesis in beans. Plant Physiology, 112, 1245–1251.
Pastenes, C., & Horton, P. (1999). Resistance of photosynthesis to
high temperature in two bean varieties. Photosynthesis Research,
62, 197–203.
Penuelas, J., Filella, I., & Gamon, J. A. (1995). Assessment of photo-
synthetic radiation-use efficiency with spectral reflectance. New
Phytologist, 131(3), 291–296.
Penuelas, J., Llusia, J., Pinol, J., & Filella, I. (1997). Photochemical
reflectance index and leaf photosynthetic radiation-use-efficiency
S.Z. Dobrowski et al. / Remote Sensing of Environment 97 (2005) 403–414414
assessment in Mediterranean trees. International Journal of Remote
Sensing, 18(13), 2863–2868.
Pospisil. (1997). Mechanisms of non-photochemical chlrorophyll
fluorescence quenching in higher plants. Photosynthetica, 34(3),
343–355.
Price, J. C. (1992). Estimating vegetation amount from visible and near
infrared reflectances. Remote Sensing of Environment, 41, 29–34.
Rosema, A., Snel, J. F. H., Zahn, H., Buurmeijer, W. F., & Van Hove, L. W.
A. (1998). The relation between laser-induced chlorophyll fluorescence
and photosynthesis. Remote Sensing of Environment, 65(2), 143–154.
Savitzky, A., & Golay, M. J. (1964). Smoothing and differentiation of
data by simplified least squares procedures. Analytical Chemistry, 36,
1627–1639.
Sharkey, T. D., Badger, M. R., von Caemmerer, S., & Andrews, T. J.
(2001). Increased heat sensitivity of photosynthesis in tobacco plants
with reduced rubisco activase. Photosynthesis Research, 67, 147–156.
Sims, D. A., & Gamon, J. A. (2002). Relationships between leaf pigment
content and spectral reflectance across a wide range of species, leaf
structures and development stages. Remote Sensing of Environment, 81,
337–354.
van Kooten, O., & Snel, J. F. H. (1990). The use of chlorophyll
fluorescence nomenclature in plant stress physiology. Photosynthesis
Research, 25, 147–150.
Verma, S. B., Sellers, P. J., Walthall, C. L., Hall, F. G., Kim, J., & Goetz,
S. J. (1993). Photosynthesis and stomatal conductance related to
reflectance on the canopy scale. Remote Sensing of Environment, 44,
103–116.
Wellburn, A. R. (1994). The spectral determination of chlorophylls a and
b, as well as total carotenoids using various solvents with spetropho-
tometers of different resolutions. Journal of Plant Physiology, 144,
307–313.
Zarco-Tejada, P. J., Miller, J. R., Haboudane, D., Tremblay, N., &
Apostol, S. (2003b). Detection of chlorophyll fluorescence in
vegetation from airborne hyperspectral CASI imagery in the red edge
spectral region, International Geoscience and Remote Sensing
Symposium (pp. 598–600). Toulouse, France’ IGARSS.Zarco-Tejada, P. J., Miller, J. R., Mohammed, G. H., & Noland, T. L.
(2000a). Chlorophyll fluorescence effects on vegetation apparent
reflectance: I. Leaf-level measurements and model simulation. Remote
Sensing of Environment, 74(3), 582–595.
Zarco-Tejada, P. J., Miller, J. R., Mohammed, G. H., Noland, T. L., &
Sampson, P. H. (2000b). Chlorophyll fluorescence effects on vegetation
apparent reflectance: II. Laboratory and airborne canopy-level measure-
ments with hyperspectral data. Remote Sensing of Environment, 74(3),
596–608.
Zarco-Tejada, P. J., Pushnik, J. C., Dobrowski, S. Z., & Ustin, S. L. (2003a).
Steady state chlorophyll a fluorescence detection from canopy
derivative reflectance and double pead red edge effects. Remote Sensing
of Environment, 84, 283–294.


