Embed Size (px)
Citation preview

Annual Report 2016
SERVICEEXCELLENCETHROUGHINNOVATION

Contents
1 Interview with Chairman and CEO
6 Focus
31 Business Review 33 Financial Review
38 Business Review Divisions
44 Sustainable Development
51 Corporate Governance 54 Corporate Structure and Shareholders
54 Capital Structure
55 Board of Directors
64 Executive Committee
64 Shareholder Participation Rights
65 Takeover and Defense Measures
65 Auditors
68 Risk Management
70 Information Policy
71 Compensation Report 73 Letter to the Shareholders
75 Compensation Governance and Principles
78 Compensation Architecture
86 Compensation of the Board of Directors
and the Executive Committee
90 Shareholdings of the Board of Directors
and the Executive Committee
92 Auditor’s Report
93 Financial Reporting 95 Consolidated Financial Statements
165 Financial Statements of Sulzer Ltd
179 Investor Information

INNOVATION AND TECHNOLOGYSulzer commits itself to developing innovative, reliable, and resource-conserving solutions.
SERVICE FIELDSSulzer offers a variety of services for rotating equipment and equipment used in separation technology.
ECOLOGICAL SUSTAINABILITYSulzer reduces its own environmental footprint and develops highly efficient solutions for its customers.
CUSTOMER BENEFITSSulzer’s one-stop services help customers save time and money, and they increase the reliability, performance, and efficiency of their equipment.
SOCIAL SUSTAINABILITYSulzer drives safety excellence and fosters cultural exchange among its employees.
CORE COMPETENCIES The company’s professional service team, global footprint, and one-stop offering make Sulzer a reliable and fast service partner.
Sustainable Development
Our Service World
8
14
22
45
46
48
OUR MISSION STATEMENT
Sulzer specializes in pumping solutions, services for rotating equipment, and separation, mixing, and application technology. We create reliable and sustainable solutions for the oil and gas, power, water, and general industry markets. Combining engineering and application expertise, our innovative products and services add value for our customers and strengthen their com-petitive positions.
Pull here to read our facts and figures
SMD PumpsSMD pumps are designed for a wide range of raw, clean, sea, and brackish water applications such as water treatment and transport as well as desalination.
Mixing SystemsMixing systems are used for the packaging, metering, mixing, and dispensing of one- or two-compo-nent materials in healthcare and industrial markets.
Separation ColumnsWithin separation columns, crude oil and natural gas are separated into their many components.

Sales by division
52% Pumps Equipment
23% Rotating Equipment Services
25% Chemtech
2016
Sales by market segment
48% Oil and gas
16% Power
12% Water
24% General industry
2016
Sales by region
44% Europe, Middle East, and Africa
36% Americas
20% Asia-Pacific
2016
In 2016, Sulzer proved resilient in a challenging market environment. Currency- adjusted order intake and sales decreased by 2%. Except for the oil and gas market, activity in all other markets—power, water, general industry—increased. Order intake gross margin remained stable. Operational EBITA and operational ROSA declined.
Facts and Figures
Key figures
Production and service locations Sulzer’s production and service network spreads across the globe.
Sales in 2016 Sulzer generated sales of CHF 2.9 billion in 2016.
Employees Close to 14 000 employees from all over the world work at Sulzer.
millions of CHF 2016 2015Change in +/– % +/– %1)
Order intake 2 797.5 2 895.8 – 3.4 – 2.0
Order intake gross margin 34.0% 33.8%
Order backlog 1 439.1 1 510.7 – 4.7
Sales 2 876.7 2 971.0 – 3.2 – 2.0
EBIT 115.3 120.9 – 4.6
opEBITA 238.9 254.1 – 6.0 – 4.4
opROSA 8.3% 8.6%
opROCEA 15.7% 17.0%
Net income attributable to shareholders of Sulzer Ltd 59.0 73.9 – 20.2
Basic earnings per share from continuing operations 1.73 2.17 – 20.3
Free cash flow 200.5 155.8 28.7
Net liquidity – 35.9 695.7
Employees (number of full-time equivalents) as of December 31 14 005 14 253 – 1.7
1) Adjusted for currency effects.
14 000 2.9 billion180 CHF

Sulzer specializes in pumping solutions, services for rotating equipment, and separation, mixing, and application technology. The company holds leading positions in the oil and gas, power, water, and general industry markets. Sulzer serves customers with over 180 production and service sites in more than 40 countries.
Sulzer at a Glance
Chemtech Separation and mixing technology and associated services We offer separation and mixing technology, process solutions, and field services for the oil and gas, hydrocarbon, and chemical processing industry. Our advanced and economical solutions set standards in the field of mass transfer and static mixing.
Our market focus is on: — High-performing tower internals and separators — Process engineering and skid solutions — Service for towers and static equipment
Pumps EquipmentPump technology and solutionsWe provide a wide range of pumping solutions, related equipment, and services. Customers benefit from extensive research and development. We supply highly efficient products that help reduce emissions and energy consumption. Our state-of-the-art production and testing facilities around the globe ensure customer proximity.
Our market focus is on: — The production, transport, and processing of crude oil and its derivates — The supply, treatment, and transport of water as well as wastewater collection — Fossil-fired, nuclear, and renewable power generation — Specific general industries, e.g., pulp and paper, fertilizers, and other markets
Rotating Equipment Services Service solutions for rotating equipment We offer service solutions for turbines, pumps, compressors, motors, and generators. Customers benefit from reliable and efficient repair and maintenance services. Our technically advanced solutions reduce maintenance time and cost. Access to our global network from one point of contact ensures high-quality local service.
Our market focus is on: — Industrial gas and steam turbines — Turbocompressors — Generators and motors for the marine and rail market, the power market, and many more industries — Pumps in the oil and gas market, the power market, and many more industries
Applicator Systems (as of January 1, 2017)Systems for liquid applications We offer products and services for liquid application and mixing technology. Our customers benefit from advanced solutions in the field of precise applications as well as one- and two-component mixing and dispensing systems. Our global network ensures local knowledge and competence.
Our market focus is on: — Mixing and dispensing systems for the adhesives and dental markets — Precise application systems for liquid color cosmetics and beauty accessories — One- and two-component application systems for healthcare markets

Interview with Peter Löscher, Chairman of the Board of Directors, and Greg Poux-Guillaume, Chief Executive Officer
Sulzer looks back on a rich history of more than 180 years. What, in your opinion, does the Sulzer brand stand for today?
peter löscher | Sulzer has a distinguished industrial history. Throughout its 183 years of existence, the company has experienced significant changes. And what I find particularly impressive: whenever Sulzer has faced a market challenge, the company has been able to reinvent itself and emerge from that phase stronger than before.
greg poux-guillaume | Our brand is very strong. It is a symbol for engineering expertise, high-quality products and solutions, and it stands for innovation. Our people are true experts in their fields and are passionate about what they do. We set ourselves the highest standards in terms of quality. Being a reliable, fast, and trusted partner for our customers is our top priority.
Mr. Poux-Guillaume, you have been CEO for more than a year. Can you draw a conclusion? What was your highlight in 2016?
gpg | 2016 was certainly a year of transformation for us. Sulzer is a great company with high-quality products and services and talented people. I am very proud to be a part of this company and of this management team. Our primary goal is to make Sulzer a sustainable leader in its segments, and we have made good progress towards that.
However, it has also been a tough year. The market environ-ment remains very challenging in oil and gas, which is half of our business. We had to take some difficult but necessary measures to downsize and reposition the company. Looking back at 2016, it was great for me to see that Sulzer remained resilient in a complex market environment with a lot of
headwinds. I believe in the future of Sulzer, and I am excited to lead the team shaping it.
Sulzer’s service offering is growing. How important is the service business for you?
gpg | Our service share has steadily increased over the last few years. We currently generate roughly 50% of our sales in the aftermarket. The service and spare parts business is more resilient in the current market environment, and it tends to have higher margins than the new equipment business. So, yes, service is very important to us and takes a significant position in our strategic thoughts.
pl | The service business is becoming increasingly competi-tive as new equipment volumes wane. Traditional manufactur-ing companies are realizing the immense value of aftermarket services such as maintenance and repairs or long-term service agreements, for instance. And customers are looking for the full package—service partners who are fast, reliable, offer competitive prices, and have the ability to innovate. Sulzer has all that and more.
How was Sulzer’s performance in 2016? Did you reach your targets?
gpg | We did well in a very challenging year. Our order intake decreased to CHF 2.8 billion—a 2% drop due to headwinds from the oil and gas market. Still, Sulzer maintained or even gained market share. Our sales were also down by 2% to CHF 2.9 billion but the comprehensive Sulzer Full Potential (SFP) measures allowed us to save another CHF 88 million. Thus, we were able to mitigate most of the pricing and volume erosion, which lead to an operational profitability that is down by only 30 basis points. We delivered a strong free cash flow above last year’s level in a market where customers had less money and stretched out their payment terms. Overall, we beat our guidance on all of the key performance indicators: we fulfilled our promises. There is still a lot to do, but we are heading in the right direction.
“Sulzer proved resilient in a challenging market environment”
1

pl | Despite these difficult circumstances, we were able to generate value for our shareholders. While our core net income per share was down, we demonstrated our strong cash generation ability despite considerable market headwinds. The Board of Directors is therefore pleased to propose an ordinary dividend that is on last year’s level of CHF 3.50 per share at the Annual General Meeting on April 6, 2017.
The oil and gas market continues to be very demanding for all market players. How do you see the development in this market in 2016?
gpg | Headwinds in the oil and gas market have persisted. The pricing environment continued to deteriorate in 2016 in this market and we do not expect this pressure to abate in 2017. Customers have cut their capital expenditures and operating costs, leading to significant overcapacity in the industry. This tends to make companies more aggressive in terms of pricing as they await the rebound in the cycle.
Towards the end of the year, OPEC decided to cut its oil output and triggered a number of non-OPEC nations to follow this decision. This prospect strengthened the rebound of oil prices to over USD 50, a good development for our industry. But we remain cautious and have not changed the course of our SFP plan. So far, oil production is still sur passing demand and we have not seen an impact on our commercial pipeline. The commercial rebound we are expecting is not just a question of absolute oil prices; it also hinges on the confidence of oil companies in a sustainable recovery of the market.
When do you expect a commercial recovery in the oil and gas market?
pl | As a supplier to the oil and gas industry, we are close to the end of the value chain. When international or national oil companies start investing again, this trend usually transforms into orders for Sulzer six to eight months later. Like many market participants, we expect that supply and demand will
rebalance sometime in the second half of 2017. This means that the commercial rebound for Sulzer’s products and services is more likely to occur in 2018.
How did Sulzer perform in the other markets in 2016?
gpg | In terms of order intake in 2016, we grew in most of our other markets, including power and water. General industry, which encompasses everything else, was also healthy and boosted in part by the acquisitions we closed. Sulzer’s current struggles are oil-and-gas related and we should not lose sight of the fact that the other half of our business is performing well.
What is the status of the Sulzer Full Potential (SFP) program? What did you achieve in 2016?
gpg | Our objective with the SFP program is to save CHF 200 million on a 2018 run rate. Today, more than 90% of those savings have been secured through actions that we have already launched. We announced all significant restructuring measures in 2016. We saved CHF 88 million in 2016, and we expect another CHF 40 to 60 million of savings for 2017. So, SFP is progressing very well. We are ahead of schedule, and we will deliver the numbers we promised to deliver.
pl | We were an early mover in terms of taking out costs and optimizing our factory footprint. We have one of the most comprehensive transformation programs in the industry, and it is generating results, making Sulzer more efficient, agile, and competitive. As soon as volumes recover, this effect will become visible in our bottom line.
Sulzer acquired five businesses in 2016.
gpg | Yes, we have said that we are targeting small to midsize acquisitions at the right price, and we managed to execute on that plan.
“Our aftermarket business is more resilient and tends to have higher margins than new equipment. Sulzer has significant development potential in the service business which is exciting.”
Greg Poux-Guillaume, CEO
2

Peter Löscher, Chairman of the Board of Directors, and Greg Poux-Guillaume, CEO, discussing the past year at Sulzer.
3

Greg Poux-Guillaume looks back on an exciting
yet demanding year at Sulzer.
We more than doubled the size of our applicator business, leading us to carve it out of Chemtech and create a new division. In April, we took over PC Cox, a leading manufacturer of industrial dispensers. We then closed the acquisition of Geka in August. Through this, we diversified our applicator business into the beauty segment and gave it unrivalled industrial scale. Since January 1, 2017, these businesses have been part of our new Applicator Systems division, a leader in proprietary B2B mixing and applicator solutions.
We also grew on the pumps side. In December, we signed an agreement to acquire the pump manufacturer Ensival Moret. With this transaction, we managed to close specific product gaps in our pumps portfolio relating to axial flow pumps and slurry pumps, thereby bringing additional reach to our pumps business in the general industry segments. We also expanded our turbo equipment service footprint by acquiring control of Rotec’s gas turbine service business in Russia. This acquisition makes us a leading player in a promising energy market where localization is a must. Finally, we bought a product range from Wärtsilä to strengthen our upstream separation business in Chemtech.
What is your merger and acquisitions strategy?
pl | We target companies that fill gaps in our product portfolio and strengthen our presence in certain regions or segments. We concentrate on small and midsize acquisitions that can be integrated into our company quickly and where one plus one equals more than two.
gpg | Sulzer has an active and ongoing M&A pipeline, but it is all about value. I believe that our recent track record of deal execution will demonstrate that when we can get the right asset at the right price, we get things done. But we also know when to walk away.
How do you see your competitive landscape evolving and what does it mean for Sulzer?
pl | The flow control industry has all the markings of an industry that should consolidate. Being part of that through an industrial combination that creates significant value is always an option. But our main focus is on our transformation plan. The best value creation lever for our shareholders will remain the implementation of the SFP program. We have supportive, long-term shareholders and our focus is on what we can control.
You said that innovation is a key component of Sulzer’s brand. How do you make sure it remains a priority during your transformation?
gpg | With the introduction of many new products in 2016, we have proven that innovation is and will remain a key pillar of our strategy and our culture. It is true that during a transfor-mation, priorities need to be set. But we have not compro-mised on innovation, and we are celebrating that through the Sulzer Innovation Awards we launched recently. Once a year, we will celebrate outstanding Sulzer innovations and their inventors. Our company is bursting with talent and creativity; it is an inspiration to us all.
4

Peter Löscher wants to make Sulzer an employer of choice for the best talent.
The year 2016 brought many changes in the top manage-ment. Why?
gpg | There is certainly a market dimension to this. Four of our top five competitors in the pumps industry announced a CEO change in 2016. Market conditions change and companies adapt their leadership team to reflect that—much like in sports. In our case, we had a Division President retire and another take an extended leave of absence for family reasons. Our top Human Resources position had also been vacant for six months. And we did not have a Chief Commercial and Marketing Officer. That was a weakness in a challenging commercial environment where Sulzer had to learn to work better as a team. All of this came to a head at the same time and gave us the opportunity to not only strengthen the team but also diversify our talent pool. We believe that we now have the stable, dynamic management team that will take Sulzer to the next level.
pl | The Board of Directors was very pleased to welcome two new members: Axel C. Heitmann and Mikhail Lifshitz. Both have rich experience from their activities as board members and leaders of international companies. They had to step into the large shoes of Klaus Sturany, who did not stand for reelection. And the Board is convinced that with Greg and his team, Sulzer has the right leadership.
Looking ahead, what do you expect for 2017 in terms of financial performance?
gpg | It will be a transition year. We will reach the end of our cost-cutting measures in 2017—before the market rebound we expect for 2018. So, we are expecting a challenging year during which we will work hard to maintain volumes and to protect our profitability while we complete our transformation. But it is all about execution, and 2016 gives us solid reasons to believe that Sulzer can and will execute.
Mr. Löscher, what is your vision for Sulzer?
pl | Sulzer will be an employer of choice for the best talent and a preferred partner to our customers. We are creating an agile organization that can adapt quickly to changing market conditions. And we will grow profitably. I am convinced that Sulzer’s strong brand, its passionate employees, and its extraordinary products and solutions are the key ingredients to overcoming these challenging times. We are well on the way to achieving our goals, and we will continue to follow this path with all our energy.
“We always strive for something more with our products and solutions. Being a reliable, fast, and trusted partner for our customers is our top priority.”
Peter Löscher, Chairman of the Board of Directors
5

SERVICE EXCELLENCE THROUGH INNOVATION
Sulzer offers a variety of services for rotating equipment and equipment used in separation technology.
The company’s professional service team, global footprint, and one-stop offering make Sulzer a reliable and fast service partner.
Sulzer’s one-stop services help customers save time and money, and they increase the reliability, performance, and efficiency of their equipment.
Service Fields Core CompetenciesCustomer Benefits
8 2214
Dashboard6 Sulzer—Annual Report 2016
APACAME
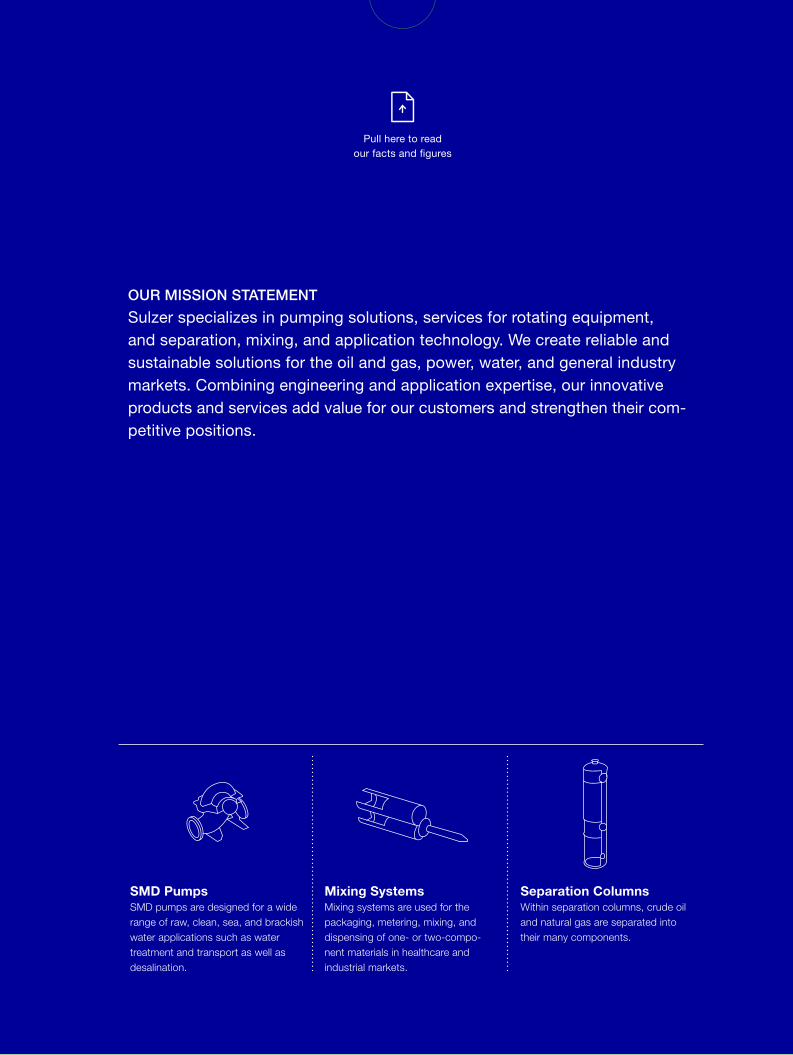
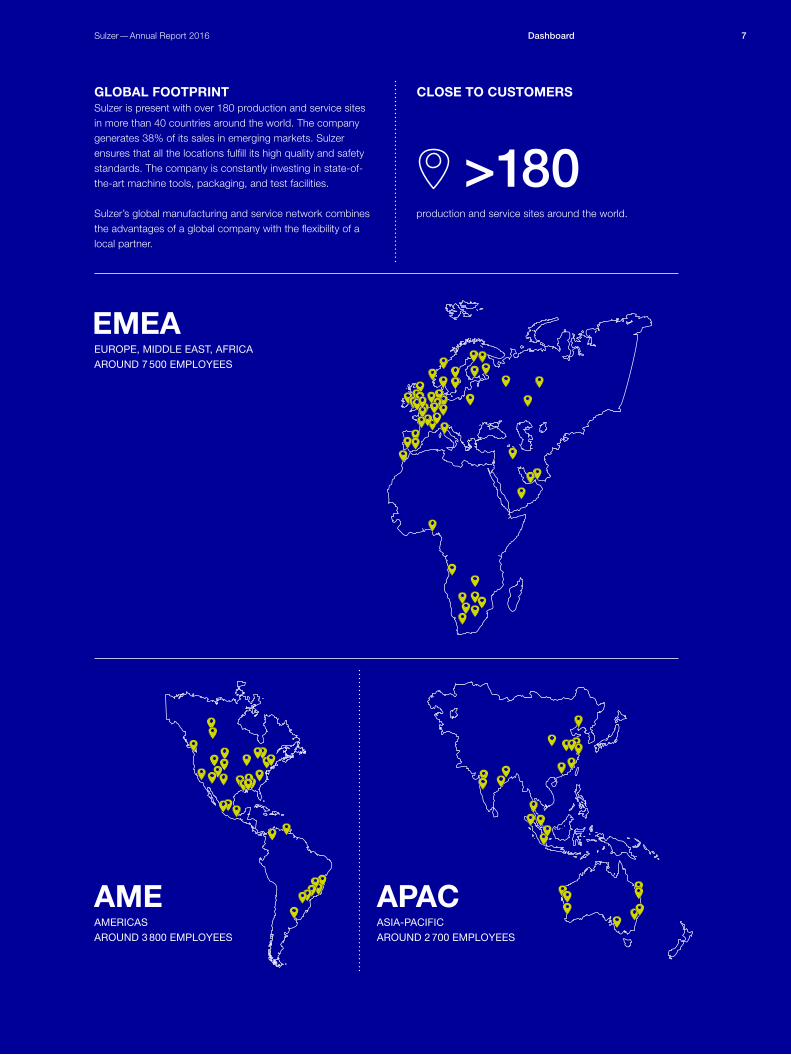
EUROPE, MIDDLE EAST, AFRICA AROUND 7 500 EMPLOYEES
AMERICASAROUND 3 800 EMPLOYEES
ASIA-PACIFICAROUND 2 700 EMPLOYEES
EMEA
GLOBAL FOOTPRINT Sulzer is present with over 180 production and service sites in more than 40 countries around the world. The company generates 38% of its sales in emerging markets. Sulzer ensures that all the locations fulfill its high quality and safety standards. The company is constantly investing in state-of-the-art machine tools, packaging, and test facilities.
Sulzer’s global manufacturing and service network combines the advantages of a global company with the flexibility of a local partner.
production and service sites around the world.
>180
CLOSE TO CUSTOMERS
7DashboardSulzer—Annual Report 2016

SERVICEFIELDS
Service Fields8 Sulzer—Annual Report 2016
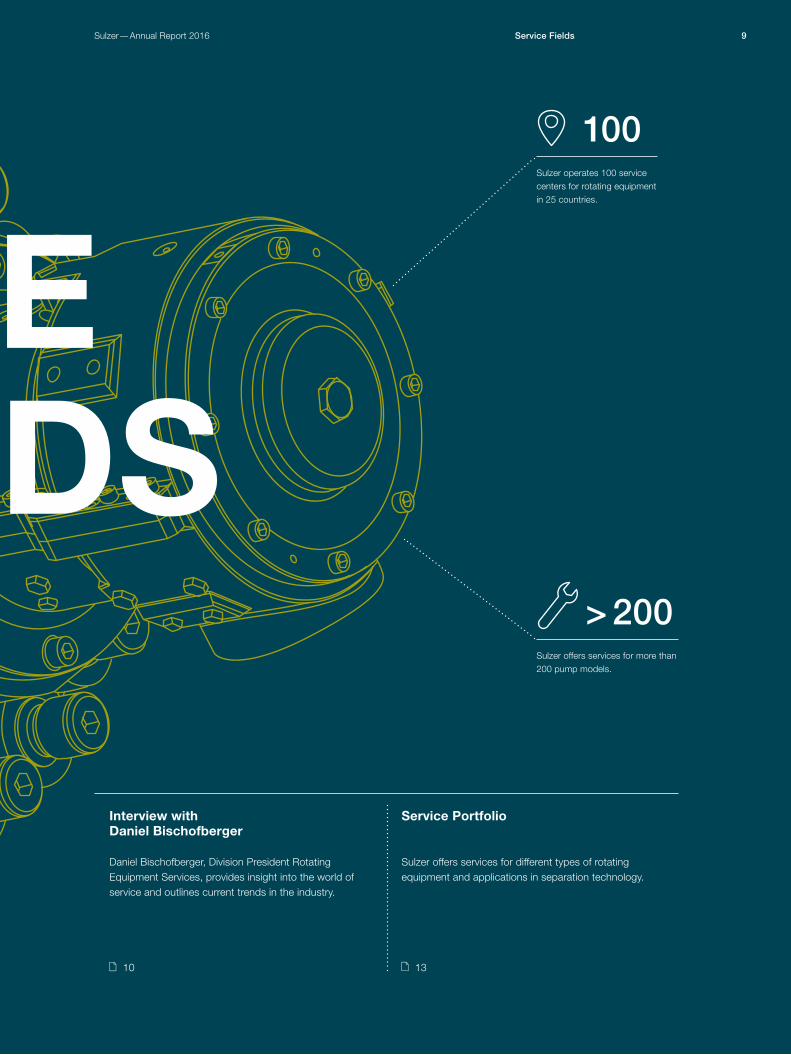
Daniel Bischofberger, Division President Rotating Equipment Services, provides insight into the world of service and outlines current trends in the industry.
Sulzer offers services for different types of rotating equipment and applications in separation technology.
Interview withDaniel Bischofberger
Service Portfolio
Sulzer operates 100 service centers for rotating equipment in 25 countries.
100
> 200Sulzer offers services for more than 200 pump models.
10 13
SERVICEFIELDS
9Service FieldsSulzer—Annual Report 2016

Daniel Bischofberger, the new President of Sulzer’s Rotating Equipment Services division, talking about customer needs and trends in the service business.
Service Fields10 Sulzer—Annual Report 2016

Interview with Daniel Bischofberger, Division President Rotating Equipment Services
“ The service business is becoming increasingly innovative”
Having been in office for a few months, Daniel Bischofberger explains what customers expect from a service supplier, why a global network and a professional team are critical, and how the service business is changing.
In today’s service industry, what are customers looking for?
daniel bischofberger | The needs of customers in our industry do not differ much from what every one of us demands from a service supplier. When people buy a product, they want it to run when they need it to run, and they need the product to work the way it is supposed to work. And the costs should be as low as possible. Customers are looking for service providers who possess the tools, equipment, and expertise to make sure that their machine is running reliably and efficiently at optimized costs.
How does Sulzer differentiate itself from other competitors?
db | Sulzer combines the best of two worlds: The company has the technical expertise of an original equipment manufac-turer (OEM) and the competencies of an independent service provider (ISP). We are flexible and fast. With our network of roughly 100 service centers in 25 countries, we are close to our customers. In addition, our product and service portfolio is exceptionally broad.
Can you give an example?
db | One of our customers relocated the gas and steam turbines of two different plants to a new combined-cycle
power plant at a different site. However, the performance of the steam turbines was not compatible with that of the gas turbine. Hence, the steam turbines had to be rerated, which means that the performance had to be adjusted. This requires know-how you would normally expect from an OEM but not from an ISP. Thanks to the competence of our team in Houston, we completed the job to the customer’s fullest satisfaction. This example shows that we are able to provide services for a broad range of products, and we have the technical expertise to do more for our customers than they normally expect from an ISP.
Sulzer has consolidated its service business. What does that mean?
db | We are becoming a one-stop service supplier. We are establishing service centers where we can repair a range of different products under one roof. That way, operators have one access point for the service of all their rotating equipment. Now that the service and new equipment businesses are in different divisions, we have to ensure that the close collaboration and knowledge exchange remain as strong as they were when they were both in the same division. For example, the pumps service teams need to share their field experience from our installed pumps base with our colleagues in product development to further optimize our pump designs.
“We combine the best of two worlds: the world of the original equipment manufacturer and the world of the independent service provider.”
11Service FieldsSulzer—Annual Report 2016

Daniel Bischofberger joined Sulzer in September 2016. Most recently, he ran the Power Products division at ABB Switzerland. Daniel Bischofberger has extensive experience in rotating equipment service, having previously led the ABB/Alstom (now GE) gas turbine service business out of Switzerland. He started his career as a commissioning engineer for gas turbine power plants in the US and Libya. He holds a Master’s degree in industrial engineering from the Swiss Federal Institute of Technology (ETH), Zurich, Switzerland, and a Master of Business Administration (MBA) from Insead, Fontainebleau, France. Daniel Bischofberger is Swiss, married, and has three children.
Daniel Bischofberger
What trends do you see in the service industry?
db | New players are entering the market, which results in growing competition but also in growing innovation. On the customer side, we see that operators are increasingly optimizing their maintenance and operation costs. This does not necessarily mean “the same but cheaper.” It also includes services enabled by digitalization, such as monitoring and maintaining equipment proactively, prolonging maintenance intervals, reducing revision time, and developing innovative repair technology to extend the lifetime of products and components. Because some customers are streamlining their organizations, they expect their service partner to take over activities they cannot perform in house anymore.
Based on your extensive experience, where do you see Sulzer’s potential?
db | We have a strong regional footprint, but we can improve in our exchange of skills and knowledge among these regions. We have to leverage the best practices of a global company and copy from each other with pride. We are working on a global growth strategy for our service ranges—turbo services, pumps services, and electromechanical services. Further, in order to be even closer to our customers, we plan to estab-lish more multipurpose service centers where we provide a variety of different services under one roof. We still have some work to do when it comes to collecting data from our installed pumps base more systematically, reducing the leadtime of pumps spares, and better integrating the motors and genera-tors business. Regionally speaking, I see growth potential for our service business in Asia.
Which skills do you expect from a service employee?
db | Service is a people business. A professional service team is essential for us. There are three skill sets that I—and our customers —expect from a service employee. First: customer focus and entrepreneurship. You have to be able to listen to customers, to ask the right questions, and to find the right solution with them. Second: flexibility. As a service supplier, you need to be available around the clock, and you need to be fast, reliable, hands-on, and pragmatic. Third: technical competence and practical experience. Because every product behaves differently in the field, theoretical knowledge is required but usually not sufficient.
Are there women in the service business?
db | Far too few [laughs]. Unfortunately, the industrial service business—we are active in markets such as oil and gas, power, or mining—attracts fewer women than other markets. In addition, many of our employees work on the shop floor as mechanics and on customers’ sites as field service engineers. These kinds of jobs traditionally have a lower share of women. Fortunately, there are many women in functions like sales, HR, finance, or engineering at Sulzer. Despite the difficulties in attracting more women, I truly believe in the power of diversity. We continue to strive for a higher share of women in our businesses, be it in white- or blue-collar functions.
“We are becoming a one-stop service supplier. We are establishing service centers where we can repair a range of different products under one roof.”
Service Fields12 Sulzer—Annual Report 2016
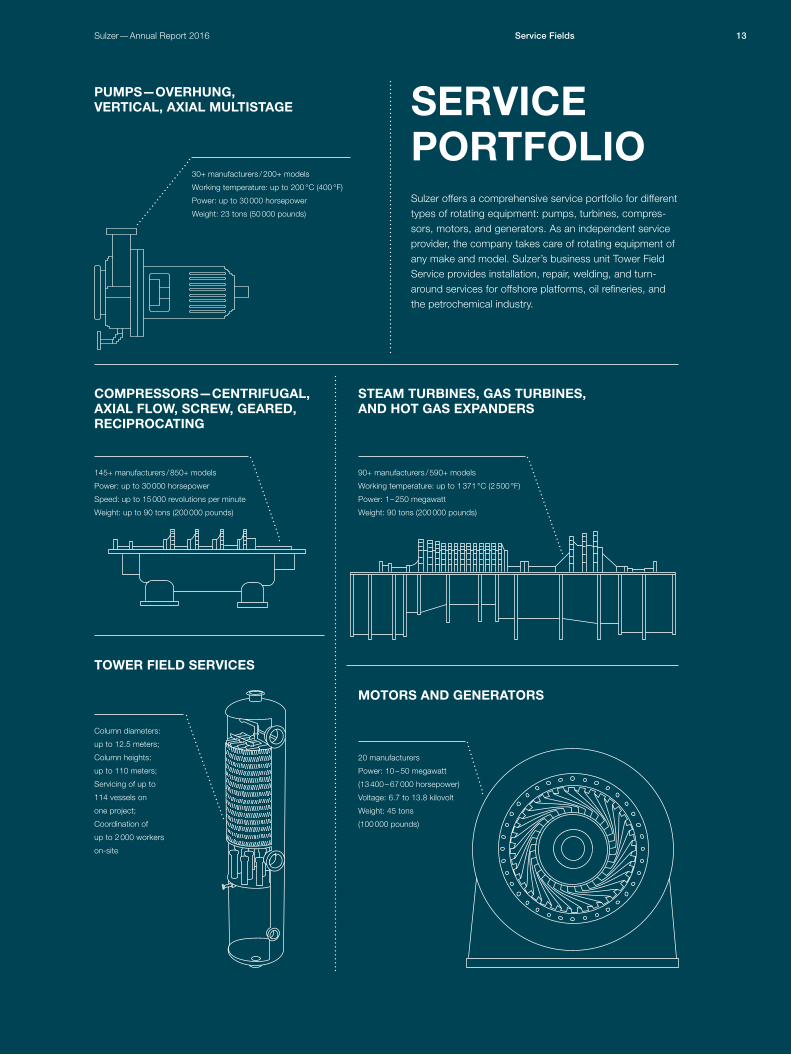
Sulzer offers a comprehensive service portfolio for different types of rotating equipment: pumps, turbines, compres-sors, motors, and generators. As an independent service provider, the company takes care of rotating equipment of any make and model. Sulzer’s business unit Tower Field Service provides installation, repair, welding, and turn-around services for offshore platforms, oil refineries, and the petrochemical industry.
SERVICE PORTFOLIO
MOTORS AND GENERATORS
STEAM TURBINES, GAS TURBINES, AND HOT GAS EXPANDERS
COMPRESSORS—CENTRIFUGAL, AXIAL FLOW, SCREW, GEARED, RECIPROCATING
TOWER FIELD SERVICES
PUMPS—OVERHUNG, VERTICAL, AXIAL MULTISTAGE
90+ manufacturers / 590+ models
Working temperature: up to 1 371 °C (2 500 °F)
Power: 1 – 250 megawatt
Weight: 90 tons (200 000 pounds)
145+ manufacturers / 850+ models
Power: up to 30 000 horsepower
Speed: up to 15 000 revolutions per minute
Weight: up to 90 tons (200 000 pounds)
20 manufacturers
Power: 10 – 50 megawatt
(13 400 – 67 000 horsepower)
Voltage: 6.7 to 13.8 kilovolt
Weight: 45 tons
(100 000 pounds)
Column diameters:
up to 12.5 meters;
Column heights:
up to 110 meters;
Servicing of up to
114 vessels on
one project;
Coordination of
up to 2 000 workers
on-site
30+ manufacturers / 200+ models
Working temperature: up to 200 °C (400 °F)
Power: up to 30 000 horsepower
Weight: 23 tons (50 000 pounds)
13Service FieldsSulzer—Annual Report 2016
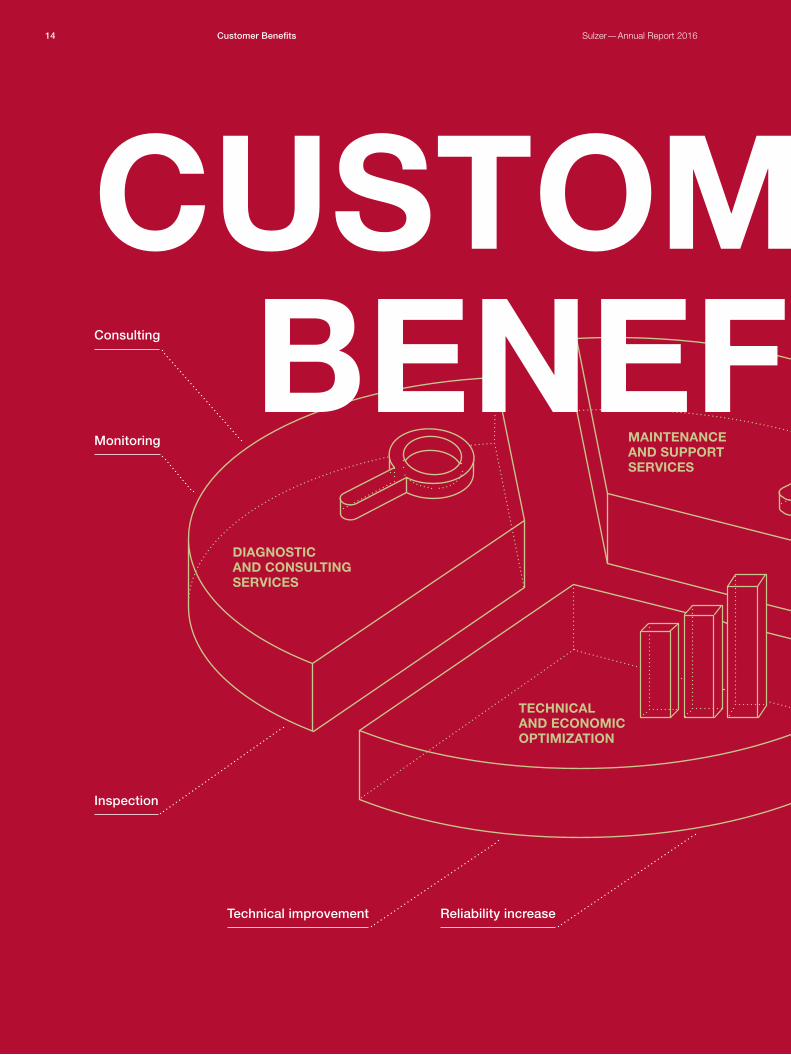
TECHNICAL AND ECONOMIC OPTIMIZATION
DIAGNOSTIC AND CONSULTING SERVICES
MAINTENANCE AND SUPPORT SERVICES
Inspection
Monitoring
Consulting
CUSTOMER
Reliability increaseTechnical improvement
BENEFITS
Customer Benefits14 Sulzer—Annual Report 2016

Workshop services
On-site services
Spare parts
CUSTOMER
Economic optimization
BENEFITS
Sulzer’s one-stop services to upgrade and protect a separation column of an oil refinery in Spain helped the customer save time and money.
Sulzer provides manifold services such as diagnostics and consulting, technical and economic optimization, and maintenance and support.
Sulzer’s data management toolkit identifies unreliable and inefficient pumps in near real time.
One-Stop Services for Separation Columns Minimize Shutdown Time
Dedicated Service Solutions for Rotating Equipment
Using the Power of Data
16 2120
15Customer BenefitsSulzer—Annual Report 2016

In oil refineries such as the Repsol Tarragona facility, crude oil is separated into its many components.
Customer Benefits16 Sulzer—Annual Report 2016
The massive size of oil refineries is a contrast to what happens inside the columns: Finely built trays and other internals separate crude oil and natural gas into heating oil, gasoline, and other valuable substances. Oil consists of up to 17 000 components; separating them is a complex under taking. Distillation columns play a central part in this process. They consist of many separation stages, where trays and other internals are used.
Separating oil into its many componentsThe oil is pumped into a furnace and then heated to 400°C. The various components of the oil evaporate and rise in the tower. The component parts, called fractions, are collected and extracted at the same level as their conden sation points. Because heavy oil consists of relatively large molecules, it already condenses at high temperatures and can be drawn off in the lower part of the column. Light distillates and gases made up of much smaller molecules only condense with decreasing temperatures. They are extracted at higher levels of the column.
One-Stop Services for Separation Columns Minimize Shutdown Time
In Repsol’s Tarragona refinery in Spain, one of the main separation columns needed to be modernized during a shutdown. Sulzer was able to provide the complete solution to upgrade and to protect the columns from corrosion. The comprehensive service from a single source saved the customer a significant amount of money and time.
The same process is used in the petrochemical industry. After the crude oil is separated in the refinery, the oil and gas components are once again separated. The results are chemicals and base materials for the plastics industry.
Keeping up with industry standards Refineries are continuously undergoing modernization to keep up with industry standards and to improve energy efficiency. Being able to offer the latest technology and to perform on-site work safely and on time is the foundation for a good and long-lasting cooperation with customers. Tower Field Service, a business unit within the Chemtech division, performs turnarounds on customer sites.
Sulzer supported Repsol Tarragona in their major refinery upgrade. The customer decided to award the service contract to Sulzer because the company was able to provide the complete solution—modernizing the separation column and protecting it from corrosion. The revamp was performed during a planned maintenance shutdown in summer 2016.
Every day countsDuring the shutdown, Sulzer’s Tower Field Service team worked inside the columns. The service representatives dismantled the existing separation trays and packings. Afterward, they applied an upgraded metallurgy to the shell
—a so-called weld overlay—and installed the new, Sulzer- manufactured equipment. Weld overlay is a welding process where one or more metals with specific characteristics are applied to a base metal. In this way, it protects the column against corrosion and erosion. In 2015, Sulzer acquired InterWeld, a specialized automated weld overlay company, and it has recently developed state-of-the-art equipment that can operate in extreme conditions.
17Sulzer—Annual Report 2016 Customer Benefits

“ Planning and executing large projects is a fascinating job”
Rodolfo Amezquita talking to his team at a customer’s site.
Rodolfo Amezquita comes from Mexico and has been working with Sulzer for seven years. He is Sales Manager in the Tower Field Service team within Sulzer’s Chemtech division. In his job, he carries out large turnaround projects for the oil and gas down-stream and the chemical industry in Latin America. In these service projects, he coordinates thousands of workers on-site:
“One of our recent projects was a large turnaround of a refinery in Latin America. We performed an extensive refurbishment of two catalytic units and were fully responsible for all the equipment: towers, heaters, exchangers, fin fans, piping, and drums. We even did some civil engineering by building a small overhead walkway in one of the units.
The biggest challenges in this project were the lack of local supplies and equipment as well as the coordination of over 1 000 workers. We had to find vendors in larger cities to meet the demands of the project. We coordi-nated the employees by dividing the work by units and tasks. Lead supervisors were responsible for the day-to-day tasks and for updating their progress daily. We were all happy in the end. We managed to success-fully finish this project with a magnitude of more than 400 000 man-hours on time and without a safety incident. For me, it is really a fascinating job to plan and execute such large projects.”
18 Sulzer—Annual Report 2016Customer Benefits
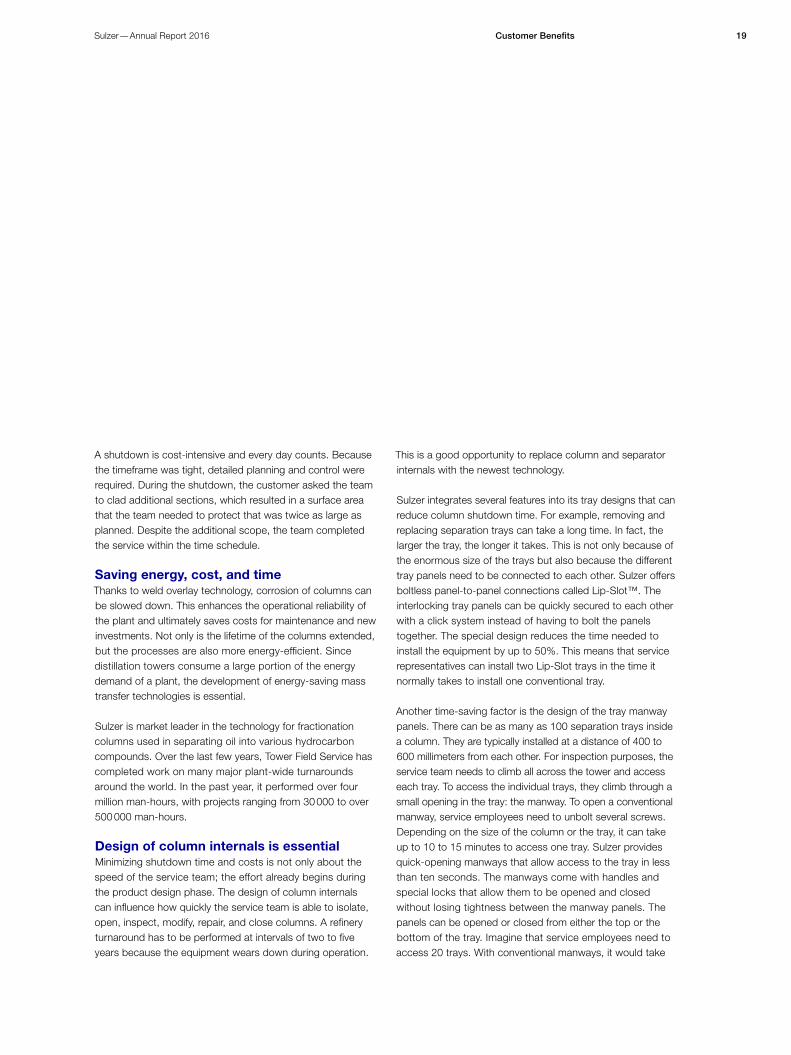
A shutdown is cost-intensive and every day counts. Because the timeframe was tight, detailed planning and control were required. During the shutdown, the customer asked the team to clad additional sections, which resulted in a surface area that the team needed to protect that was twice as large as planned. Despite the additional scope, the team completed the service within the time schedule.
Saving energy, cost, and timeThanks to weld overlay technology, corrosion of columns can be slowed down. This enhances the operational reliability of the plant and ultimately saves costs for maintenance and new investments. Not only is the lifetime of the columns extended, but the processes are also more energy-efficient. Since distillation towers consume a large portion of the energy demand of a plant, the development of energy-saving mass transfer technologies is essential.
Sulzer is market leader in the technology for fractionation columns used in separating oil into various hydrocarbon compounds. Over the last few years, Tower Field Service has completed work on many major plant-wide turnarounds around the world. In the past year, it performed over four million man-hours, with projects ranging from 30 000 to over 500 000 man-hours.
Design of column internals is essentialMinimizing shutdown time and costs is not only about the speed of the service team; the effort already begins during the product design phase. The design of column internals can influence how quickly the service team is able to isolate, open, inspect, modify, repair, and close columns. A refinery turnaround has to be performed at intervals of two to five years because the equipment wears down during operation.
This is a good opportunity to replace column and separator internals with the newest technology.
Sulzer integrates several features into its tray designs that can reduce column shutdown time. For example, removing and replacing separation trays can take a long time. In fact, the larger the tray, the longer it takes. This is not only because of the enormous size of the trays but also because the different tray panels need to be connected to each other. Sulzer offers boltless panel-to-panel connections called Lip-Slot™. The interlocking tray panels can be quickly secured to each other with a click system instead of having to bolt the panels together. The special design reduces the time needed to install the equipment by up to 50%. This means that service representatives can install two Lip-Slot trays in the time it normally takes to install one conventional tray.
Another time-saving factor is the design of the tray manway panels. There can be as many as 100 separation trays inside a column. They are typically installed at a distance of 400 to 600 millimeters from each other. For inspection purposes, the service team needs to climb all across the tower and access each tray. To access the individual trays, they climb through a small opening in the tray: the manway. To open a conventional manway, service employees need to unbolt several screws. Depending on the size of the column or the tray, it can take up to 10 to 15 minutes to access one tray. Sulzer provides quick-opening manways that allow access to the tray in less than ten seconds. The manways come with handles and special locks that allow them to be opened and closed without losing tightness between the manway panels. The panels can be opened or closed from either the top or the bottom of the tray. Imagine that service employees need to access 20 trays. With conventional manways, it would take
19Sulzer—Annual Report 2016 Customer Benefits

In a pump station, everything comes down to efficiency, performance, and reliability. For customers throughout the industry, optimizing their pumps is a priority. Sulzer offers a data management toolkit that identifies unreliable and inefficient pumps in near real time.
In today’s fast-paced environment, oil and gas, power, and water companies are constantly pressured to reduce costs and increase throughput. However, many face a challenge: they do not know how energy efficient their pumps really are. Collecting and analyzing data is a complex and time-consuming process. Nevertheless, unless it is done, there is no way to be able to identify and improve energy efficiency. Besides, the farther away a pump operates from the best efficiency point, the higher its vibration and the more frequent the outages are.
Sulzer has developed a data management toolkit called Blue Box™. Blue Box helps customers optimize their pumps’ productivity and reliability. It consists of three modules:
1) Data acquisition: Data is collected to be able to evaluate the actual efficiency and reliability of the equipment.
2) Data analysis: A customized dashboard enables customers—with the help of Sulzer experts—to analyze the data. In this way, they can identify unreliable and inefficient pumps.
3) Targeted actions: Based on the analysis—which includes information about payback time—the customers can decide if they want to modernize the equipment through a retrofit.
An example from a North American pipeline company illustrates to what extent energy efficiency directly affects costs. Data, mastered by Blue Box, revealed that the efficiency of the pipeline pumps suddenly dropped by 5% from one day to the next. This resulted in an increase in energy costs of half a million US dollars every year. Only if these efficiency gaps are visible can customers make well-informed decisions and initiate measures.
Data can support customers in identifying unreliable and inefficient pumps.
Using the Power of Data
them about five hours. With a quick-opening system, the same can be done within one hour. This time-saving techno logy leads to significant cost savings in turnaround projects.
Equipment in over 100 000 columns all over the worldSulzer offers more than 200 innovative and high-performance products for separation and mixing technology. They are installed in over 100 000 columns, 40 000 gas/liquid separators, and 100 000 mixers around the world.
In addition to separation, reaction, and mixing technology, Sulzer supplies pumps for refineries and petrochemical plants. The company also provides comprehensive repair and maintenance of gas and steam turbines as well as compressors, which increases reliability and equipment availability.
www.sulzer.com/bluebox
20 Sulzer—Annual Report 2016Customer Benefits
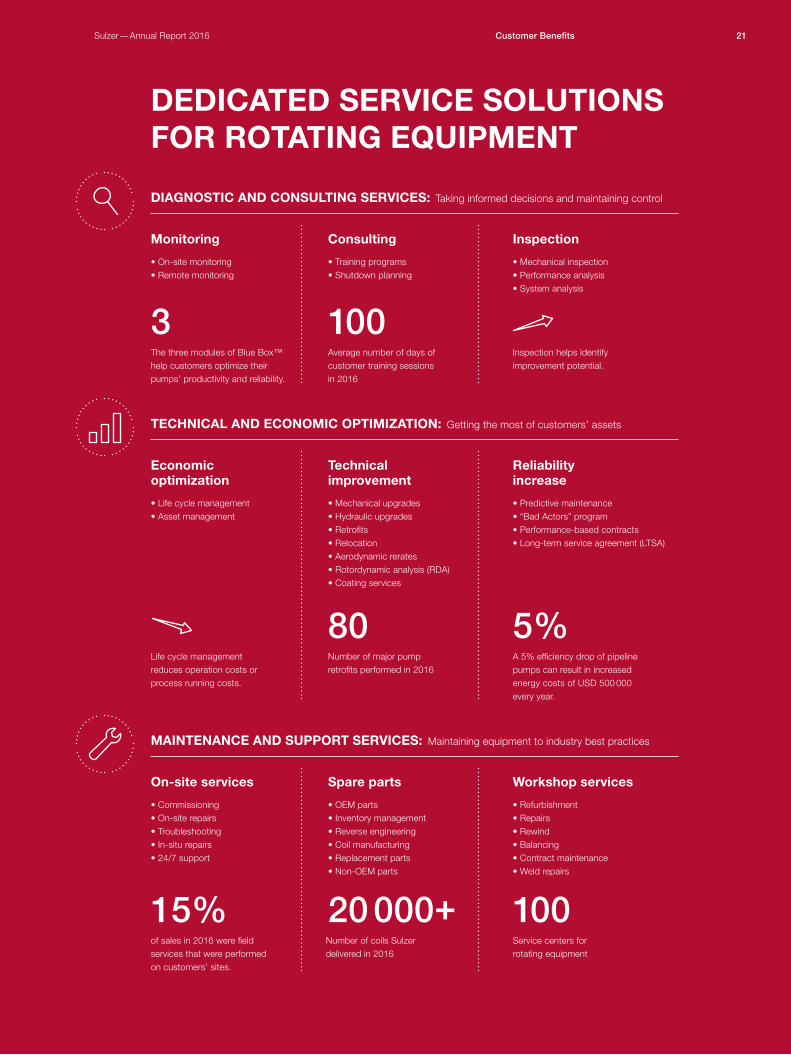
DEDICATED SERVICE SOLUTIONS FOR ROTATING EQUIPMENT
ConsultingMonitoring Inspection
• Training programs • Shutdown planning
• On-site monitoring • Remote monitoring
• Mechanical inspection • Performance analysis • System analysis
Spare partsOn-site services
• OEM parts • Inventory management • Reverse engineering • Coil manufacturing • Replacement parts • Non-OEM parts
• Commissioning • On-site repairs • Troubleshooting • In-situ repairs • 24/7 support
Workshop services
• Refurbishment • Repairs • Rewind • Balancing • Contract maintenance • Weld repairs
Economic optimization
• Life cycle management • Asset management
Technical improvement
• Mechanical upgrades • Hydraulic upgrades • Retrofits • Relocation • Aerodynamic rerates • Rotordynamic analysis (RDA) • Coating services
Reliability increase
• Predictive maintenance • “Bad Actors” program • Performance-based contracts • Long-term service agreement (LTSA)
DIAGNOSTIC AND CONSULTING SERVICES:
TECHNICAL AND ECONOMIC OPTIMIZATION:
MAINTENANCE AND SUPPORT SERVICES:
Taking informed decisions and maintaining control
Getting the most of customers’ assets
Maintaining equipment to industry best practices
15%
80
20 000+
1003
5%
100
Life cycle management reduces operation costs or process running costs.
of sales in 2016 were field services that were performed on customers’ sites.
Number of major pump retrofits performed in 2016
Number of coils Sulzer delivered in 2016
Average number of days of customer training sessions in 2016
Inspection helps identify improvement potential.
The three modules of Blue Box™ help customers optimize their pumps’ productivity and reliability.
A 5% efficiency drop of pipeline pumps can result in increased energy costs of USD 500 000 every year.
Service centers for rotating equipment
21Customer BenefitsSulzer—Annual Report 2016

The massive size of modern, industrial gas turbine rotors means that a repair facility must be equipped with cutting-edge machines. In Sulzer’s Houston Service Center, all makes and models of turbomachinery can be repaired on a floor space of 25 700 m².
CORE COMPETENCIES25 700 m²
Core Competencies22 Sulzer—Annual Report 2016

The state-of-the-art lathe was built to accommodate large gas turbine rotors that weigh up to 90 tons.
CORE COMPETENCIES
90 t
Sulzer is one of a few service suppliers with the expertise, precision, and equipment to repair the world’s largest industrial gas turbines.
Sulzer provides high-quality, fast, and cost-effective service solutions. The key to this is the company’s professional service team, its global footprint, and its one-stop offering.
With its fast-track process, Sulzer is able to replace turbocompressors for wastewater plants within 36 hours and to boost energy efficiency by up to 50%.
Repairing the World’s Largest Industrial Gas Turbines
The Key to Success
Boosting Energy Efficiency by up to 50% in 36 Hours
24 2926
23Core CompetenciesSulzer—Annual Report 2016

When they need to be repaired, the latest and largest turbine rotors are placed in this new lathe. They can weigh up to 90 tons.
Core Competencies24 Sulzer—Annual Report 2016
Imagine a hall the size of one and a half football fields. After stepping through the giant gate and looking inside, you see a massive crane that can lift compressor and turbine sections 50 meters into the air. Looking around, you see a balancing machine, capable of balancing rotors that weigh up to 82 tons. In comparison, a five-ton African elephant, the heaviest living land animal in the world, is a lightweight. There is another impressive machine that spans across more than 20 meters. It is a state-of-the-art, versatile lathe that was built to accommodate large gas turbine rotors with a capacity of 90 tons.
The plant where all this is set up is called Big Bay 3. Big Bay 3 is part of Sulzer’s Houston Service Center located in La Porte, Texas, USA. At 25 700 m², it is the company’s largest facility for rotating equipment repair. The Houston Service Center specializes in maintenance and repairs of all makes and models of turbomachinery.
Bigger turbines to satisfy increasing demandThe global energy demand is increasing. This puts the power generation industry under pressure to produce more energy in a more efficient way. As a result, industrial gas turbines are becoming bigger and bigger, and their technology has significantly developed over the last 50 years. Manufacturers
Repairing the World’s Largest Industrial Gas Turbines
Big Bay 3 is Sulzer’s largest facility for rotating equipment repair. The company is one of a handful of service suppliers with the expertise, precision, and equipment to repair the world’s largest industrial gas turbines.
are compelled to develop much larger turbines designed for uninterrupted operations.
From natural gas to energyGas turbines are used in power plants to convert natural gas into mechanical energy. This energy drives a generator that produces electrical energy. Power lines then transport the energy to homes and businesses.
In a gas turbine, air enters the compressor section that is made up of numerous blades. As the rotor turns, the air runs through the blades and is compressed. This compressed air then enters the combustion section and is mixed with a fuel such as natural gas or fuel oil. It is then ignited in the combustion section, and travels as hot gas into the turbine section. The hot gas moves through blades in the turbine and causes them to spin. Because the turbine is coupled to a generator, this rotation drives the generator. The generator then converts the mechanical energy into electricity.
Suitable equipment to handle large refurbishment projectsIndustrial gas turbines that operate in these environments require periodic repairs. Turbine operators need a one-stop service facility where maintenance providers are able to deliver a complete repair. The massive size of modern, industrial gas turbine rotors means that a repair facility must be equipped with cutting-edge equipment capable of lifting, balancing, and machining a fully assembled rotor. Having the appropriate large-scale equipment to handle these turbine rotor refurbish-ments is critical to the processes and workflow involved in the repair process. In the past, cranes and lathes that could accommodate approximately 55 tons were adequate, but as the output capacity of industrial gas turbines has increased, so has the weight of the rotors. With Big Bay 3, Sulzer is one
25Sulzer—Annual Report 2016 Core Competencies

Boosting Energy Efficiency by up to 50% in 36 Hours
Many wastewater treatment plants are aging. Hence, operators not only experience growing operating costs, but also face the risk of equipment failure. The failure of a single blower or compressor may jeopardize the functioning of the entire wastewater treatment plant. With the recently launched fast-track process, Sulzer can ship its highly efficient HST turbocompressors to a plant within 36 hours and help boost energy efficiency by up to 50%.
Back in operation and more efficient than beforeOld blowers and compressors consume a large part of the total energy of a wastewater treatment plant. One option is to repair or replace them one for one with the same make and model. The other, more economic option is to replace them with the Sulzer HST turbo-compressor. This compressor type reduces the energy costs for aeration by up to 50% and offers a payback as short as two years.
From Finland to Switzerland in less than two daysERZO, a waste disposal company in Switzerland, required an update of the electronics of an HST turbo-compressor that has been in operation for almost 20 years. Lately, the operator had to switch to manual use on a regular basis to ensure sufficient air supply for the biological process of the facility. Initially, the operator planned to update the turbocompressor with a new electronic system. Because of Sulzer’s fast-track process, the customer decided to replace the old turbocompressor. Within 36 hours, Sulzer delivered its HST compressor from its factory in Finland to Switzerland and installed it at the customer’s plant. Adrian Burkart, Division Manager ARA ERZO, said, “Thanks to the fast replacement, we were able to ensure efficiency and environmental water protection within 36 hours.”
of a handful of service suppliers who has the equipment and expertise to service such large machines.
How do you repair a gas turbine that weighs 80 tons? In heavy industrial machines such as gas turbines and electric generators, vibration is a frequent problem, because it can cause catastrophic failure and noise. By repairing and balancing the rotor, vibration can be avoided. But how do you repair a gas turbine rotor that can easily weigh as much as 16 elephants?
The repair process begins with the inspection of the rotor using the balance machine. This machine can identify any unbalance issues. After the initial balance run, the rotor is then placed into V-blocks (runout stands) and is rotated. This allows the service employee to inspect the rotor critically. Based on these first inspections, engineers decide if the rotor needs to be disassembled.
If this should be the case, it is placed in a stacking pit. For this, a large crane is necessary. Once the rotor is disassembled, the service team inspects the individual components of the respective compressor or turbine parts. Each part is thoroughly examined and inspected in detail for reuse or specialized repairs (such as replacing blades or coating compressor disks). The individual disks go through concentricity checks and are balanced in a horizontal balance stand before being reassembled. After the individual com ponents are qualified, each section is dynamically balanced and prepared for assembly. After reassembly, the compressor section and the turbine section are placed in the lathe to check runouts and correct the rotor if necessary. Each rotor section is then rechecked for balance before it returns to the stacking pit where the major sections are mated. The complete rotor is then ready for final checks and dynamic balancing before being shipped back to the customer.
Minimizing downtime and costFor the customer, speed of repair and minimizing downtime is crucial. With suitable shop facilities and equipment, it is a relatively straightforward task to deal with a single rotor. Coordinating the repairs to multiple rotors and minimizing the time between each stage is a more complicated issue. Today’s repair specialists use systematic planning, have excellent project management skills, and possess a range of versatile equipment to deliver cost-effective, timely, and successful projects.
Over the past year, Sulzer has provided services for around 70 gas turbines in its La Porte facility. Roughly 30 service employees ensure that these large projects are carried out in a timely and cost-effective manner.
www.sulzer.com/36hours
26 Sulzer—Annual Report 2016Core Competencies
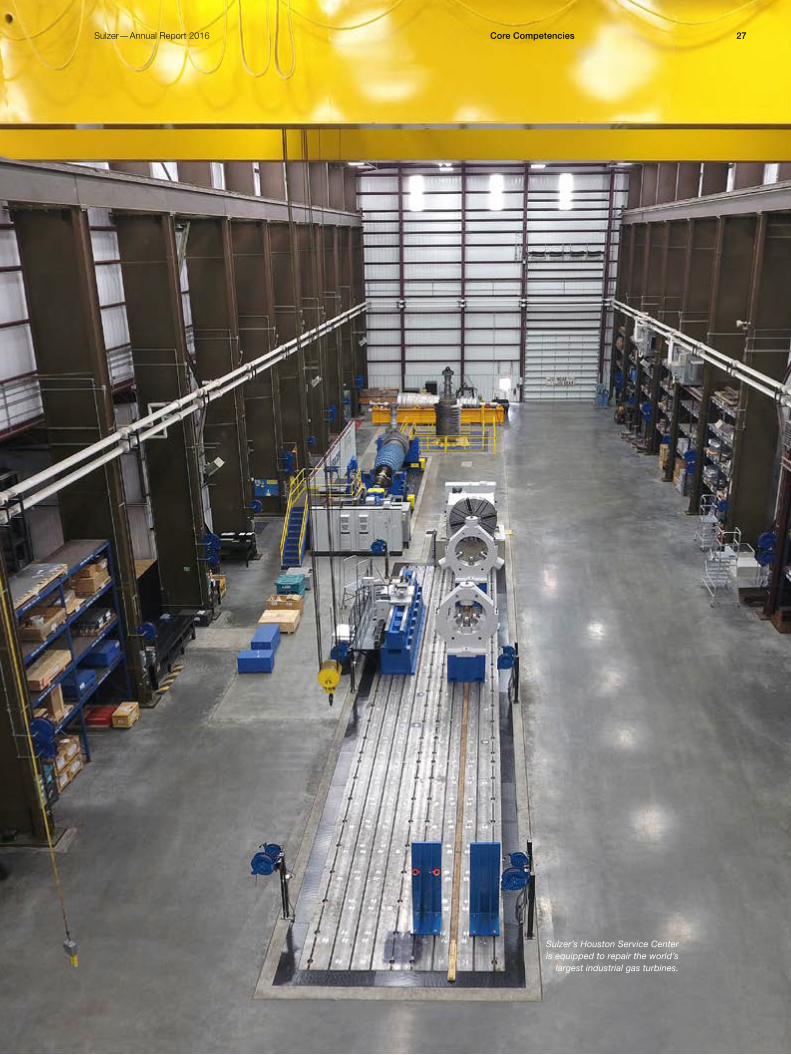
Sulzer’s Houston Service Center is equipped to repair the world’s
largest industrial gas turbines.
27Sulzer—Annual Report 2016 Core Competencies
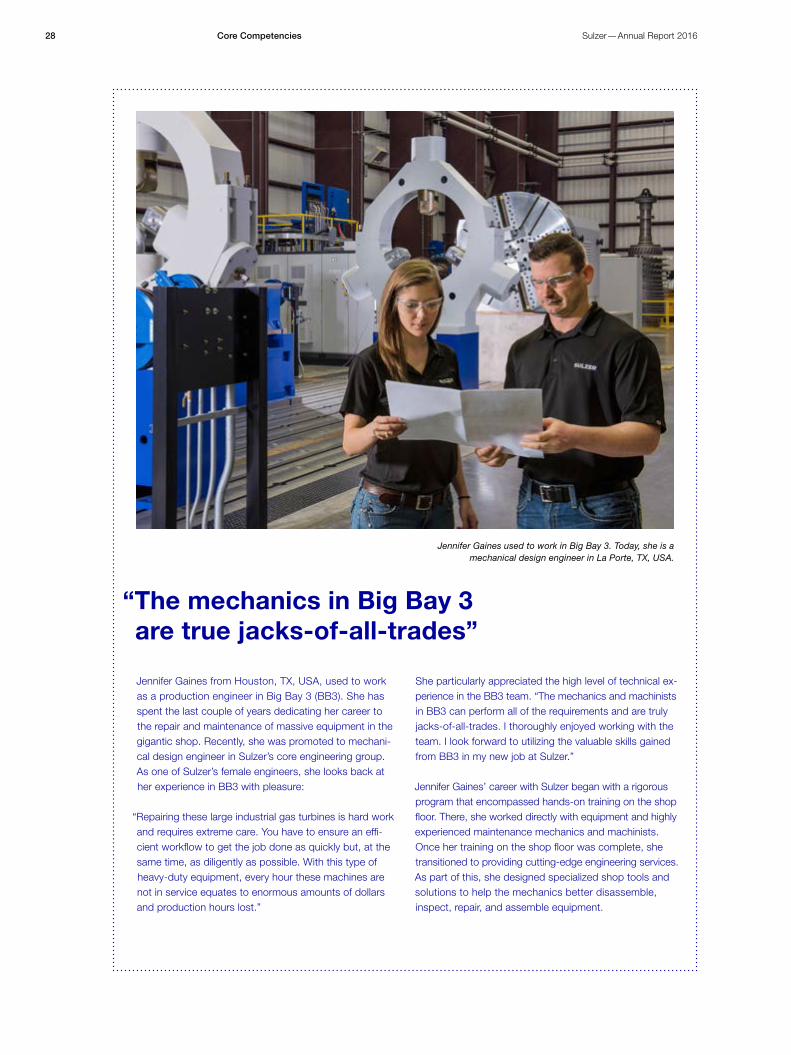
“ The mechanics in Big Bay 3 are true jacks-of-all-trades”
Jennifer Gaines used to work in Big Bay 3. Today, she is a mechanical design engineer in La Porte, TX, USA.
Jennifer Gaines from Houston, TX, USA, used to work as a production engineer in Big Bay 3 (BB3). She has spent the last couple of years dedicating her career to the repair and maintenance of massive equipment in the gigantic shop. Recently, she was promoted to mechani-cal design engineer in Sulzer’s core engineering group. As one of Sulzer’s female engineers, she looks back at her experience in BB3 with pleasure:
“Repairing these large industrial gas turbines is hard work and requires extreme care. You have to ensure an effi-cient workflow to get the job done as quickly but, at the same time, as diligently as possible. With this type of heavy-duty equipment, every hour these machines are not in service equates to enormous amounts of dollars and production hours lost.”
She particularly appreciated the high level of technical ex-perience in the BB3 team. “The mechanics and machinists in BB3 can perform all of the requirements and are truly jacks-of-all-trades. I thoroughly enjoyed working with the team. I look forward to utilizing the valuable skills gained from BB3 in my new job at Sulzer.”
Jennifer Gaines’ career with Sulzer began with a rigorous program that encompassed hands-on training on the shop floor. There, she worked directly with equipment and highly experienced maintenance mechanics and machinists. Once her training on the shop floor was complete, she transitioned to providing cutting-edge engineering services. As part of this, she designed specialized shop tools and solutions to help the mechanics better dis assemble, inspect, repair, and assemble equipment.
28 Sulzer—Annual Report 2016Core Competencies
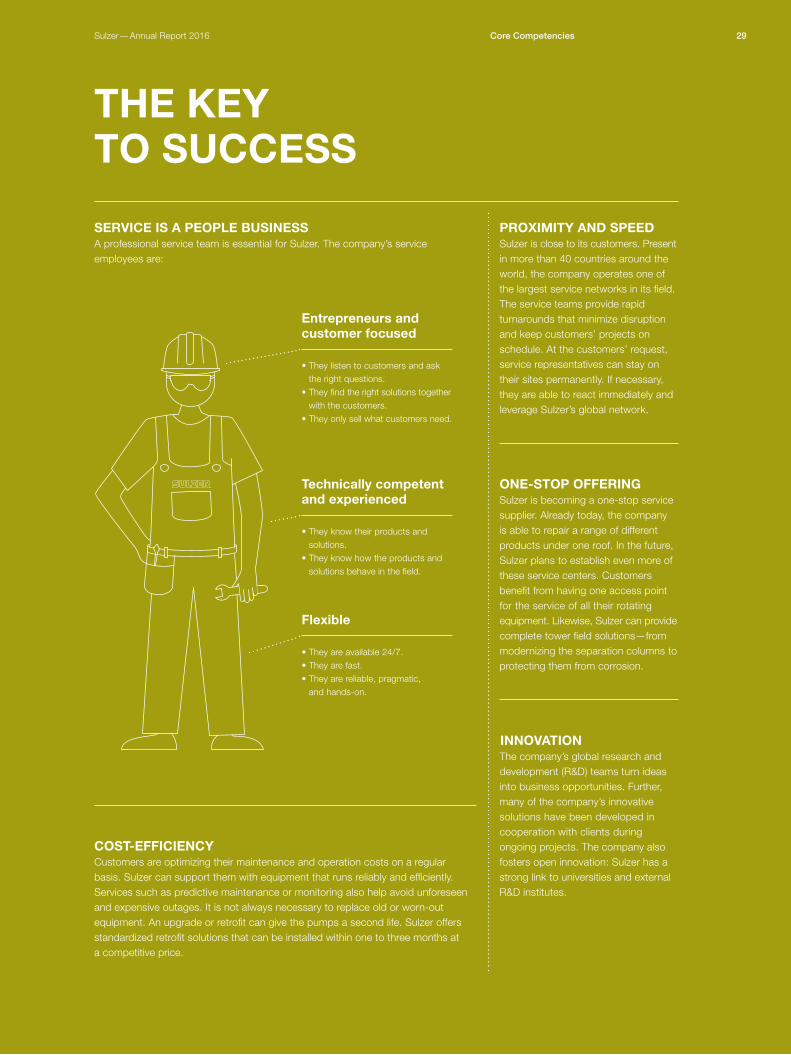
Entrepreneurs and customer focused
Flexible
Technically competent and experienced
• They listen to customers and ask the right questions.
• They find the right solutions together with the customers.
• They only sell what customers need.
• They know their products and solutions.
• They know how the products and solutions behave in the field.
• They are available 24/7.• They are fast.• They are reliable, pragmatic,
and hands-on.
Customers are optimizing their maintenance and operation costs on a regular basis. Sulzer can support them with equipment that runs reliably and efficiently. Services such as predictive maintenance or monitoring also help avoid unforeseen and expensive outages. It is not always necessary to replace old or worn-out equipment. An upgrade or retrofit can give the pumps a second life. Sulzer offers standardized retrofit solutions that can be installed within one to three months at a competitive price.
A professional service team is essential for Sulzer. The company’s service employees are:
Sulzer is close to its customers. Present in more than 40 countries around the world, the company operates one of the largest service networks in its field. The service teams provide rapid turnarounds that minimize disruption and keep customers’ projects on schedule. At the customers’ request, service representatives can stay on their sites permanently. If necessary, they are able to react immediately and leverage Sulzer’s global network.
THE KEY TO SUCCESS
COST-EFFICIENCY
SERVICE IS A PEOPLE BUSINESS PROXIMITY AND SPEED
ONE-STOP OFFERING
INNOVATION
Sulzer is becoming a one-stop service supplier. Already today, the company is able to repair a range of different products under one roof. In the future, Sulzer plans to establish even more of these service centers. Customers benefit from having one access point for the service of all their rotating equipment. Likewise, Sulzer can provide complete tower field solutions—from modernizing the separation columns to protecting them from corrosion.
The company’s global research and development (R&D) teams turn ideas into business opportunities. Further, many of the company’s innovative solutions have been developed in cooperation with clients during ongoing projects. The company also fosters open innovation: Sulzer has a strong link to universities and external R&D institutes.
29Core CompetenciesSulzer—Annual Report 2016

2016
2014
2015
2013 44.4%
45.5%
48.1%
48.2%
2016
Chemtech
Sulzer acquired industrial dispenser manufacturer PC Cox, applicator producer Geka, pump manu -facturer Ensival Moret, gas turbine maintenance provider Rotec GT, and Wärtsilä’s vessel internal electrostatic coalescer (VIEC) business.
The company introduced new pump types and agi-tators for the water market and developed a mixing tip with bendable cannula for the dental industry.
Sulzer and FMC Technologies received an order to supply the pumping equipment for one of the subsea pumping modules in Shell’s oil field off the coast of Brazil.
Sohar SWRO Company LLC commissioned Sulzer to supply pumps for the new desalination plant in Sohar, Oman.
The share of sales of aftermarket services at Sulzer has increased steadily during the last few years.
Overall, the company generates 48% of its sales in the service business. Split by divisions, Rotating Equipment Services generates 100% of its sales with services. In Pumps Equipment, services make up 33% of sales. Chemtech’s sales consist of 32% in the service business.
During the past years, more and more manufacturing com - panies have changed their business models. They have switched from only producing goods to offering a combination of products and services. Companies see the opportunity to generate additional revenues and strengthen customer loyalty. Over the next three years, it is expected that 65% of the global manufacturing industry will be headed in this direction.
Because the service business is becoming more and more competitive, it is vital for an established service provider such as Sulzer to expand its offering and presence. In 2016, the company took further steps to achieve these goals.
NEW TREND: SERVICE BUSINESS
Sales from services in 2016
Sulzer overall PumpsEquipment
48% 32%33%
Dashboard30 Sulzer—Annual Report 2016

Business Review
33 Financial Review
38 Business Review Divisions
38 Pumps Equipment
40 Rotating Equipment Services
42 Chemtech
44 Sustainable Development
44 Strategy and Management
45 Innovation and Technology
46 Ecological Sustainability
48 Social Sustainability
50 Sustainability Dashboard
31

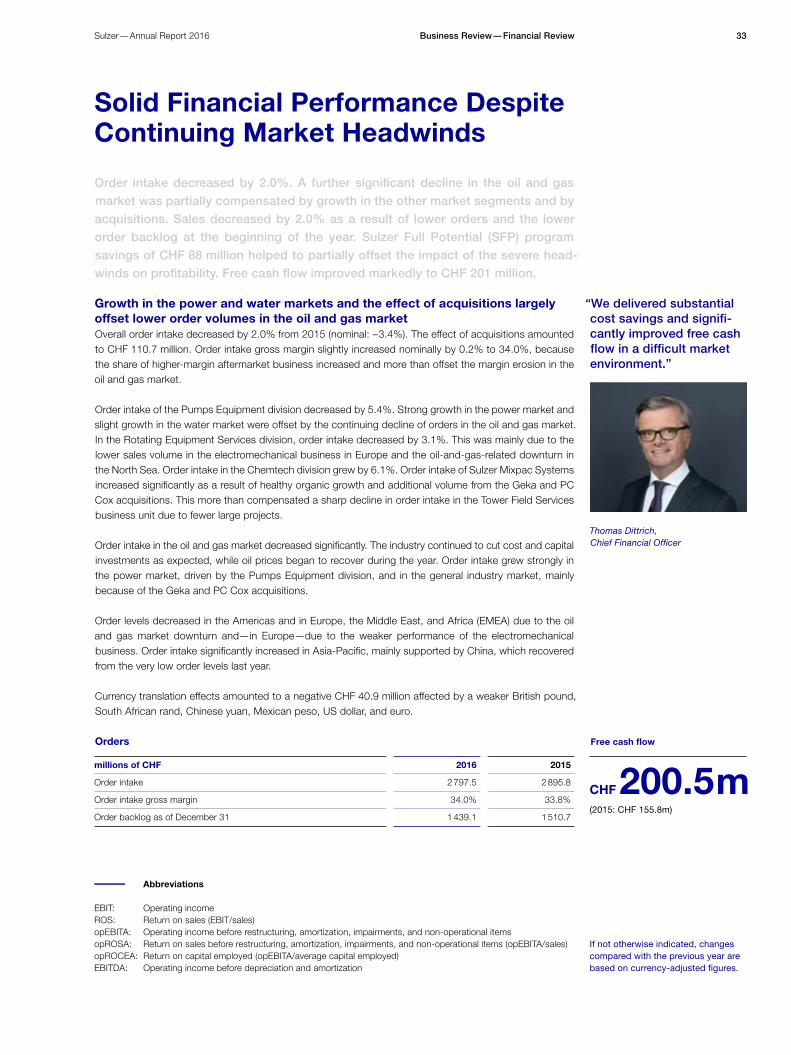
Solid Financial Performance Despite Continuing Market Headwinds
Order intake decreased by 2.0%. A further significant decline in the oil and gas market was partially compensated by growth in the other market segments and by acquisitions. Sales decreased by 2.0% as a result of lower orders and the lower order backlog at the beginning of the year. Sulzer Full Potential (SFP) program savings of CHF 88 million helped to partially offset the impact of the severe head-winds on profitability. Free cash flow improved markedly to CHF 201 million.
Growth in the power and water markets and the effect of acquisitions largely offset lower order volumes in the oil and gas market Overall order intake decreased by 2.0% from 2015 (nominal: – 3.4%). The effect of acquisitions amounted to CHF 110.7 million. Order intake gross margin slightly increased nominally by 0.2% to 34.0%, because the share of higher-margin aftermarket business increased and more than offset the margin erosion in the oil and gas market.
Order intake of the Pumps Equipment division decreased by 5.4%. Strong growth in the power market and slight growth in the water market were offset by the continuing decline of orders in the oil and gas market. In the Rotating Equipment Services division, order intake decreased by 3.1%. This was mainly due to the lower sales volume in the electromechanical business in Europe and the oil-and-gas-related downturn in the North Sea. Order intake in the Chemtech division grew by 6.1%. Order intake of Sulzer Mixpac Systems increased significantly as a result of healthy organic growth and additional volume from the Geka and PC Cox acquisitions. This more than compensated a sharp decline in order intake in the Tower Field Services business unit due to fewer large projects.
Order intake in the oil and gas market decreased significantly. The industry continued to cut cost and capital investments as expected, while oil prices began to recover during the year. Order intake grew strongly in the power market, driven by the Pumps Equipment division, and in the general industry market, mainly because of the Geka and PC Cox acquisitions.
Order levels decreased in the Americas and in Europe, the Middle East, and Africa (EMEA) due to the oil and gas market downturn and—in Europe—due to the weaker performance of the electromechanical business. Order intake significantly increased in Asia-Pacific, mainly supported by China, which recovered from the very low order levels last year.
Currency translation effects amounted to a negative CHF 40.9 million affected by a weaker British pound, South African rand, Chinese yuan, Mexican peso, US dollar, and euro.
Thomas Dittrich, Chief Financial Officer
“We delivered substantial cost savings and signifi-cantly improved free cash flow in a difficult market environment.”
If not otherwise indicated, changes compared with the previous year are based on currency-adjusted figures.
CHF 200.5m(2015: CHF 155.8m)
Free cash flow
– Abbreviations
EBIT: Operating incomeROS: Return on sales (EBIT/sales)opEBITA: Operating income before restructuring, amortization, impairments, and non-operational itemsopROSA: Return on sales before restructuring, amortization, impairments, and non-operational items (opEBITA/sales)opROCEA: Return on capital employed (opEBITA/average capital employed)EBITDA: Operating income before depreciation and amortization
Orders
millions of CHF 2016 2015
Order intake 2 797.5 2 895.8
Order intake gross margin 34.0% 33.8%
Order backlog as of December 31 1 439.1 1 510.7
33Business Review—Financial ReviewSulzer—Annual Report 2016

As of December 31, 2016, the order backlog amounted to CHF 1 439.1 million (December 31, 2015: CHF 1 510.7 million).
Sales slightly lowerSales amounted to CHF 2 876.7 million—a decline of 2.0% (nominal: –3.2%). Negative currency translation effects totaled CHF 34.5 million and the effect of acquisitions amounted to CHF 90.6 million.
In 2016, strong growth in the power market and the effect from acquisitions were offset primarily by the significant sales decline in the oil and gas market. Sales in the water market were also below the prior-year level, mainly due to a low starting backlog and timing of projects.
Sales increased in EMEA, while the Americas and Asia-Pacific regions were down from the previous year. Consequently, the share of sales in emerging markets slid from 40% in 2015 down to 38% in 2016.
Gross margin positively affected by cost savings Gross margin remained stable at 30.6%. The positive effect of the factory footprint optimization and a larger share of higher-margin aftermarket business offset the price erosion effect in the oil and gas market. Total gross profit decreased to CHF 879.4 million (2015: CHF 910.1 million) as a result of lower sales volumes.
Operational EBITA impacted by lower sales volumes Operational EBITA (opEBITA) amounted to CHF 238.9 million compared with CHF 254.1 million in 2015, a decrease of 4.4% (nominal: – 6.0%). Savings from the Sulzer Full Potential (SFP) program helped partially offset the lower sales volume and acquisition-related cost increases.
Operating expenses excluding amortization, impairment on property, plant, and equipment, restructuring expenses, and other non-operational items were down by 5.7%, ahead of the 2.0% sales decline. Savings measures in selling as well as administrative expenses were partly offset by acquisition-related cost increases. Research and development expenses slightly decreased.
Operational ROSA (opROSA) decreased to 8.3% compared with 8.6% in 2015.
The divisions achieved the following profitability figures (opROSA): — Pumps Equipment: 5.7% (2015: 7.3%). The lower profitability was due to headwinds in the oil and gas market that resulted in lower sales volumes and pricing pressure. — Rotating Equipment Services: 9.9% (2015: 10.2%). This drop was mainly due to a lower sales volume that could only be partially offset by lower operating expenses. — Chemtech: 11.4% (2015: 10.1%). This increase resulted mainly from a larger share of the high-margin Sulzer Mixpac Systems business.
8.3%opROSA
– See abbreviations on page 33.
(2015: 8.6%)
Operational key performance ratios
2016 2015
opROSA 8.3% 8.6%
opROCEA 15.7% 17.0%
Business Review—Financial Review34 Sulzer—Annual Report 2016

Restructuring expenses and SFP program costs impacted operating income As part of the SFP program, Sulzer has continued to implement planned actions to adapt its global manu-facturing capacities and streamline its organizational setup. The measures resulted in higher restructuring expenses than in 2015. The costs were mainly associated with measures taken in Germany, Switzerland, Brazil, USA, Singapore, the United Kingdom, Sweden, and China. Overall, the number of full-time equiva-lents (FTE) came down from 14 253 at the end of 2015 to 14 005 at the end of 2016. This is mainly due to a reduction of roughly 1 350 FTE from SFP measures, partly offset by approximately 1 100 FTE from acquisitions.
Other non-operational items amounted to CHF – 0.9 million in 2016. SFP-related expenses (CHF – 26.9 million), acquisition-related expenses, and other items were offset by the favorable effect resulting from a lower con-version rate of the Swiss pension plans (CHF 35.4 million).
Consequently, EBIT amounted to CHF 115.3 million compared with CHF 120.9 million in 2015. Return on sales (ROS) was 4.0% compared with 4.1% in 2015.
Financial income: lower interest expenses Total financial expenses amounted to CHF 19.3 million compared with CHF 24.7 million in 2015. Interest expenses were reduced by CHF 10.5 million, partly offset by lower interest income and higher other finan-cial expenses. Lower interest expenses in 2016 resulted from the bond refinancing at favorable conditions at around mid-year (coupon expenses of CHF 7.4 million compared with CHF 12.0 million in 2015).
Furthermore, there were no significant extraordinary expenses in 2016; this stands in contrast to the CHF 5.2 million in 2015 that were related to the settlement of a dispute with the purchaser of the group’s locomotive business.
– See abbreviations on page 33.
Bridge from EBIT to operational EBITA
millions of CHF 2016 2015
EBIT 115.3 120.9
Amortization 47.3 42.3
Impairment on tangible and intangible assets 18.4 13.0
Restructuring expenses 57.0 41.2
Adjustments for other non-operational items1) 0.9 36.7
opEBITA 238.9 254.1
opROSA 8.3% 8.6%
1) Other non-operational items include significant acquisition-related expenses, gains, and losses from sale of businesses or real estate (including release of provisions), and certain non-operational items that are non-recurring or do not regularly occur in similar magnitude.
35Business Review—Financial ReviewSulzer—Annual Report 2016
Kap
itel
tren
ner
Oil and gas market downturn impacted results from joint ventures In 2016, Sulzer incurred a loss of CHF 0.8 million from joint ventures compared with a profit of CHF 3.7 million in the prior year. This relates to a joint venture in China for the service of gas turbines and a joint venture in the Middle East for the service of rotating equipment for its oil and gas and power customers.
Slightly lower adjusted effective tax rate Income tax expenses increased to CHF 35.1 million (2015: CHF 24.9 million) on a broadly stable pre-tax income. This increase was due to restructuring expenses in 2016 without corresponding tax effect. The effective tax rate for 2016 amounted to 36.9% compared with 24.9% in 2015. Adjusted for the restructur-ing expense tax effect, the effective income tax rate for 2016 would have amounted to 24.3%.
Core net income In 2016, net income amounted to CHF 60.1 million compared with CHF 75.0 million in the previous year. Core net income excluding the tax-adjusted effects of non-operational items totaled CHF 153.8 million compared with CHF 175.0 million in 2015. Basic earnings per share decreased from CHF 2.17 in 2015 to CHF 1.73 in 2016.
Improved balance sheet efficiency Total assets as of December 31, 2016, amounted to CHF 3 735.9 million, which is a decrease of CHF 518.9 mil-lion from 2015.
Non-current assets increased nominally by CHF 235.9 million due to higher goodwill (CHF 100.3 million), other intangibles (CHF 88.9 million), and higher property, plant, and equipment (CHF 19.6 million). Goodwill, other intangible assets, and property, plant, and equipment increased by CHF 233.7 million on a currency- adjusted basis, mainly due to acquisitions.
Current assets decreased nominally by CHF 754.8 million, mainly due to the dividend payments to Sulzer shareholders of CHF 617.5 million in April 2016 as well as lower marketable securities and working capital.
Total liabilities nominally increased by CHF 124.3 million to CHF 2 144.9 million as of December 31, 2016. An increase of trade accounts payable (CHF 55.5 million), defined benefit obligations (CHF 44.8 million), provisions (CHF 39.1 million), and tax liabilities (CHF 30.2 million) was partly offset by lower borrowings (CHF 56.2 million).
Equity nominally decreased by CHF 643.2 million to CHF 1 591.0 million, mainly due to the above- mentioned dividend payments to Sulzer shareholders.
Net debt to EBITDA increased from – 2.78 in 2015 to 0.14, mainly due to the special dividend payment and acquisitions.
– See abbreviations on page 33.
Business Review—Financial Review36 Sulzer—Annual Report 2016
Strong free cash flow Free cash flow amounted to CHF 200.5 million compared with CHF 155.8 million reported in the prior year. This was driven by dynamic net working capital management, lower tax payments, and the fact that a substantial portion of restructuring expenses recorded in 2016 will only be paid in 2017.
Cash flow from investing activities totaled CHF –168.8 million compared with CHF – 242.0 million in the prior year. Cash-out for acquisitions amounted to CHF – 313.4 million compared with CHF – 70.1 million in 2015. In 2016, marketable securities of CHF 208.4 million were sold to fund the dividends paid in April 2016, while in 2015 marketable securities were purchased (CHF –104.6 million). Capital expenditures amounted to CHF 74.9 million, broadly unchanged compared with CHF 73.7 million in 2015.
Cash flow from financing activities totaled CHF – 680.6 million. It included the dividend payments of CHF 617.5 million (including the special dividend of CHF 498.1 million) compared with dividend payments of CHF 119.2 million in 2015. Repayments of borrowings reduced cash by CHF 59.4 million (2015: CHF 9.9 million). Exchange gains on cash amounted to CHF 6.7 million compared with a loss of CHF 34.0 million in 2015.
Outlook 2017Sulzer expects that the oil and gas market, which accounted for approximately half of its revenue before recent acquisitions, will remain challenging in 2017 and that pricing pressure will persist throughout the year. Early signs of an impending recovery of oil CAPEX should only translate into a commercial rebound for Sulzer in 2018. Sulzer’s other businesses are expected to grow slightly in 2017, leading to an organic order level for the company broadly stable versus 2016, supplemented by additional volume from newly acquired businesses.
Sulzer expects its SFP program to deliver incremental cost savings in 2017 in the range of CHF 40 to 60 million. The company confirms its overall target of CHF 200 million from 2018 onwards.
For the full year 2017, including acquisitions signed in 2016 and adjusted for currency effects, order intake is expected to grow by 5 to 8% and sales to grow by 3 to 5%. Sulzer expects opEBITA margin at around 8.5% (opEBITA in percent of sales).
– See abbreviations on page 33.
37Business Review—Financial ReviewSulzer—Annual Report 2016

Pumps Equipment reported a decrease in order intake and sales in 2016. Operational EBITA and operational ROSA declined from the previous year. The oil and gas market continued to impact the division’s results. Sulzer announced the acquisition of the pump manufacturer Ensival Moret.
Forging ahead through acquisition and significant ordersIn 2016, Sulzer’s largest division Pumps Equipment extended its product offering. The company announced the acquisition of the pump manufacturer Ensival Moret. With this transaction, Sulzer closes specific product gaps in its pumps portfolio. For example, it adds axial flow and slurry pumps that are used in general industry markets such as fertilizers, sugar, mining, and chemicals. Ensival Moret generates roughly CHF 120 million of sales and employs more than 700 people.
Pumps Equipment won significant orders in the reporting year. It will supply pumps for a new desalination plant in Sohar, Oman. The facility has a capacity of 250 000 m3 a day and is expected to go into operation in 2018. Sulzer’s energy-efficient pumps help cope with the growing water demand in the North Batinah region. Further, Sulzer will deliver process pumps to Metsä Group’s next-generation bio product mill in Äänekoski, Finland. The company will also supply a pump package to Fibria Celulose SA, a Brazilian forestry company and the world’s leading eucalyptus pulp producer.
Decrease in order intakeOrder intake decreased in 2016. The main reason was the significantly lower order intake in the oil and gas market (– 20%). Despite the recovery of oil prices during the year, the industry continued to cut cost and hold investments back. Order intake in the power market increased significantly, driven by orders from the Middle East and Asia. Demand in the water and the general industry markets grew compared with the previous year. Order intake gross margin decreased, impacted by pricing pressure in the oil and gas market.
Regionally, Pumps Equipment reported lower order intake in Europe and strong growth in the Middle East. Order intake dropped significantly in the Americas. Demand in the Asia-Pacific region was strong and clearly above last year’s level.
Decrease in Order Intake— Complementary Pumps Added
César Montenegro, Division President Pumps Equipment
“We are very excited to welcome Ensival Moret to the Sulzer family. Together we can grow stronger in our general industry business by serving our customers’ process needs.”
– See abbreviations on page 33.
38 Sulzer—Annual Report 2016Business Review—Pumps Equipment
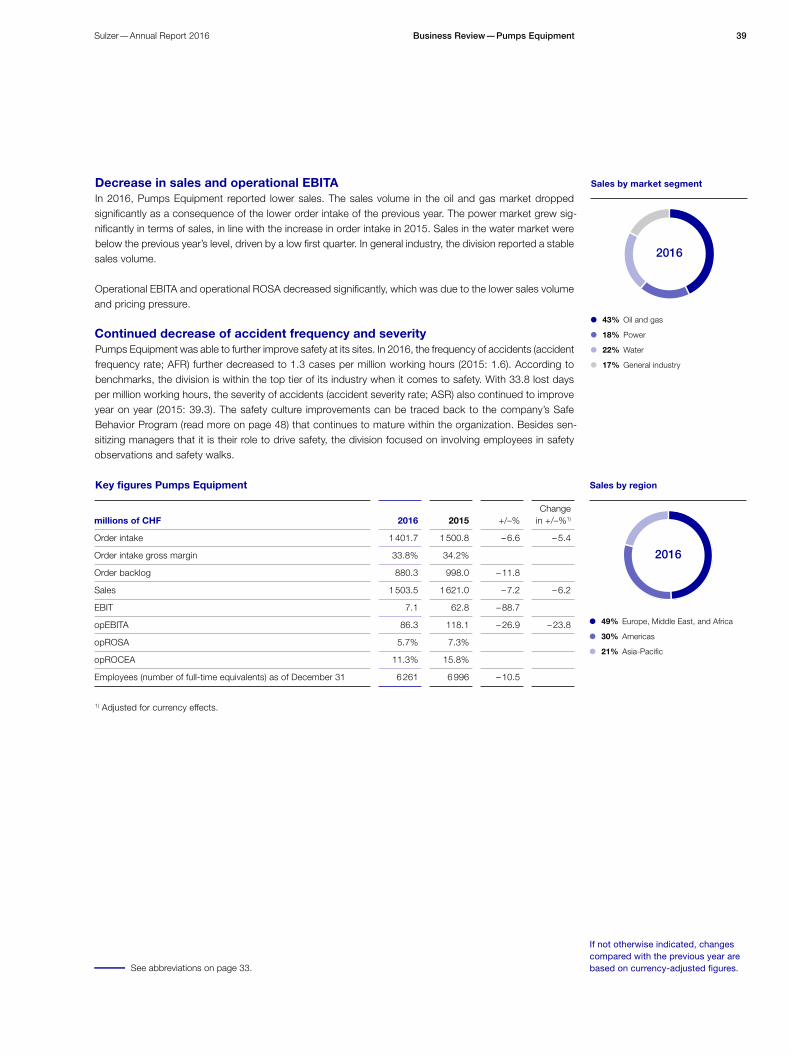
Sales by market segment
43% Oil and gas
18% Power
22% Water
17% General industry
2016
Sales by region
49% Europe, Middle East, and Africa
30% Americas
21% Asia-Pacific
2016
Decrease in sales and operational EBITAIn 2016, Pumps Equipment reported lower sales. The sales volume in the oil and gas market dropped significantly as a consequence of the lower order intake of the previous year. The power market grew sig-nificantly in terms of sales, in line with the increase in order intake in 2015. Sales in the water market were below the previous year’s level, driven by a low first quarter. In general industry, the division reported a stable sales volume.
Operational EBITA and operational ROSA decreased significantly, which was due to the lower sales volume and pricing pressure.
Continued decrease of accident frequency and severity Pumps Equipment was able to further improve safety at its sites. In 2016, the frequency of accidents (accident frequency rate; AFR) further decreased to 1.3 cases per million working hours (2015: 1.6). Accord ing to benchmarks, the division is within the top tier of its industry when it comes to safety. With 33.8 lost days per million working hours, the severity of accidents (accident severity rate; ASR) also continued to improve year on year (2015: 39.3). The safety culture improvements can be traced back to the company’s Safe Behavior Program (read more on page 48) that continues to mature within the organization. Besides sen-sitizing managers that it is their role to drive safety, the division focused on involving employees in safety observations and safety walks.
– See abbreviations on page 33.
If not otherwise indicated, changes compared with the previous year are based on currency-adjusted figures.
Key figures Pumps Equipment
millions of CHF 2016 2015 +/–%Change
in +/–%1)
Order intake 1 401.7 1 500.8 – 6.6 – 5.4
Order intake gross margin 33.8% 34.2%
Order backlog 880.3 998.0 – 11.8
Sales 1 503.5 1 621.0 – 7.2 – 6.2
EBIT 7.1 62.8 – 88.7
opEBITA 86.3 118.1 – 26.9 – 23.8
opROSA 5.7% 7.3%
opROCEA 11.3% 15.8%
Employees (number of full-time equivalents) as of December 31 6 261 6 996 – 10.5
1) Adjusted for currency effects.
39Sulzer—Annual Report 2016 Business Review—Pumps Equipment

Order intake and sales decreased compared with 2015. Operational EBITA and operational ROSA declined slightly. Sulzer signed an agreement to acquire control of Rotec’s gas turbine service business in Russia and further extended its one-stop service offering.
Becoming a one-stop service supplierIn 2016, Sulzer signed an agreement to acquire control of Rotec’s gas turbine service business in Russia. Rotec GT, which has around 50 employees, is headquartered in Moscow and has a refurbishment center for gas turbine components in Ekaterinburg, Russia. The business will be combined with Sulzer Russia’s turbo service activities. Through this transaction, Sulzer becomes a leading independent gas turbine service provider for Russia and the CIS countries with revenues of about CHF 40 million.
Three years ago, Rotating Equipment Services (RES) integrated the pump service center network that was previously managed within the Pumps Equipment (PE) division. In 2016, the company prepared for the transfer of the spare parts business from the PE to the RES division. The integration will be carried out in 2017. Customers benefit from a single access point for services and parts. Likewise, the division continued to establish service centers where a range of different products can be repaired under one roof (read more in the interview with new Division President Daniel Bischofberger on page 10). These are further milestones on the company’s journey to becoming a one-stop service supplier.
Decrease in order intakeCompared with the previous year, order intake decreased in 2016. It was impacted by a decline in the general industry market. One of the reasons was weak electromechanical business in the UK, which suffered from the continuous change of the industrial landscape. Activity in the oil and gas and the power markets remained stable. Order intake gross margin decreased only slightly compared with 2015, because significant pricing pressure was largely offset by business mix effects.
Regionally, activity in the Asia-Pacific region decreased significantly. Europe, the Middle East, and Africa (EMEA) and the Americas decreased slightly compared with the previous year.
Order Intake Declined—Strengthening Service Business in Russia
“Through Rotec GT, we are taking our service business in Russia to the next level. We are well on our way to becoming a one-stop service supplier with an extensive network across the globe.”
Daniel Bischofberger, Division President Rotating Equipment Services
– See abbreviations on page 33.
40 Sulzer—Annual Report 2016Business Review—Rotating Equipment Services

Sales by market segment
49% Oil and gas
28% Power
2% Water
21% General industry
2016
Sales by region
34% Europe, Middle East, and Africa
55% Americas
11% Asia-Pacific
2016
Sales and operational EBITA decreased The division reported slightly lower sales in 2016. Sales in EMEA remained stable and increased slightly in North America. The sales volume in Central and Latin America declined, impacted by low oil prices. Sales in the Asia-Pacific region were down from the higher level in 2015, which had resulted from large gas turbine orders that year.
Operational EBITA decreased compared with 2015. This results from the lower sales volume that could only be partially offset by lower operating expenditures. Operational ROSA also declined slightly.
Significantly lower number of accidentsIn 2016, the frequency of accidents (accident frequency rate; AFR) decreased to 1.9 cases per million work-ing hours (2015: 2.5). With 44.9 lost days per million working hours, the division was able to decrease the accident severity rate (ASR; 2015: 60.5). This is a result of the company’s Safe Behavior Program (SBP). An assessment of the program’s implementation was conducted in 2016. The company continued to focus on reporting and analyzing minor and near accidents, which contributed to the strong performance. To further align the safety processes and programs throughout the regions, the division held regional QESH councils (quality, environment, safety, and health) with a focus on safe behavior at the workplace. Please read more about the company’s safety and health efforts on page 48.
– See abbreviations on page 33.
Key figures Rotating Equipment Services
millions of CHF 2016 2015 +/–%Change
in +/–%1)
Order intake 661.1 698.2 – 5.3 – 3.1
Order intake gross margin 30.3% 30.5%
Order backlog 195.8 205.0 – 4.5
Sales 666.8 693.2 – 3.8 – 1.9
EBIT 57.3 51.4 11.5
opEBITA 66.2 70.8 – 6.5 – 7.2
opROSA 9.9% 10.2%
opROCEA 16.5% 16.8%
Employees (number of full-time equivalents) as of December 31 3 436 3 538 – 2.9
1) Adjusted for currency effects.
If not otherwise indicated, changes compared with the previous year are based on currency-adjusted figures.
41Sulzer—Annual Report 2016 Business Review—Rotating Equipment Services
Order intake and sales increased in 2016. The acquisitions more than offset the organic decline. The division reported a higher operational EBITA and operational ROSA. Through three important acquisitions, Chemtech expanded its product port-folio and diversified into new segments.
Growing and diversifying product portfolioIn 2016, Sulzer took important steps to grow and further diversify its product portfolio. In August, Sulzer acquired Geka, headquartered in Bechhofen, Germany. Geka produces applicator devices for the cosmetics industry with an emerging business in healthcare. Through this acquisition, Sulzer almost doubled the sales of its most profitable business unit Sulzer Mixpac Systems (SMS), and the company entered into the beauty segment. Further, Sulzer took over PC Cox Group Ltd, a leading manufacturer of industrial dispensers headquartered in Newbury, UK. The combination of SMS, Geka, and PC Cox is being reported as the new division Applicator Systems as of January 1, 2017.
In December 2016, Sulzer signed a binding agreement to acquire a unique oil separation technology from Wärtsilä—the vessel internal electrostatic coalescer business. This business, based in Asker, Norway, strengthens Chemtech’s upstream separation business. Further, the division successfully started up a new fatty acid plant for a customer in Malaysia. Sulzer’s latest developments in the field of distillation, fraction-ation, and hydrogenation enable the highly efficient separation of various fatty acid fractions. With the support of this technology, producers can quickly adapt their production outputs to the current volatile market demand.
Increase in order intakeChemtech reported growing order intake in 2016. The additional orders from the acquisitions more than offset the organic decrease in order intake in the Tower Field Services (TFS) business unit. The TFS business had fewer large projects compared with the previous year. The overall business suffered from lacking oil and gas upstream projects globally. Order intake in the general industry market increased because of the strong performance of Sulzer Mixpac Systems and the acquisitions. Order intake gross margin increased.
Regionally, the division reported growing order intake in Europe, the Middle East, and Africa as well as in the Asia-Pacific region. Demand in the Americas was down compared with the previous year.
Increase in Order Intake Through Acquisitions
“In 2016, Chemtech raised its profitability thanks to three acquisitions and operational improvements. At the same time, we sig-nificantly expanded and diversified our product portfolio.”
Torsten Wintergerste, Division President Chemtech
– See abbreviations on page 33.
42 Sulzer—Annual Report 2016Business Review—Chemtech

Sales by market segment
59% Oil and gas
41% General industry
2016
Sales by region
44% Europe, Middle East, and Africa
31% Americas
25% Asia-Pacific
2016
Higher sales and operational EBITAIn 2016, sales increased compared with the previous year, due to the PC Cox and Geka acquisitions. The other Chemtech businesses—Separation Technology and Tower Field Services—reported lower sales because of the challenging oil and gas market that particularly affected the downstream business in the Americas.
The acquisitions and operational improvements led to a significantly higher operational EBITA and opera-tional ROSA compared with the previous year.
Fall-back in safety performanceIn 2016, the accident frequency rate (AFR) at Chemtech increased to 2.8 cases per million working hours (2015: 1.9). In parallel, the accident severity rate (ASR) increased to 88.5 lost days per million working hours (2015: 52.5). As such, Chemtech could not sustain the strong safety performance of the previous years 2014 and 2015. Unfortunately, Chemtech had to report a fatality in the TFS business unit. The company is implementing corrective and preventive actions based on this tragic incident. Please read more about the company’s safety and health efforts on page 48.
– See abbreviations on page 33.
Key figures Chemtech
millions of CHF 2016 2015 +/–%Change
in +/–%1)
Order intake 744.5 708.9 5.0 6.1
Order intake gross margin 37.3% 35.6%
Order backlog 362.9 307.7 17.9
Sales 718.1 669.6 7.2 8.0
EBIT 37.2 33.5 11.0
opEBITA 82.1 67.4 21.8 23.0
opROSA 11.4% 10.1%
opROCEA 18.5% 16.6%
Employees (number of full-time equivalents) as of December 31 4 135 3 539 16.8
1) Adjusted for currency effects.
If not otherwise indicated, changes compared with the previous year are based on currency-adjusted figures.
43Sulzer—Annual Report 2016 Business Review—Chemtech

C
ustomer partnership
Operatio
nal e
xcel
len
ce
Co
mm
itted people
O
utst
andi
ng se
rvices
Continuous operational improvem
ent
Technology leadership
Colla
borativ
e ad
vant
age
Complying with international laws
L
EA
N a
nd
saf
e b
ehav
ior
Manag
emen
t framew
orks
Fair and transparent reporting
VISION
Our customers recognize us for our lead ing technologies and services as well as for delivering innovative and
sustainable solutions.
VALUES
STRATEGIC PRIORITIES
Committed to Sustainable Business Practices
Sulzer builds its activities on its vision, values, and strategic priorities. Through a centralized reporting system and local initiatives, Sulzer monitors and drives its sustainability efforts globally and locally.
The Sulzer vision constitutes the core of the company’s global activities. Sulzer’s values act as an inner compass and guide all activities. Based on them, Sulzer’s four strategic priorities define the overall direction of the company.
Sulzer has a transparent reporting system in place to benchmark its extrafinancial performance from year to year. The company collects its group-wide financial and extrafinancial data on a centralized reporting platform. The group function ESH (environment, safety, and health) is in charge of data management. It defines standards and initiatives that are implemented locally. Two of the most important activities are Sulzer’s Safe Behavior Program (SBP, read more on page 48) and Sulzer LEAN, a waste reduction initiative.
Sulzer complies with international and national laws and standards. The company participates in the OECD Guidelines for Multinational Enterprises, the United Nations’ Universal Declaration of Human Rights and its protocols, the UN Global Compact, and the ILO’s Declaration on Fundamental Principles and Rights at Work.
44 Sulzer—Annual Report 2016Business Review—Strategy and Management

Global Research and Development Network Reduces Time to Market
Sulzer commits itself to designing, developing, and manufacturing innovative, reliable, and resource-conserving solutions. The company’s global research and development network supports manifold innovation projects and helps reduce time to market.
Because markets are changing fast, it is critical for companies to shorten their innovation cycles and reduce time to market. Hence, technology experts around the world support Sulzer in the development of products and services. In 2016, Sulzer invested CHF 71.4 million, or 2.5% relative to sales, in research and develop-ment (R&D) (2015: CHF 73.4 million, 2.5% of sales).
Sharing and exchanging knowledge across borders As a global company, Sulzer has built an extensive and international research and development network. Its R&D competence centers around the world support core technology and engineering projects in reducing time to market. For example, the Technical Resource Center in Navi Mumbai, India, was inaugurated ten years ago. Around 100 employees—from mechanical engineers to IT specialists—provide R&D services to all major Sulzer sites.
Collaboration is pivotal for every player in the industry. Sulzer has maintained relationships with academic institutions such as the ETH (Swiss Federal Institute of Technology) and Texas A&M for a long time. The company also collaborates with customers and suppliers during various stages of its product development.
Driving innovation in wastewater treatmentWastewater has changed dramatically in recent years. It contains less water and more solids and fibrous materials. This change places tough new demands on collection networks. In 2016, Sulzer introduced the highly efficient recirculation pump for wastewater treatment, launched new lifting station types for the au-tomatic pumping of wastewater and sewage, and presented standardized agitators for the wastewater industry. The future-proof solutions not only respond to the changing conditions but also reduce customers’ operating costs and environmental footprint.
Introducing new products and solutions across marketsTo complement its strong presence in the desalination and wastewater markets, Sulzer introduced an ex-tended product portfolio that also covers clean water applications. The design and innovative construction of the clean water equipment lead to energy savings and improve customers’ processes. In the pulp and paper industry, Sulzer supplied the largest medium-consistency pump that has ever been manufactured. In the oil and gas market, the company helped to lower the cost of a floating production, storage, and offload-ing (FPSO) ship offshore Angola through an innovative oil-cleaning process.
Near real-time monitoring to make informed decisions The Internet of Things has a considerable impact on innovation and technology. Remote-control programs help operators monitor and maintain their plants in near real time. Sulzer provides web-based control and monitoring solutions specifically designed for the water market. With a software called AquaWeb, operators are able to examine the status of their pumping stations in near real time. The data helps identify unreliable and inefficient pumps, which cause costs. Based on these findings, customers can make informed decisions and modernize their equipment—for example with Sulzer’s retrofit solutions. The software also contains an alarm function: as soon as performance deteriorates, automated alarms warn the operator. Before sending an engineer on-site, the program allows the operator to reset motor protection devices remotely. This helps customers improve the efficiency, performance, and reliability of their equipment.
“In a competitive environ-ment with difficult market conditions, it is a decisive advantage to have a global R&D network. It helps us reduce time to market and develop solutions close to our customers.”
Ralf Gerdes, Head Global Technology
CHF 71mR&D investments
(2.5% of sales) (2015: CHF 73m/2.5% of sales)
31Number of patents
(2015: 30)
45Sulzer—Annual Report 2016 Business Review—Innovation and Technology
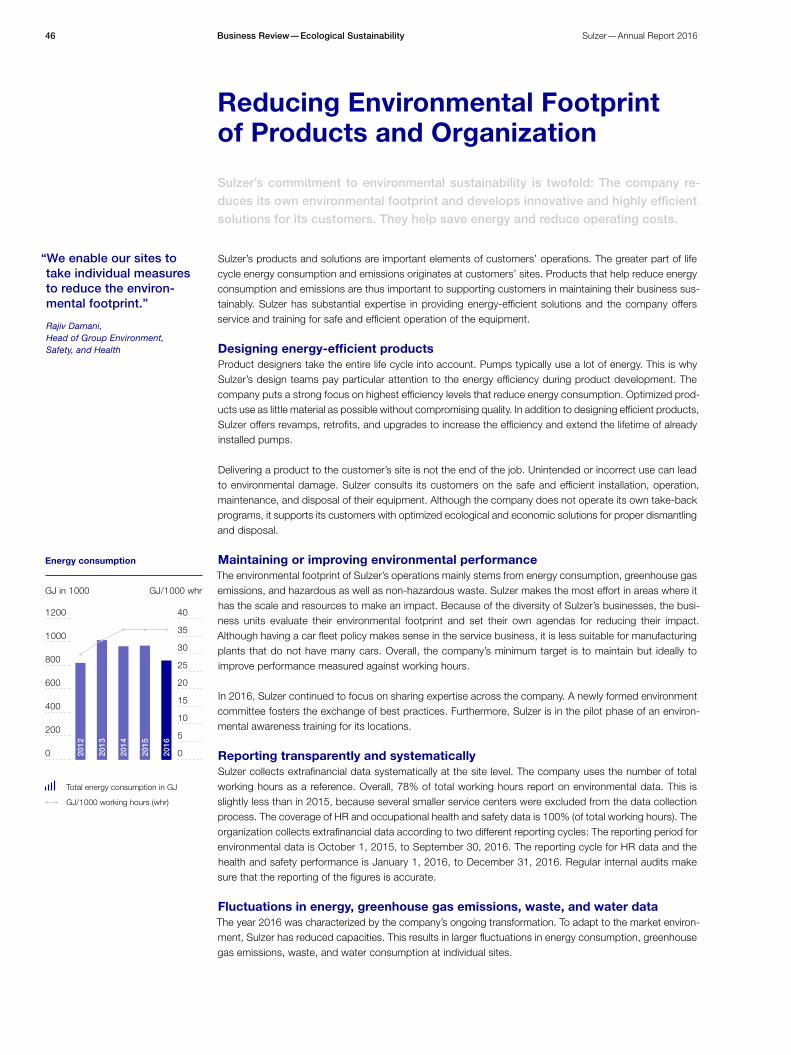
GJ in 1 000 GJ/1 000 whr
Total energy consumption in GJ
GJ/1 000 working hours (whr)
Energy consumption
2012
1 200
1 000
800
600
400
200
0
40
35
30
25
20
15
10
5
02013
2014
2015
2016
Sulzer’s commitment to environmental sustainability is twofold: The company re-duces its own environmental footprint and develops innovative and highly efficient solutions for its customers. They help save energy and reduce operating costs.
Sulzer’s products and solutions are important elements of customers’ operations. The greater part of life cycle energy consumption and emissions originates at customers’ sites. Products that help reduce energy consumption and emissions are thus important to supporting customers in maintaining their business sus-tainably. Sulzer has substantial expertise in providing energy-efficient solutions and the company offers service and training for safe and efficient operation of the equipment.
Designing energy-efficient productsProduct designers take the entire life cycle into account. Pumps typically use a lot of energy. This is why Sulzer’s design teams pay particular attention to the energy efficiency during product development. The company puts a strong focus on highest efficiency levels that reduce energy consumption. Optimized prod-ucts use as little material as possible without compromising quality. In addition to designing efficient products, Sulzer offers revamps, retrofits, and upgrades to increase the efficiency and extend the lifetime of already installed pumps.
Delivering a product to the customer’s site is not the end of the job. Unintended or incorrect use can lead to environmental damage. Sulzer consults its customers on the safe and efficient installation, operation, maintenance, and disposal of their equipment. Although the company does not operate its own take-back programs, it supports its customers with optimized ecological and economic solutions for proper dismantling and disposal.
Maintaining or improving environmental performance The environmental footprint of Sulzer’s operations mainly stems from energy consumption, greenhouse gas emissions, and hazardous as well as non-hazardous waste. Sulzer makes the most effort in areas where it has the scale and resources to make an impact. Because of the diversity of Sulzer’s businesses, the busi-ness units evaluate their environmental footprint and set their own agendas for reducing their impact. Although having a car fleet policy makes sense in the service business, it is less suitable for manufacturing plants that do not have many cars. Overall, the company’s minimum target is to maintain but ideally to improve performance measured against working hours.
In 2016, Sulzer continued to focus on sharing expertise across the company. A newly formed environment committee fosters the exchange of best practices. Furthermore, Sulzer is in the pilot phase of an environ-mental awareness training for its locations.
Reporting transparently and systematicallySulzer collects extrafinancial data systematically at the site level. The company uses the number of total working hours as a reference. Overall, 78% of total working hours report on environmental data. This is slightly less than in 2015, because several smaller service centers were excluded from the data collection process. The coverage of HR and occupational health and safety data is 100% (of total working hours). The organization collects extrafinancial data according to two different reporting cycles: The reporting period for environmental data is October 1, 2015, to September 30, 2016. The reporting cycle for HR data and the health and safety performance is January 1, 2016, to December 31, 2016. Regular internal audits make sure that the reporting of the figures is accurate.
Fluctuations in energy, greenhouse gas emissions, waste, and water dataThe year 2016 was characterized by the company’s ongoing transformation. To adapt to the market environ-ment, Sulzer has reduced capacities. This results in larger fluctuations in energy consumption, greenhouse gas emissions, waste, and water consumption at individual sites.
Reducing Environmental Footprint of Products and Organization
“We enable our sites to take individual measures to reduce the environ-mental footprint.”
Rajiv Damani, Head of Group Environment, Safety, and Health
46 Sulzer—Annual Report 2016Business Review—Ecological Sustainability

2012
Tons t/1 000 whr
Total hazardous waste in t (metric)
t/1 000 working hours (whr)
7 000
6 000
5 000
4 000
3 000
2 000
1 000
0
0.45
0.30
0.35
0.40
0.25
0.20
0.15
0.10
0.05
0.002013
2014
2015
2016
Hazardous wasteOn the whole, both energy consumption and waste were reduced by 13% and almost 8% respectively, largely due to reduced utilization rates. The rate of energy consumption per 1 000 working hours remained stable. Waste production per 1 000 working hours increased slightly because the company cleared out obsolete inventory and stock.
In contrast, the total consumption of water increased significantly by 22%. This increase was almost entirely due to two factors: First, the successfully growing Sulzer Mixpac Systems business was able to increase production significantly in 2016. It invested heavily in new and more efficient plants and equipment, which also consume considerably higher amounts of water for cooling parts and molds. Second, one of the larger manufacturing plants implemented changes to its cooling systems and used ground water instead of an aging refrigerant system. If these two factors are excluded, water consumption was reduced throughout the company. Again, this is largely due to reduced utilization and adjustments in capacities.
Find further sustainability data at www.sulzer.com/sustainability
Key figures
2016 2015Change in +/– %
Energy GJ 845 056 970 832 – 13.0
— Energy consumption per working hours (whr) GJ per 1 000 whr 37.3 37.2 0.1
— Share of electricity % 56.8 54.9 3.4
— Share of gases % 23.0 23.7 – 3.1
— Share of fuels % 11.7 12.4 – 6.1
— Share of fuel oils % 1.5 1.6 – 5.9
— Share of district heating % 6.1 6.7 – 8.5
— Share of other sources % < 1 < 1 –
Greenhouse gas emissions tons CO2 eq. 91 440 105 960 – 13.7
— GHG emissions per working hours tons CO2 eq. per 1 000 whr 4.03 4.06 – 0.7
— GHG scope 11) tons CO2 eq. 17 690 20 560 – 14.0
— GHG scope 2 2) tons CO2 eq. 56 970 66 290 – 14.1
— GHG scope 3 3) tons CO2 eq. 16 780 19 110 – 12.2
Waste tons 26 811 29 071 – 7.8
— Waste per working hours tons per 1 000 whr 1.2 1.1 6.1
By treatment
— Recycling % 77.4 66.5 16.4
— Waste to landfill/incineration/other treatment % 22.6 33.5 – 32.6
By hazardousness
— Non-hazardous waste % 76.7 83.8 – 8.5
— Hazardous waste % 23.3 16.2 43.9
Water m3 1 600 383 1 311 922 22.0
— Water consumption per working hours m3 per 1 000 whr 70.6 50.3 40.3
1) Direct emissions from Sulzer stemming from primary energy sources such as natural gas and fuels used on-site.2) Indirect emissions from secondary (converted) energy sources such as electricity and district heating.3) Indirect emissions from the production and transport of fuels and gases not included in scopes 1 or 2.
47Sulzer—Annual Report 2016 Business Review—Ecological Sustainability

2012
2013
2014
2015
2016
Number of cases AFR
Number of cases that last > 1 lost day due to occupational accidents
Accident frequency rate (AFR) in cases per million working hours
140
120
100
80
60
40
20
0
Accidents
5.0
3.0
3.5
4.0
4.5
2.5
2.0
1.5
1.0
0.5
0.0
Driving Safety Excellence and Fostering Cultural Exchange
Sulzer wants its employees to be safe and healthy, and the company continues to carry out its Safe Behavior Program. To develop people skills, Sulzer offers effective and pragmatic training opportunities. The company strives for a performance- rewarding culture that encourages its employees to speak up and exchange ideas globally.
Improving safety is increasingly difficult with conventional safety control measures. An organization needs to enable its employees to recognize hazards and anticipate risks while empowering them to act in the in-terests of each other’s safety. To achieve a mature safety culture, Sulzer has had its Safe Behavior Program (SBP) in place for four years. Since then, the company has achieved a 38% drop in its accident rate. Raising awareness for safe behavior and developing skills is key for Sulzer.
Maintaining low accident frequency rateIn 2016, Sulzer was able to sustain the previous year’s performance and reached an accident frequency rate of below two cases per million working hours. Nevertheless, the health and safety organization faced severe challenges last year. In total, Sulzer suffered 51 cases of major accidents, which resulted in 1 414 lost working days. Tragically, one employee died while working at a customer’s site early in the year. Thus, Sulzer is critically examining the entire system of operational health and safety management in its service activities.
Sulzer continues to implement the SBP as its main vehicle for driving improvement in the safety culture. In 2016, the company paid particular attention to developing and raising the safety program competence of both novice health and safety experts and critical management teams. In total, Sulzer held three environ-ment, safety, and health (ESH) training sessions and an additional five management workshops in Asia, Europe, and the Americas. In total, over 150 ESH professionals and middle- to senior-level managers received training.
Effective, applicable, and pragmatic people developmentSulzer recognizes that people development is not only critical to ensuring employees have the necessary knowledge and skills to do their jobs; it also drives employee satisfaction and company commitment. Hence, Sulzer provides effective, applicable, and pragmatic development opportunities.
The company takes a diverse and varied approach to training topics. The Sulzer Management Training (SMT) program, developed in 2014, enables junior managers to master the basics of management topics. It facilitates the transition from individual contributor to manager. SMT includes web-based, classroom, and peer group activities. In 2016, Sulzer carried out the SMT program in all three regions. More than 60 participants earned their completion certificates.
The Learning Management System (LMS), a cloud-based platform, makes development activities available on a global scale. The learning history ensures that the development of competencies remains transparent and is available in the long run. LMS accommodates over 7 000 users, 2 500 active training offerings, and is available in six languages.
48 Sulzer—Annual Report 2016Business Review—Social Sustainability

Geographical spread of employees
53% Europe, Middle East, and Africa
27% Americas
20% Asia-Pacific
2016
Rewarding contributions and resultsIn 2016, Sulzer further refined its talent management and employee review processes. Running from the very top of the organization through to local management, the processes enable improved succession planning. To share talent information better across the globe, the succession planning online tool was further developed. Sulzer’s goal is to build an even stronger high-performance culture where contributions and results are valued and rewarded. Thus, the company is streamlining and harmonizing its performance evaluation processes.
Assuming ethical responsibilitySulzer values and fosters performance. The company also remains deeply committed to personal respon-sibility, integrity, and ethical behavior. Every employee signs Sulzer’s Code of Business Conduct. The com-pany’s compliance training sessions and Code of Business Conduct refresher courses ensure that Sulzer employees are fully aware of their individual ethical responsibilities and that they act accordingly. Read more on Corporate Governance on pages 51– 70.
Appreciating cultural diversity and exchange Sulzer welcomes a diverse workforce. People of different cultural backgrounds, nationalities, genders, and ages collaborate and share ideas across the company. Through job rotation programs, internships, and temporary relocations, Sulzer fosters cultural exchange. The company also believes in a speak-up culture and encourages its employees to communicate openly. With tools such as an “ask your CEO” e-mail address, CEO Skype meetings that everyone can participate in, and the intranet, the company provides easy access to the top management.
“In our offices, manufactur-ing plants, and service centers, you meet open-minded people from all over the world who are excited to share ideas and solve problems. This international spirit is reflected in everything we do.”
Armand Sohet, Chief Human Resources Officer
Find further sustainability data at www.sulzer.com/sustainability
Key figures
2016 2015Change in +/– %
Accident frequency rate (AFR) Cases per million working hours 1.8 1.9 – 5.3
Accident severity rate (ASR) Lost days per million working hours 51.2 48.1 6.4
Health and safety training hours 119 153 106 610 11.7
Voluntary attrition rate % 8.0 7.5 0.5
Share of women (of total workforce) % 17.1 14.5 2.5
Leaders from internal talent pipeline % 56.0 60.0 – 6.7
Number of employees FTE 14 005 14 253 – 1.7
49Sulzer—Annual Report 2016 Business Review—Social Sustainability

Employees are one of the most valuable sources of innovation ideas. For this reason, Sulzer’s Chemtech division introduced a new ideation platform in 2015. This platform allows all employees to post their ideas for innovations in Sulzer’s technologies, products, and applications. After they pass the initial evaluation, the ideas enter the company’s product innovation process. By the end of 2016, employees from different locations and business units had submitted 72 ideas. Three of them were realized and launched.
Chemtech Innovation Award
Sulzer Academy for Pumps and Systems
Two Novel Skill Development Initiatives in India
Donation
72 ideas
3 products launched
180 participants trained in 2016
100% placement rate
1 million US dollars donated in the past 20 years
For 20 years, Sulzer’s Houston Service Center in Texas, USA, has been collecting money for the Boys and Girls Harbor charity. Boys and Girls Harbor is a local non-profit organization that provides a safe, caring home for children that have been abused, abandoned, or neglected. In total, the employees have collected and donated USD 1 million to the charity in the past 20 years.
India is in transition from an agriculture-based economy to a knowledge-based economy. In the future, the abilities of its people to create, share, and use knowledge more effectively will decide its competitive edge. To reduce the global skill shortages, Sulzer’s site in India has established training courses to support the success of young people: the Earn and Learn program and the GET program.Sulzer provides training workshops for
interested engineers, operators, and main-tenance personnel. The Sulzer Academy for Pumps and Systems offers comprehensive courses to help participants better under-stand the centrifugal pumps and associated auxiliary equipment that is used in their facilities. The goal is to further develop the competencies of the attendees so they can react in time to changing demands and situations within their plants. With more effective and timely decisions, participants are well prepared to ensure the reliability of the operation of the systems and cope with the unexpected.
Earn and Learn programThe unique Earn and Learn program is open for young people both with and without a college degree. It provides employment to rural or semiurban youth who have completed at least 12 years of formal schooling. In this way, the company helps underprivileged students to complete their bachelor’s degree while working and introduces them to attractive opportunities in the growing market.
GET programThe Graduate Engineer Trainee program (GET program) is designed for new engineering graduates who have demonstrated impressive academic ability but who have little or no job experience. With its training and development opportunities, the program eases candidates into the working world. It has been running consistently for five years. The placement rate is 100%, which means that every single graduate has found a job after Sulzer’s training.
50 Sulzer—Annual Report 2016Business Review—Sustainability Dashboard

Corporate Governance
54 Corporate Structure and Shareholders
54 Capital Structure
55 Board of Directors
64 Executive Committee
64 Shareholder Participation Rights
65 Takeover and Defense Measures
65 Auditors
68 Risk Management
70 Information Policy
51

Committed to the Principles of Good Corporate Governance
Sulzer is committed to the principles of good corporate governance. They ensure a sound balance of power and support the company in creating sustainable value for its various stakeholders.
In brief
Core principles
The rigorous application of sound corporate governance helps to consolidate and strengthen trust in the company. Sulzer is subject to Swiss corporate and stock exchange laws and applies the Swiss Code of Best Practice for Corporate Governance.See page 54
Board composition
The Board of Directors comprises eight members. Each member is elected individually. The term for mem-bers of the Board of Directors is one year. Except for the elections reserved to the Shareholders’ Meeting, the Board of Directors constitutes itself. It appoints from among its members the Vice Chairman of the Board of Directors and the members of the Board committees (except for the members of the Nomination and Remuneration Committee who are elected by the Shareholders’ Meeting). See pages 55 – 57
Committees of the Board
There are three standing committees within the Board of Directors: — The Audit Committee assesses the midyear and annual accounts and the activities of the internal and external auditors, the Internal Control System (ICS), and risk management. — The Nomination and Remuneration Committee assesses the criteria for the election and reelection of Board members and nominations for the top two management levels. It also deals with succession plan-ning, compensation systems, and compensation for the members of the Board of Directors and the Executive Committee. — The Strategy Committee advises the Board of Directors on strategic matters (such as material acquisi-tions, divestitures, alliances, and joint ventures) as well as strategic planning and definition of develop-ment priorities.
See pages 57 – 60
Changes
The following changes occurred in the Board of Directors and the Executive Committee: — Klaus Sturany, member of the Board of Directors since August 2009, did not stand for reelection at the Annual General Meeting of April 7, 2016. — Axel C. Heitmann and Mikhail Lifshitz were newly elected as members of the Board of Directors at the Annual General Meeting of April 7, 2016. — All other Board members were reelected for terms of one year. — Armand Sohet was appointed Chief Human Resources Officer and member of the Executive Committee as of March 1, 2016. — Frédéric Lalanne was appointed Chief Commercial and Marketing Officer and member of the Executive Committee as of June 15, 2016. — Fabrice Billard resigned as Chief Strategy Officer and member of the Executive Committee as of July 31, 2016. — Peter Alexander retired from his position as Division President Rotating Equipment Services and member of the Executive Committee as of August 31, 2016.
53Sulzer—Annual Report 2016 Corporate Governance
Sulzer Ltd is subject to the laws of Switzerland, in particular Swiss corporation and stock exchange law. The company also applies the Swiss Code of Best Practice for Corporate Governance. The rigorous application of sound corporate governance helps to consolidate and strengthen trust in the company. Sulzer has had a single share class and has separated the functions of Chairman of the Board of Directors and CEO for many years. Since the Annual General Meeting of April 8, 2009, only individuals who have never held executive positions at Sulzer have been members of the Board of Directors. Unless otherwise indicated, the following information refers to the situation on December 31, 2016. Further information on corporate governance is published at www.sulzer.com/corpgov. The information in the following section is set out in the order defined by the SIX Swiss Exchange guidelines on corporate governance information (RLCG), with subsections sum-marized as far as possible. Sulzer’s consolidated financial statements comply with International Financial Reporting Standards (IFRS), and in certain sections, readers are referred to the Financial Reporting section in the Sulzer Annual Report 2016. The Compensation Report can be found on pages 71 to 92.
1 Corporate Structure and Shareholders
Corporate structure The operational corporate structure is shown in the graphic on page 60 and in the segment reports in the Financial Reporting section on pages 101 to 104 (note 3). Sulzer Ltd is the only Sulzer company listed on a stock exchange. It is based in Winterthur, Switzerland. Its shares are listed and traded on the SIX Swiss Exchange in Zurich (Securities No. 3838891/ISIN CH0038388911). On December 31, 2016, the market capitalization of all registered shares was CHF 3 597 548 800. Information on the major subsidiaries included in the consolidation can be found under note 37 on pages 149 to 152 of the Financial Reporting section.
Significant shareholders According to notifications of Sulzer shareholders, one shareholder held more than 3% of Sulzer Ltd’s share capital on December 31, 2016. On December 8, 2015 (published on the SIX disclosure platform on De-cember 16, 2015), Viktor Vekselberg held 63.42% of Sulzer shares. The shares are directly held by Liwet Holding AG and Tiwel Holding AG. Both are part of the Renova Group. For detailed information, see the respective disclosure notifications on www.six-exchange-regulation.com/en/home/publications/significant-share holders.html. For the positions held by Sulzer and information on shareholders, see note 24 in the Financial Reporting section (pages 129 to 130). There are no cross-shareholdings where the capital or voting stakes on either side exceed the threshold of 3%.
2 Capital Structure
Share capital The fully paid-up share capital of Sulzer Ltd amounts to CHF 342 623.70 and is divided into 34 262 370 registered shares with a par value of CHF 0.01 per share. Each registered share entitles the holder to one vote at the Shareholders’ Meeting. There is neither any authorized nor conditional capital, nor are there any participation or dividend certificates. The latest version of the Articles of Association can be viewed at www.sulzer.com/regulations. Information on capital changes can be found in the Financial Statements of Sulzer Ltd (page 165).
Changes
— Daniel Bischofberger was appointed Division President Rotating Equipment Services and member of the Executive Committee as of September 1, 2016. — Torsten Wintergerste, Division President Chemtech and member of the Executive Committee ad interim since June 14, 2016, was confirmed in this role as of September 26, 2016, replacing Oliver Bailer.
See pages 55, 64
54 Sulzer—Annual Report 2016Corporate Governance—Corporate Structure and Shareholders

Restrictions on transferability and nominee registrations Sulzer shares are freely transferable provided that, when requested by the company to do so, buyers de-clare that they have purchased and will hold the shares in their own name and for their own account. Nomi-nees shall only be entered in the share register with the right to vote if they meet the following conditions: the nominee is subject to the supervision of a recognized banking and financial market regulator; the nominee has entered into a written agreement with the Board of Directors concerning its status; the share capital held by the nominee does not exceed 3% of the registered share capital entered in the commercial regis-ter; and the names, addresses, and number of shares of those individuals for whose accounts the nominee holds at least 0.5% of the share capital have been disclosed. The Board of Directors is also entitled, beyond these limits, to enter shares of nominees with voting rights in the share register if the abovementioned conditions are met (see also paragraph 6a of the Articles of Association at www.sulzer.com/regulations). On December 31, 2016, nine nominees holding a total of 1 790 740 shares (5.23% of total shares) had entered into agreements concerning their status. No exceptions have been granted. All of those shares have been entered in the share register with voting rights. There are no transfer restrictions and no privileges under the Articles of Association. A removal or amendment of the transfer restriction requires a shareholders’ resolution with a majority of at least two-thirds of the votes represented.
Convertible bonds and options No convertible bonds or warrants are currently outstanding. Details of the restricted stock units issued to the members of the Board of Directors (from 2009) as well as performance share units issued to the members of the Executive Committee (in 2010 and yearly as from 2013) are set out in the Financial Reporting section under note 33 (page 137) and in the Financial Statements of Sulzer Ltd under note 10 (pages 172 to 173).
3 Board of Directors None of the members of the Board of Directors has ever belonged to the management of a Sulzer company or to the Executive Committee, nor do any significant business relationships exist between members of the Board of Directors and Sulzer Ltd or a subsidiary of Sulzer Ltd. Exceptions are Marco Musetti and Mikhail Lifshitz who have a business relationship with Sulzer’s largest shareholder; Marco Musetti is an employee of Renova Management AG. Mikhail Lifshitz is High-tech Asset Business Development Director of Renova Group, Russia, and Chairman of the Board of JSC Rotec, Russia, a company belonging to the Renova Group. Business relationships in the low-single-digit-million range exist with companies that are directly or indirectly controlled by the Renova Group. For further information, see Financial Reporting section, note 33 on page 137. There are no interlocking directorships.
On November 30, 2016, Sulzer signed an agreement to acquire control of Rotec’s gas turbine maintenance business (Rotec GT). Rotec GT will be combined with Sulzer Russia’s rotating equipment service activities. Renova, the current majority owner of Rotec, will remain an investor with a 49% stake in the combined entity (see media release of December 1, 2016, on www.sulzer.com/news).
Elections and terms of office The Articles of Association stipulate that the Board of Directors of Sulzer Ltd shall comprise five to nine members. Each member is elected individually. The term for members of the Board of Directors is one year. Klaus Sturany, member of the Board of Directors since August 2009, did not stand for reelection at the An-nual General Meeting of April 7, 2016. Mikhail Lifshitz and Axel C. Heitmann were newly elected as mem-bers of the Board of Directors at the Annual General Meeting of April 7, 2016. All other Board members were reelected for terms of one year. Accordingly, as of April 7, 2016, the Board of Directors comprises eight members: two from Austria, one from Italy, one from Singapore, one from Russia, one from Germany, and two from Switzerland. Professional expertise and international experience played a key role in the selection of the members. The members of the Board of Directors are presented on pages 58 to 59 and their CVs can be viewed at www.sulzer.com/board.
55Sulzer—Annual Report 2016 Corporate Governance—Capital Structure

According to the Board of Directors and Organization Regulations, the term of office of a Board member ends no later than on the date of the Annual General Meeting in the year when the member reaches the age of 70. The Board of Directors can make exceptions up to but not exceeding the year in which the mem-ber reaches the age of 73.
Internal organization The Board of Directors constitutes itself, except for the Chairman of the Board of Directors who is elected by the Shareholders’ Meeting. The Board of Directors appoints from among its members the Vice Chairman of the Board of Directors and the members of the Board committees, except for the members of the Nomination and Remuneration Committee, who are elected by the Shareholders’ Meeting. There are currently three standing Board committees: the Audit Committee (AC), the Nomination and Remuneration Committee (NRC), and the Strategy Committee (SC); for their constitutions, see page 57. The Board of Directors and Organization Regulations and the relevant Committee Regulations, which are published at www.sulzer.com/regulations, define the division of responsibilities between the Board of Directors and the CEO. They also define the authorities and responsibilities of the Chairman of the Board of Directors and of the three standing Board committees.
Operating principles of the Board of Directors and its committees All decisions are made by the full Board of Directors. For each application, written documentation is distributed to the members of the Board of Directors prior to the meeting. The Board of Directors and the committees meet as often as required by circumstances. The Board of Directors meets at least six times per year, the Audit Committee and the Nomination and Remuneration Committee meet at least three times per year, and the Strategy Committee meets at least twice per year. In 2016, the Board held three full-day meetings, two half-day meetings, and four shorter Board meetings. The latter lasted up to one hour on average. For further details, see the table below. The CEO, the CFO, and the Group General Counsel (who is the Secretary of the Board of Directors) also generally attend the Board meetings in an advisory role. Other members of the Executive Committee are invited to attend Board meetings as required to discuss the midterm planning, the strategy, and the budget, as well as division-specific items (such as large investments and acquisitions).
The committees do not make any decisions, but rather review and discuss the matters assigned to them and submit the required proposals to the full Board of Directors for a decision. At the next full Board meet-ing following the committee meeting, the chairpersons of the committees report to the full Board of Direc-tors on all matters discussed, including key findings, opinions, and recommendations.
Board of Directors
Name Nationality Position EntryElected until
Attending meetings of theBoard AC NRC SC
Peter Löscher Austria Chairman, Chairman SC March 2014 2017 9 3
Matthias Bichsel Switzerland Vice Chairman of the Board, Member SC March 2014 2017 7 3
Jill Lee Singapore Chairwoman AC 1), Member NRC April 2011 2017 9 4 9
Marco Musetti Italy Member AC 2), NRC April 2011 2017 9 1 9
Thomas Glanzmann Switzerland Chairman NRC, Member AC 1), SC 2) April 2012 2017 9 3 9 1
Gerhard Roiss Austria Member SC April 2015 2017 8 3
Axel C. Heitmann 1) Germany Member AC April 2016 2017 7 3
Mikhail Lifshitz 1) Russia Member SC April 2016 2017 6 2
Klaus Sturany 2) Austria Chairman AC, Member SC August 2009 2016 1 1
AC = Audit Committee, NRC = Nomination and Remuneration Committee, SC = Strategy Committee1) As of April 7, 2016.2) Until April 7, 2016.
Corporate Governance—Board of Directors56 Sulzer—Annual Report 2016
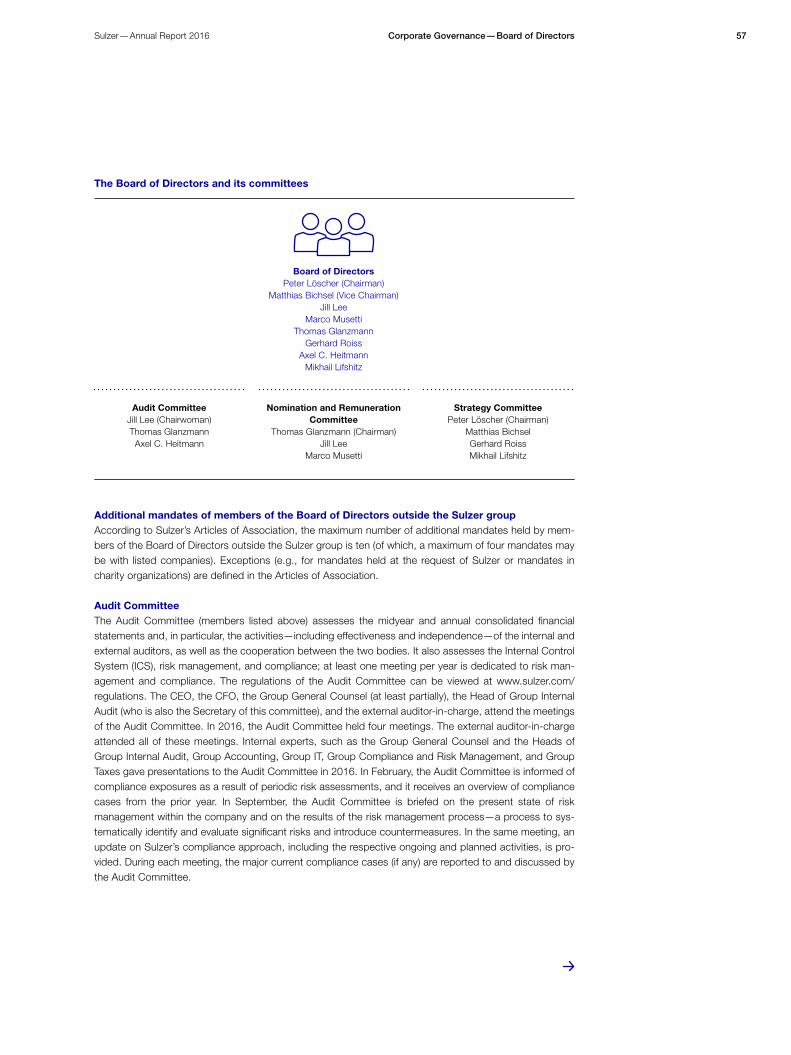
Additional mandates of members of the Board of Directors outside the Sulzer groupAccording to Sulzer’s Articles of Association, the maximum number of additional mandates held by mem-bers of the Board of Directors outside the Sulzer group is ten (of which, a maximum of four mandates may be with listed companies). Exceptions (e.g., for mandates held at the request of Sulzer or mandates in charity organizations) are defined in the Articles of Association.
Audit Committee The Audit Committee (members listed above) assesses the midyear and annual consolidated financial statements and, in particular, the activities—including effectiveness and independence—of the internal and external auditors, as well as the cooperation between the two bodies. It also assesses the Internal Control System (ICS), risk management, and compliance; at least one meeting per year is dedicated to risk man-agement and compliance. The regulations of the Audit Committee can be viewed at www.sulzer.com/ regulations. The CEO, the CFO, the Group General Counsel (at least partially), the Head of Group Internal Audit (who is also the Secretary of this committee), and the external auditor-in-charge, attend the meetings of the Audit Committee. In 2016, the Audit Committee held four meetings. The external auditor-in-charge attended all of these meetings. Internal experts, such as the Group General Counsel and the Heads of Group Internal Audit, Group Accounting, Group IT, Group Compliance and Risk Management, and Group Taxes gave presentations to the Audit Committee in 2016. In February, the Audit Committee is informed of compliance exposures as a result of periodic risk assessments, and it receives an overview of compliance cases from the prior year. In September, the Audit Committee is briefed on the present state of risk management within the company and on the results of the risk management process—a process to sys-temat ically identify and evaluate significant risks and introduce countermeasures. In the same meeting, an update on Sulzer’s compliance approach, including the respective ongoing and planned activities, is pro-vided. During each meeting, the major current compliance cases (if any) are reported to and discussed by the Audit Committee.
Board of DirectorsPeter Löscher (Chairman)
Matthias Bichsel (Vice Chairman)Jill Lee
Marco MusettiThomas Glanzmann
Gerhard RoissAxel C. Heitmann
Mikhail Lifshitz
Audit CommitteeJill Lee (Chairwoman)Thomas Glanzmann
Axel C. Heitmann
Nomination and Remuneration Committee
Thomas Glanzmann (Chairman)Jill Lee
Marco Musetti
Strategy CommitteePeter Löscher (Chairman)
Matthias BichselGerhard RoissMikhail Lifshitz
The Board of Directors and its committees
57Corporate Governance—Board of DirectorsSulzer—Annual Report 2016
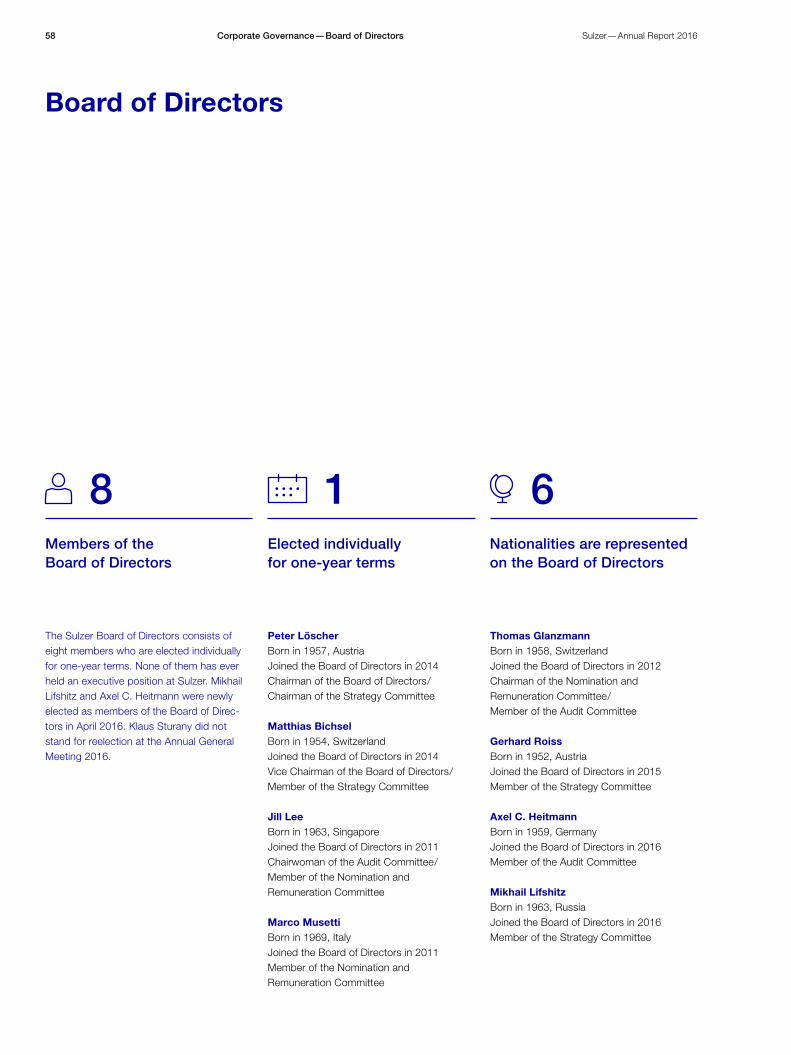
Board of Directors
Matthias BichselBorn in 1954, Switzerland Joined the Board of Directors in 2014Vice Chairman of the Board of Directors / Member of the Strategy Committee
Marco MusettiBorn in 1969, ItalyJoined the Board of Directors in 2011Member of the Nomination and Remuneration Committee
Axel C. Heitmann Born in 1959, GermanyJoined the Board of Directors in 2016Member of the Audit Committee
Jill LeeBorn in 1963, SingaporeJoined the Board of Directors in 2011Chairwoman of the Audit Committee / Member of the Nomination and Remuneration Committee
Gerhard RoissBorn in 1952, AustriaJoined the Board of Directors in 2015Member of the Strategy Committee
Thomas GlanzmannBorn in 1958, SwitzerlandJoined the Board of Directors in 2012Chairman of the Nomination and Remuneration Committee / Member of the Audit Committee
Mikhail LifshitzBorn in 1963, RussiaJoined the Board of Directors in 2016Member of the Strategy Committee
Peter LöscherBorn in 1957, Austria Joined the Board of Directors in 2014Chairman of the Board of Directors / Chairman of the Strategy Committee
Members of the Board of Directors
8Elected individually for one-year terms
1Nationalities are represented on the Board of Directors
6
The Sulzer Board of Directors consists of eight members who are elected individually for one-year terms. None of them has ever held an executive position at Sulzer. Mikhail Lifshitz and Axel C. Heitmann were newly elected as members of the Board of Direc-tors in April 2016. Klaus Sturany did not stand for reelection at the Annual General Meeting 2016.
Corporate Governance—Board of Directors58 Sulzer—Annual Report 2016

For full CVs, visit www.sulzer.com/board
From left to right: Axel C. Heitmann, Marco Musetti, Mikhail Lifshitz, Peter Löscher, Gerhard Roiss, Jill Lee, Matthias Bichsel, Thomas Glanzmann.
59

Nomination and Remuneration Committee The Nomination and Remuneration Committee (members listed on page 57) assesses the criteria for the election and reelection of Board members and the nomination of candidates for the top two management levels. It deals with succession planning. It also regularly assesses the compensation systems and recom-mends compensation for the members of the Board of Directors and the Executive Committee (including bonus targets for the latter) on behalf of the Board of Directors and in accordance with its specifications. It carries out broadly based compensation benchmarks with an international comparison group, supported by studies of consulting firms such as Mercer and Willis Towers Watson, and it scrutinizes the work of in-ternal and external consultants. The members of the Nomination and Remuneration Committee are elected by the Shareholders’ Meeting. The regulations of the Nomination and Remuneration Committee can be viewed at www.sulzer.com/regulations. The CEO and the Chief Human Resources Officer (who is also the Secretary of this committee) attend the meetings of the Nomination and Remuneration Committee. In 2016, nine meetings were held. External experts from Willis Towers Watson provided benchmarking services (see Compensation Report, pages 71 to 92) and supported the Nomination and Remuneration Committee in re-viewing the compensation packages of the members of the Board of Directors and the Executive Committee.
Strategy Committee The Strategy Committee (members listed on page 57) advises the Board of Directors on strategic matters (such as material acquisitions, divestitures, alliances, and joint ventures) as well as strategic planning and definition of development priorities. The regulations of the Strategy Committee can be viewed at www.sulzer. com/regulations. In 2016, three meetings took place. The CEO and the CFO attended all three meetings.
Organizational structure
Chief Executive OfficerGreg Poux-Guillaume
Board of Directors
Division President Pumps EquipmentCésar Montenegro
Chief Financial OfficerThomas Dittrich
Division President Rotating Equipment ServicesDaniel Bischofberger
Chief Commercial and Marketing OfficerFrédéric Lalanne
Division President ChemtechTorsten Wintergerste
Chief Human Resources OfficerArmand Sohet
Corporate Governance—Board of Directors60 Sulzer—Annual Report 2016

Division of powers between the Board of Directors and the CEO The Board of Directors has largely delegated executive management powers to the CEO. However, it is still responsible for matters that cannot be delegated in accordance with Art. 716a of the Swiss Code of Obli-gations. These matters include corporate strategy, the approval of midterm planning, and the annual budget, as well as key personnel decisions and the creation of the Compensation Report. The same applies to acquisition and divestiture decisions involving an enterprise value exceeding CHF 15 million or CHF 20 mil-lion respectively, investments in fixed assets exceeding CHF 15 million, major corporate restructurings, approval of dispute settlements with an impact on operating income of more than CHF 20 million, approval of research and development projects exceeding CHF 10 million, as well as other matters relevant to the company, and decisions that must be made by law by the Board of Directors (including those defined in the Swiss Mergers Act). The competency regulations and the nature of the collaboration between the Board of Directors and the Executive Committee can be viewed in the organizational regulations at www.sulzer.com/regulations.
Information and control instrumentsEach member of the Board of Directors receives a copy of the monthly financial statements (January to May and July to November), plus the midyear and annual financial statements. These include information about the balance sheet, the income and cash flow statements, and key figures for the company and its divisions. They incorporate comments on the respective business results and a six-month rolling forecast of the key figures. The CEO and CFO report at every Board meeting on business developments and all matters relevant to the company; once each year, the Board receives the forecasted annual results. During these meetings, the chairmen of the committees also report on all matters discussed by their committees and on the key findings and assessments, and they submit proposals accordingly. Each year, the Board of Directors discusses and approves the budget for the following year, and every three years it establishes a midterm plan, which is also subject to periodic review. The Chairman of the Board of Directors regularly consults with the CEO and other representatives of the Executive Committee. In addition, the Board of Directors receives a status update on investor relations on a regular basis.
Group Internal Audit Group Internal Audit reports functionally directly to the Chairman of the Audit Committee, but administra-tively to the CFO. Meetings between internal audit and external auditors take place regularly. They are used to prepare for the meetings of the Audit Committee, to review the interim and final reports of the external auditors, to plan and coordinate internal and external audits, and to prepare audit instructions for the atten-tion of external auditors of the individual companies. Group companies are audited by Group Internal Audit based on an audit plan that is approved by the Audit Committee. Depending on the risk category, such audits are carried out on a rotational basis either annually or every second, third, or fourth year. Group Internal Audit carried out 34 audits in the year under review. One of the focal points is the Internal Control System (ICS). The results of each audit are discussed in detail with the companies and (where necessary) the divisions concerned, and key measures are agreed upon. The Chairman of the Board of Directors, the members of the Audit Committee, the CEO, the CFO, the Group General Counsel, as well as the respective Division President and other line managers of the audited entity receive a copy of the audit report. Signifi-cant findings and recommendations are also presented to and discussed with the Executive Committee and the Group General Counsel during the monthly Executive Committee meetings. Twice a year, the divi-sions present the status of key measures agreed on. A follow-up process is in place for all Group internal audits, which allows efficient and effective monitoring of how the improvement measures are being imple-mented. Each year, the Head of Group Internal Audit compiles a report summarizing activities and results. This report is distributed to members of the Board of Directors and the members of the Executive Com-mittee, and it is presented to the Executive Committee and the Audit Committee. It is discussed in both committees and, thereafter, reported to the Board of Directors.
61Corporate Governance—Board of DirectorsSulzer—Annual Report 2016
Risk management and compliance Sulzer has established and implemented a comprehensive, value- and risk-based compliance program that focuses on prevention. It consists of the following main elements:
Strong values and setting an ethical organizational toneSulzer puts a high priority on carrying out its business with integrity, in compliance with all applicable laws and internal rules (“a clean deal or no deal”), and on accepting only reasonable contractual risks. The Board of Directors and the Executive Committee are convinced that compliant and ethical behavior in all aspects and on all levels is a precondition for successful and sustainable business. The ethical tone is set at the top, carried through to the middle, and is transmitted to the entire organization. Sulzer also fosters a speak-up culture and encourages employees to address potentially non-compliant behaviors.
Risk assessmentAs part of Sulzer’s integrated risk management process, compliance risks are assessed regularly, and the results are discussed both with the management and with the Audit Committee. The Audit Committee dedicates at least one full meeting per year to risk management and compliance. An overview of the main risks and corresponding mitigation measures is provided on pages 68 to 69.
Internal rules and toolsSulzer has a Code of Business Conduct, which can be viewed in 19 languages at www.sulzer.com/regula-tions. Every employee of the company (including employees of newly acquired businesses) has to confirm in writing that he or she has read and understood this code, and will comply with it. Every member of the Sulzer Management Group (approximately 100 managers), the heads of the operating companies, and the headquarters, regional, and local compliance officers must reconfirm this compliance commitment in writing annually. Furthermore, Sulzer joined the UN Global Compact initiative in 2010. The latest Commu-nication on Progress Report was published on July 29, 2016, and can be downloaded from www.sulzer.com/sustainability.
Rules Although Sulzer follows a behavior- and principle-based approach, compliance directives and processes have been implemented as elements of the governance framework. Sulzer focuses on the major compli-ance risks, e.g.:
— Bribery and corruption risks: Sulzer has had a group-wide antibribery and anticorruption program in place since 2010. This program includes a web-based process that addresses the due diligence of in-termediaries, a corporate-wide directive for offering and receiving gifts and hospitalities, and an e-train-ing (in 13 languages) to familiarize Sulzer employees with the requirements of the directive. — Antitrust and anticompetition risks: Sulzer has an antitrust guideline and a directive addressing behav-iors in trade associations in place. Employees representing Sulzer in trade association meetings have to sign a compliance declaration. — Export control risks: Employees involved in export activities have to comply with all applicable export and re-export laws and regulations. In 2015, Sulzer rolled out and implemented its global Trade Control Directive in all legal entities concerned. In 2016, a new export compliance initiative was launched to maintain and further improve export compliance oversight for countries with specific US export and/or re-export requirements. — Further risks (e.g., stock exchange laws and regulations; human-resource-related issues; intellectual property and know-how; privacy and data protection laws; product liability; environment, quality, safety, and health, etc.): Focused rules and processes address these and many other potential risks. Sulzer has processes that ensure compliance with insider laws as well as stock exchange reporting and notification duties. Local compliance officers performed 56 face-to-face training sessions in 2016.
Corporate Governance—Board of Directors62 Sulzer—Annual Report 2016

ToolsSulzer has a compliance hotline and an incident reporting system that provides employees with one of many options for reporting (potential) violations of laws or internal rules. Reports can be made anonymously or openly via a free hotline or a dedicated website. The company has a directive that sets clear rules for internal investigations. Further tools are available to all employees on Sulzer’s intranet (e.g., presentations address-ing the major exposures; draft agreements; sales and procurement handbooks with compliance-specific explanations and standard clauses). Sulzer has a compliance risk assessment process in place to identify and assess potential compliance risks on a local entity level and to define appropriate measures.
Organization Since 2013, a “Legal, Compliance, and Risk Management” group function exists within Sulzer (headed by the Group General Counsel). Within this organization, a line reporting structure is in place for the three regions: Americas (AME); Europe, Middle East, and Africa (EMEA); and Asia-Pacific (APAC). The local Compliance Officers ultimately report—via Regional Compliance Officers—to the Group General Counsel (who is also the Chief Compliance Officer). In addition, the headquartered Compliance and Risk Manage-ment team steers and runs the group-wide compliance program. The Head of Risk Management and Compliance also reports to the Group General Counsel. To ensure the consistent rollout of Group Com-pliance initiatives, a dotted reporting line exists between the Regional Compliance Officers and the Head of Compliance and Risk Management. The Group General Counsel informs the Board of Directors and the Executive Committee regularly about legal matters and key changes in legislation that may affect Sulzer, as well as on important litigation. Twice a year, the Audit Committee receives a report about any pending or threatened litigation with worst-case exposure exceeding CHF 0.5 million. Further information on reports to the Audit Committee is provided in the Audit Committee section on page 57.
Awareness building and trainingsSulzer puts substantial effort into training its employees. Training is carried out through e-learning programs (two to three new programs are rolled out every year), in person, or through web conferences. In 2016, Sulzer employees completed over 16 600 e-learning courses, and the company conducted web confer-ences on specific compliance matters.
Controls and sanctions Group Function Legal carried out seven audits of the contract review process in 2016. These audits were conducted within the framework of the audits done by Group Internal Audit and followed the same audit process. Group Function Environment, Safety, and Health (ESH) carried out 12 audits and organized 17 ex-ternal health and safety compliance audits. The focal points were primarily environmental protection and workplace safety. The results of each of these audits were discussed directly with the responsible man-agers, and an agreement was reached on any improvements required. The latest status of the company’s risks relating to environment, safety, and health is reported to the Audit Committee once a year. Apart from these formal audits, internal investigations (triggered by reports from the compliance hotlines, e-mails, telephone calls, or other avenues of communication) were carried out during 2016 and at least five em-ployees had to leave Sulzer because of non-compliant behavior with Sulzer’s Code of Business Conduct. Others received warnings or were transferred internally. However, most of the reports received concerned non-material issues.
Continuous improvementIt is Sulzer’s goal to constantly improve its compliance and risk management approach. Findings of audits and internal investigations are assessed, internal processes and rules are adjusted, and training modules are improved. Sulzer always reviews compliance violations to determine whether they are rooted in a pro-cess weakness. If that is found to be the case, the process will be improved and risk-mitigating measures will be set up.
63Corporate Governance—Board of DirectorsSulzer—Annual Report 2016

4 Executive Committee The Executive Committee consists of the Chief Executive Officer (CEO), the Chief Financial Officer (CFO), the Chief Human Resources Officer (CHRO, since March 2016), the Chief Commercial and Marketing Officer (CCMO, since June 2016), and three Division Presidents. The Board of Directors delegates executive management powers to the CEO. The CEO delegates the appropriate powers to the members of the Executive Committee. The Division Presidents define and attain business targets for their respective divisions in accordance with group-wide goals. The Board of Directors and Organization Regulations govern, among other things, the transfer of responsibilities from the Board of Directors to the CEO. These regulations can be viewed at www.sulzer.com/regulations. There are no management contracts with third parties. None of the Executive Committee members has a contract with a notice period exceeding 12 months. The members of the Executive Committee are presented on pages 66 to 67 and their CVs can be viewed at www.sulzer.com/management.
Additional mandates of members of the Executive Committee outside the Sulzer groupNo member of the Executive Committee may hold more than five mandates, of which no more than one may be in listed companies. Exceptions (e.g., for mandates held at the request of Sulzer or mandates in charity organizations) are defined in the Articles of Association.
5 Compensation ReportInformation on the compensation of the Board of Directors and the Executive Committee can be found in the Compensation Report (pages 71 to 92).
6 Shareholder Participation Rights
Restrictions and representation of voting rightsOnly nominees are subject to restrictions (see Capital Structure, page 54). No exceptions were granted during the reporting year, and no measures to remove these restrictions are planned. According to the Articles of Association, a shareholder may be represented at a Shareholders’ Meeting by its legal represen-tative, another shareholder with the right to vote, or the independent proxy. Shares held by a shareholder may be represented by only one person.
Statutory quorumChanges to the Articles of Association may only be approved by a majority of at least two-thirds of the vot-ing rights represented at the Shareholders’ Meeting; share capital increases are carried out, however, upon an absolute majority of the votes represented. The dissolution or a merger of the company can only be decided upon if at least half the shares issued are represented at the Shareholders’ Meeting and two-thirds thereof vote in favor of the corresponding proposal (see also paragraph 16 of the Articles of Association).
Convocation of the Shareholders’ Meeting and submission of agenda itemsThe applicable regulations are in line with the applicable law regarding the convocation of a Shareholders’ Meeting. Shareholders representing at least 2% of the share capital may submit items for inclusion on the agenda of a Shareholders’ Meeting. Such submissions must be requested in writing at least two months prior to the meeting and must specify the agenda items and proposals of the shareholder concerned.
64 Sulzer—Annual Report 2016Corporate Governance—Executive Committee

Entry in the share registerVoting rights may be exercised by shareholders who are already registered in the share register on the record date stated in the invitation to the respective Shareholders’ Meeting.
Independent proxyAt the Annual General Meeting of April 7, 2016, Proxy Voting Services GmbH was elected as the indepen-dent proxy for a term of office extending until completion of the next Annual General Meeting.
7 Takeover and Defense Measures The Articles of Association contain no opting-out or opting-up clauses. None of the contracts with mem-bers of the Board of Directors contains a change of control clause. The contracts of the members of the Executive Committee who joined the Executive Committee before April 2009 contain a remuneration clause provided the contract is terminated or the member’s function is changed considerably within 18 months after a change of control (see Compensation Report, pages 71 to 92). If there is a change of control (which, for members of the Executive Committee, also includes a replacement of the majority of the members of the Board of Directors) or a public takeover bid that is not supported by the Board of Directors, all allocat-ed restricted stock units (RSU) are automatically vested and the performance share units (PSU) are auto-matically converted into shares on a pro rata basis without being subject to blocking restrictions.
8 AuditorsThe statutory auditor is elected at the Annual General Meeting for a one-year term of office. KPMG AG has been acting as the statutory auditor since 2013. The acting external auditor-in-charge is François Rouiller (since March 27, 2013). The external auditor-in-charge is replaced every seven years. The Audit Committee is in charge of supervising and monitoring the statutory auditor, and it reports to the Board of Directors (see Board of Directors, page 55). The members of the Audit Committee receive summaries of audit findings and improvement proposals at least once a year. The external auditor-in-charge is invited to attend meetings of the Audit Committee. In 2016, he attended all four Audit Committee meetings. The Audit Committee or its Chairwoman meets separately with the Head of Group Internal Audit and the external auditor-in-charge at least once a year to assess (among other things) the independence of the internal and external auditors. The Audit Committee evaluates the work done by the auditors based on the documents, reports, and pre-sentations provided by the auditors, as well as on the materiality and objectivity of their statements. To do so, the committee gathers the opinions of the CFO and the Head of Group Internal Audit. The Audit Com-mittee reviews the fee paid to the auditor regularly and compares it with the auditing fees paid by other internationally active Swiss industrial companies. Said fee is negotiated by the CFO and approved by the Board of Directors. Further information on the auditor, in particular the auditor’s fees and any additional fees received by the auditor for advisory services outside its statutory audit mandate, is listed in the Financial Reporting section under note 34 (page 137). All advisory services provided outside the statutory audit mandate (essentially, consulting services related to audit and accounting as well as legal and tax advisory services) are compliant with the applicable independence rules.
65Sulzer—Annual Report 2016 Corporate Governance—Shareholder Participation Rights

Executive Committee
Daniel BischofbergerBorn in 1966, SwitzerlandJoined the Executive Committee in 2016Division President Rotating Equipment Services
Torsten WintergersteBorn in 1965, SwitzerlandJoined the Executive Committee in 2016Division President Chemtech
César MontenegroBorn in 1953, Venezuela / USAJoined the Executive Committee in 2008Division President Pumps Equipment
Frédéric LalanneBorn in 1963, FranceJoined the Executive Committee in 2016Chief Commercial and Marketing Officer
Thomas DittrichBorn in 1964, Switzerland / GermanyJoined the Executive Committee in 2014Chief Financial Officer
Armand SohetBorn in 1965, FranceJoined the Executive Committee in 2016Chief Human Resources Officer
Greg Poux-GuillaumeBorn in 1970, FranceJoined the Executive Committee in 2015Chief Executive Officer
The Sulzer Executive Committee consists of the CEO, the CFO, the Chief Human Resources Officer (CHRO), the Chief Com-mercial and Marketing Officer (CCMO), and three Division Presidents. Armand Sohet joined the Executive Committee as CHRO on March 1, 2016. Frédéric Lalanne joined as CCMO on June 15, 2016. Fabrice Billard resigned as Chief Strategy Officer as of July 31, 2016. Peter Alexander retired from his position as Division President Rotating Equipment Services as of August 31, 2016. Daniel Bischofberger was appointed Division President Rotating Equipment Services as of September 1, 2016. Torsten Wintergerste, Division President Chemtech ad interim since June 14, 2016, was confirmed in this role as of September 26, 2016, replacing Oliver Bailer.
Members of the Executive Committee
Nationalities are represented on the Executive Committee
7 5
66 Sulzer—Annual Report 2016Corporate Governance—Executive Committee

For full CVs, visit www.sulzer.com/management
From left to right and from front to back: Greg Poux-Guillaume, Frédéric Lalanne, Thomas Dittrich, Daniel Bischofberger, César Montenegro, Armand Sohet, Torsten Wintergerste.
67

At Sulzer, compliance risks are assessed regularly as part of the company’s integrated risk management process. The results are discussed with the management and the Audit Committee.
Assessing and Managing Risks
Risk Risk exposure Main loss controls
External and markets
Market assessment Market developments that are assessed inappropriately could lead to missed business opportunities or losses.
— Continuous monitoring and assessment of market developments — Systematic midrange planning based on market developments and expectations
Geopolitical shocks A geopolitical shock event could have an impact on operations and travel. Also, it could imply currency risks and default risks of countries and banks.
— Monitoring of exposure in critical countries — Monitoring of debt situation of countries and banks — Continuous monitoring of raw material prices and inflation indicators — Sulzer’s global presence mitigates the effect of geopolitical shocks
Strategic
Innovation— More information
on page 45
Failure in R&D and innovation activities could negatively impact the ability to operate and to grow the business. Insufficient investments in innovation to maintain technology leadership and develop innovative products.
— Stage-Gate® process and key performance indicators — Product Development Council with strong focus on midrange planning process and value engineering — Core Technology Council for development of basic technology — Focus on innovation with strategic customers — Innovation projects planned for 2017 — Implementation of an expert development program for key critical resources in 2017
Operational
Attraction and retention— More information
on page 48
Failure to attract and retain people could lead to a lack of expertise and negatively impact the ability to operate.
— Active fostering of corporate values and high ethical standards — Strong Sulzer employer brand strategy — Regular talent review workshops — Development plans and education of employees — Salary benchmarks and reviews — Close monitoring of voluntary attrition rate
Health and safety— More information
on page 48
An unsafe working environment could lead to harm to people, reputational damage, fines, as well as liability claims and could have a serious economic impact.
— Health and safety directives, guidelines, programs (e.g., Safe Behavior Program), and training — OHSAS 18001 certifications — Monthly health and safety controlling and regular audits — Global network of health and safety officers
68 Sulzer—Annual Report 2016Corporate Governance—Risk Management

Risk Risk exposure Main loss controls
Operational
Compliance— More information
on page 62
Non-compliant or unethical behavior could lead to reputational damage, fines, and liability claims.
— Active fostering of high ethical standards by tone from the top and middle management — Continuous monitoring and assessment of potential exposures — Sulzer Code of Business Conduct and a number of supporting regulations (e.g., anticorruption, antitrust, trade control) — Global network of compliance and trade compliance officers — Compliance training (incl. e-learning) and audits — Speak-up culture, compliance hotline, and sanctions
Quality of products and services
Failure of high-quality products and services could lead to repeated work, reputational damage, or liability claims.
— Quality management and assurance systems tailored to specific businesses — Third-party accreditation — Competence development programs and training of employees — Test centers
Business interruptions Business interruption, such as a fire, could cause damage to people, property, and equipment. It could have a negative effect on the ability to operate at the affected site.
— Crisis and emergency management systems (at global and local level) — Risk management policy and guidelines — Global manufacturing footprint and global procurement — Disaster recovery plans in IT
Financial
Financial markets— More information
on page 107
The unpredictability of financial markets may have a negative effect on Sulzer’s financial performance and its ability to raise or access capital.
— Group financial policy — Foreign exchange risk policy — Trading loss limits for financial instruments
Credit— More information
on page 109
Credit risks arising from financial institutions and from customers could have a negative effect on Sulzer’s financial performance and ability to operate.
— For financial institutions, only parties with a strong credit quality are accepted (third-party rated) — Individual risk assessment of customers with large order volumes — Continuous monitoring of country risks
Liquidity— More information
on page 109
Failure in liquidity risk management may have a negative effect on Sulzer’s financial performance and its ability to operate.
— Continuous liquidity monitoring — Management of liquidity reserves at group level — Cash flow program to optimize liquidity and cash flow management — Efficient use of available cash through cash pooling
69Sulzer—Annual Report 2016 Corporate Governance—Risk Management
9 Information PolicySulzer Ltd reports on its order intake every quarter (media releases) and on its financial results every half year. In each case, it also comments on business performance and outlook. In addition, the company reports on important events on an ongoing basis (ad hoc publications). The reporting referred to in section 5 of this Corporate Governance Report (including the respective references to the Financial Reporting section) complies with the recommendations on the content of the Compensation Report as laid out in section 38 of annex 1 to the Swiss Code of Best Practice for Corporate Governance.
Key dates in 2017March 1 Annual results 2016April 6 Annual General Meeting 2017April 27 Order intake Q1 2017July 27 Midyear results 2017October 26 Order intake Q1 – Q3 2017
These dates and any changes can be viewed at www.sulzer.com/events. Media releases (sent via e-mail) can be subscribed to at www.sulzer.com/newsletter. Other information is available on the Sulzer website www.sulzer.com.
Material changesThe text makes reference to any material changes occurring between the balance sheet date (Decem-ber 31, 2016) and the copy deadline for the Annual Report (February 22, 2017).
70 Sulzer—Annual Report 2016Corporate Governance—Information Policy

Compensation Report
73 Letter to the Shareholders
75 Compensation Governance and Principles
78 Compensation Architecture
86 Compensation of the Board of Directors and the Executive Committee
90 Shareholdings of the Board of Directors and the Executive Committee
92 Auditor’s Report
71


On behalf of the Board of Directors and the Nomination and Remuneration Committee of Sulzer, please find enclosed our 2016 Compensation Report.
The purpose of the Sulzer compensation policy is to enable the company to attract, retain, and motivate the talents that are key to the company’s performance and long-term success. With that in mind, our compensation programs have been designed to reward performance that delivers sustainable growth, and long-term shareholder value creation.
During the reporting year, the Board of Directors and the Nomination and Remuneration Committee continued to review Sulzer’s compensation policy and programs in order to ensure that they are aligned with the company’s strategy and shareholders’ interests while being compliant with the regulatory requirements. As a consequence, we implemented the following changes:
— Refinement of performance metrics of the short-term and long-term incentive plans applicable to the members of the Executive Committee; — Introduction of malus and clawback provisions on share-based awards granted under the long-term incentive plan.
In 2016, the Nomination and Remuneration Committee also focused on strengthening the Executive Committee. Aligning with the company’s strategic transformation, the Executive Committee was expanded to include the positions of Chief Human Resources Officer and the Chief Commercial and Marketing Officer. The company was able to successfully hire the Division President Rotating Equipment Services, the Division President Chemtech, the Chief Human Resources Officer, and the Chief Commercial and Marketing Officer. These new members bring extensive international experience and expertise to the Executive Committee and significantly strengthen the management team for the realization of our ambitious goals and strategies.
You will find further information on our activities and on the Sulzer compensation system and governance on the following pages. This Compen-sation Report will be submitted for a non-binding, consultative shareholders’ vote at the Annual General Meeting (AGM) in April 2017. Shareholders will also vote on the maximum aggregate compensation amount to the Board for the term from the 2017 AGM to the 2018 AGM and on the maximum aggregate Executive Committee compensation for 2018.
Looking ahead, we are committed to regularly assess and review our compensation programs to ensure that they are effective. We will also continue the open dialogue with you, our shareholders, and your representatives.
We would like to thank you for taking the time to share your views with us and trust that you will find this report informative.
Sincerely,
Thomas GlanzmannChairman of the Nomination and Remuneration Committee
Winterthur, February 22, 2017
Incentives for Sustainable Performance
Compensation policies and plans at Sulzer reward performance, sustainable growth, and long-term shareholder value creation.
The Compensation Report is prepared in accordance with the Ordinance against Excessive Compensation in Listed Stock Corporations (Compensation Ordinance), the SIX Swiss Exchange Guidelines on Corporate Governance Information (RLCG), and the principles of the Swiss Code of Best Practice for Corporate Governance of economiesuisse.
In brief
Core principles and compensation governance
Compensation policies and plans at Sulzer reward performance, sustainable growth, and long-term share-holder value creation. Compensation programs are competitive, internally equitable, straightforward, and transparent.
The Nomination and Remuneration Committee reviews the compensation policy, programs, and amounts on an annual basis. If necessary, it proposes changes that are subject to the approval of the full Board of Directors.See page 75
Shareholders’ engagement
The shareholders are asked to approve the aggregate maximum amounts of compensation that may be awarded to the Board of Directors and to the Executive Committee in a binding prospective vote. Further, shareholders have the opportunity to express their opinions on the compensation framework and on the compensation actually awarded for the reporting year in a consultative vote on the Compensation Report. See page 76
Compensation of the Board of Directors
To reinforce the independence of the Board of Directors in fulfilling its supervisory duties, the compensation of the Board of Directors consists of a fixed remuneration only, delivered as follows:
— Fixed cash component — Restricted stock unit (RSU) component
The fixed amount of compensation for the Chairman and the other members of the Board of Directors depends on the amount of responsibility and complexity of the respective function, the professional and personal requirements placed on them, and the expected time requirement to fulfill their duties.See pages 78, 86
Compensation of the Executive Committee
In line with the pay-for-performance key principle, a significant portion of the compensation of the CEO and the other members of the Executive Committee consists of variable incentives based on performance. The compensation includes the following components:
— Fixed compensation:— Base salary (cash)— Retirement and fringe benefits — Variable compensation:— Short-term annual bonus (cash)— Long-term incentives (performance share units)
To ensure that the remuneration is competitive, Sulzer regularly participates in relevant benchmarking surveys. See pages 79, 87
74 Sulzer—Annual Report 2016Compensation Report

The Compensation Report provides information on Sulzer’s principles of compensation, its compensation policy and programs, how compensation is determined, as well as the compensation awarded in the reporting year to the members of the Board of Directors and members of the Executive Committee.
1 Compensation Governance and Principles
Nomination and Remuneration Committee The Articles of Association, the Board of Directors and Organization Regulations, and the Nomination and Remuneration Committee Regulations (www.sulzer.com/regulations) define the functions of the Nomination and Remuneration Committee (NRC). The NRC supports the Board of Directors in nominating and assess-ing candidates for positions to the Board of Directors and Executive Committee positions, in establishing and reviewing the compensation strategy and principles, and in preparing the respective proposals to the Shareholders’ Meeting regarding the compensation of the members of the Board of Directors and of the Executive Committee.
The NRC is responsible for the following activities and submits all proposals concerning these activities to the Board of Directors, which has the final decision authority:
— Periodic assessment of the membership structure of the Board of Directors, determination of selection principles, and identification of potential candidates to the Board of Directors — Succession planning for the CEO and Executive Committee positions (two upper management levels) — Periodic assessment of the compensation policy and programs — Determination of performance targets for the CEO and the Executive Committee positions for the purpose of the incentive plans — Preparation of the respective motions to the Shareholders’ Meeting on the maximum aggregate amounts of compensation for the Board of Directors and for the Executive Committee — Determination of the target compensation for the CEO and for the Executive Committee positions — Preparation of the Compensation Report
The table below describes the levels of authority:
The NRC consists of a maximum of three members who are non-executive and independent and who are elected individually and annually by the Shareholders’ Meeting for the period of office until the following ordinary Annual General Meeting. At the 2016 Annual General Meeting, Thomas Glanzmann (Chairman), Jill Lee, and Marco Musetti were reelected as members of the NRC.
Decision authority
CEO NRC Board Shareholders’ Meeting
Selection criteria and succession planning for Board of Directors proposes approves
Selection criteria and succession planning for Executive Committee proposes reviews approves
Compensation policy and programs proposes approves
Total maximum compensation amounts to be submitted to vote at the Annual General Meeting proposes reviews approves (binding vote)
Individual compensation of the members of the Board of Directors proposes approves
Compensation of the CEO proposes approves
Individual compensation of the Executive Committee proposes reviews approves
Performance objectives and assessment of the CEO proposes approves
Performance objectives and assessment of the Executive Committee proposes reviews approves
Compensation Report proposes approves consultative vote
75Compensation Report—Compensation Governance and PrinciplesSulzer—Annual Report 2016

The NRC meets as often as the business requires, but at least twice a year. In 2016, the NRC held six regular meetings and three conference calls that were attended by all members. Besides the standard agenda items, the NRC concentrated its efforts on the selection and nomination of new EC members for the positions of Division President Rotating Equipment Services, Division President Chemtech, Chief Human Resources Officer, and Chief Commercial and Marketing Officer. Further, the NRC redesigned the long-term incentive plan and slightly refined performance criteria of the short-term incentive plan in order to strengthen further the pay-for-performance alignment. The section Compensation of the Executive Com-mittee (page 79) describes the changes in detail.
The CEO and the Chief Human Resources Officer, who serves as the Secretary of the NRC, generally attend the meetings. The Chairman of the Committee may invite other executives to join the meeting in an advisory capacity, when appropriate. However, the CEO and any other executives do not participate in the meetings, or parts of it, when their own remuneration and/or performance is discussed.
The Chairman of the NRC reports to the next meeting of the full Board of Directors on the activities of the NRC and the matters debated. The Chairman, as far as necessary, submits the respective proposals for approval by the Board of Directors. The minutes of the NRC meetings are available to all members of the Board of Directors.
The NRC may appoint third-party companies to provide independent advice or perform services as it deems necessary for the fulfillment of its duties. In the reporting year, the committee appointed Willis Towers Watson to provide consulting and benchmarking services on compensation matters. Willis Towers Watson has no other mandate with Sulzer.
Shareholders’ role and engagementThe company is keen to receive shareholders’ feedback on the compensation policy and programs, and it began the practice of holding a consultative vote on the Compensation Report in 2011. Further, the company regularly meets with shareholders and shareholder representatives to understand their perspectives. With the implementation of the Compensation Ordinance, the shareholders’ role and their say in compensation matters have become more prevalent. At the Annual General Meeting, shareholders approve the maximum aggregate compensation amounts for the Board of Directors and for the Executive Committee in an annual binding vote.
Further, the Articles of Association regulate the principles of compensation. They include the following provisions related to compensation (the full version of the Articles of Association can be found under www.sulzer.com/regulations):
— Principles of compensation: non-executive members of the Board of Directors receive a fixed compen-sation only. Members of the Executive Committee receive fixed and variable compensation elements. The variable compensation may include short-term and long-term variable compensation components. These are governed by performance metrics that take into account the performance of the company, the group or parts of it, targets in relation to the market, other companies or comparable benchmarks and/or individual targets, as well as strategic and/or financial objectives. Compensation may be paid in the form of cash, shares, options, financial instruments or similar units, in kind, in services, or in other types of benefits; — Shareholders’ binding vote on remuneration: the Shareholders’ Meeting shall approve the maximum aggregate amount of compensation for the Board of Directors for the next term of office and the maxi-mum aggregate amount of compensation for the Executive Committee for the following financial year. The Board of Directors shall submit the annual Compensation Report to an advisory vote at the Annual General Meeting; — Additional amount for members of the Executive Committee hired after the vote on remuneration by the Shareholders’ Meeting: to the extent that the maximum aggregate amount of compensation as approved by the Shareholders’ Meeting does not suffice, up to 40% of the maximum aggregate amount
Compensation Report—Compensation Governance and Principles76 Sulzer—Annual Report 2016

of compensation approved for the Executive Committee is available, without further approval, for the compensation of the members of the Executive Committee who were appointed after the Annual General Meeting; — Loans, credit facilities, and postemployment benefits for members of the Board of Directors and of the Executive Committee: the company may not grant loans or credits to members of the Board of Directors and of the Executive Committee.
Compensation principles The compensation of the Board of Directors is fixed and does not contain any performance-based variable component. This ensures that the Board of Directors is truly independent in fulfilling its supervisory duties towards the Executive Committee.
The compensation of the Executive Committee is driven by the main principle of pay for performance. The compensation policy and programs are designed to reward performance, sustainable growth, and long-term shareholder value creation, while offering competitive remuneration to be able to attract and retain highly qualified employees. The compensation principles are:
Method of determination of compensation: benchmarking and annual target-setting process To ensure compensation levels that are competitive and in line with market practice, the compensation of the Board of Directors and of the Executive Committee is regularly benchmarked against that of similar roles in comparable companies. For this purpose, the Nomination and Remuneration Committee selected a peer group of international industrial companies headquartered in Switzerland based on their revenue and number of employees (see box Compensation benchmark on this page). Sulzer is positioned between the first quartile and median of the peer group.
The intention is to pay target compensation around the median of the relevant market. For the Executive Committee, sustainable superior performance is rewarded through actual compensation significantly above the market median.
The compensation effectively paid out depends on the performance of the company and/or the divisions and on the achievement of individual performance objectives. Performance objectives are defined at the beginning of the year during annual target setting. Achievement is assessed against each of those objec-tives after year-end and directly influences the variable incentive payouts.
A substantial portion of the compensation is delivered in the form of variable incentives based on company and individual performance.
Part of the compensation is delivered in the form of company equity to foster ownership and to align the interests of executives with those of shareholders.
Compensation levels are competitive and in line with market practice to attract and retain highly qualified employees.
The internal compensation structure is based on a job-grading methodology applied globally.
Compensation programs are straightforward and transparent.
Pay for performance
Ownership
Market competitiveness
Internal equity
Transparency
Compensation benchmark
The comparison group reflects Sulzer’s ambitious business strategy:
— ABB — Actelion — Clariant — Georg Fischer — Lonza — OC Oerlikon — Rieter — Schindler — Sika — Sonova — Syngenta — Tetra Laval Group
77Compensation Report—Compensation Governance and PrinciplesSulzer—Annual Report 2016

2 Compensation Architecture
Compensation of the Board of DirectorsThe compensation policy applicable to the Board of Directors is governed by a compensation regulation, is reviewed by the NRC annually, and, if necessary, is adjusted by a decision of the full Board of Directors based on a proposal by the NRC.
The compensation of the Board of Directors consists of a fixed cash component and a restricted stock unit (RSU) component with a fixed grant value. Further, Board members are entitled to a lump sum to cover business expenses. The RSU replaced the option plan in 2009 and strengthens the long-term alignment of the interests of the Board members with those of the shareholders. To reinforce the focus of the Board of Directors on the long-term strategy and to strengthen its independence from the Executive Committee, the compensation of the Board of Directors contains no performance-related elements and Board members are not entitled to pension benefits.
The amount of compensation for the Chairman and for the other members of the Board of Directors is determined based on the relevant compensation benchmarks (see box Compensation benchmark on page 77). The compensation reflects the responsibility and complexity of their respective function, the professional and personal requirements placed on them, and the expected time required to fulfill their duties. The compensation structure and amounts were reviewed in 2016 and remained unchanged. They are described in the table below.
Target settingDefinition of two to four individual performance objectives at the beginning of the year
Performance assessmentPerformance assessment at year-end
Compensation determinationDetermination of incentive payouts on the basis of the company’s/division’s perfor mance and achievement of individual objectives
Performance appraisal
Annual compensation of the Board of Directors 1)
in CHF
Cash component (net of social security
contributions)
Grant value of restricted
stock units (net of social security contributions)
Lump-sum expenses
Base fee for Board Chairmanship 2) 420 000 250 000 10 000
Base fee for Board Vice Chairmanship 100 000 155 000 5 000
Base fee for Board membership 70 000 125 000 5 000
Additional committee fees:
Committee Chairmanship 40 000
Committee membership 25 000
1) Compensation for the period of service (from AGM to AGM).2) The Chairman of the Board of Directors does not receive additional remuneration for committee activities.
78 Sulzer—Annual Report 2016Compensation Report—Compensation Architecture

The members of the Board of Directors are remunerated for their service during their term of office. The cash remuneration is paid in quarterly installments for Board members and monthly installments for the Chairman; the expense lump sum is paid out in December and the RSU are granted once a year. The grant value of the RSU is fixed at CHF 250 000 for the Chairman of the Board of Directors, CHF 155 000 for the Vice Chairman, and CHF 125 000 for a Board member. The number of RSU is determined by dividing the fixed grant value by the volume-weighted average share price of the last ten trading days before the grant date, which lies between the date of the publication of the year-end results and the Annual General Meeting. In 2016, this weighted average share price has been adjusted for the special dividend payment proposed. One-third of the RSU each vest after the first, second, and third anniversaries of the grant date respectively. Upon vesting, one vested RSU is converted into one share of the company. The vesting period for RSU granted to the members of the Board of Directors ends no later than on the date on which the member steps down from the Board. Although the value of the RSU grant is fixed (at grant), it then fluctuates with the share price during the vesting period, which means that the value at vesting will differ from the value at grant.
Compensation of the Executive CommitteeThe compensation of the Executive Committee is governed by internal regulations such as the total reward policy, the bonus plan, the performance share plan, and benefits plans. The compensation of the Executive Committee is reviewed by the NRC annually and, if necessary, adjusted and approved by decision of the Board of Directors based on a proposal by the NRC.
In line with the pay-for-performance principle, a significant portion of the compensation of the CEO and the other members of the Executive Committee consists of variable incentives based on performance. The compensation is structured as follows:
— Fixed compensation:— Base salary (cash)— Retirement and fringe benefits — Variable compensation:— Short-term annual bonus (cash)— Long-term incentives (performance share plan)
The elements of the compensation of the members of the Executive Committee are summarized in the table below.
Base salary Base salary
Short-term incentive plan
Bonus plan
Benefits Pension and social
security contributions, fringe benefits
Long-term incentive plan
Performance share plan (PSP)
Fixed compensation Variable compensation
Overview of compensation elements
79Sulzer—Annual Report 2016 Compensation Report—Compensation Architecture

Compensation elements for the members of the Executive Committee
Base salary Benefits Short-term incentive plan (bonus plan)
Long-term incentive plan (PSP 2016)
Main parameters Function, level of role, profile of incumbent (skill set, experience)
Pension and social security contributions, fringe benefits
Achievement of financial and individual objectives
Achievement of long-term, company-wide objectives
Key drivers Labor market Protection against risks, labor market
• Operational EBITA • Sales• Operating net cash
flow (ONCF)
• Operational EBITA growth
• Average return on capital employed adjusted (ROCEA)
• Relative total share-holder return (TSR)
Link to compensation principles
Competitive compensation
Competitive compensation
Pay for performance Sustainable growth and value creation
Vehicle Cash Pension and insurance plans, perquisites
Cash Performance share units (PSU) settled in shares
Amount Fixed Fixed Variable, capped at 200% of target bonus. Target bonus amounts to 90% of annual base salary for the CEO and 60% of annual base salary for the other members of the Executive Committee.
Variable. Grant value is defined based on the Global Grade and corresponds to CHF 1 400 000 for the CEO and between CHF 330 000 and CHF 400 000 for the other members of the Executive Committee. Vesting payout percent-age is capped at 250% and vesting value is capped to CHF 3 600 000 for the CEO and to CHF 825 000 to CHF 1 000 000 for the other members of the Executive Committee.
Grant date Monthly Monthly and /or annually
March of the following year
August 1, 2016
Performance period – – 1 year (January 1, 2016 – December 31, 2016)
3 years (January 1, 2016 – December 31, 2018)
Vesting date – – – December 31, 2018
80 Sulzer—Annual Report 2016Compensation Report—Compensation Architecture
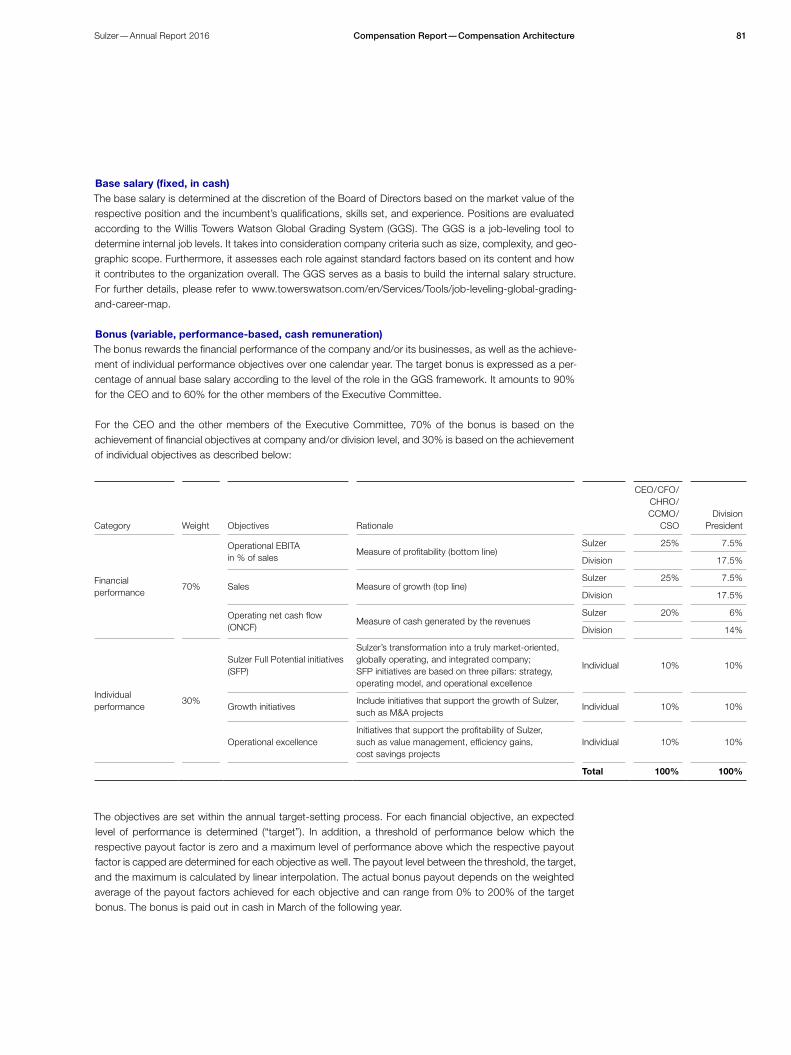
Base salary (fixed, in cash)The base salary is determined at the discretion of the Board of Directors based on the market value of the respective position and the incumbent’s qualifications, skills set, and experience. Positions are evaluated according to the Willis Towers Watson Global Grading System (GGS). The GGS is a job-leveling tool to determine internal job levels. It takes into consideration company criteria such as size, complexity, and geo-graphic scope. Furthermore, it assesses each role against standard factors based on its content and how it contributes to the organization overall. The GGS serves as a basis to build the internal salary structure. For further details, please refer to www.towerswatson.com/en/Services/Tools/job-leveling-global-grading-and-career-map.
Bonus (variable, performance-based, cash remuneration) The bonus rewards the financial performance of the company and/or its businesses, as well as the achieve-ment of individual performance objectives over one calendar year. The target bonus is expressed as a per-centage of annual base salary according to the level of the role in the GGS framework. It amounts to 90% for the CEO and to 60% for the other members of the Executive Committee.
For the CEO and the other members of the Executive Committee, 70% of the bonus is based on the achievement of financial objectives at company and/or division level, and 30% is based on the achievement of individual objectives as described below:
The objectives are set within the annual target-setting process. For each financial objective, an expected level of performance is determined (“target”). In addition, a threshold of performance below which the respective payout factor is zero and a maximum level of performance above which the respective payout factor is capped are determined for each objective as well. The payout level between the threshold, the target, and the maximum is calculated by linear interpolation. The actual bonus payout depends on the weighted average of the payout factors achieved for each objective and can range from 0% to 200% of the target bonus. The bonus is paid out in cash in March of the following year.
Category Weight Objectives Rationale
CEO / CFO /CHRO /CCMO /
CSODivision
President
Financial performance
70%
Operational EBITA in % of sales
Measure of profitability (bottom line)Sulzer 25% 7.5%
Division 17.5%
Sales Measure of growth (top line)Sulzer 25% 7.5%
Division 17.5%
Operating net cash flow (ONCF)
Measure of cash generated by the revenuesSulzer 20% 6%
Division 14%
Individual performance
30%
Sulzer Full Potential initiatives (SFP)
Sulzer’s transformation into a truly market-oriented, globally operating, and integrated company; SFP initiatives are based on three pillars: strategy, operating model, and operational excellence
Individual 10% 10%
Growth initiativesInclude initiatives that support the growth of Sulzer, such as M&A projects
Individual 10% 10%
Operational excellenceInitiatives that support the profitability of Sulzer, such as value management, efficiency gains, cost savings projects
Individual 10% 10%
Total 100% 100%
81Sulzer—Annual Report 2016 Compensation Report—Compensation Architecture

Sulzer strives for transparency in relation to pay for performance. However, disclosure of financial and indi-vidual objectives may create a competitive disadvantage to the company, because it renders sensitive insights into Sulzer’s strategy. To ensure transparency while avoiding competitive risk, Sulzer provides a general performance assessment at the end of the performance cycle (see Compensation of the Executive Committee on page 87).
Performance share plan (variable, performance-based, share-based remuneration)The performance share plan (PSP) rewards the performance of the company over three years and aligns the interests of the participants with those of the shareholders by delivering a substantial portion of the compensation as company equity. The PSP is a plan with annual grants and is available exclusively to the members of the Executive Committee and of the Sulzer Management Group (defined by the job level in the GGS framework). The grant value is determined based on the level of the executive’s role. It amounts to CHF 1 440 000 for the CEO and to between CHF 330 000 and CHF 400 000 for the other members of the Executive Committee. The number of performance share units (PSU) granted is calculated by dividing the grant value by the three-month volume-weighted average share price before the grant date. In 2016, this weighted average share price has been adjusted for the special dividend payment proposed.
Each PSU is a conditional right to a certain number of shares of the company. The PSU are subject to a three-year performance period with three performance conditions:
— Operational EBITA growth, weighted with 25%; — Average ROCEA, weighted with 25%; — Relative total shareholder return (TSR) weighted with 50% and measured against two different peer groups: 75% is based on the performance against international peers measured as percentile ranking and 25% is based on the performance against the companies of the Swiss Market Index Mid (SMIM) measured as a delta (see box on page 83).
Bonus calculation
Annual base salary Target bonus % Bonus
Individual performance (30%)
Payout factor (0%– 200%)
Financial performance (70%)
82 Sulzer—Annual Report 2016Compensation Report—Compensation Architecture

The Board of Directors has the right to change the composition of the peer group in case of a merger or acquisition or any other change leading to a delisting or a fundamental change in the scope of the business of a peer group company. In such a situation, the Board will select a new peer company. There is a pre-defined successor list of companies to support the Board of Directors in the selection process.
For each performance condition of the PSP, an achievement factor is calculated based on the following formula:
On the vesting date, the number of vested shares is calculated by multiplying the initial number of PSU granted by the weighted average of the achievement factor of each performance condition as follows: Number of PSU granted x [(achievement factor opEBITA growth x 25%) + (achievement factor ROCEA x 25%) + (achievement factor relative TSR x 50%)] = number of performance shares vested. The number of vested shares is subject to an absolute cap based on the level of the executive’s role in the GGS framework. The absolute vesting cap amounts to CHF 3 600 000 for the CEO and between CHF 825 000 and CHF 1 000 000 for other Executive Committee members. The fair value of the PSU at grant date has been calculated using the Monte Carlo simulation.
Peer group for relative TSR performance of PSP 2016
Swiss industrial peersInternational peers
• Ebara• Flowserve• ITT• Kirloskar Brothers• KSB
• Pentair• SPX• Weir• Wood Group• Xylem
All companies of the SMIM
Achievement factorLevel of performance
• Below threshold• Threshold• Target• Cap• Points in between
0%50%100%250%Linear interpolation
83Sulzer—Annual Report 2016 Compensation Report—Compensation Architecture

Sulzer strives for transparency in relation to pay for performance. The target achievement level of relative performance objectives are not considered confidential and are thus disclosed (see above). However, disclosure of internal financial and individual objectives may create a competitive disadvantage to the com-pany because it renders sensitive insights into Sulzer’s strategy. To ensure transparency while avoiding competitive risk, Sulzer provides a general performance assessment at the end of the performance cycle.
In case of termination of employment, the following provisions apply: — Resignation of the participant: unvested PSU forfeit. — Termination by the employer for cause: unvested PSU forfeit. — Termination of employment because of retirement: for Executive Committee members, unvested PSU vest on a pro rata basis (number of months between grant date and termination date) according to the achievement factor at the end of the vesting period. There is no early allocation of the shares. — Termination following change of control: unvested PSU immediately vest based on a performance assessment by the Board of Directors on the date of change of control.
Number of PSU vested
Number of PSU granted
Achievement opEBITA growth(0 – 250%) x 25%
Achievement average ROCEA (0 – 250%) x 25%
Achievement relative TSR (0 – 250%) x 50%
Number of PSU granted Grant values are defined based on the level of the role in the GGS framework:
• CEO: CHF 1 440 000• EC: CHF 330 000 to
CHF 400 000
Factor based on average ROCEAAverage ROCEA is the sum of adjusted ROCE based on audited figures in each fiscal year of the performance period, divided by the number of such years.
• Threshold: not disclosed• Target: any performance
between target entry point and target end point (not disclosed)
• Cap: not disclosed
Factor based on relative TSRRelative TSR is defined as share price growth plus dividends during the vesting period divided by the ending share price, measured against peers.
Industrial peers (75%)• Threshold: 25th per centile• Target: median • Cap: 75th percentile
SMIM (25%)• Threshold: SMIM
– 10 percentage points• Target: SMIM • Cap: SMIM
+ 10 percentage points
Factor based on operational EBITA growthOperational EBITA growth is the percentage change between opEBITA in the last fiscal year before the start of the performance period and opEBITA in the last fiscal year of the performance period.
• Threshold: not disclosed• Target: any performance
between target entry point and target end point (not disclosed)
• Cap: not disclosed
Number of PSU vested
Number of PSU vested The maximum vesting value is capped at a multiple of the value at grant:
• CEO: CHF 3 600 000• EC: CHF 825 000 to
CHF 1 000 000
84 Sulzer—Annual Report 2016Compensation Report—Compensation Architecture

Clawback and malus provisions: the Board of Directors may determine that an award is forfeited in full or in part (malus) or that a vested award will be recovered in full or in part (clawback) in situations of material misstatement of the financial results, an error in assessing a performance condition, or in the information or assumptions on which the award was granted or vested, serious reputational damage to the company, gross negligence, or willful misconduct on the part of the participant.
Further information on share-based compensation can be found in the Financial Statements of Sulzer Ltd under note 10 (pages 172 to 173).
Discontinued restricted stock unit plan (variable, fixed grant value, share-based remuneration) The RSU plan that was in place as a long-term incentive for members of the Executive Committee since 2009 was discontinued in 2013 when the PSP 2013 was introduced. The RSU plan was discontinued in 2016 for all other participants who are not members of the Executive Committee. As of 2016, those participants also receive awards under the PSP as described above.
However, RSU may still be granted to newly hired Executive Committee members to compensate for deferred awards forfeited at their previous employer because of joining Sulzer.
Benefits Members of the Executive Committee participate in the regular employee pension fund applicable to all employees in Switzerland. The retirement plan consists of a basic plan that covers annual earnings up to CHF 146 628 per year and a supplementary plan in which income over this limit, up to the ceiling set by law, is insured (including variable cash remuneration). The contributions are age-related and are shared between the employer and the employee.
Furthermore, each member of the Executive Committee is entitled to a representation allowance in line with the expense regulations for all members of management in Switzerland and approved by the tax authorities.
Contracts of employment The employment contracts of the Executive Committee are of undetermined duration and have a notice period of maximum 12 months. Members of the Executive Committee are not entitled to any impermissible severance or change of control payments. The employment contracts of the Executive Committee may include non-competition agreements with a time limit of one year and with a maximum total compensation of one annual target compensation.
85Sulzer—Annual Report 2016 Compensation Report—Compensation Architecture

3 Compensation of the Board of Directors and the Executive Committee
Compensation of the Board of DirectorsIn 2016, the Board of Directors received a total compensation of CHF 2 722 620 (previous year: CHF 2 075 000). Of this total, CHF 1 254 035 was in form of cash fees (previous year: CHF 1 068 000); CHF 1 092 500 was in RSU (previous year: CHF 874 000); CHF 265 417 was in the form of social security contributions (previous year: CHF 133 000), and CHF 110 668 was in the form of other payments (previous year: CHF 0).
This is an increase of 31% from the previous year. The increase was mainly driven by the two additional members since the 2016 AGM and by a special cash payment made as compensation for the fact that RSU granted in the years 2014 and 2015 did not entitle Board members to the extraordinary dividend that was distributed to shareholders in 2016. The structure and level of the Board compensation remained unchanged compared to the previous year.
The portion of compensation delivered in RSU amounts to 52% of the cash compensation for the Chairman, and to between 76% and 123% for the other members of the Board of Directors. The RSU are subject to a staged three-year vesting period.
Compensation of the Board of Directors (audited)
2016 2015
thousands of CHFCash fees
Restricted stock unit
(RSU) plan 8)
Social security
contribu-tions 9) Other 10) Total
Cash fees
Restricted stock unit
(RSU) plan
Social security
contribu-tions 9) Other Total
Board of Directors 1 254 1 093 265 111 2 723 1 068 874 133 0 2 075
Peter Löscher, Chairman 1) 452 250 72 32 807 443 250 45 0 738
Matthias Bichsel, Vice Chairman 138 155 35 19 347 125 155 20 0 300
Thomas Glanzmann 2) 149 125 31 16 322 143 125 19 0 287
Jill Lee 3) 145 125 31 16 317 121 125 17 0 263
Marco Musetti 114 125 29 16 284 127 125 18 0 270
Gerhard Roiss 104 125 28 11 268 76 94 12 0 182
Axel C. Heitmann 4) 76 94 20 0 189 0 0 0 0 0
Mikhail Lifshitz 5) 76 94 20 0 189 0 0 0 0 0
Luciano Respini 6) 0 0 0 0 0 33 0 2 0 35
Klaus Sturany 7) 0 0 0 0 0 0 0 0 0 0
1) Chairman of the Board of Directors and Chairman of the Strategy Committee. 2) Chairman of the Nomination and Remuneration Committee. 3) Chairwoman of the Audit Committee. 4) Member of the Board of Directors since April 7, 2016. 5) Member of the Board of Directors since April 7, 2016. 6) Vice Chairman until April 1, 2015. 7) Member of the Board of Directors until April 7, 2016. Klaus Sturany waived his compensation for personal reasons.
In return, Sulzer made donations to two non-profit organizations in the amount of the cash fees. 8) RSU awards granted in 2016 had a fair value of CHF 79.32 at grant date which takes into consideration a discount for
dividend payments in the amount of CHF 14.60 (including the extraordinary dividend distributed to shareholders in 2016). 9) The amount includes mandatory social security contributions on the cash fees and estimated contributions on
the RSU (based on their fair value at grant) and includes both the employer and employee contributions paid by the company on behalf of the Board members. As of 2016, RSU are provided net of social security as well.
10) Special cash payment of CHF 14.60 per RSU in order to compensate for the fact that RSU granted in 2014 and 2015 did not entitle Board members to the extraordinary dividend payment distributed to shareholders in 2016.
86 Sulzer—Annual Report 2016Compensation Report—Compensation of the Board of Directors and the Executive Committee

Compensation of the Executive Committee Performance in 2016In 2016, Sulzer made substantial progress towards its transformation goals. Financial targets were exceeded despite an unsupportive energy market environment. All divisions signed acquisitions and the Sulzer Full Potential savings came in above target and ahead of schedule. This led to a financial component of the bonus ranging from 102% to 117% of targeted payout and strong performance versus individual objectives, translating into an overall bonus payout factor ranging between 100% and 130% (on average 111%) for the members of the Executive Committee.
As of December 31, 2015, and 2016, there were no outstanding loans or credits granted to the members of the Board of Directors or former members of the Board of Directors (audited).
In 2015 and 2016, no compensation was granted to former members of the Board of Directors or related parties (audited).
At the 2015 AGM, shareholders approved a maximum aggregate compensation amount of CHF 2 802 000 for the Board of Directors for the period of office from the 2016 AGM until the 2017 AGM and of CHF 2 400 000 for the period of office from the 2015 AGM until the 2016 AGM. The table below shows the reconciliation between the compensation that is/will be paid out for the two periods of office and the maximum aggregate compensation amounts approved by the shareholders.
Reconciliation between the reported Board compensation and the amount approved by the shareholders at the Annual General Meeting
Compensation earned during financial year
as reported (A)
Minus compensation
earned from Jan to AGM of
financial year (B)
Plus compensation accrued from
Jan to AGM of year following financial year
(C)
Total compensation earned for the
period from AGM to AGM
(A – B+C)
Amount approved by shareholders at respective
AGM
Ratio between compensation earned for the
period from AGM to AGM
versus amount approved by shareholders
AGM16 – AGM17 2016
Jan 1, 2016 to
2016 AGM
Jan 1, 2017 to
2017 AGM
2016 AGM to
2017 AGM 2016 AGM 2016 AGM
Board (total) 2 722 620 320 292 362 854 2 765 182 2 802 000 98.7%
AGM15 – AGM16 2015
Jan 1, 2015 to
2015 AGM
Jan 1, 2016 to
2016 AGM
2015 AGM to
2016 AGM 2015 AGM 2015 AGM
Board (total) 2 075 000 271 561 320 292 2 123 732 2 400 000 88.5%
Objectives Assessment relative to plan
Threshold Target Cap
Sales
Operational EBITA
ROCEA
Operating net cash flow (ONCF)
Individual objectives
87Sulzer—Annual Report 2016 Compensation Report—Compensation of the Board of Directors and the Executive Committee

In 2016, the first performance-based grant vested (awarded under the PSP 2013). The PSP 2013 was based on the relative TSR performance and on cumulative EBIT, both calculated over the performance period from January 1, 2013, until December 31, 2015. The threshold of the cumulative EBIT objective was not reached. The achieved relative TSR performance was between the predefined threshold and target (median performance in the peer group). Therefore, the overall vesting amounted to 25%.
In 2015, the acquisition of a further 29.5% of Sulzer’s share capital by Renova triggered a change of control under the PSP plan rules. The provisions of the PSP allow for a pro rata accelerated vesting based on the performance achieved between the grant date and the date of change of control. All members of the Executive Committee had agreed to waive their rights to the accelerated pro rata vesting. Therefore, the PSU granted under the PSP 2013, 2014, and 2015 continue to vest according to the original vesting schedule. However, for the two Executive Committee members who are taxable residents in the US, the accelerated pro rata vesting had to be implemented to ensure compliance with US tax legislation. Consequently, a por-tion of the PSP 2013, 2014, and 2015 awards have automatically forfeited due to the pro rata vesting rule. In order to compensate for the forfeiture, additional PSU were granted in 2016. Those additional grants are subject to the same performance conditions as the original grants and are disclosed at their fair value in the compensation table on page 89.
Compensation awarded to the Executive Committee in 2016In 2016, the Executive Committee received a total compensation of CHF 19 476 608 (previous year: CHF 14 283 000). Of this total, 8 306 400 was in cash (previous year: CHF 5 190 000); CHF 6 529 346 was in PSU (previous year: CHF 4 204 000); CHF 2 517 275 was in pension and social security contributions (previous year: CHF 1 781 000); CHF 1 523 497 was in other payments (previous year: CHF 185 000); and CHF 600 000 was in form of RSU (previous year: CHF 2 923 000).
This is an overall increase of 36% from the previous year. The main reasons for this increase are as follows: — Four new members joined the EC in 2016: two positions (CHRO and CCMO) were promoted to the EC and two EC members were replaced. In addition, EC members who left Sulzer during the course of 2016 still received compensation during their contractual notice period and are therefore included in the com-pensation table. This results in overlaps in compensation for several EC functions; — The base salaries of the EC members employed in both years (2015 – 2016) have increased by 0.4% in total, as only one EC member received a salary increase in 2016. However, the sum of base salaries rose in aggregate by 41%, due to the higher number of EC members and the compensation overlaps in 2016 as mentioned above; — Other payments have substantially increased compared to the previous year. This is due to 1) replace-ment payments paid to new EC members as replacement for forfeited compensation at their previous employer as a result of joining Sulzer, and 2) a special cash payment made as compensation for the fact that RSU granted in the years 2014 and 2015 did not entitle Executive Committee members to the extraordinary dividend that was distributed to shareholders in 2016; — Increase of cash bonus payments by 94% due to: 1) the higher number of EC members and the com-pensation overlaps in 2016 mentioned above and 2) a higher performance achievement under the bonus plan where financial targets were exceeded with strong growth of all divisions and substantial cost savings under the Sulzer Full Potential program; — Higher grant value of long-term incentive (LTI) awards because of one replacement award in the form of RSU made to a new EC member, and because of two additional PSU grants made to EC members to com-pensate the pro rata forfeiture of their previous grant following the change of control, as explained above.
88 Sulzer—Annual Report 2016Compensation Report—Compensation of the Board of Directors and the Executive Committee

Executive Committee
4 727 000 Base salary
3 579 000 Bonus
6 529 000 Grant of PSU
4 041 000 Benefits
2016
For the entire Executive Committee, the variable component (without replacement award) represented 122% of the fixed component (base salary, other, pension and social security contributions). The relation-ship between the fixed and the variable components of compensation reflects Sulzer’s high performance orientation. Further, it represents the company’s strong emphasis on aligning the interests of the Executive Committee and the shareholders to create long-term shareholder value and profitable growth.
The total compensation of CHF 19 476 608 awarded to the members of the Executive Committee for the 2016 business year is above the maximum aggregate compensation amount of CHF 18 800 000 that was approved by the shareholders at the 2015 AGM. This is due to the hiring of four new EC members. Accord-ing to the provisions of the Articles of Association, the Board of Directors may award up to 40% of the last approved maximum aggregate compensation amount for newly promoted EC members. Concretely, the additional amount corresponds to CHF 7 520 000. CHF 676 608 of this additional amount have been utilized for replacement payments awarded to two new EC members as compensation for forfeited compensation at the previous employer as a result of joining Sulzer: CHF 600 000 were granted to Frédéric Lalanne, Chief Commercial and Marketing Officer, in the form of RSU and CHF 98 730 were paid to Armand Sohet, Chief Human Resources Officer, in the form of cash (audited).
Compensation of the Executive Committee (audited)
2016 2015
thousands of CHFBase
salary Bonus 2) Other 3)
Re-stricted
stock unit
(RSU ) plan 4)
Perfor-mance
share plan
(PSP)5)
Pension and
social security contri-
butions 6) TotalBase
salary Bonus 2) Other
Re-stricted
stock unit
(RSU ) plan
Perfor-mance
share plan
(PSP) 2014
Pension and
social security contri-
butions Total
Highest single compensation, Greg Poux-Guillaume, CEO 950 1 005 747 0 2 201 510 5 413 79 71 0 2 923 122 230 3 425
Total Executive Committee 1) 4 727 3 579 1 523 600 6 529 2 517 19 477 3 349 1 841 185 2 923 4 204 1 781 14 283
1) Members of the Executive Committee: — Greg Poux-Guillaume, CEO since December 1, 2015 — Klaus Stahlmann, CEO until August 10, 2015. The total Executive Committee compensation includes the compensation of Klaus Stahlmann during the 12-month notice period that ended in August 2016. — Thomas Dittrich, CFO — Fabrice Billard, Chief Strategy Officer until July 2016 — César Montenegro, Division President Pumps Equipment — Peter Alexander, Division President Rotating Equipment Services until August 2016 — Daniel Bischofberger, Division President Rotating Equipment Services since September 2016 — Oliver Bailer, Division President Chemtech until June 2016 — Torsten Wintergerste, Division President Chemtech since June 2016 — Armand Sohet, Chief Human Resources Officer since March 2016 — Frédéric Lalanne, Chief Commercial and Marketing Officer since June 2016.
2) Expected bonus for the performance years 2016 and 2015, respectively. Includes pro rata short-term incentive (STI) payments for EC members whose employment contracts started or were terminated during the year.
3) Other consists of housing allowances, schooling allowances, private use of company car, tax services, holiday compensation, and child allowances. Also includes a special cash payment of CHF 98 730 for a new EC member as compensation for forfeited incentives at the previous employer as a result of joining Sulzer and a special cash payment of CHF 14.60 per RSU in order to compensate for the fact that RSU granted in 2014 and 2015 did not entitle Executive Committee members to the extraordinary dividend payment distributed to shareholders in 2016.
4) Replacement awards to compensate for forfeited remuneration at the previous employer as a result of joining Sulzer. The amount represents the full fair value at grant.
5) Represents the full fair value of the PSU granted under the PSP 2016 and additional CHF 617 165 for additional grants to two EC members to replace pro rata forfeiture following the change of control in 2015.
6) Includes the employer contribution to social security (including the expected employer contributions on equity awards), based on the fair value of all grants made in 2016 (RSU and PSP).
89Sulzer—Annual Report 2016 Compensation Report—Compensation of the Board of Directors and the Executive Committee

No severance payments to members of the Executive Committee were made during the reporting year.
As of December 31, 2015 and 2016, there were no outstanding loans or credits granted to the members of the Executive Committee or former members of the Executive Committee (audited).
In 2015 and 2016, no compensation was granted to former members of the Executive Committee or related parties (audited).
4 Shareholdings of the Board of Directors and the Executive Committee
Shareholdings of the Board of Directors As of the end of 2015 and 2016, the members of the Board of Directors held the following shares in the company:
Shareholdings at December 31, 2015
Sulzer sharesRestricted stock units
(RSU) Total share awards
and shares
Board of Directors 45 633 13 149 58 782
Peter Löscher 26 684 3 657 30 341
Matthias Bichsel 342 2 103 2 445
Thomas Glanzmann 4 616 2 081 6 697
Jill Lee 3 095 2 081 5 176
Marco Musetti 2 692 2 081 4 773
Gerhard Roiss 4 000 1 146 5 146
Klaus Sturany 4 204 0 4 204
Shareholdings at December 31, 2016
Sulzer sharesRestricted stock units
(RSU) Total share awards
and shares
Board of Directors 50 998 22 157 73 155
Peter Löscher 28 131 5 363 33 494
Matthias Bichsel 1 157 3 244 4 401
Thomas Glanzmann 5 591 2 684 8 275
Axel C. Heitmann 0 1 578 1 578
Jill Lee 4 070 2 684 6 754
Mikhail Lifshitz 0 1 578 1 578
Marco Musetti 3 667 2 684 6 351
Gerhard Roiss 8 382 2 342 10 724
90 Sulzer—Annual Report 2016Compensation Report—Shareholdings of the Board of Directors and the Executive Committee

Shareholdings of the Executive CommitteeAs of the end of 2015 and 2016, the members of the Executive Committee held the following shares in the company:
Shareholdings at December 31, 2016
Sulzer shares
Restricted stock units
(RSU)
Total share awards
and shares
Perfor-mance
share units (PSU) 2014
Perfor-mance
share units (PSU) 2015
Perfor-mance
share units (PSU)2016
Executive Committee 28 726 43 029 71 755 3 278 6 594 37 266
Greg Poux-Guillaume 0 30 242 30 242 0 942 18 641
Daniel Bischofberger 0 0 0 0 0 1 424
Thomas Dittrich 14 000 4 921 18 921 964 2 826 5 178
Frédéric Lalanne 0 7 026 7 026 0 0 2 314
César Montenegro 13 858 0 13 858 2 314 2 826 5 178
Armand Sohet 0 0 0 0 0 3 560
Torsten Wintergerste 868 840 1 708 0 0 971
Shareholdings at December 31, 2015
Sulzer shares
Restricted stock units
(RSU)
Total share awards
and shares
Perfor-mance
share units (PSU) 2013
Perfor-mance
share units (PSU) 2014
Perfor-mance
share units (PSU) 2015
Executive Committee 33 301 40 976 74 277 4 860 7 212 13 800
Greg Poux-Guillaume 0 30 242 30 242 0 0 942
Peter Alexander 10 928 0 10 928 4 860 1 967 2 402
Oliver Bailer 1 303 231 1 534 0 1 967 2 402
Fabrice Billard 1 187 0 1 187 0 0 2 402
Thomas Dittrich 7 000 9 842 16 842 0 964 2 826
César Montenegro 12 883 661 13 544 0 2 314 2 826
91Sulzer—Annual Report 2016 Compensation Report—Shareholdings of the Board of Directors and the Executive Committee
Report of the Statutory Auditor To the General Meeting of Sulzer Ltd, Winterthur
We have audited the accompanying compensation report of Sulzer Ltd for the year ended December 31, 2016. The audit was limited to the information according to articles 14 – 16 of the Ordinance against Excessive compensation in Stock Exchange Listed Companies (Ordinance) contained in the tables and sections labeled “audited” on pages 86 to 90 of the compensation report.
Responsibility of the Board of Directors
The Board of Directors is responsible for the preparation and overall fair presentation of the compensation report in accordance with Swiss law and the Ordinance against Excessive compensation in Stock Exchange Listed Companies (Ordinance). The Board of Directors is also responsible for designing the remuneration system and defining individual remuneration packages.
Auditor's Responsibility
Our responsibility is to express an opinion on the accompanying compensation report. We conducted our audit in accordance with Swiss Auditing Standards. Those standards require that we comply with ethical requirements and plan and perform the audit to obtain reasonable assurance about whether the compensation report complies with Swiss law and articles 14 – 16 of the Ordinance.
An audit involves performing procedures to obtain audit evidence on the disclosures made in the compensation report with regard to compensation, loans and credits in accordance with articles 14 – 16 of the Ordinance. The procedures selected depend on the auditor’s judgment, including the assessment of the risks of material misstatements in the compensation report, whether due to fraud or error. This audit also includes evaluating the reasonableness of the methods applied to value components of remuneration, as well as assessing the overall presentation of the compensation report.
We believe that the audit evidence we have obtained is sufficient and appropriate to provide a basis for our opinion.
Opinion
In our opinion, the compensation report for the year ended December 31, 2016 of Sulzer Ltd complies with Swiss law and articles 14 – 16 of the Ordinance.
KPMG AG
François Rouiller Nanda Buess Licensed Audit Expert Auditor in Charge
Licensed Audit Expert
Zurich, February 22, 2017
KPMG AG, Badenerstrasse 172, PO Box, CH-8036 Zurich KPMG AG is a subsidiary of KPMG Holding AG, which is a member of the KPMG network of independent firms affiliated with KPMG International Cooperative (“KPMG International”), a Swiss legal entity. All rights reserved.
92 Sulzer—Annual Report 2016Compensation Report—Report of the Statutory Auditor
Fin
anci
al S
tate
men
ts
Financial Reporting
95 Consolidated Financial Statements
95 Consolidated Income Statement
96 Consolidated Statement of Comprehensive Income
97 Consolidated Balance Sheet
98 Consolidated Statement of Changes in Equity
99 Consolidated Statement of Cash Flows
100 Notes to the Consolidated Financial Statements
153 Auditor’s Report
161 Five-Year Summaries
165 Financial Statements of Sulzer Ltd
167 Balance Sheet of Sulzer Ltd
168 Income Statement of Sulzer Ltd
168 Statement of Changes in Equity of Sulzer Ltd
169 Notes to the Financial Statements of Sulzer Ltd
174 Appropriation of Net Profit
175 Auditor’s Report
93

Notes to the Consolidated Financial Statements
100 01 | General information
100 02 | Significant events and transactions during the reporting period
101 03 | Segment information
104 04 | Acquisitions of subsidiaries
106 05 | Critical accounting estimates and judgments
107 06 | Financial risk management
114 07 | Corporate risk management
114 08 | Personnel expenses
114 09 | Employee benefit plans
119 10 | Research and development expenses
119 11 | Other operating income and expenses
120 12 | Financial income and expenses
120 13 | Income taxes
123 14 | Intangible assets
125 15 | Property, plant, and equipment
126 16 | Associates
127 17 | Other financial assets
127 18 | Inventories
127 19 | Percentage of completion contracts
128 20 | Trade accounts receivable
129 21 | Other accounts receivable and prepaid expenses
129 22 | Cash and cash equivalents
129 23 | Marketable securities
129 24 | Share capital
131 25 | Earnings per share
131 26 | Borrowings
132 27 | Provisions
133 28 | Other current and accrued liabilities
133 29 | Derivative financial instruments
134 30 | Other financial commitments
134 31 | Contingent liabilities
134 32 | Share participation plans
137 33 | Transactions with members of the Board of Directors, Executive Committee, and related parties
137 34 | Auditor remuneration
137 35 | Key accounting policies and valuation methods
148 36 | Subsequent events after the balance sheet date
149 37 | Major subsidiaries

95Financial Reporting—Consolidated Financial StatementsSulzer—Annual Report 2016
Consolidated income statementJanuary 1– December 31
millions of CHF Notes 2016 2015
Sales 3 2 876.7 2 971.0
Cost of goods sold – 1 997.3 – 2 060.9
Gross profit 879.4 910.1
Selling and distribution expenses – 309.2 – 303.9
General and administrative expenses – 324.6 – 348.2
Research and development expenses 10 – 71.4 – 73.4
Other operating income and expenses, net 11 – 58.9 – 63.7
Operating income 115.3 120.9
Interest and securities income 12 5.2 6.5
Interest expenses 12 – 17.4 – 27.9
Other financial income and expenses, net 12 – 7.1 – 3.3
Share of profit/(loss) of associates 16 – 0.8 3.7
Income before income tax expenses 95.2 99.9
Income tax expenses 13 – 35.1 – 24.9
Net income 60.1 75.0
Attributable to shareholders of Sulzer Ltd 59.0 73.9
Attributable to non-controlling interests 1.1 1.1
Earnings per share (in CHF)
Basic earnings per share 25 1.73 2.17
Diluted earnings per share 25 1.72 2.16
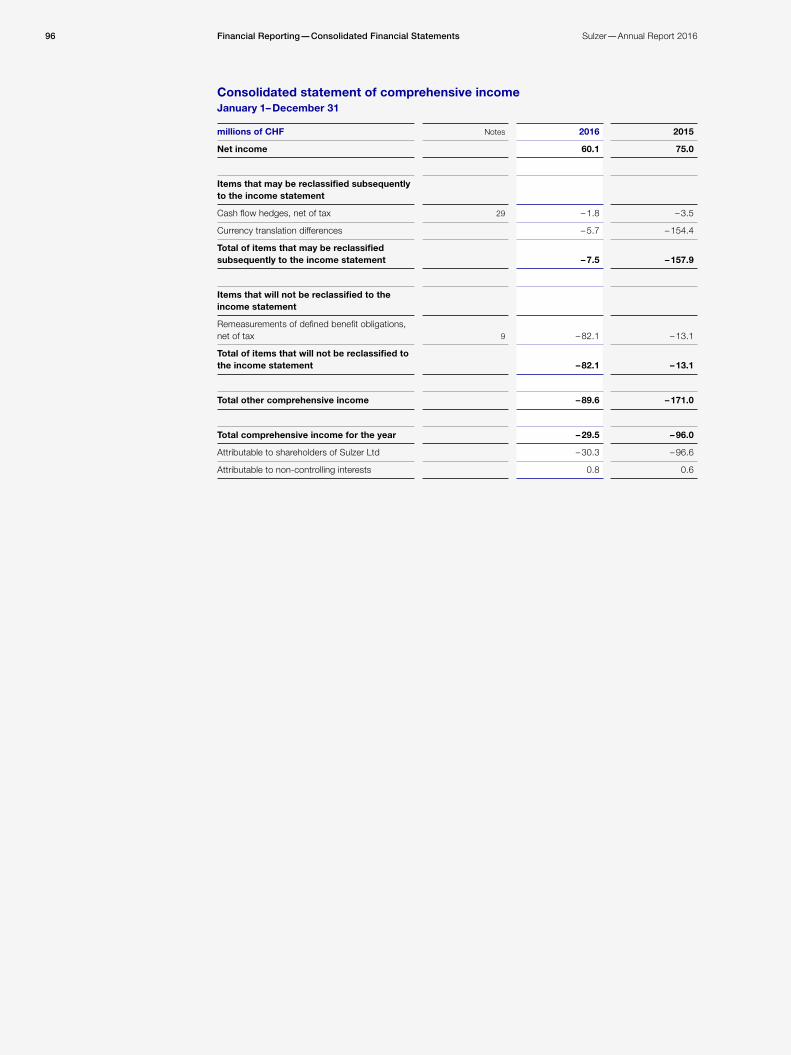
Financial Reporting—Consolidated Financial Statements96 Sulzer—Annual Report 2016
Consolidated statement of comprehensive incomeJanuary 1– December 31
millions of CHF Notes 2016 2015
Net income 60.1 75.0
Items that may be reclassified subsequently to the income statement
Cash flow hedges, net of tax 29 – 1.8 – 3.5
Currency translation differences – 5.7 – 154.4
Total of items that may be reclassified subsequently to the income statement – 7.5 – 157.9
Items that will not be reclassified to the income statement
Remeasurements of defined benefit obligations, net of tax 9 – 82.1 – 13.1
Total of items that will not be reclassified to the income statement – 82.1 – 13.1
Total other comprehensive income – 89.6 – 171.0
Total comprehensive income for the year – 29.5 – 96.0
Attributable to shareholders of Sulzer Ltd – 30.3 – 96.6
Attributable to non-controlling interests 0.8 0.6

97Financial Reporting—Consolidated Financial StatementsSulzer—Annual Report 2016
Consolidated balance sheetDecember 31
millions of CHF Notes 2016 2015
Non-current assets
Goodwill 14 780.1 679.8
Other intangible assets 14 335.3 246.4
Property, plant, and equipment 15 511.0 491.4
Associates 16 5.8 4.0
Other financial assets 17 13.1 11.6
Non-current receivables 7.0 7.1
Deferred income tax assets 13 157.6 133.7
Total non-current assets 1 809.9 1 574.0
Current assets
Inventories 18 401.7 409.3
Advance payments to suppliers 82.0 79.8
Trade accounts receivable 20 883.2 851.1
Other accounts receivable and prepaid expenses 21 129.6 123.3
Marketable securities 23 – 208.3
Cash and cash equivalents 22 429.5 1 009.0
Total current assets 1 926.0 2 680.8
Total assets 3 735.9 4 254.8
Equity
Share capital 24 0.3 0.3
Reserves 1 580.9 2 224.4
Equity attributable to shareholders of Sulzer Ltd 1 581.2 2 224.7
Non-controlling interest 9.8 9.5
Total equity 1 591.0 2 234.2
Non-current liabilities
Non-current borrowings 26 458.3 7.2
Deferred income tax liabilities 13 95.6 69.4
Non-current income tax liabilities 13 2.6 2.6
Defined benefit obligations 9 339.6 294.8
Non-current provisions 27 73.8 73.5
Other non-current liabilities 10.4 24.6
Total non-current liabilities 980.3 472.1
Current liabilities
Current borrowings 26 7.1 514.4
Current income tax liabilities 13 13.9 9.9
Current provisions 27 176.1 137.3
Trade accounts payable 379.3 323.8
Advance payments from customers 179.8 197.5
Other current and accrued liabilities 28 408.4 365.6
Total current liabilities 1 164.6 1 548.5
Total liabilities 2 144.9 2 020.6
Total equity and liabilities 3 735.9 4 254.8

Financial Reporting—Consolidated Financial Statements98 Sulzer—Annual Report 2016
Consolidated statement of changes in equityJanuary 1– December 31
Attributable to shareholders of Sulzer Ltd
millions of CHF NotesShare
capitalRetained earnings
Treasury shares
Cash flow hedge
reserve
Currency translation
adjustment Total
Non-controlling
interestsTotal
equity
Equity as of January 1, 2015 0.3 2 720.3 – 23.4 – 5.7 – 256.1 2 435.4 6.6 2 442.0
Comprehensive income for the year:
Net income 73.9 73.9 1.1 75.0
— Cash flow hedges, net of tax 29 – 3.5 – 3.5 – 3.5
— Remeasurements of defined benefit obligations, net of tax 9 – 13.1 – 13.1 – 13.1
— Currency translation differences – 153.9 – 153.9 – 0.5 – 154.4
Other comprehensive income – 13.1 – 3.5 – 153.9 – 170.5 – 0.5 – 171.0
Total comprehensive income for the year – 60.8 – – 3.5 – 153.9 – 96.6 0.6 – 96.0
Transactions with owners of the company:
Changes in ownership in subsidiaries – 1.8 – 1.8 0.9 – 0.9
Transactions in treasury shares – 7.0 5.6 – 1.4 – 1.4
Share-based payments 32 8.3 8.3 8.3
Dividends – 119.2 – 119.2 – 1.9 – 121.1
Change in scope of consolidation – 3.3 3.3
Equity as of December 31, 2015 24 0.3 2 661.4 – 17.8 – 9.2 – 410.0 2 224.7 9.5 2 234.2
Comprehensive income for the year:
Net income 59.0 59.0 1.1 60.1
— Cash flow hedges, net of tax 29 – 1.8 – 1.8 – 1.8
— Remeasurements of defined benefit obligations, net of tax 9 – 82.1 – 82.1 – 82.1
— Currency translation differences – 5.4 – 5.4 – 0.3 – 5.7
Other comprehensive income – 82.1 – 1.8 – 5.4 – 89.3 – 0.3 – 89.6
Total comprehensive income for the year – – 23.1 – – 1.8 – 5.4 – 30.3 0.8 – 29.5
Transactions with owners of the company:
Allocation of treasury shares to share plan participants – 4.1 4.1 – –
Acquisition of treasury shares – 3.2 – 3.2 – 3.2
Share-based payments 32 7.5 7.5 7.5
Dividends – 617.5 – 617.5 – 0.5 – 618.0
Equity as of December 31, 2016 24 0.3 2 024.2 – 16.9 – 11.0 – 415.4 1 581.2 9.8 1 591.0

99Financial Reporting—Consolidated Financial StatementsSulzer—Annual Report 2016
Consolidated statement of cash flowsJanuary 1– December 31
millions of CHF Notes 2016 2015
Cash and cash equivalents as of January 1 1 009.0 1 194.7
Net income 60.1 75.0
Interest and securities income 12 – 5.2 – 6.5
Interest expenses 12 17.4 27.9
Income tax expenses 13 35.1 24.9
Depreciation, amortization, and impairments 14,15 135.2 129.4
Income from disposals of subsidiaries; property, plant, and equipment; and financial instruments – 1.2 – 0.1
Changes in inventories 43.0 49.6
Changes in advance payments to suppliers 3.4 – 4.2
Changes in trade accounts receivable – 17.4 32.6
Changes in advance payments from customers – 21.5 3.9
Changes in trade accounts payable 49.8 – 33.4
Change in provision for employee benefit plans – 37.9 9.4
Changes in provisions 35.3 3.2
Changes in other net current assets 37.2 0.6
Other non-cash items – 7.1 – 2.1
Interest received 5.2 6.4
Interest paid – 15.1 – 20.4
Income tax paid – 53.1 – 73.4
Total cash flow from operating activities 263.2 222.8
Purchase of intangible assets – 1.4 – 2.1
Purchase of property, plant, and equipment – 73.5 – 71.6
Sale of property, plant, and equipment 12.2 6.7
Acquisitions of subsidiaries, net of cash acquired 4 – 309.1 – 70.1
Acquisitions of associates – 4.3 –
Divestitures of subsidiaries – 0.2
Purchase of financial assets 17 – 1.1 – 0.5
Purchase of marketable securities – – 253.6
Sale of marketable securities 208.4 149.0
Total cash flow from investing activities – 168.8 – 242.0
Dividend – 617.5 – 119.2
Purchase of treasury shares – 3.2 – 3.5
Sale of treasury shares – 2.1
Dividend paid to non-controlling interests – 0.5 – 1.9
Changes in non-controlling interests – – 0.1
Additions in non-current borrowings451.5 0.6
Repayment of non-current borrowings – 2.5 – 0.4
Additions in current borrowings 216.9 6.4
Repayment of current borrowings – 725.3 – 16.5
Total cash flow from financing activities – 680.6 – 132.5
Exchange gains/(losses) on cash and cash equivalents 6.7 – 34.0
Net change in cash and cash equivalents – 579.5 – 185.7
Cash and cash equivalents as of December 31 22 429.5 1 009.0
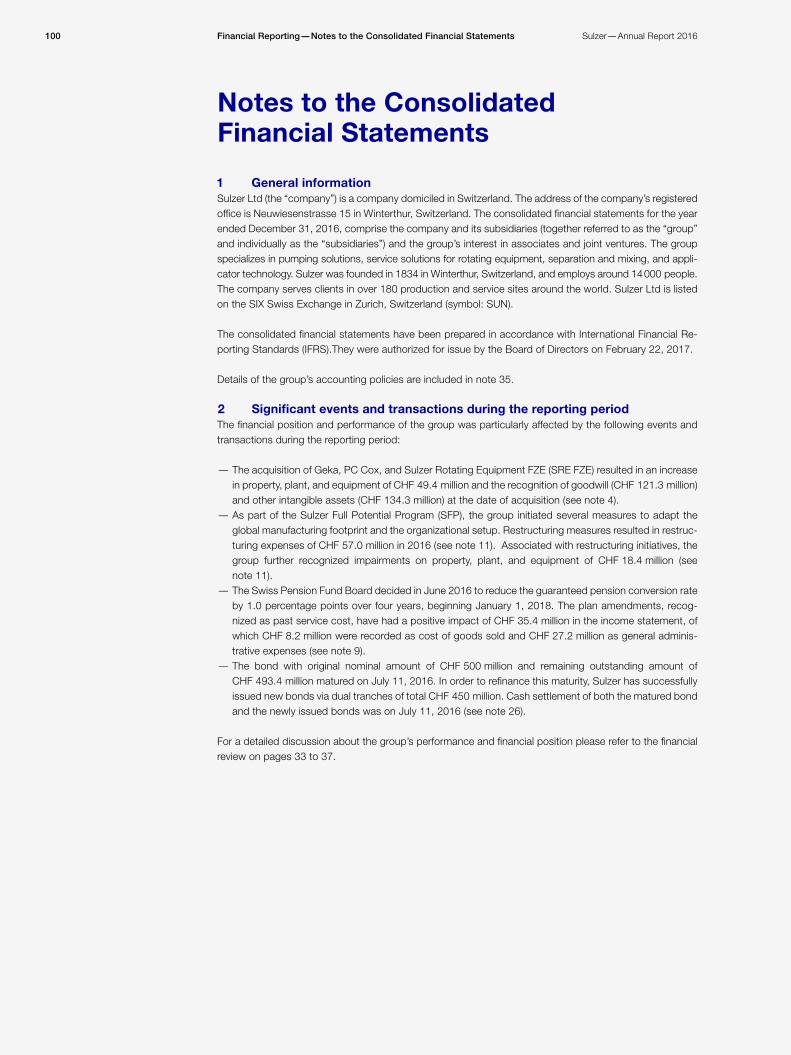
100 Sulzer—Annual Report 2016Financial Reporting—Notes to the Consolidated Financial Statements
Notes to the Consolidated Financial Statements
1 General informationSulzer Ltd (the “company”) is a company domiciled in Switzerland. The address of the company’s registered office is Neuwiesenstrasse 15 in Winterthur, Switzerland. The consolidated financial statements for the year ended December 31, 2016, comprise the company and its subsidiaries (together referred to as the “group” and individually as the “subsidiaries”) and the group’s interest in associates and joint ventures. The group specializes in pumping solutions, service solutions for rotating equipment, separation and mixing, and appli-cator technology. Sulzer was founded in 1834 in Winterthur, Switzerland, and employs around 14 000 people. The company serves clients in over 180 production and service sites around the world. Sulzer Ltd is listed on the SIX Swiss Exchange in Zurich, Switzerland (symbol: SUN).
The consolidated financial statements have been prepared in accordance with International Financial Re-porting Standards (IFRS).They were authorized for issue by the Board of Directors on February 22, 2017.
Details of the group’s accounting policies are included in note 35.
2 Significant events and transactions during the reporting periodThe financial position and performance of the group was particularly affected by the following events and transactions during the reporting period:
— The acquisition of Geka, PC Cox, and Sulzer Rotating Equipment FZE (SRE FZE) resulted in an increase in property, plant, and equipment of CHF 49.4 million and the recognition of goodwill (CHF 121.3 million) and other intangible assets (CHF 134.3 million) at the date of acquisition (see note 4). — As part of the Sulzer Full Potential Program (SFP), the group initiated several measures to adapt the global manufacturing footprint and the organizational setup. Restructuring measures resulted in restruc-turing expenses of CHF 57.0 million in 2016 (see note 11). Associated with restructuring initiatives, the group further recognized impairments on property, plant, and equipment of CHF 18.4 million (see note 11). — The Swiss Pension Fund Board decided in June 2016 to reduce the guaranteed pension conversion rate by 1.0 percentage points over four years, beginning January 1, 2018. The plan amendments, recog-nized as past service cost, have had a positive impact of CHF 35.4 million in the income statement, of which CHF 8.2 million were recorded as cost of goods sold and CHF 27.2 million as general adminis-trative expenses (see note 9). — The bond with original nominal amount of CHF 500 million and remaining outstanding amount of CHF 493.4 million matured on July 11, 2016. In order to refinance this maturity, Sulzer has successfully issued new bonds via dual tranches of total CHF 450 million. Cash settlement of both the matured bond and the newly issued bonds was on July 11, 2016 (see note 26).
For a detailed discussion about the group’s performance and financial position please refer to the financial review on pages 33 to 37.

101Sulzer—Annual Report 2016 Financial Reporting—Notes to the Consolidated Financial Statements
3 Segment informationSegment information by divisions
millions of CHF Pumps EquipmentRotating Equipment
Services Chemtech
2016 2015 2016 2015 2016 2015
Order intake (unaudited) 1 401.7 1 500.8 661.1 698.2 744.5 708.9
Nominal growth (unaudited) – 6.6% – 13.0% – 5.3% – 3.7% 5.0% – 1.3%
Adjusted growth1) (unaudited) – 5.4% – 6.7% – 3.1% – 0.9% 6.1% 1.4%
Order backlog as of December 31 (unaudited) 880.3 998.0 195.8 205.0 362.9 307.7
Sales2) 1 503.5 1 621.0 666.8 693.2 718.1 669.6
Nominal growth – 7.2% – 7.6% – 3.8% – 4.3% 7.2% – 9.7%
Adjusted growth1) (unaudited) – 6.2% – 1.6% – 1.9% – 1.9% 8.0% – 7.8%
opEBITA3) 86.3 118.1 66.2 70.8 82.1 67.4
in % of sales4) 5.7% 7.3% 9.9% 10.2% 11.4% 10.1%
in % of average capital employed 11.3% 15.8% 16.5% 16.8% 18.5% 16.6%
Restructuring expenses – 41.5 – 23.8 1.8 – 10.3 – 16.1 – 7.2
Amortization – 17.9 – 17.2 – 6.3 – 6.3 – 21.7 – 16.7
Impairments on tangible and intangible assets – 8.8 – 6.4 – 3.8 – 1.3 – 5.9 – 5.4
Non-operational items – 11.0 – 7.9 – 0.6 – 1.5 – 1.2 – 4.6
EBIT5) 7.1 62.8 57.3 51.4 37.2 33.5
Depreciation – 27.0 – 29.2 – 15.0 – 14.7 – 25.1 – 26.3
Operating assets 1 512.2 1 557.9 594.6 624.8 1 273.8 846.9
Unallocated assets – – – – – –
Total assets as of December 31 1 512.2 1 557.9 594.6 624.8 1 273.8 846.9
Operating liabilities 740.8 688.8 158.5 210.4 596.0 324.5
Unallocated liabilities – – – – – –
Total liabilities as of December 31 740.8 688.8 158.5 210.4 596.0 324.5
Operating net assets 771.4 869.1 436.1 414.4 677.8 522.4
Unallocated net assets – – – – – –
Total net assets as of December 31 771.4 869.1 436.1 414.4 677.8 522.4
Capital expenditure 25.1 30.6 16.2 16.6 32.9 24.0
Employees (number of full-time equivalents) as of December 31 6 261 6 996 3 436 3 538 4 135 3 539
1) Adjusted for currency effects.2) Sales between segments are not material.3) Operating income before restructuring, amortization, impairments, and non-operational items.4) Return on sales before restructuring, amortization, impairments, and non-operational items (opEBITA/sales).5) Operating income.

102 Sulzer—Annual Report 2016Financial Reporting—Notes to the Consolidated Financial Statements
Segment information by divisions
millions of CHF Total Divisions Others2) Total Sulzer
2016 2015 2016 2015 2016 2015
Order intake 2 807.3 2 907.9 – 9.8 – 12.1 2 797.5 2 895.8
Nominal growth (unaudited) – 3.5% – 8.2% n/a n/a – 3.4% – 8.4%
Adjusted growth1) (unaudited) – 2.0% – 3.6% n/a n/a – 2.0% – 3.7%
Order backlog as of December 31 (unaudited) 1 439.0 1 510.7 0.1 – 1 439.1 1 510.7
Sales 2 888.4 2 983.8 – 11.7 – 12.8 2 876.7 2 971.0
Nominal growth – 3.2% – 7.4% n/a n/a – 3.2% – 7.5%
Adjusted growth1) (unaudited) – 2.0% – 3.1% n/a n/a – 2.0% – 3.2%
opEBITA3) 234.6 256.3 4.3 – 2.2 238.9 254.1
in % of sales4) 8.1% 8.6% n/a n/a 8.3% 8.6%
in % of average capital employed 16.7% 16.3% n/a n/a 15.7% 17.0%
Restructuring expenses – 55.8 – 41.3 – 1.2 0.1 – 57.0 – 41.2
Amortization – 45.9 – 40.2 – 1.4 – 2.1 – 47.3 – 42.3
Impairments on tangible and intangible assets – 18.5 – 13.1 0.1 0.1 – 18.4 – 13.0
Non-operational items – 12.8 – 14.0 11.9 – 22.7 – 0.9 – 36.7
EBIT5) 101.6 147.7 13.7 – 26.8 115.3 120.9
Depreciation – 67.1 – 70.2 – 2.4 – 3.9 – 69.5 – 74.1
Operating assets 3 380.6 3 029.6 – 216.4 – 159.3 3 164.2 2 870.3
Unallocated assets – – 571.7 1 384.5 571.7 1 384.5
Total assets as of December 31 3 380.6 3 029.6 355.3 1 225.2 3 735.9 4 254.8
Operating liabilities 1 495.3 1 223.7 1.7 106.6 1 497.0 1 330.3
Unallocated liabilities – – 647.9 690.3 647.9 690.3
Total liabilities as of December 31 1 495.3 1 223.7 649.6 796.9 2 144.9 2 020.6
Operating net assets 1 885.3 1 805.9 – 218.1 – 265.9 1 667.2 1 540.0
Unallocated net assets – – 1 420.8 694.2 1 420.8 694.2
Total net assets as of December 31 1 885.3 1 805.9 1 202.7 428.3 3 088.0 2 234.2
Capital expenditure 74.2 71.2 0.7 2.5 74.9 73.7
Employees (number of full-time equivalents) as of December 31 13 832 14 073 173 180 14 005 14 253
1) Adjusted for currency effects.2) The most significant activities under “Others” relate to the Corporate Center. Interdivisional order intake, sales, and
operating assets and liabilities are eliminated in this column.3) Operating income before restructuring, amortization, impairments, and non-operational items.4) Return on sales before restructuring, amortization, impairments, and non-operational items (opEBITA/sales).5) Operating income.

103Sulzer—Annual Report 2016 Financial Reporting—Notes to the Consolidated Financial Statements
Information about reportable segmentsOperating segments are determined based on the reports reviewed by the Chief Executive Officer that are used to track performance, make strategic decisions, and allocate resources to the segments. The busi-ness is managed on a divisional basis and the reported segments have been identified as follows:
Pumps Equipment—pump technology and solutions: This division offers a wide range of pumping solutions and related equipment. The market focus is on (a) production, transport, and processing of crude oil and its derivates, (b) supply, treatment, and transport of water as well as wastewater collection, (c) fossil-fired, nuclear, and renewable power generation, and (d) specific general industries, e.g., pulp and paper, fertilizers, and other markets. A global manufacturing and service network ensures high customer proximity.
Rotating Equipment Services—provider of service solutions for rotating equipment: This division offers a full range of repair and maintenance services. The market focus is on (a) industrial gas and steam turbines, (b) turbocompressors, (c) generators and motors, and (d) pumps.
Chemtech—separation, mixing, and service solutions:This division offers products and services for separation, reaction, liquid application, and mixing technology. The market focus is on (a) separation solutions, (b) tower field services, (c) liquid application systems for the dental, healthcare, and cosmetics markets, and (d) two-component mixing and dispensing systems. Customers benefit from advanced solutions in the fields of process technology and separation equipment, as well as two-component mixing and dispensing systems.
Applicator Systems:Starting January 1, 2017, Sulzer has separated the business for liquid applications and mixing technolo-gies, previously reported in the Chemtech division, into a new division called Applicator Systems. The market focus is on (a) mixing and dispenser systems and (b) liquid application systems for the dental, healthcare, and cosmetics markets. As of December 31, 2016, the business was still reported within the Chemtech division, in line with the reports reviewed by the Chief Executive Officer.
Others: Certain expenses related to the Corporate Center are not attributable to a particular segment and are re-viewed as a whole across the group. Also included are reconciling and other items, e.g., adjustments made in preparing the financial statements, and interdivisional order intake, sales, and operating assets and lia-bilities elimination.
The Chief Executive Officer primarily uses a measure of adjusted earnings before interest, tax, and amorti-zation (operational EBITA) to assess the performance of the operating segments. However, the Chief Executive Officer also receives information about the segments’ order intake and backlog, revenue, and operating assets and liabilities on a monthly basis.
Operational EBITA (opEBITA) excludes amortization, restructuring expenses, and impairments when the impairment is the result of an isolated, non-recurring event. It also excludes certain non-operational items that are non-recurring or do not regularly occur in similar magnitude such as acquisition-related expenses, gains and losses from sale of businesses or real estate, expenses related to the Sulzer Full Potential pro-gram, or amendments to the pension plans.
Revenue from external customers reported to the Chief Executive Officer is measured in a manner consis-tent with that in the income statement. There are no significant sales between the segments. No individual customer represents a significant portion of the group’s revenue.
Operating assets and liabilities are assets or liabilities related to the operating activities of an entity and contributing to the operating income.

104 Sulzer—Annual Report 2016Financial Reporting—Notes to the Consolidated Financial Statements
Segment information by regionThe allocation of assets is based on their geographical location. Non-current assets exclude other financial assets, deferred tax assets, and employee benefit assets. The allocation of sales is based on the location of the customer.
millions of CHFNon-current assets
by region Sales by region
2016 2015 2016 2015
Europe, Middle East, Africa 1 203.3 1 003.2 1 271.8 1 214.0
— thereof Switzerland 161.9 171.9 22.7 19.4
— thereof Germany 292.5 21.3 199.1 160.7
— thereof United Kingdom 159.9 171.4 143.9 191.2
— thereof Sweden 259.8 295.9 40.0 41.5
— thereof other countries 329.2 342.7 866.1 801.2
Americas 290.5 279.3 1 041.9 1 134.9
— thereof USA 238.3 227.3 735.9 778.0
— thereof Brazil 23.9 20.8 101.3 89.9
— thereof other countries 28.3 31.2 204.7 267.0
Asia-Pacific 138.3 137.1 563.0 622.1
— thereof China 68.2 76.8 206.4 236.2
— thereof India 22.2 17.5 49.9 51.6
— thereof other countries 47.9 42.8 306.7 334.3
Total 1 632.1 1 419.6 2 876.7 2 971.0
4 Acquisitions of subsidiariesAcquisitions in 2016The following table summarizes the recognized amounts of assets acquired and liabilities assumed at the date of acquisition, including the resulting goodwill and the total consideration paid.
Net assets acquired
millions of CHF Geka PC Cox SRE FZE Total
Intangible assets 122.6 11.7 – 134.3
Property, plant, and equipment 46.7 2.1 0.6 49.4
Cash and cash equivalents 8.2 8.5 1.0 17.7
Trade accounts receivable 32.9 4.1 1.2 38.2
Other current assets 38.2 4.0 0.8 43.0
Liabilities with third parties – 35.7 – 9.8 – 1.4 – 46.9
Deferred tax liabilities – 34.6 – 2.3 – – 36.9
Net identifiable assets 178.3 18.3 2.2 198.8
Goodwill 117.1 4.0 0.2 121.3
Total consideration 295.4 22.3 2.4 320.1
Satisfied by:
Purchase price paid in cash 295.4 22.3 1.2 318.9
Existing 49% shareholding in SRE FZE – – 1.2 1.2
Total consideration 295.4 22.3 2.4 320.1
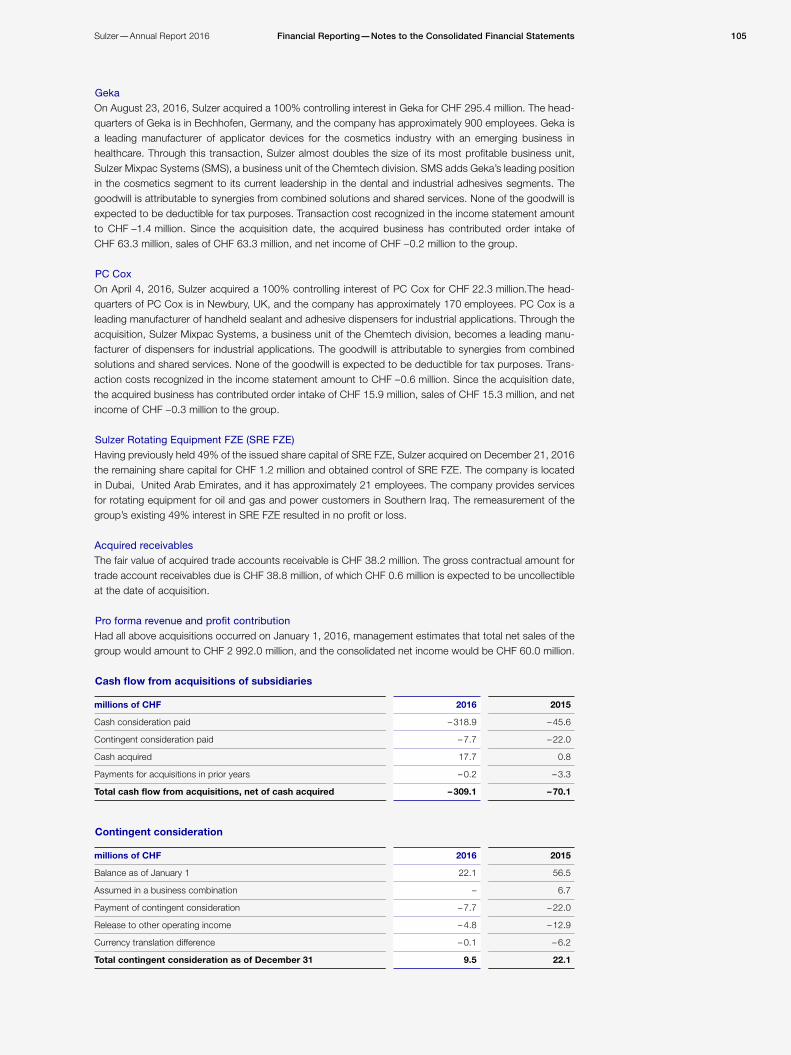
105Sulzer—Annual Report 2016 Financial Reporting—Notes to the Consolidated Financial Statements
GekaOn August 23, 2016, Sulzer acquired a 100% controlling interest in Geka for CHF 295.4 million. The head-quarters of Geka is in Bechhofen, Germany, and the company has approximately 900 employees. Geka is a leading manufacturer of applicator devices for the cosmetics industry with an emerging business in healthcare. Through this transaction, Sulzer almost doubles the size of its most profitable business unit, Sulzer Mixpac Systems (SMS), a business unit of the Chemtech division. SMS adds Geka’s leading position in the cosmetics segment to its current leadership in the dental and industrial adhesives segments. The goodwill is attributable to synergies from combined solutions and shared services. None of the goodwill is expected to be deductible for tax purposes. Transaction cost recognized in the income statement amount to CHF –1.4 million. Since the acquisition date, the acquired business has contributed order intake of CHF 63.3 million, sales of CHF 63.3 million, and net income of CHF – 0.2 million to the group.
PC CoxOn April 4, 2016, Sulzer acquired a 100% controlling interest of PC Cox for CHF 22.3 million.The head-quarters of PC Cox is in Newbury, UK, and the company has approximately 170 employees. PC Cox is a leading manufacturer of handheld sealant and adhesive dispensers for industrial applications. Through the acquisition, Sulzer Mixpac Systems, a business unit of the Chemtech division, becomes a leading manu-facturer of dispensers for industrial applications. The goodwill is attributable to synergies from combined solutions and shared services. None of the goodwill is expected to be deductible for tax purposes. Trans-action costs recognized in the income statement amount to CHF – 0.6 million. Since the acquisition date, the acquired business has contributed order intake of CHF 15.9 million, sales of CHF 15.3 million, and net income of CHF – 0.3 million to the group.
Sulzer Rotating Equipment FZE (SRE FZE)Having previously held 49% of the issued share capital of SRE FZE, Sulzer acquired on December 21, 2016 the remaining share capital for CHF 1.2 million and obtained control of SRE FZE. The company is located in Dubai, United Arab Emirates, and it has approximately 21 employees. The company provides services for rotating equipment for oil and gas and power customers in Southern Iraq. The remeasurement of the group’s existing 49% interest in SRE FZE resulted in no profit or loss.
Acquired receivablesThe fair value of acquired trade accounts receivable is CHF 38.2 million. The gross contractual amount for trade account receivables due is CHF 38.8 million, of which CHF 0.6 million is expected to be uncollectible at the date of acquisition.
Pro forma revenue and profit contributionHad all above acquisitions occurred on January 1, 2016, management estimates that total net sales of the group would amount to CHF 2 992.0 million, and the consolidated net income would be CHF 60.0 million.
Cash flow from acquisitions of subsidiaries
millions of CHF 2016 2015
Cash consideration paid – 318.9 – 45.6
Contingent consideration paid – 7.7 – 22.0
Cash acquired 17.7 0.8
Payments for acquisitions in prior years – 0.2 – 3.3
Total cash flow from acquisitions, net of cash acquired – 309.1 – 70.1
Contingent consideration
millions of CHF 2016 2015
Balance as of January 1 22.1 56.5
Assumed in a business combination – 6.7
Payment of contingent consideration – 7.7 – 22.0
Release to other operating income – 4.8 – 12.9
Currency translation difference – 0.1 – 6.2
Total contingent consideration as of December 31 9.5 22.1

106 Sulzer—Annual Report 2016Financial Reporting—Notes to the Consolidated Financial Statements
As of December 31, 2016, there was a decrease of CHF 4.8 million recognized in the income statement for the contingent consideration arrangements, as the assumed probability-adjusted gross profit and EBITDA (earnings before interests, taxes, depreciation, and amortization) was recalculated.
5 Critical accounting estimates and judgments All estimates and assessments are continually reviewed and are based on historical experience and other factors, including expectations regarding future events that appear reasonable under the given circum-stances. The group makes estimates and assumptions that relate to the future. By their nature, these esti-mates will only rarely correspond to actual subsequent events. The estimates and assumptions that carry a significant risk, in the form of a substantial adjustment to the present values of assets and liabilities within the next financial year, are set out below.
Contingent considerationsAs of December 31, 2016, total contingent considerations resulting from business combinations amounted to CHF 9.5 million (December 31, 2015: CHF 22.1 million). The total payments under contingent consider-ations arrangements could be up to CHF 15.0 million (December 31, 2015: CHF 55.0 million). The estimat-ed amounts are the expected payments, determined by considering the possible scenarios of forecast sales and other performance criteria, probabilities of occurrence, and the use of simulation models. The estimates could change substantially over time as new facts emerge and scenarios develop.
Employee benefit plans The present value of the pension obligation and the plan assets depends on a number of factors that are determined on an actuarial basis using a number of assumptions. Assumptions used in determining the defined benefit obligation and the plan assets include the discount rate, future salary and pension increas-es, and mortality rates. The assumptions are reviewed and reassessed at the end of each year based on observable market data, i.e. interest rate of high-quality corporate bonds denominated in the corresponding currency and asset management studies. Further details are provided in note 9.
Income taxesThe group is obliged to pay income taxes in numerous jurisdictions. Significant assumptions are required in order to determine income tax provisions. There are many transactions and calculations for which the ultimate tax determination is uncertain during the ordinary course of the business. The group recognizes liabilities for anticipated tax audit issues based on estimates of whether additional taxes will be due. Where the final tax outcome of these matters is different from the amounts that were initially recorded, such differ-ences will impact the income tax and deferred tax provisions in the period in which such determination is made. Management believes that the estimates are reasonable, and that the recognized liabilities for income tax related uncertainties are adequate. Further details are disclosed in note 13.
Goodwill and other intangible assetsAs of December 31, 2016, total goodwill amounted to CHF 780.1 million (December 31, 2015: CHF 679.8 mil-lion). In accordance with the accounting policies set forth in section 35.6 “Intangible assets,” the group carries out an annual impairment test on goodwill in the fourth quarter of the year, or when indications of a potential impairment exist. The recoverable amount from cash-generating units is measured on the basis of value-in-use calculations influenced materially by the terminal growth rate, the discount rate, and the projected cash flows. Information about assumptions and estimation uncertainties that have significant risk of resulting in a material adjustment in the year ending December 31, 2016, are disclosed in note 14.
Revenue recognitionThe group uses the percentage of completion method (PoC) in accounting for major long-term contracts. The use of the PoC method requires the group to estimate the proportional revenue and costs. If circum-stances arise that may change the original estimates of revenues, costs, or extent of progress toward completion, estimates are revised. These revisions may result in increases or decreases in estimated reve-nues or costs and are reflected in income in the period in which the circumstances that give rise to the revision become known by management. Revenue from the application of the PoC method recognized in the year 2016 amounted to CHF 597.2 million (2015: CHF 469.8 million). Further details are disclosed in note 19.

107Sulzer—Annual Report 2016 Financial Reporting—Notes to the Consolidated Financial Statements
ProvisionsProvisions are made, among other reasons, for warranties, disputes, litigation, and restructuring. A provi-sion is recognized in the balance sheet when the group has a legal or constructive obligation as a result of a past event, and it is probable that an outflow of economic benefits will be required to settle the obligation. The nature of these costs is such that judgment has to be applied to estimate the timing and amount of cash outflows. Depending on the outcome of the respective transactions, actual payments may differ from these estimates. Further details are disclosed in note 27.
6 Financial risk management
6.1 Financial risk factorsThe group’s activities expose it to a variety of financial risks: market risk (including currency risk, fair value interest rate risk, cash flow interest rate risk, and price risk), credit risk, and liquidity risk. The group’s over-all risk management program focuses on the unpredictability of financial markets and seeks to minimize potential adverse effects on the group’s financial performance. The group uses derivative financial instru-ments to hedge certain risk exposures.
Risk management is carried out by a central treasury department (Group Treasury). Group Treasury identi-fies, evaluates, and hedges financial risks in close cooperation with the group’s subsidiaries. Principles for overall risk management, as well as policies covering specific areas, such as foreign exchange risk, interest rate risk, credit risk, use of derivative financial instruments and non-derivative financial instruments, and investment of excess liquidity exist in writing.
a) Market risk(I) Foreign exchange riskThe group operates internationally and is exposed to foreign exchange risk arising from various currency exposures. Foreign exchange risk arises when future commercial transactions or recognized assets or liabilities are denominated in a currency that is not the entity’s functional currency. Management has set up a policy to require subsidiaries to manage their foreign exchange risk against their functional currency. The subsidiaries are required to hedge their major foreign exchange risk exposure using forward contracts or other standard instruments, usually transacted with Group Treasury.
Presently, most of the contracts are designated as cash flow hedges. External foreign exchange contracts are designated as hedges of foreign exchange risk on specific assets, liabilities, or future transactions on a gross basis. The group has certain investments in foreign operations, whose net assets are exposed to foreign currency translation risk. If required, currency exposure arising from the net assets of the group’s foreign operations is managed primarily through borrowings denominated in the relevant foreign currencies. Derivative financial instruments are only used on an ad hoc basis to manage foreign currency translation risk.
The following tables show the hypothetical influence on the income statement for 2016 and 2015 related to foreign exchange risk of financial instruments. The volatility used for the calculation is the one-year his-toric volatility on December 31 for the relevant currency pair and year. For 2016, the currency pair with the most significant exposure and inherent risk was the EUR versus the USD. If, on December 31, 2016, the EUR had increased by 8.3% against the USD with all other variables held constant, profit after tax for the year would have been CHF 0.5 million lower mainly due to foreign exchange losses on USD-denominated financial assets. A decrease of the rate would have caused a gain of the same amount.
Hypothetical impact of foreign exchange risk on income statement
millions of CHF 2016
Currency pairEUR/ USD
EUR/ RUB
EUR/ CNY
USD/ INR
Exposure – 7.8 3.0 6.8 7.9
Volatility 8.3% 20.6% 7.7% 5.1%
Effect on profit after tax (rate increase) – 0.5 0.5 0.4 0.3
Effect on profit after tax (rate decrease) 0.5 – 0.5 – 0.4 – 0.3

108 Sulzer—Annual Report 2016Financial Reporting—Notes to the Consolidated Financial Statements
millions of CHF 2015
Currency pairEUR/ CHF
EUR/ RUB
EUR/ CNY
EUR/ USD
Exposure – 10.4 – 3.4 5.4 – 5.4
Volatility 22.6% 27.8% 12.6% 12.3%
Effect on profit after tax (rate increase) – 1.8 – 0.7 0.5 – 0.5
Effect on profit after tax (rate decrease) 1.8 0.7 – 0.5 0.5
The following tables show the hypothetical influence on equity for 2016 and 2015 related to foreign exchange risk of financial instruments for the most important currency pairs as at December 31 of the re-spective year. The volatility used for the calculation is the one-year historic volatility on December 31 for the relevant currency pair and year. Most of the hypothetical effect on equity is a result of fair value changes of derivative financial instruments designated as hedges of future cash flows in foreign currencies.
Hypothetical impact of foreign exchange risk on equity
millions of CHF 2016
Currency pairUSD / MXN
GBP/ USD
USD / CHF
USD / INR
EUR / USD
USD / BRL
EUR / CHF
Exposure – 44.5 49.0 – 42.1 – 56.6 34.9 – 15.1 – 30.4
Volatility 17.0% 14.1% 7.9% 5.1% 8.3% 18.4% 4.5%
Effect on equity, net of taxes (rate increase) – 5.7 5.2 – 2.5 – 2.2 2.2 – 2.1 – 1.0
Effect on equity, net of taxes (rate decrease) 5.7 – 5.2 2.5 2.2 – 2.2 2.1 1.0
millions of CHF 2015
Currency pairUSD/ CHF
EUR/ CHF
USD/ MXN
USD/ BRL
EUR/ USD
GBP/ USD
USD/ INR
Exposure – 43.0 – 29.0 – 48.6 – 23.7 39.2 47.9 – 40.6
Volatility 22.9% 22.6% 10.9% 21.2% 12.3% 8.4% 6.3%
Effect on equity, net of taxes (rate increase) – 7.4 – 4.9 – 4.0 – 3.8 3.6 3.0 – 1.9
Effect on equity, net of taxes (rate decrease) 7.4 4.9 4.0 3.8 – 3.6 – 3.0 1.9
(II) Price riskAs of December 31, 2016, the group was not exposed to significant price risk related to investments in equity securities either classified as “available-for-sale” or at “fair value through profit or loss.”
(III) Interest rate sensitivityThe group’s interest rate risk arises from interest-bearing assets and liabilities. Assets and liabilities at vari-able rates expose the group to cash flow interest rate risk. Assets and liabilities at fixed rates only expose the group to fair value interest rate risk in the case of debt instruments that are classified as at fair value through profit or loss. The group analyzes its interest rate exposure on a net basis, and if required, enters into derivative instruments in order to keep the volatility of net interest income or expense limited. Currently, the group has not entered into such derivative financial instruments related to interest rate risk manage-ment. The group’s interest-bearing liabilities mainly comprise two bonds with a fixed interest rate.
The following table shows the hypothetical influence on the income statement for variable-interest-bearing assets net of liabilities at variable interest rates, assuming market interest rate levels would have increased/decreased by 100 basis points. For the most significant currencies, USD, EUR, CNY, CHF, and INR, in-creasing interest rates would have had a positive impact on the income statement, since the value of vari-able-interest-bearing assets (comprising mainly cash and cash equivalents) would exceed the value of variable-interest-bearing liabilities.

109Sulzer—Annual Report 2016 Financial Reporting—Notes to the Consolidated Financial Statements
Hypothetical impact of interest rate risk on income statement
millions of CHF 2016
Variable-interest-bearing assets (net) AmountSensitivity in basis points
Impact on post-tax profit
rate increase rate decrease
USD 191.6 100 1.4 – 1.4
EUR 43.0 100 0.3 – 0.3
CNY 40.5 100 0.3 – 0.3
CHF 36.5 100 0.3 – 0.3
INR 23.3 100 0.2 – 0.2
millions of CHF 2015
Variable-interest-bearing assets (net) AmountSensitivity in basis points
Impact on post-tax profit
rate increase rate decrease
CHF 331.0 100 2.5 – 2.5
USD 212.3 100 1.6 – 1.6
CNY 58.9 100 0.4 – 0.4
INR 31.6 100 0.2 – 0.2
EUR – 28.0 100 – 0.2 0.2
On December 31, 2016, if the interest rates on USD-denominated assets net of liabilities had been 100 ba-sis points higher with all other variables held constant, post-tax profit for the year would have been CHF 1.4 million higher (2015: CHF 1.6 million higher), mainly as a result of higher interest income on cash and cash equivalents. A decrease of interest rates on USD-denominated assets net of liabilities would have caused a loss of the same amount. As of December 31, 2016, the CHF amount exposed to interest rate risk was reduced compared with 2015, mainly because of the dividend payment of CHF 617.5 million to the shareholders, which reduced the cash held in CHF accordingly.
b) Credit riskCredit risk arises from cash and cash equivalents, derivative financial instruments, and deposits with banks and financial institutions, as well as credit exposures to customers, including outstanding receivables and committed transactions. The maximum exposure to credit risk per class of financial assets is outlined in the fair value table in note 6.3. Not exposed to credit risks are equity securities classified as available-for-sale.
Credit risks of banks and financial institutions are monitored and managed centrally. Generally, only inde-pendently rated parties with a strong credit rating are accepted, and the total volume of transactions is split among several banks to reduce the individual risk with one bank.
For every customer with a large order volume, an individual risk assessment of the credit quality of the customer is performed that considers independent ratings, financial position, past experience, and other factors. Additionally, bank guarantees and letters of credit are requested. For more details on the credit risk out of trade accounts receivable, please refer to note 20.
c) Liquidity riskPrudent liquidity risk management includes the maintenance of sufficient cash and marketable securities, the availability of funding from an adequate number of committed credit facilities, and the ability to close out market positions. Due to the dynamic nature of the underlying businesses, Group Treasury maintains flexibility in funding through a committed credit line.
Management anticipates the future development of the group’s liquidity reserve on the basis of expected cash flows by performing regular group-wide cash forecasts. In 2015, the syndicated credit line of CHF 500 million has been extended to 2020, with two further one-year extension options, and in 2016, the credit line has been extended to 2021 accordingly. If special needs arise, financing will be reviewed case by case.

110 Sulzer—Annual Report 2016Financial Reporting—Notes to the Consolidated Financial Statements
The following table analyzes the group’s financial liabilities into relevant maturity groupings based on the remaining period at the balance sheet to the contractual maturity date. The amounts disclosed in the table are the contractual undiscounted cash flows calculated with the year-end closing rates. Borrowings include the notional amount as well as interest payments.
Maturity profile of financial liabilities
millions of CHF 2016
Carrying amount < 1 year 1– 2 years 3 – 5 years > 5 years Total
Borrowings 465.4 10.1 8.7 9.3 454.0 482.1
Trade accounts payable 379.3 379.3 – – – 379.3
Other current and non-current liabilities 63.8 53.4 9.2 – 1.2 63.8
millions of CHF 2015
Carrying amount < 1 year 1– 2 years 3 – 5 years > 5 years Total
Borrowings 521.6 522.0 5.9 1.8 0.2 529.9
Trade accounts payable 323.8 323.8 – – – 323.8
Other current and non-current liabilities 79.4 54.8 17.0 6.2 1.4 79.4
6.2 Capital risk managementThe group’s objectives when managing capital are to safeguard the group’s ability to continue as a going concern in order to provide returns for shareholders and benefits for other stakeholders and to maintain an optimal capital structure to reduce the cost of capital. In this respect, the group aims at maintaining an in-vestment grade credit rating, either as a perceived rating or an external rating issued by a credit rating agency.
In order to maintain or adjust the capital structure, the group may adjust the amount of dividends paid to shareholders, return capital to shareholders, issue new shares, or sell assets to reduce debt.
The following table shows the net debt / EBITDA ratio as at December 31, 2016 and 2015. The change of the net liquidity into a net debt situation is mainly due to the extraordinary dividend paid, as well as due to the acquisitions completed in 2016.
Net debt / EBITDA ratio
millions of CHF 2016 2015
Net liquidity / (net debt) – 35.9 695.7
EBITDA 250.5 250.3
Net debt / EBITDA 0.14 – 2.78
Another important ratio for the group is the gearing ratio (debt-to-equity ratio), which is calculated as total financial debt divided by equity attributable to shareholders of Sulzer Ltd. The equity capital as shown in the balance sheet corresponds to the managed equity capital.
The increase in the gearing ratio during 2016 resulted from a decrease in equity mainly due to the extra-ordinary dividend paid in 2016.
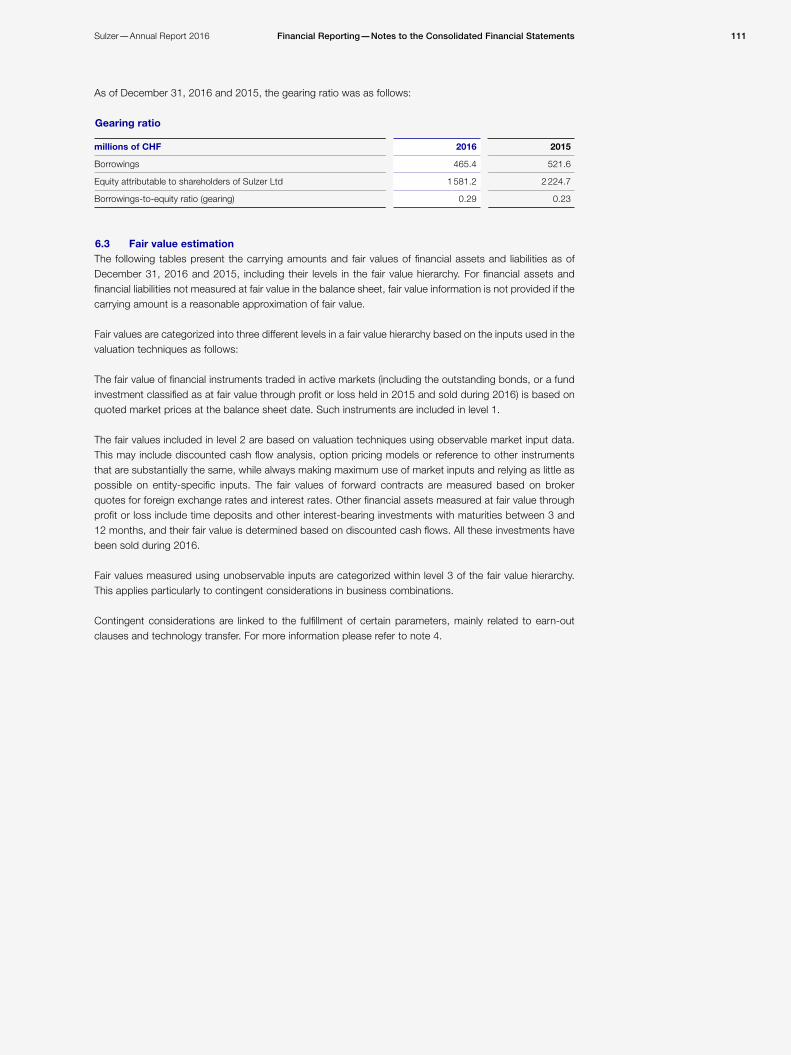
111Sulzer—Annual Report 2016 Financial Reporting—Notes to the Consolidated Financial Statements
As of December 31, 2016 and 2015, the gearing ratio was as follows:
Gearing ratio
millions of CHF 2016 2015
Borrowings 465.4 521.6
Equity attributable to shareholders of Sulzer Ltd 1 581.2 2 224.7
Borrowings-to-equity ratio (gearing) 0.29 0.23
6.3 Fair value estimationThe following tables present the carrying amounts and fair values of financial assets and liabilities as of December 31, 2016 and 2015, including their levels in the fair value hierarchy. For financial assets and financial liabilities not measured at fair value in the balance sheet, fair value information is not provided if the carry ing amount is a reasonable approximation of fair value.
Fair values are categorized into three different levels in a fair value hierarchy based on the inputs used in the valuation techniques as follows:
The fair value of financial instruments traded in active markets (including the outstanding bonds, or a fund investment classified as at fair value through profit or loss held in 2015 and sold during 2016) is based on quoted market prices at the balance sheet date. Such instruments are included in level 1.
The fair values included in level 2 are based on valuation techniques using observable market input data. This may include discounted cash flow analysis, option pricing models or reference to other instruments that are substantially the same, while always making maximum use of market inputs and relying as little as possible on entity-specific inputs. The fair values of forward contracts are measured based on broker quotes for foreign exchange rates and interest rates. Other financial assets measured at fair value through profit or loss include time deposits and other interest-bearing investments with maturities between 3 and 12 months, and their fair value is determined based on discounted cash flows. All these investments have been sold during 2016.
Fair values measured using unobservable inputs are categorized within level 3 of the fair value hierarchy. This applies particularly to contingent considerations in business combinations.
Contingent considerations are linked to the fulfillment of certain parameters, mainly related to earn-out clauses and technology transfer. For more information please refer to note 4.
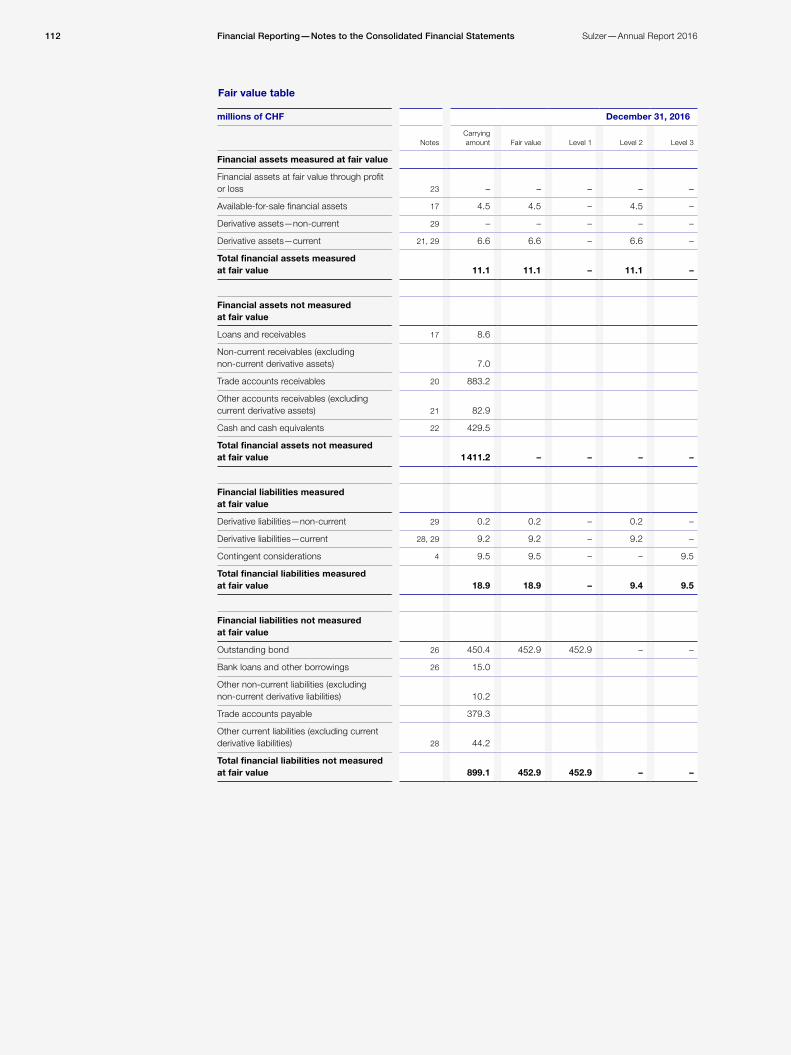
112 Sulzer—Annual Report 2016Financial Reporting—Notes to the Consolidated Financial Statements
Fair value table
millions of CHF December 31, 2016
NotesCarrying amount Fair value Level 1 Level 2 Level 3
Financial assets measured at fair value
Financial assets at fair value through profit or loss 23 – – – – –
Available-for-sale financial assets 17 4.5 4.5 – 4.5 –
Derivative assets—non-current 29 – – – – –
Derivative assets—current 21, 29 6.6 6.6 – 6.6 –
Total financial assets measured at fair value 11.1 11.1 – 11.1 –
Financial assets not measured at fair value
Loans and receivables 17 8.6
Non-current receivables (excluding non-current derivative assets) 7.0
Trade accounts receivables 20 883.2
Other accounts receivables (excluding current derivative assets) 21 82.9
Cash and cash equivalents 22 429.5
Total financial assets not measured at fair value 1 411.2 – – – –
Financial liabilities measured at fair value
Derivative liabilities—non-current 29 0.2 0.2 – 0.2 –
Derivative liabilities—current 28, 29 9.2 9.2 – 9.2 –
Contingent considerations 4 9.5 9.5 – – 9.5
Total financial liabilities measured at fair value 18.9 18.9 – 9.4 9.5
Financial liabilities not measured at fair value
Outstanding bond 26 450.4 452.9 452.9 – –
Bank loans and other borrowings 26 15.0
Other non-current liabilities (excluding non-current derivative liabilities) 10.2
Trade accounts payable 379.3
Other current liabilities (excluding current derivative liabilities) 28 44.2
Total financial liabilities not measured at fair value 899.1 452.9 452.9 – –
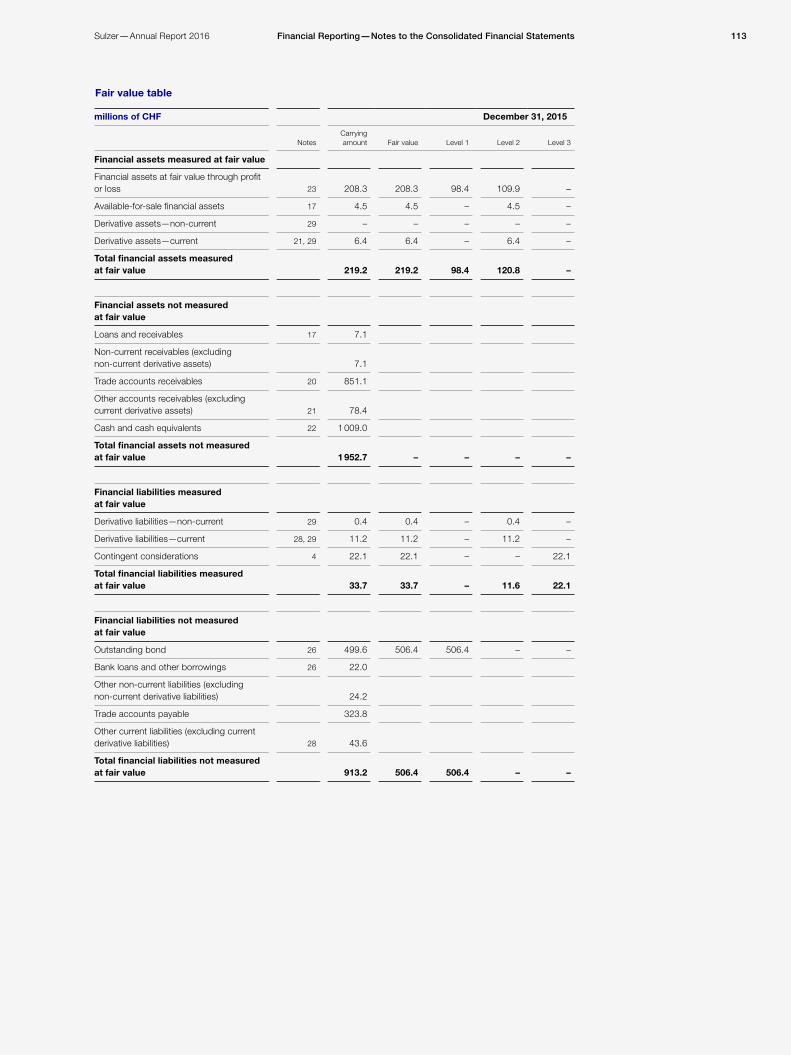
113Sulzer—Annual Report 2016 Financial Reporting—Notes to the Consolidated Financial Statements
Fair value table
millions of CHF December 31, 2015
NotesCarrying amount Fair value Level 1 Level 2 Level 3
Financial assets measured at fair value
Financial assets at fair value through profit or loss 23 208.3 208.3 98.4 109.9 –
Available-for-sale financial assets 17 4.5 4.5 – 4.5 –
Derivative assets—non-current 29 – – – – –
Derivative assets—current 21, 29 6.4 6.4 – 6.4 –
Total financial assets measured at fair value 219.2 219.2 98.4 120.8 –
Financial assets not measured at fair value
Loans and receivables 17 7.1
Non-current receivables (excluding non-current derivative assets) 7.1
Trade accounts receivables 20 851.1
Other accounts receivables (excluding current derivative assets) 21 78.4
Cash and cash equivalents 22 1 009.0
Total financial assets not measured at fair value 1 952.7 – – – –
Financial liabilities measured at fair value
Derivative liabilities—non-current 29 0.4 0.4 – 0.4 –
Derivative liabilities—current 28, 29 11.2 11.2 – 11.2 –
Contingent considerations 4 22.1 22.1 – – 22.1
Total financial liabilities measured at fair value 33.7 33.7 – 11.6 22.1
Financial liabilities not measured at fair value
Outstanding bond 26 499.6 506.4 506.4 – –
Bank loans and other borrowings 26 22.0
Other non-current liabilities (excluding non-current derivative liabilities) 24.2
Trade accounts payable 323.8
Other current liabilities (excluding current derivative liabilities) 28 43.6
Total financial liabilities not measured at fair value 913.2 506.4 506.4 – –
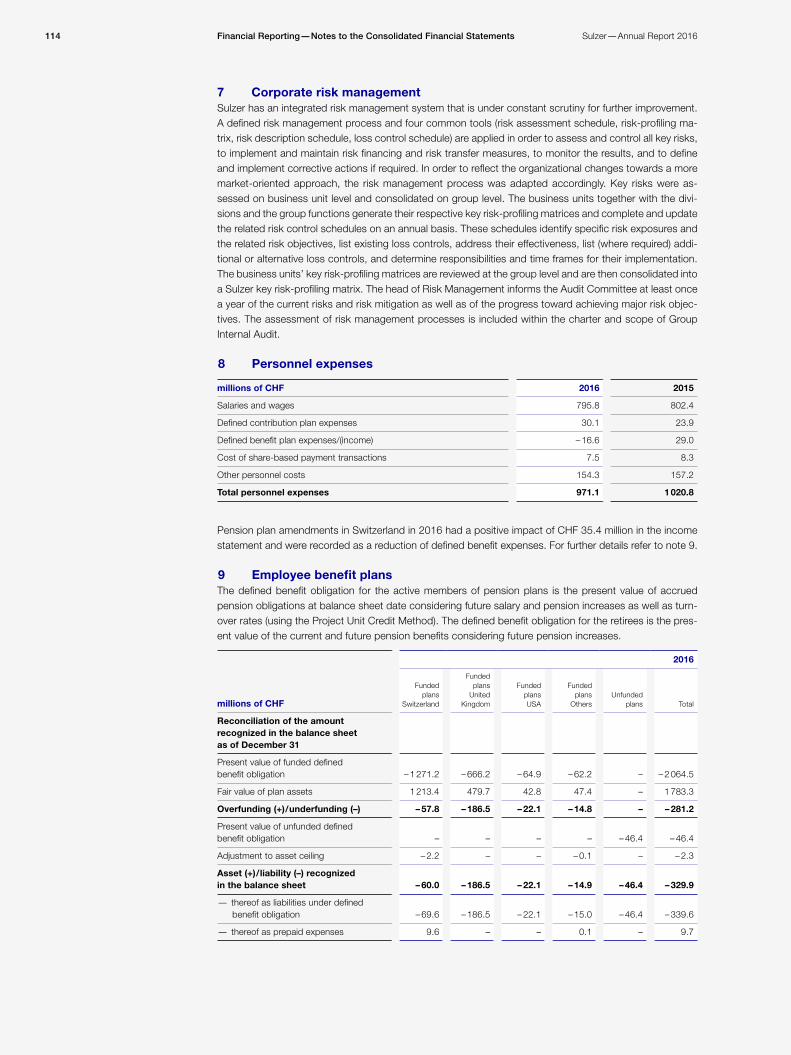
Financial Reporting—Notes to the Consolidated Financial Statements114 Sulzer—Annual Report 2016
7 Corporate risk managementSulzer has an integrated risk management system that is under constant scrutiny for further improvement. A defined risk management process and four common tools (risk assessment schedule, risk-profiling ma-trix, risk description schedule, loss control schedule) are applied in order to assess and control all key risks, to implement and maintain risk financing and risk transfer measures, to monitor the results, and to define and implement corrective actions if required. In order to reflect the organizational changes towards a more market-oriented approach, the risk management process was adapted accordingly. Key risks were as-sessed on business unit level and consolidated on group level. The business units together with the divi-sions and the group functions generate their respective key risk-profiling matrices and complete and update the related risk control schedules on an annual basis. These schedules identify specific risk exposures and the related risk objectives, list existing loss controls, address their effectiveness, list (where required) addi-tional or alternative loss controls, and determine responsibilities and time frames for their implementation. The business units’ key risk-profiling matrices are reviewed at the group level and are then consolidated into a Sulzer key risk-profiling matrix. The head of Risk Management informs the Audit Committee at least once a year of the current risks and risk mitigation as well as of the progress toward achieving major risk objec-tives. The assessment of risk management processes is included within the charter and scope of Group Internal Audit.
8 Personnel expenses
millions of CHF 2016 2015
Salaries and wages 795.8 802.4
Defined contribution plan expenses 30.1 23.9
Defined benefit plan expenses/(income) – 16.6 29.0
Cost of share-based payment transactions 7.5 8.3
Other personnel costs 154.3 157.2
Total personnel expenses 971.1 1 020.8
Pension plan amendments in Switzerland in 2016 had a positive impact of CHF 35.4 million in the income statement and were recorded as a reduction of defined benefit expenses. For further details refer to note 9.
9 Employee benefit plansThe defined benefit obligation for the active members of pension plans is the present value of accrued pension obligations at balance sheet date considering future salary and pension increases as well as turn-over rates (using the Project Unit Credit Method). The defined benefit obligation for the retirees is the pres-ent value of the current and future pension benefits considering future pension increases.
2016
millions of CHF
Funded plans
Switzerland
Funded plans
United Kingdom
Funded plans USA
Funded plans
OthersUnfunded
plans Total
Reconciliation of the amount recognized in the balance sheet as of December 31
Present value of funded defined benefit obligation – 1 271.2 – 666.2 – 64.9 – 62.2 – – 2 064.5
Fair value of plan assets 1 213.4 479.7 42.8 47.4 – 1 783.3
Overfunding (+) / underfunding (–) – 57.8 – 186.5 – 22.1 – 14.8 – – 281.2
Present value of unfunded defined benefit obligation – – – – – 46.4 – 46.4
Adjustment to asset ceiling – 2.2 – – – 0.1 – – 2.3
Asset (+) / liability (–) recognized in the balance sheet – 60.0 – 186.5 – 22.1 – 14.9 – 46.4 – 329.9
— thereof as liabilities under defined benefit obligation – 69.6 – 186.5 – 22.1 – 15.0 – 46.4 – 339.6
— thereof as prepaid expenses 9.6 – – 0.1 – 9.7

115Financial Reporting—Notes to the Consolidated Financial StatementsSulzer—Annual Report 2016
2015
millions of CHF
Funded plans
Switzerland
Funded plans
United Kingdom
Funded plans USA
Funded plans
OthersUnfunded
plans Total
Reconciliation of the amount recognized in the balance sheet as of December 31
Present value of funded defined benefit obligation – 1 326.2 – 598.3 – 63.6 – 54.6 – – 2 042.7
Fair value of plan assets 1 239.6 478.6 41.3 45.1 – 1 804.6
Overfunding (+) / underfunding (–) – 86.6 – 119.7 – 22.3 – 9.5 – – 238.1
Present value of unfunded defined benefit obligation – – – – – 45.8 – 45.8
Adjustment to asset ceiling – 1.3 – – – – – 1.3
Asset (+) / liability (–) recognized in the balance sheet – 87.9 – 119.7 – 22.3 – 9.5 – 45.8 – 285.2
— thereof as liabilities under defined benefit obligation – 97.5 – 119.7 – 22.3 – 9.5 – 45.8 – 294.8
— thereof as prepaid expenses 9.6 – – – – 9.6
Sulzer operates major funded defined benefit (“DB”) pension plans in Switzerland, UK, Ireland, and the USA. Unfunded defined benefit plans relate to German pension benefit plans. The plans are exposed to actuarial risks, e.g. longevity risk, currency risk, interest rate risk, and the funded plans additionally to market (invest-ment) risk.
In Switzerland, Sulzer contributes to two pension plans funded via two different pension funds, i.e. a base plan for all employees and a supplementary plan for employees with salaries exceeding a certain limit. Both plans provide benefits depending on the pension savings at retirement. They include certain legal minimum interest credits to the pension savings (i.e. investment return) and guaranteed rates of conversion of pension savings into an annuity at retirement. In addition, the plans offer death in service and disability benefits. The two pension funds are collective funds administrating pension plans of Sulzer group companies and also unrelated companies. In case of a material underfunding of the pension plans, the regulations include pre-defined steps, such as higher contribution by employer and employees or lower interest on pension sav-ings, to eliminate the underfunding. The pension funds are legally separated from the group. The vast ma-jority of the active participants in the two pension funds are employed by companies not belonging to the Sulzer group. The Board of Trustees for the base plan comprises ten employee and ten employer represen-tatives. Based on the actual market environment, the average discount rate decreased in 2016 to 0.5% (2015: 0.7%). The lower discount rate resulted in lower return on plan assets and higher DBOs. The income statement effect for 2016 was an income of CHF 17.9 million, impacted by pension plan amendments (2015: expense of CHF 18.0 million). The Swiss Pension Fund Board decided in June 2016 to reduce the guaranteed pension conversion rate by 1.0 percentage points over four years, beginning January 1, 2018. The plan amendments, recognized as past service cost, have had a positive impact of CHF 35.4 million in the income statement, of which CHF 8.2 million were recorded as cost of goods sold and CHF 27.2 million as general administrative expenses.
In the UK, Sulzer operates two funded defined benefit plans managed as sections of the Sulzer Pension Scheme. The Company operates a defined benefit scheme in the UK which is a final salary plan and provides benefits linked to salary at retirement or earlier date of leaving service. The scheme consists of two sections, of which both sections are closed to new entrants and future accruals. The scheme is managed by six trustees forming the Board. Both plans are multi-employer schemes with Sulzer (UK) Holding being the principal sponsor. Based on the persistent low market interest rate, the discount rate decreased to 2.5% (2015: 3.6%), which resulted in higher net pension liabilities of CHF 186.5 million in 2016 (2015: CHF 119.7 million). The total expense recognized in the income statement in 2016 was CHF 4.0 million compared to CHF 13.3 million in 2015, due to income from past service cost and lower employer contribution.

Financial Reporting—Notes to the Consolidated Financial Statements116 Sulzer—Annual Report 2016
In the USA, Sulzer operates non-contributory defined benefit retirement plans covering substantially all of their employees. The salaried plans provide benefits that are based on years of service and the employee’s compensation, averaged over the five highest consecutive years preceding retirement. The hourly plans’ benefits are based on years of service and a flat dollar benefit multiplier. All plans were closed for new en-trants. In 2016, an expense of CHF 0.9 million was recognized in the income statement (2015: an expense of CHF 0.7 million). The discount rate remained unchanged in 2016 at 4.0%. The amount recognized in other comprehensive income (OCI) in 2016 was CHF – 0.6 million (2015: CHF 4.3 million). In Germany, Sulzer operates a range of different DB pension plans. The majority of these plans are unfund-ed and benefits are paid directly by the employer to the beneficiaries as they became due. All DB plans are closed for new joiners and a new defined contribution plan for all employees was introduced in 2007. Existing employees who participated in the DB plans continued to be eligible for these DB pensions but became also eligible for the new defined contribution pensions. However, benefits received under the defined contribution plan are offset against the benefits under the DB plans. The different DB plans offer retirement pension, disability pension, and survivor’s pension benefits.
Employee benefit plans
millions of CHF 2016 2015
Reconciliation of effect of asset ceiling
Adjustment to asset ceiling at January 1 – 1.3 – 2.4
Change in effect of asset ceiling excl. interest income/(expense) – 1.0 1.1
Adjustment to asset ceiling at December 31 – 2.3 – 1.3
Reconciliation of asset (+) / liability (–) recognized in the balance sheet
Asset (+) / liability (–) recognized at January 1 – 285.2 – 270.2
Defined benefit cost recognized in the income statement 9.8 – 35.8
Defined benefit cost recognized in OCI – 98.2 – 13.6
Employer contribution 28.3 25.7
Acquired through business combination – 7.0 –
Currency translation differences 22.4 8.7
Asset (+) / liability (–) recognized at December 31 – 329.9 – 285.2
Components of defined benefit cost in the income statement
Current service cost (employer) – 20.8 – 28.4
Interest cost – 33.5 – 38.1
Interest income on plan assets 26.7 31.3
Past service cost 37.6 –
Effects of curtailments and settlement 0.4 0.2
Other administrative cost – 0.6 – 0.8
Income/(expense) recognized in the income statement 9.8 – 35.8
— thereof charged to personnel expenses 16.6 – 29.0
— thereof charged to financial expense – 6.8 – 6.8
Components of defined benefit cost in OCI
Actuarial gain/(loss) on defined benefit obligation – 202.5 54.6
Return on plan assets excl. interest income 104.9 – 69.5
Change in effect of asset ceiling excl. interest expense/income – 1.0 1.1
Return on reimbursement right excl. interest income 0.4 0.2
Defined benefit cost recognized in OCI1) – 98.2 – 13.6
1) The tax effect on defined benefit cost recognized in OCI amounted to CHF 16.1 million (2015: CHF 0.5 million).

117Financial Reporting—Notes to the Consolidated Financial StatementsSulzer—Annual Report 2016
Employee benefit plans
millions of CHF 2016 2015
Reconciliation of defined benefit obligation
Defined benefit obligation as of January 1 – 2 088.5 – 2 219.1
Interest cost – 33.5 – 38.1
Current service cost (employer) – 20.8 – 28.4
Contributions by plan participants – 9.0 – 9.1
Past service cost 37.6 –
Benefits paid/deposited 128.2 111.5
Effects of curtailments and settlement 2.6 0.2
Acquired through business combination – 20.0 –
Other administrative cost – 0.6 – 0.9
Actuarial gain (+) / loss (–) on obligation – 202.5 54.6
Currency translation differences 95.6 40.8
Defined benefit obligation as of December 311) – 2 110.9 – 2 088.5
Reconciliation of the fair value of plan assets
Fair value of plan assets as of January 1 1 804.6 1 951.3
Interest income on plan assets 26.7 31.3
Employer contribution 28.3 25.7
Contributions by plan participants 9.0 9.1
Benefits paid/deposited – 128.0 – 111.3
Effects of curtailments and settlement – 2.2 –
Acquired through business combination 13.0 –
Return on plan assets excl. interest income 104.9 – 69.5
Currency translation differences – 73.0 – 32.0
Fair value of plan assets as of December 31 1 783.3 1 804.6
Total plan assets at fair value—quoted market price
Cash and cash equivalents 134.6 95.3
Equity instruments third parties 598.6 646.1
Debt instruments third parties 526.6 558.3
Real estate funds 30.0 33.7
Investment funds 4.0 0.2
Others 38.3 34.0
Total assets at fair value—quoted market priceas of December 31 1 332.1 1 367.6
Total plan assets at fair value—non-quoted market price
Properties occupied by or used by third-parties (real estate) 267.0 265.8
Others 184.2 171.2
Total assets at fair value—non-quoted market price as of December 31 451.2 437.0
Best estimate of contributions for upcoming financial year
Contributions by the employer 25.0 28.6
1) The defined benefit obligation 2016 includes the funded part (CHF 2 064.5 million) and the unfunded part (CHF 46.4 million).

Financial Reporting—Notes to the Consolidated Financial Statements118 Sulzer—Annual Report 2016
Employee benefit plans
millions of CHF 2016 2015
Components of defined benefit obligation, split
Defined benefit obligation at December 31 for active members – 334.8 – 475.7
Defined benefit obligation at December 31 for pensioners – 1 367.9 – 1 362.5
Defined benefit obligation at December 31 for deferred members – 408.2 – 250.3
Total defined benefit obligation at December 31 – 2 110.9 – 2 088.5
Components of actuarial gain/(losses) on obligations
Actuarial gain/(loss) arising from changes in financial assumptions – 158.0 17.7
Actuarial gain/(loss) arising from changes in demogr. assumptions – 27.5 4.4
Actuarial gain/(loss) arising from experience adjustments – 17.0 32.5
Total actuarial gain/(loss) on defined benefit obligation – 202.5 54.6
Components of economic benefit available
Economic benefits available in form of reduction in future contribution 9.8 10.5
Total economic benefit available 9.8 10.5
Maturity profile of defined benefit obligation
Weighted average duration of defined benefit obligation in years 13.5 12.7
Since the defined benefit obligation for the Swiss and UK pension plans represents more than 94% (2015: 94%) of the group, the following significant actuarial assumptions apply exclusively to the two countries:
millions of CHF 2016 2015
Principal actuarial assumptions as of December 31 Switzerland United Kingdom Switzerland United Kingdom
Discount rate for active employees 0.8% 2.5% 1.1% 3.6%
Discount rate for pensioners 0.4% 2.5% 0.6% 3.6%
Future salary increases 1.0% 0.0% 1.0% 3.4%
Future pension increases 0.0% 2.5% 0.0% 2.5%
Life expectancy at retirement age (male/female) in years 22/24 22/24 22/24 22/24
millions of CHF 2016 2015
Sensitivity analysis of defined benefit obligation
Discount rate (decrease 0.25%) – 75.6 – 67.3
Discount rate (increase 0.25%) 71.0 71.6
Future salary growth (decrease 0.25%) 3.7 3.5
Future salary growth (increase 0.25%) – 3.8 4.9
Life expectancy (decrease 1 year) 113.4 115.7
Life expectancy (increase 1 year) – 111.7 – 105.2

119Financial Reporting—Notes to the Consolidated Financial StatementsSulzer—Annual Report 2016
10 Research and development expensesA breakdown of the research and development expenses per division is shown in the table below:
millions of CHF 2016 2015
Pumps Equipment 33.3 32.8
Rotating Equipment Services 0.5 1.3
Chemtech 37.5 37.6
Others 0.1 1.7
Total 71.4 73.4
11 Other operating income and expenses
millions of CHF 2016 2015
Income from release of contingent consideration 4.8 12.9
Income from sale of property, plant, and equipment 3.1 0.3
Release of real estate provision – 6.8
Operating currency exchange gains, net 4.1 –
Other operating income 11.4 14.5
Total other operating income 23.4 34.5
Restructuring expenses – 57.0 – 41.2
Impairments of tangible and intangible assets – 18.4 – 13.0
Cost for mergers and acquisitions – 5.0 – 3.4
Loss from PP&E sold – 1.9 – 0.5
Expenses related to defined benefit plans – – 8.8
Loss from legal cases – – 10.8
Operating currency exchange losses, net – – 3.8
Other operating expenses – – 16.7
Total other operating expenses – 82.3 – 98.2
Total other operating income and expenses, net – 58.9 – 63.7
During 2016, the group reassessed the achievement of the earn-out targets related to contingent consid-eration arrangements. The reassessment resulted in an income of CHF 4.8 million (2015: CHF 12.9 million).
In 2015, the group released a provision of CHF 6.8 million for warranties made relating to the sale of SulzerReal Estate Ltd in 2010.
Other operating income includes income from litigation cases, government grants and incentives, and re-charges to third parties not qualified as sales from customers.
Following the restructuring announcements in 2016, the group recognized restructuring cost of CHF 57.0 million (2015: CHF 41.2 million). As part of the Sulzer Full Potential (SFP) program, Sulzer has initiated several measures to adapt the global manufacturing capacities and streamline the organizational setup. The restructuring expenses are mainly associated with restructuring plans in Switzerland, Sweden, Germany, and Brazil. These measures entailed a reduction of roughly 1 350 full-time equivalents. The group further performed impairment tests on the related production machines and facilities leading to impairments of CHF 18.4 million (2015: CHF 13.0 million). For more details refer to note 15.
Following the decision of the arbitral tribunal regarding a dispute with the purchaser of the locomotive business (sold in 1998), the group recognized, in addition to the existing provision, expenses of CHF 8.7 million as loss from legal cases in 2015.

Financial Reporting—Notes to the Consolidated Financial Statements120 Sulzer—Annual Report 2016
The functional allocation of the total restructuring expenses and impairments is as follows:Cost of goods sold CHF – 52.7 million (2015: CHF – 42.7 million), selling and distribution expenses CHF – 2.9 million (2015: CHF –1.5 million), and general and administrative expenses CHF –19.8 million (2015: CHF –10.0 million).
12 Financial income and expenses
millions of CHF 2016 2015
Interest and securities income 5.2 6.5
Total interest and securities income 5.2 6.5
Interest expenses – 10.6 – 21.1
Interest expenses on employee benefit plans – 6.8 – 6.8
Total interest expenses – 17.4 – 27.9
Net interest expenses – 12.2 – 21.4
Income from investments and other financial assets 0.1 0.1
Fair value changes 2.0 12.8
Other financial income/(expenses) – 1.6 – 1.4
Currency exchange gains/(losses) (net) – 7.6 – 14.8
Total other financial expenses – 7.1 – 3.3
Total financial expenses – 19.3 – 24.7
— thereof from financial assets held at fair value through profit or loss 2.0 12.8
— thereof from loans and receivables – 4.0 – 9.7
— thereof from borrowings – 10.6 – 21.1
— thereof from investments 0.1 0.1
— thereof from employee benefit plans – 6.8 – 6.8
The income on interest and securities slightly decreased, while interest expenses decreased significantly compared with 2015, mainly due to an extraordinary interest expense of CHF 5.2 million in 2015 related to the dispute with the purchaser of the locomotive business, as well as lower coupon expenses on the new CHF 450 million bond issued on July 11, 2016, replacing the maturing CHF 500 million bond (as further detailed in note 26). Thus, total interest expenses on bonds in 2016 reduced to CHF 7.4 million from CHF 12.0 million in 2015. The “Fair value changes” largely comprise the fair valuation of derivative financial instruments that are classified as financial assets or financial liabilities at fair value through profit or loss and that are used as hedging instruments with regard to foreign exchange risks.
13 Income taxes
millions of CHF 2016 2015
Current income tax expenses -54.3 – 52.9
Deferred income tax income 19.2 28.0
Total income tax expenses -35.1 – 24.9
The weighted average tax rate results from applying each subsidiary’s statutory income tax rate to the in-come before taxes. Since the group operates in countries that have differing tax laws and rates, the con-solidated weighted average effective tax rate will vary from year to year according to variations in income per country and changes in applicable tax rates.

121Financial Reporting—Notes to the Consolidated Financial StatementsSulzer—Annual Report 2016
Reconciliation of income tax expenses
millions of CHF 2016 2015
Income/(loss) from continuing operations before income tax expenses 95.2 99.9
Weighted average tax rate 23.1% 23.2%
Income taxes at weighted average tax rate – 22.0 – 23.2
Income taxed at different tax rates 3.4 13.0
Effect of tax loss carryforwards and allowances for deferred income tax assets – 6.0 – 3.7
Expenses not deductible for tax purposes – 4.0 – 4.3
Effect of changes in tax rates and legislation – 1.9 – 1.0
Prior year items and others – 4.6 – 5.7
Total income tax expenses – 35.1 – 24.9
Effective income tax rate 36.9% 24.9%
The increase in the effective income tax rate to 36.9% (2015: 24.9%) is related to restructuring expenses with no corresponding tax effect. Excluding the restructuring expenses, the effective income tax rate would have been at 24.3%. Lower intercompany payments during 2016 resulted in a decrease of income taxed at different tax rates to CHF 3.4 million (2015: CHF 13.0 million).
Income tax liabilities
millions of CHF 2016 2015
Balance as of January 1 12.5 35.0
Acquired through business combination 3.8 0.7
Additions 51.6 54.7
Released as no longer required – 9.0 – 13.4
Utilized – 40.5 – 61.6
Currency translation differences – 1.9 – 2.9
Total income tax liabilities as of December 31 16.5 12.5
— thereof non-current 2.6 2.6
— thereof current 13.9 9.9
Summary of deferred income tax assets and liabilities in the balance sheet
2016 2015
millions of CHF Assets Liabilities Net Assets Liabilities Net
Intangible assets 0.3 – 98.9 – 98.6 0.3 – 70.1 – 69.8
Property, plant, and equipment 4.6 – 15.4 – 10.8 2.9 – 16.3 – 13.4
Other financial assets 0.8 – 1.5 – 0.7 3.4 – 0.8 2.6
Inventories 22.9 – 5.2 17.7 20.6 – 6.8 13.8
Other assets 27.1 – 11.5 15.6 16.8 – 9.2 7.6
Non-current provisions 17.3 – 2.3 15.0 15.0 – 2.8 12.2
Defined benefit plans 60.5 – 0.6 59.9 52.4 – 52.4
Current provisions 25.5 – 0.5 25.0 26.3 – 1.2 25.1
Other current liabilities 24.4 – 15.0 9.4 23.2 – 15.5 7.7
Tax loss carryforwards 28.8 – 28.8 25.4 – 25.4
Elimination of intercompany profits 0.7 – 0.7 0.7 – 0.7
Tax assets/liabilities 212.9 – 150.9 62.0 187.0 – 122.7 64.3
Offset of assets and liabilities – 55.3 55.3 – – 53.3 53.3 –
Net recorded deferred income tax assets and liabilities 157.6 – 95.6 62.0 133.7 – 69.4 64.3

Financial Reporting—Notes to the Consolidated Financial Statements122 Sulzer—Annual Report 2016
Cumulative deferred income taxes directly recorded in equity as of December 31, 2016, amounted to CHF 48.8 million (December 31, 2015: CHF 33.1 million). In compliance with the exception clause of IAS 12, the group does not recognize deferred taxes on investments in subsidiaries in the balance sheet.
Movement of deferred income tax assets and liabilities in the balance sheet
2016
millions of CHFBalance as
of January 1
Recognized in profit or
loss
Recognized in other
comprehen-sive income
Acquisition of
sub sidiaries
Currency translation differences
Balance as of
Decem-ber 31
Intangible assets – 69.8 6.2 – – 36.7 1.7 – 98.6
Property, plant, and equipment – 13.4 1.8 – 0.8 – – 10.8
Other financial assets 2.6 – 3.4 – 0.4 – 0.5 – 0.7
Inventories 13.8 4.2 – – 1.0 0.7 17.7
Other assets 7.6 6.1 – – 1.9 15.6
Non-current provisions 12.2 2.5 – – 0.3 15.0
Defined benefit plans 52.4 – 4.9 16.1 – – 3.7 59.9
Current provisions 25.1 – 1.2 – – 1.1 25.0
Other current liabilities 7.7 5.4 – – – 3.7 9.4
Tax loss carryforwards 25.4 2.5 – – 0.9 28.8
Elimination of intercompany profits 0.7 – – – – 0.7
Total 64.3 19.2 15.7 – 36.9 – 0.3 62.0
2015
millions of CHFBalance as
of January 1
Recognized in profit or
loss
Recognized in other
comprehen-sive income
Acquisition of
subsidiaries
Currency translation differences
Balance as of
Decem-ber 31
Intangible assets – 82.4 7.2 – – 0.3 5.7 – 69.8
Property, plant, and equipment – 20.0 5.9 – – 0.7 – 13.4
Other financial assets – 1.1 1.1 0.8 – 1.8 2.6
Inventories 12.7 0.9 – – 0.2 13.8
Other assets 17.6 – 5.0 – – – 5.0 7.6
Non-current provisions 9.7 3.2 – – – 0.7 12.2
Defined benefit plans 50.7 – 0.3 0.5 – 1.5 52.4
Current provisions 23.8 3.5 – – – 2.2 25.1
Other current liabilities 0.5 5.8 – – 1.4 7.7
Tax loss carryforwards 21.6 7.5 – – – 3.7 25.4
Elimination of intercompany profits 2.5 – 1.8 – – – 0.7
Total 35.6 28.0 1.3 – 0.3 – 0.3 64.3
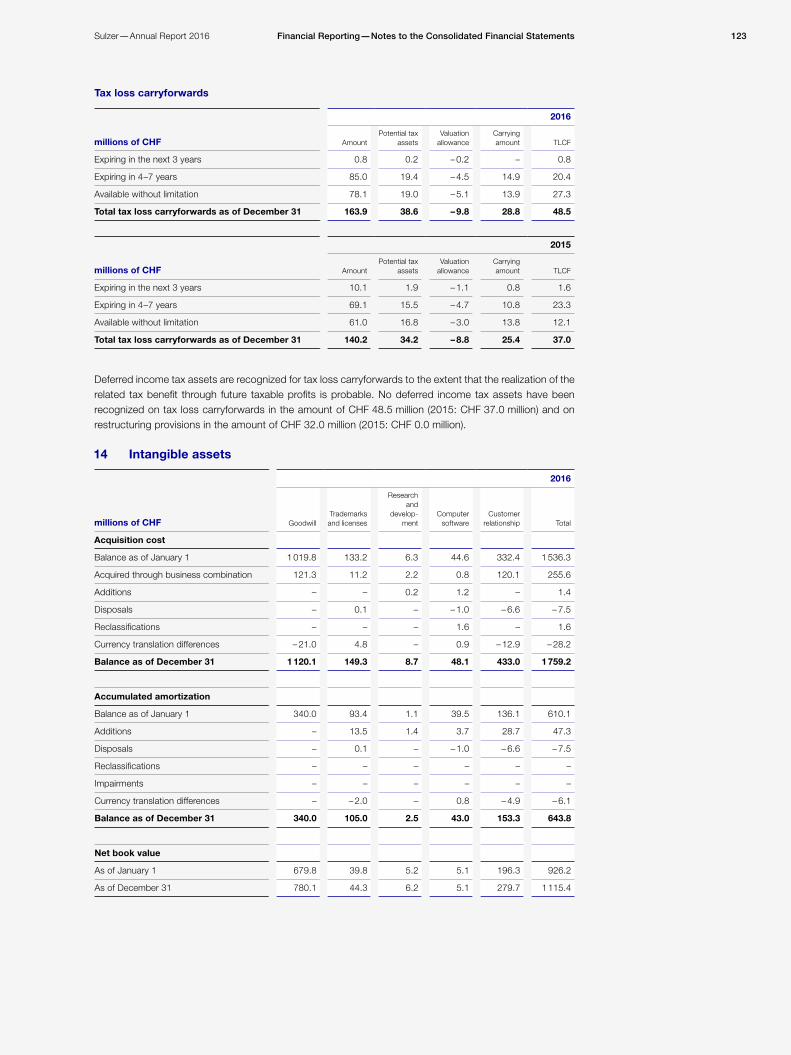
123Financial Reporting—Notes to the Consolidated Financial StatementsSulzer—Annual Report 2016
Tax loss carryforwards
2016
millions of CHF AmountPotential tax
assetsValuation
allowanceCarrying amount TLCF
Expiring in the next 3 years 0.8 0.2 – 0.2 – 0.8
Expiring in 4 –7 years 85.0 19.4 – 4.5 14.9 20.4
Available without limitation 78.1 19.0 – 5.1 13.9 27.3
Total tax loss carryforwards as of December 31 163.9 38.6 – 9.8 28.8 48.5
2015
millions of CHF AmountPotential tax
assetsValuation
allowanceCarrying amount TLCF
Expiring in the next 3 years 10.1 1.9 – 1.1 0.8 1.6
Expiring in 4 –7 years 69.1 15.5 – 4.7 10.8 23.3
Available without limitation 61.0 16.8 – 3.0 13.8 12.1
Total tax loss carryforwards as of December 31 140.2 34.2 – 8.8 25.4 37.0
Deferred income tax assets are recognized for tax loss carryforwards to the extent that the realization of the related tax benefit through future taxable profits is probable. No deferred income tax assets have been recognized on tax loss carryforwards in the amount of CHF 48.5 million (2015: CHF 37.0 million) and on restructuring provisions in the amount of CHF 32.0 million (2015: CHF 0.0 million). 14 Intangible assets
2016
millions of CHF GoodwillTrademarks
and licenses
Research and
develop-ment
Computer software
Customer relationship Total
Acquisition cost
Balance as of January 1 1 019.8 133.2 6.3 44.6 332.4 1 536.3
Acquired through business combination 121.3 11.2 2.2 0.8 120.1 255.6
Additions – – 0.2 1.2 – 1.4
Disposals – 0.1 – – 1.0 – 6.6 – 7.5
Reclassifications – – – 1.6 – 1.6
Currency translation differences – 21.0 4.8 – 0.9 – 12.9 – 28.2
Balance as of December 31 1 120.1 149.3 8.7 48.1 433.0 1 759.2
Accumulated amortization
Balance as of January 1 340.0 93.4 1.1 39.5 136.1 610.1
Additions – 13.5 1.4 3.7 28.7 47.3
Disposals – 0.1 – – 1.0 – 6.6 – 7.5
Reclassifications – – – – – –
Impairments – – – – – –
Currency translation differences – – 2.0 – 0.8 – 4.9 – 6.1
Balance as of December 31 340.0 105.0 2.5 43.0 153.3 643.8
Net book value
As of January 1 679.8 39.8 5.2 5.1 196.3 926.2
As of December 31 780.1 44.3 6.2 5.1 279.7 1 115.4

Financial Reporting—Notes to the Consolidated Financial Statements124 Sulzer—Annual Report 2016
2015
millions of CHF GoodwillTrademarks
and licenses
Research and
develop-ment
Computer software
Customer relationship Total
Acquisition cost
Balance as of January 1 1 033.7 144.6 9.6 44.7 348.3 1 580.9
Acquired through business combination 31.4 0.4 – – 8.5 40.3
Additions – – – 2.1 – 2.1
Disposals – – – 0.7 – 0.7 – 0.1 – 1.5
Reclassifications – 0.1 – 0.1 0.7 – 0.4 0.3
Currency translation differences – 45.3 – 11.9 – 2.5 – 2.2 – 23.9 – 85.8
Balance as of December 31 1 019.8 133.2 6.3 44.6 332.4 1 536.3
Accumulated amortization
Balance as of January 1 340.0 82.5 2.0 38.3 119.4 582.2
Additions – 13.1 1.0 4.0 24.2 42.3
Disposals – – – 0.7 – 0.7 – 0.1 – 1.5
Reclassifications – – – – – 0.1 – 0.1
Impairments – – 1.1 – – 1.1
Currency translation differences – – 2.2 – 2.3 – 2.1 – 7.3 – 13.9
Balance as of December 31 340.0 93.4 1.1 39.5 136.1 610.1
Net book value
As of January 1 693.7 62.1 7.6 6.4 228.9 998.7
As of December 31 679.8 39.8 5.2 5.1 196.3 926.2
Goodwill impairment test
2016 2015
millions of CHF Goodwill
Growth rate residual
value
Pre-tax discount
rate Goodwill
Growth rate residual
value
Pre-tax discount
rate
Goodwill, net book value as of December 31 is allocated as follows 780.1 679.8
Pumps Equipment—business unit Water 264.1 1.0% 10.6% 272.9 1.0% 11.0%
Pumps Equipment—other business units, individually not significant 25.2 2.0% 11.6% 25.3 2.0% 10.6%
Rotating Equipment Services—region EMEA 129.9 2.0% 10.0% 145.1 2.0% 10.8%
Rotating Equipment Services—other business units, individually not significant 82.6 2.0% 10.0% 79.2 2.0% 10.6%
Chemtech 278.3 1.0% 8.9% 157.3 0.0% 10.0%
Goodwill is allocated to the smallest cash-generating unit (CGU) at which the goodwill is monitored for internal management purposes (i.e. business units or areas). The fair value of these units is determined by calculating its value in use over a three-year cash flow projection period. The calculation uses the budget for next year and the two-year plan for subsequent periods that have been reviewed and approved by management. Cash flows beyond this planning period are extrapolated using a terminal value including the growth rates as stated above.
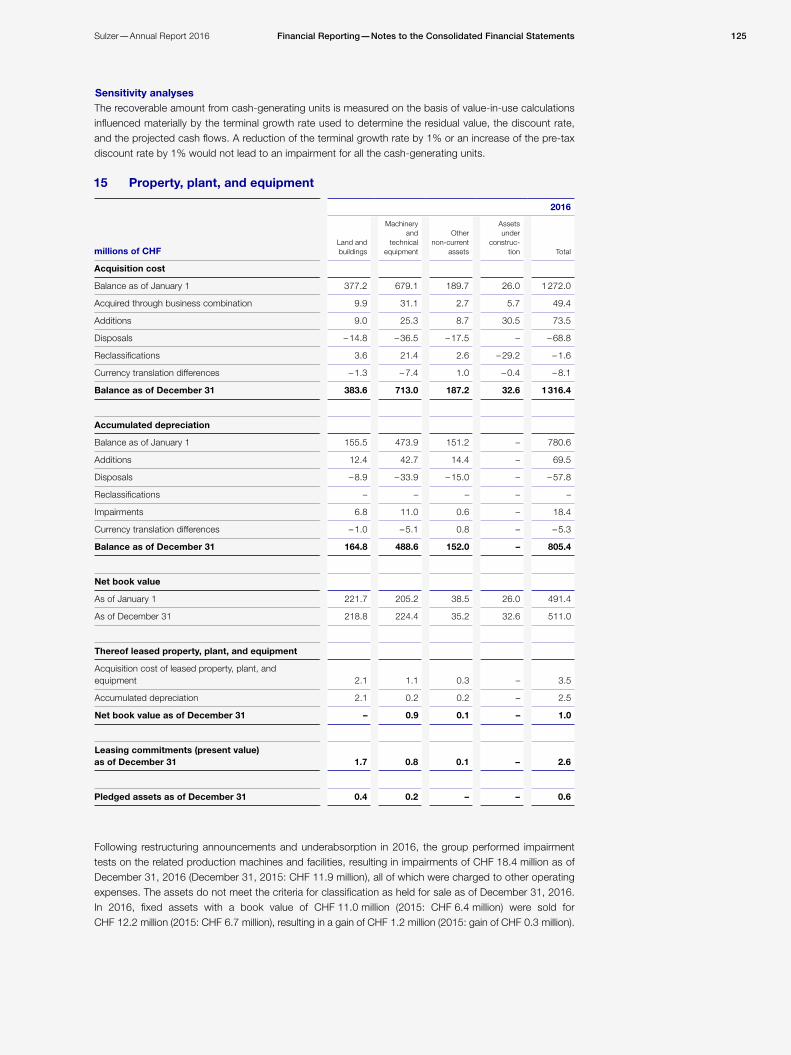
125Financial Reporting—Notes to the Consolidated Financial StatementsSulzer—Annual Report 2016
Sensitivity analyses The recoverable amount from cash-generating units is measured on the basis of value-in-use calculations influenced materially by the terminal growth rate used to determine the residual value, the discount rate, and the projected cash flows. A reduction of the terminal growth rate by 1% or an increase of the pre-tax discount rate by 1% would not lead to an impairment for all the cash-generating units.
15 Property, plant, and equipment
2016
millions of CHFLand and buildings
Machinery and
technical equipment
Other non-current
assets
Assets under
construc-tion Total
Acquisition cost
Balance as of January 1 377.2 679.1 189.7 26.0 1 272.0
Acquired through business combination 9.9 31.1 2.7 5.7 49.4
Additions 9.0 25.3 8.7 30.5 73.5
Disposals – 14.8 – 36.5 – 17.5 – – 68.8
Reclassifications 3.6 21.4 2.6 – 29.2 – 1.6
Currency translation differences – 1.3 – 7.4 1.0 – 0.4 – 8.1
Balance as of December 31 383.6 713.0 187.2 32.6 1 316.4
Accumulated depreciation
Balance as of January 1 155.5 473.9 151.2 – 780.6
Additions 12.4 42.7 14.4 – 69.5
Disposals – 8.9 – 33.9 – 15.0 – – 57.8
Reclassifications – – – – –
Impairments 6.8 11.0 0.6 – 18.4
Currency translation differences – 1.0 – 5.1 0.8 – – 5.3
Balance as of December 31 164.8 488.6 152.0 – 805.4
Net book value
As of January 1 221.7 205.2 38.5 26.0 491.4
As of December 31 218.8 224.4 35.2 32.6 511.0
Thereof leased property, plant, and equipment
Acquisition cost of leased property, plant, and equipment 2.1 1.1 0.3 – 3.5
Accumulated depreciation 2.1 0.2 0.2 – 2.5
Net book value as of December 31 – 0.9 0.1 – 1.0
Leasing commitments (present value) as of December 31 1.7 0.8 0.1 – 2.6
Pledged assets as of December 31 0.4 0.2 – – 0.6
Following restructuring announcements and underabsorption in 2016, the group performed impairment tests on the related production machines and facilities, resulting in impairments of CHF 18.4 million as of December 31, 2016 (December 31, 2015: CHF 11.9 million), all of which were charged to other operating expenses. The assets do not meet the criteria for classification as held for sale as of December 31, 2016.In 2016, fixed assets with a book value of CHF 11.0 million (2015: CHF 6.4 million) were sold for CHF 12.2 million (2015: CHF 6.7 million), resulting in a gain of CHF 1.2 million (2015: gain of CHF 0.3 million).

Financial Reporting—Notes to the Consolidated Financial Statements126 Sulzer—Annual Report 2016
2015
millions of CHFLand and buildings
Machinery and
technical equipment
Other non-current
assets
Assets under
construc-tion Total
Acquisition cost
Balance as of January 1 381.1 701.4 198.6 34.7 1 315.8
Acquired through business combination 8.9 5.2 2.1 – 16.2
Additions 5.2 24.5 6.8 35.1 71.6
Disposals – 3.2 – 35.6 – 5.8 – – 44.6
Reclassifications 9.9 28.4 2.7 – 41.4 – 0.4
Currency translation differences – 24.7 – 44.8 – 14.7 – 2.4 – 86.6
Balance as of December 31 377.2 679.1 189.7 26.0 1 272.0
Accumulated depreciation
Balance as of January 1 148.0 488.4 148.7 – 785.1
Additions 13.7 43.5 16.9 – 74.1
Disposals – 3.0 – 30.6 – 4.6 – – 38.2
Reclassifications 0.1 – 0.3 0.4 – 0.2
Impairments 6.3 5.1 0.5 – 11.9
Currency translation differences – 9.6 – 32.2 – 10.7 – – 52.5
Balance as of December 31 155.5 473.9 151.2 – 780.6
Net book value
As of January 1 233.1 213.0 49.9 34.7 530.7
As of December 31 221.7 205.2 38.5 26.0 491.4
Thereof leased property, plant, and equipment
Acquisition cost of leased property, plant, and equipment 0.5 0.4 0.2 – 1.1
Accumulated depreciation 0.5 – – – 0.5
Net book value as of December 31 – 0.4 0.2 – 0.6
Leasing commitments (present value) as of December 31 0.2 0.3 0.2 – 0.7
Pledged assets as of December 31 – 2.3 – – 2.3
16 Associates
millions of CHF 2016 2015
Balance as of January 1 4.0 2.5
Additions 5.0 0.1
Disposal as a result of the acquisition of SRE FZE – 1.1 –
Share of profit/(loss) of associates – 0.8 3.7
Dividend payments received – 0.7 – 2.3
Currency translation differences – 0.6 –
Total investments in associates as of December 31 5.8 4.0
In 2016, Sulzer paid in line with the proportion of ownership interest CHF 4.8 million to its associated com-pany Hua Rui in China. Sulzer’s share in the associated company remained accordingly at 49%.

127Financial Reporting—Notes to the Consolidated Financial StatementsSulzer—Annual Report 2016
As of December 21, 2016, the group acquired 51% of the shares and voting interests in SRE FZE. As a result, the group’s equity interest in SRE FZE increased from 49% to 100% (see note 4). Consequently, the associated share of 49% was eliminated from investments in associates.
17 Other financial assets
2016
millions of CHFAvailable-for-
saleLoans and receivables Total
Balance as of January 1 4.5 7.1 11.6
Additions – 1.1 1.1
Currency translation differences – 0.4 0.4
Balance as of December 31 4.5 8.6 13.1
2015
millions of CHFAvailable-for-
saleLoans and receivables Total
Balance as of January 1 4.5 7.4 11.9
Additions – 0.5 0.5
Currency translation differences – – 0.8 – 0.8
Balance as of December 31 4.5 7.1 11.6
Financial assets that belong to the category “Available-for-sale financial assets” include investments in equity securities. The category “Loans and receivables” includes items with maturities beyond 12 months.
18 Inventories
millions of CHF 2016 2015
Raw materials, supplies, and consumables 134.6 120.9
Work in progress 180.8 207.6
Finished products and trade merchandise 86.3 80.8
Total inventories as of December 31 401.7 409.3
In 2016, Sulzer recognized write-downs of CHF 13.3 million (2015: CHF 22.5 million) in the income statement. Total accumulated write-downs on inventories amounted to CHF 69.4 million as of Decem-ber 31, 2016 (2015: CHF 72.9 million). Material expenses in 2016 amounted to CHF 1 095.8 million (2015: CHF 1 137.6 million).
19 Percentage of completion contracts
millions of CHF 2016 2015
Contract revenue recognized for the year 597.2 469.8
Net receivables resulting from construction contracts as of December 31 230.2 190.7
Net liabilities resulting from construction contracts as of December 31 – 32.1 – 31.9
Advance payments received from customers for construction contracts as of December 31 – 388.4 – 399.1
Sales recognized in accordance with the percentage of completion method for the year 2016 amounted to CHF 597.2 million (thereof related to ongoing contracts CHF 353.3 million), which corresponds to 20.8% of total sales (2015: CHF 469.8 million, or 15.8% of sales). The costs related to these sales amounted to CHF 434.8 million (thereof related to ongoing contracts CHF 276.9 million) and to CHF 338.3 million in 2015. The impact on gross profit was CHF 162.4 million (thereof related to ongoing contracts CHF 76.4 million), which corresponds to 18.5% of total gross profit (2015: CHF 131.5 million, 14.4%; amount related to ongoing contracts CHF 63.3 million).

Financial Reporting—Notes to the Consolidated Financial Statements128 Sulzer—Annual Report 2016
20 Trade accounts receivableAging structure of trade accounts receivable
2016 2015
millions of CHFGross
amount AllowanceNet book
valueGross
amount AllowanceNet book
value
Not past due 654.8 – 0.3 654.5 613.8 – 1.0 612.8
Past due
1– 30 days 102.2 – 0.6 101.6 85.7 – 0.5 85.2
31– 60 days 35.8 – 0.5 35.3 38.8 – 0.6 38.2
61–120 days 35.0 – 1.4 33.6 33.9 – 2.0 31.9
>120 days 107.7 – 49.5 58.2 116.6 – 33.6 83.0
Total trade accounts receivable as of December 31
935.5 – 52.3 883.2 888.8 – 37.7 851.1
Allowance for doubtful trade accounts receivable
millions of CHF 2016 2015
Balance as of January 1 37.7 39.7
Additions 27.6 15.8
Released as no longer required – 8.9 – 9.8
Utilized – 4.8 – 5.0
Currency translation differences 0.7 – 3.0
Balance as of December 31 52.3 37.7
Approximately 30% (2015: 31%) of the gross amount of trade accounts receivable were past due, and an allowance of CHF 52.3 million (2015: CHF 37.7 million) was recorded. The recoverability of trade accounts receivable is regularly reviewed, and the credit quality of new customers is thoroughly assessed. Due to the large and heterogeneous customer base, the credit risk of the group is limited.
Accounts receivable by geographical region
millions of CHF Accounts receivable by region
2016 2015
Europe, Middle East, Africa 437.3 453.2
— thereof United Kingdom 120.6 167.2
— thereof Germany 65.5 54.1
— thereof Switzerland 24.6 39.6
— thereof other countries 226.6 192.3
Americas 232.2 203.5
— thereof USA 145.1 143.4
— thereof Mexico 15.6 27.0
— thereof other countries 71.5 33.1
Asia-Pacific 213.7 194.4
— thereof China 135.8 134.1
— thereof India 31.8 25.1
— thereof other countries 46.1 35.2
Total as of December 31 883.2 851.1
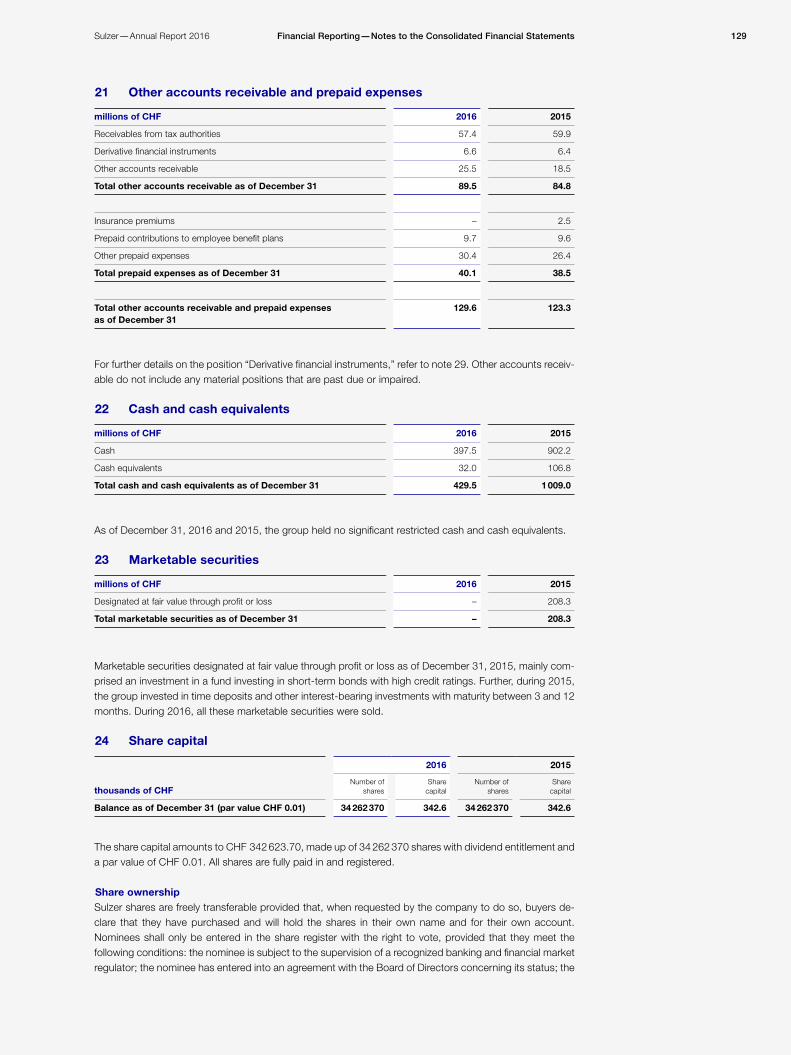
129Financial Reporting—Notes to the Consolidated Financial StatementsSulzer—Annual Report 2016
21 Other accounts receivable and prepaid expenses
millions of CHF 2016 2015
Receivables from tax authorities 57.4 59.9
Derivative financial instruments 6.6 6.4
Other accounts receivable 25.5 18.5
Total other accounts receivable as of December 31 89.5 84.8
Insurance premiums – 2.5
Prepaid contributions to employee benefit plans 9.7 9.6
Other prepaid expenses 30.4 26.4
Total prepaid expenses as of December 31 40.1 38.5
Total other accounts receivable and prepaid expenses as of December 31
129.6 123.3
For further details on the position “Derivative financial instruments,” refer to note 29. Other accounts receiv-able do not include any material positions that are past due or impaired.
22 Cash and cash equivalents
millions of CHF 2016 2015
Cash 397.5 902.2
Cash equivalents 32.0 106.8
Total cash and cash equivalents as of December 31 429.5 1 009.0
As of December 31, 2016 and 2015, the group held no significant restricted cash and cash equivalents.
23 Marketable securities
millions of CHF 2016 2015
Designated at fair value through profit or loss – 208.3
Total marketable securities as of December 31 – 208.3
Marketable securities designated at fair value through profit or loss as of December 31, 2015, mainly com-prised an investment in a fund investing in short-term bonds with high credit ratings. Further, during 2015, the group invested in time deposits and other interest-bearing investments with maturity between 3 and 12 months. During 2016, all these marketable securities were sold.
24 Share capital
2016 2015
thousands of CHFNumber of
sharesShare
capitalNumber of
sharesShare
capital
Balance as of December 31 (par value CHF 0.01) 34 262 370 342.6 34 262 370 342.6
The share capital amounts to CHF 342 623.70, made up of 34 262 370 shares with dividend entitlement and a par value of CHF 0.01. All shares are fully paid in and registered.
Share ownershipSulzer shares are freely transferable provided that, when requested by the company to do so, buyers de-clare that they have purchased and will hold the shares in their own name and for their own account. Nominees shall only be entered in the share register with the right to vote, provided that they meet the following conditions: the nominee is subject to the supervision of a recognized banking and financial market regulator; the nominee has entered into an agreement with the Board of Directors concerning its status; the

Financial Reporting—Notes to the Consolidated Financial Statements130 Sulzer—Annual Report 2016
share capital held by the nominee does not exceed 3% of the registered share capital entered in the com-mercial register; and the names, addresses, and number of shares of those individuals for whose accounts the nominee holds at least 0.5% of the share capital have been disclosed. The Board of Directors is also entitled, beyond these limits, to enter shares of nominees with voting rights in the share register, provided that the above-mentioned conditions are met (see also paragraph 6a of the Articles of Association at www.sulzer.com/regulations).
Shareholders holding more than 3%
Dec 31, 2016 Dec 31, 2015
Number of shares in %
Number of shares in %
Renova Group 21 728 414 63.42 21 728 414 63.42
T. Rowe Price Associates n/a n/a 1 051 364 3.07
Sulzer Ltd is not aware of any agreements between the shareholders named above regarding the shares held or regarding the execution of voting rights.
Retained earningsThe retained earnings include prior years’ undistributed income of consolidated companies and all remea-surements of the net liability for defined benefit plans.
Treasury sharesThe total number of shares held by Sulzer Ltd as of December 31, 2016, amounted to 177 461 treasury shares (December 31, 2015: 187 191 shares), which are mainly held for the purpose of issuing shares under the management share-based payment programs.
Cash flow hedge reserveThe hedging reserve comprises the effective portion of the cumulative net change in the fair value of cash flow hedging instruments where the hedged transaction has not yet occurred. Amounts are reclassified to profit or loss when the associated hedged transaction affects the income statement.
Currency translation reserveThe currency translation reserve comprises all foreign exchange differences arising on the translation of the financial statements of controlled entities, whose functional currency differs from the reporting currency of the group. The cumulative amount is reclassified to profit or loss when the net investment is disposed of.
DividendsOn April 7, 2016, the Annual General Meeting approved an ordinary dividend of CHF 3.50 (2015: CHF 3.50)per share and a special dividend of CHF 14.60 (2015: CHF 0.00) per share to be paid out of reserves. Thedividend was paid to shareholders on April 13, 2016. The total amount of the dividend paid was CHF 617.5 mil-lion (2015: CHF 119.2 million).
The Board of Directors decided to propose to the Annual General Meeting 2017 a dividend for the year 2016 of CHF 3.50 per share (2015: ordinary dividend CHF 3.50 and special dividend CHF 14.60).

131Financial Reporting—Notes to the Consolidated Financial StatementsSulzer—Annual Report 2016
25 Earnings per share
2016 2015
Net income attributable to shareholders of Sulzer Ltd (millions of CHF) 59.0 73.9
Issued number of shares 34 262 370 34 262 370
Adjustment for the average treasury shares held – 159 760 – 226 508
Average number of shares outstanding as of December 31 34 102 610 34 035 862
Adjustment for share participation plans 228 043 148 139
Average number of shares for calculating diluted earnings per share as of December 31 34 330 653 34 184 001
Earnings per share, attributable to a shareholder of Sulzer Ltd (in CHF) as of December 31
Basic earnings per share 1.73 2.17
Diluted earnings per share 1.72 2.16
26 Borrowings
2016 2015
millions of CHF Short-term Long-term Total Short-term Long-term Total
Bonds – 450.4 450.4 499.6 – 499.6
Bank and other loans 6.9 5.4 12.3 14.5 6.5 21.0
Leasing obligations 0.2 2.5 2.7 0.3 0.7 1.0
Total borrowings as of December 31 7.1 458.3 465.4 514.4 7.2 521.6
— thereof due in <1 year 7.1 – 7.1 514.4 – 514.4
— thereof due in 1–5 years – 7.0 7.0 – 7.0 7.0
— thereof due in >5 years – 451.3 451.3 – 0.2 0.2
Borrowings by currency
2016 2015
millions of CHF in %
Interest rate
millions of CHF in %
Interest rate
BRL 4.8 1.0 8.0% 7.0 1.3 8.0%
CHF 450.5 96.8 0.5% 499.7 95.8 2.4%
EUR 1.7 0.4 4.8% 0.3 0.1 2.9%
KRW 1.8 0.4 2.8% 1.8 0.3 2.9%
SAR 1.8 0.4 2.9% 8.8 1.7 4.2%
Other 4.8 1.0 – 4.0 0.8 –
Total as of December 31 465.4 100.0 – 521.6 100.0 –
In 2015, Sulzer arranged a CHF 500 million syndicated credit facility with maturity date in May 2020 with two one-year extension options. During 2016, the facility was extended for one year until May 2021. The facility is available for general corporate purposes including financing of acquisitions. The facility is subject to financial covenants based on net financial indebtedness and EBITDA, which were adhered to throughout the reporting period. The facility was not used as per December 31, 2016 due to the group’s liquidity situ-ation, and also the amount of other borrowings was further reduced compared with 2015.
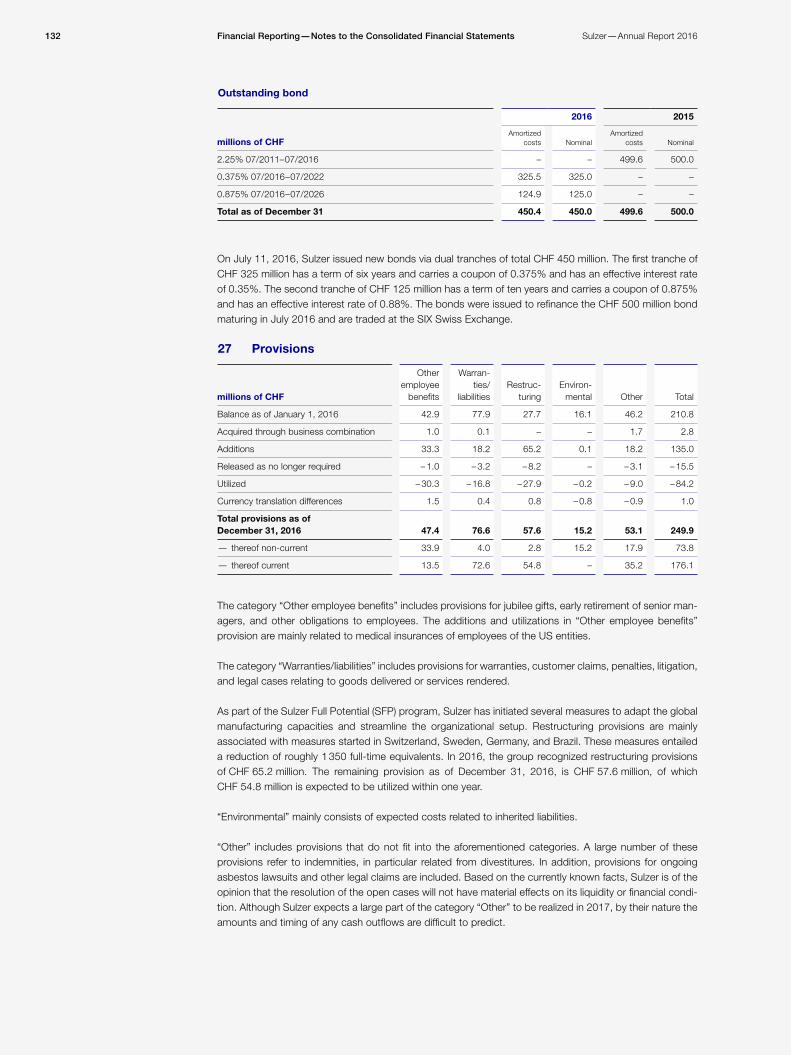
Financial Reporting—Notes to the Consolidated Financial Statements132 Sulzer—Annual Report 2016
Outstanding bond
2016 2015
millions of CHFAmortized
costs NominalAmortized
costs Nominal
2.25% 07/2011– 07/2016 – – 499.6 500.0
0.375% 07/2016 – 07/2022 325.5 325.0 – –
0.875% 07/2016 – 07/2026 124.9 125.0 – –
Total as of December 31 450.4 450.0 499.6 500.0
On July 11, 2016, Sulzer issued new bonds via dual tranches of total CHF 450 million. The first tranche of CHF 325 million has a term of six years and carries a coupon of 0.375% and has an effective interest rate of 0.35%. The second tranche of CHF 125 million has a term of ten years and carries a coupon of 0.875% and has an effective interest rate of 0.88%. The bonds were issued to refinance the CHF 500 million bond maturing in July 2016 and are traded at the SIX Swiss Exchange.
27 Provisions
millions of CHF
Other employee
benefits
Warran-ties/
liabilitiesRestruc-
turingEnviron-
mental Other Total
Balance as of January 1, 2016 42.9 77.9 27.7 16.1 46.2 210.8
Acquired through business combination 1.0 0.1 – – 1.7 2.8
Additions 33.3 18.2 65.2 0.1 18.2 135.0
Released as no longer required – 1.0 – 3.2 – 8.2 – – 3.1 – 15.5
Utilized – 30.3 – 16.8 – 27.9 – 0.2 – 9.0 – 84.2
Currency translation differences 1.5 0.4 0.8 – 0.8 – 0.9 1.0
Total provisions as of December 31, 2016 47.4 76.6 57.6 15.2 53.1 249.9
— thereof non-current 33.9 4.0 2.8 15.2 17.9 73.8
— thereof current 13.5 72.6 54.8 – 35.2 176.1
The category “Other employee benefits” includes provisions for jubilee gifts, early retirement of senior man-agers, and other obligations to employees. The additions and utilizations in “Other employee benefits” provision are mainly related to medical insurances of employees of the US entities.
The category “Warranties/liabilities” includes provisions for warranties, customer claims, penalties, litigation, and legal cases relating to goods delivered or services rendered.
As part of the Sulzer Full Potential (SFP) program, Sulzer has initiated several measures to adapt the global manufacturing capacities and streamline the organizational setup. Restructuring provisions are mainly associated with measures started in Switzerland, Sweden, Germany, and Brazil. These measures entailed a reduction of roughly 1 350 full-time equivalents. In 2016, the group recognized restructuring provisions of CHF 65.2 million. The remaining provision as of December 31, 2016, is CHF 57.6 million, of which CHF 54.8 million is expected to be utilized within one year.
“Environmental” mainly consists of expected costs related to inherited liabilities.
“Other” includes provisions that do not fit into the aforementioned categories. A large number of these provisions refer to indemnities, in particular related from divestitures. In addition, provisions for ongoing asbestos lawsuits and other legal claims are included. Based on the currently known facts, Sulzer is of the opinion that the resolution of the open cases will not have material effects on its liquidity or financial condi-tion. Although Sulzer expects a large part of the category “Other” to be realized in 2017, by their nature the amounts and timing of any cash outflows are difficult to predict.

133Financial Reporting—Notes to the Consolidated Financial StatementsSulzer—Annual Report 2016
28 Other current and accrued liabilities
millions of CHF 2016 2015
Taxes (VAT, withholding tax) 18.9 19.3
Derivative financial instruments 9.2 11.2
Other current liabilities 25.3 24.3
Total other current liabilities as of December 31 53.4 54.8
Vacation and overtime claims 27.5 26.7
Salaries, wages, and bonuses 96.8 82.5
Contract-related costs 123.5 103.7
Other accrued liabilities 107.2 97.9
Total accrued liabilities as of December 31 355.0 310.8
Total other current and accrued liabilities as of December 31 408.4 365.6
29 Derivative financial instruments
2016 2015
Derivative assets Derivative liabilities Derivative assets Derivative liabilities
millions of CHFNotional
valueFair
valueNotional
valueFair
valueNotional
valueFair
valueNotional
valueFair
value
Forward exchange contracts 375.8 6.6 394.6 9.4 437.5 6.4 589.5 11.6
Total as of December 31 375.8 6.6 394.6 9.4 437.5 6.4 589.5 11.6
— thereof due in < 1 year 374.8 6.6 382.8 9.2 437.3 6.4 571.7 11.2
— thereof due in 1– 2 years 1.0 – 11.7 0.2 0.2 – 17.7 0.4
— thereof due in 3 – 5 years – 0.1 – 0.1
The notional and the fair value of derivative assets and liabilities include current and also non-current deriv-ative financial instruments. The cash flow hedges of the expected future sales were assessed as highly effective. As at December 31, 2016, net cumulative unrealized losses of CHF 14.2 million (2015: loss of CHF 12.8 million) with a deferred tax asset of CHF 3.2 million (2015: CHF 3.6 million) relating to these cash flow hedges were included in other comprehensive income. In 2016, a gain of CHF 1.0 million (2015: a loss of CHF 3.1 million) cash flow hedge reserve was recognized in profit or loss. There was no ineffectiveness that arose from cash flow hedges in 2016 (2015: CHF 0.0 million). The maximum exposure to credit risk at the reporting date is the fair value of the derivative assets in the balance sheet.
The hedged, highly probable forecast transactions denominated in foreign currency are mostly expected to occur at various dates during the next 12 months. Gains and losses recognized in the hedging reserve (cash flow hedges) in equity on forward foreign exchange contracts as of December 31, 2016, are recognized either in sales, cost of goods sold, or in other operating income/expenses in the period or periods during which the hedged transaction affects the income statement. This is generally within 12 months from the balance sheet date unless the gain or loss is included in the initial amount recognized for the purchase of fixed assets, in which case recognition is over the lifetime of the asset (five to ten years).
The group enters into derivative financial instruments under enforceable master netting arrangements. These agreements do not meet the criteria for offsetting derivative assets and derivative liabilities in the consolidated balance sheet. As per December 31, 2016, the amount subject to such netting arrangements was CHF 3.2 million (2015: CHF 3.8 million). Considering the effect of these agreements, the amount of derivative assets would be reduced from CHF 6.6 million to CHF 3.4 million (2015: from CHF 6.4 million to CHF 2.6 million), and the amount of derivative liabilities would be reduced from CHF 9.4 million to CHF 6.2 million (2015: from CHF 11.6 million to CHF 7.8 million).

Financial Reporting—Notes to the Consolidated Financial Statements134 Sulzer—Annual Report 2016
30 Other financial commitments
2016 2015
millions of CHFRented
premises Other TotalRented
premises Other Total
Maturity < 1 year 22.0 7.0 29.0 20.4 9.0 29.4
Maturity 1– 5 years 51.8 11.7 63.5 51.8 12.3 64.1
Maturity > 5 years 16.5 0.2 16.7 23.1 – 23.1
Operating lease as of December 31 90.3 18.9 109.2 95.3 21.3 116.6
Total commitments for future investments and acquisitions as of December 31 0.1 2.4 2.5 0.7 1.6 2.3
31 Contingent liabilities
millions of CHF 2016 2015
Guarantees in favor of third parties 10.0 10.0
Total contingent liabilities as of December 31 10.0 10.0
As of December 31, 2016, guarantees provided to third parties amounted to CHF 10 million and expiration in 2022 regarding certain environmental matters related to disposed business.
32 Share participation plansShare-based payments charged to personnel expenses
millions of CHF 2016 2015
Restricted share unit plan 2.6 9.6
Performance share plan 4.9 – 1.3
Total charged to personnel expenses 7.5 8.3
Restricted share unit plan settled in Sulzer shares This long-term incentive plan covers the Board of Directors and until 2015 the members of the Sulzer Man-agement Group. Restricted share units (RSU) are granted annually depending on the organizational position of the employee. Vesting of the RSU is subject to continuous employment over the vesting period. Awards to members of the Board of Directors automatically vest with the departure from the Board. The plan fea-tures graded vesting over a three-year period. One RSU award is settled with one Sulzer share at the end of the vesting period. The fair value of the RSU granted is measured at the grant date closing share price of Sulzer Ltd, and discounted over the vesting period using a discount rate that is based on the yield of Swiss government bonds for the duration of the vesting period. Participants are not entitled to dividends declared during the vesting period. Consequently, the grant date fair value of the RSU is reduced by the present value of the dividends expected to be paid during the vesting period.
During 2015, the Renova shareholder group exceeded the threshold of 50% of the voting rights in Sulzer Ltd., qualifying as a Change of Control under the RSU plan. The Change of Control triggered the acceler-ated vesting of all outstanding RSU and entitled the plan participants to immediately receive shares. The group offered the plan participants the opportunity to continue participating in the RSU plans. If the plan participants waived the right to accelerated vesting and immediate allocation of shares and agreed to hold the RSU through to the end of their original vesting periods, plan participants, not including the members of the Board of Directors and the Executive Committee, received additional RSU in a number equal to 20% of the number of unvested RSU that the plan participants held at the time of the Change of Control. The additional RSU granted will vest at the same date as the last tranche of the original RSU.
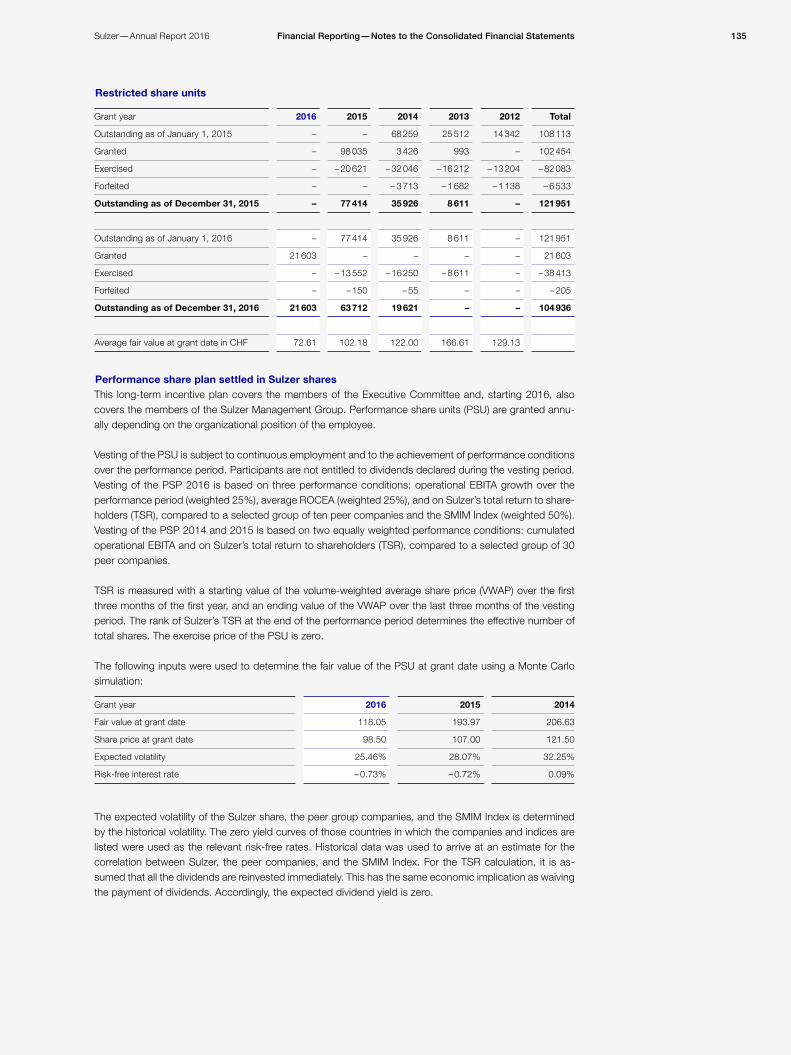
135Financial Reporting—Notes to the Consolidated Financial StatementsSulzer—Annual Report 2016
Restricted share units
Grant year 2016 2015 2014 2013 2012 Total
Outstanding as of January 1, 2015 – – 68 259 25 512 14 342 108 113
Granted – 98 035 3 426 993 – 102 454
Exercised – – 20 621 – 32 046 – 16 212 – 13 204 – 82 083
Forfeited – – – 3 713 – 1 682 – 1 138 – 6 533
Outstanding as of December 31, 2015 – 77 414 35 926 8 611 – 121 951
Outstanding as of January 1, 2016 – 77 414 35 926 8 611 – 121 951
Granted 21 603 – – – – 21 603
Exercised – – 13 552 – 16 250 – 8 611 – – 38 413
Forfeited – – 150 – 55 – – – 205
Outstanding as of December 31, 2016 21 603 63 712 19 621 – – 104 936
Average fair value at grant date in CHF 72.61 102.18 122.00 166.61 129.13
Performance share plan settled in Sulzer shares This long-term incentive plan covers the members of the Executive Committee and, starting 2016, also covers the members of the Sulzer Management Group. Performance share units (PSU) are granted annu-ally depending on the organizational position of the employee.
Vesting of the PSU is subject to continuous employment and to the achievement of performance conditions over the performance period. Participants are not entitled to dividends declared during the vesting period. Vesting of the PSP 2016 is based on three performance conditions: operational EBITA growth over the performance period (weighted 25%), average ROCEA (weighted 25%), and on Sulzer’s total return to share-holders (TSR), compared to a selected group of ten peer companies and the SMIM Index (weighted 50%). Vesting of the PSP 2014 and 2015 is based on two equally weighted performance conditions: cumulated operational EBITA and on Sulzer’s total return to shareholders (TSR), compared to a selected group of 30 peer companies.
TSR is measured with a starting value of the volume-weighted average share price (VWAP) over the first three months of the first year, and an ending value of the VWAP over the last three months of the vesting period. The rank of Sulzer’s TSR at the end of the performance period determines the effective number of total shares. The exercise price of the PSU is zero.
The following inputs were used to determine the fair value of the PSU at grant date using a Monte Carlo simulation:
Grant year 2016 2015 2014
Fair value at grant date 118.05 193.97 206.63
Share price at grant date 98.50 107.00 121.50
Expected volatility 25.46% 28.07% 32.25%
Risk-free interest rate – 0.73% – 0.72% 0.09%
The expected volatility of the Sulzer share, the peer group companies, and the SMIM Index is determined by the historical volatility. The zero yield curves of those countries in which the companies and indices are listed were used as the relevant risk-free rates. Historical data was used to arrive at an estimate for the correlation between Sulzer, the peer companies, and the SMIM Index. For the TSR calculation, it is as-sumed that all the dividends are reinvested immediately. This has the same economic implication as waiving the payment of dividends. Accordingly, the expected dividend yield is zero.

Financial Reporting—Notes to the Consolidated Financial Statements136 Sulzer—Annual Report 2016
Performance share units—terms of awards
Grant year 2016 2015 2014
Number of awards granted 116 472 21 665 15 965
Grant date August 1,16 April 1,15 April 1,14
Performance period for cumulative EBIT 01/16 –12/18 01/15 –12/17 01/14 –12/16
Performance period for TSR 01/16 –12/18 04/15 – 03/18 04/14 – 03/17
Fair value at grant date in CHF 118.05 193.97 206.63
Performance share units
Grant year 2016 2015 2014 2013 Total
Outstanding as of January 1, 2015 – – 13 651 26 458 40 109
Granted – 21 665 – – 21 665
Exercised – – – – 5 717 – 5 717
Forfeited – – 7 865 – 6 439 – 15 881 – 30 185
Outstanding as of December 31, 2015 – 13 800 7 212 4 860 25 872
Outstanding as of January 1, 2016 – 13 800 7 212 4 860 25 872
Granted 116 472 5 228 4 281 – 125 981
Exercised – 217 – 1 748 – 2 533 – 808 – 5 306
Forfeited – 7 389 – 8 284 – 3 715 – 4 052 – 23 440
Outstanding as of December 31, 2016 108 866 8 996 5 245 – 123 107
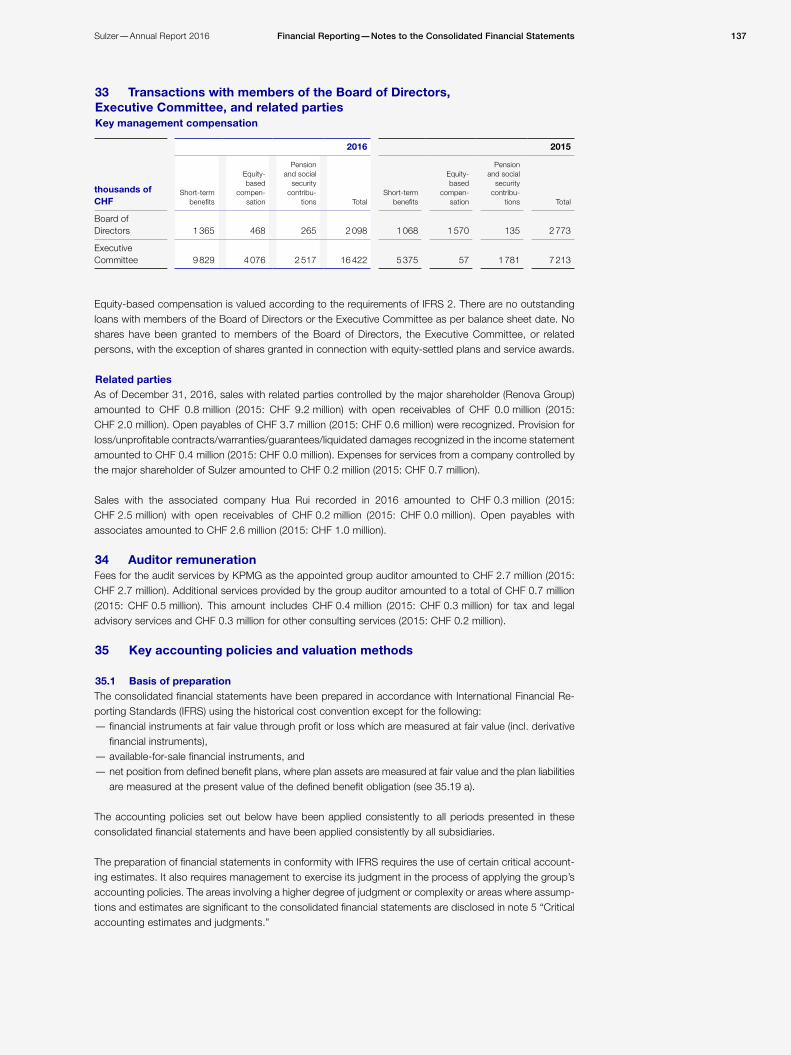
137Financial Reporting—Notes to the Consolidated Financial StatementsSulzer—Annual Report 2016
33 Transactions with members of the Board of Directors, Executive Committee, and related partiesKey management compensation
2016 2015
thousands of CHF
Short-term benefits
Equity- based
compen- sation
Pension and social
security contribu-
tions TotalShort-term
benefits
Equity- based
compen-sation
Pension and social
security contribu-
tions Total
Board of Directors 1 365 468 265 2 098 1 068 1 570 135 2 773
Executive Committee 9 829 4 076 2 517 16 422 5 375 57 1 781 7 213
Equity-based compensation is valued according to the requirements of IFRS 2. There are no outstanding loans with members of the Board of Directors or the Executive Committee as per balance sheet date. No shares have been granted to members of the Board of Directors, the Executive Committee, or related persons, with the exception of shares granted in connection with equity-settled plans and service awards.
Related partiesAs of December 31, 2016, sales with related parties controlled by the major shareholder (Renova Group) amounted to CHF 0.8 million (2015: CHF 9.2 million) with open receivables of CHF 0.0 million (2015: CHF 2.0 million). Open payables of CHF 3.7 million (2015: CHF 0.6 million) were recognized. Provision for loss/unprofitable contracts/warranties/guarantees/liquidated damages recognized in the income statement amounted to CHF 0.4 million (2015: CHF 0.0 million). Expenses for services from a company controlled by the major shareholder of Sulzer amounted to CHF 0.2 million (2015: CHF 0.7 million).
Sales with the associated company Hua Rui recorded in 2016 amounted to CHF 0.3 million (2015: CHF 2.5 million) with open receivables of CHF 0.2 million (2015: CHF 0.0 million). Open payables with associates amounted to CHF 2.6 million (2015: CHF 1.0 million).
34 Auditor remunerationFees for the audit services by KPMG as the appointed group auditor amounted to CHF 2.7 million (2015: CHF 2.7 million). Additional services provided by the group auditor amounted to a total of CHF 0.7 million (2015: CHF 0.5 million). This amount includes CHF 0.4 million (2015: CHF 0.3 million) for tax and legal advisory services and CHF 0.3 million for other consulting services (2015: CHF 0.2 million).
35 Key accounting policies and valuation methods
35.1 Basis of preparation The consolidated financial statements have been prepared in accordance with International Financial Re-porting Standards (IFRS) using the historical cost convention except for the following:
— financial instruments at fair value through profit or loss which are measured at fair value (incl. derivative financial instruments), — available-for-sale financial instruments, and — net position from defined benefit plans, where plan assets are measured at fair value and the plan liabilities are measured at the present value of the defined benefit obligation (see 35.19 a).
The accounting policies set out below have been applied consistently to all periods presented in these consolidated financial statements and have been applied consistently by all subsidiaries.
The preparation of financial statements in conformity with IFRS requires the use of certain critical account-ing estimates. It also requires management to exercise its judgment in the process of applying the group’s accounting policies. The areas involving a higher degree of judgment or complexity or areas where assump-tions and estimates are significant to the consolidated financial statements are disclosed in note 5 “Critical accounting estimates and judgments.”

Financial Reporting—Notes to the Consolidated Financial Statements138 Sulzer—Annual Report 2016
35.2 Change in accounting policies a) Standards, amendments, and interpretations which are effective for 2016The group has adopted the following new standards and amendments with a date of initial application of January 1, 2016. The adoption of these amendments did not have any impact on the current period.
— Amendment to IAS 1 ‘Presentation of Financial Statements’. The amendments clarify guidance in IAS 1 on materiality and aggregation of the presentation of subtotals, the structure of financial statements, and the disclosure of accounting policies. — Amendments to IAS 16 ‘Property, Plant, and Equipment’ and IAS 38 ‘Intangible Assets’. The amend-ments clarify the acceptable methods of depreciation and amortization. — Amendments deriving from the annual improvement program 2012–2014 addressing specific aspects in various standards.
b) Standards, amendments, and interpretations issued but not yet effective which the group has decided not to early adopt in 2016A number of new standards and amendments to standards have been published that are not mandatory for December 31, 2016 reporting periods and have not been early adopted by the group. None of these are expected to have a significant effect on the consolidated financial statements of the group, except the following:
— Amendments to IAS 7 ‘Statement of Cash Flows’, requires disclosures that enable users of financial statements to evaluate changes in liabilities arising from financing activities, including both changes arising from cash flow and non-cash changes. The amendments are effective for annual reporting peri-ods beginning on or after January 1, 2017. — Amendments to IAS 12 ‘Income Taxes’. The amendments clarify the recognition of a deductible tempo-rary differences for unrealized losses. The amendments are effective for annual reporting periods begin-ning on or after January 1, 2017. — IFRS 9 ‘Financial Instruments’, published in July 2014, replaces the existing guidance in IAS 39 ‘Finan-cial Instruments: Recognition and Measurement’. IFRS 9 includes revised guidance on the classification and measurement of financial instruments, including a new expected credit loss model for calculating impairment on financial assets, and the new general hedge accounting requirements. It also carries forward the guidance on recognition and derecognition of financial instruments from IAS 39. IFRS 9 is effective for annual reporting periods beginning on or after January 1, 2018. The group is assessing the potential impact on its consolidated financial statements resulting from the application of IFRS 9. — IFRS 15 ‘Revenue from Contracts with Customers’ establishes a comprehensive framework for deter-mining whether, how much, and when revenue is recognized. It replaces existing revenue recognition guidance, including IAS 18 ‘Revenue’, IAS 11 ‘Construction Contracts’, and IFRIC 13 ‘Customer Loy-alty Programs’. The core principle of IFRS 15 is that an entity should recognize revenue to depict the transfer of promised goods and services to customers in an amount that reflects the consideration to which the entity expects to be entitled in exchange for those goods and services. Under IFRS 15, an entity recognizes revenue when a performance obligation is satisfied. IFRS 15 is effective for annual reporting periods beginning on or after January 1, 2018. Sulzer has started a project and is assessing the potential impact on its consolidated financial statements resulting from the application of IFRS 15. At this stage, the group is not able to estimate the impact of the new standard on the group’s financial statements. Sulzer will assess the impact in more detail over the next year. — IFRS 16 ‘Leases’, published in January 2016, introduces a single lessee accounting model and requires a lessee to recognize assets and liabilities for all leases with a term of more than 12 months, unless the underlying asset is of low value. A lessee is required to recognize a right-of-use asset representing its right to use the underlying leased asset and a lease liability representing its obligation to make lease payments. Sulzer has started a project and is assessing the potential impact on its consolidated financial statements resulting from the application of IFRS 16. So far, the most significant impact identified is that the Group will recognize new assets and liabilities for its operating leases of buildings and equipment. In addition, the nature of expenses related to those leases will now change as IFRS 16 replaces the straight-line operating lease expense with a depreciation charge for right-of-use assets and interest expense on lease liabilities. IFRS 16 is effective for annual periods beginning on or after January 1, 2019.

139Financial Reporting—Notes to the Consolidated Financial StatementsSulzer—Annual Report 2016
35.3 Consolidationa) Business combinationsThe group accounts for business combinations using the acquisition method when control is transferred to the group (see 35.3 b). The consideration transferred in the acquisition is measured at the fair value of the assets given, the liabilities incurred to the former owner of the acquiree, and the equity interest issued by the group. Any goodwill arising is tested annually for impairment (see 35.6 a). Any gain on a bargain pur-chase is recognized in the income statement immediately. Acquisition-related costs are expensed as in-curred, except if related to the issue of debt or equity securities. Identifiable assets acquired, and liabilities and contingent liabilities assumed in a business combination, are measured initially at their fair values at the acquisition date.
Any contingent consideration payable is measured at fair value at the acquisition date. If the contingent consideration is classified as equity, then it is not remeasured and settlement is accounted for within equity. Otherwise, subsequent changes in the fair value of the contingent consideration are recognized in the in-come statement.
If share-based payment awards (replacement awards) are required to be exchanged for awards held by the acquiree’s employees (acquiree’s awards), then all or a portion of the amount of the acquirer’s replacement awards is included in measuring the consideration transferred in the business combination. The determina-tion is based on the difference between the market-based measure of the replacement awards compared with the market-based measure of the acquiree’s awards and the extent to which the replacement awards relate to pre-combination service.
b) SubsidiariesSubsidiaries are all entities controlled by the group. The group controls an entity when it is exposed to, or has the rights to, variable returns from its involvement with the entity and has the ability to affect those returns through its power over the entity. The financial statements of subsidiaries are included in the con-solidated financial statements from the date on which control commences until the date on which control ceases.
According to the full consolidation method, all assets and liabilities as well as income and expenses of the subsidiaries are included in the consolidated financial statements. The share of non-controlling interests in the net assets and results is presented separately as non-controlling interests in the consolidated balance sheet and income statement, respectively.
c) Non-controlling interests The group recognizes any non-controlling interest in the acquiree on an acquisition-by-acquisition basis, at the non-controlling interest’s proportionate share of the recognized amounts of the acquiree’s identifiable net assets. Transactions with non-controlling interests that do not result in loss of control are accounted for as equity transactions.
When the group loses control over a subsidiary, it derecognizes the assets and liabilities of the subsidiary, and any related non-controlling interest and other components of equity. Any resulting gain or loss is rec-ognized in the income statement. Any interest retained in the former subsidiary is measured at fair value when control is lost.
d) Associates and joint ventures Associates are those entities in which the group has significant influence, but no control, over the financial and operating policies. Significant influence is presumed to exist when the group holds, directly or indirect-ly, between 20% and 50% of the voting rights. Joint ventures are those entities over whose activities the group has joint control, established by contractual agreement and requiring unanimous consent for strate-gic, financial, and operating decisions. Associates and joint ventures are accounted for using the equity method and are initially recognized at cost.
e) Transactions eliminated on consolidation All material intercompany transactions and balances and any unrealized gains arising from intercompany transactions are eliminated in preparing the consolidated financial statements. Unrealized losses are elimi-nated in the same way as unrealized gains, but only to the extent that there is no evidence of impairment.

Financial Reporting—Notes to the Consolidated Financial Statements140 Sulzer—Annual Report 2016
35.4 Segment reporting Operating segments are reported in a manner consistent with the internal reporting provided to the Chief Executive Officer. The Chief Executive Officer, who is responsible for allocating resources and assessing performance (e.g. operating income) of the operating segments, has been identified as chief operating decision maker.
35.5 Foreign currency translationa) Functional and presentation currencyItems included in the financial statements of subsidiaries are measured using the currency of the primary economic environment in which the entity operates (the functional currency). The consolidated financial statements are presented in Swiss francs (CHF).
The following table shows the major currency exchange rates for the reporting periods 2016 and 2015:
CHF 2016 2015
Average rate
Year-end rate
Average rate
Year-end rate
1 EUR 1.09 1.07 1.07 1.08
1 GBP 1.33 1.25 1.47 1.47
1 USD 0.99 1.02 0.96 0.99
100 CNY 14.83 14.68 15.32 15.23
100 INR 1.47 1.50 1.50 1.49
b) Transactions and balances Foreign currency transactions are translated into the functional currency using the exchange rates prevailing at the dates of the transactions. Foreign exchange gains and losses resulting from the settlement of such transactions and from the translation at year-end exchange rates of monetary assets and liabilities denom-inated in foreign currencies are recognized in the income statement.
Changes in the fair value of monetary items, denominated in foreign currency classified as available-for-sale are analyzed between translation differences resulting from changes in the amortized cost of the item and other changes in the carrying amount of the item. Translation differences related to changes in the amor-tized costs are recognized in profit or loss; other changes in the carrying amount are recognized in other comprehensive income.
Translation differences on non-monetary financial assets and liabilities are reported as part of the fair value gain or loss. Translation differences on non-monetary financial assets and liabilities, such as equities held at fair value through profit or loss, are recognized in the income statement as part of the fair value gain or loss. Translation differences on non-monetary financial assets, such as equities classified as avail able-for-sale, are included in the available-for-sale reserve in other comprehensive income.
c) SubsidiariesThe results and balance sheet positions of all the subsidiaries (excluding the ones with hyperinflationary economy) that have a functional currency different from the presentation currency of the group are translated into the presentation currency as follows:
— assets and liabilities for each balance sheet presented are translated at the closing rate at the date of that balance sheet, and — income and expenses for each income statement are translated at average exchange rates.
Translation differences resulting from consolidation are taken to other comprehensive income. In the event of a sale or liquidation of foreign subsidiaries, exchange differences that were recorded in other compre-hensive income are recognized in the income statement as part of the gain or loss on sale or liquidation.
If a loan is made to a group company, and the loan in substance forms part of the group’s investment in the group company, translation differences arising from the loan are recognized directly in other comprehensive income as foreign currency translation differences. When the group company is sold or partially disposed of, and control no longer exists, gains and losses accumulated in equity are reclassified to the income statement as part of the gain or loss on disposal.
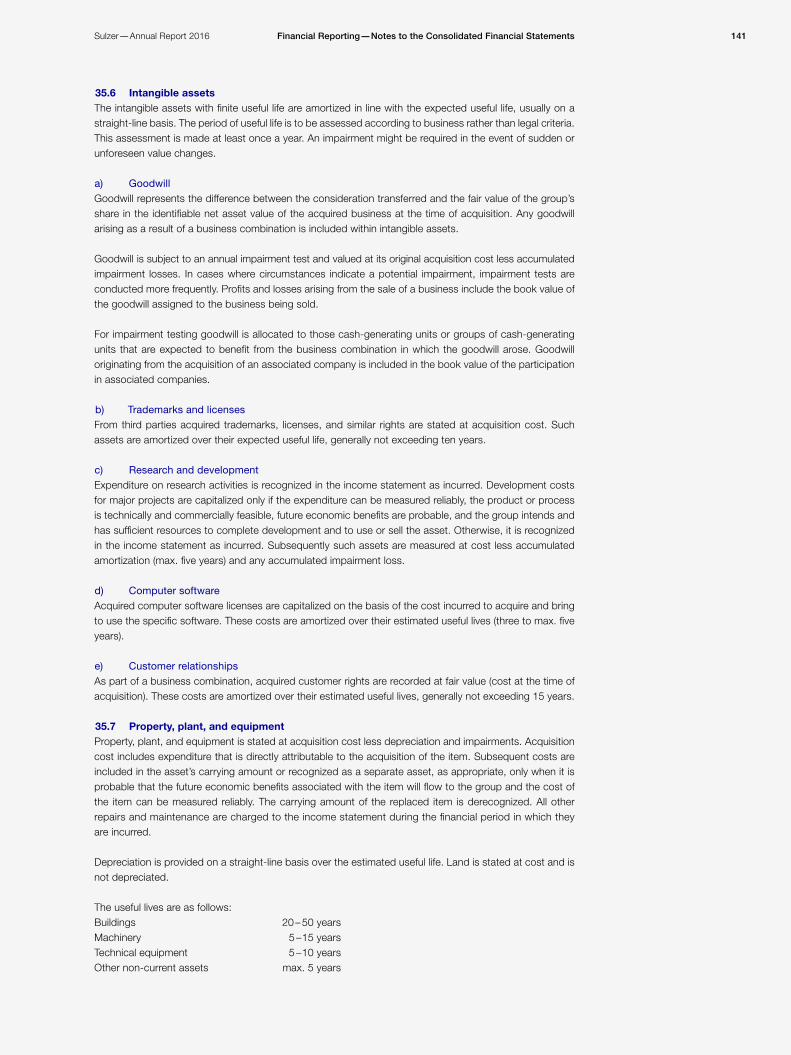
141Financial Reporting—Notes to the Consolidated Financial StatementsSulzer—Annual Report 2016
35.6 Intangible assetsThe intangible assets with finite useful life are amortized in line with the expected useful life, usually on a straight-line basis. The period of useful life is to be assessed according to business rather than legal criteria. This assessment is made at least once a year. An impairment might be required in the event of sudden or unforeseen value changes.
a) GoodwillGoodwill represents the difference between the consideration transferred and the fair value of the group’s share in the identifiable net asset value of the acquired business at the time of acquisition. Any goodwill arising as a result of a business combination is included within intangible assets. Goodwill is subject to an annual impairment test and valued at its original acquisition cost less accumulated impairment losses. In cases where circumstances indicate a potential impairment, impairment tests are conducted more frequently. Profits and losses arising from the sale of a business include the book value of the goodwill assigned to the business being sold. For impairment testing goodwill is allocated to those cash-generating units or groups of cash-generating units that are expected to benefit from the business combination in which the goodwill arose. Goodwill originating from the acquisition of an associated company is included in the book value of the participation in associated companies.
b) Trademarks and licensesFrom third parties acquired trademarks, licenses, and similar rights are stated at acquisition cost. Such assets are amortized over their expected useful life, generally not exceeding ten years.
c) Research and development Expenditure on research activities is recognized in the income statement as incurred. Development costs for major projects are capitalized only if the expenditure can be measured reliably, the product or process is technically and commercially feasible, future economic benefits are probable, and the group intends and has sufficient resources to complete development and to use or sell the asset. Otherwise, it is recognized in the income statement as incurred. Subsequently such assets are measured at cost less accumulated amortization (max. five years) and any accumulated impairment loss. d) Computer softwareAcquired computer software licenses are capitalized on the basis of the cost incurred to acquire and bring to use the specific software. These costs are amortized over their estimated useful lives (three to max. five years).
e) Customer relationships As part of a business combination, acquired customer rights are recorded at fair value (cost at the time of acquisition). These costs are amortized over their estimated useful lives, generally not exceeding 15 years.
35.7 Property, plant, and equipment Property, plant, and equipment is stated at acquisition cost less depreciation and impairments. Acquisition cost includes expenditure that is directly attributable to the acquisition of the item. Subsequent costs are included in the asset’s carrying amount or recognized as a separate asset, as appropriate, only when it is probable that the future economic benefits associated with the item will flow to the group and the cost of the item can be measured reliably. The carrying amount of the replaced item is derec ognized. All other repairs and maintenance are charged to the income statement during the financial period in which they are incurred.
Depreciation is provided on a straight-line basis over the estimated useful life. Land is stated at cost and is not depreciated.
The useful lives are as follows:Buildings 20 – 50 yearsMachinery 5 – 15 yearsTechnical equipment 5 – 10 yearsOther non-current assets max. 5 years

Financial Reporting—Notes to the Consolidated Financial Statements142 Sulzer—Annual Report 2016
Property, plant, and equipment financed by long-term financial leases is capitalized and amortized in the same way as other assets. The applicable leasing commitments are shown as liabilities and are included under long-term borrowings. An asset’s carrying amount is impaired immediately to its recoverable amount if the asset’s carrying amount is greater than its estimated recoverable amount.
35.8 Impairment of property, plant, and equipment and intangible assetsAssets with a finite useful life are only tested for impairment if relevant events or changes in circumstances indicate that the book value is no longer recoverable. An impairment loss is recorded equal to the excess of the carrying value over the recoverable amount. The recoverable amount is the higher of the fair value of the asset less disposal costs and its value in use. The value in use is based on the estimated cash flow over a three-year period and the extrapolated projections for subsequent years. The results are discounted using an appropriate pre-tax, long-term interest rate. For the purposes of the impairment test, assets are grouped together at the lowest level for which separate cash flows can be identified (cash-generating units).
35.9 Financial assets Financial assets, including marketable securities, are classified into the following three categories: “financial assets at fair value through profit or loss,” “available-for-sale financial assets,” and “loans and receivables”. Classification depends on the purpose for which the financial assets were acquired. Management deter-mines the classification of assets at the date of purchase.
a) Financial assets at fair value through profit or loss Assets in this category are either designated to this category upon initial recognition or are classified as held for trading. Financial assets designated at fair value from inception are those that are managed and their performance is evaluated on a fair value basis, in accordance with a documented investment strategy. Derivative financial assets not designated in a hedge relationship are also classified as held for trading and are presented as current assets or in case maturity is later than 12 months from the balance sheet date as non-current assets.
b) Available-for-sale financial assets Available-for-sale financial assets are non-derivatives that are either designated in this category or not in any of the other categories. They are included in non-current assets unless management intends to dispose of the investment within 12 months of the balance sheet date.
c) Loans and receivables Loans and receivables are non-derivative financial assets with fixed or determinable payments that are not quoted in an active market. They are included in the current assets, unless the maturity is greater than 12 months after the balance sheet date. These are classified as non-current assets. The group initially recognizes loans and receivables on the date when they are originated. All other financial assets are recognized on the trade date. Financial assets are initially measured at fair value plus transaction costs for all financial assets not carried at fair value through profit or loss. Financial assets carried at fair value through profit or loss are initially recognized at fair value and transaction costs are expensed in the income statement. Available-for-sale financial assets and financial assets at fair value through profit or loss are subsequently carried at fair value. Loans and receivables are carried at amortized cost using the effective interest method. With the exception of derivative financial instruments designated in a “cash flow hedge” or a “net investment hedge” gains or losses arising from changes in the fair value of the financial assets at fair value through profit or loss are recognized in the income statement line “Other financial income” in the period they arise. Changes in the fair value of financial assets classified as available-for-sale are recognized in equity. When these assets are sold or impaired, the accumulated fair value adjustments recorded in equity are reclassified and booked to the financial income. The group assesses at each balance sheet date whether there is objective evidence that a financial asset or group of financial assets is impaired.
Financial assets are derecognized when the right to receive cash flows from the investments has expired or has been transferred and the group has transferred all substantial risks and rewards of ownership.

143Financial Reporting—Notes to the Consolidated Financial StatementsSulzer—Annual Report 2016
35.10 Derivative financial instruments and hedging activities The group uses derivative financial instruments, such as forward currency contracts, other forward contracts and options, to hedge its risks associated with fluctuations in foreign currencies arising from operational and financing activities. Such derivative financial instruments are initially recognized at fair value on the date on which a derivative contract is entered into and are subsequently remeasured at fair value. Derivatives are carried as assets when the fair value is positive and as liabilities when the fair value is negative.
Any gains or losses arising from changes in fair value on the derivatives during the year that do not qualify for hedge accounting are taken directly into profit or loss.
Sulzer applies hedge accounting to secure future cash flows which have a high probability of occurrence. These hedges are classified as “cash flow hedges”, whereas the hedge instrument is recorded on the bal-ance sheet at fair value and the effective portions are booked against “Other comprehensive income” in the column “Cash flow hedge reserve.” If the hedge relates to a non-financial transaction which will subse-quently be recorded on the balance sheet, the adjustments accumulated under “Other comprehensive in-come” at that time will be included in the initial book value of the asset or liability. In all other cases, the cumulative changes of fair value of the hedging instrument that have been recorded in other comprehensive income are included as a charge or credit to income when the forecasted trans action is recognized or when hedge accounting is discontinued as the criteria are no longer met. In general, the fair value of financial instruments traded in active markets is based on quoted market prices at the balance sheet date.
Hedges of net investments in foreign operations are accounted for similarly to cash flow hedges. Any gain or loss on the hedging instrument relating to the effective portion on the hedge is recognized in other comprehensive income. The gain or loss relating to the ineffective portion is recognized immediately in the income statement. Gains and losses accumulated in equity are included in the income statement when the foreign operation is partially disposed of or sold.
At the inception of the transaction, the group documents the relationship between hedging instruments and hedged items, as well as its risk management objectives and strategy for undertaking various hedging transactions. The group also documents its assessment, both at hedge inception and on an ongoing basis, of whether the derivatives that are used in hedging transactions are highly effective in offsetting changes in fair values or cash flows of hedged items.
35.11 Offsetting financial instrumentsFinancial assets and liabilities are offset and the net amount reported in the balance sheet when there is a legally enforceable right to offset the recognized amounts, and there is an intention to settle on a net basis or realize the asset and settle the liability simultaneously.
35.12 Inventories Raw materials, supplies, and consumables are stated at the lower of cost or net realizable value. Finished products and work in progress are stated at the lower of production cost or net realizable value. Production cost includes the costs of materials, direct and indirect manufacturing costs, and contract-related costs of construction. Inventories are valued by reference to weighted average costs. Provisions are made for slow-moving and excess inventories.
35.13 Trade receivablesTrade and other accounts receivable are stated at nominal value less provision for impairments. The respec-tive value corresponds approximately to the amortized cost. Trade receivables are classified as loans and receivables. A provision for impairment of trade receivables is established when there is objective evidence that the group will not be able to collect all the amounts due according to the original payment terms of the receivables. Significant financial difficulties of the debtor, probability that the debtor will enter bankruptcy or financial reorganization, and default or delinquency in payments are considered indicators that the trade receivable is impaired. Receivables are subject to regular review and adequate impairment is considered. The amount of the impairment provision is the difference between the carrying amount and the present value of estimated future cash flows, discounted at the original effective interest rate. An impairment charge is booked within selling and marketing expenses in the income statement and the carrying amount of the trade receivable is deducted through an allowance account. When a trade receivable is uncollectible, it is written off against the allowance account for trade receivables. Any subsequent recoveries of amounts previously written off are credited against selling and marketing costs in the income statement.

Financial Reporting—Notes to the Consolidated Financial Statements144 Sulzer—Annual Report 2016
35.14 Cash and cash equivalents Cash and cash equivalents comprise bills, postal giros, and bank accounts, together with other short-term highly liquid investments with a maturity of three months or less from the date of acquisition. Bank over-drafts are reported within borrowings in the current liabilities.
35.15 Share capital Ordinary shares are classified as equity. Costs directly attributable to the issue of ordinary shares and share options are recognized as a deduction from equity, net of any tax effects. When share capital is repur-chased, the amount of the consideration paid, which includes directly attributable cost, is net of any tax effects and is recognized as a deduction from equity. Repurchased shares are classified as treasury shares and are presented as a deduction from total equity. When treasury shares are sold or reissued subsequent-ly, the amount received is recognized as an increase in equity and the resulting surplus or deficit on the transaction is transferred to/from retained earnings.
35.16 Trade payables Trade payables and other payables are stated at face value. The respective value corresponds approx-imately to the amortized cost.
35.17 BorrowingsFinancial debt is stated at fair value when initially recognized, after recognition of transaction costs. In sub-sequent periods, it is valued at amortized cost. Any difference between the amount borrowed (after deduc-tion of transaction costs) and the repayment amount is reported in the income statement over the duration of the loan using the effective interest method. Borrowings are classified as current liabilities unless the group has an unconditional right to defer settlement of the liability for at least 12 months after the balance sheet date.
35.18 Current and deferred income taxesThe current income tax charge comprises the expected tax payable or receivable on the taxable income or loss for the year and any adjustment to the tax payable or receivable in respect of previous years. It is calculated on the basis of the tax laws enacted or substantively enacted at the balance sheet date in the countries where the group’s subsidiaries and associates operate and generate taxable income. The man-agement periodically evaluates positions taken in tax returns with respect to situations in which applicable tax regulations are subject to interpretation and establishes provisions where appropriate on the basis of amounts expected to be paid to the tax authorities.
The liability method is used to provide deferred taxes on all temporary differences between the tax base of assets and liabilities and their carry ing amounts in the consolidated financial statements. Deferred taxes are valued by applying tax rates (and regulations) substantially enacted on the balance sheet date or any that have essentially been legally approved and are expected to apply at the time when the deferred tax asset is realized or the deferred tax liability is settled.
Income tax is recognized in profit of loss except to the extent that it relates to items recognized directly in equity or other comprehensive income, in which case it is recognized directly in equity or other comprehen-sive income.
Deferred tax assets are recognized for unused tax losses and deductible temporary differences to the extent that it is probable that a taxable profit will be available against which they can be used. Deferred tax liabilities arising as a result of temporary differences relating to investments in subsidiaries and asso ciated companies are applied, unless the group can control when temporary differences are reversed and it is unlikely that they will be reversed in the foreseeable future.

145Financial Reporting—Notes to the Consolidated Financial StatementsSulzer—Annual Report 2016
35.19 Employee benefitsa) Defined benefit plansThe group’s net obligation in respect of defined benefit plans is calculated separately for each plan by esti-mating the amount of future benefit that employees have earned in the current and prior periods, discount-ing that amount using interest rates of high-quality corporate bonds that are denominated in the currency in which the benefits will be paid and deducting the fair value of any plan assets.
The calculation of defined benefit obligations is performed annually by a qualified actuary using the project-ed unit credit method. When the calculation results in a potential asset for the group, the recognized asset is limited to the present value of economic benefits available in the form of any future refunds from the plan or reductions in future contributions to the plan. To calculate the present value of economic benefits, con-sideration is given to any applicable minimum funding requirements.
Remeasurements of the net defined benefit liability, which comprise actuarial gains and losses, the return on plan assets (excluding interest income on plan assets), and the effect of the asset ceiling (if any, exclud-ing interest), are recognized immediately in OCI. The group determines the net interest expense/(income) on the net defined benefit liability/(asset) for the period by applying the discount rate used to measure the defined benefit obligation at the beginning of the annual period to the then net defined benefit liability/(asset), taking into account any changes in the net defined benefit liability/(asset) during the period as a result of contributions and benefit payments. Net interest expenses and other expenses related to defined benefit plans are recognized in the income statement.
When the benefits of a plan are changed or when a plan is curtailed, the resulting change in benefit that relates to past service or the gain or loss on curtailment is recognized immediately in the income statement. The group recognizes gains and losses on the settlement of a defined benefit plan when the settlement occurs.
b) Defined contribution plans Defined contribution plans are defined to be pure savings plans, under which the employer makes certain contributions into a separate legal entity (fund) and does not have a legal or an extendible (constructive) liability to contribute any additional amounts in the event this entity does not have enough funds to pay out benefits. A “constructive” commitment exists when it can be assumed that the employer will voluntarily make additional contributions in order not to endanger the relationship with its employees. Company con-tributions to such plans are considered in the income statement as personnel expenses.
c) Other employee benefits Some subsidiaries provide other employee benefits like “Early retirement benefits” or “Jubilee gifts” to their employees. Early retirement benefits are defined as termination benefits for employees accepting voluntary redundancy in exchange for those benefits. Jubilee gifts are other long-term benefits. For example, in Swit-zerland, Sulzer makes provisions for jubilee benefits based on a Swiss local directive. The provisions are reported in the category “Other employee benefits” (Note 27).
Short-term benefits are payable within 12 months after the end of the period in which the employees render the related employee service. In the case of liabilities of a long-term nature, the discounting effects and employee turnover are to be taken into consideration.
Obligations to employees arising from restructuring measures are included under the category “Restruc-turing provisions.”

Financial Reporting—Notes to the Consolidated Financial Statements146 Sulzer—Annual Report 2016
35.20 Share-based compensationSulzer operates two equity-settled share-based payment programs. A performance share plan (PSP) covers the members of the Executive Committee and starting 2016 also the members of the Sulzer Management Group. A restricted stock plan (RSP) covers the members of the Board of Directors and until 2015 also covered the members of the Sulzer Management Group.
a) Performance share plan (PSP)The fair value of the employee services received in exchange for the grant of the performance share units is recognized as a personnel expense with a corresponding increase in equity. The total amount to be expensed over the vesting period is determined by reference to the fair value of the share units granted, excluding the impact of any non-market vesting conditions (e.g. profitability targets). At each balance sheet date, the group reassesses its estimates of the number of share units that are expected to vest. It recog-nizes the impact of the reassessment of original estimates, if any, in the income statement, and a corre-sponding adjustment to equity. The fair value of performance share units granted is measured by external valuation specialists based on a Monte Carlo simulation.
The group accrues for the expected cost of social charges in connection with the allotment of shares under the PSP. The dilution effect of the share-based awards is considered when calculating diluted earnings per share.
b) Restricted share plan (RSP)The fair value of the employee services received in exchange for the grant of the share units is recognized as a personnel expense with a corresponding increase in equity. The total amount expensed is recognized over the vesting period, which is the period over which the specified service conditions are expected to be met.
The fair value of the restricted share units granted for services rendered is measured at the Sulzer closing share price at grant date, and discounted over the vesting period using a discount rate that is based on the yield of Swiss government bonds with maturities matching the duration of the vesting period. Participants are not entitled to dividends declared during the vesting period. The grant date fair value of the restricted share units is consequently reduced by the present value of dividends expected to be paid during the vesting period.
The group accrues for the expected cost of social charges in connection with the allotment of shares under the RSP. The dilutive effect of the share-based awards is considered when calculating diluted earnings per share.
35.21 ProvisionsProvisions are recognized when: the group has a present legal or constructive obligation as a result of past events; it is probable that an outflow of resources will be required to settle the obligation; and the amount has been reliably estimated. Restructuring provisions comprise lease termination penalties and employee termination payments. Provisions are not recognized for future operating losses. Where there are a number of similar obligations, the likelihood that an outflow will be required is determined by considering the class of obligation as a whole. A provision is recognized even if the likelihood of an outflow with respect to a single item included in the class of obligations may be small.
Provisions are measured at the present value of the expenditures expected to be required to settle the obligation using a pre-tax rate that reflects current market assessments of the time value of money and the risks specific to the obligation. The increase in the provision due to the passage of time is recognized as interest expense.

147Financial Reporting—Notes to the Consolidated Financial StatementsSulzer—Annual Report 2016
35.22 Revenue recognition Revenue comprises the fair value of the consideration received or receivable for the sale of goods and rendering of services in the ordinary course of the group’s activities. Revenue is shown net of value-added tax, returns, rebates, and discounts and after eliminating sales within the group. The group recog nizes revenue when the amount of revenue can be reliably measured, when it is probable that future economic benefits will flow to the entity, and when specific criteria have been met.
a) Sale of goods/products Revenue from the sale of goods/products derives in the ordinary course of business. Goods and products are described as ordinary when they are part of the official product range of the organization. Goods and products are those items produced/engineered and/or purchased for resale. This includes standard prod-ucts (off the rack) as well as (pre-) engineered or tailor-made products.
Revenue from the sale of goods is recognized when all of the conditions stated below are fulfilled. The return rights of products and goods are also considered. The conditions for the recognition of revenue from sale of goods and products are as follows:
— it is probable that any future economic benefit associated with the revenue will flow to the entity, — the revenue can be measured reliably, — the cost incurred or to be incurred can be measured reliably, — the entity (seller) has transferred significant risks and rewards of ownership to the buyer; basis of the risk/reward terms are the agreed clauses with the customer in the sales contract, generally linked to the internationally accepted Incoterms, and — the entity (seller) has retained neither continuing managerial involvement nor effective control over the goods.
Revenue is recognized only when it is probable that it is collectible and measurable. Revenue can only be collectible when there is a binding sales agreement. Once revenue is recognized, any subsequent uncer-tainty about the collectability of the revenue is recognized as an expense/adjustment to the amount receiv-able rather than as an adjustment to revenue.
b) Rendering of servicesThe rendering of services involves an entity performing an agreed task for a customer. This service may involve asset maintenance; professional services; and the construction, development, or customization of assets. Service contracts may be single-element contracts, in which the entity renders one type of service, or multiple-element contracts that provide for the delivery of more than one service, or may include the delivery of goods as well as services. Services are often performed within the reporting period.
Services that are provided over a period beyond the reporting period involve estimates. Revenue is then recognized according to the stage, or percentage, of completion of the contract. The method used to de-termine the stage of completion will depend on the nature of the contract. A consistent approach is taken to the revenue recognition of similar contracts.
Revenue from rendering of services is recognized by reference to the stage of completion of the transaction when the following conditions are cumulatively met:
— the amount of revenue can be measured reliably, — the flow of economic benefits to the entity is probable, — the state of completion at the period end can be measured reliably, and — the cost incurred to date and the cost to completion can be measured reliably.

Financial Reporting—Notes to the Consolidated Financial Statements148 Sulzer—Annual Report 2016
c) Percentage of completion method (PoC)Major long-term customer orders are reported using the percentage of completion method (PoC), based on the percentage of costs to date compared with the total estimated contract costs, contractual mile-stones, or performance. The income statement contains a share of sales, including an estimated share of profit, while the balance sheet includes the corresponding trade accounts receivable after adjustment for advance payments received. When it appears probable that the total costs of an order will exceed the expected income, the total amount of expected loss is recognized immediately in the income statement.
d) Other revenueRevenue from the use of entity assets by third parties yielding interest, royalties, and dividends in the form of:
— interest charges for the use of cash or cash equivalents or amounts due to the entity, — royalty charges for the use of long-term assets (e.g. patents, trademarks, copyrights, and computer software), and — dividend distribution of profits to holders of equity investments in proportion to their holdings of a par-ticular class of capital.
Interest is recognized using the effective interest method. Royalties are recognized on an accrual basis in accordance with the substance of the relevant agreement. Dividends are recognized when the sharehold-er’s right to receive payment is established.
35.23 Assets and disposal groups held for sale A non-current asset or a group of assets is classified as “held for sale” if its carrying amount will be recov-ered principally through a sale transaction rather than through continuing use. For this to be the case, the management must be committed to sell the assets, the assets must be actively marketed for sale, and the sale is expected to be completed within one year. A non-current asset or a group of assets classified as “held for sale” shall be measured at the lower of its carrying amount or fair value less selling cost.
35.24 Dividend distributionDividend distribution to the shareholders of Sulzer Ltd is resolved upon decision at the Annual General Meeting and will be paid in the same reporting period.
36 Subsequent events after the balance sheet date The Board of Directors authorized these consolidated financial statements for issue on February 22, 2017. They are subject to approval at the Annual General Meeting, which will be held on April 6, 2017. At the time when these consolidated financial statements were authorized for issue, the Board of Directors and the Executive Committee were not aware of any events that would materially affect these financial statements.

149Financial Reporting—Notes to the Consolidated Financial StatementsSulzer—Annual Report 2016
37 Major subsidiariesDecember 31, 2016
December 31, 2016 Europe Subsidiary
Sulzer owner-
ship and voting rights
Registered capital (including paid-in
capital in the USA and Canada) D
irect
pa
rtic
ipat
ion
by S
ulze
r Lt
d
Res
earc
h &
de
velo
pmen
t
Pro
duct
ion
&
engi
neer
ing
Sal
es
Ser
vice
Switzerland Sulzer Chemtech AG, Winterthur 100% CHF 10 000 000
Sulzer Mixpac AG, Haag 100% CHF 100 000
Sulzer Markets and Technology AG, Winterthur 100% CHF 4 000 000
Sulzer Management AG, Winterthur 100% CHF 500 000
Tefag AG, Winterthur 100% CHF 500 000
Sulzer International AG, Winterthur 100% CHF 100 000
Belgium Sulzer Pumps Wastewater Belgium N.V./S.A., St. Stevens-Woluwe 100% EUR 123 947
Germany Sulzer Pumpen (Deutschland) GmbH, Bruchsal 100% EUR 3 000 000
Sulzer Pumps Wastewater Germany GmbH, Bonn 100% EUR 300 000
Sulzer Pump Solutions Germany GmbH, Lohmar 100% EUR 1 000 000
Sulzer Chemtech GmbH, Linden 100% EUR 300 000
Sulzer Pumps Grundbesitz Germany GmbH, Lohmar 100% EUR 300 000
Black Deutschland GmbH1), Bechhofen 100% EUR 870 000
Geka GmbH1), Bechhofen 100% EUR 878 600
Denmark Sulzer Mixpac Denmark A/S, Greve 100% DKK 500 000
Sulzer Pumps Denmark A/S, Farum 100% DKK 500 000
Finland Sulzer Pumps Finland Oy, Kotka 100% EUR 16 000 000
France Sulzer Pompes France SASU, Mantes 100% EUR 6 600 000
Greece Sulzer Pumps Wastewater Greece A.E., Athens 100% EUR 117 400
Great Britain Sulzer Pumps (UK) Ltd., Leeds 100% GBP 9 610 000
Sulzer Chemtech (UK) Ltd., Stockton on Tees 100% GBP 100 000
Dowding & Mills Plc., Birmingham 100% GBP 15 409 555
Sulzer (UK) Holdings Ltd., Leeds 100% GBP 6 100 000
Sulzer Mixpac (UK) Ltd.1), Newbury 100% GBP 1 000 000
Ireland Sulzer Pump Solutions Ireland Ltd., Wexford 100% EUR 2 222 500
Sulzer Finance (Ireland) Limited, Wexford 100% EUR 100
Italy Sulzer Pumps Wastewater Italy S.r.l., Casalecchio di Reno 100% EUR 600 000
Sulzer Chemtech Italia S.r.l., Milano 100% EUR 100 000
Norway Sulzer Pumps Wastewater Norway A/S, Sandvika 100% NOK 502 000
Sulzer Pumps Norway A/S, Klepp Stasjon 100% NOK 500 000
The Netherlands Sulzer Pumps Wastewater Netherlands B.V., Maastricht-Airport 100% EUR 15 882
Sulzer Chemtech Nederland B.V., Breda 100% EUR 1 134 451
Sulzer Turbo Services Rotterdam B.V., Europoort 100% EUR 18 000
Advanced Separation Company (Ascom) B.V., Arnhem 100% EUR 18 000
Process Laboratories Netherlands (PROLAB NL) B.V., Arnhem 100% EUR 18 000
Sulzer Turbo Services Venlo B.V., Lomm 100% EUR 444 704
Sulzer Netherlands Holding B.V., Breda 100% EUR 10 010 260
Sulzer Capital B.V., Breda 100% EUR 50 000
1) Acquired in 2016.
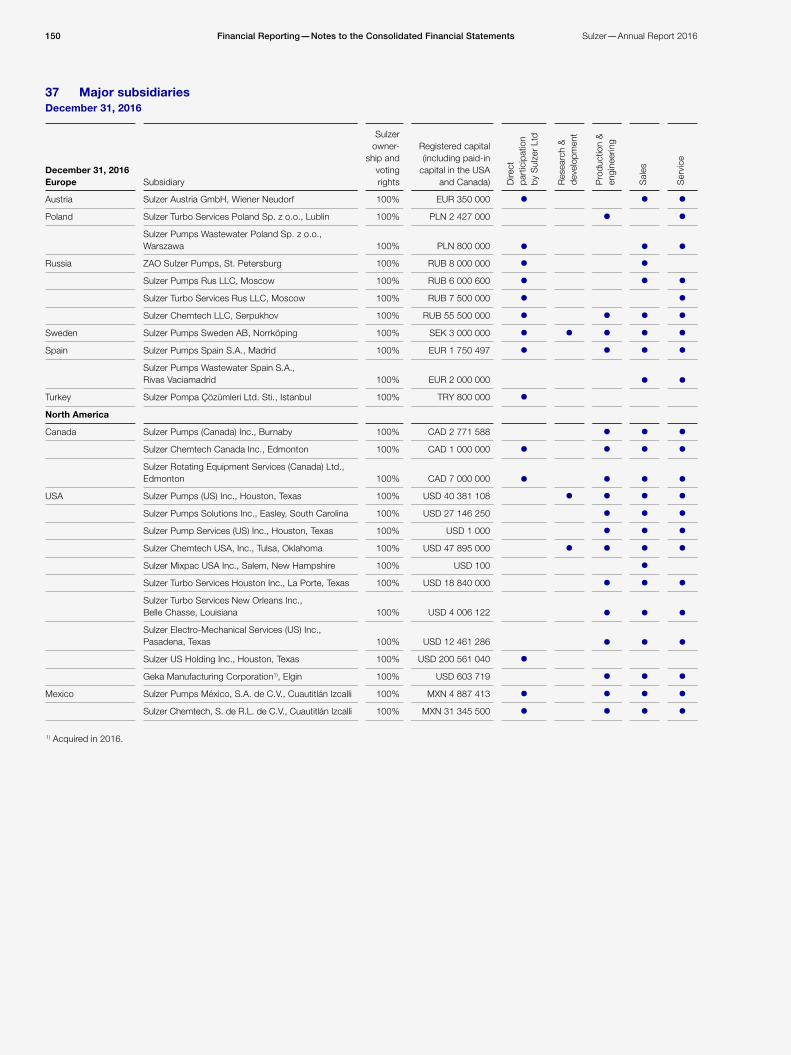
Financial Reporting—Notes to the Consolidated Financial Statements150 Sulzer—Annual Report 2016
Austria Sulzer Austria GmbH, Wiener Neudorf 100% EUR 350 000
Poland Sulzer Turbo Services Poland Sp. z o.o., Lublin 100% PLN 2 427 000
Sulzer Pumps Wastewater Poland Sp. z o.o., Warszawa 100% PLN 800 000
Russia ZAO Sulzer Pumps, St. Petersburg 100% RUB 8 000 000
Sulzer Pumps Rus LLC, Moscow 100% RUB 6 000 600
Sulzer Turbo Services Rus LLC, Moscow 100% RUB 7 500 000
Sulzer Chemtech LLC, Serpukhov 100% RUB 55 500 000
Sweden Sulzer Pumps Sweden AB, Norrköping 100% SEK 3 000 000
Spain Sulzer Pumps Spain S.A., Madrid 100% EUR 1 750 497
Sulzer Pumps Wastewater Spain S.A., Rivas Vaciamadrid 100% EUR 2 000 000
Turkey Sulzer Pompa Çözümleri Ltd. Sti., Istanbul 100% TRY 800 000
North America
Canada Sulzer Pumps (Canada) Inc., Burnaby 100% CAD 2 771 588
Sulzer Chemtech Canada Inc., Edmonton 100% CAD 1 000 000
Sulzer Rotating Equipment Services (Canada) Ltd., Edmonton 100% CAD 7 000 000
USA Sulzer Pumps (US) Inc., Houston, Texas 100% USD 40 381 108
Sulzer Pumps Solutions Inc., Easley, South Carolina 100% USD 27 146 250
Sulzer Pump Services (US) Inc., Houston, Texas 100% USD 1 000
Sulzer Chemtech USA, Inc., Tulsa, Oklahoma 100% USD 47 895 000
Sulzer Mixpac USA Inc., Salem, New Hampshire 100% USD 100
Sulzer Turbo Services Houston Inc., La Porte, Texas 100% USD 18 840 000
Sulzer Turbo Services New Orleans Inc., Belle Chasse, Louisiana 100% USD 4 006 122
Sulzer Electro-Mechanical Services (US) Inc., Pasadena, Texas 100% USD 12 461 286
Sulzer US Holding Inc., Houston, Texas 100% USD 200 561 040
Geka Manufacturing Corporation1), Elgin 100% USD 603 719
Mexico Sulzer Pumps México, S.A. de C.V., Cuautitlán Izcalli 100% MXN 4 887 413
Sulzer Chemtech, S. de R.L. de C.V., Cuautitlán Izcalli 100% MXN 31 345 500
37 Major subsidiariesDecember 31, 2016
December 31, 2016 Europe Subsidiary
Sulzer owner-
ship and voting rights
Registered capital (including paid-in
capital in the USA and Canada) D
irect
pa
rtic
ipat
ion
by S
ulze
r Lt
d
Res
earc
h &
de
velo
pmen
t
Pro
duct
ion
&
engi
neer
ing
Sal
es
Ser
vice
1) Acquired in 2016.

151Financial Reporting—Notes to the Consolidated Financial StatementsSulzer—Annual Report 2016
Argentina Sulzer Turbo Services Argentina S.A., Buenos Aires 100% ARS 9 730 091
Brazil Sulzer Brasil S.A., Jundiaí 100% BRL 82 054 659
Sulzer Pumps Wastewater Brasil Ltda., Curitiba 100% BRL 18 166 785
Sulzer Services Brasil, Triunfo 100% BRL 40 675 856
Chile Sulzer Bombas Chile Ltda., Vitacura 100% CLP 46 400 000
Ecuador Sulzer-Ecuador S.A., Quito 100% USD 12 500
Colombia Sulzer Pumps Colombia S.A.S., Cota 100% COP 7 142 000 000
Venezuela Sulzer Pumps (Venezuela) S.A., Barcelona 100% VEB 200 000 000
Sulzer Turbo Services Venezuela S.A., Caracas 100% VEB 5 000
Africa
South Africa Sulzer Pumps (South Africa) (Pty) Ltd., Elandsfontein 75% ZAR 100 450 000
Sulzer (South Africa) Holdings (Pty) Ltd., Elandsfontein 100% ZAR 16 476
Sulzer Chemtech (Pty) Ltd., Johannesburg 100% ZAR 121
Sulzer Pumps Wastewater South Africa (Pty) Ltd., Johannesburg 100% ZAR 1 001
Morocco Sulzer Maroc S.A.R.L. A.U., Ain Sebaa 100% MAD 3 380 000
Nigeria Sulzer Pumps (Nigeria) Ltd., Lagos 100% NGN 10 000 000
Zambia Sulzer Zambia Ltd., Chingola 100% ZMK 15 000 000
Middle East
United Arab Emirates Sulzer Pumps Middle East FZCO, Dubai 100% AED 500 000
Sulzer Rotating Equipment FZE1), Dubai 100% USD 272 000
Saudi Arabia Sulzer Saudi Pump Company Limited, Riyadh 75% SAR 44 617 000
Bahrain Sulzer Chemtech Middle East S.P.C., Al Seef 100% BHD 50 000
December 31, 2016 Central and South America Subsidiary
Sulzer owner-
ship and voting rights
Registered capital (including paid-in
capital in the USA and Canada) D
irect
pa
rtic
ipat
ion
by S
ulze
r Lt
d
Res
earc
h &
de
velo
pmen
t
Pro
duct
ion
&
engi
neer
ing
Sal
es
Ser
vice
1) Acquired in 2016.
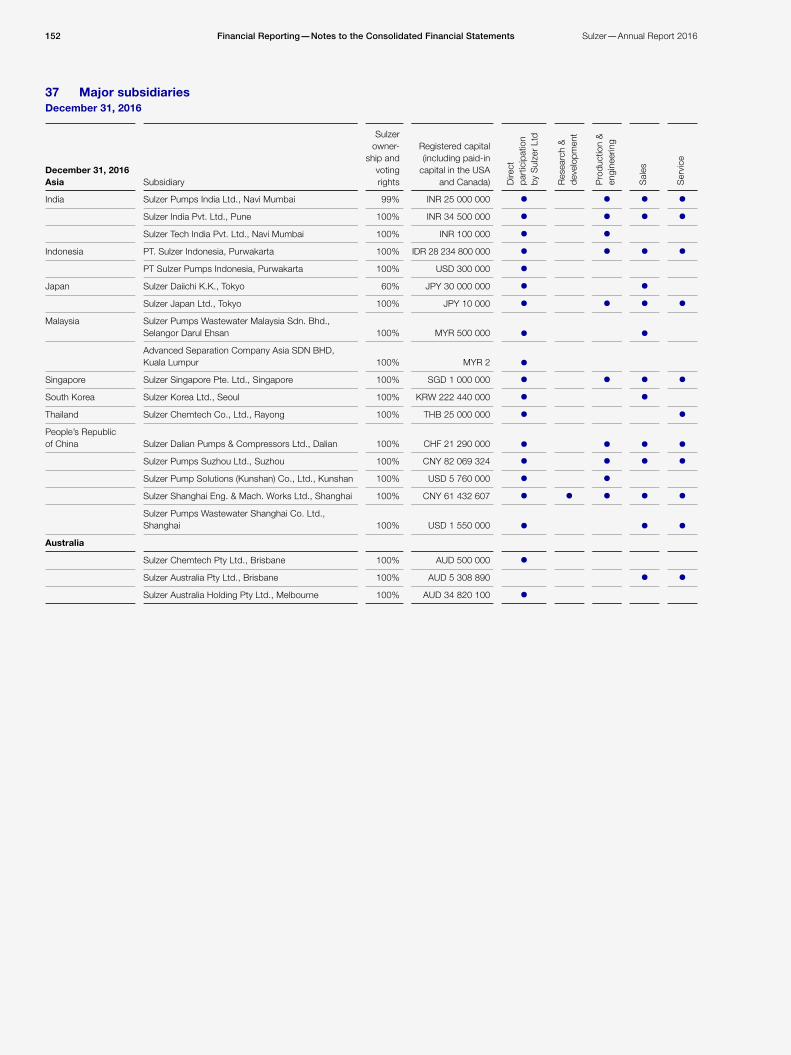
Financial Reporting—Notes to the Consolidated Financial Statements152 Sulzer—Annual Report 2016
37 Major subsidiariesDecember 31, 2016
December 31, 2016 Asia Subsidiary
Sulzer owner-
ship and voting rights
Registered capital (including paid-in
capital in the USA and Canada) D
irect
pa
rtic
ipat
ion
by S
ulze
r Lt
d
Res
earc
h &
de
velo
pmen
t
Pro
duct
ion
&
engi
neer
ing
Sal
es
Ser
vice
India Sulzer Pumps India Ltd., Navi Mumbai 99% INR 25 000 000
Sulzer India Pvt. Ltd., Pune 100% INR 34 500 000
Sulzer Tech India Pvt. Ltd., Navi Mumbai 100% INR 100 000
Indonesia PT. Sulzer Indonesia, Purwakarta 100% IDR 28 234 800 000
PT Sulzer Pumps Indonesia, Purwakarta 100% USD 300 000
Japan Sulzer Daiichi K.K., Tokyo 60% JPY 30 000 000
Sulzer Japan Ltd., Tokyo 100% JPY 10 000
Malaysia Sulzer Pumps Wastewater Malaysia Sdn. Bhd., Selangor Darul Ehsan 100% MYR 500 000
Advanced Separation Company Asia SDN BHD, Kuala Lumpur 100% MYR 2
Singapore Sulzer Singapore Pte. Ltd., Singapore 100% SGD 1 000 000
South Korea Sulzer Korea Ltd., Seoul 100% KRW 222 440 000
Thailand Sulzer Chemtech Co., Ltd., Rayong 100% THB 25 000 000
People’s Republic of China Sulzer Dalian Pumps & Compressors Ltd., Dalian 100% CHF 21 290 000
Sulzer Pumps Suzhou Ltd., Suzhou 100% CNY 82 069 324
Sulzer Pump Solutions (Kunshan) Co., Ltd., Kunshan 100% USD 5 760 000
Sulzer Shanghai Eng. & Mach. Works Ltd., Shanghai 100% CNY 61 432 607
Sulzer Pumps Wastewater Shanghai Co. Ltd., Shanghai 100% USD 1 550 000
Australia
Sulzer Chemtech Pty Ltd., Brisbane 100% AUD 500 000
Sulzer Australia Pty Ltd., Brisbane 100% AUD 5 308 890
Sulzer Australia Holding Pty Ltd., Melbourne 100% AUD 34 820 100

153Sulzer—Annual Report 2016 Financial Reporting—Auditor’s Report
1
Statutory Auditor’s Report To the General Meeting of Sulzer Ltd, Winterthur
Report on the Audit of the Consolidated Financial Statements
Opinion
We have audited the consolidated financial statements of Sulzer Ltd and its subsidiaries (the Group), which comprise the consolidated balance sheet as at December 31, 2016 and the consolidated income statement, consolidated statement of comprehensive income, consolidated statement of changes in equity and consolidated statement of cash flows for the year then ended, and notes to the consolidated financial statements, including a summary of significant accounting policies.
In our opinion the consolidated financial statements (pages 93 to 152) give a true and fair view of the consolidated financial position of the Group as at December 31, 2016, and its consolidated financial performance and its consolidated cash flows for the year then ended in accordance with International Financial Reporting Standards (IFRS) and comply with Swiss law.
Basis for Opinion
We conducted our audit in accordance with Swiss law, International Standards on Auditing (ISAs) and Swiss Auditing Standards. Our responsibilities under those provisions and standards are further described in the Auditor’s Responsibilities for the Audit of the Consolidated Financial Statements section of our report. We are independent of the Group in accordance with the provisions of Swiss law and the requirements of the Swiss audit profession, as well as the IESBA Code of Ethics for Professional Accountants, and we have fulfilled our other ethical responsibilities in accordance with these requirements.
We believe that the audit evidence we have obtained is sufficient and appropriate to provide a basis for our opinion.
Key Audit Matters
Customer contracts – accuracy of revenue recognition, valuation of work in progress (WIP) and trade accounts receivable
Provisions for liquidated damages and warranty
Valuation of trade accounts receivable and WIP considering counterparty default risks
Valuation of goodwill
Accounting for the acquisition of GEKA
Key audit matters are those matters that, in our professional judgment, were of most significance in our audit of the consolidated financial statements of the current period. These matters were addressed in the context of our audit of the consolidated financial statements as a whole, and in forming our opinion thereon, and we do not provide a separate opinion on these matters.
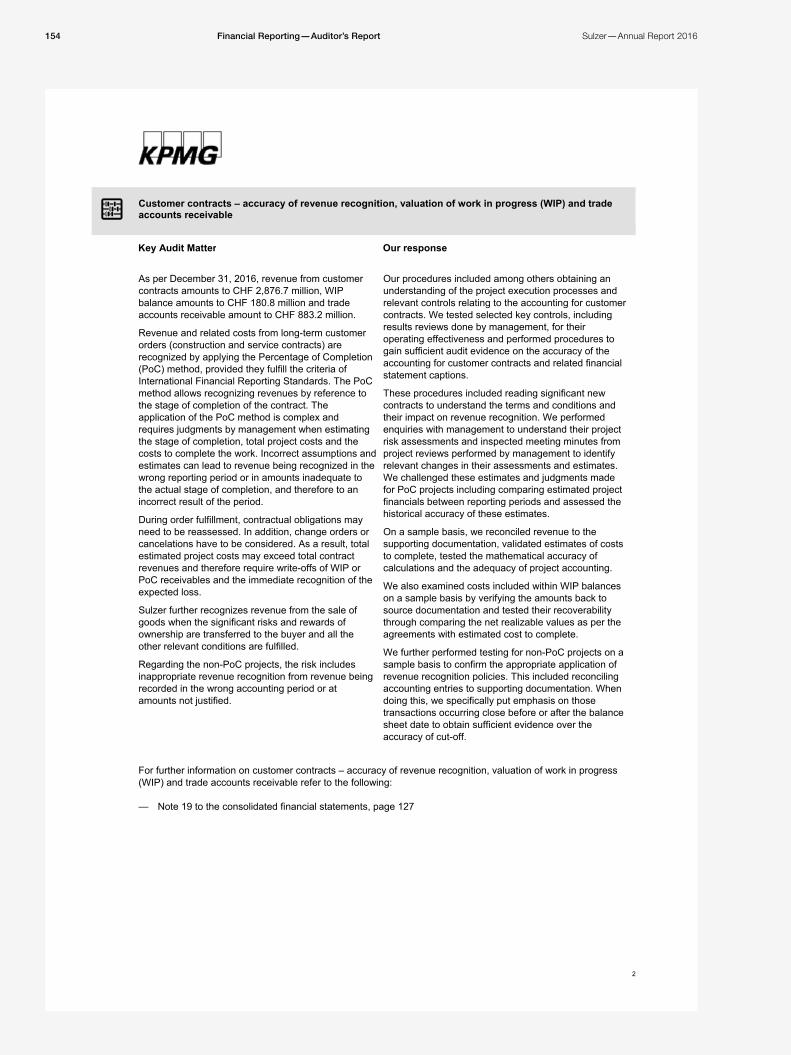
154 Sulzer—Annual Report 2016Financial Reporting—Auditor’s Report
2
Customer contracts – accuracy of revenue recognition, valuation of work in progress (WIP) and trade accounts receivable
Key Audit Matter Our response
As per December 31, 2016, revenue from customer contracts amounts to CHF 2,876.7 million, WIP balance amounts to CHF 180.8 million and trade accounts receivable amount to CHF 883.2 million.
Revenue and related costs from long-term customer orders (construction and service contracts) are recognized by applying the Percentage of Completion (PoC) method, provided they fulfill the criteria of International Financial Reporting Standards. The PoC method allows recognizing revenues by reference to the stage of completion of the contract. The application of the PoC method is complex and requires judgments by management when estimating the stage of completion, total project costs and the costs to complete the work. Incorrect assumptions and estimates can lead to revenue being recognized in the wrong reporting period or in amounts inadequate to the actual stage of completion, and therefore to an incorrect result of the period.
During order fulfillment, contractual obligations may need to be reassessed. In addition, change orders or cancelations have to be considered. As a result, total estimated project costs may exceed total contract revenues and therefore require write-offs of WIP or PoC receivables and the immediate recognition of the expected loss.
Sulzer further recognizes revenue from the sale of goods when the significant risks and rewards of ownership are transferred to the buyer and all the other relevant conditions are fulfilled.
Regarding the non-PoC projects, the risk includes inappropriate revenue recognition from revenue being recorded in the wrong accounting period or at amounts not justified.
Our procedures included among others obtaining an understanding of the project execution processes and relevant controls relating to the accounting for customer contracts. We tested selected key controls, including results reviews done by management, for their operating effectiveness and performed procedures to gain sufficient audit evidence on the accuracy of the accounting for customer contracts and related financial statement captions.
These procedures included reading significant new contracts to understand the terms and conditions and their impact on revenue recognition. We performed enquiries with management to understand their project risk assessments and inspected meeting minutes from project reviews performed by management to identify relevant changes in their assessments and estimates. We challenged these estimates and judgments made for PoC projects including comparing estimated project financials between reporting periods and assessed the historical accuracy of these estimates.
On a sample basis, we reconciled revenue to the supporting documentation, validated estimates of costs to complete, tested the mathematical accuracy of calculations and the adequacy of project accounting.
We also examined costs included within WIP balances on a sample basis by verifying the amounts back to source documentation and tested their recoverability through comparing the net realizable values as per the agreements with estimated cost to complete.
We further performed testing for non-PoC projects on a sample basis to confirm the appropriate application of revenue recognition policies. This included reconciling accounting entries to supporting documentation. When doing this, we specifically put emphasis on those transactions occurring close before or after the balance sheet date to obtain sufficient evidence over the accuracy of cut-off.
For further information on customer contracts – accuracy of revenue recognition, valuation of work in progress (WIP) and trade accounts receivable refer to the following:
— Note 19 to the consolidated financial statements, page 127
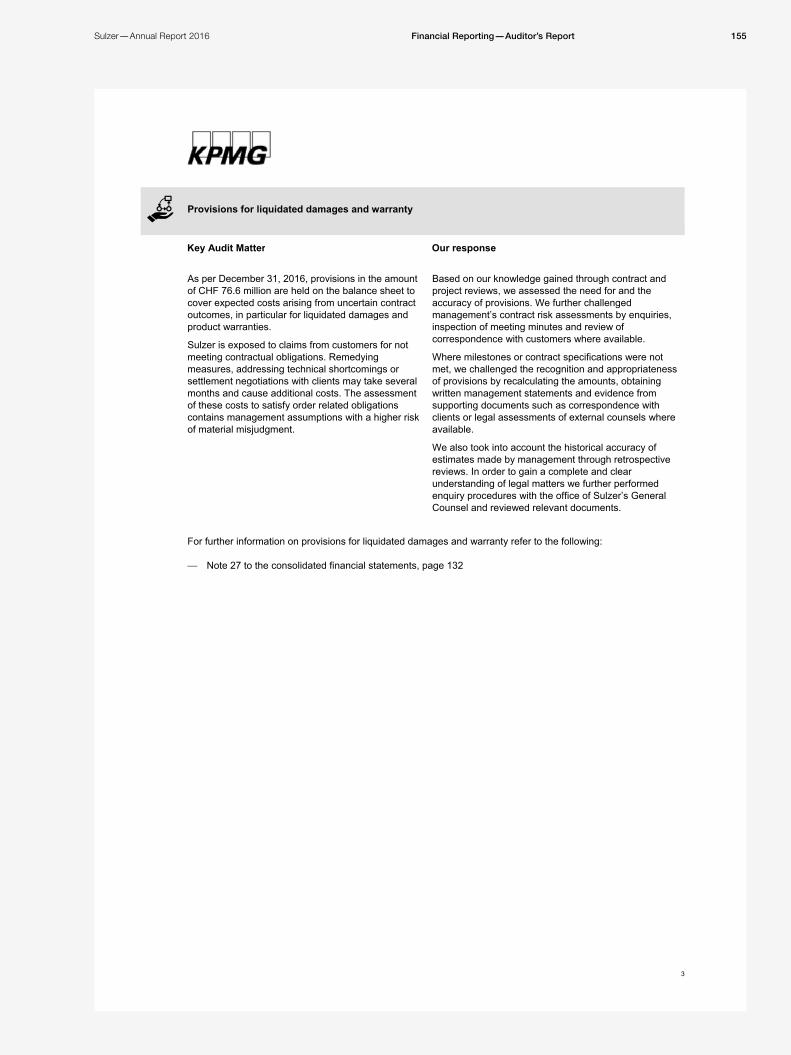
155Sulzer—Annual Report 2016 Financial Reporting—Auditor’s Report
3
Provisions for liquidated damages and warranty
Key Audit Matter Our response
As per December 31, 2016, provisions in the amount of CHF 76.6 million are held on the balance sheet to cover expected costs arising from uncertain contract outcomes, in particular for liquidated damages and product warranties.
Sulzer is exposed to claims from customers for not meeting contractual obligations. Remedying measures, addressing technical shortcomings or settlement negotiations with clients may take several months and cause additional costs. The assessment of these costs to satisfy order related obligations contains management assumptions with a higher risk of material misjudgment.
Based on our knowledge gained through contract and project reviews, we assessed the need for and the accuracy of provisions. We further challenged management’s contract risk assessments by enquiries, inspection of meeting minutes and review of correspondence with customers where available.
Where milestones or contract specifications were not met, we challenged the recognition and appropriateness of provisions by recalculating the amounts, obtaining written management statements and evidence from supporting documents such as correspondence with clients or legal assessments of external counsels where available.
We also took into account the historical accuracy of estimates made by management through retrospective reviews. In order to gain a complete and clear understanding of legal matters we further performed enquiry procedures with the office of Sulzer’s General Counsel and reviewed relevant documents.
For further information on provisions for liquidated damages and warranty refer to the following:
— Note 27 to the consolidated financial statements, page 132

156 Sulzer—Annual Report 2016Financial Reporting—Auditor’s Report
4
Valuation of trade accounts receivable and WIP considering counterparty default risks
Key Audit Matter Our response
Total balances from trade accounts receivable and WIP amount to CHF 1,064.0 million as at December 31, 2016.
Sulzer carries significant receivables on its balance sheet from customers in the oil and gas industry or such where the funding for order depends on cash flows from this industry.
A number of companies, including state owned enterprises, in this sector are under financial stress due to the low oil prices. Since the beginning of 2015, there is significant headwind in the oil and gas market, which is increasing the risk of financial difficulties or even default of Sulzer clients. Therefore, there is a higher risk on the recoverability of these balances.
Our procedures included assessing the activities related to credit control and the receivables collection processes.
We considered management’s assumptions and challenged the appropriateness of estimates used in the allowance calculation, based on an ageing analysis of amounts due, the existence of credit insurances, past payment practices as well as recent bad debt experience of customers in the oil and gas industry.
We also considered management’s assessment of country risks in the case of public enterprises that are in financial difficulties and the results from selected customer’s confirmation of outstanding balances. We further tested subsequent payments and vouched cash received after year-end to bank records.
For further information on valuation of trade accounts receivable and WIP considering counterparty default risks refer to the following:
— Note 18 to the consolidated financial statements, page 127
— Note 20 to the consolidated financial statements, page 128

157Sulzer—Annual Report 2016 Financial Reporting—Auditor’s Report
5
Valuation of goodwill
Key Audit Matter Our response
As at December 31, 2016, Sulzer’s balance sheet included goodwill amounting to CHF 780.1 million.
Goodwill has to be assessed for impairment on a yearly basis by management using a discounted cash flow model to individually determine the value in use of goodwill balances. This requires the use of a number of key assumptions and judgments, including the estimated future cash flows, long-term growth rates, profitability levels and discount rates applied.
The goodwill balance is significant compared to total assets, there are a number of judgments involved in performing the impairment test, and the economic conditions continue to be challenging in some of Sulzer’s key markets, specifically the oil and gas sector. With half of its business within this market segment, Sulzer’s financial performance is significantly affected by the low oil prices and the resulting subdued demand and price pressure from its oil and gas customers.
Our audit procedures included, amongst others, evaluating the methodical and mathematical accuracy of the model used for the impairment testing, the appropriateness of the assumptions, and the methodology used by management to prepare its cash flow forecasts. We involved our own valuation specialists to support our procedures.
We thereby focused on those cash generating units („CGUs”) with the most significant goodwill balances or where reasonably possible changes of key assumptions would lead to an impairment and performed the following procedures amongst others:
gaining an understanding and assessing the reasonableness of business plans by comparing them to prior year’s assumptions;
comparing business plan data against the management approved budgets and two-year plans;
recalculating the value in use calculations; challenging the robustness of the key
assumptions used to determine the value in use, including the allocation of goodwill to the adequate CGUs, cash flow forecasts, long-term growth rates and the discount rates based on our understanding of the commercial prospects of the related CGUs and by comparing them with publicly available data, where possible;
conducting sensitivity analysis, taking into account the historical forecasting accuracy; and
comparing the sum of calculated values in use to the market capitalization of the Group.
We also considered the appropriateness of disclosures in the consolidated financial statements.
For further information on valuation of goodwill refer to the following:
— Note 14 to the consolidated financial statements, page 123

158 Sulzer—Annual Report 2016Financial Reporting—Auditor’s Report
6
Accounting for the acquisition GEKA
Key Audit Matter Our response
During the reporting year, Sulzer acquired GEKA for a total consideration of CHF 295.4 million.
As part of the acquisition accounting, International Financial Reporting Standards require the recognition and measurement of the identifiable assets acquired and liabilities assumed at their fair values, resulting in the recognition of goodwill in cases where the total consideration exceeds the fair value of the net assets acquired.
There is an inherent uncertainty in assessing the fair values of the assets acquired and liabilities assumed. In particular, the valuation of intangible assets such as customer relationships and technology require estimates to be made by management. In determining the fair values of these intangible assets, management uses a valuation model that incorporates, amongst others, assumptions in respect of future revenues and margins, useful lives, customer attrition and royalty rates and discount rates.
We read the purchase agreement to understand the key terms and conditions of the transaction and their implications on the accounting. We agreed the consideration transferred to the agreement and traced payments made to bank statements.
Regarding the identification and valuation of intangible assets, we involved our own valuation specialists. They supported us in gaining sufficient assurance over the adequacy of valuation methodologies and the assumptions used. In addition, we discussed and challenged the underlying business forecasts with management and tested the calculations for their accuracy.
We further reconciled the amounts as per the purchase price allocation to the opening balance sheet. We also considered the adequacy of the disclosures for the transaction in the consolidated financial statements.
For further information on the accounting for the acquisition of GEKA refer to the following:
— Note 4 to the consolidated financial statements, page 104

159Sulzer—Annual Report 2016 Financial Reporting—Auditor’s Report
7
Other Information in the Annual Report
The Board of Directors is responsible for the other information in the annual report. The other information comprises all information included in the annual report, but does not include the consolidated financial statements, the stand-alone financial statements of the Company, the compensation report and our auditor’s reports thereon.
Our opinion on the consolidated financial statements does not cover the other information in the annual report and we do not express any form of assurance conclusion thereon.
In connection with our audit of the consolidated financial statements, our responsibility is to read the other information in the annual report and, in doing so, consider whether the other information is materially inconsistent with the consolidated financial statements or our knowledge obtained in the audit, or otherwise appears to be materially misstated. If, based on the work we have performed, we conclude that there is a material misstatement of this other information, we are required to report that fact. We have nothing to report in this regard.
Responsibility of the Board of Directors for the Consolidated Financial Statements
The Board of Directors is responsible for the preparation of the consolidated financial statements that give a true and fair view in accordance with IFRS and the provisions of Swiss law, and for such internal control as the Board of Directors determines is necessary to enable the preparation of consolidated financial statements that are free from material misstatement, whether due to fraud or error.
In preparing the consolidated financial statements, the Board of Directors is responsible for assessing the Group’s ability to continue as a going concern, disclosing, as applicable, matters related to going concern and using the going concern basis of accounting unless the Board of Directors either intends to liquidate the Group or to cease operations, or has no realistic alternative but to do so.
Auditor’s Responsibilities for the Audit of the Consolidated Financial Statements
Our objectives are to obtain reasonable assurance about whether the consolidated financial statements as a whole are free from material misstatement, whether due to fraud or error, and to issue an auditor’s report that includes our opinion. Reasonable assurance is a high level of assurance, but is not a guarantee that an audit conducted in accordance with Swiss law, ISAs and Swiss Auditing Standards will always detect a material misstatement when it exists. Misstatements can arise from fraud or error and are considered material if, individually or in the aggregate, they could reasonably be expected to influence the economic decisions of users taken on the basis of these consolidated financial statements.
As part of an audit in accordance with Swiss law, ISAs and Swiss Auditing Standards, we exercise professional judgment and maintain professional skepticism throughout the audit. We also:
— Identify and assess the risks of material misstatement of the consolidated financial statements, whether due to fraud or error, design and perform audit procedures responsive to those risks, and obtain audit evidence that is sufficient and appropriate to provide a basis for our opinion. The risk of not detecting a material misstatement resulting from fraud is higher than for one resulting from error, as fraud may involve collusion, forgery, intentional omissions, misrepresentations, or the override of internal control.
— Obtain an understanding of internal control relevant to the audit in order to design audit procedures that are appropriate in the circumstances, but not for the purpose of expressing an opinion on the effectiveness of the Group’s internal control.
— Evaluate the appropriateness of accounting policies used and the reasonableness of accounting estimates and related disclosures made.

160 Sulzer—Annual Report 2016Financial Reporting—Auditor’s Report
8
— Conclude on the appropriateness of the Board of Directors’ use of the going concern basis of accounting and, based on the audit evidence obtained, whether a material uncertainty exists related to events or conditions that may cast significant doubt on the Group’s ability to continue as a going concern. If we conclude that a material uncertainty exists, we are required to draw attention in our auditor’s report to the related disclosures in the consolidated financial statements or, if such disclosures are inadequate, to modify our opinion. Our conclusions are based on the audit evidence obtained up to the date of our auditor’s report. However, future events or conditions may cause the Group to cease to continue as a going concern.
— Evaluate the overall presentation, structure and content of the consolidated financial statements, including the disclosures, and whether the consolidated financial statements represent the underlying transactions and events in a manner that achieves fair presentation.
— Obtain sufficient appropriate audit evidence regarding the financial information of the entities or business activities within the Group to express an opinion on the consolidated financial statements. We are responsible for the direction, supervision and performance of the Group audit. We remain solely responsible for our audit opinion.
We communicate with the Board of Directors or its relevant committee regarding, among other matters, the planned scope and timing of the audit and significant audit findings, including any significant deficiencies in internal control that we identify during our audit.
We also provide the Board of Directors or its relevant committee with a statement that we have complied with relevant ethical requirements regarding independence, and to communicate with them all relationships and other matters that may reasonably be thought to bear on our independence, and where applicable, related safeguards.
From the matters communicated with the Board of Directors or its relevant committee, we determine those matters that were of most significance in the audit of the consolidated financial statements of the current period and are therefore the key audit matters. We describe these matters in our auditor’s report, unless law or regulation precludes public disclosure about the matter or when, in extremely rare circumstances, we determine that a matter should not be communicated in our report because the adverse consequences of doing so would reasonably be expected to outweigh the public interest benefits of such communication.
Report on Other Legal and Regulatory Requirements
In accordance with article 728a para. 1 item 3 CO and the Swiss Auditing Standard 890, we confirm that an internal control system exists, which has been designed for the preparation of consolidated financial statements according to the instructions of the Board of Directors.
We recommend that the consolidated financial statements submitted to you be approved.
KPMG AG
François Rouiller Nanda Buess Licensed Audit Expert Auditor in Charge
Licensed Audit Expert
Zurich, February 22, 2017
KPMG AG, Badenerstrasse 172, PO Box, CH-8036 Zurich KPMG AG is a subsidiary of KPMG Holding AG, which is a member of the KPMG network of independent firms affiliated with KPMG International Cooperative (“KPMG International”), a Swiss legal entity. All rights reserved.

161Sulzer—Annual Report 2016 Financial Reporting—Five-Year Summaries of Key Financial Data
Five-year summaries of key financial dataKey figures from consolidated income statement and statement of cash flows
millions of CHF 2016 2015 2014 2013 2012
Order intake 2 797.5 2 895.8 3 160.8 3 249.9 3 343.4
Order intake gross margin 34.0% 33.8% 33.5% 33.5% 34.5%
Order backlog 1 439.1 1 510.7 1 699.6 1 672.1 1 753.6
Sales 2 876.7 2 971.0 3 212.1 3 263.9 3 340.7
Operating income EBIT 115.3 120.9 – 69.0 264.0 328.7
Operational EBITA opEBITA 238.9 254.1 302.9 304.1 378.4
Operational EBITA margin (operational EBITA/sales) opROSA 8.3% 8.6% 9.4% 9.3% 11.3%
Return on capital employed (operational EBITA in % of average capital employed)1) opROCEA 15.7% 17.0% 17.1% 14.6% 18.1%
Net income attributable to shareholders of Sulzer Ltd 59.0 73.9 275.0 234.4 302.9
— in percentage of equity attributable to shareholders of Sulzer Ltd ROE 3.7% 3.3% 11.3% 10.0% 13.7%
Reported EPS EPS 1.73 2.17 8.09 6.89 8.91
Depreciation – 69.5 – 74.1 – 79.2 – 73.0 – 66.8
Amortization – 47.3 – 42.3 – 43.3 – 41.6 – 41.5
Impairments2) – 18.4 – 13.0 – 0.4 – – 0.2
Research and development expenses – 71.4 – 73.4 – 76.2 – 70.6 – 66.9
Capital expenditure 74.9 73.7 96.0 80.5 93.0
Free cash flow 200.5 155.8 98.0 218.7 347.9
FCF conversion (free cash flow/net income) 3.34 2.08 0.35 0.93 1.12
Employees (number of full-time equivalents) as of December 31 14 005 14 253 15 494 15 382 15 537
Personnel expenses 971.1 1 020.8 1 046.2 1 047.4 1 019.8
1) Since 2014 opEBITA/operational capital employed (excl. other intangible assets). For 2013 and earlier capital employed.
2) Amortization does not include impairment on goodwill.

162 Sulzer—Annual Report 2016Financial Reporting—Five-Year Summaries of Key Financial Data
Key figures from consolidated balance sheet
millions of CHF 2016 2015 2014 2013 2012
Non-current assets 1 809.9 1 574.0 1 681.9 1 891.5 2 237.8
— thereof property, plant, and equipment 511.0 491.4 530.7 492.0 650.0
Current assets 1 926.0 2 680.8 2 971.1 2 652.4 2 371.7
— thereof cash and cash equivalents and marketable securities 429.5 1 217.3 1 301.5 528.7 513.1
Total assets 3 735.9 4 254.8 4 653.0 4 543.9 4 609.5
Equity attributable to shareholders of Sulzer Ltd 1 581.2 2 224.7 2 435.4 2 334.4 2 216.6
Non-current liabilities 980.3 472.1 994.5 825.3 956.5
— thereof long-term borrowings 458.3 7.2 510.3 515.9 533.0
Current liabilities 1 164.6 1 548.5 1 216.5 1 377.9 1 429.6
— thereof short-term borrowings 7.1 514.4 17.7 56.6 76.0
Net liquidity1) – 35.9 695.7 773.5 – 36.2 – 95.9
Equity ratio2) 42.3% 52.3% 52.4% 51.4% 48.1%
Borrowings-to-equity ratio (gearing) 0.29 0.23 0.22 0.25 0.27
1) Cash and cash equivalents and marketable securities, less short- and long-term borrowings from continuing and discontinued operations.
2) Equity attributable to shareholders of Sulzer Ltd in relation to total assets.

163Sulzer—Annual Report 2016 Financial Reporting—Five-Year Summaries of Key Financial Data
Five-year summaries by division
Order intake Sales
millions of CHF 2016 2015 2014 2013 2012 2016 2015 2014 2013 2012
Divisions 2 807.3 2 907.9 3 169.1 3 250.7 3 334.6 2 888.4 2 983.8 3 221.0 3 270.9 3 332.6
Pumps Equipment/Sulzer Pumps3) 1 401.7 1 500.8 1 725.5 1 801.5 2 094.3 1 503.5 1 621.0 1 754.9 1 821.6 2 097.5
Rotating Equipment Services/Sulzer Turbo Services3) 661.1 698.2 725.2 699.3 535.2 666.8 693.2 724.6 705.6 510.5
Chemtech 744.5 708.9 718.4 749.9 705.1 718.1 669.6 741.5 743.7 724.6
Others – 9.8 – 12.1 – 8.3 – 0.8 8.8 – 11.7 – 12.8 – 8.9 – 7.0 8.1
Total 2 797.5 2 895.8 3 160.8 3 249.9 3 343.4 2 876.7 2 971.0 3 212.1 3 263.9 3 340.7
Order backlog Employees1)
millions of CHF 2016 2015 2014 2013 2012 2016 2015 2014 2013 2012
Divisions 1 439.0 1 510.7 1 703.6 1 672.1 1 754.3 13 832 14 073 15 361 15 198 15 362
Pumps Equipment/Sulzer Pumps3) 880.3 998.0 1 209.4 1 190.9 1 309.1 6 261 6 996 7 365 7 389 8 573
Rotating Equipment Services/Sulzer Turbo Services3) 195.8 205.0 212.2 190.7 151.6 3 436 3 538 3 709 3 642 2 703
Chemtech 362.9 307.7 282.0 290.5 293.6 4 135 3 539 4 287 4 167 4 086
Others 0.1 – – 4.0 – – 0.7 173 180 133 184 175
Total 1 439.1 1 510.7 1 699.6 1 672.1 1 753.6 14 005 14 253 15 494 15 382 15 537
Operational EBITA Operational capital employed
millions of CHF 2016 2015 2014 2013 2012 2016 2015 2014 20132) 20122)
Divisions 234.6 256.3 318.7 332.9 373.1 1 605.0 1 574.6 1 866.9 2 158.7 2 270.1
Pumps Equipment/Sulzer Pumps3) 86.3 118.1 160.6 166.9 228.1 760.6 746.3 1 115.6 n/a 1 464.6
Rotating Equipment Services/Sulzer Turbo Services3) 66.2 70.8 64.5 71.0 61.7 400.6 422.0 408.7 n/a 371.5
Chemtech 82.1 67.4 93.6 95.0 83.3 443.8 406.3 342.6 412.8 434.0
Others 4.3 – 2.2 – 15.8 – 28.8 5.3 – 85.1 – 76.8 – 99.6 – 68.9 – 26.2
Total 238.9 254.1 302.9 304.1 378.4 1 519.9 1 497.8 1 767.3 2 089.8 2 243.9
1) Number of full-time equivalents as of December 31.2) Since 2014 operational capital employed (excl. other intangible assets). For 2013 and earlier capital employed.3) Values for the year 2012 are based on the former divisional structure with Sulzer Pumps, Sulzer Turbo Services, and
Sulzer Chemtech.

164 Sulzer—Annual Report 2016Financial Reporting—Five-Year Summaries of Key Financial Data
Five-year summaries by regionOrder intake by region
millions of CHF 2016 2015 2014 2013 2012
Europe, Middle East, Africa 1 254.8 1 303.7 1 305.5 1 329.7 1 431.2
Americas 949.8 1 065.3 1 165.4 1 123.2 1 214.9
Asia-Pacific 592.9 526.8 689.9 797.0 697.3
Total 2 797.5 2 895.8 3 160.8 3 249.9 3 343.4
Sales by region
millions of CHF 2016 2015 2014 2013 2012
Europe, Middle East, Africa 1 271.8 1 214.0 1 264.7 1 402.4 1 421.2
Americas 1 041.9 1 134.9 1 177.4 1 130.0 1 145.5
Asia-Pacific 563.0 622.1 770.0 731.5 774.0
Total 2 876.7 2 971.0 3 212.1 3 263.9 3 340.7
Capital employed (average) by company location
millions of CHF 2016 2015 2014 20131) 20121)
Europe, Middle East, Africa 941.8 875.5 1 152.4 1 365.1 1 500.2
Americas 391.8 415.8 406.6 481.0 497.0
Asia-Pacific 186.3 206.5 208.3 243.7 246.7
Total 1 519.9 1 497.8 1 767.3 2 089.8 2 243.9
1) Since 2014 operational capital employed (excl. other intangible assets). For 2013 and earlier capital employed.
Employees by company location1)
2016 2015 2014 2013 2012
Europe, Middle East, Africa 6 804 6 504 6 607 6 749 6 938
Americas 3 822 4 139 4 545 4 361 4 653
Asia-Pacific 3 379 3 610 4 342 4 272 3 946
Total 14 005 14 253 15 494 15 382 15 537
1) Number of full-time equivalents as of December 31.

Financial Statements of Sulzer Ltd
165 167 Balance Sheet of Sulzer Ltd
168 Income Statement of Sulzer Ltd
168 Statement of Changes in Equity of Sulzer Ltd
169 Notes to the Financial Statements of Sulzer Ltd
174 Appropriation of Net Profit
175 Auditor’s Report


167Financial Reporting—Financial Statements of Sulzer LtdSulzer—Annual Report 2016
Balance sheet of Sulzer LtdDecember 31
millions of CHF Notes 2016 2015
Current assets
Cash and cash equivalents 3 1.9 563.3
Marketable securities – 98.4
Accounts receivable from subsidiaries 65.8 392.9
Other current accounts receivable 0.2 1.2
Prepaid expenses 2.2 1.8
Total current assets 70.1 1 057.6
Non-current assets
Loans to subsidiaries 819.1 472.9
Other loans and financial assets 4.5 4.5
Investments in subsidiaries 4 1 497.1 1 465.4
Investments in third parties 4.7 3.6
Total non-current assets 2 325.4 1 946.4
Total assets 2 395.5 3 004.0
Current liabilities
Current interest-bearing liabilities 6 – 499.6
Current interest-bearing liabilities with subsidiaries 43.7 21.9
Current liabilities with subsidiaries 78.6 22.1
Other current liabilities 0.5 2.6
Accrued liabilities 16.7 20.1
Current provisions 5.3 5.7
Total current liabilities 144.8 572.0
Non-current liabilities
Non-current interest-bearing liabilities 6 450.4 –
Non-current provisions 37.9 57.8
Total non-current liabilities 488.3 57.8
Total liabilities 633.1 629.8
Equity
Registered share capital 5 0.3 0.3
Legal capital reserves 205.5 205.5
Voluntary retained earnings
— Free reserves 1 486.5 1 786.5
— Retained earnings 82.2 170.6
— Net profit for the year 4.8 229.2
Treasury shares 5 – 16.9 – 17.9
Total equity 1 762.4 2 374.2
Total equity and liabilities 2 395.5 3 004.0

Financial Reporting—Financial Statements of Sulzer Ltd168 Sulzer—Annual Report 2016
Income statement of Sulzer LtdJanuary 1– December 31
millions of CHF Notes 2016 2015
Income
Investment income 9 86.2 278.5
Financial income 42.8 46.7
Other income 38.0 40.2
Total income 167.0 365.4
Expenses
Administrative expenses 8 60.9 72.8
Financial expenses 14.2 36.8
Investment and loan expenses 9 82.3 22.4
Other expenses 3.5 2.0
Direct taxes 1.3 2.2
Total expenses 162.2 136.2
Net profit for the year 4.8 229.2
Statement of changes in equity of Sulzer LtdJanuary 1– December 31
millions of CHFShare
capitalLegal
reservesFree
reservesRetained earnings
Net income
Treasury shares Total
Equity as of January 1, 2015 0.3 205.5 1 486.5 15.5 575.0 – 27.0 2 255.8
Dividend – 119.9 – 119.9
Allocation of net income 300.0 155.1 – 455.1 –
Net profit for the year 229.2 229.2
Change in treasury shares 9.1 9.1
Equity as of December 31, 2015 0.3 205.5 1 786.5 170.6 229.2 – 17.9 2 374.2
Dividend – 617.5 – 617.5
Allocation of net income – 300.0 – 88.4 388.3 – 0.1
Net profit for the year 4.8 4.8
Change in treasury shares 1.0 1.0
Equity as of December 31, 2016 0.3 205.5 1 486.5 82.2 4.8 – 16.9 1 762.4

169Sulzer—Annual Report 2016 Financial Reporting—Notes to the Financial Statements of Sulzer Ltd
Notes to the Financial Statements of Sulzer Ltd
1 General informationSulzer Ltd, Winterthur, Switzerland (the Company), is the parent company of the Sulzer Group. Its uncon-solidated financial statements are prepared in accordance with Swiss law and serve as complementary information to the consolidated financial statements.
These financial statements were prepared according to the provisions of the Swiss Law on Accounting and Financial Reporting (32nd title of the Swiss Code of Obligations). Where not prescribed by law, the significant accounting and valuation principles applied are described below.
2 Key accounting policies and principles
Treasury sharesTreasury shares are recognized at acquisition cost and deducted from shareholders’ equity at the time of acquisition. In case of a resale, the gain or loss is recognized through the income statement as financial income or financial expenses.
Investments in subsidiaries and third partiesThe participations are valued at acquisition cost or if the value is lower, at value in use, using generally accepted valuation principles.
Marketable securitiesMarketable securities mainly comprise an investment in a fund investing in short-term bonds with high credit ratings and are valued at their quoted market price as at the balance sheet date. A valuation adjust-ment reserve has not been accounted for.
Interest-bearing liabilitiesInterest-bearing liabilities are recognized in the balance sheet at amortized cost. Discounts and issue costs for bonds are amortized on a straight-line basis over the bond’s maturity period.
Share-based paymentsShould treasury shares be used for share-based payment programs, the difference between the acquisition costs and any consideration paid by the plan participants at grant date is recognized as compensation to the Board of Directors.
Foregoing a cash flow statement and additional disclosures in the notesAs Sulzer Ltd has prepared its consolidated financial statements in accordance with a recognized account-ing standard (IFRS), it has decided to forego presenting additional information on audit fees and inter-est-bearing liabilities in the notes as well as a cash flow statement in accordance with the law.
3 Cash and cash equivalentsIn 2015, Sulzer Ltd arranged a CHF 500 million syndicated credit facility with maturity date in May 2020 with two one-year extension options. During 2016, the facility was extended for one year until May 2021. The facility is available for general corporate purposes including financing of acquisitions. The facility is subject to financial covenants based on net financial indebtedness and EBITDA, which were adhered to throughout the reporting period. The facility was not used as per December 31, 2016.
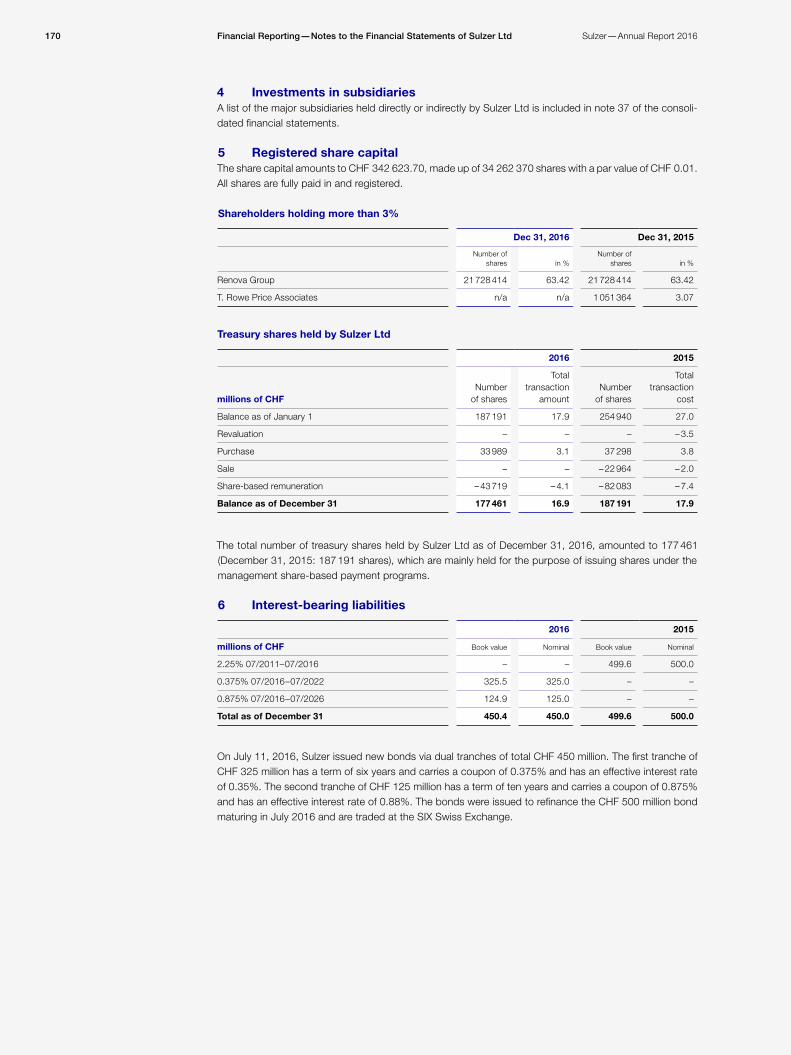
170 Sulzer—Annual Report 2016Financial Reporting—Notes to the Financial Statements of Sulzer Ltd
4 Investments in subsidiariesA list of the major subsidiaries held directly or indirectly by Sulzer Ltd is included in note 37 of the consoli-dated financial statements.
5 Registered share capitalThe share capital amounts to CHF 342 623.70, made up of 34 262 370 shares with a par value of CHF 0.01. All shares are fully paid in and registered.
Shareholders holding more than 3%
Dec 31, 2016 Dec 31, 2015
Number of shares in %
Number of shares in %
Renova Group 21 728 414 63.42 21 728 414 63.42
T. Rowe Price Associates n/a n/a 1 051 364 3.07
Treasury shares held by Sulzer Ltd
2016 2015
millions of CHFNumber
of shares
Total transaction
amountNumber
of shares
Total transaction
cost
Balance as of January 1 187 191 17.9 254 940 27.0
Revaluation – – – – 3.5
Purchase 33 989 3.1 37 298 3.8
Sale – – – 22 964 – 2.0
Share-based remuneration – 43 719 – 4.1 – 82 083 – 7.4
Balance as of December 31 177 461 16.9 187 191 17.9
The total number of treasury shares held by Sulzer Ltd as of December 31, 2016, amounted to 177 461 (December 31, 2015: 187 191 shares), which are mainly held for the purpose of issuing shares under the management share-based payment programs.
6 Interest-bearing liabilities
2016 2015
millions of CHF Book value Nominal Book value Nominal
2.25% 07/2011– 07/2016 – – 499.6 500.0
0.375% 07/2016 – 07/2022 325.5 325.0 – –
0.875% 07/2016 – 07/2026 124.9 125.0 – –
Total as of December 31 450.4 450.0 499.6 500.0
On July 11, 2016, Sulzer issued new bonds via dual tranches of total CHF 450 million. The first tranche of CHF 325 million has a term of six years and carries a coupon of 0.375% and has an effective interest rate of 0.35%. The second tranche of CHF 125 million has a term of ten years and carries a coupon of 0.875% and has an effective interest rate of 0.88%. The bonds were issued to refinance the CHF 500 million bond maturing in July 2016 and are traded at the SIX Swiss Exchange.

171Sulzer—Annual Report 2016 Financial Reporting—Notes to the Financial Statements of Sulzer Ltd
7 Contingent liabilities
millions of CHF 2016 2015
Guarantees, sureties, comfort letters for subsidiaries
— to banks and insurance companies 1 316.4 1 268.4
— to customers 404.4 360.1
— to others 110.9 45.1
Guarantees for third parties 10.0 10.0
Total contingent liabilities as of December 31 1 841.7 1 683.6
As of December 31, 2016, CHF 272.8 million (2015: CHF 336.2 million) of guarantees, sureties, and com-fort letters for subsidiaries to banks and insurance companies were utilized.
8 Administrative expenses
millions of CHF 2016 2015
Compensation of Board of Directors 2.1 2.3
Other administrative expenses 58.8 70.5
Total administrative expenses 60.9 72.8
Sulzer Ltd does not have any employees. The compensation to the Board of Directors includes share-based payments and remuneration. Other administrative expenses contain management services and cost related to the Sulzer Full Potential program.
9 Investment income and investment and loan expensesIn 2016, the investment income contains ordinary and extraordinary dividend payments from subsidiaries amounting to CHF 86.2 million (2015: CHF 131.3 million). In 2015, Sulzer Pumps Ltd was merged with Sulzer Ltd. The merger gain amounted to CHF 135.2 million and is included in investment income.
The investment and loan expenses contain allowances on investments and loans amounting to CHF 105.7 million (2015: CHF 18.4 million) and release of hidden reserves amounting to CHF 25.0 million.
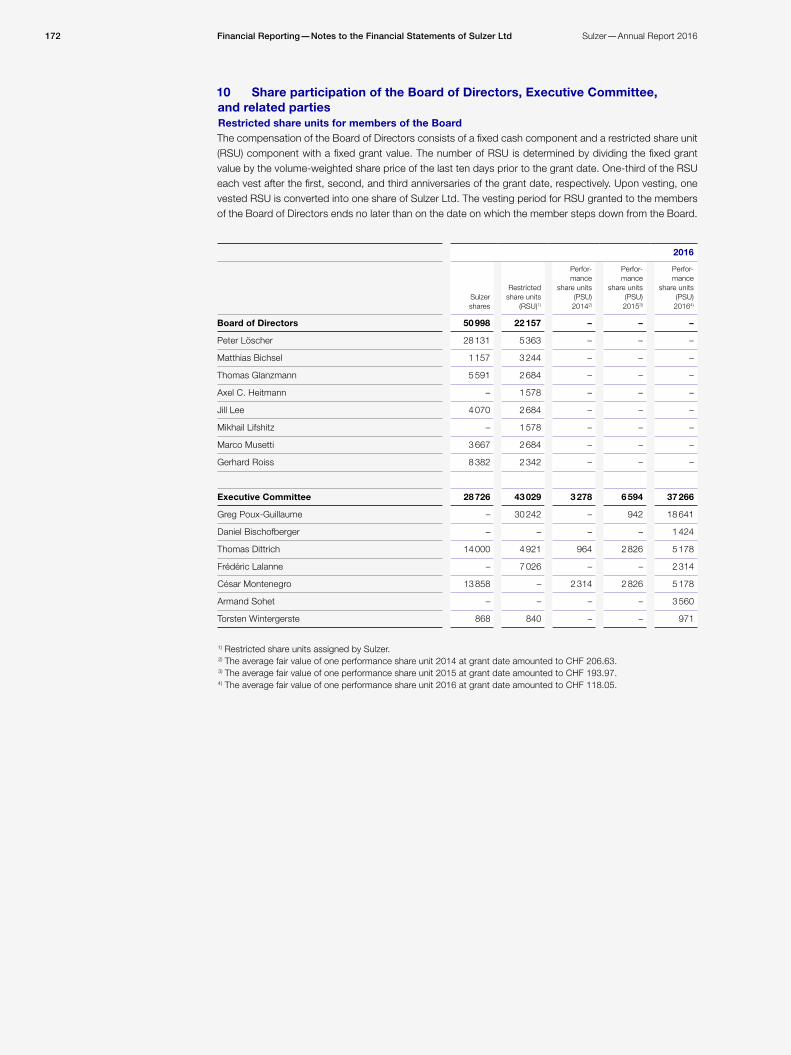
172 Sulzer—Annual Report 2016Financial Reporting—Notes to the Financial Statements of Sulzer Ltd
10 Share participation of the Board of Directors, Executive Committee, and related partiesRestricted share units for members of the BoardThe compensation of the Board of Directors consists of a fixed cash component and a restricted share unit (RSU) component with a fixed grant value. The number of RSU is determined by dividing the fixed grant value by the volume-weighted share price of the last ten days prior to the grant date. One-third of the RSU each vest after the first, second, and third anniversaries of the grant date, respectively. Upon vesting, one vested RSU is converted into one share of Sulzer Ltd. The vesting period for RSU granted to the members of the Board of Directors ends no later than on the date on which the member steps down from the Board.
2016
Sulzer shares
Restricted share units
(RSU)1)
Perfor-mance
share units (PSU) 20142)
Perfor-mance
share units (PSU) 20153)
Perfor-mance
share units (PSU) 20164)
Board of Directors 50 998 22 157 – – –
Peter Löscher 28 131 5 363 – – –
Matthias Bichsel 1 157 3 244 – – –
Thomas Glanzmann 5 591 2 684 – – –
Axel C. Heitmann – 1 578 – – –
Jill Lee 4 070 2 684 – – –
Mikhail Lifshitz – 1 578 – – –
Marco Musetti 3 667 2 684 – – –
Gerhard Roiss 8 382 2 342 – – –
Executive Committee 28 726 43 029 3 278 6 594 37 266
Greg Poux-Guillaume – 30 242 – 942 18 641
Daniel Bischofberger – – – – 1 424
Thomas Dittrich 14 000 4 921 964 2 826 5 178
Frédéric Lalanne – 7 026 – – 2 314
César Montenegro 13 858 – 2 314 2 826 5 178
Armand Sohet – – – – 3 560
Torsten Wintergerste 868 840 – – 971
1) Restricted share units assigned by Sulzer.2) The average fair value of one performance share unit 2014 at grant date amounted to CHF 206.63.3) The average fair value of one performance share unit 2015 at grant date amounted to CHF 193.97.4) The average fair value of one performance share unit 2016 at grant date amounted to CHF 118.05.
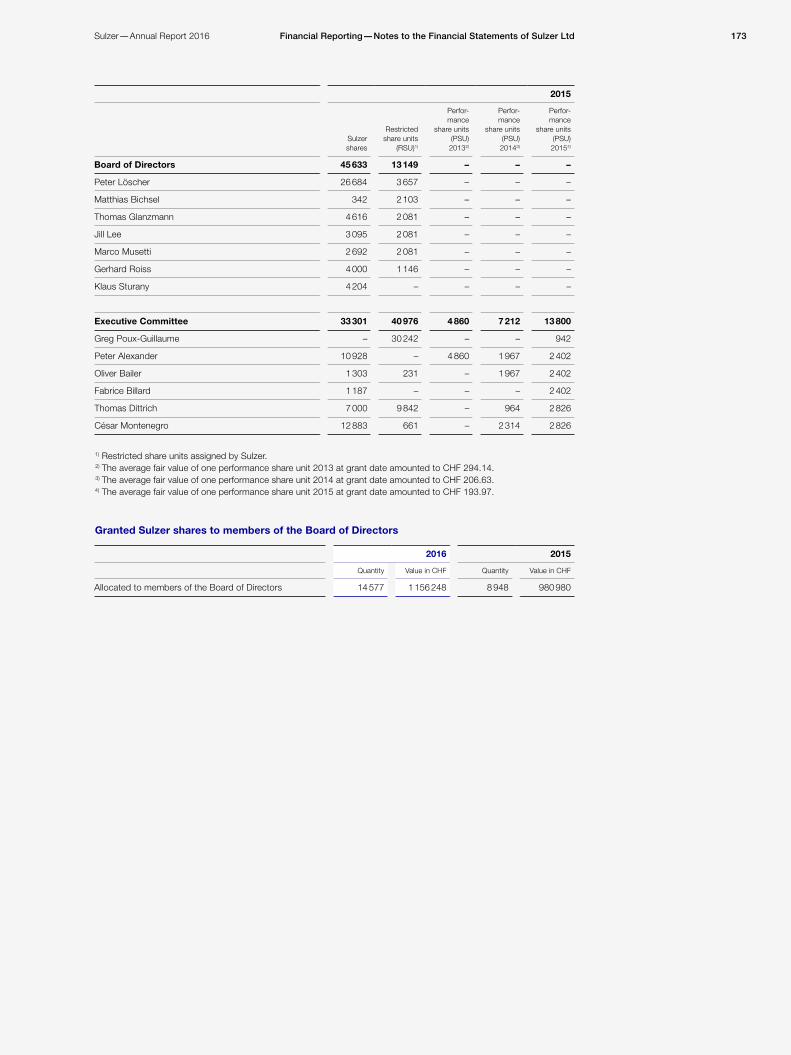
173Sulzer—Annual Report 2016 Financial Reporting—Notes to the Financial Statements of Sulzer Ltd
2015
Sulzer shares
Restricted share units
(RSU)1)
Perfor-mance
share units (PSU) 20132)
Perfor-mance
share units (PSU) 20143)
Perfor-mance
share units (PSU) 20154)
Board of Directors 45 633 13 149 – – –
Peter Löscher 26 684 3 657 – – –
Matthias Bichsel 342 2 103 – – –
Thomas Glanzmann 4 616 2 081 – – –
Jill Lee 3 095 2 081 – – –
Marco Musetti 2 692 2 081 – – –
Gerhard Roiss 4 000 1 146 – – –
Klaus Sturany 4 204 – – – –
Executive Committee 33 301 40 976 4 860 7 212 13 800
Greg Poux-Guillaume – 30 242 – – 942
Peter Alexander 10 928 – 4 860 1 967 2 402
Oliver Bailer 1 303 231 – 1 967 2 402
Fabrice Billard 1 187 – – – 2 402
Thomas Dittrich 7 000 9 842 – 964 2 826
César Montenegro 12 883 661 – 2 314 2 826
1) Restricted share units assigned by Sulzer.2) The average fair value of one performance share unit 2013 at grant date amounted to CHF 294.14.3) The average fair value of one performance share unit 2014 at grant date amounted to CHF 206.63.4) The average fair value of one performance share unit 2015 at grant date amounted to CHF 193.97.
Granted Sulzer shares to members of the Board of Directors
2016 2015
Quantity Value in CHF Quantity Value in CHF
Allocated to members of the Board of Directors 14 577 1 156 248 8 948 980 980

174 Sulzer—Annual Report 2016Financial Reporting—Notes to the Financial Statements of Sulzer Ltd
11 Subsequent events after the balance sheet dateAt the time when these financial statements were authorized for issue, the Board of Directors were not aware of any events that would materially affect these financial statements.
Appropriation of net profit
in CHF 2016 2015
Net profit for the year 4 800 000 229 200 000
Unallocated profit carried forward from previous year 82 184 595 170 532 721
Total available profit 86 984 595 399 732 721
Proposal by the Board of Directors: Appropriation from free reserves 100 000 000 300 000 000
Ordinary dividend – 119 297 182 – 119 415 384
Special dividend – – 498 132 743
Balance carried forward 67 687 413 82 184 595
Distribution per share CHF 0.01
Gross dividend 3.50 18.10
less 35% withholding tax 1.23 6.34
Net payment 2.27 11.76
The Board of Directors proposes the payment of a dividend of CHF 3.50 per share to the Annual General Meeting on April 6, 2017. The company will not pay a dividend on treasury shares held by Sulzer Ltd or one of its subsidiaries.

175Sulzer—Annual Report 2016 Financial Reporting—Auditor’s Report
1
Statutory Auditor’s Report To the General Meeting of Sulzer Ltd, Winterthur
Report on the Audit of the Financial Statements
Opinion
We have audited the financial statements of Sulzer Ltd, which comprise the balance sheet as at December 31, 2016, the income statement and the statement of changes in equity for the year then ended, and notes to the financial statements, including a summary of significant accounting policies.
In our opinion the financial statements (pages 165 to 174) for the year ended December 31, 2016 comply with Swiss law and the company’s articles of incorporation.
Basis for Opinion
We conducted our audit in accordance with Swiss law and Swiss Auditing Standards. Our responsibilities under those provisions and standards are further described in the Auditor’s Responsibilities for the Audit of the Financial Statements section of our report. We are independent of the entity in accordance with the provisions of Swiss law and the requirements of the Swiss audit profession and we have fulfilled our other ethical responsibilities in accordance with these requirements.
We believe that the audit evidence we have obtained is sufficient and appropriate to provide a basis for our opinion.
Report on Key Audit Matters based on the circular 1/2015 of the Federal Audit Oversight Authority
We have determined that there are no key audit matters to communicate in our report.
Responsibility of the Board of Directors for the Financial Statements
The Board of Directors is responsible for the preparation of the financial statements in accordance with the provisions of Swiss law and the company’s articles of incorporation, and for such internal control as the Board of Directors determines is necessary to enable the preparation of financial statements that are free from material misstatement, whether due to fraud or error.
In preparing the financial statements, the Board of Directors is responsible for assessing the entity’s ability to continue as a going concern, disclosing, as applicable, matters related to going concern and using the going concern basis of accounting unless the Board of Directors either intends to liquidate the entity or to cease operations, or has no realistic alternative but to do so.

176 Sulzer—Annual Report 2016Financial Reporting—Auditor’s Report
2
Auditor’s Responsibilities for the Audit of the Financial Statements
Our objectives are to obtain reasonable assurance about whether the financial statements as a whole are free from material misstatement, whether due to fraud or error, and to issue an auditor’s report that includes our opinion. Reasonable assurance is a high level of assurance, but is not a guarantee that an audit conducted in accordance with Swiss law and Swiss Auditing Standards will always detect a material misstatement when it exists. Misstatements can arise from fraud or error and are considered material if, individually or in the aggregate, they could reasonably be expected to influence the economic decisions of users taken on the basis of these financial statements.
As part of an audit in accordance with Swiss law and Swiss Auditing Standards, we exercise professional judgment and maintain professional skepticism throughout the audit. We also:
— Identify and assess the risks of material misstatement of the financial statements, whether due to fraud or error, design and perform audit procedures responsive to those risks, and obtain audit evidence that is sufficient and appropriate to provide a basis for our opinion. The risk of not detecting a material misstatement resulting from fraud is higher than for one resulting from error, as fraud may involve collusion, forgery, intentional omissions, misrepresentations, or the override of internal control.
— Obtain an understanding of internal control relevant to the audit in order to design audit procedures that are appropriate in the circumstances, but not for the purpose of expressing an opinion on the effectiveness of internal control.
— Evaluate the appropriateness of accounting policies used and the reasonableness of accounting estimates and related disclosures made.
— Conclude on the appropriateness of the Board of Directors’ use of the going concern basis of accounting and, based on the audit evidence obtained, whether a material uncertainty exists related to events or conditions that may cast significant doubt on the entity’s ability to continue as a going concern. If we conclude that a material uncertainty exists, we are required to draw attention in our auditor’s report to the related disclosures in the financial statements or, if such disclosures are inadequate, to modify our opinion. Our conclusions are based on the audit evidence obtained up to the date of our auditor’s report. However, future events or conditions may cause the entity to cease to continue as a going concern.
We communicate with the Board of Directors or its relevant committee regarding, among other matters, the planned scope and timing of the audit and significant audit findings, including any significant deficiencies in internal control that we identify during our audit.
We also provide the Board of Directors or its relevant committee with a statement that we have complied with relevant ethical requirements regarding independence, and to communicate with them all relationships and other matters that may reasonably be thought to bear on our independence, and where applicable, related safeguards.
From the matters communicated with the Board of Directors or its relevant committee, we determine those matters that were of most significance in the audit of the financial statements of the current period and are therefore the key audit matters. We describe these matters in our auditor’s report, unless law or regulation precludes public disclosure about the matter or when, in extremely rare circumstances, we determine that a matter should not be communicated in our report because the adverse consequences of doing so would reasonably be expected to outweigh the public interest benefits of such communication.

177Sulzer—Annual Report 2016 Financial Reporting—Auditor’s Report
3
Report on Other Legal and Regulatory Requirements
In accordance with article 728a para. 1 item 3 CO and the Swiss Auditing Standard 890, we confirm that an internal control system exists, which has been designed for the preparation of financial statements according to the instructions of the Board of Directors.
We further confirm that the proposed appropriation of available earnings complies with Swiss law and the company’s articles of incorporation. We recommend that the financial statements submitted to you be approved.
KPMG AG
François Rouiller Nanda Buess Licensed Audit Expert Auditor in Charge
Licensed Audit Expert
Zurich, February 22, 2017
KPMG AG, Badenerstrasse 172, PO Box, CH-8036 Zurich KPMG AG is a subsidiary of KPMG Holding AG, which is a member of the KPMG network of independent firms affiliated with KPMG International Cooperative (“KPMG International”), a Swiss legal entity. All rights reserved.
carbon neutralnatureOffice.com | DE-149-684587
print production
This document may contain forward-looking statements, including, but not limited to, projections of financial developments and future performance of materials and products, containing risks and uncer-tainties. These statements are subject to change based on known and unknown risks and various other factors that could cause the actual results or performance to differ materially from the statements made herein.
The Sulzer Annual Report 2016 is also available in German and online at www.sulzer.com/AR16. Furthermore, the report is available as a summary in English or in German. The original version is in English.
This report is printed in a climate-neutral process on Forest Stewardship Council® (FSC®) certified paper.
Imprint
Published by:Sulzer Ltd, Winterthur, Switzerland, © 2017
Concept/Layout: wirDesign Berlin Braunschweig, Germany
Photographs:Geri Krischker, Zurich, Switzerland(pages 3 – 5 / 10 / 33 / 38 / 40 / 42 / 59 / 67);Repsol (page 16);Sulzer Ltd (pages 18 / 20 / 24 / 27 – 28)
Printing:Kunst- und Werbedruck, Bad Oeynhausen, Germany
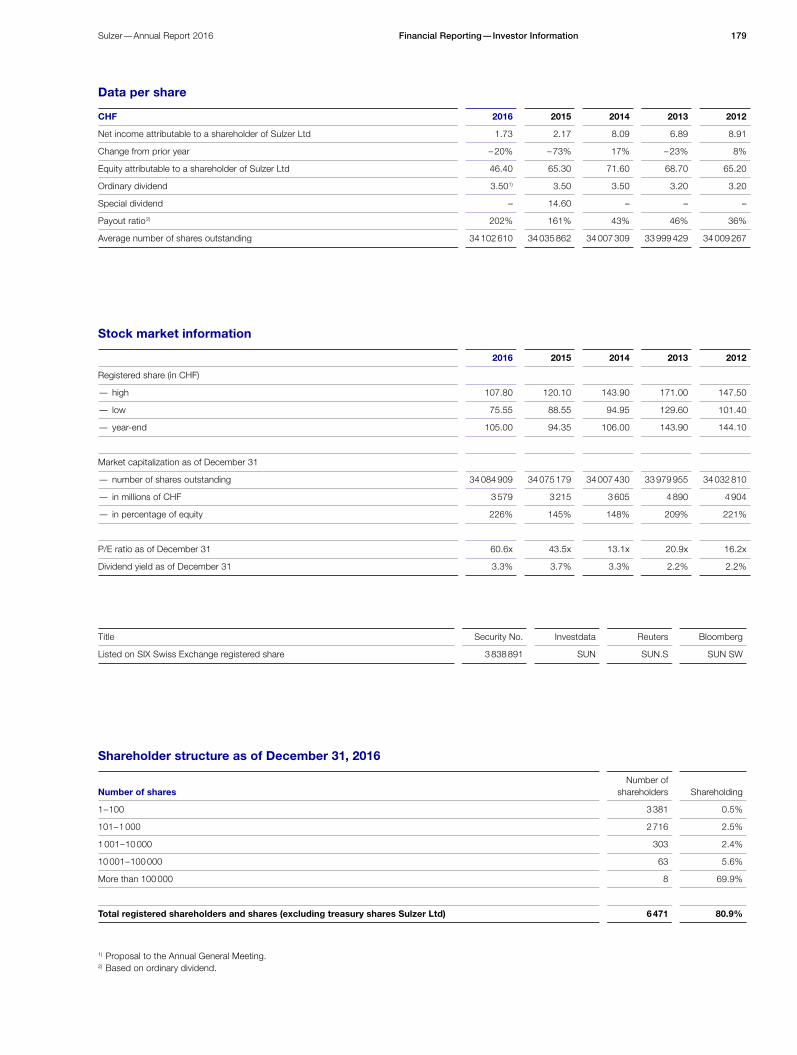
Data per share
Stock market information
1) Proposal to the Annual General Meeting.2) Based on ordinary dividend.
Shareholder structure as of December 31, 2016
179Financial Reporting—Investor InformationSulzer—Annual Report 2016
Number of sharesNumber of
shareholders Shareholding
1 – 100 3 381 0.5%
101 – 1 000 2 716 2.5%
1 001 – 10 000 303 2.4%
10 001 – 100 000 63 5.6%
More than 100 000 8 69.9%
Total registered shareholders and shares (excluding treasury shares Sulzer Ltd) 6 471 80.9%
Title Security No. Investdata Reuters Bloomberg
Listed on SIX Swiss Exchange registered share 3 838 891 SUN SUN.S SUN SW
2016 2015 2014 2013 2012
Registered share (in CHF)
— high 107.80 120.10 143.90 171.00 147.50
— low 75.55 88.55 94.95 129.60 101.40
— year-end 105.00 94.35 106.00 143.90 144.10
Market capitalization as of December 31
— number of shares outstanding 34 084 909 34 075 179 34 007 430 33 979 955 34 032 810
— in millions of CHF 3 579 3 215 3 605 4 890 4 904
— in percentage of equity 226% 145% 148% 209% 221%
P/E ratio as of December 31 60.6x 43.5x 13.1x 20.9x 16.2x
Dividend yield as of December 31 3.3% 3.7% 3.3% 2.2% 2.2%
CHF 2016 2015 2014 2013 2012
Net income attributable to a shareholder of Sulzer Ltd 1.73 2.17 8.09 6.89 8.91
Change from prior year – 20% – 73% 17% – 23% 8%
Equity attributable to a shareholder of Sulzer Ltd 46.40 65.30 71.60 68.70 65.20
Ordinary dividend 3.501) 3.50 3.50 3.20 3.20
Special dividend – 14.60 – – –
Payout ratio 2) 202% 161% 43% 46% 36%
Average number of shares outstanding 34 102 610 34 035 862 34 007 309 33 999 429 34 009 267

Sulzer Ltd8401 WinterthurSwitzerlandPhone +41 52 262 30 00Fax +41 52 262 31 00
www.sulzer.com