Embed Size (px)
Citation preview
Department für Biotechnologie
Institut für angewandte Mikrobiologie
Vorstand: Florian Rüker, Ao.Univ.Prof. Dipl.-Ing. Dr.nat.techn.
Betreuer: Alois Jungbauer, Ao.Univ.Prof. Dipl.-Ing. Dr.nat.techn.
SEPARATION OF MONOCLONAL ANTIBODY VARIANTS
Dissertation
zur Erlangung des Doktorgrades
an der Universität für Bodenkultur Wien
Eingereicht von
Nico Lingg, Dipl.-Ing.
Wien, November 2014
II
Zusammenfassung
Monoklonale Antikörper sind eine interessante und lukrative Klasse von Proteinen, die
mittlerweile einen festen Bestandteil der biopharmazeutischen Industrie darstellen. Die
Mikroheterogenität ist eine inhärente Eigenschaft dieser Klasse von therapeutischen
Proteinen und entsteht durch unterschiedliche posttranslationale Modifikation und
chemische Modifizierungen bei der Herstellung. Die Erforschung dieser
Mikroheterogenität gestaltet sich äußerst schwierig bedingt durch die schiere Anzahl
dieser Varianten in einer typischen monoklonalen Antikörper Formulierung.
Ionenaustauschchromatographie ist die Standardmethode für die Auftrennung von
Biomolekülen, basierend auf Unterschieden in der Oberflächenladungsverteilung. Es
wurde eine neuartige pH-Gradientenelutionsmethode für Kationenaustausch-
chromatographie entwickelt, welche eine verbesserte Auftrennung von Immunglobulin
G Ladungsvarianten ermöglicht. Ursprünglich als analytische Methode konzipiert,
konnte das Verfahren allerdings auch in größerem Maßstab, für präparative
Anwendungen umgesetzt werden. Die Möglichkeit Immunglobulin G Isoformen im
großen Maßstab aufzutrennen, erlaubt die tiefgreifende Untersuchung der
Eigenschaften von Immunglobulin G Varianten und die Analyse der Effekte von
Mikroheterogenität.
III
Abstract
Monoclonal antibodies are an interesting and lucrative class of protein, that has gained
big importance in the biopharmaceutical industry. The microheterogeneity inherent in
this class of therapeutic proteins stems from differential post-translational processing
and chemical modifications during production. Due to the large amount of variants
present in a typical monoclonal antibody formulation, the study of this
microheterogeneity is challenging. Ion exchange chromatography is a trusted and
powerful tool for the separation of biomolecules based on the surface charge
distribution. A novel pH gradient elution method for cation-exchange chromatography
was developed. This method shows an improved separation of immunoglobulin G
charge variants, compared to other chromatographic methods. The method was
initially developed as an analytical tool, but can be scaled up for preparative
applications. Being able to separate immunoglobulin G isoforms in a large scale
enables the in-depth study of the characteristics of immunoglobulin G variants and the
analysis of the effects of microheterogeneity.
IV
Acknowledgments
I would like to express my deepest gratitude to my advisors, Alois Jungbauer and
Muriel Bardor for their help and giving me this opportunity. Their continued support
and scientific advice helped me achieve my goals.
I also want to thank the many people I had the pleasure of collaborating with over the
years. In Singapore, I want to thank everyone at the Bioprocessing Technology
Institute, in particular Eddy Tan, Zhang Peiqing, Kornelia Schriebl, Monika Müller,
Miranda van Beers and the entire Analytics group. In Vienna, I want to thank everyone
in the Downstream Processing group, in particular Beate Hintersteiner, Peter Satzer
and Michael Samassa for their continued moral and scientific support. Special thanks
to Manfred Schuster at Apeiron Biologics, for their invaluable collaboration over the
last years.
I would also like to extend my deepest gratitude to my family. To my wife Lezley, for
travelling with me, no matter where life would take me. To my parents for their years
of support during my studies.
1
Table of Contents
Zusammenfassung ........................................................................................................... II
Abstract ......................................................................................................................... III
Acknowledgments ......................................................................................................... IV
Table of Contents ............................................................................................................ 1
1 Introduction .............................................................................................................. 2
1.1 Monoclonal antibodies ...................................................................................... 2
1.2 Microheterogeneity ........................................................................................... 4
1.3 Chromatography ................................................................................................ 8
1.4 Steric mass action model ................................................................................... 9
1.5 Separation of charge variants .......................................................................... 11
1.6 Displacement chromatography ........................................................................ 12
1.7 pH gradients .................................................................................................... 17
1.8 Alternative methods ........................................................................................ 25
2 Objective ................................................................................................................ 26
3 Conclusion .............................................................................................................. 27
4 References .............................................................................................................. 33
5 Publications ............................................................................................................ 40
6 Additional publications .......................................................................................... 40
2
1 Introduction
1.1 Monoclonal antibodies
MAbs have become an incredibly useful and versatile recombinant therapeutic
glycoprotein. Due to their ability to bind to a large variety of antigens and to interact
with the human immune system, they have become an important molecule in the
biopharmaceutical industry [1]. In humans five isotypes of antibodies have been
identified (IgA, IgD, IgE, IgG, IgM), which are used by the adaptive immune system.
The immunoglobulin G (IgG) isotype has been the most successful to be used as a
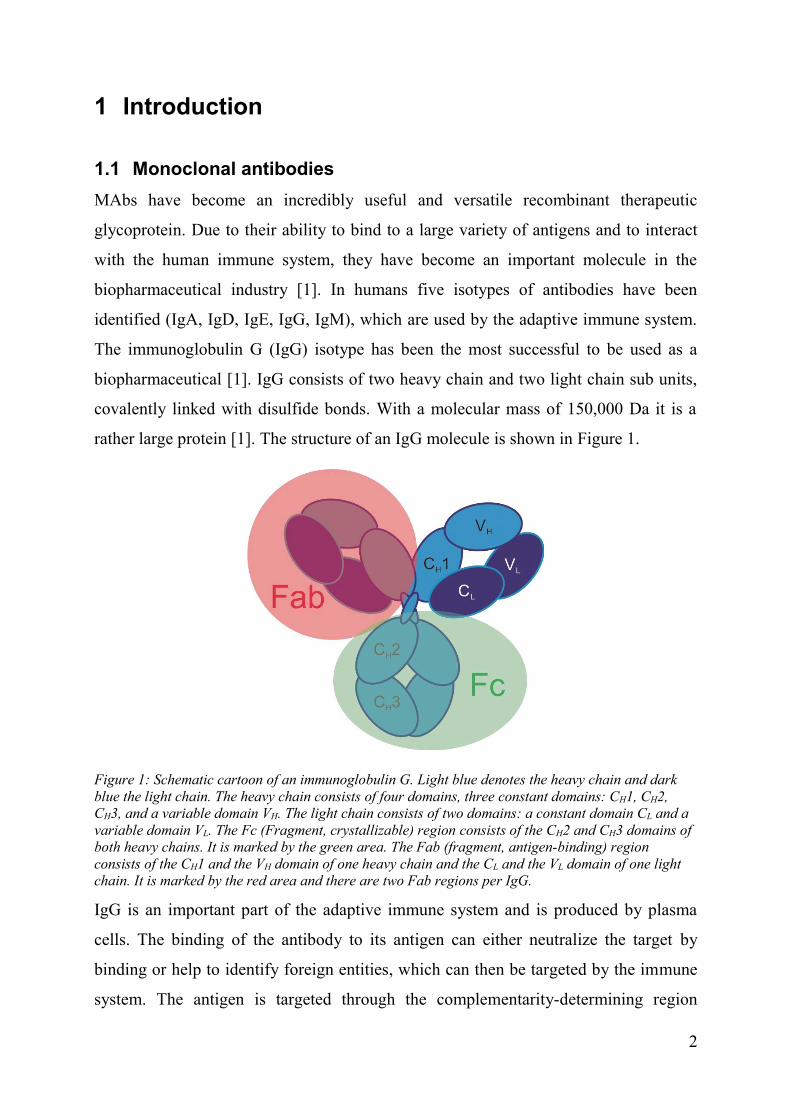
biopharmaceutical [1]. IgG consists of two heavy chain and two light chain sub units,
covalently linked with disulfide bonds. With a molecular mass of 150,000 Da it is a
rather large protein [1]. The structure of an IgG molecule is shown in Figure 1.
Figure 1: Schematic cartoon of an immunoglobulin G. Light blue denotes the heavy chain and dark blue the light chain. The heavy chain consists of four domains, three constant domains: CH1, CH2,CH3, and a variable domain VH. The light chain consists of two domains: a constant domain CL and a variable domain VL. The Fc (Fragment, crystallizable) region consists of the CH2 and CH3 domains of both heavy chains. It is marked by the green area. The Fab (fragment, antigen-binding) region consists of the CH1 and the VH domain of one heavy chain and the CL and the VL domain of one light chain. It is marked by the red area and there are two Fab regions per IgG.
IgG is an important part of the adaptive immune system and is produced by plasma
cells. The binding of the antibody to its antigen can either neutralize the target by
binding or help to identify foreign entities, which can then be targeted by the immune
system. The antigen is targeted through the complementarity-determining region
3
(CDR) three of which are located on each VH and VL domain. Two major pathways
exist, through which antibodies can elicit the destruction of targeted cells: the
complement dependent cytotoxicity (CDC) and the antibody dependent cellular
cytotoxicity (ADCC) pathways. After binding to an antigen the Fc region of an IgG
can bind to C1q of the complement system and start the recruitment of the membrane
attack complex or it can bind to Fcγ receptors, e.g. FcγRIII, which are located on
natural killer cells and other cells of the immune system. The Fc region can also bind
the neonatal Fc receptor (FcRn) of endothelial cells through which the IgG is
internalized and released at a later point. This greatly increases the serum half-life of
IgG.
In the biopharmaceutical industry, the product is still often defined by the process [2],
which means that changes in the process lead to a new product. Under the quality by
design (QbD) framework proposed by the US FDA, the influence of the process on the
product should be sufficiently transparent, so that changes in the process become
possible, without changing the product. In order to realize this idea, the critical quality
attributes (CQA) have to be defined and correlated with the process parameters [3, 4].
This requires extensive knowledge on microheterogeneity of the therapeutic protein,
for which high resolution analytical tools are required [4]. For mAb, this is a
challenging task, due to the sheer number of variants present, due to the large size of
the molecule. Being able to separate and identify variants, and gain insightful
knowledge on CQA is not only of importance under the QbD framework, but is of
immense advantage in the development of a biosimilar.
In this work, microheterogeneity is defined as slight differences in the structure of
essentially identical proteins. This is due to the presence of: protein variants, which
exhibit identical amino acid sequences, but different posttranslational or chemical
modifications; glycoforms, which only exhibit differences in the saccharide portion;
and isoforms, which show minor differences in the amino acid sequence due to point
mutations. Some of these variants, glycoforms and isoforms can exhibit charge
heterogeneity, in which case they are charge variants.
4
Microheterogeneity of antibodies is an active field of research. The sources of
antibody microheterogeneity are manifold. The modifications are post-translational
and can be classified as either enzymatic or non-enzymatic, but can also be created at a
later point of the production process of a therapeutic mAb [5]. The formation of
disulfide bonds, glycosylation, glycation, C-terminal lysine processing, N-terminal
pyroglutamate formation from glutamine or glutamic acid, deamidation of asparagine
and glutamine, oxidation and other modifications can all result in a heterogeneous
population of antibodies, produced from the same sequence in the same cell line [5, 6].
This heterogeneity has first been observed by isoelectric focusing in 1970 by Awdeh,
et al. [7] and has since been studied in detail [8-27].
While the sources of microheterogeneity are often known, the elucidation of its effects
was hardly successful. Khawli et al. [17] set out to quantify the effects of charge
heterogeneity on some selected effector functions and pharmacokinetics, but no
general rules for how certain modifications affect antibodies have emerged since.
1.2 Microheterogeneity
A main source of microheterogeneity of IgG is a conserved N-glycosylation site at
Asn-297 in the CH2 domain of the heavy chain. This results in two N-glycosylation
sites per IgG. Unlike many other glycoproteins, the glycan is facing inwards toward a
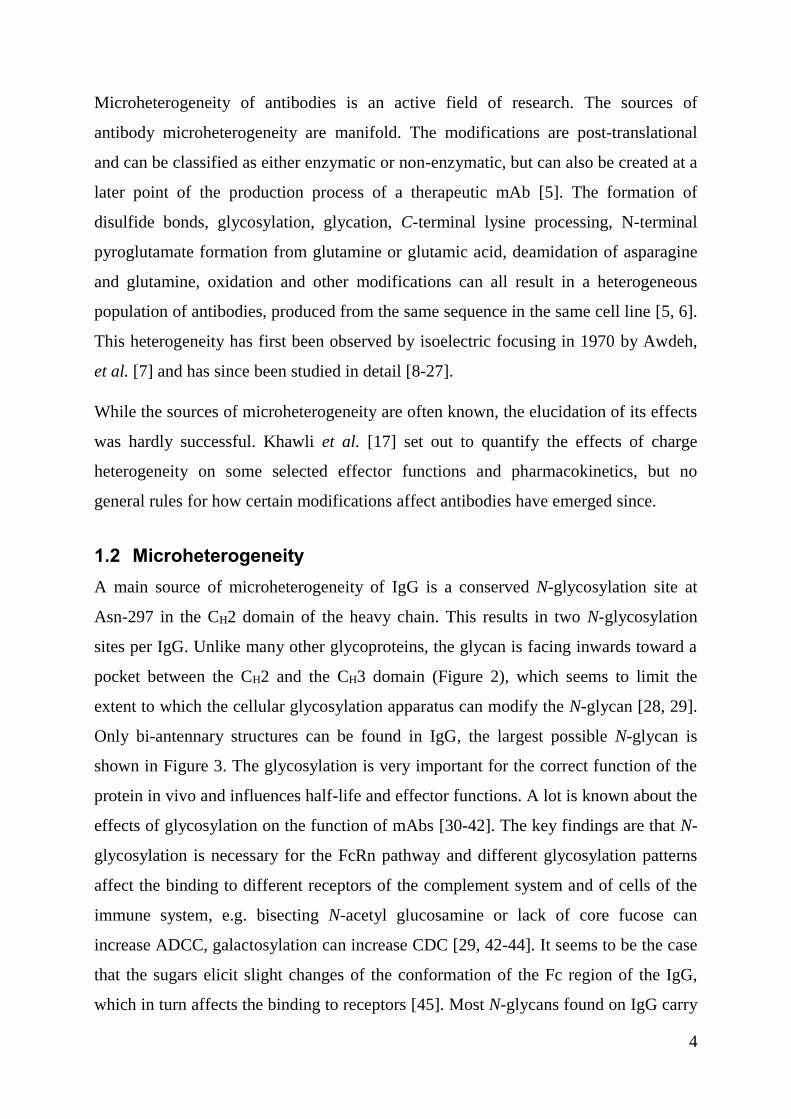
pocket between the CH2 and the CH3 domain (Figure 2), which seems to limit the
extent to which the cellular glycosylation apparatus can modify the N-glycan [28, 29].
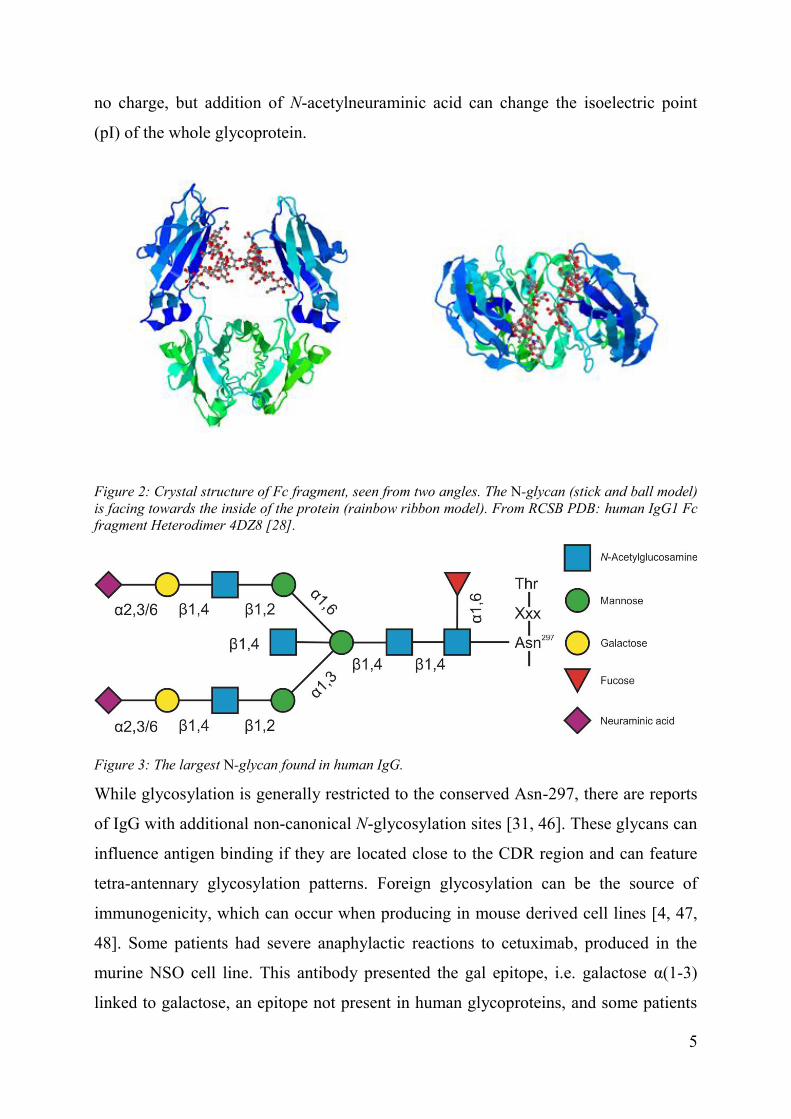
Only bi-antennary structures can be found in IgG, the largest possible N-glycan is
shown in Figure 3. The glycosylation is very important for the correct function of the
protein in vivo and influences half-life and effector functions. A lot is known about the
effects of glycosylation on the function of mAbs [30-42]. The key findings are that N-
glycosylation is necessary for the FcRn pathway and different glycosylation patterns
affect the binding to different receptors of the complement system and of cells of the
immune system, e.g. bisecting N-acetyl glucosamine or lack of core fucose can
increase ADCC, galactosylation can increase CDC [29, 42-44]. It seems to be the case
that the sugars elicit slight changes of the conformation of the Fc region of the IgG,
which in turn affects the binding to receptors [45]. Most N-glycans found on IgG carry
5
no charge, but addition of N-acetylneuraminic acid can change the isoelectric point
(pI) of the whole glycoprotein.
Figure 2: Crystal structure of Fc fragment, seen from two angles. The N-glycan (stick and ball model) is facing towards the inside of the protein (rainbow ribbon model). From RCSB PDB: human IgG1 Fc fragment Heterodimer 4DZ8 [28].
Figure 3: The largest N-glycan found in human IgG.
While glycosylation is generally restricted to the conserved Asn-297, there are reports
of IgG with additional non-canonical N-glycosylation sites [31, 46]. These glycans can
influence antigen binding if they are located close to the CDR region and can feature
tetra-antennary glycosylation patterns. Foreign glycosylation can be the source of
immunogenicity, which can occur when producing in mouse derived cell lines [4, 47,
48]. Some patients had severe anaphylactic reactions to cetuximab, produced in the
murine NSO cell line. This antibody presented the gal epitope, i.e. galactose α(1-3)
linked to galactose, an epitope not present in human glycoproteins, and some patients
6
primed to this epitope due to environmental exposure showed severe adverse reactions
to an IgE response of their immune system. Murine cell lines, such as NSO and Sp2/0
can present immunogenic glycans such as the gal epitope and N-glycolylneuraminic
acid [48]. Such aberrant glycoforms have to be avoided, to avoid severe adverse
reactions. Antibodies produced in CHO or in glycoengineered plant cells feature
human like glycoforms, which is important both for safety and efficacy of therapeutics
[49-54].
Glycation is a non-enzymatic reaction between amines of the N-terminus or lysine and
reducing sugars. This reaction occurs both in vivo and in vitro but seems to have a low
impact on the function of antibodies [5, 55]. Due to the masking of amines after
glycation, the pI of the antibody shifts towards the acidic.
Oxidation of methionine side chains can occur under oxidizing environments, at
elevated temperatures or after prolonged storage. The oxidation of methionine to the
sulfoxide increases the polarity of the side chain [5]. Even though methionine
oxidation should not affect the pI of an antibody, Chumsae et al. have reported
differential binding of oxidized IgG1 in cation exchange chromatography, which is
most likely due to conformational changes [56]. Stracke et al. have shown altered
binding behavior of oxidized IgG to FcRn [57]. Oxidation of tryptophan has also been
observed, but occurs rarely compared to the oxidation of methionine [58].
C-terminal lysine processing is the most common post-translational modification
found in monoclonal IgG [5, 59]. The heavy chain gene codes for this lysine, but is
removed either partially or completely by carboxypeptidases. The shift in pI is the only
observable effect on the antibody, and there is evidence that C-terminal lysine
processing even takes place in the serum after injection [60, 61].
N-terminal pyroglutamate formation is another common post-translational
modification, which has similar negligible effects [5]. It changes the pI of the antibody
by removing a primary amine, but otherwise seems to play no role for the function
[59].
7
Incomplete removal of the signal peptide from the N-terminus has been reported by
Meert et al. [18]. No measurable effects of the signal peptide have been observed so
far [59].
Deamidation is another common modification found in mAb. The amino acid
sequence asparagine – glycine is most susceptible and results in the formation of
aspartate and iso-aspartate [5]. Due to its high frequency and the importance that
asparagine can play both for antigen and receptor binding, deamidation can have
deleterious effects on antibody function [62]. The reaction is influenced by many
factors including pH, temperature and buffer composition, with elevated temperatures
and alkaline pH greatly increasing the rate of deamidation [63, 64]. Deamidation of
glutamine occurs at a much slower rate and as such is found far less frequently [6].
Deamidation always results in a change of the pI of the antibody.
Iso-aspartate can also be formed by the direct isomerization of aspartate, which leads
to changes in the pI of the antibody and can induce conformational changes, due to the
introduction of a methyl group to the peptide backbone [5]. As with deamidation, this
can have detrimental effects on the function of the antibody [65]
Disulfide bonds can also be the source of isoforms, although this affects mostly the
IgG2 subtype, which is utilized far less as a biopharmaceutical [16, 66-68].
Very harsh conditions such as extreme pH values or elevated temperatures can also
induce peptide bond cleavage in the hinge region or between the CH2-CH3 domains
[69]. During a standard downstream process for mAb purification a low pH step for
virus inactivation is often used, which can lead to the creation of fragments. These
fragments, with varying pI and size, have to be removed in subsequent polishing steps.
The intra and inter chain disulfide bonds in IgG are susceptible to forming non-
reducible covalent bonds [69]. This cross-linking might be a common phenomenon in
IgG, with very little effect on structure and function [5].
IgG is not a symmetrical protein, as a consequence the same modification sequence
wise can have a different effect depending on which light or heavy chain is affected.
8
Aggregation is commonly observed in all types of antibodies, just as most other
proteins [5]. Misfolded or partially unfolded proteins and temporarily unfolded areas
of proteins can aggregate due to interactions of hydrophobic regions. Conditions such
as elevated temperatures and extreme pH values can favor this rearrangement. High
titer cell cultures can exhibit environments that induce aggregation, e.g. large amount
of improperly folded proteins, high concentrations. Improvement of the storage buffer
composition can reduce aggregation and other sources of heterogeneity [70].
Aggregates contribute to size heterogeneity and are routinely monitored using size
exclusion chromatography.
All of these modifications can have some effect on antibodies, which lead to
microheterogeneity being defined as a CQA under the QbD initiative of the US FDA
[3].
1.3 Chromatography
Liquid chromatography is a standard method both in the downstream processing [71]
and the analysis of antibodies [27]. The downstream processing of antibodies has
become standardized, following a common pattern [71]. Protein A chromatography is
most often used for the capture of the antibody from the clarified cell culture
supernatant. Protein A from Staphylococcus aureus has the ability to bind the Fc
region of antibodies, which makes it incredibly useful in affinity chromatography. The
capture step is followed by up to three polishing steps, which are generally a
combination of anion exchange, cation exchange or hydrophobic interaction
chromatography (AEX, CEX and HIC respectively). While protein A chromatography
uses evolved affinity for binding, ion exchange and hydrophobic interaction
chromatography utilize electrostatic or hydrophobic interactions for selective binding.
Ion exchange chromatography (IEC) uses strong or weak ionic groups immobilized on
the stationary phase to bind proteins [72]. IgG generally have a pI in the alkaline
range, owing to the conserved Fc region, which differentiates it from most host cell
proteins, which have a pI below 7. This makes IEC a favorable unit operation for the
polishing, and sometimes the capture, of mAb. Two different modes often find use as
polishing steps. AEX is often used in flow-through mode, in which the target protein
9
has the same charge as the stationary phase and as such do not bind to the stationary
phase, whereas impurities carrying an opposite charge are bound. CEX is generally
used in a bind-elute fashion, in which the target protein is bound on the stationary
phase and subsequently eluted. In order to bind a CEX column the protein needs to be
positively charged, which proteins are at a pH below their pI. The elution is carried out
by increasing the modifier concentration, NaCl is the preferred modifier in ion
exchange chromatography, since it is cheap and safe to use. The modifier
concentration can be increased in a linear gradient or in one or more step gradients
[73].
A major advantage of IEC are the mild operating conditions, compared to other
chromatographic methods, i.e. reversed phase chromatography. In IEC, aqueous
solutions with a pH around neutral and no organic modifiers are routinely employed.
This feature makes it very attractive for the use in the biopharmaceutical industry,
since proteins are prone to denature under harsh conditions, which compromises their
biological activity. IEC also boasts high resolving power, high binding capacities, a
large theoretical body of knowledge and a plethora of different stationary phases
offered by many manufacturers [74]. As mentioned before, elution usually takes place
by increasing the NaCl concentration, which is a safe and cheap chemical that interacts
well with virtually all proteins. This is usually done in a linear gradient fashion, which
provides certain advantages over isocratic elution. By increasing the concentration of
salt during the chromatographic experiment, two things are achieved: the elution of
stronger retained proteins is sped up and the method becomes more robust compared
to isocratic elution. The increase in robustness stems from surveying a variety of salt
concentrations, making the elution time and the separation less dependent on the actual
salt concentration in either one of the buffers. Alternatively, pH can be used as the
modifier in IEC, and just as salt, the change in pH modifies the strength of the
interaction between solute and stationary phase.
1.4 Steric mass action model
The equilibrium between protein adsorbed on the stationary phase and protein in
solution is highly dependent on the modifier concentration [72]. The steric mass-action
10
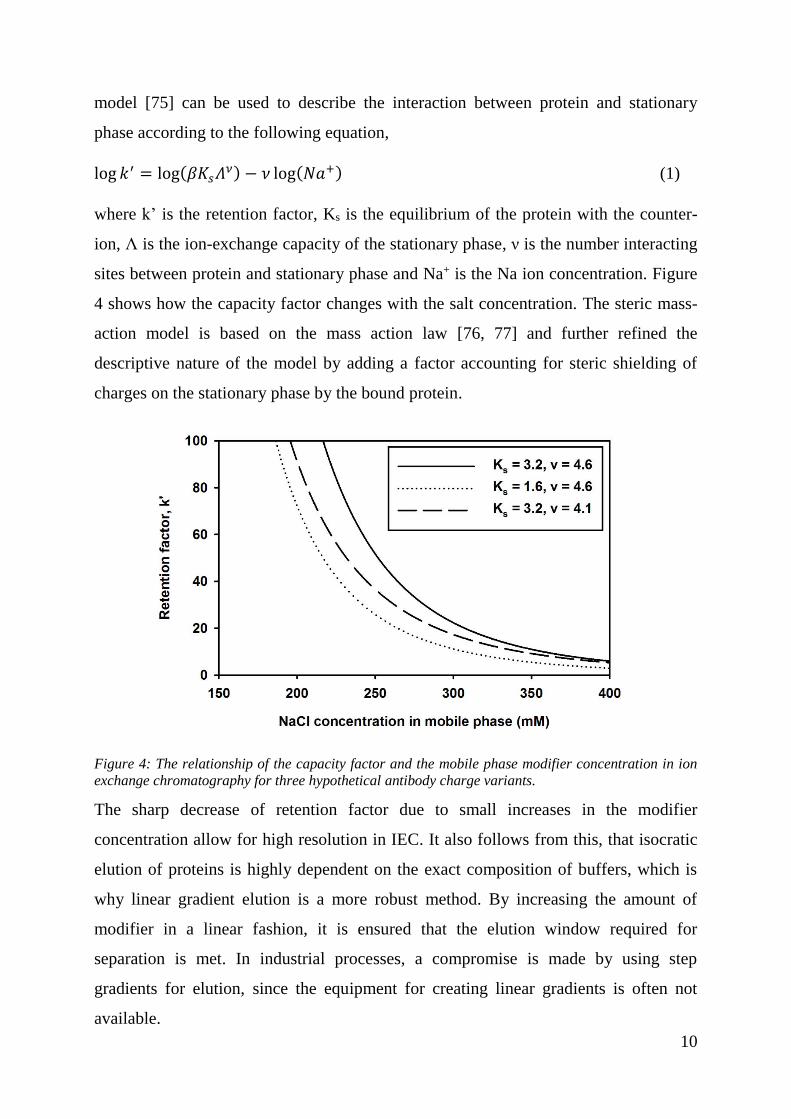
model [75] can be used to describe the interaction between protein and stationary
phase according to the following equation,
log 𝑘′ = log(𝛽𝐾𝑠𝛬𝜈) − 𝜈 log(𝑁𝑎+) (1)
where k’ is the retention factor, Ks is the equilibrium of the protein with the counter-
ion, Λ is the ion-exchange capacity of the stationary phase, ν is the number interacting
sites between protein and stationary phase and Na+ is the Na ion concentration. Figure
4 shows how the capacity factor changes with the salt concentration. The steric mass-
action model is based on the mass action law [76, 77] and further refined the
descriptive nature of the model by adding a factor accounting for steric shielding of
charges on the stationary phase by the bound protein.
Figure 4: The relationship of the capacity factor and the mobile phase modifier concentration in ion
exchange chromatography for three hypothetical antibody charge variants.
The sharp decrease of retention factor due to small increases in the modifier
concentration allow for high resolution in IEC. It also follows from this, that isocratic
elution of proteins is highly dependent on the exact composition of buffers, which is
why linear gradient elution is a more robust method. By increasing the amount of
modifier in a linear fashion, it is ensured that the elution window required for
separation is met. In industrial processes, a compromise is made by using step
gradients for elution, since the equipment for creating linear gradients is often not
available.
11
1.5 Separation of charge variants
IEC is able to separate proteins and protein variants from each other, e.g. Harris [78]
was able to separate variants of IgG1 based on the presence of C-terminal lysine and
tissue plasminogen activator based on the presence of C-terminal arginine. This
separation was carried out using a salt gradient on a cation exchange column and was
able to separate proteins based on the presence or absence of only one amino acid.
Weitzhandler et al. [11] were able to separate cytochrome C from three different
species, which are very similar in their primary structure, and their pI. The high
resolving power of IEC can be exploited to separate variants of mAb based on their
difference in charge distribution.
IEC salt gradient elution is therefore suitable for separation of charge variants of mAb.
As shown earlier many modifications responsible for microheterogeneity in mAb
microheterogeneity induce a difference in the pI of the antibody or in the charge
distribution through conformational changes [5]. A method for the analytical or
preparative separation of mAb charge variants is highly valuable in the study of the
effects of charge heterogeneity on the function. Du et al. [79] pointed out the need for
a preparative separation method in order to study the effect of charge heterogeneity.
Teshima et al. [80] were successful in separating IgG charge variants in the single
digit mg scale. They used AEX salt gradient elution at a neutral pH, a method that is
not applicable for all mAb, due to their pI values in the range of 8-9. A protein
generally binds to an AEX column at a pH above or close to its pI, which can be a
problem for very basic proteins, as very high pH can denature proteins.
Another example for mAb charge variant separation is given by Melter et al. [81].
They employed a Dionex ProPacWCX-10 cation exchange column to separate C-
terminal lysine variants of an IgG antibody using salt gradient elution. A lumped
kinetic model was used to optimize the separation of charge variants at two different
pH values. The stationary phase they chose is highly suitable for such difficult
separations as it has a fast mass transfer compared to many other stationary phases.
This is due to the fact that the ProPac packing material does not consist of porous
beads, but instead is made up of non-porous particles on which a layer of polymer
chains is grafted on [11]. This pellicular layer of polymer chains carry ion exchange
12
functional groups, which makes the paths for diffusive transport very short, compared
to conventional porous media. The increase in separation power stems from the
decreased peak spreading that is caused by mass transfer resistance [73]. This high rate
of mass transport comes at the cost of surface area, which results in a much lower
overall binding capacity. This problem is further amplified by the fact that Melter et al.
are operating in the linear region of the adsorption isotherm, which means that such
high resolution methods are only useful for analytical approaches with very low
loadings [81, 82]. Guélat et al. were also successful in modelling the retention of mAb
in cation exchange chromatography by using an adsorption equilibrium model [83].
They used the amino acid sequence and structural information about the stationary
phase to predict the influence of ionic strength and pH on the retention time of mAb.
The approach can be used for the separation of charge variants, but it suffers from the
inaccuracy of the model used. The interaction between protein and chromatography
surface as simplified as spheres and planes and the protein charge is calculated as a
charge density on spheres, whereas the actual interaction depends on charge
distribution. In order to improve such an approach, detailed structural information has
to be known.
1.6 Displacement chromatography
Another mode of IEC is displacement chromatography, in which the proteins are
eluted by a strong binding displacer. In general, the column is loaded with protein to a
high degree, above 50% of the dynamic binding capacity, and subsequently a displacer
is introduced in a step change at the column inlet. The displacer has a higher affinity to
the stationary phase than the sample and the proteins are displaced into the mobile
phase. At this point competitive binding between the proteins takes place while they
travel down the column in an isotachic displacement train [75, 84]. The proteins in the
displacement train will be separated by their affinity to the stationary phase, with the
weakest binding protein eluting first and the strongest binding protein eluting just
before the displacer. The proteins are separated into zones of pure proteins, bordered
by zones containing mixtures.
13
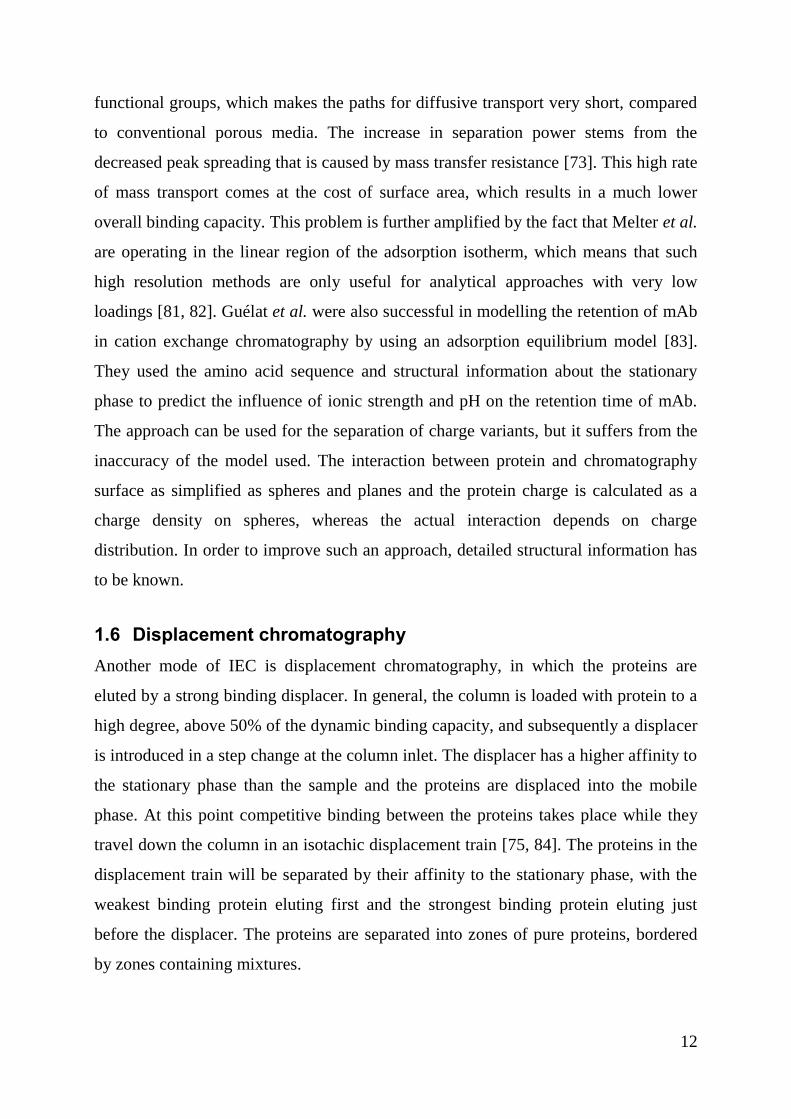
Figure 5: A schematic representation of an ideal displacement train. In this example protein, Y has a lower binding affinity than protein X, with the impurities having intermediate affinities. The weaker binding protein is eluted first, in a zone of pure protein, followed by a zone containing a mixture of both proteins and the impurities. Protein X elutes in a pure zone, followed by the displacer, again creating a mixed zone.
Zhang et al. have successfully used displacement chromatography to separate charge
variants for one mAb at a hundreds of mg scale [85]. This method is highly useful for
the study of mAb microheterogeneity, since they were able to separate ~100 mg of IgG
charge variants in one experiment using a high performance anionic displacer, Sachem
Expell SP1, for cation exchange chromatography. The CHO produced mAb they used
in their work was of the IgG1 type, with a pI of 8.7, but otherwise undisclosed
properties. Khawli et al. managed to purify even larger quantities of another CHO
produced IgG1 antibody [17]. In their work, they managed to separate charge variants
in the scale of 1 g, which is enough for a variety of analytical procedures, which
allowed them to compare the pharmacokinetics of IgG charge variants.
Without a doubt, displacement chromatography is a very elegant method for the
separation problem at hand, but the set up and optimization are not straightforward.
Brooks and Cramer have suggested the use of the steric mass action (SMA) model to
optimize separations in displacement chromatography [75]. This model builds on the
stoichiometric displacement model, which is based on the mass-action law [77].
Simple isocratic or linear gradient elution experiments are enough to determine the
protein parameters required for the SMA model. For the displacer, breakthrough
experiments are required. With the knowledge of the protein, displacer and stationary
14
phase parameters the optimal displacement conditions can be determined. In order to
optimize the displacement of mAb charge variants, the parameters of each or at least a
number of charge variants have to be determined. This means that in order to use the
SMA model to arrive at conditions for successful displacement chromatography, pure
material of the charge variants is required. This poses a significant problem and
hinders the implementation of displacement chromatography for the separation of
mixtures, for which no pure substances are available. In summary, even though there
are positive results in the literature, the separation does not seem to be consistent.
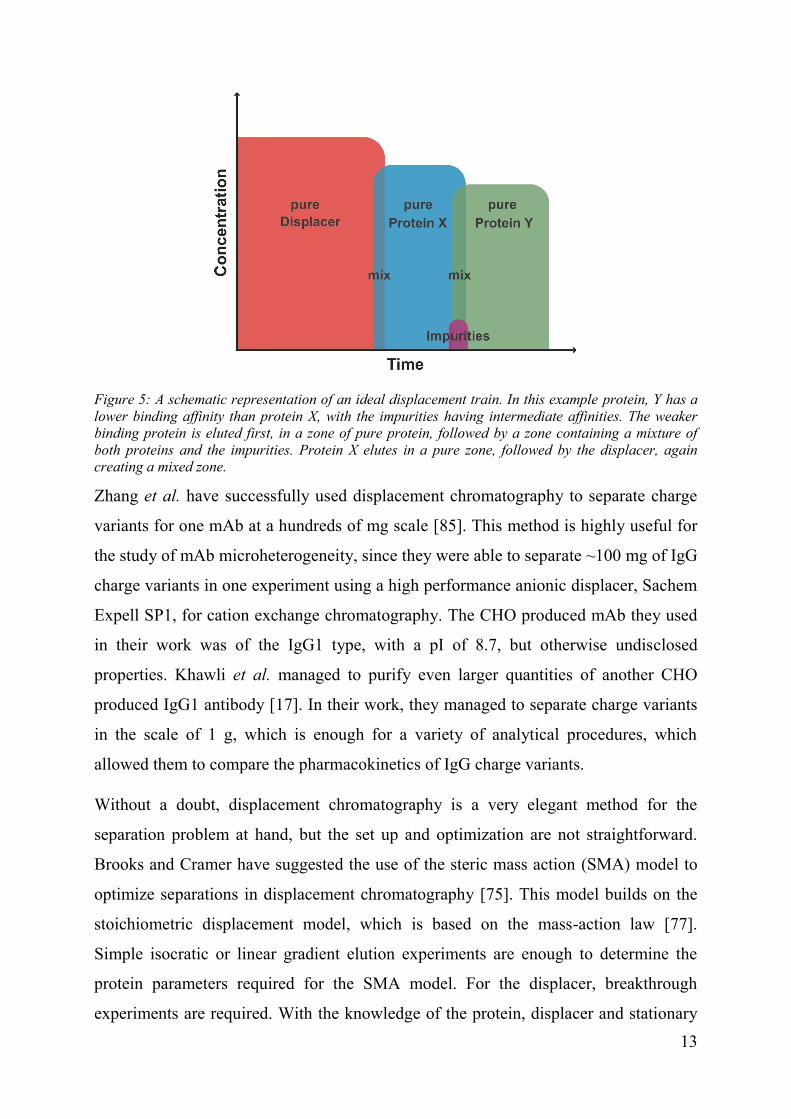
In our own experiments, we have observed limited separation between IgG charge
variants. In the first experiments, the only separation achieved was between IgG and
impurities as shown in Figure 6, and confirmed through Western blot. In this
experiment, a micropellicular column with 5µm SCX particles and an aspect ratio of
around 70 was used. The large aspect ratio allows enough time for a displacement train
to develop. The mobile phase conditions were standard conditions taken from the
supplier and from Zhang et al. [85].
Figure 6: Non-reducing SDS-PAGE of displacement fractions. Stationary phase: Sepax SCX NP 5µm,
2.1 x 150 mm. Mobile phase: 30 mM MES, 10 mM NaCl, pH 6.1. Displacer: 5 mM Expell SP1. Sample
IgG 84 at 50% of DBC. Lanes 1 and 9 are marker. Lanes 2-7 are displacement fractions in order of
elution. Lane 8 is the original sample, IgG 84. Lane 10 is trastuzumab biosimilar. An early eluting
impurity was detected in the first two fractions.
15
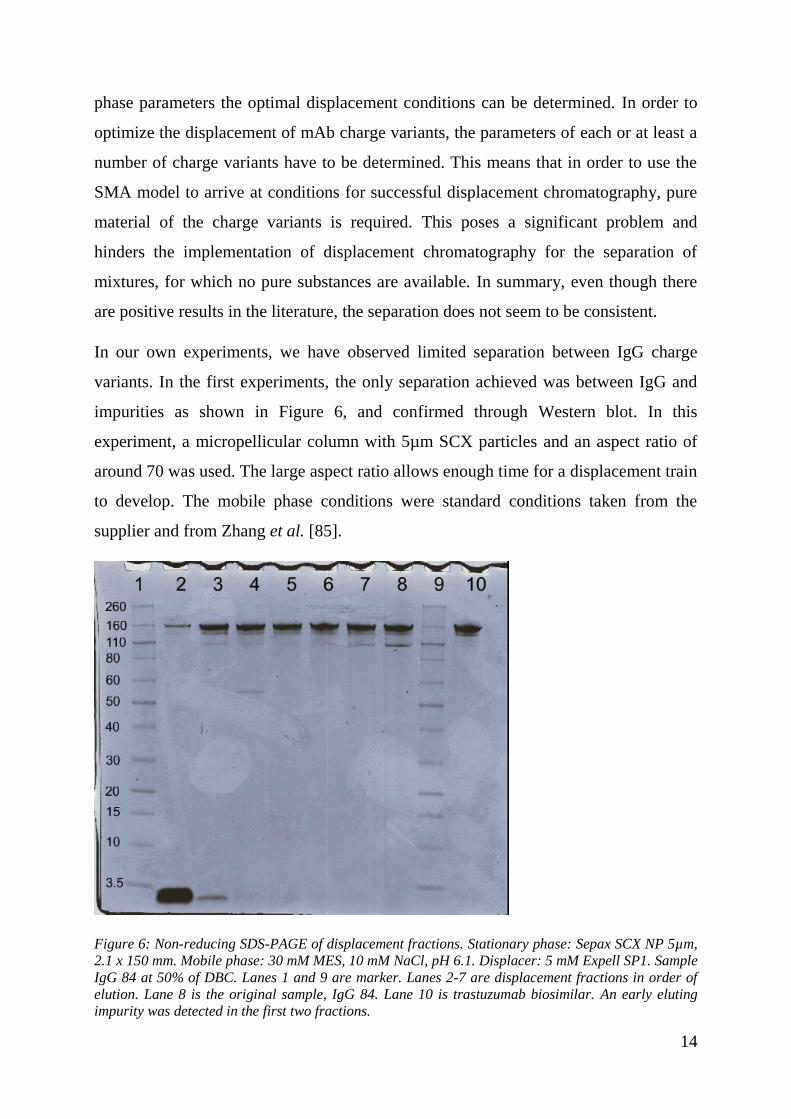
We hypothesized that the binding capacity of the core-shell particles we used was not
sufficient to ensure the development of a displacement train, since the only separation
we saw was between the impurity and the antibody. An IEF showed no differences in
charge variant distribution between the fractions. We then decided to use a stationary
phase with improved binding capacity, and chose the GE Mono S stationary phase.
Figure 7 shows the separation possible with this stationary phase. The antibody used in
these experiments, IgG 84, is an in house product of the Bioprocessing Technology
Institute.
Figure 7: IEF of displacement fractions. Stationary phase: GE Mono S, 4.6 x 100 mm. Mobile phase:
40 mM MES, 10 mM NaCl, pH 5.5. Displacer: 5 mM Expell SP1. Sample IgG 84 at 55% of DBC.
Lanes 1-12 are displacement fractions in order of elution. Lane 13 is the original sample, IgG 84. An
increase in acidic variants in the later eluting fractions is apparent.
It was attempted to recreate the separation achieved with a different antibody,
APN311, a chimeric IgG1 antibody provided by Apeiron Biologics. Interestingly the
16
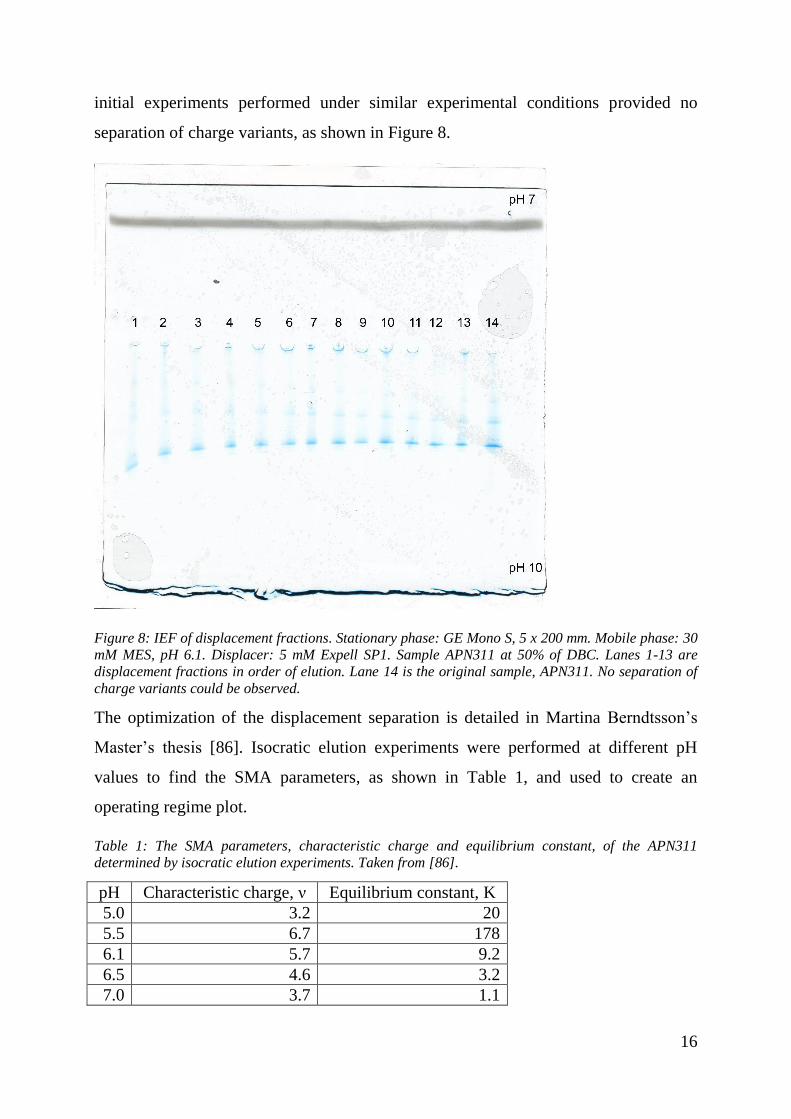
initial experiments performed under similar experimental conditions provided no
separation of charge variants, as shown in Figure 8.
Figure 8: IEF of displacement fractions. Stationary phase: GE Mono S, 5 x 200 mm. Mobile phase: 30
mM MES, pH 6.1. Displacer: 5 mM Expell SP1. Sample APN311 at 50% of DBC. Lanes 1-13 are
displacement fractions in order of elution. Lane 14 is the original sample, APN311. No separation of
charge variants could be observed.
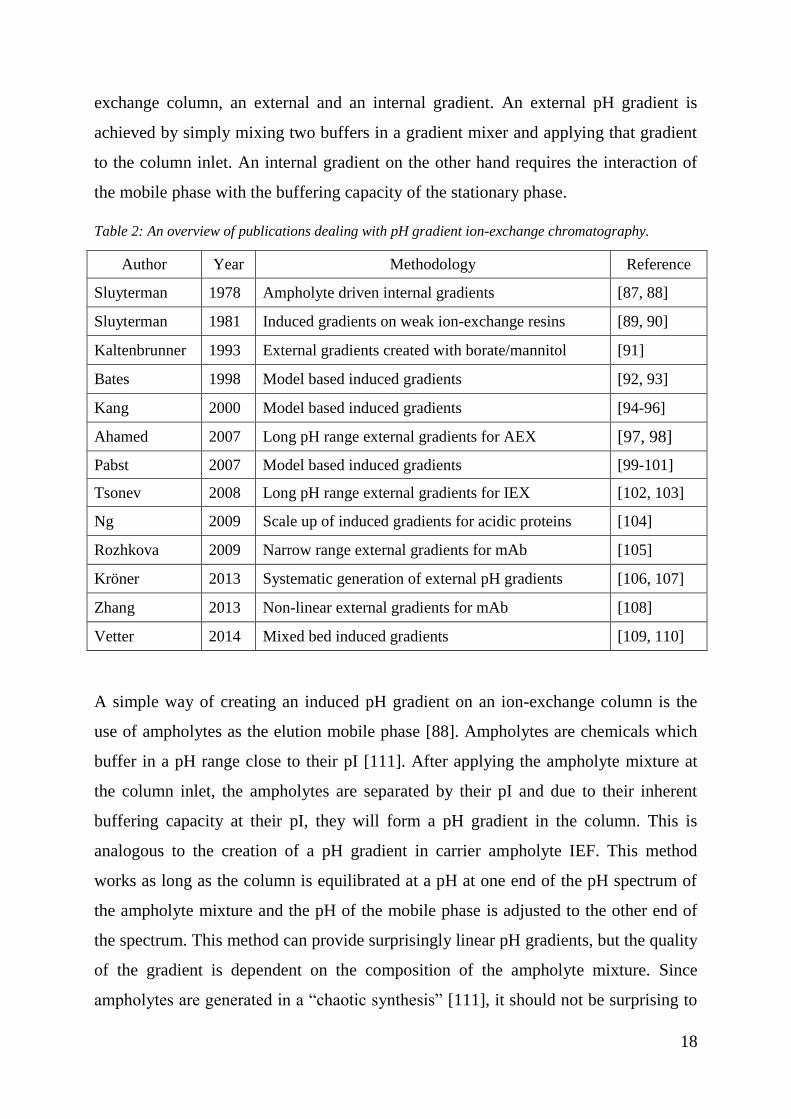
The optimization of the displacement separation is detailed in Martina Berndtsson’s
Master’s thesis [86]. Isocratic elution experiments were performed at different pH
values to find the SMA parameters, as shown in Table 1, and used to create an
operating regime plot.
Table 1: The SMA parameters, characteristic charge and equilibrium constant, of the APN311
determined by isocratic elution experiments. Taken from [86].
pH Characteristic charge, ν Equilibrium constant, K
5.0 3.2 20
5.5 6.7 178
6.1 5.7 9.2
6.5 4.6 3.2
7.0 3.7 1.1
17
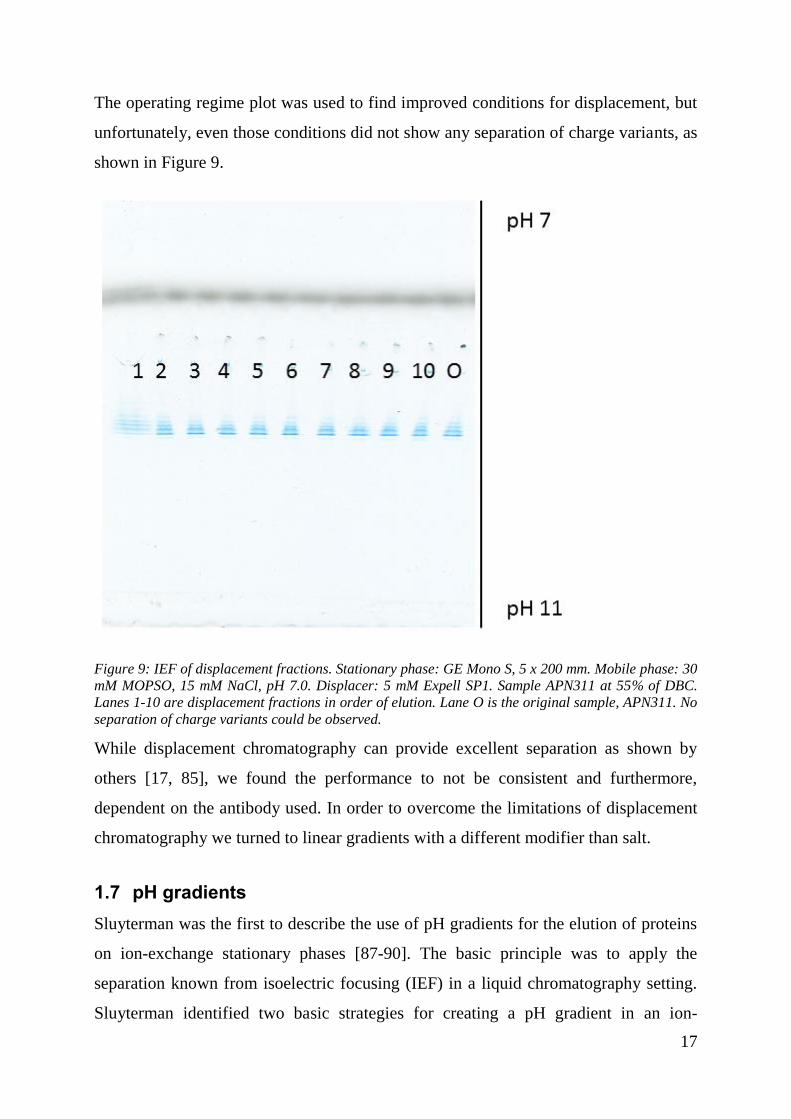
The operating regime plot was used to find improved conditions for displacement, but
unfortunately, even those conditions did not show any separation of charge variants, as
shown in Figure 9.
Figure 9: IEF of displacement fractions. Stationary phase: GE Mono S, 5 x 200 mm. Mobile phase: 30
mM MOPSO, 15 mM NaCl, pH 7.0. Displacer: 5 mM Expell SP1. Sample APN311 at 55% of DBC.
Lanes 1-10 are displacement fractions in order of elution. Lane O is the original sample, APN311. No
separation of charge variants could be observed.
While displacement chromatography can provide excellent separation as shown by
others [17, 85], we found the performance to not be consistent and furthermore,
dependent on the antibody used. In order to overcome the limitations of displacement
chromatography we turned to linear gradients with a different modifier than salt.
1.7 pH gradients
Sluyterman was the first to describe the use of pH gradients for the elution of proteins
on ion-exchange stationary phases [87-90]. The basic principle was to apply the
separation known from isoelectric focusing (IEF) in a liquid chromatography setting.
Sluyterman identified two basic strategies for creating a pH gradient in an ion-
18
exchange column, an external and an internal gradient. An external pH gradient is
achieved by simply mixing two buffers in a gradient mixer and applying that gradient
to the column inlet. An internal gradient on the other hand requires the interaction of
the mobile phase with the buffering capacity of the stationary phase.
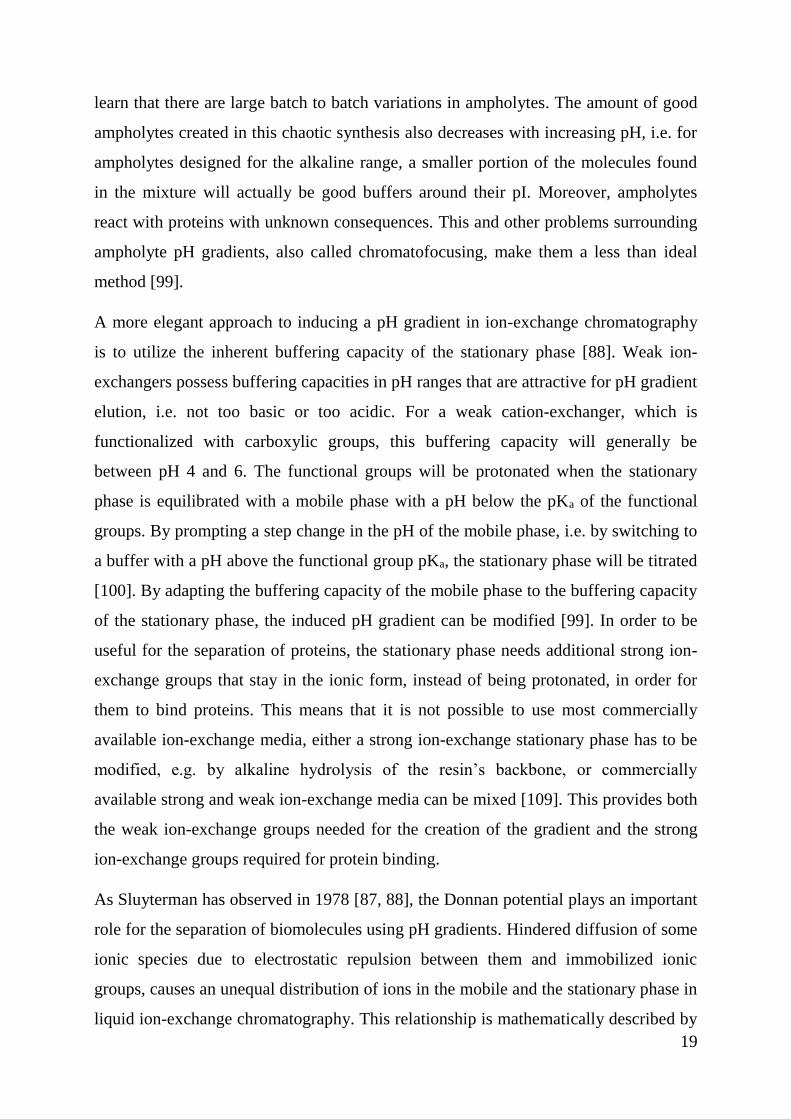
Table 2: An overview of publications dealing with pH gradient ion-exchange chromatography.
Author Year Methodology Reference
Sluyterman 1978 Ampholyte driven internal gradients [87, 88]
Sluyterman 1981 Induced gradients on weak ion-exchange resins [89, 90]
Kaltenbrunner 1993 External gradients created with borate/mannitol [91]
Bates 1998 Model based induced gradients [92, 93]
Kang 2000 Model based induced gradients [94-96]
Ahamed 2007 Long pH range external gradients for AEX [97, 98]
Pabst 2007 Model based induced gradients [99-101]
Tsonev 2008 Long pH range external gradients for IEX [102, 103]
Ng 2009 Scale up of induced gradients for acidic proteins [104]
Rozhkova 2009 Narrow range external gradients for mAb [105]
Kröner 2013 Systematic generation of external pH gradients [106, 107]
Zhang 2013 Non-linear external gradients for mAb [108]
Vetter 2014 Mixed bed induced gradients [109, 110]
A simple way of creating an induced pH gradient on an ion-exchange column is the
use of ampholytes as the elution mobile phase [88]. Ampholytes are chemicals which
buffer in a pH range close to their pI [111]. After applying the ampholyte mixture at
the column inlet, the ampholytes are separated by their pI and due to their inherent
buffering capacity at their pI, they will form a pH gradient in the column. This is
analogous to the creation of a pH gradient in carrier ampholyte IEF. This method
works as long as the column is equilibrated at a pH at one end of the pH spectrum of
the ampholyte mixture and the pH of the mobile phase is adjusted to the other end of
the spectrum. This method can provide surprisingly linear pH gradients, but the quality
of the gradient is dependent on the composition of the ampholyte mixture. Since
ampholytes are generated in a “chaotic synthesis” [111], it should not be surprising to
19
learn that there are large batch to batch variations in ampholytes. The amount of good
ampholytes created in this chaotic synthesis also decreases with increasing pH, i.e. for
ampholytes designed for the alkaline range, a smaller portion of the molecules found
in the mixture will actually be good buffers around their pI. Moreover, ampholytes
react with proteins with unknown consequences. This and other problems surrounding
ampholyte pH gradients, also called chromatofocusing, make them a less than ideal
method [99].
A more elegant approach to inducing a pH gradient in ion-exchange chromatography
is to utilize the inherent buffering capacity of the stationary phase [88]. Weak ion-
exchangers possess buffering capacities in pH ranges that are attractive for pH gradient
elution, i.e. not too basic or too acidic. For a weak cation-exchanger, which is
functionalized with carboxylic groups, this buffering capacity will generally be
between pH 4 and 6. The functional groups will be protonated when the stationary
phase is equilibrated with a mobile phase with a pH below the pKa of the functional
groups. By prompting a step change in the pH of the mobile phase, i.e. by switching to
a buffer with a pH above the functional group pKa, the stationary phase will be titrated
[100]. By adapting the buffering capacity of the mobile phase to the buffering capacity
of the stationary phase, the induced pH gradient can be modified [99]. In order to be
useful for the separation of proteins, the stationary phase needs additional strong ion-
exchange groups that stay in the ionic form, instead of being protonated, in order for
them to bind proteins. This means that it is not possible to use most commercially
available ion-exchange media, either a strong ion-exchange stationary phase has to be
modified, e.g. by alkaline hydrolysis of the resin’s backbone, or commercially
available strong and weak ion-exchange media can be mixed [109]. This provides both
the weak ion-exchange groups needed for the creation of the gradient and the strong
ion-exchange groups required for protein binding.
As Sluyterman has observed in 1978 [87, 88], the Donnan potential plays an important
role for the separation of biomolecules using pH gradients. Hindered diffusion of some
ionic species due to electrostatic repulsion between them and immobilized ionic
groups, causes an unequal distribution of ions in the mobile and the stationary phase in
liquid ion-exchange chromatography. This relationship is mathematically described by
20
the Donnan potential. The resolution achievable in pH gradient elution is directly
proportional to the Donnan potential, which can be increased by decreasing the ionic
strength of the mobile phase, or increasing the buffering capacity of the stationary
phase [26, 88].
The resolution is determined by peak separation and peak width. The peak width in pH
units can be written as,
ΔpH2 ≈ [𝐷 ∗ (𝑑pH/𝑑V)] /[φ ∗ (𝑑pH/𝑑V)] (2)
where D is the protein diffusion coefficient, dpH/dV is the pH gradient slope and φ is
the dimensionless Donnan potential [26]. Therefore, a stationary phase with a high
ionic capacity and a mobile phase with a low ionic strength is beneficial for high
resolution in pH gradient elution of proteins in ion-exchange chromatography.
One advantage of induced pH gradients over salt gradients for the elution of proteins is
the high peak compression that is inherent in induced pH gradient elution. Peak
compression is generally observed when steep gradients are used in salt gradient
elution [73]. The compression effect stems from the difference in chromatographic
velocity that an analyte experiences at the front of the peak versus the back of the
peak. At steep gradients, there will be a considerable difference in salt concentration
through the length of a column, and an analyte peak will not be exposed to one
discrete salt concentration, but instead will experience an axial salt gradient. Since the
chromatographic velocity is a function of the modifier concentration, it follows that
there exists a velocity gradient through the analyte peak as well. This results in the
front of the peak being slowed down, relative to the center, whereas the tailing end of
the peak is travelling at a faster chromatographic velocity than the peak average. This
axial modifier and the resulting chromatographic velocity gradient, creates the peak
compression effect.
In pH gradient elution, the change in pH acts as the modifier, and akin to salt gradient
elution there also exists an axial modifier gradient [74]. Due to the peculiar fashion in
which the pH gradient is induced, the temporal pH gradient that can be measured at the
column outlet, also exists as an axial gradient in the column [87]. As pointed out
earlier, instead of changing the modifier concentration by combining two buffers in a
21
gradient mixer, a pH gradient is induced by switching to a different buffer altogether,
that then proceeds to titrate the stationary phases buffering groups. This results in an
immediate pH change at the column inlet, and a delayed response at the column outlet.
The consequence of this behavior is a steep axial gradient even when a shallow
temporal gradient is used. This results in a focusing of the analyte peaks, driven by the
same mechanism that creates peak compression in steep salt gradient elution.
Giorgio Carta’s group were successful in using induced pH gradients for the separation
of proteins in CEX [99] and AEX [101]. For these separations, they used modified
chromatography media with additional functional groups that contained the buffering
capacity required for the induced pH gradients. While they were even able to separate
mAb charge variants, with this approach, the fact that it requires special stationary
phases is a drawback. Recently they introduced a new method of providing the
functional groups required for buffering and for binding, by using columns packed
with two types of media; a weak ion-exchange resin with small pores for creating the
gradients and a strong ion-exchange resin with larger pores to add the binding capacity
[109, 110]. While induced pH gradients offer an inherent focusing effect, their main
drawback is the non-linearity of the resulting gradient, which is most often concave
[104]. This results in uneven gradient slopes over the gradient range, which means that
not it is not equally suitable for separation problems. Moreover, the shape of the
created gradient depends on the stationary phase used and as such cannot be modified
easily.
In order to avoid the restrictions and issues surrounding induced, or internal, pH
gradients a different approach has to be employed. External gradients, as mentioned
earlier, are not dependent on the buffering capacity of the stationary phase, but also do
not offer the inherent focusing effect associated with the steep axial gradients of
internal gradients.
Schmidt et al. succeeded in modelling the elution behavior of proteins under salt and
pH gradient elution, by using the stoichiometric displacement model combined with
Yamamoto’s linear gradient elution model [74, 112]. Lysozyme and IgG were used as
model proteins and Interesting differences were found in the binding behavior. For
22
Lysozyme, about 50% of the total charges of the protein are interacting with the
stationary phase, which is plausible considering the small size and the globular shape
of the protein. For IgG only about 15% of the net charge is involved in binding, mostly
due to the large mass and the smaller contact surface area. They further investigated
the elution behavior of IgG charge variants in salt and pH gradient elution. Differences
in the distribution coefficients between the charge variants were large at higher pH
values, possibly explaining the increased resolution observed in pH gradient elution
[74].
Considering that, pH gradients are more suitable for the elucidation of antibody
microheterogeneity and internal pH gradients having various limitations that limit their
usefulness, what other pH gradient methods are available? Already in 1993 external
pH gradient elution was performed in this lab [91]. Kaltenbrunner et al. used a
chemical reaction to release H3O+ from the reaction of mannitol with borate to create a
linear pH gradient. While this creates a pH gradient of good linearity and can be used
in an analytical and preparative scale, relying on this chemical reaction limits the use
to cation exchange chromatography. Borate may also react with the glycans present on
the mAb, forming stable complexes with the protein of interest, which is problematic
if the protein is to be recovered and analyzed further.
Other attempts were made to create controlled pH gradients with simple buffer
compounds. Kang and Frey used mixtures of simple, low molecular weight buffers,
such as citric acid and phosphates to create linear pH gradients spanning several pH
units [96]. The resulting pH gradients are comparable in linearity to those created by
using ampholytes as the mobile phase, making them a worthwhile replacement for
chromatofocusing.
In 2008 Tsonev and Hirsh introduced a new method of pH gradient elution for both
modes of ion-exchange chromatography [102]. The pH gradients span 10 pH units,
from pH 2 to 12, enabling the elution of a wide variety of proteins. The method relies
on using a mobile phase consistent of anionic and cationic buffering compounds with
pKa values evenly spread across the pH range of the gradient. In total only five
buffering compounds are used and the resulting pH gradients are not linear. In order to
23
overcome this issue, an algorithm is used to correct for the non-linearity in the
gradient, by adjusting the actual gradient that the pumps of the liquid chromatography
system are administering. This results in very complicated methods, instead of a linear
increase of mobile phase ratios. The issue is further complicated by using both anionic
and cationic buffering compounds on both anion and cation exchangers. The obvious
drawback is further deviation from linearity by interaction of the buffering compounds
and the stationary phase functional groups, which results in partial retention of the
mobile phase. This results in changes of the buffer concentrations and therefore
changes in the buffering capacity. Unsurprisingly, even though an intricate gradient
delivery method has to be programmed, the algorithm employed cannot also correct
for the deviations in buffering capacity caused by the interaction of the mobile phase
with the chromatographic media. While Tsonev and Hirsh’s approach was a big step
away from traditional chromatofocusing by using defined buffers, the method itself
was still lackluster due to the non-linear gradients.
Dell Farnan was involved in a number of publications dealing with pH gradient elution
of mAb charge variants [15, 19, 108]. By using a mixture of three cationic buffer
substances, namely piperazine, imidazole and Tris, with pKa values of 9.8, 7.1 and 8.1
respectively, it is possible to maintain a relatively stable buffering capacity over a pH
range from ~6 to 9.5 [15]. By varying the relative amounts of buffer compounds used,
it is possible to influence the shape of the resulting pH gradient. The method was
developed for the routine analysis of charge heterogeneity of a group of mAb, as a
replacement of salt gradient elution. The biggest advantage is the not need of
optimizing the method for each antibody, as in the case of salt gradient elution were
stationary phase, mobile phase pH and additives and gradient conditions have to be
optimized for each product [15]. Other researchers have presented similar pH gradient
methods with varying pH ranges [14, 97, 105].
No thorough investigation of the fundamental reasons for the non-linearity of the
previously discussed external pH gradients has been performed until 2013, when
Kröner and Hubbuch published a theoretical framework that offers an in depth
treatment of the requirements for linearity [106]. Firstly, they correctly identified one
of the main problems of many previously presented methods, namely utilizing
24
buffering compounds carrying the opposite charge of the stationary phase in their ionic
state. This obviously leads to interaction between the mobile and the stationary phase,
resulting in retention of some buffering compounds depending on their charge state,
distorting the desired concentration profile.
Secondly, and most importantly they recognized that the linearity of an external pH
gradient depends solely on the buffer capacity of the mobile phase over the gradient
pH range, if the buffering compounds are unretained [106]. They identified an
abundance of commercially available cationic, anionic and zwitterionic buffering
compounds with pKa values from 2 to 11 for the use in either cation- or anion-
exchange chromatography. By using an algorithm that assumes additive buffering
capacity of all ions in a solution, they were able to predict two buffer systems for both
modes of ion-exchange chromatography. A pH 4.0 to 11.0 gradient using anionic or
zwitterionic buffers for the use in cation-exchange chromatography and a pH 10.5 to
3.5 gradient using basic buffers for the use in anionic-exchange chromatography. The
resulting pH gradients were exceptionally linear, quantified by a coefficient of
correlation R² > 0.99 and could be used for the elution of proteins in ion-exchange
chromatography.
Chromatographic ion-exchange methods, based on either pH gradient or salt gradient
elution or displacement are able to separate mAb charge variants. While displacement
is a highly efficient chromatographic mode, the practical implementation of the
method can be tricky. Elution chromatography is straightforward and the literature in
the recent years has confirmed that pH gradients are superior for the elution of mAb
charge variants. Various methods exist for the creation of pH gradients, each with its
own set of advantages and disadvantages. Cation exchange pH gradient methods can
be used on an analytical scale for the determination of the chromatographic pI, based
on the surface charge distribution, and for the quantification of charge heterogeneity
and on a preparative scale for the separation and purification of mAb charge variants
for the study mAb microheterogeneity.
25
1.8 Alternative methods
For the analysis of antibody charge heterogeneity, a few gel-based methods are also
available. They can be useful as orthogonal methods, but can only be operated at an
analytical scale, making them ineffective for the preparation of charge variants for
further analysis [27, 113]. IEF can be performed using two different methods to create
a pH gradient in the polyacrylamide gel, either using ampholytes or immobilizing a pH
gradient using acrylamide with buffering side chains [111, 114, 115]. The immobilized
pH gradient method is far superior, providing stable gradients over a large range of pH
values, but both methods are generally used for proteins with a pI below seven.
Capillary zone electrophoresis can be coupled to mass spectrometry detectors and has
been used somewhat successfully for the analysis of mAb variants, but cannot be
considered a method of choice [16, 20, 24, 116].
Capillary IEF is a powerful analytical method that is analogous to gel based IEF.
Excellent resolution and repeatability makes this method very useful for the standard
monitoring of mAb charge heterogeneity. Different approaches for detection are
available were the analyte is either eluted and detected in a one or two step process or
a transparent capillary can be used in so called imaging capillary IEF [18, 22, 117].
A main difference in the determination of pI values by electrophoretic methods and
chromatographic methods is based on the separation mode. While the analyte travels
to a pH region in which its net charge is zero, which corresponds to the true pI, a
chromatographic method will only be able to measure the surface charge of an analyte.
Large deviations between pI values have been observed for many proteins [106], so a
pI measured chromatographically should be labeled as such.
While most of these electrophoretic methods offer high-resolution separations, they
cannot be scaled up to preparative scale, a large drawback compared to a
chromatographic method.
26
2 Objective
The objective of this doctoral thesis was the development of a high-resolution method
for the separation of mAb variants. The method should not only be usable at analytical
scales, but should be scalable to preparative and even industrial scale, to allow not
only the generation of material for further analysis but to improve the possibilities in
the downstream processing of mAb. Conceptually it should be based on ion-exchange
chromatography, due to its low cost and ease of implementation. The method should
be able to resolve isoforms based on the various chemical modifications found on
mAbs, i.e. glycosylation, deamidation and others. The method should be evaluated
with different IgG, produced in Chinese hamster ovary cells. For sample analysis, an
electrophoretic method for the identification of charge variants should be developed
that is viable for proteins with an alkaline pI.
27
3 Conclusion
In a review article, the influence of one source of mAb microheterogeneity is
reviewed, namely glycosylation. The effect of differential glycosylation on three
biopharmaceuticals, among them IgG, is outlined. Furthermore, various state of the art
strategies for glycan analysis are presented and discussed. It should be apparent that
glycosylation is a big influence on the efficacy of a therapeutical mAb, and therefore
should be controlled and monitored. Glycosylation being a big part of the
microheterogeneity observed in monoclonal antibodies, it was important to review the
literature of the current state of glycobiology of biopharmaceuticals.
A pH gradient cation exchange chromatography method for the separation of IgG
charge variants was developed. The work was focused on the IgG isotype, since it is
the clearly the dominant antibody variant in the pharmaceutical industry. Cation
exchange chromatography media were chosen as the stationary phase due to their
ubiquity in mAb downstream processes and analytical applications. A linear pH
gradient was chosen as the driving force for elution, as it offers a higher selectivity for
IgG charge variants than salt gradients. The methods for creating pH gradients in ion-
exchange chromatography found in the literature offered only unsatisfying gradients.
A new method to creating external pH gradients for ion-exchange chromatography
was developed, based on keeping the buffering capacity constant. This approach was
subsequently confirmed by Kröner and Hubbuch’s theoretical framework [106]. In
detail, it was observed that other groups have tried using buffer compounds with pKa
values covering the intended pH gradient range, but their concentrations were
generally just kept the same for all compounds. This results in increased buffering
capacity close to the pKa of the buffers, and valleys of buffering capacity between two
buffer compounds. This deviation in buffering capacity creates concave and convex
pH gradients when the mobile phases are mixed in a gradient mixer, the gradient
becomes steeper at a lower buffering capacity and shallower when the buffering
capacity increases. In order to counter act this behavior, it was hypothesized that using
a simple equation to calculate the total buffering capacity of the solution at discrete pH
28
values along the gradient based on the assumption that buffering capacities behave in
an additive fashion, as shown in the equation below,
𝛽𝑡 = ∑ 𝛽𝑖𝑛𝑖=1 (3)
where βt is the total buffering capacity and βi the buffering capacity of each buffering
compound. This additive effect of buffering capacities should hold true at low
concentrations.
The buffering capacity of each buffering substance i, can in turn be calculated with the
following equation,
𝛽𝑖 =𝑑B+
𝑑pH= ln(10) ×
𝐶𝑖𝐾𝐴𝑖[𝐻+]
(𝐾𝐴𝑖+[𝐻+])2 (4)
where dB+ is the infinitesimal amount of base added, dpH is the resulting change in
pH, Ci is the concentration of buffering compound i, and KAi is the dissociation
constant of compound i. After accounting for all buffers, the inherent buffering
capacity of water has to be taken into consideration, which is important at very low or
high pH.
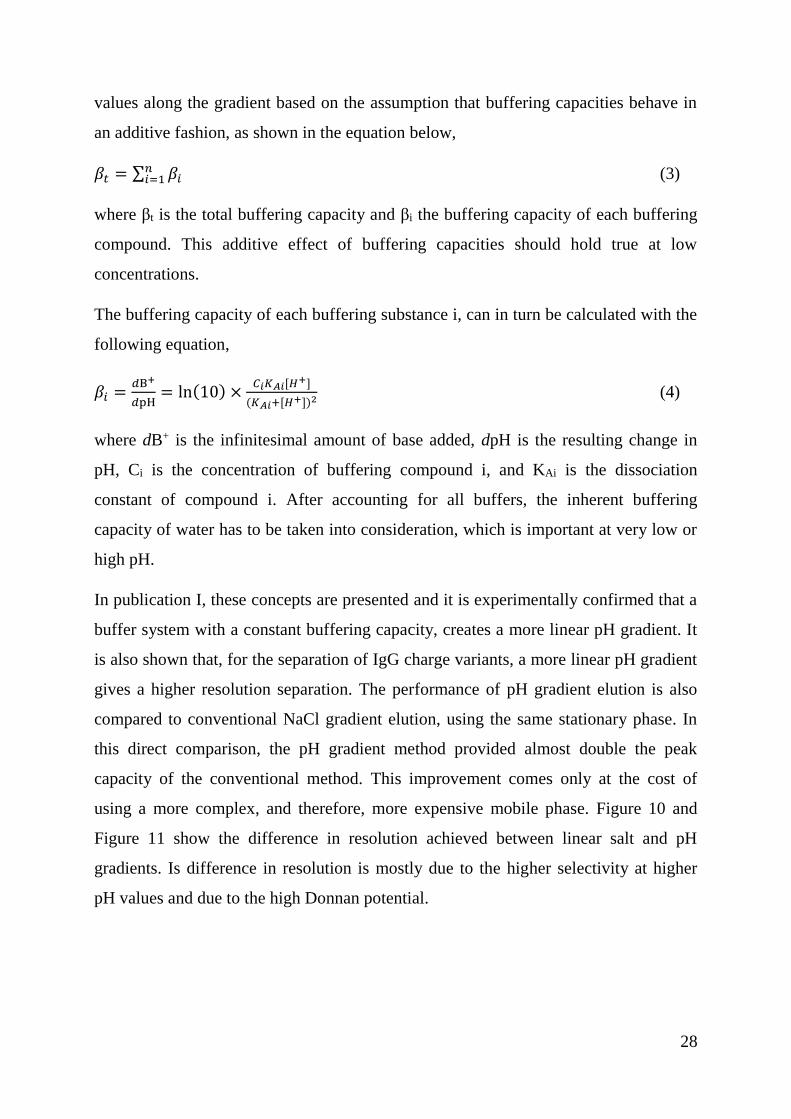
In publication I, these concepts are presented and it is experimentally confirmed that a
buffer system with a constant buffering capacity, creates a more linear pH gradient. It
is also shown that, for the separation of IgG charge variants, a more linear pH gradient
gives a higher resolution separation. The performance of pH gradient elution is also
compared to conventional NaCl gradient elution, using the same stationary phase. In
this direct comparison, the pH gradient method provided almost double the peak
capacity of the conventional method. This improvement comes only at the cost of
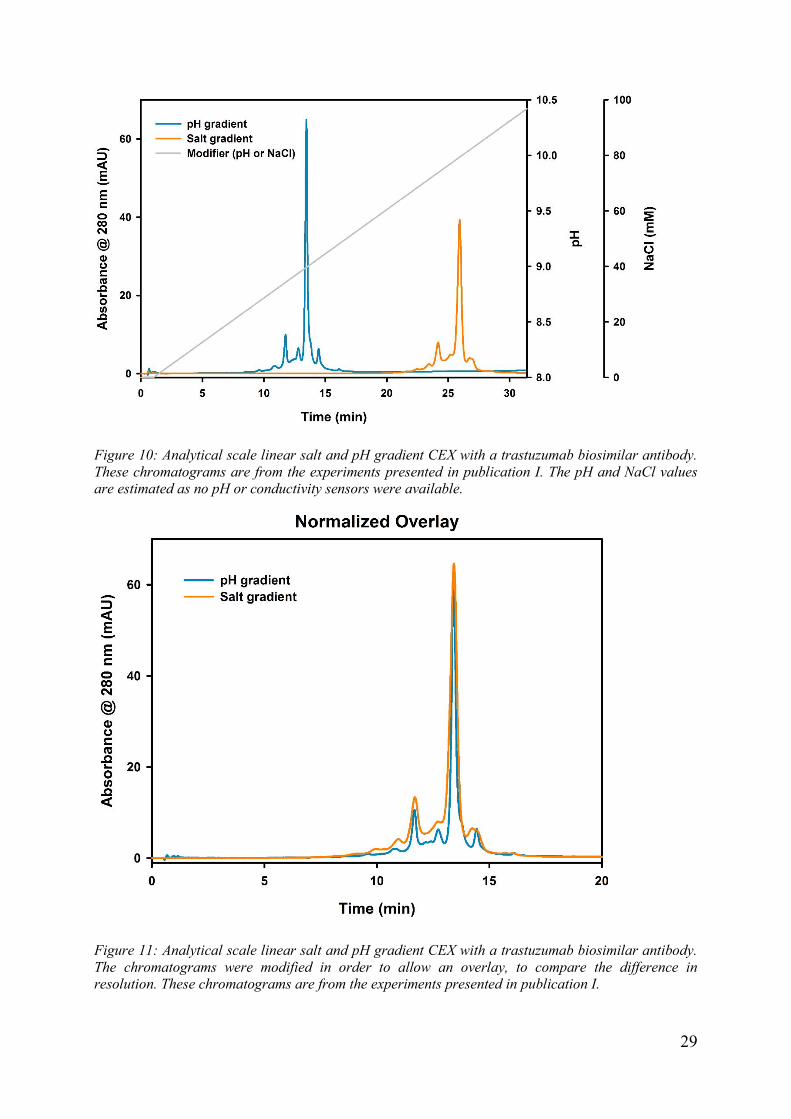
using a more complex, and therefore, more expensive mobile phase. Figure 10 and
Figure 11 show the difference in resolution achieved between linear salt and pH
gradients. Is difference in resolution is mostly due to the higher selectivity at higher
pH values and due to the high Donnan potential.
29
Figure 10: Analytical scale linear salt and pH gradient CEX with a trastuzumab biosimilar antibody. These chromatograms are from the experiments presented in publication I. The pH and NaCl values are estimated as no pH or conductivity sensors were available.
Figure 11: Analytical scale linear salt and pH gradient CEX with a trastuzumab biosimilar antibody. The chromatograms were modified in order to allow an overlay, to compare the difference in resolution. These chromatograms are from the experiments presented in publication I.
30
In publication II, the same pH gradient method is validated for the routine use as a
monitoring method for charge heterogeneity. In order to validate an analytical method,
a defined standard material is required. Different routes of obtaining IgG charge
variant standard material were explored. The three most fruitful were all based on
cation-exchange chromatography, and utilized either salt or pH gradient elution or
displacement chromatography.
It was observed that salt gradient elution has a very narrow operating window of pH
and starting and final NaCl concentration, in which sufficient resolution between
charge variants was possible. Unfortunately, the binding capacity under these
operating conditions was very low. Therefore, Salt gradient elution was not a feasible
method for the generation of sufficiently pure standard material.
Displacement chromatography was attempted with various IgG and under various
conditions, but even the best separation observed was inferior to preparative pH
gradient elution. Consequentially most of the experiments performed remain
unpublished. The reasons for this disappointing performance, compared to some
results reported in the literature [17, 85, 118], were never elucidated, even though a
systematic approach based on the SMA model was pursued [86]. Due to the
disappointing results, no charge variant standard material could be generated with
displacement chromatography.
Eventually, the pH gradient method was scaled up to semi-preparative scale, in order
separate IgG charge isoforms in the hundreds of mg scale, to generate the required
amounts of standard material. The scale up was performed by keeping the residence
time constant. In practice, the residence time had to be increased in the semi-
preparative approach, due to pressure limitations. The resulting chromatograms were
similar, if the normalized gradient slope was identical in terms of column volumes.
Owing to the lack of an orthogonal method to create the standards, the distinctiveness
of the acidic and the main charge variant standards had to be confirmed using another
method.
In detail, the dimensionless gradient slope, γ, expressed in modifier/column volume
was calculated. In the analytical scale, a γ of 0.25 pH/CV was used, i.e. per column
31
volume of mobile phase the pH was increased by 0.25. This γ was kept constant when
scaling up from the 4 x 250 mm column to the 9 x 250 mm column, and when scaling
up from the 9 x 250 mm column to the 22 x 250 mm column. This ensured that the
resolution observed in the quantitative scale would be achieved in the two larger
scales. Since the residence time had to be increased when scaling up, due to system
limitations, the overall resolution was increased slightly.
IEF in IPG acrylamide gels was adapted for the analysis of proteins with isoelectric
points in the alkaline range. The use of ampholyte based gels was fruitless, owing to
the many problems reported for gradients above neutral [111], but immobilized pH
gradients could successfully be modified as shown by Görg et al. [119] for 2D
electrophoresis. This IEF method was then used as a quasi-orthogonal analytical
method for the confirmation of the quality of the standard material.
The validation of the pH gradient method with the standard material showed excellent
linearity for samples with a relative content of between 1 and 50% of charge variants.
The other method parameters were also in agreement with standards for bio-analytical
methods [120, 121].
The wider scope of the project is aimed at the elucidation of the origin and the effects
of the microheterogeneity of IgG. In order to achieve this goal glycosylation analysis,
peptide mapping, in-vitro receptor binding assays as well as cellular activity assays
were performed. The, as of yet, unpublished glycan data shows that some separation of
IgG glycoforms was achieved with the pH gradient method described in this thesis. It
was possible to obtain fractions containing almost no charged glycan species, i.e.
sialylated glycans. The peptide map showed differences in deamidation state between
variant fractions. Receptor binding and activity assays showed varying results across
fractions, suggesting that the antibody isoforms, which could be separated with the pH
gradient method, have different biological activity. This is a promising start for
proving a long-standing biological doctrine false, namely that antibody modifications
leading to microheterogeneity do not affect the in vivo function of the drug product.
Under the quality by design (QbD) framework introduced by the US food and drug
administration, analytical tools for the elucidation of complex product characteristics,
32
such as antibody microheterogeneity, are of immense importance in the development
and production of a biopharmaceutical. The pH gradient method presented in this work
can be used for the study of a drug product’s microheterogeneity, in order to quantify
the biological activity of the different variants. This in turn helps identifying a design
space of acceptable isoforms, leading to safer and more effective biopharmaceuticals.
The method can also be important in comparability studies, proving consistency
between production batches [2].
In summary, it can be said that the objectives of this thesis were met:
1 A high-resolution method for the separation of mAb variants based on ion-
exchange chromatography was developed.
2 The method was scaled up to preparative scale, and 180 mg of monoclonal
antibody variants could be separated in one run.
3 Enough charge variant material could be separated to allow the use of various
analytical methods, including biological assays.
4 While reproducible separation of charge variants was accomplished, a
conclusion on the exact influence of all modifications and their influence on
retention time is not available yet.
5 The method was evaluated using various CHO produced antibodies.
6 The method was validated for the quantification of monoclonal antibody charge
variants, which allows the use in analytical labs and for process monitoring.
Contributions to the publications:
In publication I, Nico Lingg devised the method, conducted the chromatographic
experiments and drafted the manuscript.
In publication II, Nico Lingg planned the validation scheme, conducted the
chromatographic experiments and drafted the manuscript.
In the additional publication I, Nico Lingg drafted the introduction, the chapters about
IgG, HPLC profiling of released glycans, LC-MS approach for site-specific
glycosylation and the conclusion.
33
4 References
[1] Elvin JG, Couston RG, van der Walle CF. Therapeutic antibodies: market considerations, disease targets and bioprocessing. Int J Pharm 2013;440:83-98.
[2] Schaffner G, Haase M, Giess S. Criteria for investigation of the product equivalence of monoclonal antibodies for therapeutic and in vivo-diagnostic use in case of introduction of changes in the manufacturing process. Biologicals 1995;23:253-259.
[3] Goetze AM, Schenauer MR, Flynn GC. Assessing monoclonal antibody product quality attribute criticality through clinical studies. mAbs 2010;2:500-507.
[4] van Beers MM, Bardor M. Minimizing immunogenicity of biopharmaceuticals by controlling critical quality attributes of proteins. Biotechnol J 2012;7:1473-1484.
[5] Liu H, Gaza-Bulseco G, Faldu D, Chumsae C, Sun J. Heterogeneity of monoclonal antibodies. J Pharm Sci 2008;97:2426-2447.
[6] Liu H, Gaza-Bulseco G, Chumsae C. Glutamine deamidation of a recombinant monoclonal antibody. Rapid Commun Mass Spectrom 2008;22:4081-4088.
[7] Awdeh ZL, Williamson AR, Askonas BA. One cell-one immunoglobulin. Origin of limited heterogeneity of myeloma proteins. Biochem J 1970;116:241-248.
[8] Tsai PK, Bruner MW, Irwin JI, Ip CC, Oliver CN, Nelson RW, Volkin DB, Middaugh CR. Origin of the isoelectric heterogeneity of monoclonal immunoglobulin h1B4. Pharm Res 1993;10:1580-1586.
[9] Perkins M, Theiler R, Lunte S, Jeschke M. Determination of the origin of charge heterogeneity in a murine monoclonal antibody. Pharm Res 2000;17:1110-1117.
[10] Harris RJ, Kabakoff B, Macchi FD, Shen FJ, Kwong M, Andya JD, Shire SJ, Bjork N, Totpal K, Chen AB. Identification of multiple sources of charge heterogeneity in a recombinant antibody. Journal of chromatography B, Analytical technologies in the biomedical and life sciences 2001;752:233-245.
[11] Weitzhandler M, Farnan D, Rohrer JS, Avdalovic N. Protein variant separations using cation exchange chromatography on grafted, polymeric stationary phases. PROTEOMICS 2001;1:179-185.
[12] Ahrer K, Jungbauer A. Chromatographic and electrophoretic characterization of protein variants. Journal of chromatography B, Analytical technologies in the biomedical and life sciences 2006;841:110-122.
[13] Vlasak J, Ionescu R. Heterogeneity of monoclonal antibodies revealed by charge-sensitive methods. Curr Pharm Biotechnol 2008;9:468-481.
[14] Nordborg A, Zhang B, He XZ, Hilder EF, Haddad PR. Characterization of monoclonal antibodies using polymeric cation exchange monoliths in combination with salt and pH gradients. J Sep Sci 2009;32:2668-2673.
[15] Farnan D, Moreno GT. Multiproduct high-resolution monoclonal antibody charge variant separations by pH gradient ion-exchange chromatography. Anal Chem 2009;81:8846-8857.
[16] He Y, Lacher NA, Hou W, Wang Q, Isele C, Starkey J, Ruesch M. Analysis of identity, charge variants, and disulfide isomers of monoclonal antibodies with capillary zone electrophoresis in an uncoated capillary column. Anal Chem 2010;82:3222-3230.
[17] Khawli LA, Goswami S, Hutchinson R, Kwong ZW, Yang J, Wang X, Yao Z, Sreedhara A, Cano T, Tesar D, Nijem I, Allison DE, Wong PY, Kao YH, Quan C, Joshi A, Harris RJ, Motchnik P. Charge variants in IgG1: Isolation, characterization, in vitro binding properties and pharmacokinetics in rats. mAbs 2010;2:613-624.
[18] Meert CD, Brady LJ, Guo A, Balland A. Characterization of antibody charge heterogeneity resolved by preparative immobilized pH gradients. Anal Chem 2010;82:3510-3518.
34
[19] Rea JC, Moreno GT, Lou Y, Farnan D. Validation of a pH gradient-based ion-exchange chromatography method for high-resolution monoclonal antibody charge variant separations. J Pharm Biomed Anal 2011;54:317-323.
[20] He Y, Isele C, Hou W, Ruesch M. Rapid analysis of charge variants of monoclonal antibodies with capillary zone electrophoresis in dynamically coated fused-silica capillary. J Sep Sci 2011;34:548-555.
[21] Michels DA, Tu AW, McElroy W, Voehringer D, Salas-Solano O. Charge heterogeneity of monoclonal antibodies by multiplexed imaged capillary isoelectric focusing immunoassay with chemiluminescence detection. Anal Chem 2012;84:5380-5386.
[22] Salas-Solano O, Kennel B, Park SS, Roby K, Sosic Z, Boumajny B, Free S, Reed-Bogan A, Michels D, McElroy W, Bonasia P, Hong M, He X, Ruesch M, Moffatt F, Kiessig S, Nunnally B. Robustness of iCIEF methodology for the analysis of monoclonal antibodies: an interlaboratory study. J Sep Sci 2012;35:3124-3129.
[23] Anderson CL, Wang Y, Rustandi RR. Applications of imaged capillary isoelectric focussing technique in development of biopharmaceutical glycoprotein-based products. ELECTROPHORESIS 2012;33:1538-1544.
[24] Espinosa-de la Garza CE, Perdomo-Abundez FC, Padilla-Calderon J, Uribe-Wiechers JM, Perez NO, Flores-Ortiz LF, Medina-Rivero E. Analysis of recombinant monoclonal antibodies by capillary zone electrophoresis. ELECTROPHORESIS 2013;34:1133-1140.
[25] Kang X, Kutzko JP, Hayes ML, Frey DD. Monoclonal antibody heterogeneity analysis and deamidation monitoring with high-performance cation-exchange chromatofocusing using simple, two component buffer systems. J Chromatogr A 2013;1283:89-97.
[26] Talebi M, Nordborg A, Gaspar A, Lacher NA, Wang Q, He XZ, Haddad PR, Hilder EF. Charge heterogeneity profiling of monoclonal antibodies using low ionic strength ion-exchange chromatography and well-controlled pH gradients on monolithic columns. J Chromatogr A 2013;1317:148-154.
[27] Beck A, Wagner-Rousset E, Ayoub D, Van Dorsselaer A, Sanglier-Cianferani S. Characterization of therapeutic antibodies and related products. Anal Chem 2013;85:715-736.
[28] Strop P, Ho WH, Boustany LM, Abdiche YN, Lindquist KC, Farias SE, Rickert M, Appah CT, Pascua E, Radcliffe T, Sutton J, Chaparro-Riggers J, Chen W, Casas MG, Chin SM, Wong OK, Liu SH, Vergara G, Shelton D, Rajpal A, Pons J. Generating bispecific human IgG1 and IgG2 antibodies from any antibody pair. J Mol Biol 2012;420:204-219.
[29] Castilho A, Bohorova N, Grass J, Bohorov O, Zeitlin L, Whaley K, Altmann F, Steinkellner H. Rapid high yield production of different glycoforms of Ebola virus monoclonal antibody. PLoS ONE 2011;6:e26040.
[30] Jefferis R. Glycosylation as a strategy to improve antibody-based therapeutics. Nat Rev Drug Discov 2009;8:226-234.
[31] Beck A, Wagner-Rousset E, Bussat MC, Lokteff M, Klinguer-Hamour C, Haeuw JF, Goetsch L, Wurch T, Van Dorsselaer A, Corvaia N. Trends in glycosylation, glycoanalysis and glycoengineering of therapeutic antibodies and Fc-fusion proteins. Curr Pharm Biotechnol 2008;9:482-501.
[32] Rudd PM, Elliott T, Cresswell P, Wilson IA, Dwek RA. Glycosylation and the immune system. Science 2001;291:2370-2376.
[33] Anthony RM, Ravetch JV. A novel role for the IgG Fc glycan: the anti-inflammatory activity of sialylated IgG Fcs. J Clin Immunol 2010;30 Suppl 1:S9-14.
[34] Peipp M, Lammerts van Bueren JJ, Schneider-Merck T, Bleeker WW, Dechant M, Beyer T, Repp R, van Berkel PH, Vink T, van de Winkel JG, Parren PW, Valerius T. Antibody fucosylation differentially impacts cytotoxicity mediated by NK and PMN effector cells. Blood 2008;112:2390-2399.
[35] Kanda Y, Yamada T, Mori K, Okazaki A, Inoue M, Kitajima-Miyama K, Kuni-Kamochi R, Nakano R, Yano K, Kakita S, Shitara K, Satoh M. Comparison of biological activity among
35
nonfucosylated therapeutic IgG1 antibodies with three different N-linked Fc oligosaccharides: the high-mannose, hybrid, and complex types. Glycobiology 2007;17:104-118.
[36] Hodoniczky J, Zheng YZ, James DC. Control of recombinant monoclonal antibody effector functions by Fc N-glycan remodeling in vitro. Biotechnol Prog 2005;21:1644-1652.
[37] Houde D, Peng Y, Berkowitz SA, Engen JR. Post-translational modifications differentially affect IgG1 conformation and receptor binding. Mol Cell Proteomics 2010;9:1716-1728.
[38] Davies J, Jiang L, Pan LZ, LaBarre MJ, Anderson D, Reff M. Expression of GnTIII in a recombinant anti-CD20 CHO production cell line: Expression of antibodies with altered glycoforms leads to an increase in ADCC through higher affinity for FC gamma RIII. Biotechnol Bioeng 2001;74:288-294.
[39] Scallon BJ, Tam SH, McCarthy SG, Cai AN, Raju TS. Higher levels of sialylated Fc glycans in immunoglobulin G molecules can adversely impact functionality. Mol Immunol 2007;44:1524-1534.
[40] Kaneko Y, Nimmerjahn F, Ravetch JV. Anti-inflammatory activity of immunoglobulin G resulting from Fc sialylation. Science 2006;313:670-673.
[41] Jefferis R. Isotype and glycoform selection for antibody therapeutics. Arch Biochem Biophys 2012;526:159-166.
[42] Lingg N, Zhang P, Song Z, Bardor M. The sweet tooth of biopharmaceuticals: importance of recombinant protein glycosylation analysis. Biotechnol J 2012;7:1462-1472.
[43] Sola RJ, Griebenow K. Glycosylation of therapeutic proteins: an effective strategy to optimize efficacy. BioDrugs 2010;24:9-21.
[44] Zeitlin L, Pettitt J, Scully C, Bohorova N, Kim D, Pauly M, Hiatt A, Ngo L, Steinkellner H, Whaley KJ, Olinger GG. Enhanced potency of a fucose-free monoclonal antibody being developed as an Ebola virus immunoprotectant. Proc Natl Acad Sci U S A 2011;108:20690-20694.
[45] Raju TS. Terminal sugars of Fc glycans influence antibody effector functions of IgGs. Curr Opin Immunol 2008;20:471-478.
[46] Qian J, Liu T, Yang L, Daus A, Crowley R, Zhou Q. Structural characterization of N-linked oligosaccharides on monoclonal antibody cetuximab by the combination of orthogonal matrix-assisted laser desorption/ionization hybrid quadrupole-quadrupole time-of-flight tandem mass spectrometry and sequential enzymatic digestion. Anal Biochem 2007;364:8-18.
[47] Varki A. Evolutionary Forces Shaping the Golgi Glycosylation Machinery: Why Cell Surface Glycans Are Universal to Living Cells. Cold Spring Harbor Perspectives in Biology 2011;3.
[48] Jefferis R. Recombinant antibody therapeutics: the impact of glycosylation on mechanisms of action. Trends Pharmacol Sci 2009;30:356-362.
[49] Loos A, Gruber C, Altmann F, Mehofer U, Hensel F, Grandits M, Oostenbrink C, Stadlmayr G, Furtmuller PG, Steinkellner H. Expression and glycoengineering of functionally active heteromultimeric IgM in plants. Proc Natl Acad Sci U S A 2014;111:6263-6268.
[50] Loos A, Van Droogenbroeck B, Hillmer S, Grass J, Kunert R, Cao J, Robinson DG, Depicker A, Steinkellner H. Production of monoclonal antibodies with a controlled N-glycosylation pattern in seeds of Arabidopsis thaliana. Plant Biotechnol J 2011;9:179-192.
[51] Triguero A, Cabrera G, Royle L, Harvey DJ, Rudd PM, Dwek RA, Bardor M, Lerouge P, Cremata JA. Chemical and enzymatic N-glycan release comparison for N-glycan profiling of monoclonal antibodies expressed in plants. Anal Biochem 2010;400:173-183.
[52] Forthal DN, Gach JS, Landucci G, Jez J, Strasser R, Kunert R, Steinkellner H. Fc-glycosylation influences Fcgamma receptor binding and cell-mediated anti-HIV activity of monoclonal antibody 2G12. Journal of immunology 2010;185:6876-6882.
[53] Schahs M, Strasser R, Stadlmann J, Kunert R, Rademacher T, Steinkellner H. Production of a monoclonal antibody in plants with a humanized N-glycosylation pattern. Plant Biotechnol J 2007;5:657-663.
[54] Rademacher T, Sack M, Arcalis E, Stadlmann J, Balzer S, Altmann F, Quendler H, Stiegler G, Kunert R, Fischer R, Stoger E. Recombinant antibody 2G12 produced in maize endosperm
36
efficiently neutralizes HIV-1 and contains predominantly single-GlcNAc N-glycans. Plant Biotechnol J 2008;6:189-201.
[55] Quan C, Alcala E, Petkovska I, Matthews D, Canova-Davis E, Taticek R, Ma S. A study in glycation of a therapeutic recombinant humanized monoclonal antibody: where it is, how it got there, and how it affects charge-based behavior. Anal Biochem 2008;373:179-191.
[56] Chumsae C, Gaza-Bulseco G, Sun J, Liu H. Comparison of methionine oxidation in thermal stability and chemically stressed samples of a fully human monoclonal antibody. J Chromatogr B Analyt Technol Biomed Life Sci 2007;850:285-294.
[57] Stracke J, Emrich T, Rueger P, Schlothauer T, Kling L, Knaupp A, Hertenberger H, Wolfert A, Spick C, Lau W, Drabner G, Reiff U, Koll H, Papadimitriou A. A novel approach to investigate the effect of methionine oxidation on pharmacokinetic properties of therapeutic antibodies. mAbs 2014;6:0--1.
[58] Fernández LEM, Kalume DE, Calvo L, Fernández Mallo M, Vallin A, Roepstorff P. Characterization of a recombinant monoclonal antibody by mass spectrometry combined with liquid chromatography. J Chromatogr B Analyt Technol Biomed Life Sci 2001;752:247-261.
[59] Brorson K, Jia AY. Therapeutic monoclonal antibodies and consistent ends: terminal heterogeneity, detection, and impact on quality. Curr Opin Biotechnol 2014;30C:140-146.
[60] Dick LW, Jr., Qiu D, Mahon D, Adamo M, Cheng KC. C-terminal lysine variants in fully human monoclonal antibodies: investigation of test methods and possible causes. Biotechnol Bioeng 2008;100:1132-1143.
[61] Cai B, Pan H, Flynn GC. C-terminal lysine processing of human immunoglobulin G2 heavy chain in vivo. Biotechnol Bioeng 2011;108:404-412.
[62] Vlasak J, Bussat MC, Wang S, Wagner-Rousset E, Schaefer M, Klinguer-Hamour C, Kirchmeier M, Corvaia N, Ionescu R, Beck A. Identification and characterization of asparagine deamidation in the light chain CDR1 of a humanized IgG1 antibody. Anal Biochem 2009;392:145-154.
[63] Song Y, Schowen RL, Borchardt RT, Topp EM. Effect of 'pH' on the rate of asparagine deamidation in polymeric formulations: 'pH'-rate profile. J Pharm Sci 2001;90:141-156.
[64] Stratton LP, Kelly RM, Rowe J, Shively JE, Smith DD, Carpenter JF, Manning MC. Controlling deamidation rates in a model peptide: effects of temperature, peptide concentration, and additives. J Pharm Sci 2001;90:2141-2148.
[65] Wakankar AA, Borchardt RT, Eigenbrot C, Shia S, Wang YJ, Shire SJ, Liu JL. Aspartate isomerization in the complementarity-determining regions of two closely related monoclonal antibodies. Biochemistry 2007;46:1534-1544.
[66] Dillon TM, Ricci MS, Vezina C, Flynn GC, Liu YD, Rehder DS, Plant M, Henkle B, Li Y, Deechongkit S, Varnum B, Wypych J, Balland A, Bondarenko PV. Structural and functional characterization of disulfide isoforms of the human IgG2 subclass. J Biol Chem 2008;283:16206-16215.
[67] Wypych J, Li M, Guo A, Zhang Z, Martinez T, Allen MJ, Fodor S, Kelner DN, Flynn GC, Liu YD, Bondarenko PV, Ricci MS, Dillon TM, Balland A. Human IgG2 antibodies display disulfide-mediated structural isoforms. J Biol Chem 2008;283:16194-16205.
[68] Bloom JW, Madanat MS, Marriott D, Wong T, Chan SY. Intrachain disulfide bond in the core hinge region of human IgG4. Protein science : a publication of the Protein Society 1997;6:407-415.
[69] Jiskoot W, Beuvery EC, de Koning AA, Herron JN, Crommelin DJ. Analytical approaches to the study of monoclonal antibody stability. Pharm Res 1990;7:1234-1241.
[70] Mueller M, Loh MQ, Tscheliessnig R, Tee DH, Tan E, Bardor M, Jungbauer A. Liquid formulations for stabilizing IgMs during physical stress and long-term storage. Pharm Res 2013;30:735-750.
[71] Kelley B. Industrialization of mAb production technology The bioprocessing industry at a crossroads. mAbs 2009;1:443-452.
37
[72] Jungbauer A, Hahn R. Ion-exchange chromatography. Methods Enzymol 2009;463:349-371. [73] Carta G, Jungbauer A. Protein Chromatography; Process Development and Scale-Up. John Wiley
& Sons, Inc.; 2010. p. 346. [74] Schmidt M, Hafner M, Frech C. Modeling of salt and pH gradient elution in ion-exchange
chromatography. J Sep Sci 2014;37:5-13. [75] Brooks CA, Cramer SM. Steric Mass-Action Ion-Exchange - Displacement Profiles and Induced
Salt Gradients. AIChE Journal 1992;38:1969-1978. [76] Boardman NK, Partridge SM. Separation of neutral proteins on ion-exchange resins. Biochem J
1955;59:543-552. [77] Kopaciewicz W, Rounds MA, Fausnaugh J, Regnier FE. Retention Model for High-Performance
Ion-Exchange Chromatography. J Chromatogr 1983;266:3-21. [78] Harris RJ. Processing of C-terminal lysine and arginine residues of proteins isolated from
mammalian cell culture. J Chromatogr A 1995;705:129-134. [79] Du Y, Walsh A, Ehrick R, Xu W, May K, Liu H. Chromatographic analysis of the acidic and basic
species of recombinant monoclonal antibodies. mAbs 2012;4:578-585. [80] Teshima G, Li MX, Danishmand R, Obi C, To R, Huang C, Kung J, Lahidji V, Freeberg J, Thorner L,
Tomic M. Separation of oxidized variants of a monoclonal antibody by anion-exchange. J Chromatogr A 2011;1218:2091-2097.
[81] Melter L, Strohlein G, Butte A, Morbidelli M. Adsorption of monoclonal antibody variants on analytical cation-exchange resin. J Chromatogr A 2007;1154:121-131.
[82] Flores-Ortiz LF, Campos-Garcia VR, Perdomo-Abundez FC, Perez NO, Medina-Rivero E. Physicochemical Properties of Rituximab. J Liq Chromatogr R T 2014;37:1438-1452.
[83] Guelat B, Delegrange L, Valax P, Morbidelli M. Model-based prediction of monoclonal antibody retention in ion-exchange chromatography. J Chromatogr A 2013;1298:17-25.
[84] Cramer M. 9 Bioseparations by displacement chromatography. In: A. Satinder editor. Separation Science and Technology vol. Volume 2: Academic Press; 2000. p. 379-415.
[85] Zhang T, Bourret J, Cano T. Isolation and characterization of therapeutic antibody charge variants using cation exchange displacement chromatography. J Chromatogr A 2011;1218:5079-5086.
[86] Berndtsson M. Method Development for Separation of Charge Isoforms of IgG by Displacement Cation Exchange Chromatography.Lund, Sweden: Lund University; Master of Science; 2014.
[87] Sluyterman LAAE, Elgersma O. Chromatofocusing: Isoelectric focusing on ion-exchange columns. I. General Principles. J Chromatogr A 1978;150:17-30.
[88] Sluyterman LAAE, Wijdenes J. Chromatofocusing: Isoelectric focusing on ion-exchange columns. II. Experimental verification. J Chromatogr A 1978;150:31-44.
[89] Sluyterman LAÆ, Wijdenes J. Chromatofocusing. III. The properties of a DEAE-agarose anion exchanger and its suitability for protein separations. J Chromatogr A 1981;206:441-447.
[90] Sluyterman LAÆ, Wijdenes J. Chromatofocusing. IV. Properties of an agarose polyethyleneimine ion exchanger and its suitability for protein separations. J Chromatogr A 1981;206:429-440.
[91] Kaltenbrunner O, Tauer C, Brunner J, Jungbauer A. Isoprotein Analysis by Ion-Exchange Chromatography Using a Linear Ph Gradient Combined with a Salt Gradient. J Chromatogr 1993;639:41-49.
[92] Bates RC, Frey DD. Quasi-linear pH gradients for chromatofocusing using simple buffer mixtures: local equilibrium theory and experimental verification. Journal of Chromatography A 1998;814:43-54.
[93] Bates RC, Kang X, Frey DD. High-performance chromatofocusing using linear and concave pH gradients formed with simple buffer mixtures: I. Effect of buffer composition on the gradient shape. Journal of Chromatography A 2000;890:25-36.
[94] Kang X, Bates RC, Frey DD. High-performance chromatofocusing using linear and concave pH gradients formed with simple buffer mixtures. II. Separation of proteins. J Chromatogr A 2000;890:37-43.
38
[95] Kang X, Frey DD. Chromatofocusing Using Micropellicular Column Packings with Computer-Aided Design of the Elution Buffer Composition. Analytical Chemistry 2002;74:1038-1045.
[96] Kang X, Frey DD. High-performance cation-exchange chromatofocusing of proteins. J Chromatogr A 2003;991:117-128.
[97] Ahamed T, Nfor BK, Verhaert PD, van Dedem GW, van der Wielen LA, Eppink MH, van de Sandt EJ, Ottens M. pH-gradient ion-exchange chromatography: an analytical tool for design and optimization of protein separations. J Chromatogr A 2007;1164:181-188.
[98] Ahamed T, Chilamkurthi S, Nfor BK, Verhaert PD, van Dedem GW, van der Wielen LA, Eppink MH, van de Sandt EJ, Ottens M. Selection of pH-related parameters in ion-exchange chromatography using pH-gradient operations. J Chromatogr A 2008;1194:22-29.
[99] Pabst TM, Antos D, Carta G, Ramasubramanyan N, Hunter AK. Protein separations with induced pH gradients using cation-exchange chromatographic columns containing weak acid groups. J Chromatogr A 2008;1181:83-94.
[100] Pabst TM, Carta G. pH transitions in cation exchange chromatographic columns containing weak acid groups. J Chromatogr A 2007;1142:19-31.
[101] Pabst TM, Carta G, Ramasubramanyan N, Hunter AK, Mensah P, Gustafson ME. Separation of protein charge variants with induced pH gradients using anion exchange chromatographic columns. Biotechnol Prog 2008;24:1096-1106.
[102] Tsonev LI, Hirsh AG. Theory and applications of a novel ion exchange chromatographic technology using controlled pH gradients for separating proteins on anionic and cationic stationary phases. J Chromatogr A 2008;1200:166-182.
[103] Tsonev LI, Hirsh AG. Improved resolution in the separation of monoclonal antibody isoforms using controlled pH gradients in IEX chromatography. American Biotechnology Laboratory 2009;27:10-12.
[104] Ng PK, He J, Snyder MA. Separation of protein mixtures using pH-gradient cation-exchange chromatography. J Chromatogr A 2009;1216:1372-1376.
[105] Rozhkova A. Quantitative analysis of monoclonal antibodies by cation-exchange chromatofocusing. J Chromatogr A 2009;1216:5989-5994.
[106] Kroner F, Hubbuch J. Systematic generation of buffer systems for pH gradient ion exchange chromatography and their application. J Chromatogr A 2013;1285:78-87.
[107] Kroner F, Hanke AT, Nfor BK, Pinkse MW, Verhaert PD, Ottens M, Hubbuch J. Analytical characterization of complex, biotechnological feedstocks by pH gradient ion exchange chromatography for purification process development. J Chromatogr A 2013;1311:55-64.
[108] Zhang L, Patapoff T, Farnan D, Zhang B. Improving pH gradient cation-exchange chromatography of monoclonal antibodies by controlling ionic strength. J Chromatogr A 2013;1272:56-64.
[109] Vetter TA, Ferreira G, Robbins D, Carta G. Mixed-Beds of Strong and Weak Anion Exchange Resins for Protein Separations with Step-Induced pH Gradients. Sep Sci Technol 2014;49:477-489.
[110] Vetter TA, Ferreira G, Robbins D, Carta G. Predicting Retention and Resolution of Protein Charge Variants in Mixed-Beds of Strong and Weak Anion Exchange Resins with Step-Induced pH Gradients. Separation Science and Technology 2014;49:1775-1786.
[111] Righetti PG, Simó C, Sebastiano R, Citterio A. Carrier ampholytes for IEF, on their fortieth anniversary (1967–2007), brought to trial in court: The verdict. ELECTROPHORESIS 2007;28:3799-3810.
[112] Yamamoto S, Nakanishi K, Matsuno R. Ion-exchange chromatography of proteins. New York: CRC Press; 1988.
[113] Fekete S, Gassner AL, Rudaz S, Schappler J, Guillarme D. Analytical strategies for the characterization of therapeutic monoclonal antibodies. Trac-Trends in Anal Chem 2013;42:74-83.
[114] Righetti PG. The Alpher, Bethe, Gamow of isoelectric focusing, the alpha-Centaury of electrokinetic methodologies. Part I. ELECTROPHORESIS 2006;27:923-938.
39
[115] Righetti PG. The Alpher, Bethe and Gamow of IEF, the alpha-Centaury of electrokinetic methodologies. Part II: Immobilized pH gradients. ELECTROPHORESIS 2007;28:545-555.
[116] Madajová V, Šimuničová E, Kaniansky D, Marák J, Zelenská V. Fractionation of glycoforms of recombinant human erythropoietin by preparative capillary isotachophoresis. ELECTROPHORESIS 2005;26:2664-2673.
[117] Lin J, Tan Q, Wang S. A high-resolution capillary isoelectric focusing method for the determination of therapeutic recombinant monoclonal antibody. J Sep Sci 2011;34:1696-1702.
[118] McAtee CP, Hornbuckle J. Isolation of Monoclonal Antibody Charge Variants by Displacement Chromatography. Curr Protoc Protein Sci: John Wiley & Sons, Inc.; 2012.
[119] Gorg A, Obermaier C, Boguth G, Csordas A, Diaz JJ, Madjar JJ. Very alkaline immobilized pH gradients for two-dimensional electrophoresis of ribosomal and nuclear proteins. Electrophoresis 1997;18:328-337.
[120] Hartmann C, Smeyers-Verbeke J, Massart DL, McDowall RD. Validation of bioanalytical chromatographic methods. J Pharm Biomed Anal 1998;17:193-218.
[121] Peters FT, Drummer OH, Musshoff F. Validation of new methods. Forensic Sci Int 2007;165:216-224.
40
5 Publications
I. Lingg, N., Tan, E., Hintersteiner, B., Bardor, M., Jungbauer, A., Highly linear
pH gradients for analyzing monoclonal antibody charge heterogeneity in the
alkaline range, Journal of Chromatography A 1319 (2013) 65-71.
II. Lingg, N., Berndtsson, M., Hintersteiner, B., Schuster, M., Bardor, M.,
Jungbauer, A., Highly linear pH gradients for analyzing monoclonal antibody
charge heterogeneity in the alkaline range: validation of the method
parameters, Manuscript accepted for publication in Journal of Chromatography
A (2014).
6 Additional publications
I. Review article: Lingg, N., Zhang, P., Song, Z., Bardor, M., The sweet tooth of
biopharmaceuticals: importance of recombinant protein glycosylation analysis,
Biotechnology Journal 7 (2012) 1462-1472.
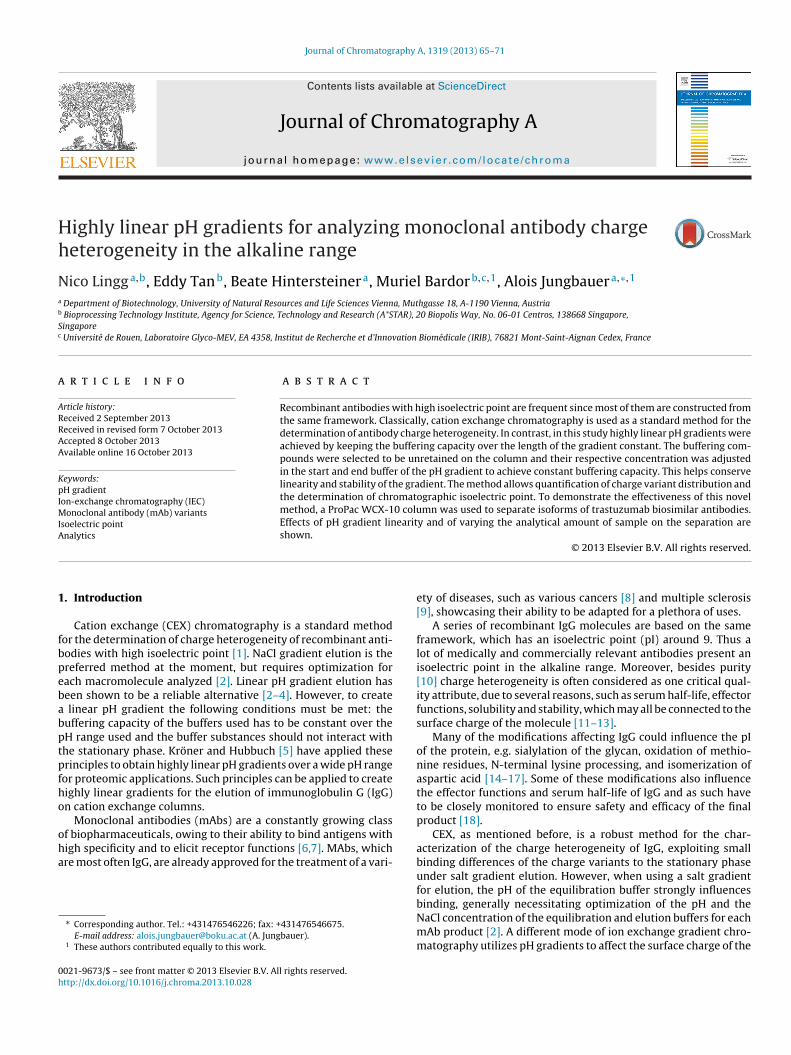
Journal of Chromatography A, 1319 (2013) 65– 71
Contents lists available at ScienceDirect
Journal of Chromatography A
jou rn al hom epage: www.elsev ier .com/ locate /chroma
Highly linear pH gradients for analyzing monoclonal antibody chargeheterogeneity in the alkaline range
Nico Lingga,b, Eddy Tanb, Beate Hintersteinera, Muriel Bardorb,c,1, Alois Jungbauera,∗,1
a Department of Biotechnology, University of Natural Resources and Life Sciences Vienna, Muthgasse 18, A-1190 Vienna, Austriab Bioprocessing Technology Institute, Agency for Science, Technology and Research (A*STAR), 20 Biopolis Way, No. 06-01 Centros, 138668 Singapore,Singaporec Université de Rouen, Laboratoire Glyco-MEV, EA 4358, Institut de Recherche et d’Innovation Biomédicale (IRIB), 76821 Mont-Saint-Aignan Cedex, France
a r t i c l e i n f o
Article history:Received 2 September 2013Received in revised form 7 October 2013Accepted 8 October 2013Available online 16 October 2013
Keywords:pH gradientIon-exchange chromatography (IEC)Monoclonal antibody (mAb) variantsIsoelectric pointAnalytics
a b s t r a c t
Recombinant antibodies with high isoelectric point are frequent since most of them are constructed fromthe same framework. Classically, cation exchange chromatography is used as a standard method for thedetermination of antibody charge heterogeneity. In contrast, in this study highly linear pH gradients wereachieved by keeping the buffering capacity over the length of the gradient constant. The buffering com-pounds were selected to be unretained on the column and their respective concentration was adjustedin the start and end buffer of the pH gradient to achieve constant buffering capacity. This helps conservelinearity and stability of the gradient. The method allows quantification of charge variant distribution andthe determination of chromatographic isoelectric point. To demonstrate the effectiveness of this novelmethod, a ProPac WCX-10 column was used to separate isoforms of trastuzumab biosimilar antibodies.Effects of pH gradient linearity and of varying the analytical amount of sample on the separation areshown.
© 2013 Elsevier B.V. All rights reserved.
1. Introduction
Cation exchange (CEX) chromatography is a standard methodfor the determination of charge heterogeneity of recombinant anti-bodies with high isoelectric point [1]. NaCl gradient elution is thepreferred method at the moment, but requires optimization foreach macromolecule analyzed [2]. Linear pH gradient elution hasbeen shown to be a reliable alternative [2–4]. However, to createa linear pH gradient the following conditions must be met: thebuffering capacity of the buffers used has to be constant over thepH range used and the buffer substances should not interact withthe stationary phase. Kröner and Hubbuch [5] have applied theseprinciples to obtain highly linear pH gradients over a wide pH rangefor proteomic applications. Such principles can be applied to createhighly linear gradients for the elution of immunoglobulin G (IgG)on cation exchange columns.
Monoclonal antibodies (mAbs) are a constantly growing classof biopharmaceuticals, owing to their ability to bind antigens withhigh specificity and to elicit receptor functions [6,7]. MAbs, whichare most often IgG, are already approved for the treatment of a vari-
∗ Corresponding author. Tel.: +431476546226; fax: +431476546675.E-mail address: [email protected] (A. Jungbauer).
1 These authors contributed equally to this work.
ety of diseases, such as various cancers [8] and multiple sclerosis[9], showcasing their ability to be adapted for a plethora of uses.
A series of recombinant IgG molecules are based on the sameframework, which has an isoelectric point (pI) around 9. Thus alot of medically and commercially relevant antibodies present anisoelectric point in the alkaline range. Moreover, besides purity[10] charge heterogeneity is often considered as one critical qual-ity attribute, due to several reasons, such as serum half-life, effectorfunctions, solubility and stability, which may all be connected to thesurface charge of the molecule [11–13].
Many of the modifications affecting IgG could influence the pIof the protein, e.g. sialylation of the glycan, oxidation of methio-nine residues, N-terminal lysine processing, and isomerization ofaspartic acid [14–17]. Some of these modifications also influencethe effector functions and serum half-life of IgG and as such haveto be closely monitored to ensure safety and efficacy of the finalproduct [18].
CEX, as mentioned before, is a robust method for the char-acterization of the charge heterogeneity of IgG, exploiting smallbinding differences of the charge variants to the stationary phaseunder salt gradient elution. However, when using a salt gradientfor elution, the pH of the equilibration buffer strongly influencesbinding, generally necessitating optimization of the pH and theNaCl concentration of the equilibration and elution buffers for eachmAb product [2]. A different mode of ion exchange gradient chro-matography utilizes pH gradients to affect the surface charge of the
0021-9673/$ – see front matter © 2013 Elsevier B.V. All rights reserved.http://dx.doi.org/10.1016/j.chroma.2013.10.028
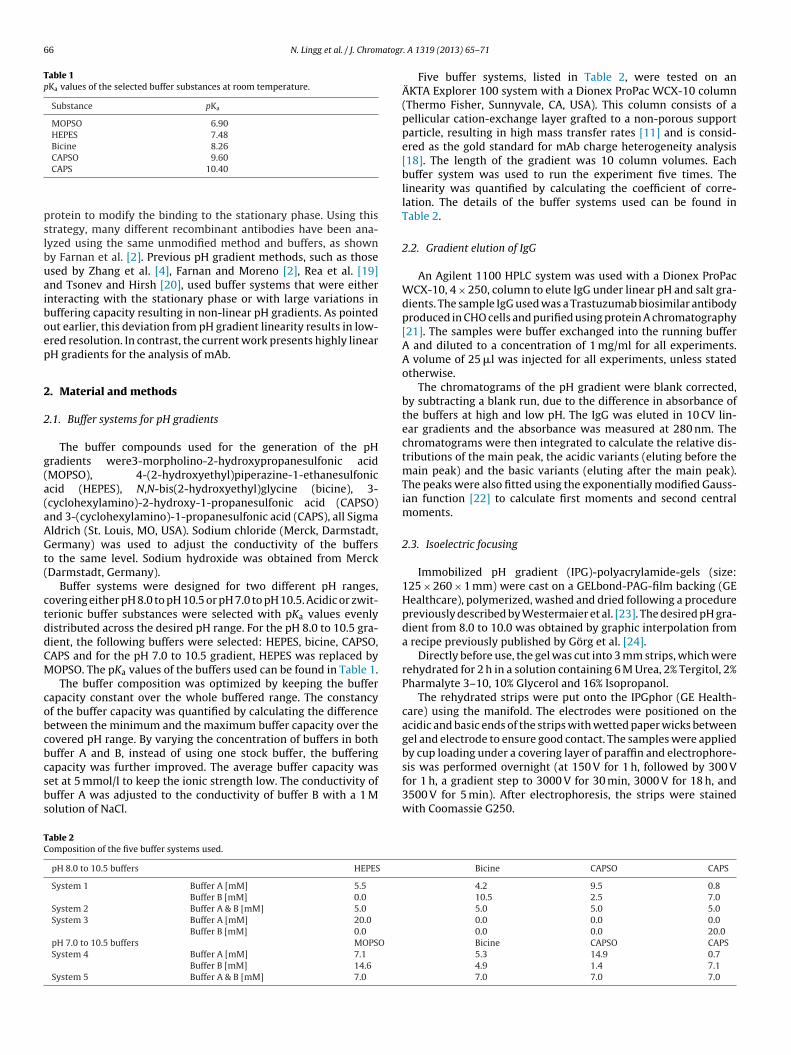
66 N. Lingg et al. / J. Chromatogr. A 1319 (2013) 65– 71
Table 1pKa values of the selected buffer substances at room temperature.
Substance pKa
MOPSO 6.90HEPES 7.48Bicine 8.26CAPSO 9.60CAPS 10.40
protein to modify the binding to the stationary phase. Using thisstrategy, many different recombinant antibodies have been ana-lyzed using the same unmodified method and buffers, as shownby Farnan et al. [2]. Previous pH gradient methods, such as thoseused by Zhang et al. [4], Farnan and Moreno [2], Rea et al. [19]and Tsonev and Hirsh [20], used buffer systems that were eitherinteracting with the stationary phase or with large variations inbuffering capacity resulting in non-linear pH gradients. As pointedout earlier, this deviation from pH gradient linearity results in low-ered resolution. In contrast, the current work presents highly linearpH gradients for the analysis of mAb.
2. Material and methods
2.1. Buffer systems for pH gradients
The buffer compounds used for the generation of the pHgradients were3-morpholino-2-hydroxypropanesulfonic acid(MOPSO), 4-(2-hydroxyethyl)piperazine-1-ethanesulfonicacid (HEPES), N,N-bis(2-hydroxyethyl)glycine (bicine), 3-(cyclohexylamino)-2-hydroxy-1-propanesulfonic acid (CAPSO)and 3-(cyclohexylamino)-1-propanesulfonic acid (CAPS), all SigmaAldrich (St. Louis, MO, USA). Sodium chloride (Merck, Darmstadt,Germany) was used to adjust the conductivity of the buffersto the same level. Sodium hydroxide was obtained from Merck(Darmstadt, Germany).
Buffer systems were designed for two different pH ranges,covering either pH 8.0 to pH 10.5 or pH 7.0 to pH 10.5. Acidic or zwit-terionic buffer substances were selected with pKa values evenlydistributed across the desired pH range. For the pH 8.0 to 10.5 gra-dient, the following buffers were selected: HEPES, bicine, CAPSO,CAPS and for the pH 7.0 to 10.5 gradient, HEPES was replaced byMOPSO. The pKa values of the buffers used can be found in Table 1.
The buffer composition was optimized by keeping the buffercapacity constant over the whole buffered range. The constancyof the buffer capacity was quantified by calculating the differencebetween the minimum and the maximum buffer capacity over thecovered pH range. By varying the concentration of buffers in bothbuffer A and B, instead of using one stock buffer, the bufferingcapacity was further improved. The average buffer capacity wasset at 5 mmol/l to keep the ionic strength low. The conductivity ofbuffer A was adjusted to the conductivity of buffer B with a 1 Msolution of NaCl.
Five buffer systems, listed in Table 2, were tested on anÄKTA Explorer 100 system with a Dionex ProPac WCX-10 column(Thermo Fisher, Sunnyvale, CA, USA). This column consists of apellicular cation-exchange layer grafted to a non-porous supportparticle, resulting in high mass transfer rates [11] and is consid-ered as the gold standard for mAb charge heterogeneity analysis[18]. The length of the gradient was 10 column volumes. Eachbuffer system was used to run the experiment five times. Thelinearity was quantified by calculating the coefficient of corre-lation. The details of the buffer systems used can be found inTable 2.
2.2. Gradient elution of IgG
An Agilent 1100 HPLC system was used with a Dionex ProPacWCX-10, 4 × 250, column to elute IgG under linear pH and salt gra-dients. The sample IgG used was a Trastuzumab biosimilar antibodyproduced in CHO cells and purified using protein A chromatography[21]. The samples were buffer exchanged into the running bufferA and diluted to a concentration of 1 mg/ml for all experiments.A volume of 25 �l was injected for all experiments, unless statedotherwise.
The chromatograms of the pH gradient were blank corrected,by subtracting a blank run, due to the difference in absorbance ofthe buffers at high and low pH. The IgG was eluted in 10 CV lin-ear gradients and the absorbance was measured at 280 nm. Thechromatograms were then integrated to calculate the relative dis-tributions of the main peak, the acidic variants (eluting before themain peak) and the basic variants (eluting after the main peak).The peaks were also fitted using the exponentially modified Gauss-ian function [22] to calculate first moments and second centralmoments.
2.3. Isoelectric focusing
Immobilized pH gradient (IPG)-polyacrylamide-gels (size:125 × 260 × 1 mm) were cast on a GELbond-PAG-film backing (GEHealthcare), polymerized, washed and dried following a procedurepreviously described by Westermaier et al. [23]. The desired pH gra-dient from 8.0 to 10.0 was obtained by graphic interpolation froma recipe previously published by Görg et al. [24].
Directly before use, the gel was cut into 3 mm strips, which wererehydrated for 2 h in a solution containing 6 M Urea, 2% Tergitol, 2%Pharmalyte 3–10, 10% Glycerol and 16% Isopropanol.
The rehydrated strips were put onto the IPGphor (GE Health-care) using the manifold. The electrodes were positioned on theacidic and basic ends of the strips with wetted paper wicks betweengel and electrode to ensure good contact. The samples were appliedby cup loading under a covering layer of paraffin and electrophore-sis was performed overnight (at 150 V for 1 h, followed by 300 Vfor 1 h, a gradient step to 3000 V for 30 min, 3000 V for 18 h, and3500 V for 5 min). After electrophoresis, the strips were stainedwith Coomassie G250.
Table 2Composition of the five buffer systems used.
pH 8.0 to 10.5 buffers HEPES Bicine CAPSO CAPS
System 1 Buffer A [mM] 5.5 4.2 9.5 0.8Buffer B [mM] 0.0 10.5 2.5 7.0
System 2 Buffer A & B [mM] 5.0 5.0 5.0 5.0System 3 Buffer A [mM] 20.0 0.0 0.0 0.0
Buffer B [mM] 0.0 0.0 0.0 20.0pH 7.0 to 10.5 buffers MOPSO Bicine CAPSO CAPSSystem 4 Buffer A [mM] 7.1 5.3 14.9 0.7
Buffer B [mM] 14.6 4.9 1.4 7.1System 5 Buffer A & B [mM] 7.0 7.0 7.0 7.0
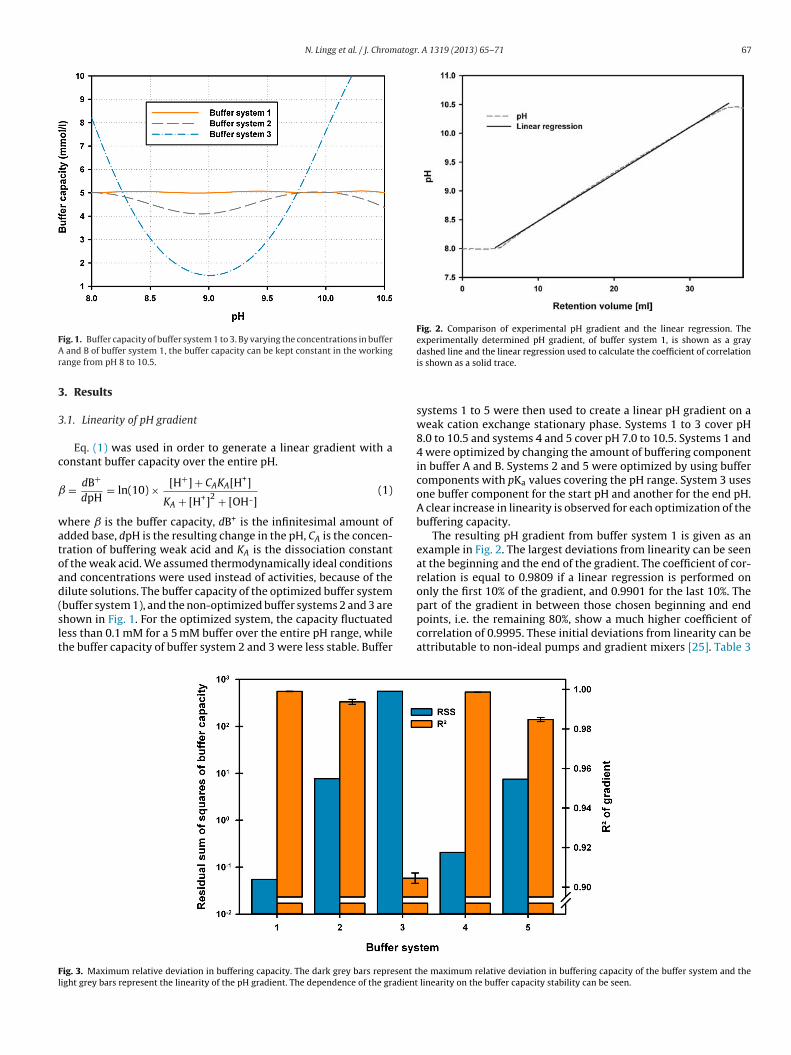
N. Lingg et al. / J. Chromatogr. A 1319 (2013) 65– 71 67
Fig. 1. Buffer capacity of buffer system 1 to 3. By varying the concentrations in bufferA and B of buffer system 1, the buffer capacity can be kept constant in the workingrange from pH 8 to 10.5.
3. Results
3.1. Linearity of pH gradient
Eq. (1) was used in order to generate a linear gradient with aconstant buffer capacity over the entire pH.
= dB+
dpH= ln(10) × [H+] + CAKA[H+]
KA + [H+]2 + [OH ](1)
where is the buffer capacity, dB+ is the infinitesimal amount ofadded base, dpH is the resulting change in the pH, CA is the concen-tration of buffering weak acid and KA is the dissociation constantof the weak acid. We assumed thermodynamically ideal conditionsand concentrations were used instead of activities, because of thedilute solutions. The buffer capacity of the optimized buffer system(buffer system 1), and the non-optimized buffer systems 2 and 3 areshown in Fig. 1. For the optimized system, the capacity fluctuatedless than 0.1 mM for a 5 mM buffer over the entire pH range, whilethe buffer capacity of buffer system 2 and 3 were less stable. Buffer
Fig. 2. Comparison of experimental pH gradient and the linear regression. Theexperimentally determined pH gradient, of buffer system 1, is shown as a graydashed line and the linear regression used to calculate the coefficient of correlationis shown as a solid trace.
systems 1 to 5 were then used to create a linear pH gradient on aweak cation exchange stationary phase. Systems 1 to 3 cover pH8.0 to 10.5 and systems 4 and 5 cover pH 7.0 to 10.5. Systems 1 and4 were optimized by changing the amount of buffering componentin buffer A and B. Systems 2 and 5 were optimized by using buffercomponents with pKa values covering the pH range. System 3 usesone buffer component for the start pH and another for the end pH.A clear increase in linearity is observed for each optimization of thebuffering capacity.
The resulting pH gradient from buffer system 1 is given as anexample in Fig. 2. The largest deviations from linearity can be seenat the beginning and the end of the gradient. The coefficient of cor-relation is equal to 0.9809 if a linear regression is performed ononly the first 10% of the gradient, and 0.9901 for the last 10%. Thepart of the gradient in between those chosen beginning and endpoints, i.e. the remaining 80%, show a much higher coefficient ofcorrelation of 0.9995. These initial deviations from linearity can beattributable to non-ideal pumps and gradient mixers [25]. Table 3
Fig. 3. Maximum relative deviation in buffering capacity. The dark grey bars represent the maximum relative deviation in buffering capacity of the buffer system and thelight grey bars represent the linearity of the pH gradient. The dependence of the gradient linearity on the buffer capacity stability can be seen.
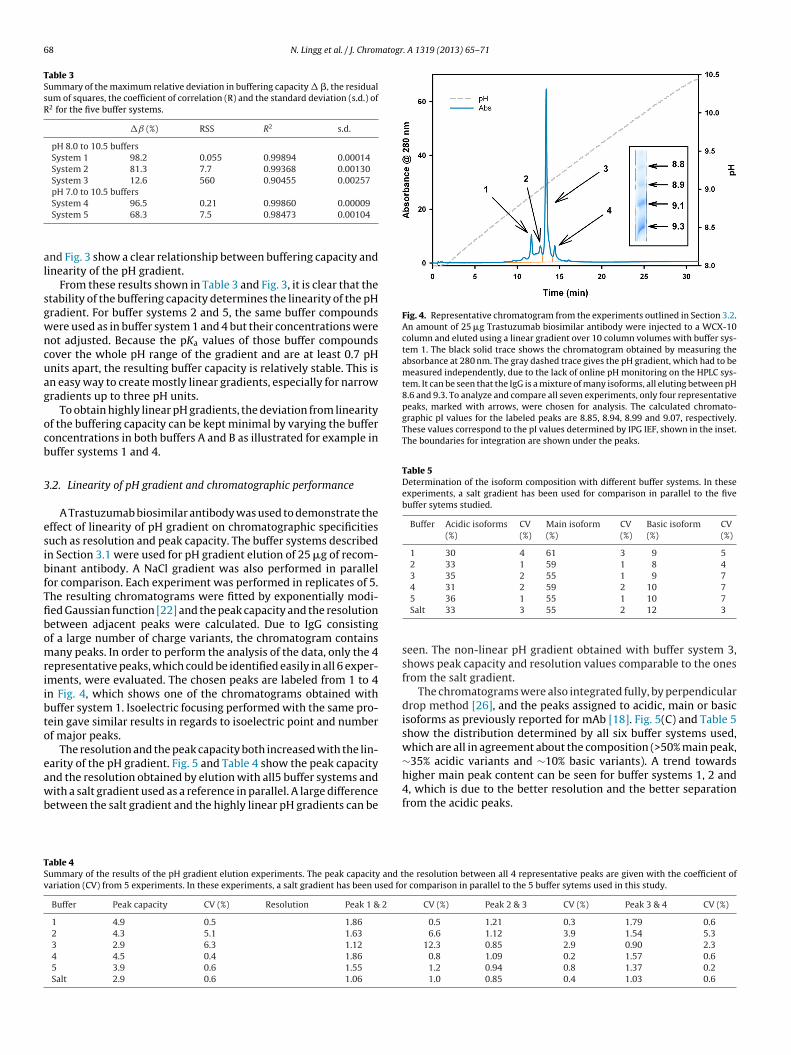
68 N. Lingg et al. / J. Chromatogr. A 1319 (2013) 65– 71
Table 3Summary of the maximum relative deviation in buffering capacity � �, the residualsum of squares, the coefficient of correlation (R) and the standard deviation (s.d.) ofR2 for the five buffer systems.
� (%) RSS R2 s.d.
pH 8.0 to 10.5 buffersSystem 1 98.2 0.055 0.99894 0.00014System 2 81.3 7.7 0.99368 0.00130System 3 12.6 560 0.90455 0.00257pH 7.0 to 10.5 buffersSystem 4 96.5 0.21 0.99860 0.00009System 5 68.3 7.5 0.98473 0.00104
and Fig. 3 show a clear relationship between buffering capacity andlinearity of the pH gradient.
From these results shown in Table 3 and Fig. 3, it is clear that thestability of the buffering capacity determines the linearity of the pHgradient. For buffer systems 2 and 5, the same buffer compoundswere used as in buffer system 1 and 4 but their concentrations werenot adjusted. Because the pKa values of those buffer compoundscover the whole pH range of the gradient and are at least 0.7 pHunits apart, the resulting buffer capacity is relatively stable. This isan easy way to create mostly linear gradients, especially for narrowgradients up to three pH units.
To obtain highly linear pH gradients, the deviation from linearityof the buffering capacity can be kept minimal by varying the bufferconcentrations in both buffers A and B as illustrated for example inbuffer systems 1 and 4.
3.2. Linearity of pH gradient and chromatographic performance
A Trastuzumab biosimilar antibody was used to demonstrate theeffect of linearity of pH gradient on chromatographic specificitiessuch as resolution and peak capacity. The buffer systems describedin Section 3.1 were used for pH gradient elution of 25 �g of recom-binant antibody. A NaCl gradient was also performed in parallelfor comparison. Each experiment was performed in replicates of 5.The resulting chromatograms were fitted by exponentially modi-fied Gaussian function [22] and the peak capacity and the resolutionbetween adjacent peaks were calculated. Due to IgG consistingof a large number of charge variants, the chromatogram containsmany peaks. In order to perform the analysis of the data, only the 4representative peaks, which could be identified easily in all 6 exper-iments, were evaluated. The chosen peaks are labeled from 1 to 4in Fig. 4, which shows one of the chromatograms obtained withbuffer system 1. Isoelectric focusing performed with the same pro-tein gave similar results in regards to isoelectric point and numberof major peaks.
The resolution and the peak capacity both increased with the lin-earity of the pH gradient. Fig. 5 and Table 4 show the peak capacityand the resolution obtained by elution with all5 buffer systems andwith a salt gradient used as a reference in parallel. A large differencebetween the salt gradient and the highly linear pH gradients can be
Fig. 4. Representative chromatogram from the experiments outlined in Section 3.2.An amount of 25 �g Trastuzumab biosimilar antibody were injected to a WCX-10column and eluted using a linear gradient over 10 column volumes with buffer sys-tem 1. The black solid trace shows the chromatogram obtained by measuring theabsorbance at 280 nm. The gray dashed trace gives the pH gradient, which had to bemeasured independently, due to the lack of online pH monitoring on the HPLC sys-tem. It can be seen that the IgG is a mixture of many isoforms, all eluting between pH8.6 and 9.3. To analyze and compare all seven experiments, only four representativepeaks, marked with arrows, were chosen for analysis. The calculated chromato-graphic pI values for the labeled peaks are 8.85, 8.94, 8.99 and 9.07, respectively.These values correspond to the pI values determined by IPG IEF, shown in the inset.The boundaries for integration are shown under the peaks.
Table 5Determination of the isoform composition with different buffer systems. In theseexperiments, a salt gradient has been used for comparison in parallel to the fivebuffer sytems studied.
Buffer Acidic isoforms(%)
CV(%)
Main isoform(%)
CV(%)
Basic isoform(%)
CV(%)
1 30 4 61 3 9 52 33 1 59 1 8 43 35 2 55 1 9 74 31 2 59 2 10 75 36 1 55 1 10 7Salt 33 3 55 2 12 3
seen. The non-linear pH gradient obtained with buffer system 3,shows peak capacity and resolution values comparable to the onesfrom the salt gradient.
The chromatograms were also integrated fully, by perpendiculardrop method [26], and the peaks assigned to acidic, main or basicisoforms as previously reported for mAb [18]. Fig. 5(C) and Table 5show the distribution determined by all six buffer systems used,which are all in agreement about the composition (>50% main peak,∼35% acidic variants and ∼10% basic variants). A trend towardshigher main peak content can be seen for buffer systems 1, 2 and4, which is due to the better resolution and the better separationfrom the acidic peaks.
Table 4Summary of the results of the pH gradient elution experiments. The peak capacity and the resolution between all 4 representative peaks are given with the coefficient ofvariation (CV) from 5 experiments. In these experiments, a salt gradient has been used for comparison in parallel to the 5 buffer sytems used in this study.
Buffer Peak capacity CV (%) Resolution Peak 1 & 2 CV (%) Peak 2 & 3 CV (%) Peak 3 & 4 CV (%)
1 4.9 0.5 1.86 0.5 1.21 0.3 1.79 0.62 4.3 5.1 1.63 6.6 1.12 3.9 1.54 5.33 2.9 6.3 1.12 12.3 0.85 2.9 0.90 2.34 4.5 0.4 1.86 0.8 1.09 0.2 1.57 0.65 3.9 0.6 1.55 1.2 0.94 0.8 1.37 0.2Salt 2.9 0.6 1.06 1.0 0.85 0.4 1.03 0.6
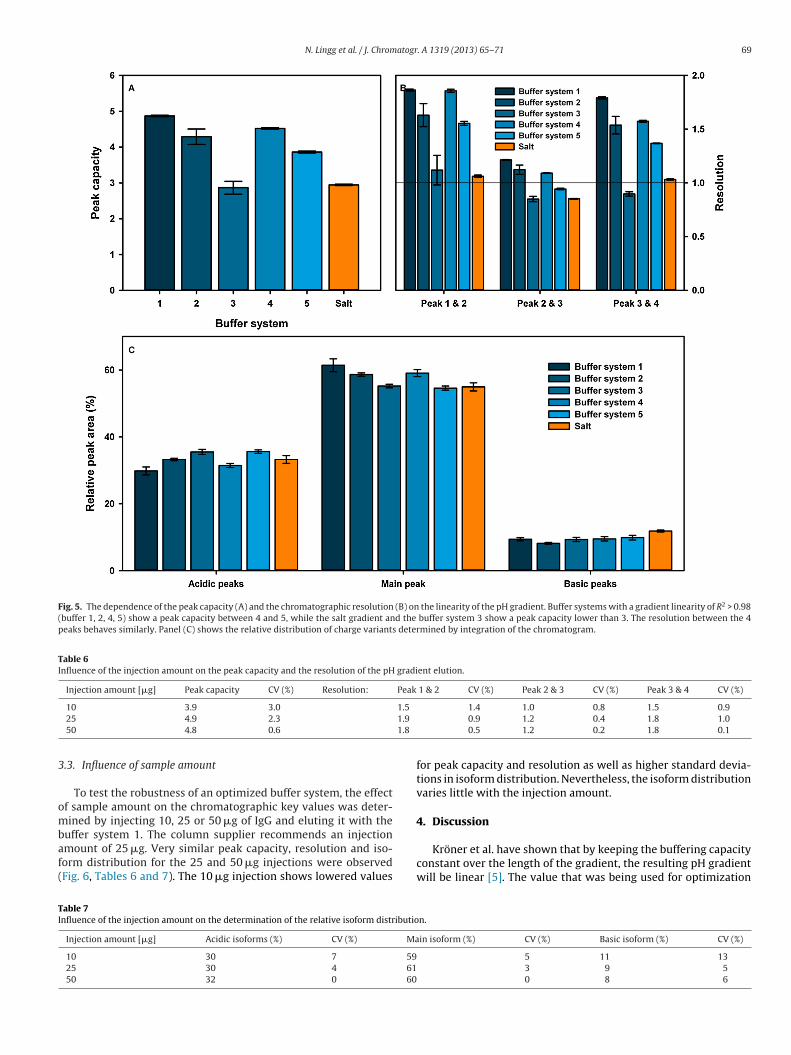
N. Lingg et al. / J. Chromatogr. A 1319 (2013) 65– 71 69
Fig. 5. The dependence of the peak capacity (A) and the chromatographic resolution (B) on the linearity of the pH gradient. Buffer systems with a gradient linearity of R2 > 0.98(buffer 1, 2, 4, 5) show a peak capacity between 4 and 5, while the salt gradient and the buffer system 3 show a peak capacity lower than 3. The resolution between the 4peaks behaves similarly. Panel (C) shows the relative distribution of charge variants determined by integration of the chromatogram.
Table 6Influence of the injection amount on the peak capacity and the resolution of the pH gradient elution.
Injection amount [�g] Peak capacity CV (%) Resolution: Peak 1 & 2 CV (%) Peak 2 & 3 CV (%) Peak 3 & 4 CV (%)
10 3.9 3.0 1.5 1.4 1.0 0.8 1.5 0.925 4.9 2.3 1.9 0.9 1.2 0.4 1.8 1.050 4.8 0.6 1.8 0.5 1.2 0.2 1.8 0.1
3.3. Influence of sample amount
To test the robustness of an optimized buffer system, the effectof sample amount on the chromatographic key values was deter-mined by injecting 10, 25 or 50 �g of IgG and eluting it with thebuffer system 1. The column supplier recommends an injectionamount of 25 �g. Very similar peak capacity, resolution and iso-form distribution for the 25 and 50 �g injections were observed(Fig. 6, Tables 6 and 7). The 10 �g injection shows lowered values
for peak capacity and resolution as well as higher standard devia-tions in isoform distribution. Nevertheless, the isoform distributionvaries little with the injection amount.
4. Discussion
Kröner et al. have shown that by keeping the buffering capacityconstant over the length of the gradient, the resulting pH gradientwill be linear [5]. The value that was being used for optimization
Table 7Influence of the injection amount on the determination of the relative isoform distribution.
Injection amount [�g] Acidic isoforms (%) CV (%) Main isoform (%) CV (%) Basic isoform (%) CV (%)
10 30 7 59 5 11 1325 30 4 61 3 9 550 32 0 60 0 8 6
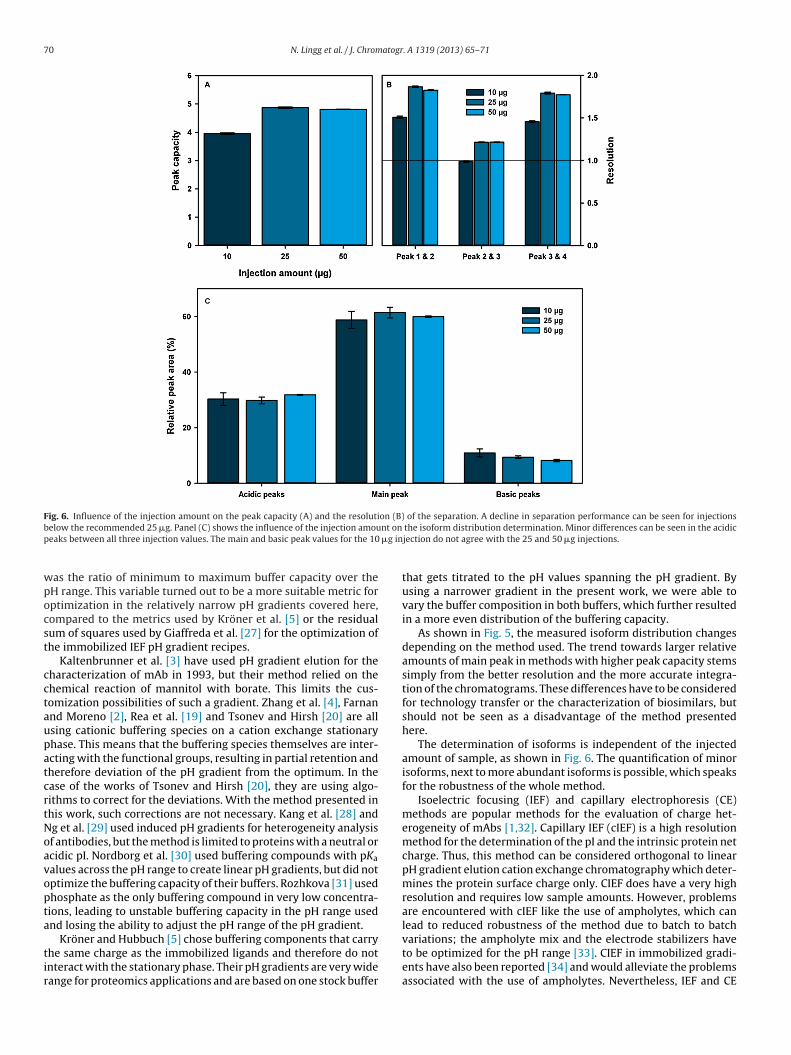
70 N. Lingg et al. / J. Chromatogr. A 1319 (2013) 65– 71
Fig. 6. Influence of the injection amount on the peak capacity (A) and the resolution (B) of the separation. A decline in separation performance can be seen for injectionsbelow the recommended 25 �g. Panel (C) shows the influence of the injection amount on the isoform distribution determination. Minor differences can be seen in the acidicpeaks between all three injection values. The main and basic peak values for the 10 �g injection do not agree with the 25 and 50 �g injections.
was the ratio of minimum to maximum buffer capacity over thepH range. This variable turned out to be a more suitable metric foroptimization in the relatively narrow pH gradients covered here,compared to the metrics used by Kröner et al. [5] or the residualsum of squares used by Giaffreda et al. [27] for the optimization ofthe immobilized IEF pH gradient recipes.
Kaltenbrunner et al. [3] have used pH gradient elution for thecharacterization of mAb in 1993, but their method relied on thechemical reaction of mannitol with borate. This limits the cus-tomization possibilities of such a gradient. Zhang et al. [4], Farnanand Moreno [2], Rea et al. [19] and Tsonev and Hirsh [20] are allusing cationic buffering species on a cation exchange stationaryphase. This means that the buffering species themselves are inter-acting with the functional groups, resulting in partial retention andtherefore deviation of the pH gradient from the optimum. In thecase of the works of Tsonev and Hirsh [20], they are using algo-rithms to correct for the deviations. With the method presented inthis work, such corrections are not necessary. Kang et al. [28] andNg et al. [29] used induced pH gradients for heterogeneity analysisof antibodies, but the method is limited to proteins with a neutral oracidic pI. Nordborg et al. [30] used buffering compounds with pKa
values across the pH range to create linear pH gradients, but did notoptimize the buffering capacity of their buffers. Rozhkova [31] usedphosphate as the only buffering compound in very low concentra-tions, leading to unstable buffering capacity in the pH range usedand losing the ability to adjust the pH range of the pH gradient.
Kröner and Hubbuch [5] chose buffering components that carrythe same charge as the immobilized ligands and therefore do notinteract with the stationary phase. Their pH gradients are very widerange for proteomics applications and are based on one stock buffer
that gets titrated to the pH values spanning the pH gradient. Byusing a narrower gradient in the present work, we were able tovary the buffer composition in both buffers, which further resultedin a more even distribution of the buffering capacity.
As shown in Fig. 5, the measured isoform distribution changesdepending on the method used. The trend towards larger relativeamounts of main peak in methods with higher peak capacity stemssimply from the better resolution and the more accurate integra-tion of the chromatograms. These differences have to be consideredfor technology transfer or the characterization of biosimilars, butshould not be seen as a disadvantage of the method presentedhere.
The determination of isoforms is independent of the injectedamount of sample, as shown in Fig. 6. The quantification of minorisoforms, next to more abundant isoforms is possible, which speaksfor the robustness of the whole method.
Isoelectric focusing (IEF) and capillary electrophoresis (CE)methods are popular methods for the evaluation of charge het-erogeneity of mAbs [1,32]. Capillary IEF (cIEF) is a high resolutionmethod for the determination of the pI and the intrinsic protein netcharge. Thus, this method can be considered orthogonal to linearpH gradient elution cation exchange chromatography which deter-mines the protein surface charge only. CIEF does have a very highresolution and requires low sample amounts. However, problemsare encountered with cIEF like the use of ampholytes, which canlead to reduced robustness of the method due to batch to batchvariations; the ampholyte mix and the electrode stabilizers haveto be optimized for the pH range [33]. CIEF in immobilized gradi-ents have also been reported [34] and would alleviate the problemsassociated with the use of ampholytes. Nevertheless, IEF and CE
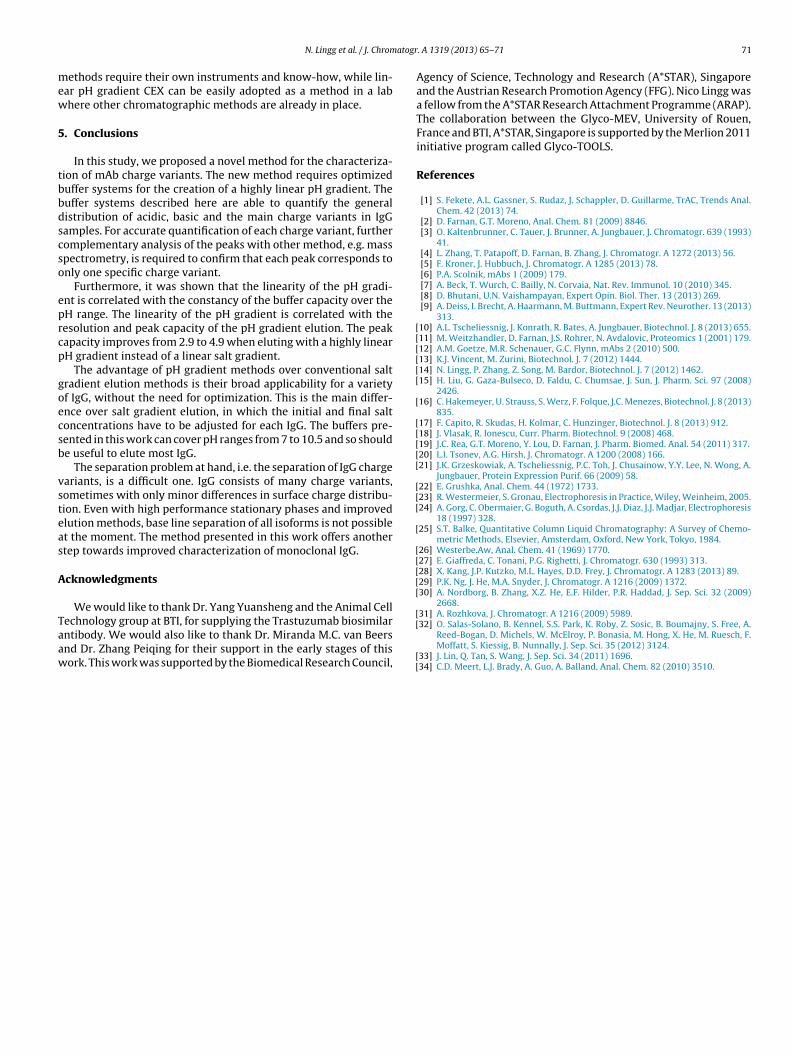
N. Lingg et al. / J. Chromatogr. A 1319 (2013) 65– 71 71
methods require their own instruments and know-how, while lin-ear pH gradient CEX can be easily adopted as a method in a labwhere other chromatographic methods are already in place.
5. Conclusions
In this study, we proposed a novel method for the characteriza-tion of mAb charge variants. The new method requires optimizedbuffer systems for the creation of a highly linear pH gradient. Thebuffer systems described here are able to quantify the generaldistribution of acidic, basic and the main charge variants in IgGsamples. For accurate quantification of each charge variant, furthercomplementary analysis of the peaks with other method, e.g. massspectrometry, is required to confirm that each peak corresponds toonly one specific charge variant.
Furthermore, it was shown that the linearity of the pH gradi-ent is correlated with the constancy of the buffer capacity over thepH range. The linearity of the pH gradient is correlated with theresolution and peak capacity of the pH gradient elution. The peakcapacity improves from 2.9 to 4.9 when eluting with a highly linearpH gradient instead of a linear salt gradient.
The advantage of pH gradient methods over conventional saltgradient elution methods is their broad applicability for a varietyof IgG, without the need for optimization. This is the main differ-ence over salt gradient elution, in which the initial and final saltconcentrations have to be adjusted for each IgG. The buffers pre-sented in this work can cover pH ranges from 7 to 10.5 and so shouldbe useful to elute most IgG.
The separation problem at hand, i.e. the separation of IgG chargevariants, is a difficult one. IgG consists of many charge variants,sometimes with only minor differences in surface charge distribu-tion. Even with high performance stationary phases and improvedelution methods, base line separation of all isoforms is not possibleat the moment. The method presented in this work offers anotherstep towards improved characterization of monoclonal IgG.
Acknowledgments
We would like to thank Dr. Yang Yuansheng and the Animal CellTechnology group at BTI, for supplying the Trastuzumab biosimilarantibody. We would also like to thank Dr. Miranda M.C. van Beersand Dr. Zhang Peiqing for their support in the early stages of thiswork. This work was supported by the Biomedical Research Council,
Agency of Science, Technology and Research (A*STAR), Singaporeand the Austrian Research Promotion Agency (FFG). Nico Lingg wasa fellow from the A*STAR Research Attachment Programme (ARAP).The collaboration between the Glyco-MEV, University of Rouen,France and BTI, A*STAR, Singapore is supported by the Merlion 2011initiative program called Glyco-TOOLS.
References
[1] S. Fekete, A.L. Gassner, S. Rudaz, J. Schappler, D. Guillarme, TrAC, Trends Anal.Chem. 42 (2013) 74.
[2] D. Farnan, G.T. Moreno, Anal. Chem. 81 (2009) 8846.[3] O. Kaltenbrunner, C. Tauer, J. Brunner, A. Jungbauer, J. Chromatogr. 639 (1993)
41.[4] L. Zhang, T. Patapoff, D. Farnan, B. Zhang, J. Chromatogr. A 1272 (2013) 56.[5] F. Kroner, J. Hubbuch, J. Chromatogr. A 1285 (2013) 78.[6] P.A. Scolnik, mAbs 1 (2009) 179.[7] A. Beck, T. Wurch, C. Bailly, N. Corvaia, Nat. Rev. Immunol. 10 (2010) 345.[8] D. Bhutani, U.N. Vaishampayan, Expert Opin. Biol. Ther. 13 (2013) 269.[9] A. Deiss, I. Brecht, A. Haarmann, M. Buttmann, Expert Rev. Neurother. 13 (2013)
313.[10] A.L. Tscheliessnig, J. Konrath, R. Bates, A. Jungbauer, Biotechnol. J. 8 (2013) 655.[11] M. Weitzhandler, D. Farnan, J.S. Rohrer, N. Avdalovic, Proteomics 1 (2001) 179.[12] A.M. Goetze, M.R. Schenauer, G.C. Flynn, mAbs 2 (2010) 500.[13] K.J. Vincent, M. Zurini, Biotechnol. J. 7 (2012) 1444.[14] N. Lingg, P. Zhang, Z. Song, M. Bardor, Biotechnol. J. 7 (2012) 1462.[15] H. Liu, G. Gaza-Bulseco, D. Faldu, C. Chumsae, J. Sun, J. Pharm. Sci. 97 (2008)
2426.[16] C. Hakemeyer, U. Strauss, S. Werz, F. Folque, J.C. Menezes, Biotechnol. J. 8 (2013)
835.[17] F. Capito, R. Skudas, H. Kolmar, C. Hunzinger, Biotechnol. J. 8 (2013) 912.[18] J. Vlasak, R. Ionescu, Curr. Pharm. Biotechnol. 9 (2008) 468.[19] J.C. Rea, G.T. Moreno, Y. Lou, D. Farnan, J. Pharm. Biomed. Anal. 54 (2011) 317.[20] L.I. Tsonev, A.G. Hirsh, J. Chromatogr. A 1200 (2008) 166.[21] J.K. Grzeskowiak, A. Tscheliessnig, P.C. Toh, J. Chusainow, Y.Y. Lee, N. Wong, A.
Jungbauer, Protein Expression Purif. 66 (2009) 58.[22] E. Grushka, Anal. Chem. 44 (1972) 1733.[23] R. Westermeier, S. Gronau, Electrophoresis in Practice, Wiley, Weinheim, 2005.[24] A. Gorg, C. Obermaier, G. Boguth, A. Csordas, J.J. Diaz, J.J. Madjar, Electrophoresis
18 (1997) 328.[25] S.T. Balke, Quantitative Column Liquid Chromatography: A Survey of Chemo-
metric Methods, Elsevier, Amsterdam, Oxford, New York, Tokyo, 1984.[26] Westerbe.Aw, Anal. Chem. 41 (1969) 1770.[27] E. Giaffreda, C. Tonani, P.G. Righetti, J. Chromatogr. 630 (1993) 313.[28] X. Kang, J.P. Kutzko, M.L. Hayes, D.D. Frey, J. Chromatogr. A 1283 (2013) 89.[29] P.K. Ng, J. He, M.A. Snyder, J. Chromatogr. A 1216 (2009) 1372.[30] A. Nordborg, B. Zhang, X.Z. He, E.F. Hilder, P.R. Haddad, J. Sep. Sci. 32 (2009)
2668.[31] A. Rozhkova, J. Chromatogr. A 1216 (2009) 5989.[32] O. Salas-Solano, B. Kennel, S.S. Park, K. Roby, Z. Sosic, B. Boumajny, S. Free, A.
Reed-Bogan, D. Michels, W. McElroy, P. Bonasia, M. Hong, X. He, M. Ruesch, F.Moffatt, S. Kiessig, B. Nunnally, J. Sep. Sci. 35 (2012) 3124.
[33] J. Lin, Q. Tan, S. Wang, J. Sep. Sci. 34 (2011) 1696.[34] C.D. Meert, L.J. Brady, A. Guo, A. Balland, Anal. Chem. 82 (2010) 3510.
Please cite this article in press as: N. Lingg, et al., Highly linear pH gradients for analyzing monoclonal antibody charge heterogeneityin the alkaline range: Validation of the method parameters, J. Chromatogr. A (2014), http://dx.doi.org/10.1016/j.chroma.2014.11.021
ARTICLE IN PRESSG ModelCHROMA 356007 1–7
Journal of Chromatography A, xxx (2014) xxx–xxx
Contents lists available at ScienceDirect
Journal of Chromatography A
journa l homepage: www.e lsev ier .com/ locate /chroma
Highly linear pH gradients for analyzing monoclonal antibody chargeheterogeneity in the alkaline range: Validation of the methodparameters
1
2
3
Nico Lingga,b, Martina Berndtssona,c, Beate Hintersteinera, Manfred Schusterd,Q1
Muriel Bardorb,e,1, Alois Jungbauera,∗,14
5
a Department of Biotechnology, University of Natural Resources and Life Sciences, Vienna, Muthgasse 18, A-1190 Vienna, AustriaQ26b Bioprocessing Technology Institute, Agency for Science, Technology and Research (A*STAR), 20 Biopolis Way, No. 06-01, Centros 138668, Singapore7c Department of Pure and Applied Biochemistry, Lund University, Faculty of Engineering, Lund, Sweden8d Apeiron Biologics AG, Campus-Vienna-Biocenter 5, A-1030 Vienna, Austria9e Normandie Université, Laboratoire Glyco-MEV, EA 4358, Institut de Recherche et d’Innovation Biomédicale (IRIB), 76821 Mont-Saint-Aignan Cedex, France10
11
a r t i c l e i n f o12
13
Article history:14
Received 23 September 201415
Received in revised form 3 November 201416
Accepted 4 November 201417
Available online xxx18
19
Keywords:20
pH gradient21
Ion-exchange chromatography22
Monoclonal antibody variants23
Validation24
a b s t r a c t
Cation exchange chromatography has been routinely used for the quantification of monoclonal antibody(mAb) charge heterogeneity. A previously developed method utilizing pH gradients for the elution insteadof salt gradients was validated according to current guidelines proposed by the ICH. The linearity, stability,accuracy, precision and the lower limit of quantification have been determined, using pure charge variantstandards. The method is valid for the quantification of mAb samples with a charge heterogeneity between1% and 50%. Three different approaches to obtaining pure standard material for the validation of bio-analytical methods for the quantification of charge heterogeneity of IgG are presented. These methods arebased on salt gradient elution, pH gradient elution and displacement in cation exchange chromatography.
© 2014 Published by Elsevier B.V.
25
1. Introduction26
Monoclonal antibodies (mAb) are a highly researched class of27
proteins which represent a very profitable part of the biopharma-28
ceutical industry [1]. Indeed, their ability to target a wide range of29
antigens, e.g. other proteins, carbohydrates, and the strong effector30
functions they can elicit, e.g. antibody dependent cellular cyto-31
toxicity, complement dependent cytotoxicity, make them an ideal32
molecule to be used as a therapeutic [2]. Immunoglobulin G (IgG)33
is the most commonly used isotype. It is a rather large protein with34
∼150 kDa and consists of four subunits. In order for the protein to35
function properly it requires proper folding, correct disulfide bonds36
and correct N-glycosylation for effector functions [3,4]. Other post-37
translational modifications, e.g. methionine oxidation, C-terminal38
lysine processing, deamidation of asparagine and isomerization of39
aspartic acid influence the behavior of mAb, as such they can be40
considered a critical quality attribute (CQA) [5,6]. The emergence41
∗ Corresponding author. Tel.: +43 1 47654 6226; fax: +43 1 47654 6675.E-mail address: [email protected] (A. Jungbauer).
1 These authors contributed equally to this work.
of novel purification strategies demands sophisticated analytical 42
methods to ensure comparability of the product [7–11], and such 43
analytical methods should be validated for their intended purpose 44
[12,13]. 45
In order to facilitate this goal, we decided to validate our pre- 46
viously presented pH gradient method for the analysis of antibody 47
charge heterogeneity based on cation exchange chromatography 48
(CEX) [14]. This method is intended to be used for the determination 49
of acidic and basic charge variants, relative to the main charge vari- 50
ant found in a monoclonal antibody batch. In order to validate the 51
method parameters, we purified mAb charge variants, to be used as 52
a standard. The preparative separation of charge variants requires 53
methods with a high resolving power. In this work, we describe 54
different approaches to obtain pure standard material using CEX. 55
The charge variants will be referred to as the main charge vari- 56
ant (MCV) and the acidic charge variants (ACV). The MCV is the 57
main peak eluting in the chromatogram, and is usually not unmo- 58
dified antibody, it is rather the antibody with the most common 59
modifications [15]. The ACV are simply all charge variants eluting 60
before the MCV in CEX. Basic charge variants could not be purified 61
in sufficient amounts to allow usage as standard material, but the 62
method should be valid for all charge variants. Isoelectric focusing 63
http://dx.doi.org/10.1016/j.chroma.2014.11.0210021-9673/© 2014 Published by Elsevier B.V.
Please cite this article in press as: N. Lingg, et al., Highly linear pH gradients for analyzing monoclonal antibody charge heterogeneityin the alkaline range: Validation of the method parameters, J. Chromatogr. A (2014), http://dx.doi.org/10.1016/j.chroma.2014.11.021
ARTICLE IN PRESSG ModelCHROMA 356007 1–7
2 N. Lingg et al. / J. Chromatogr. A xxx (2014) xxx–xxx
Table 1Summary of the salt gradient elution experiments performed on a semi-preparative ProPac WCX-10 column. [M] is the modifier (NaCl) concentration, with the indices i andf meaning initial and final respectively.
Buffer [NaCl] buffer A (mM) [NaCl] buffer B (mM) pH [M]i (mM) [M]f (mM) Gradient slope (CV)
30 mM MES 0 1000 6.0 50 350 2010 mM phosphate 50 100 7.0 50 100 510 mM phosphate 50 100 7.0 70 77 510 mM phosphate 50 100 7.0 63 70 510 mM phosphate 50 100 7.0 63 65.5 510 mM phosphate 50 100 7.0 60 65.5 5
Table 2Summary of the displacement chromatography experiments performed on a Mono S column.
Buffer pH Displacer (mM) Load (mg/ml) Load (% DBC10)
40 mM MES, 15 mM NaCl 5.5 5 35 5030 mM MES, 100 mM NaCl 6.1 5 14.9 6030 mM MOPSO, 15 mM NaCl 7.0 5 33.6 60
(IEF) was used as an orthogonal method to check the purity of the64
standards.65
Our first approach for the preparative scale separation of charge66
variants was standard CEX elution chromatography, using NaCl as67
the mobile phase modifier. This method has been used success-68
fully for decades [16] and requires only a simple setup. The next69
approach was displacement CEX [17], which has been shown to70
be a method capable of high resolution separations of mAb charge71
variants [18]. With the advent of high performance displacers, this72
approach was very promising. Our last approach focused on the73
scale up of our own pH gradient elution CEX method into prepar-74
ative scale, which we have previously shown to have a higher75
resolution than standard NaCl gradient elution CEX [14].76
In order for this method to be used as a standard for the77
quantification of mAb charge heterogeneity, we validated the key78
performance parameters of the method, by following the recom-79
mendations for the validation of bioanalytical chromatographic80
methods presented by Hartmann et al. [12], while using the ter-81
minology from Peters et al. in this work [19]. In detail the following82
parameters have been determined: selectivity, calibration model83
(linearity), stability, accuracy (bias), precision (repeatability, inter-84
mediate precision) and the lower limit of quantification (LLOQ).85
This was done in a similar fashion to the work published by Tsche-86
liessnig and Jungbauer [20] and Rozhkova [21]. The upper limit of87
quantification (ULOQ) was not determined, instead a charge het-88
erogeneity of 50% was taken as the upper limit.89
Our final goal was to provide evidence that our previously pre-90
sented method is indeed valid for the quantification of mAb charge91
variants.92
Other methods, such as imaging capillary isoelectric focusing93
(iCIEF), can also be used for quantification of mAb charge variant94
content and are well established in the biopharmaceutical industry95
[22,23]. Such methods have shown great inter-laboratory robust-96
ness and are reliable methods [24].97
2. Material and methods98
2.1. Materials and chemicals99
All chemicals were of analytical grade, unless stated otherwise.100
3-Morpholino-2-hydroxypropanesulfonic acid (MOPSO), 4-(2-101
hydroxyethyl)piperazine-1-ethanesulfonic acid (HEPES), N,N-102
bis(2-hydroxyethyl)glycine (bicine), 3-(cyclohexylamino)-2-hyd-103
roxy-1-propanesulfonic acid (CAPSO) and 3-(cyclohexylamino)-104
1-propanesulfonic acid (CAPS), 2-(N-Morpholino)ethanesulfonic105
acid (MES), NaH2PO4, Tergitol (70% in water) and isopropanol106
were purchased from Sigma-Aldrich (St. Louis, MO, USA). NaCl,107
Table 3The buffer system used throughout this work for the creation of linear pH gradients.
HEPES Bicine CAPSO CAPS NaCl pH
Buffer A [mM] 5.5 4.2 9.5 0.8 6.3 8.0Buffer B [mM] 0.0 10.5 2.5 7.0 0.0 10.5
Na2HPO4, NaOH, Urea and glycerol was purchased from Merck 108
(Darmstadt, Germany). Pharmalyte 3–10 was purchased from (GE 109
Healthcare, Uppsala, Sweden). Histidine, research grade (>98.5% 110
purity) was from Serva (Heidelberg, Germany). Tween 20 was 111
obtained from Bio-Rad (Hercules, CA, USA). ExpellTM SP1 (Sachem 112
Inc., Austin, TX, USA) was used as the displacer in displacement 113
chromatography experiments. 114
2.2. Preparative chromatography 115
The mAb used for the validation was a chimeric IgG 1, provided 116
by Apeiron Biologics (Vienna, Austria). An ÄKTA Explorer 100 (GE 117
Healthcare) was used for all preparative chromatography steps. The 118
outlet was monitored at 280 nm. 119
2.2.1. Salt gradient elution 120
A Dionex ProPac WCX-10 column, 9 × 250 mm (Thermo Fisher, 121
Sunnyvale, CA, USA) was used. The flow rate was 2.5 ml/min 122
(236 cm/h). The buffers used for the salt gradient experiments are 123
described in Table 1. The method used consisted of a 1 CV equili- 124
bration step at 0% B, 10 ml injections via sample loop, a 1 CV wash 125
step at 0% B, a 1 CV gradient to the initial elution conductivity and 126
the elution gradient with varying gradient length, found in Table 1. 127
2.2.2. Displacement chromatography 128
For displacement chromatography, a Mono S column, 129
4 × 200 mm (GE Healthcare, Uppsala, Sweden) was used. The 130
flow rate was 0.25 ml/min (76 cm/h). Before each experiment, 131
the dynamic binding capacity (DBC) at 10% breakthrough was 132
determined for each mobile phase. The buffers and conditions 133
used for displacement chromatography can be found in Table 2. 134
The displacement experiments were performed according to 135
Zhang et al. [18] and McAtee and Hornbuckle [17]. 136
2.2.3. pH gradient elution 137
For salt gradient and pH gradient preparative experiments, a 138
Dionex ProPac WCX-10 column, 9 × 250 mm (Thermo Fisher, Sun- 139
nyvale, CA, USA) was used. The flow rate for the ProPac column 140
was 2.5 ml/min (236 cm/h). The buffers used for pH gradient exper- 141
iments are found in Table 3. The various gradients used are detailed 142
in Table 4. The collected acidic and main fractions from each 143
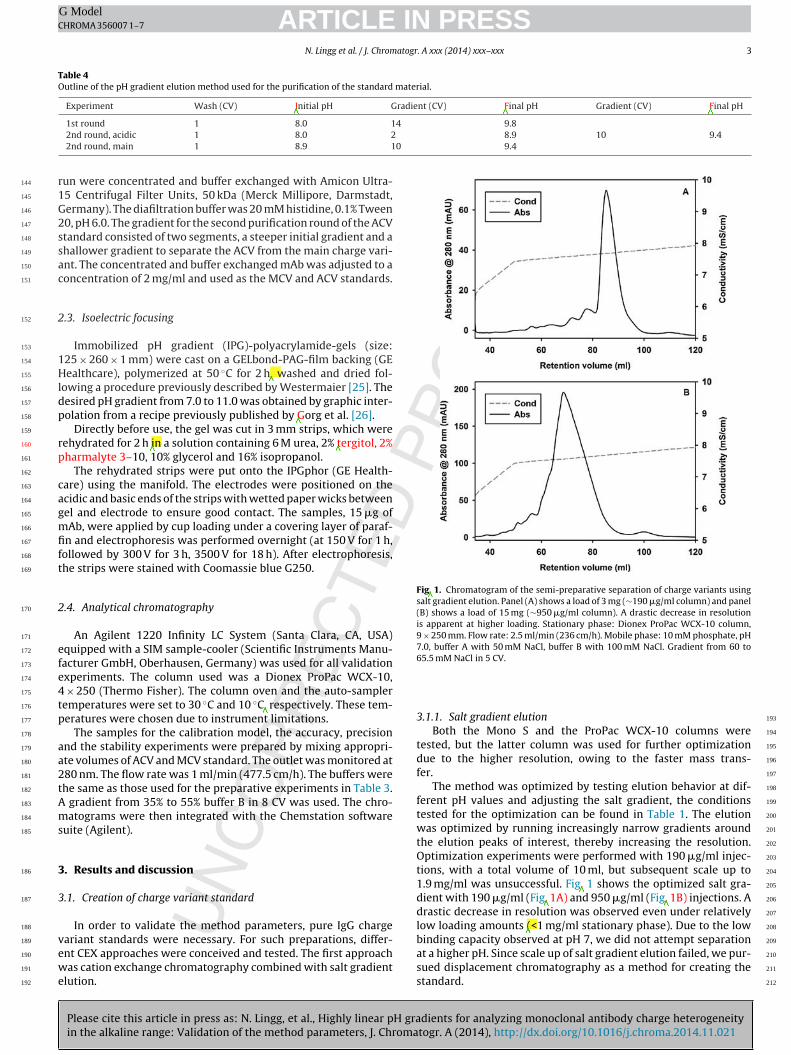
Please cite this article in press as: N. Lingg, et al., Highly linear pH gradients for analyzing monoclonal antibody charge heterogeneityin the alkaline range: Validation of the method parameters, J. Chromatogr. A (2014), http://dx.doi.org/10.1016/j.chroma.2014.11.021
ARTICLE IN PRESSG ModelCHROMA 356007 1–7
N. Lingg et al. / J. Chromatogr. A xxx (2014) xxx–xxx 3
Table 4Outline of the pH gradient elution method used for the purification of the standard material.
Experiment Wash (CV) Initial pH Gradient (CV) Final pH Gradient (CV) Final pH
1st round 1 8.0 14 9.82nd round, acidic 1 8.0 2 8.9 10 9.42nd round, main 1 8.9 10 9.4
run were concentrated and buffer exchanged with Amicon Ultra-144
15 Centrifugal Filter Units, 50 kDa (Merck Millipore, Darmstadt,145
Germany). The diafiltration buffer was 20 mM histidine, 0.1% Tween146
20, pH 6.0. The gradient for the second purification round of the ACV147
standard consisted of two segments, a steeper initial gradient and a148
shallower gradient to separate the ACV from the main charge vari-149
ant. The concentrated and buffer exchanged mAb was adjusted to a150
concentration of 2 mg/ml and used as the MCV and ACV standards.151
2.3. Isoelectric focusing152
Immobilized pH gradient (IPG)-polyacrylamide-gels (size:153
125 × 260 × 1 mm) were cast on a GELbond-PAG-film backing (GE154
Healthcare), polymerized at 50 ◦C for 2 h, washed and dried fol-155
lowing a procedure previously described by Westermaier [25]. The156
desired pH gradient from 7.0 to 11.0 was obtained by graphic inter-157
polation from a recipe previously published by Gorg et al. [26].158
Directly before use, the gel was cut in 3 mm strips, which were159
rehydrated for 2 h in a solution containing 6 M urea, 2% tergitol, 2%160
pharmalyte 3–10, 10% glycerol and 16% isopropanol.161
The rehydrated strips were put onto the IPGphor (GE Health-162
care) using the manifold. The electrodes were positioned on the163
acidic and basic ends of the strips with wetted paper wicks between164
gel and electrode to ensure good contact. The samples, 15 �g of165
mAb, were applied by cup loading under a covering layer of paraf-166
fin and electrophoresis was performed overnight (at 150 V for 1 h,167
followed by 300 V for 3 h, 3500 V for 18 h). After electrophoresis,168
the strips were stained with Coomassie blue G250.169
2.4. Analytical chromatography170
An Agilent 1220 Infinity LC System (Santa Clara, CA, USA)171
equipped with a SIM sample-cooler (Scientific Instruments Manu-172
facturer GmbH, Oberhausen, Germany) was used for all validation173
experiments. The column used was a Dionex ProPac WCX-10,174
4 × 250 (Thermo Fisher). The column oven and the auto-sampler175
temperatures were set to 30 ◦C and 10 ◦C, respectively. These tem-176
peratures were chosen due to instrument limitations.177
The samples for the calibration model, the accuracy, precision178
and the stability experiments were prepared by mixing appropri-179
ate volumes of ACV and MCV standard. The outlet was monitored at180
280 nm. The flow rate was 1 ml/min (477.5 cm/h). The buffers were181
the same as those used for the preparative experiments in Table 3.182
A gradient from 35% to 55% buffer B in 8 CV was used. The chro-183
matograms were then integrated with the Chemstation software184
suite (Agilent).185
3. Results and discussion186
3.1. Creation of charge variant standard187
In order to validate the method parameters, pure IgG charge188
variant standards were necessary. For such preparations, differ-189
ent CEX approaches were conceived and tested. The first approach190
was cation exchange chromatography combined with salt gradient191
elution.192
Fig. 1. Chromatogram of the semi-preparative separation of charge variants usingsalt gradient elution. Panel (A) shows a load of 3 mg (∼190 �g/ml column) and panel(B) shows a load of 15 mg (∼950 �g/ml column). A drastic decrease in resolutionis apparent at higher loading. Stationary phase: Dionex ProPac WCX-10 column,9 × 250 mm. Flow rate: 2.5 ml/min (236 cm/h). Mobile phase: 10 mM phosphate, pH7.0, buffer A with 50 mM NaCl, buffer B with 100 mM NaCl. Gradient from 60 to65.5 mM NaCl in 5 CV.
3.1.1. Salt gradient elution 193
Both the Mono S and the ProPac WCX-10 columns were 194
tested, but the latter column was used for further optimization 195
due to the higher resolution, owing to the faster mass trans- 196
fer. 197
The method was optimized by testing elution behavior at dif- 198
ferent pH values and adjusting the salt gradient, the conditions 199
tested for the optimization can be found in Table 1. The elution 200
was optimized by running increasingly narrow gradients around 201
the elution peaks of interest, thereby increasing the resolution. 202
Optimization experiments were performed with 190 �g/ml injec- 203
tions, with a total volume of 10 ml, but subsequent scale up to 204
1.9 mg/ml was unsuccessful. Fig. 1 shows the optimized salt gra- 205
dient with 190 �g/ml (Fig. 1A) and 950 �g/ml (Fig. 1B) injections. A 206
drastic decrease in resolution was observed even under relatively 207
low loading amounts (<1 mg/ml stationary phase). Due to the low 208
binding capacity observed at pH 7, we did not attempt separation 209
at a higher pH. Since scale up of salt gradient elution failed, we pur- 210
sued displacement chromatography as a method for creating the 211
standard. 212
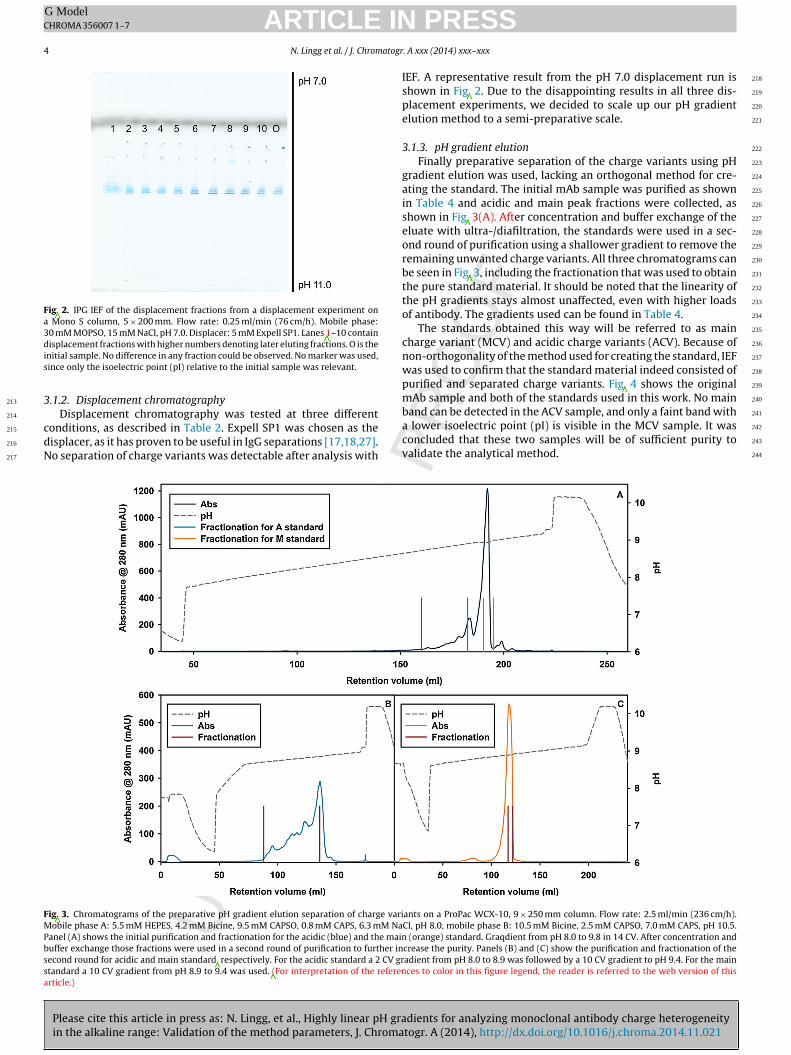
Please cite this article in press as: N. Lingg, et al., Highly linear pH gradients for analyzing monoclonal antibody charge heterogeneityin the alkaline range: Validation of the method parameters, J. Chromatogr. A (2014), http://dx.doi.org/10.1016/j.chroma.2014.11.021
ARTICLE IN PRESSG ModelCHROMA 356007 1–7
4 N. Lingg et al. / J. Chromatogr. A xxx (2014) xxx–xxx
Fig. 2. IPG IEF of the displacement fractions from a displacement experiment ona Mono S column, 5 × 200 mm. Flow rate: 0.25 ml/min (76 cm/h). Mobile phase:30 mM MOPSO, 15 mM NaCl, pH 7.0. Displacer: 5 mM Expell SP1. Lanes 1–10 containdisplacement fractions with higher numbers denoting later eluting fractions. O is theinitial sample. No difference in any fraction could be observed. No marker was used,since only the isoelectric point (pI) relative to the initial sample was relevant.
3.1.2. Displacement chromatography213
Displacement chromatography was tested at three different214
conditions, as described in Table 2. Expell SP1 was chosen as the215
displacer, as it has proven to be useful in IgG separations [17,18,27].216
No separation of charge variants was detectable after analysis with217
IEF. A representative result from the pH 7.0 displacement run is 218
shown in Fig. 2. Due to the disappointing results in all three dis- 219
placement experiments, we decided to scale up our pH gradient 220
elution method to a semi-preparative scale. 221
3.1.3. pH gradient elution 222
Finally preparative separation of the charge variants using pH 223
gradient elution was used, lacking an orthogonal method for cre- 224
ating the standard. The initial mAb sample was purified as shown 225
in Table 4 and acidic and main peak fractions were collected, as 226
shown in Fig. 3(A). After concentration and buffer exchange of the 227
eluate with ultra-/diafiltration, the standards were used in a sec- 228
ond round of purification using a shallower gradient to remove the 229
remaining unwanted charge variants. All three chromatograms can 230
be seen in Fig. 3, including the fractionation that was used to obtain 231
the pure standard material. It should be noted that the linearity of 232
the pH gradients stays almost unaffected, even with higher loads 233
of antibody. The gradients used can be found in Table 4. 234
The standards obtained this way will be referred to as main 235
charge variant (MCV) and acidic charge variants (ACV). Because of 236
non-orthogonality of the method used for creating the standard, IEF 237
was used to confirm that the standard material indeed consisted of 238
purified and separated charge variants. Fig. 4 shows the original 239
mAb sample and both of the standards used in this work. No main 240
band can be detected in the ACV sample, and only a faint band with 241
a lower isoelectric point (pI) is visible in the MCV sample. It was 242
concluded that these two samples will be of sufficient purity to 243
validate the analytical method. 244
Fig. 3. Chromatograms of the preparative pH gradient elution separation of charge variants on a ProPac WCX-10, 9 × 250 mm column. Flow rate: 2.5 ml/min (236 cm/h).Mobile phase A: 5.5 mM HEPES, 4.2 mM Bicine, 9.5 mM CAPSO, 0.8 mM CAPS, 6.3 mM NaCl, pH 8.0, mobile phase B: 10.5 mM Bicine, 2.5 mM CAPSO, 7.0 mM CAPS, pH 10.5.Panel (A) shows the initial purification and fractionation for the acidic (blue) and the main (orange) standard. Graqdient from pH 8.0 to 9.8 in 14 CV. After concentration andbuffer exchange those fractions were used in a second round of purification to further increase the purity. Panels (B) and (C) show the purification and fractionation of thesecond round for acidic and main standard, respectively. For the acidic standard a 2 CV gradient from pH 8.0 to 8.9 was followed by a 10 CV gradient to pH 9.4. For the mainstandard a 10 CV gradient from pH 8.9 to 9.4 was used. (For interpretation of the references to color in this figure legend, the reader is referred to the web version of thisarticle.)
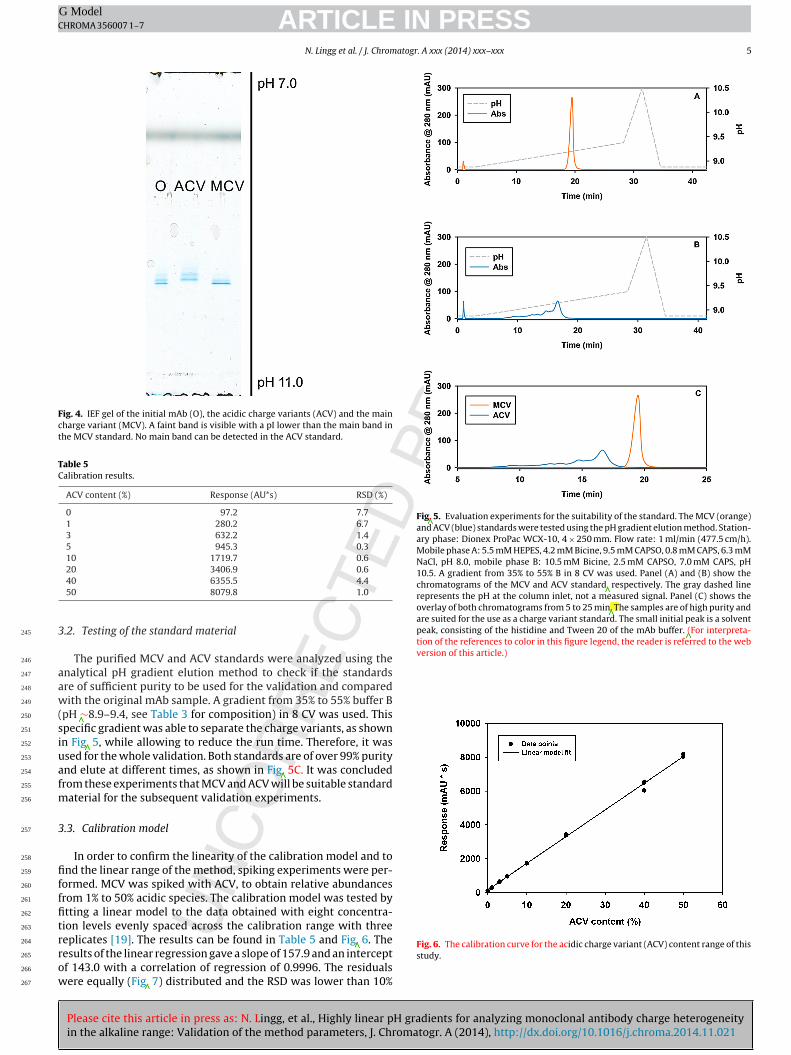
Please cite this article in press as: N. Lingg, et al., Highly linear pH gradients for analyzing monoclonal antibody charge heterogeneityin the alkaline range: Validation of the method parameters, J. Chromatogr. A (2014), http://dx.doi.org/10.1016/j.chroma.2014.11.021
ARTICLE IN PRESSG ModelCHROMA 356007 1–7
N. Lingg et al. / J. Chromatogr. A xxx (2014) xxx–xxx 5
Fig. 4. IEF gel of the initial mAb (O), the acidic charge variants (ACV) and the maincharge variant (MCV). A faint band is visible with a pI lower than the main band inthe MCV standard. No main band can be detected in the ACV standard.
Table 5Calibration results.
ACV content (%) Response (AU*s) RSD (%)
0 97.2 7.71 280.2 6.73 632.2 1.45 945.3 0.310 1719.7 0.620 3406.9 0.640 6355.5 4.450 8079.8 1.0
3.2. Testing of the standard material245
The purified MCV and ACV standards were analyzed using the246
analytical pH gradient elution method to check if the standards247
are of sufficient purity to be used for the validation and compared248
with the original mAb sample. A gradient from 35% to 55% buffer B249
(pH ∼8.9–9.4, see Table 3 for composition) in 8 CV was used. This250
specific gradient was able to separate the charge variants, as shown251
in Fig. 5, while allowing to reduce the run time. Therefore, it was252
used for the whole validation. Both standards are of over 99% purity253
and elute at different times, as shown in Fig. 5C. It was concluded254
from these experiments that MCV and ACV will be suitable standard255
material for the subsequent validation experiments.256
3.3. Calibration model257
In order to confirm the linearity of the calibration model and to258
find the linear range of the method, spiking experiments were per-259
formed. MCV was spiked with ACV, to obtain relative abundances260
from 1% to 50% acidic species. The calibration model was tested by261
fitting a linear model to the data obtained with eight concentra-262
tion levels evenly spaced across the calibration range with three263
replicates [19]. The results can be found in Table 5 and Fig. 6. The264
results of the linear regression gave a slope of 157.9 and an intercept265
of 143.0 with a correlation of regression of 0.9996. The residuals266
were equally (Fig. 7) distributed and the RSD was lower than 10%267
Fig. 5. Evaluation experiments for the suitability of the standard. The MCV (orange)and ACV (blue) standards were tested using the pH gradient elution method. Station-ary phase: Dionex ProPac WCX-10, 4 × 250 mm. Flow rate: 1 ml/min (477.5 cm/h).Mobile phase A: 5.5 mM HEPES, 4.2 mM Bicine, 9.5 mM CAPSO, 0.8 mM CAPS, 6.3 mMNaCl, pH 8.0, mobile phase B: 10.5 mM Bicine, 2.5 mM CAPSO, 7.0 mM CAPS, pH10.5. A gradient from 35% to 55% B in 8 CV was used. Panel (A) and (B) show thechromatograms of the MCV and ACV standard, respectively. The gray dashed linerepresents the pH at the column inlet, not a measured signal. Panel (C) shows theoverlay of both chromatograms from 5 to 25 min. The samples are of high purity andare suited for the use as a charge variant standard. The small initial peak is a solventpeak, consisting of the histidine and Tween 20 of the mAb buffer. (For interpreta-tion of the references to color in this figure legend, the reader is referred to the webversion of this article.)
Fig. 6. The calibration curve for the acidic charge variant (ACV) content range of thisstudy.
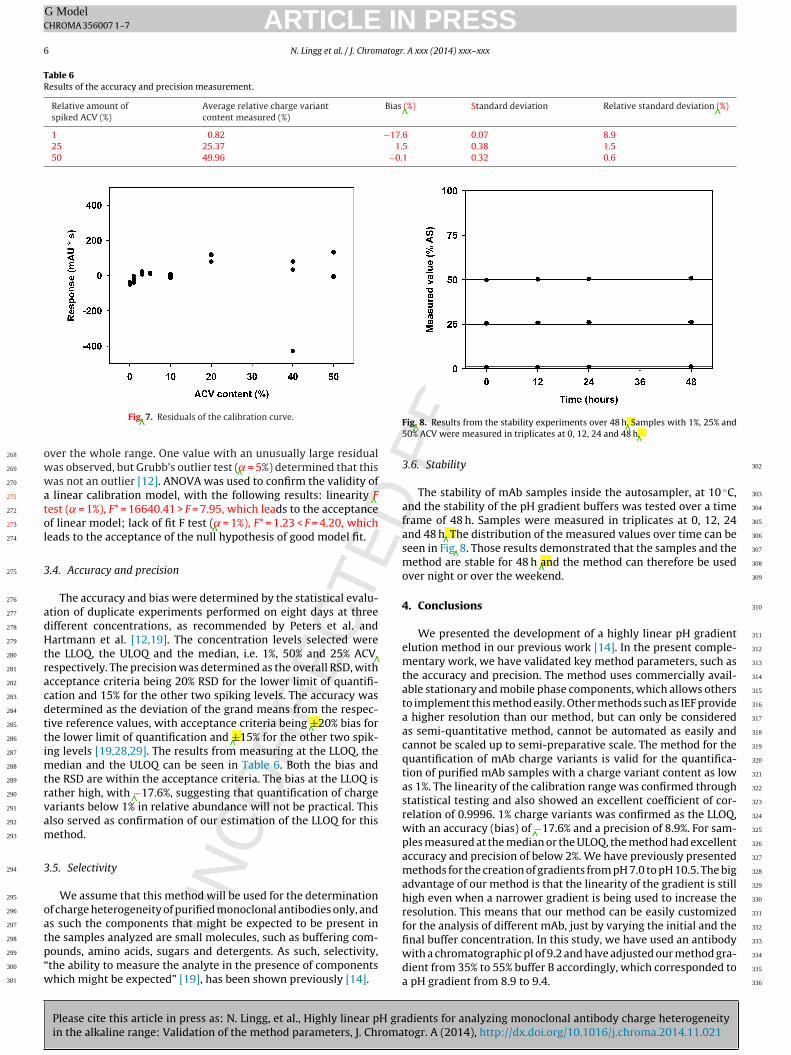
Please cite this article in press as: N. Lingg, et al., Highly linear pH gradients for analyzing monoclonal antibody charge heterogeneityin the alkaline range: Validation of the method parameters, J. Chromatogr. A (2014), http://dx.doi.org/10.1016/j.chroma.2014.11.021
ARTICLE IN PRESSG ModelCHROMA 356007 1–7
6 N. Lingg et al. / J. Chromatogr. A xxx (2014) xxx–xxx
Table 6Results of the accuracy and precision measurement.
Relative amount ofspiked ACV (%)
Average relative charge variantcontent measured (%)
Bias (%) Standard deviation Relative standard deviation (%)
1 0.82 −17.6 0.07 8.925 25.37 1.5 0.38 1.550 49.96 −0.1 0.32 0.6
Fig. 7. Residuals of the calibration curve.
over the whole range. One value with an unusually large residual268
was observed, but Grubb’s outlier test (˛ = 5%) determined that this269
was not an outlier [12]. ANOVA was used to confirm the validity of270
a linear calibration model, with the following results: linearity F271
test (˛ = 1%), F* = 16640.41 > F = 7.95, which leads to the acceptance272
of linear model; lack of fit F test (˛ = 1%), F* = 1.23 < F = 4.20, which273
leads to the acceptance of the null hypothesis of good model fit.274
3.4. Accuracy and precision275
The accuracy and bias were determined by the statistical evalu-276
ation of duplicate experiments performed on eight days at three277
different concentrations, as recommended by Peters et al. and278
Hartmann et al. [12,19]. The concentration levels selected were279
the LLOQ, the ULOQ and the median, i.e. 1%, 50% and 25% ACV,280
respectively. The precision was determined as the overall RSD, with281
acceptance criteria being 20% RSD for the lower limit of quantifi-282
cation and 15% for the other two spiking levels. The accuracy was283
determined as the deviation of the grand means from the respec-284
tive reference values, with acceptance criteria being ±20% bias for285
the lower limit of quantification and ±15% for the other two spik-286
ing levels [19,28,29]. The results from measuring at the LLOQ, the287
median and the ULOQ can be seen in Table 6. Both the bias and288
the RSD are within the acceptance criteria. The bias at the LLOQ is289
rather high, with −17.6%, suggesting that quantification of charge290
variants below 1% in relative abundance will not be practical. This291
also served as confirmation of our estimation of the LLOQ for this292
method.293
3.5. Selectivity294
We assume that this method will be used for the determination295
of charge heterogeneity of purified monoclonal antibodies only, and296
as such the components that might be expected to be present in297
the samples analyzed are small molecules, such as buffering com-298
pounds, amino acids, sugars and detergents. As such, selectivity,299
“the ability to measure the analyte in the presence of components300
which might be expected” [19], has been shown previously [14].301
Fig. 8. Results from the stability experiments over 48 h. Samples with 1%, 25% and50% ACV were measured in triplicates at 0, 12, 24 and 48 h.
3.6. Stability 302
The stability of mAb samples inside the autosampler, at 10 ◦C, 303
and the stability of the pH gradient buffers was tested over a time 304
frame of 48 h. Samples were measured in triplicates at 0, 12, 24 305
and 48 h. The distribution of the measured values over time can be 306
seen in Fig. 8. Those results demonstrated that the samples and the 307
method are stable for 48 h and the method can therefore be used 308
over night or over the weekend. 309
4. Conclusions 310
We presented the development of a highly linear pH gradient 311
elution method in our previous work [14]. In the present comple- 312
mentary work, we have validated key method parameters, such as 313
the accuracy and precision. The method uses commercially avail- 314
able stationary and mobile phase components, which allows others 315
to implement this method easily. Other methods such as IEF provide 316
a higher resolution than our method, but can only be considered 317
as semi-quantitative method, cannot be automated as easily and 318
cannot be scaled up to semi-preparative scale. The method for the 319
quantification of mAb charge variants is valid for the quantifica- 320
tion of purified mAb samples with a charge variant content as low 321
as 1%. The linearity of the calibration range was confirmed through 322
statistical testing and also showed an excellent coefficient of cor- 323
relation of 0.9996. 1% charge variants was confirmed as the LLOQ, 324
with an accuracy (bias) of −17.6% and a precision of 8.9%. For sam- 325
ples measured at the median or the ULOQ, the method had excellent 326
accuracy and precision of below 2%. We have previously presented 327
methods for the creation of gradients from pH 7.0 to pH 10.5. The big 328
advantage of our method is that the linearity of the gradient is still 329
high even when a narrower gradient is being used to increase the 330
resolution. This means that our method can be easily customized 331
for the analysis of different mAb, just by varying the initial and the 332
final buffer concentration. In this study, we have used an antibody 333
with a chromatographic pI of 9.2 and have adjusted our method gra- 334
dient from 35% to 55% buffer B accordingly, which corresponded to 335
a pH gradient from 8.9 to 9.4. 336
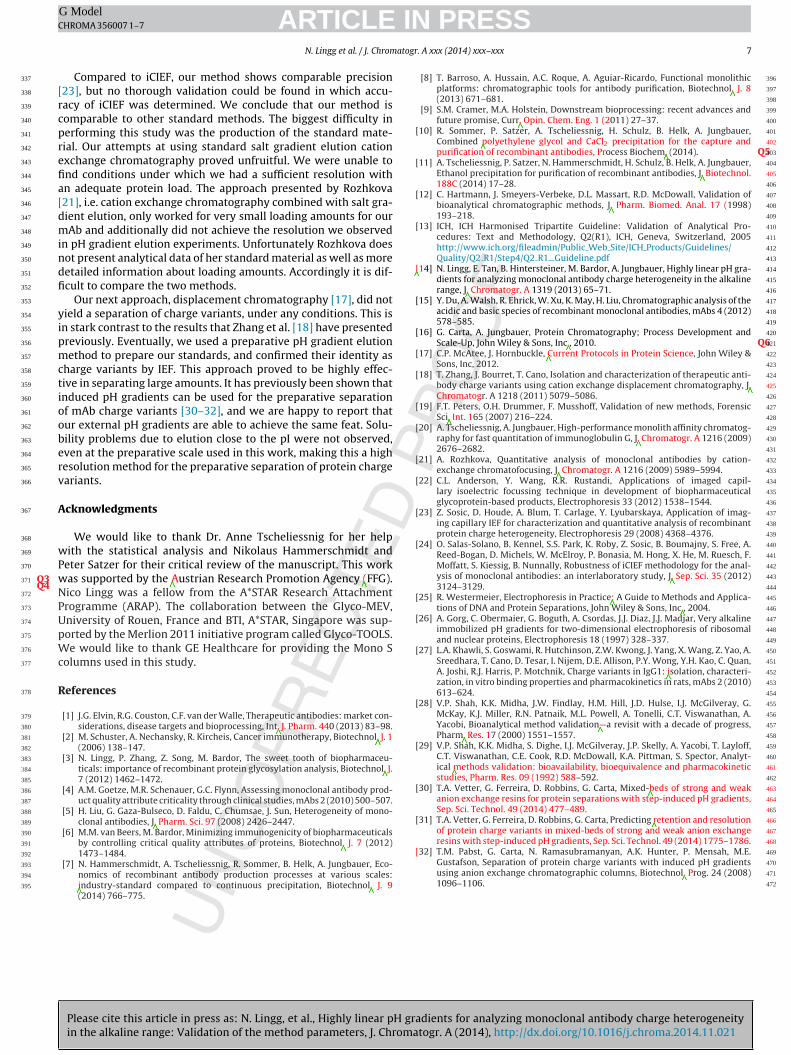
Please cite this article in press as: N. Lingg, et al., Highly linear pH gradients for analyzing monoclonal antibody charge heterogeneityin the alkaline range: Validation of the method parameters, J. Chromatogr. A (2014), http://dx.doi.org/10.1016/j.chroma.2014.11.021
ARTICLE IN PRESSG ModelCHROMA 356007 1–7
N. Lingg et al. / J. Chromatogr. A xxx (2014) xxx–xxx 7
Compared to iCIEF, our method shows comparable precision337
[23], but no thorough validation could be found in which accu-338
racy of iCIEF was determined. We conclude that our method is339
comparable to other standard methods. The biggest difficulty in340
performing this study was the production of the standard mate-341
rial. Our attempts at using standard salt gradient elution cation342
exchange chromatography proved unfruitful. We were unable to343
find conditions under which we had a sufficient resolution with344
an adequate protein load. The approach presented by Rozhkova345
[21], i.e. cation exchange chromatography combined with salt gra-346
dient elution, only worked for very small loading amounts for our347
mAb and additionally did not achieve the resolution we observed348
in pH gradient elution experiments. Unfortunately Rozhkova does349
not present analytical data of her standard material as well as more350
detailed information about loading amounts. Accordingly it is dif-351
ficult to compare the two methods.352
Our next approach, displacement chromatography [17], did not353
yield a separation of charge variants, under any conditions. This is354
in stark contrast to the results that Zhang et al. [18] have presented355
previously. Eventually, we used a preparative pH gradient elution356
method to prepare our standards, and confirmed their identity as357
charge variants by IEF. This approach proved to be highly effec-358
tive in separating large amounts. It has previously been shown that359
induced pH gradients can be used for the preparative separation360
of mAb charge variants [30–32], and we are happy to report that361
our external pH gradients are able to achieve the same feat. Solu-362
bility problems due to elution close to the pI were not observed,363
even at the preparative scale used in this work, making this a high364
resolution method for the preparative separation of protein charge365
variants.366
Acknowledgments367
We would like to thank Dr. Anne Tscheliessnig for her help368
with the statistical analysis and Nikolaus Hammerschmidt and369
Peter Satzer for their critical review of the manuscript. This work370
was supported by the Austrian Research Promotion Agency (FFG).Q3Q4
371
Nico Lingg was a fellow from the A*STAR Research Attachment372
Programme (ARAP). The collaboration between the Glyco-MEV,373
University of Rouen, France and BTI, A*STAR, Singapore was sup-374
ported by the Merlion 2011 initiative program called Glyco-TOOLS.375
We would like to thank GE Healthcare for providing the Mono S376
columns used in this study.377
References378
[1] J.G. Elvin, R.G. Couston, C.F. van der Walle, Therapeutic antibodies: market con-379
siderations, disease targets and bioprocessing, Int. J. Pharm. 440 (2013) 83–98.380
[2] M. Schuster, A. Nechansky, R. Kircheis, Cancer immunotherapy, Biotechnol. J. 1381
(2006) 138–147.382
[3] N. Lingg, P. Zhang, Z. Song, M. Bardor, The sweet tooth of biopharmaceu-383
ticals: importance of recombinant protein glycosylation analysis, Biotechnol. J.384
7 (2012) 1462–1472.385
[4] A.M. Goetze, M.R. Schenauer, G.C. Flynn, Assessing monoclonal antibody prod-386
uct quality attribute criticality through clinical studies, mAbs 2 (2010) 500–507.387
[5] H. Liu, G. Gaza-Bulseco, D. Faldu, C. Chumsae, J. Sun, Heterogeneity of mono-388
clonal antibodies, J. Pharm. Sci. 97 (2008) 2426–2447.389
[6] M.M. van Beers, M. Bardor, Minimizing immunogenicity of biopharmaceuticals390
by controlling critical quality attributes of proteins, Biotechnol. J. 7 (2012)391
1473–1484.392
[7] N. Hammerschmidt, A. Tscheliessnig, R. Sommer, B. Helk, A. Jungbauer, Eco-393
nomics of recombinant antibody production processes at various scales:394
industry-standard compared to continuous precipitation, Biotechnol. J. 9395
(2014) 766–775.
[8] T. Barroso, A. Hussain, A.C. Roque, A. Aguiar-Ricardo, Functional monolithic 396
platforms: chromatographic tools for antibody purification, Biotechnol. J. 8 397
(2013) 671–681. 398
[9] S.M. Cramer, M.A. Holstein, Downstream bioprocessing: recent advances and 399
future promise, Curr. Opin. Chem. Eng. 1 (2011) 27–37. 400
[10] R. Sommer, P. Satzer, A. Tscheliessnig, H. Schulz, B. Helk, A. Jungbauer, 401
Combined polyethylene glycol and CaCl2 precipitation for the capture and 402
purification of recombinant antibodies, Process Biochem. (2014). Q5403
[11] A. Tscheliessnig, P. Satzer, N. Hammerschmidt, H. Schulz, B. Helk, A. Jungbauer, 404
Ethanol precipitation for purification of recombinant antibodies, J. Biotechnol. 405
188C (2014) 17–28. 406
[12] C. Hartmann, J. Smeyers-Verbeke, D.L. Massart, R.D. McDowall, Validation of 407
bioanalytical chromatographic methods, J. Pharm. Biomed. Anal. 17 (1998) 408
193–218. 409
[13] ICH, ICH Harmonised Tripartite Guideline: Validation of Analytical Pro- 410
cedures: Text and Methodology, Q2(R1), ICH, Geneva, Switzerland, 2005 411
http://www.ich.org/fileadmin/Public Web Site/ICH Products/Guidelines/ 412
Quality/Q2 R1/Step4/Q2 R1 Guideline.pdf 413
[14] N. Lingg, E. Tan, B. Hintersteiner, M. Bardor, A. Jungbauer, Highly linear pH gra- 414
dients for analyzing monoclonal antibody charge heterogeneity in the alkaline 415
range, J. Chromatogr. A 1319 (2013) 65–71. 416
[15] Y. Du, A. Walsh, R. Ehrick, W. Xu, K. May, H. Liu, Chromatographic analysis of the 417
acidic and basic species of recombinant monoclonal antibodies, mAbs 4 (2012) 418
578–585. 419
[16] G. Carta, A. Jungbauer, Protein Chromatography; Process Development and 420
Scale-Up, John Wiley & Sons, Inc., 2010. Q6421
[17] C.P. McAtee, J. Hornbuckle, Current Protocols in Protein Science, John Wiley & 422
Sons, Inc, 2012. 423
[18] T. Zhang, J. Bourret, T. Cano, Isolation and characterization of therapeutic anti- 424
body charge variants using cation exchange displacement chromatography, J. 425
Chromatogr. A 1218 (2011) 5079–5086. 426
[19] F.T. Peters, O.H. Drummer, F. Musshoff, Validation of new methods, Forensic 427
Sci. Int. 165 (2007) 216–224. 428
[20] A. Tscheliessnig, A. Jungbauer, High-performance monolith affinity chromatog- 429
raphy for fast quantitation of immunoglobulin G, J. Chromatogr. A 1216 (2009) 430
2676–2682. 431
[21] A. Rozhkova, Quantitative analysis of monoclonal antibodies by cation- 432
exchange chromatofocusing, J. Chromatogr. A 1216 (2009) 5989–5994. 433
[22] C.L. Anderson, Y. Wang, R.R. Rustandi, Applications of imaged capil- 434
lary isoelectric focussing technique in development of biopharmaceutical 435
glycoprotein-based products, Electrophoresis 33 (2012) 1538–1544. 436
[23] Z. Sosic, D. Houde, A. Blum, T. Carlage, Y. Lyubarskaya, Application of imag- 437
ing capillary IEF for characterization and quantitative analysis of recombinant 438
protein charge heterogeneity, Electrophoresis 29 (2008) 4368–4376. 439
[24] O. Salas-Solano, B. Kennel, S.S. Park, K. Roby, Z. Sosic, B. Boumajny, S. Free, A. 440
Reed-Bogan, D. Michels, W. McElroy, P. Bonasia, M. Hong, X. He, M. Ruesch, F. 441
Moffatt, S. Kiessig, B. Nunnally, Robustness of iCIEF methodology for the anal- 442
ysis of monoclonal antibodies: an interlaboratory study, J. Sep. Sci. 35 (2012) 443
3124–3129. 444
[25] R. Westermeier, Electrophoresis in Practice: A Guide to Methods and Applica- 445
tions of DNA and Protein Separations, John Wiley & Sons, Inc., 2004. 446
[26] A. Gorg, C. Obermaier, G. Boguth, A. Csordas, J.J. Diaz, J.J. Madjar, Very alkaline 447
immobilized pH gradients for two-dimensional electrophoresis of ribosomal 448
and nuclear proteins, Electrophoresis 18 (1997) 328–337. 449
[27] L.A. Khawli, S. Goswami, R. Hutchinson, Z.W. Kwong, J. Yang, X. Wang, Z. Yao, A. 450
Sreedhara, T. Cano, D. Tesar, I. Nijem, D.E. Allison, P.Y. Wong, Y.H. Kao, C. Quan, 451
A. Joshi, R.J. Harris, P. Motchnik, Charge variants in IgG1: isolation, characteri- 452
zation, in vitro binding properties and pharmacokinetics in rats, mAbs 2 (2010) 453
613–624. 454
[28] V.P. Shah, K.K. Midha, J.W. Findlay, H.M. Hill, J.D. Hulse, I.J. McGilveray, G. 455
McKay, K.J. Miller, R.N. Patnaik, M.L. Powell, A. Tonelli, C.T. Viswanathan, A. 456
Yacobi, Bioanalytical method validation—a revisit with a decade of progress, 457
Pharm. Res. 17 (2000) 1551–1557. 458
[29] V.P. Shah, K.K. Midha, S. Dighe, I.J. McGilveray, J.P. Skelly, A. Yacobi, T. Layloff, 459
C.T. Viswanathan, C.E. Cook, R.D. McDowall, K.A. Pittman, S. Spector, Analyt- 460
ical methods validation: bioavailability, bioequivalence and pharmacokinetic 461
studies, Pharm. Res. 09 (1992) 588–592. 462
[30] T.A. Vetter, G. Ferreira, D. Robbins, G. Carta, Mixed-beds of strong and weak 463
anion exchange resins for protein separations with step-induced pH gradients, 464
Sep. Sci. Technol. 49 (2014) 477–489. 465
[31] T.A. Vetter, G. Ferreira, D. Robbins, G. Carta, Predicting retention and resolution 466
of protein charge variants in mixed-beds of strong and weak anion exchange 467
resins with step-induced pH gradients, Sep. Sci. Technol. 49 (2014) 1775–1786. 468
[32] T.M. Pabst, G. Carta, N. Ramasubramanyan, A.K. Hunter, P. Mensah, M.E. 469
Gustafson, Separation of protein charge variants with induced pH gradients 470
using anion exchange chromatographic columns, Biotechnol. Prog. 24 (2008) 471
1096–1106. 472
© 2012 Wiley-VCH Verlag GmbH & Co. KGaA, Weinheim 1
Biotechnol. J. 2012, 7 DOI 10.1002/biot.201200078 www.biotechnology-journal.com
1 Introduction
Biopharmaceuticals appeared 30 years ago with the ap-proval of Humulin®, the first recombinantly produced in-
sulin [1]. Today, the biopharmaceutical market is a highlycompetitive and growing sector of the pharmaceutical in-dustry representing 99 billion US$ of sales in 2009 [2].Many patents for blockbuster therapeutic proteins areabout to expire and the question of biosimilar and bio-generic regulation has come to the fore [3]. Owing to thefact that the majority of those biopharmaceuticals are gly-coproteins [4], the elucidation of their glycosylation pat-terns, a key determinant of functionality and efficacy, is ofutmost importance.
Glycosylation is the most common modification foundin secreted proteins, but also the most structurally diverse[4]. Indeed, unlike DNA, RNA or protein, glycan synthesisis not based on templates, but consists instead of an as-sembly of monosaccharides that are enzymatically linkedin various ways [5]. Additionally, proteins can present dif-ferent glycoforms that vary both in the type and numberof glycans and their attachment sites. Because correctglycosylation is usually required for the optimal functionof glycoprotein pharmaceuticals, they are currently pro-duced in eukaryotic systems [6]. Efforts are underway to
Review
The sweet tooth of biopharmaceuticals: Importance of recombinant protein glycosylation analysis
Nico Lingg1,2,*, Peiqing Zhang1,*, Zhiwei Song1 and Muriel Bardor1
1 Bioprocessing Technology Institute, Agency for Science, Technology and Research (A*STAR), Singapore, Singapore2 Department of Biotechnology, University of Natural Resources and Life Sciences, Vienna, Austria
Biopharmaceuticals currently represent the fastest growing sector of the pharmaceutical industry,mainly driven by a rapid expansion in the manufacture of recombinant protein-based drugs. Gly-cosylation is the most prominent post-translational modification occurring on these protein drugs.It constitutes one of the critical quality attributes that requires thorough analysis for optimal effi-cacy and safety. This review examines the functional importance of glycosylation of recombinantprotein drugs, illustrated using three examples of protein biopharmaceuticals: IgG antibodies, ery-thropoietin and glucocerebrosidase. Current analytical methods are reviewed as solutions for qual-itative and quantitative measurements of glycosylation to monitor quality target product profilesof recombinant glycoprotein drugs. Finally, we propose a framework for designing the quality tar-get product profile of recombinant glycoproteins and planning workflow for glycosylation analysiswith the selection of available analytical methods and tools.
Keywords: Analytical biotechnology · Carbohydrates · Chromatography · Mass spectrometry · Recombinant proteins
Correspondence: Dr. Muriel Bardor, Bioprocessing Technology Institute,Agency for Science, Technology and Research (A*STAR), 20 Biopolis Way,#06-01 Centros, Singapore (138668), SingaporeE-mail: [email protected]
Abbreviations: ADCC, antibody-dependent cellular cytotoxicity; CDC, com-plement-dependent cytotoxicity; CID, collision-induced dissociation; CQA,critical quality attribute; DMB, 1,2-diamino-4,5-methylenedioxybenzene;EPO, erythropoietin; ESI, electrospray ionization; ETD, electron-transfer dis-sociation; Fab, fragment antigen-binding; Fc, fragment crystallizable; Fuc,fucose; Gal, galactose; GalNAc, N-acetylgalactosamine; GCase, glucocere-brosidase; GlcNAc, N-acetylglucosamine; HILIC, hydrophilic-interactionliquid chromatography; HPAEC-PAD, high pH anion exchange chromatog-raphy with pulsed amperometric detection; HPLC, high performance liquidchromatography; HTM, high throughput method; IEF, isoelectric focusing;LC-MS, liquid chromatography-mass spectrometry; mAb, monoclonal anti-body; MALDI-TOF, matrix-assisted laser desorption ionization coupled witha time-of-flight analyzer; Man, mannose; MS, mass spectrometry; MSn,multi-stage mass spectrometry; Neu5Ac, N-acetylneuraminic acid;Neu5Gc, N-glycolylneuraminic acid; NP, normal phase; QbD, quality by de-sign; QTPP, quality target product profile; RP, reversed phase
Received 18 APR 2012Revised 06 JUN 2012Accepted 18 JUN 2012
* These authors contributed equally to this work.
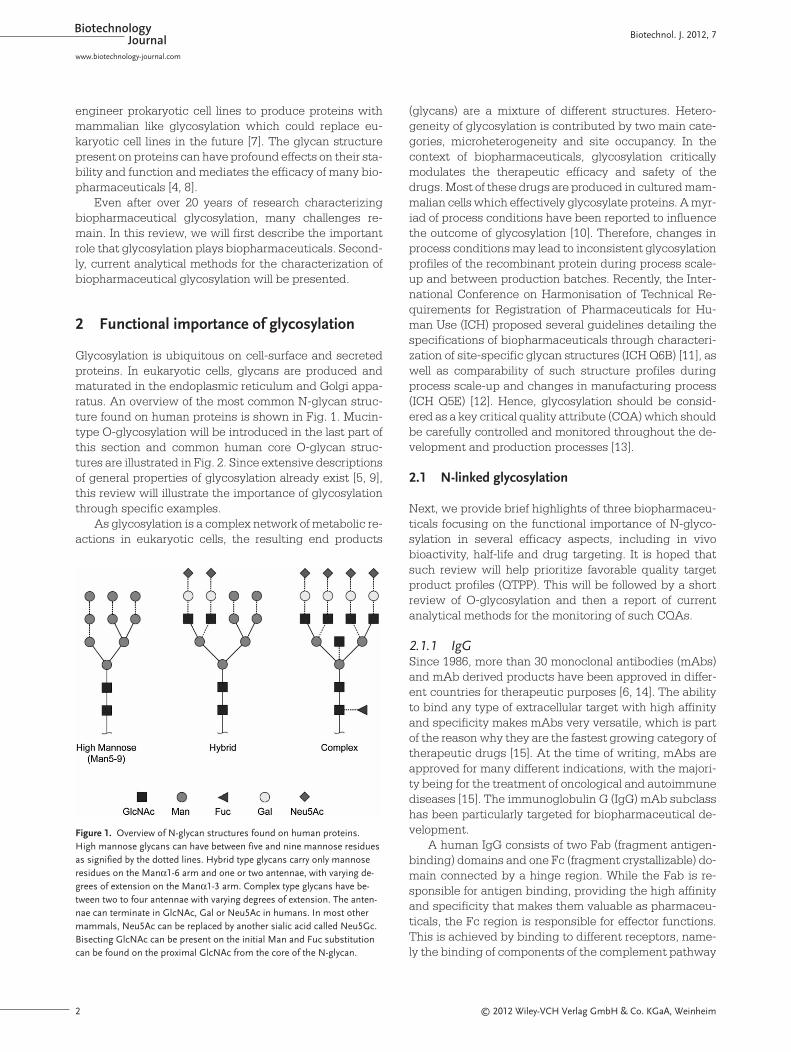
BiotechnologyJournal Biotechnol. J. 2012, 7
2 © 2012 Wiley-VCH Verlag GmbH & Co. KGaA, Weinheim
engineer prokaryotic cell lines to produce proteins withmammalian like glycosylation which could replace eu-karyotic cell lines in the future [7]. The glycan structurepresent on proteins can have profound effects on their sta-bility and function and mediates the efficacy of many bio-pharmaceuticals [4, 8].
Even after over 20 years of research characterizingbiopharmaceutical glycosylation, many challenges re-main. In this review, we will first describe the importantrole that glycosylation plays biopharmaceuticals. Second-ly, current analytical methods for the characterization ofbiopharmaceutical glycosylation will be presented.
2 Functional importance of glycosylation
Glycosylation is ubiquitous on cell-surface and secretedproteins. In eukaryotic cells, glycans are produced andmaturated in the endoplasmic reticulum and Golgi appa-ratus. An overview of the most common N-glycan struc-ture found on human proteins is shown in Fig. 1. Mucin-type O-glycosylation will be introduced in the last part ofthis section and common human core O-glycan struc-tures are illustrated in Fig. 2. Since extensive descriptionsof general properties of glycosylation already exist [5, 9],this review will illustrate the importance of glycosylationthrough specific examples.
As glycosylation is a complex network of metabolic re-actions in eukaryotic cells, the resulting end products
(glycans) are a mixture of different structures. Hetero-geneity of glycosylation is contributed by two main cate-gories, microheterogeneity and site occupancy. In thecontext of biopharmaceuticals, glycosylation criticallymodulates the therapeutic efficacy and safety of thedrugs. Most of these drugs are produced in cultured mam-malian cells which effectively glycosylate proteins. A myr-iad of process conditions have been reported to influencethe outcome of glycosylation [10]. Therefore, changes inprocess conditions may lead to inconsistent glycosylationprofiles of the recombinant protein during process scale-up and between production batches. Recently, the Inter-national Conference on Harmonisation of Technical Re-quirements for Registration of Pharmaceuticals for Hu-man Use (ICH) proposed several guidelines detailing thespecifications of biopharmaceuticals through characteri-zation of site-specific glycan structures (ICH Q6B) [11], aswell as comparability of such structure profiles duringprocess scale-up and changes in manufacturing process(ICH Q5E) [12]. Hence, glycosylation should be consid-ered as a key critical quality attribute (CQA) which shouldbe carefully controlled and monitored throughout the de-velopment and production processes [13].
2.1 N-linked glycosylation
Next, we provide brief highlights of three biopharmaceu-ticals focusing on the functional importance of N-glyco-sylation in several efficacy aspects, including in vivobioactivity, half-life and drug targeting. It is hoped thatsuch review will help prioritize favorable quality targetproduct profiles (QTPP). This will be followed by a shortreview of O-glycosylation and then a report of current analytical methods for the monitoring of such CQAs.
2.1.1 IgGSince 1986, more than 30 monoclonal antibodies (mAbs)and mAb derived products have been approved in differ-ent countries for therapeutic purposes [6, 14]. The abilityto bind any type of extracellular target with high affinityand specificity makes mAbs very versatile, which is partof the reason why they are the fastest growing category oftherapeutic drugs [15]. At the time of writing, mAbs areapproved for many different indications, with the majori-ty being for the treatment of oncological and autoimmunediseases [15]. The immunoglobulin G (IgG) mAb subclasshas been particularly targeted for biopharmaceutical de-velopment.
A human IgG consists of two Fab (fragment antigen-binding) domains and one Fc (fragment crystallizable) do-main connected by a hinge region. While the Fab is re-sponsible for antigen binding, providing the high affinityand specificity that makes them valuable as pharmaceu-ticals, the Fc region is responsible for effector functions.This is achieved by binding to different receptors, name-ly the binding of components of the complement pathway
www.biotechnology-journal.com
Figure 1. Overview of N-glycan structures found on human proteins.High mannose glycans can have between five and nine mannose residuesas signified by the dotted lines. Hybrid type glycans carry only mannoseresidues on the Manα1-6 arm and one or two antennae, with varying de-grees of extension on the Manα1-3 arm. Complex type glycans have be-tween two to four antennae with varying degrees of extension. The anten-nae can terminate in GlcNAc, Gal or Neu5Ac in humans. In most othermammals, Neu5Ac can be replaced by another sialic acid called Neu5Gc.Bisecting GlcNAc can be present on the initial Man and Fuc substitutioncan be found on the proximal GlcNAc from the core of the N-glycan.
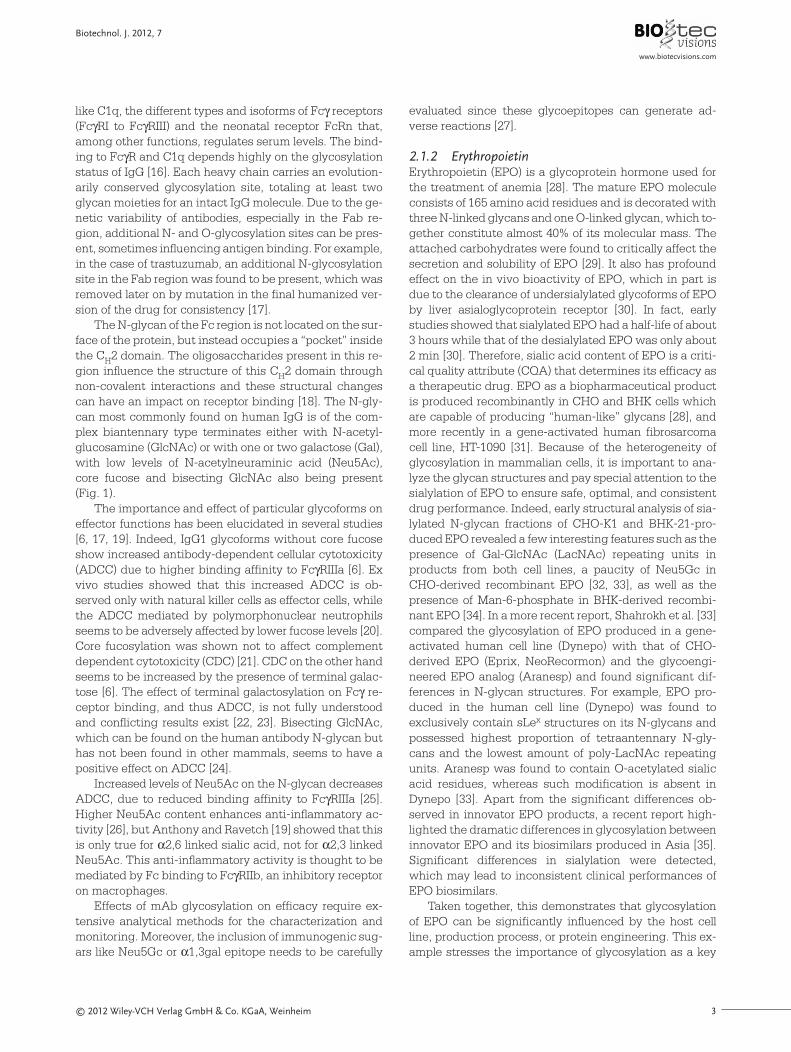
© 2012 Wiley-VCH Verlag GmbH & Co. KGaA, Weinheim 3
like C1q, the different types and isoforms of Fcγ receptors(FcγRI to FcγRIII) and the neonatal receptor FcRn that,among other functions, regulates serum levels. The bind-ing to FcγR and C1q depends highly on the glycosylationstatus of IgG [16]. Each heavy chain carries an evolution-arily conserved glycosylation site, totaling at least twoglycan moieties for an intact IgG molecule. Due to the ge-netic variability of antibodies, especially in the Fab re-gion, additional N- and O-glycosylation sites can be pres-ent, sometimes influencing antigen binding. For example,in the case of trastuzumab, an additional N-glycosylationsite in the Fab region was found to be present, which wasremoved later on by mutation in the final humanized ver-sion of the drug for consistency [17].
The N-glycan of the Fc region is not located on the sur-face of the protein, but instead occupies a “pocket” insidethe CH2 domain. The oligosaccharides present in this re-gion influence the structure of this CH2 domain throughnon-covalent interactions and these structural changescan have an impact on receptor binding [18]. The N-gly-can most commonly found on human IgG is of the com-plex biantennary type terminates either with N-acetyl-glucosamine (GlcNAc) or with one or two galactose (Gal),with low levels of N-acetylneuraminic acid (Neu5Ac), core fucose and bisecting GlcNAc also being present (Fig. 1).
The importance and effect of particular glycoforms oneffector functions has been elucidated in several studies[6, 17, 19]. Indeed, IgG1 glycoforms without core fucoseshow increased antibody-dependent cellular cytotoxicity(ADCC) due to higher binding affinity to FcγRIIIa [6]. Exvivo studies showed that this increased ADCC is ob-served only with natural killer cells as effector cells, whilethe ADCC mediated by polymorphonuclear neutrophilsseems to be adversely affected by lower fucose levels [20].Core fucosylation was shown not to affect complementdependent cytotoxicity (CDC) [21]. CDC on the other handseems to be increased by the presence of terminal galac-tose [6]. The effect of terminal galactosylation on Fcγ re-ceptor binding, and thus ADCC, is not fully understoodand conflicting results exist [22, 23]. Bisecting GlcNAc,which can be found on the human antibody N-glycan buthas not been found in other mammals, seems to have apositive effect on ADCC [24].
Increased levels of Neu5Ac on the N-glycan decreasesADCC, due to reduced binding affinity to FcγRIIIa [25].Higher Neu5Ac content enhances anti-inflammatory ac-tivity [26], but Anthony and Ravetch [19] showed that thisis only true for α2,6 linked sialic acid, not for α2,3 linkedNeu5Ac. This anti-inflammatory activity is thought to bemediated by Fc binding to FcγRIIb, an inhibitory receptoron macrophages.
Effects of mAb glycosylation on efficacy require ex-tensive analytical methods for the characterization andmonitoring. Moreover, the inclusion of immunogenic sug-ars like Neu5Gc or α1,3gal epitope needs to be carefully
evaluated since these glycoepitopes can generate ad-verse reactions [27].
2.1.2 ErythropoietinErythropoietin (EPO) is a glycoprotein hormone used forthe treatment of anemia [28]. The mature EPO moleculeconsists of 165 amino acid residues and is decorated withthree N-linked glycans and one O-linked glycan, which to-gether constitute almost 40% of its molecular mass. Theattached carbohydrates were found to critically affect thesecretion and solubility of EPO [29]. It also has profoundeffect on the in vivo bioactivity of EPO, which in part isdue to the clearance of undersialylated glycoforms of EPOby liver asialoglycoprotein receptor [30]. In fact, earlystudies showed that sialylated EPO had a half-life of about3 hours while that of the desialylated EPO was only about2 min [30]. Therefore, sialic acid content of EPO is a criti-cal quality attribute (CQA) that determines its efficacy asa therapeutic drug. EPO as a biopharmaceutical productis produced recombinantly in CHO and BHK cells whichare capable of producing “human-like” glycans [28], andmore recently in a gene-activated human fibrosarcomacell line, HT-1090 [31]. Because of the heterogeneity ofglycosylation in mammalian cells, it is important to ana-lyze the glycan structures and pay special attention to thesialylation of EPO to ensure safe, optimal, and consistentdrug performance. Indeed, early structural analysis of sia-lylated N-glycan fractions of CHO-K1 and BHK-21-pro-duced EPO revealed a few interesting features such as thepresence of Gal-GlcNAc (LacNAc) repeating units inproducts from both cell lines, a paucity of Neu5Gc inCHO-derived recombinant EPO [32, 33], as well as thepresence of Man-6-phosphate in BHK-derived recombi-nant EPO [34]. In a more recent report, Shahrokh et al. [33]compared the glycosylation of EPO produced in a gene-activated human cell line (Dynepo) with that of CHO- derived EPO (Eprix, NeoRecormon) and the glycoengi-neered EPO analog (Aranesp) and found significant dif-ferences in N-glycan structures. For example, EPO pro-duced in the human cell line (Dynepo) was found toexclusively contain sLex structures on its N-glycans andpossessed highest proportion of tetraantennary N-gly-cans and the lowest amount of poly-LacNAc repeatingunits. Aranesp was found to contain O-acetylated sialicacid residues, whereas such modification is absent inDynepo [33]. Apart from the significant differences ob-served in innovator EPO products, a recent report high-lighted the dramatic differences in glycosylation betweeninnovator EPO and its biosimilars produced in Asia [35].Significant differences in sialylation were detected,which may lead to inconsistent clinical performances ofEPO biosimilars.
Taken together, this demonstrates that glycosylationof EPO can be significantly influenced by the host cellline, production process, or protein engineering. This ex-ample stresses the importance of glycosylation as a key
Biotechnol. J. 2012, 7
www.biotecvisions.com
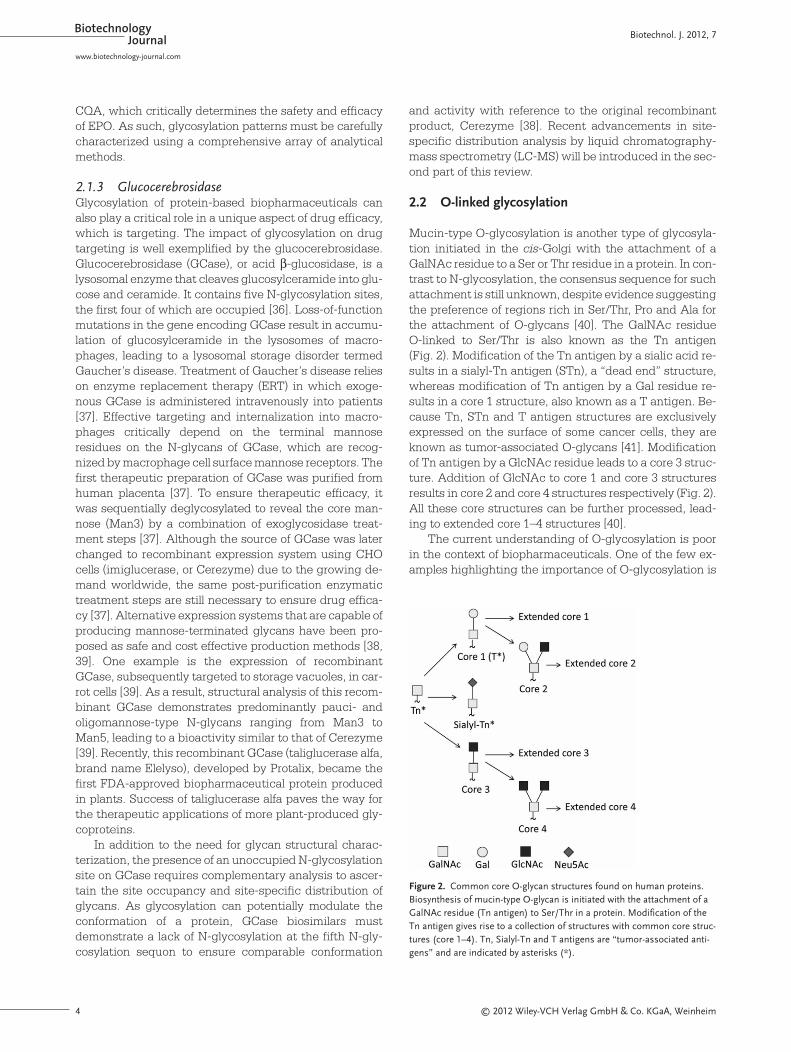
BiotechnologyJournal Biotechnol. J. 2012, 7
4 © 2012 Wiley-VCH Verlag GmbH & Co. KGaA, Weinheim
CQA, which critically determines the safety and efficacyof EPO. As such, glycosylation patterns must be carefullycharacterized using a comprehensive array of analyticalmethods.
2.1.3 GlucocerebrosidaseGlycosylation of protein-based biopharmaceuticals canalso play a critical role in a unique aspect of drug efficacy,which is targeting. The impact of glycosylation on drugtargeting is well exemplified by the glucocerebrosidase.Glucocerebrosidase (GCase), or acid β-glucosidase, is alysosomal enzyme that cleaves glucosylceramide into glu-cose and ceramide. It contains five N-glycosylation sites,the first four of which are occupied [36]. Loss-of-functionmutations in the gene encoding GCase result in accumu-lation of glucosylceramide in the lysosomes of macro -phages, leading to a lysosomal storage disorder termedGaucher’s disease. Treatment of Gaucher’s disease relieson enzyme replacement therapy (ERT) in which exoge-nous GCase is administered intravenously into patients[37]. Effective targeting and internalization into macro -phages critically depend on the terminal mannoseresidues on the N-glycans of GCase, which are recog-nized by macrophage cell surface mannose receptors. Thefirst therapeutic preparation of GCase was purified fromhuman placenta [37]. To ensure therapeutic efficacy, itwas sequentially deglycosylated to reveal the core man-nose (Man3) by a combination of exoglycosidase treat-ment steps [37]. Although the source of GCase was laterchanged to recombinant expression system using CHOcells (imiglucerase, or Cerezyme) due to the growing de-mand worldwide, the same post-purification enzymatictreatment steps are still necessary to ensure drug effica-cy [37]. Alternative expression systems that are capable ofproducing mannose-terminated glycans have been pro-posed as safe and cost effective production methods [38,39]. One example is the expression of recombinantGCase, subsequently targeted to storage vacuoles, in car-rot cells [39]. As a result, structural analysis of this recom-binant GCase demonstrates predominantly pauci- andoligomannose-type N-glycans ranging from Man3 toMan5, leading to a bioactivity similar to that of Cerezyme[39]. Recently, this recombinant GCase (taliglucerase alfa,brand name Elelyso), developed by Protalix, became thefirst FDA-approved biopharmaceutical protein producedin plants. Success of taliglucerase alfa paves the way forthe therapeutic applications of more plant-produced gly-coproteins.
In addition to the need for glycan structural charac-terization, the presence of an unoccupied N-glycosylationsite on GCase requires complementary analysis to ascer-tain the site occupancy and site-specific distribution ofglycans. As glycosylation can potentially modulate theconformation of a protein, GCase biosimilars mustdemonstrate a lack of N-glycosylation at the fifth N-gly-cosylation sequon to ensure comparable conformation
and activity with reference to the original recombinantproduct, Cerezyme [38]. Recent advancements in site-specific distribution analysis by liquid chromatography-mass spectrometry (LC-MS) will be introduced in the sec-ond part of this review.
2.2 O-linked glycosylation
Mucin-type O-glycosylation is another type of glycosyla-tion initiated in the cis-Golgi with the attachment of aGalNAc residue to a Ser or Thr residue in a protein. In con-trast to N-glycosylation, the consensus sequence for suchattachment is still unknown, despite evidence suggestingthe preference of regions rich in Ser/Thr, Pro and Ala forthe attachment of O-glycans [40]. The GalNAc residue O-linked to Ser/Thr is also known as the Tn antigen (Fig. 2). Modification of the Tn antigen by a sialic acid re-sults in a sialyl-Tn antigen (STn), a “dead end” structure,whereas modification of Tn antigen by a Gal residue re-sults in a core 1 structure, also known as a T antigen. Be-cause Tn, STn and T antigen structures are exclusivelyexpressed on the surface of some cancer cells, they areknown as tumor-associated O-glycans [41]. Modificationof Tn antigen by a GlcNAc residue leads to a core 3 struc-ture. Addition of GlcNAc to core 1 and core 3 structuresresults in core 2 and core 4 structures respectively (Fig. 2).All these core structures can be further processed, lead-ing to extended core 1–4 structures [40].
The current understanding of O-glycosylation is poorin the context of biopharmaceuticals. One of the few ex-amples highlighting the importance of O-glycosylation is
www.biotechnology-journal.com
Figure 2. Common core O-glycan structures found on human proteins.Biosynthesis of mucin-type O-glycan is initiated with the attachment of aGalNAc residue (Tn antigen) to Ser/Thr in a protein. Modification of theTn antigen gives rise to a collection of structures with common core struc-tures (core 1–4). Tn, Sialyl-Tn and T antigens are “tumor-associated anti-gens” and are indicated by asterisks (*).
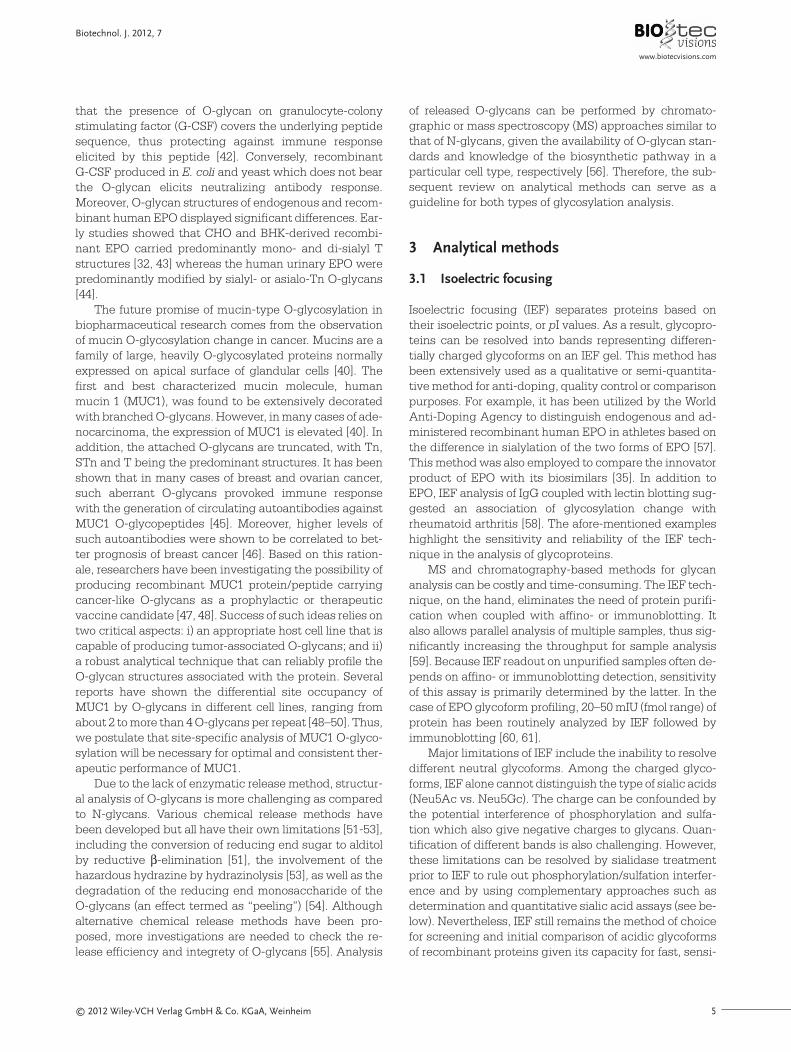
© 2012 Wiley-VCH Verlag GmbH & Co. KGaA, Weinheim 5
that the presence of O-glycan on granulocyte-colonystimulating factor (G-CSF) covers the underlying peptidesequence, thus protecting against immune responseelicited by this peptide [42]. Conversely, recombinant G-CSF produced in E. coli and yeast which does not bearthe O-glycan elicits neutralizing antibody response.Moreover, O-glycan structures of endogenous and recom-binant human EPO displayed significant differences. Ear-ly studies showed that CHO and BHK-derived recombi-nant EPO carried predominantly mono- and di-sialyl Tstructures [32, 43] whereas the human urinary EPO werepredominantly modified by sialyl- or asialo-Tn O-glycans[44].
The future promise of mucin-type O-glycosylation inbiopharmaceutical research comes from the observationof mucin O-glycosylation change in cancer. Mucins are afamily of large, heavily O-glycosylated proteins normallyexpressed on apical surface of glandular cells [40]. Thefirst and best characterized mucin molecule, humanmucin 1 (MUC1), was found to be extensively decoratedwith branched O-glycans. However, in many cases of ade-nocarcinoma, the expression of MUC1 is elevated [40]. Inaddition, the attached O-glycans are truncated, with Tn,STn and T being the predominant structures. It has beenshown that in many cases of breast and ovarian cancer,such aberrant O-glycans provoked immune responsewith the generation of circulating autoantibodies againstMUC1 O-glycopeptides [45]. Moreover, higher levels ofsuch autoantibodies were shown to be correlated to bet-ter prognosis of breast cancer [46]. Based on this ration-ale, researchers have been investigating the possibility ofproducing recombinant MUC1 protein/peptide carryingcancer-like O-glycans as a prophylactic or therapeuticvaccine candidate [47, 48]. Success of such ideas relies ontwo critical aspects: i) an appropriate host cell line that iscapable of producing tumor-associated O-glycans; and ii)a robust analytical technique that can reliably profile theO-glycan structures associated with the protein. Severalreports have shown the differential site occupancy ofMUC1 by O-glycans in different cell lines, ranging fromabout 2 to more than 4 O-glycans per repeat [48–50]. Thus,we postulate that site-specific analysis of MUC1 O-glyco-sylation will be necessary for optimal and consistent ther-apeutic performance of MUC1.
Due to the lack of enzymatic release method, structur-al analysis of O-glycans is more challenging as comparedto N-glycans. Various chemical release methods havebeen developed but all have their own limitations [51-53],including the conversion of reducing end sugar to alditolby reductive β-elimination [51], the involvement of thehazardous hydrazine by hydrazinolysis [53], as well as thedegradation of the reducing end monosaccharide of theO-glycans (an effect termed as “peeling”) [54]. Althoughalternative chemical release methods have been pro-posed, more investigations are needed to check the re-lease efficiency and integrety of O-glycans [55]. Analysis
of released O-glycans can be performed by chromato-graphic or mass spectroscopy (MS) approaches similar tothat of N-glycans, given the availability of O-glycan stan-dards and knowledge of the biosynthetic pathway in aparticular cell type, respectively [56]. Therefore, the sub-sequent review on analytical methods can serve as aguideline for both types of glycosylation analysis.
3 Analytical methods
3.1 Isoelectric focusing
Isoelectric focusing (IEF) separates proteins based ontheir isoelectric points, or pI values. As a result, glycopro-teins can be resolved into bands representing differen-tially charged glycoforms on an IEF gel. This method hasbeen extensively used as a qualitative or semi-quantita-tive method for anti-doping, quality control or comparisonpurposes. For example, it has been utilized by the WorldAnti-Doping Agency to distinguish endogenous and ad-ministered recombinant human EPO in athletes based onthe difference in sialylation of the two forms of EPO [57].This method was also employed to compare the innovatorproduct of EPO with its biosimilars [35]. In addition toEPO, IEF analysis of IgG coupled with lectin blotting sug-gested an association of glycosylation change withrheumatoid arthritis [58]. The afore-mentioned exampleshighlight the sensitivity and reliability of the IEF tech-nique in the analysis of glycoproteins.
MS and chromatography-based methods for glycananalysis can be costly and time-consuming. The IEF tech-nique, on the hand, eliminates the need of protein purifi-cation when coupled with affino- or immunoblotting. Italso allows parallel analysis of multiple samples, thus sig-nificantly increasing the throughput for sample analysis[59]. Because IEF readout on unpurified samples often de-pends on affino- or immunoblotting detection, sensitivityof this assay is primarily determined by the latter. In thecase of EPO glycoform profiling, 20–50 mIU (fmol range) ofprotein has been routinely analyzed by IEF followed byimmunoblotting [60, 61].
Major limitations of IEF include the inability to resolvedifferent neutral glycoforms. Among the charged glyco-forms, IEF alone cannot distinguish the type of sialic acids(Neu5Ac vs. Neu5Gc). The charge can be confounded bythe potential interference of phosphorylation and sulfa-tion which also give negative charges to glycans. Quan-tification of different bands is also challenging. However,these limitations can be resolved by sialidase treatmentprior to IEF to rule out phosphorylation/sulfation interfer-ence and by using complementary approaches such asdetermination and quantitative sialic acid assays (see be-low). Nevertheless, IEF still remains the method of choicefor screening and initial comparison of acidic glycoformsof recombinant proteins given its capacity for fast, sensi-
Biotechnol. J. 2012, 7
www.biotecvisions.com
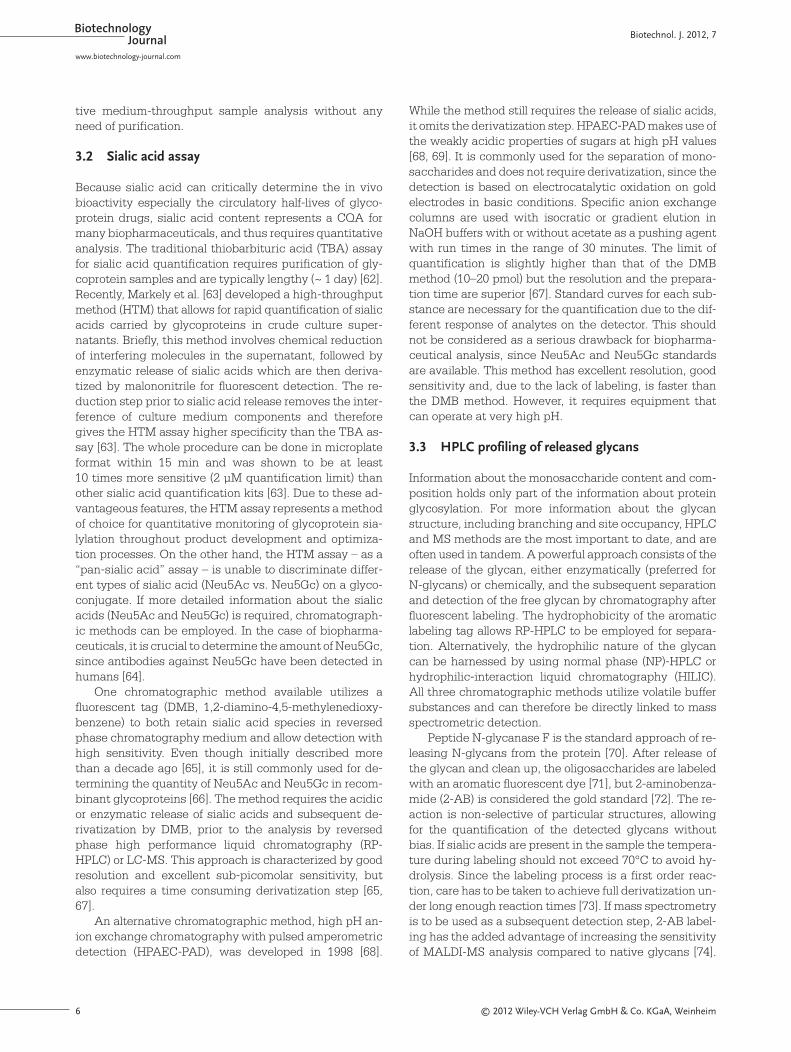
BiotechnologyJournal Biotechnol. J. 2012, 7
6 © 2012 Wiley-VCH Verlag GmbH & Co. KGaA, Weinheim
tive medium-throughput sample analysis without anyneed of purification.
3.2 Sialic acid assay
Because sialic acid can critically determine the in vivobioactivity especially the circulatory half-lives of glyco-protein drugs, sialic acid content represents a CQA formany biopharmaceuticals, and thus requires quantitativeanalysis. The traditional thiobarbituric acid (TBA) assayfor sialic acid quantification requires purification of gly-coprotein samples and are typically lengthy (~ 1 day) [62].Recently, Markely et al. [63] developed a high-throughputmethod (HTM) that allows for rapid quantification of sialicacids carried by glycoproteins in crude culture super-natants. Briefly, this method involves chemical reductionof interfering molecules in the supernatant, followed byenzymatic release of sialic acids which are then deriva-tized by malononitrile for fluorescent detection. The re-duction step prior to sialic acid release removes the inter-ference of culture medium components and thereforegives the HTM assay higher specificity than the TBA as-say [63]. The whole procedure can be done in microplateformat within 15 min and was shown to be at least 10 times more sensitive (2 µM quantification limit) thanother sialic acid quantification kits [63]. Due to these ad-vantageous features, the HTM assay represents a methodof choice for quantitative monitoring of glycoprotein sia-lylation throughout product development and optimiza-tion processes. On the other hand, the HTM assay – as a“pan-sialic acid” assay – is unable to discriminate differ-ent types of sialic acid (Neu5Ac vs. Neu5Gc) on a glyco-conjugate. If more detailed information about the sialicacids (Neu5Ac and Neu5Gc) is required, chromatograph-ic methods can be employed. In the case of biopharma-ceuticals, it is crucial to determine the amount of Neu5Gc,since antibodies against Neu5Gc have been detected inhumans [64].
One chromatographic method available utilizes a fluorescent tag (DMB, 1,2-diamino-4,5-methylenedioxy-benzene) to both retain sialic acid species in reversedphase chromatography medium and allow detection withhigh sensitivity. Even though initially described morethan a decade ago [65], it is still commonly used for de-termining the quantity of Neu5Ac and Neu5Gc in recom-binant glycoproteins [66]. The method requires the acidicor enzymatic release of sialic acids and subsequent de-rivatization by DMB, prior to the analysis by reversedphase high performance liquid chromatography (RP-HPLC) or LC-MS. This approach is characterized by goodresolution and excellent sub-picomolar sensitivity, butalso requires a time consuming derivatization step [65,67].
An alternative chromatographic method, high pH an-ion exchange chromatography with pulsed amperometricdetection (HPAEC-PAD), was developed in 1998 [68].
While the method still requires the release of sialic acids,it omits the derivatization step. HPAEC-PAD makes use ofthe weakly acidic properties of sugars at high pH values[68, 69]. It is commonly used for the separation of mono-saccharides and does not require derivatization, since thedetection is based on electrocatalytic oxidation on goldelectrodes in basic conditions. Specific anion exchangecolumns are used with isocratic or gradient elution inNaOH buffers with or without acetate as a pushing agentwith run times in the range of 30 minutes. The limit ofquantification is slightly higher than that of the DMBmethod (10–20 pmol) but the resolution and the prepara-tion time are superior [67]. Standard curves for each sub-stance are necessary for the quantification due to the dif-ferent response of analytes on the detector. This shouldnot be considered as a serious drawback for biopharma-ceutical analysis, since Neu5Ac and Neu5Gc standardsare available. This method has excellent resolution, goodsensitivity and, due to the lack of labeling, is faster thanthe DMB method. However, it requires equipment thatcan operate at very high pH.
3.3 HPLC profiling of released glycans
Information about the monosaccharide content and com-position holds only part of the information about proteinglycosylation. For more information about the glycanstructure, including branching and site occupancy, HPLCand MS methods are the most important to date, and areoften used in tandem. A powerful approach consists of therelease of the glycan, either enzymatically (preferred forN-glycans) or chemically, and the subsequent separationand detection of the free glycan by chromatography afterfluorescent labeling. The hydrophobicity of the aromaticlabeling tag allows RP-HPLC to be employed for separa-tion. Alternatively, the hydrophilic nature of the glycancan be harnessed by using normal phase (NP)-HPLC orhydrophilic-interaction liquid chromatography (HILIC).All three chromatographic methods utilize volatile buffersubstances and can therefore be directly linked to massspectrometric detection.
Peptide N-glycanase F is the standard approach of re-leasing N-glycans from the protein [70]. After release ofthe glycan and clean up, the oligosaccharides are labeledwith an aromatic fluorescent dye [71], but 2-aminobenza-mide (2-AB) is considered the gold standard [72]. The re-action is non-selective of particular structures, allowingfor the quantification of the detected glycans withoutbias. If sialic acids are present in the sample the tempera -ture during labeling should not exceed 70°C to avoid hy-drolysis. Since the labeling process is a first order reac-tion, care has to be taken to achieve full derivatization un-der long enough reaction times [73]. If mass spectrometryis to be used as a subsequent detection step, 2-AB label-ing has the added advantage of increasing the sensitivityof MALDI-MS analysis compared to native glycans [74].
www.biotechnology-journal.com
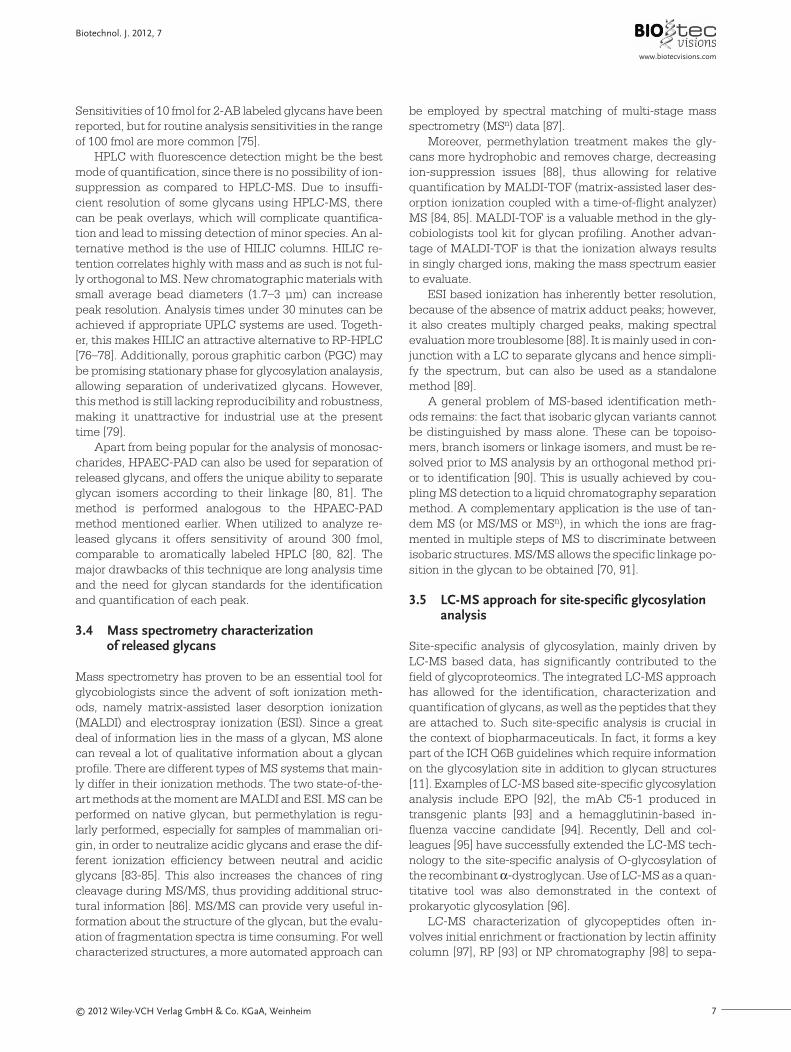
© 2012 Wiley-VCH Verlag GmbH & Co. KGaA, Weinheim 7
be employed by spectral matching of multi-stage massspectrometry (MSn) data [87].
Moreover, permethylation treatment makes the gly-cans more hydrophobic and removes charge, decreasingion-suppression issues [88], thus allowing for relativequantification by MALDI-TOF (matrix-assisted laser des-orption ionization coupled with a time-of-flight analyzer)MS [84, 85]. MALDI-TOF is a valuable method in the gly-cobiologists tool kit for glycan profiling. Another advan-tage of MALDI-TOF is that the ionization always resultsin singly charged ions, making the mass spectrum easierto evaluate.
ESI based ionization has inherently better resolution,because of the absence of matrix adduct peaks; however,it also creates multiply charged peaks, making spectralevaluation more troublesome [88]. It is mainly used in con-junction with a LC to separate glycans and hence simpli-fy the spectrum, but can also be used as a standalonemethod [89].
A general problem of MS-based identification meth-ods remains: the fact that isobaric glycan variants cannotbe distinguished by mass alone. These can be topoiso-mers, branch isomers or linkage isomers, and must be re-solved prior to MS analysis by an orthogonal method pri-or to identification [90]. This is usually achieved by cou-pling MS detection to a liquid chromatography separationmethod. A complementary application is the use of tan-dem MS (or MS/MS or MSn), in which the ions are frag-mented in multiple steps of MS to discriminate betweenisobaric structures. MS/MS allows the specific linkage po-sition in the glycan to be obtained [70, 91].
3.5 LC-MS approach for site-specific glycosylationanalysis
Site-specific analysis of glycosylation, mainly driven byLC-MS based data, has significantly contributed to thefield of glycoproteomics. The integrated LC-MS approachhas allowed for the identification, characterization andquantification of glycans, as well as the peptides that theyare attached to. Such site-specific analysis is crucial inthe context of biopharmaceuticals. In fact, it forms a keypart of the ICH Q6B guidelines which require informationon the glycosylation site in addition to glycan structures[11]. Examples of LC-MS based site-specific glycosylationanalysis include EPO [92], the mAb C5-1 produced intransgenic plants [93] and a hemagglutinin-based in-fluenza vaccine candidate [94]. Recently, Dell and col-leagues [95] have successfully extended the LC-MS tech-nology to the site-specific analysis of O-glycosylation ofthe recombinant α-dystroglycan. Use of LC-MS as a quan-titative tool was also demonstrated in the context ofprokaryotic glycosylation [96].
LC-MS characterization of glycopeptides often in-volves initial enrichment or fractionation by lectin affinitycolumn [97], RP [93] or NP chromatography [98] to sepa-
Biotechnol. J. 2012, 7
www.biotecvisions.com
Sensitivities of 10 fmol for 2-AB labeled glycans have beenreported, but for routine analysis sensitivities in the rangeof 100 fmol are more common [75].
HPLC with fluorescence detection might be the bestmode of quantification, since there is no possibility of ion-suppression as compared to HPLC-MS. Due to insuffi-cient resolution of some glycans using HPLC-MS, therecan be peak overlays, which will complicate quantifica-tion and lead to missing detection of minor species. An al-ternative method is the use of HILIC columns. HILIC re-tention correlates highly with mass and as such is not ful-ly orthogonal to MS. New chromatographic materials withsmall average bead diameters (1.7–3 µm) can increasepeak resolution. Analysis times under 30 minutes can beachieved if appropriate UPLC systems are used. Togeth-er, this makes HILIC an attractive alternative to RP-HPLC[76–78]. Additionally, porous graphitic carbon (PGC) maybe promising stationary phase for glycosylation analaysis,allowing separation of underivatized glycans. However,this method is still lacking reproducibility and robustness,making it unattractive for industrial use at the presenttime [79].
Apart from being popular for the analysis of monosac-charides, HPAEC-PAD can also be used for separation ofreleased glycans, and offers the unique ability to separateglycan isomers according to their linkage [80, 81]. Themethod is performed analogous to the HPAEC-PADmethod mentioned earlier. When utilized to analyze re-leased glycans it offers sensitivity of around 300 fmol,comparable to aromatically labeled HPLC [80, 82]. Themajor drawbacks of this technique are long analysis timeand the need for glycan standards for the identificationand quantification of each peak.
3.4 Mass spectrometry characterization of released glycans
Mass spectrometry has proven to be an essential tool forglycobiologists since the advent of soft ionization meth-ods, namely matrix-assisted laser desorption ionization(MALDI) and electrospray ionization (ESI). Since a greatdeal of information lies in the mass of a glycan, MS alonecan reveal a lot of qualitative information about a glycanprofile. There are different types of MS systems that main-ly differ in their ionization methods. The two state-of-the-art methods at the moment are MALDI and ESI. MS can beperformed on native glycan, but permethylation is regu-larly performed, especially for samples of mammalian ori-gin, in order to neutralize acidic glycans and erase the dif-ferent ionization efficiency between neutral and acidicglycans [83-85]. This also increases the chances of ringcleavage during MS/MS, thus providing additional struc-tural information [86]. MS/MS can provide very useful in-formation about the structure of the glycan, but the evalu-ation of fragmentation spectra is time consuming. For wellcharacterized structures, a more automated approach can
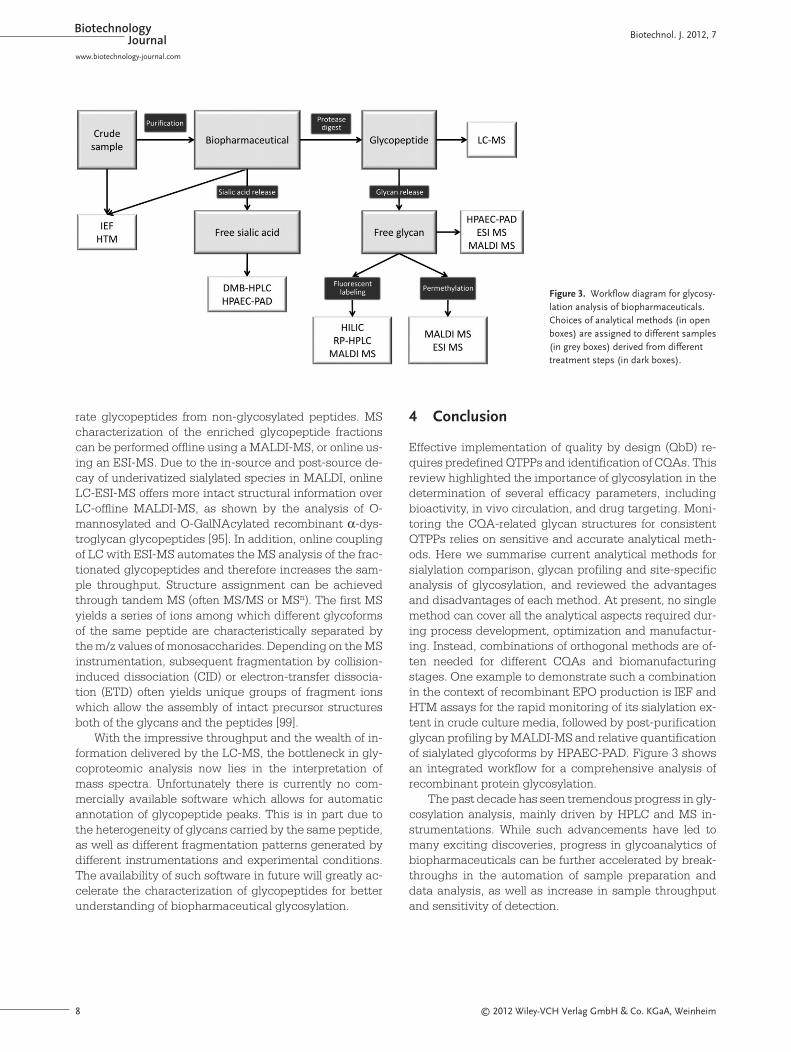
BiotechnologyJournal Biotechnol. J. 2012, 7
8 © 2012 Wiley-VCH Verlag GmbH & Co. KGaA, Weinheim
rate glycopeptides from non-glycosylated peptides. MScharacterization of the enriched glycopeptide fractionscan be performed offline using a MALDI-MS, or online us-ing an ESI-MS. Due to the in-source and post-source de-cay of underivatized sialylated species in MALDI, onlineLC-ESI-MS offers more intact structural information overLC-offline MALDI-MS, as shown by the analysis of O-mannosylated and O-GalNAcylated recombinant α-dys-troglycan glycopeptides [95]. In addition, online couplingof LC with ESI-MS automates the MS analysis of the frac-tionated glycopeptides and therefore increases the sam-ple throughput. Structure assignment can be achievedthrough tandem MS (often MS/MS or MSn). The first MSyields a series of ions among which different glycoformsof the same peptide are characteristically separated bythe m/z values of monosaccharides. Depending on the MSinstrumentation, subsequent fragmentation by collision-induced dissociation (CID) or electron-transfer dissocia-tion (ETD) often yields unique groups of fragment ionswhich allow the assembly of intact precursor structuresboth of the glycans and the peptides [99].
With the impressive throughput and the wealth of in-formation delivered by the LC-MS, the bottleneck in gly-coproteomic analysis now lies in the interpretation ofmass spectra. Unfortunately there is currently no com-mercially available software which allows for automaticannotation of glycopeptide peaks. This is in part due tothe heterogeneity of glycans carried by the same peptide,as well as different fragmentation patterns generated bydifferent instrumentations and experimental conditions.The availability of such software in future will greatly ac-celerate the characterization of glycopeptides for betterunderstanding of biopharmaceutical glycosylation.
4 Conclusion
Effective implementation of quality by design (QbD) re-quires predefined QTPPs and identification of CQAs. Thisreview highlighted the importance of glycosylation in thedetermination of several efficacy parameters, includingbioactivity, in vivo circulation, and drug targeting. Moni-toring the CQA-related glycan structures for consistentQTPPs relies on sensitive and accurate analytical meth-ods. Here we summarise current analytical methods forsialylation comparison, glycan profiling and site-specificanalysis of glycosylation, and reviewed the advantagesand disadvantages of each method. At present, no singlemethod can cover all the analytical aspects required dur-ing process development, optimization and manufactur-ing. Instead, combinations of orthogonal methods are of-ten needed for different CQAs and biomanufacturingstages. One example to demonstrate such a combinationin the context of recombinant EPO production is IEF andHTM assays for the rapid monitoring of its sialylation ex-tent in crude culture media, followed by post-purificationglycan profiling by MALDI-MS and relative quantificationof sialylated glycoforms by HPAEC-PAD. Figure 3 showsan integrated workflow for a comprehensive analysis ofrecombinant protein glycosylation.
The past decade has seen tremendous progress in gly-cosylation analysis, mainly driven by HPLC and MS in-strumentations. While such advancements have led tomany exciting discoveries, progress in glycoanalytics ofbiopharmaceuticals can be further accelerated by break-throughs in the automation of sample preparation anddata analysis, as well as increase in sample throughputand sensitivity of detection.
www.biotechnology-journal.com
Figure 3. Workflow diagram for glycosy-lation analysis of biopharmaceuticals.Choices of analytical methods (in openboxes) are assigned to different samples(in grey boxes) derived from differenttreatment steps (in dark boxes).
© 2012 Wiley-VCH Verlag GmbH & Co. KGaA, Weinheim 9
We would like to thank Drs. Y.S. Ho and T. Wang for criti-cal review of the manuscript. This work is supported byBiomedical Research Council, Agency of Science, Tech-nology and Research (A*STAR), Singapore. Nico Lingg isa fellow from the A*STAR Research Attachment Pro-gramme (ARAP).
The authors declare no conflict of interest.
5 References
[1] Leader, B., Baca, Q. J., Golan, D. E., Protein therapeutics: a summa-ry and pharmacological classification. Nat. Rev. Drug Discov. 2008,7, 21–39.
[2] Walsh, G., Biopharmaceutical benchmarks 2010. Nat. Biotechnol.2010, 28, 917–924.
[3] Ratner, M., Pharma swept up in biogenerics gold rush. Nat. Biotech-nol. 2009, 27, 299–301.
[4] Higgins, E., Carbohydrate analysis throughout the development of aprotein therapeutic. Glycoconjugate J. 2010, 27, 211–225.
[5] Stanley, P., Schachter, H., Taniguchi, N., Chapter 8: N-Glycans, in:Varki, A., Cummings, R., Esko, J., Freeze, H. et al. (Eds.), Essentialsof Glycobiology, 2nd edition, Cold Spring Harbor Laboratory Press,Cold Spring Harbor, NY 2009, pp. 101–114.
[6] Jiang, X. R., Song, A., Bergelson, S., Arroll, T. et al., Advances in theassessment and control of the effector functions of therapeutic anti-bodies. Nat. Rev. Drug Discov. 2011, 10, 101–111.
[7] Pandhal, J., Wright, P., N-Linked glycoengineering for human thera-peutic proteins in bacteria. Biotechnol. Lett. 2010, 32, 1189–1198.
[8] Sola, R. J., Griebenow, K., Glycosylation of therapeutic proteins: aneffective strategy to optimize efficacy. BioDrugs 2010, 24, 9–21.
[9] Brooks, S. A., Chapter 1: An introduction to human N- and O-linkedprotein glycosylation, in: Brooks, S., Rudd, P., Appelmelk, B. (Eds.),Glycosylation in Diverse Cell Systems: Challenges and New Fron-tiers in Experimental Biology, Society for Experimental Biology, Lon-don, UK 2011, pp. 1–24.
[10] Hossler, P., Khattak, S. F., Li, Z. J., Optimal and consistent proteinglycosylation in mammalian cell culture. Glycobiology 2009, 19, 936–949.
[11] International conference on harmonisation; guidance on specifica-tions: test procedures and acceptance criteria for biotechnologi-cal/biological products. Notice. Food and Drug Administration,HHS. Fed. Regist. 1999, 64, 44928–44935.
[12] International conference on harmonisation; guidance on Q5E com-parability of biotechnological/biological products subject to changesin their manufacturing process; availability. Notice. Fed. Regist.2005, 70, 37861–37862.
[13] Fernandes, D., Comparability of biopharmaceutical glycosylationduring scale-up. Biopharm International 2011, 44–50, 52–53.
[14] Beck, A., Wurch, T., Bailly, C., Corvaia, N., Strategies and challengesfor the next generation of therapeutic antibodies. Nat. Rev. Immunol.2010, 10, 345–352.
[15] Scolnik, P. A., mAbs: A business perspective. mAbs 2009, 1, 179–184.
[16] Jefferis, R., Glycosylation as a strategy to improve antibody-basedtherapeutics. Nat. Rev. Drug Discov. 2009, 8, 226–234.
[17] Beck, A., Wagner-Rousset, E., Bussat, M.-C., Lokteff, M. et al.,Trends in glycosylation, glycoanalysis and glycoengineering of ther-apeutic antibodies and Fc-fusion proteins. Curr. Pharm. Biotechnol.2008, 9, 482–501.
[18] Rudd, P. M., Elliott, T., Cresswell, P., Wilson, I. A., Dwek, R. A., Gly-cosylation and the immune system. Science 2001, 291, 2370–2376.
[19] Anthony, R. M., Ravetch, J. V., A novel role for the IgG Fc glycan: theanti-inflammatory activity of sialylated IgG Fcs. J. Clin. Immunol.2010, 30 Suppl 1, S9–14.
[20] Peipp, M., Lammerts van Bueren, J. J., Schneider-Merck, T., Bleek-er, W. W. K. et al., Antibody fucosylation differentially impacts cyto-toxicity mediated by NK and PMN effector cells. Blood 2008, 112,2390–2399.
[21] Kanda, Y., Yamada, T., Mori, K., Okazaki, A. et al., Comparison of bi-ological activity among nonfucosylated therapeutic IgG1 antibodieswith three different N-linked Fc oligosaccharides: the high-man-nose, hybrid, and complex types. Glycobiology 2007, 17, 104–118.
[22] Hodoniczky, J., Zheng, Y. Z., James, D. C., Control of recombinantmonoclonal antibody effector functions by Fc N-glycan remodelingin vitro. Biotechnol. Prog. 2005, 21, 1644–1652.
[23] Houde, D., Peng, Y., Berkowitz, S. A., Engen, J. R., Post-translation-al modifications differentially affect IgG1 conformation and receptorbinding. Mol. Cell. Proteomics 2010, 9, 1716–1728.
[24] Davies, J., Jiang, L., Pan, L.-Z., LaBarre, M. J. et al., Expression of Gn-TIII in a recombinant anti-CD20 CHO production cell line: Expres-sion of antibodies with altered glycoforms leads to an increase inADCC through higher affinity for FCγRIII. Biotechnol. Bioeng. 2001,74, 288–294.
[25] Scallon, B. J., Tam, S. H., McCarthy, S. G., Cai, A. N., Raju, T. S., High-er levels of sialylated Fc glycans in immunoglobulin G molecules canadversely impact functionality. Mol. Immunol. 2007, 44, 1524–1534.
[26] Kaneko, Y., Nimmerjahn, F., Ravetch, J. V., Anti-inflammatory activ-ity of immunoglobulin G resulting from Fc sialylation. Science 2006,313, 670–673.
[27] Jefferis, R., Recombinant antibody therapeutics: the impact of gly-cosylation on mechanisms of action. Trends Pharmacol. Sci. 2009,30, 356–362.
[28] Reichel, C., Gmeiner, G., Erythropoietin and analogs. Handb. Exp.Pharmacol. 2010, 251–294.
[29] Wasley, L. C., Timony, G., Murtha, P., Stoudemire, J. et al., The im-portance of N- and O-linked oligosaccharides for the biosynthesisand in vitro and in vivo biologic activities of erythropoietin. Blood1991, 77, 2624–2632.
Biotechnol. J. 2012, 7
www.biotecvisions.com
Dr Muriel Bardor’s PhD thesis focused
on the humanization of the N-glycosy-
lation of recombinant mAb produced in
transgenic plants. After her graduation
in 2001 she joined Prof Ajit Varki’s
group at the Glycobiology Research
and Training Center, University of
California San Diego, USA where she
demonstrated the uptake mechanism
of the non-human sialic acid N-glycolylneuraminic acid into human
and mammalian cells. At the end of 2003, she obtained an Associate
Professor position at the University of Rouen, France. There she initi-
ated and led a project regarding the characterization of the N-glycosy-
lation processing in microalgae. She is currently group leader of the
Analytics department at Bioprocessing Technology Institute, A*STAR,
Singapore. Her group is developing analytical tools for the glycoanaly-
sis of recombinant proteins produced in mammalian cells and for the
characterization of the glycosylation of the host producer cells.
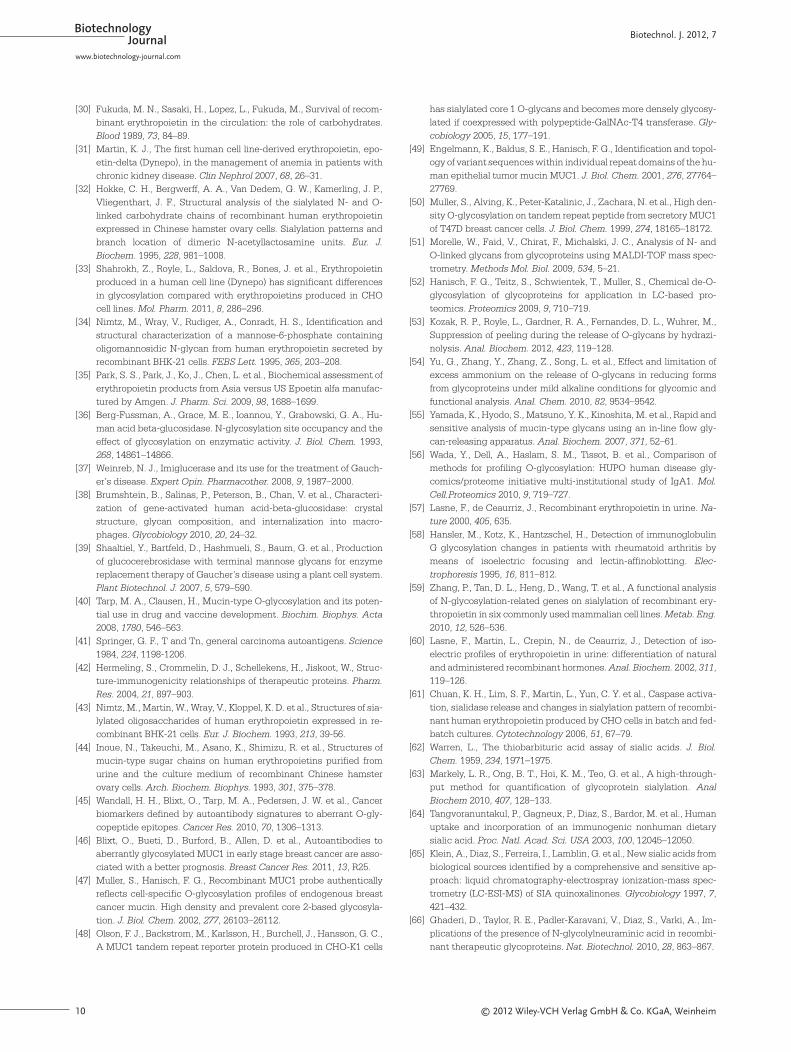
BiotechnologyJournal Biotechnol. J. 2012, 7
10 © 2012 Wiley-VCH Verlag GmbH & Co. KGaA, Weinheim
[30] Fukuda, M. N., Sasaki, H., Lopez, L., Fukuda, M., Survival of recom-binant erythropoietin in the circulation: the role of carbohydrates.Blood 1989, 73, 84–89.
[31] Martin, K. J., The first human cell line-derived erythropoietin, epo-etin-delta (Dynepo), in the management of anemia in patients withchronic kidney disease. Clin Nephrol 2007, 68, 26–31.
[32] Hokke, C. H., Bergwerff, A. A., Van Dedem, G. W., Kamerling, J. P.,Vliegenthart, J. F., Structural analysis of the sialylated N- and O-linked carbohydrate chains of recombinant human erythropoietinexpressed in Chinese hamster ovary cells. Sialylation patterns andbranch location of dimeric N-acetyllactosamine units. Eur. J.Biochem. 1995, 228, 981–1008.
[33] Shahrokh, Z., Royle, L., Saldova, R., Bones, J. et al., Erythropoietinproduced in a human cell line (Dynepo) has significant differencesin glycosylation compared with erythropoietins produced in CHOcell lines. Mol. Pharm. 2011, 8, 286–296.
[34] Nimtz, M., Wray, V., Rudiger, A., Conradt, H. S., Identification andstructural characterization of a mannose-6-phosphate containingoligomannosidic N-glycan from human erythropoietin secreted byrecombinant BHK-21 cells. FEBS Lett. 1995, 365, 203–208.
[35] Park, S. S., Park, J., Ko, J., Chen, L. et al., Biochemical assessment oferythropoietin products from Asia versus US Epoetin alfa manufac-tured by Amgen. J. Pharm. Sci. 2009, 98, 1688–1699.
[36] Berg-Fussman, A., Grace, M. E., Ioannou, Y., Grabowski, G. A., Hu-man acid beta-glucosidase. N-glycosylation site occupancy and theeffect of glycosylation on enzymatic activity. J. Biol. Chem. 1993,268, 14861–14866.
[37] Weinreb, N. J., Imiglucerase and its use for the treatment of Gauch-er’s disease. Expert Opin. Pharmacother. 2008, 9, 1987–2000.
[38] Brumshtein, B., Salinas, P., Peterson, B., Chan, V. et al., Characteri-zation of gene-activated human acid-beta-glucosidase: crystalstructure, glycan composition, and internalization into macro -phages. Glycobiology 2010, 20, 24–32.
[39] Shaaltiel, Y., Bartfeld, D., Hashmueli, S., Baum, G. et al., Productionof glucocerebrosidase with terminal mannose glycans for enzymereplacement therapy of Gaucher’s disease using a plant cell system.Plant Biotechnol. J. 2007, 5, 579–590.
[40] Tarp, M. A., Clausen, H., Mucin-type O-glycosylation and its poten-tial use in drug and vaccine development. Biochim. Biophys. Acta2008, 1780, 546–563.
[41] Springer, G. F., T and Tn, general carcinoma autoantigens. Science1984, 224, 1198-1206.
[42] Hermeling, S., Crommelin, D. J., Schellekens, H., Jiskoot, W., Struc-ture-immunogenicity relationships of therapeutic proteins. Pharm.Res. 2004, 21, 897–903.
[43] Nimtz, M., Martin, W., Wray, V., Kloppel, K. D. et al., Structures of sia-lylated oligosaccharides of human erythropoietin expressed in re-combinant BHK-21 cells. Eur. J. Biochem. 1993, 213, 39-56.
[44] Inoue, N., Takeuchi, M., Asano, K., Shimizu, R. et al., Structures ofmucin-type sugar chains on human erythropoietins purified fromurine and the culture medium of recombinant Chinese hamsterovary cells. Arch. Biochem. Biophys. 1993, 301, 375–378.
[45] Wandall, H. H., Blixt, O., Tarp, M. A., Pedersen, J. W. et al., Cancerbiomarkers defined by autoantibody signatures to aberrant O-gly-copeptide epitopes. Cancer Res. 2010, 70, 1306–1313.
[46] Blixt, O., Bueti, D., Burford, B., Allen, D. et al., Autoantibodies toaberrantly glycosylated MUC1 in early stage breast cancer are asso-ciated with a better prognosis. Breast Cancer Res. 2011, 13, R25.
[47] Muller, S., Hanisch, F. G., Recombinant MUC1 probe authenticallyreflects cell-specific O-glycosylation profiles of endogenous breastcancer mucin. High density and prevalent core 2-based glycosyla-tion. J. Biol. Chem. 2002, 277, 26103–26112.
[48] Olson, F. J., Backstrom, M., Karlsson, H., Burchell, J., Hansson, G. C.,A MUC1 tandem repeat reporter protein produced in CHO-K1 cells
has sialylated core 1 O-glycans and becomes more densely glycosy-lated if coexpressed with polypeptide-GalNAc-T4 transferase. Gly-cobiology 2005, 15, 177–191.
[49] Engelmann, K., Baldus, S. E., Hanisch, F. G., Identification and topol-ogy of variant sequences within individual repeat domains of the hu-man epithelial tumor mucin MUC1. J. Biol. Chem. 2001, 276, 27764–27769.
[50] Muller, S., Alving, K., Peter-Katalinic, J., Zachara, N. et al., High den-sity O-glycosylation on tandem repeat peptide from secretory MUC1of T47D breast cancer cells. J. Biol. Chem. 1999, 274, 18165–18172.
[51] Morelle, W., Faid, V., Chirat, F., Michalski, J. C., Analysis of N- andO-linked glycans from glycoproteins using MALDI-TOF mass spec-trometry. Methods Mol. Biol. 2009, 534, 5–21.
[52] Hanisch, F. G., Teitz, S., Schwientek, T., Muller, S., Chemical de-O-glycosylation of glycoproteins for application in LC-based pro-teomics. Proteomics 2009, 9, 710–719.
[53] Kozak, R. P., Royle, L., Gardner, R. A., Fernandes, D. L., Wuhrer, M.,Suppression of peeling during the release of O-glycans by hydrazi-nolysis. Anal. Biochem. 2012, 423, 119–128.
[54] Yu, G., Zhang, Y., Zhang, Z., Song, L. et al., Effect and limitation ofexcess ammonium on the release of O-glycans in reducing formsfrom glycoproteins under mild alkaline conditions for glycomic andfunctional analysis. Anal. Chem. 2010, 82, 9534–9542.
[55] Yamada, K., Hyodo, S., Matsuno, Y. K., Kinoshita, M. et al., Rapid andsensitive analysis of mucin-type glycans using an in-line flow gly-can-releasing apparatus. Anal. Biochem. 2007, 371, 52–61.
[56] Wada, Y., Dell, A., Haslam, S. M., Tissot, B. et al., Comparison ofmethods for profiling O-glycosylation: HUPO human disease gly-comics/proteome initiative multi-institutional study of IgA1. Mol.Cell.Proteomics 2010, 9, 719–727.
[57] Lasne, F., de Ceaurriz, J., Recombinant erythropoietin in urine. Na-ture 2000, 405, 635.
[58] Hansler, M., Kotz, K., Hantzschel, H., Detection of immunoglobulinG glycosylation changes in patients with rheumatoid arthritis bymeans of isoelectric focusing and lectin-affinoblotting. Elec-trophoresis 1995, 16, 811–812.
[59] Zhang, P., Tan, D. L., Heng, D., Wang, T. et al., A functional analysisof N-glycosylation-related genes on sialylation of recombinant ery-thropoietin in six commonly used mammalian cell lines. Metab. Eng.2010, 12, 526–536.
[60] Lasne, F., Martin, L., Crepin, N., de Ceaurriz, J., Detection of iso-electric profiles of erythropoietin in urine: differentiation of naturaland administered recombinant hormones. Anal. Biochem. 2002, 311,119–126.
[61] Chuan, K. H., Lim, S. F., Martin, L., Yun, C. Y. et al., Caspase activa-tion, sialidase release and changes in sialylation pattern of recombi-nant human erythropoietin produced by CHO cells in batch and fed-batch cultures. Cytotechnology 2006, 51, 67–79.
[62] Warren, L., The thiobarbituric acid assay of sialic acids. J. Biol.Chem. 1959, 234, 1971–1975.
[63] Markely, L. R., Ong, B. T., Hoi, K. M., Teo, G. et al., A high-through-put method for quantification of glycoprotein sialylation. AnalBiochem 2010, 407, 128–133.
[64] Tangvoranuntakul, P., Gagneux, P., Diaz, S., Bardor, M. et al., Humanuptake and incorporation of an immunogenic nonhuman dietarysialic acid. Proc. Natl. Acad. Sci. USA 2003, 100, 12045–12050.
[65] Klein, A., Diaz, S., Ferreira, I., Lamblin, G. et al., New sialic acids frombiological sources identified by a comprehensive and sensitive ap-proach: liquid chromatography-electrospray ionization-mass spec-trometry (LC-ESI-MS) of SIA quinoxalinones. Glycobiology 1997, 7,421–432.
[66] Ghaderi, D., Taylor, R. E., Padler-Karavani, V., Diaz, S., Varki, A., Im-plications of the presence of N-glycolylneuraminic acid in recombi-nant therapeutic glycoproteins. Nat. Biotechnol. 2010, 28, 863–867.
www.biotechnology-journal.com
© 2012 Wiley-VCH Verlag GmbH & Co. KGaA, Weinheim 11
[67] Harazono, A., Kobayashi, T., Kawasaki, N., Itoh, S. et al., A compar-ative study of monosaccharide composition analysis as a carbohy-drate test for biopharmaceuticals. Biologicals 2011, 39, 171–180.
[68] Rohrer, J. S., Thayer, J., Weitzhandler, M., Avdalovic, N., Analysis ofthe N-acetylneuraminic acid and N-glycolylneuraminic acid con-tents of glycoproteins by high-pH anion-exchange chromatographywith pulsed amperometric detection (HPAEC/PAD). Glycobiology1998, 8, 35–43.
[69] Cataldi, T. R. I., Campa, C., De Benedetto, G. E., Carbohydrate analy-sis by high-performance anion-exchange chromatography withpulsed amperometric detection: The potential is still growing. Fre-senius’ Journal of Anal. Chem. 2000, 368, 739–758.
[70] Triguero, A., Cabrera, G., Royle, L., Harvey, D. J. et al., Chemical andenzymatic N-glycan release comparison for N-glycan profiling ofmonoclonal antibodies expressed in plants. Anal. Biochem. 2010,400, 173–183.
[71] Anumula, K. R., Advances in fluorescence derivatization methodsfor high-performance liquid chromatographic analysis of glycopro-tein carbohydrates. Anal. Biochem. 2006, 350, 1–23.
[72] Ruhaak, L., Zauner, G., Huhn, C., Bruggink, C. et al., Glycan labelingstrategies and their use in identification and quantification. Analyt-ical and BioAnal. Chem. 2010, 397, 3457–3481.
[73] Melmer, M., Stangler, T., Schiefermeier, M., Brunner, W. et al., HILICanalysis of fluorescence-labeled N-glycans from recombinant bio-pharmaceuticals. Anal. Bioanal. Chem. 2010, 398, 905–914.
[74] Séveno, M., Cabrera, G., Triguero, A., Burel, C. et al., Plant N-glycanprofiling of minute amounts of material. Anal. Biochem. 2008, 379,66–72.
[75] Chen, X., Flynn, G. C., Analysis of N-glycans from recombinant im-munoglobulin G by on-line reversed-phase high-performance liquidchromatography/mass spectrometry. Anal. Biochem. 2007, 370,147–161.
[76] Gilar, M., Yu, Y.-Q., Ahn, J., Xie, H. et al., Characterization of glyco-protein digests with hydrophilic interaction chromatography andmass spectrometry. Anal. Biochem. 2011, 417, 80–88.
[77] Ahn, J., Bones, J., Yu, Y. Q., Rudd, P. M., Gilar, M., Separation of 2-aminobenzamide labeled glycans using hydrophilic interactionchromatography columns packed with 1.7 [mu]m sorbent. J. Chro-matogr. B 2010, 878, 403–408.
[78] Bones, J., McLoughlin, N., Hilliard, M., Wynne, K. et al., 2D-LC analy-sis of BRP 3 erythropoietin N-glycosylation using anion exchangefractionation and hydrophilic interaction UPLC reveals long poly-N-acetyl lactosamine extensions. Anal. Chem. 2011, 83, 4154–4162.
[79] Melmer, M., Stangler, T., Premstaller, A., Lindner, W., Comparison ofhydrophilic-interaction, reversed-phase and porous graphitic car-bon chromatography for glycan analysis. J. Chromatogr. A 2011,1218, 118-123.
[80] Grey, C., Edebrink, P., Krook, M., Jacobsson, S. P., Development of ahigh performance anion exchange chromatography analysis formapping of oligosaccharides. J. Chromatogr. B 2009, 877, 1827–1832.
[81] Ceaglio, N., Etcheverrigaray, M., Conradt, H. S., Grammel, N. et al.,Highly glycosylated human alpha interferon: sn insight into a newtherapeutic candidate. J. Biotechnol. 2010, 146, 74–83.
[82] Davies, M. J., Hounsell, E. F., Carbohydrate chromatography: to-wards yoctomole sensitivity. Biomed. Chromatogr. 1996, 10, 285–289.
[83] Mechref, Y., Novotny, M. V., Structural investigations of glycoconju-gates at high sensitivity. Chem. Rev. 2002, 102, 321–369.
[84] Wada, Y., Azadi, P., Costello, C. E., Dell, A. et al., Comparison of themethods for profiling glycoprotein glycans - HUPO human diseaseglycomics/proteome initiative multi-institutional study. Glycobiolo-gy 2007, 17, 411–422.
[85] Kang, P., Mechref, Y., Kyselova, Z., Goetz, J. A., Novotny, M. V., Com-parative glycomic mapping through quantitative permethylationand stable-isotope labeling. Anal. Chem. 2007, 79, 6064–6073.
[86] Harvey, D. J., Quantitative aspects of the matrix-assisted laser des-orption mass spectrometry of complex oligosaccharides. RapidCommun. Mass Spectrom. 1993, 7, 614–619.
[87] Takegawa, Y., Ito, S., Yoshioka, S., Deguchi, K. et al., Structural as-signment of isomeric 2-aminopyridine-derivatized oligosaccharidesusing MSn spectral matching. Rapid Commun. Mass Spectrom.2004, 18, 385–391.
[88] Zaia, J., Mass spectrometry and glycomics. OMICS 2010, 14, 401–418.
[89] Ritchie, G., Harvey, D. J., Stroeher, U., Feldmann, F. et al., Identifica-tion of N-glycans from Ebola virus glycoproteins by matrix-assistedlaser desorption/ionisation time-of-flight and negative ion electro-spray tandem mass spectrometry. Rapid Commun. Mass Spectrom.[90] Pabst, M., Altmann, F., Glycan analysis by modern instru-mental methods. Proteomics 2011, 11, 631–643.
[91] Harvey, D. J., Rudd, P. M., Fragmentation of negative ions from N-linked carbohydrates. Part 5: Anionic N-linked glycans. Int. J. MassSpectrom. 2011, 305, 120–130.
[92] Kawasaki, N., Ohta, M., Hyuga, S., Hyuga, M., Hayakawa, T., Appli-cation of liquid chromatography/mass spectrometry and liquid chro-matography with tandem mass spectrometry to the analysis of thesite-specific carbohydrate heterogeneity in erythropoietin. Anal.Biochem. 2000, 285, 82–91.
[93] Bardor, M., Loutelier-Bourhis, C., Paccalet, T., Cosette, P. et al., Mon-oclonal C5-1 antibody produced in transgenic alfalfa plants exhibitsa N-glycosylation that is homogenous and suitable for glyco-engi-neering into human-compatible structures. Plant Biotechnol. J.2003, 1, 451–462.
[94] Xie, H., Doneanu, C., Chen, W., Rininger, J., Mazzeo, J. R., Charac-terization of a recombinant influenza vaccine candidate using com-plementary LC-MS methods. Curr. Pharm. Biotechnol. 2011, 12,1568–1579.
[95] Harrison, R., Hitchen, P. G., Panico, M., Morris, H. R. et al., Glyco-proteomic characterization of recombinant mouse alpha-dystrogly-can. Glycobiology 2012, 22, 662–675.
[96] Pandhal, J., Ow, S. Y., Noirel, J., Wright, P. C., Improving N-glycosy-lation efficiency in Escherichia coli using shotgun proteomics,metabolic network analysis, and selective reaction monitoring.Biotechnol. Bioeng. 2011, 108, 902–912.
[97] Kaji, H., Yamauchi, Y., Takahashi, N., Isobe, T., Mass spectrometricidentification of N-linked glycopeptides using lectin-mediated affin-ity capture and glycosylation site-specific stable isotope tagging.Nat. Protoc. 2006, 1, 3019–3027.
[98] Wuhrer, M., Koeleman, C. A., Hokke, C. H., Deelder, A. M., Proteinglycosylation analyzed by normal-phase nano-liquid chromatogra-phy – mass spectrometry of glycopeptides. Anal. Chem. 2005, 77,886–894.
[99] Wuhrer, M., Catalina, M. I., Deelder, A. M., Hokke, C. H., Glycopro-teomics based on tandem mass spectrometry of glycopeptides. J. Chromatogr. B 2007, 849, 115–128.
Biotechnol. J. 2012, 7
www.biotecvisions.com