Embed Size (px)
Citation preview
© 2020 JETIR May 2020, Volume 7, Issue 5 www.jetir.org (ISSN-2349-5162)
JETIR2005412 Journal of Emerging Technologies and Innovative Research (JETIR) www.jetir.org 711
SEISMIC ANALYSIS OF MULTISTORY
BUILDING USING ETABS WITH
COMPARISON OF RESPONSE SPECTRUM
METHOD AND TIME HISTORY METHOD Kusuma.S Dr. E. Ramesh Babu
PG Student, M Tech Associate Professor
Dept of Civil Engineering Dept of Civil Engineering
Ghousia College of Engineering Ghousia College of Engineering
Ramanagaram Ramanagaram
Abstract: - Most of the buildings were damaged
and collapse during in strong earthquake hence we
will have to confirm safety against the earthquake
force that are affecting the structure, and determine
seismic responses of such building.
The present work deals with the analysis of
multistorey building subjected to seismic condition.
In addition to the dead load and live load, the
seismic loads are applied and analysis is carried
out. In the present scenario, a structure of situated
in Bangalore is considered for analysis which
consists of a ground floor upto tenth floor. The
analysis is carried out for seismic zone -2. The
building model are analyzed using IS1893-2002
recommended Response spectrum method and Time
history method. Time history analysis is significant
technique for structural seismic analysis
particularly when evaluated structural response is
nonlinear. In Time history analysis, earthquake
data from previous earthquake (EL Centro 1940) is
taken. Study focuses to evaluate two important
parameters which are (a) Base shear and (b)
maximum deflection. Analysis has been carried out
using E-Tabs software. The E-Tabs software has
been adopted as with its new features surpassed its
predecessors with its data sharing for analysis and
design. Based on result it is found that the base
shear obtain from RSM is slightly higher compared
to THM, and also storey deflection is more in
Response spectrum method than Time history
method.
Keywords: Seismic analysis, Response spectrum
method and Time history method.
1. INTRODUCTION
As our country is the fastest growing country
across the globe so the need of shelter for highly
populated cities where the cost of land is high and
further horizontal expansion is not possible due to
unavailability of space, so the only solution is
vertical expansion. After an earthquake occurs it
causes great damage due to unpredictable seismic
motion striking & when the height of building is
increased the wind load effect also acts on building.
This causes major loss of life with a more casualties
therefore such structures need to be analyzed and
designed properly before constructing.
Different earthquake have different intensities,
different magnitude at different place and in this
place the destruction causes are also different.
Therefore it is very important to study the seismic
behavior of RC structure for different function in
terms of responses such as Base shear, storey
displacement etc. Seismic analysis is needed to
calculate the seismic response of the building,
seismic analysis is part of the process of structural
design where earthquakes are prevalent.
© 2020 JETIR May 2020, Volume 7, Issue 5 www.jetir.org (ISSN-2349-5162)
JETIR2005412 Journal of Emerging Technologies and Innovative Research (JETIR) www.jetir.org 712
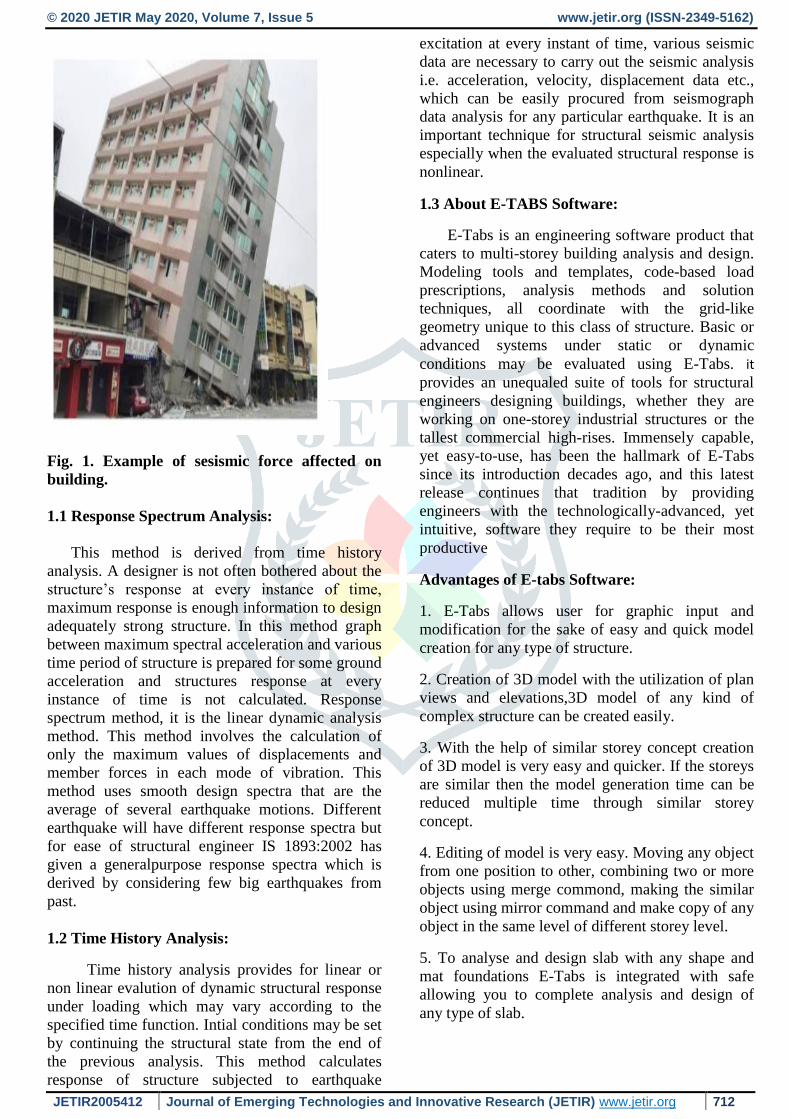
Fig. 1. Example of sesismic force affected on
building.
1.1 Response Spectrum Analysis:
This method is derived from time history
analysis. A designer is not often bothered about the
structure’s response at every instance of time,
maximum response is enough information to design
adequately strong structure. In this method graph
between maximum spectral acceleration and various
time period of structure is prepared for some ground
acceleration and structures response at every
instance of time is not calculated. Response
spectrum method, it is the linear dynamic analysis
method. This method involves the calculation of
only the maximum values of displacements and
member forces in each mode of vibration. This
method uses smooth design spectra that are the
average of several earthquake motions. Different
earthquake will have different response spectra but
for ease of structural engineer IS 1893:2002 has
given a generalpurpose response spectra which is
derived by considering few big earthquakes from
past.
1.2 Time History Analysis:
Time history analysis provides for linear or
non linear evalution of dynamic structural response
under loading which may vary according to the
specified time function. Intial conditions may be set
by continuing the structural state from the end of
the previous analysis. This method calculates
response of structure subjected to earthquake
excitation at every instant of time, various seismic
data are necessary to carry out the seismic analysis
i.e. acceleration, velocity, displacement data etc.,
which can be easily procured from seismograph
data analysis for any particular earthquake. It is an
important technique for structural seismic analysis
especially when the evaluated structural response is
nonlinear.
1.3 About E-TABS Software:
E-Tabs is an engineering software product that
caters to multi-storey building analysis and design.
Modeling tools and templates, code-based load
prescriptions, analysis methods and solution
techniques, all coordinate with the grid-like
geometry unique to this class of structure. Basic or
advanced systems under static or dynamic
conditions may be evaluated using E-Tabs. it
provides an unequaled suite of tools for structural
engineers designing buildings, whether they are
working on one-storey industrial structures or the
tallest commercial high-rises. Immensely capable,
yet easy-to-use, has been the hallmark of E-Tabs
since its introduction decades ago, and this latest
release continues that tradition by providing
engineers with the technologically-advanced, yet
intuitive, software they require to be their most
productive
Advantages of E-tabs Software:
1. E-Tabs allows user for graphic input and
modification for the sake of easy and quick model
creation for any type of structure.
2. Creation of 3D model with the utilization of plan
views and elevations,3D model of any kind of
complex structure can be created easily.
3. With the help of similar storey concept creation
of 3D model is very easy and quicker. If the storeys
are similar then the model generation time can be
reduced multiple time through similar storey
concept.
4. Editing of model is very easy. Moving any object
from one position to other, combining two or more
objects using merge commond, making the similar
object using mirror command and make copy of any
object in the same level of different storey level.
5. To analyse and design slab with any shape and
mat foundations E-Tabs is integrated with safe
allowing you to complete analysis and design of
any type of slab.
© 2020 JETIR May 2020, Volume 7, Issue 5 www.jetir.org (ISSN-2349-5162)
JETIR2005412 Journal of Emerging Technologies and Innovative Research (JETIR) www.jetir.org 713
Procedure for Analysis and Design Building by
Etabs:
The procedure carried out for Modeling and
analyzing the structure involves the followings
Step1: Create the Grid points and Generation of
structure After getting opened the program, select a
new model and a window appears where we had
entered the details of grid dimensions and storey
dimensions of our building. Here the program had
generated 2D and 3D structure by specifying the
building details in the following two windows
Step 2: Define property
After created the grids, start to define the material
property by selecting define menu material
properties (define concrete and steel
reinforcements). After that define section properties
(beams, columns, slabs, and wall) by giving the
specified details in defining. After that we define
section size by selecting frame sections as shown
below and added the required section for beams,
columns etc.
Step 3: Assigning of Property
After defining the property for materials and
section properties, now draw the structural
components using command menu → Draw line for
beam and create columns in region for columns by
which property assigning is completed for beams
and columns sections.
Step 4: Assigning of Supports
After drawing the details of building (beams,
columns, slabs, wall), now assigned the supports by
going to assign menu →joint\frame →Restraints
(supports) →fixed.
Step 5: Defining of loads
The loads in ETABS program are defined as using
static load cases command in define menu.
Step 6: Assigning of Dead loads
After defining all the loads, dead loads are assigned
for external walls and internal walls.
Step 7: Assigning of Live loads Live loads are
assigned for the entire structure including floor
finishing.
Step 8: Assigning of wind loads
Wind loads are defined and assigned as per IS 875
1987 PART 3 (Indian code) by giving the value of
wind speed and wind angle in X, X1, Z & Z1
directions as 0, 180, 90, 270 respectively.
Step 9: Assigning of Seismic loads
Seismic loads are defined and assigned as per IS
1893: 2002(Indian code) by giving the details of
zone, soil type, and response reduction factor in X
and Y directions.
Step 10: Assigning of load combinations
Load combinations are given based on IS 875 1987
PART 5 (Indian code) using load combinations
command in define menu
Step 11: Analysis After the completed all the above
steps, now performed the analysis and check all the
errors.
2. AIM AND OBJECTIVES
1.To make the building earthquake resistant against
seismic effect.
2.To study the behavior of multi storey building in
various seismic zone 2.
3.Analysis of multi-storey building subjected to all
possible loading conditions including seismic load
and to see that structure is safe against those loading
conditions.
4.To analysis storey drift, displacement, shear,
storey stiffness,model period & frequency on
different storeys.
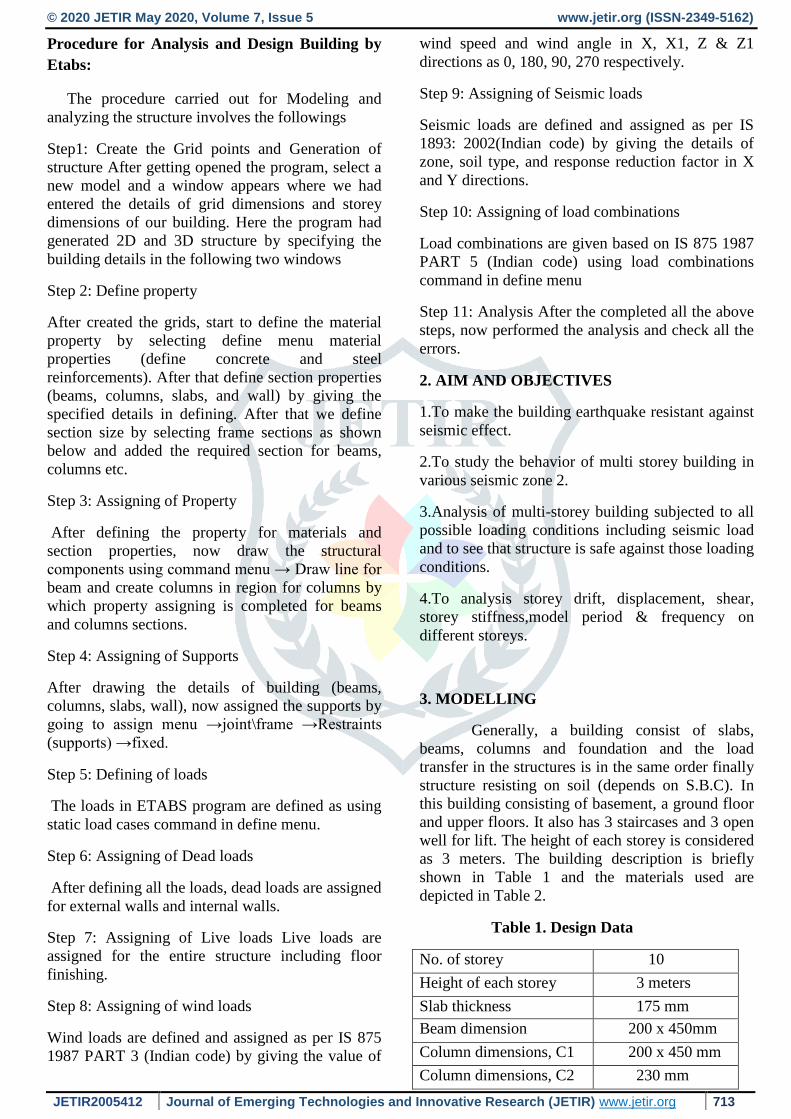
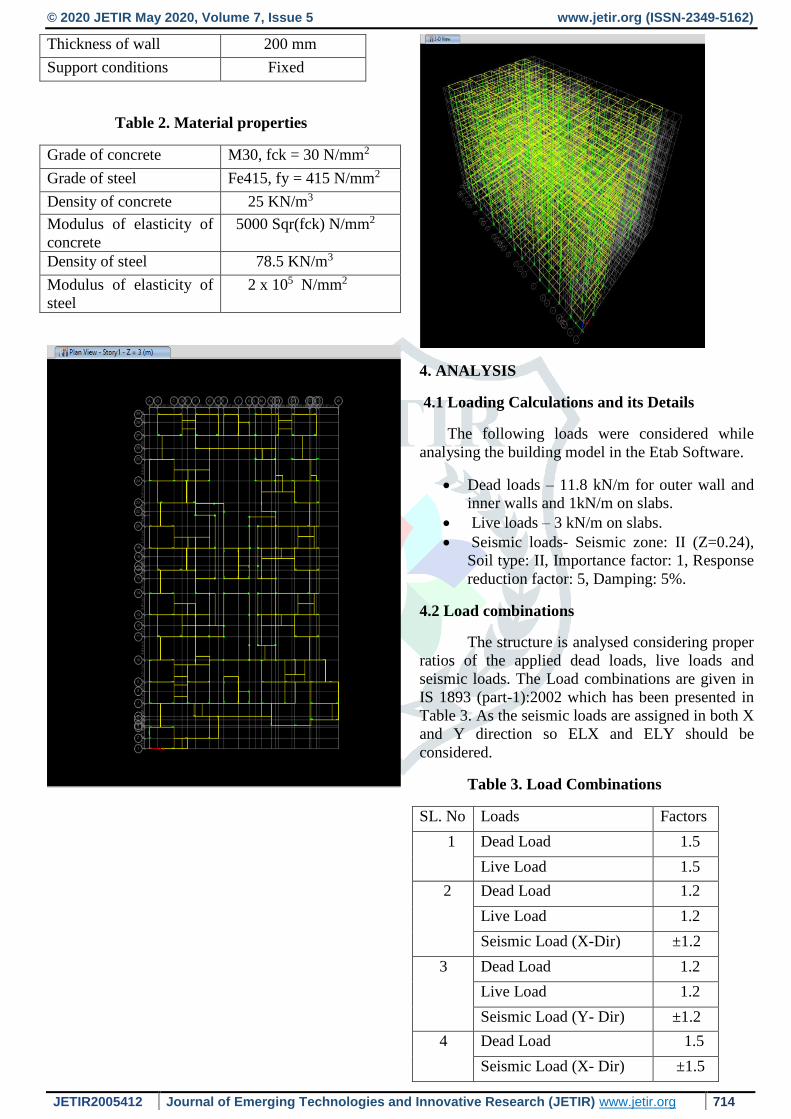
3. MODELLING
Generally, a building consist of slabs,
beams, columns and foundation and the load
transfer in the structures is in the same order finally
structure resisting on soil (depends on S.B.C). In
this building consisting of basement, a ground floor
and upper floors. It also has 3 staircases and 3 open
well for lift. The height of each storey is considered
as 3 meters. The building description is briefly
shown in Table 1 and the materials used are
depicted in Table 2.
Table 1. Design Data
No. of storey 10
Height of each storey 3 meters
Slab thickness 175 mm
Beam dimension 200 x 450mm
Column dimensions, C1 200 x 450 mm
Column dimensions, C2 230 mm
© 2020 JETIR May 2020, Volume 7, Issue 5 www.jetir.org (ISSN-2349-5162)
JETIR2005412 Journal of Emerging Technologies and Innovative Research (JETIR) www.jetir.org 714
Thickness of wall 200 mm
Support conditions Fixed
Table 2. Material properties
Grade of concrete M30, fck = 30 N/mm2
Grade of steel Fe415, fy = 415 N/mm2
Density of concrete 25 KN/m3
Modulus of elasticity of
concrete
5000 Sqr(fck) N/mm2
Density of steel 78.5 KN/m3
Modulus of elasticity of
steel
2 x 10⁵ N/mm2
4. ANALYSIS
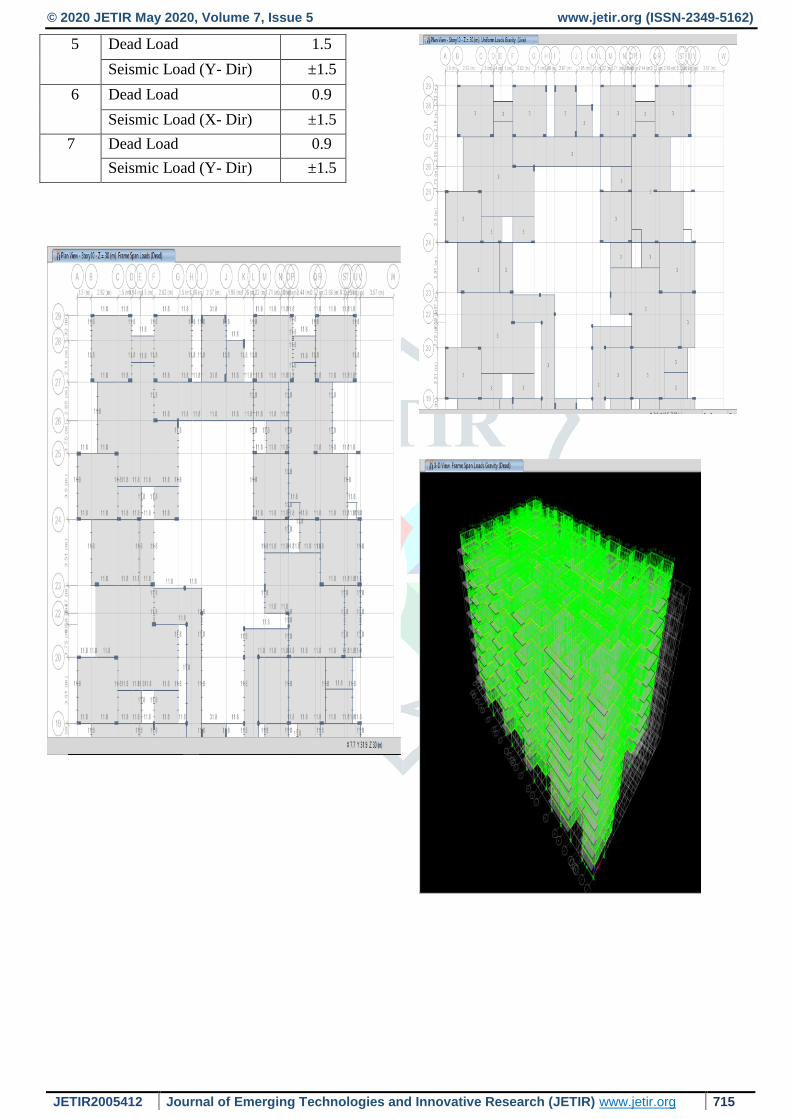
4.1 Loading Calculations and its Details
The following loads were considered while
analysing the building model in the Etab Software.
Dead loads – 11.8 kN/m for outer wall and
inner walls and 1kN/m on slabs.
Live loads – 3 kN/m on slabs.
Seismic loads- Seismic zone: II (Z=0.24),
Soil type: II, Importance factor: 1, Response
reduction factor: 5, Damping: 5%.
4.2 Load combinations
The structure is analysed considering proper
ratios of the applied dead loads, live loads and
seismic loads. The Load combinations are given in
IS 1893 (part-1):2002 which has been presented in
Table 3. As the seismic loads are assigned in both X
and Y direction so ELX and ELY should be
considered.
Table 3. Load Combinations
SL. No Loads Factors
1 Dead Load 1.5
Live Load 1.5
2 Dead Load 1.2
Live Load 1.2
Seismic Load (X-Dir) ±1.2
3 Dead Load 1.2
Live Load 1.2
Seismic Load (Y- Dir) ±1.2
4 Dead Load 1.5
Seismic Load (X- Dir) ±1.5
© 2020 JETIR May 2020, Volume 7, Issue 5 www.jetir.org (ISSN-2349-5162)
JETIR2005412 Journal of Emerging Technologies and Innovative Research (JETIR) www.jetir.org 715
5 Dead Load 1.5
Seismic Load (Y- Dir) ±1.5
6 Dead Load 0.9
Seismic Load (X- Dir) ±1.5
7 Dead Load 0.9
Seismic Load (Y- Dir) ±1.5
© 2020 JETIR May 2020, Volume 7, Issue 5 www.jetir.org (ISSN-2349-5162)
JETIR2005412 Journal of Emerging Technologies and Innovative Research (JETIR) www.jetir.org 716
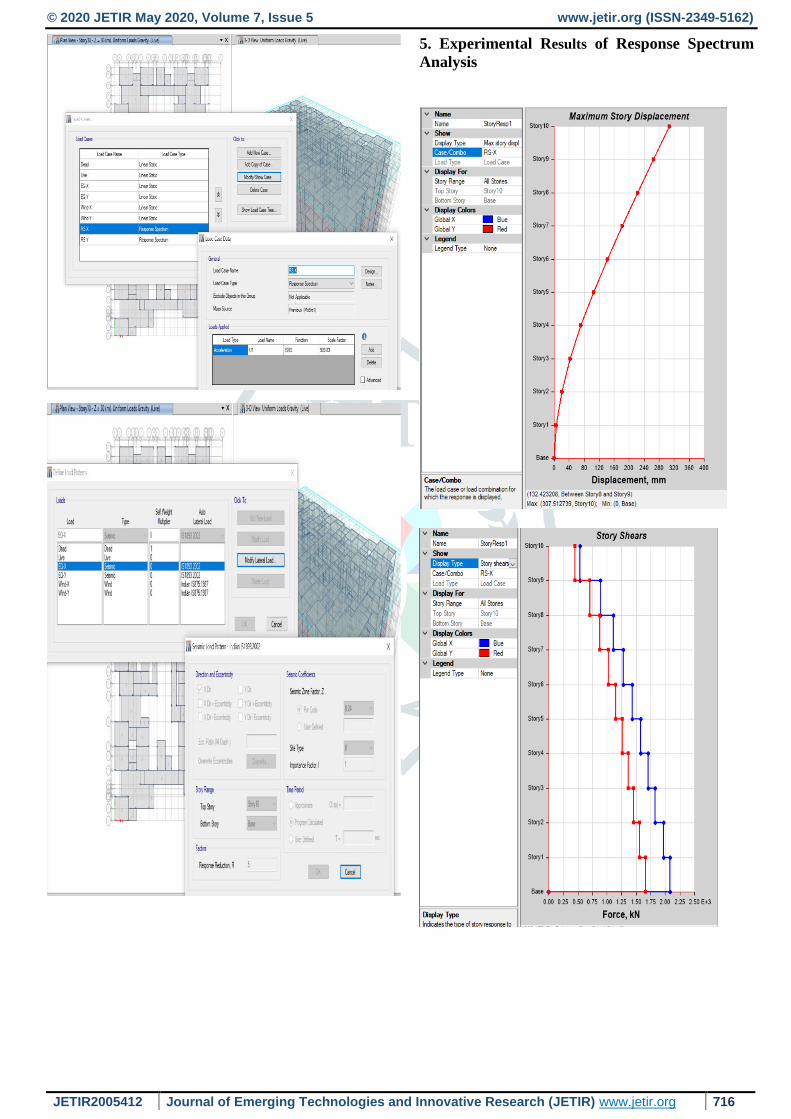
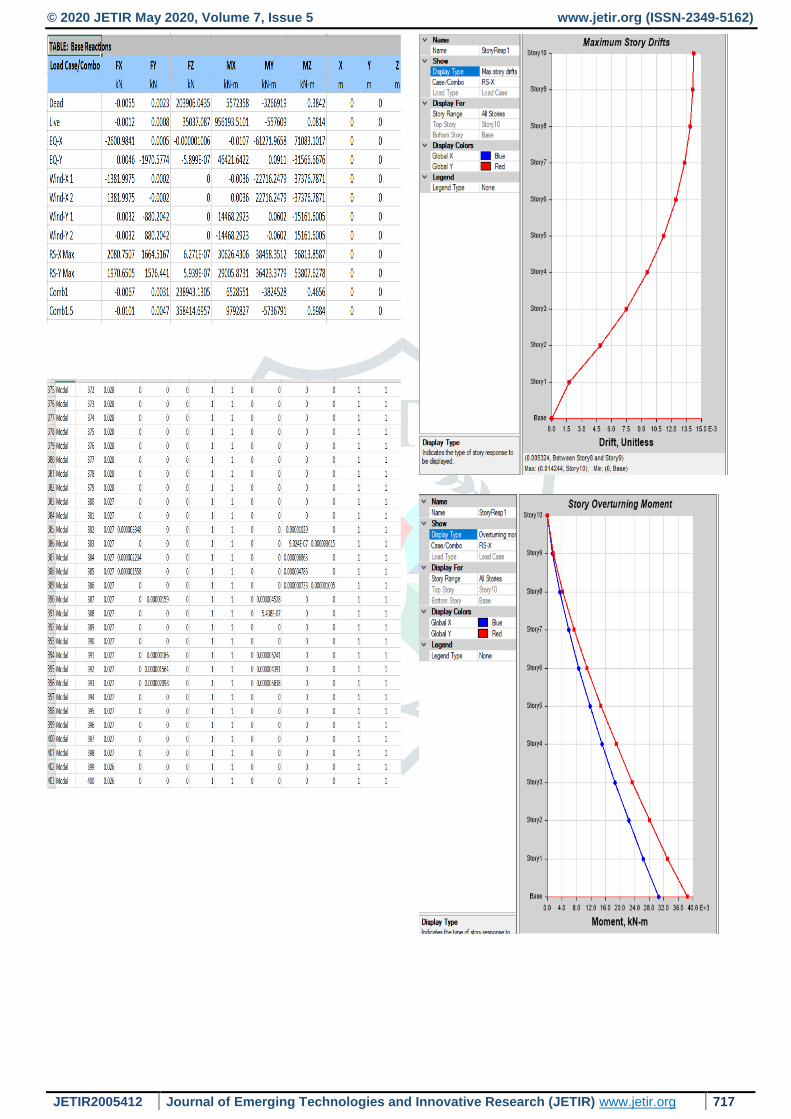
5. Experimental Results of Response Spectrum
Analysis
© 2020 JETIR May 2020, Volume 7, Issue 5 www.jetir.org (ISSN-2349-5162)
JETIR2005412 Journal of Emerging Technologies and Innovative Research (JETIR) www.jetir.org 717
© 2020 JETIR May 2020, Volume 7, Issue 5 www.jetir.org (ISSN-2349-5162)
JETIR2005412 Journal of Emerging Technologies and Innovative Research (JETIR) www.jetir.org 718
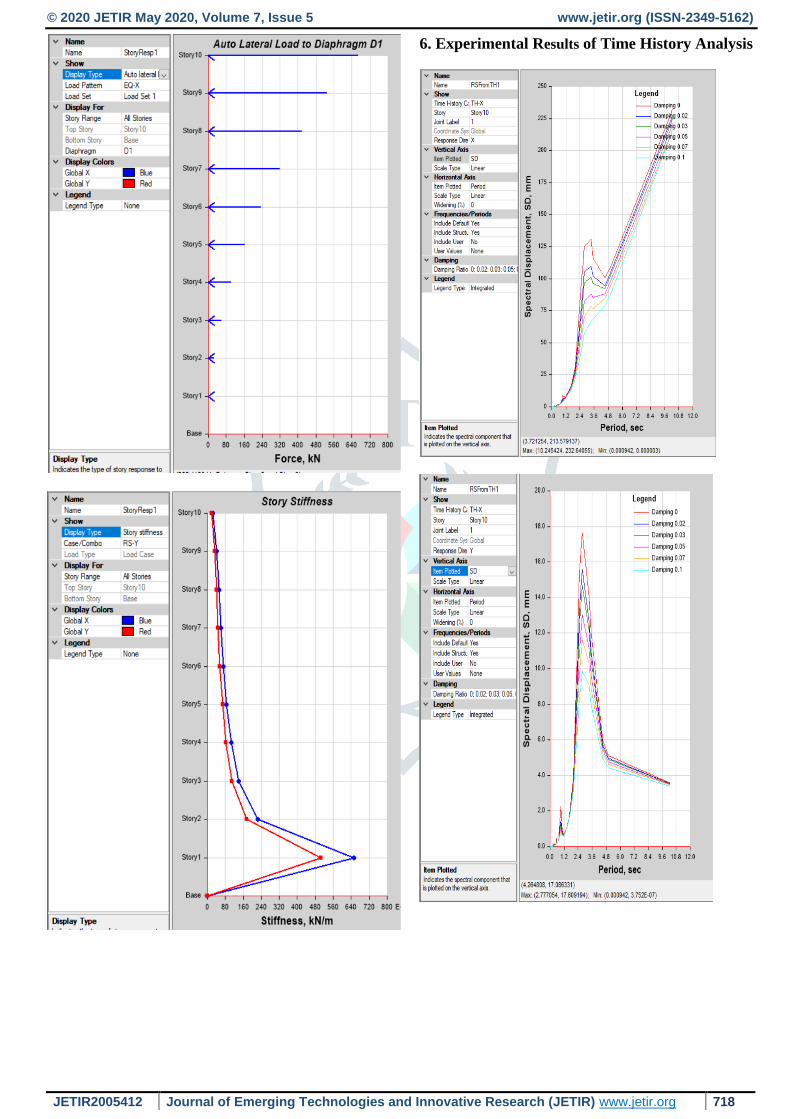
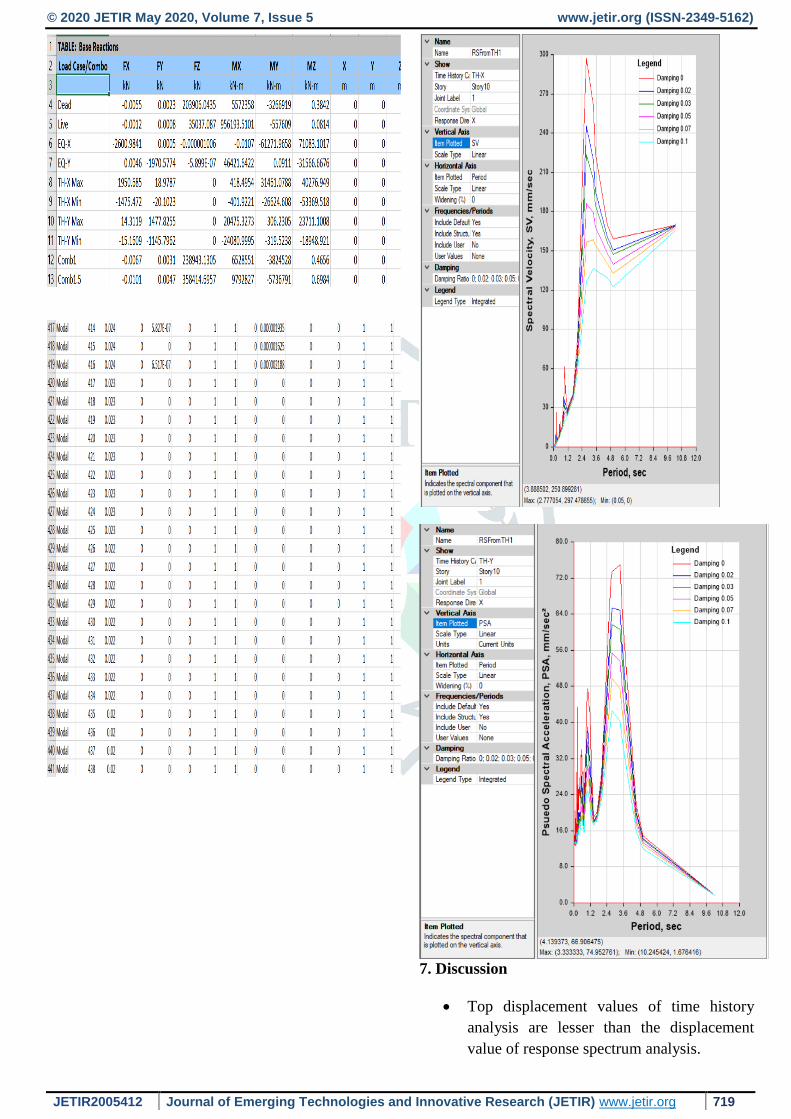
6. Experimental Results of Time History Analysis
© 2020 JETIR May 2020, Volume 7, Issue 5 www.jetir.org (ISSN-2349-5162)
JETIR2005412 Journal of Emerging Technologies and Innovative Research (JETIR) www.jetir.org 719
7. Discussion
Top displacement values of time history
analysis are lesser than the displacement
value of response spectrum analysis.
© 2020 JETIR May 2020, Volume 7, Issue 5 www.jetir.org (ISSN-2349-5162)
JETIR2005412 Journal of Emerging Technologies and Innovative Research (JETIR) www.jetir.org 720
For important structure time history method
should be used over response analysis as it
predicts structure behavior more accurately.
Difference in structure displacement is very
small in lower stories in both the methods
results predicts almost same for lower
stories.
Difference in structural displacement by
both methods become large for higher
stories only.
Time history method is accurate but very
resource consuming, on the other hand
response spectrum is quick but marginally
uneconomical.
8. Conclusion
By use of Response spectrum method will
get higher base shear value 2% and higher
displacement value 15 to 25% when
compare to Time history.
Time history methods results depends
heavily on earthquake excitation so a
number of various earthquakes of varying
intensities should be taken and maximum of
these should be considered.
Based on this study it can be concluded that
use of time history method will give
reasonable value when compare to response
spectrum method. Time history method
should be prefered whenever detailed
analysis is required but response spectrum is
not a bad approximation. Response
spectrum method gives fairly accurate
results.
9.References
[1]. N R Shwetha, Naveen, Pampanna Moolimani,
S Naveen kumar, Mahesh Sajjan “Analysis and
design of multi storey building subjected to
seismic load using E-tabs” (Department of Civil
Engineering, RYMEC Ballari), published-6 June
2019, (IRJET).
[2]. Ali Kadhim Sallal “Design and analysis ten
storied building using ETABS software-2016” Department of Hydraulic Structures, College of
Water Resource Engineering, Iraq, published- 2
May 2018, (IJRAET).
[3]. Sayyed A. Ahad, Hashmi S Afzal, Pathan
Tabrej, Shaikh Ammar, Shaikh Vikhar, Shivaji
Bidve “Analysis and design of multistorey
apartment building using ETABS” India
(Department of Civil Engineering, Sandipani
Technical Campus Faculty of Engineering,
SRTMUN University, Latur, Maharashtra),
published-5 May 2017, International Journal of
Engineering and Computer Science.
[4]. Yash Kumar K. Jain, V. Naga Sri Nikhil
“Analysis of a commercial building using
ETABS” Department of Civil Engineering K L
University, Andhra Pradesh, India, published- 4
April 2017, International Journal of Civil
Engineering and Technology (IJCIET).
[5]. Prakriti Chandrakar, Dr. P. S. Bokare
“Earthquake Analysis of G+10 Building using
Response Spectrum Method and Time History
Method - A Comparison” Department of Civil
Engineering RSR Rungta Collage of Engineering
and Technology, Bhilai (C.G), India, published- 8,
August 2017, International Journal of Science and
Research (IJSR).
Author Profile:
Kusuma.S
PG student MTec
Dept of Civil Engineering
Ghousia College of Engineering
Ramanagaram
Author Profile:
Dr. E. Ramesh Babu
Associate Professor
Dept of Civil Engineering
Ghousia College of Engineering
Ramanagaram


