Embed Size (px)
Citation preview
Instructional Science 30: 433–464, 2002.© 2002 Kluwer Academic Publishers. Printed in the Netherlands.
433
Scaffolding cognitive and metacognitive processes in low verbalability learners: Use of diagrams in computer-based trainingenvironments
HAYDEE M. CUEVAS1, STEPHEN M. FIORE1 & RANDALL L. OSER2
1University of Central Florida, U.S.A.; 2Naval Air Warfare Center, Training SystemsDivision, Orlando, Florida, U.S.A.
Received: 19 February 2002; in final form: 11 July 2002; accepted: 11 July 2002
Abstract. This study investigated how instructional strategies can support learners’ knowl-edge acquisition and metacomprehension of complex systems in a computer-based trainingenvironment, and how individual characteristics interact with these manipulations. Incorporat-ing diagrams into the training facilitated performance on measures of integrative knowledge(i.e., the integration and application of task-relevant knowledge), but had no significant effecton measures of declarative knowledge (i.e., mastery of basic factual knowledge). Diagramsadditionally facilitated the development of accurate mental models (as measured via a cardsorting task) and significantly improved the instructional efficiency of the training (i.e., higherlevel of performance was achieved with less mental effort). Finally, diagrams effectivelyscaffolded participants’ metacognition, improving their metacomprehension accuracy (i.e.,their ability to accurately monitor their comprehension). These beneficial effects of diagramson learners’ cognitive and metacognitive processes were found to be strongest for participantswith low verbal ability. Results are discussed in terms of implications for the design of adaptivelearning systems.
Keywords: computer-based training, diagrams, individual differences, instructionalefficiency, learning, mental models, metacognition, verbal ability
Introduction
Advances in computing technology and instructional design have led to asubstantial increase in the reliance on computer-mediated distance learningapproaches (Brown & Ford, 2002). Such programs now place the controlof instruction in the hands of the learner, with limited external monit-oring from an instructor (Salas, Kosarzycki, Burke, Fiore & Stone, 2002).However, successful outcomes in these learning environments are dependenton the training design’s ability to both support the acquisition of well-definedknowledge structures as well as foster the development of the necessarymetacognitive skills for learning (Mayer, 1999). Following a learner-centeredapproach to the design of these complex task training environments requiresconsideration of three principle objectives: a) understanding the cognitive
434
processes underlying knowledge and skill acquisition; b) assisting learners intheir attempts to monitor their subjective learning experiences, namely theirmetacognitive processes; and c) investigating the role of individual differ-ences in these cognitive and metacognitive processes (Annett, 1989; Bjork,1994; Jonassen & Grabowski, 1993). Simply stated, the question beforeinstructional program designers is how instructional technologies can best beused to foster successful learning outcomes. Along these lines, the primarypurpose of this paper is to investigate how instructional strategies may beincorporated into complex task training to scaffold learners’ cognitive andmetacognitive processes, particularly for low ability learners. The first sectionof this paper will discuss how diagrams can be used to facilitate knowledgeacquisition and highlight how a multi-faceted approach to assessment is crit-ical to detecting learning gains from such interventions. The next section willprovide an overview of the importance of metacognitive skills to successfullearning outcomes. The role of individual differences will be presented in thecourse of describing these first two factors. The final section will describe astudy conducted to evaluate the differential benefit of diagrams in scaffoldingknowledge acquisition and metacognitive processes in different populationsof learners.
Scaffolding cognitive processes
Diagrams and mental model development
Supplementing text-based instruction with illustrations or diagrams has along history, dating back to at least the 15th century (Ferguson, 1977).Although diagrams have long been known to be a beneficial learning aid, theiruse in complex task training environments has only recently been systemati-cally investigated in controlled studies. Several theories have been offeredto elucidate why the inclusion of illustrations, such as pictures and diagrams,leads to better understanding of the presented material and improved retentionand application of its contents (for a discussion, see Gyselinck & Tardieu,1999). One theory suggests that diagrams repeat the information presented inthe text. Thus, improved performance in knowledge acquisition may be dueto a repetition effect because the material is presented twice, once verballyand then again pictorially. Another interpretation of the positive effects ofdiagrams that has garnered wide acceptance attributes improved learning todual coding of the information in memory. Paivio (1971) proposed that verbaland nonverbal (i.e., visual/spatial) information are processed by separate andfunctionally distinct, although interconnected, long term memory systems.Numerous studies have been conducted by Paivio (1975) as well as other
435
researchers to test this claim (e.g., Kruley, Sciama & Glenberg, 1994; Mayer& Anderson, 1991; Mayer & Sims, 1994) and their results have generallysupported the existence of two distinct mechanisms at work. Accordingly,presenting information using both text and diagrams activates more than onemechanism of memory for processing and encoding for subsequent storageand activation when needed; that is, the diagrams are coded visually, and theinformation they provide is coded verbally. Therefore, since the informationis processed by two distinct mechanisms, encoding is reinforced, and retrievalfrom memory should be facilitated.
Dual-coding theory offers a plausible rationale for the facilitative effectsof diagrams when they accompany text in a learning task. Nonetheless, if dualencoding alone could account for this successful storage and retrieval, partici-pants provided with diagrams should outperform control group participants(i.e., participants given material with no diagrams) on all assessment tests ofknowledge acquisition. Yet several studies have shown that the presence orabsence of diagrams has no effect on performance in recognition or declar-ative knowledge tests (e.g., Fiore, Cuevas & Oser, in press; Mayer, 1989;Mayer & Gallini, 1990). It appears that the benefit of diagrams is evident onlyin transfer tasks that require integration of information. Thus, dual-codingtheory is insufficient to justify these findings and a more elaborate theory isnecessary to resolve this discrepancy.
Evidence from a growing number of studies (e.g., Fiore, Cuevas & Oser,in press; Hegarty & Just, 1993; Kieras, 1988; Kieras & Bovair, 1984; Mayer,1989) has supported an alternate theory for why diagrams are so effective ininstruction. Mental model theory has been the focus of investigation sinceCraik (as cited in Johnson-Laird, 1983) first proposed that what we refer toas “thinking” is really the product of manipulations of our internal represen-tations of the world. This internal representation is commonly referred to asa mental model. Gyselinck and Tardieu (1999) argue that diagrams are bene-ficial because they aid the learner in building a mental model of the contentof the text that they accompany. The mental model formed by the user ofa system and/or task provides most, if not all, of the user’s understandingof that system or task (Wilson & Rutherford, 1989). The completeness andaccuracy of this understanding dictates the level of performance in the task.The advantage to dual coding of information is that it supports the forma-tion of the knowledge structures needed by the learner to comprehend howthe system functions (Jonassen, Beissner & Yacci, 1993). These knowledgestructures, in turn, serve as the basis for the mental model created by thelearner.
Diagrams may serve as scaffolding (i.e., as a supporting framework) forthe development of these knowledge structures, guiding the learner to build
436
an appropriate model of the relations between the concepts in the material(Fiore, Cuevas & Oser, in press; Marcus, Cooper & Sweller, 1996; Mayer &Sims, 1994). With this supportive framework as a guide, the learner would bebetter able to integrate this information and generate elaborative inferencesabout the material. As a result, incorporating diagrams into the training mayfacilitate the construction of more accurate, better organized mental modelswhereas the knowledge structures formed by learners presented only with text(i.e., no diagrams) will suffice to answer only basic declarative (i.e., factualknowledge) questions. Thus, mental model theory supports the results ofstudies where the presence of diagrams has led to improved performance ontests requiring the integration of information and yet has shown no differencesin declarative knowledge performance.
Mental model assessment
Following the mental model theoretical approach, we investigated the facili-tative effects of diagrams in acquiring knowledge of complex systems. Assuch, a primary goal of this study was to evaluate, both qualitatively andquantitatively, how diagrams facilitate accurate mental model development.Incorporating diagrams into training for complex systems would be expectedto facilitate not only a trainee’s conceptualization and acquisition of a givenconcept in isolation, but also facilitate a more macro-conceptualization ofhow such concepts are interconnected (that is, encourage the acquisition ofknowledge structures more similar to an expert model – see Glaser, 1989).Specifically, diagrams may help identify and connect main ideas in thetraining material and may facilitate the accurate organization of these ideasinto categories. Nonetheless, appropriate metrics are needed to accuratelyevaluate how well training assists novices in effectively integrating theseconcepts and structures (Bjork, 1994), a topic we turn to next.
Although a variety of quantitative and qualitative methods have beenused to measure mental models (e.g., concept maps, similarity ratings), eachtechnique presents unique advantages and disadvantages in assessment (e.g.,Evans, Jentsch, Hitt, Bowers & Salas, 2001). For example, although a some-what limited method because trainees are forced to group together itemsrather rigidly, the card sort technique has been shown to be an effective toolin identifying the level of organization of key concepts, that is, card sort datamay be used to ascertain the degree to which one accurately views relationsamong concepts (Jonassen, Beissner & Yacci, 1993). Moreover, in previouswork, we have found that card sorts are a reliable indicator of how bothnovices evaluate concepts (Fiore, Cuevas & Oser, in press; Fiore, Cuevas,Scielzo & Salas, 2002) as well as how experts view conceptual relations(Fiore, Fowlkes, Martin-Milham & Oser, 2000). Further, such knowledge
437
elicitation techniques readily lend themselves to computerized data collectionfor on-line assessment of trainees’ knowledge acquisition in relation to an“expert model” of the domain (e.g., Fiore, Cuevas, Scielzo & Salas, 2002).
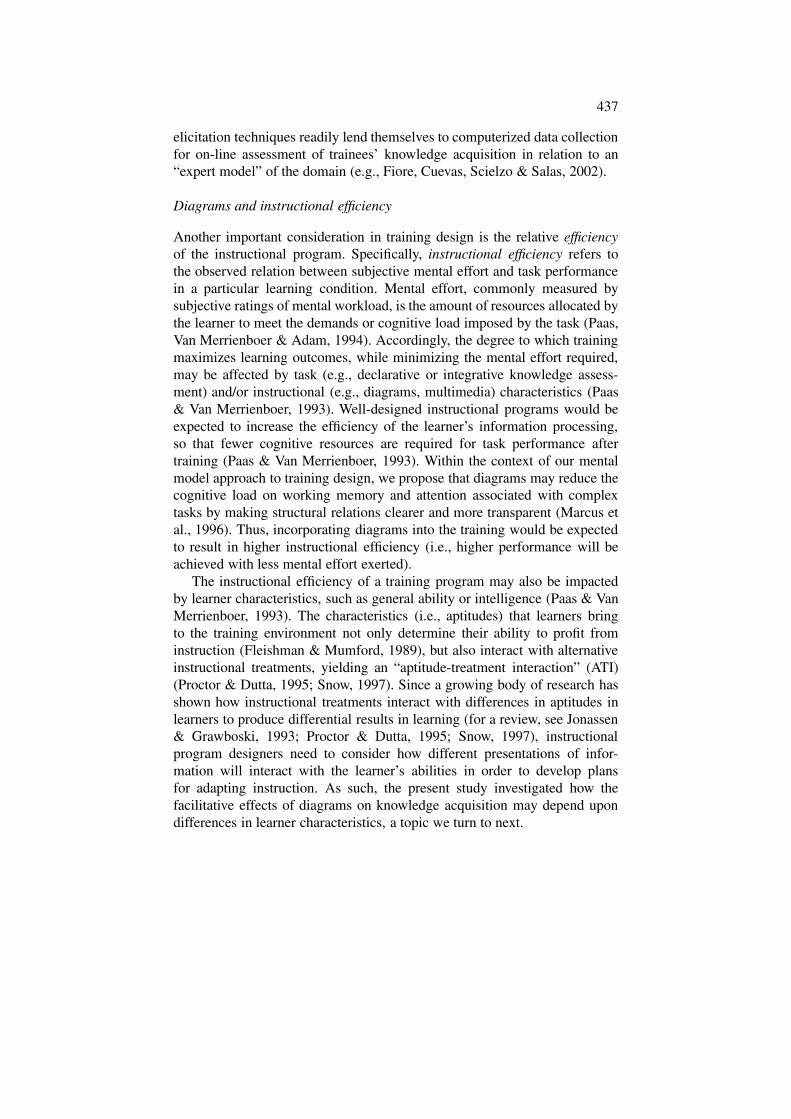
Diagrams and instructional efficiency
Another important consideration in training design is the relative efficiencyof the instructional program. Specifically, instructional efficiency refers tothe observed relation between subjective mental effort and task performancein a particular learning condition. Mental effort, commonly measured bysubjective ratings of mental workload, is the amount of resources allocated bythe learner to meet the demands or cognitive load imposed by the task (Paas,Van Merrienboer & Adam, 1994). Accordingly, the degree to which trainingmaximizes learning outcomes, while minimizing the mental effort required,may be affected by task (e.g., declarative or integrative knowledge assess-ment) and/or instructional (e.g., diagrams, multimedia) characteristics (Paas& Van Merrienboer, 1993). Well-designed instructional programs would beexpected to increase the efficiency of the learner’s information processing,so that fewer cognitive resources are required for task performance aftertraining (Paas & Van Merrienboer, 1993). Within the context of our mentalmodel approach to training design, we propose that diagrams may reduce thecognitive load on working memory and attention associated with complextasks by making structural relations clearer and more transparent (Marcus etal., 1996). Thus, incorporating diagrams into the training would be expectedto result in higher instructional efficiency (i.e., higher performance will beachieved with less mental effort exerted).
The instructional efficiency of a training program may also be impactedby learner characteristics, such as general ability or intelligence (Paas & VanMerrienboer, 1993). The characteristics (i.e., aptitudes) that learners bringto the training environment not only determine their ability to profit frominstruction (Fleishman & Mumford, 1989), but also interact with alternativeinstructional treatments, yielding an “aptitude-treatment interaction” (ATI)(Proctor & Dutta, 1995; Snow, 1997). Since a growing body of research hasshown how instructional treatments interact with differences in aptitudes inlearners to produce differential results in learning (for a review, see Jonassen& Grawboski, 1993; Proctor & Dutta, 1995; Snow, 1997), instructionalprogram designers need to consider how different presentations of infor-mation will interact with the learner’s abilities in order to develop plansfor adapting instruction. As such, the present study investigated how thefacilitative effects of diagrams on knowledge acquisition may depend upondifferences in learner characteristics, a topic we turn to next.
438
Scaffolding metacognitive processes
Metacomprehension
Several studies have modeled the manner in which individual differencesare related to learning. For example, Britton, Stimson, Stennett, and Gulgoz(1998) identified four variables hypothesized to affect knowledge acquisition(i.e., metacognition, inference-making ability, working memory, and domainknowledge) and developed a model that predicted how well learners makethe necessary connections among ideas from material under study and priorknowledge. They found that metacognitive ability was significantly related toone’s ability to successfully bridge critical aspects of text. The present studyinvestigated this component of their model, namely metacognition. Morespecifically, this study focused on one aspect of metacognition (i.e., meta-comprehension) in order to determine how the inclusion of diagrams mayimpact learners’ metacognitive processes and subsequent learning. Meta-cognition is a complex construct involving both knowledge of one’s owncognitive processes and the ability to control and regulate these processes(Flavell, 1979; Osman & Hannafin, 1992; Schraw, 1998). Accordingly,metacomprehension refers to the “conscious processes of knowing aboutcomprehending and knowing how to comprehend” (Brown as cited in Osman& Hannafin, 1992, p. 85). Metacomprehension is not just limited to one’sability to recognize a failure to comprehend, but also to know when to engagein behaviors to remediate, or repair, this failure in comprehension once it hasbeen recognized (Osman & Hannafin, 1992).
Metacomprehension and complex training environments
Metacognitive skills, such as metacomprehension, are important becausethey have been shown to be critical in a variety of domains, including self-regulated learning (e.g., Hofer, Yu & Pintrich, 1998; Winne & Stockley,1998), communication and comprehension (both oral and written) (seeFlavell, 1979), problem solving (e.g., Davidson, Deuser & Sternberg, 1994;Mayer, 1998), memory (e.g., Bjork, 1994; Brown, 1978), and the develop-ment of expertise (e.g., Smith, Ford & Kozlowski, 1997; Sternberg, 1998).Moreover, these metacognitive skills may also interact with other charac-teristics of the trainee (e.g., verbal ability), influencing the effective useof metacognitive processes (e.g., Davidson et al., 1994; Everson & Tobias,1998; Hartman, 2001a; Sternberg, 1998). For example, studies have shownthat participants with better verbal comprehension and faster reading abilitywere more accurate in their posttest confidence judgments of performance(indicating better metacomprehension) than were poorer comprehenders and
439
slower readers (Maki, Jonas & Kallod, 1994). Ford, Smith, Weissbein, Gully,and Salas (1998) further illustrated the essential role of metacognitive skillsin complex task training. Their study found that metacognitive activity wassignificantly related to knowledge acquisition, skilled performance at theend of training, and self-efficacy. Moreover, these three training outcomes(knowledge, skilled performance, and self-efficacy) positively influencedtransfer of learning to a more complex task.
The aforementioned findings are of particular relevance to computer-basedcomplex task training because of the self-paced, learner-controlled natureof these environments. Complex learning tasks require both higher-levelcognitive and metacognitive abilities (Hartman, 2001a). Verbal comprehen-sion ability, for example, has been shown to be indicative of skill acquisitionof a complex task (Fleishman & Mumford, 1989). Furthermore, in previouswork, we have similarly documented the significant positive relationshipbetween metacomprehension ability and knowledge acquisition in complextask training (e.g., Fiore, Cuevas, Scielzo & Salas, 2002). Notably, studieshave also demonstrated a significant positive relationship between meta-comprehension and verbal comprehension ability (e.g., Everson & Tobias,1998; Maki et al., 1994; Moore, Zabrucky & Commander, 1997). In viewof these findings and since studies indicate that metacognitive skills areamenable to training (e.g., Gourgey, 1998; Hartman, 2001a, 2001b; Maqsud,1998; McInerney, McInerney & Marsh, 1997; Schmidt & Ford, 2001; Volet,1991), it behooves instructional designers of learner-controlled computer-based training environments to determine which interventions prove mosteffective in order to develop plans for adapting instruction to the needsof the learner. Simply stated, a major goal of training should be to assisttrainees, particularly low ability learners, in their attempts to better monitortheir subjective learning experience (Bjork, 1994), that is, elevate their meta-cognitive awareness (comprehension monitoring). As such, the present studyinvestigated the degree to which training manipulations could scaffold (i.e.,serve as a supporting framework for) metacomprehension in trainees varyingin verbal aptitudes. Specifically, we explored if diagrams could serve as aproxy for low verbal ability learners’ limited metacognitive processes toenable them to successfully bridge critical aspects of the text (cf. Britton etal., 1998).
Metacomprehension assessment
Several measures have been used to investigate learners’ metacognitiveprocesses such as in feeling-of-knowing and judgement-of-learning assess-ments (for a review, see Maki, 1998). These methods primarily focus onlearners’ awareness or knowledge of their cognitive processes, rather than
440
on learners’ regulation of these processes. For example, bias scores (i.e.,the discrepancy between self-assessment of performance and actual perfor-mance) are a commonly used measure to ascertain learners’ degree of confi-dence (i.e., overconfidence or underconfidence) in their perceived learning(e.g., Fiore, Cuevas, Scielzo & Salas, 2002; Kelemen, Frost & Weaver, 2000).Researchers interested in the accuracy of learners’ assessments often usemeasures of absolute accuracy (i.e., match between predicted performanceand actual performance) (see Hartman, 2001a; also, Maki, 1998) or relativeaccuracy (i.e., degree to which predicted performance correlates with actualperformance) (e.g., Dunlosky, Rawson & McDonald, 2002; Hall & Cremer,2000). In the present study, we were interested in learners’ ability to recognizea failure in their comprehension of complex concepts, a principal metacom-prehension process. As such, we focused on metacomprehension accuracy,defined as the relative accuracy of learners’ metacomprehension assessments.Specifically, we examined whether learners’ predictions of performance(based on their comprehension monitoring) varied in a correlated mannerwith their actual performance.
Present study
A testbed for training introductory concepts associated with the principlesof flight was developed for this experiment. This task was chosen specifi-cally because it requires the integration of multiple knowledge formats (e.g.,declarative and integrative), and thus mimics complex task training. Twoversions of this interactive tutorial were developed (diagrams present orabsent) to explore the differential benefit of diagrams in facilitating: knowl-edge acquisition, mental model development, instructional efficiency, andmetacomprehension accuracy. Last, because the role of individual differ-ences in aptitude should be taken into account in any learning environment,and in view of the significant relationship of verbal comprehension abilitywith metacomprehension (e.g., Maki et al., 1994) and knowledge acquisi-tion (e.g., Fleishman & Mumford, 1989), verbal comprehension ability wasalso assessed to determine its influence on performance. Specifically, thefollowing hypotheses were proposed:
Mental model development hypotheses
This set of hypotheses pertained to the development of organized knowledgestructures. Specifically, these hypotheses addressed the degree to which thepresentation of diagrams facilitates accurate mental model development, asmeasured via a card sorting task.
441
Similarity to expert modelExpert knowledge consists of increased connectedness among criticalconcepts (e.g., Glaser, 1989). As such, learners’ ability to make connec-tions among concepts in a manner similar to that of an expert model of thetask, would be expected to be positively related to learning, as indicatedby more standard measures of performance.Hypothesis 1: The degree of similarity to an expert model was predicted tobe directly related to performance on measures of knowledge acquisition.
Diagrams and mental model developmentBy making abstract concepts associated with complex tasks moreexplicit (i.e., via graphical representation), incorporating diagrams intothe training would be expected to encourage the acquisition of knowl-edge structures more similar to an expert model (e.g., Glaser, 1989).Specifically, presentation of diagrams would be expected to increase thelikelihood that learners relate task-relevant concepts in a manner similarto that of an expert model of the task.Hypothesis 2: Participants presented with diagrams were predicted toshow greater similarity to an expert model than participants not presentedwith diagrams.
Verbal ability and mental model developmentVerbal comprehension ability has been shown to be important to skillacquisition of complex tasks (e.g., Fleishman & Mumford, 1989).Consequently, verbal comprehension ability would be expected to facili-tate the acquisition of the knowledge structures necessary for taskexpertise by supporting the understanding and integration of complexconcepts and relations.Hypothesis 3: Participants with higher verbal comprehension ability werepredicted to have greater similarity to an expert model than participantswith low verbal comprehension ability.
Diagrams and verbal ability on mental model developmentDiagrams may support learners’ integration of important concepts bymaking conceptual relations more explicit (e.g., Marcus et al., 1996).Since low verbal ability learners typically have less cognitive resourcesavailable for acquisition of higher level knowledge (e.g., Davidson etal., 1994; Hartman, 2001a), incorporating diagrams into complex tasktraining would be expected to be even more beneficial for these learners.Hypothesis 4: Presentation of diagrams was predicted to increase simi-larity to an expert model for participants with low verbal comprehensionability, but not for participants with high verbal comprehension ability.
442
Knowledge assessment hypotheses
This hypothesis pertained to the degree to which the diagrams facilitateperformance on distinct measures of knowledge assessment.
Diagrams and knowledge acquisitionPrevious studies have demonstrated that the beneficial effect of diagramsis dependent upon the nature of the task (e.g., Fiore, Cuevas & Oser, inpress; Mayer, 1989; Mayer & Gallini, 1990). Specifically, incorporatingdiagrams into training increased performance on tasks requiring integra-tion and application of knowledge, but not on tasks relying on retrieval ofbasic factual information.Hypothesis 5: Presentation of diagrams was predicted to facilitate partici-pants’ performance on integrative knowledge assessment, but not ondeclarative knowledge assessment.
Instructional efficiency hypotheses
This set of hypotheses pertained to the degree to which the presentation ofdiagrams increases the instructional efficiency of the training.
Diagrams and instructional efficiencyBy facilitating knowledge acquisition, diagrams would be expected toimprove learners’ performance on a knowledge assessment task as wellas reduce the cognitive load associated with complex task training.Hypothesis 6: Participants presented with diagrams were predicted toexperience higher instructional efficiency than participants not presentedwith diagrams.
Verbal ability and instructional efficiencyIn complex task training environments, learners with higher verbalcomprehension ability would be expected to have higher performance andreport experiencing a lower cognitive load.Hypothesis 7: Participants with high verbal comprehension ability werepredicted to experience higher instructional efficiency than participantswith low verbal comprehension ability.
Diagrams and verbal ability on instructional efficiencyDiagrams would be expected to reduce the cognitive load associated withcomplex task training by scaffolding the learners’ cognitive processes(i.e., their acquisition of knowledge). The impact of diagrams on theefficiency of learning would be expected to be greater for learners withlow verbal comprehension ability since they may have less cognitive
443
resources available for acquisition of the higher level knowledge requiredfor successful task performance.Hypothesis 8: Presentation of diagrams was predicted to increase instruc-tional efficiency for participants with low verbal comprehension ability,but not for participants with high verbal comprehension ability.
Metacomprehension hypotheses
This set of hypotheses pertained to the participants’ accuracy in monitoringtheir comprehension. Specifically, these hypotheses addressed the degree towhich the presentation of diagrams scaffolds participants’ metacomprehen-sion accuracy.
Diagrams and metacomprehension accuracyDiagrams may serve to scaffold learners’ knowledge acquisition andsubsequently, their metacomprehension processes. Specifically, diagramsmay assist learners in identifying the connection of critical concepts,thereby building the appropriate mental model of the task domain. Assuch, diagrams would be expected to better enable learners to accuratelymonitor their comprehension of the material and identify gaps in theirunderstanding.Hypothesis 9: Participants presented with diagrams were predictedto exhibit greater metacomprehension accuracy than participants notpresented with diagrams.
Diagrams and verbal ability on metacomprehension accuracyPrevious studies have shown that high ability learners actively engagetheir metacognitive processes more than low ability learners (e.g.,Davidson et al., 1994; Hall & Cremer, 2000; see also Gourgey, 1998;Hartman, 2001a; Osman & Hannafin, 1992; Weinstein & Mayer, 1986).Yet, diagrams may serve as a proxy for low ability learners’ limitedmetacognitive processes by facilitating their knowledge acquisition andassisting them in recognizing gaps in their knowledge.Hypothesis 10: Presentation of diagrams was predicted to increase meta-comprehension accuracy for participants with low verbal comprehensionability, but not for participants with high verbal comprehension ability.
444
Method
Participants
Seventy-eight undergraduate students enrolled in psychology courses at asoutheastern university participated in this experiment for course credit. Ademographic form was used to screen out participants with previous experi-ence with the aviation domain to ensure that only naïve participants were usedin this study. Data from 17 participants was excluded from the analysis dueto either prior familiarity with aviation and/or technical/procedural problems,leaving a total of 61 for analysis (25 males and 36 females, mean age = 22.66years).
Design
A 2×2 mixed between/within design was used in this study, with diagram(presence or absence) as the between-subject variable and test type (integ-rative vs. declarative) as the within-subject variable. The dependent variableswere mental model development, percent correct on the performance test,instructional efficiency scores, and metacomprehension accuracy. Mentalmodel development was evaluated with respect to the degree of similarityto an expert model, as measured via a card sorting task. Performance testaccuracy was measured using separate techniques for integrative knowl-edge (i.e., the integration and application of task-relevant knowledge) anddeclarative knowledge (i.e., mastery of basic factual knowledge). Instruc-tional efficiency and metacomprehension accuracy were calculated in theanalysis of the results. Verbal comprehension ability was measured as an indi-vidual differences variable to assess its potential influence on the dependentmeasures.
Materials and apparatus
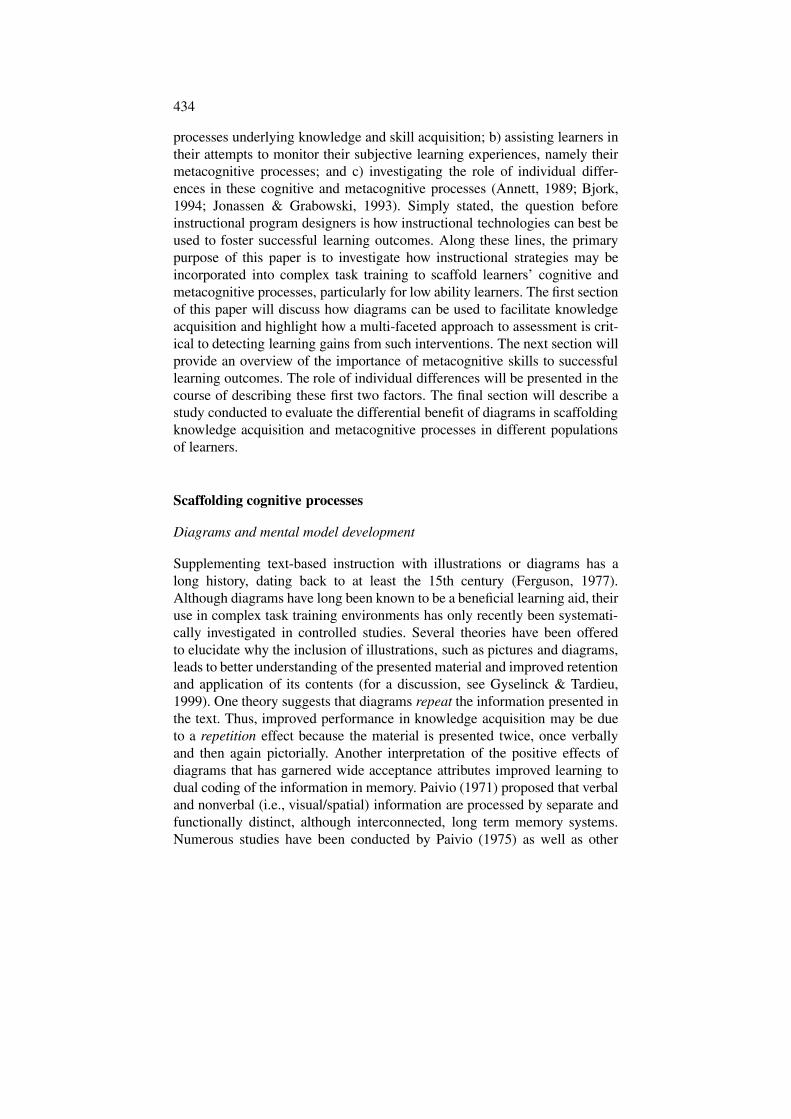
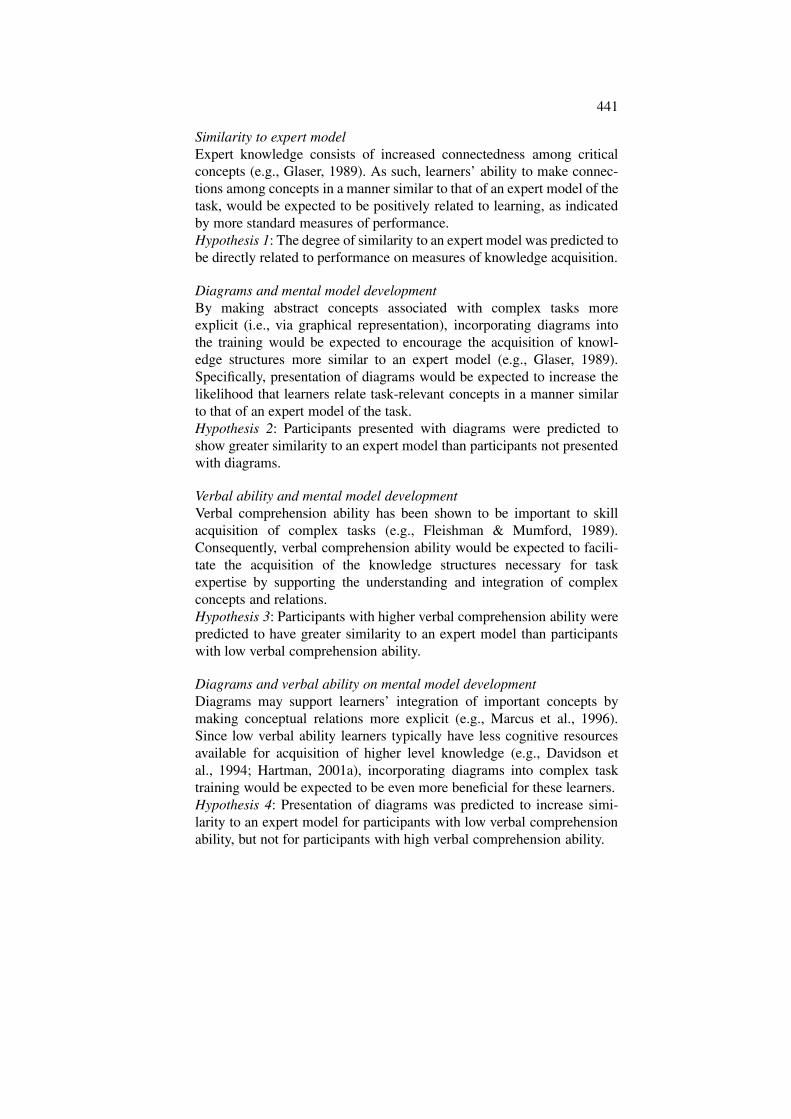
Training tutorial (Knowledge Acquisition). In order to assess the manner inwhich diagrams impact knowledge acquisition and mental model develop-ment in a complex task, a multi-part tutorial was devised that included avariety of inter-related concepts. Two versions of this interactive instructionaltutorial based on the principles of flight were created for this experiment usingMicrosoft PowerPoint 97, with diagrams either present or absent (see illus-trative content in Figure 1). The software program for the tutorial was hostedon an IBM compatible Pentium 586 computer with a 15-inch color monitor.Material for the tutorial was adapted from the Jeppesen Sanderson PrivatePilot Manual (1996) and the Jeppesen Sanderson Private Pilot ManeuversManual (1996); both are standard training products for the instruction of
445
pilots in the private and public sector. The tutorial was divided into threemodules (Airplane Parts, Flight Movements, Flight Instruments), describednext.
Airplane Parts: The first module described a number of airplane partscritical for flight. Participants were presented with an overview slide and2 main slides (e.g., wings, tail), with hyperlinks to 4 additional slidesthat provided more detailed explanation of the concepts (e.g., ailerons,rudder).
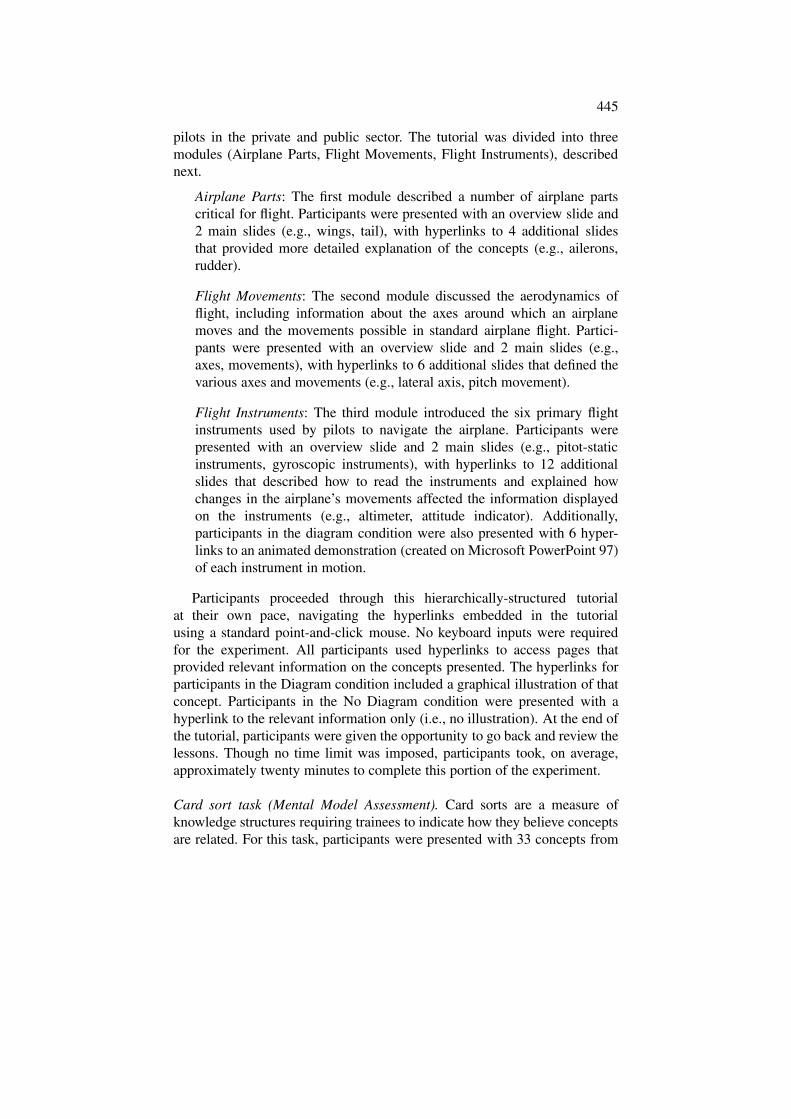
Flight Movements: The second module discussed the aerodynamics offlight, including information about the axes around which an airplanemoves and the movements possible in standard airplane flight. Partici-pants were presented with an overview slide and 2 main slides (e.g.,axes, movements), with hyperlinks to 6 additional slides that defined thevarious axes and movements (e.g., lateral axis, pitch movement).
Flight Instruments: The third module introduced the six primary flightinstruments used by pilots to navigate the airplane. Participants werepresented with an overview slide and 2 main slides (e.g., pitot-staticinstruments, gyroscopic instruments), with hyperlinks to 12 additionalslides that described how to read the instruments and explained howchanges in the airplane’s movements affected the information displayedon the instruments (e.g., altimeter, attitude indicator). Additionally,participants in the diagram condition were also presented with 6 hyper-links to an animated demonstration (created on Microsoft PowerPoint 97)of each instrument in motion.
Participants proceeded through this hierarchically-structured tutorialat their own pace, navigating the hyperlinks embedded in the tutorialusing a standard point-and-click mouse. No keyboard inputs were requiredfor the experiment. All participants used hyperlinks to access pages thatprovided relevant information on the concepts presented. The hyperlinks forparticipants in the Diagram condition included a graphical illustration of thatconcept. Participants in the No Diagram condition were presented with ahyperlink to the relevant information only (i.e., no illustration). At the end ofthe tutorial, participants were given the opportunity to go back and review thelessons. Though no time limit was imposed, participants took, on average,approximately twenty minutes to complete this portion of the experiment.
Card sort task (Mental Model Assessment). Card sorts are a measure ofknowledge structures requiring trainees to indicate how they believe conceptsare related. For this task, participants were presented with 33 concepts from
446
Figure 1. Illustration of aviation tutorial page with diagrams.
the tutorial, each typed on a separate index card. Participants were instructedto group these concepts into as many categories as they desired and werethen asked to name or describe the categories that they created for each groupof cards. Though no time limit was imposed, participants took, on average,approximately twenty minutes to complete this portion of the experiment.
Performance test (Knowledge Assessment). In order to separately assessknowledge acquisition, a test comprised of three distinct forms of perfor-mance measurement questions was developed using Microsoft PowerPoint97. Participants proceeded through the 48-item computer-based performancetest at their own pace, recording their responses using a standard point-and-click mouse. A log file was programmed to record participant responsesto each item. The Declarative Knowledge questions were presented first,followed by the Integrative Knowledge questions, and finally, the ConceptRecognition questions (each described in detail shortly). Only one questionwas presented at a time on the screen and a multiple-choice format was usedfor all questions. Unlike the tutorial, participants were not able to go backand review or change their responses once the program had moved to the nextscreen, and no feedback was provided as to the accuracy of their responses.Participants, on average, completed the test in about thirty minutes.
Declarative Knowledge Assessment. Twenty questions, adopted from astandard introductory flight manual (Jeppesen Sanderson Private PilotExercise Book, 1996), assessed participants’ mastery of basic factual
447
information associated with the training tutorial (e.g., definitions of thevarious parts of the plane). Standardized testing procedures have longrelied on such assessment based upon one’s effective mastery of task-relevant knowledge. Indeed, this is one of the standard methods in usein distance learning (i.e., computer-based) environments (e.g., Proctor& Dutta, 1995; Van Oostendorp & Goldman, 1999). For this declarativeknowledge assessment task, participants were presented with text-baseddefinitions taken from the training tutorial and were required to identifythe concept being described.
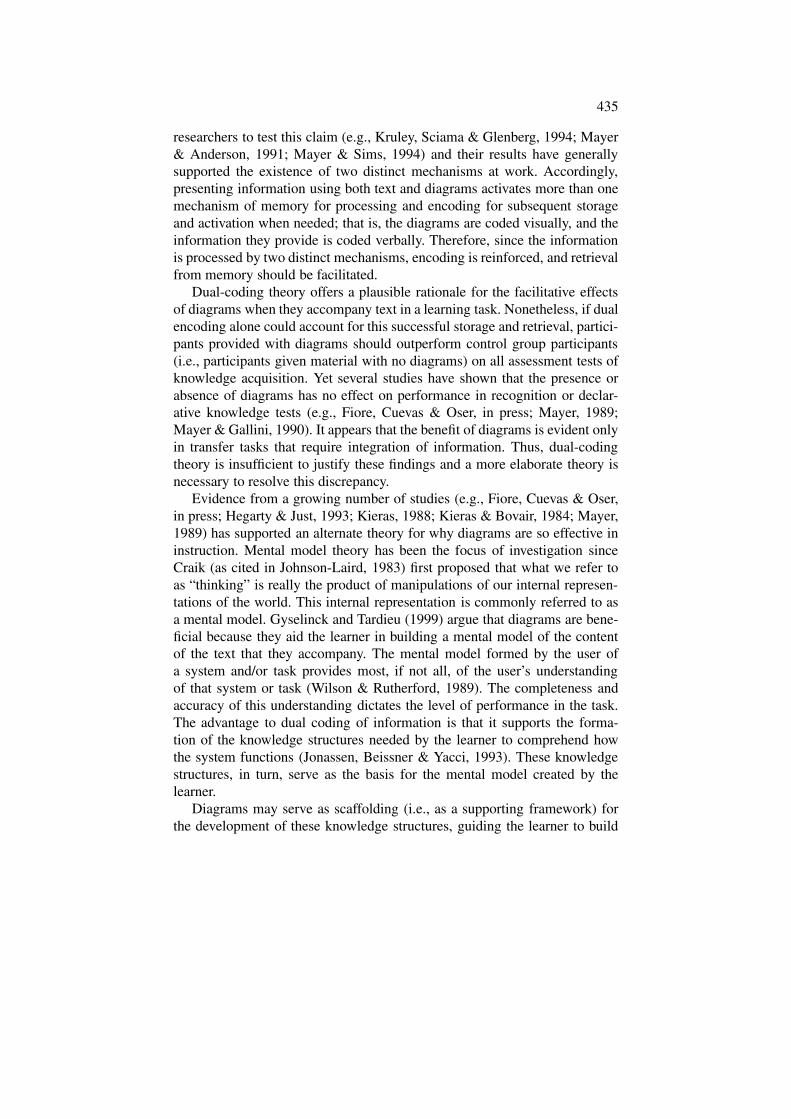
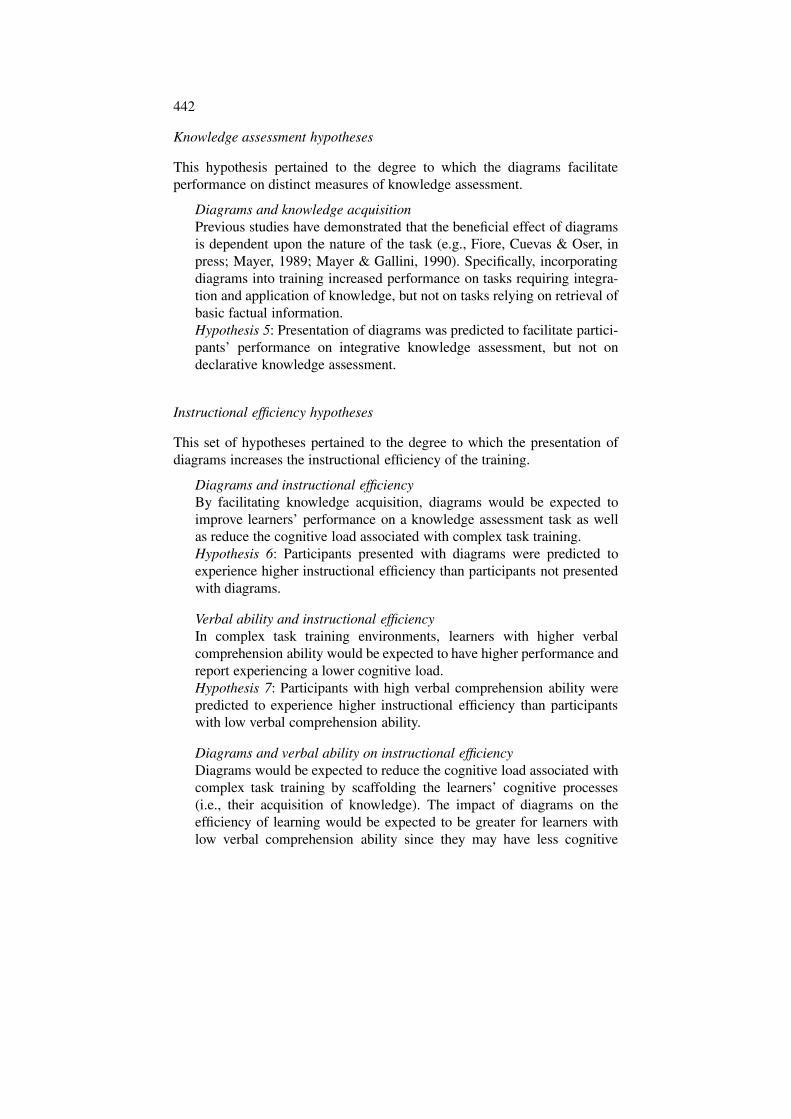
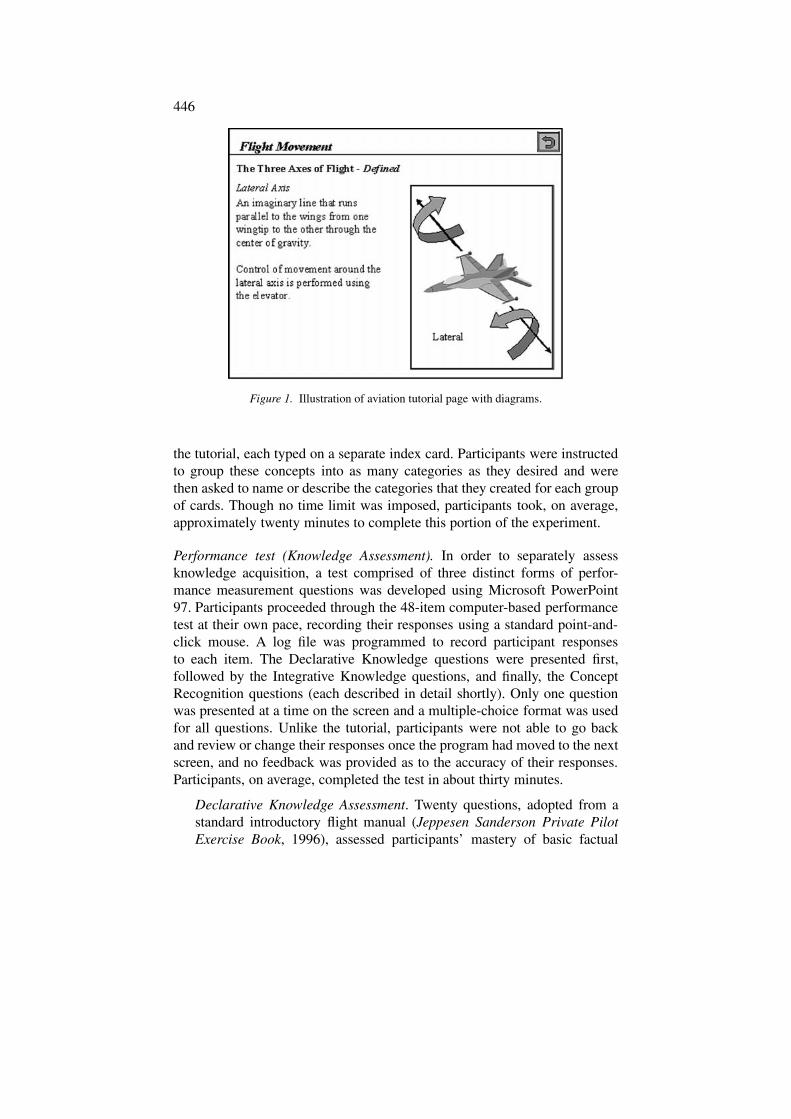
Integrative Knowledge Assessment. Ten questions assessing participants’ability to integrate task knowledge were created. This is a less commonform of assessment requiring trainees to apply their newly acquiredknowledge in a variety of task-relevant scenarios. Specifically, a traineeis presented with a vignette illustrating an application of task-relatedconcepts and they must, either ascertain the accuracy of that application,or identify the concepts being applied. Typically, such assessment is inthe form of a text-based vignette but the hypermedia capabilities of ourcomputer-based training system allowed for the presentation of dynamictest scenarios (see also Oser, Cannon-Bowers, Salas & Dwyer, 1999and Oser, Gualtieri, Cannon-Bowers & Salas, 1999, for a discussion of“scenario-based” training). Thus, this task measured participants’ abilityto integrate and apply their knowledge on a transfer task, rather thansimply their ability to retrieve factual knowledge, such as definitions, as inthe first set of questions. For this integrative knowledge assessment task,participants were presented with animated images of airplane maneuvers(using audio-video interleaved file format) and they were to determine,for example, which airplane parts and instruments were being utilized inthis maneuver (see illustrative content in Figure 2).
Concept Recognition Assessment. Eighteen questions tested participants’recognition ability with respect to airplane parts, axes, movements, andinstruments. Participants were presented with illustrations of the principleconcepts from the tutorial and asked to identify the concept depicted. Thisthird section served as a manipulation check of the diagram condition.
Tutorial evaluation questionnaire. A questionnaire was designed to informus of the effectiveness of the training tutorial in terms of instructionalefficiency and metacomprehension accuracy. Ratings were collected on a7-point Likert-type scale. The subjective mental workload (cognitive load)associated with learning the instructional material was assessed by askingparticipants to report how easy or difficult they found it to understand
448
Figure 2. Illustration of integrative knowledge assessment question.
the concepts presented in the tutorial, with responses ranging from veryeasy (1) to very difficult (7). The final item asked participants to ratehow well they thought they would do on multiple-choice questions onthe material presented in the tutorial, with responses ranging from verypoorly (1) to very well (7). This served as the prediction measure used todetermine metacomprehension accuracy, operationally defined as the degreeto which the trainees’ assessment of their perceived learning performancevaries in a correlated manner with their actual performance. Specifically,metacomprehension accuracy was measured by calculating the Pearson rcorrelation coefficient between trainees’ prediction of future performance ona task with their actual performance (Maki, 1998).
Verbal comprehension. The nature of the material presented in the tutorialrequired understanding and integration of complex concepts and rela-tions. Given the aforementioned relationship between verbal comprehension,knowledge acquisition, and metacomprehension, Part 1 (Verbal Comprehen-sion) of the Guilford-Zimmerman Aptitude Survey (Copyright 1953 SheridanSupply Co.) was administered to assess the influence of individual differ-ences in verbal comprehension ability, both in comprehending the conceptsin the tutorial and on participants’ metacomprehension processes. For thispaper-and-pencil task, participants were given 10 minutes to respond to 72multiple-choice questions, assessing knowledge of semantic meanings.
449
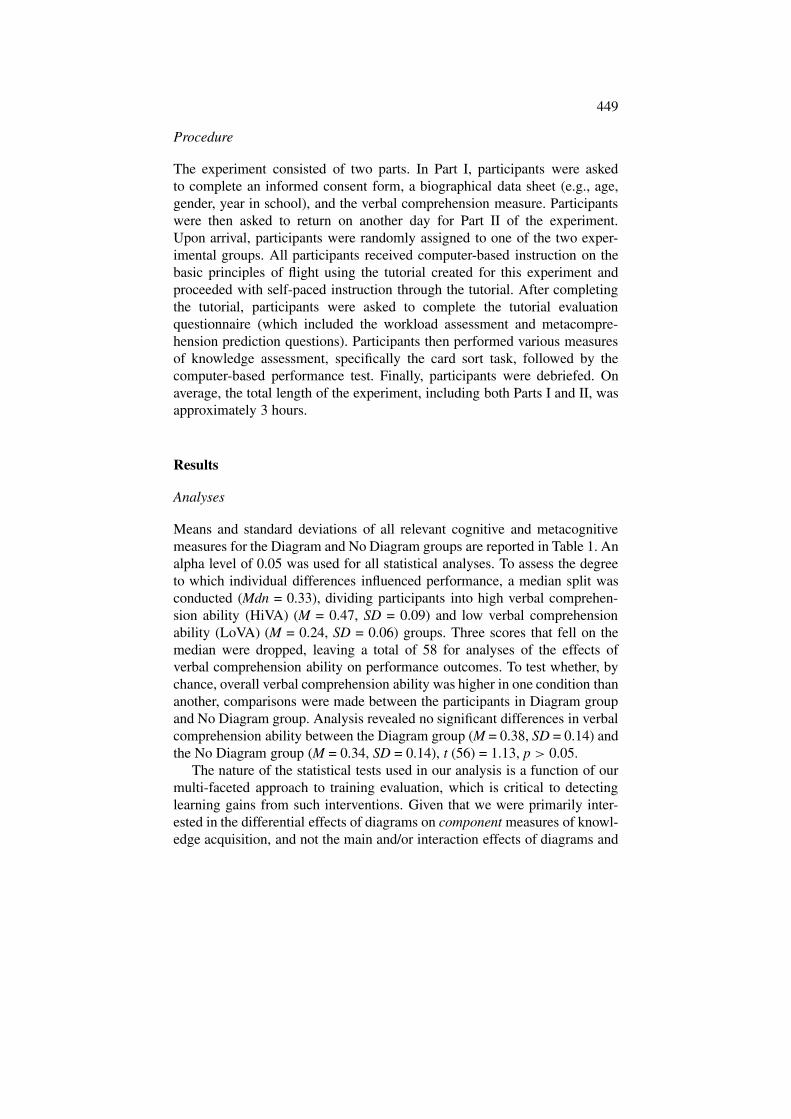
Procedure
The experiment consisted of two parts. In Part I, participants were askedto complete an informed consent form, a biographical data sheet (e.g., age,gender, year in school), and the verbal comprehension measure. Participantswere then asked to return on another day for Part II of the experiment.Upon arrival, participants were randomly assigned to one of the two exper-imental groups. All participants received computer-based instruction on thebasic principles of flight using the tutorial created for this experiment andproceeded with self-paced instruction through the tutorial. After completingthe tutorial, participants were asked to complete the tutorial evaluationquestionnaire (which included the workload assessment and metacompre-hension prediction questions). Participants then performed various measuresof knowledge assessment, specifically the card sort task, followed by thecomputer-based performance test. Finally, participants were debriefed. Onaverage, the total length of the experiment, including both Parts I and II, wasapproximately 3 hours.
Results
Analyses
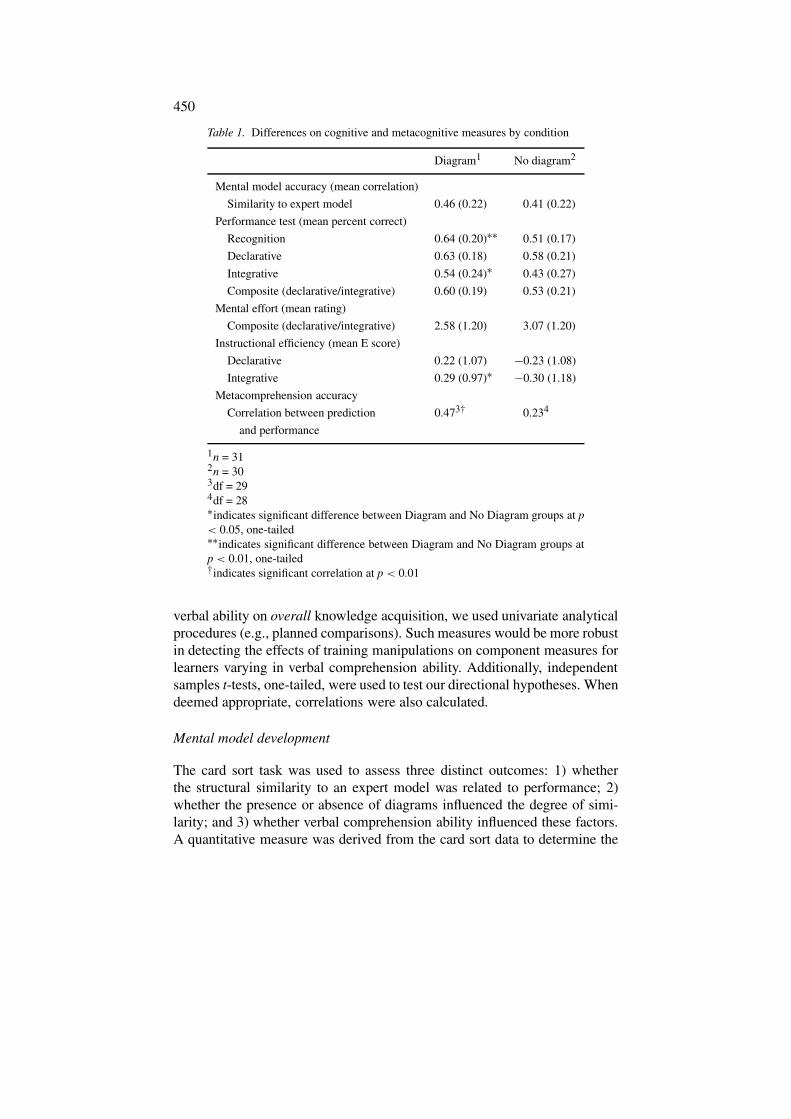
Means and standard deviations of all relevant cognitive and metacognitivemeasures for the Diagram and No Diagram groups are reported in Table 1. Analpha level of 0.05 was used for all statistical analyses. To assess the degreeto which individual differences influenced performance, a median split wasconducted (Mdn = 0.33), dividing participants into high verbal comprehen-sion ability (HiVA) (M = 0.47, SD = 0.09) and low verbal comprehensionability (LoVA) (M = 0.24, SD = 0.06) groups. Three scores that fell on themedian were dropped, leaving a total of 58 for analyses of the effects ofverbal comprehension ability on performance outcomes. To test whether, bychance, overall verbal comprehension ability was higher in one condition thananother, comparisons were made between the participants in Diagram groupand No Diagram group. Analysis revealed no significant differences in verbalcomprehension ability between the Diagram group (M = 0.38, SD = 0.14) andthe No Diagram group (M = 0.34, SD = 0.14), t (56) = 1.13, p > 0.05.
The nature of the statistical tests used in our analysis is a function of ourmulti-faceted approach to training evaluation, which is critical to detectinglearning gains from such interventions. Given that we were primarily inter-ested in the differential effects of diagrams on component measures of knowl-edge acquisition, and not the main and/or interaction effects of diagrams and
450
Table 1. Differences on cognitive and metacognitive measures by condition
Diagram1 No diagram2
Mental model accuracy (mean correlation)
Similarity to expert model 0.46 (0.22) 0.41 (0.22)
Performance test (mean percent correct)
Recognition 0.64 (0.20)∗∗ 0.51 (0.17)
Declarative 0.63 (0.18) 0.58 (0.21)
Integrative 0.54 (0.24)∗ 0.43 (0.27)
Composite (declarative/integrative) 0.60 (0.19) 0.53 (0.21)
Mental effort (mean rating)
Composite (declarative/integrative) 2.58 (1.20) 3.07 (1.20)
Instructional efficiency (mean E score)
Declarative 0.22 (1.07) −0.23 (1.08)
Integrative 0.29 (0.97)∗ −0.30 (1.18)
Metacomprehension accuracy
Correlation between prediction 0.473† 0.234
and performance
1n = 312n = 303df = 294df = 28∗indicates significant difference between Diagram and No Diagram groups at p< 0.05, one-tailed∗∗indicates significant difference between Diagram and No Diagram groups atp < 0.01, one-tailed†indicates significant correlation at p < 0.01
verbal ability on overall knowledge acquisition, we used univariate analyticalprocedures (e.g., planned comparisons). Such measures would be more robustin detecting the effects of training manipulations on component measures forlearners varying in verbal comprehension ability. Additionally, independentsamples t-tests, one-tailed, were used to test our directional hypotheses. Whendeemed appropriate, correlations were also calculated.
Mental model development
The card sort task was used to assess three distinct outcomes: 1) whetherthe structural similarity to an expert model was related to performance; 2)whether the presence or absence of diagrams influenced the degree of simi-larity; and 3) whether verbal comprehension ability influenced these factors.A quantitative measure was derived from the card sort data to determine the
451
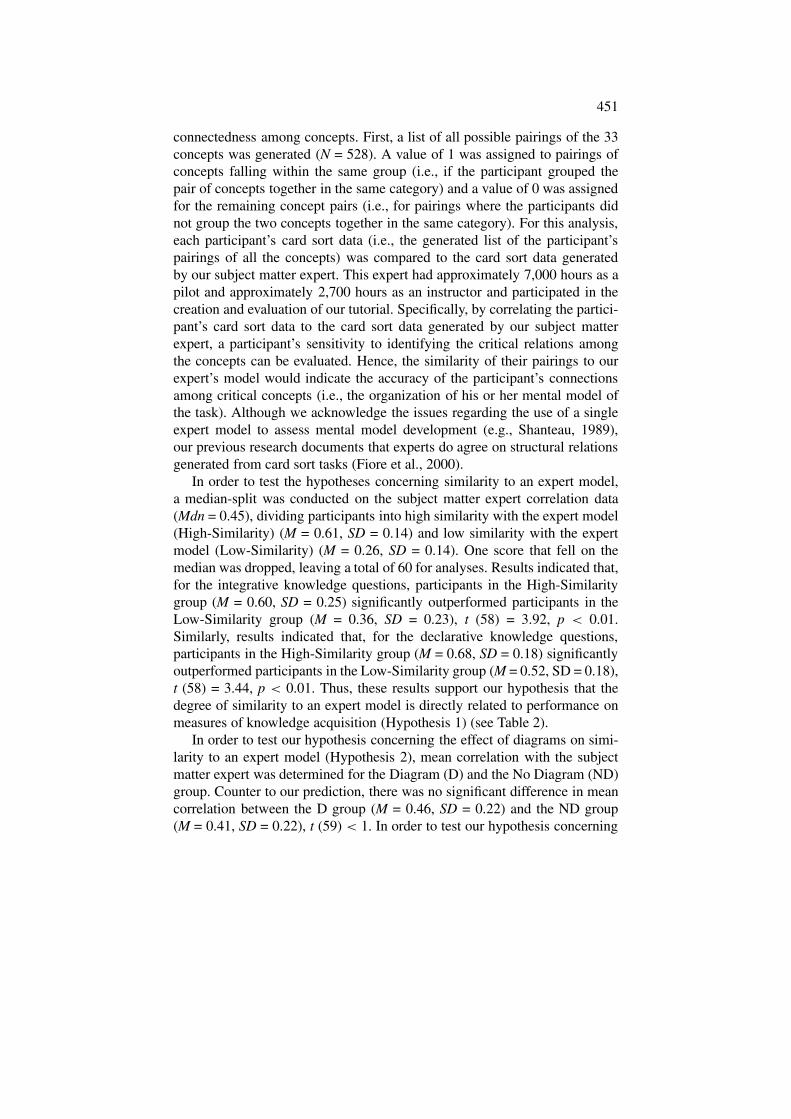
connectedness among concepts. First, a list of all possible pairings of the 33concepts was generated (N = 528). A value of 1 was assigned to pairings ofconcepts falling within the same group (i.e., if the participant grouped thepair of concepts together in the same category) and a value of 0 was assignedfor the remaining concept pairs (i.e., for pairings where the participants didnot group the two concepts together in the same category). For this analysis,each participant’s card sort data (i.e., the generated list of the participant’spairings of all the concepts) was compared to the card sort data generatedby our subject matter expert. This expert had approximately 7,000 hours as apilot and approximately 2,700 hours as an instructor and participated in thecreation and evaluation of our tutorial. Specifically, by correlating the partici-pant’s card sort data to the card sort data generated by our subject matterexpert, a participant’s sensitivity to identifying the critical relations amongthe concepts can be evaluated. Hence, the similarity of their pairings to ourexpert’s model would indicate the accuracy of the participant’s connectionsamong critical concepts (i.e., the organization of his or her mental model ofthe task). Although we acknowledge the issues regarding the use of a singleexpert model to assess mental model development (e.g., Shanteau, 1989),our previous research documents that experts do agree on structural relationsgenerated from card sort tasks (Fiore et al., 2000).
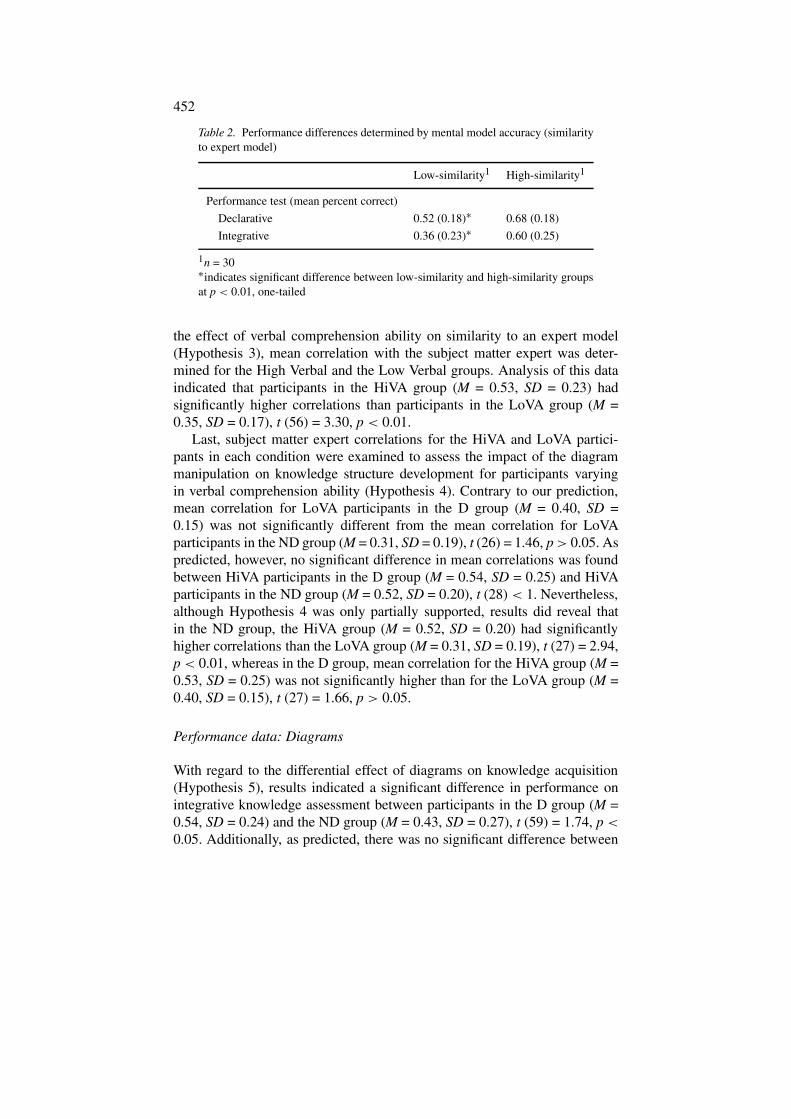
In order to test the hypotheses concerning similarity to an expert model,a median-split was conducted on the subject matter expert correlation data(Mdn = 0.45), dividing participants into high similarity with the expert model(High-Similarity) (M = 0.61, SD = 0.14) and low similarity with the expertmodel (Low-Similarity) (M = 0.26, SD = 0.14). One score that fell on themedian was dropped, leaving a total of 60 for analyses. Results indicated that,for the integrative knowledge questions, participants in the High-Similaritygroup (M = 0.60, SD = 0.25) significantly outperformed participants in theLow-Similarity group (M = 0.36, SD = 0.23), t (58) = 3.92, p < 0.01.Similarly, results indicated that, for the declarative knowledge questions,participants in the High-Similarity group (M = 0.68, SD = 0.18) significantlyoutperformed participants in the Low-Similarity group (M = 0.52, SD = 0.18),t (58) = 3.44, p < 0.01. Thus, these results support our hypothesis that thedegree of similarity to an expert model is directly related to performance onmeasures of knowledge acquisition (Hypothesis 1) (see Table 2).
In order to test our hypothesis concerning the effect of diagrams on simi-larity to an expert model (Hypothesis 2), mean correlation with the subjectmatter expert was determined for the Diagram (D) and the No Diagram (ND)group. Counter to our prediction, there was no significant difference in meancorrelation between the D group (M = 0.46, SD = 0.22) and the ND group(M = 0.41, SD = 0.22), t (59) < 1. In order to test our hypothesis concerning
452
Table 2. Performance differences determined by mental model accuracy (similarityto expert model)
Low-similarity1 High-similarity1
Performance test (mean percent correct)
Declarative 0.52 (0.18)∗ 0.68 (0.18)
Integrative 0.36 (0.23)∗ 0.60 (0.25)
1n = 30∗indicates significant difference between low-similarity and high-similarity groupsat p < 0.01, one-tailed
the effect of verbal comprehension ability on similarity to an expert model(Hypothesis 3), mean correlation with the subject matter expert was deter-mined for the High Verbal and the Low Verbal groups. Analysis of this dataindicated that participants in the HiVA group (M = 0.53, SD = 0.23) hadsignificantly higher correlations than participants in the LoVA group (M =0.35, SD = 0.17), t (56) = 3.30, p < 0.01.
Last, subject matter expert correlations for the HiVA and LoVA partici-pants in each condition were examined to assess the impact of the diagrammanipulation on knowledge structure development for participants varyingin verbal comprehension ability (Hypothesis 4). Contrary to our prediction,mean correlation for LoVA participants in the D group (M = 0.40, SD =0.15) was not significantly different from the mean correlation for LoVAparticipants in the ND group (M = 0.31, SD = 0.19), t (26) = 1.46, p > 0.05. Aspredicted, however, no significant difference in mean correlations was foundbetween HiVA participants in the D group (M = 0.54, SD = 0.25) and HiVAparticipants in the ND group (M = 0.52, SD = 0.20), t (28) < 1. Nevertheless,although Hypothesis 4 was only partially supported, results did reveal thatin the ND group, the HiVA group (M = 0.52, SD = 0.20) had significantlyhigher correlations than the LoVA group (M = 0.31, SD = 0.19), t (27) = 2.94,p < 0.01, whereas in the D group, mean correlation for the HiVA group (M =0.53, SD = 0.25) was not significantly higher than for the LoVA group (M =0.40, SD = 0.15), t (27) = 1.66, p > 0.05.
Performance data: Diagrams
With regard to the differential effect of diagrams on knowledge acquisition(Hypothesis 5), results indicated a significant difference in performance onintegrative knowledge assessment between participants in the D group (M =0.54, SD = 0.24) and the ND group (M = 0.43, SD = 0.27), t (59) = 1.74, p <
0.05. Additionally, as predicted, there was no significant difference between
453
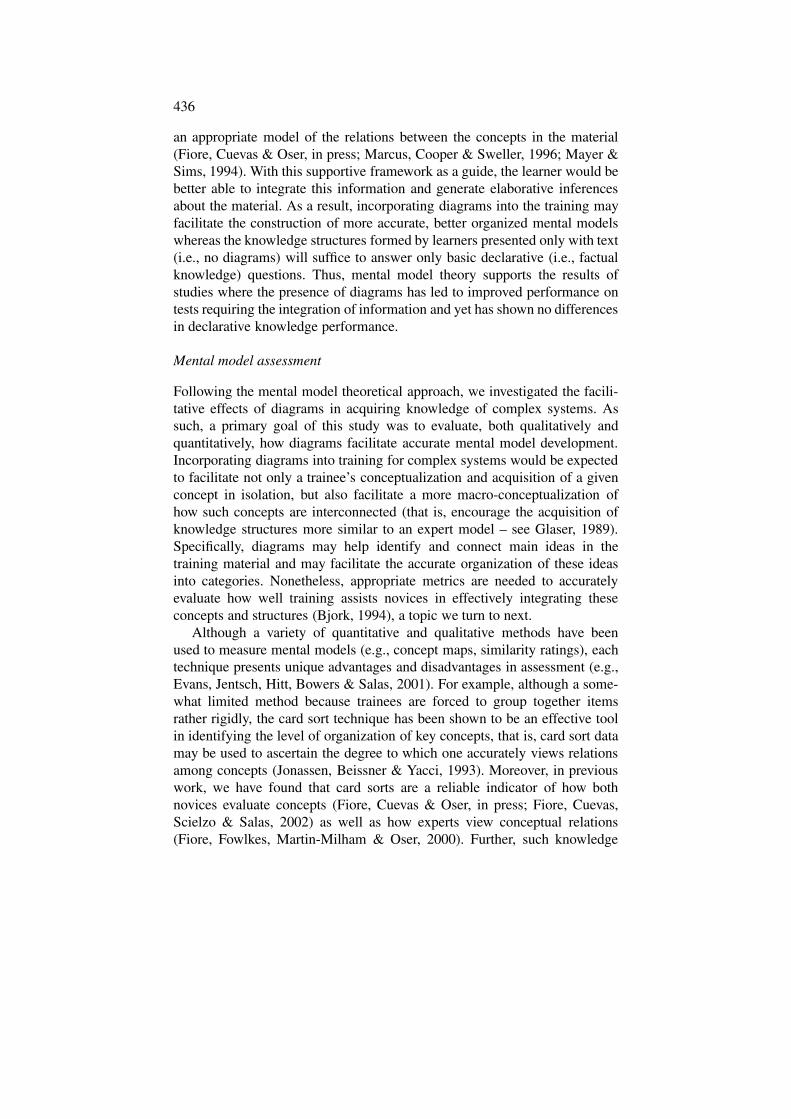
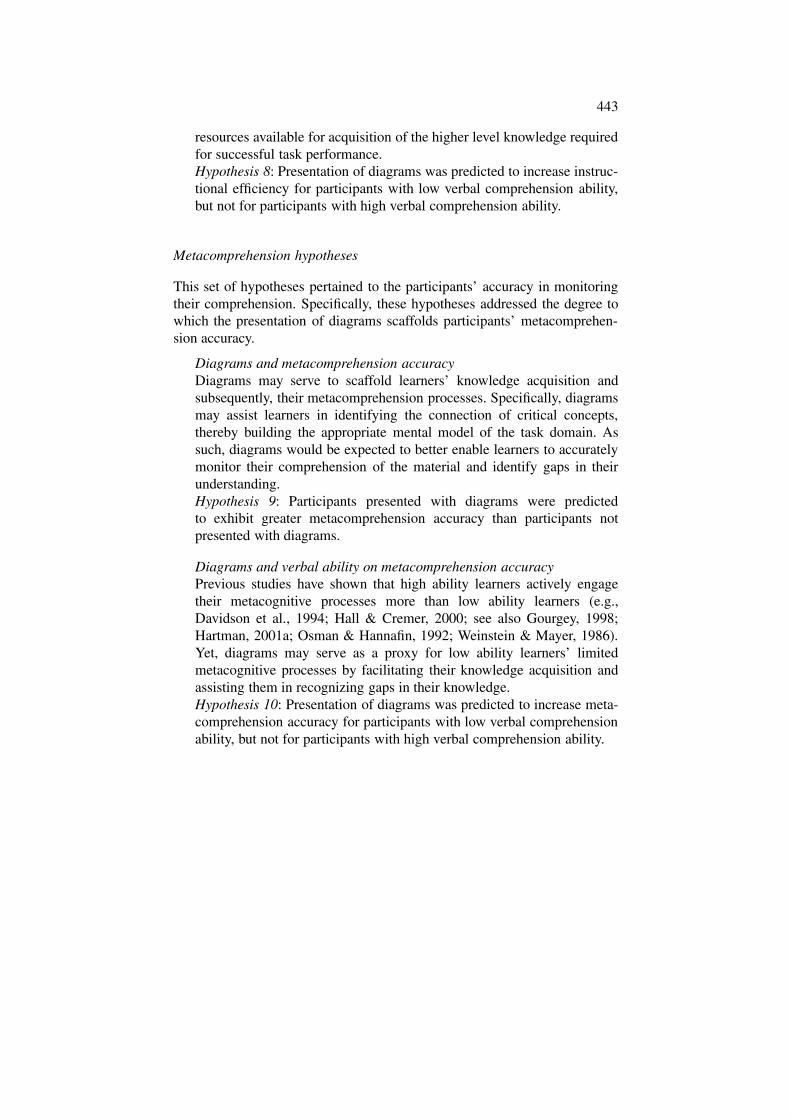
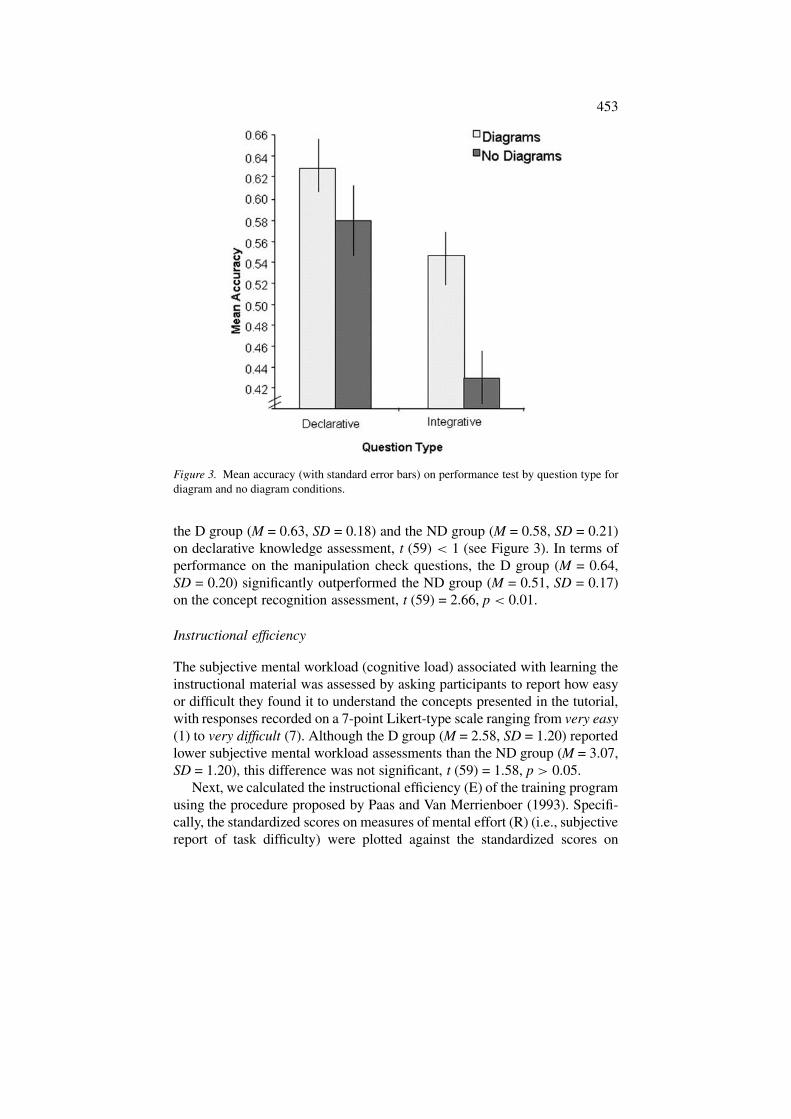
Figure 3. Mean accuracy (with standard error bars) on performance test by question type fordiagram and no diagram conditions.
the D group (M = 0.63, SD = 0.18) and the ND group (M = 0.58, SD = 0.21)on declarative knowledge assessment, t (59) < 1 (see Figure 3). In terms ofperformance on the manipulation check questions, the D group (M = 0.64,SD = 0.20) significantly outperformed the ND group (M = 0.51, SD = 0.17)on the concept recognition assessment, t (59) = 2.66, p < 0.01.
Instructional efficiency
The subjective mental workload (cognitive load) associated with learning theinstructional material was assessed by asking participants to report how easyor difficult they found it to understand the concepts presented in the tutorial,with responses recorded on a 7-point Likert-type scale ranging from very easy(1) to very difficult (7). Although the D group (M = 2.58, SD = 1.20) reportedlower subjective mental workload assessments than the ND group (M = 3.07,SD = 1.20), this difference was not significant, t (59) = 1.58, p > 0.05.
Next, we calculated the instructional efficiency (E) of the training programusing the procedure proposed by Paas and Van Merrienboer (1993). Specifi-cally, the standardized scores on measures of mental effort (R) (i.e., subjectivereport of task difficulty) were plotted against the standardized scores on
454
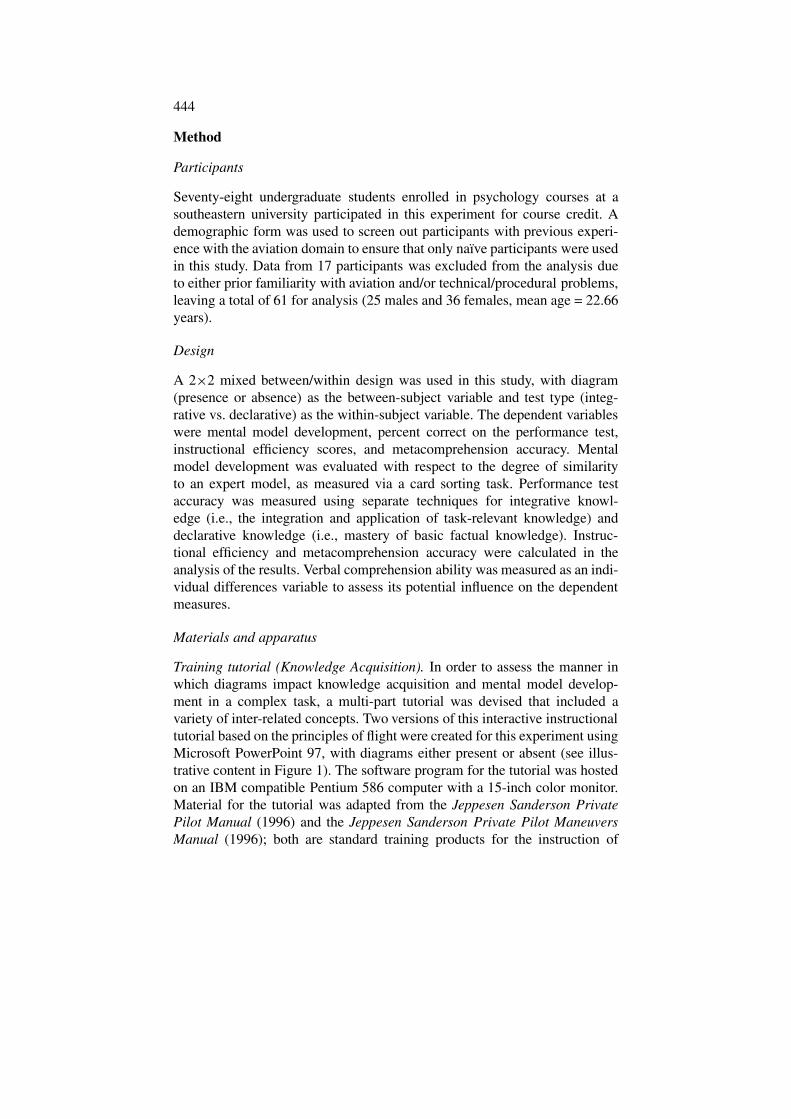
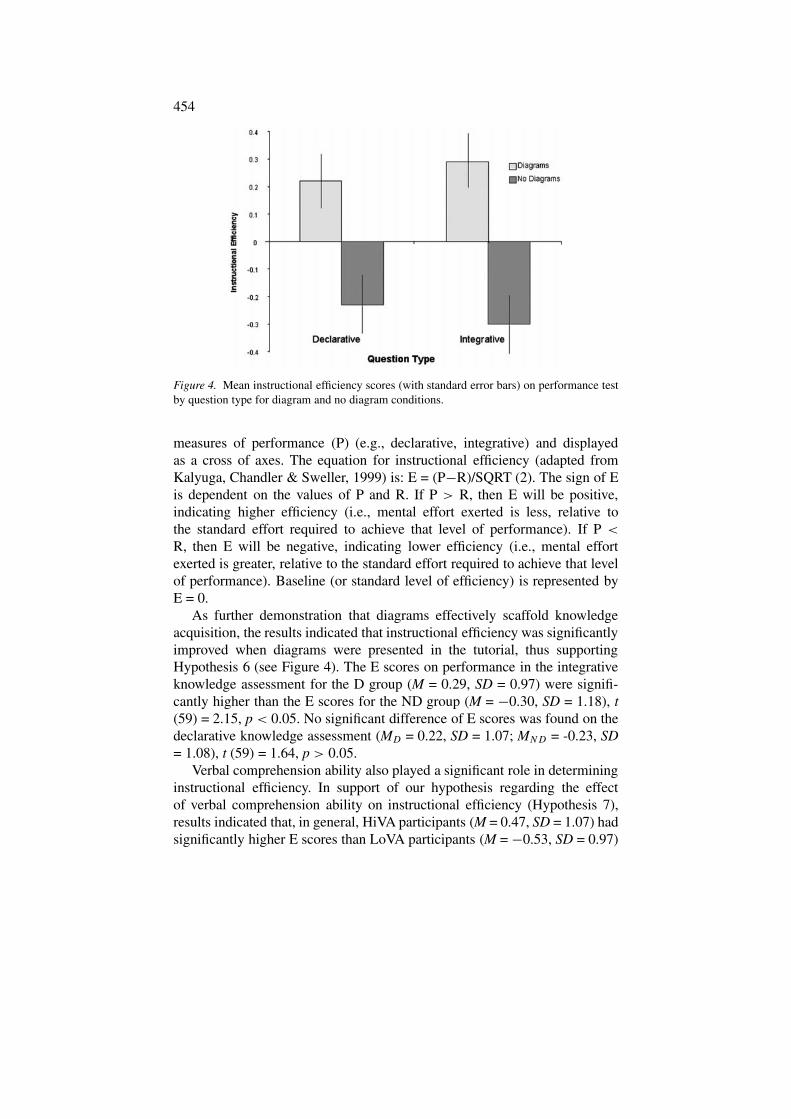
Figure 4. Mean instructional efficiency scores (with standard error bars) on performance testby question type for diagram and no diagram conditions.
measures of performance (P) (e.g., declarative, integrative) and displayedas a cross of axes. The equation for instructional efficiency (adapted fromKalyuga, Chandler & Sweller, 1999) is: E = (P−R)/SQRT (2). The sign of Eis dependent on the values of P and R. If P > R, then E will be positive,indicating higher efficiency (i.e., mental effort exerted is less, relative tothe standard effort required to achieve that level of performance). If P <
R, then E will be negative, indicating lower efficiency (i.e., mental effortexerted is greater, relative to the standard effort required to achieve that levelof performance). Baseline (or standard level of efficiency) is represented byE = 0.
As further demonstration that diagrams effectively scaffold knowledgeacquisition, the results indicated that instructional efficiency was significantlyimproved when diagrams were presented in the tutorial, thus supportingHypothesis 6 (see Figure 4). The E scores on performance in the integrativeknowledge assessment for the D group (M = 0.29, SD = 0.97) were signifi-cantly higher than the E scores for the ND group (M = −0.30, SD = 1.18), t(59) = 2.15, p < 0.05. No significant difference of E scores was found on thedeclarative knowledge assessment (MD = 0.22, SD = 1.07; MND = -0.23, SD= 1.08), t (59) = 1.64, p > 0.05.
Verbal comprehension ability also played a significant role in determininginstructional efficiency. In support of our hypothesis regarding the effectof verbal comprehension ability on instructional efficiency (Hypothesis 7),results indicated that, in general, HiVA participants (M = 0.47, SD = 1.07) hadsignificantly higher E scores than LoVA participants (M = −0.53, SD = 0.97)
455
on the integrative knowledge assessment, t (56) = 3.75, p < 0.01. Significantdifferences were also found on the declarative knowledge assessment (MHiV A
= 0.47, SD = 0.95; MLoVA = −0.52, SD = 1.08), t (56) = 3.73, p < 0.01.Although predicted by Hypothesis 8, diagrams did not have a more beneficialeffect on instructional efficiency for participants with low verbal comprehen-sion ability. Specifically, no significant differences in E scores were foundbetween LoVA participants in the D group and the ND group on either thedeclarative (MD = −0.45, SD = 1.08; MND = −0.58, SD = 1.11), t (26) < 1,or the integrative knowledge assessments, (MD = −0.26, SD = 0.92; MND =−0.78, SD = 0.98), t (26) = 1.44, p > 0.05. Although HiVA participants in theD group (MD = 0.77, SD = 0.81) did have significantly higher E scores thanHiVA participants in the ND group (MD = 0.13, SD = 1.01) on the declarativeknowledge assessment, t (28) = 1.94, p < 0.05, no significant differences in Escores were found on the integrative knowledge assessment (MD = 0.74, SD= 0.85; MND = 0.17, SD = 1.24), t (28) = 1.49, p > 0.05.
Metacomprehension accuracy
Responses to the performance prediction question in the tutorial evaluationquestionnaire were used to assess participants’ metacomprehension accuracy(i.e., their accuracy in monitoring their comprehension). Pearson’s r correla-tion coefficients between predicted and actual performance were calculatedacross participants, overall and by condition. Results showed that meta-comprehension prediction was significantly correlated to actual performanceon the performance test (composite score of the declarative and integrativeknowledge assessment sections), r (59) = 0.36, p < 0.01. However, whenmetacomprehension prediction was examined by condition, this correlationwas significant only for the D group, r (29) = 0.47, p < 0.01, thus supportingour hypothesis on the effect of diagrams on metacomprehension accuracy(Hypothesis 9). No significant correlation was found for the ND group, r (28)= 0.23, p > 0.05.
To assess the degree to which individual differences in verbal abilityinfluenced metacomprehension accuracy, comparisons were made betweenHiVA and LoVA groups. Consistent with previous studies, overall, LoVAparticipants were poor in metacomprehension accuracy, as indicated by thenonsignificant correlation between their predictions and actual performance,r (26) = 0.28, p > 0.05. In contrast, metacomprehension accuracy wassignificant for HiVA participants, r (28) = 0.45, p < 0.05.
Next, the degree to which diagrams scaffold metacomprehension inparticipants of differing verbal comprehension ability was assessed. Corre-lations were calculated for HiVA and LoVA groups in each condition. Thisanalysis revealed that, when correlating prediction accuracy with actual
456
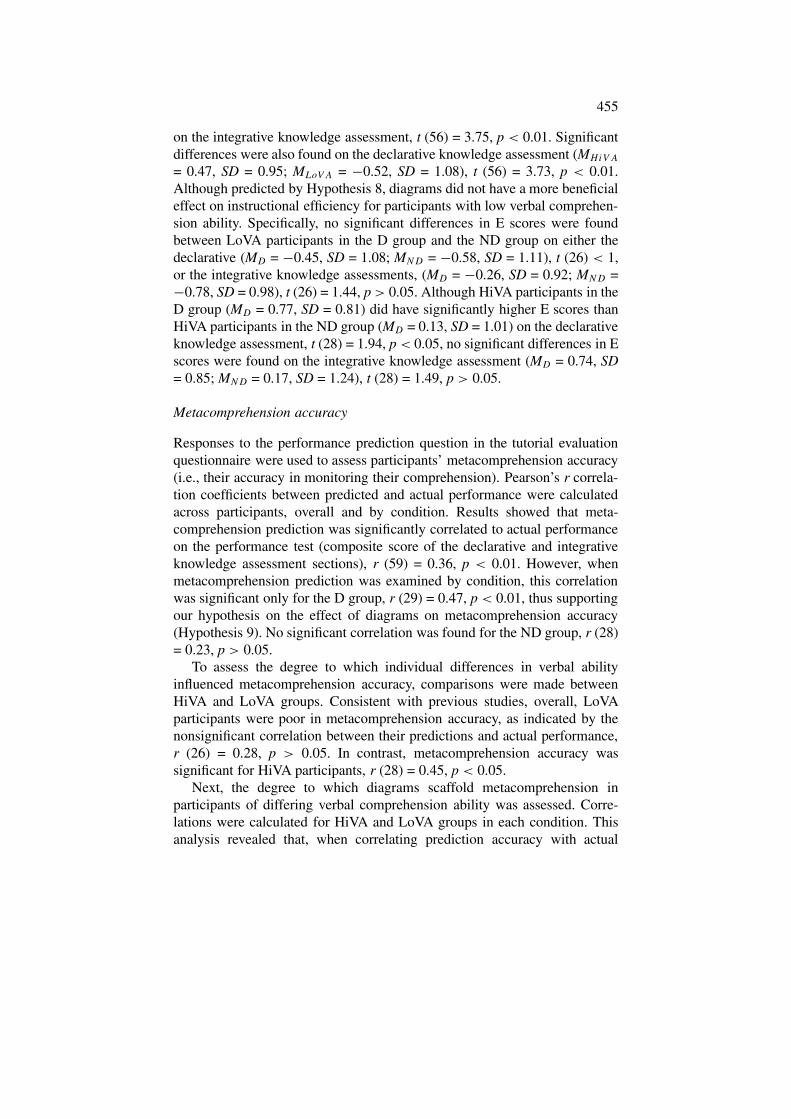
Figure 5. Mean metacomprehension accuracy correlations for low and high verbal compre-hension ability participants by condition.
performance, LoVA participants in the D group showed a significant correla-tion (r (11) = 0.60, p < 0.05) whereas LoVA participants in the ND group didnot (r (13) = 0.13, p > 0.05). No significant correlations for metacompre-hension accuracy were found for participants with HiVA, either in the Dgroup (r (14) = 0.37, p > 0.05) or the ND group (r (12) = 0.46, p > 0.05). Aspredicted in Hypotheses 10, these results indicate that the effect of diagramson metacomprehension accuracy was strongest for low verbal comprehensionability participants (illustrated in Figure 5).
Performance data: Verbal comprehension ability
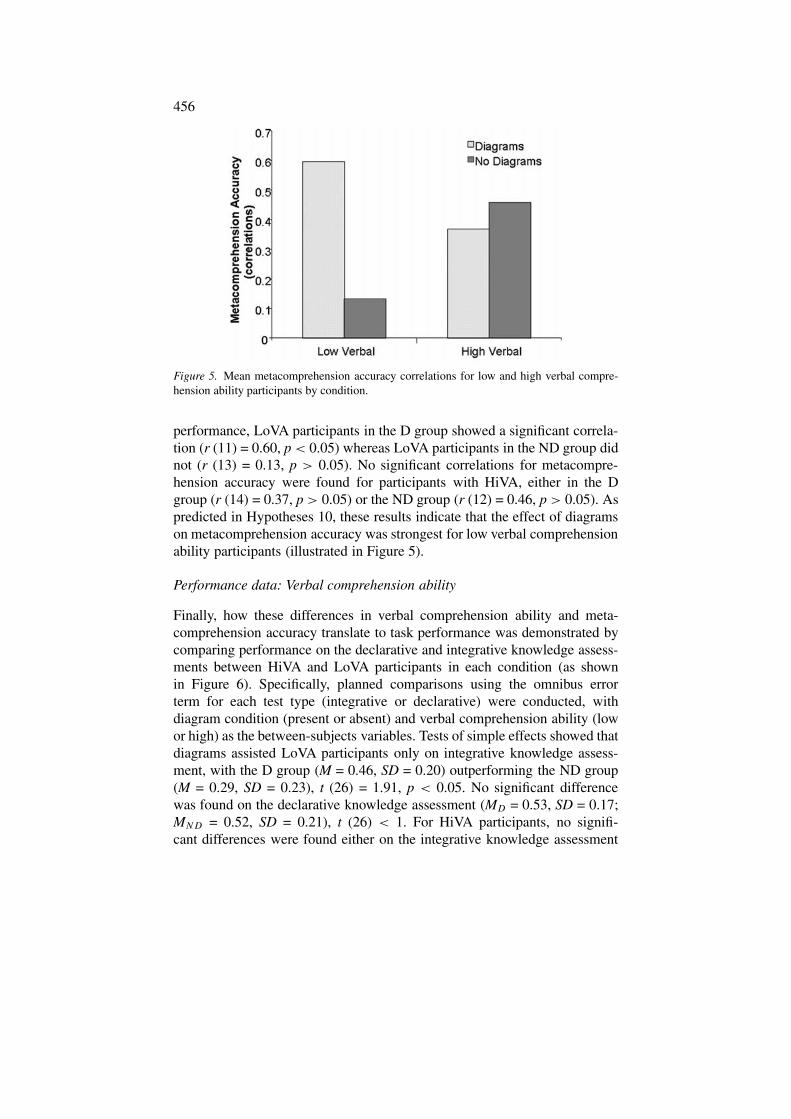
Finally, how these differences in verbal comprehension ability and meta-comprehension accuracy translate to task performance was demonstrated bycomparing performance on the declarative and integrative knowledge assess-ments between HiVA and LoVA participants in each condition (as shownin Figure 6). Specifically, planned comparisons using the omnibus errorterm for each test type (integrative or declarative) were conducted, withdiagram condition (present or absent) and verbal comprehension ability (lowor high) as the between-subjects variables. Tests of simple effects showed thatdiagrams assisted LoVA participants only on integrative knowledge assess-ment, with the D group (M = 0.46, SD = 0.20) outperforming the ND group(M = 0.29, SD = 0.23), t (26) = 1.91, p < 0.05. No significant differencewas found on the declarative knowledge assessment (MD = 0.53, SD = 0.17;MND = 0.52, SD = 0.21), t (26) < 1. For HiVA participants, no signifi-cant differences were found either on the integrative knowledge assessment
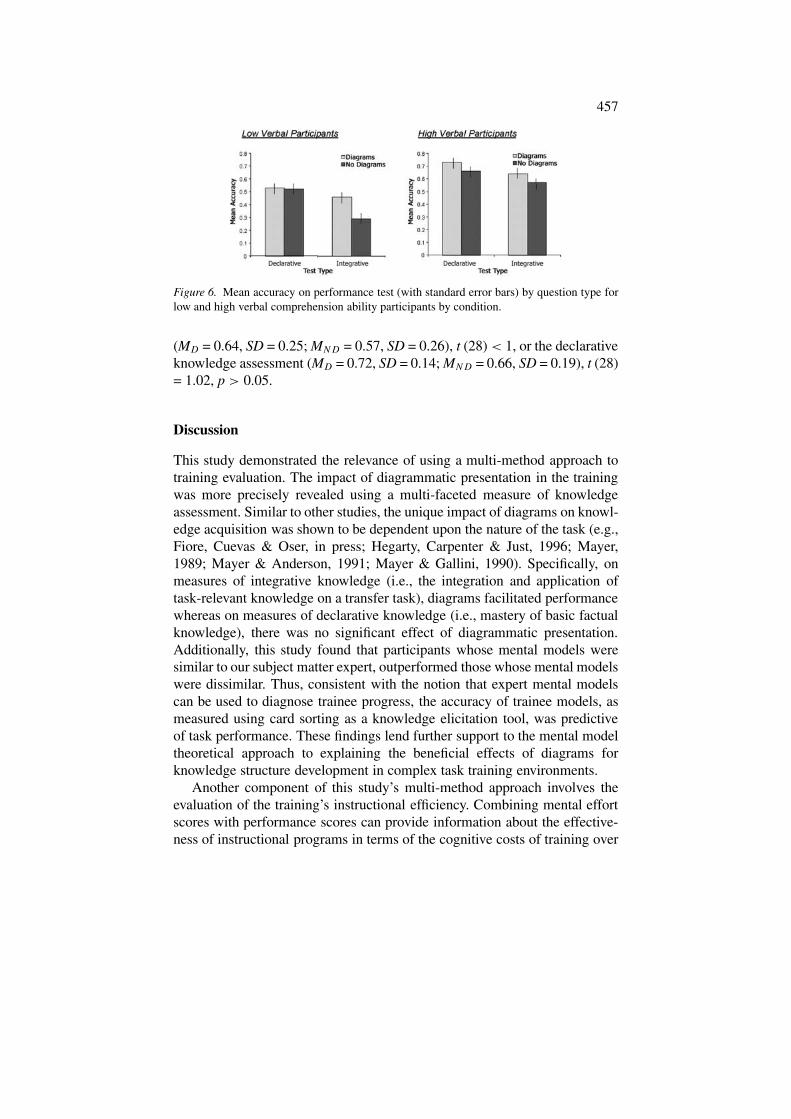
457
Figure 6. Mean accuracy on performance test (with standard error bars) by question type forlow and high verbal comprehension ability participants by condition.
(MD = 0.64, SD = 0.25; MND = 0.57, SD = 0.26), t (28) < 1, or the declarativeknowledge assessment (MD = 0.72, SD = 0.14; MND = 0.66, SD = 0.19), t (28)= 1.02, p > 0.05.
Discussion
This study demonstrated the relevance of using a multi-method approach totraining evaluation. The impact of diagrammatic presentation in the trainingwas more precisely revealed using a multi-faceted measure of knowledgeassessment. Similar to other studies, the unique impact of diagrams on knowl-edge acquisition was shown to be dependent upon the nature of the task (e.g.,Fiore, Cuevas & Oser, in press; Hegarty, Carpenter & Just, 1996; Mayer,1989; Mayer & Anderson, 1991; Mayer & Gallini, 1990). Specifically, onmeasures of integrative knowledge (i.e., the integration and application oftask-relevant knowledge on a transfer task), diagrams facilitated performancewhereas on measures of declarative knowledge (i.e., mastery of basic factualknowledge), there was no significant effect of diagrammatic presentation.Additionally, this study found that participants whose mental models weresimilar to our subject matter expert, outperformed those whose mental modelswere dissimilar. Thus, consistent with the notion that expert mental modelscan be used to diagnose trainee progress, the accuracy of trainee models, asmeasured using card sorting as a knowledge elicitation tool, was predictiveof task performance. These findings lend further support to the mental modeltheoretical approach to explaining the beneficial effects of diagrams forknowledge structure development in complex task training environments.
Another component of this study’s multi-method approach involves theevaluation of the training’s instructional efficiency. Combining mental effortscores with performance scores can provide information about the effective-ness of instructional programs in terms of the cognitive costs of training over
458
and above what would be found by using measures of mental effort or perfor-mance alone (Paas & Van Merrienboer, 1993). The instructional efficiency ofthe training was significantly improved when diagrams were presented in thetutorial. Results also showed that verbal comprehension ability significantlyinfluenced the efficiency of learning (i.e., mental effort exerted relative tothe level of performance achieved), with high verbal comprehension abilitylearners demonstrating higher instructional efficiency scores. As such, thecognitive load imposed by different instructional programs on learners ofvarying levels of ability warrants further investigation.
Finally, this study also provides further evidence of the differential benefitof diagrams as a learning aid. Specifically, not only did diagrams facilitatethe acquisition of integrative knowledge, but they also effectively scaffoldedparticipants’ metacognition. More importantly, this effect was found to bestrongest for participants with low verbal comprehension ability. Perfor-mance predictions for low verbal comprehension ability participants in theDiagram group were significantly correlated to actual performance whereasno significant correlation was found between predicted and actual perfor-mance for low verbal comprehension ability participants in the No Diagramgroup. Furthermore, the results demonstrated how these differences in verbalcomprehension ability and metacomprehension accuracy translated to taskperformance. In low verbal comprehension ability learners, the facilitativeeffects of diagrams served not only to scaffold metacognition (improvingmetacomprehension accuracy), but also resulted in improved acquisition ofintegrative knowledge.
Implications for training and future research
Multimedia in complex task training environments
Our study focused on the beneficial effects of diagrams within the context ofthe aviation domain, a complex training environment that is primarily spatialin nature. Others have explored the efficacy of using various graphical formatsto scaffold one’s understanding of more abstract (i.e., less tangible) concepts.For example, Suthers, Weiner, Connelly, and Paolucci (1995) documentedthe efficacy of diagrammatic presentation to facilitate argument construc-tion in the context of scientific anomalies. Further, Suthers (1999) foundthat methods facilitating representation of evidence in scientific argumentsproduce qualitatively different communication outcomes (see also Stenning& Oberlander, 1995). Additionally, graphical representations, such as conceptmaps and flow charts, can effectively be used as graphic organizers to aidlearners in text comprehension and problem solving tasks (see Hartman,
459
2001a; 2001b). In sum, such studies indicate that the beneficial effects ofdiagrammatic representation for complex tasks is not limited to tangiblecontexts such as aviation (e.g., Fiore, Cuevas & Oser, in press) or mechan-ical instruments (e.g., Mayer, 1989; Mayer & Gallini, 1990). Thus, broadlyspeaking, such forms of multimedia training augmentation may alter cogni-tion and subsequently impact learning by affecting knowledge integrationand/or metacognitive processes.
Metacognitive skills in computer-based training environments
The results of this study suggest that additional experimentation should moresystematically attempt to scaffold metacognition for learners of differingability levels. Specifically, if diagrams are effective in scaffolding importantlearning components, then manipulations which force the processing of thosecomponents, may increase retention and/or aid performance on a transfertask. In particular, the inclusion of various prompting mechanisms in trainingsystems may facilitate learning and memory for complex tasks. For example,by using diagrams with other metacognition manipulations (e.g., content-freeprompts), learners may be better able to recognize a failure to comprehendby more closely attending to potential gaps in their knowledge (cf. Britton etal., 1998).
Moreover, this study focused only on one component of metacompre-hension, namely learners’ ability to detect failures in their comprehension.It is also necessary to investigate how instructional strategies can promptlearners to control and regulate their comprehension. With this goal inmind, we are currently investigating the utility of a guided learner-generatedquestioning strategy, using generic questions stems, designed to prompt high-level elaboration of new material (see King, 1992). It is expected that thisstrategy will scaffold (i.e., support) learners’ metacognitive and cognitiveprocesses by prompting them to “stop and think” about the informationalready presented before proceeding to new concepts in the training (i.e.,focusing their attention on what they know and what they do not know),thereby calibrating their metacomprehension. Furthermore, by scaffoldingtheir metacomprehension, these instructional strategies would be expectedto elicit the appropriate metacomprehension behaviors, such as reviewingthe material when they recognize a failure in their comprehension (Schraw,1998). Such instructional strategies are particularly critical in computer-basedtraining environments where learners control the pacing of instruction as wellas monitor and evaluate their own comprehension of the presented materialbefore proceeding to the next lesson (e.g., Brown & Ford, 2002; Ford etal., 1998; Schmidt & Ford, 2001; Salas et al., 2002). Learners may overes-timate their comprehension and terminate instruction prematurely due to an
460
inaccurate perception of their level of understanding, leading to ineffectivetransfer of training and poor task performance (Osman & Hannafin, 1992).
In sum, these findings highlight the importance of designing training tosupport not only the learners’ knowledge acquisition, but also their meta-cognitive processes (Mayer, 1999). Furthermore, the results of this study alsorevealed the significant role of individual differences in successful knowledgeacquisition from instructional programs. As advances in instructional designand computing technologies increase the reliance on computer-mediateddistance learning approaches (Brown & Ford, 2002), training designers needto more fully understand the cognitive and metacognitive processes involvedin learning within such environments and how individual differences impactthese processes (Annett, 1989; Jonassen & Grabowski, 1993). In this way,training systems may more flexibly adapt to the idiosyncratic needs of thelearner.
Acknowledgements
The views herein are those of the authors and do not necessarily reflectthose of the organizations with which the authors are affiliated. This researchwas funded by Contract No. N61399-99-C-0106 from the Naval Air WarfareCenter, Training Systems Division, Orlando, FL, to Stephen M. Fiore. Wethank Gwendolyn Campbell for her comments on earlier versions of thismanuscript. Portions of this research paper were reported at the 45th AnnualMeeting of the Human Factors and Ergonomics Society.
References
Annett, J. (1989). Training of skilled performance. In A.M. Colley & J.R. Beech, eds, Acquisi-tion and Performance of Cognitive Skills, pp. 61–84. New York, NY: John Wiley & Sons.
Bjork, R.A. (1994). Memory and metamemory considerations in the training of human beings.In J. Metcalfe & A.P. Shimamura, eds, Metacognition: Knowing about Knowing, pp. 185–205. Cambridge, MA: The MIT Press.
Britton, B.K., Stimson, M., Stennett, B. & Gulgoz, S (1998). Learning from instructional text:Test of an individual-differences model. Journal of Educational Psychology 90: 476–491.
Brown, A.L. (1978). Knowing when, where, and how to remember: A problem of meta-cognition. In R. Glaser, ed, Advances in Instructional Psychology (Vol. 1), pp. 77–165.Hillsdale, NJ: LEA.
Brown, K.G. & Ford, J.K. (2002). Using computer technology in training: Building an infra-structure of active learning. In K. Kraiger, ed, Creating, Implementing, and ManagingEffective Training and Development: State-of-the-Art Lessons for Practice, pp. 192–233.San Francisco, CA: Jossey-Bass.
461
Davidson, J.E., Deuser, R. & Sternberg, R.J. (1994). The role of metacognition in problemsolving. In J. Metcalfe & A.P. Shimamura, eds, Metacognition: Knowing about Knowing,pp. 207–226. Cambridge, MA: The MIT Press.
Dunlosky, J., Rawson, K.A. & McDonald, S.L (in press). Influence of practice tests on theaccuracy of predicting memory performance for paired associates, sentences, and textmaterial. To appear in T. Perfect & B. Schwartz. eds, Applied Metacognition. Cambridge,UK: Cambridge University.
Evans, W.E., III, Jentsch, F., Hitt, J.M., II, Bowers, C.A. & Salas, E. (2001). Mental modelassessment: Is there convergence among different methods? Proceedings of the HumanFactors and Ergonomics Society 45th Annual Meeting, pp. 293–296. Santa Monica, CA:HFES.
Everson, H.T. & Tobias, S. (1998). The ability to estimate knowledge and performance incollege: A metacognitive analysis. Instructional Science 26: 65–79.
Ferguson, E.S. (1977). The mind’s eye: Nonverbal thought in technology. Science 197:827–836.
Fiore, S.M., Cuevas, H.M. & Oser, R.L. (in press). A picture is worth a thousand connections:The facilitative effects of diagrams on task performance and mental model development.Computers in Human Behavior.
Fiore, S.M., Cuevas, H.M., Scielzo, S. & Salas, E. (2002). Training individuals for distributedteams: Problem solving assessment for distributed mission research. Computers in HumanBehavior 18: 125–140.
Fiore, S.M., Fowlkes, J., Martin-Milham, L. & Oser, R.L. (2000). Convergence or divergenceof expert models: On the utility of knowledge structure assessment in training research.Proceedings of the XIVth Triennial Congress of the International Ergonomics Associationand 44th Annual Meeting of the Human Factors and Ergonomic Society, Vol. 2, pp.427–430. Santa Monica, CA: HFES.
Flavell, J.H. (1979). Metacognition and cognitive monitoring: A new area of cognitive-developmental inquiry. American Psychologist 34: 906–911.
Fleishman, E.A. & Mumford, M.D. (1989). Individual attributes and training performance.In I.L. Goldstein, ed, Training and Development in Organizations, pp. 183–255. SanFrancisco, CA: Jossey-Bass.
Ford, J.K., Smith, E.M., Weissbein, D.A., Gully, S.M. & Salas, E. (1998). Relationships ofgoal orientation, metacognitive activity, and practice strategies with learning outcomesand transfer. Journal of Applied Psychology 83: 218–233.
Glaser, R. (1989). Expertise in learning: How do we think about instructional processes nowthat we have discovered knowledge structure? In D. Klahr & D. Kotosfky, eds, ComplexInformation Processing: The Impact of Herbert A. Simon, pp. 269–282. Hillsdale, NJ:LEA.
Gourgey, A.E. (1998). Metacognition in basic skills instruction. Instructional Science 26:81–96.
Gyselinck, V. & Tardieu, H. (1999). The role of illustrations in text comprehension: What,when, for whom, and why? In H. van Oostenddorp & S.R. Goldman, eds, The Constructionof Mental Representations During Reading, pp. 195–218. Mahwah, NJ: LEA.
Hall, L.K. & Cremer, E.M. (2000, November). Metacognitive judgments of exam perfor-mance. Presented at the 41st Meeting of the Psychonomic Society, New Orleans, LA.Retrieved from http://www.owu.edu/˜lkhall/psychonomics000.pdf.
Hartman, H.J. (2001a). Developing students metacognitive knowledge and skills. In H.J.Hartman, ed, Metacognition in Learning and Instruction: Theory, Research, and Practice,pp. 33–68. The Netherlands: Kluwer Academic.
462
Hartman, H.J. (2001b). Metacognition in science teaching and learning. In H.J. Hartman, ed,Metacognition in Learning and Instruction: Theory, Research, and Practice, pp. 173–201.The Netherlands: Kluwer Academic.
Hegarty, M., Carpenter, P.A. & Just, M.A. (1996). Diagrams in the comprehension of scientifictexts. In R. Barr & M. Kamil, eds, Handbook of Reading Research, Vol. 2, pp. 641–648.Mahwah, NJ: LEA.
Hegarty, M. & Just, M.A. (1993). Constructing mental models of machines from text anddiagrams. Journal of Memory and Language 32: 717–742.
Hofer, B.K., Yu, S.L. & Pintrich, P.R. (1998). Teaching college students to be self-regulatedlearners. In D.H. Schunk, & B.J. Zimmerman, eds, Self-Regulated Learning: FromTeaching to self-Reflective Practice, pp. 57–85. New York, NY: Guilford Publications.
Jeppesen Sanderson Training Systems (1996). Jeppesen Sanderson Private Pilot ExercisesBook. Englewood, CO: Jeppesen Sanderson, Inc.
Jeppesen Sanderson Training Systems (1996). Jeppesen Sanderson Private Pilot ManeuversManual, 6th edn. Englewood, CO: Jeppesen Sanderson, Inc.
Jeppesen Sanderson Training Systems (1996). Jeppesen Sanderson Private Pilot Manual, 15thedn. Englewood, CO: Jeppesen Sanderson, Inc.
Johnson-Laird, P.N. (1983). Mental Models: Toward a Cognitive Science of Language,Inference, and Consciousness. Cambridge, MA: Harvard University Press.
Jonassen, D.H., Beissner, K. & Yacci, M. (1993). Structural Knowledge: Techniques forRepresenting, Conveying, and Acquiring Structural Knowledge. Hillsdale, NJ: LEA.
Jonassen, D.H. & Grabowski, B.L. (1993). Handbook of Individual Differences, Learning, andInstruction. Hillsdale, NJ: LEA.
Kalyuga, S., Chandler, P & Sweller, P. (1999). Managing split-attention and redundancy inmultimedia instruction. Applied Cognitive Psychology 13: 351–371.
Kelemen, W.L., Frost, P.J. & Weaver, C.A., III. (2000). Individual differences in meta-cognition: Evidence against a general metacognitive ability. Memory and Cognition 28:92–107.
Kieras, D.E. (1988). What mental model should be taught: Choosing instructional content forcomplex engineered systems. In J. Psotka, L.D. Massey & S.A. Mutter, eds, IntelligentTutoring Systems: Lessons Learned, pp. 85–111. Hillsdale, NJ: LEA.
Kieras, D.E. & Bovair, S. (1984). The role of a mental model in learning to operate a device.Cognitive Science 8: 255–273.
King, A. (1992). Facilitating elaborative learning through guided student-generated ques-tioning. Educational Psychologist 27: 111–126.
Kruley, P., Sciama, S.C. & Glenberg, A.M. (1994). On-line processing of textual illustrationsin the visuospatial sketchpad: Evidence from dual-task studies. Memory and Cognition22: 261–272.
Maki, R.H. (1998). Metacomprehension of text: Influence of absolute confidence level onbias and accuracy. In D. Medin, ed, The Psychology of Learning and Motivation, Vol. 38,pp. 223–248. New York: Academic Press.
Maki, R.H., Jonas, D. & Kallod, M. (1994). The relationship between comprehension andmetacomprehension ability. Psychonomic Bulletin and Review 1: 126–129.
Maqsud, M. (1998). Effects of metacognitive instruction on mathematics achievement andattitude towards mathematics of low mathematics achievers. Educational Research 40:237–243.
Marcus, N. Cooper, M. & Sweller, J. (1996). Understanding instructions. Journal of Educa-tional Psychology 88: 49–63.
463
Mayer, R.E. (1989). Systematic thinking fostered by illustration in scientific text. Journal ofEducational Psychology 81: 240–246.
Mayer, R.E. (1998). Cognitive, metacognitive, and motivational aspects of problem solving.Instructional Science 26: 46–63.
Mayer, R.E. (1999). Instructional technology. In F.T. Durso, R.S. Nickerson, R.W.Schvaneveldt, S.T. Dumais, D.S. Lindsay, & M.T.H. Chi, eds, Handbook of AppliedCognition, pp. 551–569. Chichester, England: John Wiley & Sons.
Mayer, R.E. & Anderson, R.B. (1991). Animations need narrations: An experimental test of adual-coding hypothesis. Journal of Educational Psychology 83: 484–490.
Mayer, R.E. & Gallini, J.K. (1990). When is an illustration worth ten thousand words? Journalof Educational Psychology 82: 715–726.
Mayer, R.E. & Sims, V.K. (1994). For whom is a picture worth a thousand words? Extensionsof a dual-coding theory of multimedia learning. Journal of Educational Psychology 86:389–401.
McInerney, V., McInerney, D.M. & Walsh, H.W. (1997). Effects of metacognitive strategytraining within a cooperative group learning context on computer achievement andanxiety: An aptitude-treatment interaction study. Journal of Educational Psychology 89:686–695.
Moore, D., Zabrucky, K & Commander, N.E. (1997). Metacomprehension and comprehensionperformance in younger and older adults. Educational Gerontology 23: 467–475.
Oser, R.L., Cannon-Bowers, J.A., Salas, E., & Dwyer, D.J. (1999). Enhancing human perfor-mance in technology-rich environments: Guidelines for scenario-based training. In E.Salas, ed, Human/Technology Interaction in Complex Systems, Vol. 9, pp. 175–202.Stamford, CT: JAI Press.
Oser, R.L., Gualtieri, J.W., Cannon-Bowers, J.A. & Salas, E. (1999). Training team problemsolving skills: An event-based approach. Computers in Human Behavior 15: 441–462.
Osman, M.E. & Hannafin, M.J. (1992). Metacognition research and theory: Analysis andimplications for instructional design. Educational Technology Research and Development40: 83–99.
Paas, F.G.W.C. & Van Merrienboer, J.J.G. (1993). The efficiency of instructional conditions:An approach to combine mental effort and performance measures. Human Factors 35:737–743.
Paas, F.G.W.C., Van Merrienboer, J.J.G. & Adam, J.J. (1994). Measurement of cognitive loadin instructional research. Perceptual and Motor Skills 79: 419–430.
Paivio, A. (1971). Imagery and Verbal Processes. New York: Holt, Rinehart & Winston.Paivio, A. (1975). Perceptual comparisons through the mind’s eye. Memory and Cognition 3:
635–647.Proctor, R.W. & Dutta, A (1995). Skill Acquisition and Human Performance. Thousand Oaks,
CA: Sage Publications.Salas, E., Kosarzycki, M.P., Burke, C.S., Fiore, S.M. & Stone, D.L. (2002). Emerging themes
in distance learning research and practice: Some food for thought. International Journalof Management Reviews 4: 135–153.
Schraw, G. (1998). Promoting general metacognitive awareness. Instructional Science 26:113–125.
Shanteau, J. (1992). How much information does an expert use? Is it relevant? ActaPsychologica 81: 75–86.
Schmidt, A.M. & Ford, J.K. (2001, April). Promoting active learning through metacognitiveinstruction. Paper presented at the 16th Annual Conference of the Society of Industrialand Organizational Psychology, San Diego, CA.
464
Smith, E.M., Ford, J.K. & Kozlowski, S.W.J. (1997). Building adaptive expertise: Implica-tions for training design strategies. In M.A. Quinones & A. Ehrenstein, eds, Trainingfor a Rapidly Changing Workplace: Applications of Psychological Research, pp. 89–118.Washington, D. C.: American Psychological Association.
Snow, R.E. (1997). Individual differences. In R.D. Tennyson, F. Schott, N.M. Seel, &S. Dijkstra, eds, Instructional Design: International Perspectives, Volume 1: Theory,Research, and Models, pp. 215–241. Mahwah, NJ: LEA.
Stenning, K. & Oberlander, J. (1995). A cognitive theory of graphical and linguistic reasoning:Logic and implementation. Cognitive Science 19: 97–140.
Sternberg, R.J. (1998). Metacognition, abilities, and developing expertise: What makes anexpert student? Instructional Science 26: 127–140.
Suthers, D. (1999). Effects of alternate representations of evidential relations on collaborativelearning discourse. In Proceedings of CSCL99. pp. 611–621. Stanford, CT, December.
Suthers, D., Weiner, A., Connelly, J. & Paolucci, M. (1995). Belvedere: Engaging students incritical discussion of science and public policy issues. In Proceedings of AIED-95.
Van Oostendorp, H. & Goldman, S.R., eds (1999). The Construction of Mental Representa-tions During Reading. Mahwah, NJ: LEA.
Volet, S.E. (1991). Modelling and coaching of relevant metacognitive strategies for enhancinguniversity students’ learning. Learning and Instruction 1: 319–336.
Weinstein, C.E. & Mayer, R.E. (1986). The teaching of learning strategies. In M.C. Wittrock,ed, Handbook of Research on Teaching, 3rd edn., pp. 315–327. New York, NY: Macmillan.
Wilson J.R. & Rutherford, A. (1989). Mental models: Theory and application in humanfactors. Human Factors 31: 617–634.
Winne, P.H. & Stockley, D.B. (1998). Computing technologies as sites for developing self-regulated learning. In D.H. Schunk & B.J. Zimmerman, eds, Self-Regulated Learning:From Teaching to Self-Reflective Practice, pp. 106–136. New York, NY: Guilford Publica-tions.
Address for correspondence: Haydee M. Cuevas, UCF Team Performance Lab, 12424Research Parkway, Room 408, Orlando, FL 32826, U.S.A.E-mail: [email protected]; Phone: 407-384-2103; Fax: 407-384-2899


