Embed Size (px)
Citation preview
SAP HANA Operation Expert Summit RUN - Performance Analysis Matthias Kretschmer, SAP HANA Competence Center
May 2014 Customer
© 2014 SAP AG or an SAP affiliate company. All rights reserved. 2 Customer
Disclaimer
This presentation outlines our general product direction and should not be relied on in making a
purchase decision. This presentation is not subject to your license agreement or any other agreement
with SAP. SAP has no obligation to pursue any course of business outlined in this presentation or to
develop or release any functionality mentioned in this presentation. This presentation and SAP's
strategy and possible future developments are subject to change and may be changed by SAP at any
time for any reason without notice. This document is provided without a warranty of any kind, either
express or implied, including but not limited to, the implied warranties of merchantability, fitness for a
particular purpose, or non-infringement. SAP assumes no responsibility for errors or omissions in this
document, except if such damages were caused by SAP intentionally or grossly negligent.
© 2014 SAP AG or an SAP affiliate company. All rights reserved. 3 Customer
You and the SAP HANA platform
• SAP HANA provides, amongst other things, database management system capabilities.
• As that it takes care about storing and retrieving your data safely and efficiently.
• That means:
You don’t have to care about that – SAP HANA offers this as a service to you.
• Focus on your application (code) and let SAP HANA figure out how to deal with your data.
• But: Don‘t treat SAP HANA as a black box. You should understand how SAP HANA works and use it
based on that!
© 2014 SAP AG or an SAP affiliate company. All rights reserved. 4 Customer
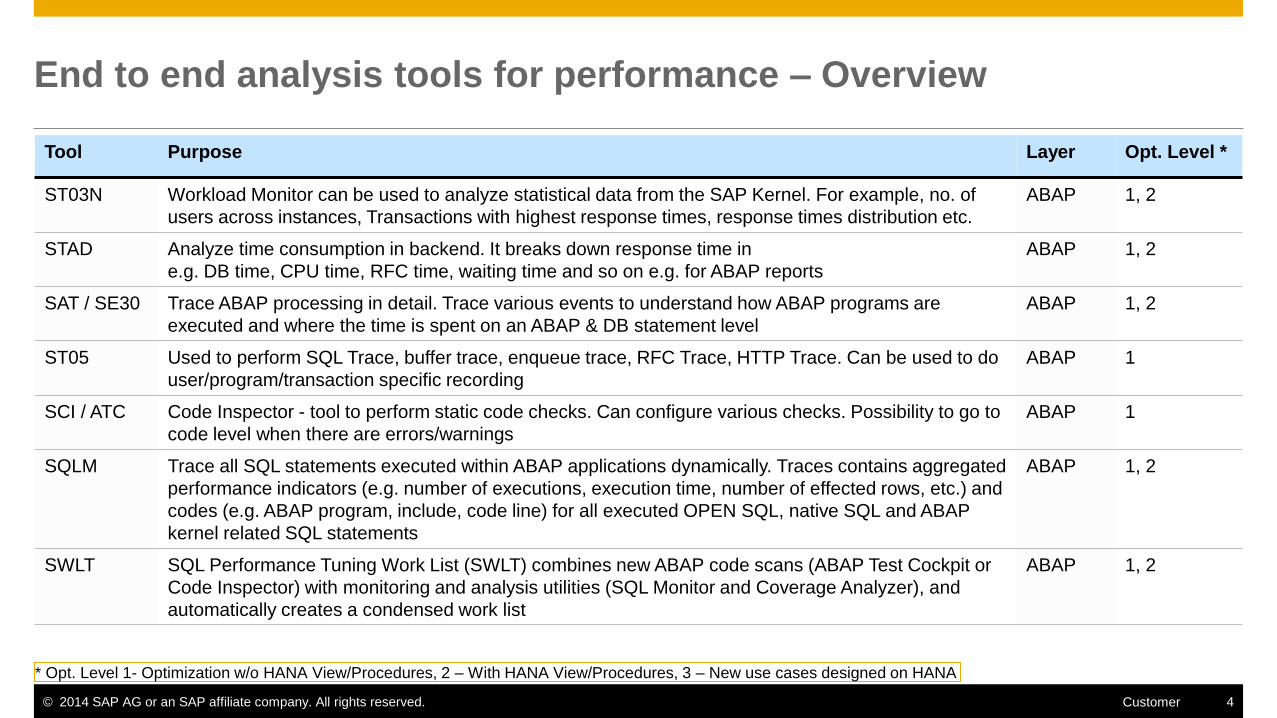
End to end analysis tools for performance – Overview
Tool Purpose Layer Opt. Level *
ST03N Workload Monitor can be used to analyze statistical data from the SAP Kernel. For example, no. of
users across instances, Transactions with highest response times, response times distribution etc.
ABAP 1, 2
STAD Analyze time consumption in backend. It breaks down response time in
e.g. DB time, CPU time, RFC time, waiting time and so on e.g. for ABAP reports
ABAP 1, 2
SAT / SE30 Trace ABAP processing in detail. Trace various events to understand how ABAP programs are
executed and where the time is spent on an ABAP & DB statement level
ABAP 1, 2
ST05 Used to perform SQL Trace, buffer trace, enqueue trace, RFC Trace, HTTP Trace. Can be used to do
user/program/transaction specific recording
ABAP 1
SCI / ATC Code Inspector - tool to perform static code checks. Can configure various checks. Possibility to go to
code level when there are errors/warnings
ABAP 1
SQLM Trace all SQL statements executed within ABAP applications dynamically. Traces contains aggregated
performance indicators (e.g. number of executions, execution time, number of effected rows, etc.) and
codes (e.g. ABAP program, include, code line) for all executed OPEN SQL, native SQL and ABAP
kernel related SQL statements
ABAP 1, 2
SWLT SQL Performance Tuning Work List (SWLT) combines new ABAP code scans (ABAP Test Cockpit or
Code Inspector) with monitoring and analysis utilities (SQL Monitor and Coverage Analyzer), and
automatically creates a condensed work list
ABAP 1, 2
* Opt. Level 1- Optimization w/o HANA View/Procedures, 2 – With HANA View/Procedures, 3 – New use cases designed on HANA
© 2014 SAP AG or an SAP affiliate company. All rights reserved. 5 Customer
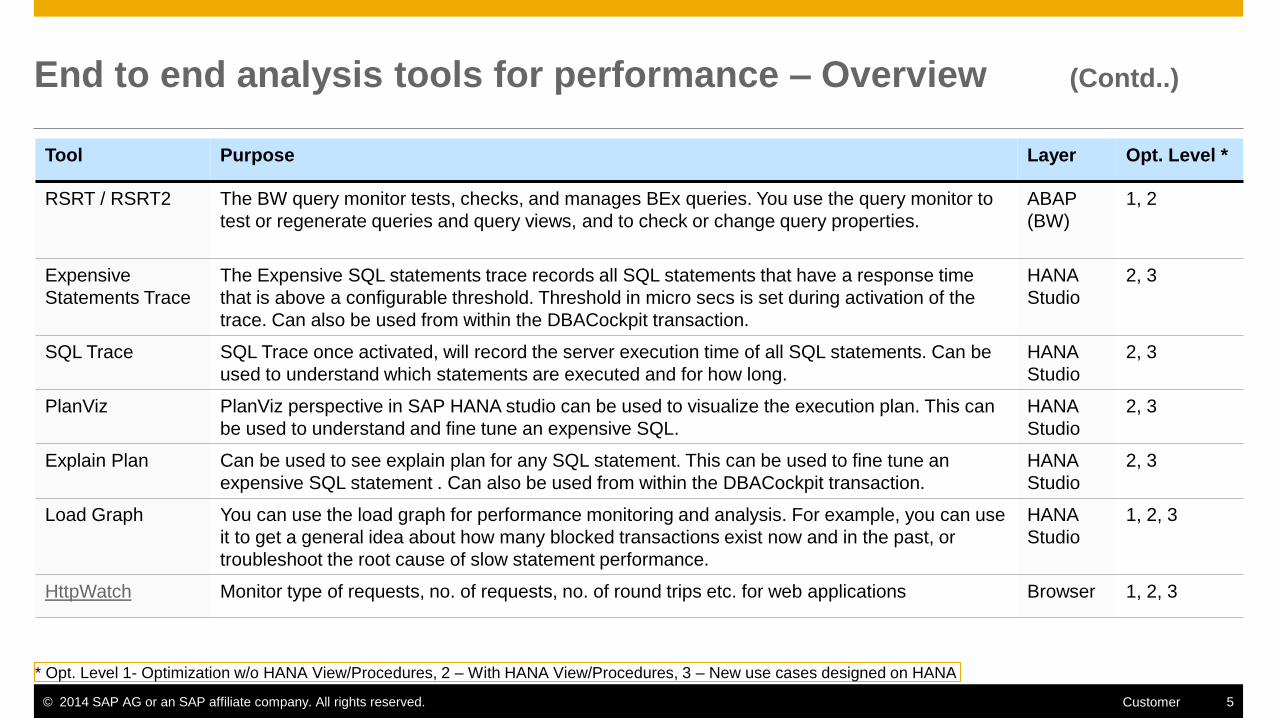
End to end analysis tools for performance – Overview (Contd..)
Tool Purpose Layer Opt. Level *
RSRT / RSRT2 The BW query monitor tests, checks, and manages BEx queries. You use the query monitor to
test or regenerate queries and query views, and to check or change query properties.
ABAP
(BW)
1, 2
Expensive
Statements Trace
The Expensive SQL statements trace records all SQL statements that have a response time
that is above a configurable threshold. Threshold in micro secs is set during activation of the
trace. Can also be used from within the DBACockpit transaction.
HANA
Studio
2, 3
SQL Trace SQL Trace once activated, will record the server execution time of all SQL statements. Can be
used to understand which statements are executed and for how long.
HANA
Studio
2, 3
PlanViz PlanViz perspective in SAP HANA studio can be used to visualize the execution plan. This can
be used to understand and fine tune an expensive SQL.
HANA
Studio
2, 3
Explain Plan Can be used to see explain plan for any SQL statement. This can be used to fine tune an
expensive SQL statement . Can also be used from within the DBACockpit transaction.
HANA
Studio
2, 3
Load Graph You can use the load graph for performance monitoring and analysis. For example, you can use
it to get a general idea about how many blocked transactions exist now and in the past, or
troubleshoot the root cause of slow statement performance.
HANA
Studio
1, 2, 3
HttpWatch Monitor type of requests, no. of requests, no. of round trips etc. for web applications Browser 1, 2, 3
* Opt. Level 1- Optimization w/o HANA View/Procedures, 2 – With HANA View/Procedures, 3 – New use cases designed on HANA
© 2014 SAP AG or an SAP affiliate company. All rights reserved. 6 Customer
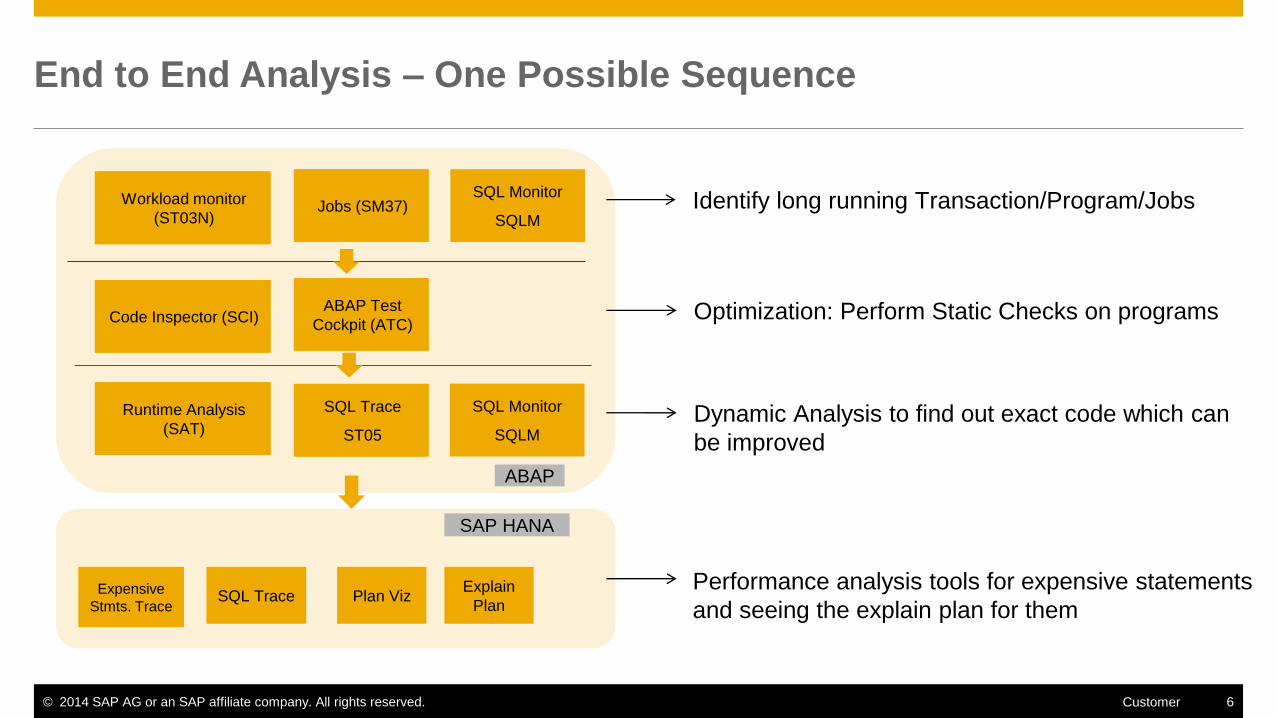
End to End Analysis – One Possible Sequence
Workload monitor
(ST03N) Jobs (SM37) Identify long running Transaction/Program/Jobs
Runtime Analysis
(SAT)
SQL Trace
ST05
Code Inspector
(SCI) Optimization: Perform Static Checks on programs
Dynamic Analysis to find out exact code which can
be improved
SQL Monitor
SQLM
ABAP Test
Cockpit
(ATC)
ABAP
Workload monitor
(ST03N) Jobs (SM37)
Runtime Analysis
(SAT)
SQL Trace
ST05
Code Inspector (SCI) ABAP Test
Cockpit (ATC)
SAP HANA
Expensive
Stmts. Trace SQL Trace Plan Viz
Explain
Plan
Performance analysis tools for expensive statements
and seeing the explain plan for them
SQL Monitor
SQLM
Performance Analysis Tools How to use them…
© 2014 SAP AG or an SAP affiliate company. All rights reserved. 8 Customer
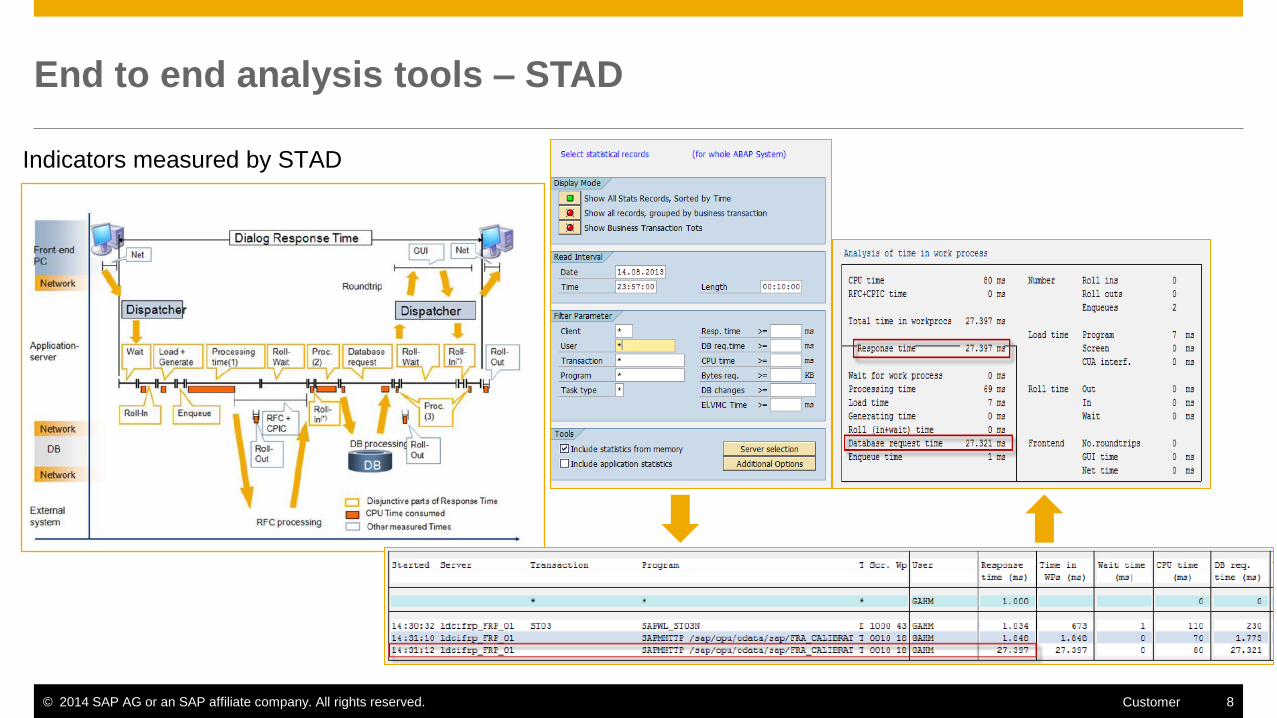
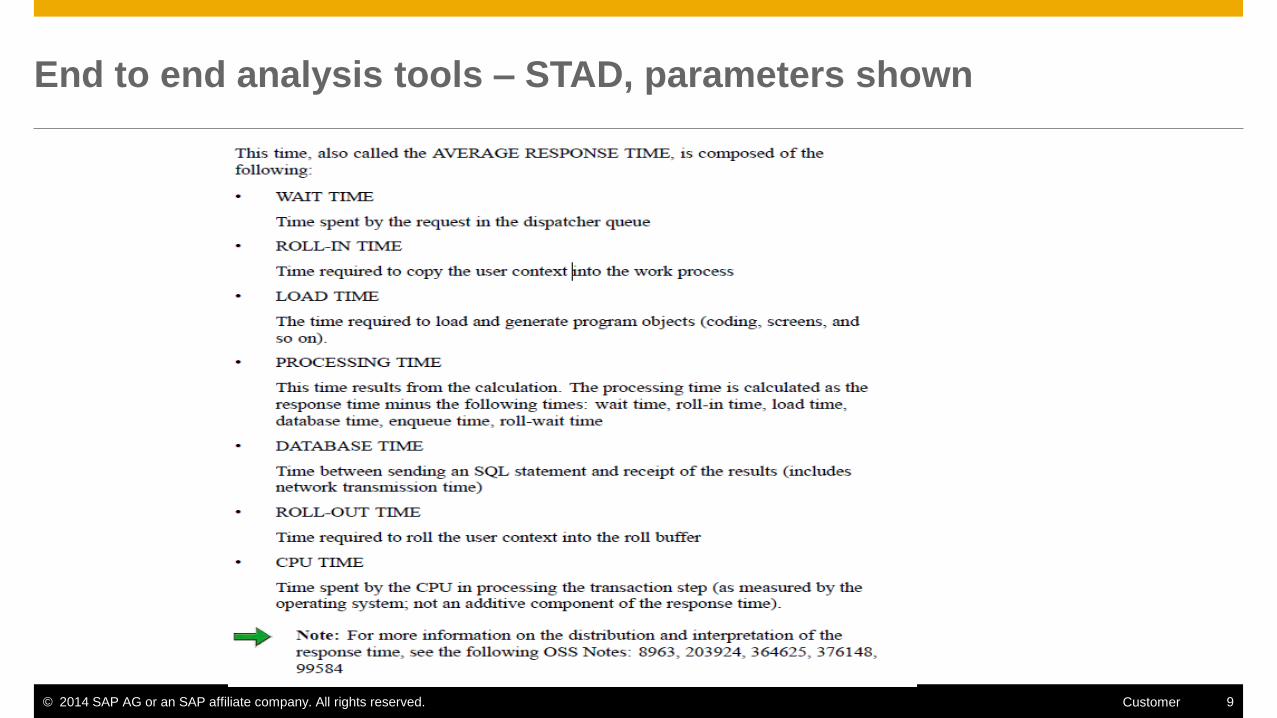
End to end analysis tools – STAD
Indicators measured by STAD
© 2014 SAP AG or an SAP affiliate company. All rights reserved. 9 Customer
End to end analysis tools – STAD, parameters shown
© 2014 SAP AG or an SAP affiliate company. All rights reserved. 10 Customer
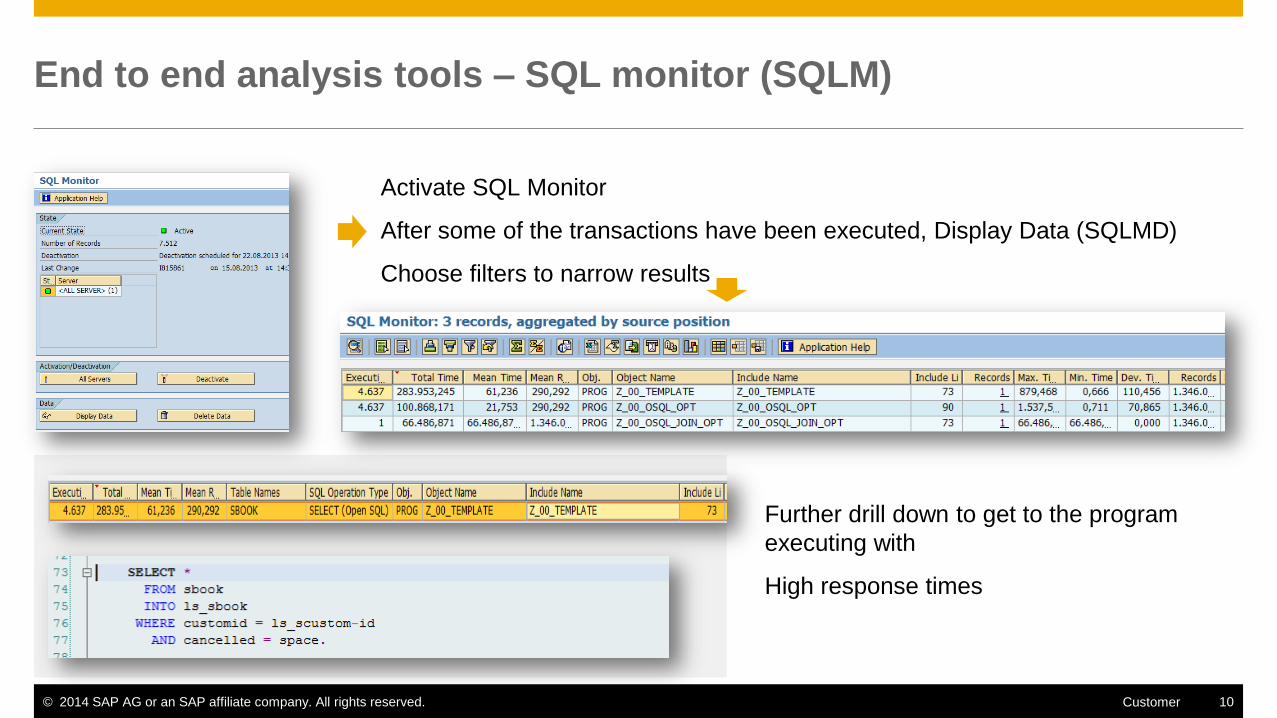
End to end analysis tools – SQL monitor (SQLM)
Activate SQL Monitor
After some of the transactions have been executed, Display Data (SQLMD)
Choose filters to narrow results
Further drill down to get to the program
executing with
High response times
© 2014 SAP AG or an SAP affiliate company. All rights reserved. 11 Customer
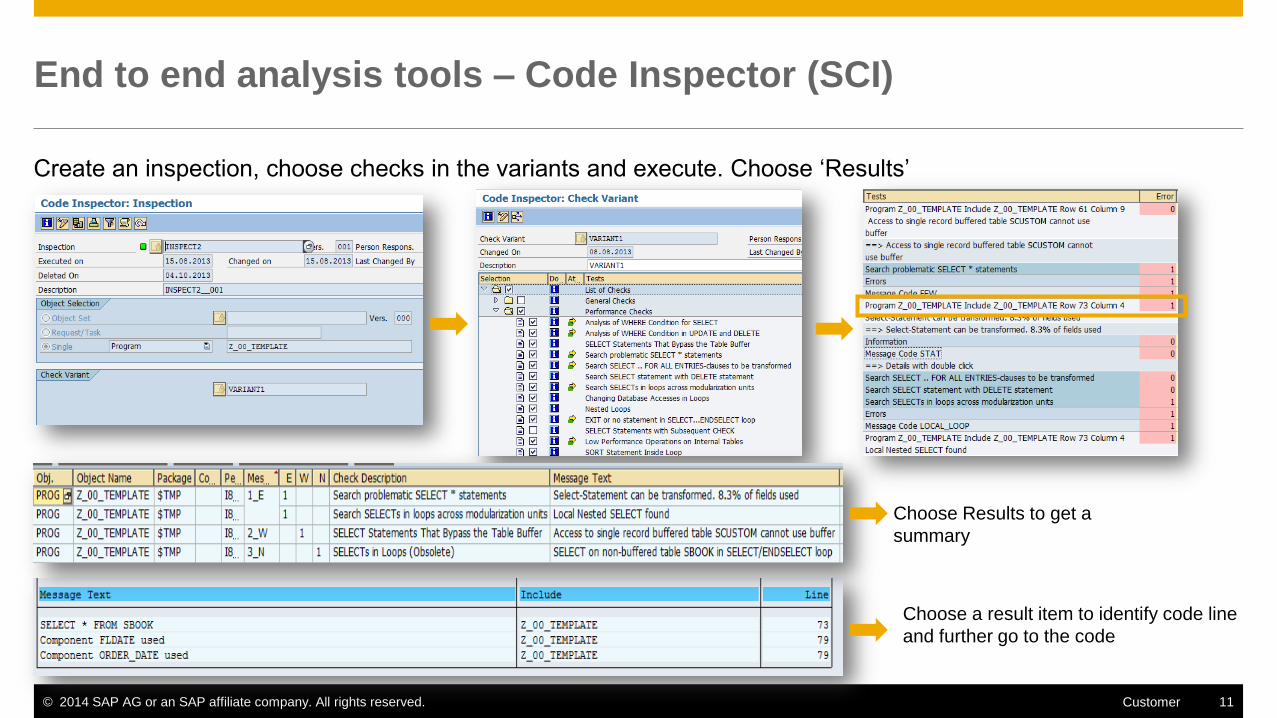
End to end analysis tools – Code Inspector (SCI)
Choose Results to get a
summary
Choose a result item to identify code line
and further go to the code
Create an inspection, choose checks in the variants and execute. Choose ‘Results’
© 2014 SAP AG or an SAP affiliate company. All rights reserved. 12 Customer
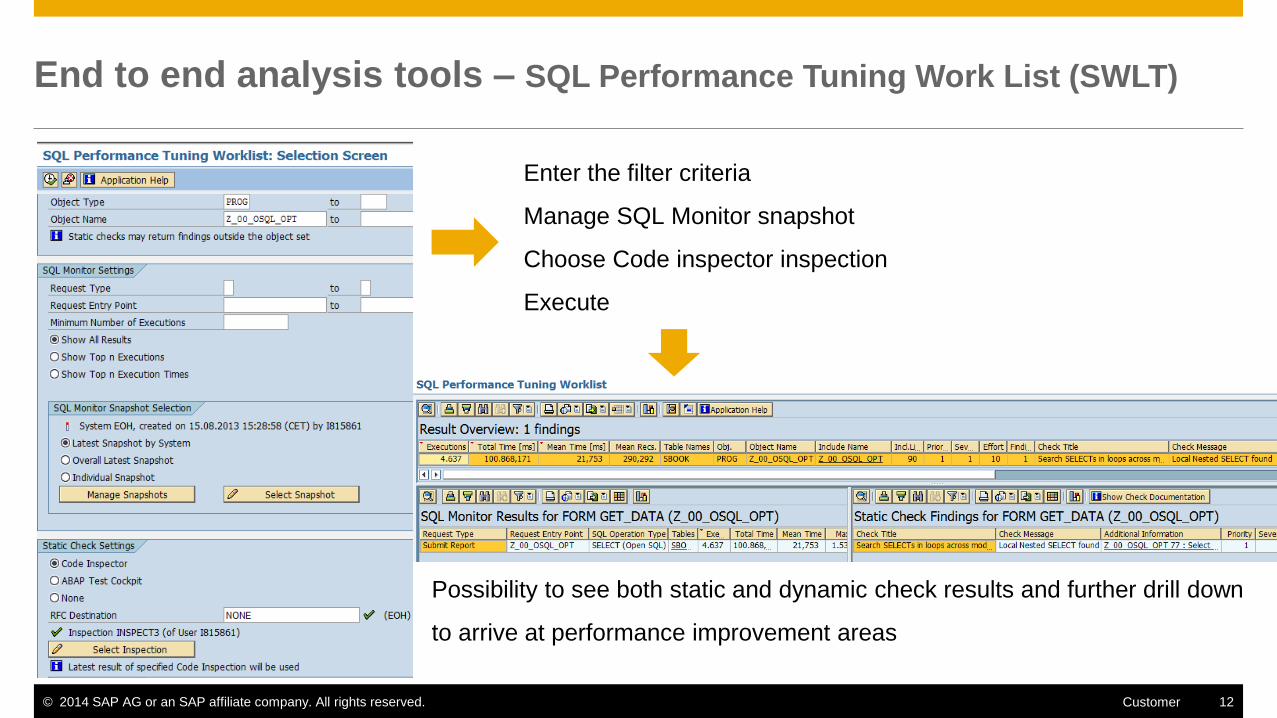
End to end analysis tools – SQL Performance Tuning Work List (SWLT)
Enter the filter criteria
Manage SQL Monitor snapshot
Choose Code inspector inspection
Execute
Possibility to see both static and dynamic check results and further drill down
to arrive at performance improvement areas
© 2014 SAP AG or an SAP affiliate company. All rights reserved. 13 Customer
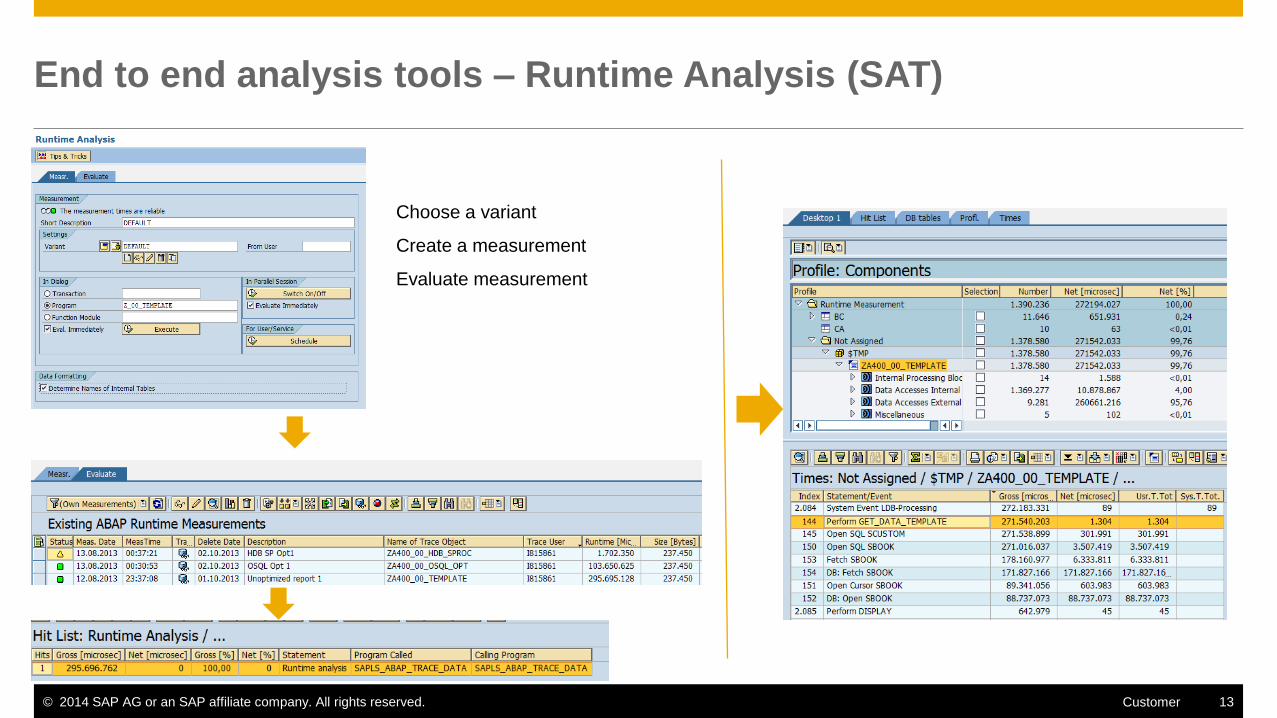
End to end analysis tools – Runtime Analysis (SAT)
Choose a variant
Create a measurement
Evaluate measurement
© 2014 SAP AG or an SAP affiliate company. All rights reserved. 14 Customer
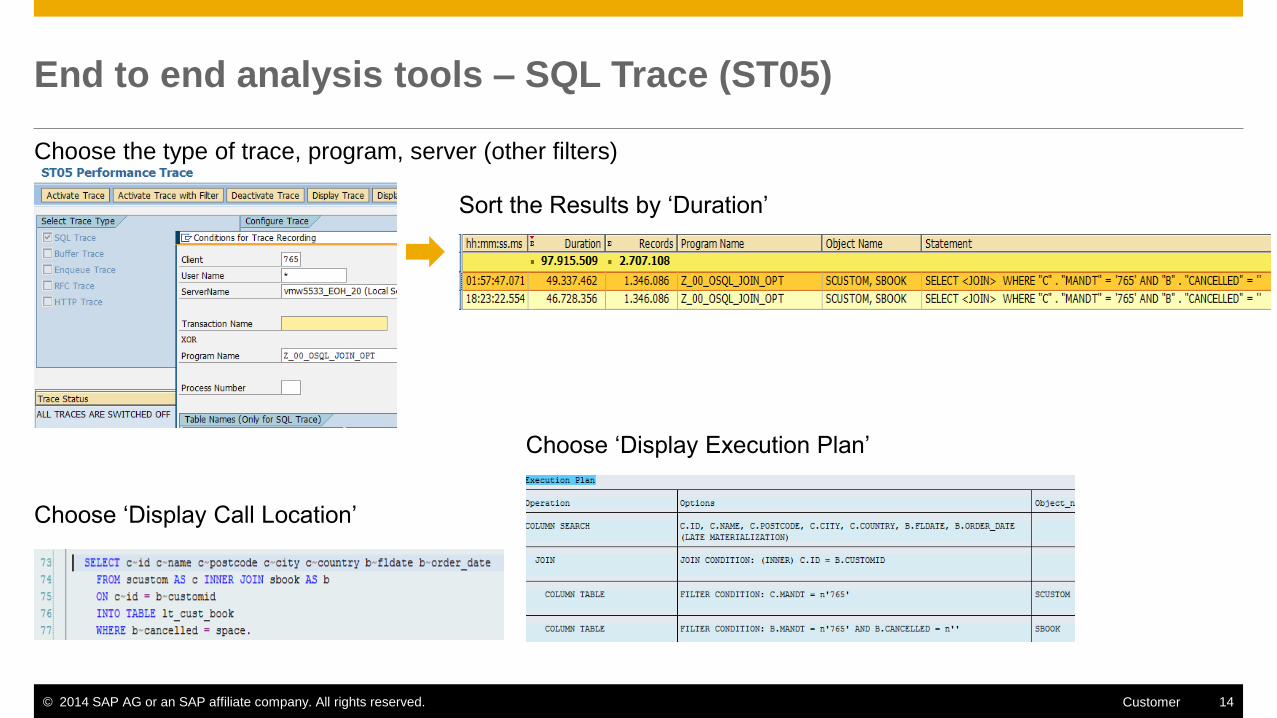
End to end analysis tools – SQL Trace (ST05)
Choose ‘Display Call Location’
Choose ‘Display Execution Plan’
Sort the Results by ‘Duration’
Choose the type of trace, program, server (other filters)
© 2014 SAP AG or an SAP affiliate company. All rights reserved. 15 Customer
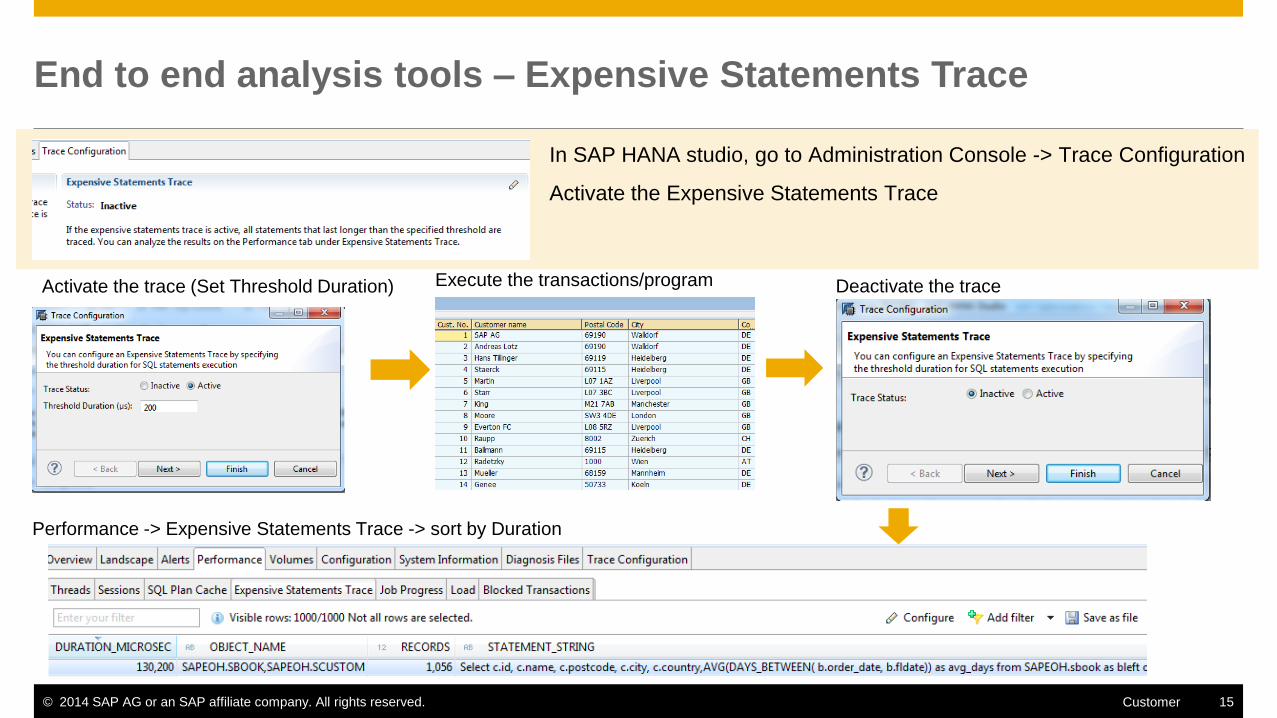
End to end analysis tools – Expensive Statements Trace
Activate the trace (Set Threshold Duration) Deactivate the trace Execute the transactions/program
Performance -> Expensive Statements Trace -> sort by Duration
In SAP HANA studio, go to Administration Console -> Trace Configuration
Activate the Expensive Statements Trace
© 2014 SAP AG or an SAP affiliate company. All rights reserved. 16 Customer
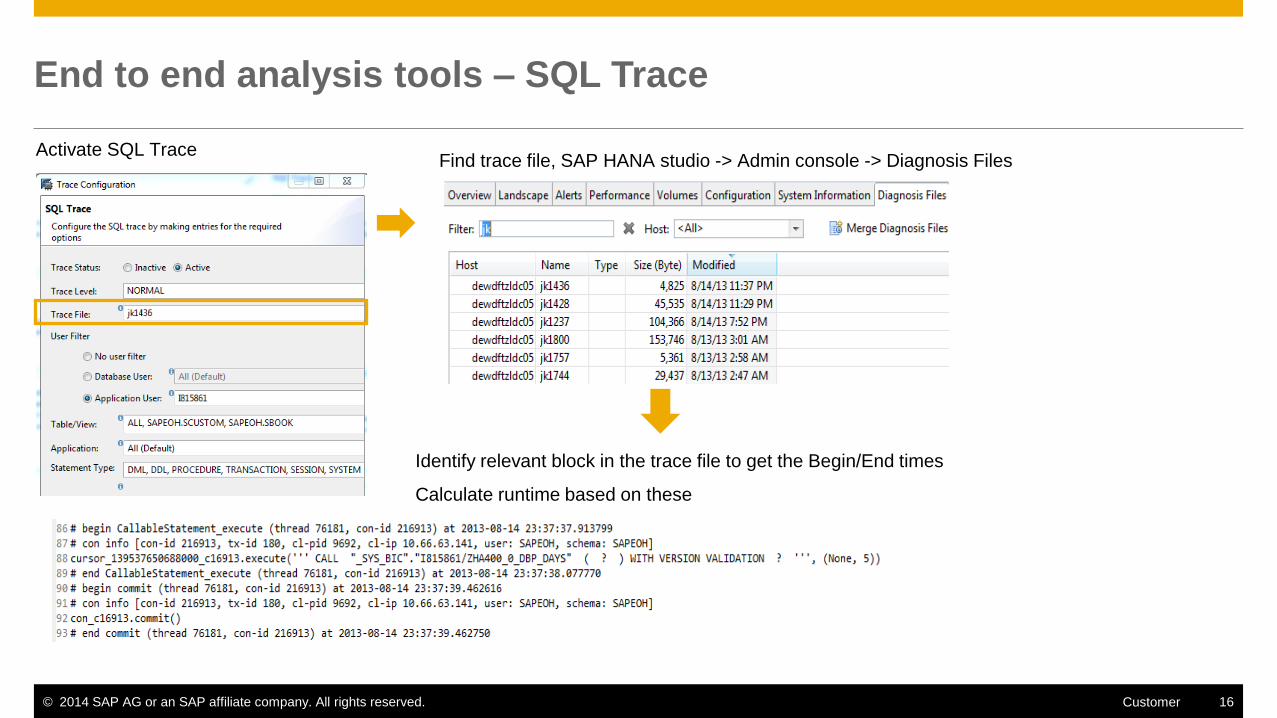
End to end analysis tools – SQL Trace
Activate SQL Trace Find trace file, SAP HANA studio -> Admin console -> Diagnosis Files
Identify relevant block in the trace file to get the Begin/End times
Calculate runtime based on these
© 2014 SAP AG or an SAP affiliate company. All rights reserved. 17 Customer
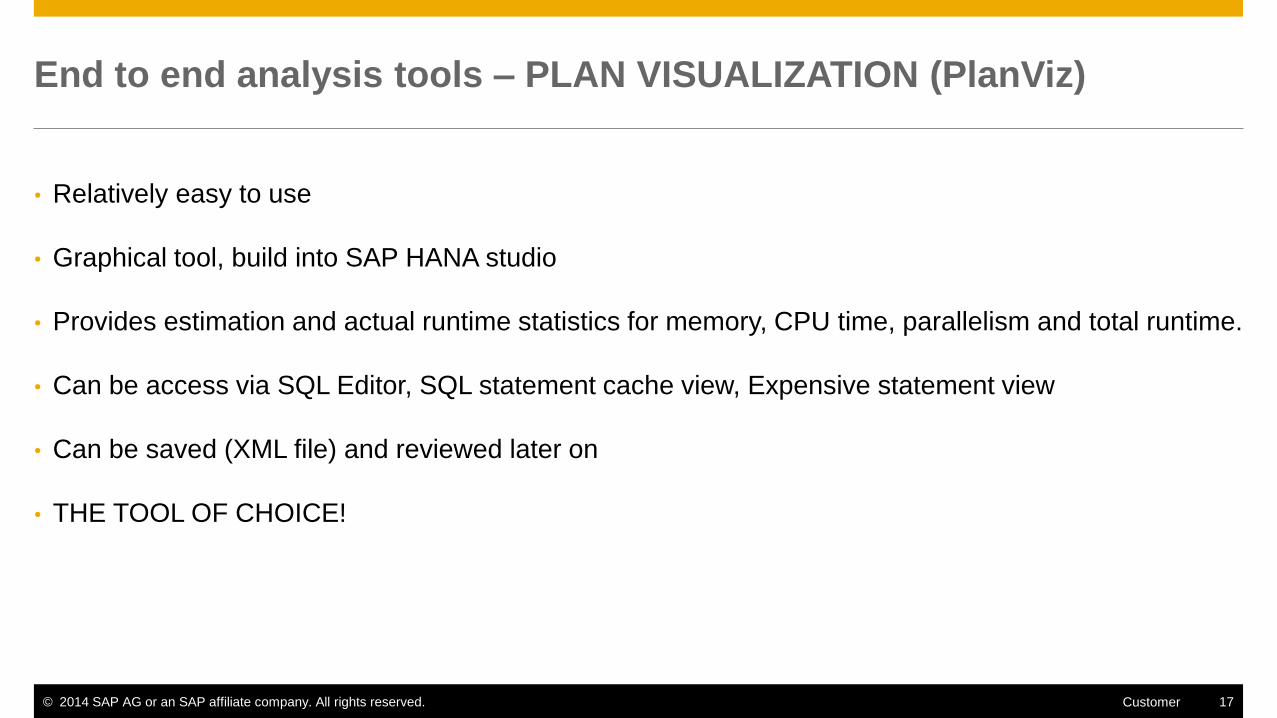
End to end analysis tools – PLAN VISUALIZATION (PlanViz)
• Relatively easy to use
• Graphical tool, build into SAP HANA studio
• Provides estimation and actual runtime statistics for memory, CPU time, parallelism and total runtime.
• Can be access via SQL Editor, SQL statement cache view, Expensive statement view
• Can be saved (XML file) and reviewed later on
• THE TOOL OF CHOICE!
© 2014 SAP AG or an SAP affiliate company. All rights reserved. 18 Customer
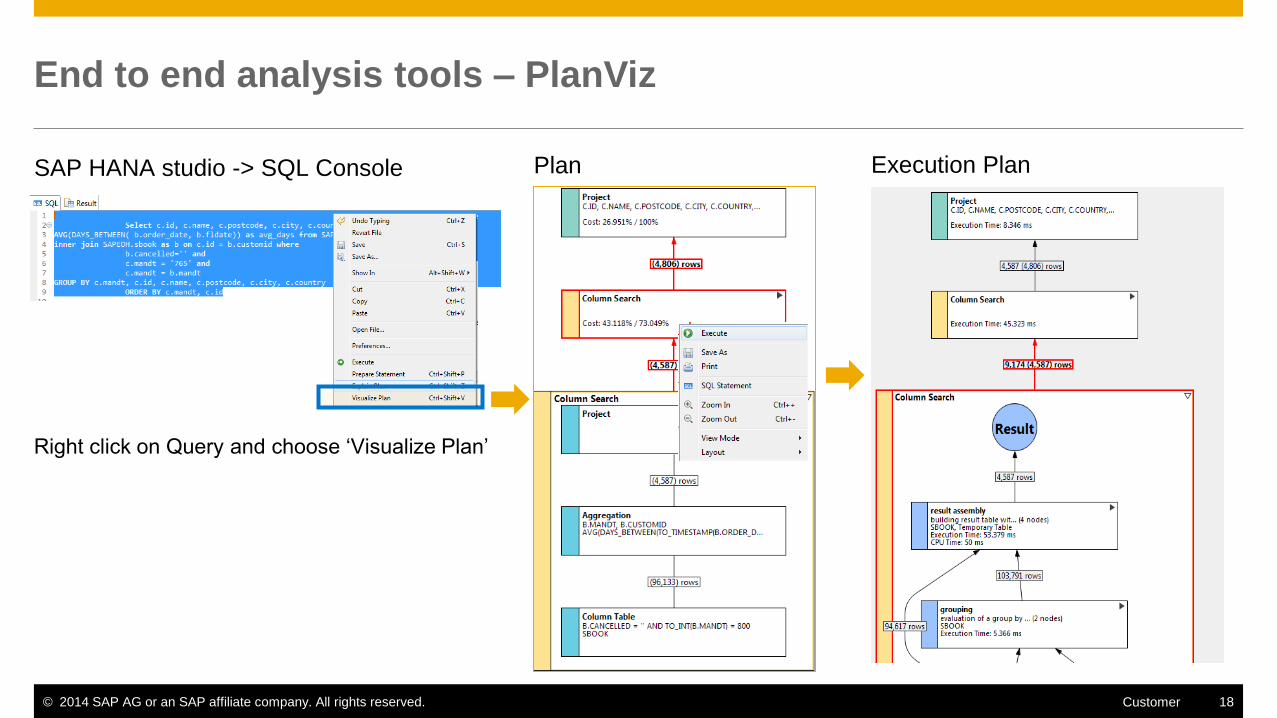
End to end analysis tools – PlanViz
Right click on Query and choose ‘Visualize Plan’
SAP HANA studio -> SQL Console Plan Execution Plan
© 2014 SAP AG or an SAP affiliate company. All rights reserved. 19 Customer
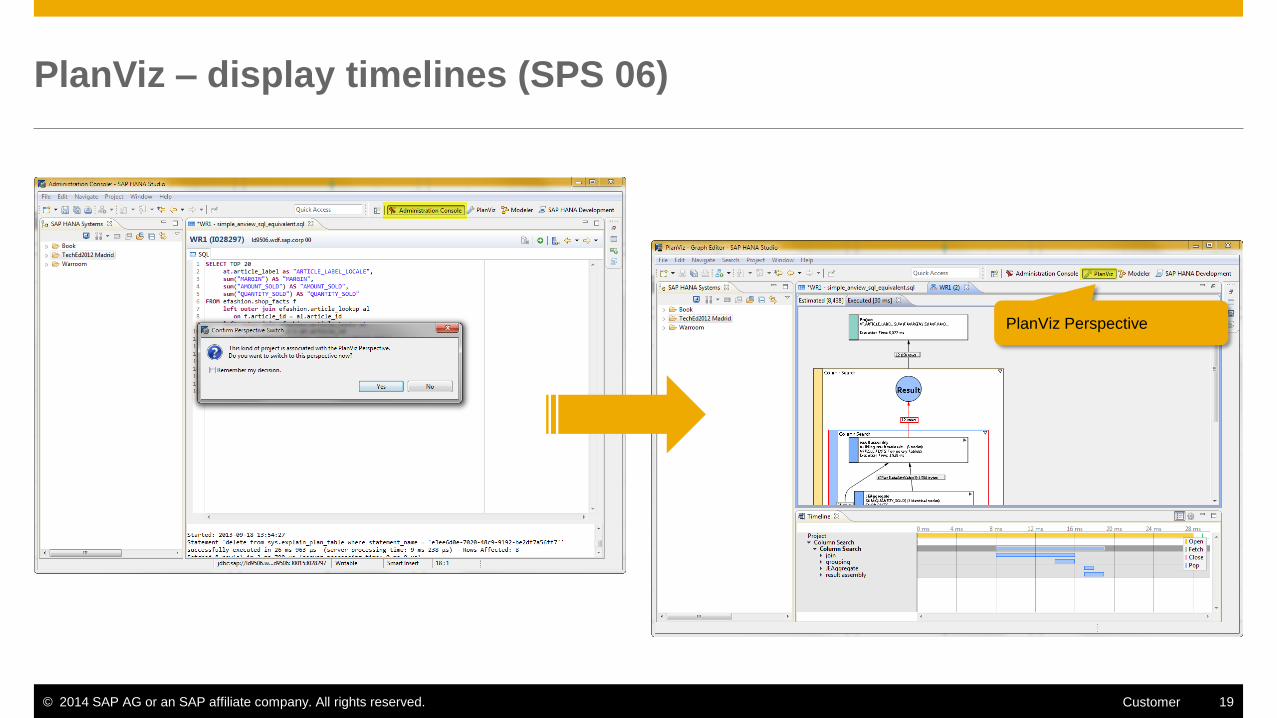
PlanViz – display timelines (SPS 06)
PlanViz Perspective
© 2014 SAP AG or an SAP affiliate company. All rights reserved. 20 Customer
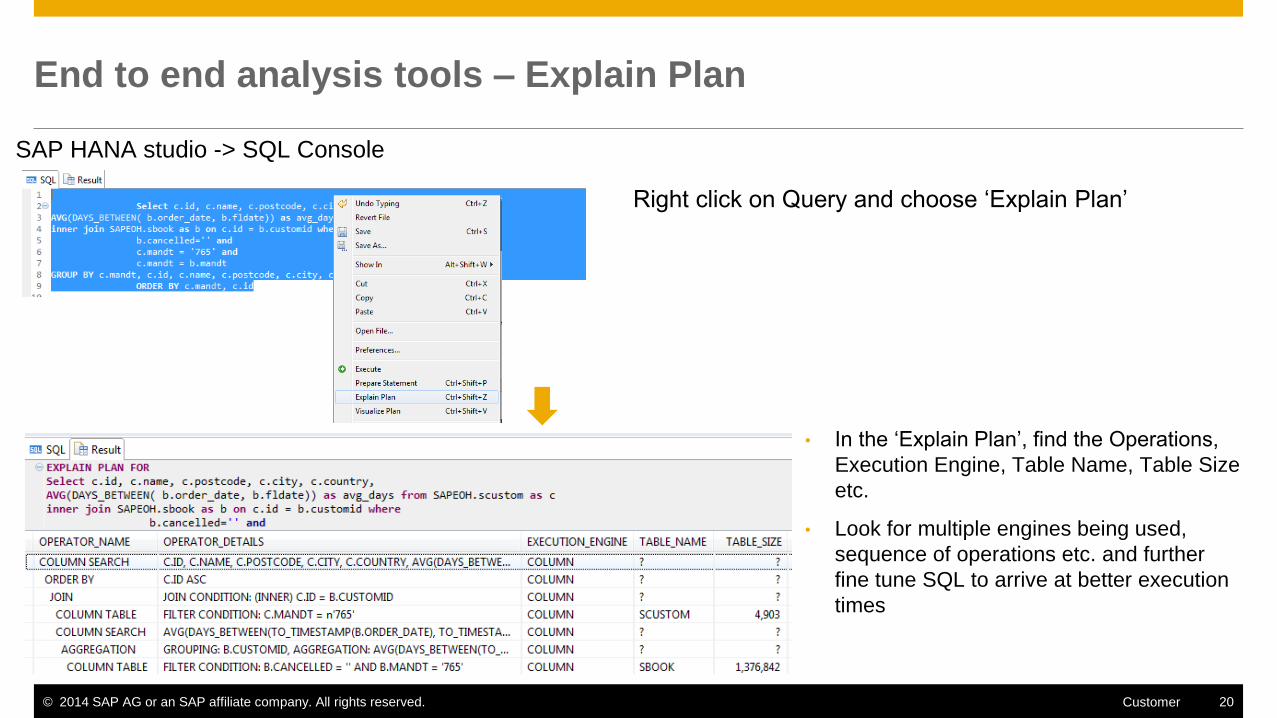
End to end analysis tools – Explain Plan
Right click on Query and choose ‘Explain Plan’
SAP HANA studio -> SQL Console
• In the ‘Explain Plan’, find the Operations,
Execution Engine, Table Name, Table Size
etc.
• Look for multiple engines being used,
sequence of operations etc. and further
fine tune SQL to arrive at better execution
times
© 2014 SAP AG or an SAP affiliate company. All rights reserved. 21 Customer
End to end analysis tools – LOAD GRAPH
• Nameserver data (nameserver_history.trc)
• SAP TREX heritage
• Highly aggregated data - cannot (easily) be mapped to a specific user action
• Yet, give a "feeling" of how workload "looks like"
• Could be used to give a rough baseline
• No function to compare two time frames side-by-side or by overlay
• MIN/MAX/AVG numbers are highly volatile and fully depend on the chosen time frame
© 2014 SAP AG or an SAP affiliate company. All rights reserved. 22 Customer
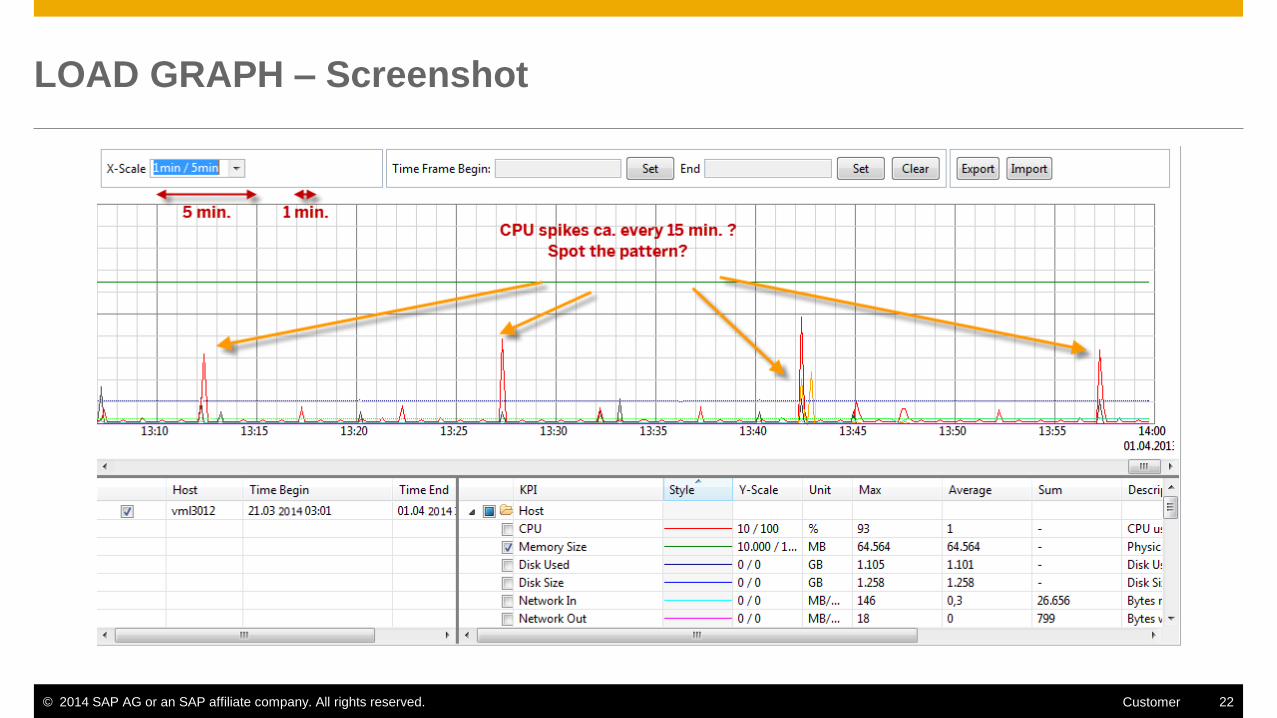
LOAD GRAPH – Screenshot
© 2014 SAP AG or an SAP affiliate company. All rights reserved. 23 Customer
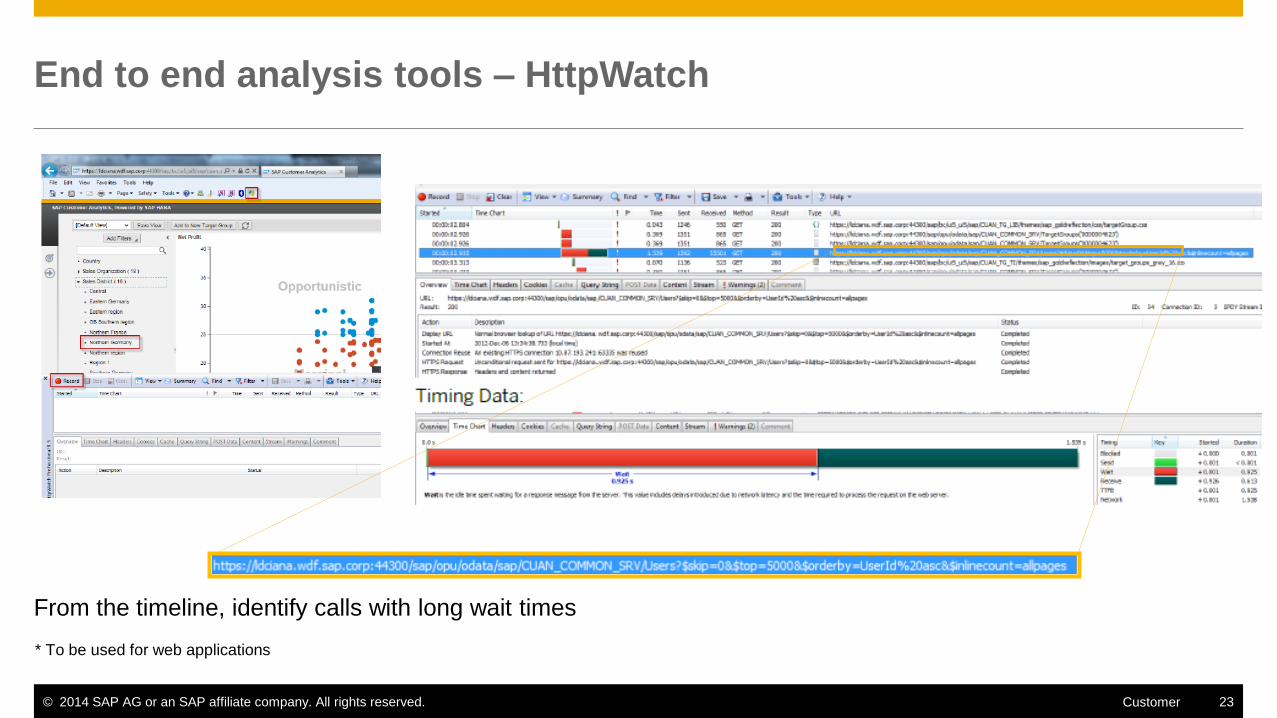
End to end analysis tools – HttpWatch
* To be used for web applications
From the timeline, identify calls with long wait times

© 2014 SAP AG or an SAP affiliate company. All rights reserved.
Thank you
Matthias Kretschmer
SAP HANA Competence Center
SAP AG
© 2014 SAP AG or an SAP affiliate company. All rights reserved. 25 Customer
© 2014 SAP AG or an SAP affiliate company. All rights reserved.
No part of this publication may be reproduced or transmitted in any form or for any purpose without the express permission of SAP AG or an SAP affiliate company.
SAP and other SAP products and services mentioned herein as well as their respective logos are trademarks or registered trademarks of SAP AG (or an SAP affiliate
company) in Germany and other countries. Please see http://global12.sap.com/corporate-en/legal/copyright/index.epx for additional trademark information and notices.
Some software products marketed by SAP AG and its distributors contain proprietary software components of other software vendors.
National product specifications may vary.
These materials are provided by SAP AG or an SAP affiliate company for informational purposes only, without representation or warranty of any kind, and SAP AG or its
affiliated companies shall not be liable for errors or omissions with respect to the materials. The only warranties for SAP AG or SAP affiliate company products and services
are those that are set forth in the express warranty statements accompanying such products and services, if any. Nothing herein should be construed as constituting an
additional warranty.
In particular, SAP AG or its affiliated companies have no obligation to pursue any course of business outlined in this document or any related presentation, or to develop or
release any functionality mentioned therein. This document, or any related presentation, and SAP AG’s or its affiliated companies’ strategy and possible future
developments, products, and/or platform directions and functionality are all subject to change and may be changed by SAP AG or its affiliated companies at any time for
any reason without notice. The information in this document is not a commitment, promise, or legal obligation to deliver any material, code, or functionality. All forward-
looking statements are subject to various risks and uncertainties that could cause actual results to differ materially from expectations. Readers are cautioned not to place
undue reliance on these forward-looking statements, which speak only as of their dates, and they should not be relied upon in making purchasing decisions.


