Embed Size (px)
Citation preview
ASDA Research Reports are available on Thomson Reuters 1
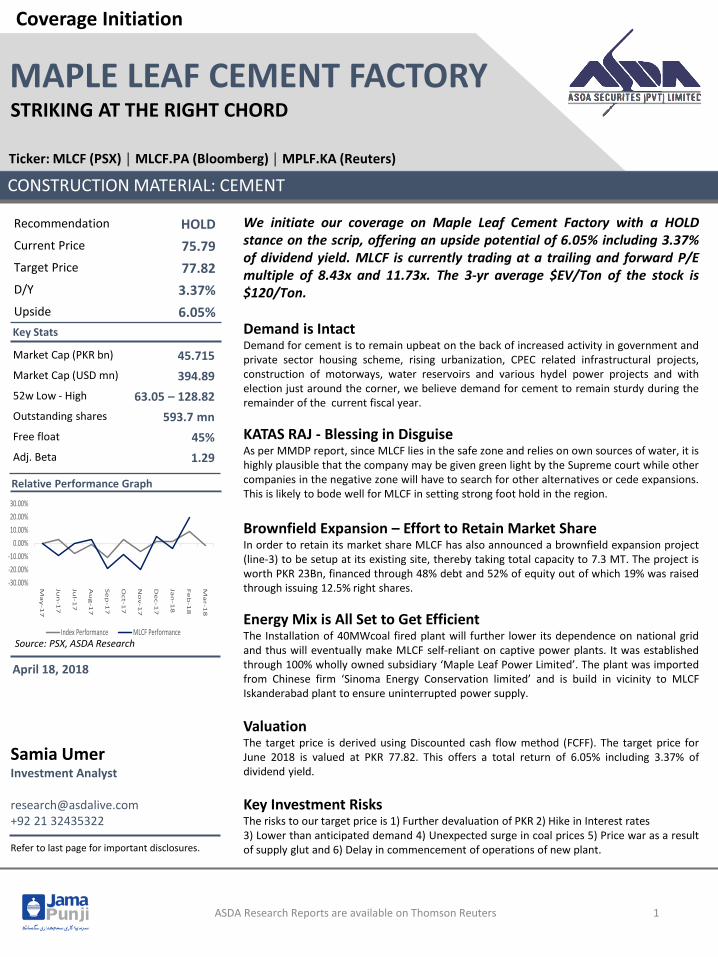
Relative Performance Graph
Key Stats
Samia UmerInvestment Analyst
[email protected]+92 21 32435322
Refer to last page for important disclosures.
April 18, 2018
Recommendation HOLD
Current Price 75.79
Target Price 77.82
D/Y 3.37%
Upside 6.05%
Market Cap (PKR bn) 45.715
Market Cap (USD mn) 394.89
52w Low - High 63.05 – 128.82
Outstanding shares 593.7 mn
Free float 45%
Adj. Beta 1.29
Source: PSX, ASDA Research
We initiate our coverage on Maple Leaf Cement Factory with a HOLDstance on the scrip, offering an upside potential of 6.05% including 3.37%of dividend yield. MLCF is currently trading at a trailing and forward P/Emultiple of 8.43x and 11.73x. The 3-yr average $EV/Ton of the stock is$120/Ton.
Demand is IntactDemand for cement is to remain upbeat on the back of increased activity in government andprivate sector housing scheme, rising urbanization, CPEC related infrastructural projects,construction of motorways, water reservoirs and various hydel power projects and withelection just around the corner, we believe demand for cement to remain sturdy during theremainder of the current fiscal year.
KATAS RAJ - Blessing in DisguiseAs per MMDP report, since MLCF lies in the safe zone and relies on own sources of water, it ishighly plausible that the company may be given green light by the Supreme court while othercompanies in the negative zone will have to search for other alternatives or cede expansions.This is likely to bode well for MLCF in setting strong foot hold in the region.
Brownfield Expansion – Effort to Retain Market ShareIn order to retain its market share MLCF has also announced a brownfield expansion project(line-3) to be setup at its existing site, thereby taking total capacity to 7.3 MT. The project isworth PKR 23Bn, financed through 48% debt and 52% of equity out of which 19% was raisedthrough issuing 12.5% right shares.
Energy Mix is All Set to Get EfficientThe Installation of 40MWcoal fired plant will further lower its dependence on national gridand thus will eventually make MLCF self-reliant on captive power plants. It was establishedthrough 100% wholly owned subsidiary ‘Maple Leaf Power Limited’. The plant was importedfrom Chinese firm ‘Sinoma Energy Conservation limited’ and is build in vicinity to MLCFIskanderabad plant to ensure uninterrupted power supply.
ValuationThe target price is derived using Discounted cash flow method (FCFF). The target price forJune 2018 is valued at PKR 77.82. This offers a total return of 6.05% including 3.37% ofdividend yield.
Key Investment RisksThe risks to our target price is 1) Further devaluation of PKR 2) Hike in Interest rates3) Lower than anticipated demand 4) Unexpected surge in coal prices 5) Price war as a resultof supply glut and 6) Delay in commencement of operations of new plant.
-30.00%
-20.00%
-10.00%
0.00%
10.00%
20.00%
30.00%
Ma
y-1
7
Jun
-17
Jul-1
7
Au
g-1
7
Se
p-1
7
Oct-1
7
No
v-1
7
De
c-1
7
Jan
-18
Fe
b-1
8
Ma
r-1
8
Index Performance MLCF Performance
Source: PSX, ASDA Research
Investment ThesisEarlier when other companies were announcing expansions, Maple leaf on the other handprudently focused on effective and effective utilization of its business. We base ourinvestment case for Maple Leaf Factory Cement (MLCF) on the back of robust demand as aresult of increased urbanization and government spending on infrastructural and CPECrelated projects, escaping production halt over Katas Raj and other environmental issues, 2.3MT of expansion project at its existing site and addition of 40MW coal fired power plant toits already cost effective power mix.
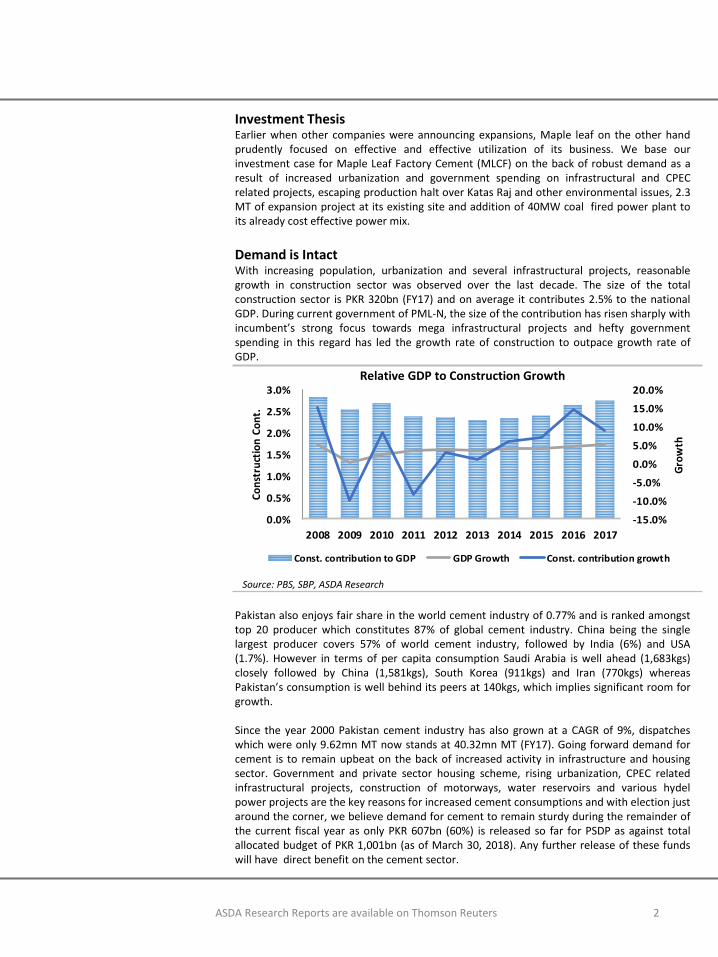
Demand is IntactWith increasing population, urbanization and several infrastructural projects, reasonablegrowth in construction sector was observed over the last decade. The size of the totalconstruction sector is PKR 320bn (FY17) and on average it contributes 2.5% to the nationalGDP. During current government of PML-N, the size of the contribution has risen sharply withincumbent’s strong focus towards mega infrastructural projects and hefty governmentspending in this regard has led the growth rate of construction to outpace growth rate ofGDP.
Pakistan also enjoys fair share in the world cement industry of 0.77% and is ranked amongsttop 20 producer which constitutes 87% of global cement industry. China being the singlelargest producer covers 57% of world cement industry, followed by India (6%) and USA(1.7%). However in terms of per capita consumption Saudi Arabia is well ahead (1,683kgs)closely followed by China (1,581kgs), South Korea (911kgs) and Iran (770kgs) whereasPakistan’s consumption is well behind its peers at 140kgs, which implies significant room forgrowth.
Since the year 2000 Pakistan cement industry has also grown at a CAGR of 9%, dispatcheswhich were only 9.62mn MT now stands at 40.32mn MT (FY17). Going forward demand forcement is to remain upbeat on the back of increased activity in infrastructure and housingsector. Government and private sector housing scheme, rising urbanization, CPEC relatedinfrastructural projects, construction of motorways, water reservoirs and various hydelpower projects are the key reasons for increased cement consumptions and with election justaround the corner, we believe demand for cement to remain sturdy during the remainder ofthe current fiscal year as only PKR 607bn (60%) is released so far for PSDP as against totalallocated budget of PKR 1,001bn (as of March 30, 2018). Any further release of these fundswill have direct benefit on the cement sector.
-15.0%
-10.0%
-5.0%
0.0%
5.0%
10.0%
15.0%
20.0%
0.0%
0.5%
1.0%
1.5%
2.0%
2.5%
3.0%
2008 2009 2010 2011 2012 2013 2014 2015 2016 2017
Gro
wth
Co
nst
ruct
ion
Co
nt.
Const. contribution to GDP GDP Growth Const. contribution growth
ASDA Research Reports are available on Thomson Reuters 2
Source: PBS, SBP, ASDA Research
Relative GDP to Construction Growth
ASDA Research Reports are available on Thomson Reuters 3
Maple Leaf Cement Factory (MLCF) is primarily engaged in producing grey cement. Besidesthis MLCF company also manufactures white cement and enjoys a healthy market share ofmore than 90%. Since white cement sells at a premium of 10%-20%, thereby contributing itsfair share in maintaining highest retention level in the industry.
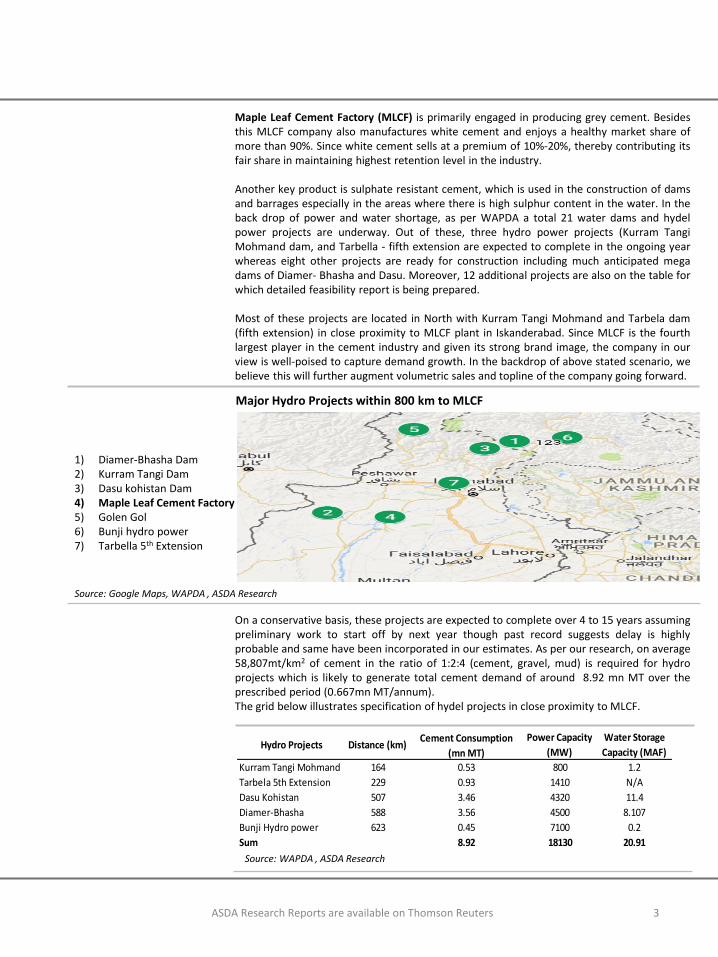
Another key product is sulphate resistant cement, which is used in the construction of damsand barrages especially in the areas where there is high sulphur content in the water. In theback drop of power and water shortage, as per WAPDA a total 21 water dams and hydelpower projects are underway. Out of these, three hydro power projects (Kurram TangiMohmand dam, and Tarbella - fifth extension are expected to complete in the ongoing yearwhereas eight other projects are ready for construction including much anticipated megadams of Diamer- Bhasha and Dasu. Moreover, 12 additional projects are also on the table forwhich detailed feasibility report is being prepared.
Most of these projects are located in North with Kurram Tangi Mohmand and Tarbela dam(fifth extension) in close proximity to MLCF plant in Iskanderabad. Since MLCF is the fourthlargest player in the cement industry and given its strong brand image, the company in ourview is well-poised to capture demand growth. In the backdrop of above stated scenario, webelieve this will further augment volumetric sales and topline of the company going forward.
On a conservative basis, these projects are expected to complete over 4 to 15 years assumingpreliminary work to start off by next year though past record suggests delay is highlyprobable and same have been incorporated in our estimates. As per our research, on average58,807mt/km2 of cement in the ratio of 1:2:4 (cement, gravel, mud) is required for hydroprojects which is likely to generate total cement demand of around 8.92 mn MT over theprescribed period (0.667mn MT/annum).The grid below illustrates specification of hydel projects in close proximity to MLCF.
1) Diamer-Bhasha Dam2) Kurram Tangi Dam3) Dasu kohistan Dam4) Maple Leaf Cement Factory5) Golen Gol6) Bunji hydro power7) Tarbella 5th Extension
Source: Google Maps, WAPDA , ASDA Research
Source: WAPDA , ASDA Research
Hydro Projects Distance (km)Cement Consumption
(mn MT)
Power Capacity
(MW)
Water Storage
Capacity (MAF)
Kurram Tangi Mohmand 164 0.53 800 1.2
Tarbela 5th Extension 229 0.93 1410 N/A
Dasu Kohistan 507 3.46 4320 11.4
Diamer-Bhasha 588 3.56 4500 8.107
Bunji Hydro power 623 0.45 7100 0.2
Sum 8.92 18130 20.91
Major Hydro Projects within 800 km to MLCF
(15) (10) (5) - 5 10
2017
2018
2019
2020
PKR 'mn
CFF
CFI
CFO
0 2000 4000 6000 8000 10000 12000
2012
2013
2014
2015
2016
2017
2018
2019
2020
2021
2022
4,438
6,515
6,746
7,356
9,371
9,087
7807
7726
9203
11388
11714
ASDA Research Reports are available on Thomson Reuters 4
KATAS RAJ - Blessing in DisguiseSupreme Court on Katas Raj case has directed all companies located near Katas Raj Temple toseek prior approval before undergoing expansionary projects. Moreover, Mines and MineralDepartment of Punjab (MMDP) also conducted a feasibility report to evaluate impact onecology with respect to new addition of cement plants in the Salt Range region. As perreport, MLCF is located in the safe zone plus the company relies on own sources of watermainly extracted from tube wells situated within the plant while other companies thatappeared in the negative zone consumed more water than were actually allowed. This hasresulted in drying of the Katas raj pond. These companies will either have to search for otherlocation or cede expansion but in our view all the expansions will eventually come onlineafter fullfiling/going through stringent regulations. We believe it is beneficial for MLCF asnew capacities of 16.4 MT (58%) out of total planned 28.5 MT lies in the Punjab region.Furthermore, with the deferral of new plants competition/price war within the region willalso ease out and this offers a greater opportunity for MLCF to increase its foot hold in theregion.
Brownfield Expansion – Effort to Retain Market ShareEarlier when other companies were announcing expansions, Maple Leaf on the other handprudently focused on effective and effective utilization of its business. Following theexpansion spree and to retain its market share, MLCF has also announced a brownfieldexpansion project (line-3) of 2.3 MT which is to be build at its existing site at Iskanderabad.The total capacity of the company will go up to 7.3 MT.
The project is worth PKR 23Bn, financed through 48% of debt and 52% of equity, out of which19% was raised through issuing 12.5% right shares. Following the foot steps of other majorplayers in the industry, MLCF has too ordered the new state-of-the-art plant from a Danishbased company, FLS Smidth.
The plant was initially expected to be online by FY19 but the construction was halted overenvironmental concerns by EPA which was later over-ruled by Lahore High Court. Once thecase is completely over, we believe the construction will be is in full swing however, weexpect the plant to be operational by FY 1H20 with a delay of 3-5 months, along with a slightincrease in total estimated cost and we have incorporated these assumptions in our model.
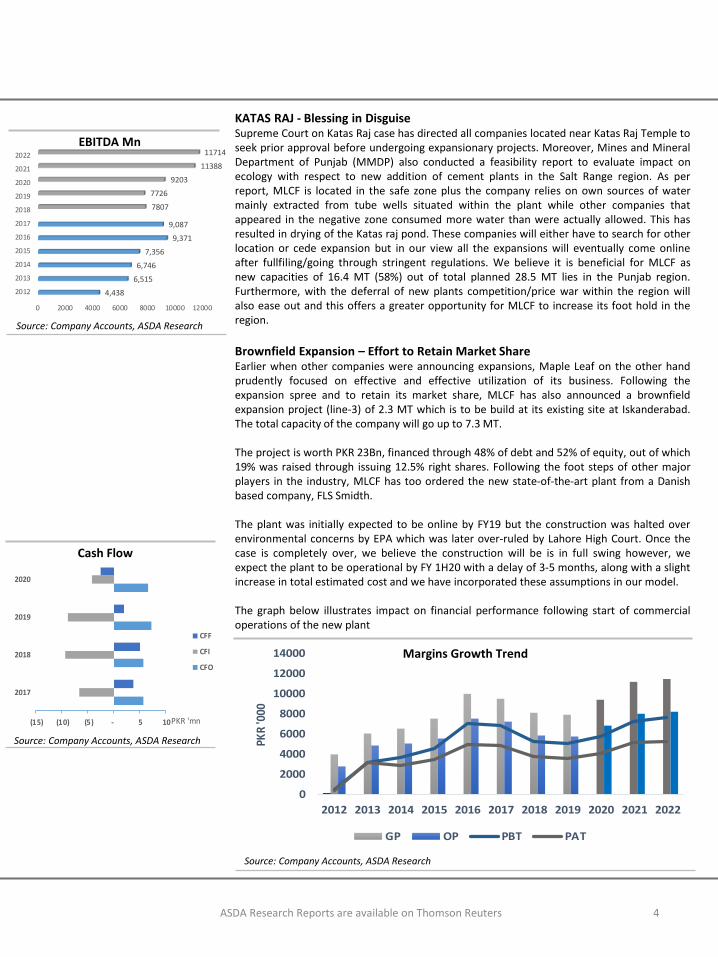
The graph below illustrates impact on financial performance following start of commercialoperations of the new plant
Source: Company Accounts, ASDA Research
Source: Company Accounts, ASDA Research
Source: Company Accounts, ASDA Research
0
2000
4000
6000
8000
10000
12000
14000
2012 2013 2014 2015 2016 2017 2018 2019 2020 2021 2022
PKR
'000
GP OP PBT PAT
Margins Growth Trend
Cash Flow
EBITDA Mn
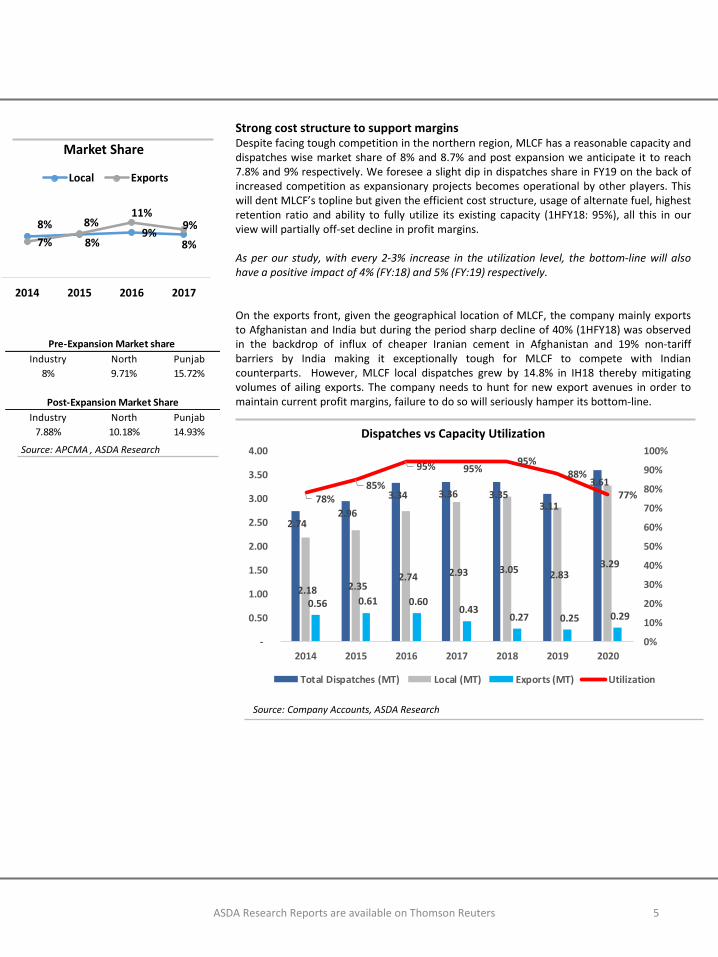
Strong cost structure to support marginsDespite facing tough competition in the northern region, MLCF has a reasonable capacity anddispatches wise market share of 8% and 8.7% and post expansion we anticipate it to reach7.8% and 9% respectively. We foresee a slight dip in dispatches share in FY19 on the back ofincreased competition as expansionary projects becomes operational by other players. Thiswill dent MLCF’s topline but given the efficient cost structure, usage of alternate fuel, highestretention ratio and ability to fully utilize its existing capacity (1HFY18: 95%), all this in ourview will partially off-set decline in profit margins.
As per our study, with every 2-3% increase in the utilization level, the bottom-line will alsohave a positive impact of 4% (FY:18) and 5% (FY:19) respectively.
On the exports front, given the geographical location of MLCF, the company mainly exportsto Afghanistan and India but during the period sharp decline of 40% (1HFY18) was observedin the backdrop of influx of cheaper Iranian cement in Afghanistan and 19% non-tariffbarriers by India making it exceptionally tough for MLCF to compete with Indiancounterparts. However, MLCF local dispatches grew by 14.8% in IH18 thereby mitigatingvolumes of ailing exports. The company needs to hunt for new export avenues in order tomaintain current profit margins, failure to do so will seriously hamper its bottom-line.
2.74 2.96
3.34 3.36 3.35 3.11
3.61
2.18 2.35 2.74 2.93 3.05 2.83
3.29
0.56 0.61 0.60 0.43
0.27 0.25 0.29
78%85%
95% 95%95%
88%
77%
0%
10%
20%
30%
40%
50%
60%
70%
80%
90%
100%
-
0.50
1.00
1.50
2.00
2.50
3.00
3.50
4.00
2014 2015 2016 2017 2018 2019 2020
Total Dispatches (MT) Local (MT) Exports (MT) Utilization
ASDA Research Reports are available on Thomson Reuters 5
Industry North Punjab
8% 9.71% 15.72%
Industry North Punjab
7.88% 10.18% 14.93%
Pre-Expansion Market share
Post-Expansion Market Share
8% 8% 9%
8% 7% 8%
11% 9%
2014 2015 2016 2017
Market Share
Local Exports
Source: APCMA , ASDA Research
Source: Company Accounts, ASDA Research
Dispatches vs Capacity Utilization
2016 2017 2018 2019
27% 27% 27% 25%
22% 18% 22% 23%
28% 33% 23%7%
0% 0%25%
45%
23% 22%3% 0%
WHR GAS FO COAL GRID
ASDA Research Reports are available on Thomson Reuters 6
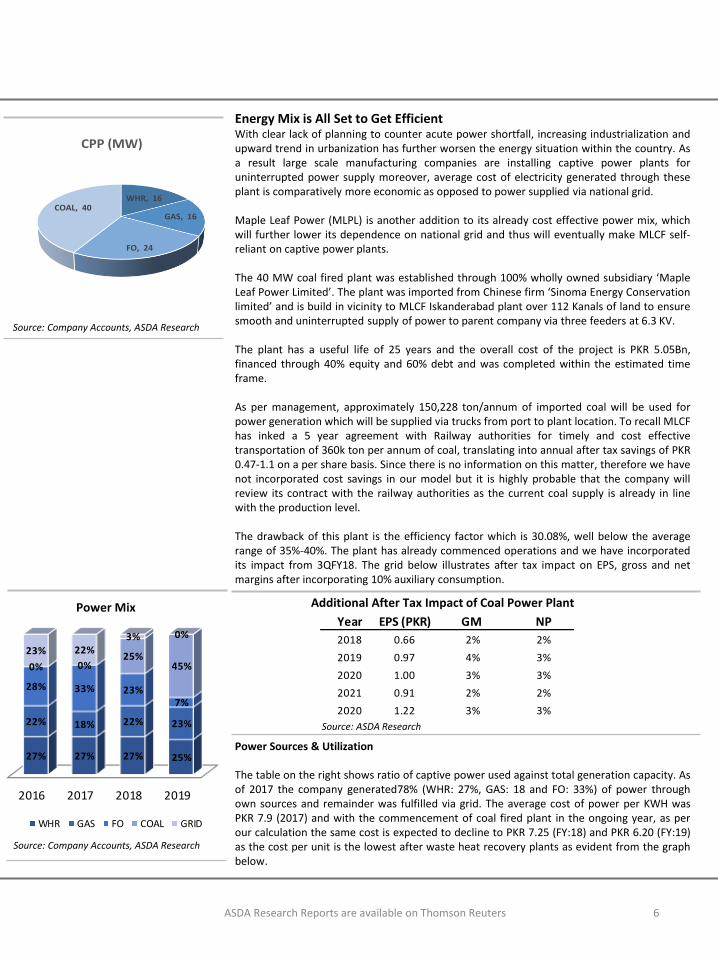
Energy Mix is All Set to Get EfficientWith clear lack of planning to counter acute power shortfall, increasing industrialization andupward trend in urbanization has further worsen the energy situation within the country. Asa result large scale manufacturing companies are installing captive power plants foruninterrupted power supply moreover, average cost of electricity generated through theseplant is comparatively more economic as opposed to power supplied via national grid.
Maple Leaf Power (MLPL) is another addition to its already cost effective power mix, whichwill further lower its dependence on national grid and thus will eventually make MLCF self-reliant on captive power plants.
The 40 MW coal fired plant was established through 100% wholly owned subsidiary ‘MapleLeaf Power Limited’. The plant was imported from Chinese firm ‘Sinoma Energy Conservationlimited’ and is build in vicinity to MLCF Iskanderabad plant over 112 Kanals of land to ensuresmooth and uninterrupted supply of power to parent company via three feeders at 6.3 KV.
The plant has a useful life of 25 years and the overall cost of the project is PKR 5.05Bn,financed through 40% equity and 60% debt and was completed within the estimated timeframe.
As per management, approximately 150,228 ton/annum of imported coal will be used forpower generation which will be supplied via trucks from port to plant location. To recall MLCFhas inked a 5 year agreement with Railway authorities for timely and cost effectivetransportation of 360k ton per annum of coal, translating into annual after tax savings of PKR0.47-1.1 on a per share basis. Since there is no information on this matter, therefore we havenot incorporated cost savings in our model but it is highly probable that the company willreview its contract with the railway authorities as the current coal supply is already in linewith the production level.
The drawback of this plant is the efficiency factor which is 30.08%, well below the averagerange of 35%-40%. The plant has already commenced operations and we have incorporatedits impact from 3QFY18. The grid below illustrates after tax impact on EPS, gross and netmargins after incorporating 10% auxiliary consumption.
Power Sources & Utilization
The table on the right shows ratio of captive power used against total generation capacity. Asof 2017 the company generated78% (WHR: 27%, GAS: 18 and FO: 33%) of power throughown sources and remainder was fulfilled via grid. The average cost of power per KWH wasPKR 7.9 (2017) and with the commencement of coal fired plant in the ongoing year, as perour calculation the same cost is expected to decline to PKR 7.25 (FY:18) and PKR 6.20 (FY:19)as the cost per unit is the lowest after waste heat recovery plants as evident from the graphbelow.
Source: Company Accounts, ASDA Research
Source: Company Accounts, ASDA Research
Source: ASDA Research
Year EPS (PKR) GM NP
2018 0.66 2% 2%
2019 0.97 4% 3%
2020 1.00 3% 3%
2021 0.91 2% 2%
2020 1.22 3% 3%
WHR, 16
GAS, 16
FO, 24
COAL, 40
CPP (MW)
Power Mix Additional After Tax Impact of Coal Power Plant
ASDA Research Reports are available on Thomson Reuters 7
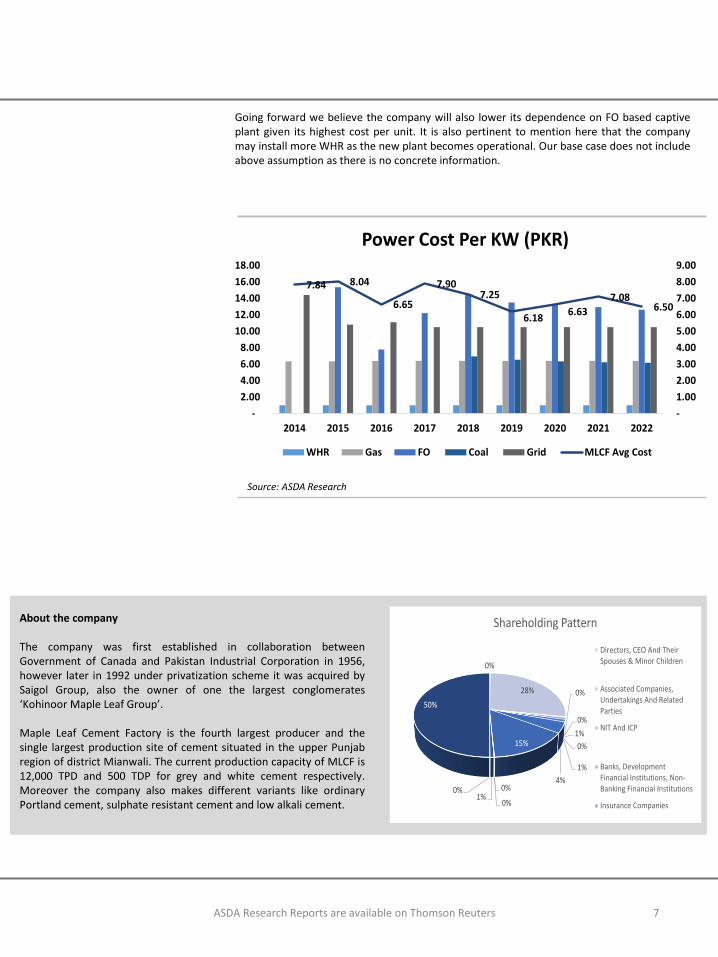
Going forward we believe the company will also lower its dependence on FO based captiveplant given its highest cost per unit. It is also pertinent to mention here that the companymay install more WHR as the new plant becomes operational. Our base case does not includeabove assumption as there is no concrete information.
0%
28% 0%
0%
1%
0%
1%
4%
15%
0%
0%1%
0%
50%
Shareholding Pattern
Directors, CEO And TheirSpouses & Minor Children
Associated Companies,Undertakings And RelatedParties
NIT And ICP
Banks, DevelopmentFinancial Institutions, Non-Banking Financial Institutions
Insurance Companies
About the company
The company was first established in collaboration betweenGovernment of Canada and Pakistan Industrial Corporation in 1956,however later in 1992 under privatization scheme it was acquired bySaigol Group, also the owner of one the largest conglomerates‘Kohinoor Maple Leaf Group’.
Maple Leaf Cement Factory is the fourth largest producer and thesingle largest production site of cement situated in the upper Punjabregion of district Mianwali. The current production capacity of MLCF is12,000 TPD and 500 TDP for grey and white cement respectively.Moreover the company also makes different variants like ordinaryPortland cement, sulphate resistant cement and low alkali cement.
7.84 8.04
6.65
7.90 7.25
6.18 6.63
7.08 6.50
-
1.00
2.00
3.00
4.00
5.00
6.00
7.00
8.00
9.00
-
2.00
4.00
6.00
8.00
10.00
12.00
14.00
16.00
18.00
2014 2015 2016 2017 2018 2019 2020 2021 2022
Power Cost Per KW (PKR)
WHR Gas FO Coal Grid MLCF Avg Cost
Source: ASDA Research
ASDA Research Reports are available on Thomson Reuters 8
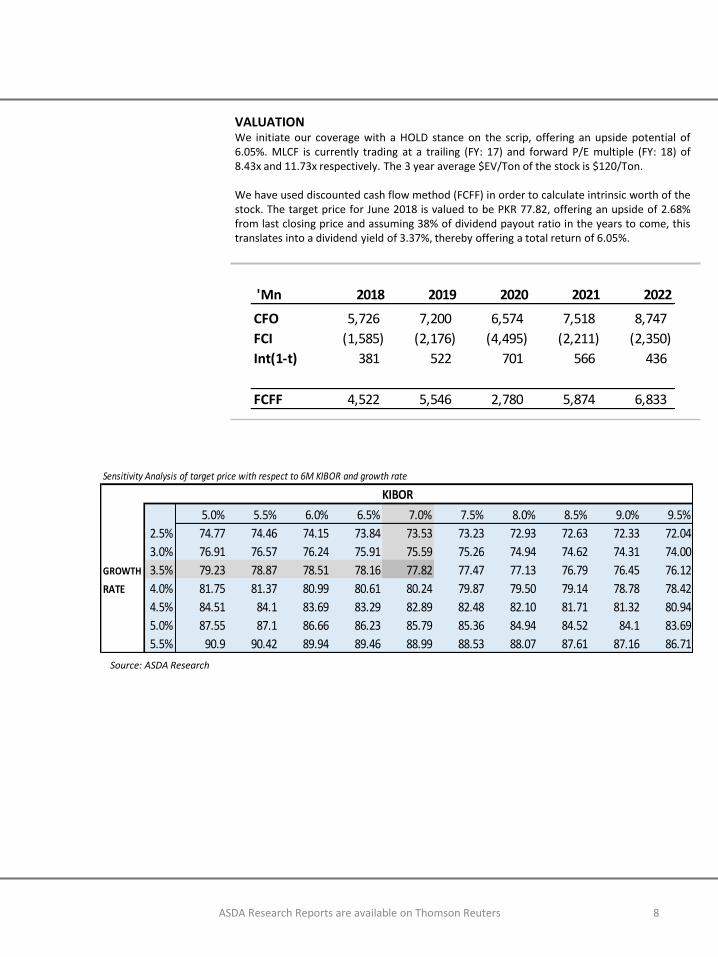
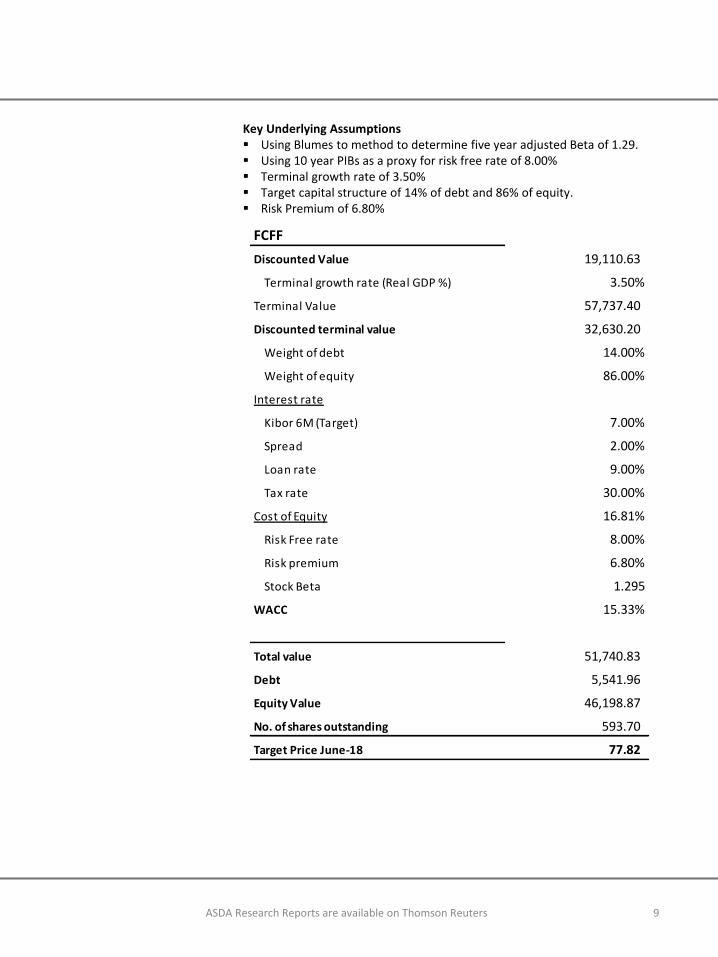
VALUATIONWe initiate our coverage with a HOLD stance on the scrip, offering an upside potential of6.05%. MLCF is currently trading at a trailing (FY: 17) and forward P/E multiple (FY: 18) of8.43x and 11.73x respectively. The 3 year average $EV/Ton of the stock is $120/Ton.
We have used discounted cash flow method (FCFF) in order to calculate intrinsic worth of thestock. The target price for June 2018 is valued to be PKR 77.82, offering an upside of 2.68%from last closing price and assuming 38% of dividend payout ratio in the years to come, thistranslates into a dividend yield of 3.37%, thereby offering a total return of 6.05%.
'Mn 2018 2019 2020 2021 2022
CFO 5,726 7,200 6,574 7,518 8,747
FCI (1,585) (2,176) (4,495) (2,211) (2,350)
Int(1-t) 381 522 701 566 436
FCFF 4,522 5,546 2,780 5,874 6,833
Source: ASDA Research
Sensitivity Analysis of target price with respect to 6M KIBOR and growth rate
5.0% 5.5% 6.0% 6.5% 7.0% 7.5% 8.0% 8.5% 9.0% 9.5%
2.5% 74.77 74.46 74.15 73.84 73.53 73.23 72.93 72.63 72.33 72.04
3.0% 76.91 76.57 76.24 75.91 75.59 75.26 74.94 74.62 74.31 74.00
GROWTH 3.5% 79.23 78.87 78.51 78.16 77.82 77.47 77.13 76.79 76.45 76.12
RATE 4.0% 81.75 81.37 80.99 80.61 80.24 79.87 79.50 79.14 78.78 78.42
4.5% 84.51 84.1 83.69 83.29 82.89 82.48 82.10 81.71 81.32 80.94
5.0% 87.55 87.1 86.66 86.23 85.79 85.36 84.94 84.52 84.1 83.69
5.5% 90.9 90.42 89.94 89.46 88.99 88.53 88.07 87.61 87.16 86.71
KIBOR
ASDA Research Reports are available on Thomson Reuters 9
FCFF
Discounted Value 19,110.63
Terminal growth rate (Real GDP %) 3.50%
Terminal Value 57,737.40
Discounted terminal value 32,630.20
Weight of debt 14.00%
Weight of equity 86.00%
Interest rate
Kibor 6M (Target) 7.00%
Spread 2.00%
Loan rate 9.00%
Tax rate 30.00%
Cost of Equity 16.81%
Risk Free rate 8.00%
Risk premium 6.80%
Stock Beta 1.295
WACC 15.33%
Total value 51,740.83
Debt 5,541.96
Equity Value 46,198.87
No. of shares outstanding 593.70
Target Price June-18 77.82
Key Underlying Assumptions Using Blumes to method to determine five year adjusted Beta of 1.29. Using 10 year PIBs as a proxy for risk free rate of 8.00% Terminal growth rate of 3.50% Target capital structure of 14% of debt and 86% of equity. Risk Premium of 6.80%
ASDA Research Reports are available on Thomson Reuters 10
INVESTMENTS RISKS
Lower than anticipated demand Price war as a result of supply glut Unexpected rise in commodity prices Further devaluation of PKR Decline in infrastructural and CPEC related projects Increase in interest rates
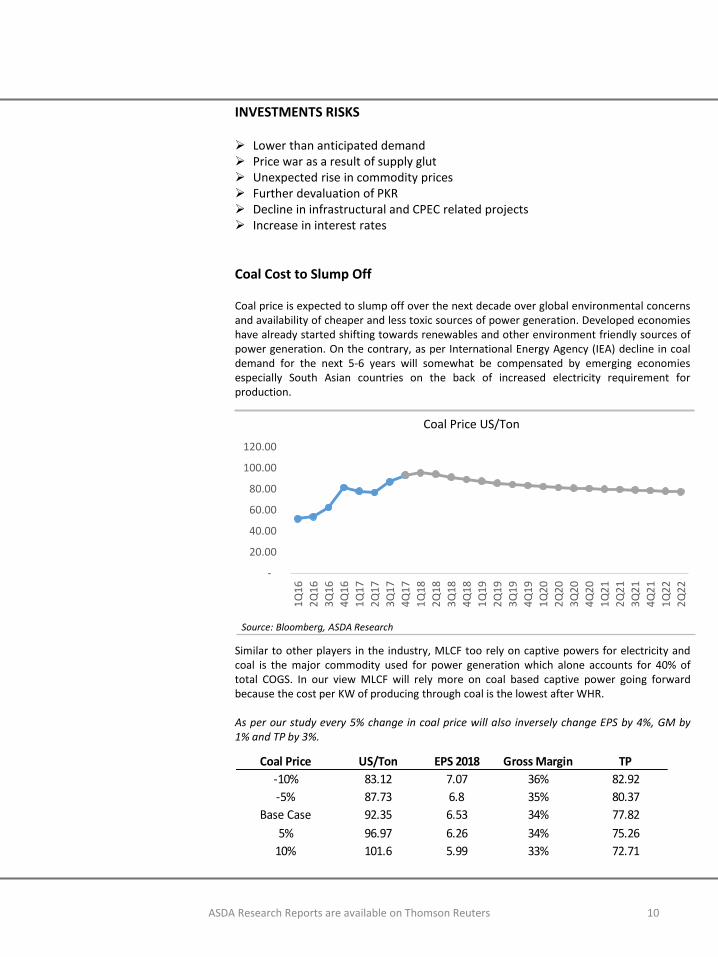
Coal Cost to Slump Off
Coal price is expected to slump off over the next decade over global environmental concernsand availability of cheaper and less toxic sources of power generation. Developed economieshave already started shifting towards renewables and other environment friendly sources ofpower generation. On the contrary, as per International Energy Agency (IEA) decline in coaldemand for the next 5-6 years will somewhat be compensated by emerging economiesespecially South Asian countries on the back of increased electricity requirement forproduction.
Similar to other players in the industry, MLCF too rely on captive powers for electricity andcoal is the major commodity used for power generation which alone accounts for 40% oftotal COGS. In our view MLCF will rely more on coal based captive power going forwardbecause the cost per KW of producing through coal is the lowest after WHR.
As per our study every 5% change in coal price will also inversely change EPS by 4%, GM by1% and TP by 3%.
-
20.00
40.00
60.00
80.00
100.00
120.00
1Q
16
2Q
16
3Q
16
4Q
16
1Q
17
2Q
17
3Q
17
4Q
17
1Q
18
2Q
18
3Q
18
4Q
18
1Q
19
2Q
19
3Q
19
4Q
19
1Q
20
2Q
20
3Q
20
4Q
20
1Q
21
2Q
21
3Q
21
4Q
21
1Q
22
2Q
22
Coal Price US/Ton
Source: Bloomberg, ASDA Research
Coal Price US/Ton EPS 2018 Gross Margin TP
-10% 83.12 7.07 36% 82.92
-5% 87.73 6.8 35% 80.37
Base Case 92.35 6.53 34% 77.82
5% 96.97 6.26 34% 75.26
10% 101.6 5.99 33% 72.71
ASDA Research Reports are available on Thomson Reuters 11
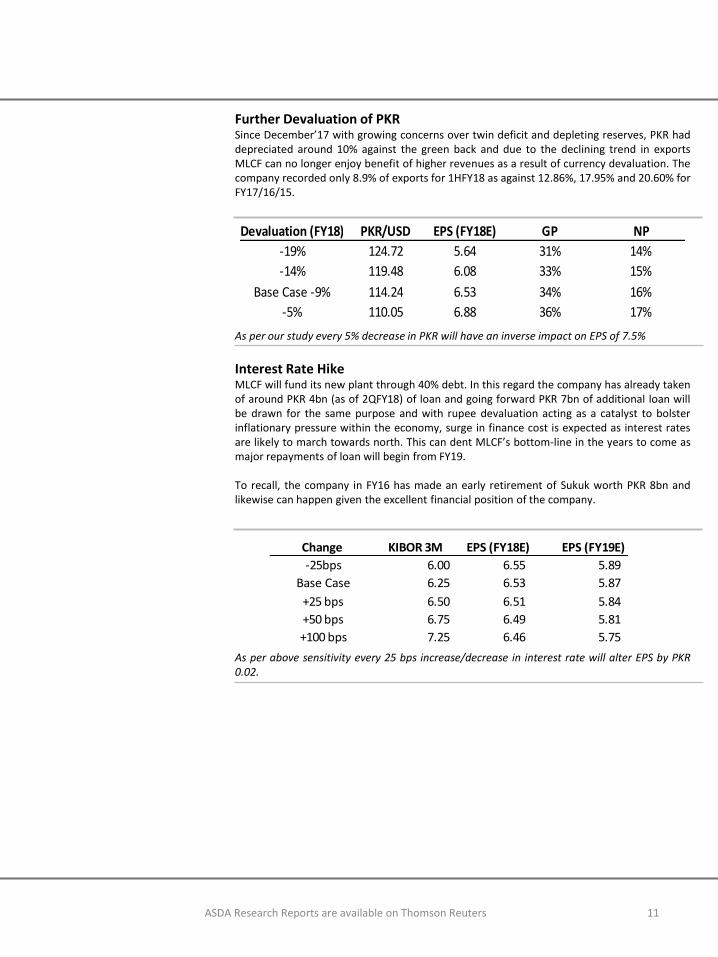
Further Devaluation of PKRSince December’17 with growing concerns over twin deficit and depleting reserves, PKR haddepreciated around 10% against the green back and due to the declining trend in exportsMLCF can no longer enjoy benefit of higher revenues as a result of currency devaluation. Thecompany recorded only 8.9% of exports for 1HFY18 as against 12.86%, 17.95% and 20.60% forFY17/16/15.
As per our study every 5% decrease in PKR will have an inverse impact on EPS of 7.5%
Interest Rate HikeMLCF will fund its new plant through 40% debt. In this regard the company has already takenof around PKR 4bn (as of 2QFY18) of loan and going forward PKR 7bn of additional loan willbe drawn for the same purpose and with rupee devaluation acting as a catalyst to bolsterinflationary pressure within the economy, surge in finance cost is expected as interest ratesare likely to march towards north. This can dent MLCF’s bottom-line in the years to come asmajor repayments of loan will begin from FY19.
To recall, the company in FY16 has made an early retirement of Sukuk worth PKR 8bn andlikewise can happen given the excellent financial position of the company.
As per above sensitivity every 25 bps increase/decrease in interest rate will alter EPS by PKR0.02.
Devaluation (FY18) PKR/USD EPS (FY18E) GP NP
-19% 124.72 5.64 31% 14%
-14% 119.48 6.08 33% 15%
Base Case -9% 114.24 6.53 34% 16%
-5% 110.05 6.88 36% 17%
Change KIBOR 3M EPS (FY18E) EPS (FY19E)
-25bps 6.00 6.55 5.89
Base Case 6.25 6.53 5.87
+25 bps 6.50 6.51 5.84
+50 bps 6.75 6.49 5.81
+100 bps 7.25 6.46 5.75
ASDA Research Reports are available on Thomson Reuters 12
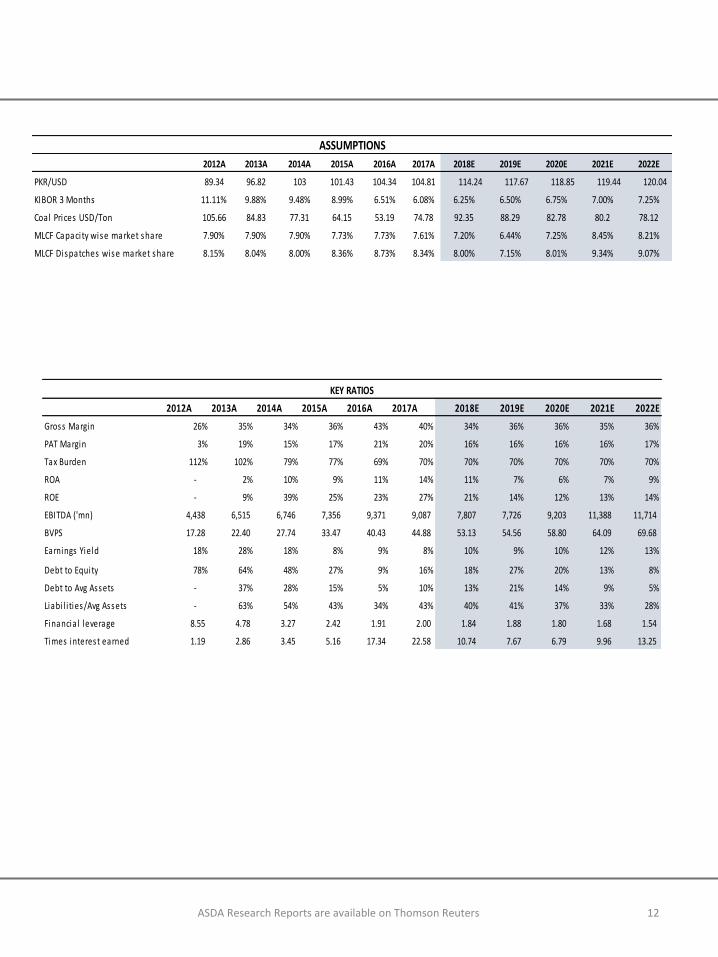
2012A 2013A 2014A 2015A 2016A 2017A 2018E 2019E 2020E 2021E 2022E
Gross Margin 26% 35% 34% 36% 43% 40% 34% 36% 36% 35% 36%
PAT Margin 3% 19% 15% 17% 21% 20% 16% 16% 16% 16% 17%
Tax Burden 112% 102% 79% 77% 69% 70% 70% 70% 70% 70% 70%
ROA - 2% 10% 9% 11% 14% 11% 7% 6% 7% 9%
ROE - 9% 39% 25% 23% 27% 21% 14% 12% 13% 14%
EBITDA ('mn) 4,438 6,515 6,746 7,356 9,371 9,087 7,807 7,726 9,203 11,388 11,714
BVPS 17.28 22.40 27.74 33.47 40.43 44.88 53.13 54.56 58.80 64.09 69.68
Earnings Yield 18% 28% 18% 8% 9% 8% 10% 9% 10% 12% 13%
Debt to Equity 78% 64% 48% 27% 9% 16% 18% 27% 20% 13% 8%
Debt to Avg Assets - 37% 28% 15% 5% 10% 13% 21% 14% 9% 5%
Liabi l i ties/Avg Assets - 63% 54% 43% 34% 43% 40% 41% 37% 33% 28%
Financia l leverage 8.55 4.78 3.27 2.42 1.91 2.00 1.84 1.88 1.80 1.68 1.54
Times interest earned 1.19 2.86 3.45 5.16 17.34 22.58 10.74 7.67 6.79 9.96 13.25
KEY RATIOS
2012A 2013A 2014A 2015A 2016A 2017A 2018E 2019E 2020E 2021E 2022E
PKR/USD 89.34 96.82 103 101.43 104.34 104.81 114.24 117.67 118.85 119.44 120.04
KIBOR 3 Months 11.11% 9.88% 9.48% 8.99% 6.51% 6.08% 6.25% 6.50% 6.75% 7.00% 7.25%
Coal Prices USD/Ton 105.66 84.83 77.31 64.15 53.19 74.78 92.35 88.29 82.78 80.2 78.12
MLCF Capacity wise market share 7.90% 7.90% 7.90% 7.73% 7.73% 7.61% 7.20% 6.44% 7.25% 8.45% 8.21%
MLCF Dispatches wise market share 8.15% 8.04% 8.00% 8.36% 8.73% 8.34% 8.00% 7.15% 8.01% 9.34% 9.07%
ASSUMPTIONS
ASDA Research Reports are available on Thomson Reuters 13
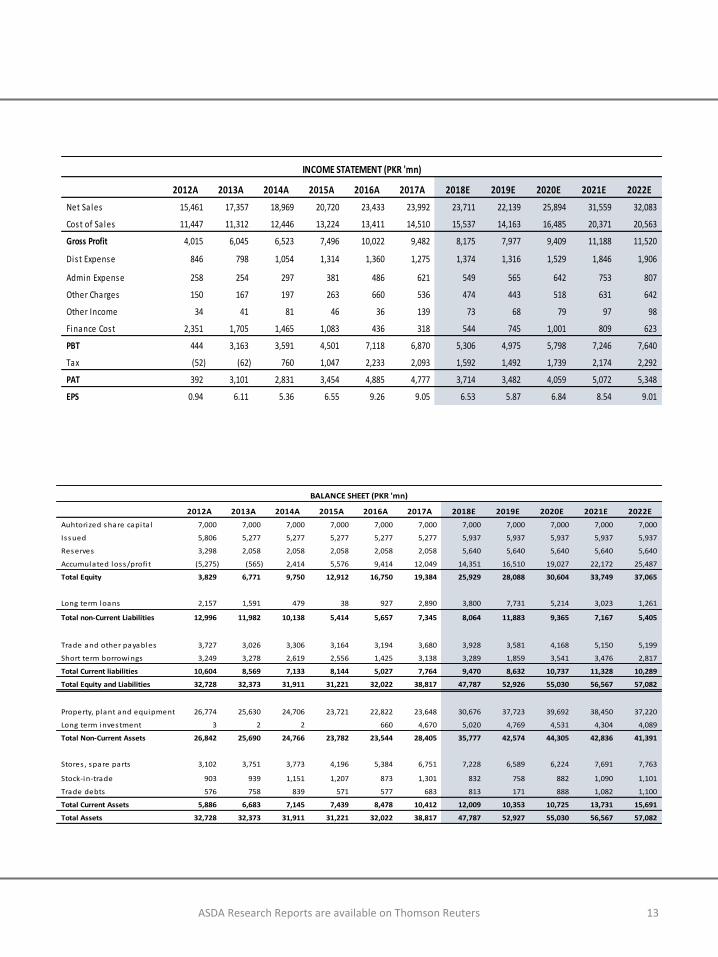
2012A 2013A 2014A 2015A 2016A 2017A 2018E 2019E 2020E 2021E 2022E
Net Sa les 15,461 17,357 18,969 20,720 23,433 23,992 23,711 22,139 25,894 31,559 32,083
Cost of Sa les 11,447 11,312 12,446 13,224 13,411 14,510 15,537 14,163 16,485 20,371 20,563
Gross Profit 4,015 6,045 6,523 7,496 10,022 9,482 8,175 7,977 9,409 11,188 11,520
Dis t Expense 846 798 1,054 1,314 1,360 1,275 1,374 1,316 1,529 1,846 1,906
Admin Expense 258 254 297 381 486 621 549 565 642 753 807
Other Charges 150 167 197 263 660 536 474 443 518 631 642
Other Income 34 41 81 46 36 139 73 68 79 97 98
Finance Cost 2,351 1,705 1,465 1,083 436 318 544 745 1,001 809 623
PBT 444 3,163 3,591 4,501 7,118 6,870 5,306 4,975 5,798 7,246 7,640
Tax (52) (62) 760 1,047 2,233 2,093 1,592 1,492 1,739 2,174 2,292
PAT 392 3,101 2,831 3,454 4,885 4,777 3,714 3,482 4,059 5,072 5,348
EPS 0.94 6.11 5.36 6.55 9.26 9.05 6.53 5.87 6.84 8.54 9.01
INCOME STATEMENT (PKR 'mn)
2012A 2013A 2014A 2015A 2016A 2017A 2018E 2019E 2020E 2021E 2022E
Auhtorized share capita l 7,000 7,000 7,000 7,000 7,000 7,000 7,000 7,000 7,000 7,000 7,000
Is sued 5,806 5,277 5,277 5,277 5,277 5,277 5,937 5,937 5,937 5,937 5,937
Reserves 3,298 2,058 2,058 2,058 2,058 2,058 5,640 5,640 5,640 5,640 5,640
Accumulated loss/profi t (5,275) (565) 2,414 5,576 9,414 12,049 14,351 16,510 19,027 22,172 25,487
Total Equity 3,829 6,771 9,750 12,912 16,750 19,384 25,929 28,088 30,604 33,749 37,065
Long term loans 2,157 1,591 479 38 927 2,890 3,800 7,731 5,214 3,023 1,261
Total non-Current Liabilities 12,996 11,982 10,138 5,414 5,657 7,345 8,064 11,883 9,365 7,167 5,405
Trade and other payables 3,727 3,026 3,306 3,164 3,194 3,680 3,928 3,581 4,168 5,150 5,199
Short term borrowings 3,249 3,278 2,619 2,556 1,425 3,138 3,289 1,859 3,541 3,476 2,817
Total Current liabilities 10,604 8,569 7,133 8,144 5,027 7,764 9,470 8,632 10,737 11,328 10,289
Total Equity and Liabilities 32,728 32,373 31,911 31,221 32,022 38,817 47,787 52,926 55,030 56,567 57,082
Property, plant and equipment 26,774 25,630 24,706 23,721 22,822 23,648 30,676 37,723 39,692 38,450 37,220
Long term investment 3 2 2 660 4,670 5,020 4,769 4,531 4,304 4,089
Total Non-Current Assets 26,842 25,690 24,766 23,782 23,544 28,405 35,777 42,574 44,305 42,836 41,391
Stores , spare parts 3,102 3,751 3,773 4,196 5,384 6,751 7,228 6,589 6,224 7,691 7,763
Stock-in-trade 903 939 1,151 1,207 873 1,301 832 758 882 1,090 1,101
Trade debts 576 758 839 571 577 683 813 171 888 1,082 1,100
Total Current Assets 5,886 6,683 7,145 7,439 8,478 10,412 12,009 10,353 10,725 13,731 15,691
Total Assets 32,728 32,373 31,911 31,221 32,022 38,817 47,787 52,927 55,030 56,567 57,082
BALANCE SHEET (PKR 'mn)
14
Analyst CertificationASDA Research, primarily involved in the preparation of this report, certifies that (1) the views expressed in this report accuratelyreflect the researcher’s personal views about the subject company/stock /sector and (2) no part of researcher’s compensation was, isor will be directly or indirectly related to the specific recommendations or views expressed in this report.
Research Dissemination PolicyASDA Research endeavours to make all reasonable efforts to disseminate research to all eligible clients in a timely manner througheither physical or electronic distribution such as email, fax mail etc.
Valuation MethodologyTo arrive at our 12-months Target Price, ASDA Research uses multiple valuation methods which include:1) DCF methodology (DCF, DDM)2) Relative valuation methodology (P/E/, P/B, P/S etc.)3) Equity & Asset-based valuation methodology (EVA, Residual Income etc.)
Rating Expected Total ReturnBuy Greater than 15%Hold Neither Buy nor SellSell Less than and equal to -5%
Ratings are updated to account for any development impacting the economy/sector/company, changes in analysts’ assumptions or acombination of these factors.
DisclaimerThis report has been prepared by Research Department of ASDA Securities (Pvt.) Limited and is provided for information purposesonly. Under no circumstances, should this be used or considered as an offer to sell or solicitation of any offer to buy. Whilereasonable care has been taken to ensure that the information contained herein is not untrue or misleading at the time ofpublication, we make no representation as to its accuracy or completeness and it should not be relied upon as such. This report isprovided only for the information of professional advisers who are expected to make their own investment decisions without unduereliance on this report. Investments in capital markets are subject to market risk and ASDA Research accepts no responsibilitywhatsoever for any direct or indirect consequential loss arising from any use of this report or its contents. In particular, the reporttakes no account of the investment objectives, financial situation and particular needs of investors, who should seek furtherprofessional advice or rely upon their own judgment and acumen before making any investment. The views expressed in this reportare of the Research Department and do not necessarily reflect those of the company or its directors. All rights reserved by ASDASecurities (Private) Limited. This report or any portion hereof may not be reproduced, distributed or published by any person for anypurpose whatsoever. Nor can it be sent to a third party without prior consent of ASDA Research. Action could be taken forunauthorized reproduction, distribution or publication.
Furthermore, in accordance with clause 8(2) sub- clause (i) of RAR 2015, we currently do not have any financial interest associated inthe subject security aggregating more than 1% of the value of the company.
ASDA Research Reports are available on Thomson Reuters
406 - 408, 4th Floor,New Stock Exchange Building, Pakistan Stock Exchange,
I.I. Chundrigar Road, Karachi – 74000+92(21) 32467805 - 10


