Embed Size (px)
Citation preview
Routing Through an Integrated Communication and Social Network
Michael W. Bigrigg, Kathleen M. Carley Institute for Software Research
Carnegie Mellon University Pittsburgh PA
Kyriakos Manousakis, Anthony McAuley Telecordia Technologies, Inc.
Piscataway, NJ
ABSTRACT1
This paper explores the robust routing of messages among individuals. Traditional routing assumes individuals provide messages to a device connected to a communications network that assumes all responsibility for message delivery. Although each individual may have links to multiple communication devices (office computer, PDA, cell phone), messages are delivered only if there is an end-to-end communication path between communication devices available to each individual. To improve robustness of communication, especially in dynamic ad hoc military networks, this paper models a novel routing paradigm using an integrated communication and social network. The understanding is that individuals can and do route messages through a social network in conjunction with the communication network. An example of this is an individual asking another in his immediate social network to place a call on his behalf when the official communication system is not convenient or is unavailable. We show that it is possible to route messages through the integrated social and communication network by: a) using the ORA social analysis tool to select normalized costs for the social and communication network links (e.g., to reflect the link delay, quality or robustness), and b) using the MONOPATI communication design tool to model the integrated socio-communication network as a graph and performing QoS routing. Results show that the robustness of message delivery can be improved by 5X through this joint routing, without unnecessary impacts on end to end latency.
INTRODUCTION
Mobile ad hoc communication networks (MANETs) are often fragmented, making it impossible to route messages. While there are enhanced protocols for MANETS, such as providing Delay/Disruption Tolerant Networking (DTN) routing [1][2], in many cases messages may be delayed too long to be useful for many applications. In battlefield scenarios, for example, message delivery time is critical 1 Prepared through collaborative participation in the Communications and Networks Consortium sponsored by the U.S. Army Research La-boratory under the Collaborative Technology Alliance (CTA) Pro-gram, Cooperative Agreement DAAD19-01-2-0011. The U.S. Gov-ernment is authorized to reproduce and distribute reprints for Government purposes notwithstanding any copyright notation thereon.
and delay may be unacceptable. While more resources can be applied to help ameliorate the problem, the nature of the hostile (e.g., jamming) and rapidly changing environment means that a communication network solution is not always feasible.
To enhance the robustness of message delivery, we consider exploiting the social network to enhance the communication network. A communication network consists of communication devices, which transmits data from a source through devices that make up the communication network to eventually end up at a destination device or devices. A social network consists of people as individuals that have personal relationships. In general, the social network, of individuals and relationships, uses the communication network, of devices and transmission links. A link also exists from an individual in the social network to a device in the communication network, which is used to send information locally from individual to device. The communication network focuses on the end to end transmission of messages using a routing protocol to decide the path among devices.
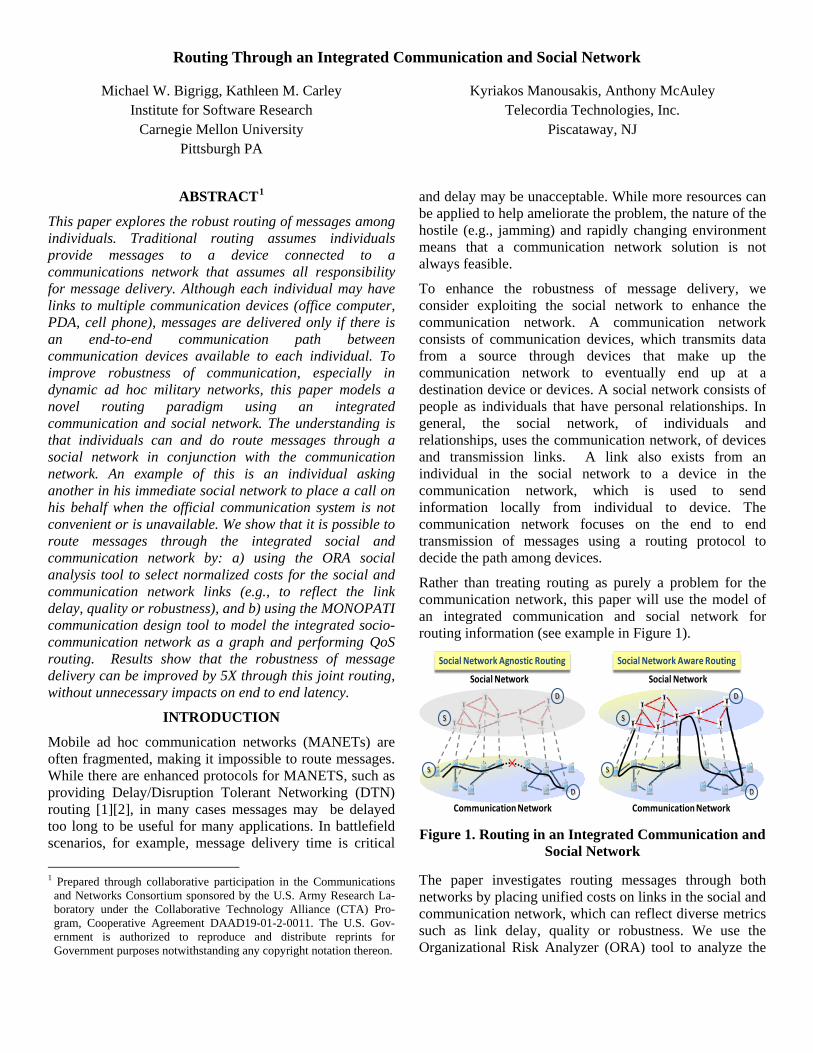
Rather than treating routing as purely a problem for the communication network, this paper will use the model of an integrated communication and social network for routing information (see example in Figure 1).
Social Network
Communication Network
×S
D
Social Network Agnostic Routing
Social Network
Communication Network
S
D
S
D
Social Network Aware Routing
S
D
Figure 1. Routing in an Integrated Communication and
Social Network
The paper investigates routing messages through both networks by placing unified costs on links in the social and communication network, which can reflect diverse metrics such as link delay, quality or robustness. We use the Organizational Risk Analyzer (ORA) tool to analyze the
social network in order to place weights on the social network links. Typically, for example, the social network has a much larger delay metric on its links than those in the communication network.
This paper also investigates how much the robustness of message delivery can be enhanced through this joint routing. Social network can be used to relay information opportunistically to overcome failures or limitations in the communication network. The Multi-Objective Network Optimization and Assessment Tool (MONOPATI) is used to compute QoS paths [12] using the unified link metrics.
The remainder of the paper is organized as follows. Section II overviews the (ORA) and (MONAPATI) tools that combinendly perform the analysis and design of the socio-communication networks and routing paths. Section III overviews the use of ORA on the DARPA Intrusion Detection System (IDS) data to analyze social and communications networks. Section IV describes the use of MONOPATI on scenarios inspired by the DARPA IDS data, together with results and analysis from the application of socio-communcation routing. Finally, Section V summarizes the results and describes future directions.
II TOOLS OVERVIEW
This section describes existing tools to analyze social networks (ORA) and analyze and design communication networks (MONOPATI).
A. ORA Social Network Analysis
The Organizational Risk Analyzer (ORA) Tool [15] is used to analyze diverse social networks, including terrorist networks, blue force networks, and commercial corporations. From the social network data ORA locates patterns of behavior, groups, key actors, critical events, and identifies vulnerabilities. It puts the results into user selected & customized reports:
• Intelligence Report
• Management Report
• Immediate Impact Report
• Near Term Impact Report
• Event Analysis
• Location Analysis
• Ego “Sphere of Influence” Report
It uses an ontology developed by Carley and Krackhart[13], and further extended by Carley[14] to model entities into such categories as agents, resources, tasks, knowledge, locations, and events.
Analysis of social networks is done through the use of criticality measures that have been developed to evaluate the network. These measures are based on network theory, social psychology, operations research, and management theory.
Betweenness measures the number of times that connections must pass through a single individual to be connected [16]. For example, betweenness tells us which node is the most connected to other parts of a network or which node (e.g. person) in a network is the most central to the network as a whole. The degree centrality calculates the relative number of direct connections an entity might have in a network; the higher the score the more likely an entity might be likely to receive and potentially pass on critical information that flows through the organization [17]. Betweenness and degree centrality are examples of key measures of social network analysis and Dynamic Network Analysis.
An analysis of communication networks using ORA applies traditional social network metrics to the assessment of the reliability of message transmission through a communication routing network.
Information about the potential partitioning of the network:
• boundary spanner: how likely is it if the node is removed that the network will be partitioned into major subnetworks. • potential boundary spanner: how likely is it if the node is removed that the network has a greater chance of being partitioned into major subnetworks. • exclusivity: how likely is it if the node is removed that the network will partition a small subnetwork from a large subnetwork.
Information about the reliability of sending a message:
• total degree centrality: how well a node can transmit a message onto the network. • eigenvalue centrality: how well a node can have a message transmitted onto the network
Information about the reliability of message transmission through the network:
• betweenness centrality: how critical is the node in routing messages. • clustering: how redundant is a node for routing messages.
The standard approach to using these measures is through ORA’s reporting mechanism, which provides context for understanding. The Communications Network Assessment report provides the above information in the context of a computer communication network.
B. MONOPATI Communication Network Design and Analysis Tool The Multi-Objective Network Optimization and Assess-ment Tool (MONOPATI) [7] designs and analyzes diverse multi-dimensional communication networks. MONOPATI has been used in a wide variety of network optimizations, including: create routing clusters [10], intrusion detection hierarchies [8] and network topologies [9]. It has been used to design and analyze networks with thousands of nodes.
MONOPATI uses an enhanced Simulated Annealing (SA) algorithm for rapid network optimization and assessment based on objective functions and constraints that represent the design goals. A unique feature of MONOPATI is the flexible mathematical representation of goals in objective functions and constraints, providing a flexible and multi-faceted definition of network goodness.
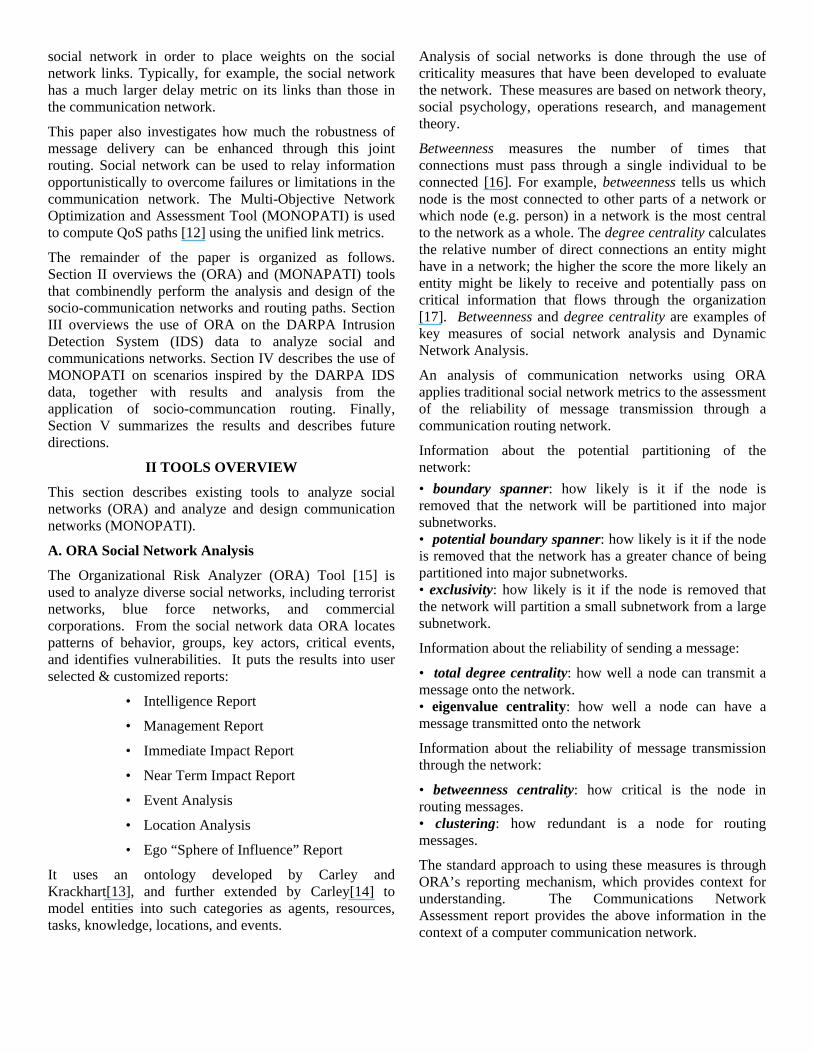
Obtaining the optimum communication configuration is similar to the crystallization of a liquid in a physical annealing process. In SA, however, the temperature is used as a control parameter without any physical meaning. Figure 2 highlights the general SA steps. The objective is to approach or reach the optimal configuration, C*, that optimizes a particular objective function subject to constraints. The process starts with an initial temperature value, T0, which is iteratively decreased by a cooling schedule (sa_cooling) until the termination condition is reached (sa_stop).
Initialization (sa_init):Initialization (sa_init):Temperature
(T0)Initial Solution
(sa_init_config)
Objective Function:Cost Evaluation of Initial Solution
Objective Function:Cost Evaluation of Initial Solution
Objective Function (sa_energy_changed):Cost Evaluation of New Candidate SolutionObjective Function (sa_energy_changed):Cost Evaluation of New Candidate Solution
State Transition (sa_reconfig):New Candidate Solution
State Transition (sa_reconfig):New Candidate Solution
Stop Criterion (sa_stop)?Stop Criterion (sa_stop)?
Final Solution:Optimal Solution and Optimal Cost
Final Solution:Optimal Solution and Optimal Cost
YES
NO
Cooling Schedule (sa_cooling):Update Temperature
Cooling Schedule (sa_cooling):Update Temperature
Metropolis Criterion:Accept New Candidate Solution?
Metropolis Criterion:Accept New Candidate Solution?
Optimal Solution = Initial SolutionOptimal Cost = Cost of Initial Solution (sa_init_energy)
Optimal Solution = Initial SolutionOptimal Cost = Cost of Initial Solution (sa_init_energy)
NOUpdate Optimal Solution and Optimal Cost:
Optimal Solution = New Candidate SolutionOptimal Cost = New Candidate Solution Cost
Update Optimal Solution and Optimal Cost:Optimal Solution = New Candidate Solution
Optimal Cost = New Candidate Solution Cost
YES
Equilibrium (sa_equilibrium):Reached?
Equilibrium (sa_equilibrium):Reached?
NO
YES
Figure 2 General Simulated Annealing (SA) for optimization of diverse communication network
functions
The process starts by generating an initial valid configuration (sa_init_config) for which SA calculates the
initial cost, which is called energy (sa_energy) in annealing's terminology. At each algorithmic iteration, a state transition happens, where the SA algorithm slightly perturbs the current optimal configuration C for obtaining a new candidate configuration C’ (sa_reconfig). This new candidate configuration is evaluated (sa_energy_change) against the currently optimal C by computing the energy difference.
For avoiding being trapped into local minima and by assuming (without loss of generality) a minimization problem, SA randomly decides to replace the currently optimal solution with the new candidate solution. The stochastic decision is based on the Metropolis criterion:
( )1 if 0
exp if 0T
EP C C E E
T
∆ >′← = ∆ ∆ ≤
(1)
The higher the temperature (T), the higher the probability SA will accept worse reconfigurations. At high temperatures SA will simply take a random walk around the solution space. For each temperature T, the number of iterations required to reach equilibrium (sa_equilibrium) can be a simple constant (e.g., 1000) or a function of the temperature and other parameters specific to the optimization problem, such as number of network nodes.
Although SA is generally considered slow; it can be considerably accelerated by trading off optimality. In dynamic environments, less optimal configurations are acceptable, since conditions change due to various dynamics (mobility, failures). This can be achieved by faster Cooling Schedule, Termination Condition, and having better initial configurations [7].
MONOPATI generates metrics that characterize the communication network including: Capacity, Diameter, Path Cost, Transmit Power, Visibility, and Connectivity.
III. SCENARIO AND METRICS
This section overviews the use of ORA to analyze the DARPA Intrusion Detection System (IDS) data [18] to create representative social and communications networks with weights that reflect the different kinds of links.
The 1999 DARPA IDS data is being used to create social and communications networks. It contains computer network trace data from a controlled testbed of machines on a network, collected using tcpdump on a computer on the local network. The purpose of the data was to provide a testbed for intrusion detection researchers. This dataset provides the data needed to evaluate a relationship between computer communication network and social network. A communication network and a social network can be extracted from this dataset. Data was collected for a
period of Monday to Friday for five weeks. Several networks were extracted: computer to computer, person to computer, and person to person.
The first network is the most obvious; it is a computer to compute relationship with each node representing a computer with the links between them identifying that communication has occurred between them. A weight value is placed on the link to identify the amount of communication that has occurred between the two computers. The link is unidirectional to show the communication that has been initiated by each machine. It is important to note that the relationship between computers is based on the highest level of the network stack capturing only the endpoint communication as it does not model the routing of data through the network. Using the ontology in ORA, computers are modeled as resources.
The communication networks will identify the following: What computers are on the network? Who is using which computer? What are the users doing? (e.g. file transfer, email, chat, etc.) Who communicates with whom? What are the computers used for? (email server, etc.) How is the data exchanged? (the physical transmission)
The social network was extracted through the analysis of the payload of the packets that have been transmitted. The testbed used a simulated workload which included email traffic. Analysis of the email sent using the network uncovered a social network, linking the email sender with the email recipients. It was not necessary to analyze the email text, as the sender and recipients were transmitted in the header of the email message. The nodes of the network are people, modeled as agents in the ontology used by ORA. The links capture the exchange of email, with a weight on the link to reflect the amount of email that has been exchanged.
The person to computer relationship is extracted by relating the sender of an email with the source computer used to send the email message. The email address was not used as a means to relate a person to a computer, as it is provided by the user and may not reflect the relationship between a person and the computer used by the person. Similarly, the email address of recipients was not used for the same reason. The protocol used to transmit email messages deliver a message to an email (pop, smtp, etc.) server for retrieval by a user. The machine to which the email message has been delivered is often an email server, and not a specific machine that a person is using. The relationship between person and computer is only identified when the person is a sender of email and not a recipient.
The following values represent the elements of the social and communication networks extracted from the DARPA IDS data:
• 1,791 agent (people) nodes • 2,476 resource (computer) nodes • 18,631 resource (computer) to resource (computer) links • 21,335 agent (people) to resource (computer) links • 47,317 agent (people) to agent (people) links
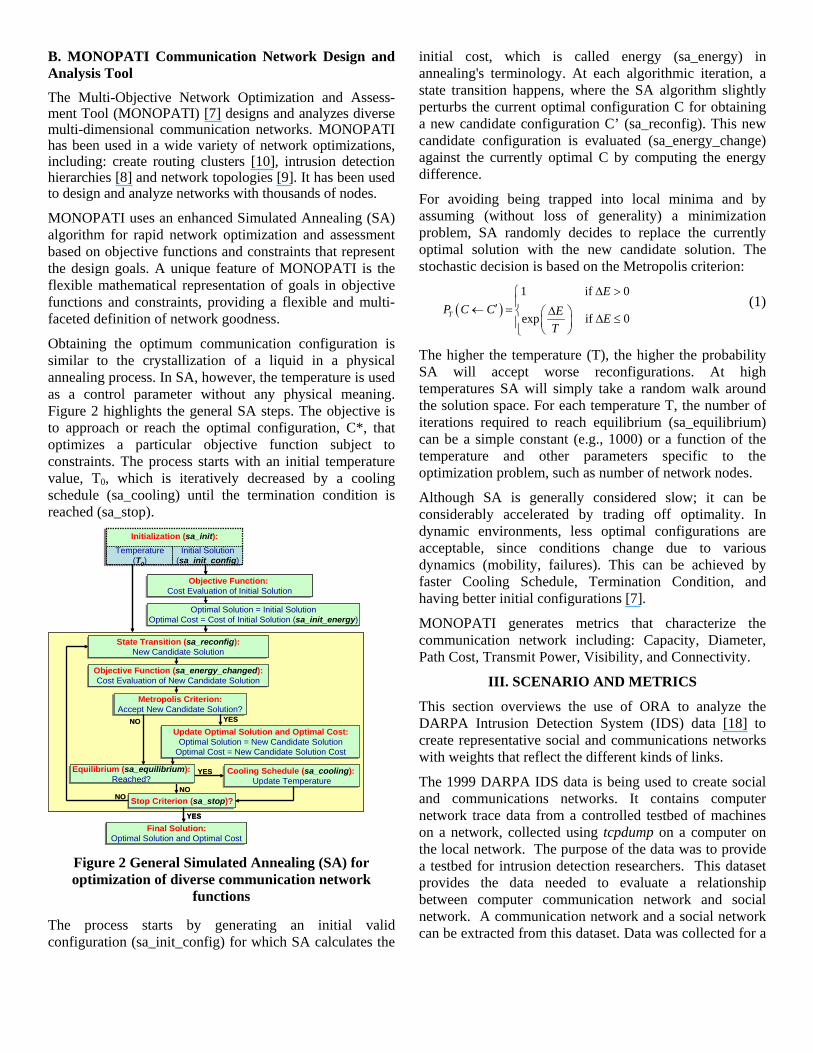
The social network analysis of the data set provides information on how effective the social network can be at providing an alternative mechanism for communication. For instance, the total degree centrality metric can identify how well the users are able to reach out to another person to transmit a message.
Figure 3. Total Degree Centrality
Figure 3 displays the total degree centrality applied only to the person to person social network, as calculated by ORA. Most individuals are connected to others to some amount. Only a small number of people are “well connected” to others. In a real world example, a company receptionist may be a person that is otherwise well connected as he would know most of the people in the organization. Centrality does not take into account the strength of those relationships, but only identifies the individual with the most number of relationships. ORA provides other social network measures that would be able to capture more complex relationships between people.
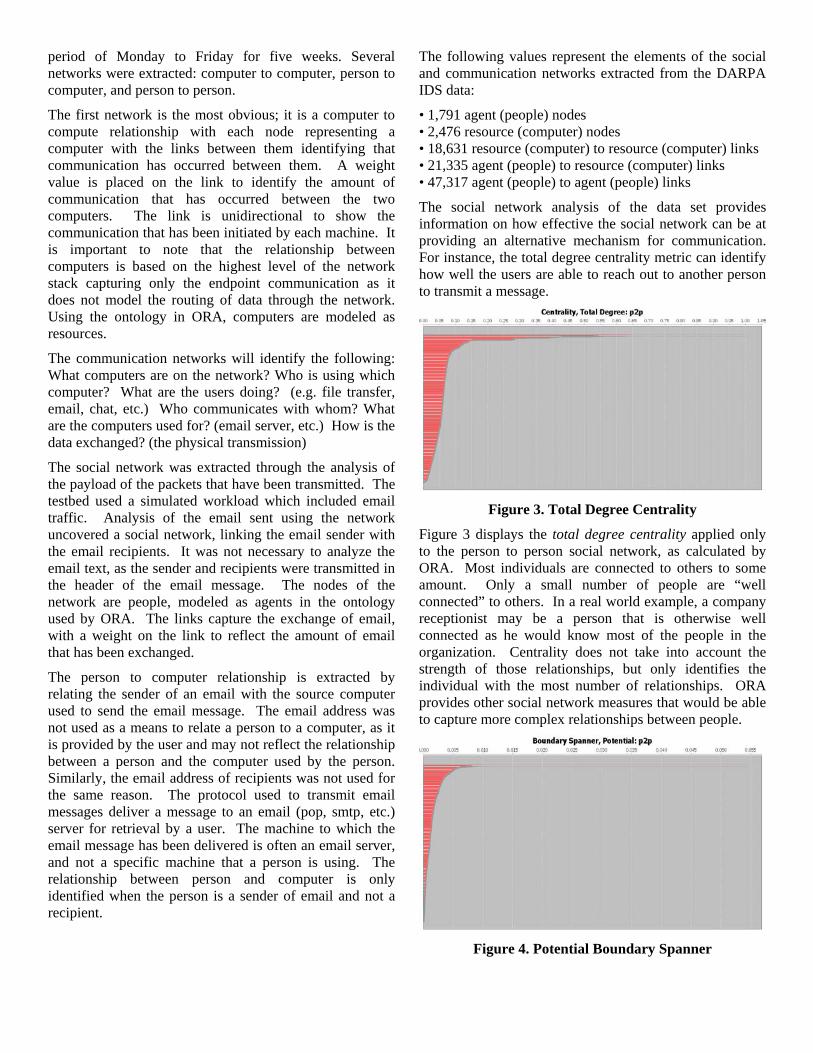
Figure 4. Potential Boundary Spanner
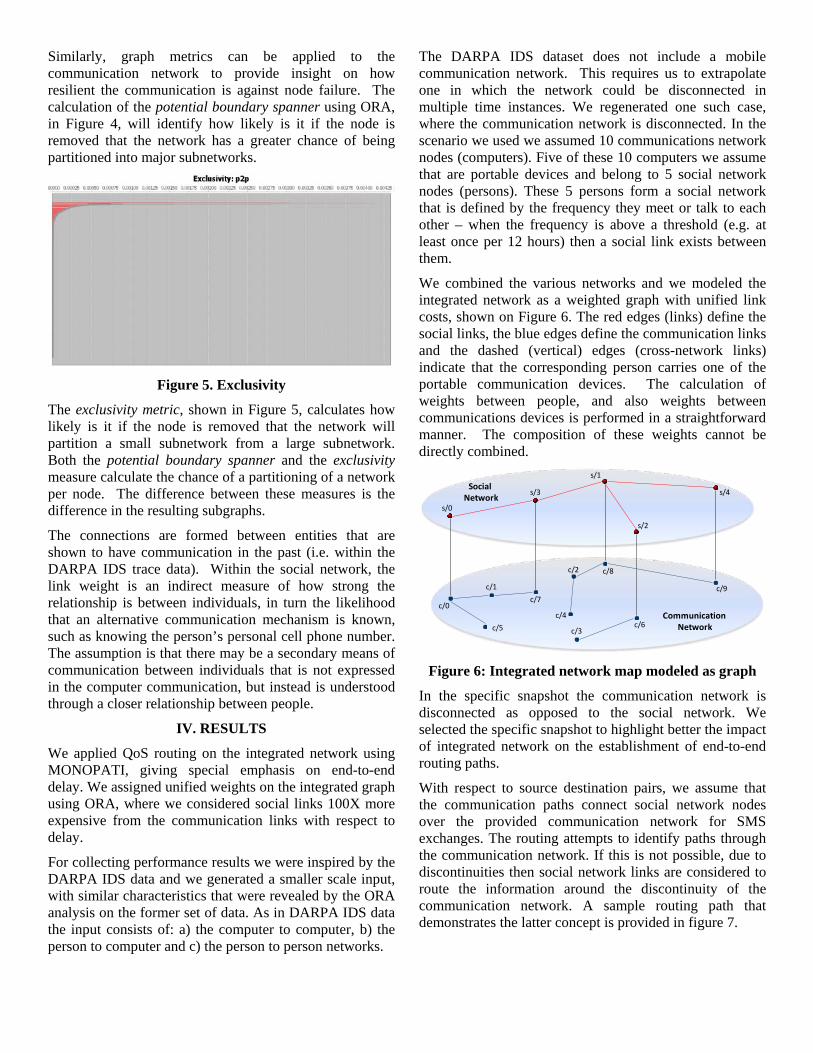
Similarly, graph metrics can be applied to the communication network to provide insight on how resilient the communication is against node failure. The calculation of the potential boundary spanner using ORA, in Figure 4, will identify how likely is it if the node is removed that the network has a greater chance of being partitioned into major subnetworks.
Figure 5. Exclusivity
The exclusivity metric, shown in Figure 5, calculates how likely is it if the node is removed that the network will partition a small subnetwork from a large subnetwork. Both the potential boundary spanner and the exclusivity measure calculate the chance of a partitioning of a network per node. The difference between these measures is the difference in the resulting subgraphs.
The connections are formed between entities that are shown to have communication in the past (i.e. within the DARPA IDS trace data). Within the social network, the link weight is an indirect measure of how strong the relationship is between individuals, in turn the likelihood that an alternative communication mechanism is known, such as knowing the person’s personal cell phone number. The assumption is that there may be a secondary means of communication between individuals that is not expressed in the computer communication, but instead is understood through a closer relationship between people.
IV. RESULTS
We applied QoS routing on the integrated network using MONOPATI, giving special emphasis on end-to-end delay. We assigned unified weights on the integrated graph using ORA, where we considered social links 100X more expensive from the communication links with respect to delay.
For collecting performance results we were inspired by the DARPA IDS data and we generated a smaller scale input, with similar characteristics that were revealed by the ORA analysis on the former set of data. As in DARPA IDS data the input consists of: a) the computer to computer, b) the person to computer and c) the person to person networks.
The DARPA IDS dataset does not include a mobile communication network. This requires us to extrapolate one in which the network could be disconnected in multiple time instances. We regenerated one such case, where the communication network is disconnected. In the scenario we used we assumed 10 communications network nodes (computers). Five of these 10 computers we assume that are portable devices and belong to 5 social network nodes (persons). These 5 persons form a social network that is defined by the frequency they meet or talk to each other – when the frequency is above a threshold (e.g. at least once per 12 hours) then a social link exists between them.
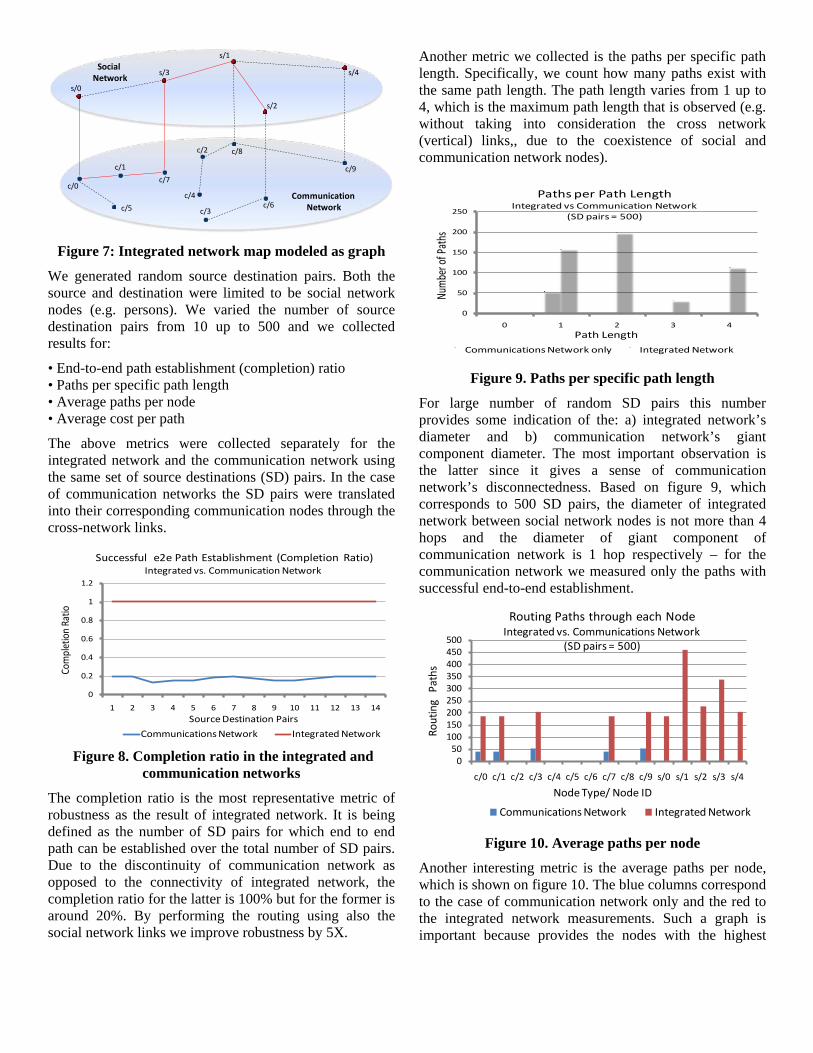
We combined the various networks and we modeled the integrated network as a weighted graph with unified link costs, shown on Figure 6. The red edges (links) define the social links, the blue edges define the communication links and the dashed (vertical) edges (cross-network links) indicate that the corresponding person carries one of the portable communication devices. The calculation of weights between people, and also weights between communications devices is performed in a straightforward manner. The composition of these weights cannot be directly combined.
Social Network
Communication Network
c/1
c/7
c/3c/5
c/4
c/2
c/9
c/8
c/0
c/6
s/0
s/4s/3
s/1
s/2
Figure 6: Integrated network map modeled as graph
In the specific snapshot the communication network is disconnected as opposed to the social network. We selected the specific snapshot to highlight better the impact of integrated network on the establishment of end-to-end routing paths.
With respect to source destination pairs, we assume that the communication paths connect social network nodes over the provided communication network for SMS exchanges. The routing attempts to identify paths through the communication network. If this is not possible, due to discontinuities then social network links are considered to route the information around the discontinuity of the communication network. A sample routing path that demonstrates the latter concept is provided in figure 7.
Social Network
Communication Network
c/1
c/7
c/3c/5
c/4
c/2
c/9
c/8
c/0
c/6
s/0
s/4s/3
s/1
s/2
Figure 7: Integrated network map modeled as graph
We generated random source destination pairs. Both the source and destination were limited to be social network nodes (e.g. persons). We varied the number of source destination pairs from 10 up to 500 and we collected results for:
• End-to-end path establishment (completion) ratio • Paths per specific path length • Average paths per node • Average cost per path
The above metrics were collected separately for the integrated network and the communication network using the same set of source destinations (SD) pairs. In the case of communication networks the SD pairs were translated into their corresponding communication nodes through the cross-network links.
0
0.2
0.4
0.6
0.8
1
1.2
1 2 3 4 5 6 7 8 9 10 11 12 13 14
Communications Network Integrated Network
Successful e2e Path Establishment (Completion Ratio)Integrated vs. Communication Network
Source Destination Pairs
Com
plet
ion
Ratio
Figure 8. Completion ratio in the integrated and communication networks
The completion ratio is the most representative metric of robustness as the result of integrated network. It is being defined as the number of SD pairs for which end to end path can be established over the total number of SD pairs. Due to the discontinuity of communication network as opposed to the connectivity of integrated network, the completion ratio for the latter is 100% but for the former is around 20%. By performing the routing using also the social network links we improve robustness by 5X.
Another metric we collected is the paths per specific path length. Specifically, we count how many paths exist with the same path length. The path length varies from 1 up to 4, which is the maximum path length that is observed (e.g. without taking into consideration the cross network (vertical) links,, due to the coexistence of social and communication network nodes).
0
50
100
150
200
250
0 1 2 3 4
Communications Network only Integrated Network
Paths per Path LengthIntegrated vs Communication Network
(SD pairs = 500)
Path Length
Num
ber o
f Pat
hs
Figure 9. Paths per specific path length
For large number of random SD pairs this number provides some indication of the: a) integrated network’s diameter and b) communication network’s giant component diameter. The most important observation is the latter since it gives a sense of communication network’s disconnectedness. Based on figure 9, which corresponds to 500 SD pairs, the diameter of integrated network between social network nodes is not more than 4 hops and the diameter of giant component of communication network is 1 hop respectively – for the communication network we measured only the paths with successful end-to-end establishment.
050
100150200250300350400450500
c/0 c/1 c/2 c/3 c/4 c/5 c/6 c/7 c/8 c/9 s/0 s/1 s/2 s/3 s/4
Communications Network Integrated Network
Routing Paths through each NodeIntegrated vs. Communications Network
(SD pairs = 500)
Rout
ing
Pat
hs
Node Type/ Node ID
Figure 10. Average paths per node
Another interesting metric is the average paths per node, which is shown on figure 10. The blue columns correspond to the case of communication network only and the red to the integrated network measurements. Such a graph is important because provides the nodes with the highest
betweeness. The graph is not interesting for communication networks but is very interesting for the integrated network since it indicates the social network nodes that will be important contributors to the recovery from the communication network disconnectedness – the nodes that correspond to single columns are social network nodes. As we can see social network nodes s/1 and s/3 are closer to discontinuities of the communication network – when there is no path to destination through the lowest delay cost communication network, the routing algorithm uses social network links.
0
20
40
60
80
100
120
140
10 20 30 40 50 60 70 80 90 100 200 300 400 500
Integrated Network Communications Network
Average Cost per PathIntegrated vs. Communications Network
Source Destination Pairs
Aver
age
Cos
t
Figure 11. Average cost per path
Last but not least is the average cost per path metric (figure 11), which we collected for various SD pairs. The cost for the specific scenario is the end-to-end delay. Due to the discontinuity of communication network, the more expensive (with respect to delay) social network links must be used, resulting on increase in the delay by ~100X. This result is consistent with the relative social and communication network link weights as we set them (social links were set 100X more expensive than communication links). The importance of the result lies on the number of times the average path cost is larger from the relative weight of communication and social links. In this case is O(1X) so it means that the optimized socio-communication paths are using one social link in average, thus there is an average of one discontinuity per path on the communication network.
V. SUMMARY AND FUTURE WORK
This paper presents results showing the effectiveness of a novel routing paradigm where the routing performance with respect to robustness metric is considerably improved by enabling the routing of messages through a social network wherever is required for alleviating failures or limitations in the communication network. There is promise in being able to use insights from a social network to overcome failures. This initial work is based on a smaller data set with similar characteristics to allow for easier conceptualization and review of the results. With greater confidence in the modeling of the integrated social and communication network, we will evaluate larger
networks. Our future work also includes an adaptation of our algorithm to account for additional concerns such as trust, reliability, latency, and security.
REFERENCES
[1] K. Fall, “DTN: An Architectural Retrospective,” IEEE Journal on Selected Areas in Communications, Vol 26 (5), pp.828, June 2008
[2] Z. Zhang, “Routing in intermittently connected mobile ad hoc networks and delay tolerant networks: overview and challenges,” IEEE Communications Surveys and Tutorials, vol. 8(1), pp. 24–37, 2006
[3] K. Chang, P. Gopalakrishnan, L. Kant, K. Krishnan, K. Manousakis, A. McAuley, E. Van den Berg, K. Young, C. Graff, D. Yee, T. Cook, “NEDAT - A Network Engineering Design Analytic Toolset to Design and Analyze Large Scale MANETs,” MILCOM 2007, FL, USA, October 2007.
[4] K. Manousakis, A. J. McAuley, R. Morera, “Applying Simulated Annealing for Domain Generation in Ad Hoc Networks,” International Conference on Communications (ICC 2004), Paris, France, 2004.
[5] Z. Wang and J. Crowcroft, “Quality-of-service routing for supporting multimedia applications,” IEEE Journal on Selected Areas in Communications, Vol. 14, pp. 1228.1234, 1996.
[6] G. Xue, A. Sen, W. Zhang, J. Tang K. Thulasiraman, “Finding ,a Path Subject to Many Additive QoS Constraints,” IEEE/ACM Transactions on Networking, Vol. 15, No. 1, pp. 201-211 Feb. 2007.
[7] K. Manousakis, A. McAuley, “MONOPATI: A Multi-Objective Network Optimization and Analysis Tool Applied to Hierarchical Network Structure.” MILCOM 2006, Washington, D.C., October 2006.
[8] A. McAuley, K. Manousakis, D. Sterne, R. Gopaul, P. Kruus, “Creating and Maintaining a Good Intrusion Detection Hierarchy in Dynamic Ad Hoc Networks,” MILCOM 2006, Washington, D.C., October 2006.
[9] K. Manousakis and A.. McAuley, “Minimum Necessary Transmission Range Assignments for Network Connectivity,” 18th Annual IEEE International Symposium on Personal, Indoor and Mobile Radio Communications (PIMRC), Athens, Greece, September 2007.
[10] K. Manousakis and A.. McAuley, “Designing OSPF Routing Areas to Meet Diverse End-to-end Performance,” IEEE MILCOM, Orlando, Florida, USA, October 2007.
[11] S. Kirkpatrick, C. Gelatt and M. Vecchi, “Optimization by Simulated Annealing,” Science 220, 671-680, May 1983.
[12] A. McAuley, K. Manousakis, L. Kant, “Flexible QoS Route Selection with Diverse Objectives and Constraints,” 16th International Workshop on Quality of Service (IWQoS 2008), Enschede, The Netherlands, June 20082
[13] Krackhardt D, Carley KM (1998) A PCANS model of structure in organization. In: Proceedings of the 1998 international symposium on command and control, research and technology, Monterrey, CA, June 1998, pp 113–119.
.
[14] Carley KM (2002) Smart agents and organizations of the future. In: Lievrouw L, Livingstone S (eds) The handbook of new media. Sage, Thousand Oaks, pp 206–220.
[15] Carley, Kathleen & Columbus, Dave & DeReno, Matt & Reminga, Jeffrey & Moon, Il-Chul. (2008). ORA User's Guide 2008. Carnegie Mellon University, School of Computer Science, Institute for Software Research, Technical Report CMU-ISR-08-125.
[16] Freeman, L.C. (1979), Centrality in Social Networks I: Conceptual Clarification. Social Networks, 1, 215-239.
[17] Wasserman, Stanley and Katherine Faust, Social Network Analysis: Methods and Applications, Cambridge: Cambridge University Press, 1994.
[18] R. Lippmann, et al., "The 1999 DARPA Off-Line Intrusion Detection Evaluation", Computer Networks 34(4) 579-595, 2000.
2 The views and conclusions contained in this document are those of
the authors and should not be interpreted as representing the official policies, either expressed or implied of the Army Research Laborato-ry or the U.S. Government


![[Integrated Peer Teaching of Communication and Clinical Skills How to Train Student Tutors?]](https://img.dokumen.tips/doc/110x75/634a94439fa0ab3f6b080a8d/integrated-peer-teaching-of-communication-and-clinical-skills-how-to-train-student.jpg)