Embed Size (px)
Citation preview
ORIGINAL
Roughness induced forced convective laminar-transitionalmicropipe flow: energy and exergy analysis
A. Alper Ozalp
Received: 7 June 2007 / Accepted: 21 April 2008 / Published online: 16 May 2008
� Springer-Verlag 2008
Abstract Variable fluid property continuity, Navier–
Stokes and energy equations are solved for roughness
induced forced convective laminar-transitional flow in a
micropipe. Influences of Reynolds number, heat flux and
surface roughness, on the momentum-energy transport
mechanisms and second-law of thermodynamics, are
investigated for the ranges of Re = 1–2,000, Q = 5–
100 W/m2 and e = 1–50 lm. Numerical investigations put
forward that surface roughness accelerates transition with
flatter velocity profiles and increased intermittency values
(c); such that a high roughness of e = 50 lm resulted in
transitional character at Retra = 450 with c = 0.136. Nor-
malized friction coefficient (Cf*) values showed
augmentation with Re, as the evaluated Cf* are 1.006, 1.028
and 1.088 for Re = 100, 500 and 1,500, respectively, at
e = 1 lm, the corresponding values rise to Cf* = 1.021,
1.116 and 1.350 at e = 50 lm. Heat transfer rates are also
recorded to rise with Re and e; moreover the growing
influence of e on Nusselt number with Re is determined by
the Nue=50 lm/Nue=1 lm ratios of 1.086, 1.168 and 1.259 at
Re = 500, 1,000 and 1,500. Thermal volumetric entropy
generation ð�S000DTÞ values decrease with Re and e in heating;
however the contrary is recorded for frictional volumetric
entropy generation ð�S000DPÞ data, where the augmentations in�S000
DP are more considerable when compared with the
decrease rates of �S000
DT:
List of symbols
a curve fit constants
A cross-sectional area (m2)
Cd discharge coefficient
Cf friction coefficient
Cf* normalized friction coefficient
Cv constant volume specific heat (J/kgK)
Cp constant pressure specific heat (J/kgK)
D diameter (m)
e internal energy per unit mass (J/kg)
fe(z) surface roughness model function
h convective heat transfer coefficient (W/m2K)
H shape factor
k kinetic energy per unit mass (J/kg)
L pipe length (m)
_m mass flow rate (kg/s)
M Mach number
Nu Nusselt number
P static pressure (Pa)
Q surface heat flux (W/m2)_Q volumetric flow rate (m3/s)
R radius (m), gas constant (J/kgK)
Re Reynolds number
S total entropy generation (W/K)
S000
total volumetric entropy generation (W/m3K)
S000
DP frictional volumetric entropy generation (W/m3K)
S000
DT thermal volumetric entropy generation (W/m3K)
T temperature (K)
U axial velocity (m/s)
V~ velocity vector
Greek symbols
a thermal diffusivity (m2/s)
e roughness amplitude (lm)
e* non-dimensional surface roughness (=e/D)
A. A. Ozalp (&)
Department of Mechanical Engineering,
University of Uludag,
16059 Gorukle, Bursa, Turkey
e-mail: [email protected]
123
Heat Mass Transfer (2008) 45:31–46
DOI 10.1007/s00231-008-0407-3
/ irreversibility distribution ratio
jf thermal conductivity of fluid (W/mK)
c intermittency
l dynamic viscosity (Pa s)
q density (kg/m3)
s shear stress (Pa)
n air properties
winp energy input (W)
wloss energy loss (W)
x roughness period (lm)
N entropy generation aspect ratio
Subscripts
c, s center, surface
i dimension
in inlet
lam laminar
m, o maximum, mean
r, h, z radial, peripheral, axial
tra transition
turb turbulent
Superscripts
T temperature dependency
_ volumetric average
1 Introduction
In various thermo-fluid systems, irreversibility is widely
accepted as a general criterion for determining the amount
of wasted useful energy, where the design studies, con-
centrating on internal flow, mainly focus on controlling the
overall entropy generation. Flow and heat transfer char-
acteristics are the main concerns of internal flow
applications; however investigations on surface roughness
based viscous effects, velocity and temperature profiles
(TP) constitute a wide research area due to their direct role
in entropy generation of thermo-fluid systems; and have
recently been the topic of great interest in various fields
such as fuel cells [1], heat exchangers [2] and even for
micropipe systems [3].
In the last decade, momentum and heat transfer inves-
tigations of laminar fluid flow with surface roughness has
attracted considerable attention, thus reports on several
numerical and experimental studies have been published. A
literature review on friction and heat/mass transfer in mi-
crochannels was prepared by Obot [3]. According to the
available literature on microchannels, the arbitrary defini-
tion of microchannels is given with a hydraulic diameter of
Dh B 1,000 lm (1 mm). The main records are: (1) onset of
transition to turbulent flow in smooth microchannels does
not occur if the Reynolds number is less than 1,000, (2)
Nusselt number Nu varies as the square root of the Rey-
nolds number in laminar flow. Effects of surface roughness
on pressure drop and heat transfer in circular tubes was
studied by Kandlikar et al. [4]. They reported, for single-
phase flow in channels with small hydraulic diameters, that
transition to turbulent flows occurs at Reynolds number
values much below 2,300. Wen et al. [5] experimentally
investigated the characteristics of the augmentation of heat
transfer and pressure drop by different strip-type inserts in
small tubes; they examined the effects of the imposed wall
heat flux, mass flux and strip inserts on heat transfer rates.
Surface roughness provoked surface friction was investi-
gated by Guo and Li [6], who reported that frictional
activity is responsible for the early transition from laminar
to turbulent flow. The significance of viscous dissipation on
the temperature field and on the friction factor was pointed
out in the numerical and experimental investigations of [7].
Morini [8] worked on the role of the cross-sectional
geometry on viscous dissipation and the minimum Rey-
nolds number for which viscous dissipation effects cannot
be neglected. The following works of [9, 10] described the
roles of surface roughness on viscous dissipation, the
resulting earlier transitional activity, increased friction
factor values and head loss data. Wu and Cheng [11]
reported that the laminar Nu and apparent friction coeffi-
cient increase with the increase of surface roughness,
moreover the increase rates were determined to become
more obvious at larger Reynolds numbers. Phares et al.
[12] experimentally considered the pressure drop for liquid
flow through short microtubes. Experimental investigations
of [13], on dimpled tubes for laminar and transition flows,
pointed out that the roughness induced friction factors were
10% higher than the smooth tube ones and the transition
onset was at a relatively low Reynolds number of 1,400.
Wall roughness effects in microtube flows were also con-
sidered by Engin et al. [14], who determined significant
departures from the conventional laminar flow theory.
Due to its direct contribution to system performance,
reliability and efficiency for long term applications, second-
law analysis and entropy generation based investigations, on
internal fluid flow related problems, have became more
frequent recently. Lin and Lee [2] defined the effects of the
fin tube spacing along spanwise direction on the second-law
performance of wavy plate fin-and-tube heat exchangers.
Sahin [15] analytically investigated entropy generation for a
fully developed laminar viscous flow in a duct subjected to
constant wall temperature and determined that for low heat
transfer conditions the entropy generation due to viscous
friction becomes dominant and the dependence of viscosity
on temperature becomes essentially important in accurately
determining the entropy generation. Passive heat transfer
augmentation techniques, to conserve the useful part of
energy (exergy) of single-phase flows, were reviewed by
32 Heat Mass Transfer (2008) 45:31–46
123
Zimparov [16]. Ko [17] numerically investigated laminar
forced convection and entropy generation in a helical coil
with constant wall heat flux and suggested that the optimal
Reynolds number is to be chosen according to the flow
operating condition so that the thermal system can have the
least irreversibility and best exergy utilization. Ko [18] also
numerically performed the thermal design of plate heat
exchanger double-sine ducts, from the point of entropy
generation and exergy utilization. Ratts and Raut [19]
obtained optimal Reynolds numbers for single-phase, con-
vective, fully developed internal laminar and turbulent flows
with uniform heat flux, by employing the entropy generation
minimization method. Richardson et al. [20] investigated the
existence of an optimum laminar flow regime, in singly
connected microchannels with finite temperature differences
and fluid friction, based on second-law analysis. Zimparov
[21] investigated the effects of streamwise variation of fluid
temperature and rib height to diameter ratio on the entropy
production of a tubular heat exchanger with enhanced heat
transfer surfaces. Rakshit and Balaji [22] reported the results
of a numerical investigation of conjugate convection from a
finned channel, where the vertical rectangular fins were
mounted outside of the horizontal channel.
Roughness definition and impacts of roughness on the
flow and heat transfer performances of various applications
have been the main concern of some recent work, due to
the fact that surface roughness constitutes a major role in
systems with heat transfer and fluid flow. A few of the
latest studies can be outlined as: the numerical works of
Ozalp [23, 24] on compressible flow in converging and
aerospace propulsion nozzles with various surface rough-
ness conditions, Sahin et al.’s [25] study on entropy
generation due to fouling as compared to that for clean
surface tubes, non-equilibrium molecular dynamics simu-
lation of Cao et al. [26] to investigate the effect of the
surface roughness on slip flow of gaseous argon, Wang
et al.’s [27] regular perturbation method to investigate the
influence of two-dimensional roughness on laminar flow in
microchannels between two parallel plates and Sheikh
et al.’s [28] model to eliminate the discrepancy in the
fouling measurements by characterizing the fouling as a
correlated random process.
In spite of the fact that, the impacts of surface
roughness on internal flow were widely investigated, the
available literature, on circular duct flows with surface
roughness and heat flux conditions, handles the fluid
motion, heat transfer and second-law analysis separately.
The present numerical work aims to develop a complete
overview on the energy and exergy analysis of roughness
induced forced convective laminar-transitional micropipe
flow, for wide ranges of Reynolds number, surface
roughness and heat flux. Momentum and energy transfer
records are discussed through radial velocity and TP,
boundary layer parameters, friction and discharge coeffi-
cients (Cd), Nu, frictional energy loss and mean-
temperature variations in the flow direction, which also
identifies the viscous dissipation rates. Exergy analysis
results are presented by radial entropy profiles, thermal,
frictional and overall entropy generation rates, irrevers-
ibility distribution and entropy generation aspect ratio
values.
2 Theoretical background
2.1 Micropipe and roughness
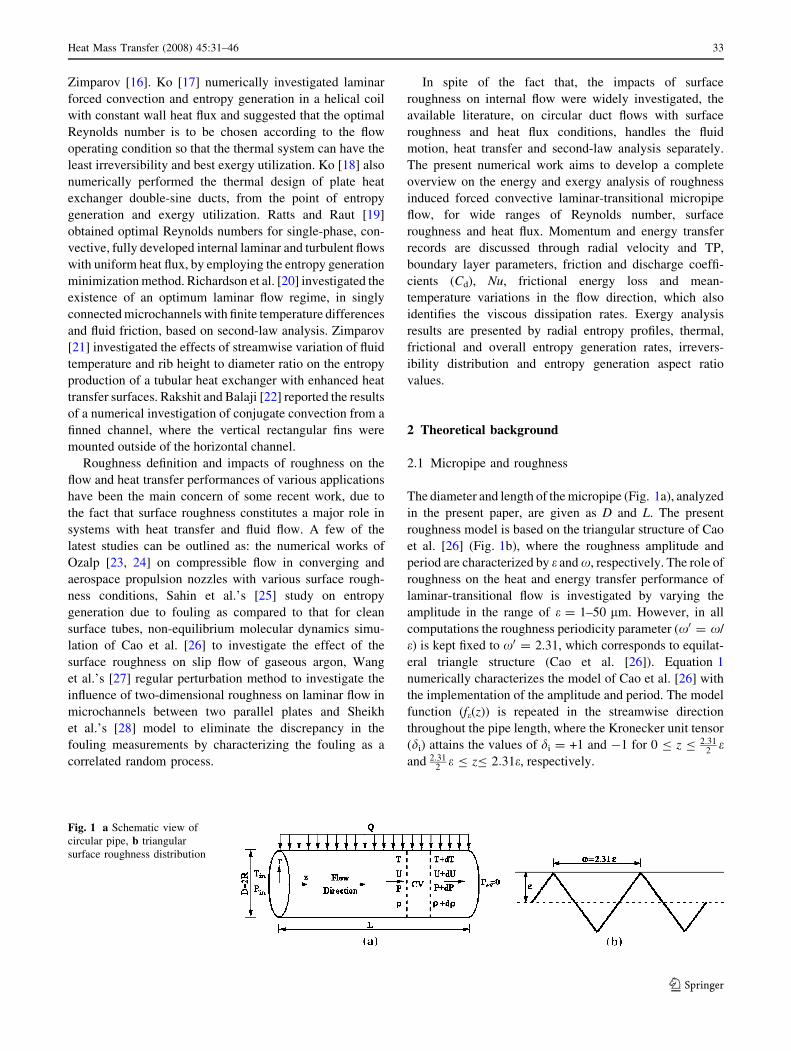
The diameter and length of the micropipe (Fig. 1a), analyzed
in the present paper, are given as D and L. The present
roughness model is based on the triangular structure of Cao
et al. [26] (Fig. 1b), where the roughness amplitude and
period are characterized by e and x, respectively. The role of
roughness on the heat and energy transfer performance of
laminar-transitional flow is investigated by varying the
amplitude in the range of e = 1–50 lm. However, in all
computations the roughness periodicity parameter (x0 = x/
e) is kept fixed to x0 = 2.31, which corresponds to equilat-
eral triangle structure (Cao et al. [26]). Equation 1
numerically characterizes the model of Cao et al. [26] with
the implementation of the amplitude and period. The model
function (fe(z)) is repeated in the streamwise direction
throughout the pipe length, where the Kronecker unit tensor
(di) attains the values of di = +1 and -1 for 0 B z B 2:312
eand 2:31
2e B zB 2:31e, respectively.
Fig. 1 a Schematic view of
circular pipe, b triangular
surface roughness distribution
Heat Mass Transfer (2008) 45:31–46 33
123
feðzÞ ¼ die 1� 4
2:31ez
� �ð1Þ
2.2 Governing equations
The average density and velocity of the flow at any cross-
section of the duct are defined with qo and Uo, and m (=l/q)
and l stand for the kinematic and dynamic viscosity. As the
surface and mean flow temperatures are denoted by Ts and To,
thermal conductivity and convective heat transfer coefficient
are characterized by jf and h. Using these definitions Rey-
nolds number and Nu are given by Eqs. 2a, b. Air has been
selected as the working fluid in the present study, and the
compressible character is handled by the ideal gas formula of
q ¼ PRT : It is well known that air properties, like specific heat
at constant pressure (Cp), kinematic viscosity (m) and thermal
conductivity (jf), are substantially dependent on tempera-
ture (Incropera and DeWitt [29]). To sensitively implement
the property (n) variations with temperature into the calcu-
lations, the necessary air data of [29] is fitted into sixth order
polynomials, which can be presented in closed form by
Eq. 2c. The uncertainty of the fitted air data is less than
0.02% and the temperature dependency is indicated by the
superscript T throughout the formulation.
Re ¼ UoD
mT¼ qoUoD
lTð2aÞ
Nu ¼ hD
jTf
¼oT=or
��r¼R
D
Ts � To
ð2bÞ
fT ¼X6
j¼0
ajTj ð2cÞ
The problem considered here is steady o=ot
� �¼ 0; fully
developed and the flow direction is coaxial with pipe
centerline Ur ¼ Uh ¼ 0ð Þ; thus the velocity vector simplifies
to V~ ¼ Uz r; zð Þk̂; denoting oUz=oh ¼ 0: These justifications
are common in several recent numerical studies, on
roughness induced flow and heat transfer investigations,
like those of [14]. The flow boundary conditions are based on
the facts that, on the pipe wall no-slip condition and constant
heat flux exist, and flow and thermal values are maximum at
the centerline. As given in Fig. 1a, at the pipe inlet, pressure
and temperature values are known and the exit pressure is
atmospheric. Denoting Uz = U(r, z) and T = T(r, z), the
boundary conditions can be summarized as follows:
r ¼ Rþ feðzÞ ! U ¼ 0 & r ¼ 0! oUor ¼ 0
r ¼ Rþ feðzÞ ! oTor ¼ �
Qr
jTf
& r ¼ 0! oTor ¼ 0
z ¼ 0! P ¼ Pin; T ¼ Tin & z ¼ L! P ¼ 0
ðManometricÞ
ð3Þ
As the components of the viscous stress tensor (s) and
heat flux terms (Q) can be written as Eqs. (4–5), internal
and kinetic energy terms are defined as e = CvT and
k = U2z=2, respectively.
srz ¼ lT oUz
orð4aÞ
szz ¼4
3lT oUz
ozð4bÞ
Qr ¼ �jTf
oT
orð5aÞ
Qz ¼ �jTf
oT
ozð5bÞ
With these problem definitions and above
implementations, for a laminar compressible flow with
variable fluid properties, continuity, momentum and energy
equations are given as:
o
ozqUzð Þ ¼ 0 ð6Þ
q Uz
oUz
oz
� �þ oP
oz¼ 1
r
o
orrsrzð Þ þ oszz
ozð7Þ
o
ozq eþ P
qþ k
� �Uz
� �þ 1
r
o
orðrQrÞ þ
oQz
oz
¼ szz
oUz
ozþ srz
oUz
orþ Uz
1
r
o
orrsrzð Þ þ oszz
oz
� �ð8Þ
The average fluid velocity and temperature are obtained
from
Uo ¼2p
Rr¼R
r¼0
qðrÞUðrÞrdr
qopR2ð9aÞ
To ¼2p
Rr¼R
r¼0
qðrÞUðrÞCpðrÞTðrÞrdr
qoUo Cp
� opR2
ð9bÞ
and the shear stress and mass flow rate are defined as
s ¼ Cf
1
2qoU2
o ¼ lT du
dr
����r¼R
�������� ð10aÞ
_m ¼ qoUoA ¼ 2pZr¼R
r¼0
qðrÞUðrÞrdr ð10bÞ
Gouy–Stodola theorem considers the lost available work
to be directly proportional to entropy generation, which
results from the non-equilibrium phenomenon of exchange
of energy and momentum within the fluid and at the solid
boundaries. Due to the existence of the velocity and
temperature gradients in the flow volume, the volumetric
entropy generation rate is positive and finite. Computation
of the temperature and the velocity fields through Eqs. (6–
8) on the problem domain, will produce the input data for
Eq. (11), which defines the local rate of entropy generation
34 Heat Mass Transfer (2008) 45:31–46
123
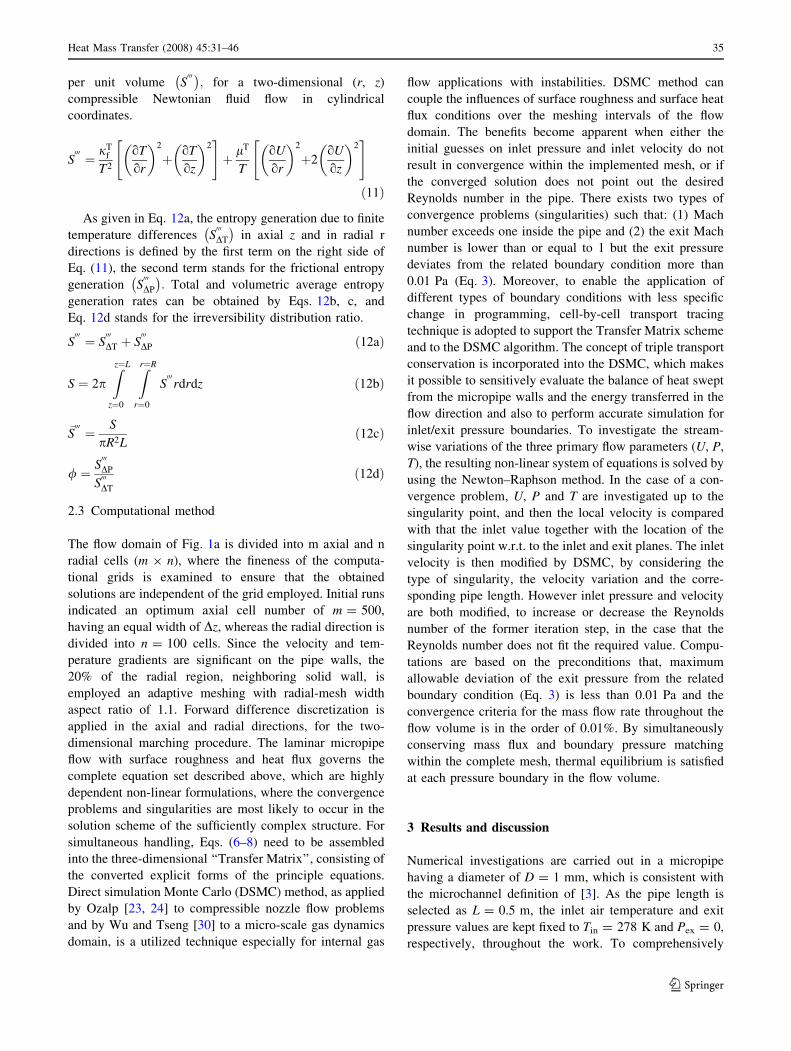
per unit volume S000� ; for a two-dimensional (r, z)
compressible Newtonian fluid flow in cylindrical
coordinates.
S000 ¼ jT
f
T2
oT
or
� �2
þ oT
oz
� �2" #
þ lT
T
oU
or
� �2
þ2oU
oz
� �2" #
ð11Þ
As given in Eq. 12a, the entropy generation due to finite
temperature differences S000
DT
� in axial z and in radial r
directions is defined by the first term on the right side of
Eq. (11), the second term stands for the frictional entropy
generation S000
DP
� : Total and volumetric average entropy
generation rates can be obtained by Eqs. 12b, c, and
Eq. 12d stands for the irreversibility distribution ratio.
S000 ¼ S
000
DT þ S000
DP ð12aÞ
S ¼ 2pZz¼L
z¼0
Zr¼R
r¼0
S000
rdrdz ð12bÞ
�S000 ¼ S
pR2Lð12cÞ
/ ¼ S000
DP
S000DT
ð12dÞ
2.3 Computational method
The flow domain of Fig. 1a is divided into m axial and n
radial cells (m 9 n), where the fineness of the computa-
tional grids is examined to ensure that the obtained
solutions are independent of the grid employed. Initial runs
indicated an optimum axial cell number of m = 500,
having an equal width of Dz, whereas the radial direction is
divided into n = 100 cells. Since the velocity and tem-
perature gradients are significant on the pipe walls, the
20% of the radial region, neighboring solid wall, is
employed an adaptive meshing with radial-mesh width
aspect ratio of 1.1. Forward difference discretization is
applied in the axial and radial directions, for the two-
dimensional marching procedure. The laminar micropipe
flow with surface roughness and heat flux governs the
complete equation set described above, which are highly
dependent non-linear formulations, where the convergence
problems and singularities are most likely to occur in the
solution scheme of the sufficiently complex structure. For
simultaneous handling, Eqs. (6–8) need to be assembled
into the three-dimensional ‘‘Transfer Matrix’’, consisting of
the converted explicit forms of the principle equations.
Direct simulation Monte Carlo (DSMC) method, as applied
by Ozalp [23, 24] to compressible nozzle flow problems
and by Wu and Tseng [30] to a micro-scale gas dynamics
domain, is a utilized technique especially for internal gas
flow applications with instabilities. DSMC method can
couple the influences of surface roughness and surface heat
flux conditions over the meshing intervals of the flow
domain. The benefits become apparent when either the
initial guesses on inlet pressure and inlet velocity do not
result in convergence within the implemented mesh, or if
the converged solution does not point out the desired
Reynolds number in the pipe. There exists two types of
convergence problems (singularities) such that: (1) Mach
number exceeds one inside the pipe and (2) the exit Mach
number is lower than or equal to 1 but the exit pressure
deviates from the related boundary condition more than
0.01 Pa (Eq. 3). Moreover, to enable the application of
different types of boundary conditions with less specific
change in programming, cell-by-cell transport tracing
technique is adopted to support the Transfer Matrix scheme
and to the DSMC algorithm. The concept of triple transport
conservation is incorporated into the DSMC, which makes
it possible to sensitively evaluate the balance of heat swept
from the micropipe walls and the energy transferred in the
flow direction and also to perform accurate simulation for
inlet/exit pressure boundaries. To investigate the stream-
wise variations of the three primary flow parameters (U, P,
T), the resulting non-linear system of equations is solved by
using the Newton–Raphson method. In the case of a con-
vergence problem, U, P and T are investigated up to the
singularity point, and then the local velocity is compared
with that the inlet value together with the location of the
singularity point w.r.t. to the inlet and exit planes. The inlet
velocity is then modified by DSMC, by considering the
type of singularity, the velocity variation and the corre-
sponding pipe length. However inlet pressure and velocity
are both modified, to increase or decrease the Reynolds
number of the former iteration step, in the case that the
Reynolds number does not fit the required value. Compu-
tations are based on the preconditions that, maximum
allowable deviation of the exit pressure from the related
boundary condition (Eq. 3) is less than 0.01 Pa and the
convergence criteria for the mass flow rate throughout the
flow volume is in the order of 0.01%. By simultaneously
conserving mass flux and boundary pressure matching
within the complete mesh, thermal equilibrium is satisfied
at each pressure boundary in the flow volume.
3 Results and discussion
Numerical investigations are carried out in a micropipe
having a diameter of D = 1 mm, which is consistent with
the microchannel definition of [3]. As the pipe length is
selected as L = 0.5 m, the inlet air temperature and exit
pressure values are kept fixed to Tin = 278 K and Pex = 0,
respectively, throughout the work. To comprehensively
Heat Mass Transfer (2008) 45:31–46 35
123
investigate the influences of Reynolds number, heat flux
and surface roughness on the momentum-energy transport
mechanisms and second-law of thermodynamics of
roughness induced laminar-transitional flow, computations
are performed for the ranges of Re = 1–2,000,
Q = 5–100 W/m2 and e = 1–50 lm (e* = e/D = 0.001–
0.05). The applied surface roughness values are similar to
those of [27] (e* = 0.005–0.05), [14] (e* B 0.08) and [25]
(e* B 0.25). Due to their contribution in entropy genera-
tion, discussions are based on radial velocity and TP, both
for heating and viscous dissipation based cooling scenarios.
Mean-temperature variations, momentum and heat transfer
characteristics are handled by cross-correlations with
radial, thermal, frictional and overall entropy generation
mechanisms; by also considering the rates of power loss
and entropy generation aspect ratio.
3.1 Momentum and energy transfer
3.1.1 Mean-temperature variations (DT)
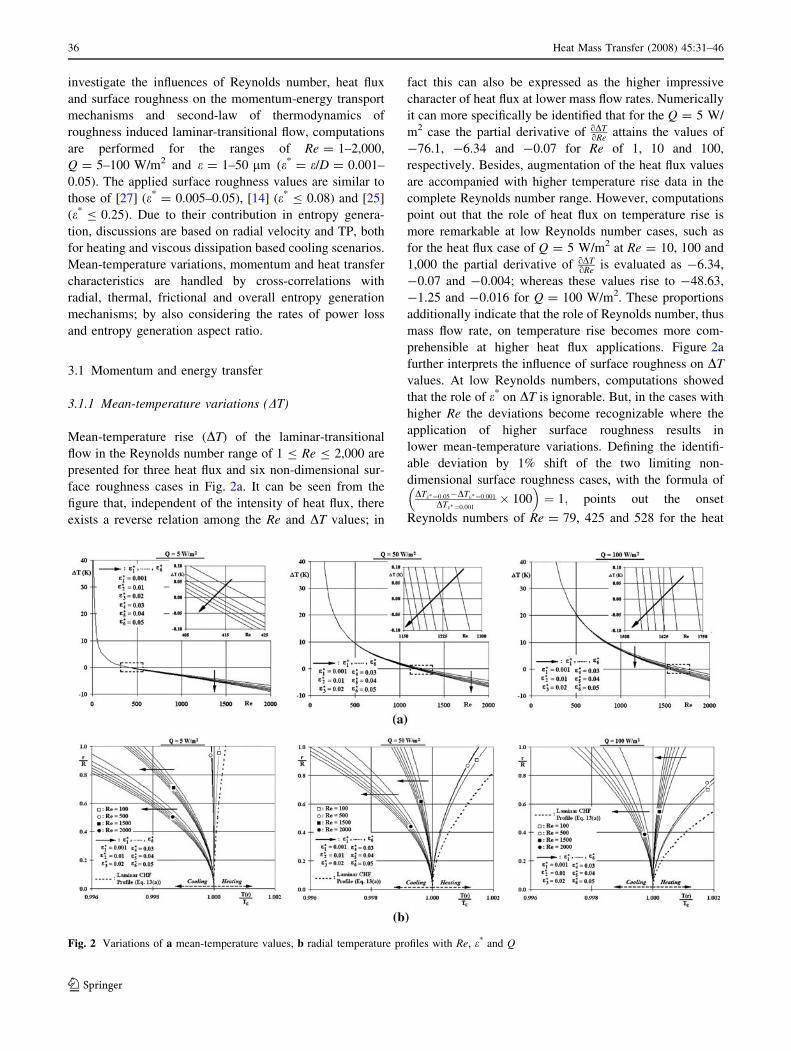
Mean-temperature rise (DT) of the laminar-transitional
flow in the Reynolds number range of 1 B Re B 2,000 are
presented for three heat flux and six non-dimensional sur-
face roughness cases in Fig. 2a. It can be seen from the
figure that, independent of the intensity of heat flux, there
exists a reverse relation among the Re and DT values; in
fact this can also be expressed as the higher impressive
character of heat flux at lower mass flow rates. Numerically
it can more specifically be identified that for the Q = 5 W/
m2 case the partial derivative of oDToRe attains the values of
-76.1, -6.34 and -0.07 for Re of 1, 10 and 100,
respectively. Besides, augmentation of the heat flux values
are accompanied with higher temperature rise data in the
complete Reynolds number range. However, computations
point out that the role of heat flux on temperature rise is
more remarkable at low Reynolds number cases, such as
for the heat flux case of Q = 5 W/m2 at Re = 10, 100 and
1,000 the partial derivative of oDToRe is evaluated as -6.34,
-0.07 and -0.004; whereas these values rise to -48.63,
-1.25 and -0.016 for Q = 100 W/m2. These proportions
additionally indicate that the role of Reynolds number, thus
mass flow rate, on temperature rise becomes more com-
prehensible at higher heat flux applications. Figure 2a
further interprets the influence of surface roughness on DT
values. At low Reynolds numbers, computations showed
that the role of e* on DT is ignorable. But, in the cases with
higher Re the deviations become recognizable where the
application of higher surface roughness results in
lower mean-temperature variations. Defining the identifi-
able deviation by 1% shift of the two limiting non-
dimensional surface roughness cases, with the formula ofDTe�¼0:05�DTe�¼0:001
DTe�¼0:001� 100
� �¼ 1; points out the onset
Reynolds numbers of Re = 79, 425 and 528 for the heat
Fig. 2 Variations of a mean-temperature values, b radial temperature profiles with Re, e* and Q
36 Heat Mass Transfer (2008) 45:31–46
123
flux values of Q = 5, 50 and 100 W/m2, respectively.
These limits put forward that higher heat flux values nar-
rows the influential Re range of e* on DT in laminar flow.
On the other hand Fig. 2a shows that, although heat is
added through the lateral walls of the circular pipe, beyond
certain Reynolds numbers the flow temperature decreases
in the axial direction. To provide a deeper insight for the
cooling outputs, Table 1 shows the applied flux and the
corresponding total surface heat transfer values (Qs),
together with the amount of viscous energy loss data (wloss)
for five Reynolds numbers and also for the surface
roughness range of e* = 0.001 (e1*)–0.05 (e6
*). In the case
with Q = 5 W/m2, the total heat added through the duct
walls (Qs = 7.85 9 10-3 W) is lower than the energy loss
values for Re = 500 for the complete e* range
(wloss = 1.11 9 10-2–1.21 9 10-2 W), where the gap
between the Qs and wloss values rise in the cases with
higher Re. The tabulated data is projected to Fig. 2a with
augmented cooling behavior with the increase of Reynolds
number. Particularly, the thermally critical Reynolds
numbers ((Recr)th) can be visualized through the zoomed
plots of Fig. 2a and determined as (Recr)th & 414 ± 7,
&1,210 ± 50 and &1,635 ± 85 for Q = 5, 50 and
100 W/m2, respectively, where the lower and upper limits
refer to the non-dimensional surface roughness applications
of e6* = 0.05 and e1
* = 0.001. It can be seen that (Recr)th
increase with higher heat flux; moreover the enhanced
impact of e* on DT values at higher Q are also clarified
with the expanded (Recr)th limits. Energy loss and tem-
perature decrease due to friction in laminar flow was also
reported in recent works by Koo and Kleinstreuer [7],
Morini [8] and Celata et al. [9, 10]. Their common findings
are wall heating due to viscous dissipation; the dissipated
energy resulted in loss of flow temperature even the surface
roughness effects were disregarded. Additionally they also
indicated that, viscous dissipation is directly related with
Reynolds number where they experimentally and numeri-
cally recorded exponential augmentations in energy loss
due to high Re. These results show harmony with the
present evaluations on heating/cooling behaviors of Fig. 2a
and the energy loss data of Table 1.
3.1.2 Radial temperature profiles
The radial variations of temperature values, in non-
dimensional form w.r.t. to the centerline value (Tc), for
various heat flux, surface roughness and Reynolds numbers
are displayed in Fig. 2b. Since the development of TP is
based both on energy loss (wloss) due to viscous dissipation
on the solid walls and surface heat transfer rates, the
computed profiles are presented in conjunction with the
laminar constant heat flux formula of Eq. 13a, where a is
the thermal diffusivity (Eq. 13b).
TðrÞ ¼ Ts �2UoR2
aT
dTo
dz
� �3
16þ 1
16
r
R
� �4
� 1
4
r
R
� �2� �
ð13aÞ
aT ¼ jTf
qCTp
ð13bÞ
It can be seen from the figure that the TP of the flows for
Re B 500 did not experienced the influence of surface
roughness, resulting in coinciding TPs for the complete erange investigated. This outcome is completely in harmony
with the temperature rise discussions through Fig. 2a. On
the other hand, with the increase of flow velocity, thus
Reynolds number (Re [ 500), the role of surface roughness
becomes apparent. For the lowest heat flux case of
Q = 5 W/m2, the TP of Re = 100 is very similar to the
laminar constant heat flux profile (Eq. 13a). The slight
deviation can be explained by the low power loss rates that
are in the order of wloss = *4.4 9 10-4 W. However, for
the same Reynolds number case of Re = 100, with the
increase of heat flux values (Q = 50 and 100 W/m2) the
power loss values also rise (Table 1), due to the augmented
flow viscosity with higher flow temperatures, which result
in comparably more evident shifts in TPs from that of
Eq. 13a. The increase in Reynolds numbers brings about
significant variations in the TPs, which can be attributed to
the elevated power loss amounts as given in Table 1.
Heating of the flowing air is computed for the condition of
wloss \ Qs, but in the cases where viscous dissipation
dominates the surface heat addition (wloss [ Qs) cooling is
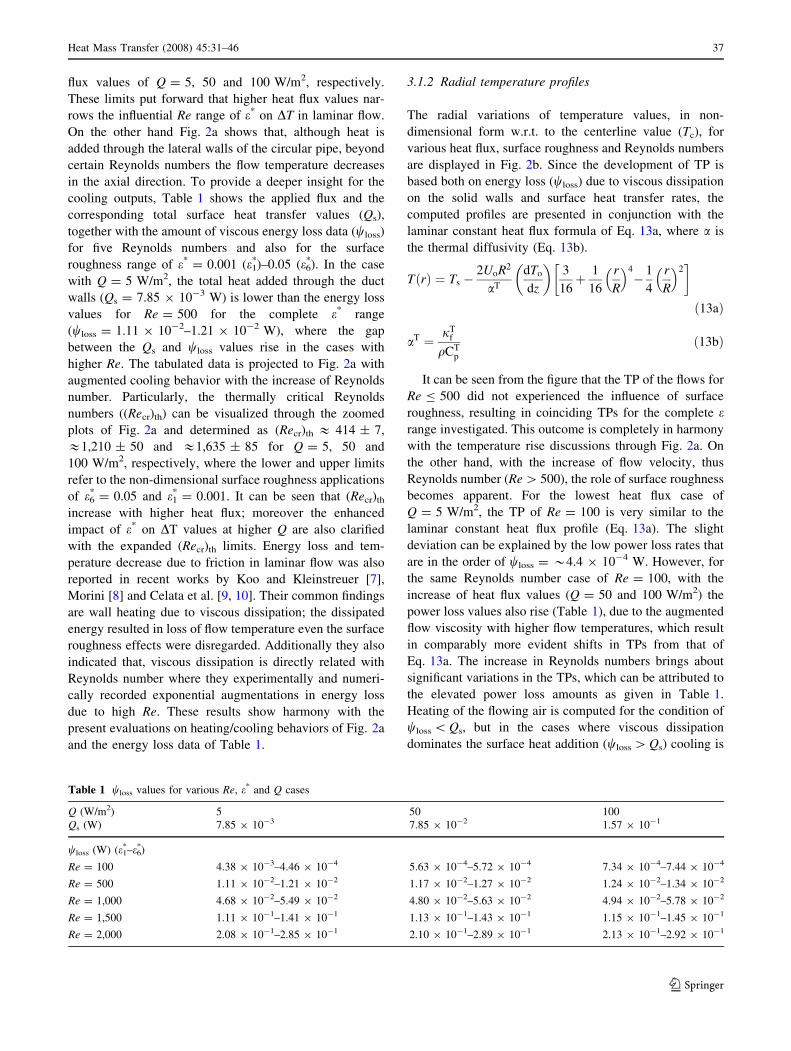
Table 1 wloss values for various Re, e* and Q cases
Q (W/m2) 5 50 100
Qs (W) 7.85 9 10-3 7.85 9 10-2 1.57 9 10-1
wloss (W) (e1*–e6
*)
Re = 100 4.38 9 10-3–4.46 9 10-4 5.63 9 10-4–5.72 9 10-4 7.34 9 10-4–7.44 9 10-4
Re = 500 1.11 9 10-2–1.21 9 10-2 1.17 9 10-2–1.27 9 10-2 1.24 9 10-2–1.34 9 10-2
Re = 1,000 4.68 9 10-2–5.49 9 10-2 4.80 9 10-2–5.63 9 10-2 4.94 9 10-2–5.78 9 10-2
Re = 1,500 1.11 9 10-1–1.41 9 10-1 1.13 9 10-1–1.43 9 10-1 1.15 9 10-1–1.45 9 10-1
Re = 2,000 2.08 9 10-1–2.85 9 10-1 2.10 9 10-1–2.89 9 10-1 2.13 9 10-1–2.92 9 10-1
Heat Mass Transfer (2008) 45:31–46 37
123
the outcome, where the thermally critical Reynolds
numbers are as described in Fig. 2a. Figure 2b also shows
that, the role of surface roughness grows with Reynolds
number, especially in the flows with decreasing mean flow
temperatures. Table 1 indicates the power loss amounts for
the low flux case of Q = 5 W/m2 as wloss = 1.11 9 10-1–
1.41 9 10-1 W (e1*–e6
*) and wloss = 2.08 9 10-1–
2.85 9 10-1 W for Re = 1,500 and 2,000, respectively;
these ranges rise to wloss = 1.15 9 10-1–1.45 9 10-1 and
wloss = 2.13 9 10-1–2.92 9 10-1 for the highest heat flux
of Q = 100 W/m2. The rise of the wloss values with heat
flux can be attributed to the augmented viscosity values at
higher temperature values, being an outcome of the elevated
streamwise temperature values. The deviations of the TPs
from the CHF profile for the complete set of applied surface
heat fluxes, become more recognizable at higher Reynolds
numbers and surface roughness conditions, which clearly
puts forward that the viscous dissipation and the associated
frictional energy loss rates augment with both Re and e.Ozalp [23, 24] also determined augmented frictional power
loss records in compressible high speed converging nozzle
with increase of surface heat flux. The tabulated power loss
values also indicate that the gap among the lower and upper
wloss limits enlarge significantly with Reynolds number and
secondarily with surface heat flux. The common
determination from Fig. 2a, b and Table 1 can be
summarized as the necessity of considering the amount of
viscous dissipation in the flow domain before deciding the
heat flux level to match the required heating/cooling
activity in a micropipe.
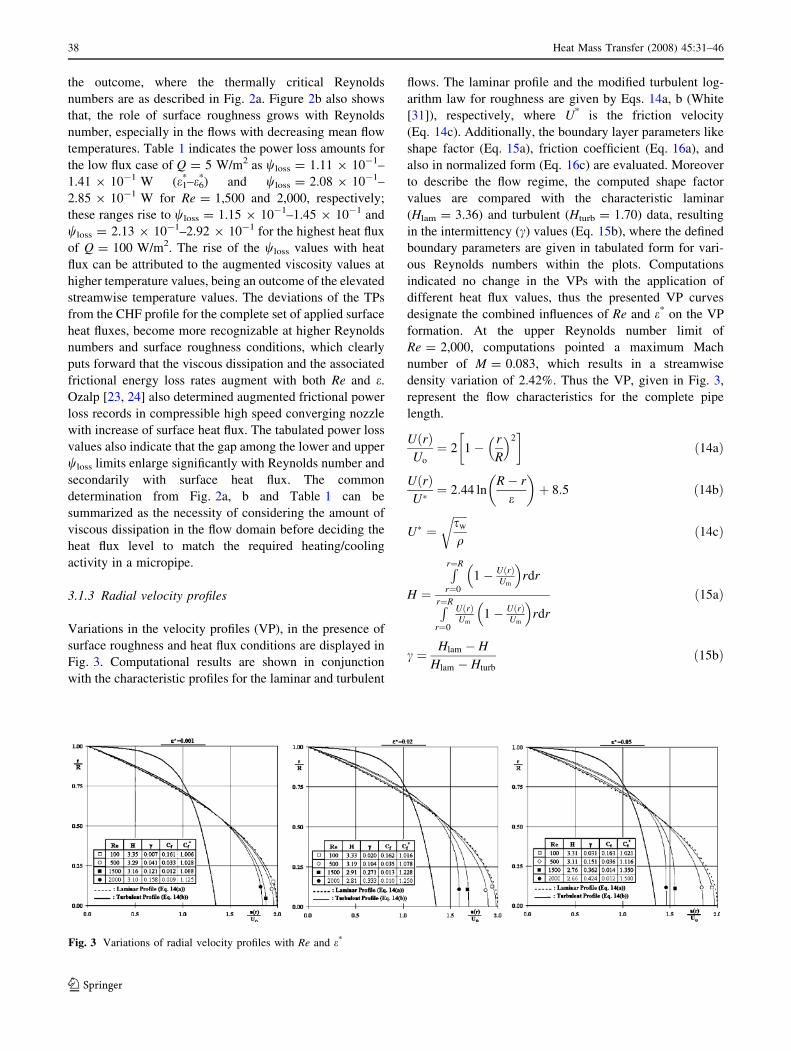
3.1.3 Radial velocity profiles
Variations in the velocity profiles (VP), in the presence of
surface roughness and heat flux conditions are displayed in
Fig. 3. Computational results are shown in conjunction
with the characteristic profiles for the laminar and turbulent
flows. The laminar profile and the modified turbulent log-
arithm law for roughness are given by Eqs. 14a, b (White
[31]), respectively, where U* is the friction velocity
(Eq. 14c). Additionally, the boundary layer parameters like
shape factor (Eq. 15a), friction coefficient (Eq. 16a), and
also in normalized form (Eq. 16c) are evaluated. Moreover
to describe the flow regime, the computed shape factor
values are compared with the characteristic laminar
(Hlam = 3.36) and turbulent (Hturb = 1.70) data, resulting
in the intermittency (c) values (Eq. 15b), where the defined
boundary parameters are given in tabulated form for vari-
ous Reynolds numbers within the plots. Computations
indicated no change in the VPs with the application of
different heat flux values, thus the presented VP curves
designate the combined influences of Re and e* on the VP
formation. At the upper Reynolds number limit of
Re = 2,000, computations pointed a maximum Mach
number of M = 0.083, which results in a streamwise
density variation of 2.42%. Thus the VP, given in Fig. 3,
represent the flow characteristics for the complete pipe
length.
UðrÞUo
¼ 2 1� r
R
� �2� �
ð14aÞ
UðrÞU�¼ 2:44 ln
R� r
e
� �þ 8:5 ð14bÞ
U� ¼ffiffiffiffiffisw
q
rð14cÞ
H ¼
Rr¼R
r¼0
1� UðrÞUm
� �rdr
Rr¼R
r¼0
UðrÞUm
1� UðrÞUm
� �rdr
ð15aÞ
c ¼ Hlam � H
Hlam � Hturb
ð15bÞ
Fig. 3 Variations of radial velocity profiles with Re and e*
38 Heat Mass Transfer (2008) 45:31–46
123
Cf ¼2lT dU
dr
��r¼R
�� ��qoU2
o
ð16aÞ
Cfð Þlam¼16
Reð16bÞ
C�f ¼Cf
Cfð Þlam
ð16cÞ
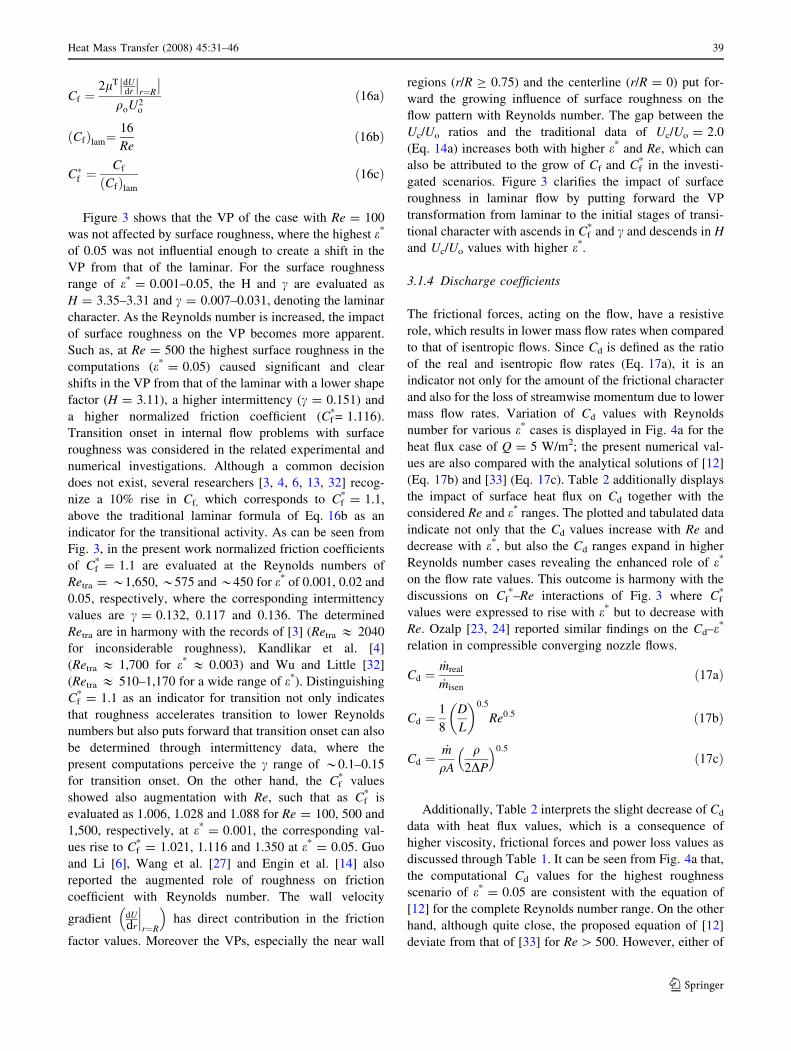
Figure 3 shows that the VP of the case with Re = 100
was not affected by surface roughness, where the highest e*
of 0.05 was not influential enough to create a shift in the
VP from that of the laminar. For the surface roughness
range of e* = 0.001–0.05, the H and c are evaluated as
H = 3.35–3.31 and c = 0.007–0.031, denoting the laminar
character. As the Reynolds number is increased, the impact
of surface roughness on the VP becomes more apparent.
Such as, at Re = 500 the highest surface roughness in the
computations (e* = 0.05) caused significant and clear
shifts in the VP from that of the laminar with a lower shape
factor (H = 3.11), a higher intermittency (c = 0.151) and
a higher normalized friction coefficient (Cf*= 1.116).
Transition onset in internal flow problems with surface
roughness was considered in the related experimental and
numerical investigations. Although a common decision
does not exist, several researchers [3, 4, 6, 13, 32] recog-
nize a 10% rise in Cf, which corresponds to Cf* = 1.1,
above the traditional laminar formula of Eq. 16b as an
indicator for the transitional activity. As can be seen from
Fig. 3, in the present work normalized friction coefficients
of Cf* = 1.1 are evaluated at the Reynolds numbers of
Retra = *1,650, *575 and *450 for e* of 0.001, 0.02 and
0.05, respectively, where the corresponding intermittency
values are c = 0.132, 0.117 and 0.136. The determined
Retra are in harmony with the records of [3] (Retra & 2040
for inconsiderable roughness), Kandlikar et al. [4]
(Retra & 1,700 for e* & 0.003) and Wu and Little [32]
(Retra & 510–1,170 for a wide range of e*). Distinguishing
Cf* = 1.1 as an indicator for transition not only indicates
that roughness accelerates transition to lower Reynolds
numbers but also puts forward that transition onset can also
be determined through intermittency data, where the
present computations perceive the c range of *0.1–0.15
for transition onset. On the other hand, the Cf* values
showed also augmentation with Re, such that as Cf* is
evaluated as 1.006, 1.028 and 1.088 for Re = 100, 500 and
1,500, respectively, at e* = 0.001, the corresponding val-
ues rise to Cf* = 1.021, 1.116 and 1.350 at e* = 0.05. Guo
and Li [6], Wang et al. [27] and Engin et al. [14] also
reported the augmented role of roughness on friction
coefficient with Reynolds number. The wall velocity
gradient dUdr
���r¼R
� �has direct contribution in the friction
factor values. Moreover the VPs, especially the near wall
regions (r/R C 0.75) and the centerline (r/R = 0) put for-
ward the growing influence of surface roughness on the
flow pattern with Reynolds number. The gap between the
Uc/Uo ratios and the traditional data of Uc/Uo = 2.0
(Eq. 14a) increases both with higher e* and Re, which can
also be attributed to the grow of Cf and Cf* in the investi-
gated scenarios. Figure 3 clarifies the impact of surface
roughness in laminar flow by putting forward the VP
transformation from laminar to the initial stages of transi-
tional character with ascends in Cf* and c and descends in H
and Uc/Uo values with higher e*.
3.1.4 Discharge coefficients
The frictional forces, acting on the flow, have a resistive
role, which results in lower mass flow rates when compared
to that of isentropic flows. Since Cd is defined as the ratio
of the real and isentropic flow rates (Eq. 17a), it is an
indicator not only for the amount of the frictional character
and also for the loss of streamwise momentum due to lower
mass flow rates. Variation of Cd values with Reynolds
number for various e* cases is displayed in Fig. 4a for the
heat flux case of Q = 5 W/m2; the present numerical val-
ues are also compared with the analytical solutions of [12]
(Eq. 17b) and [33] (Eq. 17c). Table 2 additionally displays
the impact of surface heat flux on Cd together with the
considered Re and e* ranges. The plotted and tabulated data
indicate not only that the Cd values increase with Re and
decrease with e*, but also the Cd ranges expand in higher
Reynolds number cases revealing the enhanced role of e*
on the flow rate values. This outcome is harmony with the
discussions on Cf*–Re interactions of Fig. 3 where Cf
*
values were expressed to rise with e* but to decrease with
Re. Ozalp [23, 24] reported similar findings on the Cd–e*
relation in compressible converging nozzle flows.
Cd ¼_mreal
_misen
ð17aÞ
Cd ¼1
8
D
L
� �0:5
Re0:5 ð17bÞ
Cd ¼_m
qA
q2DP
� �0:5
ð17cÞ
Additionally, Table 2 interprets the slight decrease of Cd
data with heat flux values, which is a consequence of
higher viscosity, frictional forces and power loss values as
discussed through Table 1. It can be seen from Fig. 4a that,
the computational Cd values for the highest roughness
scenario of e* = 0.05 are consistent with the equation of
[12] for the complete Reynolds number range. On the other
hand, although quite close, the proposed equation of [12]
deviate from that of [33] for Re [ 500. However, either of
Heat Mass Transfer (2008) 45:31–46 39
123
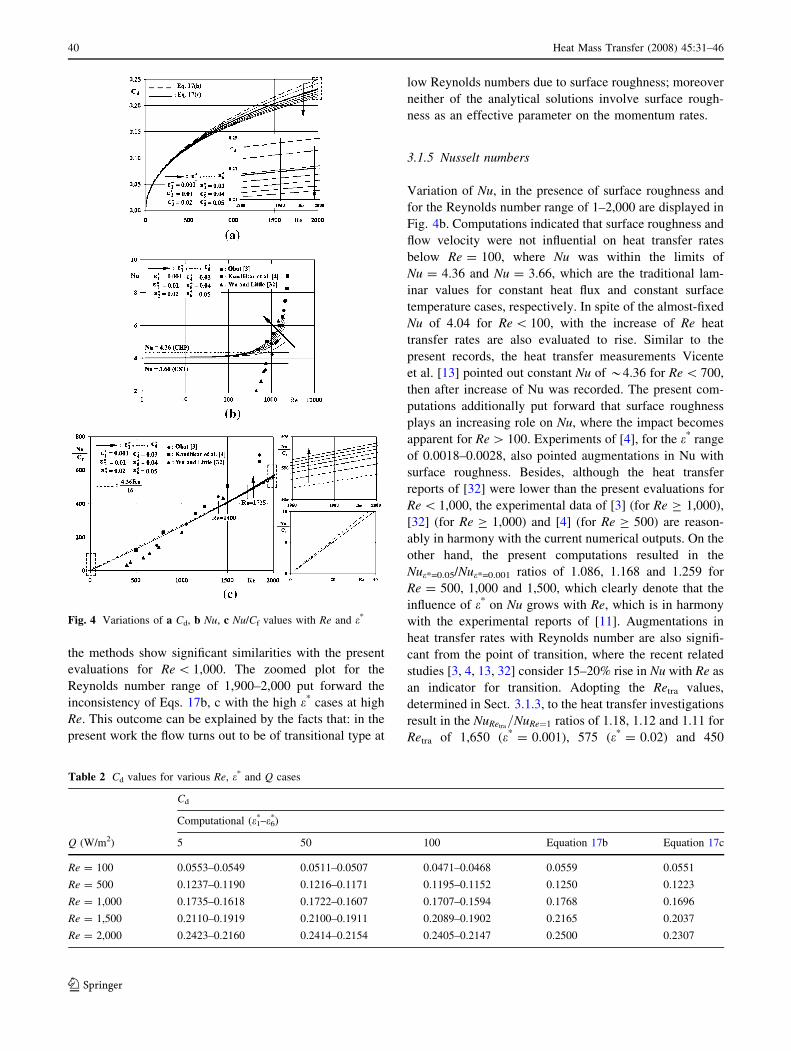
the methods show significant similarities with the present
evaluations for Re \ 1,000. The zoomed plot for the
Reynolds number range of 1,900–2,000 put forward the
inconsistency of Eqs. 17b, c with the high e* cases at high
Re. This outcome can be explained by the facts that: in the
present work the flow turns out to be of transitional type at
low Reynolds numbers due to surface roughness; moreover
neither of the analytical solutions involve surface rough-
ness as an effective parameter on the momentum rates.
3.1.5 Nusselt numbers
Variation of Nu, in the presence of surface roughness and
for the Reynolds number range of 1–2,000 are displayed in
Fig. 4b. Computations indicated that surface roughness and
flow velocity were not influential on heat transfer rates
below Re = 100, where Nu was within the limits of
Nu = 4.36 and Nu = 3.66, which are the traditional lam-
inar values for constant heat flux and constant surface
temperature cases, respectively. In spite of the almost-fixed
Nu of 4.04 for Re \ 100, with the increase of Re heat
transfer rates are also evaluated to rise. Similar to the
present records, the heat transfer measurements Vicente
et al. [13] pointed out constant Nu of *4.36 for Re \ 700,
then after increase of Nu was recorded. The present com-
putations additionally put forward that surface roughness
plays an increasing role on Nu, where the impact becomes
apparent for Re [ 100. Experiments of [4], for the e* range
of 0.0018–0.0028, also pointed augmentations in Nu with
surface roughness. Besides, although the heat transfer
reports of [32] were lower than the present evaluations for
Re \ 1,000, the experimental data of [3] (for Re C 1,000),
[32] (for Re C 1,000) and [4] (for Re C 500) are reason-
ably in harmony with the current numerical outputs. On the
other hand, the present computations resulted in the
Nue*=0.05/Nue*=0.001 ratios of 1.086, 1.168 and 1.259 for
Re = 500, 1,000 and 1,500, which clearly denote that the
influence of e* on Nu grows with Re, which is in harmony
with the experimental reports of [11]. Augmentations in
heat transfer rates with Reynolds number are also signifi-
cant from the point of transition, where the recent related
studies [3, 4, 13, 32] consider 15–20% rise in Nu with Re as
an indicator for transition. Adopting the Retra values,
determined in Sect. 3.1.3, to the heat transfer investigations
result in the NuRetra=NuRe¼1 ratios of 1.18, 1.12 and 1.11 for
Retra of 1,650 (e* = 0.001), 575 (e* = 0.02) and 450
Fig. 4 Variations of a Cd, b Nu, c Nu/Cf values with Re and e*
Table 2 Cd values for various Re, e* and Q cases
Cd
Computational (e1*–e6
*)
Q (W/m2) 5 50 100 Equation 17b Equation 17c
Re = 100 0.0553–0.0549 0.0511–0.0507 0.0471–0.0468 0.0559 0.0551
Re = 500 0.1237–0.1190 0.1216–0.1171 0.1195–0.1152 0.1250 0.1223
Re = 1,000 0.1735–0.1618 0.1722–0.1607 0.1707–0.1594 0.1768 0.1696
Re = 1,500 0.2110–0.1919 0.2100–0.1911 0.2089–0.1902 0.2165 0.2037
Re = 2,000 0.2423–0.2160 0.2414–0.2154 0.2405–0.2147 0.2500 0.2307
40 Heat Mass Transfer (2008) 45:31–46
123
(e* = 0.05), respectively. These ratios show similarity with
those of [3, 4, 13, 32]; moreover they also indicate that the
present computational analysis on flow and heat transfer
characteristics coincide from the point of transition onset.
3.1.6 Cross-correlations with friction factor (Nu/Cf)
As described above, surface roughness augments both heat
transfer rates and friction factor values; thus the question of
‘‘Whether Nu or Cf is more considerably influenced by
surface roughness?’’ arises. Figure 4c displays the variation
of the computational Nu/Cf ratios with Re, where the present
results are not only compared with those of the recent work
but also with the traditional ratio of 4.36Re/16 for laminar
flow with constant heat flux. It can be seen from the figure
that, up to Re & 1,400 (e* = 0.05)–1,725 (e* = 0.001) the
affect of e* on Cf is higher than its impact on Nu, which in
return result in lower Nu/Cf ratios than the traditional line.
Moreover, the zoomed plot for 0 \ Re \ 40 puts forward
that the level of roughness amplitude is not affective on the
ratio, where this range extends up to Re & 500. Beyond the
Re limit of 1,400–1,725, the role of e* on heat transfer and
friction factor characteristics inversely change, resulting in
the rise of Nu/Cf ratios above the traditional line. Addi-
tionally, in the same Reynolds number range the influential
character of roughness amplitude level becomes apparent.
The zoomed plot for 1,960 \ Re \ 2,000 clearly puts for-
ward that at high Re, surface roughness augments heat
transfer rates more remarkably than friction factors and this
determination becomes important at high e* cases. The
works of [4] concluded in similar outputs with the present
study. At low Re their Nu/Cf ratios were either lower than or
compatible with the traditional line; however with the
increase of Reynolds number their findings as well elevated
above the traditional line.
3.2 Exergy analysis
3.2.1 Entropy generation
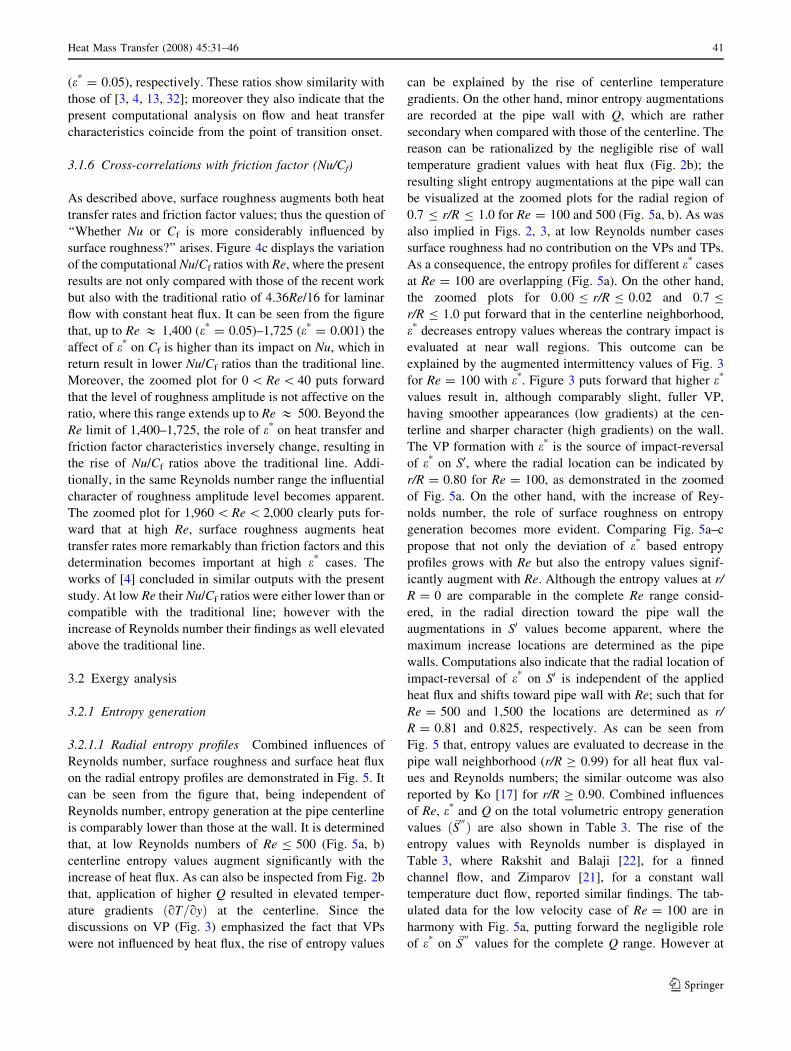
3.2.1.1 Radial entropy profiles Combined influences of
Reynolds number, surface roughness and surface heat flux
on the radial entropy profiles are demonstrated in Fig. 5. It
can be seen from the figure that, being independent of
Reynolds number, entropy generation at the pipe centerline
is comparably lower than those at the wall. It is determined
that, at low Reynolds numbers of Re B 500 (Fig. 5a, b)
centerline entropy values augment significantly with the
increase of heat flux. As can also be inspected from Fig. 2b
that, application of higher Q resulted in elevated temper-
ature gradients oT=oyð Þ at the centerline. Since the
discussions on VP (Fig. 3) emphasized the fact that VPs
were not influenced by heat flux, the rise of entropy values
can be explained by the rise of centerline temperature
gradients. On the other hand, minor entropy augmentations
are recorded at the pipe wall with Q, which are rather
secondary when compared with those of the centerline. The
reason can be rationalized by the negligible rise of wall
temperature gradient values with heat flux (Fig. 2b); the
resulting slight entropy augmentations at the pipe wall can
be visualized at the zoomed plots for the radial region of
0.7 B r/R B 1.0 for Re = 100 and 500 (Fig. 5a, b). As was
also implied in Figs. 2, 3, at low Reynolds number cases
surface roughness had no contribution on the VPs and TPs.
As a consequence, the entropy profiles for different e* cases
at Re = 100 are overlapping (Fig. 5a). On the other hand,
the zoomed plots for 0.00 B r/R B 0.02 and 0.7 B
r/R B 1.0 put forward that in the centerline neighborhood,
e* decreases entropy values whereas the contrary impact is
evaluated at near wall regions. This outcome can be
explained by the augmented intermittency values of Fig. 3
for Re = 100 with e*. Figure 3 puts forward that higher e*
values result in, although comparably slight, fuller VP,
having smoother appearances (low gradients) at the cen-
terline and sharper character (high gradients) on the wall.
The VP formation with e* is the source of impact-reversal
of e* on S0, where the radial location can be indicated by
r/R = 0.80 for Re = 100, as demonstrated in the zoomed
of Fig. 5a. On the other hand, with the increase of Rey-
nolds number, the role of surface roughness on entropy
generation becomes more evident. Comparing Fig. 5a–c
propose that not only the deviation of e* based entropy
profiles grows with Re but also the entropy values signif-
icantly augment with Re. Although the entropy values at r/
R = 0 are comparable in the complete Re range consid-
ered, in the radial direction toward the pipe wall the
augmentations in S0 values become apparent, where the
maximum increase locations are determined as the pipe
walls. Computations also indicate that the radial location of
impact-reversal of e* on S0 is independent of the applied
heat flux and shifts toward pipe wall with Re; such that for
Re = 500 and 1,500 the locations are determined as r/
R = 0.81 and 0.825, respectively. As can be seen from
Fig. 5 that, entropy values are evaluated to decrease in the
pipe wall neighborhood (r/R C 0.99) for all heat flux val-
ues and Reynolds numbers; the similar outcome was also
reported by Ko [17] for r/R C 0.90. Combined influences
of Re, e* and Q on the total volumetric entropy generation
values ð�S000 Þ are also shown in Table 3. The rise of the
entropy values with Reynolds number is displayed in
Table 3, where Rakshit and Balaji [22], for a finned
channel flow, and Zimparov [21], for a constant wall
temperature duct flow, reported similar findings. The tab-
ulated data for the low velocity case of Re = 100 are in
harmony with Fig. 5a, putting forward the negligible role
of e* on �S000
values for the complete Q range. However at
Heat Mass Transfer (2008) 45:31–46 41
123
higher Reynolds number flows the role of roughness
becomes visible where the �S000e�¼0:05=
�S000e�¼0:001 ratio attains the
flux independent values of 1.03 and 1.09 at Re = 1,000 and
2,000, respectively. The augmentation in the ratio is not
only an indicator of the more influential character of e* at
high Re but also put forward that entropy generation due to
surface roughness becomes more remarkable with the rise
of intermittency data (Fig. 3) and due to the transitional
character. Table 3 additionally interprets the significant
increase rates in the �S000
values at Re = 100 with higher heat
flux applications. As the ratio of �S000Q¼50=
�S000Q¼5 is 1.30 for
Re = 100, it decreases to *1.006 for Re = 2,000. The
minor ratio at Re = 2,000 is due to the slightly higher
temperature values (*2�C—Fig. 2a) at Q = 50 W/m2,
that causes minor grows in flow viscosity and frictional
activity.
3.2.1.2 Radial irreversibility distribution (/) pro-
files Since the generated entropy is composed of two
terms, �S000
DT: the thermal part and �S000
DP: the frictional part, a
deeper survey by decomposing the overall generation rate
into sub-sections will be helpful in understanding the
entropy mechanism. Irreversibility distribution (/), as
defined by Eq. 12d, is the ratio of the frictional ð�S000DPÞ to
thermal (�S000
DTÞ based entropy generations. It can be seen
from Fig. 6a that, being independent of Re, e and Q, in the
Fig. 5 Variations of radial entropy profiles with e* and Q at a Re = 100, b Re = 500, c Re = 1,500
42 Heat Mass Transfer (2008) 45:31–46
123
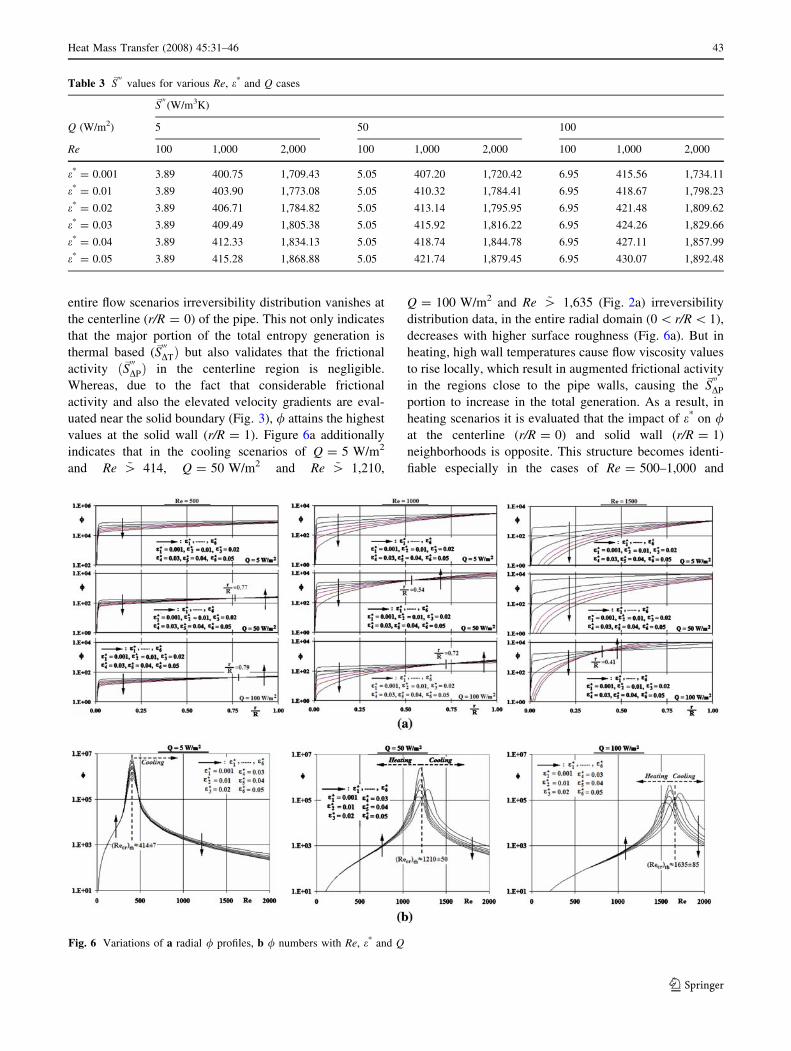
entire flow scenarios irreversibility distribution vanishes at
the centerline (r/R = 0) of the pipe. This not only indicates
that the major portion of the total entropy generation is
thermal based (�S000
DTÞ but also validates that the frictional
activity ð�S000DPÞ in the centerline region is negligible.
Whereas, due to the fact that considerable frictional
activity and also the elevated velocity gradients are eval-
uated near the solid boundary (Fig. 3), / attains the highest
values at the solid wall (r/R = 1). Figure 6a additionally
indicates that in the cooling scenarios of Q = 5 W/m2
and Re ~[ 414, Q = 50 W/m2 and Re ~[ 1,210,
Q = 100 W/m2 and Re ~[ 1,635 (Fig. 2a) irreversibility
distribution data, in the entire radial domain (0 \ r/R \ 1),
decreases with higher surface roughness (Fig. 6a). But in
heating, high wall temperatures cause flow viscosity values
to rise locally, which result in augmented frictional activity
in the regions close to the pipe walls, causing the �S000
DP
portion to increase in the total generation. As a result, in
heating scenarios it is evaluated that the impact of e* on /at the centerline (r/R = 0) and solid wall (r/R = 1)
neighborhoods is opposite. This structure becomes identi-
fiable especially in the cases of Re = 500–1,000 and
Table 3 �S000
values for various Re, e* and Q cases
�S000
(W/m3K)
Q (W/m2) 5 50 100
Re 100 1,000 2,000 100 1,000 2,000 100 1,000 2,000
e* = 0.001 3.89 400.75 1,709.43 5.05 407.20 1,720.42 6.95 415.56 1,734.11
e* = 0.01 3.89 403.90 1,773.08 5.05 410.32 1,784.41 6.95 418.67 1,798.23
e* = 0.02 3.89 406.71 1,784.82 5.05 413.14 1,795.95 6.95 421.48 1,809.62
e* = 0.03 3.89 409.49 1,805.38 5.05 415.92 1,816.22 6.95 424.26 1,829.66
e* = 0.04 3.89 412.33 1,834.13 5.05 418.74 1,844.78 6.95 427.11 1,857.99
e* = 0.05 3.89 415.28 1,868.88 5.05 421.74 1,879.45 6.95 430.07 1,892.48
Fig. 6 Variations of a radial / profiles, b / numbers with Re, e* and Q
Heat Mass Transfer (2008) 45:31–46 43
123
Q = 50 W/m2 and Re = 1,000–1,500 and Q = 100 W/m2.
Besides, Fig. 6a points out that, the near-wall increasing
role of e* on / becomes stronger for fixed heat flux values
with Reynolds number; additionally, the radial region of
the heating-based increasing role, also enlarges. Such that
for Q = 50 W/m2, as the defined region is 0.77 B r/R B 1
for Re = 500, the corresponding one is 0.54 B r/R B 1 for
Re = 1,000; whereas at the heat flux of Q = 100 W/m2 for
Re = 500, 1,000 and 1,500 these radial zones become
0.79 B r/R B 1, 0.72 B r/R B 1 and 0.41 B r/R B 1,
respectively.
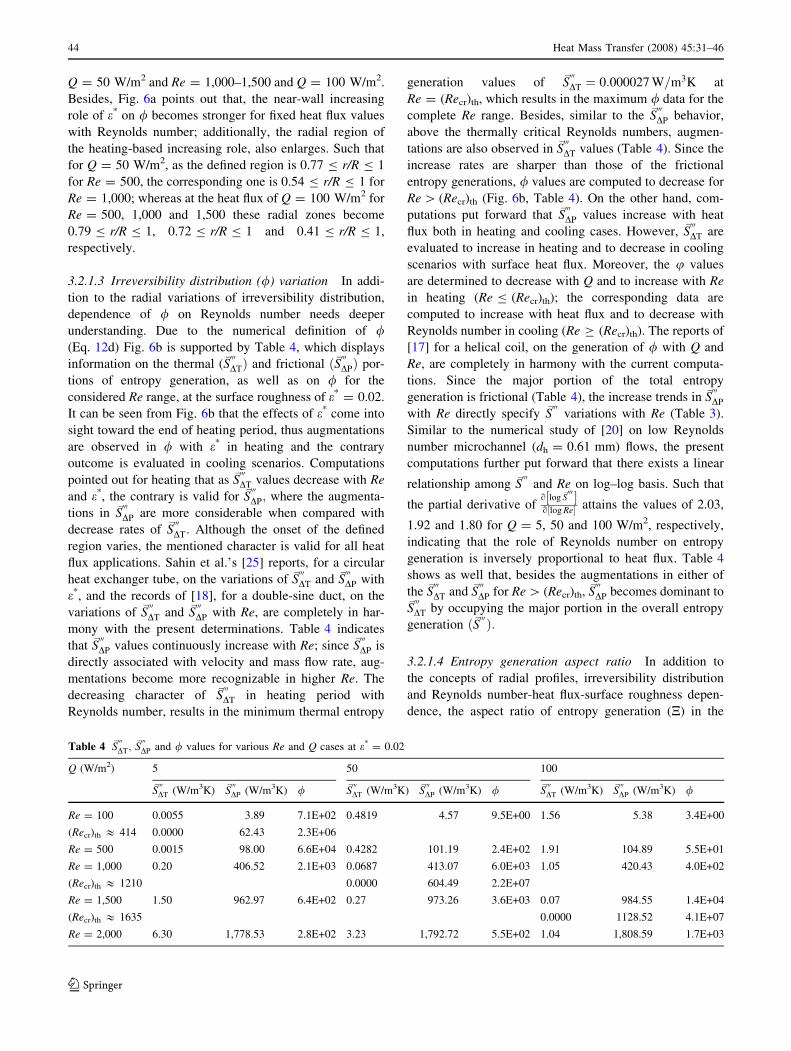
3.2.1.3 Irreversibility distribution (/) variation In addi-
tion to the radial variations of irreversibility distribution,
dependence of / on Reynolds number needs deeper
understanding. Due to the numerical definition of /(Eq. 12d) Fig. 6b is supported by Table 4, which displays
information on the thermal (�S000
DTÞ and frictional ð�S000DPÞ por-
tions of entropy generation, as well as on / for the
considered Re range, at the surface roughness of e* = 0.02.
It can be seen from Fig. 6b that the effects of e* come into
sight toward the end of heating period, thus augmentations
are observed in / with e* in heating and the contrary
outcome is evaluated in cooling scenarios. Computations
pointed out for heating that as �S000
DT values decrease with Re
and e*, the contrary is valid for �S000
DP; where the augmenta-
tions in �S000
DP are more considerable when compared with
decrease rates of �S000
DT: Although the onset of the defined
region varies, the mentioned character is valid for all heat
flux applications. Sahin et al.’s [25] reports, for a circular
heat exchanger tube, on the variations of �S000
DT and �S000
DP with
e*, and the records of [18], for a double-sine duct, on the
variations of �S000
DT and �S000
DP with Re, are completely in har-
mony with the present determinations. Table 4 indicates
that �S000
DP values continuously increase with Re; since �S000
DP is
directly associated with velocity and mass flow rate, aug-
mentations become more recognizable in higher Re. The
decreasing character of �S000
DT in heating period with
Reynolds number, results in the minimum thermal entropy
generation values of �S000
DT ¼ 0:000027 W=m3K at
Re = (Recr)th, which results in the maximum / data for the
complete Re range. Besides, similar to the �S000
DP behavior,
above the thermally critical Reynolds numbers, augmen-
tations are also observed in �S000
DT values (Table 4). Since the
increase rates are sharper than those of the frictional
entropy generations, / values are computed to decrease for
Re [ (Recr)th (Fig. 6b, Table 4). On the other hand, com-
putations put forward that �S000
DP values increase with heat
flux both in heating and cooling cases. However, �S000
DT are
evaluated to increase in heating and to decrease in cooling
scenarios with surface heat flux. Moreover, the u values
are determined to decrease with Q and to increase with Re
in heating (Re B (Recr)th); the corresponding data are
computed to increase with heat flux and to decrease with
Reynolds number in cooling (Re C (Recr)th). The reports of
[17] for a helical coil, on the generation of / with Q and
Re, are completely in harmony with the current computa-
tions. Since the major portion of the total entropy
generation is frictional (Table 4), the increase trends in �S000
DP
with Re directly specify �S000
variations with Re (Table 3).
Similar to the numerical study of [20] on low Reynolds
number microchannel (dh = 0.61 mm) flows, the present
computations further put forward that there exists a linear
relationship among �S000
and Re on log–log basis. Such that
the partial derivative ofo log �S
000½ �o log Re½ � attains the values of 2.03,
1.92 and 1.80 for Q = 5, 50 and 100 W/m2, respectively,
indicating that the role of Reynolds number on entropy
generation is inversely proportional to heat flux. Table 4
shows as well that, besides the augmentations in either of
the �S000
DT and �S000
DP for Re [ (Recr)th, �S000
DP becomes dominant to�S000
DT by occupying the major portion in the overall entropy
generation ð�S000 Þ:
3.2.1.4 Entropy generation aspect ratio In addition to
the concepts of radial profiles, irreversibility distribution
and Reynolds number-heat flux-surface roughness depen-
dence, the aspect ratio of entropy generation (N) in the
Table 4 �S000
DT;�S000
DP and / values for various Re and Q cases at e* = 0.02
Q (W/m2) 5 50 100
�S000
DT (W/m3K) �S000
DP (W/m3K) / �S000
DT (W/m3K) �S000
DP (W/m3K) / �S000
DT (W/m3K) �S000
DP (W/m3K) /
Re = 100 0.0055 3.89 7.1E+02 0.4819 4.57 9.5E+00 1.56 5.38 3.4E+00
(Recr)th & 414 0.0000 62.43 2.3E+06
Re = 500 0.0015 98.00 6.6E+04 0.4282 101.19 2.4E+02 1.91 104.89 5.5E+01
Re = 1,000 0.20 406.52 2.1E+03 0.0687 413.07 6.0E+03 1.05 420.43 4.0E+02
(Recr)th & 1210 0.0000 604.49 2.2E+07
Re = 1,500 1.50 962.97 6.4E+02 0.27 973.26 3.6E+03 0.07 984.55 1.4E+04
(Recr)th & 1635 0.0000 1128.52 4.1E+07
Re = 2,000 6.30 1,778.53 2.8E+02 3.23 1,792.72 5.5E+02 1.04 1,808.59 1.7E+03
44 Heat Mass Transfer (2008) 45:31–46
123
overall energy input (winp) of the pipe flow also needs to be
considered. Defining winp with Eq. 18a will point out N as
Eq. 18b, where as the term Pin_Q stands for the pumping
energy, _Q ¼ _mq
� �is the volumetric flow rate and Qs is the
total surface heat addition.
Winp ¼ Pin_Qþ Qs ð18aÞ
N ¼ STin
Winp
ð18bÞ
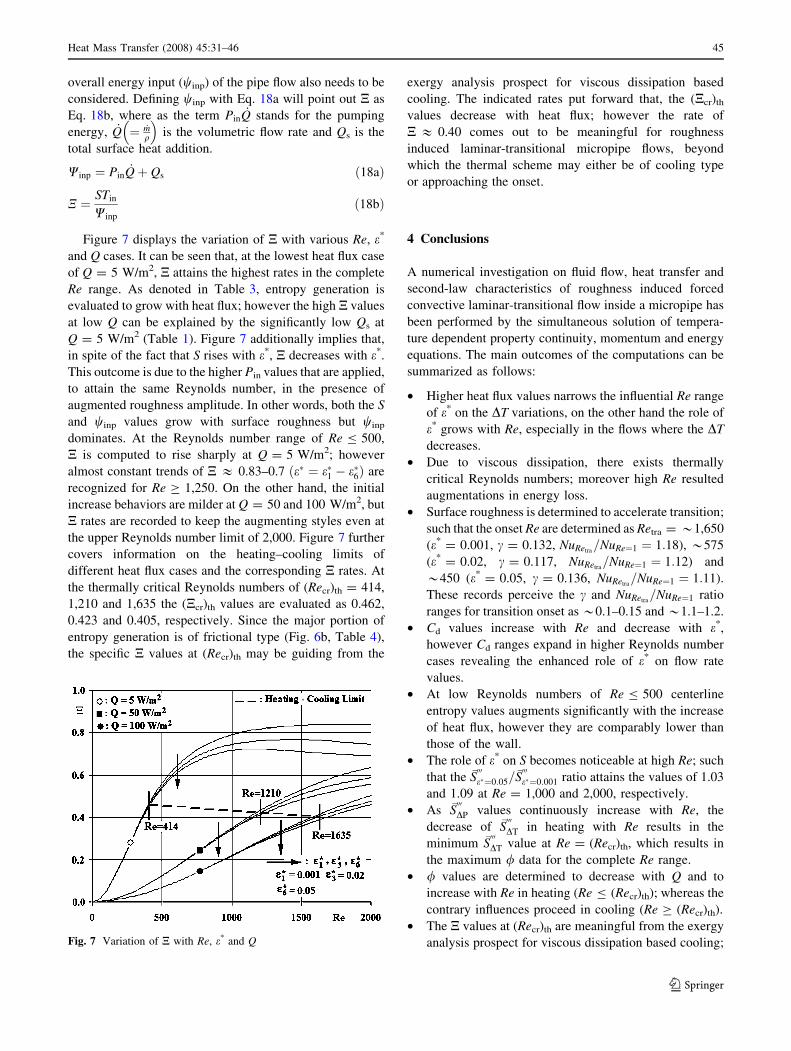
Figure 7 displays the variation of N with various Re, e*
and Q cases. It can be seen that, at the lowest heat flux case
of Q = 5 W/m2, N attains the highest rates in the complete
Re range. As denoted in Table 3, entropy generation is
evaluated to grow with heat flux; however the high N values
at low Q can be explained by the significantly low Qs at
Q = 5 W/m2 (Table 1). Figure 7 additionally implies that,
in spite of the fact that S rises with e*, N decreases with e*.
This outcome is due to the higher Pin values that are applied,
to attain the same Reynolds number, in the presence of
augmented roughness amplitude. In other words, both the S
and winp values grow with surface roughness but winp
dominates. At the Reynolds number range of Re B 500,
N is computed to rise sharply at Q = 5 W/m2; however
almost constant trends of N & 0.83–0.7 ðe� ¼ e�1 � e�6Þ are
recognized for Re C 1,250. On the other hand, the initial
increase behaviors are milder at Q = 50 and 100 W/m2, but
N rates are recorded to keep the augmenting styles even at
the upper Reynolds number limit of 2,000. Figure 7 further
covers information on the heating–cooling limits of
different heat flux cases and the corresponding N rates. At
the thermally critical Reynolds numbers of (Recr)th = 414,
1,210 and 1,635 the (Ncr)th values are evaluated as 0.462,
0.423 and 0.405, respectively. Since the major portion of
entropy generation is of frictional type (Fig. 6b, Table 4),
the specific N values at (Recr)th may be guiding from the
exergy analysis prospect for viscous dissipation based
cooling. The indicated rates put forward that, the (Ncr)th
values decrease with heat flux; however the rate of
N & 0.40 comes out to be meaningful for roughness
induced laminar-transitional micropipe flows, beyond
which the thermal scheme may either be of cooling type
or approaching the onset.
4 Conclusions
A numerical investigation on fluid flow, heat transfer and
second-law characteristics of roughness induced forced
convective laminar-transitional flow inside a micropipe has
been performed by the simultaneous solution of tempera-
ture dependent property continuity, momentum and energy
equations. The main outcomes of the computations can be
summarized as follows:
• Higher heat flux values narrows the influential Re range
of e* on the DT variations, on the other hand the role of
e* grows with Re, especially in the flows where the DT
decreases.
• Due to viscous dissipation, there exists thermally
critical Reynolds numbers; moreover high Re resulted
augmentations in energy loss.
• Surface roughness is determined to accelerate transition;
such that the onset Re are determined as Retra = *1,650
(e* = 0.001, c = 0.132, NuRetra=NuRe¼1 ¼ 1:18), *575
(e* = 0.02, c = 0.117, NuRetra=NuRe¼1 ¼ 1:12) and
*450 (e* = 0.05, c = 0.136, NuRetra=NuRe¼1 ¼ 1:11).
These records perceive the c and NuRetra=NuRe¼1 ratio
ranges for transition onset as *0.1–0.15 and *1.1–1.2.
• Cd values increase with Re and decrease with e*,
however Cd ranges expand in higher Reynolds number
cases revealing the enhanced role of e* on flow rate
values.
• At low Reynolds numbers of Re B 500 centerline
entropy values augments significantly with the increase
of heat flux, however they are comparably lower than
those of the wall.
• The role of e* on S becomes noticeable at high Re; such
that the �S000
e�¼0:05=�S000
e�¼0:001 ratio attains the values of 1.03
and 1.09 at Re = 1,000 and 2,000, respectively.
• As �S000
DP values continuously increase with Re, the
decrease of �S000
DT in heating with Re results in the
minimum �S000
DT value at Re = (Recr)th, which results in
the maximum / data for the complete Re range.
• / values are determined to decrease with Q and to
increase with Re in heating (Re B (Recr)th); whereas the
contrary influences proceed in cooling (Re C (Recr)th).
• The N values at (Recr)th are meaningful from the exergy
analysis prospect for viscous dissipation based cooling;Fig. 7 Variation of N with Re, e* and Q
Heat Mass Transfer (2008) 45:31–46 45
123
moreover, the rate of N & 0.40 comes out to be an
indicator for cooling onset.
References
1. Granovskii M, Dincer I, Rosen MA (2006) Application of oxygen
ion-conductive membranes for simultaneous electricity and
hydrogen generation. Chem Eng J 120:193–202
2. Lin WW, Lee DJ (1998) Second-law analysis on wavy plate fin-
and-tube heat exchangers. J Heat Trans ASME Trans 120:797–
801
3. Obot NT (2002) Toward a better understanding of friction and
heat/mass transfer in microchannels—a literature review.
Microscale Thermophys Eng 6:155–173
4. Kandlikar SG, Joshi S, Tian S (2003) Effect of surface roughness
on heat transfer and fluid flow characteristics at low Reynolds
numbers in small diameter tubes. Heat Trans Eng 24:4–16
5. Wen MY, Jang KJ, Yang CC (2003) Augmented heat transfer and
pressure drop of strip-type inserts in the small tubes. Heat Mass
Trans 40:133–141
6. Guo ZY, Li ZX (2003) Size effect on microscale single-phase
flow and heat transfer. Int J Heat Mass Trans 46:149–159
7. Koo J, Kleinstreuer C (2004) Viscous dissipation effects in
microtubes and microchannels. Int J Heat Mass Trans 47:3159–
3169
8. Morini GL (2005) Viscous heating in liquid flows in micro-
channels. Int J Heat Mass Trans 48:3637–3647
9. Celata GP, Cumo M, McPhail S, Zummo G (2006) Character-
ization of fluid dynamic behaviour and channel wall effects in
microtube. Int J Heat Fluid Flow 27:135–143
10. Celata GP, Morini GL, Marconi V, McPhail SJ, Zummo G (2006)
Using viscous heating to determine the friction factor in micro-
channels–An experimental validation. Exp Thermal Fluid Sci
30:725–731
11. Wu HY, Cheng P (2003) An experimental study of convective
heat transfer in silicon microchannels with different surface
conditions. Int J Heat Mass Trans 46:2547–2556
12. Phares DJ, Smedley GT, Zhou J (2005) Laminar flow resistance
in short microtubes. Int J Heat Fluid Flow 26:506–512
13. Vicente PG, Garcia A, Viedma A (2002) Experimental study of
mixed convection and pressure drop in helically dimpled tubes
for laminar and transition flow. Int J Heat Mass Trans 45:5091–
5105
14. Engin T, Dogruer U, Evrensel C, Heavin S, Gordaninejad F
(2004) Effect of wall roughness on laminar flow of Bingham
plastic fluids through microtubes. J Fluids Eng ASME Trans
126:880–883
15. Sahin AZ (1998) Second-law analysis of laminar viscous flow
through a duct subjected to constant wall temperature. J Heat
Trans ASME Trans 120:77–83
16. Zimparov V (2002) Energy conservation through heat transfer
enhancement techniques. Int J Energy Res 26:675–696
17. Ko TH (2006) Numerical investigation of laminar forced con-
vection and entropy generation in a helical coil with constant wall
heat flux. Num Heat Trans Part A 49:257–278
18. Ko TH (2006) Numerical analysis of entropy generation and
optimal Reynolds number for developing laminar forced con-
vection in double-sine ducts with various aspect ratios. Int J Heat
Mass Trans 49:718–726
19. Ratts EB, Raut AG (2004) Entropy generation minimization of
fully developed internal flow with constant heat flux. J Heat Trans
ASME Trans 126:656–659
20. Richardson DH, Sekulic DP, Campo A (2000) Low Reynolds
number flow inside straight micro channels with irregular cross
sections. Heat Mass Trans 36:187–193
21. Zimparov V (2000) Extended performance evaluation criteria for
enhanced heat transfer surfaces: heat transfer through ducts with
constant wall temperature. Int J Heat Mass Trans 43:3137–3155
22. Rakshit D, Balaji C (2005) Thermodynamic optimization of
conjugate convection from a finned channel using genetic algo-
rithms. Heat Mass Trans 41:535–544
23. Ozalp AA (2006) A computational study to predict the combined
effects of surface roughness and heat flux conditions on con-
verging-nozzle flows. Trans Can Soc Mech Eng 29:67–80
24. Ozalp AA (2007) Parallel effects of acceleration and surface
heating on compressible flow: simulation of an aerospace pro-
pulsion nozzle with a medium amount of surface wear. Strojniski
Vestnik J Mech Eng 53:3–12
25. Sahin AZ, Zubair SM, Al-Garni AZ, Kahraman R (2000) Effect
of fouling on operational cost in pipe flow due to entropy gen-
eration. Energy Conv Manag 41:1485–1496
26. Cao BY, Chen M, Guo ZY (2006) Effect of surface roughness on
gas flow in microchannels by molecular dynamics simulation. Int
J Eng Sci 44:927–937
27. Wang H, Wang Y, Zhang J (2005) Influence of ribbon structure
rough wall on the microscale Poiseuille flow. J Fluids Eng ASME
Trans 127:1140–1145
28. Sheikh AK, Zubair SM, Younas M, Budair MO (2001) Statistical
aspects of fouling processes. Proc Instn Mech Engrs Part E
215:331–354
29. Incropera FP, DeWitt DP (2001) Fundamentals of heat and mass
transfer. Wiley, New York
30. Wu JS, Tseng KC (2001) Analysis of micro-scale gas flows with
pressure boundaries using direct simulation Monte Carlo method.
Comput Fluids 30:711–735
31. White FM (1988) Fluid mechanics. McGraw-Hill, Singapore
32. Wu P, Little WA (1983) Measurement of friction factors for the
flow of gases in very fine channels used for microminiature
Joule–Thompson refrigerators. Cryogenics 23:273–277
33. Sahin B, Ceyhan H (1996) Numerical and experimental analysis
of laminar flow through square-edged orifice with variable
thickness. Trans Inst Meas Control 178:166–174
46 Heat Mass Transfer (2008) 45:31–46
123


