Embed Size (px)
Citation preview

arX
iv:h
ep-p
h/05
0620
0v2
17
Oct
200
5
Rotating Resonator-Oscillator Experiments to
Test Lorentz Invariance in Electrodynamics
Michael E. Tobar1, Paul L. Stanwix1, Mohamad Susli1, Peter Wolf2,3,Clayton R. Locke1 and Eugene N. Ivanov1
1 University of Western Australia, School of Physics M013, 35 Stirling Hwy.,Crawley 6009 WA, Australia. [email protected]
2 SYRTE, Observatoire de Paris, 61 Av. de l’Observatoire, 75014 Paris, France.3 Bureau International des Poids et Mesures, Pavillon de Breteuil, 92312 Sevres
Cedex, France.
1 Introduction
The Einstein Equivalence Principle (EEP) is a founding principle of relativ-ity [1]. One of the constituent elements of EEP is Local Lorentz Invariance(LLI), which postulates that the outcome of a local experiment is indepen-dent of the velocity and orientation of the apparatus. The central importanceof this postulate has motivated tremendous work to experimentally test LLI.Also, a number of unification theories suggest a violation of LLI at some level.However, to test for violations it is necessary to have an alternative theoryto allow interpretation of experiments [1], and many have been developed[2, 3, 4, 5, 6, 7]. The kinematical frameworks (RMS) [2, 3] postulate a sim-ple parameterization of the Lorentz transformations with experiments settinglimits on the deviation of those parameters from their values in special relativ-ity (SR). Because of their simplicity they have been widely used to interpretmany experiments [8, 9, 10, 11]. More recently, a general Lorentz violating ex-tension of the standard model of particle physics (SME) has been developed[6] whose Lagrangian includes all parameterized Lorentz violating terms thatcan be formed from known fields.
This work analyses rotating laboratory Lorentz invariance experimentsthat compare precisely the resonant frequencies of two high-Q factor (or highfinesse) cavity resonators. High stability electromagnetic oscillatory fields aregenerated by implementing state of the art frequency stabilization systemswith the narrow line width of the resonators. Previous non-rotating experi-ments [12, 10, 13] relied on the rotation of the Earth to modulate putativeLorentz violating effects. This is not optimal for two reasons. Firstly, the sensi-tivity to Lorentz violations is proportional to the noise of the oscillators at themodulation frequency, typically best for periods between 10 and 100 seconds.Secondly, the sensitivity is proportional to the square root of the number of

2 Tobar, Stanwix, et. al.
periods of the modulation signal, therefore taking a relatively long time toacquire sufficient data. Thus, by rotating the experiment the data integra-tion rate is increased and the relevant signals are translated to the optimaloperating regime [14].
In this work we outline the two most commonly used test theories (RMSand SME) for testing LLI of the photon. Then we develop the general frame-work of applying these test theories to resonator experiments with an emphasison rotating experiments in the laboratory. We compare the inherent sensitivityfactors of common experiments and propose some new configurations. Finallywe apply the test theories to the rotating cryogenic experiment at the Univer-sity of Western Australia, which recently set new limits in both the RMS andSME frameworks [15]. Note added: Two other concurrent experiments haveset some similar limits [16, 17].
2 Common Test Theories to Characterize Lorentz
Invariance
The most famous test of LLI (or the constancy of the speed of light) was thatconducted by Michelson and Morley in 1887 [18] with a rotating table and aMichelson interferometer. In actual fact, the theoretical framework used byMichelson and Morley was not a test of LLI, since the concept did not existat the time, but that of an aether drift. The relative motion of the apparatusthrough the aether was thought to induce a phase difference between thearms of the interferometer (and hence an interference pattern) dependingon the orientation. Thus, as the Earth moved from one end of its orbit tothe opposite end, the change in its velocity should be a detectable value.Michelson and Morley found no fringe shifts due to Earth motion around thesun and reported a null result. Since the Michelson Morley experiment, therehave been many other types of experiments devised to test the validity of SRand the constancy of light. However, to interpret these experiments one mustformulate an alternative test theory, and in this section we outline two of themost commonly used.
2.1 Robertson, Mansouri, Sexl Framework
A simple kinematic test theory that has been widely used is that of Robert-son, Mansouri and Sexl (RMS)[2, 3], where time standards (“clocks”) andlength standards (“rods”) are considered without taking into account theirunderlying structure. This framework postulates a preferred frame Σ(T,X)which satisfies LLI, and a moving frame S(t,x), which does not. The primecandidate for the preferred frame is taken as the Cosmic Microwave Back-ground (CMB), since any anticipated non-symmetries are expected to arise

Resonator Tests of Lorentz Invariance 3
from Planck-scale effects during the creation of the universe. In this frame-work we analyse the Poynting vector direction of the electromagnetic signalwith respect to the velocity of the lab through the CMB.
The normal Lorentz Transformations for a boost in the x direction areexpressed in a special form below (where c is the speed of light in the Σframe):
dT =1
a
(dt +
vdx
c2
); dX =
dx
b+
v
a
(dt +
vdx
c2
); dY =
dy
d; dZ =
dz
d; (1)
Here we take a Taylor expansion for a, b and d of the form: a ≈ 1 + αv2/c2 +O(c−4); b ≈ 1 + βv2/c2 + O(c−4); d ≈ 1 + δv2/c2 + O(c−4). Recalling thatγ = 1√
1−v2/c2from Special Relativity (SR), we see that SR predicts α = −1/2
and β = 1/2. Since SR predicts no contraction in directions orthogonal to aboost, it also predicts that δ = 0. Thus, the RMS parameterizes a possibleLorentz violation by a deviation of the parameters (α, β, δ) from the SR values(− 1
2 , 12 , 0).
By manipulating equation (1) to form the infinitesimals in the S frame,we can separate the equation into a boost term (β − α − 1), anisotropy term(δ−β+ 1
2 ) and time dilation parameter α+ 12 . Thus, a complete verification of
LLI in the RMS framework [2, 3] requires a test of (i) the isotropy of the speedof light (measuring PMM = δ−β + 1
2 ), a Michelson-Morley (MM) experiment[18], (ii) the boost dependence of the speed of light (measuring PKT = β −α−1), a Kennedy-Thorndike (KT) experiment [19] and (iii) the time dilationparameter (measuring PIS = α+ 1
2 ), an Ives-Stillwell (IS) experiment [20, 21].Rotating experiments may be considered Michelson-Morley experiments andonly measure PMM , so in this section we restrict ourselves to these types ofmeasurements.
Assuming only a MM type Lorentz violation, and setting ds2 = c2dT 2 −dX2 − dY 2 − dZ2 = 0 in Σ, and transforming according to Eqn. (1) we findthe coordinate travel time of a light signal in S becomes;
dt =dl
c
(PMM × sin2θ
v2
c2
)+ O(c−4) (2)
where dl =√
dx2 + dy2 + dz2 and θ is the angle between the Poynting vectorand the velocity v of S in Σ. For a modern MM experiment that measures thedifference frequency between two resonant cavities, the fractional frequencydifference may be calculated from (2) in a similar way to [11] to give:
∆ν0
ν0=
PMM
2πc2
[∮ (v.Ia(qa )
)2
dqa −∮ (
v.Ib(qb))2
dqb
](3)
Where Ij(qj) is the unit vector in the direction of light propagation (Poyntingvector) of each resonator (labeled by subscripts a and b), and qj is the variable

4 Tobar, Stanwix, et. al.
of integration around the closed path coordinates of the Poynting vector ofeach resonator.
To calculate the relevant time dependent expressions for v, velocities aretransformed to a geocentric non-rotating (with respect to distant stars) refer-ence frame (denoted as the MM-frame) centred at the centre of mass of theEarth with its z-axis perpendicular to the equator, pointing north, the x-axispointing towards 11.2h right ascension (aligned with the equatorial projectionof u defined below). A pictorial representation of the frame is shown in Fig. 1.Classical (Galilean) transformations for the velocities and sin2θ are sufficient
Fig. 1. This frame is an Earth centred frame in which the spin axis of the earth isthe z-axis, and the velocity of the Sun with respect to the CMB is defined to haveno component in the y direction. Thus, the Earth is spinning at the sidereal ratewithin this frame, and the angle θ is shown pictorially, but in general is a functionof position and time as the Earth spins and the experiment rotates.
as relativistic terms are of order O(c−2) and therefore give rise in Eqn. (2) toterms of order O(c−5). We consider two velocities, the velocity of the sun withrespect to the CMB u (declination -6.4, right ascension 11.2 h) and the or-bital velocity of the Earth vo. Velocities due to the spinning of the Earth andlaboratory are much smaller and do not impact on the calculations and maybe ignored. Thus, the sum of the two provide the velocity of the laboratory inthe universal frame to be inserted in Eqn. (3). In the MM-Earth frame, theCMB velocity is:
u = u
cosφµ
0sinφµ
(4)

Resonator Tests of Lorentz Invariance 5
where u ≈ 377km/s and φµ ≈ −6.4. To calculate the orbital velocity we firstconsider the Earth in a barycentric non-rotating frame (BRS) with the z-axisperpendicular to the Earth’s orbital plane and the x-axis pointing towards 0o
right ascension (pointing from the Sun to the Earth at the moment of theautumn equinox).
vBRSo = vo
−sinλ0
cosλ0
0
(5)
where vo ≈ 29.78km/s is the orbital speed of the Earth, and λ0 = Ω⊕(t − to)with Ω⊕ ≈ 2.0 10−7rad/s the angular orbital velocity and t− t0 the time sincethe autumnal equinox. We first transform to a geocentric frame (GRS) thathas its x-axis aligned with the BRS one but its z-axis perpendicular to theequatorial plane of the Earth
vGRSo =
vxBRSo
vyBRSo cosε − vzBRS
o sinε
vyBRSo sinε + vzBRS
o cosε
(6)
where ε ≈ 23.27o is the angle between the equatorial and orbital planes of theEarth. We then transform to the MM-Earth frame:
vo =
vxGRS
o cosαµ + vyGRSo sinαµ
−vxGRSo sinαµ + vyGRS
o cosαµ
vzGRSo
(7)
where αµ ≈ 167.9o is the right ascension of u. Summing the two velocitiesfrom Eqns. (4) and (7) we obtain the velocity of the lab with respect to the”universe rest frame”, transformed to the MM-Earth frame
v =
ucosφµ + vo(−sinλ0cosαµ + cosλ0sinαµcosε)vo(sinλ0sinαµ + cosλ0cosαµcosε)
usinφµ + vocosλ0sinε
. (8)
Substituting in the numeric values gives an orbital velocity of (in m/s);
v =
374651 + 5735 cos(λ0) + 29118 sin(λ0)
−26750 cos(λ0) + 6242 sin(λ0)−42024 + 11765 cos(λ0)
. (9)
The last calculation to make is the time dependence of the the unit vectorl along the direction of light propagation, which will depend on the config-uration of the experiment, including the type of resonator and whether it isrotating in the laboratory or not. In section 5 we calculate this dependencefor a specific experiment, which uses WG modes rotating in the laboratory.

6 Tobar, Stanwix, et. al.
2.2 Standard Model Extension
The SME [6] conglomerates all possible Lorentz-Violating terms and incor-porates them in a framework, which is an extension of the Standard Modelof Particle Physics. There are numerous Lorentz-violating terms per parti-cle sector (i.e. fermions, bosons and photons). However in this work we arerestricted to the so called minimal “photon-sector”, which only includes 19terms. The SME adds additional terms to the Lagrangian of the StandardModel for photons. Where as the standard Lagrangian was simply:
L = −1
4FµνFµν (10)
Under the SME, it becomes [7]:
L = −1
4FµνFµν − 1
4(kF )κλµνFκλFµν +
1
2(kAF )κǫκλµνAλFµν (11)
where Aλ is the 4-potential. The (kAF )κ terms have the dimensions of mass,and are the CPT odd terms [22]. It is argued in [6] that these should be zerobecause they induce instabilities as they are non-negative in the Lagrangian.There are also astronomical measurements [7] which place stringent limits onkAF . From here on these terms are set to zero.
On the other hand, the (kF )κλµν terms are CPT even, dimensionless andhave 19 independent terms out of the 256 possible combinations of κ, λ, µand ν. Out of these independent Lorentz violating terms, 10 combinationshave been analysed using astrophysical polarisation tests and have an upper-limit of 2 × 10⁻³² [7]. This limit is many orders of magnitude less than whatis expected from laboratory experiments, so these terms are set to zero tosimplify the calculations and to remain consistent with previous results.
We can derive the equations of motion for this system by minimisingthe action given by (11), using variational techniques and the definitionFµν ≡ ∂µAν − ∂νAµ and Aµ ≡ (φ,A). These equations are similar to thoseof a Maxwellian model in anisotropic media instead of a vacuum. In order toexpress these in a convenient form, we form linear combinations of the CPTeven term. These are given below [7]:
κDEjk = −2(kF )
0j0k; κHB
jk =1
2ǫjpqǫkrs(kF )
pqrs;
κDBjk = −κHE
kj = (kF )0jpq
ǫkpq. (12)
The dynamics of the model can be described in terms of equivalent B, E,H and D fields [7, 11] in a vacuum using the matrices in (12):
(D
H
)=
ǫ0(1 + κDE)
√ǫ0µ0
κDB√ǫ0µ0
κHE µ−10 (1 + κHB)
(
E
B
)(13)

Resonator Tests of Lorentz Invariance 7
Note that (13) is rank 6, as the κ matrices are rank 3 as defined in (12).The standard Maxwell equations in a vacuum are recovered if these κ matricesare set to zero.
Thus the effect of the SME in the photon-sector can be interpreted asintroducing medium-like properties to the vacuum. In the full SME, this isconsidered as an effect from Planck-scale physics in the early universe. Theκ matrices are all position dependent and thus act as “values” positionedthroughout space. If one or more of these values are zero, it does not implythe rest are also zero as there is no relation between each of the independentcomponents. However, there is a linear combination of these components whichallows us to separate them into birefringent [7] and non-birefringent terms. Byeliminating those values which have been constrained beyond what we hopeto achieve in this experiment, these terms can be simply written as in (14).
(κe+)jk =1
2κDE
jk + κHBjk; (κe−)jk =
1
2κDE
jk − κHBjk − 1
3δjk(κDE)ll
(κo+)jk =1
2κDB
jk + κHEjk; κjk
o− =1
2κDB
jk − κHEjk (14)
κtr =1
3δjk(κDE)ll
Fig. 2. The Sun-Centred Celestial Equatorial Frame (SCCEF), with the Earthat different equinoxes during the year. Note that during the vernal equinox, thelongitude which is at noon has it’s Y axis pointing east, while the longitude whichis at midnight has it’s Y axis pointing west, and vice-versa for the autumn equinox.
In the above definitions, κe+, κe− and κtr are parity-even matrices, whileκo+ and κo− are the parity-odd matrices. As mentioned in [7, 23], the κe+
and κo− are constrained such that∣∣κJK
∣∣ ≤ 2 × 10⁻³². Thus, both κe+ andκo− are set to zero each time they appear in our equations. Also, κtr is ascalar, which resonator experiments are usually insensitive to [24], and is notconsidered in this work.

8 Tobar, Stanwix, et. al.
The standard reference frame that we use is the Sun-Centred CelestialEquatorial Frame (SCCEF), which is shown in Fig. 2. This is the frame inwhich the sun is at the center, and is inertial with respect to the CMB to firstorder. The axes in this frame are labeled X , Y and Z. The Z axis is defined[7, pg. 6][25, pg. 3] to be parallel to the Earth’s north pole, or 90 declination.The X axis points from the sun towards the Earth at the moment of theautumn equinox, or 0 right ascension (RA) and 0 declination, while the Yaxis is at 90 RA and also at 0 declination, usually taken in the J2000.0frame.
The convention described in [7, pg. 18], which has the raised capital indicies(J, K) in the SCCEF, has been used. Local coordinates x, y and z are definedon the Earth’s surface (at the point of the experiment). The z axis is definedas being locally normal to the ground, vertically upwards. The x axis pointssouth and the y axis points east. These coordinates are denoted by the loweredcapital indicies (j, k) and they rotate with sidereal period ∆T⊕ = 1
ω⊕≈ 23 h
56 min. There is a relation between these two coordinates which is given bythe following rotation matrix:
RjJ =
cosχ cosω⊕T⊕ cosχ sin ω⊕T⊕ − sinχ− sinω⊕T⊕ cosω⊕T⊕ 0
sin χ cosω⊕T⊕ sin χ sinω⊕T⊕ sin χ
(15)
Here χ is the co-latitude of the laboratory from the north pole, and the T⊕ isthe time coordinate that is related to the sidereal frequency of the Earth. Thetime T⊕ is defined in [7] as any time when the y axis and the Y axis align.This has been taken to be the first time this occurs after the vernal equinox,which points along the negative x-axis.
When searching for leading order violations it is only necessary to considerthe spinning of the Earth about itself. However, the orbit of the Earth aboutthe sun may also be considered, since it induces Lorentz boosts and we maycalculate proportional terms to these. Since the Earth moves relatively slowlyaround the Sun compared to the speed of light, the boost terms will be sup-pressed by the velocity with respect to the speed of light (β⊕ = v⊕
c ≈ 10−4).The boost velocity of a point on the Earth’s surface is given by the followingrelation:
β = β⊕
sin Ω⊕T− cosη cosΩ⊕T− sin η cosΩ⊕T
+ βL
− sinω⊕Tcosω⊕T
0
(16)
Here β⊕ is the value for the boost speed of the orbital motion of the Earthand βL is the boost speed of the lab at the surface of the Earth due to itsspin motion. The latter is location dependent, but is less than 1.5× 10⁻⁶ andis zero at the poles (η is as defined in Fig. 2). The Lorentz matrix, Λµ
ν , thatimplements the transformation from the SCCEF to the laboratory frame withthe sidereal rotation RjJ and a boost β is given by,
Resonator Tests of Lorentz Invariance 9
Λµν =
1 −β1 −β2 −β3
−(R · β)1 R11 R12 R13
−(R · β)2 R21 R22 R23
−(R · β)3 R31 R32 R33
(17)
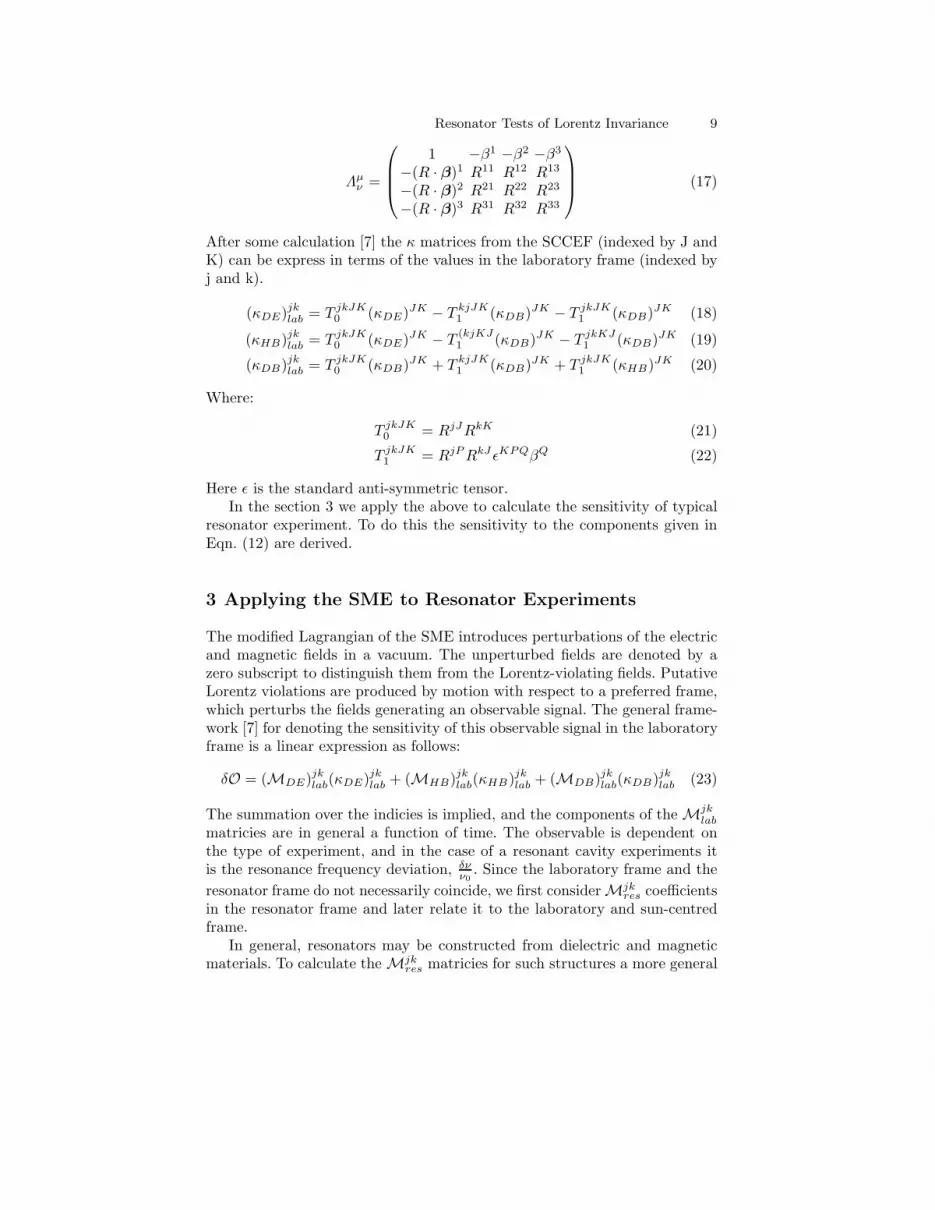
After some calculation [7] the κ matrices from the SCCEF (indexed by J andK) can be express in terms of the values in the laboratory frame (indexed byj and k).
(κDE)jklab = T jkJK
0 (κDE)JK − T kjJK1 (κDB)JK − T jkJK
1 (κDB)JK (18)
(κHB)jklab = T jkJK
0 (κDE)JK − T(kjKJ1 (κDB)JK − T jkKJ
1 (κDB)JK (19)
(κDB)jklab = T jkJK
0 (κDB)JK + T kjJK1 (κDB)JK + T jkJK
1 (κHB)JK (20)
Where:
T jkJK0 = RjJRkK (21)
T jkJK1 = RjP RkJ ǫKPQβQ (22)
Here ǫ is the standard anti-symmetric tensor.In the section 3 we apply the above to calculate the sensitivity of typical
resonator experiment. To do this the sensitivity to the components given inEqn. (12) are derived.
3 Applying the SME to Resonator Experiments
The modified Lagrangian of the SME introduces perturbations of the electricand magnetic fields in a vacuum. The unperturbed fields are denoted by azero subscript to distinguish them from the Lorentz-violating fields. PutativeLorentz violations are produced by motion with respect to a preferred frame,which perturbs the fields generating an observable signal. The general frame-work [7] for denoting the sensitivity of this observable signal in the laboratoryframe is a linear expression as follows:
δO = (MDE)jklab(κDE)jk
lab + (MHB)jklab(κHB)jk
lab + (MDB)jklab(κDB)jk
lab (23)
The summation over the indicies is implied, and the components of the Mjklab
matricies are in general a function of time. The observable is dependent onthe type of experiment, and in the case of a resonant cavity experiments itis the resonance frequency deviation, δν
ν0. Since the laboratory frame and the
resonator frame do not necessarily coincide, we first consider Mjkres coefficients
in the resonator frame and later relate it to the laboratory and sun-centredframe.
In general, resonators may be constructed from dielectric and magneticmaterials. To calculate the Mjk
res matricies for such structures a more general

10 Tobar, Stanwix, et. al.
form of (13) must be considered, which includes the properties of the medium,µr (permeability) and ǫr (permittivity), which are in general second ordertensors.
(D
H
)=
ǫ0(ǫr + κDE)
√ǫ0µ0
κDB√ǫ0µ0
κHE µ−10 (µ−1
r + κHB)
(
E
B
)(24)
Here as was derived in [7], we assume that the fractional frequency shift dueto Lorentz violations is given by:
∆ν
ν0= − 1
4 〈U〉 × (25)
∫
V
d3x
(ǫ0E
∗0 · κDE ·E0 − µ−1
0 B∗0 · κHB · B0 + 2Re
(√ǫ0µ0
E∗0 · κDB ·B0
))
Here 〈U〉 is the energy stored in the field and is given by the standard elec-trodynamic integral.
〈U〉 =1
4
∫
V
d3x(E0 ·D∗0 + B0 ·H∗
0) (26)
In Maxwellian electrodynamics the balance of magnetic and electrical energyin a resonator is equal, so the following is true:
〈U〉 =1
2
∫
V
d3xE0 ·D∗0 =
1
2
∫
V
d3xB0 ·H∗0 (27)
This reduces 〈U〉 to an effective normalisation factor for either an electricor magnetic filling factor. Also, since the κ terms from the integral of (25)are only time dependent rather than spatially dependent, the κ terms canbe removed from the integral. Thus, the final term in (25) will be zero sincethe electric and magnetic fields are orthogonal in a resonant structure. Byequating (23) and (25) in the resonator frame the (MDB)jk
res coefficients arecalculated to be zero, eliminating the possibility of making a measurementof κtr[24, 26]. Assuming the resonator permeability and permittivity have nooff-diagonal coefficients (i.e. non-gyrotropic) such that;
ǫr = ǫ0
ǫx 0 00 ǫy 00 0 ǫz
µr = µ0
µx 0 00 µy 00 0 µz
(28)
the only non-zero coefficients may then be calculated to be
(MDE)jjres = − 1
ǫj
∫V d3x
∣∣∣Ej0
∣∣∣2
2∫V
d3xE0∗ · E0
= −Pej
2ǫj(29)

Resonator Tests of Lorentz Invariance 11
(MHB)jjres = µj
∫V d3x
∣∣∣Hj0
∣∣∣2
2∫
V d3xH0∗ ·H0
= µjPmj
2(30)
Thus the MDE and MHB matricies are diagonal and simply related to theelectric and magnetic energy filling factors, Pej and Pmj respectively [11]. Ingeneral a resonator may consist of more than one material, and may includevacuum. In this case (29) and (30) may be written more generally (s is thenumber of different materials including vacuum).
(MDE)jjres = −
s∑
i=1
Peij
2ǫij
(31)
(MHB)jjres =
s∑
i=1
µijPmi
j
2(32)
To measure the resonant frequency it is necessary excite electromagneticfields inside the resonator and then compare it against a similar frequency. Tobe sensitive to violations of LLI, the comparison frequency must be generatedby a source which exhibits a different dependence on Lorentz violations inthe photon sector. For example, an atomic standard (such as a hydrogenmaser) may operate in a mode which is not sensitive to Lorentz violations [11,13]. Alternatively, the resonant frequency may be compared against anotherresonator designed to have a different dependence. The latter can be achievedby orientating two identical resonators orthogonally [10], or by exciting twomodes in a matter filled resonator with orthogonal polarizations. In both casesthe field components must be considered with respect to the laboratory frameand not the resonator. For such an experiment the observable becomes thefrequency difference (between a resonator labeled a and b) such that;
δO =δνa
νa− δνb
νb(33)
Thus, with respect to the laboratory frame, the effective (MDE)lab and(MHB)lab matricies consistent with (23) become:
(MDE)a−b = (34)
(MDE)xx
a − (MDE)xxb 0 0
0 (MDE)yya − (MDE)yy
b 00 0 (MDE)zz
a − (MDE)zzb
(MHB)a−b = (35)
(MHB)xxa − (MHB)xx
b 0 00 (MHB)yy
a − (MHB)yyb 0
0 0 (MHB)zza − (MHB)zz
b

12 Tobar, Stanwix, et. al.
These equations are general for any resonator experiments, including Fabry-Perot and microwave cavity experiments, and simplify the analysis for complexresonator configurations, such as whispering gallery mode resonators. Onlythe electric and magnetic filling factors need to be calculated to determinethe sensitivity coefficients to the observable, which is possible using standardnumerical techniques [27].
To determine the sensitivity of stationary laboratory experiments one cal-culates the time dependence of (33) due to the sidereal and orbital motionof the Earth around the Sun in terms of the Sun-centred coefficients given in(14) and (18). This calculation has already been done in [7, 11, 28] and willnot be repeated here. In the following subsection we generalize this analysisto rotating experiments.
3.1 Rotation in the Laboratory Frame
Non-rotating experiments [12, 10, 13] that rely on Earth rotation to modulatea Lorentz violating effect are not optimal for two reasons. Firstly, the sensi-tivity is proportional to the noise in the system at the modulation frequency,typically best for microwave resonator-oscillators and Fabry-Perot stabilizedlasers for periods between 10 to 100 seconds. Secondly, the sensitivity is pro-portional to the square root of the number of periods of the modulation signal,therefore taking a relatively long time to acquire sufficient data. Thus, by ro-tating the experiment the data integration rate is increased and the relevantsignals are translated to the optimal operating regime [14]. For rotation in the
laboratory frame the (M)jklab coefficients become a function of time and depend
on the axis of rotation. In the laboratory it is most practical to rotate aroundthe axis of the gravitational field to reduce gravity induced perturbation of theexperiment. Thus, our analysis includes rotation about the laboratory z-axis.If we set the time, t = 0, to be defined when the experiment and laboratoryaxes are aligned, and we only consider the time varying components (i.e. themost sensitive ones induced by rotation), then for clock-wise rotation of ωR
rads/sec, (34) and (35)become:
(MDE)lab =
SDE cos(2ωRt) −SDE sin(2ωRt) 0−SDE sin(2ωRt) −SDE cos(2ωRt) 0
0 0 0
(36)
SDE =1
2((MDE)xx
a − (MDE)yya − (MDE)xx
b + (MDE)yyb ) (37)
(MHB)lab =
SHB cos(2ωRt) −SHB sin(2ωRt) 0−SHB sin(2ωRt) −SHB cos(2ωRt) 0
0 0 0
(38)
SHB =1
2((MHB)xx
a − (MHB)yya − (MHB)xx
b + (MHB)yyb ) (39)

Resonator Tests of Lorentz Invariance 13
Note that if one resonator is tested with respect to a stationary generatedfrequency, then the (M)jj
i coefficients in the definition of SHB and SHB per-taining to that frequency must be set to zero.
To determine the time dependence of the observable (33) we follow thesame procedure as presented in subsection 2.2 to transform the κ matriciesgiven in (14) to the κ matricies in the laboratory given by (18), (19) and (20).We then substitute (37) to (39) into (23) to calculate the time dependence ofthe observable of (33). This is a tedious process and the details are omitted.Essentially, because the (MDE)lab and (MHB)lab matricies are time depen-dent at 2ωR, the observable signals are at frequencies close to this value andare summarized in Table 1. Here the frequency of Earth rotation is defined asω⊕, and orbit around the sun as Ω⊕. The ω⊕ is commonly referred to as thesidereal frequency, while the Ω⊕ is referred to as the annual frequency. Wealso define the sensitivity factor, S of the experiment as:
S = SHB − SDE (40)
ωi Cosine Coefficient Cωi/S Sine Coefficient Sωi
/S
2ωR3
2sin2(χ)κZZ
e− 2βL sin(χ)κXYo+
2ωR + Ω⊕ − 1
2β⊕ sin2(χ)× − 1
2β⊕ sin2(χ)κY Z
o+
(2 sin(η)κXYo+ + cos(η)κXZ
o+ )
2ωR − Ω⊕ − 1
2β⊕ sin2(χ)× 1
2β⊕ sin2(χ)κY Z
o+
(2 sin(η)κXYo+ + cos(η)κXZ
o+ )
2ωR + ω⊕ −2 sin2(χ
2)× −2 sin2(χ
2)(sin(χ)κY Z
e− − βLκY Zo+ )
(−βLκXZo+ + sin(χ)κXZ
e− )
2ωR + ω⊕ + Ω⊕ −2β⊕ cos(χ
2) sin(η) sin3(χ
2)κY Z
o+ 4β⊕ cos(χ
2) sin( η
2) sin3(χ
2)×
(sin( η
2)κXY
o+ + cos( η
2)κXZ
o+ )
2ωR + ω⊕ − Ω⊕ −2β⊕ cos(χ
2) sin(η) sin3(χ
2)κY Z
o+ −4β⊕ cos(χ
2) cos( η
2) sin3(χ
2)×
(cos( η
2)κXY
o+ − sin( η
2)κXZ
o+ )
2ωR + 2ω⊕ − sin4(χ
2)(κXX
e− − κY Ye− ) −2 sin4(χ
2)κXY
e−
2ωR + 2ω⊕ + Ω⊕ 2β⊕ sin2( η
2) sin4(χ
2)κXZ
o+ 2β⊕ sin2( η
2) sin4(χ
2)κY Z
o+
2ωR + 2ω⊕ − Ω⊕ −2β⊕ cos2( η
2) sin4(χ
2)κXZ
o+ −2β⊕ cos2( η
2) sin4(χ
2)κY Z
o+
2ωR − ω⊕ 2 cos2(χ
2)(βLκXZ
o+ + sin(χ)κXZe− ) −2 cos2(χ
2)(βLκY Z
o+ + sin(χ)κY Ze− )
2ωR − ω⊕ + Ω⊕ 2β⊕ cos3(χ
2) sin(η) sin(χ
2)κY Z
o+ −4β⊕ cos( η
2) cos3(χ
2) sin(χ
2)×
(cos( η
2)κXY
o+ − sin( η
2)κXZ
o+ )
2ωR − ω⊕ − Ω⊕ 2β⊕ cos3(χ
2) sin(η) sin(χ
2)κY Z
o+ 4β⊕ sin( η
2) cos3(χ
2) sin(χ
2)×
(sin( η
2)κXY
o+ + cos( η
2)κXZ
o+ )
2ωR − 2ω⊕ − cos4(χ
2)(κXX
e− − κ22e−) 2cos4(χ
2)κXY
e−
2ωR − 2ω⊕ + Ω⊕ −2β⊕ cos2( η
2) cos4(χ
2)κXZ
o+ 2β⊕ cos2( η
2) cos4(χ
2)κY Z
o+
2ωR − 2ω⊕ − Ω⊕ 2β⊕ sin2( η
2) cos4(χ
2)κXZ
o+ −2β⊕ sin2( η
2) cos4(χ
2)κY Z
o+
Table 1. Normalized sensitivities with respect to the experiment sensitivity factorS for all predicted frequency modulated components.

14 Tobar, Stanwix, et. al.
To decorrelate all side bands, more than one year of data is necessary. Inthis case we have eight unknown κ coefficients and thirty possible individualmeasurements listed in Table 1, which is an over parameterization. For shortdata sets (less than a year) we do not have enough information to satisfy theNyquist condition to distinguish between frequencies that differ by the annualoffset (collected in the same blocks). Thus, to make a short data set approx-imation, we collect the sidebands together (see Fig. 3). The short data set
Fig. 3. This “frequency stick diagram” shows a schematic of the frequency modu-lation components of the beat frequency in a convenient form. The sidebands offsetby ±Ω⊕ have been trimmed for brevity. Each frequency has two degrees of freedom,i.e. a sine and a cosine term, with the phase set by a time t = 0 set with respect tothe SCCEF.
approximation is achieved by knowing the angle of the orbit, Φ = Ω⊕t, in thesun-centered frame with respect to the negative X-axis (which occurs at thevernal equinox as shown in Fig. 2), and then taking a Taylor series expansionaround that angle. Here we define the phase of the combined rotational andsidereal term as θ and Φ0 as the value of Φ when a short data set is taken.Since δΦ ≡ Φ − Φ0 is small with respect to 2π, via the double angle rule wecan derive the following relationships:
sin(θ ± (δΦ + Φ0)) = sin(θ ± δΦ) cos(Φ0) ± cos(θ ± δΦ) sin(Φ0)
≈ sin(θ) cos(Φ0) ± cos(θ) sin(Φ0)
cos(θ ± (δΦ + Φ0)) = cos(θ ± δΦ) cos(Φ0) ∓ sin(θ ± δΦ) sin(Φ0)
≈ cos(θ) cos(Φ0) ∓ sin(θ) sin(Φ0)
Now we can combine the sidebands as shown in Fig. 3 by applying the aboverelationships to eliminate the dependence on Ω⊕. In this case the componentsfrom Table 1 decompose to those listed in Table 2. The first feature to noticeis that the 2ωR ± 2ω⊕ sidebands are redundant. One might also expect the

Resonator Tests of Lorentz Invariance 15
Coefficient (normalized with respect to S)
S2ωR−2ω⊕− cot4(χ
2) × S2ωR+2ω⊕
C2ωR−2ω⊕cot4(χ
2) × C2ωR+2ω⊕
S2ωR−ω⊕−2 cos2(χ
2)×
(βLκY Zo+ + sin(χ)(β⊕ cos(Φ0)(cos(η)κXY
o+ − sin(η)κXZo+ ) + κY Z
e− ))
C2ωR−ω⊕2 cos2(χ
2)×
(βLκXZo+ + sin(χ)(−β⊕ sin(Φ0)κ
XYo+ + β⊕ cos(Φ0) sin(η)κY Z
o+ + κXZe− ))
S2ωR2βL sin(χ)κXY
o+
C2ωR- 1
2sin2(χ)(2β⊕ cos(Φ0)(2 sin(η)κXY
o+ + cos(η)κXZo+ ) + 2β⊕ sin(Φ0)κ
Y Zo+ )
+ 3
2sin2(χ)κZZ
e− )
S2ωR+ω⊕−2 sin2(χ
2)×
(−βLκY Zo+ + sin(χ)(β⊕ cos(Φ0)(cos(η)κXY
o+ − sin(η)κXZo+ ) + κY Z
e− ))
C2ωR+ω⊕−2 sin2(χ
2)×
(−βLκXZo+ + sin(χ)(−β⊕ sin(Φ0)κ
XYo+ + β⊕ cos(Φ0) sin(η)κY Z
o+ + κXZe− ))
S2ωR+2ω⊕−2 sin4(χ
2)(β⊕ sin(Φ0)κ
XZo+ + β⊕ cos(η) cos(Φ0)κ
Y Zo+ + κXY
e− )
C2ωR+2ω⊕− sin4(χ
2)(2β⊕ cos(η) cos(Φ0)κ
XZo+ − 2β⊕ sin(Φ0)κ
Y Zo+ + (κXX
e− − κY Ye− ))
Table 2. Normalized sensitivities with respect to the experiment sensitivity fac-tor S for all predicted frequency modulated components using the short data setapproximation.
2ωR ± ω⊕ sidebands to be redundant as well. The only reason they are notis because we have taken into account the velocity of the laboratory due tothe Earth spinning on its axis, βL. In fact it turns out that it is not useful tokeep this term because β⊕ is two orders of magnitude larger and when oneapplies the data analysis procedures the sensitivities will be degraded if theanalysis depends on the βL terms for the uniqueness of the solution. Thus,since it makes no practical sense to keep these terms, we set them to zero. Forthis case the coefficients are listed in Table 3.
For data sets of less than one year, the components in Table 3 may be usedto set upper limits on the κ coefficients in the SME. Since there are only fivepossible independent components, to set limits on eight coefficients we usethe same technique as adopted by Lipa et. al. [12]. The κo+ boost coefficientsare set to zero to calculate limits on the κe− isotropy coefficients and viceversa. This technique assumes no correlation between the isotropy and boostcoefficients. It would be unlikely that a cancelation of Lorentz violating effectswould occur, as this would necessitate a fortuitous relationship between thecoefficients of the same order of value as the boost suppression coefficient (i.e.orbit velocity, β⊕), and consistent with the correct linear combinations aspresented in Tab 3.
Another practical point is that the largest systematic effect occurs at 2ωR.Thus, when setting the limits on the three κXY
o+ , κXZo+ and κY Z
o+ coefficientswe only use the data collected at 2ωR ± ω⊕ and 2ωR ± 2ω⊕ frequencies.Likewise for the κXY
e− , κXZe− , κY Z
e− and (κXXe− − κY Y
e− ) coefficients. These arethe same coefficients that have had limits set by the non-rotating experiments

16 Tobar, Stanwix, et. al.
Coefficient (normalized with respect to S)
S2ωR−2ω⊕− cot4(χ
2) × S2ωR+2ω⊕
C2ωR−2ω⊕cot4(χ
2) × C2ωR+2ω⊕
S2ωR−ω⊕cot2(χ
2) × S2ωR+ω⊕
C2ωR−ω⊕− cot2(χ
2) × C2ωR+ω⊕
S2ωR—-
C2ωR− 1
2sin2(χ)(2β⊕ cos(Φ0)(2 sin(η)κXY
o+ + cos(η)κXZo+ ) + 2β⊕ sin(Φ0)κ
Y Zo+ )
+ 3
2sin2(χ)κZZ
e− )
S2ωR+ω⊕−2 sin2(χ
2)(sin(χ)(β⊕ cos(Φ0)(cos(η)κXY
o+ − sin(η)κXZo+ ) + κY Z
e− ))
C2ωR+ω⊕−2 sin2(χ
2)(sin(χ)(−β⊕ sin(Φ0)κ
XYo+ + β⊕ cos(Φ0) sin(η)κY Z
o+ + κXZe− ))
S2ωR+2ω⊕−2 sin4(χ
2)(β⊕ sin(Φ0)κ
XZo+ + β⊕ cos(η) cos(Φ0)κ
Y Zo+ + κXY
e− )
C2ωR+2ω⊕− sin4(χ
2)(2β⊕ cos(η) cos(Φ0)κ
XZo+ − 2β⊕ sin(Φ0)κ
Y Zo+ + (κXX
e− − κY Ye− ))
Table 3. Normalized sensitivities with respect to the experiment sensitivity fac-tor S for all predicted frequency modulated components, using the short data setapproximation and neglecting components of order βL.
[10][12][13]. The remaining coefficient κZZe− (≡ κXX
e− + κY Ye− ) can only be set
amongst a systematic signal at 2ωR, which is in general much greater than thestatistical uncertainties at the other frequencies. In this case we can assume allcoefficients are zero except for the κZZ
e− coefficient. However, it is not straightforward to set a limit on any putative Lorentz violation amongst a largesystematic as one can not be sure if the systematic signal actually cancels aneffect. Since the signal at 2ωR is dominated by systematic effects, it is likelythat its phase and amplitude will vary across different data sets. In this casethe systematic signal from multiple data sets can be treated statistically toplace an upper limit on κZZ
e− . In our experiment we use this technique to setan upper of 2.1(5.7)× 10−14 [15] (see section 6).
3.2 Phase with respect to the SCCEF
To extract the κ components of the SME out of our observed signal we firstneed to determine the relevant C2ωi
and S2ωicoefficients listed in Table 1.
This in turn requires us to know the phase of the experiment’s orientationwith respect to the SCCEF. In this section we will derive an expression forthis phase in terms of the time origins of the experiment’s rotation, the Earth’ssidereal rotation, and the orbit of the Earth around the Sun.
In general, we are interested in the frequency components
2ω[a,b] = 2ωR + aω⊕ + bΩ⊕ (41)
where a and b take on values in the domains
a ∈ [−2, 2], b ∈ [−1, 1] (42)

Resonator Tests of Lorentz Invariance 17
Thus to determine the C2ω[a,b]coefficient we fit the data with a model of the
formcos(2ωRTR + aω⊕T⊕ + bΩ⊕T ) (43)
where TR is the experiment’s rotation time, T⊕ is the sidereal time, and T isthe time since the vernal equinox.
To simplify our analysis we aim to transform this expression to the formcos(αt+φ). To achieve this we note that the difference δR between the exper-iment’s rotation time TR and the time since the vernal equinox T is constantover the course of the measurement, as determined by the initial configurationof the experiment, and we may write,
δR = TR − T. (44)
Similarly the sidereal time and the time since the vernal equinox are relatedby δ⊕,
δ⊕ = T⊕ − T (45)
By combining (43), (44) and (45) we arrive at an expression of the desiredform.
cos(2ωRTR + aω⊕T⊕ + bΩ⊕T ) = cos(2ωR(δR + T ) + aω⊕(δ⊕ + T ) + bΩ⊕T )
= cos((2ωR + aω⊕ + bΩ⊕)T
+2ωRδR + aω⊕δ⊕)
Thus we can account for the phase of the experiment relative to the SCCEFby determining δR and δ⊕. The origin of the experiment’s rotation time TR
is defined to be the instant at which the axis of symmetry of the first res-onator (resonator a) is aligned with the local y axis. Our experiment has beendesigned such that the time origin of the data acquisition coincides with thesame event, rendering δR = 0 in our case.
We also need to obtain δ⊕ for the sidereal rotation. We define T⊕ = 0 asin [7] to be the instant the local y axis and the SCCEF Y axis are aligned(noon) in the laboratory (see figure 2). Let us define Tv to be the time inseconds after midnight UTC+0, at which the vernal equinox has occurredin the J2000.0 frame [7]. For convenience we also define our longitude TL
in terms of sidereal seconds from midnight (in the case of our laboratoryTl = 115.826× 23hr56min
360 = 27721sec). There exists a special location whosemeridian is at noon at the vernal equinox. For this special location (duringthe vernal equinox), δ⊕ = 0 since the time when the y and Y axes align andthe vernal equinox are the same. We see geometrically that any longitudegreater than this meridian will have positive δ⊕, otherwise if the longitude isless than this meridian it would have negative δ⊕. As shown in Fig. 4, we cannow derive an expression for δ⊕.
δ⊕ = TL + Tv − 23hr56min
2(46)
Hence we are able to determine the phase of the experiment’s orientationrelative to the SCCEF.

18 Tobar, Stanwix, et. al.
Fig. 4. Diagram showing meridians and angles.
4 Comparison of sensitivity of various resonator
experiments in the SME
In this section we show how the general analysis may be applied to somecommon resonator configurations for testing LLI. Also, we propose some newconfigurations based on exciting two modes in matter filled resonators. Thecomparison is made by calculating the sensitivity parameter S of the resonatorusing Eqns. (31) to (40). Note that the sign of the S factor depends on thedefinition of the first resonator. Practically this will need to be the resonatorthat exhibits the largest value of frequency. In this work, where appropriate,we assume the first resonator is aligned along the y-axis.
4.1 Fabry-Perot resonators
Experiments based on laser stabilized Fabry-Perot resonators typically useeither one [8] or two [10] cavities placed with the lengths orthogonal to thelaboratory z-axis. In a vacuum filled cavity it is easy to show that |S| = 1
2for the configuration in Fig .5. In contrast, when one rotating cavity is com-pared to a stationary one the value is reduced by a factor of 2, to |S| = 1
4 .It is also interesting to consider the sensitivity of matter filled cavities in thephoton sector. Here, for simplicity we assume the relative permeability andpermittivity are scalars of µr and ǫr respectively. It is straight forward toadd anisotropy and only modifies the sensitivity slightly, so for brevity is notconsidered here. If similar configurations to Fig. 5 are constructed from solidmaterial the sensitivity factor, S, becomes dependent on polarization. Thiseffect also allows for a sensitive experiment by exciting two modes of different

Resonator Tests of Lorentz Invariance 19
Fig. 5. Typical configuration of a rotating Lorentz invariance test using Fabry-Perotcavities.
polarization inside one cavity (Dual-Mode), of which some examples are shownin Fig . 6. Such cavities have been built previously to measure birefringence[29]. High finesse matter cavities can be made by using low-loss crystallinedielectric materials at optical frequencies [30, 31]. The sensitivity for differentconfigurations are compared in Table 4. For a low-loss dielectric material with
Fig. 6. New proposed matter filled Fabry-Perot cavity configurations in which twomodes of orthogonal polarization are excited and compared, and are sensitive toviolations in Lorentz invariance in the photon sector of the SME
Ez polarization in the two orthogonal cavities (Fig .5) the sensitive factor, S,is the same as the vacuum cavity, while for the circularly polarized case, thesensitivity is close to that of the single vacuum cavity resonator. In contrastthe same experiment with Hz polarization has reduced sensitivity of the or-

20 Tobar, Stanwix, et. al.
Configuration Sensitivity Factor S
Fig . 5 Ezµr
2
Fig . 5 Hz1
2ǫr
Fig . 5 Circular Polarization 1
4
(1
ǫr+ µr
)
Fig . 6 (a) 1
2
(1
ǫr− µr
)
Fig . 6 (b) 1
4
(1
ǫr− µr
)
Table 4. Value of the S factor for various configurations of Fabry-Perot cavityexperiments
der of the permittivity of the material. The sensitivity of the two Dual-Moderesonators gives the possibility of realizing a similar sensitivity to dual cav-ity experiments, but within the same cavity. The configuration should havea large degree of common mode rejection, and will be much more insensitiveto external effects like temperature, vibration etc. and other systematics, andmay be worth pursuing for these reasons. Note that Muller has recently com-pleted an analysis of conventional cavity configurations in the electron (dueto dispersion changes) and photon sector [32]. In our analysis we have onlyconsidered the photon sector and we have proposed some new unconventionalconfigurations. It may be interesting to analyze these configurations in theelectron sector. In the next subsection we consider similar configurations forWhispering Gallery (WG) modes.
4.2 Whispering gallery mode resonators
In this subsection we consider ’pure’ WG modes, with the electric and mag-netic fields propagating around with cylindrical symmetry at a discontinuity,with the direction of the Poynting vector (E×B) as shown in figure 7. Thus,it is natural to analyse such modes in cylindrical coordinates r, φ, z.
For an actual WG mode the wave is reflected off an electromagnetic dis-continuity, and the fields mainly lie within the radius of the discontinuity anda smaller inner caustic[11]. However, by taking the limit as the azimuthalmode number m tends to infinity, the inner caustic converges to the radius ofthe discontinuity and the fields are reduced to a Dirac delta function. Thereare two possible polarizations, WGE with dominant Hz and Er fields andWGH with dominant Ez and Hr. For ’pure’ WG modes, WGE have non-zeroelectric and magnetic filling factors of Per = 1 and Pmz = 1, and WGH haveelectric and magnetic filling factors of Pez = 1 and Pmr = 1, in cylindricalcoordinates. The electric and magnetic filling factors may be converted fromcylindrical to cartesian symmetry by (the z component of the filling factorneed not be transformed):
Pex = Pey =Per + Peφ
2: Pmx = Pmy =
Pmr + Pmφ
2(47)

Resonator Tests of Lorentz Invariance 21
Fig. 7. A visual representation of the electric and magnetic fields of a ’pure’ Whis-pering Gallery mode propagating in the φ direction with a radius of r = R.
We can now do a similar analysis to subsection 4.1 for configurations shownin Fig. 8 and 9 for the WG case, with the computed sensitivities listed in Table5. In vacuum the S factor is half that of the FP cavities in subsection 4.1,and the Dual-Mode resonator is insensitive. However, in a low loss dielectricthe S factor approaches the same value for WGE modes as the FP cavityexperiments, but the WGH modes remain about a factor of two less sensitive.The value of the S factor for the Dual-Mode resonator is the mean value ofthe WGE and WGH modes.
Fig. 8. Rotating Lorentz invariance test using two WG mode cavities

22 Tobar, Stanwix, et. al.
Fig. 9. Rotating Lorentz invariance test using two WG modes excited in one cavity(Dual-Mode resonator)
Configuration Sensitivity Factor S
Fig . 8 WGH − 1
2ǫr+ µr
4
Fig . 8 WGE 1
4ǫr− µr
2
Fig . 9 (a) 0
Fig . 9 (b) 3
8
(1
ǫr− µr
)
Table 5. Value of the S factor for various configurations of WG mode resonatorcavity experiments
We have shown that similar sensitivities can be achieved with FP and WGcavity resonators. At UWA we have developed an experiment that uses lowloss sapphire crystals, which exhibit a small uniaxial dielectric anistropy. Thecalculations of the sensitivity are presented section 6.
5 Applying the RMS to Whispering Gallery Mode
Resonator Experiments
In this section we restrict ourselves to analysis of whispering gallery moderesonator experiments, as the analysis has been well described for Fabry-Perot resonators previously [28]. For the whispering gallery mode experimentas shown in Fig. 8, the variable of integration around the path of the resonatoris naturally chosen as the azimuthal angle, φj , relative to the cylindrical co-ordinates of each resonator. Thus, from Eqn. (3) a frequency shift due to aputative Lorentz violation in the RMS framework is given by,
∆ν0
ν0=
PMM
2πc2
[∮ (v.Ia(φa)
)2
dφa −∮ (
v.Ib(φb))2
dφb
](48)

Resonator Tests of Lorentz Invariance 23
The dominant components of the velocity vector v were already calculatedin section 2.1, so to complete the calculation the time dependence of Ia andIb must be calculated with respect to the MM-Earth frame. This of coursedepends on the sidereal and semi-sidereal frequencies, as well as the rotationfrequency of the experiment. To start the calculation we define the time,t = 0 when the axis of the two WG resonators are aligned as shown in Fig.8 (i.e. the resonators align with the laboratory frame). Then from this timewe assume the resonator is rotated in a anti-clockwise direction of frequencyωs, so the angle of rotation is γ = ωs(t − ts). Also, the longitudinal angle ofthe experiment is λ, which is dependent on the sidereal frequency and givenby λ = ω⊕(t − tl). Then we define the resonator with its cylinder axis in they direction as resonator a, and the resonator with its cylinder axis in the xdirection as resonator b. We also assume the WG modes are oscillating ina clockwise direction. In actual fact the calculation has been verified to beindependent of the WG mode direction, and in most experiments is usuallya standing wave (depending on the excitation) [33]. Thus in the laboratoryframe at t = 0 the unit vectors in the direction of the Poynting vector are;
Ia(φa) =
−sinφa
0cosφa
Ib(φb) =
0
cosφb
sinφb
(49)
Now if we transform from the resonator to the laboratory, then to the MM-Earth frame the unit vectors become.
IEarth:a =
−sinφa(cosλcosχcosγ − sinγsinλ) + cosφacosλsinχ−sinφa(cosλsinγ + cosγcosχsinλ) + cosφasinλsinχ
cosχcosφa + sinχcosγsinφa
(50)
IEarth:b =
−sinφb(cosλcosχsinγ + cosγsinλ) + cosφbcosλsinχsinφb(cosλcosγ − sinγcosχsinλ) + cosφbsinλsinχ
cosχcosφb + sinχsinγsinφb
(51)
Here as in the previous sections χ is the angle from the north pole (co-latitude).
The next step is to substitute (50), (51) and (9) into (48). However, to beconsistent with the SME analysis the phase should be calculated with respectto the vernal equinox, so that λ0 = Φ0 + π is substituted into Eqn. (9) beforewe substitute it into (48) to calculate the frequency shift. Also, because wedefined the rotation to be clockwise in the SME, to be consistent we defineγR = ωR(t − ts) where ωR = −ωs. In this case the frequency components,which experience a frequency shift are given in Table 6. From the results ofthe calculation we note that perturbations due to Lorentz violations occur atthe same frequencies as the SME (see subsection 7.2). Fortunately, it is notnecessary to consider perturbations at exactly twice the spin frequency, 2ωs,that are primarily due to the larger systematic effects associated with therotation, as we only need to put a limit on one parameter. Also, the cosine

24 Tobar, Stanwix, et. al.
ωi 107Cuωi/PMM
2ωR −3.904 + 3.904cos(χ)2 + 0.098sin(χ)2
− sin(Φ0)(−0.607 + 0.607cos(χ)2
)
− cos(Φ0)(−0.120 + 0.120cos(χ)2 − 0.055sin(χ)2
)
2ωR + ω⊕ −0.876 sin(χ) + 0.876 cos(χ) sin(χ)+ sin(Φ0) (0.068 sin(χ) − 0.068 cos(χ) sin(χ))
+ cos(Φ0) (−0.232 sin(χ) + 0.232 cos(χ) sin(χ))
2ωR − ω⊕ 0.876 sin(χ) + 0.876 cos(χ) sin(χ)+ sin(Φ0) (−0.068 sin(χ) − 0.068 cos(χ) sin(χ))+ cos(Φ0) (0.232 sin(χ) + 0.232 cos(χ) sin(χ))
2ωR + 2ω⊕ 1.952 − 3.904 cos(χ) + 1.952cos(χ)2
+cos(Φ0)(−0.060 + 0.120 cos(χ) − 0.060cos(χ)2
)
+ sin(Φ0)(−0.303 + 0.607 cos(χ) − 0.303cos(χ)2
)
2ωR − 2ω⊕ 1.952 + 3.904 cos(χ) + 1.952cos(χ)2
+cos(Φ0)(−0.060 − 0.120 cos(χ) − 0.060cos(χ)2
)
+ sin(Φ0)(−0.303 − 0.607 cos(χ) − 0.303cos(χ)2
)
Table 6. Dominant coefficients in the RMS, using a short data set approximationcalculated from Eqn. (48).
components (Cuωi) with respect to the CMB are the most sensitive, so we
need not consider the sine components.
5.1 Phase with respect to the CMB
To extract the PMM term from our data we must first determine the phase ofour experiment with respect to the CMB. Thus, in similar way to the reasoningfor the SME (see subsection 3.2) we require δR, the difference between theexperiment’s rotation time and the time since the vernal equinox, and δ⊕, thedifference between the sidereal time and the time since the vernal equinox.
As was the case for the SME, δR = 0 since the axis of symmetry of thefirst resonator, a, is aligned with the local y-axis at TR = 0. However, δ⊕will be different since in the case of the RMS it is measured with respectto the CMB (or MM-Earth frame), not the SCCEF. The CMB is orientedat 11.2 h right ascension, 6.4 degrees declination relative to the equatorialplane. Let us define Tv to be the time in seconds after midnight UTC+0,at which the vernal equinox has occurred in the J2000.0 frame [7]. Tu is thedirection of the CMB (11.2h). For convenience we also define our longitudeTL in terms of sidereal seconds from midnight (in the case of our laboratoryTl = 115.826× 23hr56min
360 = 27721sec). As shown in Fig. 10, we now have anexpression for δ⊕.
δ⊕ = TL + Tv − (Tu +23hr56min
2) (52)

Resonator Tests of Lorentz Invariance 25
Fig. 10. Diagram showing meridians and angles used to determine the phase of theexperiment with respect to the CMB.
Hence we are able to determine the phase of the experiment orientationrelative to the CMB.
6 The University of Western Australia Rotating
Experiment
Our experiment consists of two cylindrical sapphire resonators of 3 cm diam-eter and height supported by spindles at either end within superconductingniobium cavities [34], which are oriented with their cylindrical axes orthog-onal to each other in the horizontal plane (see Fig. 11). Whispering gallerymodes [35] are excited close to 10 GHz, with a difference frequency of 226 kHz.The frequencies are stabilized using a Pound locking scheme, and amplitudevariations are suppressed using an additional control circuit. A detailed de-scription of the cryogenic oscillators can be found in [36, 37], and a schematicof the experimental setup is shown in Fig. 12. The resonators are mounted ina common copper block, which provides common mode rejection of tempera-ture fluctuations due to high thermal conductivity at cryogenic temperatures.The structure is in turn mounted inside two successive stainless steel vacuumcylinders from a copper post, which provides the thermal connection betweenthe cavities and the liquid helium bath. A stainless steel section within thecopper post provides thermal filtering of bath temperature fluctuations. Afoil heater and carbon-glass temperature sensor attached to the copper postcontrols the temperature set point to 6 K with mK stability. Two stages ofvacuum isolation are used to avoid contamination of the sapphire resonators

26 Tobar, Stanwix, et. al.
Fig. 11. The two resonators are positioned orthogonal to each other in the mountingstructure. One of the sapphires can be seen mounted inside the superconductingniobium cavity. The spindles are firmly held in each lid by sprung brass bushes.
from the microwave and temperature control devices located in the cryogenicenvironment.
A schematic of the rotation system is shown in Fig.13. A cryogenic dewarcontaining the resonators, along with the room temperature oscillator circuitsand control electronics, is suspended within a ring bearing. A multiple ”V”shaped suspension made from loops of elastic shock cord avoids high Q-factorpendulum modes by ensuring that the cord has to stretch and shrink (pro-viding damping losses) for horizontal motion as well as vertical. The rotationsystem is driven by a microprocessor controlled stepper motor. A commercial18 conductor slip ring connector, with a hollow through bore, transfers power

Resonator Tests of Lorentz Invariance 27
Fig. 12. Schematic of the experimental setup
and various signals to and from the rotating experiment. A mercury basedrotating coaxial connector transmits the difference frequency to a stationaryfrequency counter referenced to an Oscilloquartz oscillator. The data acquisi-tion system logs the difference frequency as a function of orientation, as wellas monitoring systematic effects including the temperature of the resonators,liquid helium bath level, ambient room temperature, oscillator control signals,tilt, and helium return line pressure.
Inside the sapphire crystals standing waves are set up with the dominantelectric and magnetic fields in the axial and radial directions respectively,corresponding to a propagation (Poynting) vector around the circumference.The observable of the experiment is the difference frequency, and to test forLorentz violations the perturbation of the observable with respect to an alter-native test theory must be derived. The mode which we excite is a WhisperingGallery mode we have a choice of WGEm,n,p or WGHm,n,p modes, the firstsubscript, m, gives the azimuthal mode number, while n and p give the num-ber of zero crossings in the radial and z-direction respectively. Typically theso called fundamental mode families WGEm,0,0 or WGHm,0,0 as they have thehighest Q-factors. To calculate the sensitivity in the RMS we use the tech-

28 Tobar, Stanwix, et. al.
Fig. 13. Schematic of the cryogenic dewar, mounted in the rotation table. Insidethe dewar a schematic of the two orthogonally orientated resonators is shown, alongwith the Poynting vectors of propagation S1 and S2.
nique presented in section 5, while in the following subsection we numericallycompute the sensitivity in the SME.
6.1 Sensitivity in the SME
In this subsection we calculate the sensitivity of the fundamental WG modefamilies, WGEm,0,0 and WGHm,0,0 to putative Lorentz violation in the SME,and compare it with the ’pure’ WG approximation given in Fig. 8. For aproper analysis of the sapphire loaded cavity resonators two regions of spaceneed to be taken into account: the anisotropic crystal and the cavity freespace surrounding it (see Fig. 14). The latter has a relative permittivity of 1,while both have relative permeability of 1 in all directions. The calculations

Resonator Tests of Lorentz Invariance 29
proceed by splitting up V into V1 (the crystal) and V2 (the freespace), so wemay sum the components of the M matricies over the two volumes (see Eqns.(31) and (32)). The resonator operates close to liquid helium temperatures (6Kelvin), where the permittivity of sapphire is, ǫ⊥ = 9.272 and ǫ|| = 11.349. To
Fig. 14. Schematic of a cylindrical sapphire crystal resonator, with dimensions inmm. The crystal exhibits uniaxial anisotropy with the axis of symmetry (c-axis)aligned along the cylindrical z axis. The permittivity along the c-axis given by ǫ||.Perpendicular to the c-axis in the x, y or r, φ plane, the permittivity is given by ǫ⊥.The two regions shown are 1. the crystal and 2. the cavity.
determine the sensitivity, we need to just calculate the experiments S factorin a similar way to the calculation for the ’pure’ WG modes in subsection4.2. In this case the electric and magnetic filling factors must be calculatedusing a numeric technique such as finite element analysis, method of lines orseparation of variables[11]. In this work we have chosen to use method of linesdeveloped at IRCOM at the University of Limoges [39] . The calculated electricand magnetic field densities for the chosen mode (WGH8,0,0) of operation at10 GHz is shown in figure 15, and the S factor is calculated to be 0.19575.
The actual WG modes have all field components in both regions of thecrystal. This modifies the sensitivity slightly, but approaches the limit of the’pure’ WG mode as m → ∞. The magnitude of the S factor for the funda-mental WGE and WGH modes at X-Band (8GHz-12GHz) are plotted in Fig.16. The WGH modes seem converge nicely towards the predicted ’pure’ WGHmode sensitivity, while the WGE modes have a dip in sensitivity. This canbe explained by an intersection with another mode of the same m number,resulting in a spurious mode interaction[38] . This does not occur in WGHmodes since they are the lowest frequency modes for the mode number m(refer to figure 2 of [38]). It is important to note that about a factor of two insensitivity can be gained if we use a WGE mode rather than a WGH mode.

30 Tobar, Stanwix, et. al.
Fig. 15. The magnetic and electric field density plots shown in the top right-handquadrant of an axial slice through the sapphire crystal and cavity for the WGH8,0,0
mode. Note the dominant fields are Ez and Hr consistent with a pure whisperinggallery mode approximation.
However because we are using a 3 cm crystal rather than a 5 cm crystal, theQ-factor of WGE modes are degraded due to radiation and wall losses. Inthe future we can markedly improve the sensitivity by employing the typical5 cm cavities that operate in WGE modes, as were used in the non-rotatingexperiments [11].
7 Data Analysis and Interpretation of Results
Fig.17 shows typical fractional frequency instability of the 226 kHz differ-ence with respect to 10 GHz, and compares the instability when rotating andstationary. A minimum of 1.6 × 10⁻¹⁴ is recorded at 40s. Rotation inducedsystematic effects degrade the stability up to 18s due to signals at the rotationfrequency of 0.056Hz and its harmonics. We have determined that tilt varia-tions dominate the systematic by measuring the magnitude of the fractionalfrequency dependence on tilt and the variation in tilt at twice the rotationfrequency, 2ωR(0.11Hz), as the experiment rotates. We minimize the effect oftilt by manually setting the rotation bearing until our tilt sensor reads a min-imum at 2ωR. The latter data sets were up to an order of magnitude reducedin amplitude as we became more experienced at this process. The remainingsystematic signal is due to the residual tilt variations, which could be further

Resonator Tests of Lorentz Invariance 31
Fig. 16. The frequency and |S| factor as a function of mode number, m for the twolowest frequency WGE and WGH mode families. Note the general convergence tothe ’pure’ WG value as m increases.
Fig. 17. Square Root Allan Variance fractional frequency instability measurement ofthe difference frequency when rotating (crosses) and stationary (circles). The humpat short integration times is due to systematic effects associated with the rotationof the experiment, with a period of 18 seconds. Above 18 seconds the instability isthe same as when the experiment is stationary.
annulled with an automatic tilt control system. It is still possible to be sen-sitive to Lorentz violations in the presence of these systematics by measuringthe sidereal, ω⊕, and semi-sidereal, 2ω⊕, sidebands about 2ωR, as was donein [8]. The amplitude and phase of a Lorentz violating signal is determinedby fitting the parameters of Eq. (53) to the data, with the phase of the fitadjusted according to the test theory used.

32 Tobar, Stanwix, et. al.
∆ν0
ν0= A + Bt +
∑
i
Cωicos(ωit + ϕi) + Sωi
sin(ωit + ϕi) (53)
Here ν0 is the average unperturbed frequency of the two sapphire resonators,and ∆ν0 is the perturbation of the 226 kHz difference frequency, A and Bdetermine the frequency offset and drift, and Cωi
and Sωiare the amplitudes
of a cosine and sine at frequency ωi respectively. In the final analysis wefit 5 frequencies to the data, ωi = (2ωR, 2ωR ± ω⊕, 2ωR ± 2ω⊕), as well asthe frequency offset and drift. The correlation coefficients between the fittedparameters are all between 10−2 to 10−5. Since the residuals exhibit a signif-icantly non-white behavior, the optimal regression method is weighted leastsquares (WLS) [13]. WLS involves pre-multiplying both the experimental dataand the model matrix by a whitening matrix determined by the noise type ofthe residuals of an ordinary least squares analysis.
We have acquired 5 sets of data over a period of 3 months beginningDecember 2004, totaling 18 days. The length of the sets (in days) and sizeof the systematic are (3.6, 2.3 × 10⁻¹⁴), (2.4, 2.1 × 10⁻¹⁴), (1.9, 2.6 × 10⁻¹⁴),(4.7, 1.4×10⁻¹⁵), and (6.1, 8.8×10⁻¹⁵) respectively. We have observed leakageof the systematic into the neighboring side bands due to aliasing when thedata set is not long enough or the systematic is too large. Fig.18 shows thetotal amplitude resulting from a WLS fit to 2 of the data sets over a range offrequencies about 2ωR. It is evident that the systematic of data set 1 at 2ωR
is affecting the fitted amplitude of the sidereal sidebands 2ωR ±ω⊕ due to itsrelatively short length and large systematics. By analyzing all five data setssimultaneously using WLS the effective length of the data is increased, reduc-ing the width of the systematic sufficiently as to not contribute significantlyto the sidereal and semi-sidereal sidebands.
7.1 Standard Model Extension Framework
In the photon sector of the SME 10 independent components of κe+ and κo−
have been constrained by astronomical measurements to < 2 × 10⁻³² [7, 23].Seven components of κe− and κo+ have been constrained in optical and mi-crowave cavity experiments [10, 13] at the 10−15 and 10−11 level respectively,while the scalar κtr component recently had an upper limit set of < 10−4 [24].The remaining κZZ
e− component could not be previously constrained in non-rotating experiments [10, 13]. In contrast, our rotating experiment is sensitiveto κZZ
e− . However, it appears only at 2ωR, which is dominated by systematiceffects. By using the formulas derived in Table 3 for short data sets and theS factor for the WGH8,0,0 mode in Fig. 16, the resulting numerical relationbetween the parameters of the SME and the Cωi
and Sωicoefficients were
calculated and are given in Table 7.From our combined analysis of all data sets, and using the relation to κZZ
e−
given in Table 7, we determine a value for κZZe− of 4.1(0.5)× 10−15. However,
since we do not know if the systematic has canceled a Lorentz violating signal

Resonator Tests of Lorentz Invariance 33
Fig. 18. Spectrum of amplitudes√
C2ωi
+ S2ωi
calculated using WLS, showing sys-tematic leakage about 2ωR for 2 data sets, data set 1 (3.6 days, circles), data set 5(6.1 days, squares) and the combined data (18 days spanning 3 months, solid trian-gles). Here ω⊕ is the sidereal frequency (11.6µHz). By comparing a variety of datasets we have seen that leakage is reduced in longer data sets with lower systemat-ics. The insets show the typical amplitude away from the systematic, which havestatistical uncetainties of order 10−16.
at 2ωR, we cannot reasonably claim this as an upper limit. Since we have fiveindividual data sets, a limit can be set by treating the C2ωR
coefficient as astatistic. The phase of the systematic depends on the initial experimental con-ditions, and is random across the data sets. Thus, we have five values of C2ωR
,(−4.2, 11.4, 21.4, 1.3,−8.1 in 10−15), two are negative coefficients and threeare positive. If we take the mean of these coefficients, the systematic signalwill cancel if the phase is random, but the possible Lorentz violating signalwill not, since the phase is constant. Thus a limit can be set by taking themean and standard deviation of the five coefficient of C2ωR
. This gives a moreconservative bound of 2.1(5.7) × 10−14, which includes zero. Our experimentis also sensitive to all other seven components of κe− and κo+ (see Table 7)and improves present limits by up to a factor of 7, as shown in Table 8.
7.2 Robertson, Mansouri, Sexl Framework
From Eqn. (48), the dominant coefficients are calculated to be only due to thecosine terms with respect to the CMB right ascension, Cuωi
, and the theorypredicts no perturbations in the quadrature term. Since our experiment isrotating clock wise we can substitute 2ωs = −2ωR, and once we performthe integral and substitute all the numeric values. Following this method wecalculate the coefficients as shown in Table 9.
The same five data sets were then re-analysed in the correct quadraturewith respect to the CMB, with the results listed with the coefficients in Ta-ble 9. The measured and statistical uncertainty of PMM is determined to be

34 Tobar, Stanwix, et. al.
ωi CωiSωi
2ωR 0.21κZZe− -
2ωR + ω⊕ 2.5 × 10⁻⁵ sin Φ0κXYo+ − cos Φ0
[2.3 × 10⁻⁵κXY
o+ − 1.0 × 10⁻⁵κXZo+
]
−1.0 × 10⁻⁵ cos Φ0κY Zo+ −0.27κY Z
e−
−0.27 κXZe−
2ωR + 2ω⊕ −2.1 × 10⁻⁵ cos Φ0κXZo+ −2.3 × 10⁻⁵ sin Φ0κ
XZo+
+2.3 × 10⁻⁵ sin Φ0κY Zo+ −2.1 × 10⁻⁵ cos Φ0κ
Y Zo+ − 0.23 κXY
e−
−0.11(κXXe− − κY Y
e− )
2ωR − ω⊕ −0.31C2ωR+ω⊕0.31S2ωR+2ω⊕
2ωR − 2ω⊕ 9.4 × 10⁻²C2ωR+2ω⊕−9.4 × 10⁻²S2ωR+2ω⊕
Table 7. Coefficients Cωiand Sωi
in (1) for the five frequencies of interest and theirrelation to the components of the SME parameters κe− and κo+, derived using ashort data set approximation including terms up to first order in orbital velocity,where Φ0 is the phase of the orbit since the vernal equinox. Note that for shortdata sets the upper and lower sidereal sidebands are redundant, which reduces thenumber of independent measurements to 5. To lift the redundancy, more than a yearof data is required so annual offsets may be de-correlated from the twice rotationaland sidereal sidebands listed.
κXYe− κXZ
e− κY Ze− (κXX
e− − κY Ye− )
this work -0.63(0.43) 0.19(0.37) -0.45(0.37) -1.3(0.9)from [13] -5.7(2.3) -3.2(1.3) -0.5(1.3) -3.2(4.6)
κZZe− κXY
o+ κXZo+ κY Z
o+
this work 21(57) 0.20(0.21) -0.91(0.46) 0.44(0.46)from [13] − -1.8(1.5) -1.4(2.3) 2.7(2.2)
Table 8. Results for the SME Lorentz violation parameters, assuming no cancelationbetween the isotropy terms. κe− (in 10−15) and first order boost terms κo+ (in 10−11)[12].
ωi CuωiPMM
2ωR + ω⊕ [−1.13 × 10⁻⁷ − 3.01 × 10⁻⁸ cos Φ0 −2.1(7.2)+8.83 × 10⁻⁹ sin Φ0]PMM
2ωR − ω⊕ [3.51 × 10⁻⁸ + 9.31 × 10⁻⁹ cos Φ0 62.4(23.3)−2.73 × 10⁻⁹ sin Φ0]PMM
2ωR + 2ω⊕ [4.56 × 10⁻⁷ − 1.39 × 10⁻⁸ cos Φ0 −1.3(2.1)−7.08 × 10⁻⁸ sin Φ0]PMM
2ωR − 2ω⊕ [4.37 × 10⁻⁸ − 1.34 × 10⁻⁹ cos Φ0 −7.5(22.1)−6.78 × 10⁻⁹ sin Φ0]PMM
Table 9. Dominant coefficients in the RMS, using a short data set approximationcalculated from Eq. (48). The measured values of PMM (in 10−10) are shown togetherwith the statistical uncertainties in the bracket. From this data the measured andstatistical uncertainty of PMM is determined to be −0.9(2.0) × 10−10, which repre-sents more than a factor of 7.5 improvement over previous results 2.2(1.5)×10−9 [10].

Resonator Tests of Lorentz Invariance 35
−0.9(2.0)×10−10, which represents a factor of 7.5 improvement over previousresults 2.2(1.5)× 10−9[10].
8 Summary
Rotating resonator experiments are emerging as one of the most sensitive typesof Local Lorentz Invariance tests in electrodynamics (also see other contribu-tions within these proceedings). In this work we have analysed in detail suchexperiments to putative Lorentz violation in both the RMS and SME frame-works. In the RMS, rotating experiments only enhance the sensitivity to theMichelson-Morley parameter, PMM , and are not sensitive to the Kennedy-Thorndike , PKT , or Ives-Stilwell , PIS , parameters. In the SME non-rotatingresonator experiments in the laboratory test for four components of the κe−
tensor and three components of the κo+ tensor, with the scalar coefficient κtr
and κZZe− unmeasurable. Rotation in the SME enhances the sensitivity to the
seven components and also allows the determination of the κZZe− component.
We have shown that all resonator experiment exhibit the same relative fre-quency spectrum to the putative signal to within a multiplicative sensitivityfactor, S. This was utilized to compare the sensitivity of different FP andWG resonator configurations, leading to the proposal of some new dual-moderesonator experiments.
We applied the above analysis to our experiment at the University ofWestern Australia, which is based on rotating cryogenic sapphire whisperinggallery mode microwave oscillators. In summary, we presented the first resultsof the experiment, which we set bounds on 7 components of the SME photonsector (Table 8) and PMM (Table 9) of the RMS framework up to a factor of 7.5more stringent than those obtained from previous experiments. We also set anupper limit (2.1(5.7)×10−14) on the previously unmeasured SME componentκZZ
e− . To further improve these results, tilt and environmental controls will beimplemented to reduce systematic effects. To remove the assumption that theκo+ and κe− do not cancel each other, data integration will continue for morethan a year.
9 Acknowledgment
This work was funded by the Australian Research Council.
References
1. Will C. M., Theory and Experiment in Gravitational Physics, revised edition(Cambridge University Press, Cambridge, 1993).
2. Robertson H.P., Rev. Mod. Phys. 21, 378 (1949).

36 Tobar, Stanwix, et. al.
3. Mansouri R., Sexl R.U., Gen. Rel. Grav. 8, 497, (1977).4. Lightman A.P., Lee D.L., Phys. Rev. D8, 2, 364, (1973).5. Ni W.-T., Phys. Rev. Lett. 38, 301, (1977).6. Colladay D., Kostelecky V.A., Phys.Rev. D55, 6760, (1997); Colladay D., Kost-
elecky V.A., Phys.Rev. D58, 116002, (1998)7. Kostelecky V.A.,Mewes M.,Phys.Rev. D66,056005,(2002).8. Brillet A., Hall J., Phys. Rev. Lett. 42, 9, 549, (1979).9. Wolf P. et al., Phys. Rev. Lett. 90, 6, 060402, (2003).
10. Muller H. et al., Phys. Rev. Lett. 91, 2, 020401, (2003).11. Wolf P., et al., Gen. Rel. and Grav., 36, 10, 2351, (2004).12. Lipa J.A. et al. Phys. Rev. Lett. 90, 6, 060403, (2003).13. Wolf P, et al., Phys. Rev. D70, 051902(R), (2004).14. Tobar M.E. et al., Phys. Lett. A 300, 1, 33, (2002).15. Stanwix P.L., Tobar, M.E., Wolf P. et al., Phys. Rev. Lett. 95, 040404, (2005).16. Antonini P. et al., Phys. Rev. A. 71, 050101, (2005).17. Herrmann S. et al., arXiv: physics 050809, accepted for publication in Phys.
Rev. Lett., (2005).18. Michelson A.A. and Morley E.W., Am. J. Sci. 34, 333 (1887).19. Kennedy R.J. and Thorndike E.M., Phys. Rev. B42, 400 (1932).20. Ives H.E. and Stilwell G.R., J. Opt. Soc. Am. 28, 215 (1938).21. Saathoff G., et al., Phys. Rev. Lett 91, 190403 (2003).22. Jackiw R. and Kostelecky V. A., Phys. Rev. Lett”, 82 (1999).23. Kostelecky V.A., and Mewes M., Phys. Rev. Lett. 87, 251304 (2001).24. Tobar M.E. et. al., Phys.Rev.D71, 025004,(2005).25. Bluhm R. et. al., Phys.Rev.D68, 125008,(2003).26. Bailey Q.G., and Kostelecky V. A., Phys. Rev. D70, 076006 (2004).27. Krupka J., Derzakowski K., Abramowicz A., Tobar M. E. and Geyer R., IEEE
Trans. on Microw. Theory Tech. 47, 752-759, (1999).28. H. Muller, S. Herrmann, C. Braxmaier, S. Schiller and A. Peters, Appl Phys.
B (Laser Opt.) 77, 719-773, (2004).29. Hall J.L., Ye J., and Ma L-S., Phys. Rev. A62, 013815 (2000).30. Tobar M.E., Hartnett J.G., Phys. Rev. D67, 062001 (2003).31. Braxmaier C., Pradl O., Muller H., Peters A., Mlynek J., Loriette V., Schiller
S., Phys. Rev. D64, 042001 (2001).32. Muller H., Phys. Rev. D71, 045004 (2003).33. Tobar M.E. et. al. ,IEEE Trans. on Ultrason., Ferroelect. Freq. Contr., 47,
421, (2000).34. Giles A.J. et. al., Physica B 165, 145, (1990).35. Tobar M.E., Mann A.G., IEEE Trans. Microw. Theory Tech. 39, 2077, (1991).36. Mann A.G., Topics in Appl. Phys. 79, 37, (2001).37. Hartnett J.G., Tobar M.E., Topics in Appl. Phys. 79, 67, (2001).38. Tobar M.E., Hartnett J.G., Ivanov E.N., Cros D., Blondy P., IEEE Trans. Instr.
and Meas. 30, , 522, (2001).39. Tobar M.E. et. al., IEEE Trans. Ultrason., Ferroelect. Freq. Contr., 52, 17,
(2005).