Embed Size (px)
Citation preview

R i v e r N o r t h U r b a n D e s i g n O v e r l a y
Attachment to Third Substitute of Ordinance No. BL2017-932as adopted on May 15, 2018
MPC case #: 2017UD-005-001

2
Section I: Introduction
BL2017-932
Document Contact Information
Planning Department staff provides consultations for developing within the River North Urban Design Overlay. Call (615) 862-7190 to schedule a meeting.
The Planning Department does not discriminate on the basis of age, race, sex, color, national origin, religion or disability in access to, or operation of, its programs, services, and activities, or in its hiring or employment practices. For ADA inquiries, contact ADA Compliance Coordinator, at 862-7150. For Title VI inquiries contact Human Relations at 880-3370. For all employment-related inquiries call 862-6640.

3
Section I: Introduction
BL2017-932
Table of Contents
Section I: Introduction 4History and Intent . . . . . . . . . . . . . . . . . . . . . . 4How to Use this Document . . . . . . . . . . . . . . . . . . 6Compliance . . . . . . . . . . . . . . . . . . . . . . . . . . 7Modifications . . . . . . . . . . . . . . . . . . . . . . . . . 8
Section II: Regulating Plan & Subdistricts 11Illustrative Plan . . . . . . . . . . . . . . . . . . . . . . . 12 Regulating Plan . . . . . . . . . . . . . . . . . . . . . . . 13 Subdistrict 1 . . . . . . . . . . . . . . . . . . . . . . . . . 14Subdistrict 2 . . . . . . . . . . . . . . . . . . . . . . . . . 16
Section III: General Standards 19Measurements . . . . . . . . . . . . . . . . . . . . . . . . 20Base Zoning Clarifications . . . . . . . . . . . . . . . . . 20Step-backs . . . . . . . . . . . . . . . . . . . . . . . . . . 20Frontages . . . . . . . . . . . . . . . . . . . . . . . . . . 21Build-to Zone . . . . . . . . . . . . . . . . . . . . . . . . 22Entrances . . . . . . . . . . . . . . . . . . . . . . . . . . 22Active Use . . . . . . . . . . . . . . . . . . . . . . . . . . 23Glazing and Massing . . . . . . . . . . . . . . . . . . . . 23Frontage Types . . . . . . . . . . . . . . . . . . . . . . . 24
Storefront Frontage . . . . . . . . . . . . . . . . . . . . 24Stoop Frontage . . . . . . . . . . . . . . . . . . . . . . 26Porch Frontage . . . . . . . . . . . . . . . . . . . . . . 28Civic Frontage . . . . . . . . . . . . . . . . . . . . . . 30
Canopies and Awnings . . . . . . . . . . . . . . . . . . . 31Street Character . . . . . . . . . . . . . . . . . . . . . . . 32
River North Proposed Street Network . . . . . . . . . . 34Street Trees . . . . . . . . . . . . . . . . . . . . . . . . 36
Parking and Access . . . . . . . . . . . . . . . . . . . . . 37Specific to Structured Parking . . . . . . . . . . . . . . 38Specific to Surface Parking . . . . . . . . . . . . . . . . 39
Mechanical, Service and Loading . . . . . . . . . . . . . . 40Fences and Walls . . . . . . . . . . . . . . . . . . . . . . 42Open Space . . . . . . . . . . . . . . . . . . . . . . . . . 43
Bonus Height Program . . . . . . . . . . . . . . . . . . . 45LEED and LEED ND . . . . . . . . . . . . . . . . . . 46Pervious Surface . . . . . . . . . . . . . . . . . . . . . 47Upper Level Garage Liner . . . . . . . . . . . . . . . . 47Underground Parking . . . . . . . . . . . . . . . . . . . 47Public Parking . . . . . . . . . . . . . . . . . . . . . . . 47Adaptable Garage Levels . . . . . . . . . . . . . . . . . 48Shared Parking . . . . . . . . . . . . . . . . . . . . . . 48Civil Support Space . . . . . . . . . . . . . . . . . . . . 48Public Open Space . . . . . . . . . . . . . . . . . . . . 49Public Greenway . . . . . . . . . . . . . . . . . . . . . 49Inclusionary Housing . . . . . . . . . . . . . . . . . . . 49
Appendix 51Development Capacity Evaluation Study . . . . . . . . . . 52

4
Section I: Introduction
BL2017-932
History and OverviewThe East Nashville Community includes a portion of the “East Bank”—the area on the east bank of the Cumberland River . The bulk of the East Bank is in the Downtown Community; however, a portion of the East Bank from Spring Street on the south to the I-24/I-65 interchange to the north is in the East Nashville Community . This area is commonly referred to as “River North .” For years, this area has been home to light industrial and warehousing businesses and it also experienced severe flooding during the flood of 2010 . As downtown redevelops, developers are looking to the East Bank, including the northern portion in East Nashville, for redevelopment opportunities . This area is envisioned to redevelop to greater intensity, with taller buildings, capitalizing upon its river location and proximity to downtown .
River North is conceptualized as a vibrant, mixed-use, active neighborhood . The activation of the Cumberland River and publicly accessible greenspace are both important aspects of the neighborhood’s development . The culture of creation within “Production Row,” is a key aspect of the neighborhood’s culture . Therefore, the music industry is encouraged to continue to locate within River North, and use the District for various uses . Re-use and adaptation of existing structures and elements within River North is encouraged as a part of the area’s development to respect the history of warehousing and light industry .
While portions of River North sit within a floodplain, various mitigation strategies are available to allow for sustainable development in this area . These strategies include, but are not limited to:
• Floodable underground detention basins • Flow-through construction • Development of infiltrative, sustainable landscapes • Elevation of building sites
IntentThe goals of the Urban Design Overlay are as follows:
• Establish a compact mixed use development patterndistributed along a system of streets that transitions in scalefrom the core to the neighborhood .
• Ensure that buildings are oriented to and linked by acohesive pedestrian system .
• Encourage a balance of transportation options forpedestrians, bicycles, vehicles and transit .
• Encourage high quality (function and aesthetic) openspaces for assembly, relaxation, civic events, display ofpublic art and other similar purposes .
• Encourage a high level of pedestrian-generating activityalong streets and a pedestrian friendly environment .
• Encourage environmentally sensitive development andgreen space .
Introduction

5
Section I: Introduction
BL2017-932
Location
Located along the East bank of the Cumberland River, River North is a mixed-use, urban neighborhood, and extension of the Downtown core .
River North UDO
Legend
River North UDO
Cleveland St.
Jefferson St.
Cowan St.
I-65
I-24
Spring St.
Dick
erso
n Pike

6
Section I: Introduction
BL2017-932
How to Use this Document
This document is to be used by developers, property owners, government officials, residents, and any individual who is interested in development or redevelopment of any property located within the UDO boundary .
A UDO is a zoning tool that requires unique physical design standards for development or redevelopment within a designated area that would otherwise not be ensured by the standard provisions of the zoning regulations . A UDO can modify base zoning standards such as setbacks, building height, floor area ratio, and parking per the provisions outlined in Section 17 .36 .320 of the Zoning Code . The standards established in this document vary from the underlying base zone district standards for the properties in the UDO . All provisions are regulatory in nature and have the same force and effect as the zoning regulations of the Metro Code. Any final plans submitted for approval under the UDO will be reviewed for adherence to these provisions and to the provisions of the base zoning that are not varied by the UDO. If a final plan is consistent with the UDO and the zoning standards it can be approved administratively by the Executive Director as expressed in the Planning Commission’s bylaws and as clarified here.
The design standards established in the UDO are intended to direct future development in a manner that addresses strategies for site design including placement, massing and orientation of buildings, architectural treatment, landscaping and screening, general access and parking, and signage . In some instances, desired standards that are beyond the authority of the zoning ordinance accompany the goals and objectives . These desired standards pertain to areas for which Metropolitan Government exercises final authority over design, construction and operation of facilities, such as public rights-of-way and stormwater detention and conveyance . The incorporation of these standards into any final development construction plans will depend on Metropolitan Government review for consistency with policies, laws, and related standards of various departments .
Overlapping PlansWithin the UDO boundary area, there may exist other regulations and design guidelines intended to work in conjunction with the UDO . Property owners and developers should consult with all departments and agencies during the development process to address any and all rules, regulations and policies . Property owners should consult with Metro Planning and Public Works to make the necessary improvements to the streetscape in accordance with the Major and Collector Street Plan and the Strategic Plan for Sidewalks and Bikeways and Title 17 .20 .120 Provision of sidewalks .
• If a property is zoned Specific Plan then all standardscontained with the Specific Plan shall apply and the UDOstandards would apply for any standard not addressed inthe SP .
• If a property has a Planned Unit Development Overlaythen the standards of the PUD shall apply and the UDOstandards would apply for any standards not addressed inthe PUD .
• Final construction drawings shall comply with the designregulations established by the Department of Public Works,in effect at the time of the approval of the preliminarydevelopment plan or final development plan or buildingpermit, as applicable. Final design may vary based on fieldconditions .
SubdistrictsThe River North UDO is organized by Subdistricts, as identified on the Regulating Plan. Subdistricts are smaller districts within the larger UDO area that are envisioned to have unique character and development standards .
To determine the standards which apply to a particular property:
• On the Regulating Plan, identify the Subdistrict in whichthe property is located .
• Consult the Subdistrict Standards section for thedevelopment standards relevant to the Subdistrict .
• Consult the General Standards section for guidance ondevelopment standards for all Subdistricts .

7
Section I: Introduction
BL2017-932
Compliance, Modifications and Design Review
ComplianceAll provisions of the Metro Zoning Code shall apply, unless otherwise addressed by the River North UDO standards . The UDO standards shall apply as follows:
New Development Full Compliance with all standards of the UDO .
An addition to the square footage of an existing building:The addition shall be in compliance with applicable standards of the UDO and shall not increase any degree of non-conformity .
A new structure on a lot with existing building(s):The new structure shall be in compliance with applicable standards of the UDO and shall not increase any degree of non-conformity .
Signage Compliance:Signage is per base Zoning District with review via the Codes Department
Redevelopment of existing riverfront building:For the property located on the river, commonly referred to as “Cherokee Marine,” the property may be redeveloped and deviations from the UDO may be permitted via a minor modification. The development shall try, where possible, to comply with the terms of this UDO and the permitted uses in the base zone shall apply . Nevertheless, development shall be encouraged and allowed, including deviations, so long as the overall plan is consistent with the intent and purpose of the UDO .
Inclusionary HousingApplicants shall provide two scenarios with proposed residential development . One scenario shall illustrate the residential development entitlements provided by the underlying zoning at the time this UDO was adopted, and the second scenario shall illustrate the residential development entitlements permitted by the UDO standards .
If residential entitlements provided by the UDO standards are greater and the proposed development involves five or more residential rental units, affordable or workforce housing shall be recognized as set forth in Ordinance Nos . BL2016-133, and BL2016-342, which authorizes Metro grants to offset the provision of affordable or workforce housing units .
If the underlying zoning for the property has changed since the adoption of this UDO, applicants shall provide a third scenario showing residential entitlements provided by the current zoning with the UDO applied . If the proposed development involves five or more residential rental units, affordable or workforce housing shall be recognized as set forth in Ordinance Nos . BL2016-133, and BL2016-342, which authorizes Metro grants to offset the provision of affordable or workforce housing units, due to residential development entitlements gained through the underlying zone change .

8
Section I: Introduction
BL2017-932
Modifications to the StandardsAn applicant may seek modifications to the standards of this document . Any standard within the UDO may be modified, insofar as the intent of the standard is being met, the modification results in an equal or better urban design for the neighborhood as a whole, and the modification does not impede or burden existing or future development of adjacent properties .
The River North UDO, the East Nashville Community Plan, the Major Street and Collector Plan, and any other policies and regulations from governing agencies shall be consulted when considering modifications.
Modifications may be approved by Planning staff, the Planning Commission or MDHA’s Design Review Committee:
• Minor modifications – deviations of 20 percent or less,or minor deviations in non-numerical standards – may beapproved by Planning Staff .
• Any determination made by the Planning Staff may beappealed to the Planning Commission by the applicant .
• Major modifications – deviations of more than 20 percent–and major deviations from non-numerical standards maybe approved by either the Planning Commission or theMDHA Design Review Committee .
• For any property that falls within an MDHARedevelopment District the Design Review Committeeshall have jurisdiction to approve deviations .
• For modifications to overall height, the Executive Directorof the Planning Department shall determine whetherthe developer has made reasonable efforts to use allappropriate bonuses . The Executive Director’s decisionmay be appealed to the MDHA DRC if a RedevelopmentDistrict is in place . If it has been determined that allreasonable efforts have been made to use the Bonus HeightProgram, the applicant shall hold a community meetingwith the property owners within 300 feet , providingnotice to these owners, and the Planning Commission shallreview the modification request and may grant additionalheight for exceptional design including but not limited tounique architecture, exceptionally strong streetscape andimprovements to the project’s relationship to surroundingproperties .
Variances and Special ExceptionsVariances and special exceptions that are not specifically for standards of the River North UDO shall follow the procedures of the applicable chapters of the Zoning Code .
Variances and special exceptions shall not be applicable to the height standards of the UDO which are governed by the earlier procedure reference above. Standards specific to the River North UDO may be modified based on the Modifications section of this document.
Civic BuildingsFor Civic Buildings within the UDO:
• The Metro Planning Commission or its designee shallmake the final determination of compliance with the UDOstandards .
• Civic Buildings within the River North UDO shall beiconic, shall not be prototypical design, and must respondto the materiality and form of the surrounding context .

9
Section I: Introduction
BL2017-932
By-rightall standards of
the UDO are met
BuildingPermits
MinorModification
BuildingPermits
MajorModification
BuildingPermits
Final Site Plan
Final Site Plan
Variances and Special
Exceptions to the Zoning
Codestandards, that are not specific
to the River North UDO district, shall
follow the procedures set
forth in the Chapter
17.40, Articles VII and VIII.
BuildingPermits
Final Site Plan
Final Site Plan
MPC or MDHA DRC
StaffReview
StaffReview
MPC or MDHA DRC

10
This page left intentionally blank

11
Sect ion I I :Subd is t r i c t S tandards

12
Section II: Regulating Plan & Subdistricts
Illustrative Plan
1”= 400’ 0’ 200’ 400’ 800’
0 9 / 1 9 / 2 0 1 7© 2 0 1 7
R I V E R N O R T H | S I T E P L A N D I A G R A M
P E DE S T R I A
N B R I D G E
River North is intended to be a dense, mixed-use, urban neighbhorhood . Connection to the surrounding neighbhoroods is an important aspect of River North . Activated, consolidated, usable greenspace and open space are encouraged within the neighborhood .
Illustrative Masterplan

13
Section II: Regulating Plan & Subdistricts
Regulating Plan
The Regulating Plan is the official zoning map of the UDO. The Regulating Plan shows the Subdistricts that govern the development standards for each property .
Subdistrict 1
Subdistrict 2
Riverfront Condition
Primary Streets
Secondary Streets
Tertiary Streets

14
Section II: Regulating Plan & Subdistricts
Subdistrict 1: Regulating Plan
Subdistrict 1
Primary Streets
Secondary Streets
Tertiary Streets
Subdistrict 1
Legend
Riverfront Condition

15
Section II: Regulating Plan & Subdistricts
Subdistrict 1: Building Regulations
C
F
A
G
Building Section
E
Building Plan
Street
Parking Placement
Sidewalk
Planting Strip
Stre
et
Side
walk
Plan
ting S
trip
A
C
B
A
C
B
Prop
erty
Line
Frontage
Build-to Zone 0’-15’
Facade WidthPrimary Streets 60% of lot frontage min .Secondary Street 40% of lot frontage min .Tertiary Street 20% of lot frontage min .
Remaining lot frontage may be used for pedestrian amenities and shall not be used for parking .
Min. building depth 15’ from building facade
Height
Min. 14’
Max. 15 storiesAdditional height available through the Bonus Height Program
Step-back *Step-back required on all streets and Open SpaceStep-back between Buildings taller than 7 stories by the 8th storyMin . step-back depth 15’
Side & Rear Setbacks
Min. 0’
Sidewalk & Planting
Improvements to the sidewalk corridor according to the General Standards and the Major and Collector Street Plan
Riverfront Condition
By the 11th story, 20% min . of the total length of the Riverfront Condition frontage must be open to provide for views across the site
* See page 20 for full description of step-back .
A
C
D
E
F
B
H
HG
D

16
Section II: Regulating Plan & Subdistricts
Subdistrict 2: Regulating Plan
Primary Streets
Secondary Streets
Tertiary Streets
Subdistrict 2
Subdistrict 2
Legend
Riverfront Condition

17
Section II: Regulating Plan & Subdistricts
Subdistrict 2: Building Regulations
C
F
A
G
Building Section
E
Building Plan
Street
Parking Placement
Sidewalk
Planting Strip
Stre
et
Side
walk
Plan
ting S
trip
A
C
B
A
C
B
Prop
erty
Line
Frontage
Build-to Zone 0’-15’
Facade WidthPrimary Streets 60% of lot frontage min .Secondary Street 40% of lot frontage min .Tertiary Street 20% of lot frontage min .
Remaining lot frontage may be used for pedestrian amenities and shall not be used for parking .
Min. building depth 15’ from building facade
Height
Min. 14’
Max. 25 storiesAdditional height available through the Bonus Height Program
Step-back *Step-back required on all streets and Open SpaceStep-back between Buildings taller than 7 stories by the 8th storyMin . step-back depth 15’
Side & Rear Setbacks
Min. 0’
Sidewalk & Planting
Improvements to the sidewalk corridor according to the General Standards and the Major and Collector Street Plan
Riverfront Condition
By the 11th story, 20% min . of the total length of the Riverfront Condition frontage must be open to provide for views across the site
* See page 20 for full description of step-back .
A
C
D
E
F
B
H
HG
D

18
This page left intentionally blank

19
Sect ion I I I :Genera l S tandards

2020
Section III: General Standards
General Standards
Measurement from “Grade” • Unless otherwise indicated, reference to measurements ofheight shall be calculated using the average elevation alongthe public right-of-way fronting the property . Thus, gradewill generally be measured from the public sidewalk, notfrom grade on site .▫ When buildings are set back from the property line more
than 15 feet, grade shall be measured as the averageexisting elevation at the building façade .
• In the event that the base flood elevation, as establishedby FEMA, is higher than the sidewalk or grade elevations,the height of the first story, shall be measured from 1 footabove the base flood elevation.
Measurement of Height • Unless otherwise specified herein, the height of buildingsshall be measured in stories .
• The maximum height for an individual story shall notexceed 25 feet from finished floor to finished floor for eachof the first 2 stories, 18 feet floor to floor above the secondstory, and 25 feet for the top story of buildings greater than5 stories .
• Where a parking liner exists, 2 liner stories shall be countedas a single story, and any number of parking levels may beconcealed behind it .
• The maximum height for a raised foundation is 6 feetabove grade .
• Basements are not considered stories for the purposes ofdetermining building height .
• Building height shall be measured from each StreetFrontage (excluding alleys) or Open Space .
• The height of fences, walls and hedges shall be measured infeet from the average sidewalk elevation .
Base Zoning Clarifications • All properties within the UDO shall be exempt from theFloor Area Ratio (FAR) requirements of the underlyingbase Zoning districts .
• All properties within the UDO shall be exempt from theHeight Control Plane, height limitations, Step-back, andfront, rear, and side Setback requirements of the underlyingbase Zoning districts (including Height Control Planesfrom adjacent residential districts) .
• Impervious Surface Ratio is per the base Zoning District . • There is no minimum lot size within the UDO . • Landscaping standards and required buffers shall becontrolled by the general standards of this document andare exempt from the requirements of the base Zoningdistricts .
• Plans within the River North UDO shall comply with theMetro Tree Ordinance Standards .
Step-backs • Within the River North UDO, the step-back is definedas the required minimum distance the upper stories of abuilding must be stepped back from the outer edge of thebuild-to-zone, along all applicable frontages .
• To allow for massing variation, stories within the rangemay be permitted to step-back to a lesser extent or not atall, so long as the minimum step-back depth is met by therequired step-back story .
BL2017-932

21
Section III: General Standards
General Standards
FrontagesA Frontage is the specific way in which the building face addresses the street . It is the transition and interaction between the private and public realms . Building Frontages define the character and form of the public spaces within each neighborhood . The following standards shall apply to all development within the River North UDO .
• Buildings shall front a street (excluding alleys), open space,and/or a pedestrian passage .
• Facade Width▫ The minimum facade width is the minimum amount of
the frontage that must be defined by a building, and isdesignated as a percentage of the frontage .
▫ Every property shall establish one Principal Frontagealong a street .
▫ When a lot fronts more than one street the followingpriority shall be given when establishing the PrincipalFrontage: Primary Street, Secondary Street, TertiaryStreet, Other Street .
▫ In the instance a property fronts multiple Primary Streets,any may be chosen as the Principal Frontage .
▫ Along a Minor Frontage, modifications may be grantedfor the reduction of ground level garage Liners and orglazing requirements .
▫ For parcels larger than [1] Acre in size, frontagerequirements may be further reduced by minormodification.
• Open Space Frontages▫ Facade width and active use requirements shall apply to
these frontages the same as a street frontage .▫ All buildings fronting open space shall have a minimum
of one primary pedestrian entrance on the open space .
BL2017-932
2222
Section III: General Standards
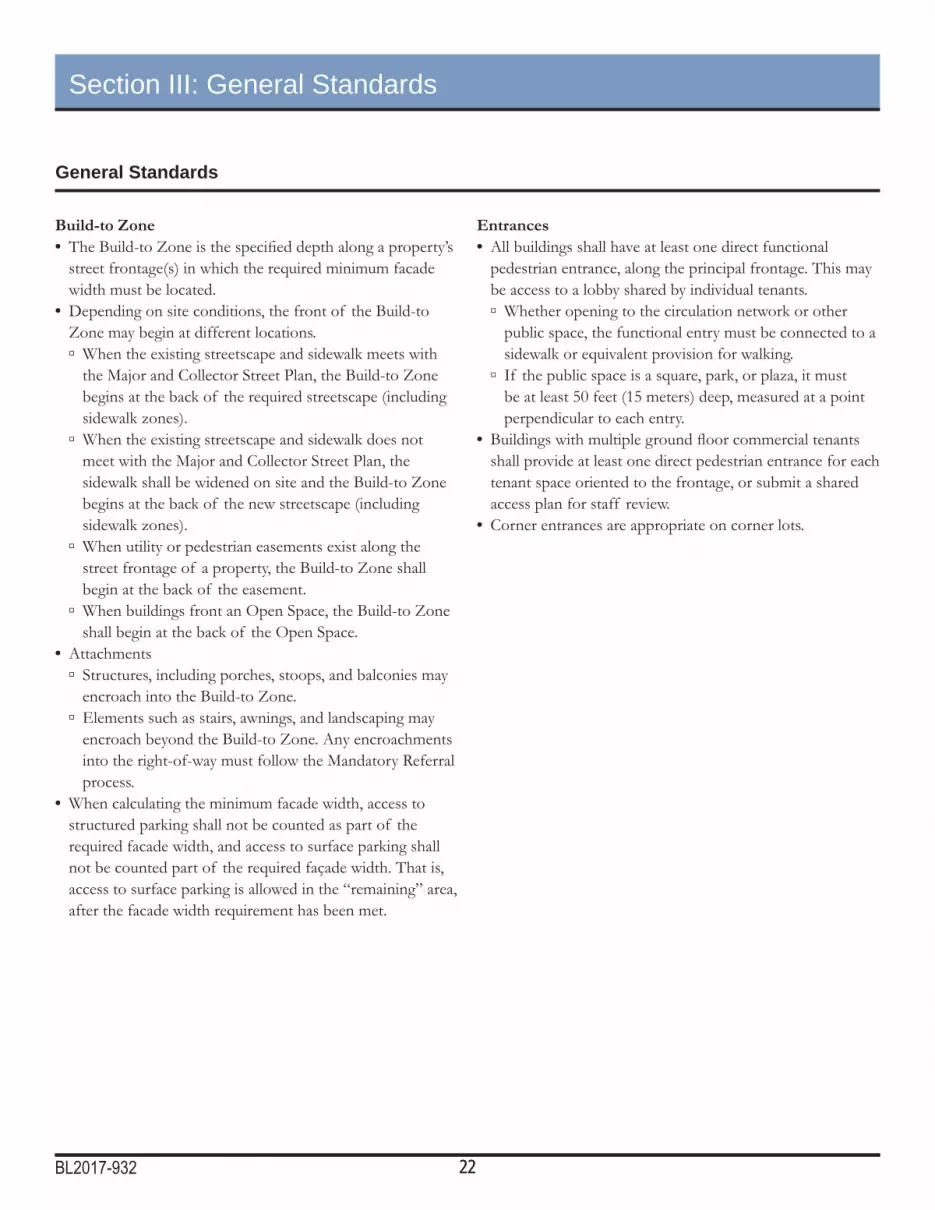
Build-to Zone • The Build-to Zone is the specified depth along a property’sstreet frontage(s) in which the required minimum facadewidth must be located .
• Depending on site conditions, the front of the Build-toZone may begin at different locations .▫ When the existing streetscape and sidewalk meets with
the Major and Collector Street Plan, the Build-to Zonebegins at the back of the required streetscape (includingsidewalk zones) .
▫ When the existing streetscape and sidewalk does notmeet with the Major and Collector Street Plan, thesidewalk shall be widened on site and the Build-to Zonebegins at the back of the new streetscape (includingsidewalk zones) .
▫ When utility or pedestrian easements exist along thestreet frontage of a property, the Build-to Zone shallbegin at the back of the easement .
▫ When buildings front an Open Space, the Build-to Zoneshall begin at the back of the Open Space .
• Attachments▫ Structures, including porches, stoops, and balconies may
encroach into the Build-to Zone .▫ Elements such as stairs, awnings, and landscaping may
encroach beyond the Build-to Zone . Any encroachmentsinto the right-of-way must follow the Mandatory Referralprocess .
• When calculating the minimum facade width, access tostructured parking shall not be counted as part of therequired facade width, and access to surface parking shallnot be counted part of the required façade width . That is,access to surface parking is allowed in the “remaining” area,after the facade width requirement has been met .
General Standards
Entrances • All buildings shall have at least one direct functionalpedestrian entrance, along the principal frontage . This maybe access to a lobby shared by individual tenants .▫ Whether opening to the circulation network or other
public space, the functional entry must be connected to asidewalk or equivalent provision for walking .
▫ If the public space is a square, park, or plaza, it mustbe at least 50 feet (15 meters) deep, measured at a pointperpendicular to each entry .
• Buildings with multiple ground floor commercial tenantsshall provide at least one direct pedestrian entrance for eachtenant space oriented to the frontage, or submit a sharedaccess plan for staff review .
• Corner entrances are appropriate on corner lots .
BL2017-932

23
Section III: General Standards
General Standards
Active Use • An active ground floor use requirement shall mean ahabitable space occupied by retail, office, residential,institutional or recreational uses, specifically excludingparking and mechanical uses . Minimum 15 feet in depth .
• Active uses are those programmed spaces that generatepedestrian street activity and interaction . Hallways, storagerooms, fitness centers, and other ancillary spaces shall notqualify as an active use .
• An active use is required on the ground floor of all streets,open spaces and greenways other than Tertiary streets .
• The term “active use” and ground level “building liner” aresynonymous .
• Active ground floor uses must match the facade widthpercentage requirements . For example, if 60% facade widthmin . is required along a lot’s frontage, then 60% min . of thelot’s frontage must also consist of an active ground flooruse .
Glazing and Massing • Openings for vehicular access to parking structures on thefirst floor shall be included in calculation of total facadearea .
• All street and open space level exterior windows must havea minimum light transmission of 60 percent .▫ Modifications may be permitted in so far as it is
determined that tinting does not substantially diminishthe effect of the building wall or the pedestrian characterof the street .
BL2017-932

2424
Section III: General Standards
Frontage Types: Storefront Frontage
The Storefront Frontage has a limited Build-to Zone that is close to the street, with building entrances accessible at sidewalk grade . The Storefront Frontage has substantial glazing on the facade at ground level, space for pedestrian-oriented signage, awnings, retail display, and other design features conducive with creating an active commercial streetscape .
The Storefront Frontage is commonly used for general commercial, office, retail, restaurant, lobby, etc.
BL2017-932

25
Section III: General Standards
Frontage Types: Storefront Frontage
Elevation
D
E
E
Storefront Frontage
Max. sill height 3 ft
Min. ground floor height 14 ft from grade
Min. upper floor(s) height 10 ft floor to floor
Min. ground floor glazing* Principal Frontage 40% floor to floor Minor Frontage 30% floor to floor
Min. upper floor(s) openings 25% from floor to floor
Notes Where Storefront frontage is allowed, modifications may be given to allow for a Storefront arcade . All Storefront Frontage standards shall be met on the facade behind the arcade .
*All grade-level retail shall provide clear vision glass between 3’ and8’ above grade for a minimum of 60% of its frontage area .
A
B
C
D
E
Section
B
C
C
A
BL2017-932

2626
Section III: General Standards
Frontage Types: Stoop Frontage
The Stoop Frontage has a limited to moderate Build-to Zone with the first floor elevated from the sidewalk grade. This frontage type utilizes a stoop - a small landing connecting a building entrance to the sidewalk by a stair or ramp - to transition from the public sidewalk or open space into the building .
Stoops are generally provided externally, but may be provided internally as necessitated for ADA compliance .
The Stoop Frontage is generally used for residential and live-work buildings, but may be appropriate for other uses .
BL2017-932

27
Section III: General Standards
Frontage Types: Stoop Frontage
Elevation
E
Section
A
B
C
F
Fron
t of B
uild-
to Zo
ne
Prop
erty
Line
D
Plan
E F
Fron
t of B
uild-
to Zo
ne
Prop
erty
Line
Porch Frontage
First floor elevationMin . 24” from gradeMax . 5 ft from grade
Min. ground floor openings 30% floor to floor
Min. upper floor(s) openings 25% from floor to floor
StoopMin . porch depth 5 ftStoops may extend into the Build-to Zone .Steps may extend into the Build-to Zone, but may not encroach into the public Right-of-Way .
NotesGreater first floor elevation allowed by modification for:• Property with significant elevation change across the site at
the street frontage .• Development that incorporates below grade basement floors
that are accessible from the exterior of the building .Transition to first floor elevation may be accommodated on the interior of the building to allow for compliance with ADA accessibility requirements .Entries shall not be recessed more than 4 feet from the facade of the building .Doors shall face the street .
A
B
C
DE
F
BL2017-932

2828
Section III: General Standards
Frontage Types: Porch Frontage
26Attachment to Ordinance No. BLas adopted on
26Attachment to Ordinance No. BLas adopted on
Section III: General Standards
Frontage Types: Porch Frontage
The Porch Frontage has a moderate Build-to Zone with the rst oor elevated from the sidewalk grade. The Porch Front-age utilizes a porch - an open air room appended to the mass of a building with oor and roof but no walls on at least two sides - to transition from the public sidewalk or open space into the building.
The Porch Frontage is primarily used for residential buildings.
The Porch Frontage has a moderate Build-to Zone with the first floor elevated from the sidewalk grade. The Porch Front-age utilizes a porch - an open air room appended to the mass of a building with floor and roof but no walls on at least two sides - to transition from the public sidewalk or open space into the building .
The Porch Frontage is primarily used for residential buildings .
BL2017-932

29
Section III: General Standards
Frontage Types: Porch Frontage
Elevation
E
Section
A
B
C
F
Fron
t of B
uild-
to Zo
ne
Prop
erty
Line
D
Plan
E F
Fron
t of B
uild-
to Zo
ne
Prop
erty
Line
Porch Frontage
First floor elevationMin . 18” from gradeMax . 5 ft from grade
Min. ground floor openings 30% floor to floor
Min. upper floor(s) openings 25% from floor to floor
PorchMin . porch depth 5 ftPorches may extend into the front of the Build-to Zone .Steps may extend into the Build-to Zone, but may not encroach into the public Right-of-Way .
NotesGreater first floor elevation allowed by modification for:• Property with significant elevation change across the site at
the street frontage .• Development that incorporates below grade basement floors
that are accessible from the exterior of the building .Transition to first floor elevation may be accommodated on the interior of the building to allow for compliance with ADA accessibility requirements .Entries shall not be recessed more than 4 feet from the facade of the building .Doors shall face the street .
A
B
C
DE
F
BL2017-932
303030
Section II: General Standards
Frontage Types: Civic Frontage
28Attachment to Ordinance No. BLas adopted on
28Attachment to Ordinance No. BLas adopted on
28Attachment to Ordinance No. BLas adopted on
Section II: General Standards
Frontage Types: Civic Frontage
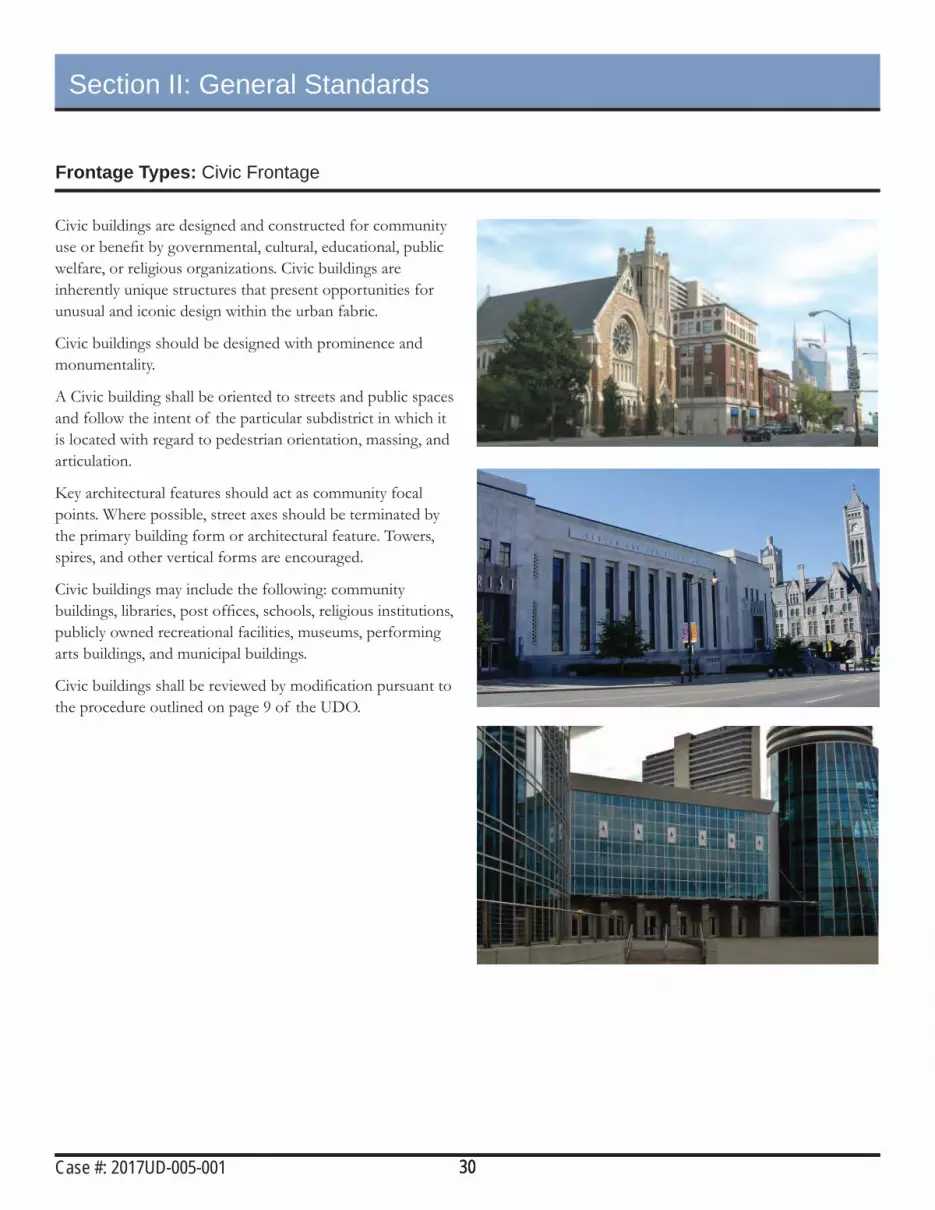
Civic buildings are designed and constructed for community use or bene t by governmental, cultural, educational, public welfare, or religious organizations. Civic buildings are inherently unique structures that present opportunities for unusual and iconic design within the urban fabric. Civic buildings should be designed with prominence and monumentality.
A Civic building shall be oriented to streets and public spaces and follow the intent of the particular subdistrict in which it is located with regard to pedestrian orientation, massing, and articulation.
Key architectural features should act as community focal points. Where possible, street axes should be terminated by the primary building form or architectural feature. Towers, spires, and other vertical forms are encouraged.
Civic buildings may include the following: community buildings, libraries, post of ces, schools, religious institutions, publicly owned recreational facilities, museums, performing arts buildings, and municipal buildings.
Civic buildings are designed and constructed for community use or benefit by governmental, cultural, educational, public welfare, or religious organizations . Civic buildings are inherently unique structures that present opportunities for unusual and iconic design within the urban fabric .
Civic buildings should be designed with prominence and monumentality .
A Civic building shall be oriented to streets and public spaces and follow the intent of the particular subdistrict in which it is located with regard to pedestrian orientation, massing, and articulation .
Key architectural features should act as community focal points . Where possible, street axes should be terminated by the primary building form or architectural feature . Towers, spires, and other vertical forms are encouraged .
Civic buildings may include the following: community buildings, libraries, post offices, schools, religious institutions, publicly owned recreational facilities, museums, performing arts buildings, and municipal buildings .
Civic buildings shall be reviewed by modification pursuant to the procedure outlined on page 9 of the UDO .
Case #: 2017UD-005-001

31
Section III: General Standards
Canopies and Awnings
Section
Section
C
B
The name and logo of the establishment are the only advertising permitted on awnings . All shall follow the Sign Standards .
No awning shall exceed 25 feet in length .
Awnings shall not be constructed of materials that are glossy in finish.
Encroachments in the public right-of-way must meet Metropolitan Government’s current clearance standards and be approved under the mandatory referral process prior to installation .
Canopy and Awning standards do not apply to brise soleil or sun-shades .
B
C
Awnings
ClearanceMinimum from sidewalk 8’
Maximum projection First floor 4’ from facadeUpper floors not permitted
Maximum awning height 5’
A
B
C
A
A
Canopies
ClearanceMinimum from sidewalk 8’Maximum 25’
Maximum projection within 2’ of curb
Maximum canopy height 4’
Encroachments in the public right-of-way must meet Metropolitan Government’s current clearance standards and be approved under the mandatory referral process prior to installation .
Canopies
Awnings
A
B
C
Auto-oriented canopies and awnings Auto-oriented canopies and awnings, for uses such as drive-thrus and gas station pumps, may be attached to a building according to the following:
• The building shall comply with all Frontage standards . • The canopy and/or awning shall be lower in height than the
primary building . • The setback of the canopy and/or awning shall be a minimum of
15 feet from the back of the front facade of the building . • A drive-though canopy and/or awning shall not be located along
the principal frontage .
BL2017-932

3232
Section III: General Standards
Street Types
Primary StreetPrimary Streets accommodate high levels of pedestrian activity and high levels of vehicular traffic. On Primary Streets, active uses – residential, retail, restaurant or office – lining parking structures and on the first floor of buildings, and restricted vehicular access enhance the pedestrian experience . Primary streets provide the opportunity for more intense, urban development including shallow Build-to Zones and, in some cases, increased building height . Pedestrian comfort on these streets is of highest importance . Primary streets should have a continuous street wall, wide sidewalks between 14 and 20 feet to provide room for street furniture such as benches, trash receptacles, and bicycle parking . Primary Streets have the highest level of urban activity such as, outdoor dining, retail displays, and community activities like markets, parades, and music . Street trees provide protection from the sun and rain, reduce stormwater runoff and air pollution, and provide aesthetic value to the city . Trees should be planted in wells with tree grates to allow for the uninterrupted flow of pedestrian traffic.
Street Character
The public right-of-way, including streets, sidewalks and public utility infrastructure, plays both a functional and social role in the life of the city and its citizens. Streets organize the city, help to define space, and link destinations. The street is also a public place where people congregate, shop, socialize and live . Active, attractive streets are critical to the continued growth and success of River North . The UDO includes urban design tools to make working, living and playing in River North lively, safe and comfortable .
The UDO uses Street Types as an urban design and organizing tool. All streets are classified on the Regulating Plan as Primary, Secondary, Tertiary, Other, or Alley . The location of vehicular access from all other streets shall be determined on a case-by-case basis . NashvilleNext calls for a strong emphasis on expanding other modes of transportation including walking, cycling and transit . The UDO emphasizes walking, cycling and transit as primary modes of transportation within River North through the urban design of individual buildings, blocks, and neighborhoods .
All Streets • Streets refer to publicly or privately owned right-of-way . They are intended for use by pedestrian, bicycle, transit andvehicular traffic and provide access to property.
• Streets consist of vehicular lanes and the SidewalkCorridor . The vehicular lanes, in a variety of widths,provide traffic and parking capacity and may include bicyclepaths . The Sidewalk Corridor contributes to the urbancharacter of each neighborhood . It may include pedestrianpaths, landscaped planters, street furnishings and streettrees .
• Pedestrian safety, comfort, and accessibility should be aprimary consideration of street design and dimensioning .
• When alleys are present, vehicular access from alleys isencouraged . Vehicular access from public streets shall beconsidered in the following order: Other Streets, TertiaryStreets, Secondary Streets, and then Primary Streets asapproved by Metro departments .
• Final construction plans shall comply with Metro PublicWorks standards and specifications.
BL2017-932

33
Section III: General Standards
Street Character
Secondary StreetSecondary Streets have moderate levels of pedestrian activity and moderate levels of vehicular traffic. Secondary Streets may be mixed-use or more residential in character . The Build-to Zone is generally shallow, and building heights are limited . In mixed-use areas, a continuous street wall should be maintained and sidewalks should be between 12 and 16 feet wide to accommodate pedestrian traffic. In residential areas, the required minimum façade width is limited – allowing for more space between buildings – and sidewalks may be narrower . Both tree wells and open landscaped planters are appropriate depending on sidewalk width .
Tertiary StreetTertiary Streets are the less important than Primary and Secondary streets . They may function as “back of house” for buildings with multiple street frontages . Care should be taken to make these streets as pedestrian-friendly as possible while accommodating loading and access needs . Unless appropriately designed to share street space, an 8 foot sidewalk is a minimal dimension for walking accommodations in a highly urbanized area such as River North .
Other StreetOther Streets are streets that do not fall into any of the other street categories . They may have high or moderate levels of vehicular traffic, but often have no access to property and limited pedestrian activity . Building height along these streets is regulated by the other property frontages . Buildings do not front on these streets and may be built up to the property line .
AlleyAlleys are service roads that provide shared access to property . Public utilities as well as access to mechanical equipment and trash should be located off an alley whenever possible . Alleys are encouraged for access and loading .
Sidewalk CorridorThe Sidewalk Corridor is the portion of the right-of way between the vehicular lanes and the property line or building façade .
• The primary function of the Sidewalk Corridor is toprovide a safe, comfortable, and convenient routefor pedestrian travel that is separated from vehicularmovements .
• The Sidewalk Corridor is a public space that should includepedestrian amenities such as seating, shade trees, bike racks,places to congregate, trash and recycling receptacles andoutdoor dining .
• The Sidewalk Corridor may accommodate public utilitiessuch as electric poles and vaults, water and sewer lines, busstops and traffic signals.
• The Sidewalk Corridor may also accommodate separatedbikeway facilities by providing protection to cyclists fromtraffic. This may be achieved by an adjacent grass stripor planting zone and may function as a dedicated facilitymeant for cyclists only, or mixed with pedestrian traffic likea multi-use path .
• As property develops, property owners shall consult withMetro Planning and Public Works to make the necessaryimprovements to the streetscape in accordance withthe Major and Collector Street Plan and the Strategic Plan forSidewalks.
BL2017-932

3434
Section III: General Standards
Primary Streets
Secondary Streets
Tertiary Streets
Future Streets
Proposed Street Network
Legend
Street Character: Future Streets
Pedestrian Connection
BL2017-932

35
Section III: General Standards
Street Character: Future Streets
Future StreetsThis area will see significant growth and change over the next few years . The Future Streets Plan show how streets could be realigned, connected and created in the future to improve mobility within the area .
Properties near an area highlighted for change on the Future Streets Plan shall consult with the Planning Department and the Department of Public Works to discuss the potential change .
Any future street listed in the UDO as a future street can be moved or realigned prior to construction and the designa-tion for that street can be changed . When a street is moved, relocated or the designation is changed prior to construction this is a modification that may be approved by the Planning Department with a recommendation from Public Works .
BL2017-932

3636
Section III: General Standards
Street TreesShade-producing street trees shall be planted in the public right-of-way along the length of the lot frontage at a maximum spacing of forty feet or in accordance with the regulations of Metro departments and agencies .
Tree QualityTree species shall be chosen from the Urban Forestry Recommended and Prohibited Tree and Shrub List based on tree size and planting area provided or an alternative species deemed appropriate by the Urban Forester .
• At planting trees, shall meet the requirements for street trees set out in the American Standard for Nursery Stock . • All nursery stock used as street trees shall be vigorous, healthy and free of diseases or infestation . • No species considered invasive in the project’s context according to USDA or other state agriculture services shall beallowed .
• Planting Area Dimension▫ The following standards are minimum standards . All development is encouraged to provide street trees with the largest
area of pervious surface and volume of soil that can be accommodated .▫ Trees shall be accommodated in planting areas that follow Metro Public Works’ Street Tree Standards and Specifications .▫ The minimum pervious opening at grade shall be 24 square feet .▫ Tree vaults shall have the capability to drain water .▫ Planting areas shall not inhibit ingress/egress from buildings or pedestrian traffic along the Sidewalk Corridor.
Street Character
BL2017-932

37
Section III: General Standards
Parking and Access: General
Parking and Access: General • No parking is required within the boundaries of the UDO . • No onsite parking is allowed between the street and thebuilding .
Parking and Access General Standards • 17 .20 .050 Handicapped Parking, 17 .20 .060 Parkingarea design standards, and 17 .20 .130 Loading spacerequirements shall apply .
Valet and drop-off areas • They shall be located within the right of way when spaceallows . If not provided in the right of way they shall belocated internal to the development .
• Where driveways to parking facilities or drop off areascross the Sidewalk Corridor, priority should be given to thepedestrian realm and the following shall be required:▫ The UDO and the MCSP sidewalks and tree planting
standards shall be maintained for any pedestrian islandthat is created .
▫ Bollards or other devices shall be used to separate thepedestrian and vehicular areas .
▫ Distinction behind vehicular lane and pedestrian areasshall be indicated through changes in grade, color, textureand/or material .
• Curbside management plans are required . Consolidationof drop-off locations to a single location for multipleproperties is highly recommended .
Stormwater • Utilize LDI strategies in Metro Water Services StormwaterBMPs for hardscape including parking and drive lanes .
• Prior to Final Site Plan approval, projects must demonstratestormwater and flood mitigation design, and floodplainmanagement .
BL2017-932
3838
Section III: General Standards
Parking and Access: Specific to Structured Parking
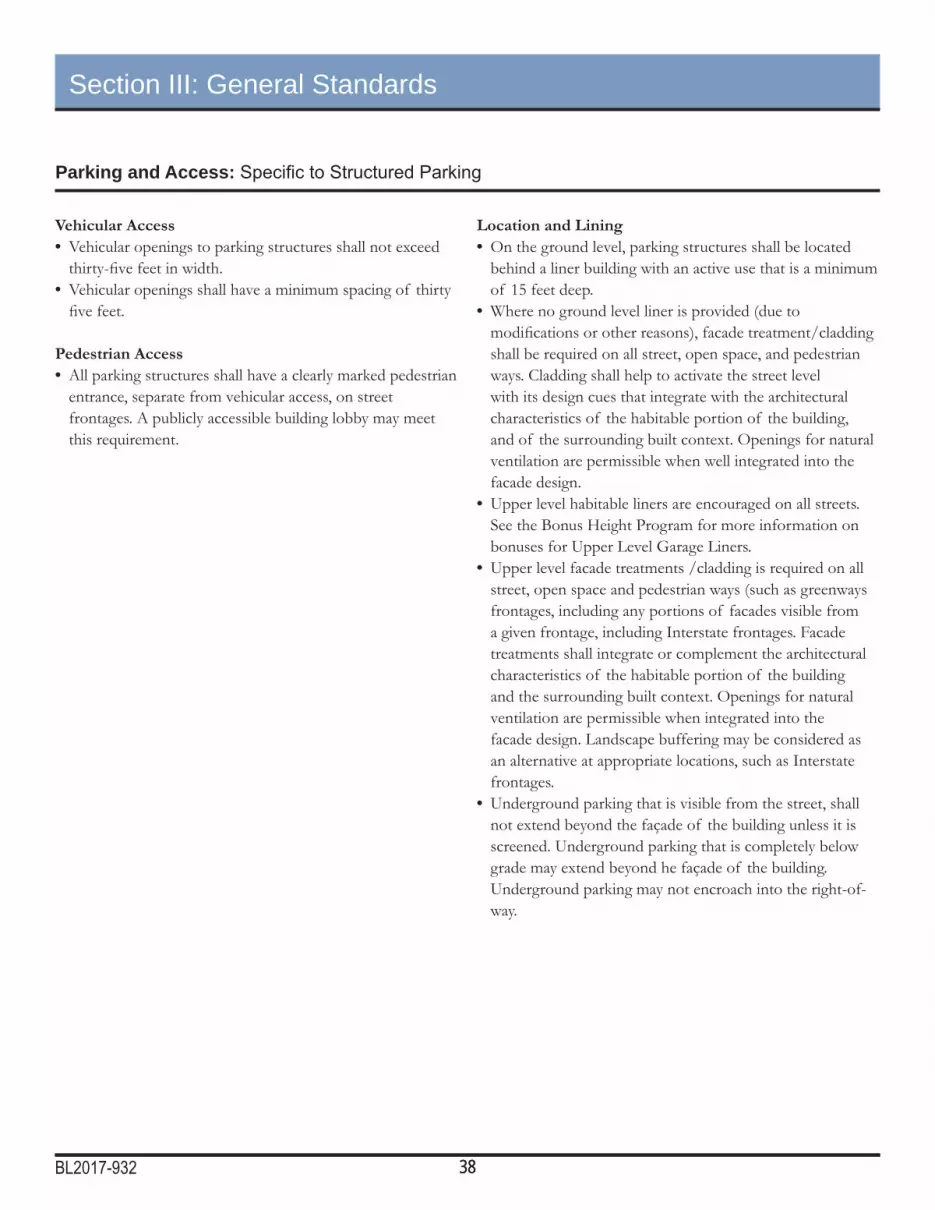
Vehicular Access • Vehicular openings to parking structures shall not exceedthirty-five feet in width.
• Vehicular openings shall have a minimum spacing of thirtyfive feet.
Pedestrian Access • All parking structures shall have a clearly marked pedestrianentrance, separate from vehicular access, on streetfrontages . A publicly accessible building lobby may meetthis requirement .
Location and Lining • On the ground level, parking structures shall be locatedbehind a liner building with an active use that is a minimumof 15 feet deep .
• Where no ground level liner is provided (due tomodifications or other reasons), facade treatment/claddingshall be required on all street, open space, and pedestrianways . Cladding shall help to activate the street levelwith its design cues that integrate with the architecturalcharacteristics of the habitable portion of the building,and of the surrounding built context . Openings for naturalventilation are permissible when well integrated into thefacade design .
• Upper level habitable liners are encouraged on all streets . See the Bonus Height Program for more information onbonuses for Upper Level Garage Liners .
• Upper level facade treatments /cladding is required on allstreet, open space and pedestrian ways (such as greenwaysfrontages, including any portions of facades visible froma given frontage, including Interstate frontages . Facadetreatments shall integrate or complement the architecturalcharacteristics of the habitable portion of the buildingand the surrounding built context . Openings for naturalventilation are permissible when integrated into thefacade design . Landscape buffering may be considered asan alternative at appropriate locations, such as Interstatefrontages .
• Underground parking that is visible from the street, shallnot extend beyond the façade of the building unless it isscreened . Underground parking that is completely belowgrade may extend beyond he façade of the building . Underground parking may not encroach into the right-of-way .
BL2017-932

39
Section III: General Standards
Parking and Access: Specific to Surface Parking
General Standards for Surface Parking • Parking area screening and landscaping standards shallapply to all surface parking lots including, but not limitedto, public and private parking facilities, driveways andaccess aisles, the outdoor display of automobiles and othervehicles that are for sale or lease .
• Surface Parking is best suited at the side or rear of abuilding, leaving the building frontage facing the circulationroute .
Perimeter Screening Standards for Surface Parking • Parking areas adjacent to public streets and open space shallbe separated from the edge of the right-of-way and/oreasements and property lines by a perimeter landscape stripa minimum of five feet in width which shall be landscapedper the standards of this section .▫ All perimeter landscape strips adjacent to public streets
and open space shall include a transparent fence or kneewall in accordance with the Fence and Wall Standards .
• Parking areas shall be separated from adjacent side lotlines(with the exception of cross-access points) by aperimeter landscape strip a minimum of 5 feet in width,which shall be landscaped per the standards of this section .▫ A two and one-half foot landscape strip may be provided
if the required trees are to be planted in tree islandslocated adjacent to the property line .
▫ Two adjacent properties may share equally in the estab-lishment of a 5 foot (minimum) planting strip along thecommon property line . In instances where the commonperimeter planting strip is part of a plan for shared ac-cess, each owner may count the respective area contribut-ed toward that common planting strip toward the interiorplanting area requirements for the lot . Conversely, ashared parking lot across property lines may be devel-oped with no side lot perimeter planting strip, dependentupon the design and functional use of the space .
• Surface Parking Lots shall provides cross-access to alladjacent development and parking lots .
Interior Planting Requirements • Parking areas shall be landscaped in accordance with theinterior planting requirements of Title 17 .24 .160 .
• Parking areas with less than twelve thousand square feet intotal area shall be exempt from the interior and side lot lineplanting requirements .
Landscape Materials • Perimeter landscape strips along public streets, open spaceand side lot lines .▫ Trees shall be installed at a rate of one tree for every
thirty feet of frontage . Spacing may be adjusted with theapproval of the Urban Forester based upon tree species,the presence of utilities, and the dimensions of theplanting strip .
▫ Evergreen shrubs and trees shall be installed atappropriate spacing to fully screen vehicles to a minimumheight of two and one-half feet .
▫ Plantings within fifteen feet of driveways or streetintersections shall be maintained to a maximum height oftwo and one-half feet .
▫ Plantings shall not obstruct views onto site as to impedethe security of users .
• Tree and shrub species shall be chosen from the UrbanForestry Recommended and Prohibited Tree and ShrubList or an alternative species deemed appropriate by theUrban Forester .
• At planting, trees shall be a minimum of six feet in heightand two caliper inches .
• All landscaping shall be in a functioning bio-swale, orirritated using drip irrigation or sub-surface irrigation . Ifdrought-tolerant species are used, no irrigation is required .
• At planting, all landscaping shall meet the standards forsize, form and quality set out in the American Standard forNursery Stock (ANSI Z60 .1, latest edition) .
• All nursery stock shall be vigorous, healthy and free ofdiseases or infestation .
BL2017-932

4040
Section III: General Standards
Mechanical, Service, and Loading
Location and Access • Applicable site elements shall be located along the alley,along an interior property line, or internal to the property .
• Service elements, such as loading docks and trash collectionlocations, shall not be accessible from Primary Streetsunless a Primary Street is the only frontage .
• Vehicular or service bay openings shall make up no morethan 20% of the total frontage length along PrimaryStreets, Secondary Streets, or Open Space frontages .
• Where access to loading areas and service elementscross the Sidewalk Corridor, priority shall be given to thepedestrian realm and the following design elements shall berequired:▫ The MCSP sidewalks and streetscape standards shall be
maintained for any pedestrian islands or indentationscreated .
▫ Bollards or other protective device shall be used toseparate pedestrian and vehicular areas .
▫ Distinction between vehicular lane and pedestrian areasshall be indicated through changes in grade, color, textureand/or material .
Screening Standards • Applicable site elements shall be fully screened at all times . • Refuse collection and refuse handling areas shall bescreened by a walled enclosure with gates in accordancewith the Fence and Wall Standards of the UDO .
ApplicabilityThe following elements shall be shielded from view from adjacent public streets, pedestrian corridors, and open spaces .
• Refuse collection, dumpsters, recycling bins, and refusehandling areas that accommodate a dumpster or five ormore trash or recycling cans .
• Building or ground-mounted mechanical equipment,including, but not limited, to transformers, back-flow preventors, telephone risers, equipment cabinets,generators, or similar devices .
• Mechanical equipment on roofs shall be fully screened . • Air conditioning or similar HVAC equipment . • Loading docks, berths, or similar spaces including, but notlimited to, service entrances and maintenance areas .
• Outdoor storage of materials, equipment, and vehicles .
BL2017-932

41
Section III: General Standards
Mechanical, Service, and Loading
Screening Methods • Vegetative Materials:▫ Vegetative materials shall be planted in two rows in
staggered fashion .▫ All trees shall be evergreen with a minimum height at
time of planting of at least six feet above the root ball .▫ All shrubs shall be evergreen with the minimum height
and spacing necessary to fully screen the item intendedfor screening (but no less than thirty inches in height) atthe time of planting .
▫ Vegetative material shall be located immediately adjacentto the element being screened in a planting area aminimum of four feet wide .
• Fencing and Walls▫ Screening is permitted through the use of a fence or wall
constructed in accordance with the Fences and WallsStandards of the River North UDO .
• Mechanical Penthouse▫ Rooftop mechanical areas must be fully visually screened .▫ Penthouse height limited to 20’ .▫ Penthouse must be setback from the edge of the building
roof below, by a distance equal to the penthouse height(1:1)
▫ Penthouse walls and design shall minimize its visual im-pact, and be otherwise complementary to the building’sarchitecture and design .
▫ Habitable space is not permitted . • Parapet Walls▫ Parapet walls or other techniques included as an integral
part of the building design shall be used to totally screenany rooftop mechanical equipment from view fromadjacent public rights-of-way or open space .
• Integrated Building Elements or Features▫ Building design or other structural features (e .g ., knee
walls, alcoves, wing walls, roof extensions, etc .) may alsobe used to fully or partially enclose site features requiredto be screened .
• Alternative Screening Methods▫ Alternative screening methods or materials that are not
listed may be used following approval by the PlanningCommission or its designee, provided that they aredetermined to be comparable to screening methodsdescribed in this subsection .
** In order to properly locate and screen mechanical equipment, approval may be required from applicable Metro departments and agencies .
BL2017-932

4242
Section III: General Standards
Fences and Walls
BL2017-932
Location • Permitted Locations: Fences and walls constructed inaccordance with the standards in this section may beconstructed within:▫ The Build-to Zone .▫ A utility easement only through the express written con-
sent from the utility or entity holding the easement .▫ A required landscape area, Tree Protection Zone, or open
space . • Prohibited Locations: No fence or wall shall be installedthat:▫ Encroaches into a right-of-way (without approval
through the Mandatory Referral process) .▫ Blocks or diverts a natural drainage flow on to or off of
any other land .▫ Compromises safety by blocking vision at street intersec-
tions or obstructs the visibility of vehicles entering orleaving driveways or alleys .
▫ Blocks access to any above ground or pad-mounted elec-trical transformer, equipment vault, fire hydrant or similardevice .
Appearance • All fences shall be installed so that the finished side shallface outward; all bracing shall be on the inside of the fence .
• Fences and walls shall be constructed of any combinationof brick, stone, masonry materials, treated wood postsand planks, rot-resistant wood, metal, and wear resistantnonglossy plastics and recycled materials . Chain link fencingshall be coated with dark colored vinyl when visible from apublic street or open space (excluding alleys) .
• Chain-link fences are prohibited along street and openspace frontages (including along greenways or multi-usetrails) .
• Razor wire is prohibited . • Fences and walls used to screen refuse areas shall beopaque and include gates that prohibit unauthorized usersto access the area .
Standards by function and location • Fences and walls within the Build-to Zone shall not exceedfour feet in height .▫ Modifications may be made in order to properly secure
playgrounds and parks .▫ The height of fences and walls along a sidewalk shall be
measure from sidewalk grade . • Fences and walls within the Build-to Zone that are greaterthan three feet high shall be a minimum of thirty percenttransparent to allow visibility into the property .
• Fences and walls used to screen parking shall be a minimumof two and one-half feet above the grade of the parkinglot .▫ When a fence or wall is combined with plantings the ma-
jority of the plantings shall be between the right-of-wayand the fence or wall .
• Fences and walls used to screen mechanical, loading andrefuse elements shall be a minimum of two feet taller thanthe element being screened .
• All other fences and walls shall have a maximum height often feet measured from grade .
• Fences surrounding athletic fields and courts may exceedthe previous height .

43
Section III: General Standards
Open Space Plan
Open Space
Future Urban Greenway
Existing Urban Greenway
River North UDO Boundary
Open Space Plan
Legend
The design of River North accommodates a variety of formal parks and open spaces as focal points within the community . The Open Space Plan depicts formal greens, squares, and linear parks that create publicly accessible settings for outdoor enjoyment . All of these spaces will be linked by a network of sidewalks, multi-purpose paths, walkable lanes, and bikeways, allowing continuous, non-motorized movement throughout the site, through a sequence of quality open-air environments that ultimately lead to the Cumberland River or a proposed “Central Park” within the center of the neighborhood . Buildings, streets, and parcels should generally be oriented toward open spaces to encourage safe interactive use .
BL2017-932

4444
Section III: General Standards
Open Space: General Standards
BL2017-932
Open SpacesActual detailed plans, design, and locations of River North open spaces, parks, greenways, and green connections may vary, subject to constraints and conditions as yet to be determined . However, all proposed open spaces and/or alternatives must be consistent with the intent of the Open Space Plan and UDO .
“Central Park”A centrally located park, consisting of a minimum of two contiguous acres shall be located with the UDO boundary . The park space shall allow for public gathering and recreation, with activated uses along its edges .
Riverfront GreenwayA north-south greenway with a linear park space will be provided along the riverfront of the Cumberland River . Recreation opportunities, outdoor dining, overlooks, wayfinding, and other interactive programming are appropriate components .
Green ConnectionsGreen connections will link the riverfront greenway and linear park space to the internal open space network and “Central Park” of the larger UDO area . Such connections may serve multiple purposes, but shall facilitate the movement of pedestrians through the open spaces of the UDO .
Modifications may be made in order to properly secure Standards of Title 17 not varied by the following Open Space Standards shall apply within the UDO .
Access • Every open space shall have a minimum of one primarypedestrian entrance along each street frontage andpedestrian frontage .
• All publicly accessible open space shall meet theappropriate standards of the American’s with DisabilitiesAct .
Paving Materials • Asphalt may be approved by the Planning Commission orits designee for recreational jogging or bicycle paths only .
Landscaping • Planting areas shall not impede ingress/egress frombuildings or pedestrian traffic.
• Tree and shrub species shall be chosen from the UrbanForestry Recommended and Prohibited Tree and ShrubList based on tree size and planting area provided or analternative species deemed appropriate by the UrbanForester .

45
Section III: General Standards
Bonus Height Program
Subdistrict One Two
Subdistrict Height 15 stories 25 stories
BONUSESLEED Building Silver = 1 story; Gold = 1 story;
Platinum = 2 storiesSilver = 2 stories; Gold = 2 stories;
Platinum = 3 storiesLEED ND 2 stories 2 storiesPervious Surface 1 story 2 storiesUpper Level Garage Liner 1 story 4 storiesUnderground Parking 1 story 3 storiesPublic Parking No Bonus 2 storiesAdaptable Garage Levels 2 stories 8 storiesShared Parking No Bonus 1 storyCivil Support Space 1 story 2 storiesPublic Open Space 2 stories 8 storiesPublic Greenway 2 stories 4 storiesInclusionary Housing 3 stories 10 storiesMaximum Bonus Height 18 stories 38 stories
BL2017-932
The Bonus Height Program allows additional building height in the River North UDO in exchange for contribution to speci-fied programs that provide benefits to the public. The additional building height shall be entitled if the proposed development contributes to specific public benefits in the amount and manner set forth herein.
Bonus Height Standards • Upon providing a binding commitment for the specified public benefit, the proposed development project shall be allowedto build within the restrictions of the Subdistrict, up to the Bonus Height Maximum as established within this section .
• Multiple height bonuses may be compounded insofar as the total additional height does not exceed the Bonus HeightMaximum for the Subdistrict .
• Additional development rights achieved through the BHP may be transferred to other sites within the UDO, one time toone receiving site, provided the transferred height does not exceed the Bonus Height Maximum of the receiving site . Byright height may not be transferred; only bonus height received through the BHP may be transferred .
• Bonus height transfers shall be based on the square footage of the sending site, not the receiving site . • No building permit shall be issued for bonus height until the Planning Commission has certified compliance with theprovisions of this section, upon referral and assurance of compliance from applicable departments .
Bonus Height Chart

4646
Section III: General Standards
Bonus Height Program
BL2017-932
LEED and LEED NDThe U.S. Green Building Council (USGBC) is a non-profit organization that oversees the Leadership in Energy and Environmental Design (LEED) Green Building Rating System .
LEED for Neighborhood Development integrates the principles of smart growth, urbanism and green building into the first national system for neighborhood design. LEED ND goes beyond the building to address sustainability on a neighborhood-wide basis .
The bonuses are specific to each Subdistrict. See the BHP Chart for details .
A different nationally-recognized, third-party system of overseeing green building and/or sustainable development practices may be substituted for LEED . Bonuses will be determined by the Planning Commission based on ratings equivalent to LEED silver, gold, and platinum .
Bonuses for individual buildings are given upon pre-certification of LEED silver, gold and platinum. Bonuses for neighborhoods are given upon pre-certification of LEED ND . Every property within the LEED ND neighborhood may utilize the bonus height. The bonuses are specific to each Subdistrict . See the BHP Chart for details .
The following shall apply to all new construction that utilizes the Bonus Height Program for LEED:
• Prior to issuance of a temporary certificate of occupancyfor any use of the development, a report shall be providedfor the review of the Department of Codes Administrationand the Planning Commission by a LEED accredited pro-fessional . The report shall certify that all construction prac-tices and building materials used in the construction are incompliance with the LEED certified plans and shall reporton the likelihood of certification. If certification appearslikely, temporary certificates of occupancy (as set forthbelow) may be issued . Monthly reports shall be providedas to the status of certification and the steps being taken
to achieve certification. Once certification is achieved, the initial certificate of LEED compliance, as set forth herein, and a final certificate of occupancy (assuming all other ap-plicable conditions are satisfied) shall be issued.
• To ensure that LEED certification is attained the Depart-ment of Codes Administration is authorized to issue a tem-porary certificate of occupancy once the building is other-wise completed for occupancy and prior to attainment ofLEED certification. A temporary certificate of occupancyshall be for a period not to exceed three (3) months (witha maximum of two extensions) to allow necessary time toachieve final certification. Fees for the temporary certifi-cate (and a maximum of two extensions) shall be $100 oras may otherwise be set by the Metro Council . Once twoextensions of the temporary certificate of occupancy aregranted, any additional extensions shall be granted only inconjunction with a valid certificate of LEED noncompli-ance as set forth herein .
• If the property fails to achieve LEED certification, theDepartment of Codes Administration is authorized to issuea short-term certificate of LEED noncompliance. Thiscertificate will allow the building to retain its certificate ofoccupancy pending attainment of LEED certification. Acertificate of LEED noncompliance shall be for a periodnot to exceed three (3) months and may be renewed asnecessary to achieve certification. The fee for noncompli-ance shall be issued every time the certificate is issued forup to ten years .
• The fee for a certificate of LEED noncompliance shall bebased on the following formula: F = [(CN-CE)/CN] × CV× 0 .0075, where:▫ F is the fee;▫ CN is the minimum number of credits to earn the level
of LEED certification for which the project was pre-certified;
▫ CE is the number of credits earned as documented bythe report; and
▫ CV is the Construction Value as set forth on the buildingpermit for the structure .

47
Section III: General Standards
Bonus Height Program
BL2017-932
Pervious SurfaceThe integration of pervious surfaces into site design and building design benefits the individual development, the neighborhood and the city . Pervious surfaces can reduce stormwater runoff, flood risk, irrigation needs and the burden on infrastructure . Examples of pervious surfaces include pervious pavement, green roofs, bio-swales, landscaping, and green screens. As technology in this field advances, additional pervious surfaces may meet the intent of this standard .
• The number of square feet of Bonus Height shall be twicethat of the number of square feet of Pervious Surface . Theadditional square footage may be used to the Bonus HeightMaximum as determined on the BHP Chart .
• Green roofs that are utilized to meet LEED certificationmay not be “double counted” for both the LEED heightbonus and the Pervious Surface height bonus . If the levelof LEED certification would be met without the greenroof, then the green roof may be counted for the PerviousSurface height bonus .
• Pervious Surfaces may not be double counted if usedtowards the Public Open Space or Public GreenwayBonuses .
Upper Level Garage LinerThe public realm of the streetscape is improved by lining above ground parking structures with habitable space . See the BHP Chart for a list of Subdistricts in which the Upper Level Garage Liner bonus may be utilized .
• Height bonuses are given for upper levels of habitablespace, a minimum of 15’ in depth, which masks a parkingstructure from view along streets or open space (includinggreenways and multi-use trails) .
• The number of square feet of Bonus Height shall be twicethat of the number of square feet in Garage Liners . Theadditional square footage may be used to the Bonus HeightMaximum as determined on the BHP Chart .
Underground ParkingThe public realm of the streetscape is improved by providing parking in underground structures . See the BHP Chart for a list of Subdistricts in which the Underground Parking bonus may be utilized .
• The number of square feet of Bonus Height shall be equalto the number of square feet in Underground Parking . Theadditional square footage may be used to the Bonus HeightMaximum as determined on the BHP Chart .
• Height bonuses are not given for ground level liners, or up-per level liners that are required by the UDO .
Public ParkingParking accessible to the general public is important to the continued growth and vitality of Downtown . See the BHP Chart for a list of Subdistricts in which the Public Parking bonuses may be utilized .
• The number of square feet of Bonus Height shall be twicethat of the number of square feet in Public Parking . Theadditional square footage may be used to the Bonus HeightMaximum as determined on the BHP Chart .
• Public Parking shall be clearly marked as public, and shallbe accessible to the public, at all hours that the garage isopen, for the lifetime of the building .

4848
Section III: General Standards
Bonus Height Program
BL2017-932
Adaptable Garage LevelsParking Garages built to accommodate future uses, with a ceiling height of 11 feet or greater, are encouraged and desired . See the BHP Chart for a list of Subdistricts in which the Adaptable Garage Levels bonus may be utilized .
• The number of square feet of Bonus Height shall be twicethat of the number of square feet in the Parking Garage, solong as the garage is designed with 11 foot high ceilings orgreater and an Architect has provided a letter to Planningasserting that the garage can be easily converted to analternative use if parking is no longer needed or desired . The additional square footage may be used to the BonusHeight Maximum as determined on the BHP Chart .
• Underground parking levels are not applicable for theAdaptable Garage Levels Bonus .
Shared ParkingShared Parking provides opportunities for businesses and establishments to consolidate parking needs, thereby consuming less physical space to satisfy their joint parking demands . In addition, Shared Parking can consist of Park and Ride, or dedicated car-sharing spaces . See the BHP Chart for a list of Subdistricts in which the Shared Parking Bonus may be utilized:
• The number of square feet of Bonus Height shall be equalto twice the number of square feet in Shared Parking(including Park and Ride or car sharing lots) . The additionalsquare footage may be used to the Bonus Height Maximumas determined on the BHP Chart .
• Shared Parking must demonstrate that the parking resultsin less parking spaces than would typically be provided asindividual allocations .
• Parking agreements must be recorded and remain in placefor the lifetime of the buildings .
• Park and Ride and car sharing options must demonstrateacceptance by all applicable entities including MetroDepartments .
Civil Support SpaceThe dedication of Civil Support Space offers height bonus for the developer’s contribution of space to a specific use or entity that serves to better the neighborhood or community . See the BHP Chart for details for a list of Subdistricts in which the Civil Support Space bonus may be utilized .
• Civil Support Space is typically on the ground level . Upperlevels may be appropriate depending on the intended use .
• The number of square feet of Bonus Height shall be twicethat of the number of square feet donated to Civil SupportSpace . The additional square footage may be used to theBonus Height Maximum as determined on the BHP Chart .
• Civil Support Space shall be dedicated to the chosen useor uses for 15 years . Adherence to this standard shall bechecking yearly by the Planning Commission or its desig-nee .
The Planning Commission may require the developer to execute an agreement, restrictive covenant, or other binding restriction on land use that preserves the use of Civil Support Space for the required period before final site plan review.
The following are examples appropriate for Civil Support Spaces:
• Institutional Uses▫ Cultural center▫ Day care center▫ School day care
• Education▫ Community education
• Transportation Uses▫ Transit Center
• Waste Management Uses▫ Recycling collection center
• Recreational, Civic, or Entertainment Uses▫ Community playground
• Other Uses▫ Community garden
Other uses may be appropriate for Civil Support Space . The applicant may propose a different use for Civil Support Space to be approved by the Executive Director .

49
Section III: General Standards
Bonus Height Program
BL2017-932
Public Open SpaceOpen Space accessible to the general public is critical to the continued health and vitality of River North . See the BHP Chart for a list of Subdistricts in which the Public Open Space bonus may be utilized .
• The number of square feet of Bonus Height shall beseven times that of the number of square feet in PublicOpen Space . The additional square footage may be used ortransferred to the Bonus Height Maximum as determinedon the BHP Chart .
• Public Open Space may be provided on the property beingdeveloped, or on another property within the UDO . In thelatter case, the derived bonus shall be transferred from theOpen Space Site to the Development Site .
• Public Open Space shall be clearly marked as public, andshall be accessible to the public, at all hours that the openspace is open, in perpetuity .
• In order to qualify for the bonus, all of the followingrequirements shall be met:▫ Minimum contiguous area of ¼ acre .▫ Accessible to the public through a secured public
easement, dedication, or agreement with Metro Parks or aMetro approved third party trust .
Public GreenwayGreenways and multi-use paths serve a key dual function: to provide recreational enjoyment for River North, and to provide increased connectivity to destinations in East Nashville that provides a critical alternative mode of transportation for residents and visitors to navigate the surrounding area without the need of a car . See the BHP Chart for a list of Subdistricts in which the Public Greenway bonus may be utilized .
• The number of square feet of Bonus Height shall be 50times that of the number of linear feet in Public Greenway/ multi-use path dedicated . The additional square footagemay be used to the Bonus Height Maximum as determinedon the BHP Chart .
• Public Greenways requires the dedication of land to Metro(or acceptance of a permanent public easement) for theexplicit use of Greenways/multi-use paths .
• In order to qualify for the bonus, all of the followingrequirements shall be met:▫ Accessible to the public through a secured public ease-
ment, dedication, or agreement with Metro Parks .▫ When feasible, pedestrian linkages shall be provided to
adjacent neighborhoods and developments .▫ Proposed buildings abutting the Greenway or multiuse
path shall include ground level active uses, with at leastone direct pedestrian entrance .
Inclusionary Housing • Bonus Height is available for compliance with Section17 .40 .780 of the Zoning Code as shown in the BonusHeight Program Chart .

50Attachment to Ordinance No. BLas adopted on
This page left intentionally blank

51Attachment to Ordinance No. BLas adopted on
Append ix

DEVELOPMENT CAPACITY
EVALUATION STUDY
RIVER NORTH
NASHVILLE, TENNESSEE
PREPARED FOR:
MONROE INVESTMENT PARTNERS, LLC
1101 17TH AVENUE SOUTH
NASHVILLE, TENNESSEE 37212
OCTOBER 2017

DEVELOPMENT CAPACITY EVALUATION STUDY
RIVER NORTH
NASHVILLE, TENNESSEE
PREPARED FOR:
MONROE INVESTMENT PARTNERS, LLC
PREPARED BY:
KCI TECHNOLOGIES, INC
1101 17th Avenue South
Nashville, TN 37212
615.370.8410 office 615.370.8455 fax
www.kci.com

River North Development Study October 2017
16-0908
TABLE OF CONTENTS
1. INTRODUCTION ........................................................................................................................ 1
2. PROJECT DESCRIPTION ......................................................................................................... 3
3. EXISTING SETTING .................................................................................................................. 4
3.1 Regional and Local Access ................................................................................................. 4
3.2 Existing Traffic Volumes ...................................................................................................... 4
3.3 Existing Traffic Operations ................................................................................................. 8
4. IMPACTS .................................................................................................................................. 10
4.1 Trip Generation .................................................................................................................... 10
4.2 Evaluation ............................................................................................................................. 12
4.2.1 Low Level and Medium Level Improvements ......................................................... 12
4.2.2 High-Level Improvements ............................................................................................ 18
4.2.3 Cowan Street Cross-Section ........................................................................................ 25
7. CONCLUSIONS AND RECOMMENDATIONS ............................................................... 32

River North Development Study October 2017
16-0908
LIST OF FIGURES
FIGURE 1. LOCATION OF THE PROJECT SITE .............................................................................. 3
FIGURE 2. EXISTING PEAK HOUR TRAFFIC VOLUMES ............................................................. 6
FIGURE 3. 2016 AADT DATA ............................................................................................................. 7
FIGURE 4. DIRECTIONAL DISTRIBUTION OF TRAFFIC GENERATED BY THE PROJECT
SITE UNDER LOW-LEVEL AND MEDIUM-LEVEL IMPROVEMENTS .................................... 14
FIGURE 5. LOW-LEVEL IMPROVEMENTS AT THE INTERSECTION OF JEFFERSON
STREET AND COWAN STREET ....................................................................................................... 16
FIGURE 6. MEDIUM-LEVEL IMPROVEMENTS AT THE INTERSECTION OF JEFFERSON
STREET AND COWAN STREET ....................................................................................................... 17
FIGURE 7. DIRECTIONAL DISTRIBUTION OF TRAFFIC GENERATED BY THE PROJECT
SITE HIGH-LEVEL IMPROVEMENTS-OPTION 1 ........................................................................ 18
FIGURE 8. DIRECTIONAL DISTRIBUTION OF TRAFFIC GENERATED BY THE PROJECT
SITE HIGH-LEVEL IMPROVEMENTS-OPTION 2 ........................................................................ 20
FIGURE 9. DIRECTIONAL DISTRIBUTION OF TRAFFIC GENERATED BY THE PROJECT
SITE HIGH-LEVEL IMPROVEMENTS-OPTION 3 ........................................................................ 22
FIGURE 10. DIRECTIONAL DISTRIBUTION OF TRAFFIC GENERATED BY THE PROJECT
SITE HIGH-LEVEL IMPROVEMENTS-OPTION 4 ........................................................................ 24
FIGURE 11. TOTAL PROJECTED PEAK HOUR TRAFFIC VOLUMES (LOW-LEVEL
IMPROVEMENTS) ............................................................................................................................... 27
FIGURE 12. TOTAL PROJECTED PEAK HOUR TRAFFIC VOLUMES (MEDIUM-LEVEL
IMPROVEMENTS) ............................................................................................................................... 28
FIGURE 13. TOTAL PROJECTED PEAK HOUR TRAFFIC VOLUMES (HIGH-LEVEL
IMPROVEMENTS-A) .......................................................................................................................... 29
FIGURE 14. TOTAL PROJECTED PEAK HOUR TRAFFIC VOLUMES (HIGH-LEVEL
IMPROVEMENTS-B) .......................................................................................................................... 30

River North Development Study October 2017
16-0908
FIGURE 15. TOTAL PROJECTED PEAK HOUR TRAFFIC VOLUMES (HIGH-LEVEL
IMPROVEMENTS-C ........................................................................................................................... 31
LIST OF TABLES
TABLE 1. PHASE 1 OF THE DEVELOPMENT PROGRAM ........................................................... 3
TABLE 2. DESCRIPTIONS OF LEVEL OF SERVICE FOR SIGNALIZED INTERSECTIONS .... 8
TABLE 3. EXISTING AM PEAK HOUR LEVELS OF SERVICE ...................................................... 9
TABLE 4. EXISTING PM PEAK HOUR LEVELS OF SERVICE ...................................................... 9
TABLE 5. DEVELOPMENT TRIP GENERATION (PHASE 1) ....................................................... 11
TABLE 6. MAXIMUM NEWLY GENERATED TRIPS BY THE PROPOSED DEVELOPMENT
DURING PM PEAK HOUR UNDER LOW-LEVEL IMPROVEMENTS SCENARIO ................ 15
TABLE 7. MAXIMUM NEWLY GENERATED TRIPS BY THE PROPOSED DEVELOPMENT
DURING PM PEAK HOUR UNDER MEDIUM-LEVEL IMPROVEMENTS SCENARIO ........ 15
TABLE 8. MAXIMUM NEWLY GENERATED TRIPS BY THE PROPOSED DEVELOPMENT
DURING PM PEAK HOUR UNDER HIGH-LEVEL IMPROVEMENTS SCENARIO-OPTION 1
................................................................................................................................................................. 19
TABLE 9. MAXIMUM NEWLY GENERATED TRIPS BY THE PROPOSED DEVELOPMENT
DURING PM PEAK HOUR UNDER HIGH-LEVEL IMPROVEMENTS SCENARIO-OPTION 2
................................................................................................................................................................. 21
TABLE 10. MAXIMUM NEWLY GENERATED TRIPS BY THE PROPOSED DEVELOPMENT
DURING PM PEAK HOUR UNDER HIGH-LEVEL IMPROVEMENTS SCENARIO-OPTION 3
................................................................................................................................................................. 23
TABLE 11. MAXIMUM NEWLY GENERATED TRIPS BY THE PROPOSED DEVELOPMENT
DURING PM PEAK HOUR UNDER HIGH-LEVEL IMPROVEMENTS SCENARIO-OPTION 4
................................................................................................................................................................. 25

River North Development Study October 2017
-i of vi- 16-0908
EXECUTIVE SUMMARY
Project Description
The planned River North project proposes the development of approximately 125
acres on the east side of Cumberland River between Jefferson Street and I-24 and I-
65 in downtown Nashville. This study evaluates the high-level impacts of the southern
40 acres of the development, which the study will refer to as Phase 1. The traffic
analysis is based on more density than is currently contemplated by the developer.
Given variables such as local demand and overall economy, it is prudent to underwrite
conservatively.
Phase 1 of the development, as considered for this analysis, includes a total of
approximately three (3) million square feet of office space, 1,735 residential units,
285,000 square feet of retail/restaurant space, 550 hotel rooms and 186,500 square
feet of civic space. While Phase 1 consists of 40 acres and could take 15 years or more
depending on economic cycles, and zoning permits significant density, it is anticipated
that the entirety of the development will be completed in multiple phases that could
take 30 years or more to complete.
The master plan proposes a variety of new roadway extensions, bridges,
interchanges and access connections to the interstate system as well as to existing
streets. Therefore, the purpose of this study is to evaluate the feasibility and desirability
of these access improvements and to determine maximum newly generated traffic that
can be managed under low, medium, and high levels of roadways improvements
based on these evaluations. Finally, potential transportation strategies were explored
and are recommended in order to achieve higher density for the proposed
development by improving the overall local and regional mobility of the area.
Data Collection
In order to provide data for the traffic impact analysis, manual traffic counts were
conducted at the following intersections:
1. Jefferson Street/Spring Street and Cowan Street
2. Spring Street and North 1st Street
3. Spring Street and Dickerson Pike
4. I-24 On & Off-Ramps at Spring Street
5. I-24 Eastbound Off-ramp at North 1st Street

River North Development Study October 2017
-ii of vi- 16-0908
Traffic counts for the study intersections were conducted in June 2016 by KCI.
Specifically, the turning movement counts were conducted from 7:00 – 9:00 AM and
4:00 – 6:00 PM on a typical weekday in June 2016. From the counts, it was determined
that the peak hours of traffic flow for the study intersections occurred from 8:00 – 9:00
AM and 4:00 – 5:00 PM.
Evaluations
Various combinations of the potential improvements within the study area were
developed. Directional distributions of traffic generated by the proposed project were
then established based on the proposed access connections under each scenario and
the existing travel patterns developed from the existing peak hour traffic counts.
For the purpose of this study and based on the capacity analysis it was determined
that the intersection of Jefferson Street/Spring Street and Cowan Street is the control
intersection for the sensitivity analysis. In addition, the proposed development has
higher impacts at that intersection during the PM peak hour when compared to the
AM peak hour. As a result, for the sensitivity analysis, capacity analyses were conducted
at the intersection of Jefferson Street/Spring Street and Cowan Street during the PM
peak hour under each of the various scenarios. Finally, the maximum new trip-
generated traffic volumes by the proposed development (based on the PM peak hour
volumes) which can be accommodated under each scenario were presented.
Conclusions and Recommendations
A review was conducted of the roadway extensions, bridges and interstate access
connections that are proposed as part of the River North master plan. Sensitivity
analyses were also conducted to estimate the maximum expected newly generated
trips by the proposed development, which can be managed by implementing those
conceptual improvements within different stages. The suggested improvements are
categorized as Low Level, Medium Level, and High Level. Conclusions of the reviews
and analyses are as follows:
The Cleveland Street extension and a connection across I-24 make a significant
connection to the East Nashville area and will provide access to Dickerson Pike,
Whites Creek Pike, Ellington Parkway (US 31E) and Gallatin Pike. Cleveland
Street has a four-lane cross-section from Dickerson Pike to east of Ellington
Parkway. Utilizing the highest PM peak hour trip generation (Option 4B) and
the associated distribution, the Cleveland Street extension has the potential to
add approximately 1,000 PM peak hour trips along the corridor; this serves as a

River North Development Study October 2017
-iii of vi- 16-0908
significant increase over the 9,000 vpd currently served by the corridor. There
are currently two (2) all-way stop controlled intersections along this portion of
Cleveland Street, located at Meridian Street and Lischey Avenue. Improvements
will likely be necessary at these intersections, at the Ellington Parkway ramps,
and potentially at other intersections along the corridor when the Cleveland
Street extension is constructed.
Previous versions of the River North master plan included new on and off ramps
to I-65 and I-24. Interchange modifications and/or new connections to the
interstate system require both state and federal approval and there are strict
standards regarding minimum spacing between ramps that must be met in
order to obtain the necessary approvals. State and federal approval of any new
interstate access is likely to require considerable modifications to the existing
interchanges including the employment of one or more strategies to eliminate
weaving on the interstate. These strategies include the addition of collector-
distributor roads or grade separated ramps (ramp braids). Requirements for
these type of freeway modifications are described in the NCHRP 687 report,
Guidelines for Ramp and Interchange Spacing. Specific details regarding the
operations and feasibility of any interchange modifications or additional access
points will need to be evaluated more thoroughly before understanding the
feasibility of such improvements.
The two proposed bridges over the Cumberland River have the potential to
significantly improve access and provide alternative routes that would help
lessen the impact of the project on the interstate system and on Jefferson
Street/Spring Street. The current master plan illustrates the northern bridge as
a vehicular and multimodal bridge and the southern bridge as a pedestrian and
bicycle only bridge. It would be desirable for at least one of the bridges to have
significant transit carrying capabilities.
Consideration should be given to connecting the northern Cumberland River
bridge to 3rd Avenue as well to provide more accessibility to and from north
Nashville.
A potential connection to Oldham Street has been discussed during the
development of the masterplan. This connection would create a new
north/south connection for project related traffic that may relieve development
related traffic at the intersection of Jefferson Street/Spring Street and Cowan
Street. The effectiveness of this connection could be further supported by

River North Development Study October 2017
-iv of vi- 16-0908
improvements to South 1st Street, which provides access to Woodland Street to
the south.
The Grace Street extension and a connection across I-24 will provide a
convenient connection to East Nashville and to Meridian Street, a north/south
collector street. In addition, the Grace Street extension has the potential to be
a strong bicycle/pedestrian connection to the pedestrian/bicycle bridge over
Ellington Parkway. It should be noted that this proposed improvement was not
included in the capacity analysis, for the purpose of this study. It was assumed
that a portion of the distributed traffic on the Cleveland Street connector would
be distributed onto the Grace Street extension, which would result in the same
reduction of traffic on Jefferson Street/Spring Street as without the
implementation of this improvement.
As previously described, the maximum full buildout of the southern 40 acres of
the development is referred to as Phase 1 in this study. Improvement
recommendations at the existing intersection of Jefferson Street/Spring Street
and Cowan Street associated with , Phase 1 of the development were also
evaluated and are described below.
Add additional turning lanes at the intersection of Jefferson Street and
Cowan Street such that southbound Cowan Street consists of two or three
left-turn lanes, a shared through/right lane and a right-turn lane. Further,
an additional westbound lane will enhance capacity at this intersection. A
right-turn lane with sufficient storage is recommended on the eastbound
approach of Jefferson Street as well. It may be necessary to widen the
eastern portion of the Jefferson Street bridge in order to add the
recommended eastbound lane along Jefferson Street. Other feasible
alternatives which may not require the widening of the bridge in order to
accommodate additional eastbound travel lane, should also be considered
and analyzed.
The results of capacity analyses indicated that with low-level roadway
improvements within the study area as described in the evaluation section,
approximately 22% of the newly generated Phase 1 trips can be accommodated
by the study area roadway system. Maximizing the density within the River
North development is best accommodated with the high-level roadway
improvements described previously in this study. Those improvements include
the proposed new connectors/bridges with partial movement accesses to I-24
and/or I-65, providing an additional eastbound travel lane on Jefferson Street

River North Development Study October 2017
-v of vi- 16-0908
and the I-24 bridge over Spring Street, and additional turning lanes on Cowan
Street at Jefferson Street/Spring Street. It is estimated that 133% of the PM peak
hour (5,940 vehicles per hour) for Phase 1 can be accommodated by
implementing those improvements.
It should be noted that intersections along Jefferson Street/Spring Street within the
study area currently operate at or near capacity levels during peak times. Therefore,
improving the operational performance and traffic flow of Jefferson Street/Spring
Street within the study area is warranted as of today even without the completion
of any stages of River North development. Any development along the east bank
is likely to exacerbate this existing need, and access and capacity improvements
will be needed to provide adequate traffic operations within the study area .
It should be noted that the thresholds of development identified in this study
are based on trips that are projected to be generated by the development of
the River North project. As the development of River North progresses, the
land uses and sizes that are actually developed may be different than those
assumed for this study. If this occurs, continuing to use PM peak hour trips as
the warranting criteria for improvements will be an effective way to ensure that
the recommended improvements are provided when needed.
The evaluation of the proposed improvements and estimation of the maximum
newly generated trips for the proposed development under each phase can be
used as a helpful tool to plan different stages of the development. However,
the capacity analysis procedure used in this study was based on several
assumptions. It is recommended that the development conduct traffic counts
as certain portions of the development is being completed and occupied in
order to identify actual trip generation for the developed portions of the River
North development. Those counts will provide a stronger foundation to verify
the assumptions made in this study and also to explore further improvements
using the actual travel patterns in and out of the development.
It is important to note that traffic impact assumptions in this study are
conservative, meaning analyses of network impacts were limited to the
immediate vicinity of the development. Given the site’s size and location
adjacent to downtown and critical regional roadway junctions, impacts (positive
or negative) will occur well beyond the site. Should more robust high-level
improvements be constructed, such as additional bridge connections or
interstate improvements, functionality of the greater network in this area may
in fact improve. Neither TDOT nor Metro Nashville has significant infrastructure
improvements planned for the near term in this area, and while new trips will

River North Development Study October 2017
-vi of vi- 16-0908
be added, these potential high-level improvements could provide alternative
connections in the downtown area.
Higher density for the proposed development may be achieved by emphasizing
ride-share, and public transportation. Based on Mayor Barry’s Transportation
Action Agenda (Moving the Music City) plan, Metro Nashville, in partnership
with TDOT, is developing a plan called Nashville Complete Trips. As part of the
plan, Metro will promote other modes of transportation by reaching out to
major employers and connecting employers and commuters to information
about transportation options such as the transit and bikeshare systems, flex-
scheduling and telecommuting, bike parking, and MTA/RTA park-and-ride
locations. This plan would provide more opportunities for public-private
partnerships by the proposed development. Such partnerships could be
accomplished by providing private ride-share vehicles and/or sponsoring public
transportation commutes for the employees. Upon the success of sponsoring
other modes of commute, higher density for the proposed development could
potentially be achieved with less traffic impacts on the roadway system.

River North Development Study October 2017
-1- 16-0908
1. INTRODUCTION
The purpose of this study is to evaluate the high-level traffic impacts associated
with the southern 40 acres of the proposed River North development project, which
the study will refer to as Phase 1, in Nashville, Tennessee. Specifically, a sensitivity
analysis was conducted to estimate the maximum newly generated trips, which could
be accommodated with the roadway network under various minor and major roadway
improvements. The traffic analysis is based on more density than is currently
contemplated by the developer. Given variables such as local demand and overall
economy, it is prudent to underwrite conservatively.
The proposed 125-acre development will include a mix of land uses including
office, retail, hotel, residential, and civic spaces. Currently, the plan for the Phase 1 of
the development, as considered for this analysis, includes a total of approximately
three (3) million square feet of office space, 1,735 residential units, 285,000 square feet
of retail/restaurant space, 550 hotel rooms and 186,500 square feet of civic space.
While Phase 1 consists of 40 acres and could take 15 years or more depending on
economic cycles, and zoning permits significant density, it is anticipated that the
entirety of the development will be completed in multiple phases that could take 30
years or more to complete.
The property is generally bound to the south by Jefferson Street, to the east by
Interstate 24 (I-24), to the north by the Interstate 65 (I-65) northbound to I-24
eastbound ramp and on the west by the Cumberland River. Access to the
development will be provided at multiple locations as indicated in the attached master
plan (see Appendix).
The master plan proposes a variety of new roadway extensions, bridges,
interchanges and access connections to the interstate system as well as to existing
streets. Therefore, evaluations were conducted for the feasibility and desirability of
these access improvements and based on these evaluations, maximum newly
generated traffic that can be managed under low, medium, and high levels of
roadways improvements were determined. Finally, potential transportation strategies
were explored and are recommended in order to achieve higher density for the
proposed development by improving the overall local and regional mobility of the
area.
It should be noted that the purpose of this study is not to evaluate the traffic
impacts associated with the proposed development at each individual intersection
within the study area. Rather, this study intends to estimate the maximum new number

River North Development Study October 2017
-2- 16-0908
of vehicular trips that the whole roadway system in the study area can manage. To
achieve that, a control intersection (Spring Street/Jefferson Street and Cowan Street)
where the majority of the new trips will be assigned through, was selected and a
sensitivity analysis during the worst peak hour (PM peak hour) was conducted to
determine the highest manageable capacity at that intersection under various
improvements scenarios. Therefore, the results of this study provides maximum newly
generated hourly traffic volumes during the PM peak hour after typical internal capture
and alternative modes reductions. This study does not provide any specific threshold
for the land usage density. However, various land usage scenarios may be developed
which generate hourly vehicular trips of equal or less than the maximum PM peak hour
trips as estimated in this study.

River North Development Study October 2017
-3- 16-0908
2. PROJECT DESCRIPTION
The planned River North project proposes the development of approximately 125
acres on the east side of Cumberland River between Jefferson Street and I-24 and I-
65 in downtown Nashville. As shown in Figure 1, the site sits just northeast of the
Nashville Central Business District (CBD).
Table 1 provides a summary of the land uses and sizes based on Phase 1 of the
proposed master plan, as considered in this study, and information provided by the
developer team. The current master plan for the River North development is shown in
Appendix A.
TABLE 1. PHASE 1 OF THE DEVELOPMENT PROGRAM
LAND USE SIZE
OFFICE 3,029,000 SQ. FT.
RESIDENTIAL 1,735 UNITS
HOTEL 550 ROOMS
RETAIL/RESTAURANT 258,000 SQ. FT.
FIGURE 1. LOCATION OF THE PROJECT SITE

River North Development Study October 2017
-4- 16-0908
3. EXISTING SETTING
3.1 Regional and Local Access
The downtown interstate network consisting of Interstates 24 and 65 will provide
regional access to the site. In the vicinity of the site, these six-lane freeway facilities
form part of Nashville’s “Inner Loop” that encircles the downtown area of Nashville.
The nearest interchanges to the site are provided at Spring Street, just east of the site,
James Robertson Parkway, located approximately one mile southeast of the site and
Brick Church Pike, located approximately 1.5 miles north of the site. Additional regional
roadways that provide access to the site are Ellington Parkway, a four-lane expressway,
Jefferson Street/Spring Street, a four to six-lane major arterial street, and Dickerson
Pike/North 1st Street, another four-lane major arterial street.
Cowan Street, Vashti Street and Brick Church Pike/Baptist World Center Drive will
provide local access to the site. In addition, the proposed master plan includes
connections across I-24 to connect with Cleveland Street and Grace Street, which are
local east-west streets that provide connections to the McFerrin Park, Cleveland Park
and East Nashville areas of Nashville. In addition, new multimodal and pedestrian
bridges over Cumberland River are proposed in the master plan which will enhance
the connectivity of Germantown and Downtown significantly.
3.2 Existing Traffic Volumes
In addition to examining the classification and laneage of the surrounding roadway
network, traffic volume counts located in proximity to the site were available from a
variety of sources. One of these sources is TDOT, which has permanent count stations
located throughout the state that collect both daily and hourly traffic volumes.
Additionally, peak period turning movement traffic counts were collected by KCI at the
following locations:
1. Jefferson Street/Spring Street and Cowan Street
2. Spring Street and North 1st Street
3. Spring Street and Dickerson Pike
4. I-24 On & Off-Ramps at Spring Street
5. I-24 Eastbound Off-ramp at North 1st Street
Traffic counts for the study intersections were conducted in June 2016 by KCI.
Specifically, the turning movement counts were conducted from 7:00 – 9:00 AM and
4:00 – 6:00 PM on a typical weekday in June 2016. From the counts, it was determined

River North Development Study October 2017
-5- 16-0908
that the peak hours of traffic flow for the study intersections occurred from 8:00 – 9:00
AM and 4:00 – 5:00 PM. The existing peak hour turning movement volumes are
presented in Figure 2. A detailed summary of the turning movement counts is included
in Appendix B.

(Not to Scale)
Existing Peak Hour Traffic Volumes
16-0908
River North Development Study
Co
w
an St
Jefferso
n St
N 1st St
I -
2
4
N
1st St
D
ickerso
n Pk
D
ic
k
e
r
s
o
n
P
k
I -24
Sp
rin
g
St
Merid
ian
St
(1089)1819
614
(1152)
(349)168
(885)534
421(126)
138(90)
(84
5)1761
(558)190
104
(189)
481(1092)
75(178)
(702)14
57
(266)714
571(1385)
(702)14
57
571(1385)
412(276)
(978)1869
335(1190)
(195)236
(772)1194
(206)675
335(1190)
(53)13
(59)10
(53)17
441(101)
44(34)
204(133)
(18)11
(805)1695
(108)124
39(150)
579(1773)
55(222)
525(184)
383(175)
248(99)
(66)57
(620)1124
(86)13
74
(34
)
625(134
7)
97(579)
(113)58
(406)94
(195)102
947(335)
209(123)
I -24
(772)1194
64
0(4
51)
335(1190)
N
Figure 2.
-6-
October 2017

River North Development Study October 2017
-7- 16-0908
In addition to the above information, average daily traffic volumes were obtained from
the Tennessee Department of Transportation (TDOT). Figure 3 identifies the 2016
annual average daily traffic (AADT) at the TDOT count stations in the study area. TDOT
Count Station data is included in Appendix C.
As shown in Figure 3, I-24 and I-65 carry two-way daily volumes in excess of
100,000 vehicles per day. Other streets in the project site vicinity that carry significant
daily traffic volumes are Ellington Parkway (50,255 vehicles per day), Jefferson Street
(31,635 vehicles per day), Dickerson Pike (18,903 vehicles per day), and James
Robertson Parkway (28,363 vehicles per day). Cleveland Street, which the masterplan
proposes to extend across I-24 as part of the proposed River North project, has a daily
two-way traffic volume of 9,309 vehicles per day.
FIGURE 3. 2016 AADT DATA Source: TDOT
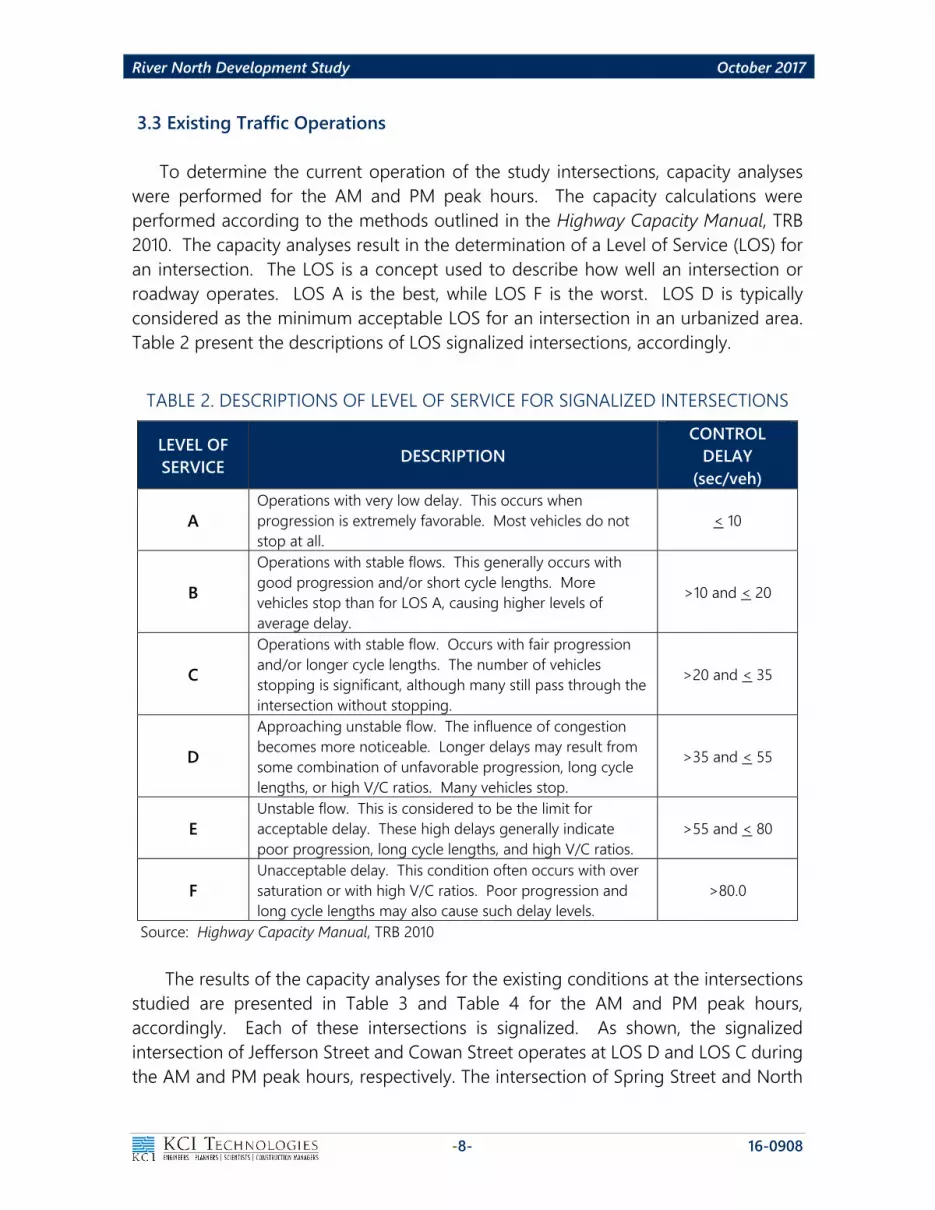
River North Development Study October 2017
-8- 16-0908
3.3 Existing Traffic Operations
To determine the current operation of the study intersections, capacity analyses
were performed for the AM and PM peak hours. The capacity calculations were
performed according to the methods outlined in the Highway Capacity Manual, TRB
2010. The capacity analyses result in the determination of a Level of Service (LOS) for
an intersection. The LOS is a concept used to describe how well an intersection or
roadway operates. LOS A is the best, while LOS F is the worst. LOS D is typically
considered as the minimum acceptable LOS for an intersection in an urbanized area.
Table 2 present the descriptions of LOS signalized intersections, accordingly.
TABLE 2. DESCRIPTIONS OF LEVEL OF SERVICE FOR SIGNALIZED INTERSECTIONS
LEVEL OF
SERVICE DESCRIPTION
CONTROL
DELAY
(sec/veh)
A
Operations with very low delay. This occurs when
progression is extremely favorable. Most vehicles do not
stop at all.
< 10
B
Operations with stable flows. This generally occurs with
good progression and/or short cycle lengths. More
vehicles stop than for LOS A, causing higher levels of
average delay.
>10 and < 20
C
Operations with stable flow. Occurs with fair progression
and/or longer cycle lengths. The number of vehicles
stopping is significant, although many still pass through the
intersection without stopping.
>20 and < 35
D
Approaching unstable flow. The influence of congestion
becomes more noticeable. Longer delays may result from
some combination of unfavorable progression, long cycle
lengths, or high V/C ratios. Many vehicles stop.
>35 and < 55
E
Unstable flow. This is considered to be the limit for
acceptable delay. These high delays generally indicate
poor progression, long cycle lengths, and high V/C ratios.
>55 and < 80
F
Unacceptable delay. This condition often occurs with over
saturation or with high V/C ratios. Poor progression and
long cycle lengths may also cause such delay levels.
>80.0
Source: Highway Capacity Manual, TRB 2010
The results of the capacity analyses for the existing conditions at the intersections
studied are presented in Table 3 and Table 4 for the AM and PM peak hours,
accordingly. Each of these intersections is signalized. As shown, the signalized
intersection of Jefferson Street and Cowan Street operates at LOS D and LOS C during
the AM and PM peak hours, respectively. The intersection of Spring Street and North

River North Development Study October 2017
-9- 16-0908
1st Street operates at LOS E during the AM peak hour and LOS D during the PM peak
hour. The intersection of Spring Street and Dickerson Pike operates at LOS D during
the AM peak hour and LOS B during the PM peak hour. The intersection of Spring
Street and I-24 WB Off-Ramp operates at LOS B during the AM peak hour and LOS A
during the PM peak hour. Capacity analyses worksheets are included in Appendix D.
TABLE 3. EXISTING AM PEAK HOUR LEVELS OF SERVICE
INTERSECTION TURNING
MOVEMENT
LEVEL OF SERVICE
(Average Approach
Delay in sec/veh)
AM Peak Hour
Jefferson Street &
Cowan Street
Overall
Intersection D (53.9)
Spring Street &
North 1st Street
Overall
Intersection E (69.9)
Spring Street &
Dickerson Pike*
Overall
Intersection D (35.6)
Spring Street & I-24
WB Off-Ramp*
Overall
Intersection B (13.3)
Note: Asterisks denote intersections that utilize non-NEMA phasing
and are, therefore, analyzed using HCM 2000 results
TABLE 4. EXISTING PM PEAK HOUR LEVELS OF SERVICE
INTERSECTION TURNING
MOVEMENT
LEVEL OF SERVICE
(Average Approach
Delay in sec/veh)
PM Peak Hour
Jefferson Street &
Cowan Street
Overall
Intersection C (20.1)
Spring Street &
North 1st Street
Overall
Intersection D (48.4)
Spring Street &
Dickerson Pike*
Overall
Intersection B (13.5)
Spring Street & I-24
WB Off-Ramp*
Overall
Intersection A (8.8)
Note: Asterisks denote intersections that utilize non-NEMA phasing
and are, therefore, analyzed using HCM 2000 results

River North Development Study October 2017
-10- 16-0908
4. IMPACTS
4.1 Trip Generation
A traffic generation process was used to estimate the amount of traffic expected
to be generated by Phase 1 of the proposed River North development. Factors for the
trip generation were taken from ITE’s Trip Generation, Ninth Edition. As previously
discussed, Phase 1 of the proposed development, as considered in this analysis,
consists of a total of approximately three (3) million square feet of office space, 1,735
residential units, 285,000 square feet of retail/restaurant space, 550 hotel rooms and
186,500 square feet of civic space. As part of the development of the project site,
significant pedestrian infrastructure improvements are planned to be included both
within the project site and along the adjacent public rights-of-way. Additionally, the
project site is located in an area that already includes a relatively dense mix of land
uses with regular transit service. Therefore, using reductions in the base ITE trip
generation rates, 5% reductions were applied to account for walking, biking, and transit
modes, conservatively.
Data presented in the ITE publication, Trip Generation Handbook, shows that
developments containing multiple land uses will commonly have internal trips. A
process was used to estimate the amount of internal trips that can be expected
between land uses based on methodology presented in NCHRP Report 684,
“Enhancing Internal Trip Capture Estimation for Mixed-Use Developments.” The
methodology contained in the NCHRP Report expands on ITE’s methodology,
including additional land uses and supporting data. The internal trip reduction process
resulted in an approximate 22% internal capture rate for the AM, 19% for the PM, and
20% for daily trip generation under full buildout scenario of the proposed
development.
Table 6 presents the daily, AM, and PM peak hour trip generation for Phase 1 of
the proposed mixed-use development. As shown by Table 6, Phase 1 of the proposed
development, as considered in this analysis, is expected to generate approximately
36,949 new trips per day. The AM and PM peak hour trip generations will equal
approximately 3,634, and 4,483 new trips, respectively. As it was mentioned
previously, the traffic analysis is based on more density than is currently contemplated
by the developer. Given variables such as local demand and overall economy, it is
prudent to underwrite conservatively. The calculations for trip generation are included
in Appendix E.

River North Development Study October 2017
-11- 16-0908
TABLE 5. DEVELOPMENT TRIP GENERATION (PHASE 1)
LAND USE SIZE
GENERATED TRAFFIC1
DAILY AM PEAK
HOUR
PM PEAK
HOUR
TRIPS ENTER EXIT ENTER EXIT
Office (LUC 710) 3,029,000 s.f. 13,328 2,163 233 535 2,623
Retail (LUC 826) 200,000 s.f. 6,531 52 74 80 102
Restaurant2 58,000 s.f. 5,549 142 149 187 66
Apartments (LUC
220) 1,735 d.u. 8,084 151 486 402 233
Hotel (LUC 310) 550 rooms 3,457 157 27 122 133
SUBTOTAL 36,949 2,665 969 1,326 3,157
NEW TRIPS 36,949 3,634 4,483
Notes:
1) Calculations above represent only new traffic generated by the project site. The
internal trips and alternative mode trips are not included in the numbers above.
2) Combination of LUC 931, LUC 932, and LUC 936
Source: Trip Generation, Ninth Edition

River North Development Study October 2017
-12- 16-0908
4.2 Evaluation
As mentioned previously, the master plan proposed a variety of new roadway
extensions, bridges, interchanges and access connections to the Interstate system as
well as to existing streets. Various combinations of the potential improvements within
the study area were developed. Directional distributions of traffic generated by the
proposed project were then established based on the proposed access connections
under each scenario and the existing travel patterns developed from the existing peak
hour traffic counts. Capacity analysis using Synchro 9 along with a sensitivity analysis
were then conducted at the critical study intersections to estimate the maximum new
trip-generated traffic volumes by the proposed development which can be managed
under each scenario.
It should be noted that since the existing operational performance at the study
intersections indicated that at least one of the intersections (Spring Street and North
1st Street) operates at LOS E during the peak hours, some improvements are required
to be implemented upon the construction of the proposed development at any stage
if LOS D operation is to be achieved.
For the purpose of this study and based on the capacity analysis it was determined
that the intersection of Jefferson Street/Spring Street and Cowan Street is the control
intersection for the sensitivity analysis. In addition, the proposed development has
higher impacts at that intersection during the PM peak hour when compared to the
AM peak hour. As a result, for the sensitivity analysis, capacity analyses were conducted
at the intersection of Jefferson Street/Spring Street and Cowan Street during the PM
peak hour under each of the various scenarios.
Directional distribution within the study area and specifically the study intersection
of Jefferson Street/Spring Street and Cowan Street varies based on the proposed
improvements. Consequently, directional distributions under each scenario were
developed and the maximum newly generated trips by the proposed development,
which can be managed under each scenario was determined. Description of the
proposed improvements, specific directional distributions, and the maximum new trip-
generated traffic volumes by the proposed development (based on the PM peak hour
volumes) which can be accommodated under each scenario are presented as follows.
4.2.1 Low Level and Medium Level Improvements
Under the low level and medium level improvements scenarios, the proposed
developments do not include construction of any new roadway bridges and/or
connectors. Moreover, under the low-level improvements scenario, widening of

River North Development Study October 2017
-13- 16-0908
Jefferson Street/Spring Street within the study area is not being considered. However,
under the scenario with medium level improvements, potential improvements which
require widening of Jefferson Street/Spring Street within the study area were
considered and included in the analysis. Since no new roadway connectors were
proposed under either the low level and medium level improvements scenarios, the
same directional distribution was utilized for both scenarios. Figure 4, Table 7, and
Table 8 present the directional distribution, proposed improvements, and maximum
newly generated trips by the proposed development that can be accommodated by
implementing those improvements. Conceptual recommended improvements at the
intersection of Jefferson Street/Spring Street and Cowan Street under low-level and
medium-level improvements scenarios are presented in Figure 5 and Figure 6.

River North Development Study October 2017
-14- 16-0908
FIGURE 4. DIRECTIONAL DISTRIBUTION OF TRAFFIC GENERATED BY THE PROJECT
SITE UNDER LOW-LEVEL AND MEDIUM-LEVEL IMPROVEMENTS
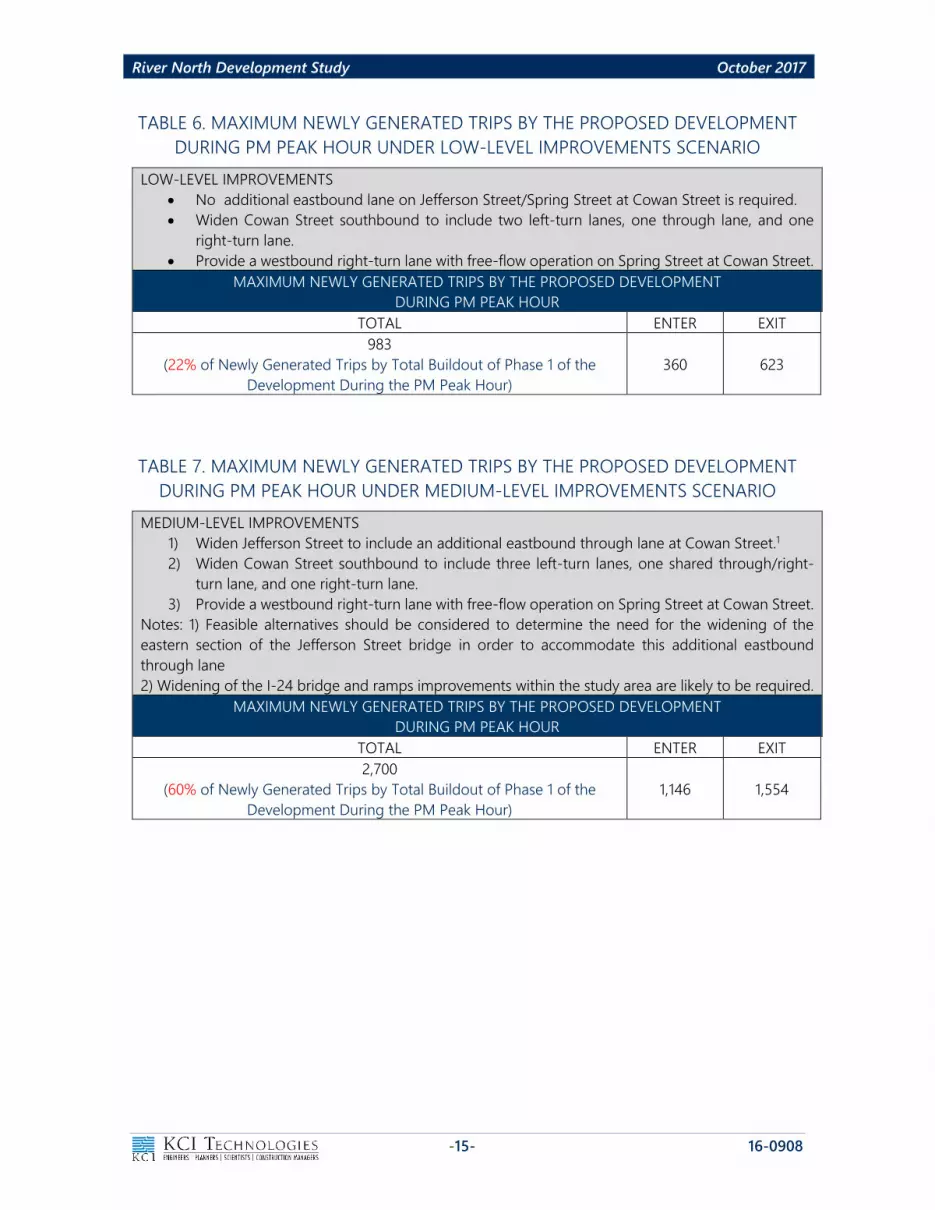
River North Development Study October 2017
-15- 16-0908
TABLE 6. MAXIMUM NEWLY GENERATED TRIPS BY THE PROPOSED DEVELOPMENT
DURING PM PEAK HOUR UNDER LOW-LEVEL IMPROVEMENTS SCENARIO
LOW-LEVEL IMPROVEMENTS
No additional eastbound lane on Jefferson Street/Spring Street at Cowan Street is required.
Widen Cowan Street southbound to include two left-turn lanes, one through lane, and one
right-turn lane.
Provide a westbound right-turn lane with free-flow operation on Spring Street at Cowan Street.
MAXIMUM NEWLY GENERATED TRIPS BY THE PROPOSED DEVELOPMENT
DURING PM PEAK HOUR
TOTAL ENTER EXIT
983
(22% of Newly Generated Trips by Total Buildout of Phase 1 of the
Development During the PM Peak Hour)
360 623
TABLE 7. MAXIMUM NEWLY GENERATED TRIPS BY THE PROPOSED DEVELOPMENT
DURING PM PEAK HOUR UNDER MEDIUM-LEVEL IMPROVEMENTS SCENARIO
MEDIUM-LEVEL IMPROVEMENTS
1) Widen Jefferson Street to include an additional eastbound through lane at Cowan Street.1
2) Widen Cowan Street southbound to include three left-turn lanes, one shared through/right-
turn lane, and one right-turn lane.
3) Provide a westbound right-turn lane with free-flow operation on Spring Street at Cowan Street.
Notes: 1) Feasible alternatives should be considered to determine the need for the widening of the
eastern section of the Jefferson Street bridge in order to accommodate this additional eastbound
through lane
2) Widening of the I-24 bridge and ramps improvements within the study area are likely to be required.
MAXIMUM NEWLY GENERATED TRIPS BY THE PROPOSED DEVELOPMENT
DURING PM PEAK HOUR
TOTAL ENTER EXIT
2,700
(60% of Newly Generated Trips by Total Buildout of Phase 1 of the
Development During the PM Peak Hour)
1,146 1,554

Co
wan
Street
Widen Cowan Street to
include two left turn
lanes, one through lane,
and one right turn lane.
Widen Jefferson Street to
include an additional
westbound through lane to
operate as a free-flow right
turn lane at the Cowan
Street intersection.
Jefferson Stre
et
River North Development Study October 2017
16-0908
Recommended Improvements - Low Level Improvements
Figure 5.GRAPHIC SCALE
160'80'0'
-16-
N
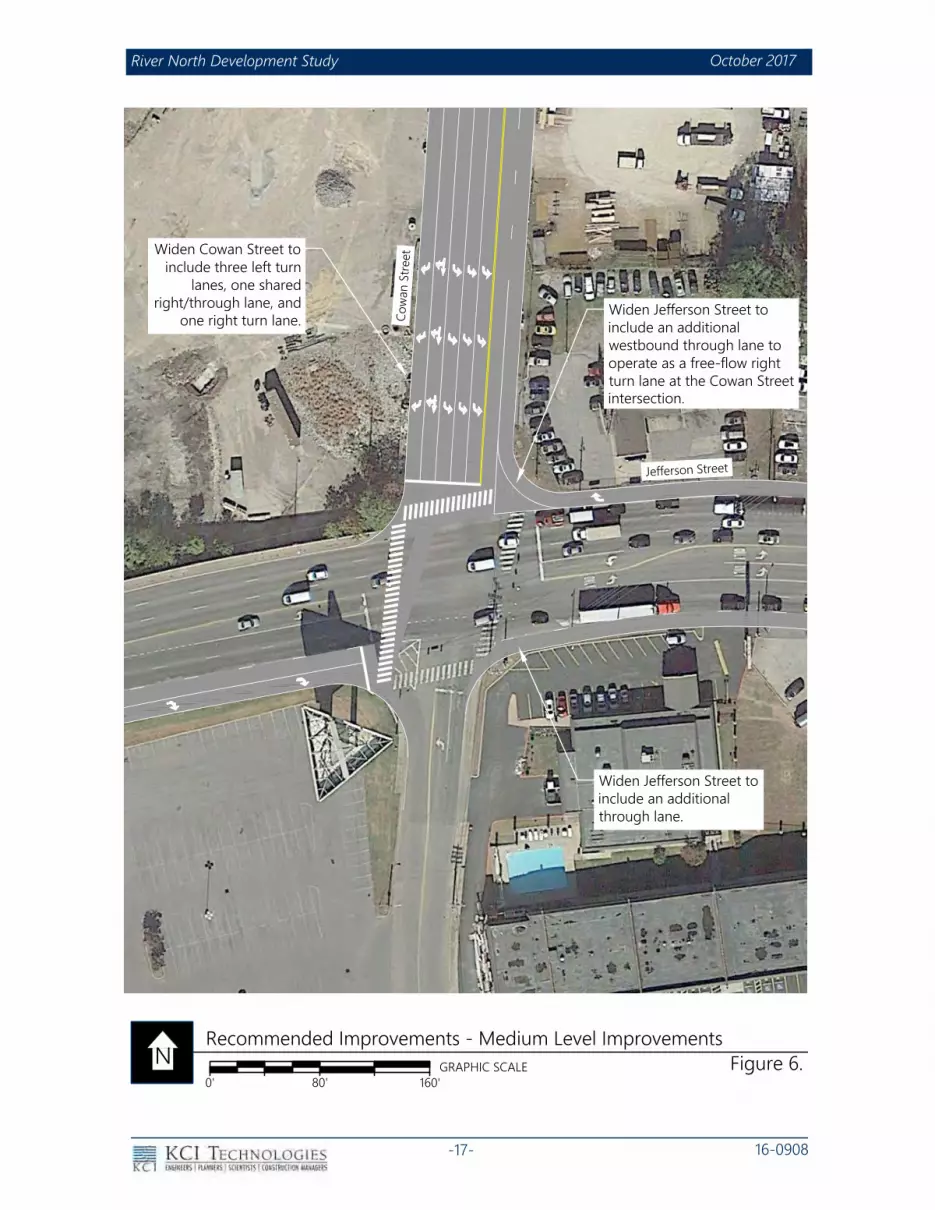
Co
wan
Street
Jefferso
n Street
Widen Cowan Street to
include three left turn
lanes, one shared
right/through lane, and
one right turn lane.
Widen Jefferson Street to
include an additional
westbound through lane to
operate as a free-flow right
turn lane at the Cowan Street
intersection.
Widen Jefferson Street to
include an additional
through lane.
River North Development Study October 2017
16-0908
Recommended Improvements - Medium Level Improvements
Figure 6.GRAPHIC SCALE
160'80'0'
-17-
N

River North Development Study October 2017
-18- 16-0908
4.2.2 High-Level Improvements
Under the high-level improvements scenarios, construction of new roadway
connectors and bridges were considered as part of the potential developments in
addition to the proposed improvements under the medium-level improvements
scenario. Several high-level improvement scenarios were evaluated using revised
directional distributions that would result with the specific improvements. Directional
distributions, proposed improvements, and maximum newly generated trips which can
be accommodated by implementing those improvements are presented in the
following tables and figures.
FIGURE 7. DIRECTIONAL DISTRIBUTION OF TRAFFIC GENERATED BY THE PROJECT SITE
HIGH-LEVEL IMPROVEMENTS-OPTION 1

River North Development Study October 2017
-19- 16-0908
TABLE 8. MAXIMUM NEWLY GENERATED TRIPS BY THE PROPOSED DEVELOPMENT
DURING PM PEAK HOUR
UNDER HIGH-LEVEL IMPROVEMENTS SCENARIO-OPTION 1
HIGH-LEVEL IMPROVEMENTS-OPTION 1
Provide a new roadway connector across I-24 between Cleveland Street and the proposed
development.
ADDITIONAL IMPROVEMENTS-OPTION 1A
Include medium-level improvements #1, and #3 as described in Table 7 in addition to the following:
Widen Cowan Street southbound to include two left-turn lanes, one shared through/right-turn
lane, and one right-turn lane.
Note: Widening of the I-24 bridge and ramps improvements within the study area are likely to be
required.
ADDITIONAL IMPROVEMENTS-OPTION 1B
Include all the medium-level improvements as described in Table 7.
Note: Widening of the I-24 bridge and ramps improvements within the study area are likely to be
required.
ADDITIONAL IMPROVEMENTS-OPTION 1C
Include all the low-level improvements as described in Table 6.
MAXIMUM NEWLY GENERATED TRIPS BY THE PROPOSED DEVELOPMENT DURING PM PEAK HOUR
OPTIONS TOTAL ENTER EXIT
OPTION 1A
1,350
(30% of Newly Generated Trips by Total
Buildout of Phase 1 of the Development
During the PM Peak Hour)
573 777
OPTION 1B
3,240
(72% of Newly Generated Trips by Total
Buildout of Phase 1 of the Development
During the PM Peak Hour)
1,375 1,865
OPTION 1C
1,215
(27% of Newly Generated Trips by Total
Buildout of Phase 1 of the Development
During the PM Peak Hour)
516 699

River North Development Study October 2017
-20- 16-0908
FIGURE 8. DIRECTIONAL DISTRIBUTION OF TRAFFIC GENERATED BY THE PROJECT SITE
HIGH-LEVEL IMPROVEMENTS-OPTION 2

River North Development Study October 2017
-21- 16-0908
TABLE 9. MAXIMUM NEWLY GENERATED TRIPS BY THE PROPOSED DEVELOPMENT
DURING PM PEAK HOUR
UNDER HIGH-LEVEL IMPROVEMENTS SCENARIO-OPTION 2
HIGH-LEVEL IMPROVEMENTS-OPTION 2
Provide a new roadway connector across I-24 between Cleveland Street and the proposed
development.
Provide new pedestrian and multimodal bridge connectors to Germantown over Cumberland
River.
ADDITIONAL IMPROVEMENTS-OPTION 2A
Include medium-level improvements #1, and #3 as described in Table 7 in addition to the following:
Widen Cowan Street southbound to include two left-turn lanes, one shared through/right-turn
lane, and one right-turn lane.
Note: Widening of the I-24 bridge and ramps improvements within the study area are likely to be
required.
ADDITIONAL IMPROVEMENTS-OPTION 2B
Include all the medium-level improvements as described in Table 7.
Note: Widening of the I-24 bridge and ramps improvements within the study area are likely to be
required.
ADDITIONAL IMPROVEMENTS-OPTION 2C
Include all the low-level improvements as described in Table 6.
MAXIMUM NEWLY GENERATED TRIPS BY THE PROPOSED DEVELOPMENT DURING PM PEAK HOUR
OPTIONS TOTAL ENTER EXIT
OPTION 2A
2,970
(66% of Newly Generated Trips by Total
Buildout of Phase 1 of the Development
During the PM Peak Hour)
1,261 1,709
OPTION 2B
4,590
(102% of Newly Generated Trips by Total
Buildout of Phase 1 of the Development
During the PM Peak Hour)
1,948 2,642
OPTION 2C
1,620
(36% of Newly Generated Trips by Total
Buildout of Phase 1 of the Development
During the PM Peak Hour)
688 932

River North Development Study October 2017
-22- 16-0908
FIGURE 9. DIRECTIONAL DISTRIBUTION OF TRAFFIC GENERATED BY THE PROJECT SITE
HIGH-LEVEL IMPROVEMENTS-OPTION 3

River North Development Study October 2017
-23- 16-0908
TABLE 10. MAXIMUM NEWLY GENERATED TRIPS BY THE PROPOSED DEVELOPMENT
DURING PM PEAK HOUR
UNDER HIGH-LEVEL IMPROVEMENTS SCENARIO-OPTION 3
HIGH-LEVEL IMPROVEMENTS-OPTION 3
Provide a new roadway connector across I-24 between Cleveland Street and the proposed
development with partial movements’ accesses to Interstate.
ADDITIONAL IMPROVEMENTS-OPTION 3A
Include medium-level improvements #1, and #3 as described in Table 7 in addition to the following:
Widen Cowan Street southbound to include two left-turn lanes, one shared through/right-turn
lane, and one right-turn lane.
Note: Widening of the I-24 bridge and ramps improvements within the study area are likely to be
required.
ADDITIONAL IMPROVEMENTS-OPTION 3B
Include all the medium-level improvements as described in Table 7.
Note: Widening of the I-24 bridge and ramps improvements within the study area are likely to be
required.
ADDITIONAL IMPROVEMENTS-OPTION 3C
Include all the low-level improvements as described in Table 6.
MAXIMUM NEWLY GENERATED TRAFFIC VOLUMES BY THE PROPOSED DEVELOPMENT DURING PM
PEAK HOUR
OPTIONS TOTAL ENTER EXIT
OPTION 3A
2,970
(66% of Newly Generated Trips by Total
Buildout of Phase 1 of the Development
During the PM Peak Hour)
1,261 1,709
OPTION 3B
4,050
(90% of Newly Generated Trips by Total
Buildout of Phase 1 of the Development
During the PM Peak Hour)
1,719 2,331
OPTION 3C
1,620
(36% of Newly Generated Trips by Total
Buildout of Phase 1 of the Development
During the PM Peak Hour)
688 932

River North Development Study October 2017
-24- 16-0908
FIGURE 10. DIRECTIONAL DISTRIBUTION OF TRAFFIC GENERATED BY THE PROJECT SITE
HIGH-LEVEL IMPROVEMENTS-OPTION 4

River North Development Study October 2017
-25- 16-0908
TABLE 11. MAXIMUM NEWLY GENERATED TRIPS BY THE PROPOSED DEVELOPMENT
DURING PM PEAK HOUR
UNDER HIGH-LEVEL IMPROVEMENTS SCENARIO-OPTION 4
HIGH-LEVEL IMPROVEMENTS-OPTION 4
Provide a new roadway connector across I-24 between Cleveland Street and the proposed
development with partial movements’ accesses to Interstate.
Provide new pedestrian and multimodal bridge connectors to Germantown over Cumberland
River.
ADDITIONAL IMPROVEMENTS-OPTION 4A
Include medium-level improvements #1, and #3 as described in Table 7 in addition to the following:
Widen Cowan Street southbound to include two left-turn lanes, one shared through/right-turn
lane, and one right-turn lane.
Note: Widening of the I-24 bridge and ramps improvements within the study area are likely to be
required.
ADDITIONAL IMPROVEMENTS-OPTION 4B
Include all the medium-level improvements as described in Table 7.
Note: Widening of the I-24 bridge and ramps improvements within the study area are likely to be
required.
ADDITIONAL IMPROVEMENTS-OPTION 4C
Include all the low-level improvements as described in Table 6.
MAXIMUM NEWLY GENERATED TRIPS BY THE PROPOSED DEVELOPMENT DURING PM PEAK HOUR
OPTION TOTAL ENTER EXIT
OPTION 4A
4,050
(90% of Newly Generated Trips by Total
Buildout of Phase 1 of the Development
During the PM Peak Hour)
1,719 2,331
OPTION 4B
5,940
(133% of Newly Generated Trips by Total
Buildout of Phase 1 of the Development
During the PM Peak Hour)
2,521 3,419
OPTION 4C
2,430
(54% of Newly Generated Trips by Total
Buildout of Phase 1 of the Development
During the PM Peak Hour)
1,031 1,399
4.2.3 Cowan Street Cross-Section
Total projected traffic volumes and lane configurations at the control study
intersection of Jefferson Street/Spring Street and Cowan Street are presented in Figure
9 through Figure 13. As shown in the figures, total bi-directional projected traffic
volumes on Cowan Street north of Jefferson Street/Spring Street during the PM Peak

River North Development Study October 2017
-26- 16-0908
hour (worst case) is expected to be within the range of 1,365-4,934 vehicles per hour
under various improvements scenarios.
An urban roadway with 4,934 traffic volumes during the peak hour is very likely to
carry daily trips of more than 40,000 vehicles per day, which typically requires a six-
lane cross-section. The aesthetics and functionality of this wide of a roadway, however,
is not compatible with the livability desires for the development or the overall vision
for the downtown core – one that is walkable and supports a thriving transit system.
The blank slate the site provides allows Metro to “rightsize” this corridor from the
concept phase to ensure a functional and livable urban neighborhood environment
that flourishes in the near-term, while allowing for strategic right-of-way dedication to
adequately accommodate future growth. Whether the roadway needs to be widened
to enhance mobility along the corridor, such as through the addition of turn lanes at
intersections, dedicated transit lanes, or improvements for non-motorized users,
having an appropriate amount of right-of-way already set aside will ensure that future
buildings are appropriately located along the street’s frontage and also provide a
tremendous amount of cost savings and effort for Metro in the future. Long-term
planning considerations such as these also better positions this critical area, which will
act as a gateway into and out of downtown, to play an effective role in accomplishing
the city’s grander visions for multimodal transportation as growth continues.
Other mobility strategies within the study area could be considered and
coordinated between the development team and Metro Nashville in order to achieve
the high densities envisioned for the proposed development. Those strategies are
likely to improve the mobility of the study area and to avoid extensive widening of
Cowan Street. Some of the potential recommendations are described in the
conclusions section of this study.

-27-
N
River North Development Study October 2017
(Not to Scale)
16-0908
Figure 11.Total Projected Peak Hour Traffic Volumes (Low-Level Improvements)
304
805
18
53
77
53
179
65
473
267
1773
150
Co
wan
St.
Jefferson
St.
Spring
St.
Co
wan
St.
Jefferson
St.
Spring
St.
TOTAL PROJECTED TRAFFIC VOLUMESLANE CONFIGURATIONS
XXX - PM Peak Hour
Traffic Volumes

-28-
N
River North Development Study October 2017
(Not to Scale)
16-0908
733
805
18
53
116
53
295
112
981
365
1773
150
Co
wan
St.
Jefferson
St.
Spring
St.
Co
wan
St.
Jefferson
St.
Spring
St.
TOTAL PROJECTED TRAFFIC VOLUMESLANE CONFIGURATIONS
Total Projected Peak Hour Traffic Volumes (Medium-Level Improvements)
Figure 12.
XXX - PM Peak Hour
Traffic Volumes

-29-
N
XXX - PM Peak Hour
Traffic Volumes
(Not to Scale)
16-0908
River North Development Study October 2017
1046
805
18
53
14
5
53
392
151
14
04
437
1773
150
795
805
18
53
122
53
315
119
1063
380
1773
150
420
805
18
53
88
53
198
73
556
294
1773
150
LANE CONFIGURATIONS
TOTAL PROJECTED TRAFFIC VOLUMES
OPTION 4A
TOTAL PROJECTED TRAFFIC VOLUMES
OPTION 3A
TOTAL PROJECTED TRAFFIC VOLUMES
OPTION 2A
TOTAL PROJECTED TRAFFIC VOLUMES
OPTION 1A
Co
wan
St.
Jefferson
St.
Spring
St.
Co
wan
St.
Jefferson
St.
Spring
St.
Co
wan
St.
Jefferson
St.
Spring
St.
Co
wan
St.
Jefferson
St.
Spring
St.
Co
wan
St.
Jefferson
St.
Spring
St.
Figure 13.
Total Projected Peak Hour Traffic Volumes (High-Level Improvements - A)
795
805
18
53
122
53
315
119
1063
380
1773
150

N
XXX - PM Peak Hour
Traffic Volumes
(Not to Scale)
16-0908
River North Development Study October 2017
Total Projected Peak Hour Traffic Volumes (High-Level Improvements - B)
-30-
Figure 14.
Spring
St.
Jefferson
St.
Co
wan
St.
Spring
St.
Jefferson
St.
Co
wan
St.
Spring
St.
Jefferson
St.
Co
wan
St.
Spring
St.
Jefferson
St.
Co
wan
St.
Spring
St.
Jefferson
St.
Co
wan
St.
TOTAL PROJECTED TRAFFIC VOLUMES
OPTION 1B
TOTAL PROJECTED TRAFFIC VOLUMES
OPTION 2B
TOTAL PROJECTED TRAFFIC VOLUMES
OPTION 3B
TOTAL PROJECTED TRAFFIC VOLUMES
OPTION 4B
LANE CONFIGURATIONS
394
1773
150
334
127
114
9
53
128
53
858
805
18
466
1773
150
431
166
1573
53
156
53
1169
805
18
437
1773
150
392
151
14
04
53
14
5
53
1046
805
18
537
1773
150
528
205
1997
53
185
53
1482
805
18

-31-
N
XXX - PM Peak Hour
Traffic Volumes
(Not to Scale)
16-0908
River North Development Study October 2017
Spring
St.
Jefferson
St.
Co
wan
St.
Spring
St.
Jefferson
St.
Co
wan
St.
Spring
St.
Jefferson
St.
Co
wan
St.
Spring
St.
Jefferson
St.
Co
wan
St.
Spring
St.
Jefferson
St.
Co
wan
St.
TOTAL PROJECTED TRAFFIC VOLUMES
OPTION 1C
TOTAL PROJECTED TRAFFIC VOLUMES
OPTION 2C
TOTAL PROJECTED TRAFFIC VOLUMES
OPTION 3C
TOTAL PROJECTED TRAFFIC VOLUMES
OPTION 4C
LANE CONFIGURATIONS
287
1773
150
188
69
514
53
85
53
389
805
18
308
1773
150
218
81
64
1
53
93
53
483
805
18
351
1773
150
276
104
896
53
111
53
670
805
18
Total Projected Peak Hour Traffic Volumes (High-Level Improvements - C)
Figure 15.
308
1773
150
218
81
64
1
53
93
53
483
805
18

River North Development Study October 2017
-32- 16-0908
5. CONCLUSIONS AND RECOMMENDATIONS
A review was conducted of the roadway extensions, bridges and interstate access
connections that are proposed as part of the River North master plan. This review
consisted of evaluating the concepts based on federal and state requirements for the
proposed new and modified interchanges and ramps and considering the
improvements to network capacity and accessibility that would result with these
concepts. Sensitivity analyses were also conducted to estimate the maximum expected
newly generated trips by the proposed development, which can be managed by
implementing those conceptual improvements within different stages. The suggested
improvements are categorized as Low Level, Medium Level, and High Level.
Conclusions of the reviews are as follows:
The Cleveland Street extension and a connection across I-24 make a significant
connection to the East Nashville area and will provide access to Dickerson Pike,
Whites Creek Pike, Ellington Parkway (US 31E) and Gallatin Pike. Cleveland
Street has a four-lane cross-section from Dickerson Pike to east of Ellington
Parkway. Utilizing the highest PM peak hour trip generation (Option 4B) and
the associated distribution, the Cleveland Street extension has the potential to
add approximately 1,000 PM peak hour trips along the corridor; this serves as a
significant increase over the 9,000 vpd currently served by the corridor. There
are currently two (2) all-way stop controlled intersections along this portion of
Cleveland Street, located at Meridian Street and Lischey Avenue. Improvements
will likely be necessary at these intersections, at the Ellington Parkway ramps,
and potentially at other intersections along the corridor when the Cleveland
Street extension is constructed.
Previous versions of the River North master plan included new on and off ramps
to I-65 and I-24. Interchange modifications and/or new connections to the
interstate system require both state and federal approval and there are strict
standards regarding minimum spacing between ramps that must be met in
order to obtain the necessary approvals. State and federal approval of any new
interstate access is likely to require considerable modifications to the existing
interchanges including the employment of one or more strategies to eliminate
weaving on the interstate. These strategies include the addition of collector-
distributor roads or grade separated ramps (ramp braids). Requirements for
these type of freeway modifications are described in the NCHRP 687 report,
Guidelines for Ramp and Interchange Spacing. Specific details regarding the
operations and feasibility of any interchange modifications or additional access

River North Development Study October 2017
-33- 16-0908
points will need to be evaluated more thoroughly before understanding the
feasibility of such improvements.
The two proposed bridges over the Cumberland River have the potential to
significantly improve access and provide alternative routes that would help
lessen the impact of the project on the interstate system and on Jefferson
Street/Spring Street. The current master plan illustrates the northern bridge as
a vehicular and multimodal bridge and the southern bridge as a pedestrian and
bicycle only bridge. It would be desirable for at least one of these bridges to
have significant transit carrying capabilities.
Consideration should be given to connecting the northern Cumberland River
bridge to 3rd Avenue as well to provide more accessibility to and from north
Nashville.
A potential connection to Oldham Street has been discussed during the
development of the masterplan. This connection would create a new
north/south connection for project related traffic that may relieve development
related traffic at the intersection of Jefferson Street/Spring Street and Cowan
Street. The effectiveness of this connection could be further supported by
improvements to South 1st Street, which provides access to Woodland Street to
the south.
The Grace Street extension and a connection across I-24 will provide a
convenient connection to East Nashville and to Meridian Street, a north/south
collector street. In addition, the Grace Street extension has the potential to be
a strong bicycle/pedestrian connection to the pedestrian/bicycle bridge over
Ellington Parkway. It should be noted that this proposed improvement was not
included in the capacity analysis, for the purpose of this study. It was assumed
that a portion of the distributed traffic on Cleveland Street connector would be
distributed onto the Grace Street extension, which would result in the same
reduction of traffic on Jefferson Street/Spring Street as without the
implementation of this improvement.
As previously described, the maximum full buildout of the southern 40 acres of
the development is referred to as Phase 1 in this study. Improvement
recommendations at the existing intersection of Jefferson Street/Spring Street
and Cowan Street associated with Phase 1 of the development were also
evaluated and are described below.

River North Development Study October 2017
-34- 16-0908
Add additional turning lanes at the intersection of Jefferson Street and
Cowan Street such that southbound Cowan Street consists of two or three
left-turn lanes, a shared through/right lane and a right-turn lane. Further,
an additional westbound lane will enhance capacity at this intersection. A
right-turn lane with sufficient storage is recommended on the eastbound
approach of Jefferson Street as well. It may be necessary to widen the
eastern portion of the Jefferson Street bridge in order to add the
recommended eastbound lane along Jefferson Street. Other feasible
alternatives which may not require the widening of the bridge in order to
accommodate additional eastbound travel lane, should also be considered
and analyzed.
The results of capacity analyses indicated that with low-level roadway
improvements within the study area as described in the evaluation section,
approximately 22% of the newly generated Phase 1 trips can be accommodated
by the study area roadway system. Maximizing the density within the River
North development is best accommodated with the high-level roadway
improvements described previously in this study. Those improvements include
the proposed new connectors/bridges with partial movement accesses to I-24
and/or I-65, providing additional eastbound travel lane on Jefferson Street and
the I-24 bridge over Spring Street, and additional turning lanes on Cowan Street
at Jefferson Street/Spring Street. It is estimated that 133% of the PM peak hour
(5,940 vehicles per hour) for Phase 1 can be accommodated by implementing
those improvements.
It should be noted that intersections along Jefferson Street/Spring Street within
the study area currently operate at or near capacity during peak hours.
Therefore, improving the operational performance and traffic flow of Jefferson
Street/Spring Street within the study area is warranted as of today even without
the completion of any stages of River North development. Any development
along the east bank is likely to exacerbate this existing need and access and
capacity improvements will be needed to provide adequate traffic operations
within the study area.
It should be noted that the thresholds of development identified in this study
are based on trips that are projected to be generated by the development of
the River North project. As the development of River North progresses, the
land uses and sizes that are actually developed may be different than those
assumed for this study. If this occurs, continuing to use PM peak hour trips as

River North Development Study October 2017
-35- 16-0908
the warranting criteria for improvements will be an effective way to ensure that
the recommended improvements are provided when needed.
The evaluation of the proposed improvements and estimation of the maximum
newly generated trips for the proposed development under each phase can be
used as a helpful tool to plan different stages of the development. However,
the capacity analysis procedure used in this study was based on several
assumptions. It is recommended that the development conduct traffic counts
as certain portions of the development is being completed and occupied in
order to identify actual trip generation for the developed portions of the River
North development. Those counts will provide a stronger foundation to verify
the assumptions made in this study and also to explore further improvements
using the actual travel patterns in and out of the development.
It is important to note that traffic impact assumptions in this study are
conservative, meaning analyses of network impacts were limited to the
immediate vicinity of the development. Given the site’s size and location
adjacent to downtown and critical regional roadway junctions, , impacts
(positive or negative) will occur well beyond the site. Should more robust high-
level improvements be constructed, such as additional bridge connections or
interstate improvements, functionality of the greater network in this area may
in fact improve. Neither TDOT nor Metro Nashville has significant infrastructure
improvements planned for the near term in this area, and while new trips will
be added, these potential high-level improvements could provide alternative
connections in the downtown area.
Higher density for the proposed development may be achieved by emphasizing
ride-share, and public transportation. Based on Mayor Barry’s Transportation
Action Agenda (Moving the Music City) plan, Metro Nashville, in partnership
with TDOT, is developing a plan called Nashville Complete Trips. As part of the
plan, Metro will promote other modes of transportation by reaching out to
major employers and connecting employers and commuters to information
about transportation options such as the transit and bikeshare systems, flex-
scheduling and telecommuting, bike parking, and MTA/RTA park-and-ride
locations. This plan would provide more opportunities for public-private
partnerships by the proposed development. Such partnerships could be
accomplished by providing private ride-share vehicles and/or sponsoring public
transportation commutes for the employees. Upon the success of sponsoring
other modes of commute, higher density for the proposed development could
potentially be achieved with less traffic impacts on the roadway system.

River North Development Study October 2017
-36- 16-0908
APPENDICES
APPENDIX A
PRELIMINARY SITE PLAN
APPENDIX B
DETAILED TURNING MOVEMENT COUNTS
APPENDIX C
TDOT COUNT DATA
APPENDIX D
CAPACITY ANALYSES
APPENDIX E
TRIP GENERATION CALCULATIONS

River North Development Study October 2017
-36- 16-0908
APPENDICES
APPENDIX A
PRELIMINARY SITE PLAN
APPENDIX B
DETAILED TURNING MOVEMENT COUNTS
APPENDIX C
TDOT COUNT DATA
APPENDIX D
CAPACITY ANALYSES
APPENDIX E
TRIP GENERATION CALCULATIONS

River North Development Study October 2017
-37- 16-0908
APPENDIX A
PRELIMINARY SITE PLAN

1”= 400’ 0’ 200’ 400’ 800’
0 9 / 1 9 / 2 0 1 7© 2 0 1 7
R I V E R N O R T H | S I T E P L A N D I A G R A M

CO
WA
N S
TR
EE
TG R A C E S T R E E T
P E D E S T R I A N B R I D G E
MIXED-USE OFFICE
OFFICE
OFFICERESIDENTIAL
OFFICEMIXED-USE
OFFICE/ RETAIL
RESIDENTIAL/ RETAIL
RESIDENTIAL/ RETAIL
MIXED-USE
RESIDENTIAL/ HOTEL
RESTAURANTS/ ENTERTAINMENT/
OFFICE
PADPARCEL
SIZEGROSS
BUILDABLEAREA (SF)
OFFICE (GROSS SF)
RESIDENTIAL (UNITS)
HOTEL (ROOMS)
RETAIL(SF) NOTES
A +/- 2.4 AC 524,000 456,000 68,000 RETROFIT FOR RESTAURAUNTS,ENTERTAINMENT, EXPANDABLE
TO ADD OTHER USES
B +/- 1.5 AC 327,000 310 25,000C +/- 2.2 AC 480,000 455,000 25,000D +/- 1.8 AC 393,000 250 150 20,000
E +/- 3.1 AC 720,000 460 250F +/- 1.6 AC 458,000 368,000 90,000 RETAIL, OFFICE
G +/- 1.4 AC 306,000 150,000 90 150 20,000H +/- 1.2 AC 262,000 250 10,000I +/- 1.8 AC 395,000 395,000J +/- 1.9 AC 415,000 375K +/- 1.9 AC 415,000 415,000L +/- 1.6 AC 350,000 350,000M +/- 1.9 AC 415,000 415,000
TOTALS +/- 24.3 AC 5,460,000 3,029,000 1,735 550 258,000
A
C
D H J
E
G
B
F
M
I L
K
1”= 100’ 0’ 50’ 100’ 200’
0 9 / 1 9 / 2 0 1 7© 2 0 1 7
R I V E R N O R T H | P H A S E I P L A N
River North Development Study October 2017
-40- 16-0908
APPENDIX B
DETAILED TURNING MOVEMENT COUNTS

River North Development Study October 2017
-41- 16-0908
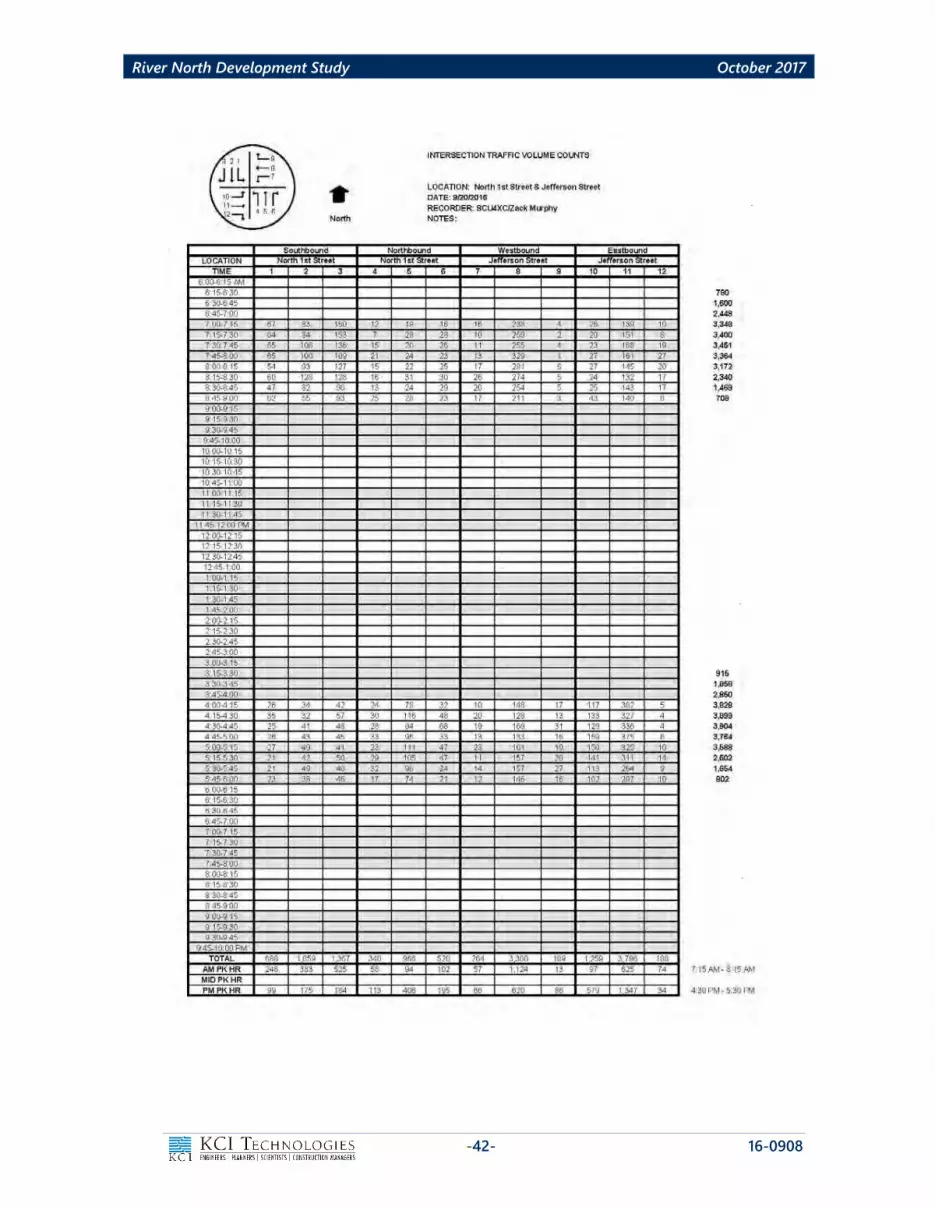
River North Development Study October 2017
-42- 16-0908

River North Development Study October 2017
-43- 16-0908

River North Development Study October 2017
-44- 16-0908

River North Development Study October 2017
-45- 16-0908
APPENDIX C
TDOT COUNT DATA
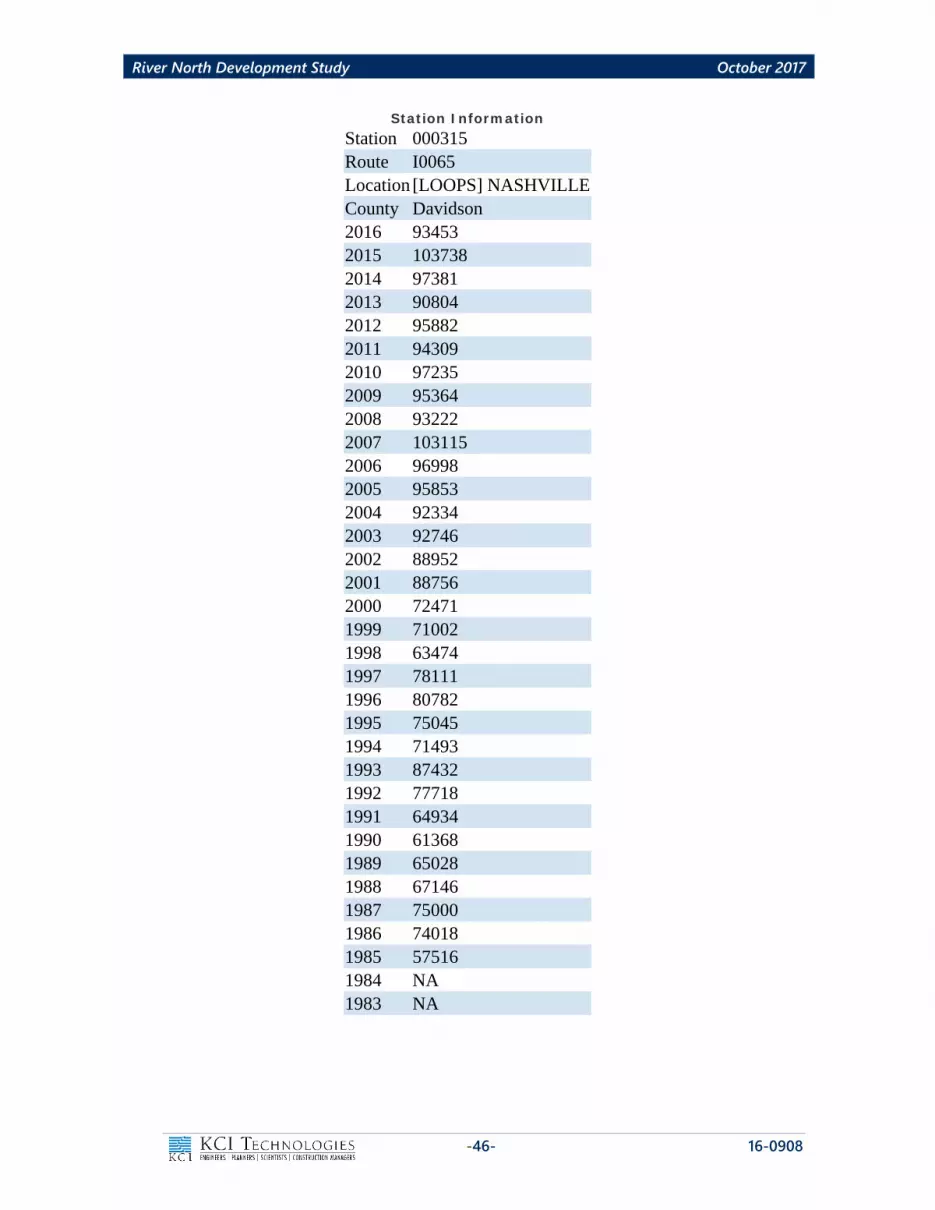
River North Development Study October 2017
-46- 16-0908
Station Information
Station 000315
Route I0065
Location [LOOPS] NASHVILLE
County Davidson
2016 93453
2015 103738
2014 97381
2013 90804
2012 95882
2011 94309
2010 97235
2009 95364
2008 93222
2007 103115
2006 96998
2005 95853
2004 92334
2003 92746
2002 88952
2001 88756
2000 72471
1999 71002
1998 63474
1997 78111
1996 80782
1995 75045
1994 71493
1993 87432
1992 77718
1991 64934
1990 61368
1989 65028
1988 67146
1987 75000
1986 74018
1985 57516
1984 NA
1983 NA

River North Development Study October 2017
-47- 16-0908
Station Information
Station 000053
Route SR011
Location N OF JEFERSON ST BRIDGE
County Davidson
2016 18903
2015 17557
2014 16205
2013 16362
2012 16008
2011 15595
2010 15429
2009 18698
2008 17447
2007 18969
2006 20698
2005 20184
2004 22680
2003 21955
2002 21516
2001 21112
2000 21826
1999 21653
1998 24912
1997 22000
1996 19840
1995 25646
1994 16286
1993 14296
1992 16759
1991 28340
1990 22541
1989 26548
1988 28282
1987 21535
1986 21599
1985 19097
1984 NA
1983 NA

River North Development Study October 2017
-48- 16-0908
Station Information
Station 000389
Route 04915
Location EASTLAND - SW OF 388
County Davidson
2016 9309
2015 9432
2014 8930
2013 7716
2012 7171
2011 7328
2010 7252
2009 7961
2008 7729
2007 8117
2006 8801
2005 8623
2004 9725
2003 9765
2002 10454
2001 10692
2000 10546
1999 10134
1998 10525
1997 12373
1996 12468
1995 11051
1994 10772
1993 11402
1992 9639
1991 8340
1990 9220
1989 9285
1988 10062
1987 10005
1986 10498
1985 9926
1984 NA
1983 NA

River North Development Study October 2017
-49- 16-0908
Station Information
Station 000304
Route SR006
Location ELLINGTON PKWY - NASHVILLE
County Davidson
2016 50255
2015 50371
2014 46513
2013 45282
2012 42915
2011 40692
2010 41316
2009 38007
2008 42233
2007 44400
2006 39093
2005 46319
2004 45875
2003 45418
2002 42341
2001 39381
2000 37385
1999 43710
1998 45690
1997 42037
1996 40757
1995 41146
1994 39959
1993 34825
1992 31816
1991 32874
1990 35477
1989 36798
1988 34849
1987 34485
1986 35573
1985 27535
1984 NA
1983 NA

River North Development Study October 2017
-50- 16-0908
Station Information
Station 000387
Route 04915
Location EASTLAND - N OF GALLATIN RD
County Davidson
2016 6476
2015 6489
2014 6265
2013 6203
2012 6339
2011 5818
2010 5618
2009 5755
2008 6020
2007 5875
2006 5629
2005 6184
2004 6790
2003 6685
2002 7884
2001 7798
2000 6328
1999 6968
1998 8187
1997 9124
1996 6463
1995 7957
1994 6075
1993 5493
1992 6500
1991 6470
1990 6329
1989 5547
1988 6408
1987 6576
1986 5468
1985 5864
1984 NA
1983 NA

River North Development Study October 2017
-51- 16-0908
Station Information
Station 000224
Route SR006
Location ELLINGTON PKWY-E OF SPRING ST
County Davidson
2016 41246
2015 46791
2014 45829
2013 44726
2012 43117
2011 41325
2010 41129
2009 37709
2008 42033
2007 42230
2006 47602
2005 46597
2004 45916
2003 45454
2002 42514
2001 44231
2000 37966
1999 43188
1998 48124
1997 41792
1996 41569
1995 39028
1994 39115
1993 35933
1992 38096
1991 36281
1990 44593
1989 42994
1988 39707
1987 36574
1986 31942
1985 27608
1984 NA
1983 NA

River North Development Study October 2017
-52- 16-0908
Station Information
Station 000223
Route SR011
Location NEAR JEFFERSON ST BRIDGE
County Davidson
2016 5437
2015 4443
2014 4397
2013 4337
2012 4303
2011 4153
2010 3954
2009 4154
2008 4033
2007 4002
2006 3578
2005 3719
2004 4246
2003 3993
2002 4096
2001 3967
2000 4293
1999 4303
1998 4611
1997 4533
1996 6014
1995 5724
1994 5362
1993 6632
1992 5809
1991 5021
1990 6824
1989 6491
1988 5391
1987 5305
1986 5249
1985 4639
1984 NA
1983 NA

River North Development Study October 2017
-53- 16-0908
Station Information
Station 000300
Route I0024
Location [LOOPS] N OF MAIN ST
County Davidson
2016 112585
2015 111471
2014 106517
2013 111467
2012 102166
2011 98292
2010 100916
2009 94330
2008 102899
2007 104740
2006 107073
2005 103884
2004 104700
2003 102898
2002 100955
2001 93684
2000 109108
1999 106372
1998 95515
1997 104550
1996 106939
1995 101150
1994 97873
1993 96369
1992 74169
1991 94591
1990 81165
1989 77000
1988 75000
1987 73843
1986 63000
1985 56584
1984 NA
1983 NA

River North Development Study October 2017
-54- 16-0908
Station Information
Station 000422
Route 03262
Location 3RD AVE N - NEAR I- 65 LOOP
County Davidson
2016 6143
2015 5965
2014 4992
2013 6046
2012 5874
2011 6173
2010 6203
2009 6444
2008 6600
2007 6497
2006 6669
2005 6388
2004 5807
2003 5240
2002 4971
2001 5609
2000 5818
1999 5655
1998 6507
1997 4724
1996 6300
1995 6886
1994 5615
1993 5834
1992 5523
1991 5600
1990 5412
1989 5417
1988 5263
1987 5817
1986 5095
1985 5489
1984 NA
1983 NA

River North Development Study October 2017
-55- 16-0908
Station Information
Station 000054
Route SR012
Location BETWEEN GARFIELD & HUONE
County Davidson
2016 18100
2015 16877
2014 15329
2013 15980
2012 15088
2011 13575
2010 15577
2009 14619
2008 16223
2007 16673
2006 17369
2005 17433
2004 17169
2003 16450
2002 16472
2001 16346
2000 16651
1999 18127
1998 16435
1997 17786
1996 17583
1995 19397
1994 19713
1993 16156
1992 18345
1991 12821
1990 11934
1989 13510
1988 15975
1987 13146
1986 10792
1985 7992
1984 NA
1983 NA

River North Development Study October 2017
-56- 16-0908
Station Information
Station 000390
Route NA
Location 2ND AVE. N. - NEAR JEFFERSON ST
County Davidson
2016 6119
2015 6262
2014 5722
2013 5754
2012 5350
2011 5976
2010 5543
2009 5885
2008 5876
2007 5829
2006 5774
2005 5708
2004 5038
2003 5504
2002 5226
2001 5163
2000 5107
1999 5120
1998 4922
1997 5406
1996 5309
1995 5953
1994 2327
1993 4310
1992 4300
1991 4294
1990 3671
1989 4301
1988 4140
1987 5486
1986 3578
1985 4070
1984 NA
1983 NA

River North Development Study October 2017
-57- 16-0908
Station Information
Station 000074
Route 03258
Location JEFFERSON ST BRIDGE
County Davidson
2016 31635
2015 31203
2014 29320
2013 27923
2012 28299
2011 27571
2010 26851
2009 24562
2008 28511
2007 30169
2006 30722
2005 31547
2004 32265
2003 30221
2002 31550
2001 32233
2000 30563
1999 35288
1998 38609
1997 33561
1996 28849
1995 30268
1994 NA
1993 NA
1992 24000
1991 23317
1990 18628
1989 22363
1988 23614
1987 26263
1986 22564
1985 26529
1984 NA
1983 NA

River North Development Study October 2017
-58- 16-0908
Station Information
Station 000393
Route 0F718
Location 5TH AVE. N. - INSIDE NASHVILLE LOOP
County Davidson
2016 2979
2015 2874
2014 3059
2013 2748
2012 2406
2011 2595
2010 2707
2009 2816
2008 3025
2007 3107
2006 3359
2005 3352
2004 3302
2003 3210
2002 3088
2001 2921
2000 3083
1999 3342
1998 3188
1997 3041
1996 2190
1995 2115
1994 2361
1993 2937
1992 2910
1991 2841
1990 2903
1989 3700
1988 3614
1987 3459
1986 3336
1985 4393
1984 NA
1983 NA

River North Development Study October 2017
-59- 16-0908
Station Information
Station 000391
Route 03262
Location 3RD AVE - (ONE-WAY)
County Davidson
2016 1957
2015 2000
2014 1928
2013 2020
2012 2138
2011 2092
2010 2199
2009 2013
2008 2652
2007 2575
2006 2560
2005 2765
2004 2738
2003 2651
2002 2541
2001 2646
2000 2808
1999 3996
1998 5557
1997 5543
1996 5398
1995 8095
1994 6550
1993 6064
1992 5711
1991 4437
1990 5005
1989 4862
1988 5280
1987 4678
1986 4802
1985 4451
1984 NA
1983 NA

River North Development Study October 2017
-60- 16-0908
Station Information
Station 000154
Route 03266
Location N FIRST ST-B/T WOODLAND & SPRING ST
County Davidson
2016 9006
2015 9376
2014 8716
2013 8272
2012 8293
2011 8803
2010 8547
2009 11047
2008 9886
2007 11086
2006 12233
2005 11794
2004 13162
2003 12767
2002 11374
2001 10847
2000 11491
1999 13977
1998 13656
1997 16834
1996 14372
1995 20654
1994 16624
1993 13342
1992 13056
1991 10950
1990 13141
1989 14000
1988 13704
1987 15869
1986 16095
1985 16266
1984 NA
1983 NA

River North Development Study October 2017
-61- 16-0908
Station Information
Station 000194
Route I0024
Location B/T SPRING ST & MAIN ST
County Davidson
2016 129692
2015 131220
2014 124525
2013 129338
2012 117695
2011 115690
2010 117916
2009 107920
2008 116432
2007 118216
2006 120632
2005 117768
2004 115814
2003 115826
2002 112503
2001 105611
2000 121571
1999 112691
1998 108202
1997 119326
1996 122262
1995 112157
1994 112077
1993 103101
1992 76383
1991 98143
1990 88132
1989 96185
1988 82000
1987 80935
1986 67000
1985 60835
1984 NA
1983 NA

River North Development Study October 2017
-62- 16-0908
Station Information
Station 000153
Route 03252
Location NEAR WOODLAND ST BRIDGE
County Davidson
2016 25719
2015 26927
2014 23787
2013 22081
2012 21122
2011 21843
2010 19634
2009 19349
2008 19326
2007 21059
2006 20697
2005 21889
2004 21320
2003 20284
2002 22555
2001 23039
2000 19467
1999 20946
1998 22388
1997 20995
1996 22653
1995 20092
1994 26974
1993 27569
1992 18783
1991 20304
1990 16573
1989 20742
1988 20026
1987 20439
1986 21656
1985 19142
1984 NA
1983 NA

River North Development Study October 2017
-63- 16-0908
Station Information
Station 000220
Route 03244
Location E OF I-65
County Davidson
2016 7608
2015 7338
2014 7320
2013 7304
2012 7338
2011 7319
2010 7216
2009 7215
2008 7492
2007 7941
2006 8038
2005 8016
2004 9062
2003 8790
2002 9255
2001 9330
2000 8018
1999 9111
1998 8566
1997 9009
1996 8154
1995 15530
1994 11841
1993 8639
1992 8585
1991 8507
1990 8021
1989 4364
1988 8863
1987 8847
1986 8346
1985 9743
1984 NA
1983 NA

River North Development Study October 2017
-64- 16-0908
Station Information
Station 000488
Route 03272
Location 5TH ST - N OF WOODLAND ST
County Davidson
2016 16646
2015 16346
2014 16324
2013 15680
2012 15924
2011 14138
2010 14526
2009 17258
2008 15649
2007 16472
2006 17171
2005 16713
2004 16422
2003 15864
2002 14358
2001 15834
2000 16195
1999 16467
1998 19346
1997 15691
1996 19798
1995 19528
1994 16239
1993 14395
1992 13991
1991 NA
1990 NA
1989 NA
1988 NA
1987 NA
1986 NA
1985 NA
1984 NA
1983 NA

River North Development Study October 2017
-65- 16-0908
Station Information
Station 000075
Route SR006
Location VIC MEM BRIDGE - CBD
County Davidson
2016 28363
2015 28174
2014 25326
2013 24513
2012 23735
2011 23308
2010 23759
2009 23321
2008 23917
2007 23220
2006 23923
2005 25387
2004 25162
2003 27026
2002 26835
2001 27907
2000 30207
1999 28434
1998 40316
1997 24041
1996 31519
1995 32169
1994 32390
1993 29739
1992 29592
1991 27111
1990 24410
1989 24233
1988 25669
1987 24163
1986 31721
1985 22134
1984 NA
1983 NA

River North Development Study October 2017
-66- 16-0908
Station Information
Station 000046
Route 03244
Location WOODLAND ST - CBD
County Davidson
2016 13823
2015 13811
2014 13388
2013 13239
2012 13137
2011 12333
2010 11817
2009 22087
2008 23335
2007 14758
2006 20569
2005 19970
2004 19393
2003 21435
2002 26960
2001 25451
2000 25835
1999 21649
1998 26950
1997 25374
1996 24547
1995 27518
1994 20116
1993 19896
1992 19272
1991 15639
1990 15682
1989 18300
1988 18255
1987 15194
1986 18314
1985 18206
1984 NA
1983 NA

River North Development Study October 2017
-67- 16-0908
Station Information
Station 000290
Route I0024
Location N OF SHELBY AVE
County Davidson
2016 139532
2015 141434
2014 134002
2013 138277
2012 127367
2011 124211
2010 128164
2009 116164
2008 122101
2007 122710
2006 127482
2005 125224
2004 123065
2003 124196
2002 120150
2001 112752
2000 127612
1999 120841
1998 117474
1997 128593
1996 130289
1995 119324
1994 118514
1993 110401
1992 89409
1991 101606
1990 99930
1989 95067
1988 88141
1987 83000
1986 82000
1985 75000
1984 NA
1983 NA

River North Development Study October 2017
-68- 16-0908
APPENDIX D
CAPACITY ANALYSES

River North Development Study October 2017
-69- 16-0908
EXISTING CONDITIONS
CAPACITY ANALYSES
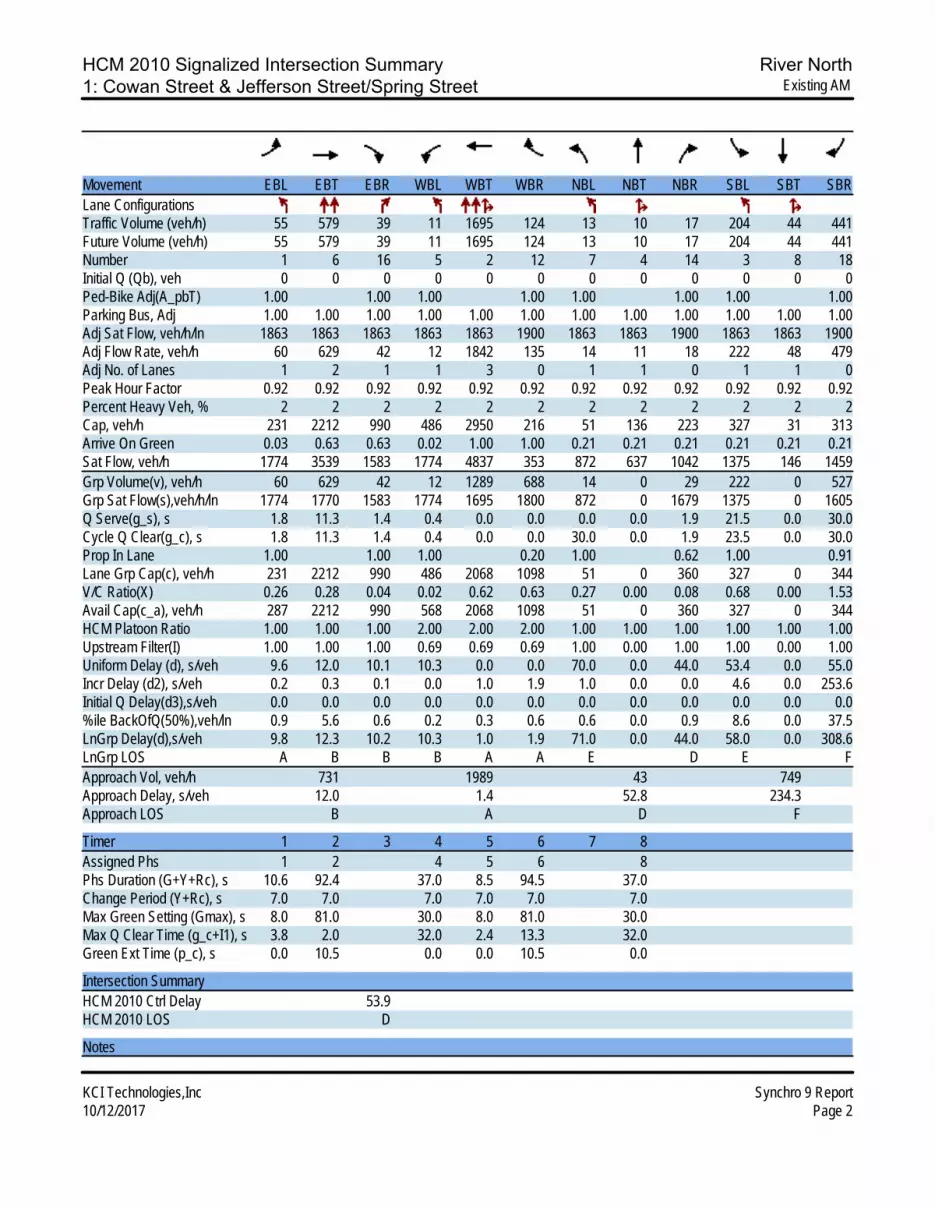
HCM 2010 Signalized Intersection Summary River North1: Cowan Street & Jefferson Street/Spring Street Existing AM
KCI Technologies,Inc Synchro 9 Report10/12/2017 Page 2
Movement EBL EBT EBR WBL WBT WBR NBL NBT NBR SBL SBT SBRLane ConfigurationsTraffic Volume (veh/h) 55 579 39 11 1695 124 13 10 17 204 44 441Future Volume (veh/h) 55 579 39 11 1695 124 13 10 17 204 44 441Number 1 6 16 5 2 12 7 4 14 3 8 18Initial Q (Qb), veh 0 0 0 0 0 0 0 0 0 0 0 0Ped-Bike Adj(A_pbT) 1.00 1.00 1.00 1.00 1.00 1.00 1.00 1.00Parking Bus, Adj 1.00 1.00 1.00 1.00 1.00 1.00 1.00 1.00 1.00 1.00 1.00 1.00Adj Sat Flow, veh/h/ln 1863 1863 1863 1863 1863 1900 1863 1863 1900 1863 1863 1900Adj Flow Rate, veh/h 60 629 42 12 1842 135 14 11 18 222 48 479Adj No. of Lanes 1 2 1 1 3 0 1 1 0 1 1 0Peak Hour Factor 0.92 0.92 0.92 0.92 0.92 0.92 0.92 0.92 0.92 0.92 0.92 0.92Percent Heavy Veh, % 2 2 2 2 2 2 2 2 2 2 2 2Cap, veh/h 231 2212 990 486 2950 216 51 136 223 327 31 313Arrive On Green 0.03 0.63 0.63 0.02 1.00 1.00 0.21 0.21 0.21 0.21 0.21 0.21Sat Flow, veh/h 1774 3539 1583 1774 4837 353 872 637 1042 1375 146 1459Grp Volume(v), veh/h 60 629 42 12 1289 688 14 0 29 222 0 527Grp Sat Flow(s),veh/h/ln 1774 1770 1583 1774 1695 1800 872 0 1679 1375 0 1605Q Serve(g_s), s 1.8 11.3 1.4 0.4 0.0 0.0 0.0 0.0 1.9 21.5 0.0 30.0Cycle Q Clear(g_c), s 1.8 11.3 1.4 0.4 0.0 0.0 30.0 0.0 1.9 23.5 0.0 30.0Prop In Lane 1.00 1.00 1.00 0.20 1.00 0.62 1.00 0.91Lane Grp Cap(c), veh/h 231 2212 990 486 2068 1098 51 0 360 327 0 344V/C Ratio(X) 0.26 0.28 0.04 0.02 0.62 0.63 0.27 0.00 0.08 0.68 0.00 1.53Avail Cap(c_a), veh/h 287 2212 990 568 2068 1098 51 0 360 327 0 344HCM Platoon Ratio 1.00 1.00 1.00 2.00 2.00 2.00 1.00 1.00 1.00 1.00 1.00 1.00Upstream Filter(I) 1.00 1.00 1.00 0.69 0.69 0.69 1.00 0.00 1.00 1.00 0.00 1.00Uniform Delay (d), s/veh 9.6 12.0 10.1 10.3 0.0 0.0 70.0 0.0 44.0 53.4 0.0 55.0Incr Delay (d2), s/veh 0.2 0.3 0.1 0.0 1.0 1.9 1.0 0.0 0.0 4.6 0.0 253.6Initial Q Delay(d3),s/veh 0.0 0.0 0.0 0.0 0.0 0.0 0.0 0.0 0.0 0.0 0.0 0.0%ile BackOfQ(50%),veh/ln 0.9 5.6 0.6 0.2 0.3 0.6 0.6 0.0 0.9 8.6 0.0 37.5LnGrp Delay(d),s/veh 9.8 12.3 10.2 10.3 1.0 1.9 71.0 0.0 44.0 58.0 0.0 308.6LnGrp LOS A B B B A A E D E FApproach Vol, veh/h 731 1989 43 749Approach Delay, s/veh 12.0 1.4 52.8 234.3Approach LOS B A D F
Timer 1 2 3 4 5 6 7 8Assigned Phs 1 2 4 5 6 8Phs Duration (G+Y+Rc), s 10.6 92.4 37.0 8.5 94.5 37.0Change Period (Y+Rc), s 7.0 7.0 7.0 7.0 7.0 7.0Max Green Setting (Gmax), s 8.0 81.0 30.0 8.0 81.0 30.0Max Q Clear Time (g_c+I1), s 3.8 2.0 32.0 2.4 13.3 32.0Green Ext Time (p_c), s 0.0 10.5 0.0 0.0 10.5 0.0
Intersection SummaryHCM 2010 Ctrl Delay 53.9HCM 2010 LOS D
Notes

HCM 2010 Signalized Intersection Summary River North2: N 1st Street & Spring Street Existing AM
KCI Technologies,Inc Synchro 9 Report10/12/2017 Page 5
Movement EBL EBT EBR WBL WBT WBR NBL NBT NBR SBL SBT SBRLane ConfigurationsTraffic Volume (veh/h) 97 625 74 57 1124 13 58 94 102 248 383 525Future Volume (veh/h) 97 625 74 57 1124 13 58 94 102 248 383 525Number 1 6 16 5 2 12 7 4 14 3 8 18Initial Q (Qb), veh 0 0 0 0 0 0 0 0 0 0 0 0Ped-Bike Adj(A_pbT) 1.00 1.00 1.00 1.00 1.00 1.00 1.00 1.00Parking Bus, Adj 1.00 1.00 1.00 1.00 1.00 1.00 1.00 1.00 1.00 1.00 1.00 1.00Adj Sat Flow, veh/h/ln 1863 1863 1900 1863 1863 1900 1863 1863 1863 1863 1863 1863Adj Flow Rate, veh/h 105 679 80 62 1222 14 63 102 111 270 416 571Adj No. of Lanes 2 2 0 1 2 0 1 2 1 1 1 2Peak Hour Factor 0.92 0.92 0.92 0.92 0.92 0.92 0.92 0.92 0.92 0.92 0.92 0.92Percent Heavy Veh, % 2 2 2 2 2 2 2 2 2 2 2 2Cap, veh/h 226 1730 204 446 1907 22 144 362 162 336 293 498Arrive On Green 0.13 1.00 1.00 0.05 0.53 0.53 0.05 0.10 0.10 0.11 0.16 0.16Sat Flow, veh/h 3442 3191 376 1774 3584 41 1774 3539 1583 1774 1863 3167Grp Volume(v), veh/h 105 376 383 62 603 633 63 102 111 270 416 571Grp Sat Flow(s),veh/h/ln 1721 1770 1796 1774 1770 1856 1774 1770 1583 1774 1863 1583Q Serve(g_s), s 4.0 0.0 0.0 2.6 33.9 33.9 4.4 3.7 9.5 15.5 22.0 17.8Cycle Q Clear(g_c), s 4.0 0.0 0.0 2.6 33.9 33.9 4.4 3.7 9.5 15.5 22.0 17.8Prop In Lane 1.00 0.21 1.00 0.02 1.00 1.00 1.00 1.00Lane Grp Cap(c), veh/h 226 959 974 446 942 987 144 362 162 336 293 498V/C Ratio(X) 0.46 0.39 0.39 0.14 0.64 0.64 0.44 0.28 0.69 0.80 1.42 1.15Avail Cap(c_a), veh/h 226 959 974 493 942 987 153 379 170 336 293 498HCM Platoon Ratio 2.00 2.00 2.00 1.00 1.00 1.00 1.00 1.00 1.00 1.00 1.00 1.00Upstream Filter(I) 0.92 0.92 0.92 1.00 1.00 1.00 1.00 1.00 1.00 1.00 1.00 1.00Uniform Delay (d), s/veh 58.5 0.0 0.0 18.4 23.2 23.3 52.6 58.1 60.7 50.8 59.0 38.5Incr Delay (d2), s/veh 1.7 1.1 1.1 0.1 3.3 3.2 0.8 0.2 8.3 12.3 208.4 87.7Initial Q Delay(d3),s/veh 0.0 0.0 0.0 0.0 0.0 0.0 0.0 0.0 0.0 0.0 0.0 0.0%ile BackOfQ(50%),veh/ln 1.9 0.3 0.3 1.2 17.3 18.1 2.2 1.8 4.5 10.3 28.2 13.8LnGrp Delay(d),s/veh 60.2 1.1 1.1 18.5 26.6 26.4 53.4 58.3 69.0 63.2 267.4 126.2LnGrp LOS E A A B C C D E E E F FApproach Vol, veh/h 864 1298 276 1257Approach Delay, s/veh 8.3 26.1 61.5 159.4Approach LOS A C E F
Timer 1 2 3 4 5 6 7 8Assigned Phs 1 2 3 4 5 6 7 8Phs Duration (G+Y+Rc), s 15.7 81.0 22.0 21.3 14.3 82.4 14.3 29.0Change Period (Y+Rc), s 6.5 6.5 6.5 7.0 7.0 6.5 7.0 7.0Max Green Setting (Gmax), s 8.5 74.5 15.5 15.0 11.0 71.5 8.0 22.0Max Q Clear Time (g_c+I1), s 6.0 35.9 17.5 11.5 4.6 2.0 6.4 24.0Green Ext Time (p_c), s 0.1 2.9 0.0 1.5 0.0 2.2 0.0 0.0
Intersection SummaryHCM 2010 Ctrl Delay 69.9HCM 2010 LOS E
Notes

HCM Signalized Intersection Capacity Analysis River North3: Spring Street & Dickerson Pike Existing AM
KCI Technologies,Inc Synchro 9 Report10/12/2017 Page 7
Movement EBL EBT EBR WBL WBT WBR SBL2 SBL SBR NWL NWRLane ConfigurationsTraffic Volume (vph) 75 481 104 0 1750 190 138 0 421 0 0Future Volume (vph) 75 481 104 0 1750 190 138 0 421 0 0Ideal Flow (vphpl) 1900 1900 1900 1900 1900 1900 1900 1900 1900 1900 1900Total Lost time (s) 6.5 6.5 6.5 6.5 6.5 4.5 4.5Lane Util. Factor 1.00 0.95 1.00 0.91 0.91 1.00 1.00Frt 1.00 1.00 0.85 1.00 0.85 1.00 0.85Flt Protected 0.95 1.00 1.00 1.00 1.00 0.95 1.00Satd. Flow (prot) 1770 3539 1583 3385 1441 1770 1583Flt Permitted 0.04 1.00 1.00 1.00 1.00 0.95 1.00Satd. Flow (perm) 79 3539 1583 3385 1441 1770 1583Peak-hour factor, PHF 0.92 0.92 0.92 0.92 0.92 0.92 0.92 0.92 0.92 0.92 0.92Adj. Flow (vph) 82 523 113 0 1902 207 150 0 458 0 0RTOR Reduction (vph) 0 0 36 0 0 43 0 0 123 0 0Lane Group Flow (vph) 82 523 77 0 1923 143 150 0 335 0 0Turn Type D.P+P NA custom NA Perm Prot ProtProtected Phases 1 2 2 3 4 4Permitted Phases 2 3 2 3 2 3 2 3Actuated Green, G (s) 101.0 89.2 95.7 95.7 95.7 23.5 23.5Effective Green, g (s) 101.0 89.2 95.7 95.7 95.7 23.5 23.5Actuated g/C Ratio 0.72 0.64 0.68 0.68 0.68 0.17 0.17Clearance Time (s) 6.5 6.5 4.5 4.5Vehicle Extension (s) 2.0 2.0 2.0 2.0Lane Grp Cap (vph) 121 2419 1082 2313 985 297 265v/s Ratio Prot c0.03 0.13 c0.57 0.08 c0.21v/s Ratio Perm 0.47 0.01 0.05 0.10v/c Ratio 0.68 0.22 0.07 0.83 0.15 0.51 1.26Uniform Delay, d1 26.7 10.7 7.4 16.2 7.8 53.0 58.2Progression Factor 1.14 0.79 0.36 0.32 0.12 1.00 1.00Incremental Delay, d2 11.0 0.0 0.0 1.5 0.0 0.5 145.2Delay (s) 41.3 8.5 2.6 6.7 1.0 53.5 203.5Level of Service D A A A A D FApproach Delay (s) 11.3 6.2 166.4 0.0Approach LOS B A F A
Intersection SummaryHCM 2000 Control Delay 35.6 HCM 2000 Level of Service DHCM 2000 Volume to Capacity ratio 0.96Actuated Cycle Length (s) 140.0 Sum of lost time (s) 22.0Intersection Capacity Utilization 85.6% ICU Level of Service EAnalysis Period (min) 15c Critical Lane Group

HCM Signalized Intersection Capacity Analysis River North4: I-24 WB Off-Ramp & Spring Street Existing AM
KCI Technologies,Inc Synchro 9 Report10/12/2017 Page 9
Movement EBT EBR WBL WBT NBL NBRLane ConfigurationsTraffic Volume (vph) 619 0 0 1772 168 534Future Volume (vph) 619 0 0 1772 168 534Ideal Flow (vphpl) 1900 1900 1900 1900 1900 1900Total Lost time (s) 6.5 6.5 4.5 4.0Lane Util. Factor 0.95 0.95 0.97 1.00Frt 1.00 1.00 1.00 0.85Flt Protected 1.00 1.00 0.95 1.00Satd. Flow (prot) 3539 3539 3433 1583Flt Permitted 1.00 1.00 0.95 1.00Satd. Flow (perm) 3539 3539 3433 1583Peak-hour factor, PHF 0.92 0.92 0.92 0.92 0.92 0.92Adj. Flow (vph) 673 0 0 1926 183 580RTOR Reduction (vph) 0 0 0 0 0 0Lane Group Flow (vph) 673 0 0 1926 183 580Turn Type NA NA Prot FreeProtected Phases 6 7 6 7 5 8Permitted Phases FreeActuated Green, G (s) 96.0 96.0 35.0 140.0Effective Green, g (s) 96.0 96.0 35.0 140.0Actuated g/C Ratio 0.69 0.69 0.25 1.00Clearance Time (s)Vehicle Extension (s)Lane Grp Cap (vph) 2426 2426 858 1583v/s Ratio Prot 0.19 c0.54 0.05v/s Ratio Perm c0.37v/c Ratio 0.28 0.79 0.21 0.37Uniform Delay, d1 8.5 15.2 41.6 0.0Progression Factor 0.69 1.00 1.00 1.00Incremental Delay, d2 0.0 1.7 0.0 0.7Delay (s) 5.9 16.9 41.6 0.7Level of Service A B D AApproach Delay (s) 5.9 16.9 10.5Approach LOS A B B
Intersection SummaryHCM 2000 Control Delay 13.3 HCM 2000 Level of Service BHCM 2000 Volume to Capacity ratio 0.77Actuated Cycle Length (s) 140.0 Sum of lost time (s) 22.0Intersection Capacity Utilization 64.0% ICU Level of Service BAnalysis Period (min) 15c Critical Lane Group

HCM 2010 Signalized Intersection Summary River North1: Cowan Street & Jefferson Street/Spring Street Existing PM
KCI Technologies,Inc Synchro 9 Report10/12/2017 Page 2
Movement EBL EBT EBR WBL WBT WBR NBL NBT NBR SBL SBT SBRLane ConfigurationsTraffic Volume (veh/h) 222 1773 150 18 805 108 53 59 53 133 34 101Future Volume (veh/h) 222 1773 150 18 805 108 53 59 53 133 34 101Number 1 6 16 5 2 12 7 4 14 3 8 18Initial Q (Qb), veh 0 0 0 0 0 0 0 0 0 0 0 0Ped-Bike Adj(A_pbT) 1.00 1.00 1.00 1.00 1.00 1.00 1.00 1.00Parking Bus, Adj 1.00 1.00 1.00 1.00 1.00 1.00 1.00 1.00 1.00 1.00 1.00 1.00Adj Sat Flow, veh/h/ln 1863 1863 1863 1863 1863 1900 1863 1863 1900 1863 1863 1900Adj Flow Rate, veh/h 241 1927 163 20 875 117 58 64 58 145 37 110Adj No. of Lanes 1 2 1 1 3 0 1 1 0 1 1 0Peak Hour Factor 0.92 0.92 0.92 0.92 0.92 0.92 0.92 0.92 0.92 0.92 0.92 0.92Percent Heavy Veh, % 2 2 2 2 2 2 2 2 2 2 2 2Cap, veh/h 506 2279 1019 122 2687 358 189 172 156 214 79 235Arrive On Green 0.07 0.64 0.64 0.03 1.00 1.00 0.19 0.19 0.19 0.19 0.19 0.19Sat Flow, veh/h 1774 3539 1583 1774 4542 605 1236 902 817 1264 414 1231Grp Volume(v), veh/h 241 1927 163 20 652 340 58 0 122 145 0 147Grp Sat Flow(s),veh/h/ln 1774 1770 1583 1774 1695 1756 1236 0 1719 1264 0 1645Q Serve(g_s), s 7.2 59.6 5.7 0.6 0.0 0.0 6.1 0.0 8.7 15.8 0.0 11.1Cycle Q Clear(g_c), s 7.2 59.6 5.7 0.6 0.0 0.0 17.2 0.0 8.7 24.5 0.0 11.1Prop In Lane 1.00 1.00 1.00 0.34 1.00 0.48 1.00 0.75Lane Grp Cap(c), veh/h 506 2279 1019 122 2006 1039 189 0 328 214 0 314V/C Ratio(X) 0.48 0.85 0.16 0.16 0.33 0.33 0.31 0.00 0.37 0.68 0.00 0.47Avail Cap(c_a), veh/h 589 2279 1019 196 2006 1039 200 0 344 226 0 329HCM Platoon Ratio 1.00 1.00 1.00 2.00 2.00 2.00 1.00 1.00 1.00 1.00 1.00 1.00Upstream Filter(I) 1.00 1.00 1.00 0.83 0.83 0.83 1.00 0.00 1.00 1.00 0.00 1.00Uniform Delay (d), s/veh 8.7 19.5 9.9 21.4 0.0 0.0 58.0 0.0 49.3 60.0 0.0 50.3Incr Delay (d2), s/veh 0.3 4.1 0.3 0.2 0.4 0.7 0.3 0.0 0.3 5.7 0.0 0.4Initial Q Delay(d3),s/veh 0.0 0.0 0.0 0.0 0.0 0.0 0.0 0.0 0.0 0.0 0.0 0.0%ile BackOfQ(50%),veh/ln 3.5 30.2 2.6 0.3 0.1 0.2 2.1 0.0 4.1 5.9 0.0 5.1LnGrp Delay(d),s/veh 8.9 23.6 10.2 21.6 0.4 0.7 58.3 0.0 49.6 65.7 0.0 50.7LnGrp LOS A C B C A A E D E DApproach Vol, veh/h 2331 1012 180 292Approach Delay, s/veh 21.1 0.9 52.4 58.2Approach LOS C A D E
Timer 1 2 3 4 5 6 7 8Assigned Phs 1 2 4 5 6 8Phs Duration (G+Y+Rc), s 16.5 89.8 33.7 9.2 97.1 33.7Change Period (Y+Rc), s 7.0 7.0 7.0 7.0 7.0 7.0Max Green Setting (Gmax), s 16.0 75.0 28.0 8.0 83.0 28.0Max Q Clear Time (g_c+I1), s 9.2 2.0 19.2 2.6 61.6 26.5Green Ext Time (p_c), s 0.3 16.2 0.9 0.0 11.4 0.2
Intersection SummaryHCM 2010 Ctrl Delay 20.1HCM 2010 LOS C
Notes

HCM 2010 Signalized Intersection Summary River North2: N 1st Street & Spring Street Existing PM
KCI Technologies,Inc Synchro 9 Report10/12/2017 Page 5
Movement EBL EBT EBR WBL WBT WBR NBL NBT NBR SBL SBT SBRLane ConfigurationsTraffic Volume (veh/h) 579 1347 34 66 620 86 113 406 195 99 175 184Future Volume (veh/h) 579 1347 34 66 620 86 113 406 195 99 175 184Number 1 6 16 5 2 12 7 4 14 3 8 18Initial Q (Qb), veh 0 0 0 0 0 0 0 0 0 0 0 0Ped-Bike Adj(A_pbT) 1.00 1.00 1.00 1.00 1.00 1.00 1.00 1.00Parking Bus, Adj 1.00 1.00 1.00 1.00 1.00 1.00 1.00 1.00 1.00 1.00 1.00 1.00Adj Sat Flow, veh/h/ln 1863 1863 1900 1863 1863 1900 1863 1863 1863 1863 1863 1863Adj Flow Rate, veh/h 629 1464 37 72 674 93 123 441 212 108 165 217Adj No. of Lanes 2 2 0 1 2 0 1 2 1 1 1 2Peak Hour Factor 0.92 0.92 0.92 0.92 0.92 0.92 0.92 0.92 0.92 0.92 0.92 0.92Percent Heavy Veh, % 2 2 2 2 2 2 2 2 2 2 2 2Cap, veh/h 824 2066 52 251 1261 174 173 379 170 159 200 339Arrive On Green 0.48 1.00 1.00 0.05 0.40 0.40 0.06 0.11 0.11 0.06 0.11 0.11Sat Flow, veh/h 3442 3528 89 1774 3126 431 1774 3539 1583 1774 1863 3167Grp Volume(v), veh/h 629 734 767 72 381 386 123 441 212 108 165 217Grp Sat Flow(s),veh/h/ln 1721 1770 1847 1774 1770 1787 1774 1770 1583 1774 1863 1583Q Serve(g_s), s 21.0 0.0 0.0 3.7 22.9 23.0 8.0 15.0 15.0 7.6 12.1 5.7Cycle Q Clear(g_c), s 21.0 0.0 0.0 3.7 22.9 23.0 8.0 15.0 15.0 7.6 12.1 5.7Prop In Lane 1.00 0.05 1.00 0.24 1.00 1.00 1.00 1.00Lane Grp Cap(c), veh/h 824 1036 1082 251 714 721 173 379 170 159 200 339V/C Ratio(X) 0.76 0.71 0.71 0.29 0.53 0.53 0.71 1.16 1.25 0.68 0.83 0.64Avail Cap(c_a), veh/h 824 1036 1082 257 714 721 173 379 170 159 200 339HCM Platoon Ratio 2.00 2.00 2.00 1.00 1.00 1.00 1.00 1.00 1.00 1.00 1.00 1.00Upstream Filter(I) 0.53 0.53 0.53 1.00 1.00 1.00 1.00 1.00 1.00 1.00 1.00 1.00Uniform Delay (d), s/veh 33.2 0.0 0.0 29.2 31.7 31.8 54.1 62.5 62.5 52.4 61.2 23.3Incr Delay (d2), s/veh 2.4 2.2 2.1 0.2 2.8 2.8 11.0 98.5 151.7 9.2 22.7 3.1Initial Q Delay(d3),s/veh 0.0 0.0 0.0 0.0 0.0 0.0 0.0 0.0 0.0 0.0 0.0 0.0%ile BackOfQ(50%),veh/ln 10.1 0.6 0.6 1.8 11.8 11.9 1.4 12.5 13.7 4.1 7.5 2.6LnGrp Delay(d),s/veh 35.6 2.2 2.1 29.4 34.6 34.6 65.1 161.0 214.2 61.6 83.9 26.4LnGrp LOS D A A C C C E F F E F CApproach Vol, veh/h 2130 839 776 490Approach Delay, s/veh 12.0 34.1 160.4 53.5Approach LOS B C F D
Timer 1 2 3 4 5 6 7 8Assigned Phs 1 2 3 4 5 6 7 8Phs Duration (G+Y+Rc), s 40.0 63.0 15.0 22.0 14.5 88.5 15.0 22.0Change Period (Y+Rc), s 6.5 6.5 6.5 7.0 7.0 6.5 7.0 7.0Max Green Setting (Gmax), s 33.5 56.5 8.5 15.0 8.0 81.5 8.0 15.0Max Q Clear Time (g_c+I1), s 23.0 25.0 9.6 17.0 5.7 2.0 10.0 14.1Green Ext Time (p_c), s 5.7 1.6 0.0 0.0 0.0 9.7 0.0 0.4
Intersection SummaryHCM 2010 Ctrl Delay 48.4HCM 2010 LOS D
Notes

HCM Signalized Intersection Capacity Analysis River North3: Spring Street & Dickerson Pike Existing PM
KCI Technologies,Inc Synchro 9 Report10/12/2017 Page 7
Movement EBL EBT EBR WBL WBT WBR SBL2 SBL SBR NWL NWRLane ConfigurationsTraffic Volume (vph) 178 1092 189 0 845 558 90 0 126 0 0Future Volume (vph) 178 1092 189 0 845 558 90 0 126 0 0Ideal Flow (vphpl) 1900 1900 1900 1900 1900 1900 1900 1900 1900 1900 1900Total Lost time (s) 6.5 6.5 6.5 6.5 6.5 4.5 4.5Lane Util. Factor 1.00 0.95 1.00 0.91 0.91 1.00 1.00Frt 1.00 1.00 0.85 0.98 0.85 1.00 0.85Flt Protected 0.95 1.00 1.00 1.00 1.00 0.95 1.00Satd. Flow (prot) 1770 3539 1583 3320 1441 1770 1583Flt Permitted 0.23 1.00 1.00 1.00 1.00 0.95 1.00Satd. Flow (perm) 421 3539 1583 3320 1441 1770 1583Peak-hour factor, PHF 0.92 0.92 0.92 0.92 0.92 0.92 0.92 0.92 0.92 0.92 0.92Adj. Flow (vph) 193 1187 205 0 918 607 98 0 137 0 0RTOR Reduction (vph) 0 0 57 0 7 127 0 0 122 0 0Lane Group Flow (vph) 193 1187 148 0 1057 334 98 0 15 0 0Turn Type D.P+P NA custom NA Perm Prot ProtProtected Phases 1 2 2 3 4 4Permitted Phases 2 3 2 3 2 3 2 3Actuated Green, G (s) 109.0 94.8 101.3 101.3 101.3 15.5 15.5Effective Green, g (s) 109.0 94.8 101.3 101.3 101.3 15.5 15.5Actuated g/C Ratio 0.78 0.68 0.72 0.72 0.72 0.11 0.11Clearance Time (s) 6.5 6.5 4.5 4.5Vehicle Extension (s) 2.0 2.0 2.0 2.0Lane Grp Cap (vph) 401 2560 1145 2402 1042 195 175v/s Ratio Prot c0.03 0.30 0.32 c0.06 0.01v/s Ratio Perm c0.35 0.04 0.09 0.23v/c Ratio 0.48 0.46 0.13 0.44 0.32 0.50 0.09Uniform Delay, d1 4.7 10.6 5.9 7.8 7.0 58.6 55.9Progression Factor 0.82 0.81 0.43 1.11 3.36 1.00 1.00Incremental Delay, d2 0.3 0.0 0.0 0.0 0.1 0.7 0.1Delay (s) 4.2 8.6 2.5 8.7 23.5 59.4 56.0Level of Service A A A A C E EApproach Delay (s) 7.3 13.2 57.4 0.0Approach LOS A B E A
Intersection SummaryHCM 2000 Control Delay 13.5 HCM 2000 Level of Service BHCM 2000 Volume to Capacity ratio 0.51Actuated Cycle Length (s) 140.0 Sum of lost time (s) 22.0Intersection Capacity Utilization 58.3% ICU Level of Service BAnalysis Period (min) 15c Critical Lane Group

HCM Signalized Intersection Capacity Analysis River North4: I-24 WB Off-Ramp & Spring Street Existing PM
KCI Technologies,Inc Synchro 9 Report10/12/2017 Page 9
Movement EBT EBR WBL WBT NBL NBRLane ConfigurationsTraffic Volume (vph) 1152 0 0 1089 349 885Future Volume (vph) 1152 0 0 1089 349 885Ideal Flow (vphpl) 1900 1900 1900 1900 1900 1900Total Lost time (s) 6.5 6.5 4.5 4.0Lane Util. Factor 0.95 0.95 0.97 1.00Frt 1.00 1.00 1.00 0.85Flt Protected 1.00 1.00 0.95 1.00Satd. Flow (prot) 3539 3539 3433 1583Flt Permitted 1.00 1.00 0.95 1.00Satd. Flow (perm) 3539 3539 3433 1583Peak-hour factor, PHF 0.92 0.92 0.92 0.92 0.92 0.92Adj. Flow (vph) 1252 0 0 1184 379 962RTOR Reduction (vph) 0 0 0 0 0 0Lane Group Flow (vph) 1252 0 0 1184 379 962Turn Type NA NA Prot FreeProtected Phases 6 7 6 7 5 8Permitted Phases FreeActuated Green, G (s) 103.5 103.5 27.5 140.0Effective Green, g (s) 103.5 103.5 27.5 140.0Actuated g/C Ratio 0.74 0.74 0.20 1.00Clearance Time (s)Vehicle Extension (s)Lane Grp Cap (vph) 2616 2616 674 1583v/s Ratio Prot 0.35 0.33 0.11v/s Ratio Perm c0.61v/c Ratio 0.48 0.45 0.56 0.61Uniform Delay, d1 7.4 7.2 50.8 0.0Progression Factor 0.39 1.00 1.00 1.00Incremental Delay, d2 0.0 0.0 0.6 1.7Delay (s) 2.9 7.2 51.5 1.7Level of Service A A D AApproach Delay (s) 2.9 7.2 15.8Approach LOS A A B
Intersection SummaryHCM 2000 Control Delay 8.8 HCM 2000 Level of Service AHCM 2000 Volume to Capacity ratio 0.72Actuated Cycle Length (s) 140.0 Sum of lost time (s) 22.0Intersection Capacity Utilization 51.0% ICU Level of Service AAnalysis Period (min) 15c Critical Lane Group

River North Development Study October 2017
-78- 16-0908
PROJECTED CONDITIONS
CAPACITY ANALYSES

HCM 2010 Signalized Intersection Summary River North-Low-Level1: Cowan Street & Jefferson Street/Spring Street Projected PM
KCI Technologies,Inc Synchro 9 Report10/12/2017 Page 1
Movement EBL EBT EBR WBL WBT WBR NBL NBT NBR SBL SBT SBRLane ConfigurationsTraffic Volume (veh/h) 267 1773 150 18 805 376 53 77 53 597 65 179Future Volume (veh/h) 267 1773 150 18 805 376 53 77 53 597 65 179Number 1 6 16 5 2 12 7 4 14 3 8 18Initial Q (Qb), veh 0 0 0 0 0 0 0 0 0 0 0 0Ped-Bike Adj(A_pbT) 1.00 1.00 1.00 1.00 1.00 1.00 1.00 1.00Parking Bus, Adj 1.00 1.00 1.00 1.00 1.00 1.00 1.00 1.00 1.00 1.00 1.00 1.00Adj Sat Flow, veh/h/ln 1863 1863 1863 1863 1863 1863 1863 1863 1900 1863 1863 1863Adj Flow Rate, veh/h 290 1927 163 20 875 0 58 84 58 649 71 195Adj No. of Lanes 1 2 1 1 3 1 1 1 0 2 1 1Peak Hour Factor 0.92 0.92 0.92 0.92 0.92 0.92 0.92 0.92 0.92 0.92 0.92 0.92Percent Heavy Veh, % 2 2 2 2 2 2 2 2 2 2 2 2Cap, veh/h 478 1821 815 75 2157 672 159 102 71 691 615 523Arrive On Green 0.11 0.51 0.51 0.03 0.85 0.00 0.10 0.10 0.10 0.20 0.33 0.33Sat Flow, veh/h 1774 3539 1583 1774 5085 1583 1109 1028 710 3442 1863 1583Grp Volume(v), veh/h 290 1927 163 20 875 0 58 0 142 649 71 195Grp Sat Flow(s),veh/h/ln 1774 1770 1583 1774 1695 1583 1109 0 1738 1721 1863 1583Q Serve(g_s), s 13.4 77.2 8.4 1.0 6.0 0.0 7.5 0.0 12.0 27.9 4.0 14.1Cycle Q Clear(g_c), s 13.4 77.2 8.4 1.0 6.0 0.0 7.5 0.0 12.0 27.9 4.0 14.1Prop In Lane 1.00 1.00 1.00 1.00 1.00 0.41 1.00 1.00Lane Grp Cap(c), veh/h 478 1821 815 75 2157 672 159 0 173 691 615 523V/C Ratio(X) 0.61 1.06 0.20 0.27 0.41 0.00 0.37 0.00 0.82 0.94 0.12 0.37Avail Cap(c_a), veh/h 574 1821 815 95 2157 672 285 0 371 700 832 707HCM Platoon Ratio 1.00 1.00 1.00 2.00 2.00 2.00 1.00 1.00 1.00 1.00 1.00 1.00Upstream Filter(I) 1.00 1.00 1.00 0.83 0.83 0.00 1.00 0.00 1.00 1.00 1.00 1.00Uniform Delay (d), s/veh 19.1 36.4 19.7 36.8 7.0 0.0 64.1 0.0 66.2 59.1 35.0 38.3Incr Delay (d2), s/veh 0.5 38.5 0.6 0.6 0.5 0.0 0.5 0.0 3.6 20.5 0.0 0.2Initial Q Delay(d3),s/veh 0.0 0.0 0.0 0.0 0.0 0.0 0.0 0.0 0.0 0.0 0.0 0.0%ile BackOfQ(50%),veh/ln 6.6 47.4 3.8 0.5 2.7 0.0 2.3 0.0 6.0 15.2 2.1 6.2LnGrp Delay(d),s/veh 19.6 74.9 20.3 37.4 7.5 0.0 64.7 0.0 69.8 79.5 35.0 38.5LnGrp LOS B F C D A E E E C DApproach Vol, veh/h 2380 895 200 915Approach Delay, s/veh 64.4 8.1 68.3 67.3Approach LOS E A E E
Timer 1 2 3 4 5 6 7 8Assigned Phs 1 2 3 4 5 6 8Phs Duration (G+Y+Rc), s 22.8 70.6 34.6 22.0 9.3 84.2 56.6Change Period (Y+Rc), s 7.0 7.0 4.5 7.0 7.0 7.0 7.0Max Green Setting (Gmax), s 24.0 38.0 30.5 32.0 4.0 58.0 67.0Max Q Clear Time (g_c+I1), s 15.4 8.0 29.9 14.0 3.0 79.2 16.1Green Ext Time (p_c), s 0.4 13.1 0.2 0.9 0.0 0.0 1.0
Intersection SummaryHCM 2010 Ctrl Delay 53.7HCM 2010 LOS D
Notes

HCM 2010 Signalized Intersection Summary River North-Medium-Level1: Cowan Street & Jefferson Street/Spring Street Projected PM
KCI Technologies,Inc Synchro 9 Report10/12/2017 Page 1
Movement EBL EBT EBR WBL WBT WBR NBL NBT NBR SBL SBT SBRLane ConfigurationsTraffic Volume (veh/h) 365 1773 150 18 805 964 53 116 53 1291 112 295Future Volume (veh/h) 365 1773 150 18 805 964 53 116 53 1291 112 295Number 1 6 16 5 2 12 7 4 14 3 8 18Initial Q (Qb), veh 0 0 0 0 0 0 0 0 0 0 0 0Ped-Bike Adj(A_pbT) 1.00 1.00 1.00 1.00 1.00 1.00 1.00 1.00Parking Bus, Adj 1.00 1.00 1.00 1.00 1.00 1.00 1.00 1.00 1.00 1.00 1.00 1.00Adj Sat Flow, veh/h/ln 1863 1863 1863 1863 1863 1863 1863 1863 1900 1863 1863 1863Adj Flow Rate, veh/h 397 1927 163 20 875 0 58 126 58 1403 271 222Adj No. of Lanes 1 3 1 1 3 1 1 1 0 3 1 1Peak Hour Factor 0.92 0.92 0.92 0.92 0.92 0.92 0.92 0.92 0.92 0.92 0.92 0.92Percent Heavy Veh, % 2 2 2 2 2 2 2 2 2 2 2 2Cap, veh/h 432 2192 682 86 1360 424 201 113 52 1473 648 551Arrive On Green 0.18 0.43 0.43 0.01 0.27 0.00 0.04 0.09 0.09 0.28 0.35 0.35Sat Flow, veh/h 1774 5085 1583 1774 5085 1583 1774 1208 556 5322 1863 1583Grp Volume(v), veh/h 397 1927 163 20 875 0 58 0 184 1403 271 222Grp Sat Flow(s),veh/h/ln 1774 1695 1583 1774 1695 1583 1774 0 1765 1774 1863 1583Q Serve(g_s), s 23.5 52.1 9.8 1.2 22.8 0.0 4.4 0.0 14.0 38.8 16.7 16.0Cycle Q Clear(g_c), s 23.5 52.1 9.8 1.2 22.8 0.0 4.4 0.0 14.0 38.8 16.7 16.0Prop In Lane 1.00 1.00 1.00 1.00 1.00 0.32 1.00 1.00Lane Grp Cap(c), veh/h 432 2192 682 86 1360 424 201 0 165 1473 648 551V/C Ratio(X) 0.92 0.88 0.24 0.23 0.64 0.00 0.29 0.00 1.12 0.95 0.42 0.40Avail Cap(c_a), veh/h 736 2192 682 100 1360 424 221 0 165 1490 648 551HCM Platoon Ratio 1.00 1.00 1.00 1.00 1.00 1.00 1.00 1.00 1.00 1.00 1.00 1.00Upstream Filter(I) 1.00 1.00 1.00 0.73 0.73 0.00 1.00 0.00 1.00 1.00 1.00 1.00Uniform Delay (d), s/veh 32.9 39.1 27.1 42.2 48.6 0.0 58.4 0.0 68.0 53.3 37.3 37.1Incr Delay (d2), s/veh 6.1 5.4 0.8 0.4 1.7 0.0 0.8 0.0 105.1 13.4 0.2 0.2Initial Q Delay(d3),s/veh 0.0 0.0 0.0 0.0 0.0 0.0 0.0 0.0 0.0 0.0 0.0 0.0%ile BackOfQ(50%),veh/ln 12.1 25.4 4.4 0.6 10.9 0.0 2.2 0.0 11.6 20.8 8.6 7.0LnGrp Delay(d),s/veh 39.0 44.5 27.9 42.5 50.3 0.0 59.2 0.0 173.1 66.7 37.5 37.3LnGrp LOS D D C D D E F E D DApproach Vol, veh/h 2487 895 242 1896Approach Delay, s/veh 42.6 50.2 145.8 59.0Approach LOS D D F E
Timer 1 2 3 4 5 6 7 8Assigned Phs 1 2 3 4 5 6 7 8Phs Duration (G+Y+Rc), s 33.4 47.1 48.5 21.0 8.8 71.6 10.3 59.2Change Period (Y+Rc), s 7.0 7.0 7.0 7.0 7.0 7.0 4.5 7.0Max Green Setting (Gmax), s 52.0 14.0 42.0 14.0 3.0 63.0 7.5 51.0Max Q Clear Time (g_c+I1), s 25.5 24.8 40.8 16.0 3.2 54.1 6.4 18.7Green Ext Time (p_c), s 0.8 0.0 0.7 0.0 0.0 6.2 0.0 1.4
Intersection SummaryHCM 2010 Ctrl Delay 54.0HCM 2010 LOS D
Notes

HCM 2010 Signalized Intersection Summary River North-High-Level-Option 1A1: Cowan Street & Jefferson Street/Spring Street Projected PM
KCI Technologies,Inc Synchro 9 Report10/12/2017 Page 1
Movement EBL EBT EBR WBL WBT WBR NBL NBT NBR SBL SBT SBRLane ConfigurationsTraffic Volume (veh/h) 294 1773 150 18 805 420 53 88 53 556 73 198Future Volume (veh/h) 294 1773 150 18 805 420 53 88 53 556 73 198Number 1 6 16 5 2 12 7 4 14 3 8 18Initial Q (Qb), veh 0 0 0 0 0 0 0 0 0 0 0 0Ped-Bike Adj(A_pbT) 1.00 1.00 1.00 1.00 1.00 1.00 1.00 1.00Parking Bus, Adj 1.00 1.00 1.00 1.00 1.00 1.00 1.00 1.00 1.00 1.00 1.00 1.00Adj Sat Flow, veh/h/ln 1863 1863 1863 1863 1863 1863 1863 1863 1900 1863 1863 1863Adj Flow Rate, veh/h 320 1927 163 20 875 0 58 96 58 604 181 147Adj No. of Lanes 1 3 1 1 3 1 1 1 0 2 1 1Peak Hour Factor 0.92 0.92 0.92 0.92 0.92 0.92 0.92 0.92 0.92 0.92 0.92 0.92Percent Heavy Veh, % 2 2 2 2 2 2 2 2 2 2 2 2Cap, veh/h 415 2607 812 110 2060 641 217 114 69 656 508 432Arrive On Green 0.12 0.51 0.51 0.00 0.13 0.00 0.03 0.10 0.10 0.18 0.27 0.27Sat Flow, veh/h 1774 5085 1583 1774 5085 1583 1774 1089 658 3548 1863 1583Grp Volume(v), veh/h 320 1927 163 20 875 0 58 0 154 604 181 147Grp Sat Flow(s),veh/h/ln 1774 1695 1583 1774 1695 1583 1774 0 1747 1774 1863 1583Q Serve(g_s), s 15.3 44.6 8.4 1.0 23.7 0.0 4.4 0.0 13.0 25.1 11.7 11.2Cycle Q Clear(g_c), s 15.3 44.6 8.4 1.0 23.7 0.0 4.4 0.0 13.0 25.1 11.7 11.2Prop In Lane 1.00 1.00 1.00 1.00 1.00 0.38 1.00 1.00Lane Grp Cap(c), veh/h 415 2607 812 110 2060 641 217 0 183 656 508 432V/C Ratio(X) 0.77 0.74 0.20 0.18 0.42 0.00 0.27 0.00 0.84 0.92 0.36 0.34Avail Cap(c_a), veh/h 570 2607 812 126 2060 641 217 0 262 710 621 528HCM Platoon Ratio 1.00 1.00 1.00 0.33 0.33 0.33 1.00 1.00 1.00 1.00 1.00 1.00Upstream Filter(I) 1.00 1.00 1.00 0.73 0.73 0.00 1.00 0.00 1.00 1.00 1.00 1.00Uniform Delay (d), s/veh 24.1 28.7 19.9 29.1 48.9 0.0 57.6 0.0 66.0 60.1 43.9 43.7Incr Delay (d2), s/veh 2.7 1.9 0.6 0.2 0.5 0.0 0.7 0.0 11.1 16.0 0.2 0.2Initial Q Delay(d3),s/veh 0.0 0.0 0.0 0.0 0.0 0.0 0.0 0.0 0.0 0.0 0.0 0.0%ile BackOfQ(50%),veh/ln 7.8 21.3 3.8 0.5 11.2 0.0 2.2 0.0 6.9 13.8 6.1 4.9LnGrp Delay(d),s/veh 26.8 30.6 20.4 29.3 49.4 0.0 58.3 0.0 77.0 76.1 44.1 43.9LnGrp LOS C C C C D E E E D DApproach Vol, veh/h 2410 895 212 932Approach Delay, s/veh 29.4 48.9 71.9 64.8Approach LOS C D E E
Timer 1 2 3 4 5 6 7 8Assigned Phs 1 2 3 4 5 6 7 8Phs Duration (G+Y+Rc), s 24.8 67.8 34.7 22.7 8.7 83.9 9.5 47.9Change Period (Y+Rc), s 7.0 7.0 7.0 7.0 7.0 7.0 4.5 7.0Max Green Setting (Gmax), s 31.0 38.5 30.0 22.5 3.0 66.5 5.0 50.0Max Q Clear Time (g_c+I1), s 17.3 25.7 27.1 15.0 3.0 46.6 6.4 13.7Green Ext Time (p_c), s 0.6 8.1 0.6 0.7 0.0 10.5 0.0 1.0
Intersection SummaryHCM 2010 Ctrl Delay 42.8HCM 2010 LOS D
Notes

HCM 2010 Signalized Intersection Summary River North-High-Level-Option 1B1: Cowan Street & Jefferson Street/Spring Street Projected PM
KCI Technologies,Inc Synchro 9 Report10/12/2017 Page 1
Movement EBL EBT EBR WBL WBT WBR NBL NBT NBR SBL SBT SBRLane ConfigurationsTraffic Volume (veh/h) 394 1773 150 18 805 858 53 128 53 1149 127 334Future Volume (veh/h) 394 1773 150 18 805 858 53 128 53 1149 127 334Number 1 6 16 5 2 12 7 4 14 3 8 18Initial Q (Qb), veh 0 0 0 0 0 0 0 0 0 0 0 0Ped-Bike Adj(A_pbT) 1.00 1.00 1.00 1.00 1.00 1.00 1.00 1.00Parking Bus, Adj 1.00 1.00 1.00 1.00 1.00 1.00 1.00 1.00 1.00 1.00 1.00 1.00Adj Sat Flow, veh/h/ln 1863 1863 1863 1863 1863 1863 1863 1863 1900 1863 1863 1863Adj Flow Rate, veh/h 428 1927 163 20 875 0 58 139 58 1249 307 250Adj No. of Lanes 1 3 1 1 3 1 1 1 0 3 1 1Peak Hour Factor 0.92 0.92 0.92 0.92 0.92 0.92 0.92 0.92 0.92 0.92 0.92 0.92Percent Heavy Veh, % 2 2 2 2 2 2 2 2 2 2 2 2Cap, veh/h 435 2121 660 85 1239 386 227 160 67 1293 653 555Arrive On Green 0.19 0.42 0.42 0.01 0.24 0.00 0.04 0.13 0.13 0.24 0.35 0.35Sat Flow, veh/h 1774 5085 1583 1774 5085 1583 1774 1249 521 5322 1863 1583Grp Volume(v), veh/h 428 1927 163 20 875 0 58 0 197 1249 307 250Grp Sat Flow(s),veh/h/ln 1774 1695 1583 1774 1695 1583 1774 0 1771 1774 1863 1583Q Serve(g_s), s 25.2 49.8 9.4 1.2 22.0 0.0 3.9 0.0 15.3 32.5 17.9 17.1Cycle Q Clear(g_c), s 25.2 49.8 9.4 1.2 22.0 0.0 3.9 0.0 15.3 32.5 17.9 17.1Prop In Lane 1.00 1.00 1.00 1.00 1.00 0.29 1.00 1.00Lane Grp Cap(c), veh/h 435 2121 660 85 1239 386 227 0 226 1293 653 555V/C Ratio(X) 0.98 0.91 0.25 0.23 0.71 0.00 0.26 0.00 0.87 0.97 0.47 0.45Avail Cap(c_a), veh/h 435 2121 660 101 1239 386 231 0 253 1293 677 576HCM Platoon Ratio 1.00 1.00 1.00 1.00 1.00 1.00 1.00 1.00 1.00 1.00 1.00 1.00Upstream Filter(I) 1.00 1.00 1.00 0.73 0.73 0.00 1.00 0.00 1.00 1.00 1.00 1.00Uniform Delay (d), s/veh 33.5 38.3 26.5 41.8 48.4 0.0 50.4 0.0 59.9 52.4 35.4 35.1Incr Delay (d2), s/veh 38.4 7.2 0.9 0.4 2.5 0.0 0.6 0.0 22.8 17.4 0.2 0.2Initial Q Delay(d3),s/veh 0.0 0.0 0.0 0.0 0.0 0.0 0.0 0.0 0.0 0.0 0.0 0.0%ile BackOfQ(50%),veh/ln 21.1 24.6 4.3 0.6 10.6 0.0 2.0 0.0 8.9 18.0 9.2 7.5LnGrp Delay(d),s/veh 71.9 45.5 27.4 42.2 50.9 0.0 50.9 0.0 82.7 69.9 35.6 35.3LnGrp LOS E D C D D D F E D DApproach Vol, veh/h 2518 895 255 1806Approach Delay, s/veh 48.8 50.7 75.5 59.2Approach LOS D D E E
Timer 1 2 3 4 5 6 7 8Assigned Phs 1 2 3 4 5 6 7 8Phs Duration (G+Y+Rc), s 33.0 41.1 41.0 24.9 8.7 65.4 9.8 56.1Change Period (Y+Rc), s 7.0 7.0 7.0 7.0 7.0 7.0 4.5 7.0Max Green Setting (Gmax), s 26.0 32.0 34.0 20.0 3.0 55.0 5.6 50.9Max Q Clear Time (g_c+I1), s 27.2 24.0 34.5 17.3 3.2 51.8 5.9 19.9Green Ext Time (p_c), s 0.0 5.7 0.0 0.6 0.0 2.6 0.0 1.6
Intersection SummaryHCM 2010 Ctrl Delay 53.8HCM 2010 LOS D
Notes

HCM 2010 Signalized Intersection Summary River North-High-Level-Option 1C1: Cowan Street & Jefferson Street/Spring Street Projected PM
KCI Technologies,Inc Synchro 9 Report10/12/2017 Page 1
Movement EBL EBT EBR WBL WBT WBR NBL NBT NBR SBL SBT SBRLane ConfigurationsTraffic Volume (veh/h) 287 1773 150 18 805 389 53 85 53 514 69 188Future Volume (veh/h) 287 1773 150 18 805 389 53 85 53 514 69 188Number 1 6 16 5 2 12 7 4 14 3 8 18Initial Q (Qb), veh 0 0 0 0 0 0 0 0 0 0 0 0Ped-Bike Adj(A_pbT) 1.00 1.00 1.00 1.00 1.00 1.00 1.00 1.00Parking Bus, Adj 1.00 1.00 1.00 1.00 1.00 1.00 1.00 1.00 1.00 1.00 1.00 1.00Adj Sat Flow, veh/h/ln 1863 1863 1863 1863 1863 1863 1863 1863 1900 1863 1863 1863Adj Flow Rate, veh/h 312 1927 163 20 875 0 58 92 58 559 172 140Adj No. of Lanes 1 2 1 1 3 1 1 1 0 2 1 1Peak Hour Factor 0.92 0.92 0.92 0.92 0.92 0.92 0.92 0.92 0.92 0.92 0.92 0.92Percent Heavy Veh, % 2 2 2 2 2 2 2 2 2 2 2 2Cap, veh/h 442 1867 835 68 2164 674 216 110 69 610 481 408Arrive On Green 0.11 0.53 0.53 0.01 0.43 0.00 0.03 0.10 0.10 0.17 0.26 0.26Sat Flow, veh/h 1774 3539 1583 1774 5085 1583 1774 1070 674 3548 1863 1583Grp Volume(v), veh/h 312 1927 163 20 875 0 58 0 150 559 172 140Grp Sat Flow(s),veh/h/ln 1774 1770 1583 1774 1695 1583 1774 0 1744 1774 1863 1583Q Serve(g_s), s 14.3 79.1 8.1 1.0 17.9 0.0 4.4 0.0 12.7 23.2 11.3 10.8Cycle Q Clear(g_c), s 14.3 79.1 8.1 1.0 17.9 0.0 4.4 0.0 12.7 23.2 11.3 10.8Prop In Lane 1.00 1.00 1.00 1.00 1.00 0.39 1.00 1.00Lane Grp Cap(c), veh/h 442 1867 835 68 2164 674 216 0 179 610 481 408V/C Ratio(X) 0.71 1.03 0.20 0.29 0.40 0.00 0.27 0.00 0.84 0.92 0.36 0.34Avail Cap(c_a), veh/h 714 1867 835 83 2164 674 216 0 285 662 621 528HCM Platoon Ratio 1.00 1.00 1.00 1.00 1.00 1.00 1.00 1.00 1.00 1.00 1.00 1.00Upstream Filter(I) 1.00 1.00 1.00 0.73 0.73 0.00 1.00 0.00 1.00 1.00 1.00 1.00Uniform Delay (d), s/veh 20.9 35.4 18.7 37.6 29.9 0.0 57.9 0.0 66.1 61.1 45.5 45.3Incr Delay (d2), s/veh 0.8 29.7 0.5 0.6 0.4 0.0 0.7 0.0 6.2 16.2 0.2 0.2Initial Q Delay(d3),s/veh 0.0 0.0 0.0 0.0 0.0 0.0 0.0 0.0 0.0 0.0 0.0 0.0%ile BackOfQ(50%),veh/ln 7.1 46.1 3.7 0.5 8.4 0.0 2.2 0.0 6.4 12.8 5.9 4.7LnGrp Delay(d),s/veh 21.7 65.1 19.2 38.3 30.3 0.0 58.5 0.0 72.2 77.2 45.7 45.5LnGrp LOS C F B D C E E E D DApproach Vol, veh/h 2402 895 208 871Approach Delay, s/veh 56.4 30.5 68.4 65.9Approach LOS E C E E
Timer 1 2 3 4 5 6 7 8Assigned Phs 1 2 3 4 5 6 7 8Phs Duration (G+Y+Rc), s 24.0 70.8 32.8 22.4 8.7 86.1 9.5 45.7Change Period (Y+Rc), s 7.0 7.0 7.0 7.0 7.0 7.0 4.5 7.0Max Green Setting (Gmax), s 40.0 29.5 28.0 24.5 3.0 66.5 5.0 50.0Max Q Clear Time (g_c+I1), s 16.3 19.9 25.2 14.7 3.0 81.1 6.4 13.3Green Ext Time (p_c), s 0.6 6.7 0.6 0.7 0.0 0.0 0.0 0.9
Intersection SummaryHCM 2010 Ctrl Delay 53.5HCM 2010 LOS D
Notes

HCM 2010 Signalized Intersection Summary River North-High-Level-Option 2A1: Cowan Street & Jefferson Street/Spring Street Projected PM
KCI Technologies,Inc Synchro 9 Report10/12/2017 Page 1
Movement EBL EBT EBR WBL WBT WBR NBL NBT NBR SBL SBT SBRLane ConfigurationsTraffic Volume (veh/h) 254 1596 150 18 724 757 53 97 53 1012 85 144Future Volume (veh/h) 254 1596 150 18 724 757 53 97 53 1012 85 144Number 1 6 16 5 2 12 7 4 14 3 8 18Initial Q (Qb), veh 0 0 0 0 0 0 0 0 0 0 0 0Ped-Bike Adj(A_pbT) 1.00 1.00 1.00 1.00 1.00 1.00 1.00 1.00Parking Bus, Adj 1.00 1.00 1.00 1.00 1.00 1.00 1.00 1.00 1.00 1.00 1.00 1.00Adj Sat Flow, veh/h/ln 1863 1863 1863 1863 1863 1863 1863 1863 1900 1863 1863 1863Adj Flow Rate, veh/h 276 1735 163 20 787 0 58 105 58 1100 141 124Adj No. of Lanes 1 3 1 1 3 1 1 1 0 2 1 1Peak Hour Factor 0.92 0.92 0.92 0.92 0.92 0.92 0.92 0.92 0.92 0.92 0.92 0.92Percent Heavy Veh, % 2 2 2 2 2 2 2 2 2 2 2 2Cap, veh/h 354 1890 588 84 1334 415 241 123 68 1090 737 626Arrive On Green 0.12 0.37 0.37 0.01 0.26 0.00 0.04 0.11 0.11 0.31 0.40 0.40Sat Flow, veh/h 1774 5085 1583 1774 5085 1583 1774 1129 624 3548 1863 1583Grp Volume(v), veh/h 276 1735 163 20 787 0 58 0 163 1100 141 124Grp Sat Flow(s),veh/h/ln 1774 1695 1583 1774 1695 1583 1774 0 1753 1774 1863 1583Q Serve(g_s), s 15.5 45.6 10.1 1.2 18.9 0.0 4.0 0.0 12.8 43.0 6.9 7.2Cycle Q Clear(g_c), s 15.5 45.6 10.1 1.2 18.9 0.0 4.0 0.0 12.8 43.0 6.9 7.2Prop In Lane 1.00 1.00 1.00 1.00 1.00 0.36 1.00 1.00Lane Grp Cap(c), veh/h 354 1890 588 84 1334 415 241 0 191 1090 737 626V/C Ratio(X) 0.78 0.92 0.28 0.24 0.59 0.00 0.24 0.00 0.85 1.01 0.19 0.20Avail Cap(c_a), veh/h 354 1890 588 100 1334 415 242 0 250 1090 798 679HCM Platoon Ratio 1.00 1.00 1.00 1.00 1.00 1.00 1.00 1.00 1.00 1.00 1.00 1.00Upstream Filter(I) 1.00 1.00 1.00 0.73 0.73 0.00 1.00 0.00 1.00 1.00 1.00 1.00Uniform Delay (d), s/veh 32.7 42.0 30.8 40.8 45.1 0.0 52.6 0.0 61.3 48.5 27.7 27.8Incr Delay (d2), s/veh 9.7 8.7 1.2 0.4 1.4 0.0 0.5 0.0 15.7 29.6 0.0 0.1Initial Q Delay(d3),s/veh 0.0 0.0 0.0 0.0 0.0 0.0 0.0 0.0 0.0 0.0 0.0 0.0%ile BackOfQ(50%),veh/ln 8.5 22.9 4.6 0.6 9.1 0.0 2.0 0.0 7.0 25.5 3.6 3.2LnGrp Delay(d),s/veh 42.4 50.6 32.0 41.2 46.5 0.0 53.1 0.0 77.0 78.1 27.7 27.8LnGrp LOS D D C D D D E F C CApproach Vol, veh/h 2174 807 221 1365Approach Delay, s/veh 48.2 46.3 70.7 68.3Approach LOS D D E E
Timer 1 2 3 4 5 6 7 8Assigned Phs 1 2 3 4 5 6 7 8Phs Duration (G+Y+Rc), s 24.0 43.7 50.0 22.3 8.7 59.0 9.9 62.4Change Period (Y+Rc), s 7.0 7.0 7.0 7.0 7.0 7.0 4.5 7.0Max Green Setting (Gmax), s 17.0 32.0 43.0 20.0 3.0 46.0 5.5 60.0Max Q Clear Time (g_c+I1), s 17.5 20.9 45.0 14.8 3.2 47.6 6.0 9.2Green Ext Time (p_c), s 0.0 6.6 0.0 0.5 0.0 0.0 0.0 0.9
Intersection SummaryHCM 2010 Ctrl Delay 55.0HCM 2010 LOS D
Notes

HCM 2010 Signalized Intersection Summary River North-High-Level-Option 2B1: Cowan Street & Jefferson Street/Spring Street Projected PM
KCI Technologies,Inc Synchro 9 Report10/12/2017 Page 1
Movement EBL EBT EBR WBL WBT WBR NBL NBT NBR SBL SBT SBRLane ConfigurationsTraffic Volume (veh/h) 271 1596 150 18 724 1111 53 117 53 1494 113 167Future Volume (veh/h) 271 1596 150 18 724 1111 53 117 53 1494 113 167Number 1 6 16 5 2 12 7 4 14 3 8 18Initial Q (Qb), veh 0 0 0 0 0 0 0 0 0 0 0 0Ped-Bike Adj(A_pbT) 1.00 1.00 1.00 1.00 1.00 1.00 1.00 1.00Parking Bus, Adj 1.00 1.00 1.00 1.00 1.00 1.00 1.00 1.00 1.00 1.00 1.00 1.00Adj Sat Flow, veh/h/ln 1863 1863 1863 1863 1863 1863 1863 1863 1900 1863 1863 1863Adj Flow Rate, veh/h 295 1735 163 20 787 0 58 127 58 1624 167 152Adj No. of Lanes 1 3 1 1 3 1 1 1 0 3 1 1Peak Hour Factor 0.92 0.92 0.92 0.92 0.92 0.92 0.92 0.92 0.92 0.92 0.92 0.92Percent Heavy Veh, % 2 2 2 2 2 2 2 2 2 2 2 2Cap, veh/h 364 1843 574 81 1196 372 219 113 51 1769 753 640Arrive On Green 0.14 0.36 0.36 0.01 0.24 0.00 0.04 0.09 0.09 0.33 0.40 0.40Sat Flow, veh/h 1774 5085 1583 1774 5085 1583 1774 1212 553 5322 1863 1583Grp Volume(v), veh/h 295 1735 163 20 787 0 58 0 185 1624 167 152Grp Sat Flow(s),veh/h/ln 1774 1695 1583 1774 1695 1583 1774 0 1765 1774 1863 1583Q Serve(g_s), s 17.1 46.2 10.2 1.2 19.6 0.0 4.1 0.0 13.0 41.0 8.2 8.9Cycle Q Clear(g_c), s 17.1 46.2 10.2 1.2 19.6 0.0 4.1 0.0 13.0 41.0 8.2 8.9Prop In Lane 1.00 1.00 1.00 1.00 1.00 0.31 1.00 1.00Lane Grp Cap(c), veh/h 364 1843 574 81 1196 372 219 0 164 1769 753 640V/C Ratio(X) 0.81 0.94 0.28 0.25 0.66 0.00 0.27 0.00 1.13 0.92 0.22 0.24Avail Cap(c_a), veh/h 497 1843 574 97 1196 372 219 0 164 1901 798 679HCM Platoon Ratio 1.00 1.00 1.00 1.00 1.00 1.00 1.00 1.00 1.00 1.00 1.00 1.00Upstream Filter(I) 1.00 1.00 1.00 0.73 0.73 0.00 1.00 0.00 1.00 1.00 1.00 1.00Uniform Delay (d), s/veh 34.2 43.2 31.7 43.2 48.4 0.0 54.5 0.0 63.5 44.9 27.3 27.5Incr Delay (d2), s/veh 5.0 11.1 1.2 0.4 2.1 0.0 0.6 0.0 109.1 7.0 0.1 0.1Initial Q Delay(d3),s/veh 0.0 0.0 0.0 0.0 0.0 0.0 0.0 0.0 0.0 0.0 0.0 0.0%ile BackOfQ(50%),veh/ln 8.8 23.6 4.7 0.6 9.4 0.0 2.0 0.0 11.3 21.3 4.2 3.9LnGrp Delay(d),s/veh 39.3 54.3 33.0 43.7 50.5 0.0 55.2 0.0 172.6 51.9 27.4 27.6LnGrp LOS D D C D D E F D C CApproach Vol, veh/h 2193 807 243 1943Approach Delay, s/veh 50.7 50.4 144.5 47.9Approach LOS D D F D
Timer 1 2 3 4 5 6 7 8Assigned Phs 1 2 3 4 5 6 7 8Phs Duration (G+Y+Rc), s 26.5 39.9 53.5 20.0 8.7 57.7 10.0 63.6Change Period (Y+Rc), s 7.0 7.0 7.0 7.0 7.0 7.0 4.5 7.0Max Green Setting (Gmax), s 30.0 19.0 50.0 13.0 3.0 46.0 5.5 60.0Max Q Clear Time (g_c+I1), s 19.1 21.6 43.0 15.0 3.2 48.2 6.1 10.9Green Ext Time (p_c), s 0.5 0.0 3.5 0.0 0.0 0.0 0.0 1.0
Intersection SummaryHCM 2010 Ctrl Delay 54.0HCM 2010 LOS D
Notes

HCM 2010 Signalized Intersection Summary River North-High-Level-Option 2C1: Cowan Street & Jefferson Street/Spring Street Projected PM
KCI Technologies,Inc Synchro 9 Report10/12/2017 Page 1
Movement EBL EBT EBR WBL WBT WBR NBL NBT NBR SBL SBT SBRLane ConfigurationsTraffic Volume (veh/h) 239 1596 150 18 724 463 53 80 53 613 62 124Future Volume (veh/h) 239 1596 150 18 724 463 53 80 53 613 62 124Number 1 6 16 5 2 12 7 4 14 3 8 18Initial Q (Qb), veh 0 0 0 0 0 0 0 0 0 0 0 0Ped-Bike Adj(A_pbT) 1.00 1.00 1.00 1.00 1.00 1.00 1.00 1.00Parking Bus, Adj 1.00 1.00 1.00 1.00 1.00 1.00 1.00 1.00 1.00 1.00 1.00 1.00Adj Sat Flow, veh/h/ln 1863 1863 1863 1863 1863 1863 1863 1863 1900 1863 1863 1863Adj Flow Rate, veh/h 260 1735 163 20 787 0 58 87 58 666 118 101Adj No. of Lanes 1 2 1 1 3 1 1 1 0 2 1 1Peak Hour Factor 0.92 0.92 0.92 0.92 0.92 0.92 0.92 0.92 0.92 0.92 0.92 0.92Percent Heavy Veh, % 2 2 2 2 2 2 2 2 2 2 2 2Cap, veh/h 409 1777 795 74 2118 659 221 103 68 716 528 449Arrive On Green 0.10 0.50 0.50 0.00 0.14 0.00 0.03 0.10 0.10 0.20 0.28 0.28Sat Flow, veh/h 1774 3539 1583 1774 5085 1583 1774 1044 696 3548 1863 1583Grp Volume(v), veh/h 260 1735 163 20 787 0 58 0 145 666 118 101Grp Sat Flow(s),veh/h/ln 1774 1770 1583 1774 1695 1583 1774 0 1740 1774 1863 1583Q Serve(g_s), s 12.2 71.8 8.6 1.0 21.1 0.0 4.4 0.0 12.3 27.7 7.3 7.3Cycle Q Clear(g_c), s 12.2 71.8 8.6 1.0 21.1 0.0 4.4 0.0 12.3 27.7 7.3 7.3Prop In Lane 1.00 1.00 1.00 1.00 1.00 0.40 1.00 1.00Lane Grp Cap(c), veh/h 409 1777 795 74 2118 659 221 0 171 716 528 449V/C Ratio(X) 0.64 0.98 0.21 0.27 0.37 0.00 0.26 0.00 0.85 0.93 0.22 0.23Avail Cap(c_a), veh/h 497 1777 795 89 2118 659 221 0 238 757 621 528HCM Platoon Ratio 1.00 1.00 1.00 0.33 0.33 0.33 1.00 1.00 1.00 1.00 1.00 1.00Upstream Filter(I) 1.00 1.00 1.00 0.73 0.73 0.00 1.00 0.00 1.00 1.00 1.00 1.00Uniform Delay (d), s/veh 22.6 36.5 20.7 37.7 46.9 0.0 58.5 0.0 66.5 58.8 41.1 41.1Incr Delay (d2), s/veh 0.9 16.5 0.6 0.5 0.4 0.0 0.6 0.0 13.8 17.0 0.1 0.1Initial Q Delay(d3),s/veh 0.0 0.0 0.0 0.0 0.0 0.0 0.0 0.0 0.0 0.0 0.0 0.0%ile BackOfQ(50%),veh/ln 6.0 39.0 3.9 0.5 10.0 0.0 2.2 0.0 6.6 15.3 3.7 3.2LnGrp Delay(d),s/veh 23.5 52.9 21.3 38.2 47.2 0.0 59.1 0.0 80.3 75.8 41.2 41.2LnGrp LOS C D C D D E F E D DApproach Vol, veh/h 2158 807 203 885Approach Delay, s/veh 47.0 47.0 74.3 67.3Approach LOS D D E E
Timer 1 2 3 4 5 6 7 8Assigned Phs 1 2 3 4 5 6 7 8Phs Duration (G+Y+Rc), s 21.5 69.5 37.3 21.7 8.7 82.3 9.5 49.5Change Period (Y+Rc), s 7.0 7.0 7.0 7.0 7.0 7.0 4.5 7.0Max Green Setting (Gmax), s 22.0 47.5 32.0 20.5 3.0 66.5 5.0 50.0Max Q Clear Time (g_c+I1), s 14.2 23.1 29.7 14.3 3.0 73.8 6.4 9.3Green Ext Time (p_c), s 0.3 10.3 0.6 0.4 0.0 0.0 0.0 0.7
Intersection SummaryHCM 2010 Ctrl Delay 52.8HCM 2010 LOS D
Notes

HCM 2010 Signalized Intersection Summary River North-High-Level-Option 3A1: Cowan Street & Jefferson Street/Spring Street Projected PM
KCI Technologies,Inc Synchro 9 Report10/12/2017 Page 1
Movement EBL EBT EBR WBL WBT WBR NBL NBT NBR SBL SBT SBRLane ConfigurationsTraffic Volume (veh/h) 380 1773 150 18 805 606 53 122 53 807 119 315Future Volume (veh/h) 380 1773 150 18 805 606 53 122 53 807 119 315Number 1 6 16 5 2 12 7 4 14 3 8 18Initial Q (Qb), veh 0 0 0 0 0 0 0 0 0 0 0 0Ped-Bike Adj(A_pbT) 1.00 1.00 1.00 1.00 1.00 1.00 1.00 1.00Parking Bus, Adj 1.00 1.00 1.00 1.00 1.00 1.00 1.00 1.00 1.00 1.00 1.00 1.00Adj Sat Flow, veh/h/ln 1863 1863 1863 1863 1863 1863 1863 1863 1900 1863 1863 1863Adj Flow Rate, veh/h 413 1927 163 20 875 0 58 133 58 877 289 236Adj No. of Lanes 1 3 1 1 3 1 1 1 0 2 1 1Peak Hour Factor 0.92 0.92 0.92 0.92 0.92 0.92 0.92 0.92 0.92 0.92 0.92 0.92Percent Heavy Veh, % 2 2 2 2 2 2 2 2 2 2 2 2Cap, veh/h 432 2026 631 84 1112 346 235 157 68 873 661 562Arrive On Green 0.19 0.40 0.40 0.01 0.22 0.00 0.04 0.13 0.13 0.25 0.35 0.35Sat Flow, veh/h 1774 5085 1583 1774 5085 1583 1774 1231 537 3548 1863 1583Grp Volume(v), veh/h 413 1927 163 20 875 0 58 0 191 877 289 236Grp Sat Flow(s),veh/h/ln 1774 1695 1583 1774 1695 1583 1774 0 1768 1774 1863 1583Q Serve(g_s), s 23.2 47.7 9.0 1.1 21.1 0.0 3.7 0.0 13.7 32.0 15.4 14.7Cycle Q Clear(g_c), s 23.2 47.7 9.0 1.1 21.1 0.0 3.7 0.0 13.7 32.0 15.4 14.7Prop In Lane 1.00 1.00 1.00 1.00 1.00 0.30 1.00 1.00Lane Grp Cap(c), veh/h 432 2026 631 84 1112 346 235 0 226 873 661 562V/C Ratio(X) 0.96 0.95 0.26 0.24 0.79 0.00 0.25 0.00 0.85 1.00 0.44 0.42Avail Cap(c_a), veh/h 432 2026 631 102 1112 346 235 0 279 873 716 609HCM Platoon Ratio 1.00 1.00 1.00 1.00 1.00 1.00 1.00 1.00 1.00 1.00 1.00 1.00Upstream Filter(I) 1.00 1.00 1.00 0.73 0.73 0.00 1.00 0.00 1.00 1.00 1.00 1.00Uniform Delay (d), s/veh 32.5 37.9 26.2 41.4 47.9 0.0 46.8 0.0 55.5 49.0 32.0 31.8Incr Delay (d2), s/veh 31.9 11.4 1.0 0.4 4.2 0.0 0.5 0.0 15.2 31.5 0.2 0.2Initial Q Delay(d3),s/veh 0.0 0.0 0.0 0.0 0.0 0.0 0.0 0.0 0.0 0.0 0.0 0.0%ile BackOfQ(50%),veh/ln 18.4 24.4 4.1 0.6 10.3 0.0 1.8 0.0 7.7 19.5 8.0 6.4LnGrp Delay(d),s/veh 64.4 49.2 27.2 41.8 52.1 0.0 47.3 0.0 70.7 80.5 32.2 32.0LnGrp LOS E D C D D D E F C CApproach Vol, veh/h 2503 895 249 1402Approach Delay, s/veh 50.3 51.9 65.2 62.4Approach LOS D D E E
Timer 1 2 3 4 5 6 7 8Assigned Phs 1 2 3 4 5 6 7 8Phs Duration (G+Y+Rc), s 32.0 35.4 39.0 23.6 8.6 58.8 9.5 53.1Change Period (Y+Rc), s 7.0 7.0 7.0 7.0 7.0 7.0 4.5 7.0Max Green Setting (Gmax), s 25.0 24.5 32.0 20.5 3.0 46.5 5.0 50.0Max Q Clear Time (g_c+I1), s 25.2 23.1 34.0 15.7 3.1 49.7 5.7 17.4Green Ext Time (p_c), s 0.0 1.2 0.0 0.8 0.0 0.0 0.0 1.5
Intersection SummaryHCM 2010 Ctrl Delay 54.7HCM 2010 LOS D
Notes

HCM 2010 Signalized Intersection Summary River North-High-Level-Option 3B1: Cowan Street & Jefferson Street/Spring Street Projected PM
KCI Technologies,Inc Synchro 9 Report10/12/2017 Page 1
Movement EBL EBT EBR WBL WBT WBR NBL NBT NBR SBL SBT SBRLane ConfigurationsTraffic Volume (veh/h) 437 1773 150 18 805 788 53 145 53 1054 151 392Future Volume (veh/h) 437 1773 150 18 805 788 53 145 53 1054 151 392Number 1 6 16 5 2 12 7 4 14 3 8 18Initial Q (Qb), veh 0 0 0 0 0 0 0 0 0 0 0 0Ped-Bike Adj(A_pbT) 1.00 1.00 1.00 1.00 1.00 1.00 1.00 1.00Parking Bus, Adj 1.00 1.00 1.00 1.00 1.00 1.00 1.00 1.00 1.00 1.00 1.00 1.00Adj Sat Flow, veh/h/ln 1863 1863 1863 1863 1863 1863 1863 1863 1900 1863 1863 1863Adj Flow Rate, veh/h 475 1927 163 20 875 0 58 158 58 1146 360 295Adj No. of Lanes 1 3 1 1 3 1 1 1 0 3 1 1Peak Hour Factor 0.92 0.92 0.92 0.92 0.92 0.92 0.92 0.92 0.92 0.92 0.92 0.92Percent Heavy Veh, % 2 2 2 2 2 2 2 2 2 2 2 2Cap, veh/h 502 2348 731 99 1300 405 186 108 40 1295 567 482Arrive On Green 0.22 0.46 0.46 0.01 0.26 0.00 0.04 0.08 0.08 0.24 0.30 0.30Sat Flow, veh/h 1774 5085 1583 1774 5085 1583 1774 1301 478 5322 1863 1583Grp Volume(v), veh/h 475 1927 163 20 875 0 58 0 216 1146 360 295Grp Sat Flow(s),veh/h/ln 1774 1695 1583 1774 1695 1583 1774 0 1778 1774 1863 1583Q Serve(g_s), s 27.6 46.0 8.6 1.2 21.7 0.0 4.2 0.0 11.6 29.1 23.3 22.3Cycle Q Clear(g_c), s 27.6 46.0 8.6 1.2 21.7 0.0 4.2 0.0 11.6 29.1 23.3 22.3Prop In Lane 1.00 1.00 1.00 1.00 1.00 0.27 1.00 1.00Lane Grp Cap(c), veh/h 502 2348 731 99 1300 405 186 0 147 1295 567 482V/C Ratio(X) 0.95 0.82 0.22 0.20 0.67 0.00 0.31 0.00 1.47 0.89 0.63 0.61Avail Cap(c_a), veh/h 673 2348 731 116 1300 405 211 0 147 1559 633 538HCM Platoon Ratio 1.00 1.00 1.00 1.00 1.00 1.00 1.00 1.00 1.00 1.00 1.00 1.00Upstream Filter(I) 1.00 1.00 1.00 0.73 0.73 0.00 1.00 0.00 1.00 1.00 1.00 1.00Uniform Delay (d), s/veh 31.9 32.7 22.6 39.1 46.9 0.0 55.7 0.0 64.2 51.1 42.0 41.6Incr Delay (d2), s/veh 16.9 3.4 0.7 0.3 2.1 0.0 0.9 0.0 242.8 5.0 1.1 1.0Initial Q Delay(d3),s/veh 0.0 0.0 0.0 0.0 0.0 0.0 0.0 0.0 0.0 0.0 0.0 0.0%ile BackOfQ(50%),veh/ln 20.3 22.1 3.9 0.6 10.4 0.0 2.1 0.0 15.6 14.8 12.2 9.9LnGrp Delay(d),s/veh 48.8 36.0 23.3 39.4 48.9 0.0 56.7 0.0 307.0 56.1 43.1 42.6LnGrp LOS D D C D D E F E D DApproach Vol, veh/h 2565 895 274 1801Approach Delay, s/veh 37.6 48.7 254.0 51.3Approach LOS D D F D
Timer 1 2 3 4 5 6 7 8Assigned Phs 1 2 3 4 5 6 7 8Phs Duration (G+Y+Rc), s 37.6 42.8 41.1 18.6 8.7 71.6 10.0 49.6Change Period (Y+Rc), s 7.0 7.0 7.0 7.0 7.0 7.0 4.5 7.0Max Green Setting (Gmax), s 44.0 15.4 41.0 11.6 3.0 56.4 7.5 47.6Max Q Clear Time (g_c+I1), s 29.6 23.7 31.1 13.6 3.2 48.0 6.2 25.3Green Ext Time (p_c), s 1.0 0.0 3.0 0.0 0.0 6.0 0.0 1.8
Intersection SummaryHCM 2010 Ctrl Delay 54.6HCM 2010 LOS D
Notes

HCM 2010 Signalized Intersection Summary River North-High-Level-Option 3C1: Cowan Street & Jefferson Street/Spring Street Projected PM
KCI Technologies,Inc Synchro 9 Report10/12/2017 Page 1
Movement EBL EBT EBR WBL WBT WBR NBL NBT NBR SBL SBT SBRLane ConfigurationsTraffic Volume (veh/h) 308 1773 150 18 805 380 53 93 53 502 81 218Future Volume (veh/h) 308 1773 150 18 805 380 53 93 53 502 81 218Number 1 6 16 5 2 12 7 4 14 3 8 18Initial Q (Qb), veh 0 0 0 0 0 0 0 0 0 0 0 0Ped-Bike Adj(A_pbT) 1.00 1.00 1.00 1.00 1.00 1.00 1.00 1.00Parking Bus, Adj 1.00 1.00 1.00 1.00 1.00 1.00 1.00 1.00 1.00 1.00 1.00 1.00Adj Sat Flow, veh/h/ln 1863 1863 1863 1863 1863 1863 1863 1863 1900 1863 1863 1863Adj Flow Rate, veh/h 335 1927 163 20 875 0 58 101 58 546 200 162Adj No. of Lanes 1 2 1 1 3 1 1 1 0 2 1 1Peak Hour Factor 0.92 0.92 0.92 0.92 0.92 0.92 0.92 0.92 0.92 0.92 0.92 0.92Percent Heavy Veh, % 2 2 2 2 2 2 2 2 2 2 2 2Cap, veh/h 498 1859 832 68 2105 655 217 120 69 598 484 412Arrive On Green 0.12 0.53 0.53 0.02 0.83 0.00 0.03 0.11 0.11 0.17 0.26 0.26Sat Flow, veh/h 1774 3539 1583 1774 5085 1583 1774 1112 638 3548 1863 1583Grp Volume(v), veh/h 335 1927 163 20 875 0 58 0 159 546 200 162Grp Sat Flow(s),veh/h/ln 1774 1770 1583 1774 1695 1583 1774 0 1750 1774 1863 1583Q Serve(g_s), s 15.7 78.8 8.2 1.0 6.8 0.0 4.4 0.0 13.4 22.7 13.4 12.7Cycle Q Clear(g_c), s 15.7 78.8 8.2 1.0 6.8 0.0 4.4 0.0 13.4 22.7 13.4 12.7Prop In Lane 1.00 1.00 1.00 1.00 1.00 0.36 1.00 1.00Lane Grp Cap(c), veh/h 498 1859 832 68 2105 655 217 0 189 598 484 412V/C Ratio(X) 0.67 1.04 0.20 0.29 0.42 0.00 0.27 0.00 0.84 0.91 0.41 0.39Avail Cap(c_a), veh/h 884 1859 832 83 2105 655 217 0 286 662 621 528HCM Platoon Ratio 1.00 1.00 1.00 2.00 2.00 2.00 1.00 1.00 1.00 1.00 1.00 1.00Upstream Filter(I) 1.00 1.00 1.00 0.73 0.73 0.00 1.00 0.00 1.00 1.00 1.00 1.00Uniform Delay (d), s/veh 19.3 35.6 18.8 37.5 8.2 0.0 57.2 0.0 65.6 61.3 46.0 45.8Incr Delay (d2), s/veh 0.6 31.0 0.5 0.6 0.4 0.0 0.7 0.0 8.3 15.3 0.2 0.2Initial Q Delay(d3),s/veh 0.0 0.0 0.0 0.0 0.0 0.0 0.0 0.0 0.0 0.0 0.0 0.0%ile BackOfQ(50%),veh/ln 7.7 46.2 3.7 0.5 3.2 0.0 2.2 0.0 6.9 12.4 6.9 5.6LnGrp Delay(d),s/veh 19.9 66.6 19.4 38.1 8.6 0.0 57.8 0.0 73.9 76.5 46.2 46.0LnGrp LOS B F B D A E E E D DApproach Vol, veh/h 2425 895 217 908Approach Delay, s/veh 56.9 9.3 69.6 64.4Approach LOS E A E E
Timer 1 2 3 4 5 6 7 8Assigned Phs 1 2 3 4 5 6 7 8Phs Duration (G+Y+Rc), s 25.4 69.1 32.3 23.2 8.7 85.8 9.5 46.0Change Period (Y+Rc), s 7.0 7.0 7.0 7.0 7.0 7.0 4.5 7.0Max Green Setting (Gmax), s 51.0 18.5 28.0 24.5 3.0 66.5 5.0 50.0Max Q Clear Time (g_c+I1), s 17.7 8.8 24.7 15.4 3.0 80.8 6.4 15.4Green Ext Time (p_c), s 0.7 6.8 0.6 0.8 0.0 0.0 0.0 1.1
Intersection SummaryHCM 2010 Ctrl Delay 49.5HCM 2010 LOS D
Notes

HCM 2010 Signalized Intersection Summary River North-High-Level-Option 4A1: Cowan Street & Jefferson Street/Spring Street Projected PM
KCI Technologies,Inc Synchro 9 Report10/12/2017 Page 1
Movement EBL EBT EBR WBL WBT WBR NBL NBT NBR SBL SBT SBRLane ConfigurationsTraffic Volume (veh/h) 265 1596 150 18 724 736 53 111 53 984 104 159Future Volume (veh/h) 265 1596 150 18 724 736 53 111 53 984 104 159Number 1 6 16 5 2 12 7 4 14 3 8 18Initial Q (Qb), veh 0 0 0 0 0 0 0 0 0 0 0 0Ped-Bike Adj(A_pbT) 1.00 1.00 1.00 1.00 1.00 1.00 1.00 1.00Parking Bus, Adj 1.00 1.00 1.00 1.00 1.00 1.00 1.00 1.00 1.00 1.00 1.00 1.00Adj Sat Flow, veh/h/ln 1863 1863 1863 1863 1863 1863 1863 1863 1900 1863 1863 1863Adj Flow Rate, veh/h 288 1735 163 20 787 0 58 121 58 1070 158 143Adj No. of Lanes 1 3 1 1 3 1 1 1 0 2 1 1Peak Hour Factor 0.92 0.92 0.92 0.92 0.92 0.92 0.92 0.92 0.92 0.92 0.92 0.92Percent Heavy Veh, % 2 2 2 2 2 2 2 2 2 2 2 2Cap, veh/h 365 1883 586 84 1263 393 246 140 67 1064 739 629Arrive On Green 0.13 0.37 0.37 0.01 0.25 0.00 0.04 0.12 0.12 0.30 0.40 0.40Sat Flow, veh/h 1774 5085 1583 1774 5085 1583 1774 1191 571 3548 1863 1583Grp Volume(v), veh/h 288 1735 163 20 787 0 58 0 179 1070 158 143Grp Sat Flow(s),veh/h/ln 1774 1695 1583 1774 1695 1583 1774 0 1762 1774 1863 1583Q Serve(g_s), s 16.4 45.7 10.1 1.2 19.3 0.0 4.0 0.0 14.0 42.0 7.8 8.4Cycle Q Clear(g_c), s 16.4 45.7 10.1 1.2 19.3 0.0 4.0 0.0 14.0 42.0 7.8 8.4Prop In Lane 1.00 1.00 1.00 1.00 1.00 0.32 1.00 1.00Lane Grp Cap(c), veh/h 365 1883 586 84 1263 393 246 0 207 1064 739 629V/C Ratio(X) 0.79 0.92 0.28 0.24 0.62 0.00 0.24 0.00 0.87 1.01 0.21 0.23Avail Cap(c_a), veh/h 482 1883 586 100 1263 393 247 0 252 1064 785 667HCM Platoon Ratio 1.00 1.00 1.00 1.00 1.00 1.00 1.00 1.00 1.00 1.00 1.00 1.00Upstream Filter(I) 1.00 1.00 1.00 0.73 0.73 0.00 1.00 0.00 1.00 1.00 1.00 1.00Uniform Delay (d), s/veh 33.2 42.1 30.9 41.9 46.8 0.0 51.6 0.0 60.7 49.0 27.8 28.0Incr Delay (d2), s/veh 4.5 8.9 1.2 0.4 1.7 0.0 0.5 0.0 19.7 28.9 0.1 0.1Initial Q Delay(d3),s/veh 0.0 0.0 0.0 0.0 0.0 0.0 0.0 0.0 0.0 0.0 0.0 0.0%ile BackOfQ(50%),veh/ln 8.5 22.9 4.6 0.6 9.2 0.0 2.0 0.0 7.9 24.8 4.0 3.7LnGrp Delay(d),s/veh 37.7 51.1 32.1 42.3 48.5 0.0 52.1 0.0 80.4 77.9 27.9 28.1LnGrp LOS D D C D D D F F C CApproach Vol, veh/h 2186 807 237 1371Approach Delay, s/veh 47.9 48.3 73.5 66.9Approach LOS D D E E
Timer 1 2 3 4 5 6 7 8Assigned Phs 1 2 3 4 5 6 7 8Phs Duration (G+Y+Rc), s 25.8 41.8 49.0 23.4 8.7 58.8 9.9 62.6Change Period (Y+Rc), s 7.0 7.0 7.0 7.0 7.0 7.0 4.5 7.0Max Green Setting (Gmax), s 28.0 22.0 42.0 20.0 3.0 47.0 5.5 59.0Max Q Clear Time (g_c+I1), s 18.4 21.3 44.0 16.0 3.2 47.7 6.0 10.4Green Ext Time (p_c), s 0.4 0.6 0.0 0.5 0.0 0.0 0.0 1.0
Intersection SummaryHCM 2010 Ctrl Delay 55.0HCM 2010 LOS D
Notes

HCM 2010 Signalized Intersection Summary River North-High-Level-Option 4B1: Cowan St & Jefferson St/Spring St Projected PM
KCI Technologies,Inc Synchro 9 Report10/12/2017 Page 1
Movement EBL EBT EBR WBL WBT WBR NBL NBT NBR SBL SBT SBRLane ConfigurationsTraffic Volume (veh/h) 285 1596 150 18 724 1028 53 135 53 1381 137 186Future Volume (veh/h) 285 1596 150 18 724 1028 53 135 53 1381 137 186Number 1 6 16 5 2 12 7 4 14 3 8 18Initial Q (Qb), veh 0 0 0 0 0 0 0 0 0 0 0 0Ped-Bike Adj(A_pbT) 1.00 1.00 1.00 1.00 1.00 1.00 1.00 1.00Parking Bus, Adj 1.00 1.00 1.00 1.00 1.00 1.00 1.00 1.00 1.00 1.00 1.00 1.00Adj Sat Flow, veh/h/ln 1863 1863 1863 1863 1863 1863 1863 1863 1900 1863 1863 1863Adj Flow Rate, veh/h 310 1735 163 20 787 0 58 147 58 1501 189 176Adj No. of Lanes 1 3 1 1 3 1 1 1 0 3 1 1Peak Hour Factor 0.92 0.92 0.92 0.92 0.92 0.92 0.92 0.92 0.92 0.92 0.92 0.92Percent Heavy Veh, % 2 2 2 2 2 2 2 2 2 2 2 2Cap, veh/h 371 1806 562 82 1112 346 257 169 67 1515 742 631Arrive On Green 0.15 0.36 0.36 0.01 0.22 0.00 0.04 0.13 0.13 0.28 0.40 0.40Sat Flow, veh/h 1774 5085 1583 1774 5085 1583 1774 1272 502 5322 1863 1583Grp Volume(v), veh/h 310 1735 163 20 787 0 58 0 205 1501 189 176Grp Sat Flow(s),veh/h/ln 1774 1695 1583 1774 1695 1583 1774 0 1774 1774 1863 1583Q Serve(g_s), s 17.0 43.4 9.6 1.1 18.6 0.0 3.6 0.0 14.7 36.5 8.8 9.8Cycle Q Clear(g_c), s 17.0 43.4 9.6 1.1 18.6 0.0 3.6 0.0 14.7 36.5 8.8 9.8Prop In Lane 1.00 1.00 1.00 1.00 1.00 0.28 1.00 1.00Lane Grp Cap(c), veh/h 371 1806 562 82 1112 346 257 0 235 1515 742 631V/C Ratio(X) 0.84 0.96 0.29 0.24 0.71 0.00 0.23 0.00 0.87 0.99 0.25 0.28Avail Cap(c_a), veh/h 448 1806 562 101 1112 346 263 0 273 1515 775 659HCM Platoon Ratio 1.00 1.00 1.00 1.00 1.00 1.00 1.00 1.00 1.00 1.00 1.00 1.00Upstream Filter(I) 1.00 1.00 1.00 1.00 1.00 0.00 1.00 0.00 1.00 1.00 1.00 1.00Uniform Delay (d), s/veh 32.7 41.0 30.1 41.6 47.0 0.0 46.2 0.0 55.3 46.3 26.2 26.5Incr Delay (d2), s/veh 9.4 13.8 1.3 0.6 3.8 0.0 0.4 0.0 20.8 20.9 0.1 0.1Initial Q Delay(d3),s/veh 0.0 0.0 0.0 0.0 0.0 0.0 0.0 0.0 0.0 0.0 0.0 0.0%ile BackOfQ(50%),veh/ln 9.2 22.5 4.4 0.6 9.1 0.0 1.8 0.0 8.6 20.9 4.6 4.3LnGrp Delay(d),s/veh 42.2 54.8 31.4 42.2 50.8 0.0 46.7 0.0 76.1 67.2 26.3 26.6LnGrp LOS D D C D D D E E C CApproach Vol, veh/h 2208 807 263 1866Approach Delay, s/veh 51.3 50.6 69.6 59.2Approach LOS D D E E
Timer 1 2 3 4 5 6 7 8Assigned Phs 1 2 3 4 5 6 7 8Phs Duration (G+Y+Rc), s 26.4 35.4 44.0 24.2 8.6 53.2 9.4 58.8Change Period (Y+Rc), s 7.0 7.0 7.0 7.0 7.0 7.0 4.5 7.0Max Green Setting (Gmax), s 25.0 20.0 37.0 20.0 3.0 42.0 5.4 54.1Max Q Clear Time (g_c+I1), s 19.0 20.6 38.5 16.7 3.1 45.4 5.6 11.8Green Ext Time (p_c), s 0.4 0.0 0.0 0.5 0.0 0.0 0.0 1.2
Intersection SummaryHCM 2010 Ctrl Delay 55.0HCM 2010 LOS D
Notes

HCM 2010 Signalized Intersection Summary River North-High-Level-Option 4C1: Cowan Street & Jefferson Street/Spring Street Projected PM
KCI Technologies,Inc Synchro 9 Report10/12/2017 Page 1
Movement EBL EBT EBR WBL WBT WBR NBL NBT NBR SBL SBT SBRLane ConfigurationsTraffic Volume (veh/h) 248 1596 150 18 724 485 53 90 53 644 76 136Future Volume (veh/h) 248 1596 150 18 724 485 53 90 53 644 76 136Number 1 6 16 5 2 12 7 4 14 3 8 18Initial Q (Qb), veh 0 0 0 0 0 0 0 0 0 0 0 0Ped-Bike Adj(A_pbT) 1.00 1.00 1.00 1.00 1.00 1.00 1.00 1.00Parking Bus, Adj 1.00 1.00 1.00 1.00 1.00 1.00 1.00 1.00 1.00 1.00 1.00 1.00Adj Sat Flow, veh/h/ln 1863 1863 1863 1863 1863 1863 1863 1863 1900 1863 1863 1863Adj Flow Rate, veh/h 270 1735 163 20 787 0 58 98 58 700 132 116Adj No. of Lanes 1 2 1 1 3 1 1 1 0 2 1 1Peak Hour Factor 0.92 0.92 0.92 0.92 0.92 0.92 0.92 0.92 0.92 0.92 0.92 0.92Percent Heavy Veh, % 2 2 2 2 2 2 2 2 2 2 2 2Cap, veh/h 428 1729 773 68 2011 626 225 114 68 743 553 470Arrive On Green 0.10 0.49 0.49 0.01 0.40 0.00 0.03 0.10 0.10 0.21 0.30 0.30Sat Flow, veh/h 1774 3539 1583 1774 5085 1583 1774 1098 650 3548 1863 1583Grp Volume(v), veh/h 270 1735 163 20 787 0 58 0 156 700 132 116Grp Sat Flow(s),veh/h/ln 1774 1770 1583 1774 1695 1583 1774 0 1748 1774 1863 1583Q Serve(g_s), s 13.1 73.3 8.8 1.0 16.6 0.0 4.4 0.0 13.2 29.1 8.0 8.3Cycle Q Clear(g_c), s 13.1 73.3 8.8 1.0 16.6 0.0 4.4 0.0 13.2 29.1 8.0 8.3Prop In Lane 1.00 1.00 1.00 1.00 1.00 0.37 1.00 1.00Lane Grp Cap(c), veh/h 428 1729 773 68 2011 626 225 0 182 743 553 470V/C Ratio(X) 0.63 1.00 0.21 0.29 0.39 0.00 0.26 0.00 0.86 0.94 0.24 0.25Avail Cap(c_a), veh/h 728 1729 773 83 2011 626 225 0 239 757 621 528HCM Platoon Ratio 1.00 1.00 1.00 1.00 1.00 1.00 1.00 1.00 1.00 1.00 1.00 1.00Upstream Filter(I) 1.00 1.00 1.00 0.73 0.73 0.00 1.00 0.00 1.00 1.00 1.00 1.00Uniform Delay (d), s/veh 22.9 38.4 21.9 38.4 32.4 0.0 57.7 0.0 66.1 58.4 39.9 40.0Incr Delay (d2), s/veh 0.6 22.5 0.6 0.6 0.4 0.0 0.6 0.0 16.9 19.5 0.1 0.1Initial Q Delay(d3),s/veh 0.0 0.0 0.0 0.0 0.0 0.0 0.0 0.0 0.0 0.0 0.0 0.0%ile BackOfQ(50%),veh/ln 6.4 41.2 4.0 0.5 7.9 0.0 2.2 0.0 7.2 16.3 4.2 3.7LnGrp Delay(d),s/veh 23.4 60.9 22.5 39.1 32.8 0.0 58.3 0.0 83.0 77.9 40.0 40.1LnGrp LOS C F C D C E F E D DApproach Vol, veh/h 2168 807 214 948Approach Delay, s/veh 53.3 33.0 76.3 68.0Approach LOS D C E E
Timer 1 2 3 4 5 6 7 8Assigned Phs 1 2 3 4 5 6 7 8Phs Duration (G+Y+Rc), s 22.7 66.3 38.4 22.6 8.7 80.3 9.5 51.5Change Period (Y+Rc), s 7.0 7.0 7.0 7.0 7.0 7.0 4.5 7.0Max Green Setting (Gmax), s 41.0 28.5 32.0 20.5 3.0 66.5 5.0 50.0Max Q Clear Time (g_c+I1), s 15.1 18.6 31.1 15.2 3.0 75.3 6.4 10.3Green Ext Time (p_c), s 0.5 6.2 0.3 0.5 0.0 0.0 0.0 0.8
Intersection SummaryHCM 2010 Ctrl Delay 53.9HCM 2010 LOS D
Notes

River North Development Study October 2017
-93- 16-0908
APPENDIX E
TRIP GENERATION CALCULATIONS

River North Development Study October 2017
-94- 16-0908
TRIP GENERATION
River North Mixed-Use Development-Phase 1 Evaluation
Office – 3,029,000 square feet
Use ITE Land Use Code 710 and associated trip generation rates for 24-hour total trips
and peak hour trips.
Average Daily Traffic – Use Average Rate for Average Daily Traffic on a Weekday
LN (T) = 0.76 LN (X/1000) + 3.68
LN (T) = 0.76 LN (3,029) + 3.68
T = 17,538
A.M. Peak Hour - Use Average Rate for AM Peak Hour of the Adjacent Street (between
7:00 AM and 9:00 AM)
LN (T) = 0.8 LN (X/1000) + 1.57
LN (T) = 0.8 LN (3,029) + 1.57
T = 2,930
Enter = 0.88 (2,930) = 2,578
Exit = 0.12 (2,930) = 352
P.M. Peak Hour - Use Average Rate for PM Peak Hour of the Adjacent Street (between
4:00 PM and 6:00 PM)
T = 1.12 (X/1000) + 78.45
T = 1.12 (3,029) + 78.45
T = 3,471
Enter = 0.17 (3,471) = 590
Exit = 0.83 (3,471) = 2,881

River North Development Study October 2017
-95- 16-0908
TRIP GENERATION
River North Mixed-Use Development – Phase 1 Evaluation
Apartment – 1,735 Units
Use ITE Land Use Code 220 and associated trip generation rates for 24-hour total trips
and peak hour trips.
Average Daily Traffic – Use the Fitted Curve Equation for Average Daily Traffic on a
Weekday
T = 6.06 (X) + 123.56
T = 6.06 (1,735) + 123.56
T = 10,638
A.M. Peak Hour - Use the Fitted Curve Equation for the AM Peak Hour of the Adjacent
Street Traffic (one hour between 7:00 AM and 9:00 AM) on a Weekday
T = 0.49 (X) + 3.73
T = 0.49 (1,735) + 3.73
T = 854
Enter = 0.20 (854) = 171
Exit = 0.80 (854) = 683
P.M. Peak Hour - Use the Fitted Curve Equation for the PM Peak Hour of the Adjacent
Street Traffic (one hour between 4:00 PM and 6:00 PM) on a Weekday
T = 0.55 (X) + 17.65
T = 0.55 (1,735) + 17.65
T = 972
Enter = 0.65 (972) = 632
Exit = 0.35 (972) = 340

River North Development Study October 2017
-96- 16-0908
TRIP GENERATION
River North Mixed-Use Development – Phase 1 Evaluation
Hotel – 550 Rooms
Use ITE Land Use Code 310 and associated trip generation rates for 24-hour total trips
and peak hour trips.
Average Daily Traffic – Use the Fitted Curve Equation for Average Daily Traffic on a
Weekday
T = 8.95 (X) – 373.16
T = 8.95 (550) – 373.16
T = 4,549
A.M. Peak Hour - Use the Fitted Curve Equation for the AM Peak Hour of the Adjacent
Street Traffic (one hour between 7:00 AM and 9:00 AM) on a Weekday
T = 0.53 (X)
T = 0.53 (550)
T = 292
Enter = 0.59 (292) = 172
Exit = 0.41 (292) = 120
P.M. Peak Hour - Use the Fitted Curve Equation for the PM Peak Hour of the Adjacent
Street Traffic (one hour between 4:00 PM and 6:00 PM) on a Weekday
T = 0.60 (X)
T = 0.60 (550)
T = 330
Enter = 0.51 (330) = 168
Exit = 0.49 (330) = 162

River North Development Study October 2017
-97- 16-0908
TRIP GENERATION
River North Mixed-Use Development – Phase 1 Evaluation
Specialty Retail – 200,000 square feet
Use ITE Land Use Code 826 and associated trip generation rates for 24-hour total trips
and peak hour trips.
Average Daily Traffic
T = 42.78 (X/1000) + 37.66
T = 42.78 (200) + 37.66
T = 8,594
AM Peak Hour – None in the Trip Gen Manual- Assumed 50% of the PM Peak Hour.
PM Peak Hour - Use PM Peak Hour of the Adjacent Street (between 4:00 and 6:00 PM)
T = 2.40(X/1000) +21.48
T = 2.40(200) +21.48
T = 501
Enter = 0.44 (501) = 221 Exit = 0.56 (501) = 281

River North Development Study October 2017
-98- 16-0908
TRIP GENERATION
River North Mixed-Use Development – Phase 1 Evaluation
Quality Restaurant – 27,840 square feet
Use ITE Land Use Code 931 and associated trip generation rates for 24-hour total trips
and peak hour trips.
Average Daily Traffic
T = 89.95 (X/1000)
T = 89.95 (27.840)
T = 2,504
A.M. Peak Hour - Use average rate for the AM Peak Hour of the Adjacent Street
(between 7:00 AM and 9:00 AM). Directional Distribution not provided, use AM Peak
Hour of Generator distribution.
T = 0.81 (X/1000)
T = 0.81 (27.840)
T = 23
Enter = 0.82 (23) = 18
Exit = 0.18 (23) = 5
P.M. Peak Hour - Use average rate for the PM Peak Hour of the Adjacent Street
(between 4:00 PM and 6:00 PM)
T = 7.49 (X/1000)
T = 7.49 (27.840)
T = 209
Enter = 0.67 (209) = 140
Exit = 0.33 (209) = 69

River North Development Study October 2017
-99- 16-0908
TRIP GENERATION
River North Mixed-Use Development – Phase 1 Evaluation
High Turnover Restaurant – 27,840 square feet
Use ITE Land Use Code 932 and associated trip generation rates for 24-hour total trips
and peak hour trips.
Average Daily Traffic
T = 127.15 (X/1000)
T = 127.15 (27.840)
T = 3,540
A.M. Peak Hour - Use average rate for the AM Peak Hour of the Adjacent Street
(between 7:00 AM and 9:00 AM). Directional Distribution not provided, use AM Peak
Hour of Generator distribution.
T = 10.81 (X/1000)
T = 10.81 (27.840)
T = 301
Enter = 0.55 (301) = 166
Exit = 0.45 (301) = 135
P.M. Peak Hour - Use average rate for the PM Peak Hour of the Adjacent Street
(between 4:00 PM and 6:00 PM)
T = 9.85 (X/1000)
T = 9.85 (27.840)
T = 274
Enter = 0.60 (274) = 164
Exit = 0.40 (274) = 110

River North Development Study October 2017
-100- 16-0908
TRIP GENERATION
River North Mixed-Use Development – Phase 1 Evaluation
Coffee/Donut Shop without Drive-Through Window – 2,320 square feet
Use ITE Land Use Code 936 and associated trip generation rates peak hour trips.
Average Daily Traffic – Assume AM peak hour trips account for 20% of average daily
traffic
T = 5 (AM Peak Hour)
T = 5 (251)
T = 1,257
A.M. Peak Hour – Use AM Peak Hour of the Adjacent Street (between 7:00 AM and
9:00 AM)
T = 108.38 (X/1000)
T = 108.38 (2.320)
T = 251
Enter = 0.51 (251) = 128
Exit = 0.49 (251) = 123
P.M. Peak Hour - Use PM Peak Hour of the Adjacent Street (between 4:00 PM and 6:00
PM)
T = 40.75 (X/1000)
T = 40.75 (2.320)
T = 95
Enter = 0.50 (95) = 47
Exit = 0.50 (95) = 47

River North Development Study October 2017
-101- 16-0908
Project Name: Organization:Project Location: Performed By:Scenario Description: Date:Analysis Year: Checked By:Analysis Period: Date:
ITE LUCs1 Quantity Units Total Entering ExitingOffice 710 0 ksf 2,930 2,578 352Retail 826 0 ksf 251 110 140Restaurant 932/931/ 936 0 ksf 575 312 263Cinema/Entertainment 445 0 seats 0 0 0Residential 220,230 0 du 854 171 683Hotel 310 0 rooms 292 172 120All Other Uses - 0 - 0 0 0Total - - - 4,901 3,344 1,557
Veh. Occ. % Transit % Non-Motorized Veh. Occ. % Transit % Non-MotorizedOffice 1.00 0% 0% 1.00 0% 0%Retail 1.00 0% 0% 1.00 0% 0%Restaurant 1.00 0% 0% 1.00 0% 0%Cinema/Entertainment 1.00 0% 0% 1.00 0% 0%Residential 1.00 0% 0% 1.00 0% 0%Hotel 1.00 0% 0% 1.00 0% 0%All Other Uses2 1.00 0% 0% 1.00 0% 0%Total
Office Retail Restaurant Residential HotelOffice 0 500 500 500 500Retail 500 0 500 500 500Restaurant 500 500 0 500 500Cinema/Entertainment 500 500 500 500 500Residential 500 500 500 0 500Hotel 500 500 500 500 0
Office Retail Restaurant Residential HotelOffice 35 72 0 0Retail 41 18 3 0Restaurant 81 9 9 7Cinema/Entertainment 0 0 0 0 0Residential 102 7 62 0Hotel 77 4 11 0
Total Entering Exiting Land Use Entering Trips Exiting TripsAll Person-Trips 4,901 3,344 1,557 Office 11.7% 30.4%Internal Trips 1,076 538 538 Retail 49.9% 44.2%Interal Capture Percentage 22.0% 16.1% 34.5% Restaurant 52.2% 40.4%External Vehicle-Trips3 3,825 2,806 1,019 Cinema/Entertainment #DIV/0! #DIV/0!External Transit-Trips4 0 0 0 Residential 7.0% 25.0%External Non-motorized Trips4 0 0 0 Hotel 4.1% 77.0%
4 Person-trips
000
00
Table 5-A: Computations Summary Table 6-A: Internal Trip Capture Percentages by Land Use
1 Land Use Codes (LUCs) from Trip Generation Informational Report, ITE.2 Total estimate for all other land uses at mixed-use development site-not subject to internal trip capture computations in this estimator.3 Vehicle-trips computed using the mode split and vehicle occupancy values provided in Table 2-A
0500500
Table 4-A: Internal Person-Trip Origin-Destination Matrix
Origin (From) Destination (To)Cinema/Entertainment
500
Table 2-A: Mode Split and Vehicle Occupancy Estimates
Land Use Entering Trips Exiting Trips
Table 3-A: Average Land Use Interchange Distances (Feet Walking Distance)
Origin (From) Destination (To)Cinema/Entertainment
500500
Table 1-A: Base Vehicle-Trip Generation Estimates (Single-Use Site Estimate)
Land Use Development Data Estimated Vehicle-Trips
NCHRP 684 Internal Trip Capture EstimatorRiver North KCI Technologies, Inc
AM Peak Hour

River North Development Study October 2017
-102- 16-0908
Project Name: Organization:Project Location: Performed By:Scenario Description: Date:Analysis Year: Checked By:Analysis Period: Date:
ITE LUCs1 Quantity Units Total Entering ExitingOffice 710 0 ksf 3,471 590 2,881Retail 826 0 ksf 501 221 281Restaurant 932/931/ 936 0 ksf 577 352 226Cinema/Entertainment 445 0 seats 0 0 0Residential 220,230 0 du 972 632 340Hotel 310 0 rooms 330 168 162All Other Uses - 0 - 0 0 0Total - - - 5,852 1,962 3,889
Veh. Occ. % Transit % Non-Motorized Veh. Occ. % Transit % Non-MotorizedOffice 1.00 0% 0% 1.00 0% 0%Retail 1.00 0% 0% 1.00 0% 0%Restaurant 1.00 0% 0% 1.00 0% 0%Cinema/Entertainment 1.00 0% 0% 1.00 0% 0%Residential 1.00 0% 0% 1.00 0% 0%Hotel 1.00 0% 0% 1.00 0% 0%All Other Uses2 1.00 0% 0% 1.00 0% 0%Total
Office Retail Restaurant Residential HotelOffice 0 500 500 500 500Retail 500 0 500 500 500Restaurant 500 500 0 500 500Cinema/Entertainment 500 500 500 500 500Residential 500 500 500 0 500Hotel 500 500 500 500 0
Office Retail Restaurant Residential HotelOffice 18 7 95 0Retail 6 81 73 14Restaurant 7 93 41 16Cinema/Entertainment 0 0 0 0 0Residential 14 22 49 10Hotel 0 4 18 0
Total Entering Exiting Land Use Entering Trips Exiting TripsAll Person-Trips 5,852 1,962 3,889 Office 4.6% 4.2%Internal Trips 1,136 568 568 Retail 62.1% 62.0%Interal Capture Percentage 19.4% 28.9% 14.6% Restaurant 44.1% 69.5%External Vehicle-Trips3 4,716 1,394 3,321 Cinema/Entertainment #DIV/0! #DIV/0!External Transit-Trips4 0 0 0 Residential 33.1% 27.9%External Non-motorized Trips4 0 0 0 Hotel 23.8% 13.6%
4 Person-trips
000
00
Table 5-P: Computations Summary Table 6-P: Internal Trip Capture Percentages by Land Use
1 Land Use Codes (LUCs) from Trip Generation Informational Report, ITE.2 Total estimate for all other land uses at mixed-use development site-not subject to internal trip capture computations in this estimator.3 Vehicle-trips computed using the mode split and vehicle occupancy values provided in Table 2-P
0500500
Table 4-P: Internal Person-Trip Origin-Destination Matrix
Origin (From) Destination (To)Cinema/Entertainment
500
Table 2-P: Mode Split and Vehicle Occupancy Estimates
Land Use Entering Trips Exiting Trips
Table 3-P: Average Land Use Interchange Distances (Feet Walking Distance)
Origin (From) Destination (To)Cinema/Entertainment
500500
Table 1-P: Base Vehicle-Trip Generation Estimates (Single-Use Site Estimate)
Land Use Development Data Estimated Vehicle-Trips
NCHRP 684 Internal Trip Capture EstimatorKCI Technologies, Inc
PM Peak Hour

River North Development Study October 2017
-103- 16-0908
DAILY
TRAFFIC ENTER EXIT ENTER EXIT
Office 3,029,000 s.f. 17,538 2,578 352 590 2,881
Specialty Retail 200,000 s.f. 8,594 110 140 221 281
Restaurant 58,000 s.f. 7,301 312 263 352 226
Apartments 1,735 d.u. 10,638 171 683 632 340
Hotel 550 rooms 4,549 172 120 168 162
TOTAL 48,620 3,343 1,558 1,963 3,890
Assumes: 20% Internal (for daily traffic)use internal capture spread sheet for AM and PM reduction factor
DAILY
TRAFFIC ENTER EXIT ENTER EXIT
Office 3,029,000 s.f. 3,508 301 107 27 120
Specialty Retail 200,000 s.f. 1,719 55 62 137 174
Restaurant 58,000 s.f. 1,460 163 106 155 157
Apartments 1,735 d.u. 2,128 12 171 209 95
Hotel 550 rooms 910 7 92 40 22
TOTAL 9,725 538 538 568 568
Assumes: 20% Internal (for daily traffic)
DAILY
TRAFFIC ENTER EXIT ENTER EXIT
Office 3,029,000 s.f. 14,030 2,277 245 563 2,761
Specialty Retail 200,000 s.f. 6,875 55 78 84 107
Restaurant 58,000 s.f. 5,841 149 157 197 69
Apartments 1,735 d.u. 8,510 159 512 423 245
Hotel 550 rooms 3,639 165 28 128 140
TOTAL 38,895 2,805 1,020 1,395 3,322
AM PEAK HR. PM PEAK HR.
TRIP GENERATION
EXTERNAL SITE-GENERATED TRAFFIC
LAND USE SIZE
GENERATED TRAFFIC
AM PEAK HR. PM PEAK HR.
LAND USE SIZE
GENERATED TRAFFIC
TRIP GENERATION
INTERNAL SITE-GENERATED TRAFFIC
TRIP GENERATION
TOTAL SITE-GENERATED TRAFFIC
LAND USE SIZE
GENERATED TRAFFIC
AM PEAK HR. PM PEAK HR.

River North Development Study October 2017
-104- 16-0908
DAILY
TRAFFIC ENTER EXIT ENTER EXIT Use:
Office 3,029,000 s.f. 702 114 12 28 138 5%Specialty Retail 200,000 s.f. 344 3 4 4 5 5%Restaurant 58,000 s.f. 292 7 8 10 3 5%Apartments 1,735 d.u. 426 8 26 21 12 5%Hotel 550 rooms 182 8 1 6 7 5%TOTAL 1,338 124 24 42 146
DAILY
TRAFFIC ENTER EXIT ENTER EXIT
Office 3,029,000 s.f. 13,328 2,163 233 535 2,623Specialty Retail 200,000 s.f. 6,531 52 74 80 102Restaurant 58,000 s.f. 5,549 142 149 187 66Apartments 1,735 d.u. 8,084 151 486 402 233Hotel 550 rooms 3,457 157 27 122 133
TOTAL 36,949 2,665 969 1,326 3,157
TRIP GENERATION
NEW SITE-GENERATED VEHICULAR TRAFFIC
LAND USE SIZE
GENERATED TRAFFIC
AM PEAK HR. PM PEAK HR.
LAND USE SIZE
GENERATED TRAFFIC
AM PEAK HR. PM PEAK HR.
TRIP GENERATION
ALTERNATE MODE SITE-GENERATED TRAFFIC


