Embed Size (px)
Citation preview
Strathprints Institutional Repository
Konovessis, Dimitris and Vassalos, Dracos (2008) Risk evaluation for RoPax vessels. Proceedingsof the Institution of Mechanical Engineers, Part M: Journal of Engineering for the MaritimeEnvironment, 222 (1). pp. 13-26. ISSN 1475-0902
Strathprints is designed to allow users to access the research output of the University of Strathclyde.Copyright c© and Moral Rights for the papers on this site are retained by the individual authorsand/or other copyright owners. You may not engage in further distribution of the material for anyprofitmaking activities or any commercial gain. You may freely distribute both the url (http://strathprints.strath.ac.uk/) and the content of this paper for research or study, educational, ornot-for-profit purposes without prior permission or charge.
Any correspondence concerning this service should be sent to Strathprints administrator:mailto:[email protected]
http://strathprints.strath.ac.uk/
http://pim.sagepub.com/the Maritime Environment
Engineers, Part M: Journal of Engineering for Proceedings of the Institution of Mechanical
http://pim.sagepub.com/content/222/1/13The online version of this article can be found at:
DOI: 10.1243/14750902JEME90
222: 13 2008Proceedings of the Institution of Mechanical Engineers, Part M: Journal of Engineering for the Maritime Environment
D Konovessis and D VassalosRisk evaluation for RoPax vessels
Published by:
http://www.sagepublications.com
On behalf of:
Institution of Mechanical Engineers
can be found at:Maritime EnvironmentProceedings of the Institution of Mechanical Engineers, Part M: Journal of Engineering for theAdditional services and information for
http://pim.sagepub.com/cgi/alertsEmail Alerts:
http://pim.sagepub.com/subscriptionsSubscriptions:
http://www.sagepub.com/journalsReprints.navReprints:
http://www.sagepub.com/journalsPermissions.navPermissions:
http://pim.sagepub.com/content/222/1/13.refs.htmlCitations:
What is This?
- Mar 1, 2008Version of Record >>
at University of Strathclyde Library on November 11, 2011pim.sagepub.comDownloaded from
Risk evaluation for RoPax vesselsD Konovessis* and D Vassalos
The Ship Stability Research Centre, Department of Naval Architecture and Marine Engineering, Universities of Glasgow
and Strathclyde, Glasgow, UK
The manuscript was received on 31 July 2007 and was accepted after revision for publication on 14 November 2007.
DOI: 10.1243/14750902JEME90
Abstract: The paper presents the results of a recent risk evaluation study for roll-on–roll-offpassenger (RoPax) vessels, carried out as part of the activities of the SAFEDOR IntegratedProject. The objective of the study was to investigate hazards and their causes during RoPaxoperation and to quantify, to the extent possible, their frequencies and consequences. Aprevious study on the safety assessment of RoPax vessels sailing in north-west Europeanwaters, covering the period until 1994, was used as the basis in putting together a high-level riskmodel for the current study. All scenarios are presented in the form of event trees,quantification of which is made on the basis of worldwide accident experience (from 1994 to2004), relevant past studies, and judgement. The study estimates the risk of loss of life amongpassengers and crew (by calculating for each scenario the individual risk and the potential lossof life and by plotting the corresponding F–N curves) and compares them with current riskacceptance criteria.
Keywords: Marine accident analysis, formal safety assessment, risk acceptance criteria
1 INTRODUCTION
The overall scope of this high-level generic risk
evaluation study is to investigate and quantify
credible accident scenarios that may occur during
roll-on–roll-off passenger (RoPax) operations. As
such, the work relates to step 1 (hazard identifica-
tion) and step 2 (risk assessment) of the Interna-
tional Maritime Organization’s (IMO) formal safety
assessment (FSA) process and has been performed
in accordance with the relevant FSA guidelines [1].
Occupational accidents that would affect indivi-
dual members of the crew and passengers’ personal
accidents, such as slips or falls, have not been
included in the study. The following operational
phases, as considered during a hazard identification
(HAZID) session, provide the range that is taken into
account in performing this study:
(a) loading;
(b) departing quay;
(c) transit and navigation in coastal waters;
(d) transit in open sea;
(e) arriving at port, mooring, and preparing for
unloading;
(f) unloading.
In this respect, no analysis has been carried out for
accident scenarios that may occur during construc-
tion, sea trials, dry docking, repairs, and scrapping,
as well as for security hazards.
2 SAFETY REGULATIONS
The main consequences on a RoPax following an
accident may be graceful sinking or capsize and/or
fire, which can result in great loss of life among the
passengers and crew on board. Some of IMO’s
regulations, namely the International Convention
for the Safety of Life at Sea (SOLAS) [2], are
particularly relevant to RoPax operations and are
briefly outlined in under the following headings:
subdivision and damage stability; fire safety; im-
plementation of the International Safety Manage-
ment (ISM) Code.
*Corresponding author: The Ship Stability Research Centre,
Department of Naval Architecture and Marine Engineering,
Universities of Glasgow and Strathclyde, 100 Montrose Street,
Glasgow, G4 0LZ, UK. email: [email protected]
13
JEME90 F IMechE 2008 Proc. IMechE Vol. 222 Part M: J. Engineering for the Maritime Environment
at University of Strathclyde Library on November 11, 2011pim.sagepub.comDownloaded from
2.1 Subdivision and damage stability (SOLASChapter II-1 [2])
Currently the global standard for the damage
stability of RoPax ships is for the vessel to be able
to sustain any two-compartment damage and also to
fulfil a set of deterministic requirements known as
SOLAS 90. This represents a significant improvement
on the standards applicable at the beginning of
1990s and is in general considered a sufficient and
satisfactory standard. In north-west Europe, an
increased standard is applied for existing ships,
known as the ‘Stockholm Agreement’ or SOLAS
90+50, which requires either fulfilment of the
deterministic standards of SOLAS 90 with an addi-
tional height of water on deck (maximum of 50 cm),
or the demonstration by means of model experi-
ments that the vessel can survive in damaged
conditions in the sea state in the area of operation,
as this is characterized by the corresponding
significant wave height not exceeded by a probability
of more than 10 per cent [3, 4].
The IMO’s Sub-Committee on Subdivision, Load
Lines and Fishing Vessel Safety has developed a new
set of probabilistic rules for all ship types for global
application from 2009 onwards. These rules follow
the approach developed in Resolution A.265 (IMO
issued this resolution in 1974, as an alternative to the
deterministic SOLAS damage stability requirements)
and are mainly based on extensive research work
carried out in the late 1990s and early 2000s as part
of the activities of the research project HARDER,
funded by the European Commission.
2.2 Fire safety (SOLAS Chapter II-2 [2])
To accommodate novel designs and issues relating
to the human element, the IMO Sub-Committee on
Fire Protection undertook an 8 year effort that led to
the adoption of an entirely new structure for SOLAS
Chapter II-2 which may better accommodate the
way that port and flag states and ship designers
would deal with fire safety issues in the future.
The new structure focuses on the ‘fire scenario
process’ rather than on ship type, as the current
SOLAS Chapter II-2 is structured. Thus, the regula-
tions start with prevention, detection, and suppres-
sion and progress to cover all aspects of the process
through to escape. In addition, to make the revised
SOLAS Chapter II-2 a more user-friendly specific
system, related technical requirements were moved
to a new International Fire Safety Systems (FSS)
Code and each regulation will now have a purpose
statement and functional requirements to assist port
and flag states in resolving matters that may not be
fully addressed by prescriptive requirements.
The revised SOLAS Chapter II-2 also has a new
part E that deals exclusively with human element
matters such as training, drills, and maintenance
issues and a new part F that sets out a methodology
for approving alternative (or novel) designs and
arrangements. With regard to the latter, the regula-
tions contained in part F will be supported by a new
set of guidelines. The new guidelines are intended to
provide technical justification for alternative design
and arrangements to SOLAS Chapter II-2. The
guidelines will outline the methodology for the
engineering analysis required by the new SOLAS
regulation II-2/17, dealing with alternative design
and arrangements, where approval of an alternative
design deviating from the prescriptive requirements
of SOLAS Chapter II-2 is sought.
The revised SOLAS Chapter II-2 and the associated
FSS Code entered into force on 1 July 2002 and will
apply to all ships built on or after 1 July 2002,
although some of the amendments apply to existing
ships as well as new ships.
2.3 ISM Code (SOLAS, Chapter IX [2])
The ISM Code was adopted by the 1993 Assembly at
IMO as Resolution A.741(18). The ISM Code is
mandatory for all SOLAS ships, regardless of their
year of construction.
The Code requires a safety management system
(SMS) to be established by the shipowner or
manager to ensure compliance with all mandatory
regulations and that codes, guidelines, and stan-
dards recommended by IMO and others are taken
into account. Shipping companies are required to
prepare plans and instructions for key shipboard
operations and to make preparations for dealing
with any emergencies that might arise. The im-
portance of maintenance is stressed and companies
are required to ensure that regular inspections are
held and corrective measures taken where neces-
sary. The procedures required by the ISM Code
should be documented and compiled in a safety
management manual, a copy of which should be
kept on board. Regular checks and audits should be
held by the company to ensure that the SMS is
being complied with and the system itself should be
reviewed periodically to evaluate its efficiency. The
ISM Code has been applied on RoPax ships since
July 1998.
14 D Konovessis and D Vassalos
Proc. IMechE Vol. 222 Part M: J. Engineering for the Maritime Environment JEME90 F IMechE 2008
at University of Strathclyde Library on November 11, 2011pim.sagepub.comDownloaded from
3 REFERENCE DATA
3.1 World RoPax fleet
Table 1 shows the number and size distribution of
the RoPax fleet worldwide, as of March 2006,
according to Lloyds Register – Fairplay (LRFP) data.
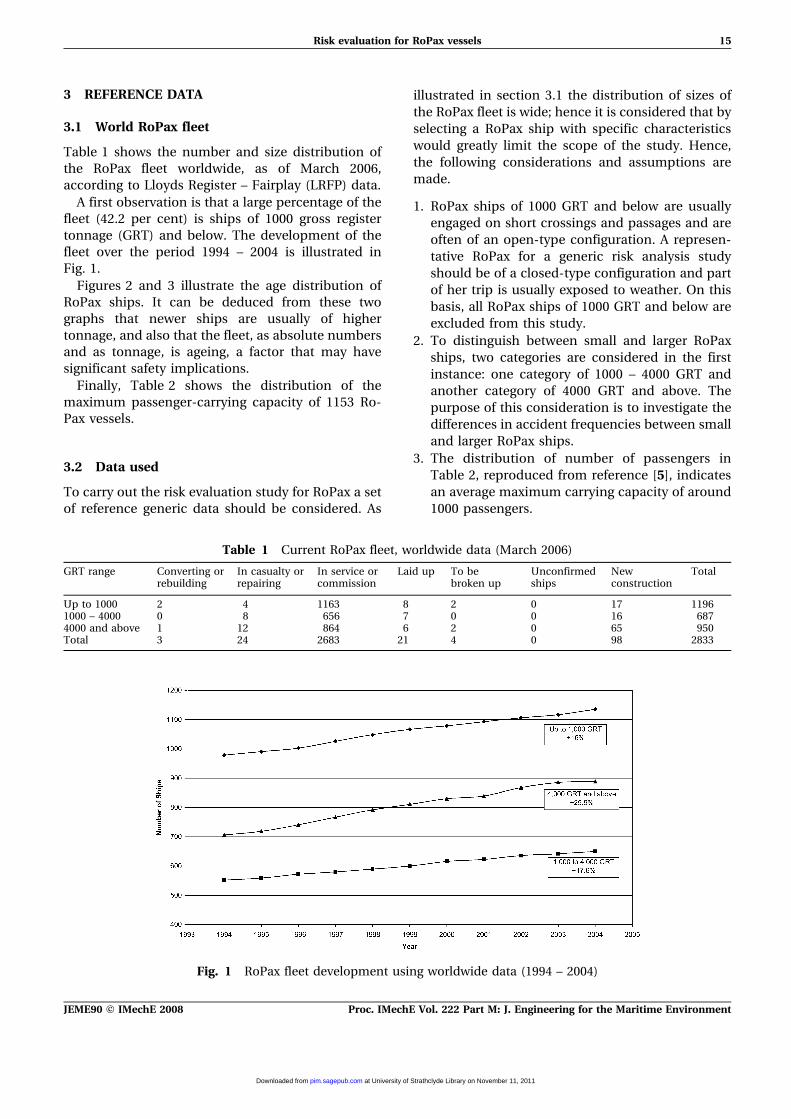
A first observation is that a large percentage of the
fleet (42.2 per cent) is ships of 1000 gross register
tonnage (GRT) and below. The development of the
fleet over the period 1994 – 2004 is illustrated in
Fig. 1.
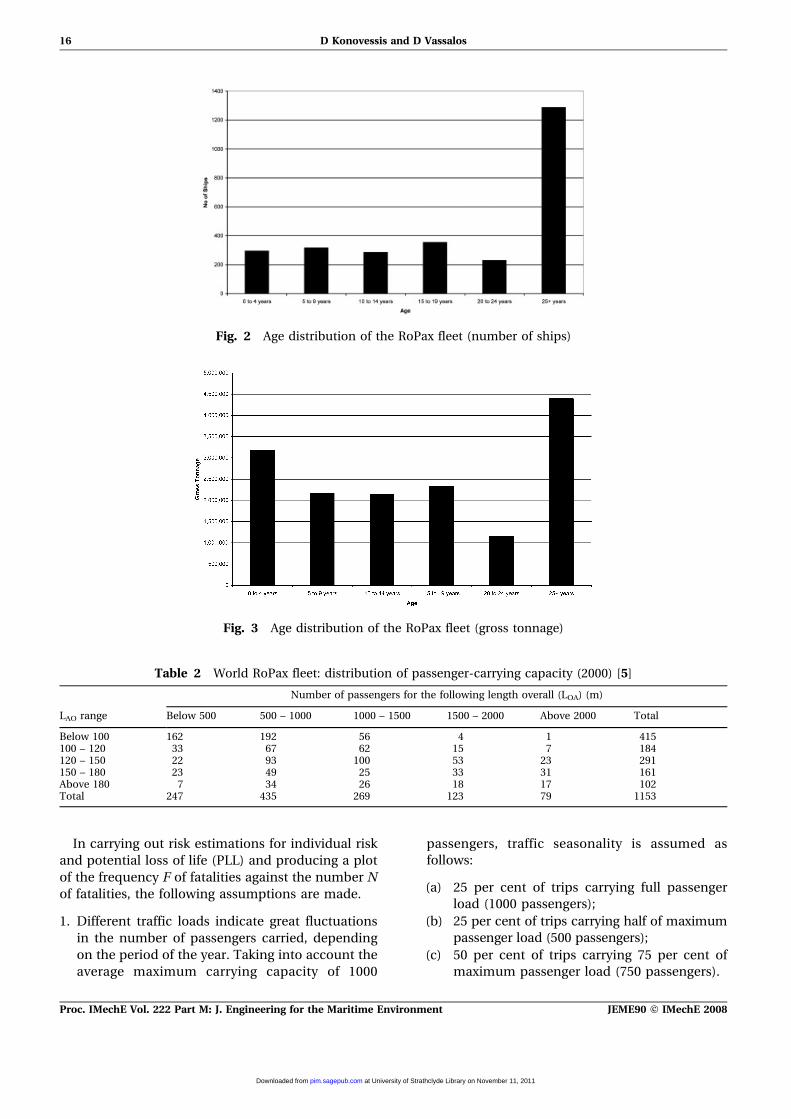
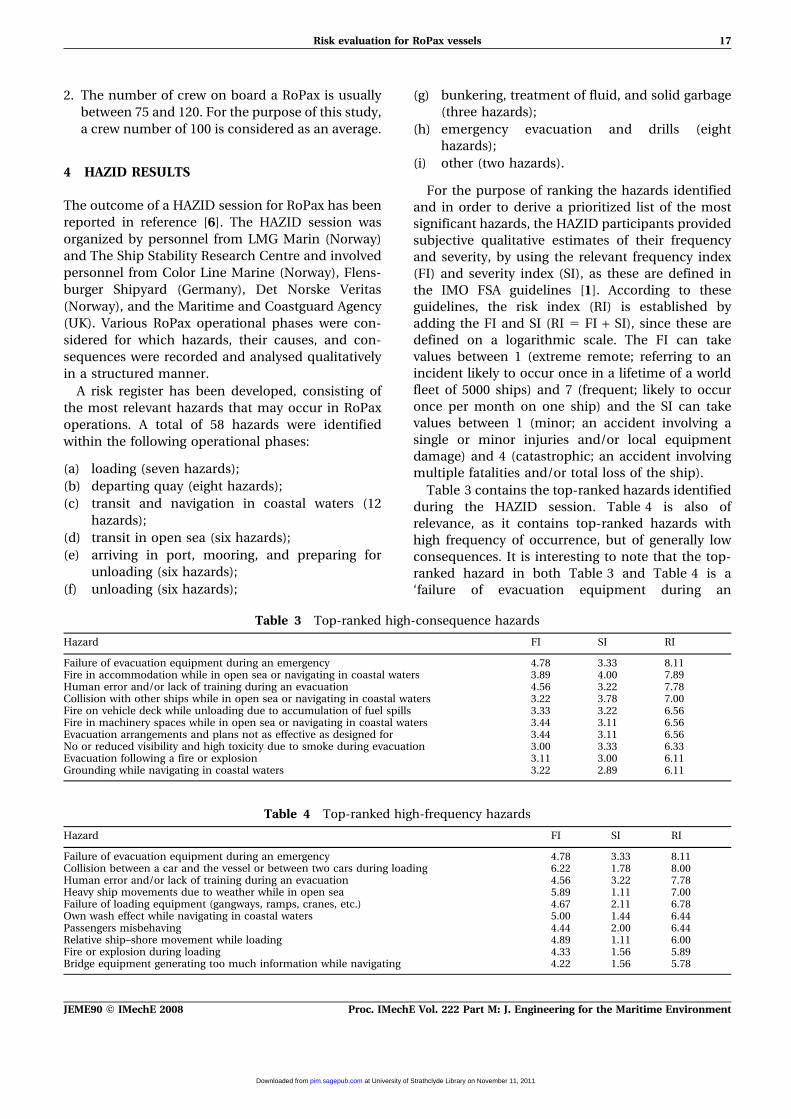
Figures 2 and 3 illustrate the age distribution of
RoPax ships. It can be deduced from these two
graphs that newer ships are usually of higher
tonnage, and also that the fleet, as absolute numbers
and as tonnage, is ageing, a factor that may have
significant safety implications.
Finally, Table 2 shows the distribution of the
maximum passenger-carrying capacity of 1153 Ro-
Pax vessels.
3.2 Data used
To carry out the risk evaluation study for RoPax a set
of reference generic data should be considered. As
illustrated in section 3.1 the distribution of sizes of
the RoPax fleet is wide; hence it is considered that by
selecting a RoPax ship with specific characteristics
would greatly limit the scope of the study. Hence,
the following considerations and assumptions are
made.
1. RoPax ships of 1000 GRT and below are usually
engaged on short crossings and passages and are
often of an open-type configuration. A represen-
tative RoPax for a generic risk analysis study
should be of a closed-type configuration and part
of her trip is usually exposed to weather. On this
basis, all RoPax ships of 1000 GRT and below are
excluded from this study.
2. To distinguish between small and larger RoPax
ships, two categories are considered in the first
instance: one category of 1000 – 4000 GRT and
another category of 4000 GRT and above. The
purpose of this consideration is to investigate the
differences in accident frequencies between small
and larger RoPax ships.
3. The distribution of number of passengers in
Table 2, reproduced from reference [5], indicates
an average maximum carrying capacity of around
1000 passengers.
Table 1 Current RoPax fleet, worldwide data (March 2006)
GRT range Converting orrebuilding
In casualty orrepairing
In service orcommission
Laid up To bebroken up
Unconfirmedships
Newconstruction
Total
Up to 1000 2 4 1163 8 2 0 17 11961000 – 4000 0 8 656 7 0 0 16 6874000 and above 1 12 864 6 2 0 65 950Total 3 24 2683 21 4 0 98 2833
Fig. 1 RoPax fleet development using worldwide data (1994 – 2004)
Risk evaluation for RoPax vessels 15
JEME90 F IMechE 2008 Proc. IMechE Vol. 222 Part M: J. Engineering for the Maritime Environment
at University of Strathclyde Library on November 11, 2011pim.sagepub.comDownloaded from
In carrying out risk estimations for individual risk
and potential loss of life (PLL) and producing a plot
of the frequency F of fatalities against the number N
of fatalities, the following assumptions are made.
1. Different traffic loads indicate great fluctuations
in the number of passengers carried, depending
on the period of the year. Taking into account the
average maximum carrying capacity of 1000
passengers, traffic seasonality is assumed as
follows:
(a) 25 per cent of trips carrying full passenger
load (1000 passengers);
(b) 25 per cent of trips carrying half of maximum
passenger load (500 passengers);
(c) 50 per cent of trips carrying 75 per cent of
maximum passenger load (750 passengers).
Fig. 2 Age distribution of the RoPax fleet (number of ships)
Fig. 3 Age distribution of the RoPax fleet (gross tonnage)
Table 2 World RoPax fleet: distribution of passenger-carrying capacity (2000) [5]
LAO range
Number of passengers for the following length overall (LOA) (m)
Below 500 500 – 1000 1000 – 1500 1500 – 2000 Above 2000 Total
Below 100 162 192 56 4 1 415100 – 120 33 67 62 15 7 184120 – 150 22 93 100 53 23 291150 – 180 23 49 25 33 31 161Above 180 7 34 26 18 17 102Total 247 435 269 123 79 1153
16 D Konovessis and D Vassalos
Proc. IMechE Vol. 222 Part M: J. Engineering for the Maritime Environment JEME90 F IMechE 2008
at University of Strathclyde Library on November 11, 2011pim.sagepub.comDownloaded from
2. The number of crew on board a RoPax is usually
between 75 and 120. For the purpose of this study,
a crew number of 100 is considered as an average.
4 HAZID RESULTS
The outcome of a HAZID session for RoPax has been
reported in reference [6]. The HAZID session was
organized by personnel from LMG Marin (Norway)
and The Ship Stability Research Centre and involved
personnel from Color Line Marine (Norway), Flens-
burger Shipyard (Germany), Det Norske Veritas
(Norway), and the Maritime and Coastguard Agency
(UK). Various RoPax operational phases were con-
sidered for which hazards, their causes, and con-
sequences were recorded and analysed qualitatively
in a structured manner.
A risk register has been developed, consisting of
the most relevant hazards that may occur in RoPax
operations. A total of 58 hazards were identified
within the following operational phases:
(a) loading (seven hazards);
(b) departing quay (eight hazards);
(c) transit and navigation in coastal waters (12
hazards);
(d) transit in open sea (six hazards);
(e) arriving in port, mooring, and preparing for
unloading (six hazards);
(f) unloading (six hazards);
(g) bunkering, treatment of fluid, and solid garbage
(three hazards);
(h) emergency evacuation and drills (eight
hazards);
(i) other (two hazards).
For the purpose of ranking the hazards identified
and in order to derive a prioritized list of the most
significant hazards, the HAZID participants provided
subjective qualitative estimates of their frequency
and severity, by using the relevant frequency index
(FI) and severity index (SI), as these are defined in
the IMO FSA guidelines [1]. According to these
guidelines, the risk index (RI) is established by
adding the FI and SI (RI 5 FI + SI), since these are
defined on a logarithmic scale. The FI can take
values between 1 (extreme remote; referring to an
incident likely to occur once in a lifetime of a world
fleet of 5000 ships) and 7 (frequent; likely to occur
once per month on one ship) and the SI can take
values between 1 (minor; an accident involving a
single or minor injuries and/or local equipment
damage) and 4 (catastrophic; an accident involving
multiple fatalities and/or total loss of the ship).
Table 3 contains the top-ranked hazards identified
during the HAZID session. Table 4 is also of
relevance, as it contains top-ranked hazards with
high frequency of occurrence, but of generally low
consequences. It is interesting to note that the top-
ranked hazard in both Table 3 and Table 4 is a
‘failure of evacuation equipment during an
Table 3 Top-ranked high-consequence hazards
Hazard FI SI RI
Failure of evacuation equipment during an emergency 4.78 3.33 8.11Fire in accommodation while in open sea or navigating in coastal waters 3.89 4.00 7.89Human error and/or lack of training during an evacuation 4.56 3.22 7.78Collision with other ships while in open sea or navigating in coastal waters 3.22 3.78 7.00Fire on vehicle deck while unloading due to accumulation of fuel spills 3.33 3.22 6.56Fire in machinery spaces while in open sea or navigating in coastal waters 3.44 3.11 6.56Evacuation arrangements and plans not as effective as designed for 3.44 3.11 6.56No or reduced visibility and high toxicity due to smoke during evacuation 3.00 3.33 6.33Evacuation following a fire or explosion 3.11 3.00 6.11Grounding while navigating in coastal waters 3.22 2.89 6.11
Table 4 Top-ranked high-frequency hazards
Hazard FI SI RI
Failure of evacuation equipment during an emergency 4.78 3.33 8.11Collision between a car and the vessel or between two cars during loading 6.22 1.78 8.00Human error and/or lack of training during an evacuation 4.56 3.22 7.78Heavy ship movements due to weather while in open sea 5.89 1.11 7.00Failure of loading equipment (gangways, ramps, cranes, etc.) 4.67 2.11 6.78Own wash effect while navigating in coastal waters 5.00 1.44 6.44Passengers misbehaving 4.44 2.00 6.44Relative ship–shore movement while loading 4.89 1.11 6.00Fire or explosion during loading 4.33 1.56 5.89Bridge equipment generating too much information while navigating 4.22 1.56 5.78
Risk evaluation for RoPax vessels 17
JEME90 F IMechE 2008 Proc. IMechE Vol. 222 Part M: J. Engineering for the Maritime Environment
at University of Strathclyde Library on November 11, 2011pim.sagepub.comDownloaded from
emergency’, which was considered to be of high
frequency and also of potentially high consequences
by the participants of the HAZID session.
The HAZID results have confirmed the haz-
ards expected to be significant. In this respect,
scenarios initiated by collisions, groundings, fire,
and flooding from other causes are carried forward
for consideration in the risk analysis study of this
report.
5 CASUALTY DATA ANALYSIS
This work is based on casualty historical data for the
period 1994 – 2004, obtained by the Lloyds Maritime
Information Unit (LMIU) and on fleet statistics for
the same period, obtained by Lloyds Register –
Fairplay (LMFP). These two sources are considered
the most comprehensive available for casualty data
and fleet-at-risk data respectively. The reason for the
selection of the said period is that the safety
assessment study for RoPax vessels carried out as
part of the North-West European Project by DNV
Technica [7, 8] covered the period 1978 – 1994 and
hence providing some reasonable basis for compar-
ison of the corresponding safety records over the two
periods.
5.1 Frequency analysis
The LMIU casualty database includes 1147 incidents
for RoPax ships worldwide for the period 1994 –
2004. 54 incidents have occurred during repairs or
conversions, labour, and other disputes on vessels
that were already laid up or to be broken up (nine
incidents for RoPax of 1000 – 4000 GRT and 45
incidents for RoPax of 4000 GRT and above). These
incidents have not been taken into account in the
analysis. Also, there were a further three incidents
which are attributed to acts of terrorism (notably one
explosion involving a considerable number of fatal-
ities), which have also not been taken into account
in the analysis. 42 of the incidents included in the
database have occurred on RoPax of 100 – 1000 GRT.
These are excluded from the analysis for the reasons
given in section 3.2. Irrespective of this, given the
great number of RoPax ships under 1000 GRT (1196
ships, according to LRFP data of March 2006), this
casualty figure indicates serious under-reporting of
casualties.
Casualty records held by LMIU classify incidents
as serious and non-serious. An incident is consid-
ered as serious if it has involved a single fatality or
multiple fatalities, damage to the vessel that has
interrupted her service, or if the vessel has been lost.
Tables 5, 6 and 7 contain analyses of the LMIU ro–
pax casualty data for the period 1994 – 2004, for
RoPax of 1000 – 4000 GRT, for RoPax of 4000 GRT
and above, and for RoPax of 1000 GRT and above
respectively.
Other recent studies have also estimated accident
frequencies, covering periods similar to that ana-
lysed in this paper. More specifically there are as
follows.
1. In reference [9] the frequency of collisions for all
passenger ships over 4000 GRT for the period
1990 – 2000 was estimated as 5.1661023 per ship
year. Table 6 indicates a collision frequency of
1.5961022 per ship year, of which only 57 per cent
represent collisions under way, i.e. a frequency of
collisions under way of 9.0661023 per ship year.
2. Similarly, reference [9] reported a frequency of
groundings for all passenger ships over 4000 GRT
for the period 1990 – 2000 of 1.0361022 per ship
year. Table 6 indicates a grounding frequency of
1.1361022 per ship year.
3. Finally, in reference [10] the frequency of serious
fires for RoPax over 5000 GRT for the period 1990
– 2002 was estimated as 1.9061023 per ship year.
Table 5 Number of incidents and frequencies: RoPax of 1000 – 4000 GRT (1994 – 2004)
Number of incidents Percentage of incidents (%) Frequency (per ship year)
Total Serious Total Serious Total Serious
Collision 53 4 18.6 8.2 8.0161023 6.0461024
Contact 62 8 21.8 16.3 9.3761023 1.2161023
Fire/explosion 29 13 10.2 26.5 4.3861023 1.9661023
Wrecked/stranded 48 14 16.8 28.6 7.2561023 2.1161023
Hull damage 5 0 1.8 0.0 7.5561024 0.00Foundered 0 0 0.0 0.0 0.00 0.00Machinery damage 75 10 26.3 20.4 1.1361022 1.5161023
Miscellaneous 13 0 4.6 0.0 1.9661023 0.00Total 285 49 100.0 100.0 4.3161022 7.4061023
Fleet at risk (1994 – 2004) 6620
18 D Konovessis and D Vassalos
Proc. IMechE Vol. 222 Part M: J. Engineering for the Maritime Environment JEME90 F IMechE 2008
at University of Strathclyde Library on November 11, 2011pim.sagepub.comDownloaded from
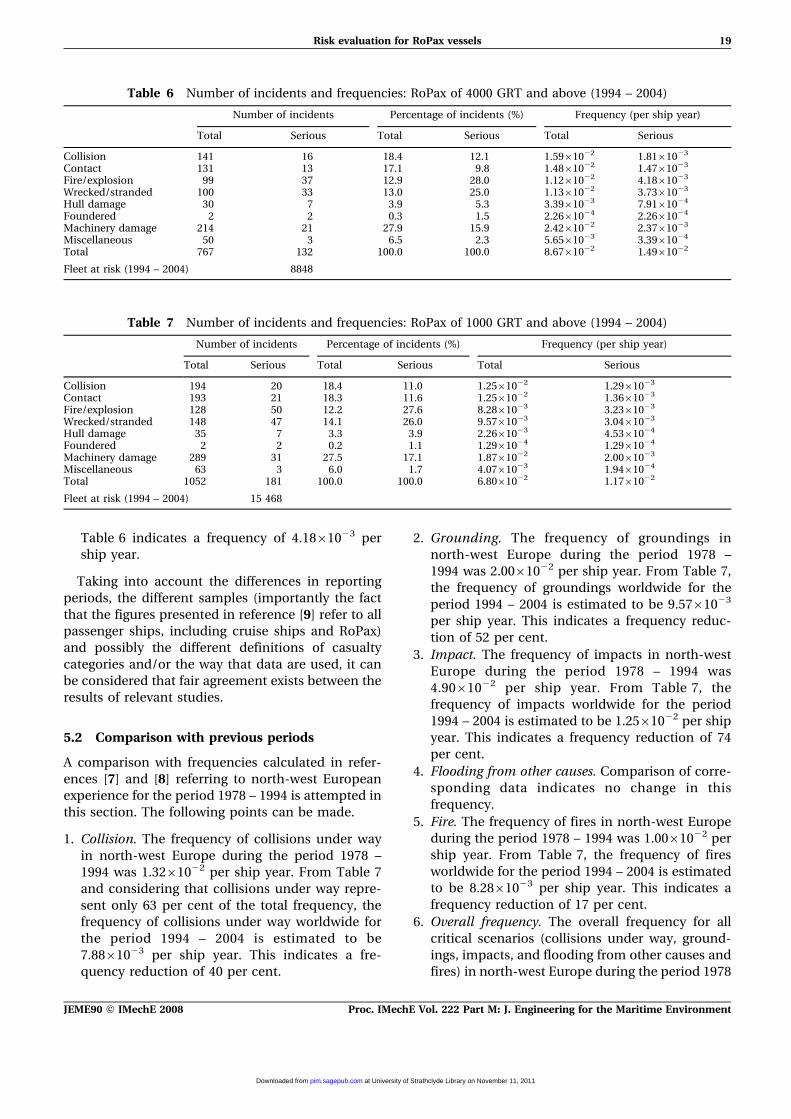
Table 6 indicates a frequency of 4.1861023 per
ship year.
Taking into account the differences in reporting
periods, the different samples (importantly the fact
that the figures presented in reference [9] refer to all
passenger ships, including cruise ships and RoPax)
and possibly the different definitions of casualty
categories and/or the way that data are used, it can
be considered that fair agreement exists between the
results of relevant studies.
5.2 Comparison with previous periods
A comparison with frequencies calculated in refer-
ences [7] and [8] referring to north-west European
experience for the period 1978 – 1994 is attempted in
this section. The following points can be made.
1. Collision. The frequency of collisions under way
in north-west Europe during the period 1978 –
1994 was 1.3261022 per ship year. From Table 7
and considering that collisions under way repre-
sent only 63 per cent of the total frequency, the
frequency of collisions under way worldwide for
the period 1994 – 2004 is estimated to be
7.8861023 per ship year. This indicates a fre-
quency reduction of 40 per cent.
2. Grounding. The frequency of groundings in
north-west Europe during the period 1978 –
1994 was 2.0061022 per ship year. From Table 7,
the frequency of groundings worldwide for the
period 1994 – 2004 is estimated to be 9.5761023
per ship year. This indicates a frequency reduc-
tion of 52 per cent.
3. Impact. The frequency of impacts in north-west
Europe during the period 1978 – 1994 was
4.9061022 per ship year. From Table 7, the
frequency of impacts worldwide for the period
1994 – 2004 is estimated to be 1.2561022 per ship
year. This indicates a frequency reduction of 74
per cent.
4. Flooding from other causes. Comparison of corre-
sponding data indicates no change in this
frequency.
5. Fire. The frequency of fires in north-west Europe
during the period 1978 – 1994 was 1.0061022 per
ship year. From Table 7, the frequency of fires
worldwide for the period 1994 – 2004 is estimated
to be 8.2861023 per ship year. This indicates a
frequency reduction of 17 per cent.
6. Overall frequency. The overall frequency for all
critical scenarios (collisions under way, ground-
ings, impacts, and flooding from other causes and
fires) in north-west Europe during the period 1978
Table 7 Number of incidents and frequencies: RoPax of 1000 GRT and above (1994 – 2004)
Number of incidents Percentage of incidents (%) Frequency (per ship year)
Total Serious Total Serious Total Serious
Collision 194 20 18.4 11.0 1.2561022 1.2961023
Contact 193 21 18.3 11.6 1.2561022 1.3661023
Fire/explosion 128 50 12.2 27.6 8.2861023 3.2361023
Wrecked/stranded 148 47 14.1 26.0 9.5761023 3.0461023
Hull damage 35 7 3.3 3.9 2.2661023 4.5361024
Foundered 2 2 0.2 1.1 1.2961024 1.2961024
Machinery damage 289 31 27.5 17.1 1.8761022 2.0061023
Miscellaneous 63 3 6.0 1.7 4.0761023 1.9461024
Total 1052 181 100.0 100.0 6.8061022 1.1761022
Fleet at risk (1994 – 2004) 15 468
Table 6 Number of incidents and frequencies: RoPax of 4000 GRT and above (1994 – 2004)
Number of incidents Percentage of incidents (%) Frequency (per ship year)
Total Serious Total Serious Total Serious
Collision 141 16 18.4 12.1 1.5961022 1.8161023
Contact 131 13 17.1 9.8 1.4861022 1.4761023
Fire/explosion 99 37 12.9 28.0 1.1261022 4.1861023
Wrecked/stranded 100 33 13.0 25.0 1.1361022 3.7361023
Hull damage 30 7 3.9 5.3 3.3961023 7.9161024
Foundered 2 2 0.3 1.5 2.2661024 2.2661024
Machinery damage 214 21 27.9 15.9 2.4261022 2.3761023
Miscellaneous 50 3 6.5 2.3 5.6561023 3.3961024
Total 767 132 100.0 100.0 8.6761022 1.4961022
Fleet at risk (1994 – 2004) 8848
Risk evaluation for RoPax vessels 19
JEME90 F IMechE 2008 Proc. IMechE Vol. 222 Part M: J. Engineering for the Maritime Environment
at University of Strathclyde Library on November 11, 2011pim.sagepub.comDownloaded from
– 1994 was estimated to be 9.4461022 per ship
year. From Table 7, the overall frequency for
these accident scenarios worldwide for the period
1994 – 2004 is estimated to be 4.0561022 per ship
year. This indicates an overall frequency reduc-
tion of 57 per cent.
Because of differences in reporting (LMIU started
a systematic collection of casualty data on 1994;
before that, only serious accidents were reported),
the frequency reductions calculated above should be
used for reference only. In any case, the estimated
reductions provide a concise indication that safety
has improved during the period 1994 – 2004.
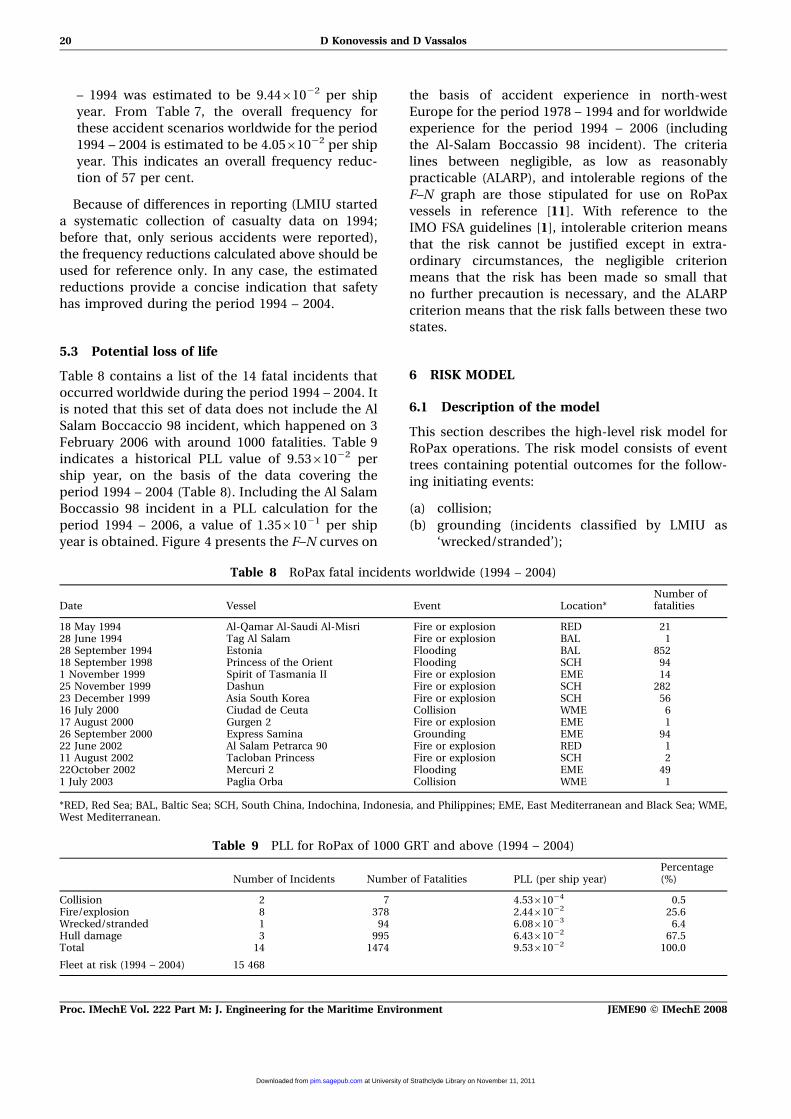
5.3 Potential loss of life
Table 8 contains a list of the 14 fatal incidents that
occurred worldwide during the period 1994 – 2004. It
is noted that this set of data does not include the Al
Salam Boccaccio 98 incident, which happened on 3
February 2006 with around 1000 fatalities. Table 9
indicates a historical PLL value of 9.5361022 per
ship year, on the basis of the data covering the
period 1994 – 2004 (Table 8). Including the Al Salam
Boccassio 98 incident in a PLL calculation for the
period 1994 – 2006, a value of 1.3561021 per ship
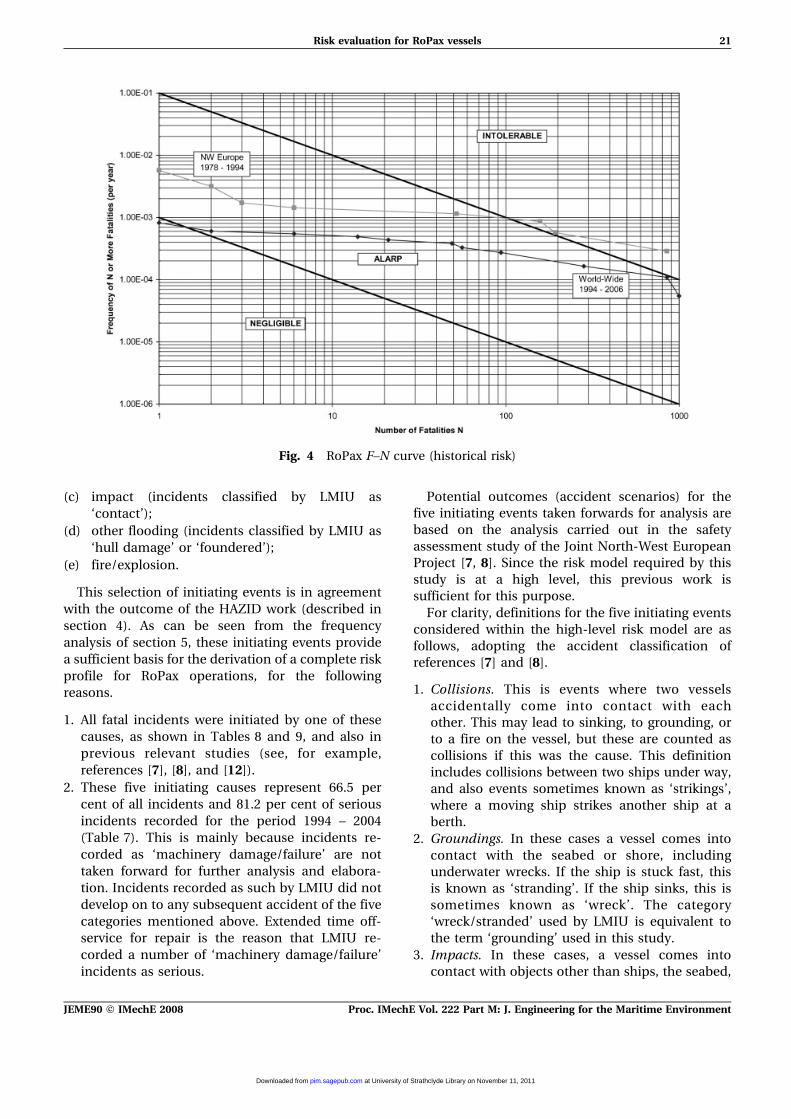
year is obtained. Figure 4 presents the F–N curves on
the basis of accident experience in north-west
Europe for the period 1978 – 1994 and for worldwide
experience for the period 1994 – 2006 (including
the Al-Salam Boccassio 98 incident). The criteria
lines between negligible, as low as reasonably
practicable (ALARP), and intolerable regions of the
F–N graph are those stipulated for use on RoPax
vessels in reference [11]. With reference to the
IMO FSA guidelines [1], intolerable criterion means
that the risk cannot be justified except in extra-
ordinary circumstances, the negligible criterion
means that the risk has been made so small that
no further precaution is necessary, and the ALARP
criterion means that the risk falls between these two
states.
6 RISK MODEL
6.1 Description of the model
This section describes the high-level risk model for
RoPax operations. The risk model consists of event
trees containing potential outcomes for the follow-
ing initiating events:
(a) collision;
(b) grounding (incidents classified by LMIU as
‘wrecked/stranded’);
Table 8 RoPax fatal incidents worldwide (1994 – 2004)
Date Vessel Event Location*Number offatalities
18 May 1994 Al-Qamar Al-Saudi Al-Misri Fire or explosion RED 2128 June 1994 Tag Al Salam Fire or explosion BAL 128 September 1994 Estonia Flooding BAL 85218 September 1998 Princess of the Orient Flooding SCH 941 November 1999 Spirit of Tasmania II Fire or explosion EME 1425 November 1999 Dashun Fire or explosion SCH 28223 December 1999 Asia South Korea Fire or explosion SCH 5616 July 2000 Ciudad de Ceuta Collision WME 617 August 2000 Gurgen 2 Fire or explosion EME 126 September 2000 Express Samina Grounding EME 9422 June 2002 Al Salam Petrarca 90 Fire or explosion RED 111 August 2002 Tacloban Princess Fire or explosion SCH 222October 2002 Mercuri 2 Flooding EME 491 July 2003 Paglia Orba Collision WME 1
*RED, Red Sea; BAL, Baltic Sea; SCH, South China, Indochina, Indonesia, and Philippines; EME, East Mediterranean and Black Sea; WME,West Mediterranean.
Table 9 PLL for RoPax of 1000 GRT and above (1994 – 2004)
Number of Incidents Number of Fatalities PLL (per ship year)Percentage(%)
Collision 2 7 4.5361024 0.5Fire/explosion 8 378 2.4461022 25.6Wrecked/stranded 1 94 6.0861023 6.4Hull damage 3 995 6.4361022 67.5Total 14 1474 9.5361022 100.0
Fleet at risk (1994 – 2004) 15 468
20 D Konovessis and D Vassalos
Proc. IMechE Vol. 222 Part M: J. Engineering for the Maritime Environment JEME90 F IMechE 2008
at University of Strathclyde Library on November 11, 2011pim.sagepub.comDownloaded from
(c) impact (incidents classified by LMIU as
‘contact’);
(d) other flooding (incidents classified by LMIU as
‘hull damage’ or ‘foundered’);
(e) fire/explosion.
This selection of initiating events is in agreement
with the outcome of the HAZID work (described in
section 4). As can be seen from the frequency
analysis of section 5, these initiating events provide
a sufficient basis for the derivation of a complete risk
profile for RoPax operations, for the following
reasons.
1. All fatal incidents were initiated by one of these
causes, as shown in Tables 8 and 9, and also in
previous relevant studies (see, for example,
references [7], [8], and [12]).
2. These five initiating causes represent 66.5 per
cent of all incidents and 81.2 per cent of serious
incidents recorded for the period 1994 – 2004
(Table 7). This is mainly because incidents re-
corded as ‘machinery damage/failure’ are not
taken forward for further analysis and elabora-
tion. Incidents recorded as such by LMIU did not
develop on to any subsequent accident of the five
categories mentioned above. Extended time off-
service for repair is the reason that LMIU re-
corded a number of ‘machinery damage/failure’
incidents as serious.
Potential outcomes (accident scenarios) for the
five initiating events taken forwards for analysis are
based on the analysis carried out in the safety
assessment study of the Joint North-West European
Project [7, 8]. Since the risk model required by this
study is at a high level, this previous work is
sufficient for this purpose.
For clarity, definitions for the five initiating events
considered within the high-level risk model are as
follows, adopting the accident classification of
references [7] and [8].
1. Collisions. This is events where two vessels
accidentally come into contact with each
other. This may lead to sinking, to grounding, or
to a fire on the vessel, but these are counted as
collisions if this was the cause. This definition
includes collisions between two ships under way,
and also events sometimes known as ‘strikings’,
where a moving ship strikes another ship at a
berth.
2. Groundings. In these cases a vessel comes into
contact with the seabed or shore, including
underwater wrecks. If the ship is stuck fast, this
is known as ‘stranding’. If the ship sinks, this is
sometimes known as ‘wreck’. The category
‘wreck/stranded’ used by LMIU is equivalent to
the term ‘grounding’ used in this study.
3. Impacts. In these cases, a vessel comes into
contact with objects other than ships, the seabed,
Fig. 4 RoPax F–N curve (historical risk)
Risk evaluation for RoPax vessels 21
JEME90 F IMechE 2008 Proc. IMechE Vol. 222 Part M: J. Engineering for the Maritime Environment
at University of Strathclyde Library on November 11, 2011pim.sagepub.comDownloaded from
or the shore. This includes impacts on berths,
bridges, and offshore platforms. It is known by
LMIU as ‘contact’.
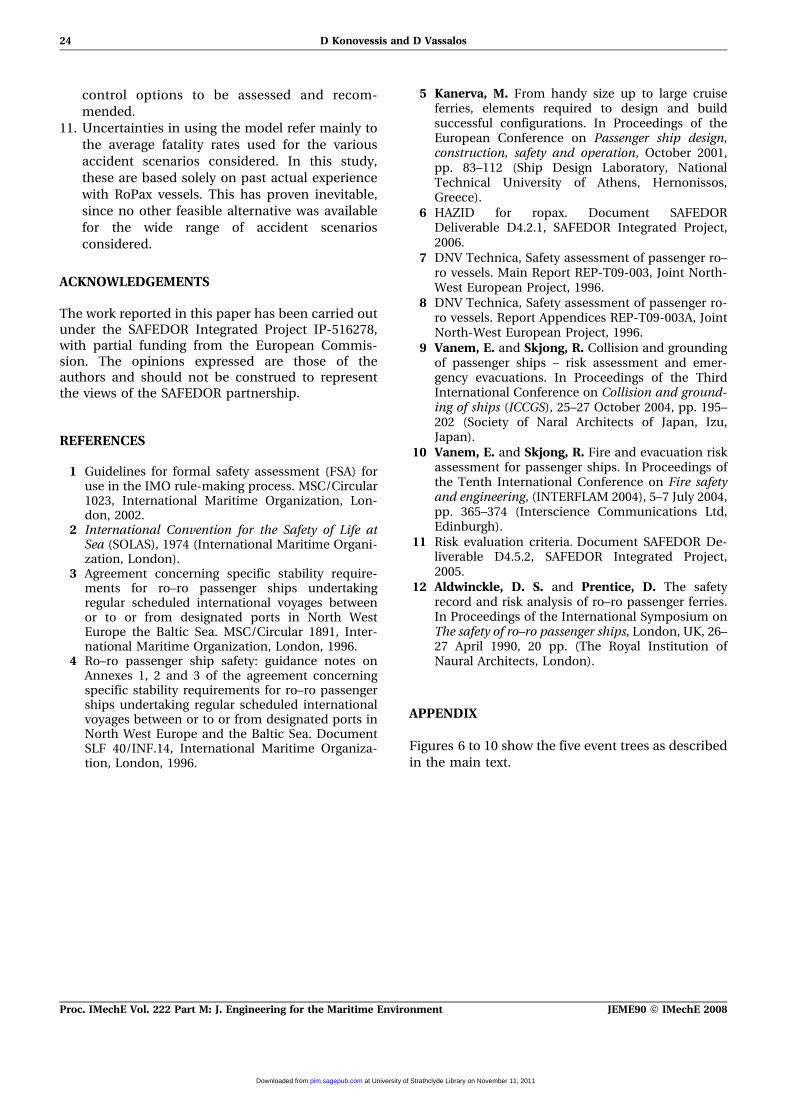
4. Other flooding. These are cases where water
enters a ship for reasons other than collision,
impact, or grounding (treated separately). Some
of these events are included by LMIU under the
category ‘hull/machinery damage’. If the ship
sinks, this is known by LMIU as ‘foundering’. The
‘other flooding’ category is also taken to include
weather damage, cargo shifting, and intact in-
stability events which would lead to flooding if the
ship were to sink.
5. Fire/explosion. In these cases, fires and/or explo-
sions occur for reasons other than collision,
impact, or grounding (treated separately).
The Appendix contains the five event trees (Figs 6
to 10) put together for the high-level risk model. The
scenarios included in the event trees are in accor-
dance with the outcome of the HAZID session
(section 4) and historical risk evaluations (section
5) and follow to a large extent the event trees
developed in references [7] and [8]. The branch
probabilities have been derived using data available
and reflect possible outcomes following collisions,
groundings, impacts, flooding from other causes,
and fires.
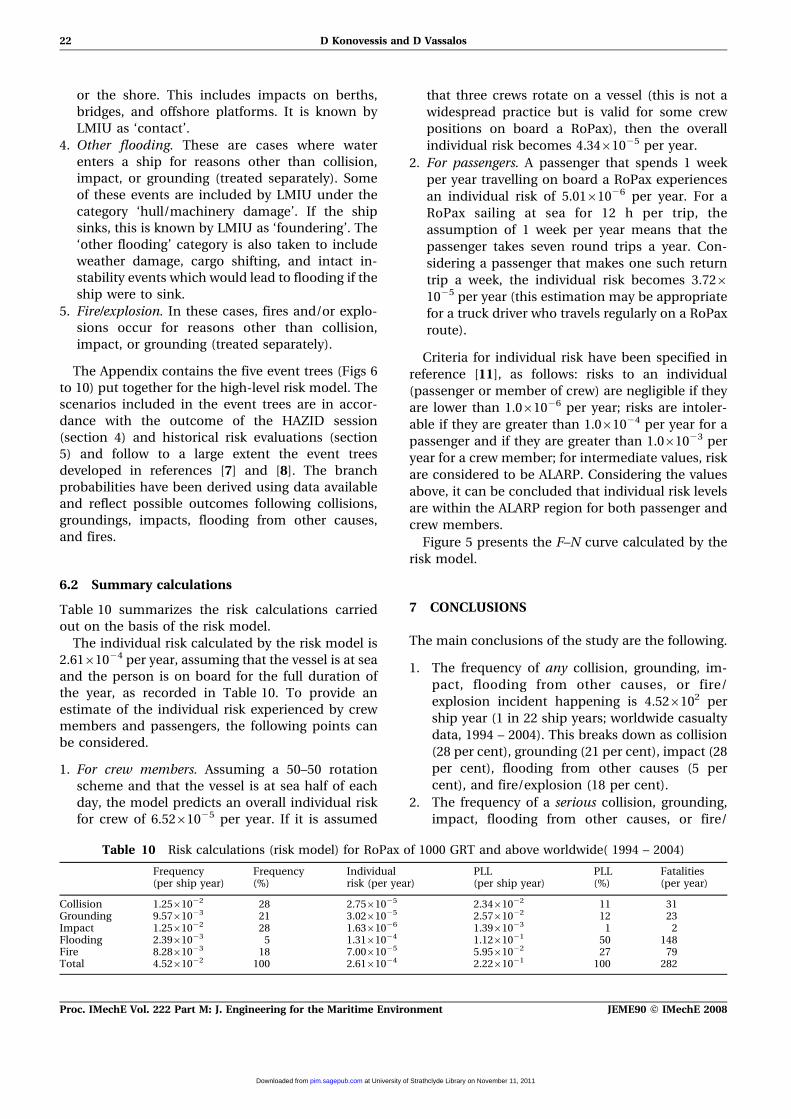
6.2 Summary calculations
Table 10 summarizes the risk calculations carried
out on the basis of the risk model.
The individual risk calculated by the risk model is
2.6161024 per year, assuming that the vessel is at sea
and the person is on board for the full duration of
the year, as recorded in Table 10. To provide an
estimate of the individual risk experienced by crew
members and passengers, the following points can
be considered.
1. For crew members. Assuming a 50–50 rotation
scheme and that the vessel is at sea half of each
day, the model predicts an overall individual risk
for crew of 6.5261025 per year. If it is assumed
that three crews rotate on a vessel (this is not a
widespread practice but is valid for some crew
positions on board a RoPax), then the overall
individual risk becomes 4.3461025 per year.
2. For passengers. A passenger that spends 1 week
per year travelling on board a RoPax experiences
an individual risk of 5.0161026 per year. For a
RoPax sailing at sea for 12 h per trip, the
assumption of 1 week per year means that the
passenger takes seven round trips a year. Con-
sidering a passenger that makes one such return
trip a week, the individual risk becomes 3.7261025 per year (this estimation may be appropriate
for a truck driver who travels regularly on a RoPax
route).
Criteria for individual risk have been specified in
reference [11], as follows: risks to an individual
(passenger or member of crew) are negligible if they
are lower than 1.061026 per year; risks are intoler-
able if they are greater than 1.061024 per year for a
passenger and if they are greater than 1.061023 per
year for a crew member; for intermediate values, risk
are considered to be ALARP. Considering the values
above, it can be concluded that individual risk levels
are within the ALARP region for both passenger and
crew members.
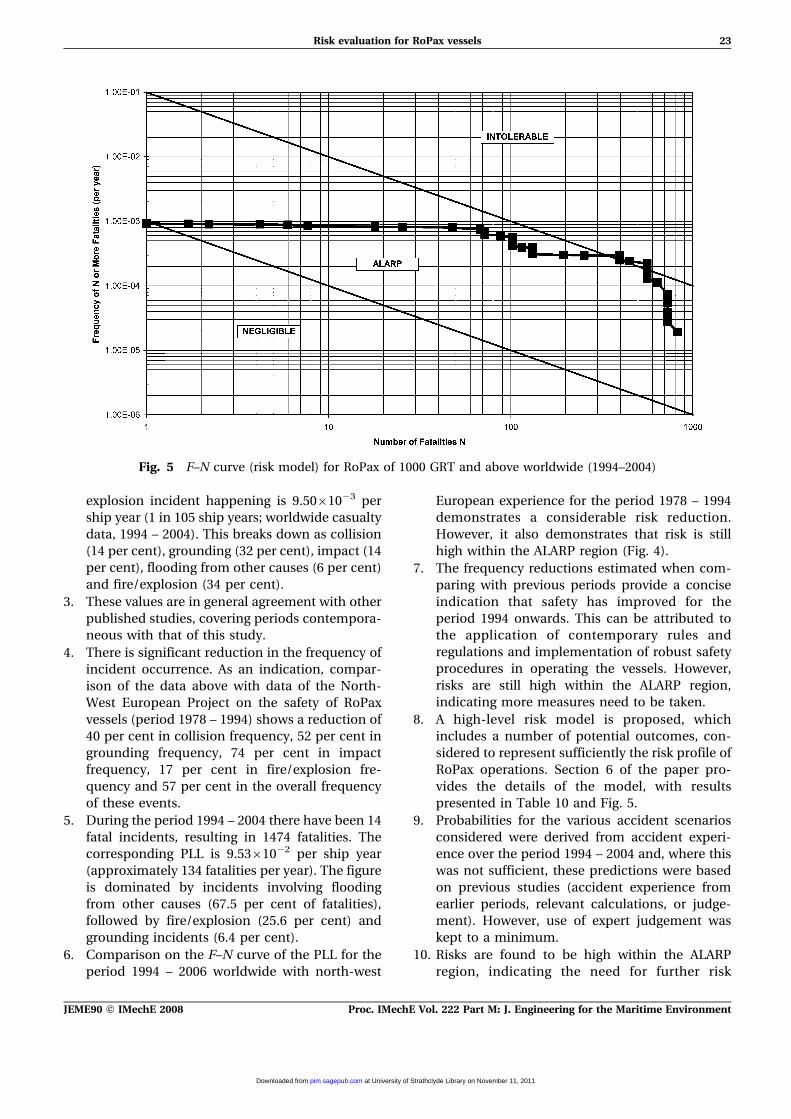
Figure 5 presents the F–N curve calculated by the
risk model.
7 CONCLUSIONS
The main conclusions of the study are the following.
1. The frequency of any collision, grounding, im-
pact, flooding from other causes, or fire/
explosion incident happening is 4.526102 per
ship year (1 in 22 ship years; worldwide casualty
data, 1994 – 2004). This breaks down as collision
(28 per cent), grounding (21 per cent), impact (28
per cent), flooding from other causes (5 per
cent), and fire/explosion (18 per cent).
2. The frequency of a serious collision, grounding,
impact, flooding from other causes, or fire/
Table 10 Risk calculations (risk model) for RoPax of 1000 GRT and above worldwide( 1994 – 2004)
Frequency(per ship year)
Frequency(%)
Individualrisk (per year)
PLL(per ship year)
PLL(%)
Fatalities(per year)
Collision 1.2561022 28 2.7561025 2.3461022 11 31Grounding 9.5761023 21 3.0261025 2.5761022 12 23Impact 1.2561022 28 1.6361026 1.3961023 1 2Flooding 2.3961023 5 1.3161024 1.1261021 50 148Fire 8.2861023 18 7.0061025 5.9561022 27 79Total 4.5261022 100 2.6161024 2.2261021 100 282
22 D Konovessis and D Vassalos
Proc. IMechE Vol. 222 Part M: J. Engineering for the Maritime Environment JEME90 F IMechE 2008
at University of Strathclyde Library on November 11, 2011pim.sagepub.comDownloaded from
explosion incident happening is 9.5061023 per
ship year (1 in 105 ship years; worldwide casualty
data, 1994 – 2004). This breaks down as collision
(14 per cent), grounding (32 per cent), impact (14
per cent), flooding from other causes (6 per cent)
and fire/explosion (34 per cent).
3. These values are in general agreement with other
published studies, covering periods contempora-
neous with that of this study.
4. There is significant reduction in the frequency of
incident occurrence. As an indication, compar-
ison of the data above with data of the North-
West European Project on the safety of RoPax
vessels (period 1978 – 1994) shows a reduction of
40 per cent in collision frequency, 52 per cent in
grounding frequency, 74 per cent in impact
frequency, 17 per cent in fire/explosion fre-
quency and 57 per cent in the overall frequency
of these events.
5. During the period 1994 – 2004 there have been 14
fatal incidents, resulting in 1474 fatalities. The
corresponding PLL is 9.5361022 per ship year
(approximately 134 fatalities per year). The figure
is dominated by incidents involving flooding
from other causes (67.5 per cent of fatalities),
followed by fire/explosion (25.6 per cent) and
grounding incidents (6.4 per cent).
6. Comparison on the F–N curve of the PLL for the
period 1994 – 2006 worldwide with north-west
European experience for the period 1978 – 1994
demonstrates a considerable risk reduction.
However, it also demonstrates that risk is still
high within the ALARP region (Fig. 4).
7. The frequency reductions estimated when com-
paring with previous periods provide a concise
indication that safety has improved for the
period 1994 onwards. This can be attributed to
the application of contemporary rules and
regulations and implementation of robust safety
procedures in operating the vessels. However,
risks are still high within the ALARP region,
indicating more measures need to be taken.
8. A high-level risk model is proposed, which
includes a number of potential outcomes, con-
sidered to represent sufficiently the risk profile of
RoPax operations. Section 6 of the paper pro-
vides the details of the model, with results
presented in Table 10 and Fig. 5.
9. Probabilities for the various accident scenarios
considered were derived from accident experi-
ence over the period 1994 – 2004 and, where this
was not sufficient, these predictions were based
on previous studies (accident experience from
earlier periods, relevant calculations, or judge-
ment). However, use of expert judgement was
kept to a minimum.
10. Risks are found to be high within the ALARP
region, indicating the need for further risk
Fig. 5 F–N curve (risk model) for RoPax of 1000 GRT and above worldwide (1994–2004)
Risk evaluation for RoPax vessels 23
JEME90 F IMechE 2008 Proc. IMechE Vol. 222 Part M: J. Engineering for the Maritime Environment
at University of Strathclyde Library on November 11, 2011pim.sagepub.comDownloaded from
control options to be assessed and recom-
mended.
11. Uncertainties in using the model refer mainly to
the average fatality rates used for the various
accident scenarios considered. In this study,
these are based solely on past actual experience
with RoPax vessels. This has proven inevitable,
since no other feasible alternative was available
for the wide range of accident scenarios
considered.
ACKNOWLEDGEMENTS
The work reported in this paper has been carried outunder the SAFEDOR Integrated Project IP-516278,with partial funding from the European Commis-sion. The opinions expressed are those of theauthors and should not be construed to representthe views of the SAFEDOR partnership.
REFERENCES
1 Guidelines for formal safety assessment (FSA) foruse in the IMO rule-making process. MSC/Circular1023, International Maritime Organization, Lon-don, 2002.
2 International Convention for the Safety of Life atSea (SOLAS), 1974 (International Maritime Organi-zation, London).
3 Agreement concerning specific stability require-ments for ro–ro passenger ships undertakingregular scheduled international voyages betweenor to or from designated ports in North WestEurope the Baltic Sea. MSC/Circular 1891, Inter-national Maritime Organization, London, 1996.
4 Ro–ro passenger ship safety: guidance notes onAnnexes 1, 2 and 3 of the agreement concerningspecific stability requirements for ro–ro passengerships undertaking regular scheduled internationalvoyages between or to or from designated ports inNorth West Europe and the Baltic Sea. DocumentSLF 40/INF.14, International Maritime Organiza-tion, London, 1996.
5 Kanerva, M. From handy size up to large cruiseferries, elements required to design and buildsuccessful configurations. In Proceedings of theEuropean Conference on Passenger ship design,construction, safety and operation, October 2001,pp. 83–112 (Ship Design Laboratory, NationalTechnical University of Athens, Hernonissos,Greece).
6 HAZID for ropax. Document SAFEDORDeliverable D4.2.1, SAFEDOR Integrated Project,2006.
7 DNV Technica, Safety assessment of passenger ro–ro vessels. Main Report REP-T09-003, Joint North-West European Project, 1996.
8 DNV Technica, Safety assessment of passenger ro-ro vessels. Report Appendices REP-T09-003A, JointNorth-West European Project, 1996.
9 Vanem, E. and Skjong, R. Collision and groundingof passenger ships – risk assessment and emer-gency evacuations. In Proceedings of the ThirdInternational Conference on Collision and ground-ing of ships (ICCGS), 25–27 October 2004, pp. 195–202 (Society of Naral Architects of Japan, Izu,Japan).
10 Vanem, E. and Skjong, R. Fire and evacuation riskassessment for passenger ships. In Proceedings ofthe Tenth International Conference on Fire safetyand engineering, (INTERFLAM 2004), 5–7 July 2004,pp. 365–374 (Interscience Communications Ltd,Edinburgh).
11 Risk evaluation criteria. Document SAFEDOR De-liverable D4.5.2, SAFEDOR Integrated Project,2005.
12 Aldwinckle, D. S. and Prentice, D. The safetyrecord and risk analysis of ro–ro passenger ferries.In Proceedings of the International Symposium onThe safety of ro–ro passenger ships, London, UK, 26–27 April 1990, 20 pp. (The Royal Institution ofNaural Architects, London).
APPENDIX
Figures 6 to 10 show the five event trees as described
in the main text.
24 D Konovessis and D Vassalos
Proc. IMechE Vol. 222 Part M: J. Engineering for the Maritime Environment JEME90 F IMechE 2008
at University of Strathclyde Library on November 11, 2011pim.sagepub.comDownloaded from

Fig. 6 Generic collision event tree using worldwide experience (1994–2004)
Fig. 7 Generic grounding event tree using worldwide experience (1994–2004)
Fig. 8 Generic impact event tree using worldwide experience (1994–2004)
Risk evaluation for RoPax vessels 25
JEME90 F IMechE 2008 Proc. IMechE Vol. 222 Part M: J. Engineering for the Maritime Environment
at University of Strathclyde Library on November 11, 2011pim.sagepub.comDownloaded from
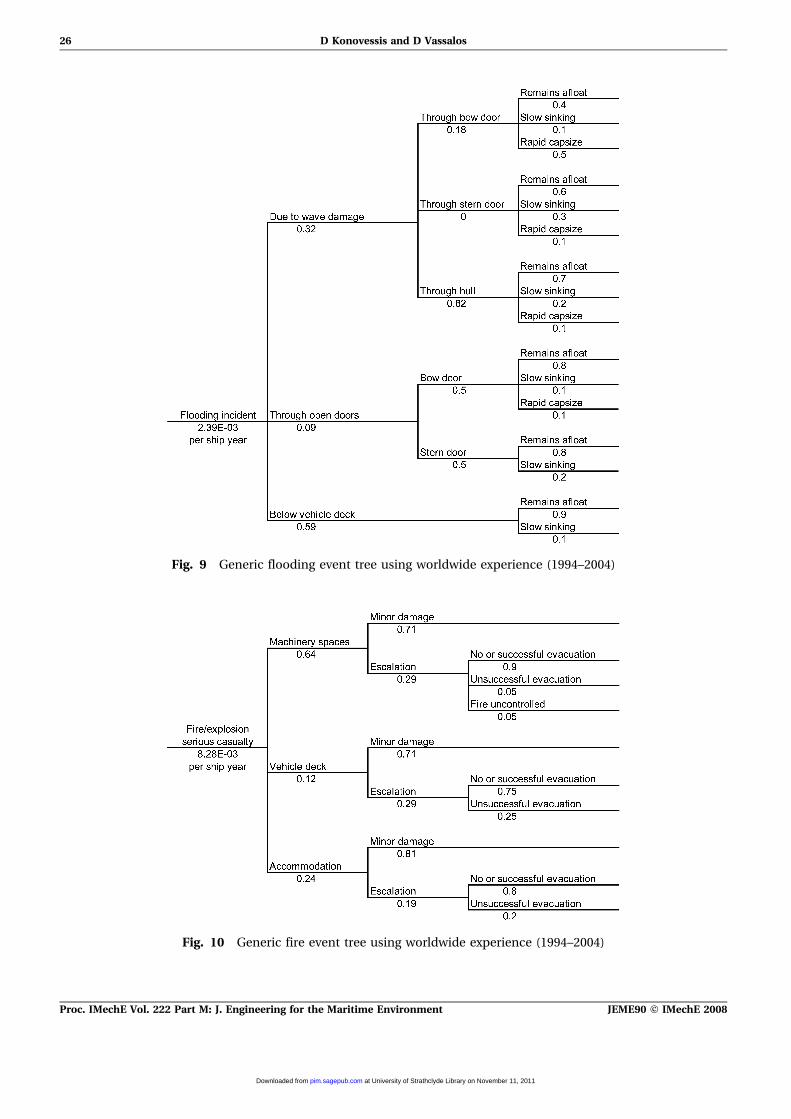
Fig. 9 Generic flooding event tree using worldwide experience (1994–2004)
Fig. 10 Generic fire event tree using worldwide experience (1994–2004)
26 D Konovessis and D Vassalos
Proc. IMechE Vol. 222 Part M: J. Engineering for the Maritime Environment JEME90 F IMechE 2008
at University of Strathclyde Library on November 11, 2011pim.sagepub.comDownloaded from


