Embed Size (px)
Citation preview
Seismic Vulnerability Assessmentof Reinforced Concrete BuildingsUsing Hierarchical Fuzzy RuleBase Modeling
Solomon Tesfamariam,a)M.EERI, and Murat Saatcioglu,b)
M.EERI
A reliable building vulnerability assessment is required for developing arisk-based assessment and retrofit prioritization. Tesfamariam and Saatcioglu(2008) proposed a simple building vulnerability module where the buildingperformance modifiers are in congruence with FEMA 154. This paper is anextension of the building vulnerability assessment that include detailedperformance modifier in congruence with FEMA 310 that is represented in aheuristic based hierarchical structure. Some of the input parameters areobtained through a walk down survey and are subject to vagueness uncertaintythat is modelled through fuzzy set theory. A knowledge base fuzzy rule basemodeling is developed and illustrated for reinforced concrete buildingsdamaged in the 1 May 2003 Bingöl, Turkey earthquake.�DOI: 10.1193/1.3280115�
INTRODUCTION
Seismic risk analysis of reinforced concrete (RC) buildings can be undertaken byintegrating site seismic hazard, building vulnerability, and importance/exposure factor.Tesfamariam and Saatcioglu (2008) have proposed a simple hierarchical risk assessmenttool that incorporates building performance modifiers in congruence with FEMA 154(2002). This paper is an extension of the building vulnerability module by incorporatingelaborate structural deficiencies as specified in FEMA 310 (1998; Table 1). Discussionand implementation of the overall risk assessment, by considering site seismic hazardand building importance/exposure are outside the scope of this paper, and are providedin Tesfamariam and Saatcioglu (2008).
The interactions between the structural deficiencies provided in Table 1 are complex,and often full-fledged nonlinear structural analysis is performed. However, the complex-ity of building vulnerability assessment can be handled through a system based ap-proach. A system is defined as an “assemblage of components acting as a whole”(Meirovitch 1967). Building structures are essentially an assemblage of different com-ponents, e.g., beams, columns, slabs, and hence they can be described as a system. Each
a) Assistant Professor, School of Engineering, The University of British Columbia | Okanagan, 3333 Universityway, Kelowna, BC, Canada, V1 V 1V7, Tel: (250)-807-8185, E-mail: [email protected]
b) Professor and University Research Chair, University of Ottawa, Ottawa, Ontario Canada K1A 0R6, Tel:
(613)-562-5800 ext 6129; Fax: (613)-562-5173, E-mail: [email protected]235Earthquake Spectra, Volume 26, No. 1, pages 235–256, February 2010; © 2010, Earthquake Engineering Research Institute
236 S.TESFAMARIAM AND M. SAATCIOGLU
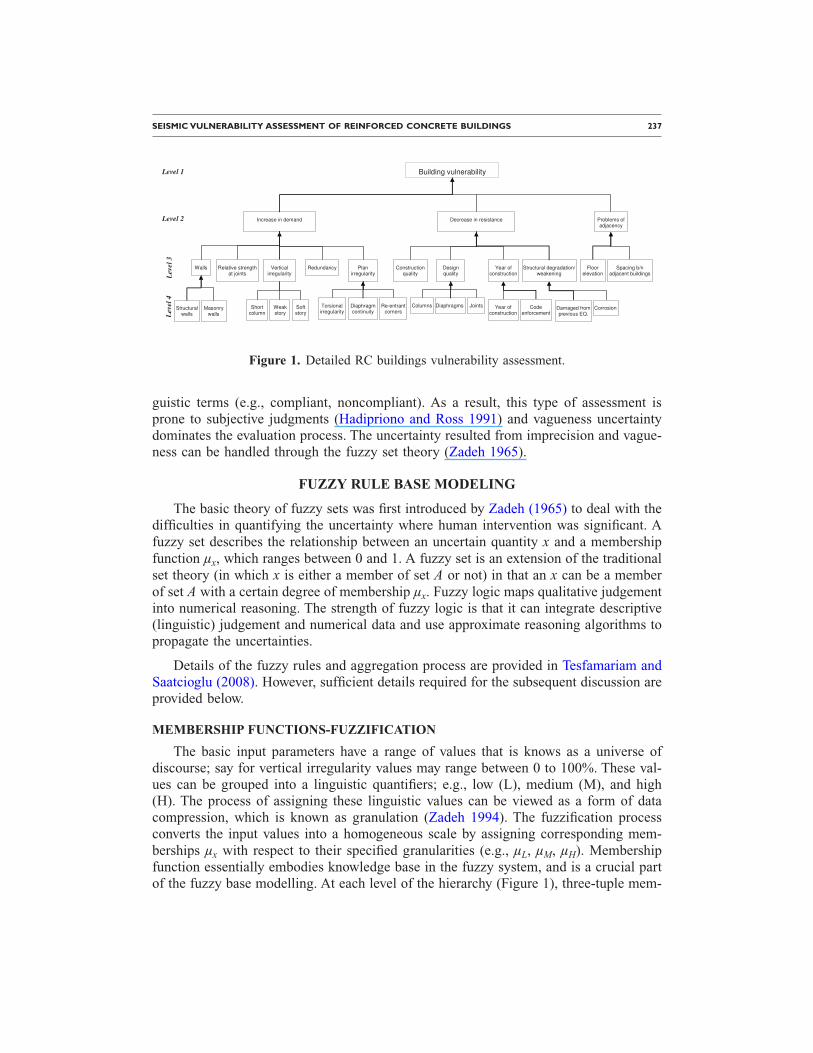
system in turn encapsulates different subcomponents and be described as a subsystem.In this paper, a heuristic based building vulnerability assessment hierarchical structure isproposed and illustrated in Figure 1.
Seismic risk assessment and decision making is subject to uncertainty (Wen et al.2003). Klir and Yuan (1995) have broadly categorized uncertainty into vagueness andambiguity. The vagueness (imprecision) refers to lack of definite or sharp distinction,whereas ambiguity is due to unclear distinction of various alternatives, which is furtherdivided into discord (conflict) and non-specificity. In a walk down survey, for example,the evaluation is performed by an expert and the information is readily provided in lin-
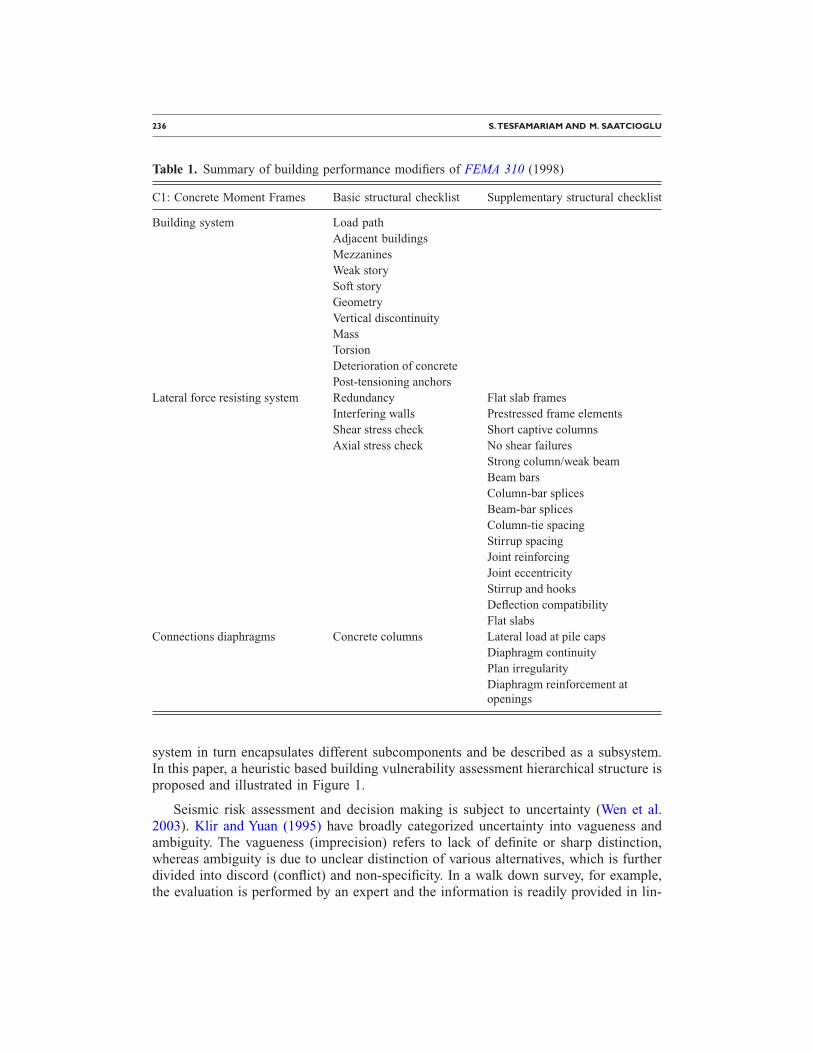
Table 1. Summary of building performance modifiers of FEMA 310 (1998)
C1: Concrete Moment Frames Basic structural checklist Supplementary structural checklist
Building system Load pathAdjacent buildingsMezzaninesWeak storySoft storyGeometryVertical discontinuityMassTorsionDeterioration of concretePost-tensioning anchors
Lateral force resisting system Redundancy Flat slab framesInterfering walls Prestressed frame elementsShear stress check Short captive columnsAxial stress check No shear failures
Strong column/weak beamBeam barsColumn-bar splicesBeam-bar splicesColumn-tie spacingStirrup spacingJoint reinforcingJoint eccentricityStirrup and hooksDeflection compatibilityFlat slabs
Connections diaphragms Concrete columns Lateral load at pile capsDiaphragm continuityPlan irregularityDiaphragm reinforcement atopenings
SEISMIC VULNERABILITY ASSESSMENT OF REINFORCED CONCRETE BUILDINGS 237
guistic terms (e.g., compliant, noncompliant). As a result, this type of assessment isprone to subjective judgments (Hadipriono and Ross 1991) and vagueness uncertaintydominates the evaluation process. The uncertainty resulted from imprecision and vague-ness can be handled through the fuzzy set theory (Zadeh 1965).
FUZZY RULE BASE MODELING
The basic theory of fuzzy sets was first introduced by Zadeh (1965) to deal with thedifficulties in quantifying the uncertainty where human intervention was significant. Afuzzy set describes the relationship between an uncertain quantity x and a membershipfunction µx, which ranges between 0 and 1. A fuzzy set is an extension of the traditionalset theory (in which x is either a member of set A or not) in that an x can be a memberof set A with a certain degree of membership µx. Fuzzy logic maps qualitative judgementinto numerical reasoning. The strength of fuzzy logic is that it can integrate descriptive(linguistic) judgement and numerical data and use approximate reasoning algorithms topropagate the uncertainties.
Details of the fuzzy rules and aggregation process are provided in Tesfamariam andSaatcioglu (2008). However, sufficient details required for the subsequent discussion areprovided below.
MEMBERSHIP FUNCTIONS-FUZZIFICATION
The basic input parameters have a range of values that is knows as a universe ofdiscourse; say for vertical irregularity values may range between 0 to 100%. These val-ues can be grouped into a linguistic quantifiers; e.g., low (L), medium (M), and high(H). The process of assigning these linguistic values can be viewed as a form of datacompression, which is known as granulation (Zadeh 1994). The fuzzification processconverts the input values into a homogeneous scale by assigning corresponding mem-berships µx with respect to their specified granularities (e.g., µL, µM, µH). Membershipfunction essentially embodies knowledge base in the fuzzy system, and is a crucial partof the fuzzy base modelling. At each level of the hierarchy (Figure 1), three-tuple mem-
Level
3L
evel
4Building vulnerability
Weakstory
Increase in demand Decrease in resistance
Structural degradation/weakening
Planirregularity
Shortcolumn
Year ofconstruction
CorrosionDamaged fromprevious EQ.
Codeenforcement
Year ofconstruction
Designquality
Problems ofadjacency
Floorelevation
Spacing b/nadjacent buildings
Verticalirregularity
Softstory
Relative strengthat joints
Walls
Structuralwalls
Masonrywalls
Re-entrantcorners
Diaphragmcontinuity
Redundancy Constructionquality
Diaphragms JointsColumnsTorsionalirregularity
Level 1
Level 2
Figure 1. Detailed RC buildings vulnerability assessment.
238 S.TESFAMARIAM AND M. SAATCIOGLU
bership values are used. Different methods of assigning membership values or functionsto a fuzzy variable are available (Ross 2004), and herein a heuristic based method isused.
FUZZY RULE BASE AND INFERENCING
For linguistic consequent parameters, Mamdani-type inferencing can be used (Mam-dani 1977). Mamdani’s inference mechanism consists of three connectives: the aggrega-tion of antecedents in each rule (AND connectives), implication (i.e., IF-THEN connec-tives), and aggregation of the rules (ALSO connectives). The IF-THEN rules can beestablished as
Ri: IF x1 is Ai1 AND x2 is Ai2 THEN y is Bi, i = 1, . . . ,n �1�Thus, for each level of the hierarchy, a fuzzy rule base (FRB) has to be established.
Given the rule base and corresponding fuzzification, fuzzy inferencing is performed us-ing Equation 1.
DEFUZZIFICATION
At each level of the hierarchy, the fuzzy output is converted into a crisp numberthrough a process of defuzzification. Several techniques are available for defuzzification,e.g., Center of Area, Center of Maxima and Mean of Maxima (Klir and Yuan 1995). Inthis paper, the weighted average method is used (Ross 2004):
z* =
�i=1
N
µi�x� · x
�i=1
N
µi�x�
�2�
where z* is the defuzzified value, x the universe of discourse for the specified input pa-rameter, and µi�x� are the three-tuple fuzzy numbers.
HIERARCHICAL FUZZY RULE BASE MODELING
In a fuzzy based modeling, increase in number of input parameters results in an ex-ponential increase in the number of rules. This is described as a curse of dimensionality,and causes problems in computational efforts, real time performance, and system defi-nition (Torra 2002). Several alternatives have been presented to deal with the curse ofdimensionality. These include; i) identification of functional relationships, ii) sensory fu-sion, iii) rule hierarchy, and iv) interpolation (Torra 2002). The rule hierarchy decom-poses at the level of rules, whereas Magdalena (2002) showed decomposition at the levelof variables. For example, from Figure 1, it can be shown that increase in demand (Level2) have five inputs; walls, relative strength at joints, vertical irregularity, redundancy, andplan irregularity (Level 3). Using a three-tuples fuzzy number, the required numbers ofrules are 35=243. However, a rule hierarchy shown in Figure 2 can be developed by con-sidering the functional relation of each performance modifier, consequently the required
SEISMIC VULNERABILITY ASSESSMENT OF REINFORCED CONCRETE BUILDINGS 239
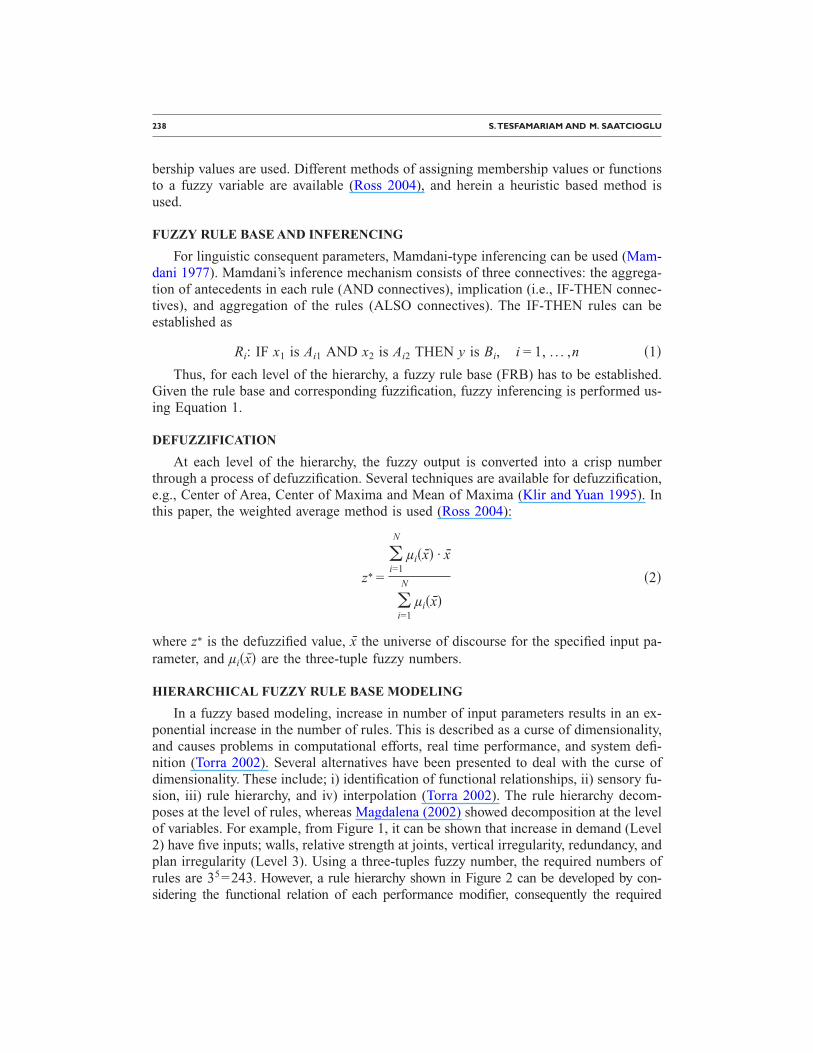
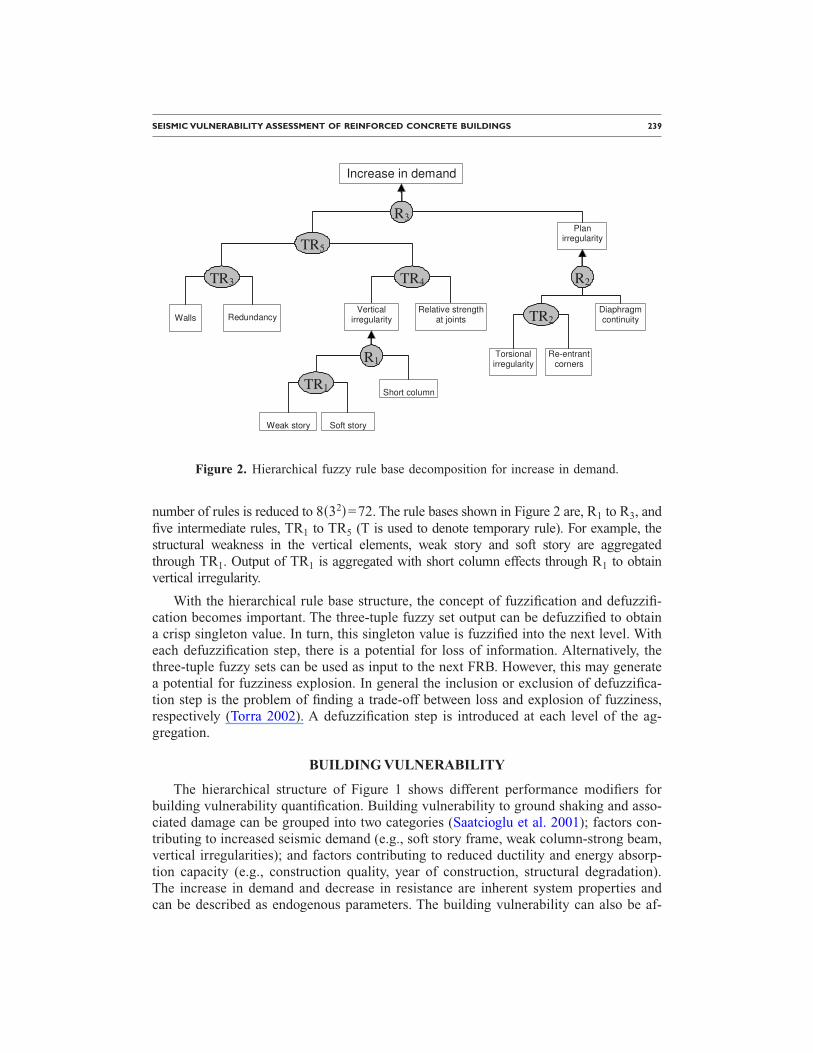
number of rules is reduced to 8�32�=72. The rule bases shown in Figure 2 are, R1 to R3, andfive intermediate rules, TR1 to TR5 (T is used to denote temporary rule). For example, thestructural weakness in the vertical elements, weak story and soft story are aggregatedthrough TR1. Output of TR1 is aggregated with short column effects through R1 to obtainvertical irregularity.
With the hierarchical rule base structure, the concept of fuzzification and defuzzifi-cation becomes important. The three-tuple fuzzy set output can be defuzzified to obtaina crisp singleton value. In turn, this singleton value is fuzzified into the next level. Witheach defuzzification step, there is a potential for loss of information. Alternatively, thethree-tuple fuzzy sets can be used as input to the next FRB. However, this may generatea potential for fuzziness explosion. In general the inclusion or exclusion of defuzzifica-tion step is the problem of finding a trade-off between loss and explosion of fuzziness,respectively (Torra 2002). A defuzzification step is introduced at each level of the ag-gregation.
BUILDING VULNERABILITY
The hierarchical structure of Figure 1 shows different performance modifiers forbuilding vulnerability quantification. Building vulnerability to ground shaking and asso-ciated damage can be grouped into two categories (Saatcioglu et al. 2001); factors con-tributing to increased seismic demand (e.g., soft story frame, weak column-strong beam,vertical irregularities); and factors contributing to reduced ductility and energy absorp-tion capacity (e.g., construction quality, year of construction, structural degradation).The increase in demand and decrease in resistance are inherent system properties andcan be described as endogenous parameters. The building vulnerability can also be af-
Weak story
Increase in demand
Planirregularity
Short column
Verticalirregularity
Soft story
Relative strengthat jointsWalls
Re-entrantcorners
DiaphragmcontinuityRedundancy
Torsionalirregularity
TR3
R1
R2TR4
R3
TR2
TR1
TR5
Figure 2. Hierarchical fuzzy rule base decomposition for increase in demand.
240 S.TESFAMARIAM AND M. SAATCIOGLU
fected through an exogenous parameter, such as problem of adjacency. The problem ofadjacency can simultaneously contribute to an increase in demand and decrease in re-sistance of the affected building.
INCREASE IN DEMAND
Vertical Irregularity (VI)
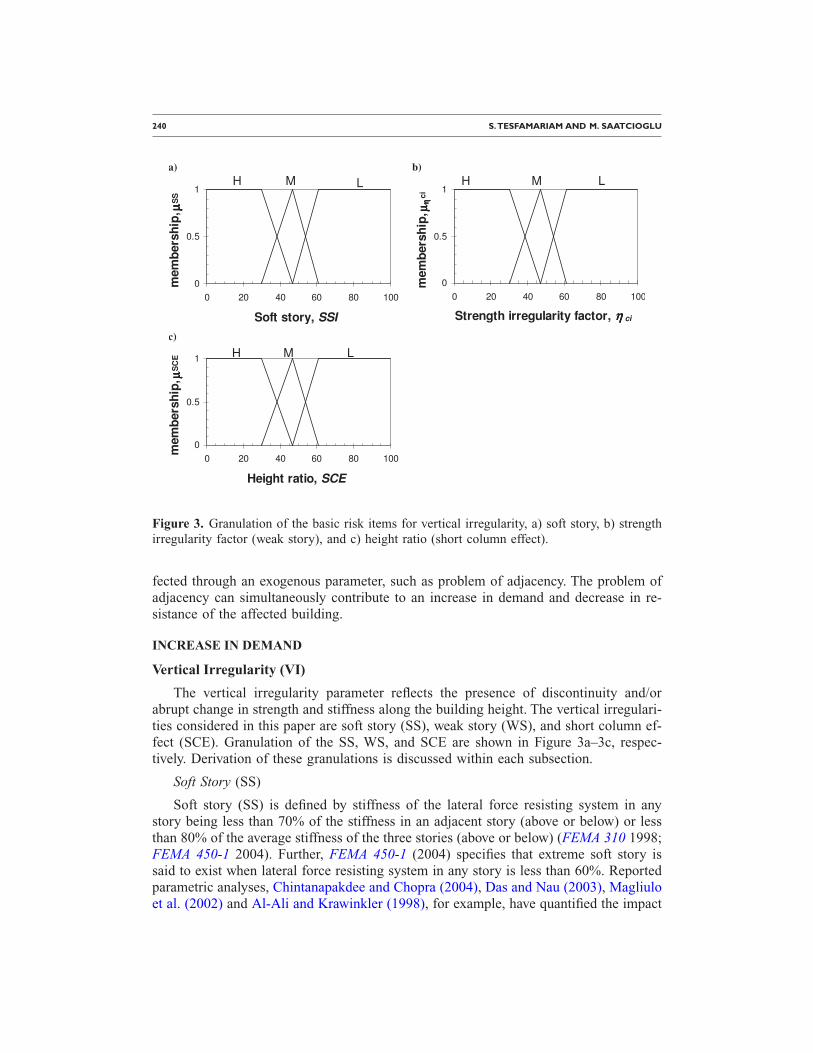
The vertical irregularity parameter reflects the presence of discontinuity and/orabrupt change in strength and stiffness along the building height. The vertical irregulari-ties considered in this paper are soft story (SS), weak story (WS), and short column ef-fect (SCE). Granulation of the SS, WS, and SCE are shown in Figure 3a–3c, respec-tively. Derivation of these granulations is discussed within each subsection.
Soft Story (SS)
Soft story (SS) is defined by stiffness of the lateral force resisting system in anystory being less than 70% of the stiffness in an adjacent story (above or below) or lessthan 80% of the average stiffness of the three stories (above or below) (FEMA 310 1998;FEMA 450-1 2004). Further, FEMA 450-1 (2004) specifies that extreme soft story issaid to exist when lateral force resisting system in any story is less than 60%. Reportedparametric analyses, Chintanapakdee and Chopra (2004), Das and Nau (2003), Magliuloet al. (2002) and Al-Ali and Krawinkler (1998), for example, have quantified the impact
0
0.5
1
0 20 40 60 80 100
Soft story, SSI
mem
bers
hip
, µµ µµS
S
LH M
0
0.5
1
0 20 40 60 80 100
Height ratio, SCE
mem
bers
hip
, µµ µµS
CE LH M
0
0.5
1
0 20 40 60 80 100
Strength irregularity factor, ηηηη ci
mem
bers
hip
, µµ µµηη ηη
ci
LH M
a) b)
c)
Figure 3. Granulation of the basic risk items for vertical irregularity, a) soft story, b) strengthirregularity factor (weak story), and c) height ratio (short column effect).
SEISMIC VULNERABILITY ASSESSMENT OF REINFORCED CONCRETE BUILDINGS 241
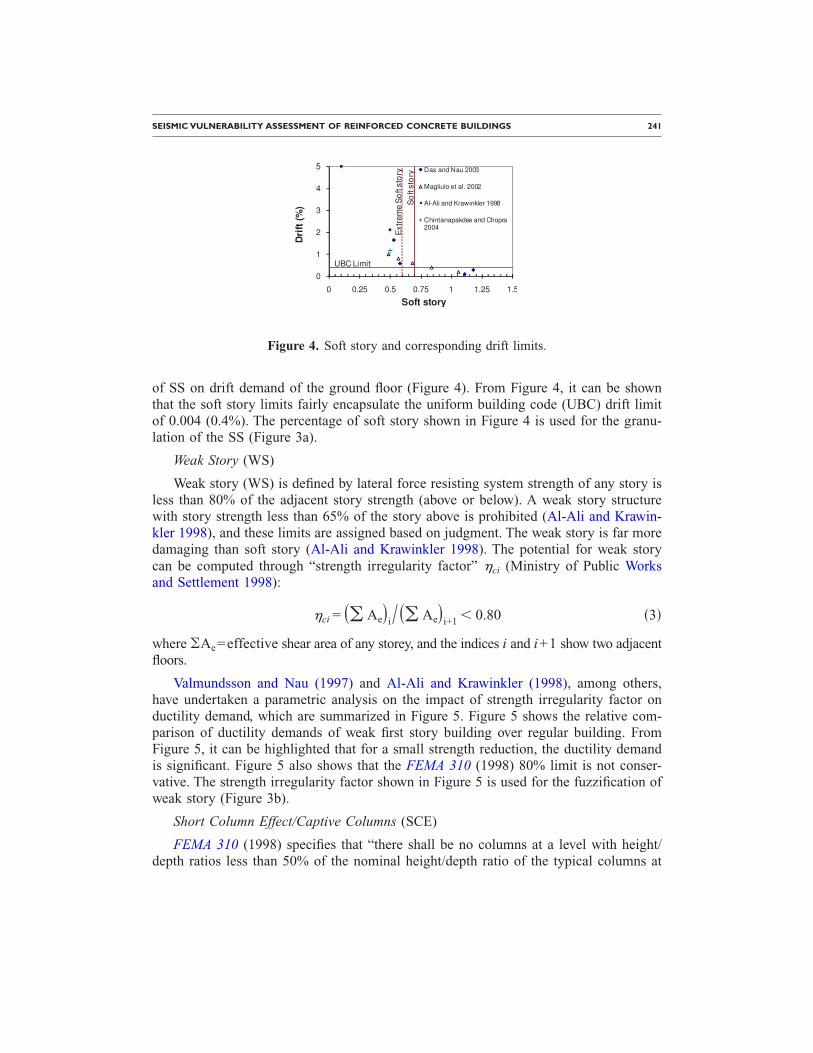
of SS on drift demand of the ground floor (Figure 4). From Figure 4, it can be shownthat the soft story limits fairly encapsulate the uniform building code (UBC) drift limitof 0.004 (0.4%). The percentage of soft story shown in Figure 4 is used for the granu-lation of the SS (Figure 3a).
Weak Story (WS)
Weak story (WS) is defined by lateral force resisting system strength of any story isless than 80% of the adjacent story strength (above or below). A weak story structurewith story strength less than 65% of the story above is prohibited (Al-Ali and Krawin-kler 1998), and these limits are assigned based on judgment. The weak story is far moredamaging than soft story (Al-Ali and Krawinkler 1998). The potential for weak storycan be computed through “strength irregularity factor” �ci (Ministry of Public Worksand Settlement 1998):
�ci = �� Ae�i � �� Ae�i+1 � 0.80 �3�
where �Ae=effective shear area of any storey, and the indices i and i+1 show two adjacentfloors.
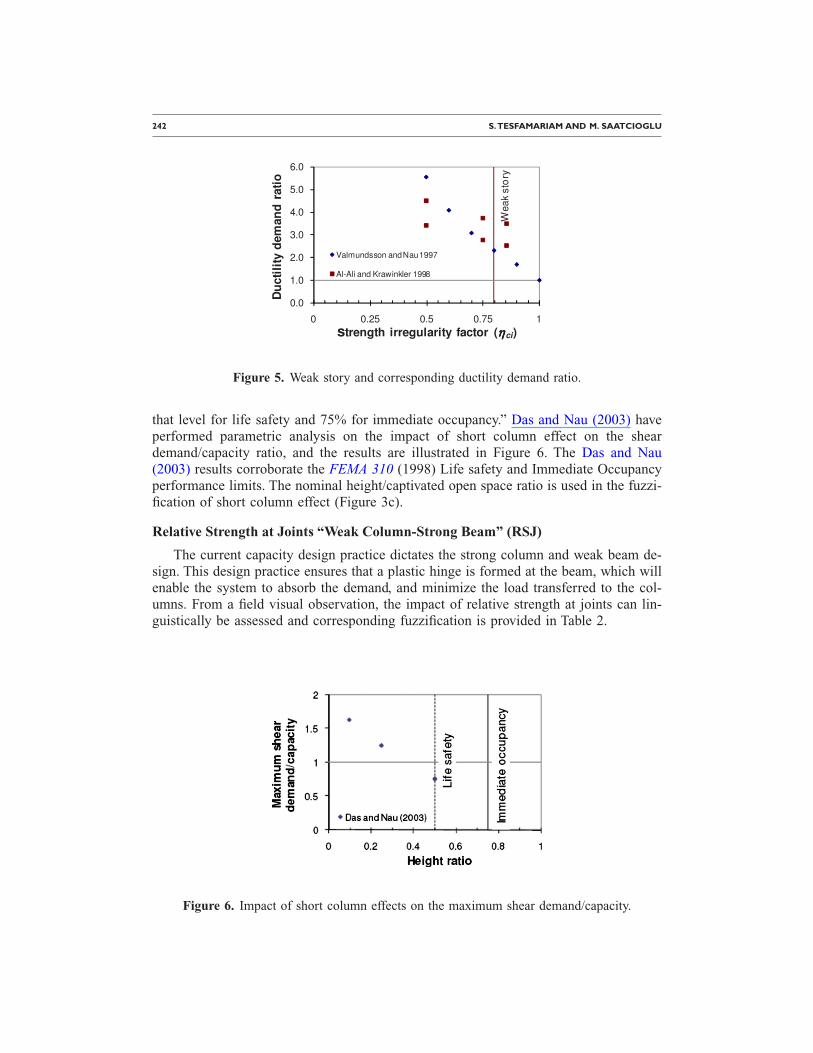
Valmundsson and Nau (1997) and Al-Ali and Krawinkler (1998), among others,have undertaken a parametric analysis on the impact of strength irregularity factor onductility demand, which are summarized in Figure 5. Figure 5 shows the relative com-parison of ductility demands of weak first story building over regular building. FromFigure 5, it can be highlighted that for a small strength reduction, the ductility demandis significant. Figure 5 also shows that the FEMA 310 (1998) 80% limit is not conser-vative. The strength irregularity factor shown in Figure 5 is used for the fuzzification ofweak story (Figure 3b).
Short Column Effect/Captive Columns (SCE)
FEMA 310 (1998) specifies that “there shall be no columns at a level with height/depth ratios less than 50% of the nominal height/depth ratio of the typical columns at
0
1
2
3
4
5
0 0.25 0.5 0.75 1 1.25 1.5
Dri
ft(%
)Soft story
Das and Nau 2003
Magliulo et al. 2002
Al-Ali and Krawinkler 1998
Chintanapakdee and Chopra2004
So
ftsto
ry
Extr
em
eS
oft
sto
ry
UBC Limit
Figure 4. Soft story and corresponding drift limits.
242 S.TESFAMARIAM AND M. SAATCIOGLU
that level for life safety and 75% for immediate occupancy.” Das and Nau (2003) haveperformed parametric analysis on the impact of short column effect on the sheardemand/capacity ratio, and the results are illustrated in Figure 6. The Das and Nau(2003) results corroborate the FEMA 310 (1998) Life safety and Immediate Occupancyperformance limits. The nominal height/captivated open space ratio is used in the fuzzi-fication of short column effect (Figure 3c).
Relative Strength at Joints “Weak Column-Strong Beam” (RSJ)
The current capacity design practice dictates the strong column and weak beam de-sign. This design practice ensures that a plastic hinge is formed at the beam, which willenable the system to absorb the demand, and minimize the load transferred to the col-umns. From a field visual observation, the impact of relative strength at joints can lin-guistically be assessed and corresponding fuzzification is provided in Table 2.
0.0
1.0
2.0
3.0
4.0
5.0
6.0
0 0.25 0.5 0.75 1
Du
cti
lity
dem
an
dra
tio
strength irregularity factor (ηηηηci)
Valmundsson andNau1997
Al-Ali and Krawinkler 1998
Weak
sto
ry
Figure 5. Weak story and corresponding ductility demand ratio.
Figure 6. Impact of short column effects on the maximum shear demand/capacity.
SEISMIC VULNERABILITY ASSESSMENT OF REINFORCED CONCRETE BUILDINGS 243
Redundancy
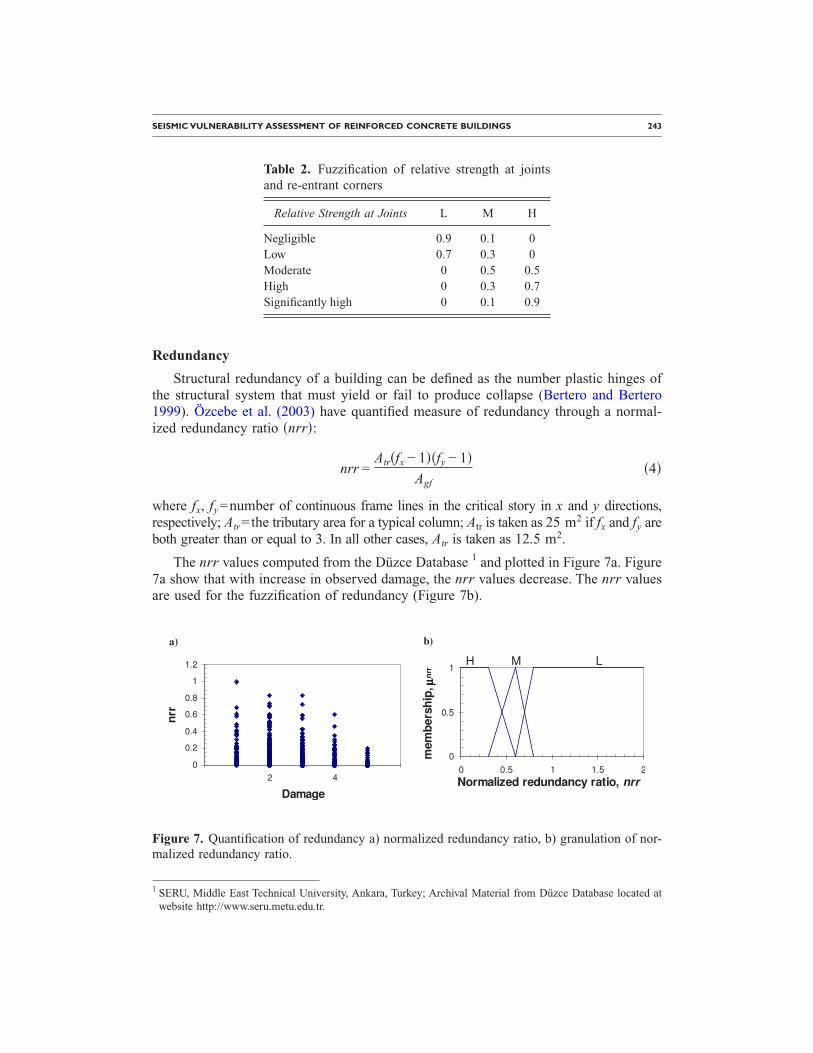
Structural redundancy of a building can be defined as the number plastic hinges ofthe structural system that must yield or fail to produce collapse (Bertero and Bertero1999). Özcebe et al. (2003) have quantified measure of redundancy through a normal-ized redundancy ratio �nrr�:
nrr =Atr�fx − 1��fy − 1�
Agf�4�
where fx, fy=number of continuous frame lines in the critical story in x and y directions,respectively; Atr=the tributary area for a typical column; Atr is taken as 25 m2 if fx and fy areboth greater than or equal to 3. In all other cases, Atr is taken as 12.5 m2.
The nrr values computed from the Düzce Database 1 and plotted in Figure 7a. Figure7a show that with increase in observed damage, the nrr values decrease. The nrr valuesare used for the fuzzification of redundancy (Figure 7b).
1 SERU, Middle East Technical University, Ankara, Turkey; Archival Material from Düzce Database located at
Table 2. Fuzzification of relative strength at jointsand re-entrant corners
Relative Strength at Joints L M H
Negligible 0.9 0.1 0Low 0.7 0.3 0Moderate 0 0.5 0.5High 0 0.3 0.7Significantly high 0 0.1 0.9
0
0.2
0.4
0.6
0.8
1
1.2
0 2 4 6
Damage
nrr
0
0.5
1
0 0.5 1 1.5 2
Normalized redundancy ratio, nrr
mem
bers
hip
, µµ µµ
nrr
LH M
a) b)
Figure 7. Quantification of redundancy a) normalized redundancy ratio, b) granulation of nor-malized redundancy ratio.
website http://www.seru.metu.edu.tr.
244 S.TESFAMARIAM AND M. SAATCIOGLU
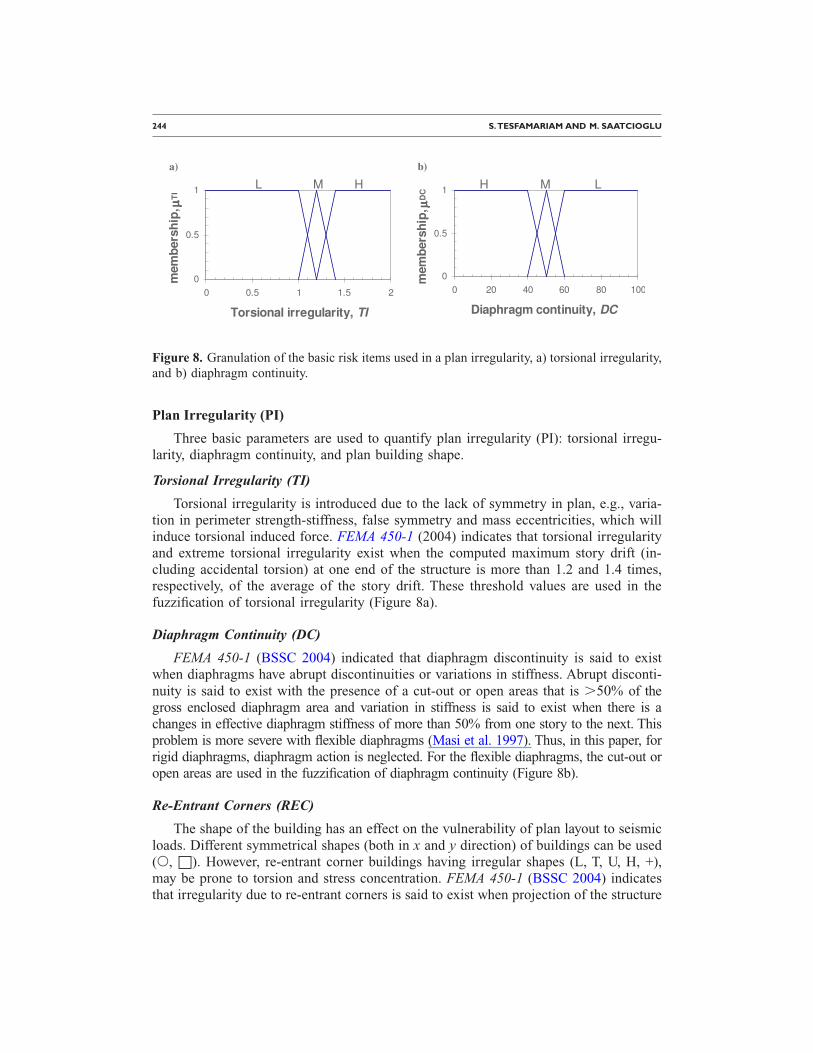
Plan Irregularity (PI)
Three basic parameters are used to quantify plan irregularity (PI): torsional irregu-larity, diaphragm continuity, and plan building shape.
Torsional Irregularity (TI)
Torsional irregularity is introduced due to the lack of symmetry in plan, e.g., varia-tion in perimeter strength-stiffness, false symmetry and mass eccentricities, which willinduce torsional induced force. FEMA 450-1 (2004) indicates that torsional irregularityand extreme torsional irregularity exist when the computed maximum story drift (in-cluding accidental torsion) at one end of the structure is more than 1.2 and 1.4 times,respectively, of the average of the story drift. These threshold values are used in thefuzzification of torsional irregularity (Figure 8a).
Diaphragm Continuity (DC)
FEMA 450-1 (BSSC 2004) indicated that diaphragm discontinuity is said to existwhen diaphragms have abrupt discontinuities or variations in stiffness. Abrupt disconti-nuity is said to exist with the presence of a cut-out or open areas that is �50% of thegross enclosed diaphragm area and variation in stiffness is said to exist when there is achanges in effective diaphragm stiffness of more than 50% from one story to the next. Thisproblem is more severe with flexible diaphragms (Masi et al. 1997). Thus, in this paper, forrigid diaphragms, diaphragm action is neglected. For the flexible diaphragms, the cut-out oropen areas are used in the fuzzification of diaphragm continuity (Figure 8b).
Re-Entrant Corners (REC)
The shape of the building has an effect on the vulnerability of plan layout to seismicloads. Different symmetrical shapes (both in x and y direction) of buildings can be used(�, �). However, re-entrant corner buildings having irregular shapes (L, T, U, H, +),may be prone to torsion and stress concentration. FEMA 450-1 (BSSC 2004) indicatesthat irregularity due to re-entrant corners is said to exist when projection of the structure
0
0.5
1
0 0.5 1 1.5 2
Torsional irregularity, TI
mem
bers
hip
, µµ µµT
I
L HM
0
0.5
1
0 20 40 60 80 100
Diaphragm continuity, DC
mem
bers
hip
, µµ µµD
C
LH M
a) b)
Figure 8. Granulation of the basic risk items used in a plan irregularity, a) torsional irregularity,and b) diaphragm continuity.
SEISMIC VULNERABILITY ASSESSMENT OF REINFORCED CONCRETE BUILDINGS 245
beyond a re-entrant corner is greater than 15% of the plan dimension of the structure inthe given direction. Linguistic assessment and fuzzification of re-entrant corners are pro-vided in Table 2.
Walls
The moment-resistant frames resist lateral forces by bending and shearing of col-umns and beams, which are connected by moment connections. The columns are respon-sible for overall strength and stability and hence are critical elements. Performance ofbare frame RC buildings is often modified through the use of structural walls. Thesestructural walls can be categorized under structural (or shear) walls and masonry walls.
Shear walls resist seismic forces almost entirely when used in buildings. They typi-cally act as vertical cantilevers and provide lateral bracing to the system, while receivinglateral forces from diaphragms and transmitting them to the foundation. Shear wallstructures have been reported to behave well under moderate to strong earthquake exci-tations (Saatcioglu et al. 2001).
Many older frame buildings include masonry infill panels. Though unreinforced ma-sonry behaves in a brittle manner and is regarded as undesirable construction materialfor seismically active regions, they may act as shear walls in controlling deformations,and may save non-ductile concrete frames until their elastic limit is exceeded. Therehave been many cases of non-ductile frames that have survived strong earthquakes dueto the participation of masonry infill walls, especially when the wall-to-floor area ratio ishigh.
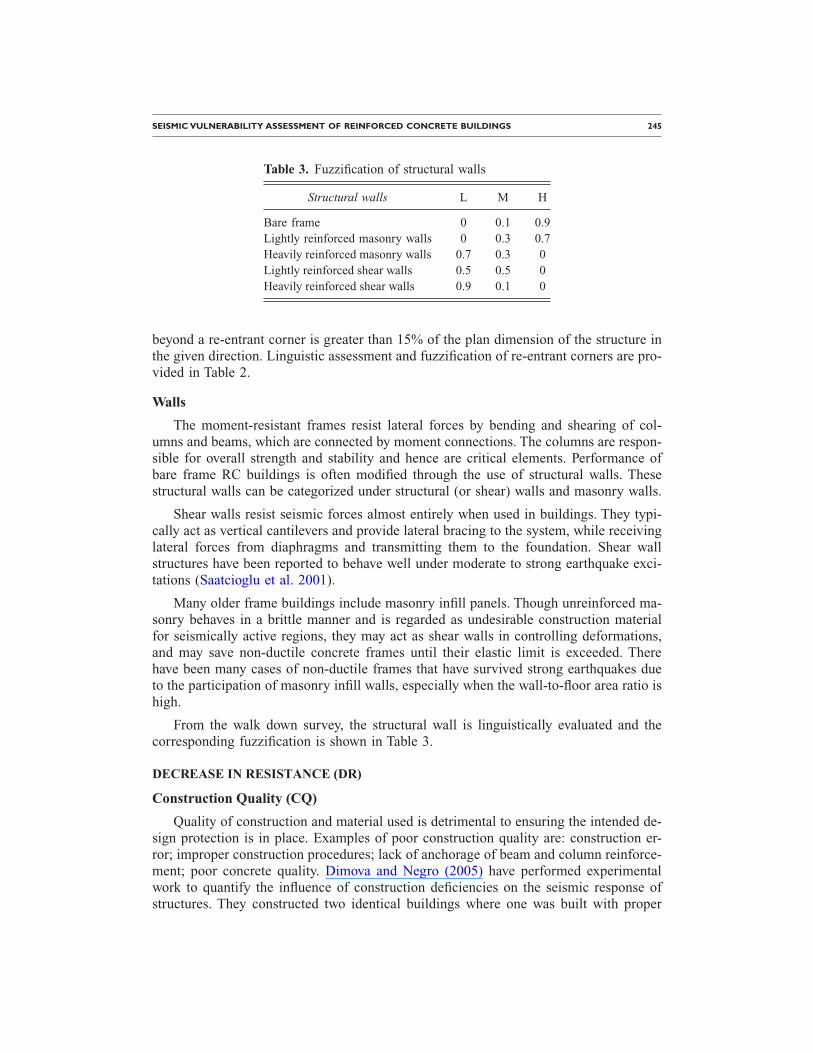
From the walk down survey, the structural wall is linguistically evaluated and thecorresponding fuzzification is shown in Table 3.
DECREASE IN RESISTANCE (DR)
Construction Quality (CQ)
Quality of construction and material used is detrimental to ensuring the intended de-sign protection is in place. Examples of poor construction quality are: construction er-ror; improper construction procedures; lack of anchorage of beam and column reinforce-ment; poor concrete quality. Dimova and Negro (2005) have performed experimentalwork to quantify the influence of construction deficiencies on the seismic response ofstructures. They constructed two identical buildings where one was built with proper
Table 3. Fuzzification of structural walls
Structural walls L M H
Bare frame 0 0.1 0.9Lightly reinforced masonry walls 0 0.3 0.7Heavily reinforced masonry walls 0.7 0.3 0Lightly reinforced shear walls 0.5 0.5 0Heavily reinforced shear walls 0.9 0.1 0
246 S.TESFAMARIAM AND M. SAATCIOGLU
construction design and detailing, and other building with construction deficiencies. Asa result of these deficiencies, the yield displacement and corresponding base shear forcehas decreased by 27% and 12%, respectively. Similarly, ultimate story displacement andmaximum base shear force are reduced by 34% and 22%, respectively.
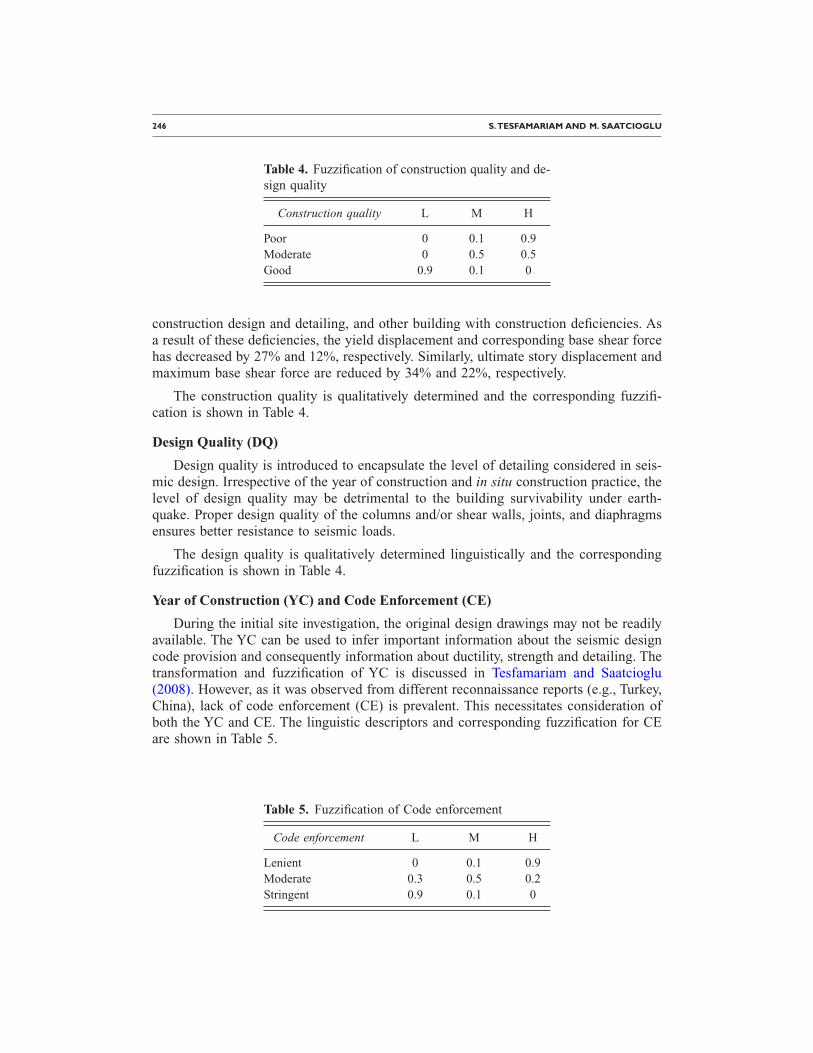
The construction quality is qualitatively determined and the corresponding fuzzifi-cation is shown in Table 4.
Design Quality (DQ)
Design quality is introduced to encapsulate the level of detailing considered in seis-mic design. Irrespective of the year of construction and in situ construction practice, thelevel of design quality may be detrimental to the building survivability under earth-quake. Proper design quality of the columns and/or shear walls, joints, and diaphragmsensures better resistance to seismic loads.
The design quality is qualitatively determined linguistically and the correspondingfuzzification is shown in Table 4.
Year of Construction (YC) and Code Enforcement (CE)
During the initial site investigation, the original design drawings may not be readilyavailable. The YC can be used to infer important information about the seismic designcode provision and consequently information about ductility, strength and detailing. Thetransformation and fuzzification of YC is discussed in Tesfamariam and Saatcioglu(2008). However, as it was observed from different reconnaissance reports (e.g., Turkey,China), lack of code enforcement (CE) is prevalent. This necessitates consideration ofboth the YC and CE. The linguistic descriptors and corresponding fuzzification for CEare shown in Table 5.
Table 4. Fuzzification of construction quality and de-sign quality
Construction quality L M H
Poor 0 0.1 0.9Moderate 0 0.5 0.5Good 0.9 0.1 0
Table 5. Fuzzification of Code enforcement
Code enforcement L M H
Lenient 0 0.1 0.9Moderate 0.3 0.5 0.2Stringent 0.9 0.1 0
SEISMIC VULNERABILITY ASSESSMENT OF REINFORCED CONCRETE BUILDINGS 247
Structural Degradation and Weakening
Damage from Previous Earthquake (DPE)
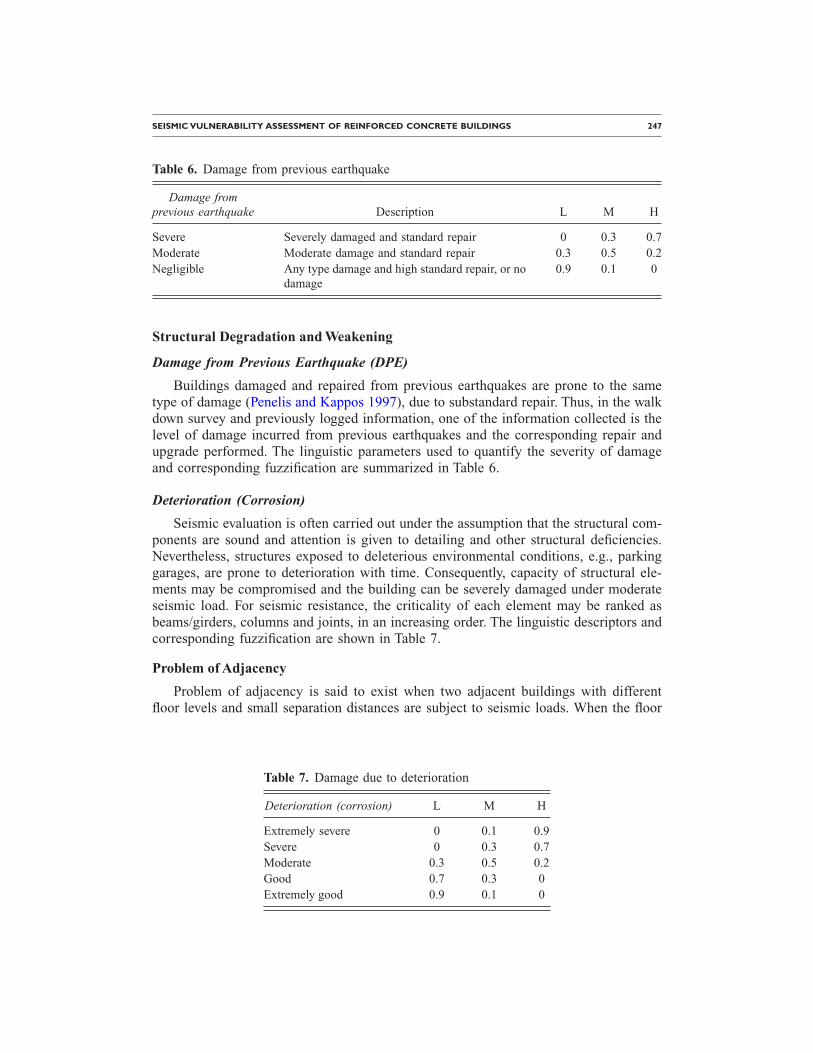
Buildings damaged and repaired from previous earthquakes are prone to the sametype of damage (Penelis and Kappos 1997), due to substandard repair. Thus, in the walkdown survey and previously logged information, one of the information collected is thelevel of damage incurred from previous earthquakes and the corresponding repair andupgrade performed. The linguistic parameters used to quantify the severity of damageand corresponding fuzzification are summarized in Table 6.
Deterioration (Corrosion)
Seismic evaluation is often carried out under the assumption that the structural com-ponents are sound and attention is given to detailing and other structural deficiencies.Nevertheless, structures exposed to deleterious environmental conditions, e.g., parkinggarages, are prone to deterioration with time. Consequently, capacity of structural ele-ments may be compromised and the building can be severely damaged under moderateseismic load. For seismic resistance, the criticality of each element may be ranked asbeams/girders, columns and joints, in an increasing order. The linguistic descriptors andcorresponding fuzzification are shown in Table 7.
Problem of Adjacency
Problem of adjacency is said to exist when two adjacent buildings with differentfloor levels and small separation distances are subject to seismic loads. When the floor
Table 6. Damage from previous earthquake
Damage fromprevious earthquake Description L M H
Severe Severely damaged and standard repair 0 0.3 0.7Moderate Moderate damage and standard repair 0.3 0.5 0.2Negligible Any type damage and high standard repair, or no
damage0.9 0.1 0
Table 7. Damage due to deterioration
Deterioration (corrosion) L M H
Extremely severe 0 0.1 0.9Severe 0 0.3 0.7Moderate 0.3 0.5 0.2Good 0.7 0.3 0Extremely good 0.9 0.1 0
248 S.TESFAMARIAM AND M. SAATCIOGLU
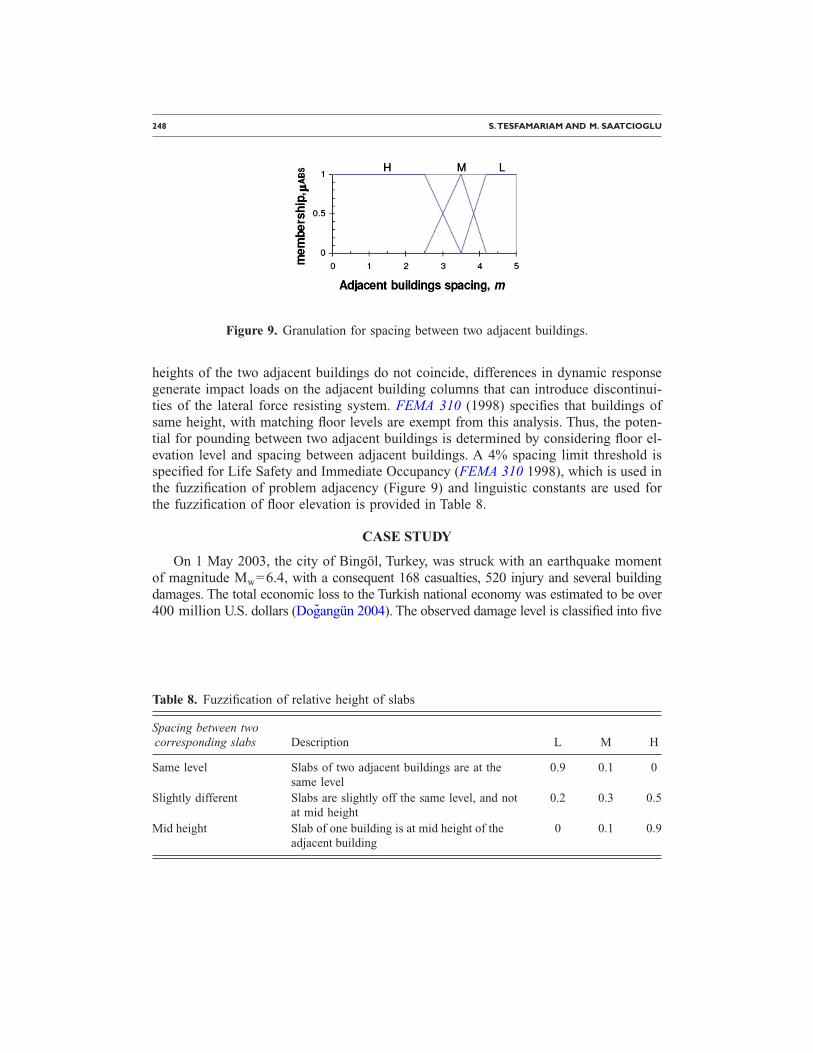
heights of the two adjacent buildings do not coincide, differences in dynamic responsegenerate impact loads on the adjacent building columns that can introduce discontinui-ties of the lateral force resisting system. FEMA 310 (1998) specifies that buildings ofsame height, with matching floor levels are exempt from this analysis. Thus, the poten-tial for pounding between two adjacent buildings is determined by considering floor el-evation level and spacing between adjacent buildings. A 4% spacing limit threshold isspecified for Life Safety and Immediate Occupancy (FEMA 310 1998), which is used inthe fuzzification of problem adjacency (Figure 9) and linguistic constants are used forthe fuzzification of floor elevation is provided in Table 8.
CASE STUDY
On 1 May 2003, the city of Bingöl, Turkey, was struck with an earthquake momentof magnitude Mw=6.4, with a consequent 168 casualties, 520 injury and several buildingdamages. The total economic loss to the Turkish national economy was estimated to be over400 million U.S. dollars (Dogangün 2004). The observed damage level is classified into five
Figure 9. Granulation for spacing between two adjacent buildings.
Table 8. Fuzzification of relative height of slabs
Spacing between twocorresponding slabs Description L M H
Same level Slabs of two adjacent buildings are at thesame level
0.9 0.1 0
Slightly different Slabs are slightly off the same level, and notat mid height
0.2 0.3 0.5
Mid height Slab of one building is at mid height of theadjacent building
0 0.1 0.9
SEISMIC VULNERABILITY ASSESSMENT OF REINFORCED CONCRETE BUILDINGS 249
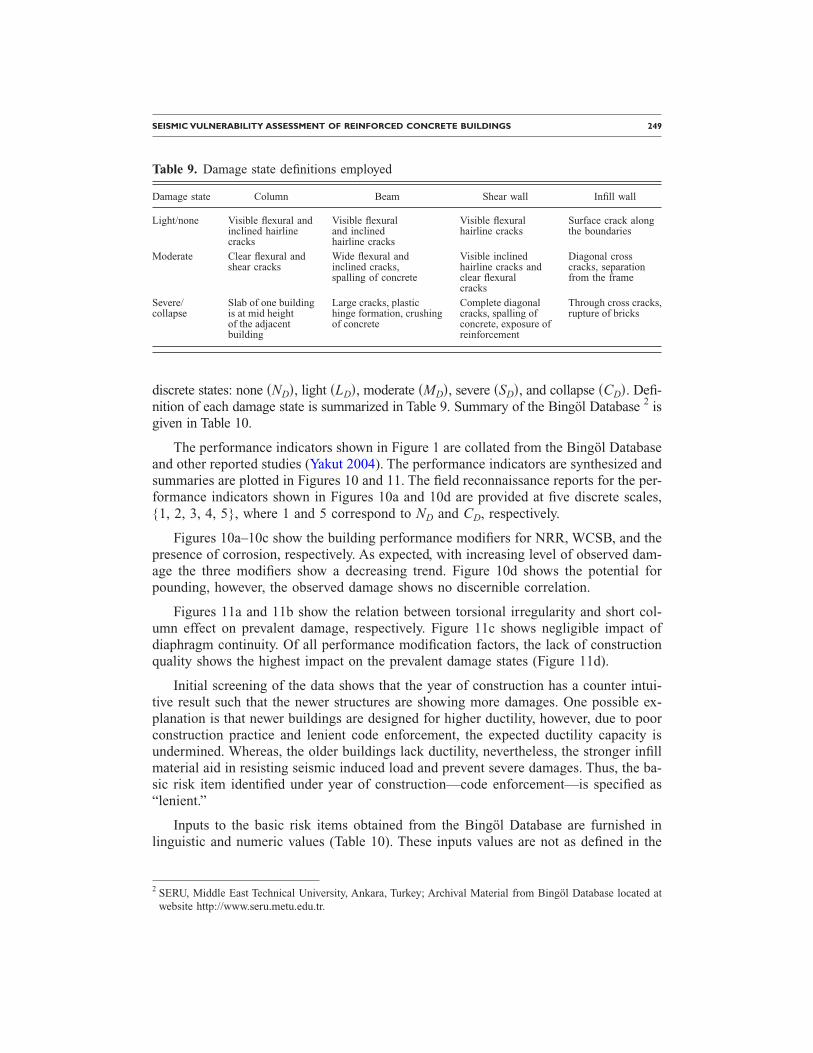
discrete states: none �ND�, light �LD�, moderate �MD�, severe �SD�, and collapse �CD�. Defi-nition of each damage state is summarized in Table 9. Summary of the Bingöl Database 2 isgiven in Table 10.
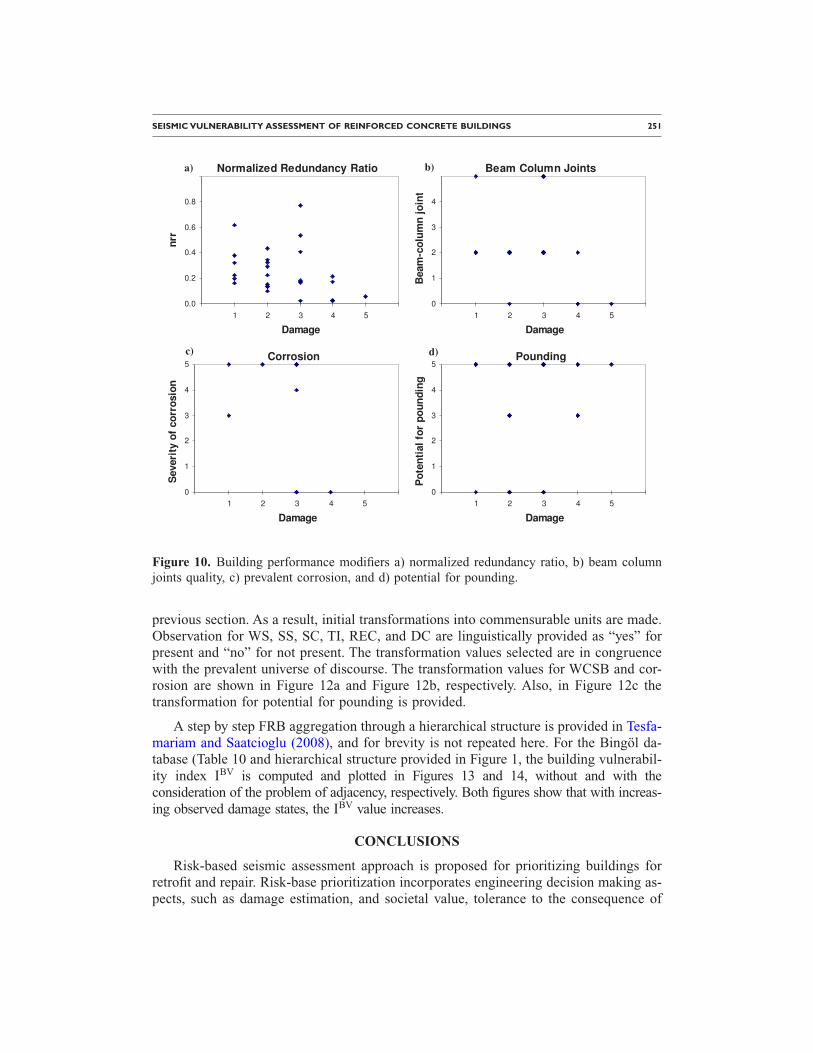
The performance indicators shown in Figure 1 are collated from the Bingöl Databaseand other reported studies (Yakut 2004). The performance indicators are synthesized andsummaries are plotted in Figures 10 and 11. The field reconnaissance reports for the per-formance indicators shown in Figures 10a and 10d are provided at five discrete scales,{1, 2, 3, 4, 5}, where 1 and 5 correspond to ND and CD, respectively.
Figures 10a–10c show the building performance modifiers for NRR, WCSB, and thepresence of corrosion, respectively. As expected, with increasing level of observed dam-age the three modifiers show a decreasing trend. Figure 10d shows the potential forpounding, however, the observed damage shows no discernible correlation.
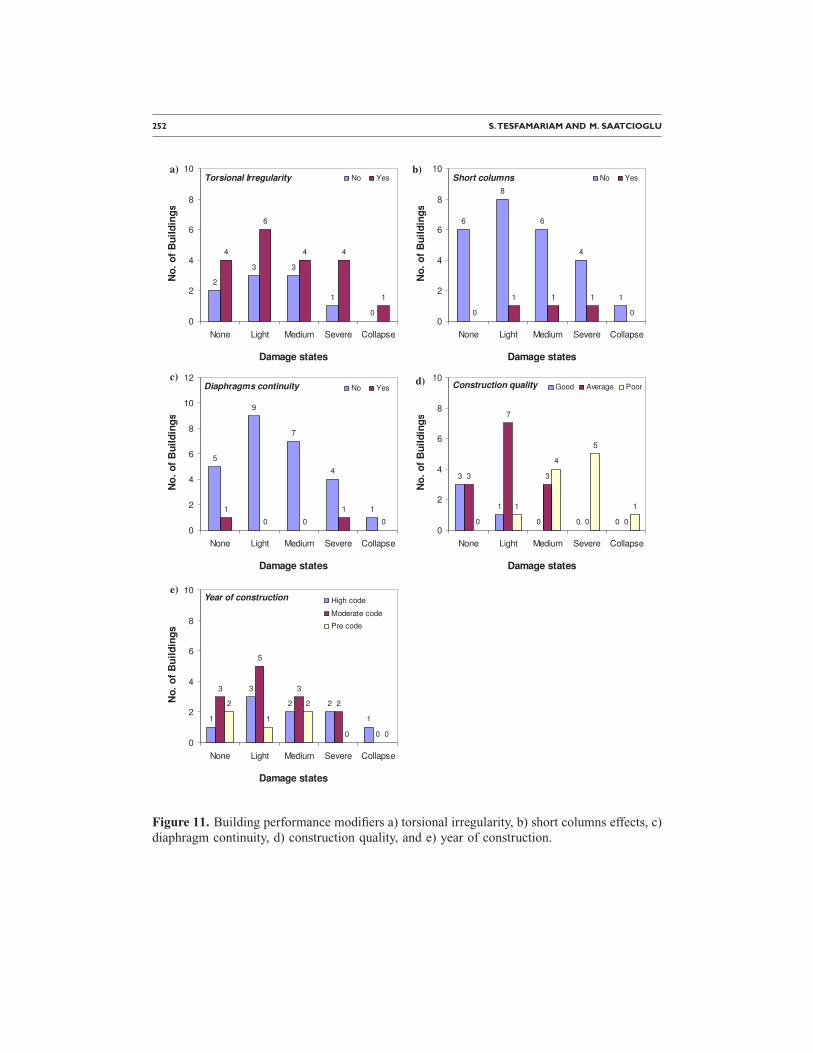
Figures 11a and 11b show the relation between torsional irregularity and short col-umn effect on prevalent damage, respectively. Figure 11c shows negligible impact ofdiaphragm continuity. Of all performance modification factors, the lack of constructionquality shows the highest impact on the prevalent damage states (Figure 11d).
Initial screening of the data shows that the year of construction has a counter intui-tive result such that the newer structures are showing more damages. One possible ex-planation is that newer buildings are designed for higher ductility, however, due to poorconstruction practice and lenient code enforcement, the expected ductility capacity isundermined. Whereas, the older buildings lack ductility, nevertheless, the stronger infillmaterial aid in resisting seismic induced load and prevent severe damages. Thus, the ba-sic risk item identified under year of construction—code enforcement—is specified as“lenient.”
Inputs to the basic risk items obtained from the Bingöl Database are furnished inlinguistic and numeric values (Table 10). These inputs values are not as defined in the
2 SERU, Middle East Technical University, Ankara, Turkey; Archival Material from Bingöl Database located at
Table 9. Damage state definitions employed
Damage state Column Beam Shear wall Infill wall
Light/none Visible flexural andinclined hairlinecracks
Visible flexuraland inclinedhairline cracks
Visible flexuralhairline cracks
Surface crack alongthe boundaries
Moderate Clear flexural andshear cracks
Wide flexural andinclined cracks,spalling of concrete
Visible inclinedhairline cracks andclear flexuralcracks
Diagonal crosscracks, separationfrom the frame
Severe/collapse
Slab of one buildingis at mid heightof the adjacentbuilding
Large cracks, plastichinge formation, crushingof concrete
Complete diagonalcracks, spalling ofconcrete, exposure ofreinforcement
Through cross cracks,rupture of bricks
website http://www.seru.metu.edu.tr.
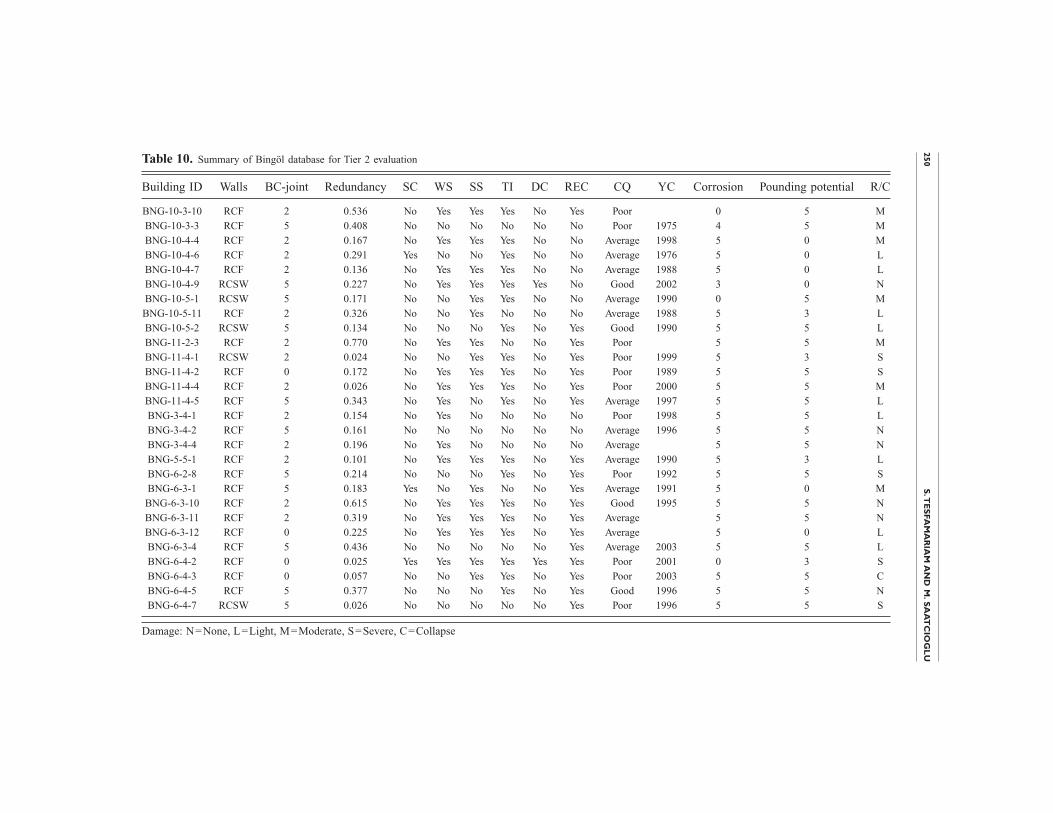
Table 10. Summary of Bingöl database for Tier 2 evaluation
Bu C Corrosion Pounding potential R/C
BN 0 5 M
B 75 4 5 M
B 98 5 0 M
B 76 5 0 L
B 88 5 0 L
B 02 3 0 N
B 90 0 5 M
BN 88 5 3 L
B 90 5 5 L
B 5 5 M
B 99 5 3 S
B 89 5 5 S
B 00 5 5 M
B 97 5 5 L
B 98 5 5 L
B 96 5 5 N
B 5 5 N
B 90 5 3 L
B 92 5 5 S
B 91 5 0 M
B 95 5 5 N
B 5 5 N
B 5 0 L
B 03 5 5 L
B 01 0 3 S
B 03 5 5 C
B 96 5 5 N
B 96 5 5 S
Da
250S
.TE
SFA
MA
RIA
MA
ND
M.S
AA
TC
IOG
LU
ilding ID Walls BC-joint Redundancy SC WS SS TI DC REC CQ Y
G-10-3-10 RCF 2 0.536 No Yes Yes Yes No Yes Poor
NG-10-3-3 RCF 5 0.408 No No No No No No Poor 19
NG-10-4-4 RCF 2 0.167 No Yes Yes Yes No No Average 19
NG-10-4-6 RCF 2 0.291 Yes No No Yes No No Average 19
NG-10-4-7 RCF 2 0.136 No Yes Yes Yes No No Average 19
NG-10-4-9 RCSW 5 0.227 No Yes Yes Yes Yes No Good 20
NG-10-5-1 RCSW 5 0.171 No No Yes Yes No No Average 19
G-10-5-11 RCF 2 0.326 No No Yes No No No Average 19
NG-10-5-2 RCSW 5 0.134 No No No Yes No Yes Good 19
NG-11-2-3 RCF 2 0.770 No Yes Yes No No Yes Poor
NG-11-4-1 RCSW 2 0.024 No No Yes Yes No Yes Poor 19
NG-11-4-2 RCF 0 0.172 No Yes Yes Yes No Yes Poor 19
NG-11-4-4 RCF 2 0.026 No Yes Yes Yes No Yes Poor 20
NG-11-4-5 RCF 5 0.343 No Yes No Yes No Yes Average 19
NG-3-4-1 RCF 2 0.154 No Yes No No No No Poor 19
NG-3-4-2 RCF 5 0.161 No No No No No No Average 19
NG-3-4-4 RCF 2 0.196 No Yes No No No No Average
NG-5-5-1 RCF 2 0.101 No Yes Yes Yes No Yes Average 19
NG-6-2-8 RCF 5 0.214 No No No Yes No Yes Poor 19
NG-6-3-1 RCF 5 0.183 Yes No Yes No No Yes Average 19
NG-6-3-10 RCF 2 0.615 No Yes Yes Yes No Yes Good 19
NG-6-3-11 RCF 2 0.319 No Yes Yes Yes No Yes Average
NG-6-3-12 RCF 0 0.225 No Yes Yes Yes No Yes Average
NG-6-3-4 RCF 5 0.436 No No No No No Yes Average 20
NG-6-4-2 RCF 0 0.025 Yes Yes Yes Yes Yes Yes Poor 20
NG-6-4-3 RCF 0 0.057 No No Yes Yes No Yes Poor 20
NG-6-4-5 RCF 5 0.377 No No No Yes No Yes Good 19
NG-6-4-7 RCSW 5 0.026 No No No No No Yes Poor 19
mage: N=None, L=Light, M=Moderate, S=Severe, C=Collapse
SEISMIC VULNERABILITY ASSESSMENT OF REINFORCED CONCRETE BUILDINGS 251
previous section. As a result, initial transformations into commensurable units are made.Observation for WS, SS, SC, TI, REC, and DC are linguistically provided as “yes” forpresent and “no” for not present. The transformation values selected are in congruencewith the prevalent universe of discourse. The transformation values for WCSB and cor-rosion are shown in Figure 12a and Figure 12b, respectively. Also, in Figure 12c thetransformation for potential for pounding is provided.
A step by step FRB aggregation through a hierarchical structure is provided in Tesfa-mariam and Saatcioglu (2008), and for brevity is not repeated here. For the Bingöl da-tabase (Table 10 and hierarchical structure provided in Figure 1, the building vulnerabil-ity index IBV is computed and plotted in Figures 13 and 14, without and with theconsideration of the problem of adjacency, respectively. Both figures show that with increas-ing observed damage states, the IBV value increases.
CONCLUSIONS
Risk-based seismic assessment approach is proposed for prioritizing buildings forretrofit and repair. Risk-base prioritization incorporates engineering decision making as-pects, such as damage estimation, and societal value, tolerance to the consequence of
Normalized Redundancy Ratio
0.0
0.2
0.4
0.6
0.8
1.0
0 1 2 3 4 5 6
Damage
nrr
Beam Column Joints
0
1
2
3
4
5
0 1 2 3 4 5 6
Damage
Beam
-co
lum
njo
int
Pounding
0
1
2
3
4
5
0 1 2 3 4 5 6
Damage
Po
ten
tial
for
po
un
din
g
Corrosion
0
1
2
3
4
5
0 1 2 3 4 5 6
Damage
Severi
tyo
fco
rro
sio
na) b)
c) d)
Figure 10. Building performance modifiers a) normalized redundancy ratio, b) beam columnjoints quality, c) prevalent corrosion, and d) potential for pounding.
252 S.TESFAMARIAM AND M. SAATCIOGLU
3
1
0 0 0
3
7
3
0 00
1
4
5
1
0
2
4
6
8
10
None Light Medium Severe Collapse
Damage states
No
.o
fB
uil
din
gs
Good Average PoorConstruction quality
2
3 3
1
0
4
6
4 4
1
0
2
4
6
8
10
None Light Medium Severe Collapse
Damage states
No
.o
fB
uil
din
gs
No YesTorsional Irregularity
5
9
7
4
11
0 0
1
00
2
4
6
8
10
12
None Light Medium Severe Collapse
Damage states
No
.o
fB
uil
din
gs
No YesDiaphragms continuity
6
8
6
4
1
0
1 1 1
00
2
4
6
8
10
None Light Medium Severe Collapse
Damage states
No
.o
fB
uil
din
gs
No YesShort columns
1
3
2 2
1
3
5
3
2
0
2
1
2
0 00
2
4
6
8
10
None Light Medium Severe Collapse
Damage states
No
.o
fB
uil
din
gs
High code
Moderate code
Pre code
Year of construction
a) b)
c) d)
e)
Figure 11. Building performance modifiers a) torsional irregularity, b) short columns effects, c)
diaphragm continuity, d) construction quality, and e) year of construction.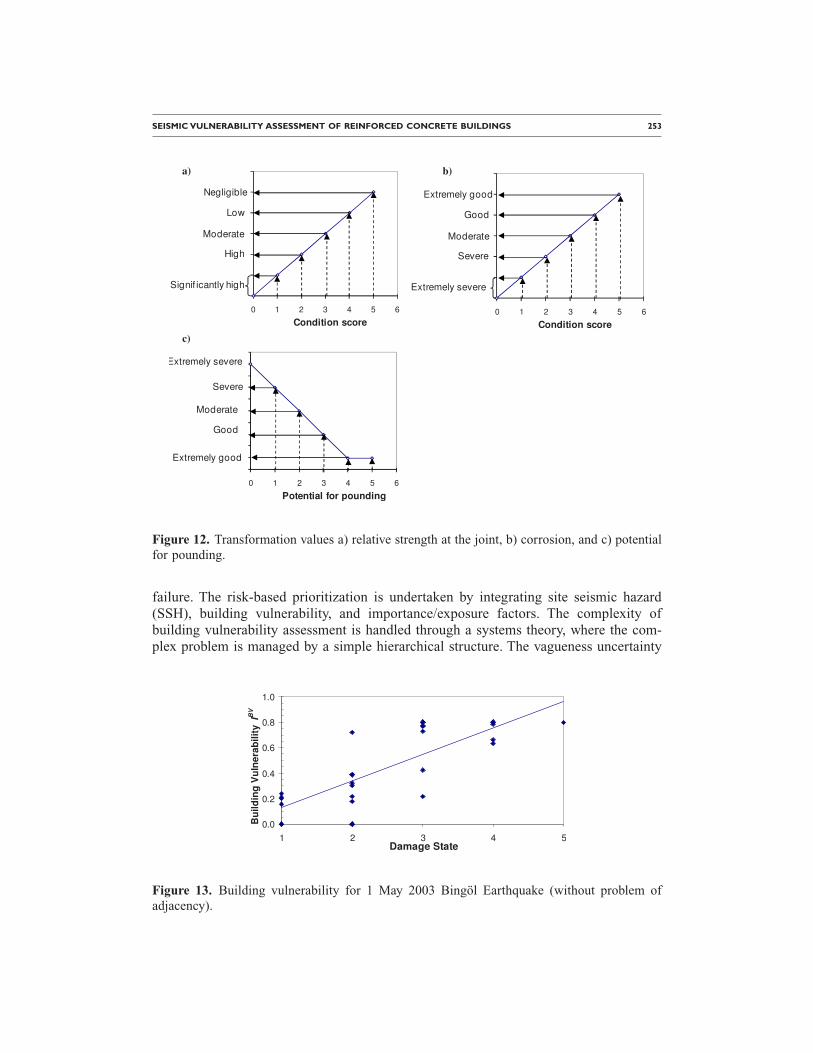
SEISMIC VULNERABILITY ASSESSMENT OF REINFORCED CONCRETE BUILDINGS 253
failure. The risk-based prioritization is undertaken by integrating site seismic hazard(SSH), building vulnerability, and importance/exposure factors. The complexity ofbuilding vulnerability assessment is handled through a systems theory, where the com-plex problem is managed by a simple hierarchical structure. The vagueness uncertainty
0 1 2 3 4 5 6
Condition score
Negligible
Low
Signif icantly high
High
Moderate
0 1 2 3 4 5 6
Condition score
Extremely good
Good
Extremely severe
Severe
Moderate
0 1 2 3 4 5 6
Potential for pounding
Extremely good
Good
Extremely severe
Severe
Moderate
a) b)
c)
Figure 12. Transformation values a) relative strength at the joint, b) corrosion, and c) potentialfor pounding.
0.0
0.2
0.4
0.6
0.8
1.0
1 2 3 4 5
Damage State
Bu
ild
ing
Vu
lne
rab
ilit
yIB
V
Figure 13. Building vulnerability for 1 May 2003 Bingöl Earthquake (without problem of
adjacency).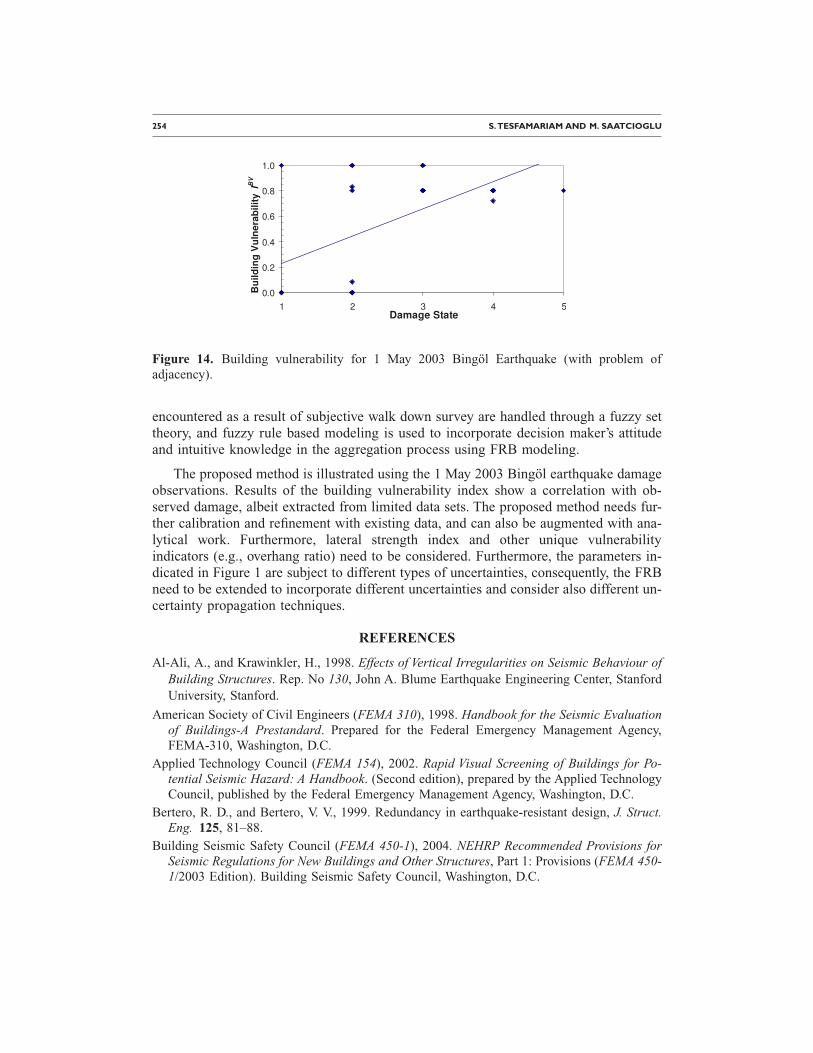
254 S.TESFAMARIAM AND M. SAATCIOGLU
encountered as a result of subjective walk down survey are handled through a fuzzy settheory, and fuzzy rule based modeling is used to incorporate decision maker’s attitudeand intuitive knowledge in the aggregation process using FRB modeling.
The proposed method is illustrated using the 1 May 2003 Bingöl earthquake damageobservations. Results of the building vulnerability index show a correlation with ob-served damage, albeit extracted from limited data sets. The proposed method needs fur-ther calibration and refinement with existing data, and can also be augmented with ana-lytical work. Furthermore, lateral strength index and other unique vulnerabilityindicators (e.g., overhang ratio) need to be considered. Furthermore, the parameters in-dicated in Figure 1 are subject to different types of uncertainties, consequently, the FRBneed to be extended to incorporate different uncertainties and consider also different un-certainty propagation techniques.
REFERENCES
Al-Ali, A., and Krawinkler, H., 1998. Effects of Vertical Irregularities on Seismic Behaviour ofBuilding Structures. Rep. No 130, John A. Blume Earthquake Engineering Center, StanfordUniversity, Stanford.
American Society of Civil Engineers (FEMA 310), 1998. Handbook for the Seismic Evaluationof Buildings-A Prestandard. Prepared for the Federal Emergency Management Agency,FEMA-310, Washington, D.C.
Applied Technology Council (FEMA 154), 2002. Rapid Visual Screening of Buildings for Po-tential Seismic Hazard: A Handbook. (Second edition), prepared by the Applied TechnologyCouncil, published by the Federal Emergency Management Agency, Washington, D.C.
Bertero, R. D., and Bertero, V. V., 1999. Redundancy in earthquake-resistant design, J. Struct.Eng. 125, 81–88.
Building Seismic Safety Council (FEMA 450-1), 2004. NEHRP Recommended Provisions forSeismic Regulations for New Buildings and Other Structures, Part 1: Provisions (FEMA 450-1/2003 Edition). Building Seismic Safety Council, Washington, D.C.
0.0
0.2
0.4
0.6
0.8
1.0
1 2 3 4 5
Damage State
Bu
ild
ing
Vu
lne
rab
ilit
yIB
V
Figure 14. Building vulnerability for 1 May 2003 Bingöl Earthquake (with problem ofadjacency).
SEISMIC VULNERABILITY ASSESSMENT OF REINFORCED CONCRETE BUILDINGS 255
Chintanapakdee, C., and Chopra, A., 2004. Seismic response of vertical irregular frames: re-sponse history and modal pushover analyses, J. Struct. Eng. 130, 1117–1185.
Das, S., and Nau, J. M., 2003. Seismic design aspects of vertically irregular reinforced concretebuildings, Earthquake Spectra 19, 455–477.
Dimova, S. L., and Negro, P., 2005. Influence of construction deficiencies on the seismic re-sponse of structures, Earthquake Eng. Struct. Dyn. 34, 613–635.
Dogangün, A., 2004. Performance of reinforced concrete buildings during the May 1, 2003Bingöl earthquake in Turkey, Eng. Struct. 26, 841–856.
Hadipriono, F. C., and Ross, T. J., 1991. A rule-based fuzzy logic deduction technique for dam-age assessment of protective structures, Fuzzy Sets Syst. 44, 459–468.
Klir, G. J., and Yuan, B., 1995. Fuzzy Sets and Fuzzy Logic: Theory and Applications, PrenticeHall International, Upper Saddle River, NJ, 595 pp.
Magdalena, L., 2002. On the role of context in hierarchical fuzzy controllers, Int. J. Intell. Syst.17, 471–493.
Magliulo, G., Ramasco, R., and Realfonzo, R., 2002. Seismic behaviour of irregular in eleva-tion plane frames, Proceedings of the 12th European Conference on Earthquake Engineer-ing, Paper No. 219.
Mamdani, E. H., 1977. Application of fuzzy logic to approximate reasoning using linguisticsynthesis, IEEE Trans. Comput. 26, 1182–1191.
Masi, A., Dolce, M., and Caterina, F., 1997. Seismic response of irregular multi-storey build-ings with flexible inelastic diaphragms, Struct. Des. Tall Build. 6, 99–124.
Meirovitch, L., 1967. Analytical Methods in Vibrations, Prentice Hall, New York, 576 pp.Ministry of Public Works and Settlement, 1998. Specification for Structures to be Built in Di-
saster Areas; Part III-Earthquake Disaster Prevention, Government of the Republic of Tur-key.
Özcebe, G. M., Yücemen, S., Yakut, A., and Aydogan, V., 2003. Seismic Vulnerability Assess-ment Procedure for Low- to Medium-Rise Reinforced Concrete Buildings, SERU StructuralEngineering Research Unit, REPORT NO. 2003 /2, 63 pp.
Penelis, G. G., and Kappos, A. J., 1997. Earthquake-Resistant Concrete Structures, E & FNSpon, New York, 572 pp.
Ross, T. J., 2004. Fuzzy Logic with Engineering Applications, Second Edition, John Wiley &Sons, UK, 650 pp.
Saatcioglu, M., Mitchell, D., Tinawi, R., Gardner, N. J., Gillies, A. G., Ghobarah, A., Anderson,D. L., and Lau, D., 2001. The August 17, 1999 Kocaeli (Turkey) earthquake-damage tostructures, Can. J. Civ. Eng. 30, 715–737.
Tesfamariam, S., and Saatcioglu, M., 2008. Risk-based seismic evaluation of RC buildings,Earthquake Spectra 24, 795–821.
Torra, V., 2002. A review of the construction of hierarchical fuzzy systems, Int. J. Intell. Syst.17, 531–543.
Valmundsson, E. V., and Nau, J. M., 1997. Seismic response of building frames with verticalstructural irregularities, J. Struct. Eng. 123, 30–41.
Wen, Y. K., Ellingwood, B. R., Veneziano, D., and Bracci, J., 2003. Uncertainty Modeling inEarthquake Engineering, MAE Center Project FD-2 Report.
Yakut, A., 2004. Preliminary seismic performance assessment procedure for existing RC build-ings, Eng. Struct. 26, 1447–1461.

256 S.TESFAMARIAM AND M. SAATCIOGLU
Zadeh, L. A., 1965. Fuzzy sets, Information Control 8, 338–353.––—, 1994. Fuzzy logic, neural networks, and soft computing, Commun. ACM 37, 77–84.
(Received 11 November 2008; accepted 10 July 2009�


