Embed Size (px)
Citation preview
polymers
Article
Rheological and Textural Properties of Apple Pectin-BasedComposite Formula with Xanthan Gum Modification forPreparation of Thickened Matrices withDysphagia-Friendly Potential
Huaiwen Yang 1,*, Chai-Chun Tsai 1, Jung-Shiun Jiang 2 and Chi-Chung Hua 2,*
�����������������
Citation: Yang, H.; Tsai, C.-C.; Jiang,
J.-S.; Hua, C.-C. Rheological and
Textural Properties of Apple
Pectin-Based Composite Formula
with Xanthan Gum Modification for
Preparation of Thickened Matrices
with Dysphagia-Friendly Potential.
Polymers 2021, 13, 873. https://
doi.org/10.3390/polym13060873
Academic Editor: José
Antonio Gabaldón Hernández
Received: 22 February 2021
Accepted: 9 March 2021
Published: 12 March 2021
Publisher’s Note: MDPI stays neutral
with regard to jurisdictional claims in
published maps and institutional affil-
iations.
Copyright: © 2021 by the authors.
Licensee MDPI, Basel, Switzerland.
This article is an open access article
distributed under the terms and
conditions of the Creative Commons
Attribution (CC BY) license (https://
creativecommons.org/licenses/by/
4.0/).
1 Department of Food Science, National Chiayi University, Chiayi 60004, Taiwan; [email protected] Department of Chemical Engineering, National Chung Cheng University, Chiayi 62102, Taiwan;
[email protected]* Correspondence: [email protected] (H.Y.); [email protected] (C.-C.H.); Tel.: +886-52717620 (H.Y.)
Abstract: Modifying the consistency of a given edible fluid matrix by incorporating food thickenersis a common nursing remedy for individuals with dysphagia when adequate water consump-tion is a concern. As apple pectin (AP) offers nutraceutical benefits, properly formulated applepectin (AP)-based thickeners featuring xanthan gum (XG) can be superior candidates for prepara-tion of dysphagia-friendly matrices (DFMs). Our recruited DFMs exhibit fluid-like behavior (lossmodulus > storage modulus, G” > G’) at lower AP concentrations (2 and 5%, w/w); they turn intoweak/critical gels (G’ ≈ G”) as the concentration becomes higher (9%). In contrast, XG-DFMs displaygel-like attributes with G’ > G”, even at rather low concentrations (<1%) and become more resistant tosugar, Na+, and Ca2+ modifications. The composite matrix of AP1.8XG0.2 (constraint at 2%) exhibitsa confined viscosity of 278 ± 11.7 mPa·s, which is considered a DFM, in comparison to only AP- orXG-thickened ones. The hardness measurements of XG0.6 and AP1.2XG0.8 are 288.33 ± 7.506 and302.00 ± 9.849 N/m2, respectively, which potentially represent a promising formulation base for fu-ture applications with DFMs; these textural values are not significantly different from a commerciallyavailable product (p > 0.05) for dysphagia nursing administrations.
Keywords: apple pectin; xanthan gum; rheological properties; texture profile; dysphagia
1. Introduction
The normal swallowing process in adults is divided into four phases: oral preparatory,oral transit, pharyngeal, and esophageal [1]. Oropharyngeal dysphagia, defined as diffi-culty swallowing, is a neurological disorder often diagnosed among the elderly, especiallyin patients with stroke, motor neuron disease, and Parkinson’s disease [2]. Conserva-tive estimates suggest that 8% of the world population experiences difficulty consumingregular thin liquids because of dysphagia; regular thin liquid intake for elderly patientswith dysphagia is problematic, as its turbulent and fast propagation is difficult to controlduring passage through the pharynx [3]. Therefore, dysphagic patients tend to developa reluctance toward consuming the recommended amount of water/moisture from thinliquids to avoid aspiration (leading to frequent bulking or even pneumonia), exposingthemselves to severe dehydration and malnutrition [4].
Edible thickeners are commonly employed to modify the consistency of food liquidsfor patients with dysphagia, as they make smoother and safer swallowing progressionpossible, as compared to thin liquids that may cause choking [5]. The viscosity of thickenedfood liquid must be carefully assessed to ensure safer swallowing for elderly dysphagicindividuals with the expectation of maintaining their quality of life [6]. Besides, the stabilityof dysphagia-friendly food liquids is another important concern. Modified starches, forexample, are one of the most common food thickeners. Modified-starch-oriented meals or
Polymers 2021, 13, 873. https://doi.org/10.3390/polym13060873 https://www.mdpi.com/journal/polymers
Polymers 2021, 13, 873 2 of 23
meal replacements are usually prepared prior to serving or on a daily basis and stored at lowtemperatures in residential care establishments, like day hospitals and rehabilitation centers.Several issues related to the utilization of this conventional food thickener have beenreported. First, modified starch for commercial formulation could undergo sedimentationwith prolonged storage [7,8]. Moreover, they are susceptible to thermal degradation thatresults in considerable viscosity reduction, especially upon heating in a retort grade duringsterilization by pressured/supersaturated steam. Lastly, before a piece of food bolus reachesthe stomach through pharyngeal and esophageal phases, it is hydrolyzed by amylase inthe saliva during oral preparatory and oral transit phases; consequently, the hydrolyzedresidue of carbohydrates could increase the risk of inhalation cough during swallowing [6].For these reasons, non-starch hydrocolloid gels have gained considerable interest recentlyas edible thickeners because of their superior stability than modified starches.
Pectin is a heterogeneous polysaccharide found in the cell wall compartment ofterrestrial plants [9,10]. Partially methyl-esterified or acetylated galacturonic acids assembleto form the backbone polymers of pectin and rhamnopyranosyl residues, with neutral sugarside chains attached to the backbone [10]. Individual pectin molecules can aggregate toform three-dimensional structures and act as thickening agents in liquid food matrices [11].Viscosity and other rheological characteristics of a thickener have long served as usefuland reliable indicators for the evaluation of its modification competence for liquid foodconsistency as well as for the stability of the resulting hydrocolloids against physicalalterations, like those encountered during the human swallowing process, when usedat appropriate concentrations [12]. In this regard, the rheological properties of pectinthickened food matrices have been known to strongly correlate with its concentration andthe interactions with common food ingredients like sugar and cations [12–14]. Pectin can befound in almost all plants, but commercially, most pectin merchandises are produced fromcitrus fruits and apples [15]. Apple pomace, 95% made of skin and pulp with attentiondrawing bioactive polyphenols exerting antioxidant activity, is left in the magnitude ofseveral million tons, with an increase trend, annually, required for further sustainableprocessing or otherwise discarded as waste [16]. Once extracted from apple pomace,commercialized apple pectin is wildly used as an edible thickener or emulsifier [17].
Hydrocolloid gelling gums are also frequently employed as thickeners for the formu-lation of dysphagia-friendly matrices (DFMs) to avoid hydrolysis by the salivary amylase.Among the hydrocolloid gelling gums, xanthan gum (XG) is of great interest due to itsfavorable rheological characteristics and stability [18,19]. XG is a high-molecular-weightexopolysaccharide with a linear 1,4-D-glucose backbone and charged trisaccharide sidechains at alternate residues [19]. The electrostatic repulsions between the charged sidechains allow the disordered backbone to become highly extended. Thus, XG is often capableof modifying the rheological behavior of other hydrocolloids, given the complex structuresthat could be formed [18,19]. These combined features make XG an ideal candidate toreplace pectin for dysphagia-friendly formulation, as Funami [18] reported that it is one ofthe most popular thickeners used in DFMs, second only to modified starches. Furthermore,pectin materials are considered to possess nutraceutical benefits for patients with diabetesand high cholesterol [20]. Recently, commercialized pectin products in powdered formsare commonly available as nutrition supplements, which can be fully miscible food fluidsprior to serving.
Rheological properties of commercial edible thickening formula with gum-basedcomposite used for the nursing administration of dysphagia have been reported; of allthose, the selected commercial sample in the study contained the same major ingredient,namely dextrin, [21,22]. Dextrin is basically safe and capable of promoting the consistencyof edible fluid suitable for serving individuals with dysphasia; however, a rare relateddietetic function with regards to dextrin has been reported, other than its contribution tothe texture or structure of the fluid matrix. Some later studies on thickeners have evokedinterest in starch-based formula due to the desperate need for calorie supplementationin the difficulty swallowing hurdle to normal consumption of solid bolus [23,24]. The
Polymers 2021, 13, 873 3 of 23
rheological modification effect of XG on dextrin- and starch-based DFMs have been elab-orately reported with promising outcomes to confine dysphasia diet standards [22–25].Pectin is profoundly recognized as a gelling, thickening, and stabilizing agent, whichalso has great formulation potential to develop DFMs [26]. To the best of our knowledge,DFMs formulated by pectin-based composites have not been reported. Pectin-based DFMscould simultaneously supplement other nutraceutical benefits, therefore being deductivelysuperior to dextrin- and starch-based DFMs beyond textural/theological confinements.As an excellent source of dietary fiber, pectin is well classified as an emerging prebioticfor international fermentation [27–29]. There have been additional studies indicating itspositive effects in reduction of blood glucose [30,31], total cholesterol, and low-densitylipoprotein [32]. Commercialized pectin products are also prefered for certain consciousethnic groups, as they are more likely to be naturally obtained [16], comparing to chemicallymodified starch. Nevertheless, prior to the confined usage of a pectin-based composite toprepare DFMs, a systematic study is necessary, one that studies the rhetorical and texturalproperties of the general modifier (XG) as well as pectin-related basic food ingredients,such as sugar (sucrose), salt (sodium), and calcium.
As per the above justified concerns, this study aims to conduct a systematic study onthe rheological and textural properties of an apple pectin (AP)-based composite formulawith dysphagia-friendly potential by incorporating XG as a modifier as well as commonlyavailable food ingredients, including sugar or sucrose, table salt or monovalent sodium ion,and divalent calcium ion, when formulated for DFMs. The results shed light on promisingalternatives of existing formulations for future applications to DFMs.
2. Materials and Methods2.1. Materials and Reagents
The AP as powdered form (Solgar, Inc., Leonia, NJ, USA) and XG of molecule weightcirca 2000 kDA (Gemfont Co., Taipei, Taiwan) were used as thickeners in this study. A com-mercial powdered thickener, Neo-high Toromeal III® (TRM, Food-care, Inc., Tokyo, Japan)was also utilized as a control sample (1.5%) for texture profile analysis. White granulatedsugar (Taisugar Co., Kaohsiung, Taiwan) and iodized table salt (Taisalt Co., Tainan, Taiwan)were purchased from local producers, and chemical-grade sucrose and sodium chloride(Sigma-Aldrich Co. Oakville, Ontario, Canada) were utilized for comparative purposes.Calcium chloride dihydrate was used as a divalent cation source (Ca2+) (Sigma-AldrichCo.). Unless stated otherwise, all other chemicals in this study were of chemical grade.
2.2. Preparation of Model Food Matrices (MFDs)
Basic formulation ingredients (BFIs; sugar, sucrose and cations) were added to reverseosmosis water and mixed thoroughly at ambient temperature using a magnetic stirrer(Mini-P, Yotec Instruments Co., Taipei, Taiwan) at moderate speed for 3 h. The thickenerbases (XG, AP, and AP-XG blend) were then dispersed in reverse osmosis water, with orwithout sucrose and cations. The hydrocolloids so prepared were transferred to 15 mLcentrifugation tubes and stored at 4 ◦C for 24 h prior to the rheological measurements.Table 1 summarises the formulations of the model food matrices in this study.
2.3. Degree of Esterification (DE)
The DE of AP was estimated in a way described previously [33] with only minormodifications. Briefly, 1.0 g of AP powder was thoroughly dissolved in 50 mL deionizedwater by stirring at ambient temperature for 2 h. Upon complete mixing, 6 drops ofphenolphthalein solution (C20H14O4; Sigma-Aldrich Co., MO, USA) was added as anindicator and titrated with 0.1 M NaOH until the mixture turned pink, lasting for 30 s;the depletion volume of NaOH (mL) was recorded as V1. Subsequently, 10 mL of 0.25 MHCl was thoroughly mixed with the pink solution to neutralize the solution until it turnedtransparent, followed by a second titration of 0.1 M NaOH until the neutralized solution
Polymers 2021, 13, 873 4 of 23
turned pink again for another 30 s. The second depletion volume of NaOH was recordedas V2. The DE was calculated using the following relation (Equation (1)):
DE(%) = 100× V2
V1 + V2(1)
Table 1. Summary of the thickeners, sugars, and cations in terms of concentrations and abbreviationfor dysphagia-friendly potential evaluation.
Thickener (%, w/w) BFI (%, w/w) Abbreviation
Apple pectin(AP)
2–9 - - AP2-AP9
2
Table salt
5/10
AP2Salt5Sugar granule AP2Sugar5
NaCl AP2Na5Sucrose AP2Sucrose5CaCl2 AP2Ca5/10
Xanthan gum(XG)
0.05–2.5 - - XG0.5-XG2.5
0.5NaCl
5/10XG0.5Na5
Sucrose XG0.5Sucrose5CaCl2 XG0.5Ca5/10
CombinedAP-XG *
AP1-1.8+
XG1-0.2- -
AP1XG1through
AP1.8XG0.2* The total concentration of AP-XG composite formula is constrained at 2% (w/w).
2.4. Rheological Measurements and Flow Behavior Characterization
A controlled-stress rheometer (DHR-2, TA Instruments, New Castle, DE, USA) equippedwith a cone-and-plate fixture (diameter = 60 mm, cone angle = 1◦, and gap size = 55 mm)and Peltier temperature controller was used at 25.0± 1 ◦C. Solvent traps were used throughthe entire measurement to avoid solvent evaporation. Rheological characterization wasperformed by the following sequences: (dynamic oscillatory) strain sweep, frequencysweep, and startup of steady shear. To help relax possible residual stress, the sample wasrested for a period of 60 s between two consecutive strains or frequency sweeps and 30 sfor the steady-state viscosity (η) measurement. A constant frequency of 1 Hz was utilizedin the strain-sweep experiment. The storage (G’) and loss (G”) modulus obtained in thefrequency-sweep experiment utilized a small strain (1%) identified to fall in the linearviscoelastic (LVE) region in a prior strain-sweep experiment. The viscosity measured inthe steady-shear experiment was taken from the steady-state value at long times for agiven shear rate. The shear rate was increased in a stepwise manner from low to high. Todescribe the flow behavior of a DFM, the shear stress (σ) versus shear rate (γ) data over arange of shear rates 0.1–100 s−1 at 25 ◦C were fitted to the power-law model to indicatethe consistency index (K) and flow-behavior index (n) as Equation (2); the results wereanalyzed on a double logarithmic scale, with the values of K and n determined from theintercept and slope of the plot, respectively [22,34].
σ = K γ n (2)
2.5. Texture Profile Analysis (TPA)
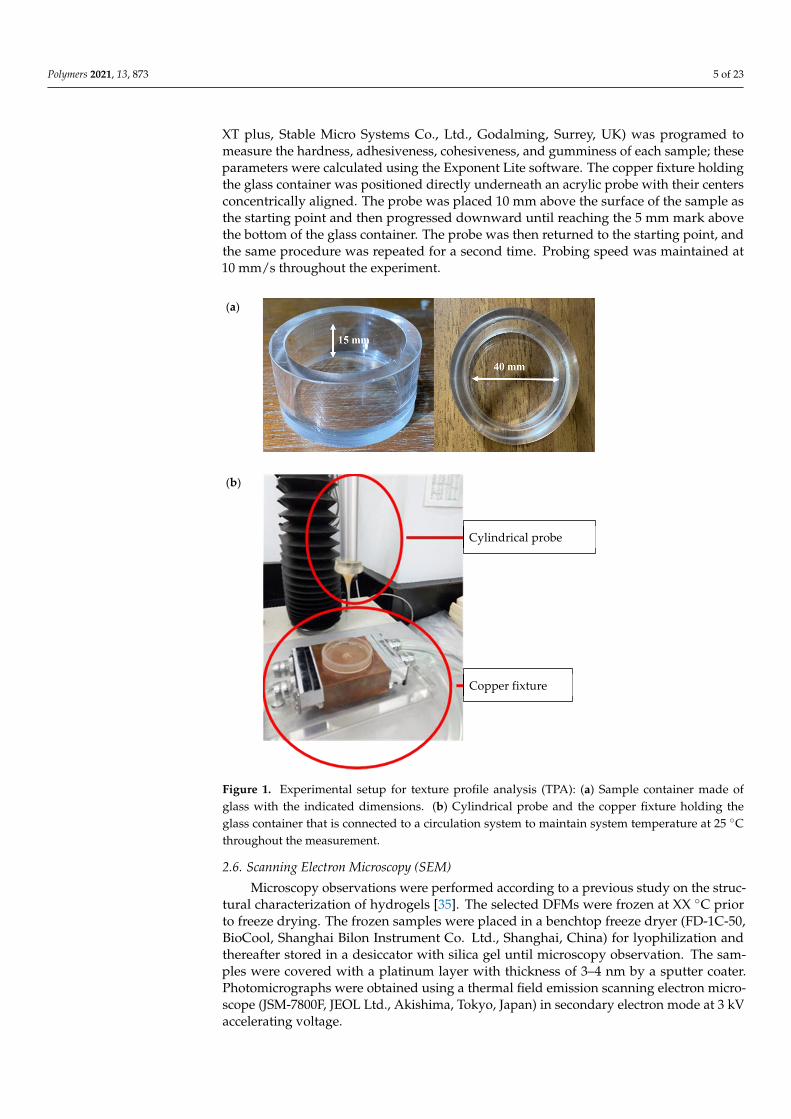
The authorized method of TPA issued in 2009 by the Japanese Ministry of Consumers,“Food for patients with swallowing difficulty,” under regulation of “Food for special dietaryuses” was adopted for the characterization of model food matrices [18]. A customizedglass container (40 mm diameter × 20 mm depth) was filled with the fluid sample, upto the 15 mm level (Figure 1a). The measurement was performed with a cylindricalprobe (20 mm diameter) made of acrylic, while the system was maintained at 25 ◦Cusing a customized temperature controller (Figure 1b). The texture profile analyzer (TA.
Polymers 2021, 13, 873 5 of 23
XT plus, Stable Micro Systems Co., Ltd., Godalming, Surrey, UK) was programed tomeasure the hardness, adhesiveness, cohesiveness, and gumminess of each sample; theseparameters were calculated using the Exponent Lite software. The copper fixture holdingthe glass container was positioned directly underneath an acrylic probe with their centersconcentrically aligned. The probe was placed 10 mm above the surface of the sample asthe starting point and then progressed downward until reaching the 5 mm mark abovethe bottom of the glass container. The probe was then returned to the starting point, andthe same procedure was repeated for a second time. Probing speed was maintained at10 mm/s throughout the experiment.
Polymers 2021, 13, x FOR PEER REVIEW 5 of 24
σ = K γ n (2)
2.5. Texture Profile Analysis (TPA) The authorized method of TPA issued in 2009 by the Japanese Ministry of Consum-
ers, “Food for patients with swallowing difficulty,” under regulation of “Food for special dietary uses” was adopted for the characterization of model food matrices [18]. A custom-ized glass container (40 mm diameter × 20 mm depth) was filled with the fluid sample, up to the 15 mm level (Figure 1a). The measurement was performed with a cylindrical probe (20 mm diameter) made of acrylic, while the system was maintained at 25 °C using a cus-tomized temperature controller (Figure 1b). The texture profile analyzer (TA. XT plus, Stable Micro Systems Co., Ltd., Godalming, Surrey, UK) was programed to measure the hardness, adhesiveness, cohesiveness, and gumminess of each sample; these parameters were calculated using the Exponent Lite software. The copper fixture holding the glass container was positioned directly underneath an acrylic probe with their centers concen-trically aligned. The probe was placed 10 mm above the surface of the sample as the start-ing point and then progressed downward until reaching the 5 mm mark above the bottom of the glass container. The probe was then returned to the starting point, and the same procedure was repeated for a second time. Probing speed was maintained at 10 mm/s throughout the experiment.
(a)
(b)
Figure 1. Experimental setup for texture profile analysis (TPA): (a) Sample container made of glass with the indicated dimensions. (b) Cylindrical probe and the copper fixture holding the glass con-tainer that is connected to a circulation system to maintain system temperature at 25 °C through-out the measurement.
Cylindrical probe
Copper fixture
Figure 1. Experimental setup for texture profile analysis (TPA): (a) Sample container made ofglass with the indicated dimensions. (b) Cylindrical probe and the copper fixture holding theglass container that is connected to a circulation system to maintain system temperature at 25 ◦Cthroughout the measurement.
2.6. Scanning Electron Microscopy (SEM)
Microscopy observations were performed according to a previous study on the struc-tural characterization of hydrogels [35]. The selected DFMs were frozen at XX ◦C priorto freeze drying. The frozen samples were placed in a benchtop freeze dryer (FD-1C-50,BioCool, Shanghai Bilon Instrument Co. Ltd., Shanghai, China) for lyophilization andthereafter stored in a desiccator with silica gel until microscopy observation. The sam-ples were covered with a platinum layer with thickness of 3–4 nm by a sputter coater.Photomicrographs were obtained using a thermal field emission scanning electron micro-scope (JSM-7800F, JEOL Ltd., Akishima, Tokyo, Japan) in secondary electron mode at 3 kVaccelerating voltage.
Polymers 2021, 13, 873 6 of 23
2.7. Data Manipulation and Statistical Analysis
Each experimental dataset was reported based on triplicates, except for texture profilemeasurement data and microscopic observations; for texture profile analysis, each experi-mental dataset was based on nine replications. The regression equations resulting fromflow properties and rheological behavior were obtained using SigmaPlot® version 10.0(SYSTAT software, Inc., San Jose, CA, USA) with percentage R-square indication for thedegree of model fitness. The shear rate dependent viscosities with respect to other groupswere subjected to paired t-test comparisons. Duncan’s multiple range test based on analysisof variance (ANOVA) was utilized to justify the significance of differences among the meanvalues of the fitted consistency coefficient and flow-behavior index of the correspondingformulated matrices, as well as textural properties with a 95% confidence interval usingSPSS (Statistical Package for the Social Science) version 19.0.
3. Results and Discussion3.1. Degree of Esterification (DE)
Theoretically, the DE can range from 0% to 100%. Whether a pectin bears a DE above50% has been used to characterize the high- (or low-) methoxyl pectin [10]. The DE ofthe AP powder under investigation is 45.2 ± 1.42%. Citrus pectin samples were reportedto have DE ranging from 27.9% to 77.8% [22], whereas pectin extracted from sugar beetswas reported to range from 61.29 to 70.13% depending on the pH value [18]. Rascón-Chu et al. [36] recently conducted a pectin collecting process by extracting pectin fromthinning apple (Malus demestica Borkh) with a DE of 41%, which is comparable to ourmeasured value. Pectin substances possess complex O-ether or O-ester groups, whichare contained in the polysaccharide-oriented molecular structure composed of as manyas 18 monosaccharides [17]. The AP sample powder recruited in this study appears tobe a merely, instead of extremely, low-methoxyl pectin. It could be expected that bothsugar associated high-methoxyl effects and divalent calcium ion associated low-methoxyleffects on rheological characterization would be attainable for AP-contained fluid matrices.Moreover, the structural attributes of the AP-contained fluid matrices with the addition ofdivalent calcium ion can be apparently different from those with the addition of sugar. TheDE value could be modified as needed by an alkaline solution, followed by neutralizationand a 70% ethanol sedimentation. The DE value could be reduced to as low as 5.6%, an86% minimizing rate, for pectin made from thinning apple with a 41% DE value [36].
3.2. Rheological Characterization3.2.1. Rheological Features of AP at Various Concentrations
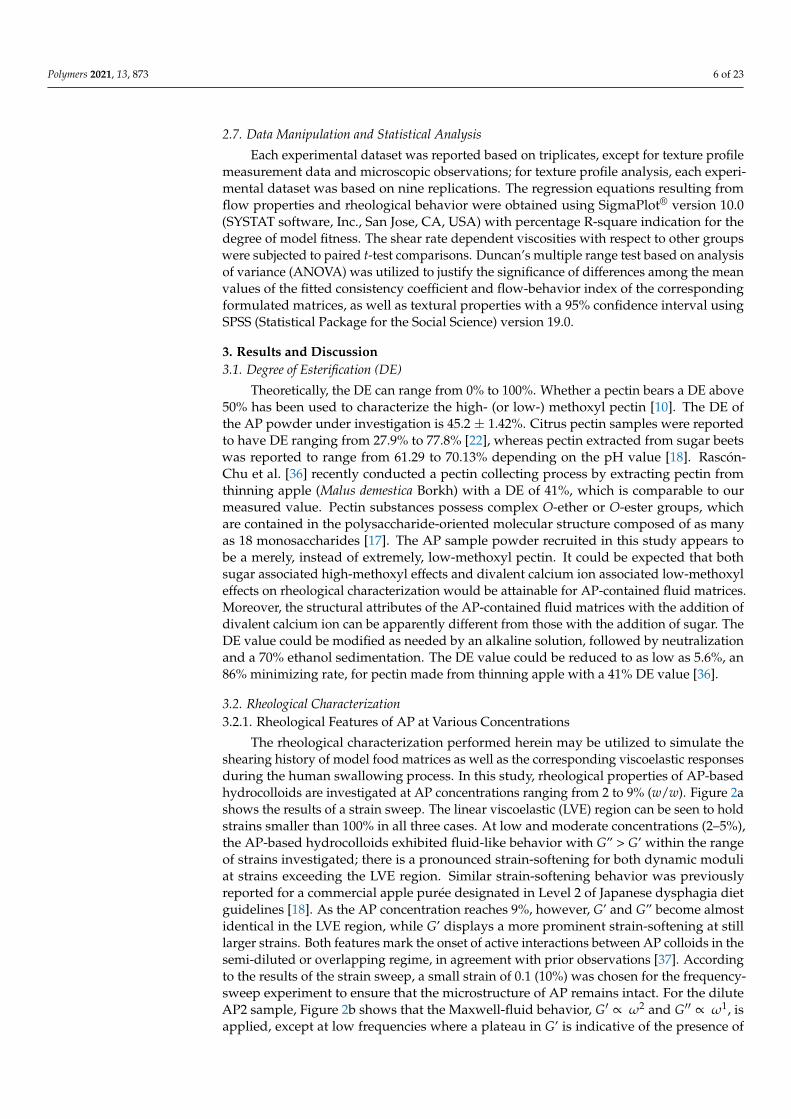
The rheological characterization performed herein may be utilized to simulate theshearing history of model food matrices as well as the corresponding viscoelastic responsesduring the human swallowing process. In this study, rheological properties of AP-basedhydrocolloids are investigated at AP concentrations ranging from 2 to 9% (w/w). Figure 2ashows the results of a strain sweep. The linear viscoelastic (LVE) region can be seen to holdstrains smaller than 100% in all three cases. At low and moderate concentrations (2–5%),the AP-based hydrocolloids exhibited fluid-like behavior with G” > G’ within the rangeof strains investigated; there is a pronounced strain-softening for both dynamic moduliat strains exceeding the LVE region. Similar strain-softening behavior was previouslyreported for a commercial apple purée designated in Level 2 of Japanese dysphagia dietguidelines [18]. As the AP concentration reaches 9%, however, G’ and G” become almostidentical in the LVE region, while G’ displays a more prominent strain-softening at stilllarger strains. Both features mark the onset of active interactions between AP colloids in thesemi-diluted or overlapping regime, in agreement with prior observations [37]. Accordingto the results of the strain sweep, a small strain of 0.1 (10%) was chosen for the frequency-sweep experiment to ensure that the microstructure of AP remains intact. For the diluteAP2 sample, Figure 2b shows that the Maxwell-fluid behavior, G′ ∝ ω2 and G′′ ∝ ω1, isapplied, except at low frequencies where a plateau in G’ is indicative of the presence of
Polymers 2021, 13, 873 7 of 23
large aggregate species [38]. Zhao et al. [39] recently studied the structural formation ofhigh-methoxyl apple pectin systems without an acidifier; the 1% apple pectin with differentDE values and different sucrose levels were subjected to structural investigation. Ourfrequency sweep results indicate that AP2 hydrocolloid represent a behavior pattern withrespect to shear moduli ranging from 0.01–200 (rad/s), which resembles the behavior of1% high-methoxyl (66.1%) apple pectin contained hydrocolloid with additional 45 and50% of sucrose undergoing the sweep range between 1–100 rad/s [39]; however, it isgenerally precautious for the elderly to consume high amounts of sugar for various healthconcerns. In contrast, the concentrated sample, AP9, exhibits critical-gel behavior [40],G′ ∼ G′′ ∼ ω
n ( n ≈ 0.9), as often observed for colloidal suspensions just below thepercolation or gelation threshold. Likely, these features suggest that the AP hydrocolloidsare constituted of colloid-like particles in aqueous solution, and that the AP concentrationcan offer an excellent opportunity to gain precise control over their viscoelastic propertiesfor various applications with DFMs.
Polymers 2021, 13, x FOR PEER REVIEW 7 of 24
seen to hold strains smaller than 100% in all three cases. At low and moderate concentra-tions (2–5%), the AP-based hydrocolloids exhibited fluid-like behavior with G” > G’ within the range of strains investigated; there is a pronounced strain-softening for both dynamic moduli at strains exceeding the LVE region. Similar strain-softening behavior was previ-ously reported for a commercial apple purée designated in Level 2 of Japanese dysphagia diet guidelines [18]. As the AP concentration reaches 9%, however, G’ and G” become almost identical in the LVE region, while G’ displays a more prominent strain-softening at still larger strains. Both features mark the onset of active interactions between AP col-loids in the semi-diluted or overlapping regime, in agreement with prior observations [37]. According to the results of the strain sweep, a small strain of 0.1 (10%) was chosen for the frequency-sweep experiment to ensure that the microstructure of AP remains in-tact. For the dilute AP2 sample, Figure 2b shows that the Maxwell-fluid behavior, G’ ∝ ω2 and G” ∝ ω1, is applied, except at low frequencies where a plateau in G’ is indicative of the presence of large aggregate species [38]. Zhao et al. [39] recently studied the struc-tural formation of high-methoxyl apple pectin systems without an acidifier; the 1% apple pectin with different DE values and different sucrose levels were subjected to structural investigation. Our frequency sweep results indicate that AP2 hydrocolloid represent a be-havior pattern with respect to shear moduli ranging from 0.01–200 (rad/s), which resem-bles the behavior of 1% high-methoxyl (66.1%) apple pectin contained hydrocolloid with additional 45 and 50% of sucrose undergoing the sweep range between 1–100 rad/s [39]; however, it is generally precautious for the elderly to consume high amounts of sugar for various health concerns. In contrast, the concentrated sample, AP9, exhibits critical-gel behavior [40], G’ ~ G” ~ ωn(n ≈ 0.9), as often observed for colloidal suspensions just be-low the percolation or gelation threshold. Likely, these features suggest that the AP hy-drocolloids are constituted of colloid-like particles in aqueous solution, and that the AP concentration can offer an excellent opportunity to gain precise control over their viscoe-lastic properties for various applications with DFMs.
Figure 2. Concentration dependent shear storage modulus (G’) and loss (G”) modulus profiles with respect to percentage strain and angular frequency alterations as for sole thickeners: (a) strain sweep of AP, (b) frequency sweep of AP, (c) strain sweep of XG, (d) frequency sweep of XG.
Figure 2. Concentration dependent shear storage modulus (G’) and loss (G”) modulus profiles with respect to percentagestrain and angular frequency alterations as for sole thickeners: (a) strain sweep of AP, (b) frequency sweep of AP, (c) strainsweep of XG, (d) frequency sweep of XG.
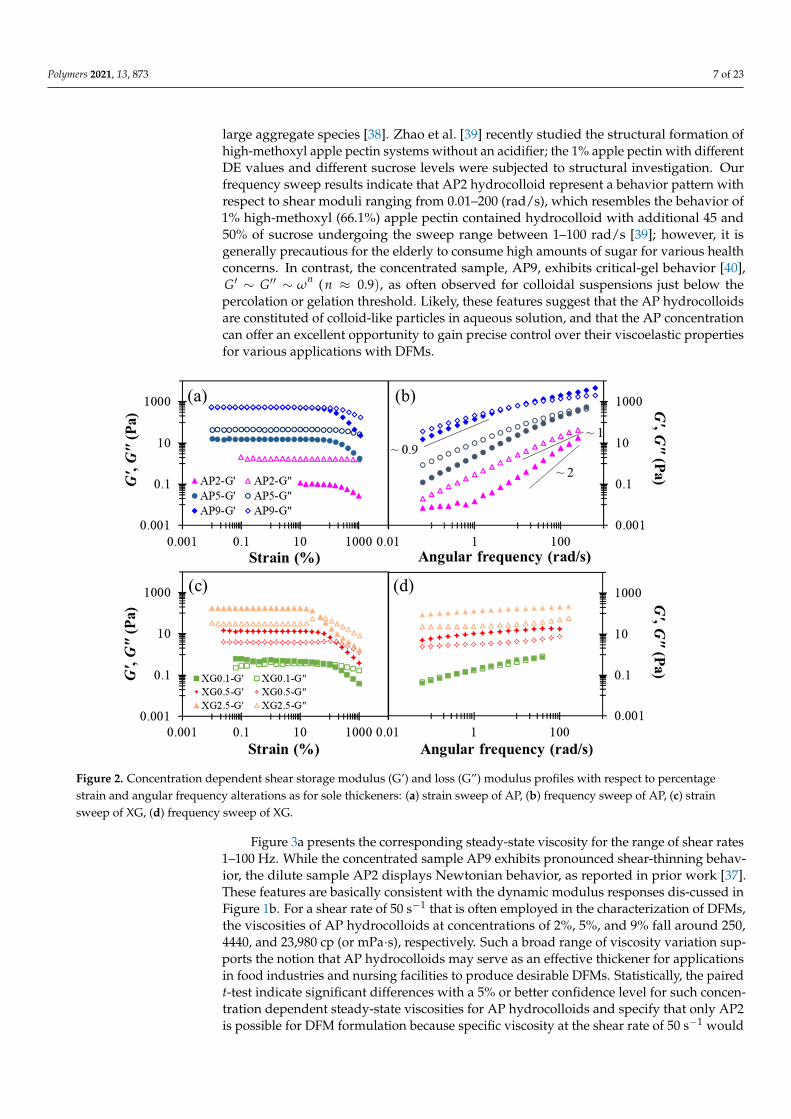
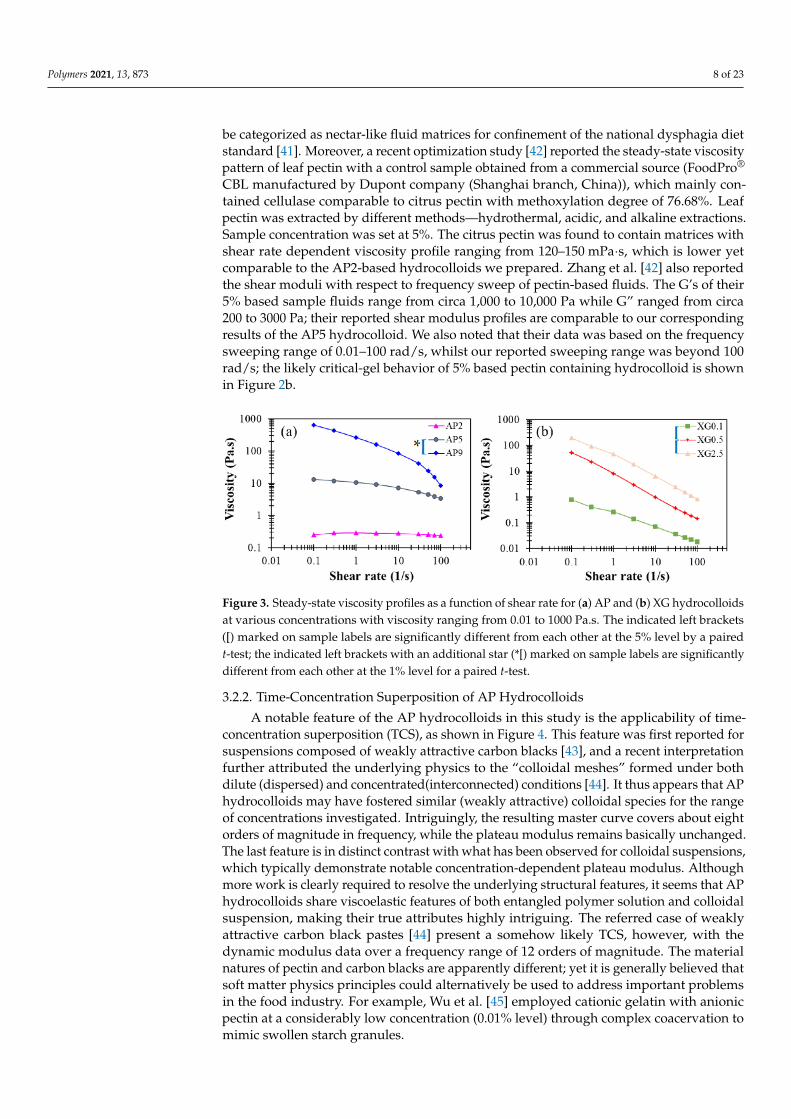
Figure 3a presents the corresponding steady-state viscosity for the range of shear rates1–100 Hz. While the concentrated sample AP9 exhibits pronounced shear-thinning behav-ior, the dilute sample AP2 displays Newtonian behavior, as reported in prior work [37].These features are basically consistent with the dynamic modulus responses dis-cussed inFigure 1b. For a shear rate of 50 s−1 that is often employed in the characterization of DFMs,the viscosities of AP hydrocolloids at concentrations of 2%, 5%, and 9% fall around 250,4440, and 23,980 cp (or mPa·s), respectively. Such a broad range of viscosity variation sup-ports the notion that AP hydrocolloids may serve as an effective thickener for applicationsin food industries and nursing facilities to produce desirable DFMs. Statistically, the pairedt-test indicate significant differences with a 5% or better confidence level for such concen-tration dependent steady-state viscosities for AP hydrocolloids and specify that only AP2is possible for DFM formulation because specific viscosity at the shear rate of 50 s−1 would
Polymers 2021, 13, 873 8 of 23
be categorized as nectar-like fluid matrices for confinement of the national dysphagia dietstandard [41]. Moreover, a recent optimization study [42] reported the steady-state viscositypattern of leaf pectin with a control sample obtained from a commercial source (FoodPro®
CBL manufactured by Dupont company (Shanghai branch, China)), which mainly con-tained cellulase comparable to citrus pectin with methoxylation degree of 76.68%. Leafpectin was extracted by different methods—hydrothermal, acidic, and alkaline extractions.Sample concentration was set at 5%. The citrus pectin was found to contain matrices withshear rate dependent viscosity profile ranging from 120–150 mPa·s, which is lower yetcomparable to the AP2-based hydrocolloids we prepared. Zhang et al. [42] also reportedthe shear moduli with respect to frequency sweep of pectin-based fluids. The G’s of their5% based sample fluids range from circa 1,000 to 10,000 Pa while G” ranged from circa200 to 3000 Pa; their reported shear modulus profiles are comparable to our correspondingresults of the AP5 hydrocolloid. We also noted that their data was based on the frequencysweeping range of 0.01–100 rad/s, whilst our reported sweeping range was beyond 100rad/s; the likely critical-gel behavior of 5% based pectin containing hydrocolloid is shownin Figure 2b.
Polymers 2021, 13, x FOR PEER REVIEW 8 of 24
Figure 3a presents the corresponding steady-state viscosity for the range of shear rates 1–100 Hz. While the concentrated sample AP9 exhibits pronounced shear-thinning behavior, the dilute sample AP2 displays Newtonian behavior, as reported in prior work [37]. These features are basically consistent with the dynamic modulus responses dis-cussed in Figure 1b. For a shear rate of 50 s−1 that is often employed in the characterization of DFMs, the viscosities of AP hydrocolloids at concentrations of 2%, 5%, and 9% fall around 250, 4440, and 23,980 cp (or mPa∙s), respectively. Such a broad range of viscosity variation supports the notion that AP hydrocolloids may serve as an effective thickener for applications in food industries and nursing facilities to produce desirable DFMs. Sta-tistically, the paired t-test indicate significant differences with a 5% or better confidence level for such concentration dependent steady-state viscosities for AP hydrocolloids and specify that only AP2 is possible for DFM formulation because specific viscosity at the shear rate of 50 s−1 would be categorized as nectar-like fluid matrices for confinement of the national dysphagia diet standard [41]. Moreover, a recent optimization study [42] re-ported the steady-state viscosity pattern of leaf pectin with a control sample obtained from a commercial source (FoodPro® CBL manufactured by Dupont company (Shanghai branch, China)), which mainly contained cellulase comparable to citrus pectin with meth-oxylation degree of 76.68%. Leaf pectin was extracted by different methods—hydrother-mal, acidic, and alkaline extractions. Sample concentration was set at 5%. The citrus pectin was found to contain matrices with shear rate dependent viscosity profile ranging from 120–150 mPa∙s, which is lower yet comparable to the AP2-based hydrocolloids we pre-pared. Zhang et al. [42] also reported the shear moduli with respect to frequency sweep of pectin-based fluids. The G’s of their 5% based sample fluids range from circa 1,000 to 10,000 Pa while G” ranged from circa 200 to 3000 Pa; their reported shear modulus profiles are comparable to our corresponding results of the AP5 hydrocolloid. We also noted that their data was based on the frequency sweeping range of 0.01–100 rad/s, whilst our re-ported sweeping range was beyond 100 rad/s; the likely critical-gel behavior of 5% based pectin containing hydrocolloid is shown in Figure 2b.
Figure 3. Steady-state viscosity profiles as a function of shear rate for (a) AP and (b) XG hydrocolloids at various concen-trations with viscosity ranging from 0.01 to 1000 Pa.s. The indicated left brackets ([) marked on sample labels are signifi-cantly different from each other at the 5% level by a paired t-test; the indicated left brackets with an additional star (*[) marked on sample labels are significantly different from each other at the 1% level for a paired t-test.
3.2.2. Time-Concentration Superposition of AP Hydrocolloids A notable feature of the AP hydrocolloids in this study is the applicability of time-
concentration superposition (TCS), as shown in Figure 4. This feature was first reported for suspensions composed of weakly attractive carbon blacks [43], and a recent interpre-tation further attributed the underlying physics to the “colloidal meshes” formed under both dilute (dispersed) and concentrated(interconnected) conditions [44]. It thus appears that AP hydrocolloids may have fostered similar (weakly attractive) colloidal species for the range of concentrations investigated. Intriguingly, the resulting master curve covers
Figure 3. Steady-state viscosity profiles as a function of shear rate for (a) AP and (b) XG hydrocolloidsat various concentrations with viscosity ranging from 0.01 to 1000 Pa.s. The indicated left brackets([) marked on sample labels are significantly different from each other at the 5% level by a pairedt-test; the indicated left brackets with an additional star (*[) marked on sample labels are significantlydifferent from each other at the 1% level for a paired t-test.
3.2.2. Time-Concentration Superposition of AP Hydrocolloids
A notable feature of the AP hydrocolloids in this study is the applicability of time-concentration superposition (TCS), as shown in Figure 4. This feature was first reported forsuspensions composed of weakly attractive carbon blacks [43], and a recent interpretationfurther attributed the underlying physics to the “colloidal meshes” formed under bothdilute (dispersed) and concentrated(interconnected) conditions [44]. It thus appears that APhydrocolloids may have fostered similar (weakly attractive) colloidal species for the rangeof concentrations investigated. Intriguingly, the resulting master curve covers about eightorders of magnitude in frequency, while the plateau modulus remains basically unchanged.The last feature is in distinct contrast with what has been observed for colloidal suspensions,which typically demonstrate notable concentration-dependent plateau modulus. Althoughmore work is clearly required to resolve the underlying structural features, it seems that APhydrocolloids share viscoelastic features of both entangled polymer solution and colloidalsuspension, making their true attributes highly intriguing. The referred case of weaklyattractive carbon black pastes [44] present a somehow likely TCS, however, with thedynamic modulus data over a frequency range of 12 orders of magnitude. The materialnatures of pectin and carbon blacks are apparently different; yet it is generally believed thatsoft matter physics principles could alternatively be used to address important problemsin the food industry. For example, Wu et al. [45] employed cationic gelatin with anionicpectin at a considerably low concentration (0.01% level) through complex coacervation tomimic swollen starch granules.
Polymers 2021, 13, 873 9 of 23
Polymers 2021, 13, x FOR PEER REVIEW 9 of 24
about eight orders of magnitude in frequency, while the plateau modulus remains basi-cally unchanged. The last feature is in distinct contrast with what has been observed for colloidal suspensions, which typically demonstrate notable concentration-dependent plateau modulus. Although more work is clearly required to resolve the underlying struc-tural features, it seems that AP hydrocolloids share viscoelastic features of both entangled polymer solution and colloidal suspension, making their true attributes highly intriguing. The referred case of weakly attractive carbon black pastes [44] present a somehow likely TCS, however, with the dynamic modulus data over a frequency range of 12 orders of magnitude. The material natures of pectin and carbon blacks are apparently different; yet it is generally believed that soft matter physics principles could alternatively be used to address important problems in the food industry. For example, Wu et al. [45] employed cationic gelatin with anionic pectin at a considerably low concentration (0.01% level) through complex coacervation to mimic swollen starch granules.
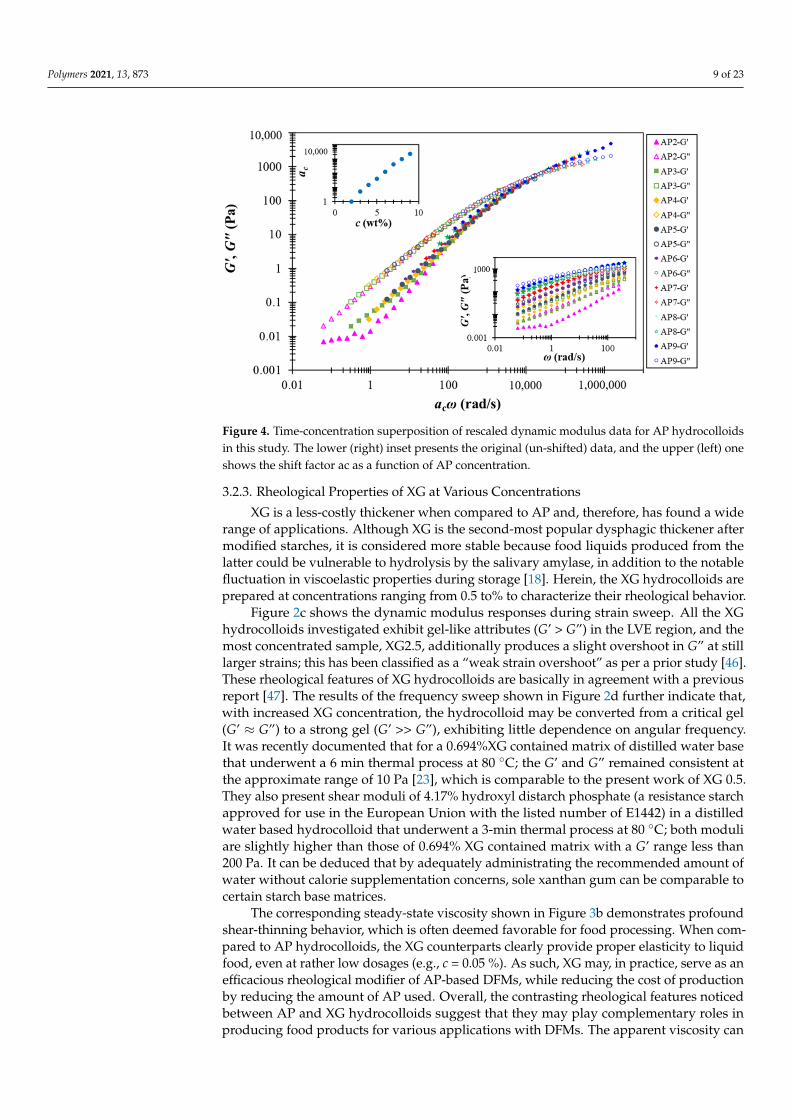
Figure 4. Time-concentration superposition of rescaled dynamic modulus data for AP hydrocol-loids in this study. The lower (right) inset presents the original (un-shifted) data, and the upper (left) one shows the shift factor ac as a function of AP concentration.
3.2.3. Rheological Properties of XG at Various Concentrations XG is a less-costly thickener when compared to AP and, therefore, has found a wide
range of applications. Although XG is the second-most popular dysphagic thickener after modified starches, it is considered more stable because food liquids produced from the latter could be vulnerable to hydrolysis by the salivary amylase, in addition to the notable fluctuation in viscoelastic properties during storage [18]. Herein, the XG hydrocolloids are prepared at concentrations ranging from 0.5 to% to characterize their rheological behav-ior.
Figure 2c shows the dynamic modulus responses during strain sweep. All the XG hydrocolloids investigated exhibit gel-like attributes (G’ > G”) in the LVE region, and the most concentrated sample, XG2.5, additionally produces a slight overshoot in G” at still larger strains; this has been classified as a “weak strain overshoot” as per a prior study [46]. These rheological features of XG hydrocolloids are basically in agreement with a pre-vious report [47]. The results of the frequency sweep shown in Figure 2d further indicate that, with increased XG concentration, the hydrocolloid may be converted from a critical gel (G’ ≈ G”) to a strong gel (G’ >> G”), exhibiting little dependence on angular frequency. It was recently documented that for a 0.694%XG contained matrix of distilled water base
Figure 4. Time-concentration superposition of rescaled dynamic modulus data for AP hydrocolloidsin this study. The lower (right) inset presents the original (un-shifted) data, and the upper (left) oneshows the shift factor ac as a function of AP concentration.
3.2.3. Rheological Properties of XG at Various Concentrations
XG is a less-costly thickener when compared to AP and, therefore, has found a widerange of applications. Although XG is the second-most popular dysphagic thickener aftermodified starches, it is considered more stable because food liquids produced from thelatter could be vulnerable to hydrolysis by the salivary amylase, in addition to the notablefluctuation in viscoelastic properties during storage [18]. Herein, the XG hydrocolloids areprepared at concentrations ranging from 0.5 to% to characterize their rheological behavior.
Figure 2c shows the dynamic modulus responses during strain sweep. All the XGhydrocolloids investigated exhibit gel-like attributes (G’ > G”) in the LVE region, and themost concentrated sample, XG2.5, additionally produces a slight overshoot in G” at stilllarger strains; this has been classified as a “weak strain overshoot” as per a prior study [46].These rheological features of XG hydrocolloids are basically in agreement with a previousreport [47]. The results of the frequency sweep shown in Figure 2d further indicate that,with increased XG concentration, the hydrocolloid may be converted from a critical gel(G’ ≈ G”) to a strong gel (G’ >> G”), exhibiting little dependence on angular frequency.It was recently documented that for a 0.694%XG contained matrix of distilled water basethat underwent a 6 min thermal process at 80 ◦C; the G’ and G” remained consistent atthe approximate range of 10 Pa [23], which is comparable to the present work of XG 0.5.They also present shear moduli of 4.17% hydroxyl distarch phosphate (a resistance starchapproved for use in the European Union with the listed number of E1442) in a distilledwater based hydrocolloid that underwent a 3-min thermal process at 80 ◦C; both moduliare slightly higher than those of 0.694% XG contained matrix with a G’ range less than200 Pa. It can be deduced that by adequately administrating the recommended amount ofwater without calorie supplementation concerns, sole xanthan gum can be comparable tocertain starch base matrices.
The corresponding steady-state viscosity shown in Figure 3b demonstrates profoundshear-thinning behavior, which is often deemed favorable for food processing. When com-pared to AP hydrocolloids, the XG counterparts clearly provide proper elasticity to liquidfood, even at rather low dosages (e.g., c = 0.05 %). As such, XG may, in practice, serve as anefficacious rheological modifier of AP-based DFMs, while reducing the cost of productionby reducing the amount of AP used. Overall, the contrasting rheological features noticedbetween AP and XG hydrocolloids suggest that they may play complementary roles inproducing food products for various applications with DFMs. The apparent viscosity can
Polymers 2021, 13, 873 10 of 23
be measured by a rotary viscometer with recommend shear rate of 50 s−1; it was previouslyreported that apparent viscosity of a 0.694% XG contained matrix is 307.1 ± 936 mPa·s [23],which is comparable to our XG0.5 data of 238.9 ± 5.61 mPa·s, as well as our AP2 data of238.2 ± 4.82 mPa·s.
3.2.4. Effects of Basic Formulation Ingredients (BFIs) on AP and XG Hydrocolloids
Sugar and some basic formulation ingredients (BFIs) containing cations, such as Ca2+
and Na+, may add modifications to the rheological properties of AP and XG hydrocolloids,considering especially their ubiquitous presence in liquid foods. Thus, we employ thebenchmark AP2 and XG0.5 hydrocolloids containing granulated sugar (with sucrose as thepositive control), table salt (with sodium chloride as the positive control), or calcium chlo-ride to shed light on their effects on the rheological properties of AP and XG hydrocolloids.
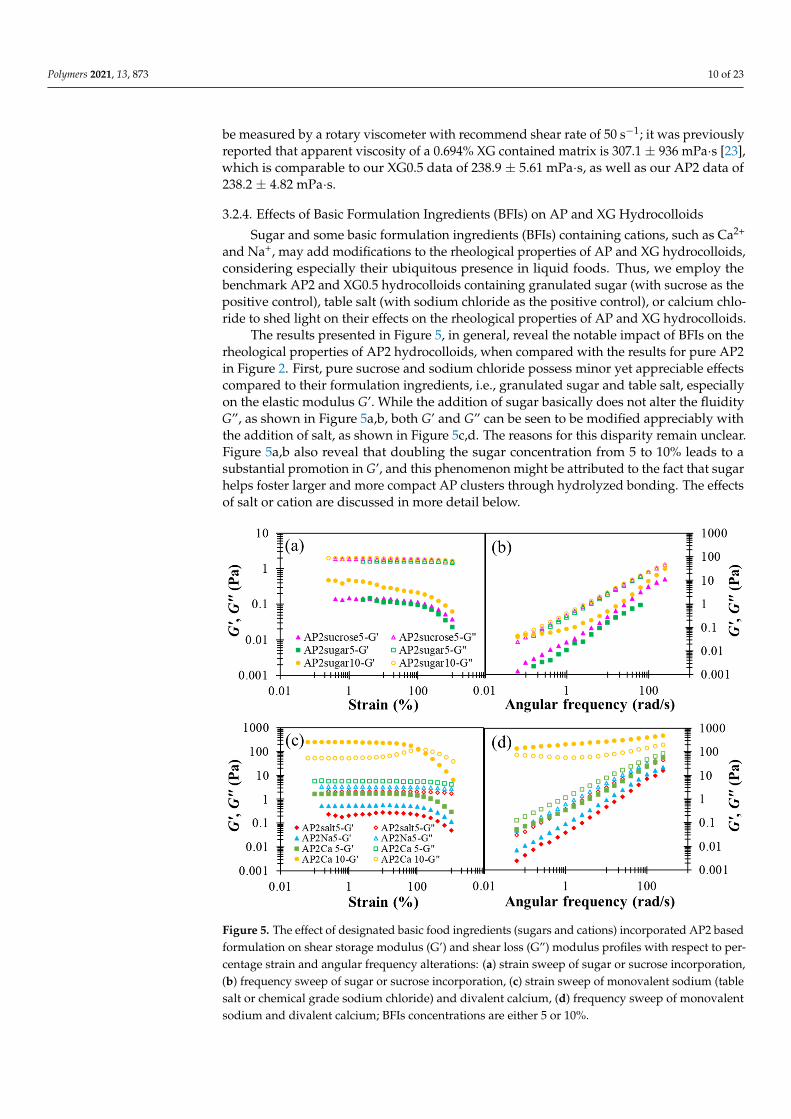
The results presented in Figure 5, in general, reveal the notable impact of BFIs on therheological properties of AP2 hydrocolloids, when compared with the results for pure AP2in Figure 2. First, pure sucrose and sodium chloride possess minor yet appreciable effectscompared to their formulation ingredients, i.e., granulated sugar and table salt, especiallyon the elastic modulus G’. While the addition of sugar basically does not alter the fluidityG”, as shown in Figure 5a,b, both G’ and G” can be seen to be modified appreciably withthe addition of salt, as shown in Figure 5c,d. The reasons for this disparity remain unclear.Figure 5a,b also reveal that doubling the sugar concentration from 5 to 10% leads to asubstantial promotion in G’, and this phenomenon might be attributed to the fact that sugarhelps foster larger and more compact AP clusters through hydrolyzed bonding. The effectsof salt or cation are discussed in more detail below.
Polymers 2021, 13, x FOR PEER REVIEW 11 of 24
and XG, again, points to the open opportunity of their individual utilization and combi-nation to meet various requirements in future applications with DFMs.
Figure 5. The effect of designated basic food ingredients (sugars and cations) incorporated AP2 based formulation on shear storage modulus (G’) and shear loss (G”) modulus profiles with respect to percentage strain and angular frequency alterations: (a) strain sweep of sugar or sucrose incorporation, (b) frequency sweep of sugar or sucrose incorporation, (c) strain sweep of monovalent sodium (table salt or chemical grade sodium chloride) and divalent calcium, (d) frequency sweep of monovalent sodium and divalent calcium; BFIs concentrations are either 5 or 10%.
Figure 6. Steady-state viscosity profiles as a function of shear rate for AP-based matrices with (a) sugar incorporation and, (b) cations at either 5 or 10 % concentrations; the indicated left brackets ([) marked on sample labels are significantly different from each other at the 5% level by a paired t-test; the indicated left brackets with an additional star (*[) marked on sample labels are significantly different from each other at the 1% level by a paired t-test.
Figure 5. The effect of designated basic food ingredients (sugars and cations) incorporated AP2 basedformulation on shear storage modulus (G’) and shear loss (G”) modulus profiles with respect to per-centage strain and angular frequency alterations: (a) strain sweep of sugar or sucrose incorporation,(b) frequency sweep of sugar or sucrose incorporation, (c) strain sweep of monovalent sodium (tablesalt or chemical grade sodium chloride) and divalent calcium, (d) frequency sweep of monovalentsodium and divalent calcium; BFIs concentrations are either 5 or 10%.
Polymers 2021, 13, 873 11 of 23
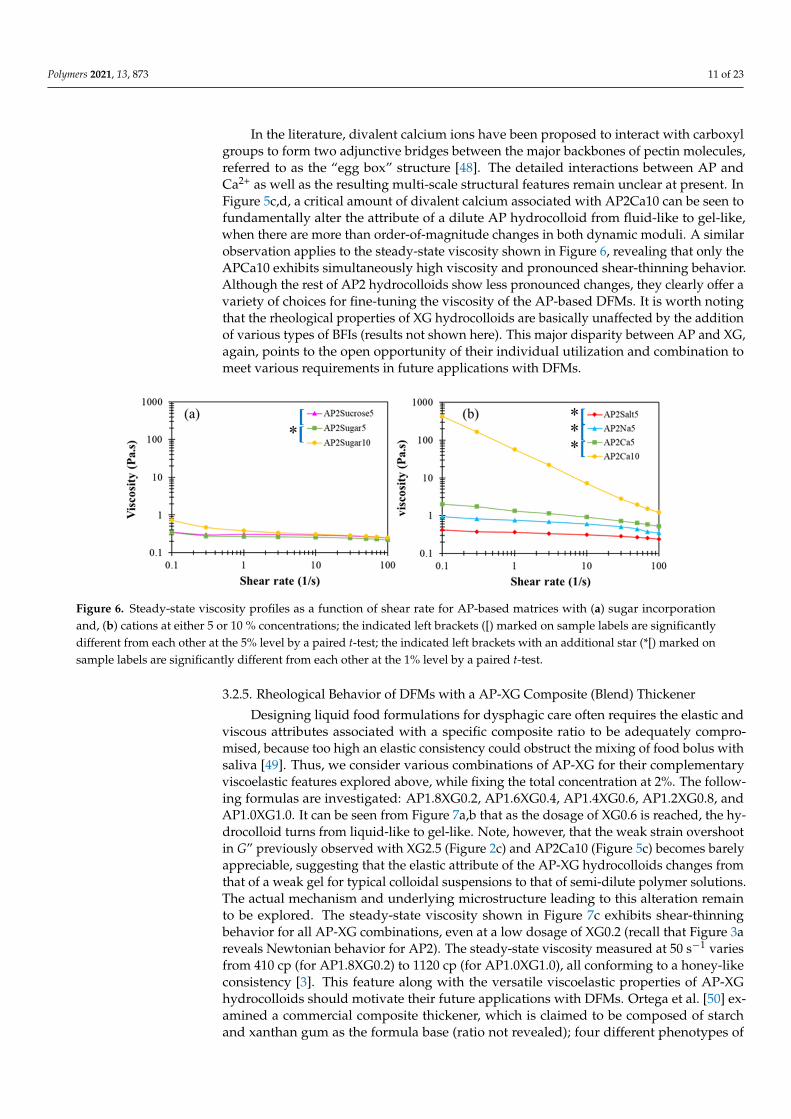
In the literature, divalent calcium ions have been proposed to interact with carboxylgroups to form two adjunctive bridges between the major backbones of pectin molecules,referred to as the “egg box” structure [48]. The detailed interactions between AP andCa2+ as well as the resulting multi-scale structural features remain unclear at present. InFigure 5c,d, a critical amount of divalent calcium associated with AP2Ca10 can be seen tofundamentally alter the attribute of a dilute AP hydrocolloid from fluid-like to gel-like,when there are more than order-of-magnitude changes in both dynamic moduli. A similarobservation applies to the steady-state viscosity shown in Figure 6, revealing that only theAPCa10 exhibits simultaneously high viscosity and pronounced shear-thinning behavior.Although the rest of AP2 hydrocolloids show less pronounced changes, they clearly offer avariety of choices for fine-tuning the viscosity of the AP-based DFMs. It is worth notingthat the rheological properties of XG hydrocolloids are basically unaffected by the additionof various types of BFIs (results not shown here). This major disparity between AP and XG,again, points to the open opportunity of their individual utilization and combination tomeet various requirements in future applications with DFMs.
Polymers 2021, 13, x FOR PEER REVIEW 11 of 24
and XG, again, points to the open opportunity of their individual utilization and combi-nation to meet various requirements in future applications with DFMs.
Figure 5. The effect of designated basic food ingredients (sugars and cations) incorporated AP2 based formulation on shear storage modulus (G’) and shear loss (G”) modulus profiles with respect to percentage strain and angular frequency alterations: (a) strain sweep of sugar or sucrose incorporation, (b) frequency sweep of sugar or sucrose incorporation, (c) strain sweep of monovalent sodium (table salt or chemical grade sodium chloride) and divalent calcium, (d) frequency sweep of monovalent sodium and divalent calcium; BFIs concentrations are either 5 or 10%.
Figure 6. Steady-state viscosity profiles as a function of shear rate for AP-based matrices with (a) sugar incorporation and, (b) cations at either 5 or 10 % concentrations; the indicated left brackets ([) marked on sample labels are significantly different from each other at the 5% level by a paired t-test; the indicated left brackets with an additional star (*[) marked on sample labels are significantly different from each other at the 1% level by a paired t-test.
Figure 6. Steady-state viscosity profiles as a function of shear rate for AP-based matrices with (a) sugar incorporationand, (b) cations at either 5 or 10 % concentrations; the indicated left brackets ([) marked on sample labels are significantlydifferent from each other at the 5% level by a paired t-test; the indicated left brackets with an additional star (*[) marked onsample labels are significantly different from each other at the 1% level by a paired t-test.
3.2.5. Rheological Behavior of DFMs with a AP-XG Composite (Blend) Thickener
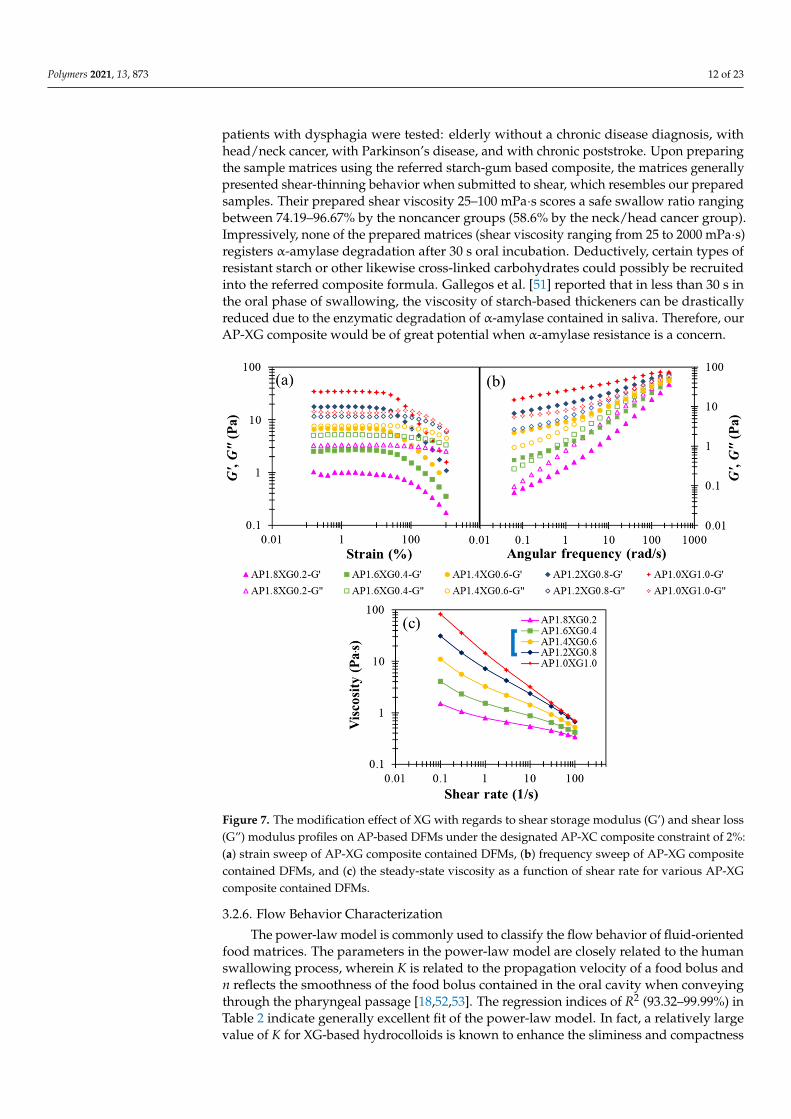
Designing liquid food formulations for dysphagic care often requires the elastic andviscous attributes associated with a specific composite ratio to be adequately compro-mised, because too high an elastic consistency could obstruct the mixing of food bolus withsaliva [49]. Thus, we consider various combinations of AP-XG for their complementaryviscoelastic features explored above, while fixing the total concentration at 2%. The follow-ing formulas are investigated: AP1.8XG0.2, AP1.6XG0.4, AP1.4XG0.6, AP1.2XG0.8, andAP1.0XG1.0. It can be seen from Figure 7a,b that as the dosage of XG0.6 is reached, the hy-drocolloid turns from liquid-like to gel-like. Note, however, that the weak strain overshootin G” previously observed with XG2.5 (Figure 2c) and AP2Ca10 (Figure 5c) becomes barelyappreciable, suggesting that the elastic attribute of the AP-XG hydrocolloids changes fromthat of a weak gel for typical colloidal suspensions to that of semi-dilute polymer solutions.The actual mechanism and underlying microstructure leading to this alteration remainto be explored. The steady-state viscosity shown in Figure 7c exhibits shear-thinningbehavior for all AP-XG combinations, even at a low dosage of XG0.2 (recall that Figure 3areveals Newtonian behavior for AP2). The steady-state viscosity measured at 50 s−1 variesfrom 410 cp (for AP1.8XG0.2) to 1120 cp (for AP1.0XG1.0), all conforming to a honey-likeconsistency [3]. This feature along with the versatile viscoelastic properties of AP-XGhydrocolloids should motivate their future applications with DFMs. Ortega et al. [50] ex-amined a commercial composite thickener, which is claimed to be composed of starchand xanthan gum as the formula base (ratio not revealed); four different phenotypes of
Polymers 2021, 13, 873 12 of 23
patients with dysphagia were tested: elderly without a chronic disease diagnosis, withhead/neck cancer, with Parkinson’s disease, and with chronic poststroke. Upon preparingthe sample matrices using the referred starch-gum based composite, the matrices generallypresented shear-thinning behavior when submitted to shear, which resembles our preparedsamples. Their prepared shear viscosity 25–100 mPa·s scores a safe swallow ratio rangingbetween 74.19–96.67% by the noncancer groups (58.6% by the neck/head cancer group).Impressively, none of the prepared matrices (shear viscosity ranging from 25 to 2000 mPa·s)registers α-amylase degradation after 30 s oral incubation. Deductively, certain types ofresistant starch or other likewise cross-linked carbohydrates could possibly be recruitedinto the referred composite formula. Gallegos et al. [51] reported that in less than 30 s inthe oral phase of swallowing, the viscosity of starch-based thickeners can be drasticallyreduced due to the enzymatic degradation of α-amylase contained in saliva. Therefore, ourAP-XG composite would be of great potential when α-amylase resistance is a concern.
Polymers 2021, 13, x FOR PEER REVIEW 13 of 24
Figure 7. The modification effect of XG with regards to shear storage modulus (G’) and shear loss (G”) modulus profiles on AP-based DFMs under the designated AP-XC composite constraint of 2%: (a) strain sweep of AP-XG composite con-tained DFMs, (b) frequency sweep of AP-XG composite contained DFMs, and (c) the steady-state viscosity as a function of shear rate for various AP-XG composite contained DFMs.
3.2.6. Flow Behavior Characterization The power-law model is commonly used to classify the flow behavior of fluid-ori-
ented food matrices. The parameters in the power-law model are closely related to the human swallowing process, wherein K is related to the propagation velocity of a food bolus and n reflects the smoothness of the food bolus contained in the oral cavity when conveying through the pharyngeal passage [18,52,53]. The regression indices of R2 (93.32–99.99%) in Table 2 indicate generally excellent fit of the power-law model. In fact, a rela-tively large value of K for XG-based hydrocolloids is known to enhance the sliminess and compactness of food bolus, which is unfavorable for dysphagic individuals. Thus, as a good DFM candidate, it is often necessary to reduce the concentration of XG or to blend it with other low-K hydrocolloids [52,54]. Yang and Lin [23] recently incorporated 0.467–0.694% of XG into different aquatic bases of distilled water, sport drink, and orange juice; the K and n values from regression model range between 6.726–7.554 and 0.143–0.177, respectively, and agree with the present study comparing to XG0.5; they also reported the fitness regarding the regression models of Herschel-Bulkley, power law, and Casson. Their modeling results indicate that the terms of yield index are present in negative values
Figure 7. The modification effect of XG with regards to shear storage modulus (G’) and shear loss(G”) modulus profiles on AP-based DFMs under the designated AP-XC composite constraint of 2%:(a) strain sweep of AP-XG composite contained DFMs, (b) frequency sweep of AP-XG compositecontained DFMs, and (c) the steady-state viscosity as a function of shear rate for various AP-XGcomposite contained DFMs.
3.2.6. Flow Behavior Characterization
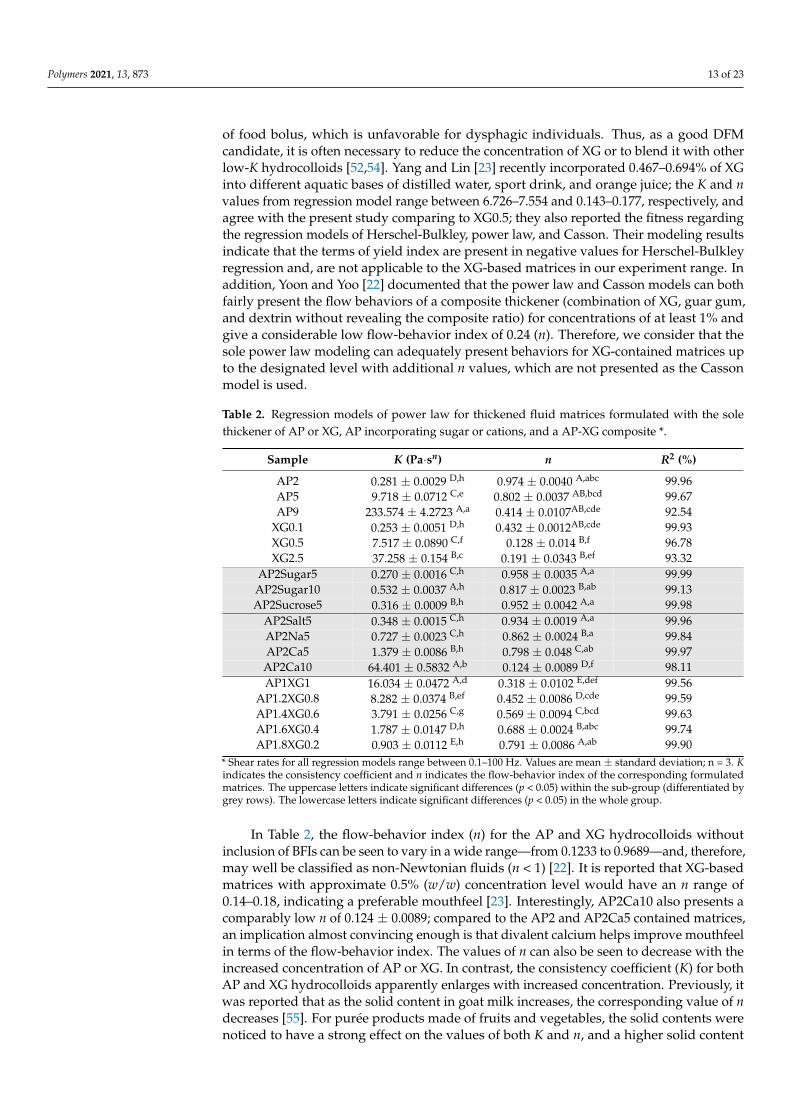
The power-law model is commonly used to classify the flow behavior of fluid-orientedfood matrices. The parameters in the power-law model are closely related to the humanswallowing process, wherein K is related to the propagation velocity of a food bolus andn reflects the smoothness of the food bolus contained in the oral cavity when conveyingthrough the pharyngeal passage [18,52,53]. The regression indices of R2 (93.32–99.99%) inTable 2 indicate generally excellent fit of the power-law model. In fact, a relatively largevalue of K for XG-based hydrocolloids is known to enhance the sliminess and compactness
Polymers 2021, 13, 873 13 of 23
of food bolus, which is unfavorable for dysphagic individuals. Thus, as a good DFMcandidate, it is often necessary to reduce the concentration of XG or to blend it with otherlow-K hydrocolloids [52,54]. Yang and Lin [23] recently incorporated 0.467–0.694% of XGinto different aquatic bases of distilled water, sport drink, and orange juice; the K and nvalues from regression model range between 6.726–7.554 and 0.143–0.177, respectively, andagree with the present study comparing to XG0.5; they also reported the fitness regardingthe regression models of Herschel-Bulkley, power law, and Casson. Their modeling resultsindicate that the terms of yield index are present in negative values for Herschel-Bulkleyregression and, are not applicable to the XG-based matrices in our experiment range. Inaddition, Yoon and Yoo [22] documented that the power law and Casson models can bothfairly present the flow behaviors of a composite thickener (combination of XG, guar gum,and dextrin without revealing the composite ratio) for concentrations of at least 1% andgive a considerable low flow-behavior index of 0.24 (n). Therefore, we consider that thesole power law modeling can adequately present behaviors for XG-contained matrices upto the designated level with additional n values, which are not presented as the Cassonmodel is used.
Table 2. Regression models of power law for thickened fluid matrices formulated with the solethickener of AP or XG, AP incorporating sugar or cations, and a AP-XG composite *.
Sample K (Pa·sn) n R2 (%)
AP2 0.281 ± 0.0029 D,h 0.974 ± 0.0040 A,abc 99.96AP5 9.718 ± 0.0712 C,e 0.802 ± 0.0037 AB,bcd 99.67AP9 233.574 ± 4.2723 A,a 0.414 ± 0.0107AB,cde 92.54
XG0.1 0.253 ± 0.0051 D,h 0.432 ± 0.0012AB,cde 99.93XG0.5 7.517 ± 0.0890 C,f 0.128 ± 0.014 B,f 96.78XG2.5 37.258 ± 0.154 B,c 0.191 ± 0.0343 B,ef 93.32
AP2Sugar5 0.270 ± 0.0016 C,h 0.958 ± 0.0035 A,a 99.99AP2Sugar10 0.532 ± 0.0037 A,h 0.817 ± 0.0023 B,ab 99.13AP2Sucrose5 0.316 ± 0.0009 B,h 0.952 ± 0.0042 A,a 99.98
AP2Salt5 0.348 ± 0.0015 C,h 0.934 ± 0.0019 A,a 99.96AP2Na5 0.727 ± 0.0023 C,h 0.862 ± 0.0024 B,a 99.84AP2Ca5 1.379 ± 0.0086 B,h 0.798 ± 0.048 C,ab 99.97
AP2Ca10 64.401 ± 0.5832 A,b 0.124 ± 0.0089 D,f 98.11AP1XG1 16.034 ± 0.0472 A,d 0.318 ± 0.0102 E,def 99.56
AP1.2XG0.8 8.282 ± 0.0374 B,ef 0.452 ± 0.0086 D,cde 99.59AP1.4XG0.6 3.791 ± 0.0256 C,g 0.569 ± 0.0094 C,bcd 99.63AP1.6XG0.4 1.787 ± 0.0147 D,h 0.688 ± 0.0024 B,abc 99.74AP1.8XG0.2 0.903 ± 0.0112 E,h 0.791 ± 0.0086 A,ab 99.90
* Shear rates for all regression models range between 0.1–100 Hz. Values are mean ± standard deviation; n = 3. Kindicates the consistency coefficient and n indicates the flow-behavior index of the corresponding formulatedmatrices. The uppercase letters indicate significant differences (p < 0.05) within the sub-group (differentiated bygrey rows). The lowercase letters indicate significant differences (p < 0.05) in the whole group.
In Table 2, the flow-behavior index (n) for the AP and XG hydrocolloids withoutinclusion of BFIs can be seen to vary in a wide range—from 0.1233 to 0.9689—and, therefore,may well be classified as non-Newtonian fluids (n < 1) [22]. It is reported that XG-basedmatrices with approximate 0.5% (w/w) concentration level would have an n range of0.14–0.18, indicating a preferable mouthfeel [23]. Interestingly, AP2Ca10 also presents acomparably low n of 0.124 ± 0.0089; compared to the AP2 and AP2Ca5 contained matrices,an implication almost convincing enough is that divalent calcium helps improve mouthfeelin terms of the flow-behavior index. The values of n can also be seen to decrease with theincreased concentration of AP or XG. In contrast, the consistency coefficient (K) for bothAP and XG hydrocolloids apparently enlarges with increased concentration. Previously, itwas reported that as the solid content in goat milk increases, the corresponding value of ndecreases [55]. For purée products made of fruits and vegetables, the solid contents werenoticed to have a strong effect on the values of both K and n, and a higher solid content
Polymers 2021, 13, 873 14 of 23
generally yields a larger K and smaller n [56,57]. Divalent metal salts are particularlyconsidered to associate themselves with pectin molecules in purée and result in weakgels [58]. Clearly, the AP2Ca10 in this study exhibits the smallest n as well as the largestK (except for AP9) among the AP-based hydrocolloids investigated. We note in passingthat a larger K usually implies the requirement of a longer time or greater force to modifyfood consistency.
For AP-XG composite (blend) hydrocolloids, K is found to decrease while n increaseswith increasing AP content; a similar trend was noticed with tapioca starch when employedas a dysphagia-friendly formulation [23,56]. Thus, AP may serve as an alternative thickenerto replace common starches. Still others have reported that the flow behavior of XG canbe modified by increasing the polysaccharide content to enhance the association betweenthe biopolymers in a hydrocolloid system [59]. It is believed that AP-XG blend thickenersalone or with the addition of some BFIs may help achieve functions associated with starch-based DFMs, while providing other health benefits of AP (e.g., in preventing diabetes andregulating cholesterol level; AP has been classified as a source dietary fiber [18]).
3.3. Texture Profile Analysis (TPA)
In addition to the rheological characterization, TPA provides other important measure-ments of a dysphagia-friendly matrix (DFM). In this study, TPA is conducted by applyinga vertical pressing force to mimic the human oral chewing process, and the setup andprotocols follow those recommended by the Japanese Ministry of Health and Welfare inJapanese [60], first revealed by Funami [18] and, thereafter reviewed and discussed by Mat-suo and Fujishima [61]. The characterization utilizes the standard parameters of hardness,adhesiveness, and cohesiveness. Hardness represents the maximum force required to crashor break a food bolus and is related to the maximum velocity of swallowing. Note, how-ever, that according to the Japanese Ministry of Health and Welfare, hardness is measuredin terms of N/m2 (pressure) rather than newton (force). The glass container (40 mm indiameter) employed in the characterization bears the dimensions of the human oral cavity.Adhesiveness is defined by the degree of sticking or adhering between the food bolusand the upper swallowing system, which includes the oral cavity and pharyngeal mucosa.Cohesiveness is a measure of interior binding strength, which constructs bolus tightness toprevent its collapse during swallowing. Gumminess, which is related to the effort requiredfor preparation of fluid-oriented bolus by the oral cavity, can then be evaluated by multiply-ing the measured hardness by the corresponding cohesiveness [62]. Several studies haveincluded gumminess as a major textural index of certain food samples. One set of mixed gelwas prepared by Huang et al. [63] using sticky rice with a composite thickener and CaCl2for the preparation of an aquatic phase, which is subjected to textural studies, includinggumminess. Momosaki et al. [64] also reported the statistically positive correlation betweengumminess of semi-solid foods and post-stroke dysphagic individuals. Carrot purees weresubject to textual modification with thickeners, including pectin xanthan, thereafter, andwere proven to be correlated well with certain sensory attributes [65].
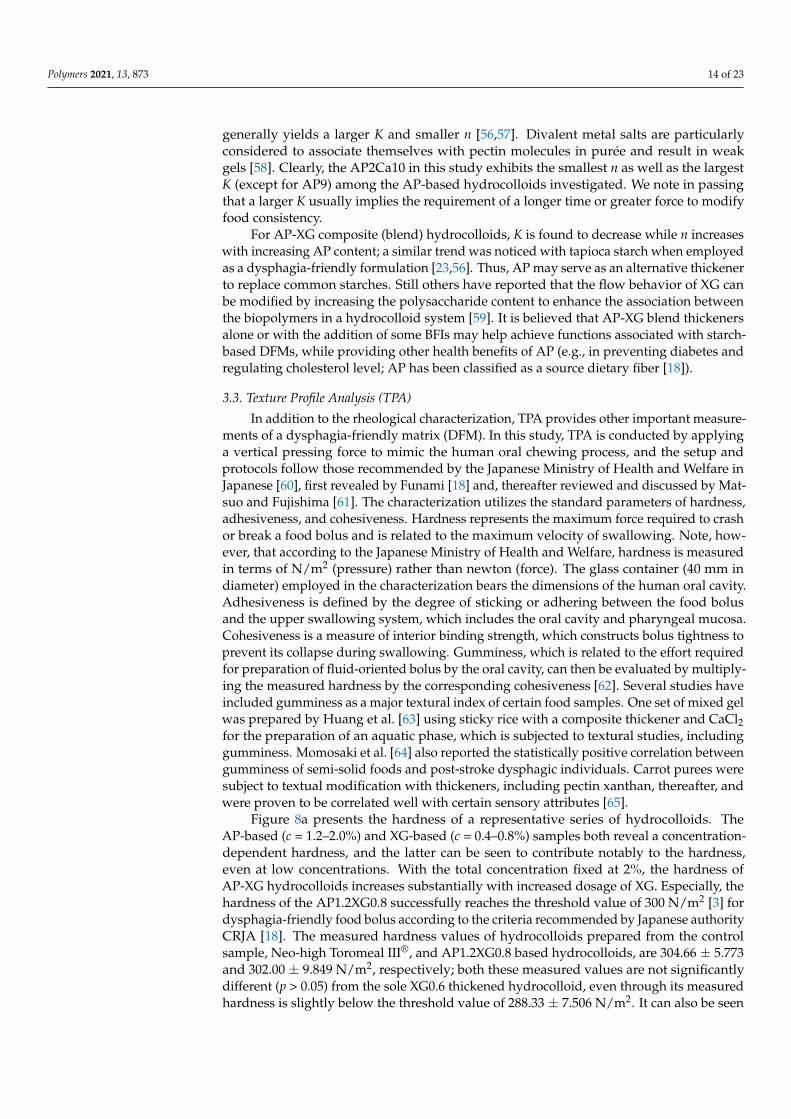
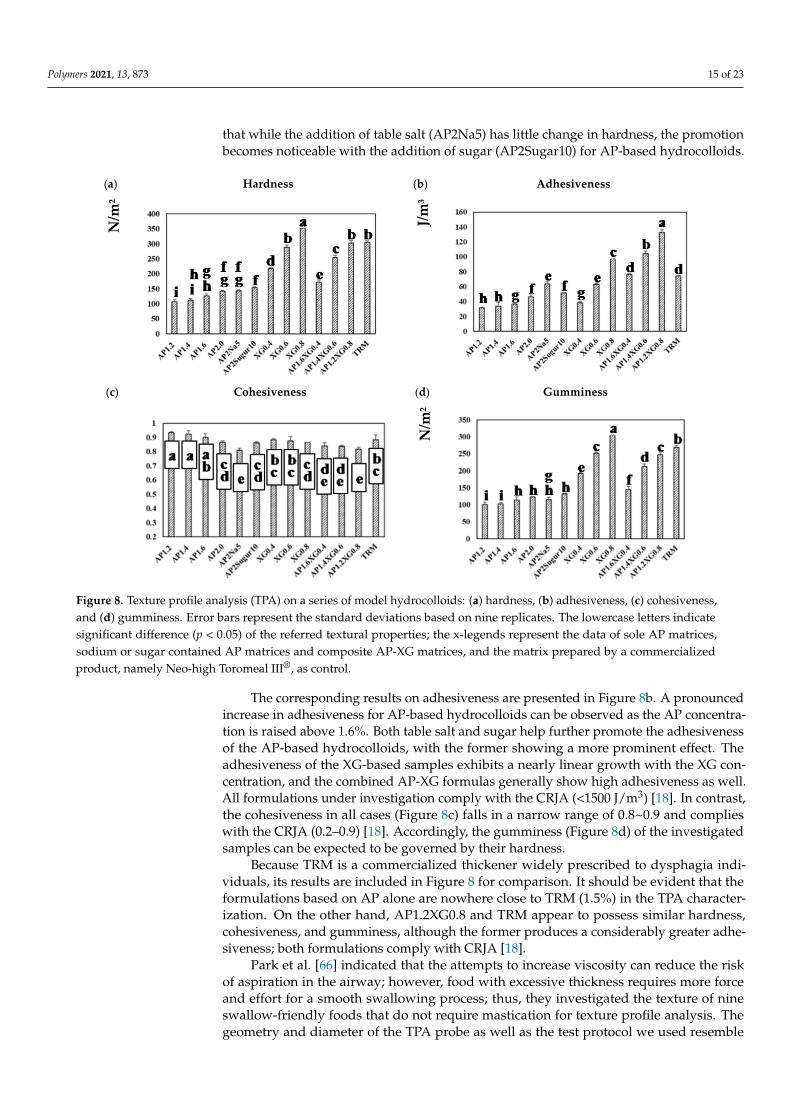
Figure 8a presents the hardness of a representative series of hydrocolloids. TheAP-based (c = 1.2–2.0%) and XG-based (c = 0.4–0.8%) samples both reveal a concentration-dependent hardness, and the latter can be seen to contribute notably to the hardness,even at low concentrations. With the total concentration fixed at 2%, the hardness ofAP-XG hydrocolloids increases substantially with increased dosage of XG. Especially, thehardness of the AP1.2XG0.8 successfully reaches the threshold value of 300 N/m2 [3] fordysphagia-friendly food bolus according to the criteria recommended by Japanese authorityCRJA [18]. The measured hardness values of hydrocolloids prepared from the controlsample, Neo-high Toromeal III®, and AP1.2XG0.8 based hydrocolloids, are 304.66 ± 5.773and 302.00 ± 9.849 N/m2, respectively; both these measured values are not significantlydifferent (p > 0.05) from the sole XG0.6 thickened hydrocolloid, even through its measuredhardness is slightly below the threshold value of 288.33 ± 7.506 N/m2. It can also be seen
Polymers 2021, 13, 873 15 of 23
that while the addition of table salt (AP2Na5) has little change in hardness, the promotionbecomes noticeable with the addition of sugar (AP2Sugar10) for AP-based hydrocolloids.
Polymers 2021, 13, x FOR PEER REVIEW 16 of 24
The corresponding results on adhesiveness are presented in Figure 8b. A pronounced increase in adhesiveness for AP-based hydrocolloids can be observed as the AP concen-tration is raised above 1.6%. Both table salt and sugar help further promote the adhesive-ness of the AP-based hydrocolloids, with the former showing a more prominent effect. The adhesiveness of the XG-based samples exhibits a nearly linear growth with the XG concentration, and the combined AP-XG formulas generally show high adhesiveness as well. All formulations under investigation comply with the CRJA (<1500 J/m3) [18]. In con-trast, the cohesiveness in all cases (Figure 8c) falls in a narrow range of 0.8~0.9 and com-plies with the CRJA (0.2–0.9) [18]. Accordingly, the gumminess (Figure 8d) of the investi-gated samples can be expected to be governed by their hardness.
Because TRM is a commercialized thickener widely prescribed to dysphagia individ-uals, its results are included in Figure 8 for comparison. It should be evident that the for-mulations based on AP alone are nowhere close to TRM (1.5%) in the TPA characteriza-tion. On the other hand, AP1.2XG0.8 and TRM appear to possess similar hardness, cohe-siveness, and gumminess, although the former produces a considerably greater adhesive-ness; both formulations comply with CRJA [18].
Park et al. [66] indicated that the attempts to increase viscosity can reduce the risk of aspiration in the airway; however, food with excessive thickness requires more force and effort for a smooth swallowing process; thus, they investigated the texture of nine swal-low-friendly foods that do not require mastication for texture profile analysis. The geom-etry and diameter of the TPA probe as well as the test protocol we used resemble that of a previous study [66]. As we have taken probe dimensions into account, the dimensions involving TPA parameters of hardness and adhesiveness are comparable by trends but different in units between the present study and the mentioned study; however, the di-mensionless TPA parameter of cohesiveness is directly comparable between the two stud-ies. The cohesiveness of mayonnaise and peanut butter is reported to be 0.87 ± 0.03 and 0.8 ± 0.04, respectively; these values are comparable to our most employed samples, while other test samples, including whipped cream, soft tofu, mango pudding, boiled mashed starchy vegetable (pumpkin, potato, and sweet potato), and red bean paste possess con-siderably lower cohesiveness, compared to our AP-based matrices. By converting the pre-sent hardness into area-dependent data, 350 N/m2 is approximately 0.44 N; and the values apparently fall between the measured values of 0.26 ± 0.03 and 0.63 ± 0.02 N for whipped cream and mayonnaise, respectively. It should be noted that the hardness unit of N/m2 is consistently used for categorization of dysphagia-friendly foods CRJA [18].
(a) Hardness (b) Adhesiveness
N/m
2
J/m
3
Polymers 2021, 13, x FOR PEER REVIEW 17 of 24
(c) Cohesiveness (d) Gumminess
N/m
2
Figure 8. Texture profile analysis (TPA) on a series of model hydrocolloids: (a) hardness, (b) adhesiveness, (c) cohesive-ness, and (d) gumminess. Error bars represent the standard deviations based on nine replicates. The lowercase letters indicate significant difference (p < 0.05) of the referred textural properties; the x-legends represent the data of sole AP matrices, sodium or sugar contained AP matrices and composite AP-XG matrices, and the matrix prepared by a commer-cialized product, namely Neo-high Toromeal III®, as control.
3.4. Scanning Electron Microscopic (SEM) Analysis The analysis of the internal microstructure by scanning microscopy was performed
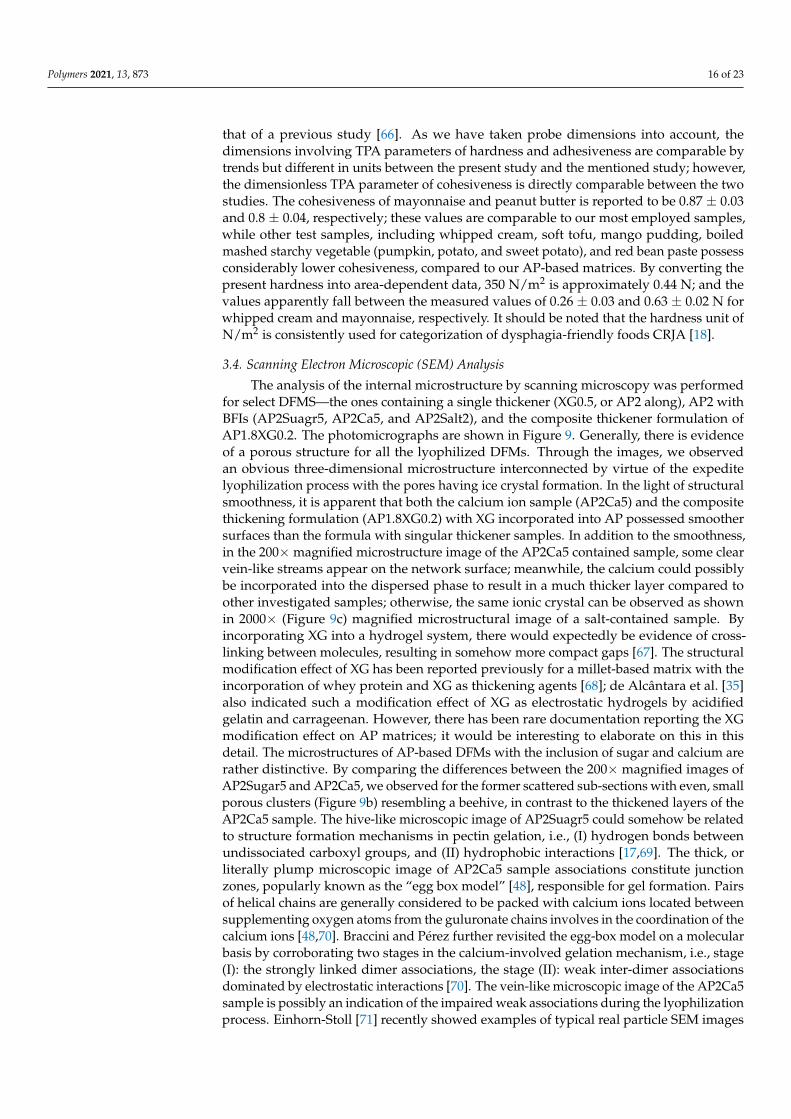
for select DFMS—the ones containing a single thickener (XG0.5, or AP2 along), AP2 with BFIs (AP2Suagr5, AP2Ca5, and AP2Salt2), and the composite thickener formulation of AP1.8XG0.2. The photomicrographs are shown in Figure 9. Generally, there is evidence of a porous structure for all the lyophilized DFMs. Through the images, we observed an ob-vious three-dimensional microstructure interconnected by virtue of the expedite lyophi-lization process with the pores having ice crystal formation. In the light of structural smoothness, it is apparent that both the calcium ion sample (AP2Ca5) and the composite thickening formulation (AP1.8XG0.2) with XG incorporated into AP possessed smoother surfaces than the formula with singular thickener samples. In addition to the smoothness, in the 200× magnified microstructure image of the AP2Ca5 contained sample, some clear vein-like streams appear on the network surface; meanwhile, the calcium could possibly be incorporated into the dispersed phase to result in a much thicker layer compared to other investigated samples; otherwise, the same ionic crystal can be observed as shown in 2000× (Figure 9c) magnified microstructural image of a salt-contained sample. By incor-porating XG into a hydrogel system, there would expectedly be evidence of cross-linking between molecules, resulting in somehow more compact gaps [67]. The structural modi-fication effect of XG has been reported previously for a millet-based matrix with the in-corporation of whey protein and XG as thickening agents [68]; de Alcântara et al. [35] also indicated such a modification effect of XG as electrostatic hydrogels by acidified gelatin and carrageenan. However, there has been rare documentation reporting the XG modifi-cation effect on AP matrices; it would be interesting to elaborate on this in this detail. The microstructures of AP-based DFMs with the inclusion of sugar and calcium are rather distinctive. By comparing the differences between the 200× magnified images of AP2Sugar5 and AP2Ca5, we observed for the former scattered sub-sections with even, small porous clusters (Figure 9b) resembling a beehive, in contrast to the thickened layers of the AP2Ca5 sample. The hive-like microscopic image of AP2Suagr5 could somehow be related to structure formation mechanisms in pectin gelation, i.e., (I) hydrogen bonds be-tween undissociated carboxyl groups, and (II) hydrophobic interactions [17,69]. The thick, or literally plump microscopic image of AP2Ca5 sample associations constitute junction zones, popularly known as the “egg box model” [48], responsible for gel formation. Pairs of helical chains are generally considered to be packed with calcium ions located between supplementing oxygen atoms from the guluronate chains involves in the coordination of the calcium ions [48,70]. Braccini and Pérez further revisited the egg-box model on a mo-lecular basis by corroborating two stages in the calcium-involved gelation mechanism,
Figure 8. Texture profile analysis (TPA) on a series of model hydrocolloids: (a) hardness, (b) adhesiveness, (c) cohesiveness,and (d) gumminess. Error bars represent the standard deviations based on nine replicates. The lowercase letters indicatesignificant difference (p < 0.05) of the referred textural properties; the x-legends represent the data of sole AP matrices,sodium or sugar contained AP matrices and composite AP-XG matrices, and the matrix prepared by a commercializedproduct, namely Neo-high Toromeal III®, as control.
The corresponding results on adhesiveness are presented in Figure 8b. A pronouncedincrease in adhesiveness for AP-based hydrocolloids can be observed as the AP concentra-tion is raised above 1.6%. Both table salt and sugar help further promote the adhesivenessof the AP-based hydrocolloids, with the former showing a more prominent effect. Theadhesiveness of the XG-based samples exhibits a nearly linear growth with the XG con-centration, and the combined AP-XG formulas generally show high adhesiveness as well.All formulations under investigation comply with the CRJA (<1500 J/m3) [18]. In contrast,the cohesiveness in all cases (Figure 8c) falls in a narrow range of 0.8~0.9 and complieswith the CRJA (0.2–0.9) [18]. Accordingly, the gumminess (Figure 8d) of the investigatedsamples can be expected to be governed by their hardness.
Because TRM is a commercialized thickener widely prescribed to dysphagia indi-viduals, its results are included in Figure 8 for comparison. It should be evident that theformulations based on AP alone are nowhere close to TRM (1.5%) in the TPA character-ization. On the other hand, AP1.2XG0.8 and TRM appear to possess similar hardness,cohesiveness, and gumminess, although the former produces a considerably greater adhe-siveness; both formulations comply with CRJA [18].
Park et al. [66] indicated that the attempts to increase viscosity can reduce the riskof aspiration in the airway; however, food with excessive thickness requires more forceand effort for a smooth swallowing process; thus, they investigated the texture of nineswallow-friendly foods that do not require mastication for texture profile analysis. Thegeometry and diameter of the TPA probe as well as the test protocol we used resemble
Polymers 2021, 13, 873 16 of 23
that of a previous study [66]. As we have taken probe dimensions into account, thedimensions involving TPA parameters of hardness and adhesiveness are comparable bytrends but different in units between the present study and the mentioned study; however,the dimensionless TPA parameter of cohesiveness is directly comparable between the twostudies. The cohesiveness of mayonnaise and peanut butter is reported to be 0.87 ± 0.03and 0.8 ± 0.04, respectively; these values are comparable to our most employed samples,while other test samples, including whipped cream, soft tofu, mango pudding, boiledmashed starchy vegetable (pumpkin, potato, and sweet potato), and red bean paste possessconsiderably lower cohesiveness, compared to our AP-based matrices. By converting thepresent hardness into area-dependent data, 350 N/m2 is approximately 0.44 N; and thevalues apparently fall between the measured values of 0.26 ± 0.03 and 0.63 ± 0.02 N forwhipped cream and mayonnaise, respectively. It should be noted that the hardness unit ofN/m2 is consistently used for categorization of dysphagia-friendly foods CRJA [18].
3.4. Scanning Electron Microscopic (SEM) Analysis
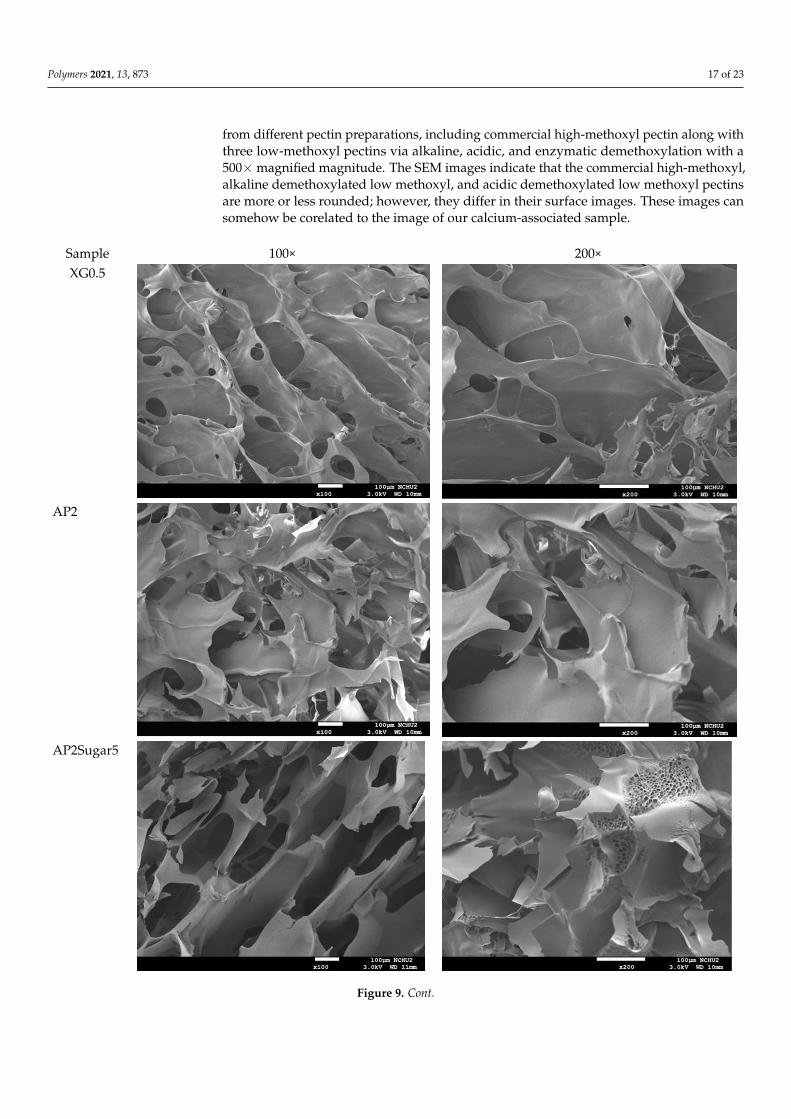
The analysis of the internal microstructure by scanning microscopy was performedfor select DFMS—the ones containing a single thickener (XG0.5, or AP2 along), AP2 withBFIs (AP2Suagr5, AP2Ca5, and AP2Salt2), and the composite thickener formulation ofAP1.8XG0.2. The photomicrographs are shown in Figure 9. Generally, there is evidenceof a porous structure for all the lyophilized DFMs. Through the images, we observedan obvious three-dimensional microstructure interconnected by virtue of the expeditelyophilization process with the pores having ice crystal formation. In the light of structuralsmoothness, it is apparent that both the calcium ion sample (AP2Ca5) and the compositethickening formulation (AP1.8XG0.2) with XG incorporated into AP possessed smoothersurfaces than the formula with singular thickener samples. In addition to the smoothness,in the 200×magnified microstructure image of the AP2Ca5 contained sample, some clearvein-like streams appear on the network surface; meanwhile, the calcium could possiblybe incorporated into the dispersed phase to result in a much thicker layer compared toother investigated samples; otherwise, the same ionic crystal can be observed as shownin 2000× (Figure 9c) magnified microstructural image of a salt-contained sample. Byincorporating XG into a hydrogel system, there would expectedly be evidence of cross-linking between molecules, resulting in somehow more compact gaps [67]. The structuralmodification effect of XG has been reported previously for a millet-based matrix with theincorporation of whey protein and XG as thickening agents [68]; de Alcântara et al. [35]also indicated such a modification effect of XG as electrostatic hydrogels by acidifiedgelatin and carrageenan. However, there has been rare documentation reporting the XGmodification effect on AP matrices; it would be interesting to elaborate on this in thisdetail. The microstructures of AP-based DFMs with the inclusion of sugar and calcium arerather distinctive. By comparing the differences between the 200× magnified images ofAP2Sugar5 and AP2Ca5, we observed for the former scattered sub-sections with even, smallporous clusters (Figure 9b) resembling a beehive, in contrast to the thickened layers of theAP2Ca5 sample. The hive-like microscopic image of AP2Suagr5 could somehow be relatedto structure formation mechanisms in pectin gelation, i.e., (I) hydrogen bonds betweenundissociated carboxyl groups, and (II) hydrophobic interactions [17,69]. The thick, orliterally plump microscopic image of AP2Ca5 sample associations constitute junctionzones, popularly known as the “egg box model” [48], responsible for gel formation. Pairsof helical chains are generally considered to be packed with calcium ions located betweensupplementing oxygen atoms from the guluronate chains involves in the coordination of thecalcium ions [48,70]. Braccini and Pérez further revisited the egg-box model on a molecularbasis by corroborating two stages in the calcium-involved gelation mechanism, i.e., stage(I): the strongly linked dimer associations, the stage (II): weak inter-dimer associationsdominated by electrostatic interactions [70]. The vein-like microscopic image of the AP2Ca5sample is possibly an indication of the impaired weak associations during the lyophilizationprocess. Einhorn-Stoll [71] recently showed examples of typical real particle SEM images
Polymers 2021, 13, 873 17 of 23
from different pectin preparations, including commercial high-methoxyl pectin along withthree low-methoxyl pectins via alkaline, acidic, and enzymatic demethoxylation with a500×magnified magnitude. The SEM images indicate that the commercial high-methoxyl,alkaline demethoxylated low methoxyl, and acidic demethoxylated low methoxyl pectinsare more or less rounded; however, they differ in their surface images. These images cansomehow be corelated to the image of our calcium-associated sample.
Polymers 2021, 13, x FOR PEER REVIEW 18 of 24
i.e., stage (I): the strongly linked dimer associations, the stage (II): weak inter-dimer asso-ciations dominated by electrostatic interactions [70]. The vein-like microscopic image of the AP2Ca5 sample is possibly an indication of the impaired weak associations during the lyophilization process. Einhorn-Stoll [71] recently showed examples of typical real parti-cle SEM images from different pectin preparations, including commercial high-methoxyl pectin along with three low-methoxyl pectins via alkaline, acidic, and enzymatic demeth-oxylation with a 500× magnified magnitude. The SEM images indicate that the commercial high-methoxyl, alkaline demethoxylated low methoxyl, and acidic demethoxylated low methoxyl pectins are more or less rounded; however, they differ in their surface images. These images can somehow be corelated to the image of our calcium-associated sample.
Sample 100× 200× XG0.5
AP2
AP2Sugar5
Figure 9. Cont.
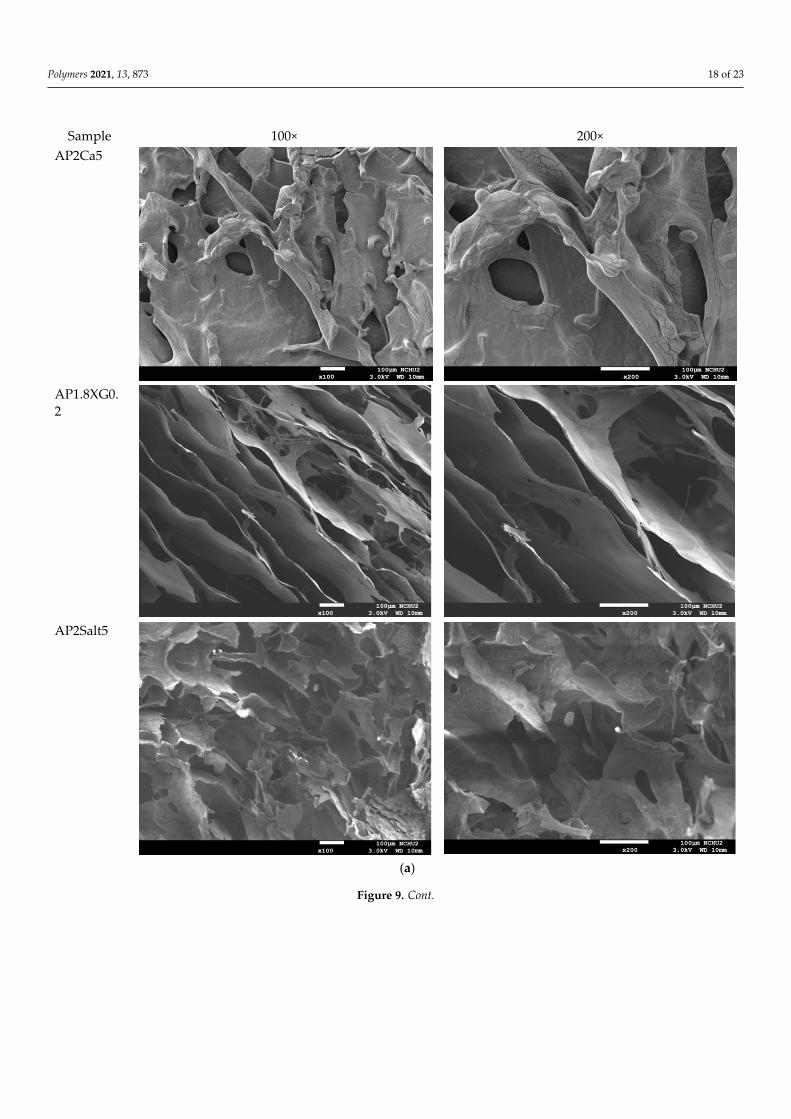
Polymers 2021, 13, 873 18 of 23Polymers 2021, 13, x FOR PEER REVIEW 19 of 24
Sample 100× 200× AP2Ca5
AP1.8XG0.2
AP2Salt5
(a)
Figure 9. Cont.
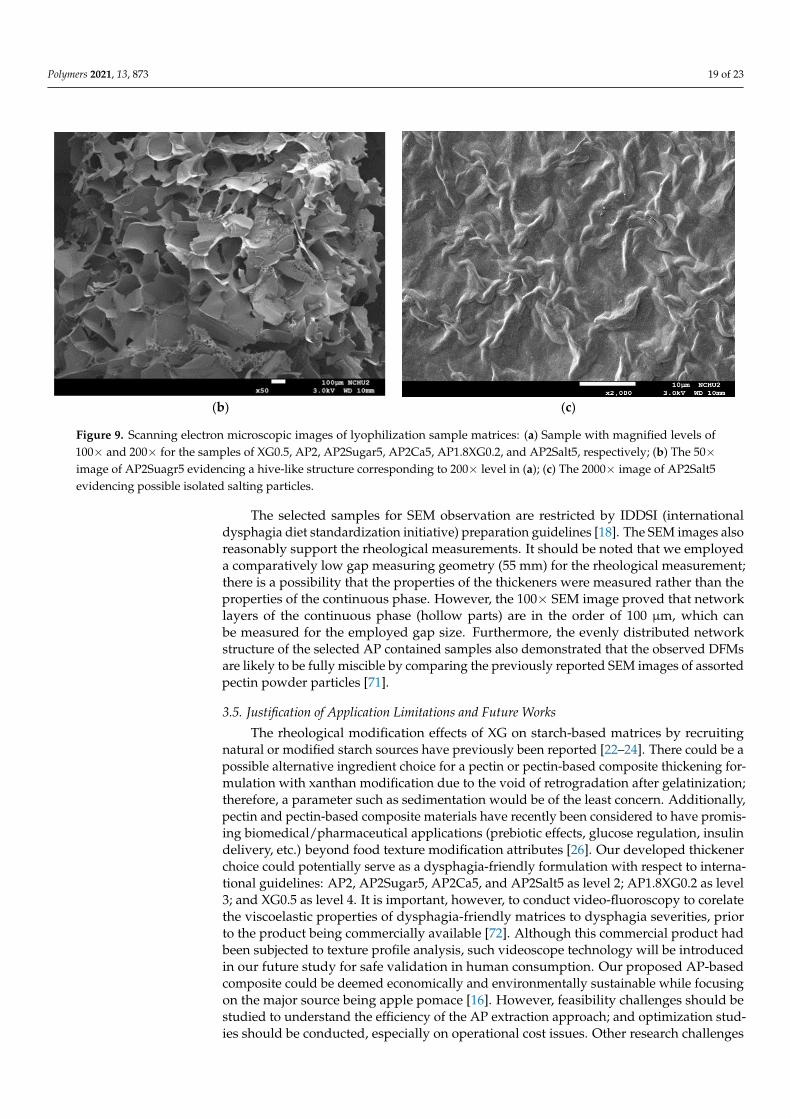
Polymers 2021, 13, 873 19 of 23Polymers 2021, 13, x FOR PEER REVIEW 20 of 24
(b) (c)
Figure 9. Scanning electron microscopic images of lyophilization sample matrices: (a) Sample with magnified levels of 100× and 200× for the samples of XG0.5, AP2, AP2Sugar5, AP2Ca5, AP1.8XG0.2, and AP2Salt5, respectively; (b) The 50× image of AP2Suagr5 evidencing a hive-like structure corresponding to 200× level in (a); (c) The 2000× image of AP2Salt5 evidencing possible isolated salting particles.
The selected samples for SEM observation are restricted by IDDSI (international dys-phagia diet standardization initiative) preparation guidelines [18]. The SEM images also reasonably support the rheological measurements. It should be noted that we employed a comparatively low gap measuring geometry (55 mm) for the rheological measurement; there is a possibility that the properties of the thickeners were measured rather than the properties of the continuous phase. However, the 100× SEM image proved that network layers of the continuous phase (hollow parts) are in the order of 100 μm, which can be measured for the employed gap size. Furthermore, the evenly distributed network struc-ture of the selected AP contained samples also demonstrated that the observed DFMs are likely to be fully miscible by comparing the previously reported SEM images of assorted pectin powder particles [71].
3.5. Justification of Application Limitations and Future Works The rheological modification effects of XG on starch-based matrices by recruiting nat-
ural or modified starch sources have previously been reported [22–24]. There could be a possible alternative ingredient choice for a pectin or pectin-based composite thickening formulation with xanthan modification due to the void of retrogradation after gelatiniza-tion; therefore, a parameter such as sedimentation would be of the least concern. Addi-tionally, pectin and pectin-based composite materials have recently been considered to have promising biomedical/pharmaceutical applications (prebiotic effects, glucose regu-lation, insulin delivery, etc.) beyond food texture modification attributes [26]. Our devel-oped thickener choice could potentially serve as a dysphagia-friendly formulation with respect to international guidelines: AP2, AP2Sugar5, AP2Ca5, and AP2Salt5 as level 2; AP1.8XG0.2 as level 3; and XG0.5 as level 4. It is important, however, to conduct video-fluoroscopy to corelate the viscoelastic properties of dysphagia-friendly matrices to dys-phagia severities, prior to the product being commercially available [72]. Although this commercial product had been subjected to texture profile analysis, such videoscope tech-nology will be introduced in our future study for safe validation in human consumption. Our proposed AP-based composite could be deemed economically and environmentally sustainable while focusing on the major source being apple pomace [16]. However, feasi-bility challenges should be studied to understand the efficiency of the AP extraction ap-
Figure 9. Scanning electron microscopic images of lyophilization sample matrices: (a) Sample with magnified levels of100× and 200× for the samples of XG0.5, AP2, AP2Sugar5, AP2Ca5, AP1.8XG0.2, and AP2Salt5, respectively; (b) The 50×image of AP2Suagr5 evidencing a hive-like structure corresponding to 200× level in (a); (c) The 2000× image of AP2Salt5evidencing possible isolated salting particles.
The selected samples for SEM observation are restricted by IDDSI (internationaldysphagia diet standardization initiative) preparation guidelines [18]. The SEM images alsoreasonably support the rheological measurements. It should be noted that we employeda comparatively low gap measuring geometry (55 mm) for the rheological measurement;there is a possibility that the properties of the thickeners were measured rather than theproperties of the continuous phase. However, the 100× SEM image proved that networklayers of the continuous phase (hollow parts) are in the order of 100 µm, which canbe measured for the employed gap size. Furthermore, the evenly distributed networkstructure of the selected AP contained samples also demonstrated that the observed DFMsare likely to be fully miscible by comparing the previously reported SEM images of assortedpectin powder particles [71].
3.5. Justification of Application Limitations and Future Works
The rheological modification effects of XG on starch-based matrices by recruitingnatural or modified starch sources have previously been reported [22–24]. There could be apossible alternative ingredient choice for a pectin or pectin-based composite thickening for-mulation with xanthan modification due to the void of retrogradation after gelatinization;therefore, a parameter such as sedimentation would be of the least concern. Additionally,pectin and pectin-based composite materials have recently been considered to have promis-ing biomedical/pharmaceutical applications (prebiotic effects, glucose regulation, insulindelivery, etc.) beyond food texture modification attributes [26]. Our developed thickenerchoice could potentially serve as a dysphagia-friendly formulation with respect to interna-tional guidelines: AP2, AP2Sugar5, AP2Ca5, and AP2Salt5 as level 2; AP1.8XG0.2 as level3; and XG0.5 as level 4. It is important, however, to conduct video-fluoroscopy to corelatethe viscoelastic properties of dysphagia-friendly matrices to dysphagia severities, priorto the product being commercially available [72]. Although this commercial product hadbeen subjected to texture profile analysis, such videoscope technology will be introducedin our future study for safe validation in human consumption. Our proposed AP-basedcomposite could be deemed economically and environmentally sustainable while focusingon the major source being apple pomace [16]. However, feasibility challenges should bestudied to understand the efficiency of the AP extraction approach; and optimization stud-ies should be conducted, especially on operational cost issues. Other research challenges
Polymers 2021, 13, 873 20 of 23
would be the optimization of the formulation with a more complex module of AP-XGcomposite blending sugar and/or cations that are to be fully miscible in different aquaticcontinuous phases, for example, the acidified ones. Future research will possibly focus onthe evaluation of AP composites for the controlled delivery of drugs—which has recentlyfound increased interest [26]—as individuals with dysphagia find it impossible to takeorally administrated drugs and thin liquids.
4. Conclusions
AP hydrocolloids are shown to exhibit fluid-like behavior at low and moderate con-centrations and turn into weak gels (or critical gels) above 9%. The resulting dynamicmodulus data (2–9%) exhibit excellent time-concentration superposition over eight ordersof magnitude in frequency, a phenomenon often associated with weakly attractive col-loidal systems but previously unreported for AP systems. The addition of common BFIscan notably promote the elasticity of the AP hydrocolloids without majorly altering theviscous attribute. The most prominent effect was identified with divalent calcium with athreshold concentration of 10%. XG hydrocolloids were seen to serve as an effective andinexpensive modifier for AP-based hydrocolloids, as they can substantially promote theelastic modulus, even at rather low dosages (<1%) and remain largely unaffected by thepresence of common BFIs. The AP-XG hydrocolloids at a constrained total concentration of2% exhibit the capability for further modification with respect to the viscoelastic attributesthat were previously unobserved with non-composite (pure) AP and XG hydrocolloids.The composite AP1.2XG0.8 presents a measured hardness almost identical to that of thecommercialized product, namely, Neo-high Toromeal III®, with similar cohesiveness andgumminess; the discrepancy of the adhesion could possibly be modified by XG or BFIs.AP2, AP2Sugar5, AP2Ca5, AP2Salt5, AP1.8XG0.2, and XG0.5 are dysphagia-friendly for-mula bases with respect to viscosity consideration. About 5 or 10% divalent calcium in anAP2-based matrix offers better mouthfeel.
Author Contributions: Conceptualization, H.Y., C.-C.T., and C.-C.H.; methodology, H.Y., C.-C.T.,and C.-C.H.; software, H.Y., C.-C.T., and J.-S.J.; validation, H.Y., C.-C.T., J.-S.J., and C.-C.H.; formalanalysis, H.Y. and C.-C.T.; investigation, H.Y., C.-C.T., and C.-C.H.; resources, H.Y. and C.-C.H.; datacuration, H.Y., C.-C.T., and J.-S.J.; writing—original draft preparation, H.Y. and C.-C.T.; writing—review and editing, H.Y. and C.-C.H.; visualization, H.Y., C.-C.T., J.-S.J., and C.-C.H.; supervision,H.Y. and C.-C.H.; project administration, H.Y. and C.-C.H.; funding acquisition, H.Y. All authorshave read and agreed to the published version of the manuscript.
Funding: This study was sponsored by the Council of Agriculture of Taiwan, Republic of China:Grant number 107-3.5.2-Z1(1).
Institutional Review Board Statement: Not applicable.
Informed Consent Statement: The consent statement is not applicable here as the study does notinvolve animals or humans.
Data Availability Statement: Data are contained within the article or supplemented upon requestfrom the section editors.
Acknowledgments: The authors acknowledge the administration help provided by the Departmentof Food Science, National Chiayi University, Taiwan, Republic of China. We also acknowledge thelaboratory apparatus (SEM) provided by National Chung Hsing University.
Conflicts of Interest: The authors declare no conflict of interest.
References1. Aslam, M.; Vaezi, M.F. Dysphagia in the elderly. Gastroenterol. Hepatol. 2013, 9, 784–795. [CrossRef]2. Newman, R.; Vilardell, N.; Clavé, P.; Speyer, R. Effect of bolus viscosity on the safety and efficacy of swallowing and the kinematics
of the swallow response in patients with oropharyngeal dysphagia: White paper by the European society for swallowing disorders(ESSD). Dysphagia 2016, 3, 232–249. [CrossRef]
Polymers 2021, 13, 873 21 of 23
3. Cichero, J.A.; Steele, C.; Duivestein, J.; Clavé, P.; Chen, J.; Kayashita, J.; Lam, P. The need for international terminology anddefinitions for texture-modified foods and thickened liquids used in dysphagia management: Foundations of a global initiative.Curr. Phys. Med. Rehabil. Rep. 2013, 1, 280–291. [CrossRef]
4. Andersen, U.T.; Beck, A.M.; Kjaersgaard, A.; Hansen, T.; Poulsen, I. Systematic review and evidence based recommendations ontexture modified foods and thickened fluids for adults (≥18 years) with oropharyngeal dysphagia. e-SPEN 2013, 8, e127–e134.[CrossRef]
5. Vilardell, N.; Rofes, L.; Arreola, V.; Speyer, R.; Clavé, P. A comparative study between modified starch and xanthan gum thickenersin post-stroke oropharyngeal dysphagia. Dysphagia 2016, 31, 169–179. [CrossRef] [PubMed]
6. Rofes, L.; Arreola, V.; Mukherjee, R.; Swanson, J.; Clavé, P. The effects of a xanthan gum-based thickener on the swallowingfunction of patients with dysphagia. Aliment. Pharmacol. Ther. 2014, 39, 1169–1179. [CrossRef]
7. Matta, Z.; Chambers, E., IV; Garcia, J.M.; Helverson, J.M. Sensory characteristics of beverages prepared with commercialthickeners used for dysphagia diets. J. Am. Diet. Assoc. 2006, 106, 1049–1054. [CrossRef] [PubMed]
8. Payne, C.; Methven, L.; Fairfield, C.; Gosney, M.; Bell, A.E. Variability of starch-based thickened drinks for patients with dysphagiain the hospital setting. J. Texture Stud. 2012, 43, 95–105. [CrossRef]
9. Tombs, M.P.; Harding, S.E. An Introduction to Polysaccharide Biotechnology, 2nd ed.; Taylor and Francis: London, UK, 1998.10. Van Buren, J.P. Function of pectin in plant tissue structure and firmness. In The Chemistry and Technology of Pectin; Reginald, H.W.,
Ed.; Academic Press: New York, NY, USA, 1991; pp. 1–22.11. Thibault, J.F.; Ralet, M.C. Physico-chemical properties of pectins in the cell walls and after extraction. In Advances in Pectin and
Pectinase Research; Voragen, A.G.J., Schols, F.H., Visser, R., Eds.; Kluwer Academic: Dordrecht, The Netherlands, 2003; pp. 91–105.[CrossRef]
12. Mesbahi, G.; Jamalian, J.; Farahnaky, A. A comparative study on functional properties of beet and citrus pectins in food systems.Food Hydrocoll. 2005, 19, 731–738. [CrossRef]
13. Gawkowska, D.; Cybulska, J.; Zdunek, A. Structure-related gelling of pectins and linking with other natural compounds: Areview. Polymers 2018, 10, 762. [CrossRef]
14. Löfgren, C.; Guillotin, S.; Hermansson, A.-M.J.B. Microstructure and kinetic rheological behavior of amidated and nonamidatedLM pectin gels. Biomacromolecules 2006, 7, 114–121. [CrossRef]
15. Naqash, F.; Masoodi, F.A.; Rather, S.A.; Wani, S.M.; Gani, A. Emerging concepts in the nutraceutical and functional properties ofpectin—A review. Carbohydr. Polym. 2017, 168, 227–239. [CrossRef]
16. Morales-Contreras, B.E.; Wicker, L.; Rosas-Flores, W.; Contreras-Esquivel, J.C.; Gallegos-Infante, J.A.; Reyes-Jaquez, D.; Morales-Castro, J. Apple pomace from variety “Blanca de Asturias” as sustainable source of pectin: Composition, rheological, and thermalproperties. Lwt 2020, 117, 108641. [CrossRef]
17. Ropartz, D.; Ralet, M.C. Pectin Structure. In Pectin: Technological and Physiological Properties, 1st ed.; Kontogiorgos, V., Ed.; SpringerInternational Publishing: Cham, Switzerland, 2020; pp. 17–34. [CrossRef]
18. Funami, T. Next target for food hydrocolloid studies: Texture design of foods using hydrocolloid technology. Food Hydrocoll. 2011,25, 1904–1914. [CrossRef]
19. Hyun, K.; Wilhelm, M.; Klein, C.O.; Cho, K.S.; Nam, J.G.; Ahn, K.H.; McKinley, G.H. A review of nonlinear oscillatory shear tests:Analysis and application of large amplitude oscillatory shear (LAOS). Prog. Polym. Sci. 2011, 36, 1697–1753. [CrossRef]
20. Kar, F.; Arslan, N. Effect of temperature and concentration on viscosity of orange peel pectin solutions and intrinsic viscosity–molecular weight relationship. Carbohydr. Polym. 1999, 40, 277–284. [CrossRef]
21. Antonic, B.; Jancikova, S.; Dordevic, D.; Tremlova, B. Apple pomace as food fortification ingredient: A systematic review andmeta-analysis. J. Food Sci. 2020, 85, 2977–2985. [CrossRef]
22. Yoon, S.N.; Yoo, B. Rheological behaviors of thickened infant formula prepared with xanthan gum-based food thickeners fordysphagic infants. Dysphagia 2017, 32, 454–462. [CrossRef] [PubMed]
23. Yang, H.; Lin, Y. Effect of Thermal Processing on Flow Properties and Stability of Thickened Fluid Matrices Formulated byTapioca Starch, Hydroxyl Distarch Phosphate (E-1442), and Xanthan Gum Associating Dysphagia-Friendly Potential. Polymers2021, 13, 162. [CrossRef]
24. Yang, H.-W.; Dai, H.-D.; Huang, W.-C.; Sombatngamwilai, T. Formulations of dysphagia-friendly food matrices with caloriedense starchy thickeners and their stability assessments. J. Food Meas. Charact. 2020, 14, 3089–3102. [CrossRef]
25. Cichero, J.A. Evaluating chewing function: Expanding the dysphagia field using food oral processing and the IDDSI framework.J. Texture Stud. 2020, 51, 56–66. [CrossRef] [PubMed]
26. Lara-Espinoza, C.; Carvajal-Millán, E.; Balandrán-Quintana, R.; López-Franco, Y.; Rascón-Chu, A. Pectin and Pectin-BasedComposite Materials: Beyond Food Texture. Molecules 2018, 23, 942. [CrossRef] [PubMed]
27. Gómez, B.C.A.; Gullón, B.; Remoroza, C.; Schols, H.A.; Parajó, J.C.; Alonso, J.L. Purification, characterization, and prebioticproperties of pectic oligosaccharides from orange peel wastes. J. Agric. Food Chem. 2014, 62, 9769–9782. [CrossRef] [PubMed]
28. Gómez, B.C.A.; Gullón, B.; Yáñez, R.; Schols, H.; Alonso, J.L. Prebiotic potential of pectins and pectic oligosaccharides derivedfrom lemon peel wastes and sugar beet pulp: A comparative evaluation. J. Funct. Foods 2016, 20, 108–121. [CrossRef]
29. Chung, W.S.F.; Meijerink, M.; Zeuner, B.; Holck, J.; Louis, P.; Meyer, A.S.; Wells, J.M.; Flint, H.J.; Duncan, S.H. Prebiotic potentialof pectin and pectic oligosaccharides to promote anti-Inflammatory commensal bacteria in the human colon. FEMS Microbiol.Ecol. 2017, 93, 1–9. [CrossRef] [PubMed]
Polymers 2021, 13, 873 22 of 23
30. Wicker, L.; Kim, Y.; Kim, M.J.; Thirkield, B.; Lin, Z.; Jung, J. Pectin as a bioactive polysaccharide–extracting tailored Function fromLess. Food Hydrocoll. 2014, 42, 251–259. [CrossRef]
31. Makarova, E.; Górna’s, P.; Konrade, I.; Tirzite, D.; Cirule, H.; Gulbe, A.; Pugajeva, I.; Seglina, D.; Dambrova, M. Acute anti-hyperglycaemic effects of an unripe apple preparation containing phlorizin in healthy volunteers: A preliminary study. J. Sci.Food Agric. 2015, 95, 560–568. [CrossRef] [PubMed]
32. Gunness, P.; Gidley, M.J. Mechanisms underlying the cholesterol-lowering properties of soluble dietary fibre polysaccharides.Food Funct. 2010, 1, 149–155. [CrossRef]
33. Peng, X.-Y.; Mu, T.-H.; Zhang, M.; Sun, H.-N.; Chen, J.-W.; Yu, M. Effects of pH and high hydrostatic pressure on the structuraland rheological properties of sugar beet pectin. Food Hydrocoll. 2016, 60, 161–169. [CrossRef]
34. Elblbesy, M.A.; Hereba, A.T. Computation of the coefficients of the power law model for whole blood and their correlation withblood parameters. Appl. Phys. Res. 2016, 8, 1–9. [CrossRef]
35. de Alcântara, M.G.; de Freitas Ortega, N.; Souza, C.J.F.; Garcia-Rojas, E.E. Electrostatic hydrogels formed by gelatin andcarrageenan induced by acidification: Rheological and structural characterization. Food Struct. 2020, 24, 100137. [CrossRef]
36. Rascón-Chu, A.; Díaz-Baca, J.A.; Carvajal-Millan, E.; Pérez-López, E.; Hotchkiss, A.T.; González-Ríos, H.; Balandrán-Quintana,R.; Campa-Mada, C. Electrosprayed core–shell composite microbeads based on pectin-arabinoxylans for insulin carrying:Aggregation and size dispersion control. Polymers 2018, 10, 108. [CrossRef] [PubMed]
37. Morris, G.; Foster, T.; Harding, S.J.F.H. The effect of the degree of esterification on the hydrodynamic properties of citrus pectin.Food Hydrocoll. 2000, 14, 227–235. [CrossRef]
38. Li, J.; Zhang, Y.; Fan, Q.; Teng, C.; Xie, W.; Shi, Y.; Yang, Y. Combination effects of NaOH and NaCl on the rheology and gelcharacteristics of hen egg white proteins. Food Chem. 2018, 250, 1–6. [CrossRef]
39. Zhao, X.; Zhou, Y.; Liu, J.; Chen, J.; Ye, F.; Zhao, G. Effects of sucrose on the structure formation in high-methoxyl apple pectinsystems without acidifier. Food Hydrocoll. 2020, 105, 105783. [CrossRef]
40. Winter, H.H.; Chambon, F. Analysis of linear viscoelasticity of a crosslinking polymer at the gel point. J. Rheol. 1986, 30, 367–382.[CrossRef]
41. National Dysphagia Diet Task Force. In National Dysphagia Diet: Standardization for Optimal Care; American Dietetic Association:Chicago, CA, USA, 2002.
42. Zhang, C.; Zhu, X.; Zhang, F.; Yang, X.; Ni, L.; Zhang, W.; Liu, Z.; Zhang, Y. Improving viscosity and gelling properties of leafpectin by comparing five pectin extraction methods using green tea leaf as a model material. Food Hydrocoll. 2020, 98, 105246.[CrossRef]
43. Trappe, V.; Weitz, D.A. Scaling of the viscoelasticity of weakly attractive particles. Phys. Rev. Lett. 2000, 85, 449. [CrossRef]44. Jiang, J.S.; Guo, R.H.; Chiu, Y.S.; Hua, C.C. Percolation behaviors of model carbon black pastes. Soft Matter 2018, 14, 9786–9797.
[CrossRef]45. Wu, B.C.; Degner, B.; McClements, D.J. Soft matter strategies for controlling food texture: Formation of hydrogel particles by
biopolymer complex coacervation. J. Phys. Condens. Matter 2014, 26, 1–11. [CrossRef]46. Hyun, K.; Kim, S.H.; Ahn, K.H.; Lee, S.J. Large amplitude oscillatory shear as a way to classify the complex fluids. J. Nonnewton
Fluid Mech. 2002, 107, 51–65. [CrossRef]47. Marcotte, M.; Hoshahili, A.R.T.; Ramaswamy, H.S. Rheological properties of selected hydrocolloids as a function of concentration
and temperature. Food Res. Int. 2001, 34, 695–703. [CrossRef]48. Grant, G.T.; Morris, E.R.; Rees, D.A.; Smith, P.J.; Thom, D. Biological interactions between polysaccharides and divalent cations:
The egg-box model. FEBS Lett. 1973, 32, 195–198. [CrossRef]49. Ishihara, S.; Nakauma, M.; Funami, T.; Odake, S.; Nishinari, K. Swallowing profiles of food polysaccharide gels in relation to
bolus rheology. Food Hydrocoll. 2011, 25, 1016–1024. [CrossRef]50. Ortega, O.; Bolívar-Prados, M.; Arreola, V.; Nascimento, W.V.; Tomsen, N.; Gallegos, C.; Brito-de La Fuente, E.; Clavé, P.
Therapeutic effect, rheological properties and α-amylase resistance of a new mixed starch and xanthan gum thickener on fourdifferent phenotypes of patients with oropharyngeal dysphagia. Nutrients 2020, 12, 1873. [CrossRef] [PubMed]
51. Gallegos, C.; Brito-de la Fuente, E.; Clavé, P.; Costa, A.; Assegehegn, G. Nutritional aspects of dysphagia management. Adv. FoodNutr. Res. 2017, 81, 271–318. [CrossRef]
52. Cho, H.M.; Yoo, B. Rheological characteristics of cold thickened beverages containing xanthan gum-based food thickeners usedfor dysphagia diets. J. Acad. Nutr. Diet. 2015, 115, 106–111. [CrossRef]
53. Seo, C.-W.; Yoo, B. Steady and Dynamic shear rheological properties of gum-based food thickeners used for diet modification ofpatients with dysphagia: Effect of concentration. Dysphagia 2013, 28, 205–211. [CrossRef]
54. Razavi, S.M.A.; Irani, M. Rheology of Food Gum. In Bioactive Molecules in Food; Mérillon, J.M., Ramawat, K.G., Eds.; Springer:New York, NY, USA, 2019; pp. 1–29. [CrossRef]
55. Gabas, A.L.; Cabral, R.A.F.; Fernandes de Oliveira, C.A.; Telis-Romero, J. Density and rheological parameters of goat milk. FoodSci. Technol. 2012, 32, 381–385. [CrossRef]
56. Chen, C.R.; Ramaswamy, H.S. Rheology of tapioca starch. Food Res. Int. 1999, 32, 319–325. [CrossRef]57. Krokida, M.K.; Maroulis, Z.B.; Saravacos, G.D. Rheological properties of fluid fruit and vegetable puree products: Compilation of
literature data. Int. J. Food Prop. 2001, 4, 179–200. [CrossRef]
Polymers 2021, 13, 873 23 of 23
58. Mierczynska, J.; Cybulska, J.; Solowiej, B.; Zdunek, A. Effect of Ca(2+), Fe(2+) and Mg(2+) on rheological properties of new foodmatrix made of modified cell wall polysaccharides from apple. Carbohydr. Polym. 2015, 133, 547–555. [CrossRef] [PubMed]
59. Moraes, I.C.F.; Fasolin, L.H.; Cunha, R.L.; Menegalli, F.C. Dynamic and steady: Shear rheological properties of xanthan and guargums dispersed in yellow passion fruit pulp (Passiflora edulis f. flavicarpa). Braz. J. Chem. Eng. 2011, 28, 483–494. [CrossRef]
60. The dysphagia diet committee of the Japanese society of dysphagia rehabikitation. The Japanese dysphagia diet 2013. Jpn. J.Dysphagia Tehabil. 2013, 17, 255–267. (In Japanese)
61. Matsuo, K.; Fujishima, I. Textural changes by mastication and proper food texture for patients with oropharyngeal dysphagia.Nutrients 2020, 12, 1613. [CrossRef]
62. Shiozawa, K.; Kohyama, K. Effects of addition of water on masticatory behavior and the mechanical properties of the food bolus.J. Oral. Biosci. 2011, 53, 148–157. [CrossRef]
63. Huang, M.; Kennedy, J.F.; Li, B.; Xu, X.; Xie, B.J. Characters of rice starch gel modified by gellan, carrageenan, and glucomannan:A texture profile analysis study. Carbohydr. Polym. 2007, 69, 411–418. [CrossRef]
64. Momosaki, R.; Abo, M.; Kobayashi, K. Swallowing analysis for semisolid food texture in poststroke dysphagic patients. J. StrokeCerebrovasc. Dis. 2013, 22, 267–270. [CrossRef]
65. Sharma, M.; Kristo, E.; Corredig, M.; Duizer, L. Effect of hydrocolloid type on texture of pureed carrots: Rheological and sensorymeasures. Food Hydrocoll. 2017, 63, 478–487. [CrossRef]
66. Park, J.W.; Lee, S.; Yoo, B.; Nam, K. Effects of texture properties of semi-solid food on the sensory test for pharyngeal swallowingeffort in the older adults. BMC Geriatr. 2020, 20, 1–5. [CrossRef]
67. Tavares, C.; da Silva, J.L. Rheology of galactomannan–whey protein mixed systems. Int. Dairy J. 2003, 13, 699–706. [CrossRef]68. Song, X.; Sun, X.; Ban, Q.; Cheng, J.; Zhang, S.; Guo, M. Gelation and microstructural properties of a millet-based yogurt-like
product using polymerized whey protein and xanthan gum as thickening agents. J. Food Sci. 2020, 85, 3927–3933. [CrossRef][PubMed]
69. Kastner, H.; Einhorn-Stoll, U.; Senge, B. Structure formation in sugar containing pectin gels–Influence of Ca2+ on the gelation oflow-methoxylated pectin at acidic pH. Food Hydrocoll. 2012, 27, 42–49. [CrossRef]
70. Braccini, I.; Pérez, S. Molecular basis of Ca2+-induced gelation in alginates and pectins: The egg-box model revisited. Biomacro-molecules 2001, 2, 1089–1096. [CrossRef] [PubMed]
71. Einhorn-Stoll, U. Pectin-water interactions in foods–from powder to gel. Food Hydrocoll. 2018, 78, 109–119. [CrossRef]72. Barbon, C.E.; Steele, C.M. Characterizing the flow of thickened barium and non-barium liquid recipes using the IDDSI flow test.
Dysphagia 2019, 34, 73–79. [CrossRef]


