Embed Size (px)
Citation preview

1
Vol.:(0123456789)
Scientific Reports | (2021) 11:21515 | https://doi.org/10.1038/s41598-021-00838-x
www.nature.com/scientificreports
Comparative assessment of nutritional, thermal, rheological and functional properties of nine Australian lupin cultivarsKishor Mazumder1,2*, Biswajit Biswas1, Philip G. Kerr2*, Christopher Blanchard2, Afia Nabila3, Mimi Golder4, Mohammad Gulzarul Aziz5 & Asgar Farahnaky2,6
Lupin holds an important place among the legumes and the utilization of lupin as a dietary protein source is an excellent environmentally friendly alternative to animal-based products for human nutrition. In the present study, nutritional, thermal, rheological and functional properties of nine Australian lupin cultivars have been assayed in order to find the most valuable one, both nutritiously and industrially. The set comprised six Lupinus angustifolius L. viz., Barlock, Gunyadi, Jenabillup, Jindalee, Jurien, Mandelup and three Lupinus albus L. viz., Luxor, Rosetta, WK388 cultivars. The tests included analysis of color, macronutrient and micronutrient composition, pasting, textural and thermal properties, electrophoretic profile of protein isolates, swelling power, water and oil absorption capacity, emulsifying capacity, emulsion stability, creaming stability, foaming capacity and stability of the cultivars’ dehulled seed flours. The results indicated substantial variation in macro and micro-nutritional value as well as satisfactory swelling ability, solubility, surface hydrophobicity, foaming ability, emulsifying capacity and gelation property of lupin flours. Superior nutritional, thermal, rheological and functional potential was demonstrated by the L. albus cultivars compared to the L. angustifolius cultivars with the exception of Mandelup.
Scientists and policy makers around the world are currently seeking sources of sufficient amount of dietary proteins to meet the deficiencies. At the present time, a person in developed countries consume about 103 g of protein per day while in developing countries, average protein intake is below 76 g/capita/day1. Animal-based proteins are fulfilling a substantial proportion of dietary protein needs for animal feed and direct human consumption. However, from the financial and ethical perspectives, there is a necessity to develop sustainable plant based protein production2. There’s a need to discover plant protein sources for our day to day dietary requirements as the consumption of animal-based products relies on rigorous livestock farming which is envi-ronmentally detrimental and depletes natural resources3,4. Moreover, high intake of red and processed meat are considered as risk factors for the development of diabetes mellitus, cardiovascular diseases and even some cancers5,6. Hence, plant-based dietary protein consumption can be an effective way of maintaining a healthy diet and mitigating negative environmental impact. Attention towards functional foods, i.e. foods with bio-functional benefits beyond their energy providing nutritional value, has increased because of their potential role in maintaining human health and wellbeing7. By providing essential nutrients and what are commonly called ‘phytoconstituents’, these foods lessen the risk of developing systemic and chronic diseases in humans8.
Lupins belong to the genus Lupinus, of the family Fabaceae with four common species, Lupinus angustifolius L. (narrow-leaf lupin), Lupinus albus L. (white lupin), Lupinus mutabilis (tarwi, pearl lupin) and Lupinus luteus L. (yellow lupin)8. The agricultural history of lupins can be traced back 4000 years. They were first cultivated in the Mediterranean region, followed by the American continent. However, lupin emerged as a modern agricultural
OPEN
1Department of Pharmacy, Faculty of Biological Science and Technology, Jashore University of Science and Technology, Jashore 7408, Bangladesh. 2School of Biomedical Sciences, Charles Sturt University, Wagga Wagga, NSW 2650, Australia. 3Department of Pharmacy, University of Science and Technology Chittagong, Chittagong 4202, Bangladesh. 4Pharmacy Discipline, Life Science School, Khulna University, Khulna 9208, Bangladesh. 5Department of Food Technology and Rural Industries, Bangladesh Agricultural University, Mymensingh 2202, Bangladesh. 6Biosciences and Food Technology, School of Science, RMIT University, Melbourne 3083, Australia. *email: [email protected]; [email protected]

2
Vol:.(1234567890)
Scientific Reports | (2021) 11:21515 | https://doi.org/10.1038/s41598-021-00838-x
www.nature.com/scientificreports/
crop in Australia and Europe9. Among the four species, L. albus or the white lupin has always been the most significant in human nutrition, but usage of L. angustifolius, or the narrow leaf lupin, is on the rise8.
Although wild lupins are bitter tasting and toxic due to the presence of quinolizidine alkaloids (QA), domes-tication of L. angustifolius and L. albus has resulted in lower alkaloid content. When the QA content is less than 200 ppm, lupins are considered to be safe for human consumption, and no longer require rigorous treatment to remove the alkaloids before becoming palatable. In addition, de-hulling seeds further reduces the anti-nutritive contents of lupin flours10,11. In this instance, lupin is an important grain legume with desirable characteristics. They have low content of anti-nutrients (e.g. phytic acid, lectins and saponins); are free of phytoestrogens and possess good technological properties. Because of their protein content (range 30–50%) they are a potential solution in the search for plant-based dietary protein8. Lupin seeds are also a rich source of non-starch polysac-charide (30 to 40%), unsaturated fats (5 to 15%), minerals (Ca, K, P, Mg, Na, Fe, Zn etc.) with limited levels of heavy metals12,13. In addition, several studies have reported the bio-functional benefits of lupins viz., hypocho-lesterolaemic, hypoglycaemic, anti-atherogenic, hypotensive, glycaemic index controlling, antidiabetic and anti-oxidative activities8,13,14. Regular consumption of lupins has been demonstrated to counteract insulin resistance and therefore, can alleviate lifestyle disorders like obesity, diabetes and cardiovascular diseases15. This is why in recent times, lupin seed flours are being incorporated in processed foods including noodles, pasta, sausages, cereal, cookies, bread, crisps and many others16. Moreover, utilization of lupin seeds in traditional fermentation of foods like miso, tofu, sauces, tempe as well as in dairy products like yoghurt, milk without saturated fats has greatly boosted its industrial and market value15. However, because of the uncertainty of continuous supply, industrial usage of lupin flours is lessening.
The consumption and production of crops first need vigorous assessment of the ability and feasibility of particular cultivar to provide suitable yield, quality and nutritional value. Moreover, investigation of perceived functional properties is essential to assess the consequences of industrial processing on the crops like mild or harsh mechanical or thermal treatment. This could be due to denaturation or insolubilization of protein isolates by industrial treatment which may have either beneficial or deleterious impact on the nutritive values of the crops17–19. Hence in the present study, lupin seed flours, obtained from nine Australian lupin cultivars i.e., six L. angustifolius (Barlock, Gunyidi, Jenabillup, Jindalee, Jurien, Mandelup) and three L. albus (Luxor, Rosetta, WK388) have been assayed with a view to evaluating their nutritional, thermal, rheological and functional prop-erties. After de-hulling and milling the lupin seeds, the flours obtained were evaluated for color, macronutrient and micronutrient composition, pasting properties, textural and thermal properties and SDS-PAGE profiling of the protein isolates. Among different functional properties, swelling power, water absorption capacity, oil absorption capacity, emulsifying capacity, emulsion stability, creaming stability of emulsion, foaming capacity and finally, foam stability of the Australian lupin flours have been assayed. In short, the present study was designed in with the hope of establishing the significance of lupin as a major food crop in the human diet and finding the most beneficial cultivar in terms of nutritional value and industrial applicability.
ResultsDe-hulling of lupin cultivars. The seed coats of the nine lupin cultivars were separated from the kernels, with weights of both being measured separately. The weights of kernels ranged from 67.42% (Gunyidi) to 73.62% (Rosetta) of totals. Percentage of seed coat was between 24.69 and 15.16. Maximum quantity of seed coat was observed in Gunyidi while the minimum quantity was in WK388. Amount of intermediate material fluctuated between 7.47 and 13.24% (see Supplementary Table S1 online).
Color evaluation. The average lightness (L*), from black to white; greenness (−) to redness (+) (a*); and blueness (−) to yellowness (+) (b*) values of the nine lupin cultivars are presented in Table 1. Hue angle (h°, pre-senting property of the color) and chroma (C*), presenting color saturation or intensity, were calculated by using the formulas stated in the methodology20. No substantial differences were found in the L* values of the cultivars,
Table 1. Color evaluation of different lupin cultivars. Data are means of three replicates with standard deviations (SD). Data within the same column with different superscripts are significantly different, pair-wise comparison by Post Hoc Tukey test (aP < 0.05 vs. Barlock; bP < 0.05 vs. Gunyidi; cP < 0.05 vs Jenabillup; dP < 0.05 vs. Jindalee; eP < 0.05 vs Jurien; fP < 0.05 vs. Mandelup; gP < 0.05 vs Luxor; hP < 0.05 vs Rosetta; iP < 0.05 vs WK388). C* and h° are calculated using the means of L*, a*, b* values.
Species Cultivars L*-Value a*-Value b*-Value C* (Chroma) h° (Hue angle)
L. angustifolius
Barlock 86.83 ± 0.11 − 2.73 ± 0.04c,g 31.63 ± 0.15i 31.7476 180.67
Gunyidi 86.93 ± 0.08 − 2.55 ± 0.04d,g,i 31.35 ± 0.28i 31.45354 183.58
Jenabillup 87.34 ± 0.06 − 2.31 ± 0.03a,d,g,h,i 29.45 ± 0.11 29.54046 174.58
Jindalee 87.28 ± 0.05 − 2.96 ± 0.02b,c,e,f 30.05 ± 0.16 30.19543 178.88
Jurien 87.48 ± 0.05 − 2.53 ± 0.01d,g,i 29.42 ± 0.12 29.52858 180.73
Mandelup 86.94 ± 0.14 − 2.55 ± 0.02d,g,i 31.06 ± 0.09 31.1645 182.46
L. albus
Luxor 86.68 ± 0.10 − 3.14 ± 0.02a,b,c,e,f,h 30.58 ± 0.30 30.74079 176.92
Rosetta 86.16 ± 0.06 − 2.66 ± 0.03c,g 31.64 ± 0.15i 31.75162 181.26
WK388 87.27 ± 0.12 − 2.96 ± 0.04b,c,e,f 28.59 ± 0.08a,b,h 28.74282 175.80

3
Vol.:(0123456789)
Scientific Reports | (2021) 11:21515 | https://doi.org/10.1038/s41598-021-00838-x
www.nature.com/scientificreports/
with Rosetta (86.68) having the minimum, and Jurien (87.48) the maximum. For the a* values, a wider range of greenness was observed with Luxor (−3.14) and Jenabillup (−2.31). The b* values also showed yellowness, with WK388 (28.59) the lowest, leading to Rosetta and Barlock (both 31.75) at the high end of the spectrum. Although, significant variation in h° was demonstrated, C* was comparable for all cultivars (see Supplementary Fig. S1 online).
Macronutrient composition. Protein, fat and fiber compositions of 9 lupin cultivars are presented in Table 2. Protein content (%, w/w) of the cultivars varied between 41.5% (Barlock) and 48.2% (Rosetta). Substan-tial differences among the fat and fiber content of lupin cultivars were also detected. The lowest fat percentage was demonstrated by Jenabillup (4.4%) and the highest WK388 (11.9%). Soluble fiber content ranged widely from Barlock (2.09%) to Gunyidi (8.24%). Insoluble fiber content varied between 28.9% (Barlock) and 39.55% (Rosetta). Total fiber content was lowest in Rosetta (32.62%) and topped for Gunyidi (42.96%). No substan-tial differences were observed for dry matter and ash content of the lupin cultivars, with values ranging from 92.6% (Gunyidi) to 94.2% (WK388) for dry matter, and from 2% (Mandelup) to 4% (Gunyidi, Jenabillup, Luxor, WK388) for ash.
Microelemental composition. Results for the analyses of the 9 lupin cultivars are presented in Table 3. All cultivars demonstrated the presence of the nutritionally important major minerals with highest levels for Na, Mg, P, K and Ca. The trace elements Mn, Fe and Zn were found at generally lower levels than the major minerals. The nutritionally important Co and Se and toxic Cd and Pb were absent from the lupin flours. The presence of Hg was found only in Jenabillup (0.01 mg/kg). Among the major minerals, K was most abundant, with values ranging between 7054.58 mg/kg (Jindalee) and 8697.9 mg/kg (Jenabillup). Phosphorus was the second most abundant element, ranging from 3433.91 mg/kg (Rosetta) to 4327.81 mg/kg (WK388). Magnesium content was between 1307 mg/kg (Barlock) and 1896.92 mg/kg (WK388). The values for Ca were found to be between 590 mg/kg (Barlock) and 1678.43 mg/kg (WK388). The Na content ranged from 176.33 mg/kg (Jindalee) to 456.79 mg/kg (WK388). For the trace element Mn, the L. albus cultivars had the highest content - WK388 (688.58 mg/kg), Rosetta (796.25 mg/kg) and Luxor (1059.96 mg/kg). For the six L. angustifolius cultivars, the levels of Mn were considerably lower and found to be between 21.64 and 27.31 mg/kg. In the case of Fe, no substantial differ-ences were observed, and the values fluctuated between 21.67 mg/kg (Luxor) and 30.6 mg/kg (Barlock). For Zn, comparable quantities were observed for all, from 25.03 mg/kg (Jurien) to 31.76 mg/kg (Luxor) with the outlier being WK388 (41.97 mg/kg). While considering the quantity of Cu, the values skyrocketed for Jenabillup (42.59 mg/kg). Finally, all the lupin cultivars displayed a little quantity of Mo with values from 0.23 mg/kg (Jurien) to 3.2 mg/kg (Luxor).
SDS-PAGE profiling of protein isolates. These can be found as Supplementary Fig. S3 online. From the electrophoretic pattern it can be extrapolated that, β-conglutin, the major globulin component of the lupin cultivars, is formed from 10–12 major types of subunit (15–72 kDa); α-conglutin is composed of four main types of subunit (53, 60, 66, and 70 kDa), as well as a number of minor subunits; γ-conglutin, a minor globulin compo-nent, is composed of one main type of subunit (42–43 kDa) containing two polypeptide chains. Moreover, below 80 kDa, the bands of six L. angustifolius cultivars were very similar. Jenabillup, Jurin and Mandelup showed few large proteins and peptides. On the other hand, two L. albus cultivars, Luxor and Rosetta, demonstrated a total band similarity.
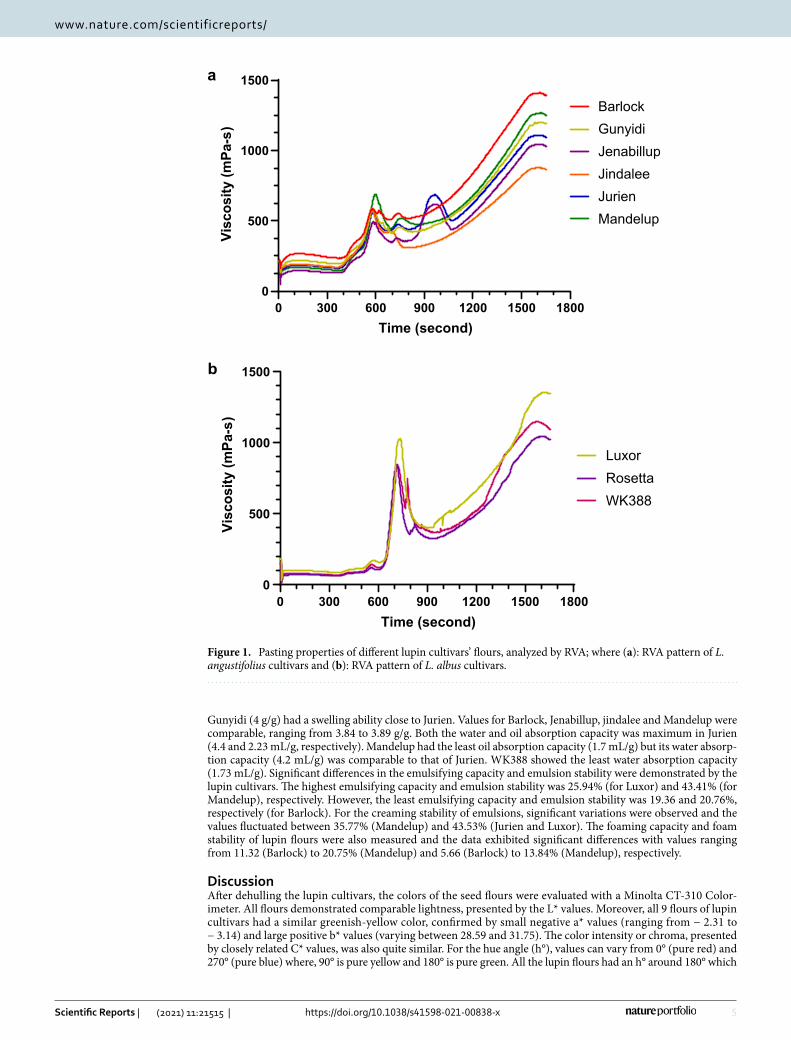
Pasting properties. Pasting properties of the lupin flours were measured by a Rapid Viscosity Analyzer (RVA) and the results are shown in Fig. 1 and Supplementary Table S2 online. Peak 1 represents the maximum viscosity attained in the heating phase of RVA analysis and the values ranged from 122.5 mPa-s (Rosetta) to 688
Table 2. Macronutrient composition of different lupin cultivars. Data are means of three replicates with standard deviations (SD). Data within the same column with different superscripts are significantly different, pair-wise comparison by Post Hoc Tukey test (aP < 0.05 vs. Barlock; bP < 0.05 vs. Gunyidi; cP < 0.05 vs Jenabillup; dP < 0.05 vs. Jindalee; eP < 0.05 vs Jurien; fP < 0.05 vs. Mandelup; gP < 0.05 vs Luxor; hP < 0.05 vs Rosetta; iP < 0.05 vs WK388).
Species CultivarsDry Matter % (w/w)
Ash % (w/w)
Protein % (w/w) Fat % (w/w)
Fiber % (w/w)
Soluble Insoluble Total
L. angusti-folius
Barlock 93.2 ± 2.24 3 ± 0.1 41.5 ± 2.03b,d,g,h,i 4.6 ± 0.66f,g,h,i 2.09 ± 0.05b,c,f,g,h,i 39.55 ± 2.03c,d,g,h,i 41.64 ± 2.07h
Gunyidi 92.6 ± 3.9 4 ± 0.2 46.2 ± 2.39a,f 4.7 ± 0.95f,g,h,i 8.24 ± 0.21a,d,e,f,g 34.72 ± 0.46h 42.96 ± 0.25g,h,i
Jenabillup 93.1 ± 0.05 4 ± 0.2 44.6 ± 1.6h 4.4 ± 1.08e,f,g,h,i 7.65 ± 0.66a,d,e,f,g,h 31.4 ± 0.39a,e 39.14 ± 1.24h
Jindalee 93.3 ± 0.95 3 ± 0.6 45.7 ± 2.74a 4.7 ± 1.49f,g,h,i 3.72 ± 0.15b,c,i 33.78 ± 2.39a 37.5 ± 2.24
Jurien 92.9 ± 0.41 3 ± 0.05 44.5 ± 1.12 5.8 ± 0.42c,f,g,h,i 3.00 ± 0.95b,c,g,h 37.24 ± 0.12c,h,i 40.24 ± 0.83h
Mandelup 93.4 ± 1.24 2 ± 0.2 42.9 ± 0.13b,g,h,i 7.4 ± 0.46a,b,c,d,e,g,h,i 4.84 ± 0.41a,b,c,i 34.6 ± 2.30h 39.44 ± 1.90h
L. albus
Luxor 94.1 ± 0.66 4 ± 0.7 47.3 ± 2.3a,f,h 10.9 ± 0.7a,b,c,d,e,f 5.10 ± 0.59a,b,c,e 31.9 ± 0.48a 37.00 ± 0.12b
Rosetta 93.5 ± 0.41 3 ± 0.2 48.2 ± 3.9a,c,e,f 11.7 ± 0.05a,b,c,d,e,f 3.17 ± 0.13b,c,g,h,i 28.9 ± 0.64a,b,e,f 32.62 ± 0.78a,b,c,e,f
WK388 94.2 ± 0.05 4 ± 0.6 46.5 ± 0.95a,f 11.9 ± 0.2a,b,c,d,e,f 6.64 ± 0.39a,d,e 30 ± 1.60a,e 36.64 ± 1.21b

4
Vol:.(1234567890)
Scientific Reports | (2021) 11:21515 | https://doi.org/10.1038/s41598-021-00838-x
www.nature.com/scientificreports/
mPa-s (Mandelup). The trough, i.e. minimum, viscosity achieved at maximum temperature, fluctuated between 327.5 mPa-s (Rosetta) and 512 mPa-s (Barlock). Peak 2, the maximum increase in viscosity during the heating phase of RVA analysis, bottomed out 379.5 mPa-s (Jenabillup) and peaked at 1036 mPa-s (Luxor). Peak 3, the maximum rate of viscosity reduction, was observed at 426.03 mPa-s (Jurien) and 316.2 mPa-s (Jenabillup)21. WK388 took the shortest time to achieve the maximum viscosity (4.85 min) while Mandelup took the longest (9.92 min). In regard to the peak 2 time, no substantial variations were observed and values were between 11.54 (Jindalee) and 12.59 min (Mandelup). Both Jurien and Jenabillup took about 16 minutes to reach peak 3. Finally, the final viscosities of lupin cultivars were measured and the values ranged from 863 mPa-s for Jindalee to 1593 mPa-s for Luxor. Compared to starch rich grains such as wheat, rice and corn, lupin flours had substantially lower RVA viscosity levels that can be accounted for by the virtual absence of starch in lupin flours.
Textural properties. The textural properties of lupin cultivars were determined by a texture analyzer using the samples prepared for RVA and left overnight. Results are presented in Fig. 2. The parameters of textural prop-erties, i.e., hardness, work and peak force, varied significantly among the cultivars (see Supplementary Table S3 online). The variation in hardness was within an order of magnitude, being lowest for WK388 (26.71 g/mm) and highest for Rosetta (63.68 g/mm). The work required for penetration of gels formed varied over an order of magnitude with that of Barlock requiring the minimum amount of work (373.41 g.mm), while the Luxor gel required the maximum work for penetration (3269.63 g.mm). The peak force required during punching also varied within and order of magnitude, and was lowest for WK388 (220.12 g) and topped for Luxor (506.59 g).
Thermal properties. While analyzing the thermal properties of lupin cultivars using differential scanning calorimetry (DSC), the onset temperature of heat absorption (T0), the denaturation or peak temperature (Td), conclusion or end-set temperature (Te) and the transition heat or denaturation enthalpy (∆H) of raw flour were recorded and presented in Fig. 3 and Table 4 (thermograms of protein isolates can be found as Supplemen-tary Fig. S2 online)22. In the thermograms, two endothermic peaks were observed for the L. angustifolius cul-tivars, which indicated the two major globulins protein classes—the vicilins (β-conglutin) and the legumins (α-conglutin)8. Whereas for the L. albus cultivars, only a single peak corresponding to the β-conglutins was observed. Significant differences in the To, Td, Te, ∆H values of the β-conglutin peak were observed for all culti-vars. The lowest values of To, Td, Te are demonstrated by Gunyidi (79.61, 88.24 and 93.15 °C, respectively) with the highest being observed for both Jindalee and Mandelup (84.69, 90 and 95.05 °C, respectively). Gunyidi has the lowest denaturation enthalpy (0.92 J/g), with Rosetta having the highest (2.74 J/g). Endothermic peaks for α-conglutin were observed only for the 6 L. angustifolius cultivars with no substantial differences in the To, Td and Te values being found. However, significant variations in the denaturation enthalpy were detected, with the values ranging from 0.72 J/g (Barlock) to 2.12 J/g (Gunyidi). Peak integration ratios (Fig. 3c) of the 6 lupin cultivars were also calculated from which, variations in the quantity of α- and β- conglutins were determined.
Functional properties of lupin cultivars. Results for these data are given in Table 5. In evaluating the swelling power, Rosetta demonstrated the lowest swelling capacity (3.37 g/g) while Jurien the highest (4.01 g/g).
Table 3. Microelemental composition of different lupin cultivars. Data are means of three replicates with standard deviations (SD) and is expressed as mg/kg dry weight; n/d (not detected, below the detection level). Data within the same row with different superscripts are significantly different, pair-wise comparison by Post Hoc Tukey test (aP < 0.05 vs. Barlock; bP < 0.05 vs. Gunyidi; cP < 0.05 vs Jenabillup; dP < 0.05 vs. Jindalee; eP < 0.05 vs Jurien; fP < 0.05 vs. Mandelup; gP < 0.05 vs Luxor; hP < 0.05 vs Rosetta; iP < 0.05 vs WK388). 1Estimated Safe and Adequate Dietary intake (ESADI); 2 Reference daily Intake (RDI); 3 expressed as weight of vitamin B12; 4 provisional tolerable intakes (PTI) expressed as mg/kg body weight.
Species L. angustifolius L. albus RDI, ESADI & PTIElements Barlock Gunyidi Jenabillup Jindalee Jurien Mandelup Luxor Rosetta WK 388
Na 250 ± 19.80i 229.45 ± 28.99i 225.78 ± 13.70i 176.33 ± 13.71h,i 225.67 ± 14.12i 225.24 ± 22.92i 229.06 ± 15.78i 269.76 ± 46.37d,i 456.79 ± 11.74a,b,c,d,e,f,g,h,i 1100–33001
Mg 1307 ± 94.75c,e,g,h,i 1466 ± 17.17g,i 1577.74 ± 8.93a,f,i 1442.61 ± 1.53g,i 1495.38 ± 29.82a,i 1398.20 ± 30.76c,g,i 1647.81 ± 44.91a,b,d,f,i 1546.27 ± 46.00a,i 1896.92 ± 35.92a,b,c,d,e.f,g,h,i 300–3502
P 4012 ± 263.04d,h 4165 ± 67.78d,f,h 4292.49 ± 31.87d,g.h 3535.68 ± 16.57a,b,c,e,i 3999.82 ± 52.12d,h 3614.76 ± 67.06b,c,i 3862.53 ± 102.32c.h,i 3433.91 ± 76.99a,b,c,e,g,i 4327.81 ± 70.38d,f,g,h 8002
K 7610 ± 615.89c 8150.97 ± 16.68d 8697.90 ± 41.28a,d,f,h,i 7054.58 ± 44.28b,c 8047.46 ± 153.75 7482.97 ± 205.30c 8014.98 ± 224.21 7544.57 ± 281.86c 7210.67 ± 87.26c 1875–56251
Ca 590 ± 24.04c,d,e,f,g,h,i 616.99 ± 12.54c,d,e,f,g,h,i 863.24 ± 7.23a,b,d,e,f,g,h,i 716.62 ± 3.90a,b,c,g,h,i 692.26 ± 12.42a,b,c,g,h,i 750.21 ± 10.97a,b,c,g,h,i 1222.36 ± 27.50a,b,c,d,e,f,h,i 1446.48 ± 27.93a,b,c,d,e,f,g,i 1678.43 ± 25.08a,b,c,d,e,f,g,h,i 8002
Mn 22.7 ± 1.41g,h,i 25.26 ± 0.46g,h,i 21.64 ± 0.23g,h,i 25.34 ± 0.43g,h,i 27.15 ± 0.51g,h,i 27.31 ± 0.42g,h,i 1059.96 ± 4.34a,b,c,d,e,f,h,i 796.25 ± 21.58a,b,c,d,e,f,g,i 688.58 ± 9.19a,b,c,d,e,f,g,h 2.5–5.01
Fe 30.6 ± 2.40 27.77 ± 2.06 28.27 ± 2.08 26.62 ± 0.56 25.97 ± 0.65 31.27 ± 5.60 21.67 ± 1.22 22.13 ± 2.49 30.11 ± 0.45 10–182
Co n/d n/d n/d n/d n/d n/d n/d n/d n/d 0.0033
Cu 3.18 ± 0.28c 3.02 ± 0.11c 42.59 ± 0.46a,b,d,e,g,h,i 3.02 ± 0.04c 3.97 ± 0.90c 20.15 ± 23.38 5.35 ± 0.10c 5.40 ± 0.10c 5.87 ± 0.05c 2—31
Zn 28.05 ± 2.05g,i 28.26 ± 0.53g,i 29.25 ± 0.01e,i 27.41 ± 0.14g,i 25.03 ± 0.58c,g,h,i 26.32 ± 0.83g,i 31.76 ± 0.57a,b,d,e,f,i 28.65 ± 0.81e,i 41.97 ± 0.57a,b,c,d,e,f,g,h,i 152
Se n/d n/d n/d n/d n/d n/d n/d n/d n/d 0.05–0.21
Mo 1.07 ± 0.92g 0.57 ± 0.13g,h 1.10 ± 0.12g 0.88 ± 0.16g,h 0.23 ± 0.04g,h,i 0.62 ± 0.06g,h 3.20 ± 0.03a,b,c,d,e,f,i 2.22 ± 0.27b,d,e,f 1.71 ± 0.19e,g 0.15–0.51
Cd n/d n/d n/d n/d n/d n/d n/d n/d n/d 0.0014
Hg n/d n/d 0.01 ± 0.41 n/d n/d n/d n/d n/d n/d 0.00074
Pb n/d n/d n/d n/d n/d n/d n/d n/d n/d 0.0074
5
Vol.:(0123456789)
Scientific Reports | (2021) 11:21515 | https://doi.org/10.1038/s41598-021-00838-x
www.nature.com/scientificreports/
Gunyidi (4 g/g) had a swelling ability close to Jurien. Values for Barlock, Jenabillup, jindalee and Mandelup were comparable, ranging from 3.84 to 3.89 g/g. Both the water and oil absorption capacity was maximum in Jurien (4.4 and 2.23 mL/g, respectively). Mandelup had the least oil absorption capacity (1.7 mL/g) but its water absorp-tion capacity (4.2 mL/g) was comparable to that of Jurien. WK388 showed the least water absorption capacity (1.73 mL/g). Significant differences in the emulsifying capacity and emulsion stability were demonstrated by the lupin cultivars. The highest emulsifying capacity and emulsion stability was 25.94% (for Luxor) and 43.41% (for Mandelup), respectively. However, the least emulsifying capacity and emulsion stability was 19.36 and 20.76%, respectively (for Barlock). For the creaming stability of emulsions, significant variations were observed and the values fluctuated between 35.77% (Mandelup) and 43.53% (Jurien and Luxor). The foaming capacity and foam stability of lupin flours were also measured and the data exhibited significant differences with values ranging from 11.32 (Barlock) to 20.75% (Mandelup) and 5.66 (Barlock) to 13.84% (Mandelup), respectively.
DiscussionAfter dehulling the lupin cultivars, the colors of the seed flours were evaluated with a Minolta CT-310 Color-imeter. All flours demonstrated comparable lightness, presented by the L* values. Moreover, all 9 flours of lupin cultivars had a similar greenish-yellow color, confirmed by small negative a* values (ranging from − 2.31 to − 3.14) and large positive b* values (varying between 28.59 and 31.75). The color intensity or chroma, presented by closely related C* values, was also quite similar. For the hue angle (h°), values can vary from 0° (pure red) and 270° (pure blue) where, 90° is pure yellow and 180° is pure green. All the lupin flours had an h° around 180° which
0 300 600 900 1200 1500 18000
500
1000
1500
Time (second)
Visc
osity
(mPa
-s)
BarlockGunyidiJenabillupJindaleeJurienMandelup
a
0 300 600 900 1200 1500 18000
500
1000
1500
Time (second)
Visc
osity
(mPa
-s)
LuxorRosettaWK388
b
Figure 1. Pasting properties of different lupin cultivars’ flours, analyzed by RVA; where (a): RVA pattern of L. angustifolius cultivars and (b): RVA pattern of L. albus cultivars.

6
Vol:.(1234567890)
Scientific Reports | (2021) 11:21515 | https://doi.org/10.1038/s41598-021-00838-x
www.nature.com/scientificreports/
is also a representative of their greenish yellow color20,23. Hence, the greenish yellow color of all nine flours can be easily be equated. Effectively all cultivars had the same color profile. None really is distinguishable from the other.
Different studies have been conducted to compare the macronutrient composition of lupin with other plant protein sources. Amongst the different legumes, pulses, beans, peas or lentils, lupin has been reported with the highest amount of dietary fiber and protein2,13. Our studies are consistent with these reported findings. Lupin macronutrient composition also varies among species according to location and genotype and its protein content has been reported to be within the 30–50% range. Soluble and insoluble fiber content was between 30 to 40% and lipid content ranged from 5 to 15% of dry matter12,24. In our study, the lupin flours demonstrated substantial amounts of protein (all over 40%). The L. albus cultivars i.e., Luxor, Rosetta and WK388, possess higher protein contents than the six L. angustifolius cultivars. Plant proteins are often considered to be inferior to animal protein. However, the essential amino acids—histidine, leucine, lysine, isoleucine, threonine, tryptophan, valine—have been reported in both L. albus and L. angustifolius25. This certainly gives lie to the myth of plants being sources of low quality protein. Having such high protein contents, lupins can provide the essential amino acids in considerable abundance, with perhaps the L. albus species being the superior protein source. Although the fat content of lupin cultivars is between 4.6 and 11.9%, studies have reported the presence of the essential fatty acids for humans—linoleic (omega-6) and linolenic (omega-3) acids—which have substantial health benefits13. Turning into the details, L. albus is reported to be comprised of 13.5% saturated fats, 55.4% monounsaturated fats and 31.1% polyunsaturated fats. While for L. angustifolius, the saturated fats content is reported to be 15.1% and the unsaturated fats content is 84.9%. The main fatty acids of L. albus are palmitic, stearic, oleic, linoleic, linolenic, gadoleic and erucic acids while for L. angustifolius, the major fatty acids are linoleic, oleic, palmitic and linolenic acids15,16,26.
The total fiber content for each of the cultivars was over 35%. The dietary fiber that helps the natural func-tioning of colon, constitutes a significant portion of lupin cultivars’ flours. Instead of starch that increases blood glucose level, the major polysaccharide carbohydrates of lupin are hemicellulose, cellulose, pectin, with galactose and arabinose amongst other monosaccharides. This fiber helps to control the glucose level as well as lower blood cholesterol27. This makes lupins an attractive source of dietary fiber and therefore a plant food that is worth promoting as a healthy food. Thus we can be assured that the macronutrient compositional analysis of the Australian lupin cultivars clearly indicates their dietary and nutritional value.
0 1000 2000 3000 4000
Barlock
Gunyidi
Jenabillup
Jindalee
Jurien
Mandelup
Luxor
Rosetta
WK388
Hardness (g/mm) Work (g.mm) Peak Force (g)
g,hb,c,d,e,f,g,h,ib,c,d,e,g,h,i
h,ia,c,d,e,f,g,h,i
a,c,e,f,g,h,i
g,ha,b,d,e,f,g,h,i
a,b,e,f,g,h,i
g,ha,b,c,e,f,g,h,i
a,e,f,g,i
g,ia,b,c,d,f,g,h,i
a,b,c,d,f,g,h,i
g,ha,b,c,d,e,g,h,i
b,c,d,e,g,h,i
a,c,d,f,ia,b,c,d,e,f,h,i
a,b,c,d,e,f,h,i
a,b,c,d,e,f,ia,b,c,d,e,f,g,i
a,b,c,f,g,i
b,c,g,ha,b,c,d,e,f,g,h
a,b,c,d,e,f,g,h
Figure 2. Texture analysis parameters of lupin flours of different cultivars. Data are means of three replicates with standard deviations (SD). Pair-wise comparison by Post Hoc Tukey test, bars with alphabetic characters demonstrate significant differences (a P < 0.05 vs. Barlock; b P < 0.05 vs. Gunyidi; c P < 0.05 vs Jenabillup; d P < 0.05 vs. Jindalee; e P < 0.05 vs Jurien; f P < 0.05 vs. Mandelup; g P < 0.05 vs Luxor; h P < 0.05 vs Rosetta; i P < 0.05 vs WK388).

7
Vol.:(0123456789)
Scientific Reports | (2021) 11:21515 | https://doi.org/10.1038/s41598-021-00838-x
www.nature.com/scientificreports/
50 60 70 80 90 100 11010.0
10.2
10.4
10.6
10.8
11.0
11.2
Temperature (οC)
mW
Barlock Gunyidi JenabillupJindalee Jurien Mandelup
Pb
Pa
a
1-1.5 mW
50 60 70 80 90 100 11010
11
12
13
14
15
Temperature (οC)
mW
Luxor Rosetta WK388
Pb
Pb
Pb
b
1-2.2 mW
0 1 2 3 4
Barlock
Gunyidi
Jenabillup
Jindalee
Jurien
Mandelup
Peak integration ratio (Pa:Pb)
Pa Pb
α>>β
α<β
α<β
α>β
α>β
α<β
c
β-conglutin α-conglutin
d
Protein subunits of L. angustifolius
Figure 3. DSC analysis of lupin flours of different cultivars showing presence of β- and α-conglutin; where (a): shows the thermograms for the L. angustifolius cultivars, (b): shows the thermograms for the L. albus cultivars, (c): bar graph depicting the endothermic peak integration ratio (Pa:Pb), where Pa is the integration of α-conglutin and Pb is the integration of β -conglutin. Here, (d) is presenting the structures of β- and α-conglutin proteins obtained using the SWISS-MODEL. DSC analysis was carried out in triplicates.
Table 4. Thermal analysis of different lupin cultivars. Data are means of three replicates with standard deviations (SD); n/d (Not detected). Data within the same column with different superscripts are significantly different, pair-wise comparison by Post Hoc Tukey test (aP < 0.05 vs. Barlock; bP < 0.05 vs. Gunyidi; cP < 0.05 vs Jenabillup; dP < 0.05 vs. Jindalee; eP < 0.05 vs Jurien; fP < 0.05 vs. Mandelup; gP < 0.05 vs Luxor; hP < 0.05 vs Rosetta; iP < 0.05 vs WK388).
Species Cultivars
Peak-1 (β-Conglutin Endothermic Peak) Peak-2 (α-Conglutin Endothermic Peak)
∆H (J/g) T0 (°C ) Td (°C ) Te (°C ) ∆H (J/g) T0 (ºC) Td (°C) Te (°C)
L. angustifolius
Barlock 1.38 ± 0.09g,h,i 84.43 ± 0.22 b,c,g,h,i 89.59 ± 0.16h 93.99 ± 0.33h,i 0.72 ± 0.88b,c 97.79 ± 0.76 103.06 ± 0.08 107.53 ± 0.14
Gunyidi 0.92 ± 0.08d,e,f,g,h,i 79.61 ± 0.21a,c,d,e,f,g,h,i 88.86 ± 0.26d,f 93.15 ± 0.30d,f,g,h,i 2.12 ± 0.32a,c,d,e,f 97.84 ± 0.33 103.18 ± 0.27 108.01 ± 0.34
Jenabillup 1.26 ± 0.08g,h,i 83.26 ± 0.23a,b,d,e,f,g,i 89.20 ± 0.01 93.31 ± 0.03d,f,g,h,i 1.38 ± 0.01a,b 98.28 ± 0.30 103.33 ± 0.47 108.26 ± 0.36e
Jindalee 1.72 ± 0.11b,h,i 84.69 ± 0.07b,c,g,h,i 90.07 ± 0.01b,h 95.05 ± 0.15b,c 0.90 ± 0.04b 98.98 ± 0.0 103.21 ± 0.23 107.44 ± 0.13
Jurien 1.46 ± 0.07b,h,i 84.66 ± 0.40b,c,g,h,i 89.94 ± 0.18h 94.62 ± 0.74 0.84 ± 0.06b 98.76 ± 0.25 103.09 ± 0.06 107.32 ± 0.05c
Mandelup 1.72 ± 0.11b,h,i 84.69 ± 0.07b,c,g,h,i 90.01 ± 0.01b,h 95.05 ± 0.15b,c 1.51 ± 0.03b 98.98 ± 0.0 103.21 ± 0.23 107.43 ± 0.13
L. albus
Luxor 1.93 ± 0.02a,b,c,h 81.55 ± 0.07a,b,c,d,e,f 89.16 ± 0.14 95.48 ± 0.28b,c n/d
Rosetta 2.74 ± 0.06a,b,c,d,e,f,g 82.60 ± 0.42a,b,d,e,f,i 88.24 ± 0.34a,d,e,f,i 95.91 ± 0.42a,b,c n/d
WK388 2.32 ± 0.28a,b,c,d,e,f,g 81.34 ± 0.42a,b,c,d,e,f,h 89.77 ± 0.71h 96.11 ± 0.57a,b,c n/d
8
Vol:.(1234567890)
Scientific Reports | (2021) 11:21515 | https://doi.org/10.1038/s41598-021-00838-x
www.nature.com/scientificreports/
Lupin fulfills substantial proportion of dietary vitamin requirements for human with high contents of vitamin B and E. The thiamin, riboflavin and niacin in L. albus have already been reported and the values were 3.9, 2.3 and 39.1 mg/kg, respectively16. L. albus is also reported for its high tocopherol contents, specifically the γ-tocopherol (20.1 mg/100g) and its moderate content of vitamin C (6.48 mg/100g)28. L. angustifolius on the other hand, has been reported to have 7.12 g/kg of thiamin and 2.36 g/kg of rivoflavin. It also has high γ-tocopherol contents (10.30 g/kg) with substantial amount of α- and β- tocopherol. Vitamin C is reported to be absent here29.
Diets deficient in minerals have detrimental effects on human health, and common mineral deficiencies include iron, zinc, magnesium, iodine, calcium, potassium, and phosphorus, which is currently affecting about 3.7 billion people worldwide30. Typical diets may not fulfill mineral requirements; hence, fortifications with minerals are warranted. Based on the results of our study, the utilization of lupin to improve the nutritional value of foods can be a cost effective approach to fight the mineral deficiencies2. Our microelement evaluation of lupin cultivars demonstrated the presence of the essential major minerals including Mg, K, Ca, P, Na, Fe and Zn which is essential for blood pressure regulation as well as maintaining balance of acid-base and functionality of muscles31. The significant differences we observed in the microelement composition among the nine lupin cultivars is undoubtedly due to multiple factors like different environmental conditions, soil characteristics and fertilizer applications. Traces of Hg were found in the flour sample of only one cultivar, viz. Jenabillup, but the concentration was far below the safe margin. Heavy metal contamination can be due to urban development, fertilizer or pesticide application or milling32. A substantial difference in the Mn content between two lupin spe-cies was observed in our study where the values for L. angustifolius ranged from 21.64 to 27.31 mg/kg and for L. albus, between 688.58 and 1059.96 mg/kg. This may be attributed to plant genotype, Mn containing fertilization, soil condition and grain processing methods33.
After evaluating the nutritional properties of nine lupin cultivars, a comparative model can be obtained by in depth reviewing of the results. All the L. albus cultivars i.e., Luxor, Rosetta and WK388, are rich in both macronutrient (protein, fat, and fiber) and macronutrient (Mg, K, Ca, P, Na, Fe, Zn etc.) composition and among these, WK388 demonstrated the most significant nutritional potential with high level of Na, Mg, P, Ca, Zn, Fe, protein and fat content. The nutritional potential of six L. angustifolius cultivars is not lagged at any instances, but comparatively at a lower level.
In the SDS-PAGE analysis, major protein bands of the flours were detected within a range of 3.5 to150 kDa. Two major globulin components were observed, one having 10–12 subunits each within a range of 15–72 kDa and another having 4 subunits at 53, 60, 66, 70 kDa. The DSC analysis of lupin flours is consistent with the SDS-PAGE analysis in that it demonstrated the presence of two endothermic peaks for corresponding to major globulin proteins. Subunit predominance was judged on the basis of intensity and band width. These evaluations correspond to previous studies where major subunits of lupin seed proteins were identified within the range of 20 to 150 kDa34. Again, a minor globulin component with two polypeptide chains and one main subunit, viz. γ-conglutin, was also identified at 42–43 kDa. This protein is ascribed as possessing a hypoglycemic effect35. Finally, a clear disparity in the electrophoretic pattern of SDS-PAGE between the L. angustifolius and L. albus cultivars highlights the variations in their globulin component.
Pasting properties of starch rich flours depend on the viscosity or swelling potential of starch granules, which is affected by the molecular structure of amylose and amylopectin, their size and content of amylose leaching out into the solution during gelation36. In our evaluation using RVA (see Fig. 1), we observed significant differences for maximum viscosity (peak 1), time of maximum viscosity, minimum viscosity at maximum temperature (trough), maximum increase in viscosity (peak 2), the time of maximum increase in viscosity and maximum reduction rate of viscosity (peak 3). The RVA pattern for Jenabillup and Jurien was fairly comparable as both had three peaks. Peak 1 viscosity as well as the time to reach peak 1 was greater for the L. angustifolius cultivars compared to the L. albus cultivars. Pasting viscosity of three L. albus cultivars improved with temperature.
Table 5. Functional properties of different lupin cultivars. Data are means of three replicates with standard deviations (SD). Data within the same column with different superscripts are significantly different, pair-wise comparison by Post Hoc Tukey test (aP < 0.05 vs. Barlock; bP < 0.05 vs. Gunyidi; cP < 0.05 vs Jenabillup; dP < 0.05 vs. Jindalee; eP < 0.05 vs Jurien; fP < 0.05 vs. Mandelup; gP < 0.05 vs Luxor; hP < 0.05 vs Rosetta; iP < 0.05 vs WK388).
Species CultivarsSwelling power (g/g) ± SD
Water absorption capacity (mL/g) ± SD
Oil absorption capacity (mL/g) ± SE
Emulsifying capacity (%) ± SD
Emulsion stability (%) ± SD
Creaming stability of emulsion (%) ± SD
Foaming capacity (%) ± SD
Foam stability (%) ± SD
L. angustifolius
Barlock 3.89 ± 0.08g 4.33 ± 0.12b,c,d,g,h,i 1.8 ± 0.35c,d,e,h,i 19.36 ± 0.22f,g,i 20.76 ± 0.66b,c,d,e,f,g,h,i 40.28 ± 1.44b,c,d,e,f,g,h,i 11.32 ± 8.22c,d,e,f,g,h,i 5.66 ± 8.21c,d,e,f,g,h,i
Gunyidi 4.0 ± 0.13g,h 3.13 ± 0.42a,c,e,f,h,i 1.87 ± 0.12d,e 21.66 ± 0.23f,g 41.41 ± 1.23a,c,d,f,g 35.89 ± 7.64a,d,e,g,i 13.21 ± 3.27c,e,f,g,h,i 6.28 ± 2.88d,e,f,g,h,i
Jenabillup 3.87 ± 0.07 2.33 ± 0.42a,b,d,e,f,g,i 2.13 ± 0.12a,f 21.02 ± 0.97f,g 36.92 ± 3.15a,b,e,f,h,i 36.92 ± 3.15a,d,e,f,g,i 16.35 ± 1.09a,b,f 8.17 ± 2.88a,f,i
Jindalee 3.87 ± 0.24 2.89 ± 0.58a,c,e,f,g,h,i 2.2 ± 0.35a,b,f,g 21.28 ± 0.59f,g 37.46 ± 3.47a,b,e,f,h,i 43.53 ± 2.89a,b,c,f,h 15.08 ± 4.10a,e,f 9.43 ± 5.66a,b,f
Jurien 4.01 ± 0.11g,h 4.4 ± 0.72b,c,d,g,h,i 2.23 ± 0.31a,b,f,g 20.64 ± 0.59f,g 41.28 ± 1.97a,c,d,f,g 43.21 ± 0.59a,b,c,f,h 17.61 ± 4.09a,b,d,f 10.06 ± 1.09a,b,f
Mandelup 3.84 ± 0.23 4.2 ± 0.72b,c,d,g,h,i 1.7 ± 0.23c,d,e,h,i 24.61 ± 1.76a,b,c,d,e,h 43.41 ± 1.77a,b,c,d,e,g,h,i 35.77 ± 3.85a,c,d,e,g 20.75 ± 1.89a,b,c,d,e,g,h,i 13.84 ± 2.88a,b,c,d,e,g,h,i
L. albus
Luxor 3.35 ± 0.21a,b,e 3.33 ± 0.31a,c,d,e,f,h,i 1.87 ± 0.46d,e,f 25.94 ± 1.13a,b,c,d,e,h,i 37.46 ± 3.47a,b,e,f,h,i 43.53 ± 2.89a,b,c,f,h,i 16.46 ± 4.75a,b,f 8.84 ± 6.01a,b,f,i
Rosetta 3.37 ± 0.19b,e 2.2 ± 0.2a,b,d,e,f,g,i 2.13 ± 0.23a,f 21.29 ± 0.06f,g 41.41 ± 1.23a,c,d,f,g 35.89 ± 3.49a,d,e,g,i 16.40 ± 4.36a,b,f 10.06 ± 3.93a,b,f
WK388 3.55 ± 0.04 1.73 ± 0.23a,b,c,d,e,f,g,h 2.13 ± 0.12a 22.64 ± 1.43a,g 41.28 ± 1.97a,c,d,f,g 43.21 ± 0.59a,b,c,f,h 16.35 ± 2.89a,b,f 11.32 ± 1.89a,b,c,f,g

9
Vol.:(0123456789)
Scientific Reports | (2021) 11:21515 | https://doi.org/10.1038/s41598-021-00838-x
www.nature.com/scientificreports/
Final viscosities of the lupin flours increased gradually, indicating the development of pasting viscosities under experimental conditions. Lupin flours have low starch levels. RVA viscosity developments and changes of lupin flours are therefore, related to hydration behavior of lupin proteins and fiber (in particular soluble fiber) and interaction of these biopolymers with water molecules during heating and mixing in excess water. In our study, due to the low starch content, moderate final viscosities were observed for all the lupin flours, in comparison to RVA profiles of other starch rich flours37.
When the lupin flour pastes were assayed, significant variations were observed for the hardness, work and peak shearing force. Rosetta, which had the minimum peak viscosity, demonstrated maximum hardness. Gel hardness of Barlock, Jenabillup, Jindalee and Mandelup was comparable to this. Retrogradation of starch, content of protein, higher content of amylose and crystallization of amylopectin may govern the gel firmness. Presence of high molecular weight polysaccharides usually affects the water absorption or penetration properties of gels. Luxor, who showed maximum increase in viscosity and had fairly high fiber content, required maximum work to penetrate the gel. Water penetration property of Gunyidi, Jindalee, Jurin was almost similar. Finally, the shearing force, a characteristic of rheological property, rigidity, volume fraction and interaction of phases, varied significantly among the lupin flour gels36,38. In short, relatively moderate hardness, water penetration capability and peak force of lupin flour gels are attributed to their lower amylose and amylopectin content as well as weak gelling properties of its biopolymers i.e. protein and fiber.
In the analysis of thermal properties, lupin flour was assayed by DSC and flour protein was converted from the native to the denatured state by heating, which in turn, disrupted intramolecular bonding and unfolded protein aggregation22. In the present study, the onset temperature (T0), the denaturation temperature (Td), the end-set temperature (Te) and the denaturation enthalpy (∆H) was measured for two endothermic peaks representing two globulin proteins—β-conglutin and α-conglutin. Both endothermic peaks were present in the six L. angustifolius cultivars while the three L. albus ones demonstrated only β-conglutin endothermic peak. In considering the β-conglutin endothermic peak, less T0 and Td but higher ∆H was observed for L. albus cultivars compared to L. angustifolius ones. Significant differences among cultivars in the ∆H, T0, Td and Te was observed. However, for the α-conglutin endothermic peak, comparable T0 and Td with small variations in the ∆H and Te was detected. The differences in the T0, Td, Te and ∆H values for the different lupin cultivars may be attributed to their varying types of globulin content and heating temperature because the unfolding of protein is influenced by intermo-lecular contacts39. The values are representative of a combination of the endothermic and exothermic reactions like hydrogen bond disruption and break up of hydrophobic interactions, and so, the DSC curve is a ‘fingerprint’ of measured protein fractions40. In our assay, DSC analysis was conducted on raw flour sample in the presence of excess water, without isolating the proteins and when compared with the thermograms of isolated β- and α-conglutin, negligible disparity in peak intensity were observed (see Supplementary Fig. S2 online.). Moreover, the peak integration ratio of β- and α-conglutin endothermic peaks, denaturation temperature and denatura-tion enthalpy can be utilized for qualitative evaluations like identification of different cultivars, conformational changes of lupin proteins, protein stability assay with temperature in future41.
Significant differences among the tested functional properties of lupin flours have been detected. Swelling power of flour is a representative of amylose and amylopectin content where amylose acts as an inhibitor of swelling42. Moreover, the capacity of the flour to retain water after gelatinization through breakdown of exist-ing hydrogen bond between starch and generation of new bonds with water, also affects the swelling ability43. Hence, cultivars with greater swelling power namely, Barlock, Gunyidi, Jurien, Mandelup also had greater water absorption capacity. Oil absorption capacity depends on the lipophilic nature of lupin proteins where non-polar side chains of amino acids bind to the hydrophobic chains of fats34. Emulsifying capacity is directly affected by protein solubility, pH, protein concentration and lipophilicity44. The creaming behavior of emulsion, however, is dependent upon the viscosity and globule size45. Finally, the foaming properties are affected by the pH and protein concentration where foaming capacity and foam stability decrease at the isoelectric point and increase with protein concentration46. While comparing the functional properties of the cultivars, it can be concluded that, Mandelup exhibited the best foaming capacity as well as substantial swelling power, water absorption capacity, emulsifying capacity, emulsion stability and foam stability. Among the others, Luxor displayed highest foaming and emulsifying capacity as well as creaming stability of emulsion, Rosetta and WK388 displayed significant oil absorption capacity, foaming capacity, emulsion stability, foam stability and creaming stability of emulsion. Functional potential of Barlock, Gunyidi, Jenabillup, Jindalee and Jurien were moderate.
To sum up, the L. angustifolius and L. albus cultivars have a valuable macronutrient and microelement pro-file with substantial health advantages including improvement of satiety, stabilization of blood glucose level, enhancement of bowel function, reduction of blood cholesterol level and blood pressure. Moreover, their favora-ble phytochemical profiles, which include wide range of polyphenols (p-hydroxybenzoic acid, protocatechuic acid, gallic acid, coumaric acid, catechin and epicatechin etc.), flavonoids, isoflavones, tannins, saponins,, con-glutin proteins etc., also have been reported for anti-inflammatory, antioxidative, hypoglycemic, anticancer effects2,13. After comparing nine cultivars, nutritional, thermal, rheological and functional potential are found to be comparatively greater in L. albus. However, Mandelup, a L. angustifolius cultivar, demonstrated the most substantial functionality amongst all. The present study has undoubtedly proven lupin’s worth over other pulses and therefore, will be beneficial in potentiating lupin’s utilization as an alternative protein source to the growing global population. The thermal, rheological and functional properties also signify its utilization in fermented foods, in dairy products, and in nutritionally poor foods as plant-derived meat equivalents. Thus, increased lupin incorporation in our dietary food products can in turn, boost up the functionality and health benefits. However, the study would have benefitted from an analysis of the major vitamins present in the cultivars as well as an investigation of their lipid and carbohydrate compositions. Moreover, the underlying reasons for the difference between nutritional and functional properties among the cultivars have not been assessed properly. Although information on the vitamin contents, lipid compositions and the causes of variations between the two

10
Vol:.(1234567890)
Scientific Reports | (2021) 11:21515 | https://doi.org/10.1038/s41598-021-00838-x
www.nature.com/scientificreports/
lupin species have been provided from existing literatures, further works on this are recommended. In addition, due to some technical difficulties, for instance absence of Cr standards, we failed to carry out some tests. These assessments in future will make the work absolute and will stimulate the utilization of lupin as plant oriented protein source in human diet.
MethodsStandards, chemicals, reagents and methods. Standards and general laboratory reagents were pur-chased from Sigma-Aldrich (Gillingham, England) and Fisher Scientific UK Ltd. (Loughborough, England). Chemicals used for Inductively Coupled Plasma Optical Emission Spectrometry (ICP-OES) analysis were nitric acid (TraceSelect Ultra) from Fluka (Gillingham, England), hydrochloric acid (30%, Ultrapure) from Merck (Darmstadt, Germany), and deionized water from Millipore (Bedford, USA). All single element standards for ICP-OES were purchased from Inorganic Ventures (Christiansburg, USA). All experiments included in this manuscript were complied with local and national regulations/guidelines and approved by the appropriate authority of the Charles Sturt University.
Collection and dehulling of lupin cultivars. Nine lupin cultivars’ seeds, six L. angustifolius i.e., Barlock, Gunyadi, Jenabillup, Jindalee, Jurien, Mandelup and three L. albus cultivars i.e., Luxor, Rosetta, WK388, were collected from New South Wales Department of Primary Industries (NSW DPI), Wagga Wagga Agricultural Institute, Australia. The seeds were mechanically dehulled with a dehulling machine available at DPI Research Center. After dehulling, the seed coats were separated from kernels by sieving. The kernels were then finely ground to pass through a 300 μm sieve using milling machine available at the Wine Research Center of Charles Sturt University, NSW, Australia. Initial weight, kernel weight, weight of seed coat and weight of the intermediate materials were separately measured. Later, the kernel flours were stored in cold room.
Color evaluation. Colors of the lupin cultivars were represented in terms of chroma or color intensity [C* = (a*2+b*2)1/2] and hue angle [h°= 180 + tan−1 (b*/a*)] using a Minolta CT-310 Colorimeter, with illuminant D65 and 10° observer angle47. In the CIELab color model, a* represents the red (+) to green (−) axis, b* the yellow (+) to blue (−) axis and L* represents lightness. These parameters were measured against a white background with the flour samples fitted in a container (height: 2 mm; diameter: 20 mm), the determinants were carried out in triplicates48,49.
Macronutrient composition. The macronutrient composition i.e., dry matter, ash, protein, fat and soluble or insoluble fiber content of the lupin flours were determined by employing routine proximate analytical pro-cedures by using the following methods: dry and grind in dry matter (Reuter & Robinson 2.E.3; 2.E.4 Method ID: LMOP 2-1100), dry matter digestibility (Wet chemistry; AFIA Method 1.7R Method ID: LMOP 2-1128 2), crude protein (DUMAS Combustion Method; AOAC 990.03, Method ID: LMOP 2-1112), crude fat by hexane soxhlet extract (Wet chemistry—CSL, Method ID: LMOP 2-1122), acid detergent fiber (CSL, Method ID: LMOP 2-1108), neutral detergent fiber (Wet chemistry; CSL, Method ID: LMOP 2-1107), calculation of metabolisable energy (AFIA Method 2.2R; Based on PC DOMD Method ID: LMOP 2-1124). All the experiments were con-ducted in triplicates at DPI, Wagga Wagga Agricultural Institute50.
Microelemental composition. Analysis of the microelemental composition of lupin samples was done according to the method described by Multari et al. with minor modifications2. Samples of different lupin flours (0.5 g) were transferred to a 250 mL tall form beaker. Nitric acid (65% v/v, 10 mL) solution was added, the beaker was covered with a watch glass and the samples were heated to ‘reflux’ on low heat for 3–4 h on a hotplate. To avoid drying out, more nitric acid was added to the sample if the volume was too low. When all brown fumes were dissipated and a light colored clear solution remained, sample digestion was considered to be complete. The samples were removed from the hotplate and allowed to cool. The watch glass was washed with deionized water and samples were diluted to 50 mL. A portion was filtered for analysis by inductively coupled plasma—optical emission spectroscopy (ICP-OES). Measured isotopes investigated were: 23Na, 24Mg, 31P, 39K, 44Ca, 55Mn, 56Fe, 59Co, 63Cu, 66Zn, 78Se, 95Mo, 111Cd, 202Hg, 208Pb. Stock solutions (1000 mg/L) of the element standards were used for preparing calibration curves and as internal standard2. The ICP-OES analysis was performed using an Agi-lent 7700X spectrometer (Agilent Technologies) equipped with nickel sampler cone and a MicroMist nebulizer with a reference to APHA 3120B methodologies51. ICP-OES analysis duration was 3.0 min, one point data was obtained with three replicates and 100 sweeps per replicate.
SDS-PAGE profiling of protein isolate. For SDS-PAGE analysis, protein isolates were prepared by micellisation. Here, lupin flours were extracted twice by adding 0.2% NaOH (at 1:5 ratio of flour to NaOH) for 14h with occasional shaking and then centrifuged at 3000 × g for 30 min. The combined supernatants were then diluted with distilled water (10 fold) and left to stand for 18 h at 4 °C. The precipitated protein isolates were sepa-rated by centrifugation (as above), freeze dried and collected34,52. The SDS-PAGE analysis of the protein isolates were done by standard procedure using the Laemmli buffer system. For protein samples, a final concentration of 2 mg/mL was obtained with 10% glycerol (v/v), 1% SDS (w/v), 1 mM EDTA, 10 mM Tris-Cl pH 6.8 and dithi-othreitol (DTT, 0.5% w/v) as the reducing agent. 2 × concentrate of sample buffer was prepared, denaturation was done by heating at 95 °C for 5 minutes and the insoluble materials were removed by centrifugation at 3000 × g for 30 min. The electrophoresis was carried out in a 13% gel of polyacrylamide (w/v). Molecular weight marker from Bio-Rad was used and the protein bands were stained with Coomassie Brilliant Blue R-25053,54.
11
Vol.:(0123456789)
Scientific Reports | (2021) 11:21515 | https://doi.org/10.1038/s41598-021-00838-x
www.nature.com/scientificreports/
Pasting properties. Pasting properties of the lupin flour samples were determined using a Rapid Visco Analyzer (RVA-S4, Newport Scientific, Narrabeen, Australia) using the standard method of the instrument. Flour sample (3.5 g, weight was adjusted on the basis of 14% moisture content) was added to an RVA aluminium canister containing 25 mL distilled water and blended well by its paddle at room temperature. It was then heated at 50 °C for 1 min. Finally, the slurry was heated from 50 to 95 °C at a rate of 12°C/min and held at 95 °C for 2.5 min. It was then cooled from 95 to 50 °C at a rate of 12 °C/min and held at 50 °C for 2 min. The mixing paddle speed was maintained at 160 rpm. Parameters including peak viscosity, trough, peak time and final viscosity were recorded36,55.
Textural properties. The flour pastes obtained after heating and cooking in the RVA canister (from the RVA test) were sealed with parafilm, and kept at 4°C for 24h to form a gel, which was then evaluated for gel tex-tural properties using a TA.XT Plus Texture Analyzer (Stable Micro Systems, Surrey, UK). A penetration test was performed with at a pretest speed of 2 mm/s, test speed of 3 mm/s and a post-test speed of 10 mm/s to a distance of 10 mm with a cylindrical stainless steel probe (50 mm diameter). The slope of the force versus distance curve was used as hardness (g/mm), surface area of force versus distance was taken as work required to penetrate the gel (g.mm) and maximum force was taken as peak force (g). Measurements were made in triplicates36,56.
Thermal properties. Thermal properties were assessed using a Perkin Elmer DSC-7 Differential Scanning Calorimeter. The analysis was carried out at temperatures between 30 and 120 °C, at a rate of 10 °C/min, on a 1:3 (w/w) lupin flour-water mixture sample. Before heating in the DSC, samples were hermetically sealed and allowed to stand at room temperature for 1 hour. Two protein denaturation peaks were observed and analyzed using the software supplied by the manufacturer and onset (To), peak (Tp), and conclusion (Tc) temperatures were determined. The enthalpy of protein denaturation (ΔH) was calculated and expressed as J/g of dry lupin flour8,36.
Functional properties of lupin cultivars. The following functional properties of lupin cultivars’ flours were assayed in the present work.
Swelling power. Swelling power of lupin flour samples were determined by the method described by Yu et al. with minor modifications57. Lupin flour (1 g) was mixed with 10 mL distilled water in a centrifuge tube (15 mL) and heated at 80 °C for 30 min with occasional shaking in a water bath. The mixture was centrifuged at 112 × g for 15 min and the supernatant layer was decanted. The paste (swelled flour) was then weighed.
Water and oil absorption capacity. Water and oil absorption capacities were determined by the method described by Rodriguez-Ambriz et al. with minor modifications58. Lupin flour (0.5 g) was taken in a 15 mL cen-trifuge tube and either 5 mL of distilled water or canola oil was added to it. The test tube was agitated for 2 min with a vortex shaker for complete dissolution. The test tube was then immerged in a water bath at a temperature of 28 °C for 30 min. Centrifugation for 20 min at 72 × g enabled the separation of the supernatant layer, which was decanted and the volume of water or free oil (supernatant) measured.
Emulsifying capacity and stability. Emulsifying capacity and emulsion stability was measured by the method of Cano-Medina et al. with minor modifications46. Lupin flour (1 g) and 12.5 mL of distilled water was blended for 2 min in order to form a homogenous mixture using a Microtron laboratory mixer. Canola oil (7 mL) was added to the mixture and blended further for 1 min. The prepared emulsion was centrifuged at 1600 × g for 10 min. For measuring emulsion stability, the prepared emulsion was heated in a water bath at 85 °C for 30 min. It was then cooled to room temperature. After that it was centrifuged at 1600 × g for 10 min. The emulsify-ing capacity and emulsion stability of the lupin cultivars were calculated by using the following formula.
Creaming stability of the emulsion. Creaming stability of the emulsion was determined by the method described by Tornberg with modifications45. After homogenization, 10 mL of the emulsion was transferred into a 15 mL centrifuge tube, which was tightly sealed and kept at ambient temperature. It was periodically checked for the separation of emulsion. After 12 h it was observed that the emulsion had separated into an opaque layer at the top and a turbid layer at bottom. Creaming stability of the emulsion was calculated using the following formula.
Swelling power(g/g) =Weight of swelled flour
Weight of dry flour
Water/oil absorption capacity(mL/g) =Volume of water/oil added − Volume of free water/oil
Weight of sample taken
Emulsion capacity/stability(%) =Height of emulsified layer
Height of total contents of tube× 100

12
Vol:.(1234567890)
Scientific Reports | (2021) 11:21515 | https://doi.org/10.1038/s41598-021-00838-x
www.nature.com/scientificreports/
Foaming capacity and stability. Foaming capacity and foam stability was measured by the method of Cano-Medina et al. with minor modifications46. Firstly, 1 g flour and 50 mL 0.01 M Na2HPO4-NaH2PO4 buffer (pH 7) were placed in a beaker. The mixture was hydrated for about 15 min and then blended for around 2 min with the Microtron laboratory mixer. The total volume was recorded. Foam capacity was expressed as foam expansion at 0 min and foam stability was expressed as foam expansion after 60 min. Foam capacity was calculated from the following equation.
Statistical analysis. Statistical evaluations of test results were done by one-way ANOVA (p < 0.05). Pair-wise comparison of mean values were performed using a Post-Hoc Tukey test. SPSS statistical analysis software of IBM Corporation, New York, USA (version 16.0) was used for analyzing the data and assessing the results59.
Data availabilityAll data generated during this study are included within our manuscript and in the supplementary materials’ file. The original (raw)/processed data necessary for the reproduction of these findings are available upon request from the corresponding authors.
Received: 24 February 2021; Accepted: 18 October 2021
References 1. Henchion, M., Hayes, M., Mullen, A. M., Fenelon, M. & Tiwari, B. Future protein supply and demand: strategies and factors
influencing a sustainable equilibrium. Foods 6, 53. 10.3390/foods6070053 (2017). 2. Multari, S. et al. Nutritional and phytochemical content of high-protein crops. J. Agric. Food Chem. 64, 7800–7811 (2016). 3. Machovina, B., Feeley, K. J. & Ripple, W. J. Biodiversity conservation: The key is reducing meat consumption. Sci. Total Environ.
536, 419–431 (2015). 4. Clonan, A., Wilson, P., Swift, J. A., Leibovici, D. G. & Holdsworth, M. Red and processed meat consumption and purchasing
behaviours and attitudes: Impacts for human health, animal welfare and environmental sustainability. Public Health Nutr. 18, 2446–2456 (2015).
5. Chan, D. S. et al. Red and processed meat and colorectal cancer incidence: Meta-analysis of prospective studies. PLoS ONE 6, e20456; https:// doi. org/ 10. 1371/ journ al. pone. 00204 56 (2011).
6. Huang, W., Han, Y., Xu, J., Zhu, W. & Li, Z. Red and processed meat intake and risk of esophageal adenocarcinoma: A meta-analysis of observational studies. Cancer Causes Control 24, 193–201 (2013).
7. Sirtori, C. R., Eberini, I. & Arnoldi, A. Hypocholesterolaemic effects of soya proteins: Results of recent studies are predictable from the Anderson meta-analysis data. Br. J Nutr. 97, 816–822 (2007).
8. Sirtori, E., Resta, D., Brambilla, F., Zacherl, C. & Arnoldi, A. The effects of various processing conditions on a protein isolate from Lupinus angustifolius. Food Chem. 120, 496–504 (2010).
9. Kurlovich, B. S. The review of genus Lupins L. In Lupins: Geography, Classification, Genetic Resources and Breeding (ed. Kurlovich, B. S.) 11–38 (Intan, St. Petersburg, 2002).
10. Gresta, F. et al. Lupins in European cropping systems in Legumes in Cropping Systems (ed. Murphy-Bokern, D., Stoddard, F. L. & Watson, C. A.) 88–108 (CAB International, 2017).
11. Wäsche, A., Müller, K. & Knauf, U. New processing of lupin protein isolates and functional properties. Mol. Nutr. Food Res. 45, 393–395 (2001).
12. Martínez-Villaluenga, C., Frías, J. & Vidal-Valverde, C. Functional lupin seeds (Lupinus albus L. and Lupinus luteus L.) after extrac-tion of α-galactosides. Food Chem. 98, 291–299 (2006).
13. Van de Noort, M. Lupin: an important protein and nutrient source in Sustainable Protein Sources (ed. Nadathur, S.R., Wanasundara, J. P. D. & Scanlin, L.) 165–183 (Elsevier, 2017).
14. Sirtori, C. R. et al. Proteins of white lupin seed, a naturally isoflavone-poor legume, reduce cholesterolemia in rats and increase LDL receptor activity in HepG2 cells. J. Nutr. 134, 18–23 (2004).
15. Janusz, P. White lupin (Lupinus albus L.)—Nutritional and health values in human nutrition—A review. Czech J. Food Sci. 35, 95–105 (2017).
16. Erbaş, M., Certel, M. & Uslu, M. Some chemical properties of white lupin seeds (Lupinus albus L.). Food Chem. 89, 341–345 (2005). 17. Porres, J. M., Aranda, P., López-Jurado, M. & Urbano, G. Nutritional potential of raw and free α-galactosides lupin (Lupinus albus
var. multolupa) seed flours. Effect of phytase treatment on nitrogen and mineral dialyzability. J. Agric. Food Chem. 53, 3088–3094 (2005).
18. Carbonaro, M., Grant, G. & Cappelloni, M. Heat-induced denaturation impairs digestibility of legume (Phaseolus vulgaris L and Vicia faba L) 7S and 11S globulins in the small intestine of rat. J. Sci. Food Agric. 85, 65–72 (2005).
19. Hancock, J., Peo, E. Jr., Lewis, A. & Crenshaw, J. Effects of ethanol extraction and duration of heat treatment of soybean flakes on the utilization of soybean protein by growing rats and pigs. J. Anim. Sci. 68, 3233–3243 (1990).
20. Mohd Nawi, N., Muhamad, I. I. & Mohd Marsin, A. The physicochemical properties of microwave‐assisted encapsulated antho-cyanins from Ipomoea batatas as affected by different wall materials. Food Sci. Nutr. 3, 91–99 (2015).
21. Juhász, R. & Salgó, A. Pasting behavior of amylose, amylopectin and their mixtures as determined by RVA curves and first deriva-tives. Starch-Starke 60, 70–78 (2008).
22. Kitabatake, N., Tahara, M. & Doi, E. Thermal denaturation of soybean protein at low water contents. Agric. Biol. Chem. 54, 2205–2212 (1990).
23. Wasson, D., Reppond, K. & Kandianis, T. Antioxidants to preserve rockfish color. J. Food Sci. 56, 1564–1566 (1991). 24. Lopez-Bellido, L. & Fuente, M. Lupin crop as an alternative source of protein. In Advances in Agronomy (ed. Brady, N. C.) 239–295
(Elsevier, 1986).
Creaming stability(%) =Height of serum layer
Height of the turbid layer× 100
Foam capacity(%) =Final volume− Initial volume
Initial volume× 100

13
Vol.:(0123456789)
Scientific Reports | (2021) 11:21515 | https://doi.org/10.1038/s41598-021-00838-x
www.nature.com/scientificreports/
25. Sujak, A., Kotlarz, A. & Strobel, W. Compositional and nutritional evaluation of several lupin seeds. Food Chem. 98, 711–719 (2006).
26. Hansen, R. P. & Czochanska, Z. Composition of the lipids of lupin seed (Lupinus angustifolius L. var.“uniwhite”). J. Sci. Food Agric. 25, 409–415 (1974).
27. Viveros, A., Centeno, C., Arija, I. & Brenes, A. Cholesterol-lowering effects of dietary lupin (Lupinus albus var multolupa) in chicken diets. Poul. Sci. 86, 2631–2638 (2007).
28. Frias, J., Miranda, M. L., Doblado, R. & Vidal-Valverde, C. Effect of germination and fermentation on the antioxidant vitamin content and antioxidant capacity of Lupinus albus L. var. Multolupa. Food Chem. 92, 211–220 (2005).
29. Torres, A., Frias, J. & Vidal-Valverde, C. Changes in chemical composition of lupin seeds (Lupinus angustifolius) after selective α-galactoside extraction. J. Sci. Food Agric. 85, 2468–2474 (2005).
30. Karaköy, T. et al. Diversity of macro-and micronutrients in the seeds of lentil landraces. Sci. World J. 2012, 710412. https:// doi. org/ 10. 1100/ 2012/ 710412 (2012).
31. Biswas, B., Golder, M., Abid, M. A., Mazumder, K. & Sadhu, S. K. Terpenoids enriched ethanol extracts of aerial roots of Ceriops decandra (Griff.) and Ceriops tagal (Perr.) promote diuresis in mice. Heliyon 7, e07580. https:// doi. org/ 10. 1016/j. heliy on. 2021. e07580 (2021).
32. Zhang, G., Pan, Z., Hou, X., Wang, X. & Li, X. Distribution and bioaccumulation of heavy metals in food web of Nansi Lake, China. Environ. Earth Sci. 73, 2429–2439 (2015).
33. Anglani, C. Wheat minerals—A review. Plant Foods Hum. Nutr. 52, 177–186 (1998). 34. Sathe, S., Deshpande, S. & Salunkhe, D. Functional properties of lupin seed (Lupinus mutabilis) proteins and protein concentrates.
J. Food Sci. 47, 491–497 (1982). 35. Magni, C. et al. Conglutin γ, a lupin seed protein, binds insulin in vitro and reduces plasma glucose levels of hyperglycemic rats.
J. Nutr. Biochem. 15, 646–650 (2004). 36. Sandhu, K. S. & Singh, N. Some properties of corn starches II: Physicochemical, gelatinization, retrogradation, pasting and gel
textural properties. Food Chem. 101, 1499–1507 (2007). 37. Lei, F., Tian, J.-C., Sun, C.-L. & Chun, L. RVA and farinograph properties study on blends of resistant starch and wheat flour. Agric.
Sci. China 7, 812–822 (2008). 38. Jayasena, V. & Nasar-Abbas, S. M. Effect of lupin flour incorporation on the physical characteristics of dough and biscuits. Qual.
Assur. Saf. Crop. Foods 3, 140–147 (2011). 39. León, A., Rosell, C. M. & De Barber, C. B. A differential scanning calorimetry study of wheat proteins. Eur. Food Res. Technol. 217,
13–16 (2003). 40. Bettzieche, A. et al. Lupin protein influences the expression of hepatic genes involved in fatty acid synthesis and triacylglycerol
hydrolysis of adult rats. Br. J. Nutr. 99, 952–962 (2008). 41. Chen, T. & Oakley, D. Thermal analysis of proteins of pharmaceutical interest. Thermochim. Acta 248, 229–244 (1995). 42. Singh, N., Kaur, L., Sodhi, N. S. & Sekhon, K. S. Physicochemical, cooking and textural properties of milled rice from different
Indian rice cultivars. Food Chem. 89, 253–259 (2005). 43. Tang, H., Mitsunaga, T. & Kawamura, Y. Functionality of starch granules in milling fractions of normal wheat grain. Carbohydr.
Polym. 59, 11–17 (2005). 44. Paredes-López, O., Guzman-Maldonado, H. & Ordorica-Falomir, C. Food proteins from emerging seed sources. In New and
Developing Sources of Food Proteins (ed. Hudson, B.J.F.) 241–279 (Springer, 1994). 45. Tornberg, E. Functional characterization of protein stabilized emulsions: creaming stability. J. Food Sci. 43, 1559–1562 (1978). 46. Cano-Medina, A. et al. Emulsifying and foaming capacity and emulsion and foam stability of sesame protein concentrates. Food
Res. Int. 44, 684–692 (2011). 47. McLellan, M., Lind, L. & Kime, R. Hue angle determinations and statistical analysis for multiquadrant Hunter L, a, b data. J. Food
Qual. 18, 235–240 (1995). 48. Stintzing, F. C., Schieber, A. & Carle, R. Evaluation of colour properties and chemical quality parameters of cactus juices. Eur. Food
Res. Technol. 216, 303–311 (2003). 49. Duangmal, K., Saicheua, B. & Sueeprasan, S. Colour evaluation of freeze-dried roselle extract as a natural food colorant in a model
system of a drink. LWT-Food Sci. Technol. 41, 1437–1445 (2008). 50. AFIA (Australian Fodder Industry Association Limited). Laboratory Methods Manual (7th ed.) https:// www. afia. org. au/ index. php/
17- quali ty/ 189- afia- labor atory- metho ds- manual (2011). 51. Woo, N. C. & Choi, M. Arsenic and metal contamination of water resources from mining wastes in Korea. Environ. Geol. 40,
305–311 (2001). 52. El-Adawy, T., Rahma, E., El-Bedawey, A. & Gafar, A. Nutritional potential and functional properties of sweet and bitter lupin seed
protein isolates. Food Chem. 74, 455–462 (2001). 53. Kopáček, P., Hall, M. & Söderhäll, K. Characterization of a clotting protein, isolated from plasma of the freshwater crayfish Paci-
fastacus leniusculus. Eur. J. Biochem. 213, 591–597 (1993). 54. Laemmli, U. K. Cleavage of structural proteins during the assembly of the head of bacteriophage T4. Nature 227, 680–685 (1970). 55. Fan, X. et al. Comparison of pasting properties measured from the whole grain flour and extracted starch in barley (Hordeum
vulgare L.). PLoS ONE 14, e0216978. https:// doi. org/ 10. 1371/ journ al. pone. 02169 78 (2019). 56. Agrahar-Murugkar, D., Gulati, P., Kotwaliwale, N. & Gupta, C. Evaluation of nutritional, textural and particle size characteristics
of dough and biscuits made from composite flours containing sprouted and malted ingredients. J. Food Sci. Technol. 52, 5129–5137 (2015).
57. Yu, S., Ma, Y., Menager, L. & Sun, D.-W. Physicochemical properties of starch and flour from different rice cultivars. Food Bioprocess Technol. 5, 626–637 (2012).
58. Rodríguez-Ambriz, S., Martínez-Ayala, A., Millán, F. & Davila-Ortiz, G. Composition and functional properties of Lupinus campestris protein isolates. Plant Foods Hum. Nutr. 60, 99–107 (2005).
59. Sarkar, K. K. et al. Comparative neuropharmacological and cytotoxic profiles of Alstonia scholaris (L.) and Mimusops elengi (L.) leaves. Adv. Tradit. Med. https:// doi. org/ 10. 1007/ s13596- 020- 00463-5 (2020).
AcknowledgementsThe authors would like to acknowledge the help of Wine Research Center and School of Biomedical Sciences, Charles Sturt University and Department of Primary Industries, Wagga Wagga Agricultural Institute, New South Wales, Australia for providing the laboratory facilities and different reagents to carry out the research. The authors also acknowledge the NSW DPI (Wagga Wagga, NSW, Australia) for providing lupin seeds for all experiments as gift.
Author contributionsK.M. initiated the research work. K.M. and A.N. conceived the experiments and conducted the studies. K.M., B.B., P.G.K, A.F. and M.G. drafted, interpreted, analyzed the data and prepared the manuscript. P.G.K., C.B.,

14
Vol:.(1234567890)
Scientific Reports | (2021) 11:21515 | https://doi.org/10.1038/s41598-021-00838-x
www.nature.com/scientificreports/
A.F. and M.G.A. edited and provided necessary suggestions to prepare the manuscript. All authors reviewed and approved the manuscript.
Competing interests The authors declare no competing interests.
Additional informationSupplementary Information The online version contains supplementary material available at https:// doi. org/ 10. 1038/ s41598- 021- 00838-x.
Correspondence and requests for materials should be addressed to K.M. or P.G.K.
Reprints and permissions information is available at www.nature.com/reprints.
Publisher’s note Springer Nature remains neutral with regard to jurisdictional claims in published maps and institutional affiliations.
Open Access This article is licensed under a Creative Commons Attribution 4.0 International License, which permits use, sharing, adaptation, distribution and reproduction in any medium or
format, as long as you give appropriate credit to the original author(s) and the source, provide a link to the Creative Commons licence, and indicate if changes were made. The images or other third party material in this article are included in the article’s Creative Commons licence, unless indicated otherwise in a credit line to the material. If material is not included in the article’s Creative Commons licence and your intended use is not permitted by statutory regulation or exceeds the permitted use, you will need to obtain permission directly from the copyright holder. To view a copy of this licence, visit http:// creat iveco mmons. org/ licen ses/ by/4. 0/.
© The Author(s) 2021


