Embed Size (px)
Citation preview
Retirement Board Agenda May 19, 2022
Click Link to Join Zoom Meeting: https://ohsers.zoom.us/j/95732849661?pwd=ak4vajFNcTZVREJxNE4zcFgycGNPQT09
Meeting ID: 957 3284 9661 Password: 820334 To join by phone, dial: (301) 715-8592 and enter the meeting ID: 957 3284 9661 and password: 820334
PLEDGE OF ALLEGIANCE
1. Roll Call
CONSENT AGENDA (R) 2. Minutes of the April 21, 2022, Retirement Board meeting3. Summary of Investment Transactions – March 1, 2022 through March 31, 20224. Retirement Report
i. Superannuation andSurvivor Benefits
ii. Special Cases
5. Disability Reporti. Approval of Disability
Benefitsii. Disapproval of Disability
Benefitsiii. Disapproval of Appeal for
Disability Benefits
iv. Termination of Disability Benefits – AnyOccupation
v. Approval of Appeal of Termination – AnyOccupation
vi. Approval of Appeal of Termination onPersonal Appearance – Any Occupation
INVESTMENT REPORT 6. Annual Overlay Program Review7. Quarterly Performance Report - Wilshire Associates8. Quarterly Investment Report9. Annual Investment Plan – FY23 Draft - Discussion10. Investment Department Incentive Program (R)
EXECUTIVE DIRECTOR’S REPORT 11. Executive session pursuant to R.C. 121.22 (G)(5) to discuss a matter required to be kept confidential
by law (R)a. Personal Appearance 10:15 a.m.
HEALTH CARE REPORT 12. Presentation of 2023 Self-Insured Rates – Cavanaugh Macdonald13. 2023 Health Care Review and Benefit Considerations
EXECUTIVE DIRECTOR’S REPORT (cont.) 14. Executive Director’s Update15. SERS FY2023 Administrative Budget Review16. Final Filing of Proposed Amended Administrative Rule (R)
RETIREMENT REPORT 17. Executive Session pursuant to R.C. 121.22 (G)(5) to review applications for Disability Retirement
Benefits (if needed) (R)
BOARD COMMUNICATION AND POLICY ISSUES 18. Calendar Dates for Future Board Meetings19. Continued or New Business
Board Information Requests and Follow-up Items
ADJOURNMENT (R)
FY2022 SERS Board Roll Call
Roll Call:
Barbra Phillips
Hugh Garside
James Haller
Matthew King
Catherine Moss
James Rossler
Frank Weglarz
Daniel Wilson
Jeffrey DeLeone
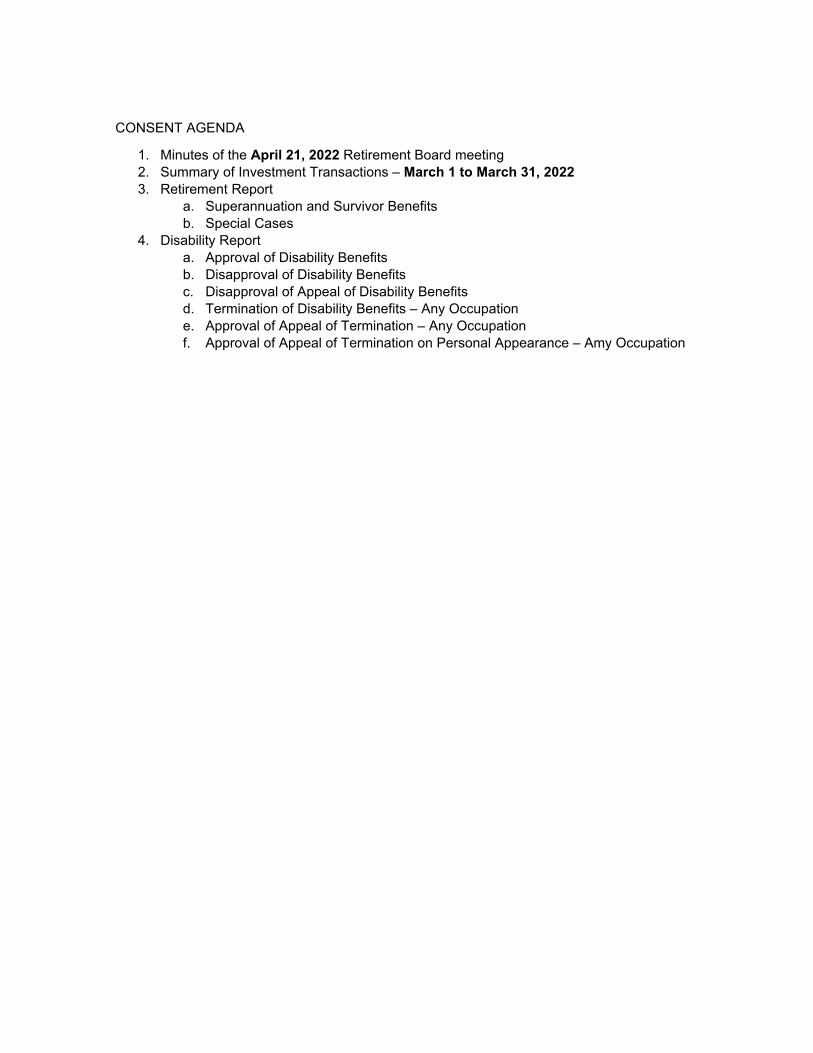
CONSENT AGENDA
1. Minutes of the April 21, 2022 Retirement Board meeting 2. Summary of Investment Transactions – March 1 to March 31, 2022 3. Retirement Report
a. Superannuation and Survivor Benefits b. Special Cases
4. Disability Report a. Approval of Disability Benefits b. Disapproval of Disability Benefits c. Disapproval of Appeal of Disability Benefits d. Termination of Disability Benefits – Any Occupation e. Approval of Appeal of Termination – Any Occupation f. Approval of Appeal of Termination on Personal Appearance – Amy Occupation
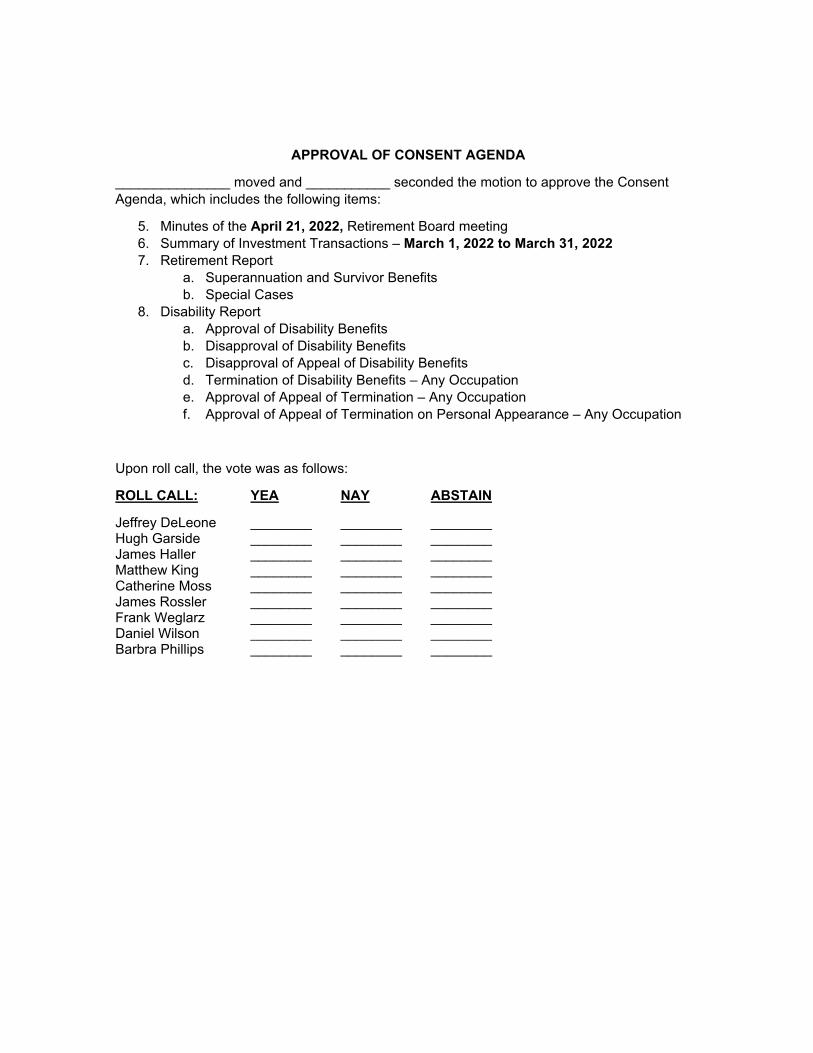
APPROVAL OF CONSENT AGENDA
_______________ moved and ___________ seconded the motion to approve the Consent Agenda, which includes the following items:
5. Minutes of the April 21, 2022, Retirement Board meeting 6. Summary of Investment Transactions – March 1, 2022 to March 31, 2022 7. Retirement Report
a. Superannuation and Survivor Benefits b. Special Cases
8. Disability Report a. Approval of Disability Benefits b. Disapproval of Disability Benefits c. Disapproval of Appeal of Disability Benefits d. Termination of Disability Benefits – Any Occupation e. Approval of Appeal of Termination – Any Occupation f. Approval of Appeal of Termination on Personal Appearance – Any Occupation
Upon roll call, the vote was as follows:
ROLL CALL: YEA NAY ABSTAIN
Jeffrey DeLeone ________ ________ ________ Hugh Garside ________ ________ ________ James Haller ________ ________ ________ Matthew King ________ ________ ________ Catherine Moss ________ ________ ________ James Rossler ________ ________ ________ Frank Weglarz ________ ________ ________ Daniel Wilson ________ ________ ________ Barbra Phillips ________ ________ ________
SERS Retirement Board Meeting Minutes April 21, 2022
The nine hundredth and forty-eighth meeting of the Retirement Board of the School Employees Retirement System was held in the boardroom at 300 E. Broad Street, Columbus, Ohio, and streamed via Zoom videoconferencing on Thursday, April 21, 2022.
Pledge of Allegiance The SERS Retirement Board meeting convened at 8:30 a.m. with the Pledge of Allegiance.
Roll Call Following the Pledge of Allegiance, the roll call was as follows: Barbra Phillips, Jeffrey DeLeone, Hugh Garside, James Haller, Matthew King, Catherine Moss, James Rossler, Frank Weglarz, and Daniel Wilson. Also attending in person was Lisa Reid, representative of the Ohio Attorney General’s Office and various members of the SERS staff. Attending virtually was several SERS staff members and members of the public. Approval of Out-of-State Board Travel Catherine Moss moved and James Rossler seconded the motion that the travel request by Board Members to travel and receive reimbursement for the following out-of-state conferences and meetings be approved.
Conference Attendee Conference Date(s) Conference Location
Estimate of Expenses
Certificate of Achievement in Public Plan Policy (CAPP) Health Part I and Part II
Frank Weglarz
June 6 – 9, 2022 Santa Monica,
CA $4,670
IFEBP 68th Annual Employee Benefits Conference
Frank Weglarz
October 23 – 26, 2022 Las Vegas, NV $3,720
Upon roll call, the vote was as follows: Yea: Hugh Garside, Jeffrey DeLeone, James Haller, Matthew King, Catherine Moss, James Rossler, Frank Weglarz, Daniel Wilson, and Barbra Phillips. The motion carried. Consent Agenda The consent agenda for April 21, 2022, included:
Minutes from the: o March 17, 2022, Board Meeting
Summary of Investment Transactions for the period of February 1, 2022, through February 28, 2022.
Retirement Report – Superannuation and Survivor Benefits and Special Cases Disability Report - Approval of Disability Benefits, Disapproval of Disability Benefits, Termination of Disability
Benefits – Any Occupation, Disapproval of Appeal on Personal Appearance – Any Occupation, and Disapproval of Appeal of Termination – Any Occupation
Frank Weglarz moved and Hugh Garside seconded the motion to approve the Consent Agenda of the Retirement Board meeting held on Thursday, April 21, 2022. Upon roll call, the vote was as follows: Yea: Hugh Garside, Jeffrey DeLeone, James Haller, Matthew King, Catherine Moss, James Rossler, Frank Weglarz, Daniel Wilson, and Barbra Phillips. The motion carried.
SERS Retirement Board Meeting Minutes April 21, 2022
Investment Report Board Education Session – Investing in Commodities Angelique Richardson, Relationship manager, and David Chang, Senior Managing Director, Partner, and Commodities Portfolio Manager with Wellington Management, an investment management firm, provided a presentation on investing in commodities. The presenters explained that commodities are a diverse asset class with many different investment options from agriculture, livestock, cotton, wheat, precious metals, and many others. The presenters stated investing in commodities often results in good returns in time of high inflation. SERS is invested in Wellington’s NA CIF II Commodities portfolio, an active management fund that is equally weighted by investments in all four commodity sectors: metal, energy, livestock and meat, and agricultural. Wellington is working to exceed benchmarks and their success is based on an understanding of commodity cycles and managing roll yields, which is the difference between maturing contracts and futures contracts. After several questions and a robust discussion, the board thanked M. Richardson and Mr. Chang for their presentation. Annual Portfolio Review – Private Equity
SERS Chief Investment Officer Farouki Majeed and SERS Investment Staff Adam Messerschmitt presented the Private Equity portfolio review for 2021. Mr. Majeed reported as of February, the portfolio was $690.6M and is comprised of 18 funds. This represents 3.9% of the total fund. Staff continues to focus on increasing the allocation to 5% by making new investments that fit within SERS’ investment policy, ensuring appropriate risk and return characteristics are present with the new target allocation, and making new investments that generate consistent income for the Total Fund.
After several questions, the board thanked Mr. Majeed for his presentation.
Monthly Investment Report SERS Chief Investment Officer, Farouki Majeed, continued by presenting the SERS monthly investment report for the period ending February 28, 2022. Mr. Majeed reported inflation is rising and will continue to rise for the foreseeable future. Mr. Majeed reported the US economy continues to be strong, however, the fed may make changes in May 2022 that could send the US into a recession. However, SERS investment portfolio is in a better position than most public pension funds and staff will continue to monitor progress and report to the board as needed. Following comments, the Board thanked Mr. Majeed for his presentation. The board took a break at 10:25 a.m. The board reconvened at 10:36 a.m. Executive Director’s Report Personal Appearances (2) James Haller moved and James Rossler seconded the motion that the board convene in Executive Session pursuant to R.C. 121.22 (G)(5) to discuss a matter required to be kept confidential by law. Upon roll call, the vote was as follows: Yea: Jeffrey DeLeone, Hugh Garside, James Haller, Matthew King, Catherine Moss, James Rossler, Frank Weglarz, Daniel Wilson, and Barbra Phillips. The motion carried. The board convened in executive session at 10:43 a.m. The board reconvened in open session at 11:30 a.m.
SERS Retirement Board Meeting Minutes April 21, 2022
Corporate Governance – New Proxy Issues 2022 Chris Collins, SERS’ Government Relations Officer, provided the Board with an overview of new and/or updated proxy issues for 2022. Because SERS owns stock in public companies, the System is responsible for voting on several shareholder issues. To keep pace with the volume of issues that require a vote each quarter, SERS uses the proxy voting services of Institutional Shareholder Services (ISS) to vote on the System's behalf according to SERS' proxy voting policy and our custom guidelines.
Ahead of the upcoming proxy season, SERS' internal proxy voting committee reviewed 32 issues that ISS expects to appear on proxy ballots in 2022. The committee relied upon guidance from the Board-adopted Corporate Governance Principles in deciding how SERS will vote.
To promote diversity on corporate boards, SERS continues to participate in the Midwest Investors Diversity Initiative (MIDI), a group of 16 institutional investors in the Midwest that engages public companies that also are located in the Midwest with the goal of encouraging diversity on their board of directors. This year, MIDI is engaging with 19 Midwest companies that meet three parameters: 1) They have no women or people of color on their board based on best available public data; 2) They fail to disclose the race and gender of their boards; and 3) They fail to disclose their EEO-1 reports. SERS also remains involved in the Investors for Opioid and Pharmaceutical Accountability (IOPA) Group. The IOPA is a group of institutional investors that engages with public companies associated with the opioid crisis and pharmaceutical pricing. Its objective is to encourage corporate governance reforms that include increased oversight and transparency. SERS is also a part of the Investor Stewardship Group (ISG), which is a nationwide initiative that developed a Framework for U.S. Stewardship and Governance best practices. The ISG Framework has been recognized as the definitive corporate governance code in the United States and includes basic investment stewardship and corporate governance standards for U.S. institutional investors and boardroom conduct. SERS is a signatory to the ISG Framework and continues to support the group’s efforts. Finally, SERS continues to be an active member of the Council for Institutional Investors (CII) and is supportive of its advocacy at the federal level. The board thanked Mr. Collins for his report. ORSC Richard Stensrud, SERS Executive Director, reported the ORSC met on April 14, 2022. Representative Adam Bird (R-New Richmond) has joined the council and SERS staff look forward to meeting with him soon. Mr. Stensrud also reported that Russian divestment continued to be discussed at the April ORSC meeting. SERS is in the same position as last month and are adding no new Russian investments until sanctions are lifted if at all. Mr. Stensrud reported STRS five-year experience study was reviewed and similar to SERS, due to some changes in actuarial assumptions, they have seen a reduction in their unfunded liability. Mr. Stensrud also reported ORSC provided an analysis of HB 499, the bill that would allow disability recipients to run for elective office without termination of benefits. SERS staff are recommending against the bill and the ORSC accepted SERS staff position and agreed. Advocacy Groups Mr. Stensrud continued, stating we continue to prepare for upcoming stakeholder events, including OASBO, which is being held on Friday, May 6 via Zoom. So far, 24 participants have signed up and the format will be similar to the January Advocacy Roundtable meeting. Key SERS staff will focus on important key topics and the goal is to set SERS apart from the other retirement systems.
SERS Retirement Board Meeting Minutes April 21, 2022
Mr. Stensrud also reported the SERO annual meeting will take place on Tuesday, May 10 at Villa Milano and this will be the first time having this meeting in person in 3 years. SERS will present the latest pension and healthcare news. Ohio General Assembly Mr. Stensrud reported the Ohio House Insurance Committee held a sponsor testimony hearing on Rep. Lightbody’s (D-Westerville) bill on April 4th. The proposed bill would increase employer contribution rates for SERS and STERS. SERS staff and stakeholders agree we do not want or need this increase. It is not anticipated that the bill will move forward as no further meetings are scheduled. SERS will continue to monitor this bill.
Mr. Stensrud also reported that SERS staff have met with Senators Hottinger (R-Newark) and Craig (D-Columbus) in an ongoing effort to recruit sponsors for SERS’ CBBC legislation. Both meetings were positive, and the Senators were generally supportive of the proposal. SERS staff is also working on next steps through Senator Schuring’s (R-Canton) office. Although Rep. Schuring is supportive of this legislation, there is still a challenge to get anything approved this year considering other dynamics in legislature. SERS staff will keep looking for other opportunities so we can add on to existing bills but will look to create a stand-alone bill, if needed.
Federal Legislation Mr. Stensrud reported on March 31, SERS participated in the Coalition to Preserve Retirement Security (CPRS) annual virtual meeting. The Coalition also heard updates on WEP and GPO reform legislation. Stakeholders have suggested compromises to Congressmen Neal (D-MA) and Brady (R-TX) to help achieve consensus between their two WEP reform bills. Those compromised include extending the hold harmless provision in the bill to all persons aged 16 and above at the time of passage. Those persons not yet age 16 at the time of passage are subject to the new proportional formula. This is closer to Brady’s version of the bill. Another compromise would be a $150 per month Social Security benefit increase for all current retirees affected by the WEP. This is similar to Neal’s version of the bill. SERS is encouraging them to pull the bills together and move this legislation forward. Coalition members continue to remain hopeful that a WEP reform solution is achievable this session before Congressman Brady’s retirement at the end of the year as this legislation could be Congressman Brady’s legacy bill. Other WEP and GPO repeal bills don’t seem to have any momentum at this time.
Mr. Stensrud further stated CPRS did a review of activity since the last annual meeting relative to mandatory Social Security coverage. There have been no legislative initiatives introduced regarding mandatory coverage and the topic remains off the table given the current Ways and Means committee leadership. But coalition members were reminded that we must remain vigilant since key legislators like Neal and Brady will not always be present to protect against various mandatory coverage proposals.
Medicare Part B Premiums Mr. Stensrud reported Medicare said last Thursday it's still considering a cut in enrollee premiums, after officials stuck with an earlier decision to sharply limit coverage for a pricey new Alzheimer's drug projected to drive up program costs. The premium for 2022 was a $22 increase in Medicare’s Part B premium, boosting it to $170.10 a month. SERS staff will continue to monitor any activity with Medicare Part B premiums.
Request for Proposal – Actuarial Audit
Mr. Stensrud further reported that SERS has put out an RFP for an actuarial audit. SERS has been working with Cavanaugh Macdonald for several years and it’s prudent to bring in another firm to check and balance what Cavanaugh Macdonald has been doing. An actuarial audit is a good way of confirming the work being done and the goal is to allow this process to work as in the past. The audit will be of the methodology used by
SERS Retirement Board Meeting Minutes April 21, 2022
Cavanaugh Macdonald and the analysis of their results will be reviewed to provide assurances that the work is accurately & being properly done. Proposals would come in and staff will review each proposal and bring a recommendation to the full board. SERS board members agree there is no need for the board to interview the firm staff selects and the board further stated it agrees with the staff making an informed decision and selecting the firm without board input. CFO Recruitment Mr. Stensrud reported SERS Chief Financial Officer, Tracy Valentino, is retiring this summer. SERS hopes to identify a successor in line with her departure date and has asked for help with recruiting. A third-party recruiter has concluded the collection of candidates and they have been presented to SERS for review. Mr. Stensrud further stated it will take until the first week of May to identify the first round of interviewees. The second round will be shorter and will take place during the second week of May. With this schedule, SERS should be able to bring the final candidate(s) to the June board meeting for an interview with the full board. Mr. Stensrud stressed this is an important position and the person in this role interfaces with the board frequently. SERS leadership wants to be sure the board feels like this person will be a good partner. The full interview and selection process may require Tracy to stay another month but she is flexible. ORSC Draft FY2023 Budget Submission Tracy Valentino, SERS Chief Financial Officer, provided an update on the FY2023 Draft Budget submitted to the ORSC. Ms. Valentino reported in April, SERS will submit a draft of the FY2023 budget to the ORSC and a draft budget has been provided for the board to review. The draft budget is being submitted in a format required by ORSC. Ms. Valentino further reported in May, an FY2023 budget will be presented to the board for consideration. This budget with provide more details and will be closer to the finalized SERS budget. Although the budget is still being fine-tuned, it won’t change significantly. Final Filing of Proposed Administrative Rule Mr. Stensrud also reported that the Administrative Rules originally discussed in December made it thru the JCARR review and will now be proposed to the board for approval. Legal Counsel discussed with the Retirement Board filing with JCARR the following proposed amended and new rules: 3309-1-14 Purchasing leave of absence service credit; 3309-1-30 Eligibility for retirement; 3309-1-40 Application and procedures for receiving disability benefits; 3309-1-41 Appeals for denial and termination of disability benefits; 3309-1-45 Release of names, addresses and information; 3309-1-57 Rule on rules; 3309-1-60 Division of property orders; and 3309-1-68 Guardianships; that have been reviewed by JCARR and are ready for final adoption by the Board.
Matthew King moved and Frank Weglarz seconded that proposed amended and new rules 3309-1-14, 3309-1-30, 3309-1-40, 3309-1-41, 3309-1-45, 3309-1-57, 3309-1-60, and 3309-1-68 be adopted. Upon roll call, the vote was as follows: Yea: Hugh Garside, Jeffrey DeLeone, James Haller, Matthew King, Catherine Moss, James Rossler, Frank Weglarz, Daniel Wilson, and Barbra Phillips. The motion carried.
SERS Retirement Board Meeting Minutes April 21, 2022
Executive Session Catherine Moss moved and Hugh Garside seconded the motion that the board convene in Executive Session pursuant to R.C. 121.22 (G)(2) to discuss the sale of property. Upon roll call, the vote was as follows: Yea: Jeffrey DeLeone, Hugh Garside, James Haller, Matthew King, Catherine Moss, James Rossler, Frank Weglarz, Daniel Wilson, and Barbra Phillips. The motion carried. The board convened in executive session at 12:14 p.m. The board reconvened in open session at 12:37 p.m. Healthcare Report Christi Pepe, SERS Director of Health Care Services, provided an update on SERS staff’s recommendation that SERS enter into a new contract with Express Scripts to provide pharmacy benefits and administration to eligible SERS benefit recipients.
The current contract with Express Scripts began January 1, 2013, was extended for 3 years beginning January 1, 2020 and will terminate December 31, 2022. Express Scripts has provided pharmacy benefit management services for SERS enrollees since 2008. Enrollee satisfaction with the benefit and with Express Scripts remains high.
Ms. Pepe further explained with assistance from Buck Consulting, SERS staff published a Request for Proposals (RFP) in December 2021 to invite proposals for the provision of pharmacy benefit management services to SERS enrollees. The RFP intended to assess and contract for the lowest cost enrollee benefit and highest service value. Five responses were received and compared. Express Scripts offered the lowest net pricing among proposals for projected 2022 pharmaceutical utilization. Express Scripts demonstrated the highest value among submitters when considering technical capability, net drug cost, and prescription drug access combined. The proposal includes transition for SERS enrollees to the National Preferred Formulary, which will offer more brand name drugs than the current formulary. The arrangement will continue the savings achieved by the Medicare Broad Performance network approved by the SERS Board for plan year 2022. Over the 3-year contract period, the Express Scripts arrangement is expected to save nearly $71 million.
Based on review of all proposals received, staff believes that a contract with Express Scripts will continue to support the needs and will provide the best value for SERS benefit recipients.
James Haller moved and Frank Weglarz seconded the motion to authorize staff to negotiate a new contract with Express Scripts in order to provide pharmacy benefit management services to eligible SERS participants. The contract shall be for a term of three years beginning January 1, 2023 with two optional one-year extensions. The Executive Director or Deputy Executive Director shall have the authority to execute any documents necessary to secure these services, subject to documentation satisfactory to legal counsel.
Upon roll call, the vote was as follows: Yea: Jeffrey DeLeone, Hugh Garside, James Haller, Matthew King, Catherine Moss, James Rossler, Frank Weglarz, Daniel Wilson, and Barbra Phillips. The motion carried.
Technology Committee Report Matt King, SERS Technology Committee Chair, provided an update on the work being done by the SERS Technology Committee. Mr. King reported the Technology Committee last met on March 17, 2022, and SERS staff continue work to refine a five-year technology investment plan and how it aligns with the strategic plan to attract and retain talent. The committee also went into executive session to discuss security matters. The committee will meet again June 16, 2022, at 12:30pm or immediately following the board meeting. The board thanked Mr. King and the Technology Committee for their work.
SERS Retirement Board Meeting Minutes April 21, 2022
Board Communication and Policy Issues
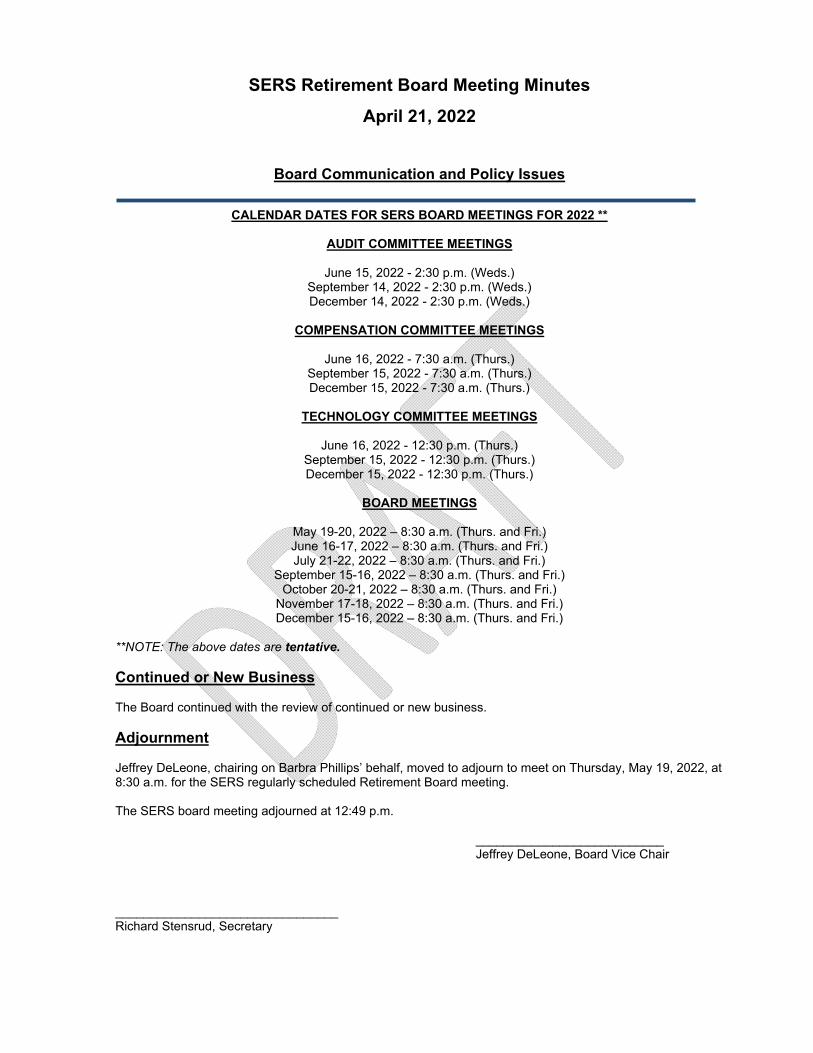
CALENDAR DATES FOR SERS BOARD MEETINGS FOR 2022 **
AUDIT COMMITTEE MEETINGS
June 15, 2022 - 2:30 p.m. (Weds.) September 14, 2022 - 2:30 p.m. (Weds.) December 14, 2022 - 2:30 p.m. (Weds.)
COMPENSATION COMMITTEE MEETINGS
June 16, 2022 - 7:30 a.m. (Thurs.)
September 15, 2022 - 7:30 a.m. (Thurs.) December 15, 2022 - 7:30 a.m. (Thurs.)
TECHNOLOGY COMMITTEE MEETINGS
June 16, 2022 - 12:30 p.m. (Thurs.)
September 15, 2022 - 12:30 p.m. (Thurs.) December 15, 2022 - 12:30 p.m. (Thurs.)
BOARD MEETINGS
May 19-20, 2022 – 8:30 a.m. (Thurs. and Fri.) June 16-17, 2022 – 8:30 a.m. (Thurs. and Fri.) July 21-22, 2022 – 8:30 a.m. (Thurs. and Fri.)
September 15-16, 2022 – 8:30 a.m. (Thurs. and Fri.) October 20-21, 2022 – 8:30 a.m. (Thurs. and Fri.)
November 17-18, 2022 – 8:30 a.m. (Thurs. and Fri.) December 15-16, 2022 – 8:30 a.m. (Thurs. and Fri.)
**NOTE: The above dates are tentative.
Continued or New Business The Board continued with the review of continued or new business. Adjournment Jeffrey DeLeone, chairing on Barbra Phillips’ behalf, moved to adjourn to meet on Thursday, May 19, 2022, at 8:30 a.m. for the SERS regularly scheduled Retirement Board meeting. The SERS board meeting adjourned at 12:49 p.m. ___________________________ Jeffrey DeLeone, Board Vice Chair ________________________________ Richard Stensrud, Secretary
Board Meeting Agenda Item
SCHOOL EMPLOYEES RETIREMENT BOARD OF OHIO
Summary of Investment Transactions to be Reported to the Retirement Board for
Ratification in May
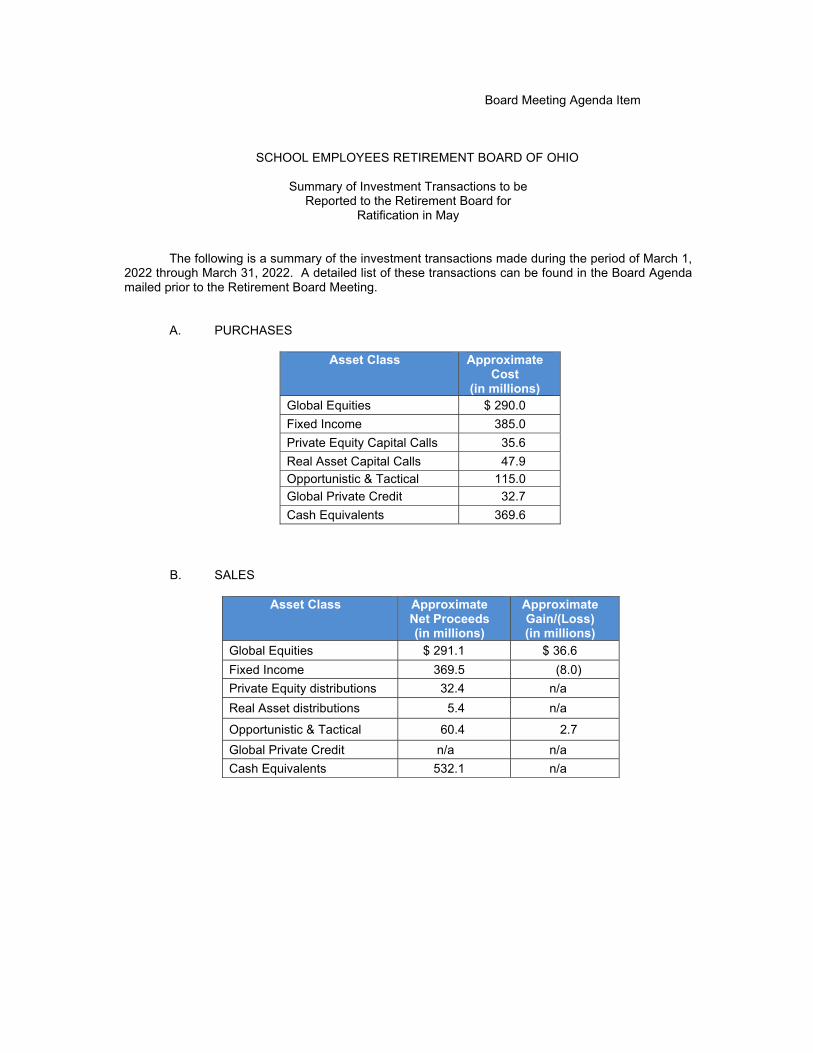
The following is a summary of the investment transactions made during the period of March 1,
2022 through March 31, 2022. A detailed list of these transactions can be found in the Board Agenda mailed prior to the Retirement Board Meeting.
A. PURCHASES
Asset Class Approximate Cost
(in millions) Global Equities $ 290.0
Fixed Income 385.0
Private Equity Capital Calls 35.6
Real Asset Capital Calls 47.9
Opportunistic & Tactical 115.0
Global Private Credit 32.7
Cash Equivalents 369.6
B. SALES
Asset Class Approximate Net Proceeds (in millions)
Approximate Gain/(Loss) (in millions)
Global Equities $ 291.1 $ 36.6
Fixed Income 369.5 (8.0)
Private Equity distributions 32.4 n/a
Real Asset distributions 5.4 n/a
Opportunistic & Tactical 60.4 2.7
Global Private Credit n/a n/a
Cash Equivalents 532.1 n/a
School Employees Retirement System
Memo To: Retirement Board
From: Farouki Majeed
cc: Richard Stensrud, Karen Roggenkamp
Date: May 6, 2022
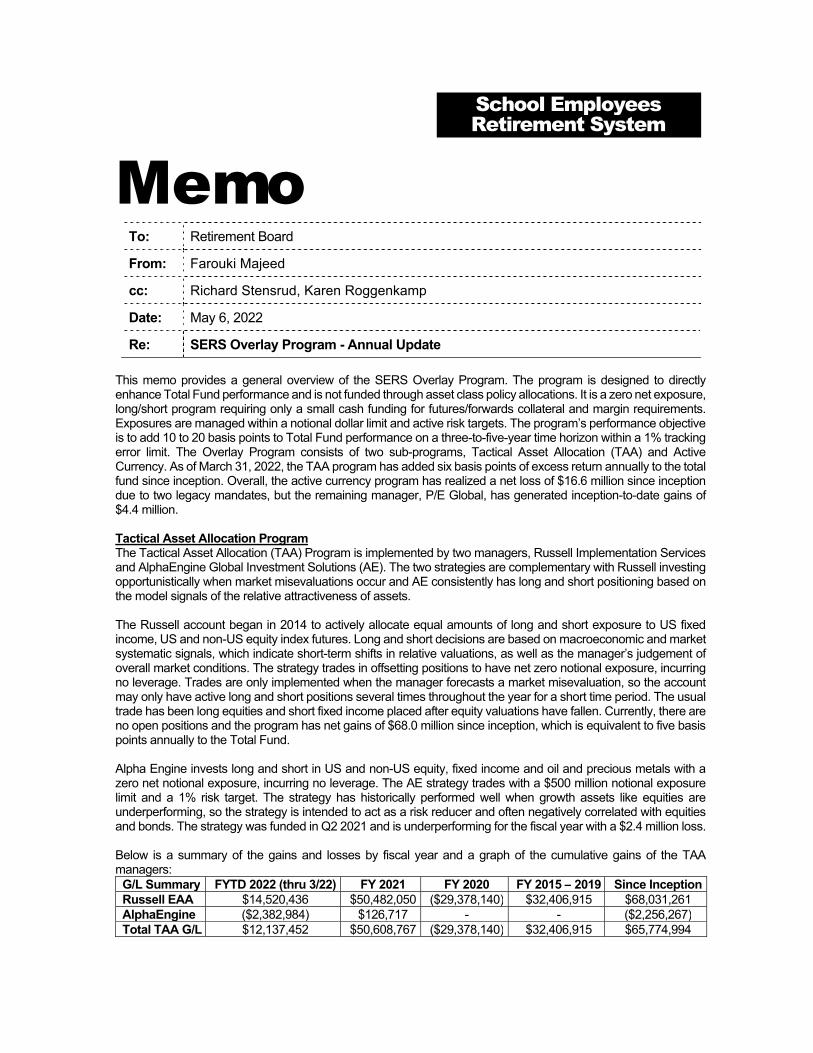
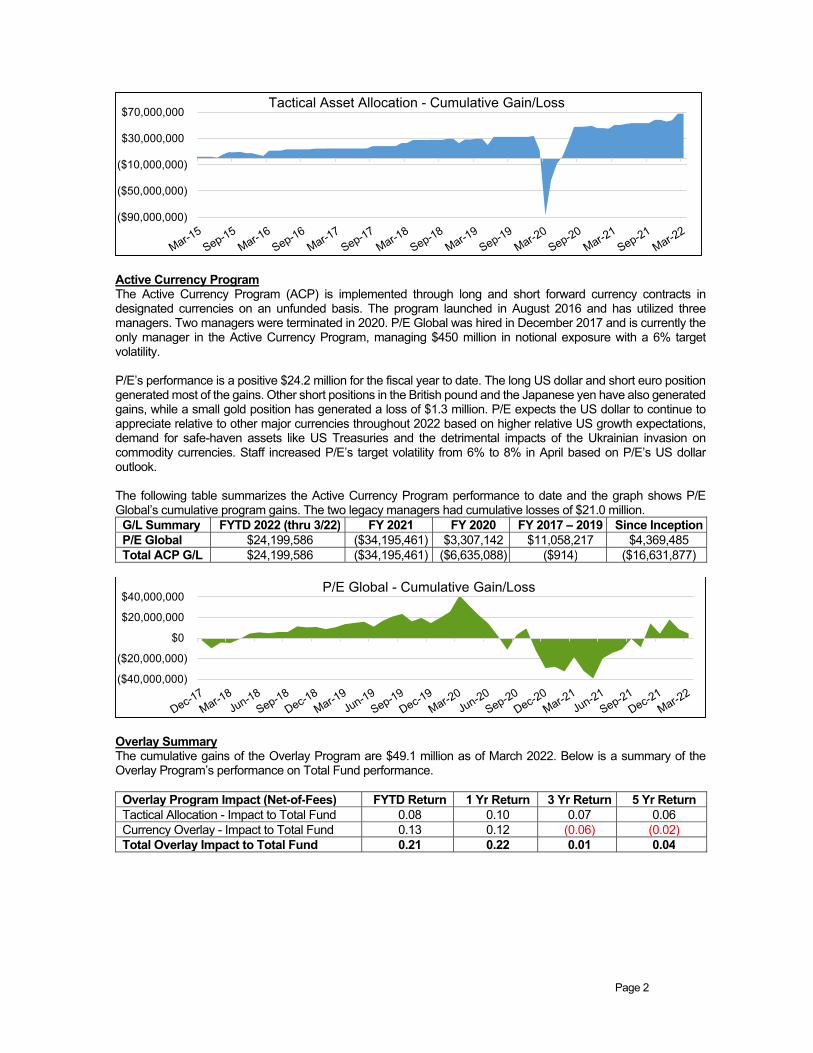
Re: SERS Overlay Program - Annual Update This memo provides a general overview of the SERS Overlay Program. The program is designed to directly enhance Total Fund performance and is not funded through asset class policy allocations. It is a zero net exposure, long/short program requiring only a small cash funding for futures/forwards collateral and margin requirements. Exposures are managed within a notional dollar limit and active risk targets. The program’s performance objective is to add 10 to 20 basis points to Total Fund performance on a three-to-five-year time horizon within a 1% tracking error limit. The Overlay Program consists of two sub-programs, Tactical Asset Allocation (TAA) and Active Currency. As of March 31, 2022, the TAA program has added six basis points of excess return annually to the total fund since inception. Overall, the active currency program has realized a net loss of $16.6 million since inception due to two legacy mandates, but the remaining manager, P/E Global, has generated inception-to-date gains of $4.4 million. Tactical Asset Allocation Program The Tactical Asset Allocation (TAA) Program is implemented by two managers, Russell Implementation Services and AlphaEngine Global Investment Solutions (AE). The two strategies are complementary with Russell investing opportunistically when market misevaluations occur and AE consistently has long and short positioning based on the model signals of the relative attractiveness of assets. The Russell account began in 2014 to actively allocate equal amounts of long and short exposure to US fixed income, US and non-US equity index futures. Long and short decisions are based on macroeconomic and market systematic signals, which indicate short-term shifts in relative valuations, as well as the manager’s judgement of overall market conditions. The strategy trades in offsetting positions to have net zero notional exposure, incurring no leverage. Trades are only implemented when the manager forecasts a market misevaluation, so the account may only have active long and short positions several times throughout the year for a short time period. The usual trade has been long equities and short fixed income placed after equity valuations have fallen. Currently, there are no open positions and the program has net gains of $68.0 million since inception, which is equivalent to five basis points annually to the Total Fund. Alpha Engine invests long and short in US and non-US equity, fixed income and oil and precious metals with a zero net notional exposure, incurring no leverage. The AE strategy trades with a $500 million notional exposure limit and a 1% risk target. The strategy has historically performed well when growth assets like equities are underperforming, so the strategy is intended to act as a risk reducer and often negatively correlated with equities and bonds. The strategy was funded in Q2 2021 and is underperforming for the fiscal year with a $2.4 million loss. Below is a summary of the gains and losses by fiscal year and a graph of the cumulative gains of the TAA managers:
G/L Summary FYTD 2022 (thru 3/22) FY 2021 FY 2020 FY 2015 – 2019 Since Inception Russell EAA $14,520,436 $50,482,050 ($29,378,140) $32,406,915 $68,031,261 AlphaEngine ($2,382,984) $126,717 - - ($2,256,267) Total TAA G/L $12,137,452 $50,608,767 ($29,378,140) $32,406,915 $65,774,994
Page 2
Active Currency Program The Active Currency Program (ACP) is implemented through long and short forward currency contracts in designated currencies on an unfunded basis. The program launched in August 2016 and has utilized three managers. Two managers were terminated in 2020. P/E Global was hired in December 2017 and is currently the only manager in the Active Currency Program, managing $450 million in notional exposure with a 6% target volatility. P/E’s performance is a positive $24.2 million for the fiscal year to date. The long US dollar and short euro position generated most of the gains. Other short positions in the British pound and the Japanese yen have also generated gains, while a small gold position has generated a loss of $1.3 million. P/E expects the US dollar to continue to appreciate relative to other major currencies throughout 2022 based on higher relative US growth expectations, demand for safe-haven assets like US Treasuries and the detrimental impacts of the Ukrainian invasion on commodity currencies. Staff increased P/E’s target volatility from 6% to 8% in April based on P/E’s US dollar outlook. The following table summarizes the Active Currency Program performance to date and the graph shows P/E Global’s cumulative program gains. The two legacy managers had cumulative losses of $21.0 million.
G/L Summary FYTD 2022 (thru 3/22) FY 2021 FY 2020 FY 2017 – 2019 Since Inception P/E Global $24,199,586 ($34,195,461) $3,307,142 $11,058,217 $4,369,485 Total ACP G/L $24,199,586 ($34,195,461) ($6,635,088) ($914) ($16,631,877)
Overlay Summary The cumulative gains of the Overlay Program are $49.1 million as of March 2022. Below is a summary of the Overlay Program’s performance on Total Fund performance.
Overlay Program Impact (Net-of-Fees) FYTD Return 1 Yr Return 3 Yr Return 5 Yr Return Tactical Allocation - Impact to Total Fund 0.08 0.10 0.07 0.06 Currency Overlay - Impact to Total Fund 0.13 0.12 (0.06) (0.02) Total Overlay Impact to Total Fund 0.21 0.22 0.01 0.04
($90,000,000)
($50,000,000)
($10,000,000)
$30,000,000
$70,000,000Tactical Asset Allocation - Cumulative Gain/Loss
($40,000,000)
($20,000,000)
$0
$20,000,000
$40,000,000P/E Global - Cumulative Gain/Loss
wilshire.com | ©2022 Wilshire Advisors LLC
Executive Summary of Investment Performance
As of March 31, 2022
wilshire.com | ©2022 Wilshire Advisors LLC
Data Sources: Bloomberg Note: Developed asset class is developed equity markets ex-U.S., ex-Canada
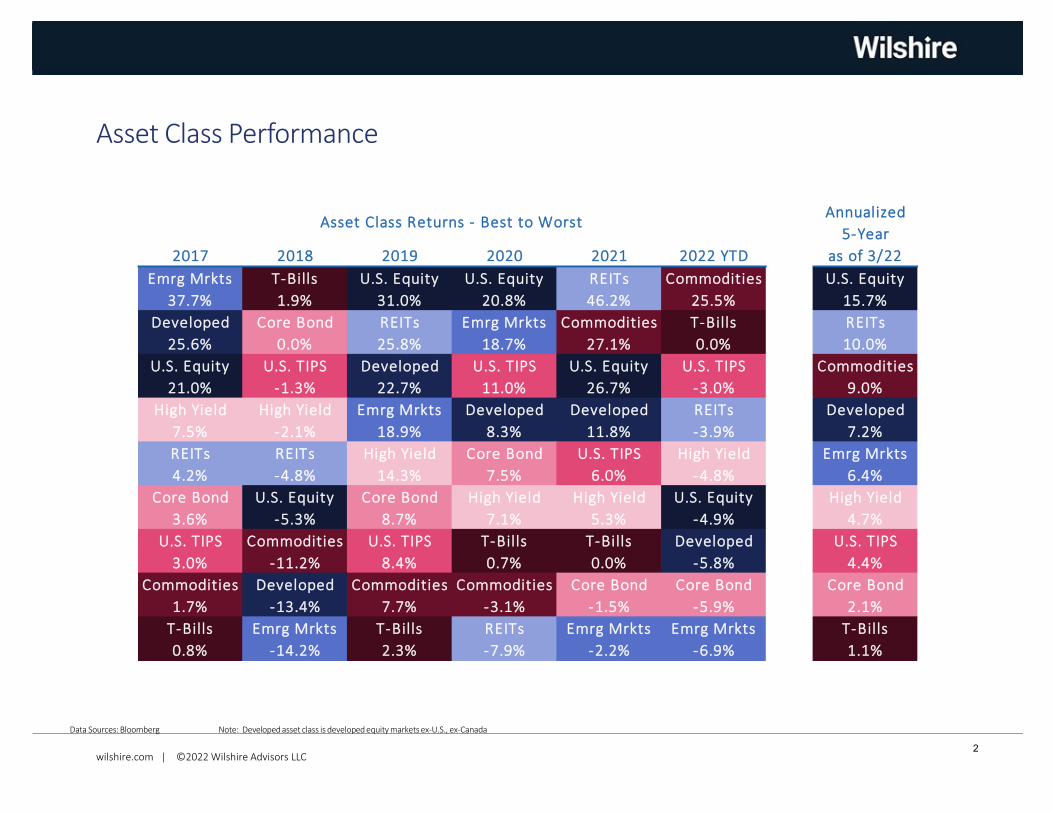
Asset Class Performance
Annualized
5-Year
2017 2018 2019 2020 2021 2022 YTD as of 3/22
Emrg Mrkts T-Bills U.S. Equity U.S. Equity REITs Commodities U.S. Equity
37.7% 1.9% 31.0% 20.8% 46.2% 25.5% 15.7%
Developed Core Bond REITs Emrg Mrkts Commodities T-Bills REITs
25.6% 0.0% 25.8% 18.7% 27.1% 0.0% 10.0%
U.S. Equity U.S. TIPS Developed U.S. TIPS U.S. Equity U.S. TIPS Commodities
21.0% -1.3% 22.7% 11.0% 26.7% -3.0% 9.0%
High Yield High Yield Emrg Mrkts Developed Developed REITs Developed
7.5% -2.1% 18.9% 8.3% 11.8% -3.9% 7.2%
REITs REITs High Yield Core Bond U.S. TIPS High Yield Emrg Mrkts
4.2% -4.8% 14.3% 7.5% 6.0% -4.8% 6.4%
Core Bond U.S. Equity Core Bond High Yield High Yield U.S. Equity High Yield
3.6% -5.3% 8.7% 7.1% 5.3% -4.9% 4.7%
U.S. TIPS Commodities U.S. TIPS T-Bills T-Bills Developed U.S. TIPS
3.0% -11.2% 8.4% 0.7% 0.0% -5.8% 4.4%
Commodities Developed Commodities Commodities Core Bond Core Bond Core Bond
1.7% -13.4% 7.7% -3.1% -1.5% -5.9% 2.1%
T-Bills Emrg Mrkts T-Bills REITs Emrg Mrkts Emrg Mrkts T-Bills
0.8% -14.2% 2.3% -7.9% -2.2% -6.9% 1.1%
Asset Class Returns - Best to Worst
2
wilshire.com | ©2022 Wilshire Advisors LLC
U.S. Equity
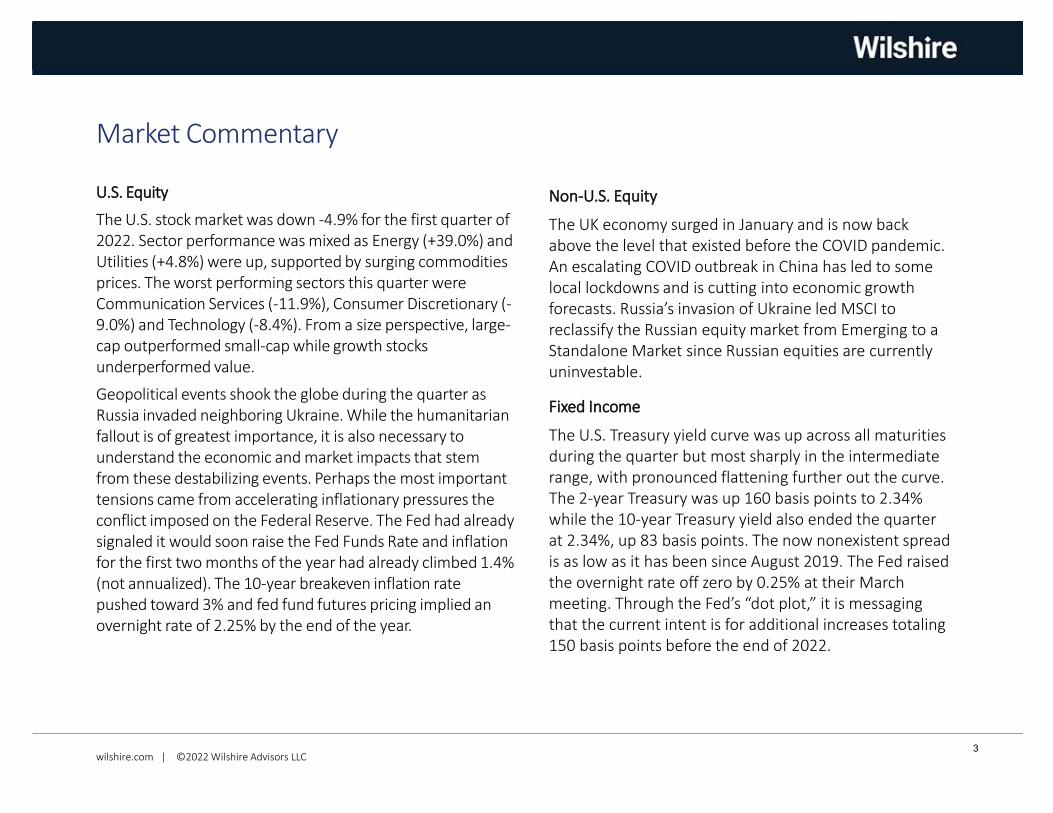
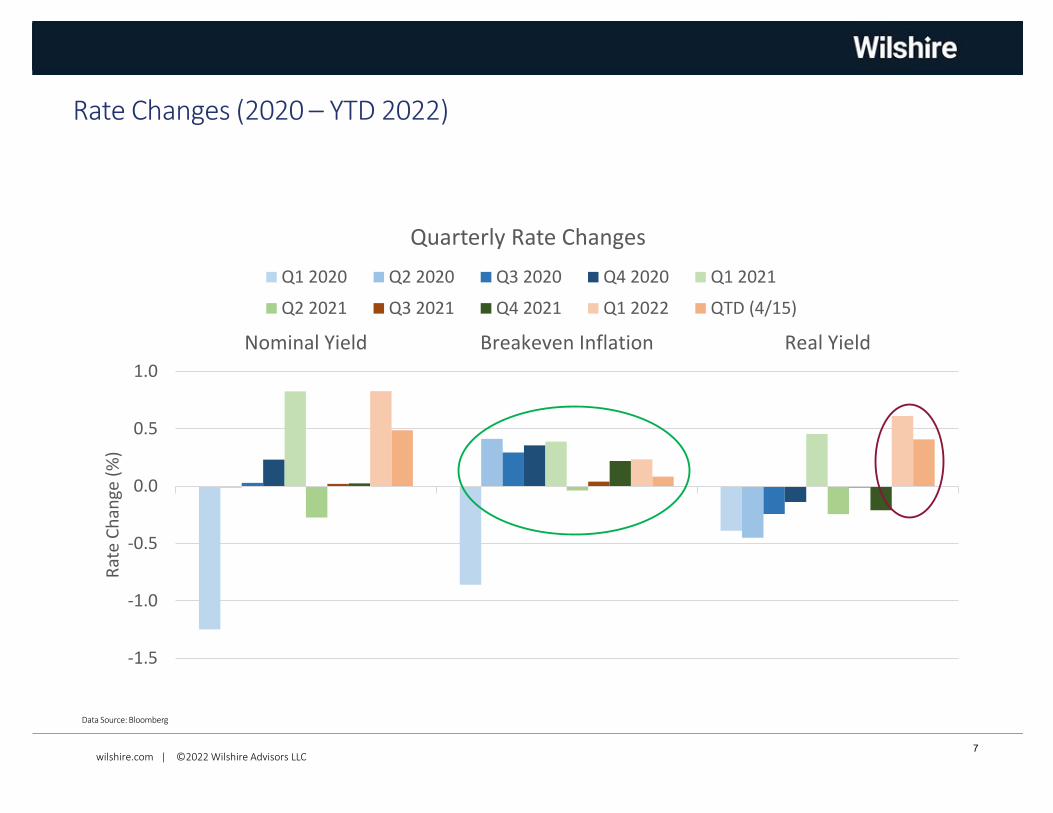
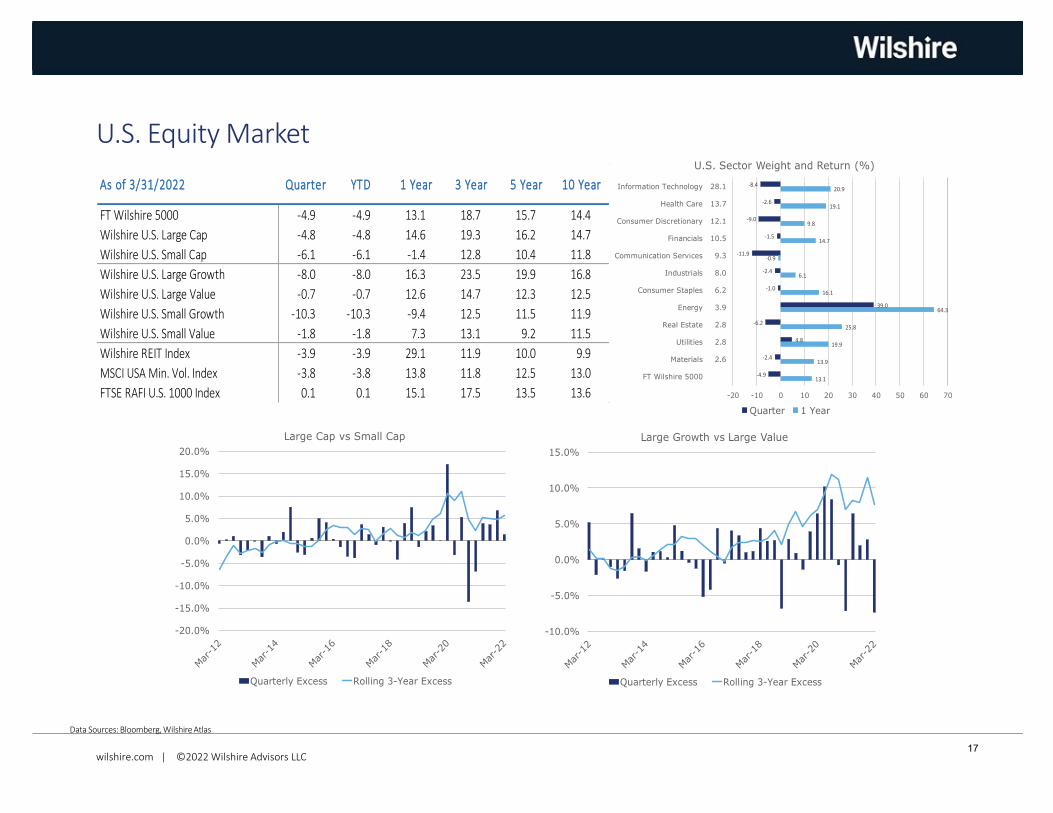
The U.S. stock market was down -4.9% for the first quarter of 2022. Sector performance was mixed as Energy (+39.0%) and Utilities (+4.8%) were up, supported by surging commodities prices. The worst performing sectors this quarter were Communication Services (-11.9%), Consumer Discretionary (-9.0%) and Technology (-8.4%). From a size perspective, large-cap outperformed small-cap while growth stocks underperformed value.
Geopolitical events shook the globe during the quarter as Russia invaded neighboring Ukraine. While the humanitarian fallout is of greatest importance, it is also necessary to understand the economic and market impacts that stem from these destabilizing events. Perhaps the most important tensions came from accelerating inflationary pressures the conflict imposed on the Federal Reserve. The Fed had already signaled it would soon raise the Fed Funds Rate and inflation for the first two months of the year had already climbed 1.4% (not annualized). The 10-year breakeven inflation rate pushed toward 3% and fed fund futures pricing implied an overnight rate of 2.25% by the end of the year.
Market Commentary
Non-U.S. Equity
The UK economy surged in January and is now back above the level that existed before the COVID pandemic. An escalating COVID outbreak in China has led to some local lockdowns and is cutting into economic growth forecasts. Russia’s invasion of Ukraine led MSCI to reclassify the Russian equity market from Emerging to a Standalone Market since Russian equities are currently uninvestable.
Fixed Income
The U.S. Treasury yield curve was up across all maturities during the quarter but most sharply in the intermediate range, with pronounced flattening further out the curve. The 2-year Treasury was up 160 basis points to 2.34% while the 10-year Treasury yield also ended the quarter at 2.34%, up 83 basis points. The now nonexistent spread is as low as it has been since August 2019. The Fed raised the overnight rate off zero by 0.25% at their March meeting. Through the Fed’s “dot plot,” it is messaging that the current intent is for additional increases totaling 150 basis points before the end of 2022.
3
wilshire.com | ©2022 Wilshire Advisors LLC
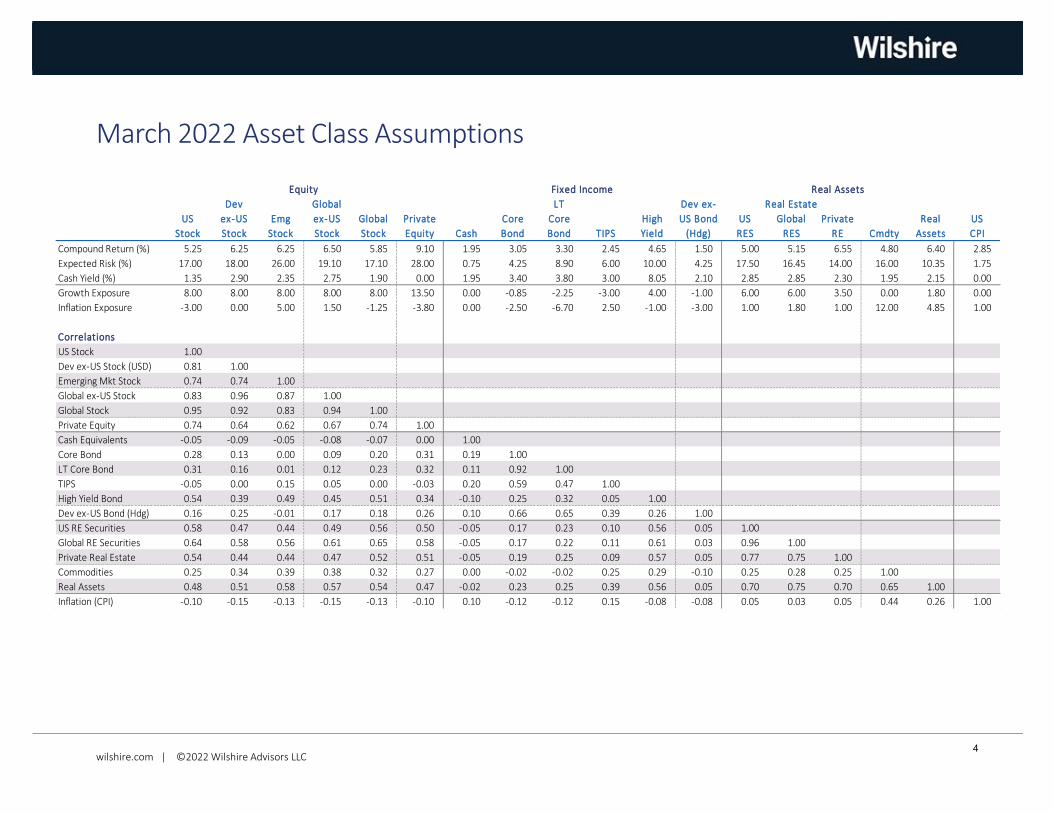
March 2022 Asset Class Assumptions
Dev Global LT Dev ex-
US ex-US Emg ex-US Global Private Core Core High US Bond US Global Private Real US
Stock Stock Stock Stock Stock Equity Cash Bond Bond TIPS Yield (Hdg) RES RES RE Cmdty Assets CPI
Compound Return (%) 5.25 6.25 6.25 6.50 5.85 9.10 1.95 3.05 3.30 2.45 4.65 1.50 5.00 5.15 6.55 4.80 6.40 2.85
Expected Risk (%) 17.00 18.00 26.00 19.10 17.10 28.00 0.75 4.25 8.90 6.00 10.00 4.25 17.50 16.45 14.00 16.00 10.35 1.75
Cash Yield (%) 1.35 2.90 2.35 2.75 1.90 0.00 1.95 3.40 3.80 3.00 8.05 2.10 2.85 2.85 2.30 1.95 2.15 0.00
Growth Exposure 8.00 8.00 8.00 8.00 8.00 13.50 0.00 -0.85 -2.25 -3.00 4.00 -1.00 6.00 6.00 3.50 0.00 1.80 0.00
Inflation Exposure -3.00 0.00 5.00 1.50 -1.25 -3.80 0.00 -2.50 -6.70 2.50 -1.00 -3.00 1.00 1.80 1.00 12.00 4.85 1.00
Correlations
US Stock 1.00
Dev ex-US Stock (USD) 0.81 1.00
Emerging Mkt Stock 0.74 0.74 1.00
Global ex-US Stock 0.83 0.96 0.87 1.00
Global Stock 0.95 0.92 0.83 0.94 1.00
Private Equity 0.74 0.64 0.62 0.67 0.74 1.00
Cash Equivalents -0.05 -0.09 -0.05 -0.08 -0.07 0.00 1.00
Core Bond 0.28 0.13 0.00 0.09 0.20 0.31 0.19 1.00
LT Core Bond 0.31 0.16 0.01 0.12 0.23 0.32 0.11 0.92 1.00
TIPS -0.05 0.00 0.15 0.05 0.00 -0.03 0.20 0.59 0.47 1.00
High Yield Bond 0.54 0.39 0.49 0.45 0.51 0.34 -0.10 0.25 0.32 0.05 1.00
Dev ex-US Bond (Hdg) 0.16 0.25 -0.01 0.17 0.18 0.26 0.10 0.66 0.65 0.39 0.26 1.00
US RE Securities 0.58 0.47 0.44 0.49 0.56 0.50 -0.05 0.17 0.23 0.10 0.56 0.05 1.00
Global RE Securities 0.64 0.58 0.56 0.61 0.65 0.58 -0.05 0.17 0.22 0.11 0.61 0.03 0.96 1.00
Private Real Estate 0.54 0.44 0.44 0.47 0.52 0.51 -0.05 0.19 0.25 0.09 0.57 0.05 0.77 0.75 1.00
Commodities 0.25 0.34 0.39 0.38 0.32 0.27 0.00 -0.02 -0.02 0.25 0.29 -0.10 0.25 0.28 0.25 1.00
Real Assets 0.48 0.51 0.58 0.57 0.54 0.47 -0.02 0.23 0.25 0.39 0.56 0.05 0.70 0.75 0.70 0.65 1.00
Inflation (CPI) -0.10 -0.15 -0.13 -0.15 -0.13 -0.10 0.10 -0.12 -0.12 0.15 -0.08 -0.08 0.05 0.03 0.05 0.44 0.26 1.00
Equity Fixed Income Real Assets
Real Estate
4
wilshire.com | ©2022 Wilshire Advisors LLC
YTD thru Jan 7 Q4 2021 2021
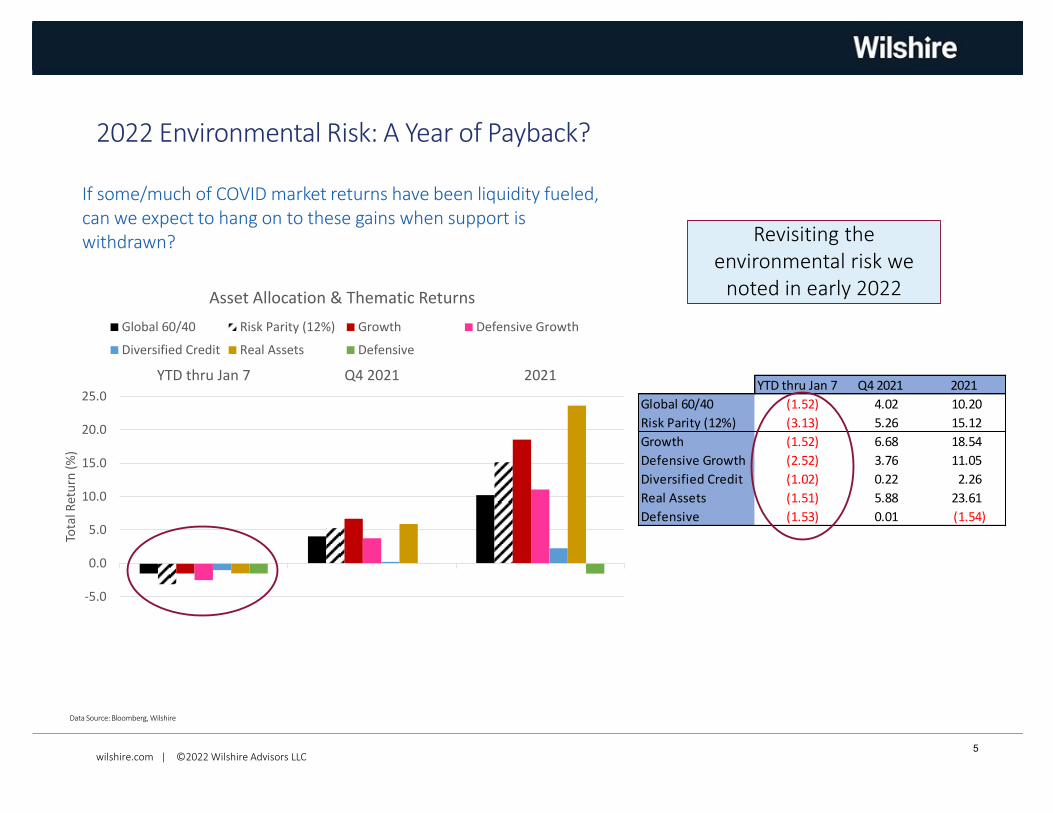
Global 60/40 (1.52) 4.02 10.20
Risk Parity (12%) (3.13) 5.26 15.12
Growth (1.52) 6.68 18.54
Defensive Growth (2.52) 3.76 11.05
Diversified Credit (1.02) 0.22 2.26
Real Assets (1.51) 5.88 23.61
Defensive (1.53) 0.01 (1.54)
-5.0
0.0
5.0
10.0
15.0
20.0
25.0
YTD thru Jan 7 Q4 2021 2021
Tota
l Ret
urn
(%
)
Asset Allocation & Thematic Returns
Global 60/40 Risk Parity (12%) Growth Defensive Growth
Diversified Credit Real Assets Defensive
2022 Environmental Risk: A Year of Payback?
If some/much of COVID market returns have been liquidity fueled, can we expect to hang on to these gains when support is withdrawn?
Data Source: Bloomberg, Wilshire
Revisiting the environmental risk we
noted in early 2022
5
wilshire.com | ©2022 Wilshire Advisors LLC
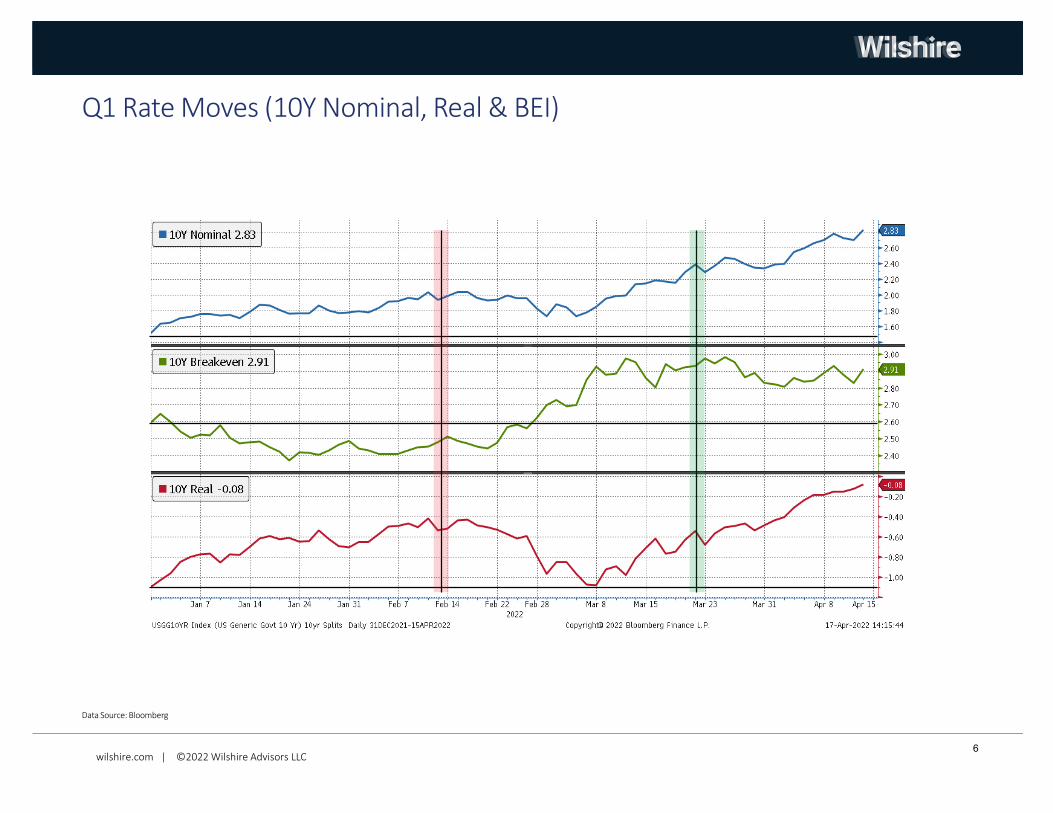
Q1 Rate Moves (10Y Nominal, Real & BEI)
Data Source: Bloomberg
6
wilshire.com | ©2022 Wilshire Advisors LLC
-1.5
-1.0
-0.5
0.0
0.5
1.0
Nominal Yield Breakeven Inflation Real Yield
Rat
e C
han
ge (
%)
Quarterly Rate Changes
Q1 2020 Q2 2020 Q3 2020 Q4 2020 Q1 2021
Q2 2021 Q3 2021 Q4 2021 Q1 2022 QTD (4/15)
Rate Changes (2020 – YTD 2022)
Data Source: Bloomberg
7
wilshire.com | ©2022 Wilshire Advisors LLC
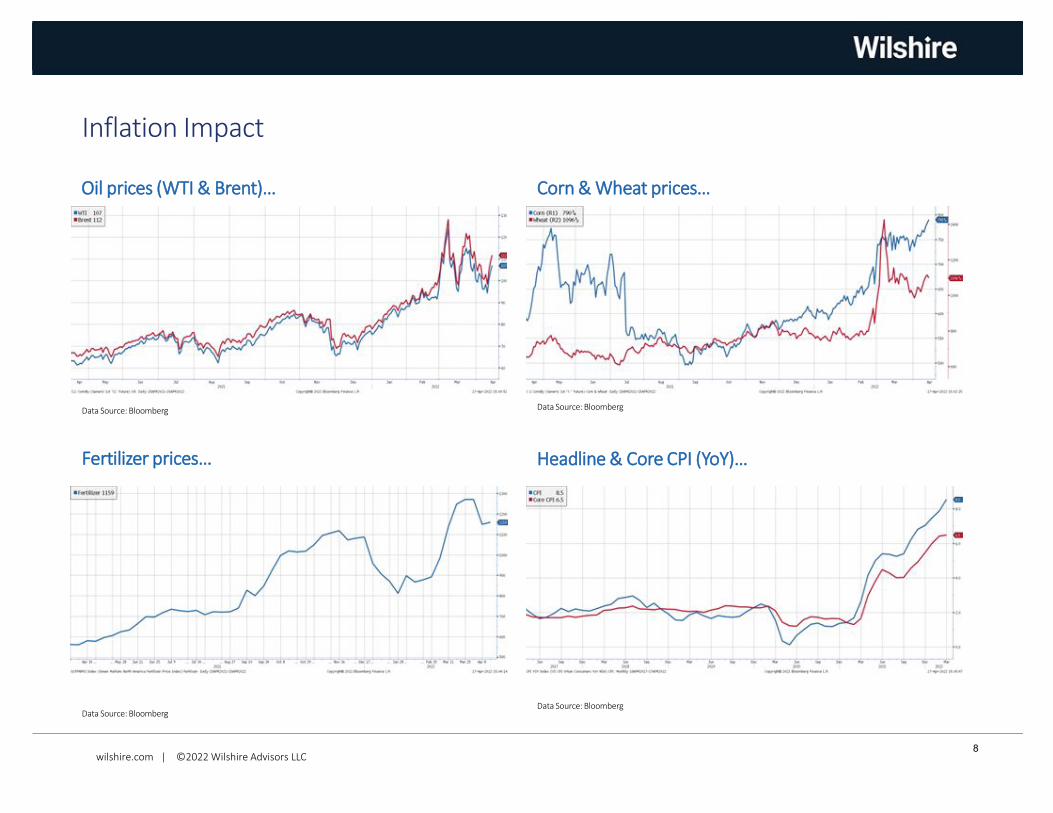
Inflation Impact
Oil prices (WTI & Brent)…
Data Source: Bloomberg
Fertilizer prices…
Data Source: Bloomberg
Corn & Wheat prices…
Data Source: Bloomberg
Headline & Core CPI (YoY)…
Data Source: Bloomberg
8
wilshire.com | ©2022 Wilshire Advisors LLC
Data Source: Bloomberg
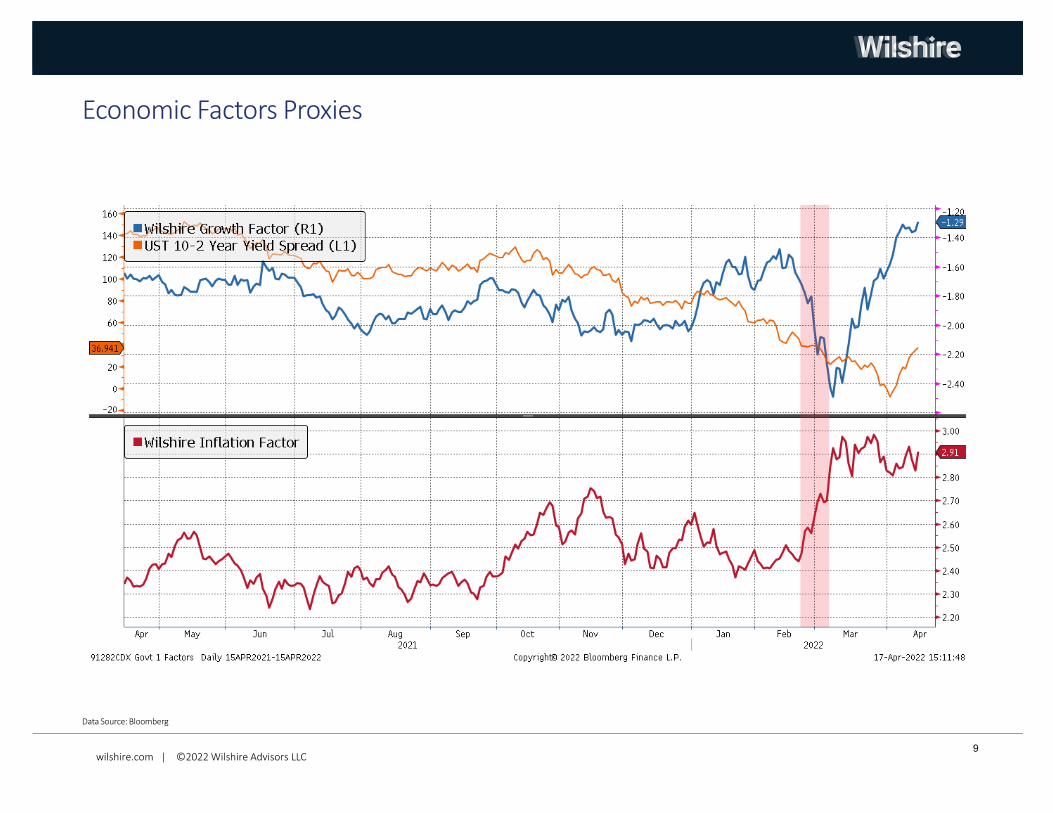
Economic Factors Proxies
9
wilshire.com | ©2022 Wilshire Advisors LLC
Data Source: Bloomberg
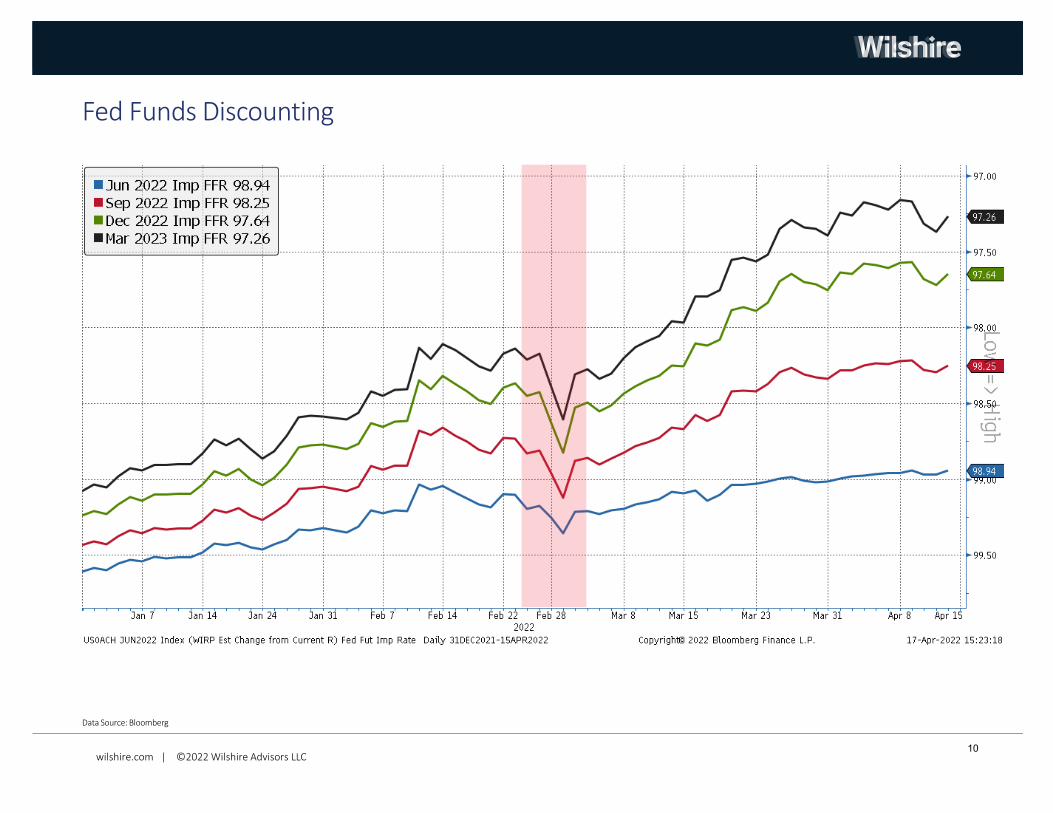
Fed Funds Discounting
10
wilshire.com | ©2022 Wilshire Advisors LLC
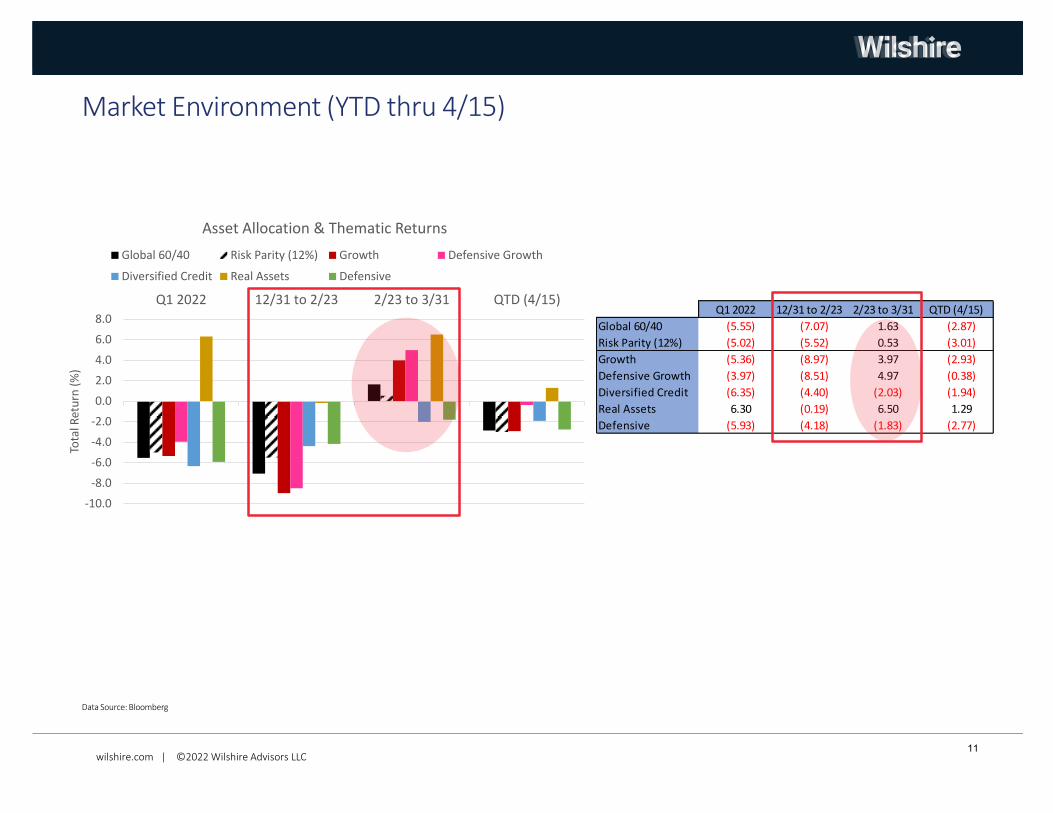
-10.0
-8.0
-6.0
-4.0
-2.0
0.0
2.0
4.0
6.0
8.0
Q1 2022 12/31 to 2/23 2/23 to 3/31 QTD (4/15)
Tota
l Ret
urn
(%
)
Asset Allocation & Thematic Returns
Global 60/40 Risk Parity (12%) Growth Defensive Growth
Diversified Credit Real Assets Defensive
Market Environment (YTD thru 4/15)
Data Source: Bloomberg
Q1 2022 12/31 to 2/23 2/23 to 3/31 QTD (4/15)
Global 60/40 (5.55) (7.07) 1.63 (2.87)
Risk Parity (12%) (5.02) (5.52) 0.53 (3.01)
Growth (5.36) (8.97) 3.97 (2.93)
Defensive Growth (3.97) (8.51) 4.97 (0.38)
Diversified Credit (6.35) (4.40) (2.03) (1.94)
Real Assets 6.30 (0.19) 6.50 1.29
Defensive (5.93) (4.18) (1.83) (2.77)
11
wilshire.com | ©2022 Wilshire Advisors LLC
Economic/Market Activity
wilshire.com | ©2022 Wilshire Advisors LLC
Data Sources: Bloomberg
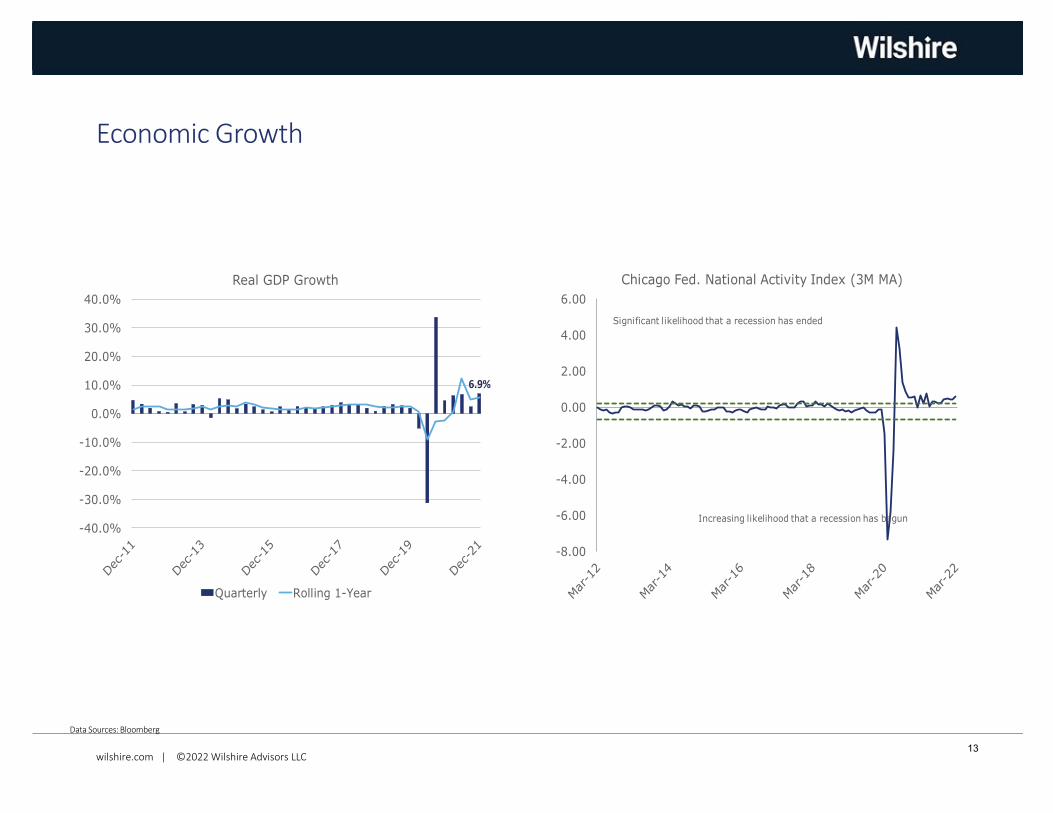
Economic Growth
6.9%
-40.0%
-30.0%
-20.0%
-10.0%
0.0%
10.0%
20.0%
30.0%
40.0%
Real GDP Growth
Quarterly Rolling 1-Year
-8.00
-6.00
-4.00
-2.00
0.00
2.00
4.00
6.00
Chicago Fed. National Activity Index (3M MA)
Increasing likelihood that a recession has begun
Significant likelihood that a recession has ended
13
wilshire.com | ©2022 Wilshire Advisors LLC
Data Sources: Bloomberg
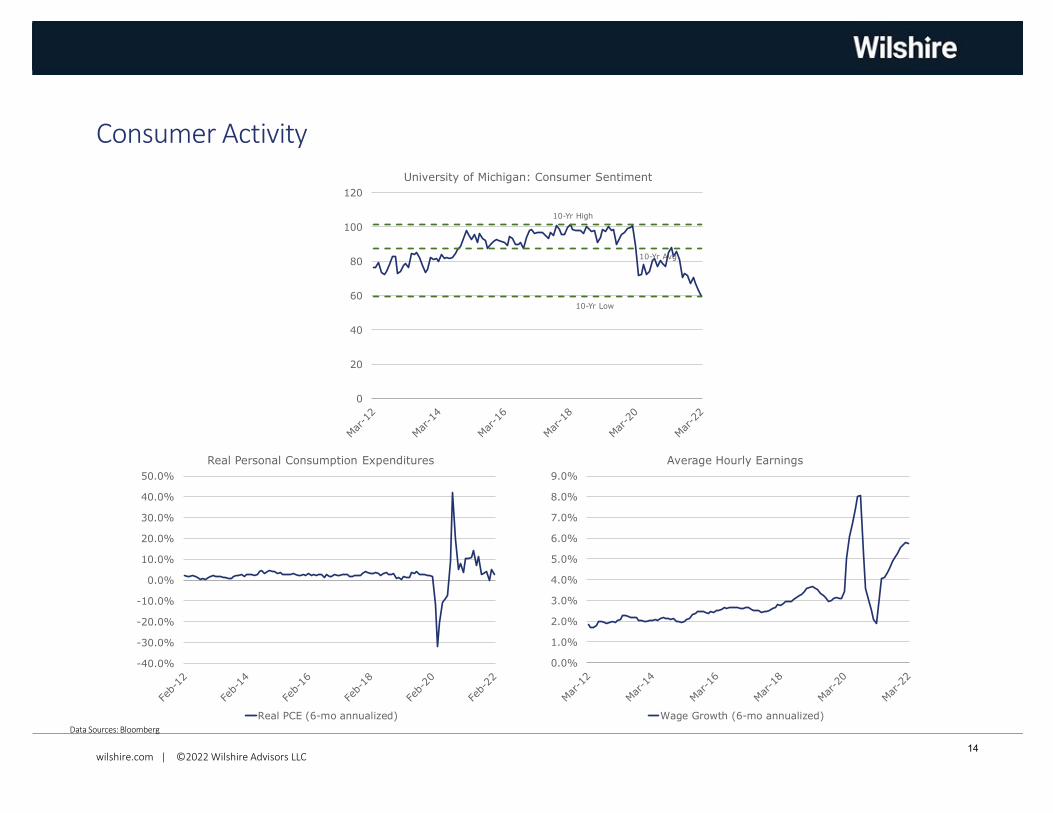
Consumer Activity
10-Yr High
10-Yr Low
10-Yr Avg
0
20
40
60
80
100
120
University of Michigan: Consumer Sentiment
-40.0%
-30.0%
-20.0%
-10.0%
0.0%
10.0%
20.0%
30.0%
40.0%
50.0%
Real Personal Consumption Expenditures
Real PCE (6-mo annualized)
0.0%
1.0%
2.0%
3.0%
4.0%
5.0%
6.0%
7.0%
8.0%
9.0%
Average Hourly Earnings
Wage Growth (6-mo annualized)
14
wilshire.com | ©2022 Wilshire Advisors LLC
Data Sources: Bloomberg
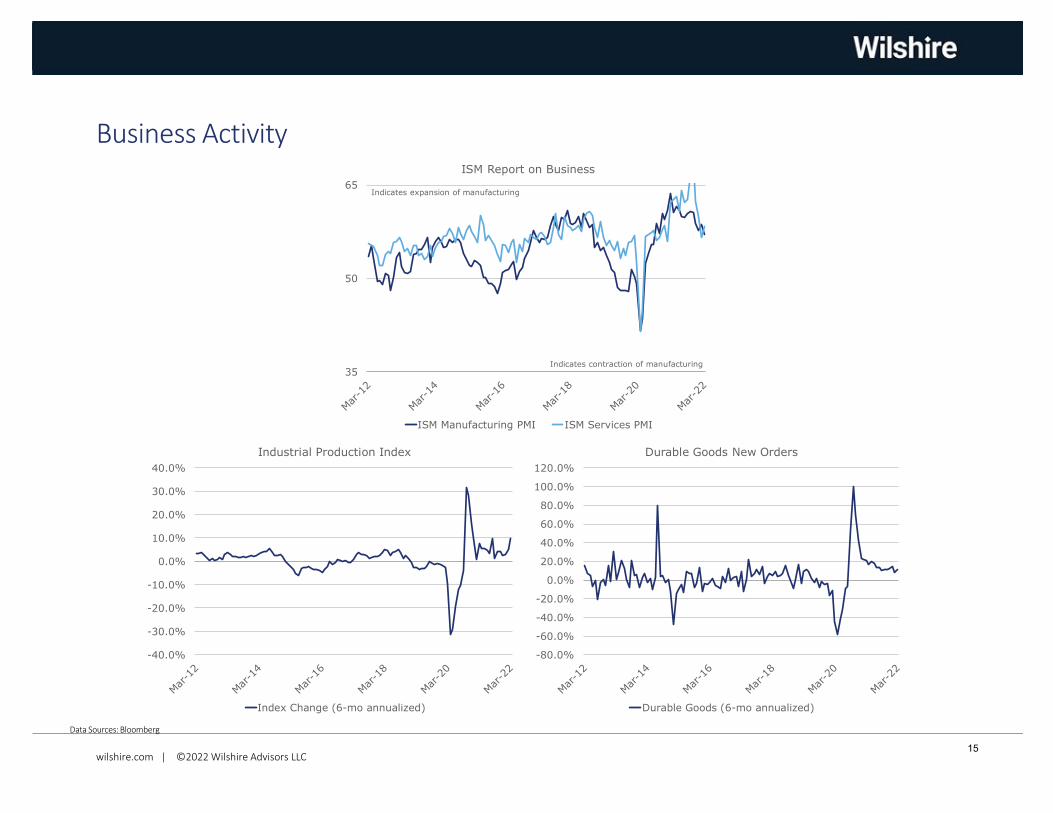
Business Activity
35
50
65
ISM Report on Business
ISM Manufacturing PMI ISM Services PMI
Indicates expansion of manufacturing
Indicates contraction of manufacturing
-40.0%
-30.0%
-20.0%
-10.0%
0.0%
10.0%
20.0%
30.0%
40.0%
Industrial Production Index
Index Change (6-mo annualized)
-80.0%
-60.0%
-40.0%
-20.0%
0.0%
20.0%
40.0%
60.0%
80.0%
100.0%
120.0%
Durable Goods New Orders
Durable Goods (6-mo annualized)
15
wilshire.com | ©2022 Wilshire Advisors LLC
Data Sources: Bloomberg
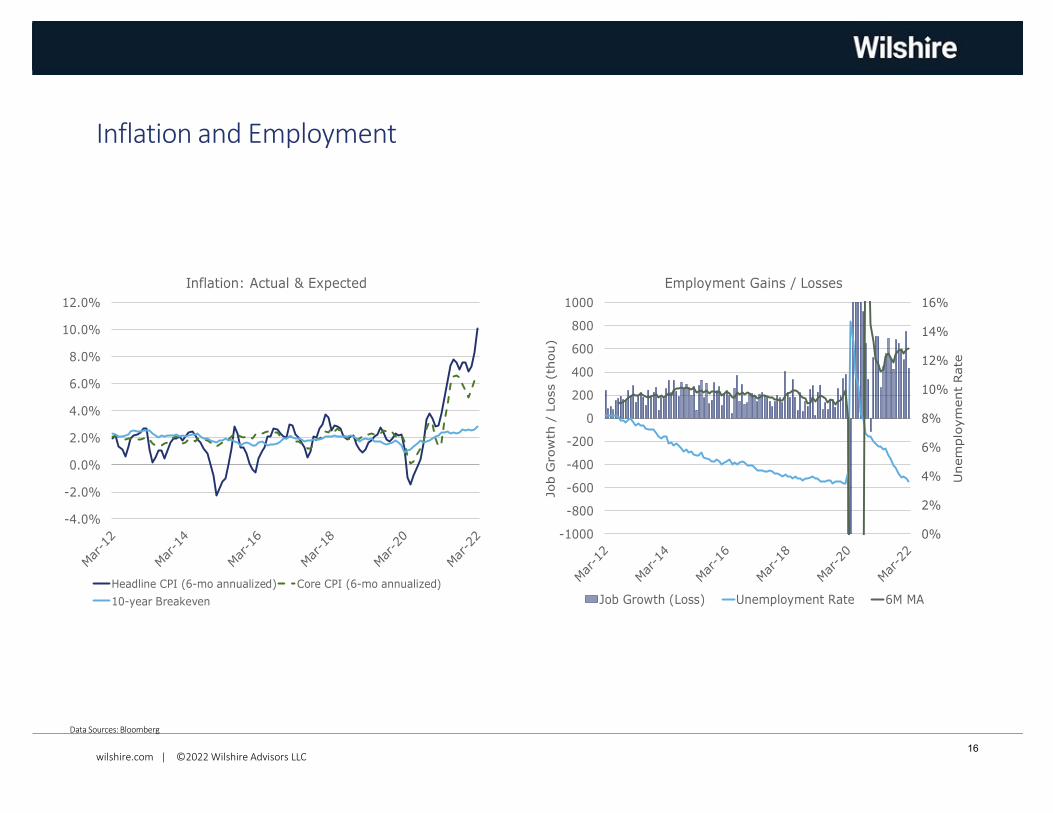
Inflation and Employment
-4.0%
-2.0%
0.0%
2.0%
4.0%
6.0%
8.0%
10.0%
12.0%
Inflation: Actual & Expected
Headline CPI (6-mo annualized) Core CPI (6-mo annualized)
10-year Breakeven
0%
2%
4%
6%
8%
10%
12%
14%
16%
-1000
-800
-600
-400
-200
0
200
400
600
800
1000
Unem
plo
ym
ent Rate
Job G
row
th /
Loss (
thou)
Employment Gains / Losses
Job Growth (Loss) Unemployment Rate 6M MA
16
wilshire.com | ©2022 Wilshire Advisors LLC
Data Sources: Bloomberg, Wilshire Atlas
U.S. Equity Market
FT Wilshire 5000 -4.9 -4.9 13.1 18.7 15.7 14.4
Wilshire U.S. Large Cap -4.8 -4.8 14.6 19.3 16.2 14.7
Wilshire U.S. Small Cap -6.1 -6.1 -1.4 12.8 10.4 11.8
Wilshire U.S. Large Growth -8.0 -8.0 16.3 23.5 19.9 16.8
Wilshire U.S. Large Value -0.7 -0.7 12.6 14.7 12.3 12.5
Wilshire U.S. Small Growth -10.3 -10.3 -9.4 12.5 11.5 11.9
Wilshire U.S. Small Value -1.8 -1.8 7.3 13.1 9.2 11.5
Wilshire REIT Index -3.9 -3.9 29.1 11.9 10.0 9.9
MSCI USA Min. Vol. Index -3.8 -3.8 13.8 11.8 12.5 13.0
FTSE RAFI U.S. 1000 Index 0.1 0.1 15.1 17.5 13.5 13.6
10 YearAs of 3/31/2022 Quarter YTD 1 Year 3 Year 5 Year -8.4
-2.6
-9.0
-1.5
-11.9
-2.4
-1.0
39.0
-6.2
4.8
-2.4
-4.9
20.9
19.1
9.8
14.7
-0.9
6.1
16.1
64.3
25.8
19.9
13.9
13.1
Information Technology
Health Care
Consumer Discretionary
Financials
Communication Services
Industrials
Consumer Staples
Energy
Real Estate
Utilities
Materials
FT Wilshire 5000
-20 -10 0 10 20 30 40 50 60 70
28.1
13.7
12.1
10.5
9.3
8.0
6.2
3.9
2.8
2.8
2.6
U.S. Sector Weight and Return (%)
Quarter 1 Year
-20.0%
-15.0%
-10.0%
-5.0%
0.0%
5.0%
10.0%
15.0%
20.0%
Large Cap vs Small Cap
Quarterly Excess Rolling 3-Year Excess
-10.0%
-5.0%
0.0%
5.0%
10.0%
15.0%
Large Growth vs Large Value
Quarterly Excess Rolling 3-Year Excess
17
wilshire.com | ©2022 Wilshire Advisors LLC
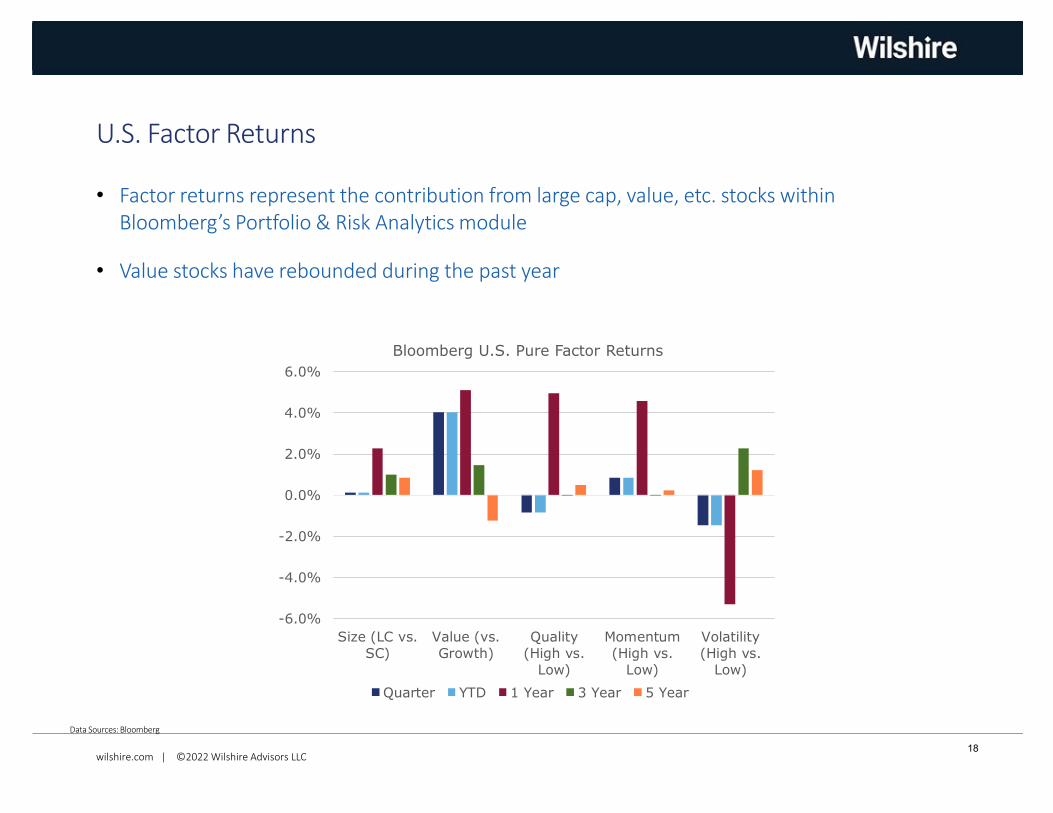
• Factor returns represent the contribution from large cap, value, etc. stocks withinBloomberg’s Portfolio & Risk Analytics module
• Value stocks have rebounded during the past year
Data Sources: Bloomberg
U.S. Factor Returns
-6.0%
-4.0%
-2.0%
0.0%
2.0%
4.0%
6.0%
Size (LC vs.
SC)
Value (vs.
Growth)
Quality
(High vs.
Low)
Momentum
(High vs.
Low)
Volatility
(High vs.
Low)
Bloomberg U.S. Pure Factor Returns
Quarter YTD 1 Year 3 Year 5 Year
18
wilshire.com | ©2022 Wilshire Advisors LLC
Data Sources: Bloomberg
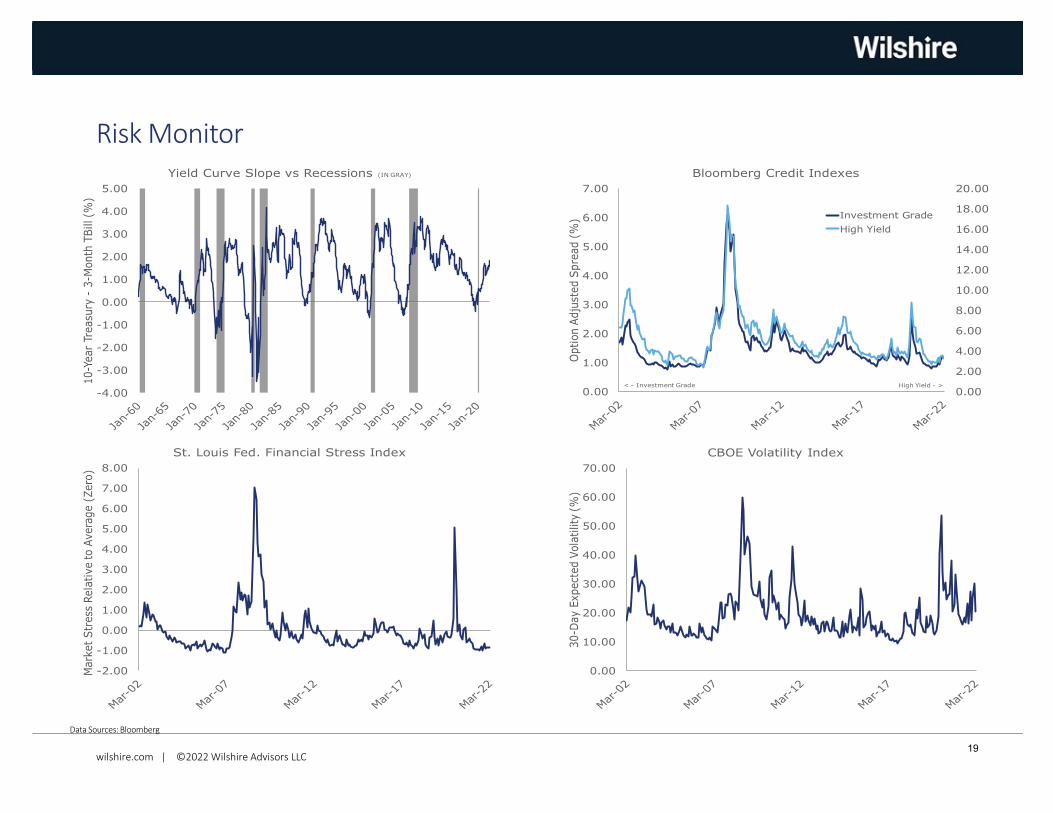
Risk Monitor
-4.00
-3.00
-2.00
-1.00
0.00
1.00
2.00
3.00
4.00
5.00
10-Y
ear
Treasu
ry -
3-M
onth
TBill (%
)
Yield Curve Slope vs Recessions (IN GRAY)
0.00
2.00
4.00
6.00
8.00
10.00
12.00
14.00
16.00
18.00
20.00
0.00
1.00
2.00
3.00
4.00
5.00
6.00
7.00
Option A
dju
sted S
pre
ad (
%)
Bloomberg Credit Indexes
Investment Grade
High Yield
< - Investment Grade High Yield - >
-2.00
-1.00
0.00
1.00
2.00
3.00
4.00
5.00
6.00
7.00
8.00
Mark
et
Str
ess
Rela
tive to A
vera
ge (
Zero
)
St. Louis Fed. Financial Stress Index
0.00
10.00
20.00
30.00
40.00
50.00
60.00
70.00
30-D
ay E
xpect
ed V
ola
tility
(%
)
CBOE Volatility Index
19
wilshire.com | ©2022 Wilshire Advisors LLC
Data Sources: Bloomberg
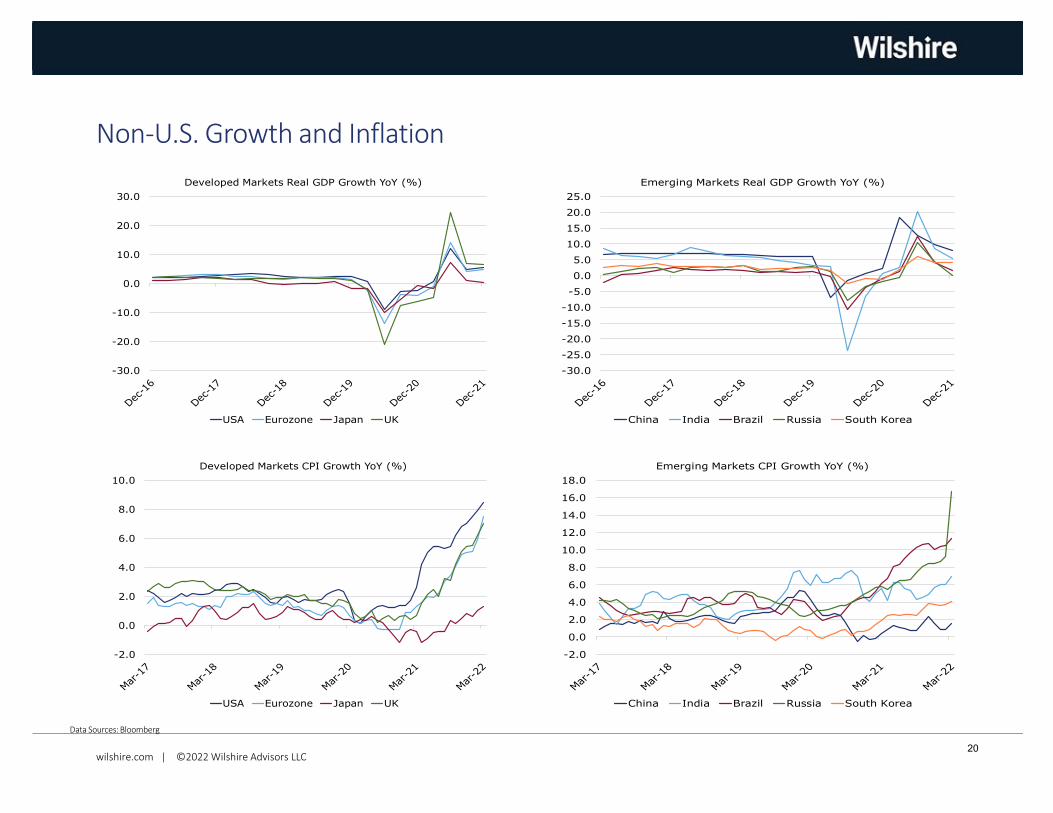
Non-U.S. Growth and Inflation
-30.0
-20.0
-10.0
0.0
10.0
20.0
30.0
Developed Markets Real GDP Growth YoY (%)
USA Eurozone Japan UK
-30.0
-25.0
-20.0
-15.0
-10.0
-5.0
0.0
5.0
10.0
15.0
20.0
25.0
Emerging Markets Real GDP Growth YoY (%)
China India Brazil Russia South Korea
-2.0
0.0
2.0
4.0
6.0
8.0
10.0
Developed Markets CPI Growth YoY (%)
USA Eurozone Japan UK
-2.0
0.0
2.0
4.0
6.0
8.0
10.0
12.0
14.0
16.0
18.0
Emerging Markets CPI Growth YoY (%)
China India Brazil Russia South Korea
20
wilshire.com | ©2022 Wilshire Advisors LLC
Data Sources: Bloomberg
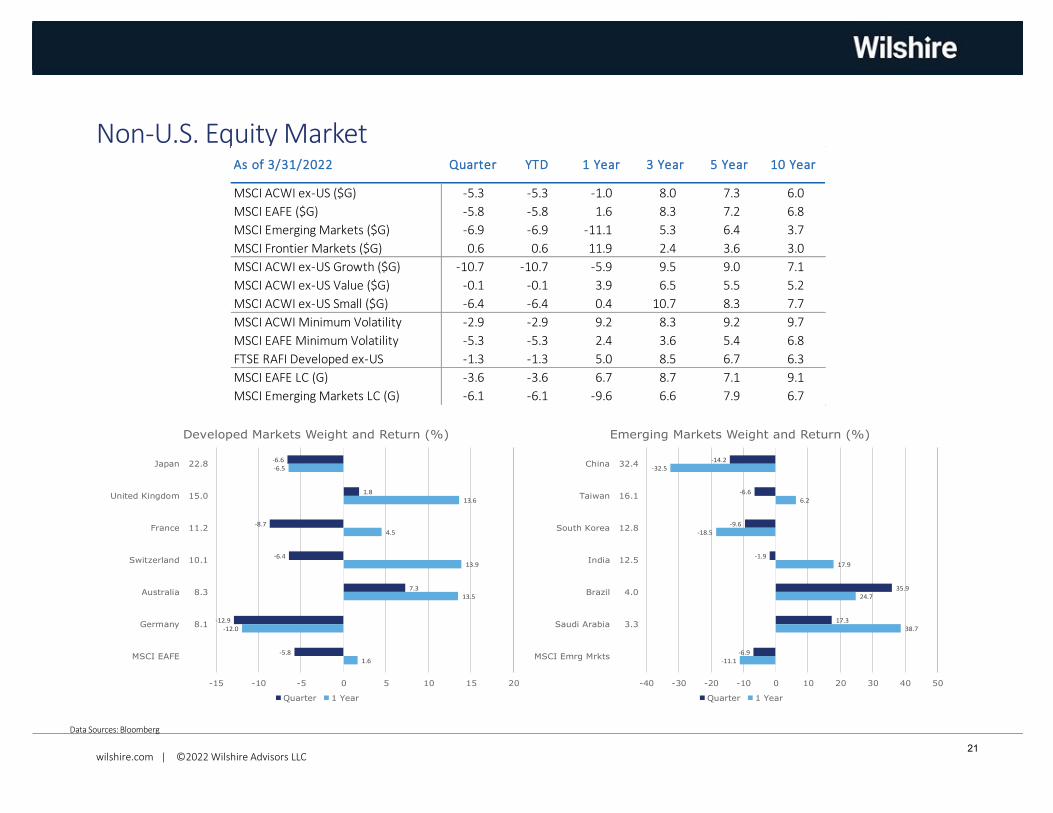
Non-U.S. Equity Market
MSCI ACWI ex-US ($G) -5.3 -5.3 -1.0 8.0 7.3 6.0
MSCI EAFE ($G) -5.8 -5.8 1.6 8.3 7.2 6.8
MSCI Emerging Markets ($G) -6.9 -6.9 -11.1 5.3 6.4 3.7
MSCI Frontier Markets ($G) 0.6 0.6 11.9 2.4 3.6 3.0
MSCI ACWI ex-US Growth ($G) -10.7 -10.7 -5.9 9.5 9.0 7.1
MSCI ACWI ex-US Value ($G) -0.1 -0.1 3.9 6.5 5.5 5.2
MSCI ACWI ex-US Small ($G) -6.4 -6.4 0.4 10.7 8.3 7.7
MSCI ACWI Minimum Volatility -2.9 -2.9 9.2 8.3 9.2 9.7
MSCI EAFE Minimum Volatility -5.3 -5.3 2.4 3.6 5.4 6.8
FTSE RAFI Developed ex-US -1.3 -1.3 5.0 8.5 6.7 6.3
MSCI EAFE LC (G) -3.6 -3.6 6.7 8.7 7.1 9.1
MSCI Emerging Markets LC (G) -6.1 -6.1 -9.6 6.6 7.9 6.7
10 YearAs of 3/31/2022 Quarter YTD 1 Year 3 Year 5 Year
-6.6
1.8
-8.7
-6.4
7.3
-12.9
-5.8
-6.5
13.6
4.5
13.9
13.5
-12.0
1.6
Japan
United Kingdom
France
Switzerland
Australia
Germany
MSCI EAFE
-15 -10 -5 0 5 10 15 20
22.8
15.0
11.2
10.1
8.3
8.1
Developed Markets Weight and Return (%)
Quarter 1 Year
-14.2
-6.6
-9.6
-1.9
35.9
17.3
-6.9
-32.5
6.2
-18.5
17.9
24.7
38.7
-11.1
China
Taiwan
South Korea
India
Brazil
Saudi Arabia
MSCI Emrg Mrkts
-40 -30 -20 -10 0 10 20 30 40 50
32.4
16.1
12.8
12.5
4.0
3.3
Emerging Markets Weight and Return (%)
Quarter 1 Year
21
wilshire.com | ©2022 Wilshire Advisors LLC
Data Sources: Bloomberg
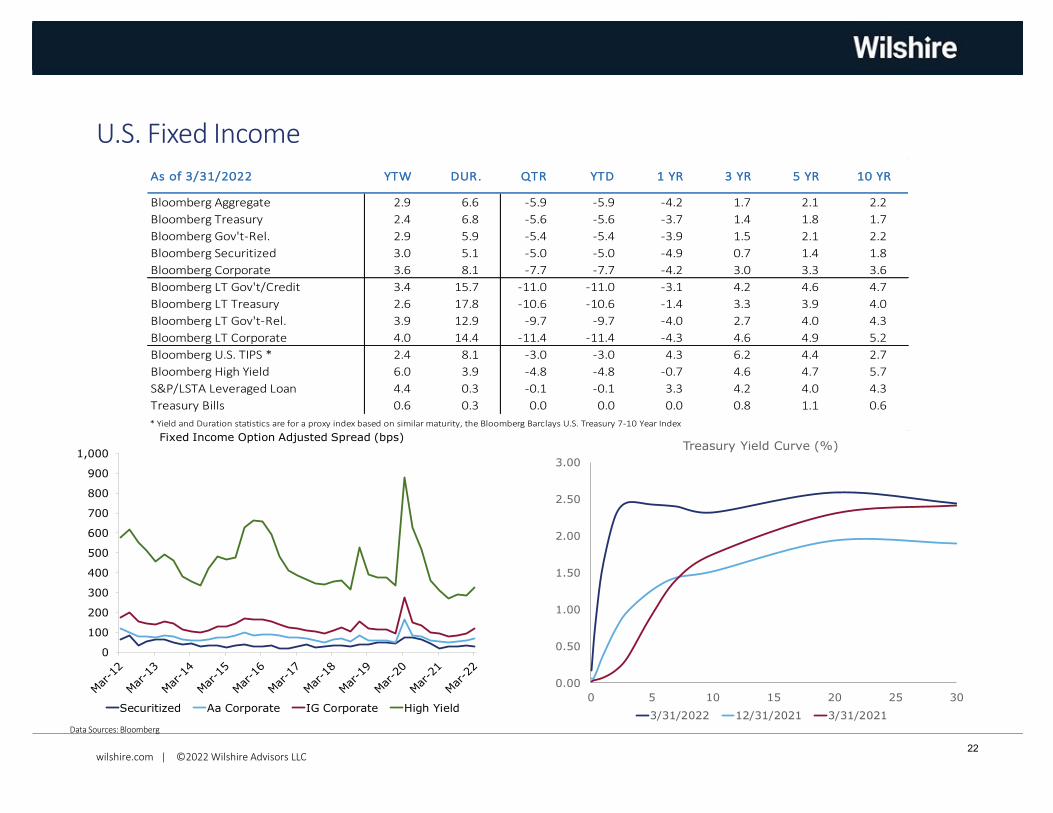
U.S. Fixed Income
0
100
200
300
400
500
600
700
800
900
1,000
Fixed Income Option Adjusted Spread (bps)
Securitized Aa Corporate IG Corporate High Yield
0.00
0.50
1.00
1.50
2.00
2.50
3.00
0 5 10 15 20 25 30
Treasury Yield Curve (%)
3/31/2022 12/31/2021 3/31/2021
Bloomberg Aggregate 2.9 6.6 -5.9 -5.9 -4.2 1.7 2.1 2.2
Bloomberg Treasury 2.4 6.8 -5.6 -5.6 -3.7 1.4 1.8 1.7
Bloomberg Gov't-Rel. 2.9 5.9 -5.4 -5.4 -3.9 1.5 2.1 2.2
Bloomberg Securitized 3.0 5.1 -5.0 -5.0 -4.9 0.7 1.4 1.8
Bloomberg Corporate 3.6 8.1 -7.7 -7.7 -4.2 3.0 3.3 3.6
Bloomberg LT Gov't/Credit 3.4 15.7 -11.0 -11.0 -3.1 4.2 4.6 4.7
Bloomberg LT Treasury 2.6 17.8 -10.6 -10.6 -1.4 3.3 3.9 4.0
Bloomberg LT Gov't-Rel. 3.9 12.9 -9.7 -9.7 -4.0 2.7 4.0 4.3
Bloomberg LT Corporate 4.0 14.4 -11.4 -11.4 -4.3 4.6 4.9 5.2
Bloomberg U.S. TIPS * 2.4 8.1 -3.0 -3.0 4.3 6.2 4.4 2.7
Bloomberg High Yield 6.0 3.9 -4.8 -4.8 -0.7 4.6 4.7 5.7
S&P/LSTA Leveraged Loan 4.4 0.3 -0.1 -0.1 3.3 4.2 4.0 4.3
Treasury Bills 0.6 0.3 0.0 0.0 0.0 0.8 1.1 0.6
* Yield and Duration statistics are for a proxy index based on similar maturity, the Bloomberg Barclays U.S. Treasury 7-10 Year Index
10 YRAs of 3/31/2022 QTR YTD 1 YR 3 YR 5 YRDUR.YTW
22
wilshire.com | ©2022 Wilshire Advisors LLC
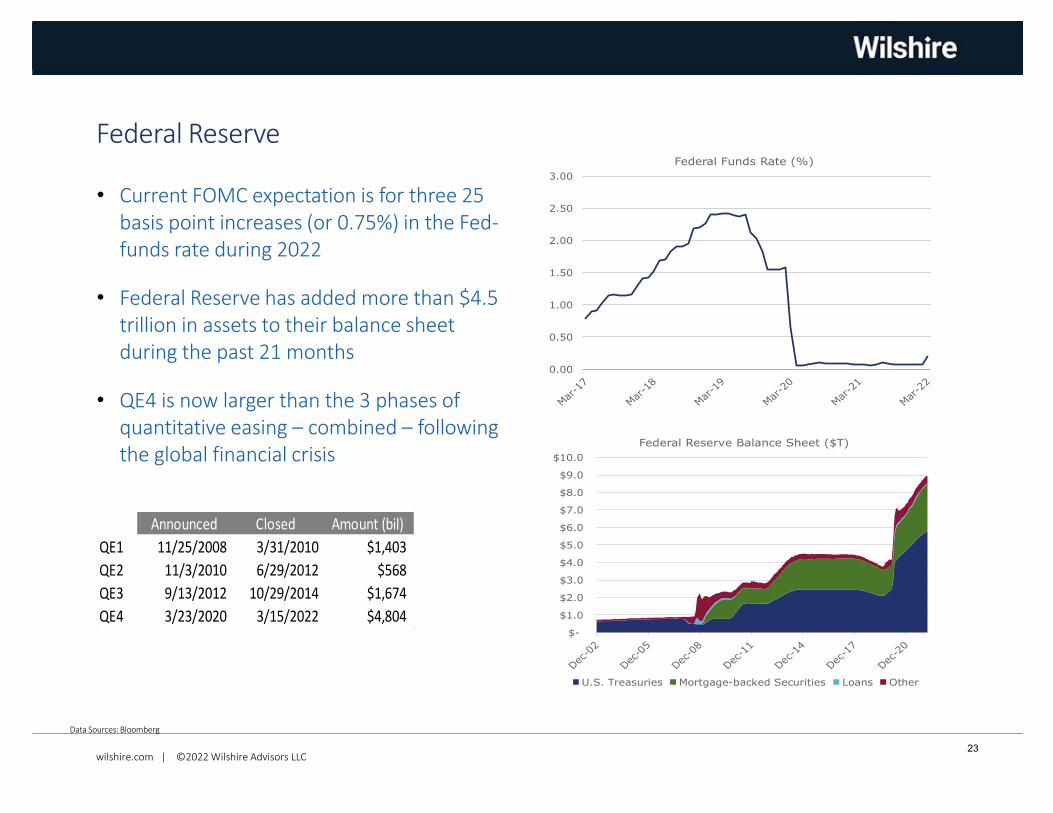
• Current FOMC expectation is for three 25basis point increases (or 0.75%) in the Fed-funds rate during 2022
• Federal Reserve has added more than $4.5trillion in assets to their balance sheetduring the past 21 months
• QE4 is now larger than the 3 phases ofquantitative easing – combined – followingthe global financial crisis
Data Sources: Bloomberg
Federal Reserve
Announced Closed Amount (bil)
QE1 11/25/2008 3/31/2010 $1,403
QE2 11/3/2010 6/29/2012 $568
QE3 9/13/2012 10/29/2014 $1,674
QE4 3/23/2020 3/15/2022 $4,804
0.00
0.50
1.00
1.50
2.00
2.50
3.00
Federal Funds Rate (%)
$-
$1.0
$2.0
$3.0
$4.0
$5.0
$6.0
$7.0
$8.0
$9.0
$10.0
Federal Reserve Balance Sheet ($T)
U.S. Treasuries Mortgage-backed Securities Loans Other
23
wilshire.com | ©2022 Wilshire Advisors LLC
Data Sources: Bloomberg
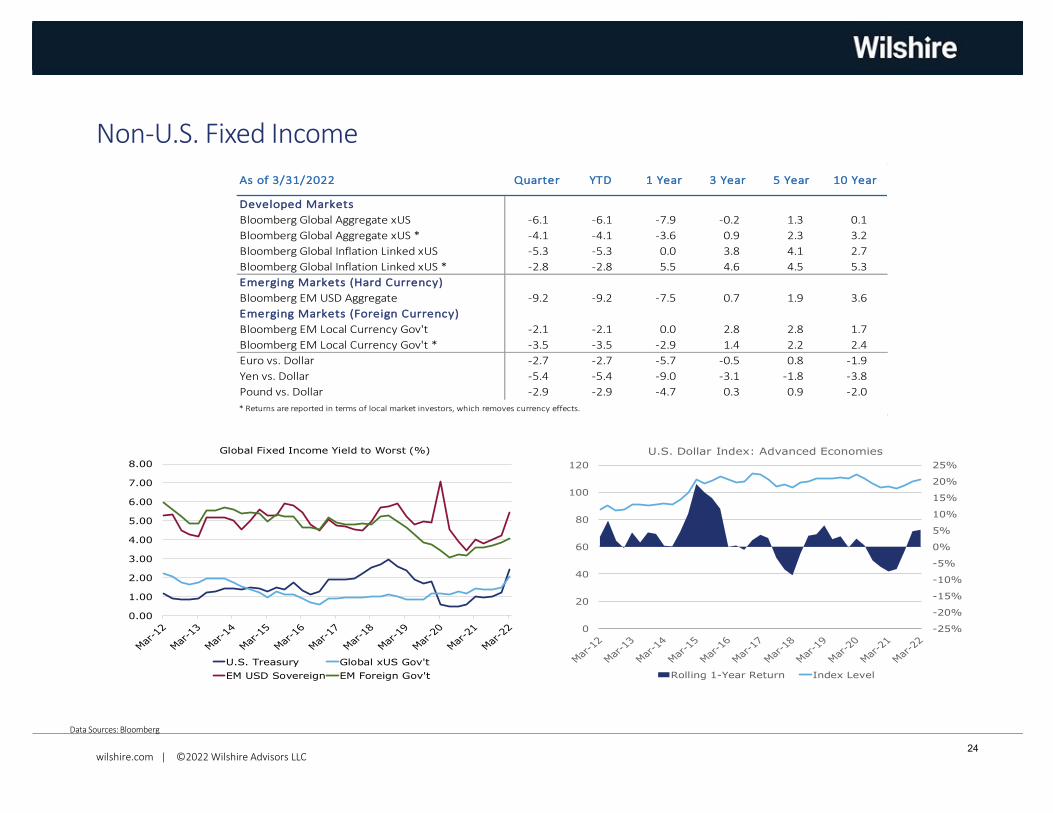
Non-U.S. Fixed Income
Developed Markets
Bloomberg Global Aggregate xUS -6.1 -6.1 -7.9 -0.2 1.3 0.1
Bloomberg Global Aggregate xUS * -4.1 -4.1 -3.6 0.9 2.3 3.2
Bloomberg Global Inflation Linked xUS -5.3 -5.3 0.0 3.8 4.1 2.7
Bloomberg Global Inflation Linked xUS * -2.8 -2.8 5.5 4.6 4.5 5.3
Emerging Markets (Hard Currency)
Bloomberg EM USD Aggregate -9.2 -9.2 -7.5 0.7 1.9 3.6
Emerging Markets (Foreign Currency)
Bloomberg EM Local Currency Gov't -2.1 -2.1 0.0 2.8 2.8 1.7
Bloomberg EM Local Currency Gov't * -3.5 -3.5 -2.9 1.4 2.2 2.4
Euro vs. Dollar -2.7 -2.7 -5.7 -0.5 0.8 -1.9
Yen vs. Dollar -5.4 -5.4 -9.0 -3.1 -1.8 -3.8
Pound vs. Dollar -2.9 -2.9 -4.7 0.3 0.9 -2.0
* Returns are reported in terms of local market investors, which removes currency effects.
3 Year 5 Year 10 YearAs of 3/31/2022 Quarter YTD 1 Year
0.00
1.00
2.00
3.00
4.00
5.00
6.00
7.00
8.00
Global Fixed Income Yield to Worst (%)
U.S. Treasury Global xUS Gov't
EM USD Sovereign EM Foreign Gov't
-25%
-20%
-15%
-10%
-5%
0%
5%
10%
15%
20%
25%
0
20
40
60
80
100
120
U.S. Dollar Index: Advanced Economies
Rolling 1-Year Return Index Level
24
wilshire.com | ©2022 Wilshire Advisors LLC
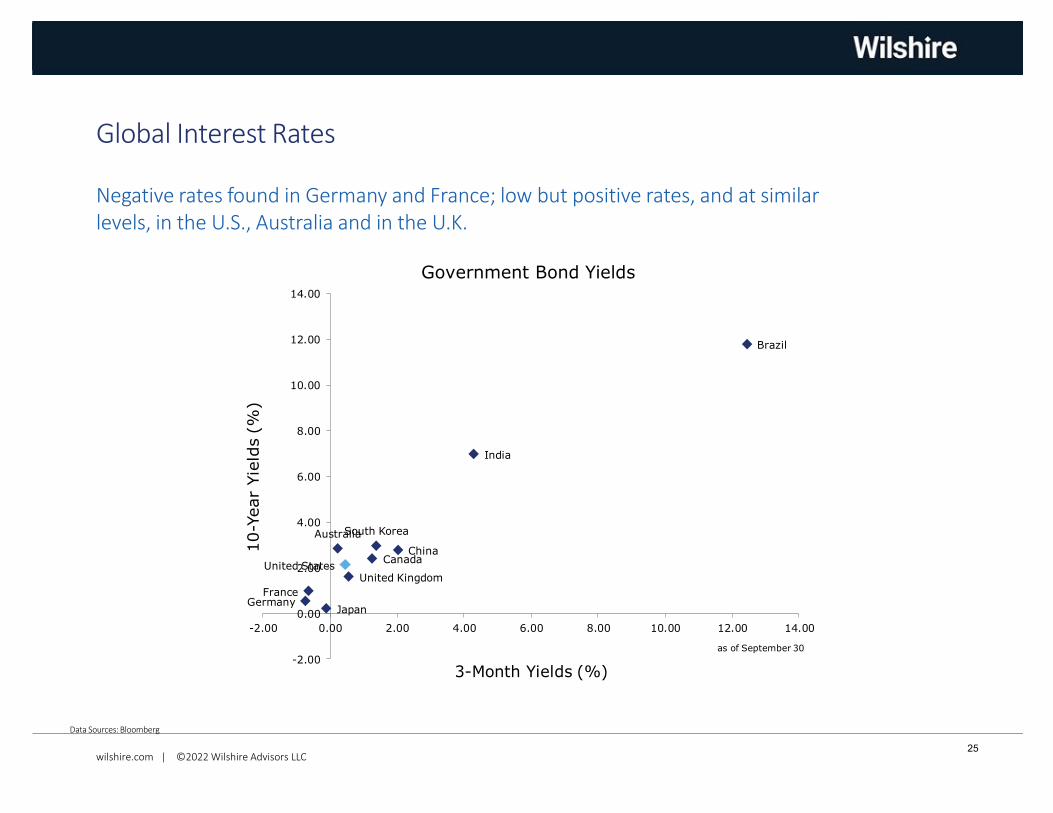
Negative rates found in Germany and France; low but positive rates, and at similar levels, in the U.S., Australia and in the U.K.
Data Sources: Bloomberg
Global Interest Rates
United States
GermanyFrance
United Kingdom
Japan
Australia
CanadaChina
South Korea
India
Brazil
-2.00
0.00
2.00
4.00
6.00
8.00
10.00
12.00
14.00
-2.00 0.00 2.00 4.00 6.00 8.00 10.00 12.00 14.00
10-Y
ear
Yie
lds (
%)
3-Month Yields (%)
Government Bond Yields
as of September 30
25
wilshire.com | ©2022 Wilshire Advisors LLC
Data Sources: Bloomberg
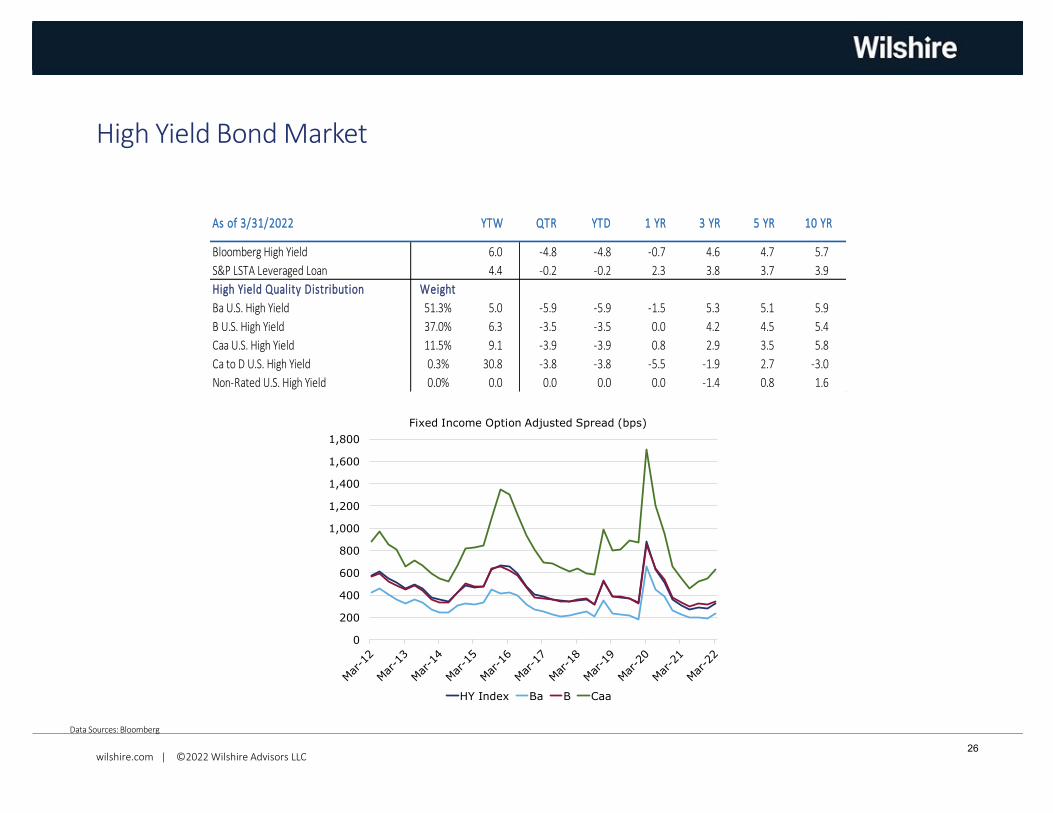
High Yield Bond Market
Bloomberg High Yield 6.0 -4.8 -4.8 -0.7 4.6 4.7 5.7
S&P LSTA Leveraged Loan 4.4 -0.2 -0.2 2.3 3.8 3.7 3.9
High Yield Quality Distribution Weight
Ba U.S. High Yield 51.3% 5.0 -5.9 -5.9 -1.5 5.3 5.1 5.9
B U.S. High Yield 37.0% 6.3 -3.5 -3.5 0.0 4.2 4.5 5.4
Caa U.S. High Yield 11.5% 9.1 -3.9 -3.9 0.8 2.9 3.5 5.8
Ca to D U.S. High Yield 0.3% 30.8 -3.8 -3.8 -5.5 -1.9 2.7 -3.0
Non-Rated U.S. High Yield 0.0% 0.0 0.0 0.0 0.0 -1.4 0.8 1.6
3 YR 5 YR 10 YRAs of 3/31/2022 YTW QTR YTD 1 YR
0
200
400
600
800
1,000
1,200
1,400
1,600
1,800
Fixed Income Option Adjusted Spread (bps)
HY Index Ba B Caa
26
wilshire.com | ©2022 Wilshire Advisors LLC
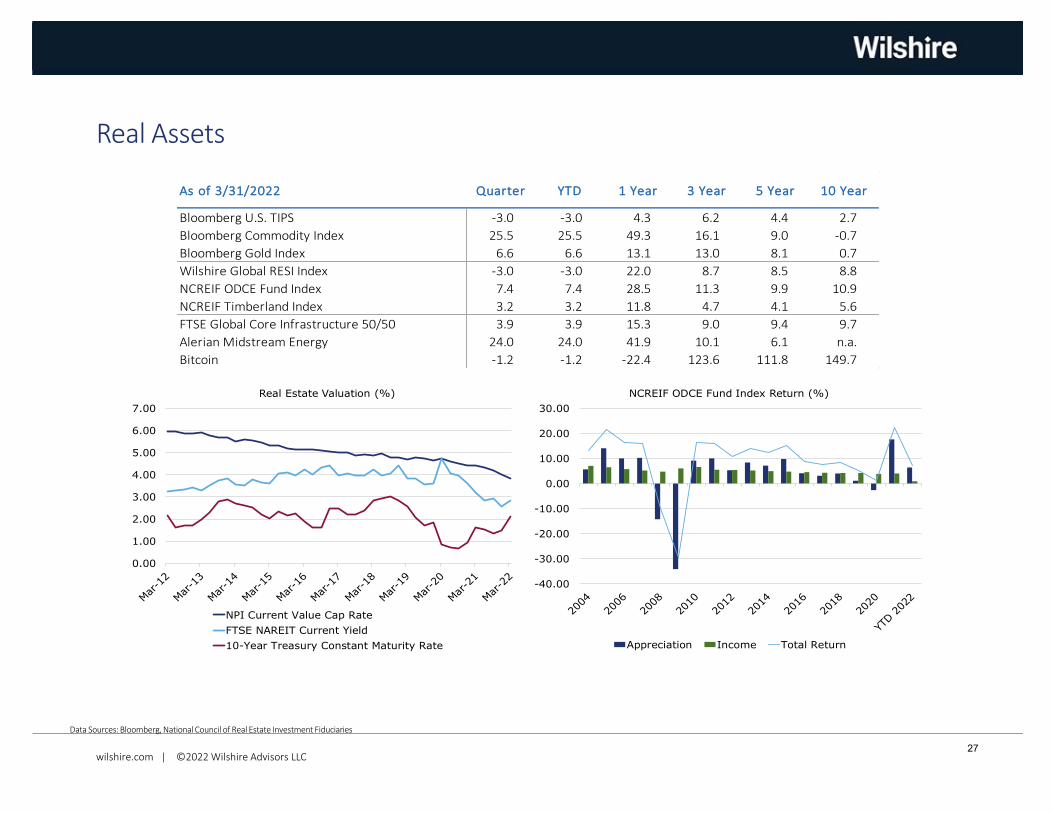
Data Sources: Bloomberg, National Council of Real Estate Investment Fiduciaries
Real Assets
-40.00
-30.00
-20.00
-10.00
0.00
10.00
20.00
30.00
NCREIF ODCE Fund Index Return (%)
Appreciation Income Total Return
0.00
1.00
2.00
3.00
4.00
5.00
6.00
7.00
Real Estate Valuation (%)
NPI Current Value Cap Rate
FTSE NAREIT Current Yield
10-Year Treasury Constant Maturity Rate
Bloomberg U.S. TIPS -3.0 -3.0 4.3 6.2 4.4 2.7
Bloomberg Commodity Index 25.5 25.5 49.3 16.1 9.0 -0.7
Bloomberg Gold Index 6.6 6.6 13.1 13.0 8.1 0.7
Wilshire Global RESI Index -3.0 -3.0 22.0 8.7 8.5 8.8
NCREIF ODCE Fund Index 7.4 7.4 28.5 11.3 9.9 10.9
NCREIF Timberland Index 3.2 3.2 11.8 4.7 4.1 5.6
FTSE Global Core Infrastructure 50/50 3.9 3.9 15.3 9.0 9.4 9.7
Alerian Midstream Energy 24.0 24.0 41.9 10.1 6.1 n.a.
Bitcoin -1.2 -1.2 -22.4 123.6 111.8 149.7
10 YearAs of 3/31/2022 Quarter YTD 1 Year 3 Year 5 Year
27
Total Fund
wilshire.com | @2022 Wilshire Advisors LLC
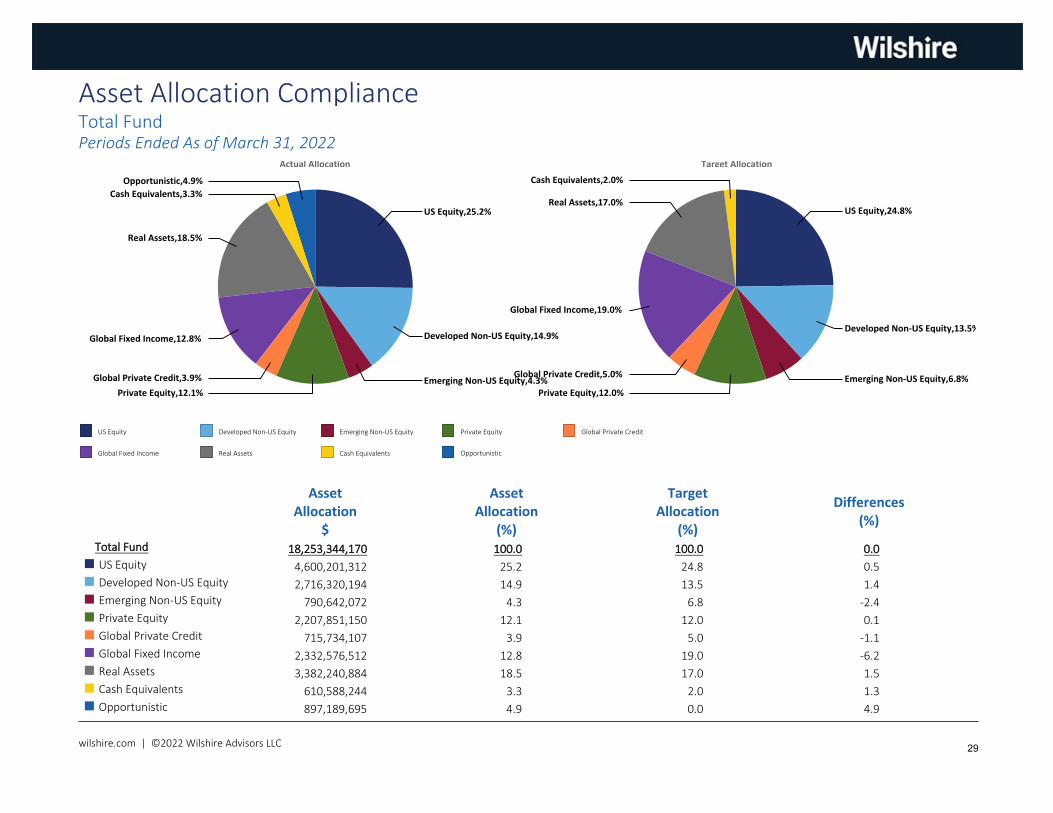
US Equity Developed Non-US Equity Emerging Non-US Equity Private Equity Global Private Credit
Global Fixed Income Real Assets Cash Equivalents Opportunistic
US Equity,25.2%
Developed Non-US Equity,14.9%
Emerging Non-US Equity,4.3%
Opportunistic,4.9%
Cash Equivalents,3.3%
Real Assets,18.5%
Global Fixed Income,12.8%
Global Private Credit,3.9%
Private Equity,12.1%
Actual Allocation
US Equity,24.8%
Developed Non-US Equity,13.5%
Emerging Non-US Equity,6.8%
Cash Equivalents,2.0%
Real Assets,17.0%
Global Fixed Income,19.0%
Global Private Credit,5.0%
Private Equity,12.0%
Target Allocation
AssetAllocation
$
AssetAllocation
(%)
TargetAllocation
(%)
Differences(%)
18,253,344,170 100.0 100.0 0.04,600,201,312 25.2 24.8 0.5
2,716,320,194 14.9 13.5 1.4
790,642,072 4.3 6.8 -2.4
2,207,851,150 12.1 12.0 0.1
715,734,107 3.9 5.0 -1.1
2,332,576,512 12.8 19.0 -6.2
3,382,240,884 18.5 17.0 1.5
610,588,244 3.3 2.0 1.3
¢Total Fund¢ US Equity
¢ Developed Non-US Equity
¢ Emerging Non-US Equity
¢ Private Equity
¢ Global Private Credit
¢ Global Fixed Income
¢ Real Assets
¢ Cash Equivalents
¢ Opportunistic 897,189,695 4.9 0.0 4.9
Asset Allocation ComplianceTotal FundPeriods Ended As of March 31, 2022
wilshire.com | ©2022 Wilshire Advisors LLC 29
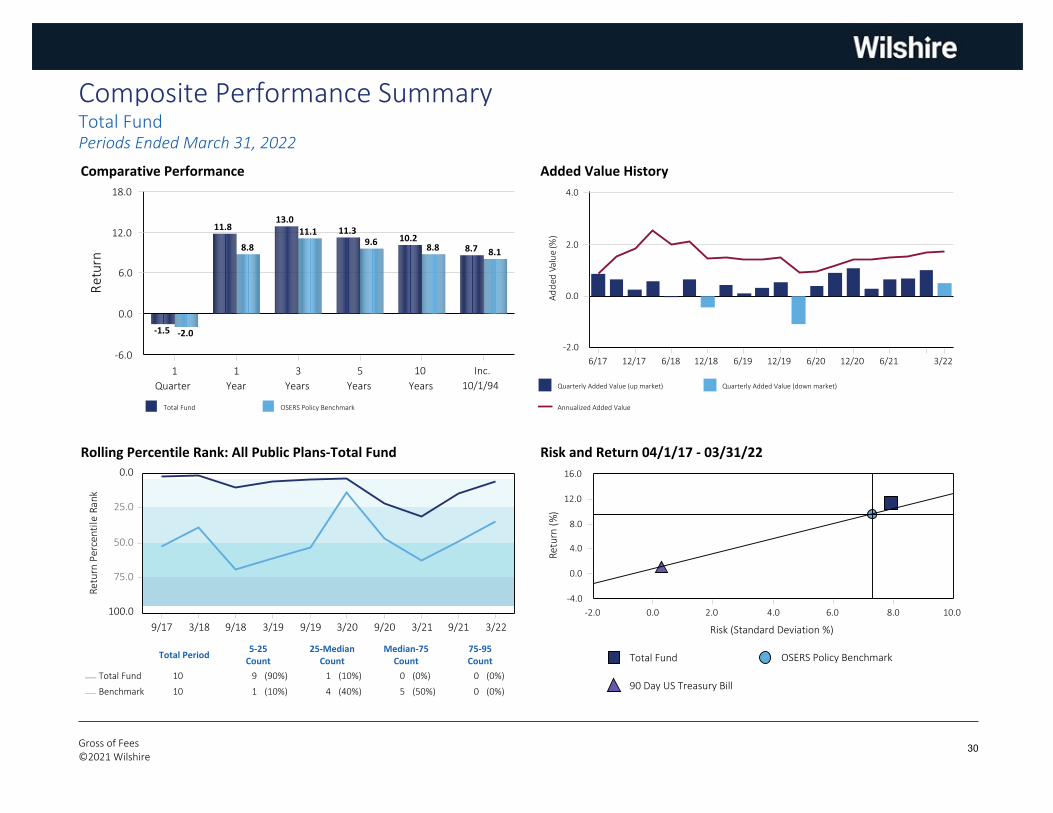
Comparative Performance
Total Fund OSERS Policy Benchmark
0.0
6.0
12.0
18.0
-6.0
Ret
urn
1
Quarter
1
Year
3
Years
5
Years
10
Years
Inc.
10/1/94
-2.0
8.8
11.19.6
8.8 8.1
-1.5
11.813.0
11.310.2
8.7
Added Value History
Quarterly Added Value (up market) Quarterly Added Value (down market)
Annualized Added Value
0.0
2.0
4.0
-2.0
Ad
ded
Valu
e (%
)
6/17 12/17 6/18 12/18 6/19 12/19 6/20 12/20 6/21 3/22
Rolling Percentile Rank: All Public Plans-Total Fund0.0
25.0
50.0
75.0
100.0
Retu
rn Pe
rcen
tile
Rank
9/17 3/18 9/18 3/19 9/19 3/20 9/20 3/21 9/21 3/22
Total Period5-25
Count25-Median
CountMedian-75
Count75-95Count
Total Fund 10 9 (90%) 1 (10%) 0 (0%) 0 (0%)¾
Benchmark 10 1 (10%) 4 (40%) 5 (50%) 0 (0%)¾
Risk and Return 04/1/17 - 03/31/22
Total Fund OSERS Policy Benchmark
90 Day US Treasury Bill
-4.0
0.0
4.0
8.0
12.0
16.0
Retu
rn (%
)
-2.0 0.0 2.0 4.0 6.0 8.0 10.0
Risk (Standard Deviation %)
Composite Performance SummaryTotal FundPeriods Ended March 31, 2022
Gross of Fees©2021 Wilshire
30
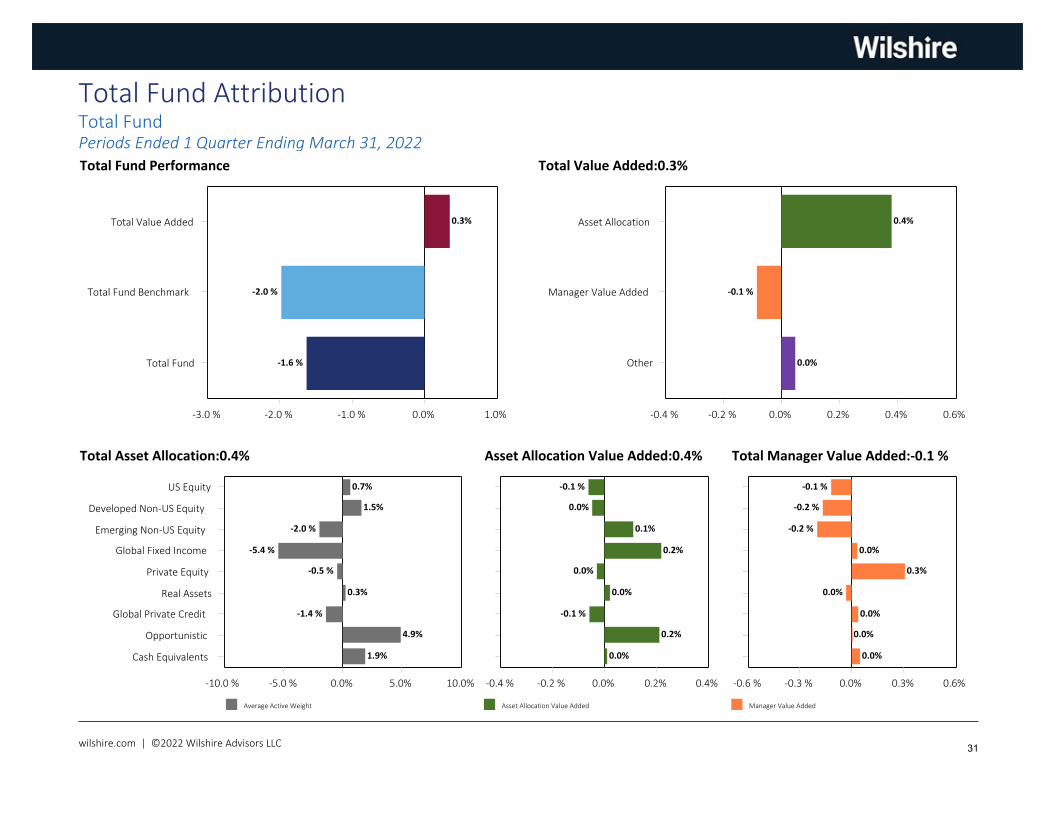
Total Fund Performance
0.0% 1.0%-1.0 %-2.0 %-3.0 %
Total Fund
Total Fund Benchmark
Total Value Added
-1.6 %
-2.0 %
0.3%
Total Value Added:0.3%
0.0% 0.2% 0.4% 0.6%-0.2 %-0.4 %
Other
Manager Value Added
Asset Allocation
0.0%
-0.1 %
0.4%
Total Asset Allocation:0.4%
Average Active Weight
0.0% 5.0% 10.0%-5.0 %-10.0 %
Cash Equivalents
Opportunistic
Global Private Credit
Real Assets
Private Equity
Global Fixed Income
Emerging Non-US Equity
Developed Non-US Equity
US Equity
1.9%
4.9%
-1.4 %
0.3%
-0.5 %
-5.4 %
-2.0 %
1.5%
0.7%
Asset Allocation Value Added:0.4%
Asset Allocation Value Added
0.0% 0.2% 0.4%-0.2 %-0.4 %
0.0%
0.2%
-0.1 %
0.0%
0.0%
0.2%
0.1%
0.0%
-0.1 %
Total Manager Value Added:-0.1 %
Manager Value Added
0.0% 0.3% 0.6%-0.3 %-0.6 %
0.0%
0.0%
0.0%
0.0%
0.3%
0.0%
-0.2 %
-0.2 %
-0.1 %
Total Fund AttributionTotal FundPeriods Ended 1 Quarter Ending March 31, 2022
wilshire.com | ©2022 Wilshire Advisors LLC 31
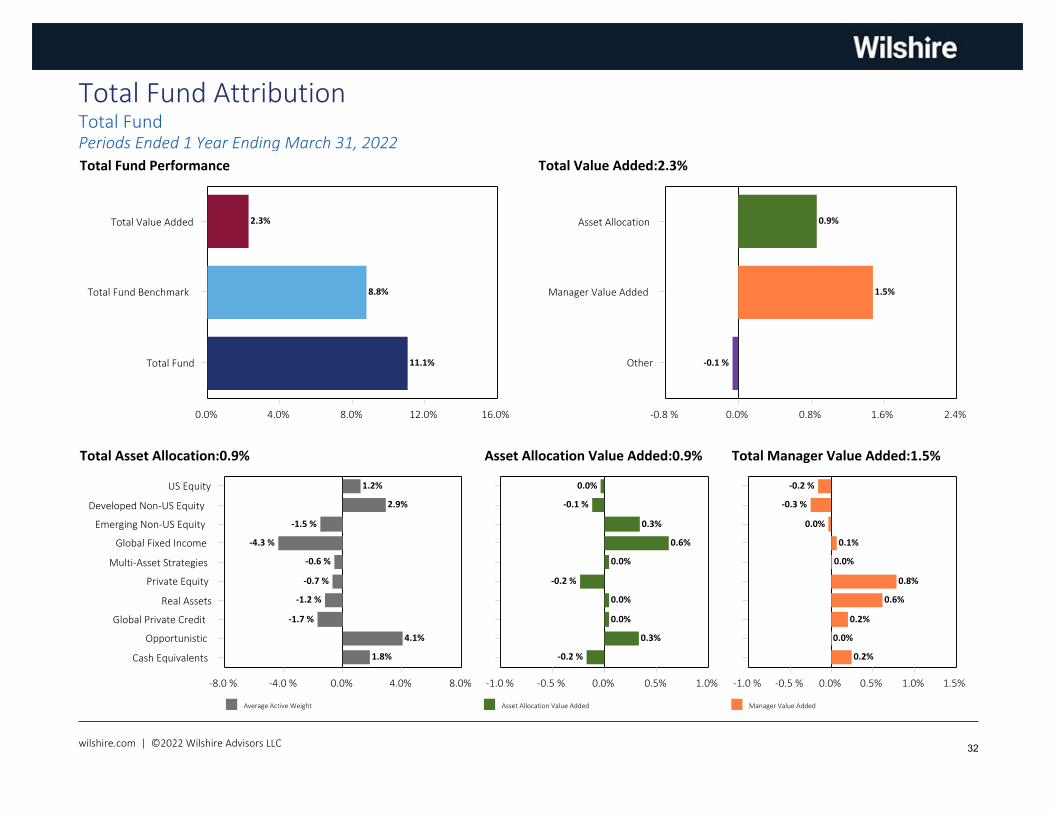
Total Fund Performance
0.0% 4.0% 8.0% 12.0% 16.0%
Total Fund
Total Fund Benchmark
Total Value Added
11.1%
8.8%
2.3%
Total Value Added:2.3%
0.0% 0.8% 1.6% 2.4%-0.8 %
Other
Manager Value Added
Asset Allocation
-0.1 %
1.5%
0.9%
Total Asset Allocation:0.9%
Average Active Weight
0.0% 4.0% 8.0%-4.0 %-8.0 %
Cash Equivalents
Opportunistic
Global Private Credit
Real Assets
Private Equity
Multi-Asset Strategies
Global Fixed Income
Emerging Non-US Equity
Developed Non-US Equity
US Equity
1.8%
4.1%
-1.7 %
-1.2 %
-0.7 %
-0.6 %
-4.3 %
-1.5 %
2.9%
1.2%
Asset Allocation Value Added:0.9%
Asset Allocation Value Added
0.0% 0.5% 1.0%-0.5 %-1.0 %
-0.2 %
0.3%
0.0%
0.0%
-0.2 %
0.0%
0.6%
0.3%
-0.1 %
0.0%
Total Manager Value Added:1.5%
Manager Value Added
0.0% 0.5% 1.0% 1.5%-0.5 %-1.0 %
0.2%
0.0%
0.2%
0.6%
0.8%
0.0%
0.1%
0.0%
-0.3 %
-0.2 %
Total Fund AttributionTotal FundPeriods Ended 1 Year Ending March 31, 2022
wilshire.com | ©2022 Wilshire Advisors LLC 32
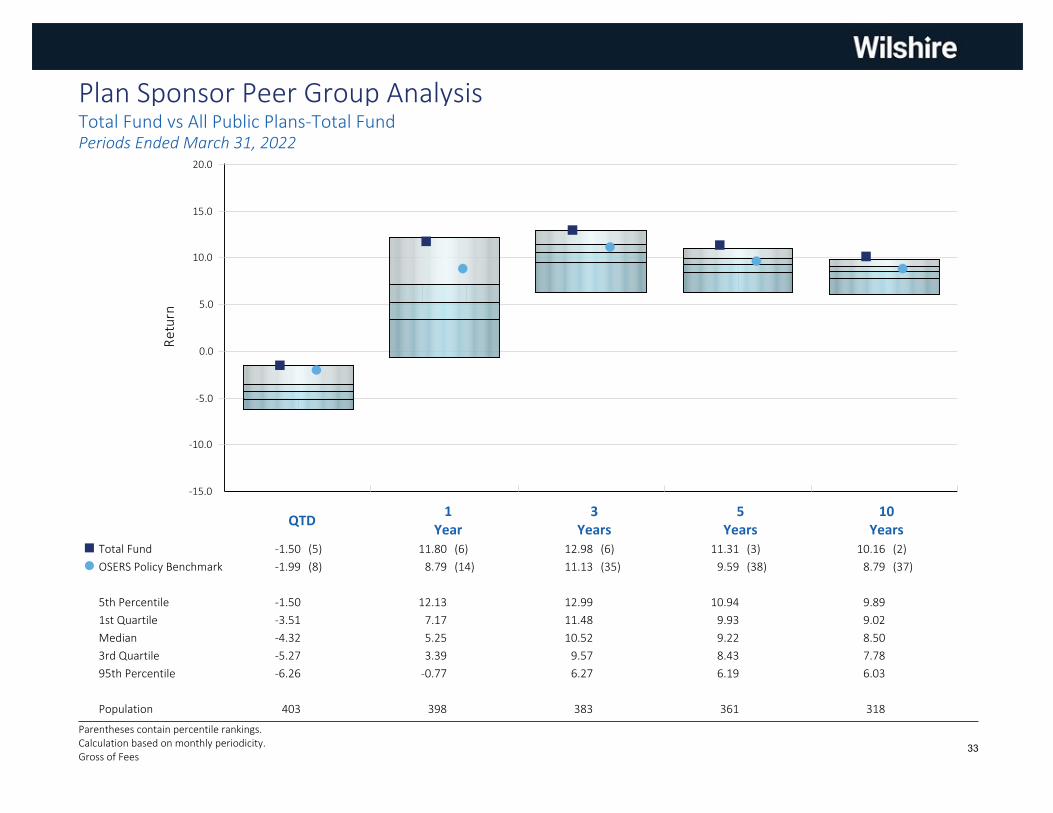
-15.0
-10.0
-5.0
0.0
5.0
10.0
15.0
20.0R
etu
rn
QTD1
Year3
Years5
Years10
YearsTotal Fund -1.50 (5) 11.80 (6) 12.98 (6) 11.31 (3) 10.16 (2)¢
OSERS Policy Benchmark -1.99 (8) 8.79 (14) 11.13 (35) 9.59 (38) 8.79 (37)�
5th Percentile -1.50 12.13 12.99 10.94 9.89
1st Quartile -3.51 7.17 11.48 9.93 9.02
Median -4.32 5.25 10.52 9.22 8.50
3rd Quartile -5.27 3.39 9.57 8.43 7.78
95th Percentile -6.26 -0.77 6.27 6.19 6.03
Population 403 398 383 361 318
Plan Sponsor Peer Group AnalysisTotal Fund vs All Public Plans-Total FundPeriods Ended March 31, 2022
Parentheses contain percentile rankings.Calculation based on monthly periodicity.Gross of Fees
33
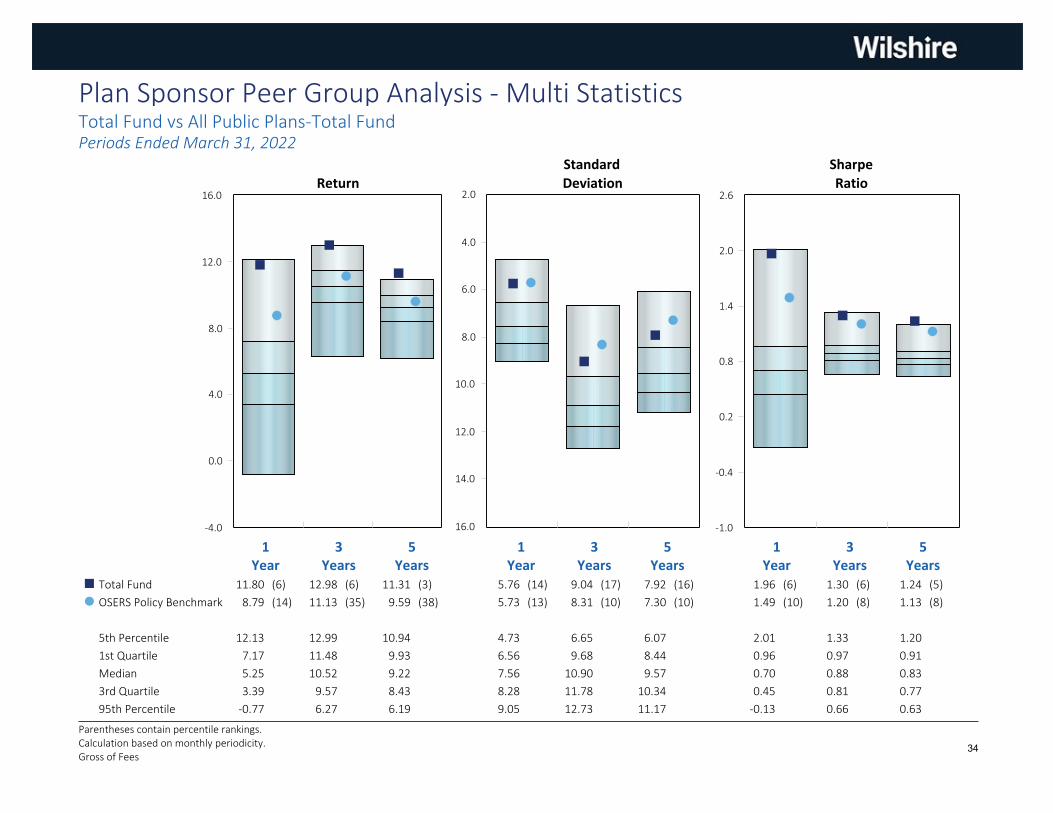
-4.0
0.0
4.0
8.0
12.0
16.0 Return
2.0
4.0
6.0
8.0
10.0
12.0
14.0
16.0
StandardDeviation
-1.0
-0.4
0.2
0.8
1.4
2.0
2.6
SharpeRatio
1Year
3Years
5Years
1Year
3Years
5Years
1Year
3Years
5Years
Total Fund 11.80 (6) 12.98 (6) 11.31 (3) 5.76 (14) 9.04 (17) 7.92 (16) 1.96 (6) 1.30 (6) 1.24 (5)¢
OSERS Policy Benchmark 8.79 (14) 11.13 (35) 9.59 (38) 5.73 (13) 8.31 (10) 7.30 (10) 1.49 (10) 1.20 (8) 1.13 (8)�
5th Percentile 12.13 12.99 10.94 4.73 6.65 6.07 2.01 1.33 1.20
1st Quartile 7.17 11.48 9.93 6.56 9.68 8.44 0.96 0.97 0.91
Median 5.25 10.52 9.22 7.56 10.90 9.57 0.70 0.88 0.83
3rd Quartile 3.39 9.57 8.43 8.28 11.78 10.34 0.45 0.81 0.77
95th Percentile -0.77 6.27 6.19 9.05 12.73 11.17 -0.13 0.66 0.63
Plan Sponsor Peer Group Analysis - Multi StatisticsTotal Fund vs All Public Plans-Total FundPeriods Ended March 31, 2022
Parentheses contain percentile rankings.Calculation based on monthly periodicity.Gross of Fees
34
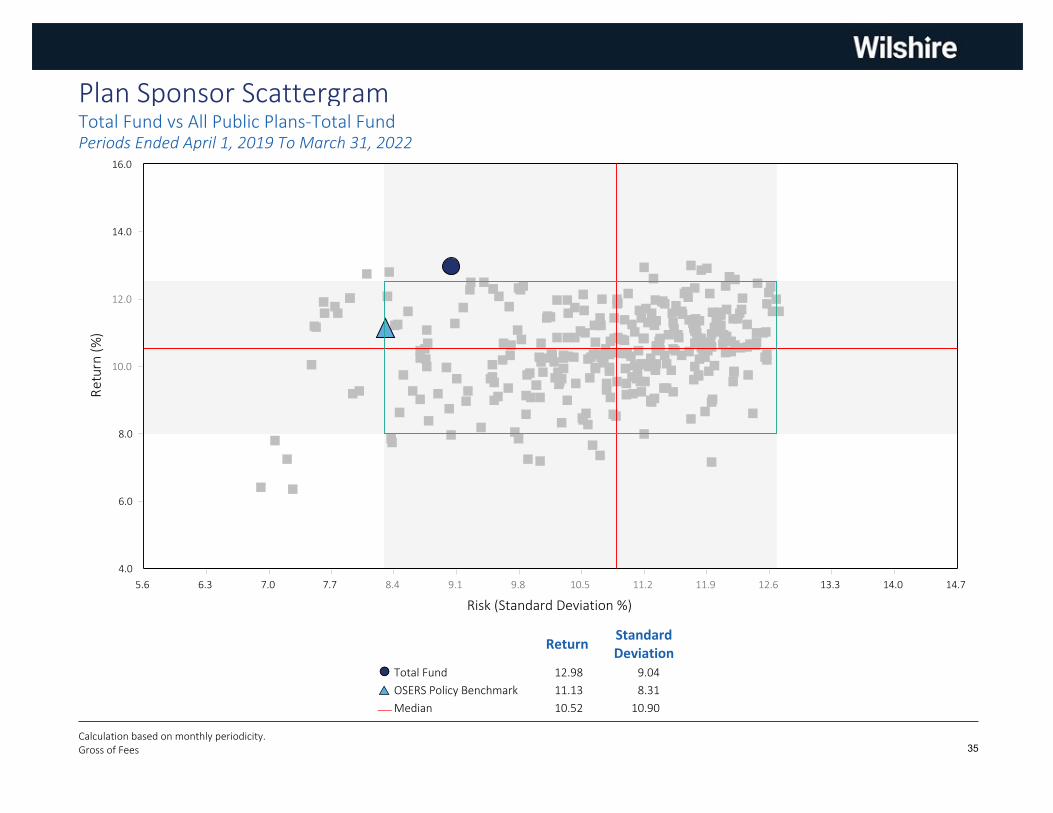
4.0
6.0
8.0
10.0
12.0
14.0
16.0
Ret
urn
(%)
5.6 6.3 7.0 7.7 8.4 9.1 9.8 10.5 11.2 11.9 12.6 13.3 14.0 14.7
Risk (Standard Deviation %)
ReturnStandardDeviation
Total Fund 12.98 9.04��
OSERS Policy Benchmark 11.13 8.31pr
Median 10.52 10.90¾
Plan Sponsor ScattergramTotal Fund vs All Public Plans-Total FundPeriods Ended April 1, 2019 To March 31, 2022
Calculation based on monthly periodicity.Gross of Fees 35
Allocation
MarketValue$000
%
Performance (%) net of fees
1Quarter
FYTD1
Year3
Years5
Years10
Years20
YearsSince
InceptionInception
Date
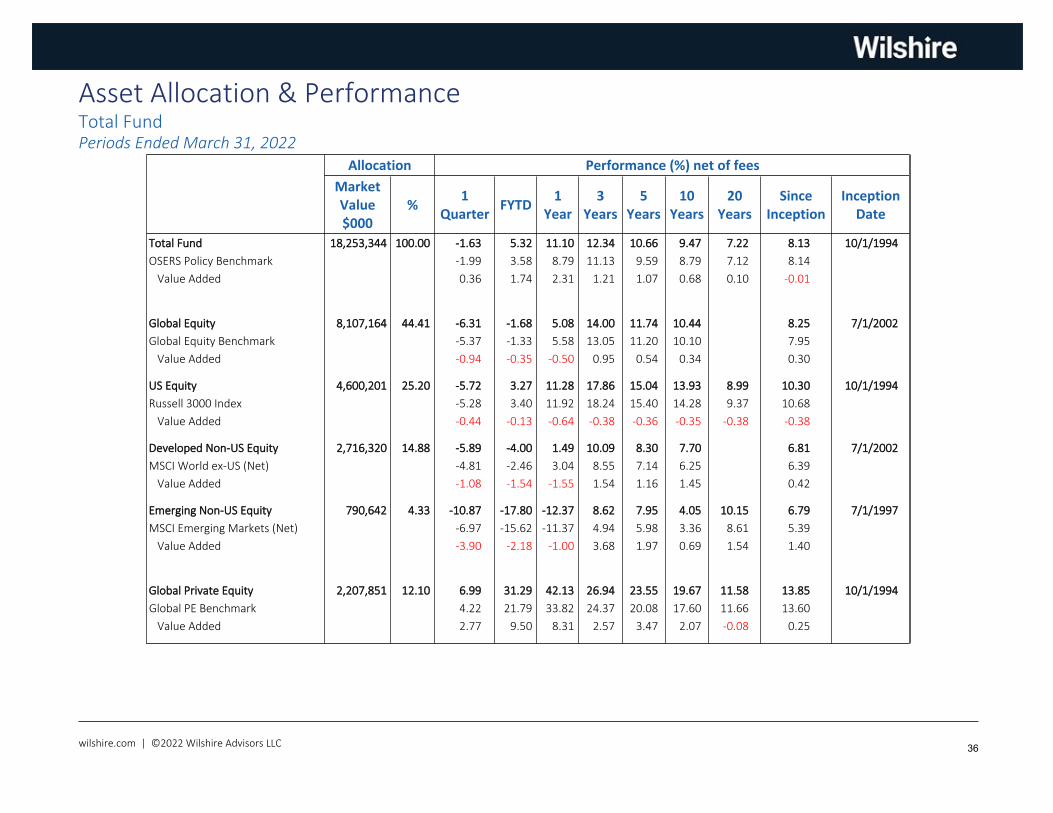
Total Fund 18,253,344 100.00 -1.63 5.32 11.10 12.34 10.66 9.47 7.22 8.13 10/1/1994
OSERS Policy Benchmark -1.99 3.58 8.79 11.13 9.59 8.79 7.12 8.14
Value Added 0.36 1.74 2.31 1.21 1.07 0.68 0.10 -0.01
Global Equity 8,107,164 44.41 -6.31 -1.68 5.08 14.00 11.74 10.44 8.25 7/1/2002
Global Equity Benchmark -5.37 -1.33 5.58 13.05 11.20 10.10 7.95
Value Added -0.94 -0.35 -0.50 0.95 0.54 0.34 0.30
US Equity 4,600,201 25.20 -5.72 3.27 11.28 17.86 15.04 13.93 8.99 10.30 10/1/1994
Russell 3000 Index -5.28 3.40 11.92 18.24 15.40 14.28 9.37 10.68
Value Added -0.44 -0.13 -0.64 -0.38 -0.36 -0.35 -0.38 -0.38
Developed Non-US Equity 2,716,320 14.88 -5.89 -4.00 1.49 10.09 8.30 7.70 6.81 7/1/2002
MSCI World ex-US (Net) -4.81 -2.46 3.04 8.55 7.14 6.25 6.39
Value Added -1.08 -1.54 -1.55 1.54 1.16 1.45 0.42
Emerging Non-US Equity 790,642 4.33 -10.87 -17.80 -12.37 8.62 7.95 4.05 10.15 6.79 7/1/1997
MSCI Emerging Markets (Net) -6.97 -15.62 -11.37 4.94 5.98 3.36 8.61 5.39
Value Added -3.90 -2.18 -1.00 3.68 1.97 0.69 1.54 1.40
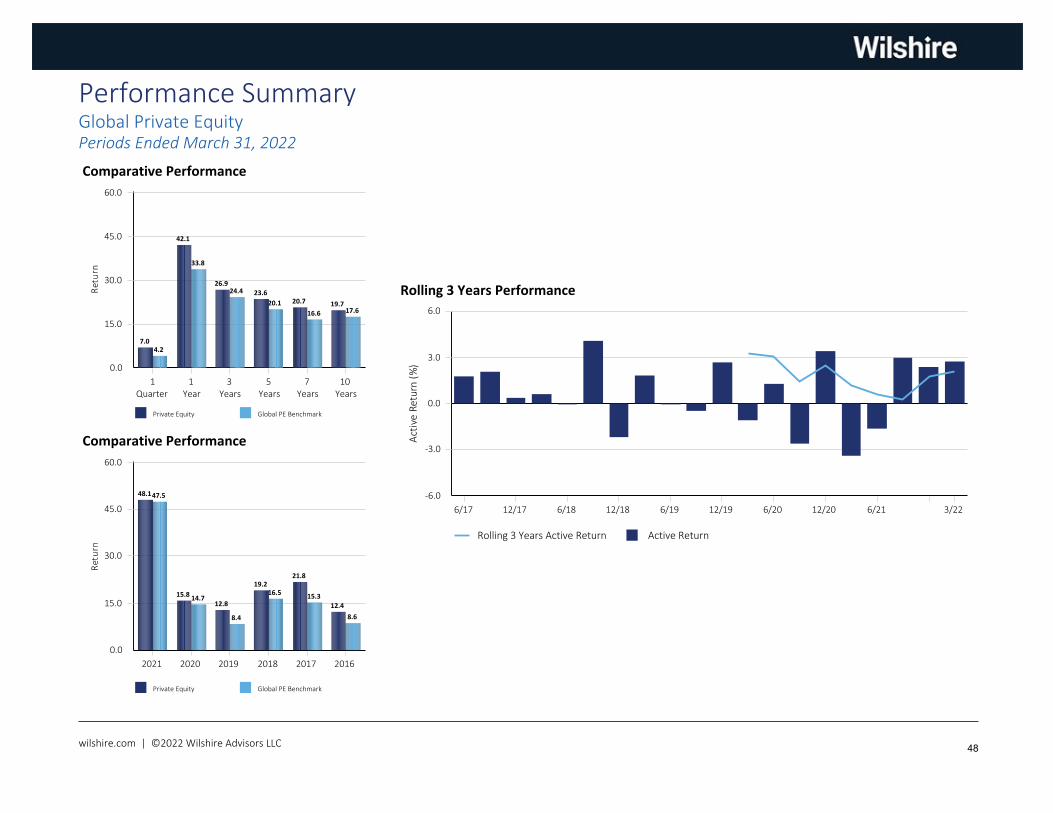
2,207,851 12.10 6.99 31.29 42.13 26.94 23.55 19.67 11.58 13.85 10/1/1994Global Private Equity Global PE Benchmark 4.22 21.79 33.82 24.37 20.08 17.60 11.66 13.60
Value Added 2.77 9.50 8.31 2.57 3.47 2.07 -0.08 0.25
Asset Allocation & PerformanceTotal FundPeriods Ended March 31, 2022
wilshire.com | ©2022 Wilshire Advisors LLC 36
Asset Allocation & PerformanceTotal FundPeriods Ended March 31, 2022
Allocation
MarketValue$000
%
Performance (%) net of fees
1Quarter
FYTD1
Year3
Years5
Years10
Years20
YearsSince
InceptionInception
Date
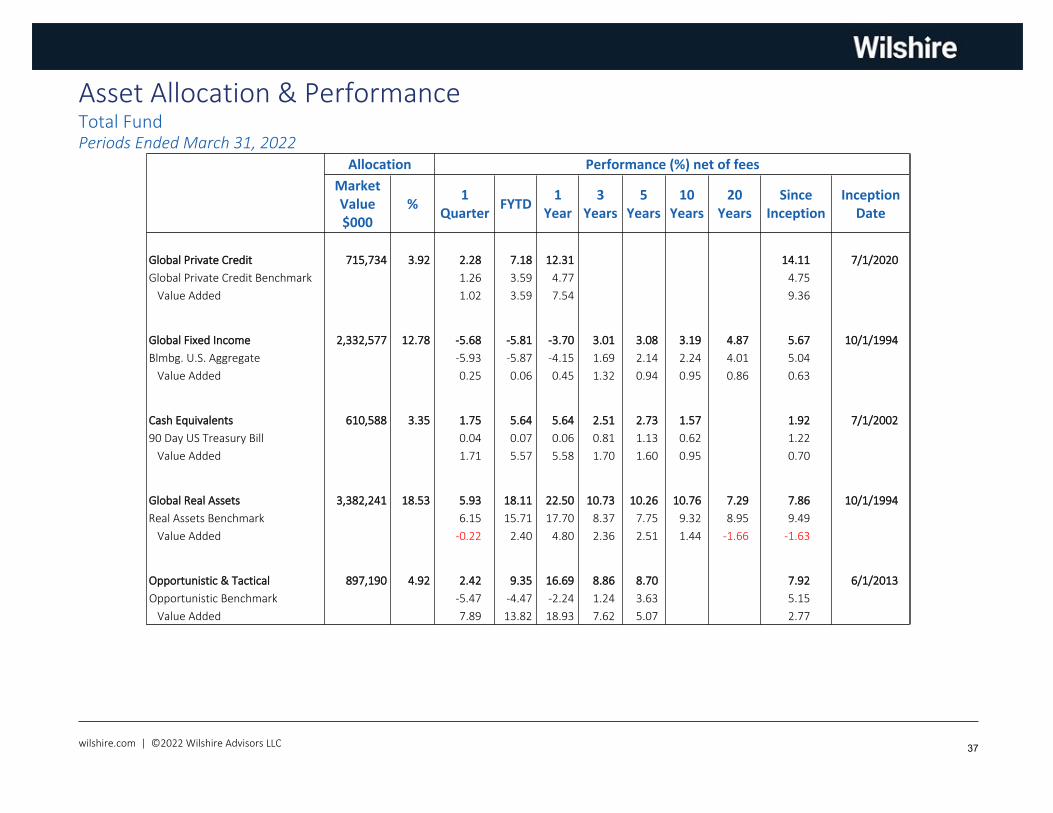
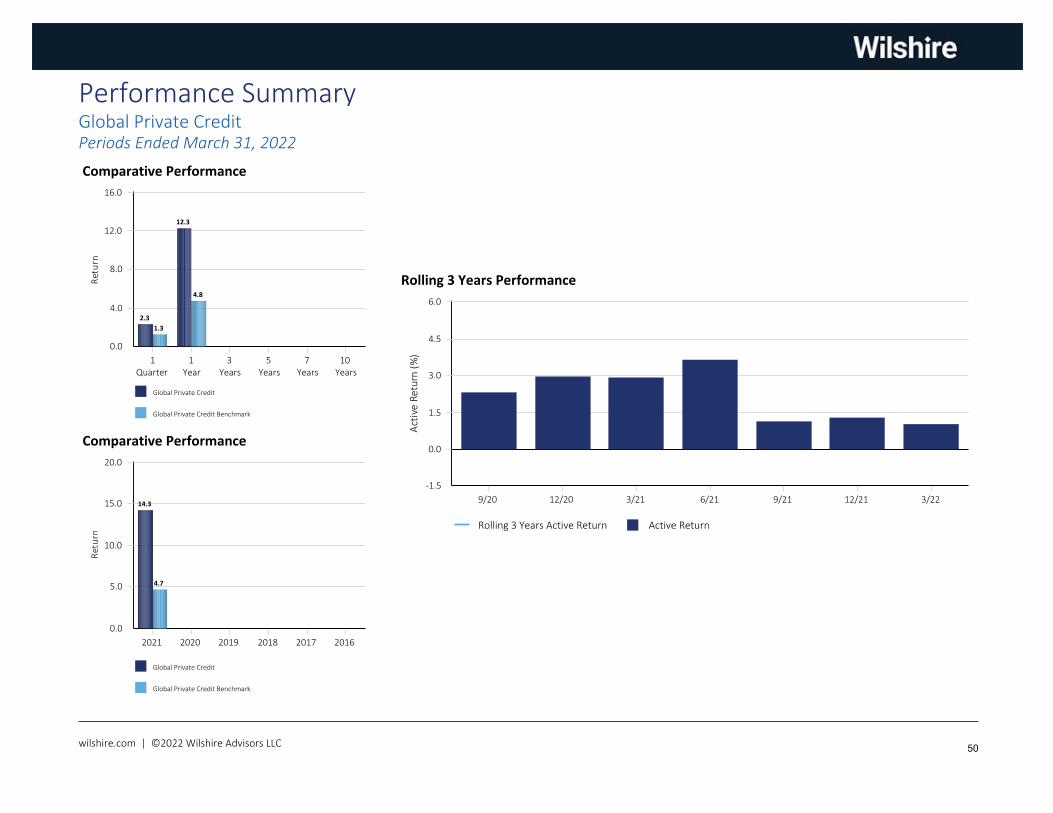
Global Private Credit 715,734 3.92 2.28 7.18 12.31 14.11 7/1/2020
Global Private Credit Benchmark 1.26 3.59 4.77 4.75
Value Added 1.02 3.59 7.54 9.36
Global Fixed Income 2,332,577 12.78 -5.68 -5.81 -3.70 3.01 3.08 3.19 4.87 5.67 10/1/1994
Blmbg. U.S. Aggregate -5.93 -5.87 -4.15 1.69 2.14 2.24 4.01 5.04
Value Added 0.25 0.06 0.45 1.32 0.94 0.95 0.86 0.63
Cash Equivalents 610,588 3.35 1.75 5.64 5.64 2.51 2.73 1.57 1.92 7/1/2002
90 Day US Treasury Bill 0.04 0.07 0.06 0.81 1.13 0.62 1.22
Value Added 1.71 5.57 5.58 1.70 1.60 0.95 0.70
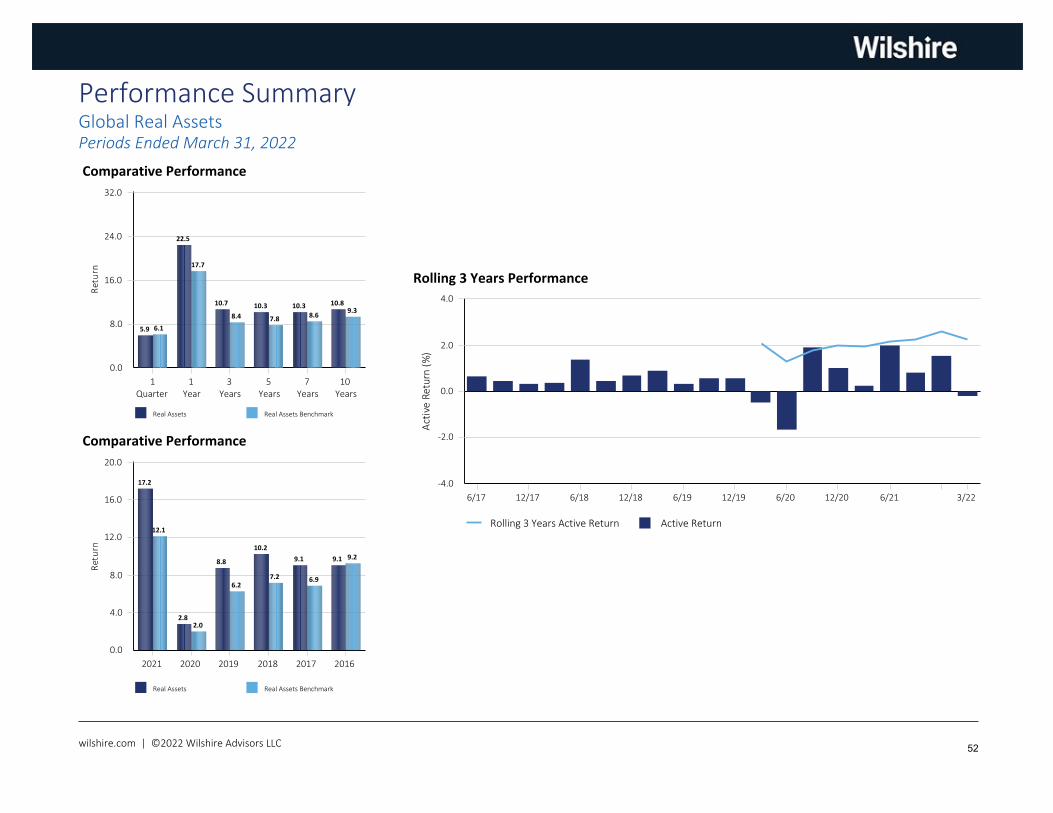
3,382,241 18.53 5.93 18.11 22.50 10.73 10.26 10.76 7.29 7.86 10/1/1994Global Real Assets
Real Assets Benchmark 6.15 15.71 17.70 8.37 7.75 9.32 8.95 9.49
Value Added -0.22 2.40 4.80 2.36 2.51 1.44 -1.66 -1.63
897,190 4.92 2.42 9.35 16.69 8.86 8.70 7.92 6/1/2013Opportunistic & Tactical Opportunistic Benchmark -5.47 -4.47 -2.24 1.24 3.63 5.15
Value Added 7.89 13.82 18.93 7.62 5.07 2.77
wilshire.com | ©2022 Wilshire Advisors LLC 37
-25.0
-10.0
5.0
20.0
35.0
50.0
65.0
80.0
Allo
cati
on (%
)
US EquityGlobal ex-US
EquityUS Fixed
Global ex-USFixed
Alternatives Total Real EstateCash &
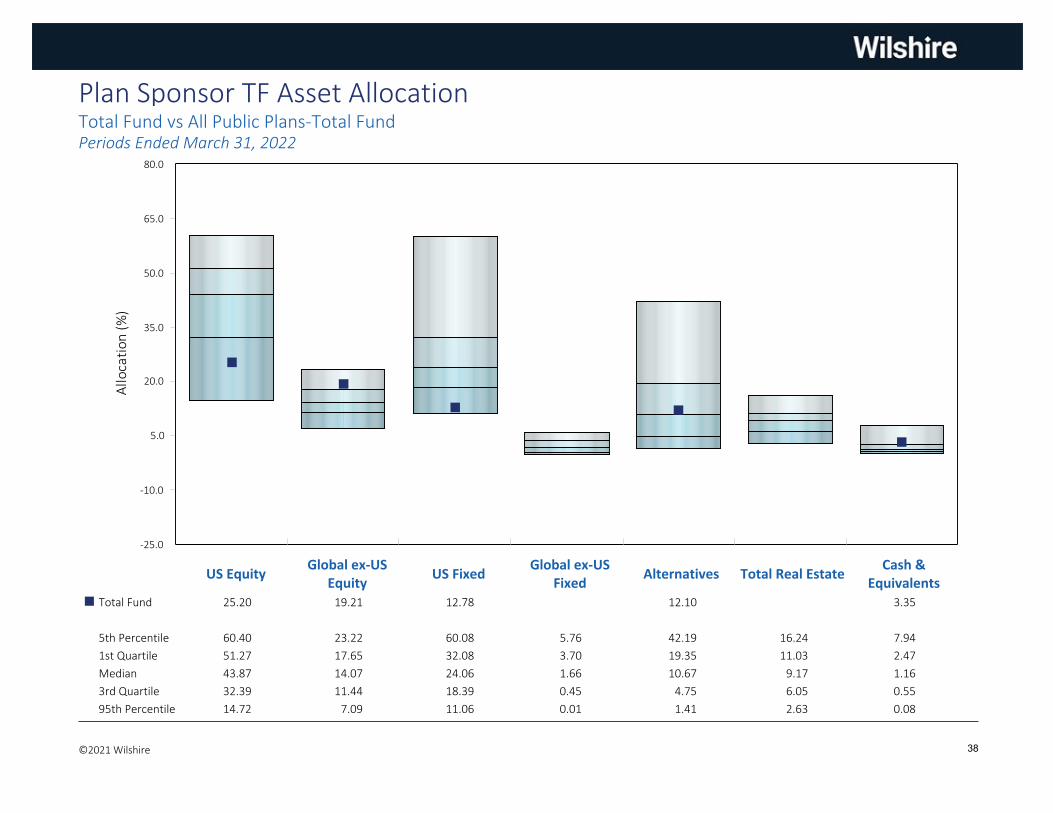
EquivalentsTotal Fund 25.20 19.21 12.78 12.10 3.35¢
5th Percentile 60.40 23.22 60.08 5.76 42.19 16.24 7.94
1st Quartile 51.27 17.65 32.08 3.70 19.35 11.03 2.47
Median 43.87 14.07 24.06 1.66 10.67 9.17 1.16
3rd Quartile 32.39 11.44 18.39 0.45 4.75 6.05 0.55
95th Percentile 14.72 7.09 11.06 0.01 1.41 2.63 0.08
Plan Sponsor TF Asset AllocationTotal Fund vs All Public Plans-Total FundPeriods Ended March 31, 2022
©2021 Wilshire 38

U.S. Equity
wilshire.com | @2022 Wilshire Advisors LLC
Peer Group Analysis: All Master Trust-US Equity Segment
-20.0
-10.0
0.0
10.0
20.0
30.0
Ret
urn
Quarter 1 Year 3 Years 5 Years 10 Years
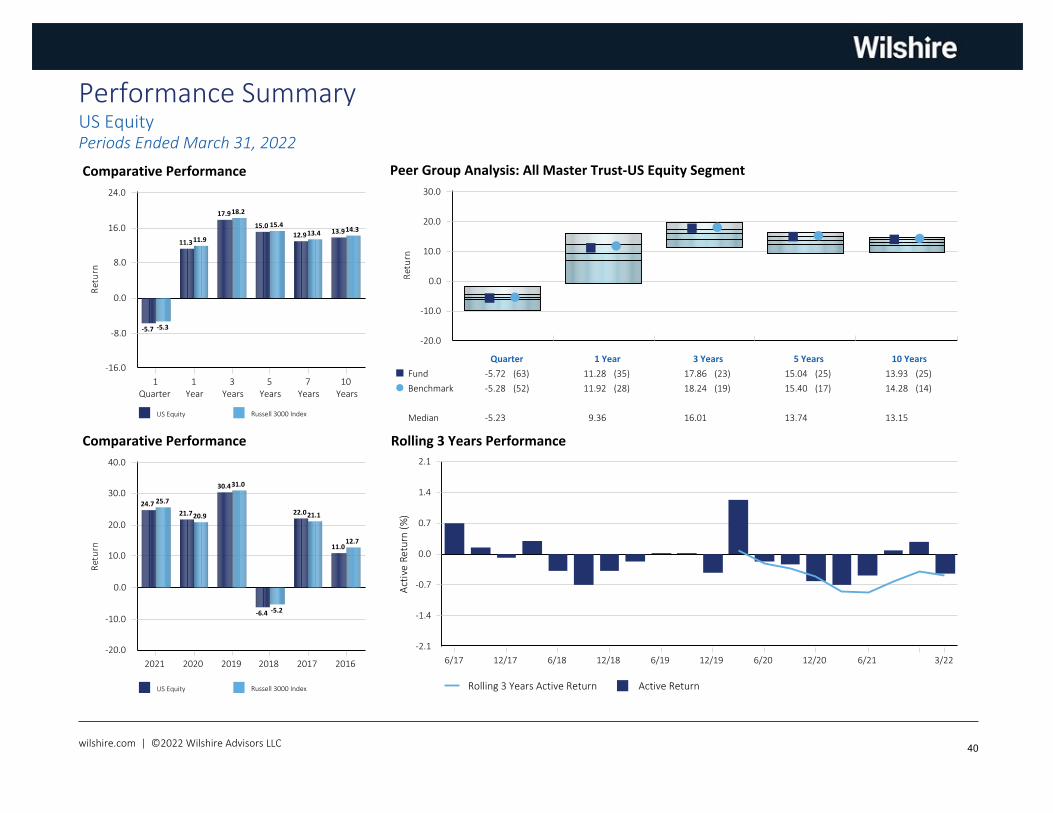
Fund -5.72 (63) 11.28 (35) 17.86 (23) 15.04 (25) 13.93 (25)¢
Benchmark -5.28 (52) 11.92 (28) 18.24 (19) 15.40 (17) 14.28 (14)�
Median -5.23 9.36 16.01 13.74 13.15
Comparative Performance
US Equity Russell 3000 Index
0.0
8.0
16.0
24.0
-8.0
-16.0
Ret
urn
1Quarter
1Year
3Years
5Years
7Years
10Years
-5.3
11.9
18.2
15.413.4
14.3
-5.7
11.3
17.9
15.012.9
13.9
Comparative Performance
US Equity Russell 3000 Index
0.0
10.0
20.0
30.0
40.0
-10.0
-20.0
Ret
urn
2021 2020 2019 2018 2017 2016
25.7
20.9
31.0
-5.2
21.1
12.7
24.7
21.7
30.4
-6.4
22.0
11.0
Rolling 3 Years Performance
Rolling 3 Years Active Return Active Return
0.0
0.7
1.4
2.1
-0.7
-1.4
-2.1
Act
ive
Retu
rn (%
)
6/17 12/17 6/18 12/18 6/19 12/19 6/20 12/20 6/21 3/22
Performance SummaryUS EquityPeriods Ended March 31, 2022
wilshire.com | ©2022 Wilshire Advisors LLC 40
Developed Non-U.S. Equity
wilshire.com | @2022 Wilshire Advisors LLC
Peer Group Analysis: IM International Equity Developed Markets (SA+CF)
-20.0
-10.0
0.0
10.0
20.0
Ret
urn
Quarter 1 Year 3 Years 5 Years 10 Years
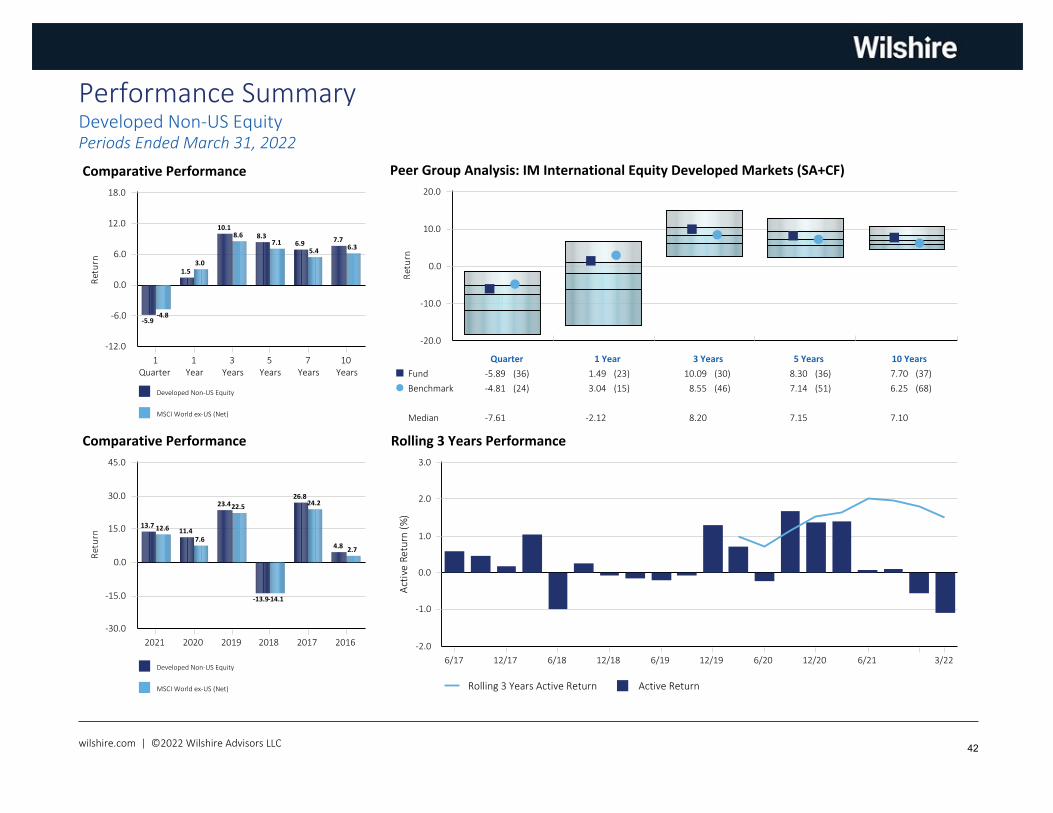
Fund -5.89 (36) 1.49 (23) 10.09 (30) 8.30 (36) 7.70 (37)¢
Benchmark -4.81 (24) 3.04 (15) 8.55 (46) 7.14 (51) 6.25 (68)�
Median -7.61 -2.12 8.20 7.15 7.10
Comparative Performance
Developed Non-US Equity
MSCI World ex-US (Net)
0.0
6.0
12.0
18.0
-6.0
-12.0
Ret
urn
1Quarter
1Year
3Years
5Years
7Years
10Years
-4.8
3.0
8.67.1
5.46.3
-5.9
1.5
10.18.3
6.97.7
Comparative Performance
Developed Non-US Equity
MSCI World ex-US (Net)
0.0
15.0
30.0
45.0
-15.0
-30.0
Ret
urn
2021 2020 2019 2018 2017 2016
12.6
7.6
22.5
-14.1
24.2
2.7
13.711.4
23.4
-13.9
26.8
4.8
Rolling 3 Years Performance
Rolling 3 Years Active Return Active Return
0.0
1.0
2.0
3.0
-1.0
-2.0
Act
ive
Retu
rn (%
)
6/17 12/17 6/18 12/18 6/19 12/19 6/20 12/20 6/21 3/22
Performance SummaryDeveloped Non-US EquityPeriods Ended March 31, 2022
wilshire.com | ©2022 Wilshire Advisors LLC 42
Emerging Markets Equity
wilshire.com | @2022 Wilshire Advisors LLC
Peer Group Analysis: IM Emerging Markets Equity (SA+CF)
-40.0
-25.0
-10.0
5.0
20.0
Ret
urn
Quarter 1 Year 3 Years 5 Years 10 Years
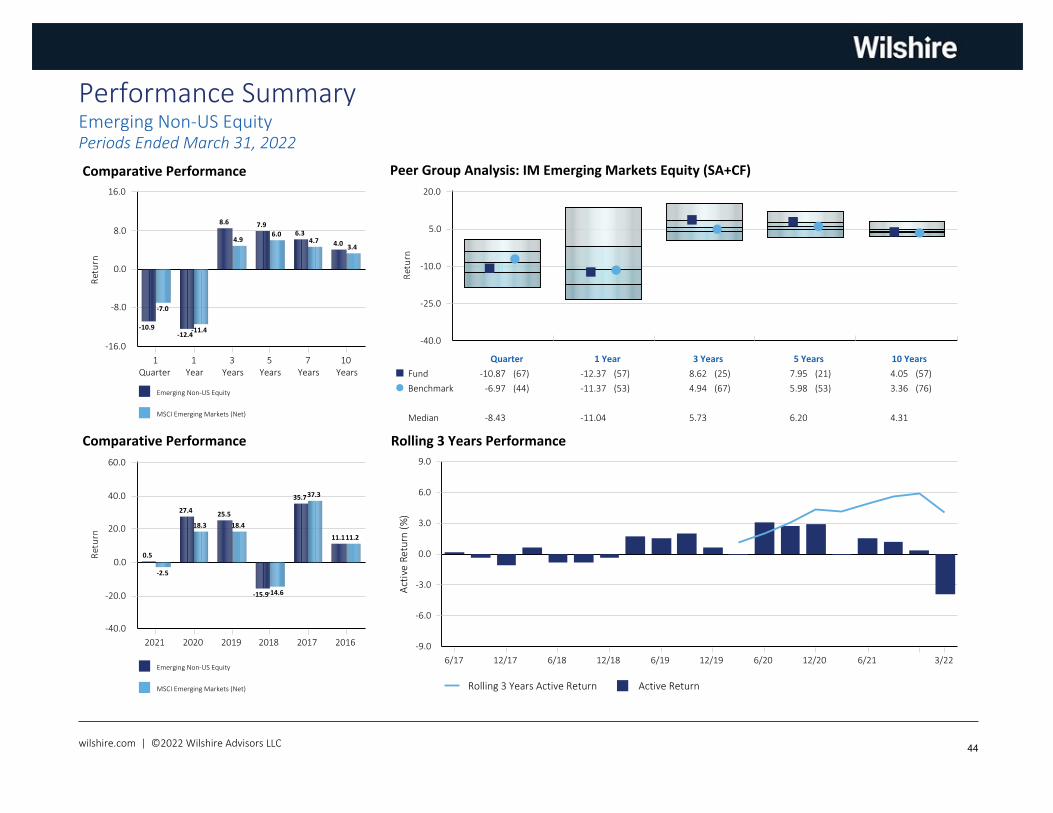
Fund -10.87 (67) -12.37 (57) 8.62 (25) 7.95 (21) 4.05 (57)¢
Benchmark -6.97 (44) -11.37 (53) 4.94 (67) 5.98 (53) 3.36 (76)�
Median -8.43 -11.04 5.73 6.20 4.31
Comparative Performance
Emerging Non-US Equity
MSCI Emerging Markets (Net)
0.0
8.0
16.0
-8.0
-16.0
Ret
urn
1Quarter
1Year
3Years
5Years
7Years
10Years
-7.0
-11.4
4.96.0
4.73.4
-10.9-12.4
8.6 7.96.3
4.0
Comparative Performance
Emerging Non-US Equity
MSCI Emerging Markets (Net)
0.0
20.0
40.0
60.0
-20.0
-40.0
Ret
urn
2021 2020 2019 2018 2017 2016
-2.5
18.3 18.4
-14.6
37.3
11.2
0.5
27.4 25.5
-15.9
35.7
11.1
Rolling 3 Years Performance
Rolling 3 Years Active Return Active Return
0.0
3.0
6.0
9.0
-3.0
-6.0
-9.0
Act
ive
Retu
rn (%
)
6/17 12/17 6/18 12/18 6/19 12/19 6/20 12/20 6/21 3/22
Performance SummaryEmerging Non-US EquityPeriods Ended March 31, 2022
wilshire.com | ©2022 Wilshire Advisors LLC 44

Global Fixed Income
wilshire.com | @2022 Wilshire Advisors LLC
Peer Group Analysis: IM U.S. Broad Market Core Fixed Income (SA+CF)
-7.0
-4.0
-1.0
2.0
5.0
Ret
urn
Quarter 1 Year 3 Years 5 Years 10 Years
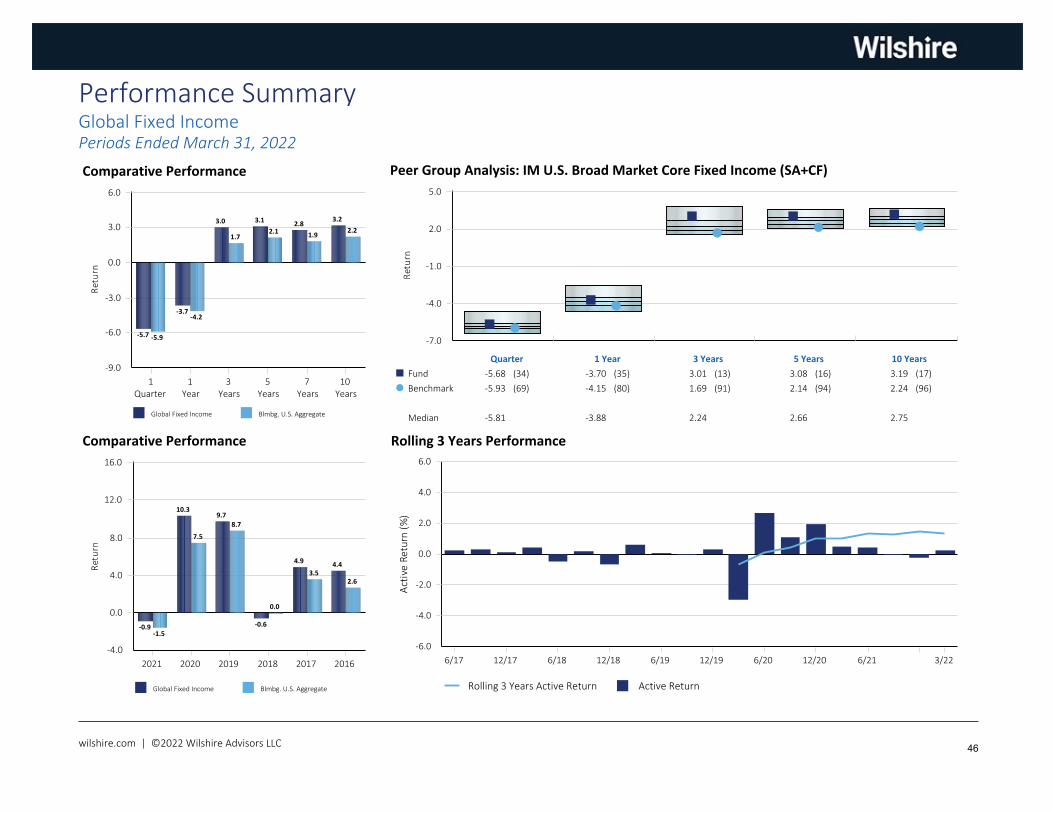
Fund -5.68 (34) -3.70 (35) 3.01 (13) 3.08 (16) 3.19 (17)¢
Benchmark -5.93 (69) -4.15 (80) 1.69 (91) 2.14 (94) 2.24 (96)�
Median -5.81 -3.88 2.24 2.66 2.75
Comparative Performance
Global Fixed Income Blmbg. U.S. Aggregate
0.0
3.0
6.0
-3.0
-6.0
-9.0
Ret
urn
1Quarter
1Year
3Years
5Years
7Years
10Years
-5.9
-4.2
1.72.1
1.92.2
-5.7
-3.7
3.0 3.1 2.83.2
Comparative Performance
Global Fixed Income Blmbg. U.S. Aggregate
0.0
4.0
8.0
12.0
16.0
-4.0
Ret
urn
2021 2020 2019 2018 2017 2016
-1.5
7.5
8.7
0.0
3.52.6
-0.9
10.39.7
-0.6
4.9 4.4
Rolling 3 Years Performance
Rolling 3 Years Active Return Active Return
0.0
2.0
4.0
6.0
-2.0
-4.0
-6.0
Act
ive
Retu
rn (%
)
6/17 12/17 6/18 12/18 6/19 12/19 6/20 12/20 6/21 3/22
Performance SummaryGlobal Fixed IncomePeriods Ended March 31, 2022
wilshire.com | ©2022 Wilshire Advisors LLC 46

Global Private Equity
wilshire.com | @2022 Wilshire Advisors LLC
Comparative Performance
Private Equity Global PE Benchmark
0.0
15.0
30.0
45.0
60.0
Ret
urn
1Quarter
1Year
3Years
5Years
7Years
10Years
4.2
33.8
24.4
20.1
16.6 17.6
7.0
42.1
26.923.6
20.7 19.7
Comparative Performance
Private Equity Global PE Benchmark
0.0
15.0
30.0
45.0
60.0
Ret
urn
2021 2020 2019 2018 2017 2016
47.5
14.7
8.4
16.5 15.3
8.6
48.1
15.8
12.8
19.221.8
12.4
Rolling 3 Years Performance
Rolling 3 Years Active Return Active Return
0.0
3.0
6.0
-3.0
-6.0
Act
ive
Retu
rn (%
)
6/17 12/17 6/18 12/18 6/19 12/19 6/20 12/20 6/21 3/22
Performance SummaryGlobal Private EquityPeriods Ended March 31, 2022
wilshire.com | ©2022 Wilshire Advisors LLC 48
Global Private Credit
wilshire.com | @2022 Wilshire Advisors LLC
Comparative Performance
Global Private Credit
Global Private Credit Benchmark
0.0
4.0
8.0
12.0
16.0
Ret
urn
1Quarter
1Year
3Years
5Years
7Years
10Years
1.3
4.8
2.3
12.3
Comparative Performance
Global Private Credit
Global Private Credit Benchmark
0.0
5.0
10.0
15.0
20.0
Ret
urn
2021 2020 2019 2018 2017 2016
4.7
14.3
Rolling 3 Years Performance
Rolling 3 Years Active Return Active Return
0.0
1.5
3.0
4.5
6.0
-1.5
Act
ive
Retu
rn (%
)
9/20 12/20 3/21 6/21 9/21 12/21 3/22
Performance SummaryGlobal Private CreditPeriods Ended March 31, 2022
wilshire.com | ©2022 Wilshire Advisors LLC 50
Global Real Assets
wilshire.com | @2022 Wilshire Advisors LLC
Comparative Performance
Real Assets Real Assets Benchmark
0.0
8.0
16.0
24.0
32.0
Ret
urn
1Quarter
1Year
3Years
5Years
7Years
10Years
6.1
17.7
8.4 7.88.6
9.3
5.9
22.5
10.7 10.3 10.3 10.8
Comparative Performance
Real Assets Real Assets Benchmark
0.0
4.0
8.0
12.0
16.0
20.0
Ret
urn
2021 2020 2019 2018 2017 2016
12.1
2.0
6.27.2 6.9
9.2
17.2
2.8
8.8
10.2
9.1 9.1
Rolling 3 Years Performance
Rolling 3 Years Active Return Active Return
0.0
2.0
4.0
-2.0
-4.0
Act
ive
Retu
rn (%
)
6/17 12/17 6/18 12/18 6/19 12/19 6/20 12/20 6/21 3/22
Performance SummaryGlobal Real AssetsPeriods Ended March 31, 2022
wilshire.com | ©2022 Wilshire Advisors LLC 52
Opportunistic & Tactical
wilshire.com | @2022 Wilshire Advisors LLC
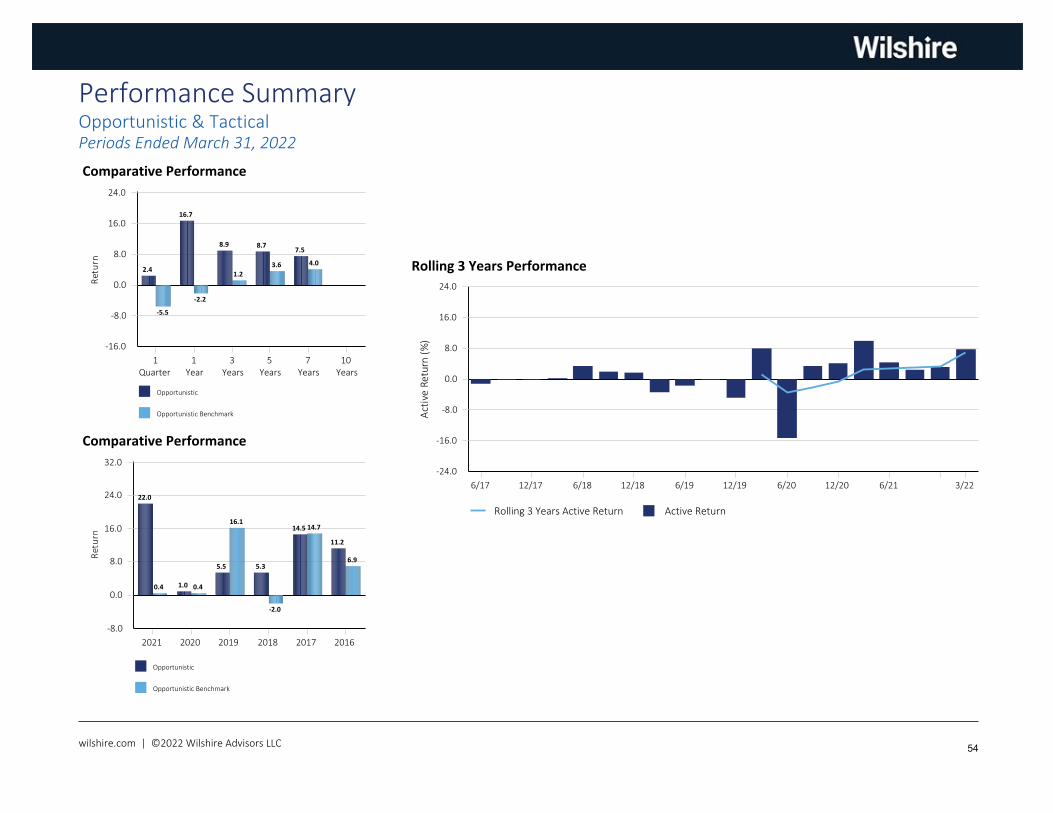
Comparative Performance
Opportunistic
Opportunistic Benchmark
0.0
8.0
16.0
24.0
-8.0
-16.0
Ret
urn
1Quarter
1Year
3Years
5Years
7Years
10Years
-5.5
-2.2
1.23.6 4.0
2.4
16.7
8.9 8.77.5
Comparative Performance
Opportunistic
Opportunistic Benchmark
0.0
8.0
16.0
24.0
32.0
-8.0
Ret
urn
2021 2020 2019 2018 2017 2016
0.4 0.4
16.1
-2.0
14.7
6.9
22.0
1.0
5.5 5.3
14.5
11.2
Performance SummaryOpportunistic & TacticalPeriods Ended March 31, 2022
wilshire.com | ©2022 Wilshire Advisors LLC
Rolling 3 Years Performance
12/17 6/18
Rolling 3 Years Active Return Active Return
0.0
8.0
16.0
24.0
-8.0
-16.0
-24.0
Act
i ve
Retu
rn(%
)
6/17 12/18 6/19 12/19 6/20 12/20 6/21 3/22
54
Ohio SERS Investment ReportQuarterly Report to the Board
Prepared by Investment and IAD StaffFarouki Majeed, Chief Investment Officer
For the period ending: March 31, 2022
Meeting Date: May 2022
Ohio SERS Investment Report | Quarter Ending: 03/31/2022
2
Investment Agenda
• Annual Overlay Program Review• Wilshire Quarterly Performance Report (March 31, 2022)• Quarterly Investment Report (March 31, 2022)• Draft of FY2023 Annual Investment Plan • Draft of FY2023 Investment Department Incentive Program (possible vote)
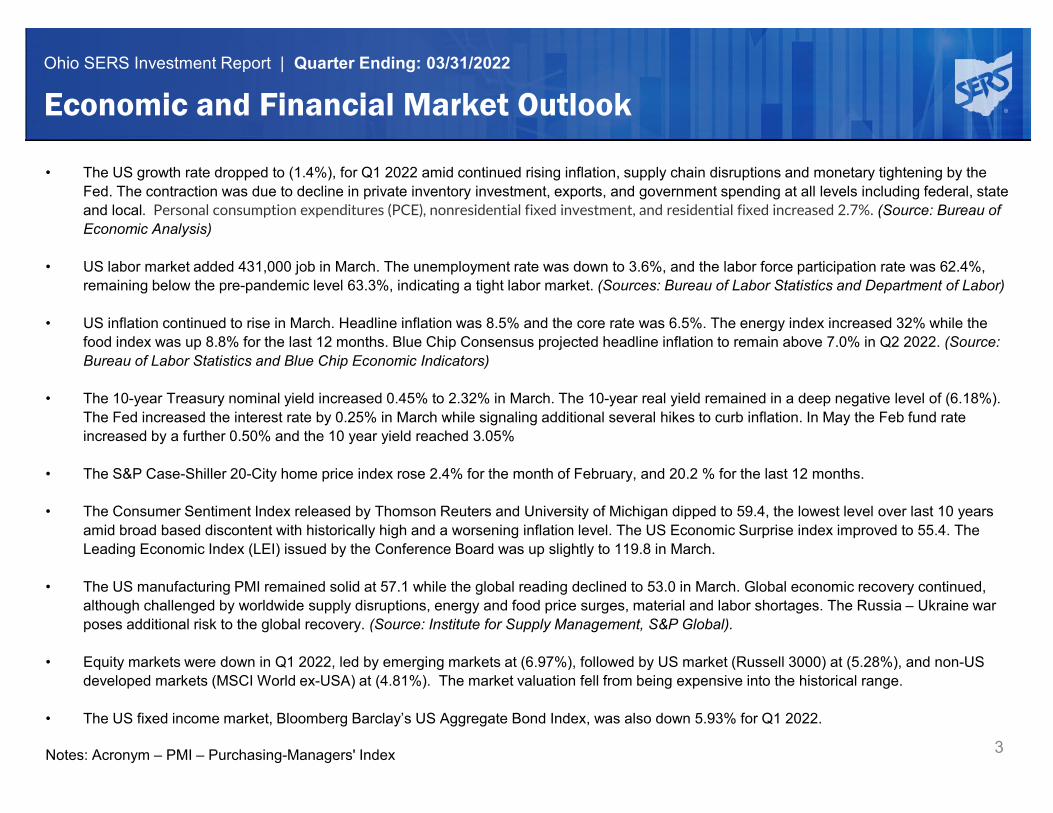
Ohio SERS Investment Report | Quarter Ending: 03/31/2022
3
Economic and Financial Market Outlook
• The US growth rate dropped to (1.4%), for Q1 2022 amid continued rising inflation, supply chain disruptions and monetary tightening by the Fed. The contraction was due to decline in private inventory investment, exports, and government spending at all levels including federal, state and local. Personal consumption expenditures (PCE), nonresidential fixed investment, and residential fixed increased 2.7%. (Source: Bureau of Economic Analysis)
• US labor market added 431,000 job in March. The unemployment rate was down to 3.6%, and the labor force participation rate was 62.4%, remaining below the pre-pandemic level 63.3%, indicating a tight labor market. (Sources: Bureau of Labor Statistics and Department of Labor)
• US inflation continued to rise in March. Headline inflation was 8.5% and the core rate was 6.5%. The energy index increased 32% while the food index was up 8.8% for the last 12 months. Blue Chip Consensus projected headline inflation to remain above 7.0% in Q2 2022. (Source: Bureau of Labor Statistics and Blue Chip Economic Indicators)
• The 10-year Treasury nominal yield increased 0.45% to 2.32% in March. The 10-year real yield remained in a deep negative level of (6.18%). The Fed increased the interest rate by 0.25% in March while signaling additional several hikes to curb inflation. In May the Feb fund rate increased by a further 0.50% and the 10 year yield reached 3.05%
• The S&P Case-Shiller 20-City home price index rose 2.4% for the month of February, and 20.2 % for the last 12 months.
• The Consumer Sentiment Index released by Thomson Reuters and University of Michigan dipped to 59.4, the lowest level over last 10 years amid broad based discontent with historically high and a worsening inflation level. The US Economic Surprise index improved to 55.4. The Leading Economic Index (LEI) issued by the Conference Board was up slightly to 119.8 in March.
• The US manufacturing PMI remained solid at 57.1 while the global reading declined to 53.0 in March. Global economic recovery continued, although challenged by worldwide supply disruptions, energy and food price surges, material and labor shortages. The Russia – Ukraine war poses additional risk to the global recovery. (Source: Institute for Supply Management, S&P Global).
• Equity markets were down in Q1 2022, led by emerging markets at (6.97%), followed by US market (Russell 3000) at (5.28%), and non-US developed markets (MSCI World ex-USA) at (4.81%). The market valuation fell from being expensive into the historical range.
• The US fixed income market, Bloomberg Barclay’s US Aggregate Bond Index, was also down 5.93% for Q1 2022.
Notes: Acronym – PMI – Purchasing-Managers' Index
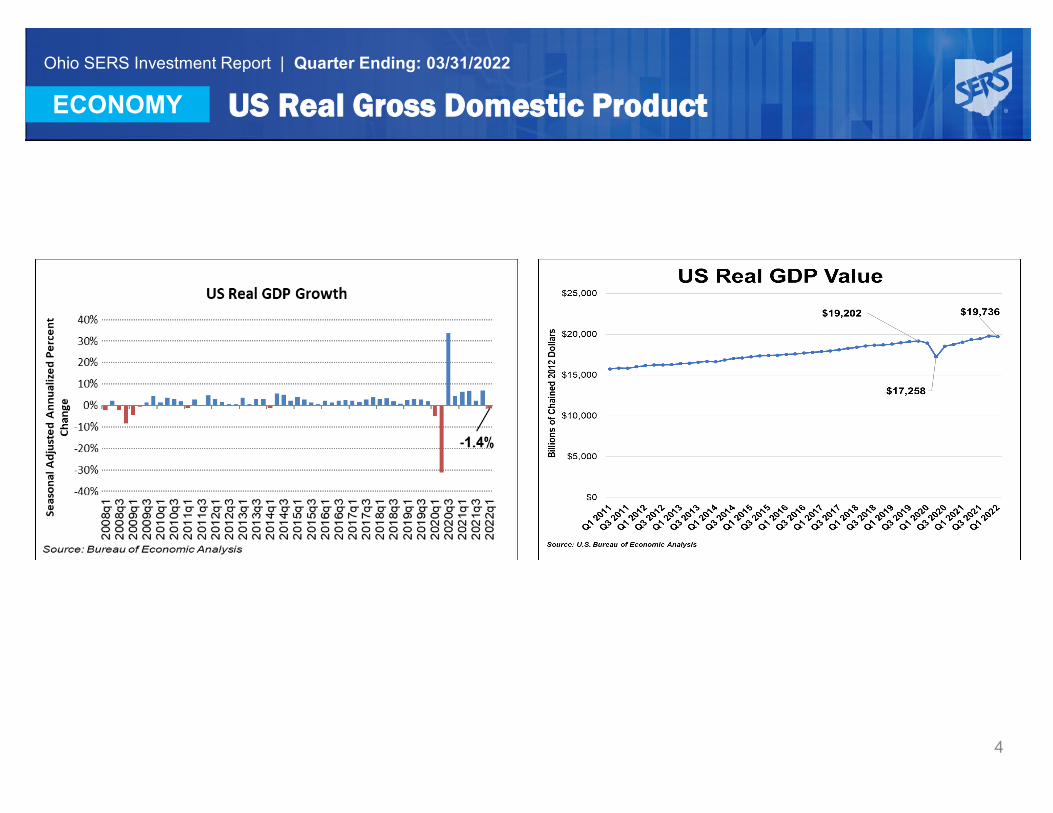
Ohio SERS Investment Report | Quarter Ending: 03/31/2022
ECONOMY
4
US Real Gross Domestic Product
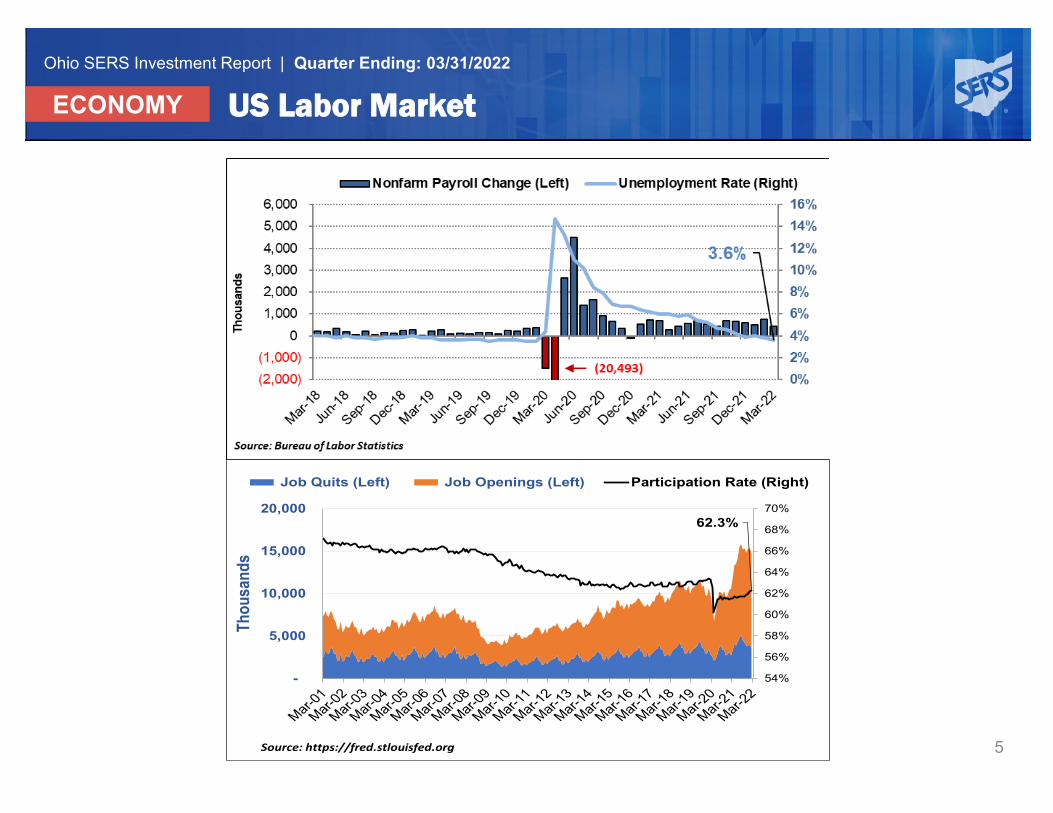
Ohio SERS Investment Report | Quarter Ending: 03/31/2022
5
ECONOMY US Labor Market
62.3%
54%
56%
58%
60%
62%
64%
66%
68%
70%
-
5,000
10,000
15,000
20,000
Thou
sand
s
Job Quits (Left) Job Openings (Left) Participation Rate (Right)
Source: https://fred.stlouisfed.org
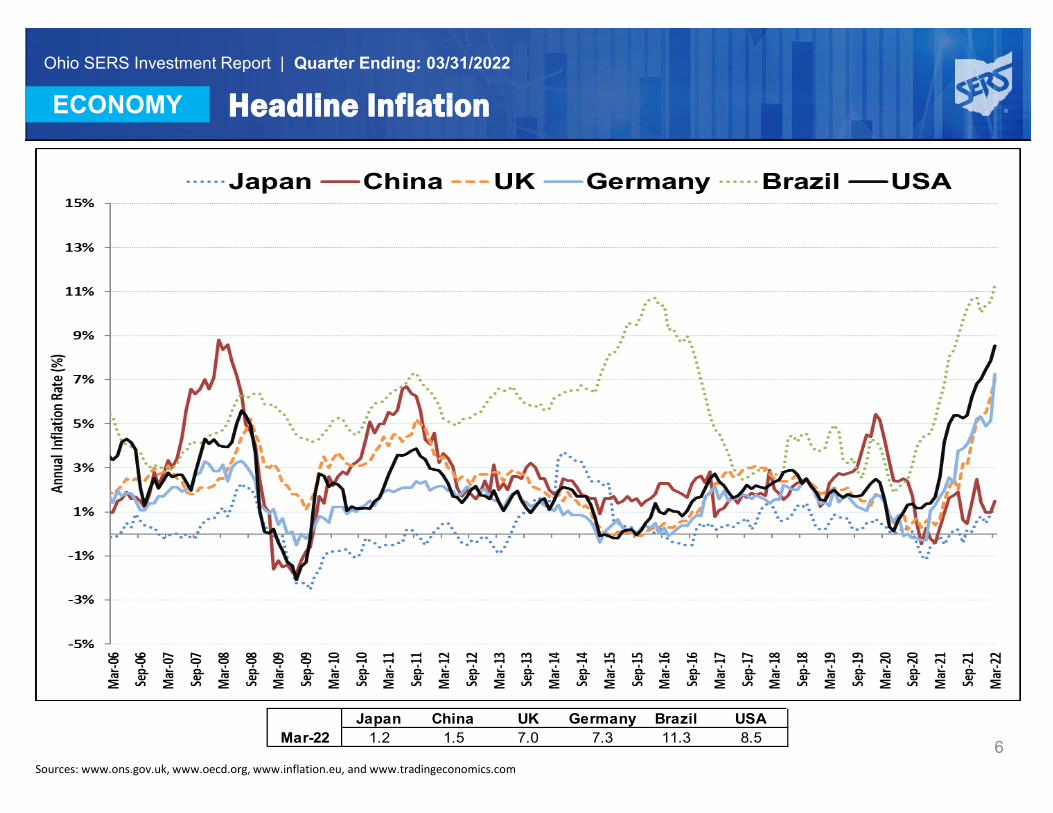
Ohio SERS Investment Report | Quarter Ending: 03/31/2022
ECONOMY
6
Headline Inflation
Japan China UK Germany Brazil USAMar-22 1.2 1.5 7.0 7.3 11.3 8.5
Sources: www.ons.gov.uk, www.oecd.org, www.inflation.eu, and www.tradingeconomics.com
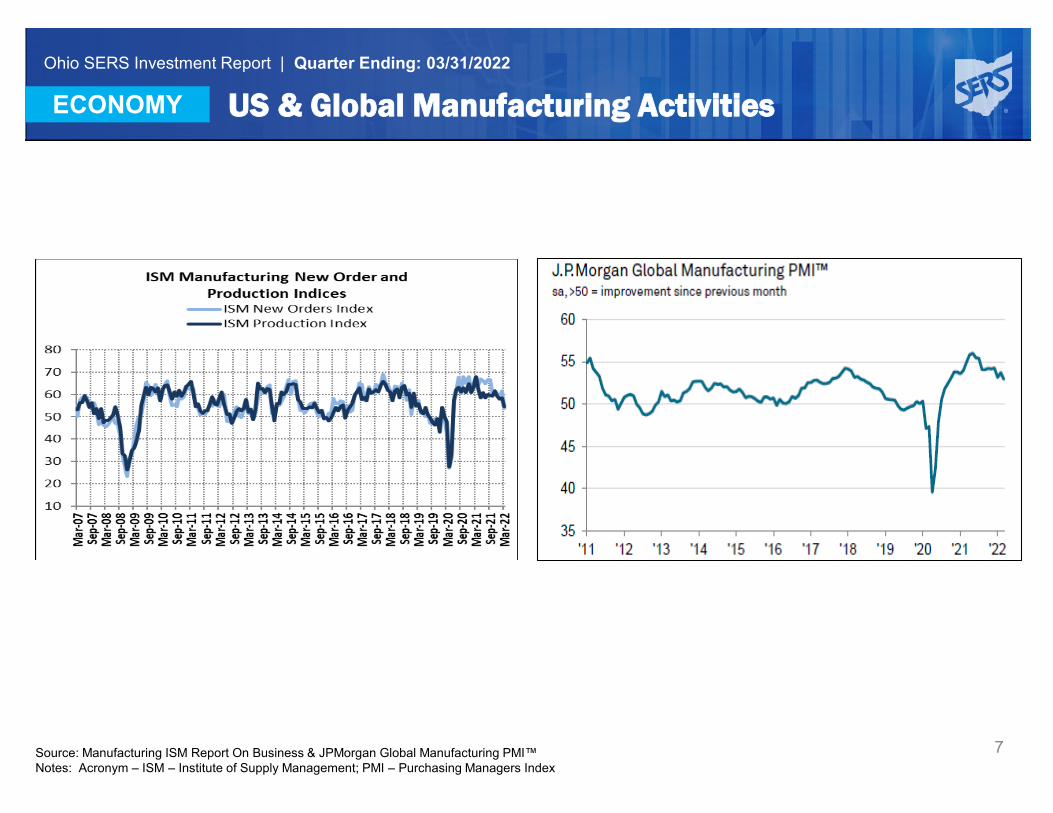
Ohio SERS Investment Report | Quarter Ending: 03/31/2022
ECONOMY
7
US & Global Manufacturing Activities
Source: Manufacturing ISM Report On Business & JPMorgan Global Manufacturing PMI™Notes: Acronym – ISM – Institute of Supply Management; PMI – Purchasing Managers Index
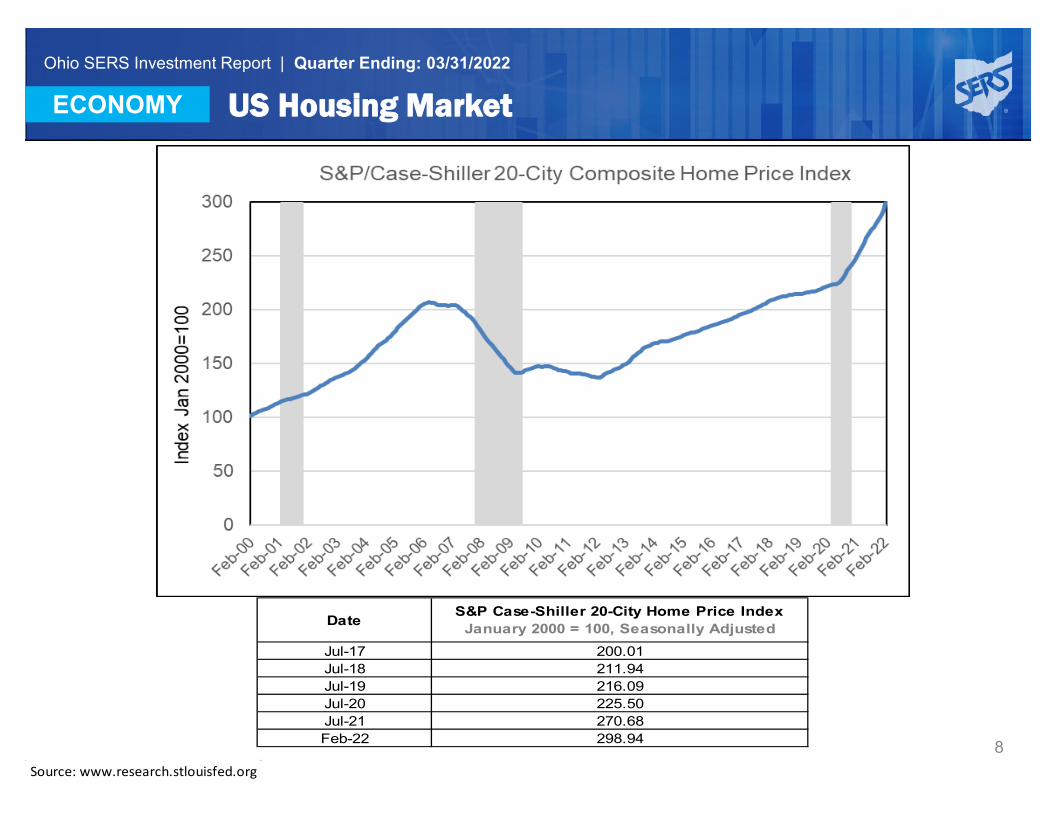
Ohio SERS Investment Report | Quarter Ending: 03/31/2022
ECONOMY
8
US Housing Market
Date S&P Case-Shiller 20-City Home Price Index January 2000 = 100, Seasonally Adjusted
Jul-17 200.01Jul-18 211.94Jul-19 216.09Jul-20 225.50Jul-21 270.68Feb-22 298.94
Source: www.research.stlouisfed.org
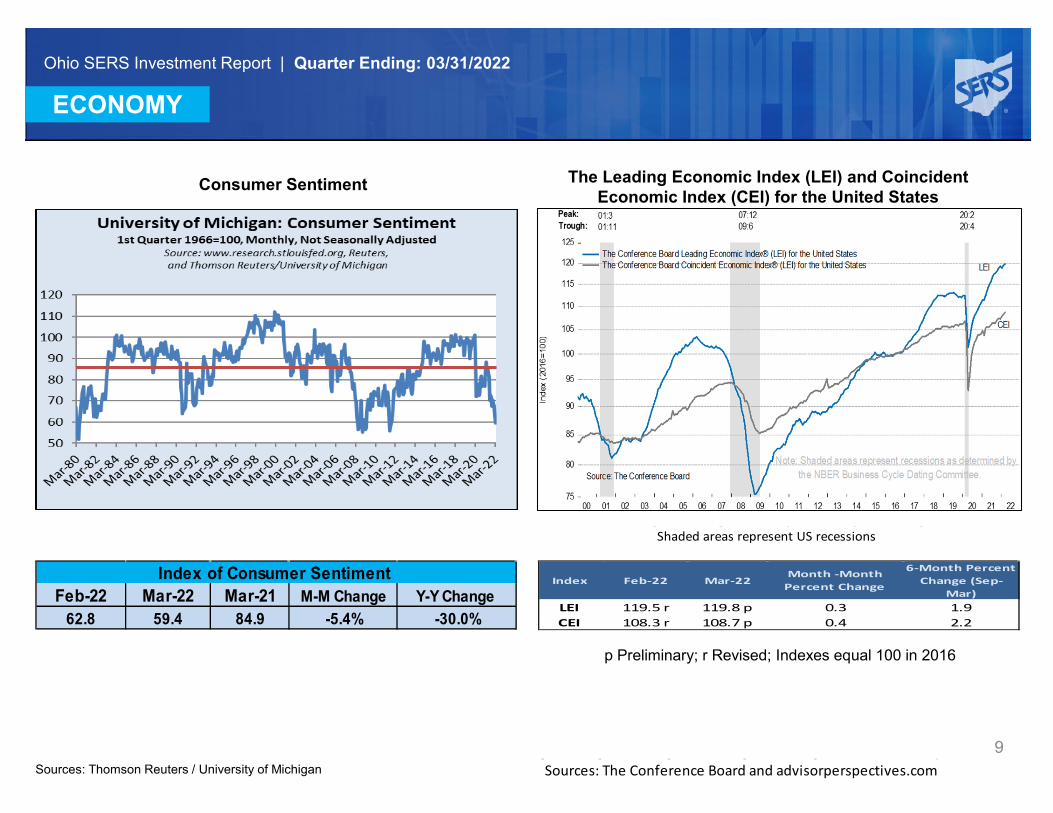
Ohio SERS Investment Report | Quarter Ending: 03/31/2022
ECONOMY
9
Consumer Sentiment The Leading Economic Index (LEI) and Coincident Economic Index (CEI) for the United States
Feb-22 Mar-22 Mar-21 M-M Change Y-Y Change 62.8 59.4 84.9 -5.4% -30.0%
Index of Consumer Sentiment
Sources: Thomson Reuters / University of Michigan
Shaded areas represent US recessions
Index Feb-22 Mar-22Month -Month
Percent Change
6-Month Percent Change (Sep-
Mar)LEI 119.5 r 119.8 p 0.3 1.9CEI 108.3 r 108.7 p 0.4 2.2
p Preliminary; r Revised; Indexes equal 100 in 2016
Sources: The Conference Board and advisorperspectives.com
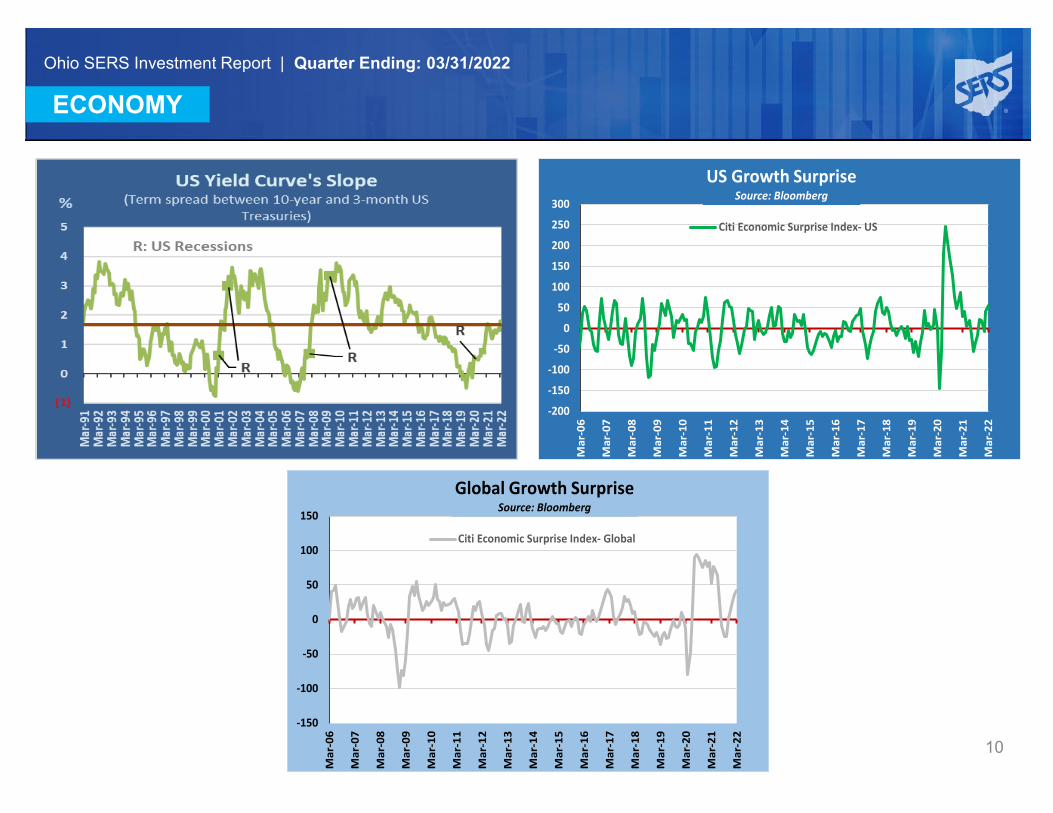
Ohio SERS Investment Report | Quarter Ending: 03/31/2022
ECONOMY
10
-200
-150
-100
-50
0
50
100
150
200
250
300
Mar
-06
Mar
-07
Mar
-08
Mar
-09
Mar
-10
Mar
-11
Mar
-12
Mar
-13
Mar
-14
Mar
-15
Mar
-16
Mar
-17
Mar
-18
Mar
-19
Mar
-20
Mar
-21
Mar
-22
US Growth Surprise Source: Bloomberg
Citi Economic Surprise Index- US
-150
-100
-50
0
50
100
150
Mar
-06
Mar
-07
Mar
-08
Mar
-09
Mar
-10
Mar
-11
Mar
-12
Mar
-13
Mar
-14
Mar
-15
Mar
-16
Mar
-17
Mar
-18
Mar
-19
Mar
-20
Mar
-21
Mar
-22
Global Growth Surprise Source: Bloomberg
Citi Economic Surprise Index- Global
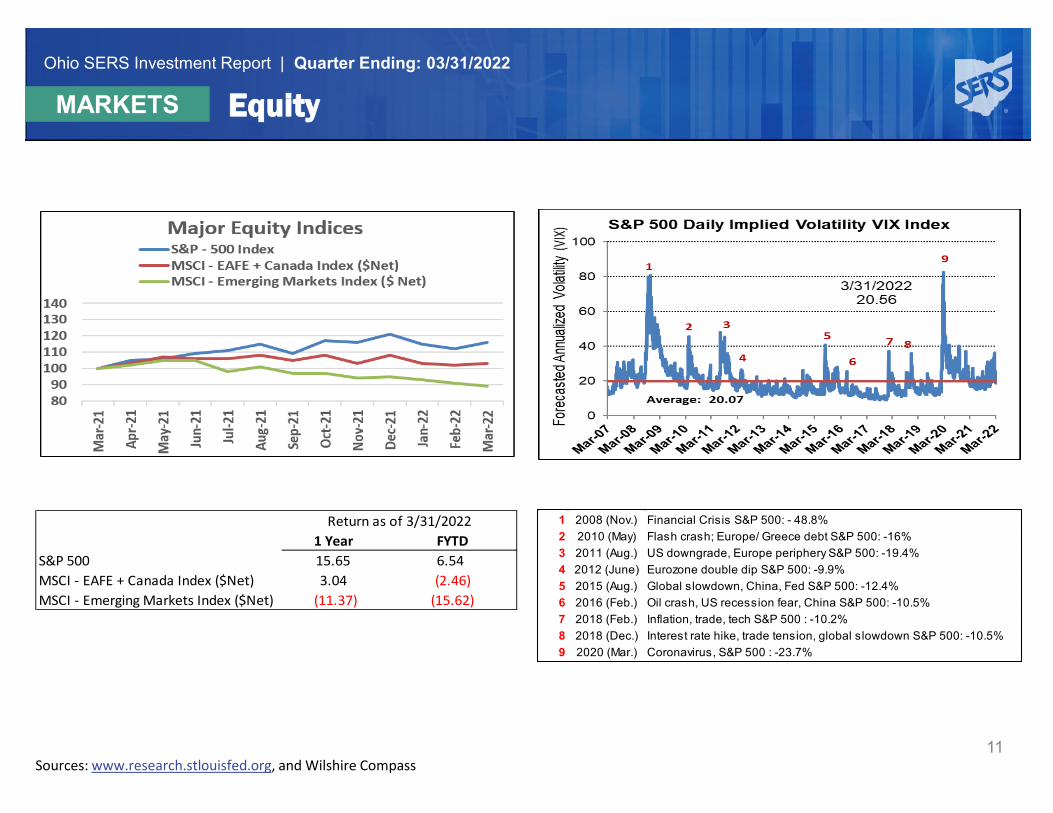
Ohio SERS Investment Report | Quarter Ending: 03/31/2022
MARKETS
11
Equity
1 Year FYTDS&P 500 15.65 6.54MSCI - EAFE + Canada Index ($Net) 3.04 (2.46)MSCI - Emerging Markets Index ($Net) (11.37) (15.62)
Return as of 3/31/2022 1 2008 (Nov.) Financial Crisis S&P 500: - 48.8%2 2010 (May) Flash crash; Europe/ Greece debt S&P 500: -16%3 2011 (Aug.) US downgrade, Europe periphery S&P 500: -19.4%4 2012 (June) Eurozone double dip S&P 500: -9.9%5 2015 (Aug.) Global slowdown, China, Fed S&P 500: -12.4%6 2016 (Feb.) Oil crash, US recession fear, China S&P 500: -10.5%7 2018 (Feb.) Inflation, trade, tech S&P 500 : -10.2%8 2018 (Dec.) Interest rate hike, trade tension, global slowdown S&P 500: -10.5%9 2020 (Mar.) Coronavirus, S&P 500 : -23.7%
Sources: www.research.stlouisfed.org, and Wilshire Compass
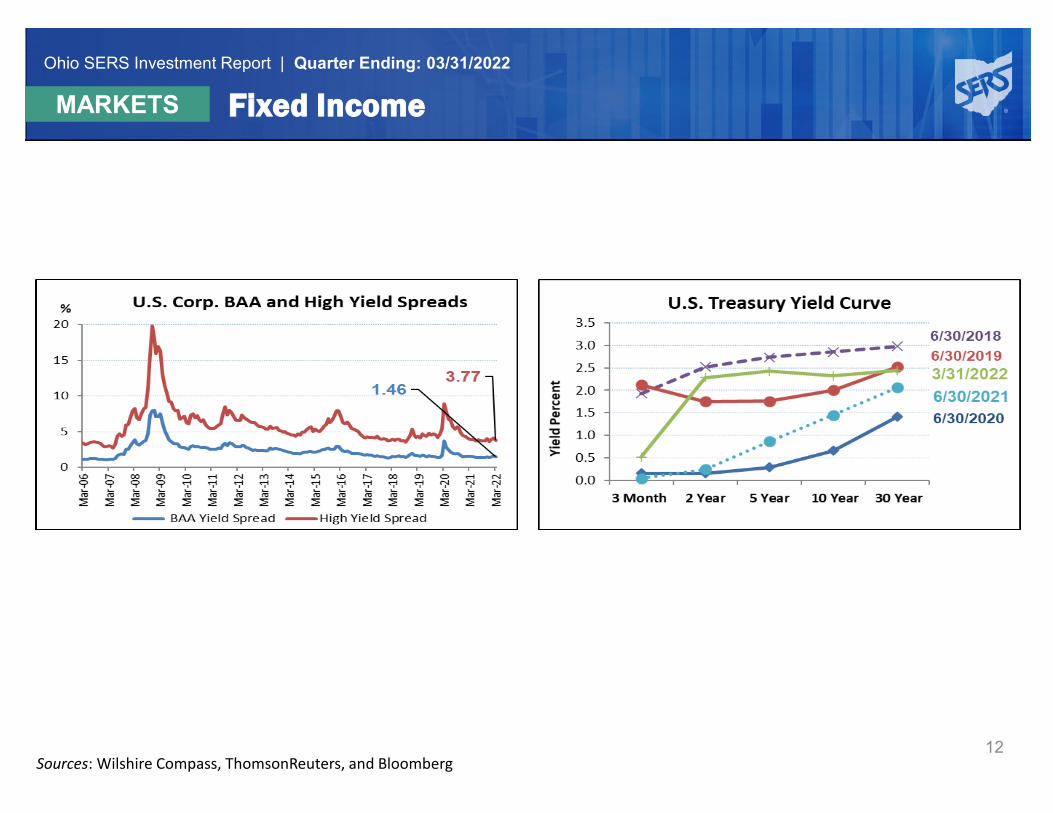
Ohio SERS Investment Report | Quarter Ending: 03/31/2022
MARKETS
12
Fixed Income
Sources: Wilshire Compass, ThomsonReuters, and Bloomberg
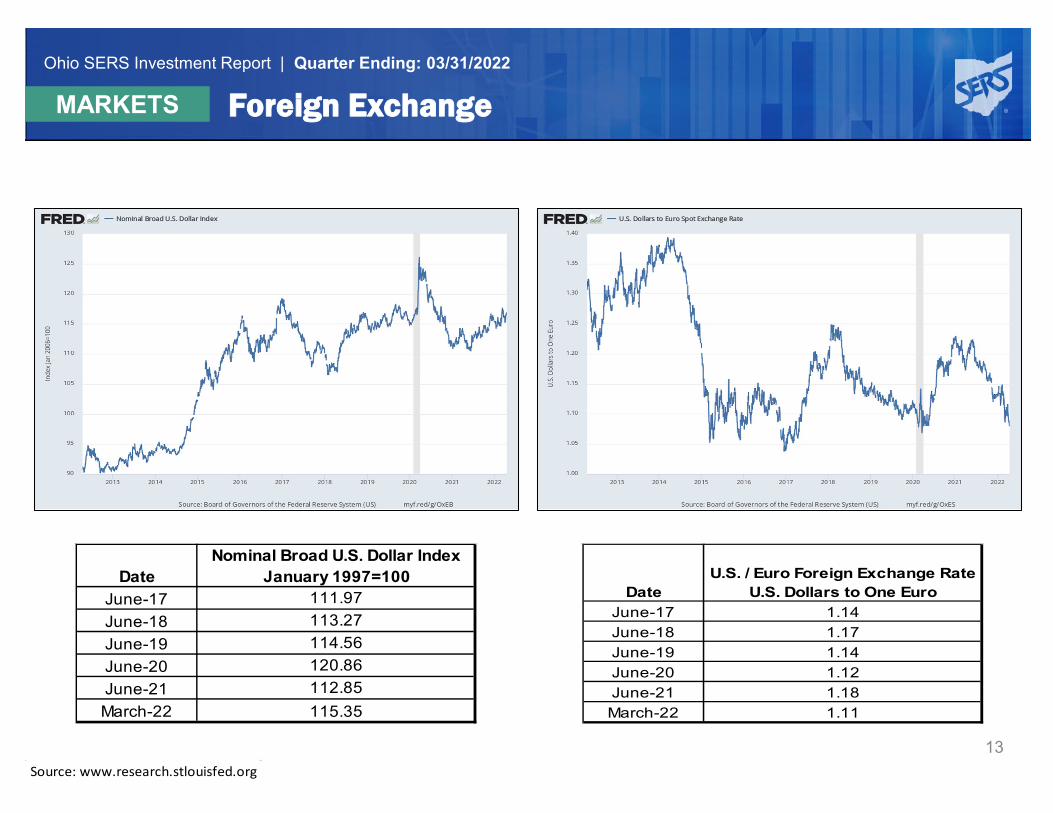
Ohio SERS Investment Report | Quarter Ending: 03/31/2022
MARKETS
13
Foreign Exchange
DateNominal Broad U.S. Dollar Index
January 1997=100 June-17 111.97June-18 113.27June-19 114.56June-20 120.86June-21 112.85March-22 115.35
DateU.S. / Euro Foreign Exchange Rate
U.S. Dollars to One EuroJune-17 1.14June-18 1.17June-19 1.14June-20 1.12June-21 1.18March-22 1.11
Source: www.research.stlouisfed.org
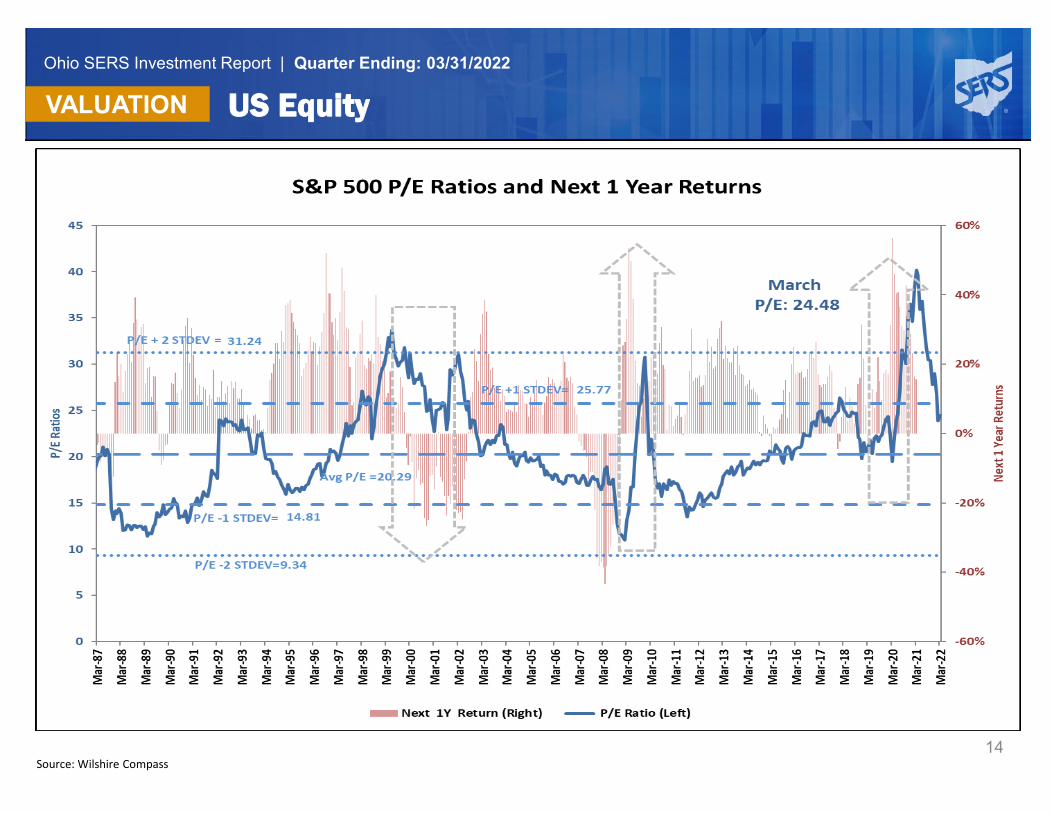
Ohio SERS Investment Report | Quarter Ending: 03/31/2022
VALUATION
14
US Equity
Source: Wilshire Compass
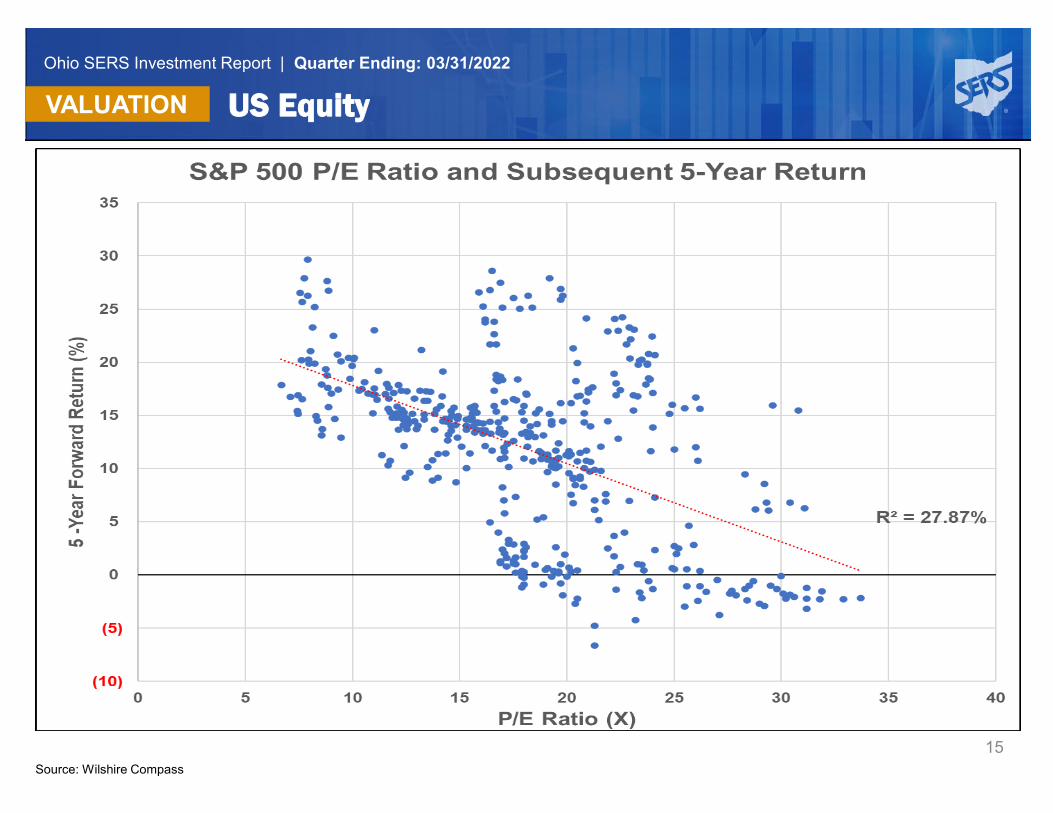
Ohio SERS Investment Report | Quarter Ending: 03/31/2022
VALUATION
15
US Equity
Source: Wilshire Compass
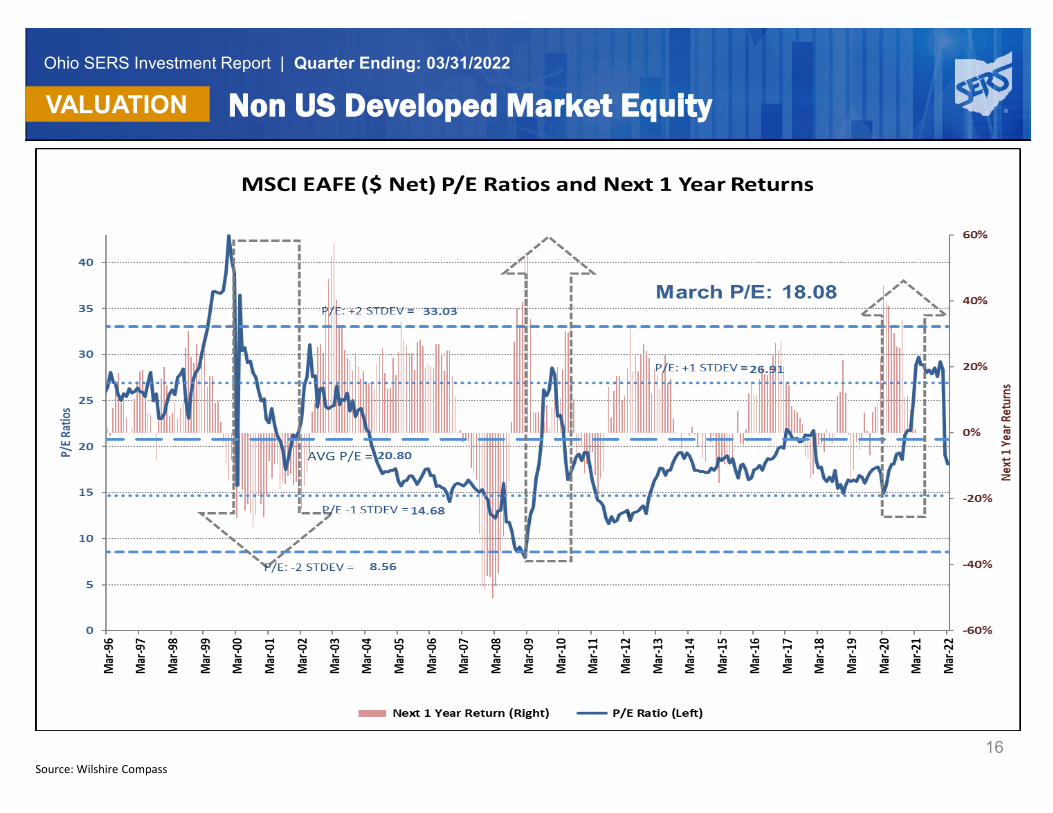
Ohio SERS Investment Report | Quarter Ending: 03/31/2022
VALUATION
16
Non US Developed Market Equity
Source: Wilshire Compass
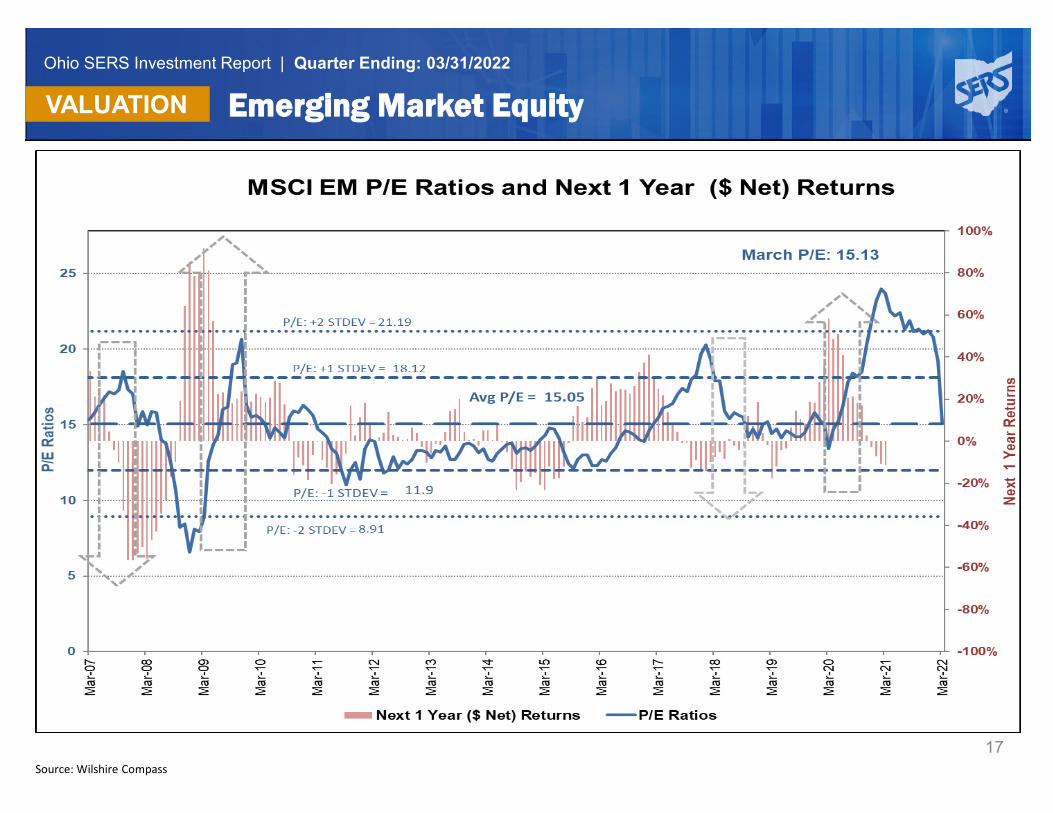
Ohio SERS Investment Report | Quarter Ending: 03/31/2022
VALUATION
17
Emerging Market Equity
Source: Wilshire Compass
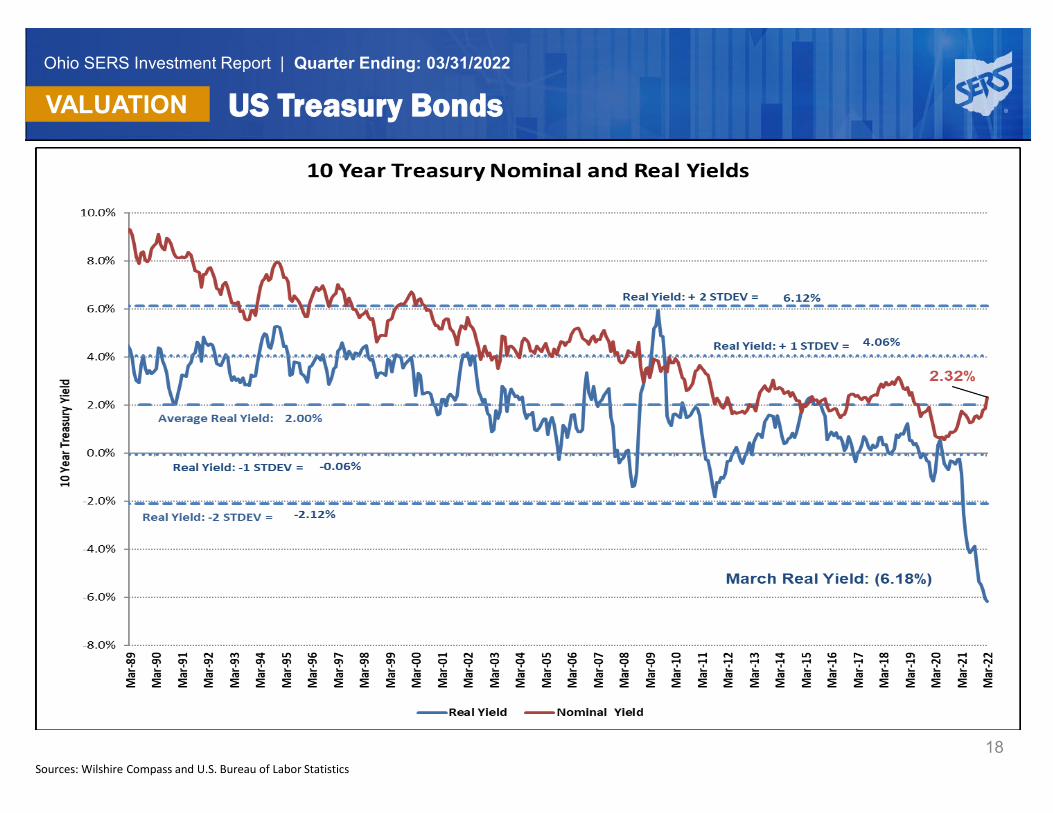
Ohio SERS Investment Report | Quarter Ending: 03/31/2022
VALUATION
18
US Treasury Bonds
Sources: Wilshire Compass and U.S. Bureau of Labor Statistics
19
SERS’ Investment Portfolios Review
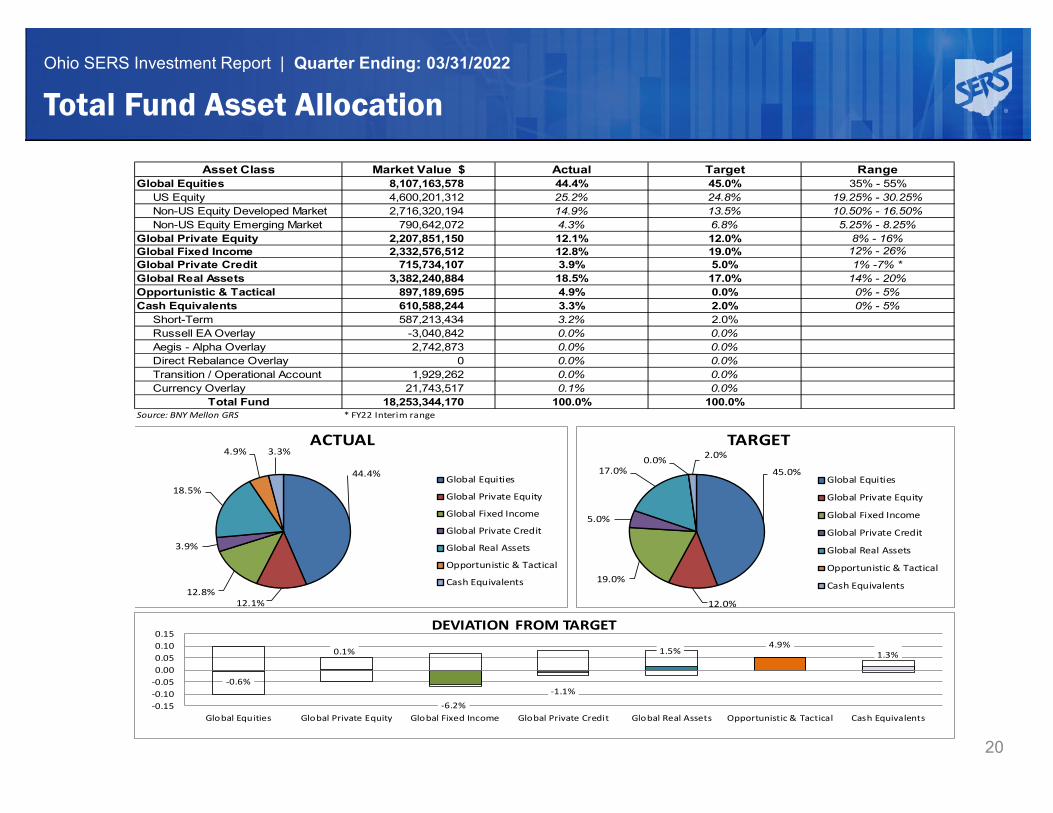
Ohio SERS Investment Report | Quarter Ending: 03/31/2022
20
Total Fund Asset Allocation
Asset Class Market Value $ Actual Target RangeGlobal Equities 8,107,163,578 44.4% 45.0% 35% - 55% US Equity 4,600,201,312 25.2% 24.8% 19.25% - 30.25% Non-US Equity Developed Market 2,716,320,194 14.9% 13.5% 10.50% - 16.50% Non-US Equity Emerging Market 790,642,072 4.3% 6.8% 5.25% - 8.25%Global Private Equity 2,207,851,150 12.1% 12.0% 8% - 16%Global Fixed Income 2,332,576,512 12.8% 19.0% 12% - 26%Global Private Credit 715,734,107 3.9% 5.0% 1% -7% *Global Real Assets 3,382,240,884 18.5% 17.0% 14% - 20%Opportunistic & Tactical 897,189,695 4.9% 0.0% 0% - 5%Cash Equivalents 610,588,244 3.3% 2.0% 0% - 5% Short-Term 587,213,434 3.2% 2.0% Russell EA Overlay -3,040,842 0.0% 0.0% Aegis - Alpha Overlay 2,742,873 0.0% 0.0% Direct Rebalance Overlay 0 0.0% 0.0% Transition / Operational Account 1,929,262 0.0% 0.0% Currency Overlay 21,743,517 0.1% 0.0%
Total Fund 18,253,344,170 100.0% 100.0%Source: BNY Mellon GRS * FY22 Interim range
45.0%
12.0%
19.0%
5.0%
17.0%0.0% 2.0%
TARGET
Global Equities
Global Private Equity
Global Fixed Income
Global Private Credit
Global Real Assets
Opportunistic & Tactical
Cash Equivalents
-0.6%
0.1%
-6.2%-1.1%
1.5%4.9%
1.3%
-0.15-0.10-0.050.000.050.100.15
Global Equities Global Private Equity Global Fixed Income Global Private Credit Global Real Assets Opportunistic & Tactical Cash Equivalents
DEVIATION FROM TARGET
44.4%
12.1%12.8%
3.9%
18.5%
4.9% 3.3%ACTUAL
Global Equities
Global Private Equity
Global Fixed Income
Global Private Credit
Global Real Assets
Opportunistic & Tactical
Cash Equivalents
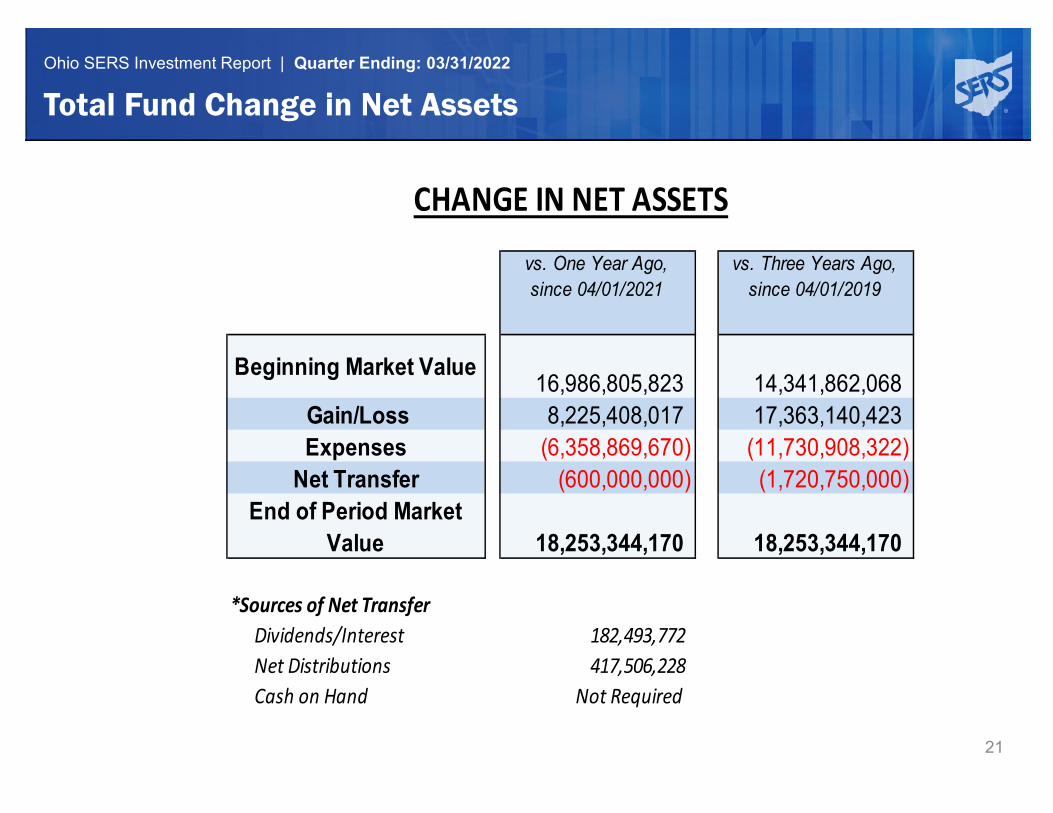
Ohio SERS Investment Report | Quarter Ending: 03/31/2022
21
Total Fund Change in Net Assets
vs. One Year Ago,since 04/01/2021
vs. Three Years Ago,since 04/01/2019
Beginning Market Value16,986,805,823 14,341,862,068
Gain/Loss 8,225,408,017 17,363,140,423Expenses (6,358,869,670) (11,730,908,322)
Net Transfer (600,000,000) (1,720,750,000)End of Period Market
Value 18,253,344,170 18,253,344,170
*Sources of Net Transfer Dividends/Interest 182,493,772 Net Distributions 417,506,228 Cash on Hand Not Required
CHANGE IN NET ASSETS
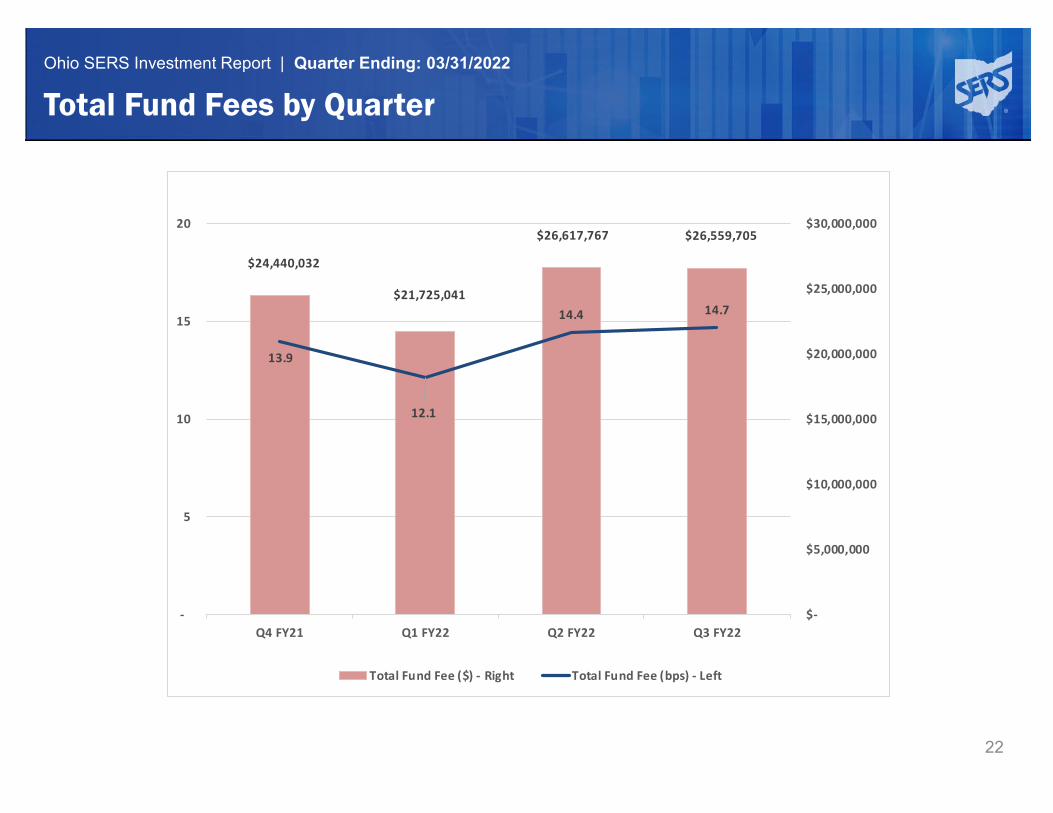
Ohio SERS Investment Report | Quarter Ending: 03/31/2022
22
Total Fund Fees by Quarter
$24,440,032
$21,725,041
$26,617,767 $26,559,705
13.9
12.1
14.4 14.7
-
5
10
15
20
Q4 FY21 Q1 FY22 Q2 FY22 Q3 FY22 $-
$5,000,000
$10,000,000
$15,000,000
$20,000,000
$25,000,000
$30,000,000
Total Fund Fee ($) - Right Total Fund Fee (bps) - Left
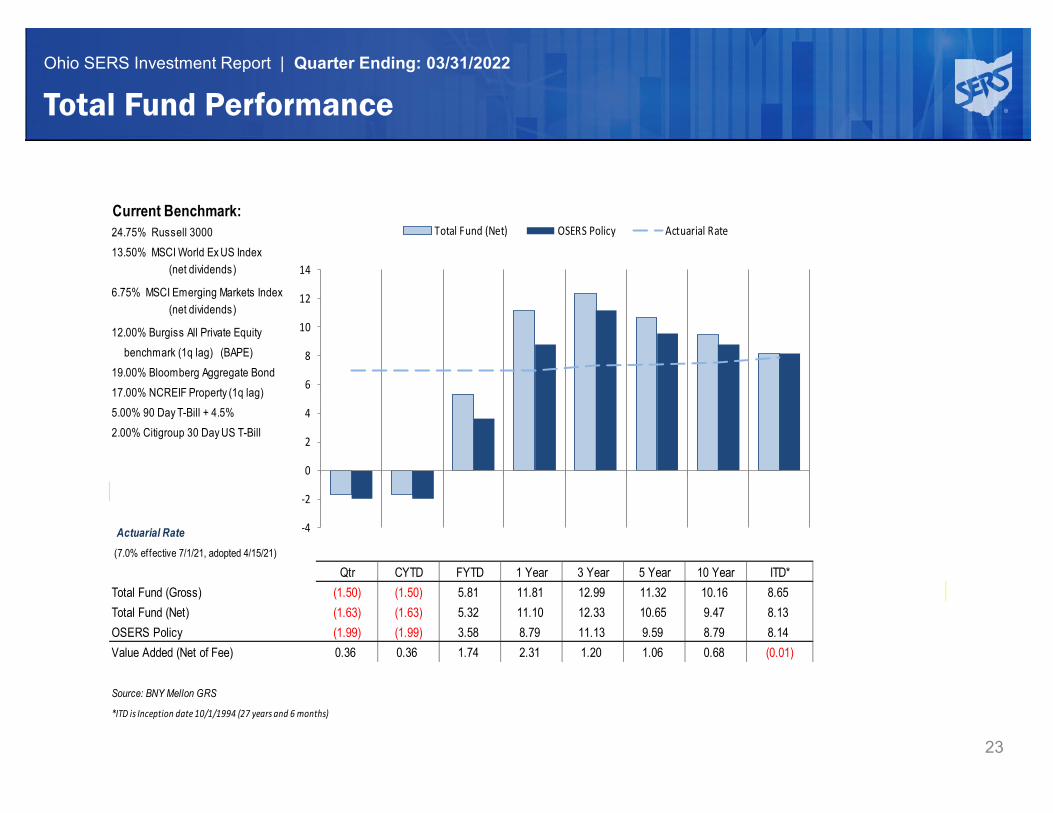
Ohio SERS Investment Report | Quarter Ending: 03/31/2022
23
Total Fund Performance
Current Benchmark:24.75% Russell 300013.50% MSCI World Ex US Index (net dividends)
6.75% MSCI Emerging Markets Index (net dividends)
12.00% Burgiss All Private Equity benchmark (1q lag) (BAPE)19.00% Bloomberg Aggregate Bond17.00% NCREIF Property (1q lag)5.00% 90 Day T-Bill + 4.5%2.00% Citigroup 30 Day US T-Bill
Actuarial Rate (7.0% effective 7/1/21, adopted 4/15/21)
Qtr CYTD FYTD 1 Year 3 Year 5 Year 10 Year ITD*Total Fund (Gross) (1.50) (1.50) 5.81 11.81 12.99 11.32 10.16 8.65Total Fund (Net) (1.63) (1.63) 5.32 11.10 12.33 10.65 9.47 8.13OSERS Policy (1.99) (1.99) 3.58 8.79 11.13 9.59 8.79 8.14Value Added (Net of Fee) 0.36 0.36 1.74 2.31 1.20 1.06 0.68 (0.01)
Source: BNY Mellon GRS
*ITD is Inception date 10/1/1994 (27 years and 6 months)
-4
-2
0
2
4
6
8
10
12
14
Total Fund (Net) OSERS Policy Actuarial Rate
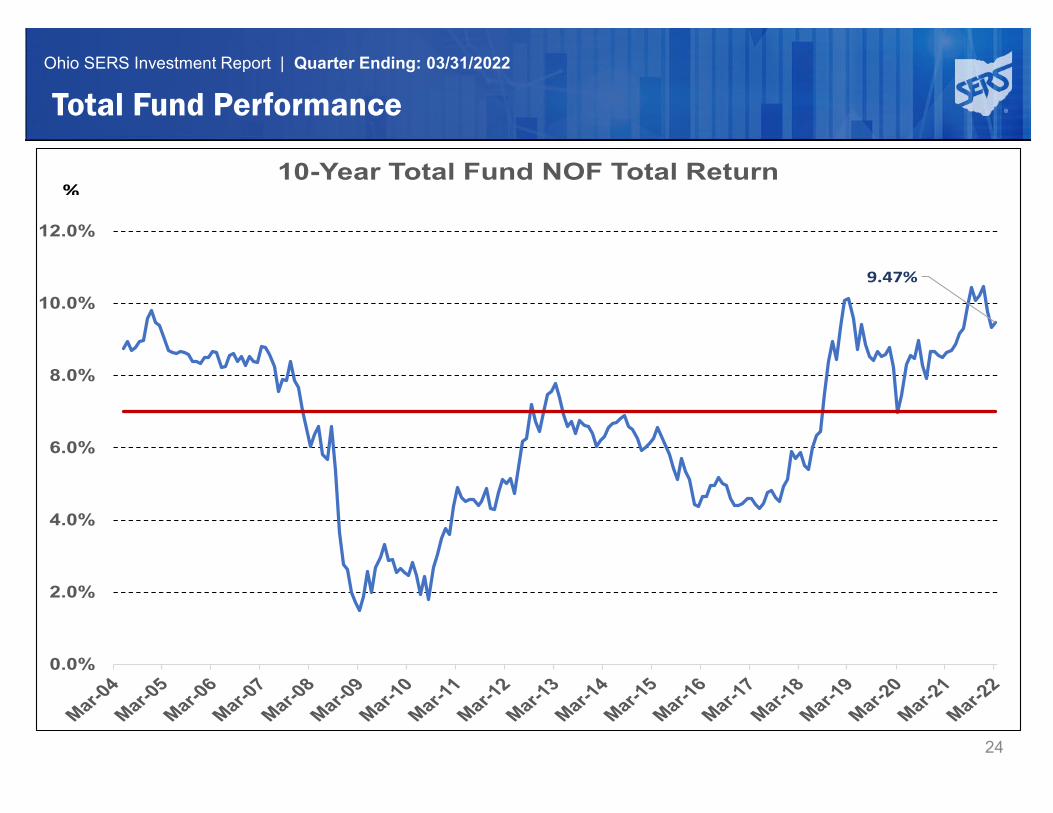
Ohio SERS Investment Report | Quarter Ending: 03/31/2022
24
Total Fund Performance
9.47%
0.0%
2.0%
4.0%
6.0%
8.0%
10.0%
12.0%
10-Year Total Fund NOF Total Return %
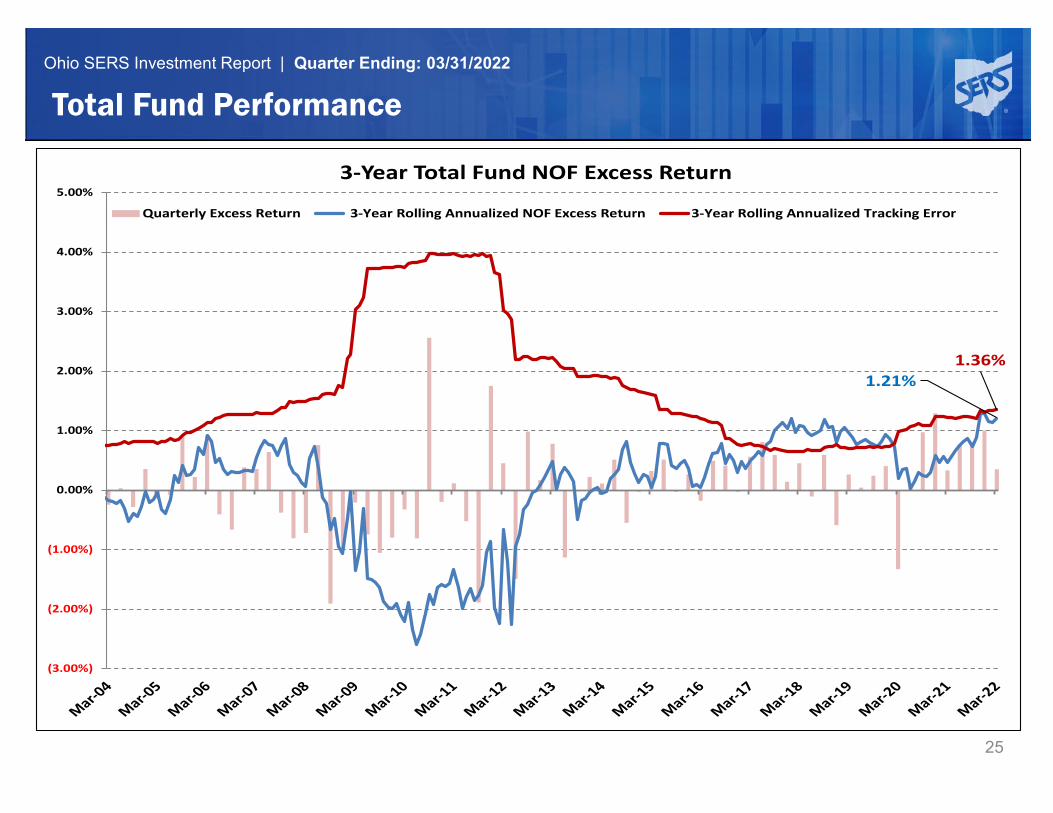
Ohio SERS Investment Report | Quarter Ending: 03/31/2022
25
Total Fund Performance
1.21%1.36%
(3.00%)
(2.00%)
(1.00%)
0.00%
1.00%
2.00%
3.00%
4.00%
5.00%3-Year Total Fund NOF Excess Return
Quarterly Excess Return 3-Year Rolling Annualized NOF Excess Return 3-Year Rolling Annualized Tracking Error
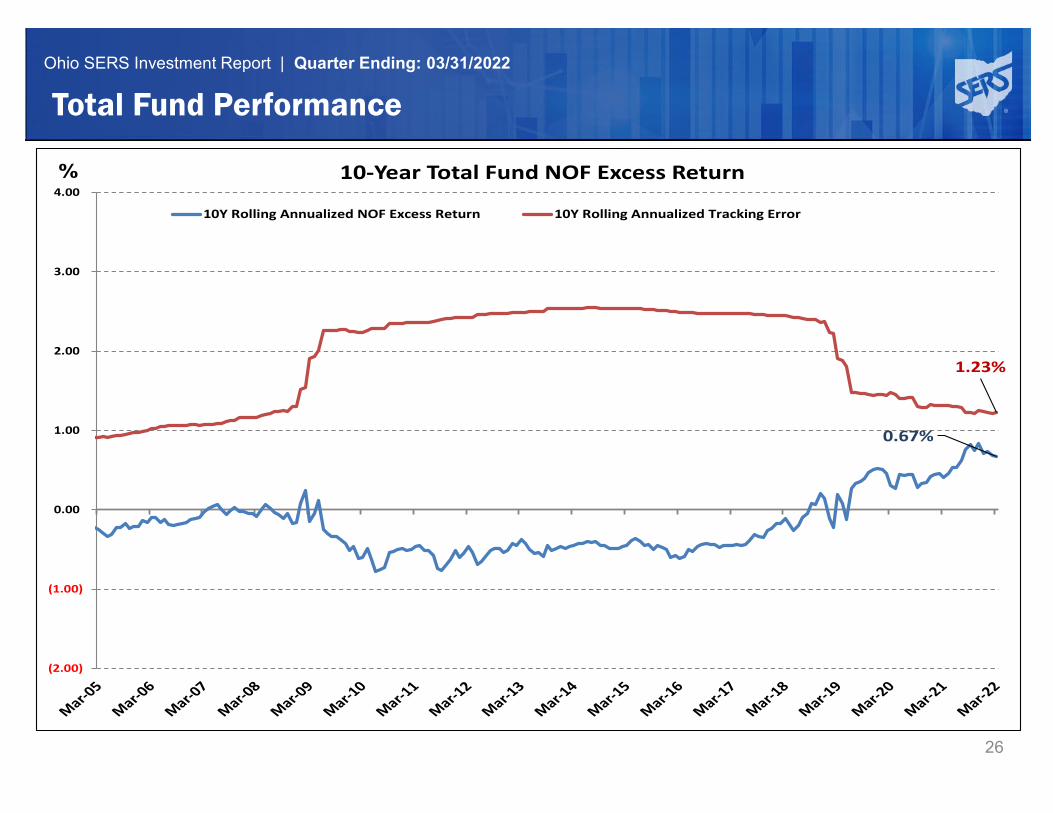
Ohio SERS Investment Report | Quarter Ending: 03/31/2022
26
Total Fund Performance
0.67%
1.23%
(2.00)
(1.00)
0.00
1.00
2.00
3.00
4.0010-Year Total Fund NOF Excess Return
10Y Rolling Annualized NOF Excess Return 10Y Rolling Annualized Tracking Error
%
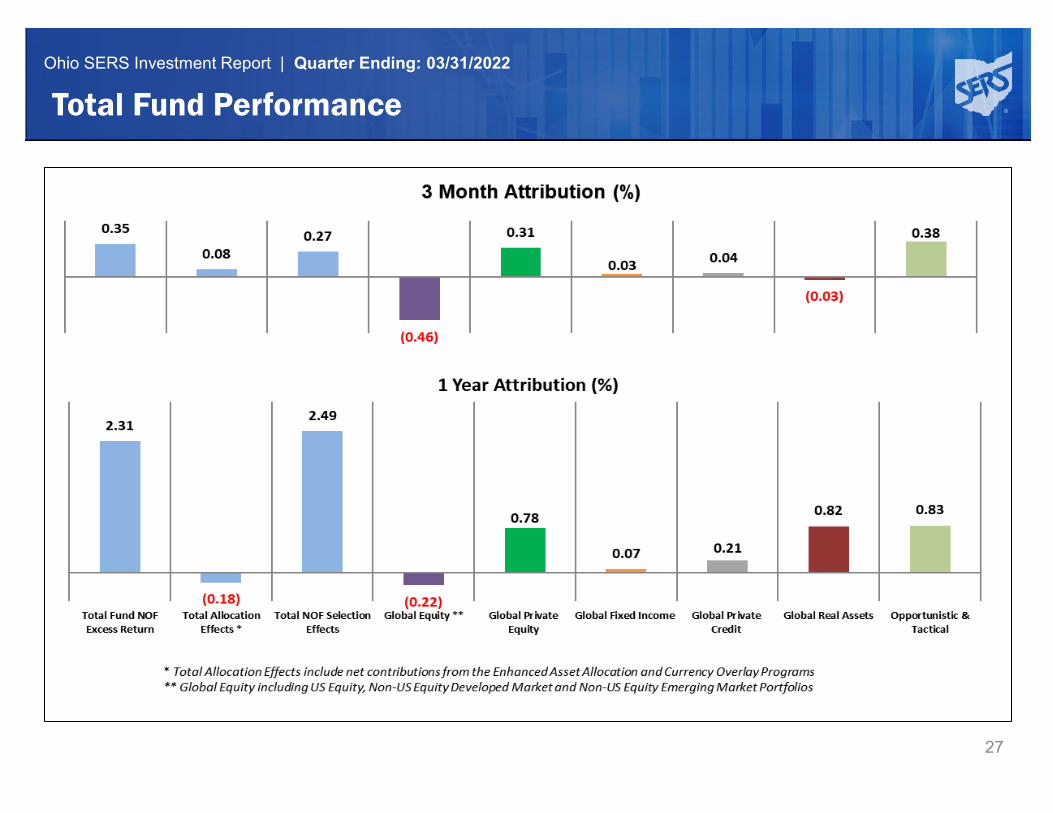
Ohio SERS Investment Report | Quarter Ending: 03/31/2022
27
Total Fund Performance
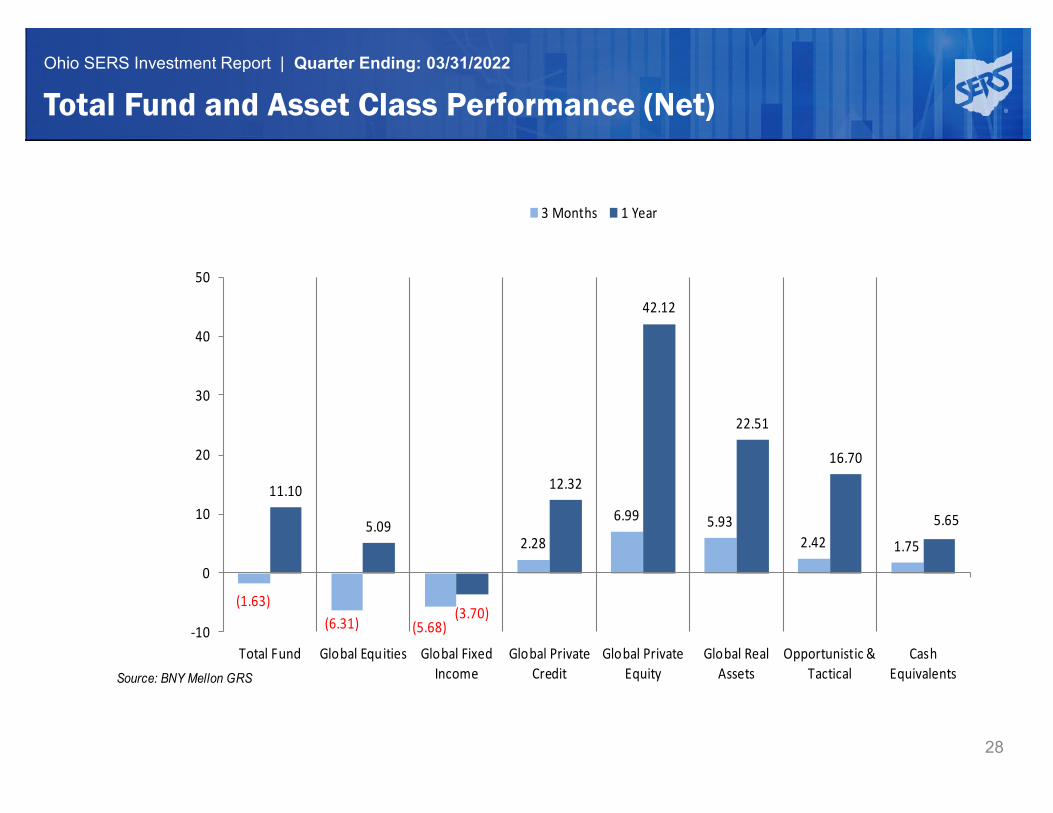
Ohio SERS Investment Report | Quarter Ending: 03/31/2022
28
Total Fund and Asset Class Performance (Net)
Source: BNY Mellon GRS
(1.63)(6.31) (5.68)
2.28
6.99 5.93 2.42 1.75
11.10
5.09
(3.70)
12.32
42.12
22.51
16.70
5.65
-10
0
10
20
30
40
50
Total Fund Global Equities Global FixedIncome
Global PrivateCredit
Global PrivateEquity
Global RealAssets
Opportunistic &Tactical
CashEquivalents
3 Months 1 Year
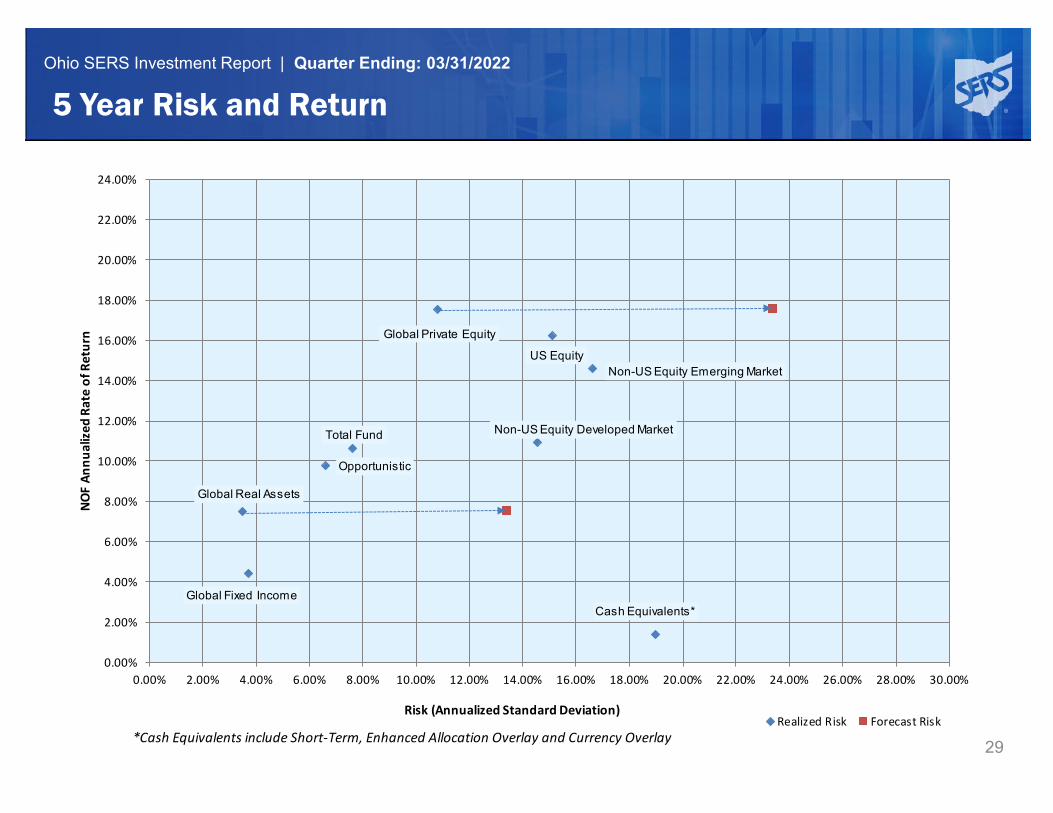
Ohio SERS Investment Report | Quarter Ending: 03/31/2022
29
5 Year Risk and Return
*Cash Equivalents include Short-Term, Enhanced Allocation Overlay and Currency Overlay
Total Fund
US Equity
Non-US Equity Developed Market
Non-US Equity Emerging Market
Global Private Equity
Global Fixed Income
Global Real Assets
Cash Equivalents*
Opportunistic
0.00%
2.00%
4.00%
6.00%
8.00%
10.00%
12.00%
14.00%
16.00%
18.00%
20.00%
22.00%
24.00%
0.00% 2.00% 4.00% 6.00% 8.00% 10.00% 12.00% 14.00% 16.00% 18.00% 20.00% 22.00% 24.00% 26.00% 28.00% 30.00%
NO
F An
nual
ized
Rat
e of
Ret
urn
Risk (Annualized Standard Deviation) Realized Risk Forecast Risk
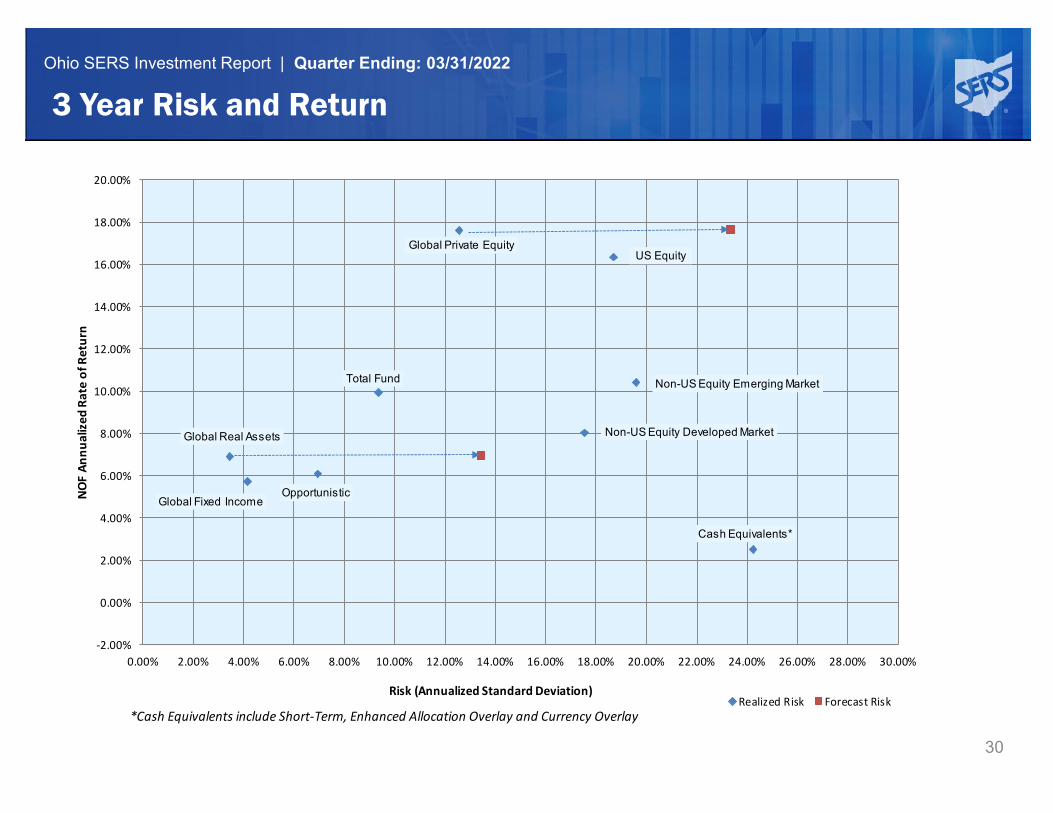
Ohio SERS Investment Report | Quarter Ending: 03/31/2022
30
3 Year Risk and Return
*Cash Equivalents include Short-Term, Enhanced Allocation Overlay and Currency Overlay
Total Fund
US Equity
Non-US Equity Developed Market
Non-US Equity Emerging Market
Global Private Equity
Global Fixed Income
Global Real Assets
Cash Equivalents*
Opportunistic
-2.00%
0.00%
2.00%
4.00%
6.00%
8.00%
10.00%
12.00%
14.00%
16.00%
18.00%
20.00%
0.00% 2.00% 4.00% 6.00% 8.00% 10.00% 12.00% 14.00% 16.00% 18.00% 20.00% 22.00% 24.00% 26.00% 28.00% 30.00%
NO
F An
nual
ized
Rat
e of
Ret
urn
Risk (Annualized Standard Deviation) Realized Risk Forecast Risk
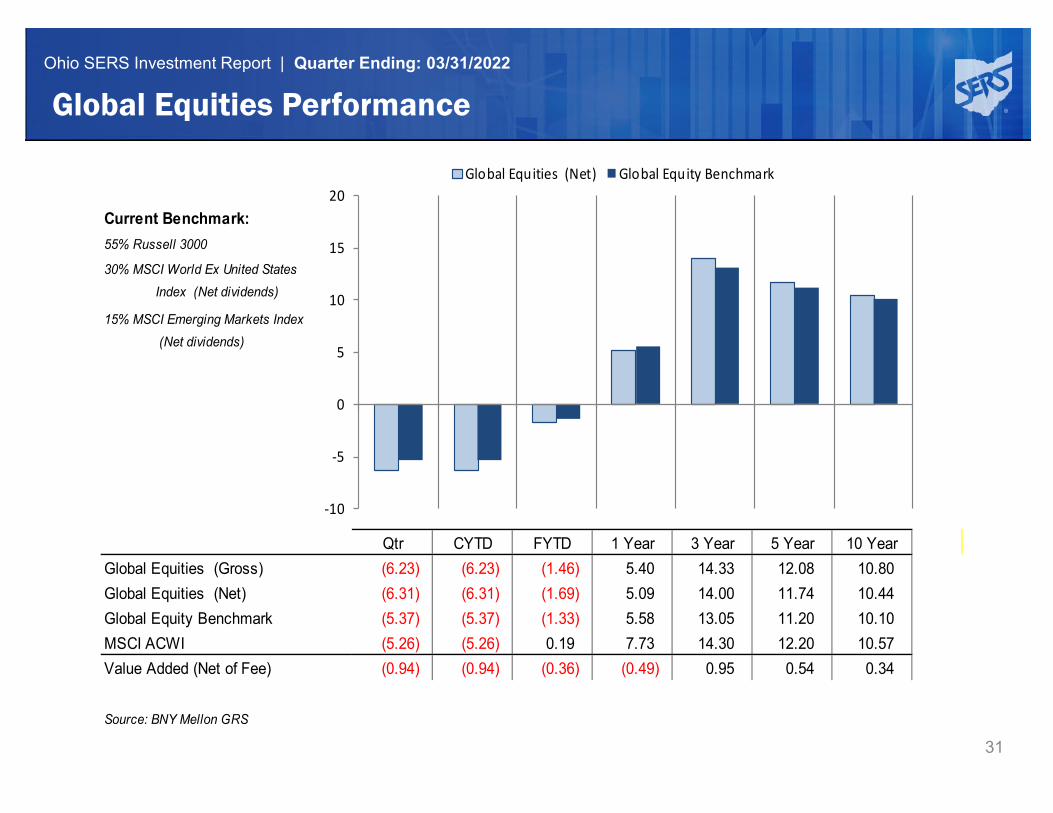
Ohio SERS Investment Report | Quarter Ending: 03/31/2022
31
Global Equities Performance
Current Benchmark:55% Russell 3000
30% MSCI World Ex United States Index (Net dividends)
15% MSCI Emerging Markets Index (Net dividends)
Qtr CYTD FYTD 1 Year 3 Year 5 Year 10 YearGlobal Equities (Gross) (6.23) (6.23) (1.46) 5.40 14.33 12.08 10.80Global Equities (Net) (6.31) (6.31) (1.69) 5.09 14.00 11.74 10.44Global Equity Benchmark (5.37) (5.37) (1.33) 5.58 13.05 11.20 10.10MSCI ACWI (5.26) (5.26) 0.19 7.73 14.30 12.20 10.57Value Added (Net of Fee) (0.94) (0.94) (0.36) (0.49) 0.95 0.54 0.34
Source: BNY Mellon GRS
-10
-5
0
5
10
15
20Global Equities (Net) Global Equity Benchmark
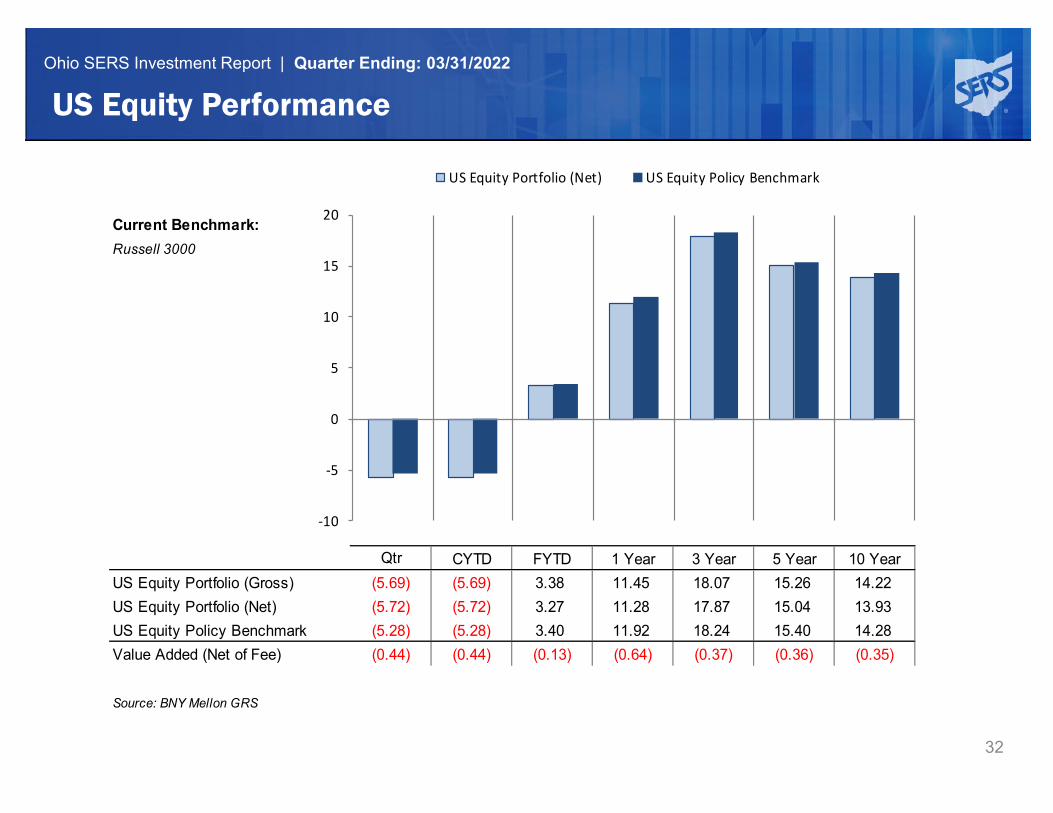
Ohio SERS Investment Report | Quarter Ending: 03/31/2022
32
US Equity Performance
Current Benchmark:Russell 3000
Qtr CYTD FYTD 1 Year 3 Year 5 Year 10 YearUS Equity Portfolio (Gross) (5.69) (5.69) 3.38 11.45 18.07 15.26 14.22US Equity Portfolio (Net) (5.72) (5.72) 3.27 11.28 17.87 15.04 13.93US Equity Policy Benchmark (5.28) (5.28) 3.40 11.92 18.24 15.40 14.28Value Added (Net of Fee) (0.44) (0.44) (0.13) (0.64) (0.37) (0.36) (0.35)
Source: BNY Mellon GRS
-10
-5
0
5
10
15
20
US Equity Portfolio (Net) US Equity Policy Benchmark
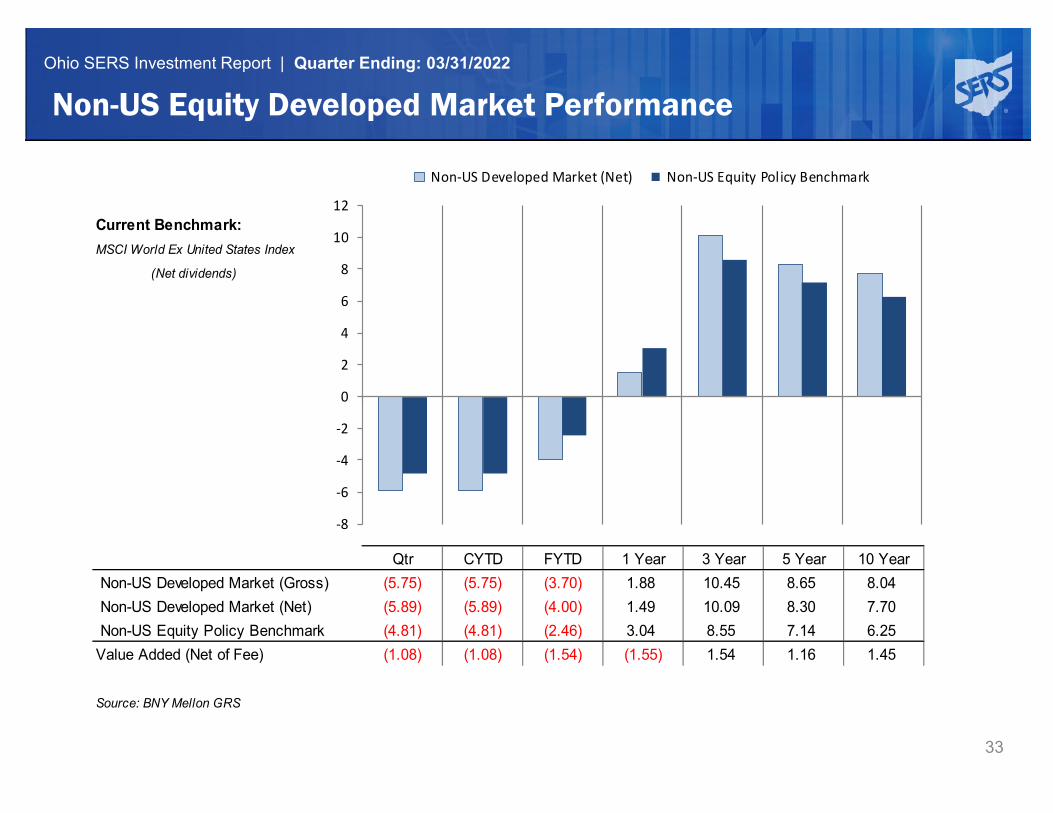
Ohio SERS Investment Report | Quarter Ending: 03/31/2022
33
Non-US Equity Developed Market Performance
Current Benchmark:MSCI World Ex United States Index
(Net dividends)
Qtr CYTD FYTD 1 Year 3 Year 5 Year 10 Year Non-US Developed Market (Gross) (5.75) (5.75) (3.70) 1.88 10.45 8.65 8.04 Non-US Developed Market (Net) (5.89) (5.89) (4.00) 1.49 10.09 8.30 7.70 Non-US Equity Policy Benchmark (4.81) (4.81) (2.46) 3.04 8.55 7.14 6.25Value Added (Net of Fee) (1.08) (1.08) (1.54) (1.55) 1.54 1.16 1.45
Source: BNY Mellon GRS
-8
-6
-4
-2
0
2
4
6
8
10
12
Non-US Developed Market (Net) Non-US Equity Policy Benchmark
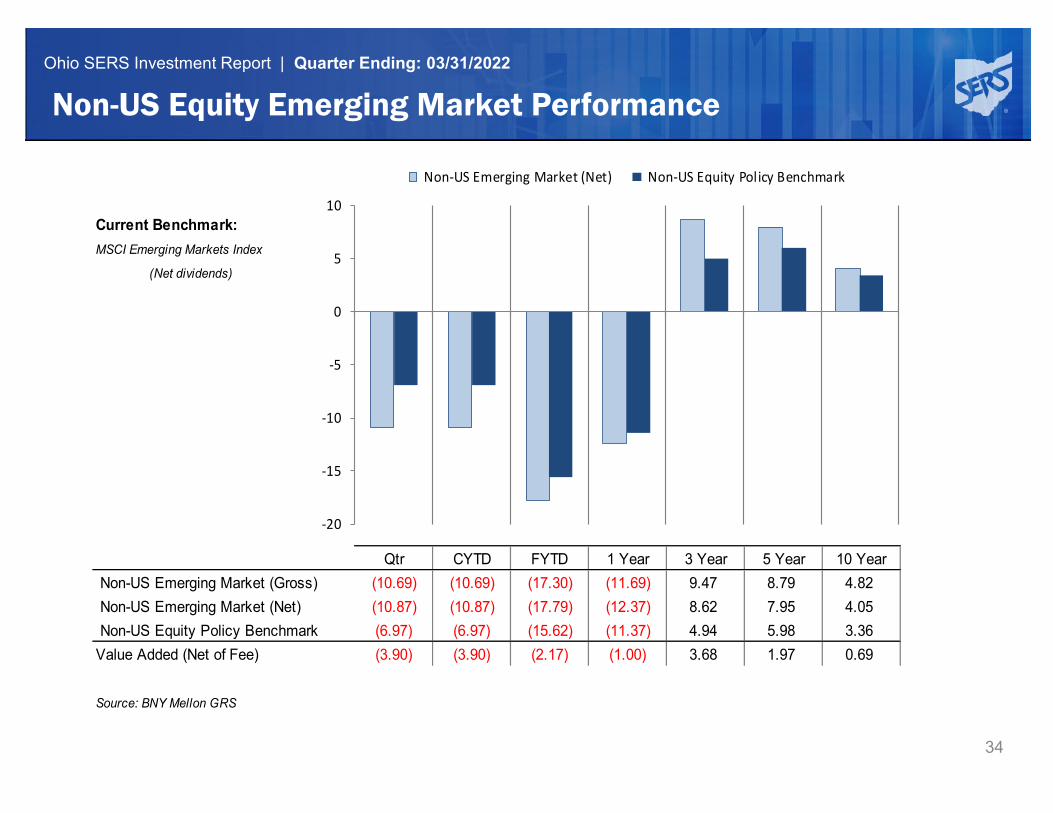
Ohio SERS Investment Report | Quarter Ending: 03/31/2022
34
Non-US Equity Emerging Market Performance
Current Benchmark:MSCI Emerging Markets Index
(Net dividends)
Qtr CYTD FYTD 1 Year 3 Year 5 Year 10 Year Non-US Emerging Market (Gross) (10.69) (10.69) (17.30) (11.69) 9.47 8.79 4.82 Non-US Emerging Market (Net) (10.87) (10.87) (17.79) (12.37) 8.62 7.95 4.05 Non-US Equity Policy Benchmark (6.97) (6.97) (15.62) (11.37) 4.94 5.98 3.36Value Added (Net of Fee) (3.90) (3.90) (2.17) (1.00) 3.68 1.97 0.69
Source: BNY Mellon GRS
-20
-15
-10
-5
0
5
10
Non-US Emerging Market (Net) Non-US Equity Policy Benchmark
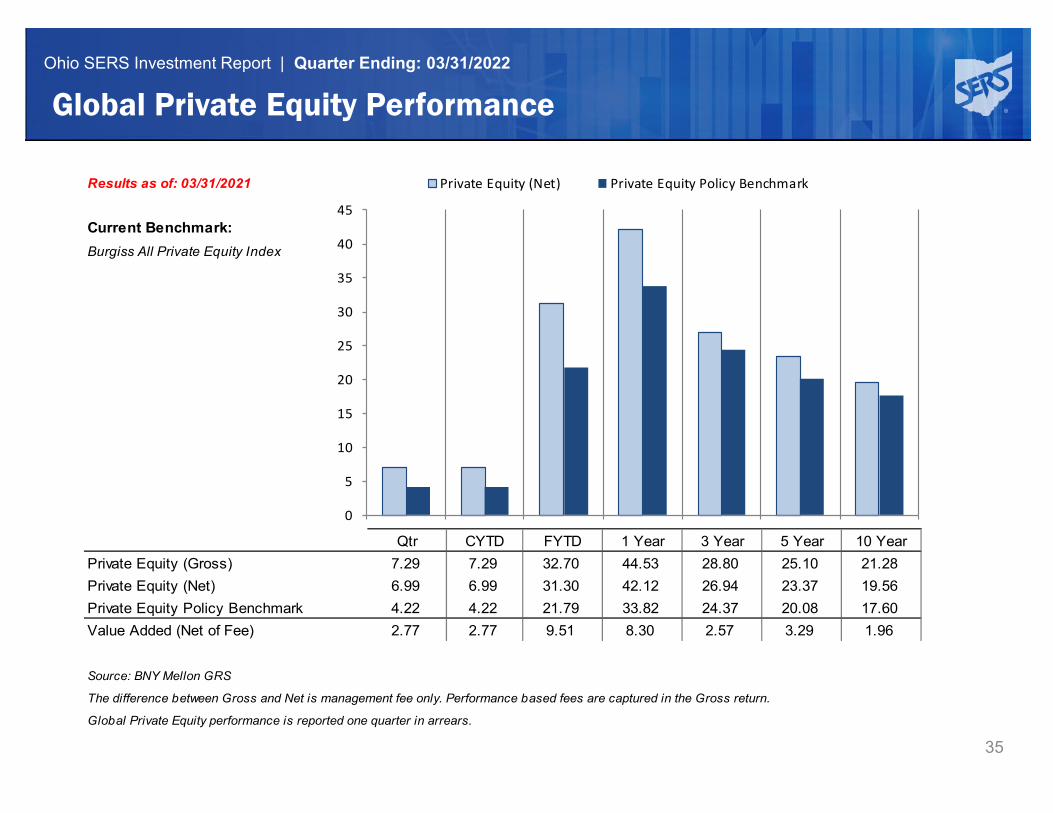
Ohio SERS Investment Report | Quarter Ending: 03/31/2022
35
Global Private Equity Performance
Results as of: 03/31/2021
Current Benchmark:Burgiss All Private Equity Index
Qtr CYTD FYTD 1 Year 3 Year 5 Year 10 YearPrivate Equity (Gross) 7.29 7.29 32.70 44.53 28.80 25.10 21.28Private Equity (Net) 6.99 6.99 31.30 42.12 26.94 23.37 19.56Private Equity Policy Benchmark 4.22 4.22 21.79 33.82 24.37 20.08 17.60Value Added (Net of Fee) 2.77 2.77 9.51 8.30 2.57 3.29 1.96
Source: BNY Mellon GRS
The difference between Gross and Net is management fee only. Performance based fees are captured in the Gross return.
Global Private Equity performance is reported one quarter in arrears.
0
5
10
15
20
25
30
35
40
45
Private Equity (Net) Private Equity Policy Benchmark
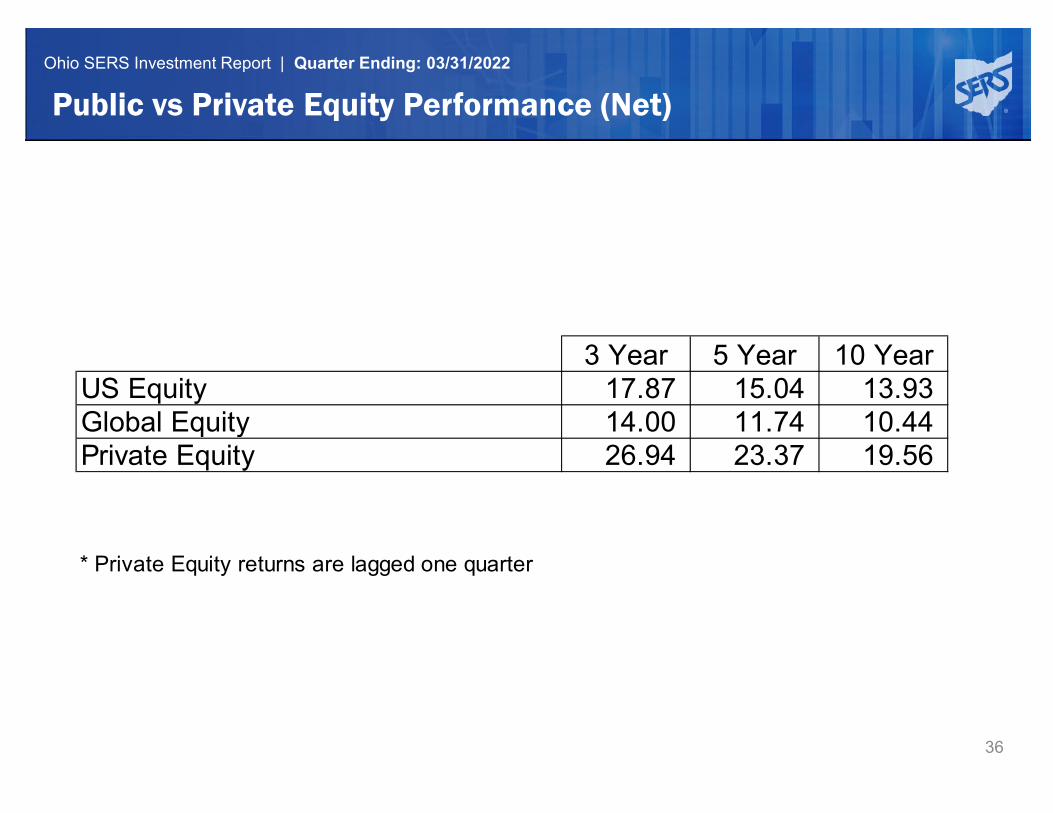
Ohio SERS Investment Report | Quarter Ending: 03/31/2022
36
Public vs Private Equity Performance (Net)
3 Year 5 Year 10 YearUS Equity 17.87 15.04 13.93Global Equity 14.00 11.74 10.44Private Equity 26.94 23.37 19.56
* Private Equity returns are lagged one quarter
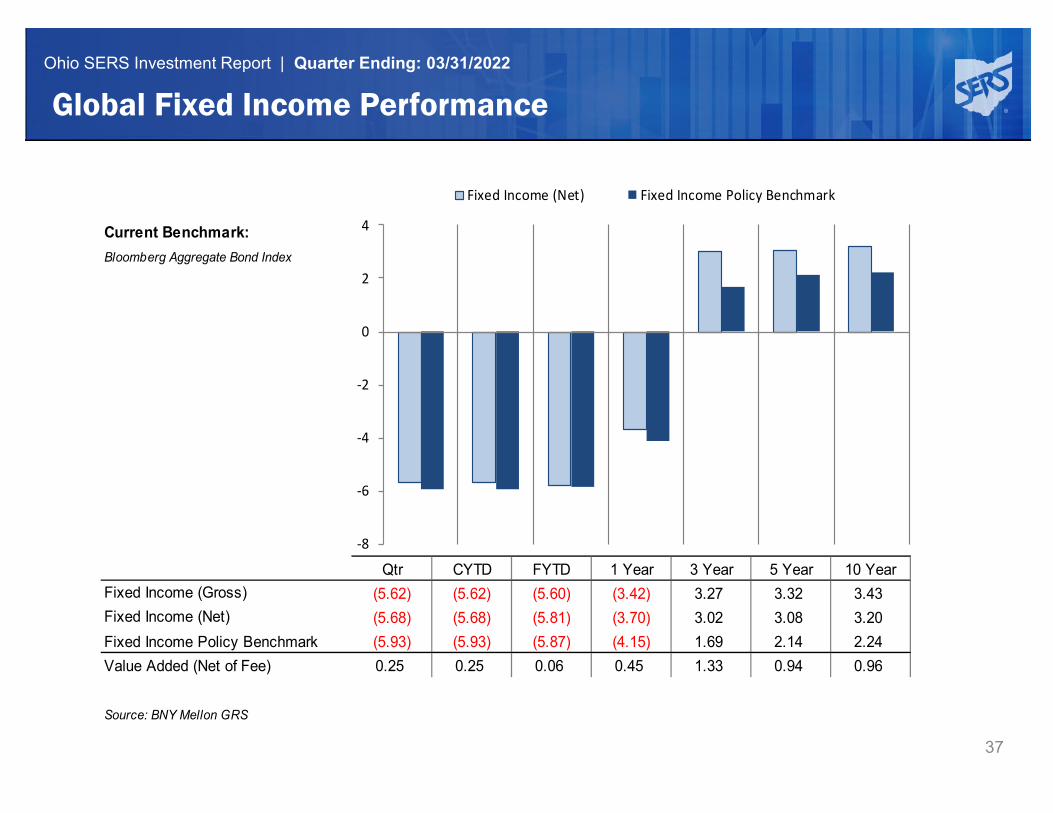
Ohio SERS Investment Report | Quarter Ending: 03/31/2022
37
Global Fixed Income Performance
Current Benchmark:Bloomberg Aggregate Bond Index
Qtr CYTD FYTD 1 Year 3 Year 5 Year 10 YearFixed Income (Gross) (5.62) (5.62) (5.60) (3.42) 3.27 3.32 3.43Fixed Income (Net) (5.68) (5.68) (5.81) (3.70) 3.02 3.08 3.20Fixed Income Policy Benchmark (5.93) (5.93) (5.87) (4.15) 1.69 2.14 2.24Value Added (Net of Fee) 0.25 0.25 0.06 0.45 1.33 0.94 0.96
Source: BNY Mellon GRS
-8
-6
-4
-2
0
2
4
Fixed Income (Net) Fixed Income Policy Benchmark
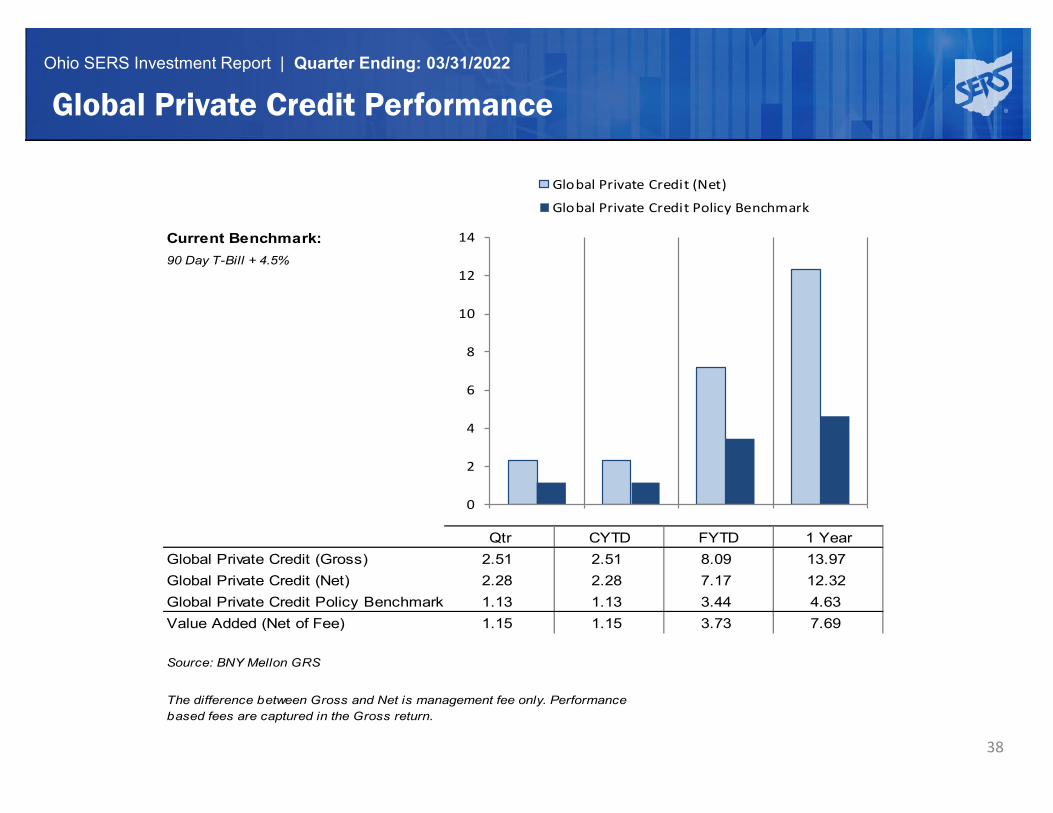
Ohio SERS Investment Report | Quarter Ending: 03/31/2022
38
Global Private Credit Performance
Current Benchmark:90 Day T-Bill + 4.5%
Qtr CYTD FYTD 1 YearGlobal Private Credit (Gross) 2.51 2.51 8.09 13.97Global Private Credit (Net) 2.28 2.28 7.17 12.32Global Private Credit Policy Benchmark 1.13 1.13 3.44 4.63Value Added (Net of Fee) 1.15 1.15 3.73 7.69
Source: BNY Mellon GRS
The difference between Gross and Net is management fee only. Performance based fees are captured in the Gross return.
0
2
4
6
8
10
12
14
Global Private Credit (Net)
Global Private Credit Policy Benchmark
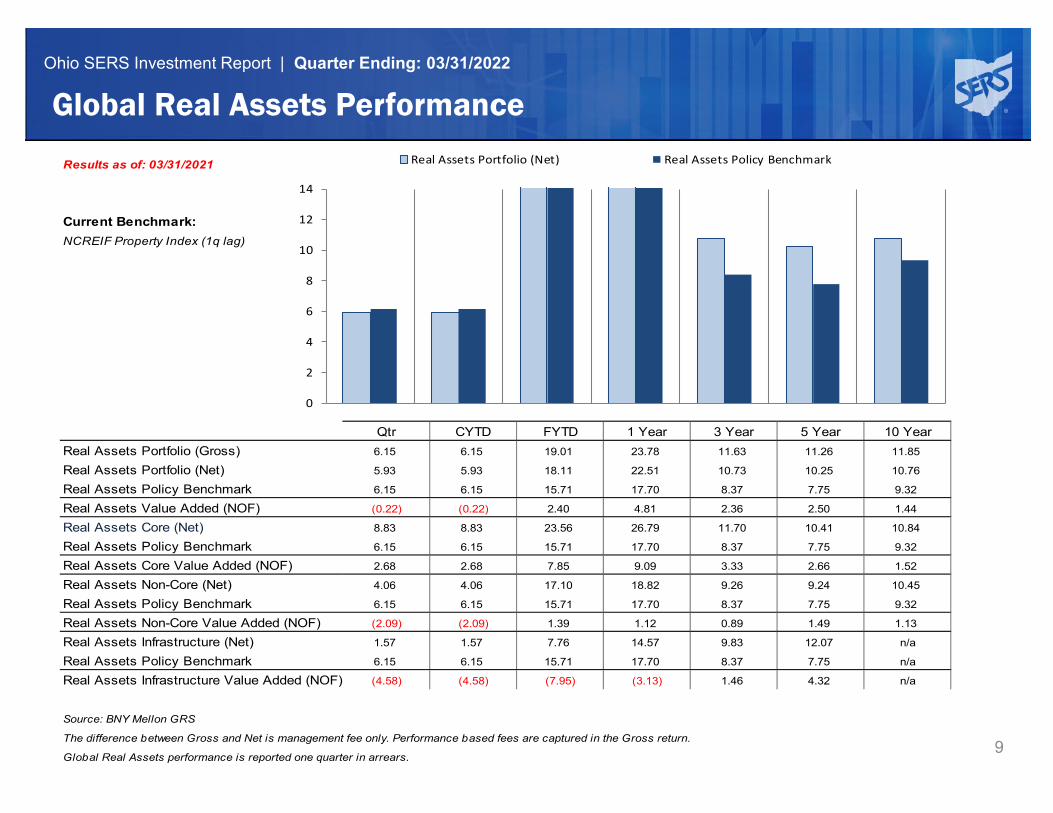
Ohio SERS Investment Report | Quarter Ending: 03/31/2022
39
Global Real Assets Performance
Results as of: 03/31/2021
Current Benchmark:NCREIF Property Index (1q lag)
Qtr CYTD FYTD 1 Year 3 Year 5 Year 10 YearReal Assets Portfolio (Gross) 6.15 6.15 19.01 23.78 11.63 11.26 11.85
Real Assets Portfolio (Net) 5.93 5.93 18.11 22.51 10.73 10.25 10.76
Real Assets Policy Benchmark 6.15 6.15 15.71 17.70 8.37 7.75 9.32
Real Assets Value Added (NOF) (0.22) (0.22) 2.40 4.81 2.36 2.50 1.44
Real Assets Core (Net) 8.83 8.83 23.56 26.79 11.70 10.41 10.84
Real Assets Policy Benchmark 6.15 6.15 15.71 17.70 8.37 7.75 9.32
Real Assets Core Value Added (NOF) 2.68 2.68 7.85 9.09 3.33 2.66 1.52
Real Assets Non-Core (Net) 4.06 4.06 17.10 18.82 9.26 9.24 10.45
Real Assets Policy Benchmark 6.15 6.15 15.71 17.70 8.37 7.75 9.32
Real Assets Non-Core Value Added (NOF) (2.09) (2.09) 1.39 1.12 0.89 1.49 1.13
Real Assets Infrastructure (Net) 1.57 1.57 7.76 14.57 9.83 12.07 n/a
Real Assets Policy Benchmark 6.15 6.15 15.71 17.70 8.37 7.75 n/a
Real Assets Infrastructure Value Added (NOF) (4.58) (4.58) (7.95) (3.13) 1.46 4.32 n/a
Source: BNY Mellon GRS
The difference between Gross and Net is management fee only. Performance based fees are captured in the Gross return.
Global Real Assets performance is reported one quarter in arrears.
0
2
4
6
8
10
12
14
Real Assets Portfolio (Net) Real Assets Policy Benchmark
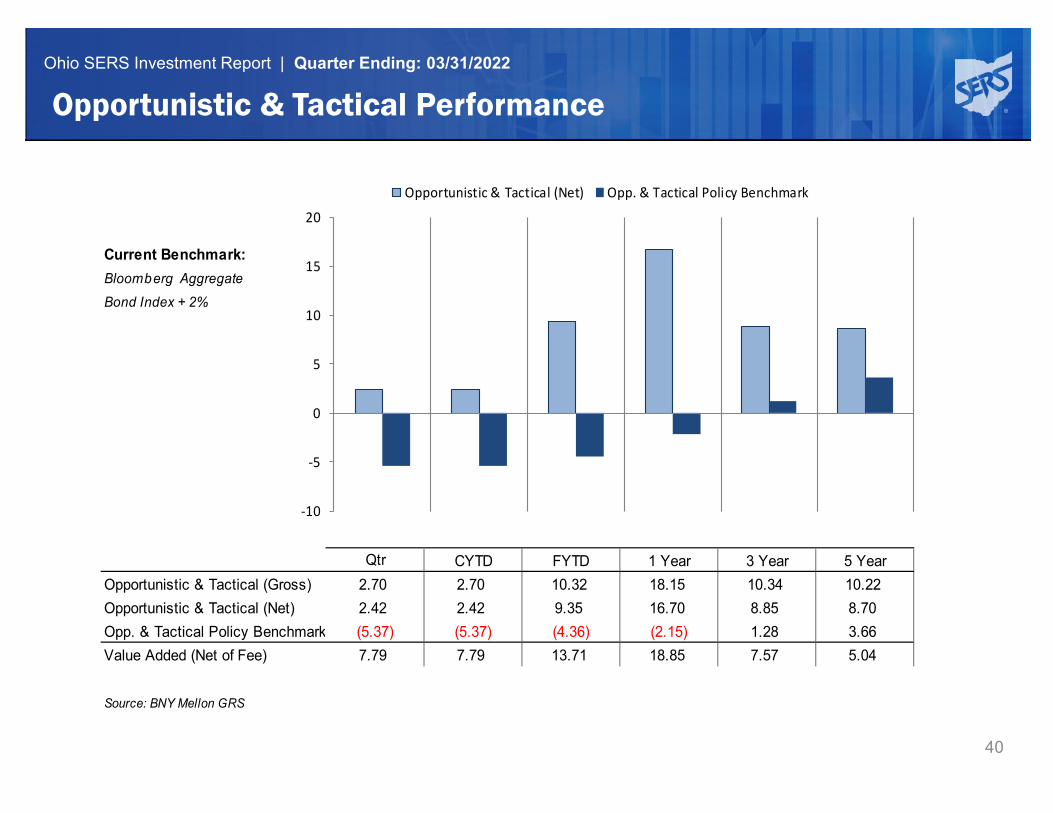
Ohio SERS Investment Report | Quarter Ending: 03/31/2022
40
Opportunistic & Tactical Performance
Current Benchmark:Bloomberg Aggregate
Bond Index + 2%
Qtr CYTD FYTD 1 Year 3 Year 5 YearOpportunistic & Tactical (Gross) 2.70 2.70 10.32 18.15 10.34 10.22Opportunistic & Tactical (Net) 2.42 2.42 9.35 16.70 8.85 8.70Opp. & Tactical Policy Benchmark (5.37) (5.37) (4.36) (2.15) 1.28 3.66Value Added (Net of Fee) 7.79 7.79 13.71 18.85 7.57 5.04
Source: BNY Mellon GRS
-10
-5
0
5
10
15
20
Opportunistic & Tactical (Net) Opp. & Tactical Policy Benchmark
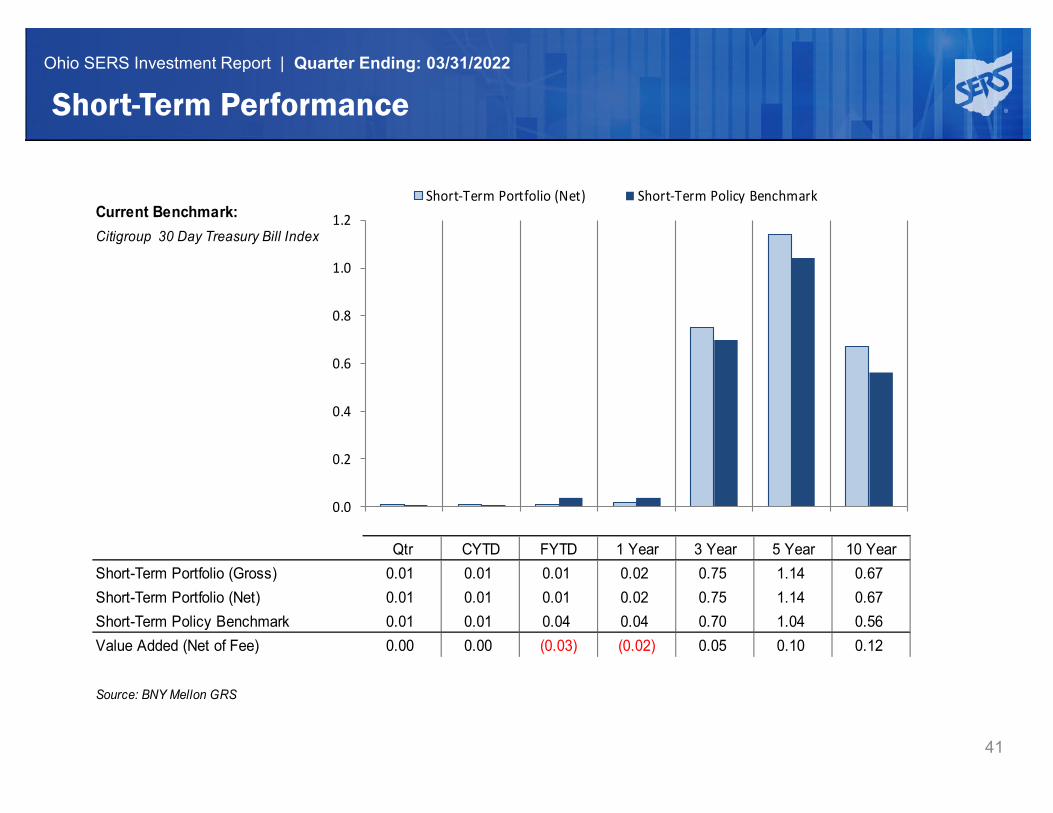
Ohio SERS Investment Report | Quarter Ending: 03/31/2022
41
Short-Term Performance
Current Benchmark:Citigroup 30 Day Treasury Bill Index
Qtr CYTD FYTD 1 Year 3 Year 5 Year 10 YearShort-Term Portfolio (Gross) 0.01 0.01 0.01 0.02 0.75 1.14 0.67Short-Term Portfolio (Net) 0.01 0.01 0.01 0.02 0.75 1.14 0.67Short-Term Policy Benchmark 0.01 0.01 0.04 0.04 0.70 1.04 0.56Value Added (Net of Fee) 0.00 0.00 (0.03) (0.02) 0.05 0.10 0.12
Source: BNY Mellon GRS
0.0
0.2
0.4
0.6
0.8
1.0
1.2Short-Term Portfolio (Net) Short-Term Policy Benchmark
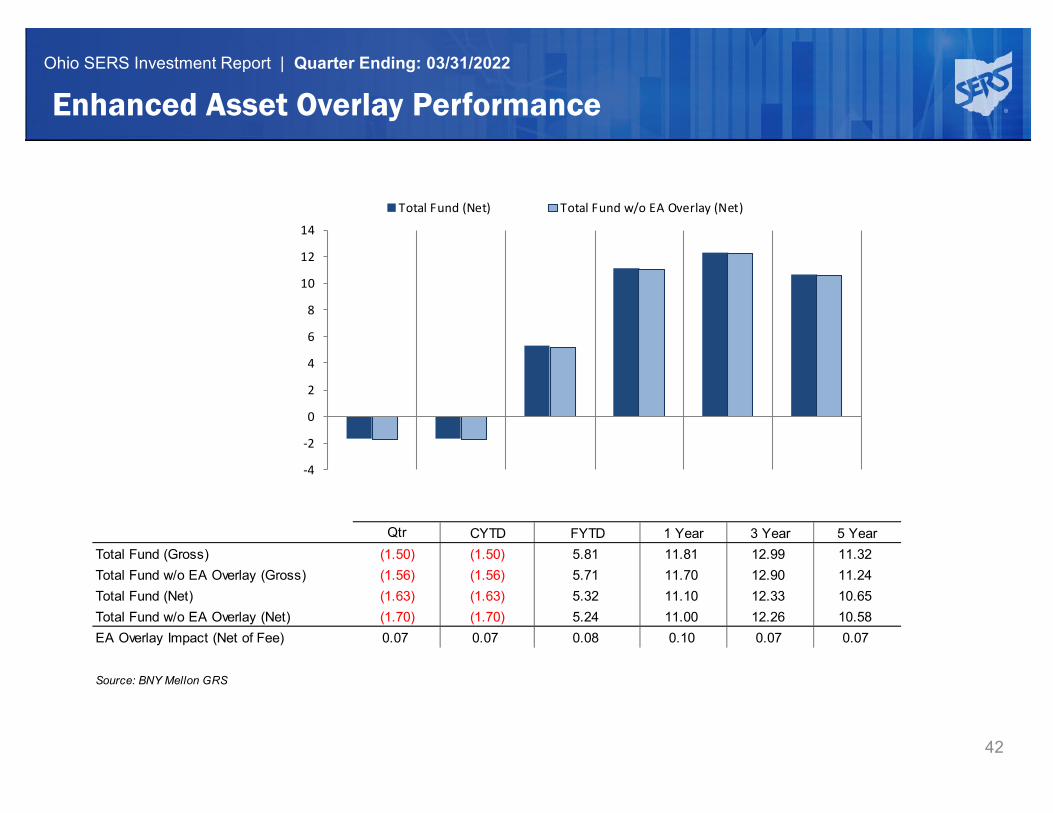
Ohio SERS Investment Report | Quarter Ending: 03/31/2022
42
Enhanced Asset Overlay Performance
Qtr CYTD FYTD 1 Year 3 Year 5 YearTotal Fund (Gross) (1.50) (1.50) 5.81 11.81 12.99 11.32Total Fund w/o EA Overlay (Gross) (1.56) (1.56) 5.71 11.70 12.90 11.24Total Fund (Net) (1.63) (1.63) 5.32 11.10 12.33 10.65Total Fund w/o EA Overlay (Net) (1.70) (1.70) 5.24 11.00 12.26 10.58EA Overlay Impact (Net of Fee) 0.07 0.07 0.08 0.10 0.07 0.07
Source: BNY Mellon GRS
-4
-2
0
2
4
6
8
10
12
14
Total Fund (Net) Total Fund w/o EA Overlay (Net)
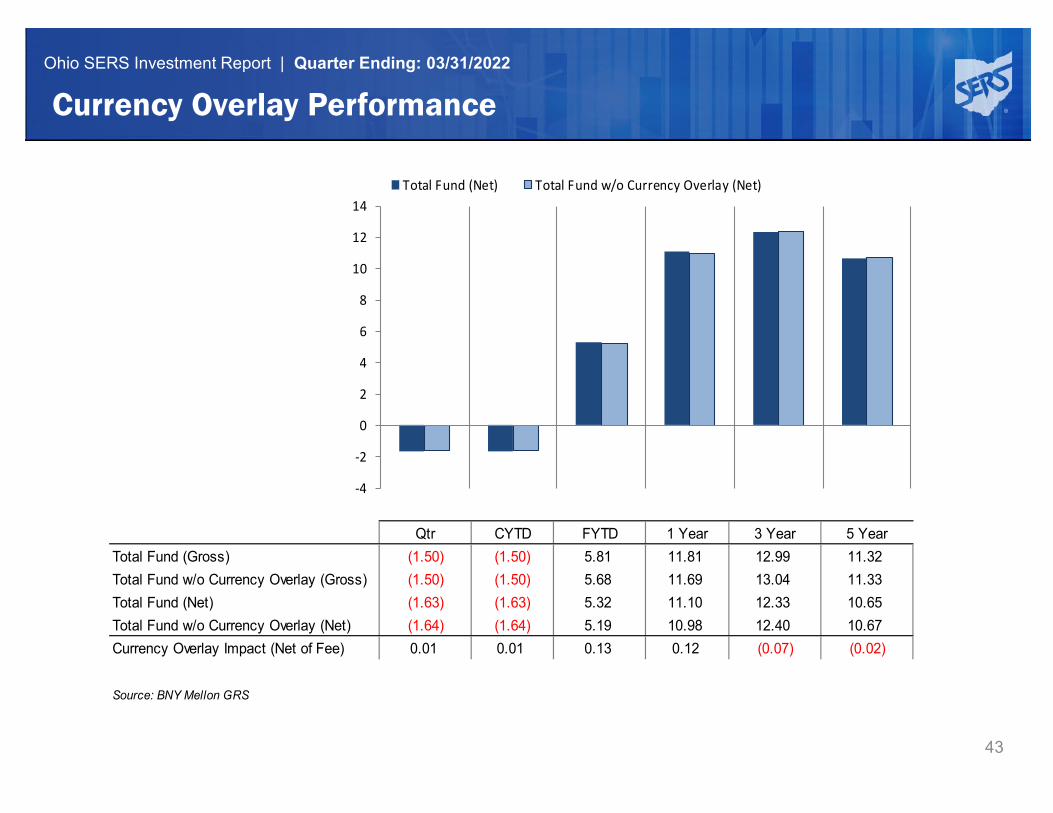
Ohio SERS Investment Report | Quarter Ending: 03/31/2022
43
Currency Overlay Performance
Qtr CYTD FYTD 1 Year 3 Year 5 YearTotal Fund (Gross) (1.50) (1.50) 5.81 11.81 12.99 11.32Total Fund w/o Currency Overlay (Gross) (1.50) (1.50) 5.68 11.69 13.04 11.33Total Fund (Net) (1.63) (1.63) 5.32 11.10 12.33 10.65Total Fund w/o Currency Overlay (Net) (1.64) (1.64) 5.19 10.98 12.40 10.67Currency Overlay Impact (Net of Fee) 0.01 0.01 0.13 0.12 (0.07) (0.02)
Source: BNY Mellon GRS
-4
-2
0
2
4
6
8
10
12
14Total Fund (Net) Total Fund w/o Currency Overlay (Net)
Ohio SERS Investment Report | Quarter Ending: 03/31/2022
44
Proposed Investment Agenda – Next Meeting
• Draft of FY2023 Annual Investment Plan (possible vote)• Investment Report (period ending April 30, 2022)
R
DRAFT – 05/19/2022
SCHOOL EMPLOYEES RETIREMENT SYSTEM OF OHIO ANNUAL INVESTMENT PLAN
For the year ended June 30, 2023
Prepared by SERS Investment Staff 300 East Broad Street, Suite 100
Columbus, Ohio 43215-3746 www.ohsers.org
Serving the People Who Serve Our Schools®
TABLE OF CONTENTS
SERS ANNUAL INVESTMENT PLAN FY2023 | 1
Executive Summary ........................................................................ 3
Global Economic Outlook ............................................................... 6
Portfolio Strategies
Total Fund Asset Allocation.......................................................... 9
Global Equities ............................................................................. 10
Global Private Equity .................................................................... 14
Global Fixed Income .................................................................... 17
Global Private Credit .................................................................... 19
Global Real Assets ....................................................................... 21
Cash Equivalents & Securities Lending ...................................... 23
Opportunistic & Tactical ............................................................... 24
Overlay Program .......................................................................... 25
Investment Risk Management & Analytics ................................... 26
Investment Operations ................................................................. 28
Investment Implementation Guidelines
Global Equities ............................................................................. 30
Global Private Equity .................................................................... 33
Global Fixed Income .................................................................... 36
Global Private Credit .................................................................... 39
Global Real Assets ....................................................................... 42
Cash Equivalents & Securities Lending ...................................... 45
Opportunistic & Tactical ............................................................... 47
Overlay Program .......................................................................... 48
References
Sources ........................................................................................ 51
Glossary ....................................................................................... 53
SERS ANNUAL INVESTMENT PLAN FY2023 | 2
Executive Summary
EXECUTIVE SUMMARY
SERS ANNUAL INVESTMENT PLAN FY2023 | 3
The Board’s Statement of Investment Policy (SIP) requires the Chief Investment Officer prepare and present to the Board for its approval an Annual Investment Plan (Plan). The following document outlines the recommended Plan for Fiscal Year (FY) 2023. As in prior years, the Plan reviews the economic environment based upon consensus reports from leading sources, SERS’ asset allocation target and long-term performance objective for each portfolio, last year’s objectives and accomplishments, a review of the market conditions over the last year and objectives for FY2023. Implementation Guidelines for each asset class portfolio are included to provide further details on how each portfolio will be managed in the coming year relative to portfolio construction parameters and risk limits. This Plan is meant to be a living document subject to adjustment during the year. If circumstances change or opportunities arise during the year, items will be discussed with the Board which may lead to intra-year changes to the Plan or Strategy Statements.
REVIEW OF FY2022 OBJECTIVES AND IMPLEMENTATION The general objectives of the Investment Department for FY2022 were as follows: • Our major strategic goals remain unchanged. The focus will continue to be value added performance, risk management, cost effectiveness and maintenance of an investment program that meets or exceeds investment objectives over the long-term. Total Fund returns exceeded the policy benchmark for all periods over ten years. For FYTD, Total Fund return of 5.32% as of March 2022 exceeded the benchmark by 2.50%. For three years the return was 12.33% which exceeded the benchmark by 1.40%, and for five years the return was 10.65% with 1.22% excess return. The excess returns have been generated with modest active risk. • Continue to implement the asset allocation framework and targets approved by the Board in FY2020, specifically, increase allocations to Private Credit, Private Equity and Real Assets on a selective basis. Asset allocation implementation is nearly complete. Required implementation was to increase Real Assets from 15% to 17%; Private Equity from 10% to 12% and Private Credit from 0% to 5%. As of March 31, 2022, the allocation to Real Assets was at 18.5%, Private Equity was 12.1% and Private Credit was at 3.9%. Private Credit is expected to reach 5% by the end of FY2022. In FY2022, the Board approved a Total Fund leverage strategy with a limit of 10%. This program will be implemented when economic and financial conditions become more stable. • Research new strategies in renewable energy, infrastructure, and commodities and implement on a selective basis. In FY2022, Staff implemented two portfolios to further diversify the Total Fund and provide direct inflation hedging. One is an actively managed commodities portfolio and the other is a portfolio with a mixture of TIPS, gold and commodities implemented through ETFs. These allocations are accounted for within the Opportunistic bucket along with other tactical and diversifying assets and contributed positively to Total Fund returns. • Re-engage the investment team as they return to the office to maintain strong investment culture and teamwork. The team performance was highly productive during the remote working phase in terms of approving new investments and monitoring the portfolio. Since returning to the office in July, team development activities were conducted to maintain team culture and cohesion.
FY2023 OBJECTIVES • Our major strategic goals remain unchanged. The focus will continue to be value added performance, risk management, cost effectiveness and maintenance of an investment program that meets or exceeds investment objectives over the long-term. • Continue to implement the asset allocation framework and targets approved by the Board and implement the leverage program as conditions and return expectations improve. • Research new strategies in renewable energy, infrastructure, and commodities and implement on a selective basis.
EXECUTIVE SUMMARY
SERS ANNUAL INVESTMENT PLAN FY2023 | 4
CONCLUSION As of March 31, 2022, SERS’ Total Fund had net returns of 10.65% over five years and 9.47% over ten years exceeding the actuarial rate of 7.00%. Staff will remain focused on adding value relative to policy benchmarks and managing risks and costs. The economic environment and market outlook have changed significantly in 2022, posing downside risks to investment returns. Inflation has spiked to 8.5% and the 10-year yield has increased to 2.8% in short order. This likely will cause GDP growth to slow and higher discount rates will depress asset valuations. So, expected returns will be lower than the returns experienced over recent periods. Staff appreciates the support and guidance received from the Board in FY2022 and looks forward to working with the Board in FY2023 for another successful year. ACKNOWLEDGEMENTS SERS is very fortunate to have an experienced and deep Investment Staff. The following individuals contributed to this report. • Economic Outlook – Farouki Majeed and Hai Yen Le • Global Equities – Judi Masri and Dustin Matthiessen • Global Private Equity – Steve Price and Phil Sisson • Global Fixed Income – Jason Naber • Global Private Credit – Adam Messerschmitt • Global Real Assets – Paul Cheng and Michael Browning • Cash Equivalents & Securities Lending – Jason Naber • Opportunistic and Tactical – Farouki Majeed, Phil Sisson, Michael Browning, Dustin Matthiessen and Adam
Messerschmitt • Overlay Program – Farouki Majeed, Jason Naber and Judi Masri • Investment Risk Management and Analytics – Hai Yen Le and Michael Browning • Investment Operations – Terri Martin and Katie Swank We would appreciate the opportunity to review the Annual Investment Plan with you at the June 2022 Board meeting. If you have any questions or comments before then, please let me know.
Respectfully submitted,
Farouki A. Majeed Chief Investment Officer

SERS ANNUAL INVESTMENT PLAN FY2023 | 5
Global Economic
Outlook
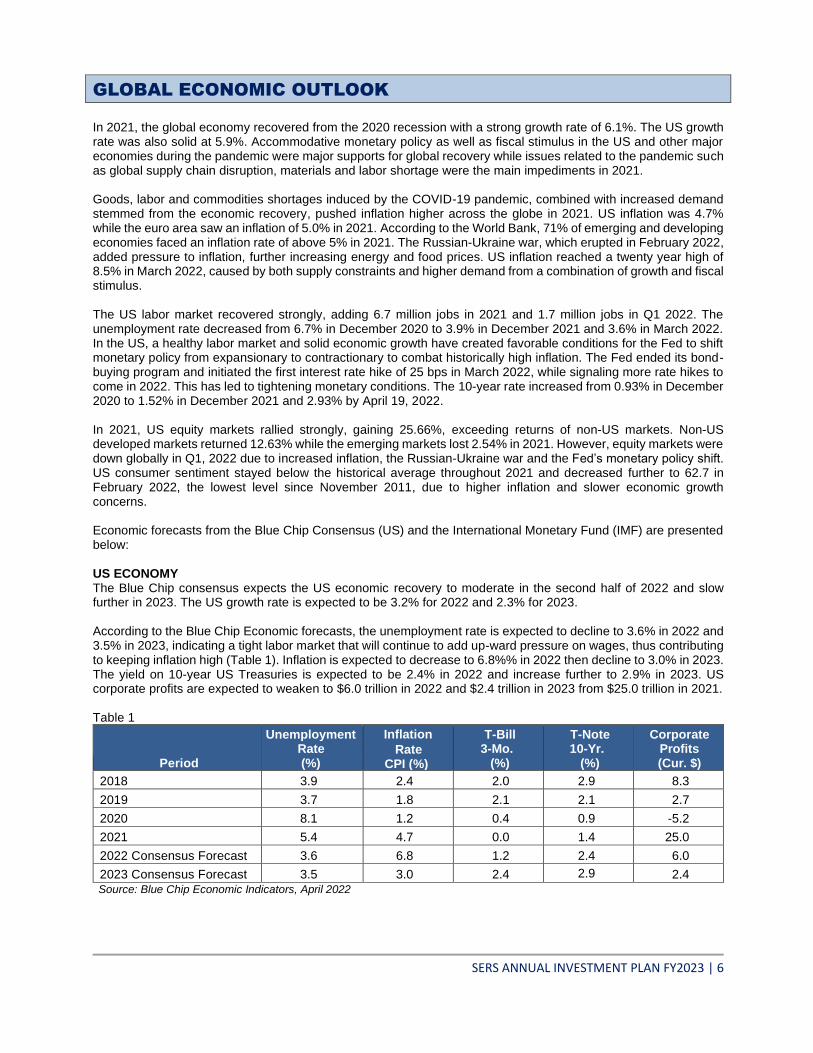
GLOBAL ECONOMIC OUTLOOK
SERS ANNUAL INVESTMENT PLAN FY2023 | 6
In 2021, the global economy recovered from the 2020 recession with a strong growth rate of 6.1%. The US growth rate was also solid at 5.9%. Accommodative monetary policy as well as fiscal stimulus in the US and other major economies during the pandemic were major supports for global recovery while issues related to the pandemic such as global supply chain disruption, materials and labor shortage were the main impediments in 2021. Goods, labor and commodities shortages induced by the COVID-19 pandemic, combined with increased demand stemmed from the economic recovery, pushed inflation higher across the globe in 2021. US inflation was 4.7% while the euro area saw an inflation of 5.0% in 2021. According to the World Bank, 71% of emerging and developing economies faced an inflation rate of above 5% in 2021. The Russian-Ukraine war, which erupted in February 2022, added pressure to inflation, further increasing energy and food prices. US inflation reached a twenty year high of 8.5% in March 2022, caused by both supply constraints and higher demand from a combination of growth and fiscal stimulus. The US labor market recovered strongly, adding 6.7 million jobs in 2021 and 1.7 million jobs in Q1 2022. The unemployment rate decreased from 6.7% in December 2020 to 3.9% in December 2021 and 3.6% in March 2022. In the US, a healthy labor market and solid economic growth have created favorable conditions for the Fed to shift monetary policy from expansionary to contractionary to combat historically high inflation. The Fed ended its bond-buying program and initiated the first interest rate hike of 25 bps in March 2022, while signaling more rate hikes to come in 2022. This has led to tightening monetary conditions. The 10-year rate increased from 0.93% in December 2020 to 1.52% in December 2021 and 2.93% by April 19, 2022. In 2021, US equity markets rallied strongly, gaining 25.66%, exceeding returns of non-US markets. Non-US developed markets returned 12.63% while the emerging markets lost 2.54% in 2021. However, equity markets were down globally in Q1, 2022 due to increased inflation, the Russian-Ukraine war and the Fed’s monetary policy shift. US consumer sentiment stayed below the historical average throughout 2021 and decreased further to 62.7 in February 2022, the lowest level since November 2011, due to higher inflation and slower economic growth concerns. Economic forecasts from the Blue Chip Consensus (US) and the International Monetary Fund (IMF) are presented below: US ECONOMY The Blue Chip consensus expects the US economic recovery to moderate in the second half of 2022 and slow further in 2023. The US growth rate is expected to be 3.2% for 2022 and 2.3% for 2023. According to the Blue Chip Economic forecasts, the unemployment rate is expected to decline to 3.6% in 2022 and 3.5% in 2023, indicating a tight labor market that will continue to add up-ward pressure on wages, thus contributing to keeping inflation high (Table 1). Inflation is expected to decrease to 6.8%% in 2022 then decline to 3.0% in 2023. The yield on 10-year US Treasuries is expected to be 2.4% in 2022 and increase further to 2.9% in 2023. US corporate profits are expected to weaken to $6.0 trillion in 2022 and $2.4 trillion in 2023 from $25.0 trillion in 2021. Table 1
Period
Unemployment Rate (%)
Inflation
Rate CPI (%)
T-Bill 3-Mo.
(%)
T-Note 10-Yr.
(%)
Corporate Profits (Cur. $)
2018 3.9 2.4 2.0 2.9 8.3
2019 3.7 1.8 2.1 2.1 2.7
2020 8.1 1.2 0.4 0.9 -5.2
2021 5.4 4.7 0.0 1.4 25.0
2022 Consensus Forecast 3.6 6.8 1.2 2.4 6.0
2023 Consensus Forecast 3.5 3.0 2.4 2.9
2.4 Source: Blue Chip Economic Indicators, April 2022
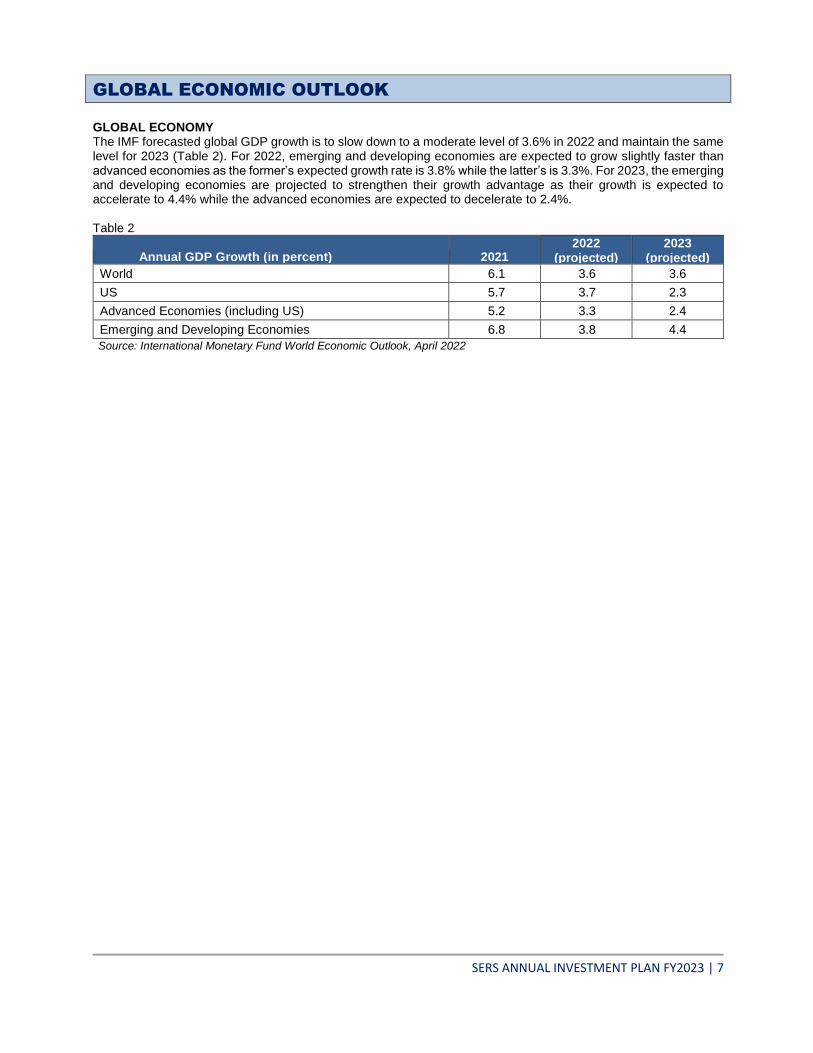
GLOBAL ECONOMIC OUTLOOK
SERS ANNUAL INVESTMENT PLAN FY2023 | 7
GLOBAL ECONOMY The IMF forecasted global GDP growth is to slow down to a moderate level of 3.6% in 2022 and maintain the same level for 2023 (Table 2). For 2022, emerging and developing economies are expected to grow slightly faster than advanced economies as the former’s expected growth rate is 3.8% while the latter’s is 3.3%. For 2023, the emerging and developing economies are projected to strengthen their growth advantage as their growth is expected to accelerate to 4.4% while the advanced economies are expected to decelerate to 2.4%. Table 2
Annual GDP Growth (in percent) 2021 2022
(projected) 2023
(projected)
World 6.1 3.6 3.6
US 5.7 3.7 2.3
Advanced Economies (including US) 5.2 3.3 2.4
Emerging and Developing Economies 6.8 3.8 4.4
Source: International Monetary Fund World Economic Outlook, April 2022

SERS ANNUAL INVESTMENT PLAN FY2023 | 8
Portfolio Strategy
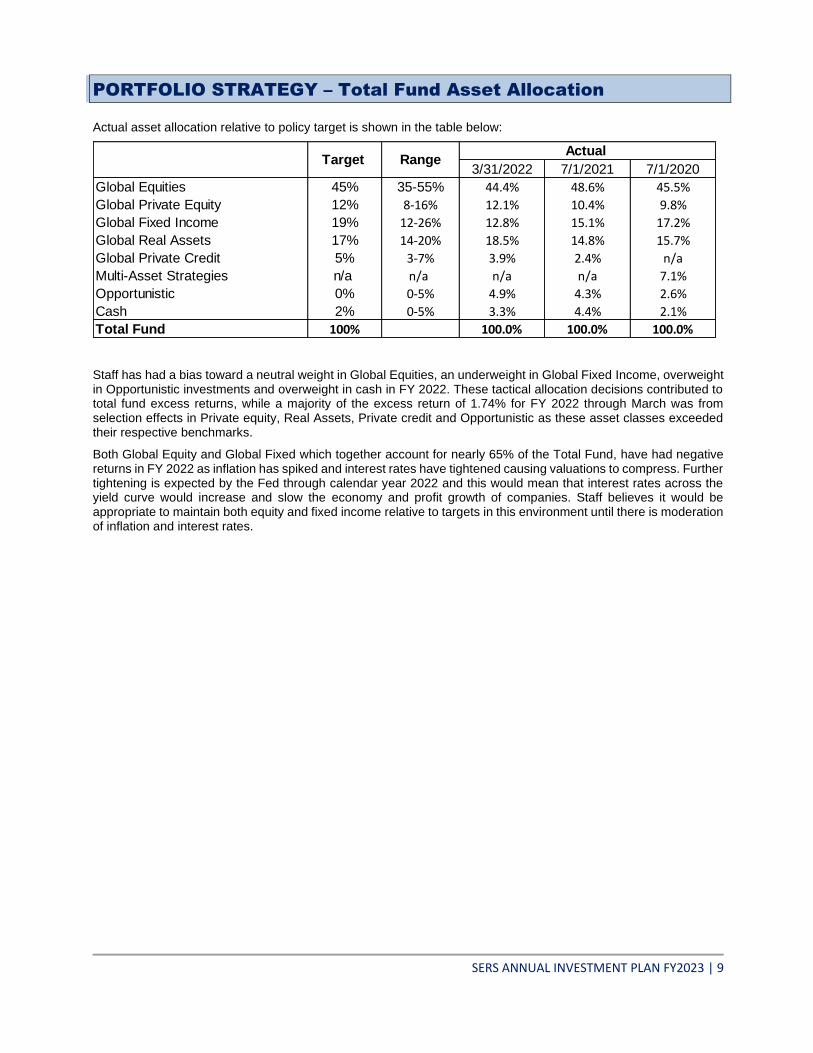
PORTFOLIO STRATEGY – Total Fund Asset Allocation
SERS ANNUAL INVESTMENT PLAN FY2023 | 9
Actual asset allocation relative to policy target is shown in the table below:
Staff has had a bias toward a neutral weight in Global Equities, an underweight in Global Fixed Income, overweight in Opportunistic investments and overweight in cash in FY 2022. These tactical allocation decisions contributed to total fund excess returns, while a majority of the excess return of 1.74% for FY 2022 through March was from selection effects in Private equity, Real Assets, Private credit and Opportunistic as these asset classes exceeded their respective benchmarks.
Both Global Equity and Global Fixed which together account for nearly 65% of the Total Fund, have had negative returns in FY 2022 as inflation has spiked and interest rates have tightened causing valuations to compress. Further tightening is expected by the Fed through calendar year 2022 and this would mean that interest rates across the yield curve would increase and slow the economy and profit growth of companies. Staff believes it would be appropriate to maintain both equity and fixed income relative to targets in this environment until there is moderation of inflation and interest rates.
3/31/2022 7/1/2021 7/1/2020
Global Equities 45% 35-55% 44.4% 48.6% 45.5%
Global Private Equity 12% 8-16% 12.1% 10.4% 9.8%
Global Fixed Income 19% 12-26% 12.8% 15.1% 17.2%
Global Real Assets 17% 14-20% 18.5% 14.8% 15.7%
Global Private Credit 5% 3-7% 3.9% 2.4% n/a
Multi-Asset Strategies n/a n/a n/a n/a 7.1%
Opportunistic 0% 0-5% 4.9% 4.3% 2.6%
Cash 2% 0-5% 3.3% 4.4% 2.1%
Total Fund 100% 100.0% 100.0% 100.0%
Actual RangeTarget
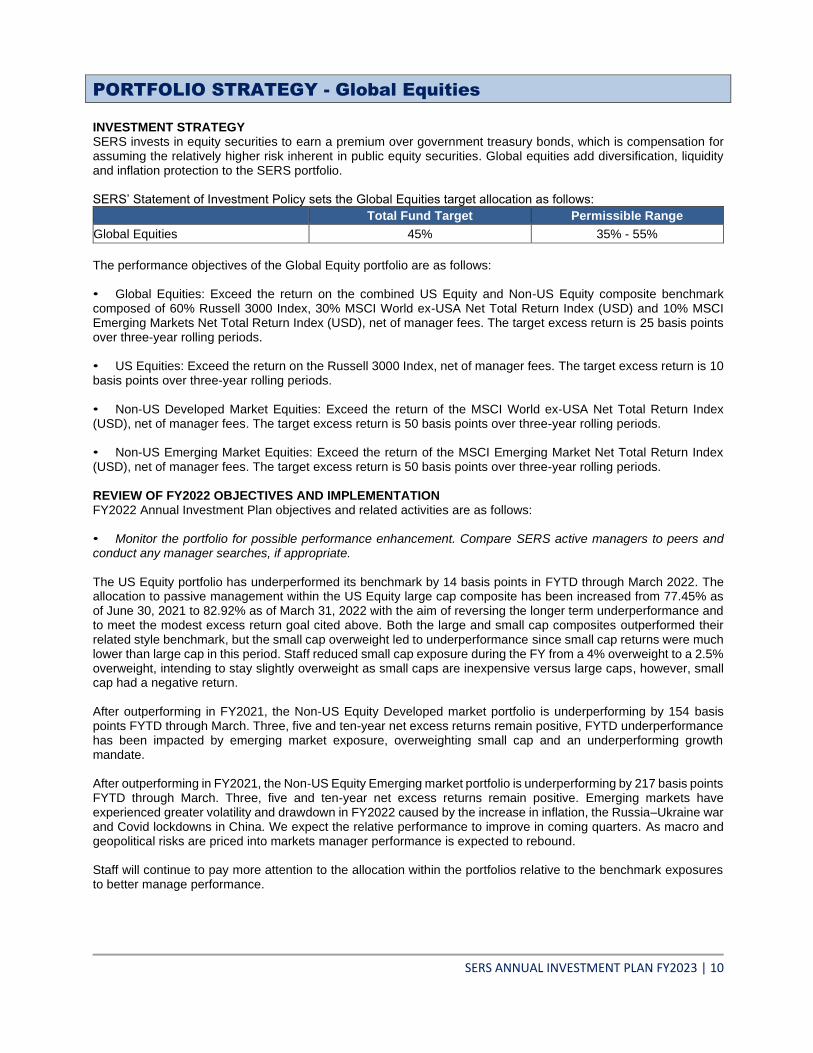
PORTFOLIO STRATEGY - Global Equities
SERS ANNUAL INVESTMENT PLAN FY2023 | 10
INVESTMENT STRATEGY SERS invests in equity securities to earn a premium over government treasury bonds, which is compensation for assuming the relatively higher risk inherent in public equity securities. Global equities add diversification, liquidity and inflation protection to the SERS portfolio. SERS’ Statement of Investment Policy sets the Global Equities target allocation as follows:
Total Fund Target Permissible Range
Global Equities 45% 35% - 55%
The performance objectives of the Global Equity portfolio are as follows: • Global Equities: Exceed the return on the combined US Equity and Non-US Equity composite benchmark composed of 60% Russell 3000 Index, 30% MSCI World ex-USA Net Total Return Index (USD) and 10% MSCI Emerging Markets Net Total Return Index (USD), net of manager fees. The target excess return is 25 basis points over three-year rolling periods. • US Equities: Exceed the return on the Russell 3000 Index, net of manager fees. The target excess return is 10 basis points over three-year rolling periods. • Non-US Developed Market Equities: Exceed the return of the MSCI World ex-USA Net Total Return Index (USD), net of manager fees. The target excess return is 50 basis points over three-year rolling periods. • Non-US Emerging Market Equities: Exceed the return of the MSCI Emerging Market Net Total Return Index (USD), net of manager fees. The target excess return is 50 basis points over three-year rolling periods. REVIEW OF FY2022 OBJECTIVES AND IMPLEMENTATION
FY2022 Annual Investment Plan objectives and related activities are as follows: • Monitor the portfolio for possible performance enhancement. Compare SERS active managers to peers and conduct any manager searches, if appropriate. The US Equity portfolio has underperformed its benchmark by 14 basis points in FYTD through March 2022. The allocation to passive management within the US Equity large cap composite has been increased from 77.45% as of June 30, 2021 to 82.92% as of March 31, 2022 with the aim of reversing the longer term underperformance and to meet the modest excess return goal cited above. Both the large and small cap composites outperformed their related style benchmark, but the small cap overweight led to underperformance since small cap returns were much lower than large cap in this period. Staff reduced small cap exposure during the FY from a 4% overweight to a 2.5% overweight, intending to stay slightly overweight as small caps are inexpensive versus large caps, however, small cap had a negative return. After outperforming in FY2021, the Non-US Equity Developed market portfolio is underperforming by 154 basis points FYTD through March. Three, five and ten-year net excess returns remain positive, FYTD underperformance has been impacted by emerging market exposure, overweighting small cap and an underperforming growth mandate. After outperforming in FY2021, the Non-US Equity Emerging market portfolio is underperforming by 217 basis points FYTD through March. Three, five and ten-year net excess returns remain positive. Emerging markets have experienced greater volatility and drawdown in FY2022 caused by the increase in inflation, the Russia–Ukraine war and Covid lockdowns in China. We expect the relative performance to improve in coming quarters. As macro and geopolitical risks are priced into markets manager performance is expected to rebound. Staff will continue to pay more attention to the allocation within the portfolios relative to the benchmark exposures to better manage performance.
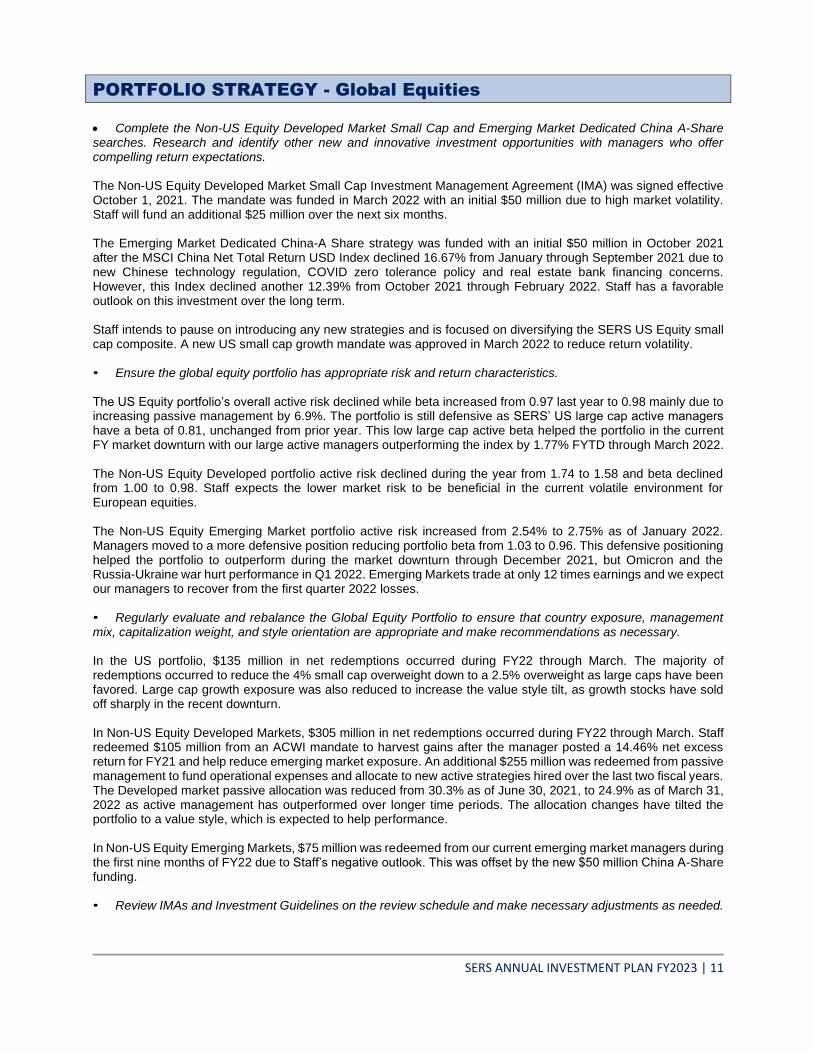
PORTFOLIO STRATEGY - Global Equities
SERS ANNUAL INVESTMENT PLAN FY2023 | 11
• Complete the Non-US Equity Developed Market Small Cap and Emerging Market Dedicated China A-Share searches. Research and identify other new and innovative investment opportunities with managers who offer compelling return expectations. The Non-US Equity Developed Market Small Cap Investment Management Agreement (IMA) was signed effective October 1, 2021. The mandate was funded in March 2022 with an initial $50 million due to high market volatility. Staff will fund an additional $25 million over the next six months. The Emerging Market Dedicated China-A Share strategy was funded with an initial $50 million in October 2021 after the MSCI China Net Total Return USD Index declined 16.67% from January through September 2021 due to new Chinese technology regulation, COVID zero tolerance policy and real estate bank financing concerns. However, this Index declined another 12.39% from October 2021 through February 2022. Staff has a favorable outlook on this investment over the long term. Staff intends to pause on introducing any new strategies and is focused on diversifying the SERS US Equity small cap composite. A new US small cap growth mandate was approved in March 2022 to reduce return volatility. • Ensure the global equity portfolio has appropriate risk and return characteristics. The US Equity portfolio’s overall active risk declined while beta increased from 0.97 last year to 0.98 mainly due to increasing passive management by 6.9%. The portfolio is still defensive as SERS’ US large cap active managers have a beta of 0.81, unchanged from prior year. This low large cap active beta helped the portfolio in the current FY market downturn with our large active managers outperforming the index by 1.77% FYTD through March 2022. The Non-US Equity Developed portfolio active risk declined during the year from 1.74 to 1.58 and beta declined from 1.00 to 0.98. Staff expects the lower market risk to be beneficial in the current volatile environment for European equities. The Non-US Equity Emerging Market portfolio active risk increased from 2.54% to 2.75% as of January 2022. Managers moved to a more defensive position reducing portfolio beta from 1.03 to 0.96. This defensive positioning helped the portfolio to outperform during the market downturn through December 2021, but Omicron and the Russia-Ukraine war hurt performance in Q1 2022. Emerging Markets trade at only 12 times earnings and we expect our managers to recover from the first quarter 2022 losses. • Regularly evaluate and rebalance the Global Equity Portfolio to ensure that country exposure, management mix, capitalization weight, and style orientation are appropriate and make recommendations as necessary. In the US portfolio, $135 million in net redemptions occurred during FY22 through March. The majority of redemptions occurred to reduce the 4% small cap overweight down to a 2.5% overweight as large caps have been favored. Large cap growth exposure was also reduced to increase the value style tilt, as growth stocks have sold off sharply in the recent downturn. In Non-US Equity Developed Markets, $305 million in net redemptions occurred during FY22 through March. Staff redeemed $105 million from an ACWI mandate to harvest gains after the manager posted a 14.46% net excess return for FY21 and help reduce emerging market exposure. An additional $255 million was redeemed from passive management to fund operational expenses and allocate to new active strategies hired over the last two fiscal years. The Developed market passive allocation was reduced from 30.3% as of June 30, 2021, to 24.9% as of March 31, 2022 as active management has outperformed over longer time periods. The allocation changes have tilted the portfolio to a value style, which is expected to help performance. In Non-US Equity Emerging Markets, $75 million was redeemed from our current emerging market managers during the first nine months of FY22 due to Staff’s negative outlook. This was offset by the new $50 million China A-Share funding. • Review IMAs and Investment Guidelines on the review schedule and make necessary adjustments as needed.
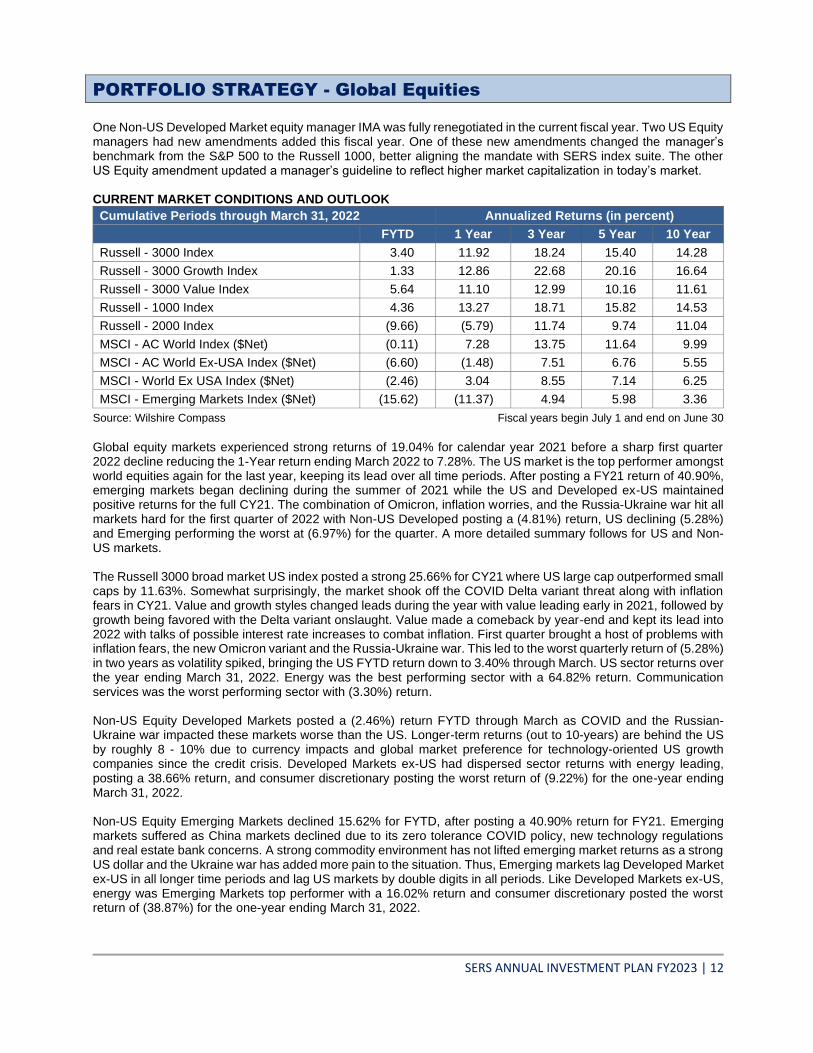
PORTFOLIO STRATEGY - Global Equities
SERS ANNUAL INVESTMENT PLAN FY2023 | 12
One Non-US Developed Market equity manager IMA was fully renegotiated in the current fiscal year. Two US Equity managers had new amendments added this fiscal year. One of these new amendments changed the manager’s benchmark from the S&P 500 to the Russell 1000, better aligning the mandate with SERS index suite. The other US Equity amendment updated a manager’s guideline to reflect higher market capitalization in today’s market. CURRENT MARKET CONDITIONS AND OUTLOOK
Cumulative Periods through March 31, 2022 Annualized Returns (in percent) FYTD 1 Year 3 Year 5 Year 10 Year
Russell - 3000 Index 3.40 11.92 18.24 15.40 14.28
Russell - 3000 Growth Index 1.33 12.86 22.68 20.16 16.64
Russell - 3000 Value Index 5.64 11.10 12.99 10.16 11.61
Russell - 1000 Index 4.36 13.27 18.71 15.82 14.53
Russell - 2000 Index (9.66) (5.79) 11.74 9.74 11.04
MSCI - AC World Index ($Net) (0.11) 7.28 13.75 11.64 9.99
MSCI - AC World Ex-USA Index ($Net) (6.60) (1.48) 7.51 6.76 5.55
MSCI - World Ex USA Index ($Net) (2.46) 3.04 8.55 7.14 6.25
MSCI - Emerging Markets Index ($Net) (15.62) (11.37) 4.94 5.98 3.36
Source: Wilshire Compass Fiscal years begin July 1 and end on June 30 Global equity markets experienced strong returns of 19.04% for calendar year 2021 before a sharp first quarter 2022 decline reducing the 1-Year return ending March 2022 to 7.28%. The US market is the top performer amongst world equities again for the last year, keeping its lead over all time periods. After posting a FY21 return of 40.90%, emerging markets began declining during the summer of 2021 while the US and Developed ex-US maintained positive returns for the full CY21. The combination of Omicron, inflation worries, and the Russia-Ukraine war hit all markets hard for the first quarter of 2022 with Non-US Developed posting a (4.81%) return, US declining (5.28%) and Emerging performing the worst at (6.97%) for the quarter. A more detailed summary follows for US and Non-US markets. The Russell 3000 broad market US index posted a strong 25.66% for CY21 where US large cap outperformed small caps by 11.63%. Somewhat surprisingly, the market shook off the COVID Delta variant threat along with inflation fears in CY21. Value and growth styles changed leads during the year with value leading early in 2021, followed by growth being favored with the Delta variant onslaught. Value made a comeback by year-end and kept its lead into 2022 with talks of possible interest rate increases to combat inflation. First quarter brought a host of problems with inflation fears, the new Omicron variant and the Russia-Ukraine war. This led to the worst quarterly return of (5.28%) in two years as volatility spiked, bringing the US FYTD return down to 3.40% through March. US sector returns over the year ending March 31, 2022. Energy was the best performing sector with a 64.82% return. Communication services was the worst performing sector with (3.30%) return. Non-US Equity Developed Markets posted a (2.46%) return FYTD through March as COVID and the Russian-Ukraine war impacted these markets worse than the US. Longer-term returns (out to 10-years) are behind the US by roughly 8 - 10% due to currency impacts and global market preference for technology-oriented US growth companies since the credit crisis. Developed Markets ex-US had dispersed sector returns with energy leading, posting a 38.66% return, and consumer discretionary posting the worst return of (9.22%) for the one-year ending March 31, 2022. Non-US Equity Emerging Markets declined 15.62% for FYTD, after posting a 40.90% return for FY21. Emerging markets suffered as China markets declined due to its zero tolerance COVID policy, new technology regulations and real estate bank concerns. A strong commodity environment has not lifted emerging market returns as a strong US dollar and the Ukraine war has added more pain to the situation. Thus, Emerging markets lag Developed Market ex-US in all longer time periods and lag US markets by double digits in all periods. Like Developed Markets ex-US, energy was Emerging Markets top performer with a 16.02% return and consumer discretionary posted the worst return of (38.87%) for the one-year ending March 31, 2022.
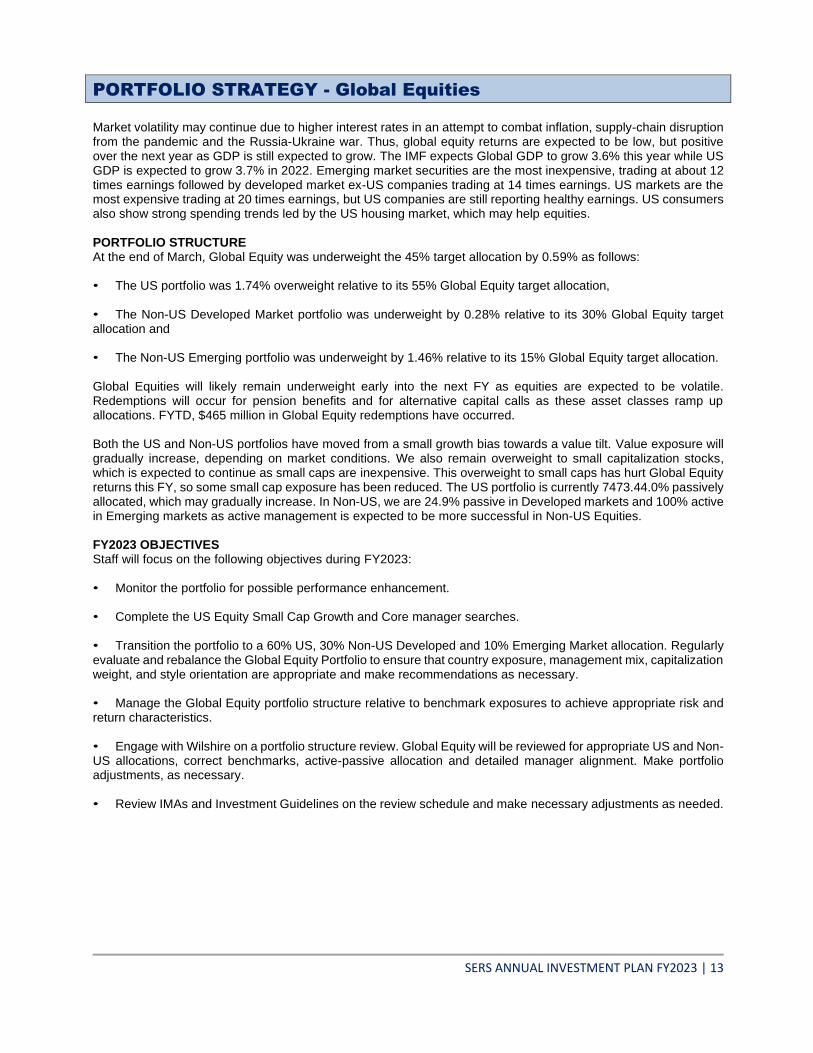
PORTFOLIO STRATEGY - Global Equities
SERS ANNUAL INVESTMENT PLAN FY2023 | 13
Market volatility may continue due to higher interest rates in an attempt to combat inflation, supply-chain disruption from the pandemic and the Russia-Ukraine war. Thus, global equity returns are expected to be low, but positive over the next year as GDP is still expected to grow. The IMF expects Global GDP to grow 3.6% this year while US GDP is expected to grow 3.7% in 2022. Emerging market securities are the most inexpensive, trading at about 12 times earnings followed by developed market ex-US companies trading at 14 times earnings. US markets are the most expensive trading at 20 times earnings, but US companies are still reporting healthy earnings. US consumers also show strong spending trends led by the US housing market, which may help equities. PORTFOLIO STRUCTURE At the end of March, Global Equity was underweight the 45% target allocation by 0.59% as follows: • The US portfolio was 1.74% overweight relative to its 55% Global Equity target allocation, • The Non-US Developed Market portfolio was underweight by 0.28% relative to its 30% Global Equity target allocation and • The Non-US Emerging portfolio was underweight by 1.46% relative to its 15% Global Equity target allocation. Global Equities will likely remain underweight early into the next FY as equities are expected to be volatile. Redemptions will occur for pension benefits and for alternative capital calls as these asset classes ramp up allocations. FYTD, $465 million in Global Equity redemptions have occurred. Both the US and Non-US portfolios have moved from a small growth bias towards a value tilt. Value exposure will gradually increase, depending on market conditions. We also remain overweight to small capitalization stocks, which is expected to continue as small caps are inexpensive. This overweight to small caps has hurt Global Equity returns this FY, so some small cap exposure has been reduced. The US portfolio is currently 7473.44.0% passively allocated, which may gradually increase. In Non-US, we are 24.9% passive in Developed markets and 100% active in Emerging markets as active management is expected to be more successful in Non-US Equities. FY2023 OBJECTIVES Staff will focus on the following objectives during FY2023: • Monitor the portfolio for possible performance enhancement. • Complete the US Equity Small Cap Growth and Core manager searches. • Transition the portfolio to a 60% US, 30% Non-US Developed and 10% Emerging Market allocation. Regularly evaluate and rebalance the Global Equity Portfolio to ensure that country exposure, management mix, capitalization weight, and style orientation are appropriate and make recommendations as necessary. • Manage the Global Equity portfolio structure relative to benchmark exposures to achieve appropriate risk and return characteristics. • Engage with Wilshire on a portfolio structure review. Global Equity will be reviewed for appropriate US and Non-US allocations, correct benchmarks, active-passive allocation and detailed manager alignment. Make portfolio adjustments, as necessary. • Review IMAs and Investment Guidelines on the review schedule and make necessary adjustments as needed.
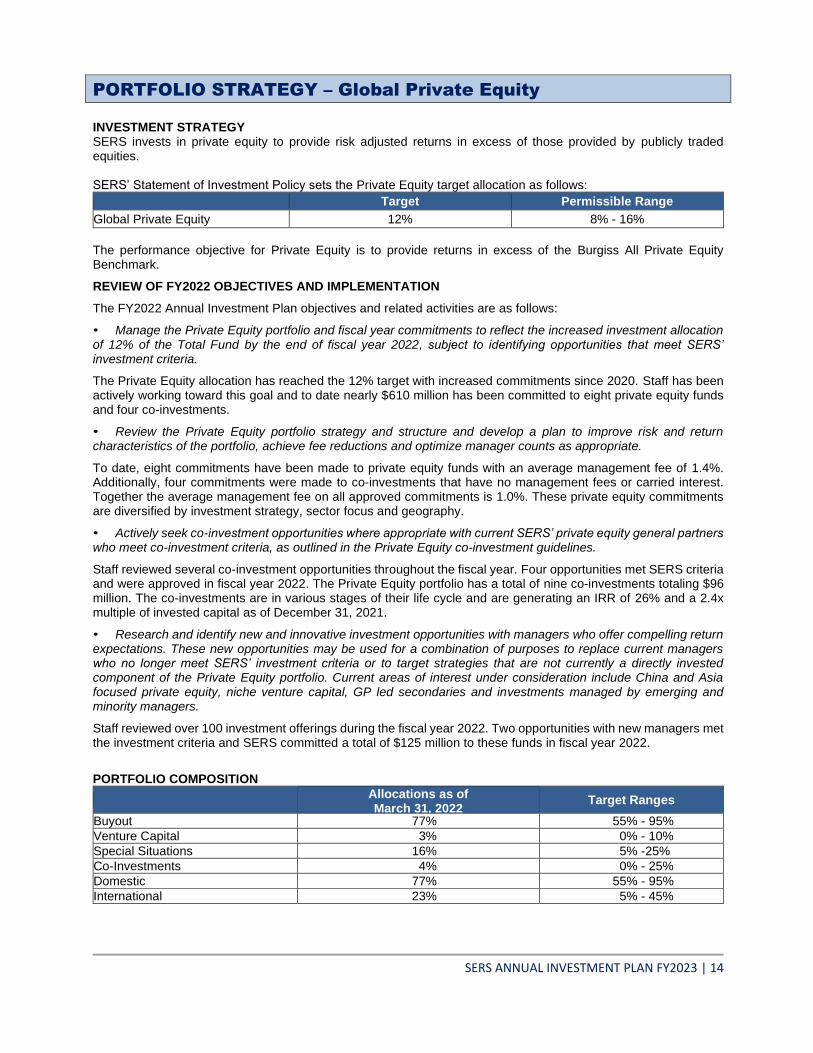
PORTFOLIO STRATEGY – Global Private Equity
SERS ANNUAL INVESTMENT PLAN FY2023 | 14
INVESTMENT STRATEGY SERS invests in private equity to provide risk adjusted returns in excess of those provided by publicly traded equities. SERS’ Statement of Investment Policy sets the Private Equity target allocation as follows:
Target Permissible Range
Global Private Equity 12% 8% - 16%
The performance objective for Private Equity is to provide returns in excess of the Burgiss All Private Equity Benchmark.
REVIEW OF FY2022 OBJECTIVES AND IMPLEMENTATION
The FY2022 Annual Investment Plan objectives and related activities are as follows:
• Manage the Private Equity portfolio and fiscal year commitments to reflect the increased investment allocation of 12% of the Total Fund by the end of fiscal year 2022, subject to identifying opportunities that meet SERS’ investment criteria.
The Private Equity allocation has reached the 12% target with increased commitments since 2020. Staff has been actively working toward this goal and to date nearly $610 million has been committed to eight private equity funds and four co-investments.
• Review the Private Equity portfolio strategy and structure and develop a plan to improve risk and return characteristics of the portfolio, achieve fee reductions and optimize manager counts as appropriate.
To date, eight commitments have been made to private equity funds with an average management fee of 1.4%. Additionally, four commitments were made to co-investments that have no management fees or carried interest. Together the average management fee on all approved commitments is 1.0%. These private equity commitments are diversified by investment strategy, sector focus and geography.
• Actively seek co-investment opportunities where appropriate with current SERS’ private equity general partners who meet co-investment criteria, as outlined in the Private Equity co-investment guidelines.
Staff reviewed several co-investment opportunities throughout the fiscal year. Four opportunities met SERS criteria and were approved in fiscal year 2022. The Private Equity portfolio has a total of nine co-investments totaling $96 million. The co-investments are in various stages of their life cycle and are generating an IRR of 26% and a 2.4x multiple of invested capital as of December 31, 2021.
• Research and identify new and innovative investment opportunities with managers who offer compelling return expectations. These new opportunities may be used for a combination of purposes to replace current managers who no longer meet SERS’ investment criteria or to target strategies that are not currently a directly invested component of the Private Equity portfolio. Current areas of interest under consideration include China and Asia focused private equity, niche venture capital, GP led secondaries and investments managed by emerging and minority managers.
Staff reviewed over 100 investment offerings during the fiscal year 2022. Two opportunities with new managers met the investment criteria and SERS committed a total of $125 million to these funds in fiscal year 2022.
PORTFOLIO COMPOSITION
Allocations as of March 31, 2022
Target Ranges
Buyout 77% 55% - 95%
Venture Capital 3% 0% - 10%
Special Situations 16% 5% -25%
Co-Investments 4% 0% - 25%
Domestic 77% 55% - 95%
International 23% 5% - 45%
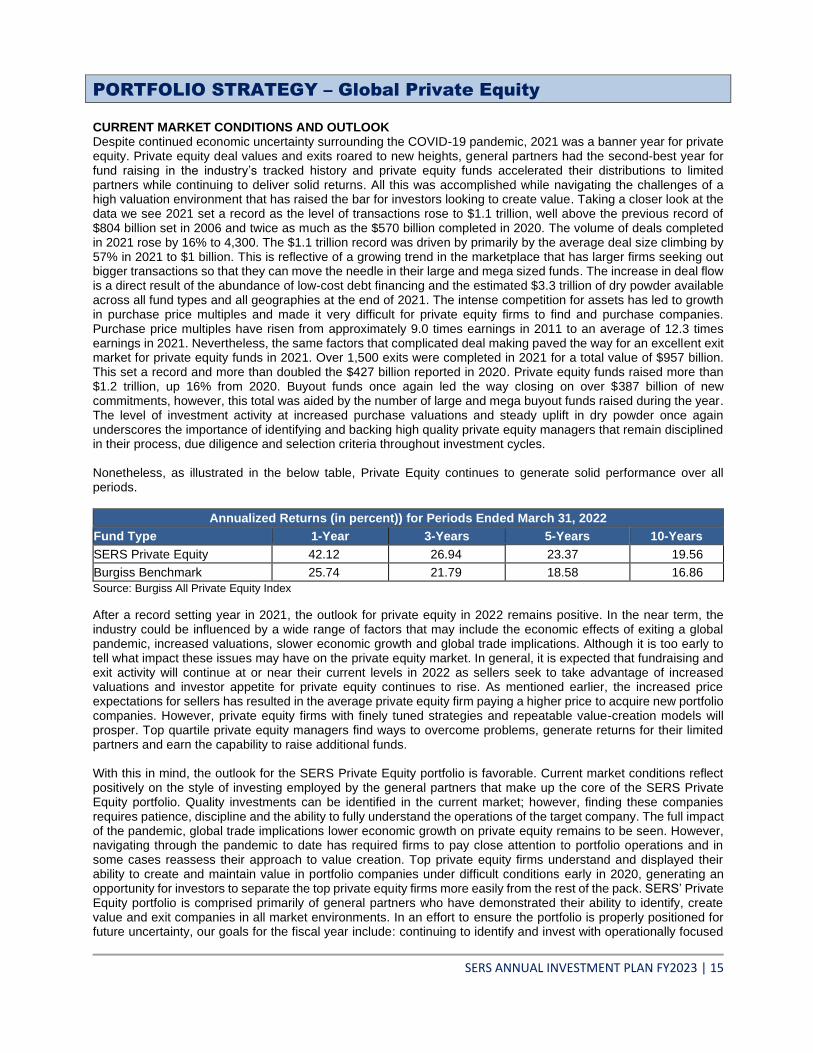
PORTFOLIO STRATEGY – Global Private Equity
SERS ANNUAL INVESTMENT PLAN FY2023 | 15
CURRENT MARKET CONDITIONS AND OUTLOOK
Despite continued economic uncertainty surrounding the COVID-19 pandemic, 2021 was a banner year for private equity. Private equity deal values and exits roared to new heights, general partners had the second-best year for fund raising in the industry’s tracked history and private equity funds accelerated their distributions to limited partners while continuing to deliver solid returns. All this was accomplished while navigating the challenges of a high valuation environment that has raised the bar for investors looking to create value. Taking a closer look at the data we see 2021 set a record as the level of transactions rose to $1.1 trillion, well above the previous record of $804 billion set in 2006 and twice as much as the $570 billion completed in 2020. The volume of deals completed in 2021 rose by 16% to 4,300. The $1.1 trillion record was driven by primarily by the average deal size climbing by 57% in 2021 to $1 billion. This is reflective of a growing trend in the marketplace that has larger firms seeking out bigger transactions so that they can move the needle in their large and mega sized funds. The increase in deal flow is a direct result of the abundance of low-cost debt financing and the estimated $3.3 trillion of dry powder available across all fund types and all geographies at the end of 2021. The intense competition for assets has led to growth in purchase price multiples and made it very difficult for private equity firms to find and purchase companies. Purchase price multiples have risen from approximately 9.0 times earnings in 2011 to an average of 12.3 times earnings in 2021. Nevertheless, the same factors that complicated deal making paved the way for an excellent exit market for private equity funds in 2021. Over 1,500 exits were completed in 2021 for a total value of $957 billion. This set a record and more than doubled the $427 billion reported in 2020. Private equity funds raised more than $1.2 trillion, up 16% from 2020. Buyout funds once again led the way closing on over $387 billion of new commitments, however, this total was aided by the number of large and mega buyout funds raised during the year. The level of investment activity at increased purchase valuations and steady uplift in dry powder once again underscores the importance of identifying and backing high quality private equity managers that remain disciplined in their process, due diligence and selection criteria throughout investment cycles. Nonetheless, as illustrated in the below table, Private Equity continues to generate solid performance over all periods.
Annualized Returns (in percent)) for Periods Ended March 31, 2022
Fund Type 1-Year 3-Years 5-Years 10-Years
SERS Private Equity 42.12 26.94 23.37 19.56
Burgiss Benchmark 25.74 21.79 18.58 16.86
Source: Burgiss All Private Equity Index
After a record setting year in 2021, the outlook for private equity in 2022 remains positive. In the near term, the industry could be influenced by a wide range of factors that may include the economic effects of exiting a global pandemic, increased valuations, slower economic growth and global trade implications. Although it is too early to tell what impact these issues may have on the private equity market. In general, it is expected that fundraising and exit activity will continue at or near their current levels in 2022 as sellers seek to take advantage of increased valuations and investor appetite for private equity continues to rise. As mentioned earlier, the increased price expectations for sellers has resulted in the average private equity firm paying a higher price to acquire new portfolio companies. However, private equity firms with finely tuned strategies and repeatable value-creation models will prosper. Top quartile private equity managers find ways to overcome problems, generate returns for their limited partners and earn the capability to raise additional funds. With this in mind, the outlook for the SERS Private Equity portfolio is favorable. Current market conditions reflect positively on the style of investing employed by the general partners that make up the core of the SERS Private Equity portfolio. Quality investments can be identified in the current market; however, finding these companies requires patience, discipline and the ability to fully understand the operations of the target company. The full impact of the pandemic, global trade implications lower economic growth on private equity remains to be seen. However, navigating through the pandemic to date has required firms to pay close attention to portfolio operations and in some cases reassess their approach to value creation. Top private equity firms understand and displayed their ability to create and maintain value in portfolio companies under difficult conditions early in 2020, generating an opportunity for investors to separate the top private equity firms more easily from the rest of the pack. SERS’ Private Equity portfolio is comprised primarily of general partners who have demonstrated their ability to identify, create value and exit companies in all market environments. In an effort to ensure the portfolio is properly positioned for future uncertainty, our goals for the fiscal year include: continuing to identify and invest with operationally focused
PORTFOLIO STRATEGY – Global Private Equity
SERS ANNUAL INVESTMENT PLAN FY2023 | 16
managers who primarily target the middle market and avoid the competition in the large and mega space; increasing exposure to attractive investments that meet our criteria and offer lower costs through co-investments; and ensuring that we stay on top of market trends and opportunities by continuing to research and seek out managers offering investment strategies that deliver private equity like returns with differentiated and unique strategies. Additionally, as the Total Fund moves into what many believe will be a low return environment, we will seek to increase the allocation level of Private Equity to its new target of 12% to obtain the benefit of this higher returning asset class to the Total Fund level. This will however take time as Private Equity is a long-term asset class where manager selection is critical and additional capital takes more time to deploy. FY2023 OBJECTIVES Staff will focus on the following objectives during FY2023: • Manage the Private Equity portfolio and fiscal year commitments to reflect the increased investment allocation of 12%, subject to identifying opportunities that meet SERS’ investment criteria. • Review the Private Equity portfolio strategy and structure and develop a plan to improve risk and return characteristics of the portfolio, achieve fee reductions and optimize manager counts as appropriate. • Actively seek co-investment opportunities where appropriate with current SERS’ private equity general partners who meet co-investment criteria, as outlined in the Private Equity co-investment guidelines. • Research and identify new and innovative investment opportunities with managers who offer compelling return expectations. These new opportunities may be used for a combination of purposes to replace current managers who no longer meet SERS’ investment criteria or to target strategies that are not currently a directly invested component of the Private Equity portfolio.
PORTFOLIO STRATEGY - Global Fixed Income
SERS ANNUAL INVESTMENT PLAN FY2023 | 17
INVESTMENT STRATEGY SERS invests in fixed income assets for the primary purpose of risk diversification and decreasing the overall risk of the investment plan. Fixed income assets may include sovereign debt securities, global corporates, securitized securities, private placements, convertibles, derivatives and currency. SERS’ Statement of Investment Policy sets the Fixed Income target allocation as follows:
Target Permissible Range
Global Fixed Income 19% 12% – 26%
The performance objective for the Fixed Income portfolio is to exceed the Bloomberg US Aggregate Bond Index, net of manager fees, by 60 basis points over rolling three-year periods. REVIEW OF FY2022 OBJECTIVES AND IMPLEMENTATION The FY2022 Annual Investment Plan objectives and related activities are as follows: • Ensure the Fixed Income portfolio has appropriate risk and return characteristics given credit spreads have already recovered to pre-pandemic levels and interest rates are expected to continue rising. Although the portfolio has a negative return of -5.81%% through March 2022, the portfolio is outperforming the benchmark by six basis points on a fiscal year-to-date basis. Rising US Treasury yields in anticipation of future interest rate hikes has been the main driver of the negative return with the US Treasury 10-year yield rising from 1.47% in June 2021 to the current 2.34% at the end of March. The US Treasury Index fell -5.33%. The portfolio underweight to interest rate duration during the fiscal year was a positive contributor to performance. Allocations to high yield, long/short and structured credit were also additive to performance while emerging market debt was a detractor. • Tactically manage the allocations to core, core plus and tactical and diversifying sectors to enhance risk and return. Continue to research other potential new and innovative investment opportunities. The following allocation changes were implemented:
1. In August, the credit dislocation strategy, funded in 2020, returned capital to investors as the opportunities presented by market dislocation were no longer available. The strategy realized an 11% return for the one-year period. This strategy was held in the tactical and diversifying sector.
2. In October, the existing emerging market debt manager was replaced with a new manager for $80 million due to longer term underperformance and high excess volatility relative to the benchmark. In addition, a small redemption from a core manager was made to rebalance the manager’s size relative to the other core managers.
3. Due to significant underperformance in 2021, the fixed income arbitrage strategy in the tactical sector was fully redeemed at the end of December. In addition, a small redemption from the emerging market macro strategy was made due to underperformance. Both of these strategies are held in the tactical and diversifying sector and reduced the sector’s overall portfolio allocation.
4. In early February, $25 million was withdrawn from a core manager to lower the exposure to a less diversified manager focused on investment grade corporate credit due to relative underperformance versus the benchmark.
5. In April, $50 million was reallocated from a core plus manager to a core manager and the high yield strategy in order to reduce the duration and emerging market debt exposure of the portfolio.
• Review IMAs and Investment Guidelines to make necessary adjustments. Two core plus manager contracts were renegotiated during the fiscal year according to the normal five year contract renegotiation schedule. In addition, the contract for the new emerging market debt manager was negotiated and funded in October.
PORTFOLIO STRATEGY - Global Fixed Income
SERS ANNUAL INVESTMENT PLAN FY2023 | 18
CURRENT MARKET CONDITIONS AND OUTLOOK The Bloomberg US Aggregate Bond Index returned -5.87% for FY2022 through March. All of the major sectors of the index have negative returns for the fiscal year due to high inflation, expectations for multiple rate hikes in 2022, the end of quantitative easing and start of quantitative tightening later this year, and the Russian invasion of Ukraine. The worst performing sector has been investment grade debt at -7.48%. The higher duration of investment grade corporates relative to the benchmark in a rising rate environment has been the primary driver of the underperformance while spread widening has also contributed. In contrast, high yield corporate debt’s shorter duration, low default rates and higher yields have led the sector to outperform with a return of -3.31%. Agency mortgages outperformed the index returning -5.23%, but the sector has started to come under pressure as the Fed ended its quantitative easing program in March. Emerging market debt has struggled during the fiscal year with the blended local and hard currency debt index returning -11.3% through March. The biggest impact has come from the Russian-Ukraine war, which caused commodity prices to increase, benefitting commodity producers, but hurting commodity importers. Additionally, in 2021 emerging market central banks started raising rates to fight rising inflation. The outlook for fixed income markets remains challenging due to growing headwinds for growth, broad and persistent inflation, hawkish monetary policy and the geopolitical tensions in Europe. The Federal Reserve is expected to increase the policy rate by 200-250 basis points and start reducing the balance sheet this year, which will negatively impact bond yields. Agency mortgages are expected to remain under pressure as the market will need to absorb record agency mortgage supply when the Fed begins reducing the size of its balance sheet later this year. Higher interest rates will also impact demand for new mortgages. Investment grade corporates’ fundamentals remain healthy despite broad financial market volatility, but elevated monetary policy and geopolitical risks make the outlook less certain going forward. High yield looks attractive with yields above 6% and strong fundamentals as default rates remain low, ratings are trending positively and companies have refinanced a significant amount of debt at lower rates over the last couple of years. The emerging market outlook remains challenged with rising global yields and geopolitical uncertainties leading to lower global growth expectations and higher volatility in these markets. PORTFOLIO STRUCTURE The Fixed Income portfolio is currently weighted 46% core, 42% core plus and 12% to tactical and diversifying strategies. The portfolio currently has a yield of 3.21% relative to the benchmark yield of 2.91% with an average investment grade credit rating of A+, which is two grades lower than the benchmark rating of AA. As the Federal Reserve is now expected to continue hiking interest rates over the next several years, the portfolio duration is 0.88 years shorter than the benchmark duration. We expect to keep the portfolio duration shorter as interest rates continue to rise. The portfolio is underweight US government assets and overweight credit sectors to earn additional yield over the benchmark. Specifically, the portfolio has the biggest overweights to the emerging market debt, high yield and asset backed sectors while underweight agency mortgages. The underweight to mortgages was in anticipation of the Federal Reserve ending the quantitative easing in March and starting to reduce the size of its balance sheet by selling US Treasury and mortgages later in 2022. The portfolio also has a small overweight to bank loans, which have a floating interest rate that makes them less sensitive to rising interest rates. FY2023 OBJECTIVES Staff will focus on the following objectives in FY2023: • Manage the portfolio structure and risk relative to the benchmark as the central banks around the globe embark on a rate hiking cycle and quantitative tightening over the next several years. • Tactically manage the allocations to core, core plus and tactical and diversifying sectors to enhance the risk and return tradeoff. Continue to research other potential new and innovative investment opportunities to mitigate the impact of rising interest rates and diversify sources of return. • Review IMAs and Investment Guidelines to make any necessary adjustments.
PORTFOLIO STRATEGY – Global Private Credit
SERS ANNUAL INVESTMENT PLAN FY2023 | 19
INVESTMENT STRATEGY SERS invests in private credit to provide risk adjusted returns in excess of those offered by publicly traded fixed income securities and to generate a consistent stream of income. SERS’ Statement of Investment Policy sets the Global Private Credit target allocation as follows:
Target Permissible Range
Global Private Credit 5% 3% - 7%
The performance objective for Global Private Credit is to produce net of fee returns in excess of the 90-day Treasury bill rate + 4.5%.
REVIEW OF FY2022 OBJECTIVES AND IMPLEMENTATION
The FY2022 Annual Investment Plan objectives and related activities are as follows:
• Increase the Private Credit allocation toward 3% of the Total Fund by making new investments that fit the SERS’ investment policy, subject to identifying opportunities that fit SERS’ investment criteria. At the end of 2021, the Global Private Credit allocation increased to 3.4% of Total Fund and exceeded the interim target of 3%. Staff expects to reach the target allocation of 5% by the end of fiscal year 2023. To date, Staff has executed nearly $1.2 billion in new capital commitments and total unfunded capital commitments has increased to $1 billion. Of the new capital commitments executed, $225 million was completed during fiscal year 2022. As the portfolio nears the target allocation, deployment will slow to a more normal pace. • Build the Private Credit allocation in line with the implementation guidelines and ensure appropriate risk and return characteristics are present within the new target allocation. Staff has executed $982 million in capital commitments to investments that fall within the direct lending sub-asset class and $175 million within the stressed/distressed sub-asset class. The portfolio continues to grow towards the target allocation of 5% and all sub-asset classes fall within the ranges stated in the implementation guidelines. In addition, Staff has executed investments that are diversified across industries, geographies, and contain various types of private credit instruments. Most of the new investments have been made within the direct lending sub-asset class, which is primarily comprised of investments that are senior in the capital structure of a company, contain a contractual income component, are structured with robust covenants to protect investors, and have priority over a company’s cash flows or other assets in the event of a default. • Make new investments that serve a primary purpose of the Private Credit allocation to generate consistent income for the Total Fund, while considering different strategies that add further diversification to the portfolio, such as venture debt, specialty finance, emerging markets, or other niche categories. All the investments that have been executed or considered for the Private Credit portfolio include an income component, which is expected to comprise the largest part of the investment return. Most of the underlying investments within private credit funds include a contractual cash payment that is distributed to investors in the form of income on a quarterly basis. During the fiscal year, Staff reviewed numerous differentiated strategies that could provide additional diversification benefits to the portfolio and will continue to consider new strategies that could be a fit for the portfolio. • Monitor the USD LIBOR transition to SOFR and implement the replacement benchmark at the appropriate time. The replacement of the benchmark has completed. In February 2022, the Board approved a benchmark change from the 3-month LIBOR + 4.5% to the 90-day Treasury bill rate + 4.5%. CURRENT MARKET CONDITIONS AND OUTLOOK The private credit market continued to grow in 2021 and reached an estimated $1.2 trillion in assets under management at the end of the year. The private credit market has been growing at an estimated 13.5% annually over the last decade and is forecast to reach nearly $2.7 trillion by the end of 2026. It is likely that private credit will become one of the largest private asset classes in the next five years. During 2021, nearly $200 billion was raised
PORTFOLIO STRATEGY – Global Private Credit
SERS ANNUAL INVESTMENT PLAN FY2023 | 20
within private credit funds, which was approximately a 14% increase from 2020. The number of funds raised during the year decreased, however, the size of funds increased as deal sizes became larger. This trend has continued in recent years as larger companies look to the private markets for capital. The direct lending strategy raised $112 billion during the year, which was the largest increase to date given the continued growth of the economy and pick up in private equity activity. Fundraising activity declined for distressed and special situation strategies that experienced larger inflows during 2020 as a result of the market disruption brought about by the pandemic. During 2021, many private credit managers saw a reversal of valuation markdowns related to the pandemic, but the long-term impacts of certain portfolio companies is still undetermined. While deal activity continued to rise during 2021, it slowed in Europe throughout the year. Nonetheless, the changing banking regulatory environment in Europe continues to promote the growth in private lending as traditional banks reduce exposure. The Private Credit asset class performed as expected during 2021. In particular, the income focused direct lending strategy delivered an estimated 8.8% yield to investors, which was an attractive premium over the US high yield market of 4.0%, the US investment grade market of 2.1%, and the US 10-year Treasury of 1.7%. The US leveraged loan market stabilized after a volatile 2020, with yields beginning to increase at the end of 2021 as the expectation for rising rates increased. The outlook for the private credit market is positive with considerable growth expected through 2026. However, the market environment is shifting as the US Federal Reserve increases interest rates in the US to combat rising inflation and the potential for slowed economic growth. While rising rates may negatively impact other assets classes, it can add to returns within the private credit asset class since many loans are structured with a floating rate. The increase in interest rates may impact the borrowers, leading to an increase in default rates. Therefore, it is increasingly important for private lenders to conduct a rigorous underwriting process on portfolio companies to ensure borrowers can withstand the impacts of a rising interest rate environment. Nonetheless, private equity dry powder remains high and deal activity is expected to be strong, providing lending opportunities within the private credit market. There also continues to be a growing need for larger borrowers to access the private markets for several reasons, including the speed and certainty of execution of loan documents. As the number of larger companies transition from the broadly syndicated loan market to private credit markets, direct lenders continue to absorb that market share. This secular shift in borrower activity is expected to continue, which can lead to an increase in the size of executed deals and the size of funds raising capital from investors. FY2023 OBJECTIVES Staff will focus on the following objectives in FY2023: • Increase the Private Credit allocation to 5% of the Total Fund by making new investments that fit the SERS’ investment policy, while managing the portfolio in conjunction with the pace of capital drawdowns for existing commitments. • Build the Private Credit allocation in line with the implementation guidelines and ensure appropriate risk and return characteristics are present within the target allocation. • Evaluate new investments with a cautious approach given the economic outlook and the rising interest rate environment, while focusing on increasing the cash yield of the portfolio and income distribution to the Total Fund. • Consider differentiated strategies that can add further diversification to the portfolio while also contributing to the portfolio’s return and cash yield.
• Continue to look for co-investment opportunities with existing managers that could be a fit for the portfolio and that increase the portfolio’s cash yield.
PORTFOLIO STRATEGY - Global Real Assets
SERS ANNUAL INVESTMENT PLAN FY2023 | 21
INVESTMENT STRATEGY The role of SERS’ Global Real Assets portfolio is to provide a stable income return from tangible assets, to be a partial inflation hedge over the long term and to provide low correlation to equities. SERS’ Statement of Investment Policy sets the Global Real Assets target allocation as follows:
Target Permissible Range
Global Real Assets 17% 14% - 20%
The performance objective for Global Real Assets is to produce net of fee returns in excess of the NCREIF Property Index (“NPI”), one quarter in arrears, over a market cycle, with the income component of the return comprising a significant portion of the total return.
REVIEW OF FY2022 OBJECTIVES AND IMPLEMENTATION
The FY2022 Annual Investment Plan objectives and related activities are as follows:
• Formulate and implement a one-year plan to achieve and maintain a 17% allocation to Real Assets.
The Real Assets portfolio ended 2021 with a Total Fund allocation of 16.8%. The Real Asset portfolio was able to increase the allocation throughout 2021 and nearly reached the target allocation because the Real Asset portfolio had approximately $444 million of capital called, and Staff made new commitments totaling $375 million during 2021. Staff will make appropriate allocation decisions to maintain the 17% Total Fund allocation.
• Tactically manage real estate and infrastructure allocations to improve portfolio structure and returns without increasing risk.
The Real Asset portfolio had about $444 million of capital called during 2021. The majority ($403 million) of the capital called during 2021 was invested in core fund strategies. Of the $375 million in new commitments during 2021, the majority ($240 million) was to core strategies. A full redemption was made from an underperforming real estate debt fund. The emphasis remains on operating assets, with the current exposure at 93%, vs non-operating assets at 7%.
• Evaluate new investment strategies for the Real Assets portfolio such as energy transition, secondaries, co-investment funds, and ESG focused funds.
Staff evaluated many new mandates for the portfolio and made commitments to three new investment strategies during the year. Staff made commitments to a new global transition fund, a single-family rental fund, and a digital infrastructure fund during FY2022. The new commitments will add exposure to new asset types in the Real Asset Portfolio.
• As the Real Assets portfolio has been built out, switch focus to actively soliciting co-investment opportunities with existing managers.
Staff reviewed several co-investment opportunities with existing general partners during 2021. Staff successfully executed one co-investment in a cell towers platform during 2021.
CURRENT MARKET CONDITIONS AND OUTLOOK Across most property types, real estate returns were strong in 2021, rebounding from their pandemic lows. SERS’ Real Assets portfolio returned 17.24% net of fees in 2021 versus a benchmark NPI return of 12.15% gross of fees, producing an excess return of 5.09%. The income return gross of fees during 2021 was 4.71%.
In general, 2021 was a cautiously optimistic year for real estate. Real estate returns are typically driven by demographics, economic growth, interest rates, and property type fundamentals. That was also true in 2021, as property types with strong fundamentals like industrial, life science, and multi-family continued to post strong net operating income (NOI) growth and asset appreciation. Property types like hotels and retail that suffered in 2020 generally saw recovery in occupancy and asset valuation. Urban-based apartments began to see an uptick in rents and occupancy in 2021 as workers returned to city-based offices.
The shift to work from home has changed the way businesses and employees use offices. However, the easing of COVID-related restrictions, “Zoom fatigue,” and employers’ mandates for office return resulted in many employees returning to the offices at least on a part-time basis by end-2021, with many organizations operating under a hybrid model of work from home / work in office. Office vacancy rates increased to about 16% at the end of 2021 (vs 15% in 2020). Rental collections for office remained strong during the pandemic because of long-term leases signed
PORTFOLIO STRATEGY - Global Real Assets
SERS ANNUAL INVESTMENT PLAN FY2023 | 22
prior to the pandemic. Several key metrics to monitor is office tenants’ lease renewal activity – square footage leased and rents – as they assess the amount of space they need in a hybrid work environment.
Retail was severely impacted by the lockdowns during the pandemic but began its recovery in 2021. A number of recent retail transactions suggest that a troughing process has occurred. While many fundamental challenges still face this sector, there was sufficient value and “green shoots” in the sector that buyers resurfaced.
Industrial was the biggest winner during the pandemic as more consumers chose to place orders online and have items delivered. As e-commerce sales continue to grow, the demand for industrial warehouses will continue to support future returns. Vacancy for industrial properties is at an all-time low of 3.2%. NOI growth for 2021 was very impressive, generally in the mid to high teens on a year-to-year basis.
Valuations for most properties increased in 2021 as transaction volumes began to recover. SERS remains overweight in the industrial and multifamily property types and underweight in office and retail. SERS’ portfolio also has properties that are not in the benchmark, such as self-storage, single-family rentals, and senior housing, which provide diversification and enhanced returns.
Infrastructure assets across sectors also saw robust rebound. The strongest recovery occurred in those sectors hit the hardest during the pandemic – transportation and energy. Although passenger volumes and energy consumption are still below 2019 pre-pandemic levels, they have rebounded from their spring 2020 lows and continue to climb. Recent transactions in the transportation space (e.g. airports) suggest that investors are looking out to 2024-25 forecasts for normalized volumes / revenues for their valuation. Although the energy transition continues to take shape, potential dislocations in energy markets arising from the Ukraine situation reminds investors of the global economy’s reliance on fossil fuels and strategic importance of certain midstream energy assets.
Sectors that demonstrated resilience during 2020 like utilities, digital infrastructure, and renewables still saw solid operating and financial results in 2021. The observable increase in sector focused fund offerings – and high LP commitments – for digital infrastructure and renewables / energy transition point to secular shifts in investors sentiments and that these sectors will increasingly become more mainstream.
Inflation, rising discount and cap rates, higher financing costs, ongoing COVID-variants, and geopolitical uncertainty must all be considered as we navigate 2022. In the US, most real estate properties benefit from continued strong fundamentals or rebound from 2020 lows. SERS’ emphasis on core strategies that focus on income returns should provide some insulation from these uncertainties. As well, new allocations to digital infrastructure and single-family rentals, both of which benefit from favorable secular trends managed by sector-focused managers, position the portfolio well.
Real Assets returns will mostly be driven by income in 2022 and total returns for the benchmark are anticipated to be approximately 9.5% per an industry consensus forecast. Infrastructure ended 2021 with an allocation of ~28% of the Real Assets portfolio with the expectation for a higher allocation in FY2022 as capital commitments are called by managers. SERS’ exposure to digital infrastructure, renewables, social, and healthcare are more defensive assets with contracted cash flows. The ongoing recovery should continue to boost asset values in real estate property types such as retail and office, and infrastructure sectors like transportation and energy.
FY2023 OBJECTIVES Staff will focus on the following objectives in FY2023:
• Formulate and implement a portfolio allocation strategy that factors in macroeconomic risks in an inflationary environment with rising geopolitical uncertainty.
• Formulate and implement a one-year plan to achieve and maintain a 17% allocation to Real Assets.
• Tactically manage the existing real estate and infrastructure allocations to improve portfolio structure and achieve favorable risk-adjusted returns.
• Evaluate new investment strategies for the Real Assets portfolio such as niche real estate property types, non-US real estate, energy transition, agriculture / timber, listed infrastructure funds, and secondaries.
• Actively pursue co-investment opportunities with existing Real Assets managers.
PORTFOLIO STRATEGY - Cash Equivalents & Securities Lending
SERS ANNUAL INVESTMENT PLAN FY2023 | 23
INVESTMENT STRATEGY SERS invests in cash equivalents for the purpose of earning market returns on cash held for benefits and expenses and to provide short-term cash needed to fund other asset classes. Cash Equivalents are fixed income assets with maturities of less than 270 days and may include US government, asset-backed, corporate and high quality money market-type securities.
SERS’ Statement of Investment Policy sets the Cash Equivalent target allocation as follows:
Target Permissible Range
Cash Equivalents 2% 0% – 5%
The performance objective for Cash Equivalents is to exceed the return on 30-day US Treasury Bills. The Securities Lending program is designed to be a low risk, intrinsic value focused strategy that generates additional income for the plan by temporarily lending equity and fixed income securities. All loans are collateralized with cash at 102-105% of security market value and reinvested in government money markets and repurchase agreements. Loans to approved borrowers are limited to 25% of the average monthly market value of the loan from the prior year. Fixed income security loans require a ten basis point minimum spread at loan initiation. The program is implemented through a third-party lending agent and collateral reinvestment manager. REVIEW OF FY2022 OBJECTIVES AND IMPLEMENTATION The FY2022 Annual Investment Plan objectives and related activities are as follows: • Research and monitor money market funds.
Staff continued to invest the daily short-term cash in the Fidelity Government Portfolio and the Federated Hermes Prime Obligations money markets. Since mid-November, only the Fidelity Government Portfolio has been utilized due to the impact of the falling NAV of Federated’s Prime Obligation Fund outweighing the income earned.
• Evaluate opportunities to improve the Cash Management process and maintain liquidity needs for the portfolio.
Improvements to the cash forecasting process to include extended projections for capital calls and distributions for the increased commitments to private equity, real assets and private credit.
• Monitor the Securities Lending program for opportunities to generate incremental income and ensure that it is operating within the program implementation guidelines.
The Securities Lending program continues to add additional income through lending otherwise idle securities held by the custodian. Lending income was lower during the fiscal year due to lower demand for SERS securities inventory and the conservative reinvestment collateral guidelines that permits reinvestment to US Treasuries and repurchase agreements only.
CURRENT MARKET CONDITIONS AND OUTLOOK Money market yields started rising in March 2022 with a 25 basis-point hike and are expected to continue rising as the markets have now priced in a further 200-250 basis points through the end of 2022. As rates increase, money markets will earn higher income. In anticipation of rate hikes, the portfolio’s weighted average maturity is anchored in the 25-30 day range. Prime money markets are seeing a pickup in the issuance of short-term commercial paper and other prime instruments offering attractive rates, but are not going too far out on the maturity spectrum due to the uncertainty of the yield curve. FY2023 OBJECTIVES Staff will focus on the following objectives in FY2023:
• Research and monitor money market funds for opportunities to earn additional yield over the portfolio benchmark.
• Evaluate opportunities to improve the Cash Management process and maintain liquidity needs for the portfolio.
• Monitor the Securities Lending program for opportunities to generate incremental income and ensure it is operating within the program implementation guidelines.
PORTFOLIO STRATEGY – Opportunistic & Tactical
SERS ANNUAL INVESTMENT PLAN FY2023 | 24
INVESTMENT STRATEGY SERS invests in opportunistic investments for the purpose of earning returns greater than the Bloomberg US Aggregate Bond Index + 2% for investments that do not fit within the existing asset classes. The investments are defined as tactical or non-traditional investment opportunities. Such investments may involve capitalizing on short-term market dislocations or other unique situations or innovative strategies including tactical allocation. SERS’ Statement of Investment Policy sets the Opportunistic investments target allocation as follows:
Target Permissible Range
Opportunistic Investments 0% 0% – 5%
The performance objective for Opportunistic investments is to exceed the return of the Bloomberg US Aggregate Bond Index + 2%. REVIEW OF FY2022 OBJECTIVES AND IMPLEMENTATION The FY2022 Annual Investment Plan objectives and related activities are as follows:
• Search for possible Opportunistic investments for the Fund that are expected to exceed the Bloomberg US Aggregate Bond Index + 2%, with an emphasis on high yielding investments. This will be accomplished through the evaluation of markets, strategies and specific funds that offer compelling risk adjusted returns. Specific investments under consideration include strategies that focus on climate sustainability as well as commodity-focused strategies that can serve as an inflation hedge. Investments that pass initial screening will undergo detailed due diligence prior to staff recommendation.
Four new investments totaling $250 million have been added to the portfolio this fiscal year, The first investment is to a commodities strategy that is focused on providing inflation protection. Two private debt funds were added to the portfolio. One is focused on providing loans to European-based companies and the other provides loans and other solutions to healthcare companies. The most recent investment is to a risk parity manager whose objective is to deliver stable returns across a variety of economic environments.
• Actively manage the liquid portion of the portfolio to improve the risk and return profile.
Staff continues to closely monitor and manage the liquid portion of the portfolio, which has grown in recent years. The portfolio is comprised of six funds that offer liquidity on a regular basis.
CURRENT MARKET CONDITIONS AND OUTLOOK The Opportunistic portfolio consists of funds that seek to take advantage of market dislocations, or which do not fit within the risk and return objectives of other asset classes. The return objective of the portfolio is to outperform the Bloomberg US Aggregate Bond Index + 2%. The portfolio is positioned to take advantage of a market experiencing higher inflation and slowing economic growth. Current strategies include distressed assets, structured credit, long/short multi strategy funds, commodities, and risk parity.
In addition to the opportunities discussed above, staff continues to evaluate new strategies that can take advantage of rapidly changing market conditions. In March 2022, the fed funds rate was increased for the first time since 2018 with several more increases expected this year. Real GDP growth is projected to slow this year as a result of slowing consumer demand, global supply disruptions, and the risks of Russia’s invasion of Ukraine, Against this backdrop, staff is actively managing the existing portfolio and researching new strategies that could benefit from this environment.
FY2023 OBJECTIVES Staff will focus on the following objectives in FY2023:
• Search for possible Opportunistic investments for the Fund that are expected to exceed the portfolio benchmark. This will be accomplished through the evaluation of markets, strategies and specific funds that offer compelling risk adjusted returns. Specific investments under consideration include strategies that provide diversification, downside protection, and inflation protection. Investments that pass initial screening will undergo detailed due diligence prior to staff recommendation.
• Actively manage the Opportunistic allocation to improve portfolio structure and returns without increasing risk.
PORTFOLIO STRATEGY – Overlay Program
SERS ANNUAL INVESTMENT PLAN FY2023 | 25
INVESTMENT STRATEGY SERS invests in overlay strategies that trade derivatives of the Total Fund’s underlying assets and currency exchange rates to enhance the Total Fund portfolio efficiency. The overlay program includes tactical asset allocation and active currency strategies. The tactical asset allocation strategy aims to add value to the Total Fund performance through active allocations (long/short) across stocks and bonds thereby exploiting short-term macro market dislocations. The active currency strategies aim to add value and risk diversification to the Total Fund, as well as help manage currency risk by utilizing short-term inefficiency in the foreign exchange markets and low correlation of the strategies to the major asset classes such as US equity and fixed income. The program is fully tactical; exposures to any overlay strategies in this program are not required by the Statement of Investment Policy. The overlay program is targeted to add 10 to 20 bps excess return to the Total Fund‘s performance on a three to five year horizon. Tracking errors of the tactical rebalancing strategy and the currency program are expected in the ranges of 5 to 15 basis points and 5 to 8%, respectively. REVIEW OF FY2022 OBJECTIVES AND IMPLEMENTATION The FY2022 Annual Investment Plan objectives and related activities are as follows:
• Actively monitor the Tactical Asset Allocation Strategy to enhance the impacts of the strategy to the Total Fund’s performance. Russell has initiated several short-term trades fiscal year to date, each time going long US equities and short fixed income. Each trade has been profitable with total realized gains of $18 million through March and $71 million since inception. The program has added six basis points annualized to Total Fund performance over the last five years. The new tactical asset allocation manager, Alpha Engine, has been primarily short US, Non-US and emerging market equities and long fixed income with modest long positions in commodities (oil and precious metals only). This positioning has led to modest losses across all three asset classes of -$2.4 million through March. • Actively monitor the Active Currency Strategies to improve the program’s risk and return characteristics. The strategy was long the US dollar relative to other major currencies like the euro, Australian dollar and Japanese yen throughout the fiscal year. Based on US dollar strength, the strategy has added $24 million in gains through March and $4 million since inception. In Q2 2022, the target volatility of the program was increased from 6% to 8% while the notional value remained $450 million. FY2023 OBJECTIVES Staff will focus on the following objectives in FY2023: • Actively monitor the Tactical Asset Allocation Strategy to enhance the impacts of the strategy on the Total Fund performance. • Actively monitor the Active Currency Strategies to improve the program’s risk and return characteristics.
PORTFOLIO STRATEGY - Investment Risk Management & Analytics
SERS ANNUAL INVESTMENT PLAN FY2023 | 26
Investment Risk Management and Analytics is responsible for the provision and communication of diligent, thorough, timely and forward-looking investment risk analytics and other investment analytics to the Board and Investment Staff. Total Fund forecast volatility trended down during 2021 from 15.5% in January to 12.2% in December as the financial markets normalized from the 2020 downturn. The 3-years realized risk of the Total Fund also declined from 9.7% in January to 8.9% in December 2021. The forecast risk is a forward-looking risk estimate based on a fund’s current holdings at a point of time while the realized risk measures volatility of the historical return of the fund over a period of time; the former counteracts the smoothing effect of infrequent valuation of private investments that is inherent in the later. Hence, the forecast risk tends to be higher than the realized risk for a fund that includes private investments. The forward-looking risk is preferable for assessing allocation among assets and risk-return reward of an asset. The Total Fund risk structure was stable over the year. The equity factors contributed 80%, and the remaining 20% was attributed to other factors like fixed income, private assets, and currency. The Total Fund’s active risk stayed under the 3% limit stated in the Statement of Investment Policy as the 3-year realized active risk was 1.3% and forecast active risk was 1.5% in December 2021. REVIEW OF FY2022 OBJECTIVES AND IMPLEMENTATION The FY2022 Annual Investment Plan objectives and related activities are as follows: • Provide risk forecasts and analyses of the Total Fund and asset class portfolios.
Staff utilized the risk system to generate risk analyses of the Total Fund and asset classes. The risk analyses based on SERS’ investment holdings provide forecasted volatility of returns of portfolios. The analyses also provide portfolio risk decomposition by strategies, as well as by factors.
• Report risk of the Total Fund to the Board and Investment Committee on a quarterly basis
The quarterly risk report on the Total Fund is provided to the Board showing risk contribution of asset class weights, and active risk of asset classes and factor risks across the portfolio. The total risk decomposition by asset classes focused on their role in the Total Fund. The total risk decomposition by factors focused on cross factor exposures, especially equity factors among the asset class portfolios as the equity factors are the largest risk driver of the Total Fund. The active risk decomposition showed risk contribution from the investment implementation, which is comprised of active allocation among the asset classes and active selection of strategies and securities.
• Communicate asset class portfolio’s risk with asset class investment officer(s) and discuss any potential changes of the portfolio structure on a quarterly basis.
Staff discussed the risk profile of asset class portfolios with each asset class team. The discussion was focused on i) trend and level of forecast risks, ii) the portfolio’s risk structure in terms of manager line-up and factor tilts and iii) the portfolio’s sensitivity to market movements. The discussions assisted each asset class team in balancing their portfolio risks and minimizing unintended risk tilts.
• Provide return attribution analysis of the Total Fund and asset classes of the Fund to the Investment Strategy Team.
Staff reported monthly return attribution analyses of the Total Fund, analyzing effects of active weights on alpha generation of each asset class. The analyses were presented to the Investment Strategy Team. Staff also delivered to the Investment Strategy Team attribution reports of each asset class portfolio analyzing the contribution of each account within an asset class.
• Perform other portfolio and market analyses and research as needed.
Staff conducted analyses of the Total Fund liquidity and leverage. Staff also conducted portfolio and market analyses as needed or upon request.
PORTFOLIO STRATEGY - Investment Risk Management & Analytics
SERS ANNUAL INVESTMENT PLAN FY2023 | 27
FY2023 OBJECTIVES Staff will focus on the following objectives in FY2023: • Provide risk forecasts and analyses of the Total Fund and asset class portfolios. • Report risk of the Total Fund to the Board on a quarterly basis. • Communicate asset class portfolios’ risk with asset class investment officer(s) and discuss any potential changes of the portfolio structure on a quarterly basis. • Provide return attribution analyses of the Total Fund and asset classes of the Fund to the Investment Strategy Team. • Perform other portfolio and market analyses and research as needed.
Investment Operations
SERS ANNUAL INVESTMENT PLAN FY2023 | 28
The Investment Operations area is responsible for managing administrative activities for the Investment department, assisting the CIO and investment officers, and providing reports and information to Staff and the Board. The objectives for FY2023 remain consistent with those of FY2022 as these broad categories reflect the primary duties of Investment Operations. REVIEW OF FY2022 OBJECTIVES AND IMPLEMENTATION The FY2022 Annual Investment Plan objectives and related activities are as follows:
• Coordinate, assist and participate in organizational initiatives including Policies, Procedures and Practices; fiscal budget; Subject Matter Experts (SMEs); and Corporate Emergency Preparedness Project (CEPP). Investment Operations assisted with the annual review and revisions to the Investment Department Policies, Procedures and Practices and participated in the system-wide Information Governance Project. Staff prepared and analyzed the fiscal budget for executive approval as well as participated in and provided feedback in relation to SME and CEPP activities. • Perform administrative duties and attend meetings for the Investment Committee, Strategy Team and Board meetings including establishing meeting dates and agendas, organizing and distributing documents to team members, producing reports and taking minutes. Operations attended all Investment Committee, Strategy Team and Board meetings. Agendas and documents were prepared and distributed, minutes were taken and distributed in a timely manner. Staff assisted with processing documents associated with hiring, terminating and redeeming of managers. • Assist with projects for the CIO and Investment officers including revising the Annual Investment Plan, updating the Statement of Investment Policy as needed, new manager searches as needed and aiding with special projects for Staff. Operations coordinated revisions to and produced the FY2022 Annual Investment Plan and the amended Statement of Investment Policy, onboarding of new Investment staff, and new manager searches throughout the fiscal year. FY2023 OBJECTIVES Staff will focus on the following objectives in FY2023: • Coordinate, assist and participate in organizational initiatives including Policies, Procedures and Practices; Information Governance Project, fiscal budget; Subject Matter Experts (SMEs); and Emergency Response Program (ERP). • Perform administrative duties and attend meetings for the Investment Committee, Strategy Team and Board meetings including establishing meeting dates and agendas, organizing and distributing documents to team members, producing reports and taking minutes. • Assist with projects for the CIO and Investment officers including revising the Annual Investment Plan, updating the Statement of Investment Policy as needed, searches for new Investment managers as needed, and aiding with special projects for Staff.
SERS ANNUAL INVESTMENT PLAN FY2023 | 29
Implementation
Guidelines
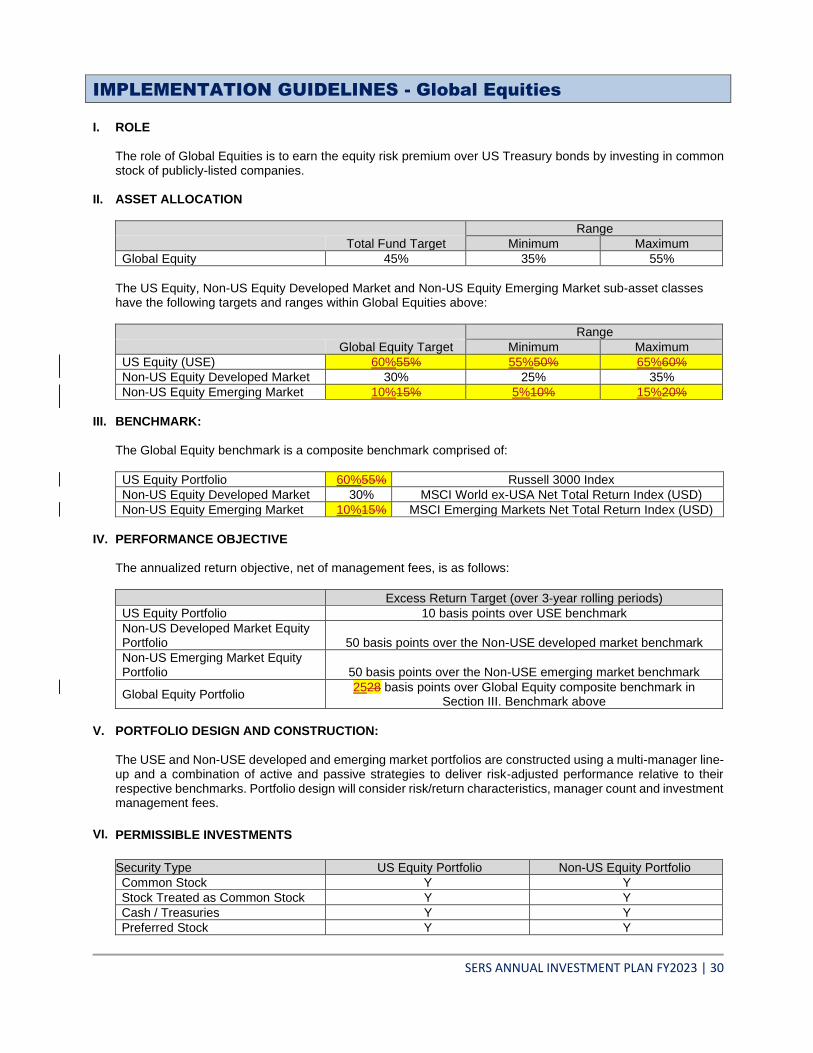
IMPLEMENTATION GUIDELINES - Global Equities
SERS ANNUAL INVESTMENT PLAN FY2023 | 30
I. ROLE The role of Global Equities is to earn the equity risk premium over US Treasury bonds by investing in common stock of publicly-listed companies.
II. ASSET ALLOCATION
Range
Total Fund Target Minimum Maximum
Global Equity 45% 35% 55%
The US Equity, Non-US Equity Developed Market and Non-US Equity Emerging Market sub-asset classes have the following targets and ranges within Global Equities above:
Range
Global Equity Target Minimum Maximum
US Equity (USE) 60%55% 55%50% 65%60%
Non-US Equity Developed Market 30% 25% 35%
Non-US Equity Emerging Market 10%15% 5%10% 15%20%
III. BENCHMARK:
The Global Equity benchmark is a composite benchmark comprised of:
US Equity Portfolio 60%55% Russell 3000 Index
Non-US Equity Developed Market 30% MSCI World ex-USA Net Total Return Index (USD)
Non-US Equity Emerging Market 10%15% MSCI Emerging Markets Net Total Return Index (USD)
IV. PERFORMANCE OBJECTIVE
The annualized return objective, net of management fees, is as follows:
Excess Return Target (over 3-year rolling periods)
US Equity Portfolio 10 basis points over USE benchmark
Non-US Developed Market Equity Portfolio 50 basis points over the Non-USE developed market benchmark
Non-US Emerging Market Equity Portfolio 50 basis points over the Non-USE emerging market benchmark
Global Equity Portfolio 2528 basis points over Global Equity composite benchmark in
Section III. Benchmark above
V. PORTFOLIO DESIGN AND CONSTRUCTION:
The USE and Non-USE developed and emerging market portfolios are constructed using a multi-manager line-up and a combination of active and passive strategies to deliver risk-adjusted performance relative to their respective benchmarks. Portfolio design will consider risk/return characteristics, manager count and investment management fees.
VI. PERMISSIBLE INVESTMENTS
Security Type US Equity Portfolio Non-US Equity Portfolio
Common Stock Y Y
Stock Treated as Common Stock Y Y
Cash / Treasuries Y Y
Preferred Stock Y Y
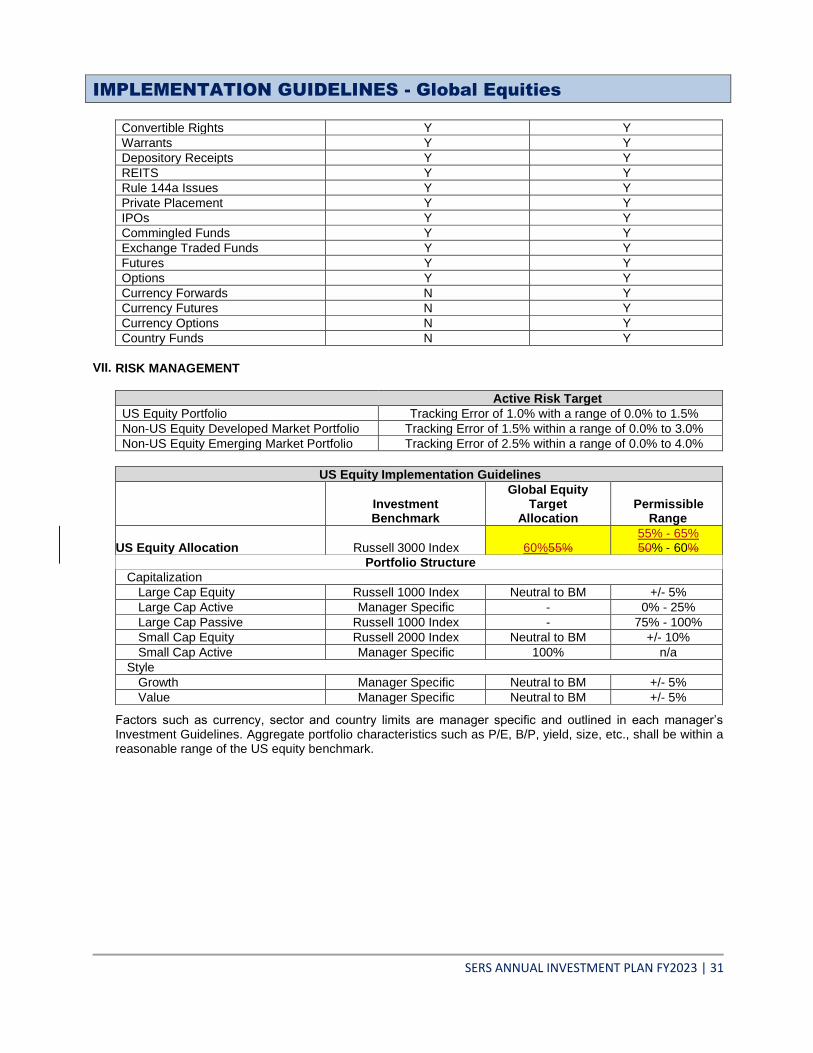
IMPLEMENTATION GUIDELINES - Global Equities
SERS ANNUAL INVESTMENT PLAN FY2023 | 31
Convertible Rights Y Y
Warrants Y Y
Depository Receipts Y Y
REITS Y Y
Rule 144a Issues Y Y
Private Placement Y Y
IPOs Y Y
Commingled Funds Y Y
Exchange Traded Funds Y Y
Futures Y Y
Options Y Y
Currency Forwards N Y
Currency Futures N Y
Currency Options N Y
Country Funds N Y
VII. RISK MANAGEMENT
Active Risk Target
US Equity Portfolio Tracking Error of 1.0% with a range of 0.0% to 1.5%
Non-US Equity Developed Market Portfolio Tracking Error of 1.5% within a range of 0.0% to 3.0%
Non-US Equity Emerging Market Portfolio Tracking Error of 2.5% within a range of 0.0% to 4.0%
US Equity Implementation Guidelines
Investment Benchmark
Global Equity Target
Allocation Permissible
Range
US Equity Allocation Russell 3000 Index 60%55% 55% - 65% 50% - 60%
Portfolio Structure
Capitalization
Large Cap Equity Russell 1000 Index Neutral to BM +/- 5%
Large Cap Active Manager Specific - 0% - 25%
Large Cap Passive Russell 1000 Index - 75% - 100%
Small Cap Equity Russell 2000 Index Neutral to BM +/- 10%
Small Cap Active Manager Specific 100% n/a
Style
Growth Manager Specific Neutral to BM +/- 5%
Value Manager Specific Neutral to BM +/- 5%
Factors such as currency, sector and country limits are manager specific and outlined in each manager’s Investment Guidelines. Aggregate portfolio characteristics such as P/E, B/P, yield, size, etc., shall be within a reasonable range of the US equity benchmark.
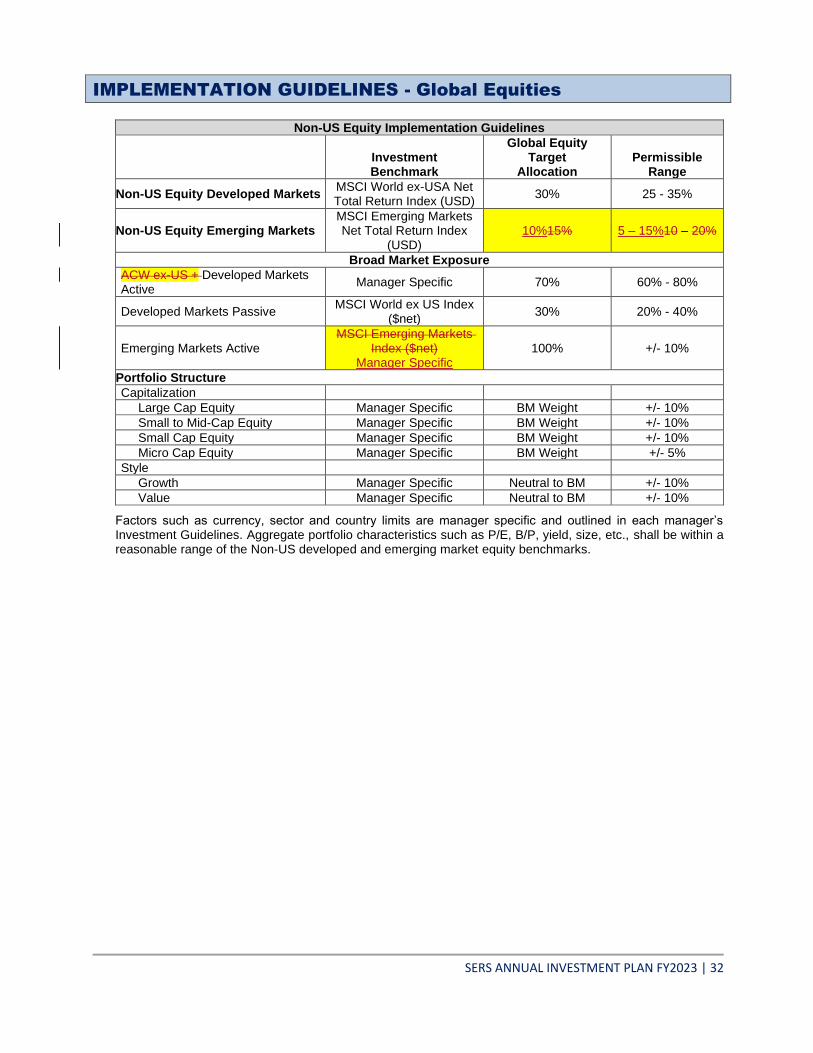
IMPLEMENTATION GUIDELINES - Global Equities
SERS ANNUAL INVESTMENT PLAN FY2023 | 32
Non-US Equity Implementation Guidelines
Investment Benchmark
Global Equity Target
Allocation Permissible
Range
Non-US Equity Developed Markets MSCI World ex-USA Net Total Return Index (USD)
30% 25 - 35%
Non-US Equity Emerging Markets MSCI Emerging Markets Net Total Return Index
(USD) 10%15% 5 – 15%10 – 20%
Broad Market Exposure
ACW ex-US + Developed Markets Active
Manager Specific 70% 60% - 80%
Developed Markets Passive MSCI World ex US Index
($net) 30% 20% - 40%
Emerging Markets Active MSCI Emerging Markets
Index ($net) Manager Specific
100% +/- 10%
Portfolio Structure
Capitalization
Large Cap Equity Manager Specific BM Weight +/- 10%
Small to Mid-Cap Equity Manager Specific BM Weight +/- 10%
Small Cap Equity Manager Specific BM Weight +/- 10%
Micro Cap Equity Manager Specific BM Weight +/- 5%
Style
Growth Manager Specific Neutral to BM +/- 10%
Value Manager Specific Neutral to BM +/- 10%
Factors such as currency, sector and country limits are manager specific and outlined in each manager’s Investment Guidelines. Aggregate portfolio characteristics such as P/E, B/P, yield, size, etc., shall be within a reasonable range of the Non-US developed and emerging market equity benchmarks.
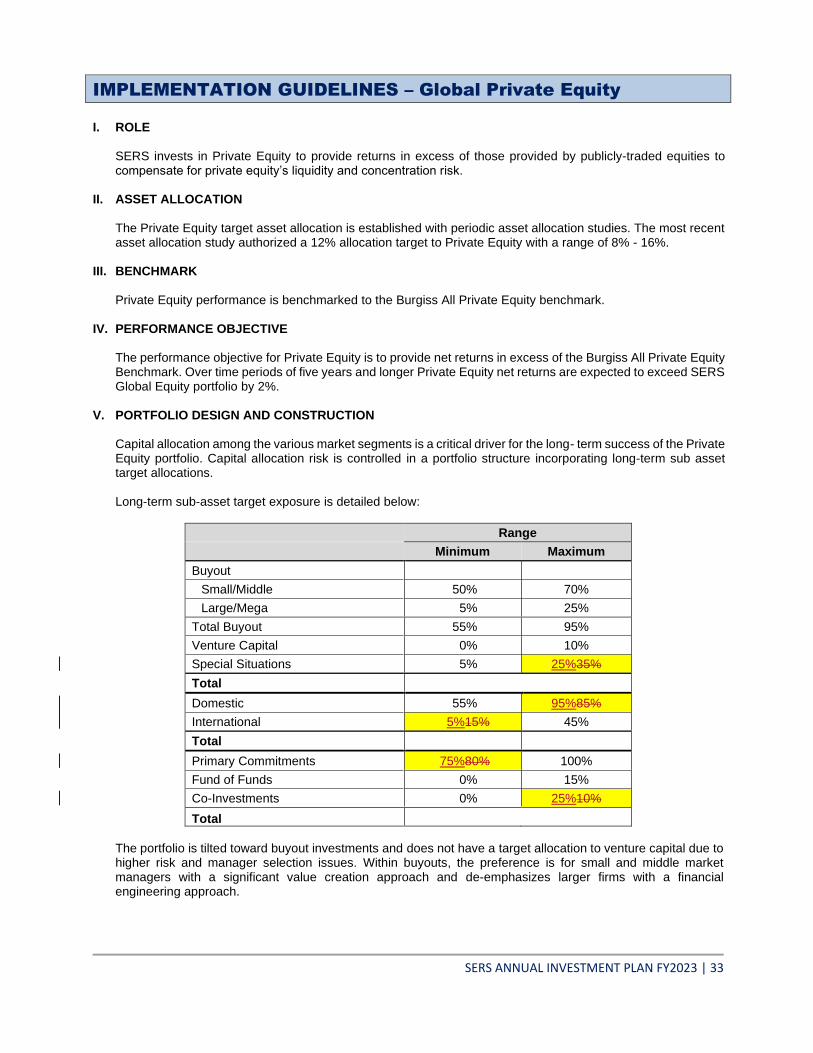
IMPLEMENTATION GUIDELINES – Global Private Equity
SERS ANNUAL INVESTMENT PLAN FY2023 | 33
I. ROLE
SERS invests in Private Equity to provide returns in excess of those provided by publicly-traded equities to compensate for private equity’s liquidity and concentration risk.
II. ASSET ALLOCATION
The Private Equity target asset allocation is established with periodic asset allocation studies. The most recent asset allocation study authorized a 12% allocation target to Private Equity with a range of 8% - 16%.
III. BENCHMARK
Private Equity performance is benchmarked to the Burgiss All Private Equity benchmark. IV. PERFORMANCE OBJECTIVE
The performance objective for Private Equity is to provide net returns in excess of the Burgiss All Private Equity Benchmark. Over time periods of five years and longer Private Equity net returns are expected to exceed SERS Global Equity portfolio by 2%.
V. PORTFOLIO DESIGN AND CONSTRUCTION
Capital allocation among the various market segments is a critical driver for the long- term success of the Private Equity portfolio. Capital allocation risk is controlled in a portfolio structure incorporating long-term sub asset target allocations.
Long-term sub-asset target exposure is detailed below:
Range
Minimum Maximum
Buyout Small/Middle 50% 70%
Large/Mega 5% 25%
Total Buyout 55% 95%
Venture Capital 0% 10%
Special Situations 5% 25%35%
Total
Domestic 55% 95%85%
International 5%15% 45%
Total
Primary Commitments 75%80% 100%
Fund of Funds 0% 15%
Co-Investments 0% 25%10%
Total
The portfolio is tilted toward buyout investments and does not have a target allocation to venture capital due to higher risk and manager selection issues. Within buyouts, the preference is for small and middle market managers with a significant value creation approach and de-emphasizes larger firms with a financial engineering approach.
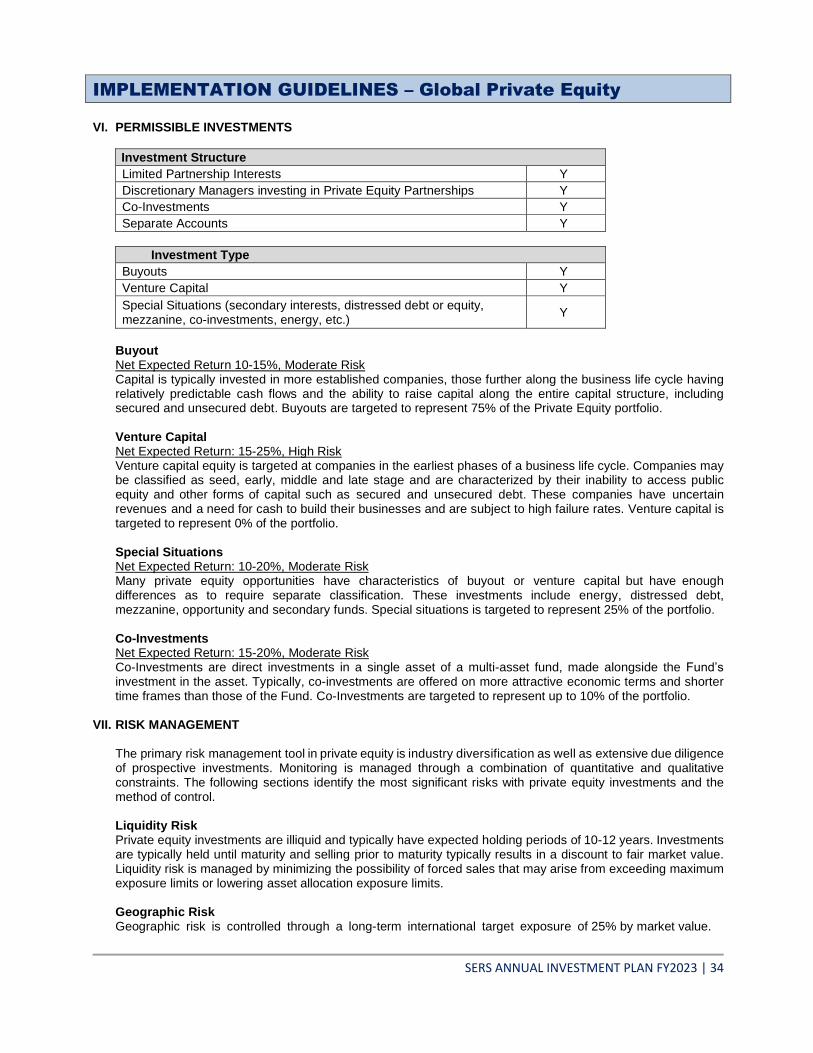
IMPLEMENTATION GUIDELINES – Global Private Equity
SERS ANNUAL INVESTMENT PLAN FY2023 | 34
VI. PERMISSIBLE INVESTMENTS
Investment Structure
Limited Partnership Interests Y
Discretionary Managers investing in Private Equity Partnerships Y
Co-Investments Y
Separate Accounts Y
Investment Type
Buyouts Y
Venture Capital Y
Special Situations (secondary interests, distressed debt or equity, mezzanine, co-investments, energy, etc.)
Y
Buyout Net Expected Return 10-15%, Moderate Risk
Capital is typically invested in more established companies, those further along the business life cycle having relatively predictable cash flows and the ability to raise capital along the entire capital structure, including secured and unsecured debt. Buyouts are targeted to represent 75% of the Private Equity portfolio. Venture Capital Net Expected Return: 15-25%, High Risk Venture capital equity is targeted at companies in the earliest phases of a business life cycle. Companies may be classified as seed, early, middle and late stage and are characterized by their inability to access public equity and other forms of capital such as secured and unsecured debt. These companies have uncertain revenues and a need for cash to build their businesses and are subject to high failure rates. Venture capital is targeted to represent 0% of the portfolio. Special Situations Net Expected Return: 10-20%, Moderate Risk Many private equity opportunities have characteristics of buyout or venture capital but have enough differences as to require separate classification. These investments include energy, distressed debt, mezzanine, opportunity and secondary funds. Special situations is targeted to represent 25% of the portfolio. Co-Investments Net Expected Return: 15-20%, Moderate Risk Co-Investments are direct investments in a single asset of a multi-asset fund, made alongside the Fund’s investment in the asset. Typically, co-investments are offered on more attractive economic terms and shorter time frames than those of the Fund. Co-Investments are targeted to represent up to 10% of the portfolio.
VII. RISK MANAGEMENT
The primary risk management tool in private equity is industry diversification as well as extensive due diligence of prospective investments. Monitoring is managed through a combination of quantitative and qualitative constraints. The following sections identify the most significant risks with private equity investments and the method of control. Liquidity Risk Private equity investments are illiquid and typically have expected holding periods of 10-12 years. Investments are typically held until maturity and selling prior to maturity typically results in a discount to fair market value. Liquidity risk is managed by minimizing the possibility of forced sales that may arise from exceeding maximum exposure limits or lowering asset allocation exposure limits. Geographic Risk Geographic risk is controlled through a long-term international target exposure of 25% by market value.
IMPLEMENTATION GUIDELINES – Global Private Equity
SERS ANNUAL INVESTMENT PLAN FY2023 | 35
Vintage Risk Vintage reflects the year of first capital draw and vintage risk refers to the variability of private equity commitments over time. The investment-pacing model controls the short and long-term private equity commitment amounts and attempts to minimize vintage risk while achieving targeted exposure. Commitments will be dependent on the availability of investments that meet SERS’ investment criteria and will not be driven by the target investment pace in any given year. Manager Risk Manager risk consists of two elements, managing the exposure within a partnership and controlling the number of general partners in our private equity portfolio. Partnership exposure is controlled by limiting the commitment size within a partnership and the maximum commitment to a partnership will be 25% of a fund’s size. The 25% limit does not apply to funds committed to a discretionary manager or a separate account. The maximum market value exposure to a single manager is targeted to be less than 20% of the portfolio. The optimum number of general partners in the portfolio varies with time. Firm Risk Firm risk is the exposure to a private equity general partner and is controlled by limiting the maximum commitment to funds operated by a general partner and its affiliates. Currency Risk The Private Equity program accepts the currency risks consistent with the geographic constraints. Private equity partnerships generally do not hedge currency risk and the private equity program will not implement currency hedges. Industry Risk Typically, private equity partnerships are permitted to invest in a wide variety of industries. Industry risk is controlled primarily through appropriate diversification across classes and subclasses. Leverage Risk General partners invest capital from private equity partnerships throughout the capital structure of firms. The capital markets control the maximum leverage available to the general partners and limited partners control leverage exposure through partnership selection and portfolio construction.
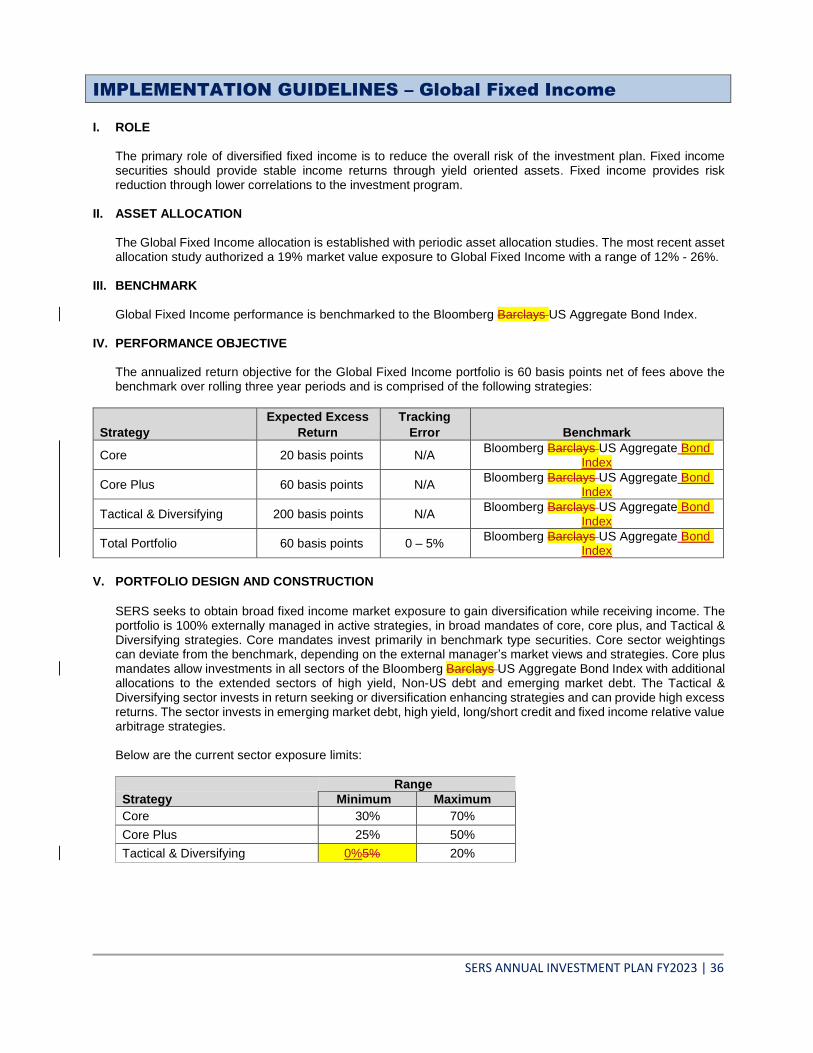
IMPLEMENTATION GUIDELINES – Global Fixed Income
SERS ANNUAL INVESTMENT PLAN FY2023 | 36
I. ROLE The primary role of diversified fixed income is to reduce the overall risk of the investment plan. Fixed income
securities should provide stable income returns through yield oriented assets. Fixed income provides risk reduction through lower correlations to the investment program.
II. ASSET ALLOCATION The Global Fixed Income allocation is established with periodic asset allocation studies. The most recent asset
allocation study authorized a 19% market value exposure to Global Fixed Income with a range of 12% - 26%. III. BENCHMARK Global Fixed Income performance is benchmarked to the Bloomberg Barclays US Aggregate Bond Index. IV. PERFORMANCE OBJECTIVE The annualized return objective for the Global Fixed Income portfolio is 60 basis points net of fees above the
benchmark over rolling three year periods and is comprised of the following strategies:
Strategy
Expected Excess
Return
Tracking
Error Benchmark
Core 20 basis points N/A Bloomberg Barclays US Aggregate Bond
Index
Core Plus 60 basis points N/A Bloomberg Barclays US Aggregate Bond
Index
Tactical & Diversifying 200 basis points N/A Bloomberg Barclays US Aggregate Bond
Index
Total Portfolio 60 basis points 0 – 5% Bloomberg Barclays US Aggregate Bond
Index
V. PORTFOLIO DESIGN AND CONSTRUCTION
SERS seeks to obtain broad fixed income market exposure to gain diversification while receiving income. The portfolio is 100% externally managed in active strategies, in broad mandates of core, core plus, and Tactical & Diversifying strategies. Core mandates invest primarily in benchmark type securities. Core sector weightings can deviate from the benchmark, depending on the external manager’s market views and strategies. Core plus mandates allow investments in all sectors of the Bloomberg Barclays US Aggregate Bond Index with additional allocations to the extended sectors of high yield, Non-US debt and emerging market debt. The Tactical & Diversifying sector invests in return seeking or diversification enhancing strategies and can provide high excess returns. The sector invests in emerging market debt, high yield, long/short credit and fixed income relative value arbitrage strategies. Below are the current sector exposure limits:
Range
Strategy Minimum Maximum
Core 30% 70%
Core Plus 25% 50%
Tactical & Diversifying 0%5% 20%
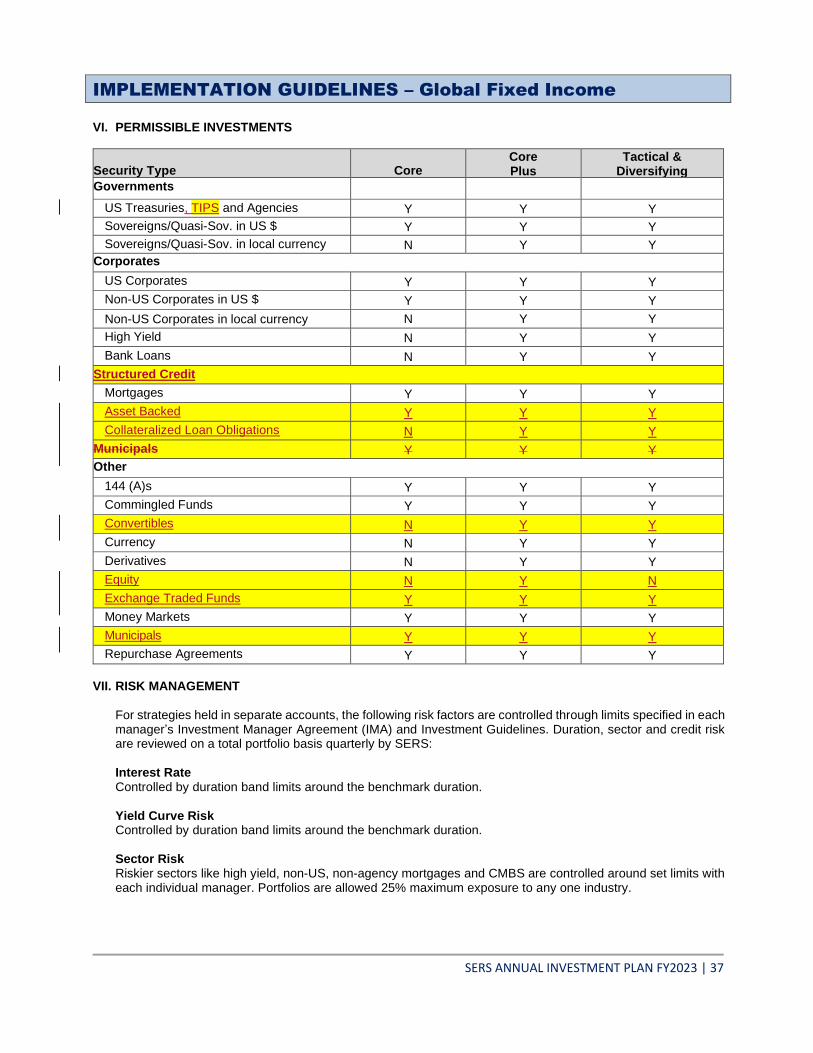
IMPLEMENTATION GUIDELINES – Global Fixed Income
SERS ANNUAL INVESTMENT PLAN FY2023 | 37
VI. PERMISSIBLE INVESTMENTS
Security Type Core Core Plus
Tactical & Diversifying
Governments
US Treasuries, TIPS and Agencies Y Y Y
Sovereigns/Quasi-Sov. in US $ Y Y Y
Sovereigns/Quasi-Sov. in local currency N Y Y
Corporates
US Corporates Y Y Y
Non-US Corporates in US $ Y Y Y
Non-US Corporates in local currency N Y Y
High Yield N Y Y
Bank Loans N Y Y
Structured Credit
Mortgages Y Y Y
Asset Backed Y Y Y
Collateralized Loan Obligations N Y Y
Municipals Y Y Y
Other
144 (A)s Y Y Y
Commingled Funds Y Y Y
Convertibles N Y Y
Currency N Y Y
Derivatives N Y Y
Equity N Y N
Exchange Traded Funds Y Y Y
Money Markets Y Y Y
Municipals Y Y Y
Repurchase Agreements Y Y Y
VII. RISK MANAGEMENT
For strategies held in separate accounts, the following risk factors are controlled through limits specified in each manager’s Investment Manager Agreement (IMA) and Investment Guidelines. Duration, sector and credit risk are reviewed on a total portfolio basis quarterly by SERS: Interest Rate Controlled by duration band limits around the benchmark duration. Yield Curve Risk Controlled by duration band limits around the benchmark duration. Sector Risk Riskier sectors like high yield, non-US, non-agency mortgages and CMBS are controlled around set limits with each individual manager. Portfolios are allowed 25% maximum exposure to any one industry.
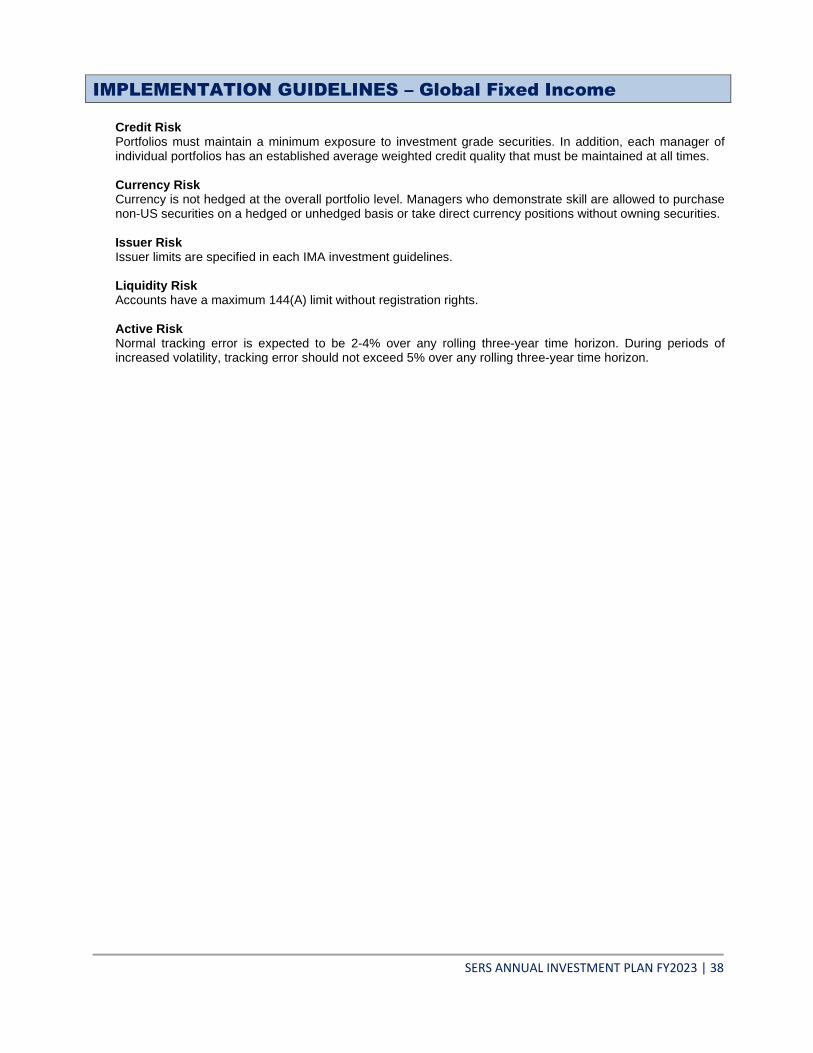
IMPLEMENTATION GUIDELINES – Global Fixed Income
SERS ANNUAL INVESTMENT PLAN FY2023 | 38
Credit Risk Portfolios must maintain a minimum exposure to investment grade securities. In addition, each manager of individual portfolios has an established average weighted credit quality that must be maintained at all times. Currency Risk Currency is not hedged at the overall portfolio level. Managers who demonstrate skill are allowed to purchase non-US securities on a hedged or unhedged basis or take direct currency positions without owning securities. Issuer Risk Issuer limits are specified in each IMA investment guidelines. Liquidity Risk Accounts have a maximum 144(A) limit without registration rights. Active Risk Normal tracking error is expected to be 2-4% over any rolling three-year time horizon. During periods of increased volatility, tracking error should not exceed 5% over any rolling three-year time horizon.
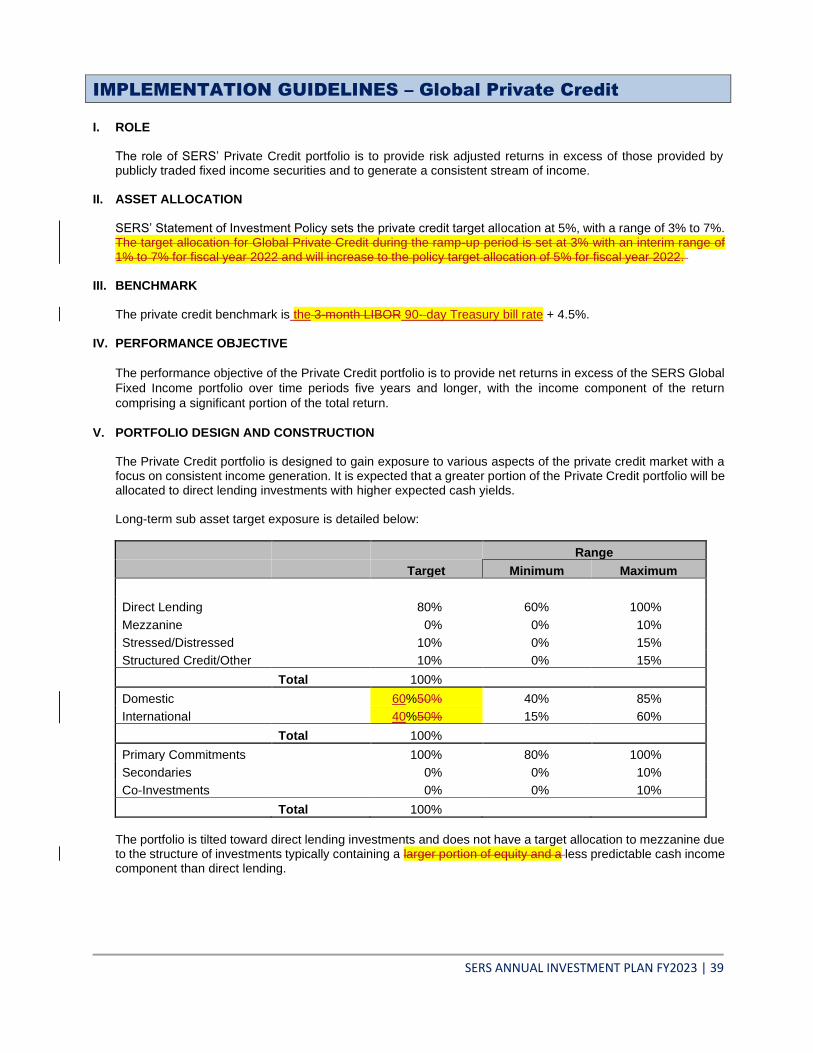
IMPLEMENTATION GUIDELINES – Global Private Credit
SERS ANNUAL INVESTMENT PLAN FY2023 | 39
I. ROLE The role of SERS’ Private Credit portfolio is to provide risk adjusted returns in excess of those provided by publicly traded fixed income securities and to generate a consistent stream of income.
II. ASSET ALLOCATION SERS’ Statement of Investment Policy sets the private credit target allocation at 5%, with a range of 3% to 7%. The target allocation for Global Private Credit during the ramp-up period is set at 3% with an interim range of 1% to 7% for fiscal year 2022 and will increase to the policy target allocation of 5% for fiscal year 2022.
III. BENCHMARK The private credit benchmark is the 3-month LIBOR 90- day Treasury bill rate + 4.5%.
IV. PERFORMANCE OBJECTIVE
The performance objective of the Private Credit portfolio is to provide net returns in excess of the SERS Global
Fixed Income portfolio over time periods five years and longer, with the income component of the return
comprising a significant portion of the total return.
V. PORTFOLIO DESIGN AND CONSTRUCTION
The Private Credit portfolio is designed to gain exposure to various aspects of the private credit market with a focus on consistent income generation. It is expected that a greater portion of the Private Credit portfolio will be allocated to direct lending investments with higher expected cash yields. Long-term sub asset target exposure is detailed below:
Range
Target Minimum Maximum
Direct Lending 80% 60% 100%
Mezzanine 0% 0% 10%
Stressed/Distressed 10% 0% 15%
Structured Credit/Other 10% 0% 15%
Total 100%
Domestic 60%50% 40% 85%
International 40%50% 15% 60%
Total 100%
Primary Commitments 100% 80% 100%
Secondaries 0% 0% 10%
Co-Investments 0% 0% 10%
Total 100%
The portfolio is tilted toward direct lending investments and does not have a target allocation to mezzanine due to the structure of investments typically containing a larger portion of equity and a less predictable cash income component than direct lending.
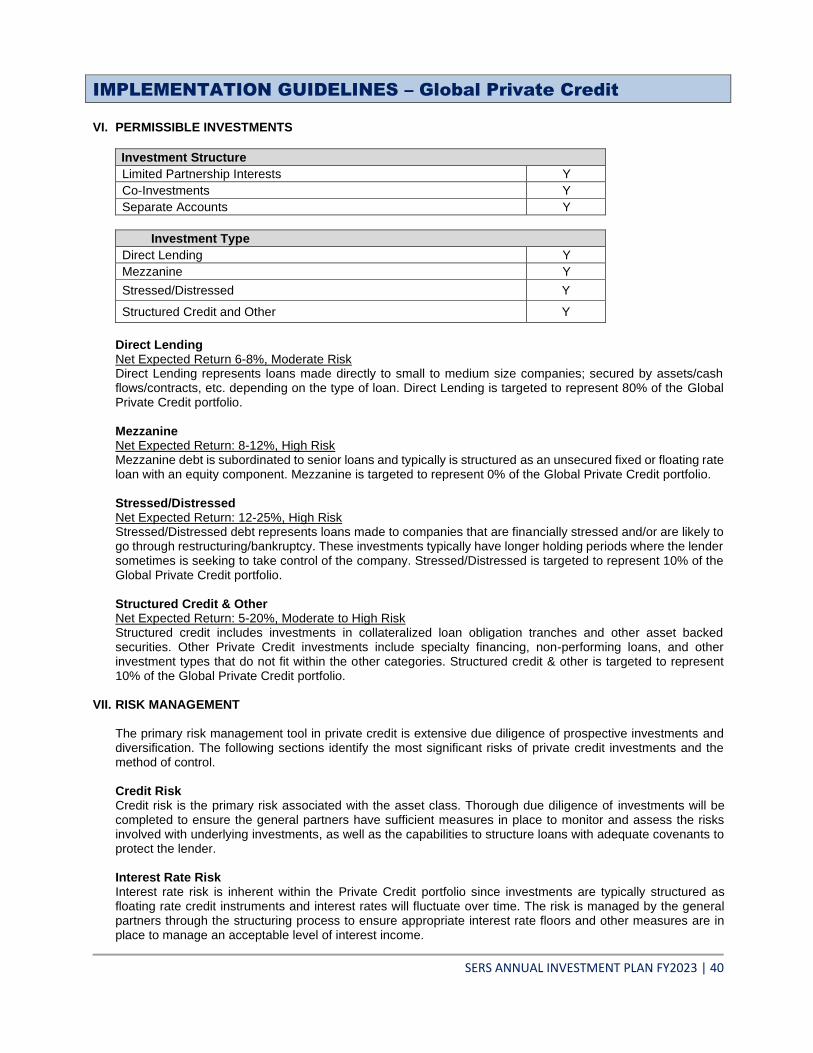
IMPLEMENTATION GUIDELINES – Global Private Credit
SERS ANNUAL INVESTMENT PLAN FY2023 | 40
VI. PERMISSIBLE INVESTMENTS
Investment Structure
Limited Partnership Interests Y
Co-Investments Y
Separate Accounts Y
Investment Type
Direct Lending Y
Mezzanine Y
Stressed/Distressed Y
Structured Credit and Other Y
Direct Lending Net Expected Return 6-8%, Moderate Risk
Direct Lending represents loans made directly to small to medium size companies; secured by assets/cash flows/contracts, etc. depending on the type of loan. Direct Lending is targeted to represent 80% of the Global Private Credit portfolio. Mezzanine Net Expected Return: 8-12%, High Risk Mezzanine debt is subordinated to senior loans and typically is structured as an unsecured fixed or floating rate loan with an equity component. Mezzanine is targeted to represent 0% of the Global Private Credit portfolio. Stressed/Distressed Net Expected Return: 12-25%, High Risk Stressed/Distressed debt represents loans made to companies that are financially stressed and/or are likely to go through restructuring/bankruptcy. These investments typically have longer holding periods where the lender sometimes is seeking to take control of the company. Stressed/Distressed is targeted to represent 10% of the Global Private Credit portfolio. Structured Credit & Other Net Expected Return: 5-20%, Moderate to High Risk Structured credit includes investments in collateralized loan obligation tranches and other asset backed securities. Other Private Credit investments include specialty financing, non-performing loans, and other investment types that do not fit within the other categories. Structured credit & other is targeted to represent 10% of the Global Private Credit portfolio.
VII. RISK MANAGEMENT The primary risk management tool in private credit is extensive due diligence of prospective investments and diversification. The following sections identify the most significant risks of private credit investments and the method of control. Credit Risk Credit risk is the primary risk associated with the asset class. Thorough due diligence of investments will be completed to ensure the general partners have sufficient measures in place to monitor and assess the risks involved with underlying investments, as well as the capabilities to structure loans with adequate covenants to protect the lender. Interest Rate Risk Interest rate risk is inherent within the Private Credit portfolio since investments are typically structured as floating rate credit instruments and interest rates will fluctuate over time. The risk is managed by the general partners through the structuring process to ensure appropriate interest rate floors and other measures are in place to manage an acceptable level of interest income.
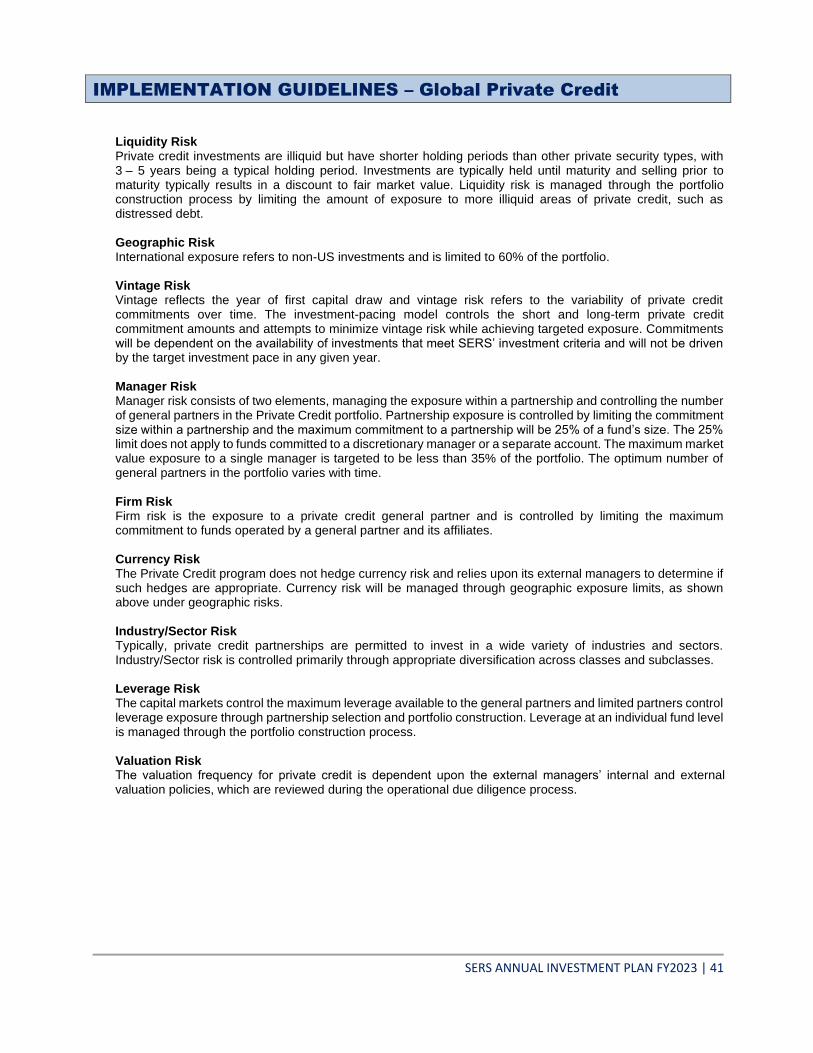
IMPLEMENTATION GUIDELINES – Global Private Credit
SERS ANNUAL INVESTMENT PLAN FY2023 | 41
Liquidity Risk Private credit investments are illiquid but have shorter holding periods than other private security types, with 3 – 5 years being a typical holding period. Investments are typically held until maturity and selling prior to maturity typically results in a discount to fair market value. Liquidity risk is managed through the portfolio construction process by limiting the amount of exposure to more illiquid areas of private credit, such as distressed debt. Geographic Risk International exposure refers to non-US investments and is limited to 60% of the portfolio. Vintage Risk Vintage reflects the year of first capital draw and vintage risk refers to the variability of private credit commitments over time. The investment-pacing model controls the short and long-term private credit commitment amounts and attempts to minimize vintage risk while achieving targeted exposure. Commitments will be dependent on the availability of investments that meet SERS’ investment criteria and will not be driven by the target investment pace in any given year. Manager Risk Manager risk consists of two elements, managing the exposure within a partnership and controlling the number of general partners in the Private Credit portfolio. Partnership exposure is controlled by limiting the commitment size within a partnership and the maximum commitment to a partnership will be 25% of a fund’s size. The 25% limit does not apply to funds committed to a discretionary manager or a separate account. The maximum market value exposure to a single manager is targeted to be less than 35% of the portfolio. The optimum number of general partners in the portfolio varies with time. Firm Risk Firm risk is the exposure to a private credit general partner and is controlled by limiting the maximum commitment to funds operated by a general partner and its affiliates. Currency Risk The Private Credit program does not hedge currency risk and relies upon its external managers to determine if such hedges are appropriate. Currency risk will be managed through geographic exposure limits, as shown above under geographic risks. Industry/Sector Risk Typically, private credit partnerships are permitted to invest in a wide variety of industries and sectors. Industry/Sector risk is controlled primarily through appropriate diversification across classes and subclasses. Leverage Risk The capital markets control the maximum leverage available to the general partners and limited partners control leverage exposure through partnership selection and portfolio construction. Leverage at an individual fund level is managed through the portfolio construction process. Valuation Risk The valuation frequency for private credit is dependent upon the external managers’ internal and external valuation policies, which are reviewed during the operational due diligence process.
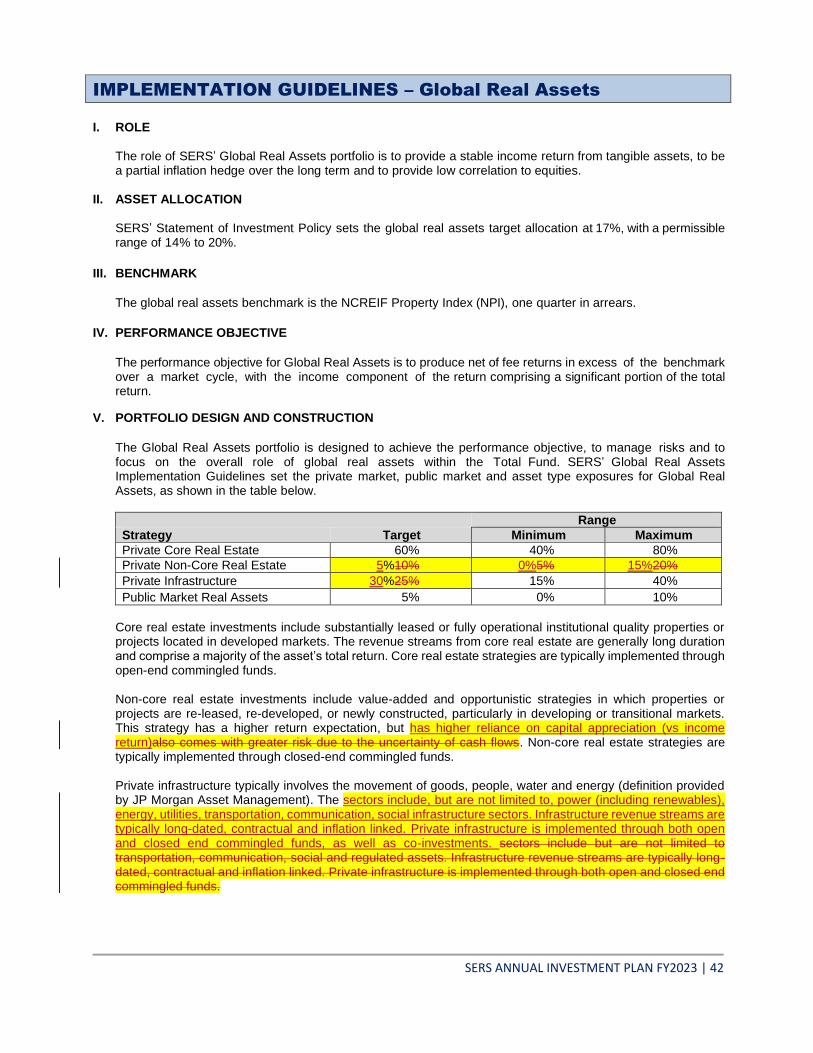
IMPLEMENTATION GUIDELINES – Global Real Assets
SERS ANNUAL INVESTMENT PLAN FY2023 | 42
I. ROLE
The role of SERS’ Global Real Assets portfolio is to provide a stable income return from tangible assets, to be a partial inflation hedge over the long term and to provide low correlation to equities.
II. ASSET ALLOCATION
SERS’ Statement of Investment Policy sets the global real assets target allocation at 17%, with a permissible range of 14% to 20%.
III. BENCHMARK
The global real assets benchmark is the NCREIF Property Index (NPI), one quarter in arrears.
IV. PERFORMANCE OBJECTIVE
The performance objective for Global Real Assets is to produce net of fee returns in excess of the benchmark over a market cycle, with the income component of the return comprising a significant portion of the total return.
V. PORTFOLIO DESIGN AND CONSTRUCTION
The Global Real Assets portfolio is designed to achieve the performance objective, to manage risks and to focus on the overall role of global real assets within the Total Fund. SERS’ Global Real Assets Implementation Guidelines set the private market, public market and asset type exposures for Global Real Assets, as shown in the table below.
Range
Strategy Target Minimum Maximum
Private Core Real Estate 60% 40% 80%
Private Non-Core Real Estate 5%10% 0%5% 15%20%
Private Infrastructure 30%25% 15% 40%
Public Market Real Assets 5% 0% 10%
Core real estate investments include substantially leased or fully operational institutional quality properties or projects located in developed markets. The revenue streams from core real estate are generally long duration and comprise a majority of the asset’s total return. Core real estate strategies are typically implemented through open-end commingled funds. Non-core real estate investments include value-added and opportunistic strategies in which properties or projects are re-leased, re-developed, or newly constructed, particularly in developing or transitional markets. This strategy has a higher return expectation, but has higher reliance on capital appreciation (vs income return)also comes with greater risk due to the uncertainty of cash flows. Non-core real estate strategies are typically implemented through closed-end commingled funds. Private infrastructure typically involves the movement of goods, people, water and energy (definition provided by JP Morgan Asset Management). The sectors include, but are not limited to, power (including renewables), energy, utilities, transportation, communication, social infrastructure sectors. Infrastructure revenue streams are typically long-dated, contractual and inflation linked. Private infrastructure is implemented through both open and closed end commingled funds, as well as co-investments. sectors include but are not limited to transportation, communication, social and regulated assets. Infrastructure revenue streams are typically long-dated, contractual and inflation linked. Private infrastructure is implemented through both open and closed end commingled funds.
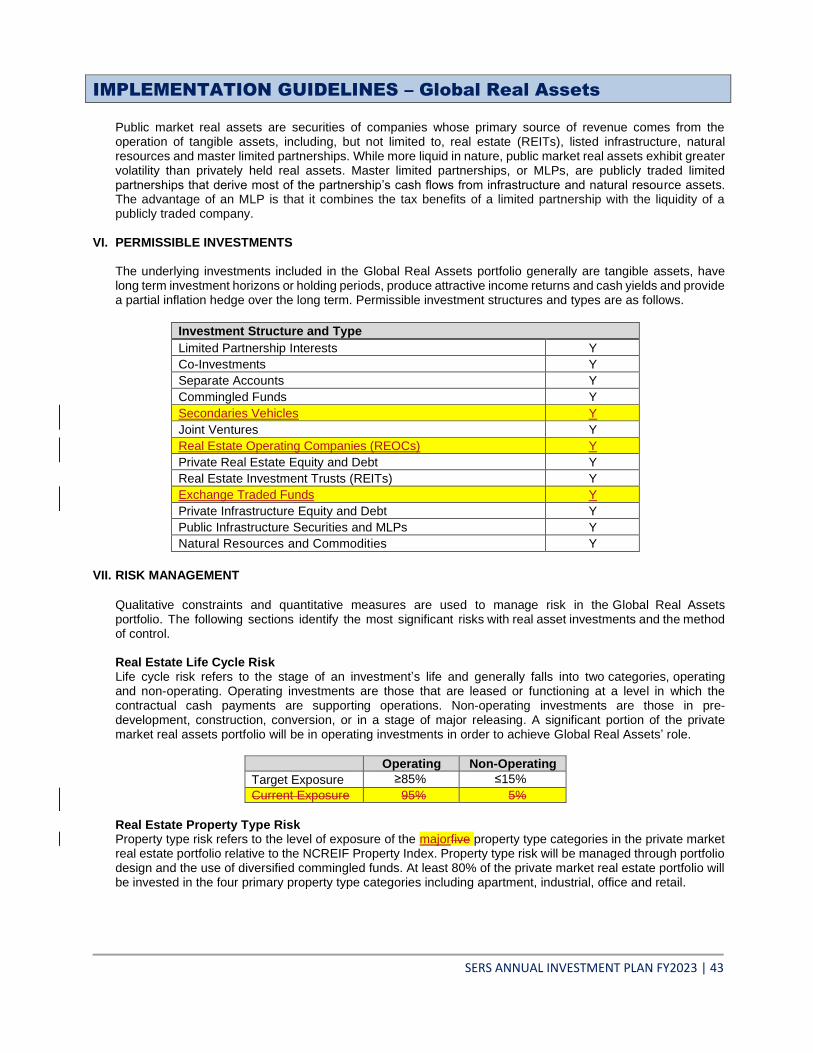
IMPLEMENTATION GUIDELINES – Global Real Assets
SERS ANNUAL INVESTMENT PLAN FY2023 | 43
Public market real assets are securities of companies whose primary source of revenue comes from the operation of tangible assets, including, but not limited to, real estate (REITs), listed infrastructure, natural resources and master limited partnerships. While more liquid in nature, public market real assets exhibit greater volatility than privately held real assets. Master limited partnerships, or MLPs, are publicly traded limited partnerships that derive most of the partnership’s cash flows from infrastructure and natural resource assets. The advantage of an MLP is that it combines the tax benefits of a limited partnership with the liquidity of a publicly traded company.
VI. PERMISSIBLE INVESTMENTS
The underlying investments included in the Global Real Assets portfolio generally are tangible assets, have long term investment horizons or holding periods, produce attractive income returns and cash yields and provide a partial inflation hedge over the long term. Permissible investment structures and types are as follows.
Investment Structure and Type
Limited Partnership Interests Y
Co-Investments Y
Separate Accounts Y
Commingled Funds Y
Secondaries Vehicles Y
Joint Ventures Y
Real Estate Operating Companies (REOCs) Y
Private Real Estate Equity and Debt Y
Real Estate Investment Trusts (REITs) Y
Exchange Traded Funds Y
Private Infrastructure Equity and Debt Y
Public Infrastructure Securities and MLPs Y
Natural Resources and Commodities Y
VII. RISK MANAGEMENT
Qualitative constraints and quantitative measures are used to manage risk in the Global Real Assets portfolio. The following sections identify the most significant risks with real asset investments and the method of control. Real Estate Life Cycle Risk Life cycle risk refers to the stage of an investment’s life and generally falls into two categories, operating and non-operating. Operating investments are those that are leased or functioning at a level in which the contractual cash payments are supporting operations. Non-operating investments are those in pre-development, construction, conversion, or in a stage of major releasing. A significant portion of the private market real assets portfolio will be in operating investments in order to achieve Global Real Assets’ role.
Operating Non-Operating
Target Exposure ≥85% ≤15%
Current Exposure 95% 5%
Real Estate Property Type Risk Property type risk refers to the level of exposure of the majorfive property type categories in the private market real estate portfolio relative to the NCREIF Property Index. Property type risk will be managed through portfolio design and the use of diversified commingled funds. At least 80% of the private market real estate portfolio will be invested in the four primary property type categories including apartment, industrial, office and retail.
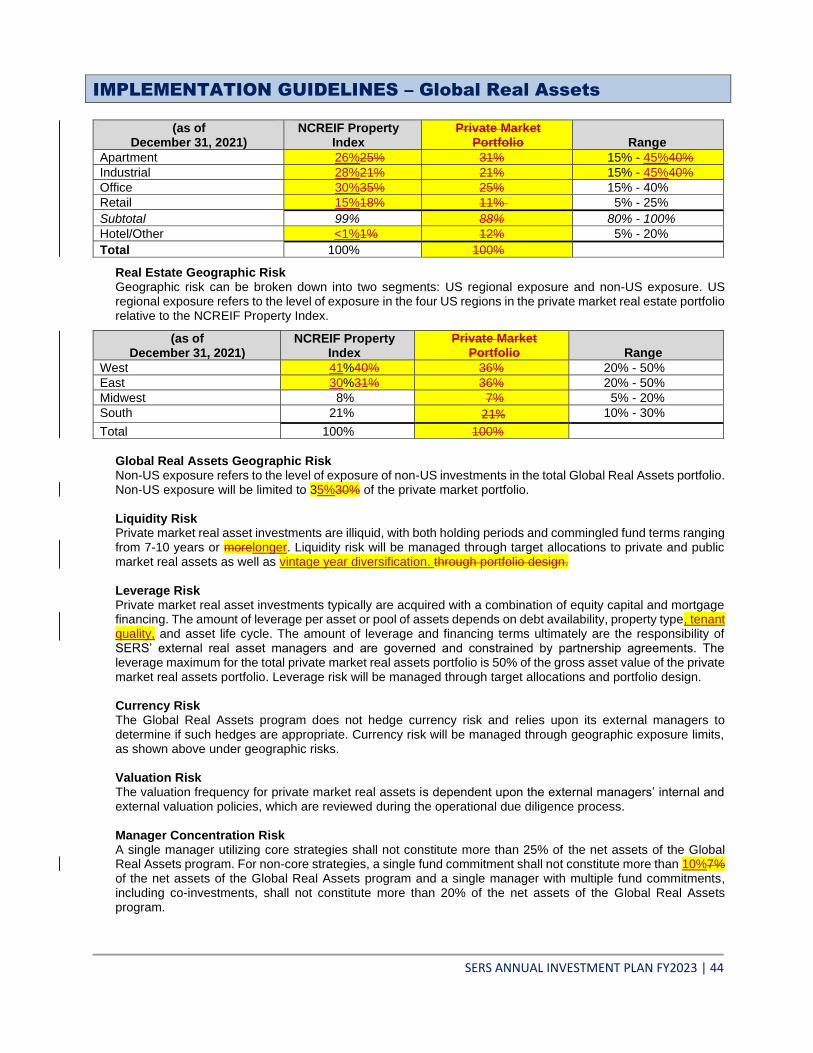
IMPLEMENTATION GUIDELINES – Global Real Assets
SERS ANNUAL INVESTMENT PLAN FY2023 | 44
(as of December 31, 2021)
NCREIF Property Index
Private Market Portfolio Range
Apartment 26%25% 31% 15% - 45%40%
Industrial 28%21% 21% 15% - 45%40%
Office 30%35% 25% 15% - 40%
Retail 15%18% 11% 5% - 25%
Subtotal 99% 88% 80% - 100%
Hotel/Other <1%1% 12% 5% - 20%
Total 100% 100%
Real Estate Geographic Risk Geographic risk can be broken down into two segments: US regional exposure and non-US exposure. US regional exposure refers to the level of exposure in the four US regions in the private market real estate portfolio relative to the NCREIF Property Index.
(as of December 31, 2021)
NCREIF Property
Index Private Market
Portfolio Range
West 41%40% 36% 20% - 50%
East 30%31% 36% 20% - 50%
Midwest 8% 7% 5% - 20%
South 21% 21% 10% - 30%
Total 100% 100%
Global Real Assets Geographic Risk Non-US exposure refers to the level of exposure of non-US investments in the total Global Real Assets portfolio. Non-US exposure will be limited to 35%30% of the private market portfolio. Liquidity Risk Private market real asset investments are illiquid, with both holding periods and commingled fund terms ranging from 7-10 years or morelonger. Liquidity risk will be managed through target allocations to private and public market real assets as well as vintage year diversification. through portfolio design. Leverage Risk Private market real asset investments typically are acquired with a combination of equity capital and mortgage financing. The amount of leverage per asset or pool of assets depends on debt availability, property type, tenant quality, and asset life cycle. The amount of leverage and financing terms ultimately are the responsibility of SERS’ external real asset managers and are governed and constrained by partnership agreements. The leverage maximum for the total private market real assets portfolio is 50% of the gross asset value of the private market real assets portfolio. Leverage risk will be managed through target allocations and portfolio design. Currency Risk The Global Real Assets program does not hedge currency risk and relies upon its external managers to determine if such hedges are appropriate. Currency risk will be managed through geographic exposure limits, as shown above under geographic risks. Valuation Risk The valuation frequency for private market real assets is dependent upon the external managers’ internal and external valuation policies, which are reviewed during the operational due diligence process. Manager Concentration Risk A single manager utilizing core strategies shall not constitute more than 25% of the net assets of the Global Real Assets program. For non-core strategies, a single fund commitment shall not constitute more than 10%7% of the net assets of the Global Real Assets program and a single manager with multiple fund commitments, including co-investments, shall not constitute more than 20% of the net assets of the Global Real Assets program.
IMPLEMENTATION GUIDELINES – Cash Equivalents & Securities Lending
SERS ANNUAL INVESTMENT PLAN FY2023 | 45
I. ROLE
Short-Term Cash should provide liquidity for funding investment capital calls and operational expenses. Cash should be invested in conservative, low risk securities/funds to preserve capital for future expenditures and investments.
II. ASSET ALLOCATION
The Cash allocation is established with periodic asset allocation studies. The most recent asset allocation study authorized a 2% exposure to cash with a range of 0% - 5%.
III. BENCHMARK
The Short-Term cash benchmark is the Citigroup 30-day Treasury Bill Index.
IV. PERFORMANCE OBJECTIVE
The annualized return objective for the Short-Term portfolio is five basis points net of fees over the benchmark.
V. PORTFOLIO DESIGN AND CONSTRUCTION
The Cash portfolio is designed with preservation of capital in mind. A cash balance of one to three months of expenditures is usually maintained. A higher allocation to cash may also be used to preserve capital in volatile markets. The average weighted maturity of the portfolio will not exceed 20 days.
Risk is constantly assessed before investment purchases are made in the portfolio. Only top tier commercial paper is purchased. Money market holdings are also reviewed on a regular basis along with choosing a top tier money market provider with a deep credit analyst team and whose short-term investments are important to the organization.
The Securities Lending program is designed to be a low risk, intrinsic value focused strategy that can generate additional income for the system. The program is implemented through a third-party lending agent and collateral reinvestment manager. Separately, additional securities lending income is earned by the commingled passive global equity accounts.
VI. PERMISSIBLE INVESTMENTS
Security Type
US Treasury Bills Y
Commercial Paper rated A-1/P-1 or higher Y
Money Market Funds rated at least A-1/P-1 Y
Unrated Market Funds comparable to an A-1/P-1 equivalent fund Y
VII. RISK MANAGEMENT
Liquidity Risk The weighted average maturity shall not exceed 20 days. All money market funds must provide daily liquidity.
Credit Risk A commercial paper issuer must be on the approved credit list or approved by the Chief Investment Officer before purchasing. Market and issuer news are reviewed daily by the Senior Investment Officer – Global Fixed Income. Money market funds must regularly send a holdings report to SERS, where it is reviewed on a regular basis.
Issuer Risk Single issuer commercial paper investments are limited to $20 million. Related entity commercial paper investments are limited to the lower of 30% of the short-term account or $40 million. Overnight commercial paper issuer maturities are limited to $50 million.
IMPLEMENTATION GUIDELINES – Cash Equivalents & Securities Lending
SERS ANNUAL INVESTMENT PLAN FY2023 | 46
Securities Lending Risk All loans will be collateralized with cash at 102% for US securities and 105% for non-US securities and marked-to-market daily. Collateral will be reinvested in government money market funds and/or repurchase agreements. Loans on fixed income securities will be subject to a ten-basis point minimum spread requirement at loan initiation. Loans to approved borrowers will be limited to 25% of the average monthly market value on loan for the prior calendar year.
IMPLEMENTATION GUIDELINES – Opportunistic & Tactical
SERS ANNUAL INVESTMENT PLAN FY2023 | 47
I. ROLE The role of SERS’ Opportunistic portfolio is to earn a return above the Bloomberg Barclays US Aggregate Bond Index + 2% by investing in assets and strategies that do not fit within the existing asset classes. The investments are defined as tactical or non-traditional investment opportunities.
II. ASSET ALLOCATION
SERS’ Statement of Investment Policy sets the opportunistic target allocation at 0%, with a range of 0% to 5%.
III. BENCHMARK The Opportunistic benchmark is the Bloomberg Barclays US Aggregate Bond Index + 2%.
IV. PERFORMANCE OBJECTIVE
The performance objective of the Opportunistic portfolio is to earn a net of fee return in excess of the Bloomberg
Barclays US Aggregate Bond Index + 2% , with a meaningful component of the total return coming from current
income.
V. PORTFOLIO DESIGN AND CONSTRUCTION The Opportunistic portfolio may consist of a wide variety of investment types, structures and strategies targeting cash yield as well as price appreciation. Investment strategies include separate accounts, commingled funds, ETFs, co-investments and derivatives.
VI. PERMISSIBLE INVESTMENTS Permissible investments include, but are not limited to, common stock, preferred stock, debt securities, currencies, commodities, etc.
VII. RISK MANAGEMENT Leverage Risk Leverage will be prudent for the given strategy and consistent with the fund’s offering memorandum.
Liquidity Risk Liquidity will be monitored regularly to ensure the portfolio can be traded or rebalanced within a reasonable timeframe. Liquidity risk will be managed through target allocations to private and public market assets as well as through portfolio design.
Currency Risk The Opportunistic portfolio does not directly hedge foreign currency risk and relies upon its external managers to determine if such hedges are appropriate.
IMPLEMENTATION GUIDELINES – Overlay Program
SERS ANNUAL INVESTMENT PLAN FY2023 | 48
I. ROLE SERS invests in Overlay strategies that trade derivatives of the Total Fund’s underlying asset exposures and currency exchange rates to enhance the Total Fund portfolio‘s efficiency. The Overlay program includes i) tactical asset allocation rebalance, and ii) active currency strategies. The tactical asset allocation strategy aims to add value to the Total Fund performance through long and short positions based on short-term relative attractiveness of assets. The active currency strategies aim to add value to the Total Fund on a risk-adjusted basis by employing long and short positions in various currency pairs based on relative attractiveness of the currencies. The strategies are expected to have low correlation to the major asset classes such as US equity and fixed income.
II. ASSET ALLOCATION The target allocation of the tactical asset allocation and Currency program is 0% since long and short positions net out. The tactical asset allocation program‘s notional exposure limit is +/-7% of the Total Fund to each of the following assets: US fixed income, US equity and Non-US equity. Since the tactical asset allocation positions are employed for short periods, the notional exposures are not subject to the policy asset allocation ranges set forth in the Statement of Investment Policy; however, the active risk contribution by the overlay program as a whole is subjected to the overall guideline on active risk for the management of the Total Fund specified in the Risk Management Policy. The notional value of the active currency program is capped at 50% of the Non-US Equity portfolio’s value.
III. BENCHMARK The benchmark for the tactical asset allocation and Currency Overlay program is 0% since net exposure is 0%.
IV. PERFORMANCE OBJECTIVE The Overlay program is expected to add 5 to 10 bps of excess return to the Total Fund‘s performance on a three to five year horizon.
V. PORTFOLIO DESIGN AND CONSTRUCTION The mandates are unfunded. The Overlay strategies buy (long) or sell (short) futures or forwards contacts to get exposures to desired markets in order to exploit shifts in relative valuation of assets and currencies. The tactical rebalancing strategy’s net exposures, sum of long and short positions, are valued at zero on the initiating position time. Active currency strategies can go either net long or net short US dollar. Both tactical rebalancing and active currency aggregate portfolios are constructed to have no dependency on any single risk factor.
VI. PERMISSIBLE INVESTMENTS Tactical asset allocation: equity, fixed income, commodity and precious metals futures and options on futures. Currency Overlay: currency forwards, currency futures, gold forwards, gold futures, and limited currency options.
IMPLEMENTATION GUIDELINES – Overlay Program
SERS ANNUAL INVESTMENT PLAN FY2023 | 49
VII. RISK MANAGEMENT Counter-party risk management:
• Futures and exchange traded options are traded at exchanges thus having default risk only to the clearinghouse while having no credit risk to trade counterparties.
• Forward contacts and over-the-counter options entail default risk of the counterparties. Counterparty risk of these contracts is managed through ISDA (International Swaps and Derivatives Association) and EMIR (European Market Infrastructure Regulation) umbrella agreements with managers.
Volatility management:
• The tactical asset allocation program’s tracking error range is 5 to 15 bps.
• All active currency strategies have targeted tracking error equal to or less than 8%; the aggregate active currency program’s tracking error is expected to be in the range of 5 to 8%.
Liquidity:
• The use of derivatives requires initial margin as well as daily variation margin for futures. Liquidity risk will be managed by ensuring that an adequate reserve of cash is available to meet margin requirements at all times.

SERS ANNUAL INVESTMENT PLAN FY2023 | 50
Sources
SOURCES
SERS ANNUAL INVESTMENT PLAN FY2023 | 51
Economic Outlook: Blue Chip Economic Indicators, April 2022 Eurostat EuroIndicators. “Flash Estimate - March 2022”, April 1, 2022 International Monetary Fund World Economic Outlook, April 2022 World Bank Blogs. “The Return of Global Inflation”. Carmen Reinhart and Clemens Graf Von Luckner, February 14, 2022 University Of Michigan. Surveys of Consumers, < http://www.sca.isr.umich.edu/> US Bureau of Labor Statistics. < https://www.bls.gov/news.release/empsit.toc.htm> US Department of the Treasury < https://home.treasury.gov/resource-center/data-chart-center/interest-rates> Global Equities: Bloomberg. <http://www.bloomberg.com/>.
FTSE Russell US Indices. <https://www.ftserussell.com/products/indices/russell-us>. Goldman. “Goldman Market Monitor”. April 1, 2022. Global Fixed Income: Goldman. “Global Fixed Income Monthly”. April 2022. JP Morgan. “Quarterly Performance Report”. March 31, 2022 Western Asset Management Company. “2Q22 Market & Strategy Update” Webcast, Ken Leech, April 6, 2022. Global Private Credit Pitchbook. <http://www.pitchbook.com>.
Preqin. <http://www.preqin.com/>. S&P Dow Jones Indices. <https://us.spindices.com/>. J.P. Morgan Asset Management. “Guide to Alternatives”. December 2021. New York Fed. <http://www.newyorkfed.org/>. Federal Reserve. <http://www.federalreserve.gov/>.
Global Private Equity: Bain and Company. “Global Private Equity Report 2022.’’ March 2022. National Venture Capital Association. <http://www.nvca.org/>. Pitchbook. <http://www.pitchbook.com>.
Preqin. <http://www.preqin.com/>.
Preqin. “2022 Preqin Global Private Equity & Venture Capital Report.” Global Real Assets: CBRE Research. <https://www.cbre.us/research-and-reports> Clarion Research <https://www.clarionpartners.com/insights> NCREIF Benchmark. <https://www.ncreif.org> PREA Consensus Survey March 31, 2022 Opportunistic and Tactical:
Preqin. <http://www.preqin.com/>. US Energy Information Administration. <https://www.eia.gov/>. Cash Equivalents:
Federated Hermes. “Balancing Expectations”. Deborah A. Cunningham. April 1, 2022. Federated Hermes. “Rates’ projected path looms large”. Deborah A. Cunningham. March 1, 2022.

SERS ANNUAL INVESTMENT PLAN FY2023 | 52
Glossary
GLOSSARY
SERS ANNUAL INVESTMENT PLAN FY2023 | 53
Active Risk – see Tracking Error. Alpha – the premium an investment portfolio earns above a certain benchmark (such as the Standard & Poor’s 500 Index). A positive alpha indicates the investor earned a return in excess of the index return. Alternative Reference Rates Committee (ARCC) – The ARCC was established by the Federal Reserve to identify risk-free alternative reference rates for USD LIBOR, identify best practices for contract robustness, and create an implementation plan with metrics of success and a timeline to support an orderly adoption of the replacement rate. Asset Allocation – the practice of allocating a certain percentage of a portfolio between different types of investment assets, such as stocks, bonds, real estate, cash, etc. By diversifying among asset classes it is expected to create a favorable risk/reward ratio for the portfolio. Bloomberg US Aggregate Bond Index – a market capitalization weighted US bond index published by Bloomberg LLC. Most US traded investment grade bonds are represented in the index. The Bloomberg US Aggregate Bond Index is SERS’ global fixed income policy benchmark. Basis Point – one hundredth of one percent. For example, an addition of 40 basis points to a yield of 7.50 percent would increase the yield to 7.90 percent. Basis points are normally used when quoting yields or returns, alpha, or fees paid to investment managers. Benchmark – a measurement or standard that serves as a point of reference by which portfolio performance is measured. Benchmarks must meet standard criteria. Burgiss All Private Equity (BAPE) – BAPE is comprised of data from more than 5,000 private equity funds contributed by limited partners that are Burgiss clients and use Burgiss’ web-based institutional portfolio management platform Private i. The benchmark data is sourced from Burgiss’ limited partner clients and includes complete transactional and valuation history between the limited partner and their fund investments. Burgiss publishes a detailed breakdown of the dataset every quarter allowing for increased transparency. Citigroup 30-day T-Bill Index – an index that measures the rate of return for 30-day US Treasury Bills, which are considered representative of the performance of short-term money market instruments. The Citigroup 30-day T-Bill index is SERS’ policy benchmark for Cash Equivalents. Co-investment – a direct investment in a single asset of a multi-asset Fund, made alongside the Fund’s investment in the asset; typically involves terms that are more attractive and with shorter time frames than those of the Fund. Derivatives (Derivative Instruments) – financial instruments (securities or contracts) whose values are derived from underlying financial assets, indices or other instruments. Derivative performance is based on the performance of assets, interest rates, currency exchange rates and various domestic and foreign indices underlying the instruments. The common forms of derivatives are forward, futures, swap and options contracts. Diversification – the method of reducing risk by distributing investment assets among a variety of investment securities which have different risk/ reward ratios. Due Diligence – an investigation or audit of a potential or existing investment. Equity Investment – claims held by the residual owners of a firm. May also be referred to as common stock. Investments in Real Estate and certain Private Markets classifications may also be considered equity. Fixed Income Investment – a security issued by a borrower that obligates the issuer to make specified payments to the holder over a specific period. May also be referred to as "debt" or "bonds." Fund – fund means a limited partnership, trust or commingled investment vehicle in which SERS invests or may invest (e.g., hedge fund, private equity fund, or real estate fund).
GLOSSARY
SERS ANNUAL INVESTMENT PLAN FY2023 | 54
Global Equities – reflects the consolidation of what had been treated by SERS as US Equity and Non-US Equity asset classes; includes equities of US and non-US origin, equities of various capitalizations (e.g., large cap, small cap, mid cap, etc.), equities from developed, emerging and frontier markets, growth and value equities and passive and active strategies. Investments in Global Equities strategies are made in accordance with established investment guidelines, and amended as necessary, by mutual agreement between the Chief Investment Officer and the Investment Consultant. Guidelines – refers to an Investment Manager’s “Investment Guidelines,” established between the Investment Manager and Staff as part in an investment management agreement. Guidelines may be general or specific. Hedge Fund – a private investment partnership or an offshore investment corporation in which the general partner has made a substantial personal investment and whose offering memorandum allows for the Fund to take both long and short positions, using leverage and derivatives and invest in many markets. Hedge funds often use strategies involving program trading, selling short, swaps and arbitrage. Investment Committee – a committee comprised of the Chief investment Officer and Investment Officers from SERS’ Investment Department who possess the Ohio State Retirement System Investment Officer (SRSIO) license, with clearly defined structure, rules and procedures for reviewing and approving investments in a timely and prudent fashion. Investment Consultant – any consultant hired by the Board or by Staff to advise or assist with the Investment Program in accordance with the Statement of Investment Policy. Board investment consultants must be approved by the Board. Staff investment consultants shall be approved by the Executive Director. Investment Manager – a manager or potential manager of SERS assets, both public market and private market. Includes, but is not limited to managers of equity, fixed income, private equity, real estate, hedge funds, commodities and cash. Investment Staff – members of the investment department of SERS, including the Chief Investment Officer, Investment Officers and other department personnel. Leverage – in investments, this is the control of a large amount of money by a smaller amount of money, such as buying on margin. In finance, this is the relationship of debt to equity on a company’s balance sheet in the form of the debt/equity ratio. LIBOR – London Interbank Offered Rate, the interest rate that is commonly used as the benchmark reference rate for lenders. The 3-month LIBOR is a reference rate previously utilized by Staff. Long a futures contract or a forward contract – buying exposure to the underlying assets of the contract without actually owing those assets. When the underlying assets deliver a positive return, the long position gains; when the underlying assets deliver a negative return, the reverse is true. Morgan Stanley Capital International – All Country World Free ex-USA Index ($Net) – an equity index representing 44 developed and emerging countries. “Free” indicates the index reflects actual investable opportunities for global investors by taking into account local market restrictions on share ownership by foreigners. “Net” indicates that dividends are reinvested after the deduction of withholding taxes applicable to non-resident institutional investors. The MSCI-ACWI ex-USA Index, net of dividends reinvested is SERS’ policy benchmark for Non-US Equities. NCREIF Property Index (NPI) – a quarterly time series composite total rate of return measure of investment performance of a very large pool of individual commercial real estate properties acquired in the private market for investment purposes only. The NCREIF Property Index is a component of SERS’ Global Real Estate Policy Benchmark. Opportunistic and Tactical Investments – global opportunistic investments are tactical or non-traditional investment opportunities that may be short-term or may not fit within the generally accepted risk/return parameters of specific asset classes or strategy groupings. Such opportunities may involve capitalizing on short-term market
GLOSSARY
SERS ANNUAL INVESTMENT PLAN FY2023 | 55
dislocations or other such unique situations. Tactical investments may include strategies with dynamic allocations to single assets or across multiple asset types or other innovative approaches. Options contract - a form of financial derivatives. In an options contract, two parties (buyer and seller) agree that the buyer, who pays an option premium to the seller, has the right to exercise an option whether or not to buy or sell a particular asset at a specified price at a specified future date. Portfolio – a collection of investments owned, managed, or overseen by an individual or investment manager, a board or an organization. Portfolio can mean a manager account or subset thereof (e.g., Goldman Sachs Core Plus account), an asset class (e.g., US Equity), or the entire fund (e.g., SERS’ Total Fund). Rebalancing – adjusting asset class or portfolio allocations relative to their targets or ranges to adjust for actual or anticipated market movements. Russell 3000 Index – a market-value weighted equity index published by the Frank Russell Company. The index measures the performance of the 3,000 largest US companies in terms of market capitalization. The Russell 3000 Index is SERS’ Domestic Equity Policy Benchmark. Secondaries – pre-existing investor capital commitments to private funds that are purchased in the secondary market. Secured Overnight Financing Rate (SOFR) – SOFR is a broad measure of the cost of borrowing cash overnight collateralized by Treasury securities. There is a considerable volume of transactions executed that utilize SOFR and the rate is published on each business day. Securities Lending – the temporary loan of a security from an institutional investor’s portfolio to a broker/dealer to support the firm’s trading activities. Loaned securities are collateralized with cash at 102-105% of the loan exposure. The lender retains the entitlement to all the benefits of the loaned security, including dividends and interest, except the right to vote proxies. The lender has a right to recall the loan at any time. Short a futures contract or forward contract – selling exposure to the underlying assets of the contract without transferring the ownership of those assets to the buyers. When the underlying assets deliver a positive return, the short position experiences losses; when the underlying assets deliver a negative return, the reverse is true. Style – style refers to an investment product, strategy or style offered by an Investment Management Firm and reflects how the assets are invested. For example, value versus growth; core versus value added; quantitative versus fundamental; etc. T-bill – refers to Treasury Bill. Staff utilizes the 90-day T-bill rate as a reference benchmark. Total Fund – refers to SERS’ total investment assets. Tracking Error – standard deviation of the excess return of the portfolio relative to the Benchmark measured over rolling three year periods.

SERS ANNUAL INVESTMENT PLAN FY2023 | 56
SCHOOL EMPLOYEES RETIREMENT SYSTEM OF OHIO 300 E. BROAD ST., SUITE 100, COLUMBUS, OHIO 43215-3746 614-222-5853 • Toll-Free 800-878-5853 • www.ohsers.org Serving the People Who Serve Our Schools ®
School Employees Retirement System
Memo To: Retirement Board
From: Joe Bell
cc: Richard Stensrud
Date: May 9, 2022
Re: Investment Department Incentive Plan for Fiscal Year 2023
Ohio Administrative Code section 3309-1-05 requires the Board to annually approve SERS' Investment Department Incentive Plan. Attached to this memo please find a redlined Plan for fiscal year 2023. The Incentive Plan Committee is not recommending any material changes to FY2023’s Plan. If the Board is comfortable with the attached Investment Department Incentive Plan, a resolution has been prepared for a vote to approve the fiscal year 2023 Plan.
School Employees Retirement
System of Ohio
Investment Department Incentive Plan for Fiscal Year 20232
Amended May 2019, 20221
i
TABLE OF CONTENTS Section Topic Page 1 Purpose of Plan 1 2 Plan Objectives 1 3 Performance Period 1 4 Eligibility 1 5 Incentive Compensation Criteria 1 6 Incentive Compensation Opportunity 2 7 Performance Goals 3 8 Incentive Compensation Calculation 3 9 Incentive Compensation Adjustment 5 10 Plan Administration 5 Exhibit A History 8
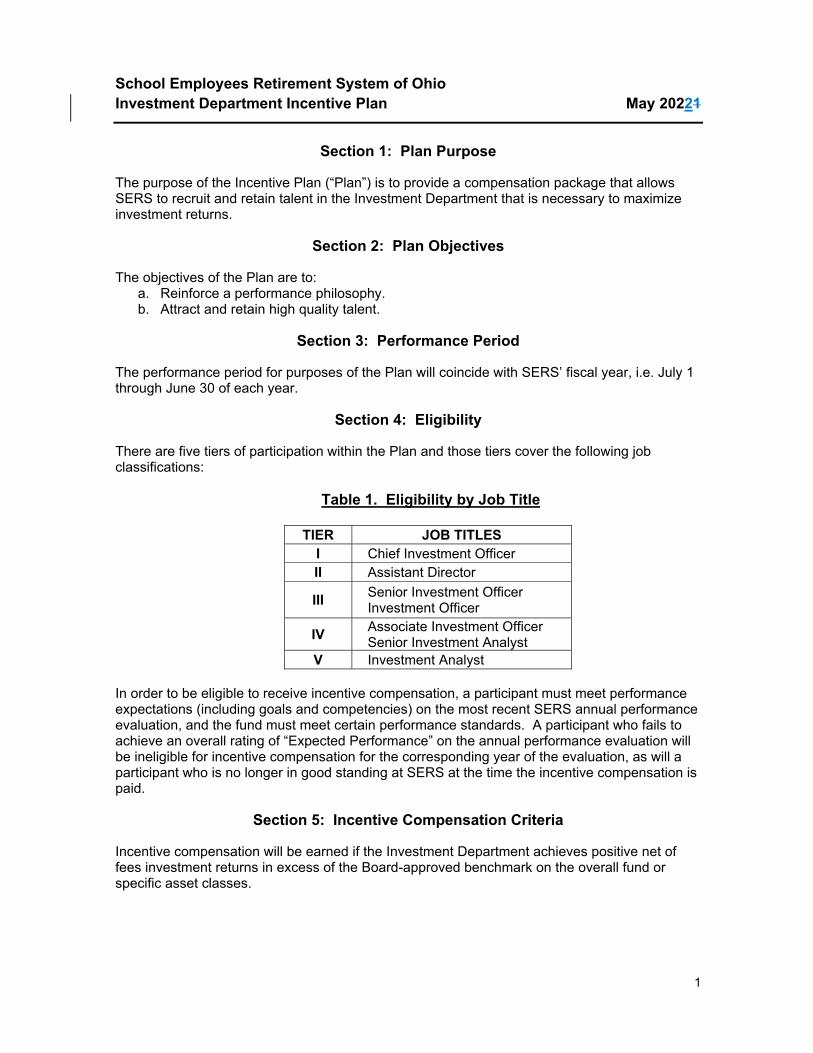
School Employees Retirement System of Ohio Investment Department Incentive Plan May 20221
1
Section 1: Plan Purpose
The purpose of the Incentive Plan (“Plan”) is to provide a compensation package that allows SERS to recruit and retain talent in the Investment Department that is necessary to maximize investment returns.
Section 2: Plan Objectives
The objectives of the Plan are to: a. Reinforce a performance philosophy. b. Attract and retain high quality talent.
Section 3: Performance Period
The performance period for purposes of the Plan will coincide with SERS’ fiscal year, i.e. July 1 through June 30 of each year.
Section 4: Eligibility
There are five tiers of participation within the Plan and those tiers cover the following job classifications:
Table 1. Eligibility by Job Title
TIER JOB TITLES I Chief Investment Officer II Assistant Director
III Senior Investment Officer Investment Officer
IV Associate Investment Officer Senior Investment Analyst
V Investment Analyst In order to be eligible to receive incentive compensation, a participant must meet performance expectations (including goals and competencies) on the most recent SERS annual performance evaluation, and the fund must meet certain performance standards. A participant who fails to achieve an overall rating of “Expected Performance” on the annual performance evaluation will be ineligible for incentive compensation for the corresponding year of the evaluation, as will a participant who is no longer in good standing at SERS at the time the incentive compensation is paid.
Section 5: Incentive Compensation Criteria
Incentive compensation will be earned if the Investment Department achieves positive net of fees investment returns in excess of the Board-approved benchmark on the overall fund or specific asset classes.
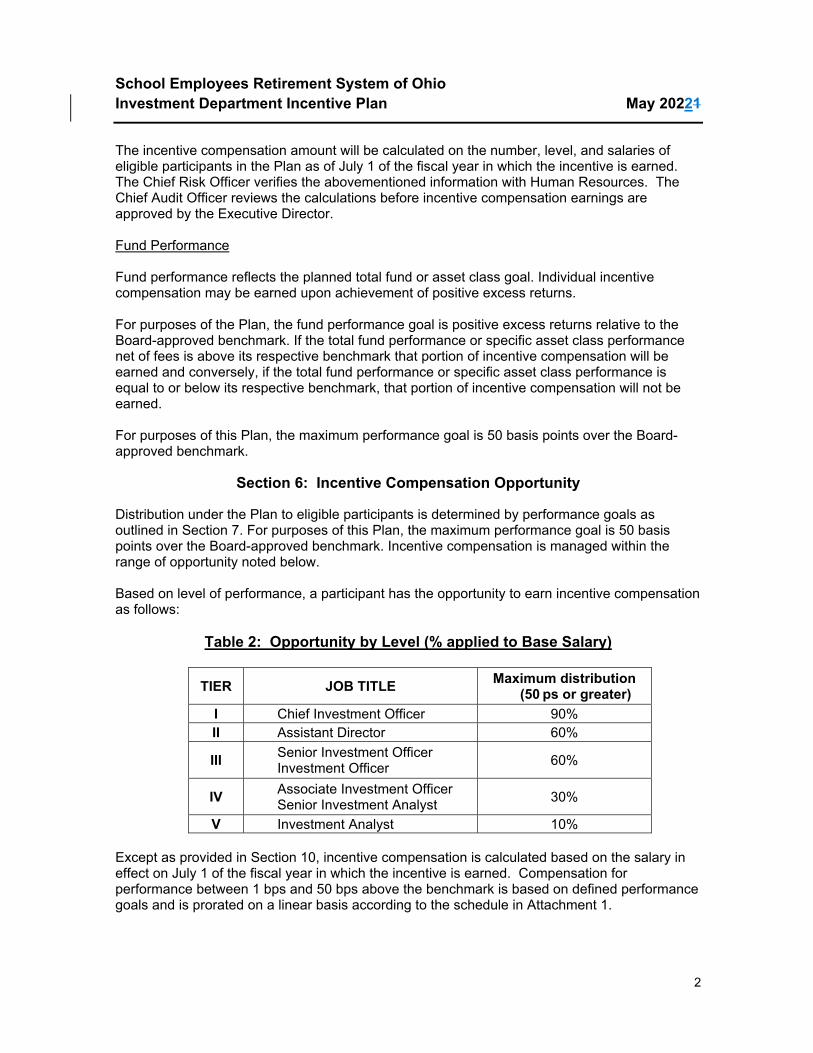
School Employees Retirement System of Ohio Investment Department Incentive Plan May 20221
2
The incentive compensation amount will be calculated on the number, level, and salaries of eligible participants in the Plan as of July 1 of the fiscal year in which the incentive is earned. The Chief Risk Officer verifies the abovementioned information with Human Resources. The Chief Audit Officer reviews the calculations before incentive compensation earnings are approved by the Executive Director. Fund Performance Fund performance reflects the planned total fund or asset class goal. Individual incentive compensation may be earned upon achievement of positive excess returns. For purposes of the Plan, the fund performance goal is positive excess returns relative to the Board-approved benchmark. If the total fund performance or specific asset class performance net of fees is above its respective benchmark that portion of incentive compensation will be earned and conversely, if the total fund performance or specific asset class performance is equal to or below its respective benchmark, that portion of incentive compensation will not be earned. For purposes of this Plan, the maximum performance goal is 50 basis points over the Board-approved benchmark.
Section 6: Incentive Compensation Opportunity
Distribution under the Plan to eligible participants is determined by performance goals as outlined in Section 7. For purposes of this Plan, the maximum performance goal is 50 basis points over the Board-approved benchmark. Incentive compensation is managed within the range of opportunity noted below. Based on level of performance, a participant has the opportunity to earn incentive compensation as follows:
Table 2: Opportunity by Level (% applied to Base Salary)
TIER JOB TITLE Maximum distribution (50 ps or greater)
I Chief Investment Officer 90% II Assistant Director 60%
III Senior Investment Officer Investment Officer
60%
IV Associate Investment Officer Senior Investment Analyst
30%
V Investment Analyst 10% Except as provided in Section 10, incentive compensation is calculated based on the salary in effect on July 1 of the fiscal year in which the incentive is earned. Compensation for performance between 1 bps and 50 bps above the benchmark is based on defined performance goals and is prorated on a linear basis according to the schedule in Attachment 1.
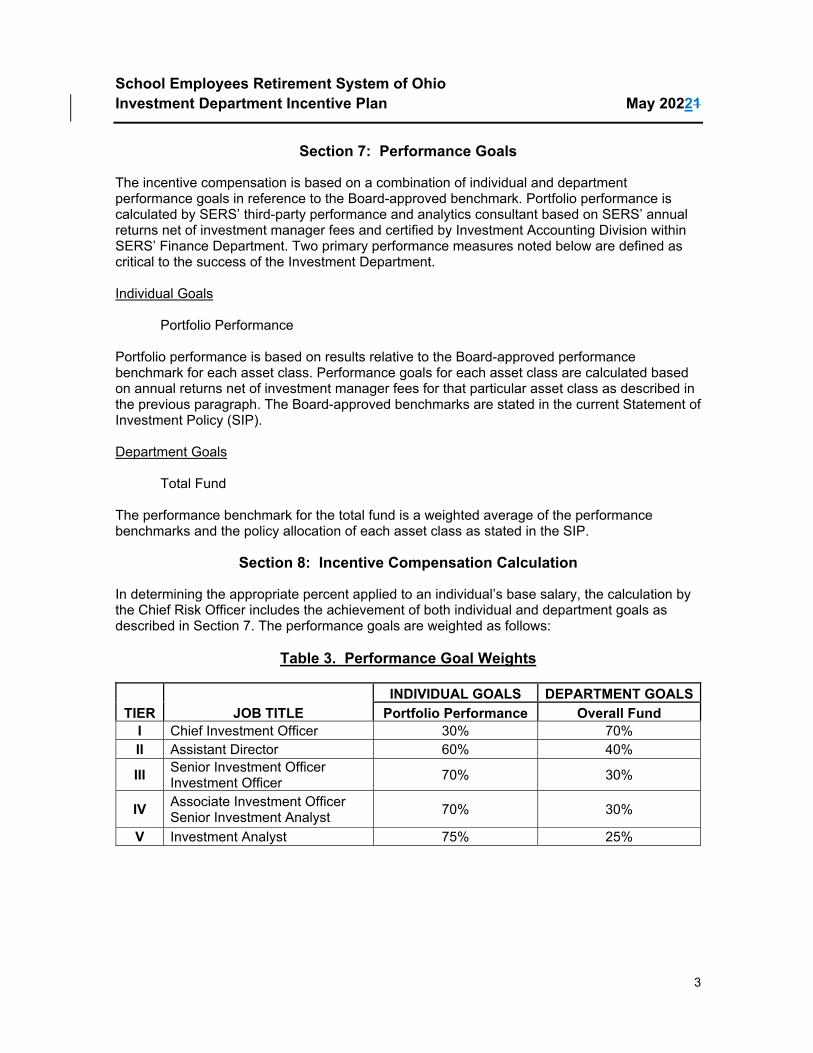
School Employees Retirement System of Ohio Investment Department Incentive Plan May 20221
3
Section 7: Performance Goals
The incentive compensation is based on a combination of individual and department performance goals in reference to the Board-approved benchmark. Portfolio performance is calculated by SERS’ third-party performance and analytics consultant based on SERS’ annual returns net of investment manager fees and certified by Investment Accounting Division within SERS’ Finance Department. Two primary performance measures noted below are defined as critical to the success of the Investment Department. Individual Goals Portfolio Performance Portfolio performance is based on results relative to the Board-approved performance benchmark for each asset class. Performance goals for each asset class are calculated based on annual returns net of investment manager fees for that particular asset class as described in the previous paragraph. The Board-approved benchmarks are stated in the current Statement of Investment Policy (SIP). Department Goals Total Fund The performance benchmark for the total fund is a weighted average of the performance benchmarks and the policy allocation of each asset class as stated in the SIP.
Section 8: Incentive Compensation Calculation
In determining the appropriate percent applied to an individual’s base salary, the calculation by the Chief Risk Officer includes the achievement of both individual and department goals as described in Section 7. The performance goals are weighted as follows:
Table 3. Performance Goal Weights
TIER JOB TITLE
INDIVIDUAL GOALS DEPARTMENT GOALS
Portfolio Performance Overall Fund I Chief Investment Officer 30% 70% II Assistant Director 60% 40%
III Senior Investment Officer Investment Officer
70% 30%
IV Associate Investment Officer Senior Investment Analyst
70% 30%
V Investment Analyst 75% 25%
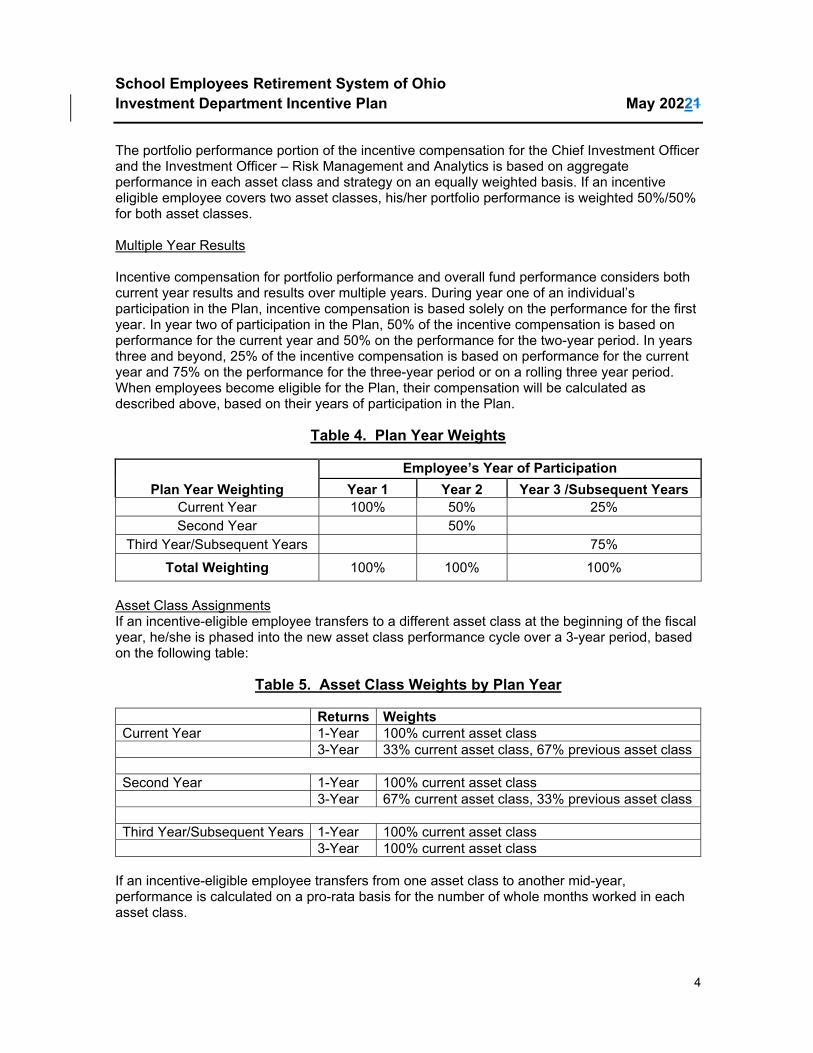
School Employees Retirement System of Ohio Investment Department Incentive Plan May 20221
4
The portfolio performance portion of the incentive compensation for the Chief Investment Officer and the Investment Officer – Risk Management and Analytics is based on aggregate performance in each asset class and strategy on an equally weighted basis. If an incentive eligible employee covers two asset classes, his/her portfolio performance is weighted 50%/50% for both asset classes. Multiple Year Results Incentive compensation for portfolio performance and overall fund performance considers both current year results and results over multiple years. During year one of an individual’s participation in the Plan, incentive compensation is based solely on the performance for the first year. In year two of participation in the Plan, 50% of the incentive compensation is based on performance for the current year and 50% on the performance for the two-year period. In years three and beyond, 25% of the incentive compensation is based on performance for the current year and 75% on the performance for the three-year period or on a rolling three year period. When employees become eligible for the Plan, their compensation will be calculated as described above, based on their years of participation in the Plan.
Table 4. Plan Year Weights
Plan Year Weighting
Employee’s Year of Participation
Year 1 Year 2 Year 3 /Subsequent Years Current Year 100% 50% 25% Second Year 50%
Third Year/Subsequent Years 75%
Total Weighting 100% 100% 100%
Asset Class Assignments If an incentive-eligible employee transfers to a different asset class at the beginning of the fiscal year, he/she is phased into the new asset class performance cycle over a 3-year period, based on the following table:
Table 5. Asset Class Weights by Plan Year
Returns Weights Current Year 1-Year 100% current asset class 3-Year 33% current asset class, 67% previous asset class Second Year 1-Year 100% current asset class 3-Year 67% current asset class, 33% previous asset class Third Year/Subsequent Years 1-Year 100% current asset class 3-Year 100% current asset class
If an incentive-eligible employee transfers from one asset class to another mid-year, performance is calculated on a pro-rata basis for the number of whole months worked in each asset class.
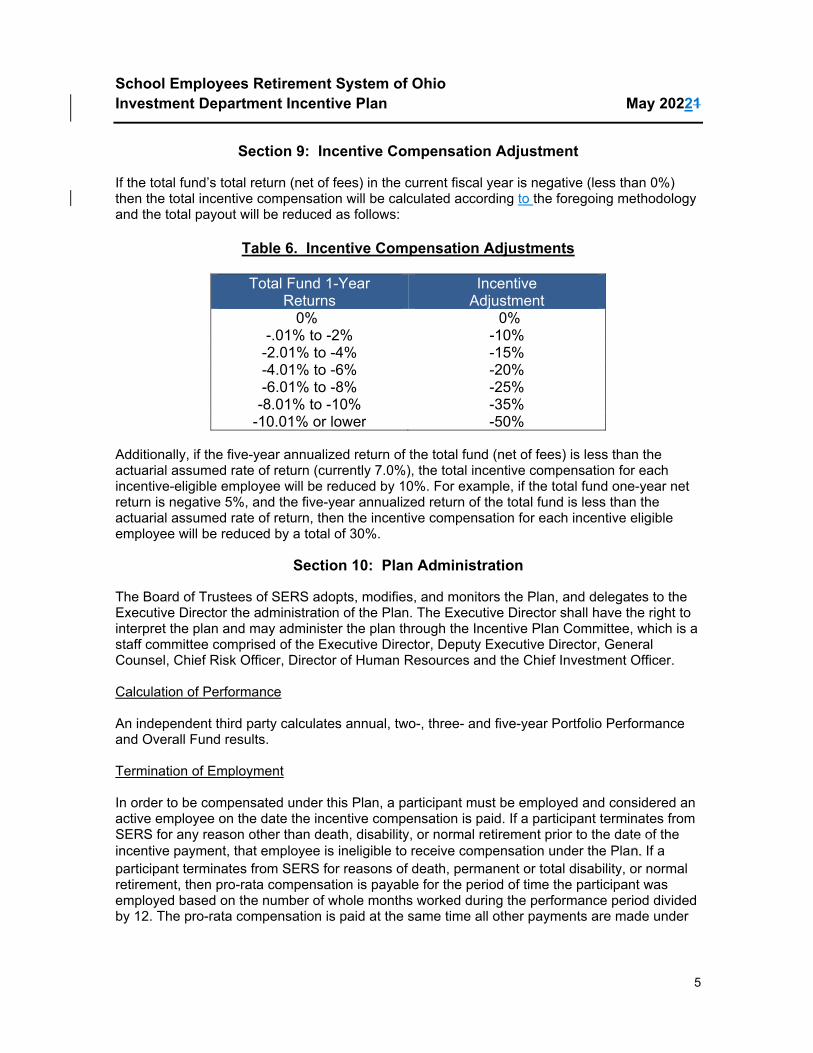
School Employees Retirement System of Ohio Investment Department Incentive Plan May 20221
5
Section 9: Incentive Compensation Adjustment
If the total fund’s total return (net of fees) in the current fiscal year is negative (less than 0%) then the total incentive compensation will be calculated according to the foregoing methodology and the total payout will be reduced as follows:
Table 6. Incentive Compensation Adjustments
Total Fund 1-Year Returns
Incentive Adjustment
0% 0% -.01% to -2% -10%
-2.01% to -4% -15% -4.01% to -6% -20% -6.01% to -8% -25% -8.01% to -10% -35%
-10.01% or lower -50% Additionally, if the five-year annualized return of the total fund (net of fees) is less than the actuarial assumed rate of return (currently 7.0%), the total incentive compensation for each incentive-eligible employee will be reduced by 10%. For example, if the total fund one-year net return is negative 5%, and the five-year annualized return of the total fund is less than the actuarial assumed rate of return, then the incentive compensation for each incentive eligible employee will be reduced by a total of 30%.
Section 10: Plan Administration
The Board of Trustees of SERS adopts, modifies, and monitors the Plan, and delegates to the Executive Director the administration of the Plan. The Executive Director shall have the right to interpret the plan and may administer the plan through the Incentive Plan Committee, which is a staff committee comprised of the Executive Director, Deputy Executive Director, General Counsel, Chief Risk Officer, Director of Human Resources and the Chief Investment Officer. Calculation of Performance An independent third party calculates annual, two-, three- and five-year Portfolio Performance and Overall Fund results. Termination of Employment In order to be compensated under this Plan, a participant must be employed and considered an active employee on the date the incentive compensation is paid. If a participant terminates from SERS for any reason other than death, disability, or normal retirement prior to the date of the incentive payment, that employee is ineligible to receive compensation under the Plan. If a participant terminates from SERS for reasons of death, permanent or total disability, or normal retirement, then pro-rata compensation is payable for the period of time the participant was employed based on the number of whole months worked during the performance period divided by 12. The pro-rata compensation is paid at the same time all other payments are made under
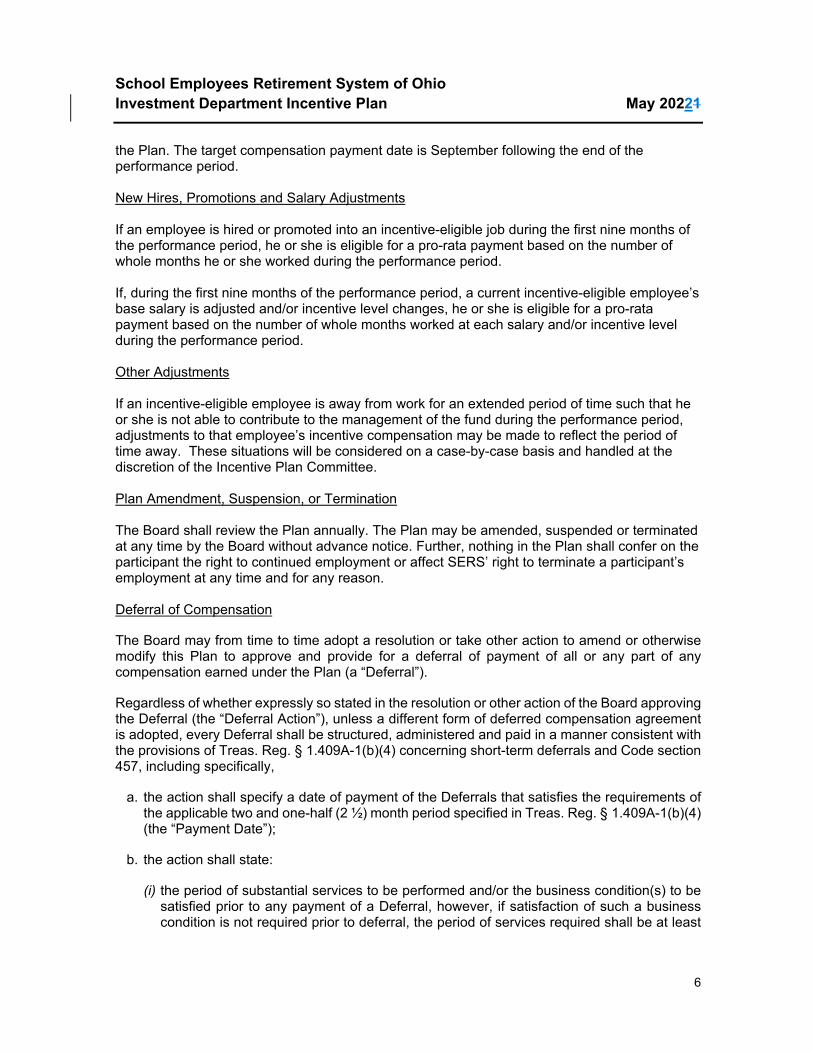
School Employees Retirement System of Ohio Investment Department Incentive Plan May 20221
6
the Plan. The target compensation payment date is September following the end of the performance period. New Hires, Promotions and Salary Adjustments If an employee is hired or promoted into an incentive-eligible job during the first nine months of the performance period, he or she is eligible for a pro-rata payment based on the number of whole months he or she worked during the performance period. If, during the first nine months of the performance period, a current incentive-eligible employee’s base salary is adjusted and/or incentive level changes, he or she is eligible for a pro-rata payment based on the number of whole months worked at each salary and/or incentive level during the performance period. Other Adjustments If an incentive-eligible employee is away from work for an extended period of time such that he or she is not able to contribute to the management of the fund during the performance period, adjustments to that employee’s incentive compensation may be made to reflect the period of time away. These situations will be considered on a case-by-case basis and handled at the discretion of the Incentive Plan Committee. Plan Amendment, Suspension, or Termination The Board shall review the Plan annually. The Plan may be amended, suspended or terminated at any time by the Board without advance notice. Further, nothing in the Plan shall confer on the participant the right to continued employment or affect SERS’ right to terminate a participant’s employment at any time and for any reason. Deferral of Compensation
The Board may from time to time adopt a resolution or take other action to amend or otherwise modify this Plan to approve and provide for a deferral of payment of all or any part of any compensation earned under the Plan (a “Deferral”).
Regardless of whether expressly so stated in the resolution or other action of the Board approving the Deferral (the “Deferral Action”), unless a different form of deferred compensation agreement is adopted, every Deferral shall be structured, administered and paid in a manner consistent with the provisions of Treas. Reg. § 1.409A-1(b)(4) concerning short-term deferrals and Code section 457, including specifically,
a. the action shall specify a date of payment of the Deferrals that satisfies the requirements of the applicable two and one-half (2 ½) month period specified in Treas. Reg. § 1.409A-1(b)(4) (the “Payment Date”);
b. the action shall state:
(i) the period of substantial services to be performed and/or the business condition(s) to be satisfied prior to any payment of a Deferral, however, if satisfaction of such a business condition is not required prior to deferral, the period of services required shall be at least
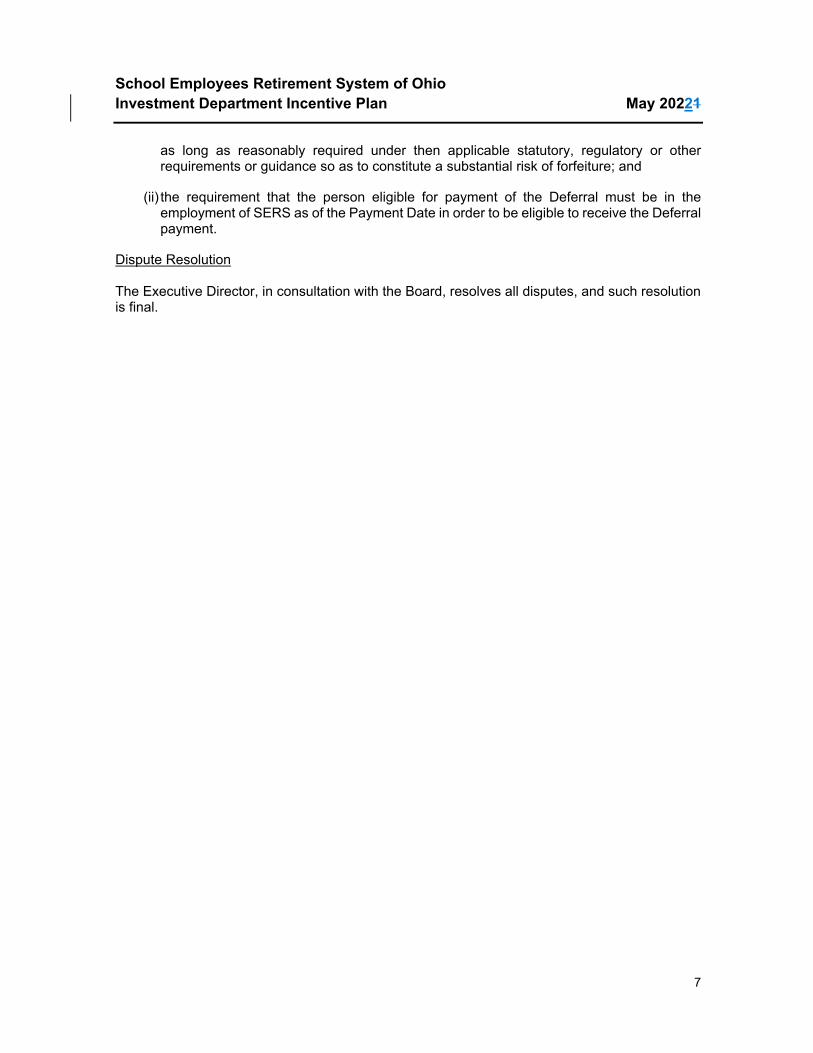
School Employees Retirement System of Ohio Investment Department Incentive Plan May 20221
7
as long as reasonably required under then applicable statutory, regulatory or other requirements or guidance so as to constitute a substantial risk of forfeiture; and
(ii) the requirement that the person eligible for payment of the Deferral must be in the employment of SERS as of the Payment Date in order to be eligible to receive the Deferral payment.
Dispute Resolution The Executive Director, in consultation with the Board, resolves all disputes, and such resolution is final.
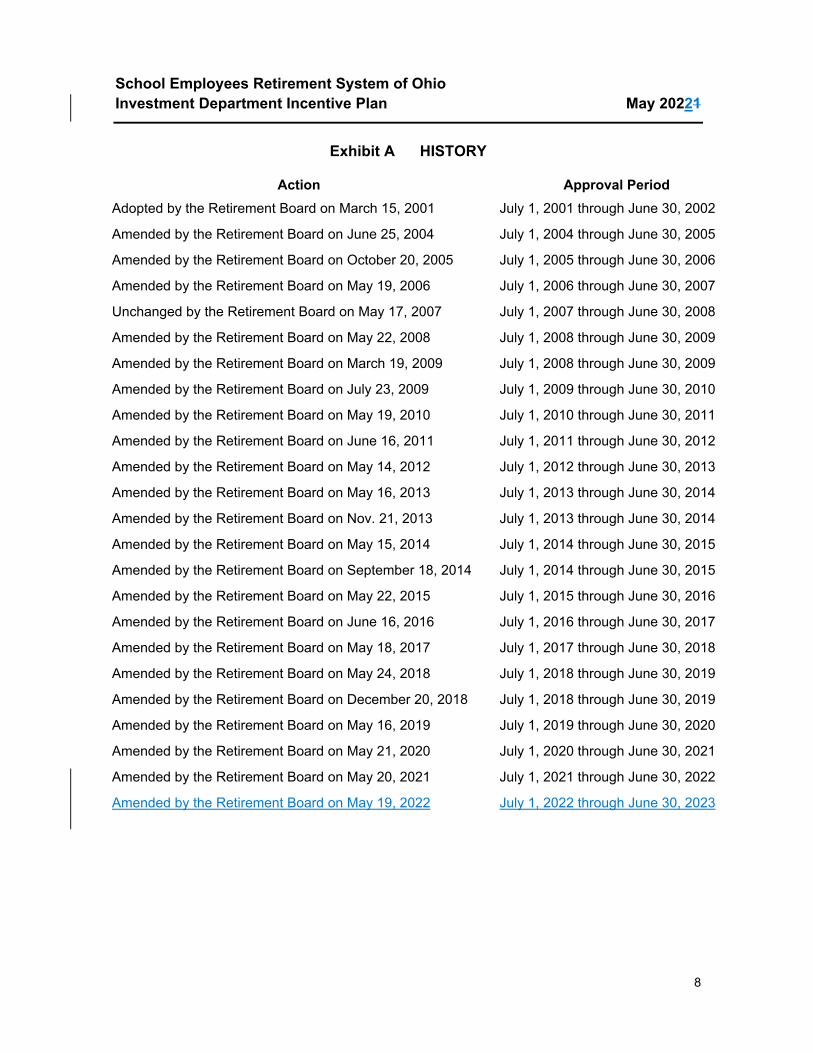
School Employees Retirement System of Ohio Investment Department Incentive Plan May 20221
8
Exhibit A HISTORY
Action Approval Period Adopted by the Retirement Board on March 15, 2001
Amended by the Retirement Board on June 25, 2004
Amended by the Retirement Board on October 20, 2005
Amended by the Retirement Board on May 19, 2006
Unchanged by the Retirement Board on May 17, 2007
Amended by the Retirement Board on May 22, 2008
Amended by the Retirement Board on March 19, 2009
Amended by the Retirement Board on July 23, 2009
Amended by the Retirement Board on May 19, 2010
Amended by the Retirement Board on June 16, 2011
Amended by the Retirement Board on May 14, 2012
Amended by the Retirement Board on May 16, 2013
Amended by the Retirement Board on Nov. 21, 2013
Amended by the Retirement Board on May 15, 2014
Amended by the Retirement Board on September 18, 2014
Amended by the Retirement Board on May 22, 2015
Amended by the Retirement Board on June 16, 2016
Amended by the Retirement Board on May 18, 2017
Amended by the Retirement Board on May 24, 2018
Amended by the Retirement Board on December 20, 2018
Amended by the Retirement Board on May 16, 2019
Amended by the Retirement Board on May 21, 2020
Amended by the Retirement Board on May 20, 2021
Amended by the Retirement Board on May 19, 2022
July 1, 2001 through June 30, 2002
July 1, 2004 through June 30, 2005
July 1, 2005 through June 30, 2006
July 1, 2006 through June 30, 2007
July 1, 2007 through June 30, 2008
July 1, 2008 through June 30, 2009
July 1, 2008 through June 30, 2009
July 1, 2009 through June 30, 2010
July 1, 2010 through June 30, 2011
July 1, 2011 through June 30, 2012
July 1, 2012 through June 30, 2013
July 1, 2013 through June 30, 2014
July 1, 2013 through June 30, 2014
July 1, 2014 through June 30, 2015
July 1, 2014 through June 30, 2015
July 1, 2015 through June 30, 2016
July 1, 2016 through June 30, 2017
July 1, 2017 through June 30, 2018
July 1, 2018 through June 30, 2019
July 1, 2018 through June 30, 2019
July 1, 2019 through June 30, 2020
July 1, 2020 through June 30, 2021
July 1, 2021 through June 30, 2022
July 1, 2022 through June 30, 2023
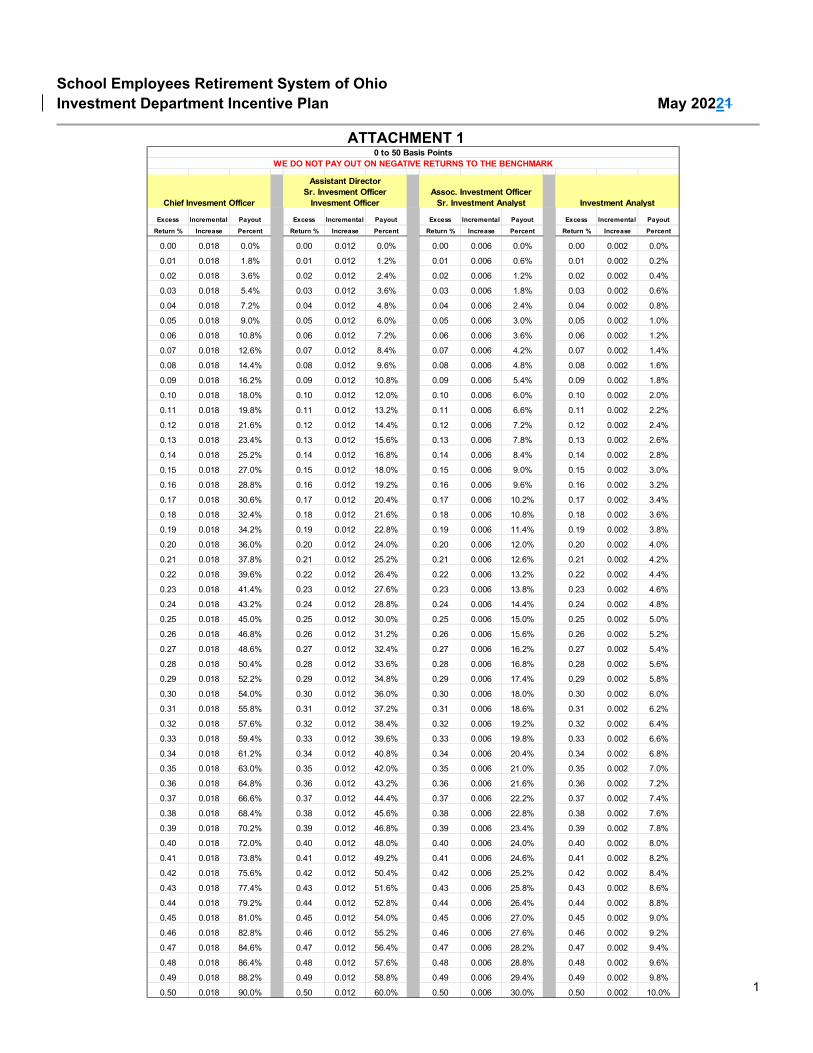
School Employees Retirement System of Ohio Investment Department Incentive Plan May 20221
ATTACHMENT 1
1
Excess Incremental Payout Excess Incremental Payout Excess Incremental Payout Excess Incremental PayoutReturn % Increase Percent Return % Increase Percent Return % Increase Percent Return % Increase Percent
0.00 0.018 0.0% 0.00 0.012 0.0% 0.00 0.006 0.0% 0.00 0.002 0.0%
0.01 0.018 1.8% 0.01 0.012 1.2% 0.01 0.006 0.6% 0.01 0.002 0.2%
0.02 0.018 3.6% 0.02 0.012 2.4% 0.02 0.006 1.2% 0.02 0.002 0.4%
0.03 0.018 5.4% 0.03 0.012 3.6% 0.03 0.006 1.8% 0.03 0.002 0.6%
0.04 0.018 7.2% 0.04 0.012 4.8% 0.04 0.006 2.4% 0.04 0.002 0.8%
0.05 0.018 9.0% 0.05 0.012 6.0% 0.05 0.006 3.0% 0.05 0.002 1.0%
0.06 0.018 10.8% 0.06 0.012 7.2% 0.06 0.006 3.6% 0.06 0.002 1.2%
0.07 0.018 12.6% 0.07 0.012 8.4% 0.07 0.006 4.2% 0.07 0.002 1.4%
0.08 0.018 14.4% 0.08 0.012 9.6% 0.08 0.006 4.8% 0.08 0.002 1.6%
0.09 0.018 16.2% 0.09 0.012 10.8% 0.09 0.006 5.4% 0.09 0.002 1.8%
0.10 0.018 18.0% 0.10 0.012 12.0% 0.10 0.006 6.0% 0.10 0.002 2.0%
0.11 0.018 19.8% 0.11 0.012 13.2% 0.11 0.006 6.6% 0.11 0.002 2.2%
0.12 0.018 21.6% 0.12 0.012 14.4% 0.12 0.006 7.2% 0.12 0.002 2.4%
0.13 0.018 23.4% 0.13 0.012 15.6% 0.13 0.006 7.8% 0.13 0.002 2.6%
0.14 0.018 25.2% 0.14 0.012 16.8% 0.14 0.006 8.4% 0.14 0.002 2.8%
0.15 0.018 27.0% 0.15 0.012 18.0% 0.15 0.006 9.0% 0.15 0.002 3.0%
0.16 0.018 28.8% 0.16 0.012 19.2% 0.16 0.006 9.6% 0.16 0.002 3.2%
0.17 0.018 30.6% 0.17 0.012 20.4% 0.17 0.006 10.2% 0.17 0.002 3.4%
0.18 0.018 32.4% 0.18 0.012 21.6% 0.18 0.006 10.8% 0.18 0.002 3.6%
0.19 0.018 34.2% 0.19 0.012 22.8% 0.19 0.006 11.4% 0.19 0.002 3.8%
0.20 0.018 36.0% 0.20 0.012 24.0% 0.20 0.006 12.0% 0.20 0.002 4.0%
0.21 0.018 37.8% 0.21 0.012 25.2% 0.21 0.006 12.6% 0.21 0.002 4.2%
0.22 0.018 39.6% 0.22 0.012 26.4% 0.22 0.006 13.2% 0.22 0.002 4.4%
0.23 0.018 41.4% 0.23 0.012 27.6% 0.23 0.006 13.8% 0.23 0.002 4.6%
0.24 0.018 43.2% 0.24 0.012 28.8% 0.24 0.006 14.4% 0.24 0.002 4.8%
0.25 0.018 45.0% 0.25 0.012 30.0% 0.25 0.006 15.0% 0.25 0.002 5.0%
0.26 0.018 46.8% 0.26 0.012 31.2% 0.26 0.006 15.6% 0.26 0.002 5.2%
0.27 0.018 48.6% 0.27 0.012 32.4% 0.27 0.006 16.2% 0.27 0.002 5.4%
0.28 0.018 50.4% 0.28 0.012 33.6% 0.28 0.006 16.8% 0.28 0.002 5.6%
0.29 0.018 52.2% 0.29 0.012 34.8% 0.29 0.006 17.4% 0.29 0.002 5.8%
0.30 0.018 54.0% 0.30 0.012 36.0% 0.30 0.006 18.0% 0.30 0.002 6.0%
0.31 0.018 55.8% 0.31 0.012 37.2% 0.31 0.006 18.6% 0.31 0.002 6.2%
0.32 0.018 57.6% 0.32 0.012 38.4% 0.32 0.006 19.2% 0.32 0.002 6.4%
0.33 0.018 59.4% 0.33 0.012 39.6% 0.33 0.006 19.8% 0.33 0.002 6.6%
0.34 0.018 61.2% 0.34 0.012 40.8% 0.34 0.006 20.4% 0.34 0.002 6.8%
0.35 0.018 63.0% 0.35 0.012 42.0% 0.35 0.006 21.0% 0.35 0.002 7.0%
0.36 0.018 64.8% 0.36 0.012 43.2% 0.36 0.006 21.6% 0.36 0.002 7.2%
0.37 0.018 66.6% 0.37 0.012 44.4% 0.37 0.006 22.2% 0.37 0.002 7.4%
0.38 0.018 68.4% 0.38 0.012 45.6% 0.38 0.006 22.8% 0.38 0.002 7.6%
0.39 0.018 70.2% 0.39 0.012 46.8% 0.39 0.006 23.4% 0.39 0.002 7.8%
0.40 0.018 72.0% 0.40 0.012 48.0% 0.40 0.006 24.0% 0.40 0.002 8.0%
0.41 0.018 73.8% 0.41 0.012 49.2% 0.41 0.006 24.6% 0.41 0.002 8.2%
0.42 0.018 75.6% 0.42 0.012 50.4% 0.42 0.006 25.2% 0.42 0.002 8.4%
0.43 0.018 77.4% 0.43 0.012 51.6% 0.43 0.006 25.8% 0.43 0.002 8.6%
0.44 0.018 79.2% 0.44 0.012 52.8% 0.44 0.006 26.4% 0.44 0.002 8.8%
0.45 0.018 81.0% 0.45 0.012 54.0% 0.45 0.006 27.0% 0.45 0.002 9.0%
0.46 0.018 82.8% 0.46 0.012 55.2% 0.46 0.006 27.6% 0.46 0.002 9.2%
0.47 0.018 84.6% 0.47 0.012 56.4% 0.47 0.006 28.2% 0.47 0.002 9.4%
0.48 0.018 86.4% 0.48 0.012 57.6% 0.48 0.006 28.8% 0.48 0.002 9.6%
0.49 0.018 88.2% 0.49 0.012 58.8% 0.49 0.006 29.4% 0.49 0.002 9.8%
0.50 0.018 90.0% 0.50 0.012 60.0% 0.50 0.006 30.0% 0.50 0.002 10.0%
Investment Analyst
WE DO NOT PAY OUT ON NEGATIVE RETURNS TO THE BENCHMARK0 to 50 Basis Points
Invesment OfficerChief Invesment Officer
Assistant DirectorSr. Invesment Officer Assoc. Investment Officer
Sr. Investment Analyst
INVESTMENT DEPARTMENT INCENTIVE PLAN FISCAL YEAR 2023
____________________ moved and ____________________ seconded the motion to approve the
Investment Department Incentive Plan for fiscal year ending June 30, 2023 which replaces the Fiscal
Year 2022 Investment Department Incentive Plan approved May 20, 2021.
Upon roll call, the vote was as follows: ROLL CALL: YEA NAY ABSTAIN Jeffrey DeLeone ____ ____ ____ Hugh Garside ____ ____ ____ James Haller ____ ____ ____ Matthew King ____ ____ ____ Catherine Moss ____ ____ ____ James Rossler ____ ____ ____ Frank Weglarz ____ ____ ____ Daniel Wilson ____ ____ ____ Barbra Phillips ____ ____ ____

EXECUTIVE SESSION moved and seconded the motion that the Committee convene in Executive Session pursuant to R.C. 121.22 (G)(5) to discuss a matter required to be kept confidential by law.
IN EXECUTIVE SESSION AT A.M./P.M.
Upon roll call, the vote was as follows: ROLL CALL: YEA NAY ABSTAIN Jeffrey DeLeone ________ ________ ________ Hugh Garside James Haller ________ ________ ________ Matthew King ________ ________ ________ Catherine Moss ________ ________ ________ James Rossler ________ ________ ________ Frank Weglarz ________ ________ ________ Daniel Wilson ________ ________ ________ Barbra Phillips ________ ________ ________
RETURN TO OPEN SESSION AT A.M. / P.M.
Health Insurance Cost Estimates for Self Funded Plans
Preliminary Plan Year 2023
www.CavMacConsulting.com
May 19, 2022Alisa Bennett, FSA, EA, FCA, MAAA
1
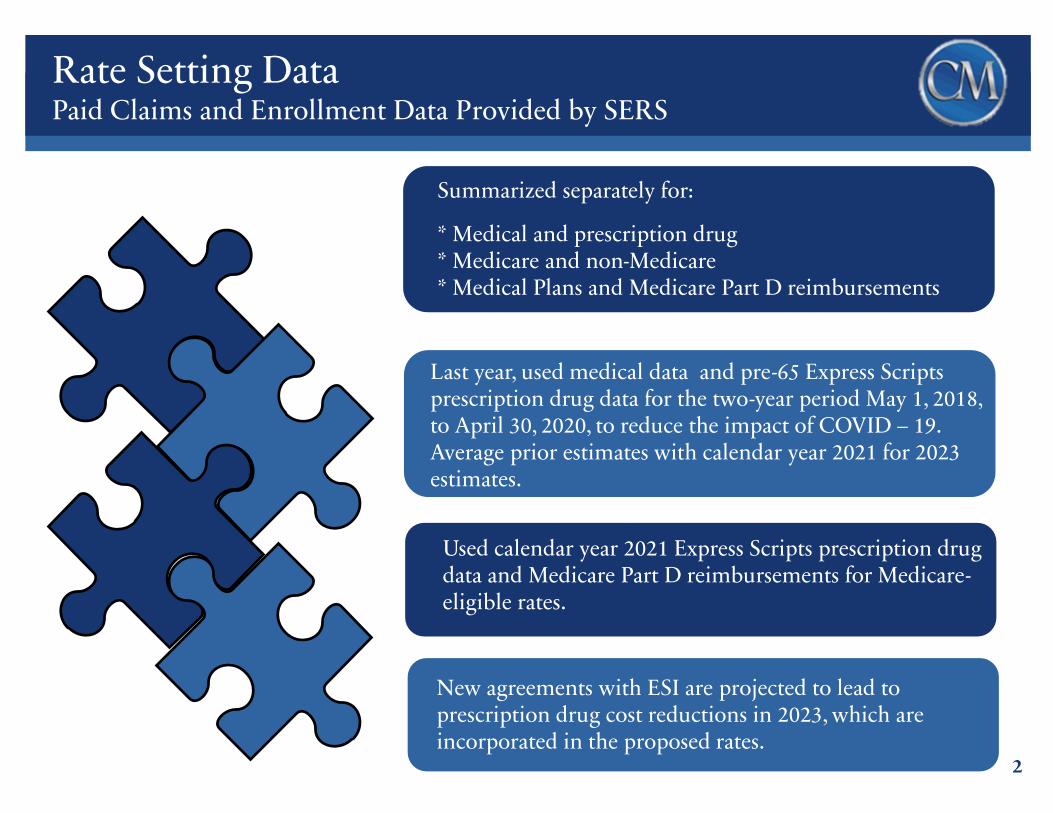
New agreements with ESI are projected to lead to prescription drug cost reductions in 2023, which are incorporated in the proposed rates.
Used calendar year 2021 Express Scripts prescription drug data and Medicare Part D reimbursements for Medicare-eligible rates.
Last year, used medical data and pre-65 Express Scripts prescription drug data for the two-year period May 1, 2018, to April 30, 2020, to reduce the impact of COVID – 19. Average prior estimates with calendar year 2021 for 2023 estimates.
Summarized separately for:
* Medical and prescription drug* Medicare and non-Medicare* Medical Plans and Medicare Part D reimbursements
Rate Setting DataPaid Claims and Enrollment Data Provided by SERS
2
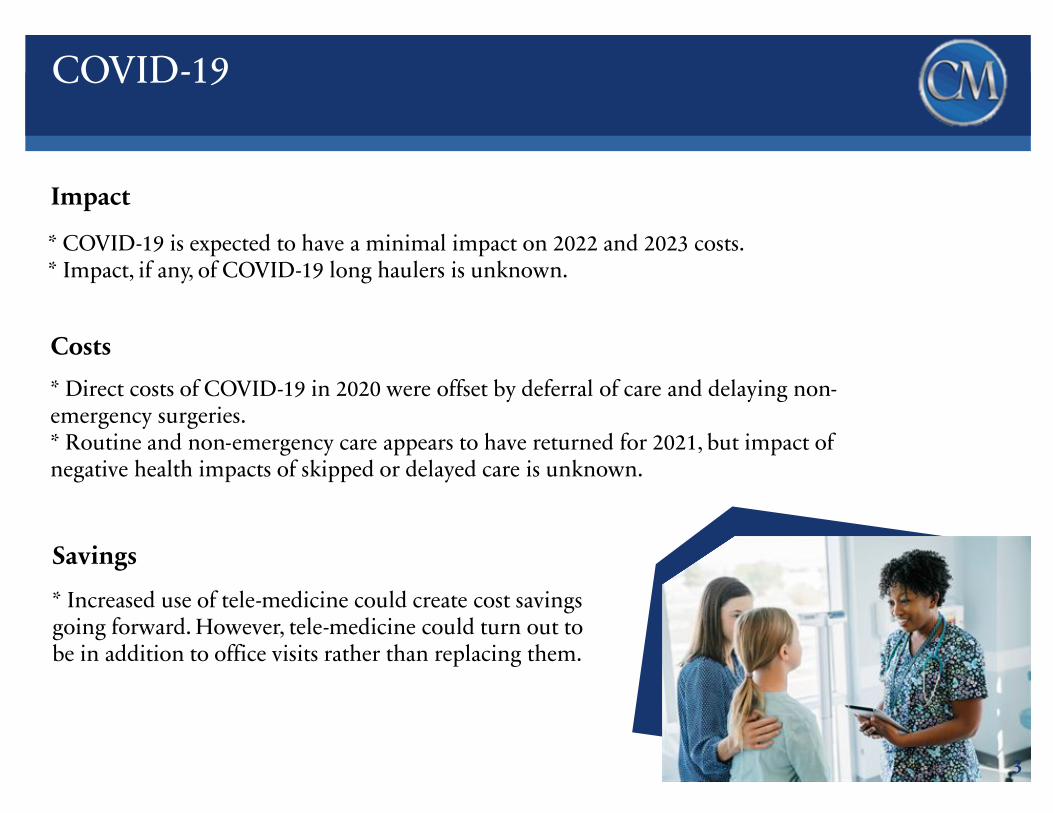
COVID-19
3
* COVID-19 is expected to have a minimal impact on 2022 and 2023 costs.* Impact, if any, of COVID-19 long haulers is unknown.
* Direct costs of COVID-19 in 2020 were offset by deferral of care and delaying non-emergency surgeries. * Routine and non-emergency care appears to have returned for 2021, but impact of negative health impacts of skipped or delayed care is unknown.
* Increased use of tele-medicine could create cost savings going forward. However, tele-medicine could turn out to be in addition to office visits rather than replacing them.
Savings
Costs
Impact
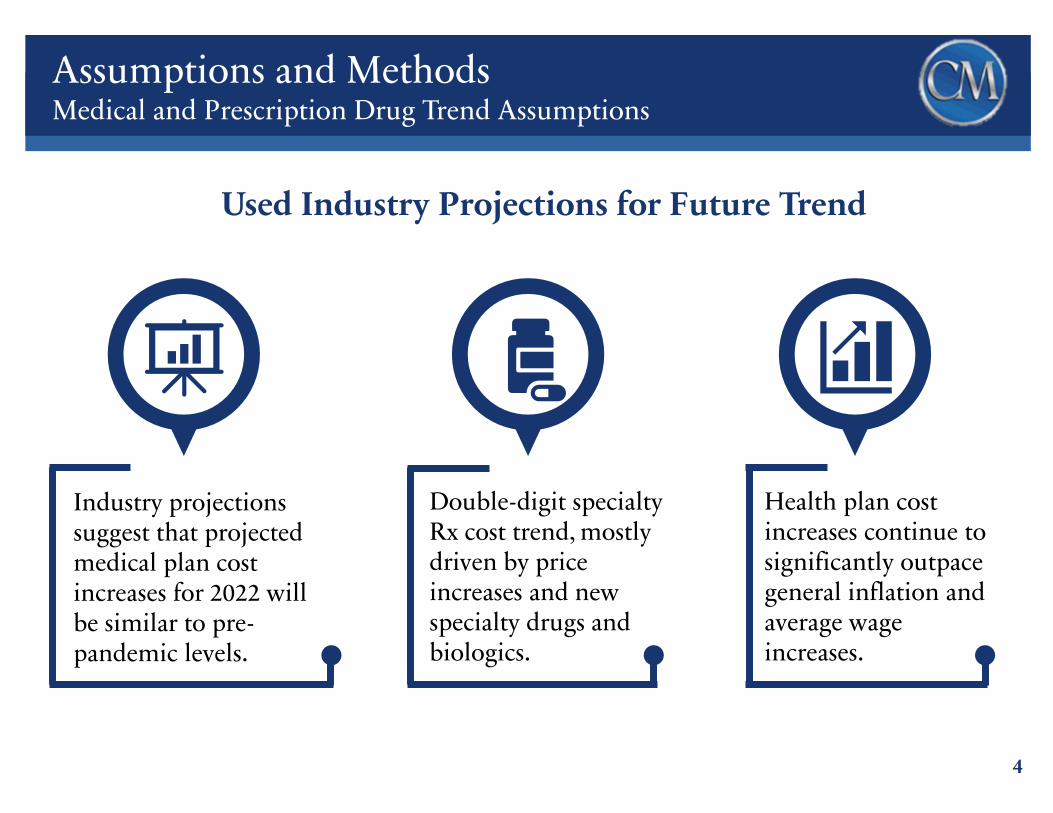
Assumptions and MethodsMedical and Prescription Drug Trend Assumptions
4
Industry projections suggest that projected medical plan cost increases for 2022 will be similar to pre-pandemic levels.
Double-digit specialty Rx cost trend, mostly driven by price increases and new specialty drugs and biologics.
Health plan cost increases continue to significantly outpace general inflation and average wage increases.
Used Industry Projections for Future Trend
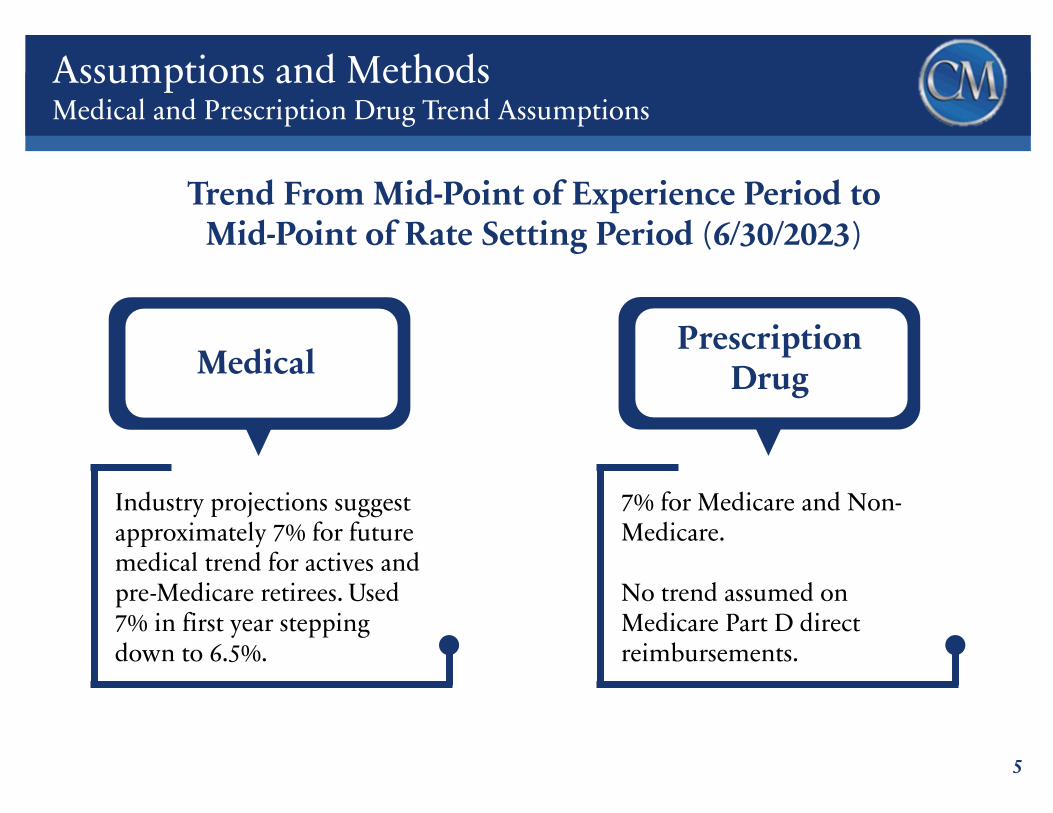
Assumptions and MethodsMedical and Prescription Drug Trend Assumptions
5
Industry projections suggest approximately 7% for future medical trend for actives and pre-Medicare retirees. Used 7% in first year stepping down to 6.5%.
Trend From Mid-Point of Experience Period to Mid-Point of Rate Setting Period (6/30/2023)
7% for Medicare and Non-Medicare.
No trend assumed on Medicare Part D direct reimbursements.
MedicalPrescription
Drug
Assumptions and MethodsSpouses and Child(ren)
6
* 25% of retiree cost for child(ren)* 80% of retiree cost for spouse
Current recommendation is ratio of:
Data supports continued use of those ratios.
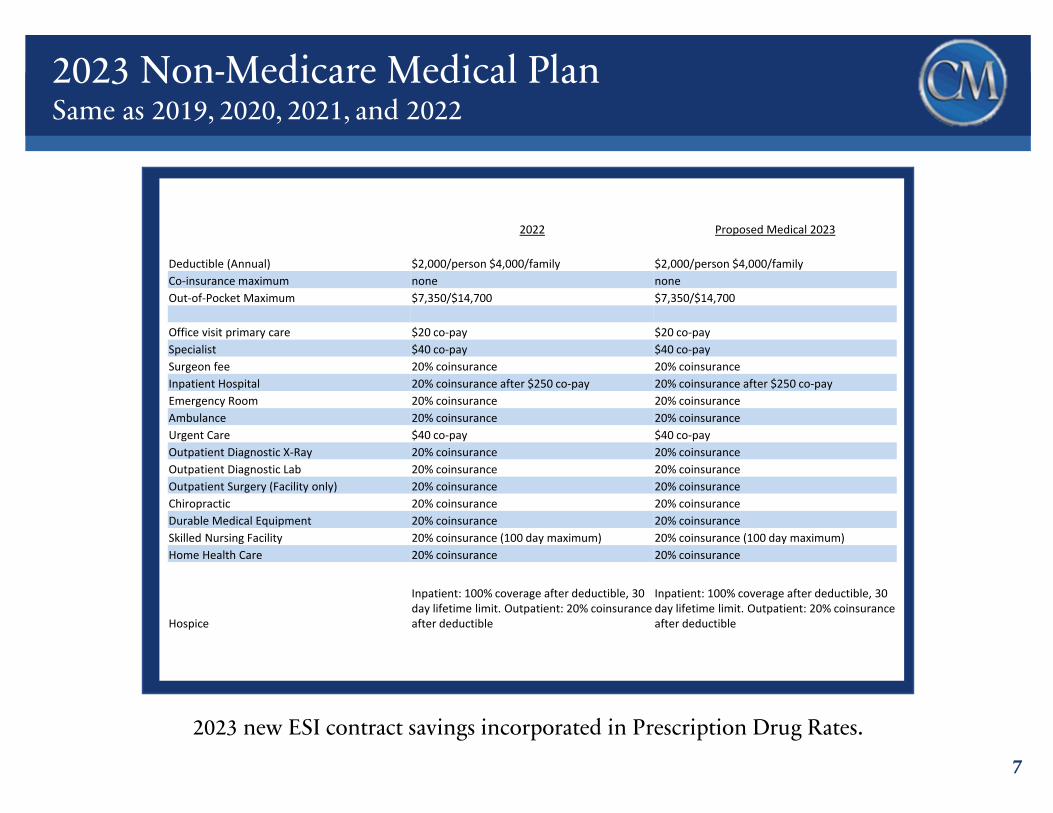
2023 Non-Medicare Medical PlanSame as 2019, 2020, 2021, and 2022
7
2022 Proposed Medical 2023
Deductible (Annual) $2,000/person $4,000/family $2,000/person $4,000/family Co-insurance maximum none noneOut-of-Pocket Maximum $7,350/$14,700 $7,350/$14,700
Office visit primary care $20 co-pay $20 co-paySpecialist $40 co-pay $40 co-paySurgeon fee 20% coinsurance 20% coinsuranceInpatient Hospital 20% coinsurance after $250 co-pay 20% coinsurance after $250 co-payEmergency Room 20% coinsurance 20% coinsuranceAmbulance 20% coinsurance 20% coinsuranceUrgent Care $40 co-pay $40 co-payOutpatient Diagnostic X-Ray 20% coinsurance 20% coinsuranceOutpatient Diagnostic Lab 20% coinsurance 20% coinsuranceOutpatient Surgery (Facility only) 20% coinsurance 20% coinsuranceChiropractic 20% coinsurance 20% coinsuranceDurable Medical Equipment 20% coinsurance 20% coinsuranceSkilled Nursing Facility 20% coinsurance (100 day maximum) 20% coinsurance (100 day maximum)Home Health Care 20% coinsurance 20% coinsurance
Hospice
Inpatient: 100% coverage after deductible, 30 day lifetime limit. Outpatient: 20% coinsurance after deductible
Inpatient: 100% coverage after deductible, 30 day lifetime limit. Outpatient: 20% coinsurance after deductible
2023 new ESI contract savings incorporated in Prescription Drug Rates.
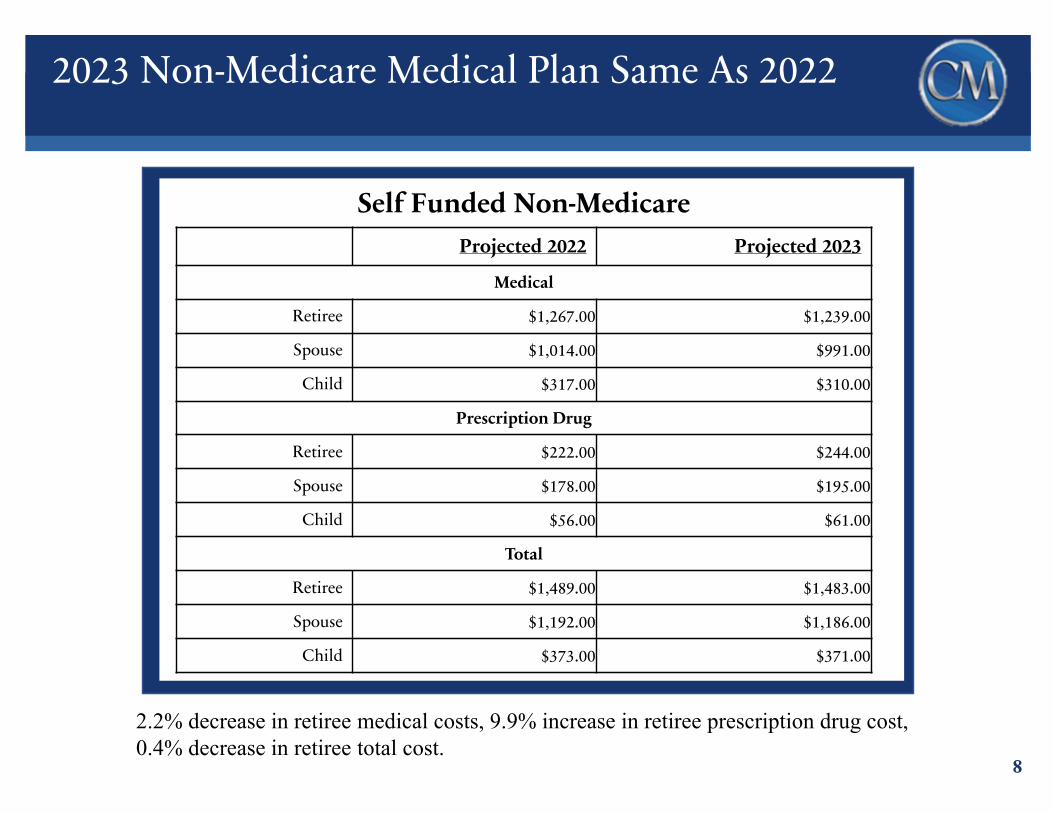
2023 Non-Medicare Medical Plan Same As 2022
8
2.2% decrease in retiree medical costs, 9.9% increase in retiree prescription drug cost, 0.4% decrease in retiree total cost.
Self Funded Non-MedicareProjected 2022 Projected 2023
Medical
Retiree $1,267.00 $1,239.00
Spouse $1,014.00 $991.00
Child $317.00 $310.00
Prescription Drug
Retiree $222.00 $244.00
Spouse $178.00 $195.00
Child $56.00 $61.00
Total
Retiree $1,489.00 $1,483.00
Spouse $1,192.00 $1,186.00
Child $373.00 $371.00

Non-Medicare Eligible SERS Wraparound HRA Plan
9
* Marketplace Wraparound HRA Plan - Participants choose insurance from any insurer offering coverage in the federal Marketplace, and if eligible, receive a federal subsidy to lower the premium and cost-sharing amounts. The SERS Marketplace Wraparound HRA Plan offers additional benefits to help pay for deductibles, co-pays, and other costs. There is no additional premium for the SERS Wraparound Plan.
* Reimbursement is capped at $1,950 per participating family per calendar year, indexed for inflation for plan years beginning after December 31, 2022, in accordance with federal limits.
* 2019, 2020 and 2021 claims experience well below cost threshold.
* The American Rescue Plan Act of 2021 (COVID-19 relief) law passed in March 2021 expandsMarketplace subsidies above 400% of poverty andalso increases subsidies for those making between100% and 400% of the poverty level, for two years(2021 and 2022). This could make the SERSWraparound HRA plan more attractive to members,creating a cost savings for SERS.
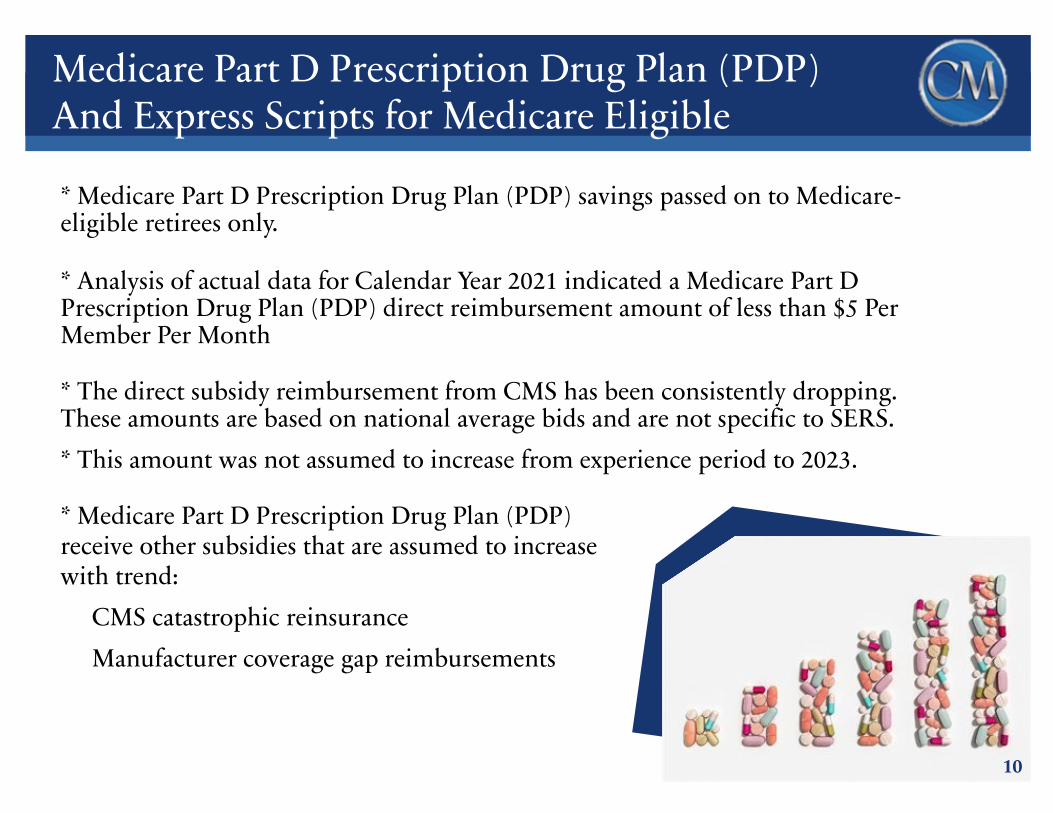
10
* Medicare Part D Prescription Drug Plan (PDP) savings passed on to Medicare-eligible retirees only.
* Analysis of actual data for Calendar Year 2021 indicated a Medicare Part D Prescription Drug Plan (PDP) direct reimbursement amount of less than $5 Per Member Per Month
* The direct subsidy reimbursement from CMS has been consistently dropping. These amounts are based on national average bids and are not specific to SERS.* This amount was not assumed to increase from experience period to 2023.
* Medicare Part D Prescription Drug Plan (PDP) receive other subsidies that are assumed to increase with trend:
CMS catastrophic reinsuranceManufacturer coverage gap reimbursements
Medicare Part D Prescription Drug Plan (PDP) And Express Scripts for Medicare Eligible
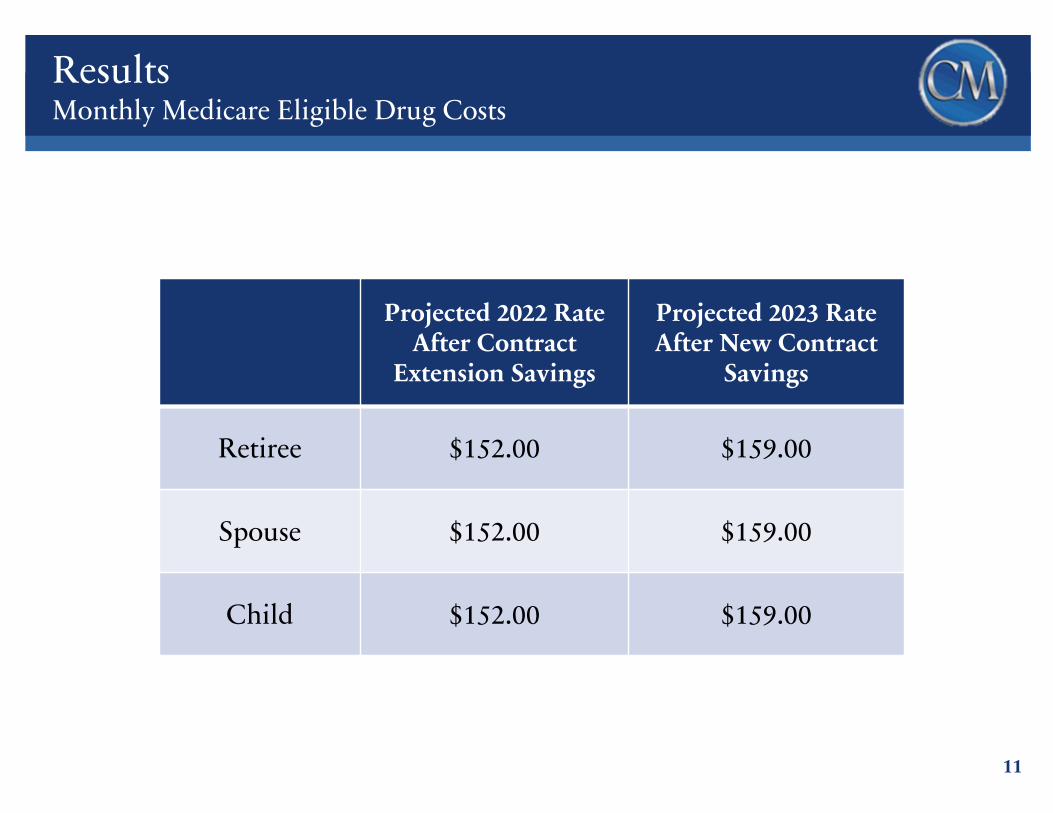
ResultsMonthly Medicare Eligible Drug Costs
11
Projected 2022 Rate After Contract
Extension Savings
Projected 2023 Rate After New Contract
Savings
Retiree $152.00 $159.00
Spouse $152.00 $159.00
Child $152.00 $159.00
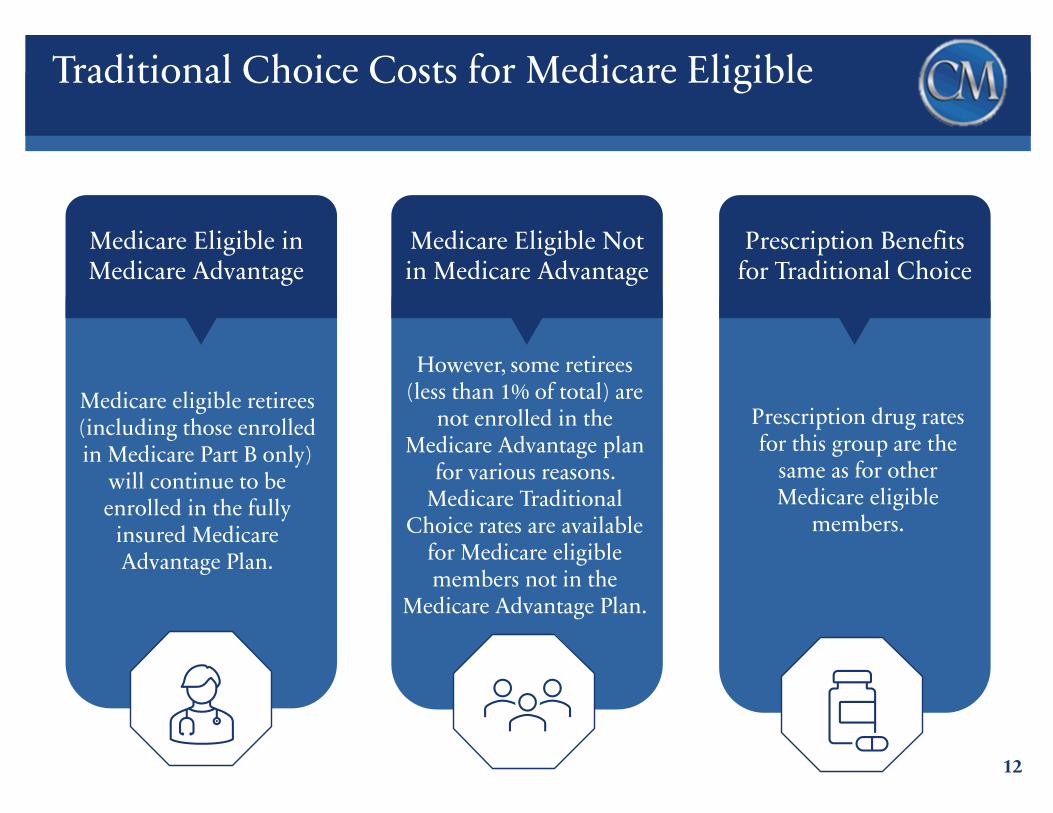
Traditional Choice Costs for Medicare Eligible
12
Medicare eligible retirees (including those enrolled in Medicare Part B only)
will continue to be enrolled in the fully
insured Medicare Advantage Plan.
Medicare Eligible in Medicare Advantage
However, some retirees (less than 1% of total) are
not enrolled in the Medicare Advantage plan
for various reasons. Medicare Traditional
Choice rates are available for Medicare eligible members not in the
Medicare Advantage Plan.
Medicare Eligible Not in Medicare Advantage
Prescription drug rates for this group are the
same as for other Medicare eligible
members.
Prescription Benefits for Traditional Choice
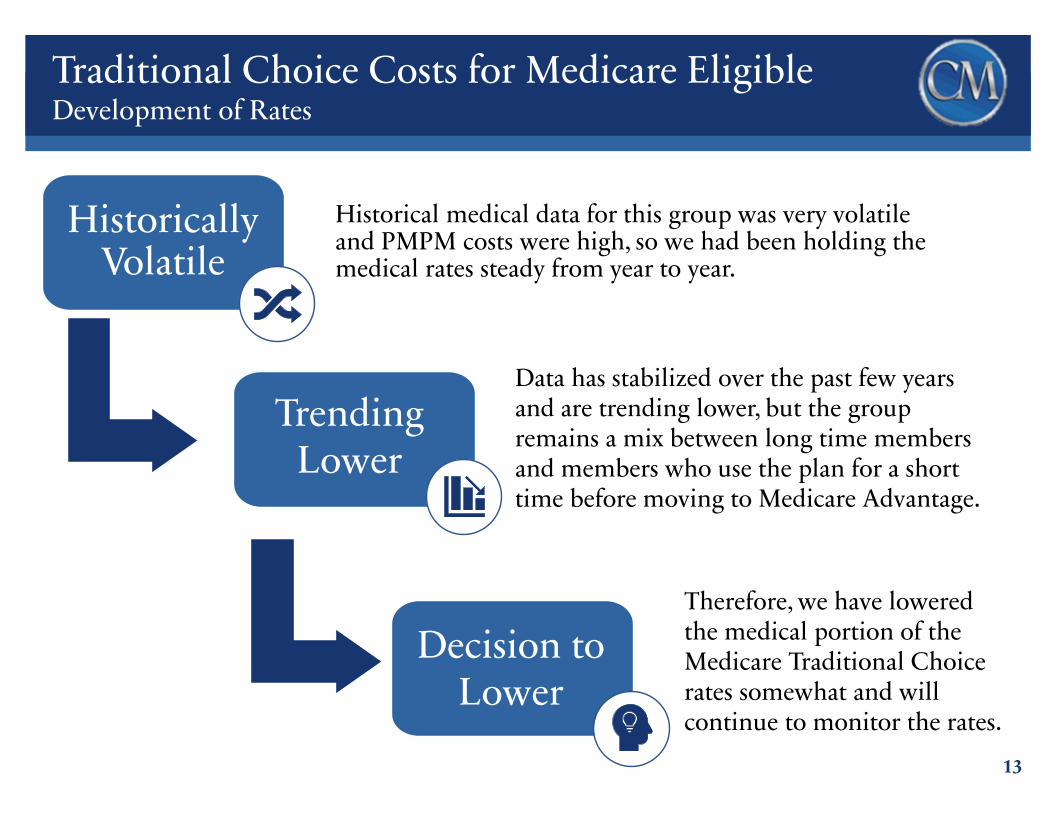
Traditional Choice Costs for Medicare EligibleDevelopment of Rates
13
Prescription drug rates for this group are the
same as for other Medicare eligible
members.
Historically Volatile
Historical medical data for this group was very volatile and PMPM costs were high, so we had been holding the medical rates steady from year to year.
Trending Lower
Decision to Lower
Data has stabilized over the past few years and are trending lower, but the group remains a mix between long time members and members who use the plan for a short time before moving to Medicare Advantage.
Therefore, we have lowered the medical portion of the Medicare Traditional Choice rates somewhat and will continue to monitor the rates.
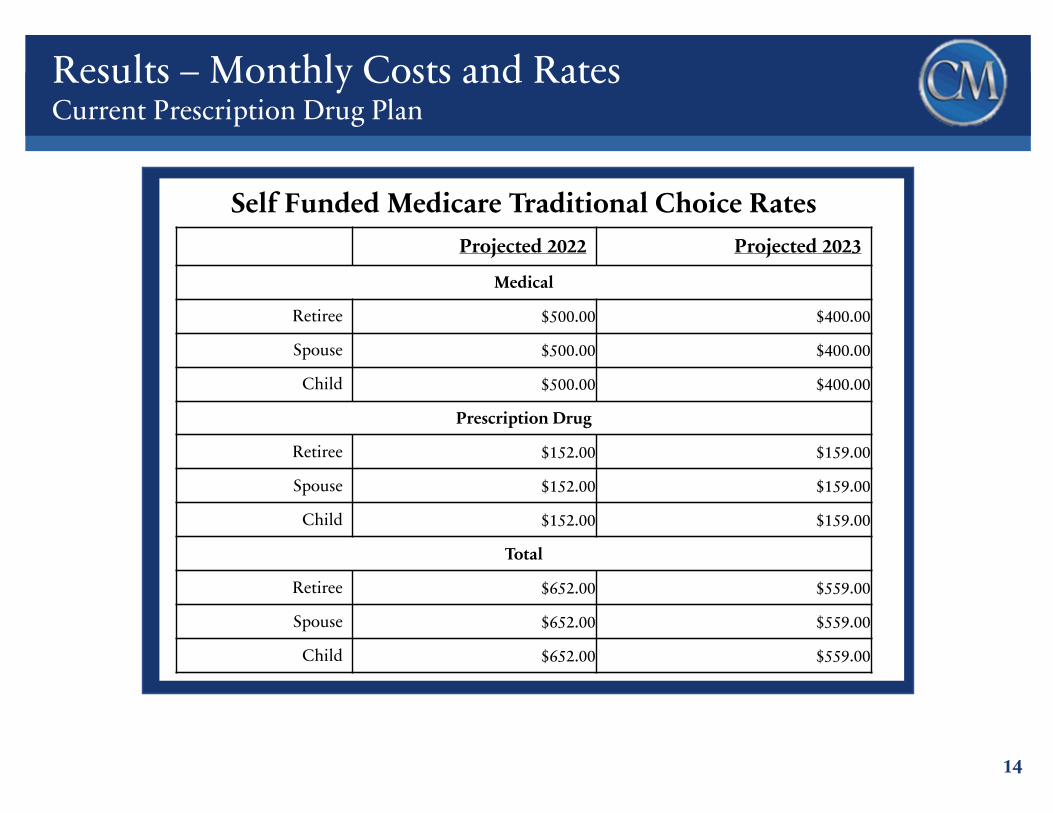
14
Self Funded Medicare Traditional Choice RatesProjected 2022 Projected 2023
Medical
Retiree $500.00 $400.00
Spouse $500.00 $400.00
Child $500.00 $400.00
Prescription Drug
Retiree $152.00 $159.00
Spouse $152.00 $159.00
Child $152.00 $159.00
Total
Retiree $652.00 $559.00
Spouse $652.00 $559.00
Child $652.00 $559.00
Results – Monthly Costs and RatesCurrent Prescription Drug Plan
School Employees Retirement SystemServing the People Who Serve Our Schools®
Health Care
Christi PepeDirector Health Care Services
May 19, 2022
School Employees Retirement SystemServing the People Who Serve Our Schools®
Agenda
• Health care program status
• 2023 rates - expectations for June
• Other 2023 program considerations
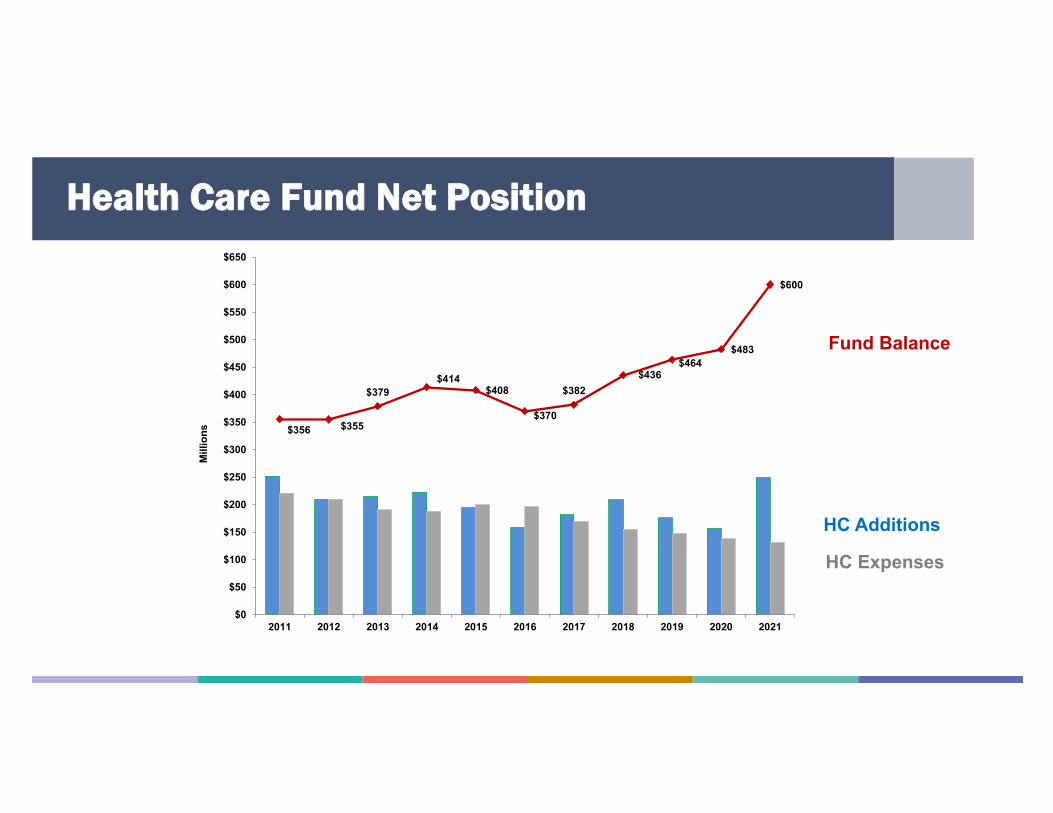
School Employees Retirement SystemServing the People Who Serve Our Schools®
Health Care Fund Net Position
$356 $355
$379 $414
$408
$370
$382 $436
$464 $483
$600
$0
$50
$100
$150
$200
$250
$300
$350
$400
$450
$500
$550
$600
$650
2011 2012 2013 2014 2015 2016 2017 2018 2019 2020 2021
Mill
ions
Fund Balance
HC Additions
HC Expenses
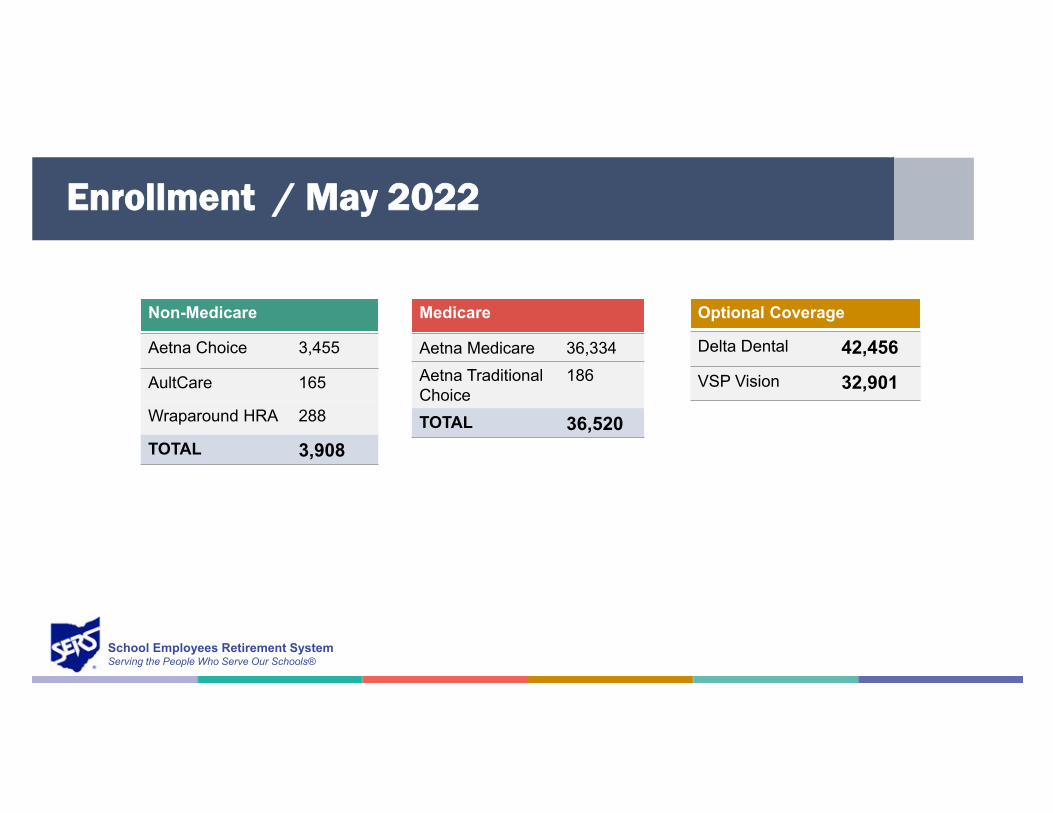
School Employees Retirement SystemServing the People Who Serve Our Schools®
Enrollment / May 2022
Non-Medicare Medicare Optional Coverage
Aetna Choice 3,455
AultCare 165
Wraparound HRA 288
TOTAL 3,908
Aetna Medicare 36,334
Aetna Traditional Choice
186
TOTAL 36,520
Delta Dental 42,456VSP Vision 32,901
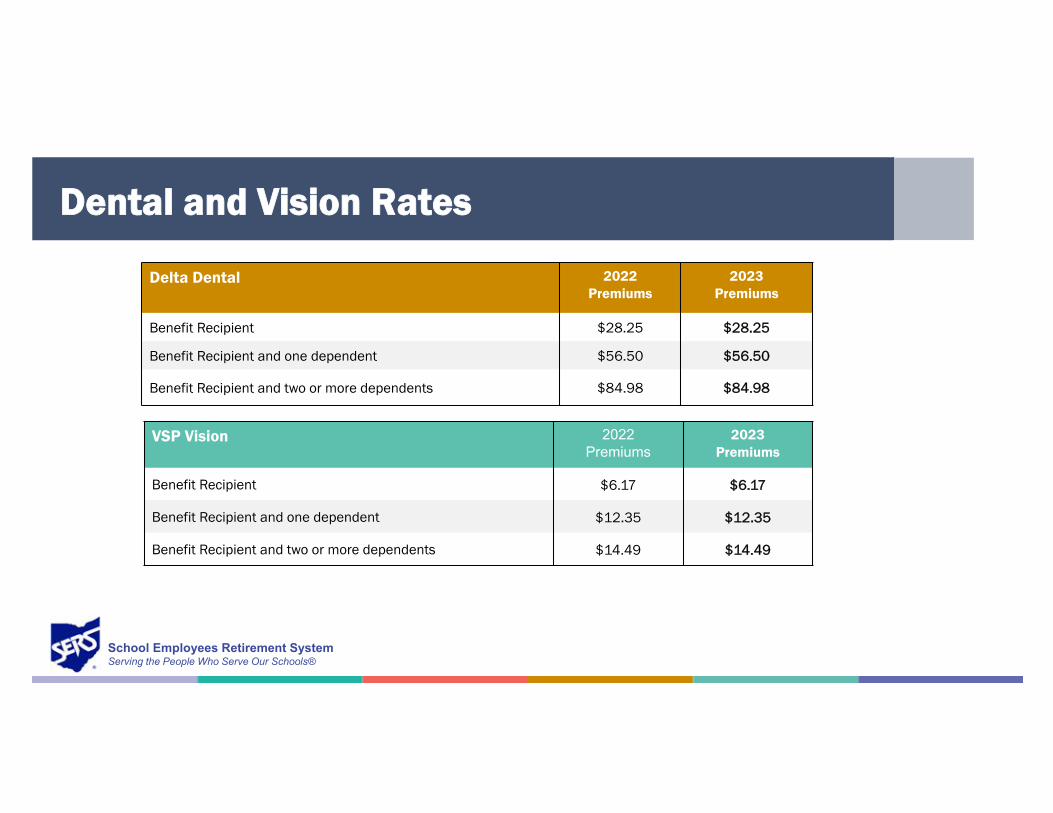
School Employees Retirement SystemServing the People Who Serve Our Schools®
Dental and Vision Rates
Delta Dental 2022Premiums
2023Premiums
Benefit Recipient $28.25 $28.25
Benefit Recipient and one dependent $56.50 $56.50
Benefit Recipient and two or more dependents $84.98 $84.98
VSP Vision 2022Premiums
2023Premiums
Benefit Recipient $6.17 $6.17
Benefit Recipient and one dependent $12.35 $12.35
Benefit Recipient and two or more dependents $14.49 $14.49
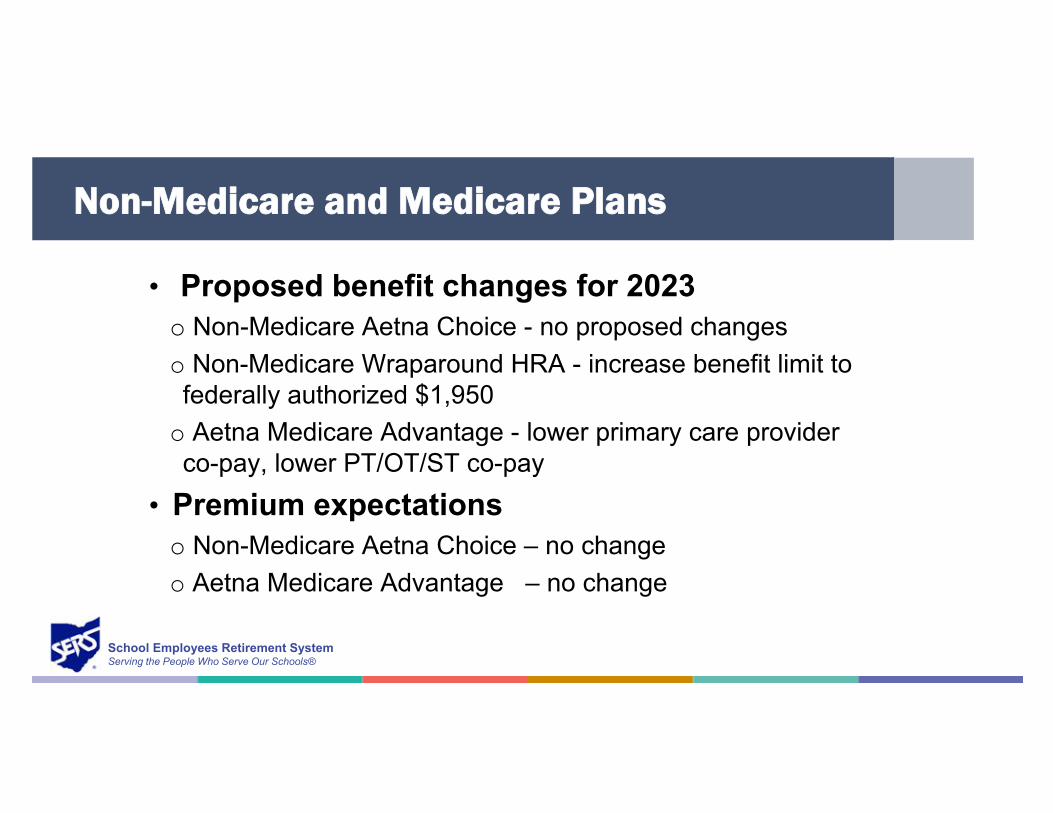
School Employees Retirement SystemServing the People Who Serve Our Schools®
Non-Medicare and Medicare Plans
• Proposed benefit changes for 2023o Non-Medicare Aetna Choice - no proposed changes
o Non-Medicare Wraparound HRA - increase benefit limit to federally authorized $1,950
o Aetna Medicare Advantage - lower primary care provider co-pay, lower PT/OT/ST co-pay
• Premium expectationso Non-Medicare Aetna Choice – no change
o Aetna Medicare Advantage – no change
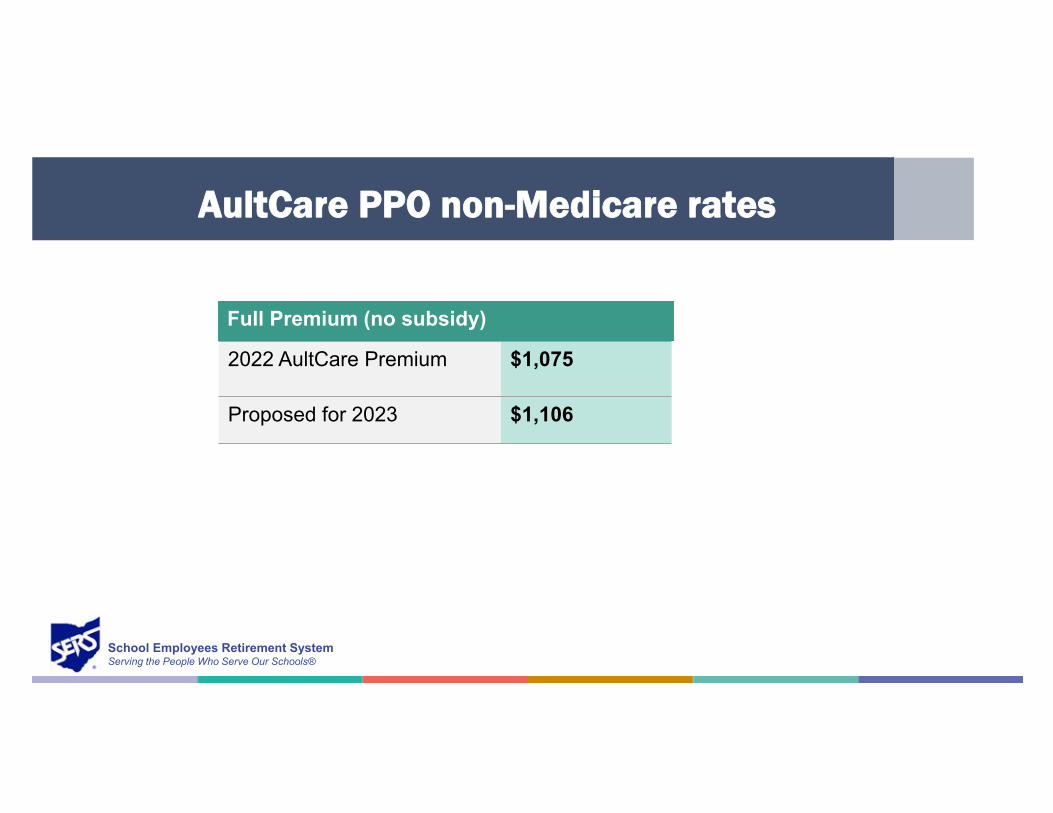
School Employees Retirement SystemServing the People Who Serve Our Schools®
AultCare PPO non-Medicare rates
Full Premium (no subsidy)
2022 AultCare Premium $1,075
Proposed for 2023 $1,106
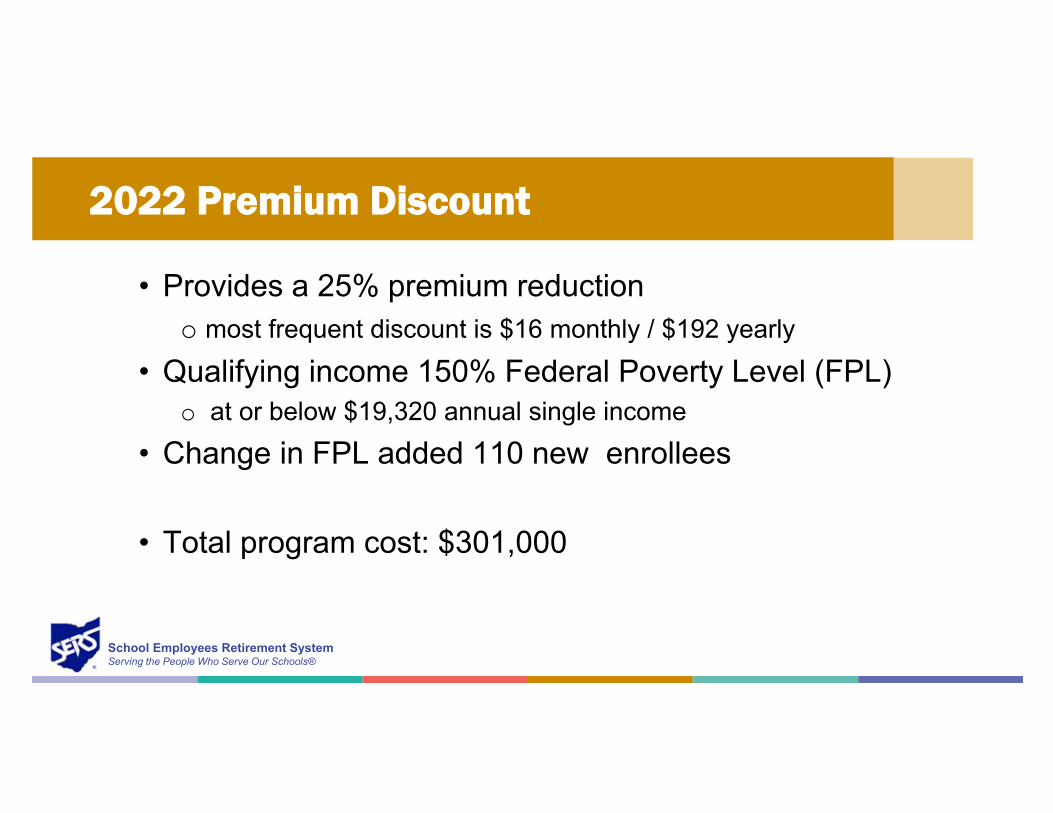
School Employees Retirement SystemServing the People Who Serve Our Schools®
2022 Premium Discount
• Provides a 25% premium reductiono most frequent discount is $16 monthly / $192 yearly
• Qualifying income 150% Federal Poverty Level (FPL)o at or below $19,320 annual single income
• Change in FPL added 110 new enrollees
• Total program cost: $301,000
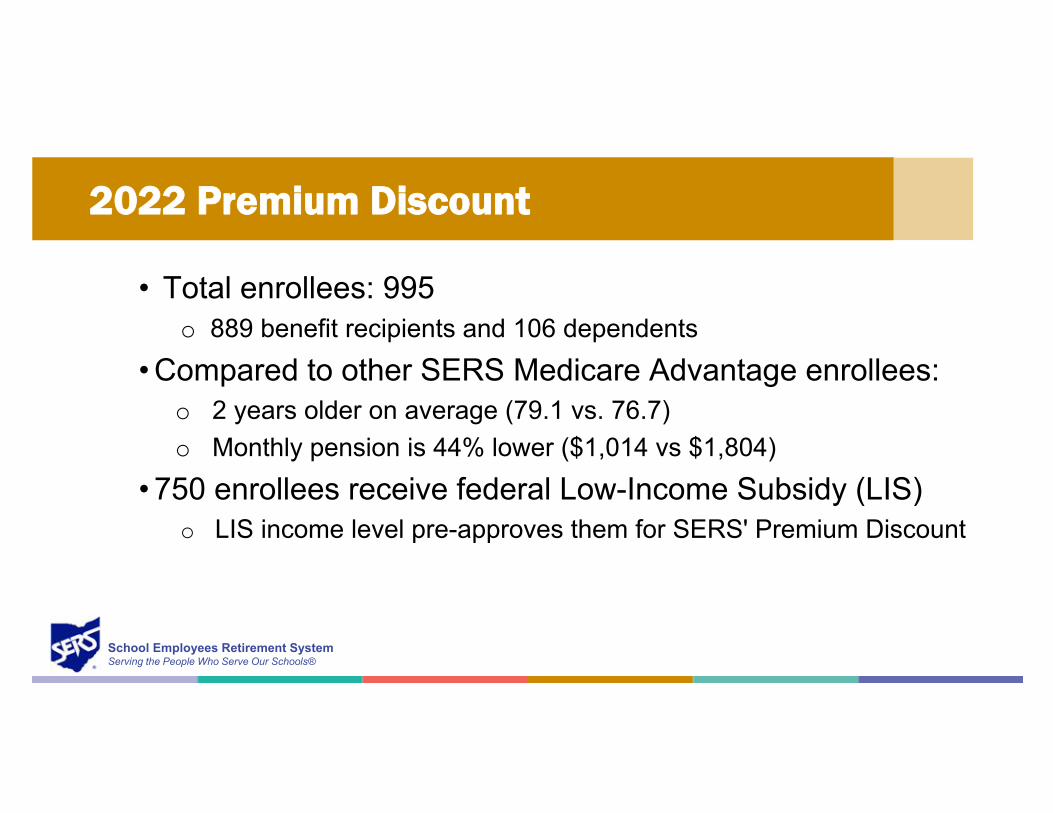
School Employees Retirement SystemServing the People Who Serve Our Schools®
2022 Premium Discount
• Total enrollees: 995o 889 benefit recipients and 106 dependents
• Compared to other SERS Medicare Advantage enrollees:o 2 years older on average (79.1 vs. 76.7)
o Monthly pension is 44% lower ($1,014 vs $1,804)
• 750 enrollees receive federal Low-Income Subsidy (LIS)o LIS income level pre-approves them for SERS' Premium Discount
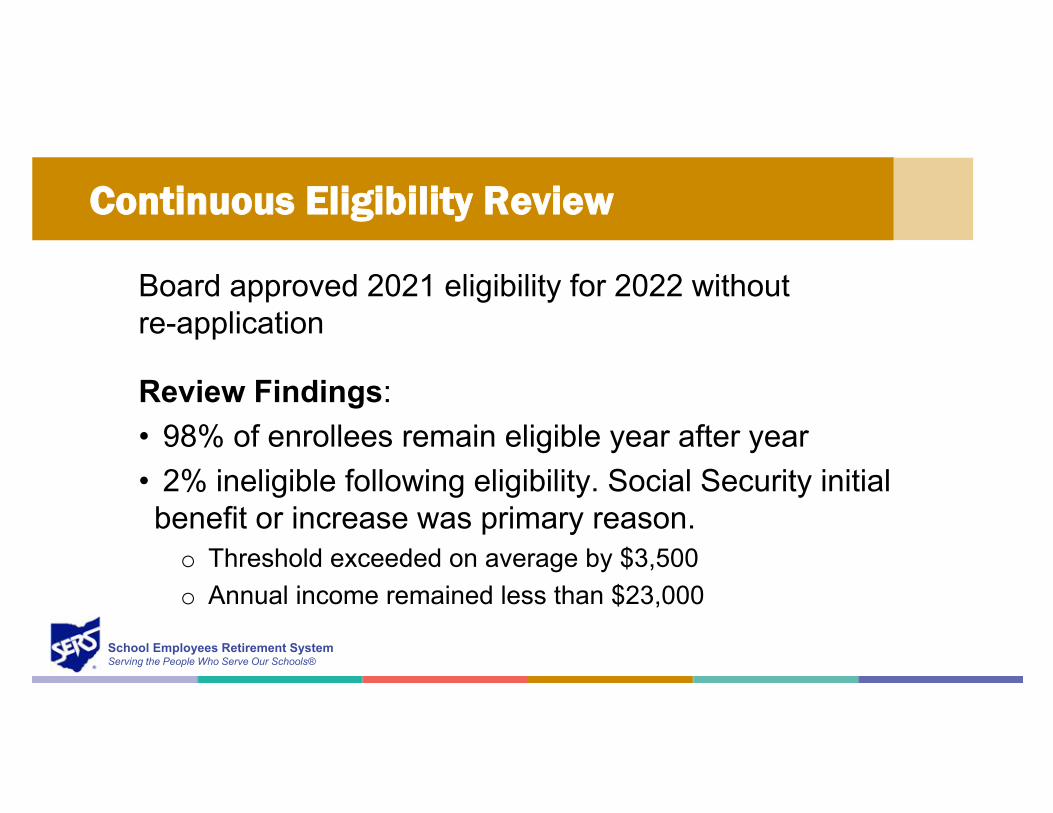
School Employees Retirement SystemServing the People Who Serve Our Schools®
Continuous Eligibility Review
Review Findings:
• 98% of enrollees remain eligible year after year
• 2% ineligible following eligibility. Social Security initial benefit or increase was primary reason.o Threshold exceeded on average by $3,500
o Annual income remained less than $23,000
Board approved 2021 eligibility for 2022 without re-application
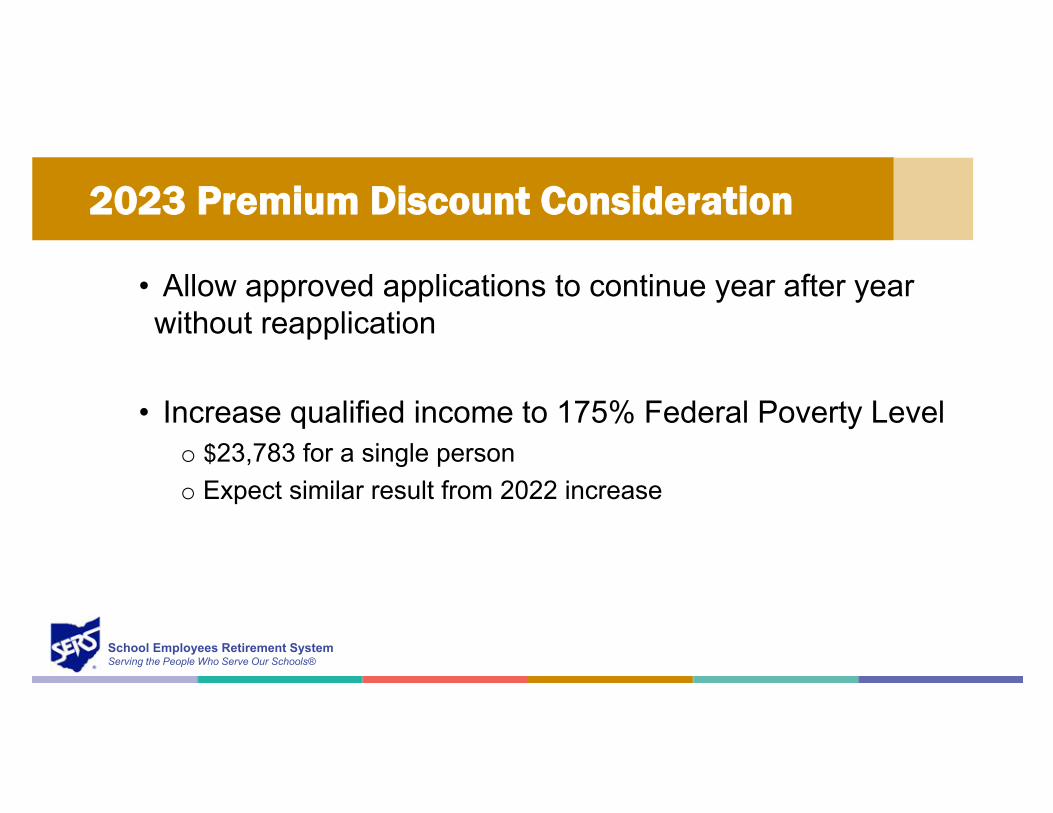
School Employees Retirement SystemServing the People Who Serve Our Schools®
2023 Premium Discount Consideration
• Allow approved applications to continue year after year without reapplication
• Increase qualified income to 175% Federal Poverty Levelo $23,783 for a single person
o Expect similar result from 2022 increase
Thank You
School Employees Retirement System
Memo To: Retirement Board
From: Chris Collins
cc: Richard Stensrud
Date: May 6, 2022
Re: Proxy Voting Activity for the Quarter ending March 31, 2022
Proxy Voting Update Attached please find a list of SERS’ proxy voting activity for the quarter ending March 31, 2022. SERS had the opportunity to vote on proposals for 383 companies that held shareholder meetings during the quarter. Our proxy voting agent, Institutional Shareholder Services (ISS), voted on 3,706 different proxy issues according to our instructions. There were a total of 2 ballots that SERS did not vote during the quarter due to circumstances that relate to not receiving ballots until after the vote deadline. These appear to be new accounts and it is anticipated that this issue will not recur in the future. Corporate Governance Activities SERS continues its involvement in both the Investors for Opioid & Pharmaceutical Accountability (IOPA) Group and the Midwest Investors Diversity Initiative (MIDI). Both groups have monthly teleconferences and continue to have successful engagements with companies on their target lists. The IOPA group is a group of institutional investors that engages with public companies associated with the opioid crisis and encourages corporate governance reforms that include increased oversight and transparency. IOPA is currently targeting 24 companies for engagement. Where appropriate IOPA is also supporting shareholder proposals with these companies encouraging independent board chairs, development of board-level opioid risk reports, adoption of misconduct clawback policies, limiting executive compensation to hold executives accountable for opioid settlements, and expanded disclosure of corporate lobbying. The MIDI group is comprised of Midwestern institutional investors that engage public companies that are also located in the Midwest with the goal of encouraging diversity on their boards of directors. This is accomplished by asking companies to adopt changes to their nominating and governance charters to encourage diversity on their boards.
Page 2
This is accomplished by asking companies to adopt changes to their nominating and governance charters to encourage diversity on their boards. MIDI has sent letters to 19 midwestern companies for engagement. So far, 5 companies have appointed or intend to appoint a diverse director, 8 companies have agreed to disclose their board diversity, 3 companies have agreed to disclose their EEO-1, and 4 companies have adopted diverse search policies in the spirit of the Rooney Rule. I will continue to update you on the progress of these groups over the course of the year. An update for the quarter ending June 30, 2022 will be provided to you in September. Please let me know if you have any questions.
School Employees Retirement System
Memo To: Retirement Board
From: Chris Collins
cc: Richard Stensrud, Karen Roggenkamp
Date: May 6, 2022
Re: Federal Legislative Report
OVERVIEW Ohio primary election results J.D. Vance rode former President Donald Trump's endorsement to victory in Tuesday's closely fought Republican U.S. Senate primary election. The author and investor will face U.S. Rep. Tim Ryan (D-Warren) who easily won the Democratic nomination with about 70% of votes based on unofficial results. The winner of the November General Election will succeed retiring U.S. Senator Rob Portman. The Trump endorsement likely was the key to victory for Mr. Vance, with public polls shifting in his favor shortly after the former president publicly backed his campaign in mid-April. While Mr. Vance's prior criticisms of the president were a frequent line of attack for his opponents, none succeeded in driving his popularity down far enough with Pro-Trump voters to secure the Republican nomination. In addition, Ohio Congressional incumbents all received voters' approvals by considerable margins on election night. Mr. Trump also lent his name to three Republican congressional candidates, Madison Gesiotto Gilbert in the 13th District (to face state Rep. Emilia Sykes in an open seat) and his former aide Max Miller in the Seventh District (to face Matthew Diemer to replace retiring U.S. Rep. Bob Gibbs), and J.R. Majewski in the Ninth District (to face incumbent U.S. Rep. Marcy Kaptur), all of whom were leading at the end of the night. Abortion ruling leaked According to an initial draft majority opinion written by Justice Samuel Alito circulated inside the court and obtained by news outlet Politico, the Supreme Court has voted to strike down the landmark Roe v. Wade decision. The court’s holding will not be final until it is published, likely in the next two months. But the ramifications of such a decision, although largely anticipated, has sent massive waves through the political establishment in Washington. According to reports a person familiar with the court’s deliberations said that four of the other Republican-appointed justices — Clarence Thomas, Neil Gorsuch, Brett Kavanaugh and Amy
Page 2
Coney Barrett — had voted with Alito in the conference held among the justices after hearing oral arguments in December. The three Democratic-appointed justices — Stephen Breyer, Sonia Sotomayor and Elena Kagan — are working on one or more dissents, according to the person. How Chief Justice John Roberts will ultimately vote, and whether he will join an already written opinion or draft his own, is unclear. The document, labeled as a first draft of the majority opinion, includes a notation that it was circulated among the justices on February 10th. If the Alito draft is adopted, it would rule in favor of Mississippi in the closely watched case over that state’s attempt to ban most abortions after 15 weeks of pregnancy. Ohio has already enacted one of the strictest abortion bans in the country, 133-SB23 (Roegner), which bans abortion after fetal cardiac activity is detected, often around six weeks' gestation. While Ohio's law remains enjoined, the U.S. Supreme Court recently allowed a similar law to go into effect in Texas. The General Assembly is currently considering "trigger ban" bills that would outlaw abortion in Ohio if the U.S. Supreme Court overturns Roe. The House Government Oversight Committee has held one hearing on HB598 (Schmidt), while the Senate Health Committee has held two hearings on SB123 (Roegner-O'Brien). War in Ukraine President Joe Biden has sent draft legislation to Congress for his $33 billion assistance package for Ukraine, but Democrats are divided on how to enact it. Democratic leaders in Congress and Biden advocate pairing the Ukraine aid with billions in additional money to combat COVID-19 as a way of pressuring Republicans skeptical of the COVID-19 funding to vote for it. But in a recent letter to House Speaker Nancy Pelosi and Minority Leader Kevin McCarthy, a group of five representatives, three of them Democrats, said the Democratic leaders' plan could bog down the flow of aid to Kyiv, which is widely supported in both parties. In a prior letter to Pelosi, Biden suggested that Congress fold in the Ukraine funds with $22.5 billion in previously requested COVID-19 funding. The pandemic funding, whittled down in talks on Capitol Hill to just $10 billion, has been held up due to a dispute over Biden's move to end the Trump-era "Title 42" immigration policy barring entry to migrants on public health grounds. Almost half of the supplemental aid package, $16.4 billion, would flow to the Defense Department where it would be used to procure additional weapons and equipment for the Ukrainian military. FEDERAL APPROPRIATIONS The House Energy and Commerce Committee recently held a hearing on President Biden’s Fiscal Year 2023 Budget proposal for the Department of Health and Human Services (HHS). Secretary of HHS, Xavier Becerra, sat before the committee for about three hours answering Representatives’ questions about the President’s budget proposal for the upcoming year as well as other pressing health policy issues. Of note, Secretary Becerra reflected on the Department’s achievements over the past year related to over 257,000 Americans receiving COVID-19 vaccinations and boosters, a record number of health insurance enrollees, and key investments to address disparities and improve equity, particularly around investments on mental and behavioral health infrastructure. Secretary Becerra also noted that the pandemic has cost the US $4 trillion, so future pandemic preparedness is necessary. Other topics discussed include ARPA-H, the Title 42 asylum moratorium, and drug pricing.
Page 3
RETIREMENT SECURITY After passing the House 414-5 earlier this year, the SECURE 2.0 Act now heads to the Senate, where the Finance and Health, Education, Labor and Pensions (“HELP”) Committees are working on their own legislation. Rather than accept the legislation as sent over by the House, Finance and HELP Committee members will likely look to pull popular provisions from an assortment of retirement bills that have been introduced in the Senate. The Finance Committee currently plans to hold a markup of its bill later this spring. A Senate version of a retirement savings bill could include provisions from Senators Booker (D-NJ) and Young (R-IN) legislation to clarify regulations around emergency savings accounts to allow automatic enrollment. Also, Senators Ben Cardin (D-MD) and Rob Portman (R-OH) have legislation to exempt individuals with less than $100,000 in retirement accounts from required minimum distributions that could be added to the omnibus retirement savings bill. It is unclear whether the Senate will pass a retirement bill this year. As demonstrated by the House vote, however, there is clearly bipartisan support for many of the measures currently under consideration. Further, some key retirement champions have announced that they will retire at the end of the year, which may be an impetus for passage. As was the case in past efforts to enact retirement legislation, the best chance for enactment likely will be through hitching a ride on a must-pass, year-end package. SOCIAL SECURITY Ohio Senators Brown and Portman have introduced bi-partisan legislation to update the resource limit for Supplemental Security Income (SSI) eligibility. They introduced S. 4102, the SSI Savings Penalty Elimination Act on April 28th. The current SSI program hasn’t been updated since the 1980s, and punishes low-income Americans for working, saving for the future, and getting married. Right now, disabled individuals getting SSI are limited to $2,000 in assets; for married couples it’s $3,000. The average current monthly benefit is $585 for individuals. For approximately 60 percent of recipients, SSI is their only source of income. The bill updated the asset limits for SSI beneficiaries, enabling them to have more savings in case of an emergency without affecting their benefit, to $10,000 and $20,000, respectively, and index them to inflation moving forward. SECURITIES AND EXCHANGE COMMISSION The U.S. Securities and Exchange Commission's ("SEC") Climate and ESG Task Force has filed one of its most significant enforcement matters to date. On April 28, 2022, the SEC brought an action in the U.S. District Court for the Eastern District of New York against Vale S.A. ("Vale"), a global mining company. The SEC alleges violations of the federal securities laws arising out of false and misleading statements in connection with the safety and stability of dams built to hold toxic waste produced in mining operations. Vale is litigating the matter. The SEC alleges that Vale manipulated dam safety audits, obtained numerous fraudulent stability certificates, and regularly misled local governments, communities, and investors about the safety of the Brumadinho dam through its ESG disclosures. The complaint demonstrates that the SEC is willing to target statements included in sustainability reports, in addition to traditional periodic filings, as a basis for enforcement actions alleging fraudulent misstatements and omissions. HEALTH CARE Build Back Better update Sen. Joe Manchin (D-WV), key holdout on President Biden’s Build Back Better agenda, said Democrats’ health care priorities are contingent on new tax hikes. Sen. Manchin recently discussed such proposal with Senate Majority Leader Chuck Schumer (D-NY), specifically about using a
Page 4
narrower version of the budget reconciliation process to undo-the Trump tax cuts for corporations and the wealthy. Manchin specifically wants half of the reconciliation bill’s offsets to pay for deficit reduction. This would mean that any of the tax hikes would likely have to pay for drug pricing reform and deficit reduction. Yesterday, Sen. Manchin was asked at the American Hospital Association conference whether he supports any of the Democrats’ health care priorities like extending the exchange insurance premium subsidies that Congress temporarily increased early on in the pandemic as well as fill the Medicaid coverage gap. Machin responded that he would not support adding to the government health care costs without tax increases. Congress has a narrowing amount of time to get any major legislation passed, as mid-term election season begins to pick up later this summer. Prescription drug cost reform Senator Elizabeth Warren (D-MA) has shared a letter that legal experts sent to her with the Department of Health and Human Services, which outlined three legal tools the Biden Administration could use to lower drug prices, in lieu of any legislative action by Congress. The three tools are:
• The government patent use power codified in 28 U.S.C. § 1498: This law formalizes the government’s ability to use any innovation described in and covered by a patent in the United States, without license, provided that the use is by or for the United States and the patent holder is afforded reasonable and entire compensation. The legal experts argue that the federal government could and should use this power to curb drug prices paid by the government. The federal government can use this power by purchasing the patented drugs from a lower-cost manufacturer, or it can manufacture the drug itself or hire a third party to use the patent in the government’s place.
• The Bayh-Dole Act’s royalty-free license: Outlined in section 202 of the Bayh-Dole Act, the section grants the government irrevocable, non-transferable, royalty-free licenses to covered patents. These licenses permit the government to manufacture drugs for its own use or license production on the government’s behalf.
• The Bayh-Dole Act’s march-in rights: Outlined in section 203 of the Bayh-Dole Act, the section allows the government to authorize generic drug companies to produce the invention for sale in the private market. Unlike the government licenses provided by section 202, march-in licenses require payment of royalties to the patent holder. In addition, to issue a march-in license, an agency that funded the research must determine that proper grounds exist.
The suggestions indicate that even if prescription drug pricing legislation were to fail to advance some legal experts believe that the administration still have tools available to them to address the rising costs of prescription drugs if they are willing to use them. Excepted benefit HRA cap increase The IRS has released the 2023 inflation-adjusted maximum dollar amount that may be made newly available for excepted benefit health reimbursement arrangements (HRAs). For plan years beginning in 2023, the maximum amount that may be made newly available for the plan year for an excepted benefit HRA under Reg § 54.9831-1(c)(3)(viii) is $1,950.
FEDERAL LEGISLATION BOARD REPORT 117th United States Congress
(Prepared by Chris Collins as of May 6, 2022)
H.R.82 SPONSOR: Rep. Rodney Davis (R-IL) LAST ACTIONS: House - 01/04/2021 Referred to the Subcommittee on Social Security. CAPTION: Social Security Fairness Act of 2021 COMMENT: Repeals the GPO and WEP. 272 co-sponsors; seven Ohioans
H.R.328 SPONSOR: Rep. Peter DeFazio (D-OR) LAST ACTION: House - 01/15/2021 Referred to the House Committee on Ways and Means. CAPTION: To amend the Internal Revenue Code of 1986 to impose a tax on certain trading transactions. COMMENT: 28 co-sponsors; one Ohioan
H.R.1319 SPONSOR: Rep. John Yarmuth (D-KY) LAST ACTIONS: 03/11/2021 Became Public Law No: 117-2. CAPTION: American Rescue Plan Act of 2021 COMMENT: Provides additional relief to address the continued impact of COVID-19 on the economy, public health, state and local governments, individuals, and businesses.
H.R.2337 SPONSOR: Rep. Richard Neal (D-MA) LAST ACTIONS: House - 04/01/2021 Referred to the House Committee on Ways and Means. CAPTION: To amend title II of the Social Security Act to provide an equitable Social Security formula for individuals with noncovered employment and to provide relief for individuals currently affected by the Windfall Elimination Provision. COMMENT: 187 cosponsors; three Ohioans
S.1302 SPONSOR: Sen. Sherrod Brown (D-OH) LAST ACTIONS: Senate - 04/22/2021 Read twice and referred to the Committee on Finance. CAPTION: A bill to amend title II of the Social Security Act to repeal the Government pension offset and windfall elimination provisions. COMMENT: 39 cosponsors
H.R.3 SPONSOR: Rep. Frank Pallone (D-NJ) LAST ACTIONS: House - 04/27/2021 Referred to the Subcommittee on Oversight and Investigations CAPTION: Elijah E. Cummings Lower Drug Costs Now Act COMMENT: 88 cosponsors; three Ohioans
H.R.5376 SPONSOR: Rep. John Yarmuth (D-KY) LAST ACTIONS: House - 11/19/2021 Motion to reconsider laid on the table. CAPTION: Build Back Better Act COMMENT: This bill provides funding, establishes programs, and otherwise modifies provisions relating to a broad array of areas, including education, labor, child care, health care, taxes, immigration, and the environment.
H.R.5834 SPONSOR: Rep. Kevin Brady (R-TX) LAST ACTIONS: House - 11/03/2021 Referred to the House Committee on Ways and Means CAPTION: Equal Treatment of Public Servants Act of 2021 COMMENT: 52 cosponsors; four Ohioans
H.R.5723 SPONSOR: Rep. Larson, John B. [D-CT-1] LAST ACTIONS: House - 10/26/2021 Referred to the Committee on Ways and Means, and in addition to the Committees on Education and Labor, and Energy and Commerce, for a period to be subsequently determined by the Speaker, in each case for consideration of such provisions as fall within the jurisdiction of the committee concerned CAPTION: Social Security 2100: A Sacred Trust COMMENT: 201 cosponsors; four Ohioans
STATE LEGISLATION BOARD REPORT (Prepared by Chris Collins as of May 6, 2022)
134th General Assembly
HB110 OPERATING BUDGET Scott Oelslager (R- North Canton) To make operating appropriations for the biennium beginning July 1, 2021, and ending June 30, 2023, to levy taxes, and to provide authorization and conditions for the operation of state programs. Current Status: 07/01/2021 SIGNED BY GOVERNOR; effective 7/1/21
HB14 REGARDS STATE RETIREMENT SYSTEM Diane Grendell (R – Chesterland) Regarding state retirement system fiduciary duties, Public Employees Retirement System management fees and employee pay, and creating the Committee on Pension Salaries and Fees. Current Status: 02/04/2021 Referred to Financial Institutions Committee
SB233 SCHOOL NURSE LICENSURE, RETIREMENT Louis Blessing III (R - Cincinnati) Regarding licensure and state retirement system membership for school nurses. Current Status: 02/15/2022 Senate Primary and Secondary Education, (Second Hearing)
HB416 AUTO-ENROLLMENT RETIREMENT PROGRAM FOR PRIVATE EMPLOYEES Juanita Brent, (D – Cleveland) Stephanie Howse (D – Cleveland) To establish an auto-enrollment retirement savings program for private sector employees. Current Status: 10/27/2021 House Insurance, (First Hearing)
HB499 ALLOW ELECTED OPERS/SERS RECIPIENTS TO RECEIVE BENEFITS (Miller, A) - To allow a Public Employees Retirement System or School Employees Retirement System disability benefit recipient elected to certain offices to continue receiving a disability benefit during the term of office. Current Status: 03/09/2022 House Insurance, (Second Hearing)
HB512 POLICE, FIRE PENSION FUND (Abrams, C; Baldridge, B) - To increase employer contributions to the Ohio Police and Fire Pension Fund. Current Status: 03/30/2022 House Insurance, (Second Hearing)
HB539 STATE RETIREMENT SYSTEMS - PUBLIC BROADCAST (Kelly, B; Ghanbari, H) - To require the state retirement systems to publicly broadcast board meetings.
Current Status: 02/15/2022 Referred to Insurance Committee
HB540 STATE RETIREMENT SYSTEMS – FINANCIAL INFORMATION (Kelly, B; Ghanbari, H) - To require the state retirement system boards to disclose certain financial information regarding alternative investments. Current Status: 02/15/2022 Referred to Insurance Committee
HB541 STATE RETIREMENT SYSTEMS – FORMER EMPLOYEES (Kelly, B; Ghanbari, H) - Regarding the prohibition against the state retirement systems doing business with a former state retirement system employee, officer, or board member. Current Status: 02/15/2022 Referred to Insurance Committee
HB601 STRS COST-OF-LIVING ADJUSTMENTS (Lightbody, M; Miller, A) - Regarding increasing contributions for employers to the State Teachers Retirement System and School Employees Retirement System, establishing minimum amounts for certain STRS cost-of-living adjustments, and eliminating an age-related eligibility criterion for retirement in STRS. Current Status: 04/06/2022 House Insurance, (First Hearing)
SB308 DIVESTMENT, RESTRICTIONS-RUSSIA (Antani, N) - To prohibit state and local governments from investing in, granting incentives to, or contracting with Russia or companies based in Russia, to require Ohio's pension and other investment funds to divest from any such holdings, and to declare an emergency. Current Status: 03/16/2022 Referred to General Government Budget Committee
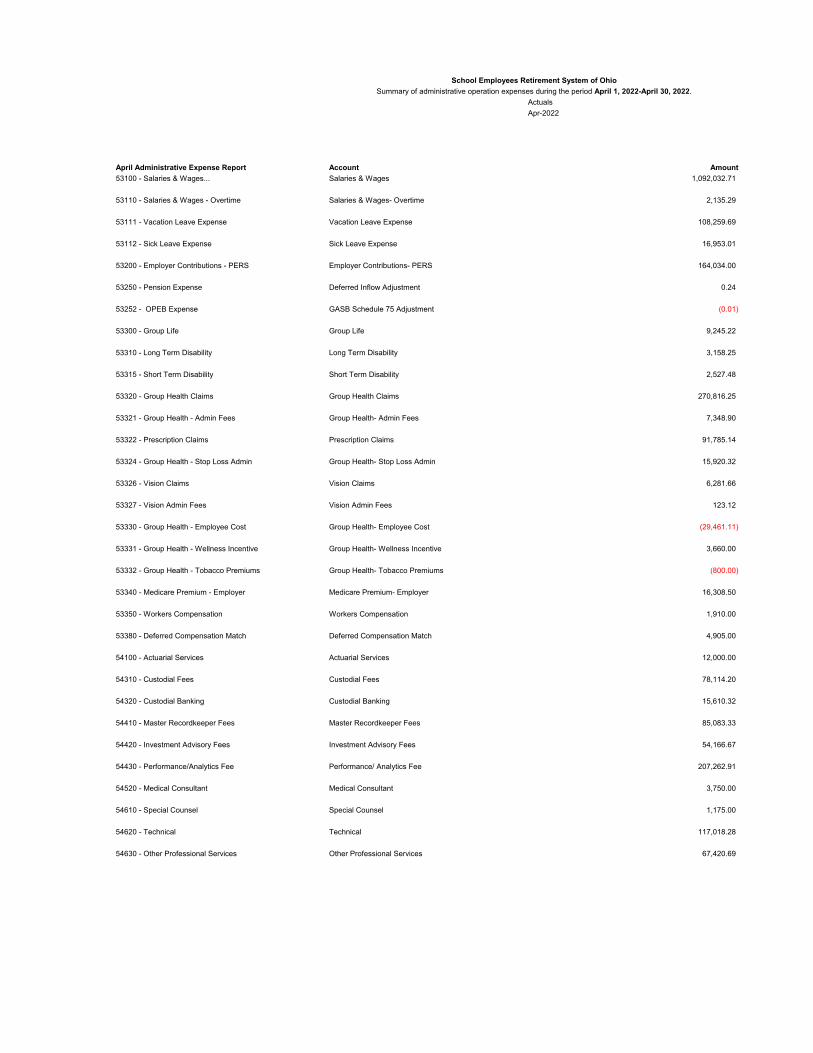
Actuals
Apr-2022
April Administrative Expense Report Account Amount53100 - Salaries & Wages... Salaries & Wages 1,092,032.71
53110 - Salaries & Wages - Overtime Salaries & Wages- Overtime 2,135.29
53111 - Vacation Leave Expense Vacation Leave Expense 108,259.69
53112 - Sick Leave Expense Sick Leave Expense 16,953.01
53200 - Employer Contributions - PERS Employer Contributions- PERS 164,034.00
53250 - Pension Expense Deferred Inflow Adjustment 0.24
53252 - OPEB Expense GASB Schedule 75 Adjustment (0.01)
53300 - Group Life Group Life 9,245.22
53310 - Long Term Disability Long Term Disability 3,158.25
53315 - Short Term Disability Short Term Disability 2,527.48
53320 - Group Health Claims Group Health Claims 270,816.25
53321 - Group Health - Admin Fees Group Health- Admin Fees 7,348.90
53322 - Prescription Claims Prescription Claims 91,785.14
53324 - Group Health - Stop Loss Admin Group Health- Stop Loss Admin 15,920.32
53326 - Vision Claims Vision Claims 6,281.66
53327 - Vision Admin Fees Vision Admin Fees 123.12
53330 - Group Health - Employee Cost Group Health- Employee Cost (29,461.11)
53331 - Group Health - Wellness Incentive Group Health- Wellness Incentive 3,660.00
53332 - Group Health - Tobacco Premiums Group Health- Tobacco Premiums (800.00)
53340 - Medicare Premium - Employer Medicare Premium- Employer 16,308.50
53350 - Workers Compensation Workers Compensation 1,910.00
53380 - Deferred Compensation Match Deferred Compensation Match 4,905.00
54100 - Actuarial Services Actuarial Services 12,000.00
54310 - Custodial Fees Custodial Fees 78,114.20
54320 - Custodial Banking Custodial Banking 15,610.32
54410 - Master Recordkeeper Fees Master Recordkeeper Fees 85,083.33
54420 - Investment Advisory Fees Investment Advisory Fees 54,166.67
54430 - Performance/Analytics Fee Performance/ Analytics Fee 207,262.91
54520 - Medical Consultant Medical Consultant 3,750.00
54610 - Special Counsel Special Counsel 1,175.00
54620 - Technical Technical 117,018.28
54630 - Other Professional Services Other Professional Services 67,420.69
School Employees Retirement System of OhioSummary of administrative operation expenses during the period April 1, 2022-April 30, 2022.
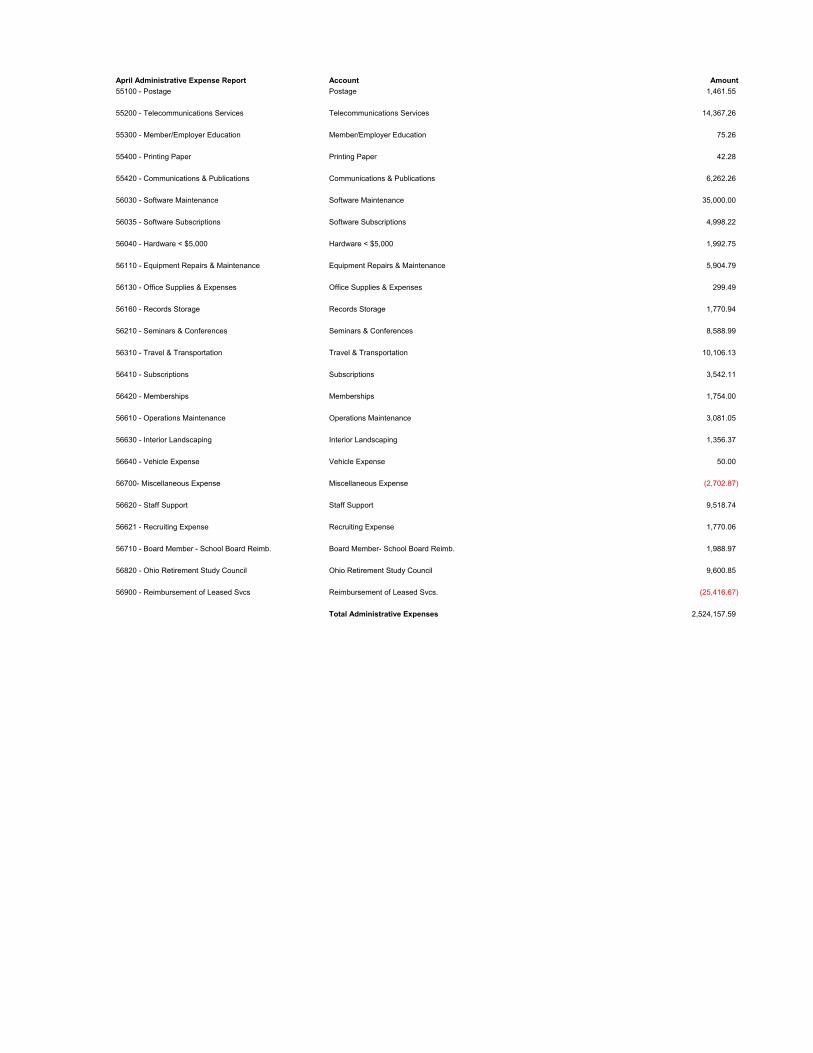
April Administrative Expense Report Account Amount55100 - Postage Postage 1,461.55
55200 - Telecommunications Services Telecommunications Services 14,367.26
55300 - Member/Employer Education Member/Employer Education 75.26
55400 - Printing Paper Printing Paper 42.28
55420 - Communications & Publications Communications & Publications 6,262.26
56030 - Software Maintenance Software Maintenance 35,000.00
56035 - Software Subscriptions Software Subscriptions 4,998.22
56040 - Hardware < $5,000 Hardware < $5,000 1,992.75
56110 - Equipment Repairs & Maintenance Equipment Repairs & Maintenance 5,904.79
56130 - Office Supplies & Expenses Office Supplies & Expenses 299.49
56160 - Records Storage Records Storage 1,770.94
56210 - Seminars & Conferences Seminars & Conferences 8,588.99
56310 - Travel & Transportation Travel & Transportation 10,106.13
56410 - Subscriptions Subscriptions 3,542.11
56420 - Memberships Memberships 1,754.00
56610 - Operations Maintenance Operations Maintenance 3,081.05
56630 - Interior Landscaping Interior Landscaping 1,356.37
56640 - Vehicle Expense Vehicle Expense 50.00
56700- Miscellaneous Expense Miscellaneous Expense (2,702.87)
56620 - Staff Support Staff Support 9,518.74
56621 - Recruiting Expense Recruiting Expense 1,770.06
56710 - Board Member - School Board Reimb. Board Member- School Board Reimb. 1,988.97
56820 - Ohio Retirement Study Council Ohio Retirement Study Council 9,600.85
56900 - Reimbursement of Leased Svcs Reimbursement of Leased Svcs. (25,416.67)
Total Administrative Expenses 2,524,157.59
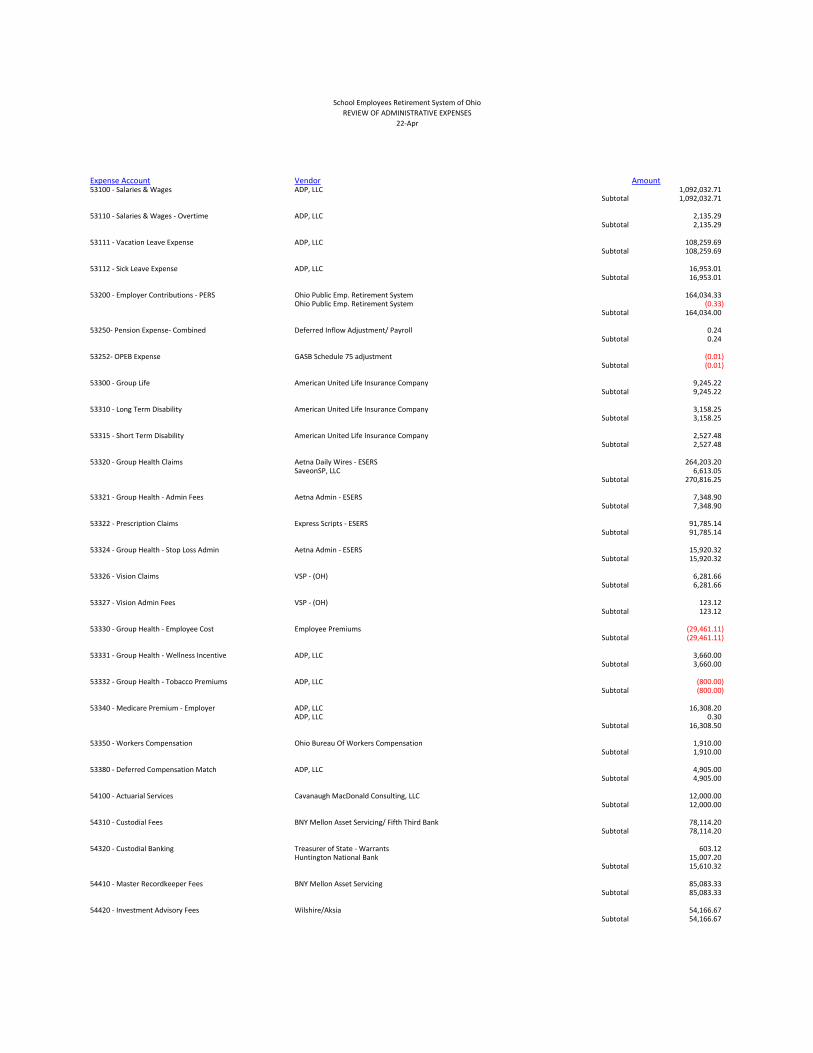
Expense Account Vendor Amount53100 ‐ Salaries & Wages ADP, LLC 1,092,032.71
Subtotal 1,092,032.71
53110 ‐ Salaries & Wages ‐ Overtime ADP, LLC 2,135.29Subtotal 2,135.29
53111 ‐ Vacation Leave Expense ADP, LLC 108,259.69Subtotal 108,259.69
53112 ‐ Sick Leave Expense ADP, LLC 16,953.01Subtotal 16,953.01
53200 ‐ Employer Contributions ‐ PERS Ohio Public Emp. Retirement System 164,034.33Ohio Public Emp. Retirement System (0.33)
Subtotal 164,034.00
53250‐ Pension Expense‐ Combined Deferred Inflow Adjustment/ Payroll 0.24Subtotal 0.24
53252‐ OPEB Expense GASB Schedule 75 adjustment (0.01)Subtotal (0.01)
53300 ‐ Group Life American United Life Insurance Company 9,245.22Subtotal 9,245.22
53310 ‐ Long Term Disability American United Life Insurance Company 3,158.25Subtotal 3,158.25
53315 ‐ Short Term Disability American United Life Insurance Company 2,527.48Subtotal 2,527.48
53320 ‐ Group Health Claims Aetna Daily Wires ‐ ESERS 264,203.20SaveonSP, LLC 6,613.05
Subtotal 270,816.25
53321 ‐ Group Health ‐ Admin Fees Aetna Admin ‐ ESERS 7,348.90Subtotal 7,348.90
53322 ‐ Prescription Claims Express Scripts ‐ ESERS 91,785.14Subtotal 91,785.14
53324 ‐ Group Health ‐ Stop Loss Admin Aetna Admin ‐ ESERS 15,920.32Subtotal 15,920.32
53326 ‐ Vision Claims VSP ‐ (OH) 6,281.66Subtotal 6,281.66
53327 ‐ Vision Admin Fees VSP ‐ (OH) 123.12Subtotal 123.12
53330 ‐ Group Health ‐ Employee Cost Employee Premiums (29,461.11)Subtotal (29,461.11)
53331 ‐ Group Health ‐ Wellness Incentive ADP, LLC 3,660.00Subtotal 3,660.00
53332 ‐ Group Health ‐ Tobacco Premiums ADP, LLC (800.00)Subtotal (800.00)
53340 ‐ Medicare Premium ‐ Employer ADP, LLC 16,308.20ADP, LLC 0.30
Subtotal 16,308.50
53350 ‐ Workers Compensation Ohio Bureau Of Workers Compensation 1,910.00Subtotal 1,910.00
53380 ‐ Deferred Compensation Match ADP, LLC 4,905.00Subtotal 4,905.00
54100 ‐ Actuarial Services Cavanaugh MacDonald Consulting, LLC 12,000.00Subtotal 12,000.00
54310 ‐ Custodial Fees BNY Mellon Asset Servicing/ Fifth Third Bank 78,114.20Subtotal 78,114.20
54320 ‐ Custodial Banking Treasurer of State ‐ Warrants 603.12Huntington National Bank 15,007.20
Subtotal 15,610.32
54410 ‐ Master Recordkeeper Fees BNY Mellon Asset Servicing 85,083.33Subtotal 85,083.33
54420 ‐ Investment Advisory Fees Wilshire/Aksia 54,166.67Subtotal 54,166.67
School Employees Retirement System of Ohio
REVIEW OF ADMINISTRATIVE EXPENSES
22‐Apr
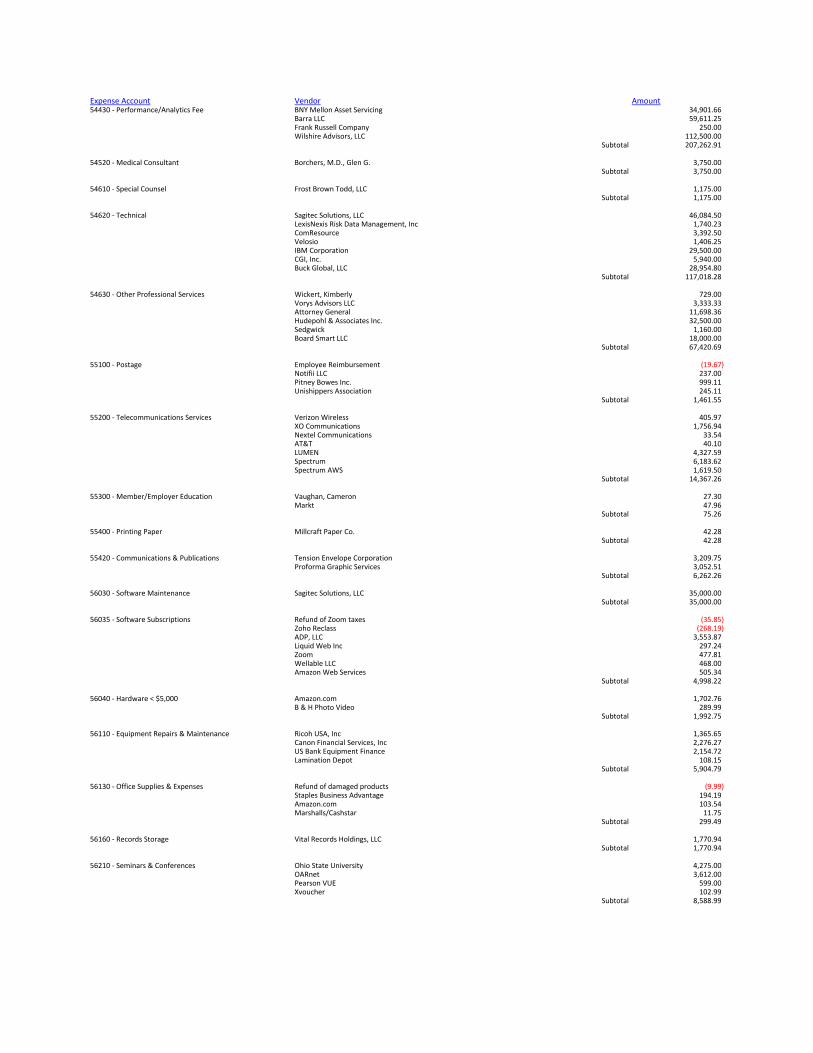
Expense Account Vendor Amount54430 ‐ Performance/Analytics Fee BNY Mellon Asset Servicing 34,901.66
Barra LLC 59,611.25Frank Russell Company 250.00Wilshire Advisors, LLC 112,500.00
Subtotal 207,262.91
54520 ‐ Medical Consultant Borchers, M.D., Glen G. 3,750.00Subtotal 3,750.00
54610 ‐ Special Counsel Frost Brown Todd, LLC 1,175.00Subtotal 1,175.00
54620 ‐ Technical Sagitec Solutions, LLC 46,084.50LexisNexis Risk Data Management, Inc 1,740.23ComResource 3,392.50Velosio 1,406.25IBM Corporation 29,500.00CGI, Inc. 5,940.00Buck Global, LLC 28,954.80
Subtotal 117,018.28
54630 ‐ Other Professional Services Wickert, Kimberly 729.00Vorys Advisors LLC 3,333.33Attorney General 11,698.36Hudepohl & Associates Inc. 32,500.00Sedgwick 1,160.00Board Smart LLC 18,000.00
Subtotal 67,420.69
55100 ‐ Postage Employee Reimbursement (19.67)Notifii LLC 237.00Pitney Bowes Inc. 999.11Unishippers Association 245.11
Subtotal 1,461.55
55200 ‐ Telecommunications Services Verizon Wireless 405.97XO Communications 1,756.94Nextel Communications 33.54AT&T 40.10LUMEN 4,327.59Spectrum 6,183.62Spectrum AWS 1,619.50
Subtotal 14,367.26
55300 ‐ Member/Employer Education Vaughan, Cameron 27.30Markt 47.96
Subtotal 75.26
55400 ‐ Printing Paper Millcraft Paper Co. 42.28Subtotal 42.28
55420 ‐ Communications & Publications Tension Envelope Corporation 3,209.75Proforma Graphic Services 3,052.51
Subtotal 6,262.26
56030 ‐ Software Maintenance Sagitec Solutions, LLC 35,000.00Subtotal 35,000.00
56035 ‐ Software Subscriptions Refund of Zoom taxes (35.85)Zoho Reclass (268.19)ADP, LLC 3,553.87Liquid Web Inc 297.24Zoom 477.81Wellable LLC 468.00Amazon Web Services 505.34
Subtotal 4,998.22
56040 ‐ Hardware < $5,000 Amazon.com 1,702.76B & H Photo Video 289.99
Subtotal 1,992.75
56110 ‐ Equipment Repairs & Maintenance Ricoh USA, Inc 1,365.65Canon Financial Services, Inc 2,276.27US Bank Equipment Finance 2,154.72Lamination Depot 108.15
Subtotal 5,904.79
56130 ‐ Office Supplies & Expenses Refund of damaged products (9.99)Staples Business Advantage 194.19Amazon.com 103.54Marshalls/Cashstar 11.75
Subtotal 299.49
56160 ‐ Records Storage Vital Records Holdings, LLC 1,770.94Subtotal 1,770.94
56210 ‐ Seminars & Conferences Ohio State University 4,275.00OARnet 3,612.00Pearson VUE 599.00Xvoucher 102.99
Subtotal 8,588.99
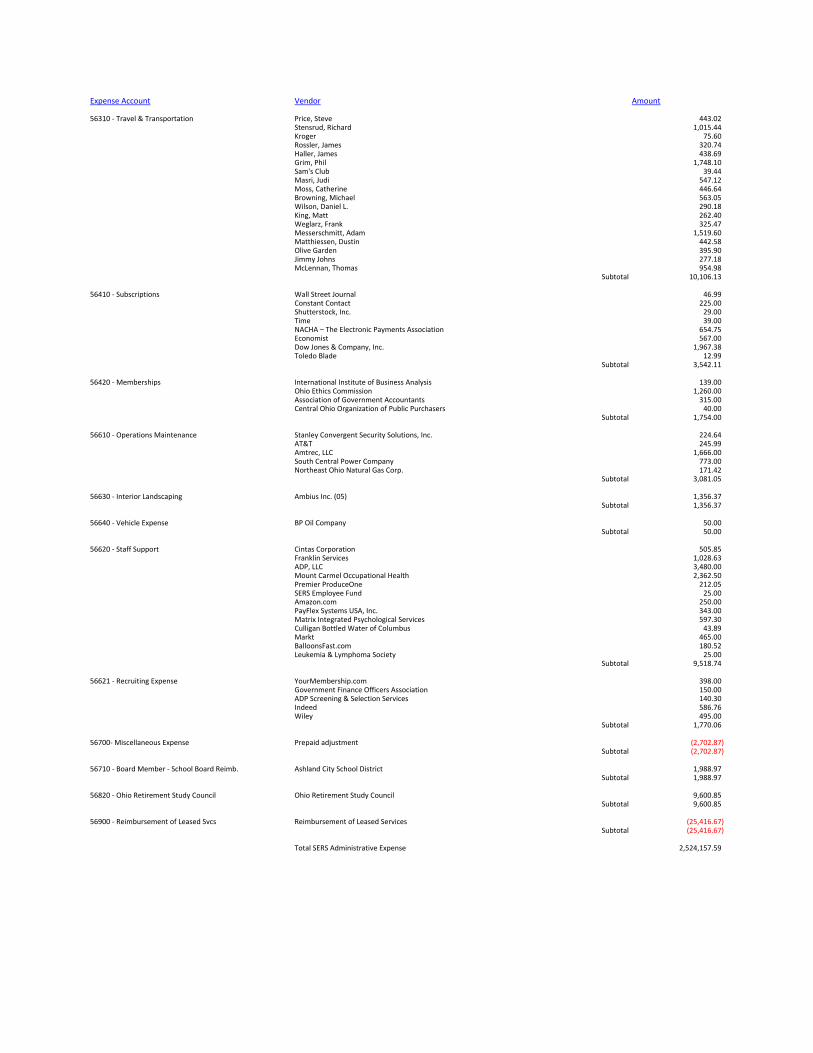
Expense Account Vendor Amount
56310 ‐ Travel & Transportation Price, Steve 443.02Stensrud, Richard 1,015.44Kroger 75.60Rossler, James 320.74Haller, James 438.69Grim, Phil 1,748.10Sam's Club 39.44Masri, Judi 547.12Moss, Catherine 446.64Browning, Michael 563.05Wilson, Daniel L. 290.18King, Matt 262.40Weglarz, Frank 325.47Messerschmitt, Adam 1,519.60Matthiessen, Dustin 442.58Olive Garden 395.90Jimmy Johns 277.18McLennan, Thomas 954.98
Subtotal 10,106.13
56410 ‐ Subscriptions Wall Street Journal 46.99Constant Contact 225.00Shutterstock, Inc. 29.00Time 39.00NACHA – The Electronic Payments Association 654.75Economist 567.00Dow Jones & Company, Inc. 1,967.38Toledo Blade 12.99
Subtotal 3,542.11
56420 ‐ Memberships International Institute of Business Analysis 139.00Ohio Ethics Commission 1,260.00Association of Government Accountants 315.00Central Ohio Organization of Public Purchasers 40.00
Subtotal 1,754.00
56610 ‐ Operations Maintenance Stanley Convergent Security Solutions, Inc. 224.64AT&T 245.99Amtrec, LLC 1,666.00South Central Power Company 773.00Northeast Ohio Natural Gas Corp. 171.42
Subtotal 3,081.05
56630 ‐ Interior Landscaping Ambius Inc. (05) 1,356.37Subtotal 1,356.37
56640 ‐ Vehicle Expense BP Oil Company 50.00Subtotal 50.00
56620 ‐ Staff Support Cintas Corporation 505.85Franklin Services 1,028.63ADP, LLC 3,480.00Mount Carmel Occupational Health 2,362.50Premier ProduceOne 212.05SERS Employee Fund 25.00Amazon.com 250.00PayFlex Systems USA, Inc. 343.00Matrix Integrated Psychological Services 597.30Culligan Bottled Water of Columbus 43.89Markt 465.00BalloonsFast.com 180.52Leukemia & Lymphoma Society 25.00
Subtotal 9,518.74
56621 ‐ Recruiting Expense YourMembership.com 398.00Government Finance Officers Association 150.00ADP Screening & Selection Services 140.30Indeed 586.76Wiley 495.00
Subtotal 1,770.06
56700‐ Miscellaneous Expense Prepaid adjustment (2,702.87)Subtotal (2,702.87)
56710 ‐ Board Member ‐ School Board Reimb. Ashland City School District 1,988.97Subtotal 1,988.97
56820 ‐ Ohio Retirement Study Council Ohio Retirement Study Council 9,600.85Subtotal 9,600.85
56900 ‐ Reimbursement of Leased Svcs Reimbursement of Leased Services (25,416.67)Subtotal (25,416.67)
Total SERS Administrative Expense 2,524,157.59
ADMINISTRATIVEBUDGET
FY2023May 19, 2022
GOALS & OBJECTIVES
Budget Policy/Process
Review the Proposed FY2023 Budget
Questions / requests for future meetings
No action required today
2
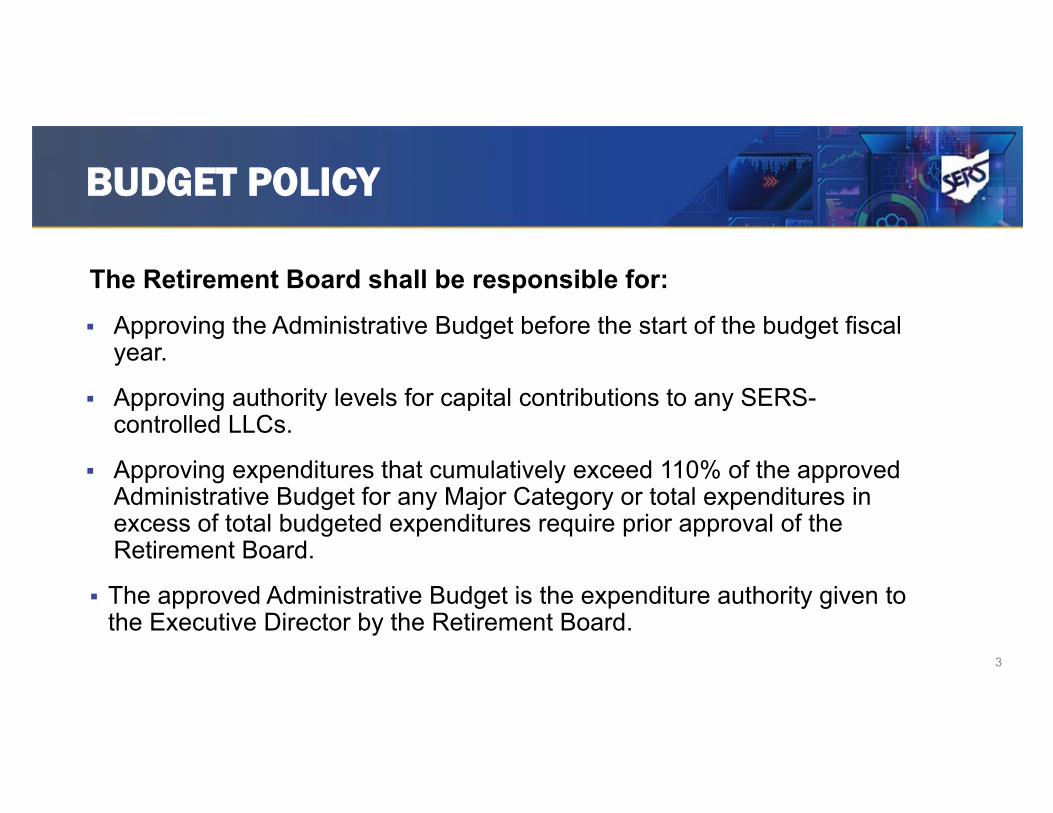
BUDGET POLICY
The Retirement Board shall be responsible for: Approving the Administrative Budget before the start of the budget fiscal
year.
Approving authority levels for capital contributions to any SERS-controlled LLCs.
Approving expenditures that cumulatively exceed 110% of the approved Administrative Budget for any Major Category or total expenditures in excess of total budgeted expenditures require prior approval of the Retirement Board.
The approved Administrative Budget is the expenditure authority given to the Executive Director by the Retirement Board.
3
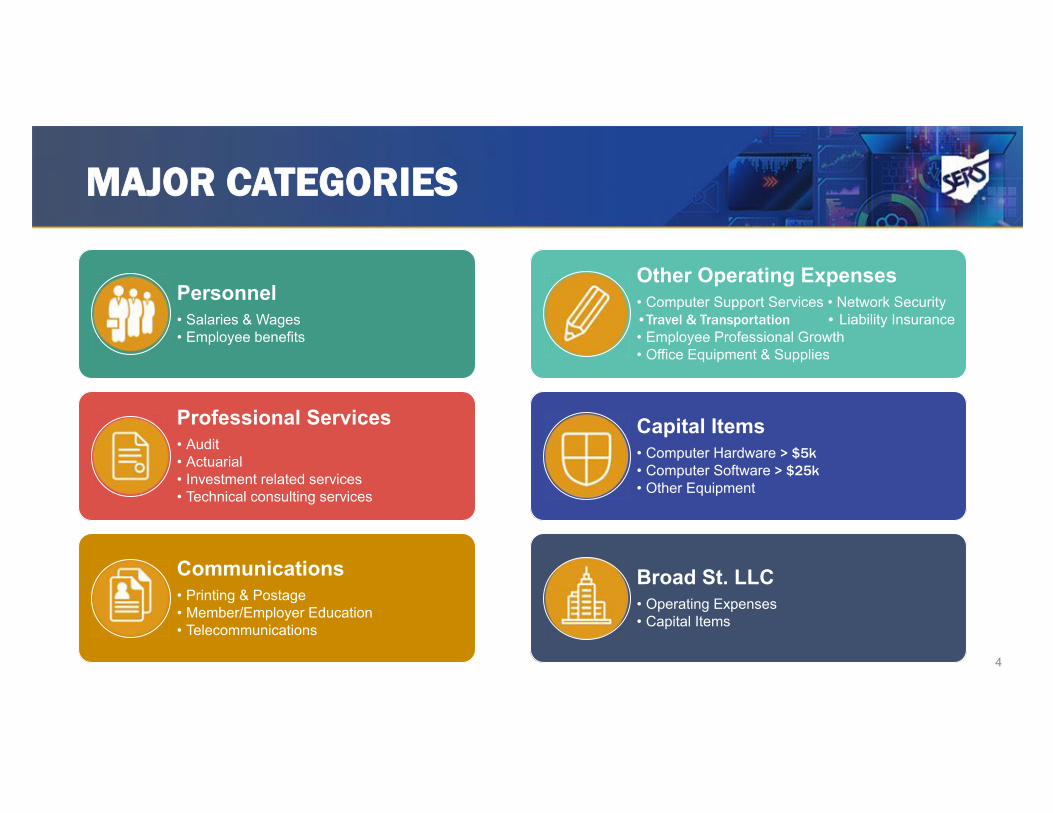
MAJOR CATEGORIES
Personnel • Salaries & Wages• Employee benefits
Professional Services • Audit• Actuarial• Investment related services• Technical consulting services
Communications• Printing & Postage• Member/Employer Education• Telecommunications
Other Operating Expenses• Computer Support Services • Network Security•Travel & Transportation • Liability Insurance• Employee Professional Growth• Office Equipment & Supplies
Capital Items• Computer Hardware > $5k• Computer Software > $25k• Other Equipment
Broad St. LLC• Operating Expenses• Capital Items
4
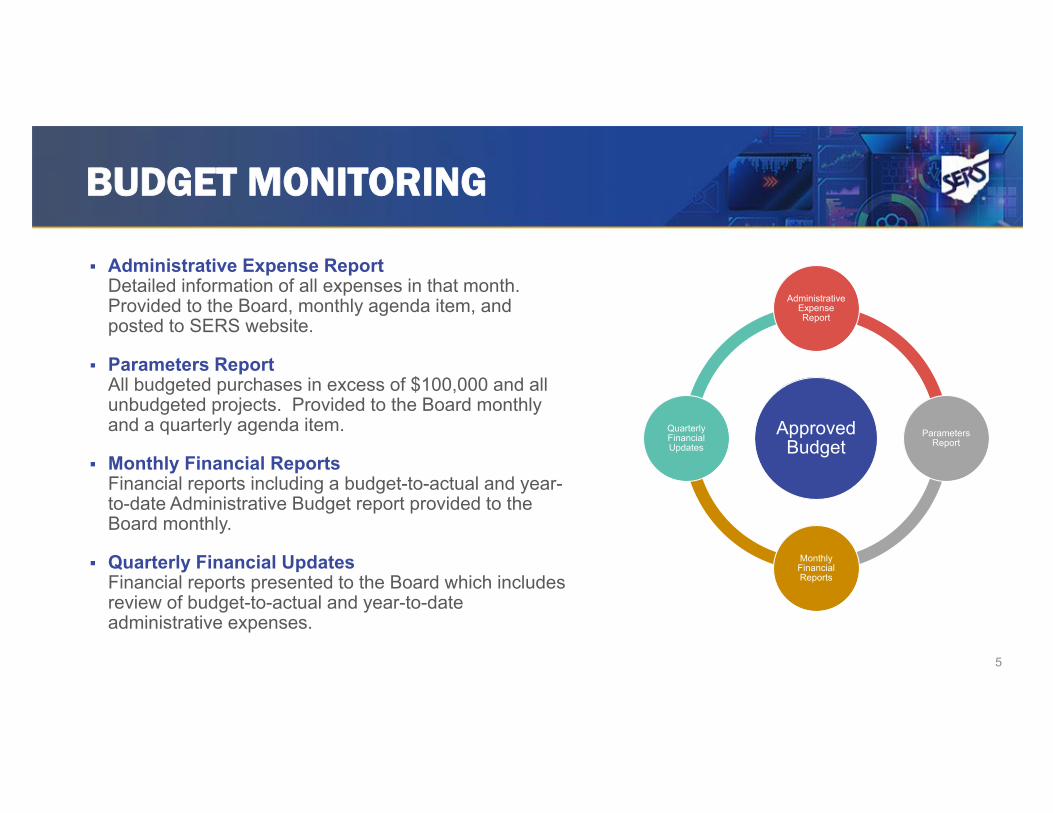
BUDGET MONITORING
Approved Budget
Administrative Expense Report
Parameters Report
Monthly Financial Reports
Quarterly Financial Updates
5
Administrative Expense ReportDetailed information of all expenses in that month. Provided to the Board, monthly agenda item, and posted to SERS website.
Parameters ReportAll budgeted purchases in excess of $100,000 and all unbudgeted projects. Provided to the Board monthly and a quarterly agenda item.
Monthly Financial ReportsFinancial reports including a budget-to-actual and year-to-date Administrative Budget report provided to the Board monthly.
Quarterly Financial UpdatesFinancial reports presented to the Board which includes review of budget-to-actual and year-to-date administrative expenses.
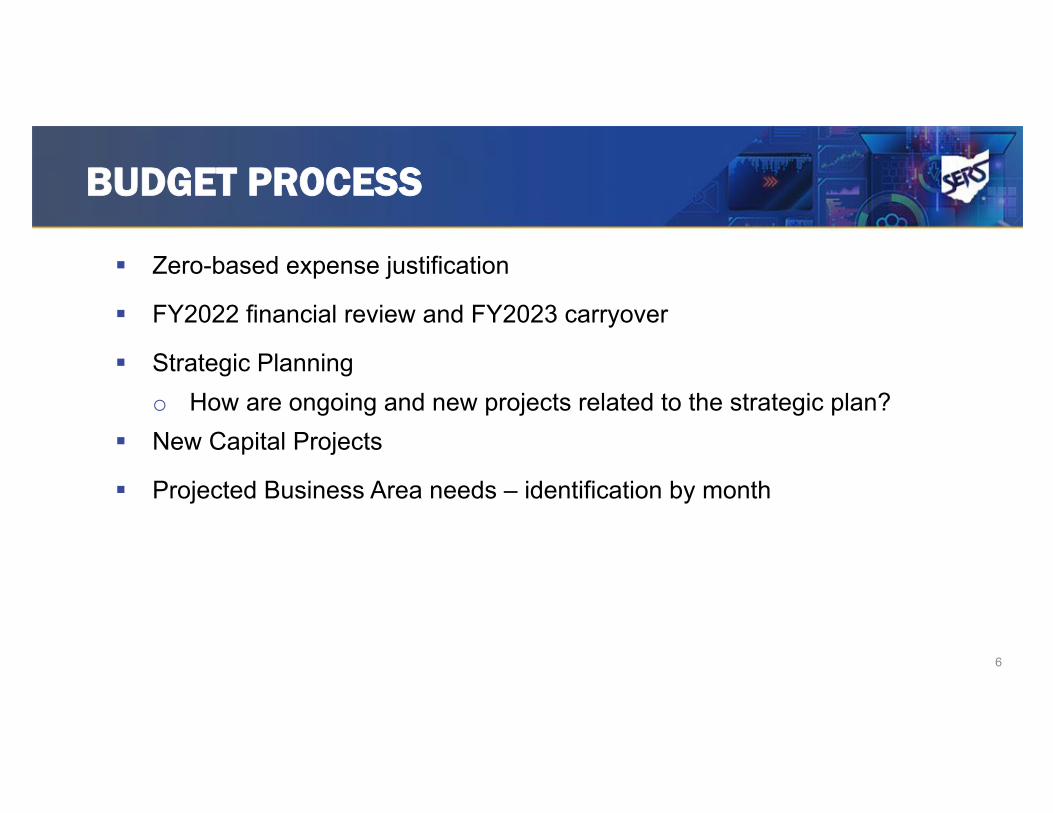
BUDGET PROCESS
Zero-based expense justification
FY2022 financial review and FY2023 carryover
Strategic Planning
o How are ongoing and new projects related to the strategic plan?
New Capital Projects
Projected Business Area needs – identification by month
6
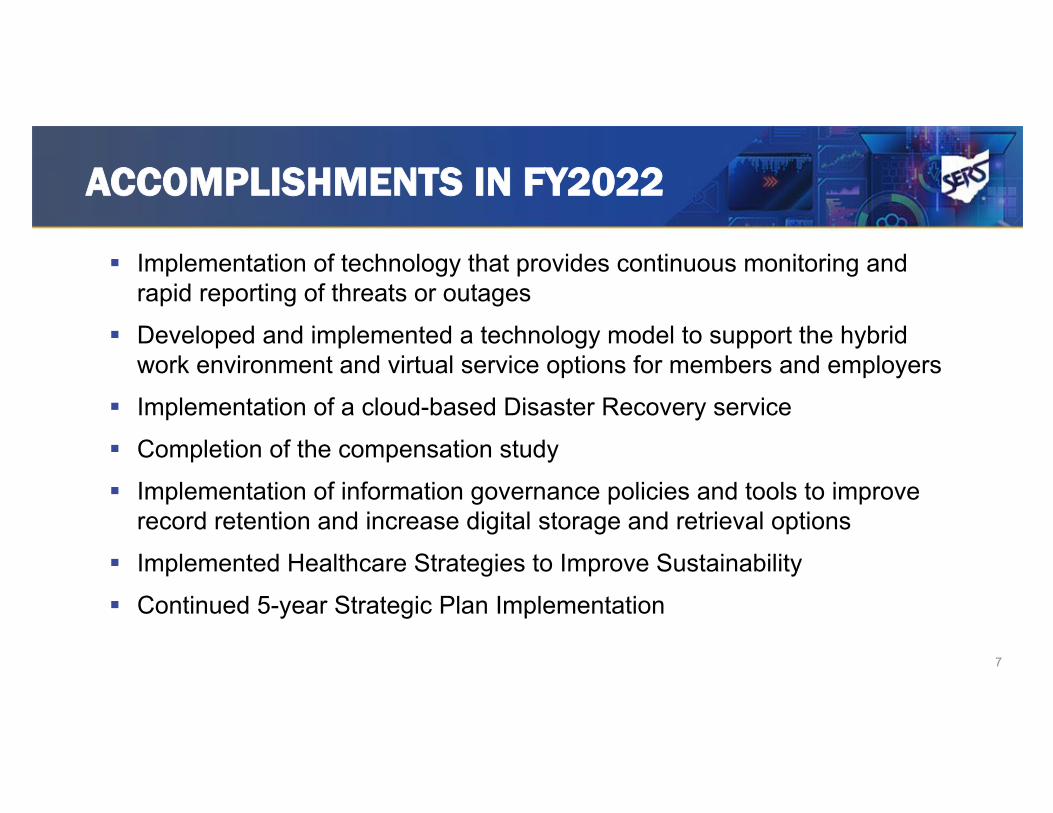
ACCOMPLISHMENTS IN FY2022
7
Implementation of technology that provides continuous monitoring and rapid reporting of threats or outages
Developed and implemented a technology model to support the hybrid work environment and virtual service options for members and employers
Implementation of a cloud-based Disaster Recovery service
Completion of the compensation study
Implementation of information governance policies and tools to improve record retention and increase digital storage and retrieval options
Implemented Healthcare Strategies to Improve Sustainability
Continued 5-year Strategic Plan Implementation
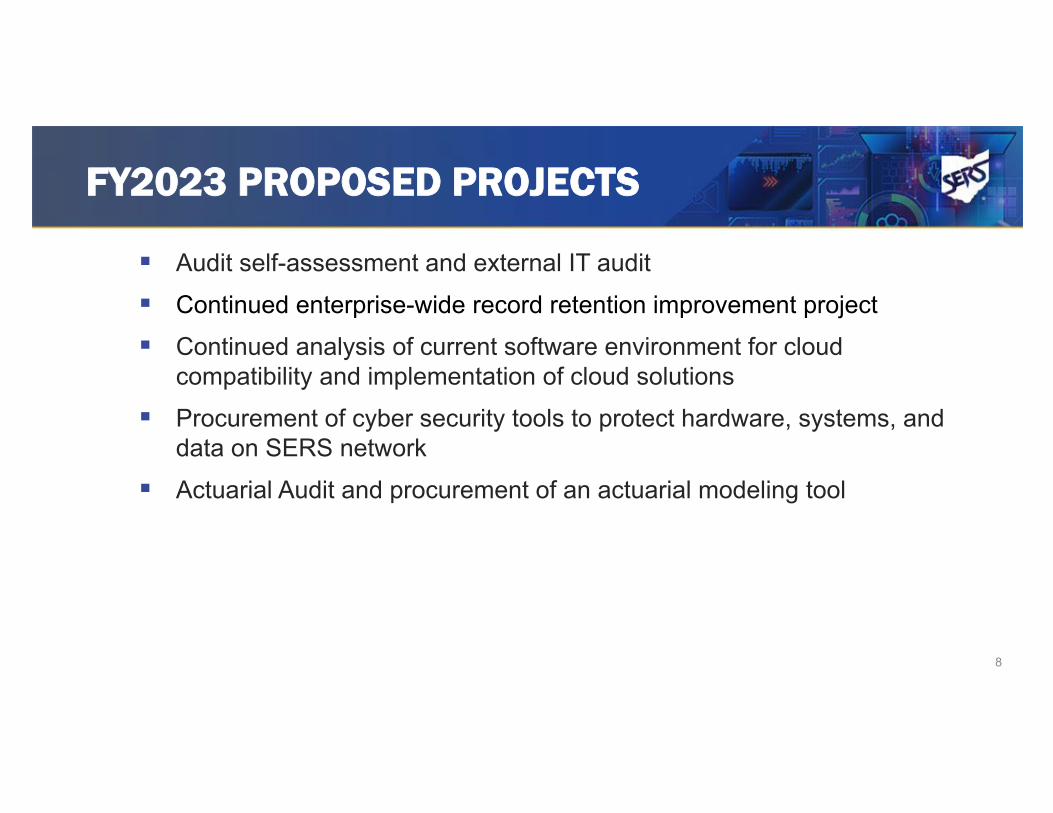
FY2023 PROPOSED PROJECTS
Audit self-assessment and external IT audit
Continued enterprise-wide record retention improvement project
Continued analysis of current software environment for cloud compatibility and implementation of cloud solutions
Procurement of cyber security tools to protect hardware, systems, and data on SERS network
Actuarial Audit and procurement of an actuarial modeling tool
8
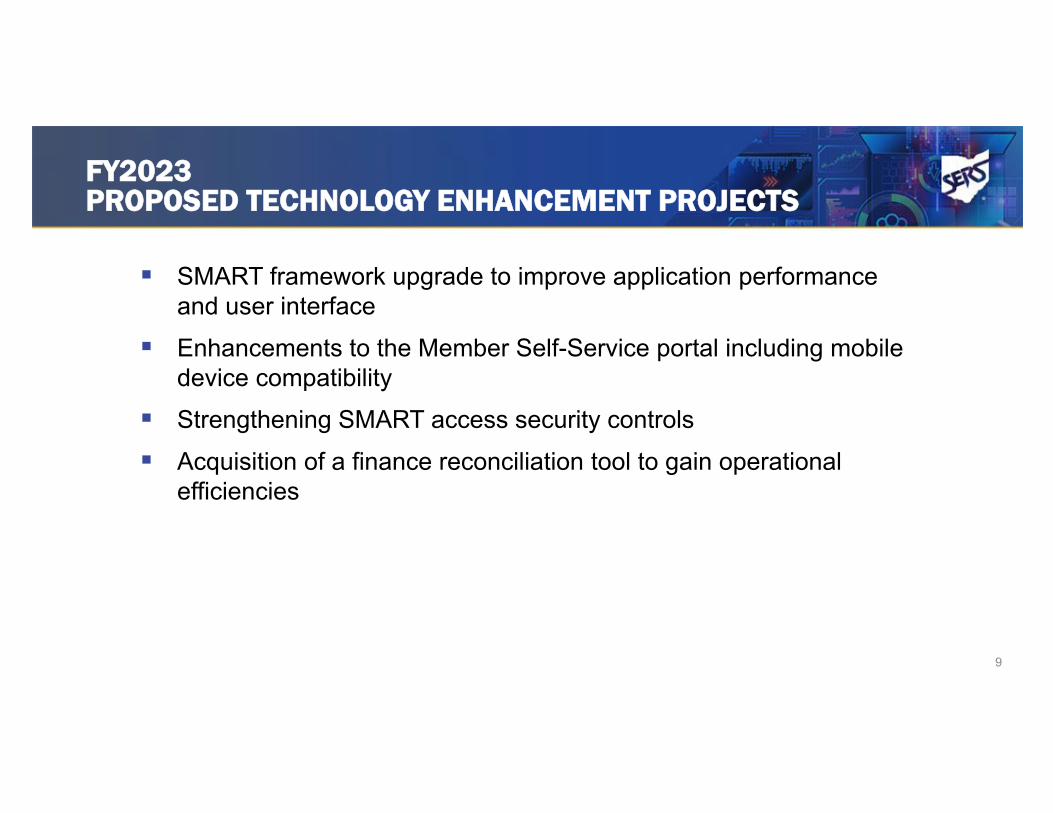
FY2023 PROPOSED TECHNOLOGY ENHANCEMENT PROJECTS
SMART framework upgrade to improve application performance and user interface
Enhancements to the Member Self-Service portal including mobile device compatibility
Strengthening SMART access security controls
Acquisition of a finance reconciliation tool to gain operational efficiencies
9
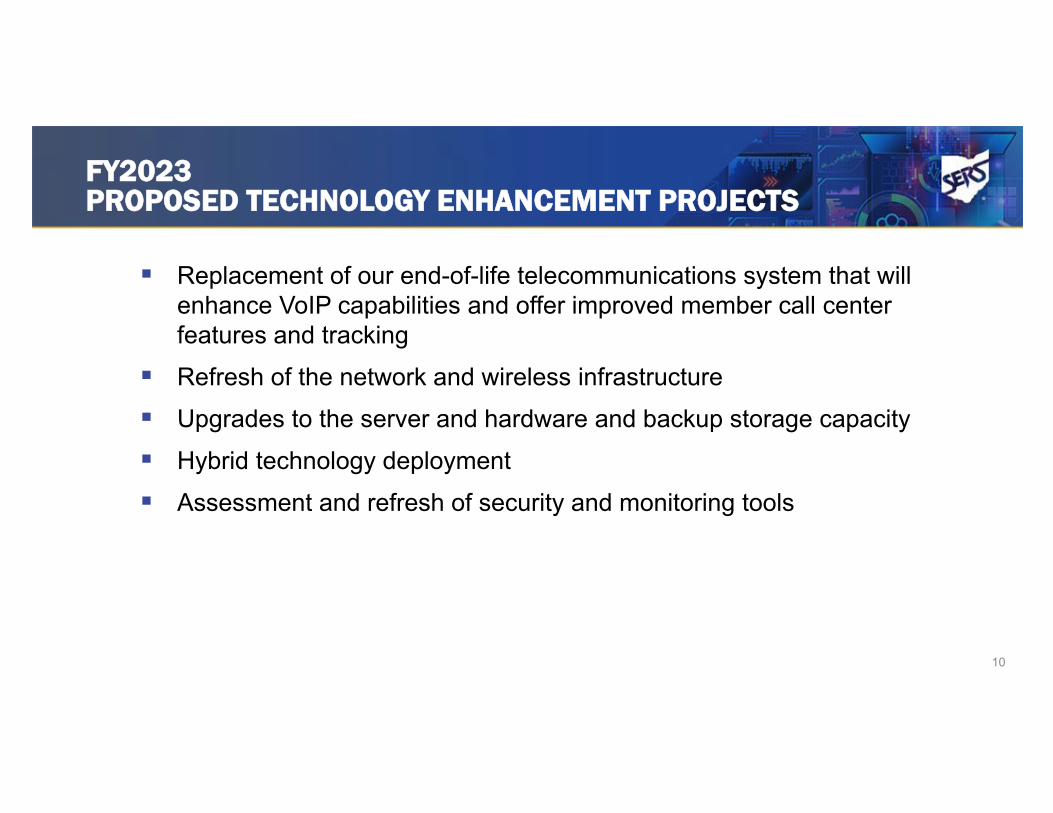
FY2023 PROPOSED TECHNOLOGY ENHANCEMENT PROJECTS
Replacement of our end-of-life telecommunications system that will enhance VoIP capabilities and offer improved member call center features and tracking
Refresh of the network and wireless infrastructure
Upgrades to the server and hardware and backup storage capacity
Hybrid technology deployment
Assessment and refresh of security and monitoring tools
10
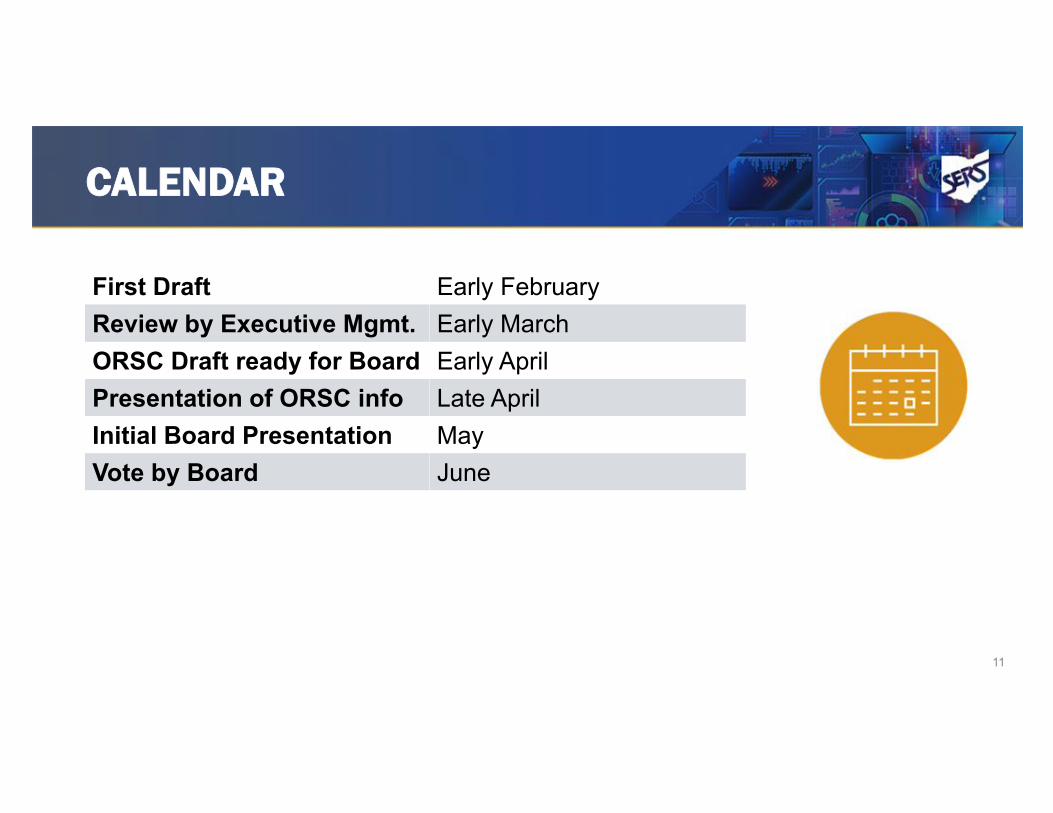
CALENDAR
First Draft Early February
Review by Executive Mgmt. Early March
ORSC Draft ready for Board Early April
Presentation of ORSC info Late April
Initial Board Presentation May
Vote by Board June
11
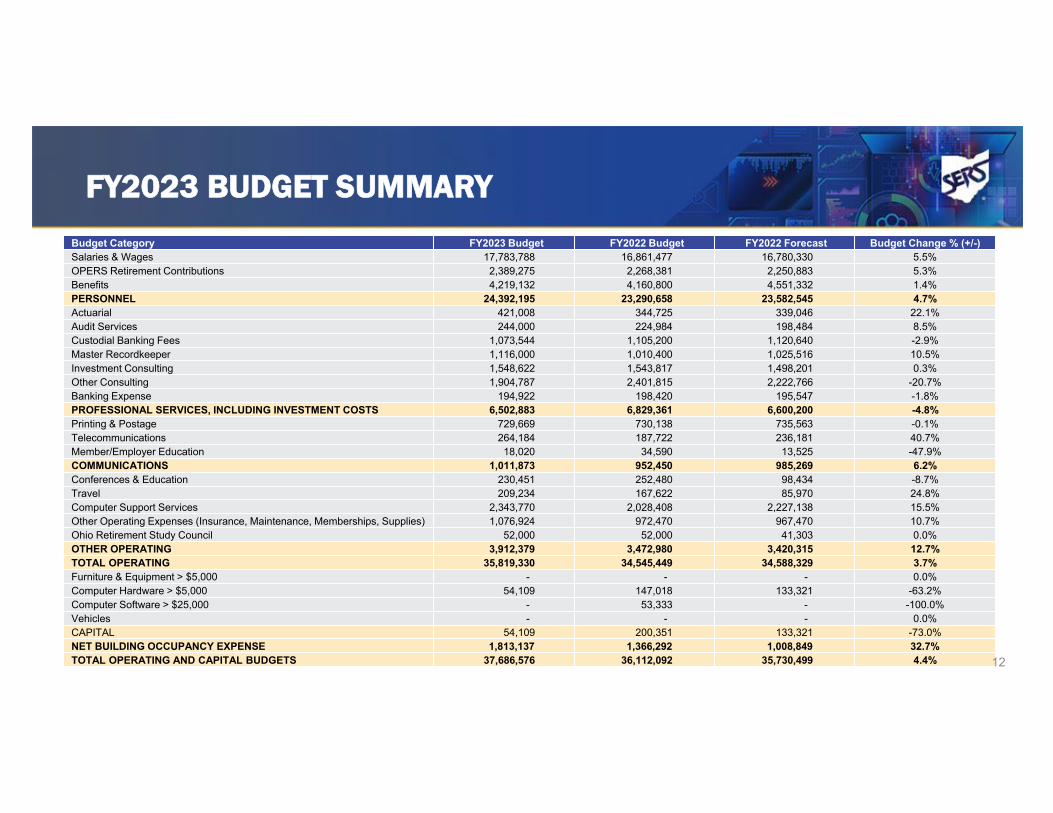
FY2023 BUDGET SUMMARY
Budget Category FY2023 Budget FY2022 Budget FY2022 Forecast Budget Change % (+/-)Salaries & Wages 17,783,788 16,861,477 16,780,330 5.5%OPERS Retirement Contributions 2,389,275 2,268,381 2,250,883 5.3%Benefits 4,219,132 4,160,800 4,551,332 1.4%PERSONNEL 24,392,195 23,290,658 23,582,545 4.7%Actuarial 421,008 344,725 339,046 22.1%Audit Services 244,000 224,984 198,484 8.5%Custodial Banking Fees 1,073,544 1,105,200 1,120,640 -2.9%Master Recordkeeper 1,116,000 1,010,400 1,025,516 10.5%Investment Consulting 1,548,622 1,543,817 1,498,201 0.3%Other Consulting 1,904,787 2,401,815 2,222,766 -20.7%Banking Expense 194,922 198,420 195,547 -1.8%PROFESSIONAL SERVICES, INCLUDING INVESTMENT COSTS 6,502,883 6,829,361 6,600,200 -4.8%Printing & Postage 729,669 730,138 735,563 -0.1%Telecommunications 264,184 187,722 236,181 40.7%Member/Employer Education 18,020 34,590 13,525 -47.9%COMMUNICATIONS 1,011,873 952,450 985,269 6.2%Conferences & Education 230,451 252,480 98,434 -8.7%Travel 209,234 167,622 85,970 24.8%Computer Support Services 2,343,770 2,028,408 2,227,138 15.5%Other Operating Expenses (Insurance, Maintenance, Memberships, Supplies) 1,076,924 972,470 967,470 10.7%Ohio Retirement Study Council 52,000 52,000 41,303 0.0%OTHER OPERATING 3,912,379 3,472,980 3,420,315 12.7%TOTAL OPERATING 35,819,330 34,545,449 34,588,329 3.7%Furniture & Equipment > $5,000 - - - 0.0%Computer Hardware > $5,000 54,109 147,018 133,321 -63.2%Computer Software > $25,000 - 53,333 - -100.0%Vehicles - - - 0.0%CAPITAL 54,109 200,351 133,321 -73.0%NET BUILDING OCCUPANCY EXPENSE 1,813,137 1,366,292 1,008,849 32.7%TOTAL OPERATING AND CAPITAL BUDGETS 37,686,576 36,112,092 35,730,499 4.4% 12
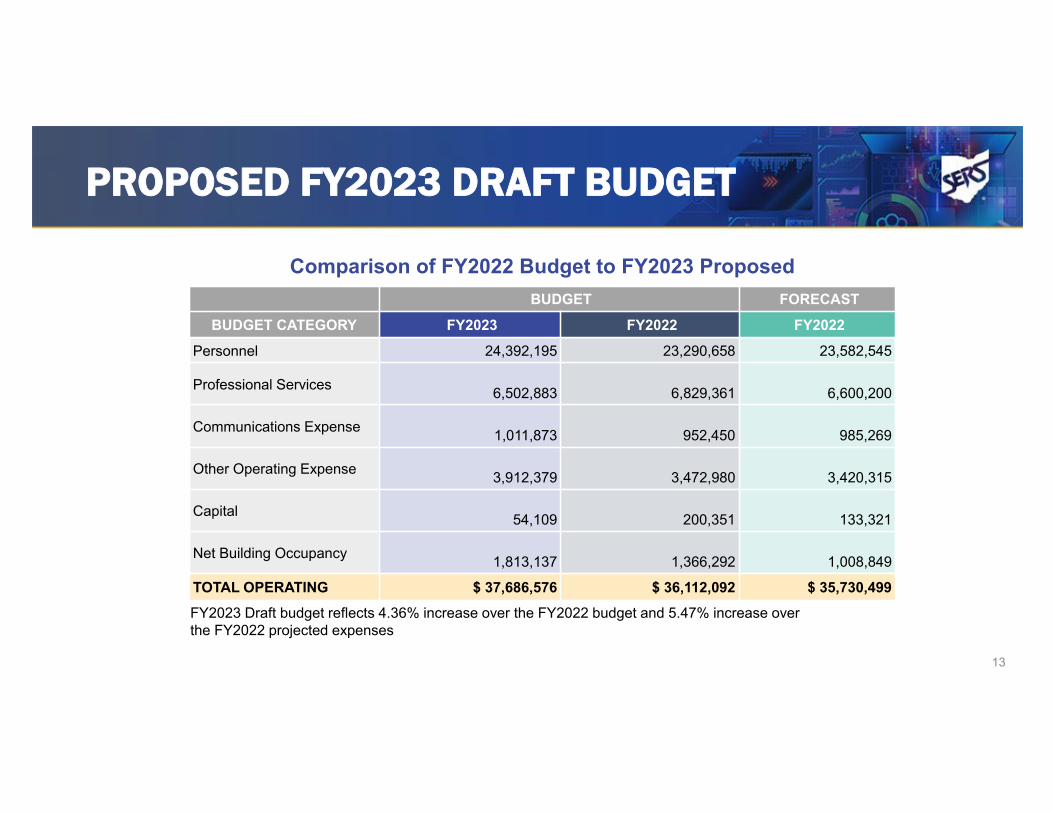
PROPOSED FY2023 DRAFT BUDGET
Comparison of FY2022 Budget to FY2023 Proposed
FY2023 Draft budget reflects 4.36% increase over the FY2022 budget and 5.47% increase over the FY2022 projected expenses
BUDGET FORECAST BUDGET CATEGORY FY2023 FY2022 FY2022
Personnel 24,392,195 23,290,658 23,582,545
Professional Services6,502,883 6,829,361 6,600,200
Communications Expense1,011,873 952,450 985,269
Other Operating Expense3,912,379 3,472,980 3,420,315
Capital54,109 200,351 133,321
Net Building Occupancy1,813,137 1,366,292 1,008,849
TOTAL OPERATING $ 37,686,576 $ 36,112,092 $ 35,730,499
13
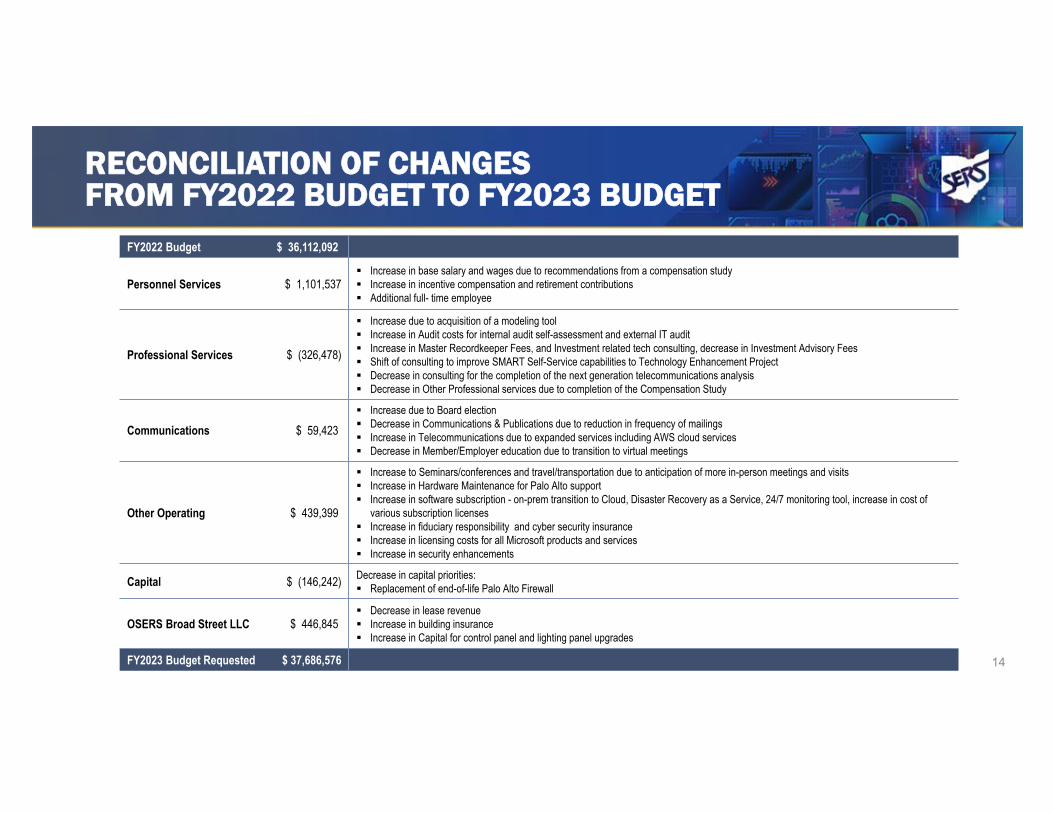
RECONCILIATION OF CHANGES FROM FY2022 BUDGET TO FY2023 BUDGET
FY2022 Budget $ 36,112,092
Personnel Services $ 1,101,537 Increase in base salary and wages due to recommendations from a compensation study Increase in incentive compensation and retirement contributions Additional full- time employee
Professional Services $ (326,478)
Increase due to acquisition of a modeling tool Increase in Audit costs for internal audit self-assessment and external IT audit Increase in Master Recordkeeper Fees, and Investment related tech consulting, decrease in Investment Advisory Fees Shift of consulting to improve SMART Self-Service capabilities to Technology Enhancement Project Decrease in consulting for the completion of the next generation telecommunications analysis Decrease in Other Professional services due to completion of the Compensation Study
Communications $ 59,423 Increase due to Board election Decrease in Communications & Publications due to reduction in frequency of mailings Increase in Telecommunications due to expanded services including AWS cloud services Decrease in Member/Employer education due to transition to virtual meetings
Other Operating $ 439,399
Increase to Seminars/conferences and travel/transportation due to anticipation of more in-person meetings and visits Increase in Hardware Maintenance for Palo Alto support Increase in software subscription - on-prem transition to Cloud, Disaster Recovery as a Service, 24/7 monitoring tool, increase in cost of
various subscription licenses Increase in fiduciary responsibility and cyber security insurance Increase in licensing costs for all Microsoft products and services Increase in security enhancements
Capital $ (146,242) Decrease in capital priorities: Replacement of end-of-life Palo Alto Firewall
OSERS Broad Street LLC $ 446,845 Decrease in lease revenue Increase in building insurance Increase in Capital for control panel and lighting panel upgrades
FY2023 Budget Requested $ 37,686,576 14
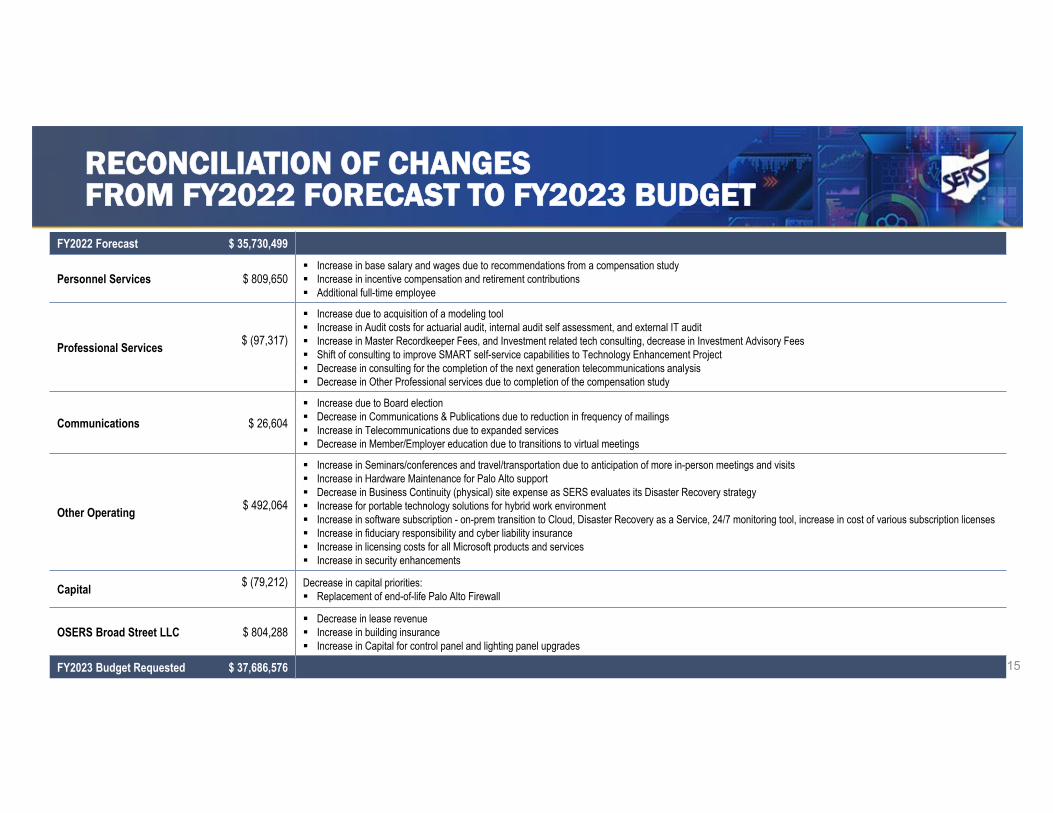
RECONCILIATION OF CHANGES FROM FY2022 FORECAST TO FY2023 BUDGET
FY2022 Forecast $ 35,730,499
Personnel Services $ 809,650 Increase in base salary and wages due to recommendations from a compensation study Increase in incentive compensation and retirement contributions Additional full-time employee
Professional Services $ (97,317)
Increase due to acquisition of a modeling tool Increase in Audit costs for actuarial audit, internal audit self assessment, and external IT audit Increase in Master Recordkeeper Fees, and Investment related tech consulting, decrease in Investment Advisory Fees Shift of consulting to improve SMART self-service capabilities to Technology Enhancement Project Decrease in consulting for the completion of the next generation telecommunications analysis Decrease in Other Professional services due to completion of the compensation study
Communications $ 26,604 Increase due to Board election Decrease in Communications & Publications due to reduction in frequency of mailings Increase in Telecommunications due to expanded services Decrease in Member/Employer education due to transitions to virtual meetings
Other Operating $ 492,064
Increase in Seminars/conferences and travel/transportation due to anticipation of more in-person meetings and visits Increase in Hardware Maintenance for Palo Alto support Decrease in Business Continuity (physical) site expense as SERS evaluates its Disaster Recovery strategy Increase for portable technology solutions for hybrid work environment Increase in software subscription - on-prem transition to Cloud, Disaster Recovery as a Service, 24/7 monitoring tool, increase in cost of various subscription licenses Increase in fiduciary responsibility and cyber liability insurance Increase in licensing costs for all Microsoft products and services Increase in security enhancements
Capital $ (79,212) Decrease in capital priorities: Replacement of end-of-life Palo Alto Firewall
OSERS Broad Street LLC $ 804,288 Decrease in lease revenue Increase in building insurance Increase in Capital for control panel and lighting panel upgrades
FY2023 Budget Requested $ 37,686,576 15
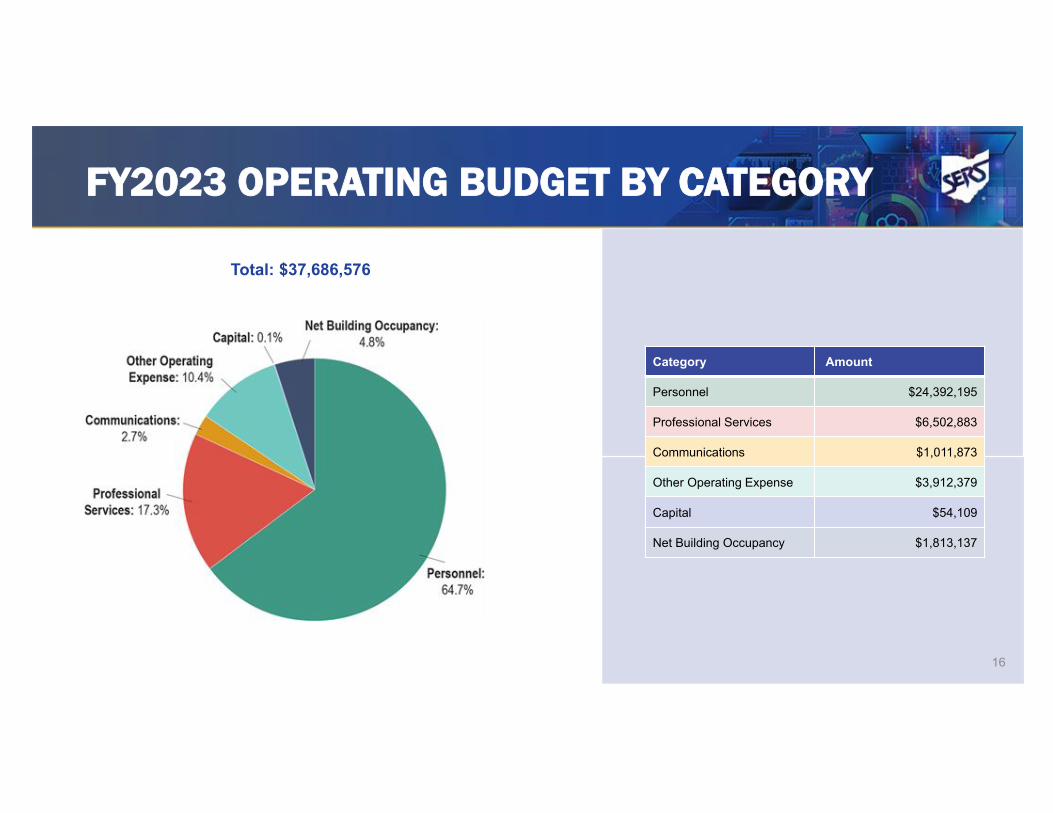
FY2023 OPERATING BUDGET BY CATEGORY
Total: $37,686,576
Category Amount
Personnel $24,392,195
Professional Services $6,502,883
Communications $1,011,873
Other Operating Expense $3,912,379
Capital $54,109
Net Building Occupancy $1,813,137
16
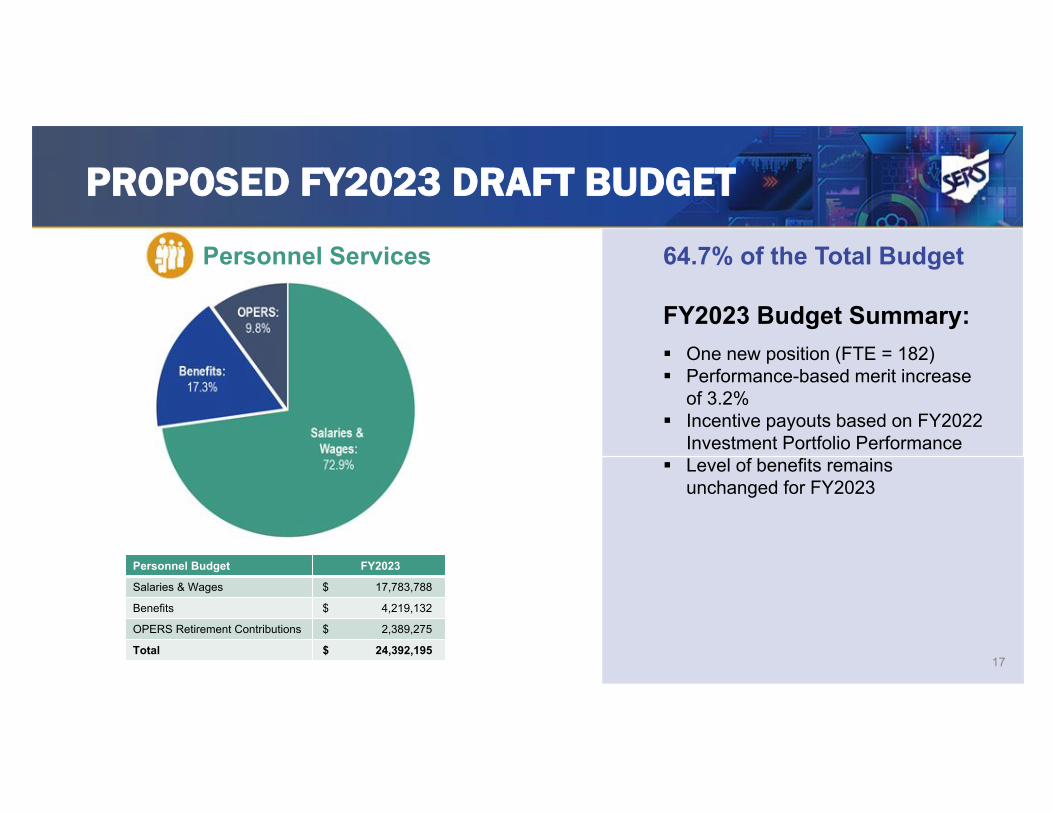
PROPOSED FY2023 DRAFT BUDGET
Personnel Services 64.7% of the Total Budget
FY2023 Budget Summary: One new position (FTE = 182) Performance-based merit increase
of 3.2% Incentive payouts based on FY2022
Investment Portfolio Performance Level of benefits remains
unchanged for FY2023
Personnel Budget FY2023
Salaries & Wages $ 17,783,788
Benefits $ 4,219,132
OPERS Retirement Contributions $ 2,389,275
Total $ 24,392,195 17
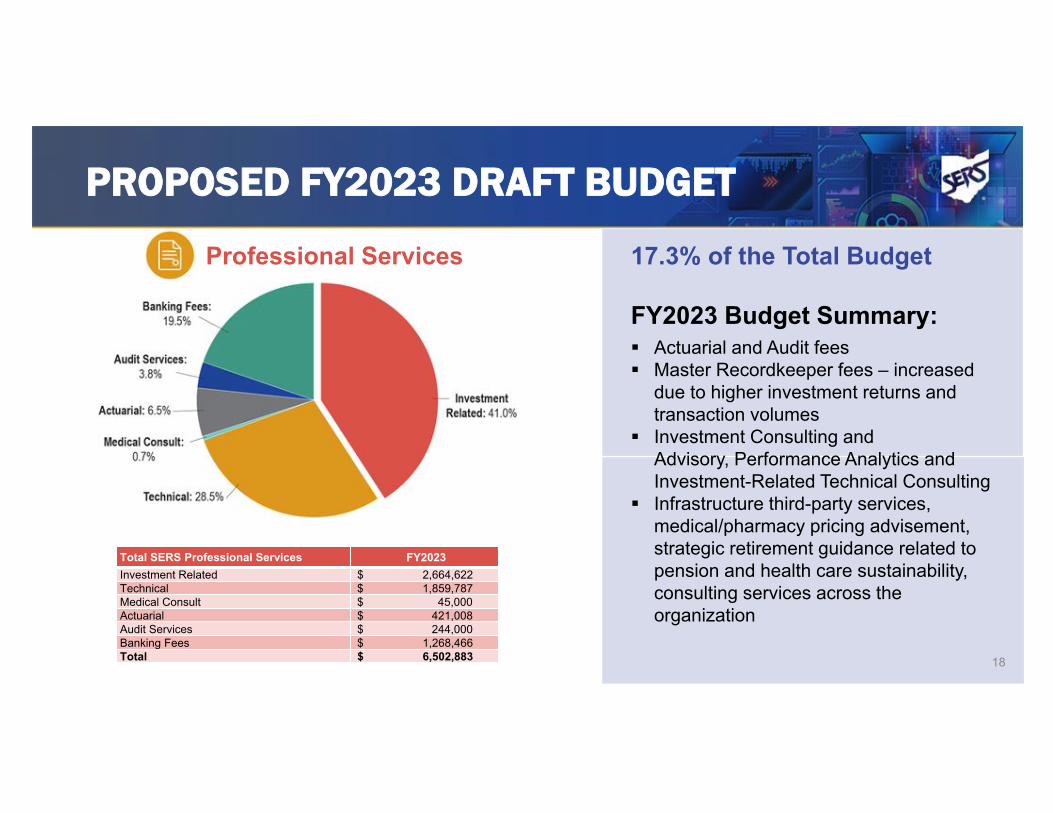
PROPOSED FY2023 DRAFT BUDGET
17.3% of the Total Budget
FY2023 Budget Summary: Actuarial and Audit fees Master Recordkeeper fees – increased
due to higher investment returns and transaction volumes
Investment Consulting and Advisory, Performance Analytics and Investment-Related Technical Consulting
Infrastructure third-party services, medical/pharmacy pricing advisement, strategic retirement guidance related to pension and health care sustainability, consulting services across the organization
Professional Services
Total SERS Professional Services FY2023 Investment Related $ 2,664,622 Technical $ 1,859,787 Medical Consult $ 45,000 Actuarial $ 421,008 Audit Services $ 244,000 Banking Fees $ 1,268,466 Total $ 6,502,883 18
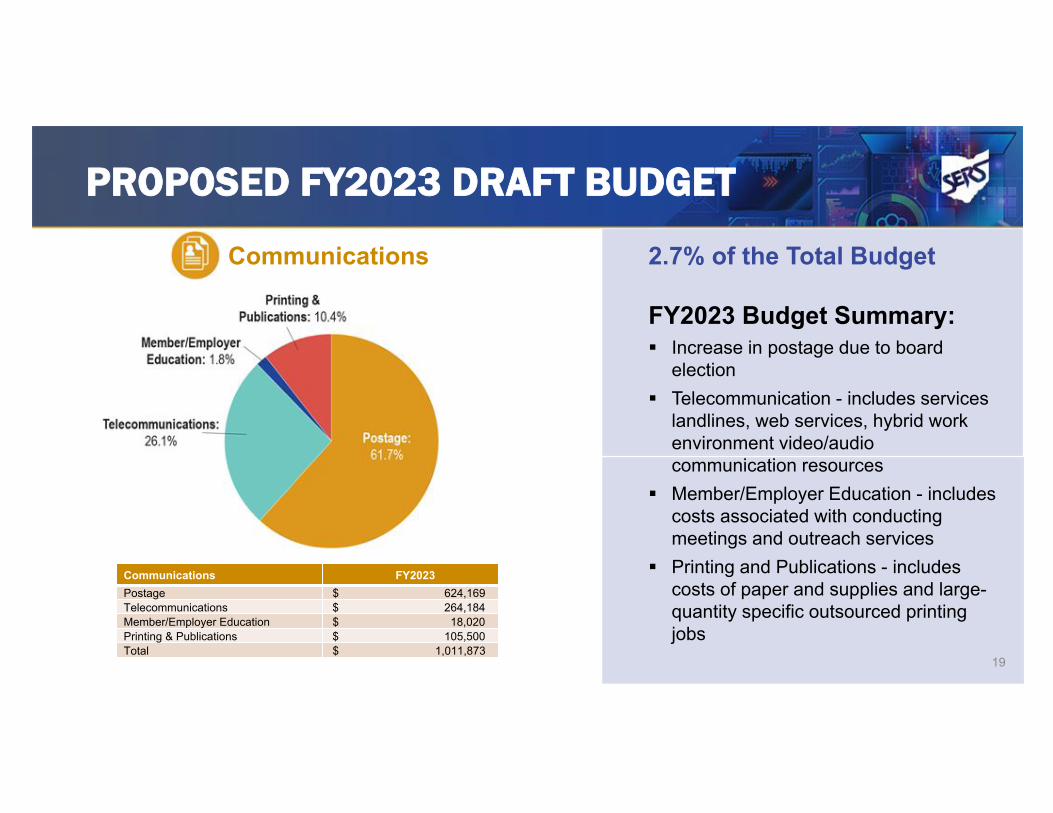
PROPOSED FY2023 DRAFT BUDGET
2.7% of the Total Budget
FY2023 Budget Summary: Increase in postage due to board
election
Telecommunication - includes services landlines, web services, hybrid work environment video/audio communication resources
Member/Employer Education - includes costs associated with conducting meetings and outreach services
Printing and Publications - includes costs of paper and supplies and large-quantity specific outsourced printing jobs
Communications
Communications FY2023 Postage $ 624,169 Telecommunications $ 264,184 Member/Employer Education $ 18,020 Printing & Publications $ 105,500 Total $ 1,011,873
19
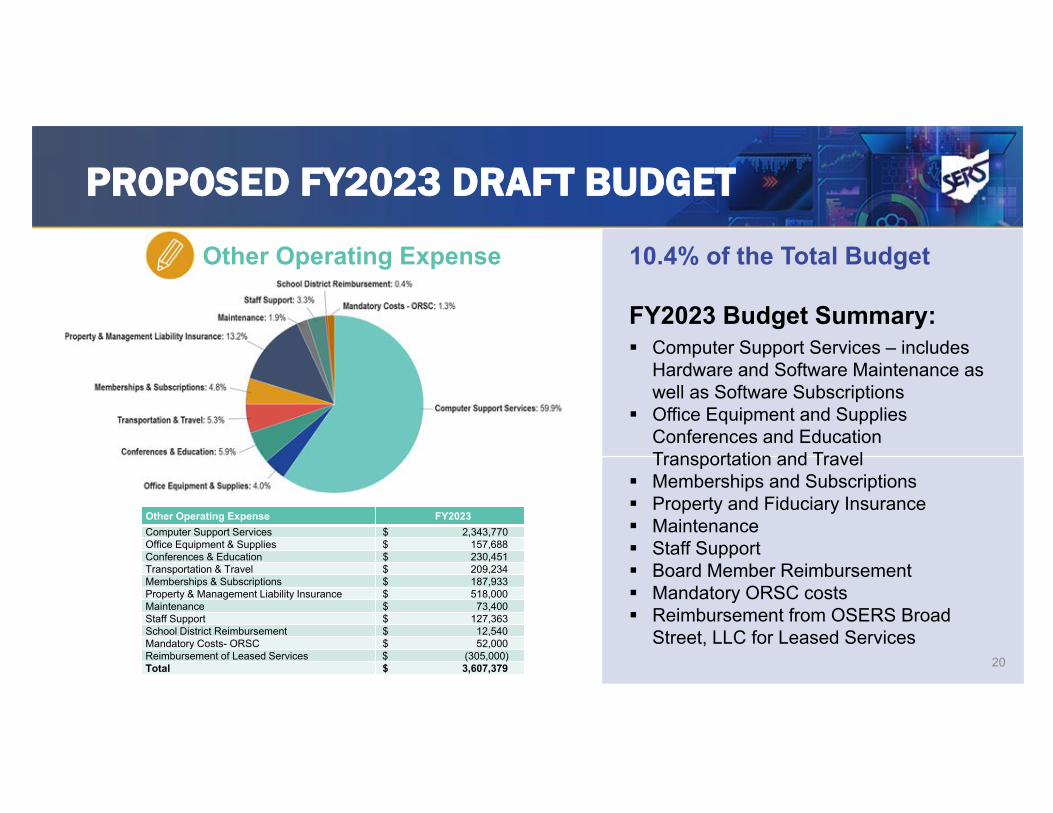
PROPOSED FY2023 DRAFT BUDGET
10.4% of the Total Budget
FY2023 Budget Summary: Computer Support Services – includes
Hardware and Software Maintenance as well as Software Subscriptions
Office Equipment and Supplies Conferences and Education Transportation and Travel
Memberships and Subscriptions Property and Fiduciary Insurance Maintenance Staff Support Board Member Reimbursement Mandatory ORSC costs Reimbursement from OSERS Broad
Street, LLC for Leased Services
Other Operating Expense
Other Operating Expense FY2023 Computer Support Services $ 2,343,770 Office Equipment & Supplies $ 157,688 Conferences & Education $ 230,451 Transportation & Travel $ 209,234 Memberships & Subscriptions $ 187,933 Property & Management Liability Insurance $ 518,000 Maintenance $ 73,400 Staff Support $ 127,363 School District Reimbursement $ 12,540 Mandatory Costs- ORSC $ 52,000 Reimbursement of Leased Services $ (305,000)Total $ 3,607,379 20
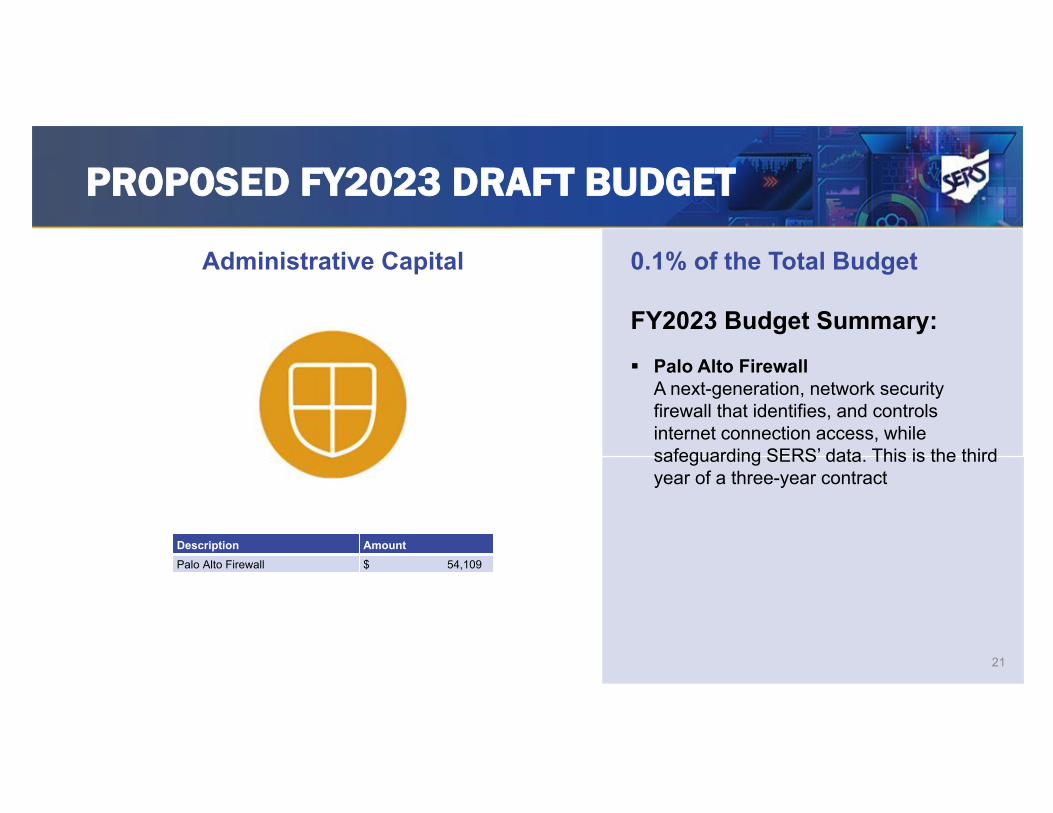
PROPOSED FY2023 DRAFT BUDGET
0.1% of the Total Budget
FY2023 Budget Summary: Palo Alto Firewall
A next-generation, network security firewall that identifies, and controls internet connection access, while safeguarding SERS’ data. This is the third year of a three-year contract
Administrative Capital
Description Amount Palo Alto Firewall $ 54,109
21
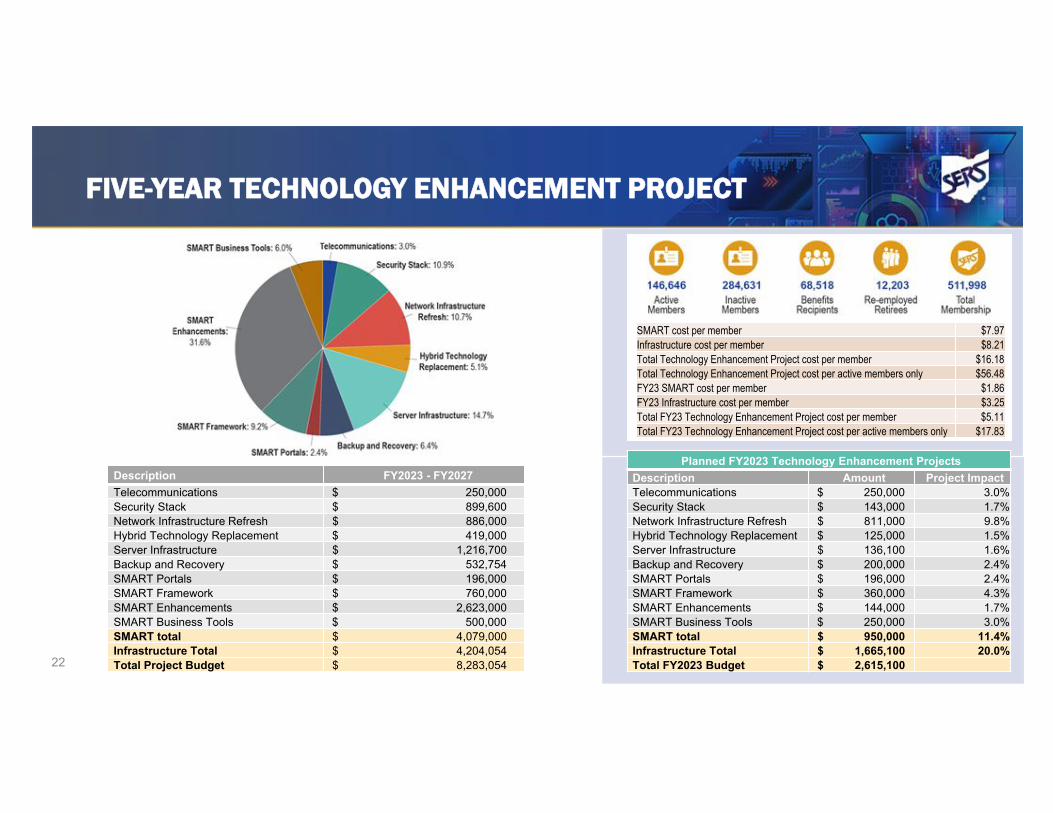
FIVE-YEAR TECHNOLOGY ENHANCEMENT PROJECT
Description FY2023 - FY2027 Telecommunications $ 250,000 Security Stack $ 899,600 Network Infrastructure Refresh $ 886,000 Hybrid Technology Replacement $ 419,000 Server Infrastructure $ 1,216,700 Backup and Recovery $ 532,754 SMART Portals $ 196,000 SMART Framework $ 760,000 SMART Enhancements $ 2,623,000 SMART Business Tools $ 500,000 SMART total $ 4,079,000 Infrastructure Total $ 4,204,054 Total Project Budget $ 8,283,054
Planned FY2023 Technology Enhancement ProjectsDescription Amount Project ImpactTelecommunications $ 250,000 3.0%Security Stack $ 143,000 1.7%Network Infrastructure Refresh $ 811,000 9.8%Hybrid Technology Replacement $ 125,000 1.5%Server Infrastructure $ 136,100 1.6%Backup and Recovery $ 200,000 2.4%SMART Portals $ 196,000 2.4%SMART Framework $ 360,000 4.3%SMART Enhancements $ 144,000 1.7%SMART Business Tools $ 250,000 3.0%SMART total $ 950,000 11.4%Infrastructure Total $ 1,665,100 20.0%Total FY2023 Budget $ 2,615,100
SMART cost per member $7.97Infrastructure cost per member $8.21Total Technology Enhancement Project cost per member $16.18Total Technology Enhancement Project cost per active members only $56.48FY23 SMART cost per member $1.86FY23 Infrastructure cost per member $3.25Total FY23 Technology Enhancement Project cost per member $5.11Total FY23 Technology Enhancement Project cost per active members only $17.83
22
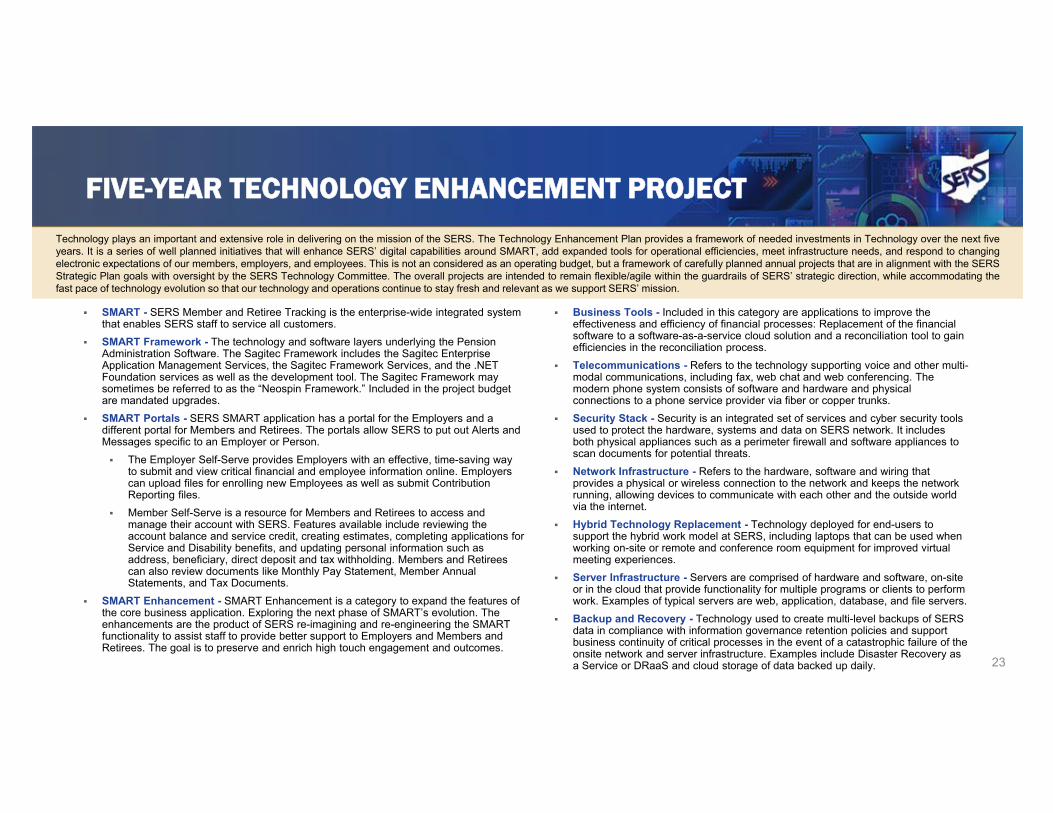
SMART - SERS Member and Retiree Tracking is the enterprise-wide integrated system that enables SERS staff to service all customers.
SMART Framework - The technology and software layers underlying the Pension Administration Software. The Sagitec Framework includes the Sagitec Enterprise Application Management Services, the Sagitec Framework Services, and the .NET Foundation services as well as the development tool. The Sagitec Framework may sometimes be referred to as the “Neospin Framework.” Included in the project budget are mandated upgrades.
SMART Portals - SERS SMART application has a portal for the Employers and a different portal for Members and Retirees. The portals allow SERS to put out Alerts and Messages specific to an Employer or Person.
The Employer Self-Serve provides Employers with an effective, time-saving way to submit and view critical financial and employee information online. Employers can upload files for enrolling new Employees as well as submit Contribution Reporting files.
Member Self-Serve is a resource for Members and Retirees to access and manage their account with SERS. Features available include reviewing the account balance and service credit, creating estimates, completing applications for Service and Disability benefits, and updating personal information such as address, beneficiary, direct deposit and tax withholding. Members and Retirees can also review documents like Monthly Pay Statement, Member Annual Statements, and Tax Documents.
SMART Enhancement - SMART Enhancement is a category to expand the features of the core business application. Exploring the next phase of SMART’s evolution. The enhancements are the product of SERS re-imagining and re-engineering the SMART functionality to assist staff to provide better support to Employers and Members and Retirees. The goal is to preserve and enrich high touch engagement and outcomes.
Business Tools - Included in this category are applications to improve the effectiveness and efficiency of financial processes: Replacement of the financial software to a software-as-a-service cloud solution and a reconciliation tool to gain efficiencies in the reconciliation process.
Telecommunications - Refers to the technology supporting voice and other multi-modal communications, including fax, web chat and web conferencing. The modern phone system consists of software and hardware and physical connections to a phone service provider via fiber or copper trunks.
Security Stack - Security is an integrated set of services and cyber security tools used to protect the hardware, systems and data on SERS network. It includes both physical appliances such as a perimeter firewall and software appliances to scan documents for potential threats.
Network Infrastructure - Refers to the hardware, software and wiring that provides a physical or wireless connection to the network and keeps the network running, allowing devices to communicate with each other and the outside world via the internet.
Hybrid Technology Replacement - Technology deployed for end-users to support the hybrid work model at SERS, including laptops that can be used when working on-site or remote and conference room equipment for improved virtual meeting experiences.
Server Infrastructure - Servers are comprised of hardware and software, on-site or in the cloud that provide functionality for multiple programs or clients to perform work. Examples of typical servers are web, application, database, and file servers.
Backup and Recovery - Technology used to create multi-level backups of SERS data in compliance with information governance retention policies and support business continuity of critical processes in the event of a catastrophic failure of the onsite network and server infrastructure. Examples include Disaster Recovery as a Service or DRaaS and cloud storage of data backed up daily.
Technology plays an important and extensive role in delivering on the mission of the SERS. The Technology Enhancement Plan provides a framework of needed investments in Technology over the next fiveyears. It is a series of well planned initiatives that will enhance SERS’ digital capabilities around SMART, add expanded tools for operational efficiencies, meet infrastructure needs, and respond to changingelectronic expectations of our members, employers, and employees. This is not an considered as an operating budget, but a framework of carefully planned annual projects that are in alignment with the SERSStrategic Plan goals with oversight by the SERS Technology Committee. The overall projects are intended to remain flexible/agile within the guardrails of SERS’ strategic direction, while accommodating thefast pace of technology evolution so that our technology and operations continue to stay fresh and relevant as we support SERS’ mission.
23
FIVE-YEAR TECHNOLOGY ENHANCEMENT PROJECT
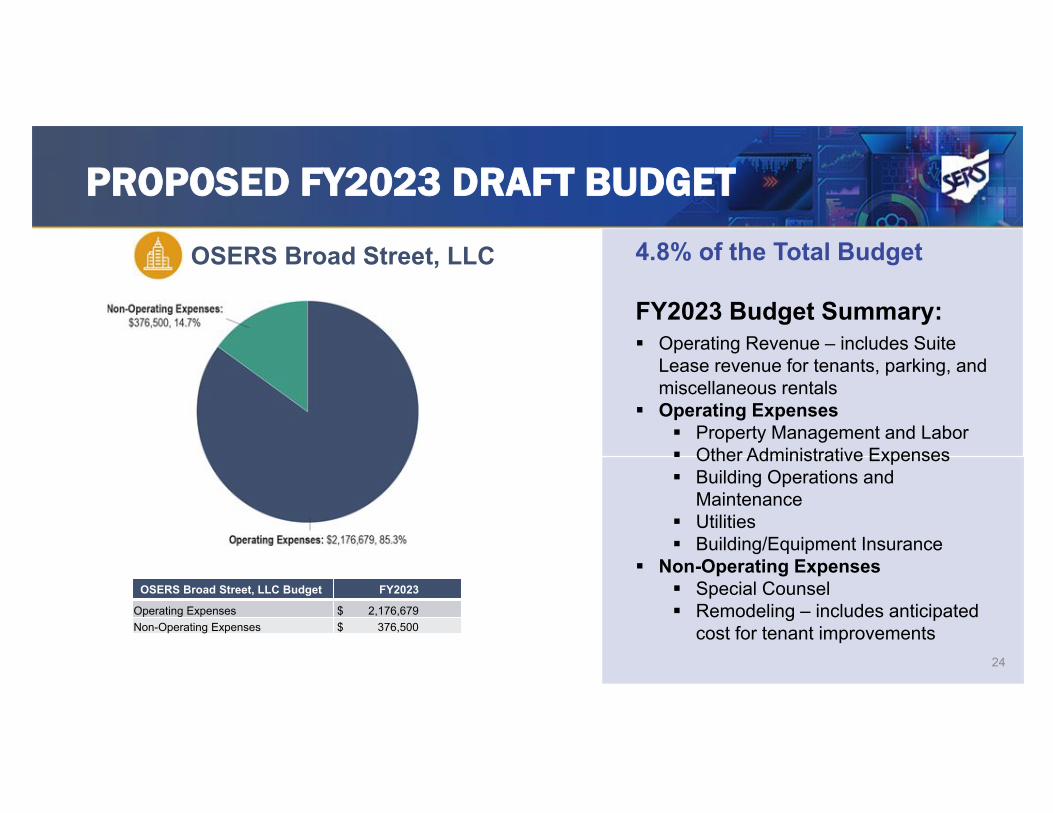
PROPOSED FY2023 DRAFT BUDGET
4.8% of the Total Budget
FY2023 Budget Summary: Operating Revenue – includes Suite
Lease revenue for tenants, parking, and miscellaneous rentals
Operating Expenses Property Management and Labor Other Administrative Expenses Building Operations and
Maintenance Utilities Building/Equipment Insurance
Non-Operating Expenses Special Counsel Remodeling – includes anticipated
cost for tenant improvements
OSERS Broad Street, LLC
OSERS Broad Street, LLC Budget FY2023
Operating Expenses $ 2,176,679
Non-Operating Expenses $ 376,500
24

Questions?
25
DRAFT
SERS is a public defined benefit pension fund that provides pensions and access to health care coverage for the people who serve our schools.
CORE BELIEFSWe are here to serve.
We are open and honest.
We are professional.
We are dedicated.
We are enthusiastic.
We are high performers.
We are valuable partners.
We are member advocates.
We are innovators.
We are SERS.
School Employees Retirement System of OhioServing the People Who Serve Our Schools®
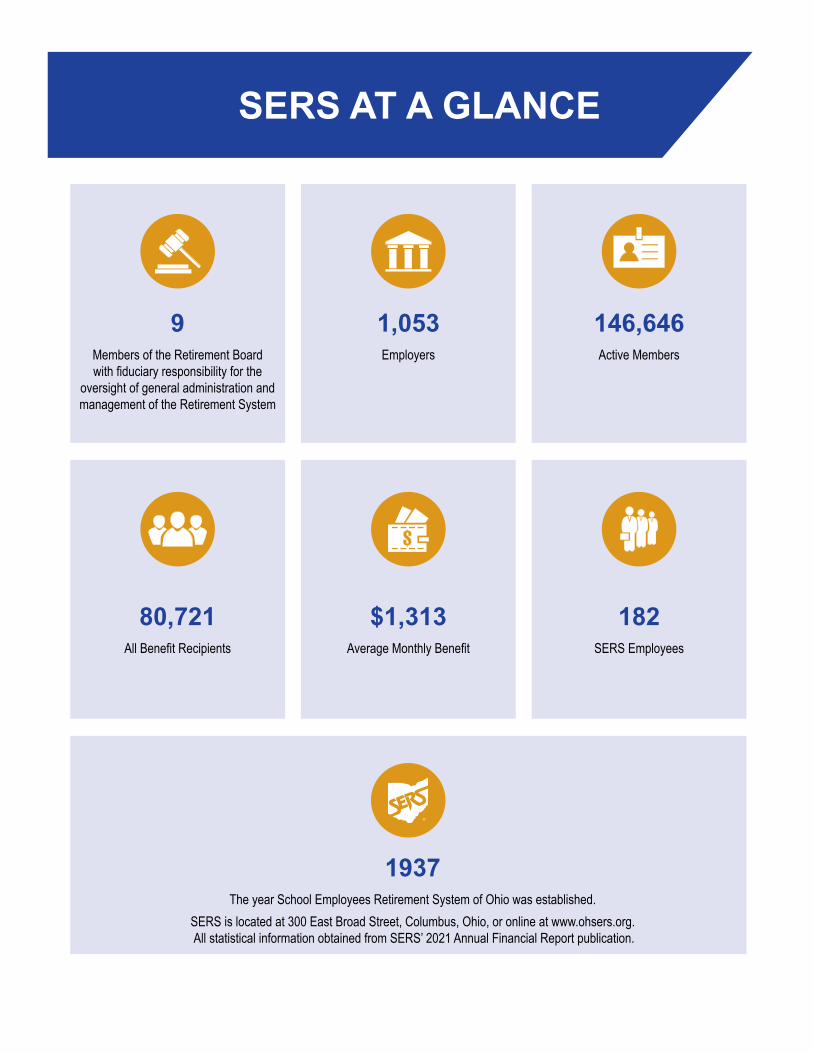
9Members of the Retirement Board with fiduciary responsibility for the
oversight of general administration and management of the Retirement System
1,053Employers
146,646 Active Members
1937The year School Employees Retirement System of Ohio was established.
SERS is located at 300 East Broad Street, Columbus, Ohio, or online at www.ohsers.org. All statistical information obtained from SERS’ 2021 Annual Financial Report publication.
SERS AT A GLANCE
80,721 All Benefit Recipients
$1,313Average Monthly Benefit
182SERS Employees
SCHOOL EMPLOYEES RETIREMENT SYSTEM OF OHIO 300 E. BROAD ST., SUITE 100 • COLUMBUS, OHIO 43215-3746
614-222-5853 • Toll-Free 800-878-5853 • www.ohsers.org RICHARD STENSRUD Executive Director
KAREN D. ROGGENKAMP Deputy Executive Director
May 6, 2022
Dear Chairperson Philips and SERS Retirement Board Members:
We are pleased to present the Retirement Board with the proposed FY2023 Administrative Budget which supports our approximately 227,000 active members, retirees, and beneficiaries with valuable pension benefit programs and healthcare services.
FY2022 Recap The ongoing Pandemic during the fiscal year changed several of our priorities and shifted focus toward providing member services and other support in a hybrid environment. This also caused category changes in budgeted expenditures. We anticipate closing the year at $35.7 million or 1.1% below budget. As our office environment transitioned to a hybrid model, we continued to have many successes during FY22.
Administration • Board meetings and other services continued to be offered virtually by securing Zoom
enterprise licenses. Upgrades to technology in the Board and O’Keefe conference rooms,increased public participation at Board meetings, and allowed counseling sessions to bescheduled using Zoom as an alternative to phone calls and on-site visits.
• Transitioned Committee and Board materials to Diligent Board Books that offered more deviceaccess options, improved data presentation, and enhanced security.
• The FY2021 valuation projected SERS’ Health Care fund to have 37 years of solvencybeginning in FY2022.
• Health care staff engaged with a consulting firm to perform a review of the medical andpharmacy retiree plans resulting in recommendations that will increase SERS’ revenue byapproximately $4 million annually and avoid cost increases of approximately $71 million overthree years.
• Health Care implemented a Board-approved rules change addressing Medicare Part B eligibilitythat will reduce expenses by approximately $1 million annually beginning FY2023.
• Completion of a staff compensation study that resulted in recommendations that align SERS’salary structure with retirement industry peers and other service organizations in the Columbuslabor market.
• Staff continued progress on the Information Governance project, which will improve recordretention and increase digital storage/retrieval options as well as enhance collaboration.
• SERS began using a Learning Management System (LMS) within ADP platform to giveemployees on demand access to a large menu of training courses and provide HR compliancetraining.
• Selected and contracted with a new Flexible Spending Account vendor and Stop Loss broker.
Technology\Information Security • SERS improved its ability to restore operations in the event of a situation that would cause the
network and/or servers to be unavailable by implementing a cloud-based Disaster Recovery
service that would facilitate critical business processes to run from any location with an internet connection.
• Staff completed several projects to help protect SERS’ network and data. This includedreplacement of hardware and implementation of monitoring software to provide 24/7 monitoringand rapid reporting of problems or outages.
• Completed an assessment of our Technology and Information Security needs over the next five-years in alignment with SERS Technology Committee objectives.
• Staff developed a hybrid technology model that supports on-going hybrid work with expandedVoIP remote capabilities for Member, Health Care, and Employer Reporting.
• Replaced our incident management program with the Enterprise Risk Program (ERP) tocentrally manage business continuity, disaster recovery, and cyber incidents. The IncidentResponse Plan was updated and successfully tested process design and effectiveness via anexternally led cyber security tabletop exercise. A ransomware playbook was developed toassist SERS in the event of a ransomware incident.
Employers and Membership • Results from our ongoing customer service surveys for retirement, counseling, and disability
continued to indicate we are still delivering high levels of customer service despite thechallenges brought on by the pandemic. Members continued to express their appreciation forthe high level of service SERS provided.
• Continued eSERS virtual training allowing greater participation levels and expanded topics forlive webinars.
• Continued to conduct member counseling sessions remotely and increased the number ofwebinars available and members participating.
• Completed Phase 1 of our member benefit payments ACH conversion.
FY2023 Budget Request As detailed in the following pages, the proposed FY2023 budget of $37.7 million reflects a 4.36% increase over the FY2022 budget and an 5.47% increase over the FY2022 projected expenses. The significant drivers of this change are a budgeted merit increase of 3.2% and salary adjustments based on CBIZ recommendations from our FY2022 compensation study, upgrade and expansion of communications services, and increases in the cost of software licenses. Additional budget additions are as follows:
• Board requested actuarial audit and procurement of an actuarial modeling tool.• Audit self-assessment and external IT audit.• Anticipation of more in-person seminars and conferences as well as the resumption of due
diligence and investment manager visits now that COVID restrictions have been lifted.• Procurement of cyber security tools to protect hardware, systems, and data on SERS network• Increase in cost associated with insurance coverage.• One additional full-time employee to support Technology initiatives.
Included in the FY2023 submission is the five-year Technology Enhancement Project Budget ($8.3 million) investing in enhancements towards the Member and Retirement Tracking System (SMART) and the organization technology infrastructure. The components of the project budget are as follows:
SCHOOL EMPLOYEES RETIREMENT SYSTEM OF OHIO 300 E. BROAD ST., SUITE 100 • COLUMBUS, OHIO 43215-3746
614-222-5853 • Toll-Free 800-878-5853 • www.ohsers.org RICHARD STENSRUD Executive Director
KAREN D. ROGGENKAMP Deputy Executive Director
• SMARTo Portalso Frameworko Enhancements
• Infrastructureo Telecommunicationso Security Stacko Network Infrastructure Refresho Hybrid Technology Replacemento Server Infrastructureo Backup and Recovery
The approximate spend for FY2023 on the Technology Enhancement Projects is $2.62 million. Projects slated for FY2023 are as follows:
• SMART framework upgrade to improve application performance and user interface• Enhancements to the Member and Employer Services portals including mobile device
compatibility• Strengthening SMART access security controls• Acquisition of a finance reconciliation tool to gain operational efficiencies• Replacement of our end-of-life telecommunications system that will enhance VoIP capabilities
and offer improved member call center features and tracking• Assessment and refresh of the network and wireless infrastructure• Upgrades to the server hardware and backup storage capacity• Hybrid technology deployment• Assessment and refresh of security and monitoring tools
We appreciate your consideration of this budget and look forward to discussions regarding its contents.
Respectfully,
Richard Stensrud Tracy L. Valentino, CPA Executive Director Chief Financial Officer
SCHOOL EMPLOYEES RETIREMENT SYSTEM OF OHIO 300 E. BROAD ST., SUITE 100 • COLUMBUS, OHIO 43215-3746
614-222-5853 • Toll-Free 800-878-5853 • www.ohsers.org RICHARD STENSRUD Executive Director
KAREN D. ROGGENKAMP Deputy Executive Director
1School Employees Retirement System of Ohio | FY2023 Administrative Budget
BUDGET OVERVIEW ....................................................................................................................... 2
FY2023 OPERATING BUDGET BY CATEGORY ............................................................................. 3FY2023 Budget Summary ........................................................................................................... 4Three-Year Review FY2021 – FY2023 Budget Presentation ...................................................... 5Three-Year Review FY2021 – FY2023 SERS Budget Presentation excluding Investments ...... 8Three-Year Review FY2021 – FY2023 Investments Budget Presentation ............................... 10
DETAILS BY MAJOR ACCOUNT CATEGORY ...............................................................................11Personnel ...................................................................................................................................11Professional Services ................................................................................................................ 13Communications ....................................................................................................................... 16Other Operating Expense ......................................................................................................... 17
ADMINISTRATIVE CAPITAL .......................................................................................................... 20
FIVE YEAR TECHNOLOGY ENHANCEMENT PROJECT ............................................................ 21
OSERS BROAD STREET, LLC ...................................................................................................... 23
TABLE OF CONTENTS
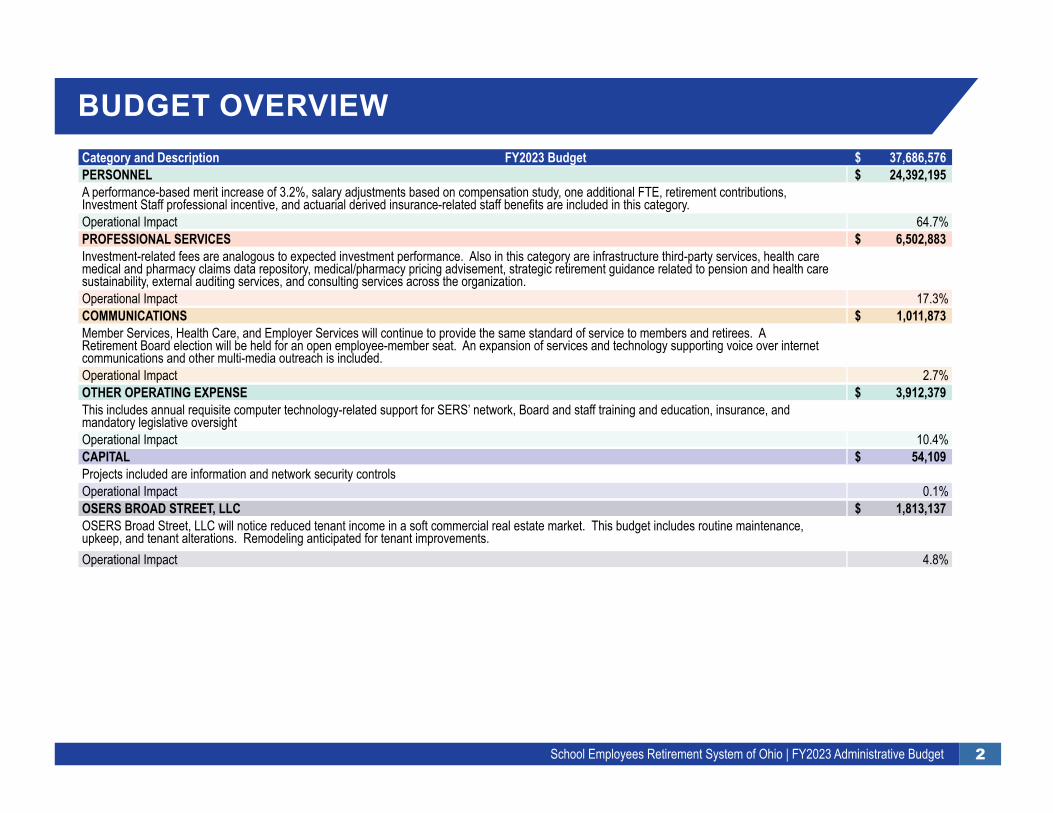
2School Employees Retirement System of Ohio | FY2023 Administrative Budget
Category and Description FY2023 Budget $ 37,686,576 PERSONNEL $ 24,392,195 A performance-based merit increase of 3.2%, salary adjustments based on compensation study, one additional FTE, retirement contributions, Investment Staff professional incentive, and actuarial derived insurance-related staff benefits are included in this category.Operational Impact 64.7%PROFESSIONAL SERVICES $ 6,502,883 Investment-related fees are analogous to expected investment performance. Also in this category are infrastructure third-party services, health care medical and pharmacy claims data repository, medical/pharmacy pricing advisement, strategic retirement guidance related to pension and health care sustainability, external auditing services, and consulting services across the organization.Operational Impact 17.3%COMMUNICATIONS $ 1,011,873 Member Services, Health Care, and Employer Services will continue to provide the same standard of service to members and retirees. A Retirement Board election will be held for an open employee-member seat. An expansion of services and technology supporting voice over internet communications and other multi-media outreach is included.Operational Impact 2.7%OTHER OPERATING EXPENSE $ 3,912,379 This includes annual requisite computer technology-related support for SERS’ network, Board and staff training and education, insurance, and mandatory legislative oversightOperational Impact 10.4%CAPITAL $ 54,109 Projects included are information and network security controlsOperational Impact 0.1%OSERS BROAD STREET, LLC $ 1,813,137 OSERS Broad Street, LLC will notice reduced tenant income in a soft commercial real estate market. This budget includes routine maintenance, upkeep, and tenant alterations. Remodeling anticipated for tenant improvements.Operational Impact 4.8%
BUDGET OVERVIEW
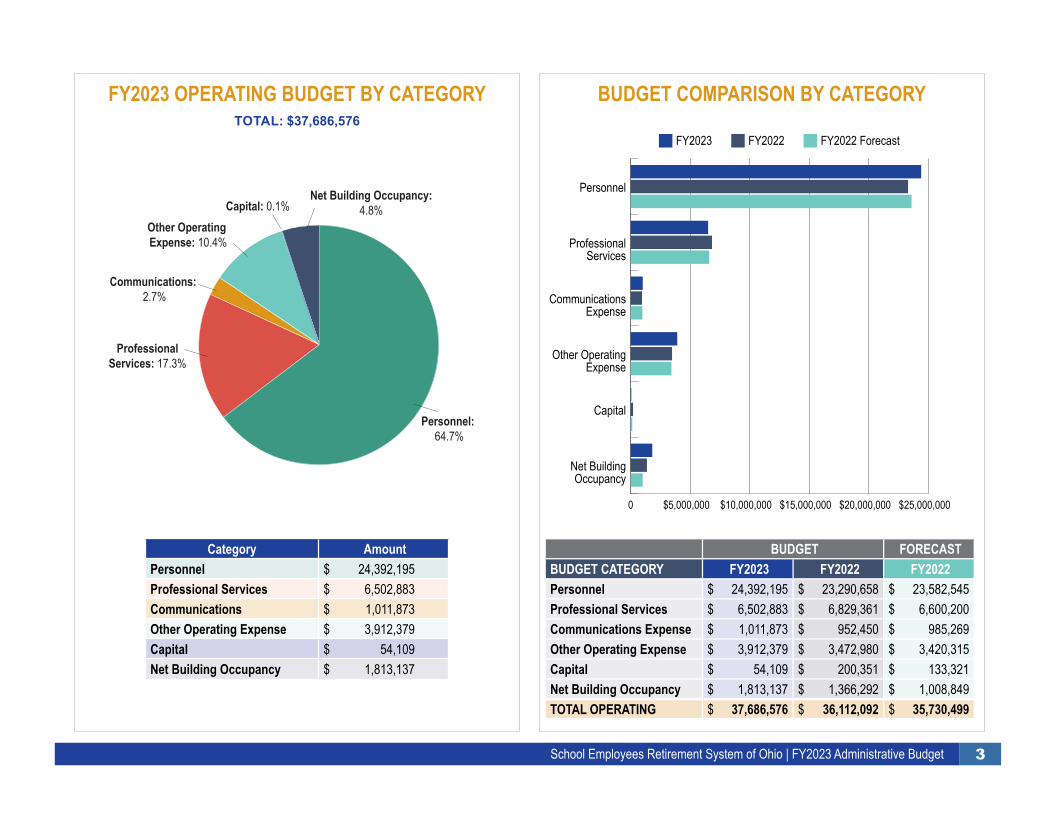
3School Employees Retirement System of Ohio | FY2023 Administrative Budget
BUDGET FORECAST BUDGET CATEGORY FY2023 FY2022 FY2022 Personnel $ 24,392,195 $ 23,290,658 $ 23,582,545 Professional Services $ 6,502,883 $ 6,829,361 $ 6,600,200 Communications Expense $ 1,011,873 $ 952,450 $ 985,269 Other Operating Expense $ 3,912,379 $ 3,472,980 $ 3,420,315 Capital $ 54,109 $ 200,351 $ 133,321 Net Building Occupancy $ 1,813,137 $ 1,366,292 $ 1,008,849 TOTAL OPERATING $ 37,686,576 $ 36,112,092 $ 35,730,499
BUDGET COMPARISON BY CATEGORY
FY2023 FY2022 FY2022 Forecast
0 $5,000,000 $10,000,000 $15,000,000 $20,000,000 $25,000,000
Net BuildingOccupancy
Capital
Other OperatingExpense
CommunicationsExpense
ProfessionalServices
Personnel
Category Amount Personnel $ 24,392,195 Professional Services $ 6,502,883 Communications $ 1,011,873 Other Operating Expense $ 3,912,379 Capital $ 54,109 Net Building Occupancy $ 1,813,137
FY2023 OPERATING BUDGET BY CATEGORYTOTAL: $37,686,576
FY2023 OPERATING BUDGET BY CATEGORY
Net Building Occupancy:4.8%Capital: 0.1%
Other Operating Expense: 10.4%
Communications: 2.7%
ProfessionalServices: 17.3%
Personnel: 64.7%
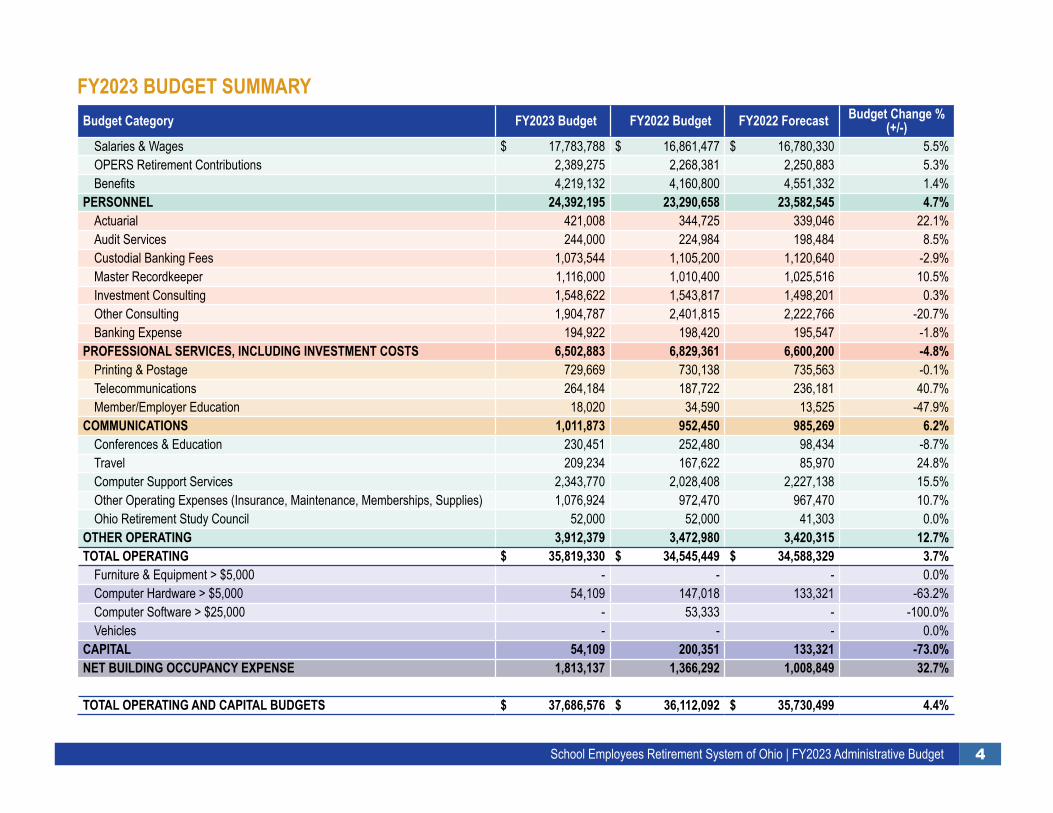
4School Employees Retirement System of Ohio | FY2023 Administrative Budget
FY2023 BUDGET SUMMARYBudget Category FY2023 Budget FY2022 Budget FY2022 Forecast Budget Change %
(+/-)Salaries & Wages $ 17,783,788 $ 16,861,477 $ 16,780,330 5.5%OPERS Retirement Contributions 2,389,275 2,268,381 2,250,883 5.3%Benefits 4,219,132 4,160,800 4,551,332 1.4%
PERSONNEL 24,392,195 23,290,658 23,582,545 4.7%Actuarial 421,008 344,725 339,046 22.1%Audit Services 244,000 224,984 198,484 8.5%Custodial Banking Fees 1,073,544 1,105,200 1,120,640 -2.9%Master Recordkeeper 1,116,000 1,010,400 1,025,516 10.5%Investment Consulting 1,548,622 1,543,817 1,498,201 0.3%Other Consulting 1,904,787 2,401,815 2,222,766 -20.7%Banking Expense 194,922 198,420 195,547 -1.8%
PROFESSIONAL SERVICES, INCLUDING INVESTMENT COSTS 6,502,883 6,829,361 6,600,200 -4.8%Printing & Postage 729,669 730,138 735,563 -0.1%Telecommunications 264,184 187,722 236,181 40.7%Member/Employer Education 18,020 34,590 13,525 -47.9%
COMMUNICATIONS 1,011,873 952,450 985,269 6.2%Conferences & Education 230,451 252,480 98,434 -8.7%Travel 209,234 167,622 85,970 24.8%Computer Support Services 2,343,770 2,028,408 2,227,138 15.5%Other Operating Expenses (Insurance, Maintenance, Memberships, Supplies) 1,076,924 972,470 967,470 10.7%Ohio Retirement Study Council 52,000 52,000 41,303 0.0%
OTHER OPERATING 3,912,379 3,472,980 3,420,315 12.7%TOTAL OPERATING $ 35,819,330 $ 34,545,449 $ 34,588,329 3.7%
Furniture & Equipment > $5,000 - - - 0.0%Computer Hardware > $5,000 54,109 147,018 133,321 -63.2%Computer Software > $25,000 - 53,333 - -100.0%Vehicles - - - 0.0%
CAPITAL 54,109 200,351 133,321 -73.0%NET BUILDING OCCUPANCY EXPENSE 1,813,137 1,366,292 1,008,849 32.7%
TOTAL OPERATING AND CAPITAL BUDGETS $ 37,686,576 $ 36,112,092 $ 35,730,499 4.4%
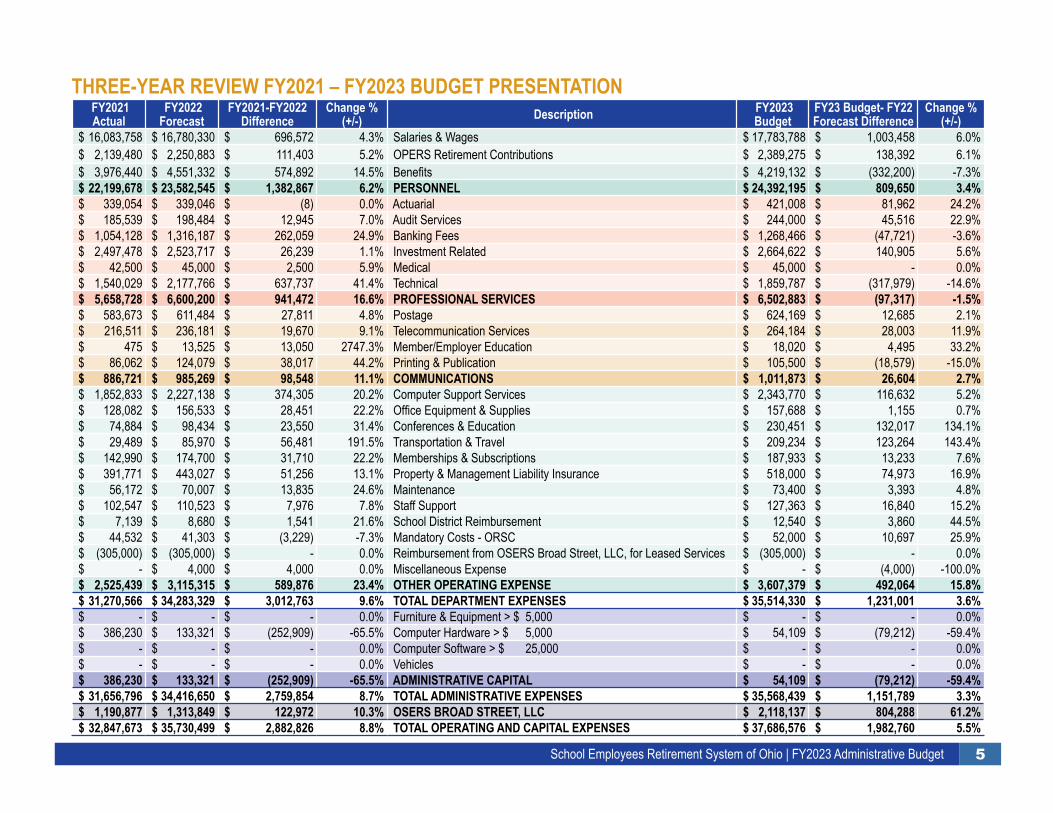
5School Employees Retirement System of Ohio | FY2023 Administrative Budget
THREE-YEAR REVIEW FY2021 – FY2023 BUDGET PRESENTATION FY2021 Actual
FY2022 Forecast
FY2021-FY2022 Difference
Change % (+/-) Description FY2023
Budget FY23 Budget- FY22 Forecast Difference
Change % (+/-)
$ 16,083,758 $ 16,780,330 $ 696,572 4.3% Salaries & Wages $ 17,783,788 $ 1,003,458 6.0% $ 2,139,480 $ 2,250,883 $ 111,403 5.2% OPERS Retirement Contributions $ 2,389,275 $ 138,392 6.1% $ 3,976,440 $ 4,551,332 $ 574,892 14.5% Benefits $ 4,219,132 $ (332,200) -7.3% $ 22,199,678 $ 23,582,545 $ 1,382,867 6.2% PERSONNEL $ 24,392,195 $ 809,650 3.4% $ 339,054 $ 339,046 $ (8) 0.0% Actuarial $ 421,008 $ 81,962 24.2% $ 185,539 $ 198,484 $ 12,945 7.0% Audit Services $ 244,000 $ 45,516 22.9% $ 1,054,128 $ 1,316,187 $ 262,059 24.9% Banking Fees $ 1,268,466 $ (47,721) -3.6% $ 2,497,478 $ 2,523,717 $ 26,239 1.1% Investment Related $ 2,664,622 $ 140,905 5.6% $ 42,500 $ 45,000 $ 2,500 5.9% Medical $ 45,000 $ - 0.0% $ 1,540,029 $ 2,177,766 $ 637,737 41.4% Technical $ 1,859,787 $ (317,979) -14.6% $ 5,658,728 $ 6,600,200 $ 941,472 16.6% PROFESSIONAL SERVICES $ 6,502,883 $ (97,317) -1.5% $ 583,673 $ 611,484 $ 27,811 4.8% Postage $ 624,169 $ 12,685 2.1% $ 216,511 $ 236,181 $ 19,670 9.1% Telecommunication Services $ 264,184 $ 28,003 11.9% $ 475 $ 13,525 $ 13,050 2747.3% Member/Employer Education $ 18,020 $ 4,495 33.2% $ 86,062 $ 124,079 $ 38,017 44.2% Printing & Publication $ 105,500 $ (18,579) -15.0% $ 886,721 $ 985,269 $ 98,548 11.1% COMMUNICATIONS $ 1,011,873 $ 26,604 2.7% $ 1,852,833 $ 2,227,138 $ 374,305 20.2% Computer Support Services $ 2,343,770 $ 116,632 5.2% $ 128,082 $ 156,533 $ 28,451 22.2% Office Equipment & Supplies $ 157,688 $ 1,155 0.7% $ 74,884 $ 98,434 $ 23,550 31.4% Conferences & Education $ 230,451 $ 132,017 134.1% $ 29,489 $ 85,970 $ 56,481 191.5% Transportation & Travel $ 209,234 $ 123,264 143.4% $ 142,990 $ 174,700 $ 31,710 22.2% Memberships & Subscriptions $ 187,933 $ 13,233 7.6% $ 391,771 $ 443,027 $ 51,256 13.1% Property & Management Liability Insurance $ 518,000 $ 74,973 16.9% $ 56,172 $ 70,007 $ 13,835 24.6% Maintenance $ 73,400 $ 3,393 4.8% $ 102,547 $ 110,523 $ 7,976 7.8% Staff Support $ 127,363 $ 16,840 15.2% $ 7,139 $ 8,680 $ 1,541 21.6% School District Reimbursement $ 12,540 $ 3,860 44.5% $ 44,532 $ 41,303 $ (3,229) -7.3% Mandatory Costs - ORSC $ 52,000 $ 10,697 25.9% $ (305,000) $ (305,000) $ - 0.0% Reimbursement from OSERS Broad Street, LLC, for Leased Services $ (305,000) $ - 0.0% $ - $ 4,000 $ 4,000 0.0% Miscellaneous Expense $ - $ (4,000) -100.0% $ 2,525,439 $ 3,115,315 $ 589,876 23.4% OTHER OPERATING EXPENSE $ 3,607,379 $ 492,064 15.8% $ 31,270,566 $ 34,283,329 $ 3,012,763 9.6% TOTAL DEPARTMENT EXPENSES $ 35,514,330 $ 1,231,001 3.6% $ - $ - $ - 0.0% Furniture & Equipment > $ 5,000 $ - $ - 0.0% $ 386,230 $ 133,321 $ (252,909) -65.5% Computer Hardware > $ 5,000 $ 54,109 $ (79,212) -59.4% $ - $ - $ - 0.0% Computer Software > $ 25,000 $ - $ - 0.0% $ - $ - $ - 0.0% Vehicles $ - $ - 0.0% $ 386,230 $ 133,321 $ (252,909) -65.5% ADMINISTRATIVE CAPITAL $ 54,109 $ (79,212) -59.4% $ 31,656,796 $ 34,416,650 $ 2,759,854 8.7% TOTAL ADMINISTRATIVE EXPENSES $ 35,568,439 $ 1,151,789 3.3% $ 1,190,877 $ 1,313,849 $ 122,972 10.3% OSERS BROAD STREET, LLC $ 2,118,137 $ 804,288 61.2% $ 32,847,673 $ 35,730,499 $ 2,882,826 8.8% TOTAL OPERATING AND CAPITAL EXPENSES $ 37,686,576 $ 1,982,760 5.5%
6School Employees Retirement System of Ohio | FY2023 Administrative Budget
FY2023SERS Operating
Budget Detail
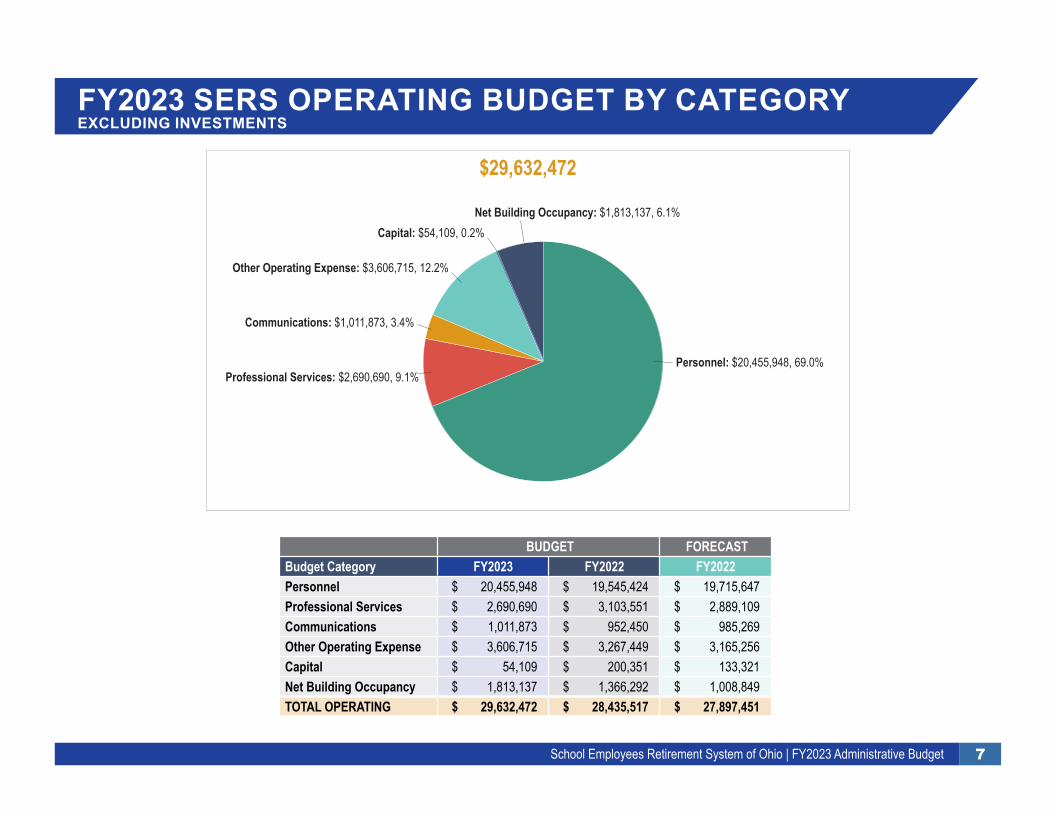
7School Employees Retirement System of Ohio | FY2023 Administrative Budget
FY2023 SERS OPERATING BUDGET BY CATEGORY EXCLUDING INVESTMENTS
BUDGET FORECAST Budget Category FY2023 FY2022 FY2022 Personnel $ 20,455,948 $ 19,545,424 $ 19,715,647 Professional Services $ 2,690,690 $ 3,103,551 $ 2,889,109 Communications $ 1,011,873 $ 952,450 $ 985,269 Other Operating Expense $ 3,606,715 $ 3,267,449 $ 3,165,256 Capital $ 54,109 $ 200,351 $ 133,321 Net Building Occupancy $ 1,813,137 $ 1,366,292 $ 1,008,849 TOTAL OPERATING $ 29,632,472 $ 28,435,517 $ 27,897,451
$29,632,472
Net Building Occupancy: $1,813,137, 6.1%Capital: $54,109, 0.2%
Other Operating Expense: $3,606,715, 12.2%
Communications: $1,011,873, 3.4%
Professional Services: $2,690,690, 9.1%Personnel: $20,455,948, 69.0%
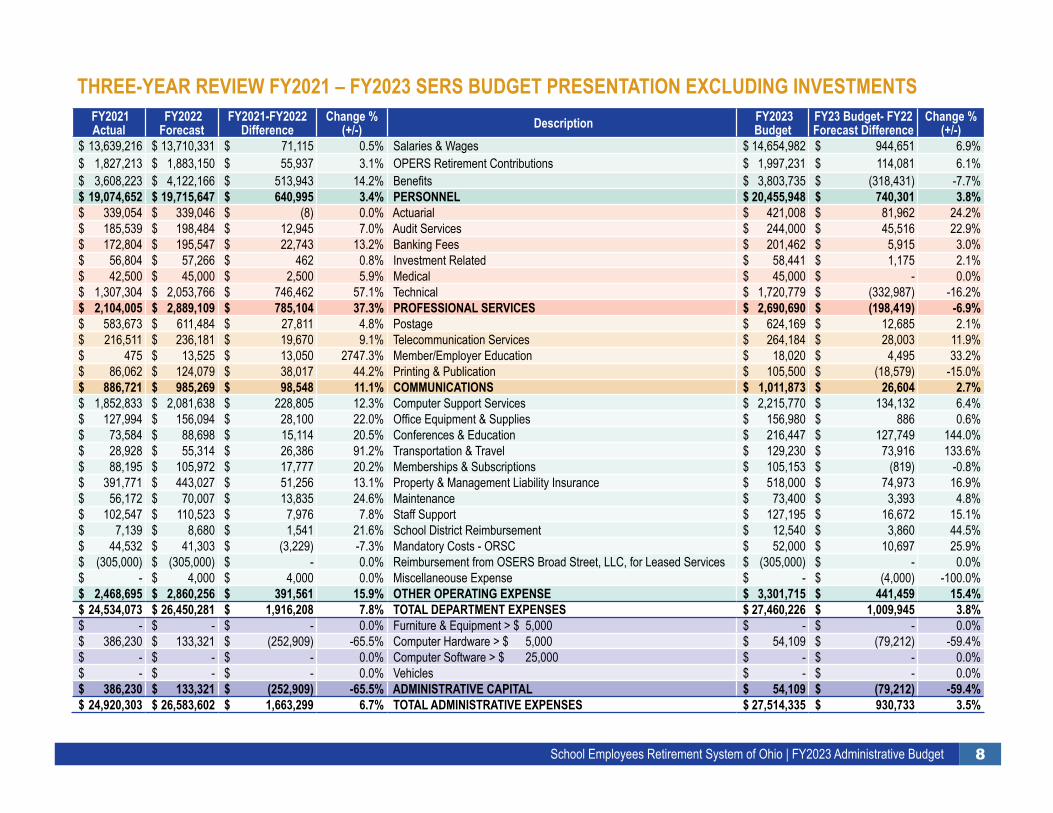
8School Employees Retirement System of Ohio | FY2023 Administrative Budget
THREE-YEAR REVIEW FY2021 – FY2023 SERS BUDGET PRESENTATION EXCLUDING INVESTMENTS FY2021 Actual
FY2022 Forecast
FY2021-FY2022 Difference
Change % (+/-) Description FY2023
Budget FY23 Budget- FY22 Forecast Difference
Change % (+/-)
$ 13,639,216 $ 13,710,331 $ 71,115 0.5% Salaries & Wages $ 14,654,982 $ 944,651 6.9% $ 1,827,213 $ 1,883,150 $ 55,937 3.1% OPERS Retirement Contributions $ 1,997,231 $ 114,081 6.1% $ 3,608,223 $ 4,122,166 $ 513,943 14.2% Benefits $ 3,803,735 $ (318,431) -7.7% $ 19,074,652 $ 19,715,647 $ 640,995 3.4% PERSONNEL $ 20,455,948 $ 740,301 3.8% $ 339,054 $ 339,046 $ (8) 0.0% Actuarial $ 421,008 $ 81,962 24.2% $ 185,539 $ 198,484 $ 12,945 7.0% Audit Services $ 244,000 $ 45,516 22.9% $ 172,804 $ 195,547 $ 22,743 13.2% Banking Fees $ 201,462 $ 5,915 3.0% $ 56,804 $ 57,266 $ 462 0.8% Investment Related $ 58,441 $ 1,175 2.1% $ 42,500 $ 45,000 $ 2,500 5.9% Medical $ 45,000 $ - 0.0% $ 1,307,304 $ 2,053,766 $ 746,462 57.1% Technical $ 1,720,779 $ (332,987) -16.2% $ 2,104,005 $ 2,889,109 $ 785,104 37.3% PROFESSIONAL SERVICES $ 2,690,690 $ (198,419) -6.9% $ 583,673 $ 611,484 $ 27,811 4.8% Postage $ 624,169 $ 12,685 2.1% $ 216,511 $ 236,181 $ 19,670 9.1% Telecommunication Services $ 264,184 $ 28,003 11.9% $ 475 $ 13,525 $ 13,050 2747.3% Member/Employer Education $ 18,020 $ 4,495 33.2% $ 86,062 $ 124,079 $ 38,017 44.2% Printing & Publication $ 105,500 $ (18,579) -15.0% $ 886,721 $ 985,269 $ 98,548 11.1% COMMUNICATIONS $ 1,011,873 $ 26,604 2.7% $ 1,852,833 $ 2,081,638 $ 228,805 12.3% Computer Support Services $ 2,215,770 $ 134,132 6.4% $ 127,994 $ 156,094 $ 28,100 22.0% Office Equipment & Supplies $ 156,980 $ 886 0.6% $ 73,584 $ 88,698 $ 15,114 20.5% Conferences & Education $ 216,447 $ 127,749 144.0% $ 28,928 $ 55,314 $ 26,386 91.2% Transportation & Travel $ 129,230 $ 73,916 133.6% $ 88,195 $ 105,972 $ 17,777 20.2% Memberships & Subscriptions $ 105,153 $ (819) -0.8% $ 391,771 $ 443,027 $ 51,256 13.1% Property & Management Liability Insurance $ 518,000 $ 74,973 16.9% $ 56,172 $ 70,007 $ 13,835 24.6% Maintenance $ 73,400 $ 3,393 4.8% $ 102,547 $ 110,523 $ 7,976 7.8% Staff Support $ 127,195 $ 16,672 15.1% $ 7,139 $ 8,680 $ 1,541 21.6% School District Reimbursement $ 12,540 $ 3,860 44.5% $ 44,532 $ 41,303 $ (3,229) -7.3% Mandatory Costs - ORSC $ 52,000 $ 10,697 25.9% $ (305,000) $ (305,000) $ - 0.0% Reimbursement from OSERS Broad Street, LLC, for Leased Services $ (305,000) $ - 0.0% $ - $ 4,000 $ 4,000 0.0% Miscellaneouse Expense $ - $ (4,000) -100.0% $ 2,468,695 $ 2,860,256 $ 391,561 15.9% OTHER OPERATING EXPENSE $ 3,301,715 $ 441,459 15.4% $ 24,534,073 $ 26,450,281 $ 1,916,208 7.8% TOTAL DEPARTMENT EXPENSES $ 27,460,226 $ 1,009,945 3.8% $ - $ - $ - 0.0% Furniture & Equipment > $ 5,000 $ - $ - 0.0% $ 386,230 $ 133,321 $ (252,909) -65.5% Computer Hardware > $ 5,000 $ 54,109 $ (79,212) -59.4% $ - $ - $ - 0.0% Computer Software > $ 25,000 $ - $ - 0.0% $ - $ - $ - 0.0% Vehicles $ - $ - 0.0% $ 386,230 $ 133,321 $ (252,909) -65.5% ADMINISTRATIVE CAPITAL $ 54,109 $ (79,212) -59.4% $ 24,920,303 $ 26,583,602 $ 1,663,299 6.7% TOTAL ADMINISTRATIVE EXPENSES $ 27,514,335 $ 930,733 3.5%
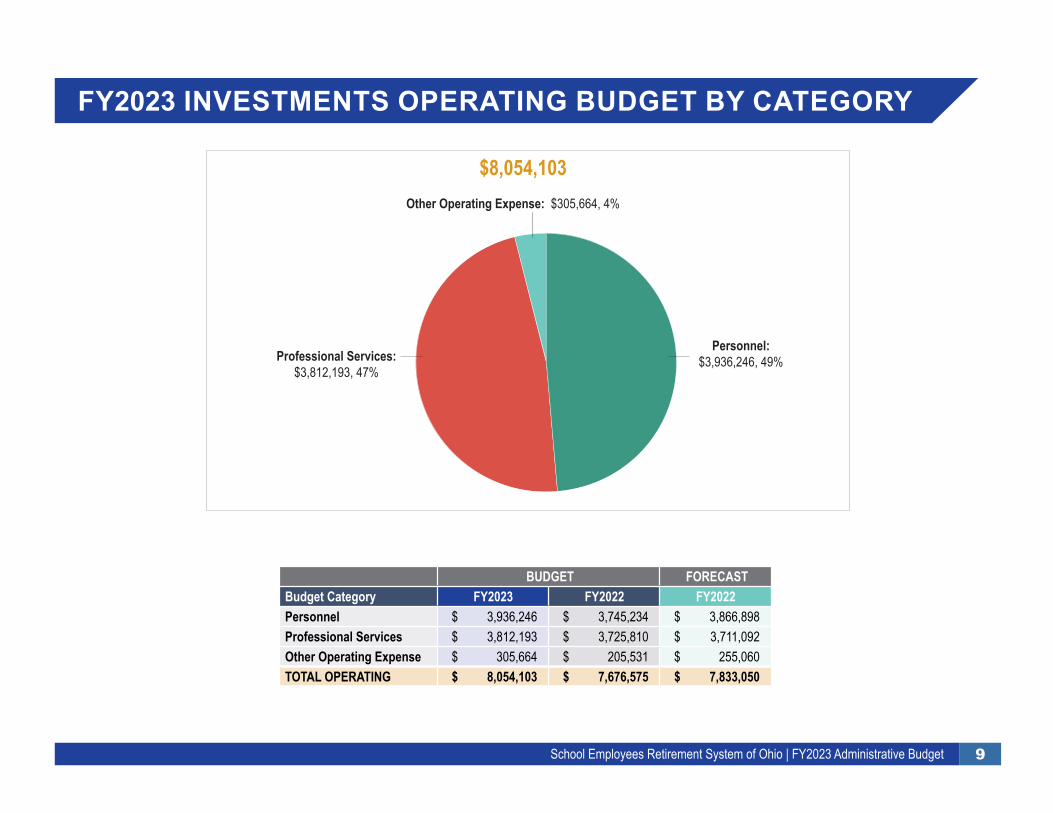
9School Employees Retirement System of Ohio | FY2023 Administrative Budget
FY2023 INVESTMENTS OPERATING BUDGET BY CATEGORY
BUDGET FORECAST Budget Category FY2023 FY2022 FY2022 Personnel $ 3,936,246 $ 3,745,234 $ 3,866,898 Professional Services $ 3,812,193 $ 3,725,810 $ 3,711,092 Other Operating Expense $ 305,664 $ 205,531 $ 255,060 TOTAL OPERATING $ 8,054,103 $ 7,676,575 $ 7,833,050
$8,054,103 Other Operating Expense: $305,664, 4%
Professional Services:$3,812,193, 47%
Personnel:$3,936,246, 49%
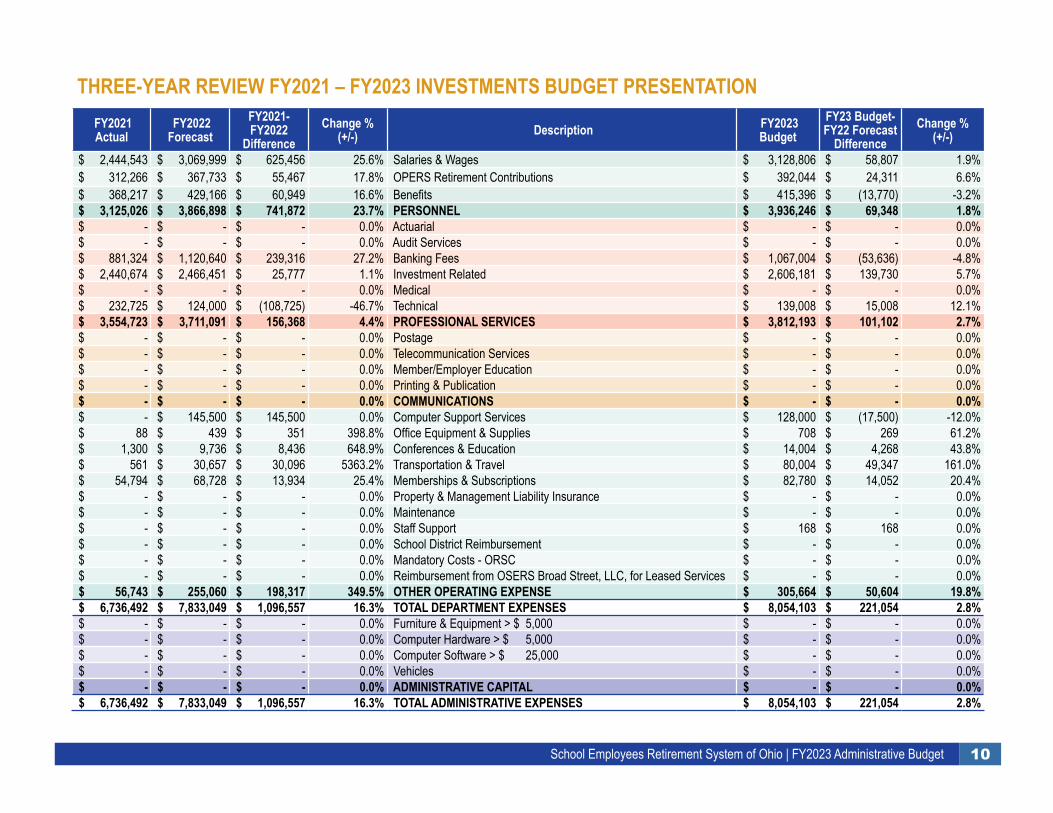
10School Employees Retirement System of Ohio | FY2023 Administrative Budget
THREE-YEAR REVIEW FY2021 – FY2023 INVESTMENTS BUDGET PRESENTATION FY2021 Actual
FY2022 Forecast
FY2021-FY2022
DifferenceChange %
(+/-) Description FY2023 Budget
FY23 Budget- FY22 Forecast
DifferenceChange %
(+/-) $ 2,444,543 $ 3,069,999 $ 625,456 25.6% Salaries & Wages $ 3,128,806 $ 58,807 1.9% $ 312,266 $ 367,733 $ 55,467 17.8% OPERS Retirement Contributions $ 392,044 $ 24,311 6.6% $ 368,217 $ 429,166 $ 60,949 16.6% Benefits $ 415,396 $ (13,770) -3.2% $ 3,125,026 $ 3,866,898 $ 741,872 23.7% PERSONNEL $ 3,936,246 $ 69,348 1.8% $ - $ - $ - 0.0% Actuarial $ - $ - 0.0% $ - $ - $ - 0.0% Audit Services $ - $ - 0.0% $ 881,324 $ 1,120,640 $ 239,316 27.2% Banking Fees $ 1,067,004 $ (53,636) -4.8% $ 2,440,674 $ 2,466,451 $ 25,777 1.1% Investment Related $ 2,606,181 $ 139,730 5.7% $ - $ - $ - 0.0% Medical $ - $ - 0.0% $ 232,725 $ 124,000 $ (108,725) -46.7% Technical $ 139,008 $ 15,008 12.1% $ 3,554,723 $ 3,711,091 $ 156,368 4.4% PROFESSIONAL SERVICES $ 3,812,193 $ 101,102 2.7% $ - $ - $ - 0.0% Postage $ - $ - 0.0% $ - $ - $ - 0.0% Telecommunication Services $ - $ - 0.0% $ - $ - $ - 0.0% Member/Employer Education $ - $ - 0.0% $ - $ - $ - 0.0% Printing & Publication $ - $ - 0.0% $ - $ - $ - 0.0% COMMUNICATIONS $ - $ - 0.0% $ - $ 145,500 $ 145,500 0.0% Computer Support Services $ 128,000 $ (17,500) -12.0% $ 88 $ 439 $ 351 398.8% Office Equipment & Supplies $ 708 $ 269 61.2% $ 1,300 $ 9,736 $ 8,436 648.9% Conferences & Education $ 14,004 $ 4,268 43.8% $ 561 $ 30,657 $ 30,096 5363.2% Transportation & Travel $ 80,004 $ 49,347 161.0% $ 54,794 $ 68,728 $ 13,934 25.4% Memberships & Subscriptions $ 82,780 $ 14,052 20.4% $ - $ - $ - 0.0% Property & Management Liability Insurance $ - $ - 0.0% $ - $ - $ - 0.0% Maintenance $ - $ - 0.0% $ - $ - $ - 0.0% Staff Support $ 168 $ 168 0.0% $ - $ - $ - 0.0% School District Reimbursement $ - $ - 0.0% $ - $ - $ - 0.0% Mandatory Costs - ORSC $ - $ - 0.0% $ - $ - $ - 0.0% Reimbursement from OSERS Broad Street, LLC, for Leased Services $ - $ - 0.0% $ 56,743 $ 255,060 $ 198,317 349.5% OTHER OPERATING EXPENSE $ 305,664 $ 50,604 19.8% $ 6,736,492 $ 7,833,049 $ 1,096,557 16.3% TOTAL DEPARTMENT EXPENSES $ 8,054,103 $ 221,054 2.8% $ - $ - $ - 0.0% Furniture & Equipment > $ 5,000 $ - $ - 0.0% $ - $ - $ - 0.0% Computer Hardware > $ 5,000 $ - $ - 0.0% $ - $ - $ - 0.0% Computer Software > $ 25,000 $ - $ - 0.0% $ - $ - $ - 0.0% Vehicles $ - $ - 0.0% $ - $ - $ - 0.0% ADMINISTRATIVE CAPITAL $ - $ - 0.0% $ 6,736,492 $ 7,833,049 $ 1,096,557 16.3% TOTAL ADMINISTRATIVE EXPENSES $ 8,054,103 $ 221,054 2.8%
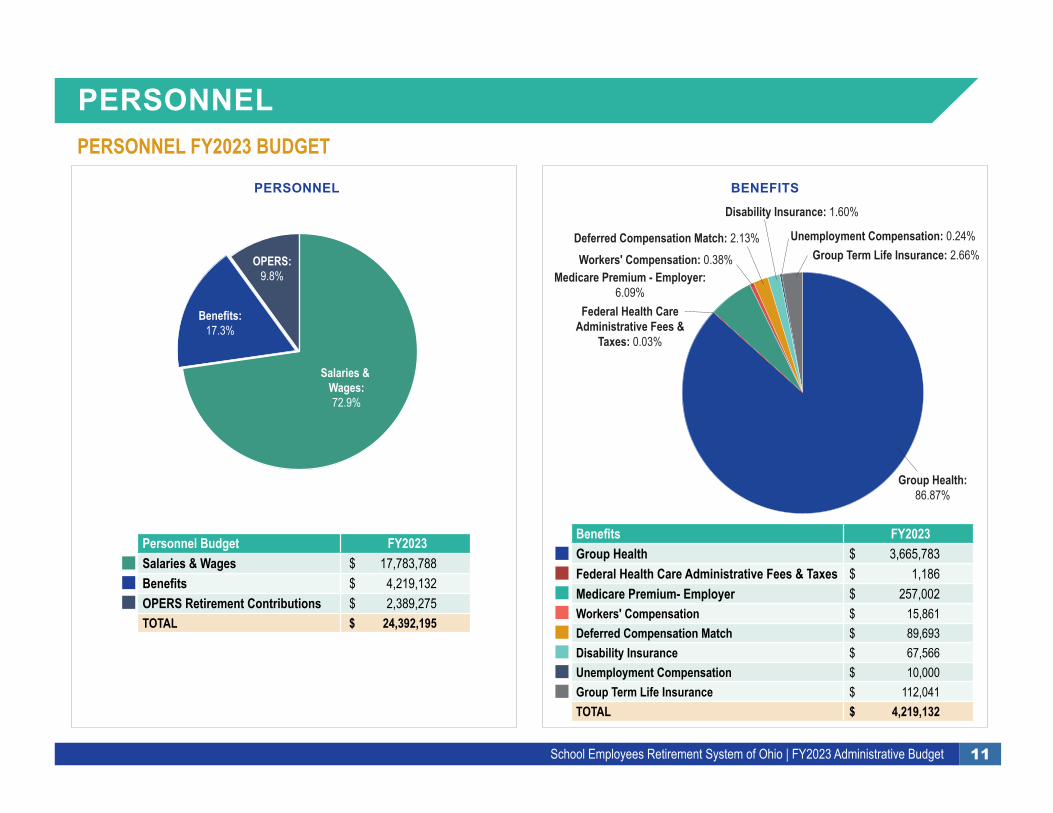
11School Employees Retirement System of Ohio | FY2023 Administrative Budget
PERSONNELPERSONNEL FY2023 BUDGET
DETAILS BY MAJOR ACCOUNT CATEGORY
BENEFITS
Benefits FY2023 Group Health $ 3,665,783Federal Health Care Administrative Fees & Taxes $ 1,186Medicare Premium- Employer $ 257,002Workers' Compensation $ 15,861Deferred Compensation Match $ 89,693Disability Insurance $ 67,566Unemployment Compensation $ 10,000Group Term Life Insurance $ 112,041TOTAL $ 4,219,132
Group Term Life Insurance: 2.66%Unemployment Compensation: 0.24%
Disability Insurance: 1.60%
Deferred Compensation Match: 2.13%Workers' Compensation: 0.38%
Medicare Premium - Employer:6.09%
Federal Health CareAdministrative Fees &
Taxes: 0.03%
Group Health:86.87%
PERSONNEL
OPERS:9.8%
Benefits:17.3%
Salaries & Wages:72.9%
Personnel Budget FY2023 Salaries & Wages $ 17,783,788 Benefits $ 4,219,132 OPERS Retirement Contributions $ 2,389,275 TOTAL $ 24,392,195
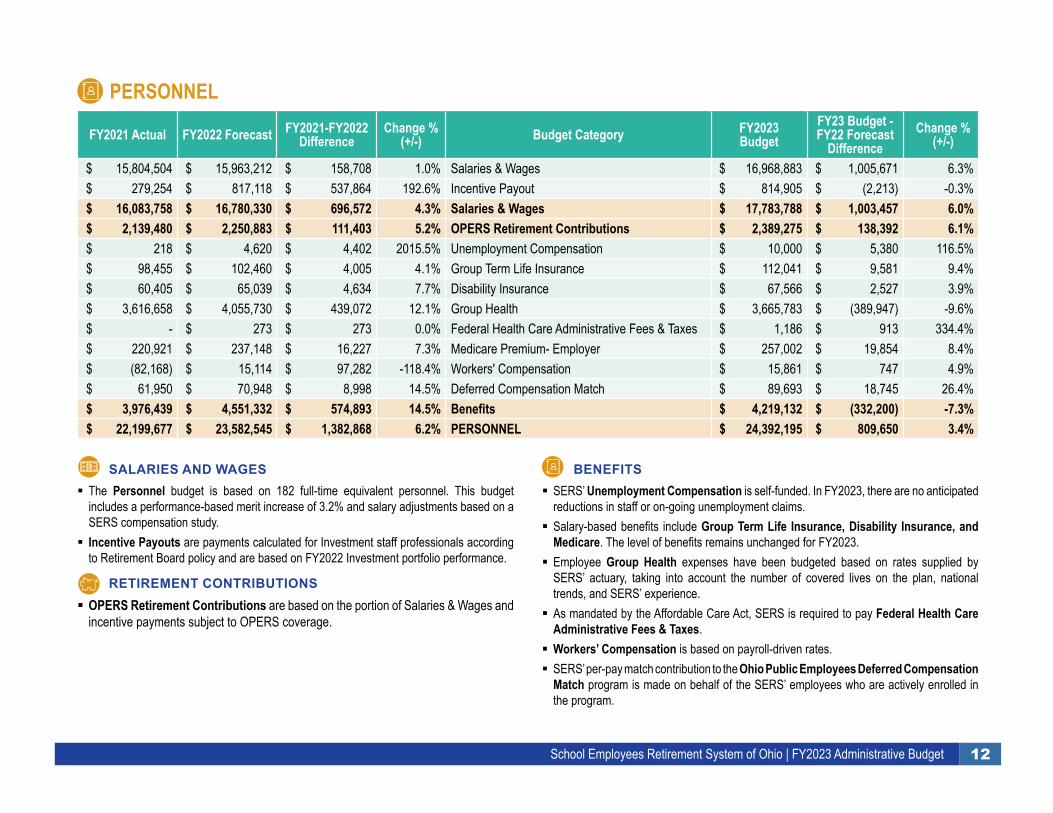
12School Employees Retirement System of Ohio | FY2023 Administrative Budget
SALARIES AND WAGES � The Personnel budget is based on 182 full-time equivalent personnel. This budget includes a performance-based merit increase of 3.2% and salary adjustments based on a SERS compensation study.
� Incentive Payouts are payments calculated for Investment staff professionals according to Retirement Board policy and are based on FY2022 Investment portfolio performance.
RETIREMENT CONTRIBUTIONS � OPERS Retirement Contributions are based on the portion of Salaries & Wages and incentive payments subject to OPERS coverage.
BENEFITS � SERS’ Unemployment Compensation is self-funded. In FY2023, there are no anticipated reductions in staff or on-going unemployment claims.
� Salary-based benefits include Group Term Life Insurance, Disability Insurance, and Medicare. The level of benefits remains unchanged for FY2023.
� Employee Group Health expenses have been budgeted based on rates supplied by SERS’ actuary, taking into account the number of covered lives on the plan, national trends, and SERS’ experience.
� As mandated by the Affordable Care Act, SERS is required to pay Federal Health Care Administrative Fees & Taxes.
� Workers’ Compensation is based on payroll-driven rates. � SERS’ per-pay match contribution to the Ohio Public Employees Deferred Compensation Match program is made on behalf of the SERS’ employees who are actively enrolled in the program.
FY2021 Actual FY2022 Forecast FY2021-FY2022 Difference
Change %(+/-) Budget Category FY2023
BudgetFY23 Budget -FY22 Forecast
DifferenceChange %
(+/-)
$ 15,804,504 $ 15,963,212 $ 158,708 1.0% Salaries & Wages $ 16,968,883 $ 1,005,671 6.3% $ 279,254 $ 817,118 $ 537,864 192.6% Incentive Payout $ 814,905 $ (2,213) -0.3% $ 16,083,758 $ 16,780,330 $ 696,572 4.3% Salaries & Wages $ 17,783,788 $ 1,003,457 6.0% $ 2,139,480 $ 2,250,883 $ 111,403 5.2% OPERS Retirement Contributions $ 2,389,275 $ 138,392 6.1% $ 218 $ 4,620 $ 4,402 2015.5% Unemployment Compensation $ 10,000 $ 5,380 116.5% $ 98,455 $ 102,460 $ 4,005 4.1% Group Term Life Insurance $ 112,041 $ 9,581 9.4% $ 60,405 $ 65,039 $ 4,634 7.7% Disability Insurance $ 67,566 $ 2,527 3.9% $ 3,616,658 $ 4,055,730 $ 439,072 12.1% Group Health $ 3,665,783 $ (389,947) -9.6% $ - $ 273 $ 273 0.0% Federal Health Care Administrative Fees & Taxes $ 1,186 $ 913 334.4% $ 220,921 $ 237,148 $ 16,227 7.3% Medicare Premium- Employer $ 257,002 $ 19,854 8.4% $ (82,168) $ 15,114 $ 97,282 -118.4% Workers' Compensation $ 15,861 $ 747 4.9% $ 61,950 $ 70,948 $ 8,998 14.5% Deferred Compensation Match $ 89,693 $ 18,745 26.4% $ 3,976,439 $ 4,551,332 $ 574,893 14.5% Benefits $ 4,219,132 $ (332,200) -7.3% $ 22,199,677 $ 23,582,545 $ 1,382,868 6.2% PERSONNEL $ 24,392,195 $ 809,650 3.4%
PERSONNEL
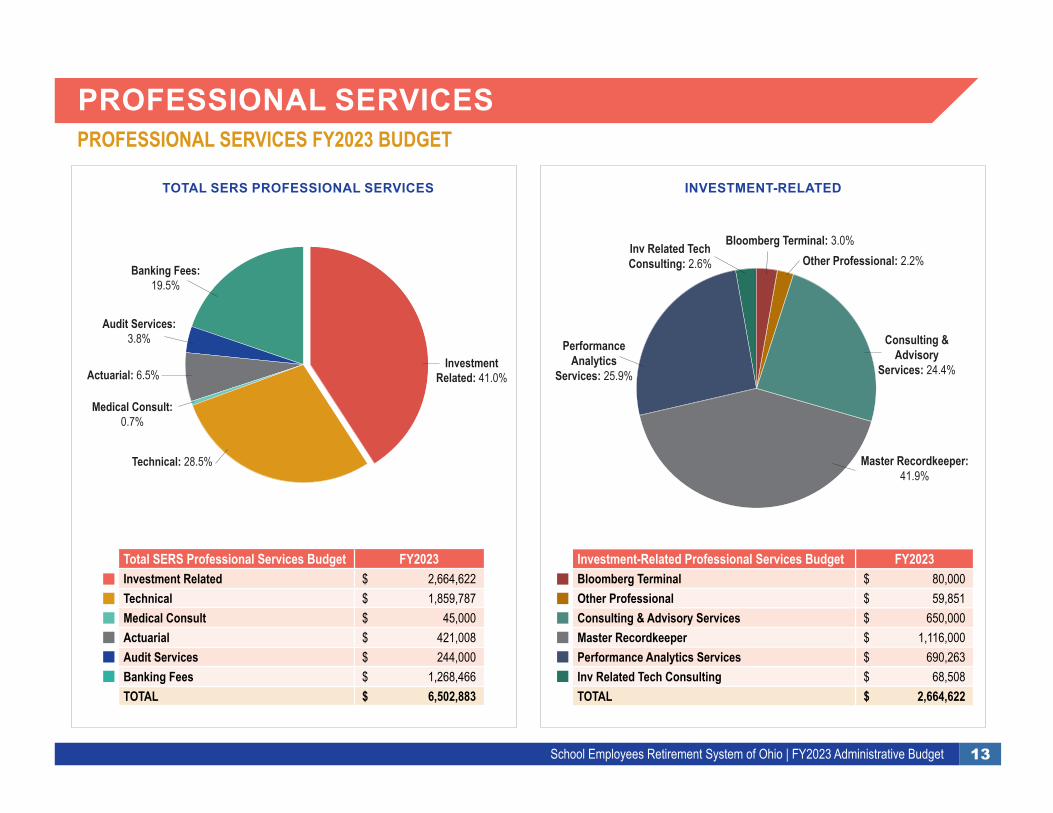
13School Employees Retirement System of Ohio | FY2023 Administrative Budget
Investment-Related Professional Services Budget FY2023 Bloomberg Terminal $ 80,000 Other Professional $ 59,851 Consulting & Advisory Services $ 650,000 Master Recordkeeper $ 1,116,000 Performance Analytics Services $ 690,263 Inv Related Tech Consulting $ 68,508 TOTAL $ 2,664,622
INVESTMENT-RELATED
Inv Related TechConsulting: 2.6%
PerformanceAnalytics
Services: 25.9%
Master Recordkeeper:41.9%
Consulting &Advisory
Services: 24.4%
Other Professional: 2.2%Bloomberg Terminal: 3.0%
PROFESSIONAL SERVICESPROFESSIONAL SERVICES FY2023 BUDGET
Total SERS Professional Services Budget FY2023 Investment Related $ 2,664,622 Technical $ 1,859,787 Medical Consult $ 45,000 Actuarial $ 421,008 Audit Services $ 244,000 Banking Fees $ 1,268,466 TOTAL $ 6,502,883
Banking Fees:19.5%
Audit Services:3.8%
Actuarial: 6.5%
Medical Consult:0.7%
Technical: 28.5%
InvestmentRelated: 41.0%
TOTAL SERS PROFESSIONAL SERVICES
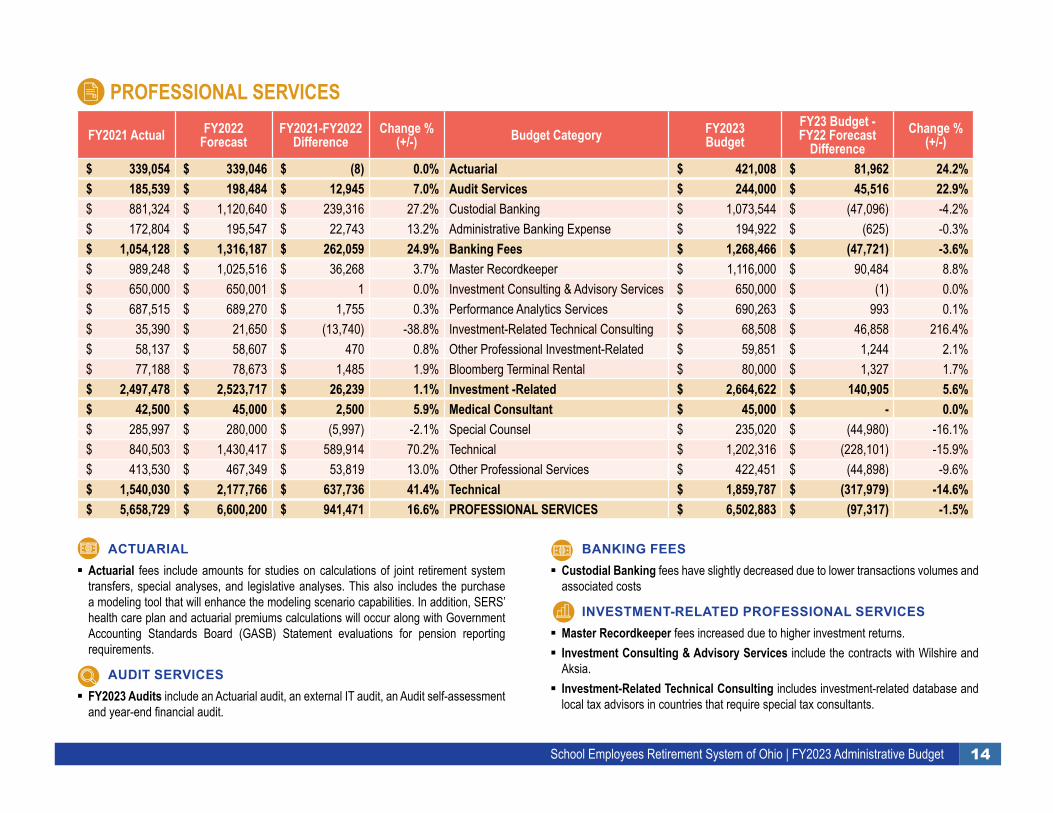
14School Employees Retirement System of Ohio | FY2023 Administrative Budget
ACTUARIAL � Actuarial fees include amounts for studies on calculations of joint retirement system transfers, special analyses, and legislative analyses. This also includes the purchase a modeling tool that will enhance the modeling scenario capabilities. In addition, SERS’ health care plan and actuarial premiums calculations will occur along with Government Accounting Standards Board (GASB) Statement evaluations for pension reporting requirements.
AUDIT SERVICES � FY2023 Audits include an Actuarial audit, an external IT audit, an Audit self-assessment and year-end financial audit.
BANKING FEES � Custodial Banking fees have slightly decreased due to lower transactions volumes and associated costs
INVESTMENT-RELATED PROFESSIONAL SERVICES � Master Recordkeeper fees increased due to higher investment returns. � Investment Consulting & Advisory Services include the contracts with Wilshire and Aksia.
� Investment-Related Technical Consulting includes investment-related database and local tax advisors in countries that require special tax consultants.
PROFESSIONAL SERVICES
FY2021 Actual FY2022 Forecast
FY2021-FY2022 Difference
Change %(+/-) Budget Category FY2023
BudgetFY23 Budget -FY22 Forecast
DifferenceChange %
(+/-)
$ 339,054 $ 339,046 $ (8) 0.0% Actuarial $ 421,008 $ 81,962 24.2% $ 185,539 $ 198,484 $ 12,945 7.0% Audit Services $ 244,000 $ 45,516 22.9% $ 881,324 $ 1,120,640 $ 239,316 27.2% Custodial Banking $ 1,073,544 $ (47,096) -4.2% $ 172,804 $ 195,547 $ 22,743 13.2% Administrative Banking Expense $ 194,922 $ (625) -0.3% $ 1,054,128 $ 1,316,187 $ 262,059 24.9% Banking Fees $ 1,268,466 $ (47,721) -3.6% $ 989,248 $ 1,025,516 $ 36,268 3.7% Master Recordkeeper $ 1,116,000 $ 90,484 8.8% $ 650,000 $ 650,001 $ 1 0.0% Investment Consulting & Advisory Services $ 650,000 $ (1) 0.0% $ 687,515 $ 689,270 $ 1,755 0.3% Performance Analytics Services $ 690,263 $ 993 0.1% $ 35,390 $ 21,650 $ (13,740) -38.8% Investment-Related Technical Consulting $ 68,508 $ 46,858 216.4% $ 58,137 $ 58,607 $ 470 0.8% Other Professional Investment-Related $ 59,851 $ 1,244 2.1% $ 77,188 $ 78,673 $ 1,485 1.9% Bloomberg Terminal Rental $ 80,000 $ 1,327 1.7% $ 2,497,478 $ 2,523,717 $ 26,239 1.1% Investment -Related $ 2,664,622 $ 140,905 5.6% $ 42,500 $ 45,000 $ 2,500 5.9% Medical Consultant $ 45,000 $ - 0.0% $ 285,997 $ 280,000 $ (5,997) -2.1% Special Counsel $ 235,020 $ (44,980) -16.1% $ 840,503 $ 1,430,417 $ 589,914 70.2% Technical $ 1,202,316 $ (228,101) -15.9% $ 413,530 $ 467,349 $ 53,819 13.0% Other Professional Services $ 422,451 $ (44,898) -9.6% $ 1,540,030 $ 2,177,766 $ 637,736 41.4% Technical $ 1,859,787 $ (317,979) -14.6% $ 5,658,729 $ 6,600,200 $ 941,471 16.6% PROFESSIONAL SERVICES $ 6,502,883 $ (97,317) -1.5%
15School Employees Retirement System of Ohio | FY2023 Administrative Budget
� Other Professional Investment-Related Consulting includes proxy and divestiture services.
� Bloomberg Terminal Rental fees are for the licenses to use the Bloomberg information systems.
MEDICAL � The Medical Consultant reviews about 1,500 cases per year with the Disability Section staff, participates in the monthly meetings of the Medical Advisory Committee, and attends Board Meetings as needed.
TECHNICAL � Special Counsel are contingent amounts for the costs of outside legal counsel. Anticipated legal fees for investment contracts comprise approximately 59% of the FY2023 Special Counsel budget.
� The Technical account includes the cost of outside consultants that provide computer security, health care data warehouse services, medical and prescription program pricing, specialized benefit system support, and website administration and design. FY2023 also illustrates a shift of infrastructure support to the five-year Technology Enhancement Project Budget.
� Other Professional Services include the cost for other consultants and advisory services, such as legislative news and political consulting providers, organizational leadership and development, professional work-study internships, surveying and focus groups, and Attorney General Staff reimbursement. Also included are consulting on initiatives around pension and health care sustainability along with the continuation of the enterprise-wide document life cycle evaluation.
PROFESSIONAL SERVICES, CONTINUED
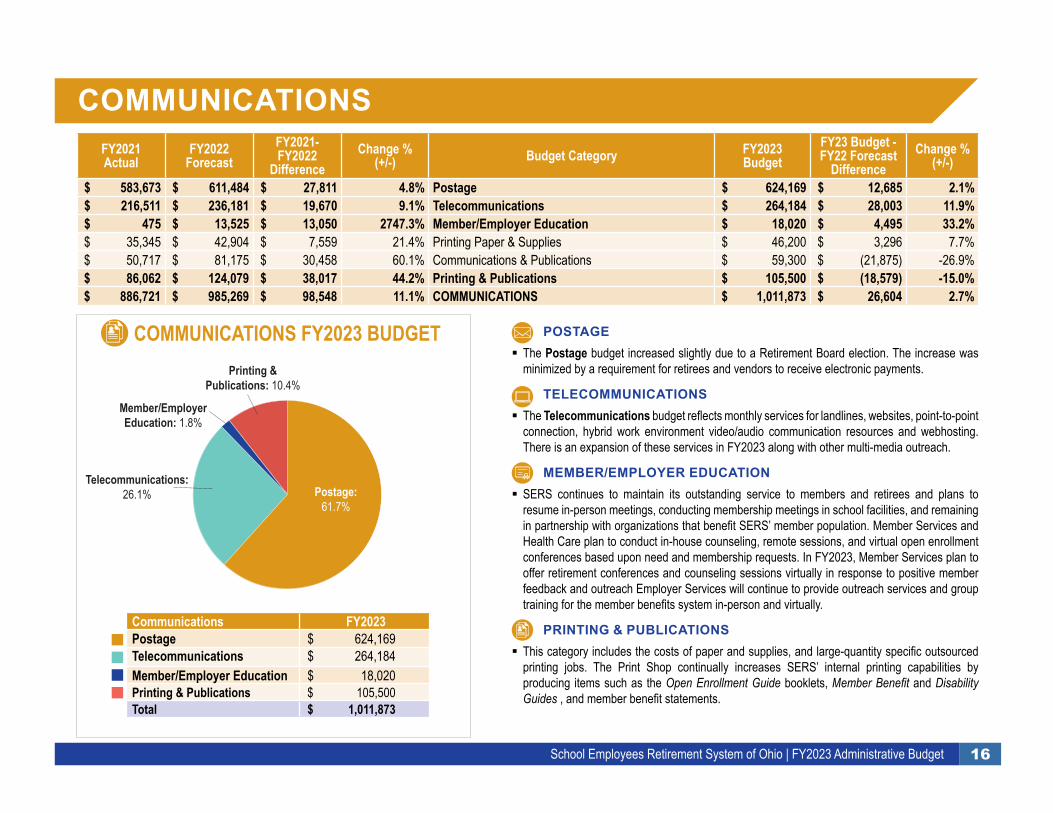
16School Employees Retirement System of Ohio | FY2023 Administrative Budget
COMMUNICATIONSFY2021 Actual
FY2022 Forecast
FY2021-FY2022
DifferenceChange %
(+/-) Budget Category FY2023Budget
FY23 Budget - FY22 Forecast
DifferenceChange %
(+/-)
$ 583,673 $ 611,484 $ 27,811 4.8% Postage $ 624,169 $ 12,685 2.1% $ 216,511 $ 236,181 $ 19,670 9.1% Telecommunications $ 264,184 $ 28,003 11.9% $ 475 $ 13,525 $ 13,050 2747.3% Member/Employer Education $ 18,020 $ 4,495 33.2% $ 35,345 $ 42,904 $ 7,559 21.4% Printing Paper & Supplies $ 46,200 $ 3,296 7.7% $ 50,717 $ 81,175 $ 30,458 60.1% Communications & Publications $ 59,300 $ (21,875) -26.9% $ 86,062 $ 124,079 $ 38,017 44.2% Printing & Publications $ 105,500 $ (18,579) -15.0% $ 886,721 $ 985,269 $ 98,548 11.1% COMMUNICATIONS $ 1,011,873 $ 26,604 2.7%
POSTAGE � The Postage budget increased slightly due to a Retirement Board election. The increase was minimized by a requirement for retirees and vendors to receive electronic payments.
TELECOMMUNICATIONS � The Telecommunications budget reflects monthly services for landlines, websites, point-to-point connection, hybrid work environment video/audio communication resources and webhosting. There is an expansion of these services in FY2023 along with other multi-media outreach.
MEMBER/EMPLOYER EDUCATION � SERS continues to maintain its outstanding service to members and retirees and plans to resume in-person meetings, conducting membership meetings in school facilities, and remaining in partnership with organizations that benefit SERS’ member population. Member Services and Health Care plan to conduct in-house counseling, remote sessions, and virtual open enrollment conferences based upon need and membership requests. In FY2023, Member Services plan to offer retirement conferences and counseling sessions virtually in response to positive member feedback and outreach Employer Services will continue to provide outreach services and group training for the member benefits system in-person and virtually.
PRINTING & PUBLICATIONS � This category includes the costs of paper and supplies, and large-quantity specific outsourced printing jobs. The Print Shop continually increases SERS’ internal printing capabilities by producing items such as the Open Enrollment Guide booklets, Member Benefit and Disability Guides , and member benefit statements.
COMMUNICATIONS FY2023 BUDGETPrinting &
Publications: 10.4%
Member/EmployerEducation: 1.8%
Telecommunications:26.1% Postage:
61.7%
Communications FY2023 Postage $ 624,169 Telecommunications $ 264,184 Member/Employer Education $ 18,020 Printing & Publications $ 105,500 Total $ 1,011,873
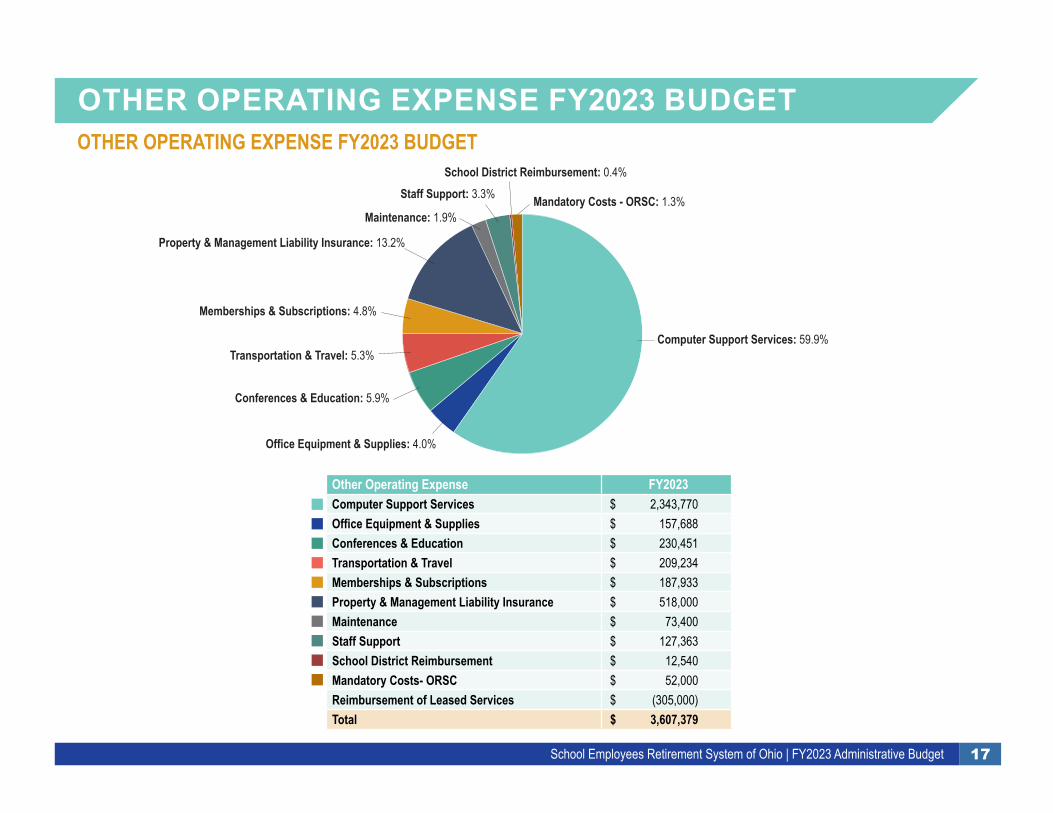
17School Employees Retirement System of Ohio | FY2023 Administrative Budget
OTHER OPERATING EXPENSE FY2023 BUDGETOTHER OPERATING EXPENSE FY2023 BUDGET
Other Operating Expense FY2023 Computer Support Services $ 2,343,770 Office Equipment & Supplies $ 157,688 Conferences & Education $ 230,451 Transportation & Travel $ 209,234 Memberships & Subscriptions $ 187,933 Property & Management Liability Insurance $ 518,000 Maintenance $ 73,400 Staff Support $ 127,363 School District Reimbursement $ 12,540 Mandatory Costs- ORSC $ 52,000 Reimbursement of Leased Services $ (305,000)Total $ 3,607,379
Mandatory Costs - ORSC: 1.3%
School District Reimbursement: 0.4%Staff Support: 3.3%
Maintenance: 1.9%
Property & Management Liability Insurance: 13.2%
Memberships & Subscriptions: 4.8%
Transportation & Travel: 5.3%
Conferences & Education: 5.9%
Office Equipment & Supplies: 4.0%
Computer Support Services: 59.9%
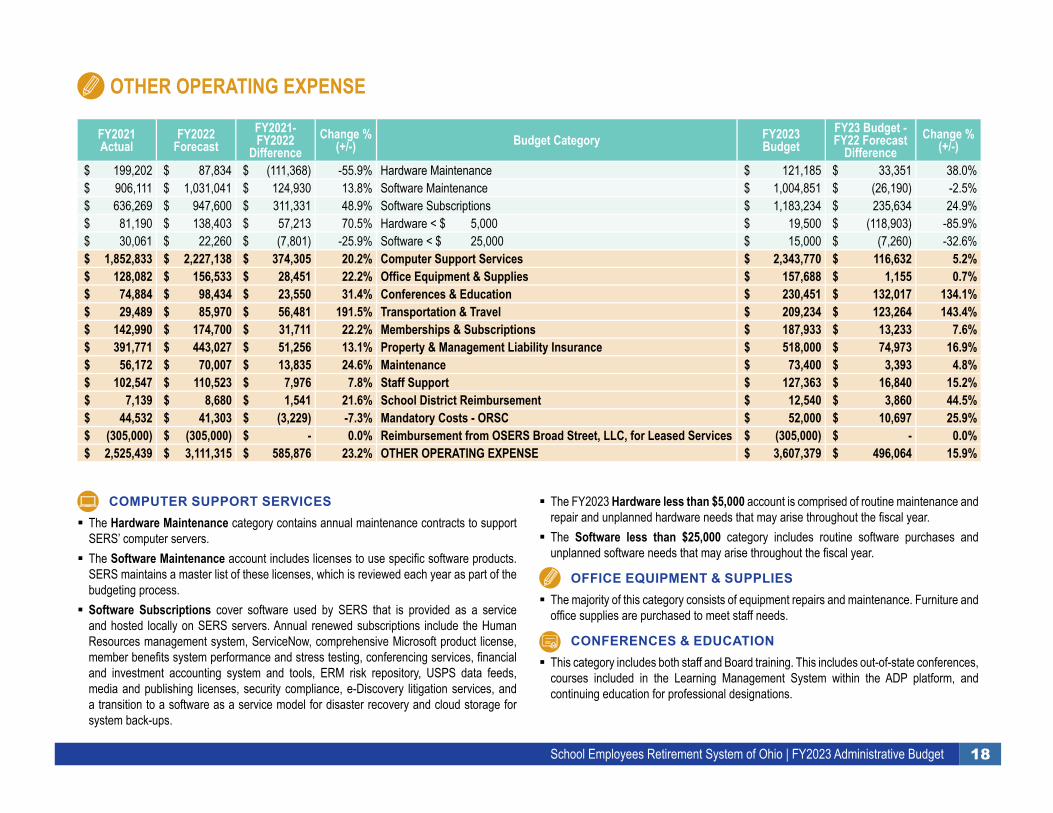
18School Employees Retirement System of Ohio | FY2023 Administrative Budget
FY2021 Actual
FY2022 Forecast
FY2021-FY2022
DifferenceChange %
(+/-) Budget Category FY2023Budget
FY23 Budget - FY22 Forecast
DifferenceChange %
(+/-)
$ 199,202 $ 87,834 $ (111,368) -55.9% Hardware Maintenance $ 121,185 $ 33,351 38.0% $ 906,111 $ 1,031,041 $ 124,930 13.8% Software Maintenance $ 1,004,851 $ (26,190) -2.5% $ 636,269 $ 947,600 $ 311,331 48.9% Software Subscriptions $ 1,183,234 $ 235,634 24.9% $ 81,190 $ 138,403 $ 57,213 70.5% Hardware < $ 5,000 $ 19,500 $ (118,903) -85.9% $ 30,061 $ 22,260 $ (7,801) -25.9% Software < $ 25,000 $ 15,000 $ (7,260) -32.6% $ 1,852,833 $ 2,227,138 $ 374,305 20.2% Computer Support Services $ 2,343,770 $ 116,632 5.2% $ 128,082 $ 156,533 $ 28,451 22.2% Office Equipment & Supplies $ 157,688 $ 1,155 0.7% $ 74,884 $ 98,434 $ 23,550 31.4% Conferences & Education $ 230,451 $ 132,017 134.1% $ 29,489 $ 85,970 $ 56,481 191.5% Transportation & Travel $ 209,234 $ 123,264 143.4% $ 142,990 $ 174,700 $ 31,711 22.2% Memberships & Subscriptions $ 187,933 $ 13,233 7.6% $ 391,771 $ 443,027 $ 51,256 13.1% Property & Management Liability Insurance $ 518,000 $ 74,973 16.9% $ 56,172 $ 70,007 $ 13,835 24.6% Maintenance $ 73,400 $ 3,393 4.8% $ 102,547 $ 110,523 $ 7,976 7.8% Staff Support $ 127,363 $ 16,840 15.2% $ 7,139 $ 8,680 $ 1,541 21.6% School District Reimbursement $ 12,540 $ 3,860 44.5% $ 44,532 $ 41,303 $ (3,229) -7.3% Mandatory Costs - ORSC $ 52,000 $ 10,697 25.9% $ (305,000) $ (305,000) $ - 0.0% Reimbursement from OSERS Broad Street, LLC, for Leased Services $ (305,000) $ - 0.0% $ 2,525,439 $ 3,111,315 $ 585,876 23.2% OTHER OPERATING EXPENSE $ 3,607,379 $ 496,064 15.9%
COMPUTER SUPPORT SERVICES � The Hardware Maintenance category contains annual maintenance contracts to support SERS’ computer servers.
� The Software Maintenance account includes licenses to use specific software products. SERS maintains a master list of these licenses, which is reviewed each year as part of the budgeting process.
� Software Subscriptions cover software used by SERS that is provided as a service and hosted locally on SERS servers. Annual renewed subscriptions include the Human Resources management system, ServiceNow, comprehensive Microsoft product license, member benefits system performance and stress testing, conferencing services, financial and investment accounting system and tools, ERM risk repository, USPS data feeds, media and publishing licenses, security compliance, e-Discovery litigation services, and a transition to a software as a service model for disaster recovery and cloud storage for system back-ups.
� The FY2023 Hardware less than $5,000 account is comprised of routine maintenance and repair and unplanned hardware needs that may arise throughout the fiscal year.
� The Software less than $25,000 category includes routine software purchases and unplanned software needs that may arise throughout the fiscal year.
OFFICE EQUIPMENT & SUPPLIES � The majority of this category consists of equipment repairs and maintenance. Furniture and office supplies are purchased to meet staff needs.
CONFERENCES & EDUCATION � This category includes both staff and Board training. This includes out-of-state conferences, courses included in the Learning Management System within the ADP platform, and continuing education for professional designations.
OTHER OPERATING EXPENSE
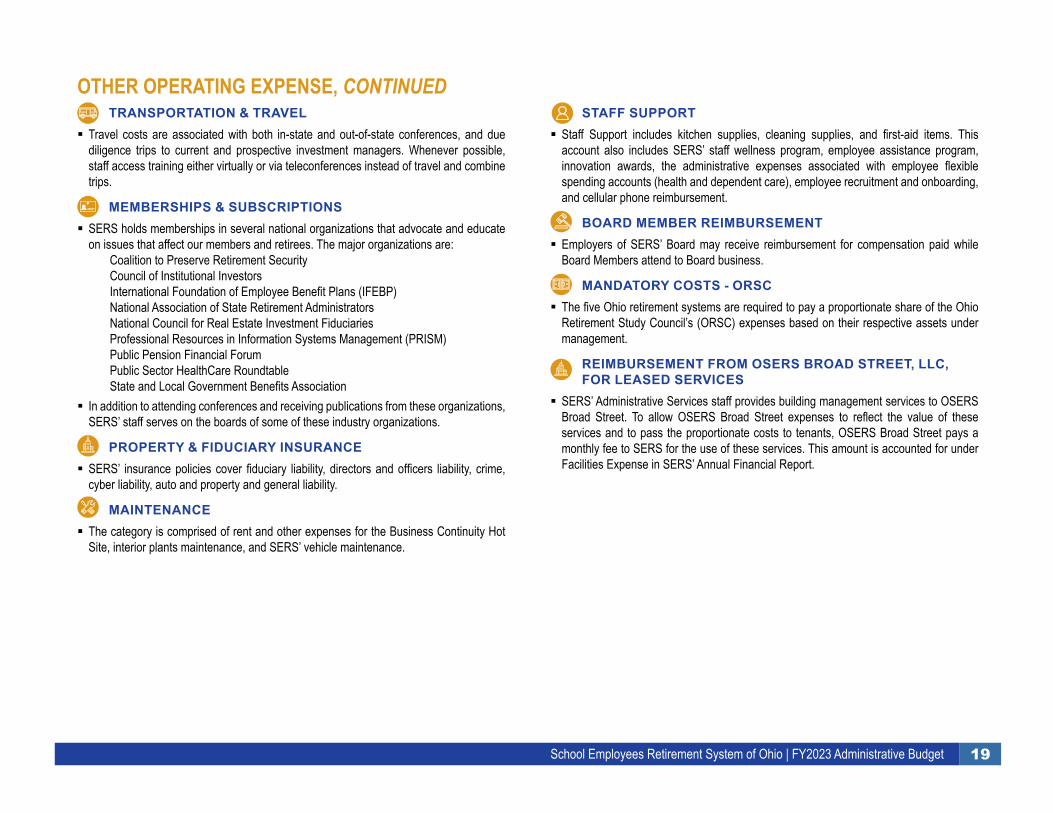
19School Employees Retirement System of Ohio | FY2023 Administrative Budget
OTHER OPERATING EXPENSE, CONTINUEDTRANSPORTATION & TRAVEL
� Travel costs are associated with both in-state and out-of-state conferences, and due diligence trips to current and prospective investment managers. Whenever possible, staff access training either virtually or via teleconferences instead of travel and combine trips.
MEMBERSHIPS & SUBSCRIPTIONS � SERS holds memberships in several national organizations that advocate and educate on issues that affect our members and retirees. The major organizations are:
Coalition to Preserve Retirement SecurityCouncil of Institutional InvestorsInternational Foundation of Employee Benefit Plans (IFEBP)National Association of State Retirement AdministratorsNational Council for Real Estate Investment FiduciariesProfessional Resources in Information Systems Management (PRISM)Public Pension Financial ForumPublic Sector HealthCare RoundtableState and Local Government Benefits Association
� In addition to attending conferences and receiving publications from these organizations, SERS’ staff serves on the boards of some of these industry organizations.
PROPERTY & FIDUCIARY INSURANCE � SERS’ insurance policies cover fiduciary liability, directors and officers liability, crime, cyber liability, auto and property and general liability.
MAINTENANCE � The category is comprised of rent and other expenses for the Business Continuity Hot Site, interior plants maintenance, and SERS’ vehicle maintenance.
STAFF SUPPORT � Staff Support includes kitchen supplies, cleaning supplies, and first-aid items. This account also includes SERS’ staff wellness program, employee assistance program, innovation awards, the administrative expenses associated with employee flexible spending accounts (health and dependent care), employee recruitment and onboarding, and cellular phone reimbursement.
BOARD MEMBER REIMBURSEMENT � Employers of SERS’ Board may receive reimbursement for compensation paid while Board Members attend to Board business.
MANDATORY COSTS - ORSC � The five Ohio retirement systems are required to pay a proportionate share of the Ohio Retirement Study Council’s (ORSC) expenses based on their respective assets under management.
REIMBURSEMENT FROM OSERS BROAD STREET, LLC, FOR LEASED SERVICES
� SERS’ Administrative Services staff provides building management services to OSERS Broad Street. To allow OSERS Broad Street expenses to reflect the value of these services and to pass the proportionate costs to tenants, OSERS Broad Street pays a monthly fee to SERS for the use of these services. This amount is accounted for under Facilities Expense in SERS’ Annual Financial Report.
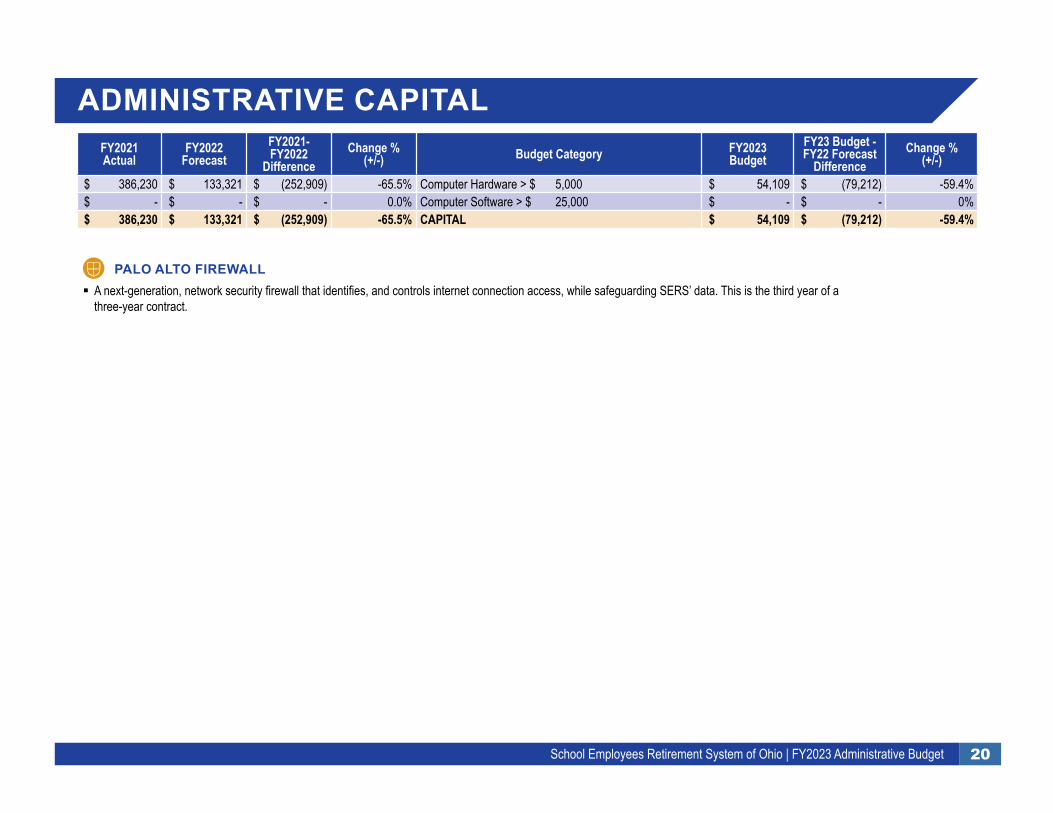
20School Employees Retirement System of Ohio | FY2023 Administrative Budget
ADMINISTRATIVE CAPITALFY2021 Actual
FY2022 Forecast
FY2021-FY2022
DifferenceChange %
(+/-) Budget Category FY2023Budget
FY23 Budget - FY22 Forecast
DifferenceChange %
(+/-)
$ 386,230 $ 133,321 $ (252,909) -65.5% Computer Hardware > $ 5,000 $ 54,109 $ (79,212) -59.4% $ - $ - $ - 0.0% Computer Software > $ 25,000 $ - $ - 0% $ 386,230 $ 133,321 $ (252,909) -65.5% CAPITAL $ 54,109 $ (79,212) -59.4%
PALO ALTO FIREWALL � A next-generation, network security firewall that identifies, and controls internet connection access, while safeguarding SERS’ data. This is the third year of a three-year contract.
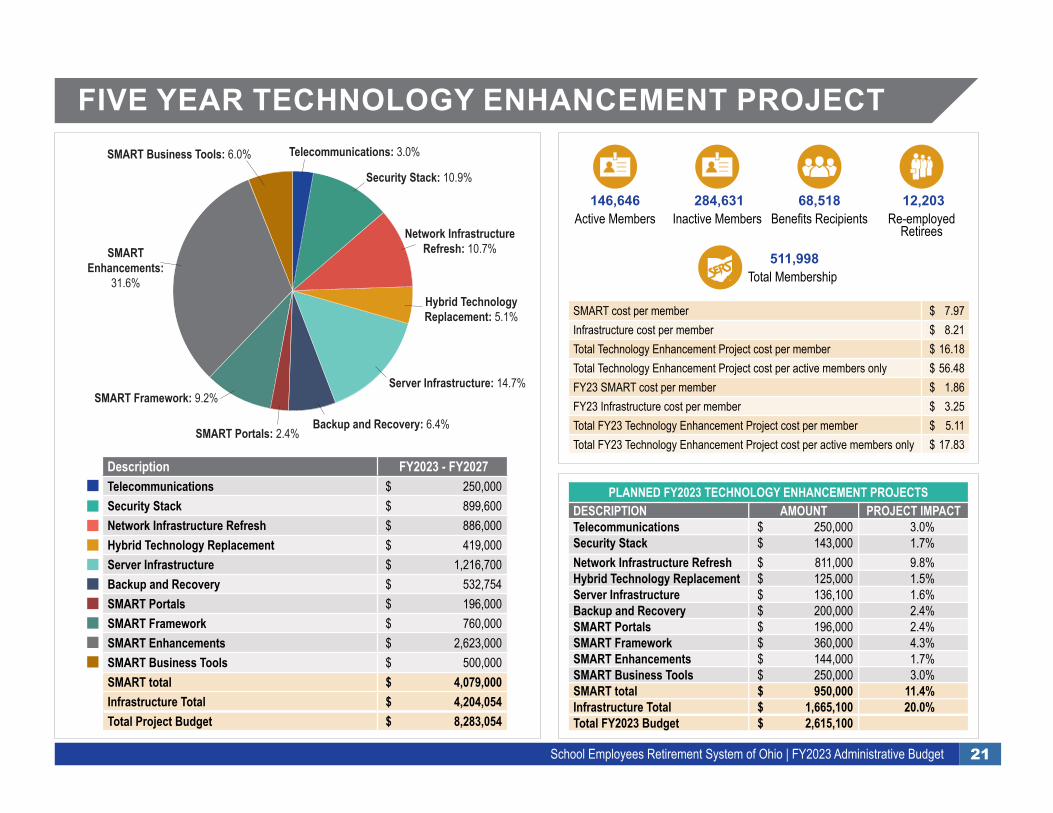
21School Employees Retirement System of Ohio | FY2023 Administrative Budget
PLANNED FY2023 TECHNOLOGY ENHANCEMENT PROJECTSDESCRIPTION AMOUNT PROJECT IMPACTTelecommunications $ 250,000 3.0%Security Stack $ 143,000 1.7%Network Infrastructure Refresh $ 811,000 9.8%Hybrid Technology Replacement $ 125,000 1.5%Server Infrastructure $ 136,100 1.6%Backup and Recovery $ 200,000 2.4%SMART Portals $ 196,000 2.4%SMART Framework $ 360,000 4.3%SMART Enhancements $ 144,000 1.7%SMART Business Tools $ 250,000 3.0%SMART total $ 950,000 11.4%Infrastructure Total $ 1,665,100 20.0%Total FY2023 Budget $ 2,615,100
FIVE YEAR TECHNOLOGY ENHANCEMENT PROJECT
Description FY2023 - FY2027 Telecommunications $ 250,000 Security Stack $ 899,600 Network Infrastructure Refresh $ 886,000 Hybrid Technology Replacement $ 419,000 Server Infrastructure $ 1,216,700 Backup and Recovery $ 532,754 SMART Portals $ 196,000 SMART Framework $ 760,000 SMART Enhancements $ 2,623,000 SMART Business Tools $ 500,000 SMART total $ 4,079,000 Infrastructure Total $ 4,204,054 Total Project Budget $ 8,283,054
SMART Business Tools: 6.0%
SMARTEnhancements:
31.6%
SMART Framework: 9.2%
SMART Portals: 2.4%Backup and Recovery: 6.4%
Server Infrastructure: 14.7%
Hybrid TechnologyReplacement: 5.1%
Network InfrastructureRefresh: 10.7%
Security Stack: 10.9%
Telecommunications: 3.0%
SMART cost per member $ 7.97Infrastructure cost per member $ 8.21Total Technology Enhancement Project cost per member $ 16.18Total Technology Enhancement Project cost per active members only $ 56.48FY23 SMART cost per member $ 1.86FY23 Infrastructure cost per member $ 3.25Total FY23 Technology Enhancement Project cost per member $ 5.11Total FY23 Technology Enhancement Project cost per active members only $ 17.83
146,646 Active Members
68,518 Benefits Recipients
284,631 Inactive Members
12,203 Re-employed
Retirees
511,998 Total Membership
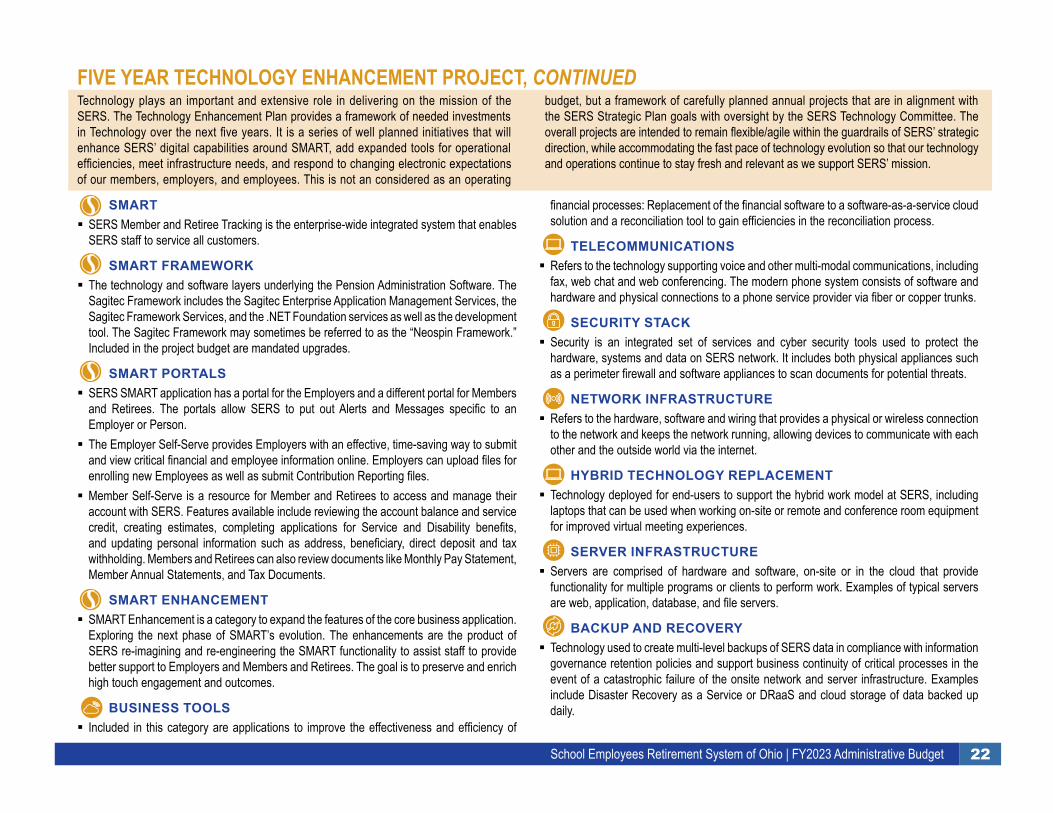
22School Employees Retirement System of Ohio | FY2023 Administrative Budget
SMART � SERS Member and Retiree Tracking is the enterprise-wide integrated system that enables SERS staff to service all customers.
SMART FRAMEWORK � The technology and software layers underlying the Pension Administration Software. The Sagitec Framework includes the Sagitec Enterprise Application Management Services, the Sagitec Framework Services, and the .NET Foundation services as well as the development tool. The Sagitec Framework may sometimes be referred to as the “Neospin Framework.” Included in the project budget are mandated upgrades.
SMART PORTALS � SERS SMART application has a portal for the Employers and a different portal for Members and Retirees. The portals allow SERS to put out Alerts and Messages specific to an Employer or Person.
� The Employer Self-Serve provides Employers with an effective, time-saving way to submit and view critical financial and employee information online. Employers can upload files for enrolling new Employees as well as submit Contribution Reporting files.
� Member Self-Serve is a resource for Member and Retirees to access and manage their account with SERS. Features available include reviewing the account balance and service credit, creating estimates, completing applications for Service and Disability benefits, and updating personal information such as address, beneficiary, direct deposit and tax withholding. Members and Retirees can also review documents like Monthly Pay Statement, Member Annual Statements, and Tax Documents.
SMART ENHANCEMENT � SMART Enhancement is a category to expand the features of the core business application. Exploring the next phase of SMART’s evolution. The enhancements are the product of SERS re-imagining and re-engineering the SMART functionality to assist staff to provide better support to Employers and Members and Retirees. The goal is to preserve and enrich high touch engagement and outcomes.
BUSINESS TOOLS � Included in this category are applications to improve the effectiveness and efficiency of
financial processes: Replacement of the financial software to a software-as-a-service cloud solution and a reconciliation tool to gain efficiencies in the reconciliation process.
TELECOMMUNICATIONS � Refers to the technology supporting voice and other multi-modal communications, including fax, web chat and web conferencing. The modern phone system consists of software and hardware and physical connections to a phone service provider via fiber or copper trunks.
SECURITY STACK � Security is an integrated set of services and cyber security tools used to protect the hardware, systems and data on SERS network. It includes both physical appliances such as a perimeter firewall and software appliances to scan documents for potential threats.
NETWORK INFRASTRUCTURE � Refers to the hardware, software and wiring that provides a physical or wireless connection to the network and keeps the network running, allowing devices to communicate with each other and the outside world via the internet.
HYBRID TECHNOLOGY REPLACEMENT � Technology deployed for end-users to support the hybrid work model at SERS, including laptops that can be used when working on-site or remote and conference room equipment for improved virtual meeting experiences.
SERVER INFRASTRUCTURE � Servers are comprised of hardware and software, on-site or in the cloud that provide functionality for multiple programs or clients to perform work. Examples of typical servers are web, application, database, and file servers.
BACKUP AND RECOVERY � Technology used to create multi-level backups of SERS data in compliance with information governance retention policies and support business continuity of critical processes in the event of a catastrophic failure of the onsite network and server infrastructure. Examples include Disaster Recovery as a Service or DRaaS and cloud storage of data backed up daily.
FIVE YEAR TECHNOLOGY ENHANCEMENT PROJECT, CONTINUEDTechnology plays an important and extensive role in delivering on the mission of the SERS. The Technology Enhancement Plan provides a framework of needed investments in Technology over the next five years. It is a series of well planned initiatives that will enhance SERS’ digital capabilities around SMART, add expanded tools for operational efficiencies, meet infrastructure needs, and respond to changing electronic expectations of our members, employers, and employees. This is not an considered as an operating
budget, but a framework of carefully planned annual projects that are in alignment with the SERS Strategic Plan goals with oversight by the SERS Technology Committee. The overall projects are intended to remain flexible/agile within the guardrails of SERS’ strategic direction, while accommodating the fast pace of technology evolution so that our technology and operations continue to stay fresh and relevant as we support SERS’ mission.
23School Employees Retirement System of Ohio | FY2023 Administrative Budget
FY2023OSERS Broad Street, LLC
andOSERS Holdings, LLC
Budget
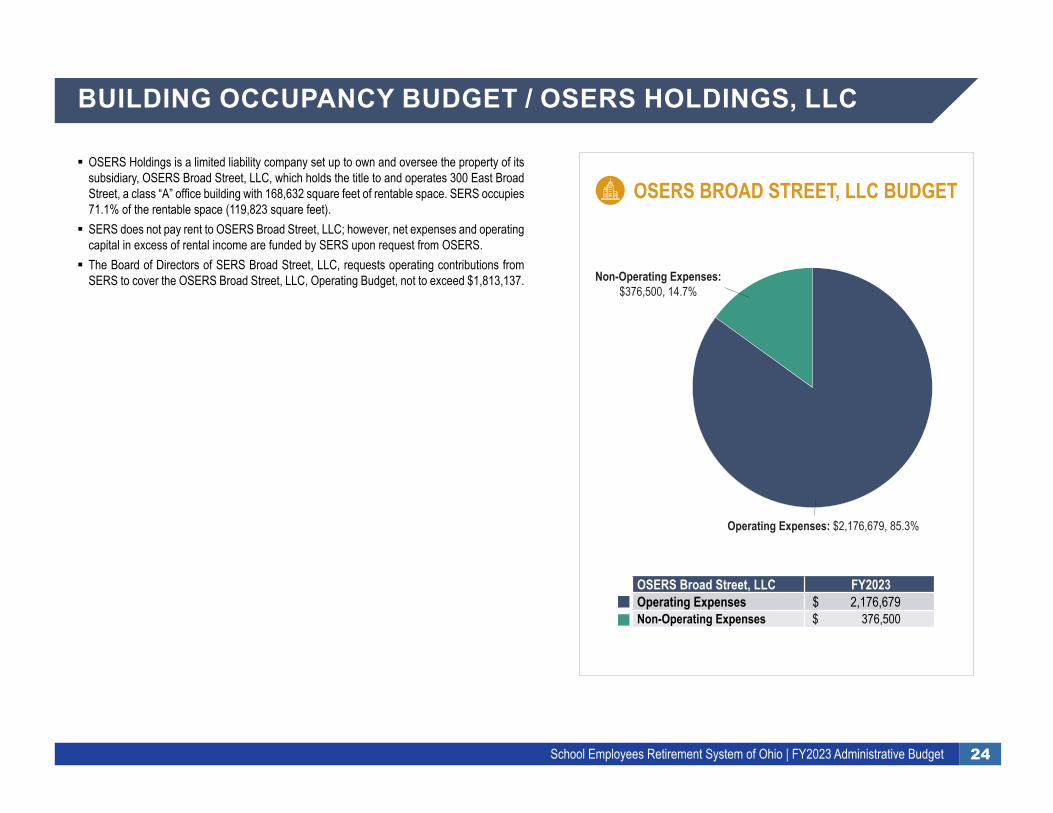
24School Employees Retirement System of Ohio | FY2023 Administrative Budget
BUILDING OCCUPANCY BUDGET / OSERS HOLDINGS, LLC
� OSERS Holdings is a limited liability company set up to own and oversee the property of its subsidiary, OSERS Broad Street, LLC, which holds the title to and operates 300 East Broad Street, a class “A” office building with 168,632 square feet of rentable space. SERS occupies 71.1% of the rentable space (119,823 square feet).
� SERS does not pay rent to OSERS Broad Street, LLC; however, net expenses and operating capital in excess of rental income are funded by SERS upon request from OSERS.
� The Board of Directors of SERS Broad Street, LLC, requests operating contributions from SERS to cover the OSERS Broad Street, LLC, Operating Budget, not to exceed $1,813,137. Non-Operating Expenses:
$376,500, 14.7%
Operating Expenses: $2,176,679, 85.3%
OSERS Broad Street, LLC FY2023 Operating Expenses $ 2,176,679 Non-Operating Expenses $ 376,500
OSERS BROAD STREET, LLC BUDGET
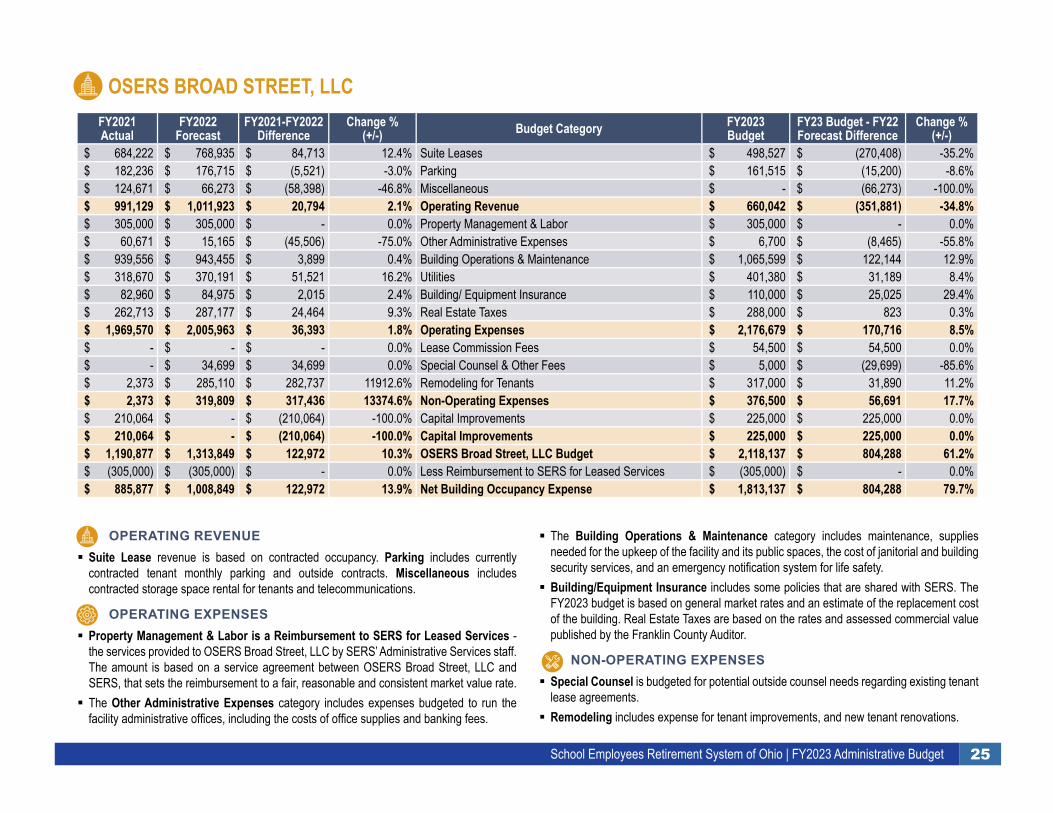
25School Employees Retirement System of Ohio | FY2023 Administrative Budget
FY2021 Actual
FY2022 Forecast
FY2021-FY2022 Difference
Change %(+/-) Budget Category FY2023
BudgetFY23 Budget - FY22 Forecast Difference
Change %(+/-)
$ 684,222 $ 768,935 $ 84,713 12.4% Suite Leases $ 498,527 $ (270,408) -35.2% $ 182,236 $ 176,715 $ (5,521) -3.0% Parking $ 161,515 $ (15,200) -8.6% $ 124,671 $ 66,273 $ (58,398) -46.8% Miscellaneous $ - $ (66,273) -100.0% $ 991,129 $ 1,011,923 $ 20,794 2.1% Operating Revenue $ 660,042 $ (351,881) -34.8% $ 305,000 $ 305,000 $ - 0.0% Property Management & Labor $ 305,000 $ - 0.0% $ 60,671 $ 15,165 $ (45,506) -75.0% Other Administrative Expenses $ 6,700 $ (8,465) -55.8% $ 939,556 $ 943,455 $ 3,899 0.4% Building Operations & Maintenance $ 1,065,599 $ 122,144 12.9% $ 318,670 $ 370,191 $ 51,521 16.2% Utilities $ 401,380 $ 31,189 8.4% $ 82,960 $ 84,975 $ 2,015 2.4% Building/ Equipment Insurance $ 110,000 $ 25,025 29.4% $ 262,713 $ 287,177 $ 24,464 9.3% Real Estate Taxes $ 288,000 $ 823 0.3% $ 1,969,570 $ 2,005,963 $ 36,393 1.8% Operating Expenses $ 2,176,679 $ 170,716 8.5% $ - $ - $ - 0.0% Lease Commission Fees $ 54,500 $ 54,500 0.0% $ - $ 34,699 $ 34,699 0.0% Special Counsel & Other Fees $ 5,000 $ (29,699) -85.6% $ 2,373 $ 285,110 $ 282,737 11912.6% Remodeling for Tenants $ 317,000 $ 31,890 11.2% $ 2,373 $ 319,809 $ 317,436 13374.6% Non-Operating Expenses $ 376,500 $ 56,691 17.7% $ 210,064 $ - $ (210,064) -100.0% Capital Improvements $ 225,000 $ 225,000 0.0% $ 210,064 $ - $ (210,064) -100.0% Capital Improvements $ 225,000 $ 225,000 0.0% $ 1,190,877 $ 1,313,849 $ 122,972 10.3% OSERS Broad Street, LLC Budget $ 2,118,137 $ 804,288 61.2% $ (305,000) $ (305,000) $ - 0.0% Less Reimbursement to SERS for Leased Services $ (305,000) $ - 0.0% $ 885,877 $ 1,008,849 $ 122,972 13.9% Net Building Occupancy Expense $ 1,813,137 $ 804,288 79.7%
OPERATING REVENUE � Suite Lease revenue is based on contracted occupancy. Parking includes currently contracted tenant monthly parking and outside contracts. Miscellaneous includes contracted storage space rental for tenants and telecommunications.
OPERATING EXPENSES � Property Management & Labor is a Reimbursement to SERS for Leased Services - the services provided to OSERS Broad Street, LLC by SERS’ Administrative Services staff. The amount is based on a service agreement between OSERS Broad Street, LLC and SERS, that sets the reimbursement to a fair, reasonable and consistent market value rate.
� The Other Administrative Expenses category includes expenses budgeted to run the facility administrative offices, including the costs of office supplies and banking fees.
� The Building Operations & Maintenance category includes maintenance, supplies needed for the upkeep of the facility and its public spaces, the cost of janitorial and building security services, and an emergency notification system for life safety.
� Building/Equipment Insurance includes some policies that are shared with SERS. The FY2023 budget is based on general market rates and an estimate of the replacement cost of the building. Real Estate Taxes are based on the rates and assessed commercial value published by the Franklin County Auditor.
NON-OPERATING EXPENSES � Special Counsel is budgeted for potential outside counsel needs regarding existing tenant lease agreements.
� Remodeling includes expense for tenant improvements, and new tenant renovations.
OSERS BROAD STREET, LLC
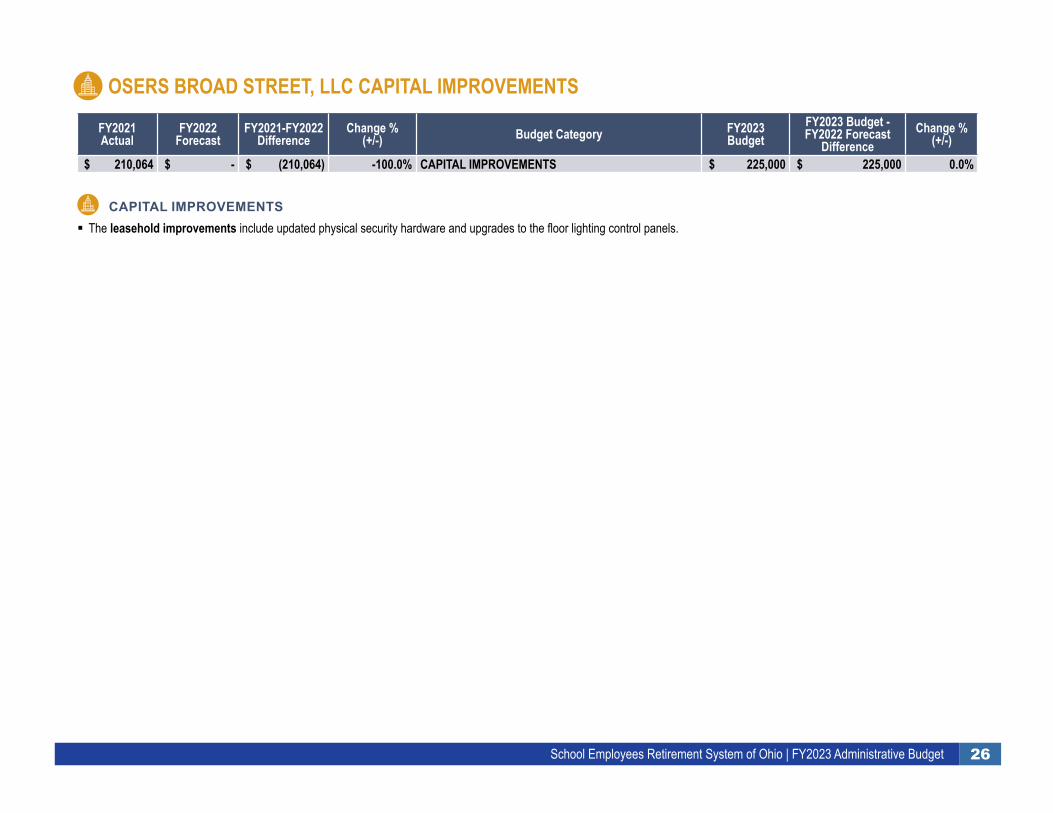
26School Employees Retirement System of Ohio | FY2023 Administrative Budget
OSERS BROAD STREET, LLC CAPITAL IMPROVEMENTS
FY2021 Actual
FY2022 Forecast
FY2021-FY2022 Difference
Change %(+/-) Budget Category FY2023
BudgetFY2023 Budget - FY2022 Forecast
DifferenceChange %
(+/-)
$ 210,064 $ - $ (210,064) -100.0% CAPITAL IMPROVEMENTS $ 225,000 $ 225,000 0.0%
CAPITAL IMPROVEMENTS � The leasehold improvements include updated physical security hardware and upgrades to the floor lighting control panels.

School Employees Retirement System of Ohio300 E. Broad St., Suite 100, Columbus, Ohio, 43215
Toll-Free 800-878-5853 | www.ohsers.org
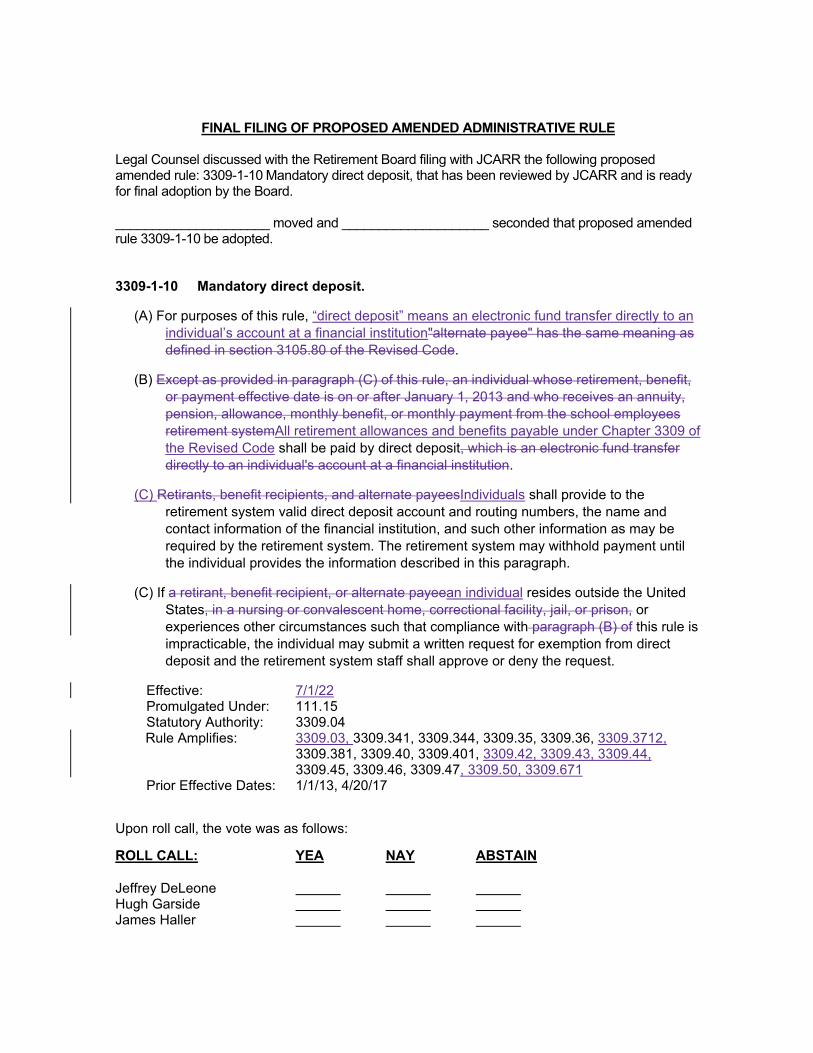
FINAL FILING OF PROPOSED AMENDED ADMINISTRATIVE RULE Legal Counsel discussed with the Retirement Board filing with JCARR the following proposed amended rule: 3309-1-10 Mandatory direct deposit, that has been reviewed by JCARR and is ready for final adoption by the Board. _____________________ moved and ____________________ seconded that proposed amended rule 3309-1-10 be adopted. 3309-1-10 Mandatory direct deposit.
(A) For purposes of this rule, “direct deposit” means an electronic fund transfer directly to an individual’s account at a financial institution"alternate payee" has the same meaning as defined in section 3105.80 of the Revised Code.
(B) Except as provided in paragraph (C) of this rule, an individual whose retirement, benefit, or payment effective date is on or after January 1, 2013 and who receives an annuity, pension, allowance, monthly benefit, or monthly payment from the school employees retirement systemAll retirement allowances and benefits payable under Chapter 3309 of the Revised Code shall be paid by direct deposit, which is an electronic fund transfer directly to an individual's account at a financial institution.
(C) Retirants, benefit recipients, and alternate payeesIndividuals shall provide to the retirement system valid direct deposit account and routing numbers, the name and contact information of the financial institution, and such other information as may be required by the retirement system. The retirement system may withhold payment until the individual provides the information described in this paragraph.
(C) If a retirant, benefit recipient, or alternate payeean individual resides outside the United States, in a nursing or convalescent home, correctional facility, jail, or prison, or experiences other circumstances such that compliance with paragraph (B) of this rule is impracticable, the individual may submit a written request for exemption from direct deposit and the retirement system staff shall approve or deny the request.
Effective: 7/1/22 Promulgated Under: 111.15 Statutory Authority: 3309.04 Rule Amplifies: 3309.03, 3309.341, 3309.344, 3309.35, 3309.36, 3309.3712,
3309.381, 3309.40, 3309.401, 3309.42, 3309.43, 3309.44, 3309.45, 3309.46, 3309.47, 3309.50, 3309.671
Prior Effective Dates: 1/1/13, 4/20/17
Upon roll call, the vote was as follows:
ROLL CALL: YEA NAY ABSTAIN Jeffrey DeLeone Hugh Garside James Haller

Matthew King Catherine Moss James Rossler Frank Weglarz Daniel Wilson Barbra Phillips _______ _______ ______
Only If Needed
EXECUTIVE SESSION
moved and seconded the motion that the Board go into Executive Session
pursuant to R.C. 121.22 (G)(5) to review applications for Disability Retirement Benefits.
IN EXECUTIVE SESSION AT A.M. / P.M. ROLL CALL: YEA NAY ABSTAIN Jeffrey DeLeone Hugh Garside James Haller Matthew King Catherine Moss James Rossler Frank Weglarz Daniel Wilson Barbra Phillips RETURNED TO OPEN SESSION AT A.M. / P.M.
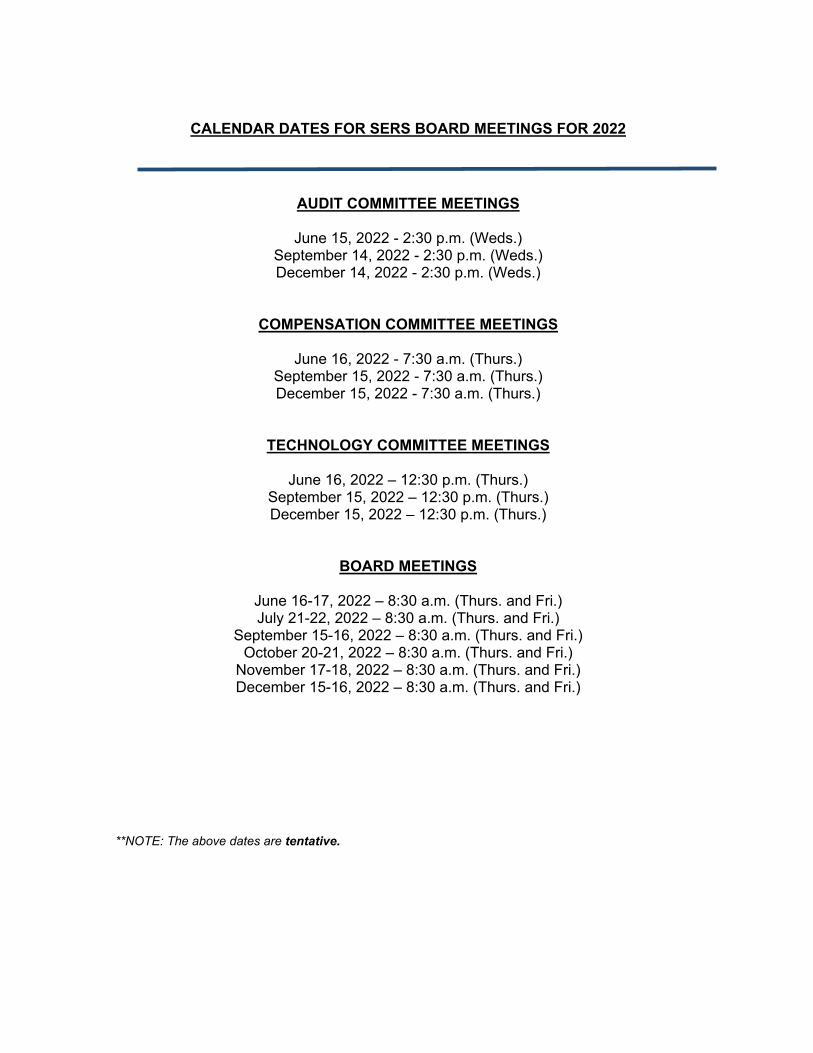
CALENDAR DATES FOR SERS BOARD MEETINGS FOR 2022
AUDIT COMMITTEE MEETINGS
June 15, 2022 - 2:30 p.m. (Weds.) September 14, 2022 - 2:30 p.m. (Weds.) December 14, 2022 - 2:30 p.m. (Weds.)
COMPENSATION COMMITTEE MEETINGS
June 16, 2022 - 7:30 a.m. (Thurs.) September 15, 2022 - 7:30 a.m. (Thurs.) December 15, 2022 - 7:30 a.m. (Thurs.)
TECHNOLOGY COMMITTEE MEETINGS
June 16, 2022 – 12:30 p.m. (Thurs.) September 15, 2022 – 12:30 p.m. (Thurs.) December 15, 2022 – 12:30 p.m. (Thurs.)
BOARD MEETINGS
June 16-17, 2022 – 8:30 a.m. (Thurs. and Fri.) July 21-22, 2022 – 8:30 a.m. (Thurs. and Fri.)
September 15-16, 2022 – 8:30 a.m. (Thurs. and Fri.) October 20-21, 2022 – 8:30 a.m. (Thurs. and Fri.)
November 17-18, 2022 – 8:30 a.m. (Thurs. and Fri.) December 15-16, 2022 – 8:30 a.m. (Thurs. and Fri.)
**NOTE: The above dates are tentative.

CONTINUED OR NEW BUSINESS
Board Information Requested

BOARD INFORMATION REQUESTS AND FOLLOW-UP ITEMS 1. 2. 3. 4. 5. 6. 7. 8. 9. 10.
ADJOURNMENT(R)
moved that the SERS Retirement board adjourn to meet on for their next regularly scheduled meeting. The meeting adjourned at p.m.
Barbra Phillips - Chairperson Richard Stensrud, Secretary