Embed Size (px)
Citation preview
Oecologia (2004) 141: 596-614 DOI 10.1007/s00442-004-1676-2
ECOSYSTEM ECOLOGY
Jeffrey Q. Chambers • Niro Higuchi • Liliane M. Teixeira • Joaquim dos Santos Susan G. Laurance • Susan E. Trumbore
Response of tree biomass and wood litter to disturbance in a Central Amazon forest
Received: 30 June 2003 / Accepted: 29 June 2004 / Published online: 7 September 2004 © Springer-Verlag 2004
Abstract We developed an individual-based stochastic- empirical model to simulate the carbon dynamics of live and dead trees in a Central Amazon forest near Manaus, Brazil. The model is based on analyses of extensive field studies carried out on permanent forest inventory plots, and syntheses of published studies. New analyses included: (1) growth suppression of small trees, (2) maximum size (trunk base diameter) for 220 tree species, (3) the relationship between growth rate and wood density, and (4) the growth response of surviving trees to catastrophic mortality (from logging). The model simu- lates a forest inventory plot, and tracks recruitment, growth, and mortality of live trees, decomposition of dead trees (coarse litter), and how these processes vary with changing environmental conditions. Model predictions were tested against aggregated field data, and also compared with independent measurements including maximum tree age and coarse litter standing stocks. Spatial analyses demonstrated that a plot size of ~10 ha was required to accurately measure wood (live and dead) carbon balance. With the model accurately predicting relevant pools and fluxes, a number of model experiments were performed to predict forest carbon balance response to perturbations including: (1) increased productivity due to CO2 fertilization, (2) a single semi-catastrophic (10%) mortality event, (3) increased recruitment and mortality (turnover) rates, and (4) the combined effects of increased
J. Q. Chambers • S. E. Trumbore Earth System Science, University of California, Irvine, CA, 92697, USA
J. Q. Chambers • N. Higuchi • L. M. Teixeira • J. dos Santos Instituto Nacional de Pesquisas da Amazonia (INPA), Manaus, AM, 69011-970, Brazil
J. Q. Chambers • S. G. Laurance Biological Dynamics of Forest Fragments Project, INPA, Manaus, AM, 69011-970, Brazil
J. Q. Chambers (M) Tulane University, Ecology and Evolutionary Biology, New Orleans, LA, 70118, USA e-mail: [email protected]
turnover, increased tree growth rates, and decreased mean wood density of new recruits. Results demonstrated that carbon accumulation over the past few decades observed on tropical forest inventory plots (~0.5 Mg C ha"^ year"') is not likely caused by CO2 fertilization. A maximum 25% increase in woody tissue productivity with a doubling of atmospheric CO2 only resulted in an accumulation rate of 0.05 Mg C ha"' year"' for the period 1980-2020 for a Central Amazon forest, or an order of magnitude less than observed on the inventory plots. In contrast, model parameterization based on extensive data from a logging experiment demonstrated a rapid increase in tree growth following disturbance, which could be misinterpreted as carbon sequestration if changes in coarse litter stocks were not considered. Combined results demonstrated that predictions of changes in forest carbon balance during the twenty-first century are highly dependent on assump- tions of tree response to various perturbations, and underscores the importance of a close coupling of model and field investigations.
Keywords Carbon cycling model • Coarse woody debris • Growth • Decomposition • Net ecosystem exchange • Productivity
Introduction
Carbon cycling in old-growth tropical evergreen forests has been the focus of considerable attention given the importance of these ecosystems in the global carbon cycle (Malhi et al. 1998; Tian et al. 1998; Cox et al. 2000; Chambers et al. 2001a; Clark et al. 2003; Saleska et al. 2003; Baker et al. 2004a, b; Lewis et al. 2004a). Efforts to curb the rise in atmospheric CO2 concentration have highlighted the importance of identifying carbon sources and sinks, although tracking the various movements of carbon into the terrestrial biosphere cannot currently be assessed with much accuracy (Bolin 1998). Human activities in tropical forests are responsible for most of the global land-use derived CO2 source of about
597
2.2 Pg C year ^ during the 1990s (Houghton 2003; Canadell et al. 2000), with at least 0.2 Pg C year"' from land-use in the Brazilian Amazon alone (Houghton et al. 2000). However, observations on forest inventory plots have indicated that tree biomass is increasing in Amazonian forests at a rate of about 0.4 Pg C year"' (0.5 Mg C ha"' year"') (Phillips et al. 1998; Baker et al. 2004a, b). It has been suggested that this apparent sink may be in response to atmospheric CO2 fertilization (Phillips et al. 2002; Lewis et al. 2004a), although other factors may play more important roles in determining year-to-year changes in forest carbon balance (Keller et al. 1996; Clark et al. 2003; Nemani et al. 2003; Chambers and Silver 2004). Because the rate of increase in atmospheric CO2 would be considerably faster without a terrestrial carbon sink (Schimel 1995), it is important to determine first, if undisturbed tropical forests are in fact acting as carbon sinks, and if so, whether they will continue to sequester carbon in the coming decades.
A number of models have been developed to simulate the gap dynamics of trees (Botkin and Schenk 1996; Bugmann 2001), and biogeochemical cycling in terrestrial ecosystems (VEMAP 1995), and a few models have linked tree population dynamics and biogeochemistry (Bolker et al. 1995; Post and Pastor 1996; Moorcroft et al. 2001) or focused on tropical forests (Alder 1995). These models vary in their complexity, but in general are difficult to parameterize. Models are often designed for specific questions, or specific ecosystems, and are not easily modified to address questions for which they were not strictly developed. Modifying existing models for tropical forests is particularly problematic because of the high tree species diversity, soils that are often physically and chemically different from temperate soils, and the lack of appropriate mechanistic studies. For this project, instead of obtaining, modifying, and parameterizing an existing model, it was more practical to develop a site-specific model to address a well-defined topic: spatial and temporal variation in carbon cycling dynamics of live and dead trees in an old-growth Central Amazon forest.
The model was designed to operate in two primary modes. In the first mode, the model simulates stand dynamics (i.e., recruitment, growth, and mortality) for live trees and above-ground biomass (AGB-mode). The AGB- mode is useful to explore how changes in processes that affect individual trees impact forest carbon balance, and can be readily compared to results obtained from forest inventory plots. In the second mode, the model focuses on the carbon balance of total large wood (TLW), which includes trunks and large branches (>10 cm in diameter) from both live and dead frees (TLW-mode). TLW-mode is useful for exploring how decomposition and heterofrophic respiration from dead frees can offset changes in live trees.
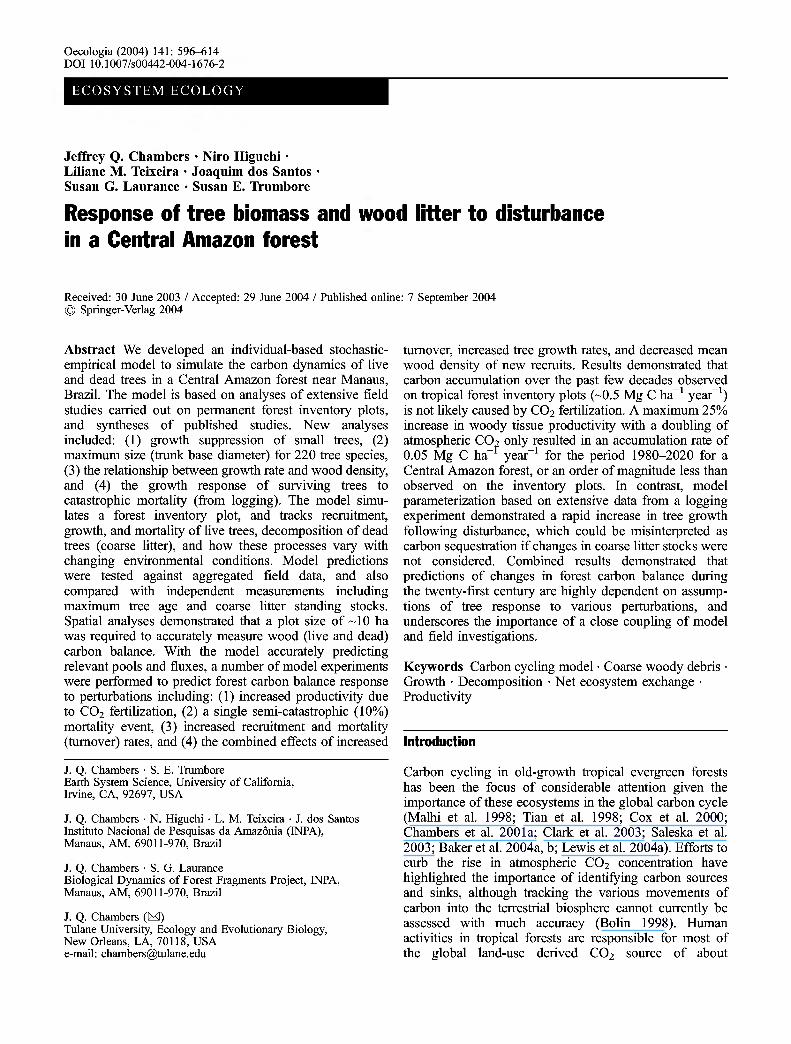
The model focuses on the carbon cycling dynamics of wood for number of reasons. First, data from litter production and biomass increment studies demonstrate that woody tissue production is a substantial portion of above-ground net primary production (ANPP) (Fig. la) (Luizâo 1989; Chambers 2001b; Clark et al. 2001).
Second, wood comprises a large portion of total ecosystem carbon storage in Cenfral Amazon forests (Fig. lb), and is also the pool that is most vulnerable to rapid changes in stocks in response to disturbance. Soil also contains a large amount of carbon, but compared to wood carbon, soil is much less susceptible to changes in carbon storage over yearly to decadal time scales (Trumbore et al. 1995; Telles et al. 2003) although studies at some sites show significant changes (Veldkamp et al. 2003). Third, years with high tree mortality rates (Nelson et al. 1994; Condit et al. 1995; Williamson et al. 2000) can cause massive shifts of wood carbon from live to dead pools, with consequent changes in ecosystem structure and dynamics. Despite the importance of wood in determining the carbon balance of tropical forests, basic parameters such as residence times, standing stocks, decomposition rates, and response to disturbance are poorly characterized (Chambers et al. 2000; Houghton et al. 2000).
Above-G round NPP
E leaves (2.5) L coarse wood (2.1) L. small wood (1.1) U fine residues (0.5) U reproductive parts (0.4)
Carbon Storage
D coarse wood (142) U sou to 2-8 m (120) U sou to 1-2 m (110) u fine wood (35.8)
coarse roots (32.4) understory (15.4) coarse iitter (14.8) fine roots (4.4) leai/es (3.7) fine iitter (3.2)
Fig. 1 a Assuming that the growth of Uve trees plus htterfall provides a reasonable estimate of ANPP, growth was estimated from BDFFP and BIONTE forest inventory plots (Chambers et al. 2001b), with between 80 and 95% of this growth as large wood (Eq. 2). Fine surface litter production averaged 7.8 Mg ha" year"', with 1.3 Mg ha year of this litter as fine wood (<10 cm diameter) (Klinge and Rodriguez 1968; Franken et al. 1979; Luizâo and Schubart 1987; Luizâo 1995). Aggregating these studies to determine carbon allocation to different production components demonstrates that woody tissues are a sizable fraction of ANPP (legend values Mg C ha year ) b Carbon stocks estimated from numerous sources demonstrate that wood is also a large carbon reservoir (legend values Mg C ha ) (Davidson and Trumbore 1995; Trumbore et al. 1995; Guimarâes and Melvo-Ivo 1997; Chambers et al. 2001b; Nascimento et al. 2002; N. Higuchi, unpublished data)
598
The model developed here serves as a means of aggregating the carbon cycling behavior of individual live and dead trees (>10 cm diameter) measured through extensive field studies including tree growth rates, recruitment and mortality patterns, and decomposition and respiration from coarse litter (dead trunks and branches >10 cm diameter). These field data were used to characterize statistical distributions of attributes for individuals, and empirical relationships between attributes and ecosystem processes, and included studies in both undisturbed and logged forests. The overall goal was to simulate spatial and temporal dynamics of trees and large wood over spatial scales of 0.04 to 100 ha, and to explore how above-ground carbon cycling responds to a number of disturbances. Although we cannot directly address the issue of whether or not old-growth fropical forests are in fact acting as net sinks for atmospheric CO2, we can help consfrain the response by quantitatively exploring how a number of factors influence forest carbon balance.
Methods and model development
Site description
Work was carried out on permanent plots monitored since the early 1980s by the biomass and nutrient experiment (BIONTE) logging experiment (Higuchi et al. 1997) of the National Institute for Amazon Research (Instituto Nacio- nal de Pesquisa da Amazonia, (INPA)) and the biological dynamics of forest fragments project (BDFFP), a colla- boration between INPA and the Smithsonian Institution (Lovejoy and Bierregaard 1990; Rankin-De Merona 1992; Laurance et al. 2002). Data obtained from the permanent plots included stand dynamics (i.e., free recruitment, growth and mortality rates), and taxonomic information for trees >10 cm trunk base diameter (D\,; measured 1.3 m or above the buttresses), hereafter referred to as "trees." Plots spanned a 50x40-km area (centered about 2°30'S, 60°W) approximately 60 km north of Manaus in the Brazilian Amazon with an elevation of 100-150 m. For the BDFFP site, only data from control plots located in undisturbed old-growth forests were used. For the BIONTE plots, data from both the control and treatment plots were used.
Site vegetation is old-growth closed-canopy terra firme (not seasonally inundated) forest. Mean annual rainfall at Manaus was 2,110 mm and mean annual temperature was 26.7°C for 1910-1983 (National Oceanic and Atmospher- ic Administration, National Climatic Data Center, Ashe- ville, N.C., USA). However sites away from the river may experience higher precipitation (Sombroek 2001), with a forested site 50 km east of our study averaging 2,610 mm year"' from 1980 to 2000, and precipitation for year 2000 at the ZF-2 site registering 3,450 mm (Silva et al. 2002). There is a distinct dry season during July, August, and September with usually <100 mm of rain during these months. The predominant soil type on plateau forests in the study area according to different classifica-
tion systems is Xanthic Ferralsols (FAO/UNESCO), Allic Haplorthoxes (Oxisols) (US), or yellow Latosols (Brazil). However, there is considerable local topographic variation, and soil type varies gradually with elevation, comprising Oxisols on plateaus (about 80% clay), Ultisols on slopes, and Spodosols (about 2-5% clay) in valleys associated with sfreams (Bravard and Righi 1989; Laurance et al. 1999). Nearly 1,200 trees species have been identified in nearby forests (Ribeiro et al. 1999) with some trees living for more than 1,000 years (Chambers et al. 1998).
Model description
The model is individual based and coded in Java (an object oriented language similar to C++) and uses a 1-year time step. Trees located in 20x20 m cells (stands) are the ftindamental objects. Stands are aggregated into a single plot with ~ 100 ha the largest manageable spatial scale (on a desktop PC) for a single run (about 65,000 trees). As described in more detail below, the model starts by filling stands with 10 cm £)(, frees. These frees grow and die, and new frees are recruited. Dead trees decompose, and carbon is either lost as respiration or fragmentation. At present, damage to living trees and relationships with carbon balance (Chambers et al. 2001b) are not incorporated into the model.
The biomass of each free was calculated using an allometric model based on the harvest of 315 frees in the Central Amazon (Chambers et al. 2001b), given by:
In(St)
-0.370 + 0.333 In [Db) + 0.933 [In (£>b)]^
-0.122[ln(£)b)]^ (1)
where Bt is the total tree biomass in oven-dry weight. In TLW-mode, the mass of large wood (>10 cm diameter) for each tree was required to link with the coarse litter decomposition submodel. For an additional 47 harvested trees, both large wood and small wood mass was estimated (N. Higuchi, unpublished data), and regression analysis showed a significant increase from 80 to 95% in the mean fraction of large wood for trees ranging from 12 to 98 cm Dy, (P<0.01), given by:
/LW = 0.774 +0.0018 xDb (2)
where yLw is the fraction of total AGB in large wood, and trees larger than 100 cm D^ were assumed to be 95% large wood. Dry biomass was set at 50%) carbon based on previous measurements (N. Higuchi, unpublished data; Chambers et al. 2000). The model fracks the large-scale carbon cycling balance of live frees in the AGB-mode, and both large live wood and coarse litter in TLW-mode, by summing the stocks and dynamics for each live and dead tree.
599
Random deviates drawn from frequency disfributions of growth, recruitment, mortality, stem density (number of trees per stand), and wood density were used to allocate attributes to individual frees, using:
M^ + SD^xR (3)
where M is the mean, SD is the standard deviation of variable x, and Risa random normal deviate. The Rs were generated using an algorithm (James 1990) that was coded into Java (P. Houle, personal communication). For attributes that were not normally distributed. A, M, and SD were transformed values (e.g., Logio).
Growth
The growth rate distribution was based on measurements of over 10,000 frees from the BDFFP inventory plots. Not all trees grew over the census intervals as a number of trees experienced zero or negative growth rates. For example at one of the BDFFP sites (1,201), 3-ha of growth data spanning the interval 1981-1991 demonsfrated 13.6% of frees (229/1,679) experienced no measurable positive growth. Lack of growth may be due, in part, to measurement error, but trees can also shrink from changes
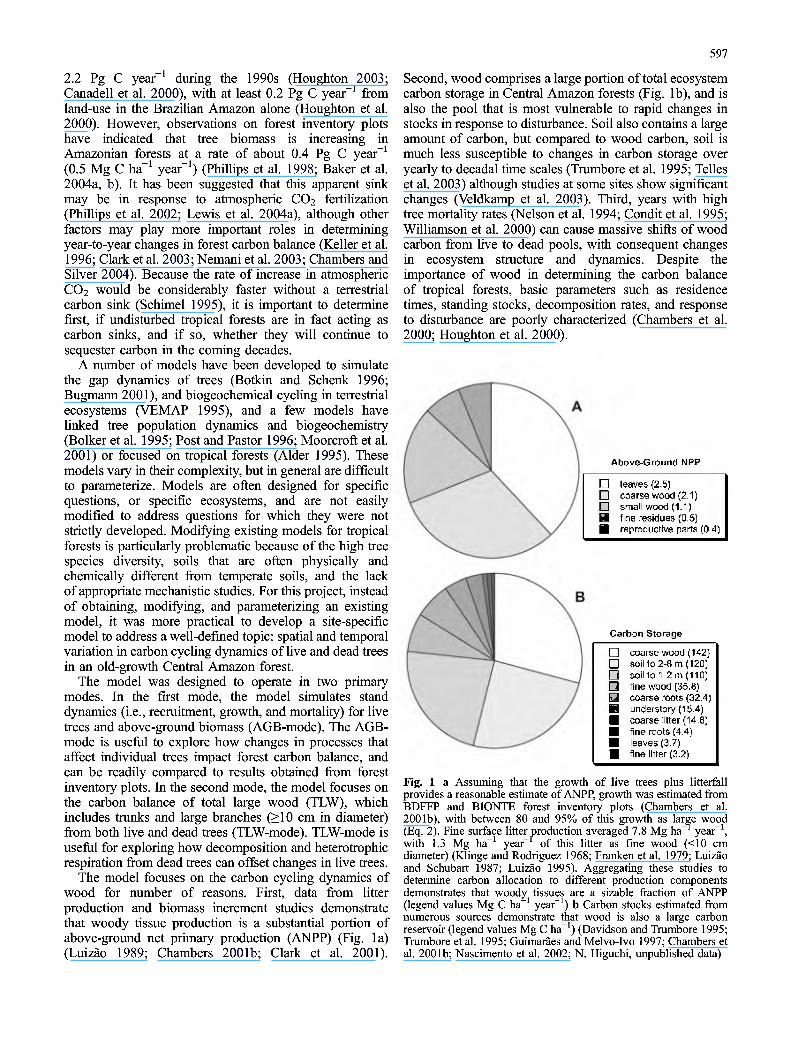
in wood moisture content and transpiration rates (Ko- zlowski et al. 1991; Clark and Clark 1999), or may live for many years without increasing in diameter. In addition, many trees may grow slower than the minimum increment that can be measured with a standard D^ tape over a typical census interval. For the purposes of this model, to develop a growth frequency distribution, only positive growth rates were used because the model uses long-term average growth rate (Gave=^b/age) which cannot, by deñnition, be zero or negative. Growth rates were assumed to be log-normally distributed (Fig. 2a). The model assigned Gave to each tree, and this average growth rate was modified by intrinsic and extrinsic factors that influence growth.
To simulate variation in growth rates among individual trees, the model required a frequency distribution of Gave- The BDFFP permanent plot inventories provided short- term growth rate (GJ data measured over a 5 to 10-year period. These data were used to approximate the Gave frequency distribution by setting the mean Gave equal to the mean Gt, and reducing the SD. This was done because variation in the SD of Gave must be less than G^. A 10-cm Z)b free cannot, for example, have experienced zero growth for its entire life, although it may demonsfrate zero (measurable) growth for many years. With respect to mean growth rate, a forest-wide mean over a 5 to 10-year period is probably a reasonable approximation over the life of the
>'0.20 c 0) g.0.15 P Ï 0.10
TO p 0.05
-2.0 -1.6 -12 -08 -O-l 0.0 0.4
growth rate (Log[cm yr"^]) 1.0 1.S 2.0 2.5
mortality rate (% stems yf^) 3.0
0,14
: ij N '
10 15 20 25 30 35 40
stem density (per 400 m^)
Fig. 2a-d The probability frequency distributions used to para- meterize the model, a Logio transformed short-term growth rate (Gt) data from BDFFP inventory plots. A histogram of annual growth rates for >8,500 trees measured for 5-10 years are shown, and compared with log-normal distribution (mean=-0.976, SD=0.431). The low end of the curve is not well defined because slow growth rates are difficult to measure accurately (flb tape resolution is 1 mm in diameter), and the census intervals were relatively short (5- 10 years), b Mortality rates from BDFFP and BIONTE data were
ra 0.04 03 •" 0.02
0.20 0 40 ü.eo 0.80 1.00 wood density (g cm"')
assumed to be log-normally distributed (mean=1.02%, SD=1.72%). Rates were estimated from 56 separate census intervals varying from 1 to 5 years on 21 1-ha permanent plots. This distribution was used to calculate a plot-scale annual mortality rate, c Distribution of stem density (number of trees) at 400 m resolution («=450, mean=24.3, SD=5.0). d Distribution of wood density for >200 tree species from the Central Amazon (mean=0.70 g cm , SD=0.15) (from Feamside 1997)
600
average tree. However, because zero and negative growth rates were not included in the analysis of growth rate variation, average growth rates are probably slightly overestimated. The SD of Gave was set to be 50% of the SD of measured Gt, and model sensitivity to this parameterization was tested. The reduction in Gt SD was the only model parameter that was tuned (i.e., not derived empirically).
Mortality and recruitment
Mortality rates were based on data from the control (undisturbed) plots at the BDFFP and BIONTE sites. Annualized mortality rates were calculated using a stan- dard logarithmic model (Swaine et al. 1987) over each census interval (Fig. 2b). A mortality event can comprise a single tree or multiple tree deaths in the same stand. The BDFFP data included information on the frequency and number of trees killed by other tree falls. These data were mapped to a 400-m^ (20x20 m) resolution to predict the probability of multiple treefall events. This analysis demonstrated that 33% of total mortality was due to multiple treefalls and these events were randomly assigned to frequency classes of from one to seven trees per gap based on the data. This allowed the model to predict some spatial aggregation of coarse litter production, although larger gaps and blowdowns (Nelson et al. 1994) were not treated. Each time step (1 year) a plot-scale mortality rate was calculated using a random deviate from the mortality frequency distribution (Eq. 1). Mortality was size-inde- pendent, with all trees having an equal likelihood of dying. Recruitment tracked mortality. When a tree died, it was replaced by a new tree in a randomly chosen stand. In this way, the total number of trees in the entire plot was conserved, but the number of trees in any individual stand varied. Changes in mortality were not implicitly tied to changes in environmental factors (e.g., precipitation). However, since changes in precipitation can be viewed as essentially random, annual mortality reflects changing conditions that produced variability in the empirical data. Census intervals much longer than a year act to reduce estimated annual mortality rates (Malhi et al. 2004), so annual rates presented here probably have small system- atic errors toward lower rates. In addition, mortality was plot-size-independent, as we had no empirical data demonstrating variability in rates when moving from, for example, a 1-ha to a 100-ha plot size.
Coarse litter decomposition
When a tree died a decomposition rate was calculated using a multiple regression model from a coarse litter decomposition study carried out in the BDFFP and BIONTE permanent plots (Chambers et al. 2000), given by:
k¿ = [1.104 - 0.670p - 0.163 logio (A)] if ká < 0.02, then ká = 0.02 (4)
where kd is the rate constant (fraction per year), p is live wood density (gram per cubic centimeter), and D^ (centimeter) was limited to a maximum of 100 cm corresponding to the largest free measured by Chambers et al. (2000). The slowest decomposition rate was limited to 2% year" which was the lowest rate quantified by Chambers et al. (2000). Decomposition losses were partitioned into respiration and fragmentation losses based on a coarse litter respiration study with 80% respiration and 20% fragmentation losses (Chambers et al. 2001c). When a dead free decomposed to 5% of its initial mass, the remaining material was assigned to fragmenta- tion losses. Since the model only fracks carbon balance of AGB and TLW, the fate of losses (e.g., respiration vs fragmentation), although important from a larger ecosys- tem perspective, does not alter the carbon balance of AGB or TLW, and was not explored for this study.
Initializing and iterating the model
A plot consisted of an area divided into 400 m^ cells (20x20 m) called stands. At the beginning of a run, a number of frees were randomly assigned to each stand using a random deviate (Eq. 1) drawn from the BDFFP stem density data (Fig. 2c). Each new tree started at 10 cm £)b and was randomly assigned (Eq. 1) an Gave (Fig. 2a), and an initial age (assumed to be Z)b/Gave)- Wood density was randomly assigned (Eq. 1) to each new tree based on data from >200 Cenfral Amazon free species (Fig. 2d) (Feamside 1997). The size of the plot and the time of the model run varied depending on the issue being explored. For example, when maximum free age was being addressed, the model ran at 100 ha for 2,500 years prior to generating output to ensure stabilization of the age-class distribution, because some frees can live longer than 1,000 years (Chambers et al. 1998).
Preliminary runs and model corrections
Preliminary runs of the model predicted size-class distributions and live wood production rates quite different from the forest inventory data. The model under-predicted the number of small frees and over-predicted the number of large frees. Since small trees are often suppressed due to an inadequate availability of light (Clark and Clark 1992), on average, small frees probably grow slower than larger trees. Regression analysis of the BDFFP data showed a subtle (i.e., low r^), yet highly significant curvilinear relationship between stem diameter and growth rate (P<0.0001), with rates increasing with D^ (e.g., Clark and Clark 1999) and slowing for the largest frees (second order term). This curvilinear relationship between growth rate and D^, was modeled by scaling the average long-term
601
growth rate (Gave) as a function of D^,, using:
logio (Go) = -2.007 + l.lOVlogio (£>b) - 0.222[logio
l2 (A
and
Gi = Go + Go (GD - Gave)
(5)
(6)
where Gs are all logio-transformed growth rates (centi- meter per year), Gave is the global average growth rate (mean of Fig. 2a), Go is the average growth rate for a given Z)b, Go is last years growth rate, and Gt is scaled for this years Dy,. Using Eq. 5, growth rate increases from about 0.8-2.0 mm year" as trees grow from 10 to 80 cm D^, and then slowly increases reaching a plateau at about 2.3 mm year"' for the largest trees. When these size- dependent changes in growth rate were accounted for, the model more accurately predicted the size-class distribution of the smallest trees.
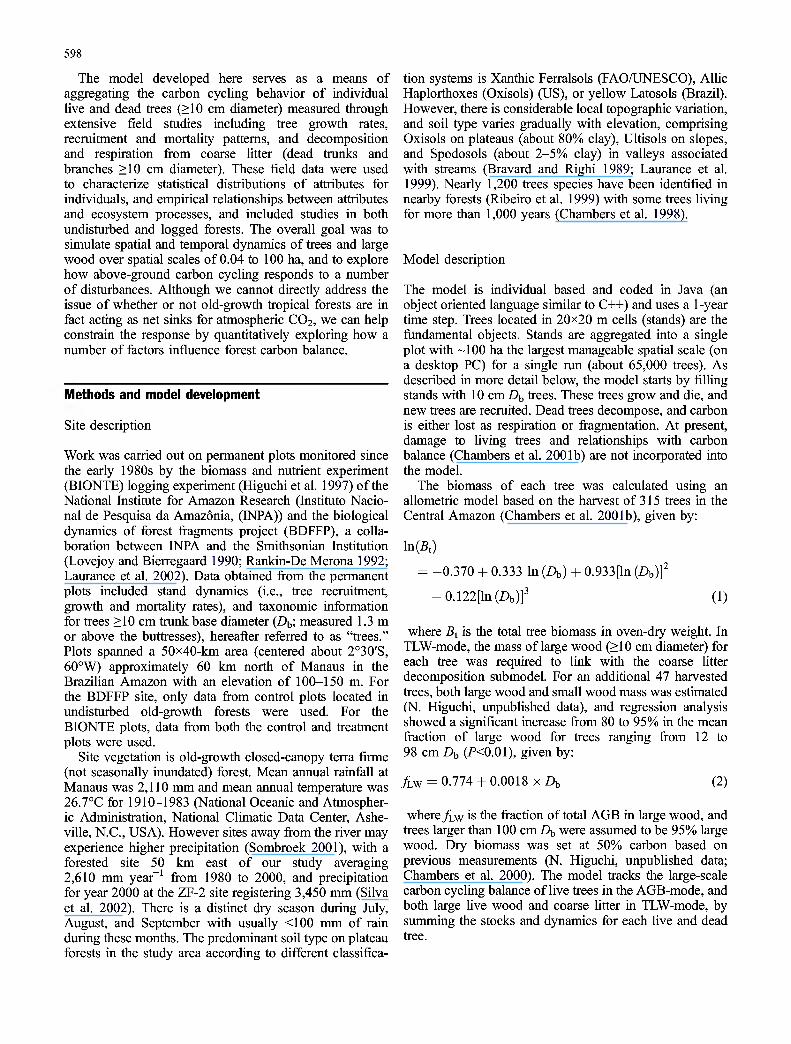
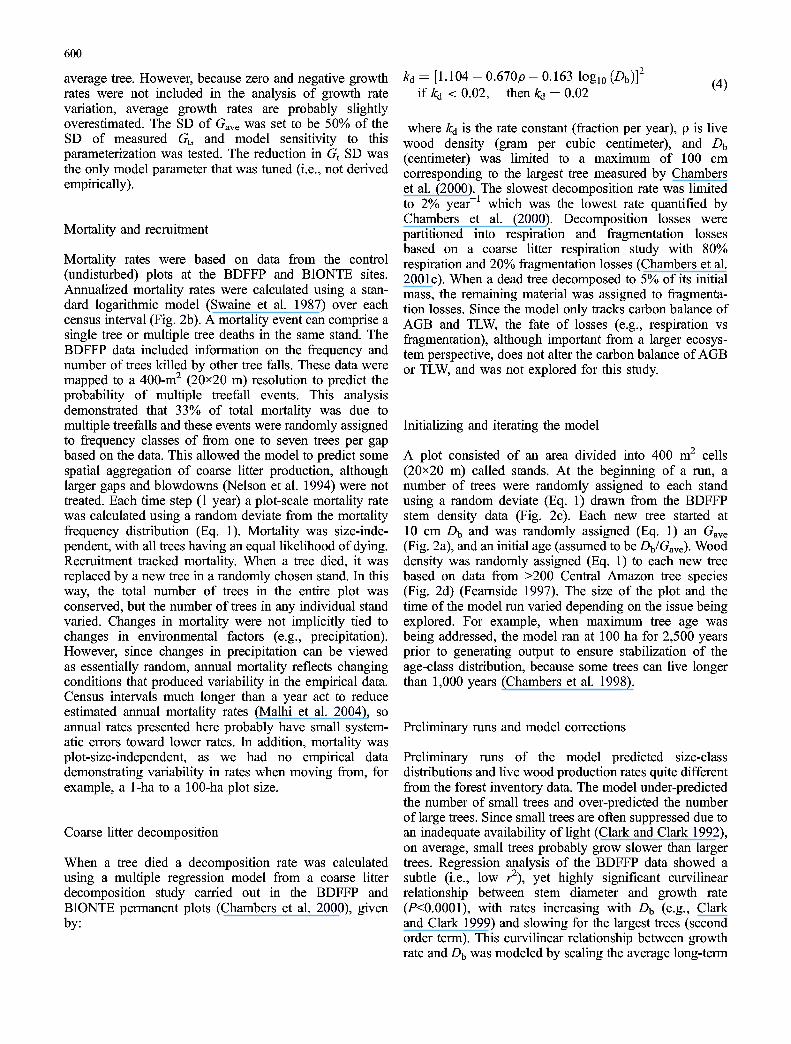
After accounting for D^, dependent variation in growth rates, the model still over-predicted the number of large trees (>50 cm D^,), resulting in substantial overestimates of live wood mass (Fig. 3a) and annual biomass increment. We suspected that lack of information on species depen- dent variation in maximum tree size was causing the model to over-predict the number of large trees. The model was assigning all trees an equal probability of attaining large sizes. However, in the Central Amazon the potential number of tree species that can colonize a gap is at least -2,000 (Ribeiro et al. 1999), and the life-history strategy of these tree species varies considerably. Some species are understory specialists that never attain large sizes, whereas others are émergents, towering many meters above the average canopy height (Lieberman and Lieberman 1987). Unfortunately, unlike most temperate tree species (McMahon 1973), there is little information concerning maximum Dy, attained by tropical trees. One problem is that most species have densities of less than one individual per hectare (Rankin-De Merona et al. 1992), and it is logistically challenging to obtain adequate sample sizes to assess variation in maximum diameters.
As a preliminary analysis, the BDFFP data provided tree species size distribution information. Maximum diameter for 220 species with at least eight individuals present in the data set was tallied. However, since eight individuals was not an adequate sample size to assess for maximum size, the data set was tested for a sampling bias. There was a significant relationship between sample size and maximum diameter (P=O.Ol), where species with fewer individuals were biased toward smaller maximum sizes. This bias was corrected by assuming that the maximum size for the species with the most individuals was not biased, and a correction factor was determined for species with fewer individuals. This resulted in a maxi-
(TJ
E O m
data 319 Mg ha
model 425 Mg ha"''
JUAIUJ 10 2D 30 40 50 eo'ro ao oo 100110120130140150
ro ^
m E o
b • i:ata319 Wlq ha"'
• model 310 Mg ha"''
r I
1 l,n,rM,^,^,_,- , -,- 10 20 30 40 50 60 70 SO 90 100 110 120 130 140 150
tree base diameter class (cm)
Fig. 3 Comparison of the distribution of biomass in 10 cm size classes for the model and from the forest inventory data, a When the model was run without the pseudo-species (see text) both the distribution and total biomass were poorly estimated, b Including species information on maximum diameter resulted in better predictions of biomass distribution across most size classes
mum correction amounting to an increase in maximum size of 50% for species with eight individuals. Next, a frequency distribution was generated, and each new tree was randomly assigned to one of 14 maximum diameter pseudo-species. Once a tree reached this diameter limit, growth stopped (see Discussion), but the probability of mortality did not increase. With this pseudo-species information, the model more accurately predicted Dy, size-class disfribution and AGB, although the model still under-predicted the number of trees in the 20-30-cm classes, and slightly over-predicted trees in the 50-90-cm classes (Fig. 3b).
The model presented here utilizes variation in growth rate, wood density, and maximum size to create pseudo- species that represent many different life-history sfrategies. Whether each combination of these attributes is equally probable remains to be investigated. For example, perhaps species with large maximum diameters, on average, grow faster than species with small maximum diameters. However, with the exfremely high diversity, species exist with attributes that may seem intuitively improbable. For example, Dinizia excelsa has very dense wood (0.92 g dry weight cm" ) and grows relatively fast as determined by radiocarbon dates of five individuals ~100 cm D\, (Cham- bers et al. 200Id). Even after accounting for large
602
radiocarbon errors for trees less than about 350 years, D. excelsa average growth rate fell somewhere between 0.33 and 1.10 cm year"', compared to an average of 0.21 cm year from Eq. 5 for 100 cm D\, tree.
Response to CO2 fertilization
Whorf 2002), and the IPCC scenario IS92a for 2000-2100 (IPCC 2000) where atmospheric CO2 concentration doubles from the pre-industrial concentration (i.e., 560 ppm) in about year 2070, and reaches about 700 ppm by 2100. The entire CO2 frajectory from 1850 to 2100 can be empirically modeled using a third order polynomial (r^=0.99) giving:
Model predictions of carbon storage response to increased [CO2 productivity driven by elevated atmospheric CO2 concen- tration has been briefly published elsewhere (Chambers et ~ al. 2001a, Chambers and Silver 2004). Chambers et al. (2001a) demonstrated a lag-time of more than 100 years before carbon storage reaches a new dynamic equilibrium in response to a 25% increase in productivity over an arbitrary 50 year interval. Chambers and Silver (2004) linked a 25% productivity increase to the actual and expected increase in atmospheric CO2 from 1850 to 2100, and predicted a small CO2 fertilization sink of about 0.2 Mg C ha"' year" over a longer ~200 year interval. The equations to model the relationship between increased productivity and atmospheric CO2 are described below.
First, the known and expected increase in atmospheric ß CO2 from 1850 to 2100 can be modeled using ice core data from 1850 to 1950 (Neftel et al. 1985; Friedh et al. 1986), data from Mauna Loa for 1950-2000 (Keeling and
-212, 048 + 341.5 year - 0.1830year2
- 0.00003270 year^ (7)
where year is the calendar year. The relationship between atmospheric CO2 concentration ([C02]atm) and increased productivity is best described by a beta (ß) response ftinction that has been defended as more appropriate than a Michaelis-Menten function (Amthor and Koch 1996). The response function ß is estimated from relevant elevated CO2 experiments as:
[(NPPe/NPPJ - 1]
ln([C02]e/[C02]J (8)
where the subscripts e and a are the corresponding
4.0
E 3.0
B TO "- 2.0
o CT 1-0 • ' """
: TO
1 1 1 1 1 1
• 11.5% ;
• 8.4% -
• 2.0% :
•Î- ^^ 4.0
>^ E E 3.0
w TO •- 2.0
% O D) ID
•'•1•'
:T1
1•1•1•1•1•1•1•1•1•1•1•1•1•1•1•1•r
1 1 1 1 1 1 1 1 1 1 1 1 1 1 1 1
1 1 1 1 1 1
• 16.1%
• 21.3%
• 22.2%
1 1 1 1 1 1
2 4 6 8 10 12
time since disturbance (years) 2 4 6 8 10 12
time since disturbance (years)
5.0
^ 4.0
E E 3.0
B •- 2.0
"S o O) 1-0
-I•I•I•I•I•I•I•I•I•I•I•I•I•I•I•I•I•I•I•I•I•I•I•I•r-
T2
• 19.8%
• 19.2%
• 18.3%
' I I I I i__i I I I I l__i I I I I I I I I I i_ 2 4 6 8 10 12 14
time since disturbance (years)
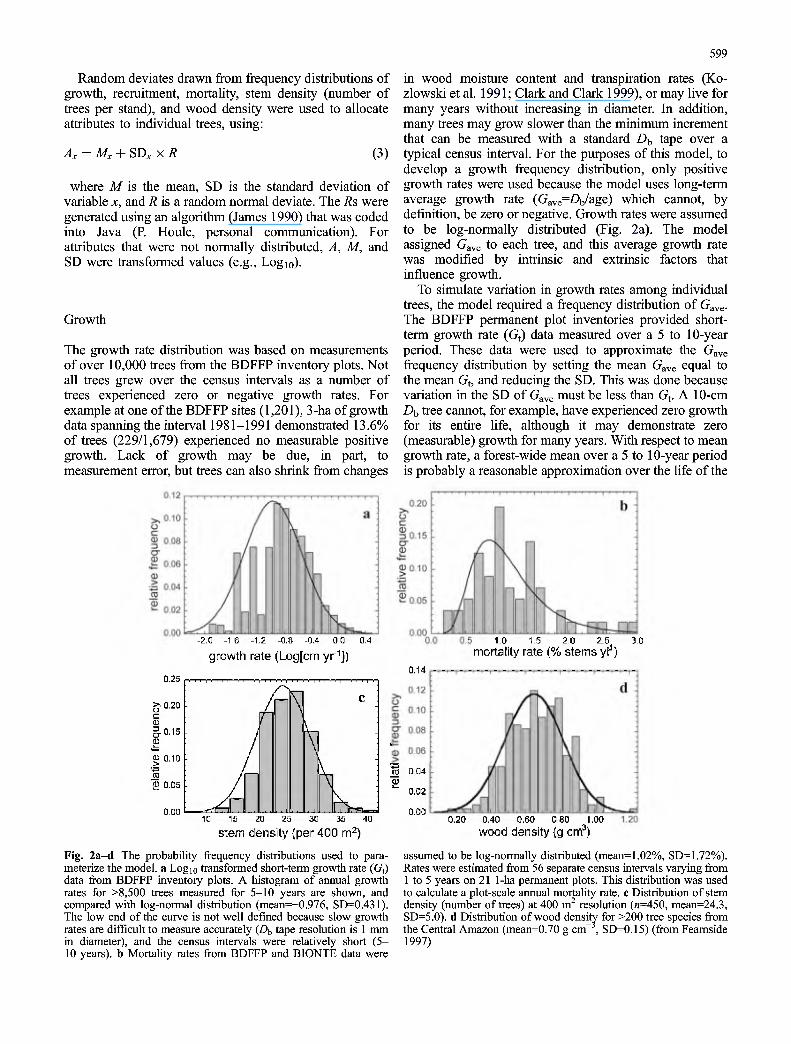
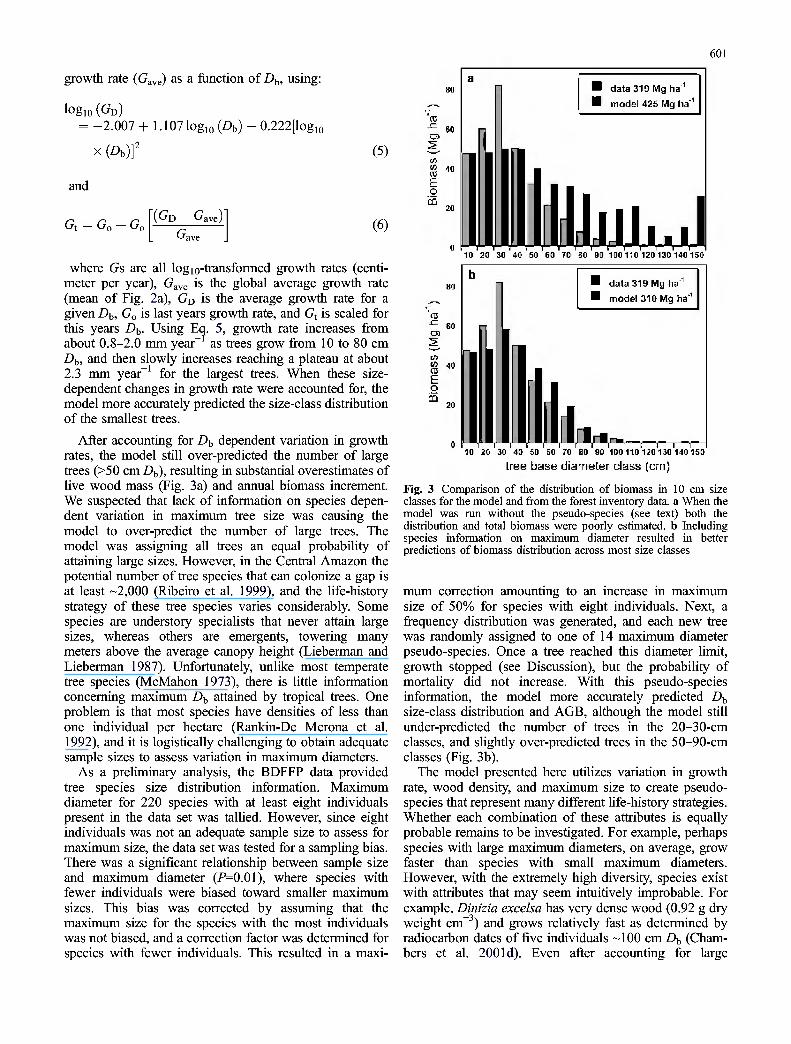
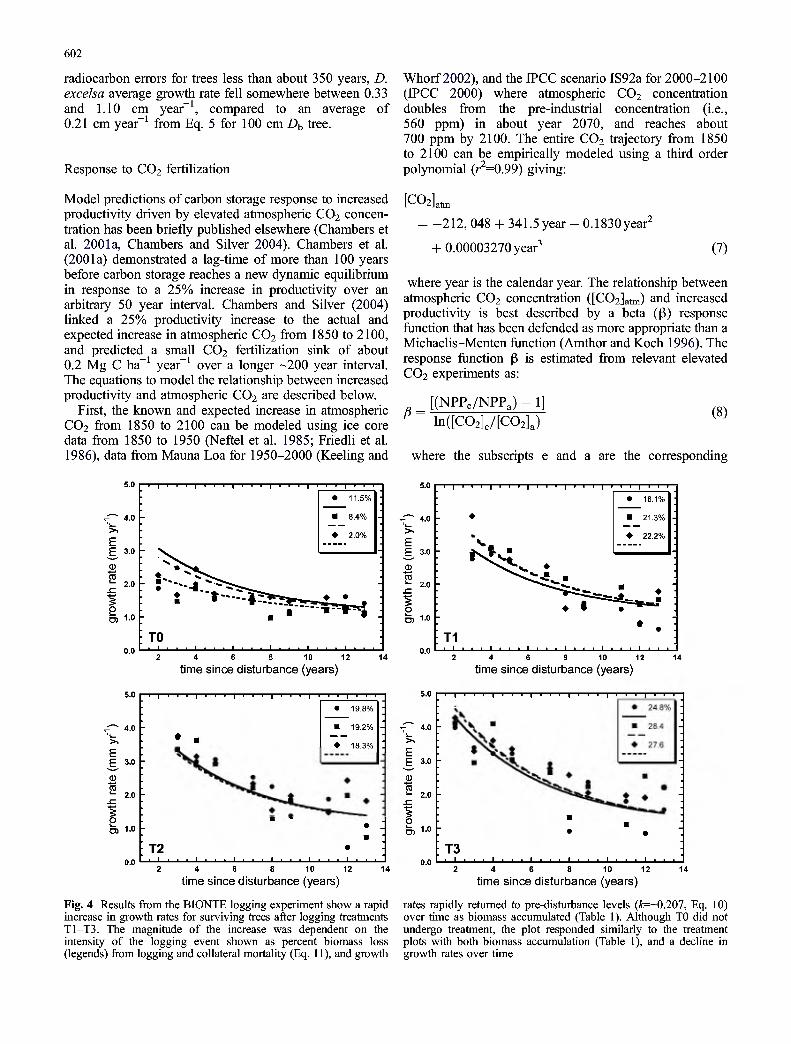
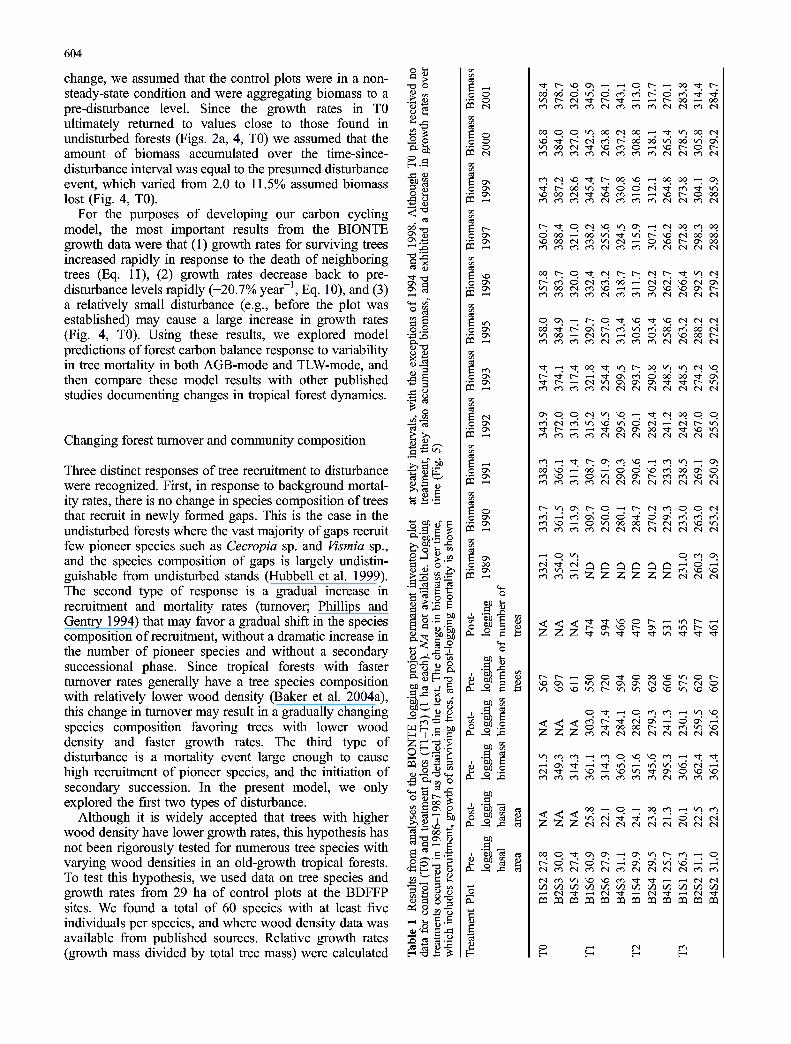
Fig. 4 Results from the BIONTE logging experiment show a rapid increase in growth rates for surviving trees after logging treatments T1-T3. The magnitude of the increase was dependent on the intensity of the logging event shown as percent biomass loss (legends) from logging and collateral mortality (Eq. 11), and growth
E 3.0
B 2.0
5 o
-I•I•I•I•I•I•I•I•I•I•I•I•I•I•I•I•I•I•I•I•I•I•I•I•r-
T3 _l I I I I I I I I I I I I I I I I I I I I I I I L.
2 4 6 8 10 12 14
time since disturbance (years)
rates rapidly returned to pre-disturbance levels (^-0.207, Eq. 10) over time as biomass accumulated (Table 1). Although TO did not undergo treatment, the plot responded similarly to the treatment plots with both biomass accumulation (Table 1), and a decline in growth rates over time
603
productivities under elevated and ambient [C02]atm (which vary from study to study). Estimating ß for old-growth forests of the Cenfral Amazon is quite difficult because there are no particularly relevant studies. However, based on studies in other intact ecosystems, and field and laboratory experiments, ß could be zero, or probably not much larger than 0.36, corresponding to a 25% increase in NPP for a doubling of [COiJatm (Chambers and Silver 2004; Clark 2004). Of the few large-scale studies of whole-forest response to elevated [C02]atm using the free- air CO2 enrichment (FACE) method, a loblolly pine plantation on relatively nutrient rich soils experienced a ~25% increase in woody tissue productivity with a doubling of [C02]atm (Hamilton et al. 2002). Thus, although it is possible that a Central Amazon forest on nutrient depleted soils could experience a stronger CO2 fertilization response than a loblolly pine plantation, given the experimental evidence, such a position is difficult to support (Chambers and Silver 2004; Clark 2004). Using the ß function, growth under elevated [C02]atm for each tree in the model is calculated as:
Gt l+;ßln[C02
[C02]a (9)
where Gt is from Eq. 6, and [C02]e is limited to a maximum of 580 ppm. Using this approach, we explored how carbon balance responds to various values of ß, and consfrained an upper limit for an above-ground CO2 fertilization response in Central Amazon forests.
Response to catasfrophic mortality
Background mortality rates were based on data from control plots (Fig. 2b) which provided information on year-to-year variation in mortality rates driven by changes in weather and other environmental variables. However, relatively catastrophic mortality events occasionally occur (Nelson et al. 1994; Condit et al. 1995; Williamson et al. 2000) and can result in marked changes in forests structure and functioning. In lieu of data directly demonstrating the effects of catastrophic mortality, we used the forest inventory data collected on the BIONTE logging treatment plots as a surrogate for varying intensities of catasfrophic mortality, which we define here as a free mortality rate that exceeds 3.0% stems year"' (~maximum in Fig. 2b).
The BIONTE was established at INPA reserves located along the ZF-2 road north of Manaus in the mid-1980s (Higuchi et al. 1997). The experiment consisted of three blocks of 24 ha each, with four treatments in each block comprising four replicate hectares. Permanent inventory plots were established in the centermost hectare of each replicate (12 ha total). The treatments (T) were: TO, control; Tl, 32% of commercial species basal area removed; T2, 42% removed, and T3, 69% removed (but see Fig. 4 legends for actual biomass loss). Each year after the logging freatments, with the exception of two 2-year
intervals, growth, recruitment and mortality for trees >10 cm Z)b was quantified.
One of the most notable characteristics of a catasfrophic mortality event is fransfer of a sizeable amount of large wood from live to dead pools. As there are no studies demonstrating altered rates of coarse litter decomposition rates in logged forests, or forests that have experienced relatively high tree mortality rates, coarse litter decompo- sition under catastrophic mortality was modeled as described above. Another characteristic of forests that have experienced high tree mortality is a competitive release from neighboring trees, and an increase in growth and productivity, by surviving frees (e.g.. Alder and Silva 2000). This response was clearly evident in the BIONTE inventory data showing an increase in growth rates for surviving frees as a function of the percent of biomass lost during the logging experiment from tree removal and collateral mortality (additional frees killed during the logging operation), along with a decrease in growth rates as a function of time since the disturbance (Fig. 4). This dynamic was best modeled by fitting an exponential decay function, which describes the growth rate of surviving trees, with:
Gt G•e-0-20^'+1.10 (10)
where Go is the average growth rate of surviving frees (in millimeter per year) immediately following the high mortality event (not including recruits), Gi is the average growth rate at t number of years after the event, -0.207 is the decay constant derived from fitting the BIONTE growth curves (Fig. 4), and 1.10 mm year"' is the long- term average growth rate for frees in undisturbed forests from the BDFFP data (Fig. 2a). The immediate growth rate response to disturbance (GQ), increased linearly with the size of the disturbance event (Fig. 4), and was modeled by:
Go = 1.41 + 13.7x5 (11)
where 5 is the mortality rate as the fraction of biomass lost during the event (removal plus collateral mortality). Combining Eqs. 9 and 10 describes the growth rate response of surviving frees as a function of the time since the disturbance (i) and the size of the disturbance event (6).
An interesting feature of results from the BIONTE study is that the control plots (TO), showed a decline in growth rates similar to the logged forests, although with a lower initial growth rate (Go) (Fig. 4, TO). At first this was perplexing, as these plots were expected to function similar to undisturbed forest with a relatively constant average growth rate taken over a number of years, and not a continuous decline in growth rates over time. The confrol plots showed an accumulation of biomass (Table 1) and a decrease in growth rates, which was qualitatively similar to forests that had undergone a high free mortality event. Although there are probably different ways to interpret this
604
change, we assumed that the control plots were in a non- steady-state condition and were aggregating biomass to a pre-disturbance level. Since the growth rates in TO ultimately returned to values close to those found in undisturbed forests (Figs. 2a, 4, TO) we assumed that the amount of biomass accumulated over the time-since- disturbance interval was equal to the presumed disturbance event, which varied from 2.0 to 11.5% assumed biomass lost (Fig. 4, TO).
For the purposes of developing our carbon cycling model, the most important results from the BIONTE growth data were that (1) growth rates for surviving trees increased rapidly in response to the death of neighboring trees (Eq. 11), (2) growth rates decrease back to pre- disturbance levels rapidly (-20.7% year"\ Eq. 10), and (3) a relatively small disturbance (e.g., before the plot was established) may cause a large increase in growth rates (Fig. 4, TO). Using these results, we explored model predictions of forest carbon balance response to variability in tree mortality in both AGB-mode and TLW-mode, and then compare these model results with other published studies documenting changes in tropical forest dynamics.
Changing forest turnover and community composition
Three distinct responses of free recruitment to disturbance were recognized. First, in response to background mortal- ity rates, there is no change in species composition of trees that recruit in newly formed gaps. This is the case in the undisturbed forests where the vast majority of gaps recruit few pioneer species such as Cecropia sp. and Vismia sp., and the species composition of gaps is largely undistin- guishable from undisturbed stands (Hubbell et al. 1999). The second type of response is a gradual increase in recruitment and mortality rates (turnover; Phillips and Gentry 1994) that may favor a gradual shift in the species composition of recruitment, without a dramatic increase in the number of pioneer species and without a secondary successional phase. Since tropical forests with faster turnover rates generally have a free species composition with relatively lower wood density (Baker et al. 2004a), this change in turnover may result in a gradually changing species composition favoring trees with lower wood density and faster growth rates. The third type of disturbance is a mortality event large enough to cause high recruitment of pioneer species, and the initiation of secondary succession. In the present model, we only explored the first two types of disturbance.
Although it is widely accepted that trees with higher wood density have lower growth rates, this hypothesis has not been rigorously tested for numerous tree species with varying wood densities in an old-growth tropical forests. To test this hypothesis, we used data on free species and growth rates from 29 ha of confrol plots at the BDFFP sites. We found a total of 60 species with at least five individuals per species, and where wood density data was available from published sources. Relative growth rates (growth mass divided by total free mass) were calculated
-2 I
»S o 2
•B 8 <-^ a
^ 'x¡
s e o.2
î-H ill
Co Ö •••
+- !" E s Í3 -3
u • 5 u .5 cd
ti'«
.S o
S. «
.S -c
_o ^^ ~! <^
es g
CO i:^
||
a M •-^ G
Mao ä.2
a»
•S g
s 3
m O
00 ? ON g '^ a ^ ^_r 00 c ON 5
g " o.tí
"3 2 B S ^ O r5 •-^ X CO T;
Oí ^ g Ä
E2^ es -3
CQ
o o o (N
ON ON
^3 ON ON
CQ -^
CQ ^
o ON
s 2
O 0^ S 2
s 2
C ON O 00
s 2
.s .Q M a M S .2 §
• S .Q
PH .2 O i3
S • 'Si 13
o s
•S • I '5b "A es ^ rN es ;.^
PH ^ ^ B
O000ÖinÖr<Srot^Örn^^'
ooooinooiNoo^H^ in 00 (N 's0^t:--(Nroi>-oooo»riooiri inco(N^^mo^H^t^or--
c^ (N ^ ^ r-; ^i>^ooin^ÖÖ(N^'rn^in <5oo(N^^m-H^^t^ooo
QO ^ ^H 00 00 -H a^
r-;^or^^^lno^^(Noq^<^oq Ooo^oo»ri^»rit^^r4oooo <5oO(Nm»ri(N^HO^t^o>oo
"^ "^ '^. ^ *^. "^ "^ *^. ^ ^. ^ *^. r-^ r<^ Ö (N ro 00 ^ r4 (N ^ (N Ov lnoO(N^<^^-H^HO^^O^t:--
O Q^ ^ l>, O ^ ^ 'ñT ^ (N (N (N O0^t^O>l>^r<S»nrn00rn00(N inoo^HCNiuo-Hooin^ooc--
^ ^H ^ 00 ^ in r-- 00 »n in (N ^ ^--^t--^H^O^^oooooo^
Ci; O O (N »n M:; ^ 'ñT (N 00 o O c^(Nrnin^inör4^r4i>^in ^i^^H•(^O^O^oo^'Ñ^<5ln
OO M¿ -^' 00 o^ M:; -H o c^ CO ro m
r-- in o^ i>- c*S --H r^ 0^ c<i ^ -H o CO m r^ m
<N ^ (N n CO in ^H |•I CO CO CO f¿-H
0^co^^H^Oln-Ha^ ^ O O »n o^ 0^ (N CM (N
O O ^ »n 00 00 (N CM (N
Û Û Û ^ ^ ^
^ ro 00 0> o c-- ro CO <5 in (N (N (N CM (N
(N m O O (N O 0^ CO CO CO t^ (N CO <5 in (N (N (N (N (N
^ O -H ,_, ^ CO ^ ^ ZH i2 (N CM (N Û Û
1•^ I•_: h-^ I ^ '-'> •M.^ »^ '-"I <'i -^1 i^ "-i.^
r^ 1^ -H o <5 o> ^H in in <; ^ in
o ^ o CM 0^ 0^ r-- in »n
00 ^ in o c-- (N o t^ (N o \o 'O *-n 'O O
o^•'Ococo^Hin^
< < < •z, "Z, "Z,
t^ -^ (N ^ 00 00 (N (N (N
ON ^ O ON -H t^ ^ (^ in NO (N (N (N rsl (N
•< ON '*' •^ 'it ir <N -^ ^ y3 ^ M: r*^ r^ r^ r^ r^ r^
IT) >ri NO (N ^ t ON o NO NO t^ fN t^ CO t^
...OO^O^OOro^inrc^
ooo'tONON-HON'Tir^m-HO r-ör-öi^•^oÑoÑ«rÍNo^^ <Ncci(Ncci(Ncci(N(NCN(Nmm
{NrciiTiNONOrci^'t^^^fNfN
mcQmeQCQeQeQmeQffleQm
o H H
605
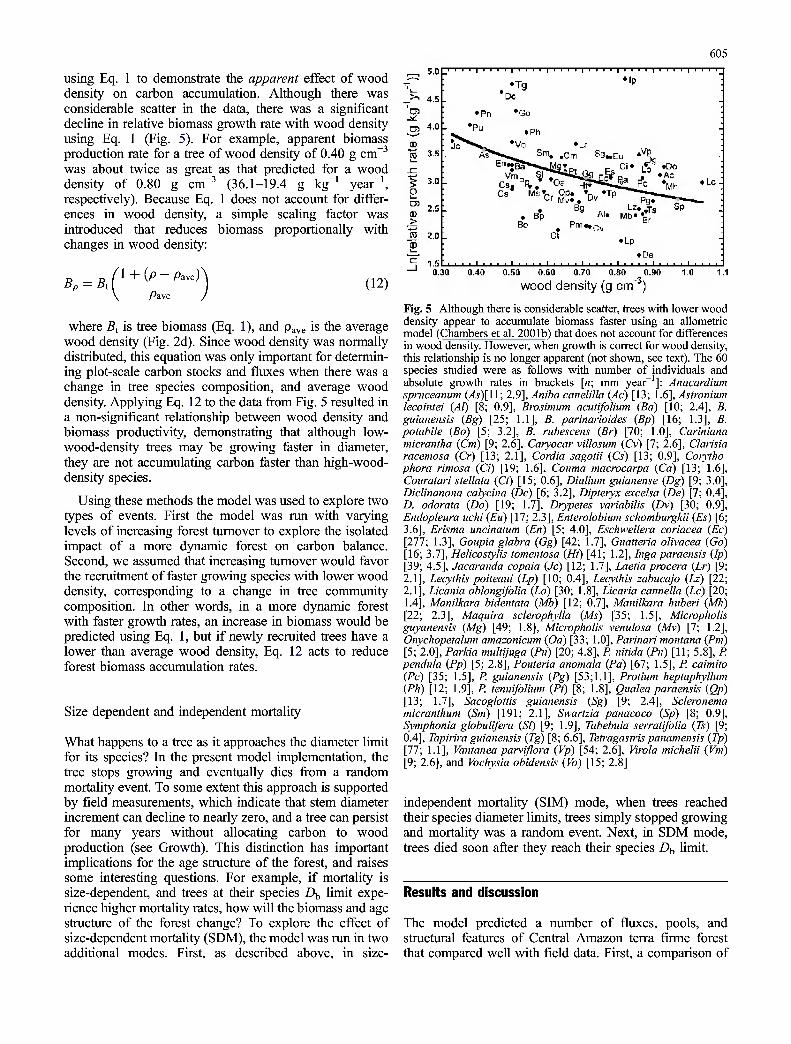
using Eq. 1 to demonstrate the apparent effect of wood density on carbon accumulation. Although there was considerable scatter in the data, there was a significant decline in relative biomass growth rate with wood density using Eq. 1 (Fig. 5). For example, apparent biomass production rate for a tree of wood density of 0.40 g cm""^ was about twice as great as that predicted for a wood density of 0.80 g cm"^ (36.1-19.4 g kg"^ year"', respectively). Because Eq. 1 does not account for differ- ences in wood density, a simple scaling factor was introduced that reduces biomass proportionally with changes in wood density:
Bp • Bi 1 + (p - Pave)
Pave (12)
where B^ is tree biomass (Eq. 1), and p^ve is the average wood density (Fig. 2d). Since wood density was normally distributed, this equation was only important for determin- ing plot-scale carbon stocks and fiuxes when there was a change in tree species composition, and average wood density. Applying Eq. 12 to the data from Fig. 5 resulted in a non-significant relationship between wood density and biomass productivity, demonstrating that although low- wood-density trees may be growing faster in diameter, they are not accumulating carbon faster than high-wood- density species.
Using these methods the model was used to explore two types of events. First the model was run with varying levels of increasing forest turnover to explore the isolated impact of a more dynamic forest on carbon balance. Second, we assumed that increasing turnover would favor the recruitment of faster growing species with lower wood density, corresponding to a change in tree community composition. In other words, in a more dynamic forest with faster growth rates, an increase in biomass would be predicted using Eq. 1, but if newly recruited trees have a lower than average wood density, Eq. 12 acts to reduce forest biomass accumulation rates.
Size dependent and independent mortality
What happens to a tree as it approaches the diameter limit for its species? In the present model implementation, the tree stops growing and eventually dies from a random mortality event. To some extent this approach is supported by field measurements, which indicate that stem diameter increment can decline to nearly zero, and a tree can persist for many years without allocating carbon to wood production (see Growth). This distinction has important implications for the age structure of the forest, and raises some interesting questions. For example, if mortality is size-dependent, and trees at their species D^ limit expe- rience higher mortality rates, how will the biomass and age structure of the forest change? To explore the effect of size-dependent mortality (SDM), the model was run in two additional modes. First, as described above, in size-
0)
CD >
0)
5,0 1 1 • , , , , • 1 1 1 1 1 ' 1 1 1 1
oTg *IP ' 4.5 _ "DC J
iPn "Go ; 4,0
- ^ •Pu • Ph -; *V^ •Vo •Lr ;
3.5 Ä?" •«-....^ Sm, .cm Sg,;Eu .^Vp
^"•"•'BÈf*''»«Ji3"r,. • Ci-í f'rT ïDO Vm sT'^^ieLGS .E^ •. \:° .AC
-
3.0 - C£.-. PP . 03 HT*-;*-^ Pt^ 'Mh *Lc-
.^^ 2.5 Bg •, LZooTs ^P j
= Bp Alo Mb- '•L^ . Bo '
2,0 ct oLp
o De I 1.5 . 1 . . . , 1 , , , . , , , , r , . . . 1 . . . , 1 . , , , 1 , , , , •
0.30 0.40 0.50 0.60 0.70 0.80 0.90
wood density (g cm"^) 1.0 1.1
Fig. 5 Although there is considerable scatter, trees with lower wood density appear to accumulate biomass faster using an allometric model (Chambers et al. 2001b) that does not account for differences in wood density. However, when growth is correct for wood density, this relationship is no longer apparent (not shown, see text). The 60 species studied were as follows with number of individuals and absolute growth rates in brackets [«; mm year ]: Anacardium spruceanum (As){ll; 2.9], Aniba canelilla (Ac) [13; 1.6], Astronium lecointei (Al) [8; 0.9], Brosimum acutifolium (Ba) [10; 2.4], B. guianensis (Bg) [25; 1.1], B. parinarioides (Bp) [16; 1.3], B. potabile (Bo) [5; 3.2], B. rubescens (Br) [70; 1.0], Cariniana micrantha (Cm) [9; 2.6], Caryocar villosum (Cv) [7; 2.6], Clarisia racemosa (Cr) [13; 2.1], Cordia sagotii (Cs) [13; 0.9], Corytho- phora rimosa (Ci) [19; 1.6], Couma macrocarpa (Co) [13; 1.6], Couratari stellata (Ci) [15; 0.6], Dialium guianense (Dg) [9; 3.0], Diclinanona calycina (Dc) [6; 3.2], Dipteryx excelsa (De) [7; 0.4], D. odorata (Do) [19; 1.7], Drypetes variabilis (Dv) [30; 0.9], Endopleura uchi (Eu) [17; 2.3], Enterolobium schomburgkii (Es) [6; 3.6], Erisma uncinatum (En) [5; 4.0], Eschweilera coriácea (Ec) [277; 1.3], Goupia glabra (Gg) [42; 1.7], Guatteria olivácea (Go) [16; 3.7], Helicostylis tomentosa (Ht) [41; 1.2], Inga paraensis (Ip) [39; 4.5], Jacaranda copaia (Je) [12; 1.7], Laetia procera (Lr) [9; 2.1], Lecythis poiteaui (Lp) [10; 0.4], Lecythis zabucajo (Lz) [22; 2.1], Licania oblongifolia (Lo) [30; 1.8], Licaria cannella (Lc) [20; 1.4], Manilkara bidentata (Mb) [12; 0.7], Manilkara huberi (Mh) [22; 2.3], Maquira sclerophylla (Ms) [35; 1.5], Micropholis guyanensis (Mg) [49; 1.8], Micropholis venulosa (Mv) [7; 1.2], Onychopetalum amazonicum (Oa) [33; 1.0], Parinari montana (Pm) [5; 2.0], Parkia multijuga (Pu) [20; 4.8], P. nitida (Pn) [11; 5.8], P. péndula (Pp) [5; 2.8], Pouteria anómala (Pa) [67; 1.5], P. caimito (Pc) [35; 1.5], P. guianensis (Pg) [53;1.1], Protium heptaphyllum (Ph) [12; 1.9], P. tenuifolium (Pt) [8; 1.8], Qualea paraensis (Qp) [13; 1.7], Sacoglottis guianensis (Sg) [9; 2.4], Scleronema micranthum (Sm) [191; 2.1], Swartzia panacoco (Sp) [8; 0.9], Symphonia globulifera (SI) [9; 1.9], Tabebuia serratifolia (Ts) [9; 0.4], Tapirira guianensis (Tg) [8; 6.6], Tetragastris panamensis (Tp) [77; 1.1], Vantanea parviflora (Vp) [54; 2.6], Virola michelii (Vm) [9; 2.6], and Vochysia obidensis (Vo) [15; 2.8]
independent mortality (SIM) mode, when trees reached their species diameter limits, trees simply stopped growing and mortality was a random event. Next, in SDM mode, trees died soon after they reach their species /)b limit.
Results and discussion
The model predicted a number of fluxes, pools, and structural features of Central Amazon terra firme forest that compared well with field data. First, a comparison of
606
size-class structure between the model and the forest inventory data demonstrated the model predicts both above-ground tree biomass and the distribution of biomass among D^, size classes reasonably well, and underscores the importance of species information in modeling forest structure (Fig. 3b). Some model predictions were com- pared with empirical data (Table 2). In many cases these comparisons were simply consistency checks because we were comparing the aggregated plot data to model predictions based on individual tree data. For example, data on individual tree growth rates were used to parameterize the model, and then compared with plot- scale productivity estimates, where the size structure is also important. However, in a few cases, independent data were available to compare with model predictions. First, predicted coarse litter standing stocks was about the same as that measured in an intensive 3 ha study in the BIONTE project control plots (Summers 1998) (Table 2). Also, radiocarbon studies of maximum tree age (Chambers et al. 1998, 2001d) found 1,000-year-old trees, and the average age for trees >100 cm Dy, also compare well with model predictions (Table 2).
CO2 fertilization
Chambers et al. (2001a), employing essentially the same model presented here, demonstrated that in response to an arbitrary 25% increase in tree growth rates, there was a lag-time of more than a century before large wood carbon balance reach a new dynamic equilibrium. Chambers and Silver (2004), also employing the model presented here, found that if the increase in tree growth rates was tied to the known and expected increase in atmospheric CO2 (Eq. 7), the long-term Central Amazon forest carbon sink for TLW would only be about 0.18 Mg C ha"' year"', although this sink strength would not be reached until ~2020-2030. In this study, we used the model in AGB- mode using various ß factors corresponding to 25, 50, 75,
Table 2 Comparison of model output and field data. ND no data. Growth and mortality rates, and tree biomass stocks, were estimated Irom the forest inventory data, and model results are based on averages from five model runs at 10 ha each. Independent comparisons include coarse litter stocks measured by Summers (1998) in three 1 ha plots from the BIONTE project control plots, and radiocarbon dates of tree ages (Chambers et al. 1998, 200Id). Maximum age, and age for trees >100 cm flb^ were based on five model runs for 2,500 years at 100 ha
Attribute Empirical Model
Live trees (Mg C ha"') 156 160 Coarse litter (Mg C ha"') 15 17 Growth (Mg C ha"' year"') 1.7 1.6 Mortality (Mg C ha"'year"') 2.1 1.7 MeanDBH(cm) 21.1 20.4 Mean age >I0 cm flb (years) ND 175 Mean age >100 cm D^ (years) 425 383 Maximum age (years) 1,372 1,192
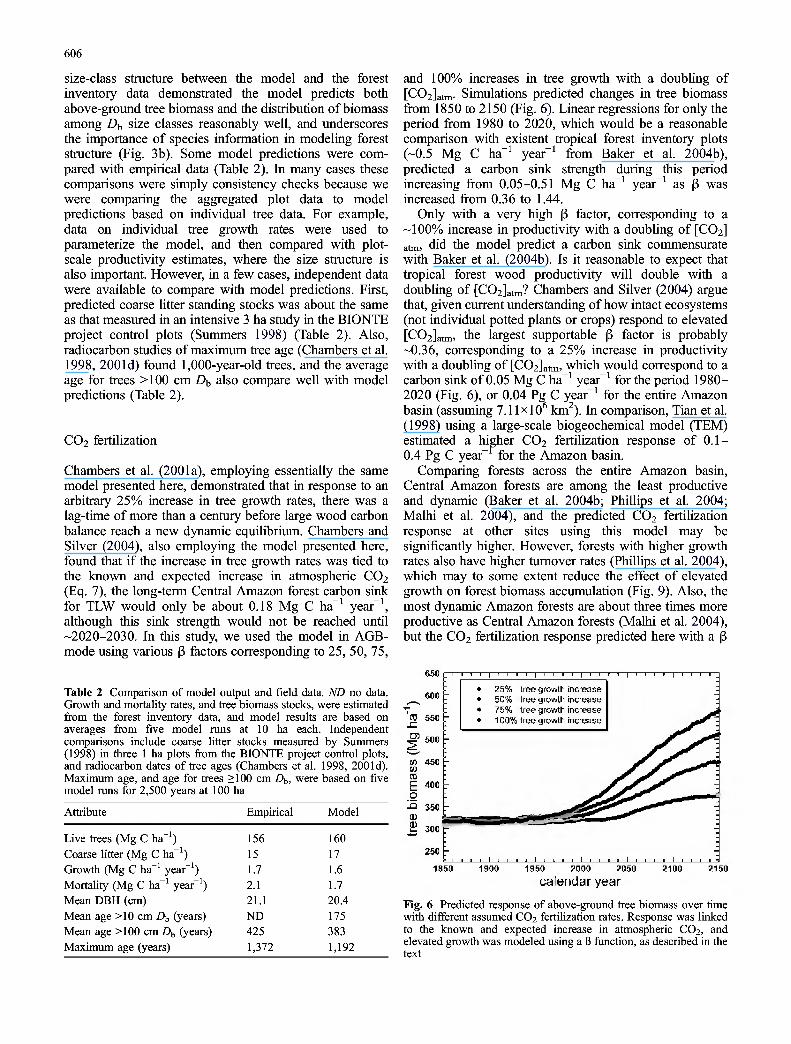
and 100% increases in tree growth with a doubling of [C02]atm- Simulations predicted changes in tree biomass from 1850 to 2150 (Fig. 6). Linear regressions for only the period from 1980 to 2020, which would be a reasonable comparison with existent tropical forest inventory plots (-0.5 Mg C ha"' year"' from Baker et al. 2004b), predicted a carbon sink strength during this period increasing from 0.05-0.51 Mg C ha"' year"' as ß was increased from 0.36 to 1.44.
Only with a very high ß factor, corresponding to a ~100% increase in productivity with a doubling of [CO2] atm, did the model predict a carbon sink commensurate with Baker et al. (2004b). Is it reasonable to expect that tropical forest wood productivity will double with a doubling of [C02]atm? Chambers and Silver (2004) argue that, given current understanding of how intact ecosystems (not individual potted plants or crops) respond to elevated [C02]atm5 the largest supportable ß factor is probably ~0.36, corresponding to a 25% increase in productivity with a doubling of [C02]atm, which would correspond to a carbon sink of 0.05 Mg C ha"' year"' for the period 1980- 2020 (Fig. 6), or 0.04 Pg C year"' for the entire Amazon basin (assuming 7.11 x 10 km ). In comparison, Tian et al. (1998) using a large-scale biogeochemical model (TEM) estimated a higher CO2 fertilization response of 0.1- 0.4 Pg C year" for the Amazon basin.
Comparing forests across the entire Amazon basin. Central Amazon forests are among the least productive and dynamic (Baker et al. 2004b; Phillips et al. 2004; Malhi et al. 2004), and the predicted CO2 fertilization response at other sites using this model may be significantly higher. However, forests with higher growth rates also have higher turnover rates (Phillips et al. 2004), which may to some extent reduce the effect of elevated growth on forest biomass accumulation (Fig. 9). Also, the most dynamic Amazon forests are about three times more productive as Central Amazon forests (Malhi et al. 2004), but the CO2 fertilization response predicted here with a ß
650
600
ra 550
U) 500 r
400
V) 450 tn
E o J2 35P 0) ^ 300
250
-
1 1 1 1 1 [ 1 1 1 1 [ 1 1 1 1 1
^
* •
25%i tree growth increase 50% tree growth increase 75% tree growth increase 100% tree growth increase
^^^^
1 1 ( 1 < 1 < 1 1 1 1 1 1
1850 1950 2000 2050
calendar year 2100 2150
Fig. 6 Predicted response of above-ground tree biomass over time with different assumed CO2 fertilization rates. Response was linked to the known and expected increase in atmospheric CO2, and elevated growth was modeled using a ß function, as described in the text
607
of 0.36 is about an order of magnitude less than the observed average pan-Amazonian biomass accumulation (Fig. 6) (Baker et al. 2004b). Additional studies are needed to differentiate between the numerous factors that can lead to changes in forest carbon balance, but it seems unlikely that CO2 fertilization can explain more than a small portion of the observed increase.
Tree mortality, coarse litter, and TLW dynamics
One of the emphases in this study is demonstrating the importance of wood carbon and coarse litter in determin- ing year-to-year variations in forest carbon balance. However, in only a few cases are both live and dead wood carbon pools quantified in forest ecosystem studies, so results in TLW-mode are difficult to compare with field data. The vast majority of carbon balance studies only focus on the above-ground portion of live trees, over relatively short time periods of a few decades, and spatial scales of a few hundred hectares (e.g.. Baker et al. 2004a, b). This live tree inventory approach may overlook important ecosystem processes that help determine forest carbon balance. For example, studies in the Eastern Amazon near the city of Santarém found a large amount of coarse litter in a ~20-ha plot, and estimated that the site was probably a net source of carbon to the atmosphere, and not a carbon sink, as would have been predicted using only the tree survey data (Saleska et al. 2003; Rice et al. 2004).
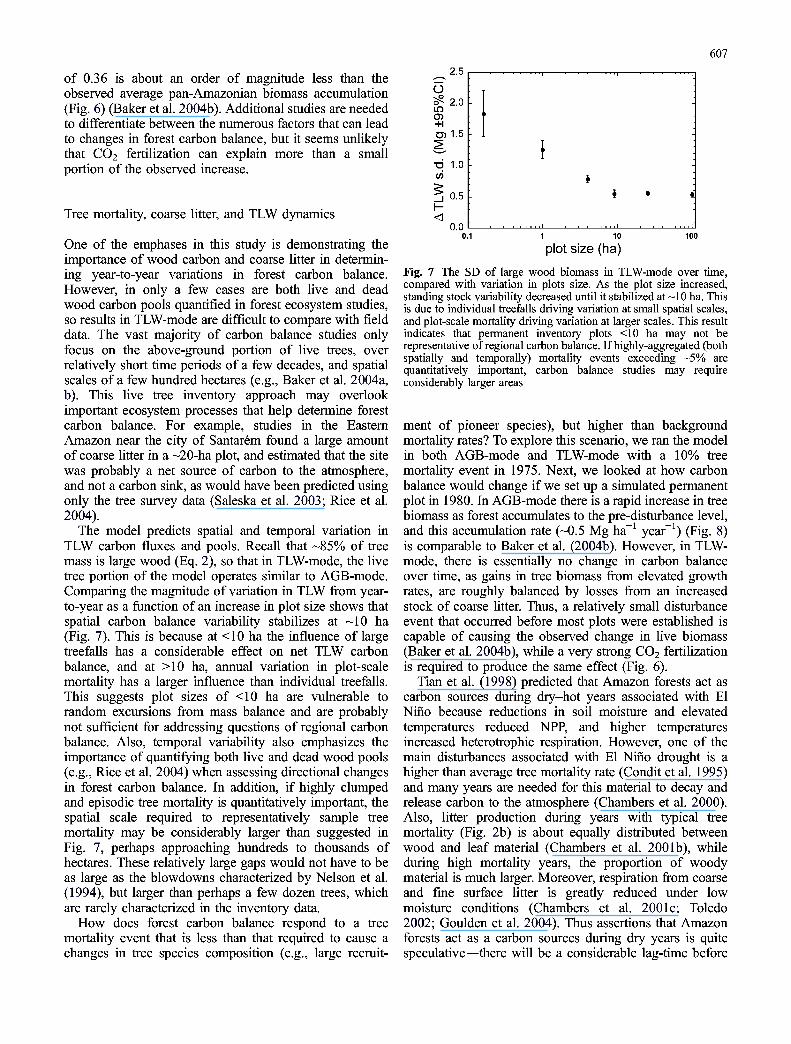
The model predicts spatial and temporal variation in TLW carbon fluxes and pools. Recall that ~85% of tree mass is large wood (Eq. 2), so that in TLW-mode, the live tree portion of the model operates similar to AGB-mode. Comparing the magnitude of variation in TLW irom year- to-year as a fiinction of an increase in plot size shows that spatial carbon balance variability stabilizes at ~10 ha (Fig. 7). This is because at <10 ha the influence of large treefalls has a considerable effect on net TLW carbon balance, and at >10 ha, annual variation in plot-scale mortality has a larger influence than individual treefalls. This suggests plot sizes of <10 ha are vulnerable to random excursions from mass balance and are probably not sufficient for addressing questions of regional carbon balance. Also, temporal variability also emphasizes the importance of quantifying both live and dead wood pools (e.g.. Rice et al. 2004) when assessing directional changes in forest carbon balance. In addition, if highly clumped and episodic tree mortality is quantitatively important, the spatial scale required to representatively sample tree mortality may be considerably larger than suggested in Fig. 7, perhaps approaching hundreds to thousands of hectares. These relatively large gaps would not have to be as large as the blowdowns characterized by Nelson et al. (1994), but larger than perhaps a few dozen trees, which are rarely characterized in the inventory data.
How does forest carbon balance respond to a tree mortality event that is less than that required to cause a changes in tree species composition (e.g., large recruit-
,•. ' . . . ..., . . . 11 < 11
0 •
â5 2.0 •
in - CD ' > - +1 •
OÎ 1.5 - - ^
\ :
"••' - •q 1.0 - - CO i .
3 0.5 i • t
1- : <1
n n ,,,, ,,., r 0.1 1 10 100
plot size (ha)
Fig. 7 The SD of large wood biomass in TLW-mode over time, compared with variation in plots size. As the plot size increased, standing stock variability decreased until it stabilized at ~10 ha. This is due to individual treefalls driving variation at small spatial scales, and plot-scale mortality driving variation at larger scales. This result indicates that permanent inventory plots <10 ha may not be representative of regional carbon balance. If highly-aggregated (both spatially and temporally) mortality events exceeding ~5% are quantitatively important, carbon balance studies may require considerably larger areas
ment of pioneer species), but higher than background mortality rates? To explore this scenario, we ran the model in both AGB-mode and TLW-mode with a 10% tree mortality event in 1975. Next, we looked at how carbon balance would change if we set up a simulated permanent plot in 1980. In AGB-mode there is a rapid increase in tree biomass as forest accumulates to the pre-disturbance level, and this accumulation rate (~0.5 Mg ha"' year"') (Fig. 8) is comparable to Baker et al. (2004b). However, in TLW- mode, there is essentially no change in carbon balance over time, as gains in free biomass from elevated growth rates, are roughly balanced by losses from an increased stock of coarse litter. Thus, a relatively small disturbance event that occurred before most plots were established is capable of causing the observed change in live biomass (Baker et al. 2004b), while a very sfrong CO2 fertilization is required to produce the same effect (Fig. 6).
Tian et al. (1998) predicted that Amazon forests act as carbon sources during dry-hot years associated with El Niño because reductions in soil moisture and elevated temperatures reduced NPP, and higher temperatures increased heterofrophic respiration. However, one of the main disturbances associated with El Niño drought is a higher than average tree mortality rate (Condit et al. 1995) and many years are needed for this material to decay and release carbon to the atmosphere (Chambers et al. 2000). Also, litter production during years with typical tree mortality (Fig. 2b) is about equally distributed between wood and leaf material (Chambers et al. 2001b), while during high mortality years, the proportion of woody material is much larger. Moreover, respiration from coarse and fine surface litter is greatly reduced under low moisture conditions (Chambers et al. 2001c; Toledo 2002; Goulden et al. 2004). Thus assertions that Amazon forests act as a carbon sources during dry years is quite speculative•there will be a considerable lag-time before
608
330
^r• 320< 'ro
310
W 300 W CO
I I I I I I I I I I I I I I I I I I I I I I I I I I I I I I I I I I I
50
45
40 03
(O 35 to
I I I I I I I I I I I I I I I I I I I I I I I I
• TLW-mode •
1800 1850 1900 1950 2000 year
••••'••••
2050 2100 2150 2200
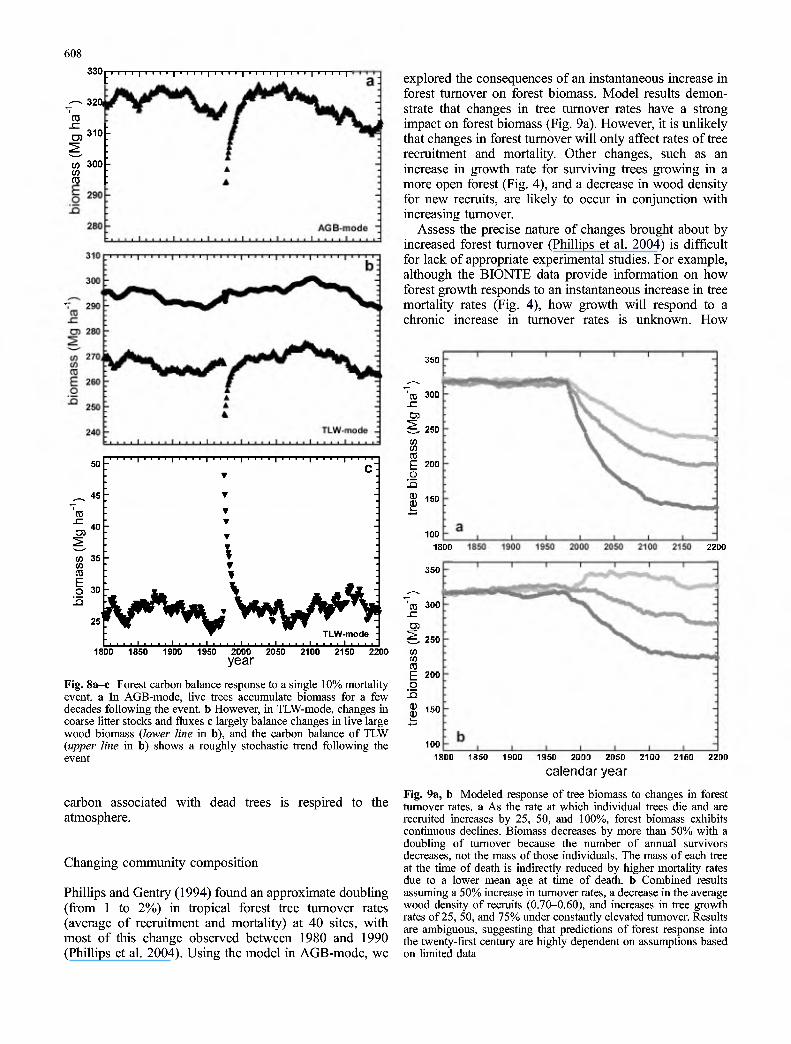
Fig. 8a-c Forest carbon balance response to a single 10% mortality event, a In AGB-mode, live trees accumulate biomass for a few decades following the event, b However, in TLW-mode, changes in coarse litter stocks and fluxes c largely balance changes in live large wood biomass (lower line in b), and the carbon balance of TLW {upper line in b) shows a roughly stochastic trend following the event
carbon associated with dead trees is respired to the atmosphere.
Changing community composition
PhilHps and Gentry (1994) found an approximate doubling (from 1 to 2%) in fropical forest tree turnover rates (average of recruitment and mortality) at 40 sites, with most of this change observed between 1980 and 1990 (Phillips et al. 2004). Using the model in AGB-mode, we
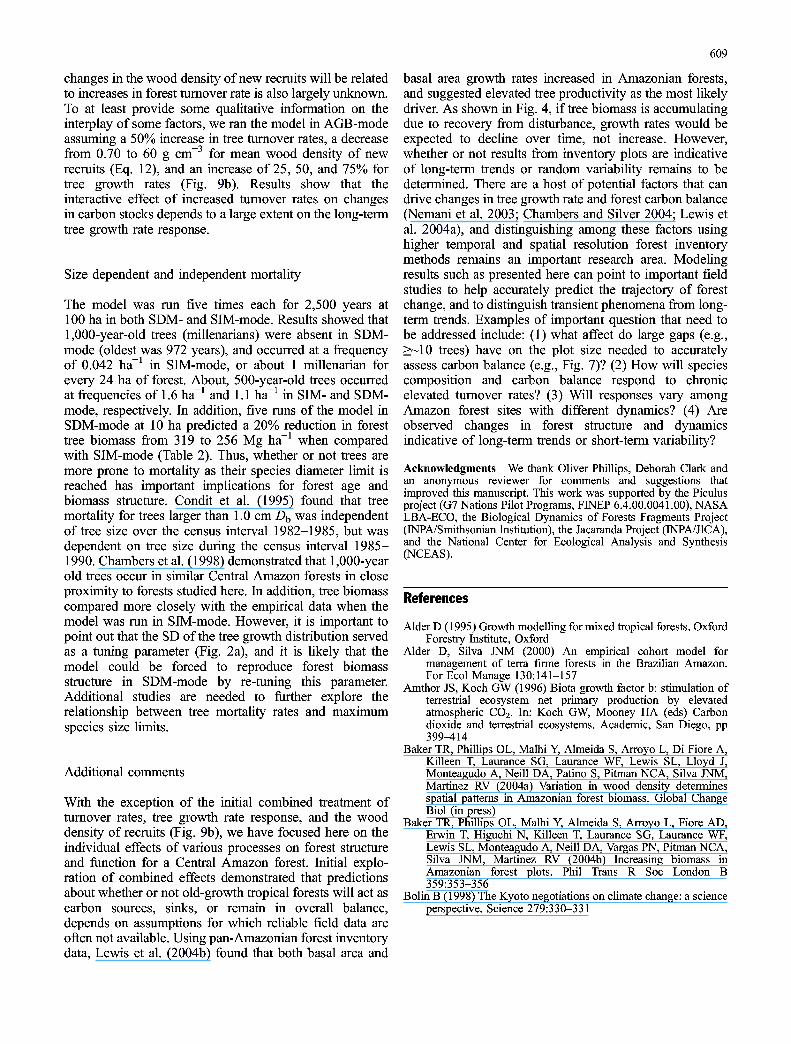
explored the consequences of an instantaneous increase in forest turnover on forest biomass. Model results demon- strate that changes in tree turnover rates have a sfrong impact on forest biomass (Fig. 9a). However, it is unlikely that changes in forest turnover will only affect rates of tree recruitment and mortality. Other changes, such as an increase in growth rate for surviving frees growing in a more open forest (Fig. 4), and a decrease in wood density for new recruits, are likely to occur in conjunction with increasing turnover.
Assess the precise nature of changes brought about by increased forest turnover (Phillips et al. 2004) is difficult for lack of appropriate experimental studies. For example, although the BIONTE data provide information on how forest growth responds to an instantaneous increase in tree mortality rates (Fig. 4), how growth will respond to a chronic increase in turnover rates is unknown. How
ro 300
250 m m TO E o
(U 150 -
1300
350 -
'm 300
250 en en CT!
E g 200
2200
100 -
1800 1350 1900 1950 2000 2050 2100
calendar year 2150 2200
Fig. 9a, b Modeled response of tree biomass to changes in forest turnover rates, a As the rate at which individual trees die and are recruited increases by 25, 50, and 100%, forest biomass exhibits continuous declines. Biomass decreases by more than 50% with a doubling of turnover because the number of annual survivors decreases, not the mass of those individuals. The mass of each tree at the time of death is indirectly reduced by higher mortality rates due to a lower mean age at time of death, b Combined results assuming a 50% increase in turnover rates, a decrease in the average wood density of recruits (0.70-0.60), and increases in tree growth rates of 25, 50, and 75% under constantly elevated turnover. Results are ambiguous, suggesting that predictions of forest response into the twenty-first century are highly dependent on assumptions based on limited data
609
changes in the wood density of new recruits will be related to increases in forest turnover rate is also largely unknown. To at least provide some qualitative information on the interplay of some factors, we ran the model in AGB-mode assuming a 50% increase in tree turnover rates, a decrease irom 0.70 to 60 g cm"^ for mean wood density of new recruits (Eq. 12), and an increase of 25, 50, and 75% for tree growth rates (Fig. 9b). Results show that the interactive effect of increased turnover rates on changes in carbon stocks depends to a large extent on the long-term tree growth rate response.
Size dependent and independent mortality
The model was run five times each for 2,500 years at 100 ha in both SDM- and SIM-mode. Resuhs showed that 1,000-year-old trees (millenarians) were absent in SDM- mode (oldest was 972 years), and occurred at a frequency of 0.042 ha^ in SIM-mode, or about 1 millenarian for every 24 ha of forest. About, 500-year-old trees occurred at fi-equencies of 1.6 ha"^ and 1.1 ha"^ in SIM- and SDM- mode, respectively. In addition, five runs of the model in SDM-mode at 10 ha predicted a 20%) reduction in forest tree biomass from 319 to 256 Mg ha"' when compared with SIM-mode (Table 2). Thus, whether or not trees are more prone to mortality as their species diameter limit is reached has important implications for forest age and biomass structure. Condit et al. (1995) found that tree mortality for trees larger than 1.0 cm D^ was independent of tree size over the census interval 1982-1985, but was dependent on tree size during the census interval 1985- 1990. Chambers et al. (1998) demonstrated that 1,000-year old trees occur in similar Central Amazon forests in close proximity to forests studied here. In addition, tree biomass compared more closely with the empirical data when the model was run in SIM-mode. However, it is important to point out that the SD of the tree growth distribution served as a tuning parameter (Fig. 2a), and it is likely that the model could be forced to reproduce forest biomass structure in SDM-mode by re-tuning this parameter. Additional studies are needed to further explore the relationship between tree mortality rates and maximum species size limits.
Additional comments
With the exception of the initial combined treatment of turnover rates, tree growth rate response, and the wood density of recruits (Fig. 9b), we have focused here on the individual effects of various processes on forest structure and function for a Central Amazon forest. Initial explo- ration of combined effects demonstrated that predictions about whether or not old-growth tropical forests will act as carbon sources, sinks, or remain in overall balance, depends on assumptions for which reliable field data are often not available. Using pan-Amazonian forest inventory data, Lewis et al. (2004b) found that both basal area and
basal area growth rates increased in Amazonian forests, and suggested elevated tree productivity as the most likely driver. As shown in Fig. 4, if tree biomass is accumulating due to recovery from disturbance, growth rates would be expected to decline over time, not increase. However, whether or not results from inventory plots are indicative of long-term trends or random variability remains to be determined. There are a host of potential factors that can drive changes in tree growth rate and forest carbon balance (Nemani et al. 2003; Chambers and Silver 2004; Lewis et al. 2004a), and distinguishing among these factors using higher temporal and spatial resolution forest inventory methods remains an important research area. Modeling results such as presented here can point to important field studies to help accurately predict the trajectory of forest change, and to distinguish transient phenomena from long- term trends. Examples of important question that need to be addressed include: (1) what affect do large gaps (e.g., >~10 trees) have on the plot size needed to accurately assess carbon balance (e.g.. Fig. 7)? (2) How will species composition and carbon balance respond to chronic elevated turnover rates? (3) Will responses vary among Amazon forest sites with different dynamics? (4) Are observed changes in forest structure and dynamics indicative of long-term trends or short-term variability?
Acknowledgments We thank Oliver Phillips, Deborah Clark and an anonymous reviewer for comments and suggestions that improved this manuscript. This work was supported by the Piculus project (G7 Nations Pilot Programs, FINEP 6.4.00.0041.00), NASA LBA-ECO, the Biological Dynamics of Forests Fragments Project (INPA/Smithsonian Institution), the Jacaranda Project (INPA/JICA), and the National Center for Ecological Analysis and Synthesis (NCEAS).
References
Alder D (1995) Growth modelling for mixed tropical forests. Oxford Forestry Institute, Oxford
Alder D, Silva JNM (2000) An empirical cohort model for management of terra firme forests in the Brazilian Amazon. For Ecol Manage 130:141-157
Amthor JS, Koch GW (1996) Biota growth factor b: stimulation of terrestrial ecosystem net primary production by elevated atmospheric CO2. In: Koch GW, Mooney HA (eds) Carbon dioxide and terrestrial ecosystems. Academic, San Diego, pp 399-414
Baker TR, Phillips OL, Malhi Y, Almeida S, Arroyo L, Di Fiore A, Killeen T, Laurance SG, Laurance WF, Lewis SL, Lloyd J, Monteagudo A, Neill DA, Patino S, Pitman NCA, Silva JNM, Martinez RV (2004a) Variation in wood density determines spatial patterns in Amazonian forest biomass. Global Change Biol (in press)
Baker TR, Phillips OL, Malhi Y, Almeida S, Arroyo L, Fiore AD, Erwin T, Higuchi N, Killeen T, Laurance SG, Laurance WF, Lewis SL, Monteagudo A, Neill DA, Vargas PN, Pitman NCA, Silva JNM, Martinez RV (2004b) Increasing biomass in Amazonian forest plots. Phil Trans R Soc London B 359:353-356
Bolin B (1998) The Kyoto negotiations on climate change: a science perspective. Science 279:330-331
610
Bolker BM, Pacala SW, Bazzaz FA, Canham CD, Levin SA (1995) Species-diversity and ecosystem response to carbon-dioxide fertilization•conclusions from a temperate forest model. Global Change Biol 1:373-381
Botkin DB, Schenk HJ (1996) History and rationales of the JABOWA model of forest growth. In: Vance E (ed) Review and analysis of JABOWA and related forest models and their use in climate change studies. NCASI, Research Triangle Park, North Carolina, pp 154-172
Bravard S, Righi D (1989) Geochemical differences in an Oxisol- Spodosol toposequence of Amazonia, Brazil. Geoderma 44:29- 42
Bugmann H (2001) A review of forest gap models. Climatic Change 51:259-305
Canadell JG, Mooney HA, Baldocchi DD, Berry JA, Ehleringer JR, Field CB, Gower ST, Hollinger DY, Hunt JE, Jackson RB, Running SW, Shaver GR, Steffen W, Trumbore SE, Valentini R, Bond BY (2000) Carbon metabolism of the terrestrial biosphere: a multitechnique approach for improved under- standing. Ecosystems 3:115-130
Chambers JQ, Silver WL (2004) Some aspects of ecophysiological and biogeochemical responses of tropical forests to atmospheric change. Phil Trans R Soc London B 359:463^76
Chambers JQ, Higuchi N, Schimel JP (1998) Ancient trees in Amazonia. Nature 391:135-136
Chambers JQ, Higuchi N, Ferreira LV, Melack JM, Schimel JP (2000) Decomposition and carbon cycling of dead trees in tropical forests of the Central Amazon. Oecologia 122:380-388
Chambers JQ, Higuchi N, Tribuzy ES, Trumbore SE (2001a) Carbon sink for a century. Nature 410:429
Chambers JQ, Santos J, Ribeiro RJ, Higuchi N (2001b) Tree damage, allometric relationships, and above-ground net prima- ry production in a tropical forest. For Ecol Manage 152:73-84
Chambers JQ, Schimel JP, Nobre AD (2001c) Respiration from coarse wood litter in Central Amazon forests. Biogeochemistry 52:115-131
Chambers JQ, Van Eldik T, Southon J, Higuchi N (200Id) Tree age structure in tropical forests of Central Amazonia. In: Bierre- gaard ROJ, Gascon C, Lovejoy TE, Mesquita RCG (eds) Lessons from Amazonia. Yale University Press, New Haven, pp 68-78
Clark DA (2004) Sources or sinks? The response of tropical forests to current and future climate and atmospheric composition. Phil Trans R Soc London B 359:477^92
Clark DA, Clark DB (1992) Life history diversity of canopy and emergent trees in a neotropical rain forest. Ecol Monogr 62:315-344
Clark DA, Clark DB (1999) Assessing the growth of tropical rain forest trees: issues for forest modeling and management. Ecol Appl 9:981-997
Clark DA, Brown S, Kicklighter DW, Chambers JQ, Thomlinson JR, Ni J, Holland EA (2001) NPP in tropical forests: an evaluation and synthesis of the existing field data. Ecol Appl 11:371-384
Clark DA, Piper SC, Keeling CD, Clark DB (2003) Tropical rain forest tree growth and atmospheric carbon dynamics linked to interannual temperature variation during 1984-2000. Proc Nati Acad Sei USA 100:5852-5857
Condit R, Hubbell SP, Foster RB (1995) Mortality rates of 205 neotropical tree and shrub species and the impact of severe drought. Ecol Monogr 65:419^39
Cox PM, Betts RA, Jones CD, Spall SA, Totterdell U (2000) Acceleration of global warming due to carbon-cycle feedbacks in a coupled climate model. Nature 408:184-187
Davidson EA, Trumbore SE (1995) Gas difñisivity and the production of CO2 in deep soils of the eastern Amazon. Tellus 47B:550-565
Feamside PM (1997) Wood density for estimating forest biomass in Brazilian Amazonia. For Ecol Manage 90:59-87
Franken M, Irmler U, Klinge H (1979) Litterfall in inundation, riverine and terra firme forests of central Amazonia. Trop Ecol 20:225-235
Friedli H, Lotscher H, Oeschger H, Siegenthaler U, Stauffer B (1986) Ice core record of the/sup 13C/12C ratio of atmospheric CO2 in the past two centuries. Nature 324:237-238
Goulden ML, Miller SD, Rocha HRD, Menton M, Freitas HC, Figueira AMSD, Sousa CADD (2004) Diel and seasonal patterns of tropical forest CO2 exchange. Global Change Biol (in press)
Guimaraes WM, Mello-Ivo W (1997) Biomassa e nutrientes de raizes finas em áreas de exploraçâo seletiva de madeira na Amazonia central, Brasil. In: Higuchi N et al (eds) Biomassa e nutrients florestais: projeto bionte relatorio final. Instituto Nacional de Pesquisas da Amazonia, Manaus, p 345
Hamilton JG, DeLucia EH, George K, Naidu SL, Finzi AC, Schlesinger WH (2002) Forest carbon balance under elevated CO2. Oecologia 131:250-260
Higuchi N, Ferraz JBS, Antony L, Luizao F, Luizao R, Biot Y, Hunter I, Proctor J, Ross S (1997) Biomassa e nutrients florestais: projeto bionte relatorio final. Instituto Nacional de Pesquisas da Amazonia, Manaus, p 345
Houghton RA (2003) Revised estimates of the annual net fiux of carbon to the atmosphere from changes in land use and land management 1850-2000. Tellus B-Chem Phys Meteorol 55:378-390
Houghton RA, Skole DL, Nobre CA, Hackler JL, Lawrence KT, Chomentowski WH (2000) Annual fluxes of carbon from deforestation and regrowth in the Brazilian Amazon. Nature 403:301-304
Hubbell SP, Foster RB, O'Brien ST, Harms KE, Condit R, Wechsler B, Wright SJ, de Lao SL (1999) Light-cap disturbances, recruitment limitation, and tree diversity in a neotropical forest. Science 283:554-557
IPCC (2000) Emissions scenarios: summary for policymakers. WMO/UNEP, Geneva
James F (1990) A review of pseudorandom number generators. Comput Phys Commun 60:329-344
Keeling CD, Whorf TP (2002) Atmospheric CO2 records from sites in the SIO air sampling network. In: Trends: a compendium of data on global change. Carbon Dioxide Information Analysis Center, Oak Ridge National Laboratory, US Department of Energy, Oak Ridge
Keller M, Clark DA, Clark DB, Weitz AM, Veldkamp E (1996) If a tree falls in the forest. Science 273:201
Klinge H, Rodrigues WA (1968) Litter production in an area of Amazonian terra firme forests. Amazoniana 1:287-301
Kozlowski TT, Kramer PJ, Pallardy SG (1991) The physiological ecology of woody plants. Academic, San Diego
Laurance WF, Feamside PM, Laurance SG, Delamonica P, Lovejoy TE, Rankin-de Merona J, Chambers JQ, Gascon C (1999) Relationship between soils and Amazon forest biomass: a landscape-scale study. For Ecol Manage 118:127-138
Laurance WF, Lovejoy TE, Vasconcelos HL, Bruna EM, Didham RK, Stouffer PC, Gascon C, Bierregaard RO, Laurance SG, Sampaio E (2002) Ecosystem decay of Amazonian forest fragments: a 22-year investigation. Conserv Biol 16:605-618
Lewis SL, Malhi Y, Phillips OL (2004a) Fingerprinting the impacts of global change on tropical forests. Phil Trans R Soc London B 359:437^62
Lewis SL, Phillips OL, Baker TR, Lloyd J, Malhi Y, Almeida S, Higuchi N, Laurance WF, Neill DA, Silva JNM, Terborgh J, Lezama AT, Martinez RV, Brown S, Chave J, Kuebler C, Vargas PN, Vinceti B (2004b) Concerted changes in tropical forest structure and dynamics: evidence from 50 South American long-term plots. Phil Trans R Soc London B 359:421^37
Lieberman D, Lieberman M (1987) Forest tree growth and dynamics at La Selva, Costa Rica (1969-1972). J Trop Ecol 3:347-358
Lovejoy T, Bierregaard R (1990) Central Amazonian forests and the minimum critical size of ecosystem project. In: Gentry A (ed) Four neotropical rainforests. Yale University Press, New Haven, pp 60-71
611
Luizâo FJ (1989) Litter production and minerai element input to the forest floor in a central Amazonian forest. GeoJournal 19:407- 417
Luizâo FJ (1995) Ecological studies in contrasting forest types in Central Amazonia. In: Department of biological and molecular sciences. University of Stirling, Stirling
Luizâo FJ, Schubart HOR (1987) Litter production and decompo- sition in a terra firme forest of Central Amazonia. Experiencia 43:259-265
Malhi Y, Nobre AD, Grace J, Kruijt B, Pereira MGP, Culf A, Scott S (1998) Carbon dioxide transfer over a Central Amazonian rain forest. J Geophys Res 31:593-631
Malhi Y, Baker TR, Phillips OL, Almeida S, Alvarez E, Arroyo L, Chave J, Czimczik CI, Di Fiore A, Higuchi N, Killeen T, Laurance SG, Laurance WF, Lewis SL, Montoya LMM, Monteagudo A, Neill C, Vargas PN, Patino S, Pitman NCA, Quesada CA, Silva JNM, Lezama AT, Martinez RV, Terborgh J, Vinceti B, Lloyd J (2004) The above-ground wood productivity and net primary productivity of 100 neotropical forests. Global Change Biol (in press)
McMahon TA (1973) Size and shape in biology. Science 179:1201- 1204
Moorcroñ PR, Hurtt GC, Pacala SW (2001) A method for scaling vegetation dynamics: the ecosystem demography model (ED). EcolMonogr 71:557-586
Nascimento HEM, Laurance WF (2002) Total aboveground biomass in central Amazonian rainforests: a landscape-scale study. For Ecol Manage 168:311-321
Neftel A, Moor E, Oeschger H, Stauffer B (1985) Evidence from polar ice cores for the increase in atmospheric CO2 in the past two centuries. Nature 315:45^7
Nelson BW, Kapos V, Adams JB, Oliveira WJ, Braun OPG, do Amaral IL (1994) Forest disturbance by large blowdowns in the Brazilian Amazon. Ecology 75:853-858
Nemani RR, Keeling CD, Hashimoto H, Jolly WM, Piper SC, Tucker CJ, Myneni RB, Running SW (2003) Climate-driven increases in global terrestrial net primary production from 1982 to 1999. Science 300:1560-1563
Phillips OL, Gentry AH (1994) Increasing turnover through time in tropical forests. Science 263:954-958
Phillips OL, Malhi Y, Higuchi N, Laurance WF, Nunez PV, Vásquez RM, Laurance SG, Ferreira LV, Stem M, Brown S, Grace J (1998) Changes in the carbon balance of tropical forests: evidence from long-term plots. Science 282:439^42
Phillips OL, Martinez RV, Arroyo L, Baker TR, Killeen T, Lewis SL, Malhi Y, Mendoza AM, Neill D, Vargas PN, Alexiades M, Ceron C, Di Fiore A, Erwin T, Jardim A, Palacios W, Saldias M, Vinceti B (2002) Increasing dominance of large lianas in Amazonian forests. Nature 418:770-774
Phillips OL, Baker TR, Arroyo L, Higuchi N, Killeen T, Laurance WF, Lewis SL, Lloyd J, Malhi Y, Monteagudo A, Neill DA, Vargas PN, Silva JNM, Terborgh J, Martinez RV, Alexiades M, Almeida S, Brown S, Chave J, Cormiskey JA, Czimczik CI, Fiore AD, Erwin T, Kuebler C, Laurance SG, Nascimento HEM, Oliveir J, Palacios W, Patino S, Pitman NCA, Quesada CA, Saldias M, Lezama AT, Vinceti B (2004) Pattern and process in Amazon tree turnover: 1976-2001. Phil Trans R Soc London B 359:381-408
Post WM, Pastor J (1996) LINKAGES-an individual-based forest ecosystem model. Climatic Change 34:253-261
Rankin-De Merona JM, Prance GT, Hutchings RW, Silva MFD, Rodrigues WA, Uehling ME (1992) Preliminary results of a large-scale tree inventory of upland rain forest in the Central Amazon. Acta Amazónica 22:493-534
Ribeiro JELS, Hopkins MJG, Vicentini A, Sothers CA, Costa MAS, Brito JM, Souza MAD, Martins LHP, Lohmann LG, Assunçâo PACE, Pereira EC, Silva CF, Mesquita MR, Procópio LC (1999) Flora da Reserva Ducke. INPA-DFID, Manaus
Rice AH, Pyle EH, Saleska SR, Hutyra L, Palace M, Keller M, Camargo PB, Portilho K, Marques DF, Wofsy SC (2004) Carbon balance of vegetation dynamics in an old-growth Amazonian forest. Ecol Appl (in press)
Saleska SR, Miller SD, Matross DM, Goulden ML, Wofsy SC, da Rocha HR, de Camargo PB, Crill P, Daube BC, de Freitas HC, Hutyra L, Keller M, Kirchhoff V, Menton M, Munger JW, Pyle EH, Rice AH, Silva H (2003) Carbon in Amazon forests: unexpected seasonal fluxes and disturbance-induced losses. Science 302:1554-1557
Schimel DS (1995) Terrestrial biogeochemical cycles: global estimates with remote sensing. Remote Sens Environ 64:49-56
Silva RP, Santos J, Tribuzy ES, Chambers JQ, Nakamura S, Higuchi N (2002) Diameter increment and growth patterns for individual trees in Central Amazon, Brazil. For Ecol Manage 116:295-301
Sombroek W (2001) Spatial and temporal patterns of Amazon rainfall•consequences for the planning of agricultural occupa- tion and the protection of primary forests. Ambio 30:388-396
Summers PM (1998) Estoque, Decomposiçâo e Nutrients da Liteira Grossa em Floresta de Terra-Firme, na Amazonia Central. In: Biología Tropical e Recursos Naturais. Instituto Nacional de Pesquisas da Amazonia, Manaus, p 103
Swaine MD, Lieberman D, Putz FE (1987) The dynamics of tree populations in tropical forest: a review. J Trop Ecol 3:359-366
Telles ECC, Camargo PB, Martinelli LA, Trumbore SE, Costa ES, Santos J, Higuchi N, Oliveira RO (2003) Influence of soil texture on carbon dynamics and storage potential in tropical soils of Amazonia. Global Biogeochem Cycles 17:1040
Tian H, Mellilo JM, Kicklighter DW, McGuire AD, Heifrich JVKI, Moore BI, Vörösmarty CJ (1998) Effect of interannual climate variability on carbon storage in Amazonian ecosystems. Nature 396:664-667
Toledo LC (2002) Efeito da umidade na respiraçâo de liteira grossa e fina em uma floresta tropical de terra-firme da Amazonia Central. In: CPST níPA, Manaus, p 50
Trumbore SE, Davidson EA, Barbosa de Carmago P, Nepstad DC, Martinelli LA (1995) Belowground cycling of carbon in forests and pastures of Eastern Amazonia. Global Biogeochem Cycles 9:515-528
Veldkamp E, Becker A, Schwendenmann L, Clark DA, Schulte- Bisping H (2003) Substantial labile carbon stocks and micro- bial activity in deeply weathered soils below a tropical wet forest. Global Change Biol 9:1171-1184
VEMAP (1995) Vegetation/ecosystem modeling and analysis project: comparing biogeography and biogeochemistry models in a continental-scale study of terrestrial ecosystem responses to climate change and C02 doubling. Global Biogeochem Cycles 9:407^37
Williamson GB, Laurance WF, Oliveira AA, Delamonica P, Gascon C, Lovejoy TE, Pohl L (2000) AmEizonian tree mortality during the 1997 El Nino drought. Conserv Biol 14:1538-1542


