Embed Size (px)
Citation preview

GlobAllomeTree’s wood density database Emily Donegan, Gael Sola, Zhuo Cheng, Luca Birigazzi, Javier Garcia-Perez Gamarra, Matieu Henry, Ghislain Vielledent & Tommaso Chiti October 2014 Rome, Italy
GlobAllomeTree

CIRAD : Centre de coopération internationale en recherche agronomique pour le
développement
42, rue Scheffer, 75116 Paris, France
UNITUS: Università degli Studi della Tuscia
Department for Innovation in Biological, Agro-Food and Forest System (DIBAF)
Via S. Camillo de Lellis, 01100 Viterbo, Italy
FAO: Food and Agriculture Organization of the United Nations
Viale delle Terme di Caracalla, Rome 00153, Italy
Contacts: [email protected]
www.globallometree.org
Citation:
Donegan, E., Sola, G., Cheng, Z., Birigazzi, L., Gamarra, J.G.P, Henry, M., Vielledent, G.,
Chiti, T., 2014. GlobAllomeTree’s wood density database.
Disclaimer:
This report is not an authoritative information source – it does not reflect the official position
of FAO, UNITUS or CIRAD and should not be used for official purposes. As part of the
GlobAllomeTree project, this report provides information related to the activities and to the
tools of the GlobAllomeTree project. In case readers find any errors in the document or would
like to provide comments for improving its quality, they are encouraged to get in touch with
the above contact.

Contents Introduction ............................................................................................................................ 4
What is wood density? ........................................................................................................... 6
How is wood density measured and calculated? .................................................................... 7
The importance of WD and a global WD database ................................................................ 4
GlobAllomeTree’s wood density database ............................................................................ 8
Completing the template ........................................................................................................ 8
The Template ........................................................................................................................ 10
Global Ecological Zones ...................................................................................................... 14
References ............................................................................................................................ 20
Appendix 1 Ecological Zone Maps ...................................................................................... 23
Acronyms
WD: Wood density
MC: Moisture content
WBD: Basic Wood Density
UNFCCC: United Nations Framework Convention on Climate Change
REDD+: Reducing Emissions from Deforestation and Degradation
R: Coefficient of retraction (%)
CIRAD: French Centre for Agricultural Research for Development
FAO: Food and Agriculture Organization
FSP: Fiber Saturation Point
WWF: Worldwide Fund for Nature
ICRAF: World Agroforestry Centre

Introduction
Wood density is is an essential component of calculations for estimating forest volume,
biomass and carbon stocks. Wood density varies significantly between species as well as trees
of the same species growing under different environmental conditions; therefore the use of a
generic wood density value can introduce error to estimates. In response to this need for
appropriate wood density values, several initiatives have compiled values at regional (e.g.
Carsan et al. (2012) for Africa, Mugasha et al (2013) for Tanzania and Huy et al (2014) for
Vietnam) and global scales (such as ICRAF (2007), Dryad (Chave, et al.,2009, Zanne, et
al.,2009), IPCC databases (2006)).
This tutorial presents the wood density database recently published on the web platform
GlobAllomeTree1 and provides a step-by-step guide on how to fill the platform’s WD
template for the addition of new data. The wood density database collates and harmonizes
existing data currently scattered across the literature and contains a dataset of previously
unpublished tropical-species data collected over the past 60 years.
The importance of WD and a global WD database
Wood density is a key ecological trait, providing information on wood mechanical properties
and useful information for many industrial, commercial and scientific purposes. Particularly,
with recent climate change concern, and deforestation as a major source of global emissions,
wood density has become useful for accurate carbon accounting. The REDD+ mechanism2
has been put in place under UNFCCC as a means for developing countries to receive benefits
1 www.globallometree.org
2 REDD+ stands for Reducing Emissions from Deforestation and Forest Degradation, “plus” conservation,
sustainable management of forests and enhancement of forest carbon stocks.

for conservation and enhancement of their forest carbon stocks with the aim of reducing the
emissions coming from forests. REDD+ is results based and partner countries are required to
report transparently and accurately on their forest resources (via a National Forest Inventory
or NFI). The IPCC Good Practice Guidance (2003) and Guidelines (2006) require basic wood
density (see following section What is wood density?) to be used when estimating biomass
and carbon stocks and losses for forest land; for both gain-loss and stock difference methods.
Wood density data can considerably increase the accuracy of carbon stock and carbon stock
change estimates. It is essential for converting tree volume into biomass – having been found
to be the second most important predictor of biomass after tree diameter at breast-height
(Sola, et al.,2014, Chave, et al.,2005). It can also work as an indicator of species diversity in
multi-species models (Picard, et al.,2012, Henry, et al.,2010); and is a common input variable
in tree biomass allometric equations. WD data is therefore crucial for National Forest
Inventories and REDD+ related projects.
Measuring the wood density of many trees is impractical, but fortunately species or genus
average values have proven to be useful, with genus and species averages explaining more
than 70 % of the variability of WD (Chave, et al.,2006;Fayolle, et al.,2013)).
Currently, a number of databases of wood density values exist, covering various regions and
species and of varying scope, quality and accessibility. Some large databases include the
African Wood Density database and other regional compilations such as those for Tanzania
and Ecuador, with the largest existing global database being located in the Dryad repository
(Zanne, et al.,2009), which contains density data on over 8412 taxa (1638 genera, 191
families) of trees. While considerable in its extent, it represents about 10% of the estimated
100,000 tree species, and the vast majority of trees that remain unmeasured are tropical
(Williamson and Weimann 2010). Much of the existing data remain spread across the
scientific and grey literature, and greater transparency of methods and consistency among
existing data is needed.
Harmonized global databases of wood density will allow data to be collated, easier to access
and more consistent; and for gaps and trends in the data to be better identified and targeted for
future research, minimising the duplication of efforts and thereby saving time, money and
avoiding additional destructive measurements of trees.
Allometric equations: statistical models that are used to express the
relationships between the respective sizes of the different components of
a tree

What is wood density?
Wood density is the mass of wood per unit volume. It can be expressed in many different
units, the most common ones being g/cm3, kg/m
3 or ton/m
3.
When the mass and volume of a wood sample are measured, it is necessary to specify the
percentage of water contained (moisture content), because change in the moisture content of
wood changes both its volume and its mass. Thus wood density and wood specific gravity
(see Box 1) are not constant, but rather depend on the moisture content conditions (MC) under
which the volume and mass were measured. Therefore the MC should always be reported
along with measures of WD values. Without that information, WD values are neither
comparable nor applicable to volume or biomass conversions.
The moisture content of a wood sample is equal to:
( )
with as the mass at moisture content and as the mass of the wood oven-dried.
Historically wood density measures were frequently taken from air-dried wood samples, a MC
of about 10-20%. Oven-dried wood has a moisture content of 0%. For carbon accounting
purposes, using a moisture content of 0% is more useful and the Basic Wood Density -
defined as the oven-dry mass of wood divided by its fresh volume (Picard, et al.,2012) is
preferred:
Basic Wood Density values are more accurate, comparable, and can be directly used to
convert green volume (as generally estimated from field measurement) to the biomass (Reyes,
et al.,1992) (IPCC,2003).
𝐵 (𝑘𝑔) 𝑉 (𝑚3) 𝑊𝐷 (𝑘𝑔.𝑚−3)
To calculate the biomass (B) of a tree or forest from its volume
(V), an equation in the form of the following can be used:
𝑊𝐵𝐷 𝑚𝑑𝑟𝑦
𝑉𝑓𝑟𝑒𝑠ℎ
With 𝑊𝐵𝐷 the Basic Wood Density of a sample, 𝑚𝑑𝑟𝑦 its
dry mass and 𝑉𝑓𝑟𝑒𝑠ℎ its fresh or green volume.

The value of WD varies:
within an individual tree along both longitudinal and transverse axes;
between trees of the same species depending on many factors including age and
environment;
and between different species (Henry, et al.,2010) (Chave, et al.,2006).
Physiologically, trees with lower wood densities have more internal voids and less lignin
within their wood, which usually corresponds to wide annual rings and in general fast-
growing, short-lived species.
How is wood density measured and calculated?
Wood samples can be taken either by coring or by destructive felling and should be placed in
air-tight containers to conserve their moisture content, if for example measurements of fresh
volume are required. After being collected, the wood samples can be taken to the laboratory to
have their mass and volume measured at the selected moisture content.
Harvesting trees
Preparing WD samples in the field
Figure 1: Field phase (photos: Gael Sola)
𝑊𝑆𝐺 𝑊𝐷
𝐷𝑤𝑎𝑡𝑒𝑟
𝑊𝐷 𝑚
𝑣
Box 1: Density and Gravity
The distinction between WD and WSG has caused some confusion and a common mistake
in recent literature is to fail to distinguish between the two (Williamson and
Wiemann,2010). Put simply, wood density is the mass (m) of wood per unit volume (v),
and wood specific gravity is the ratio of a wood density to the density of water (Dwater).
WSG is unitless.
As the density of water is 1 g/cm3 or ton/m
3 in ambient conditions, the WSG and WD have
the same value if WD is expressed in g/cm3 or ton/m
3 if they are measured at the same
moisture content.

Measurement of fresh volume (v) using water
displacement method
Preparation of WD sample in the laboratory
Figure 2: Laboratory phase, Hanoi, Vietnam, UN-REDD Project (photos: Gael Sola)
To calculate the Basic Wood Density, the sample volume should be measured as soon as
possible to ensure it still retains its natural moisture content. Samples are oven-dried at 100-
105 oC to a constant mass; that is, when all water has been removed. Oven-dry mass (g)
divided by fresh volume (cm3) will give the Basic Wood Density (g/cm
3).
GlobAllomeTree’s wood density database
The GlobAllomeTree web platform (Henry, et al.,2013) was launched in 2013 by the FAO,
the Forestry Department of the University of Tuscia and the French Centre for Agricultural
Development (CIRAD). Currently, the platform contains over 13,000 allometric equations. In
little more than a year the database already has over 2000 registered users from over 120
different countries and 1400 institutions, with over 70,000 page views since its launch.
GlobAllomeTree is a powerful tool for archiving, harmonizing and sharing tree-related data;
helping to improve estimates of forest resources.
In its second version, due to be launched in late 2015, the GlobAllomeTree platform will
make available wood densities and raw data on trees (such as diameter and height), which are
essential information for the accurate assessment of tree and forest biomass. With the upload
to GlobAllomeTree of WD data collected by CIRAD from tropical trees spanning the past 60
years, current global available data on wood specific gravity will be greatly expanded. The
data were collected using standardized field and lab procedures with a high level of accuracy.
In addition, significant national data collection efforts in a number of tropical countries
worldwide have been supported by the UN-REDD Programme and FAO. For example,
around 1,000 WD values from more than 400 species were shared by four Vietnamese forestry
institutes in 2014. GlobAllomeTree provides a platform for countries, institutions and
scientists to widely and freely share their forest-related data.
Besides WD values, the database contains information on methodology, taxonomy, location
coordinates of the sample, source/author, ecoregion (categorised according to five different
global biome classification systems), tree height and diameter . The database also includes
data on moisture content, fibre saturation point and on the variation in volume per 1% change
in moisture content (R, the volume coefficient of retraction). Another important piece of
information is the number of trees and samples per tree taken for measurement of WD, which,
in conjunction with the WD values, provides unprecedented information on data quality. It
represents one of the biggest databases of WD, and with the possibility for users to upload
data via the template means that the database will continue to grow.

A comprehensive template for wood density values
A comprehensive template has been designed to assimilate a range of wood density data and
metadata from sample measurements to species averages. The following information can be
entered into the database:
Scientific and local name to the subspecies level,
Location of the trees and corresponding ecological zones,
Reference to any document where the data was extracted from or cited,
Information on the sampled tree (Diameter, height),
Sample information (MC for mass and volume, R and Fiber saturation point (FSP)),
WD and WD measurement protocol (origin, method for measurement, MC, units,
standard deviation and min-max for average values),
Conversion of WD with a moisture content of between 10 and 18% to basic density
(Chave, et al.,2009, Appendix S1).
The identification of the ecological zones is important to facilitate the use of the WD values in
local or national contexts. Five ecological zones are used: FAO (FAO,2001), Udvardy
(Udvardy,1975), WWF (WWF,2000), Bailey (Bailey,1989), and Holdridge (Holdridge,1947,
Leemans,1992). The ecological zone can be identified using GIS and the geographic
coordinates of where the samples were extracted (see tutorial below on this) or based on
expert judgement. When using the database, each user may prefer to use a different ecological
zones or climate classification. It is also recommended to cross check the species names with
online plant list such as theplantlist.org3 to ensure the data quality.
3 www.theplantlist.org

Structure of the Wood Density template
Field Data Type Description Example 1 ID_WD numeric Identification number for the WD value 34 2 ID_species
numeric
Identification number of the tree species. Link to species table
Tropical deciduous forest
3 Family text Name of the taxonomic family to which the tree species belongs Pinaceae 4 Genus text Name of the genus in the binomial literature Pinus 5 Species text Name of the species in the binomial literature Contorta 6 Subspecies text Tree subspecies subsp. paniculata 7 Name_Author text Author who named the species Kurz 8 Scientific_name
formula
Genus and species + subspecies if necessary Should be calculated using formula: IF(E2="NA",D2&" sp.",IF(F2="No",D2&" "&E2,D2&" "&E2&" "&F2))
Pinus contorta
9 Local_name_sp text Local name of the tree species Cẩm liên 10 Local_name_latin text Local name of the tree species without accentuation cam lien 11
Alternative_local_name text
Alternative names separated with coma Should contain no accents or capital letter
Quần Đầu
12 Alternative_local_name_latin
text Alternative names separated with coma Should contain no accents or capital letter
quan dau
13 ID_Location numeric Identification number of the location 502 14 Country text Country Viet Nam 15 Region text Region Bắc Trung Bộ 16 Region_Latin text Region without accentuation bac trung bo 17 Province text Province Hà Tĩnh 18 Province_Latin text Province without accentuation ha tinh 19 District text District Hàm Yên 20 District_Latin text District without accentuation ham yen 21 Commune text Commune Cẩm Quỳ 22 Commune_Latin text Commune without accentuation cam quy

23 Location text Name of the location forest improvement center 24 X_WGS84 numeric Longitude of the plot expressed in decimal degrees 54.597285 25 Y_WGS84 numeric Latitude of the plot expressed in decimal degrees -5.93012 26 Forest_Type text Type of forest Natural forests 27 Biome_Local_Reference text Reference of country specific biome classification MARD 28 Biome_Local text Country specific biome Central Highlands 29 Biome_FAO
text
FAO biome (Field GEZ_TERM of the shapefile)
Tropical moist deciduous forest
30 Biome_UDVARDY text Biome from Udvardy classification (Field BIOMENAME of the shapefile) Tropical dry forests 31 Biome_WWF
text
Biome form WWF (field MHT_NAME of the shapefile)
Tropical and subtropical dry broadleaf forests
32 Division_BAILEY text Biome from Bailey (field DIV_DESC of the shapefile) Savanna division 33 Biome_HOLDRIDGE text Biome from Holdridge classification (field DESC of the shapefile) Tropical moist forest 34 ID_Ref numeric Link to reference of the data (AUTOMATIC of the shapefile) REF_001 35 Reference
text
Authors, year of publication, title of journal, issue, volume number, issue number, pages
Barney, R., 1978. Biomass distribution and Crown Characteristics in Two Alaskan Picea Mariana Ecosystems. Canadian Journal of Forest Research (8): 36-41
36 Author text Name of the authors who provided or published the data Sawadogo et al. 37 Year
numeric
Year of publication of the document When an author has written more than one work in the same year, use a, b, etc. to differentiate, e.g. 2000a, 2000b
2010
38 ID_Tree numeric Link to raw data table 3 39 H_tree_avg numeric Average height of tree measured 4.5 40 H_tree_min numeric Min of trees' height measured if several trees where sampled 3.5 41 H_tree_max numeric Max of trees' height measured if several trees where sampled 6

42 DBH_tree_avg numeric Average DBH of tree measured 5.95 43 DBH_tree_min numeric Min of trees' DBH measured if several trees where sampled 5.5 44 DBH_tree_max numeric Max of trees' DBH measured if several trees where sampled 6.4 45 m_WD numeric Wood mass measured g 560 46 MC_m numeric Moisture content of the wood during measurement 20 47 V_WD numeric Wood volume measured 348 48 MC_V numeric Moisture content of the wood during measurement 15 49 CR numeric Coefficient of retraction (%/%) 36 50 FSP numeric Fiber saturation point (%) 56 51 Methodology
text/character(?)
Water displacement or direct measurement
water displacement
52 Bark
text/character(?)
Yes if bark is included in the measure No if not included
No
53 Density_g_cm3 numeric Density of the wood in g/cm3 0.536 54 MC_Density text Moisture content with code for specific cases BD 55 Data_Origin character Calculated or entered from literature calculated 56 Data_Type character Unique value, average of data, average of min or max average 57 Convert_BD
formula
0.861*Density if density is at 10 to 18% 4 Formula: IF(BB2="BD",ROUND(BA2,3),IF(0.1<=BB2,IF(BB2<=0.18,ROUND(BA2*0.861,3),"NA"),"NA"))
0.753
58 Number_Sample_Tree numeric Number of sample per tree 5 59 Number_Trees numeric Number of trees 3 60 SD numeric Standard deviation 0.016343 61 Min numeric Min of WD 0.516976 62 Max numeric Max of WD 0.547273 63 CV
formula
SD/Density if Density is an average Formula: IF(BH2="NA","NA",BH2/BA2)
3%
4 See Chave, et al., 2009, Appendix S1

64 H_measure
numeric/ text Height where WD sample was collected in metres 1.3
65 Bark_Distance
numeric/ text Distance where the WD was collected in centimetres 25
66 Operator text Operator/Name of the operator who entered the data Cheng 67 Institution text Institution of the operator FREM, TNU 68 Contributor text Contributor/Name of the institution who worked on entering the data UN-REDD 69 Remark_Species
text
Remarks linked to species correction process
Old name: Dalbergia nigrescens
70 Remark_Other
text
Other remarks
Biomes non local correspond to the main biome per forest type

Identification of the Global Ecological Zones To identify the biomes corresponding to each location (coordinates) you can use any kind of GIS software such as ArcView, ArcGIS, QGIS,
etc.
Save the locations in .txt (space or tab delimited) and, in case a comma is used as decimal mark, replace it with a point. The text file needs
at least 2 columns which contain the X and Y coordinates. Please also note which system of coordinates you are using as according to that
you will have to select the appropriate projection system in the GIS software.
Figure 3: File .txt with the ID_Location, the latitude and the longitude In decimal, geographic projection WGS84
Download the shapefiles of the 5 ecological zones. They are freely available at:
FAO (2010) Global Ecological Zones: http://www.fao.org/geonetwork/srv/en/main.home
(look for Global ecological zones in the search field, then click on the download button) or:
http://www.fao.org/geonetwork/srv/en/metadata.show?id=1255&currTab=simple.
WWF Terrestrial ecoregions of the world: http://www.worldwildlife.org/publications/terrestrial-ecoregions-of-the-world
Holdridge life zones: http://www.fao.org/geonetwork/srv/en/metadata.show?id=1006&currTab=simple
Bailey Ecoregions: http://webmap.ornl.gov/wcsdown/dataset.jsp?ds_id=10010
Udvardy biogeographical provinces: http://geomatics.nlr.nl/unsdi/srv/eng/metadata.show?id=2410&currTab=simple

Using ArcView GIS:
Open the ArcView GIS software and “Add tables”, select the .txt file
you created before;
In the tools “Click View” – add “Event Theme” – open the file .txt
using X=long and Y=lat;
Using the tool “Theme” – “Convert to Shapefile”;
Using QGIS
III. Open QGIS and click on Layers ‣ Add Delimited Text Layer (in
case the command is not present you should download the
relevant plug-in)
IV. In the dialog box, click on Browse and specify the path to the text
file
Figure 5. QGIS."Create a layer form a Delimited Text File" dialog.
V. Select the appropriate tab delimiter and enter the name of the
columns containing the X and Y coordinates (if fields are already
called LONGITUDE and LATITUDE they will be automatically
selected by the software). Click on OK.
Figure 4: ArcView Gis, the table with the location data

In the tool “File” select “Extensions” – “Geoprocessing and Spatial
Analyst”;
Add the layers you are interested in (Udvardy.shp, Bailey.shp and
Holdridge.shp)
In the tool “View” select “Geoprocessing Wizard” – “Assign data by
location” combining your data .shp with map .shp of the theme you
are interested in, as in Figure 10;
VI. Enter a coordinate reference system in the Coordinate
Reference System Selector. If coordinates are lat-long decimal
degree they are likely to be WSG 84. Click on OK. The data are
now imported and displayed in the QGIS canvas.
Figure 7. QGIS canvas: points are imported and displayed.
VII. Add the first ecological zone layer. Go to Layer ‣ Add Vector
Layer. Browse to the downloaded shapefile and select open
Figure 8. QGIS: Select the ecological zone shapefile
Figure 6.ArcWiew Gis, View – Add Event Theme
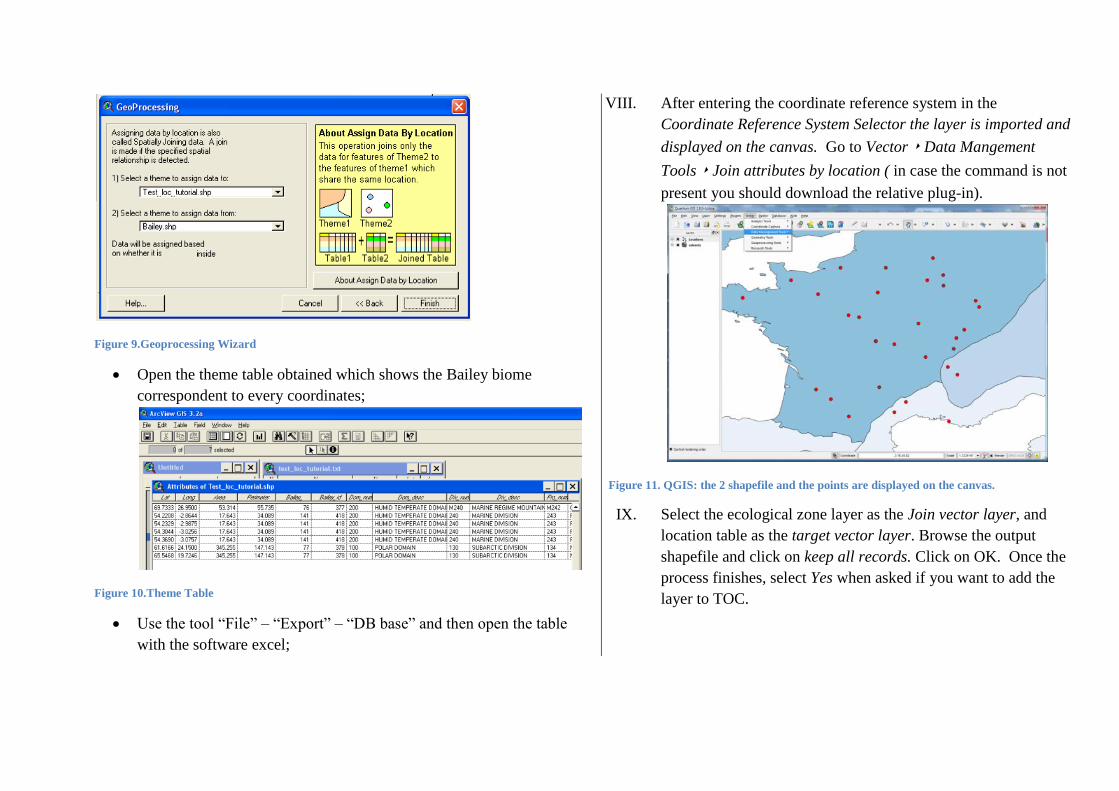
Figure 9.Geoprocessing Wizard
Open the theme table obtained which shows the Bailey biome
correspondent to every coordinates;
Figure 10.Theme Table
Use the tool “File” – “Export” – “DB base” and then open the table
with the software excel;
VIII. After entering the coordinate reference system in the
Coordinate Reference System Selector the layer is imported and
displayed on the canvas. Go to Vector ‣ Data Mangement
Tools ‣ Join attributes by location ( in case the command is not
present you should download the relative plug-in).
Figure 11. QGIS: the 2 shapefile and the points are displayed on the canvas.
IX. Select the ecological zone layer as the Join vector layer, and
location table as the target vector layer. Browse the output
shapefile and click on keep all records. Click on OK. Once the
process finishes, select Yes when asked if you want to add the
layer to TOC.

Follow the same process for all biomes (Baileys, Udvardy, Bailey and
Holdridge);
Copy the data you need (eg. In Baileys “Dom_desc”) and insert them
in the database excel.
IX. Right-click on the new layer and select Open Attribute Table.
X. The joint table is ready. You select, copy (Ctrl+C) and paste the
rows into a new spreadsheet.
XI. Repeat the procedure for all biomes.

Conclusion
GlobAllomeTree’s wood density database represents one of the largest efforts to date to
collate and harmonize wood density data. It provides complementary information on the data
(location, number of samples, measurement method), and with its transparent and robust data
sharing agreement system, it is expected to make even more data available in the future. With
wood density as a key component of many allometric equations and one of the most important
predictors of tree biomass and therefore carbon stocks, this database is useful to scientists,
foresters and national policymakers alike. The template detailed here has been designed to
guide new users through adding data correctly to the database. Data compilation makes future
research and use of the information easier, and gaps and trends more easily identified.

References
Bailey, R. G. 1989. Explanatory Supplement to Ecoregions Map of the Continents. .
Environmental Conservation,(16): 307-309.
Carsan, S., Orwa, C., Harwood, C., Kindt, R., Stroebel, A., Neufeldt, H. & Jamnadass,
R. 2012. African Wood Density Database. World Agroforestry Centre, Nairobi, pp.
Chave, J., Andalo, C., Brown, S., Cairns, M. A., Chambers, J. Q., Eamus, D., Fölster, H.,
Fromard, F., Higuchi, N., Kira, T., Lescure, J.-P., Nelson, B., Ogawa, H., Puig, H.,
Riéra, B. & Yamakura, T. 2005. Tree Allometry and Improved Estimation of Carbon Stocks
and Balance in Tropical Forests. Oecologia,(145): 87-99.
Chave, J., Coomes, D., Jansen, S., Lewis, S. L., Swenson, N. G. & Zanne, A. E. 2009.
Towards a Worldwide Wood Economics Spectrum. Ecology Letters,(12): 351-366.
http://dx.doi.org/10.1111/j.1461-0248.2009.01285.x
Chave, J., Muller-Landau, H. C., Baker, T. R., Easdale, T. A., Steege, H. t. & Webb, C.
O. 2006. Regional and Phylogenetic Variation of Wood Density across 2456 Neotropical Tree
Species. Ecological Applications,(16): 2356-2367.
http://dx.doi.org/10.1890/1051-0761(2006)016[2356:RAPVOW]2.0.CO;2
FAO. 2001. Global Ecological Zoning for the Global Forest Resources Assessment 2000
Rome: (The Forest Resources Assessment Programme).
http://www.fao.org/docrep/006/ad652e/ad652e00.htm#TopOfPage
Fayolle, A., Doucet, J.-L., Gillet, J.-F., Bourland, N. & Lejeune, P. 2013. Tree Allometry
in Central Africa: Testing the Validity of Pantropical Multi-Species Allometric Equations for
Estimating Biomass and Carbon Stocks. Forest Ecology and Management,(305): 29-37.
http://www.sciencedirect.com/science/article/pii/S0378112713003356
Henry, M., Besnard, A., Asante, W. A., Eshun, J., Adu-Bredu, S., Valentini, R.,
Bernoux, M. & Saint-André, L. 2010. Wood Density, Phytomass Variations within and
among Trees, and Allometric Equations in a Tropical Rainforest of Africa Forest
Ecology and Management,(260): 1375–1388.
Henry, M., Bombelli, A., Trotta, C., Alessandrini, A., Birigazzi, L., Sola, G., Vieilledent,
G., Santenoise, P., Longuetaud, F., Valentini, R., Picard, N. & Saint-André, L. 2013.
Globallometree: International Platform for Tree Allometric Equations to Support Volume,
Biomass and Carbon Assessment. iForest - Biogeosciences and Forestry,(6): 326-330.

http://www.sisef.it/iforest/contents/?id=ifor0901-006
Holdridge, L. R. 1947. Determination of World Plant Formations from Simple Climatic
Data. Science,(105): 367-368.
Huy, B., Pham, T. A., Vo H., Cao, T. L., Nguyen, D. D., Nguyen, C. T. A. & Nguyen, T.
H. 2014. Tree Wood Density in Viet Nam - Measurements from 2008 to 2012 by the
Department of Forest Resources and Environment Management in Tay Nguyen University.
(UN-REDD Programme, Ha Noi, Viet Nam).
ICRAF. 2007. Wood Density Database. Nairobi, Kenya: (World Agroforestry Centre.
http://www.worldagroforestrycentre.org/sea/Products/AFDbases/WD/).
IPCC. 2003. Good Practice Guidance for Land Use, Land-Use Change and Forestry.
Kanagawa, Japan, IPCC National Greenhouse Gas Inventories Programme,, pp.
http://www.ipcc.ch/
IPCC. 2006. 2006 Ipcc Guidelines for National Greenhouse Gas Inventories. Geneva,
Switzerland: ( Intergovernmental Panel on Climate Change).
Leemans, R. 1992. Global Holdridge Life Zone Classifications. Digital Raster Data on a 0.5-
Degree Cartesian Orthonormal Geodetic (Lat/Long) 360x720 Grid. pp.
Mugasha, W. A., Mwakalukwa, E. E., Luoga, E., Malimbwi, R. E., Zahabu, E., Silayo,
D., G., S., Kashindye, A., Crete, P. & Henry, M. 2013. Tree Allometric Equation
Development for Estimation of Lowland Forest above-Ground Biomass in the United
Republic of Tanzania. Report for Lowland Forests in Morogoro and Lindi Region. (Food &
Agriculture Organization of the United Nations, Rome, Italy.).
Picard, N., Saint André, L. & Henry, M. 2012. Manual for Building Tree Volume and
Biomass Allometric Equations: From Field Measurement to Prediction. (CIRAD, FAO).
Reyes, G., Brown, S., Chapman, J. & Lugo, A. E. 1992. Wood Densities of Tropical Tree
Species. New Orleans, LA.: (U.S. Department of Agriculture, Forest Service).
Sola, G., Inoguchi, A. & Henry, M. 2014. Allometric Equations at National Scale for Tree
Biomass Assessment in Viet Nam. Context, Methodology and Summary of the Results. (UN-
REDD Programme, Ha Noi, Viet Nam).
Udvardy, M. D. F. O. P. N. 18. 1975. A Classification of the Biogeographical Provinces of
the World. Morges, Switzerland: (IUCN).

Williamson, G. B. & Wiemann, M. C. 2010. Measuring Wood Specific Gravity…Correctly.
American Journal of Botany,(97): 519-524.
http://www.amjbot.org/content/97/3/519.abstract
WWF. 2000. Terrestrial Ecoregions of the World. Washington, DC., pp.
http://www.worldwildlife.org/science/ecoregions/item1847.html
Zanne, A., Lopez-Gonzalez, G., Coomes, D., Ilic, J., Jansen, S., Lewis, S., Miller, R.,
Swenson, N., Wiemann, M. & Chave, J. 2009. Global Wood Density Database. Dryad
Digital Repository,(

A
Appendix 1 Ecological Zone Maps
FAO ecological zone classification

Bailey ecological zone classification

Holdridge ecological zone classification

Udvardy ecological zone classification

WWF ecological zone classification


