Embed Size (px)
Citation preview
J O U R N A L O F P R O T E O M I C S 7 3 ( 2 0 1 0 ) 1 4 6 1 – 1 4 7 8
ava i l ab l e a t www.sc i enced i r ec t . com
www.e l sev i e r . com/ loca te / j p ro t
Response of Pseudomonas putida KT2440 to phenol at the levelof membrane proteome
Catarina Roma-Rodriguesa, Pedro M. Santosa,1, Dirk Benndorfb,Erdmann Rappc, Isabel Sá-Correiaa,⁎aIBB— Institute for Biotechnology and Bioengineering, Centre for Biological and Chemical Engineering, Instituto Superior Técnico, UniversidadeTécnica de Lisboa, Av. Rovisco Pais 1049-001 Lisboa, PortugalbBioprocess Engineering, Otto von Guericke University, Universitätsplatz 2, 39106 Magdeburg, GermanycBioprocess Engineering, Max Planck Institute for Dynamics of Complex Technical Systems, Sandtor Straße 1, 39106 Magdeburg, Germany
A R T I C L E I N F O
Abbreviations: TMF, Total membrane franodulation-division; LPS, Lipopolysaccharide⁎ Corresponding author. Tel.: +351 218 417 68
E-mail address: [email protected] (I. Sá1 Present address: CBMA-Centre of Molecu
Gualtar, 4715-057 Braga, Portugal.
1874-3919/$ – see front matter © 2010 Elsevidoi:10.1016/j.jprot.2010.02.003
A B S T R A C T
Article history:Received 11 December 2009Accepted 5 February 2010
This study led to the extension and refinement of our current model for the global responseof Pseudomonas putida KT2440 to phenol by getting insights into the adaptive responsemechanisms involving the membrane proteome. A two-dimensional gel electrophoresisbased protocol was optimized to allow the quantitative comparison of membrane proteins,by combining inner and outer membrane fractionation with membrane proteinsolubilization using the detergent dodecylmaltoside. Following phenol exposure, acoordinate increased content of protein subunits of known or putative solvent effluxpump systems (e.g. TtgA, TtgC, Ttg2A, Ttg2C, and PP_1516-7) and a decreased content ofporins OprB, OprF, OprG and OprQ was registered, consistent with an adaptive response toreduce phenol intracellular concentration. This adaptive response may in part be mediatedby post-translational modifications, as suggested by the relative content of the multipleforms identified for a few porins and efflux pump subunits. Results also suggest theimportant role of protein chaperones, of cell envelope and cell surface and of a more activerespiratory chain in the response to phenol. All thesemechanistic insights may be extendedto Pseudomonas adaptation to solvents, of possible impact in biodegradation, bioremediationand biocatalysis.
© 2010 Elsevier B.V. All rights reserved.
Keywords:Membrane proteomePhenolPseudomonasStress responseQuantitative proteomics
1. Introduction
Strains belonging to the Pseudomonas genus have been widelyused to elucidate the adaptive mechanisms underlyingincreased tolerance against toxic concentrations of organicsolvents in Gram-negative bacteria [1,2] and, whether
ction; OMF, Outer membs; ABC, ATP-binding cass2; fax: +351 218 419 199.-Correia).lar and Environmental B
er B.V. All rights reserved
genetically prepared, to use them as carbon source [3–5].Genome-wide expression analyses are being applied to getan integrative perspective of the physiology of microorgan-isms challenged with toxic compounds, including toxins,drugs and environmental pollutants. For instance, thealterations occurring in the proteome of Pseudomonas strains
rane fraction; IMF, Inner membrane fraction; RND, Resistance-ette.
iology, Department of Biology, University of Minho, Campus de
.

1462 J O U R N A L O F P R O T E O M I C S 7 3 ( 2 0 1 0 ) 1 4 6 1 – 1 4 7 8
following sudden exposure to phenol were examined byquantitative proteomics based on two-dimensional gelelectrophoresis (2-DE) and on the identification of proteinswhose content was altered in response to this solvent bymass spectrometry (MS) [5,6]. However, these studies werefocused on the soluble component of the proteome, includingcytoplasmic and a few peripheral and outer membraneproteins. Results revealed that Pseudomonas exposure totoxic concentrations of phenol may lead to: i) the inductionof the general and oxidative stress response; ii) the inductionof proteins involved in energetic metabolism, suggesting ahigher energy demand in phenol stressed cells; iii) theinduction of fatty acid biosynthesis, as a recovery mecha-nism for damaged membrane phospholipids resulting fromphenol-induced oxidative stress, and iv) the inhibition of celldivision andmotility [5,6]. Moreover, the increased content ofhomologous proteins with the same predicted or demon-strated biological function in both the experimental modelstrain P. putida KT2440 and Pseudomonas sp. M1 followingtheir sudden exposure to phenol, indicated that both strainsshare adaptive mechanisms. Pseudomonas sp. M1 exhibitsexceptional biodegrading ability and was isolated from anenriched culture of Rhine river sediments [7]. Remarkably,even though the genome sequence of strain M1 is notavailable, 60% of the total number of protein spots excisedfrom the gels was positively identified bymass spectrometry,70% of them matching P. aeruginosa proteins present indatabases [5]. Based on the comparison of 16S rRNA genesequences [5], the closest species to M1 strain is P. citronellolisbut the closest species with the genome sequenced is,indeed, P. aeruginosa. It is therefore likely that resultsemerging from studies on the solvent adaptive mechanismsusing the model strain KT2440 may contribute to predictcellular responses towards toxic solvent exposure in envi-ronmental Pseudomonas strains, more suited to be explored inbiodegradation and bioremediation.
Currently, the best studied mechanisms of adaptation totoxic solvents involve the modifications occurring at the levelof cell membrane and cell wall, to counteract the effects ofsolvents on membrane stability and cell permeability and thereduction of the toxic compound concentration inside the cellsthrough the activity of efflux pumps [1,2]. However, little isknown about the global effects of solvent stress on thecomposition and eventual modification of the membraneproteome. This is mainly due to experimental limitationsof the most commonly used proteomic analysis technique —2-DE coupled to MS. Indeed, it is very challenging to establisha suitable protocol to keep hydrophobic integral membraneproteins in solution during the isoelectric focusing (IEF)procedure. Furthermore, many membrane proteins are inlow abundance in the proteome and the use of proteases suchas trypsin, for protein digestion, is often not suitable forprotein identification by peptide mass fingerprinting due to alack of cleavage sites in themembrane spanning domains [8].Comprehensively, there are very few reports on studiescarried out using 2-DE for the analysis of membrane proteinsof Gram-negative bacteria and most of these studies aremainly focused on the analysis of outer membrane proteins[9–13]. However, once the drawbacks are circumvented orlimited, 2-DE prevails as a very attractive high throughput
methodology to study global protein expression. Indeed, ithas the capacity to separate complex mixtures and to revealthe occurrence of post-translational modifications. More-over, once a proteome reference map is produced, this can beused to readily identify protein spots in every 2-DE gelproduced using the same protocol and organism, thusfacilitating downstream data analysis.
The main objective of the present study was to elucidate,using 2-DE-based expression proteomics, the response ofP. putida KT2440 membrane proteome to sudden exposure toa toxic concentration of phenol, leading to cell growth arrestbefore adapted growth resumption [6]. To accomplish thisgoal, a 2-DE protocol was optimized to allow the separationand quantification of membrane proteins. The anticipateddifficulties in handling hydrophobic proteins were partiallysurpassed by combining proteome fractionation and proteinsolubilization with the detergent dodecylmaltoside in theisoelectric focusing buffer for 2-DE. The successful applicationof this protocol led to the extension and refinement of ourcurrent model for the global response of P. putida KT2440 tophenol by getting insights into the adaptive mechanisms atthe membrane proteome level.
2. Materials and methods
2.1. Bacterial strain and cultivation conditions in presenceor absence of phenol
The growth conditions used in this work reproduced thoseused in a previous study [6]. Briefly, P. putida KT2440 cells weregrown in basal mineral medium described by Hartmans et al.[14] supplemented with succinate 20 mM as carbon source.Cultures were grown in 250 mL Erlenmeyer flasks with 100 mLmedium with orbital shaking (250 rpm), at 30 °C, until thecultures reached a standardized optical density at 600 nm(OD600) in the range of 0.7–0.8. These cultures were used toinoculate three identical 1000 mL Erlenmeyer flasks with400 mL of fresh medium grown under the same conditions.When the cultures reached an OD600 of 0.2, phenol was addedto two of the triplicate cultures in order to obtain a finalconcentration of 800 mg/L (phenol cultures). The third culturewas left unsupplemented (control). Cells from the controlculture and fromone of the phenol cultureswere harvested 1 hafter phenol addition: Ctrl and P1 samples, respectively. Cellsfrom the other phenol supplemented culture were harvestedafter 5 h of incubation following phenol supplementation: P5sample. The three cultures (400 mL) were centrifuged for5 minutes at 11,300×g, at 4 °C, cells were washed with icecold Tris-HCl buffer (10 mMTris-HCl pH 8.5) and the pellet wasstored at −80 °C until use.
2.2. Membrane proteome fractionation
2.2.1. Preparation of total membrane fraction proteinsTo prepare the total membrane fraction, three independentcell samples were obtained for Control, Phenol 1 h, and Phenol5 h conditions. For each cell sample, 5 stored cell pellets wereresuspended in ice coldworking buffer (10 mMTris-HCl pH 8.5,1× proteases inhibitors from Halt™ protease inhibitors
1463J O U R N A L O F P R O T E O M I C S 7 3 ( 2 0 1 0 ) 1 4 6 1 – 1 4 7 8
cocktail kit (Pierce, Rockford, USA)) to a final volume of 12 mL.Cells were lysed by sonication on ice using 30 treatments of20 s with 20 s intervals between treatments. Cell debris wasremoved with two centrifugations (3000×g for 30 min at 4 °C)and the supernatant was transferred to an ultracentrifuge tube.The crude extract was fractionated by ultracentrifugation(99,000×g for 90minat4 °C) giving rise to solubleandmembraneprotein fractions. The supernatant, corresponding to the solubleprotein fraction, was discarded and the pellet, corresponding tothe total membrane fraction, was washed three times with icecold working buffer followed by ultracentrifugation (99,000×gfor 60 min at 4 °C) to reduce soluble protein contamination. Forsolubilization of total membrane fraction proteins, pelletedmembranes were resuspended in 500 µL of SDS buffer (125mMTris-HCl pH 6.8, 22% (v/v) Glycerol, 4% (w/v) SDS, 0.05% (w/v)bromophenol blue and 1% (w/v) DTT), followed by sonication(5 treatments of 5 s with 20 s intervals between treatments),incubation for 2 h at room temperature and centrifugation(12,000×g for 15 min at room temperature). The resultingsupernatant, containing solubilized total membrane fractionproteins, was transferred to a fresh tube.
2.2.2. Preparation of inner and outer membrane fractionsproteinsThe procedure used to prepare the inner and outer membranefractionswas adapted from [15,16], using two independent cellsamples obtained for Control, Phenol 1 h and Phenol 5 hconditions. For each cell sample, 12 stored cell pellets wereresuspended in ice cold working buffer and cells were lysed bysonication on ice as described for total membrane fractionpreparation. Cell debris was removedwith two centrifugations(3000×g for 30 min at 4 °C) and the supernatantwas transferredto an ultracentrifuge tube. The crude extract was ultracen-trifuged (99,000×g for 90 min at 4 °C) and total membranefraction was washed two times with ice cold working bufferfollowed by ultracentrifugation (99,000×g during 60 min at4 °C). Thepelletedmembraneswere resuspended in 2 mLof icecold working buffer and placed on top of a isopycnic sucrosegradient (2.5 mL sucrose 80% (w/v), 3.5 mL sucrose 50% (w/v)and 3.0 mL sucrose 20% (w/v)) and ultracentrifuged (116,000×gfor 20 h at 4 °C). The differences in the density of the inner andouter membranes allowed their separation in the two inter-faces formed between solutions with the three sucroseconcentrations used. The band found between the 20% and50% sucrose solutions was the fraction enriched with innermembrane proteins (Inner Membrane Fraction — IMF), whilethe band found between the 50% and 80% sucrose solutionscorresponded to the fraction enriched with outer membraneproteins (OuterMembrane Fraction—OMF) [15]. The inner andouter membrane fractions were removed with a micropipette,and a final volume of 200 µL for each membrane fraction wasobtained. For solubilization of proteins present in thesemembrane fractions, 50 µL of SDS buffer 4× (500 mM Tris-HClpH 6.8, 88% (v/v) Glycerol, 16% (w/v) SDS, 0.2% (w/v) bromo-phenol blue and 4% (w/v) DTT) were added to the outer andinner membrane fractions. After 2 h incubation at roomtemperature, the inner and outer membrane protein extractswere centrifuged (12,000×g for 15 min at room temperature)and the corresponding supernatants were transferred to aclean tube.
2.3. Two-dimensional gel electrophoresis
Protein concentrations in the total membrane fraction, outermembrane fraction and inner membrane fraction obtainedfrom cells either or not cultivated with phenol were quantifiedusing Plus One 2D-Quant kit (GE Healthcare). To eliminatecontaminants, such as lipids, nucleic acids, SDS, and salts thatmay interfere with isoelectrical focusing, 100 µg of totalmembrane fraction proteins, 100 µg of outer membranefraction proteins and 150 µg of inner membrane fractionproteins were precipitated using 2D-CleanUp kit (GE Health-care), according to the manufacturer's instructions. Proteinsfrom the three membrane fractions were gently resuspendedin 100 µL of IEF buffer (7 M urea, 2 M thiourea, 1% (w/v)dodecylmaltoside, 2% (v/v) Pharmalytes 3–10 (GE Healhtcare),10 mM DTT and traces of bromophenol blue), incubated atroom temperature for 1 h followed by centrifugation (12,000×gduring 15 min at room temperature) and the supernatant wastransferred to a clean microtube. Immobiline DryStrip (IPGstrips, GE Healthcare) with 24 cm and a 3–10 non-linear pHrange were rehydrated overnight with 450 µL of rehydrationbuffer (7 Murea, 2 M thiourea, 1% (w/v) dodecylmaltoside, 0.5%(v/v) Pharmalytes 3–10, 1.2% (v/v) Destreak reagent (GEHealthcare) and traces of bromophenol blue). Proteins wereloaded by anodic cup-loading on IPG strips. A total of 21 gelswere run, corresponding to 3 gels for total membrane fractionand 2 gels for inner and outer membrane fractions preparedfor each one of the three different experimental conditions(Control, Phenol 1 h and Phenol 5 h). Isoelectric focusing wascarried out on an Ettan IPGphor instrument (GE Healthcare) ata maximum voltage of 8000 V. After IEF, strips were incubatedfor 15 min in equilibration buffer (2% SDS, 50 mM Tris-HCl pH8.8, 6 M urea, 30% (v/v) Glycerol and traces of bromophenolblue) containing 1% (w/v) DTT, followed by 15 min incubationin the same buffer with 3% (w/v) of iodoacetamide. For thesecond dimension separation, strips were applied on top of1.5 mm 12 % SDS-polyacrylamide gels. Electrophoresis wascarried out in Ettan DALTsix instrument in two steps: the firststep at 5 W/gel for 1 h and the second step at 17 W/gel for 3 h.After SDS-PAGE of membrane proteins, gels were carefullyremoved from the cassettes and incubated in a fixationsolution (30% (v/v) ethanol and 10% (v/v) acetic acid) for atleast 2 h. The fixation solution was gently poured off and gelswere immersed in 340 mL of Flamingo staining solution(BioRad). Gel imageswere obtained by scanning in a ThyphoonTrio scanner (GE Healthcare) using a green laser (532 nm) with555 nm emission filter.
2.4. Analysis of protein expression levels
Gel images were analyzed using Progenesis SameSpots(Nonlinear dynamics, NewCastle, UK). Protein spots wereidentified by using the automatic spot detection algorithm.Individual spot volumes were normalized against total spotvolumes for a given gel. Statistical analysis was alsoperformed by Progenesis SameSpots software package.Averages of protein abundance for each membrane fractionof each growth condition were also compared by theirnormalized volume using one-way ANOVA between testgroups. This test returned a p-value that takes into account
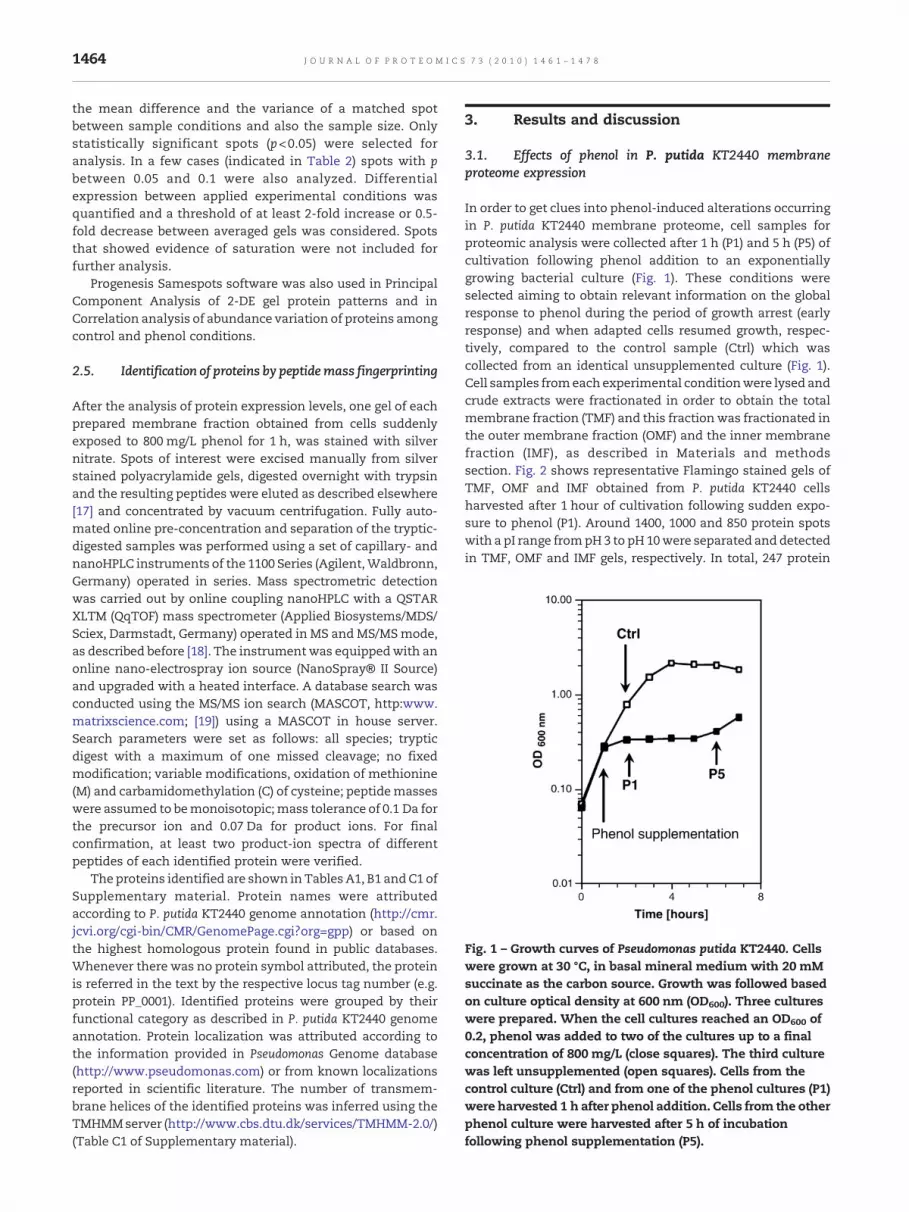
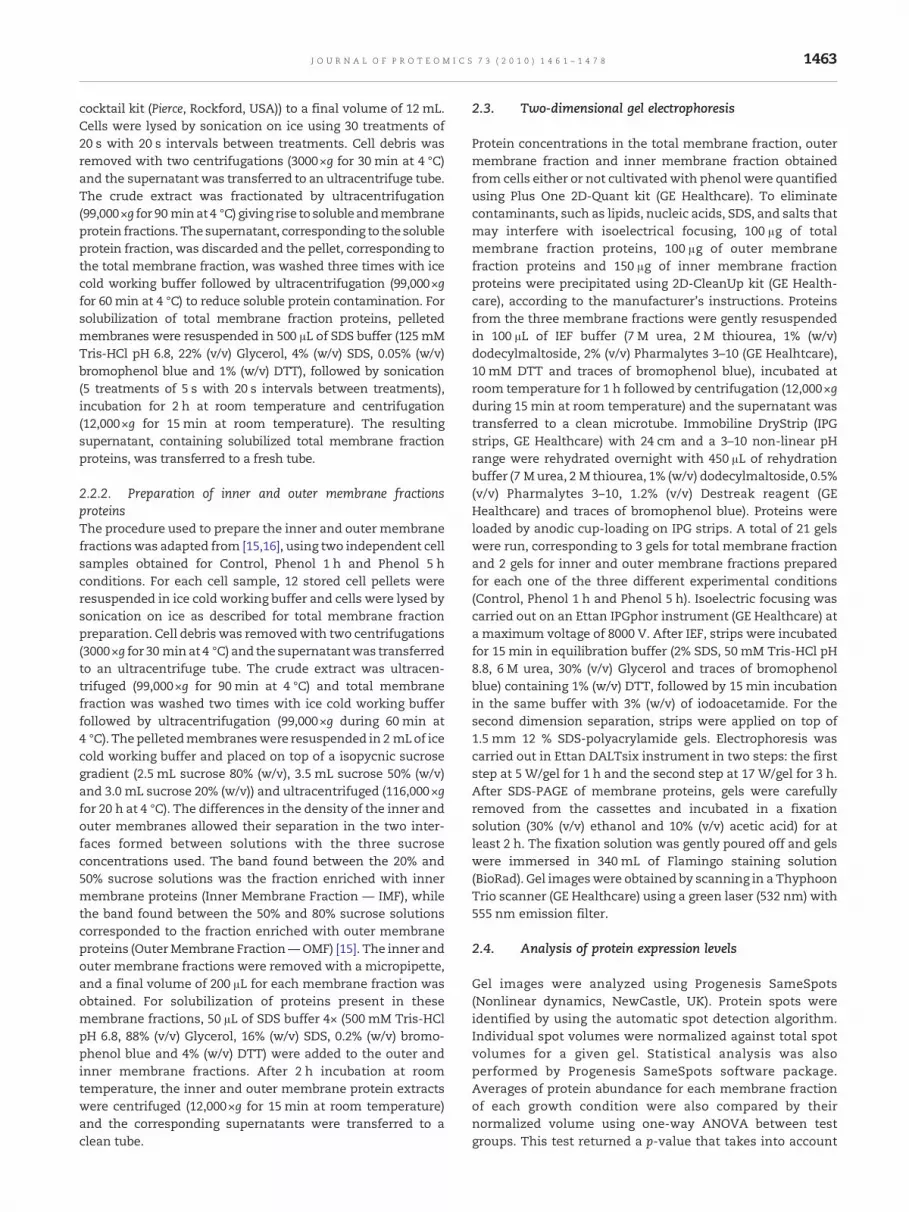
Fig. 1 – Growth curves of Pseudomonas putida KT2440. Cellswere grown at 30 °C, in basal mineral medium with 20 mMsuccinate as the carbon source. Growth was followed basedon culture optical density at 600 nm (OD600). Three cultureswere prepared. When the cell cultures reached an OD600 of0.2, phenol was added to two of the cultures up to a finalconcentration of 800 mg/L (close squares). The third culturewas left unsupplemented (open squares). Cells from thecontrol culture (Ctrl) and from one of the phenol cultures (P1)were harvested 1 h after phenol addition. Cells from the otherphenol culture were harvested after 5 h of incubationfollowing phenol supplementation (P5).
1464 J O U R N A L O F P R O T E O M I C S 7 3 ( 2 0 1 0 ) 1 4 6 1 – 1 4 7 8
the mean difference and the variance of a matched spotbetween sample conditions and also the sample size. Onlystatistically significant spots (p<0.05) were selected foranalysis. In a few cases (indicated in Table 2) spots with pbetween 0.05 and 0.1 were also analyzed. Differentialexpression between applied experimental conditions wasquantified and a threshold of at least 2-fold increase or 0.5-fold decrease between averaged gels was considered. Spotsthat showed evidence of saturation were not included forfurther analysis.
Progenesis Samespots software was also used in PrincipalComponent Analysis of 2-DE gel protein patterns and inCorrelation analysis of abundance variation of proteins amongcontrol and phenol conditions.
2.5. Identification of proteins by peptidemass fingerprinting
After the analysis of protein expression levels, one gel of eachprepared membrane fraction obtained from cells suddenlyexposed to 800 mg/L phenol for 1 h, was stained with silvernitrate. Spots of interest were excised manually from silverstained polyacrylamide gels, digested overnight with trypsinand the resulting peptides were eluted as described elsewhere[17] and concentrated by vacuum centrifugation. Fully auto-mated online pre-concentration and separation of the tryptic-digested samples was performed using a set of capillary- andnanoHPLC instruments of the 1100 Series (Agilent,Waldbronn,Germany) operated in series. Mass spectrometric detectionwas carried out by online coupling nanoHPLC with a QSTARXLTM (QqTOF) mass spectrometer (Applied Biosystems/MDS/Sciex, Darmstadt, Germany) operated in MS and MS/MSmode,as described before [18]. The instrument was equippedwith anonline nano-electrospray ion source (NanoSpray® II Source)and upgraded with a heated interface. A database search wasconducted using the MS/MS ion search (MASCOT, http:www.matrixscience.com; [19]) using a MASCOT in house server.Search parameters were set as follows: all species; trypticdigest with a maximum of one missed cleavage; no fixedmodification; variable modifications, oxidation of methionine(M) and carbamidomethylation (C) of cysteine; peptidemasseswere assumed to bemonoisotopic;mass tolerance of 0.1 Da forthe precursor ion and 0.07 Da for product ions. For finalconfirmation, at least two product-ion spectra of differentpeptides of each identified protein were verified.
The proteins identified are shown in Tables A1, B1 andC1 ofSupplementary material. Protein names were attributedaccording to P. putida KT2440 genome annotation (http://cmr.jcvi.org/cgi-bin/CMR/GenomePage.cgi?org=gpp) or based onthe highest homologous protein found in public databases.Whenever there was no protein symbol attributed, the proteinis referred in the text by the respective locus tag number (e.g.protein PP_0001). Identified proteins were grouped by theirfunctional category as described in P. putida KT2440 genomeannotation. Protein localization was attributed according tothe information provided in Pseudomonas Genome database(http://www.pseudomonas.com) or from known localizationsreported in scientific literature. The number of transmem-brane helices of the identified proteins was inferred using theTMHMMserver (http://www.cbs.dtu.dk/services/TMHMM-2.0/)(Table C1 of Supplementary material).
3. Results and discussion
3.1. Effects of phenol in P. putida KT2440 membraneproteome expression
In order to get clues into phenol-induced alterations occurringin P. putida KT2440 membrane proteome, cell samples forproteomic analysis were collected after 1 h (P1) and 5 h (P5) ofcultivation following phenol addition to an exponentiallygrowing bacterial culture (Fig. 1). These conditions wereselected aiming to obtain relevant information on the globalresponse to phenol during the period of growth arrest (earlyresponse) and when adapted cells resumed growth, respec-tively, compared to the control sample (Ctrl) which wascollected from an identical unsupplemented culture (Fig. 1).Cell samples fromeach experimental conditionwere lysed andcrude extracts were fractionated in order to obtain the totalmembrane fraction (TMF) and this fractionwas fractionated inthe outer membrane fraction (OMF) and the inner membranefraction (IMF), as described in Materials and methodssection. Fig. 2 shows representative Flamingo stained gels ofTMF, OMF and IMF obtained from P. putida KT2440 cellsharvested after 1 hour of cultivation following sudden expo-sure to phenol (P1). Around 1400, 1000 and 850 protein spotswith a pI range frompH3 to pH10were separated and detectedin TMF, OMF and IMF gels, respectively. In total, 247 protein

1465J O U R N A L O F P R O T E O M I C S 7 3 ( 2 0 1 0 ) 1 4 6 1 – 1 4 7 8
spots were positively identified by mass spectrometry,being 64 collected from TMF, 85 from OMF and 98 from IMF(Tables A1, B1 and C1 of Supplementary material). Theselection of the collected spots was carried out based on apreliminary expression analysis which was indicative of theprotein spots whose abundance was altered in response tophenol. A limited number of spots were also collected, notbased on their differential content but to verify predictedident i t ies , us ing prev ious ly repor ted referencemaps [10,11,20,21]. Interestingly, among the identified protein
Fig. 2 – Reference maps. Representative proteome maps of Pseudfraction (TMF) (a), the outermembrane fraction (OMF) (b) and the inexposed to 800 mg/L phenol for 1 h. Proteins were separated by 2stain. The identified protein spots are numbered as in Tables A1
spots, a small group of spots were detected in the threeproteome fractions (Table D1 of Supplementary material). Allthe identified protein spotswere categorized according to theirpredicted localization (Tables A1, B1 and C1 of Supplementarymaterial). In Table 1, the overall distribution of the identifiedspots according to their subcellular location is shown, high-lighting that TM, OM and IM fractions were not solelycomposed of proteins with the predicted subcellular locationbased on the fraction designation. This apparent discrepancyis not surprising since, in previous reports dealing with
omonas putida KT2440 obtained using the total membranenermembrane fraction (IMF) (c) obtained from cells suddenly-DE (IEF/SDS-PAGE) and visualized by staining with Flamingo, B1 and C1 from Supplementary material.
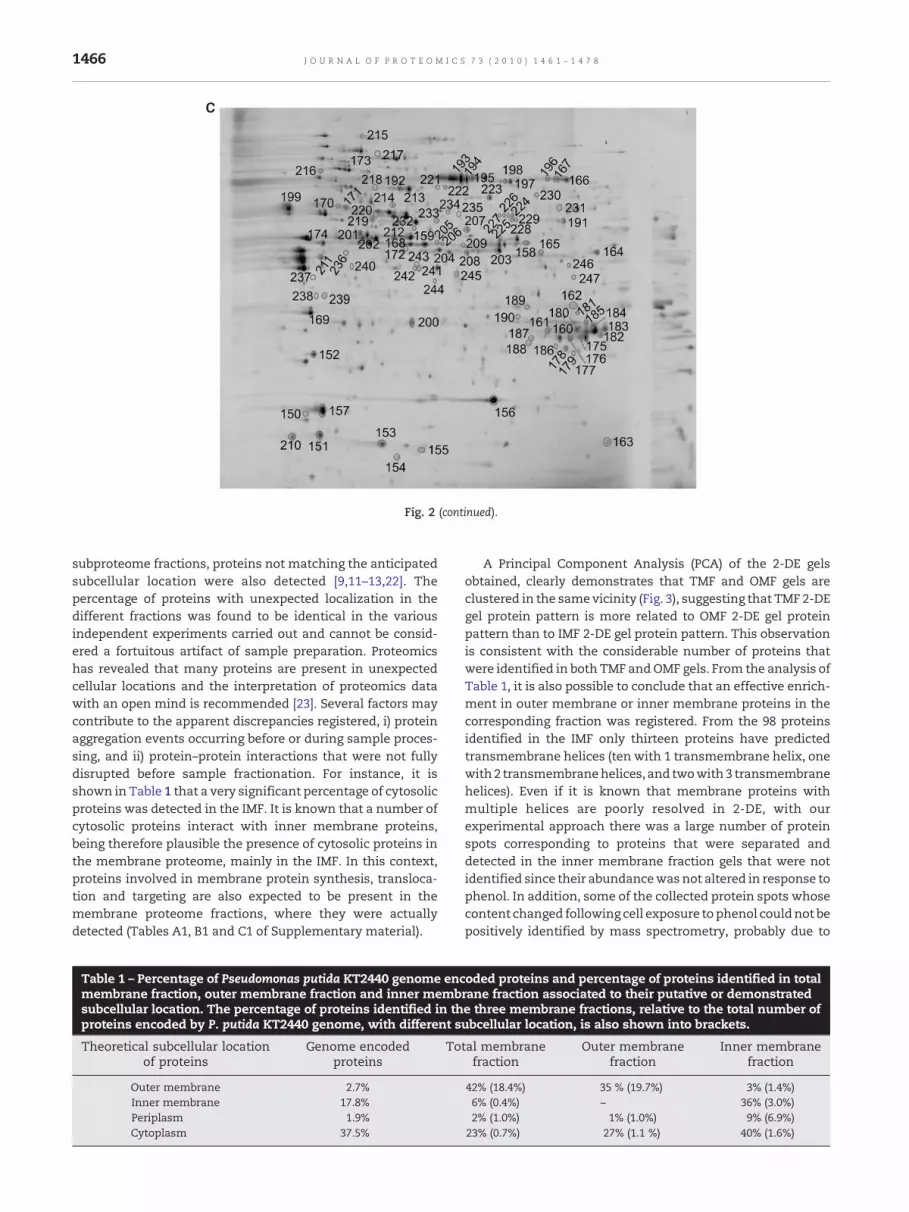
Fig. 2 (continued).
1466 J O U R N A L O F P R O T E O M I C S 7 3 ( 2 0 1 0 ) 1 4 6 1 – 1 4 7 8
subproteome fractions, proteins not matching the anticipatedsubcellular location were also detected [9,11–13,22]. Thepercentage of proteins with unexpected localization in thedifferent fractions was found to be identical in the variousindependent experiments carried out and cannot be consid-ered a fortuitous artifact of sample preparation. Proteomicshas revealed that many proteins are present in unexpectedcellular locations and the interpretation of proteomics datawith an open mind is recommended [23]. Several factors maycontribute to the apparent discrepancies registered, i) proteinaggregation events occurring before or during sample proces-sing, and ii) protein–protein interactions that were not fullydisrupted before sample fractionation. For instance, it isshown in Table 1 that a very significant percentage of cytosolicproteins was detected in the IMF. It is known that a number ofcytosolic proteins interact with inner membrane proteins,being therefore plausible the presence of cytosolic proteins inthe membrane proteome, mainly in the IMF. In this context,proteins involved in membrane protein synthesis, transloca-tion and targeting are also expected to be present in themembrane proteome fractions, where they were actuallydetected (Tables A1, B1 and C1 of Supplementary material).
Table 1 – Percentage of Pseudomonas putida KT2440 genome encmembrane fraction, outer membrane fraction and inner membsubcellular location. The percentage of proteins identified in thproteins encoded by P. putida KT2440 genome, with different s
Theoretical subcellular locationof proteins
Genome encodedproteins
To
Outer membrane 2.7%Inner membrane 17.8%Periplasm 1.9%Cytoplasm 37.5%
A Principal Component Analysis (PCA) of the 2-DE gelsobtained, clearly demonstrates that TMF and OMF gels areclustered in the same vicinity (Fig. 3), suggesting that TMF 2-DEgel protein pattern is more related to OMF 2-DE gel proteinpattern than to IMF 2-DE gel protein pattern. This observationis consistent with the considerable number of proteins thatwere identified in both TMF andOMF gels. From the analysis ofTable 1, it is also possible to conclude that an effective enrich-ment in outer membrane or inner membrane proteins in thecorresponding fraction was registered. From the 98 proteinsidentified in the IMF only thirteen proteins have predictedtransmembrane helices (ten with 1 transmembrane helix, onewith2 transmembranehelices, and twowith3 transmembranehelices). Even if it is known that membrane proteins withmultiple helices are poorly resolved in 2-DE, with ourexperimental approach there was a large number of proteinspots corresponding to proteins that were separated anddetected in the inner membrane fraction gels that were notidentified since their abundancewas not altered in response tophenol. In addition, some of the collected protein spots whosecontent changed following cell exposure to phenol couldnot bepositively identified by mass spectrometry, probably due to
oded proteins and percentage of proteins identified in totalrane fraction associated to their putative or demonstratede three membrane fractions, relative to the total number ofubcellular location, is also shown into brackets.
tal membranefraction
Outer membranefraction
Inner membranefraction
42% (18.4%) 35 % (19.7%) 3% (1.4%)6% (0.4%) – 36% (3.0%)2% (1.0%) 1% (1.0%) 9% (6.9%)
23% (0.7%) 27% (1.1 %) 40% (1.6%)
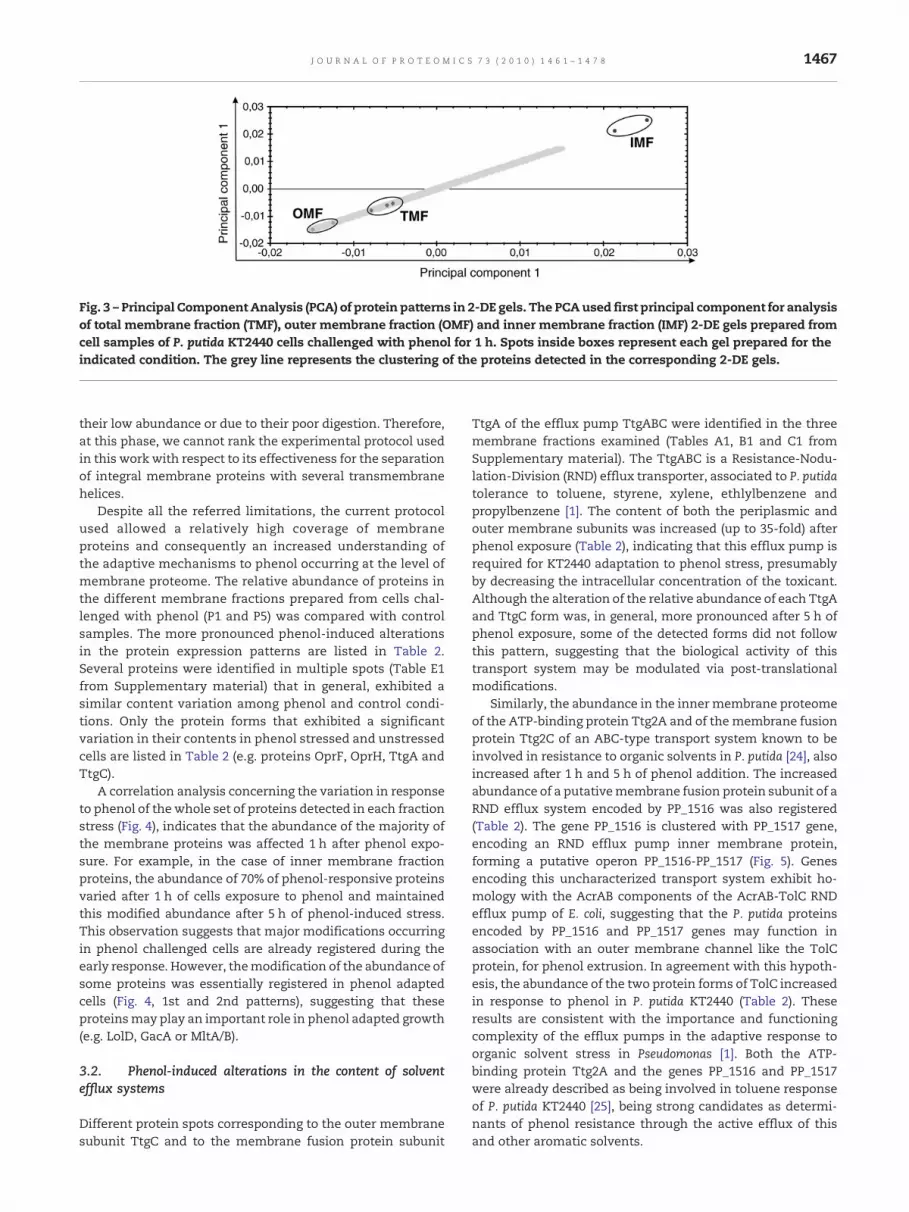
Fig. 3 – Principal Component Analysis (PCA) of protein patterns in 2-DE gels. The PCAused first principal component for analysisof total membrane fraction (TMF), outer membrane fraction (OMF) and inner membrane fraction (IMF) 2-DE gels prepared fromcell samples of P. putida KT2440 cells challenged with phenol for 1 h. Spots inside boxes represent each gel prepared for theindicated condition. The grey line represents the clustering of the proteins detected in the corresponding 2-DE gels.
1467J O U R N A L O F P R O T E O M I C S 7 3 ( 2 0 1 0 ) 1 4 6 1 – 1 4 7 8
their low abundance or due to their poor digestion. Therefore,at this phase, we cannot rank the experimental protocol usedin this work with respect to its effectiveness for the separationof integral membrane proteins with several transmembranehelices.
Despite all the referred limitations, the current protocolused allowed a relatively high coverage of membraneproteins and consequently an increased understanding ofthe adaptive mechanisms to phenol occurring at the level ofmembrane proteome. The relative abundance of proteins inthe different membrane fractions prepared from cells chal-lenged with phenol (P1 and P5) was compared with controlsamples. The more pronounced phenol-induced alterationsin the protein expression patterns are listed in Table 2.Several proteins were identified in multiple spots (Table E1from Supplementary material) that in general, exhibited asimilar content variation among phenol and control condi-tions. Only the protein forms that exhibited a significantvariation in their contents in phenol stressed and unstressedcells are listed in Table 2 (e.g. proteins OprF, OprH, TtgA andTtgC).
A correlation analysis concerning the variation in responseto phenol of the whole set of proteins detected in each fractionstress (Fig. 4), indicates that the abundance of the majority ofthe membrane proteins was affected 1 h after phenol expo-sure. For example, in the case of inner membrane fractionproteins, the abundance of 70% of phenol-responsive proteinsvaried after 1 h of cells exposure to phenol and maintainedthis modified abundance after 5 h of phenol-induced stress.This observation suggests that major modifications occurringin phenol challenged cells are already registered during theearly response. However, themodification of the abundance ofsome proteins was essentially registered in phenol adaptedcells (Fig. 4, 1st and 2nd patterns), suggesting that theseproteinsmay play an important role in phenol adapted growth(e.g. LolD, GacA or MltA/B).
3.2. Phenol-induced alterations in the content of solventefflux systems
Different protein spots corresponding to the outer membranesubunit TtgC and to the membrane fusion protein subunit
TtgA of the efflux pump TtgABC were identified in the threemembrane fractions examined (Tables A1, B1 and C1 fromSupplementary material). The TtgABC is a Resistance-Nodu-lation-Division (RND) efflux transporter, associated to P. putidatolerance to toluene, styrene, xylene, ethlylbenzene andpropylbenzene [1]. The content of both the periplasmic andouter membrane subunits was increased (up to 35-fold) afterphenol exposure (Table 2), indicating that this efflux pump isrequired for KT2440 adaptation to phenol stress, presumablyby decreasing the intracellular concentration of the toxicant.Although the alteration of the relative abundance of each TtgAand TtgC form was, in general, more pronounced after 5 h ofphenol exposure, some of the detected forms did not followthis pattern, suggesting that the biological activity of thistransport system may be modulated via post-translationalmodifications.
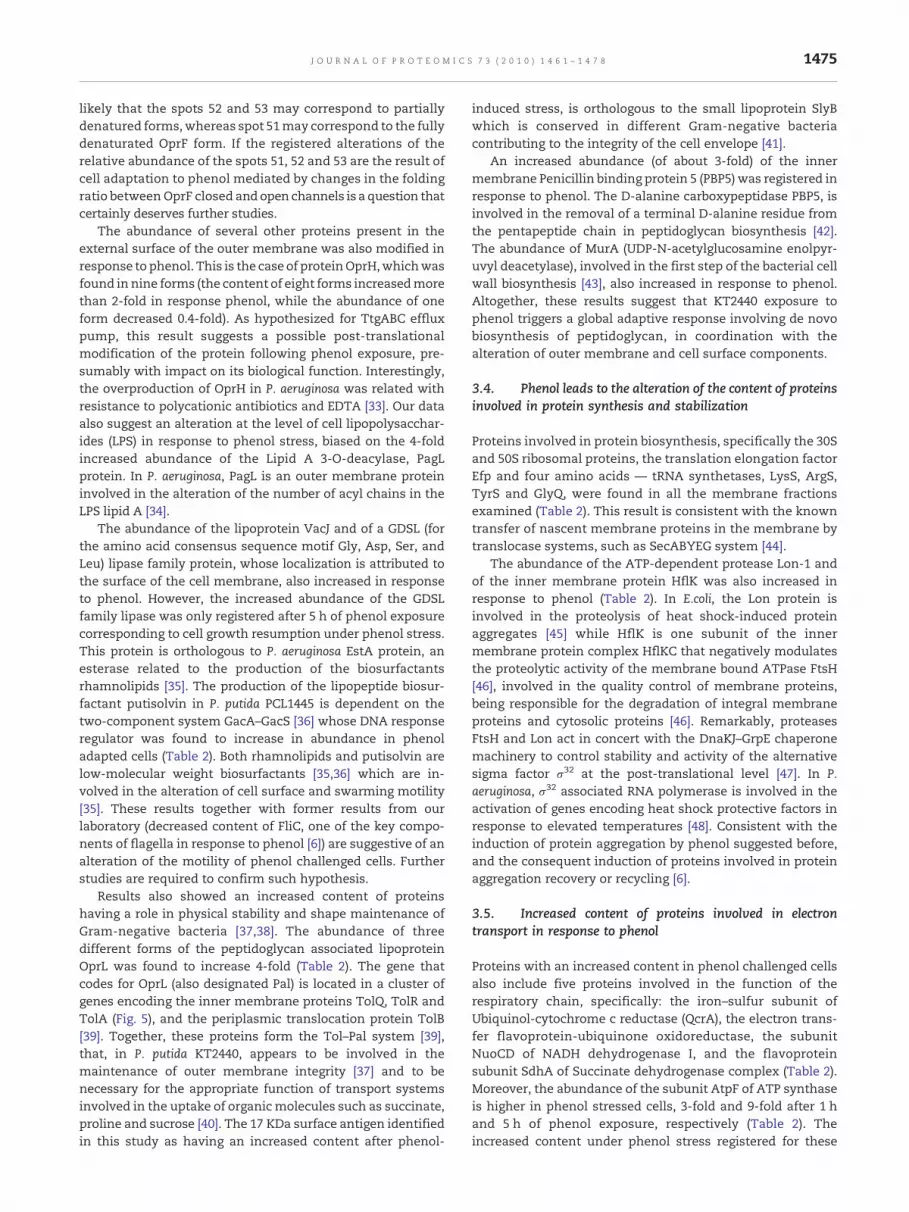
Similarly, the abundance in the inner membrane proteomeof the ATP-binding protein Ttg2A and of themembrane fusionprotein Ttg2C of an ABC-type transport system known to beinvolved in resistance to organic solvents in P. putida [24], alsoincreased after 1 h and 5 h of phenol addition. The increasedabundance of a putativemembrane fusion protein subunit of aRND efflux system encoded by PP_1516 was also registered(Table 2). The gene PP_1516 is clustered with PP_1517 gene,encoding an RND efflux pump inner membrane protein,forming a putative operon PP_1516-PP_1517 (Fig. 5). Genesencoding this uncharacterized transport system exhibit ho-mology with the AcrAB components of the AcrAB-TolC RNDefflux pump of E. coli, suggesting that the P. putida proteinsencoded by PP_1516 and PP_1517 genes may function inassociation with an outer membrane channel like the TolCprotein, for phenol extrusion. In agreement with this hypoth-esis, the abundance of the two protein forms of TolC increasedin response to phenol in P. putida KT2440 (Table 2). Theseresults are consistent with the importance and functioningcomplexity of the efflux pumps in the adaptive response toorganic solvent stress in Pseudomonas [1]. Both the ATP-binding protein Ttg2A and the genes PP_1516 and PP_1517were already described as being involved in toluene responseof P. putida KT2440 [25], being strong candidates as determi-nants of phenol resistance through the active efflux of thisand other aromatic solvents.

Table 2 – Relative alteration (above 2-fold or below 0.5-fold) of protein content in Pseudomonas putida KT2440 membranefractions after 1 h and 5 h of sudden exposure of cells to 800 mg/L phenol.
1468 J O U R N A L O F P R O T E O M I C S 7 3 ( 2 0 1 0 ) 1 4 6 1 – 1 4 7 8
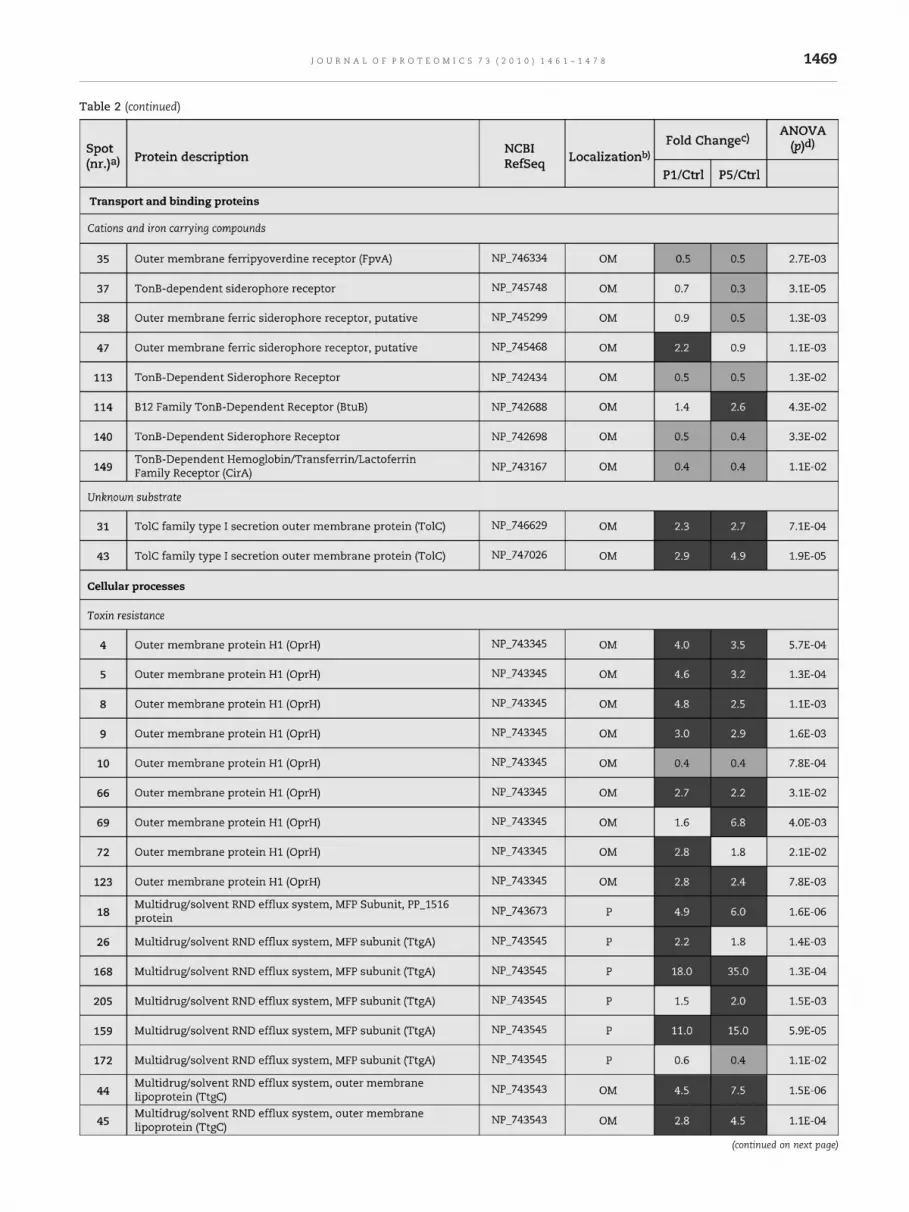
Table 2 (continued)
(continued on next page)
1469J O U R N A L O F P R O T E O M I C S 7 3 ( 2 0 1 0 ) 1 4 6 1 – 1 4 7 8

Table 2 (continued)
1470 J O U R N A L O F P R O T E O M I C S 7 3 ( 2 0 1 0 ) 1 4 6 1 – 1 4 7 8
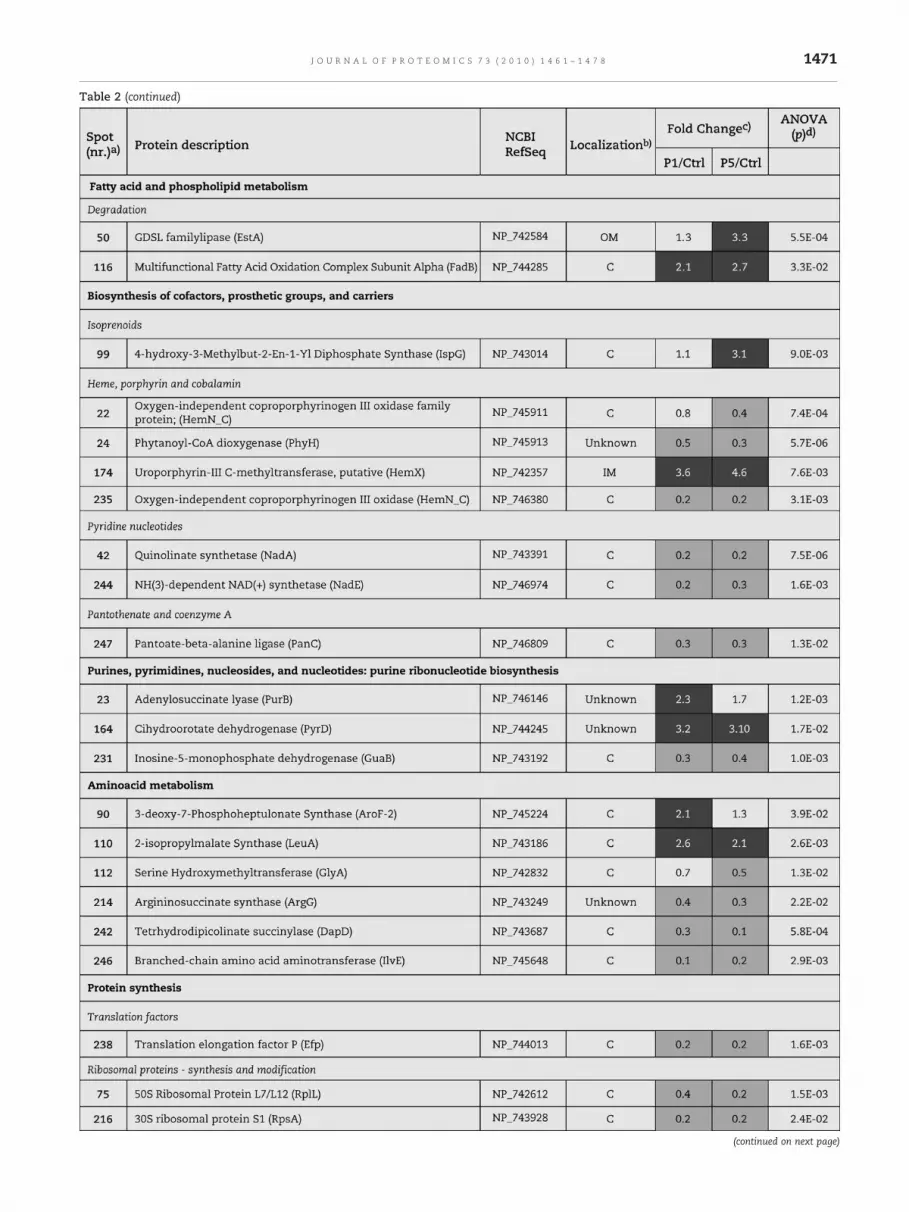
Table 2 (continued)
(continued on next page)
1471J O U R N A L O F P R O T E O M I C S 7 3 ( 2 0 1 0 ) 1 4 6 1 – 1 4 7 8
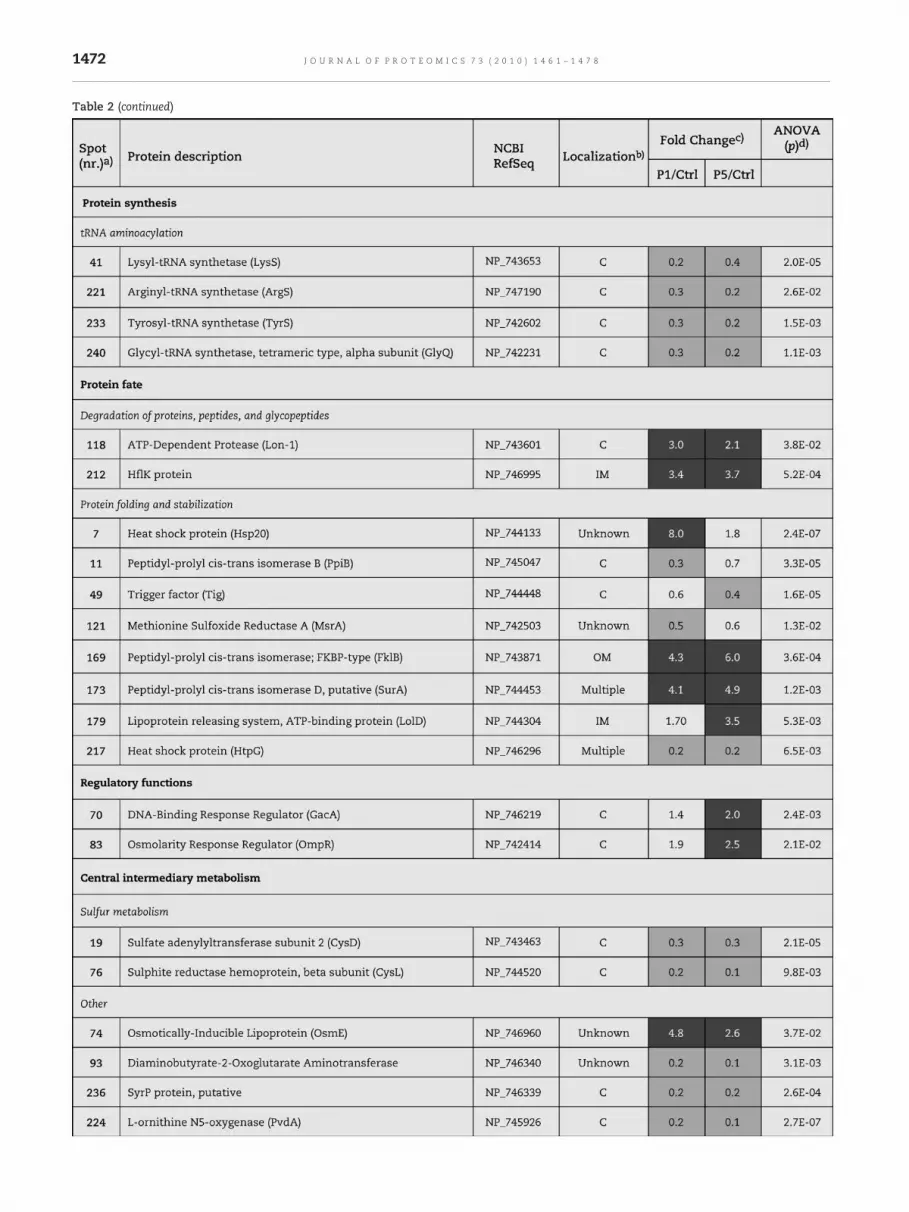
Table 2 (continued)
1472 J O U R N A L O F P R O T E O M I C S 7 3 ( 2 0 1 0 ) 1 4 6 1 – 1 4 7 8
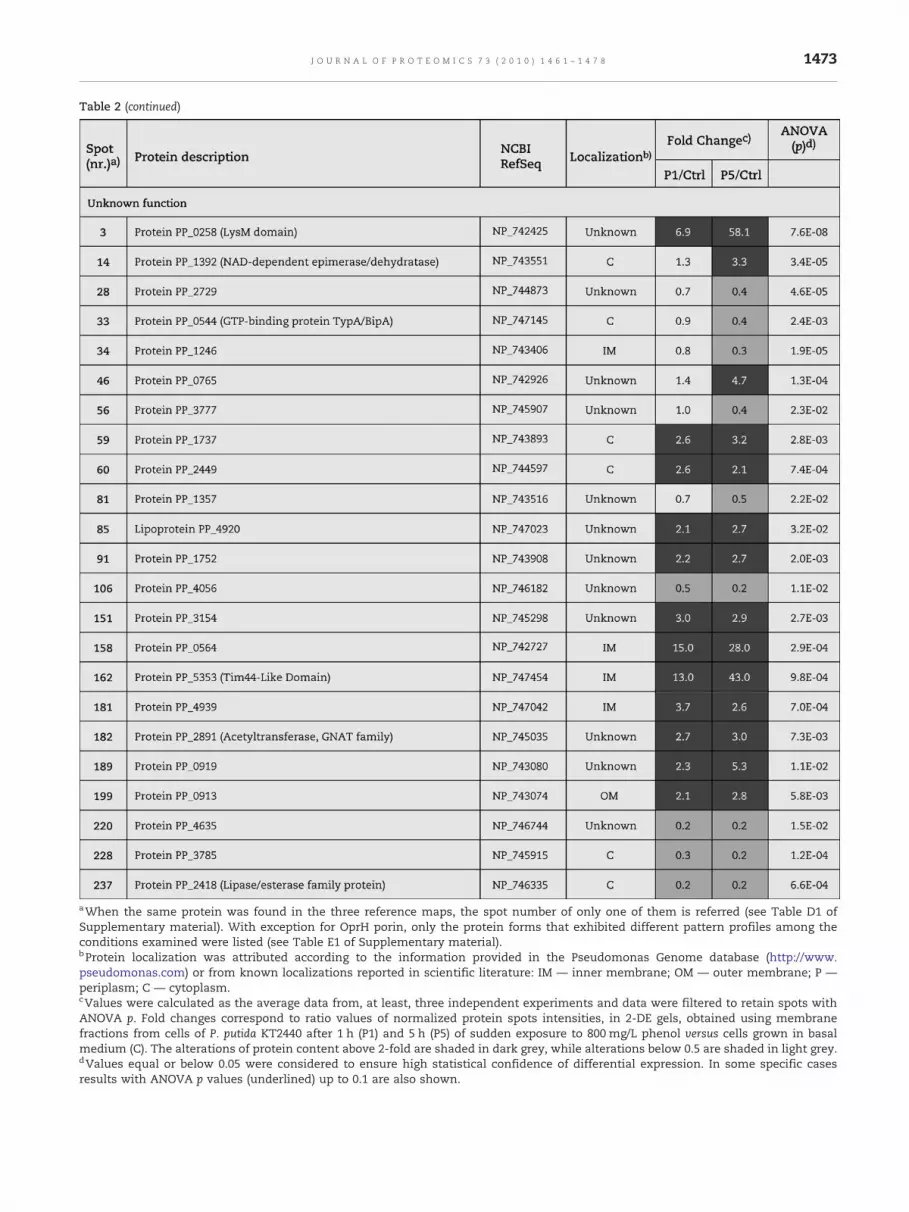
aWhen the same protein was found in the three reference maps, the spot number of only one of them is referred (see Table D1 ofSupplementary material). With exception for OprH porin, only the protein forms that exhibited different pattern profiles among theconditions examined were listed (see Table E1 of Supplementary material).bProtein localization was attributed according to the information provided in the Pseudomonas Genome database (http://www.pseudomonas.com) or from known localizations reported in scientific literature: IM — inner membrane; OM — outer membrane; P —periplasm; C — cytoplasm.cValues were calculated as the average data from, at least, three independent experiments and data were filtered to retain spots withANOVA p. Fold changes correspond to ratio values of normalized protein spots intensities, in 2-DE gels, obtained using membranefractions from cells of P. putida KT2440 after 1 h (P1) and 5 h (P5) of sudden exposure to 800 mg/L phenol versus cells grown in basalmedium (C). The alterations of protein content above 2-fold are shaded in dark grey, while alterations below 0.5 are shaded in light grey.dValues equal or below 0.05 were considered to ensure high statistical confidence of differential expression. In some specific casesresults with ANOVA p values (underlined) up to 0.1 are also shown.
Table 2 (continued)
1473J O U R N A L O F P R O T E O M I C S 7 3 ( 2 0 1 0 ) 1 4 6 1 – 1 4 7 8
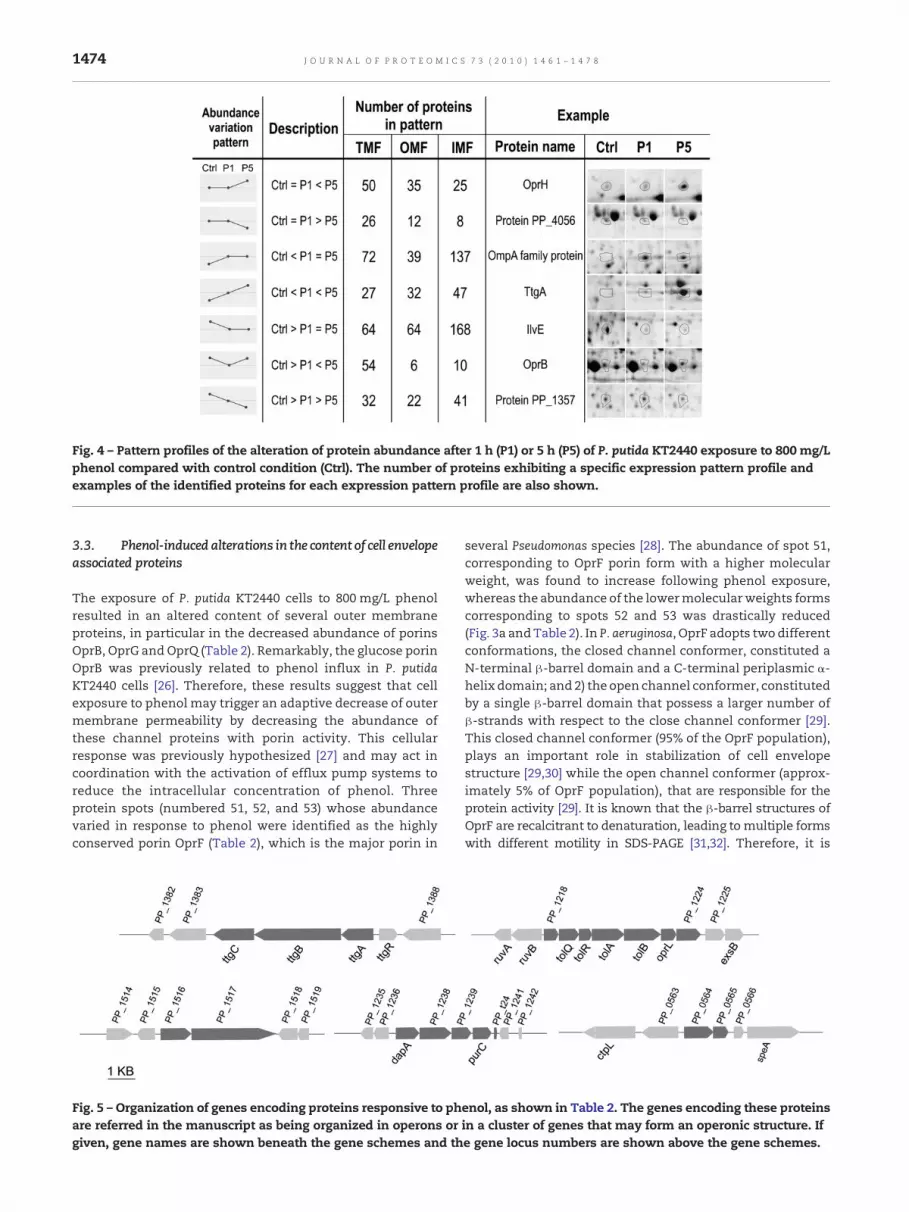
Fig. 4 – Pattern profiles of the alteration of protein abundance after 1 h (P1) or 5 h (P5) of P. putida KT2440 exposure to 800 mg/Lphenol compared with control condition (Ctrl). The number of proteins exhibiting a specific expression pattern profile andexamples of the identified proteins for each expression pattern profile are also shown.
1474 J O U R N A L O F P R O T E O M I C S 7 3 ( 2 0 1 0 ) 1 4 6 1 – 1 4 7 8
3.3. Phenol-induced alterations in the content of cell envelopeassociated proteins
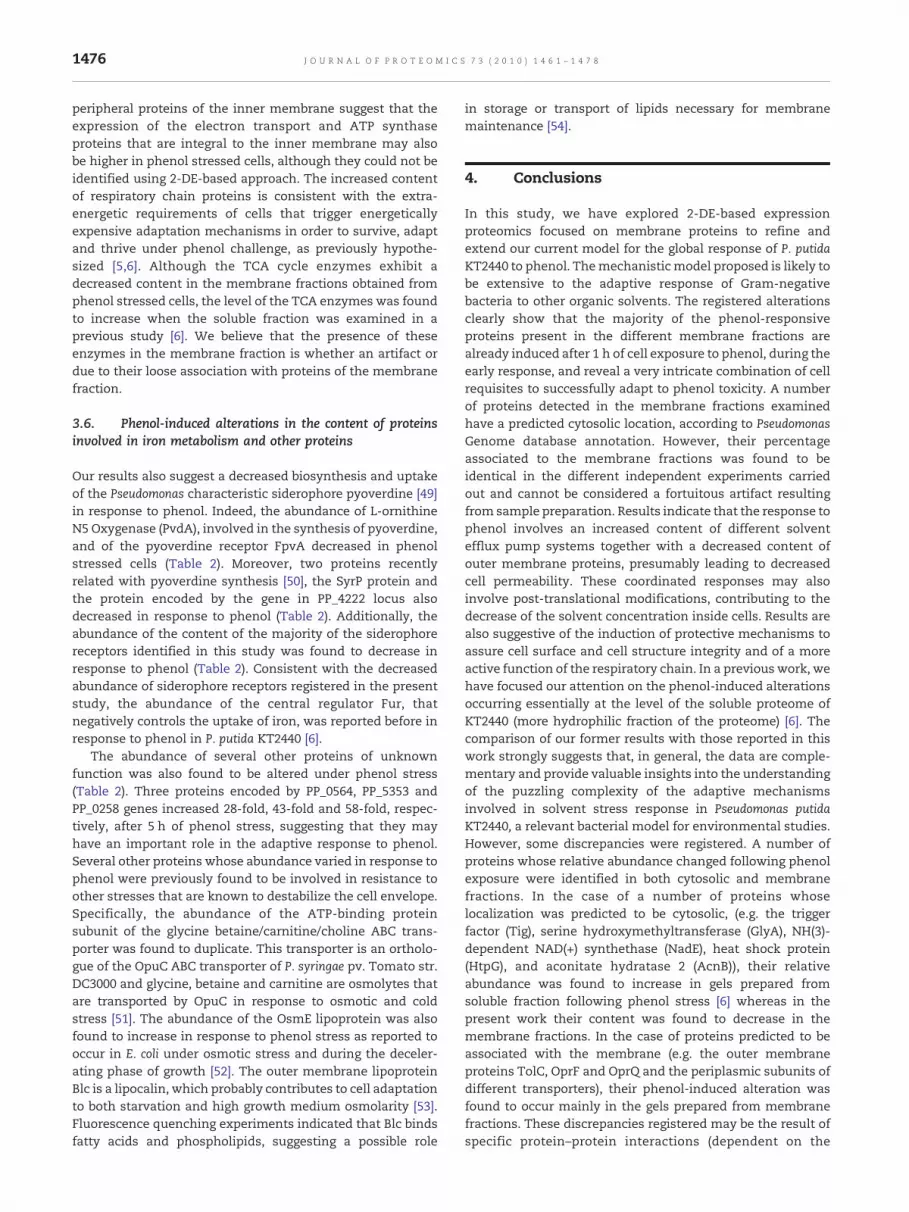
The exposure of P. putida KT2440 cells to 800 mg/L phenolresulted in an altered content of several outer membraneproteins, in particular in the decreased abundance of porinsOprB, OprG and OprQ (Table 2). Remarkably, the glucose porinOprB was previously related to phenol influx in P. putidaKT2440 cells [26]. Therefore, these results suggest that cellexposure to phenol may trigger an adaptive decrease of outermembrane permeability by decreasing the abundance ofthese channel proteins with porin activity. This cellularresponse was previously hypothesized [27] and may act incoordination with the activation of efflux pump systems toreduce the intracellular concentration of phenol. Threeprotein spots (numbered 51, 52, and 53) whose abundancevaried in response to phenol were identified as the highlyconserved porin OprF (Table 2), which is the major porin in
Fig. 5 – Organization of genes encoding proteins responsive to phare referred in the manuscript as being organized in operons orgiven, gene names are shown beneath the gene schemes and th
several Pseudomonas species [28]. The abundance of spot 51,corresponding to OprF porin form with a higher molecularweight, was found to increase following phenol exposure,whereas the abundance of the lowermolecularweights formscorresponding to spots 52 and 53 was drastically reduced(Fig. 3a andTable 2). In P. aeruginosa, OprF adopts two differentconformations, the closed channel conformer, constituted aN-terminal β-barrel domain and a C-terminal periplasmic α-helix domain; and 2) the open channel conformer, constitutedby a single β-barrel domain that possess a larger number ofβ-strands with respect to the close channel conformer [29].This closed channel conformer (95% of the OprF population),plays an important role in stabilization of cell envelopestructure [29,30] while the open channel conformer (approx-imately 5% of OprF population), that are responsible for theprotein activity [29]. It is known that the β-barrel structures ofOprF are recalcitrant to denaturation, leading to multiple formswith different motility in SDS-PAGE [31,32]. Therefore, it is
enol, as shown in Table 2. The genes encoding these proteinsin a cluster of genes that may form an operonic structure. Ife gene locus numbers are shown above the gene schemes.
1475J O U R N A L O F P R O T E O M I C S 7 3 ( 2 0 1 0 ) 1 4 6 1 – 1 4 7 8
likely that the spots 52 and 53 may correspond to partiallydenatured forms,whereas spot 51may correspond to the fullydenaturated OprF form. If the registered alterations of therelative abundance of the spots 51, 52 and 53 are the result ofcell adaptation to phenol mediated by changes in the foldingratio betweenOprF closed andopen channels is a question thatcertainly deserves further studies.
The abundance of several other proteins present in theexternal surface of the outer membrane was also modified inresponse to phenol. This is the case of proteinOprH,whichwasfound in nine forms (the content of eight forms increasedmorethan 2-fold in response phenol, while the abundance of oneform decreased 0.4-fold). As hypothesized for TtgABC effluxpump, this result suggests a possible post-translationalmodification of the protein following phenol exposure, pre-sumably with impact on its biological function. Interestingly,the overproduction of OprH in P. aeruginosa was related withresistance to polycationic antibiotics and EDTA [33]. Our dataalso suggest an alteration at the level of cell lipopolysacchar-ides (LPS) in response to phenol stress, biased on the 4-foldincreased abundance of the Lipid A 3-O-deacylase, PagLprotein. In P. aeruginosa, PagL is an outer membrane proteininvolved in the alteration of the number of acyl chains in theLPS lipid A [34].
The abundance of the lipoprotein VacJ and of a GDSL (forthe amino acid consensus sequence motif Gly, Asp, Ser, andLeu) lipase family protein, whose localization is attributed tothe surface of the cell membrane, also increased in responseto phenol. However, the increased abundance of the GDSLfamily lipase was only registered after 5 h of phenol exposurecorresponding to cell growth resumption under phenol stress.This protein is orthologous to P. aeruginosa EstA protein, anesterase related to the production of the biosurfactantsrhamnolipids [35]. The production of the lipopeptide biosur-factant putisolvin in P. putida PCL1445 is dependent on thetwo-component system GacA–GacS [36] whose DNA responseregulator was found to increase in abundance in phenoladapted cells (Table 2). Both rhamnolipids and putisolvin arelow-molecular weight biosurfactants [35,36] which are in-volved in the alteration of cell surface and swarming motility[35]. These results together with former results from ourlaboratory (decreased content of FliC, one of the key compo-nents of flagella in response to phenol [6]) are suggestive of analteration of the motility of phenol challenged cells. Furtherstudies are required to confirm such hypothesis.
Results also showed an increased content of proteinshaving a role in physical stability and shape maintenance ofGram-negative bacteria [37,38]. The abundance of threedifferent forms of the peptidoglycan associated lipoproteinOprL was found to increase 4-fold (Table 2). The gene thatcodes for OprL (also designated Pal) is located in a cluster ofgenes encoding the inner membrane proteins TolQ, TolR andTolA (Fig. 5), and the periplasmic translocation protein TolB[39]. Together, these proteins form the Tol–Pal system [39],that, in P. putida KT2440, appears to be involved in themaintenance of outer membrane integrity [37] and to benecessary for the appropriate function of transport systemsinvolved in the uptake of organicmolecules such as succinate,proline and sucrose [40]. The 17 KDa surface antigen identifiedin this study as having an increased content after phenol-
induced stress, is orthologous to the small lipoprotein SlyBwhich is conserved in different Gram-negative bacteriacontributing to the integrity of the cell envelope [41].
An increased abundance (of about 3-fold) of the innermembrane Penicillin binding protein 5 (PBP5) was registered inresponse to phenol. The D-alanine carboxypeptidase PBP5, isinvolved in the removal of a terminal D-alanine residue fromthe pentapeptide chain in peptidoglycan biosynthesis [42].The abundance of MurA (UDP-N-acetylglucosamine enolpyr-uvyl deacetylase), involved in the first step of the bacterial cellwall biosynthesis [43], also increased in response to phenol.Altogether, these results suggest that KT2440 exposure tophenol triggers a global adaptive response involving de novobiosynthesis of peptidoglycan, in coordination with thealteration of outer membrane and cell surface components.
3.4. Phenol leads to the alteration of the content of proteinsinvolved in protein synthesis and stabilization
Proteins involved in protein biosynthesis, specifically the 30Sand 50S ribosomal proteins, the translation elongation factorEfp and four amino acids — tRNA synthetases, LysS, ArgS,TyrS and GlyQ, were found in all the membrane fractionsexamined (Table 2). This result is consistent with the knowntransfer of nascent membrane proteins in the membrane bytranslocase systems, such as SecABYEG system [44].
The abundance of the ATP-dependent protease Lon-1 andof the inner membrane protein HflK was also increased inresponse to phenol (Table 2). In E.coli, the Lon protein isinvolved in the proteolysis of heat shock-induced proteinaggregates [45] while HflK is one subunit of the innermembrane protein complex HflKC that negatively modulatesthe proteolytic activity of the membrane bound ATPase FtsH[46], involved in the quality control of membrane proteins,being responsible for the degradation of integral membraneproteins and cytosolic proteins [46]. Remarkably, proteasesFtsH and Lon act in concert with the DnaKJ–GrpE chaperonemachinery to control stability and activity of the alternativesigma factor σ32 at the post-translational level [47]. In P.aeruginosa, σ32 associated RNA polymerase is involved in theactivation of genes encoding heat shock protective factors inresponse to elevated temperatures [48]. Consistent with theinduction of protein aggregation by phenol suggested before,and the consequent induction of proteins involved in proteinaggregation recovery or recycling [6].
3.5. Increased content of proteins involved in electrontransport in response to phenol
Proteins with an increased content in phenol challenged cellsalso include five proteins involved in the function of therespiratory chain, specifically: the iron–sulfur subunit ofUbiquinol-cytochrome c reductase (QcrA), the electron trans-fer flavoprotein-ubiquinone oxidoreductase, the subunitNuoCD of NADH dehydrogenase I, and the flavoproteinsubunit SdhA of Succinate dehydrogenase complex (Table 2).Moreover, the abundance of the subunit AtpF of ATP synthaseis higher in phenol stressed cells, 3-fold and 9-fold after 1 hand 5 h of phenol exposure, respectively (Table 2). Theincreased content under phenol stress registered for these
1476 J O U R N A L O F P R O T E O M I C S 7 3 ( 2 0 1 0 ) 1 4 6 1 – 1 4 7 8
peripheral proteins of the inner membrane suggest that theexpression of the electron transport and ATP synthaseproteins that are integral to the inner membrane may alsobe higher in phenol stressed cells, although they could not beidentified using 2-DE-based approach. The increased contentof respiratory chain proteins is consistent with the extra-energetic requirements of cells that trigger energeticallyexpensive adaptation mechanisms in order to survive, adaptand thrive under phenol challenge, as previously hypothe-sized [5,6]. Although the TCA cycle enzymes exhibit adecreased content in the membrane fractions obtained fromphenol stressed cells, the level of the TCA enzymes was foundto increase when the soluble fraction was examined in aprevious study [6]. We believe that the presence of theseenzymes in the membrane fraction is whether an artifact ordue to their loose association with proteins of the membranefraction.
3.6. Phenol-induced alterations in the content of proteinsinvolved in iron metabolism and other proteins
Our results also suggest a decreased biosynthesis and uptakeof the Pseudomonas characteristic siderophore pyoverdine [49]in response to phenol. Indeed, the abundance of L-ornithineN5 Oxygenase (PvdA), involved in the synthesis of pyoverdine,and of the pyoverdine receptor FpvA decreased in phenolstressed cells (Table 2). Moreover, two proteins recentlyrelated with pyoverdine synthesis [50], the SyrP protein andthe protein encoded by the gene in PP_4222 locus alsodecreased in response to phenol (Table 2). Additionally, theabundance of the content of the majority of the siderophorereceptors identified in this study was found to decrease inresponse to phenol (Table 2). Consistent with the decreasedabundance of siderophore receptors registered in the presentstudy, the abundance of the central regulator Fur, thatnegatively controls the uptake of iron, was reported before inresponse to phenol in P. putida KT2440 [6].
The abundance of several other proteins of unknownfunction was also found to be altered under phenol stress(Table 2). Three proteins encoded by PP_0564, PP_5353 andPP_0258 genes increased 28-fold, 43-fold and 58-fold, respec-tively, after 5 h of phenol stress, suggesting that they mayhave an important role in the adaptive response to phenol.Several other proteins whose abundance varied in response tophenol were previously found to be involved in resistance toother stresses that are known to destabilize the cell envelope.Specifically, the abundance of the ATP-binding proteinsubunit of the glycine betaine/carnitine/choline ABC trans-porter was found to duplicate. This transporter is an ortholo-gue of the OpuC ABC transporter of P. syringae pv. Tomato str.DC3000 and glycine, betaine and carnitine are osmolytes thatare transported by OpuC in response to osmotic and coldstress [51]. The abundance of the OsmE lipoprotein was alsofound to increase in response to phenol stress as reported tooccur in E. coli under osmotic stress and during the deceler-ating phase of growth [52]. The outer membrane lipoproteinBlc is a lipocalin, which probably contributes to cell adaptationto both starvation and high growth medium osmolarity [53].Fluorescence quenching experiments indicated that Blc bindsfatty acids and phospholipids, suggesting a possible role
in storage or transport of lipids necessary for membranemaintenance [54].
4. Conclusions
In this study, we have explored 2-DE-based expressionproteomics focused on membrane proteins to refine andextend our current model for the global response of P. putidaKT2440 to phenol. Themechanisticmodel proposed is likely tobe extensive to the adaptive response of Gram-negativebacteria to other organic solvents. The registered alterationsclearly show that the majority of the phenol-responsiveproteins present in the different membrane fractions arealready induced after 1 h of cell exposure to phenol, during theearly response, and reveal a very intricate combination of cellrequisites to successfully adapt to phenol toxicity. A numberof proteins detected in the membrane fractions examinedhave a predicted cytosolic location, according to PseudomonasGenome database annotation. However, their percentageassociated to the membrane fractions was found to beidentical in the different independent experiments carriedout and cannot be considered a fortuitous artifact resultingfrom sample preparation. Results indicate that the response tophenol involves an increased content of different solventefflux pump systems together with a decreased content ofouter membrane proteins, presumably leading to decreasedcell permeability. These coordinated responses may alsoinvolve post-translational modifications, contributing to thedecrease of the solvent concentration inside cells. Results arealso suggestive of the induction of protective mechanisms toassure cell surface and cell structure integrity and of a moreactive function of the respiratory chain. In a previous work, wehave focused our attention on the phenol-induced alterationsoccurring essentially at the level of the soluble proteome ofKT2440 (more hydrophilic fraction of the proteome) [6]. Thecomparison of our former results with those reported in thiswork strongly suggests that, in general, the data are comple-mentary and provide valuable insights into the understandingof the puzzling complexity of the adaptive mechanismsinvolved in solvent stress response in Pseudomonas putidaKT2440, a relevant bacterial model for environmental studies.However, some discrepancies were registered. A number ofproteins whose relative abundance changed following phenolexposure were identified in both cytosolic and membranefractions. In the case of a number of proteins whoselocalization was predicted to be cytosolic, (e.g. the triggerfactor (Tig), serine hydroxymethyltransferase (GlyA), NH(3)-dependent NAD(+) synthethase (NadE), heat shock protein(HtpG), and aconitate hydratase 2 (AcnB)), their relativeabundance was found to increase in gels prepared fromsoluble fraction following phenol stress [6] whereas in thepresent work their content was found to decrease in themembrane fractions. In the case of proteins predicted to beassociated with the membrane (e.g. the outer membraneproteins TolC, OprF and OprQ and the periplasmic subunits ofdifferent transporters), their phenol-induced alteration wasfound to occur mainly in the gels prepared from membranefractions. These discrepancies registered may be the result ofspecific protein–protein interactions (dependent on the
1477J O U R N A L O F P R O T E O M I C S 7 3 ( 2 0 1 0 ) 1 4 6 1 – 1 4 7 8
abundance of the interacting partners) and the contamina-tions of the fractions with proteins whose localization isdifferent. Therefore, expression proteomic analyses should beconsidered as a useful experimental approach to get clues toguide more detailed research to validate and deepen proteo-mic-based hypotheses.
As a whole, results emerging from this study providedadditionalmechanistic insights into solvent adaptation of thevery versatile Pseudomonas genus, of possible impact inbiodegradation, bioremediation and biocatalysis. Indeed, itis expected that the understanding of the adaptive strategiesemployed by P. putida KT2440 under phenol challenge can beuseful to guide the design of more robust strains to be used inwhole-cell biotransformations using two-phase solvent sys-tems and in the bioremediation of solvent contaminatedsoils.
Acknowledgments
This work was supported by Fundação para a Ciência eTecnologia (PhD scholarship SFRH/BD/38805/2007 to CRR).
Authors declare no financial and commercial conflicts ofinterest.
Appendix A. Supplementary data
Supplementary data associated with this article can be found,in the online version, at doi:10.1016/j.jprot.2010.02.003.
R E F E R E N C E S
[1] Ramos JL, Duque E, Gallegos MT, Godoy P, Ramos-GonzalezMI, Rojas A, et al. Mechanisms of solvent tolerance inGram-negative bacteria. Annu Rev Microbiol 2002;56:743–68.
[2] Sardessai Y, Bhosle S. Tolerance of bacteria to organicsolvents. Res Microbiol 2002;153:263–8.
[3] Sardessai YN, Bhosle S. Industrial potential of organic solventtolerant bacteria. Biotechnol Prog 2004;20:655–60.
[4] Heipieper HJ, Neumann G, Cornelissen S, Meinhardt F.Solvent-tolerant bacteria for biotransformations intwo-phase fermentation systems. Appl Microbiol Biotechnol2007;74:961–73.
[5] Santos PM, Roma V, Benndorf D, von Bergen M, Harms H,Sá-Correia I. Mechanistic insights into the global responseto phenol in the phenol-biodegrading strain Pseudomonas sp.M1 revealed by quantitative proteomics. OMICS 2007;11:233–51.
[6] Santos PM, Benndorf D, Sá-Correia I. Insights intoPseudomonas putida KT2440 response to phenol-induced stressby quantitative proteomics. Proteomics 2004;4:2640–52.
[7] Iurescia S, Marconi AM, Tofani D, Gambacorta A, Paterno A,Devirgiliis C, et al. Identification and sequencing ofbeta-myrcene catabolism genes from Pseudomonas sp. strainM1. Appl Env Microbiol 1999;65:2871–6.
[8] van Montfort BA, Canas B, Duurkens R,Godovac-Zimmermann J, Robillard GT. Improved in-gelapproaches to generate peptide maps of integral membraneproteins with matrix-assisted laser desorption/ionizationtime-of-flight mass spectrometry. J Mass Spectrom 2002;37:322–30.
[9] Boyce JD, Cullen PA, Nguyen V, Wilkie I, Adler B. Analysis ofthe Pasteurella multocida outer membrane sub-proteome andits response to the in vivo environment of the natural host.Proteomics 2006;6:870–80.
[10] Xia XX, Han MJ, Lee SY, Yoo JS. Comparison of theextracellular proteomes of Escherichia coli B and K-12 strainsduring high cell density cultivation. Proteomics 2008;8:2089–103.
[11] Xu C, Lin X, Ren H, Zhang Y, Wang S, Peng X. Analysis of outermembrane proteome of Escherichia coli related to resistance toampicillin and tetracycline. Proteomics 2006;6:462–73.
[12] Molloy MP, Phadke ND, Maddock JR, Andrews PC.Two-dimensional electrophoresis and peptide massfingerprinting of bacterial outer membrane proteins.Electrophoresis 2001;22:1686–96.
[13] Marti S, Sanchez-Cespedes J, Oliveira E, Bellido D, Giralt E, VilaJ. Proteomic analysis of a fraction enriched in cell envelopeproteins of Acinetobacter baumannii. Proteomics 2006;6:S82–7.
[14] Hartmans S, Smits JP, van der Werf MJ, Volkering F, de BontJAM. Metabolism of styrene oxide and 2-phenylethanol in thestyrene-degrading Xanthobacter strain 124X. Appl EnvironMicrobiol 1989;55:2850–5.
[15] Ishidate K, Creeger ES, Zrike J, Deb S, Glauner B, MacAlister TJ,et al. Isolation of differentiated membrane domains fromEscherichia coli and Salmonella typhimurium, including a fractioncontaining attachment sites between the inner and outermembranes and the murein skeleton of the cell envelope.J Biol Chem 1986;261:428–43.
[16] Horstman AL, Kuehn MJ. Enterotoxigenic Escherichia colisecretes active heat-labile enterotoxin via outer membranevesicles. J Biol Chem 2000;275:12489–96.
[17] Shevchenko A, Wilm M, Vorm O, Jensen ON, PodtelejnikovAV, Neubauer G, et al. A strategy for identifying gel-separatedproteins in sequence databases by MS alone. Biochem SocTrans 1996;24:893–6.
[18] Vester D, Rapp E, Gade D, Genzel Y, Reichl U. Quantitativeanalysis of cellular proteome alterations in human influenzaA virus-infected mammalian cell lines. Proteomics 2009;9:3316–27.
[19] Perkins DN, Pappin DJ, Creasy DM, Cottrell JS.Probability-based protein identification by searchingsequence databases using mass spectrometry data.Electrophoresis 1999;20:3551–67.
[20] Guina T, Wu M, Miller SI, Purvine SO, Yi EC, Eng J, et al.Proteomic analysis of Pseudomonas aeruginosa grown undermagnesium limitation. J Am Soc Mass Spectrom 2003;14:742–51.
[21] Sriramulu DD, Nimtz M, Romling U. Proteome analysisreveals adaptation of Pseudomonas aeruginosa to the cysticfibrosis lung environment. Proteomics 2005;5:3712–21.
[22] Papasotiriou DG, Markoutsa S, Meyer B, Papadioti A, Karas M,Tsiotis G. Comparison of themembrane subproteomes duringgrowth of a new pseudomonas strain on lysogeny brothmedium, glucose, and phenol. J Proteome Res 2008;7:4278–88.
[23] Butler GS, Overall CM. Proteomic identification ofmultitasking proteins in unexpected locations complicatesdrug targeting. Nat Rev Drug Discov 2009;8:935–48.
[24] Kim K, Sungjin L, Kyunghee L, Dongbin L. Isolation andcharacterization of toluene-sensitive mutants from thetoluene-resistant bacterium Pseudomonas putida GM73.J Bacteriol 1998;180:3692–6.
[25] Dominguez-Cuevas P, Gonzalez-Pastor JE, Marques S, RamosJL, de Lorenzo V. Transcriptional tradeoff between metabolicand stress-response programs in Pseudomonas putida KT2440cells exposed to toluene. J Biol Chem 2006;281:11981–91.
[26] Kivistik PA, Putrins M, Puvi K, Ilves H, Kivisaar M, Horak R. TheColRS two-component system regulatesmembrane functionsand protects Pseudomonas putida against phenol. J Bacteriol2006;188:8109–17.
1478 J O U R N A L O F P R O T E O M I C S 7 3 ( 2 0 1 0 ) 1 4 6 1 – 1 4 7 8
[27] Isken S, de Bont JAM. Bacteria tolerant to organic solvents.Extremophiles 1998;2:229–38.
[28] Jaouen T, De E, Chevalier S, Orange N. Pore size dependenceon growth temperature is a common characteristic of themajor outer membrane protein oprf in psychrotrophic andmesophilic Pseudomonas species. Appl Environ Microbiol2004;70:6665–9.
[29] Nestorovich EM, Sugawara E, Nikaido H, Bezrukov SM.Pseudomonas aeruginosa porin OprF: properties of the channel.J Biol Chem 2006;281:16230–7.
[30] Rawling EG, Brinkman FS, Hancock RE. Roles of thecarboxy-terminal half of Pseudomonas aeruginosa major outermembrane protein OprF in cell shape, growth inlow-osmolarity medium, and peptidoglycan association.J Bacteriol 1998;180:3556–62.
[31] Garten W, Hindennach I, Henning U. The major proteins ofthe Escherichia coli outer cell envelope membrane.Characterization of proteins II* and III, comparison of allproteins. Eur J Biochem 1975;59:215–21.
[32] Sugawara E, Nestorovich EM, Bezrukov SM, Nikaido H.Pseudomonas aeruginosa porin OprF exists in two differentconformations. J Biol Chem 2006;281:16220–9.
[33] Bell A, Bains M, Hancock REW. Pseudomonas aeruginosa outermembrane protein OprH: expression from the cloned geneand function in EDTA and gentamicin resistance. J Bacteriol1991;173:6657–64.
[34] Raetz CR, Reynolds CM, Trent MS, Bishop RE. Lipid Amodification systems in gram-negative bacteria. Annu RevBiochem 2007;76:295–329.
[35] Wilhelm S, Gdynia A, Tielen P, Rosenau F, Jaeger KE. Theautotransporter esterase EstA of Pseudomonas aeruginosa isrequired for rhamnolipid production, cell motility, andbiofilm formation. J Bacteriol 2007;189:6695–703.
[36] Dubern JF, Bloemberg GV. Influence of environmentalconditions on putisolvins I and II production in Pseudomonasputida strain PCL1445. FEMS Microbiol Lett 2006;263:169–75.
[37] Rodriguez-Herva JJ, Ramos-Gonzalez MI, Ramos JL. ThePseudomonas putida peptidoglycan-associated outermembrane lipoprotein is involved in maintenance of theintegrity of the cell cell envelope. J Bacteriol 1996;178:1699–706.
[38] Sonntag I, Schwarz H, Hirota Y, Henning U. Cell envelope andshape of Escherichia coli: multiple mutants missing the outermembrane lipoprotein and other major outer membraneproteins. J Bacteriol 1978;136:280–5.
[39] Llamas MA, Ramos JL, Rodriguez-Herva JJ. Transcriptionalorganization of the Pseudomonas putida tol-oprL genes.J Bacteriol 2003;185:184–95.
[40] Llamas MA, Rodríguez-Herva JJ, Hancock REW, Bitter W,Tommassen J, Ramos JL. Role of Pseudomonas putida tol-oprL
gene products in uptake of solutes through the cytoplasmicmembrane. J Bacteriol 2003;185:4707–16.
[41] Plesa M, Hernalsteens JP, Vandenbussche G, Ruysschaert JM,Cornelis P. The SlyB outer membrane lipoprotein ofBurkholderia multivorans contributes to membrane integrity.Res Microbiol 2006;157:582–92.
[42] Hesek D, Suvorov M, Morio KI, Lee M, Brown S, Vakulenko SB,et al. Synthetic peptidoglycan substrates forpenicillin-binding protein 5 of Gram-negative bacteria. J OrgChem 2004;69:778–84.
[43] Baum EZ, Montenegro DA, Licata L, Turchi I, Webb GC, FolenoBD, et al. Identification and characterization of new inhibitorsof the Escherichia coli MurA enzyme. Antimicrob AgentsChemother 2001;45:3182–8.
[44] Driessen AJM, Nouwen N. Protein translocation across thebacterial cytoplasmic membrane. Annu Rev Biochem 2008;77:643–67.
[45] Rosen R, Biran D, Gur E, Becher D, Hecker M, Ron EZ. Proteinaggregation in Escherichia coli: role of proteases.FEMS Microbiol Lett 2002;207:9–12.
[46] Kihara A, Akiyama Y, Ito K. A protease complex in theEscherichia coli plasma membrane: HflKC (HflA) forms acomplex with FtsH (HflB), regulating its proteolytic activityagainst SecY. EMBO J 1996;15:6122–31.
[47] Jenal U, Hengge-Aronis R. Regulation by proteolysis inbacterial cells. Curr Opin Microbiol 2003;6:163–72.
[48] Potvin E, Sanschagrin F, Levesque RC. Sigma factors inPseudomonas aeruginosa. FEMS Microbiol Rev 2008;32:38–55.
[49] Schalk IJ. Metal trafficking via siderophores in Gram-negativebacteria: specificities and characteristics of the pyoverdinepathway. J Inorg Biochem 2008;102:1159–69.
[50] Matthijs S, Laus G, Meyer JM, Abbaspour-Tehrani K, SchaferM, Budzikiewicz H, et al. Siderophore-mediated ironacquisition in the entomopathogenic bacterium Pseudomonasentomophila L48 and its close relative Pseudomonas putidaKT2440. Biometals 2009;22:951–64.
[51] Kappes RM, Kempf B, Kneip S, Boch J, Gade J, Meier-Wagner J,et al. Two evolutionarily closely related ABC transportersmediate the uptake of choline for synthesis of theosmoprotectant glycine betaine in Bacillus subtilis. MolMicrobiol 1999;32:203–16.
[52] Gutierrez C, Gordia S, Bonnassie S. Characterization of theosmotically inducible gene osmE of Escherichia coli K-12. MolMicrobiol 1995;16:553–63.
[53] Bishop RE. The bacterial lipocalins. Biochim Biophys Acta2000;1482:73–83.
[54] Campanacci V, Bishop RE, Blangy S, Tegoni M, Cambillau C.The membrane bound bacterial lipocalin Blc is a functionaldimer with binding preference for lysophospholipids. FEBSLett 2006;580:4877–83.


