Embed Size (px)
Citation preview
Research Methodology
Techniques
Dr.Sushma Jaiswal Tarun Jaiswal
Assistant Professor, CSIT AME,MCA (Pursuing) Guru Ghasidas Vishwavidyalaya, Bilaspur

Publisher :(Online)
Harshwardhan Publication Pvt.Ltd.
Limbaganesh, Dist. Beed (Maharashtra)
Pin-431126, [email protected]
Page design
Harshwardhan Publication Pvt.Ltd.
Limbaganesh, Dist. Beed, Pin-431126
Online Edition: February 2017
ISBN 978-93-85882-28-9
Price : 300/ -
All Rights Reserved, No part of this publication may be reproduced, or transmitted, in any form or by any means, electronic mechanical, recording, scanning or otherwise, without the prior written permission of the copyright owner. Responsibility for the facts stated, opinions expressed. Conclusions reached and plagiarism, If any, in this volume is entirely that of the Author. The Publisher bears no responsibility for them. What so ever © Tarun Jaiswal

Dedicated to My Parents
&
Loving Brother 'Santosh'
Research Methodology : Techniques PREFACE
The education system of India has enclosed a long distance from vidyapeeth system to British territory. During this era it has faced so many communal problems and it has tried to save their own traditions and social system for the new generation as we are feeling now and observing their qualities to develop our country, as we want. But we should not forget that present tradition system of education has their own individuality due to these qualities and philosophy it has covered a long distance of his expansion, now it is a part of the history. Here is a question that if we have our own history of edification and research than why we are carrying the British edification system and research since independence? It is a very meager question and we have to facing a lot of problems almost in every walk of life to find its answer. An Indian inhabitant can simply answer that the field of education and research has also been pol1ute dwith those significant problems, which are carrying by the Indian Education System and research since 1947. India has got the British system of Education having its own structure and functions in heritage and a concerted effort has been made since, then to utilize that heritage in order to achieve comparable results by democratic means; though we pledged in 1950 on the 26th day of January. We, the people of India having solemnly resolved to constitute into a sovereign democratic republic and to secure to all citizens; justice-social, economic and political liberty of thoughts, of status and opportunity and to promote among them all, fraternity assuring dignity of the individual and the unity of Nation; in our constituent assembly do hereby adopt, exact and give to ourselves this constitution. Could we fulfill this pledge to this date? The answer is very big no. Neither we could maintain our democratic ideals nor could we achieve justice, fraternity and liberty. Even we failed to unite our nation–mentally, and physically, both. After analyzing the various factors we come to the conclusion that it is all due to our faulty system of education and their wrong objectives directed by the our old educationist. To help our county and society and also to achieve the desired goal of life, we should understand and to create awareness about the research of our social system. The goal of life is to get good and effective research based education for which we have need good and effective education system. The present volume is a humble effort to present the research problems of social sciences through their past history, as author has perceived. Almost every social research aspect of social sciences and their problems are covered in this book. The problems can be solved only if there are a large number of idealistic education and research workers devoted to the cause. The author will be highly thankful if you will send your valuable suggestion to up-grade the chapters of this book. This book is useful those students who offer the Research Methodology at Graduation, Post Graduation and M.Phil. Level. This book is also very useful for Ph.D. Course Work examinations.
CONTENTS 1 INTRODUCTION UNIT 01 Describes the meaning and objectives of research; limitations of research in social science; To understand that the research in social science is differ from the research in physical science; To familiarize the students with the significance of economic research; The various types of research. 2 RESEARCH PROCESS UNIT 02 Describes the research process; The characteristics and qualities of a good research; essential of a good research to the students; To make aware of the general problems of the researchers in India; To acquaint the students with the use of computer technology. 3 DATA SOURCE AND MEASUREMENT UNIT 03 Describe the meaning of Data; Study the processing of data and approaches to data management; meaning, types, importance and limitations of Statistical data; The meaning of Measurement and levels of measurement; The various components of measurement; The different types and classification of data. 4 DATA SAMPLING METHOD UNIT 04 Describes the meaning of a sample; The criterion of a good sample; The various sampling methods; The different types of Probability or Random sampling; the various types of Non Probability or Non Random sampling. 5 DATA COLLECTION METHODS: PRIMARY DATA COLLECTION UNIT 05 Describes the meaning of primary data; The various sources of primary data collection; The important methods of primary data collection; The types of surveys ;The meaning and types of questionnaire ;The sample of questionnaires ;The meaning of interviews ,The preparation for the interviews. 6 SECONDARY DATA COLLECTION UNIT 06 Describes the meaning of secondary data ; The internal and external sources of secondary data; The features and Uses of secondary data ;The advantages and disadvantages of secondary data ;The evaluation of secondary data. 7 PRESENTATION AND PRELIMINARY ANALYSIS OF DATA UNIT 07 Describes the process of classifying the data; Systematically arrange the data into statistical tables ; The statistical results through graphs and diagrams. 8 MEASURES OF CENTRAL TENDENCY UNIT 08 Describes different measures of central tendency; To determine these measures with the help of graphs; Merits and demerits. 9 MEASURES OF DISPERSION
UNIT 09 Describes different measures of dispersion and their relative importance; The meaning of skewness; Simple measures of skewness. 10 ADVANCED ANALYSIS OF DATA UNIT 10 Describes the relationship between two variables; explore the relationship between the variables through scatter diagram; To mathematically derive a coefficient of correlation by Karl Pearson; Compute rank correlation by Spearman; Learn Technique to estimate the value of one variable given the value of another through regression analysis. 11 TIME SERIES ANALYSIS UNIT 11 Describes To understand the meaning and importance of time series data; To estimate the trends in the data using three, four and five yearly moving averages; Learn how linear trend can be found out using regression analysis for time series data. 12 INDEX NUMBERS UNIT 12 Describes meaning, nature and steps involved in calculating index numbers; Compute major types of weighted and un-weighted index numbers; Learn how the bases are shifted while constructing index numbers ;The concept of cost of living index numbers; Learn the problems involved in construction of index numbers. 13 HYPOTHESIS: NATURE AND ROLE IN RESEARCH UNIT 13 Describes meaning, role and types of hypothesis; To acquaint with the sources of hypothesis; Characteristics of a good hypothesis; Basic concepts in hypothesis testing. 14 REPORT WRITING UNIT 14 Describes the meaning and significance of report writing; To familiar the students about the various types of research report; The general structure of a research report. 15 ORGANIZATION AND STYLE OF RESEARCH REPORT UNIT 15 Describes the principles of writing research report; The organization structure and style of report writing; Understand that which precautions are to be taken while writing research report. 16 PHILOSOPHICAL AND HISTORICAL RESEARCH UNIT 16 Describes the Introduction, Objectives, Main content and Philosophical Research ; Main steps in Philosophical inquiry ;Historical Research ;Features of Historical Research; Main steps in historical Research. 17 NATURALISTIC INQUIRY AND CASE STUDY UNIT 17 Describes the Introduction, Objectives, Main content; Naturalistic Inquiry; Uniqueness of Naturalistic Inquiry ;Main steps in Naturalistic Inquiry; Trustworthiness and objectivity in Naturalistic studies; Case study Research; Characteristics of case study research; Main steps in case study; Is case study scientific in Nature? . 18 DESCRIPTIVE RESEARCH
UNIT 18 Describes the Introduction, Objectives, Main content; Introduction to Descriptive Research; Main Steps in Descriptive Research; Types of Descriptive Research; Survey Study; Analysis of Documents; Correlational Studies; Causal Comparative studies. 19 EXPERIMENTAL AND ACTION RESEARCHES UNIT 19 Describes Introduction, Objectives, Main content of Experimental Research and Experimental Research; Characteristics of Experimental Research; Steps in Experimental Research; Experimental Designs; Pre-experimental design; True Experimental Designs; Quasi Experimental designs; Time series Research; Action Research; Stages of action research. 20 CONDUCTING MIXED-METHOD EVALUATIONS Unit 20 Provides Guidance On Using Mixed-Methods For Evaluations. Rationale; How To Mix Methods; Parallel Combinations; Sequential Combination; Multilevel Combinations; Integrating Multiple Methods Into The Evaluation. 21 RESEARCH PROPOSALS At the end of this unit, you should be able to: Define research proposal ; state types of research proposal ;draft different types of research proposal ;list the likely questions to search for before writing a proposal for research grant. 22 RESEARCH REPORT At the end of this unit, you should be able to: State the import of report ; list the important parts of a research report ; explain each of the important parts of a research report ; write a report using a research topic. 23 LITERATURE REVIEW At the end of this unit, you should be able to: Define literature review ; know different methods of reviewing literature; understand the rudiments of a good literature review ; appreciate the importance of literature review;. know the various sources of literature review. 24 THE CITATION STYLES At the end of this unit, you should be able to: Define citation ; explain why citation is very important; distinguish between different types of citation; identify items to cite in your research; assimilate the rules guiding the different citation styles; cite your sources very well. 25 INTERNET RESEARCH At the end of this unit you should be able to: Understand the meaning of internet; know the problems associated with researching on the internet; know the type of material available for your research on the internet; know the research options available on the internet and how to use them. 26 THE USE OF LIBRARY IN RESEARCH At the end of this unit, you should be able to: Define library;list and explain the types of library; list and explain the usefulness of the library in research. 27
CASE STUDY At the end of this unit, you will be able to: learn the meaning of case study; know when a research is suited for the adoption of the case study method; know the limitations of case study ; enumerate the advantages of case study. 28 RESEARCH ETHICS At the end of this unit, you should have learnt: The meaning of ethics; The relationship between ethics and research; The historical circumstance that gave rise to researchers’ concern with ethics; The major ethical issues that are of concern to researchers. 29 PLAGIARISM At the end of this unit, you should be able to: Know the meaning of plagiarism; Identify the various types of plagiarism ; Understand the consequences of plagiarism; Learn how to avoid plagiarism. 30 DATA ANALYSIS UNIT 30 Describes the Data analysis and the main purposes of data analysis. 31 INTERPRETATION OF DATA UNIT 31 describes the main purposes of interpretation of data or results and factors. 32 TIME MANAGEMENT SKILLS UNIT 32 Describe the Time in research.; Definition of time management; Benefits of time management; Risks of improper time management; Techniques for time management; Setting goals; Setting priorities; Planning; Scheduling; Revising; Procrastination; Causes of procrastination; Overcoming procrastination; Eliminating the time wasting habits; Surfing in internet, chatting on MSN, and exploring the software; Non-stop working for hours at a time.
1 INTRODUCTION
Unit Structure 1.0 Objectives 1.1 Meaning of Research 1.2 Sources Of Acquiring Knowledge 1.3 Objectives of Research 1.4 The Functions Of Research 1.5 Fundamental characteristics of science, technology and scientists: Scientific thinking skills
1.5.1 What is science? 1.5.2 Main features of science. 1.5.3 The nature of technology. 1.5.4 Fundamental characteristics of scientists
1.6 Objectives Of Research 1.7 Scientific Research 1.7.1 Characteristics of the Scientific Method 1.8 Limitations of Social Science Research 1.8.1 Difference between Social Science Research and Physical Science Research 1.9 Significance of Economic Research 1.10 Meaning, Steps And Scope Of Educational Research : Meaning Of Educational Research 1.11 Scope Of Educational Research 1.12 Ethical Considerations Of Research 1.13 Paradigms Of Educational Research 1.14 Kinds Of Research 1.15 Classification Of Research 1.16 Points to Consider while Choosing a Research Topic 1.17 Types Of Research 1.18 There are different types of research. 1.19 Importance Of Knowing How To Conduct Research: 1.20 Qualities Of A Researcher: 1.21 Summary 1.22 Questions
2 RESEARCH PROCESS
Unit Structure: 2.0 Objectives 2.1 Research Process 2.2 Characteristics of Scientific Research 2.3 Major Characteristics Of Research. 2.4 Other General Characteristics Of Research 2.5 Qualities Of A Good Research 2.6 Specific Characteristics Of Research 2.7 Evaluation Of Good Research 2.8 Problems Of Researchers In India

2.8.1 The Concept Of Problems In Research 2.8.2 Characteristics Of Research Problem 2.8.3 Some Sources Of Suitable Research Problems 2.8.4 Selecting A Research Problem 2.9 Shaping And Refining The Problem 2.10 Important Research Concepts 2.11 Role Of Computer Technology In Research 2.12 Significance Of Research In Computer Science 2.13 Nature Of Research Problems In Computer Science 2.14. Summary 2.15 Questions
3 DATA SOURCE AND MEASUREMENT
Unit Structure: 3.0 Objectives 3.1 Introduction 3.2 Data Processing 3.3 Information 3.4 Statistical Data 3.5 Measurement 3.6 Sources of Data Collection 3.7 Types and Classification of Data 3.8 Summary 3.9 Questions
4 DATA SAMPLING METHOD
Unit Structure: 4.0 Objectives 4.1 Introduction 4.2 Criterion of good sample 4.3 Methods of Sampling 4.4 Sampling and Non-Sampling Errors 4.5 Summary 4.6 Questions
5 DATA COLLECTION METHODS PRIMARY DATA COLLECTION
Unit Structure: 5.0 Objectives 5.1 Introduction 5.2 Primary Sources Of Data
5.3 Methods Of Collecting Primary Data 5.4 Types Of Surveys 5.5 Questionnaires 5.6. Characteristics Of A Good Questionnaire 5.7. Construction Of A Questionnaire 5.8. Types Of Questionnaires 5.9. How To Improve Questionnaire Items? 5.10. Administration Of The Questionnaire. 5.11 Interviews 5.12. Types Of Interview 5.13. Steps In The Arrangement Of Interviews. 5.14. How To Conduct An Interview? 5.15. Observation As A Data Collection Technique 5.16. Characteristics Of A Good Observation. 5.17. Uses Of Observation. 5.18. Recording Observation 5.19. Concluding The Interview 5.20. Summary 5.21. Questions
6 SECONDARY DATA COLLECTION
Unit Structure: 6.0 Objectives 6.1 Secondary Sources of Data 6.2 Features and Uses of Secondary Data 6.3 Advantages and Disadvantages of Secondary Data 6.4 Evaluation of Secondary Data 6.5 Summary 6.6 Questions
7 PRESENTATION AND PRELIMINARY
ANALYSIS OF DATA Unit Structure: 7.0 Objectives 7.1 Introduction 7.2 Classification 7.3 Tabulation 7.4 Graphical representation of data 7.5 Summary 7.6 Questions
8 MEASURES OF CENTRAL TENDENCY
Unit Structure: 8.0 Objectives 8.1 Introduction 8.2 Measures of Central Tendency 8.3 Graphical determination of median, quartiles and mode. 8.4 Summary 8.5 Questions
9 MEASURES OF DISPERSION
Unit Structure: 9.0 Objectives 9.1 Introduction 9.2 Range 9.3 Quartile Deviation 9.4 Standard deviation (S.D.) & Coefficient of Variation (C.V.) 9.5 Skewness 9.6 Summary 9.7 Questions
10 ADVANCED ANALYSIS OF DATA
Unit Structure: 10.0 Objectives 10.1 Introduction 10.2 Correlation Analysis 10.3 Methods of studying correlation 10.4 Regression 10.5 Summary
10.6 Questions 11 TIME SERIES ANALYSIS
Unit Structure: 11.0 Objectives 11.1 Introduction 11.2 Estimation of trend 11.3 Summary 11.4 Questions
12 INDEX NUMBERS
Unit Structure: 12.0 Objectives 12.1 Introduction 12.2 Methods of constructing index numbers
12.3 Deflator 12.4 Base shifting 12.5 Cost of living index number 12.6 Summary 12.7 Questions
13 HYPOTHESIS: NATURE AND ROLE IN
RESEARCH Unit Structure: 13.0 Objectives 13.1 Meaning of Hypothesis 13.2 Role of Hypothesis 13.3 Types of Hypothesis 13.3.1 On the basis of their functions 13.3.2 On the basis of their nature 13.3.3 On the basis of their level of abstraction 13.4 Sources of Hypothesis 13.5 Characteristics of a Good Hypothesis 13.6 Basic concepts in Hypothesis Testing 13.6.1 Null and Alternative hypotheses 13.6.2 Parameter and Statistic 13.6.3 Type I and Type II errors 13.6.4 The level of significance 13.6.5 Critical region 13.7 Summary 13.8 Questions
14 REPORT WRITING
Unit Structure: 14.0 Objectives 14.1 Introduction 14.2 Meaning and Significance of a Research Report 14.3 Types of Research Report 14.4 Format or Structure of a Research Report: 14.5 Steps in planning Report Writing 14.6 Physical Layout of the Report 14.7 Planning and Organisation of an Academic Report
14.7.1 Stages of writing an academic report 14.8 Referencing in the text 14.9 Referencing in the bibliography 14.10 Footnotes
14.10.1 Referencing in the Text 14.10.2 Referencing in the reference
14.11 Precautions in preparing report
14.12 Evaluation of a report— Some considerations 14.12.1 Evaluation Criteria
14.13 Viva Voce examination 14.14 Summary 14.15 Keywords 14.16 Questions
15 ORGANIZATION AND STYLE OF
RESEARCH REPORT Unit Structure: 15.0 Objectives 15.1 Principles of writing the Research Repot 15.2 Summary 15.3 Questions
16 PHILOSOPHICAL AND HISTORICAL RESEARCH Unit Structures: 16.0 Introduction 16.1 Objectives 16.2 Main content 16.2.1 Philosophical Research 16.2.1.1 Main steps in Philosophical inquiry 16.3. Historical Research 16.3.1 Features of Historical Research 16.3.2 Main steps in historical Research 16.4 Conclusion 16.5 Summary 16.6 Tutor marked Assignment 16.7 References / Further Readings
17 NATURALISTIC INQUIRY AND CASE STUDY
Unit Structures: 17.0. Introduction 17.1 Objectives 17.2 Main content 17.2.1 Naturalistic Inquiry 17.2.1.1 Uniqueness of Naturalistic Inquiry 17.3 Main steps in Naturalistic Inquiry 17.3.1 Trustworthiness and objectivity in Naturalistic studies 17.4 Case study Research 17.4.1 Characteristics of case study research 17.5 Main steps in case study 17.5.1 Is case study scientific in Nature?
17.6 Conclusion 17.7 Summary
18 DESCRIPTIVE RESEARCH
Unit Structures: 18.0 Introduction 18.1 Objectives 18.2 Main content 18.2.1. Introduction to Descriptive Research 18.3 Main Steps in Descriptive Research 18.4 Types of Descriptive Research
18.4.1 Survey Study 18.4.2 Analysis of Documents 18.4.3 Correlational Studies 18.4.4 Causal Comparative studies
18.5 Conclusion 18.6 Summary 18.7 Tutor marked Assignment 18.8 References / Further Readings
19 EXPERIMENTAL AND ACTION RESEARCHES
Unit Structures: 19.0 Introduction 19.1 Objectives 19.2 Main content of Experimental Research 19.2.1 Experimental Research 19.2.2 Characteristics of Experimental Research 19.3 Steps in Experimental Research 19.4. Experimental Designs
19.4.1 Pre-experimental design 19.4.2 True Experimental Designs 19.4.3 Quasi Experimental designs 19.4.4 Time series Research
19.5 Action Research 19.6 Stages of action research 19.7 Conclusion 19.8 Summary 19.9 Tutor marked Assignment 19.10 References / Further Readings
20 CONDUCTING MIXED-METHOD EVALUATIONS Unit Structures:
Guidance On Using Mixed-Methods For Evaluations. Rationale; How To Mix Methods; Parallel Combinations; Sequential Combination; Multilevel Combinations; Integrating Multiple Methods Into The Evaluation.
21 RESEARCH PROPOSALS
Unit Structures: 21.0 Introduction 21.1 Objectives 21.2 Main Content
21.2.1 Meaning of Research Proposal 21.3 Types of Research Proposal
21.3.1 Thesis Proposal 21.3.2 Grant Proposal
21.4 Contents of a Research Proposal 21.4.1 Research Objectives and Scholarly Significance 21.4.2 Researcher’s Technical Qualifications 21.4.3 The Level of Funding Required 21.4.4 Work Plan
21.5 Key Criteria for Assessing a Research Proposal 21.5.1 Track Record 21.5.2 Originality 21.5.3 Feasibility 21.5.4 Clarity 21.5.5 Output
21.6 Conclusion 21.7 Summary 21.8 Tutor-Marked Assignment 21.9 References/Further Reading
22 RESEARCH REPORT
Unit Structures: 22.0 Introduction 22.1 Objectives 22.2 Main Content
22.2.1 Meaning of Research Report 22.2.2 Types of Research report
22.2.2.1 Written Research Report 22.2.2.2 Oral Research Report
22.3 Importance of Research Report 22.4 Contents of Research Report
22.4.1 Preliminary Pages 22.4.2 Main Body 22.4.3 References
22.5 Causes of Failure in Research Report
22.5.1 Lack of Logical Structure 22.5.2 Undeveloped Ideas 22.5.3 Lack of Organization 22.5.4 Grammatical and Spelling Mistakes 22.5.5 Plagiarism 22.5.6 Repetition/ Irrelevant Information 22.5.7 Weak Conclusion
22.7 Conclusion 22.8 Summary 22.9 Tutor-Marked Assignment 22.10 Reference:/Further Reading
23 LITERATURE REVIEW
Unit Structures: 23.0 Introduction 23.1 Objectives 23.2 Main Content 23.2.1 Definitions of Literature Review 23.3 Aims of Literature Review 23.4 Types of Literature Review
23.4.1 Integrated Research Review 23.4.2 Theoretical Review 23.4.3 Thematic Review
23.5 Qualities of a Good Literature Review 23.5.1 Accuracy 23.5.2 Relevance
23.6 The Importance of Literature Review 23.6.1 It provides Background Knowledge of the Research Topic 23.6.2 Helps the Researcher to Place His Work in Context of Previous Researches 23.6.3 Helps the Researcher to Identify Data Sources 23.6.4 Helps the Researcher to Identify Knowledge Gap 23.6.5 Helps the Researcher to Identify the Shortcomings of Previous Researches 23.6.6 Helps the Researcher to Identify Other Researchers for Possible Collaboration 23.6.7 Helps the Researcher to Learn How Others Structured Their Works 23.6.8 Helps the Researcher to Formulate Researchable Topics 23.6.9 Helps the Researcher Not to Repeat a Research
23.7 Sources of Literature 23.7.1 Books and Journals 23.7.2 Electronic Databases 23.7.3 Government 23.7.4 The Internet
23.8 Conclusion 23.9 Summary 23.10 Tutor-Marked Assignments 23.11Works Cited/Further Readings
24 THE CITATION STYLES
Unit Structures: 24.0 Introduction 24.1 Objectives 24.2 Main Content 24.2.1 Definition of Citation 24.3 Types of Citation 24.4 The Relevance of Citation 24.5 What to Cite 24.6 Explanation About the MLA Citation Style 24.7 General Guidelines About Works Cited In MLA 24.8 Samples of Works Cited for Printed Materials 24.9 Samples of Works Cited for Web Materials 24.10 Citing Additional Common Sources 24.11 The APA Style 24.12 Conclusion 24.13 Summary 24.14 Tutor-Marked Assignments 24.15 Works Cited/Further Readings
25 INTERNET RESEARCH
Unit Structures: 25.0 Introduction 25.1 Objectives 25.2 Main Content 25.2.1 Understanding the Internet 25.3 Problems of the Internet 25.4 Research information on the internet 25.5 Internet Search Engines
25.5.1 Advantages of the Search Engines 25.5.2 Disadvantages of the Search Engines
25.6 Metasearch Engines 25.6.1 Advantages of the Metasearch Engines 25.6.2 Disadvantages of the Metasearch Engines
25.7 Subject Gateways 25.7.1 Advantages of the Subject Gateways 25.7.2 Disadvantages of the Subject Gateways
25.8 Conclusion 25.9 Summary 25.10 Tutor-Marked Assignment 25.11 Works Cited/Further Readings
26 THE USE OF LIBRARY IN RESEARCH
Unit Structures: 26.0 Introduction 26.1 Objectives 26.2 Main Content 26.2.1 The Meaning of Library 26.3 Types of Libraries 26.4 The Importance of Library in Research 26.5 Other Library Services 26.6 Conclusion 26.7 Tutor Marked Assignment 26.8 Reference/ Further Reading
27 CASE STUDY
Unit Structures: 27.0 Introduction 27.1 Objectives 27.2 Main Content 27.2.1 Meaning of Case Study 27.3 Phases of Case Study 27.4 Types of Case Study 27.5 Sources of Data in Case Study 27.6 Advantages of Case Study 27.7 Disadvantages of Case Study 27.8 Conclusion 27.9 Summary 27.10 Tutor-Marked Assignment 27.11 Reference/ Further Reading
28 RESEARCH ETHICS
Unit Structures: 28.0 Introduction 28.1 Objectives 28.2 Main Content 28.2.1 Meaning of Ethics 28.3 Ethics and Research 28.4 History of Research Ethics 28.5 Some Ethical Issues in Research 28.6 Conclusion 28.7 Summary 28.8 Tutor-Marked Assignments
28.9 Works Cited/Further Reading
29 PLAGIARISM
Unit Structures: 29.0 Introduction 29.1 Objectives 29.2 Main Content 29.2.1 Meaning of Plagiarism 29.3 Types of Plagiarism 29.4 Consequences of Plagiarism 29.5 Tips on How to Avoid Plagiarism 29.6 Conclusion 29.7 Summary 29.8 Tutor-Marked Assignment 29.9 Works Cited/Further Readings
30 Data Analysis
Unit structures: Data analysis and the main purposes of data analysis
31 Interpretation of Data
Unit structures: The main purposes of interpretation of data or results and factors.
32 Time management skills
Unit Structures: 32.0 Time in research. 32.1 Definition of time management. 32.2 Benefits of time management. 32.3 Risks of improper time management. 32.4 Techniques for time management. 32.5 Setting goals. 32.6 Setting priorities. 32.7 Planning. 32.8 Scheduling. 32.9 Revising. 32.10 Procrastination. 32.11 Causes of procrastination. 32.12 Overcoming procrastination.

32.13 Eliminating the time wasting habits. 32.14 Surfing in internet, chatting on MSN, and exploring the software 32.15 Non-stop working for hours at a time.
1
INTRODUCTION
Unit Structure 1.0 Objectives 1.1 Meaning of Research 1.2 Sources Of Acquiring Knowledge 1.3 Objectives of Research 1.4 The Functions Of Research 1.5 Fundamental characteristics of science, technology and scientists: Scientific thinking skills
1.5.1 What is science? 1.5.2 Main features of science. 1.5.3 The nature of technology. 1.5.4 Fundamental characteristics of scientists
1.6 Objectives Of Research 1.7 Scientific Research 1.7.1 Characteristics of the Scientific Method 1.8 Limitations of Social Science Research 1.8.1 Difference between Social Science Research and Physical Science Research 1.9 Significance of Economic Research 1.10 Meaning, Steps And Scope Of Educational Research : Meaning Of Educational Research 1.11 Scope Of Educational Research 1.12 Ethical Considerations Of Research 1.13 Paradigms Of Educational Research 1.14 Kinds Of Research 1.15 Classification Of Research 1.16 Points to Consider while Choosing a Research Topic 1.17 Types Of Research 1.18 There are different types of research. 1.19 Importance Of Knowing How To Conduct Research: 1.20 Qualities Of A Researcher: 1.21 Summary 1.22 Questions
1.0 OBJECTIVES To know the meaning and objectives of research. To understand the limitations of research in social science. To understand that the research in social science is differ from the research in physical science. To familiarize the students with the significance of economic research. To know the various types of research. 1.1. MEANING OF RESEARCH Research in general refers to a search for knowledge. It means research is an attempt to discover intellectual and practical answers to the various problems through the application of scientific methods to the knowable universe. In fact, research is an art of scientific investigation.
Some Definitions: (1) The advanced Learner's Dictionary: Research means "a careful investigation or inquiry ". (2) Webster's Dictionary: research means "a careful critical inquiry or examination in seeking facts or principles, diligent investigation in order to ascertain something." (3) D. Slesinger and M. Stephenson in The Encyclopedia of Social Sciences define research as "the manipulation of things, concepts or symbols for the purpose of generalizing to extend, correct or verify knowledge, whether that knowledge aids in construction of theory or in the practice of an art." (4) Redman and Mory define research as a "systematized effort to gain new knowledge". In general, we can say research is an activity or a course of action to go from known to the unknown. Research purifies human life. It improves its quality. It is search for knowledge. If shows how to Solve any problem scientifically. It is a careful enquiry through search for any kind of Knowledge. It is a journey from known to unknown. It is a systematic effort to gain new knowledge in any kind of discipline. When it Seeks a solution of any educational problem it leads to educational research. Curiosity, inquisitiveness are natural gifts secured by a man. They inspire him to quest, increase his thirst for knowledge / truth. After trial and error, he worked systematically in the direction of the desired goal. His adjustment and coping with situation makes him successful in his task. Thereby he learns something‘s, becomes wise and prepares his own scientific procedure while performing the same task for second time. So is there any relationship among science, education and educational Research? ―Research is the voyage of discovery‖. It is the quest for answers to unsolved problems. Research is required in any field to come up with new theories or modify, accept, or nullify the existing theory. From time immemorial it has been seen so many discoveries and inventions took place through research and world has got so many new theories which help the human being to solve his problems. Graham Bell, Thomas Edison, JC Bose, John Dewey, Skinner, Piaget Research like have given us theories which may cause educational progress research needs expertise. 1.2. SOURCES OF ACQUIRING KNOWLEDGE From the time we were born and the present day, each one of us has accumulated a body of knowledge. Curiosity, the desire to learn about one‘s environment and the desire to improve one‘s life through problem-solving is natural to all human beings. For this purpose, human beings depend on several methods / sources of acquiring knowledge as follows: 1. Learned Authority : Human beings refer to an authority such as a teacher, a parent or the boss or an expert or consultant and seek his / her advice. Such an authority may be based on knowledge or experience or both. For example, if a child has difficulty in learning a particular subject, he / she may consult a teacher. Learned authority could also be a book / dictionary / encyclopedia / journal / web-site on internet. 2. Tradition : Human beings easily accept many of the traditions of their culture or forefathers. For example, in matters of food, dress, communications, religion, home remedies for minor ailments, the way a friend will react to an invitation, one relies on family traditions. On the other hand, students, in case of admission criteria and procedures, examination patterns and procedures, methods of maintaining discipline, co-curricular activities, acceptable manner of greeting teachers and peers rely on school traditions. Long established customs or practices are popular sources of acquiring knowledge. This is also known as tenacity which implies holding on to a perspective without any consideration of alternatives.
3. Experience : Our own prior personal experiences in matters of problem-solving or understanding educational phenomena is the most common, familiar and fundamental source of knowledge. 4. Scientific Method : In order to comprehend and accept learning acquired through these sources, we use certain approaches which are as follows: (a) Empiricism : It implies relying on what our senses tell us. Through a combination of hearing and seeing we come to know the sound of a train. i.e. through these two senses, we learn to associate specific sounds with specific objects. Our senses also enable us to compare objects / phenomena / events. They provide us with the means for studying and understanding relationships between various concepts (eg. level of education and income). (b) Rationalism : It includes mental reflection. it places emphasis on ideas rather than material substances. if we see logical interconnectedness between two or more things, we accept those things. For example, we may reason that conducive school / college environment is expected to lead to better teacher performance. (c) Fideism : It implies the use of our beliefs, emotions or gut reactions including religion. We believe in God because our parents told us though we had not sensed God, seen or heard him nor had concluded that that his existence is logically proved. Check your progress: 1) Do you think that research is an art of scientific investigation? Yes / No. 2) Prepare a general definition for research. 1.3. OBJECTIVES OF RESEARCH The purpose of research is to discover answers to questions through the application of scientific procedures. The main aim of research is to find out the truth which is hidden and which has not been discovered as yet. Thus each research study has its own specific purpose, we may think of research objectives as following: 1) To study purposive, systematic and critical investigation into a phenomena. 2) To aim at describing, interpreting and explaining a phenomenon. 3) To adopt scientific methods of investigation and involve observable or empirical facts. 4) Research directs towards finding answers to relevant questions and solutions to problems. 5) Research emphasizes the development of generalization, principles or theories. 6) To enable researchers to establish generalized laws and to enable them for reliable predictions for future events. 7) To develop new tools, concepts and theories for a better study of unknown phenomena. It is observed that social sciences are normative to a great extent. Therefore, here we are concerned with research methodology to be used in the science of Economics. Check your progress: 1) What are the purposes of research? 2) Underline the key words in the above listed objectives of the research. 1.4. THE FUNCTIONS OF RESEARCH The following are the main functions of research-- The main function of research is to improve research procedures through the refinement and extension of knowledge. The refinement of existing knowledge or the acquisition of new
knowledge is essentially an intermediate step toward the improvement of the social studies al process. The social studies al improvement is associated with various aspects of Social Studies: (a) The function of research is to aid to making a decision concerning the refinement or extension of knowledge in this particular area. (b) The function of research is to improve the students learning and classroom problem with which teacher is encountering with problems. The more effective techniques for teaching can be developed. (c) Another function of research is to aid social studies al administrators to improve the Social Studies al systems. The Researches should contribute to the theory and practice of study studies simultaneously. It should have the image of a helpful mechanism which can be used by researcher/research scholar in one way or the other, for the improvement of the process. 1.5. Fundamental characteristics of science, technology and scientists: Scientific thinking skills
• What is science? • Main features of science • The nature of technology • Fundamental characteristics of scientists 1.5.1. What is science? Science is a particular way of understanding the natural world. Science is also said to be a systematic process of seeking or producing knowledge. This process is complicated but in very general terms it involves: - observation and problem definition - development of hypothesis, - continuous testing and extensive peer review - development of theories, laws or principles But, at the same time, science benefits from some other human values like curiosity, creativity and imagination, and requires a positive attitude for being efficient and effective in scientific development. 1.5.2. Main features of science. • Scientific outcomes are universal. Science assumes that the universe is, as its name implies, a vast single system in which the basic rules are the same everywhere. Knowledge gained from studying one part of the universe is applicable to other parts. • Scientific ideas or conclusions are subject to change, i.e, they are tentative. Science welcomes revision of its outcomes (laws, theories, principles, standards etc) by continuous testing and evaluation, peer review or replication. In principle, any theory can change after disproof attempts and new theories may replace the old ones. Thus, science corrects itself. Plasticity of thought is the very essence of the scientific process. In this sense, science rejects dogmatism. Recall that the "quantum mechanics" replaced the "classical mechanics (Newton's Laws)" for studying the behavior of micro-particles (atoms, electrons etc) at the beginning of this century before which the behavior of all particles (micro- or macro-) were being explained by classical mechanics). The number of satellites of the sun is continuously changing.
• Still, scientific knowledge is durable enough; conclusions of science are reliable. Although science welcomes change, it is not easy to change the scientific outcomes once produced by scientific standards. Note that a hypothesis is an insufficiently tested idea whereas a theory is said to be a hypothesis resisting repeated disproof attempts for years or centuries. Science can’t answer all questions. It has limits. Who can answer the question: "What is the true meaning of life?" Or who can provide the budget to prepare a one ton single crystal of carbon (meaning a single piece of diamond weighing 1000 kg)? Or who can conclude all the advances in cancer treatment at once, or in 6 months, even if we assume that we have enough funding and resources? • Science demands solid evidences. Science relies on verifiable, measurable, valid evidences, i.e., accurate data, at every stage of scientific process. These evidences can be gathered by measurements by and only by our senses, or the extensions of our senses (instruments). • Scientific decisions or evaluations are not affected by human feelings, past experience or beliefs. Development of science and scientific knowledge are not affected by human factors, like prejudices, biases, hopeful or wishful thinking, personal beliefs or priorities or preferences, nationality, sex, ethnic origin, age, political convictions, moral and aesthetic judgments and choices or religion. You like it or not, water has a boiling point of 100.0 °C every time, everywhere. Science is not democratic. • Science is shaped by logic and imagination (creativity). Presence of accurate data is not enough for the advance of science. Scientific concepts do not emerge automatically from data or from any amount of analysis alone. Logic (knowledge) and creativity are needed to shape them into scientific outcomes. All scientific inquiries must conform to the principles of logical reasoning—that is, testing the validity of arguments by applying certain criteria of inference, demonstration, and common sense. • Science explains. Science has the ability to show the relationships among phenomena which normally could be treated as unrelated. For example, the theory of "moving continents" has emerged by relating various concepts like earthquakes, fossil types on different continents, shapes of different continents etc. • Science predicts. Validation of scientific claims by observation is not enough. Theories should also have predictive power. Otherwise how could we design new powerful theories like the theory of "big bang" without using the predictive power of existing theories? In other words, how could we know that the temperature of the universe was around 1 trillion °C during the big-bang, without using the predictive power of other theories? • Science is organized into content disciplines and is conducted in various institutions Organizationally, science is a collection of various disciplines like chemistry, biology, ngineering (with its own sub-disciplines like mechanical engineering) etc.
They differ from one another in many ways, including history, phenomena studied, techniques and language used, and kinds of outcomes desired. With respect to purpose and philosophy, however, all are equally scientific and together make up the same scientific endeavor.
This provides a ready conceptual structure for efficient research in a discipline, but has disadvantages like difficulty of communication with the rest of the world. The boundaries between disciplines are not usually clear-cut. For example chemistry grows in the shade of physics and mathematics. It also has a big overlap with material sciences. Sub disciplines, or new disciplines (like sociobiology) emerge from these boundaries. Science is conducted in universities, industry and government. The main motivation for universities is production of knowledge, i.e., basic sciences with no immediate benefit. Industry is mainly involved in "applied science" for immediate benefit. Today, most universities are also involved in application of science (production and application of technology). The governments motivate both: universities for the advancement of science, and industry, for the advancement of country. 1.5.3. The nature of technology. Technology is "the application of scientific knowledge for practical purposes" (Concise Oxford English Dictionary). It is as old as human history; a stone axe was an advanced technological tool once upon a time. It is a powerful tool in the development of civilization. Who could ignore the role of the computers, satellites, and advanced engines in today’s civic life? (research, design, crafts, finance, manufacturing, management, labor, marketing, maintenance, construction, medicine etc) It helps us to change our world; and these "changes" may result with unexpected benefits as much as unexpected risks and costs. Nobody knew it was going to be used in mobile communication when the microwaves were invented, and nobody still clearly knows the extend of its health hazards. Therefore, the anticipation of the "effects of technology" is of vital importance to benefit from its advantages and eliminate the disadvantages. Therefore we need to be equipped with some background about the nature of technology to use it wisely. Here are some characteristic properties of technology: • Technology grows on science, and it contributes to science It gains inspiration, or take ideas from science. Technology grew out of the accumulated practical knowledge (know-how) including life-long personal experiences in a master-apprenticeship system. In parallel to the advance of science, master-apprentice system eventually left its role to "engineering". Engineering is the "systematic application of scientific knowledge in developing and applying technology". Engineering does not only use science, but it also uses "technology itself" and "design strategies" Science helps to estimate the behavior of things even before production, or direct observation, and suggest new behavior of things. Therefore, advanced technologies strongly depend on science. • Engineers combine scientific knowledge with practical values. Both engineers and scientists think and work very similarly. Therefore, the nature of "science" and "engineering" are very similar. For example, both engineers and scientists use math, creativity, logic, and measurability (reliable evidence). Likewise, both have eagerness for originality.
Scientists make the world understandable whereas engineers make it manipulable. Scientists can not answer all questions, engineers can not design solutions to all problems. The only difference is that engineers can affect (change) the social system easier than scientists. In addition to scientific judgments, their decisions may involve social or personal values. • The essence of engineering is "design" under constraints. A successful technological product includes a successful design; and a successful design involves a great creativity. However there is no single perfect design which is safest, cheapest, the most reliable, the most efficient all at the same time. There are always some limitations either at the production level or at the application level, or at the social values level. These constraints may be - absolute constrains like physical laws, physical properties etc. For example silver copper is a good conductor but it can oxidise at high temperatures. - flexible constraints like economical, political, social, ecological, ethical limitations... For example, gold does not oxidize at high temperatures but it is expensive. Operation and maintenance costs should also be considered at the design stage. How many of us would buy a PC if we had to hire a computer engineer for the use and repair of our PC's and laptops. Doesn't this explain the success story of "user friendly" Microsoft Windows? Thus, the technology designs should be tested before the final production by using one or more of: - the complete product (Beta versions), - small scale physical models (e.g., pilot plants) - computer simulations (safer, and cheaper) - analysis of analogous systems - testing of separate components only • All technologies involve control Control is necessary for "proper operation". Control requires: - feedback (from sensors or other sources of information) - logical comparisons of measured data to standards/instructions - a means for activating changes Today microprocessors are widely used as control units. Rapid communication and rapid processing is essential for complex control systems. All control systems require human control at some point. Live human intelligence should be able to interfere automatic control systems at any level to prevent for example the false alarms due to unprogrammed parameters, or parameters whose effects are no longer valid. • Technologies always have side effects. Every design may have unintended side effects. They may be beneficial (e.g., safer) or harmful (e.g., increasing the unemployment rate with increasing automation) Side effects are not limited to nuclear reactors. Small technologies' side effects may seem to be ignorable but they may have significant cumulative effects (like contribution of refrigerators to global warming). Prediction of side effects is not easy, sometimes impossible. Systematic risk analysis is needed. Risk analysis and even the definition of the risk is complicated, and sometimes is very expensive.
• All technological systems can fail. Most modern technologies are fairly reliable. Yet, the reliability decreases as the complexity of the design increases. So called "fail-safe" systems are designed for technologies having costly consequences if they fail. For example, it is very difficult to prevent car accidents but it is possible to lower the injuries or death incidences by using safety windows, or air-bags. Possibility of failures can be reduced by collecting more data, using more variables, building more realistic models, doing computer simulations, using tighter quality control, and building auto-correction systems. • Human presence is an important issue in technology. We, the human beings, have the capacity / ability to dominate the nature and "shape the future" rather than just responding to it. This ability (through the use of technology) has the following advantages and disadvantages: Advantages: cheaper and easier access to goods and services and comfort (transportation, communication, nutrition, health care etc.) Disadvantages: new risks both to us and other species (pollution, ozone layer, global warming etc..) We now depend on nonrenewable energy (petroleum, coal) and mines. There are serious environmental problems. Other species, e.g., birds, plants etc., suffers more from the negative consequences of technology and human presence. From their standpoint they now have less areas of vegetation, less food sources, poorer habitat with changed temp and composition, destabilized ecosystems by foreign species, more altered characteristics by genetic engineering. Hence, the number of species is continuously decreasing on contrary to the rapidly developing human population (3 times in the last century). However, we have enough reasons to conclude that the human intelligence will also solve these problems.
1.5.4. Fundamental characteristics of scientists • Scientists are conducting science as a complex social activity. Scientists, men or women from all nations or ethnic backgrounds are involved in development or applications of science, and their cumulative power have strong impacts in the society or development of their own country or territory. Scientists work in various places like universities, hospitals, business and industry, government, independent research organizations, and scientific associations. They may work alone, in small groups, or as members of large research teams. Their places of work include classrooms, offices, laboratories, and natural field settings from space to the bottom of the sea. They communicate with each other or other segments of society through special communication tools like publications in scientific journals, conferences, books, internet forums or blogs, professional associations etc. They form national and international networks for better collaboration. They also form interdisciplinary networks for sophisticated scientific products. • Scientists are responsible, honorable and trustworthy individuals; they conduct science through ethical principles. Strict ethical principles are carefully, respectfully, and proudly followed by scientists in order to keep the science on top of the most valuable human assets. Scientists posses scientific integrity in their lifestyles. Within this context: - they have a commitment to intellectual honesty, and they act responsibly, - they never deviate from accuracy (cheat) for the sake of no human benefit,
- they represent collegiality in scientific interactions, including communications and sharing of resources - they demonstrate transparency in conflicts of interest or potential conflicts of interest, - they protect human subjects, animals and environment in the conduct of science and research, - they adhere to mutual responsibilities between their own teams and other scientists or researchers. Otherwise, how could we trust on science and scientists? Ethical issues are very important in science, therefore, this topic will be covered on a separate chapter within this lecture. • Scientists not only serve science, but they are also involved in public affairs as experts or knowledgeable citizens. They have an advisory role, hence, they lead the society itself, or leaders, or administrators of the society by helping to differentiate between the "facts" and "opinions", or "true" and "false", or "possible/probable" and "impossible". Thus, their opinions are treated/perceived as "truth" by ordinary citizens. Therefore, they need to be careful on declaring opinions such that they don't mislead the society on the issues they do not have enough expertise. Scientists think critically (scientifically). Critical thinking is actually a broad term including the scientific thinking which can also be owned or applied by nonscientists. It serves as a base for the "scientific method" (which will be covered on a separate chapter in this lecture). Critical thinking means "correct thinking" for reaching or producing relevant and reliable knowledge, conclusions, beliefs or values. A person who thinks critically can ask appropriate questions, gather relevant information, efficiently and creatively sort through this information, reason logically from this information, and come to reliable and trustworthy conclusions about the world that enable one to live and act successfully in it. A critical thinker can focus, identify and clarify problems and issues, and try alternative ways or methods to solve them. A person who practices critical thinking can achieve a productive, successful, ethical, happy, and, ultimately, a satisfying and fulfilling life or profession. Critical thinking assures correct or closest to correct knowledge by welcoming thinking styles like: Rational (logical) thinking, empirical thinking, skeptical thinking, pragmatic thinking (recognizes that wishes and hopes do not make a belief true or even worth holding.), reflective thinking (stopping and revising the basis of your beliefs), creative thinking (ability to think in new and innovative ways), comprehensible thinking (using empirical, repeatable, testable, verifiable, analyzable and objective evidence for firm conclusions), reasonable thinking (emotions are not evidence, and feelings are not facts), quantitative thinking (using quantitative terms to describe the nature), analytical thinking (a conscious and reasoned process of analysis, clarification, comparison, inference and evaluation), statistical thinking. Without critical thinking our beliefs, evaluations, or conclusions could be falsified by the catalysis of some ordinary thinking styles (mostly harmful at scientific level) like:
illogical thinking, intuitive thinking (superiority of mind's power), hopeful/wishful thinking, authritarian thinking (unquestioned acceptance of knowledge by an authority figure or institution), dogmatic thinking (resistance to accept new knowledge or change), idealistic thinking , absolutist thinking (black or white thinking), close-minded thinking (reliance on old),
mystical thinking, emotional thinking, qualitative thinking (using ambiguous and imprecise qualitative terms) etc. Critical thinking is essential for scientific practices, in other words, there is no alternative for the scientists and researchers. Critical thinking could be learned in childhood only from the parents or teachers. Children can not learn the critical thinking by themselves, from peers, or by their mistakes. A proper undergraduate education will help to improve one's critical thinking skills. At graduate level, you can continue to improve your critical thinking skills by continuously and consciously testing and evaluating your scientific practices and keeping them within the range described here in this section. As stated above, rational (logical) thinking, empirical thinking and skeptical thinking are the most basic characteristics of critical thinking: Empirical Thinking, or Empiricism : The Use of Empirical Evidence As mentioned earlier, an empirical (experimental) evidence is the only type of evidence used by scientists and critical thinkers to make vital decisions and reach sound conclusions. They are not interested in ad-hoc hypothesis; i.e, they do not base their arguments on spiritual claims like Elves and Gnomes. Logical Thinking, or Rationalism: The Practice of Logical Reasoning Logic allows us to reason correctly. Logic can be learned through education (either through taking logic courses, or taking science courses; especially Mathematics). The use of logic is not easy. Logical reasoning may even be painful since it may require fighting with your inner world, and sometimes deny your feelings. Thus, true scientists are conscious enough about this phenomena, and know how to stay away from wishful, hopeful, or emotional thinking. Furthermore, the scientists are conscious enough about logical fallacies and faulty reasoning. They are not trapped with false logic, falsehood and misconceptions. Here are some common sources of logical fallacies - Incorrect assumption of cause/effect relationship (For example: "every time I wash my car, it rains; therefore, if I wash my car, it will rain."
- Inaccurate or distorted use of the interpretation of numerical statistical information Example: "Fatal traffic accidents decreased by 83 % after increasing the traffic fines (monetary penalty) the last month." (1 month statistics is not comparable to years' statistics. Drawing such a conclusion requires at least 1 year measurement)
- Faulty analogy, comparison carried too far, or comparison of things that have nothing in common. For example "Apples and oranges are both fruit and grow on trees; therefore, they taste the same" - Oversimplification. Potentially relevant information is ignored in order to make a point. Example: (No color change was observed; therefore compound A and B does not react" (What if the product is colorless? Or if you are sure that it is colored, then have you tried at other reaction temperatures?) - Stereotyping. This is the application of an over-simplified label to entire group of people or objects. Example: "All Hispanic Americans speak Spanish; therefore Spanish language advertising will appeal to all of them.
- Ignoring the question, digression (deviation from the main point), obfuscation (lack of clarity, confusion) are used to avoid answering a question. For example, "When asked about a tax increase possibility, a politician replies, - I have always met the obligations I have to those I represent.!!"
- Faulty generalization. It is a judgment based on insufficient evidence. Example: Ducks and geese migrate south for the winter; therefore, all waterfowl migrate south for winter. Skeptical thinking, or skepticism: Possessing a skeptical attitude Scientists repeatedly and rigorously examine (question) their beliefs and conclusions in order not to be trapped by self deception or deception by others. Self deception is a very common human failing, especially among ordinary, uneducated people. The problem is that it goes unrecognized since nobody wants to deny themselves. Thus scientists compare the logical consequences of their beliefs with objective reality (as measured by empirical evidence). If they match, the scientists conclude that their beliefs are reliable knowledge, i.e., their beliefs have a --you can conclude that your beliefs are reliable knowledge (that is, your beliefs have a high probability of being true. Some people believe that scientists are close-minded, i.e., they resist changing. But just opposite is true, "true scientists" are undogmatic, and they are willing to replace their old beliefs when there are more reliable evidences or sound reasons for change. • Scientists are eager to learn and teach. Learning and teaching are key concepts in the life of a scientist. True scientists always reserve a time slot on their weekly schedule for following the literature to update themselves with the latest developments in his field. Likewise, true scientists see "teaching" as an integral part of their profession. They like to share their knowledge with their students, colleagues, and society whenever necessary. • Scientists learn from each other. That is the reason why scientific seminars, conferences, and workshops are common practices in scientific community. That is the reason why we have thousands of scientific journals. The term "secret information" does not go along with scientific manner except for theca cases like commercial or military research. Scientists serve to each other as peer reviewers in thesis defense juries, paper manuscript presentations, financial fund applications, etc. Formal or informal discussions are favored to guard the scientists from unforeseen errors or mistakes, as well as they provide the fuelling effect of common knowledge and synergy, develop new ideas and critical thinking skills. "Discussion" or "arguments" suggests a "fight" or a manifestation of power, or an aggressive conflict where one tries to dominate the other, or simply "win" in everyday life. In other words, for ordinary citizens, a discussion is often a totally "humanly emotional" activity. However, in science, this kind of "personal" arguments are not appropriate. It is not important who "wins" -what matters most is the quality of argument itself. Scientific discussions among true scientists may sometimes be very rigorous, and they may even seem to be hurting, but they are practiced through some scientific discussion etiquette rules. These rules will be summarized elsewhere. Scientists work systematically No invention is all of a sudden in science. "Eureka" sort of discoveries are of historical (or better "nostalgical") importance. Today, even very small discoveries are done by having carefully designed procedures or road maps. Research proposals having a small ambiguity in the design of method and experiments are easily rejected. • Scientists seek originality

They are eager to dig the universe for exploring "unknown" or "new" or "unique", i.e., originality. It could be originality in the tools, techniques, and procedures developed, originality in exploring the unknowns, originality in the products (outcomes) or byproducts, originality on the use of data and so on. This topic will be covered in more detail since originality is a "must" in graduate science, and a graduate student should comprehend it clearly. • Curiosity and a positive attitude is the fuel of scientists. Scientists see the universe through questions (curiosity), and attempt them to answer them. A positive attitude is a must for productivity and effectiveness. Who can manage to put a person into the laboratory if he believes that "he can't do it"? We will discuss the role of a positive attitude and attitude development skills elsewhere in this lecture. • Creative thinking is a powerful tool for scientists. Scientists do research. Research is a form of problem solving. Creativity is a means of increasing the productivity and efficiency of problem solving. Creativity is especially useful when new ideas are needed. This includes both the generating of ideas when identifying a research topic and overcoming setbacks that often occur during the research. Use of creative thinking activities encourages looking at the research topic or problem from a broader perspective. Creative thinking skills can be improved. Creativity Inhibitors Inhibitors are factors that limit one's use of his or her creative ability. The attitudes "I am not creative" or "I cannot improve my creative ability" are examples of creativity inhibitors. Other examples of creativity inhibitors include the fear of questioning, exploring new ideas, making mistakes, experiencing failure, and taking risks. Overcoming such fears through a study of creativity is the first step toward success in improving your creative ability. There exists a common myth: "One's creative ability is set at birth and it cannot be developed". In some cases, this myth becomes a crutch that people use to avoid self-improvement. In fact, studies have shown that individuals can improve their creative ability by learning creativity enhancement techniques and by adopting a positive attitude toward creativity. Another myth about creativity is that some people have it and others do not. While this is a common belief, all studies of creativity suggest otherwise. In fact, it is often this belief that hinders individuals from succeeding in research. They develop a mental block against creative idea development because they believe that they lack the capacity for creative thought. Creativity Stimulators What factors have influenced your current level of creative ability? Many factors are responsible, including your intellect, your life experiences, your attitude toward creative problem solving, your curiosity, your willingness to persevere, and your knowledge of and ability to use creativity stimulators, i.e., creative problem-solving methods. Your creative ability improves whenever you improve any one of these factors. The first step toward improving your creative ability is improving your attitude about the value of creative problem solving. Obviously, if you approach the topic with the attitude that it isn't important or that creative ability cannot be developed, then it is quite unlikely that you will become more creative. In this case, your attitude is a creativity inhibitor. Even the attitude that
you will explore the possibility that you can become more creative is a step in the right direction. Once you have adopted a positive attitude, you will be more open to using creativity stimulators, which are methods that can be used to generate creative ideas. While a number of stimulators or techniques are used, some will be briefly outlined:
Talking things over - Talking things with other people does not only provide the benefit of their views and ideas, the very act of talking seems to stimulate one's own thinking. The other person does not necessarily be of the same field, or the expert of the field. Talk with other colleagues or friends. If you have nobody to talk, talk yourself.
Keeping an open mind - It is a fundamental to all research. It involves identifying all the unlikely or seemingly implausible interpretations and then considering them carefully to see if they might have any validity. Keeping an open mind is particularly important when talking to others; without it, one is liable (responsible) to 'hear' (i.e., 'take in') only what one already knows.
Brainstorming - Useful particularly in problem solving in groups. Negative brainstorming - listing as many ways as one can think of about how not to
achieve a purpose, and then, when the list is complete, considering whether reversing any of them might be productive. This method may seem to be ridiculous (absurd, meaningless) but, however, it is very effective in producing "ideas" that would never have been thought of via more direct methods.
Viewing the problem from imaginative perspectives - that frees the mind from constraints which may have handicapped its creativity and which may in practice not be as convention and normal expectations have led one to expect. Technique involves asking or defining preposterous (unbelievable, absurd, seemingly impossible, ridiculous) questions or problems and trying to solve them. Some may end up with worthwhile results.
Concentrating on anomalies - it involves the reconsideration of anomalies (abnormal, unexpected, outlying results) if they offer anything worth of exploring or investigating.
Focusing on byproducts - the solution may be hidden in the byproducts. Do not waste your data easily.
Interrogating (collecting evidence through questioning) imaginary experts - Prepare a list of questions as if you are going to interview an expert of the field. The interview does not have to take place.
Viewing the problem from the perspective of another discipline - Talk the problem with other people from other fields and see how they approach. Or examine (learn) that discipline approach the problem from the point of that discipline by yourself.
Using 'the solution looking for the problem': serendipity (ability to make valuable discoveries by accident) - to keep one's eyes and ears constantly open, to question anything and everything to see if it might be used to provide a creative leap (jump) forward.
Using mind maps - freeing the mind from the constrained and ordered viewpoint from which it has been seeing a problem or issue. It provides an overview, which shows at a glance all the components of the problem or issue and the links between them.

• Scientists have refined aesthetic notion Scientists appreciate beauty, i.e., they are usually very close to art and artists. This explains why most of the universities teach arts and science topics in a single faculty named "Faculty of Arts and Sciences" • Scientists can’t answer all questions yet This is not a shame. Science is still developing and will continue to develop as long as human curiosity exists. • Scientists are human beings!!! There is a famous humor saying that "scientists live in ivory towers" meaning that thinking- and life-styles of scientists are totally incompatible with ordinary people, therefore, they isolate themselves from the rest of the society. That is not true at all. True scientists also have all human feelings. They also love, hate, enjoy, get angry, scream, joke, belive, suffer, win, gain, loose, struggle, vote etc as much as ordinary citizens do... They can also fail in in their decisions, even in their academic life.
1.6. OBJECTIVES OF RESEARCH The research has the following three objectives: 1. Theoretical objective 2. Factual objective and 3. Application objective. 1. Theoretical Objective Those researches whose objectives are theoretical formulate the new theories, principles or laws. Such type of research is explanatory because it explains the relationships of certain variables. These researches contribute some basic knowledge to the human knowledge. The researches in different disciplines i.e., Physics, Chemistry, Mathematics etc. have the theoretical objective. 2. Factual Objective Those researches whose objective is factual find out new facts. This objective is by nature descriptive. These researches describe facts or events which happened previously. Such type of research is done in history. 3. Application Objective The research having application objective does not contribute a new knowledge in the fund of human knowledge but suggests new applications. By application we mean improvement and modification in practice. For example if anyone gives a new application of electricity then such type of research has application objective. 1.7. SCIENTIFIC RESEARCH DEFINITION For some reason, probably related to a dislike for math, many people consider the word research and everything the word suggests as unpleasant. But research can be a valuable term. It can lead to uncovering the answers to "impossible" questions. Two basic questions the beginning researcher must learn to answer are how and when to use research methods and statistical procedures. Developing methods and procedures are 3 valuable tasks, but the focus for the majority of research students should be on applications. Although both statisticians and researchers are fundamental in producing research results, their specialties are different (keep in mind that one person may serve in both capacities). Statisticians generate statistical procedures or formulas called algorithms; researchers use these
algorithms to investigate research questions and hypotheses. The results of this cooperative effort are used to advance our understanding of the studied phenomenon. Scientific research may be defined as a systematic, controlled, empirical, and critical investigation of hypothetical propositions about the presumed relations among observed phenomena. This definition contains the basic terms necessary in defining the method of scientific research, and describes a procedure that has been accepted for centuries. However, regardless of its origin, all research begins with a basic question or proposition about a specific phenomenon. For example: Why do viewers select one television program over another? What sections of the newspaper do people read most often? What types of magazine covers attract the widest number of readers? Which types of advertising are most effective in selling specific types of products? Each of these questions could be answered to some degree with a well-designed research study. The difficulty, in many cases, is to determine which type of study, or which method of collecting data, is most appropriate to answer the specific question(s). The user of the method of tenacity follows the logic that something is true because it has always been true. An example is the store owner who says, "I don't advertise because my parents did not believe in advertising." The basic idea is that nothing changes; what was good, bad, or successful before will continue to be so in the future. In the method of intuition, the a priori approach, one assumes that something is true because it is "self-evident" or "stands to reason." Researchers who conduct telephone research encounter this method of knowing frequently. Many respondents assume (intuition) that all research projects involve some form of sales. This "fear," along with various consumer groups that wish to ban all forms of telephone contacts for sales, research, or solicitation, may be the downfall of telephone research in the near future. The method of authority seeks to promote belief in something because a trusted source, such as a relative, news correspondent, or teacher, says it is true. The emphasis is on the source, not on the methods the source may have used to gain the information. The claim that "The world is going to end tomorrow because the New York Times editorial said so" is based on the method of authority. The scientific method approaches learning as a series of small steps. That is, one study or one source provides only an indication of what may or may not be true; the "truth" is found only through a series of objective analyses. This means that the scientific method is self-correcting in that changes in thought or theory are appropriate when errors in previous research are uncovered. For example, scientists changed their ideas about the planets Saturn, Uranus, and Neptune when, on the basis of information gathered by the Voyager spacecraft, they uncovered errors in earlier observations. In communications, researchers discovered that the early perceptions of the power of the media (the "hypodermic needle" theory) were incorrect and, after numerous research studies, concluded that behavior and ideas are changed by a combination of communication sources and that people may react to the same message in different ways. The scientific method may be inappropriate many areas of life, such as evaluating works of art, choosing a religion, or forming friendships, but the method has been valuable in producing accurate and useful data in mass media research. The following section provides a more detailed look at this method of knowing.
1.7.1. Characteristics of the Scientific Method Five basic characteristics, or tenets, distinguish the scientific method from other methods of knowing. A research approach that does not follow these tenets cannot be considered to be a scientific approach.
Scientific research is public: Scientific advancement depends on freely available information. A researcher, especially in the academic sector, cannot plead private knowledge, methods, or data in arguing for the accuracy of his or her findings; scientific research information must be freely communicated from one researcher to another. Researchers, therefore, must take great care in published reports to include information on their use of sampling methods, measurements, and data-gathering procedures. Such information allows other researchers to verify independently a given study and to support or refute the initial research findings. This process of replication, allows for correction or verification of previous research findings. Researchers also need to save their descriptions of observations (data) and their research materials so that information not included in a formal report can be made available to other researchers on request. It is common practice to keep all raw research material for 5 years. This material is usually provided free as a courtesy to other researchers or for a nominal fee if photocopying or additional materials are required.
Science is objective: Science tries to rule out eccentricities of judgment by researchers. When a study is undertaken, explicit rules and procedures are constructed and the researcher is bound to follow them, letting the chips fall where they may. Rules for classifying behavior are used so that two or more independent observers can classify particular patterns of behavior in the same manner. For example, if the attractiveness of a television commercial is being measured, researchers might count the number of times a viewer switches channels while the commercial is shown. This is considered to be an objective measure because a change in channel would be reported by any competent observer. Conversely, to measure attractiveness by observing how many people make negative facial expressions while the ad is shown would be a subjective approach, since observers may have different ideas of what constitutes a negative expression. However, an explicit definition of the term negative facial expression might eliminate the coding error. Objectivity also requires that scientific research deal with facts rather than interpretations of facts. Science rejects its own authorities if their statements are in conflict with direct observation.
Science is empirical: Researchers are concerned with a world that is knowable and potentially measurable. (Empiricism is derived from the Greek word for "experience"). They must be able to perceive and classify what they study and to reject metaphysical and nonsensical explanations of events. For example, a newspaper publisher's claim that declining subscription rates are "God's will" would be rejected by scientists — such a statement cannot be perceived, classified, or measured. This does not mean that scientists evade abstract ideas and notions — they encounter them every day. But they recognize that concepts must be strictly defined to allow for observation and measurement. Scientists must link abstract concepts to the empirical world through observations, which may be observed either directly or indirectly via various measurement instruments. Typically this linkage is accomplished by framing an operational definition.
Operational definitions are important in science, and a brief introduction necessitates some backtracking. There are basically two kinds of definitions. A constitutive definition defines a word by substituting other words or concepts for it. For example, "An artichoke is a green leafy vegetable, a tall composite herb of the Cynara scolymus family" is a constitutive definition of the concept "artichoke". In contrast, an operational definition specifies procedures to be followed in experiencing or measuring a concept. For example, "Go to the grocery store and find the produce aisle. Look for a sign that says Artichokes. What's underneath the sign is one." Although an operational definition assures precision, it does not guarantee validity. An errant stock clerk may mistakenly stack lettuce under the artichoke sign and fool someone. This underlines the importance of considering both the constitutive and the operational definition of a concept in evaluating the trustworthiness of any measurement. A careful examination of the constitutive definition of artichoke would indicate that the operational definition might be faulty.
Science is systematic and cumulative: No single research study stands alone, nor does it rise or fall by itself. Astute researchers always utilize previous studies as building blocks for their own work. One of the first steps taken in conducting research is to review the available scientific literature on the topic so that the current study will draw on the heritage of past research. This review is valuable for identifying problem areas and important factors that might be relevant to the current study (see Cat-tell, 1966). In addition, scientists attempt to search for order and consistency among their findings. In its ideal form, scientific research begins with a single, carefully observed event and progresses ultimately to the formulation of theories and laws. A theory is a set of related propositions that presents a systematic view of phenomena by specifying relationships among concepts. Researchers develop theories by searching for patterns of uniformity to explain the data that have been collected. When relationships among variables are invariant under given conditions; that is, when the relationship is always the same, researchers may formulate a law. Both theories and laws help researchers search for and explain consistency in behavior, situations, and phenomena. Science is predictive. Science is concerned with relating the present to the future. In fact, scientists strive to develop theories because, for one reason, they are useful in predicting behavior. A theory's adequacy lies in its ability to predict a phenomenon or event successfully. If a theory suggests predictions that are not borne out by data analysis, that theory must be carefully reexamined and perhaps discarded. Conversely, if a theory generates predictions that are supported by the data, that theory can be used to make predictions in other situations.
1.8. LIMITATIONS OF SOCIAL SCIENCE RESEARCH Limitations of social science research can easily be understood by comparing it with physical science research. For this purpose, we see the difference between social science research and physical science research. 1.8.1. Difference between Social Science Research and Physical Science Research Social sciences are not exact like Physical sciences i.e. physics, chemistry, etc. They are to some extent normative. The approach in Social Science studies is evaluative. This is because these sciences deal with human beings. For example, economics is defined as a study of mankind in ordinary business of life. However, the environment in which this ordinary business of life is conducted is complex. It is, therefore, more difficult to comprehend and predict human
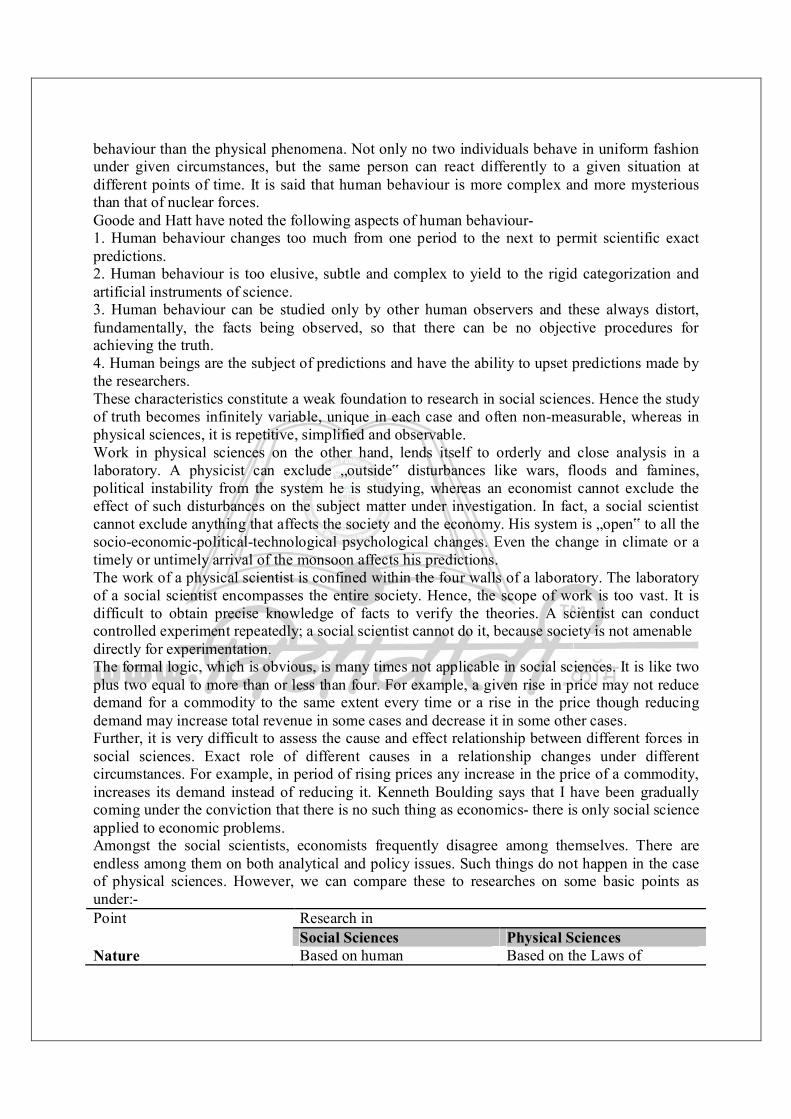
behaviour than the physical phenomena. Not only no two individuals behave in uniform fashion under given circumstances, but the same person can react differently to a given situation at different points of time. It is said that human behaviour is more complex and more mysterious than that of nuclear forces. Goode and Hatt have noted the following aspects of human behaviour- 1. Human behaviour changes too much from one period to the next to permit scientific exact predictions. 2. Human behaviour is too elusive, subtle and complex to yield to the rigid categorization and artificial instruments of science. 3. Human behaviour can be studied only by other human observers and these always distort, fundamentally, the facts being observed, so that there can be no objective procedures for achieving the truth. 4. Human beings are the subject of predictions and have the ability to upset predictions made by the researchers. These characteristics constitute a weak foundation to research in social sciences. Hence the study of truth becomes infinitely variable, unique in each case and often non-measurable, whereas in physical sciences, it is repetitive, simplified and observable. Work in physical sciences on the other hand, lends itself to orderly and close analysis in a laboratory. A physicist can exclude „outside‟ disturbances like wars, floods and famines, political instability from the system he is studying, whereas an economist cannot exclude the effect of such disturbances on the subject matter under investigation. In fact, a social scientist cannot exclude anything that affects the society and the economy. His system is „open‟ to all the socio-economic-political-technological psychological changes. Even the change in climate or a timely or untimely arrival of the monsoon affects his predictions. The work of a physical scientist is confined within the four walls of a laboratory. The laboratory of a social scientist encompasses the entire society. Hence, the scope of work is too vast. It is difficult to obtain precise knowledge of facts to verify the theories. A scientist can conduct controlled experiment repeatedly; a social scientist cannot do it, because society is not amenable directly for experimentation. The formal logic, which is obvious, is many times not applicable in social sciences. It is like two plus two equal to more than or less than four. For example, a given rise in price may not reduce demand for a commodity to the same extent every time or a rise in the price though reducing demand may increase total revenue in some cases and decrease it in some other cases. Further, it is very difficult to assess the cause and effect relationship between different forces in social sciences. Exact role of different causes in a relationship changes under different circumstances. For example, in period of rising prices any increase in the price of a commodity, increases its demand instead of reducing it. Kenneth Boulding says that I have been gradually coming under the conviction that there is no such thing as economics- there is only social science applied to economic problems. Amongst the social scientists, economists frequently disagree among themselves. There are endless among them on both analytical and policy issues. Such things do not happen in the case of physical sciences. However, we can compare these to researches on some basic points as under:- Point Research in
Social Sciences Physical Sciences Nature Based on human Based on the Laws of
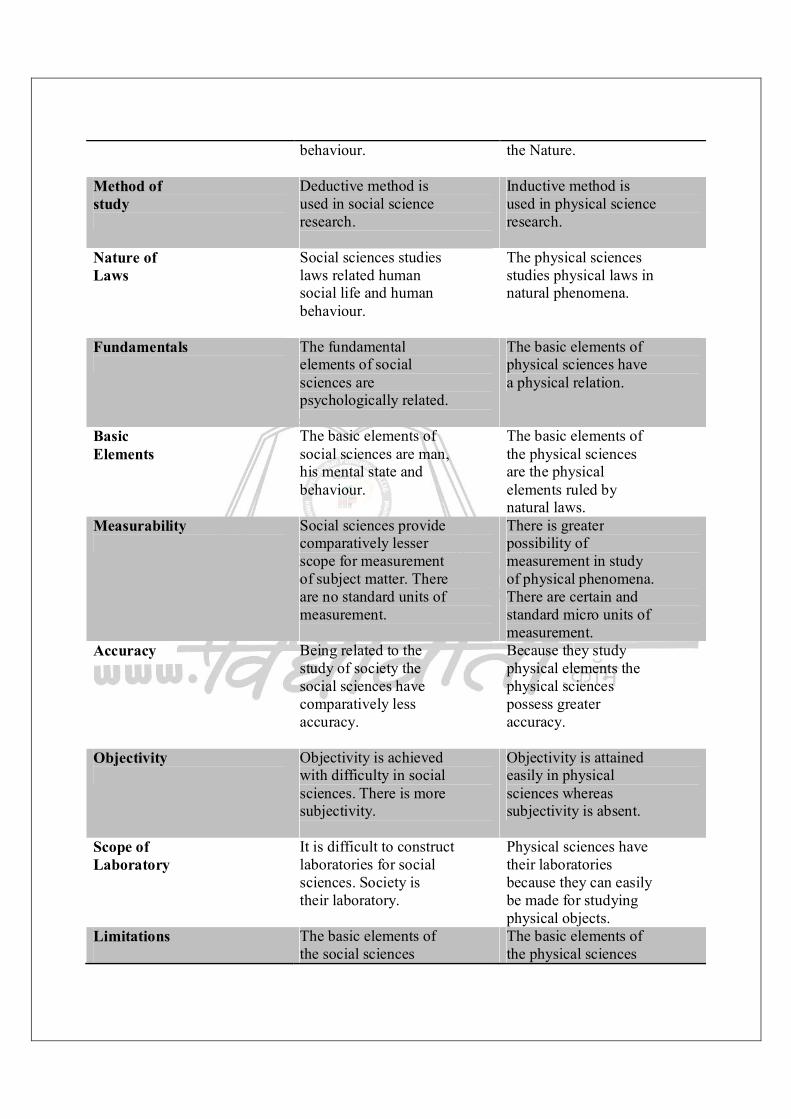
behaviour.
the Nature.
Method of study
Deductive method is used in social science research.
Inductive method is used in physical science research.
Nature of Laws
Social sciences studies laws related human social life and human behaviour.
The physical sciences studies physical laws in natural phenomena.
Fundamentals
The fundamental elements of social sciences are psychologically related.
The basic elements of physical sciences have a physical relation.
Basic Elements
The basic elements of social sciences are man, his mental state and behaviour.
The basic elements of the physical sciences are the physical elements ruled by natural laws.
Measurability
Social sciences provide comparatively lesser scope for measurement of subject matter. There are no standard units of measurement.
There is greater possibility of measurement in study of physical phenomena. There are certain and standard micro units of measurement.
Accuracy
Being related to the study of society the social sciences have comparatively less accuracy.
Because they study physical elements the physical sciences possess greater accuracy.
Objectivity
Objectivity is achieved with difficulty in social sciences. There is more subjectivity.
Objectivity is attained easily in physical sciences whereas subjectivity is absent.
Scope of Laboratory
It is difficult to construct laboratories for social sciences. Society is their laboratory.
Physical sciences have their laboratories because they can easily be made for studying physical objects.
Limitations
The basic elements of the social sciences
The basic elements of the physical sciences
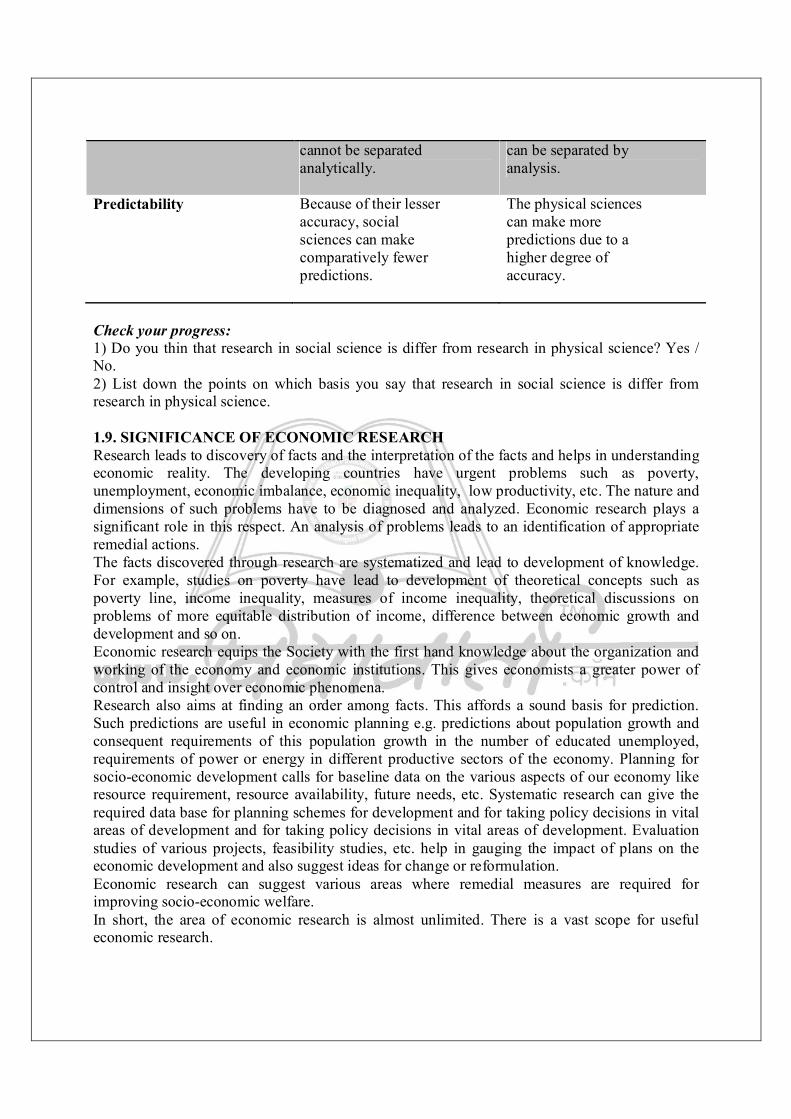
cannot be separated analytically.
can be separated by analysis.
Predictability
Because of their lesser accuracy, social sciences can make comparatively fewer predictions.
The physical sciences can make more predictions due to a higher degree of accuracy.
Check your progress: 1) Do you thin that research in social science is differ from research in physical science? Yes / No. 2) List down the points on which basis you say that research in social science is differ from research in physical science. 1.9. SIGNIFICANCE OF ECONOMIC RESEARCH Research leads to discovery of facts and the interpretation of the facts and helps in understanding economic reality. The developing countries have urgent problems such as poverty, unemployment, economic imbalance, economic inequality, low productivity, etc. The nature and dimensions of such problems have to be diagnosed and analyzed. Economic research plays a significant role in this respect. An analysis of problems leads to an identification of appropriate remedial actions. The facts discovered through research are systematized and lead to development of knowledge. For example, studies on poverty have lead to development of theoretical concepts such as poverty line, income inequality, measures of income inequality, theoretical discussions on problems of more equitable distribution of income, difference between economic growth and development and so on. Economic research equips the Society with the first hand knowledge about the organization and working of the economy and economic institutions. This gives economists a greater power of control and insight over economic phenomena. Research also aims at finding an order among facts. This affords a sound basis for prediction. Such predictions are useful in economic planning e.g. predictions about population growth and consequent requirements of this population growth in the number of educated unemployed, requirements of power or energy in different productive sectors of the economy. Planning for socio-economic development calls for baseline data on the various aspects of our economy like resource requirement, resource availability, future needs, etc. Systematic research can give the required data base for planning schemes for development and for taking policy decisions in vital areas of development and for taking policy decisions in vital areas of development. Evaluation studies of various projects, feasibility studies, etc. help in gauging the impact of plans on the economic development and also suggest ideas for change or reformulation. Economic research can suggest various areas where remedial measures are required for improving socio-economic welfare. In short, the area of economic research is almost unlimited. There is a vast scope for useful economic research.

Check your progress 1) List down the points showing the significance of economic research. 1.10. MEANING, STEPS AND SCOPE OF EDUCATIONAL RESEARCH : MEANING OF EDUCATIONAL RESEARCH Educational Research as nothing but cleansing of educational Research is nothing but cleansing of educational process. Many experts think Educational Research as under- According to Mouly, ―Educational Research is the systematic application of scientific method for solving for solving educational problem. Travers thinks, ―Educational Research is the activity for developing science of behavior in educational situations. It allows the educator to achieve his goals effectively.‖ According to Whitney, ―Educational Research aims at finding out solution of educational problems by using scientific philosophical method.‖ Thus, Educational Research is to solve educational problem in systematic and scientific manner, it is to understand, explain, predict and control human behaviour. Educational Research Characterizes as follows :
It is highly purposeful. It deals with educational problems regarding students and teachers as well. It is precise, objective, scientific and systematic process of investigation. It attempts to organize data quantitatively and qualitatively to arrive at statistical
inferences. It discovers new facts in new perspective. i. e. It generates new knowledge. It is based on some philosophic theory. It depends on the researchers ability, ingenuity and experience for its interpretation
and conclusions. It needs interdisciplinary approach for solving educational problem. It demands subjective interpretation and deductive reasoning in some cases. It uses classrooms, schools, colleges department of education as the laboratory for
conducting researches. 1.11. SCOPE OF EDUCATIONAL RESEARCH Name of Educational Research changes with the gradual development occurs with respect to knowledge and technology, so Educational Research needs to extend its horizon. Being scientific study of educational process, it involves : - individuals (Student, teachers, educational managers, parents.) - institutions (Schools, colleges, research – institutes) It discovers facts and relationship in order to make educational process more effective. It relates social sciences like education. It includes process like investigation, planning (design) collecting data, processing of data, their analysis, interpretation and drawing inferences. It covers areas from formal education and conformal education as well. Check your Progress 1. Name disciplines on which education depends. 2. How education is an art? 3. How education is a science? 4. Name the areas of Educational Research in addition to formal education? 5. Name the aspects in which Educational Research can seek improvement? 6. Name the human elements involved in Educational Research? 7. Name the institutions involved in Educational Research?
8. Name the essential qualities of Educational Researches. 9. What is the goal of Educational Research with respect to new knowledge? 1.12. ETHICAL CONSIDERATIONS OF RESEARCH Research exerts a significant influence over educational systems. Hence a researcher needs to adhere to an ethical code of conduct. These ethical considerations are as follows : While a researcher may have some obligations to his / her client in case of sponsored research where the sponsoring agency has given him / her financial aid for conducting the research, he / she has obligations to the users, the larger society, the subjects (sample / respondents) and professional colleagues. He / she should not discard data that can lead to unfavourable conclusions and interpretations for the sponsoring agency.
The researcher should maintain strict confidentiality about the information obtained from the respondents. No information about the personal details of the respondents should be revealed in any of the records, reports or to other individuals without the respondents‘ permission.
The researcher should not make use of hidden cameras, microphones, tape-recorders or observers without the respondents‘ permission. Similarly, private correspondence should not be used without the concerned respondent‘s permission.
In an experimental study, when volunteers are used as subjects, the researcher should explain the procedures completely (eg. the experiment will go on for six months) along with the risks involved and the demands that he / she would make upon the participants of the study (such as the subjects will be required to stay back for one hour after school hours etc.). If possible, the subjects should be informed about the purpose of the experiment / research. While dealing with school children (minors) or mentally challenged students, parents‘ or guardians‘ consent should be obtained. This phenomenon is known as ‗informed consent‘.
The researcher should accept the fact that the subjects have the freedom to decline to participate or to withdraw from the experiment. In order to ensure the subjects‘ inclusion and continuation in the experiment, the researcher should never try to make undue efforts giving favourable treatment after the experiment, more (additional marks) in a school subject, money and so on.
In an experimental research which may have a temporary or permanent effect on the subjects, the researcher must take all precautions to protect the subjects from mental and physical harm, danger and stress. The researcher should make his / her data available to peers for scrutiny. The respondents / subjects / participants should be provided with the reasons for the experimental procedures as well as the findings of the study if they so demand. The researcher should give due credit to all those who have helped him / her in the research procedure, tool construction, data collection, data analysis or preparation of the research report. If at all the researcher has made some promise to the participants, it must be honoured and fulfilled. 1.13. PARADIGMS OF EDUCATIONAL RESEARCH The idea of social construction of rationality can be pursued by considering Kuhn‘s idea of scientific paradigm. Thomas Kuhn, himself a historian of science, contributed to a fruitful
development in the philosophy of science with his book ―"The Structure of Scientific Revolutions" published in 1962. It brought into focus two streams of thinking about what could be regarded as 'scientific‘, the Aristotelian tradition with its teleological approach and the Galilean with its causal and mechanistic approach. It introduced the concept of 'paradigm‘ into the philosophical debate. Definition and Meaning of Paradigm of Research : ―"Paradigm" derives from the Greek verb for ―""exhibiting side by side. In lexica it is given with the translations ―"examples"or table of changes in form and differences in form. Thus, Paradigms are ways of organizing information so that fundamental, abstract relationships can be clearly understood. The idea of paradigm directs attention to science as having recognized patterns of commitments, questions, methods, and procedures that underlie and give direction to scientific work. Kuhn focuses upon the paradigmatic elements of research when he suggests that science has emotional and political as well as cognitive elements. We can distinguish the underlying assumptions of a paradigm by viewing its discourse as having different layers of abstractions. The layers exists simultaneously and are superimposed upon one another. The concept of paradigm provides a way to consider the divergence in vision, custom, and tradition. It enables us to consider science as having different sets of assumptions, commitments, procedures and theories of social affairs. A paradigm determines the criteria according to which one selects and defines problems for inquiry and how one approaches them theoretically and methodologically. A paradigm could be regarded as a cultural man made object, reflecting the dominant notions about scientific behaviour in a particular scientific community, be it national or international, and at a particular pointing time. Paradigms determine scientific approaches and procedures which stand out as exemplary to the new generation of scientists – as long as they do not oppose them. A ―revolution‖ in the world of scientific paradigms occurs when one or several researchers at a given time encounter anomalies or differences, for instance, make observations, which in a striking way to not fit the prevailing paradigm. Such anomalies can give rise to a crisis after which the universe under study is perceived in an entirely new light. Previous theories and facts become subject to thorough rethinking and revaluation. 1.14. KINDS OF RESEARCH There are various bases to classify the research. A. On the Basis of Objectives of Research On the basis of objectives of research they are of two types: 1. Fundamental research and 2. Action research. B. On the Basis of Approach of Research On the basis of approach of Research they are of two types: 1. Longitudinal research: Historical research, case study, genetic comes under longitudinal approach of research. 2. Cross sectional research: Experimental research, survey are the examples of cross sectional research. C. On the Basis of Precision in Research Findings On the basis of precision (accuracy) the researches are: 1. Experimental research and 2. Non-experimental research. Experimental research is precise while non-experimental is not.
D. On the Basis of Nature of Findings On the basis of findings Researches are of two types: 1. Explanatory research: Such researches explain more concerned theories. laws and principles. 2. Descriptive research: These are more concerned with facts. E. According to National Science Foundation These National Science Foundation formulated a three-fold classification of research. 1. Basic research: Those researches which embrace origin or unique investigation for the advancement of knowledge. 2. Applied research: Which may be characterized as the utilization in practice. 3. Development research: It is the use of scientific knowledge for the production of useful materials, devices, systems, methods for processes excluding design and production engineering. F. Another Classification 1. Adhoc research: Adhoc research is the class of inquiry used for a purpose alone and special. 2. Empirical research: Empirical research is that which depends upon the experience or observation of phenomena and events. 3. Explained research: Explained research is that which is based on a theory. 4. Boarder line research: Boarder line research is that which involves those main two branches or are as of science. For example study of public school finance. 1.15. CLASSIFICATION OF RESEARCH In actual practice, research is conducted at different levels and for different immediate purposes. The level at which a person operates in the field depends on the objectives he intends to accomplish. Generally research has two levels: 1. Basic level and 2. Applied level. 1. Basic Level Trevers has defined basic level as basic research. It is designed to add an organized body of scientific knowledge and does not necessarily produce results of immediate practical value. 2. Applied Level Applied research is undertaken to solve an immediate practical problem and the goal of adding to scientific knowledge is secondary. A common mistake is to assume that levels differ according to complexity and that basic research tends to be complex and applied research. Some applied research is quite complex and some basic research is rather simple. 1.16. Points to Consider while Choosing a Research Topic For successful choice of a researchable topic, you should put the following into consideration:
Your Knowledge of the Topic Do not choose a topic you know nothing about. It is important that you possess some reasonable knowledge of the topic you intend to choose for your project.
Your Interest Do not write on any topic that does not arouse your interest. If you do, you can hardly stimulate the interest of another person/your reader. Your research would be successful if you deal with a problem that is of your interest. This is because interest provides undisputable motivation which can sustain your interest until you round off the exercise.
Availability of Material You must ensure you have sufficient materials that will help you to produce a good work. This demands an extensive use of the library materials and the internet facilities.
Page Limit Your project should not exceed the acceptable page limit for an undergraduate or Master of Arts’ degree studies. Only doctoral degree students are free to produce any number of pages of their work, no restrictions. As a result, if you are not a doctoral candidate, you must choose a topic you would be able to handle effectively within the page limit prescribed for project writing in the Department of Computer Science of your institution. Usually, it is 45 to 60 pages for undergraduates and 120 to 150 for master’s degree candidates. The limit varies according to institutions and their requirements.
Novelty You must decide on a topic that is novel. It is true that there is hardly any problem that has not been investigated. Extensive reading confirms this fact. But problems that have some resemblance may differ markedly in the circumstances under which they are studied. The differences in circumstances can be in terms of time, place or methods of investigation. In choosing a topic, it is advisable that you do not go about repeating a work already treated by somebody else. There must be something new in your topic before it is considered worthy of investigation.
Contribution to Knowledge The topic of your choice must make some contribution, no matter how little, to knowledge. A research work in Computer Science is said to have contributed to knowledge if the findings lead to theory building, improve the “state of the art”, add to or fill a gap in the body of literature, solve some knotty problems in the area of Computer Science .
Time Limit Ensure you restrict your topic to a manageable context so that, apart from adhering to the page limit, you can conveniently investigate it within the period allotted for project writing. Your bound (completed) project should be ready for submission (through your supervisor) before you start your final degree examinations.
Relationship to your Course of Study Your topic is related to Computer Science , if its findings will contribute something new, no matter how small, to the field of the Computer Science . For instance, a topic which says “The Historical Development of Computer Science” is quite researchable. It is also possible that you may be very conversant with it and so it may capture your interest. But a topic such as “The Historical Development of English Language in Anambra State” can hardly be approved for you as a project topic in the Department of Computer Science even though it may be a hot topic in English Department.
Significance A good topic for research should be one that will guide the researcher through making a valuable contribution to his field of research.
1.17. TYPES OF RESEARCH Any classification of research into different types is inevitably arbitrary. However, researches have been classified differently depending on the approach, the purpose and the nature of
research activity. Broadly speaking, research can be classified according to its aim, purpose and method as follows: 1) Pure research, 2) Applied research, 3) Exploratory research, 4) Descriptive research, 5) Diagnostic research, 6) Evaluation studies, 7) Action research, 8) Experimental research, 9) Analytical study, 10) Survey, and 11) Historical study The above classification is just an approach to differentiate the various aspects of research. These different types do not indicate water-tight demarcations and are not clearly distinguishable from each other. However, the outcome and quality of a research project depends on the suitable choice of the type. However, each type needs a different research design. We now, discuss the salient features of these different types. (1) Pure Research: It is also called fundamental or theoretical research. It is original or basic in character. Pure research is undertaken for the sake of knowledge without any intention to apply it in practice. It is undertaken out of intellectual curiosity. The findings of pure research form the basis of applied research. Pure research may also involve improvements in the existing theory by relaxing some of its assumptions or re-interpretation or development of new theory on the basis of the existing one. For example, the Malthusian Theory of population gave rise to the Optimum theory of population. By questioning some of the assumptions of the Keynesian theory, Friedman came out with new interpretation of the monetary phenomenon. Theories of distribution have also been altered or re-interpreted to suit the changing economic conditions. (2) Applied Research: It is carried out to find out solutions to real life problems which require an action or policy decision. It is thus policy-oriented or action-directed. This type of research is based on the application of known theories and models to the actual operational fields. The applied research is conducted to test the empirical content or even the validity of a theory under given condition. For example, a researcher may use Lewis model of growth in labour-surplus economies and examine whether the real wage rate remains constant till all the surplus labour is completely used. The results of his research may stimulate further studies. Alterative strategies are developed, if a model does not work under specific conditions. In short, applied research contributes to social science by providing the required convincing evidence about usefulness of a theory to society. It also develops and utilizes techniques useful for further basic research. Applied research also provides data and ideas which may help in speeding up the process of generalization. Applied research seeks immediate and practical results. For example, marketing research for developing new markets for a product indicates the marketability and hence the viability of a new product venture. There is a vast scope for applied research in the fields of technology, management, commerce, economics, etc. Incidentally, it may contribute to the development of theoretical knowledge and may lead to the discovery of new facts. Applied research has practical
utility in the developing countries. These countries can apply the theories developed by the developed counties since pure research is very expensive and the developing countries cannot afford to spend on pure research. Applied research often takes the form of field investigation and aims at collecting data. The accuracy and adequacy of data has considerable effect on the way in which a model is tested. We, now briefly describe the purpose of a few other types of research studies. (3) Exploratory research: It is also called formulative study. Such a study is conducted to gain familiarity with a phenomenon as it is a preliminary study of an unfamiliar problem. It is similar to a doctor‟s initial investigation of a patient, for getting some clues for identifying his ailment. Exploratory research is ill structured and is usually in the form of a pilot study. It helps the researcher to formulate a more precise research problem or to develop a hypothesis, or concentrate on discovery of new ideals and insights. In short, the purpose of an exploratory study may be: i. To gather information for clarifying concepts, ii. To develop familiarity with the problem, iii. To generate new ideas, and iv. To determine the feasibility of the study. Exploratory research is necessary in social sciences as these sciences are relatively of recent origin and there are only a few researches in them. (4) Descriptive Research: It is a fact finding mission. The aim of these studies is to accurately lay down the characteristics of any group, situation or individual. It is the simplest type of research, but is more specific than exploratory study. Descriptive study is possible in the case of: i. Problems which are describable and not arguable. For example, philosophical or other controversial issues are not suitable for descriptive research. ii. The date should be amenable to an accurate, objective and if possible quantitative analysis for reliability and significance. iii. It should be possible to develop valid standards of comparison. iv. It should lend itself to verifiable procedure of collection and analysis of data. However, the study by itself does not deal with the testing of propositions or hypothesis. (5) Diagnostic Research: It is similar to the descriptive study. But it is focused towards discovering the frequency with which something occurs and to find out why does it occur. It aims at identifying the causes of a problem or association of occurrence of a problem with something else and tries to obtain a possible solution. Thus, it requires: i. Prior knowledge of the problem. ii. Its thorough formulation. iii. Clear cut definition of the population. iv. Adequate method for collecting correct information. v. Precise measurement of variables. vi. Statistical analysis. A diagnostic research involves large amount of work. It is guided by hypothesis and it is not possible in areas where knowledge is not advanced enough to make a diagnosis of the given situation. (6) Evaluation Studies: It is a type of applied research. It is made for assessing the effectiveness of various planned or implemented social or economic programmes (like family planning, adult literacy, mid-day meal for students) or to assess the impact of
developmental projects on the development of the area (like irrigation projects, rural development projects, slum clearance). Thus, its aim is: i. To appraise the effect of any activity for its qualitative and quantitative performance, ii. To determine the conditions required for success of a programme or activity, iii. To assess the changes required over time, and iv. To find the means to bring about these changes. (7) Experimental Research: It tries to assess the effect of one particular variable or a set of variables on a phenomenon. It aims at determining whether and in what manner variables are related to each other, i.e. it tests a hypothesis of causal relationship between variables. There are various types of designs available for an experimental study. These designs aim at using procedures which can reduce bias and increase the reliability of results. Discussion about type of research, based on method of study mainly concentrates on analytical, historical and survey research. Analytical study is called a study involving use of statistical methods. (8) Survey: Survey is a fact finding study. It is a method of research which involves collection of data directly from the individuals (either from the entire group i.e. a sample). It requires planning by experts in the field of surveys. It also needs careful analysis and then rational interpretation of the findings.
The surveys may be conducted for various purposes: i. Fact-finding surveys may have a descriptive purpose. They provide required information to the Government, business houses, private bodies etc. on the various subjects like expenditure patterns, market demand, etc. ii. Many inquires are conducted to explain certain phenomenon. Such surveys test hypothesis, to explain relationships between different variables, e.g. consumer behaviour or responses to certain stimuli, effect of changes in tax structure on expenditure, income earning capacity, labour productivity etc. Such surveys are useful for making predictions and for taking policy decisions. iii. Surveys are also concluded to make spatial and/or temporal comparisons of behavioural groups, economic status, demographic patterns etc. The above mentioned purposes of the survey clearly indicate that a survey is a field study and it is conducted in a natural setting. It seeks direct responses from individuals. It can cover a large population and tackle various problems. The study may be intensive or extensive. It covers a definite geographical area. Surveys can be conducted on all aspects of human behaviour. However, we can broadly divide them into two categories namely, (1) Social, (2) Economic. Survey method of conducting research is the most versatile of all methods of research. It is also the only practical way to obtain detailed first hand information on different aspects of a given topic. It enables a researcher to draw generalizations about large population on the basis of a sample study. Survey is also a useful instrument for verifying theories. However, success of a survey depends on the willingness and co-operation of the respondents. Results obtained from a survey are, therefore, subject to these response errors to consider while judging the reliability or accuracy of the results obtained from a survey. (9) Historical Research: It is a study based on past records. It is based on the belief that the past contains the key to the present and then present influences the future. This
method is more often used in sociological research. Historical study helps in tracing the evolution, growth and transformation of society. The major limitation of this method is that it is difficult to judge the accuracy and reliability of past data. If the data relates to very distant past period, it is difficult to perceive the significance of such data. Apart from these limitations, verification of results is not possible in historical studies. The scope of research in decision making varies to a considerable extent on types of organizations, field of operation, and environment of operations. The following are the areas of research where it contributes its influence in arriving at decisions: (a) Incremental Research : The role of incremental research is small advances in technology, typically based on an established foundation of scientific and engineering knowledge. A typical example of incremental research is that of reducing manufacturing costs of a continuing series of small but important advances: energy conservation, computer guided process control, better metallurgy, reduce maintenance cost etc. Although each incremental improvement is small; in the aggregate they typically produce meaningful savings. The small incremental technical steps yield large strategic results (b) Radical Research : Radical research is the discovery of new knowledge with the explicit goal of applying that knowledge to commercial use. Discovery involves substantial technical risk, cost and time. In radical research, usually exploratory projects or feasibility studies, intended to test the basic concepts on which the scientific foundation of the project rests are taken. The decision to enter the development phase takes place only after successful research already considerably reduced uncertainty to levels acceptable to the business. Consciously managing radical research is a means of reducing risk. (c) Fundamental Research : Fundamental research is an area where some of the most painful strategic decisions a company’s management must make. It won’t pay off many years and there will be a host of uncertainties – scientific, competitive, social and governmental. However, market leaders do go for it for retaining technology leadership and market share. Fundamental research is generally carried out by the government, academic institutions and by large industrial establishments. (d) Targeted Basic Research : Research projects that are basic in nature but technologically oriented are called targeted basic research. In this type of projects governments and industry closely collaborate with each other for opening up of applications of a new technological era. (f) Innovation : Technological innovation refers to the process of creation, evolution, and development of technological artifacts. It refers to the range of activities from product design to its development to its production and adoption or use. Technological innovation decisions include all the decisions pertaining to research, design, development, market research and testing.
Case and field study research: A type of qualitative research in which data are gathered directly from individual or social or community groups in their natural environment for the purpose of studying interactions, attitudes or characteristics of individuals or groups.
Correlational research: A statistical investigation of the relationship between one factor and one or more other factors. It looks at the surface relationship but does not necessarily probe for casual reasons underlying them Descriptive or Normative Survey: A survey method used to describe the incidence, frequency and distribution of certain characteristics of a population. Ethnography: - A type of qualitative inquiry that involves an in-depth study of an intact cultural group in a natural setting. Expost facto or Evaluation research: A type of research which observes existing causal comparative searches back research and through the data for plausible causal factors. Grounded theory research: - A type of qualitative research studies that aim at deriving theory through the use of multiple stages of data collection and interpretation. Historical research: A type of research that attempts to solve certain problems arising out of historical context through gathering and examining of relevant data. Phenomenological research: A type of qualitative research method that attempts to understand participants‟ perspectives and views of social realities. Quasi-experimental research: An experimental research that is not based on randomization and control. True-experimental research: An experimental study based a random assignment of subjects to groups and the administration of possibly different treatments followed by observations or measurements to assess the effect of the treatments. (Leedy. 1995)
(10) Action Research There are three types of objectives of research: theoretical, factual and application. The first two types of objectives of research contribute new knowledge in the form of new theory and facts in a particular field of study or discipline. The third objective does not contribute to knowledge but suggests new application for practical problems. Thus, the researches are classified broadly into two categories: 1. Fundamental or Basic research, and 2. Action research or Applied research. Meaning and Definition of Action Research The concept of action research is very old but Stephen M. Corey has applied this concept first in the field of social studies. He has defined the term action research: “The process by which practitioners attempt to study their problems scientifically in order to guide, correct and evaluate their decision and action is what a number of people have called action research.” According to Corey–“Action research is a process for studying problems by practitioners scientifically to take decision for improving their current practices.” “Research concerned with school problems carried on by school personal to improve schools practice is action research.” – Sara Blackwell. According Mc. Threte –“Action research is organized, investigative activity, aimed towards to study and constructive change of given endeavour by individual or group concerned with change and improvement.” On the basis of these definitions of action research, the following characteristics may be enumerated : 1. It is a process for studying practical problems of social studies.
2. It is a scientific procedure for finding out a practical solution of current problem. 3. The practitioner can only study his problem. 4. It is a personal research for clinical research work. 5. The focus is to improve and modify the current practices. 6. The individual and group problems studied by action research. 7. It does not contribute to the fund of knowledge. Origin of Action Research The concept of action research is based on the ‘Modern Human Organization Theory.’ This organization theory is task and relationship centred. It assumes that worker of the organization has the capacity to solve the problem and take decision. He brings certain values, interest and attitudes in the organization. Therefore, the opportunities should be given to the workers of the organization to study and solve the current problems of their practices so that they can improve and modify their practices. The effectiveness of an organization depends on the abilities and skills of the workers. They have to encounter some problems and can realize the gravity of the problems. The practitioner can only study and solve the problems of the current practices. The workers’ will be efficient when they will be given freedom for improving and modifying their practices. The origin of action research is also considered from the field of psychology or social psychology. Kurt Lewin explains life space in terms of person and goal. There is a barrier in between person and goal. He was to overcome the barrier to achieve the goal. ‘It depends on the abilities of the person to achieve the goal. The person’s activities are governed by the goal. The practitioner has to face this type of situation. The concept of action research is being used in Social Studies since (1926). Backingham has mentioned this concept first in his book ‘Research for Teachers’. But Stephen M. Corey used this concept for solving the problems of Social Studies for the first time. Steps of Action Research The research work is done by reflective thinking and not by traditional thinking. The reflective thinking functions systematically. The steps of research are drawn from reflective thinking. The following are the six steps of research: 1. Selection of the problem. 2. Formulation of hypotheses. 3. Design of research. 4. Collection of data. 5. Analysis of data. 6. Formulation of conclusions. First Step The problem is selected and defined. The feasibility of the problem depends on its delimitations. Hence, the problem is also delimited in this step. Second Step Some tentative solutions are given for the problem when these solutions are based on certain rationale they are termed as hypothesis. Therefore, in this step hypotheses are formulated. Third Step These hypotheses are subjected to verification. A design of research is developed for collection of data or evidences for testing the hypotheses. It involves method, sample and techniques of research. The appropriate method and techniques are selected for this purpose. Fourth Step
The observations and research tools are administered on the subjects and their responses are scored out. Thus, the obtained data are organized in tabular form. Fifth Step The appropriate statistical techniques are used to analyse the data so that some decisions may be taken about the hypotheses. The results are used to draw some conclusions. Sixth Step The results are discussed and some conclusions are drawn in the form of new information, theory, facts and solution for the practical problems. These steps are followed in both types of research: fundamental and action research, but there is significant difference between the two. The comparison of fundamental and action research has been provided in the tabular form on next pages. Objectives of Action Research The action research projects are conducted for achieving the following objectives: 1. To improve the working conditions of school plant. 2. To develop the scientific attitude among teachers and principals for studying their problems. 3. To develop the scientific attitude among students and teachers for understanding and solving their problems. 4. To bring excellence in school workers. 5. To develop the ability and understanding among administrators to improve and modify the school conditions and make it more conducive to learning. 6. To root out the traditional and mechanical environment of school. 7. To make the school system effective for generating a healthy environment for student learning. 8. To raise the level of performance and level of aspiration of the students. Fields of Action Research The action research projects may be designed in the following field of Social Studies: 1. In improving and modifying the classroom teaching strategies, tactics and teaching aids. 2. In developing interests; attitudes and values of the students towards their studies. 3. In dealing the classroom problems and school problem relating to discipline and code of conduct. 4. In assigning the home work so that students should take interest in completing them. 5. In improving the spelling errors and wrong pronunciation. 6. In dealing with the problems of poor attendance in class as well as In school and coming late in school. 7. In developing the habit of completing class notes and active participation. 8. In removing the practice of copying in the examination. 9. In solving the personal problems of students relating to school situations or poor adjustment. 10. In dealing with the problems of school administration organization. Characteristics of an Investigator A good research worker should possess the following qualities: 1. He should have the full understanding about the functions and activities of his job. 2. He should have the reflective thinking about various dimensions of his job activities. 3. He should be sensitive towards his job. A sensitive person can perceive the problem. Most of the teachers are problem blind because they are not sensitive towards the job.
4. He should be creative and imaginative. These abilities are essential in formulating the action hypotheses for his problem. 5. He should have the knowledge and training of action research. . 6. He should have insightful into his area. During his teaching experience he can identify the real problem on the basis of his insight. 7. He should have the scientific attitude for studying and observing things. 8. There should be an objectivity in his thinking. 9. His behaviour should be democratic. The action research design should not intervene the activities of other teachers of school activities. 10. The most important characteristics is the patience and pursuant of the investigator. 11. He should have knowledge and skill of measuring instruments and elementary statistics. 12. He should have open mind so that he can discuss his problems with his colleagues and experts of the field to have correct picture of the problem. 13. He should have an urge to bring about excellence in job economical performance. 14. He should be economical in designing the project from time, energy and money point of view. Steps of Action Research In designing and conducting action-hyper-research project the following steps are followed : 1. Identification of Problem A teacher should be sensitive towards job activities. The problem is isolated from the broad field. The investigator must realize the seriousness of the problem. 2. Defining and Delimiting the Problem After Identifying the problem. it should be defined so that action and goal may be specified. The delimitation means to localize the problem in terms of class subject, group and period in which a teacher perceives the problem. 3. Analysing Causes of the Problem The causes of the problem are analysed with the help of some evidences. The nature of the causes is also analysed whether it is under the control or beyond the control of the investigator. This helps in formulating the action hypothesis. 4. Formulating the Action Hypotheses The basis for the formulation action-hypotheses are the causes of the problem which are under the approach of the investigator. The statement of action-hypothesis consists of the two aspects: action and goal. It indicates that the action should be taken for achieving the goal. 5. Design for Testing the Action Hypothesis A design is developed for testing the most important action-hypothesis. Some actions may be taken and their results are observed. If the hypothesis is not accepted second design is developed for testing another hypothesis. In action-research one hypothesis is tested at a time. The design of action-research is flexible and can be changed at any time according to the convenience of the researcher. 6. Conclusions of Action Research Project The accepting or rejecting the action-hypothesis leads to draw some conclusions. The statement of conclusion indicates some prescription for the practical problem of school or classroom. The conclusions are useful in modifying and improving the current practices of school and classroom teaching. The National Council of Research and Training has been taken interest in the action research projects. The extension departments of NCERT have been conducting seminars and
workshops for in service teachers for imparting knowledge and skill of action research projects. It has developed Its own paradigm of action I research projects. A Paradigm of Action Research Projects The steps and sub-steps are proposed by NCERT for conducting action research projects: 1. Topic of the project. 2. Objective of the project. 3. The system of the project work. 4. Evaluation of the project. 5. Estimation of expenditure for the project. 6. Name of the institution, number of students enrolled with sections. 7. Number of teachers in different subjects. 8. The available facilities in school for the project work. (a) Background for the project work. (b) The importance of the project for the school. (c) Identification of problem. (d) Defining and delimiting the problem. (e) Formulation of action hypotheses. (f) Testing the action hypotheses. (g) Conclusions of the project work. (h) Remarks by the investigator. On these lines the teacher plans an experimental project, after conducting the experiment he writes a report of his project work. Experimental Project of Action Research The experimental project is designed for solving the problem of English teaching. 1. Topic of the Project A study for improving the spelling errors in English. 2. Investigator An experienced teacher of English. 3. Background for the Project Work The English teacher has observed and experienced that students commit more errors in English spellings. He has noted several types of spelling errors in student’s home assignments compositions, translation and their written work. 4. Objectives of the Project This project is designed and conducted for achieving the following objectives: (i) To make sensitive to students for their spelling errors in English. (ii) To improve the English spellings of the students. (iii) To promote the level of achievement in English. (iv) To realize the need and importance of correct spellings in English language. This project is directly conditioned by these objectives. 5. The Importance of the Project for the School English is the second language but it is the international language. Even in our country we can exchange the ideas with the persons living in every con mer. It is only the media of communication in our country as well as abroad. It is an important language. Therefore students must learn English correctly. 6. Field of the Problem The field of project is the spelling errors in English language.
7. Specification of the Problem The students of this class commit several types of spelling errors in English. 8. Analysing Causes of the Problem The causes of the problem are identified objectively so that tentative solutions may be developed for the problem. The causes are analysed with the help of following table.
The analysis of the causes of the problem provides the basis for the formulation of action hypotheses. 9. Formulation of Action Hypotheses The following two action hypotheses have been developed by considering the causes which are under the approach of the English teacher. First Action Hypothesis: The modification and improvement may be done in English spelling errors by proper correction of English written work. The first part of Action Hypothesis indicates goal and later part is the action to be taken for achieving the goal. Second Action Hypothesis: The spellings of words and their meanings should be emphasized by the teacher to improve the spelling errors in English teaching. The first part of this action hypothesis refers to the action part and second part indicates the goal. The action hypotheses are tested by using separate designs of the project. 10. Design for Testing Action Hypothesis The first action hypothesis is tested by employing the following design of the project. The data are collected during the project work if the evidences indicate significant improvement in spellings of English words. There is no need to test the second hypothesis. 11. Evaluation
The image part with relationship ID rId7 was not found in the file.
The evaluation of the project work is done in terms of accepting and rejecting the. hypothesis. The bar diagrams are prepared for the spelling errors. The percentages of errors are calculated to analyse the improvement in English spellings. Some spelling tests may be administered to examine the significance of improvement in english spellings. The conclusions may be drawn in the form of remedial measures for the problem.
12. Comments of the Investigator After testing the hypothesis teacher may improve the teaching techniques and instructional procedure. The teacher can minimize the English spelling errors. He can promote the level of achievement in English. Suggestions for Action Research Project In developing an action research project the following suggestions should be kept in mind: 1. The nature of the project should be decided whether it is developmental project or experimental project. 2. The investigator must be directly associated with the problem to be studied. 3. The form of problem should be real. 4. The project should be so planned that it should not intervene the functioning of other school working. 5. The project should be concerned directly with qualitative improvement and level of performance of the students. 6. The project should be evaluated objectively by employing reliable and valid tools. 7. The action hypothesis should be formulated by considering the causes of the problem which are under the approach of the investigator. 8. The design of action research project should be economical from money, time and energy of
The image part with relationship ID rId8 was not found in the file.
view. 9. The problem should be selected objectively and studied scientifically. 10. The causes of the problem should be isolated objectively on the basis of some evidences. Difference between Action Research and Fundamental Research The Research has two main functions: – To contribute new knowledge in Social Studies. – To improve the Social Studiesal practices. The first function is of fundamental research and second function of action research. Ex-Post-Facto Research Another form of descriptive research is ex-post-facto research. Some authors refer to it as causal-comparative research. It aims at discovering the factors that are responsible for certain occurrence, outcomes, conditions or types of behaviour by the analysis of past events or already existing conditions. A researcher adopting this kind of descriptive research, usually, has no control over the variables of interest and so cannot manipulate them, since they already exist. It is uneconomical, unethical or practically impossible to manipulate the variables involved. A good example is a study on the influence of gender on students’ performance in C.R.K examinations (WASCE or UME) or the effects of location on students’ attitudes towards C.R.K. In these examples, the students have already been assigned to appropriate levels of gender (male or female) or location (urban, semi-urban and rural) naturally. The research has no power to manipulate them, to decide who becomes a male or female or who comes from urban, semi-urban or rural locations. Again, in an ex-post-facto study on the causes of high rate of failure in C.R.K. of WAEC examination, the researcher cannot arrange students to fail the examination in order to study the causes of the failure. Rather he would be interested in the conditions associated with the failure that have already occurred in the past. Such conditions like poor reading habits, unqualified teachers, poor teaching methods, poor classroom conditions, poor reading environment, unavailability of textbooks etc., can form sources of the researcher’s data. Check your progress: (1) What are the types of research? (2) What types of researches are generally found in social sciences? 1.18. There are different types of research. The basic ones are as follows. 1. Descriptive Versus Analytical: Descriptive research consists of surveys and fact-finding enquiries of different types. The main objective of descriptive research is describing the state of affairs as it prevails at the time of study. The term ‘ex post facto research’ is quite often used for descriptive research studies in social sciences and business research. The most distinguishing feature of this method is that the researcher has no control over the variables here. He/she has to only report what is happening or what has happened. Majority of the ex post facto research projects are used for descriptive studies in which the researcher attempts to examine phenomena, such as the consumers’ preferences, frequency of purchases, shopping, etc. Despite the inability of the researchers to control the variables, ex post facto studies may also comprise attempts by them to discover the
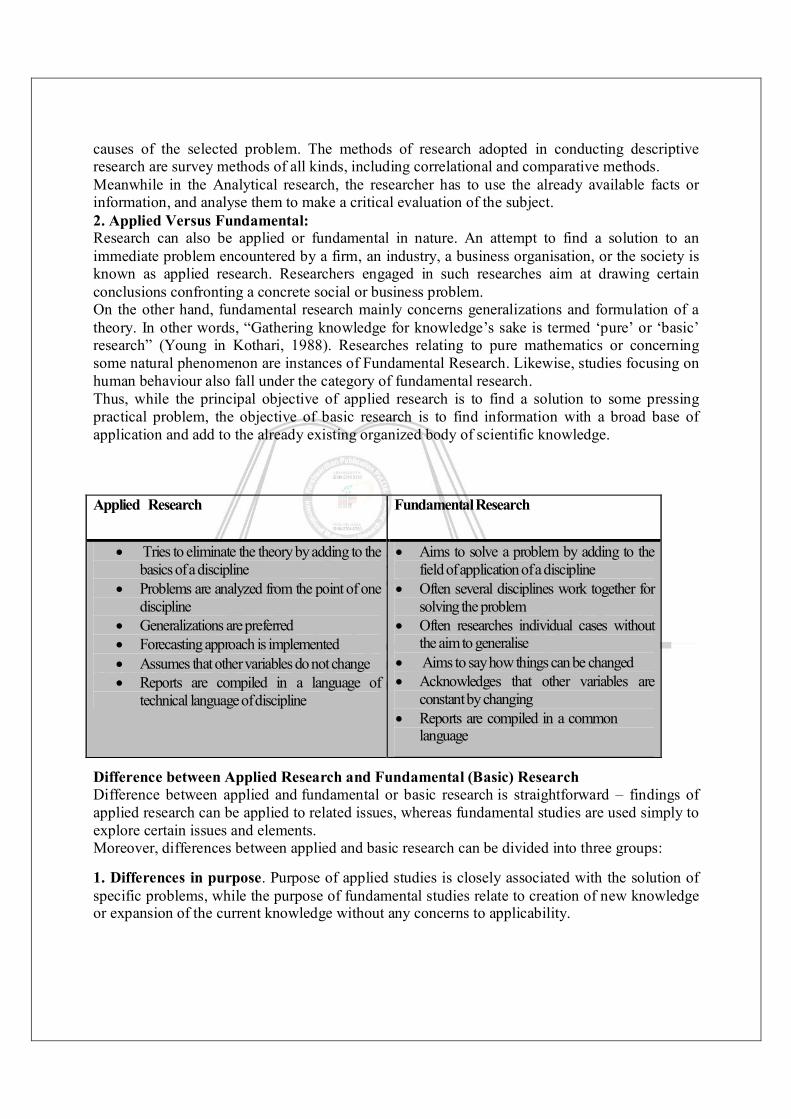
causes of the selected problem. The methods of research adopted in conducting descriptive research are survey methods of all kinds, including correlational and comparative methods. Meanwhile in the Analytical research, the researcher has to use the already available facts or information, and analyse them to make a critical evaluation of the subject. 2. Applied Versus Fundamental: Research can also be applied or fundamental in nature. An attempt to find a solution to an immediate problem encountered by a firm, an industry, a business organisation, or the society is known as applied research. Researchers engaged in such researches aim at drawing certain conclusions confronting a concrete social or business problem. On the other hand, fundamental research mainly concerns generalizations and formulation of a theory. In other words, “Gathering knowledge for knowledge’s sake is termed ‘pure’ or ‘basic’ research” (Young in Kothari, 1988). Researches relating to pure mathematics or concerning some natural phenomenon are instances of Fundamental Research. Likewise, studies focusing on human behaviour also fall under the category of fundamental research. Thus, while the principal objective of applied research is to find a solution to some pressing practical problem, the objective of basic research is to find information with a broad base of application and add to the already existing organized body of scientific knowledge.
Difference between Applied Research and Fundamental (Basic) Research Difference between applied and fundamental or basic research is straightforward – findings of applied research can be applied to related issues, whereas fundamental studies are used simply to explore certain issues and elements. Moreover, differences between applied and basic research can be divided into three groups:
1. Differences in purpose. Purpose of applied studies is closely associated with the solution of specific problems, while the purpose of fundamental studies relate to creation of new knowledge or expansion of the current knowledge without any concerns to applicability.
Applied Research Fundamental Research
Tries to eliminate the theory by adding to the basics of a discipline
Problems are analyzed from the point of one discipline
Generalizations are preferred Forecasting approach is implemented Assumes that other variables do not change Reports are compiled in a language of
technical language of discipline
Aims to solve a problem by adding to the field of application of a discipline
Often several disciplines work together for solving the problem
Often researches individual cases without the aim to generalise
Aims to say how things can be changed Acknowledges that other variables are
constant by changing Reports are compiled in a common
language
2. Differences in context. In applied studies research objectives are set by clients or sponsors as a solution to specific problems they are facing. Fundamental studies, on the other hand, are usually self-initiated in order to expand the levels of knowledge in certain areas.
3. Differences in methods. Research validity represents an important point to be addressed in all types of studies. Nevertheless, applied studies are usually more concerned with external validity, whereas internal validity can be specified as the main point of concern for fundamental researchers.
Examples of Applied Research
The following are examples for applied research. Notice, each of these studies aim to resolve a specific and an immediate problem.
A study into the ways of improving the levels of customer retention for Wall-Mart An investigation into the ways of improving employee motivation in Marriot Hotel, Hyde
Park Development of strategies to introduce change in Starbucks global supply-chain
management with the view on cost reduction A study into the ways of fostering creative deviance amongst employees without
compromising respect for authority.
3. Quantitative Versus Qualitative: Quantitative research relates to aspects that can be quantified or can be expressed in terms of quantity. It involves the measurement of quantity or amount. Various available statistical and econometric methods are adopted for analysis in such research. Which includes correlation, regressions and time series analysis etc,. On the other hand, Qualitative research is concerned with qualitative phenomena, or more specifically, the aspects related to or involving quality or kind. For example, an important type of qualitative research is ‘Motivation Research’, which investigates into the reasons for certain human behaviour. The main aim of this type of research is discovering the underlying motives and desires of human beings by using in-depth interviews. The other techniques employed in such research are story completion tests, sentence completion tests, word association tests, and other similar projective methods. Qualitative research is particularly significant in the context of behavioural sciences, which aim at discovering the underlying motives of human behaviour. Such research helps to analyse the various factors that motivate human beings to behave in a certain manner, besides contributing to an understanding of what makes individuals like or dislike a particular thing. However, it is worth noting that conducting qualitative research in practice is considerably a difficult task. Hence, while undertaking such research, seeking guidance from experienced expert researchers is important. 4. Conceptual Versus Empirical: The research related to some abstract idea or theory is known as Conceptual Research. Generally, philosophers and thinkers use it for developing new concepts or for reinterpreting the existing ones. Empirical Research, on the other hand, exclusively relies on the observation or experience with hardly any regard for theory and system. Such research is data based, which often comes up with conclusions that can be verified through experiments or observation. Empirical research is also known as experimental type of research, in which it is important to first collect the facts and their sources, and actively take steps to stimulate the production of desired information. In this type of research, the researcher first formulates a working
hypothesis, and then gathers sufficient facts to prove or disprove the stated hypothesis. He/she formulates the experimental design, which according to him/her would manipulate the variables, so as to obtain the desired information. This type of research is thus characterized by the researcher’s control over the variables under study. In simple term, empirical research is most appropriate when an attempt is made to prove that certain variables influence the other variables in some way. Therefore, the results obtained by using the experimental or empirical studies are considered to be the most powerful evidences for a given hypothesis. 5. Other Types Of Research: The remaining types of research are variations of one or more of the afore-mentioned type of research. They vary in terms of the purpose of research, or the time required to complete it, or may be based on some other similar factor. On the basis of time, research may either be in the nature of one-time or longitudinal time series research. While the research is restricted to a single time-period in the former case, it is conducted over several time-periods in the latter case. Depending upon the environment in which the research is to be conducted, it can also be laboratory research or field-setting research, or simulation research, besides being diagnostic or clinical in nature. Under such research, in-depth approaches or case study method may be employed to analyse the basic causal relations. These studies usually undertake a detailed in-depth analysis of the causes of certain events of interest, and use very small samples and sharp data collection methods. The research may also be explanatory in nature. Formalized research studies consist of substantial structure and specific hypotheses to be verified. As regards to historical research, sources like historical documents, remains, etc. Are utilized to study past events or ideas. It also includes philosophy of persons and groups of the past or any remote point of time. Research has also been classified into decision-oriented and conclusion-oriented categories. The decision-oriented research is always carried out as per the need of a decision maker and hence, the researcher has no freedom to conduct the research according to his/her own desires. On the other hand, in the case of Conclusion-oriented research, the researcher is free to choose the problem, redesign the enquiry as it progresses and even change conceptualization as he/she wishes to. Operations research is a kind of decision-oriented research, where in scientific method is used in providing the departments, a quantitative basis for decision-making with respect to the activities under their purview. 1.19. Importance Of Knowing How To Conduct Research: The importance of knowing how to conduct research are listed below:
The knowledge of research methodology provides training to new researchers and enables them to do research properly. It helps them to develop disciplined thinking or a ‘bent of mind’ to objectively observe the field;
The knowledge of doing research inculcates the ability to evaluate and utilize the research findings with confidence;
The knowledge of research methodology equips the researcher with the tools that help him/her to make the observations objectively; and
The knowledge of methodology helps the research consumers to evaluate research and make rational decisions.
1.20. Qualities Of A Researcher:
It is important for a researcher to possess certain qualities to conduct research. First and foremost, he being a scientist should be firmly committed to the ‘articles of faith’ of the scientific methods of research. This implies that a researcher should be a social science person in the truest sense. Sir Michael Foster cited by (Wilkinson and Bhandarkar, 1979) identified a few distinct qualities of a scientist. According to him, a true research scientist should possess the following qualities: (1) First of all, the nature of a researcher must be of the temperament that vibrates in unison with the theme which he is searching. Hence, the seeker of knowledge must be truthful with truthfulness of nature, which is much more important, much more exacting than what is sometimes known as truthfulness. The truthfulness relates to the desire for accuracy of observation and precision of statement. Ensuring facts is the principle rule of science, which is not an easy matter. The difficulty may arise due to untrained eye, which fails to see anything beyond what it has the power of seeing and sometimes even less than that. This may also be due to the lack of discipline in the method of science. An unscientific individual often remains satisfied with the expressions like approximately, almost, or nearly, which is never what nature is. A real research cannot see two things which differ, however minutely, as the same. (2) A researcher must possess an alert mind. Nature is constantly changing and revealing itself through various ways. A scientific researcher must be keen and watchful to notice such changes, no matter how small or insignificant they may appear. Such receptivity has to be cultivated slowly and patiently over time by the researcher through practice. An individual who is ignorant or not alert and receptive during his research will not make a good researcher. He will fail as a good researcher if he has no keen eyes or mind to observe the unusual changes behind the routine. Research demands a systematic immersion into the subject matter by the researcher grasp even the slightest hint that may culminate into significant research problems. In this context, Cohen and Negal cited by (Selltiz et al, 1965; Wilkinson and Bhandarkar, 1979) state that “the ability to perceive in some brute experience the occasion of a problem is not a common talent among men… it is a mark of scientific genius to be sensitive to difficulties where less gifted people pass by untroubled by doubt”. (3) Scientific enquiry is pre-eminently an intellectual effort. It requires the moral quality of courage, which reflects the courage of a steadfast endurance. The process of conducting research is not an easy task. There are occasions when a research scientist might feel defeated or completely lost. This is the stage when a researcher would need immense courage and the sense of conviction. The researcher must learn the art of enduring intellectual hardships. In the words of Darwin, “It’s dogged that does it”. In order to cultivate the afore-mentioned three qualities of a researcher, a fourth one may be added. This is the quality of making statements cautiously. According to Huxley, the assertion that outstrips the evidence is not only a blunder but a crime (Thompson, 1975). A researcher should cultivate the habit of reserving judgment when the required data are insufficient.
or in other words Qualities of a Good Researcher Types of research as discussed above have far-reaching implications for a researcher. The following constitute the basic qualities of a good researcher. Prospective researchers are expected to imbibe the qualities for success in their research activities. 1. Good Training
Any researcher that is worth his or her salt must be well-trained in the overall procedures and activities of research in order to cope with varying demands of different stages of research. 2. Creativity and Imagination A good researcher must possess a high degree of curiosity, creativity and imaginations that would help him grapple with the challenges of conducting research, particularly in a developing country, like Nigeria. Possession of curiosity is of paramount importance. This is because it is his curiosity that enables him to indulge in an investigation in the first place, probing into the unknown phenomenon in creative styles and imaginations, with a view to establishing its existence. 3. Patience/Endurance This is an essential quality of a good researcher. A patient researcher is very accommodating and so tolerates delays and unwilling respondents; still insisting on useful results. He/she can endure in situations of financial constraints or various difficulties that may hinder easy accessibility of information. When respondents display negative/disturbing attitudes, the researcher presses on, making positive attempts at resolving the circumstances, for purposes of successful results. 4. Ability to Carry Out an Independent Study A good researcher possesses, to his credit, the intellectual ability that propels him/her to embark successfully on an independent study, with devotion geared towards achieving the objectives of the researcher. 5. Ability to Work in a Group of other Researchers Apart from the ability to carry out an independent study, a good researcher should also possess the ability and understanding needed in a group work involving other researchers of the same or different cultures and disciplines. To achieve this, he needs the spirit of tolerance, love for one another and the joy of working together in a group, all for purposes of recording success, progress and development in the chosen research area. 6. Objectivity The quality of objectivity demands that a good researcher should, under no circumstances, allow their personal background, culture or bias to affect the activities of the research. They must be objective in all respects. 7. Extensive Reading Success in any academic research demands extensive reading. To this end, a good researcher must be a voracious reader, reading every relevant material in the course of their research, with a view to discovering new facts and detecting any lacuna in knowledge. Besides, extensive reading strengthens their intellectual ability and so offers more avenues for creativity. 8. Logical Reasoning Mental ability for logical thinking/reasoning is a prerequisite for any meaningful research. Any researcher that lacks the ability to think and reason logically may end up embarking on illogical and disorganized activities that lack coherence and may not discriminate between useful and useless information. The result is distorted exercise, abysmal failure, a waste of time, energy and resources. 9. Diligence and Optimism A good researcher must be diligent, positive and optimistic at every stage of the research. It is advisable that he/she emulates the diligent and optimistic styles of Thomas Edison. This means he/she should neither give up nor feel discouraged as a result of difficulties or failures at different levels of his/her investigations. Determination and perseverance should be his/her key and so fuel his/her desire to carry on the research until success is achieved.
This point is in line with the observation of a certain wise person: When you can keep on trying after three failures in a given undertaking, you may consider yourself a candidate of a leadership role in your present occupation. If you can keep on trying after a dozen failures, the seed of genius is sprouting in you! A good researcher must not allow circumstances or obstacles to defeat his willingness and determination to round off his investigations successfully. 10. Time Management A good researcher knows that time is his most precious commodity and so values it even above wealth. Effective investigations demand that the researcher should plan his time well, schedule their agenda appropriately and avoiding procrastination. A trained researcher sees waste of time as a capital crime. This is even more essential in academic research, where a specific period of time is allotted to research work. 11. Preparation/Planning A gram of preparation can save tons of agony. Success in any investigation is dependent upon the investigators’ ability for adequate preparation. In other words, without preparation, the research is sure to fail. To succeed, a researcher should find time to plan the A to Z of the activities of the research for successful hitch-free exercise. 12. Self-Confidence Lack of self-confidence is, usually, the reason behind the academic fraud known as plagiarism. A good researcher should believe firmly and unflinchingly in his abilities to succeed in his investigations. He should not allow an iota of doubt to creep into his confidence. This is essential because years wrinkle the skin but lack of self-confidence wrinkles the mind. Self-confidence is the first pre-requisite for any fruitful exercise, research inclusive. 13. Clarity A research can only yield successful result if the researcher is crystal clear about the type/nature of the research they are going to undertake. Is it a research on education, science, arts, social studies, mathematics, English, Geography, etc.? What type of research is necessary for the subject/topic of the study? Is it a basic research, applied research, action research, descriptive, historical, or experimental research? A good researcher asks questions and finds answers to these questions to help them know where to target their preparations/planning in the step-by-step procedures of the research. Researchers who probe aimlessly never succeed. A person who does not know where they is going to might miss their destination. Therefore, as a researcher who intends to succeed, with effective results, decide on the purpose of your research, target your investigations superbly towards achieving your objectives. It is only by so doing that you can be sure of the fruits of your labour. The success of your investigations is rooted to the clarity of your vision. There is no point in kicking the ball if you do not know where the goal post is. 1.3 Sectors of Research: Academic and Private The practice of research is divided into two major sectors: academic and private. Academic and private research are sometimes referred to as "basic" and "applied" research. However, these terms are not used in this text since research in both sectors can be basic and/or applied. Both sectors of research are equally important, and in many cases the two work together to solve mass media problems. Academic sector research is conducted by scholars from colleges and universities. It also generally means that the research has a theoretical or scholarly approach; that is, the results are intended to help explain the mass media and their effects on individuals. Some popular research
topics in the theoretical area include the use of the media and various media-related items, such as video games, teletext, and multiple-channel cable systems; lifestyle analyses of consumers; media "overload" on consumers; alternatives to present media systems; and the effects of various types of programming on children. Private sector research is conducted by nongovernmental businesses and industries or their research consultants. It is generally applied research; that is, the results are intended to be used in decision-making situations. Typical research topics in the private sector include analyses of media content and consumer preferences, acquisition research to determine whether to purchase additional businesses or facilities, public relations approaches to solve specific informational problems, sales forecasting, and image studies of the properties owned by the company. There are other differences between academic and private sector research. For instance, academic research is public. Any other researcher or research organization that wishes to use the information gathered by academic researchers should be able to do so merely by asking the original researcher for the raw data. Most private sector research, on the other hand, generates proprietary data: the results are considered to be the sole property of the sponsoring agency and cannot generally be obtained by other researchers. Some private sector research, however, is released to the public soon after it has been conducted, such as opinion polls and projections of the future of the media; still other data are released after several years, although this practice is the exception rather than the rule. Another difference between academic and private sector research involves the amount of time allowed to conduct the work. Academic researchers generally do not have specific deadlines for their research projects (except when research grants are received). Academicians usually conduct research at a pace that accommodates their teaching schedules. Private sector researchers, however, nearly always operate under some type of deadline. The time frame may be specified by management or by an outside agency that requires a decision from the company or business. Private sector researchers rarely have an opportunity to pursue research questions in a casual manner; a decision is generally waiting to be made on the basis of the research. Also, academic research is generally less expensive to conduct than research in the private sector. This is not to say that academic research is "cheap" — it is not in many cases. But academicians do not need to have enormous sums of money to cover overhead costs for office rent, equipment, facilities, computer analysis, subcontractors, and personnel. Private sector research, whether it is done within a company or hired out to a research supplier, must take such expenses into account. The reduced cost is the primary reason why many of the large media companies and groups prefer to use academic researchers rather than professional research firms. Despite these differences, it is important for beginning researchers to understand that academic research and private sector research are not completely independent of each other. The link between the two areas is important. Academicians perform many studies for the industry, and private sector groups conduct research that can be classified as theoretical (for example, the television networks have departments that conduct social research). Many college and university professors act as consultants to, and often conduct private sector research for, the media industry.
It is also important for all researchers to refrain from attaching to academic or private sector research such stereotypical labels as "unrealistic," "inappropriate," "pedantic," and "limited in scope." Research in both sectors, although differing occasionally in terms of cost and scope, uses similar methodologies and statistical analyses. In addition, both sectors have common research goals: to understand problems and to predict the future. In conducting a study according to the scientific method, researchers need to have a clear understanding of what they are investigating, how the phenomenon can be measured or observed, and what procedures are required to test the observations or measurements. Conceptualization of the research problem in question and a logical development of procedural steps are necessary to have any hope of answering a research question or hypothesis. 1.21. SUMMARY 1. Research is an attempt to discover intellectual and practical answers to the various problems through the application of scientific methods to the knowable universe. 2. The main aim of research is to find out the truth which is hidden and which has not been discovered yet. 3. There is a weak foundation to research in social sciences. Hence study of truth becomes infinitely variable, unique in each case and often non measurable, whereas in physical sciences, it is repetitive, simplified and observable . 4. Research leads to discovery of facts and the interpretation of the facts and helps in understanding economic reality. Economic research can suggest various areas where remedial measures are required for improving socio-economic welfare. 5. Researchers have been classified differently depending on the approach, the purpose and the nature of research activity. However, the outcome and quality of a research project depends on the suitable choice of the type. 1.22. QUESTIONS 1) What are the objectives of research? 2) Distinguish between research in social sciences and research in physical sciences. 3) Explain the term research and outline the significance of economic research. 4) Write a note on significance of Economic Research. 5) Explain different types of research. 6) What is Science? 7) explain Scientific Methods?
2 RESEARCH PROCESS
Unit Structure: 2.0 Objectives 2.1 Research Process 2.2 Characteristics of Scientific Research 2.3 Major Characteristics Of Research. 2.4 Other General Characteristics Of Research 2.5 Qualities Of A Good Research 2.6 Specific Characteristics Of Research 2.7 Evaluation Of Good Research 2.8 Problems Of Researchers In India 2.8.1 The Concept Of Problems In Research 2.8.2 Characteristics Of Research Problem 2.8.3 Some Sources Of Suitable Research Problems 2.8.4 Selecting A Research Problem 2.9 Shaping And Refining The Problem 2.10 Important Research Concepts 2.11 Role Of Computer Technology In Research 2.12 Significance Of Research In Computer Science 2.13 Nature Of Research Problems In Computer Science 2.14. Summary 2.15 Questions 2.0 OBJECTIVES To know the research process. To know the characteristics and qualities of a good research. To provide the essential of a good research to the students. To make aware of the general problems of the researchers in India. To acquaint the students with the use of computer technology. 2.1. RESEARCH PROCESS Before going to the details of research methodology and techniques, it is appropriate to present a brief overview of the research process. A cursory glance at different published researches suggests that research comprises of a definite sequence of processes. The process involves a number of clearly distinct steps. The number of steps, their names and their sequences may vary in different cases. However, it is necessary to note that the research process involves a number of interrelated activities. These activities overlap continuously and do not always follow a prescribed sequence. The operations involved in the research process are so interdependent that the earlier steps may determine the later steps. Thus, the researcher has to be constantly anticipating at each step, the requirements of the subsequent steps. Even then, it is worth while to determine the steps involved in planning a research project. Thus, research process consists of series of actions or steps necessary to effectively carry out research and the desired sequencing of these steps. The chart given below illustrates a research process:
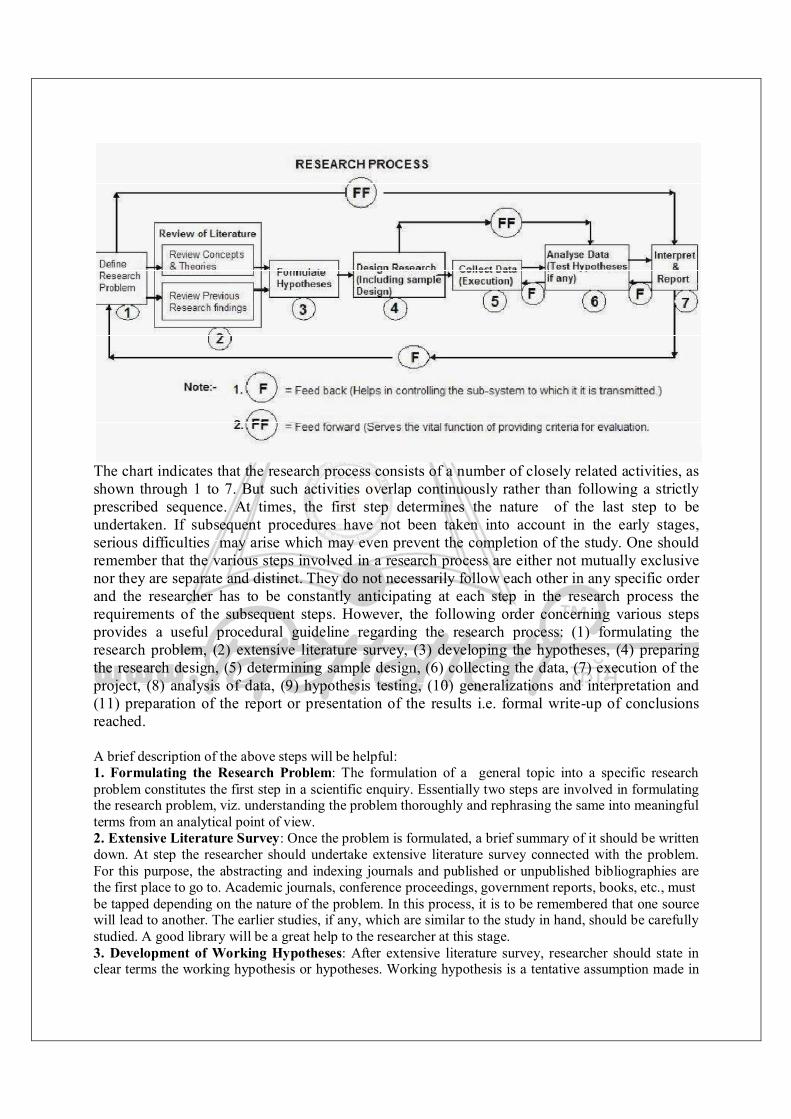
The chart indicates that the research process consists of a number of closely related activities, as shown through 1 to 7. But such activities overlap continuously rather than following a strictly prescribed sequence. At times, the first step determines the nature of the last step to be undertaken. If subsequent procedures have not been taken into account in the early stages, serious difficulties may arise which may even prevent the completion of the study. One should remember that the various steps involved in a research process are either not mutually exclusive nor they are separate and distinct. They do not necessarily follow each other in any specific order and the researcher has to be constantly anticipating at each step in the research process the requirements of the subsequent steps. However, the following order concerning various steps provides a useful procedural guideline regarding the research process: (1) formulating the research problem, (2) extensive literature survey, (3) developing the hypotheses, (4) preparing the research design, (5) determining sample design, (6) collecting the data, (7) execution of the project, (8) analysis of data, (9) hypothesis testing, (10) generalizations and interpretation and (11) preparation of the report or presentation of the results i.e. formal write-up of conclusions reached. A brief description of the above steps will be helpful: 1. Formulating the Research Problem: The formulation of a general topic into a specific research problem constitutes the first step in a scientific enquiry. Essentially two steps are involved in formulating the research problem, viz. understanding the problem thoroughly and rephrasing the same into meaningful terms from an analytical point of view. 2. Extensive Literature Survey: Once the problem is formulated, a brief summary of it should be written down. At step the researcher should undertake extensive literature survey connected with the problem. For this purpose, the abstracting and indexing journals and published or unpublished bibliographies are the first place to go to. Academic journals, conference proceedings, government reports, books, etc., must be tapped depending on the nature of the problem. In this process, it is to be remembered that one source will lead to another. The earlier studies, if any, which are similar to the study in hand, should be carefully studied. A good library will be a great help to the researcher at this stage. 3. Development of Working Hypotheses: After extensive literature survey, researcher should state in clear terms the working hypothesis or hypotheses. Working hypothesis is a tentative assumption made in
order to draw out and test its logical or empirical consequences. As such the manner in which research hypotheses are developed is particularly important since they provide the focal point for research. 4. Preparing the Research Design: The research problem having been formulated in clear cut terms, the researcher will be required to prepare a research design, i.e. he will have to state the conceptual structure within which research would be conducted. The preparation of such a design facilitates research to be as efficient as possible yielding maximal information. In other words, the function of research design is to provide for the collection of relevant evidence with minimal expenditure of effort, time and money. But it depends mainly on the research purpose. 5. Determining Sample Design: All the items under consideration in any field of inquiry constitute a 'universe' or 'population'. A complete enumeration of all the items in the 'population' is known as a census inquiry. It can be presumed that in such an inquiry when all the items are covered no element of chance is left and highest accuracy is obtained. But in practice this may not be true. But in practice this may not be true because of bias. Besides, this type of inquiry involves a great deal of time, money and energy. Also, census inquiry is not possible in practice under many circumstances. For instance, blood testing is done only on sample basis. Hence, quite often we select only a few items from the universe for our study purposes. The items so selected constitute what is technically called a sample. A sample design is a definite plan determined before any data are actually collected for obtaining a sample from a given population. Samples can be either probability samples or nonprobability samples. With probability samples each element has a known probability of being included in the sample but the nonprobability samples do not allow the researcher to determine this probability. Probability samples are those based on simple random sampling, systematic sampling, stratified sampling, cluster/ area sampling whereas non-probability samples are those based on convenience sampling, judgment sampling and quota sampling techniques. 6. Collecting the Data: In dealing with any real life problem it is often found that data at hand are inadequate and hence, it becomes necessary to collect data that are appropriate. There are several ways of collecting the appropriate data which differ considerably in context of money costs, time and other resources at the disposal of the researcher. Primary data can be collected either through experiment or through survey. If the researcher conducts an experiment, he observes some quantitative measurements, or the data, with the help of which he examines the truth contained in his hypothesis. But in the case of a survey, data can be collected by any one or more of the ways like, by observation, through personal interviews, through telephone interviews, by mailing of questionnaires, through schedules. The researcher can select one or more of these methods taking into consideration the nature of investigation, objective and scope of the inquiry, financial resources, available time and the desired degree of accuracy. 7. Execution of the project: It is a very important step in the research process. If the execution of the project proceeds on correct lines, the data to be collected would be adequate and dependable. The researcher should see that the project is executed in a systematic manner and in time. If the survey is to be conducted by means of structured questionnaires, data can be readily machine-processed. In such a situation, questions as well as the possible answers may be coded. If the data are to be collected through interviewers, arrangements should be made for proper selection and training of the interviewers. The training may be given with the help of instruction manuals which explain clearly the job of the interviewers at each step. 8. Analysis of Data: After the data have been collected, the researcher turns to the task of analyzing them. The analysis of data requires a number of closely related operations such as establishment of categories, the application of these categories to raw data through coding, tabulation and then drawing statistical inferences. The data difficult to handle should necessarily be made easy by a few manageable groups and tables for further analysis. Thus, researcher should classify the raw data into some purposeful and usable categories. Coding operation is usually done at this stage through which the categories of data are transformed into symbols that may be tabulated and counted. Editing is the procedure that improves the quality of the data for coding. With coding the stage is ready for tabulation. Tabulation is a part of the technical procedure wherein the classified data are put in the form of tables. The mechanical devices can be made use of at this juncture. A great deal of data, especially in large inquiries, is tabulated by
computers. Computers not only save time but also make it possible to study large number or variables affecting a problem simultaneously. Analysis work after tabulation is generally based on the computation of various percentages, coefficients, etc., by applying various well defined statistical formulae. In the process of analysis, relationships or differences supporting or conflicting with original or new hypotheses should be subjected to rests of significance to determine with what validity data can be said to indicate any conclusion(s). For instance, if there are two samples of weekly wages, each sample being drawn from factories in different parts of the same city, giving two different mean values, then our problem may be whether the two mean values are significantly different or the difference is just a matter of chance. Through the use of statistical tests we can establish whether such a difference is a real one or is the result of random fluctuations. If the difference happens to be real, the inference will be that the two samples come from different universes and if the difference is due to chance, the conclusion would be that the two samples belong to the same universe. Similarly, the technique of analysis of variance can help us in analyzing whether three of more varieties of seeds grown on certain fields yield significantly different results or not. In brief, the researcher can analyze the collected data with the help of various statistical measures. 9. Hypothesis Testing: After analyzing the data as stated above, the researcher is in a position to test the hypotheses, if any, he had formulated earlier. Do the facts support the hypotheses or they happen to be contrary? This is the usual question which should be answered while testing hypotheses. Various test, such as Chi-square test, t-test, F-test, have been developed by statisticians for the purpose. The hypotheses may be tested through the use of one or more of such test, depending upon the nature and object of research inquiry. Hypothesis-testing will result in either accepting the hypothesis or in rejecting it. If the researcher had no hypotheses to start with, generalizations established on the basis of data may be stated as hypotheses to be tested by subsequent researches in times to come. 10. Generalizations and Interpretation: If a hypothesis is tested and upheld several times, it may be possible for the researcher to arrive at generalization, i.e., to build a theory. As a matter of fact, the real value of research lies in its ability to arrive at certain generalizations. If the researcher had no hypothesis to start with, he might seek to explain his findings on the basis of some theory. It is known as interpretation. The process of interpretation may quite often causes to new questions which in turn may lead to further researches. 11. Preparation of the Report or the Thesis: Finally, the researcher has to prepare the report of what has been done by him. Writing of report must be done with great care keeping in view the structure of a research. Check your progress: 1. Prepare flow chart of Research Process. 2. List down sequentially various steps involved in Research Process.
2.2. CHARACTERISTICS OF SCIENTIFIC RESEARCH It is expected on general or common ground that scientific research has to satisfy the following criteria: 1. The purpose of the research should be clearly defined and common concepts be used. 2. The research procedure used should be described in sufficient detail to permit another researcher to repeat the research for further advancement, keeping the continuity of what has already been attained. 3. The procedural design of the research should be carefully planned to yield results that are as objective as possible. 4. The researcher should report with complete frankness, flaws in procedural design and estimate their effects upon the findings. 5. The analysis of data should be sufficiently adequate to reveal its significance and the methods of analysis used should be appropriate. The validity and reliability of the data should be checked carefully. 6. Conclusions should be confined to those justified by the data of the research and limited to those for which the data provide an adequate basis. 7. Greater confidence in research is warranted if the researcher is experienced, has a good reputation in research and is a person of integrity. 2.3. MAJOR CHARACTERISTICS OF RESEARCH. The major characteristics of any research are; Objectivity, precision, design and verifiability. Objectivity. In an ideal situation, a research is beyond the subjective bias of the researcher. As a researcher, you have to make deliberate efforts to eliminate all personal preferences. You should resist the temptation to seek only such data which support your hypotheses or your line of taught. In a scientific research, emphasis is on testing the hypothesis not to prove it. You have to willingly suspend your personal judgment in order to allow the data and logic to lead independently to a sound conclusion. If you want to achieve objectivity in your investigation, you have to use standardized research instruments, choose appropriate research design and analytical tools and also ensure the dependability of data. Precision When you conduct a good research and write the report but your readers do not understand what you have done, you may have succeeded in wasting your time and efforts. Every research should use a technical language in order to convey the exact meaning to the readers. Such research languages include validity, reliability, random sampling variables etc. The most precise expression in quantitative research is the mathematical equation or statistical finding which explains or represents the truth. But in qualitative research, precision is achieved through words rather than numbers. So you have to use a very precise language to describe your study accurately. This is done so that the study can be replicated or the results correctly used. Design If you want to have a good research, you must have a very good and systematic design. This implies that every scientific inquiry will generally undergo such steps as: - Definition of the problem Statement of the hypothesis Collection and analysis of data Testing and confirmation or rejection of hypothesis. Reporting of the results. Any research, which has no orderly design, cannot be replicated for verification.
Verifiability When you conduct a research, you write your report. This presents the research design and the findings to the professional community. From this point other researchers and scholars will study the report, analyze it in order to confirm or reject the outcomes. This tells you that research is a social enterprise. Its information is open for public scrutiny. Verification is related to objectivity and precision. It is only through further investigation or replication of the study can the results of any study be confirmed, revised or rejected. It is also through this process that a body of new knowledge is developed and new questions identified. Verifiability can be achieved through two different approaches. i. Analyzing the same data on the same sample through alternative analytical tools or statistical methods. ii. Replicating the study on a different sample. 2.4. OTHER GENERAL CHARACTERISTICS OF RESEARCH In accordance with the general characteristics of research we can generate the characteristics for which research in Computer Science is known. These include: 1. Systematic The scientific method of enquiry adopts a systematic approach to problem solving. There is order in the procedure. There is also control in every stage with a view to reducing interference issues that are likely to affect the results of the investigation. Research in Computer Science also follows the systematic approach to solving problems. Extraneous variables that are likely to affect the results of findings are also put in check. For instance, in a study to determine the relationship between the use of a particular teaching method and achievements in Computer Science examinations, efforts are made to control the effects of other variables such as the teaching and learning environment, other teaching methods, age and sex of the learner, etc. 2. Empirical The criterion of empiricism is concerned with the reality of facts. The scientific method of enquiry is empirical. It involves the collection of data which provides the basis for drawing conclusions. In empirical research, the researcher looks out for data which he can experience and experience with his senses. In most cases, the senses are aided with by some man-made instruments like thermometer, scale, microscope, etc. The method of research in Computer Science is also empirical. It is based on observation for purposes of obtaining the empirical evidence. Questionnaire, interview, experiments and so on are empirical tools adopted as research instruments in accordance with the demands of the research topic. Conclusions in Computer Science research are based solely on concrete evidence adduced from the analysis of data collected by careful observations of the phenomena being investigated and not on personal feelings, beliefs, and religious/ideological biases. 3. Non-ethical The scientific method of enquiry is non-ethical. This means that it does not judge any specific act as good or bad. It simply offers explanations based on the empirical evidence. This criterion is also evidenced in the method of enquiry adopted in Computer Science . Empirical evidence is used to explain the findings of the research for purposes of objectivity. Like we have in the scientific research, it does not consider moral issues. Research in Computer Science does not answer questions on whether a social action is right or wrong, just or unjust, fair or unfair, etc. Instead, it attempts to explain phenomena, behaviour or actions in line with its findings. 4. Problem Oriented Scientific method is geared towards obtaining the solution to a particular problem. Although the basic type of research is concerned with the development of principles and theories, which are used in the promotion of knowledge in practical situations, it is not a purposeless activity. In the same
way, research methods in Computer Science are targeted to problem solving. It is teleological. This means that it focuses on a purpose in the same way as scientific investigations do. 5. Cumulative Scientific method is cumulative. Principles and theories build upon one another. In other words, new research efforts necessarily develop upon already existing studies, facts, theories and findings and help in refining and extending existing principles. In the course of the research, the intending researcher re-looks/re-examines an event or phenomenon, which other researchers have previously examined. The implication here is that nothing is completely new. There is always in existence some previous research in the same area upon which a new researcher can build. The cumulative nature of scientific research is also the exact position in Computer Science . There is no aspect of research today in any area of Computer Science which is not rooted to the efforts of past researchers. Research in Computer Science is cumulative. 6. Verifiable Research in the sciences is verifiable. The process employed by a previous researcher can be repeated by a new researcher with a view to verifying the validity or otherwise of the findings. In Computer Science research is also verifiable. It is possible for a researcher, in Computer Science , to collect and analyse data previously used by a previous researcher for purposes of confirming or refuting the recorded results. 7. Generalization In the scientific method of research, the interpretations of research findings enable the scientist to make generalizations in order to explain the phenomenon that has been researched upon. The main thrust of science is to comprehend phenomena or occurrence. Facts are established based on generalized understanding of relationships between events. Generalization entails the ability to go beyond the specific at hand. It is an important aspect of the scientific method, which is also applicable to the method of enquiry obtainable in Computer Science . We can, from the result of a study on the relationship between the use of material reinforcers and performance in Computer Science , generalize that students should be taught Computer Science with material reinforcers for their successful performance in the classroom or in Computer Science examinations. 8. Theoretical Scientific generalizations are developed in the establishment of theories. An idea acquires the status of a theory if it enables us to explain and perhaps make predictions on further occurrences. Research questions and hypotheses are used in scientific research, just as they are used in Computer Science . In the course of answering research questions or testing the research hypotheses, a researcher establishes facts and determines relationships between variables. If a research hypothesis is tested and proved to be true in reality, it becomes a theory. 9. Tentative Findings in the scientific research are tentative. Findings in Computer Science research are also tentative. This means that findings in both areas are provisional, not terminal. There are constant efforts to revise and improve on previous findings. The word research as it implies demands the need for repeated search, continuous “re-looking”. We do not hold onto a finding as the ultimate truth. A new researcher may decide to improve upon a theory or upon a previous result by improving the research instruments, etc. The general summary of the issues raised above is that research in Computer Science uses the systematic method to probe into the unknown, in order to discover new facts; it is orderly and applies the scientific methodology in its investigations. It therefore meets the demands of scientific methods of enquiry. It is described as the planned, systematic and scientific process of carrying out investigations in the area of Computer Science with the intention of finding answers and solutions to existing problems or generating new knowledge in Computer Science .
2.5. QUALITIES OF A GOOD RESEARCH On the basis of the above criteria we can easily state some qualities of a good research as under: 1. Good research is Systematic: It means that research is structured with specified steps to be taken in a specified sequence in accordance with the well defined set of rules. Systematic characteristic of the research does not rule out creative thinking but it certainly does reject the use of guessing in arriving at conclusions. 2. Good Research is Logical: This implies that research is guided by the rules of logical reasoning and the logical process of induction and deduction are of great value in carrying out research. Induction is the process of reasoning from a part to the whole whereas deduction is the process of reasoning from the whole to a part. In fact, logical reasoning makes research more meaningful in the context of decision making. 3. Good Research is Empirical: It implies that research is related basically to one or more aspects of a real situation and deals with concrete data that provides a basis for external validity to research results. 4. Good Research is Replicable: This characteristic allows research results to be verified by replicating the study and thereby building a sound basis for decisions. Good research gives dependable data that are derived by efficiently conducted practices and that can be used reliably for management decision making. While, poor research is carelessly planned and executed, resulting in data that a marketer can’t use for taking decisions. Good research is based on scientific method, systematic, empirically based procedures for producing replicable research. There are several defining characteristics of the scientific method which are mentioned below: 1. Purpose of the research should be clearly defined: The main objective of the business research—the problem addressed or the decision to be made—should be clearly defined and sharply delineated in terms as clear-cut as possible. Getting this in writing is valuable even in instances where the same person serves as a researcher and decision maker. The statement of the decision problem should include its scope, its limitations, and the precise meanings of all words and terms significant to the research. Failure of the researcher to do this adequately may raise legitimate doubts in the minds of research report readers as to whether the researcher has sufficient understanding of the problem to make a sound proposal attacking it. 2. Research process should be detailed: The research methods which are used must be explained in sufficient detail to permit another researcher to repeat the research. Except when secrecy is imposed, research reports should reveal with candor the sources of data and the means by which they were obtained. Omission of significant procedural details makes it difficult or impossible to estimate the validity and reliability of the data and justifiably weakens the confidence of the reader in the research itself as well as any recommendations based on the research. 3. Research design should be thoroughly planned: The steps in the design of the research must be well planned to produce results that are as objective as possible. When a sampling of the population is involved, the report should include evidence concerning the degree of representativeness of the sample. A survey of opinions or recollections ought not to be used when more reliable evidence is available from documentary sources or by direct observation. Bibliographic searches should be as thorough and complete as possible. Experiments should have satisfactory controls. Direct observations should

be recorded in writing as soon as possible after the event. Efforts should be made to minimize the influence of personal bias in selecting and recording data. 4. High ethical standards used: The work of researchers is often independent and has significant latitude in designing and executing research projects. A research design that includes safeguards against causing mental or physical harm to participants and makes data integrity a first priority should be highly valued. Careful consideration must be given to those research situations in which there is a possibility of physical or psychological harm, exploitation, invasion of privacy, and/or loss of dignity. The research need must be judged against the potential for harmful effects. Sometimes the study can be redesigned, but sometimes it is not possible. 5. Limitations openly revealed: The flaws in procedural design and their estimated effect on the findings should be reported with complete frankness. There are very few perfect research designs. Some of the imperfections may have little effect on the validity and reliability of the data; others may invalidate them entirely. His or her experience in analyzing data should provide a basis for estimating the influence of design flaws. As a decision maker, you should question the value of research where no limitations are reported. 6. Proper analysis to meet the decision maker’s needs: Extensive analysis of the data should be done to reveal its significance, what marketers call insights. The methods of analysis used should be appropriate. The extent to which this criterion is met is frequently a good measure of the competence of the researcher. Adequate analysis of the data is the most difficult phase of research for the novice. The validity and reliability of data should be checked carefully. The data should be classified in ways that assist the researcher in reaching pertinent conclusions and clearly reveal the findings that have led to those conclusions. When statistical methods are used, the probability of error should be estimated and the criteria of statistical significance applied. 7. Findings presented clearly: The presentation of report gives evidence of the integrity and capability of the researcher. For example, language that is restrained, clear, and precise; assertions that are carefully drawn and hedged with appropriate reservations; and an apparent effort to achieve maximum objectivity tend to leave a favorable impression of the researcher with the decision maker. Generalizations that outrun the evidence on which they are based, exaggerations, and unnecessary verbiage tend to leave an unfavorable impression. Such reports are not valuable to managers wading through the minefields of marketing decision making. Presentation of data should be comprehensive, easily understood by the decision maker, and organized so that the decision maker can readily locate critical findings. 8. Conclusions should be justified: Conclusions should be provided to that extent only for which there is support of the data. Researchers are many times tempted to provide conclusions on the basis of their personal experiences and their interpretations. A good researcher should always describe the situations under which their conclusions seem to be valid. 9. Research should be carried out by an experienced researcher: Researcher should be experienced and should have a good image of conducting research and should be a person with honesty. This will lead to more confidence in the research. So the readers of the research report should be provided with sufficient information about the researcher, so that they can judge the trustworthiness of the research study and the value of the research study. For this reason the information about the qualifications of the researcher should be provided in the research report.
2.6. SPECIFIC CHARACTERISTICS OF RESEARCH The following are the main characteristics of research: 1. A sound philosophy of social studies as the basis of research Robert R. Rusk observes. “In the application of scientific procedure to social studies a sound philosophy as well as a sound commonsense must be invoked to save the scientific procedure from itself.” 2. Research is based on insight and imagination The same writer feels, “Social studies by its reliance on research must never fail to realize that in addition to its practical practitioner and skilled investigators, it stands in need of men and women of imaginative insight, who look beyond, he present and behold the vision splendid. If the vision should fade into the light of common day, not only will the people perish, but research itself will become a sterile futility.” 3. Research requires an inter-disciplinary approach Research is not the mere description of elementary and isolated facts of nature. It must be related to the study of complex relationships of various facts. It requires an inter- disciplinary approach. 4. Research usually employs deductive reasoning process Eric Hylla writes in the ‘Nature and Functions of Research’, the science of mind commonly uses methods of description, explanation, interpretation, sympathetic or intuitive understanding methods which are mainly speculative and deductive in character and which rarely furnish results that can be subjected to measurement or mathematical procedures. 5. Research should come out of a desire to do things better Stephen M. Corey writes. “Better social studies al means better development or formulation of instructional aims, better motivation of pupils, better teaching methods, better evaluation and better supervision and administration, these are ‘activities’ or ‘operations’. 6. Research is not as exact as research in physical science No two human beings have ever been found to be alike. No scientific investigations of human behaviour even those of so called “identical twins” have resulted in the findings of individuals completely similar in structure or behaviour. “In the whole world there are probably no two things exactly alike similarly no two human beings are alike, they differ physically in size, weight, height, colour of eyes and hair texture of skin and in a thousand other details as well as in thousands of details of mental, social and spiritual life,” writes H.C. McKown. This fact stands in the way of making research as an exact science. 7. Research is not the field of the specialist only W.C. Redford writes, “In sum, I believe the teachers in every country have the opportunity and the capacity to undertake some research. Such research, carried out in the day-to-day work of the school, should be concerned directly with the problems of that school. It can properly concern itself with such matters as child development, class organisation, teacher-pupil relationships, interaction with the community, curriculum matters, teaching techniques and many others.” Similarly, V.V. Kamat, in an article entitled “Can a teacher do research?” published in ‘Teaching’ making these remarks: “Any teacher with commonsense, intelligence and insight can undertake research in a problem. In the beginning such workers may require some guidance and training but this can be made easily available to them at the hands of experts.” 8. Research generally requires inexpensive material In many social studies research studies we simply need subjects, i.e., children, their social studies al tools of daily use, paper and pencil and a few tests.
9. Research is based on the subjectivity and intangibility of social phenomena Lundberg has pointed out that the physical phenomena may be known directly through sense, whereas social phenomena are known only symbolically through words representing such phenomena as tradition, custom, attitude, values and the whole realm of so called subjective worlds. 10. Research is perhaps incapable of being dealt through empirical method According to Lundberg “Exact science tends to become increasingly quantitative in its units, measures, and terminology while most of the matter of social science is quantitative and does not admit of quantitative statement. We can talk of urbanisation, cultural assimilation etc. but we can’t measure quantitatively. We may talk of growing indiscipline, but unless we can measure it, unless we can ascertain the degree of indiscipline, we cannot find a perfect cure.” According to Mitchell, “Even in the work of the most statistically minded, qualitative analysis will have a place. Always our measurements, the pre-conceptions shape our ends, our first glimpses of new problems, our widest generalisations will remain qualitative in form.” 11. Research is based on inter dependence of causes and effect In case of a social phenomena the cause and the effect are inter dependent and one stimulates the other. It becomes, therefore, very difficult to find as to what is the cause and what is the fore effect. MacIver rightly points out, “Social science has hitherto suffered greatly from the attempt to make it conform to method derived from the order and more abstract sciences. It has led us to look for impossible results and to be disappointed at not getting them. We enquire, for example, after the manner of physical sciences which of the two related social phenomena is cause and which the effect. It usually turns out in the social sphere, that both are cause and both are effect. 2.7. EVALUATION OF GOOD RESEARCH A good scientific research has to satisfy several requisites. For example the Advisory Committee on Economics and Social Research in Agriculture of the Social Science Research Council summarized the essentials of good scientific research as follows: i. Careful logical analysis of the problem, isolating it from other problems and separating its elements. This means, in some cases the formulation of a hypothesis, in the proper meaning of this expression- a trial hypothesis that will point the investigation. ii. Unequivocal definition of terms and concepts and statistical units and measures, so that others will understand exactly, and be able to repeat the analysis and test the generalizations. iii. Collection of cases and data pertinent to the subject on hand. iv. Classification of cases and phenomena and data. v. Expression of factors in quantitative terms whenever possible. vi. Rigorous and exacting experimental or statistical procedure in summarizing the data and in isolating the attributes or variables and measuring their relationships and intereffects. vii. Statement in confusing terms of the exact conclusion that warranted for the cases examined. viii. Sound logical reasoning as to the bearing of these conclusions on the trial hypothesis and in the formulation of generalizations. ix. Statement of conclusions or generalizations definitely and clearly so that others will be able to check them. x. Complete elimination of the personal equation. xi. Complete and careful reporting of the data and the methods of analysis so that others can check the analysis, or test the generalizations with new sets of data.

Check your progress: 1) Which common criteria are to be satisfied by a scientific research? 2) What are the qualities of a good research? 3) How do you evaluate a research? 2.8. PROBLEMS OF RESEARCHERS IN INDIA Researchers in India, particularly those engaged in empirical research, are facing several problems regarding following areas: 1. The lack of a scientific training in the methodology of research is a great impediment for researchers in out country. For this, efforts should be made to provide short-duration intensive courses for meeting this requirement. 2. There is insufficient interaction between the university research departments on one side and business establishments, government departments and research institutions on the other side. Efforts should be made to develop satisfactory communication and co-operation among all concerned for better and realistic researches. 3. Most of the business units in our country do not have the confidence that the material supplied by them to researchers will not be misused and as such they are often unwilling to supply the needed information to researchers. There is need for generating the confidence that the information or data obtained from a business unit will not be misused. 4. Research studies overlapping one another are undertaken quite often for want of adequate information. This results in duplication and waste of money, time and resources. This problem can be solved by proper revision of a list of subjects on which and the places where the research is going on at regular intervals. 5. There does not a code of conduct for researchers and interuniversity and inter-departmental rivalries are also quite common. Hence, there is need for developing a code of conduct for researchers which, if adhered sincerely, can win over this problem. 6. Many researchers in our country also face the difficulty of adequate and timely secretarial assistance, including computation assistance. This causes unnecessary delays in the completion of research studies. All the possible efforts are made in this direction so that efficient secretarial assistance is made available to researchers and that too well in time. 7. Library management and functioning is not satisfactory at many places and much of the time and energy of researchers are spent in tracing out the books, journals, reports, etc., rather than in tracing out relevant material from them. 8. There is also the problem that many of our libraries are not able to get copies of old and new Acts or Rules, reports and other government publications in time. Efforts should be made for the regular and speedy supply of all these publications to reach our libraries. 9. There is also the difficulty of timely availability of published data from various government and other agencies doing this job in our country. 10. There may, at times, take place the problem of conceptualization and also problems relating to the process of data collection and related things. 2.8.1. THE CONCEPT OF PROBLEMS IN RESEARCH In a research process, you have to select a topic of study from your area of study. After this you narrow down this topic for your study. The next concern is to define the problem which you are focusing on. Kerlinger (1979) defines a research problem in two ways. The first is in a general sense in which he regards a research problem as a question that states situation needing discussion, inquiring, decision or solution. The second one which is a more satisfactory definition, he regards a research problem as a question that asks for how two or more variables
are related. It means therefore that a research problem must state and show how two or more variables are related. This may be stated in a question form. The most important fact here is that the relationship between two or more variables must be specified in the research problem. Look at these problems. Does the social class/status of parent play significant role in the academic achievement of secondary school students in Abia state of Nigeria? Does intelligence differ in the children from the middle and lower income class families? Does the size of a hotel play significant role in the type of services rendered to customers? Do customers‟ satisfactions depend on hotel management styles? Looking at these definitions and examples of problems in research, you should be able to identify some key characteristics of problems in research. Now let us look at the characteristics of research problem. 2.8.2. CHARACTERISTICS OF RESEARCH PROBLEM you can see that a research problem is always stated in a sentence, in a question or interrogative form. You have also noticed that a research problem is a question which states the relationship among Phenomena or variables. According to Tuckman (1972) some characteristics of a problem in research are outlined as follows: - i. It should ask about a relationship between two or more variables ii. It should be stated clearly and unambiguously, usually in question form iii. It should be possible to collect data on it so as to answer the question(s) asked. iv. It should not represent a moral or ethnic position indicating bias or feeling of preference. From these you must note that every research topic must have two more variables that can be measured or manipulated or controlled. The research problem must ask for the relationships between the variables contained in it. E.g. what is the relationship between the socio-economic status of parents and the intelligent quotient of their children? A problem must be researchable i.e. testable through empirical methods of field or laboratory observation and collection of data. You should try as much as you can to avoid value prepositions, ideals and moral judgments that are expressed by words like good, bad, best, desirable, reliable etc when writing research problems. It is very difficult to realistically collect data on human judgment and its moral imperatives which by all standards are highly subjective. Remember that your research problem should be an empirically testable proposition stated in a question form containing two or more measurable or manipulative variables whose relationships are sort for in the problem statement itself. As a researcher, you are required to state your research problems in accordance with some principles. These principles listed by Egon Guba (1973) are as follows: - i. State the problem in terms intelligible to someone who is generally sophisticated but who is relatively uninformed in the are of the problem ii. Define and delimit the specific area of the research. iii. Fore-shadow the hypothesis to be tested or the questions to be raised in the problem statement. You have to note that these principles are intended to make the problem statement in any research report to be clear and specific. 2.8.3. SOME SOURCES OF SUITABLE RESEARCH PROBLEMS Most of the problems confronted in the school system, the community, banking industry, hotel and hospitality industries, etc, lend themselves to investigations. You can see that today we are having technological changes and developments. These are constantly bringing forth new problems and new opportunities for research.
The whole area of computer education and literacy provide avenue for a good number of research topics through the internet and websites. You can also get topics through international abstracts typed for computer processed. Classroom lectures, class discussions, seminar reports and out of class exchanges of ideas with fellow students and lecturers can suggest many stimulating problems for solution. When you read assignments, journal articles, textbooks, research report, term paper, etc can also suggest additional area of needed research. Some research topics can be selected on the basis of their use in verifying and testing a particular theory. You know that every research has some implications for existing theory. Therefore some research topics are selected specially for the purpose of testing some aspects of a given theory. In your exploration in an area, you may come across additional problems that need resolving. Most of these problems are often theoretically framed. Another fruitful source of research problem is prior research. All research projects have limitations, new questions may be raised by the findings, research reports have discussions of weakness and limitations of the research, including suggestions for further research, so focusing on these unanswered questions or expending on previous research is a good way to find research problems. Again, if you have any reason to doubt or question the results of an original study or you wish to replicate another research study, it gives you the opportunity of having a research problem. This is possible because of numerous opportunities for errors or biases to influence research results. Programme evaluation and practice effectiveness evaluation can form important activities for research purposes. Other sources of problem selection include political issues. Some of these may attract financial sponsorship from external interests like the government or its agencies, non-governmental organizations, private research organizations etc. Consultation with your supervisor or advisor may be helpful in providing research problems for your study. A very important function of your supervisor is to help you clarify your thinking, achieve a sense of focus and develop a manageable problem from one that may be vague, complex or not researchable. 2.8.4. SELECTING A RESEARCH PROBLEM Selecting a research problem is one of the most difficult tasks you have to face in the research process. This statement of fact is not in anyway intended to discourage you. However, we are going to discuss some appropriate guidance to make it easier for you. According to Best and Khan (1995) one of the most difficult phases of the graduate research project is the choice of a suitable problem. This is because most students often select problems that are too broad in scope. Of course, they do this because they lack the understanding of the nature of research and systematic problem-solving ability. Sometimes, they are so enthusiastic to solve an important problem quickly. But you have to understand that research is often very tasking, slow and rarely spectacular. Because it is the search for truth and solution to very important problems, it takes a great deal of time and energy. It takes intensive application of logical thinking. You should therefore follow some guiding principles to aid you in your problem identification and selection in research encounters. The most important and controlling point of view in selecting a research problem for your study should be that the problem should contribute to the overcoming of obstacles in your area of study. According to Good et al (1945) you should painstakingly select your problem of study upon these considerations: -
i. Novelty (newness) of the problem. ii. Your interest in the problem iii. Practical value of the research on the problem to you and others in the society. iv. Your special qualification to handle the problem v. Availability of data on the problem vi. The cost of doing the investigation on the problem. vii. The time required and available for the completion of the study. In his own contribution, Okpala (1995) insists that in selecting a topic, all effort should be made to ensure that it: i. Falls within the discipline (i.e. in time and space) ii. Is not a duplication of an existing work? iii. Conveys some reasonable information on the nature of the research problem, the variables and how they are matched. iv. It is not too lengthy v. It is not vague 2.9. SHAPING AND REFINING THE PROBLEM You have been informed earlier in this unit that it could be frustrating if you become ensnared in choosing a topic which is too broad and encompassing but by itself offers little guidance in terms on how to move on or proceeds. Look at this topic for instance; Equity in hotel management and tourism in Nigeria. You can see that this is too broad and lacks focus. So when you choose a problem area, the next step is translating the general topic of interest into a precise researchable problem. You will now narrow down the scope of the problem into a manageable proportion. The refining, shaping, narrowing and focusing of a research problem do not occur at once. It is a continuous process involving a number of procedures such as conceptual development, review of literature, etc. The successful selection of a research problem means it has to be definitely formulated, structural and well stated. Problems in research can be stated in these various forms: (a) As a question or questions namely: - i. A single question ii. Several questions iii. A single question followed by several sub questions. (b) As a declarative statement taking the form of being i. A single statement ii. A single statement containing several phrases iii. A series of complete statemenst iv. A general statement followed by subordinate statements (c) As a statement followed by a re-statement in the form of a question. (d) As a statement followed by a series of propositions. You are advised to use each of these forms one at a time to state a single problem. The types of statement you may employ in stating a formulated problem depend on your preference and the nature of the problem structured for study in your research encounter. What are we saying is that after the formulation of your research problem, you still need to define and delimit it? You are at liberty to use any or many of the procedures available in defining and delimiting your study in order to make for clarification. However you are expected to specify the problems in details and with precision. You need to specify each question and sub-ordinate question to be answered. The assumptions made and the limits of the investigations should also be determined and specified. Now let us look at the
principles of Engelhard (1928) and Egon Guba (1973) as various ways of defining the problem in research. (a) Analysis of the major problem or problems in terms of sub-ordinate problems. (b) Statement of the limits or scope of study. (c) Orientation of the problem which include giving: - i. A historical account, remote or recent ii. An analysis of previous studies or related subject. iii. A survey of previous studies or related studies iv. Preliminary survey of the problem context (d) Description of the general nature of the problem: - in terms of type, procedure and sources (e) Statement of limitations of technique employed in the investigation (f) Recognition of assumptions and implications of the problem (g) Identification of the importance, value or significance of the study (h) Definition of terms related to the problem that will provide further understanding. Check your progress: 1) What are problems that have to face the Indian researchers? 2) How would they be solved? 2.10. Important Research Concepts Deductive Reasoning Deductive reasoning is a top-down approach that leads to the specific from general. It means that in an empirical research, a researcher begins a study by taking into consideration the theories that have been already developed related to a topic of interest. The Deductive approach helps a researcher to think about research that has been already conducted and to develop an idea about extending or adding to that theoretical foundation. From the broad idea, the researcher works to develop an hypothesis. The new study by the researcher will test this new hypothesis. For this purpose specific data is to be collected and analyzed in the new study, which will form the basis of the test of the hypothesis. With the help of the data collected, it will either confirm the hypothesis, or it will not. It is also important to note that a hypothesis that is not confirmed has not been proven false. Example of deduction: All students at Global school are disciplined. (Premise 1) Sara is a student in Global school. (Premise 2) Sara is disciplined. (Conclusion) Inductive Reasoning Inductive reasoning is a bottom-up approach that moves to the general from the specific. In this case, specifically refers to an observation made by the researcher in his study that eventually leads to broad generalization and theory. An inductive research methods approach starts with specific observations made by a researcher who begins a study with an idea or a topic of interest, just as in a deductive approach to research. But, in an inductive approach, the researcher does not consider related theories very much into the research. From the observations or measures that the researcher conducts – generally in the field and not in a laboratory setting – clusters of data or patterns begin to emerge. From these identified regularities or patterns, the market researcher generates themes that come with analysis of the data. In induction we draw a conclusion on the basis of one or
more particular facts or pieces of evidence. The conclusion explains the facts, and the facts support the conclusion. For example, suppose the students in a particular school are not able to score good marks. This is a fact—students did not score well in the exams. Under such circumstances, we ask, “Why the students could not score well in the exams?” One possible answer to the question can be that the students did not prepare well for the exam. This conclusion is an induction. The nature of induction explains that the conclusion is only a hypothesis. It is only one explanation among many others, but there are other explanations also that fit the facts just as well. To illustrate, the various reasons for declining sales of a firm in a month can be:
Regional retailers did not have sufficient stock to fill customer requests during the promotional period.
A strike by the employees of the trucking firm prevented the stock from arriving in time for the promotion to be effective.
A category-five hurricane closed all the retail locations in the region for the 10 days during the month.
2.11. ROLE OF COMPUTER TECHNOLOGY IN RESEARCH Computer technology in research, no doubt, plays vital role. This technology is very user-friendly and well familiar among the various study groups and researchers. The computer is changing the technology of economic and social research. The ability of the computer to process large data makes possible. We find at every step in the research process computer technology is an essential. We can observe its importance through research process. Following points, elaborates the role of computer technology in research: 1) Because of computer technology, various study groups and researchers are more curious and widen their knowledge which arises various research problems in their minds. 2) Once researchers dealing with the problems, computer technology helps to provide easy axis in thorough wide spread literature review. 3) With the help of computer technology, researcher is able to design various types of documents and data collection tools more neatly. 4) After data collection, now a day, it is very easy job to present the data more effectively with various pictures, diagrams and graphs. 5) Now with the help of the computer one can easily analyze and compute the data by using statistical tools and various soft wares, which require short training. 6) Because of all these, computer technology saves time, money and resources. 7) Researchers are now more confident and work out the jobs more accurately. 8) These technologies double-up the research work so that researchers can easily avoid unnecessary delays in the process. 9) Computer technology provides variety of effectiveness in printing jobs. 10) Computer technology makes researchers independent and isolate to study and getting well work done. Check your progress: 1) Do you think that computer is changing the technology of economic and social research? How? 2) Explain the role of computer technology in research.
2.12. Significance of Research in Computer Science Research by its nature is an essential tool for improvement. Its purpose is to investigate an area of scholarship and record the results of the said investigation carefully and systematically in a written form, for references and appropriate usage. Research, undoubtedly, is an important method of gathering valid and reliable knowledge needed for significant changes, particularly where there is need to discard some old practices. In the absence of research, it is possible to discard the old practices in favour of inferior novel practices. In the study of Computer Science , the significance of research cannot be over-estimated. It is essential for the overall development of the students, the lecturer and administrators in the area of Computer Science . The following constitute, interalia, the benefits of research in the study of Computer Science . 1. Research stands as a sine-qua-non for making reasonable decisions for successful achievements in Computer Science . 2. Research in the area of Computer Science establishes the basis for significant increase in knowledge making and knowledge dissemination. The researcher in this area is usually pre-occupied with finding solutions to existing problems in Computer Science . At the end of the study, the results/solutions realized form additional knowledge in the area. The researcher is well acquainted with the new knowledge having been exposed to varieties of information on the issue investigated as well as on the views/contributions of the respondents and other researchers in a similar/related area. The readers, on their own, become aware of the new knowledge and use it in accordance with their individual purposes, making progress as necessary. 3. Research in Computer Science can be used to examine the validity of propositions and practices obtainable in the area. 4. Through research in Computer Science , new books, chapters in books and articles in journals have been written for libraries and for use by individual readers either for pleasure or for other numerous purposes. 5. Research provides valid and reliable information needed by priests, pastors, evangelists and teachers of Computer Science for appropriate planning. 6. Research in Computer Science , as in any other discipline, involves active learning and, as a result, its activities expose the intending researcher to many innovative areas in the use of library, procedures for data collection and analysis as well as in the acceptable documentation format, mechanics of research and the importance of critical/logical reasoning. 7. Procedures employed in research activities in Computer Science go a long way in educating the researcher on effective methods of organization, analysis and lucid-imagination. By so doing, he gains some reasonable knowledge on the subject area and disseminates this knowledge to the reader in coherent articulation. Levels of knowledge obtainable today in Computer Science are all related to the totality of investigations carried out in the area. For whatever purpose research is initiated, the procedure for the investigation is of paramount importance. The researcher is expected to take extreme care of his findings and the way he records them mainly because these are taken into consideration in the course of evaluating the final product. It is not enough to conclude any part of work based on personal knowledge only. The investigator must carry out the investigation using pertinent, relevant and related sources, with a view to discovering some new information. The findings of the investigation should not be a massive pool of the ideas of other people but a meticulous and coherent construction which presents original options gathered from a multitude of sources for any form of clarification and verification. Nwabueze (2009) sums the matter superbly: A good research should have its own problem to investigate, organize information in such a way that the reader has a new insight into the subject of investigation, and presents its own unique conclusion.
2.13. Nature of Research Problems in Computer Science We can now proffer answers to the questions: What constitutes a problem situation in Computer Science ? Is every work or assignment a problem in Computer Science ? Ideally, not every work or assignment can be accepted as a research problem in Computer Science . This is because not all problems are viable as research topics; not all problems are researchable. A viable research topic in Computer Science is one that is amenable to investigation. This implies that it is possible to gather relevant data necessary for testing the theory or finding an answer to the question under investigation. Research problems in Computer Science can be one, or at least related to any one, of the following:
An Unsatisfactory State of Affairs Any unsatisfactory state of affairs in Computer Science can constitute a problem. Such an unsatisfactory state occurs whenever positions of things are not what they ought to be. In this case the situation is so disturbing that there is ardent need to have it rectified. The disturbing situation constitutes a problem that should be solved. An example is the recurrent poor performance of students in C.R.K. during examinations. Identifying what the cause of this unsatisfactory state of affairs is and its remedies can constitute a problem of study in Computer Science .
Unanswered Question A problem in Computer Science can also take the form of an unanswered question. There are multiplicities of unanswered questions in Computer Science . These questions, which demand answers, are problems in themselves. Instances of unanswered questions are: Why do we have more male than female lecturers in the Department of Computer Science in ABC institutions?
Unsatisfied Need Research problems in Computer Science can also take the form of a need. A need which is yet to be satisfied is a problem demanding solution. For instance, establishment of open and distant learning institution in Nigeria brought the need for standard electronic facilities, eBooks inclusive, dearth of standard electronic books in Computer Science is a need, a problem demanding solution.
Imbalance An imbalance in any system is a problem inherent in that system. The presence of such an imbalance position is a distressing condition preventing effective functioning of the system. Solving the problem of imbalance creates a balanced situation for successful activities of the system. There may be cases of imbalance in Computer Science. For instance introducing students to standard literary works, standard library, without such introduction in our public schools leads to an imbalance which creates a problem not only in the education system but in the society at large.
2.14. SUMMARY 1. Research process consist of series of actions or steps necessary to effectively carry out research and the desired sequencing of these steps. 2. The scientific research should satisfy the criteria like the purpose should be clearly defined, the research procedure used should be described in detail, the procedural design should be carefully planned, the researcher should report with complete frankness, the analysis of data should be sufficiently adequate, greater confidence in research is warranted. 3. Some qualities of a good research are : good research is systematic, logical, empirical, and replicable.
4. A good scientific research has to satisfy several requisitions. 5. Researchers in India are facing several problems such as lack of a scientific training, insufficient interaction, lack of confidence, overlapping of research studies, lack of code of conduct for researchers, difficulty of adequate and timely secretarial assistance, difficulty of timely availability of published data, problem of conceptualization etc. 6. The computer is changing the technology of economic and social research. This technology is very user friendly and well familiar among the various study groups and researchers. 2.15. QUESTIONS 1) Explain / Describe the process of research work. 2) Explain various steps involved in research work. 3) What are the characteristics of a scientific research? 4) What are the qualities of a good research? 5) How do you evaluate a research work? 6) What are the difficulties faced by a researcher in India? 7) Explain the role of computer technology in social science research.
3 DATA : SOURCE AND MEASUREMENT
Unit Structure: 3.0 Objectives 3.1 Introduction 3.2 Data Processing 3.3 Information 3.4 Statistical Data 3.5 Measurement 3.6 Sources of Data Collection 3.7 Types and Classification of Data 3.8 Summary 3.9 Questions 3.0 OBJECTIVES To understand the meaning of Data. To study the processing of data and approaches to data management. To study the meaning, types, importance, limitations of Statistical data. To understand the meaning of Measurement and levels of measurement. To study the various components of measurement. To study the different types and classification of data. 3.1 INTRODUCTION Data is the raw material from which useful information is derived. The word Data is the plural of Datum. Data is commonly used in both singular and plural forms. It is defined as raw facts or observations, typically about physical phenomenon or business transactions. Example: A sale of a machine tool or an automobile would generate a lot of data describing those events. Data are objective measurements of attributes (the characteristics) of entities (such as people, place, things and events). These measurements are usually represented by symbols such as numbers, words, and codes, composed of a mixture of numerical, alphabetical and other characters. It takes a variety of forms, including numeric data, text, voice and images. Data is the collection of facts, which is unorganized but can be organized into useful information. The term data and information come across in our daily life and are often interchanged. Example: Dates, weights, prices, costs, number of items sold, employees' names, product names etc. 3.2 DATA PROCESSING The conversion of facts into meaningful information is known as data processing. It is also called in general as information processing. It is the processing of data to make it more usable meaningful, thus transforming it into information.
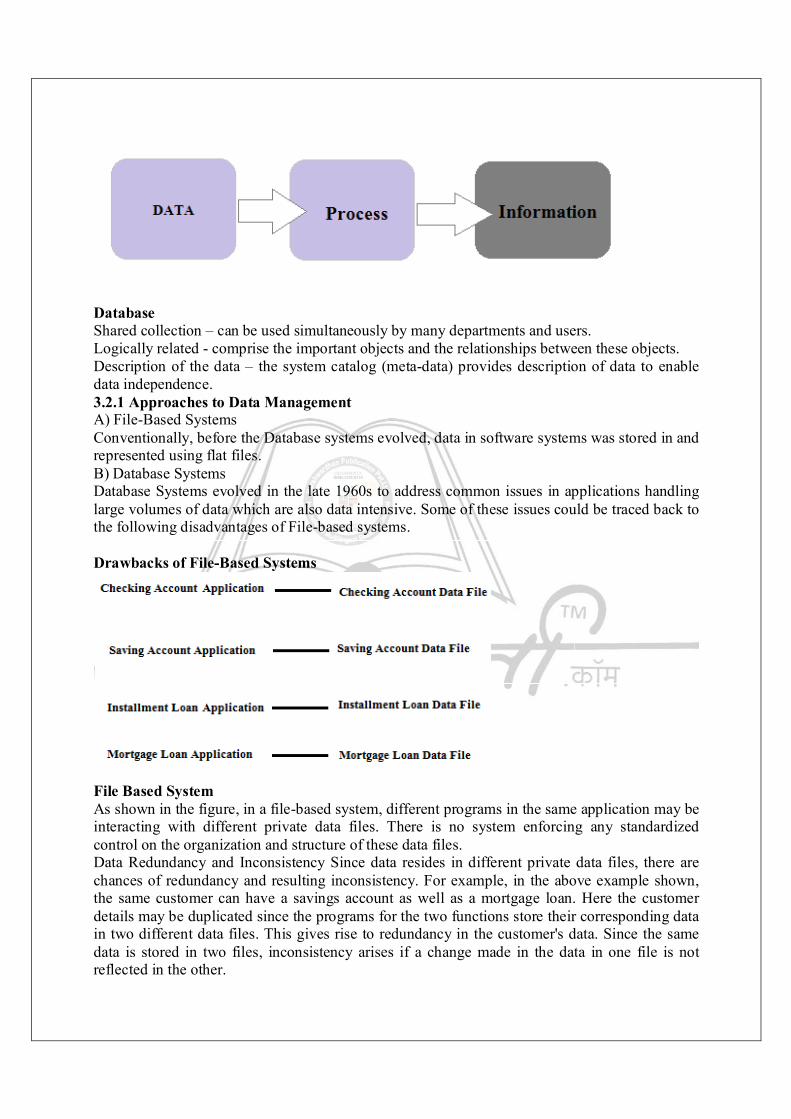
Database Shared collection – can be used simultaneously by many departments and users. Logically related - comprise the important objects and the relationships between these objects. Description of the data – the system catalog (meta-data) provides description of data to enable data independence. 3.2.1 Approaches to Data Management A) File-Based Systems Conventionally, before the Database systems evolved, data in software systems was stored in and represented using flat files. B) Database Systems Database Systems evolved in the late 1960s to address common issues in applications handling large volumes of data which are also data intensive. Some of these issues could be traced back to the following disadvantages of File-based systems. Drawbacks of File-Based Systems
File Based System As shown in the figure, in a file-based system, different programs in the same application may be interacting with different private data files. There is no system enforcing any standardized control on the organization and structure of these data files. Data Redundancy and Inconsistency Since data resides in different private data files, there are chances of redundancy and resulting inconsistency. For example, in the above example shown, the same customer can have a savings account as well as a mortgage loan. Here the customer details may be duplicated since the programs for the two functions store their corresponding data in two different data files. This gives rise to redundancy in the customer's data. Since the same data is stored in two files, inconsistency arises if a change made in the data in one file is not reflected in the other.
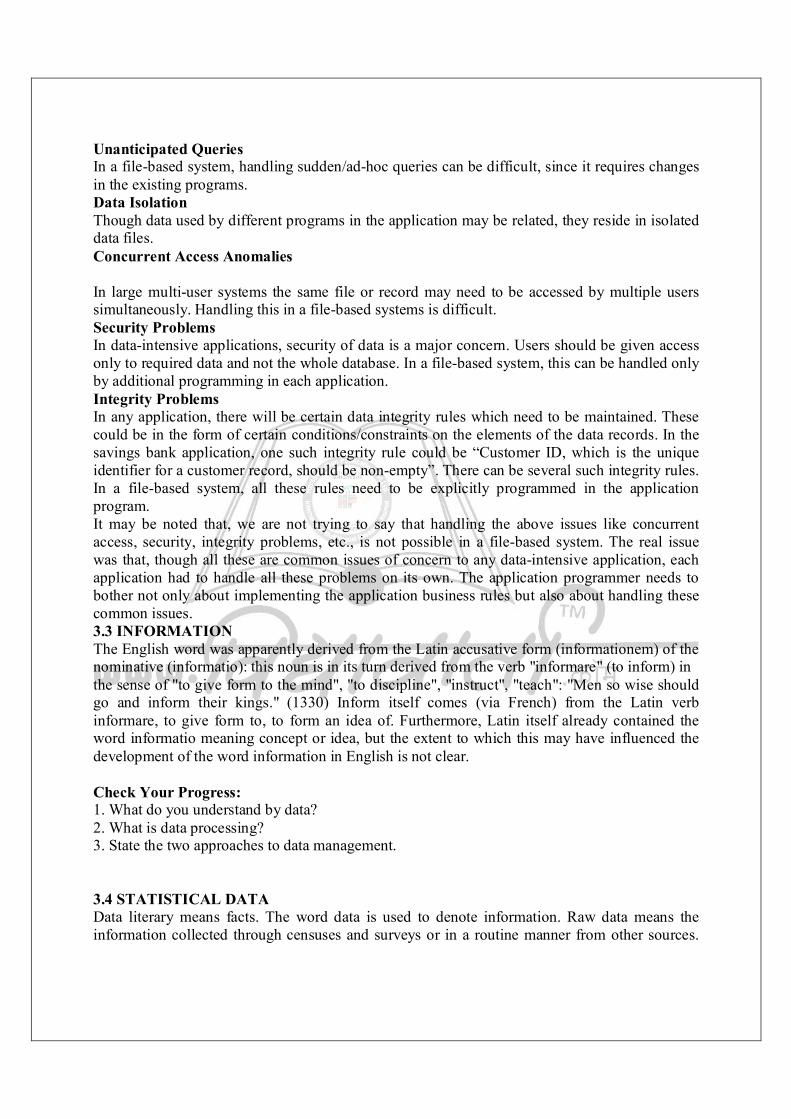
Unanticipated Queries In a file-based system, handling sudden/ad-hoc queries can be difficult, since it requires changes in the existing programs. Data Isolation Though data used by different programs in the application may be related, they reside in isolated data files. Concurrent Access Anomalies In large multi-user systems the same file or record may need to be accessed by multiple users simultaneously. Handling this in a file-based systems is difficult. Security Problems In data-intensive applications, security of data is a major concern. Users should be given access only to required data and not the whole database. In a file-based system, this can be handled only by additional programming in each application. Integrity Problems In any application, there will be certain data integrity rules which need to be maintained. These could be in the form of certain conditions/constraints on the elements of the data records. In the savings bank application, one such integrity rule could be “Customer ID, which is the unique identifier for a customer record, should be non-empty”. There can be several such integrity rules. In a file-based system, all these rules need to be explicitly programmed in the application program. It may be noted that, we are not trying to say that handling the above issues like concurrent access, security, integrity problems, etc., is not possible in a file-based system. The real issue was that, though all these are common issues of concern to any data-intensive application, each application had to handle all these problems on its own. The application programmer needs to bother not only about implementing the application business rules but also about handling these common issues. 3.3 INFORMATION The English word was apparently derived from the Latin accusative form (informationem) of the nominative (informatio): this noun is in its turn derived from the verb "informare" (to inform) in the sense of "to give form to the mind", "to discipline", "instruct", "teach": "Men so wise should go and inform their kings." (1330) Inform itself comes (via French) from the Latin verb informare, to give form to, to form an idea of. Furthermore, Latin itself already contained the word informatio meaning concept or idea, but the extent to which this may have influenced the development of the word information in English is not clear. Check Your Progress: 1. What do you understand by data? 2. What is data processing? 3. State the two approaches to data management. 3.4 STATISTICAL DATA Data literary means facts. The word data is used to denote information. Raw data means the information collected through censuses and surveys or in a routine manner from other sources.
The first step involved in statistics is the collection of statistics data. It is a basis or foundation of statistical investigations. Statistics data is of two types – 1) Primary data and 2) Secondary data Primary data is collected by a particular person or organization for its own use from the primary source. Statistic: Statistics and its methodology have gained recognition as an important tool for analysis of interpretation of data in natural biological, agricultural methodology taking business decision and engineering science. This subject found relevance in various fields. The economics commerce, psychology, geography, geology, Engineering, Mathematics, Business management. Since it is applicable to various fields as explained above, is necessary to study this subject. This may be found before in banking to take investment decision and intervene for collective and predicting customer‟s behaviors etc. Statistic is a word derived from a Latin word “STATUS” which means a Political state. Statistics is a tool for human being to translate complex facts into simple and understandable statement of facts. 3.4.1 Definition of Statistics 1. “Statistics is commonly understood nowadays as a mathematical disciple concerned with the study of masses of quantities data of any kind. “ (Encyclopedic of Britannia (1996)) 2. “As a name of a field of study, Statistics refers to the science and art of obtaining and analyzing quantitative data with a view to make a sound interference in the face of certainty (encyclopedia American (1998)). 3. “Statistics deals with the inferential process in particular, with the planning and analysis of experiments and surveys, with the nature of observational error and sources of variability that observe underlying patterns with efficient summarizing of sets of data.” (International encyclopedia of social science (1968)) Hence statistics deals with phenomena in which occurrence of events under study cannot be predicted with certainty. 3.4.2 Importance of statistics involves 1. Collection of data. 2. Analysis of data. 3. Interpretation of facts there from. To do theses statistical methodology is to be used. Collection of data is done by sampling method or experimental design. Here statistics is concerned with methodology used for summarizing data and to obtain salient information from the data. This way of doing this is called descriptive statistics. Inference that is drawn and conclusions arrived at in final stage and this is termed statistical inference. Some of the areas where statistics forward its importance they are 1. Consumption: Statistical data of consumption enable us to find out various ways in which people in different strata of society spend their income. 2. Production: Statistical data of production gives total productivity in the country, which enables us to compare ourselves with other countries of the world. 3. Exchange: In this field, an economist study market, law of prices that are determined by the forces of demand and supply, production cost, competition banking etc. A detailed and systematic study of all these can be made only with the help of statistics
4. Econometrics: This is a combination of economics, statistics and mathematics. With the help of econometrics economics has become exact science. 5. Public finance: Study of revenue and expenditure of country is called public finance. Budget (A statistical data document) fiscal policy of the government, deficit financing etc. which based on statistics, is the concept of economics. 6. Input-Output analysis: Relationship of input-output is based on statistical data explains input-output analysis. Sampling Time series, Index numbers, probability correlation and regression are some of the important applications where statistics finds its place. As per Prof. Alfred Marshall “statistics are the straws out of which I like every other economies, have to make bricks” Further statistics found important application in the following area a) Economics b) Commerce c) Auditing and accounting d) Economics planning e) Astronomy and meteorology f) Biology g) Mathematics h) Natural science i) Education j) Business k) Government l) Common man m) In army n) Banking o) Insurance companies p) Politicians q) Inversions r) Public utility services etc. Limitations of statistic: i) Statistics deals with aggregate or group of items and not individual item. ii) Statistics deals with the quantitative data. If the phenomena understudy yields only qualitative data. For ex. a situation like poverty is qualitative and as such not available to statistical analysis. This is possible only by assigning suitable quantitative measures to such a situation. iii) Statistical data holds good for averages or average individual. It may not be true for particular individual. As per W. J. King, statistics deals with averages and these may be made up of individual item radically different from each other. iv) Statistics does not reveal entire story of a problem. Since most of the problems are affected by such a factor, which are incapable of statistical analysis, it is not possible to examine problem in all its manifestation only by statistical approach. v) Statistics is liable to be misused and misrepresented. The most significant limitation of statistics is that it must be used by experts. According to Bowley “Statistics only furnishes tool though imperfect, which is dangerous in the hands of those who do not know its use and deficiencies. According to W. J. King “Statistics is clay of which you can make a God or Devil as you please”. He remarks “Science of statistics is the useful servant, but only greater value only to those who understand the proper use.”
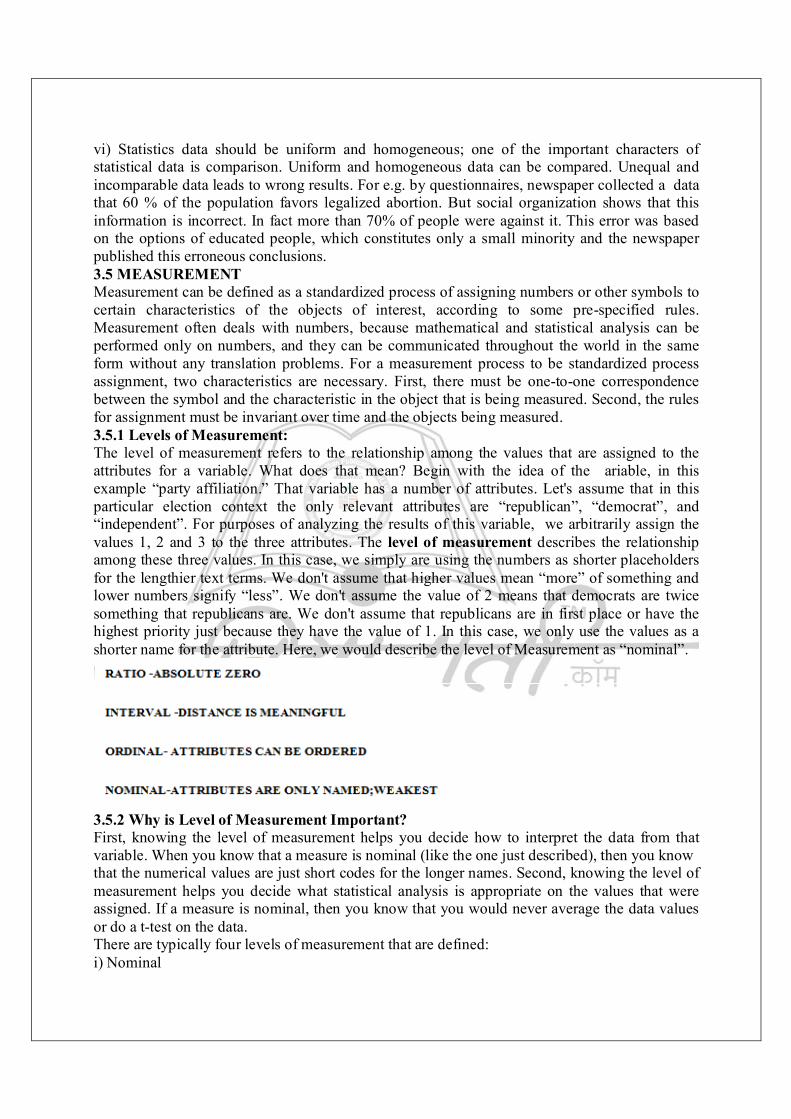
vi) Statistics data should be uniform and homogeneous; one of the important characters of statistical data is comparison. Uniform and homogeneous data can be compared. Unequal and incomparable data leads to wrong results. For e.g. by questionnaires, newspaper collected a data that 60 % of the population favors legalized abortion. But social organization shows that this information is incorrect. In fact more than 70% of people were against it. This error was based on the options of educated people, which constitutes only a small minority and the newspaper published this erroneous conclusions. 3.5 MEASUREMENT Measurement can be defined as a standardized process of assigning numbers or other symbols to certain characteristics of the objects of interest, according to some pre-specified rules. Measurement often deals with numbers, because mathematical and statistical analysis can be performed only on numbers, and they can be communicated throughout the world in the same form without any translation problems. For a measurement process to be standardized process assignment, two characteristics are necessary. First, there must be one-to-one correspondence between the symbol and the characteristic in the object that is being measured. Second, the rules for assignment must be invariant over time and the objects being measured. 3.5.1 Levels of Measurement: The level of measurement refers to the relationship among the values that are assigned to the attributes for a variable. What does that mean? Begin with the idea of the ariable, in this example “party affiliation.” That variable has a number of attributes. Let's assume that in this particular election context the only relevant attributes are “republican”, “democrat”, and “independent”. For purposes of analyzing the results of this variable, we arbitrarily assign the values 1, 2 and 3 to the three attributes. The level of measurement describes the relationship among these three values. In this case, we simply are using the numbers as shorter placeholders for the lengthier text terms. We don't assume that higher values mean “more” of something and lower numbers signify “less”. We don't assume the value of 2 means that democrats are twice something that republicans are. We don't assume that republicans are in first place or have the highest priority just because they have the value of 1. In this case, we only use the values as a shorter name for the attribute. Here, we would describe the level of Measurement as “nominal”.
3.5.2 Why is Level of Measurement Important? First, knowing the level of measurement helps you decide how to interpret the data from that variable. When you know that a measure is nominal (like the one just described), then you know that the numerical values are just short codes for the longer names. Second, knowing the level of measurement helps you decide what statistical analysis is appropriate on the values that were assigned. If a measure is nominal, then you know that you would never average the data values or do a t-test on the data. There are typically four levels of measurement that are defined: i) Nominal
ii) Ordinal iii) Interval iv) Ratio In nominal measurement the numerical values just “name” the attribute uniquely. No ordering of the cases is implied. For example, jersey numbers in basketball are measures at the nominal level. A player with number 30 is not more of anything than a player with number 15, and is certainly not twice whatever number 15 is. In ordinal measurement the attributes can be rank-ordered. Here, distances between attributes do not have any meaning. For example, on a survey you might code Educational Attainment as 0=less than H.S.; 1=some H.S.; 2=H.S. degree; 3=some college; 4=college degree; 5=post college. In this measure, higher numbers mean more education. But is distance from 0 to 1 same as 3 to 4? Of course not. The interval between values is not interpretable in an ordinal measure. In interval measurement the distance between attributes does have meaning. For example, when we measure temperature (in Fahrenheit), the distance from 30-40 is same as distance from 70-80. The interval between values is interpretable. Because of this, it makes sense to compute an average of an interval variable, where it doesn't make sense to do so for ordinal scales. But note that in interval measurement ratios don't make any sense - 80 degrees is not twice as hot as 40 degrees (although the attribute value is twice as large). Finally, in ratio measurement there is always an absolute zero that is meaningful. This means that you can construct a meaningful fraction (or ratio) with a ratio variable. Weight is a ratio variable. In applied social research most “count” variables are ratio, for example, the number of clients in past six months. Why? Because you can have zero clients and because it is meaningful to say that “...we had twice as many clients in the past six months as we did in the previous six months.” It's important to recognize that there is a hierarchy implied in the level of measurement idea. At lower levels of measurement, assumptions tend to be less restrictive and data analyses tend to be less sensitive. At each level up the hierarchy, the current level includes all of the qualities of the one below it and adds something new. In general, it is desirable to have a higher level of measurement (e.g., interval or ratio) rather than a lower one (nominal or ordinal). 3.5.3 Scales of Measurement Scaling is the process of creating a continuum on which objects are located according to the amount of the measured characteristics they possess. An illustration of a scale that is often used in research is the dichotomous scale for sex. The object with male (or female) characteristics is assigned the number 1 and the object with the opposite characteristics is assigned the number 0. This scale meets the requirements of the measurement process in that the assignment is one to one and it is invariant with respect to top time and object. Measurement and scaling are basic tools used in the scientific method and are used in almost every marketing research situation. 3.5.4 Components of Measurement The assignment of numbers is made according to rules that should correspond to the properties of whatever is being measured. The rule may be very simple, as when a bus route is given a number to distinguish it from other routes. Here, the only property is identity, and any comparisons of numbers are meaningless. This is a nominal scale. At other extreme is the Ratio scale, which has very rigorous properties. In between the extremes are ordinal scales and interval scales.
i) Nominal Scale: In a nominal scale, objects are assigned to mutually exclusive, labelled categories, but there are no necessary relationships among the categories; that is , no ordering or spacing is implied. If one entity is assigned the same number as another, they are identical with respect to a nominal variable. Otherwise, they are just different. Sex, geographic location, and marital status are nominally scaled variables. The only arithmetic operation that can be performed on such a scale is a count of each category. Thus we can count the number of automobiles dealers in the state of Karnataka or the number of buses seen on a given route in the past hour. ii) Ordinal Scale: An ordinal scale is obtained by ranking objects or by arranging them in order with regard to some common variable. The question is simply whether each object has more or less of this variable than some other object. The scale provides information as to how much difference there is between the objects. Because we do not know the amount of difference between objects, the permissible arithmetic operations are limited to statistics such as the median or mode but not median). For example, suppose a sample of 1,000 consumers ranked five brands of frozen mixed vegetables according to quality. The results for Birds-eye brand were as follows: Quality Number of respondents giving Rankings to Bird-Eye brand Highest 150 Second 300 Third 250 Fourth 200 Lowest 100 Total 1,000 The second quality category is mode; the third category is the median; however it is not possible to compute a mean ranking, because the differences between ordinal scaled values are not necessarily the same. The finishing order in a horse race per class standing illustrates this type of scale. Similarly, brands of frozen vegetables can be ranked according to quality, from highest to lowest. iii) Interval Scale: In an interval scale the numbers used to rank the objects also represent equal increments of the attribute being measured. This means that differences can be compared. The difference between 1 and 2 is the same as between 2 and 3, but is only half the difference between 2 and 4. The location of the zero point is not fixed, since zero does not denote the absence of the attribute. Fahrenheit and Celsius temperatures are measured with different interval scales and have different zero points. Interval scales have very desirable properties, because virtually the entire range of statistical operations can be employed to analyze the resulting number, including addition and subtraction. Consequently, it is possible to compute an arithmetic mean from interval-scale measures. iv) Ratio Scale: A ratio scale is a special kind of interval scale that has a meaningful zero point. With such a scale – of weight, market share, or dollars in savings accounts, for example, it is possible to say how many times greater or smaller one object is than another. This is the only type of scale that permits us to make comparisons of absolute magnitude. For example, we can say that an annual income of Rs.80, 000/- is two times as large as an income of Rs.40, 000/-. There have been some

contemporary efforts to adapt ratio scales to the measurement of social opinion. Some researchers have attempted to use magnitude estimation scales to overcome the loss of information that results when categories arbitrarily constrain the range of opinion. Magnitude scaling of attitudes has been calibrated through numeric estimation. Check Your Progress: 1. Define Statistics. 2. How data is collected in Statistics? 3. What are the areas where statistics is important? 4. Define measurement. 5. State the four levels of measurement. 6. What is Scales of measurement? 3.6 SOURCES OF DATA COLLECTION A) The primary data can be collected by the following methods- 1) Direct Personal Observation 2) Indirect oral investigation 3) Estimates from the local sources and correspondence 4) Data through Questionnaires 5) Investigations through enumerator‟s secondary data. It is the data collected by some other person or organization for their own use but the investigator also gets it for its own use. B) Sources of collecting secondary Data. Secondary data can be obtained by a) Published sources b) Unpublished Sources The secondary data can be collected by the following methods. 1) Information collected through newspapers and periodicals 2) Information obtained from the publication of trade associations 3) Information obtained from the research papers published by university departments or research bureaus or U.G.C. 4) Information obtained from the official publications of central, state and the local governments dealing with crop, industrial, trade and transport statistics. 5) Information obtained from the official publications of the foreign governments for international orgnisations. 3.7 TYPES AND CLASSIFICATION OF DATA 3.7.1 Types of classification Classification of data depends on the objectives and the purpose of the enquiry. There are four types of classification of data: Types of Classification Geographical Chronological Qualitative Qunatitative Areawise Chronological Character Numerical values Regional Time basis attribute Magnitudes 1) Geographical or Spatial Classification Under this method the data is classified on the basis of geographical or location series which are arranged on the basis of place are called spatial series.
Examples – classification of data on the basis of states, cites, regions, zones etc. Literacy figures are collected stat wise 2) Chronological Classification When the data is classified on the basis of time it is known as chronological classification For example -population recorded from 1997 to 2006. It is usually recorded with the earliest period. 3) Qualitative Classification When the data is classified on the basis of different characteristics or attributes is called Qualitative classification For example – rich-poor, Hindu-Muslim Married-Un married etc. 4) Qualitative Classification When the data is classified on the basis of phenomenon which is capable of Quantitative measurement is called Quantitative classification. For example age, height, price, sales, profits. 3.7.2 Classification of Data: When data is collected through primary methods, it is in the form of unarranged facts and figures, which give no information. It must be sorted out, arranged and properly classified in such a manner which suits the purpose most. The process of arranging things in groups or classes according to their common characteristics or attribute is called the classification of data. Secrist defined classification of data „is the process of arranging data into sequences and groups according to their common characteristics or separating them into different but related parts.‟ a) Characteristics of a Good Classification 1) It should be exhaustive 2) It should not be ambiguous 3) It should be mutually exclusive 4) It should not be unstable 5) It should be flexible. 6) It should be homogeneous 7) It should reveal classification. b) Objects of Classification The object s of classifying data are 1) To ignore unnecessary details. 2) To facilitate comparison between data 3) To study the relationship between several characteristics For example -population recorded from 1997 to 2006. It is usuallyrecorded with the earliest period. 3) Qualitative Classification When the data is classified on the basis of different characteristics or attributes is called Qualitative classification For example – rich-poor, Hindu-Muslim Married-Un married etc. 4) Qualitative Classification When the data is classified on the basis of phenomenon which is capable of Quantitative measurement is called Quantitative classification. For example age, height, price, sales, profits. 3.7.2 Classification of Data:
When data is collected through primary methods, it is in the form of unarranged facts and figures, which give no information. It must be sorted out, arranged and properly classified in such a manner which suits the purpose most. The process of arranging things in groups or classes according to their common characteristics or attribute is called the classification of data. Secrist defined classification of data „is the process of arranging data into sequences and groups according to their common characteristics or separating them into different but related parts.‟ a) Characteristics of a Good Classification 1) It should be exhaustive 2) It should not be ambiguous 3) It should be mutually exclusive 4) It should not be unstable 5) It should be flexible. 6) It should be homogeneous 7) It should reveal classification. b) Objects of Classification The object s of classifying data are 1) To ignore unnecessary details. 2) To facilitate comparison between data 3) To study the relationship between several characteristics 4) To prepare tabulation 5) To pinpoints the points of similarity and dissimilarity c) Advantages of Classification of Data 1) It condenses the data eliminating unnecessary details. 2) It is useful for comparison of data 3) It studies the relationship between several characteristics 4) It facilitates further statistical treatments. d) Rules for Classification of Data 1) Classes should be clearly defined 2) Classes should be exhaustive 3) Classes should be of equal width 4) Class number should neither be too large nor too small. 3.8 SUMMARY 1. Data is defined as raw facts or observations, typically about physical phenomenon or business transactions. Data are objective measurements of attributes of entities. 2. The conversion of facts into meaningful information is known as data processing. 3. File based systems and Database systems are the two approaches to data management. 4. Statistics is a tool for human being to translate complex facts into simple and understandable statement of facts. Statistical data is of two types – Primary and Secondary data. 5. Statistics involves collection of data, analysis of data and interpretation of facts therefrom. 6. Measurement can be defined as a standardized process of assigning numbers or other symbols to certain characteristics of the objects of interest, according to some pre-specified rules.
7. The level of measurement refers to the relationship among the values that are assigning to the attributes for a variable. 8. There are four levels of measurement Nominal, Ordinal, Interval and 9. Scaling is the process of creating a continuum on which objects are located according to the amount of the measured characteristics they possess. 10. There are four types of classification of data : Geographical, Chronological, Qualitative and Quantitative. 11. The process of arranging things in groups or classes according to their common characteristics or attribute is called the classification of data. 3.9 QUESTIONS 1. Discuss the different approaches to data management. 2. Define Statistics. Explain Statistics as a tool in collection of data. 3. Discuss the limitations of Statistics as a tool in collection of data. 4. What do you mean by levels of measurement? And why it is important? 5. What are the different components of Measurement? 6. Discuss the different types of classification of data. 7. Write a note on Classification of data.
4 DATA SAMPLING -METHOD
Unit Structure: 4.0 Objectives 4.1 Introduction 4.2 Criterion of good sample 4.3 Methods of Sampling 4.4 Sampling and Non-Sampling Errors 4.5 Summary 4.6 Questions 4.0 OBJECTIVES To understand the meaning of a sample To study the criterion of a good sample To study the various sampling methods To study the different types of Probability or Random sampling To study the various types of Non Probability or Non Random sampling 4.1 INTRODUCTION The sample method consisting of the selecting for study, a portion of the „universe‟ with a view to draw conclusions about the „universe‟ or „population‟ is known as sampling. A statistical sample ideally purports to be a miniature model or replica of the collectively or the population constituted of all the items that the study should principally encompass, that is, the items which potentially hold promise of affording information relevant to the purpose of a given research. Sampling helps in time and cost saving. It also helps in checking their accuracy. But on the other hand it demands exercise of great care caution; otherwise the results obtained may be incorrect or misleading. 4.2 CRITERION OF GOOD SAMPLE The characteristics of a good sample are described below: 1. Representative character: A sample must be representative of the population. Probability sampling technique yield representative sample. 2. No bias and prejudices : The selection of the sample should be objective . Sample should be free from bias and prejudices. Then only dependable result can be achieved . Investigator has to be very cautious in this task 3. Conformity with the subject – matter and meant: In sample methods the representative units selected, should be as per the subject matter and means. 4. Accuracy: Accuracy is defined as the degree to which bias is absent from the sample. An accurate sample is the one which exactly represents the population. 5. Precision: The sample must yield precise estimate. Precision is measured by standard error. 6. Size: A good sample must be adequate in size in order to be reliable. 4.3 METHODS OF SAMPLING Sampling techniques or methods may be classified into two generic types A] Probability or Random Sampling
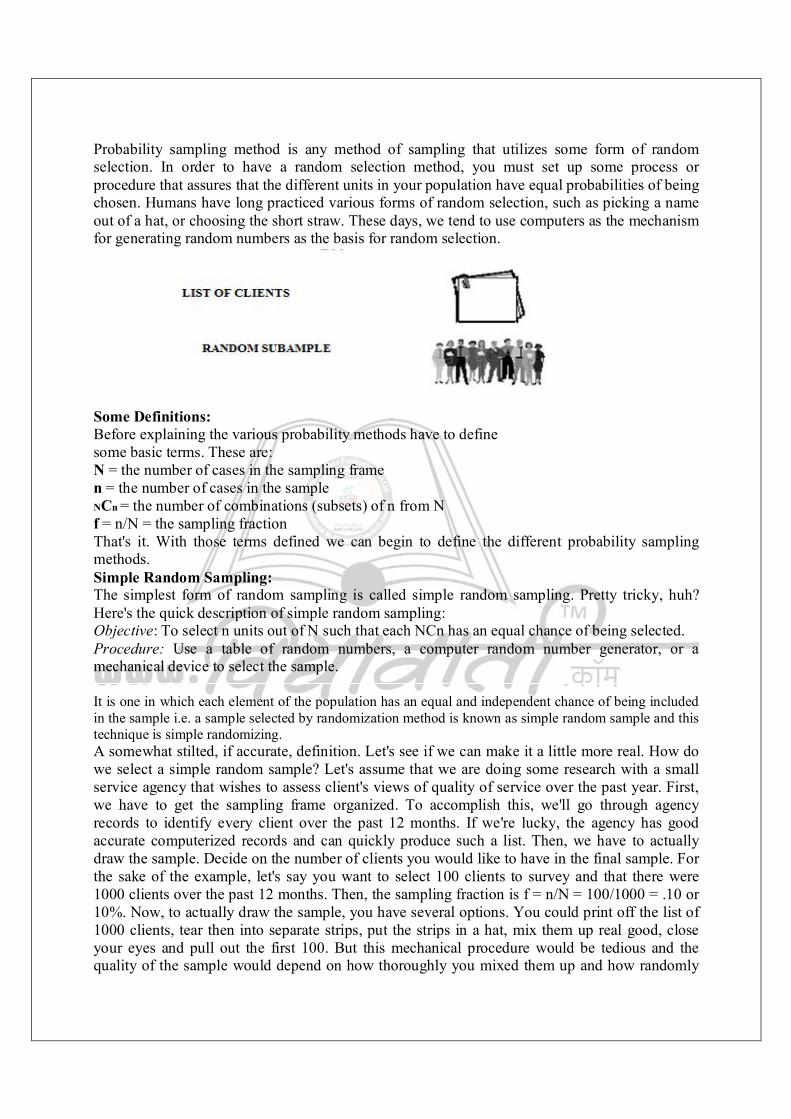
Probability sampling method is any method of sampling that utilizes some form of random selection. In order to have a random selection method, you must set up some process or procedure that assures that the different units in your population have equal probabilities of being chosen. Humans have long practiced various forms of random selection, such as picking a name out of a hat, or choosing the short straw. These days, we tend to use computers as the mechanism for generating random numbers as the basis for random selection.
Some Definitions: Before explaining the various probability methods have to define some basic terms. These are: N = the number of cases in the sampling frame n = the number of cases in the sample NCn = the number of combinations (subsets) of n from N f = n/N = the sampling fraction That's it. With those terms defined we can begin to define the different probability sampling methods. Simple Random Sampling: The simplest form of random sampling is called simple random sampling. Pretty tricky, huh? Here's the quick description of simple random sampling: Objective: To select n units out of N such that each NCn has an equal chance of being selected. Procedure: Use a table of random numbers, a computer random number generator, or a mechanical device to select the sample. It is one in which each element of the population has an equal and independent chance of being included in the sample i.e. a sample selected by randomization method is known as simple random sample and this technique is simple randomizing. A somewhat stilted, if accurate, definition. Let's see if we can make it a little more real. How do we select a simple random sample? Let's assume that we are doing some research with a small service agency that wishes to assess client's views of quality of service over the past year. First, we have to get the sampling frame organized. To accomplish this, we'll go through agency records to identify every client over the past 12 months. If we're lucky, the agency has good accurate computerized records and can quickly produce such a list. Then, we have to actually draw the sample. Decide on the number of clients you would like to have in the final sample. For the sake of the example, let's say you want to select 100 clients to survey and that there were 1000 clients over the past 12 months. Then, the sampling fraction is f = n/N = 100/1000 = .10 or 10%. Now, to actually draw the sample, you have several options. You could print off the list of 1000 clients, tear then into separate strips, put the strips in a hat, mix them up real good, close your eyes and pull out the first 100. But this mechanical procedure would be tedious and the quality of the sample would depend on how thoroughly you mixed them up and how randomly
you reached in. Perhaps a better procedure would be to use the kind of ball machine that is popular with many of the state lotteries. You would need three sets of balls numbered 0 to 9, one set for each of the digits from 000 to 999 (if we select 000 we'll call that 1000). Number the list of names from 1 to 1000 and then use the ball machine to select the three digits that selects each person. The obvious disadvantage here is that you need to get the ball machines. (Where do they make those things, anyway? Is there a ball machine industry?). Neither of these mechanical procedures is very feasible and, with the development of inexpensive computers there is a much easier way. Here's a simple procedure that's especially useful if you have the names of the clients already on the computer. Many computer programs can generate a series of random numbers. Let's assume you can copy and paste the list of client names into a column in an EXCEL spreadsheet. Then, in the column right next to it paste the function =RAND() which is EXCEL's way of putting a random number between 0 and 1 in the cells. Then, sort both columns -- the list of names and the random number -- by the random numbers. This rearranges the list in random order from the lowest to the highest random number. Then, all you have to do is take the first hundred names in this sorted list. pretty simple. You could probably accomplish the whole thing within a minute. Simple random sampling is simple to accomplish and is easy to explain to others. Because simple random sampling is a fair way to select a sample, it is reasonable to generalize the results from the sample back to the population. Simple random sampling is not the most statistically efficient method of sampling and you may, just because of the luck of the draw, not get good representation of subgroups in a population. To deal with these issues, we have to turn to other sampling methods. This sampling technique gives each element an equal and independent chance of being selected. An equal chance means equal probability of selection. An independent chance means that the draw of one element will not affect the chances of other elements being selected. The procedure of drawing a simple random sample consists of enumeration of all elements in the population. 1. Preparation of a List of all elements, giving them numbers in serial order 1, 2, 3 and so on, and 2. Drawing sample numbers by using (a) lottery method, (b) a table of random numbers or (c) a computer. Suitability: This type of sampling is suited for a small homogeneous population. Randomization is done by using the following techniques: (a) Tossing a coin (b) Throwing a dice (b) Lottery method (d) Blind folded method (c) Tippett’s table method Merits of Randomization: 1. It requires the minimum knowledge of population. 2. It is free from subjectivity and free from personal error. 3. It provides appropriate data for one’s purpose. 4. The observations of the sample can be used for inferential purpose. The advantage of this is that it is one of the easiest methods, all the elements in the population have an equal chance of being selected, simple to understand, does not require prior knowledge of the true composition of the population. Disadvantages: It is often impractical because of non-availability of population list or of difficulty in enumerating the population, does not ensure proportionate representation and it may be expensive in time and money. The amount of
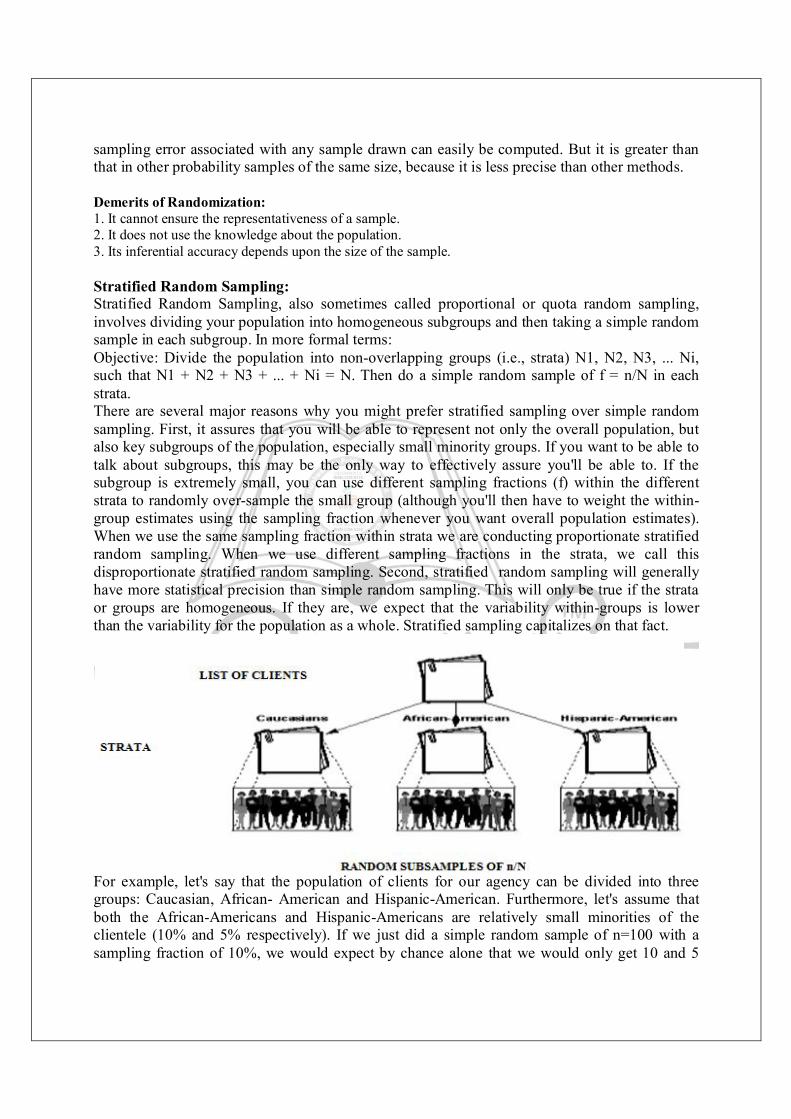
sampling error associated with any sample drawn can easily be computed. But it is greater than that in other probability samples of the same size, because it is less precise than other methods. Demerits of Randomization: 1. It cannot ensure the representativeness of a sample. 2. It does not use the knowledge about the population. 3. Its inferential accuracy depends upon the size of the sample. Stratified Random Sampling: Stratified Random Sampling, also sometimes called proportional or quota random sampling, involves dividing your population into homogeneous subgroups and then taking a simple random sample in each subgroup. In more formal terms: Objective: Divide the population into non-overlapping groups (i.e., strata) N1, N2, N3, ... Ni, such that N1 + N2 + N3 + ... + Ni = N. Then do a simple random sample of f = n/N in each strata. There are several major reasons why you might prefer stratified sampling over simple random sampling. First, it assures that you will be able to represent not only the overall population, but also key subgroups of the population, especially small minority groups. If you want to be able to talk about subgroups, this may be the only way to effectively assure you'll be able to. If the subgroup is extremely small, you can use different sampling fractions (f) within the different strata to randomly over-sample the small group (although you'll then have to weight the within-group estimates using the sampling fraction whenever you want overall population estimates). When we use the same sampling fraction within strata we are conducting proportionate stratified random sampling. When we use different sampling fractions in the strata, we call this disproportionate stratified random sampling. Second, stratified random sampling will generally have more statistical precision than simple random sampling. This will only be true if the strata or groups are homogeneous. If they are, we expect that the variability within-groups is lower than the variability for the population as a whole. Stratified sampling capitalizes on that fact.
For example, let's say that the population of clients for our agency can be divided into three groups: Caucasian, African- American and Hispanic-American. Furthermore, let's assume that both the African-Americans and Hispanic-Americans are relatively small minorities of the clientele (10% and 5% respectively). If we just did a simple random sample of n=100 with a sampling fraction of 10%, we would expect by chance alone that we would only get 10 and 5
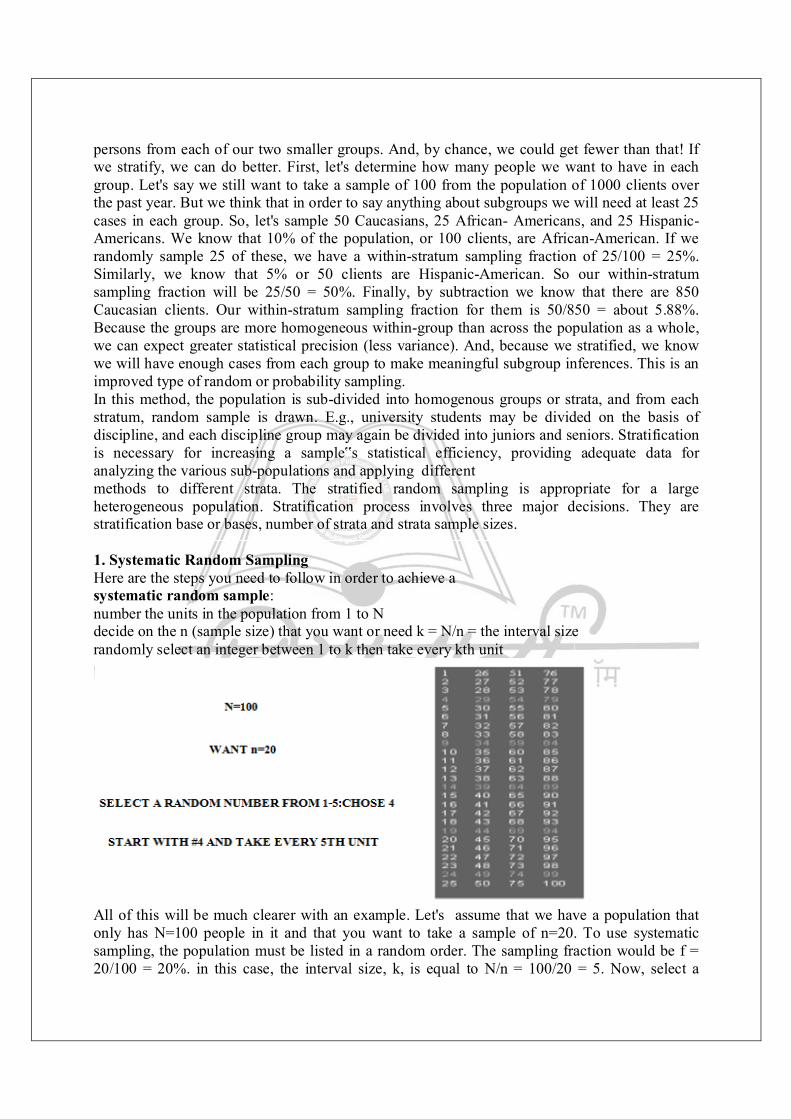
persons from each of our two smaller groups. And, by chance, we could get fewer than that! If we stratify, we can do better. First, let's determine how many people we want to have in each group. Let's say we still want to take a sample of 100 from the population of 1000 clients over the past year. But we think that in order to say anything about subgroups we will need at least 25 cases in each group. So, let's sample 50 Caucasians, 25 African- Americans, and 25 Hispanic-Americans. We know that 10% of the population, or 100 clients, are African-American. If we randomly sample 25 of these, we have a within-stratum sampling fraction of 25/100 = 25%. Similarly, we know that 5% or 50 clients are Hispanic-American. So our within-stratum sampling fraction will be 25/50 = 50%. Finally, by subtraction we know that there are 850 Caucasian clients. Our within-stratum sampling fraction for them is 50/850 = about 5.88%. Because the groups are more homogeneous within-group than across the population as a whole, we can expect greater statistical precision (less variance). And, because we stratified, we know we will have enough cases from each group to make meaningful subgroup inferences. This is an improved type of random or probability sampling. In this method, the population is sub-divided into homogenous groups or strata, and from each stratum, random sample is drawn. E.g., university students may be divided on the basis of discipline, and each discipline group may again be divided into juniors and seniors. Stratification is necessary for increasing a sample‟s statistical efficiency, providing adequate data for analyzing the various sub-populations and applying different methods to different strata. The stratified random sampling is appropriate for a large heterogeneous population. Stratification process involves three major decisions. They are stratification base or bases, number of strata and strata sample sizes. 1. Systematic Random Sampling Here are the steps you need to follow in order to achieve a systematic random sample: number the units in the population from 1 to N decide on the n (sample size) that you want or need k = N/n = the interval size randomly select an integer between 1 to k then take every kth unit
All of this will be much clearer with an example. Let's assume that we have a population that only has N=100 people in it and that you want to take a sample of n=20. To use systematic sampling, the population must be listed in a random order. The sampling fraction would be f = 20/100 = 20%. in this case, the interval size, k, is equal to N/n = 100/20 = 5. Now, select a
random integer from 1 to 5. In our example, imagine that you chose 4. Now, to select the sample, start with the 4th unit in the list and take every k-th unit (every 5th, because k=5). You would be sampling units 4, 9, 14, 19, and so on to 100 and you would wind up with 20 units in your sample. For this to work, it is essential that the units in the population are randomly ordered, at least with respect to the characteristics you are measuring. Why would you ever want to use systematic random sampling? For one thing, it is fairly easy to do. You only have to select a single random number to start things off. It may also be more precise than simple random sampling. Finally, in some situations there is simply no easier way to do random sampling. For instance, I once had to do a study that involved sampling from all the books in a library. Once selected, I would have to go to the shelf, locate the book, and record when it last circulated. I knew that I had a fairly good sampling frame in the form of the shelf list (which is a card catalog where the entries are arranged in the order they occur on the shelf). To do a simple random sample, I could have estimated the total number of books and generated random numbers to draw the sample; but how would I find book #74,329 easily if that is the number I selected? I couldn't very well count the cards until I came to 74,329! Stratifying wouldn't solve that problem either. For instance, I could have stratified by card catalog drawer and drawn a simple random sample within each drawer. But I'd still be stuck counting cards. Instead, I did a systematic random sample. I estimated the number of books in the entire collection. Let's imagine it was 100,000. I decided that I wanted to take a sample of 1000 for a sampling fraction of 1000/100,000 = 1%. To get the sampling interval k, I divided N/n = 100,000/1000 = 100. Then I selected a random integer between 1 and 100. Let's say I got 57. Next I did a little side study to determine how thick a thousand cards are in the card catalog (taking into account the varying ages of the cards). Let's say that on average I found that two cards that were separated by 100 cards were about .75 inches apart in the catalog drawer. That information gave me everything I needed to draw the sample. I counted to the 57th by hand and recorded the book information. Then, I took a compass. (Remember those from your high-school math class? They're the funny little metal instruments with a sharp pin on one end and a pencil on the other that you used to draw circles in geometry class.) Then I set the compass at .75”, stuck the pin end in at the 57th card and pointed with the pencil end to the next card (approximately 100 books away). In this way, I approximated selecting the 157th, 257th, 357th, and so on. I was able to accomplish the entire selection procedure in very little time using this systematic random sampling approach. I'd probably still be there counting cards if I'd tried another random sampling method. (Okay, so I have no life. I got compensated nicely, I don't mind saying, for coming up with this scheme.)
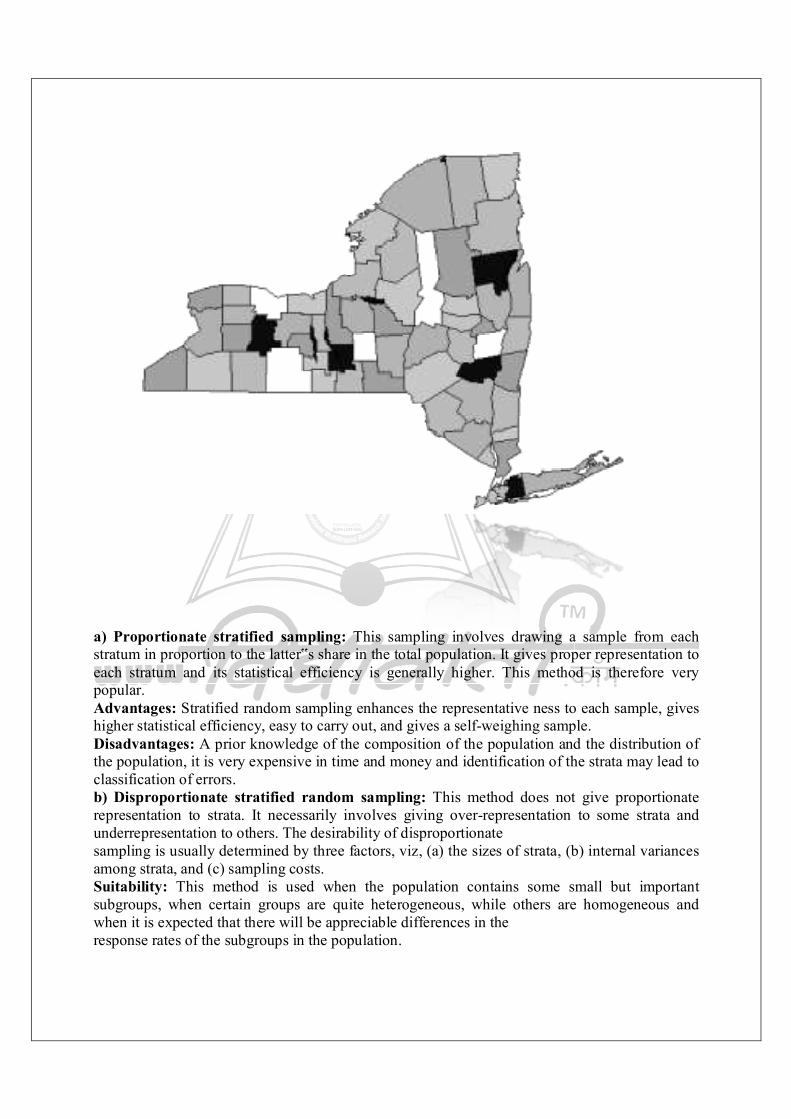
a) Proportionate stratified sampling: This sampling involves drawing a sample from each stratum in proportion to the latter‟s share in the total population. It gives proper representation to each stratum and its statistical efficiency is generally higher. This method is therefore very popular. Advantages: Stratified random sampling enhances the representative ness to each sample, gives higher statistical efficiency, easy to carry out, and gives a self-weighing sample. Disadvantages: A prior knowledge of the composition of the population and the distribution of the population, it is very expensive in time and money and identification of the strata may lead to classification of errors. b) Disproportionate stratified random sampling: This method does not give proportionate representation to strata. It necessarily involves giving over-representation to some strata and underrepresentation to others. The desirability of disproportionate sampling is usually determined by three factors, viz, (a) the sizes of strata, (b) internal variances among strata, and (c) sampling costs. Suitability: This method is used when the population contains some small but important subgroups, when certain groups are quite heterogeneous, while others are homogeneous and when it is expected that there will be appreciable differences in the response rates of the subgroups in the population.
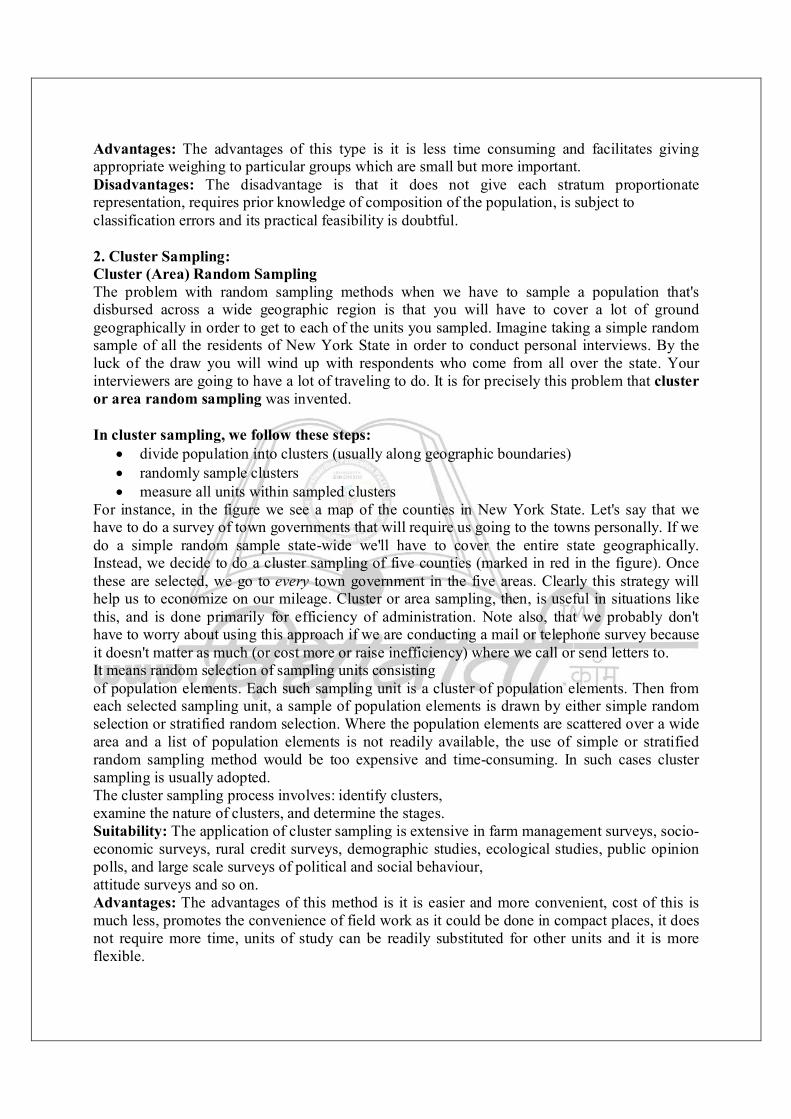
Advantages: The advantages of this type is it is less time consuming and facilitates giving appropriate weighing to particular groups which are small but more important. Disadvantages: The disadvantage is that it does not give each stratum proportionate representation, requires prior knowledge of composition of the population, is subject to classification errors and its practical feasibility is doubtful. 2. Cluster Sampling: Cluster (Area) Random Sampling The problem with random sampling methods when we have to sample a population that's disbursed across a wide geographic region is that you will have to cover a lot of ground geographically in order to get to each of the units you sampled. Imagine taking a simple random sample of all the residents of New York State in order to conduct personal interviews. By the luck of the draw you will wind up with respondents who come from all over the state. Your interviewers are going to have a lot of traveling to do. It is for precisely this problem that cluster or area random sampling was invented. In cluster sampling, we follow these steps:
divide population into clusters (usually along geographic boundaries) randomly sample clusters measure all units within sampled clusters
For instance, in the figure we see a map of the counties in New York State. Let's say that we have to do a survey of town governments that will require us going to the towns personally. If we do a simple random sample state-wide we'll have to cover the entire state geographically. Instead, we decide to do a cluster sampling of five counties (marked in red in the figure). Once these are selected, we go to every town government in the five areas. Clearly this strategy will help us to economize on our mileage. Cluster or area sampling, then, is useful in situations like this, and is done primarily for efficiency of administration. Note also, that we probably don't have to worry about using this approach if we are conducting a mail or telephone survey because it doesn't matter as much (or cost more or raise inefficiency) where we call or send letters to. It means random selection of sampling units consisting of population elements. Each such sampling unit is a cluster of population elements. Then from each selected sampling unit, a sample of population elements is drawn by either simple random selection or stratified random selection. Where the population elements are scattered over a wide area and a list of population elements is not readily available, the use of simple or stratified random sampling method would be too expensive and time-consuming. In such cases cluster sampling is usually adopted. The cluster sampling process involves: identify clusters, examine the nature of clusters, and determine the stages. Suitability: The application of cluster sampling is extensive in farm management surveys, socio-economic surveys, rural credit surveys, demographic studies, ecological studies, public opinion polls, and large scale surveys of political and social behaviour, attitude surveys and so on. Advantages: The advantages of this method is it is easier and more convenient, cost of this is much less, promotes the convenience of field work as it could be done in compact places, it does not require more time, units of study can be readily substituted for other units and it is more flexible.
Disadvantages: The cluster sizes may vary and this variation could increase the bias of the resulting sample. The sampling error in this method of sampling is greater and the adjacent units of study tend to have more similar characteristics than the units distantly apart. Area Sampling This is an important form of cluster sampling. In larger field surveys cluster consisting of specific geographical areas like districts, talukas, villages or blocks in a city are randomly drawn. As the geographical areas are selected as sampling units in such cases, their sampling is called area sampling. It is not a separatemethod of sampling, but forms part of cluster sampling. 3. Multi-Stage and Sub-Sampling The four methods we've covered so far -- simple, stratified, systematic and cluster -- are the simplest random sampling strategies. In most real applied social research, we would use sampling methods that are considerably more complex than these simple variations. The most important principle here is that we can combine the simple methods described earlier in a variety of useful ways that help us address our sampling needs in the most efficient and effective manner possible. When we combine sampling methods, we call this multi-stage sampling. For example, consider the idea of sampling New York State residents for face-to-face interviews. Clearly we would want to do some type of cluster sampling as the first stage of the process. We might sample townships or census tracts throughout the state. But in cluster sampling we would then go on to measure everyone in the clusters we select. Even if we are sampling census tracts we may not be able to measure everyone who is in the census tract. So, we might set up a stratified sampling process within the clusters. In this case, we would have a two-stage sampling process with stratified samples within cluster samples. Or, consider the problem of sampling students in grade schools. We might begin with a national sample of school districts stratified by economics and educational level. Within selected districts, we might do a simple random sample of schools. Within schools, we might do a simple random sample of classes or grades. And, within classes, we might even do a simple random sample of students. In this case, we have three or four stages in the sampling process and we use both stratified and simple random sampling. By combining different sampling methods we are able to achieve a rich variety of probabilistic sampling methods that can be used in a wide range of social research contexts. Probability sampling is based on the theory of probability. It is also known as random sampling. It provides a known nonzero chance of selection for each population element. It is used when generalization is the objective of study, and a greater degree of accuracy of estimation of population parameters is required. The cost and time required is high hence the benefit derived from it should justify the costs. In multi-stage sampling method, sampling is carried out in two or more stages. The population is regarded as being composed of a number of second stage units and so forth. That is, at each stage, a sampling unit is a cluster of the samp ling units of the subsequent stage. First, a sample of the first stage sampling units is drawn, then from each of the selected first stage sampling unit, a sample of the second stage sampling units is drawn. The procedure continues down to the final sampling units or population elements. Appropriate random sampling method is adopted at each stage. It is appropriate where the population is scattered over a wider geographical area and no frame or list is available for sampling. It is also useful when a survey has to be made within a
limited time and cost budget. The major disadvantage is that the procedure of estimating sampling error and cost advantage is complicated. Sub-sampling is a part of multi-stage sampling process. In a multi-stage sampling, the sampling in second and subsequent stage frames is called sub-sampling. Sub-sampling balances the two conflicting effects of clustering i.e., cost and sampling errors. Check Your Progress: 4. What do you mean by sampling? 5. Discuss the characteristics of a good sample. 6. State the two methods of sampling. 7. Define Probability sampling. 8. Distinguish between Proportionate Stratified sampling and Disproportionate stratified random sampling. 9. What do you understand by Area sampling? B] Non-probability or non-random sampling Non-probability sampling or non-random sampling is not based on the theory of probability. This sampling does not provide a chance of selection to each population element. The difference between non-probability and probability sampling is that non-probability sampling does not involve random selection and probability sampling does. Does that mean that non-probability samples aren't representative of the population? Not necessarily. But it does mean that non-probability samples cannot depend upon the rationale of probability theory. At least with a probabilistic sample, we know the odds or probability that we have represented the population well. We are able to estimate confidence intervals for the statistic. With non-probability samples, we may or may not represent the population well, and it will often be hard for us to know how well we've done so. In general, researchers prefer probabilistic or random sampling methods over non-probabilistic ones, and consider them to be more accurate and rigorous. However, in applied social research there may be circumstances where it is not feasible, practical or theoretically sensible to do random sampling. Here, we consider a wide range of nonprobabilistic alternatives. We can divide non-probability sampling methods into two broad types: accidental or purposive. Most sampling methods are purposive in nature because we usually approach the sampling problem with a specific plan in mind. The most important distinctions among these types of sampling methods are the onesbetween the different types of purposive sampling approaches. 1. Accidental, Haphazard or Convenience Sampling: One of the most common methods of sampling goes under the various titles listed here. I would include in this category the traditional “man on the street” (of course, now it's probably the “person on the street”) interviews conducted frequently by television news programs to get a quick (although non representative) reading of public opinion. I would also argue that the typical use of college students in much psychological research is primarily a matter of convenience. (You don't really believe that psychologists use college students because they believe they're representative of the population at large, do you?). In clinical practice, we might use clients who are available to us as our sample. In many research contexts, we sample simply by asking for volunteers. Clearly, the problem with all of these types of samples is that we have no evidence
that they are representative of the populations we're interested in generalizing to -- and in many cases we would clearly suspect that they are not. Advantages: The only merits of this type of sampling are simplicity, convenience and low cost. Disadvantages: The demerits are it does not ensure a selection chance to each population unit. The selection probability sample may not be a representative one. The selection probability is unknown. It suffers from sampling bias which will distort results. The reasons for usage of this sampling are when there is no other feasible alternative due to non-availability of a list of population, when the study does not aim at generalizing the findings to the population, when the costs required for probability sampling may be too large, when probability sampling required more time, but the time constraints and the time limit for completing the study do not permit it. It may be classified into: Convenience or Accidental Sampling: It means selecting sample units in a just „hit and miss‟ fashion E.g., interviewing people whom we happen to meet. This sampling also means selecting whatever sampling units are conveniently available, e.g., a teacher may select students in his class. This method is also known as accidental sampling because the respondents whom the researcher meets accidentally are included in the sample. Suitability: Though this type of sampling has no status, it may be used for simple purposes such as testing ideas or gaining ideas or rough impression about a subject of interest. Advantage: It is the cheapest and simplest, it does not require a list of population and it does not require any statistical expertise. Disadvantage: The disadvantage is that it is highly biased because of researcher‟s subjectivity, it is the least reliable sampling method and the findings cannot be generalized. 2. Purposive (or Judgement) Sampling: This method means deliberate selection of sample units that conform to some pre-determined criteria. This is also known as judgment sampling. This involves selection of cases which we judge as the most appropriate ones for the given study. It is based on the judgement of the researcher or some expert. It does not aim at securing a cross section of a population. The chance that a particular case be selected for the sample depends on the subjective judgement of the researcher. Suitability: This is used when what is important is the typicality and specific relevance of the sampling units to the study and not their overall representativeness to the population. Advantage: It is less costly and more convenient and guarantees inclusion of relevant elements in the sample. Disadvantage: It is less efficient for generalizing, does not ensure the representativeness, requires more prior extensive information and does not lend itself for using inferential statistics. a. Quota Sampling: In quota sampling, you select people non-randomly according to some fixed quota. There are two types of quota sampling: proportional and non proportional. i) Proportional quota sampling: Proportional quota sampling you want to represent the major characteristics of the population by sampling a proportional amount of each. For instance, if you know the population has 40% women and 60% men, and that you want a total sample size of 100, you will continue sampling until you get those percentages and then you will stop. So, if you've already got the 40 women for your sample, but not the sixty men, you will continue to sample men but even if legitimate
women respondents come along, you will not sample them because you have already “met your quota.” The problem here (as in much purposive sampling) is that you have to decide the specific characteristics on which you will base the quota. Will it be by gender, age, education race, religion, etc.? ii) Non-proportional quota sampling: Non-proportional quota sampling is a bit less restrictive. In this method, you specify the minimum number of sampled units you want in each category. here, you're not concerned with having numbers that match the proportions in the population. Instead, you simply want to have enough to assure that you will be able to talk about even small groups in the population. This method is the nonprobabilistic analogue of stratified random sampling in that it is typically used to assure that smaller groups are adequately represented in your sample. This is a form of convenient sampling involving selection of quota groups of accessible sampling units by traits such as sex, age, social class, etc. it is a method of stratified sampling in which the selection within strata is non-random. It is this Non-random element that constitutes its greatest weakness. Suitability: It is used in studies like marketing surveys, opinion polls, and readership surveys which do not aim at precision, but to get quickly some crude results. Advantage: It is less costly, takes less time, non need for a list of population, and field work can easily be organized. Disadvantage: It is impossible to estimate sampling error, strict control if field work is difficult, and subject to a higher degree of classification. Difference between Probability and Non-Probability Sampling Probability Sampling
Non-probability Sampling
1. It is a method of sampling which gives the probability that a sample is representative of population.
In the absence of any idea of probability the method of sampling is known as non-probability sampling.
2. Probability sampling is generally used in fundamental research in which the purpose is to generalize the results.
It is generally used in action researches in which one studies a class without any generalization purpose.
3. It refers from the sample as well as the population.
There is no idea of population.
4. Every individual of the population has equal probability to be taken into the sample.
There is no probability of selecting any individual.
5. It may be representative of the population.
It has free distribution. 6. Its observations (data) are used for the
inferential purpose.
The observations are not used for generalization purpose.
7. Inferential or parametric statistics are used.
Non-inferential or non-parametric statistics are used.
8. There is a risk of drawing conclusion.
There is no risk for drawing conclusions. 9. It is based on Law of probability sampling
i.e. Law of Statistical Regularity and Law of Inertia of the Large Sample.
It is not based on law of probability sampling.
4.4 SAMPLING AND NON-SAMPLING ERRORS A sample survey implies the study of small proportions of the
total universe and drawing inference about the population. It is natural that there would be certain amount of inaccuracy or errors. Such errors are known as sampling errors or sampling fluctuations. If a census is taken, sampling errors could be expected to disappear. (A) Sampling errors: The errors which arise due to the use of sampling surveys are known as the sampling errors. Even when a sample is random one, it may be exactly representative of teh population from which it is chosen. This is because samples are seldom, if ever, perfect miniature of the populations. However these errors can be controlled. Two types of sampling errors: i. Biased errors: Those errors which arise as a result of any bias or prejudice of the person in selecting a particular sampling method e.g., purposive sampling method may be adopted in place of a simple random sampling method. As a result of such a selection, some errors are bound to arise, and they are known as biased sampling errors, or cumulative errors or non-compensating errors. As biased or prejudice forms a constant component of error that does not decrease in a large population as the number in the sample increases i.e., such errors are likely to increase with an increase in the size of the sample. These errors may arise due to: 1. Faulty process of selection: Faulty selection of the sample may give rise to bias in a number of ways, such as purposive sampling, selection of sample in a haphazard way, substitution of the selected item in the sample by another, incomplete investigation or response etc. 2. Faulty work during the collection of formation: During the process of collecting the actual information in a survey , certain inaccuracies may creep in. These may arise due to the improper formulation of the decision, problem wrongly defining the population, specifying wrong decision, securing an inadequate frame, poorely designed questionnaire, an ill trained interviewer, failure of a respondent‟s memory, unorganized collection procedure, faulty editing or coding the response. 3. Faulty method of analysis: Faulty methods of analysis may also introduce bias. Such bias can be avoided by adopting the proper methods of analysis. Suggestions to reduce biases and improving sampling designs are: i. Manageable and specific problem selection ii. Intensive study, verification and reporting of methodological biases iii. Systematic documentation of related research iv. Greater investment in enumeration v. Effective pre-testing vi. Use of complementary research methods vii.Replication ii. Unbiased errors: These errors arise due to chance differences, between the members of the population included in the sample and those not included. It is known as random sampling error. The random sampling error decreases on an average as the size of the sample increases. Such error is, therefore, also known as non cumulative or compensating error. (B) Non-sampling errors: This type of error can occur in any survey, whether it be a complete enumeration or sampling. N on-sampling errors include biases and mistakes. Some of the factors responsible for the non-sampling errors are 1. vague definition of population
2. vague questionnaire 3. vague conception regarding the information desired 4. inappropriate statistical unit 5. inaccurate/inappropriate methods of interview 6. observation or measurement 7. errors in data processing operations such as coding, punching, verification, tabulation etc. 8. errors committed during presentation and printing of tabulated results. Non-sampling errors tend to increase with sample size and require to be controlled and reduced to a minimum. 4.5 SUMMARY 1. The sample method consisting of the selecting for study, a portion of the Universe with a view to draw conclusions about the Universe or population is known as sampling. 2. Sampling techniques or methods can be classified into Probability or Random sampling and Non-Probability or Non- Random sampling. 3. Probability sampling method is any method of sampling that utilizes some form of random selection. 4. Simple Random sampling is the simplest form of random sampling. This sampling technique gives each element an equal and independence chance of being selected. 5. Stratified Random sampling sometimes called proportional or quota random sampling, involves dividing entire population into homogeneous subgroups and then taking a simple random sample in each subgroup. It is appropriate for a large heterogeneous population. 6. Where the population elements are scattered over a wide area and a list of population elements is not readily available, Cluster sampling is usually adopted because it is easier and more convenient. 7. In multi-stage sampling method, sampling is carried out in two or more stages. At each stage, a sampling unit is a cluster of the sampling units of the subsequent stage. Appropriate random sampling method is adopted at each stage. It is appropriate where the population is scattered over a wider geographical area and no frame or list is available for sampling. In a multistage sampling, the sampling in second and subsequent stage frames is called sub-sampling. 8. In applied social research there may be circumstances where it is not feasible, practical or theoretically sensible to do random sampling. Therefore Non probability or Non Random sampling is used. It is divided into two broad types: accidental or purposive. 9. Sampling errors are those which arise due to the use of sampling surveys. These are of two types: Biased and Unbiased errors. Non-sampling errors can occur in any survey, whether it be a complete enumeration or sampling. It include biases and mistakes. 4.6 QUESTIONS 1. What is the implication of Sampling in research? 2. What are the types of Probability or random sampling? 3. What is the Non-probability or non random sampling? 4. Discuss the different types of sampling and non-sampling errors.

5 DATA COLLECTION METHODS:PRIMARY
DATA COLLECTION Unit Structure: 5.0 Objectives 5.1 Introduction 5.2 Primary Sources Of Data 5.3 Methods Of Collecting Primary Data 5.4 Types Of Surveys 5.5 Questionnaires 5.6. Characteristics Of A Good Questionnaire 5.7. Construction Of A Questionnaire 5.8. Types Of Questionnaires 5.9. How To Improve Questionnaire Items? 5.10. Administration Of The Questionnaire. 5.11 Interviews 5.12. Types Of Interview 5.13. Steps In The Arrangement Of Interviews. 5.14. How To Conduct An Interview? 5.15. Observation As A Data Collection Technique 5.16. Characteristics Of A Good Observation. 5.17. Uses Of Observation. 5.18. Recording Observation 5.19. Concluding The Interview 5.20. Summary 5.21. Questions 5.0 OBJECTIVES To study the meaning of primary data To understand the various sources of primary data collection To study the important methods of primary data collection To study the types of surveys To understand the meaning and types of questionnaire To study the sample of questionnaires To study the meaning of interviews To study the preparation for the interviews 5.1 INTRODUCTION Primary data collection is necessary when a researcher cannot find the data needed in secondary sources. Market researchers are interested in primary data about demographic/ socioeconomic characteristics, attitudes / opinions / interests, awareness/knowledge, intentions, motivation, and behavior. Three basic means of obtaining primary data are observation, surveys, and
experiments. The choice will be influenced by the nature of the problem and by the availability of time and money. 5.2 PRIMARY SOURCES OF DATA Primary sources are original sources from which the researcher directly collects data that have not been previously collected e.g., collection of data directly by the researcher on brand awareness, brand preference, brand loyalty and other aspects of consumer behavior from a sample of consumers by interviewing them. Primary data are first hand information collected through various methods such as observation, interviewing, mailing etc. a. Observation Observation means that the situation of interest is checked and a person or some mechanical device records the relevant facts, actions, or behaviors. Accurate data about what consumers do in certain situations is provided by observation. Observation does not tell why it happened. b. Mechanical Approaches Mechanical approaches are reliable data collection instruments because they provide objective measures. Data on the factors influencing product sales, such as competitor advertising and other promotional activities can be effectively assessed. Information can be obtained on a specific store or all the stores in a system, enabling rapid and effective comparisons at various local, regional and national levels. The information is available continuously and enables firms to plan down to the individual store level. Scanner and bar coding technologies form the basis for capturing marketing information at the retail level. Scanners are electronic devices at retail checkouts that read the bar code for each item bought. They provide up-to-the-minute data on product purchases by item and also by household. Telecommunications can transmit the information directly to the manufacturer and shorten the communications cycle from weeks to minutes. With this information the manufacturer can develop a profile for each retailer and establish the optimum retail inventory for each location. The optimum inventory ensures stocking of merchandise that customers buy with a minimum amount of inventory investment for the retailer. Combining the retailer‟s information with the manufacturer‟s database yields local promotional mailings, finetuned shelf displays, and redesigned store layouts. Other mechanical devices include video cameras, Nielsen People Meters, and single-source data systems that link consumers‟ exposure to television advertising, sales promotion, and other marketing efforts with their store purchases (Behavior Scan and Info Scan of Information Resources, Inc.). Furthermore, measurements might be taken of respondents‟ eye movements, pulse rates, or other physical reactions to advertisements. c. Personal Approaches Marketers can learn by personally observing or watching actions and situations. For example, when an organization is choosing a new location, it would observe the neighborhood conditions. Also, marketers of pet products and baby products are extremely interested in how respondents react to new products, but obviously cannot ask them to describe their opinions or to fill out surveys. They must depend on observational research. d. Surveys Surveys or questioning involve using a questionnaire (data collection instrument) to ask respondents questions to secure the desired information. Questionnaires may be administered by mail, over the telephone, by computer, or in person. Limitations of
surveys include opportunities for error in construction and administering of a questionnaire, expense, and time needed to conduct a survey. Respondents may not respond, may be unable to respond, or may give misleading responses. e. Mail Mail interviews can be used to collect large amounts of data and have a low cost per respondent. Respondents can see a concept, read a description, and think about it at their leisure. There is no interviewer bias. However, the questionnaires are not flexible, cannot be adapted to individual respondents, and generally have low response rates. The researcher has no control over who completes the questionnaire. f. Telephone Telephone interviews are easy to administer and allow data to be collected quickly at a relatively low cost. The interviewer can clarify the questions. Response rates tend to be higher and telephone interviewing allows for greater sample control. However, it is more expensive than a mail questionnaire. The presence of an interviewer on the phone may bias responses since respondents may be unwilling to discuss personal information. Also, respondents can‟t see product. A major limitation is that they must be short. g. Computer Advances in computers and technology have led to sophisticated data collection methods. Computer and online interviewing allow rapid data collection from dispersed populations at a low cost. h. Personal Personal interviews may be conducted one-on-one or with a focus group. A personal interview is a direct, face-to-face interview between the interviewer and the respondent. In the past, personal interviews were conducted door-to-door. Today, most personal interviews (one-on-one) are conducted in malls and are referred to as mall intercept. Personal interviews are the most flexible since interviewers can clarify questions and probe for answers. Respondents can see a concept as well as read a description. More information can normally be obtained through observation of the respondent‟s surroundings. Personal interviewing is expensive, yet it offers a great deal of flexibility and allows for visual stimuli. A focus group is a small group of people, carefully selected, who represent a specific target audience. They are used to generate concepts and hypotheses. The strength of focus groups is found in the group discussion and interaction. Focus group interviews are a popular way of gaining insight into consumer thoughts and feelings about a product. In the past, focus groups were regarded mainly as a simple and quick way of asking any group of respondents, usually in someone's home, to answer questions about a product. Today, focus groups are an important source of qualitative research. Advance preparation ensures that the facility, moderator, and respondents are of high quality. An example of a technique used in a focus group is a projective technique in which a People Board is used to obtain attitudes through photograph associations and forced relationships. Participants indicate which of several images in a category relate to the subject at hand. The findings from a focus group are useful for general information but do not suffice to give absolute quantifiable information. A panel is a fixed sample of individuals from who repeated measurements are taken over time with respect to the same variables. An example is MRCA, which has a 12,000 household panel that is representative of the national census in terms of significant demographics. Surveys of the panel conducted frequently throughout the year provide a means to measure relatively small

changes in household purchases and product usage. Another example is the consumer diary. Diaries are especially appropriate for answering questions on brand penetration and loyalty. This approach indicates which factors influence purchasing behaviors, such as price and advertising, and where purchases are made -- supermarkets, discount stores, drugstores. Firms in packaged goods, apparel, home furnishings, financial services, travel, and entertainment use this method. i. Experiments In an experiment, a researcher selects matched groups, gives them different experimental treatments controlling for other related factors, and checks for differences in the responses of the experimental group and the control group. Experimental research attempts to explain cause-and-effect relationships. Data in an experiment may be collected through observation and surveys. An experiment can be done in either a laboratory or field setting. In a laboratory experiment, the researcher has complete control during the experiment. A field experiment is conducted under more realistic conditions. For example, if a charitable organization wanted to see whether inclusion of return-address labels affected donors‟ responses to a mail solicitation, it could select similar sets of donors and send them the donation solicitation with and without labels to see if one method is more effective than the other is. Advantages of primary data: 1. It is original source of data 2. It is possible to capture the changes occurring in the course of time. 3. It is flexible to the advantage of researcher. 4. Extensive research study is based of primary data. Disadvantages of primary data: 1. Primary data is expensive to obtain 2. It is time consuming 3. It requires extensive research personnel who are skilled. 4. It is difficult to administer. 5.3 METHODS OF COLLECTING PRIMARY DATA Primary data are directly collected by the researcher from their original sources. In this case, the researcher can collect the required data precisely according to his research needs, he can collect them when he wants them and in the form he needs them. But the collection of primary data is costly and time consuming. Yet, for several types of social science research required data are not available from secondary sources and they have to be directly gathered from the primary sources. In such cases where the available data are inappropriate, inadequate or obsolete, primary data have to be gathered. They include: socio economic surveys, social anthropological studies of rural communities and tribal communities, sociological studies of social problems and social institutions. Marketing research, leadership studies, opinion polls, attitudinal surveys, readership, radio listening and T.V. viewing surveys, knowledge-awareness practice (KAP) studies, farm managements studies, business management studies etc. There are various methods of data collection. A „Method‟ is different from a „Tool‟ while a method refers to the way or mode of gathering data, a tool is an instruments used for the method. For example, a schedule is used for interviewing. The important methods are (a) observation, (b) interviewing, (c) mail survey, (d) experimentation, (e) simulation and (f) projective technique. Check Your Progress: 1. What do you understand by primary data? 2. State the important methods of primary data collection.
5.4 TYPES OF SURVEYS Surveys can be divided into two broad categories: the questionnaire and the interview. Questionnaires are usually paper-and-pencil instruments that the respondent completes. Interviews are completed by the interviewer based on the respondent says. Sometimes, it's hard to tell the difference between a questionnaire and an interview. For instance, some people think that questionnaires always ask short closed-ended questions while interviews always ask broad open-ended ones. But you will see questionnaires with open-ended questions (although they do tend to be shorter than in interviews) and there will often be a series of closed-ended questions asked in an interview. Survey research has changed dramatically in the last ten years. We have automated telephone surveys that use random dialing methods. There are computerized kiosks in public places that allows people to ask for input. A whole new variation of group interview has evolved as focus group methodology. Increasingly, survey research is tightly integrated with the delivery of service. Your hotel room has a survey on the desk. Your waiter presents a short customer satisfaction survey with your check. You get a call for an interview several days after your last call to a computer company for technical assistance. You're asked to complete a short survey when you visit a web site. Here, I'll describe the major types of questionnaires and interviews, keeping in mind that technology is leading to rapid evolution of methods. We'll discuss the relative advantages and disadvantages of these different survey types in Advantages and Disadvantages of Survey Methods. 5.5 QUESTIONNAIRES When most people think of questionnaires, they think of the mail survey. All of us have, at one time or another, received a questionnaire in the mail. There are many dvantages to mail surveys. They are relatively inexpensive to administer. You can send the exact same instrument to a wide number of people. They allow the respondent to fill it out at their own convenience. But there are some disadvantages as well. Response rates from mail surveys are often very low. And, mail questionnaires are not the best vehicles for asking for detailed written responses. A second type is the group administered questionnaire. A sample of respondents is brought together and asked to respond to a structured sequence of questions. Traditionally, questionnaires were administered in group settings for convenience. The researcher could give the questionnaire to those who were present and be fairly sure that there would be a high response rate. If the respondents were unclear about the meaning of a question they could ask for clarification. And, there were often organizational settings where it was relatively easy to assemble the group (in a company or business, for instance). What's the difference between a group administered questionnaire and a group interview or focus group? In the group administered questionnaire, each respondent is handed an instrument and asked to complete it while in the room. Each respondent completes an instrument. In the group interview or focus group, the interviewer facilitates the session. People work as a group, listening to each other's comments and answering the questions. Someone takes notes for the entire group -- people don't complete an interview individually. A less familiar type of questionnaire is the household dropoff survey. In this approach, a researcher goes to the respondent's home or business and hand over the respondent the instrument. In some cases, the respondent is asked to mail it back or the interview
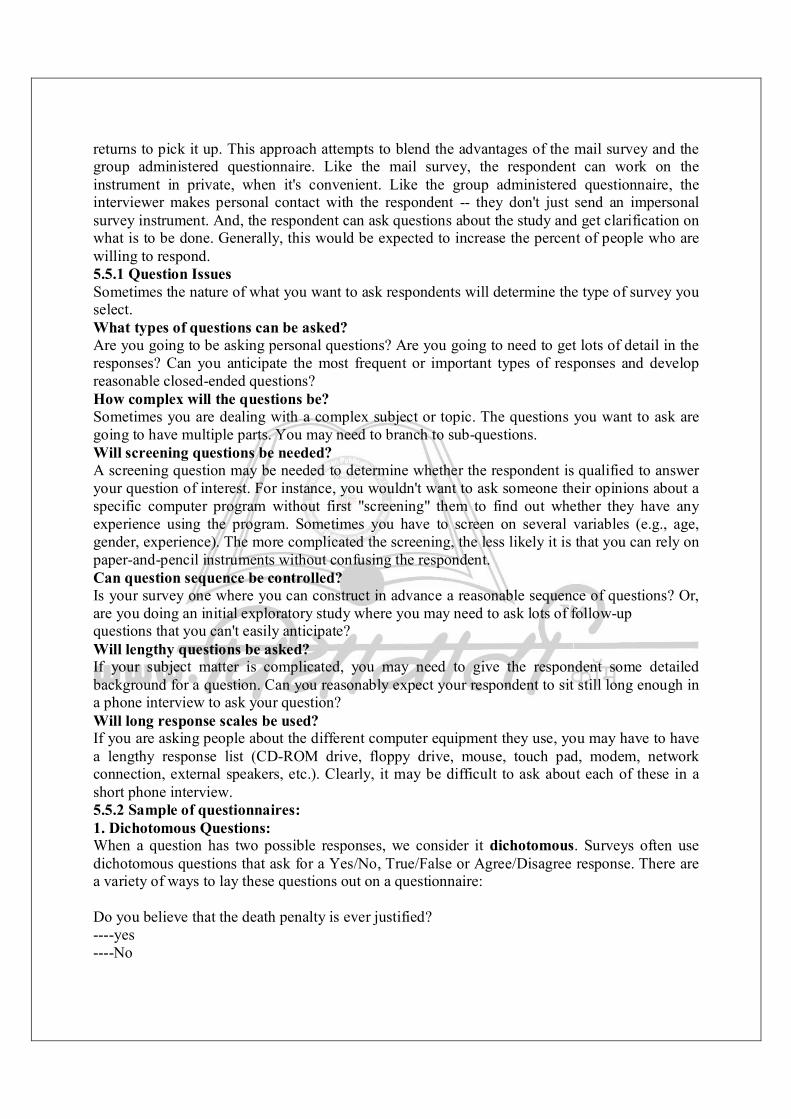
returns to pick it up. This approach attempts to blend the advantages of the mail survey and the group administered questionnaire. Like the mail survey, the respondent can work on the instrument in private, when it's convenient. Like the group administered questionnaire, the interviewer makes personal contact with the respondent -- they don't just send an impersonal survey instrument. And, the respondent can ask questions about the study and get clarification on what is to be done. Generally, this would be expected to increase the percent of people who are willing to respond. 5.5.1 Question Issues Sometimes the nature of what you want to ask respondents will determine the type of survey you select. What types of questions can be asked? Are you going to be asking personal questions? Are you going to need to get lots of detail in the responses? Can you anticipate the most frequent or important types of responses and develop reasonable closed-ended questions? How complex will the questions be? Sometimes you are dealing with a complex subject or topic. The questions you want to ask are going to have multiple parts. You may need to branch to sub-questions. Will screening questions be needed? A screening question may be needed to determine whether the respondent is qualified to answer your question of interest. For instance, you wouldn't want to ask someone their opinions about a specific computer program without first "screening" them to find out whether they have any experience using the program. Sometimes you have to screen on several variables (e.g., age, gender, experience). The more complicated the screening, the less likely it is that you can rely on paper-and-pencil instruments without confusing the respondent. Can question sequence be controlled? Is your survey one where you can construct in advance a reasonable sequence of questions? Or, are you doing an initial exploratory study where you may need to ask lots of follow-up questions that you can't easily anticipate? Will lengthy questions be asked? If your subject matter is complicated, you may need to give the respondent some detailed background for a question. Can you reasonably expect your respondent to sit still long enough in a phone interview to ask your question? Will long response scales be used? If you are asking people about the different computer equipment they use, you may have to have a lengthy response list (CD-ROM drive, floppy drive, mouse, touch pad, modem, network connection, external speakers, etc.). Clearly, it may be difficult to ask about each of these in a short phone interview. 5.5.2 Sample of questionnaires: 1. Dichotomous Questions: When a question has two possible responses, we consider it dichotomous. Surveys often use dichotomous questions that ask for a Yes/No, True/False or Agree/Disagree response. There are a variety of ways to lay these questions out on a questionnaire: Do you believe that the death penalty is ever justified? ----yes ----No
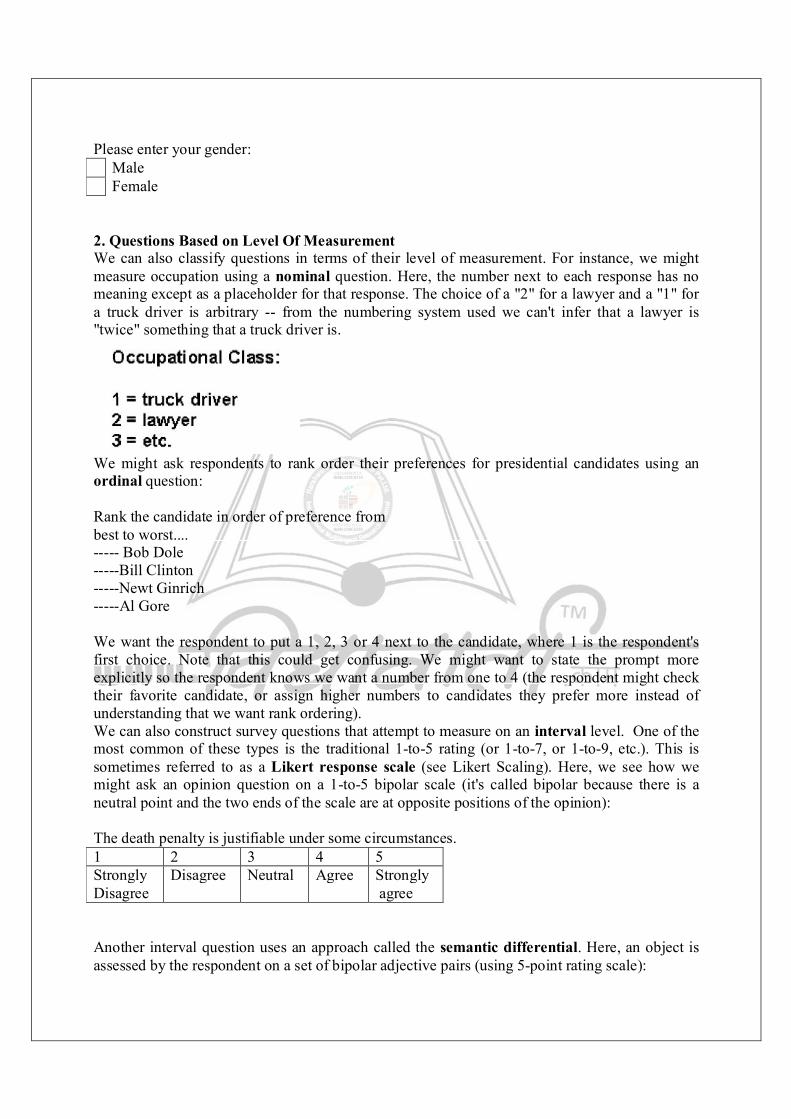
Please enter your gender: Male Female 2. Questions Based on Level Of Measurement We can also classify questions in terms of their level of measurement. For instance, we might measure occupation using a nominal question. Here, the number next to each response has no meaning except as a placeholder for that response. The choice of a "2" for a lawyer and a "1" for a truck driver is arbitrary -- from the numbering system used we can't infer that a lawyer is "twice" something that a truck driver is.
We might ask respondents to rank order their preferences for presidential candidates using an ordinal question: Rank the candidate in order of preference from best to worst.... ----- Bob Dole -----Bill Clinton -----Newt Ginrich -----Al Gore We want the respondent to put a 1, 2, 3 or 4 next to the candidate, where 1 is the respondent's first choice. Note that this could get confusing. We might want to state the prompt more explicitly so the respondent knows we want a number from one to 4 (the respondent might check their favorite candidate, or assign higher numbers to candidates they prefer more instead of understanding that we want rank ordering). We can also construct survey questions that attempt to measure on an interval level. One of the most common of these types is the traditional 1-to-5 rating (or 1-to-7, or 1-to-9, etc.). This is sometimes referred to as a Likert response scale (see Likert Scaling). Here, we see how we might ask an opinion question on a 1-to-5 bipolar scale (it's called bipolar because there is a neutral point and the two ends of the scale are at opposite positions of the opinion): The death penalty is justifiable under some circumstances. 1 2 3 4 5 Strongly Disagree
Disagree Neutral Agree Strongly agree
Another interval question uses an approach called the semantic differential. Here, an object is assessed by the respondent on a set of bipolar adjective pairs (using 5-point rating scale):
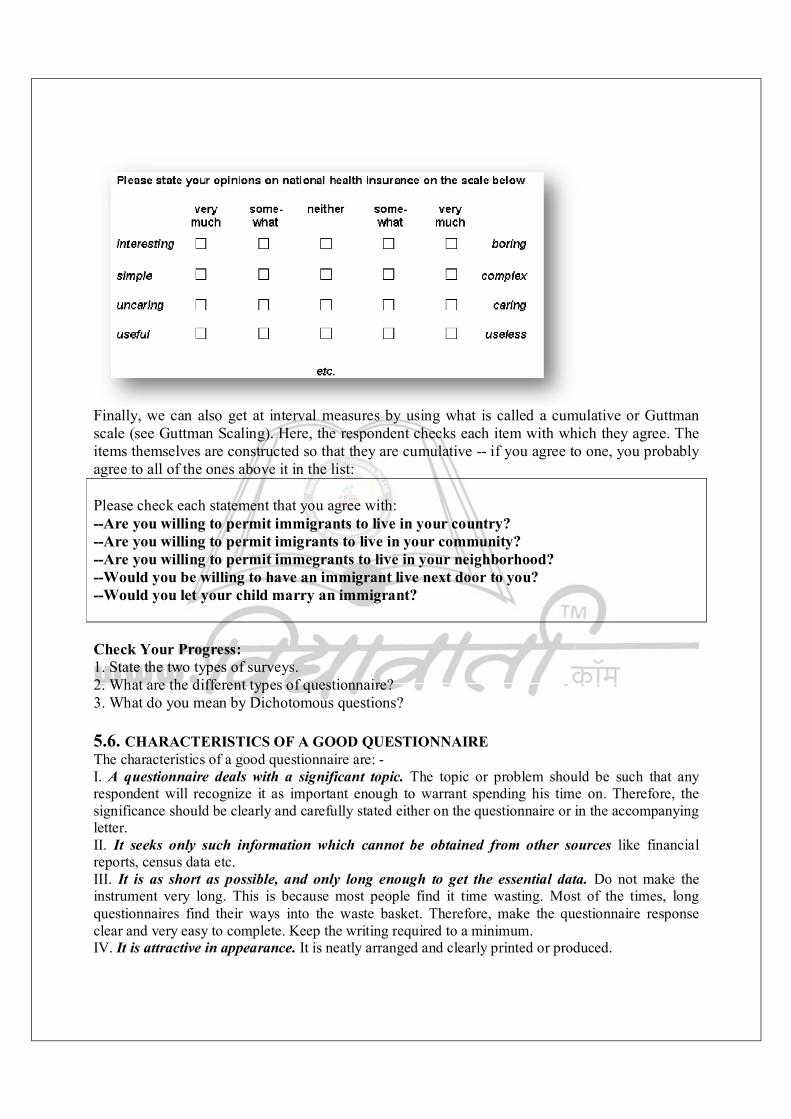
Finally, we can also get at interval measures by using what is called a cumulative or Guttman scale (see Guttman Scaling). Here, the respondent checks each item with which they agree. The items themselves are constructed so that they are cumulative -- if you agree to one, you probably agree to all of the ones above it in the list: Please check each statement that you agree with: --Are you willing to permit immigrants to live in your country? --Are you willing to permit imigrants to live in your community? --Are you willing to permit immegrants to live in your neighborhood? --Would you be willing to have an immigrant live next door to you? --Would you let your child marry an immigrant? Check Your Progress: 1. State the two types of surveys. 2. What are the different types of questionnaire? 3. What do you mean by Dichotomous questions? 5.6. CHARACTERISTICS OF A GOOD QUESTIONNAIRE The characteristics of a good questionnaire are: - I. A questionnaire deals with a significant topic. The topic or problem should be such that any respondent will recognize it as important enough to warrant spending his time on. Therefore, the significance should be clearly and carefully stated either on the questionnaire or in the accompanying letter. II. It seeks only such information which cannot be obtained from other sources like financial reports, census data etc. III. It is as short as possible, and only long enough to get the essential data. Do not make the instrument very long. This is because most people find it time wasting. Most of the times, long questionnaires find their ways into the waste basket. Therefore, make the questionnaire response clear and very easy to complete. Keep the writing required to a minimum. IV. It is attractive in appearance. It is neatly arranged and clearly printed or produced.

V. Instructions are clear and complete. Important terms are defined. Each item deals with a single idea and is worded as simply and possible. 5.7. CONSTRUCTION OF A QUESTIONNAIRE According to Okpala, et al (1995) a researcher is faced with respondents who have great amount of information that could go untapped unless the questionnaire items are valid and reliable enough to elicit the required information. Henderson et al (1978) suggested eight steps to which the process of developing and using a questionnaire can be divided. These are; i. Identifying the programmes objectives and specific information to be obtained. ii. Select a response format iii. Identifying the frame of reference of the respondents. iv. Writing the items/questions v. Preparing a data summary sheet vi. Critiquing the questions, trying them out and revising them vii. Assembling the questionnaires viii. Administering the questionnaires 5.8. TYPES OF QUESTIONNAIRES There are two main types of questionnaires based on two basic types of question formats. These are closed ended questions and open-ended questions. Closed ended questions and those that provide respondent with fixed set of alternatives from which they are to choose. For instance, the response format of multiple choice-items and scales are all closed-ended. Where as open-ended questions are those questions to which the respondents write their own response, as it is in an essay examination questions. Now lets us look at the two main types of questionnaires. 5.8.1. The Closed – Ended Questionnaire It can also be called restricted or closed form type. All questionnaire instruments that call for short, check-mark responses belong to this category. For example, you may be asked to mark yes or no, check an item from a list of suggested responses. Let us give some specific examples. i. Yes or No type: - Accountancy is a difficult subject. Yes/No ii. Short response type: - The science subjects that deals with living things is………………. iii. Marking from a list of suggested response.
All hotel management students should offer accountant courses. Strongly agree, Agree, Neutral, Disagree, Strong disagree.
The Federal Palace Hotel is a …………. Hotel. 5-star, 4-star, 3-star, 2-star, one- star iv. Ranking: - Kindly rank the options in your order of importance. Why did you choose to study Hotel management? a) Advice from friends b) Reputation of the programme c) Expense factor d) Professional choice e) Availability of job opportunities f) Others (specify) 5.8.2. The Open – Ended Questionnaire: This can also be called unrestricted questionnaire or free response type. It demands that the subjects respond in their own words. Look at this question again. Why did you choose to study Hotel Management? You can see that no clue is given here. The advantage is that open form provides for greater depth of response. The respondents may reveal their frame of reference and sometimes the reasons for their responses. It has such disadvantages as: very low returns due to greater efforts needed on the part of the respondents in filling the questionnaire. Again, the items can be difficult to interpret, tabulate or summarize in the research report. The questions can generally take this form a) List the causes of ………
b) What are your opinions about ……….? c) How do you feel about ………..? d) What do you think about ……….? 5.9. HOW TO IMPROVE QUESTIONNAIRE ITEMS? The questionnaire is the basic data gathering instrument. It is therefore very important that the items are worded carefully. You know that most questionnaires do not provide opportunities for the clarification of questions to the respondents. Again any ambiguity in the questions introduces sources of substantial errors. You should therefore follow these steps to improve on your questionnaires. i. All Statements or question should be clear, simple and direct. Each item should express only one idea. No complex statements like; Open and Distance Learning mode of education is very good, everybody should therefore support it. You can see that this is not a good item. This is because it is possible some respondents would agree with the first part but disagree with the second part or vice-versa. ii. Every slang terminology or technical jargon should be avoided. Otherwise, it should be carefully defined or explained. iii. Define, qualify or explain all terms that could be misinterpreted iv. Beware, and if possible avoid double negative. Underline negative terms and phrases for clarity. e.g. Discounts and bonuses should not be given to customers who do not patronize the hotel on regular basis. Which of these is not a term in catering? v. Always avoid inadequate alternatives. e.g. Married……. Yes/No. You can see that the options are inadequate. Widowed, Separated or Divorced are excluded. vi. If you wish to show special emphasis, underline such words or phrases e.g. all undergraduate programmes should include study skills in the ODL system. vii. Avoid unwanted assumptions viii. Include only these items which are appropriately phrased for all the respondents. ix. Construct items that will give a complete response. x. Do not include items which are socially unacceptable in the setting in which you respondents are. 5.10. ADMINISTRATION OF THE QUESTIONNAIRE. When you have concluded the process of developing the instruments, you need to administer them to the subjects. But before this is done, you will have to ensure that the instrument is usable, valid and reliable. You have to do these through the process of trial testing or pilot testing. 5.10.1. Pilot testing of the Questionnaire Every instrument used for data collection in research should be trial tested or pilot tested. There are so many reasons for doing this. Among these reasons are: I. To find out how long it takes the respondents to complete II. To ensure that all questions and instructions are clear III. To enable the researcher to remove any items which do not yield usable data IV. To enable you include any item deemed necessary to yield some relevant data. V. To use the results to find the reliability of the instrument. VI. To use the results to do the item analysis of the instrument VII. To ensure the usability of the instrument. Do not fall to the temptation of going straight to the distribution stage. No matter how pressed for time you are, do your best to give the questionnaire a trial run. You should try out the instrument on group similar to the one that will form the samples of your study. When you do these, you come out with a good questionnaire. Your respondents will not experience difficulties in filling out the instrument. Again you can carry out a preliminary analysis at the data collected.
5.10.2. Administering the Questionnaire proper There are different methods of administering the questionnaire. You shall therefore try to make early decision about how to distribute them to the respondents. You also need to decide what to do about no response. The different methods of administering the questionnaires are: - I. Administering the questionnaires personally. This has some advantages. You can explain the purpose of the study of your respondents. The questionnaires can be completed and returned on the spot. In this case, you have high percentage of returns. Again you are likely to get better co-operation if you can establish personal contact with the respondents. II. Using research assistants: - You can persuade your friends and colleagues to lend a helping hand in the distribution. You can also use research assistants. In this case, you have to make out time to train them on how to administer and collect the instruments. III. Mailing the questionnaires. If your respondents are far away and you can not personally reach them, you can sand the instruments to them by past. You should note that postal services are expensive, waste time and response rate is generally low. 5.10.3. Covering letter Remember to accompany your questionnaire with an introduction letter or a covering letter. This should inform the respondents about the objectives of the study and therefore the questionnaire. You need to let them know that will be done with the information collected. They need to know the deadline for the return of the questionnaire. It will also assure them about the anonymity and confidentiality of the information supplied. 5.11 INTERVIEWS Interviews are a far more personal form of research than questionnaires. In the personal interview, the interviewer works directly with the respondent. Unlike with mail surveys, the interviewer has the opportunity to probe or ask follow-up questions. And, interviews are generally easier for the respondent, especially if what is sought is opinions or impressions. Interviews can be very time consuming and they are resource intensive. The interviewer is considered a part of the measurement instrument and interviewers have to be well trained in how to respond to any contingency. Almost everyone is familiar with the telephone interview. Telephone interviews enable a researcher to gather information rapidly. Most of the major public opinion polls that are reported were based on telephone interviews. Like personal interviews, they allow for some personal contact between the interviewer and the respondent. And, they allow the interviewer to ask follow-up questions. But they also have some major disadvantages. Many people don't have publicly-listed telephone numbers. Some don't have telephones. People often don't like the intrusion of a call to their homes. And, telephone interviews have to be relatively short or people will feel imposed upon. Concept of Interviews Interviews are among the most challenging and rewarding forms of measurement. They require a personal sensitivity and adaptability as well as the ability to stay within the bounds of the designed protocol. Here, I describe the preparation you need to do for an interview study and the process of conducting the interview itself. 5.11.1 Preparation: The Role of the Interviewer The interviewer is really the "jack-of-all-trades" in survey research. The interviewer's role is complex and multifaceted. It includes the following tasks: Locate and enlist cooperation of respondents
The interviewer has to find the respondent. In door-to-door surveys, this means being able to locate specific addresses. Often, the interviewer has to work at the least desirable times (like immediately after dinner or on weekends) because that's when respondents are most readily available. Motivate respondents to do good job If the interviewer does not take the work seriously, why would the respondent? The interviewer has to be motivated and has to be able to communicate that motivation to the respondent. Often, this means that the interviewer has to be convinced of the importance of the research. Clarify any confusion/concerns Interviewers have to be able to think on their feet. Respondents may raise objections or concerns that were not anticipated. The interviewer has to be able to respond candidly and informatively. Observe quality of responses Whether the interview is personal or over the phone, the interviewer is in the best position to judge the quality of the information that is being received. Even a verbatim transcript will not adequately convey how seriously the respondent took the task, or any gestures or body language that were evident. Conduct a good interview Last, and certainly not least, the interviewer has to conduct a good interview! Every interview has a life of its own. Some respondents are motivated and attentive, others are distracted or disinterested. The interviewer also has good or bad days. Assuring a consistently high-quality interview is a challenge that requires constant effort. 5.11.2 Training the Interviewers: One of the most important aspects of any interview study is the training of the interviewers themselves. In many ways the interviewers are your measures, and the quality of the results is totally in their hands. Even in small studies involving only a single researcher-interviewer, it is important to organize in detail and rehearse the interviewing process before beginning the formal study. Here are some of the major topics that should be included in interviewer training: Describe the entire study Interviewers need to know more than simply how to conduct the interview itself. They should learn about the background for the study, previous work that has been done, and why the study is important. State who is sponsor of research Interviewers need to know who they are working for. They -- and their respondents -- have a right to know not just what agency or company is conducting the research, but also, who is paying for the research. Teach enough about survey research While you seldom have the time to teach a full course on survey research methods, the interviewers need to know enough that they respect the survey method and are motivated. Sometimes it may not be apparent why a question or set of questions was asked in a particular way. The interviewers will need to understand the rationale for how the instrument was constructed. Explain the sampling logic and process Naive interviewers may not understand why sampling is so important. They may wonder why you go through all the difficulties of selecting the sample so carefully. You will have to explain
that sampling is the basis for the conclusions that will be reached and for the degree to which your study will be useful. Explain interviewer bias Interviewers need to know the many ways that they can inadvertently bias the results. And, they need to understand why it is important that they not bias the study. This is especially a problem when you are investigating political or moral issues on which people have strongly held convictions. While the interviewer may think they are doing good for society by slanting results in favor of what they believe, they need to recognize that doing so could jeopardize the entire study in the eyes of others. "Walk through" the interview When you first introduce the interview, it's a good idea to walk through the entire protocol so the interviewers can get an idea of the various parts or phases and how they interrelate.
Explain respondent selection procedures, including reading maps
It's astonishing how many adults don't know how to follow directions on a map. In personal interviews, the interviewer may need to locate respondents who are spread over a wide geographic area. And, they often have to navigate by night (respondents tend to be most available in evening hours) in neighborhoods they're not familiar with. Teaching basic map reading skills and confirming that the interviewers can follow maps is essential. identifying households In many studies it is impossible in advance to say whether every sample household meets the sampling requirements for the study. In your study, you may want to interview only people who live in single family homes. It may be impossible to distinguish townhouses and apartment buildings in your sampling frame. The interviewer must know how to identify the appropriate target household. identify respondents Just as with households, many studies require respondents who meet specific criteria. For instance, your study may require that you speak with a male head-of-household between the ages of 30 and 40 who has children under 18 living in the same household. It may be impossible to obtain statistics in advance to target such respondents. The interviewer may have to ask a series of filtering questions before determining whether the respondent meets the sampling needs. Rehearse interview You should probably have several rehearsal sessions with the interviewer team. You might even videotape rehearsal interviews to discuss how the trainees responded in difficult situations. The interviewers should be very familiar with the entire interview before ever facing a respondent. Explain supervision In most interview studies, the interviewers will work under the direction of a supervisor. In some contexts, the supervisor may be a faculty advisor; in others, they may be the "boss." In order to assure the quality of the responses, the supervisor may have to observe a subsample of interviews, listen in on phone interviews, or conduct follow-up assessments of interviews with the respondents. This can be very threatening to the interviewers. You need to develop an atmosphere where everyone on the research team -- interviewers and supervisors -- feel like they're working together towards a common end. Explain scheduling
The interviewers have to understand the demands being made on their schedules and why these are important to the study. In some studies it will be imperative to conduct the entire set of interviews within a certain time period. In most studies, it's important to have the interviewers available when it's convenient for the respondents, not necessarily the interviewer. 5.11.3 The Interviewer's Kit It's important that interviewers have all of the materials they need to do a professional job. Usually, you will want to assemble an interviewer kit that can be easily carried and includes all of the important materials such as: a "professional-looking" 3-ring notebook (this might even have the logo of the company or organization conducting the interviews) maps sufficient copies of the survey instrument official identification (preferable a picture ID) a cover letter from the Principal Investigator or Sponsor a phone number the respondent can call to verify the interviewer's authenticity 5.11.4 The Interview : So all the preparation is complete, the training done, the interviewers ready to proceed, their "kits" in hand. It's finally time to do an actual interview. Each interview is unique, like a small work of art (and sometimes the art may not be very good). Each interview has its own ebb and flow -- its own pace. To the outsider, an interview looks like a fairly standard, simple, prosaic effort. But to the interviewer, it can be filled with special nuances and interpretations that aren't often immediately apparent. Every interview includes some common components. There's the opening, where the interviewer gains entry and establishes the rapport and tone for what follows. There's the middle game, the heart of the process, that consists of the protocol of questions and the improvisations of the probe. And finally, there's the endgame, the wrap-up, where the interviewer and respondent establish a sense of closure. Whether it's a two-minute phone interview or a personal interview that spans hours, the interview is a bit of theater, a mini-drama that involves real lives in real time. 5.11.5 Opening Remarks In many ways, the interviewer has the same initial problem that a salesperson has. You have to get the respondent's attention initially for a long enough period that you can sell them on the idea of participating in the study. Many of the remarks here assume an interview that is being conducted at a respondent's residence. But the analogies to other interview contexts should be straightforward. Gaining entry The first thing the interviewer must do is gain entry. Several factors can enhance the prospects. Probably the most important factor is your initial appearance. The interviewer needs to dress professionally and in a manner that will be comfortable to the respondent. In some contexts a business suit and briefcase may be appropriate. In others, it may intimidate. The way the interviewer appears initially to the respondent has to communicate some simple messages -- that you're trustworthy, honest, and nonthreatening. Cultivating a manner of professional confidence, the sense that the respondent has nothing to worry about because you know what you're doing -- is a difficult skill to teach and an indispensable skill for achieving initial entry. Doorstep technique You're standing on the doorstep and someone has opened the door, even if only halfway. You need to smile. You need to be brief. State why you are there and suggest what you would like the
respondent to do. Don't ask -- suggest what you want. Instead of saying "May I come in to do an interview?", you might try a more imperative approach like " I'd like to take a few minutes of your time to interview you for a very important study." Introduction If you've gotten this far without having the door slammed in your face, chances are you will be able to get an interview. Without waiting for the respondent to ask questions, you should move to introducing yourself. You should have this part of the process memorized so you can deliver the essential information in 20-30 seconds at most. State your name and the name of the organization you represent. Show your identification badge and the letter that introduces you. You want to have as legitimate an appearance as possible. If you have a three-ring binder or clipboard with the logo of your organization, you should have it out and visible. You should assume that the respondent will be interested in participating in your important study -- assume that you will be doing an interview here. Explaining the study At this point, you've been invited to come in (After all, you're standing there in the cold, holding an assortment of materials, clearly displaying your credentials, and offering the respondent the chance to participate in an interview -- to many respondents, it's a rare and exciting event. They hardly ever get asked their views about anything, and yet they know that important decisions are made all the time based on input from others.). Or, the respondent has continued to listen long enough that you need to move onto explaining the study. There are three rules to this critical explanation: 1) Keep it short; 2) Keep it short; and 3) Keep it short! The respondent doesn't have to or want to know all of the neat nuances of this study, how it came about, how you convinced your thesis committee to buy into it, and so on. You should have a one or two sentence description of the study memorized. No big words. No jargon. No detail. There will be more than enough time for that later (and you should bring some written materials you can leave at the end for that purpose). This is the "25 words or less" description. What you should spend some time on is assuring the respondent that you are interviewing them confidentially, and that their participation is voluntary. 5.11.6 Asking the Questions You've gotten in. The respondent has asked you to sit down and make yourself comfortable. It may be that the respondent was in the middle of doing something when you arrived and you may need to allow them a few minutes to finish the phone call or send the kids off to do homework. Now, you're ready to begin the interview itself. Use questionnaire carefully, but informally The questionnaire is your friend. It was developed with a lot of care and thoughtfulness. While you have to be ready to adapt to the needs of the setting, your first instinct should always be to trust the instrument that was designed. But you also need to establish a rapport with the respondent. If you have your face in the instrument and you read the questions, you'll appear unprofessional and disinterested. Even though you may be nervous, you need to recognize that your respondent is most likely even more nervous. If you memorize the first few questions, you can refer to the instrument only occasionally, using eye contact and a confident manner to set the tone for the interview and help the respondent get comfortable. Ask questions exactly as written Sometimes an interviewer will think that they could improve on the tone of a question by altering a few words to make it simpler or more "friendly." DON'T. You should ask the questions as they
are on the instrument. If you had a problem with a question, the time to raise it was during the training and rehearsals, not during the actual interview. It is important that the interview be as standardized as possible across respondents (this is true except in certain types of exploratory or interpretivist research where the explicit goal is to avoid any standardizing). You may think the change you made was inconsequential when, in fact, it may change the entire meaning of the question or response. Follow the order given Once you know an interview well, you may see a respondent bring up a topic that you know will come up later in the interview. You may be tempted to jump to that section of the interview while you're on the topic. DON'T. You are more likely to lose your place. You may omit questions that build a foundation for later questions. Ask every question Sometimes you'll be tempted to omit a question because you thought you already heard what the respondent will say. Don't assume that. For example, let's say you were conducting an interview with college age women about the topic of date rape. In an earlier question, the respondent mentioned that she knew of a woman on her dormitory floor who had been raped on a date within the past year. A few questions later, you are supposed to ask "Do you know of anyone personally who was raped on a date?" You figure you already know that the answer is yes, so you decide to skip the question. Instead, you might say something like "I know you may have already mentioned this, but do you know of anyone personally who was raped on a date?" At this point, the respondent may say something like "Well, in addition to the woman who lived down the hall in my dorm, I know of a friend from high school who experienced date rape." If you hadn't asked the question, you would never have discovered this detail. Don't finish sentences I don't know about you, but I'm one of those people who just hates to be left hanging. I like to keep a conversation moving. Once I know where a sentence seems to be heading, I'm aching to get to the next sentence. I finish people's sentences all the time. If you're like me, you should practice the art of patience (and silence) before doing any interviewing. As you'll see below, silence is one of the most effective devices for encouraging a respondent to talk. If you finish their sentence for them, you imply that what they had to say is transparent or obvious, or that you don't want to give them the time to express themselves in their own language. 5.11.7 Obtaining Adequate Responses - The Probe OK, you've asked a question. The respondent gives a brief, cursory answer. How do you elicit a more thoughtful, thorough response? You probe. Silent probe The most effective way to encourage someone to elaborate is to do nothing at all - just pause and wait. This is referred to as the "silent" probe. It works (at least in certain cultures) because the respondent is uncomfortable with pauses or silence. It suggests to the respondent that you are waiting, listening for what they will say next. Overt encouragement At times, you can encourage the respondent directly. Try to do so in a way that does not imply approval or disapproval of what they said (that could bias their subsequent results). Overt encouragement could be as simple as saying "Uh-huh" or "OK" after the respondent completes a thought. Elaboration
You can encourage more information by asking for elaboration. For instance, it is appropriate to ask questions like "Would you like to elaborate on that?" or "Is there anything else you would like to add?" Ask for clarification Sometimes, you can elicit greater detail by asking the respondent to clarify something that was said earlier. You might say, "A minute ago you were talking about the experience you had in high school. Could you tell me more about that?" Repetition This is the old psychotherapist trick. You say something without really saying anything new. For instance, the respondent just described a traumatic experience they had in childhood. You might say "What I'm hearing you say is that you found that experience very traumatic." Then, you should pause. The respondent is likely to say something like "Well, yes, and it affected the rest of my family as well. In fact, my younger sister..." 5.11.8 Recording the Response: Although we have the capability to record a respondent in audio and/or video, most interview methodologists don't think it's a good idea. Respondents are often uncomfortable when they know their remarks will be recorded word-for-word. They may strain to only say things in a socially acceptable way. Although you would get a more detailed and accurate record, it is likely to be distorted by the very process of obtaining it. This may be more of a problem in some situations than in others. It is increasingly common to be told that your conversation may be recorded during a phone interview. And most focus group methodologies use unobtrusive recording equipment to capture what's being said. But, in general, personal interviews are still best when recorded by the interviewer using pen and paper. Here, I assume the paper-and-pencil approach. Record responses immediately The interviewer should record responses as they are being stated. This conveys the idea that you are interested enough in what the respondent is saying to write it down. You don't have to write down every single word -- you're not taking stenography. But you may want to record certain key phrases or quotes verbatim. You need to develop a system for distinguishing what the respondent says verbatim from what you are characterizing (how about quotations, for instance!). Include all probes You need to indicate every single probe that you use. Develop a shorthand for different standard probes. Use a clear form for writing them in (e.g., place probes in the left margin). Use abbreviations where possible Abbreviations will help you to capture more of the discussion. Develop a standardized system (e.g., R=respondent; DK=don't know). If you create an abbreviation on the fly, have a way of indicating its origin. For instance, if you decide to abbreviate Spouse with a 'S', you might make a notation in the right margin saying "S=Spouse." 5.12. TYPES OF INTERVIEW The different types of interviews used in research are: - 5.12.1 Informal Conversation Interview. This is characterized by the fact that the questions emerge from the immediate context or situation and are asked in the natural course of things. There are predetermined questions or topics or wordings. This has some advantages. They include: -
i. It increases the silence and relevance of the questions ii. Interviews are built on and emerge from observations. iii. The interview can be matched to individuals and circumstances. The disadvantages are: - i. Different information‟s are collected from different questions. ii. It is less systematic and comprehensive iii. Data organization and analysis can be quite difficult. 5.12.2 Interviewer guided approach: In this type, topics and issues to be covered are specified in advance, in an outline format. You as an interviewer will decide the sequence and wording of the questions in the course of the interview. The advantages include: - i. The outline increases the comprehensiveness of the data. ii. It makes data collection somewhat systematic. iii. Logical gaps in data can be anticipated and closed. iv. Interview is fairly conversational and situational The disadvantages include: - i. Important and silent topics may be inadvertently omitted. ii. Interviewer flexibility in sequencing and wording of questions can result in substantially different responses from different perspectives. This will reduce the comparability of the responses. 5.12.3 Standardized Open-ended interview: In this case, the exact wording and sequencing of the questions are determined in advance by the researcher. All interviewees are asked the same basic question in the same order. Questions are worded in a completely open – ended format. The advantages include: - i. All respondents answer the same questions. This increases the comparability of the responses. ii. Information collected are complete for each respondents on the topics addressed in the interview. iii. It reduced interviewer effects and biases when several interviewers are used. iv. It permits the users of evaluations to see and review the instrument used for evaluation. v. It facilitates organization and analysis of the data. The disadvantages include: - i. Little flexibility in relating the interview to particular individuals and circumstances. ii. Limited and constrained naturalness and relevance of questions and answers. 5.12.4 Closed or Fixed Response Interview In this type which is the most popular in research studies, questions and response categories are determined in advance. Responses are fixed. The respondents choose from among the fixed responses provided. The advantages include: - i. Data analysis is simple ii. Responses can be directly compared and easily aggregated iii. Many questions can be asked and answered in a short time The disadvantages may include: i. Respondents must fit their experiences, knowledge and feeling into the researcher‟s response categories. ii. Sometimes it may be seen as impersonal, irrelevant and mechanistic iii. There can be a distortion of what respondents really mean or experienced by so completely limiting their response choices. 5.13. STEPS IN THE ARRANGEMENT OF INTERVIEWS. For the successful handling of the interviews as a data collection technique for your research studies, you will need to follow some simple but very important steps. These steps include: -
i. You should set up the interview plan used in advance. ii. You will prepare and send the set of questions which you will ask to the interviewee in advance iii. Sort for permission to tape-recorded the interview iv. Confirm the date of interview in writing v. Send a reminder, together with the same set of questions to the interviewee, about 10 days to the interview date. vi. On the interview day, be prompt, have another copy of the set of questions for your interviewee, should he/she has misplace his/her copy? vii. Follow the questions serially as it is in the set. viii. After the interview, prepare and submit a type script of the interview either in soft or hard copy to the interviewee tries to get a written acknowledgement of its accuracy or a corrected copy from the interviewee. ix. Ask for final approval and written permission to use the information in your research report. x. After you have incorporated the information in your research report, send the relevant section of the report to the interviewee. 5.14. HOW TO CONDUCT AN INTERVIEW? An interview is a social interaction or relationship designed to exchange information between the interviewer and the interviewee. The goal is to collect data and not make friends. Therefore the quantity of information exchanged or received depends on how astute and creative you are at understanding and managing the relationship. According to Schofield (1972) much of the success or failure of the interview depends on how you handle the opening few minutes. This signifies the need for good public relations and good approach in conducting the interview. This is to enable you and the respondents establish a report of a good two-wag communication. If you can achieve this fit, you will be assured of a successful interview that will be a pleasant experience for you and your respondents. In appearance, you must be neat, clean and business- like but also friendly. Make sure that your first contact with the interviewee must be appealing. Note that such characteristics as socio-economic statues, age, race and ethnicity might influence the interview schedule the interview to begin with the simple non-threatening questions and then let the interview progress according to the schedule. Employ the use of probes, or follow-up questions that are intended to elicit clearer and most complete responses. Use probe as a pause in conversation to encourage your subject to elaborate or an explicit request to classify on elaborate or something. Note also that an open-ended questions in which your respondents are encouraged to answer in their own words at some length is likely to provide greater depth of response. Closed questions are easier to record but may yield more superficial information. In order to obtain valid interview results Schofield (1972) advised the researcher to:- i. Listen to the respondent in a friendly and patient but intelligent critical manner. ii. Refrain from showing an authoritarian attitude iii. Refrain from giving advice on moral instruction. iv. Avoid asking questions which compel the subject to give the reply which you want to have. v. Avoid leading or prompting the subject towards certain answers. vi. Avoid entering into argument with your interviewee. vii. Avoid the use of double-barreled questions. You can only use questions or statements in order to: - i. Prompt the interviewee to talk freely and coherently. ii. Congratulate the subject on the quality of his response, the originality of his ideas and so on. iii. Clarify points on which there are uncertainties and to ascertain precisely what the subject means in places where the interviewer could interpret the candidate‟s remarks in a way detrimental to him. 5.14.1. Strengths of the interview
The interview is often regarded as being superior to other data-collecting devices. One of the reasons is that people prefer to talk than to write, especially when it comes to controversial issues. When the interview has gained support or when you have established a friendly relationship with your interviewee, certain confidential information may be obtained. Such information that an individual might be reluctant to put in writing could be elicited from subjects. You can explain more explicitly the purpose of the investigation and what type of information you want, especially: - If the subjects misinterpret the questions, you may also follow with a clarifying question. It is possible to seek the same information in several ways during the interview. It is also possible to stimulate the interviewee and possibly explore significant areas not anticipated in the original plan of investigation. Again interview is particularly appropriate when dealing with children and illiterate respondents. 5.14.2. Recording the Responses As an interviewer, your central task is to record the responses from the respondents. There are four most common ways of recording responses. These are: - Classifying responses into predetermined categories; summarizing the high points of what is said; taking verbatim notes or recording the interview with a tape recorder or video machine. To record the responses you can be taking notes as the interviews are going o, or take the notes immediately after, when the information is still fresh in your mind. This is called mental note. Alternatively, you can record the interview with recording machines. 5.15. OBSERVATION AS A DATA COLLECTION TECHNIQUE Observation can be described as the act of looking out for and recording the presence or absence of both verbal and non-verbal behaviour of an individual or group of individuals. When you use a specially designed evaluation instrument to collect observational data, it is referred to as observational technique. If you look back from the earliest history of scientific activity, you would see that observation has been the prevailing method of inquiring. When the observation of natural phenomena is aided by systematic classification and measurement, it leads to the development of theories and laws. Every type of research, whether experimental, descriptive or qualitative, incorporates the use of observational techniques. According to Monette, et al (1994) observational technique is the collection of data through direct visual or auditory behaviour or experience. It includes video or audio recording of behaviour. It means that you as a researcher looks or listens in order to see or hear the behaviours or words respectively. These provide the information needed for the research. There are two main types of observation. The first is called participant observation. In this case the researcher become part and participates in the activities of the people, group or situation that is being studied. Participant observation is very good for a highly qualitative research. The second is the non-participant observation. In this case the researcher is not part of and does not in any way participate in the activities of the people, group or situation. He observes through recording instruments or from outside. 5.16. CHARACTERISTICS OF A GOOD OBSERVATION. Observational process as data collection method in research demands a rigorous utilization of the spirit of scientific inquiry. According to Best and Khan (1995) the following standards should be the characteristics of observers and their observations. These characteristics are: - i. Observation is carefully planned. Observers who are systematic and perceptively know what to look for. They are not distracted by irrelevant situations. ii. Observers are aware of the wholeness of what is observed. They are alert to significant details. They know that the whole is often greater than the sum of its parts.
iii. Observers are objective. They recognize likely bases and strive to eliminate their influence on what they see and report. iv. Observers separate the facts from the interpretation of facts. They observe the facts and make their interpretations later. v. Observations are checked and verified by repetition or comparison with the other competent observers. vi. Observations are expertly recorded. They use appropriate instruments to systematize, quantify and preserve the results of their observations. vii. Observations are made in such a way as to make sure that the data collected are valid and reliable. 5.17. USES OF OBSERVATION. Yoloye (1977) has given a summary of the situations in which observational data could be useful. These are: - i. Measuring classroom process variables ii. Measuring attainment of programme objectives iii. Measuring the extent of programme implementation iv. Identifying difficulties in programme use. v. Identifying changes introduced by hotel owners, teachers etc vi. Identifying typical pathways to customer services. vii. Supplementing data from other sources. 5.17.1. What to be Observed There are some general categories of things you have to observe and record. These include i. The Setting: - This could be a hotel, a bank, a company etc. The records should contain descriptions of the general physical and social setting being observed. ii. The People: - These include customers, staff, management etc. The records should include a physical and social description of the main characters who are the focus of your observation iii. Individual Behaviour: - The cares of observations in most studies are the behaviour of the individuals in the settings. iv. Group Behaviours: - Most of the times, the behaviour of a group of individuals like customers, staff etc. may provide an important bit of information for your studies. 5.18. RECORDING OBSERVATION There are different kinds of devices used extensively to aid the recording of information gained through observation. These devices include checklist, rating scales, scorecards, scaled specimens etc. these provide systematic means for summarizing and/or quantifying data collected through observation or examination. For instance, you can prepare a type of form or sheet of paper to rate such things as type of food served, quality of served, neatness of the staff, neatness of the rooms, neatness of the bidding, services provided, entertainment provided etc. such assessment sheet from the observational scale which you can use for your studies. 5.19. Concluding the Interview When you've gone through the entire interview, you need to bring the interview to closure. Some important things to remember: Thank the respondent Don't forget to do this. Even if the respondent was troublesome or uninformative, it is important for you to be polite and thank them for their time. Tell them when you expect to send results I hate it when people conduct interviews and then don't send results and summaries to the people who they get the information from. You owe it to your respondent to show them what you learned. Now, they may not want your entire 300-page dissertation. It's
common practice to prepare a short, readable, jargon-free summary of interviews that you can send to the respondents. Don't be brusque or hasty Allow for a few minutes of winding down conversation. The respondent may want to know a little bit about you or how much you like doing this kind of work. They may be interested in how the results will be used. Use these kinds of interests as a way to wrap up the conversation. As you're putting away your materials and packing up to go, engage the respondent. You don't want the respondent to feel as though you completed the interview and then rushed out on them -- they may wonder what they said that was wrong. On the other hand, you have to be careful here. Some respondents may want to keep on talking long after the interview is over. You have to find a way to politely cut off the conversation and make your exit. Immediately after leaving -- write down any notes about how the interview went Sometimes you will have observations about the interview that you didn't want to write down while you were with the respondent. You may have noticed them get upset at a question, or you may have detected hostility in a response. Immediately after the interview you should go over your notes and make any other comments and observations -- but be sure to distinguish these from the notes made during the interview (you might use a different color pen, for instance). 5.20. SUMMARY 1. Primary sources are original sources from which the researcher directly collects data that have not been previously collected. Primary data are first hand information collected through various methods such as observation, interviewing, mailing etc. 2. Surveys can be divided into two broad categories: the questionnaires and the interviews. 3. A questionnaire is either a mail questionnaire or group administered questionnaire. A less familiar type of questionnaire is the household drop-off survey. 4. Mail questionnaire can be sent to a wide number of people. It is inexpensive to administer. But it is not the best tool for asking detailed written responses. 5. In group administered questionnaire a sample of respondents is brought together and asked to respond to a structured sequence of questions. 6. In household drop-off survey , a researcher goes to the respondent‟s home or business and hand over the respondent instrument. In some cases, the respondent is asked to mail it back or the interviewer returns to pick it up. This approach attempts to blend the advantages of the mail survey and the group administered questionnaire. 7. Interview may be of personal interview or telephone interview. In the personal interview, the interviewer works directly with the respondents. It is time consuming. Telephone interviews enable a researcher to gather information rapidly. 8. Interviews are among the most challenging and rewarding forms of measurement. They require a personal sensitivity and adaptability as well as the ability to stay within the bounds of the designed protocol. 5.21. QUESTIONS 1. What are the primary sources of data? 2. Explain the Advantages and disadvantages of primary data 3. write short note on: a) Survey technique b) Interview technique

c) Questionnaire 4. Write the method of collecting Primary Data. Write the detail of any one technique with example.
6 SECONDARY DATA COLLECTION
Unit Structure: 6.0 Objectives 6.1 Secondary Sources of Data 6.2 Features and Uses of Secondary Data 6.3 Advantages and Disadvantages of Secondary Data 6.4 Evaluation of Secondary Data 6.5 Summary 6.6 Questions 6.0 OBJECTIVES To know the meaning of secondary data To study The internal and external sources of secondary data To study the features and Uses of secondary data To study the advantages and disadvantages of secondary data To study the evaluation of secondary data 6.1 SECONDARY SOURCES OF DATA These are sources containing data which have been collected and compiled for another purpose. The secondary sources consists of readily compendia and already compiled statistical statements and reports whose data may be used by researchers for their studies e.g., census reports , annual reports and financial statements of companies, Statistical statement, Reports of Government Departments, Annual reports of currency and finance published by the Reserve Bank of India, Statistical statements relating to Co-operatives and Regional Banks, published by the NABARD, Reports of the National sample survey Organization, Reports of trade associations, publications of international organizations such as UNO, IMF, World Bank, ILO, WHO, etc., Trade and Financial journals newspapers etc. Secondary sources consist of not only published records and reports, but also unpublished records. The latter category includes various records and registers maintained by the firms and organizations, e.g., accounting and financial records, personnel records, register of members, minutes of meetings, inventory records etc. Secondary data is information gathered for purposes other than the completion of a research project. A variety of secondary information sources is available to the researcher gathering data on an industry, potential product applications and the market place. Secondary data is also used to gain initial insight into the research problem. Secondary data is classified in terms of its source – either internal or external. Internal, or in-house data, is secondary information acquired within the organization where research is being carried out. External secondary data is obtained from outside sources. The two major advantages of using secondary data in market research are time and cost savings.
The secondary research process can be completed rapidly – generally in 2 to 3 week. Substantial useful secondary data can be collected in a matter of days by a skillful analyst.
When secondary data is available, the researcher need only locate the source of the data and extract the required information.
Secondary research is generally less expensive than primary research. The bulk of secondary research data gathering does not require the use of expensive, specialized, highly trained personnel.
Secondary research expenses are incurred by the originator of the information. -There are also a number of disadvantages of using secondary data. These include:
Secondary information pertinent to the research topic is either not available, or is only available in insufficient quantities.
Some secondary data may be of questionable accuracy and reliability. Even government publications and trade magazines statistics can be misleading. For example, many trade magazines survey their members to derive estimates of market size, market growth rate and purchasing patterns, then average out these results. Often these statistics are merely average opinions based on less than 10% of their members.
Data may be in a different format or units than is required by the researcher. Much secondary data is several years old and may not reflect the current market
conditions. Trade journals and other publications often accept articles six months before appear in print. The research may have been done months or even years earlier.
As a general rule, a thorough research of the secondary data should be undertaken prior to conducting primary research. The secondary information will provide a useful background and will identify key questions and issues that will need to be addressed by the primary research. 6.1.1 Internal data sources: Internal secondary data is usually an inexpensive information source for the company conducting research, and is the place to start for existing operations. Internally generated sales and pricing data can be used as a research source. The use of this data is to define the competitive position of the firm, an evaluation of a marketing strategy the firm has used in the past, or gaining a better understanding of the company‟s best customers. There are three main sources of internal data. These are: 1. Sales and marketing reports: These can include such things as:
Type of product/service purchased Type of end-user/industry segment Method of payment Product or product line Sales territory Salesperson Date of purchase Amount of purchase Price Application by product Location of end-user
2. Accounting and financial records: These are often an overlooked source of internal secondary information and can be invaluable in the identification, clarification and prediction of certain problems. Accounting records can be used to evaluate the success of various marketing strategies such as revenues from a direct marketing campaign. There are several problems in using accounting and financial data. One is
the timeliness factor – it is often several months before accounting statements are available. Another is the structure of the records themselves. Most firms do not adequately setup their accounts to provide the types of answers to research questions that they need. For example, the account systems should capture project/product costs in order to identify the company‟s most profitable (and least profitable) activities. Companies should also consider establishing performance indicators based on financial data. These can be industry standards or unique ones designed to measure key performance factors that will enable the firm to monitor its performance over a period of time and compare it to its competitors. Some example may be sales per employee, sales per square foot, expenses per employee (salesperson, etc.). 3. Miscellaneous reports: These can include such things as inventory reports, service calls, number (qualifications and compensation) of staff, production and R&D reports. Also the company‟s business plan and customer calls (complaints) log can be useful sources of information. 6.1.2 External data sources: There is a variety of statistical and research data available today. Some sources are:
Federal government Provincial/state governments Statistics agencies Trade associations General business publications Magazine and newspaper articles Annual reports Academic publications Library sources Computerized bibliographies Syndicated services.
A good place to start your search is the local city, college or university library. Most reference librarians are very knowledgeable about what data is available, or where to look to find it. Also contact government libraries and departments for research reports/publications they may have done. This includes all types of information sources that you may use, including:
Books Articles (from print sources or from online article databases) Interviews E-mail or any other correspondence Web pages Government documents Non-print media (videotapes, audiotapes, pictures and images) Software or any digital formats
Check Your Progress: 1. What do you understand by secondary data? 2. State the main sources of secondary data. 3. Distinguish between Internal and External secondary sources of data.
6.2 FEATURES AND USES OF SECONDARY DATA 6.2.1 Features: Though secondary sources are diverse and consist of all sorts of materials, they have certain common characteristics. First, they are readymade and readily available, and do not require the trouble of constructing tools and administering them. Second, they consist of data which a researcher has no original control over collection and classification. Both the form and the content of secondary sources are shaped by others. Clearly, this is a feature which can limit the research value of secondary sources. Finally, secondary sources are not limited in time and space. That is, the researcher using them need not have been present when and where they were gathered. 6.2.2 Uses of Secondary data: The secondary data may be used in three ways by a researcher. First, some specific information from secondary sources may be used for reference purpose. For example, the general statistical information in the number of co-operative credit societies in the country, their coverage of villages, their capital structure, volume of business etc., may be taken from published reports and quoted as background information in a study on the evaluation of performance of cooperative credit societies in a selected district/state. Second, secondary data may be used as bench marks against which the findings of research may be tested, e.g., the findings of a local or regional survey may be compared with the national averages; the performance indicators of a particular bank may be tested against the corresponding indicators of the banking industry as a whole; and so on. Finally, secondary data may be used as the sole source of information for a research project. Such studies as securities Market Behaviour, Financial Analysis of companies, Trade in credit allocation in commercial banks, sociological studies on crimes, historical studies, and the like, depend primarily on secondary data. Year books, statistical reports of government departments, report of public organizations of Bureau of Public Enterprises, Censes Reports etc, serve as major data sources for such research studies. 6.3 ADVANTAGES AND DISADVANTAGES OF SECONDARY DATA 6.3.1 Secondary sources have some advantages: 1. Secondary data, if available can be secured quickly and cheaply. Once their source of documents and reports are located, collection of data is just matter of desk work. Even the tediousness of copying the data from the source can now be voided, thanks to Xeroxing facilities. 2. Wider geographical area and longer reference period may be covered without much cost. Thus, the use of secondary data extends the researcher‟s space and time reach. 3. The use of secondary data broadens the data base from which scientific generalizations can be made. 4. Environmental and cultural settings are required for the study. 5. The use of secondary data enables a researcher to verify the findings bases on primary data. It readily meets the need for additional empirical support. The researcher need not wait the time when additional primary data can be collected. 6.3.2 Disadvantages of secondary data: The use of a secondary data has its own limitations. 1. The most important limitation is the available data may not meet our specific needs. The definitions adopted by those who collected those data may be different; units of measure may not match; and time periods may also be different.
2. The available data may not be as accurate as desired. To assess their accuracy we need to know how the data were collected. 3. The secondary data are not up-to-date and become obsolete when they appear in print, because of time lag in producing them. For example, population census data are published two or three years later after compilation, and no new figures will be available for another ten years. 4. Finally, information about the whereabouts of sources may not be available to all social scientists. Even if the location of the source is known, the accessibility depends primarily on proximity. For example, most of the unpublished official records and compilations are located in the capital city, and they are not within the easy reach of researchers based in far off places. Check Your Progress: 1. Explain how secondary data is useful to the researchers. 2. What are the limitations of secondary sources of data? 6.4 EVALUATION OF SECONDARY DATA When a researcher wants to use secondary data for his research, he should evaluate them before deciding to use them. 1. Data Pertinence: The first consideration in evaluation is to examine the pertinence of the available secondary data to the research problem under study. The following questions should be considered. What are the definitions and classifications employed? Are they consistent ? What are the measurements of variables used? What is the degree to which they conform to the requirements of our research? What is the coverage of the secondary data in terms of topic and time? Does this coverage fit the needs of our research? On the basis of above consideration, the pertinence of the secondary data to the research on hand should be determined, as a researcher who is imaginative and flexible may be able to redefine his research problem so as to make use of otherwise unusable available data. 2. Data Quality: If the researcher is convinced about the available secondary data for his needs, the next step is to examine the quality of the data. The quality of data refers to their accuracy, reliability and completeness. The assurance and reliability of the available secondary data depends on the organization which collected them and the purpose for which they were collected. What is the authority and prestige of the organization? Is it well recognized? Is it noted for reliability? It is capable of collecting reliable data? Does it use trained and well qualified investigators? The answers to these questions determine the degree of confidence we can have in the data and their accuracy. It is important to go to the original source of the secondary data rather than to use an immediate source which has quoted from the original. Then only, there searcher can review the cautionary ands other comments that were made in the original source. 3. Data Completeness: The completeness refers to the actual coverage of the published data. This depends on the methodology and sampling design adopted by the original organization. Is the methodology sound? Is the sample size small or large? Is the sampling method appropriate? Answers to these questions may indicate the appropriateness and adequacy of the data for the problem under study. The question of possible bias should also be examined. Whether the purpose for which the original organization collected the data had a particular orientation? Has the study been made to promote the organization‟s
own interest? How the study was conducted? These are important clues. The researcher must be on guard when the source does not report the methodology and sampling design. Then it is not possible to determine the adequacy of the secondary data for the researcher‟s study. 6.5 SUMMARY 1. The secondary sources consists of readily compendia and already compiled statistical statements and reports whose data may be used by researchers for their studies. For e.g. census reports, annual reports etc. 2. Internal or In-house data, is secondary information acquired within the organization where research is being carried out. 3. External secondary data is obtained from outside sources. 4. The two major advantages of using secondary data in market research are time and cost savings. 5. Though secondary sources are diverse and consist of all sorts of materials, they have certain common characteristics. 6. Secondary data may be used in three ways by a researchers. Some specific information from secondary sources may be used for reference purposes. It may be used as bench marks against which the findings of research may be tested. It may be used as the sole source of information for a research project. 7. Secondary data have some advantages and disadvantages. 8. When a researcher wants to use secondary data for his research, he should evaluate them before deciding to use them on the basis of Data pertinence, Data quality and Data completeness. 6.6 QUESTIONS 4. Define and explain the secondary sources of data. 5. State and explain the secondary sources of data. 6. Discuss the characteristics of secondary data. 7. Describe the advantages and disadvantages of secondary data. 8. Discuss the evaluation of secondary data.
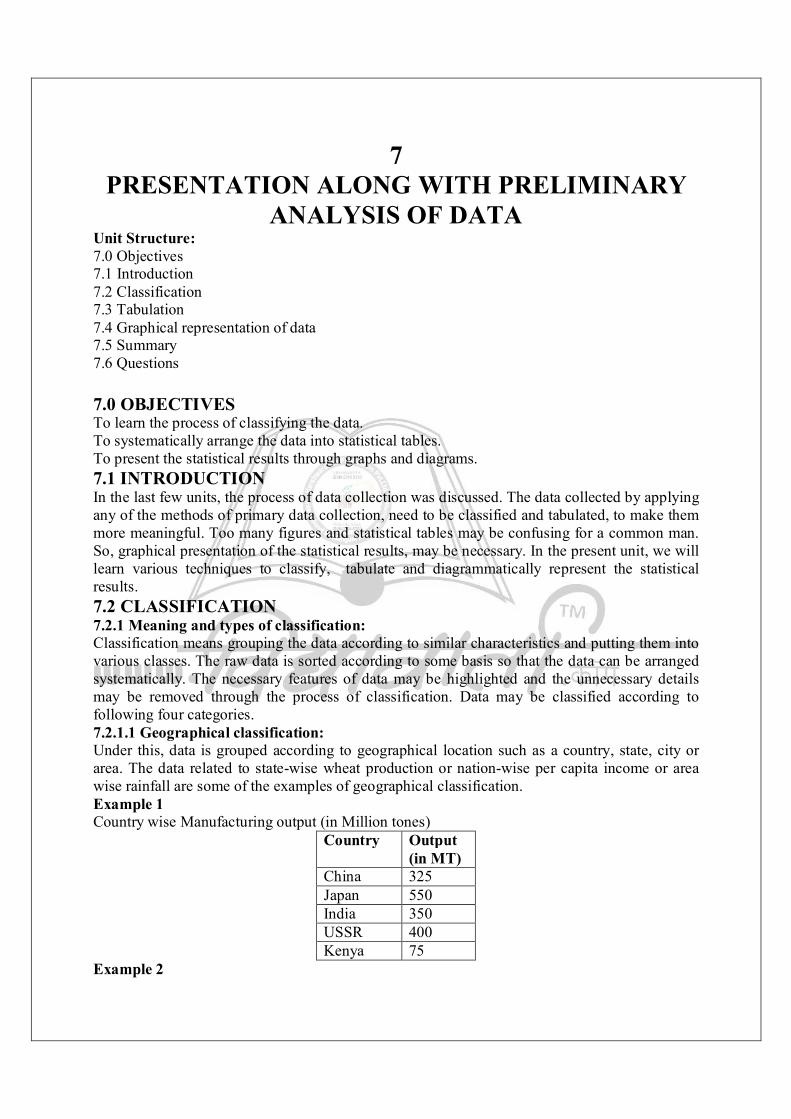
7 PRESENTATION ALONG WITH PRELIMINARY
ANALYSIS OF DATA Unit Structure: 7.0 Objectives 7.1 Introduction 7.2 Classification 7.3 Tabulation 7.4 Graphical representation of data 7.5 Summary 7.6 Questions 7.0 OBJECTIVES To learn the process of classifying the data. To systematically arrange the data into statistical tables. To present the statistical results through graphs and diagrams. 7.1 INTRODUCTION In the last few units, the process of data collection was discussed. The data collected by applying any of the methods of primary data collection, need to be classified and tabulated, to make them more meaningful. Too many figures and statistical tables may be confusing for a common man. So, graphical presentation of the statistical results, may be necessary. In the present unit, we will learn various techniques to classify, tabulate and diagrammatically represent the statistical results. 7.2 CLASSIFICATION 7.2.1 Meaning and types of classification: Classification means grouping the data according to similar characteristics and putting them into various classes. The raw data is sorted according to some basis so that the data can be arranged systematically. The necessary features of data may be highlighted and the unnecessary details may be removed through the process of classification. Data may be classified according to following four categories. 7.2.1.1 Geographical classification: Under this, data is grouped according to geographical location such as a country, state, city or area. The data related to state-wise wheat production or nation-wise per capita income or area wise rainfall are some of the examples of geographical classification. Example 1 Country wise Manufacturing output (in Million tones)
Example 2
Country
Output (in MT)
China 325 Japan 550 India 350 USSR 400 Kenya 75

Area wise sales of product x (%) Area Percentage North 15 South 25 Central 8 West 20 East 32
7.2.1.2 Chronological classification: When the data are classified according to some element of time-say year, month or day. It is called Chronological classification. For example wheat production over last 10 years, sales per day. Profit per week etc. Example 1
Day Sales per day Monday 203 Tuesday 200 Wednesday 150 Thursday 270 Friday 300 Saturday 325
7.2.1.3 Qualitative classification In this type of classification, data are classified on the basis of some characteristics which are not measurable. Such as religion, language, gender, colour of hair, etc. Quantitative classification is made on the basis of whether a particular characteristic is present or not. No quantitative measurement is possible. For example, classifying a population into illiterate and literate, male and female, vegetarian and non-vegetarian, etc. 7.2.1.4 Quantitative classification In this type of classification, data are classified on the basis of some characteristics which are quantifiable or measurable. For example height in centimeters, weights in kilograms, wages in Rs., etc. In statistics, such a classification is known as frequency distribution. Such a distribution may be discrete or continuous, on the basis of the nature of variable under study. Discrete Frequency Distribution
No. of children
No. of families
0 10 1 35 2 20 3 8 4 1 Total 74
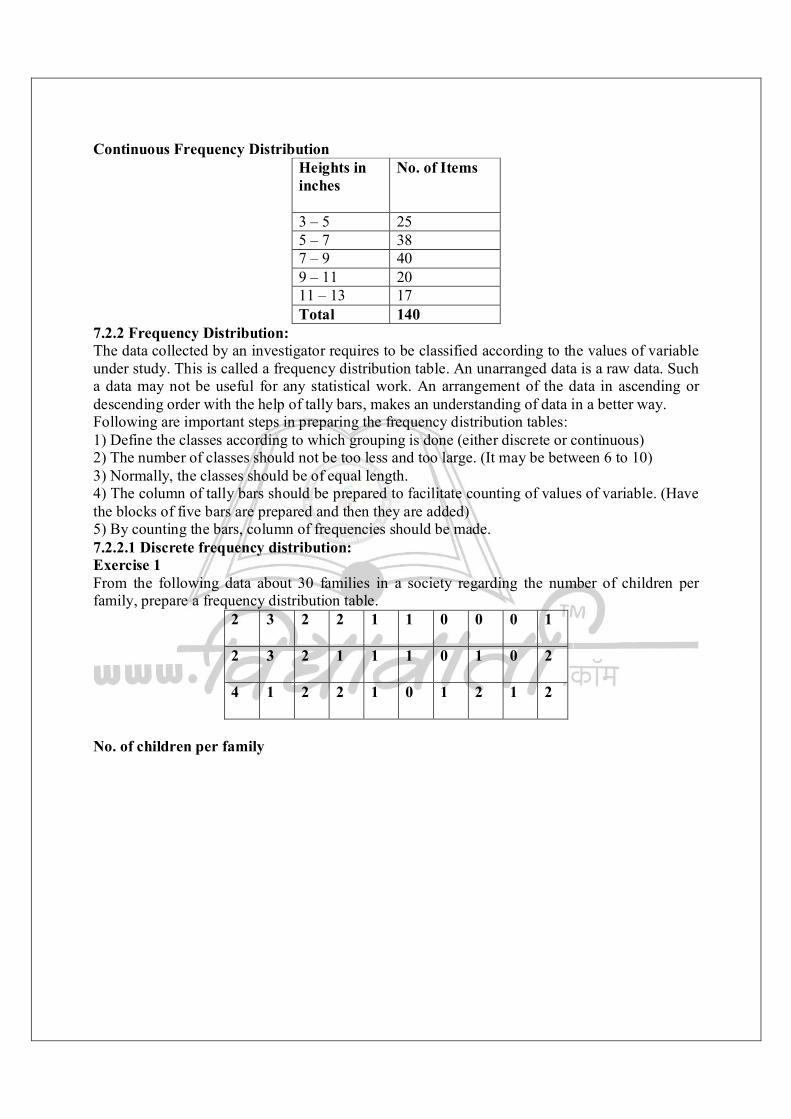
Continuous Frequency Distribution Heights in inches
No. of Items
3 – 5 25 5 – 7 38 7 – 9 40 9 – 11 20 11 – 13 17 Total 140
7.2.2 Frequency Distribution: The data collected by an investigator requires to be classified according to the values of variable under study. This is called a frequency distribution table. An unarranged data is a raw data. Such a data may not be useful for any statistical work. An arrangement of the data in ascending or descending order with the help of tally bars, makes an understanding of data in a better way. Following are important steps in preparing the frequency distribution tables: 1) Define the classes according to which grouping is done (either discrete or continuous) 2) The number of classes should not be too less and too large. (It may be between 6 to 10) 3) Normally, the classes should be of equal length. 4) The column of tally bars should be prepared to facilitate counting of values of variable. (Have the blocks of five bars are prepared and then they are added) 5) By counting the bars, column of frequencies should be made. 7.2.2.1 Discrete frequency distribution: Exercise 1 From the following data about 30 families in a society regarding the number of children per family, prepare a frequency distribution table.
2
3 2 2 1 1 0 0 0 1
2
3 2 1 1 1 0 1 0 2
4 1 2
2 1 0 1 2 1 2
No. of children per family

7.2.2.2 Continuous Frequency Distribution Some important concepts related to continuous frequency distribution are as follows: a) Class limits: There are two class limits, upper and lower. In a class, say, 0-10, „0‟ is a lower and 10 is an upper class limit. b) Class interval: A difference between upper and lower class limit is called class interval. For example in a class 0-10, Class interval is 10 (10-0) or in a class 100-200, class interval is 100 (200-100) c) Class frequency: The number of observations corresponding to a particular class is known as class frequency. For example, if number of students getting marks between 10 to 20 are 7, then the frequency of class 10-20 is 7. d) Mid point of class: It is found out with the help of following formula:
Midpointofaclass =푈푝푝푒푟푐푙푎푠푠푙푖푚푖푡 + 푙표푤푒푟푐푙푎푠푠푙푖푚푖푡
2 For example, the mid point of a class 4-8 is 6 e) Inclusive Method of classification: Under this method, both the lower and upper class-limits are included in the same class. For example:
Weights (in kgs)
No. of students
25 – 29 10 30 – 34 12 35 – 39 15 40 – 44 7 45 – 49 3
In a class 30-34, we include all those students whose weight is 30,31,32,33 or 34 kgs. Since both the upper and lower class limits are included in the class, it is called „inclusive‟ type of classification.
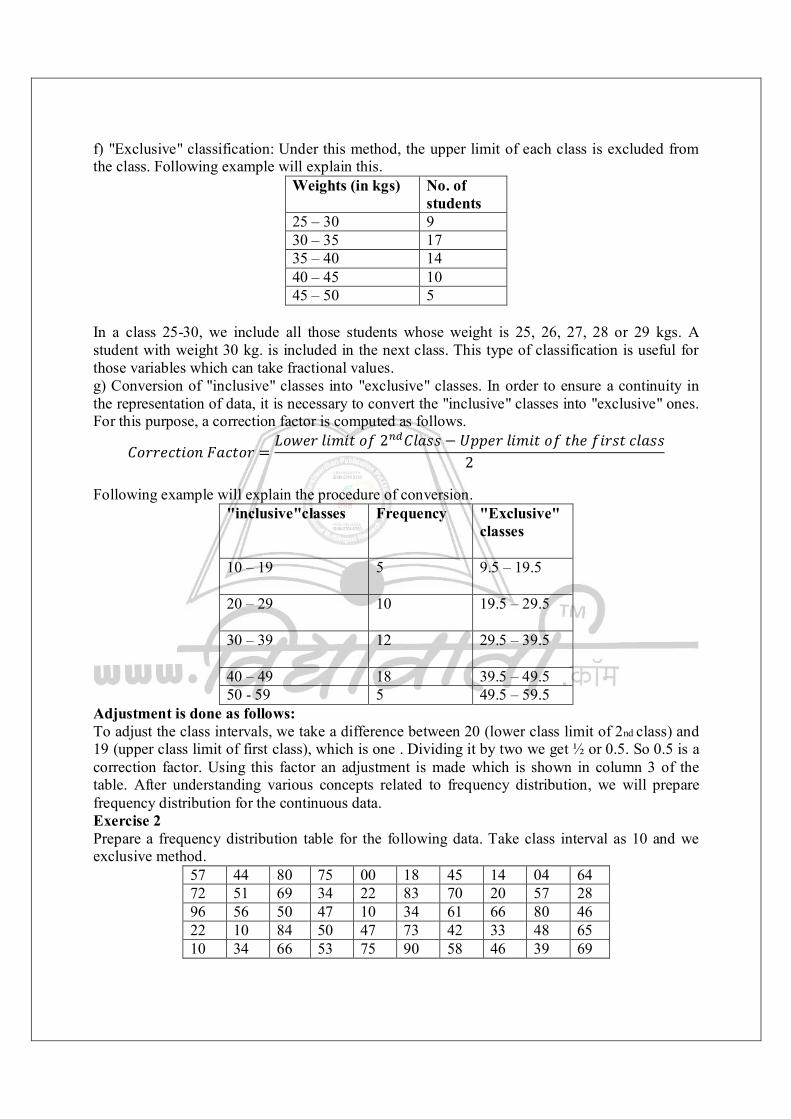
f) "Exclusive" classification: Under this method, the upper limit of each class is excluded from the class. Following example will explain this.
Weights (in kgs)
No. of students
25 – 30 9 30 – 35 17 35 – 40 14 40 – 45 10 45 – 50 5
In a class 25-30, we include all those students whose weight is 25, 26, 27, 28 or 29 kgs. A student with weight 30 kg. is included in the next class. This type of classification is useful for those variables which can take fractional values. g) Conversion of "inclusive" classes into "exclusive" classes. In order to ensure a continuity in the representation of data, it is necessary to convert the "inclusive" classes into "exclusive" ones. For this purpose, a correction factor is computed as follows.
퐶표푟푟푒푐푡푖표푛퐹푎푐푡표푟 =퐿표푤푒푟푙푖푚푖푡표푓2 퐶푙푎푠푠 − 푈푝푝푒푟푙푖푚푖푡표푓푡ℎ푒푓푖푟푠푡푐푙푎푠푠
2 Following example will explain the procedure of conversion.
"inclusive"classes
Frequency
"Exclusive" classes
10 – 19
5
9.5 – 19.5
20 – 29
10
19.5 – 29.5
30 – 39
12
29.5 – 39.5
40 – 49 18 39.5 – 49.5 50 - 59 5 49.5 – 59.5
Adjustment is done as follows: To adjust the class intervals, we take a difference between 20 (lower class limit of 2nd class) and 19 (upper class limit of first class), which is one . Dividing it by two we get ½ or 0.5. So 0.5 is a correction factor. Using this factor an adjustment is made which is shown in column 3 of the table. After understanding various concepts related to frequency distribution, we will prepare frequency distribution for the continuous data. Exercise 2 Prepare a frequency distribution table for the following data. Take class interval as 10 and we exclusive method.
57 44 80 75 00 18 45 14 04 64 72 51 69 34 22 83 70 20 57 28 96 56 50 47 10 34 61 66 80 46 22 10 84 50 47 73 42 33 48 65 10 34 66 53 75 90 58 46 39 69
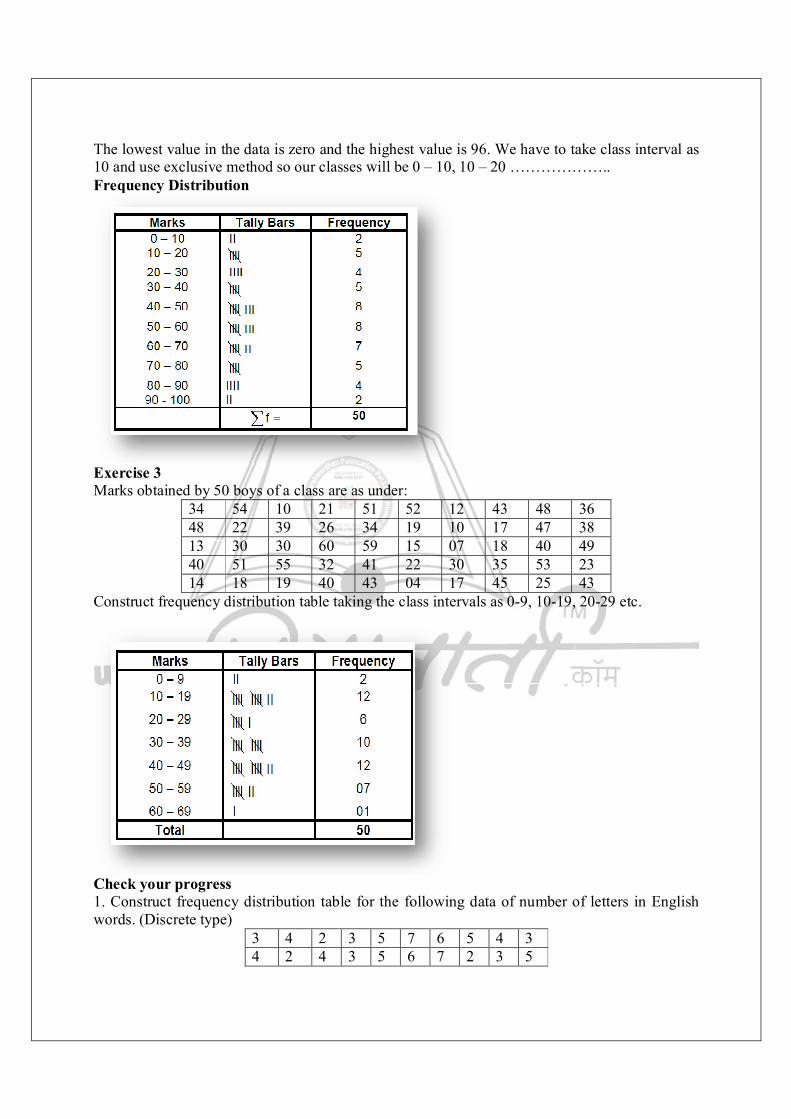
The lowest value in the data is zero and the highest value is 96. We have to take class interval as 10 and use exclusive method so our classes will be 0 – 10, 10 – 20 ……………….. Frequency Distribution
Exercise 3 Marks obtained by 50 boys of a class are as under:
34 54 10 21 51 52 12 43 48 36 48 22 39 26 34 19 10 17 47 38 13 30 30 60 59 15 07 18 40 49 40 51 55 32 41 22 30 35 53 23 14 18 19 40 43 04 17 45 25 43
Construct frequency distribution table taking the class intervals as 0-9, 10-19, 20-29 etc.
Check your progress 1. Construct frequency distribution table for the following data of number of letters in English words. (Discrete type)
3 4 2 3 5 7 6 5 4 3 4 2 4 3 5 6 7 2 3 5
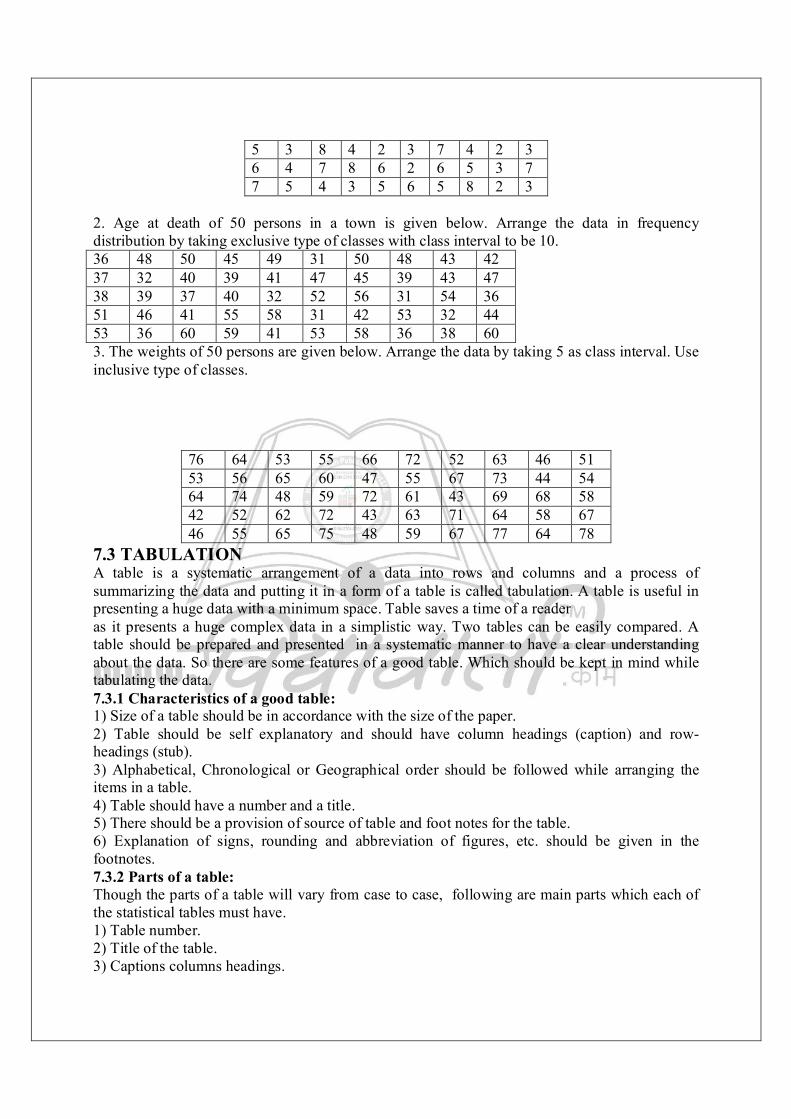
5 3 8 4 2 3 7 4 2 3 6 4 7 8 6 2 6 5 3 7 7 5 4 3 5 6 5 8 2 3
2. Age at death of 50 persons in a town is given below. Arrange the data in frequency distribution by taking exclusive type of classes with class interval to be 10. 36 48 50 45 49 31 50 48 43 42 37 32 40 39 41 47 45 39 43 47 38 39 37 40 32 52 56 31 54 36 51 46 41 55 58 31 42 53 32 44 53 36 60 59 41 53 58 36 38 60 3. The weights of 50 persons are given below. Arrange the data by taking 5 as class interval. Use inclusive type of classes.
76 64 53 55 66 72 52 63 46 51 53 56 65 60 47 55 67 73 44 54 64 74 48 59 72 61 43 69 68 58 42 52 62 72 43 63 71 64 58 67 46 55 65 75 48 59 67 77 64 78
7.3 TABULATION A table is a systematic arrangement of a data into rows and columns and a process of summarizing the data and putting it in a form of a table is called tabulation. A table is useful in presenting a huge data with a minimum space. Table saves a time of a reader as it presents a huge complex data in a simplistic way. Two tables can be easily compared. A table should be prepared and presented in a systematic manner to have a clear understanding about the data. So there are some features of a good table. Which should be kept in mind while tabulating the data. 7.3.1 Characteristics of a good table: 1) Size of a table should be in accordance with the size of the paper. 2) Table should be self explanatory and should have column headings (caption) and row-headings (stub). 3) Alphabetical, Chronological or Geographical order should be followed while arranging the items in a table. 4) Table should have a number and a title. 5) There should be a provision of source of table and foot notes for the table. 6) Explanation of signs, rounding and abbreviation of figures, etc. should be given in the footnotes. 7.3.2 Parts of a table: Though the parts of a table will vary from case to case, following are main parts which each of the statistical tables must have. 1) Table number. 2) Title of the table. 3) Captions columns headings.
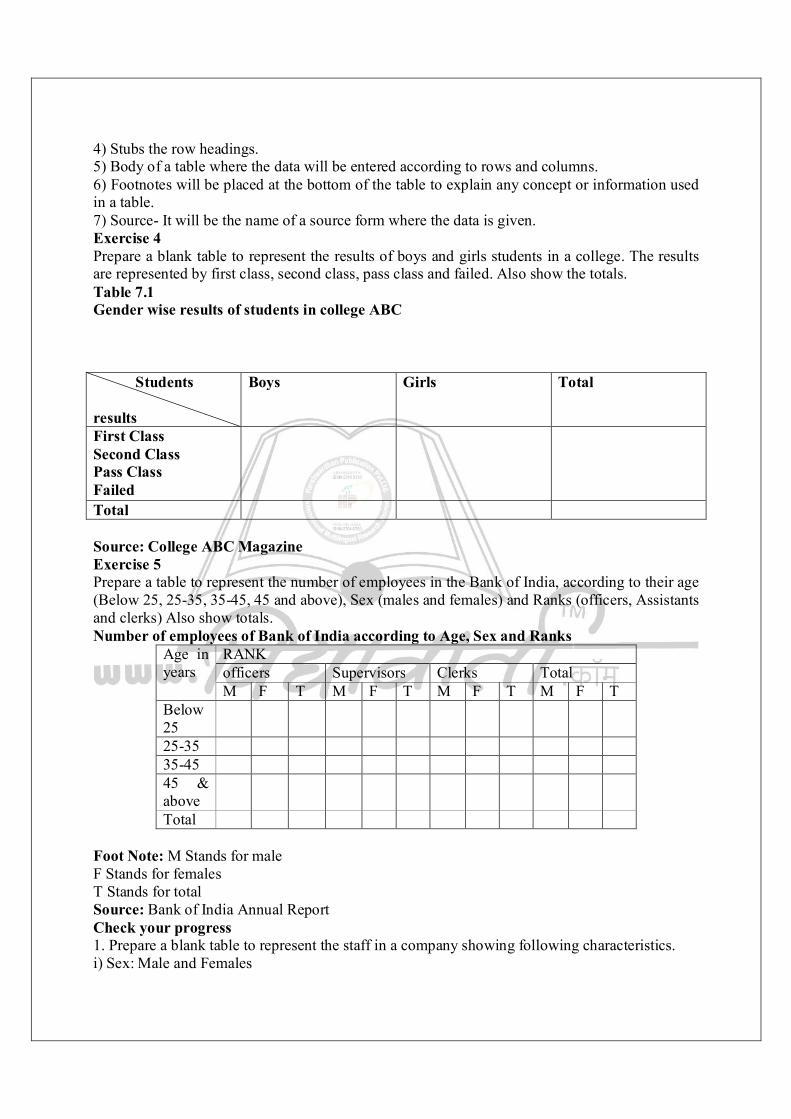
4) Stubs the row headings. 5) Body of a table where the data will be entered according to rows and columns. 6) Footnotes will be placed at the bottom of the table to explain any concept or information used in a table. 7) Source- It will be the name of a source form where the data is given. Exercise 4 Prepare a blank table to represent the results of boys and girls students in a college. The results are represented by first class, second class, pass class and failed. Also show the totals. Table 7.1 Gender wise results of students in college ABC Students results
Boys Girls Total
First Class Second Class Pass Class Failed
Total Source: College ABC Magazine Exercise 5 Prepare a table to represent the number of employees in the Bank of India, according to their age (Below 25, 25-35, 35-45, 45 and above), Sex (males and females) and Ranks (officers, Assistants and clerks) Also show totals. Number of employees of Bank of India according to Age, Sex and Ranks
Age in years
RANK officers Supervisors Clerks Total M F T M F T M F T M F T
Below 25
25-35 35-45 45 & above
Total Foot Note: M Stands for male F Stands for females T Stands for total Source: Bank of India Annual Report Check your progress 1. Prepare a blank table to represent the staff in a company showing following characteristics. i) Sex: Male and Females
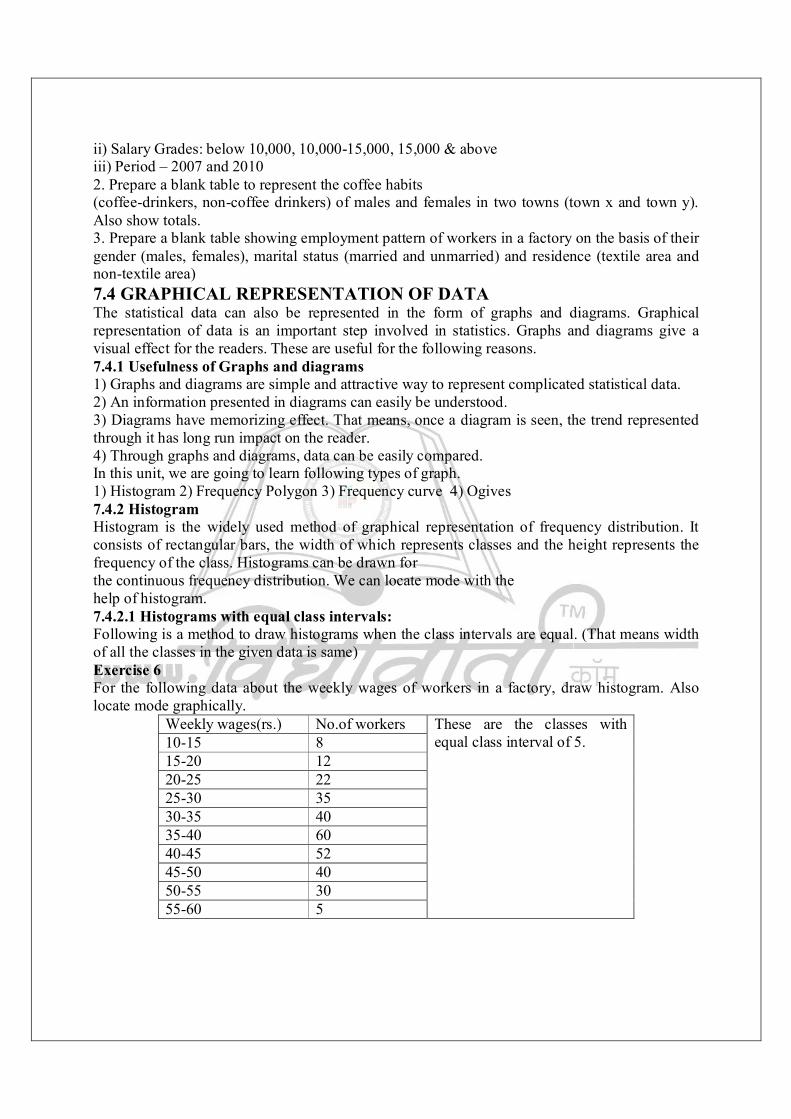
ii) Salary Grades: below 10,000, 10,000-15,000, 15,000 & above iii) Period – 2007 and 2010 2. Prepare a blank table to represent the coffee habits (coffee-drinkers, non-coffee drinkers) of males and females in two towns (town x and town y). Also show totals. 3. Prepare a blank table showing employment pattern of workers in a factory on the basis of their gender (males, females), marital status (married and unmarried) and residence (textile area and non-textile area) 7.4 GRAPHICAL REPRESENTATION OF DATA The statistical data can also be represented in the form of graphs and diagrams. Graphical representation of data is an important step involved in statistics. Graphs and diagrams give a visual effect for the readers. These are useful for the following reasons. 7.4.1 Usefulness of Graphs and diagrams 1) Graphs and diagrams are simple and attractive way to represent complicated statistical data. 2) An information presented in diagrams can easily be understood. 3) Diagrams have memorizing effect. That means, once a diagram is seen, the trend represented through it has long run impact on the reader. 4) Through graphs and diagrams, data can be easily compared. In this unit, we are going to learn following types of graph. 1) Histogram 2) Frequency Polygon 3) Frequency curve 4) Ogives 7.4.2 Histogram Histogram is the widely used method of graphical representation of frequency distribution. It consists of rectangular bars, the width of which represents classes and the height represents the frequency of the class. Histograms can be drawn for the continuous frequency distribution. We can locate mode with the help of histogram. 7.4.2.1 Histograms with equal class intervals: Following is a method to draw histograms when the class intervals are equal. (That means width of all the classes in the given data is same) Exercise 6 For the following data about the weekly wages of workers in a factory, draw histogram. Also locate mode graphically.
Weekly wages(rs.) No.of workers These are the classes with equal class interval of 5. 10-15 8
15-20 12 20-25 22 25-30 35 30-35 40 35-40 60 40-45 52 45-50 40 50-55 30 55-60 5
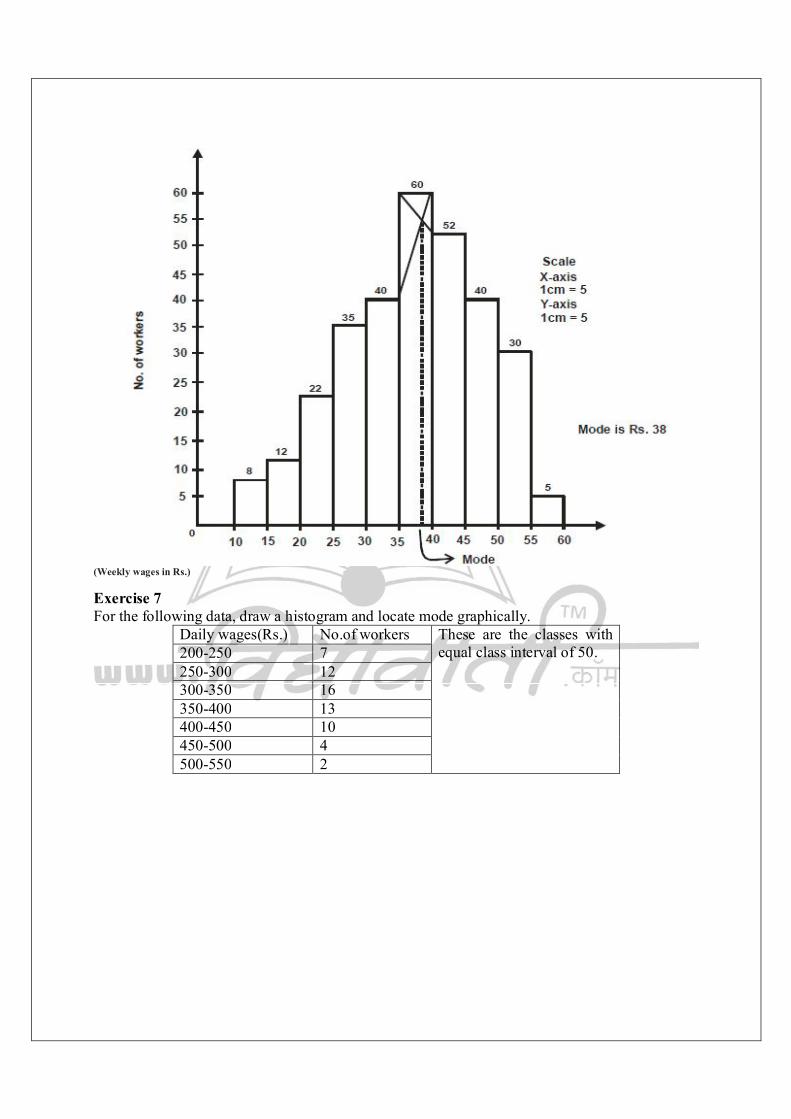
(Weekly wages in Rs.) Exercise 7 For the following data, draw a histogram and locate mode graphically.
Daily wages(Rs.) No.of workers These are the classes with equal class interval of 50. 200-250 7
250-300 12 300-350 16 350-400 13 400-450 10 450-500 4 500-550 2

Daily wages (Rs.) 7.4.2.2 Histograms with unequal class intervals: If the class intervals are not uniform, some adjustment needs to be done in the frequencies before a histogram is drawn. Following steps are to be taken: 1) Take the class with the lowest frequency as „normal‟ and adjust the other frequencies in relation to the normal class. 2) If the class interval is two times more than the normal, divide the frequency of that class by two. 3) If the class interval of the class is three times more than the normal, divide the frequency by three. Exercise 8 Draw a histogram for the following set of data. Class Frequency The class intervals of all the
classes are not equal. for example class 0-10 has ten as class interval. But class 20-40 has twenty as class interval.
0-10 10 10-20 12 20-40 30/2=15 40-50 12 50-80 33/3=11 80-90 10 90-100 8 100-110 3
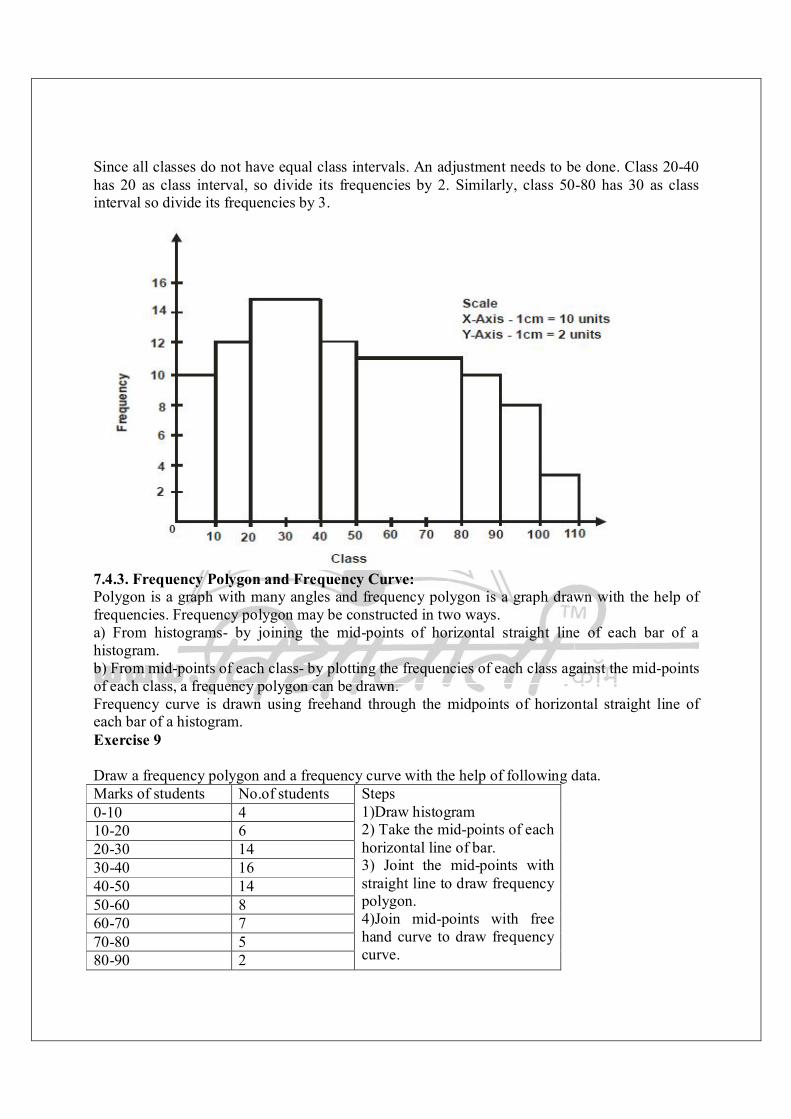
Since all classes do not have equal class intervals. An adjustment needs to be done. Class 20-40 has 20 as class interval, so divide its frequencies by 2. Similarly, class 50-80 has 30 as class interval so divide its frequencies by 3.
7.4.3. Frequency Polygon and Frequency Curve: Polygon is a graph with many angles and frequency polygon is a graph drawn with the help of frequencies. Frequency polygon may be constructed in two ways. a) From histograms- by joining the mid-points of horizontal straight line of each bar of a histogram. b) From mid-points of each class- by plotting the frequencies of each class against the mid-points of each class, a frequency polygon can be drawn. Frequency curve is drawn using freehand through the midpoints of horizontal straight line of each bar of a histogram. Exercise 9 Draw a frequency polygon and a frequency curve with the help of following data. Marks of students No.of students Steps
1)Draw histogram 2) Take the mid-points of each horizontal line of bar. 3) Joint the mid-points with straight line to draw frequency polygon. 4)Join mid-points with free hand curve to draw frequency curve.
0-10 4 10-20 6 20-30 14 30-40 16 40-50 14 50-60 8 60-70 7 70-80 5 80-90 2
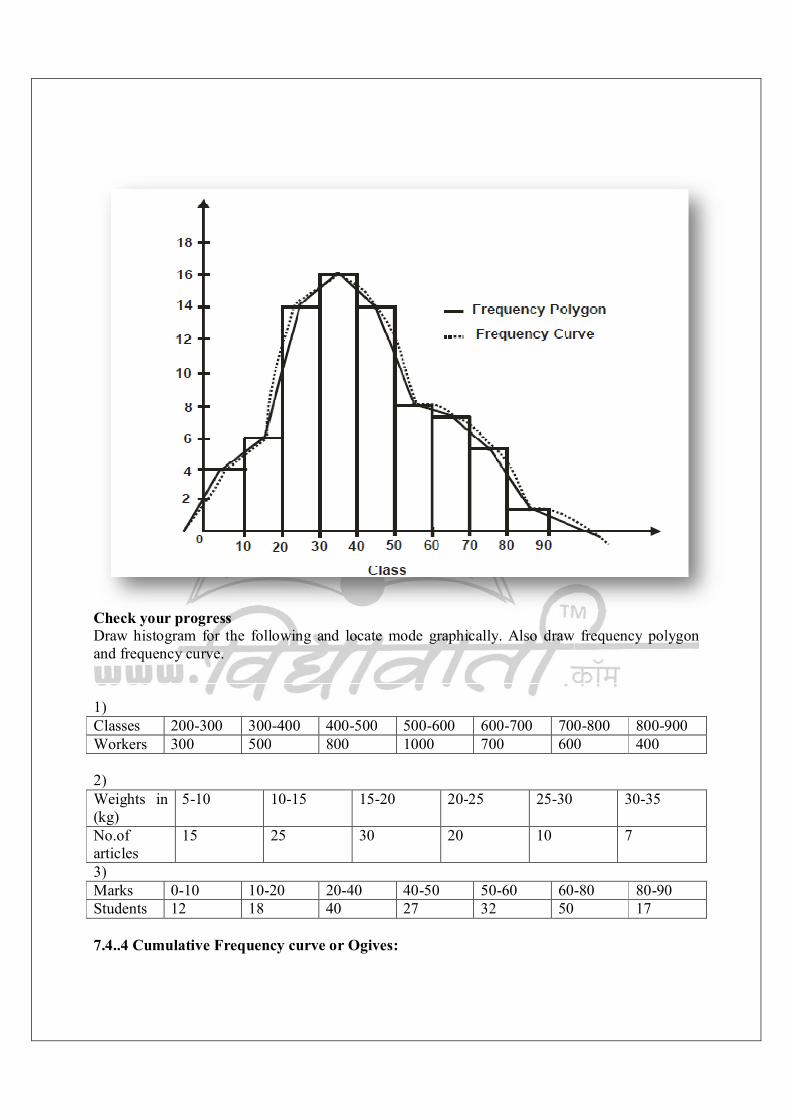
Check your progress Draw histogram for the following and locate mode graphically. Also draw frequency polygon and frequency curve. 1) Classes 200-300 300-400 400-500 500-600 600-700 700-800 800-900 Workers 300 500 800 1000 700 600 400 2) Weights in (kg)
5-10 10-15 15-20 20-25 25-30 30-35
No.of articles
15 25 30 20 10 7
3) Marks 0-10 10-20 20-40 40-50 50-60 60-80 80-90 Students 12 18 40 27 32 50 17 7.4..4 Cumulative Frequency curve or Ogives:
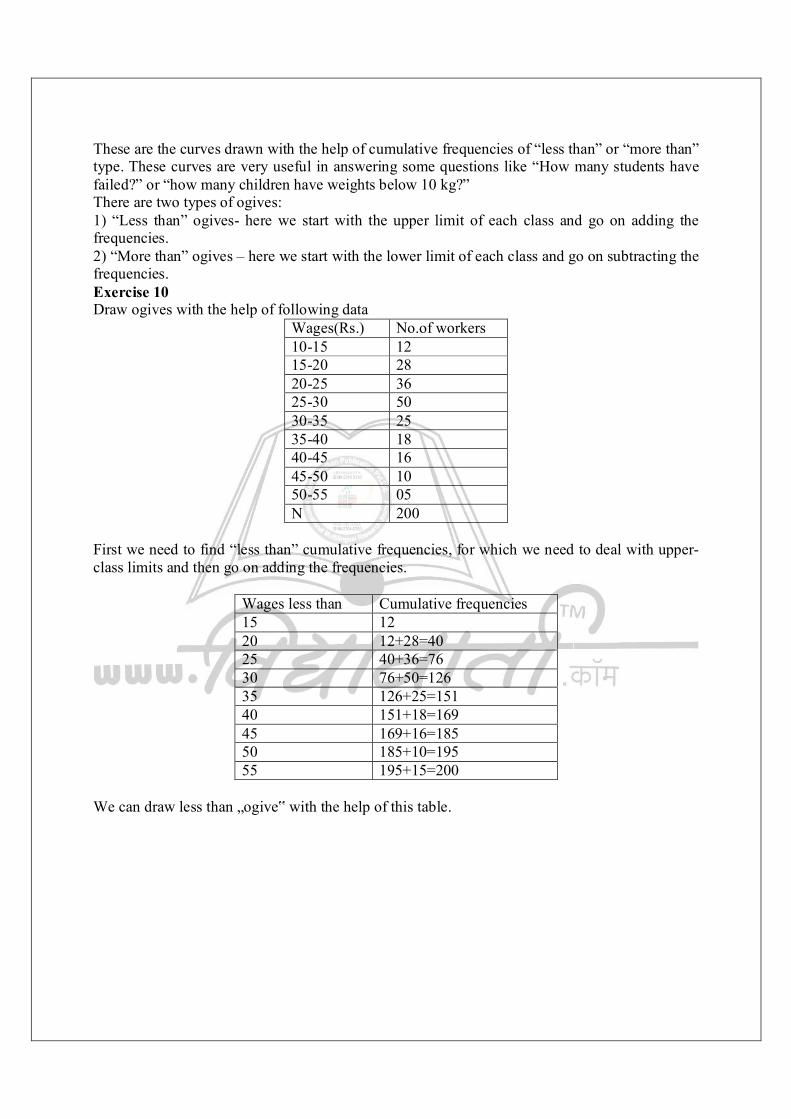
These are the curves drawn with the help of cumulative frequencies of “less than” or “more than” type. These curves are very useful in answering some questions like “How many students have failed?” or “how many children have weights below 10 kg?” There are two types of ogives: 1) “Less than” ogives- here we start with the upper limit of each class and go on adding the frequencies. 2) “More than” ogives – here we start with the lower limit of each class and go on subtracting the frequencies. Exercise 10 Draw ogives with the help of following data
Wages(Rs.) No.of workers 10-15 12 15-20 28 20-25 36 25-30 50 30-35 25 35-40 18 40-45 16 45-50 10 50-55 05 N 200
First we need to find “less than” cumulative frequencies, for which we need to deal with upper-class limits and then go on adding the frequencies.
Wages less than Cumulative frequencies 15 12 20 12+28=40 25 40+36=76 30 76+50=126 35 126+25=151 40 151+18=169 45 169+16=185 50 185+10=195 55 195+15=200
We can draw less than „ogive‟ with the help of this table.
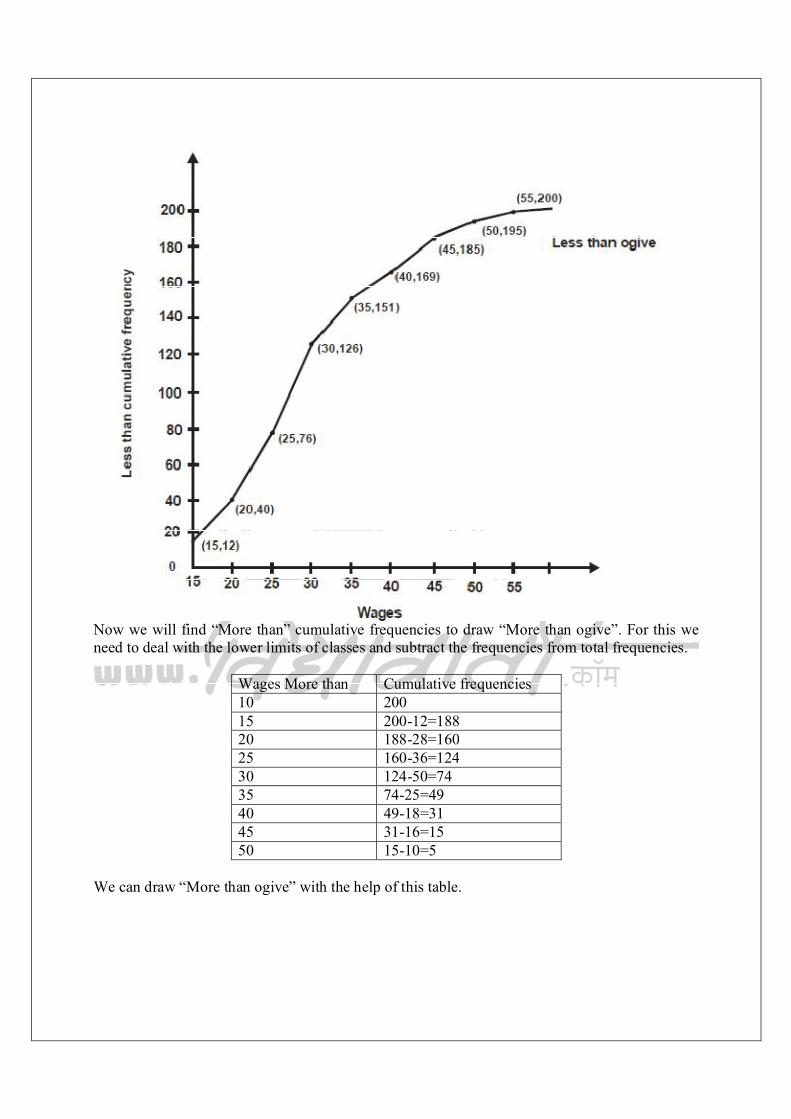
Now we will find “More than” cumulative frequencies to draw “More than ogive”. For this we need to deal with the lower limits of classes and subtract the frequencies from total frequencies.
Wages More than Cumulative frequencies 10 200 15 200-12=188 20 188-28=160 25 160-36=124 30 124-50=74 35 74-25=49 40 49-18=31 45 31-16=15 50 15-10=5
We can draw “More than ogive” with the help of this table.
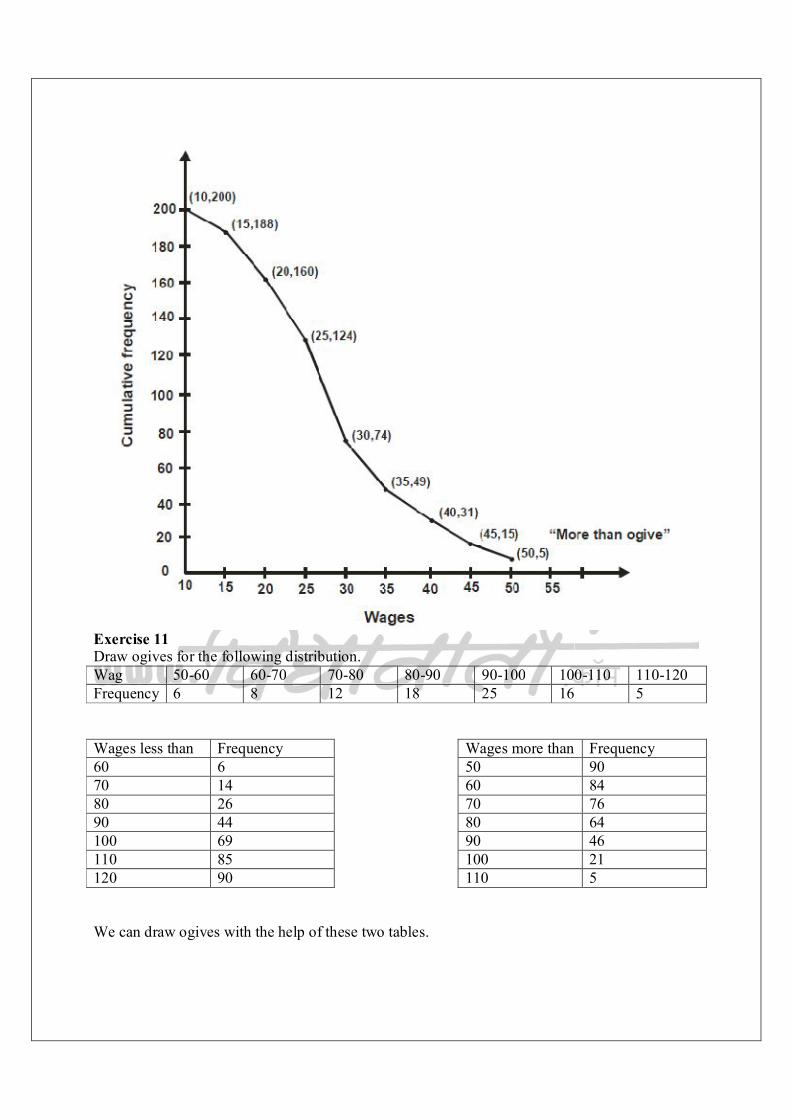
Exercise 11 Draw ogives for the following distribution. Wag 50-60 60-70 70-80 80-90 90-100 100-110 110-120 Frequency 6 8 12 18 25 16 5 Wages less than Frequency Wages more than Frequency 60 6 50 90 70 14 60 84 80 26 70 76 90 44 80 64 100 69 90 46 110 85 100 21 120 90 110 5 We can draw ogives with the help of these two tables.
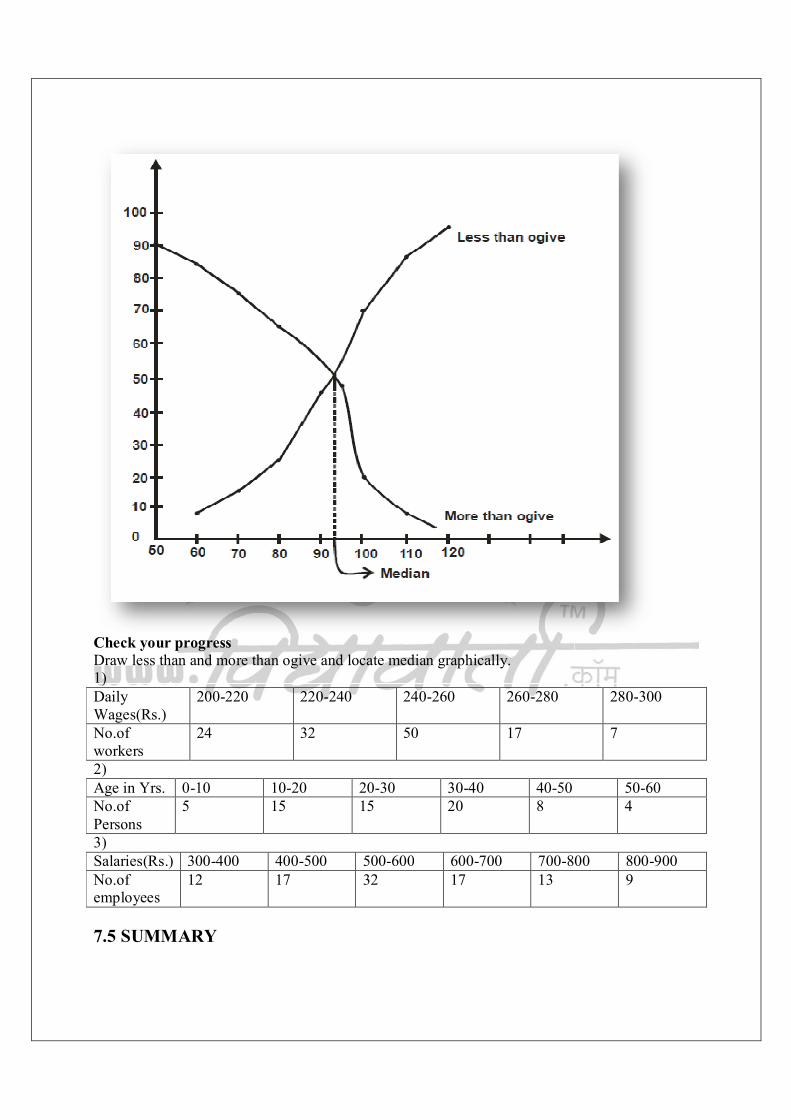
Check your progress Draw less than and more than ogive and locate median graphically. 1) Daily Wages(Rs.)
200-220 220-240 240-260 260-280 280-300
No.of workers
24 32 50 17 7
2) Age in Yrs. 0-10 10-20 20-30 30-40 40-50 50-60 No.of Persons
5 15 15 20 8 4
3) Salaries(Rs.) 300-400 400-500 500-600 600-700 700-800 800-900 No.of employees
12 17 32 17 13 9
7.5 SUMMARY

In this unit we learnt to classify, tabulate and graphically represent the data. This is a very important step involved in research. Different graphs of frequency distribution such as, a) Histogram b) Frequency Polygon c) Frequency Curve and d) Ogives are of a great help to the researcher. 7.6 QUESTIONS 1. Explain the meaning & types of classification of data. 2. What is frequency distribution? Discuss the types of frequency distribution. 3. Briefly explain tabulation. 4. Discuss the different types of graph.
8 MEASURES OF CENTRAL TENDENCY(PROPENSITY)
Unit Structure: 8.0 Objectives 8.1 Introduction 8.2 Measures of Central Tendency 8.3 Graphical determination of median, quartiles and mode. 8.4 Summary 8.5 Questions 8.0 OBJECTIVES To learn about different measures of central tendency. To determine these measures with the help of graphs. To understand their merits and demerits. 8.1 INTRODUCTION An important task of statistical analysis is to get one single value that represents the important characteristic of the data. It is difficult to remember the entire set of data. In fact, a single representative figure describing the whole data will be more useful and meaningful for interpretation and comparison. For example, instead of stating marks of all subjects in the Graphics., it is more meaningful to give average marks in Graphics. says 62.3%. Thus, an important function of measures of central tendency, is to compute a single representative value that reveals the important features of a variable. In the next section, we will discuss the meaning, types and merits and demerits of measures of central tendency. 8.2 MEASURES OF CENTRAL TENDENCY The measures of central tendency or an average is a single value selected from a group of values to represent them in some way (A.E. Waugh). In other words, an average or a measure of central tendency represent the entire data. The value of an average lies somewhere between the two extreme values (the smallest and the largest) in a data set. It is difficult to remember the incomes of millions of individuals. But it is easy to remember an average income of a country. Such a single figure, representing the entire population also is useful for comparisons. For example, average income of India can be easily compared with an average income of the USA, average marks of a student can be easily compared with the average marks of another student. Following are important measures of central tendency or averages: a) Arithmetic Mean b) Median c) Mode d) Geometric Mean e) Harmonic Mean Following is a brief overview of the first three measures of Central Tendency. 8.2.1 Arithmetic Mean (A.M.) The most popular and most widely used measure of central tendency is arithmetic mean. Its value is obtained by adding the values of all observations in a given data and then dividing the sum by the number of observations in the data. As noted earlier, there are three types of data: i) Individual observations or ungrouped data where the frequencies are not given.
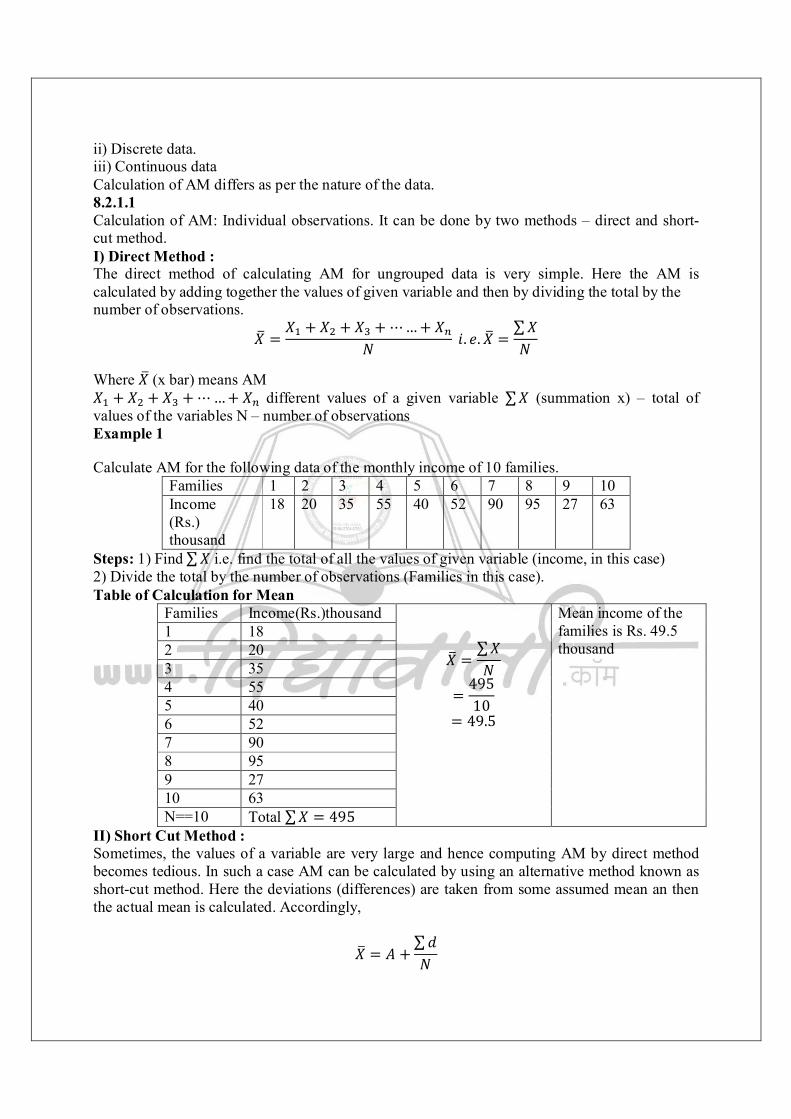
ii) Discrete data. iii) Continuous data Calculation of AM differs as per the nature of the data. 8.2.1.1 Calculation of AM: Individual observations. It can be done by two methods – direct and short-cut method. I) Direct Method : The direct method of calculating AM for ungrouped data is very simple. Here the AM is calculated by adding together the values of given variable and then by dividing the total by the number of observations.
푋 =푋 + 푋 + 푋 + ⋯… + 푋
푁 푖. 푒.푋 =∑푋푁
Where 푋 (x bar) means AM 푋 + 푋 + 푋 + ⋯… + 푋 different values of a given variable ∑푋 (summation x) – total of values of the variables N – number of observations Example 1
Calculate AM for the following data of the monthly income of 10 families. Families 1 2 3 4 5 6 7 8 9 10 Income (Rs.) thousand
18 20 35 55 40 52 90 95 27 63
Steps: 1) Find∑ 푋 i.e. find the total of all the values of given variable (income, in this case) 2) Divide the total by the number of observations (Families in this case). Table of Calculation for Mean
Families Income(Rs.)thousand
푋 =∑푋푁
=49510
= 49.5
Mean income of the families is Rs. 49.5 thousand
1 18 2 20 3 35 4 55 5 40 6 52 7 90 8 95 9 27 10 63 N==10 Total ∑푋 = 495
II) Short Cut Method : Sometimes, the values of a variable are very large and hence computing AM by direct method becomes tedious. In such a case AM can be calculated by using an alternative method known as short-cut method. Here the deviations (differences) are taken from some assumed mean an then the actual mean is calculated. Accordingly,
푋 = 퐴 +∑푑푁
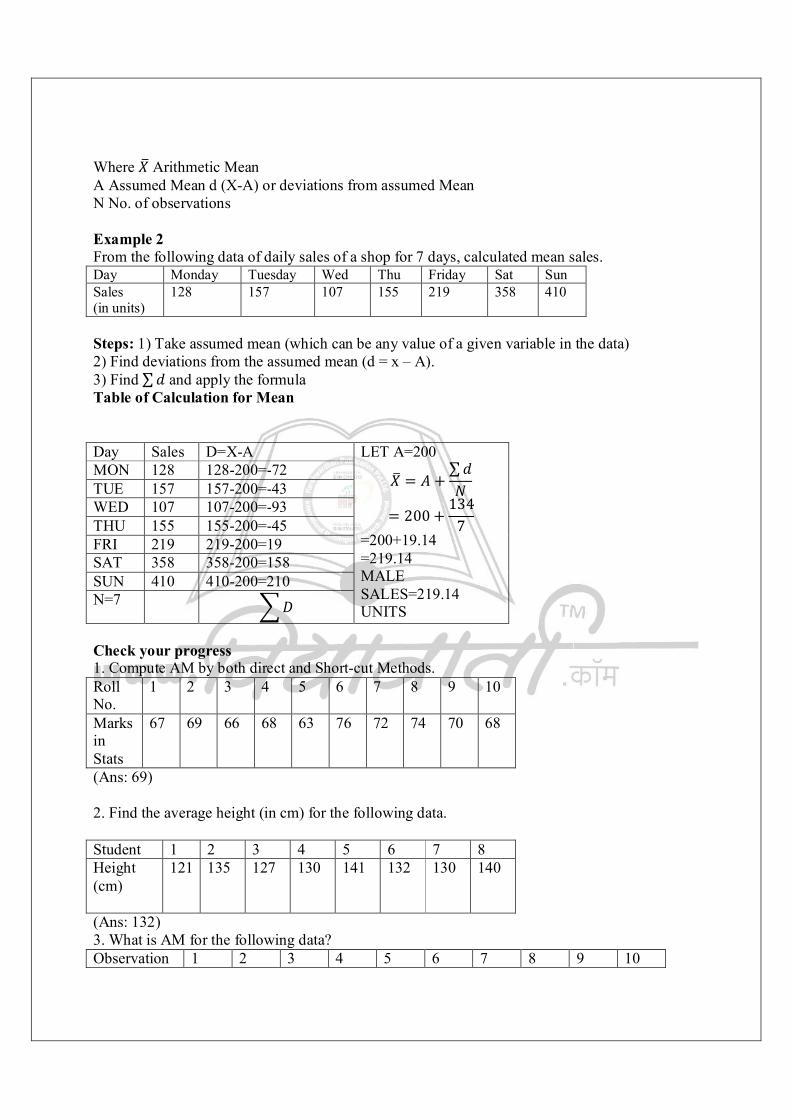
Where 푋 Arithmetic Mean A Assumed Mean d (X-A) or deviations from assumed Mean N No. of observations Example 2 From the following data of daily sales of a shop for 7 days, calculated mean sales. Day Monday Tuesday Wed Thu Friday Sat Sun Sales (in units)
128 157 107 155 219 358 410
Steps: 1) Take assumed mean (which can be any value of a given variable in the data) 2) Find deviations from the assumed mean (d = x – A). 3) Find ∑푑 and apply the formula Table of Calculation for Mean Day Sales D=X-A LET A=200
푋 = 퐴 +∑푑푁
= 200 +134
7 =200+19.14 =219.14 MALE SALES=219.14 UNITS
MON 128 128-200=-72 TUE 157 157-200=-43 WED 107 107-200=-93 THU 155 155-200=-45 FRI 219 219-200=19 SAT 358 358-200=158 SUN 410 410-200=210 N=7 퐷 Check your progress 1. Compute AM by both direct and Short-cut Methods. Roll No.
1 2 3 4 5 6 7 8 9 10
Marks in Stats
67 69 66 68 63 76 72 74 70 68
(Ans: 69) 2. Find the average height (in cm) for the following data. Student 1 2 3 4 5 6 7 8 Height (cm)
121 135 127 130 141 132 130 140
(Ans: 132) 3. What is AM for the following data? Observation 1 2 3 4 5 6 7 8 9 10
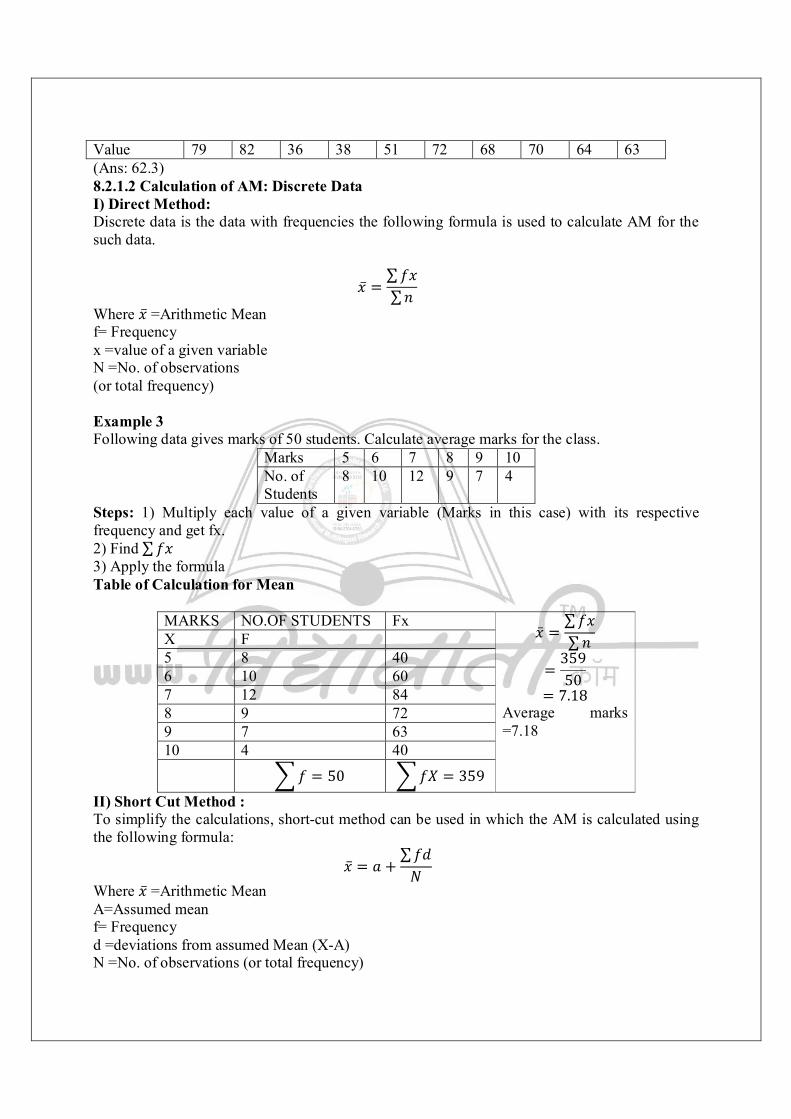
Value 79 82 36 38 51 72 68 70 64 63 (Ans: 62.3) 8.2.1.2 Calculation of AM: Discrete Data I) Direct Method: Discrete data is the data with frequencies the following formula is used to calculate AM for the such data.
푥̅ =∑푓푥∑푛
Where 푥̅ =Arithmetic Mean f= Frequency x =value of a given variable N =No. of observations (or total frequency) Example 3 Following data gives marks of 50 students. Calculate average marks for the class.
Marks 5 6 7 8 9 10 No. of Students
8 10 12 9 7 4
Steps: 1) Multiply each value of a given variable (Marks in this case) with its respective frequency and get fx. 2) Find ∑푓푥 3) Apply the formula Table of Calculation for Mean
MARKS NO.OF STUDENTS Fx 푥̅ =
∑푓푥∑푛
=35950
= 7.18 Average marks =7.18
X F 5 8 40 6 10 60 7 12 84 8 9 72 9 7 63 10 4 40 푓 = 50 푓푋 = 359
II) Short Cut Method : To simplify the calculations, short-cut method can be used in which the AM is calculated using the following formula:
푥̅ = 푎 +∑푓푑푁
Where 푥̅ =Arithmetic Mean A=Assumed mean f= Frequency d =deviations from assumed Mean (X-A) N =No. of observations (or total frequency)
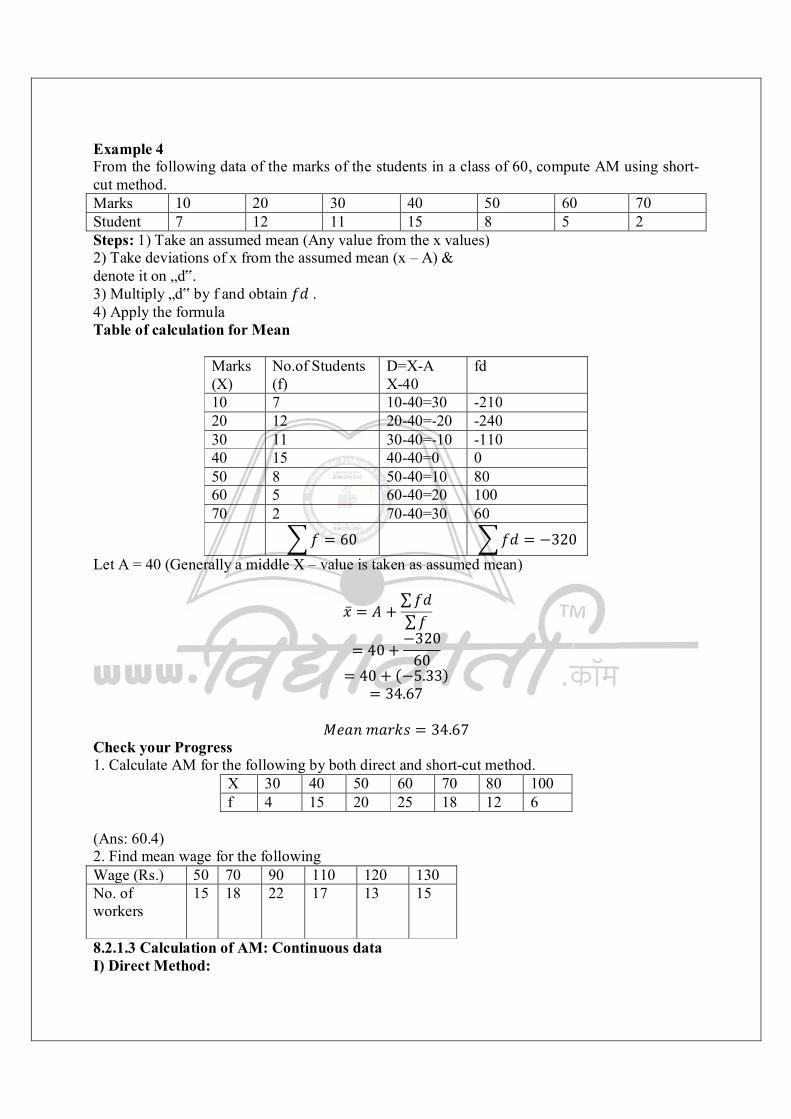
Example 4 From the following data of the marks of the students in a class of 60, compute AM using short-cut method. Marks 10 20 30 40 50 60 70 Student 7 12 11 15 8 5 2 Steps: 1) Take an assumed mean (Any value from the x values) 2) Take deviations of x from the assumed mean (x – A) & denote it on „d‟. 3) Multiply „d‟ by f and obtain 푓푑 . 4) Apply the formula Table of calculation for Mean
Marks (X)
No.of Students (f)
D=X-A X-40
fd
10 7 10-40=30 -210 20 12 20-40=-20 -240 30 11 30-40=-10 -110 40 15 40-40=0 0 50 8 50-40=10 80 60 5 60-40=20 100 70 2 70-40=30 60 푓 = 60 푓푑 = −320
Let A = 40 (Generally a middle X – value is taken as assumed mean)
푥̅ = 퐴 +∑푓푑∑푓
= 40 +−320
60
= 40 + (−5.33) = 34.67
푀푒푎푛푚푎푟푘푠 = 34.67
Check your Progress 1. Calculate AM for the following by both direct and short-cut method.
X 30 40 50 60 70 80 100 f 4 15 20 25 18 12 6
(Ans: 60.4) 2. Find mean wage for the following Wage (Rs.) 50 70 90 110 120 130 No. of workers
15 18 22 17 13 15
8.2.1.3 Calculation of AM: Continuous data I) Direct Method:
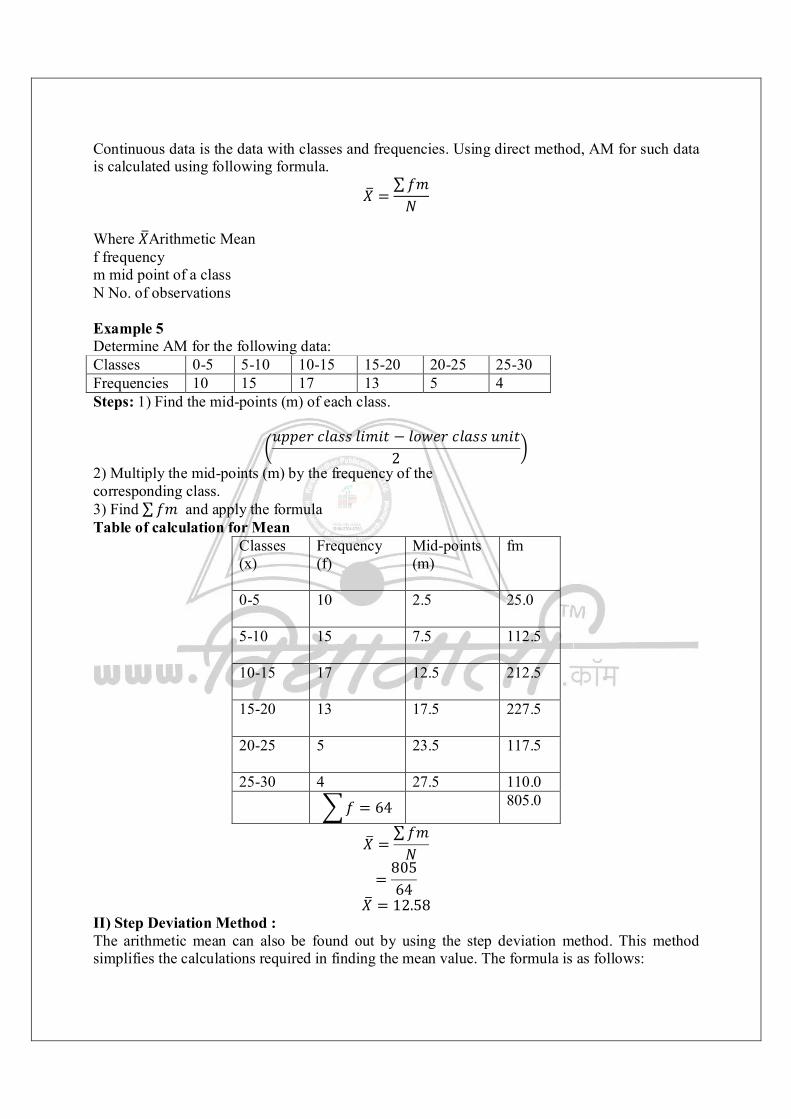
Continuous data is the data with classes and frequencies. Using direct method, AM for such data is calculated using following formula.
푋 =∑푓푚푁
Where 푋Arithmetic Mean f frequency m mid point of a class N No. of observations Example 5 Determine AM for the following data: Classes 0-5 5-10 10-15 15-20 20-25 25-30 Frequencies 10 15 17 13 5 4 Steps: 1) Find the mid-points (m) of each class.
푢푝푝푒푟푐푙푎푠푠푙푖푚푖푡 − 푙표푤푒푟푐푙푎푠푠푢푛푖푡2
2) Multiply the mid-points (m) by the frequency of the corresponding class. 3) Find ∑푓푚 and apply the formula Table of calculation for Mean
Classes (x)
Frequency (f)
Mid-points (m)
fm
0-5
10 2.5 25.0
5-10
15 7.5 112.5
10-15
17 12.5 212.5
15-20
13 17.5 227.5
20-25
5 23.5 117.5
25-30 4 27.5 110.0 푓 = 64 805.0
푋 =∑푓푚푁
=80564
푋 = 12.58 II) Step Deviation Method : The arithmetic mean can also be found out by using the step deviation method. This method simplifies the calculations required in finding the mean value. The formula is as follows:
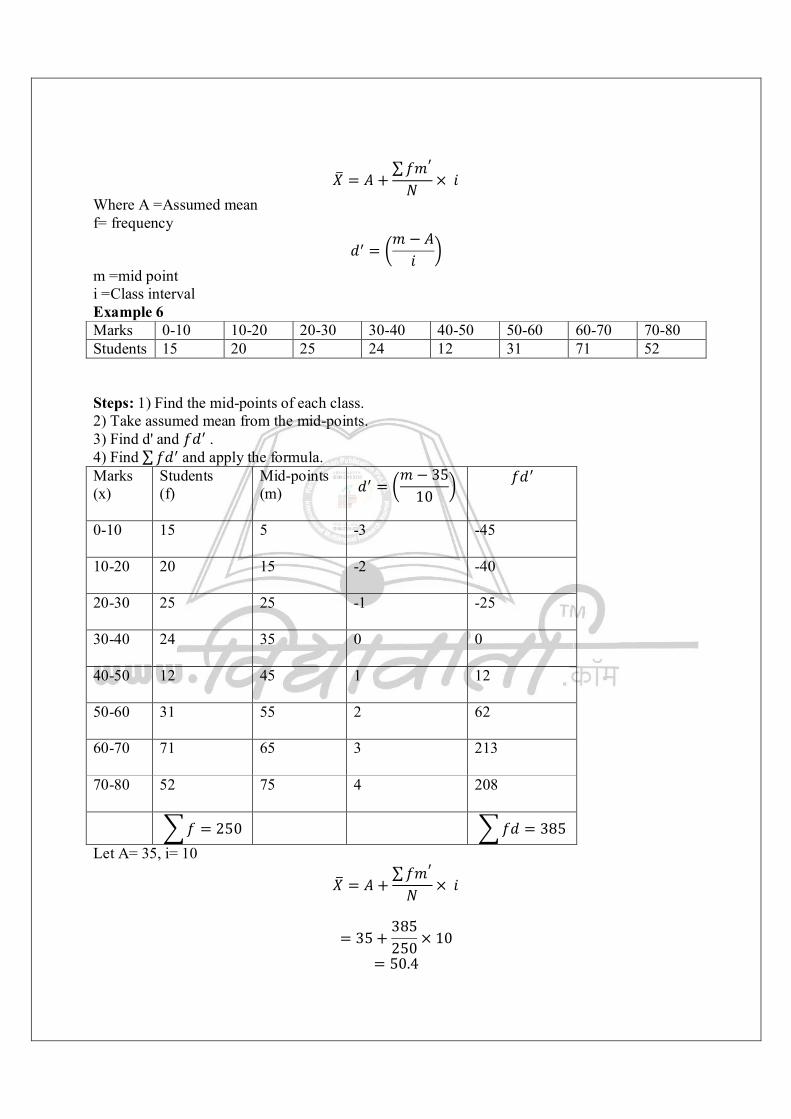
푋 = 퐴 +∑푓푚푁 × 푖
Where A =Assumed mean f= frequency
푑 =푚 − 퐴푖
m =mid point i =Class interval Example 6 Marks 0-10 10-20 20-30 30-40 40-50 50-60 60-70 70-80 Students 15 20 25 24 12 31 71 52 Steps: 1) Find the mid-points of each class. 2) Take assumed mean from the mid-points. 3) Find d' and 푓푑 . 4) Find ∑푓푑 and apply the formula. Marks (x)
Students (f)
Mid-points (m) 푑 =
푚− 3510
푓푑
0-10
15 5 -3 -45
10-20
20 15 -2 -40
20-30
25 25 -1 -25
30-40
24 35 0 0
40-50
12 45 1 12
50-60
31 55 2 62
60-70
71 65 3 213
70-80
52 75 4 208
푓 = 250 푓푑 = 385 Let A= 35, i= 10
푋 = 퐴 +∑푓푚푁 × 푖
= 35 +385250 × 10
= 50.4
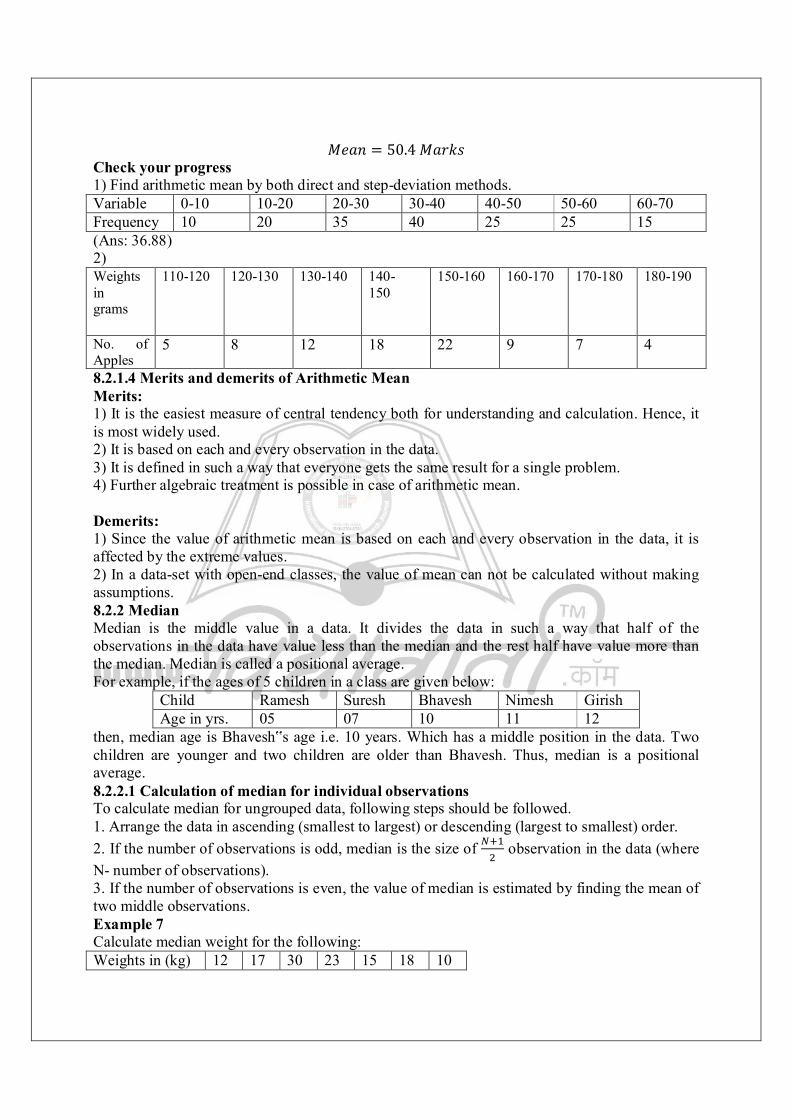
푀푒푎푛 = 50.4푀푎푟푘푠 Check your progress 1) Find arithmetic mean by both direct and step-deviation methods. Variable 0-10 10-20 20-30 30-40 40-50 50-60 60-70 Frequency 10 20 35 40 25 25 15 (Ans: 36.88) 2) Weights in grams
110-120
120-130
130-140
140- 150
150-160 160-170 170-180 180-190
No. of Apples
5 8 12 18 22 9 7 4
8.2.1.4 Merits and demerits of Arithmetic Mean Merits: 1) It is the easiest measure of central tendency both for understanding and calculation. Hence, it is most widely used. 2) It is based on each and every observation in the data. 3) It is defined in such a way that everyone gets the same result for a single problem. 4) Further algebraic treatment is possible in case of arithmetic mean. Demerits: 1) Since the value of arithmetic mean is based on each and every observation in the data, it is affected by the extreme values. 2) In a data-set with open-end classes, the value of mean can not be calculated without making assumptions. 8.2.2 Median Median is the middle value in a data. It divides the data in such a way that half of the observations in the data have value less than the median and the rest half have value more than the median. Median is called a positional average. For example, if the ages of 5 children in a class are given below:
Child Ramesh Suresh Bhavesh Nimesh Girish Age in yrs. 05 07 10 11 12
then, median age is Bhavesh‟s age i.e. 10 years. Which has a middle position in the data. Two children are younger and two children are older than Bhavesh. Thus, median is a positional average. 8.2.2.1 Calculation of median for individual observations To calculate median for ungrouped data, following steps should be followed. 1. Arrange the data in ascending (smallest to largest) or descending (largest to smallest) order. 2. If the number of observations is odd, median is the size of observation in the data (where N- number of observations). 3. If the number of observations is even, the value of median is estimated by finding the mean of two middle observations. Example 7 Calculate median weight for the following: Weights in (kg) 12 17 30 23 15 18 10
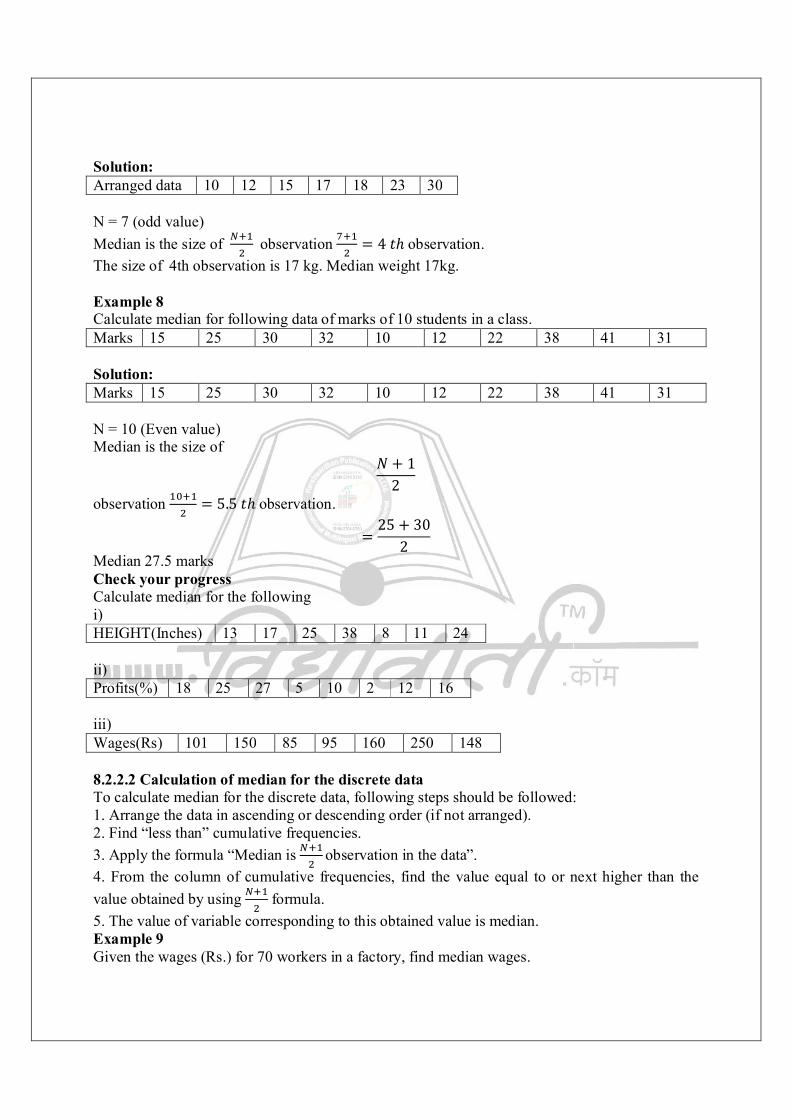
Solution: Arranged data 10 12 15 17 18 23 30 N = 7 (odd value) Median is the size of observation = 4푡ℎobservation. The size of 4th observation is 17 kg. Median weight 17kg. Example 8 Calculate median for following data of marks of 10 students in a class. Marks 15 25 30 32 10 12 22 38 41 31 Solution: Marks 15 25 30 32 10 12 22 38 41 31 N = 10 (Even value) Median is the size of
푁 + 12
observation = 5.5푡ℎobservation.
=25 + 30
2 Median 27.5 marks Check your progress Calculate median for the following i) HEIGHT(Inches) 13 17 25 38 8 11 24 ii) Profits(%) 18 25 27 5 10 2 12 16 iii) Wages(Rs) 101 150 85 95 160 250 148 8.2.2.2 Calculation of median for the discrete data To calculate median for the discrete data, following steps should be followed: 1. Arrange the data in ascending or descending order (if not arranged). 2. Find “less than” cumulative frequencies. 3. Apply the formula “Median is observation in the data”. 4. From the column of cumulative frequencies, find the value equal to or next higher than the value obtained by using formula. 5. The value of variable corresponding to this obtained value is median. Example 9 Given the wages (Rs.) for 70 workers in a factory, find median wages.
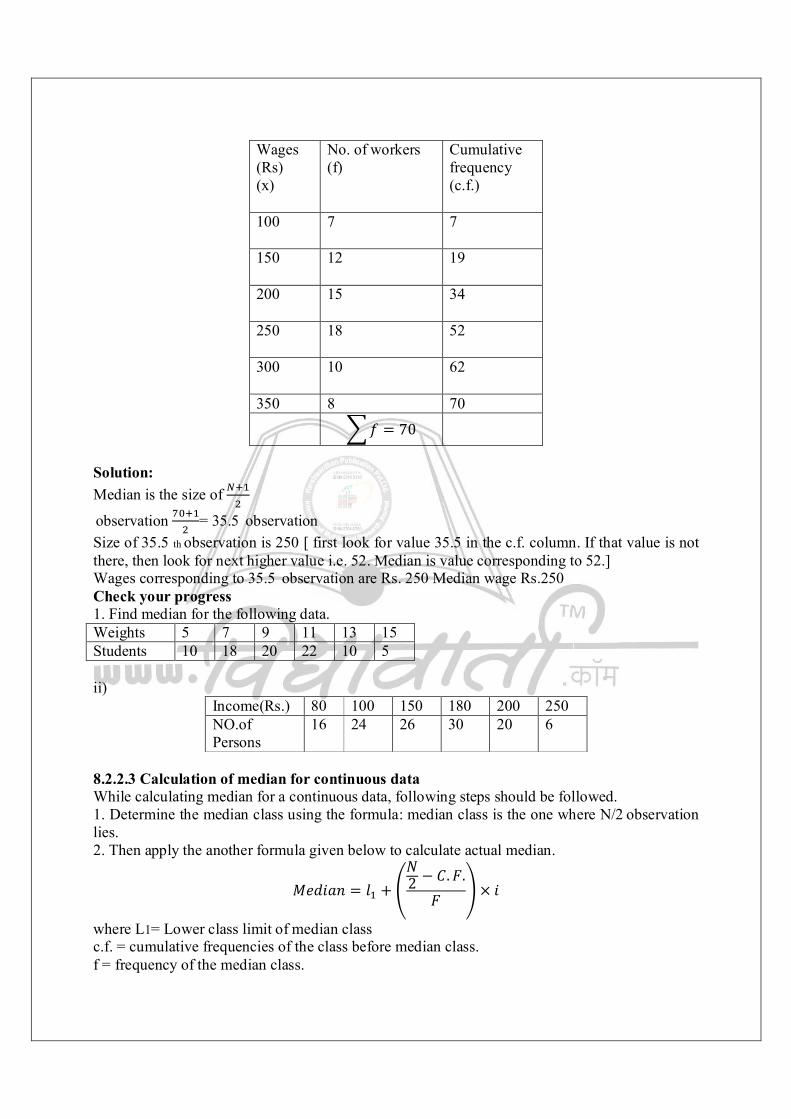
Wages (Rs) (x)
No. of workers (f)
Cumulative frequency (c.f.)
100
7 7
150
12 19
200
15 34
250
18 52
300
10 62
350 8 70 푓 = 70
Solution: Median is the size of
observation = 35.5 observation Size of 35.5 th observation is 250 [ first look for value 35.5 in the c.f. column. If that value is not there, then look for next higher value i.e. 52. Median is value corresponding to 52.] Wages corresponding to 35.5 observation are Rs. 250 Median wage Rs.250 Check your progress 1. Find median for the following data. Weights 5 7 9 11 13 15 Students 10 18 20 22 10 5 ii)
Income(Rs.) 80 100 150 180 200 250 NO.of Persons
16 24 26 30 20 6
8.2.2.3 Calculation of median for continuous data While calculating median for a continuous data, following steps should be followed. 1. Determine the median class using the formula: median class is the one where N/2 observation lies. 2. Then apply the another formula given below to calculate actual median.
푀푒푑푖푎푛 = 푙 +푁2 − 퐶.퐹.
퐹 × 푖
where L1= Lower class limit of median class c.f. = cumulative frequencies of the class before median class. f = frequency of the median class.
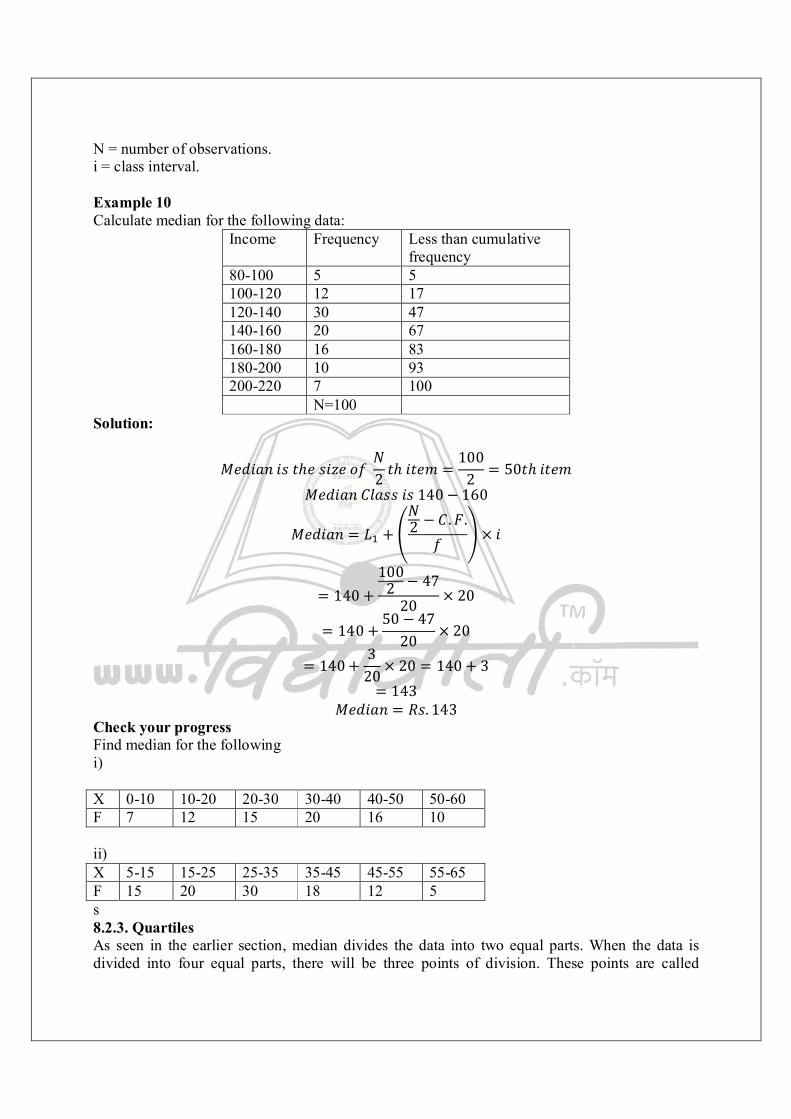
N = number of observations. i = class interval. Example 10 Calculate median for the following data:
Income
Frequency Less than cumulative frequency
80-100 5 5 100-120 12 17 120-140 30 47 140-160 20 67 160-180 16 83 180-200 10 93 200-220 7 100 N=100
Solution:
푀푒푑푖푎푛푖푠푡ℎ푒푠푖푧푒표푓푁2 푡ℎ푖푡푒푚 =
1002 = 50푡ℎ푖푡푒푚
푀푒푑푖푎푛퐶푙푎푠푠푖푠140− 160
푀푒푑푖푎푛 = 퐿 +푁2 −퐶 .퐹.
푓 × 푖
= 140 +100
2 − 4720 × 20
= 140 +50 − 47
20× 20
= 140 +3
20× 20 = 140 + 3
= 143 푀푒푑푖푎푛 = 푅푠. 143
Check your progress Find median for the following i) X 0-10 10-20 20-30 30-40 40-50 50-60 F 7 12 15 20 16 10 ii) X 5-15 15-25 25-35 35-45 45-55 55-65 F 15 20 30 18 12 5 s 8.2.3. Quartiles As seen in the earlier section, median divides the data into two equal parts. When the data is divided into four equal parts, there will be three points of division. These points are called

quartiles. Q1 is the first quartile, which divides the data in such a way that 25% observations in the data have lower value and 75% observations have higher value than Q1. Q2 or median divides the data is such a way that 50% observations have lower and 50% have higher value than Q2. Finally Q3 divides the data in such a way that 75% observations have lower and 25% observations have higher value than the third quartile. Quartiles are calculated in the same way as the median. Following example will illustrate the same. Example 10 For the following data, compute first and the third quartile. 15 18 25 20 22 12 13 Solution Arranged data: 12 13 15 18 20 22 25
푄 푖푠푡ℎ푒푠푖푧푒표푓푁 + 1
4 푡ℎ표푏푠푒푟푣푎푡푖표푛
=7 + 1
4 =84 = 2푛푑표푏푠푒푟푣푎푡푖표푛
푄 퐹푖푟푠푡푄푢푎푟푡푖푙푒 = 13
푄 푖푠푡ℎ푒푠푖푧푒표푓3푁 + 1
4 푡ℎ표푏푠푒푟푣푎푡푖표푛
=3 × 7 + 1
4푡ℎ표푏푠푒푟푣푎푡푖표푛 =
244
= 6푡ℎ표푏푠푒푟푣푎푡푖표푛 푄 푇ℎ푖푟푑푄푢푎푟푡푖푙푒 = 22
Example 11 Calculate Q1 and Q3 for the following: X f Cummulative frequencies 5 9 9 7 15 24 9 18 42 11 20 62 13 17 79 15 5 84 N=84
푄 푖푠푡ℎ푒푠푖푧푒표푓푁 + 1
4 푡ℎ푖푡푒푚푖푛푡ℎ푒푑푎푡푎
=84 + 1
4 =854 = 21.25
푆푖푧푒표푓21.25푡ℎ푖푡푒푚푖푠7 푄 = 7
푄 푖푠푡ℎ푒푠푖푧푒표푓3푁 + 1
4 푡ℎ푖푡푒푚푖푛푡ℎ푒푑푎푡푎
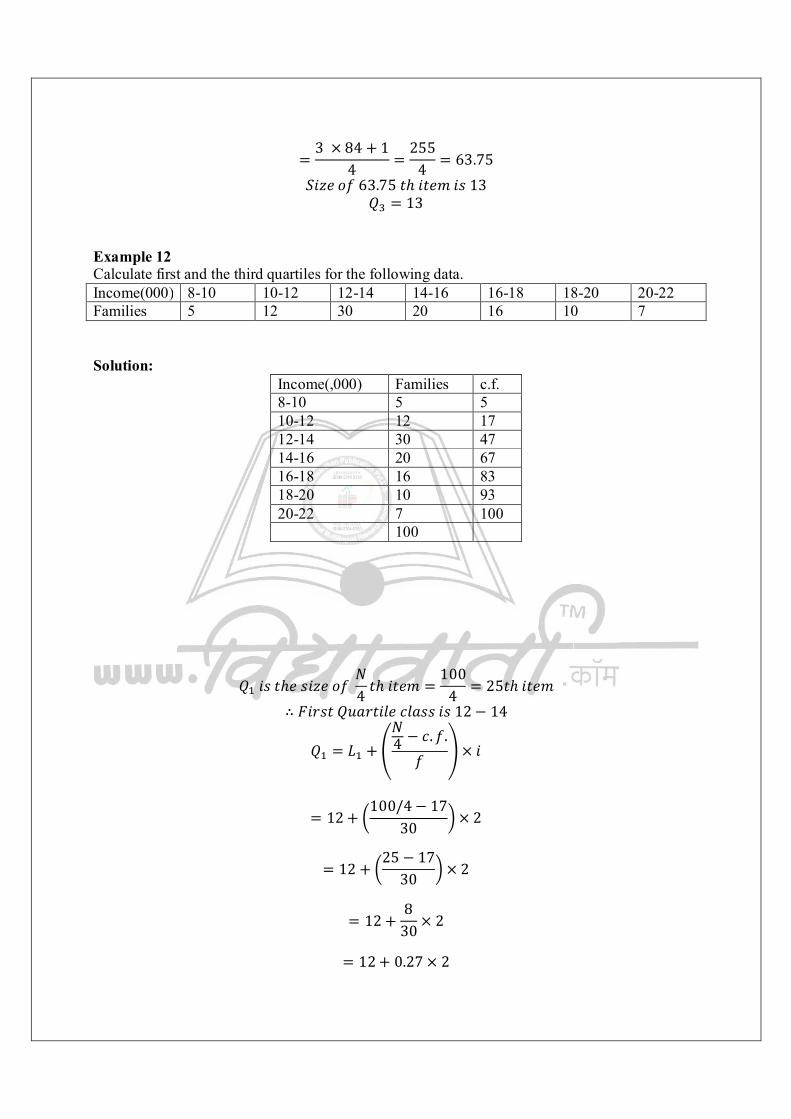
=3 × 84 + 1
4 =255
4 = 63.75
푆푖푧푒표푓63.75푡ℎ푖푡푒푚푖푠13 푄 = 13
Example 12 Calculate first and the third quartiles for the following data. Income(000) 8-10 10-12 12-14 14-16 16-18 18-20 20-22 Families 5 12 30 20 16 10 7 Solution:
Income(,000) Families c.f. 8-10 5 5 10-12 12 17 12-14 30 47 14-16 20 67 16-18 16 83 18-20 10 93 20-22 7 100 100
푄 푖푠푡ℎ푒푠푖푧푒표푓푁4 푡ℎ푖푡푒푚 =
1004 = 25푡ℎ푖푡푒푚
∴ 퐹푖푟푠푡푄푢푎푟푡푖푙푒푐푙푎푠푠푖푠12− 14
푄 = 퐿 +푁4 − 푐.푓.
푓 × 푖
= 12 +100/4− 17
30× 2
= 12 +25 − 17
30 × 2
= 12 +8
30 × 2
= 12 + 0.27 × 2
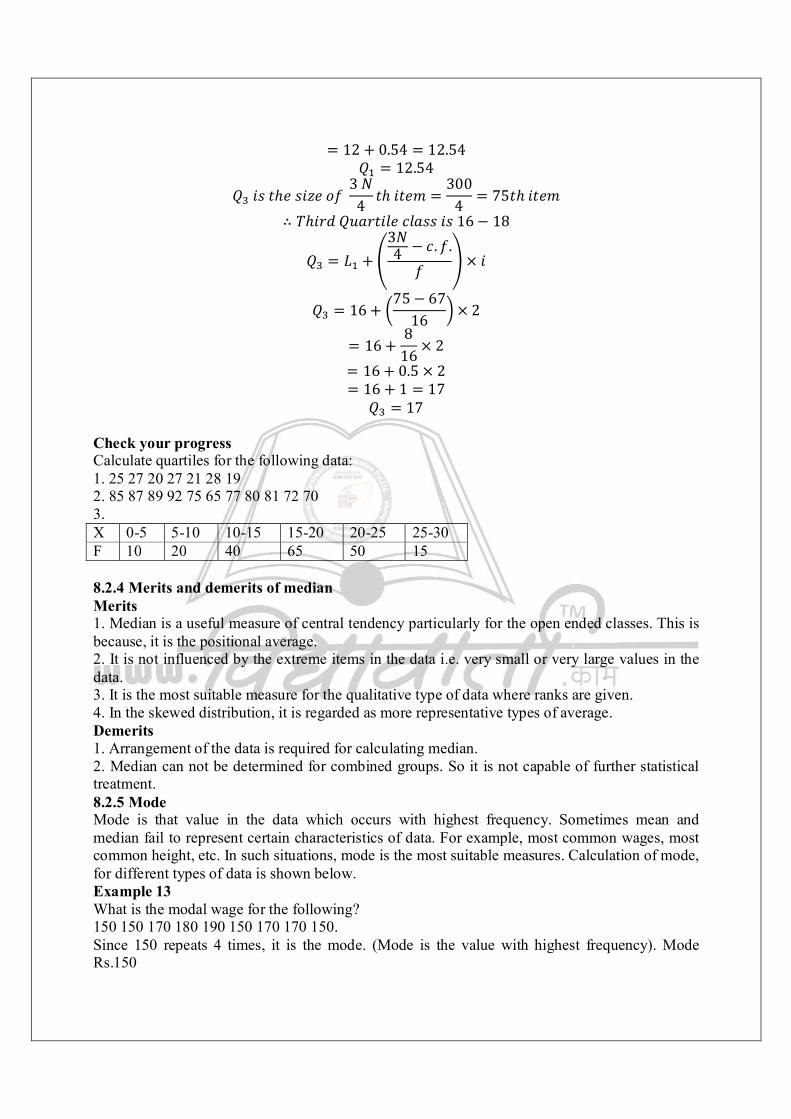
= 12 + 0.54 = 12.54 푄 = 12.54
푄 푖푠푡ℎ푒푠푖푧푒표푓3푁
4 푡ℎ푖푡푒푚 =300
4 = 75푡ℎ푖푡푒푚
∴ 푇ℎ푖푟푑푄푢푎푟푡푖푙푒푐푙푎푠푠푖푠16− 18
푄 = 퐿 +3푁4 − 푐.푓.
푓 × 푖
푄 = 16 +75− 67
16 × 2
= 16 +8
16 × 2 = 16 + 0.5 × 2 = 16 + 1 = 17
푄 = 17 Check your progress Calculate quartiles for the following data: 1. 25 27 20 27 21 28 19 2. 85 87 89 92 75 65 77 80 81 72 70 3. X 0-5 5-10 10-15 15-20 20-25 25-30 F 10 20 40 65 50 15 8.2.4 Merits and demerits of median Merits 1. Median is a useful measure of central tendency particularly for the open ended classes. This is because, it is the positional average. 2. It is not influenced by the extreme items in the data i.e. very small or very large values in the data. 3. It is the most suitable measure for the qualitative type of data where ranks are given. 4. In the skewed distribution, it is regarded as more representative types of average. Demerits 1. Arrangement of the data is required for calculating median. 2. Median can not be determined for combined groups. So it is not capable of further statistical treatment. 8.2.5 Mode Mode is that value in the data which occurs with highest frequency. Sometimes mean and median fail to represent certain characteristics of data. For example, most common wages, most common height, etc. In such situations, mode is the most suitable measures. Calculation of mode, for different types of data is shown below. Example 13 What is the modal wage for the following? 150 150 170 180 190 150 170 170 150. Since 150 repeats 4 times, it is the mode. (Mode is the value with highest frequency). Mode Rs.150
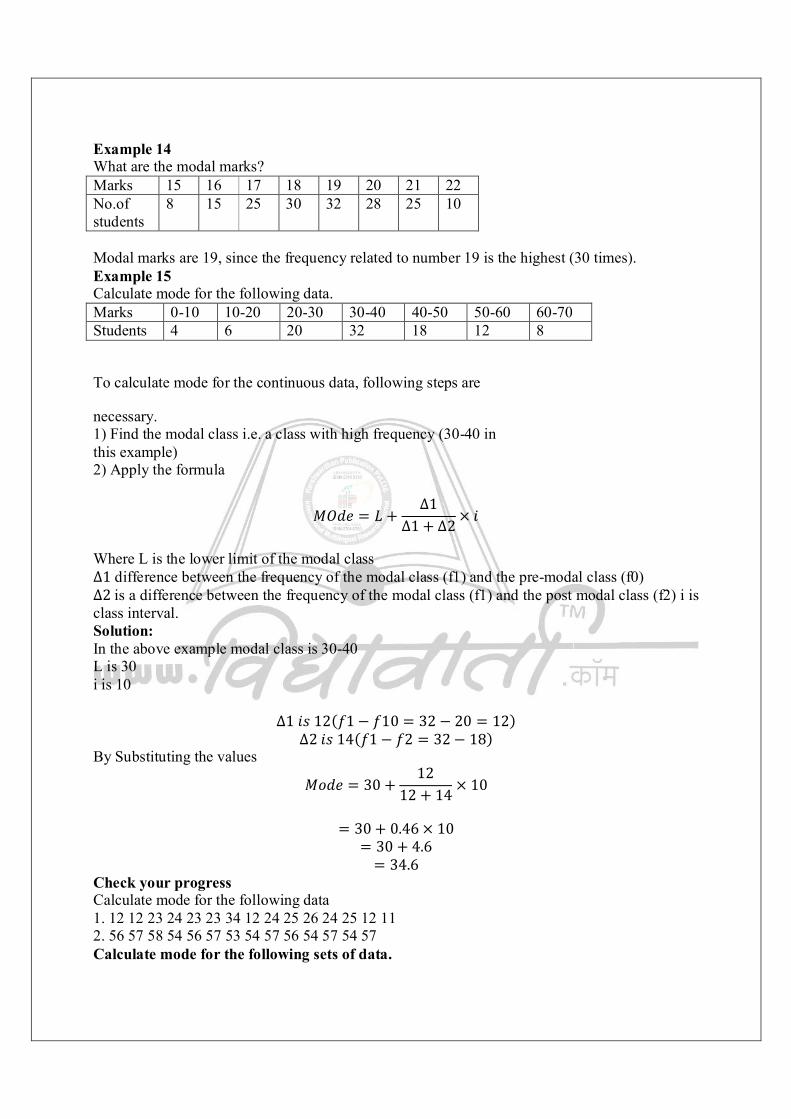
Example 14 What are the modal marks? Marks 15 16 17 18 19 20 21 22 No.of students
8 15 25 30 32 28 25 10
Modal marks are 19, since the frequency related to number 19 is the highest (30 times). Example 15 Calculate mode for the following data. Marks 0-10 10-20 20-30 30-40 40-50 50-60 60-70 Students 4 6 20 32 18 12 8
To calculate mode for the continuous data, following steps are
necessary. 1) Find the modal class i.e. a class with high frequency (30-40 in this example) 2) Apply the formula
푀푂푑푒 = 퐿 +∆1
∆1 + ∆2 × 푖 Where L is the lower limit of the modal class ∆1 difference between the frequency of the modal class (f1) and the pre-modal class (f0) ∆2is a difference between the frequency of the modal class (f1) and the post modal class (f2) i is class interval. Solution: In the above example modal class is 30-40 L is 30 i is 10
∆1푖푠12(푓1− 푓10 = 32 − 20 = 12) ∆2푖푠14(푓1− 푓2 = 32− 18)
By Substituting the values
푀표푑푒 = 30 +12
12 + 14 × 10
= 30 + 0.46 × 10 = 30 + 4.6
= 34.6 Check your progress Calculate mode for the following data 1. 12 12 23 24 23 23 34 12 24 25 26 24 25 12 11 2. 56 57 58 54 56 57 53 54 57 56 54 57 54 57 Calculate mode for the following sets of data.
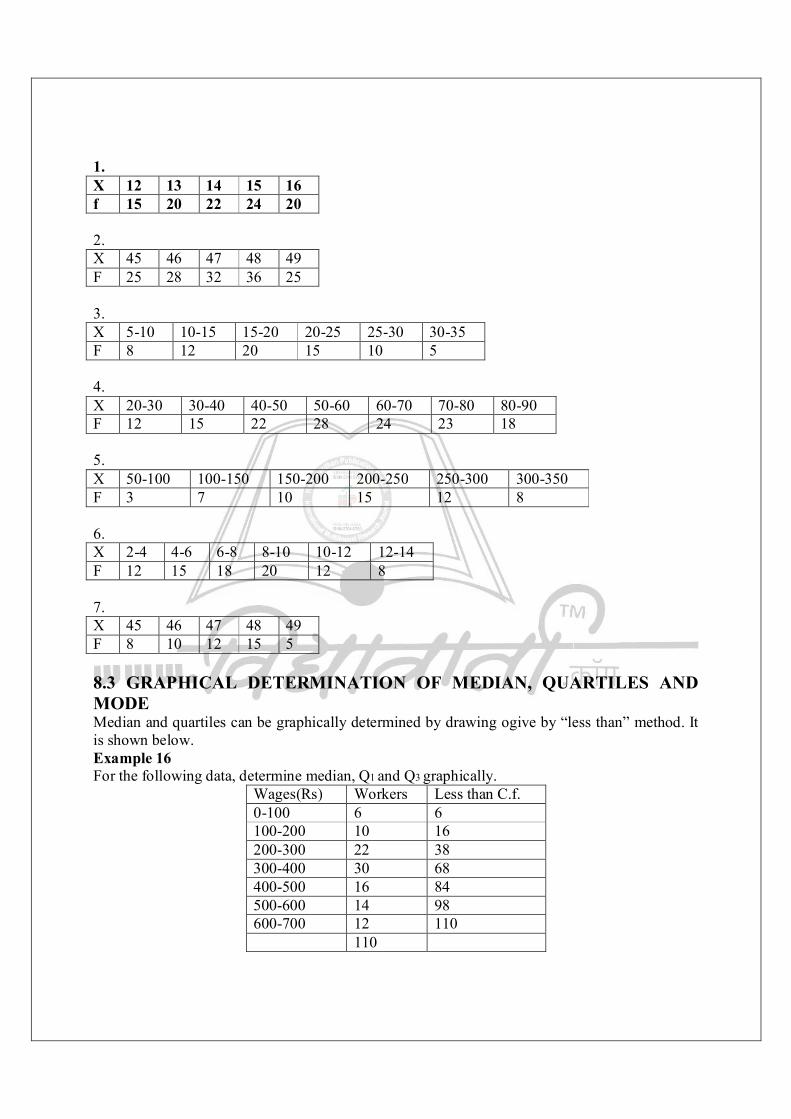
1. X 12 13 14 15 16 f 15 20 22 24 20 2. X 45 46 47 48 49 F 25 28 32 36 25 3. X 5-10 10-15 15-20 20-25 25-30 30-35 F 8 12 20 15 10 5 4. X 20-30 30-40 40-50 50-60 60-70 70-80 80-90 F 12 15 22 28 24 23 18 5. X 50-100 100-150 150-200 200-250 250-300 300-350 F 3 7 10 15 12 8 6. X 2-4 4-6 6-8 8-10 10-12 12-14 F 12 15 18 20 12 8 7. X 45 46 47 48 49 F 8 10 12 15 5 8.3 GRAPHICAL DETERMINATION OF MEDIAN, QUARTILES AND MODE Median and quartiles can be graphically determined by drawing ogive by “less than” method. It is shown below. Example 16 For the following data, determine median, Q1 and Q3 graphically.
Wages(Rs) Workers Less than C.f. 0-100 6 6 100-200 10 16 200-300 22 38 300-400 30 68 400-500 16 84 500-600 14 98 600-700 12 110 110
푀푒푑푖푎푛푖푠푡ℎ푒푠푖푧푒표푓 푡ℎ푖푡푒푚 = = 55푡ℎ푖푡푒푚 locate this value on Y – axis (55) and draw a perpendicular on less than ogive. From that point, draw a perpendicular on x-axis. The point where it meets x-axis is median (Approximately 356). 푄 푖푠푡ℎ푒푠푖푧푒표푓 푡ℎ푖푡푒푚 = = 27.5푡ℎ푖푡푒푚 locate the point (27.5) on Y-axis, draw a perpendicular on less than ogive. From the point of where it meets the ogive, draw perpendicular to X-axis. The point where it meets X-axis is 푄 (approximately 252).
푄 푖푠푡ℎ푒푠푖푧푒표푓3푁
4 푡ℎ푖푡푒푚 = 82.5푡ℎ푖푡푒푚 Follow the steps mentioned earlier to get the value of Q3 (approximately 490). Mode can be graphically determined by using histograms. This is done as follows. Example 17 For the following data, determine mode graphically.
X 0-10 10-20 20-30 30-40 40-50 50-60 Y 5 15 20 25 18 7
The image part with relationship ID rId7 was not found in the file.

First draw a histogram for the given data. Then draw two lines diagonally inside the modal class bar (the bar representing highest frequency). Then draw a perpendicular from the point of intersection on the X-axis. Value of mode is approximately 38 in this example. 8.4 SUMMARY In this unit, we learned about important measures of the central tendency. These are widely used in statistical analysis of data in all branches of knowledge. 8.5 QUESTIONS 1) Explain the various methods of calculating Arithmetic Mean. 2) Explain briefly Arithmetic Mean. Explain its merits and demerits. 3) Discuss various methods of calculation of Median.
9 MEASURES OF DISPERSION
Unit Structure: 9.0 Objectives 9.1 Introduction 9.2 Range 9.3 Quartile Deviation 9.4 Standard deviation (S.D.) & Coefficient of Variation (C.V.) 9.5 Skewness 9.6 Summary 9.7 Questions 9.0 OBJECTIVES To learn about different measures of dispersion and their relative importance. To learn the meaning of skewness. To understand simple measures of skewness. 9.1 INTRODUCTION We have learnt the important central tendency measures in the last unit. As we already know, these measures give us a single value that represents the entire data set. Sometimes, however, we need some more information about the data. Measures of dispersion are an additional step forward in understanding another important feature of the statistical data. They aim at measuring the degree of variability or scattered-ness of various items in the data from the central value. Dispersion supplements the measures of central tendency by revealing some more features of given data. The degree to which numerical data tends to spread about an average value is called the variation or dispersion of data Spiegel. In other words, dispersion measures the extent to which the given values vary from their central value. An importance of the measures of dispersion may be well understood from the following example. Series A Series b Series C 50 50 1 50 47 245 50 53 2 50 55 1 50 45 1 Total 250 250 250 Arithmetic Mean 50 50 50 All the three data sets given above have same arithmetic mean. But a closer look at each set will reveal that each of those groups are different from each other to a great extent. First group is homogenous, second group is also more or less homogenous but the third group is quite heterogeneous. But each set has the same central value. Thus, to know more about the given data, central tendency measure are not sufficient. We need to further understand the degree of dispersion related to that data. Following are important measures of dispersion: 1) Range

2) Quartile Deviation 3) Mean Deviation 4) Standard Deviation 9.2 RANGE Range is the simplest measures of dispersion. Range is defined as the difference between the highest observation (H) and the lowest observation (L) of the variable given in the data. Range = H – L
퐶표푒푓푓푖푐푖푒푛푡푅푎푛푔푒 =퐻 − 퐿퐻 + 퐿
9.2.1 Range for raw data / individual observation: Ex. 1 From the following data, find range and its coefficient. 25, 27, 17, 38, 19, 10, 30 H = 38 L = 10 Range = H – L = 38 – 10 = 28
퐶표푒푓푓푖푐푖푒푛푡푅푎푛푔푒 =퐻 − 퐿퐻 + 퐿 =
38− 1038 + 10 =
2848
= 0.58 9.2.2 Range for discrete data Ex. 2 From the following data of weights of students, calculate range and its co-efficient.
Weights(in Kg) No.of Students 퐻 = 35퐿 = 25
푅푎푛푔푒 = 퐻 − 퐿 = 35− 25
= 10 퐶표푒푓푓푖푐푖푒푛푡푅푎푛푔푒
=퐻 − 퐿퐻 + 퐿
=35− 2535 + 25
=1060
= 0.17
25 50
27 75
29 102
31 87
33 71
35 60
9.2.3 Range for continuous data Ex. 3 From the following data set, calculate range and its coefficient.
Class Frequency 퐻 = 90퐿 = 0 푅푎푛푔푒 = 퐻 − 퐿 = 90 − 0 = 90
0-10 7 10-20 12
20-30 18 퐶표푒푓푓푖푐푖푒푛푡표푓푅푎푛푔푒
=퐻 − 퐿퐻 + 퐿
=90 − 090 + 0
=9090 = 1
30-40 25 40-50 38 50-60 23 60-70 15 70-80 8 80-90 3
Check your progress What is the range and its co-efficient for the following data? 1) 7, 15, 8, 10, 6, 17, 3 2) 256, 537, 238, 407, 305, 487, 500 3) X 15 20 25 30 35 40 F 9 19 29 18 8 5 4) X 2.5 5.5 8.5 11.5 14.5 17.5 f 10 15 25 21 12 8 5) Marks 15-25 25-35 35-45 45-55 55-65 Students 3 5 8 12 10 6) Class 250-500 500-750 750-1000 1000-1250 Frequency 25 38 23 10 9.3 QUARTILE DEVIATION This measure of dispersion is based on the quartiles. As we have studied in the earlier unit, there are three quartiles. Q1 is called lower quartile, Q3 is called upper quartile and Q2 is more popularly known as median. Following three measures are computed using first and the third quartile. Inter-quartile Range - 푄 − 푄
푄푢푎푟푡푖푙푒퐷푒푣푖푎푡푖표푛 =푄 − 푄
2
퐶표푒푓푓푖푐푖푒푛푡표푓푞푢푎푟푡푖푙푒푑푒푣푖푎푡푖표푛 =푄 −푄푄 +푄
We have already learnt the computation of 푄 and 푄 for different types of data individual or raw data, discrete data and continuous data. 9.3.1 Quartile deviation for individual observation Ex. 4
Find quartile deviation (Q.D.) coefficient of quartile deviation for the following data. 30 40 53 55 60 63 65
Solution: Number of observations N = 7
푄 푖푠푡ℎ푒푠푖푧푒표푓푁 + 1
4 푡ℎ표푏푠푒푟푣푎푡푖표푛푖푛푡ℎ푒푑푎푡푎
7 + 14 푡ℎ표푏푠푒푟푣푎푡푖표푛표푟2푛푑표푏푠푒푟푣푎푡푖표푛푖푛푡ℎ푒푑푎푡푎.
∴ 푄 = 40
푄 푖푠푡ℎ푒푠푖푧푒표푓3푁 + 1
4 푡ℎ표푏푠푒푟푣푎푡푖표푛푖푛푡ℎ푒푑푎푡푎,푤ℎ푖푐ℎ푖푠3 × 7 + 1
4 푡ℎ표푟 6푡ℎ표푏푠푒푟푣푎푡푖표푛푖푛푡ℎ푒푑푎푡푎.
∴ 푄 = 63
퐼푛푡푒푟푄푢푎푟푡푖푙푒푅푎푛푔푒 = 푄 − 푄 = 63 − 40 = 23
푄푢푎푟푡푖푙푒퐷푒푣푖푎푡푖표푛 =푄 −푄
2 =63− 40
2 =232
= 11.5
퐶표푒푓푓푖푐푖푒푛푡표푓푄푢푎푟푡푖푙푒푑푒푣푖푎푡푖표푛 =푄 − 푄푄 + 푄 =
63− 4063 + 40 =
23103 = 0.22
9.3.2 Quartile deviation for discrete data: Ex. 5
X f Cumulative Frequency 80 12 12 85 18 30 90 26 56 95 15 71 100 5 76 105 4 80 N= 80
푄 푖푠푡ℎ푒푠푖푧푒표푓3푁4 표푏푠푒푟푣푎푡푖표푛
=804
= 20푡ℎ표푏푠푒푟푣푎푡푖표푛 ∴ 푄 = 85
푄 푖푠푡ℎ푒푠푖푧푒표푓3푁4 표푏푠푒푟푣푎푡푖표푛
=240
4= 60푡ℎ표푏푠푒푟푣푎푡푖표푛 ∴ 푄 = 95
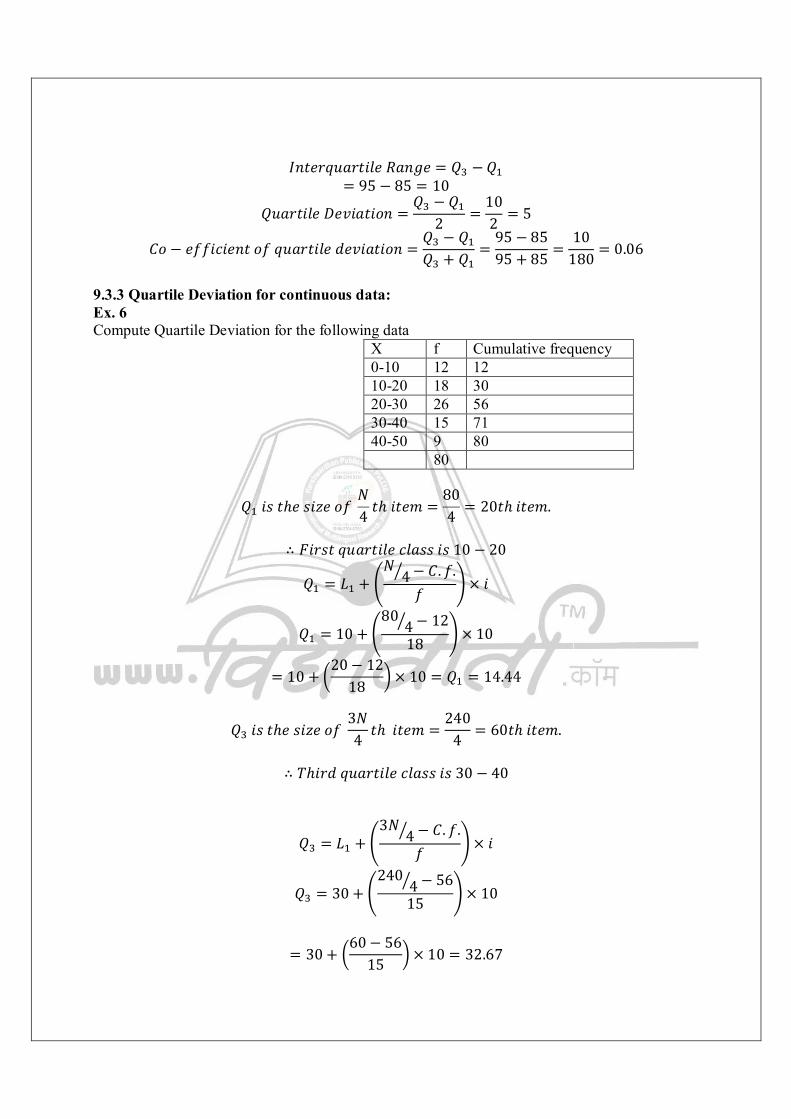
퐼푛푡푒푟푞푢푎푟푡푖푙푒푅푎푛푔푒 = 푄 −푄
= 95 − 85 = 10
푄푢푎푟푡푖푙푒퐷푒푣푖푎푡푖표푛 =푄 − 푄
2 =102 = 5
퐶표 − 푒푓푓푖푐푖푒푛푡표푓푞푢푎푟푡푖푙푒푑푒푣푖푎푡푖표푛 =푄 − 푄푄 + 푄 =
95 − 8595 + 85 =
10180 = 0.06
9.3.3 Quartile Deviation for continuous data: Ex. 6 Compute Quartile Deviation for the following data
푄 푖푠푡ℎ푒푠푖푧푒표푓푁4 푡ℎ푖푡푒푚 =
804 = 20푡ℎ푖푡푒푚.
∴ 퐹푖푟푠푡푞푢푎푟푡푖푙푒푐푙푎푠푠푖푠10 − 20
푄 = 퐿 +푁
4− 퐶. 푓.푓
× 푖
푄 = 10 +80
4− 1218 × 10
= 10 +20− 12
18 × 10 = 푄 = 14.44
푄 푖푠푡ℎ푒푠푖푧푒표푓3푁4 푡ℎ푖푡푒푚 =
2404 = 60푡ℎ푖푡푒푚.
∴ 푇ℎ푖푟푑푞푢푎푟푡푖푙푒푐푙푎푠푠푖푠30 − 40
푄 = 퐿 +3푁
4− 퐶. 푓.푓 × 푖
푄 = 30 +240
4− 5615 × 10
= 30 +60− 56
15 × 10 = 32.67
X f Cumulative frequency 0-10 12 12 10-20 18 30 20-30 26 56 30-40 15 71 40-50 9 80 80
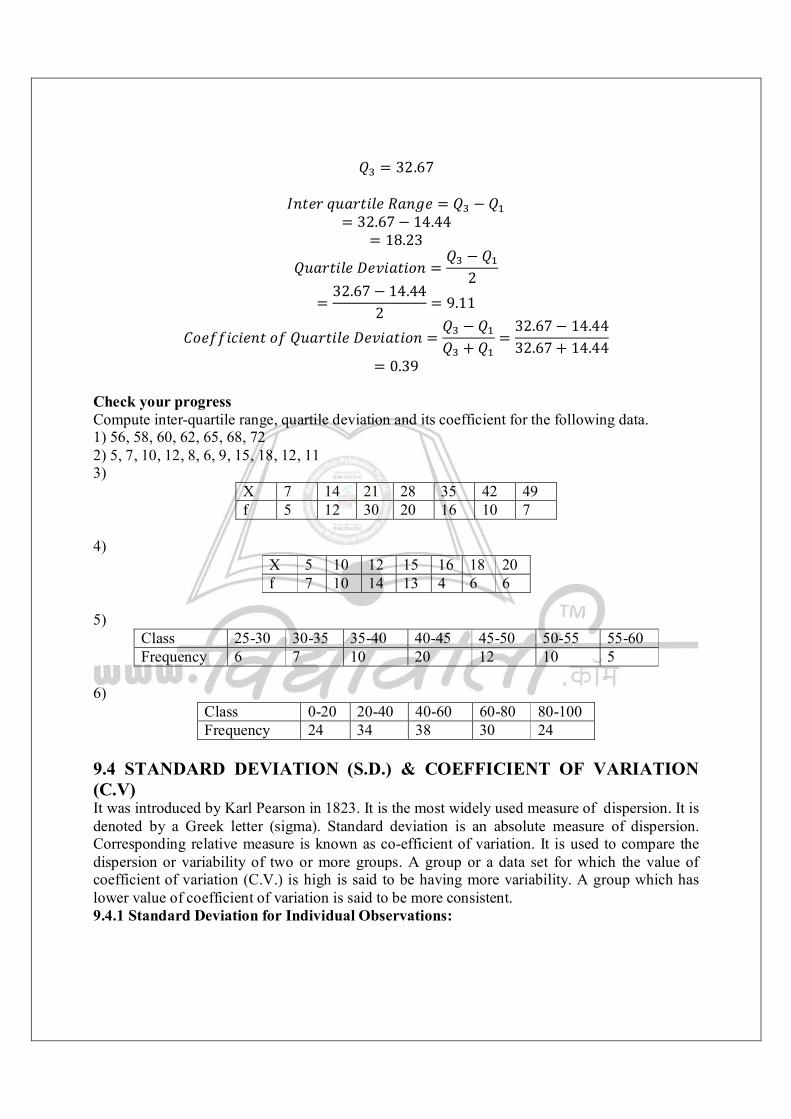
푄 = 32.67
퐼푛푡푒푟푞푢푎푟푡푖푙푒푅푎푛푔푒 = 푄 − 푄
= 32.67− 14.44 = 18.23
푄푢푎푟푡푖푙푒퐷푒푣푖푎푡푖표푛 =푄 − 푄
2
=32.67− 14.44
2 = 9.11
퐶표푒푓푓푖푐푖푒푛푡표푓푄푢푎푟푡푖푙푒퐷푒푣푖푎푡푖표푛 =푄 − 푄푄 + 푄 =
32.67− 14.4432.67 + 14.44
= 0.39 Check your progress Compute inter-quartile range, quartile deviation and its coefficient for the following data. 1) 56, 58, 60, 62, 65, 68, 72 2) 5, 7, 10, 12, 8, 6, 9, 15, 18, 12, 11 3)
X 7 14 21 28 35 42 49 f 5 12 30 20 16 10 7
4)
X 5 10 12 15 16 18 20 f 7 10 14 13 4 6 6
5)
Class 25-30 30-35 35-40 40-45 45-50 50-55 55-60 Frequency 6 7 10 20 12 10 5
6)
Class 0-20 20-40 40-60 60-80 80-100 Frequency 24 34 38 30 24
9.4 STANDARD DEVIATION (S.D.) & COEFFICIENT OF VARIATION (C.V) It was introduced by Karl Pearson in 1823. It is the most widely used measure of dispersion. It is denoted by a Greek letter (sigma). Standard deviation is an absolute measure of dispersion. Corresponding relative measure is known as co-efficient of variation. It is used to compare the dispersion or variability of two or more groups. A group or a data set for which the value of coefficient of variation (C.V.) is high is said to be having more variability. A group which has lower value of coefficient of variation is said to be more consistent. 9.4.1 Standard Deviation for Individual Observations:
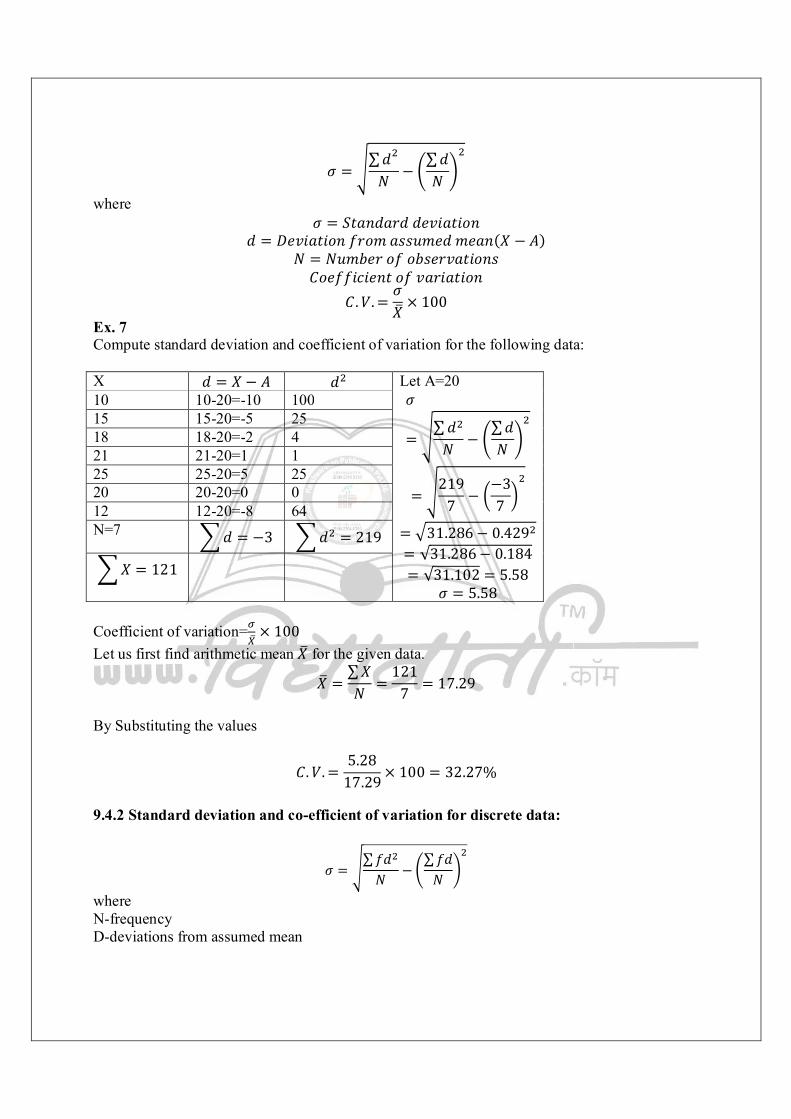
휎 =∑푑푁 −
∑푑푁
where 휎 = 푆푡푎푛푑푎푟푑푑푒푣푖푎푡푖표푛
푑 = 퐷푒푣푖푎푡푖표푛푓푟표푚푎푠푠푢푚푒푑푚푒푎푛(푋 − 퐴) 푁 = 푁푢푚푏푒푟표푓표푏푠푒푟푣푎푡푖표푛푠 퐶표푒푓푓푖푐푖푒푛푡표푓푣푎푟푖푎푡푖표푛
퐶.푉. =휎푋
× 100 Ex. 7 Compute standard deviation and coefficient of variation for the following data: X 푑 = 푋 − 퐴 푑 Let A=20
휎
=∑푑푁 −
∑푑푁
=219
7 −−37
= 31.286− 0.429 = √31.286− 0.184 = √31.102 = 5.58
휎 = 5.58
10 10-20=-10 100 15 15-20=-5 25 18 18-20=-2 4 21 21-20=1 1 25 25-20=5 25 20 20-20=0 0 12 12-20=-8 64 N=7 푑 = −3 푑 = 219
푋 = 121
Coefficient of variation= × 100 Let us first find arithmetic mean 푋 for the given data.
푋 =∑푋푁 =
1217 = 17.29
By Substituting the values
퐶.푉. =5.28
17.29 × 100 = 32.27% 9.4.2 Standard deviation and co-efficient of variation for discrete data:
휎 =∑푓푑푁
−∑푓푑푁
where N-frequency D-deviations from assumed mean
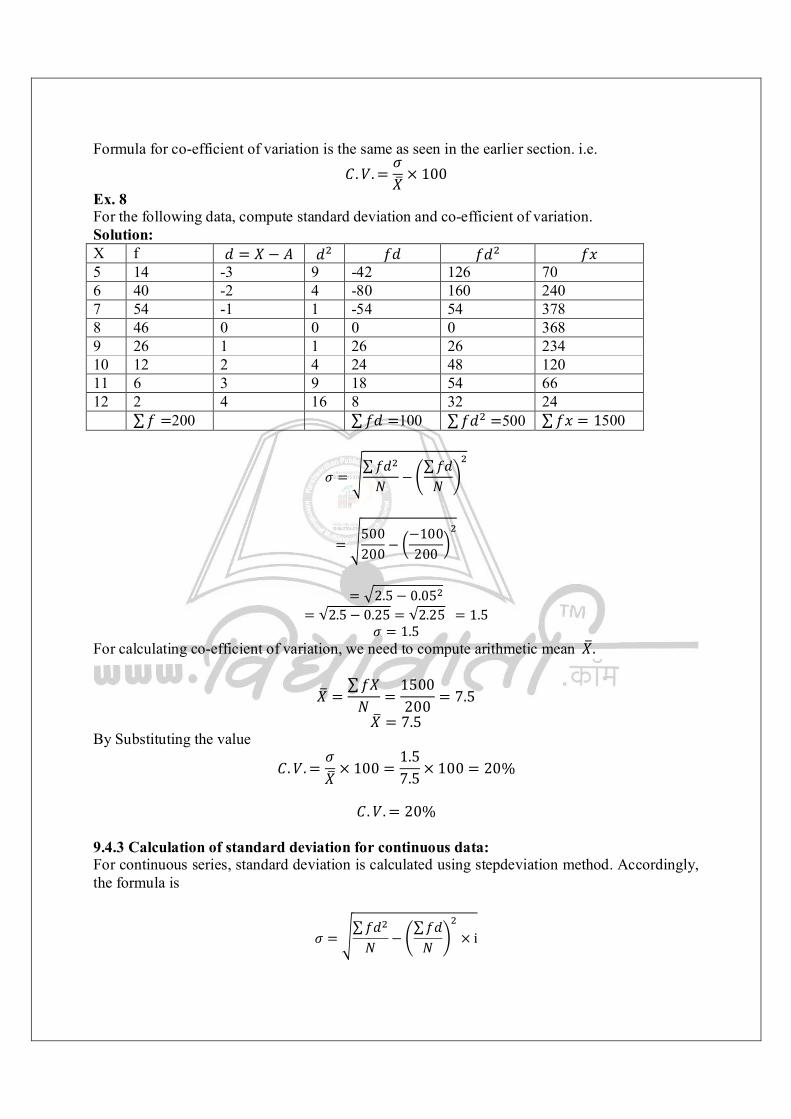
Formula for co-efficient of variation is the same as seen in the earlier section. i.e. 퐶.푉. =
휎푋
× 100 Ex. 8 For the following data, compute standard deviation and co-efficient of variation. Solution: X f 푑 = 푋 − 퐴 푑 푓푑 푓푑 푓푥 5 14 -3 9 -42 126 70 6 40 -2 4 -80 160 240 7 54 -1 1 -54 54 378 8 46 0 0 0 0 368 9 26 1 1 26 26 234 10 12 2 4 24 48 120 11 6 3 9 18 54 66 12 2 4 16 8 32 24 ∑푓 =200 ∑푓푑 =100 ∑푓푑 =500 ∑푓푥 = 1500
휎 =∑푓푑푁
−∑푓푑푁
=500200
−−100200
= 2.5− 0.05
= √2.5− 0.25 = √2.25 = 1.5 휎 = 1.5
For calculating co-efficient of variation, we need to compute arithmetic mean푋.
푋 =∑푓푋푁 =
1500200 = 7.5
푋 = 7.5 By Substituting the value
퐶.푉. =휎푋
× 100 =1.57.5 × 100 = 20%
퐶.푉. = 20%
9.4.3 Calculation of standard deviation for continuous data: For continuous series, standard deviation is calculated using stepdeviation method. Accordingly, the formula is
휎 =∑푓푑푁
−∑푓푑푁
× i
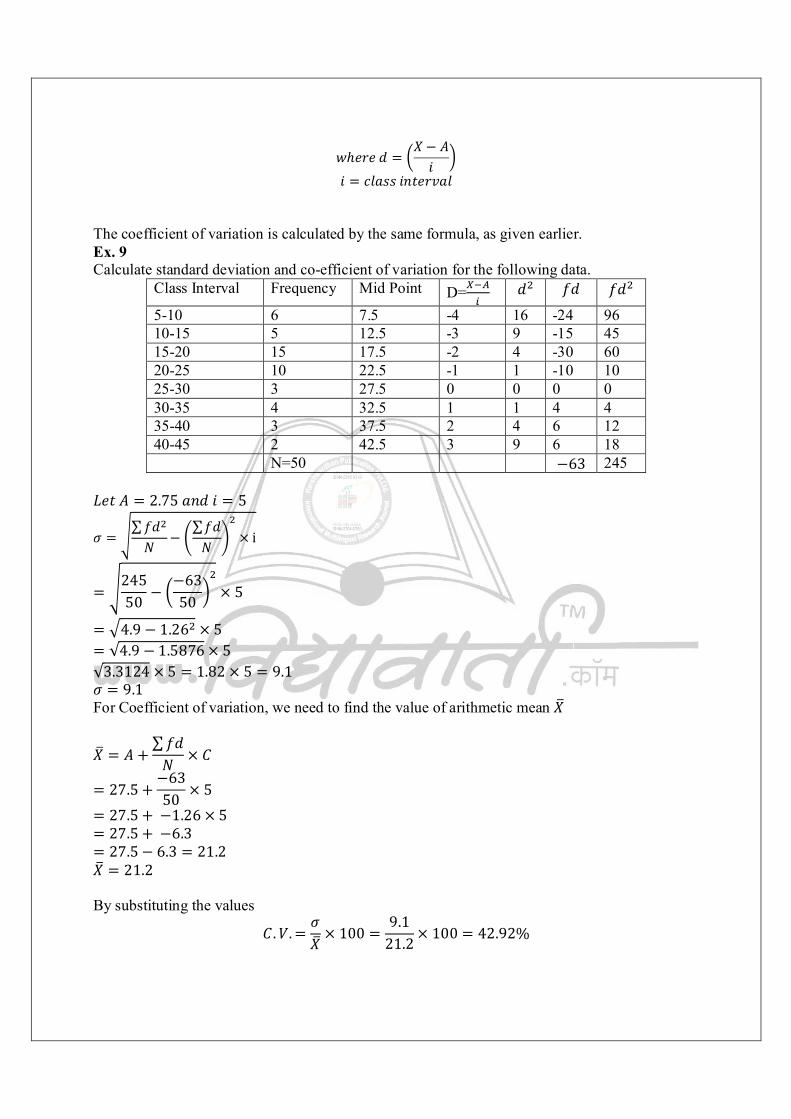
푤ℎ푒푟푒푑 =푋− 퐴푖
푖 = 푐푙푎푠푠푖푛푡푒푟푣푎푙 The coefficient of variation is calculated by the same formula, as given earlier. Ex. 9 Calculate standard deviation and co-efficient of variation for the following data.
Class Interval Frequency Mid Point D= 푑 푓푑 푓푑
5-10 6 7.5 -4 16 -24 96 10-15 5 12.5 -3 9 -15 45 15-20 15 17.5 -2 4 -30 60 20-25 10 22.5 -1 1 -10 10 25-30 3 27.5 0 0 0 0 30-35 4 32.5 1 1 4 4 35-40 3 37.5 2 4 6 12 40-45 2 42.5 3 9 6 18 N=50 −63 245
퐿푒푡퐴 = 2.75푎푛푑푖 = 5
휎 =∑푓푑푁
−∑푓푑푁
× i
=24550 −
−6350 × 5
= 4.9 − 1.26 × 5 = √4.9 − 1.5876 × 5 √3.3124 × 5 = 1.82 × 5 = 9.1 휎 = 9.1 For Coefficient of variation, we need to find the value of arithmetic mean 푋
푋 = 퐴 +∑푓푑푁 × 퐶
= 27.5 +−6350 × 5
= 27.5 + −1.26 × 5 = 27.5 + −6.3 = 27.5− 6.3 = 21.2 푋 = 21.2 By substituting the values
퐶.푉. =휎푋
× 100 =9.1
21.2× 100 = 42.92%
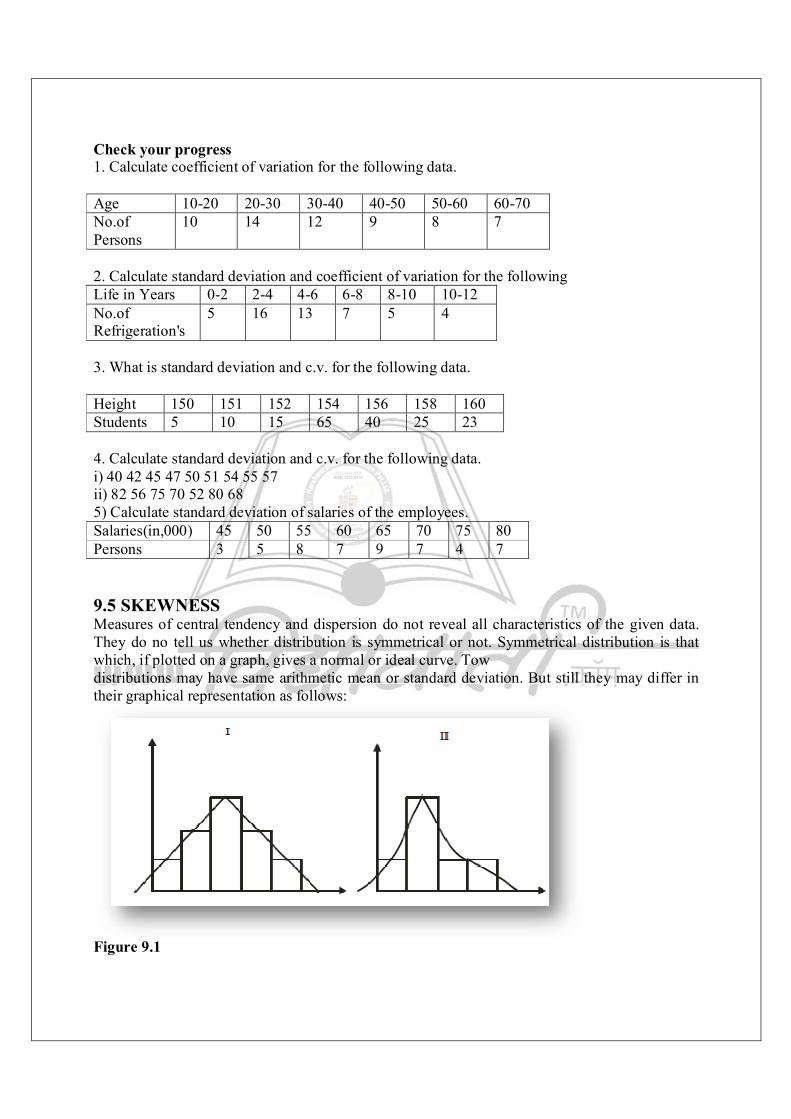
Check your progress 1. Calculate coefficient of variation for the following data. Age 10-20 20-30 30-40 40-50 50-60 60-70 No.of Persons
10 14 12 9 8 7
2. Calculate standard deviation and coefficient of variation for the following Life in Years 0-2 2-4 4-6 6-8 8-10 10-12 No.of Refrigeration's
5 16 13 7 5 4
3. What is standard deviation and c.v. for the following data. Height 150 151 152 154 156 158 160 Students 5 10 15 65 40 25 23 4. Calculate standard deviation and c.v. for the following data. i) 40 42 45 47 50 51 54 55 57 ii) 82 56 75 70 52 80 68 5) Calculate standard deviation of salaries of the employees. Salaries(in,000) 45 50 55 60 65 70 75 80 Persons 3 5 8 7 9 7 4 7 9.5 SKEWNESS Measures of central tendency and dispersion do not reveal all characteristics of the given data. They do no tell us whether distribution is symmetrical or not. Symmetrical distribution is that which, if plotted on a graph, gives a normal or ideal curve. Tow distributions may have same arithmetic mean or standard deviation. But still they may differ in their graphical representation as follows:
Figure 9.1
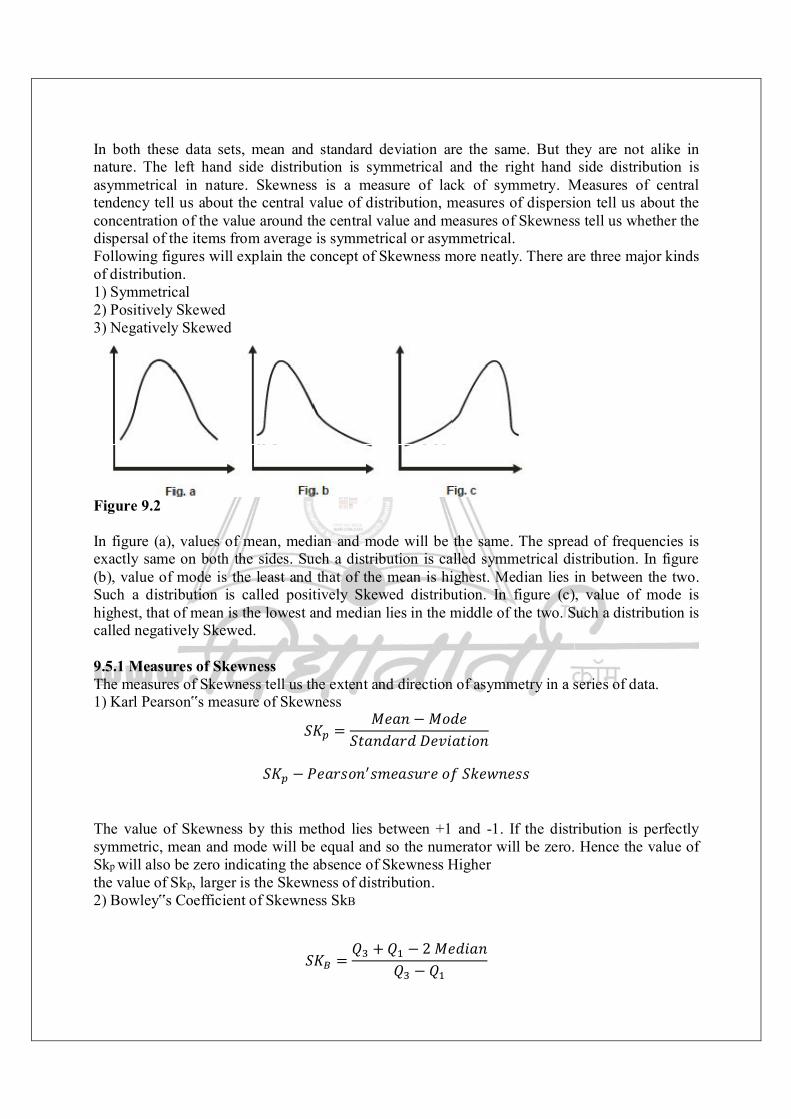
In both these data sets, mean and standard deviation are the same. But they are not alike in nature. The left hand side distribution is symmetrical and the right hand side distribution is asymmetrical in nature. Skewness is a measure of lack of symmetry. Measures of central tendency tell us about the central value of distribution, measures of dispersion tell us about the concentration of the value around the central value and measures of Skewness tell us whether the dispersal of the items from average is symmetrical or asymmetrical. Following figures will explain the concept of Skewness more neatly. There are three major kinds of distribution. 1) Symmetrical 2) Positively Skewed 3) Negatively Skewed
Figure 9.2 In figure (a), values of mean, median and mode will be the same. The spread of frequencies is exactly same on both the sides. Such a distribution is called symmetrical distribution. In figure (b), value of mode is the least and that of the mean is highest. Median lies in between the two. Such a distribution is called positively Skewed distribution. In figure (c), value of mode is highest, that of mean is the lowest and median lies in the middle of the two. Such a distribution is called negatively Skewed. 9.5.1 Measures of Skewness The measures of Skewness tell us the extent and direction of asymmetry in a series of data. 1) Karl Pearson‟s measure of Skewness
푆퐾 =푀푒푎푛 − 푀표푑푒
푆푡푎푛푑푎푟푑퐷푒푣푖푎푡푖표푛
푆퐾 − 푃푒푎푟푠표푛 푠푚푒푎푠푢푟푒표푓푆푘푒푤푛푒푠푠 The value of Skewness by this method lies between +1 and -1. If the distribution is perfectly symmetric, mean and mode will be equal and so the numerator will be zero. Hence the value of Skp will also be zero indicating the absence of Skewness Higher the value of Skp, larger is the Skewness of distribution. 2) Bowley‟s Coefficient of Skewness SkB
푆퐾 =푄 +푄 − 2푀푒푑푖푎푛
푄 − 푄

where
푄 − 퐹푖푟푠푡푞푢푎푟푡푖푙푒 푄 − 푡ℎ푖푟푑푞푢푎푟푡푖푙푒
This measure is called quartile measure of Skewness and its value always lies between +1 and -1. Note: Since we have already learnt the calculation of mean, median, quartiles and standard deviation, the students can compute measures of Skewness by using the formulae given above. Check your progress 1) Calculate Pearson and Bowley‟s Co-efficient of Skewness. X 12 17 22 27 32 37 42 47 f 28 42 54 108 129 61 45 33 2) Calculate Pearson and Bowley‟s co-efficient of Skewness. X 0-10 10-20 20-30 30-40 40-50 50-60 f 5 8 12 18 7 5 9.6 SUMMARY In this unit, we learnt two new steps in the analysis of data. How to measure the scatteredness of the data from its central value and how to measure Skewness of the data in comparison with the symmetrical distribution. All these measures are considered to be important in revealing the nature of data. 9.7 QUESTIONS 1) What is dispersion? Explain briefly the important measures of dispersion. 2) Write notes on the following: a. Range b. Quartile deviation c. Standard deviation and coefficient of variation 3) Discuss in detail the concept of Skewness.
10 ADVANCED ANALYSIS OF DATA
Unit Structure: 10.0 Objectives 10.1 Introduction 10.2 Correlation Analysis 10.3 Methods of studying correlation 10.4 Regression 10.5 Summary 10.6 Questions 10.0 OBJECTIVES To learn and understand the relationship between two variables. To explore the relationship between the variables through scatter diagram. To mathematically derive a coefficient of correlation by Karl Pearson. To understand and compute rank correlation by Spearman. To learn technique to estimate the value of one variable given the value of another through regression analysis. 10.1 INTRODUCTION Most of the variables under study are correlated to each other. For example price and demand, income and consumption, interest rate and investment, use of fertilizers and productivity of agriculture, father‟s height and sons height, etc. The nature and degree of correlation may be different. That means, some variables may be very closely related, some may not be related so closely. The correlation analysis helps in measuring the kind of such relationships. Once a nature of relationship between two variables is measured, it is possible to estimate the value of one variable, given the value of the other. For example, once we know that a price and the supply of commodity are correlated, we can estimate the expected supply for a given price. Regression analysis helps in estimating the unknown value of one variable from the known value of other variable. In this unit, we will learn the technique of correlation and regression. 10.2 CORRELATION ANALYSIS Correlation is a statistical method which helps in analyzing the relationship between two or more variables. The study of correlation is useful due to following reasons: 1) Since most of the variables have some kind of relationship, quantification of it is necessary to learn more about them. 2) Correlation is a first step towards estimation or prediction of unknown values of the variables. 3) An understanding of the degree and nature of correlation between two or more variables helps in reducing uncertainties about the economic behaviour of important variables like price level and money supply, interest rate and investment, taxation and willingness to work, etc. Correlation is classified into three ways: 1) Positive and Negative correlation (Depends upon the direction of change) : When both the variables change in the same direction, (i.e. they increase or decrease together) it is positive correlation. For example when price rises, supply also increases, when income falls, consumption also declines. When increase in one variable is accompanied by a fall in other, it is
negative correlation. For example, increase in price leads to fall in demand, increase in interest rate is accompanied by a fall in investment. 2) Simple and Multiple correlation (Depends upon number of variables under study) : Simple correlation is the relationship between two variables like height and weight of a person, or wage rate and employment in the economy. Multiple correlation, on the other hand, examines relationship between three or more variables. For example a relationship between production of rice per acre, rainfall and use of fertilizers is multiple in nature. 3) Linear and non-linear (Depends on the ratio of change between two variables) : When a change in one variable is in constant ratio with a change in other, it is linear relationship. For example doubling the amount of fertilizers used exactly doubles the yield per acre, it is linear relationship. Non-linear relationship exists when a change in one variable is not in constant ratio with a change in other. In this case doubling the amount of fertilizers may not exactly double the output per acre. 10.3 METHODS OF STUDYING CORRELATION Following important method of studying correlation between two variable will be discussed in this unit. Scatter diagram method. Karl Pearson‟s Coefficient of Correlation. Rank Correlation Coefficient. 10.3.1 Scatter diagram It is the simplest method of studying correlation, by using graphical method. Under this method, a given data about two variables is plotted in terms of dots. By looking at the spread or scatter of these dots, a quick idea about the degree and nature of correlation between the two variables can be obtained. Greater the spread of the plotted points, lesser is an association between two variables. That is, if the two variable are closely related, the scatter of the points representing them will be less and vice versa. Following are different scatter diagrams explaining the correlation of different degrees and directions.

Fig 10.1
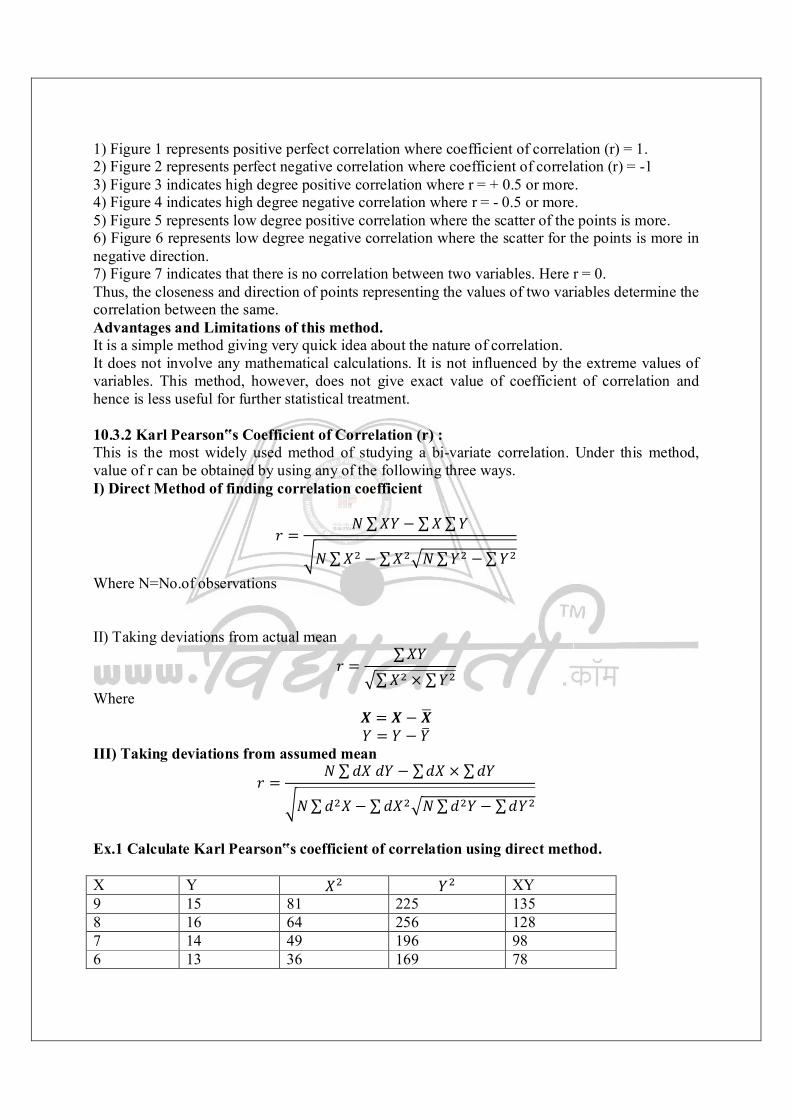
1) Figure 1 represents positive perfect correlation where coefficient of correlation (r) = 1. 2) Figure 2 represents perfect negative correlation where coefficient of correlation (r) = -1 3) Figure 3 indicates high degree positive correlation where r = + 0.5 or more. 4) Figure 4 indicates high degree negative correlation where r = - 0.5 or more. 5) Figure 5 represents low degree positive correlation where the scatter of the points is more. 6) Figure 6 represents low degree negative correlation where the scatter for the points is more in negative direction. 7) Figure 7 indicates that there is no correlation between two variables. Here r = 0. Thus, the closeness and direction of points representing the values of two variables determine the correlation between the same. Advantages and Limitations of this method. It is a simple method giving very quick idea about the nature of correlation. It does not involve any mathematical calculations. It is not influenced by the extreme values of variables. This method, however, does not give exact value of coefficient of correlation and hence is less useful for further statistical treatment. 10.3.2 Karl Pearson‟s Coefficient of Correlation (r) : This is the most widely used method of studying a bi-variate correlation. Under this method, value of r can be obtained by using any of the following three ways. I) Direct Method of finding correlation coefficient
푟 =푁∑푋푌 − ∑푋∑푌
푁∑푋 − ∑푋 푁∑푌 −∑푌
Where N=No.of observations II) Taking deviations from actual mean
푟 =∑푋푌
∑푋 × ∑푌
Where 푿 = 푿 − 푿 푌 = 푌 − 푌
III) Taking deviations from assumed mean
푟 =푁∑푑푋푑푌 − ∑푑푋 × ∑푑푌
푁∑푑 푋 − ∑푑푋 푁∑푑 푌 − ∑푑푌
Ex.1 Calculate Karl Pearson‟s coefficient of correlation using direct method. X Y 푋 푌 XY 9 15 81 225 135 8 16 64 256 128 7 14 49 196 98 6 13 36 169 78
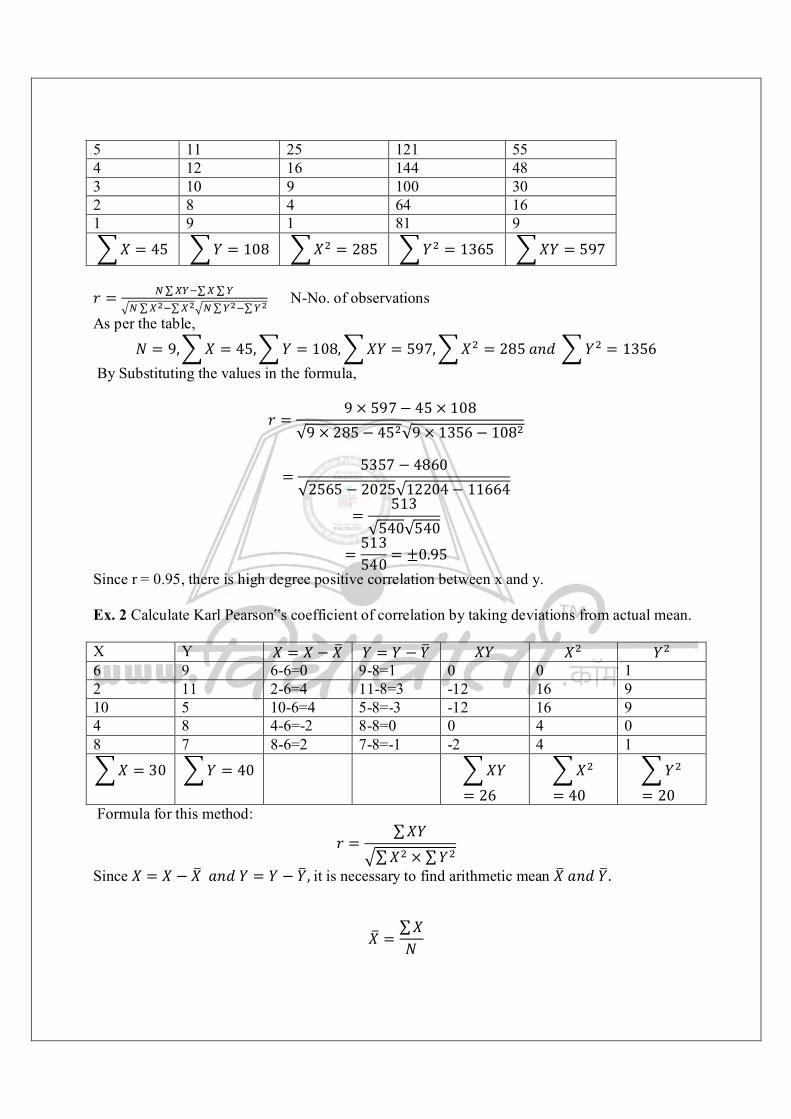
5 11 25 121 55 4 12 16 144 48 3 10 9 100 30 2 8 4 64 16 1 9 1 81 9
푋 = 45 푌 = 108 푋 = 285 푌 = 1365 푋푌 = 597 푟 = ∑ ∑ ∑
∑ ∑ ∑ ∑ N-No. of observations
As per the table,
푁 = 9, 푋 = 45, 푌 = 108, 푋푌 = 597, 푋 = 285푎푛푑 푌 = 1356 By Substituting the values in the formula,
푟 =9 × 597− 45 × 108
√9 × 285− 45 √9 × 1356 − 108
=5357 − 4860
√2565 − 2025√12204− 11664
=513
√540√540
=513540 = ±0.95
Since r = 0.95, there is high degree positive correlation between x and y. Ex. 2 Calculate Karl Pearson‟s coefficient of correlation by taking deviations from actual mean. X Y 푋 = 푋 − 푋 푌 = 푌 − 푌 푋푌 푋 푌 6 9 6-6=0 9-8=1 0 0 1 2 11 2-6=4 11-8=3 -12 16 9 10 5 10-6=4 5-8=-3 -12 16 9 4 8 4-6=-2 8-8=0 0 4 0 8 7 8-6=2 7-8=-1 -2 4 1
푋 = 30 푌 = 40 푋푌= 26
푋= 40
푌= 20
Formula for this method:
푟 =∑푋푌
∑푋 × ∑푌
Since 푋 = 푋 − 푋푎푛푑푌 = 푌 − 푌,it is necessary to find arithmetic mean 푋푎푛푑푌.
푋 =∑푋푁
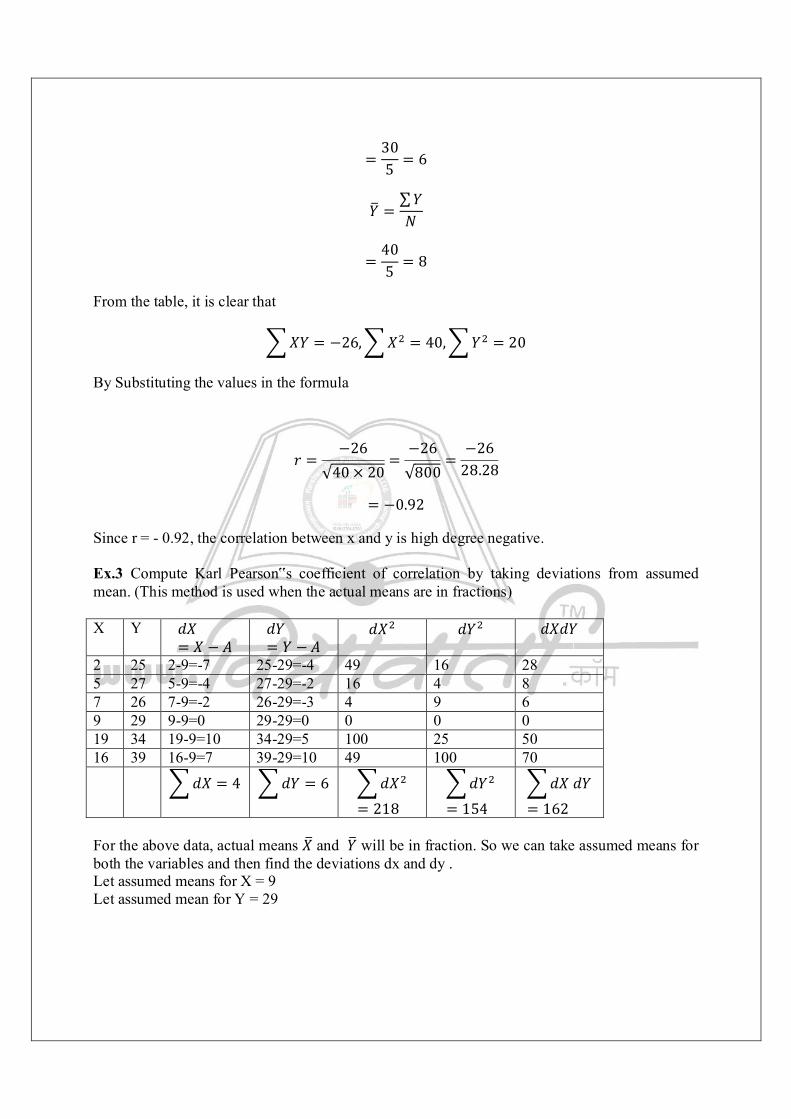
=305 = 6
푌 =∑푌푁
=405 = 8
From the table, it is clear that
푋푌 = −26, 푋 = 40, 푌 = 20
By Substituting the values in the formula
푟 =−26
√40 × 20=
−26√800
=−26
28.28
= −0.92
Since r = - 0.92, the correlation between x and y is high degree negative. Ex.3 Compute Karl Pearson‟s coefficient of correlation by taking deviations from assumed mean. (This method is used when the actual means are in fractions) X Y 푑푋
= 푋 − 퐴 푑푌= 푌 − 퐴
푑푋 푑푌 푑푋푑푌
2 25 2-9=-7 25-29=-4 49 16 28 5 27 5-9=-4 27-29=-2 16 4 8 7 26 7-9=-2 26-29=-3 4 9 6 9 29 9-9=0 29-29=0 0 0 0 19 34 19-9=10 34-29=5 100 25 50 16 39 16-9=7 39-29=10 49 100 70 푑푋 = 4 푑푌 = 6 푑푋
= 218
푑푌= 154
푑푋푑푌= 162
For the above data, actual means 푋 and 푌 will be in fraction. So we can take assumed means for both the variables and then find the deviations dx and dy . Let assumed means for X = 9 Let assumed mean for Y = 29
푟 =푁∑푑푋푑푌 − ∑푑푋 × ∑푑푌
푁∑푑 푋 −∑푑푋 푁∑푑 푌 − ∑푑푌
From the table,
푁 = 6, 푑푋푑푌 = 162, 푑푋 = 4 , 푑푌 = 6, 푑푋 = 218, 푑푌 = 154 By substituting these values in the formula,
푟 =6 × 162− 4 × 6
√6 × 218− 4 √6 × 154− 6
=972− 36
√1308 − 16√924− 36
=948
√1292√888=
948√1147296
=948
1071.12
= 0.89 Since r = 0.89, there is high degree positive correlation between X and Y. Check your progress 1) Find correlation coefficient for the following data. X 10 6 9 10 12 13 11 9 Y 9 4 6 9 11 13 8 4 Ans: 푟 = 0.896 2) X 45 70 65 30 90 40 50 75 85 60 Y 35 90 70 40 95 40 60 80 80 50 Ans.푟 = 0.903 3) X 15 12 16 15 17 14 18 Y 17 14 20 25 20 24 22 Ans: 푟 = 0.214 10.3.3 Rank Correlation: For certain categories like beauty, honestry, etc quantitative measurement is not possible. Also sometimes the population under study may not be normally distributed. In such cases, instead of Karl Pearson‟s co-efficient of correlation, Spearman‟s Rank correlation coefficient is calculated. This method is used to the determine the level of agreement or disagreement between two judges. The calculations involved in this method are much simpler than the earlier method. Rank correlation is calculated using the following formula.

푅 = 1−6∑퐷푁푁 − 1
When D-Difference between rank 1 and rank 2 N- No. of observations. Rank correlation is computed in following two ways: 1) When ranks are given. 2) When ranks are not given. 10.3.3.1 Rank correlation when ranks are given: Ex.4 Following are the ranks given by two judges in a beauty contest. Find rank correlation coefficient. Ranks by judge 1푅 Ranks by judge 2 푅 퐷 = 푅 − 푅 퐷 1 4 -3 9 2 5 -3 9 3 6 -3 9 4 7 -3 9 5 8 -3 9 6 2 4 16 7 3 4 16 8 1 7 49 N=8 퐷 = 126
푅 = 1−6 × ∑퐷푁푁 − 1
By substituting the values from the table
= 1 −6 × 1268. 8 − 1
= 1 −6 × 1268 × 63 = 1 −
756504
= 1 − 1.5 = −0.5 Since rank correlation co-efficient is -0.5, there is a moderate negative correlation between the ranking by two judges. 10.3.3.2 Calculation of rank correlation co-efficient, when the ranks are not given: Ex.4 Calculate rank correlation for the following data. X Y 푅 푅푎푛푘푡표푋 푅 푅푎푛푘푡표푌 퐷 = 푅 − 푅 퐷 67 78 2 2 0 0 42 80 8 1 7 49 53 77 7 3 4 16
66 73 3 6 -3 9 62 75 4 4 0 0 60 68 5 7 -2 4 54 63 6 8 -2 4 68 74 1 5 -4 16 퐷 = 98 When the ranks are not given, we have to assign ranks to the given data. The ranks can be assigned in ascending (Rank 1 to the lowest value) or descending (Rank 1 to the highest value) order. In this example, ranks are given in descending order. The highest value gets rank 1 and so one.
푅 = 1−6∑퐷푁푁 − 1 = 1 −
6 × 988 × 8 − 1
= 1 −6 × 988 × 63 = 1 −
588504 = 1− 1
푅 = −0.167
Since rank correlation coefficient is -0.167, the relationship between X and Y is low degree negative. Check your progress Find rank correlation coefficient for the following data Rank by Judge A
7 6 5 8 3 1 2 4
Rank by Judge B
6 8 3 7 1 2 4 5
Ans. 0.76 2) X 75 88 95 70 60 80 81 50 Y 120 134 150 115 110 140 142 100 Ans:0.929 10.4 REGRESSION 10.4.1 Introduction: Establishing relationship between two variables may be a first step towards statistical analysis. Once such a relationship is established, one may be interested in predicting the value of one variable given the value of other. Economists, businessmen policy makers or researchers are always interested in estimating profits, sales, demand, income, population, etc. Regression analysis helps in estimating or predicting the value of unknown variable with the help of known variable. The variable which is unknown or whose value is to be predicted is called dependent variable and the variable whose value is known is called independent variable. 10.4.2 Usefulness of Regression Analysis
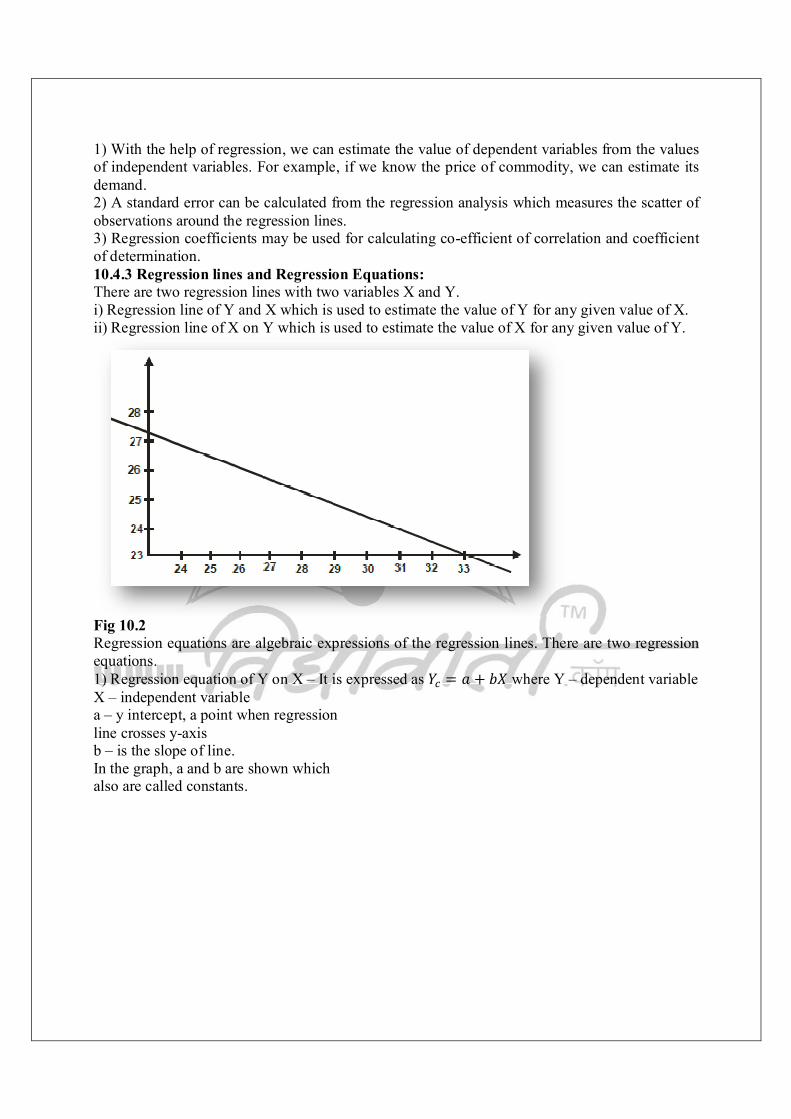
1) With the help of regression, we can estimate the value of dependent variables from the values of independent variables. For example, if we know the price of commodity, we can estimate its demand. 2) A standard error can be calculated from the regression analysis which measures the scatter of observations around the regression lines. 3) Regression coefficients may be used for calculating co-efficient of correlation and coefficient of determination. 10.4.3 Regression lines and Regression Equations: There are two regression lines with two variables X and Y. i) Regression line of Y and X which is used to estimate the value of Y for any given value of X. ii) Regression line of X on Y which is used to estimate the value of X for any given value of Y.
Fig 10.2 Regression equations are algebraic expressions of the regression lines. There are two regression equations. 1) Regression equation of Y on X – It is expressed as 푌 = 푎 + 푏푋 where Y – dependent variable X – independent variable a – y intercept, a point when regression line crosses y-axis b – is the slope of line. In the graph, a and b are shown which also are called constants.
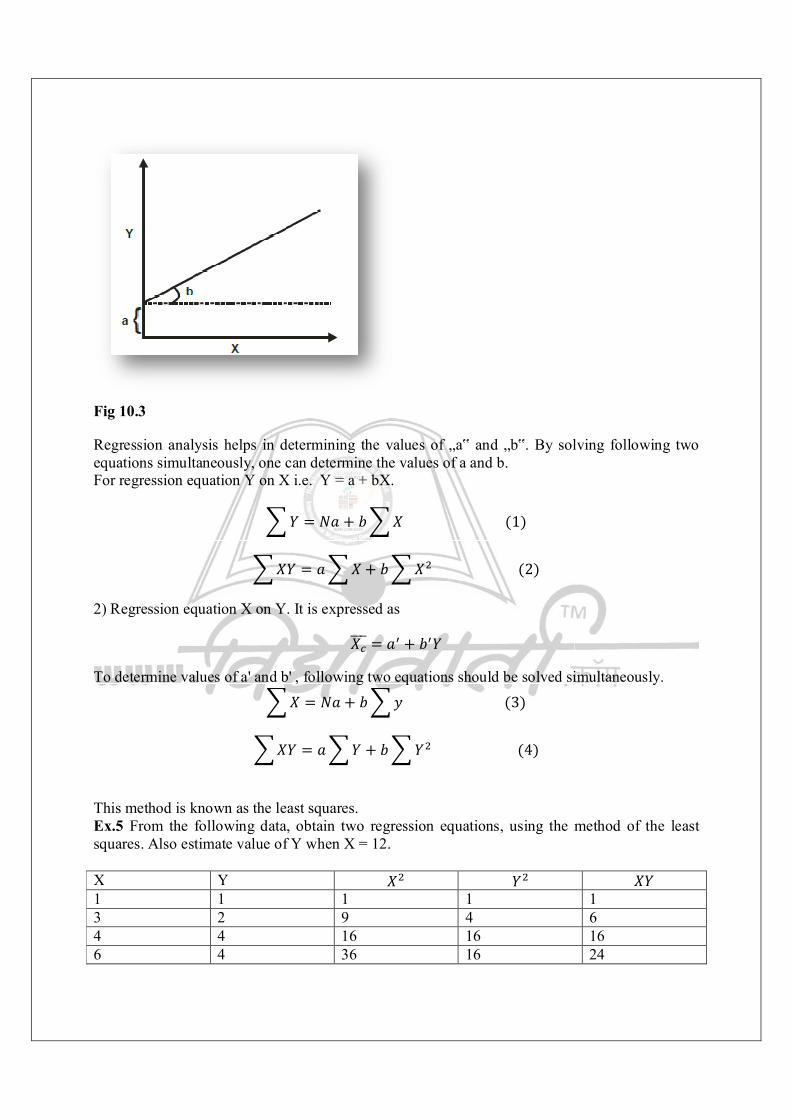
Fig 10.3
Regression analysis helps in determining the values of „a‟ and „b‟. By solving following two equations simultaneously, one can determine the values of a and b. For regression equation Y on X i.e. Y = a + bX.
푌 = 푁푎 + 푏 푋(1)
푋푌 = 푎 푋 + 푏 푋 (2)
2) Regression equation X on Y. It is expressed as
푋 = 푎 + 푏 푌
To determine values of a' and b' , following two equations should be solved simultaneously.
푋 = 푁푎 + 푏 푦(3)
푋푌 = 푎 푌 + 푏 푌 (4)
This method is known as the least squares. Ex.5 From the following data, obtain two regression equations, using the method of the least squares. Also estimate value of Y when X = 12. X Y 푋 푌 푋푌 1 1 1 1 1 3 2 9 4 6 4 4 16 16 16 6 4 36 16 24
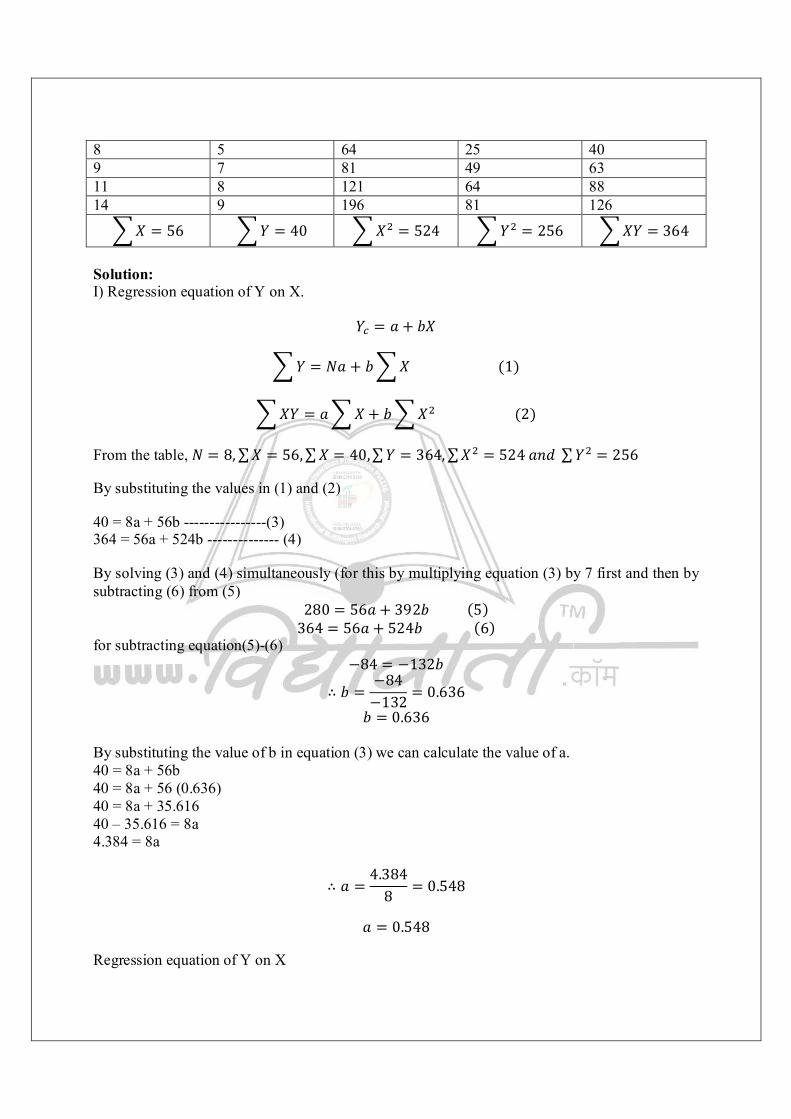
8 5 64 25 40 9 7 81 49 63 11 8 121 64 88 14 9 196 81 126
푋 = 56 푌 = 40 푋 = 524 푌 = 256 푋푌 = 364 Solution: I) Regression equation of Y on X.
푌 = 푎 + 푏푋
푌 = 푁푎 + 푏 푋(1)
푋푌 = 푎 푋 + 푏 푋 (2)
From the table, 푁 = 8,∑푋 = 56,∑푋 = 40,∑푌 = 364,∑푋 = 524푎푛푑 ∑ 푌 = 256
By substituting the values in (1) and (2)
40 = 8a + 56b ----------------(3) 364 = 56a + 524b -------------- (4)
By solving (3) and (4) simultaneously (for this by multiplying equation (3) by 7 first and then by subtracting (6) from (5)
280 = 56푎 + 392푏(5) 364 = 56푎 + 524푏(6)
for subtracting equation(5)-(6) −84 = −132푏
∴ 푏 =−84−132 = 0.636 푏 = 0.636
By substituting the value of b in equation (3) we can calculate the value of a. 40 = 8a + 56b 40 = 8a + 56 (0.636) 40 = 8a + 35.616 40 – 35.616 = 8a 4.384 = 8a
∴ 푎 =4.384
8 = 0.548
푎 = 0.548
Regression equation of Y on X
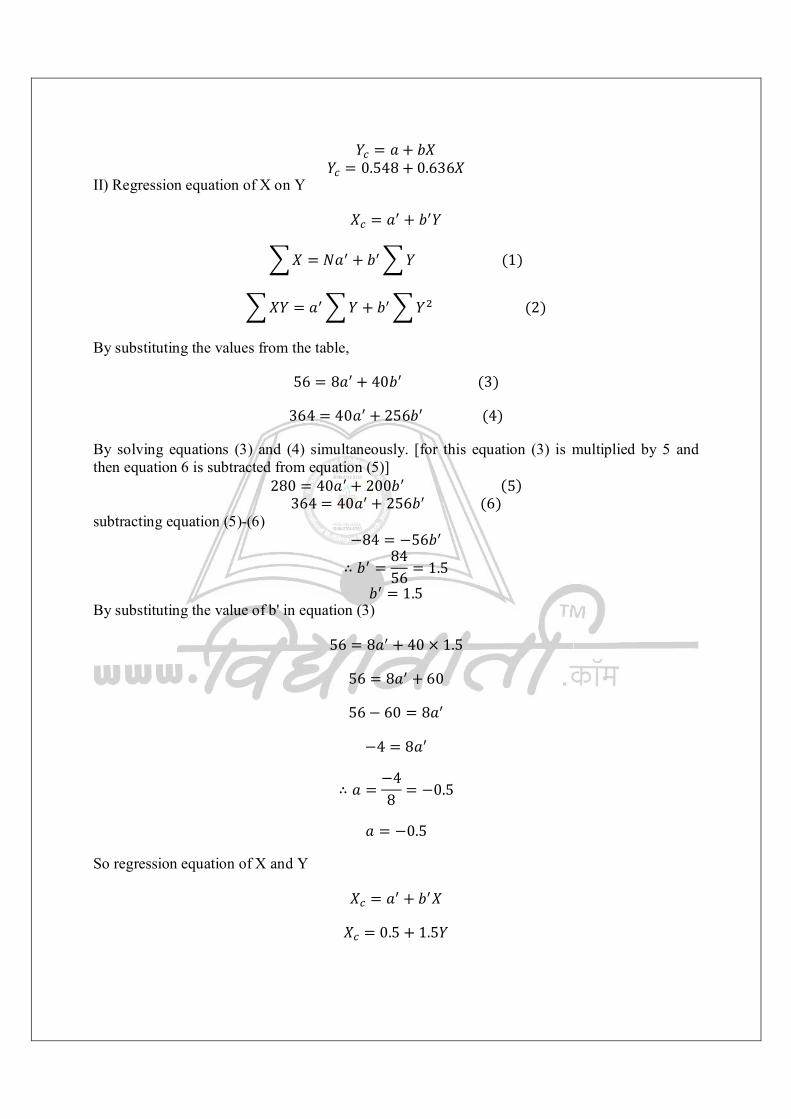
푌 = 푎 + 푏푋 푌 = 0.548 + 0.636푋
II) Regression equation of X on Y
푋 = 푎 + 푏 푌
푋 = 푁푎 + 푏 푌(1)
푋푌 = 푎 푌 + 푏 푌 (2)
By substituting the values from the table,
56 = 8푎 + 40푏 (3)
364 = 40푎 + 256푏 (4)
By solving equations (3) and (4) simultaneously. [for this equation (3) is multiplied by 5 and then equation 6 is subtracted from equation (5)]
280 = 40푎 + 200푏 (5) 364 = 40푎 + 256푏 (6)
subtracting equation (5)-(6) −84 = −56푏
∴ 푏 =8456 = 1.5
푏 = 1.5 By substituting the value of b' in equation (3)
56 = 8푎 + 40 × 1.5
56 = 8푎 + 60
56− 60 = 8푎
−4 = 8푎
∴ 푎 =−48 = −0.5
푎 = −0.5
So regression equation of X and Y
푋 = 푎 + 푏 푋
푋 = 0.5 + 1.5푌
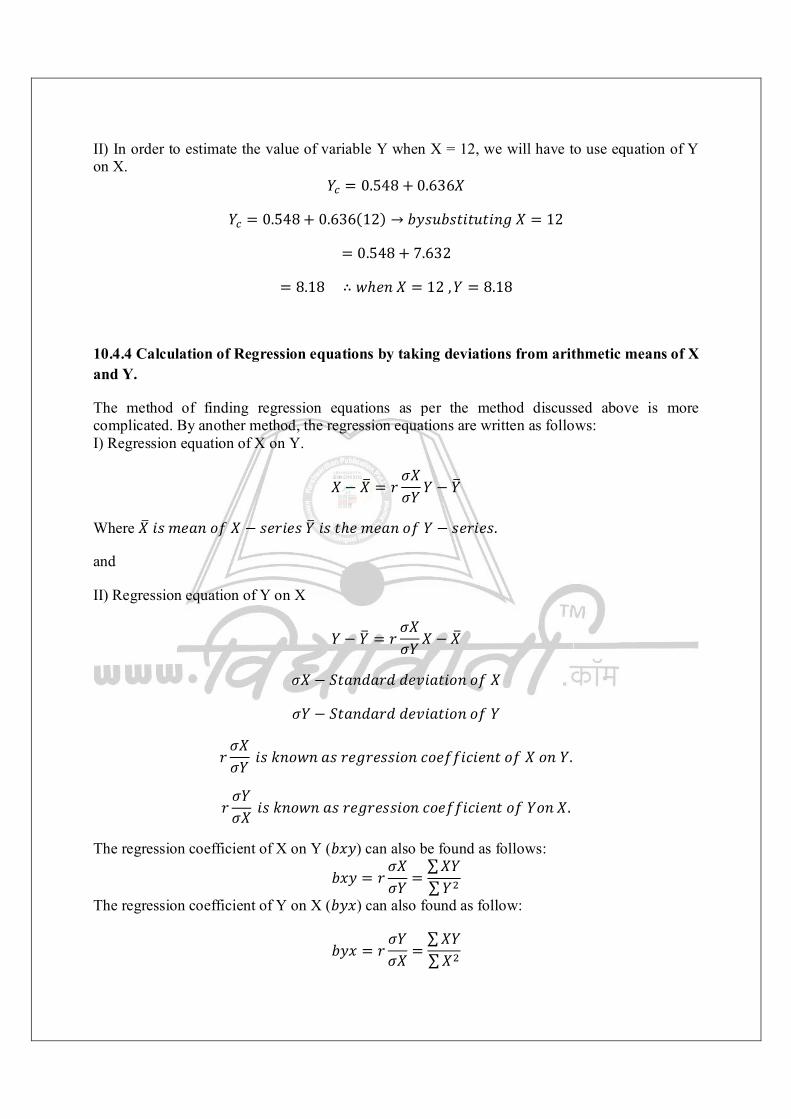
II) In order to estimate the value of variable Y when X = 12, we will have to use equation of Y on X.
푌 = 0.548 + 0.636푋
푌 = 0.548 + 0.636(12) → 푏푦푠푢푏푠푡푖푡푢푡푖푛푔푋 = 12
= 0.548 + 7.632
= 8.18 ∴ 푤ℎ푒푛푋 = 12,푌 = 8.18
10.4.4 Calculation of Regression equations by taking deviations from arithmetic means of X and Y.
The method of finding regression equations as per the method discussed above is more complicated. By another method, the regression equations are written as follows: I) Regression equation of X on Y.
푋 − 푋 = 푟휎푋휎푌 푌 − 푌
Where 푋푖푠푚푒푎푛표푓푋 − 푠푒푟푖푒푠푌푖푠푡ℎ푒푚푒푎푛표푓푌 − 푠푒푟푖푒푠.
and
II) Regression equation of Y on X
푌 − 푌 = 푟휎푋휎푌 푋 − 푋
휎푋 − 푆푡푎푛푑푎푟푑푑푒푣푖푎푡푖표푛표푓푋
휎푌 − 푆푡푎푛푑푎푟푑푑푒푣푖푎푡푖표푛표푓푌
푟휎푋휎푌 푖푠푘푛표푤푛푎푠푟푒푔푟푒푠푠푖표푛푐표푒푓푓푖푐푖푒푛푡표푓푋표푛푌.
푟휎푌휎푋 푖푠푘푛표푤푛푎푠푟푒푔푟푒푠푠푖표푛푐표푒푓푓푖푐푖푒푛푡표푓푌표푛푋.
The regression coefficient of X on Y (푏푥푦) can also be found as follows:
푏푥푦 = 푟휎푋휎푌 =
∑푋푌∑푌
The regression coefficient of Y on X (푏푦푥) can also found as follow:
푏푦푥 = 푟휎푌휎푋 =
∑푋푌∑푋
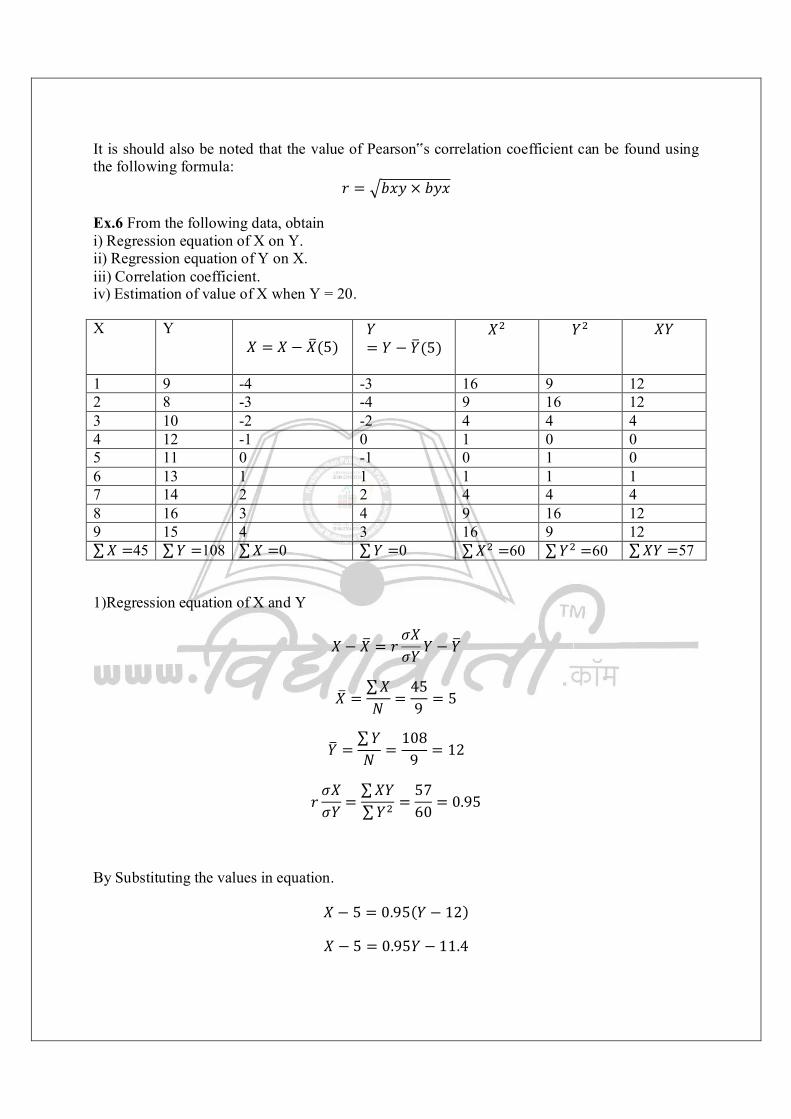
It is should also be noted that the value of Pearson‟s correlation coefficient can be found using the following formula:
푟 = 푏푥푦 × 푏푦푥
Ex.6 From the following data, obtain i) Regression equation of X on Y. ii) Regression equation of Y on X. iii) Correlation coefficient. iv) Estimation of value of X when Y = 20.
X Y 푋 = 푋 − 푋(5)
푌= 푌 − 푌(5)
푋 푌 푋푌
1 9 -4 -3 16 9 12 2 8 -3 -4 9 16 12 3 10 -2 -2 4 4 4 4 12 -1 0 1 0 0 5 11 0 -1 0 1 0 6 13 1 1 1 1 1 7 14 2 2 4 4 4 8 16 3 4 9 16 12 9 15 4 3 16 9 12 ∑푋 =45 ∑푌 =108 ∑푋 =0 ∑푌 =0 ∑푋 =60 ∑푌 =60 ∑푋푌 =57
1)Regression equation of X and Y
푋 − 푋 = 푟휎푋휎푌 푌 − 푌
푋 =∑푋푁 =
459 = 5
푌 =∑푌푁 =
1089 = 12
푟휎푋휎푌 =
∑푋푌∑푌 =
5760 = 0.95
By Substituting the values in equation.
푋 − 5 = 0.95(푌 − 12)
푋 − 5 = 0.95푌 − 11.4

푋 = 0.95푌 − 11.4 + 5
푋 = 0.95푌 − 16.4
Regression equation of X on Y → 푋 = −16.4 + 0.95푌
II) Regression equation of Y on X.
푌 − 푌 = 푟휎푌휎푋푋 − 푋
푟휎푌휎푋 =
∑푋푌∑푋 =
5760 = 0.95
By Substituting the values in equation
푌 − 12 = 0.95 × −5
푌 − 12 = 0.95푋 − 4.75
푌 = 0.95푋 − 4.75 + 12
푌 = 0.95푋 + 7.25
푅푒푔푟푒푠푠표푛푒푞푢푎푡푖표푛표푓푌표푛푋 → 푌 = 0.95푋 + 7.25
iii) Correlation Coefficient
푟 = 푏푥푦 × 푏푦푥푏푥푦 = 0.95
푟 = √0.95 × 0.95푏푦푥 = 0.95
= 0.95푟 = 0.95
iv) Value of X when Y=20
푋 = −16.4 + 0.95(20) → 푏푦푠푢푏푠푡푖푡푢푡푖푛푔푣푎푙푢푒표푓푌
푋 = −16.4 + 19
푋 = 2.6
Ex. 7 If you are given the following information, find i) Two regression equations. ii) Estimate value of X when Y = 75 X Y Arithmetic Mean 36 85 Standard Deviation 11 8
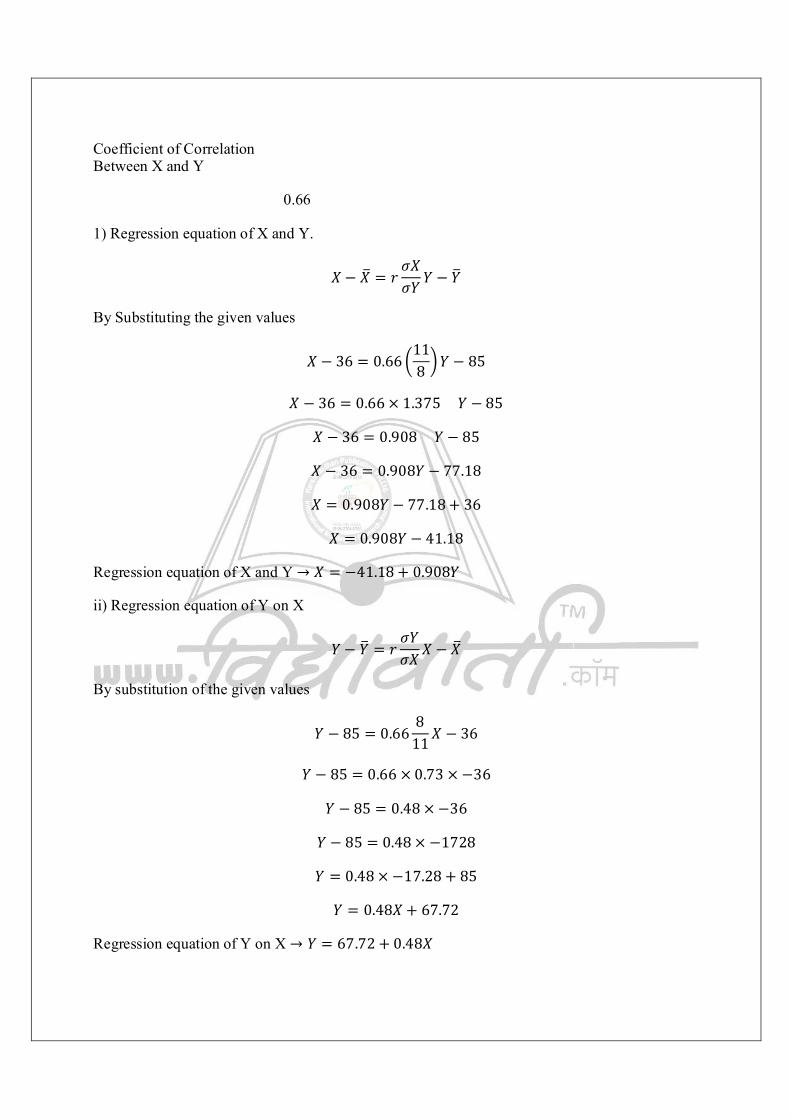
Coefficient of Correlation Between X and Y
0.66
1) Regression equation of X and Y.
푋 − 푋 = 푟휎푋휎푌 푌 − 푌
By Substituting the given values
푋 − 36 = 0.66118 푌 − 85
푋 − 36 = 0.66 × 1.375푌 − 85
푋 − 36 = 0.908푌 − 85
푋 − 36 = 0.908푌 − 77.18
푋 = 0.908푌 − 77.18 + 36
푋 = 0.908푌 − 41.18
Regression equation of X and Y → 푋 = −41.18 + 0.908푌
ii) Regression equation of Y on X
푌 − 푌 = 푟휎푌휎푋푋 − 푋
By substitution of the given values
푌 − 85 = 0.668
11푋 − 36
푌 − 85 = 0.66 × 0.73 × −36
푌 − 85 = 0.48 × −36
푌 − 85 = 0.48 × −1728
푌 = 0.48 × −17.28 + 85
푌 = 0.48푋 + 67.72
Regression equation of Y on X → 푌 = 67.72 + 0.48푋
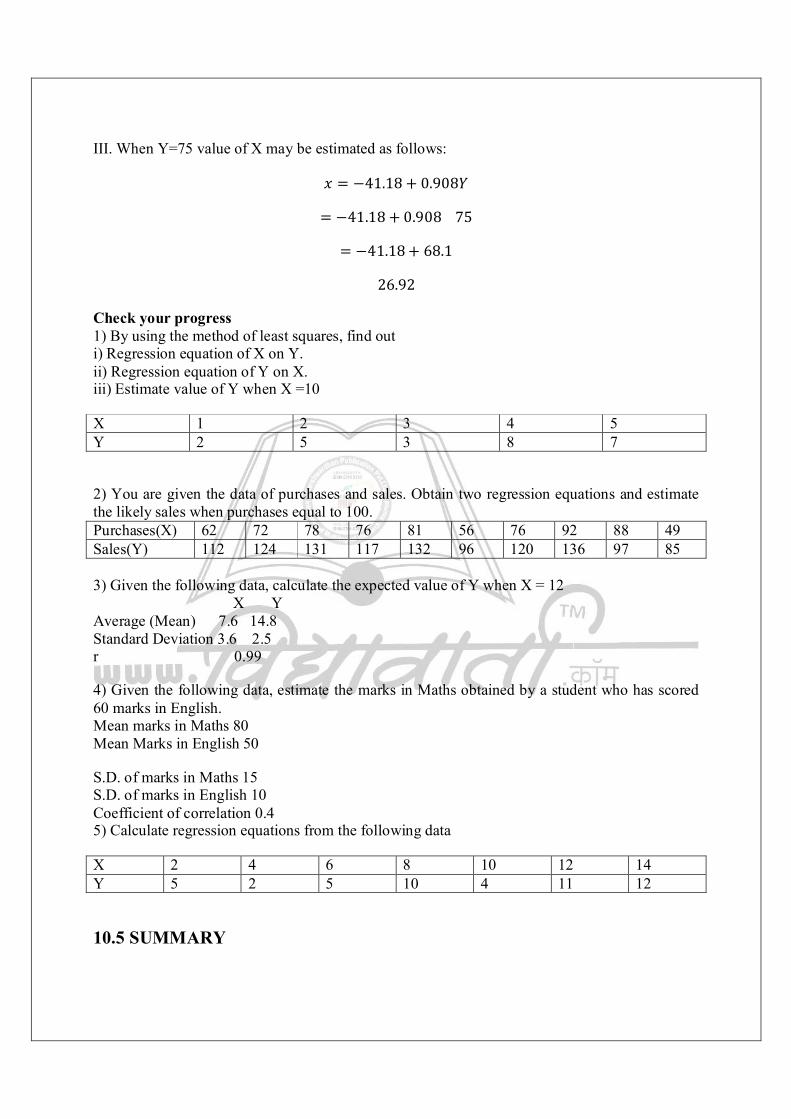
III. When Y=75 value of X may be estimated as follows:
푥 = −41.18 + 0.908푌
= −41.18 + 0.90875
= −41.18 + 68.1
26.92
Check your progress 1) By using the method of least squares, find out i) Regression equation of X on Y. ii) Regression equation of Y on X. iii) Estimate value of Y when X =10
X 1 2 3 4 5 Y 2 5 3 8 7
2) You are given the data of purchases and sales. Obtain two regression equations and estimate the likely sales when purchases equal to 100. Purchases(X) 62 72 78 76 81 56 76 92 88 49 Sales(Y) 112 124 131 117 132 96 120 136 97 85 3) Given the following data, calculate the expected value of Y when X = 12 X Y Average (Mean) 7.6 14.8 Standard Deviation 3.6 2.5 r 0.99
4) Given the following data, estimate the marks in Maths obtained by a student who has scored 60 marks in English. Mean marks in Maths 80 Mean Marks in English 50
S.D. of marks in Maths 15 S.D. of marks in English 10 Coefficient of correlation 0.4 5) Calculate regression equations from the following data
X 2 4 6 8 10 12 14 Y 5 2 5 10 4 11 12
10.5 SUMMARY
In this unit we have learnt correlation and regression analysis, which have a very important place in the statistical analysis of the data. Some important technique we learnt are: a) Karl Pearson‟s correlation of coefficient. b) Spearman‟s Rank correlation coefficient. c) Regression equations by the method of least squares. d) Regression equations by the method of deviations from arithmetic mean. e) Regression coefficients. All these concepts and calculations should be carefully studied. The students are required to refer to the books on statistics for variety of exercise. 10.6 QUESTIONS 1. Explain correlation and its classification. 2. Discuss the important methods of studying correlation between two variables. 3. Explain the meaning and usefulness of Regression analysis.
11 TIME SERIES ANALYSIS
Unit Structure: 11.0 Objectives 11.1 Introduction 11.2 Estimation of trend 11.3 Summary 11.4 Questions 11.0 OBJECTIVES To understand the meaning and importance of time series data. To estimate the trends in the data using three, four and five yearly moving averages. To learn how linear trend can be found out using regression analysis for time series data. 11.1 INTRODUCTION Time series data is the data collected on the basis of some element of time. Wheat production for last 20 years, movement of share price of a company over last 15 days. Weekly sales of a manufacturing firm are some of the examples of time series data. In other words, a time series consists of statistical data which are collected, recorded and observed over successive increments of time. Economists and business men are generally interested in finding out future trends about say demand, for a commodity, incomes of consumer or likely demand for a particular service. Such an estimate is necessary for long-term planning. 11.1.1 Significance of time series analysis: 1) Analysis of time series helps in understanding the past trends in the behaviour of a particular variable. For example, trends in the production of wheat over last 20 years will be extremely helpful in predicting about future production of wheat. 2) Time series analysis helps in planning for the future programmes. The statistical techniques provided under time series analysis help in predicting future values of a variable under consideration, on the basis of past data. For example the demand for residential needs in 2020 in Mumbai can be predicted from the past trends about the demand for housing in Mumbai. 3) Different time series can be compared and important observations can be made from such comparisons. 11.1.2 Components of Time Series: There may be fluctuations in the time series data due to many reasons. These are called the components of time series. There are four components. a) Secular Trend b) Seasonal Variations c) Cyclical Variation d) Irregular Movements a) Secular Trend: It explains the long term changes in the time series data. Generally populations, sales, production, income, consumption, etc have a rising trend whereas, the use of bullock carts, death rates and birth rates have declining trends. It implies that all the time series data have a general tendency of either a rise or fall over period of time. This tendency is known as a secular trend. b) Seasonal Variations: These are the movements in time series data which occur regularly every year, due to seasonal variations or changes in climatic or weather conditions. For example the demand for umbrellas is very high during rainy season and low during the other seasons.
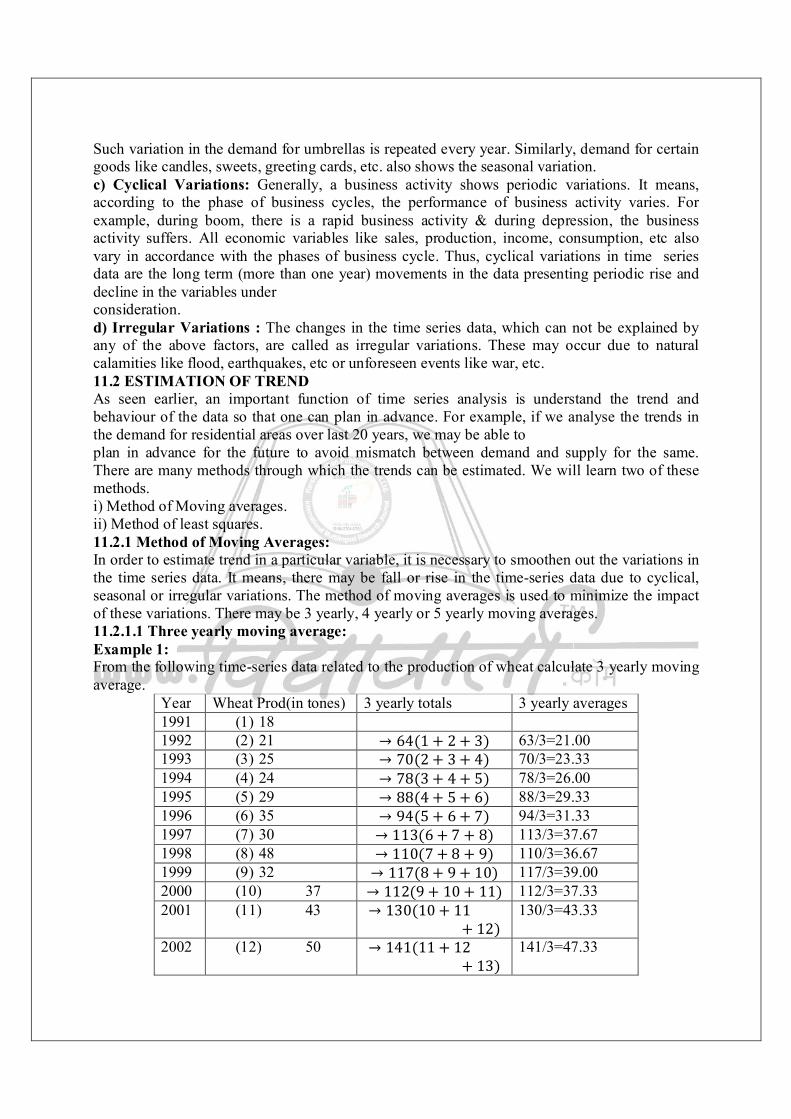
Such variation in the demand for umbrellas is repeated every year. Similarly, demand for certain goods like candles, sweets, greeting cards, etc. also shows the seasonal variation. c) Cyclical Variations: Generally, a business activity shows periodic variations. It means, according to the phase of business cycles, the performance of business activity varies. For example, during boom, there is a rapid business activity & during depression, the business activity suffers. All economic variables like sales, production, income, consumption, etc also vary in accordance with the phases of business cycle. Thus, cyclical variations in time series data are the long term (more than one year) movements in the data presenting periodic rise and decline in the variables under consideration. d) Irregular Variations : The changes in the time series data, which can not be explained by any of the above factors, are called as irregular variations. These may occur due to natural calamities like flood, earthquakes, etc or unforeseen events like war, etc. 11.2 ESTIMATION OF TREND As seen earlier, an important function of time series analysis is understand the trend and behaviour of the data so that one can plan in advance. For example, if we analyse the trends in the demand for residential areas over last 20 years, we may be able to plan in advance for the future to avoid mismatch between demand and supply for the same. There are many methods through which the trends can be estimated. We will learn two of these methods. i) Method of Moving averages. ii) Method of least squares. 11.2.1 Method of Moving Averages: In order to estimate trend in a particular variable, it is necessary to smoothen out the variations in the time series data. It means, there may be fall or rise in the time-series data due to cyclical, seasonal or irregular variations. The method of moving averages is used to minimize the impact of these variations. There may be 3 yearly, 4 yearly or 5 yearly moving averages. 11.2.1.1 Three yearly moving average: Example 1: From the following time-series data related to the production of wheat calculate 3 yearly moving average.
Year Wheat Prod(in tones) 3 yearly totals 3 yearly averages 1991 (1) 18 1992 (2) 21 → 64(1 + 2 + 3) 63/3=21.00 1993 (3) 25 → 70(2 + 3 + 4) 70/3=23.33 1994 (4) 24 → 78(3 + 4 + 5) 78/3=26.00 1995 (5) 29 → 88(4 + 5 + 6) 88/3=29.33 1996 (6) 35 → 94(5 + 6 + 7) 94/3=31.33 1997 (7) 30 → 113(6 + 7 + 8) 113/3=37.67 1998 (8) 48 → 110(7 + 8 + 9) 110/3=36.67 1999 (9) 32 → 117(8 + 9 + 10) 117/3=39.00 2000 (10) 37 → 112(9 + 10 + 11) 112/3=37.33 2001 (11) 43 → 130(10 + 11
+ 12) 130/3=43.33
2002 (12) 50 → 141(11 + 12+ 13)
141/3=47.33
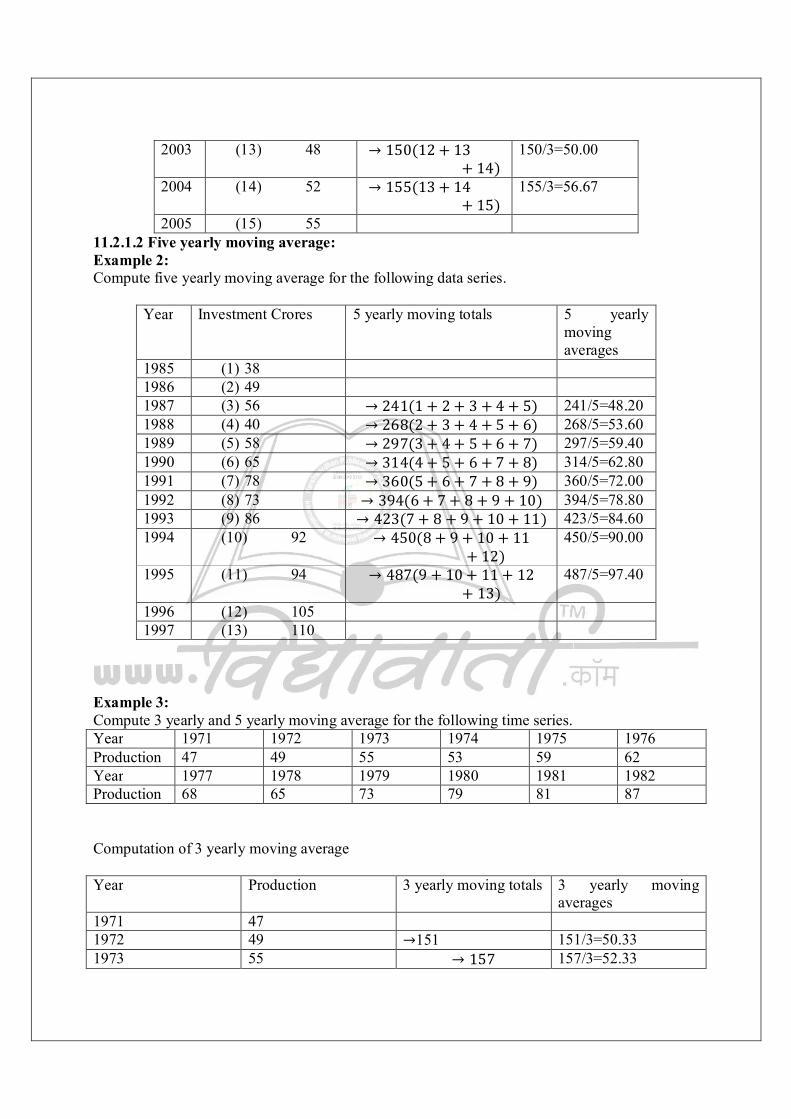
2003 (13) 48 → 150(12 + 13+ 14)
150/3=50.00
2004 (14) 52 → 155(13 + 14+ 15)
155/3=56.67
2005 (15) 55 11.2.1.2 Five yearly moving average: Example 2: Compute five yearly moving average for the following data series.
Year Investment Crores 5 yearly moving totals 5 yearly moving averages
1985 (1) 38 1986 (2) 49 1987 (3) 56 → 241(1 + 2 + 3 + 4 + 5) 241/5=48.20 1988 (4) 40 → 268(2 + 3 + 4 + 5 + 6) 268/5=53.60 1989 (5) 58 → 297(3 + 4 + 5 + 6 + 7) 297/5=59.40 1990 (6) 65 → 314(4 + 5 + 6 + 7 + 8) 314/5=62.80 1991 (7) 78 → 360(5 + 6 + 7 + 8 + 9) 360/5=72.00 1992 (8) 73 → 394(6 + 7 + 8 + 9 + 10) 394/5=78.80 1993 (9) 86 → 423(7 + 8 + 9 + 10 + 11) 423/5=84.60 1994 (10) 92 → 450(8 + 9 + 10 + 11
+ 12) 450/5=90.00
1995 (11) 94 → 487(9 + 10 + 11 + 12+ 13)
487/5=97.40
1996 (12) 105 1997 (13) 110
Example 3: Compute 3 yearly and 5 yearly moving average for the following time series. Year 1971 1972 1973 1974 1975 1976 Production 47 49 55 53 59 62 Year 1977 1978 1979 1980 1981 1982 Production 68 65 73 79 81 87 Computation of 3 yearly moving average Year Production 3 yearly moving totals 3 yearly moving
averages 1971 47 1972 49 →151 151/3=50.33 1973 55 → 157 157/3=52.33
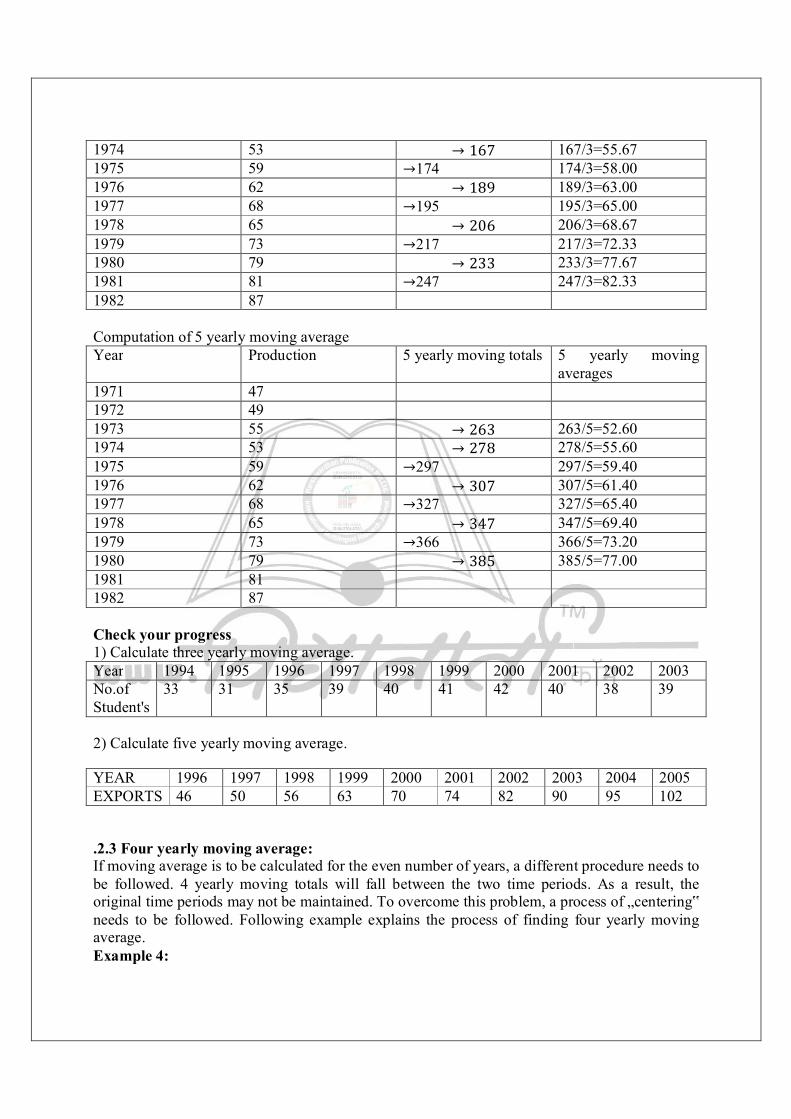
1974 53 → 167 167/3=55.67 1975 59 →174 174/3=58.00 1976 62 → 189 189/3=63.00 1977 68 →195 195/3=65.00 1978 65 → 206 206/3=68.67 1979 73 →217 217/3=72.33 1980 79 → 233 233/3=77.67 1981 81 →247 247/3=82.33 1982 87 Computation of 5 yearly moving average Year Production 5 yearly moving totals 5 yearly moving
averages 1971 47 1972 49 1973 55 → 263 263/5=52.60 1974 53 → 278 278/5=55.60 1975 59 →297 297/5=59.40 1976 62 → 307 307/5=61.40 1977 68 →327 327/5=65.40 1978 65 → 347 347/5=69.40 1979 73 →366 366/5=73.20 1980 79 → 385 385/5=77.00 1981 81 1982 87 Check your progress 1) Calculate three yearly moving average. Year 1994 1995 1996 1997 1998 1999 2000 2001 2002 2003 No.of Student's
33 31 35 39 40 41 42 40 38 39
2) Calculate five yearly moving average.
YEAR 1996 1997 1998 1999 2000 2001 2002 2003 2004 2005 EXPORTS 46 50 56 63 70 74 82 90 95 102
.2.3 Four yearly moving average: If moving average is to be calculated for the even number of years, a different procedure needs to be followed. 4 yearly moving totals will fall between the two time periods. As a result, the original time periods may not be maintained. To overcome this problem, a process of „centering‟ needs to be followed. Following example explains the process of finding four yearly moving average. Example 4:
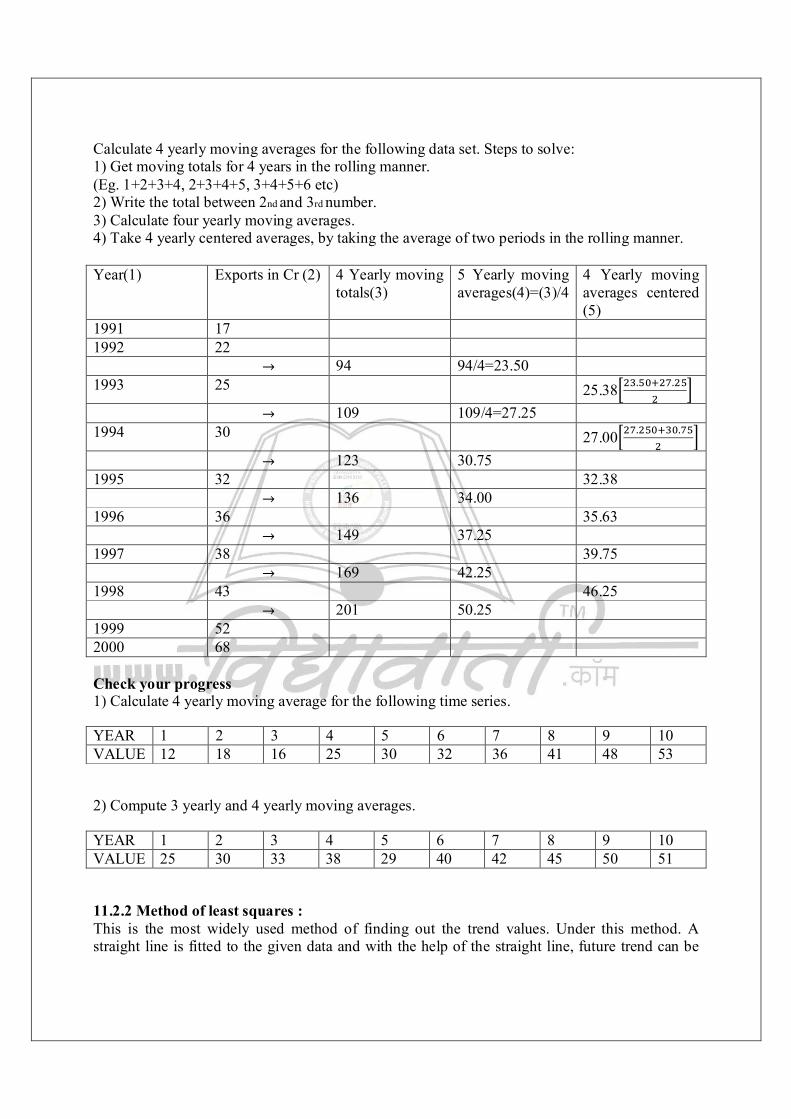
Calculate 4 yearly moving averages for the following data set. Steps to solve: 1) Get moving totals for 4 years in the rolling manner. (Eg. 1+2+3+4, 2+3+4+5, 3+4+5+6 etc) 2) Write the total between 2nd and 3rd number. 3) Calculate four yearly moving averages. 4) Take 4 yearly centered averages, by taking the average of two periods in the rolling manner. Year(1) Exports in Cr (2) 4 Yearly moving
totals(3) 5 Yearly moving averages(4)=(3)/4
4 Yearly moving averages centered (5)
1991 17 1992 22 → 94 94/4=23.50 1993 25 25.38 . . → 109 109/4=27.25 1994 30 27.00 . . → 123 30.75 1995 32 32.38 → 136 34.00 1996 36 35.63 → 149 37.25 1997 38 39.75 → 169 42.25 1998 43 46.25 → 201 50.25 1999 52 2000 68 Check your progress 1) Calculate 4 yearly moving average for the following time series.
YEAR 1 2 3 4 5 6 7 8 9 10 VALUE 12 18 16 25 30 32 36 41 48 53
2) Compute 3 yearly and 4 yearly moving averages.
YEAR 1 2 3 4 5 6 7 8 9 10 VALUE 25 30 33 38 29 40 42 45 50 51
11.2.2 Method of least squares : This is the most widely used method of finding out the trend values. Under this method. A straight line is fitted to the given data and with the help of the straight line, future trend can be
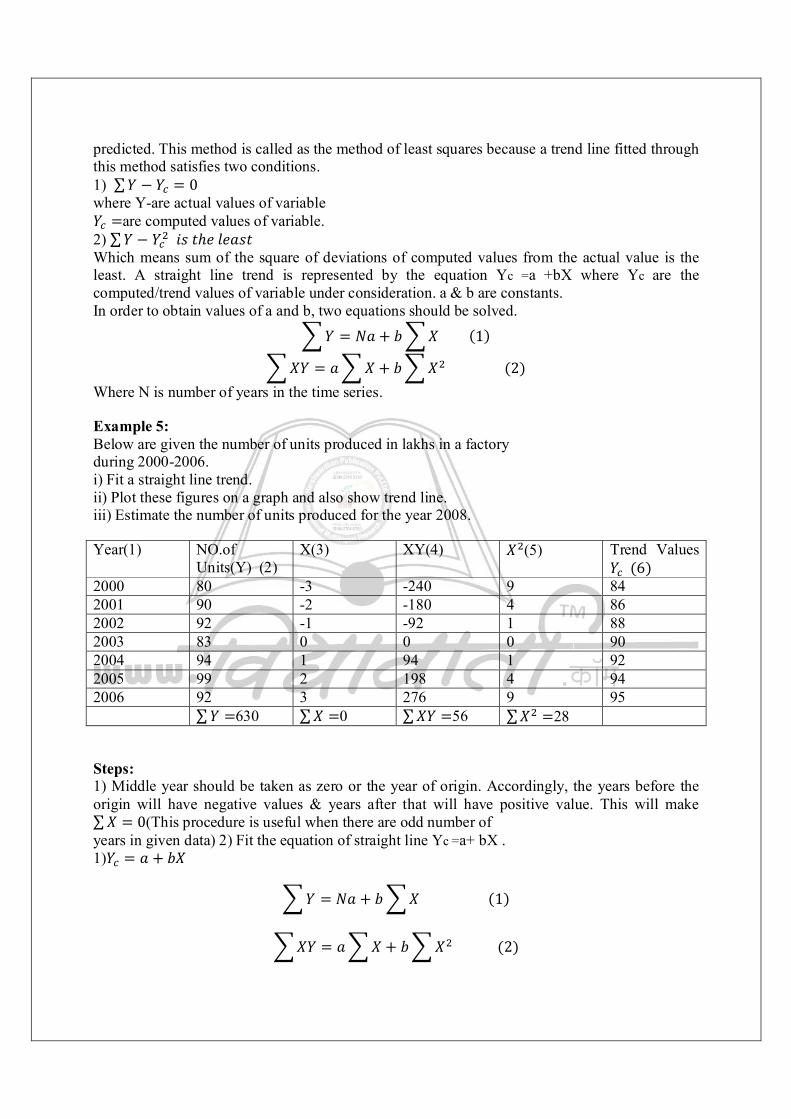
predicted. This method is called as the method of least squares because a trend line fitted through this method satisfies two conditions. 1) ∑푌 − 푌 = 0 where Y-are actual values of variable 푌 =are computed values of variable. 2) ∑푌 − 푌 푖푠푡ℎ푒푙푒푎푠푡 Which means sum of the square of deviations of computed values from the actual value is the least. A straight line trend is represented by the equation Yc =a +bX where Yc are the computed/trend values of variable under consideration. a & b are constants. In order to obtain values of a and b, two equations should be solved.
푌 = 푁푎 + 푏 푋(1)
푋푌 = 푎 푋 + 푏 푋 (2) Where N is number of years in the time series.
Example 5: Below are given the number of units produced in lakhs in a factory during 2000-2006. i) Fit a straight line trend. ii) Plot these figures on a graph and also show trend line. iii) Estimate the number of units produced for the year 2008.
Year(1) NO.of Units(Y) (2)
X(3) XY(4) 푋 (5) Trend Values 푌 (6)
2000 80 -3 -240 9 84 2001 90 -2 -180 4 86 2002 92 -1 -92 1 88 2003 83 0 0 0 90 2004 94 1 94 1 92 2005 99 2 198 4 94 2006 92 3 276 9 95 ∑푌 =630 ∑푋 =0 ∑푋푌 =56 ∑푋 =28
Steps: 1) Middle year should be taken as zero or the year of origin. Accordingly, the years before the origin will have negative values & years after that will have positive value. This will make ∑푋 = 0(This procedure is useful when there are odd number of years in given data) 2) Fit the equation of straight line Yc =a+ bX . 1)푌 = 푎 + 푏푋
푌 = 푁푎 + 푏 푋(1)
푋푌 = 푎 푋 + 푏 푋 (2)
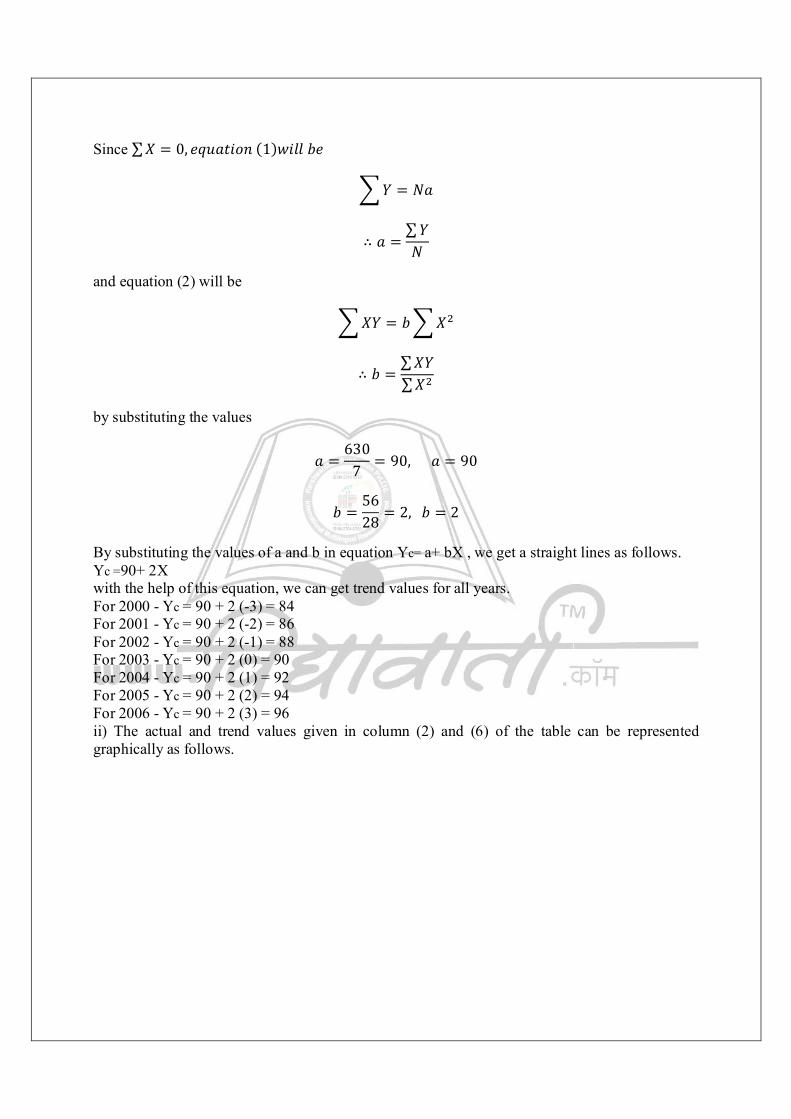
Since ∑푋 = 0, 푒푞푢푎푡푖표푛(1)푤푖푙푙푏푒
푌 = 푁푎
∴ 푎 =∑푌푁
and equation (2) will be
푋푌 = 푏 푋
∴ 푏 =∑푋푌∑푋
by substituting the values
푎 =630
7 = 90,푎 = 90
푏 =5628 = 2,푏 = 2
By substituting the values of a and b in equation Yc= a+ bX , we get a straight lines as follows. Yc =90+ 2X with the help of this equation, we can get trend values for all years. For 2000 - Yc = 90 + 2 (-3) = 84 For 2001 - Yc = 90 + 2 (-2) = 86 For 2002 - Yc = 90 + 2 (-1) = 88 For 2003 - Yc = 90 + 2 (0) = 90 For 2004 - Yc = 90 + 2 (1) = 92 For 2005 - Yc = 90 + 2 (2) = 94 For 2006 - Yc = 90 + 2 (3) = 96 ii) The actual and trend values given in column (2) and (6) of the table can be represented graphically as follows.
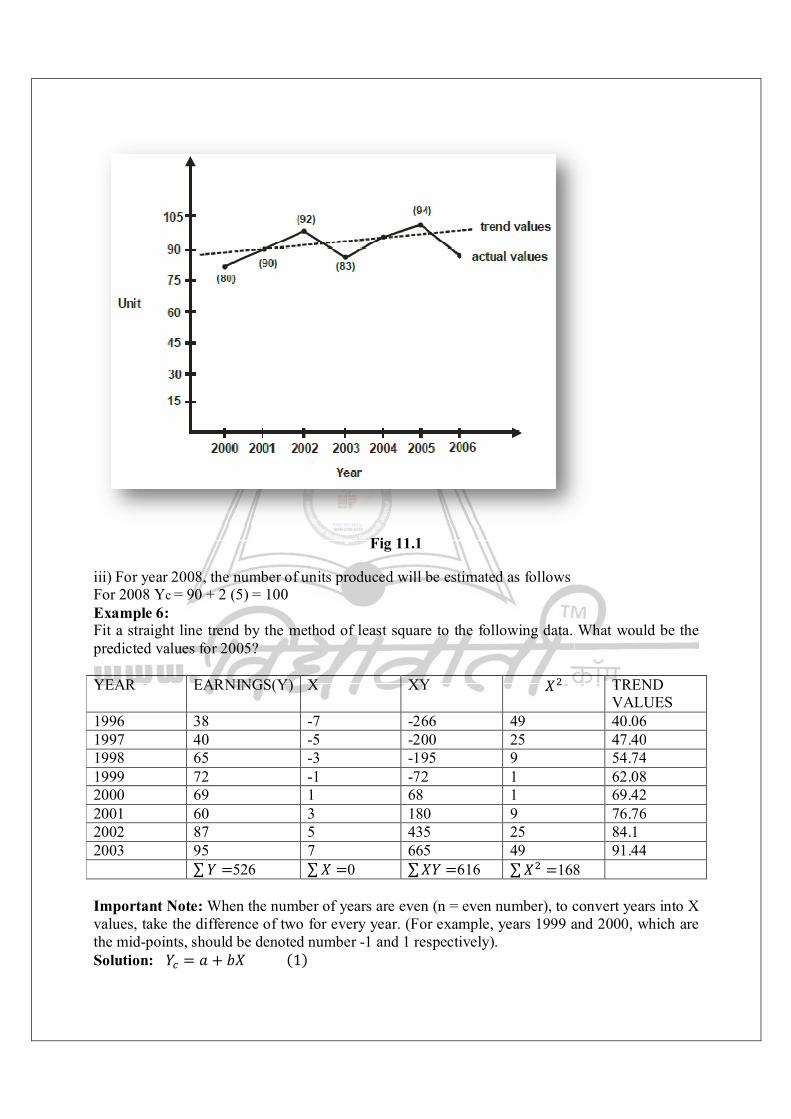
Fig 11.1
iii) For year 2008, the number of units produced will be estimated as follows For 2008 Yc = 90 + 2 (5) = 100 Example 6: Fit a straight line trend by the method of least square to the following data. What would be the predicted values for 2005? YEAR EARNINGS(Y) X XY 푋 TREND
VALUES 1996 38 -7 -266 49 40.06 1997 40 -5 -200 25 47.40 1998 65 -3 -195 9 54.74 1999 72 -1 -72 1 62.08 2000 69 1 68 1 69.42 2001 60 3 180 9 76.76 2002 87 5 435 25 84.1 2003 95 7 665 49 91.44 ∑푌 =526 ∑푋 =0 ∑푋푌 =616 ∑푋 =168 Important Note: When the number of years are even (n = even number), to convert years into X values, take the difference of two for every year. (For example, years 1999 and 2000, which are the mid-points, should be denoted number -1 and 1 respectively). Solution: 푌 = 푎 + 푏푋(1)
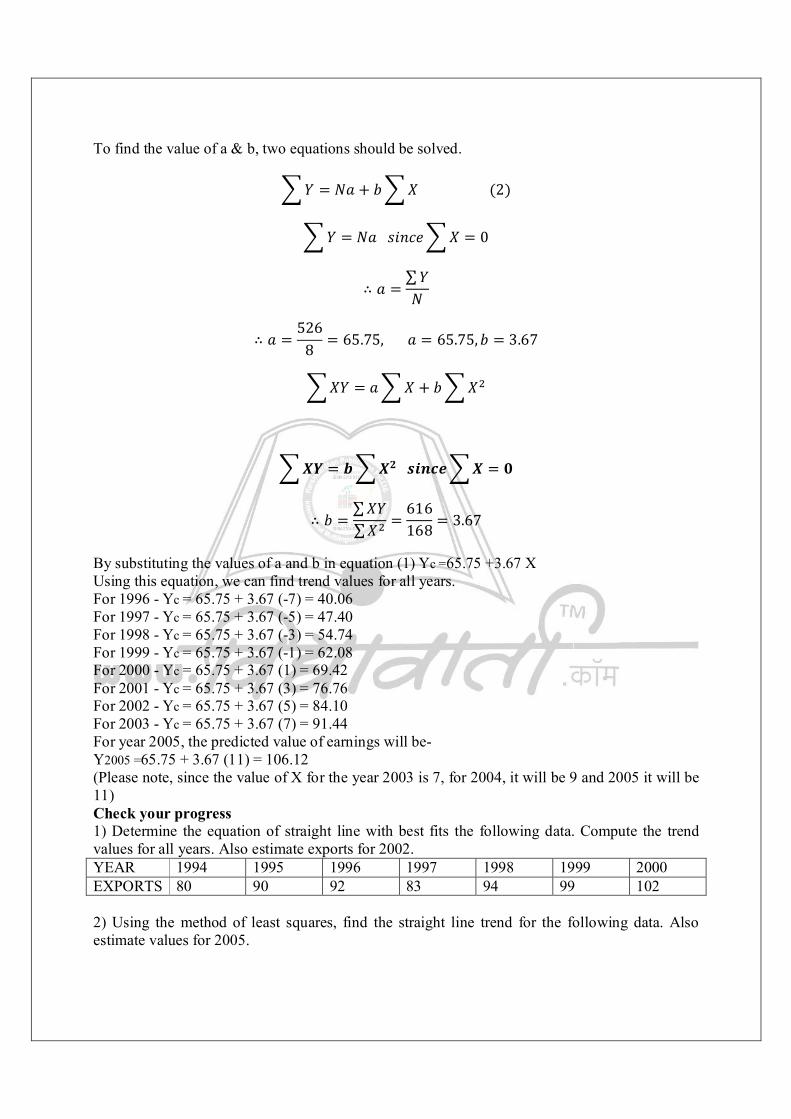
To find the value of a & b, two equations should be solved.
푌 = 푁푎 + 푏 푋(2)
푌 = 푁푎푠푖푛푐푒 푋 = 0
∴ 푎 =∑푌푁
∴ 푎 =526
8= 65.75,푎 = 65.75,푏 = 3.67
푋푌 = 푎 푋 + 푏 푋
푿풀 = 풃 푿ퟐ풔풊풏풄풆 푿 = ퟎ
∴ 푏 =∑푋푌∑푋 =
616168 = 3.67
By substituting the values of a and b in equation (1) Yc =65.75 +3.67 X Using this equation, we can find trend values for all years. For 1996 - Yc = 65.75 + 3.67 (-7) = 40.06 For 1997 - Yc = 65.75 + 3.67 (-5) = 47.40 For 1998 - Yc = 65.75 + 3.67 (-3) = 54.74 For 1999 - Yc = 65.75 + 3.67 (-1) = 62.08 For 2000 - Yc = 65.75 + 3.67 (1) = 69.42 For 2001 - Yc = 65.75 + 3.67 (3) = 76.76 For 2002 - Yc = 65.75 + 3.67 (5) = 84.10 For 2003 - Yc = 65.75 + 3.67 (7) = 91.44 For year 2005, the predicted value of earnings will be- Y2005 =65.75 + 3.67 (11) = 106.12 (Please note, since the value of X for the year 2003 is 7, for 2004, it will be 9 and 2005 it will be 11) Check your progress 1) Determine the equation of straight line with best fits the following data. Compute the trend values for all years. Also estimate exports for 2002. YEAR 1994 1995 1996 1997 1998 1999 2000 EXPORTS 80 90 92 83 94 99 102 2) Using the method of least squares, find the straight line trend for the following data. Also estimate values for 2005.

YEAR 1998 1999 2000 2001 2002 2003 2004 EXPORTS 52 53 42 60 65 67 69
3) Find trend line for the following data. Estimate the yield for 2008. YEAR 2000 2001 2002 2003 2004 2005 YIELD 73 72 78 86 90 93 11.3 SUMMARY In this unit, we learnt the meaning and significance of time series data. Out of many ways to compute trends, we learnt two important techniques of estimation. a) Method of moving averages b) Method of least square Time series data are very useful for economic analysis of the variables like income, exports, production, etc. Method of least squares is the most widely used method to compute linear trends and estimate the future trends in the variable under consideration. 11.4 QUESTIONS 1. Discuss the significance and components of Time Series Analysis. 2. Explain in detail the methods of Estimation of trend.
12 INDEX NUMBERS
Unit Structure: 12.0 Objectives 12.1 Introduction 12.2 Methods of constructing index numbers 12.3 Deflator 12.4 Base shifting 12.5 Cost of living index number 12.6 Summary 12.7 Questions 12.0 OBJECTIVES To understand meaning, nature and steps involved in calculating index numbers. Compute major types of weighted and un-weighted index numbers. Learn how the bases are shifted while constructing index numbers. Understand the concept of cost of living index numbers. Learn the problems involved in construction of index numbers. 12.1 INTRODUCTION Index numbers are called as the barometers of economy as these are useful in understanding what is happening in the economy. For example, different indices help us understand whether industrial production has gone up or gone down in comparison with some earlier period. Whether economy is experiencing inflation or deflation, whether the cost of living has gone up and by what magnitude in comparison with the earlier period. Index number is a specialized average that provides a measurement of relative changes in price or quantity from time to time or place to place. 12.1.1 Uses of Index numbers: Index numbers are useful for the economists, business men, policy-makers, researchers and also common people, in many ways. 1) The reveal trends and tendencies in the prices of group of commodities or production of industrial goods over time. So general business conditions can be very well studied through the technique of index numbers. 2) Many economic and business related policies are formulated on the basis of index numbers. For example, the dearness allowance (DA) is directly related to the cost of living index number. That means, the percentage of DA is determined on the basis of rise and fall in the index number of consumer goods. Wages and salaries are adjusted according to index numbers. 3) In order to understand the trend in time series data, it is necessary to adjust the data for price changes. This process is called deflating the data. For this, index numbers are used. 4) Index numbers are also useful in forecasting future economic activity. 12.1.2 Types of Index numbers: There are three types of index numbers: 1) Price Index Numbers: These are useful in comparing the prices of a basket of goods and service in the current year to the prices of the same basket in the reference / base year. 2) Quantity Index Numbers: They measure the quantity produced, sold or consumed in a particular year to that in a base year.
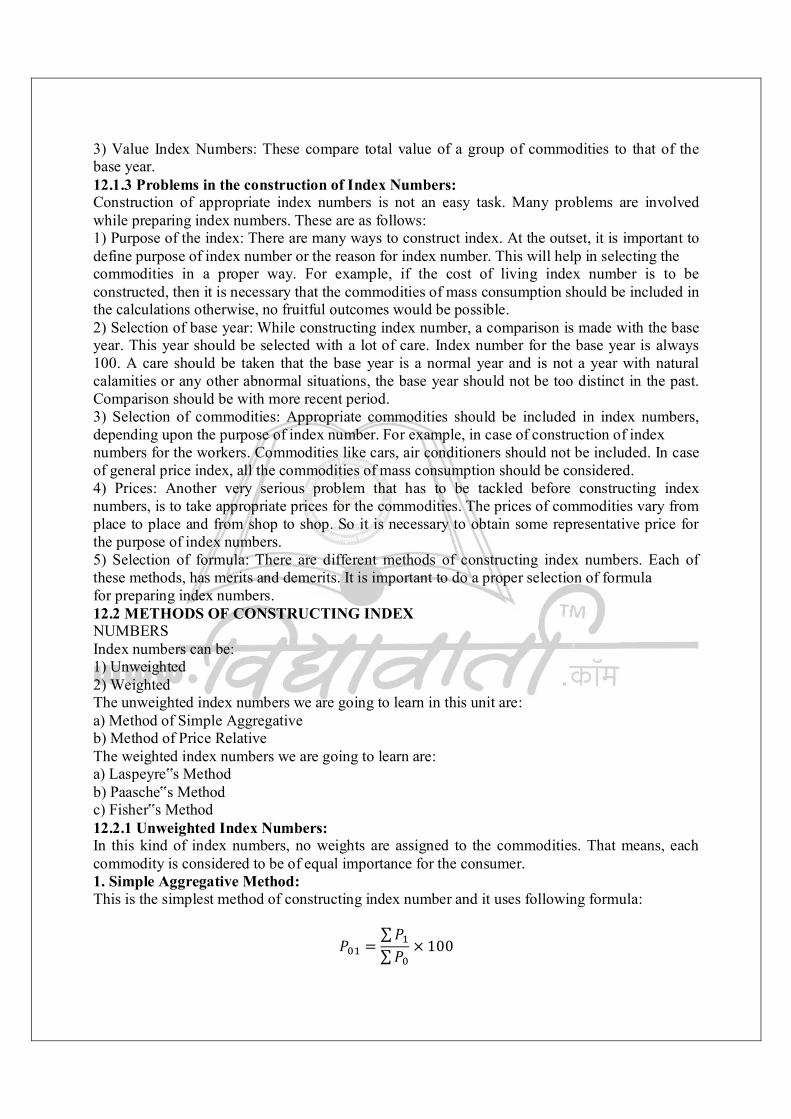
3) Value Index Numbers: These compare total value of a group of commodities to that of the base year. 12.1.3 Problems in the construction of Index Numbers: Construction of appropriate index numbers is not an easy task. Many problems are involved while preparing index numbers. These are as follows: 1) Purpose of the index: There are many ways to construct index. At the outset, it is important to define purpose of index number or the reason for index number. This will help in selecting the commodities in a proper way. For example, if the cost of living index number is to be constructed, then it is necessary that the commodities of mass consumption should be included in the calculations otherwise, no fruitful outcomes would be possible. 2) Selection of base year: While constructing index number, a comparison is made with the base year. This year should be selected with a lot of care. Index number for the base year is always 100. A care should be taken that the base year is a normal year and is not a year with natural calamities or any other abnormal situations, the base year should not be too distinct in the past. Comparison should be with more recent period. 3) Selection of commodities: Appropriate commodities should be included in index numbers, depending upon the purpose of index number. For example, in case of construction of index numbers for the workers. Commodities like cars, air conditioners should not be included. In case of general price index, all the commodities of mass consumption should be considered. 4) Prices: Another very serious problem that has to be tackled before constructing index numbers, is to take appropriate prices for the commodities. The prices of commodities vary from place to place and from shop to shop. So it is necessary to obtain some representative price for the purpose of index numbers. 5) Selection of formula: There are different methods of constructing index numbers. Each of these methods, has merits and demerits. It is important to do a proper selection of formula for preparing index numbers. 12.2 METHODS OF CONSTRUCTING INDEX NUMBERS Index numbers can be: 1) Unweighted 2) Weighted The unweighted index numbers we are going to learn in this unit are: a) Method of Simple Aggregative b) Method of Price Relative The weighted index numbers we are going to learn are: a) Laspeyre‟s Method b) Paasche‟s Method c) Fisher‟s Method 12.2.1 Unweighted Index Numbers: In this kind of index numbers, no weights are assigned to the commodities. That means, each commodity is considered to be of equal importance for the consumer. 1. Simple Aggregative Method: This is the simplest method of constructing index number and it uses following formula:
푃 =∑푃∑푃
× 100
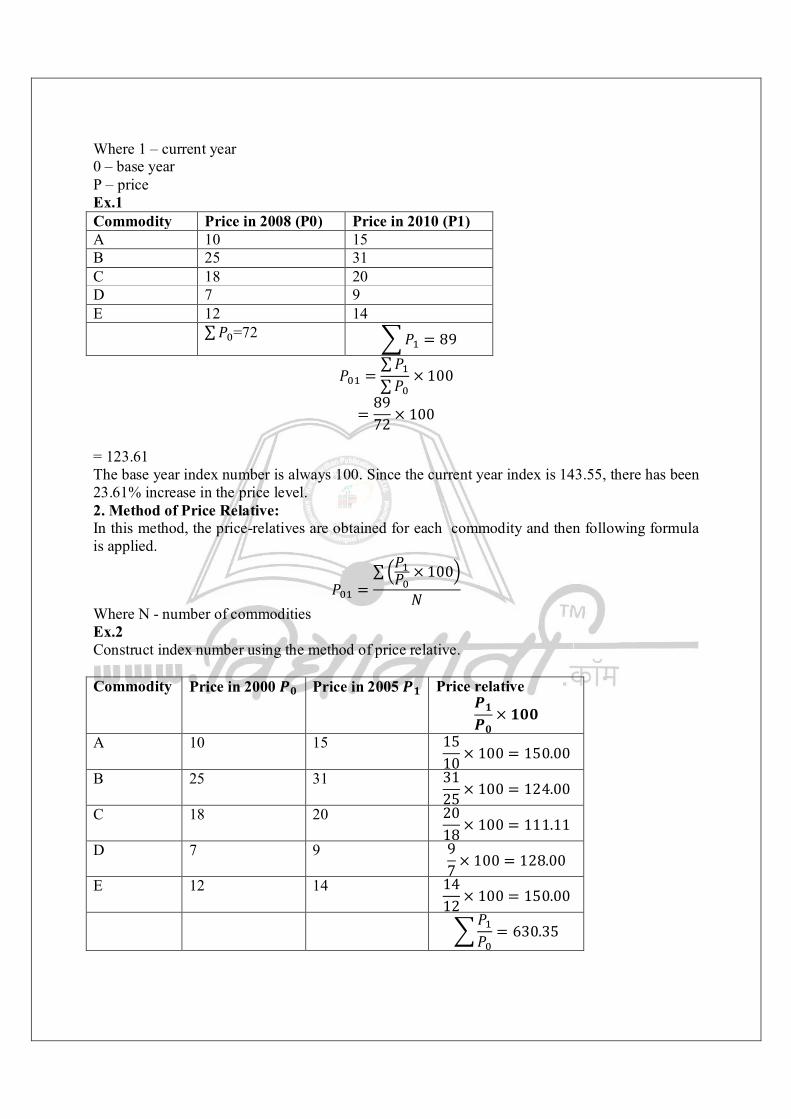
Where 1 – current year 0 – base year P – price Ex.1 Commodity Price in 2008 (P0) Price in 2010 (P1) A 10 15 B 25 31 C 18 20 D 7 9 E 12 14 ∑푃 =72 푃 = 89
푃 =∑푃∑푃 × 100
=8972 × 100
= 123.61 The base year index number is always 100. Since the current year index is 143.55, there has been 23.61% increase in the price level. 2. Method of Price Relative: In this method, the price-relatives are obtained for each commodity and then following formula is applied.
푃 =∑ 푃
푃 × 100
푁 Where N - number of commodities Ex.2 Construct index number using the method of price relative. Commodity Price in 2000 푷ퟎ Price in 2005 푷ퟏ Price relative
푷ퟏ푷ퟎ
× ퟏퟎퟎ
A 10 15 1510 × 100 = 150.00
B 25 31 3125 × 100 = 124.00
C 18 20 2018 × 100 = 111.11
D 7 9 97 × 100 = 128.00
E 12 14 1412 × 100 = 150.00
푃푃 = 630.35
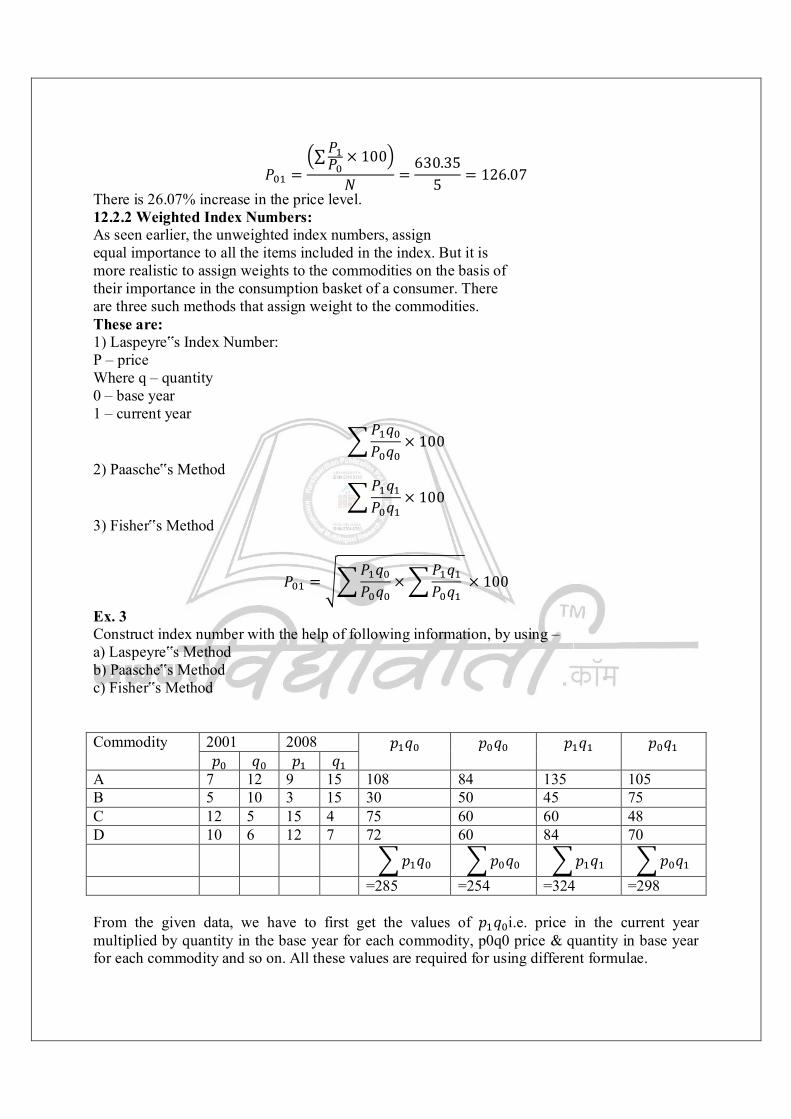
푃 =∑푃푃 × 100
푁 =630.35
5 = 126.07 There is 26.07% increase in the price level. 12.2.2 Weighted Index Numbers: As seen earlier, the unweighted index numbers, assign equal importance to all the items included in the index. But it is more realistic to assign weights to the commodities on the basis of their importance in the consumption basket of a consumer. There are three such methods that assign weight to the commodities. These are: 1) Laspeyre‟s Index Number: P – price Where q – quantity 0 – base year 1 – current year
푃 푞푃 푞 × 100
2) Paasche‟s Method 푃 푞푃 푞 × 100
3) Fisher‟s Method
푃 =푃 푞푃 푞 ×
푃 푞푃 푞 × 100
Ex. 3 Construct index number with the help of following information, by using – a) Laspeyre‟s Method b) Paasche‟s Method c) Fisher‟s Method Commodity 2001 2008 푝 푞 푝 푞 푝 푞 푝 푞
푝 푞 푝 푞 A 7 12 9 15 108 84 135 105 B 5 10 3 15 30 50 45 75 C 12 5 15 4 75 60 60 48 D 10 6 12 7 72 60 84 70 푝 푞 푝 푞 푝 푞 푝 푞 =285 =254 =324 =298 From the given data, we have to first get the values of 푝 푞 i.e. price in the current year multiplied by quantity in the base year for each commodity, p0q0 price & quantity in base year for each commodity and so on. All these values are required for using different formulae.
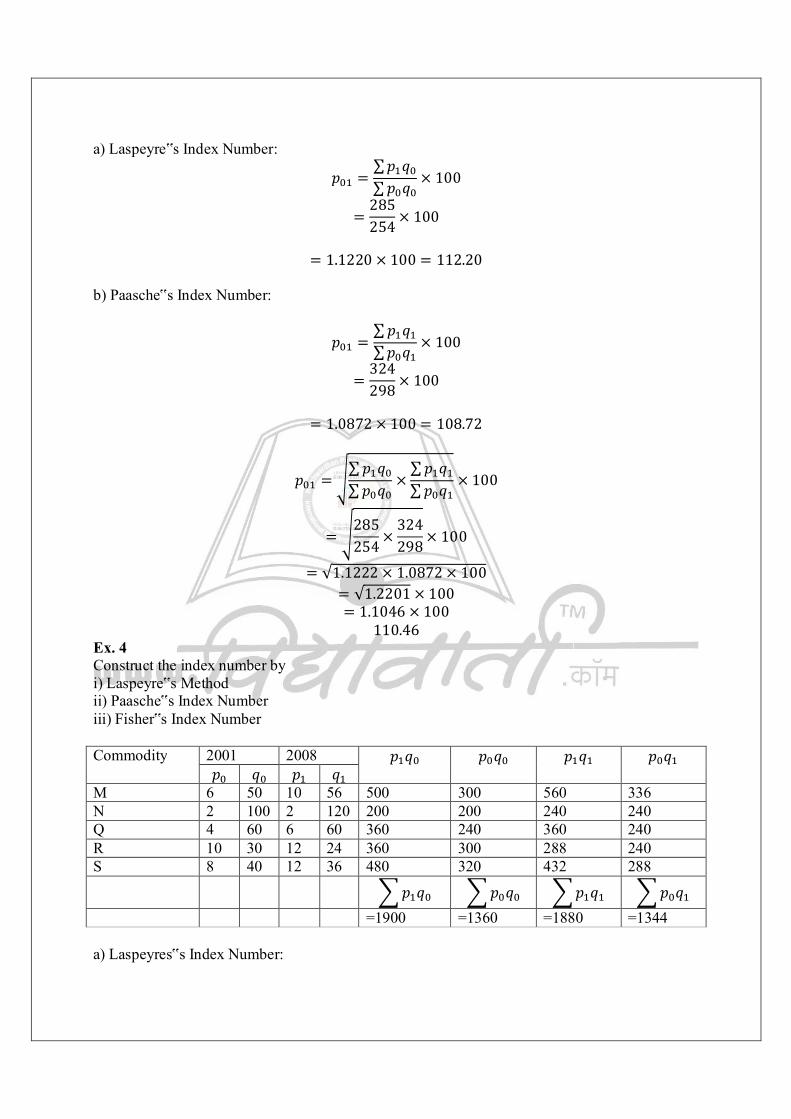
a) Laspeyre‟s Index Number:
푝 =∑푝 푞∑푝 푞 × 100
=285254 × 100
= 1.1220 × 100 = 112.20
b) Paasche‟s Index Number:
푝 =∑푝 푞∑푝 푞 × 100
=324298 × 100
= 1.0872 × 100 = 108.72
푝 =∑푝 푞∑푝 푞
×∑푝 푞∑푝 푞
× 100
=285254 ×
324298 × 100
= √1.1222 × 1.0872 × 100 = √1.2201 × 100 = 1.1046 × 100
110.46 Ex. 4 Construct the index number by i) Laspeyre‟s Method ii) Paasche‟s Index Number iii) Fisher‟s Index Number Commodity 2001 2008 푝 푞 푝 푞 푝 푞 푝 푞
푝 푞 푝 푞 M 6 50 10 56 500 300 560 336 N 2 100 2 120 200 200 240 240 Q 4 60 6 60 360 240 360 240 R 10 30 12 24 360 300 288 240 S 8 40 12 36 480 320 432 288 푝 푞 푝 푞 푝 푞 푝 푞 =1900 =1360 =1880 =1344 a) Laspeyres‟s Index Number:
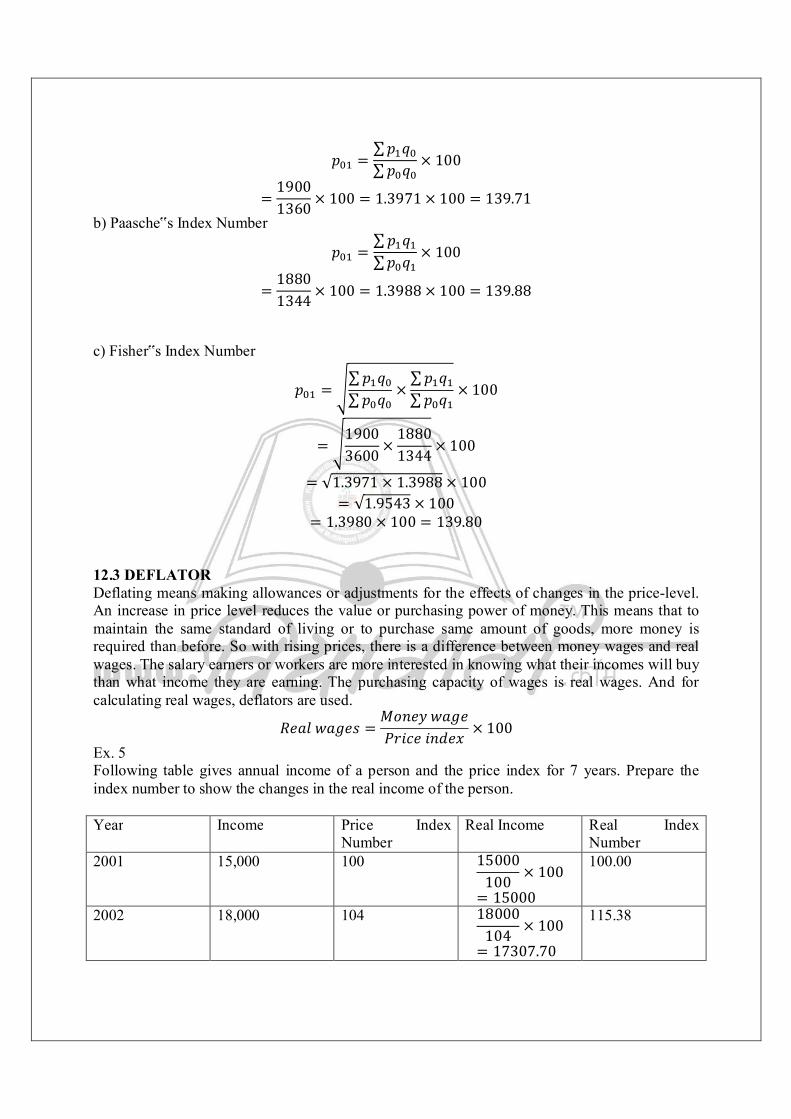
푝 =∑푝 푞∑푝 푞 × 100
=19001360 × 100 = 1.3971 × 100 = 139.71
b) Paasche‟s Index Number
푝 =∑푝 푞∑푝 푞 × 100
=18801344 × 100 = 1.3988 × 100 = 139.88
c) Fisher‟s Index Number
푝 =∑푝 푞∑푝 푞 ×
∑푝 푞∑푝 푞 × 100
=19003600 ×
18801344 × 100
= √1.3971 × 1.3988 × 100 = √1.9543 × 100
= 1.3980 × 100 = 139.80 12.3 DEFLATOR Deflating means making allowances or adjustments for the effects of changes in the price-level. An increase in price level reduces the value or purchasing power of money. This means that to maintain the same standard of living or to purchase same amount of goods, more money is required than before. So with rising prices, there is a difference between money wages and real wages. The salary earners or workers are more interested in knowing what their incomes will buy than what income they are earning. The purchasing capacity of wages is real wages. And for calculating real wages, deflators are used.
푅푒푎푙푤푎푔푒푠 =푀표푛푒푦푤푎푔푒푃푟푖푐푒푖푛푑푒푥 × 100
Ex. 5 Following table gives annual income of a person and the price index for 7 years. Prepare the index number to show the changes in the real income of the person. Year Income Price Index
Number Real Income Real Index
Number 2001 15,000 100 15000
100 × 100= 15000
100.00
2002 18,000 104 18000104 × 100
= 17307.70
115.38
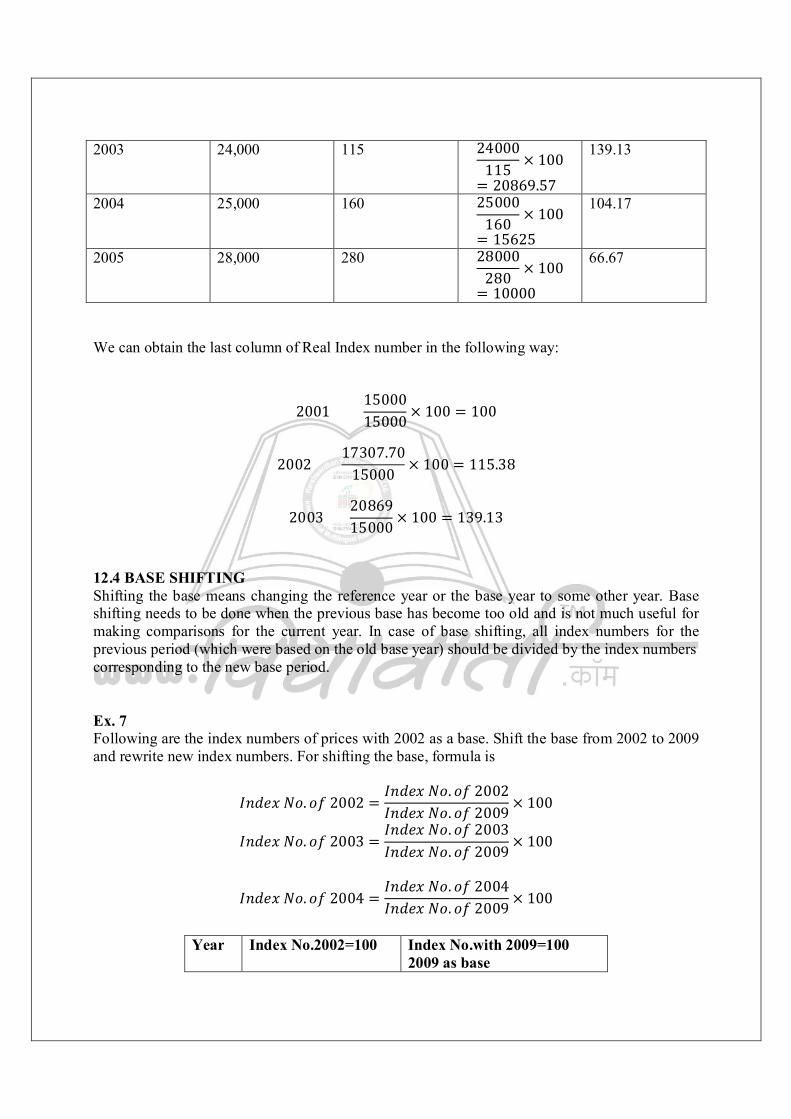
2003 24,000 115 24000115 × 100
= 20869.57
139.13
2004 25,000 160 25000160 × 100
= 15625
104.17
2005 28,000 280 28000280 × 100
= 10000
66.67
We can obtain the last column of Real Index number in the following way:
20011500015000 × 100 = 100
200217307.70
15000 × 100 = 115.38
20032086915000 × 100 = 139.13
12.4 BASE SHIFTING Shifting the base means changing the reference year or the base year to some other year. Base shifting needs to be done when the previous base has become too old and is not much useful for making comparisons for the current year. In case of base shifting, all index numbers for the previous period (which were based on the old base year) should be divided by the index numbers corresponding to the new base period. Ex. 7 Following are the index numbers of prices with 2002 as a base. Shift the base from 2002 to 2009 and rewrite new index numbers. For shifting the base, formula is
퐼푛푑푒푥푁표. 표푓2002 =퐼푛푑푒푥푁표. 표푓2002퐼푛푑푒푥푁표. 표푓2009 × 100
퐼푛푑푒푥푁표. 표푓2003 =퐼푛푑푒푥푁표. 표푓2003퐼푛푑푒푥푁표. 표푓2009
× 100
퐼푛푑푒푥푁표. 표푓2004 =퐼푛푑푒푥푁표. 표푓2004퐼푛푑푒푥푁표. 표푓2009 × 100
Year Index No.2002=100 Index No.with 2009=100
2009 as base
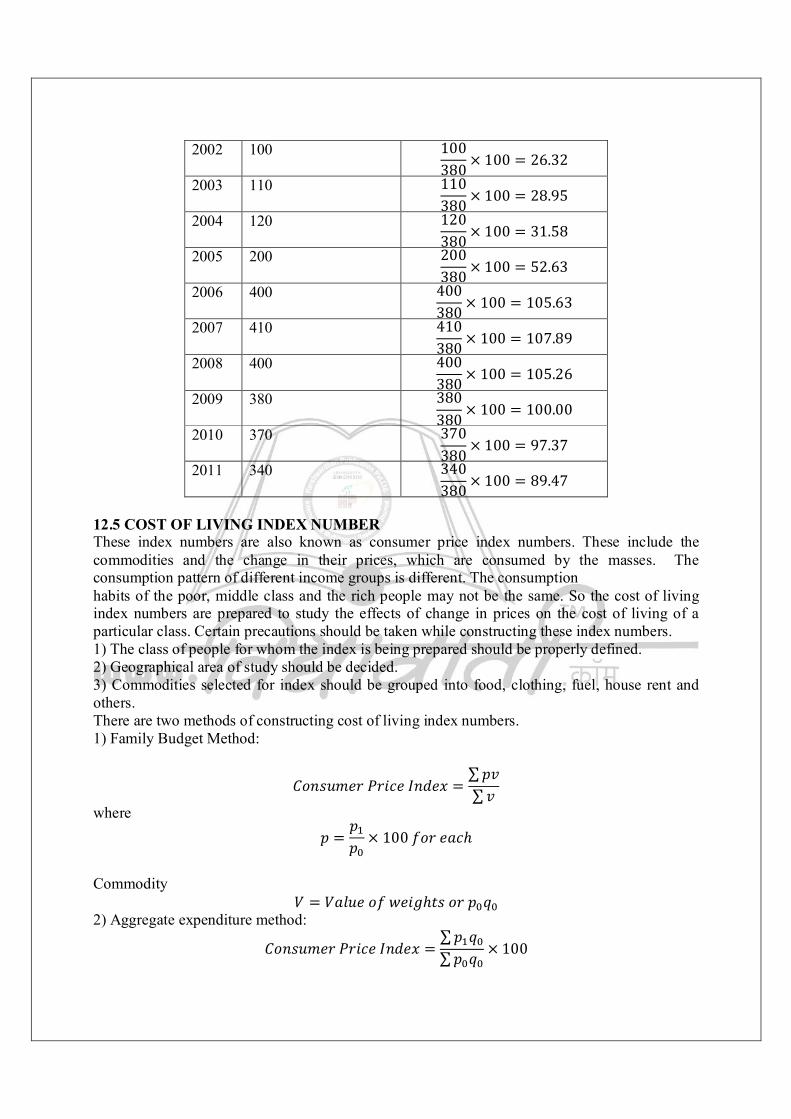
2002 100 100380 × 100 = 26.32
2003 110 110380 × 100 = 28.95
2004 120 120380 × 100 = 31.58
2005 200 200380 × 100 = 52.63
2006 400 400380 × 100 = 105.63
2007 410 410380 × 100 = 107.89
2008 400 400380 × 100 = 105.26
2009 380 380380
× 100 = 100.00 2010 370 370
380× 100 = 97.37
2011 340 340380 × 100 = 89.47
12.5 COST OF LIVING INDEX NUMBER These index numbers are also known as consumer price index numbers. These include the commodities and the change in their prices, which are consumed by the masses. The consumption pattern of different income groups is different. The consumption habits of the poor, middle class and the rich people may not be the same. So the cost of living index numbers are prepared to study the effects of change in prices on the cost of living of a particular class. Certain precautions should be taken while constructing these index numbers. 1) The class of people for whom the index is being prepared should be properly defined. 2) Geographical area of study should be decided. 3) Commodities selected for index should be grouped into food, clothing, fuel, house rent and others. There are two methods of constructing cost of living index numbers. 1) Family Budget Method:
퐶표푛푠푢푚푒푟푃푟푖푐푒퐼푛푑푒푥 =∑푝푣∑푣
where 푝 =
푝푝 × 100푓표푟푒푎푐ℎ
Commodity
푉 = 푉푎푙푢푒표푓푤푒푖푔ℎ푡푠표푟푝 푞 2) Aggregate expenditure method:
퐶표푛푠푢푚푒푟푃푟푖푐푒퐼푛푑푒푥 =∑푝 푞∑푝 푞 × 100
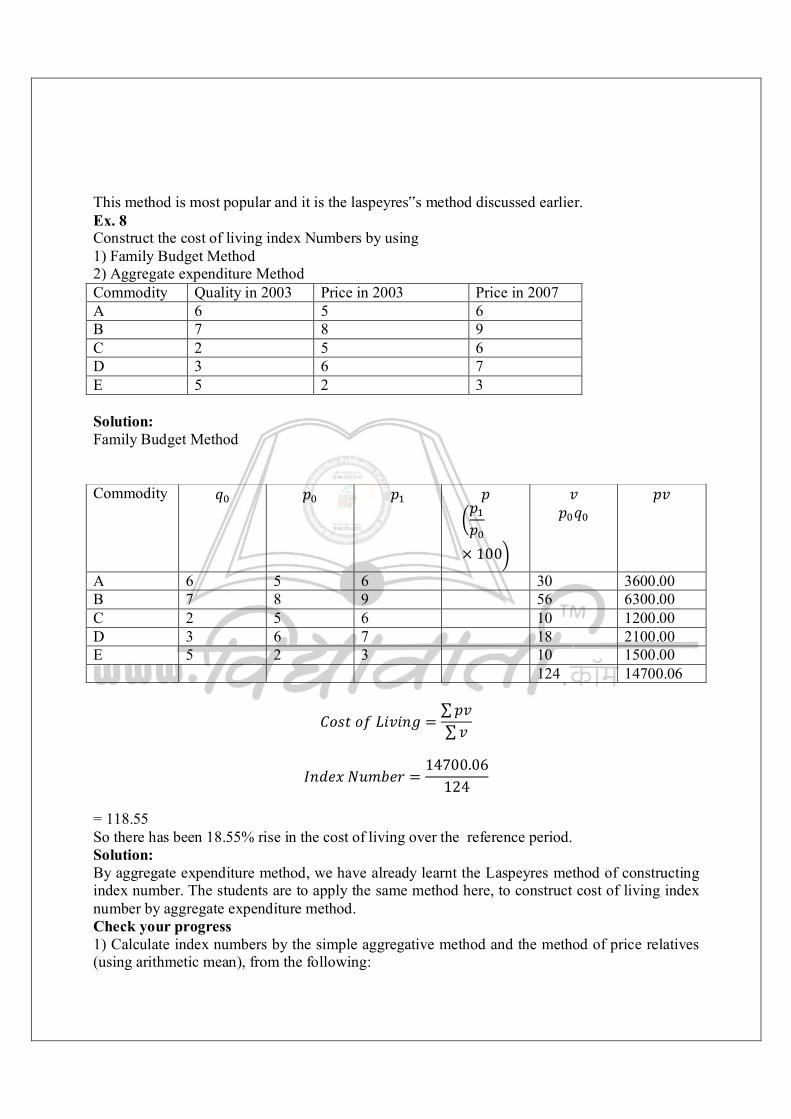
This method is most popular and it is the laspeyres‟s method discussed earlier. Ex. 8 Construct the cost of living index Numbers by using 1) Family Budget Method 2) Aggregate expenditure Method Commodity Quality in 2003 Price in 2003 Price in 2007 A 6 5 6 B 7 8 9 C 2 5 6 D 3 6 7 E 5 2 3 Solution: Family Budget Method Commodity 푞 푝 푝 푝
푝푝
× 100
푣 푝 푞
푝푣
A 6 5 6 30 3600.00 B 7 8 9 56 6300.00 C 2 5 6 10 1200.00 D 3 6 7 18 2100.00 E 5 2 3 10 1500.00 124 14700.06
퐶표푠푡표푓퐿푖푣푖푛푔 =∑푝푣∑푣
퐼푛푑푒푥푁푢푚푏푒푟 =14700.06
124 = 118.55 So there has been 18.55% rise in the cost of living over the reference period. Solution: By aggregate expenditure method, we have already learnt the Laspeyres method of constructing index number. The students are to apply the same method here, to construct cost of living index number by aggregate expenditure method. Check your progress 1) Calculate index numbers by the simple aggregative method and the method of price relatives (using arithmetic mean), from the following:
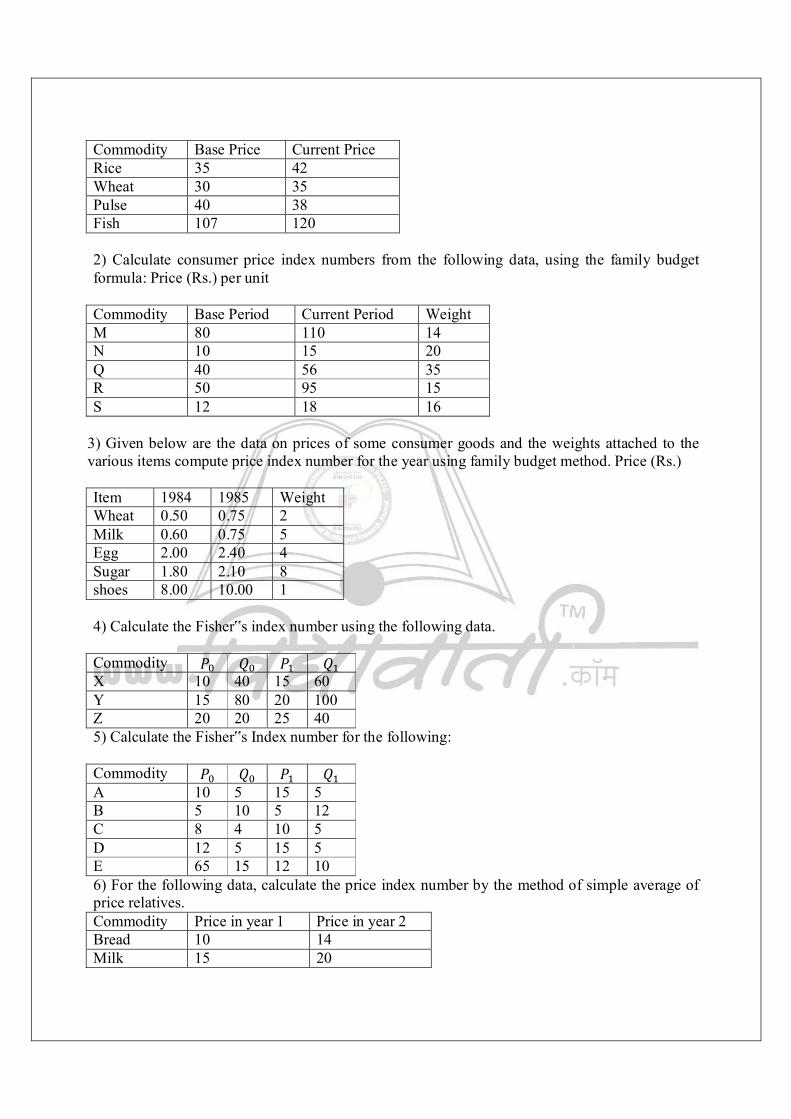
Commodity Base Price Current Price Rice 35 42 Wheat 30 35 Pulse 40 38 Fish 107 120 2) Calculate consumer price index numbers from the following data, using the family budget formula: Price (Rs.) per unit Commodity Base Period Current Period Weight M 80 110 14 N 10 15 20 Q 40 56 35 R 50 95 15 S 12 18 16
3) Given below are the data on prices of some consumer goods and the weights attached to the various items compute price index number for the year using family budget method. Price (Rs.) Item 1984 1985 Weight Wheat 0.50 0.75 2 Milk 0.60 0.75 5 Egg 2.00 2.40 4 Sugar 1.80 2.10 8 shoes 8.00 10.00 1 4) Calculate the Fisher‟s index number using the following data. Commodity 푃 푄 푃 푄 X 10 40 15 60 Y 15 80 20 100 Z 20 20 25 40 5) Calculate the Fisher‟s Index number for the following: Commodity 푃 푄 푃 푄 A 10 5 15 5 B 5 10 5 12 C 8 4 10 5 D 12 5 15 5 E 65 15 12 10 6) For the following data, calculate the price index number by the method of simple average of price relatives. Commodity Price in year 1 Price in year 2 Bread 10 14 Milk 15 20

Eggs 10 16 7) For the data, calculate the Laspeyre‟s, Paasche‟s and Fisher‟s index number. Commodity Price in 1979 Quantity in 1979 Price in 1980 Quantity in 1980 X 10 40 15 60 Y 15 80 20 100 Z 20 20 25 40 12.6 SUMMARY Technique of construction of index numbers is very useful in statistical analysis. It is used in many types of calculations such as national income accounts, calculations of dearness allowances for the workers and salaried people, industrial production prices, etc. We have learnt various formulae related to index numbers in this unit. 12.7 QUESTIONS 1. What is Index Number? Discuss the Uses and problems in the construction of Index Number. 2. Explain the method of Un-weighted Index Numbers. 3. Explain the different methods of Weighted Index Numbers. 4. What is Deflator? 5. Explain Cost of living Index Number.
13 HYPOTHESIS: NATURE AND ROLE IN
RESEARCH Unit Structure: 13.0 Objectives 13.1 Meaning of Hypothesis 13.2 Role of Hypothesis 13.3 Types of Hypothesis 13.3.1 On the basis of their functions 13.3.2 On the basis of their nature 13.3.3 On the basis of their level of abstraction 13.4 Sources of Hypothesis 13.5 Characteristics of a Good Hypothesis 13.6 Basic concepts in Hypothesis Testing 13.6.1 Null and Alternative hypotheses 13.6.2 Parameter and Statistic 13.6.3 Type I and Type II errors 13.6.4 The level of significance 13.6.5 Critical region 13.7 Summary 13.8 Questions 13.0 OBJECTIVES To know meaning, role and types of hypothesis. To acquaint with the sources of hypothesis. To understand characteristics of a good hypothesis. To know basic concepts in hypothesis testing. 13.1 MEANING OF HYPOTHESIS Hypothesis is usually considered as the principal instrument in research. Once the research problem is decided, researcher proceeds to formulate tentative solutions or answers to the problem. These proposed solutions or explanations constitute the hypothesis, i.e. hypotheses are tentative propositions relating to investigative questions. They are formulated so that a researcher can test them on the basis of the facts already known to him or which he collects in the course of his investigation. Hypothesis provides him a direction for investigation of research problem. Hypotheses aim at answering research questions and guide the researchers to see and select the relevant fact. 1. Definitions: (1) Lundberg: Hypothesis as a tentative generalization, the validity of which remains to be tested. (2) Goode and Hatt: Hypothesis as a proposition which can be put to a test to determine its validity. (3) Webster's New International Dictionary of English Language: The word hypothesis is a proposition, condition or principal, which is assumed, perhaps without belief, in order to draw out its logical consequences and by this method to test its accord with facts which are known or may be determined.
(4) Cohen and Nagel: Formulation of prepositions are the hypotheses. (5) Coffey: A hypothesis is an attempt at explanation; a provisional supposition made in order to explain scientifically some facts or phenomenon. 13.2 ROLE OF HYPOTHESIS In social science research, hypothesis serves several important functions such as: 1. A hypothesis guides the direction of study or investigation. It states what we are looking for. 2. Its purpose is to include in the investigation all available and pertinent data either to prove or disprove the hypothesis. 3. Research becomes unfocussed or random without a hypothesis and useless data may be collected in the hope that important data is not omitted. 4. Thus, a hypothesis specifies the sources of data, which shall be studied and in what context they shall be studied. 5. It also determines the data needs and prevents a blind search. 6. A hypothesis can suggest the type of research which is likely to be appropriate to study a given problem. 7. It determines the most appropriate technique of data analysis. 8. A hypothesis can contribute to the development of theory by testing various hypotheses relating to a stated theory. It is also likely, in some cases that a hypothesis helps in constructing a theory. Check your progress: 1) What do you mean by hypothesis? 2) How does hypothesis help researchers? 3) Prepare a note on role of hypothesis. 13.3 TYPES OF HYPOTHESIS Researchers in social sciences have to work with many kinds of hypotheses. Hence, they can be classified in several ways: Classification of Hypotheses On the basis of Functions On the basis of Nature On the basis of Abstraction 1) Descriptive 1)Working 1)Commonsense 2)Relation 2)Null 2)Complex 3)Statistical 3)Analytical 13.3.1 On the basis of their functions: 1. Descriptive hypotheses: These are propositions which describe the characteristics of a variable such as income, expenditure, production, hours of work, etc. 2. Relational hypothesis: These are propositions which describe the relationship between two variables. This type of hypotheses state that something is greater or less than something. For example, increase in income tends to increase in expenditure; families with small income spend large proportion of their income on necessities, etc. 13.3.2 On the basis of their nature: 3. Working hypothesis: Hypotheses are formulated while planning the study of a problem. They may not be specific in the initial stages. In such cases, they are called working hypotheses. Such hypotheses are subject to change or modification in the course of investigation.
4. Null hypotheses: These are hypothetical statements and they deny what is stated in working hypotheses. They do not ever expect to exist in reality. For example, statement like 'education does not increase the earning capacity of an individual' is a null hypothesis. 5. Statistical hypotheses: These are statements about a statistical population. The statements are derived from a sample drawn from a given population. Statistical hypotheses are quantitative in nature as they are numerically measurable. These hypotheses can be hypotheses of difference or association i.e. we can formulate them as null hypotheses or casual hypotheses. 13.3.3 On the basis of their level of abstraction: (Goode and Hatt): 6. Commonsense hypotheses: At the lowest level we have simple description which gives rise to commonsense hypotheses. They state existence of certain empirical uniformities and hence expect verification of commonsense propositions. 7. Complex hypotheses: At a relatively higher level of abstraction, we have logical derivations which give rise to complex hypotheses. These aim at testing the existence of logically derived relationships between empirical uniformities. They are purposeful distortions of empirical reality. Hence, they are also called 'Ideal types'. Such hypotheses try to create tools and problems for further research in complex areas of investigations. 8. Analytical hypotheses: The category of hypothesis at the highest level of abstraction is concerned with the relation of analytic variables. Hence, they are called analytical hypotheses. These are statements about how changes in one property will affect another property. For example, statements about relation between level of education and migration, level of income and social mobility are some such abstractions. Check your progress: 1. How do you classify the types of hypothesis? 2. Prepare a chart showing classification of hypotheses. 13.4 SOURCES OF HYPOTHESIS Hypotheses may be developed from a variety of sources. Some of them are as follows: 9. Observation: Hypotheses can be derived from observation. Relation between production, cost and output of goods or relationship between price variation and demand are hypothesized from observation. 10. Culture: A very important and major source of hypotheses is the culture in which a researcher has grown. Hypotheses regarding relationship between caste and family size, income level and education level depend on the socioeconomic background. 11. Analogies: They are often a source of meaningful hypotheses. For example, the hypotheses that similar human types or activities may be found occupying the same territory has come from plant ecology. Analogy is very suggestive. But one has to be careful in adopting models from other disciplines. Economic theory has adopted a few models from physics also. 12. Theory: Theory is an extremely fertile seed bed of hypotheses. A theory represents what is a known and logical deduction from the theory lead to new hypotheses, which must be true if the theory is true. For example, various hypotheses are derived from the theory based on profit maximization as the aim of a private enterprise. New hypotheses may be derived from the established theory by method of logical induction or logical deduction. 13. Findings of other studies: Hypotheses may also be developed from the findings of other studies. This can happen when a study is repeated under different circumstances or different type of population. The findings of an exploratory study may be formulated as hypotheses for other

structured studies which aim at testing a hypothesis for other structured studies which aim at testing a hypothesis. For example, the concept of trickle down effect of economic growth, later on becomes a testable hypothesis. 14. Level of knowledge: An important source of hypotheses is the state of knowledge of any particular science. Hypotheses can be deduced from existing formal theories. If the hypotheses are rejected, the theory can be modified. If formal theories do not exist, hypotheses are generated from formal conceptual framework. This leads to the growth of theory. 15. Continuity of research: Continuous research in a field is itself an important source of hypotheses. The rejection of hypotheses leads to the formulation of new ones. These new hypotheses explain the relationship between variables in the subsequent studies on the same subject. In short, an ideal source of fruitful and relevant hypotheses is a fusion of two elements (i) past experience and (ii) imagination in the disciplined mind of the scientist. Check Your Progress: 1. List down the sources of hypotheses. 13.5 CHARACTERISTICS OF A GOOD HYPOTHESIS An acceptable or a useable good hypothesis should fulfill following certain conditions: 16. Testability: A hypothesis should be empirically testable and should not be just a moral judgement i.e. concepts included in the hypothesis must have empirical correspondence. In other words, it should be possible to collect empirical evidence to test the hypothesis. 17. Conceptual clarity: A hypothesis must be conceptually clear. The concepts used in the hypothesis should be clearly defined, not only formally but also operationally. For example, in a hypothesis, if concept of unemployment or educated unemployment is used, the terms must be clearly defined. 18. Specificity: A hypothesis should be specific and must explain the expected relation between variables. Broad, generalized statement does not form a specific hypothesis. Specificity ensures that the research is practicable and significant. It also helps in increasing the validity of results as the predictions are specific. 19. Observable: Hypothesis must be formulated in such a manner that deductions can be made from it and consequently a decision can be reached as to whether it does or does not explain the facts. 20. Consistency: Hypothesis should be logically consistent i.e. two are more propositions logically derived from the same theory should not be contradictory. 21. Objectivity: Hypothesis should be free from researcher's own value judgements. 22. Simplicity: Hypothesis should be simple and should involve fewer assumptions. However, simplicity demands insight and it does not mean that it is obvious. 23. Theoretical relevance: A hypotheses should be related to a body of theory. Thus, it can help to quality, support or refute theory. It can then become a new leap into new areas of knowledge. Theory not only formulates what we know, but also tell us what we want to know. If hypothesis is based on theory, it would have power of prediction. 24. Availability of techniques: Hypotheses should be related to available techniques; otherwise it will not be researchable. The research cannot formulate useable questions, if the does not know about the available techniques or the required techniques are not available at all.
Check your progress: 1. List down the points showing characteristics of a good hypothesis? 2. What are characteristics of a good hypothesis? 13.6 BASIC CONCEPTS IN HYPOTHESIS TESTING Basic concepts in the context of testing of hypotheses need to be explained. Those are: 13.6.1 Null and Alternative hypotheses: In the context of statistical analysis, we often talk about null hypothesis and alternative hypothesis. If we are to compare method A with method B about its superiority and if we proceed on the assumption that both methods are equally good, then this assumption is termed as the null hypothesis. As against this, we may think that the method A is superior or the method B is inferior, we are then stating what is termed as alternative hypothesis. The null hypothesis is generally symbolized as H0 and the alternative hypothesis as 퐻 . Suppose we want to test the hypothesis that the population mean (휇) is equal to the hypothesized mean 휇퐻0 = 100. Then we would say that the null hypothesis is that the population mean is equal to the hypothesized mean 100 and symbolically we can express as:
퐻 : 휇 = 휇퐻 = 100 If our sample results do not support this null hypothesis; we should conclude that something else is true. What we conclude rejecting the null hypothesis is known as alternative hypothesis. In other words, the set of alternatives to the null hypothesis is referred to as the alternative hypothesis. If we accept H0, then we are rejecting 퐻 and if we reject 퐻 , then we are accepting 퐻 . For 퐻 : 휇 = 휇퐻 = 100, we may consider three possible alternative hypotheses as follows: If a hypothesis is of the type 휇 = 휇퐻 then we call such a hypothesis as simple (for specific) hypothesis but if it is of the type
휇 ≠ 휇퐻 표푟휇 > 휇퐻 표푟휇 < 휇퐻 then we call it a composite (or nonspecific) hypothesis.
Alternative hypothesis To be read as follows
퐻 : 휇 ≠ 휇퐻 ≠ 100 The alternative hypothesis is that the population mean is equal to 100 i.e., it may be more or less than 100.
퐻 : 휇 > 휇퐻 The alternative hypothesis is that the population mean is greater than 100.
퐻 : 휇 < 휇퐻 The alternative hypothesis is that the population mean is less than 100.
The null hypothesis and the alternative hypothesis are chose before the sample is drawn (the researcher must avoid the error of deriving hypotheses from the data that he collects and then testing the hypotheses from the same data.) In the choice of null hypothesis, the following considerations are usually kept in view: 1) Alternative hypothesis is usually the one which one wishes to prove and the null hypothesis is the one which one wishes to disprove. Thus, a null hypothesis represents the hypothesis we are trying to reject and alternative hypothesis represents all other possibilities.
2) If the rejection of a certain hypothesis when it is actually true involves great risk, it is taken as null hypothesis because then the probability of rejecting it when it is true is a (the level of significance) which is chosen very small. 3) Null hypothesis should always be specific hypothesis i.e., it should not state about or approximately a certain value. Generally, in hypothesis testing we proceed on the basis of null hypothesis, keeping the alternative hypothesis in view. Why so? The answer is that on the assumption that null hypothesis is true, one can assign the probabilities to different possible sample results, but this cannot be done if we proceed with the alternative hypothesis. Hence, the use of null hypothesis (at times also known as statistical hypothesis) is quite frequent. 13.6.2 Parameter and Statistic: The main objective of sampling is to draw inference about the characteristics of the population on the basis of a study made on the units of a sample. The statistical measures calculated from the numerical data obtained from population units are known as Parameters. Thus, a parameter may be defined as a characteristic of a population based on all the units of the population. While the statistical measures calculated from the numerical data obtained from sample units are known as Statistics. Thus a statistic may be defined as a statistical measure of sample observation and as such it is a function of sample observations. If the sample observations are denoted by 푋 ,푋 ,푋 , … . . ,푋 . Then, a statistic T may be expressed as 푇 = 푓(푋 ,푋 ,푋 , … . . ,푋 ).
Measure Mean Variance Proportion Unit Parameter 휇 휎 푃 Population Statistics 푋 푆퐷 푃 Sample
13.6.3 Type I and Type II errors: In the context of testing of hypothesis, there are basically two types of errors we can make. We may reject 퐻 when 퐻 is true and we may accept 퐻 when in fact 퐻 is not true. The former is known as Type I error and the latter as Type II error. In other words, Type I error means rejection of hypothesis which should have been accepted and Type II error means accepting the hypothesis which should have been rejected. Type I error is denoted by 훼(alpha) known as 훼 error, also called the level of significance of test; and Type II error is denoted by 훽 (beta) known as 훽error. In a tabular form the said two errors can be presented as follows:
Decision Accept 퐻 Reject 퐻 퐻 (True)
Correct decision
Type I error ( 훼error)
퐻 (False)
Type II error ( 훽error)
Correct decision
The probability of Type I error is usually determined in advance and is understood as the level of significance of testing the hypothesis. If type I error is fixed at 5 per cent, it means that there are about 5 chances in 100 that we will reject H0 when 퐻 is true. We can control Type I error just by fixing it at a lower level. For instance, if we fix it at 1 per cent, we will say that the maximum probability of committing Type I error would only be 0.01. But with a fixed sample size, 푛, when we try to reduce Type I error, the probability of committing Type II error increases. Both types of errors cannot be reduced simultaneously. There is a trade-off between these two types of errors which means that the probability of making one type of error can only be reduced if we are willing to increase the probability of making the other type of error. To deal with this trade-off in business situations, decisionmakers decide the appropriate level of Type I error by examining the costs or penalties attached to both types of errors. If Type I error involves the ti me and trouble of reworking a batch of chemicals that should have been accepted, whereas Type II error means taking a chance that an entire group of users of this chemical compound will be poisoned, then in such a situation one should prefer a Type I error to a Type II error. As a result one must set very high level for Type I error in one's testing technique of a given hypothesis. Hence, in the testing of hypothesis, one must make all possible effort to strike an adequate balance between Type I and Type II errors. 13.6.4 The level of significance: It is a very important concept in the context of hypothesis testing. We reject a null hypothesis on the basis of the results obtained from the sample. When is such a rejection justifiable? Obviously, when it is not a chance outcome. Statisticians generally consider that an event is improbable, only if it is among the extreme 5 per cent or 1 per cent of the possible outcomes. To illustrate, supposing we are studying the problem of non attendance in lecture among college students. Then, the entire number of college students is our population and the number is very large. The study is conducted by selecting a sample from this population and it gives some result (outcome). Now, it is possible to draw a large number of different samples of a given size from this population and each sample will give some result called statistic. These statistics have a probability distribution if the sampling is based on probability. The distribution of statistic is called a 'sampling distribution'. This distribution is normal, if the population is normal and sample size is large i.e. greater than 30. When we reject a null hypothesis at say 5 per cent level, it implies that only 5 per cent of sample values are extreme or highly improbable and our results are probable to the extent of 95 per cent (i.e. 1 – .05 = 0.95).
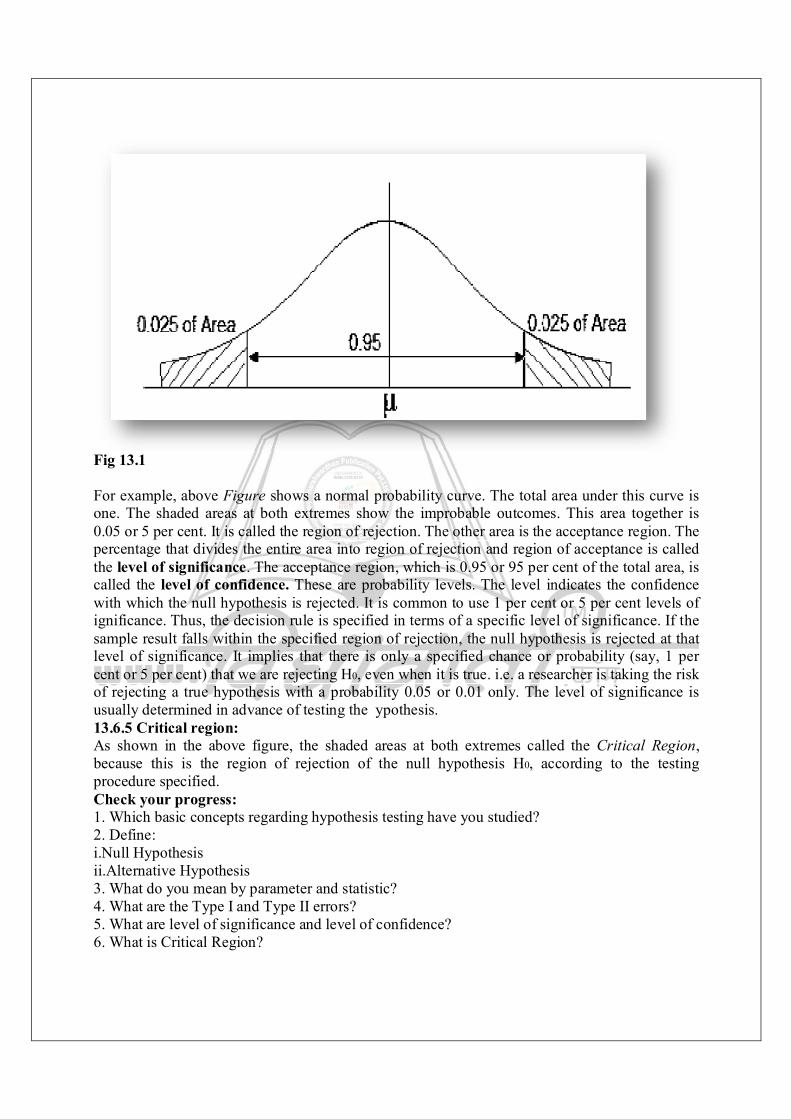
Fig 13.1 For example, above Figure shows a normal probability curve. The total area under this curve is one. The shaded areas at both extremes show the improbable outcomes. This area together is 0.05 or 5 per cent. It is called the region of rejection. The other area is the acceptance region. The percentage that divides the entire area into region of rejection and region of acceptance is called the level of significance. The acceptance region, which is 0.95 or 95 per cent of the total area, is called the level of confidence. These are probability levels. The level indicates the confidence with which the null hypothesis is rejected. It is common to use 1 per cent or 5 per cent levels of ignificance. Thus, the decision rule is specified in terms of a specific level of significance. If the sample result falls within the specified region of rejection, the null hypothesis is rejected at that level of significance. It implies that there is only a specified chance or probability (say, 1 per cent or 5 per cent) that we are rejecting H0, even when it is true. i.e. a researcher is taking the risk of rejecting a true hypothesis with a probability 0.05 or 0.01 only. The level of significance is usually determined in advance of testing the ypothesis. 13.6.5 Critical region: As shown in the above figure, the shaded areas at both extremes called the Critical Region, because this is the region of rejection of the null hypothesis H0, according to the testing procedure specified. Check your progress: 1. Which basic concepts regarding hypothesis testing have you studied? 2. Define: i.Null Hypothesis ii.Alternative Hypothesis 3. What do you mean by parameter and statistic? 4. What are the Type I and Type II errors? 5. What are level of significance and level of confidence? 6. What is Critical Region?
13.7 SUMMARY 1. Hypotheses are tentative propositions relating to investigative questions. They are formulated so that a researcher can test them on the basis of the facts already known to him or which he collects in the course of his investigation. 2. Hypotheses can be classified on the basis of their functions, on the basis of their nature, on the basis of their level of abstraction. 3. An ideal source of fruitful and relevant hypotheses is a fusion of two elements i) past experience and ii) imagination in the disciplined mind of the scientist. 4. An acceptable or a useable good hypotheses should fulfill certain conditions like testability, conceptual clarity, specificity, consistency, objectivity, simplicity etc. 5. When we compare method A with method B about its superiority and if we proceed on the assumption that both methods are equally good, then this assumption is termed as the null hypothesis. As against this, we may think that the method A is superior or the method B is inferior, we are then stating what is termed as alternative hypothesis. The null hypothesis is generally symbolized as H0 and the alternative hypothesis as Ha. 6. A parameter may be defined as a characteristic of a population based on all the units of the population. A statistic may be defined as a statistical measure of sample observation and as such it is a function of sample observations. 7. Type I error means rejection of hypothesis which should have been accepted and Type II error means accepting this hypothesis which should have been rejected. Type I error is denoted by α known as α (alpha) error, also called the level of significance of test and Type II error is denoted by β (beta) known as β error. 8. The percentage that divides the entire area into region of rejection and region of acceptance is called the level of significance. The acceptance region, which is 0.95 or 95 per cent of the total area, is called the level of confidence. These are probability levels. The level indicates the confidence with which the null hypothesis is rejected. It is common to use 1 per cent or 5 per cent levels of significance. 9. Critical region is the region of rejection of the null hypothesis H0, according to the testing procedure specified. 13.8 QUESTIONS 1. What is hypothesis? Explain different types of hypothesis. 2. Discuss the role of hypothesis in the field of economic research. 3. What are the characteristics of a good hypothesis? 4. Write notes on: a) Role of hypothesis. b) Sources of hypothesis. c) Types of hypothesis. d) Criteria of a good hypothesis. e) Type I and Type II errors. f) Level of significance. g) Null and Alternative hypotheses.
14 REPORT WRITING
Unit Structure: 14.0 Objectives 14.1 Introduction 14.2 Meaning and Significance of a Research Report 14.3 Types of Research Report 14.4 Format or Structure of a Research Report: 14.5 Steps in planning Report Writing 14.6 Physical Layout of the Report 14.7 Planning and Organisation of an Academic Report
14.7.1 Stages of writing an academic report 14.8 Referencing in the text 14.9 Referencing in the bibliography 14.10 Footnotes
14.10.1 Referencing in the Text 14.10.2 Referencing in the reference
14.11 Precautions in preparing report 14.12 Evaluation of a report— Some considerations
14.12.1 Evaluation Criteria 14.13 Viva Voce examination 14.14 Summary 14.15 Keywords 14.16 Questions 14.0 OBJECTIVES To know the meaning and significance of report writing. To familiar the students about the various types of research report. To know the general structure of a research report. 14.1 INTRODUCTION Research reporting is the oral or written presentation of evidence and the findings in such a way that it is readily understood and assessed by the reader and enables him to verify the validity of the conclusions. Research report writing is the culmination of the research investigation. It is at the stage of reporting that the researcher assembles the findings of the study, draws conclusions and evaluates his own findings. Report writing is the end product of research activity. It is highly skilled work; it is an interesting, fascinating, challenging, gruelling and sometimes even exasperating experience. Writing a research report is a technical activity that demands all the skills and patience of the researcher. It requires considerable thought, effort, patience and penetration and an overall approach to the problem, data and analysis. Also needed is firm control over language and great objectivity. A vast amount of planning and preparation is necessary for organising and writing the report. Perfection in a research report is achieved by continuous and persistent thought and creative and intelligent writing. Only hard and patient work on the facts, careful and critical assessment and intelligent planning in organising the report can facilitate communication. There are no standard criteria for the organisation of a report,
popular or technical. They depend on each investigation, problem, the novelty or familiarity of the methods, nature and volume of facts, techniques of analysis and so on. No research project is complete without a report. The nature of the report is determined by the project itself and to whom it is addressed. Academic research is expected to produce lengthy reports, or theses, covering all aspects of the research and reporting on them in a precise and rather formal manner. But no matter what the size or formality of the report, it is reasonable to expect it to convey information on a fairly standard set of topics. First, it must say why the work was done, what events led up to it and what other work was found to be relevant. This is usually contained in the introduction, which should also include the precise statement of the objective and aims of the project.
Generally, there should be a section describing what work was done. This should cover the methods used, their selection and any problems experienced in their application. From this it is easy to move on to what was found out, or the results. In turn, these lead on to the conclusions, which are a statement of what the researcher deduced from the results, and then on to the recommendations, which set out what the researcher feels should be the action taken as a result of the conclusions. Writing is not an activity that can be allocated an odd half-hour whenever it is convenient. It requires sustained concentration. The amount of time needed to make real progress in your writing depends on the way you prefer to work. Most people find that it takes a day to write about 2,000 words. But we all work in different ways. Some people, once they get started, prefer to continue until they drop from exhaustion! Others like to set a strict timetable, devoting three or four hours a day to writing. Whichever category you fall into, make sure you have time for writing allocated in your diary. We have found that it is helpful to have blocks of time where writing can take place on successive days. This ensures a degree of continuity of ideas, which isn’t easy to maintain if you keep having to ‘think your way back’ into your research.
14.2 MEANING AND SIGNIFICANCE OF A RESEARCH REPORT 1. Meaning: Writing the research report is the final and very important step in the process of research work. The research report is a means for communicating one's research experiences to others. Of course, it requires different type of skills. Research report is a narrative but authoritative document on the outcome of a research work. It presents highly specific information for a clearly targeted audience. A well written research report is a means of presenting the studied problem, the methods of data collection and analysis, findings, conclusions and recommendations in an organized manner. It is a means of judging the quality of research. Also, it is a means for evaluating the researcher's ability and competence to do research. It provides factual base for formulating policies and strategies relating to subject matter studied. It provides systematic knowledge on problems and issues analyzed. 2. Significance of Report Writing: Research report is considered a major component of the research study for the research work remains incomplete till the report has been written. As a matter of fact even the most brilliant hypothesis, highly well designed and conducted research study and the most striking generalizations and findings are of little value; if they are not effectively communicated to
others. The purpose of research is not well served unless the findings are made known to others. All this explains the significance of writing research report. There are people who do not consider writing of report as an integral part of the research process. But the general opinion is in favour of treating the presentation of research results or the writing of report is the last step in a research study and requires a set of skill somewhat different from those called for in respect of the earlier stages of research. This task should be accomplished by the researcher with most care; he may seek the assistance and guidance of experts for the purpose. Check your progress: 1. What do you mean by research report? 2. What is the significance of writing research report?
14.3 TYPES OF RESEARCH REPORT Research reports may differ in length and form. Generally, business firms prefer reports in the form of letters. Banks, insurance companies and financial institutions require short balance-sheet type of tabulation in their annual reports to customers and shareholders. The results of a research investigation can be presented in a number of ways: as a technical report, a popular report, an article, a monograph or at times even in the form of an oral presentation. A technical report is used whenever a full written report of the study is required whether for record-keeping or for public dissemination. A popular report is used if the research results have policy implications.
Research reports vary greatly in length and type. In each individual case, both the length and the form are largely dictated by the problems at hand. Let us see few details about some main types of research report: 1) Technical Report: In the technical report the main emphasis is on (i) the methodology used, (ii) assumptions made in the course of the study, (iii) the detailed presentation of the findings including their limitations and supporting data. A general outline of a technical report is as under: 1. Summary of results 2. Nature of the study 3. Methodology used 4. Data 5. Analysis of data and presentation of findings 6. Conclusions 7. Bibliography & webliography 8. Technical appendices 9. Index Summary of results 10. Nature of the study 11. Methodology used 12. Data 13. Analysis of data and presentation of findings 14. Conclusions 15. Bibliography & webliography 16. Technical appendices 17.Index
However, it is to be remembered that even in a technical report, simple presentation and ready availability of the findings remain an important consideration and as such the liberal use of charts and diagrams is considered desirable. or in other words, A technical report is written for fellow researchers and therefore should be organised on a different footing altogether. In such a report, the researcher is expected to give a full account of the technical aspects, both in the sampling methods and the subject matter. Fellow professionals are more concerned about the methods employed. In fact, the value of the findings depends on the techniques adopted. The conceptual and analytical framework sample design should be adequately explained. A technical report consists of the following aspects. 1. Major findings and contents: A technical report will contain the main findings just in two or three pages. 2. Nature of the research work: This describes the general objectives of the study, formulation of the problem in operational items, the working hypothesis, the type of analysis, data required, etc. 3. Research methodology: This explains the various methods used in the study and their limitations. For instance, sample size, sample selection, etc. 4. Data analysis: The report analyses the data and their sources, characteristics and limitations. If secondary data are used, their suitability to the problem at hand is fully assessed. In case of a survey, the manner in which data were collected should be fully described. 5. Presentation of findings: The researcher presents his main findings of the study with supporting data in the form of tables and charts. This part is the main body of the report, usually extending over several chapters. 6. Main conclusion: Here, the main findings of the research are presented and the main body of the report, usually extending over several chapters. 7. Bibliography: This contains the main sources of secondary data. 8. Technical appendices: These contain all technical matters relating to questionnaires, mathematical derivations, elaboration on particular techniques of analysis and the like. The above format provides a general idea of the nature of a technical report; the order of presentation may not necessarily be the same in all technical reports. Therefore, the presentation may differ; the different sections outlined above will not always be the same, nor will all these sections appear in any particular report. 2) Popular Report: This type of report is generally designed for non-technical users like executives, administrators, etc. It gives emphasis on simplicity and attractiveness. The emphasis is also given on practical aspects and policy implications. The format of this report is different from that of a technical report. There can be a liberal use of margins and blank spaces. The style may be more journalistic, but precise. While writing it, possibly it is made easy to rapid reading and quick comprehension.
This stresses on simplicity and attractiveness. Its writing is clear, with minimum statistical details and the liberal use of charts and diagrams. It has an attractive layout, large print size, many sub-headings, and may be even some cartoons. Besides, it emphasises on the practical aspects and policy implications. The following is the general outline of a popular report:

1. Major findings and conclusions: The report will have findings of practical interest and their implications.
2. Follow-up action: It will suggest follow-up action on the basis of the findings of the study in this section.
3. Objectives of the study: Here the problem is presented, along with the specific objectives of the study.
4. Methodology: Here, a description of the methods and techniques used, including a short review of the data on which the study is based, is provided.
5. Results: This is the main body of the report, presented in clear and non-technical terms with the liberal use of all sorts of illustrations such as charts, diagrams and the like.
6. Appendices: This consists of detailed information on the methods used, forms, etc. Appendices are generally not included if the report is meant for the general public. A popular report emphasises on simplicity and policy implications from the operational point of view, avoiding technical details.
The following outline may be adopted while preparing the research report:
(I) The preliminaries Title page. Preface or foreword, acknowledgements. Graphs or illustrations, tables, charts. Table of contents.
(II) Contents of the report:
1. Introduction Objectives of the study, statement of the problem, hypotheses and definition of concepts. Review of literature and research studies. Time, place and materials of the survey. Scope, assumptions and limitations. Organisation and sampling procedures. Methods, tools and techniques employed for data collection.
2. Analysis and presentation of results: Report of facts— nature, volume and dimension. Statistical analysis of data. Summary of findings and recommendations.
3. The reference materials: Bibliography. Appendices— questionnaires/statistical tables etc. Glossary of terms
Index 3) Interim Report: An interim report is published when there is long time lag between data collection and the presentation of the results in the case of a sponsored project. In such a case, the study may lose its significance and usefulness. This report is short and may contain either the first results of the analysis or the final outcome of the analysis of some aspects which are completely analyzed. The interim report contains a narration of what is completed so far and its results are given. It presents a summary of the findings of that part of analysis, which has been completed. 4) Summary Report: A summary report is generally prepared for the use of general public. When the findings of a study are of general interest, a summary report is desirable. It is written in non-technical and simple language. It also contains large number of charts and pictures. It contains a brief reference to the objective of the study, its major findings and their implications. It is a short report which can be published in a newspaper. 5) Research Abstract: It is a short summary of the technical report. It contains a brief presentation of the statement of the problem, objectives of study, methods and techniques used and an over-view of the report. A brief summary of the results of the study can also be added. This abstract is primarily meant for the convenience of examiner, who can decide whether the study belongs to his area of interest. Results of a research can also be published as articles in research journals. A professional journal may have its own special format for reporting research. Thus, research results can be reported in a number of ways. In academic fields, the usual practice is to write the technical report and then prepare several research papers. In practical field and problems having policy implications, it is more common to write a popular report. Researches conducted on behalf of Government or private or public organizations are usually presented in the form of technical report. Check your progress: 1. What are the main types of research report? 2. Give an outline of a technical research report. 14.4 FORMAT OR STRUCTURE OF A RESEARCH REPORT A report has a number of clearly defined sections in certain order. The order of the headings and sub-headings may vary according to nature and type of research. Yet, it is possible to suggest a general sequence of contents in general format of a research report as following: I. Introductory Items: (Preliminary Pages) 1) Title page. 2) Researcher's declaration. 3) The certificate of the research guide or supervisor. 4) Preface / Acknowledgement. 5) Contents. 6) List of tables. 7) List of graphs and charts. 8) Abstract or Synopsis. II. Body of the report: (Main Text) 1) Introduction. (This may include the following items). i. Theoretical background of the topic.

ii. Statement of the Problem. iii. Review of Literature. iv. The Scope of the study. v. Objectives of the study. vi. Hypothesis. vii. Definition of concepts used. viii. Model or Chapter Scheme. 2) The Design. i. Methodology, including overall type and methods used for data collection. ii. Sources of data. iii. Sampling plan. iv. Instruments of data collection. v. Field work. vi. Data processing and analysis (plans). vii. An overview of findings. viii. Limitations of the study. 3) Results 4) Summary, Conclusions and Recommendations. III. Concluding Items: (End Matter) 1) Bibliography and Webliography. 2) Appendix. i. Copies of data collection instruments (like interview schedules, questionnaire). ii. Technical details on sampling plan. iii. Complex tables, Primary tables. iv. Supporting documents. v. Statistical computations. vi. Glossary of new terms used in report. Check your progress: 1) Which are the main parts of the research report? 2) Prepare general structure for a research report. 14.5 STEPS IN PLANNING REPORT WRITING It is necessary to write research report with careful preplanning. This planning consists of following steps: 1. Effectiveness of communication: A research report is a means of communication and it is necessary to first consider the basic questions which determine the effectiveness of communication. The considerations of effective communication are basically linked with the target audience for whom the report is written and who writes this report i.e. the agency or individual conducting the research. The manner in which the research findings are expressed i.e. style of writing, is also equally important. 2. The identification of target audience: The form and type of reporting and other aspects depend upon the type of reader or the user of the report. The identification of the target audience depends on who is the researcher and what is his intention. The target audience can be academic community, the sponsor of the researcher or the general public. The communication
characteristics, i.e. the level of knowledge, the type of language that is understood and appreciated, the expectation form the report are not identical for different groups of audiences. 3. Logical analysis of the subject matter: The subject matter can be developed logically or chronologically. This is because logical analysis implies development of the subject from simple matter to the complex. It is also based on logical connections or associations between different factors. Therefore, planning for logical presentation is important. 4. Preparation of the final outline: Outline is a framework on which the long written report is constructed. It is an aid to decide the logical arrangement of the material to be included in the report and the relative importance of various points. Outline is drawn after preparation of the format of the report. It gives cohesiveness and direction to report writing. The outline can be according to topic or sentence. In the topic outline, the topic headings and the sub-topic headings are noted and the points to be discussed under each head are noted in short forms or with key words. In case of sentence outline, it gives more details about the points to be included in the report. 5. Preparation of the rough draft and final draft: The rough draft follows the outline and the research should write down the broad findings and generalizations. The rough draft can also include various suggestions which help in improving the final writing. A rough draft is essential to avoid mistakes or omission in the final draft. It is possible to polish the language of the rough draft in the final draft. Final draft is written after a careful scrutiny of the rough draft. 6. Preparation of Bibliography and Webliography: Bibliography is a list of books which provide references to the work undertaken and webliography is a list of website addresses where the researcher visited for references and consultancy. Both are appended to research report in a systematic manner. The bibliography should be arranged alphabetically and may be divided into three parts. Fist part may consist of books, second part may contain magazines, periodical and newspaper articles and the third part may contain web-addresses. The entries in the bibliography should be according to a certain order like name of the author, title of the book in italics, place, publisher and date of publication, edition, page number if required, etc. For example, see the list of suggested reading given below this. Check your progress: 1. What is importance of planning for report writing? 2. Which steps are necessary in planning for report writing? 3. What is outline? 4. Differentiate between draft and final research report.
14.6 PHYSICAL LAYOUT OF THE REPORT The manuscript should be typed or printed on unruled white paper, leaving one-and-a-half-inch margins on both the right and left sides (lateral sides) of the paper. There should also be a one-inch margin,
top and bottom (vertical margin/header and footer). The paper should be neat, legible and printed in double-spaced lines preferably in the Times New Roman font with 12 point letter size. The physical arrangement of the paper gives a better appearance, which elicits more interest among readers.
14.7 PLANNING AND ORGANISATION OF AN ACADEMIC REPORT
Proper planning and organisation of study materials are important while preparing the research report. At the writing stage, a researcher will have accumulated a mass of data and information that will have to be prudently and carefully used. Well-conceived planning and organisation facilitates the writing of the report, with a proper emphasis on the different aspects of the study. Planning involves each chapter and aspect of the report. It is nothing but the arrangement of ideas in a logical and coherent manner within the framework of the overall structure laid down.
14.7.1 Stages of writing an academic report
In general, there are six stages in writing a report. They are: • Systematic analysis of the subject. • Drawing the outline of the report. • Preparation of the rough draft. • Enrichment of the final draft. • Preparation of the final bibliography. • Finalising the complete draft.
Now we will discuss some of the important stages:
(a) Finalising the complete draft: This is the first step in writing a report. The final draft should be written in simple language and in a concise and condensed form. The researcher must avoid vague expressions such as ‘it seems’, ‘may be’ and ‘could be’, abstract terminology and technical jargon. At the outset, the report should reflect the study’s intention to solve some intellectual problem and adding to the knowledge of both the researcher and the reader. At the same time, it should be written in such a way that it attracts the readers’ interest and shows some originality in presentation. Some researchers may incorporate the current trends in the field, common experiences, critical incidents etc. to strengthen and reinforce the findings of the research.
(b) Formation of an outline: An outline is a must while writing a report; it is like the skeleton in a human body. The outline of the study is made at two stages: once at the beginning of the study, which serves as a design of the study, and once before writing the report. The outline prepared for writing the report should be elaborate so as to include all important aspects that should find a place in the report. The outline should be prepared at three stages: topical outline, paragraph outline and sentence outline.
Topical outline: This includes the chapters and broad aspects to be included in each chapter. It is a skeleton outline.
Paragraph outline: This includes all major paragraphs, indicating the central idea of each paragraph.
Sentence outline: This does not imply writing of sentences. It merely involves points to be covered in sentences.
The following points need to be observed while planning an outline: • It should be as detailed as possible and should enable continuous writing. • It should not be vague and should not include such value phrases as ‘body’, ‘facts and
figures’, etc, which give no direction to the report writing. It should fulfil the considerations of chronology, topical unity, coherence and
transition. • Each paragraph should contain one major idea.
(c) Important parts of a report
1. The preliminaries: The following aspects should be highlighted in the first part of the research report:
• Title of the report. • Acknowledgement • Preface • Foreword • Contents • List of tables and illustrations
2. The abstract: This is probably the most important part of the report because it may be the only part that some will read. It is a short summary of the complete project report. This enables those who are not sure whether they wish to read the complete report to make an informed decision. For those who intend to read the whole report, the abstract prepares them for what is to come. An abstract should contain four short paragraphs with the answers to the following questions:
• What are my research questions and why are they important? • How did I go about answering the research question(s)? • What did I find out? • What conclusions do I draw regarding my research question(s)?
Smith (1991) lists five characteristics of a good abstract: • It should be short. Try to keep it to a maximum of two sides of an A4-size paper sheet. It must be self-contained. Since it may be the only part of your report that some people see, it
follows that it must summarise the complete content of your report. • It must satisfy your reader’s needs. Your reader must be told about the problem or central
issue that the research addresses and the method adopted to solve it. It must also contain a brief statement of the main results and conclusions.
• It must have the same emphasis as the report, with the consequence that the reader should gain an accurate impression of the report’s content from the abstract.
• It should be objective, precise and easy to read. The project report contents page should give you the outline structure for the abstract. Summarising each section should give you an accurate resume of the content of the report. Do ensure that you stick to what you have written in the report. The abstract is not the place for elaborating any of your main themes. Be objective. You will need to write several drafts before you eliminate every word that is

not absolutely necessary. The purpose is to convey the content of your report in as clear and brief a way as possible.
• Writing a good abstract is difficult. The obvious thing to do is to write it after you have finished the report. We suggest that you draft it when you start writing the report so that your storyline is abundantly clear in your mind. You can then amend the draft when you have finished the report so that it conforms to the five principles above.
3. Research design: The researcher should highlight the research design of the project. The researcher should answer the following questions:
What is its basic design?
• What are the methods adopted to collect data? • How is the study carried out? • Is it an experimental/survey/historical data research method? • If the study is an experimental one, what are the experimental manipulations? • What type of questionnaire/interview/observations is used? • If measurements were based on observation, what instructions are given to the
observers? • Who are the subjects? • How many of them have been selected? • How have they been selected? • How have they been selected? • Are the research instruments reliable? • Do the research instruments have validity?
All these questions, when properly answered, can be used to estimate the probable limits of the findings’ generalisability. The researcher has to take proper care to develop a well-planned research design, which is free from errors and limitations. To ensure the reliability and validity of the tools and instruments, a pilot study can be conducted to verify its strengths and utility.
4. Analysis of data: Here, the researcher has to highlight the type of statistical analysis adopted to analyse the data. The analysis can be listed from simple descriptive analysis to complex multivariate analysis. 5. The results: Once the analysis is over, the results can be depicted in a tabulated form, with appropriate illustrations. A detailed presentation of the findings of the study is a major part of the research report. These can be supported in the form of tables and charts together with a validation of results. Since it comprises the main body of the report, it generally extends over several chapters. It is advisable to project summarised results rather than raw data. All the results should be presented in logical sequence and split into readily identifiable sections. All relevant results must find a place in the report. All the results of the report should address the research problems stated earlier in the report, illustrating whether the results support or reject the hypothesis. But ultimately the researcher must rely on his own judgement in deciding the outline of his report.
Interpretation of results— some hints
• To find the relationships among the variables that are studied and observing the commonality, uniqueness, diversity etc. among them. • To observe the role of extraneous variables. How they affect the various phenomena studied. • To ensure validity; the results can be cross-checked with others through consultation. • To consider all the relevant factors affecting the problem before generalising it to the whole population. The prime tasks of interpretation is to bring to the surface the gist of the findings. A researcher should explain why the findings are so, in objective terms. He should try to bring out the principles involved in the observations. He can also make reasonable prediction. On the basis of interpretation of an exploratory study, a new hypothesis can be formulated for experimental research. During interpretation, unconnected, isolated facts should not be discarded, but should be explained properly. Interpretation leads to the establishment of some explanatory concepts arising out of the connection between the underlying processes and principles, and the observed facts from a working model. A researcher’s task is to identify and disengage such principles and processes. Interpretation can also provide a theoretical conception, which can be the basis of further researcher and new knowledge. Thus, continuity in research can be established and the quest for knowing the unknown can be sustained.
Prerequisites for good interpretation: some guidelines
— While drawing inferences from the analysis of data, the researcher has to ensure that the inferences are free from any biases and mistakes that may arise due to both subjective and objective factors. This can be minimised by: checking whether (a) the data are appropriate, trustworthy and adequate for drawing inferences b) the data reflect good homogeneity and (c) proper analysis has been done through statistical methods.
— The researcher should also check for personal bias (subjective element) while interpreting the results. There are so many pitfalls that have to be avoided while observing and interpreting the results. Some of them are: stereotyping (conforming with existing results), preoccupation with set results, projecting his own views on the subject, snap judgements, lack of appreciation for others’ feelings, prejudicial treatment and so on. The researcher must remain vigilant about all such things so that false generalisations may not take place. He should be well-equipped with statistical measures and must know their correct use for drawing inferences concerning his study.
— The researcher must always keep in view that the task of interpretation is very much intertwined with analysis and cannot be separated. He should take precautions about the
reliability of data, computational checks, validation and comparison of results.
— The researcher should also pay attention to the hidden factors underlying the results. Broad generalisations should be avoided because the coverage may be restricted to a particular time, area and conditions.
— Originality and creativity are critical in interpreting the results. While linking the relationship between theoretical orientation and empirical observation, the researcher has to make use of his originality and creativity in developing concepts and models. He must pay special attention to this aspect while engaged in the task of interpretation.
6. Summary: It is a generally practice to conclude the report with a very brief summary. In business reports, it is called an executive summary. Here, all the aspects of the research report are given in capsule form.
7. Reference material: The listing of reference material comes at the end of any research report. Appendices with all technical data such as questionnaires, sample information, mathematical derivations etc. should be included at the end. The bibliography, listed in alphabetical order, should be added in the last section. Similarly, the researcher has to prepare an index (an alphabetical listing of names, places and topics along with the page numbers in the book or report in which they are mentioned). That should invariably be given at the end of the report.
8. Other considerations: Use of quotations: The appropriate use of quotations will enrich the effective presentation of research reports. Quotations should be placed within quotation marks and double-spaced. In case the quotation is
lengthy, it can be typed in single space and indented at least half an inch to the right of the normal text margin.
Punctuation and abbreviations: The researcher has to take care to check punctuation marks such as commas, full stops, colons, semicolons etc. these punctuation marks can be checked and verified in listing the bibliography, references, citations, documentations etc. For example, in listing the reference, the author’s name is followed by a comma. After the comma, the title of the book is given; the article (such as ‘a’, ‘an’, ‘the’ etc.) is omitted and only the first word, proper nouns and adjectives are capitalised. A comma follows the title. Information concerning the edition is given next. This entry is followed by a comma. The place of publication is then stated; it may be mentioned in an abbreviated form. For example, London is abbreviated as Lond, New York as N.Y. and so on.
14.8 REFERENCING IN THE TEXT
The Harvard system, which we have adopted in this book, uses the author’s name and data of publication to identify cited documents within the text. For example:
• It has been shown that… (Saunders, 1993). • When referring generally to work by different authors on the subject, place the authors
in alphabetical order: (Baker, 1991; Lewis, 1991; Thornhill, 1993). • When referring to dual authors: (Saunders and Cooper, 1993). • When there are more than two authors: (Bryce et al., 1991). • For corporate authors, for instance a company report: (Hanson Trust Plc, 1990).
• For publications with no obvious author; for example an employment gazette: (Employment Gazette, 1993).
• When referring to different publications by the same author, the works should be arranged according to date in ascending order: (Lewis, 1989, 1991).
• To differetiate between publications by the same author in the same year use a, b, c etc., (Forster, 1991a). Make sure that this is consistent throughout the research project and corresponds with the bibliography.
• To reference an author referred to by another author where the original publication has not been read: (Granovetter, 1974, cited by Saunders, 1993). In this case the author who cites and the original document’s author should both appear in the bibliography.
14.9 REFERENCING IN THE BIBLIOGRAPHY
In the bibliography, the referenced publications are listed alphabetically by author’s name. All the author’s surnames and initials are listed in full. If there is more than one work by the same author, these are listed chronologically.
• An example of a reference to a book would be: Saunders, M.N.K. and Cooper, S.A., (1993) Understanding Business Statistics, London, DP Publciations.
• A reference to a book other than the first edition would be: Morris, C., (1993) Quantitative Approaches to Business Studies (3rd ed.,) London, Pitman Publishing.
• A reference to a book with no obvious author would be: Department of Trade and Industry (1992). The Single Market: Europe open for Professions, UK Implementation, London, HMSO.
• A reference to a particular chapter in a book would be: Robsoon, C., (1993) Real World Research, Oxford, Blackwell, Chapter 3.
• A reference to a particular chapter in an edited book would be: Graig, P.B. (1991) ‘Designing and Using Mail Questionnaires’, in Smith, N.C. and Dainty, P. (eds) The Management Research Handbook, London, Routledge, pp. 181-89.
• An example of a reference to an article in a journal (in this example volume 20, part 6 would be): Brewster, C. and Bournois, F., (1992) ‘uman Resource Management: A European Perspective’, Personnel Review, 20: 6, 4-13.
14.10 FOOTNOTES
Researchers must insert footnotes in the appropriate places. These fulfil two purposes:
• The proper identification of materials used in quotations in the report.
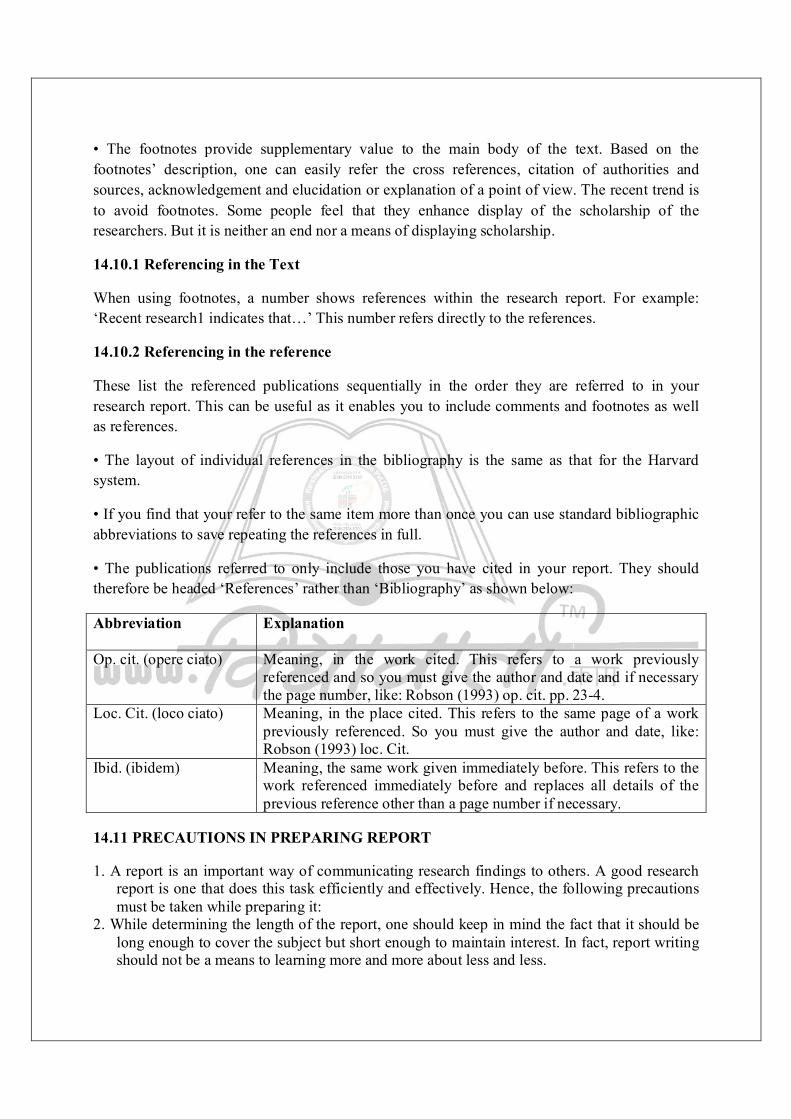
• The footnotes provide supplementary value to the main body of the text. Based on the footnotes’ description, one can easily refer the cross references, citation of authorities and sources, acknowledgement and elucidation or explanation of a point of view. The recent trend is to avoid footnotes. Some people feel that they enhance display of the scholarship of the researchers. But it is neither an end nor a means of displaying scholarship.
14.10.1 Referencing in the Text
When using footnotes, a number shows references within the research report. For example: ‘Recent research1 indicates that…’ This number refers directly to the references.
14.10.2 Referencing in the reference
These list the referenced publications sequentially in the order they are referred to in your research report. This can be useful as it enables you to include comments and footnotes as well as references.
• The layout of individual references in the bibliography is the same as that for the Harvard system.
• If you find that your refer to the same item more than once you can use standard bibliographic abbreviations to save repeating the references in full.
• The publications referred to only include those you have cited in your report. They should therefore be headed ‘References’ rather than ‘Bibliography’ as shown below:
Abbreviation
Explanation
Op. cit. (opere ciato) Meaning, in the work cited. This refers to a work previously referenced and so you must give the author and date and if necessary the page number, like: Robson (1993) op. cit. pp. 23-4.
Loc. Cit. (loco ciato) Meaning, in the place cited. This refers to the same page of a work previously referenced. So you must give the author and date, like: Robson (1993) loc. Cit.
Ibid. (ibidem) Meaning, the same work given immediately before. This refers to the work referenced immediately before and replaces all details of the previous reference other than a page number if necessary.
14.11 PRECAUTIONS IN PREPARING REPORT
1. A report is an important way of communicating research findings to others. A good research report is one that does this task efficiently and effectively. Hence, the following precautions must be taken while preparing it:
2. While determining the length of the report, one should keep in mind the fact that it should be long enough to cover the subject but short enough to maintain interest. In fact, report writing should not be a means to learning more and more about less and less.
3. Abstract terminology and technical jargon should be avoided. The report should be able to convey the matter as simply as possible. In other words, this means that reports should be written in an objective style in simple language, avoiding expressions such as ‘it seems’, ‘there may be’ and the like.
4. Readers are often interested in acquiring quick knowledge of the main findings and as such the report must make the findings readily accessible. For this purpose, charts, graphs and statistical tables may be used for the various results in the main report in addition to summaries of important findings.
5. The layout of the research should be well thought out. It must be appropriate and in accordance with the objective of the research problem.
6. The report should be free from grammatical mistakes and must be prepared strictly according to the rules of composition of research reports such as the use of quotation marks, footnotes, documentation, punctuation and use of abbreviations in footnotes and the like.
7. The report must present a logical analysis of the subject matter. It must reflect a structure wherein the different pieces of analysis relating to the research problem fit well.
8. A research report should show originality and should necessarily be an attempt to solve some intellectual problem. It must contribute to the solution of a problem and must add to the store of knowledge.
9. Towards the end, the report must also state the policy implications of the problem under consideration. It is usually considered desirable for a report to make a forecast of the probable future of the subject concerned and indicate the kind of research that still needs to be done in that particular field.
10. Appendices should be enlisted for all the technical data in the report. 11. Bibliography of sources consulted is a must for a good report. 12. An index is also considered an essential part of a good report and as such must be prepared
and appended at the end. 13. The report must have an attractive appearance. It should be neat and clean, whether typed or
printed. 14. Calculated confidence limits must be mentioned and the various constraints experienced in
conducting the research study stated. 15. The objective of the study, the nature of the problem, the methods employed and the
technique of analysis adopted must all be stated at the beginning of the report in the form of an introduction.
14.12 EVALUATION OF A REPORT— SOME CONSIDERATIONS
The evaluator has to give a report on the thesis or dissertation evaluated by him. There is no standard format for this report. The evaluator is expected to comment on (1) the importance of the study; (2) soundness of the methodology; (3) quality of analysis; (4) significance of the findings, and (5) format and style of presentation. It is not necessary for him to summarise the contents of the thesis. But he must point out the strengths and weaknesses of the work. He should give his final recommendation— whether the thesis should be accepted or rejected— in clear terms. If the thesis needs revision and re-submission, the evaluator should recommended that these be done. In this case, he should offer specific suggestions for revision.
14.12.1 Evaluation Criteria

There is no universally accepted set of standards for evaluating a research report. However, the following checklist will serve as a general guideline for a critical evaluation or analysis of a research report:
1. The appropriateness of the title
(a) Does it exactly indicate the core of the study? (b) Is it clear and concise? (c) Does it promise no more than what the study can provide?
2. Importance of the problem
(a) Is the research problem topically important? (b) Is it socially relevant in terms of its contribution to knowledge and/or solution to the
burning problem of the day? (c) Are the research questions (objectives) clearly stated?
(d) Are they specific and related to the selected theme?
(e) Are the hypotheses pertinent to the research questions? (f) Are they clearly stated and testable? (g) Are the concepts in the title, objectives and hypotheses operationally defined? (h) Are the operational definitions valid and reasonable? (i) Are assumptions and limitations stated? (j) Does the problem formulation reflect the researcher’s mastery of the subject matter of
the study?
3. Review of related literature and earlier studies
(a) Is this review covered adequately? (b) Is it well-organised and documented? (c) Has the research gap been identified? (d) Does the present study fill in the gap?
4. Soundness of the methodology:
(a) Are the type of research and sources and methods of data collection described in detail?
(b) Are the above methods appropriate to the problem under study and the respondents? (c) Is the research design appropriate to test adequately the hypothesised relationships? (d) Is the sampling design appropriate and described in detail? (e) Are the methods adopted for sampling scientific? (f) Is the sample size adequate? (g) Are relevant variables recognised, defined, inter-related and measured? (h) Are the data-gathering instruments appropriate? (i) Are the validity and reliability of the instruments established?
(j) Are the details of the methodology adequate for replicability?
5. Data analysis
(a) Is the analysis objective and deep? (b) Is the statistical treatment appropriate? (c) Is appropriate use made of tables and charts? (d) Is their format proper and complete? (e) Have the hypotheses been adequately tested? (f) Is the analysis of data relationship logical and perceptive? (g) Is the significance of statistical results tested properly? (h) Are the statistical results interpreted and presented without any bias?
6. Contribution of the study and conclusions and recommendations
(a) Are the findings of the study stated clearly? (b) Are the findings generalisable? (c) Does the study test a theory or develop a new theory, a new model or new tool or
contribute to methodology in any other way? (d) Are the conclusions logical and justified by the empirical evidence? (e) Are the implications of the results for policy and action explicitly pointed out? (f) Do the recommendatiosn flow from the findings? (g) Are the recommendatiosn specific and practical?
7. Presentation
(a) Is the format of the report appropriate? (b) Does the report have headings and sub-headings that facilitate reading and
understanding it? (c) Is the chapter scheme based on the objective of the study?
(d) Is the textual discussion clear, concise and convincing? (e) Is the style of writing smooth and simple? (f) Is it free from spelling and grammatical errors? (g) Do the footnotes/references contain full details of the sources? (h) Is the bibliography exhaustive?
14.13 VIVA VOCE EXAMINATION
The student is expected to defend his thesis in a viva voce examination. This examination has several purposes:
• To establish the authenticity of the thesis, i.e., that the student has in fact carried out the research described in the thesis. (to this end he may be questioned closely on the problem formulation, methodology and other aspects of the study).
• To test the student’s knowledge of his subject. • To seek clarification or explanation from the student upon the points made in his thesis. • To provide the student with an opportunity to know the weaknesses and shortcomings
of his thesis.

To prepare for the viva voce, the student should re-read the thesis, anticipate any points the examiners are likely to make and plan the defences to be offered for them. During the viva, the student should stay confident and relaxed and should answer all questions as fully and clearly as possible. But he should not, research systematically and presented the results carefully, the oral examination does nto pose any problem. It may turn out to be a pleasant exchange of thoughts between the student and experts in the field.
14.14 SUMMARY Finally, we come to a conclusion of our exercise of familiarising you with the art of planning and organising a research programme by describing various stages with clarity of concepts and illustrations. We advise readers to resort to IT-enabled techniques for exploring the various possibilities and arriving at a final conclusion. In this context, the author will extend all possible assistance, especially for finalisation of tests, hypotheses, sample size determination, mode of analysis and interpretation by utilising his personal network of global consultants and professors. Further, economic considerations— i.e., cost of production— prevents the author from presenting the entire concepts fully. After all, the world of research and business will always be dynamic, and it is impossible for anyone to present it in a static mode. 1. Writing the research report is the final and very important step in the process of research work. Research report is a narrative but authoritative document on the outcome of a research work. 2. In the technical report the main emphasis is on the methodology used, assumptions made in the course of the study and the detailed presentation of the findings including their limitations and supporting data. 3. In Popular report there can be liberal use of margins and blank spaces. The style may be more journalistic, but precise. The emphasis is given on practical aspects and policy implications. 4. An Interim report is published when there is long time lag between data collection and the presentation of the results in the case of a sponsored projects. It presents a summary of the findings of that part of analysis, which has been completed. 5. Summary report is written in non-technical and simple language. It also contains large number of charts and pictures. It contains a brief reference to the objective of the study, its major findings and their implications. 6. Research abstract is a short summary of the technical report. It contains a brief presentation of the statement of the problem, objectives of study, methods and techniques used and an overview of the report. 7. General format of a research report includes the following: a. Introductory items b. Body of the report : Introduction, The design, Results, Summary, Conclusions and Recommendations c. Concluding items : Bibliography and Webliography, Appendix 8. Steps in planning Report writing consists of different steps.
14.15 KEYWORDS
Research Reporting is culmination of research investigation.
Technical Report is written for fellow researchers in which the researchers are expected to give a detailed account of the technical aspects both in sampling methods and subject matter. TEN STEPS FOR WRITING RESEARCH PAPERS There are ten steps involved in writing a research paper: Step 1: Select a subject Step 2: Narrow the topic Step 3: State the tentative objective (or thesis) Step 4: Form a preliminary bibliography Step 5: Prepare a working outline Step 6: Start taking notes Step 7: Outline the paper Step 8: Write a rough draft Step 9: Edit your paper Step 10: Write the final draft Step 1: Select a subject Choose your subject carefully, keeping in mind the amount of time you have to write the paper, the length of the paper, your intended audience and the limits of the resources. Check in the library to make sure a reasonable amount of information is available on the subject you choose. Writing the paper will be much easier if you select a subject that interests you and that you can form an opinion or viewpoint about. In fact, it will be easier later on to narrow the topic if you choose a subject you already know something about. However, avoid controversial and sensational subjects that are not scholarly, or too technical, or will only restate the research material. Step 2: Narrow the topic The topic of the paper is what you want to say about the subject. To narrow the topic, you need to read background articles about your subject in encyclopedias and other general references. Do not take notes at this time other than to jot down possible main ideas. As you read, ask questions like the following: Who are the important people involved?
What are the major issues?
What are my opinions regarding the topic?
Why is this an important (controversial, interesting) subject?
How has the problem (or issue) developed? When? Where? The answers will help you narrow your topic. Remember to keep in mind the length of your paper. 14.16 QUESTIONS 1. Explain the main types of research report. 2. Explain the meaning of research report and explain its structure. 3. What are the steps involved in planning for writing research report?
15 ORGANIZATION AND STYLE OF
RESEARCH REPORT Unit Structure: 15.0 Objectives 15.1 Principles of writing the Research Repot 15.2 Summary 15.3 Questions 15.0 OBJECTIVES To know the principles of writing research report. To understand the organization structure and style of report writing. To understand that which precautions are to be taken while writing research report. 15.1 PRINCIPLES OF WRITING THE RESEARCH REPORT Considering the previously discussed general format of the research report, there are certain principles of standard practices which should be observed in writing a research report. Those principles comprise organization, style of research report and essentially some precaution in writing a research report. 1. Organization of Report: In the organization of research report, following points are essentially be considered: a. Size and physical design: Accordingly prescribed size of the paper and the given general instructions are to be maintained throughout the writing of report. Ofcourse, writing should be in double-space and on one side of the page. b. Procedure: Various steps in writing the report which are explained before in previous unit should be strictly followed. c. Layout: Keeping in view the objective and nature of the problem, the layout of the report should be suitable according to the type of research report. d. Treatment of quotations: Quotations should be placed in quotation marks and double-spaced, forming an immediate part of the text. But if a quotation is of a considerable length then it should be single-spaced and indented at least half an inch to the right of the normal text margin. e. Footnotes: Regarding footnotes one should keep in view the following things: i) It should provide proper cross references, data sources. ii) It should be written at the bottom of the page and separate from the main text. iii) It should be numbered consecutively beginning with 1 in each chapter separately and such number should be typed a little above the line at its end. iv) It is always be typed in single space and make separate form one another by double space. f. Documentation Style: Regarding documentation, the first footnote reference to any given work should be complete with all its essential facts about the edition used. g. Punctuation and Abbreviations: The punctuation marks should be proper for meaningful reading and the abbreviations used should be most familiar with all. h. Use of Statistics, Charts and Graphs: For the more clarification and simplification, use of statistics in research report is of great important. One may well remember that a good picture is often worth more than a thousand words. Statistics are usually presented in the form of tables,
charts, bars and line-graphs and pictograms. Such presentation should be self explanatory and complete in itself. It should be suitable and appropriate looking to the problem at hand. Finally, statistical presentation should be neat and attractive. i. The final draft: Revising and rewriting the rough draft of the report should be done with great care before writing the final draft. For the purpose, the researcher should put to himself questions like: Are the sentences written in the report clear? Are they grammatically correct? Do they say what is meant? Do the various points incorporated in the report fit together logically? And finally, having at least one colleague read the report just before the final revision is extremely helpful. j. Bibliography and Webliography: These should be prepared and appended to the research report as discussed earlier. k. Preparation of the index: At the end of the report, giving a neatly prepared index plays a role of a good guide to the readers. Index may be prepared both as subject index and as author index. The former gives the names of which they have appeared or discussed in the report, whereas the latter gives the similar information regarding the names of authors. The index should always be arranged alphabetically. 2. Style of Report: There are certain basic aspects relating to the style of a research report. These aspects are based on the principles of writing research report. The style of the research report is closely related with arrangement of the content, grammatical aspect, quotations, index, calculations, use of graphical presentation, arrangement of bibliography, etc. The style of the research report can be maintained by keeping the following precautions in mind while writing the research repot. 3. Precautions are to be taken while writing Report: There are certain principles of standard practice which should be observed and take precautions while writing a research report. Those are as under: a) Organization of Report: The layout should be well throughout and must be appropriate with the objective of the research problem. Each chapter may be divided into two or more sections with appropriate headings and in each section; margin headings and paragraph headings may be used. Physical presentation should also be neat. A page should not be filled from top to bottom. It should have enough margins on all sides. The report should be long enough to cover the subject, but short enough to maintain interest. b) Style: A research report should not be dull. It should be so written as to sustain a reader's interest. A report requires a style different from other academic writings like essays, stories, etc. It is a formal presentation of an objective, unbiased investigation. Therefore, it should be written in formal, Standard English without making it uninteresting. A research report does not require elegant words. It just needs a plain discussion which is accurate, concise and also readable and coherent. The writer should keep in mind the reading ability of the target audience and avoid unclear writing. To make the report clear and readable: i) Avoid jargon and pompous style. ii) Avoid offensive words. iii) Do not use adjectives that exaggerate the facts e.g. awful, gigantic, immeasurable, etc. iv) Avoid tautology or repetition like return back, the true facts and so on. v) Avoid unnecessary words or descriptions. For example, one can say 'many' instead of 'large number'.
vi) Try not to use stereotyped phrases, like 'as a rule', 'it goes without saying', 'it seems', 'last but not least', 'by and large', etc. vii) Use of slang also does not make good reading in a report. In short, the report should convey the meaning in as simple words as possible. c) Content: The report must present the logical analysis of the subject matter. Report must contain necessary charts, graphs and statistical tables in addition to the important summary tables. d) Grammar: Presentation in a report should be free from spelling mistakes and grammatical errors. The important rules of grammar relate to: Spelling of words, punctuations, capitalization and other standard rules, etc. e) Quotations: Footnotes, documentation, abbreviations are used strictly according to the convention or rules of incorporating them. Every quotation used should be acknowledged with a footnote. Do not use abbreviations in the text of the report. However, abbreviations are desirable in footnotes, tables and appendices. f) Index: It is also an essential part of a report and it should be properly prepared. g) Calculations: Calculated confidence limits for statistical results must be mentioned. The various difficulties experienced in the conduct of study may also be mentioned. h) Bibliography and Webliography: Bibliography should be arranged according to the rules. Intellectual honesty demands that all source material should be acknowledged by the researcher. Also, consulted web addresses are to be noted properly for the interest of the readers. i) Other essential Considerations: Appendices should be enlisted in respect of all the technical data on the report. Index is also an essential part of a report and it should be properly prepared. 15.2 SUMMARY 1. There are certain principles of standard practices which should be observed in writing a research report. 2. In the Organization of research report some points are essentially be considered such as size and physical design, procedure, layout, treatment of quotations, footnotes, documentation style, use of statistics, charts and graphs etc. 3. The style of the research report is closely related with arrangement of the content, grammatical aspect, quotations, index, calculations, use of graphical presentation, arrangement of bibliography etc. 4. Precautions are to be taken while writing report such as organization of report, style, content, grammer, quotations, index, calculations, bibliography and webliography etc. 15.3 QUESTIONS 1) Explain the principles of writing research report. 2) Write a note on: i. Organization of Report. ii. Style of Report. iii. Importance of Bibliography. 3) Explain the precautions to be taken in writing a research report.

16 PHILOSOPHICAL AND HISTORICAL RESEARCH Unit Structures: 16.0 Introduction 16.1 Objectives 16.2 Main content 16.2.1 Philosophical Research 16.2.1.1 Main steps in Philosophical inquiry 16.3. Historical Research 16.3.1 Features of Historical Research 16.3.2 Main steps in historical Research 16.4 Conclusion 16.5 Summary 16.6 Tutor marked Assignment 16.7 References / Further Readings 16.0 INTRODUCTION In this course, you have studied to the fact that the qualitative methods treat human mind, especially the mental insights and impressionistic view as the major means of generating knowledge. They are employed for inquires in different fields such as Philosophy, History, Social Anthropology, Field Psychology , cortex specific problems, prognosis and diagnosis of problem cases etc. you have seen that, the last unit dealt with some qualitative research methods. In this unit, you will continue with other qualitative research methods like Philosophical and Historical research methods, and may continue in the next unit. 16.1 OBJECTIVES At the end of this unit, you should be able to:- i. Explain Philosophical research ii. List the main steps in Philosophical inquiry iii. Explain Historical research iv. Discuss the main features of Historical research v. List the main steps in Historical research. 16.2 MAIN CONTENT 16.2.1 PHILOSOPHICAL RESEARCH Philosophical studies aim at the assessment of the status of knowledge through analysis of meaning and relationships of different concepts and exposition of underlying assumptions. They also aim at a fruitful synthesis of ideas from different fields concerning the theories and practices. It means that if you are a researcher in this area, you will be aiming at the analyses of meaning and nature of different concepts and the reluctance of different kinds of practices. You will have to identify appropriate norms and standard for practices through cross examination of ideas reflected by the different thinkers in your field of specialization. The main thrust of philosophical research can be summarized as follows: i. Study of the contributions made by a philosophers or groups of philosophers: These are philosophers or groups of philosophers who follow similar lines of thought expressing their ideas about the aspects of occasions in different forms – speeches, discourses, writing and institutional practices. ii. Study of the philosophical ideas propounded by a particular school of thought: You already know that philosophy is classified under different schools of thought, such as Idealism, naturalism, realism, existentialism, pragmatism, socialism or communism i.e. dialectical materialism.
iii. Study of the philosophical bases of the curriculum: So many questions are raised in the context of curriculum development. These include the desirability of the state of mind to learn, the criteria for identifying the desirability of the state of the mind. These are some of the issues related to theoretical and practical aspects which are the concerns of the philosopher. iv. Study of the philosophical bases of instructional process: Philosophical research probes in to the alternative to instructional designs and system, their worth and social desirability in the overall frame work and understanding to human development. v. Study and philosophical analysis of contributions made by theories in psychology: Philosophical studies probe into the contributions of need theories and concept formation from the psychological process. vi. Study and philosophical analysis of social theories: Issues like freedom, autonomy, democratic values, equality of opportunities, policies and practices, require philosophical analysis from time to time in order to accommodate the changes which improve or develop the societies. 16.2.1.1 Main Steps in Philosophical Inquiry There are well defined steps that need to be considered and followed in order to make a successful philosophical inquiry. i. Identification of appropriate topic: As it is in every other research method, philosophical studies start with the selection of appropriate topic. You have to ensure that the topic chosen is capable of yielding a system, of thought with sound justification. Of course, you have to consult available literature before you finalize the topic. Look at these two topics. “A critical study of the educational implications of existentialism”. “A philosophical study of Equality of Educational opportunity”. ii. Collection of data: After the identification of the topic and raising some preliminary questions about this topic, you then go to collect all possible data relevant to the topic. Data can be collected from different sources including available literature. The type and sources of data may be of literary nature like to rite ups or opinions of the philosophers concerned, commentaries on relevant philosophical works which appear in the form of books, journals, transcriptions, recording, research reports etc. collection of these types of data is mostly done through library work. You have t note that this is a very crucial stage in this type of research process. You will have to decide the relevance and authenticity of the data and the nature of the sources. iii. Classification of data and the interpretation: Logical classification of the data under different heads that focus on the topic of investigation is required here. After the classification comes the interpretation. This follows different processes such as description, comparison, appraisal, cross examination, etc. of the different ideas or concepts in the context of the major question under consideration, interpretation. Here is a scholarly exercise it rests on our analytical insight and your synthesizing ability. According to varma (1965) the task of interpretation is chiefly that of ascribing a significance, meaning, purpose and relatedness to a common end and to an apparently heterogeneous mass of data. Personal biases and subjectivity must be as much as possible avoided. iv. Reporting the study: This is the final stage of the research. You have to maintain logical sequences among the different heads of classification appropriate conclusion are drawn towards the end of the presentation. You have to be careful to ensure clarity and precision in your presentation. Cite appropriate references with quotations as well as all necessary points and emphasis on the presentations very carefully in the report. 16.3 HISTORICAL RESEARCH Right from your primary school, you have known that history is the study of the past. Therefore a historical research consists of the studies of the past happenings. In this process of searching for the
amount of what happened in the past, the historian may reveal several interacting factors that contributed to a particular event within a specific context of time and space occurring. Historical studies highlight some causal relationships of past events and unearth the background for the purpose of understanding the social phenomena both past and the present. It means that the understanding of our past will help us to develop better perceptions of the dynamics of the present times. History is a study of the road for the march of progress indicating the nature of advance in socio-economic and political contexts. According to Borg (1963) historical research can be seen as the systematic and objective location, evaluation and synthesis of evidence in order to establish facts and draw conclusions about past events. 16.3.1 Main Features of Historical Research Historical method of research otherwise called „historiography‟ has some unique features that make it count as a method of scientific inquiry. These features are: i. It aims at developing knowledge of past events within a particular framework of time and social – political, economic and cultural context. As a historical researcher, you attach importance to the meaning of specific events which have already occurred and explain their casual relationships on the basis of the analysis of the existing data. ii. You dig into the significant data that tell us about the past events. You do not have any control over data because you are studying situations that do not exist in the present. You have to consider every piece of information of the past which are relevant to your problem of investigation for analysis. iii. Historical research is conducted based on the analysis of all the known information related to the research problem. iv. Data concerning the past events are available through different sources. These sources are classified into primary and secondary sources. Before we go on let look at these. 16.3.3.1(A) Primary sources of Historical data. These provide first hand information about the past events. They include direct observation and reporting a recording of experiences. Other primary sources include:
Personal primary sources such as personal direct observation of events which the participated in the past.
Physical artifacts like collections in museum or evidence of historical spots, relics, remains etc.
Mechanical artifacts like films, video, audio and photographs Records written by actual participants or observers in the form autobiographies, charters,
court decisions, official minute or record deeds, wills, permits, licenses, certificates, bills, receipts, maps, pictures, paintings etc.
16.3.3.2 (B) Secondary Sources of data: These involve second-hand information about past events. The person giving the information is neither a participant nor an eye witness of events. The information can be in the form of written materials such as newspaper articles, magazine, books, research reports etc. You have to note that secondary sources of data are usually of limited worth because of the errors which result when information is passed on from one person to another. v. Another major feature of historical research is the evaluation of data. Doubts can be raised about the validity, reliability and relevance of the data. The process of evaluation is called historical criticism. This can be external or internal criticism. External criticism is concerned with testing the authenticity of the sources of data, while the internal criticism is concerned with the verification of the content of the data.
16.3.2 Main steps in Historical Research i. Identification of the problem: As usual this is the first step. It involves selecting a problem which falls in the area of history or which has issues of historical significance. ii. Specification of the population of data: There may be a lot of information about the past available in most cases. You need to point out the types that are relevant to your study. iii. Data Collection: The description of the required population of data will help you to develop an overview about the data and to assess whether all relevant information is available or not. You need to study the relevant literature and make efforts to discover new data in addition to what is available. To collect data:- a. You should be aware of all the data known to exist. b. You should know sources of data and be ready to explore new data from the existing sources. c. You should be ready to exercise great care in exploring the sources and previously known data in the context of the problem under investigation. iv. Organization of Data: Here you arrange the data under different headings in order to show a holistic picture of the problem. This will enable you to scrutinize the data in hand to see if they are enough for the study or if there is need for more. v. Interpretation of data: At this stage you have to show the events which give details of what happened to whom, in that place and at what time. This will lead you into being curious to know why something happened. It poses a great challenge because interpretation is based on forces which shaped event and determined policies. A sound knowledge of related fields like sociology, political science, economics, philosophy, geography, educational management and educational technology, will enable you to develop a holistic view about the situation and to deduce the implication for the present. vi. Report writing: This starts once the first round of data collection is over. There is the interaction between writing interpretations, selections of additional data and subsequent reached. The final touch will be given to the study by way of preparing a systematic and comprehensive report. SELF ASSESSMENT EXERCISE 2 i. Identify a study topic about the history of your Alma matter? ii. State the main steps you will take in conducting this historical research? 16.4 CONCLUSION:- You have added two more research methods which are qualitative researches in your repartuor of knowledge. These are research options for your study when you need to do any investigation. In the next unit you will also add more so hat you have varieties of choices when you are ready for your research project. 16.5 SUMMARY In this unit you have learnt that philosophical research aims at the assessment of the status of knowledge through analysis of meaning and relationships of different concepts and expositions of underlying assumptions. The main steps expositions of underlying assumptions. The main steps are i. Identification of appropriate topic ii. Collection of data iii. Classification of data and the interpretation iv. Reporting the study You also learnt that a historical research consists of the studies of what happened in the past in order to reveal several interacting factors that contributed to a particular event within a specific content of time and space. The main features of Historical Research highlighted in this unit. You saw the two
sources of historical data which are the primary sources and secondary sources. In evaluation of historical data which is called historical criticism, two types involve. These are external and internal criticism. The main steps in historical research are: i. Identification of the problem
ii. Specification of the population of data iii. Data Collection iv. Organization of Data v. Interpretation of data vi. Report writing 16.6 TUTOR MARKED ASSIGNMENT i. What are the main steps in Philosophical Research? ii. Explain the sources of Historical Research? iii. What are the two ways of evaluating Historical Research? 16.7 REFERENCE / FURTHER READING IGNOU (2001) Research Methods for Distance Education. ES315 New Delhi STRIDE Varma, M (1965) an Introduction to Educational and Psychological Research. New Delhi. Asia Publishing House
17 NATURALISTIC INQUIRY AND CASE STUDY
Unit Structures: 17.0. Introduction 17.1 Objectives 17.2 Main content 17.2.1 Naturalistic Inquiry 17.2.1.1 Uniqueness of Naturalistic Inquiry 17.3 Main steps in Naturalistic Inquiry 17.3.1 Trustworthiness and objectivity in Naturalistic studies 17.4 Case study Research 17.4.1 Characteristics of case study research 17.5 Main steps in case study 17.5.1 Is case study scientific in Nature? 17.6 Conclusion 17.7 Summary 17.0. INTRODUCTION In the last unit, you learnt two research methods which are qualitative. This unit is a continuation you are going to learn yet another two methods of research which are qualitative. These are the Naturalistic research method and the case study method. Under these we are going to discuss the meaning, significance, their uses and the steps in conducting them. 17.1 OBJECTIVES At the end of this unit, you should be able to:- i. Explain the meaning of naturalistic inquiry ii. Discuss the uniqueness of the naturalistic inquiry iii. Describe the main steps in naturalistic inquiry iv. Explain case study research v. Mention the characteristics of case study vi. List the main steps in case study. 17.2 MAIN CONTENT 17.2.1 NATURALISTIC INQUIRY As the name implies, this can be said to mean all investigations about social and educational phenomena conducted in natural settings. It is identified with the concept of field studies in the areas of Anthropology and Sociology. It has a unique position in the conduct of social sciences researches. For instance, if you are interested in studying the problems of hotel management in Nigeria, you may decide to use the naturalistic inquiry method. In this case, it means that you have to go down to the natural settings of the hotels and their management in order to study the problems. In an ordinary scientific inquiry, you start with the statement of the hypotheses, which you formulated through a deductive process. You can then start collecting data in order to test the hypotheses or theoretical questions. You may use a physically controlled situation or statistically controlled techniques. In whatever you are doing, objectivity must be ensured through the use of representative samples, standardized instruments and different sophisticated statistical designs for treatment of data and generalization of finds. Naturalistic inquiry does not follow these steps. It follows an altogether different conceptual framework this takes into account such factors as:- i. Multiple Realities: Naturalists believe that multiple realities exist in social situations.

These exist in concrete forms. Realities can be regarded as what people perceive at a particular point in time. You know that social situations keep changing from time to time. Therefore, realities will also be changing. ii. Meanings and Interpretations: Naturalists lay emphasis on the meaning and interpretations given to objects, events and processes concerning social and educational situations. You need to understand human behavioural or social phenomenon in order to see the changes, the way people see them, what they are doing or how they participate in an activity. iii. Generation of Knowledge: Naturalists insist on the generation of knowledge as a result of the interaction between the researcher and the respondents. The respondents answer questions from the investigator in order to show their perceptions or the meanings attached to their actions. This makes the respondents to achieve maximum levels of responsiveness and insight into the problem under investigation. iv. Generalization: Naturalists do not believe in generalization as is done by the scientists. They believe that the process of knowledge generalization must take into account the differences or the real evidence existing in specific situations. v. Human Relations: There are several intrinsic factors, events and processes that keep influencing each other. If is not possible to identify one to one cause and effect relationship in the case of naturalistic studies. Causality in social studies is not demonstrated in the hard sense, but only patterns of plausible influences can be inferred from social and behavioural studies. vi. Value Systems: There is no value – free inquiry. Naturalists assume the influence of value systems in the identification of problems, selection of samples, use of tools for data collection, the conditions in which data are gathered, and the possible interaction that takes place between the investigator and the respondents. Naturalist‟s points out that the researcher‟s bias is always there and should be mentioned in the research reports and to be ignored. 17.2.1.1 The Uniqueness of Naturalistic Inquiry In terms of procedures, naturalistic research is quite unique. Let us highlight the uniqueness as follows: i. Holistic Approach: The intention of naturalists of the development of deeper understanding of a given situations in a holistic manner. All possible information in regards to all the significant dimensions of the situation under study is collected with a view to show the situation in the totality. ii. Insightful Inquiry: This is emphasized by the naturalists where human beings are treated as the sole means of data collection. Naturalistic research makes use of qualitative methods such as participant observation informal interviews and discussions, review of relevant literature, daily observation notes and dairy writing, very often for field work. It can also make use of quantitative method like use of tests, questionnaires etc sometimes for data collection. iii. No a Prior Theory: A naturalistic research is such that you go to the field collect data without having any pre-specified theory in mind. Your belief as a naturalist is that and a prior limits the inquiry to those elements which may have been significant before developing an understanding of the situation. The process of holistic inquiry is blocked. Theoretical propositions are insistence on the development of theories afresh in every enquiry conducted. iv. No Pre-specified design of study: There is no explicit statement on the hypotheses and the conditions for data collection, analyses and interpretation. You can only develop; decisions are taken about the samples during the field work. Experiences got through personal insights, intuition, personal images and apprehensions are recast into appropriate propositions during the period of data collection. The data collected are used to analyze and adopt the study to the pattern of relationship. v. Naturalistic setting: in the description of naturalistic research above, you learnt that it takes place in the natural setting. So naturalistic believe in conducting their studies in realistic settings since
reality cannot be studied in fragmented and controlled situations. They try to bring out what happens in the realistic situation i.e. a hotel room, restaurant, bar, recreation, club etc. 17.3 MAIN STEPS IN NATURALISTIC RESEARCH. There are two groups of naturalists. One believes in the procedural details of the study, while the radical naturalists believe in non-specification of the processes of conducting the study. However, these are the main steps: i. Identifications of broader questions of Inquiry: You have to first specify the pertinent issues or questions related to the settings and which can be resolved or answered through field study. Your main focus should be on the specific structure of occurrences rather than general character of the Phenomenon. ii. Your emphasis should be on identifying individual perceptions as regards his own decisions or contributions to the occurrence of the events or processes. You should focus on the understanding of the realities by identifying satisfactory patterns in the action of the individuals participating in the activities. iii. Collection of the initial level data: The next step is to make deliberate attempts to identify a full range of variations in the social and organisational arrangement related to the problem under study. You may start the investigation from a broader context of the problem before you proceed to the specific occurrences of the events. iv. Procedures for data collection: You can collect data in different phases through participant observation. Data collection can be done through all the relevant and available sources and means like: a. Review of available literature, records and documents, dairies, pictures, photographs etc. b. Interactions with the people concerned in the programme c. Direct observation and experiences about the programme. Note that you have to use flexible approaches in the field to identify: a. The situation for participation to take place b. The persons for intensive interaction that is required c. The people with whom dialogue is needed v. Devices of data collection: Different types of devices can be employed for the purpose of data collection. These include: writing notes about an observed situation; using electronic appliances such as tape recorders and video camera; taking photographs; and collecting relevant documents and literature on the problem. You can also make arrangements for informal interviews or dialogues with different groups of respondents. In this case you have to record their opinions and perceptions. You have to be taking daily diaries about your experiences in the field. We have already told you that field work can be conducted in phases. So after the first phase, you can analyze the data qualitatively, refine the previous questions and arrive at new specific questions for further verification. vi. Data Analysis: Data are analyzed by describing them. The frequency data are presented in two or three way contingency tables to show the patterns of behaviour. You can some of the times use descriptive or nonparametric tests like chi-square, Man Whitney, rank order correlation etc to identify certain patterns of relationships in the context of the specific situation under study. A sound naturalistic research follows a cyclical process. This involves, data collection, generation of hypothesis, data examination, further generation and or modification of hypotheses, further data collection and verification until specific research questions are identified and the patterns of refined relations are arrived at. 17.3.1 Trustworthiness and objectivity in Naturalistic Research Trustworthiness: The naturalistic process of inquiry has been criticized based on the issue of trustworthiness. It is noted that qualitative approaches bring about subjectivity of inquiry. Again the investigation biases may not allow him to produce authentic information. As a result of subjectivity
valid knowledge may not be generated. The naturalists have objected these attacks. They have made efforts to fix certain standards to check the trustworthiness of the investigation. i. Credibility: This is the level of agreement between the researcher‟s data and the interpretation and the multiple realities that exist in the minds of the respondents. ii. Transferability: This is the quality that makes it possible to derive accruable meaning of information on interpretation available in specific contexts. iii. Dependability: This is the stability of information sought and interpretation derived in different situations on specific issues. iv. Confirmability: This is the possibility of studying the collected objective / systematic information and getting the same or similar conclusions by different researchers. The following principles guide naturalistic research in achieving the four criteria above. i. The use of prolonged field work to overcome biases and wrong perceptions that may appear in one short trip. ii. Persistent observation of certain typical meaningful features can help to increase the credibility of the study. iii. Interaction with colleagues helps to evolve suitable designs, share anxieties, apprehension and feelings about field work iv. Variety of data sources using different investigators with different perspectives help to project a consolidated picture of the field and enhance dependability and confirmability of data. v. Varieties of related references materials like documents, pictures, films, video and audio tapes helps to increase trustworthiness vi. Using varieties of data collection techniques can help to increase confirmability and dependability of data. vii. Cross checking of data and interpretations by some of the respondents can enhance internal validity of the study. viii. Increasing purposive sampling to collect different instances across a wide range of events can be useful in maximizing the range of information an increase external validity of data. ix. Substantive description of events in specific contexts can be useful in establishing the reliability and dependability of information and conclusion. Note that these cannot guarantee trustworthiness, but can generate a convincing situation about the meaningfulness of study. 17.4 CASE STUDY RESEARCH This can be defined as our intensive investigation about pertinent aspects of a particular unit in a given situation. This unit of investigation can be an individual, a family, a group of individuals or families, educational or social institutions, a community or a culture, a village, a tribe, a slum area, or even a hotel unit, a bank or group of banks or hotel etc. Whatever the unit is, it is treated as a whole in the context of specific situations. This wholeness is determined through an abstraction of ideas. A case study conducted on individuals may be linked with the processes of growth and development of a child, the behaviour of gifted children, psycho- analysis of a problem child, role of a leader in a specific social movement, the role of a manager in a company, etc. Case studies are conducted for developing deeper understanding of intricate relationships existing in the process – aspects of a specific unit or unit through qualitative investigation. It is not very different from naturalistic methods. This is why most of the times; it is treated as kind of naturalistic research. 17.4.1 Characteristics of Case Study Method Certain specific characteristics shown by the procedural aspect of a full-pledged case study include: i. Continuity in investigation: A continuous and prolonged enquiry about the situations is very necessary till the underlying factors are explored and plausible patterns of their interaction or
relationship are identified. For example, if you want to study the problems militating against learners support services in the Open University, NOUN for instance, you will see that is not something you can study in one ego. You have to take prolonged inquires. ii. Completeness: A sound case study must involve extensive collection of data from internal and external environment of the unit under study. Data collection will continue till the completeness of data is ensured and a complete picture emerges. iii. Authenticity of Data: A case study report must be based on meaningful, reliable and valid information about the case. Appropriate applications of both qualitative and quantitative methods like interviews, observations, records, surveys and the administration of tests and questionnaires can be made. The use of multi-techniques approaches to data collection and cross examination of data through different methods can take care of the authenticity of data. iv. Confidential recording: All data involving personal and ethnical issues like relationships of teachers and pupils with the management, discipline, confidential records, documents about the institutions etc, must be handled tactfully and care must be taken to maintain their secrecy. v. Intellectual synthesis: You know that case study involves multi-method of inquiry and deals with all significant situations concerning the unit, appropriate synthesis of the data is very necessary in order to show the uniqueness of the unit and to explore significant relationships. If you are skilled in the investigation with theoretical sophistication, insightfulness and writing skills, then you can do justice and prepare a sound case study. 17.5 Main Steps in Case Study Case study method is sometimes treated as a naturalistic inquiry in that, the same steps followed by the naturalists are also followed in case study. But the following steps are very significant. i. Selection of a case for investigation: In selecting your case for investigation, there are some basic questions: a. Are you interested in the study of a normal situation with a view to developing deeper in the phenomenon? b. Are you determined to solve the problems of a typical institution? c. Are you assigned the job of evaluating the functioning of an institution? d. Are you interested in identifying the underlying factors contributing to the excellent performance of an institution? Once you have identified the case, then you need to determine the status of the case based on preliminary information collected about the background of the case. ii. Data Collection: The process of data collection can be through both qualitative and quantitative techniques like observations, interviews, check lists, Performa, open ended questionnaires, surveys, records, psychological tests etc. Personal interaction should come first. Then care must be taken to make sure that only tools relevant to the case are used. iii. Analysis of first round data: This is done systematically in order to identify the more complicated situations or problems and therefore raise important questions about the influential factors. iv. Second Round Investigation: This is conducted for these specific questions or factors which are identified during the first round data analysis. This second round involves intensive investigation through prolonged observations. Formal and informal interviews, questionnaires, cross-examination of different documents and record, administration of specific test etc. After this round analysis and interpretations of data begin. v. Introduction of alternative measures: This is mostly done in clinical studies where most of the suitable alternatives as hypothesized through investigations are introduced.
vi. Follow-up activities: The effectiveness of the alternative measures introduced should be investigated. This will give a feedback on the strengths and weaknesses of the corrective measures. SELF ASSESSMENT EXERCISE 3 Explain the main steps in case study? 17.5.1 Is Case Study Scientific in Nature? There are criticisms against case study research for lack of scientific approach. A criticism is that case study is useful in the exploration of knowledge related to a single unit but has no scope to test hypothesis or confirm any evidence. This limitation of the case study cannot undermine its meaningfulness in the process of generating knowledge. Moreover, it accommodates the process of hypothesizing in a manner different from that o survey and experimental studies. i. Generating hypothesis in case studies: Hypotheses are stated in the form of questions or statements related to the various aspects of the process. These hypotheses are tested or confirmed using qualitative method in the given context of the investigation. ii. Testing hypotheses in the case study method: This follows a qualitative approach. This involves your insight into an impressionistic view about the process under investigation. But data processed in quantitative terms can be integrated with qualitative treatment for developing a holistic perspective regarding the case. iii. Generalization of case study findings: The process of evidence-generalization here depends on several considerations. These include the nature of the case study, the theoretical framework generated, and the extent of objectivity possible. There also possibilities of considering the findings of a case which are significantly similar to another case that will be studied at a later stage. There are also situations where studies of different cases can be useful in developing a new trend. 17.6 CONCLUSION From this unit, you have added two more research methods to your collection. This means that you have many of the qualitative research methods to choose from any time you feel. But if you are in love with the quantitative methods, you wait for the next unit where you are gong to be exposed to the major ones. 17.7 SUMMARY In this unit, you learnt about two major types of research studies which are qualitative in approach. Naturalistic studies refer to investigations about social and educational phenomena which are conducted in natural settings. It takes into account such factors as multiple realties, meanings and interpretations, generation of knowledge, generalization of knowledge, generalization, human relations and value systems. It is also unique in procedures in such ways as i. Holistic Approach ii. Insightful Inquiry iii. No a Prior Theory iv. No Pre-specified design of study v. Naturalistic setting The main steps are i. Identifications of broader questions of Inquiry ii. Collection of the initial level data iii. Procedures for data collection iv. Devices of data collection v. Data Analysis You also learnt that the naturalistic research has some standards for checking objectivity and trustworthiness these are i. Credibility
ii. Transferability iii. Dependability iv. Confirmability You also learnt about the principles of achieving these criteria A case study is an intensive study about pertinent aspects of a particular unit in a given situation. Its characteristics are i. Continuity in investigation ii. Completeness iii. Authenticity of Data iv. Confidential recording v. Intellectual synthesis The main steps are i. Selection of a case for investigation ii. Data Collection iii. Analysis of first round data iv. Second Round Investigation v. Introduction of alternative measures vi. Follow-up activities You have seen the attempt to prove that case study is scientific.
18 DESCRIPTIVE RESEARCH
Unit Structures: 18.0 Introduction 18.1 Objectives 18.2 Main content 18.2.1. Introduction to Descriptive Research 18.3 Main Steps in Descriptive Research 18.4 Types of Descriptive Research
18.4.1 Survey Study 18.4.2 Analysis of Documents 18.4.3 Correlational Studies 18.4.4 Causal Comparative studies
18.5 Conclusion 18.6 Summary 18.7 Tutor marked Assignment 18.8 References / Further Readings
18.0 INTRODUCTION In the preceding units, you have been learning some research studies that adopt the qualitative approach. You have got enough of that. So let us shift our studies to those research methods which adopt the quantitative approaches. In this unit, you are going to learn the details of descriptive research. Descriptive research as the name implies describes what is. This involves the description, recording, analyzing and interpreting such conditions that exist. It is one of the most popular research methods in the world. 18.1 OBJECTIVES By the end of this unit, you should be able to:- i. Explain descriptive research ii. Describe the main steps in conducting descriptive research iii. Discuss the types of descriptive research 18.2 MAIN CONTENT 18.2.1 INTRODUCTION OF DESCRIPTIVE RESEARCH The main aim of descriptive research is to describe “What exists” with respect to variables or conditions in a situation. They are designed to obtain information about the current status of a given phenomenon. You can say that they are concerned with the existing conditions or relationships, prevailing practices, current beliefs, points of view or attitudes processes that are on-going and their effects, developing trends etc. They determine the nature of situations as they exist at the time of the study. It is very appropriate in behavioural sciences. You can see that there are behaviours which may be of interest to you as a researcher and which cannot be arranged in a realistic setting. Think of one example of this. For instance, you know it is not possible for you as a researcher to arrange for a motorcycle accident to happen so that you can assess the effectiveness of the use of crash helmets in preventing serious injuries by „Okada‟ riders. Again, you know that it is not possible for you to bring some people and give them cigarettes to b smoking so that you can study the effects and relationship with lung cancer. You know that some experimental studies of human behaviour can be appropriately carried out both in the laboratory and in the field. But the prevailing method which is mostly used in social sciences is
descriptive. Human behaviour can be systematically examined and analyzed under the conditions that naturally exist at home, inside the classroom, on the play ground or within the community, family, social circle etc. The analysis can lead to the modification of factors or influences that determine the nature of human interaction. 18.3 MAIN STEPS IN DESCRIPTIVE RESEARCH. Descriptive studies do not present private convictions or data based on casual or cursory observations rather you: i. Examine the Problematic situations ii. Define the problems and state your hypotheses. iii. List the assumptions upon which your hypotheses and procedures are based. iv. Select appropriate subjects and source materials. v. Select or construct techniques for collecting data. vi. Validate the data gathering techniques. vii. Make objective an discrimination observations viii. Describe analyses and interpret your data in clear, precise terms. The summary of it all is that as a research, what you do is to collect evidence on the basis of some hypotheses, tabulate and summarize the data carefully, and then analyze the results thoroughly in order to draw meaningful generalizations that will advance knowledge. 18.3.1 Collection of data When you write you descriptive research report, you must identify the kind of data obtained as well as the exact nature of all population. What are the units that constitute your population? Are they people, items, events or objects? After you have identified the population, you must decide whether to collect data from the total population or a representative sample of the population. A. Total Population If you want to obtain information from every unit of a small population, it may not be very difficult in some cases, but the findings can not be applicable to any population outside the group studied. For instance when you collect information, from every student of school of Business and Human Resources Management from Lagos study centre, you may draw your generalizations based on the information. But you cannot claim these generalizations will hold true for students from the same school of BHRM outside Lagos Centre. B. Sample Population: When you try to obtain information from a large population for instance all the teachers in Imo state, you will see that it is often not practicable, impossible or exorbitantly costly. If you try to contact, observe, measure or interview every unit in the group, you will realize that it may take so much time that the information may become still or absolute before you complete the study. To this effect what you do is to collect information from a few carefully selected units drawn from the population. This few units are called samples. For instance assuming you want to study the study habits of NOUN students and there are about 75,000 students in all study centres of NOUN. You can see that you cannot collect data from all these students. What will you do? You will have to select a representative sample of this population. It means you have to select your sample from different categories of the student population. Hence, male/female, employed/unemployed, graduates/undergraduates etc. If you sample represents accurately the characteristics of the population, the any generalizations based on the data obtained from them may be applied to the entire group. But it is not easy to select a representative sample. We shall discuss this in other parts. 18.4 TYPES OF DESCRIPTIVE RESEARCH
There are different types of descriptive research. Note that this categorization is not sacrosanct. It is just to help you understand the research more clearly. 18.4.1 Survey Studies Most of the times, descriptive research is called survey research. But it is better to call survey a category under descriptive research survey itself is the most widely used method for obtaining descriptive and evaluative information. This can be used when trying to solve problems in education, government, industry, politics, organization etc. When detailed descriptions of existing phenomena are collected, they can be used with the aim of employing the data to justify current conditions or practices or to make more intelligent plans for improving them. In a survey studies, we may need to collect three types of data Data concerning existing status: e.g. find out the study habits of students of NOUN Comparison of status and standards: e.g. to compare the study habits of distance education
students and those in face to face Means of improving status: e.g. to find ay of helping distance education students improve on
their study habits. Survey can be broad or narrow in scope. They may be confined to a small geographical area like community, a local government a state or even the whole country or more. Data may be gathered from every member of a specified population or from a carefully selected sample. The steps involved in survey research are in general, similar to what obtains for descriptive research: i. Planning: This involves determining what topic to be studied, the type of population to be investigated and the methods and procedures to be used for data collection. ii. Sampling: This involves a decision about which people from the population to be included in the survey. Note that if you are going to generalize from the sample to the population. Then your selected sample must be representative of the population. iii. Development of data collection instrument: This involves listing the questions and planning for the format of the instrument to be used. Is it personal interview, questionnaires, rating scales etc? iv. Carrying out the survey: This includes pre-testing the instruments to see if it will yield the desired data, interviewing the subjects or administering the questionnaires and verifying the accuracy of the data collected. v. Processing the data: This includes tabulating the data, analyzing the data (you can use computers if you like) interpreting the results and reporting the findings. 18.4.2 Analysis of documents: Documents and records can be used to bring out pertinent data. Documentary analysis otherwise referred to as context activity or informational analysis is very much like the historical research. But while historical research is primarily concerned with the more distant past, descriptive research is concerned chiefly with the present. There are wide varieties of documentary surveys made; some researchers can analyze judicial decisions, state laws or court rulings. Some others may collect and analyze data describing existing practices, processes and conditions from administrative records, forms and reports, committee reports and minutes of meetings, budgets and financial records etc. university catalogues, bulletins, syllabi, courses of study, reading lists, text book and others may be useful in the investigation. Also newspaper, periodicals, motion pictures, cartoons and other sources can also help. Some of the advantages include: 1) To describe the prevailing practices or conditions in the field 2) To discover the relative importance of, or interest in certain problems or topics i.e. to spot trends. 3) To discover the level of difficulty of presentations available in text books or in other publications. 4) To evaluate bias, prejudices or propaganda in text book presentations.

5) To analyze the types of errors and weakness in performance. 6) To evaluate the relationships of stated objectives and what is being done practically. 7) To identify the literary style, concepts or beliefs of a writer. Documentary research produces valuable information, but the method can have its own limitations. A faulty conclusion from the data may be drawn by the investigator. There is no representativeness in the samples of sources of materials used. 18.4.3 Correlational Studies In order to have a fuller understanding of human behaviour is to begin by testing out simple relationship between factors and elements which are supposed to have some bearings on the phenomenon in question. The value of Correlational research is that it is able to achieve this end. You know that one of the primary purposes of science is to discover relationships among phenomena with a view ultimately to predicting and, in some situations, controlling their occurrences. Most of the researches in social sciences and education are concerned with the establishment of interrelationships among variables. Therefore we can simply say that Correlational studies are concerned with determining the extent of relationship existing between variables they enable us to measure the extent to which variations in one variable are associated with variations in another. For instance, what is the relationship between the income level of individuals and their expenditure patterns? What is the link between personality and academic achievement? Correlational studies are intended to answer such questions as: i. Is there a relationship between two variables or two sets of data? If the answer is yes then look at the questions below ii. What is the direction of the relationship? iii. What is the magnitude of the relationship? This is determined by a correlation coefficient. Correlational studies can be broadly classified into two methods. a) Relational Studies: Which is particularly useful in exploratory studies in the fields where title or no previous research has been conducted. It is a shot in the dark in order to verify haunches which you have about presumed relationships between some characteristics of variables. b) Prediction Studies: Which are usually conducted in an area having a firm and secure knowledge base? It is based on the assumption that at least some of the factors that will lead to the behaviour to be predicted are present and measurable at the time the prediction is made. 18.4.4 Causal-Comparative studies Some of the times, it is very necessary to discover how and why a particular event occurs, instead to confirming ourselves to investigations about what the event is like. So you try to compare the similarities and differences among phenomena to find what factors or circumstances seem to accompany or contribute to the occurrence of certain events, conditions, activities, practices etc. In the behavioural sciences you cannot select, control or manipulate factors that necessary to study cause effect relationships. You see that you cannot manipulate things like domestic background, social lass, intelligence, etc. so if you can not manipulate the independent variable and establish the controls that are required in true experiment, you can conduct a causal comparative study. Here, you study a real life situation in which subjects have experienced what you want to investigate. Causal comparative studies provide the means for tackling problems that cannot be probed in laboratory situations. Again they yield valuable information and elites about the nature of phenomena and are well suited to many types of field studies seeking to establish causal relationships. Their limitations are: i. Lack of control is a serious limitations and weakness ii. It is usually difficult to identify the relevant factors causing the particular conditions or phenomena
iii. When a relationship between variable is established, it is difficult to distinguish between the cause and the effect. iv. The classification of subjects into dichotomous groups for the purpose of comparison also presents problems v. In comparative studies of natural situations, you do not have the same control over the selection of subjects as you have in experimental studies. SELF ASSESSMENT EXERCISE i. What are the particular steps of survey research? ii. Explain the types of descriptive research? 18.5 CONCLUSION In this unit you have added yet another research method to your collection. The descriptive research method which is a quantitative approach has been discussed in details here. You can use this method when you have to investigate a very large population of respondents. In the next unit, we shall continue with other quantitative research methods. 18.6 SUMMARY In this unit, you learnt that the descriptive research methods are designed to obtain information about the current status of a given phenomenon. The summary of the main steps in this research methods include identification of the problem situation, collecting evidence on the basis of some hypotheses, tabulate and summarize the data and analyze the results in other to draw meaningful generalizations that will advance knowledge. You also studied the types of descriptive research to include i. Survey Studies ii. Analysis of documents iii. Correlational studies iv. Causal comparative studies These types have been treated in details for you to make your choice when the need arises. 18.7 TUTOR MARKED ASSIGNMENT i. What are the main steps in a Descriptive Research? ii. Explain the types of Descriptive Research? 18.8 REFERENCE / FURTHER READING Ary. D. Jacobs, L. C. and Razavich. A. (1972) Introduction to Research in Education. New York. Rinehart & Winster. Cohen, L. and Morrison, L. (1989) Research Methods in Education. London. Rutledge. IGNOU (2001) Research Methods for Distance Education. ES315 New Delhi STRIDE ANSWERS TO SELF ASSESSMENT EXERCISES The particular steps in survey research are: i. Planning ii. Sampling iii. Development of data, Collection instrument iv. Carrying out the survey Processing the data
19 EXPERIMENTAL AND ACTION RESEARCHES
Unit Structures: 19.0 Introduction 19.1 Objectives 19.2 Main content of Experimental Research 19.2.1 Experimental Research 19.2.2 Characteristics of Experimental Research 19.3 Steps in Experimental Research 19.4. Experimental Designs
19.4.1 Pre-experimental design 19.4.2 True Experimental Designs 19.4.3 Quasi Experimental designs 19.4.4 Time series Research
19.5 Action Research 19.6 Stages of action research 19.7 Conclusion 19.8 Summary 19.9 Tutor marked Assignment 19.10 References / Further Readings
19.0 INTRODUCTION A research method, as you have studied in the previous units, is a particular way of studying a problem. The method is determined by the features of the research problem and also the field inquiry. You have seen many of these research methods before now. In this unit, which is a continuation of the others we shall discuss one of the most important methods of research the experimental research. Again we are going to conclude the unit by concluding our discussions on the research methods with other research. 19.1 OBJECTIVES By the end of this unit, you should be able to:- i. Explain the experimental research? ii. Give the characteristics of experimental research iii. List the steps in experimental design iv. Explain the types of experimental designs v. Describe action research vi. Discuss the stages of action research. 19.2 MAIN CONTENT 19.2.1 EXPERIMENTAL RESEARCH The studies here are designed fro establishing causal relationships. The method begins with a question concerning the relationship between two or more variables. In order to do this, you propose one or more hypotheses stating the nature of the expected relationship. Thus an experiment is the events planned and carried out so as to enable you collect evidence relevant to the hypotheses. Kerlinger (1974) considers experimental research the idea of science because answers to research questions obtained in experiments are on the whole clearer and less ambiguous than answers obtained in non-experimental research types. An experimental research may be described as a research study in which one ore more independent variables are manipulated and in which all or nearly all possible influential variables not pertinent to the problem of investigation kept
to a minimum. You may conduct a field experiment or a laboratory experiment from which you collect data for analysis and then subsequent making of generalizations. An experimental research in its simplest form has three characteristics. These are i. The manipulation of the independent variable. ii. All other variables except the independent variable are hold constant iii. The effect of the manipulation of the independent variable on the dependent variable is observed. You have to note that both the independent and the dependent change variables are very important in an experiment. You manipulate the independent variable and then observe the effects of the changes or manipulation on the dependent variable. The dependent variable is so called because its value is hypothesized to depend upon and vary with the value of the independent variable. For instance, you can investigate the effect of warm reception on the attitude of customers. Here, you will continue to change the type of reception given to your customers and observe their attitudes. The independent variable is type of reception while the dependent variable is the attitudes of the customers. 19.2.2 Characteristics of Experimental Research. In the conduct of an experiment, there are three major ingredients. These are Control, Manipulation and Observation 19.2.2.1 Control: This is very important in experimental studies because without it, it is impossible to evaluate unambiguously the effect of an independent variable. The major purpose of control is to arrange a situation I which the effects of variables only can be measured. We can simply say that control is the term used to indicate your procedures or methods fro eliminating the differential effects of all variables extraneous to the purpose of the study. Note that an extraneous variable is one which is not related to the purpose of the study but which may affect or have influence on the dependent variable. 19.2.2.2 Manipulation This refers to a deliberate operation performed by the researcher. In the behavioural sciences and education, the manipulation of a variable takes a characteristic form in which the experimenter imposes a predetermined set of varied conditions on the subjects. This set of varied conditions is referred to as the independent variable, the experimental variable or the treatment variable. 19.2.2.3 Observation: In an experimental study, we are interested to know the effect of the manipulation of the independent variable on a dependent variable. Therefore you make observations with respect to some characteristics of the behaviour of the subjects used in the research. These observations, which are most of the times quantitative in nature, may constitute the dependent variable. For instance in an educational situation, we are interested to know the performance of students after going through some learning. These performances can only be estimated through measures like scores in a test. If we want to explain or predict student‟s performance we use their test scores. It means that these test scores are the dependent variables or observations rather than performance. 19.3 Steps in Experimental Research There are number of steps involved in experimental studies. The steps that will lead you to the actual experiment are: i. Making a survey of the literature related to the problem. ii. Identification and definition of the problem. iii. Formulating the hypotheses and defining basic terms and variables. Hypotheses must be formulated in an experimental research. This is because they suggest how an antecedent condition or phenomenon or the independent variable is related to the occurrence of another condition,
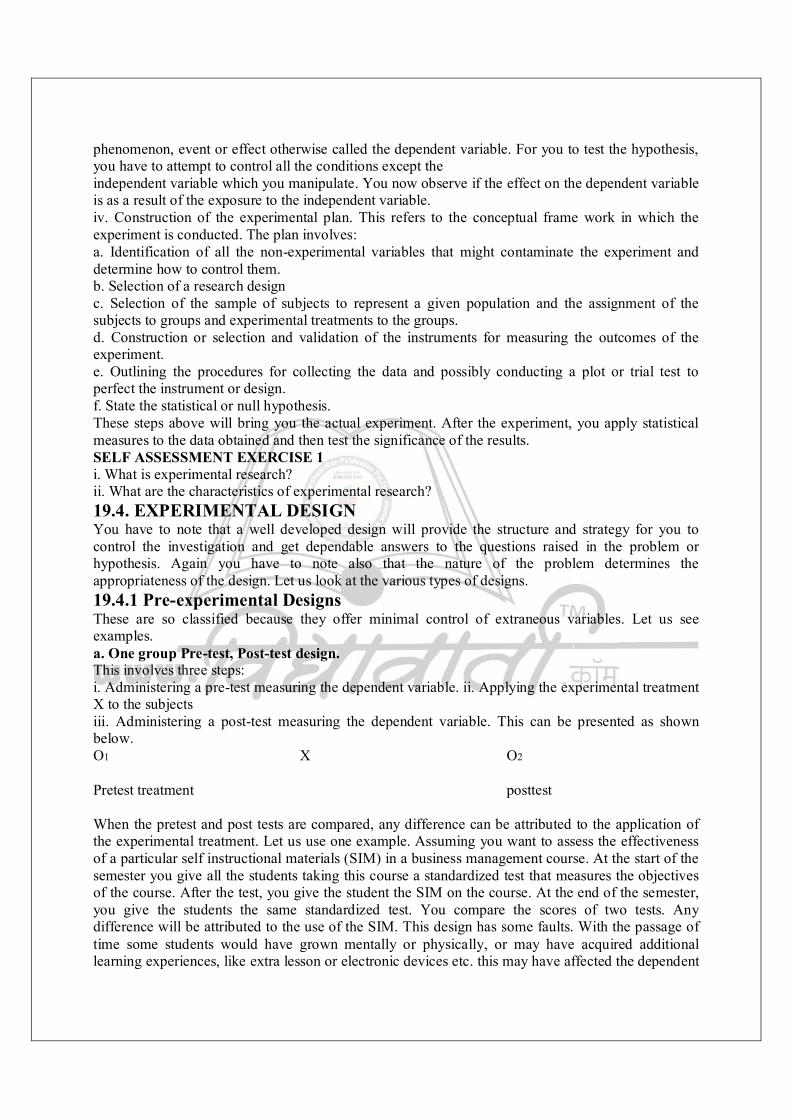
phenomenon, event or effect otherwise called the dependent variable. For you to test the hypothesis, you have to attempt to control all the conditions except the independent variable which you manipulate. You now observe if the effect on the dependent variable is as a result of the exposure to the independent variable. iv. Construction of the experimental plan. This refers to the conceptual frame work in which the experiment is conducted. The plan involves: a. Identification of all the non-experimental variables that might contaminate the experiment and determine how to control them. b. Selection of a research design c. Selection of the sample of subjects to represent a given population and the assignment of the subjects to groups and experimental treatments to the groups. d. Construction or selection and validation of the instruments for measuring the outcomes of the experiment. e. Outlining the procedures for collecting the data and possibly conducting a plot or trial test to perfect the instrument or design. f. State the statistical or null hypothesis. These steps above will bring you the actual experiment. After the experiment, you apply statistical measures to the data obtained and then test the significance of the results. SELF ASSESSMENT EXERCISE 1 i. What is experimental research? ii. What are the characteristics of experimental research? 19.4. EXPERIMENTAL DESIGN You have to note that a well developed design will provide the structure and strategy for you to control the investigation and get dependable answers to the questions raised in the problem or hypothesis. Again you have to note also that the nature of the problem determines the appropriateness of the design. Let us look at the various types of designs. 19.4.1 Pre-experimental Designs These are so classified because they offer minimal control of extraneous variables. Let us see examples. a. One group Pre-test, Post-test design. This involves three steps: i. Administering a pre-test measuring the dependent variable. ii. Applying the experimental treatment X to the subjects iii. Administering a post-test measuring the dependent variable. This can be presented as shown below. O1
X O2
Pretest treatment posttest When the pretest and post tests are compared, any difference can be attributed to the application of the experimental treatment. Let us use one example. Assuming you want to assess the effectiveness of a particular self instructional materials (SIM) in a business management course. At the start of the semester you give all the students taking this course a standardized test that measures the objectives of the course. After the test, you give the student the SIM on the course. At the end of the semester, you give the students the same standardized test. You compare the scores of two tests. Any difference will be attributed to the use of the SIM. This design has some faults. With the passage of time some students would have grown mentally or physically, or may have acquired additional learning experiences, like extra lesson or electronic devices etc. this may have affected the dependent
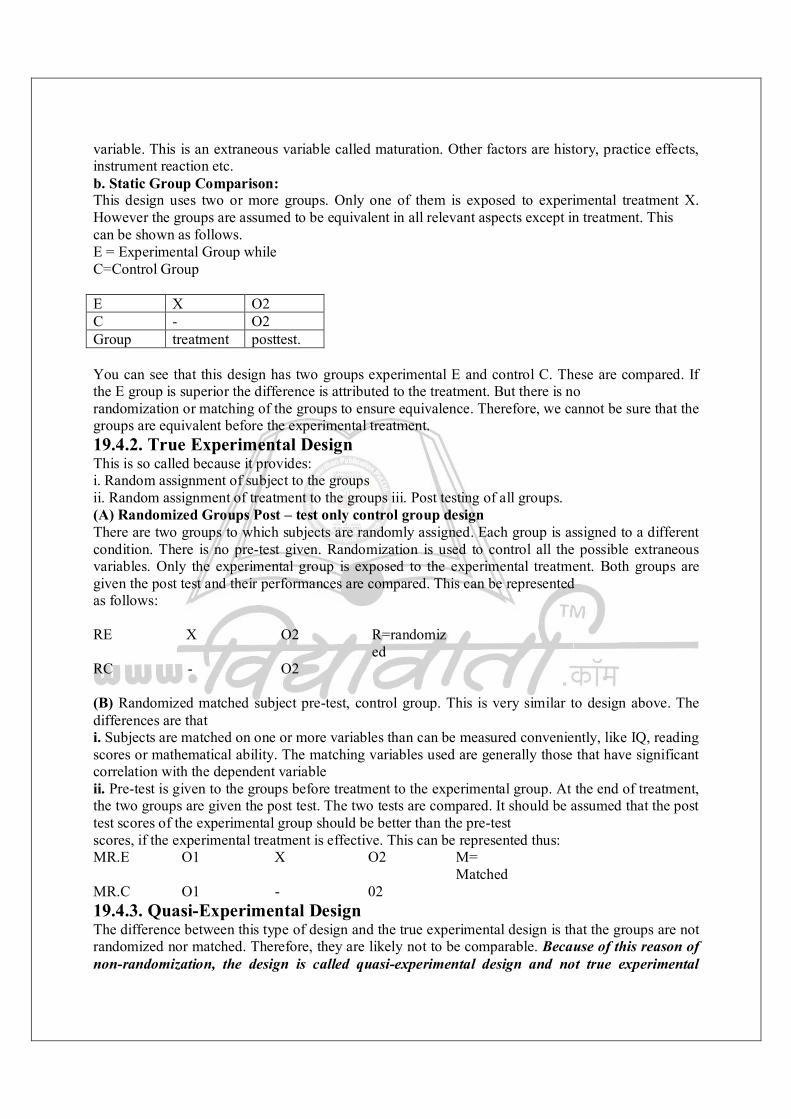
variable. This is an extraneous variable called maturation. Other factors are history, practice effects, instrument reaction etc. b. Static Group Comparison: This design uses two or more groups. Only one of them is exposed to experimental treatment X. However the groups are assumed to be equivalent in all relevant aspects except in treatment. This can be shown as follows. E = Experimental Group while C=Control Group E X O2 C - O2 Group treatment posttest. You can see that this design has two groups experimental E and control C. These are compared. If the E group is superior the difference is attributed to the treatment. But there is no randomization or matching of the groups to ensure equivalence. Therefore, we cannot be sure that the groups are equivalent before the experimental treatment. 19.4.2. True Experimental Design This is so called because it provides: i. Random assignment of subject to the groups ii. Random assignment of treatment to the groups iii. Post testing of all groups. (A) Randomized Groups Post – test only control group design There are two groups to which subjects are randomly assigned. Each group is assigned to a different condition. There is no pre-test given. Randomization is used to control all the possible extraneous variables. Only the experimental group is exposed to the experimental treatment. Both groups are given the post test and their performances are compared. This can be represented as follows: RE X O2 R=randomiz
ed RC - O2 (B) Randomized matched subject pre-test, control group. This is very similar to design above. The differences are that i. Subjects are matched on one or more variables than can be measured conveniently, like IQ, reading scores or mathematical ability. The matching variables used are generally those that have significant correlation with the dependent variable ii. Pre-test is given to the groups before treatment to the experimental group. At the end of treatment, the two groups are given the post test. The two tests are compared. It should be assumed that the post test scores of the experimental group should be better than the pre-test scores, if the experimental treatment is effective. This can be represented thus: MR.E O1 X O2 M=
Matched MR.C O1 - 02 19.4.3. Quasi-Experimental Design The difference between this type of design and the true experimental design is that the groups are not randomized nor matched. Therefore, they are likely not to be comparable. Because of this reason of non-randomization, the design is called quasi-experimental design and not true experimental
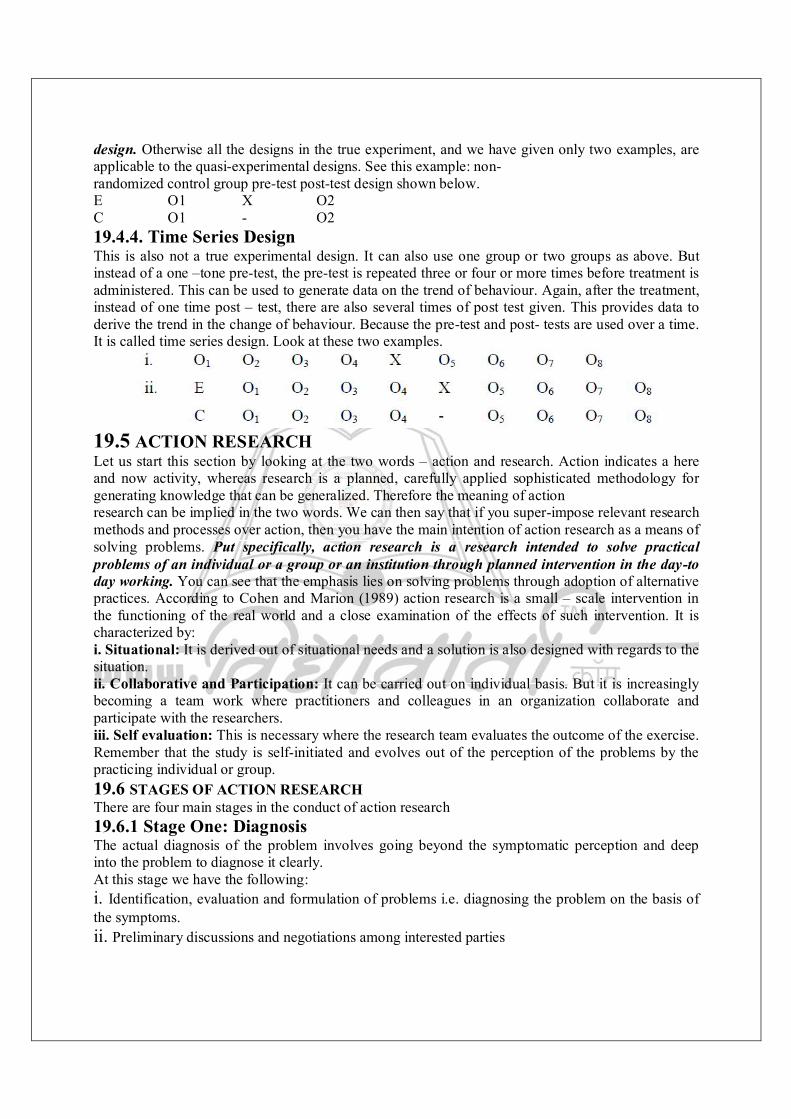
design. Otherwise all the designs in the true experiment, and we have given only two examples, are applicable to the quasi-experimental designs. See this example: non- randomized control group pre-test post-test design shown below. E O1 X O2 C O1 - O2 19.4.4. Time Series Design This is also not a true experimental design. It can also use one group or two groups as above. But instead of a one –tone pre-test, the pre-test is repeated three or four or more times before treatment is administered. This can be used to generate data on the trend of behaviour. Again, after the treatment, instead of one time post – test, there are also several times of post test given. This provides data to derive the trend in the change of behaviour. Because the pre-test and post- tests are used over a time. It is called time series design. Look at these two examples.
19.5 ACTION RESEARCH Let us start this section by looking at the two words – action and research. Action indicates a here and now activity, whereas research is a planned, carefully applied sophisticated methodology for generating knowledge that can be generalized. Therefore the meaning of action research can be implied in the two words. We can then say that if you super-impose relevant research methods and processes over action, then you have the main intention of action research as a means of solving problems. Put specifically, action research is a research intended to solve practical problems of an individual or a group or an institution through planned intervention in the day-to day working. You can see that the emphasis lies on solving problems through adoption of alternative practices. According to Cohen and Marion (1989) action research is a small – scale intervention in the functioning of the real world and a close examination of the effects of such intervention. It is characterized by: i. Situational: It is derived out of situational needs and a solution is also designed with regards to the situation. ii. Collaborative and Participation: It can be carried out on individual basis. But it is increasingly becoming a team work where practitioners and colleagues in an organization collaborate and participate with the researchers. iii. Self evaluation: This is necessary where the research team evaluates the outcome of the exercise. Remember that the study is self-initiated and evolves out of the perception of the problems by the practicing individual or group. 19.6 STAGES OF ACTION RESEARCH There are four main stages in the conduct of action research 19.6.1 Stage One: Diagnosis The actual diagnosis of the problem involves going beyond the symptomatic perception and deep into the problem to diagnose it clearly. At this stage we have the following: i. Identification, evaluation and formulation of problems i.e. diagnosing the problem on the basis of the symptoms. ii. Preliminary discussions and negotiations among interested parties

iii. Review of literature – although not in all cases, but some types of problems may call for this before articulating the problem. iv. Modification and redefinition of initial statement of problem. 19.6.2 Stage Two: Planning and Intervention This involves the selection of the research procedure-designing the intervention, sampling, administration, choice of material and methods of evaluation. 19.6.3 Stage Three: Intervention and impact assessment This is the actual implementation, collection and analysis of data to assess the change in the magnitude of the problem. It involves: i. Implementation of the project: That is actually carrying out the treatment designed on the sample. It will include collection of relevant data. ii. Interpretation of data: Using minimal statistical or qualitative analysis, the data collected can be interpreted so that the impact of the treatment on the alleviation of the problem can be assessed. 19.6.4 Stage Four: Reflection At this stage you look beyond the factual data based result, with the main purpose of interpreting the results. Reflect on the why‟s and how‟s of the finding and the onward destination. 19.7 CONCLUSION This unit brings us to the end of our discussions on the research typologies. Although our presentations are not exclusive enough, but you have got enough to enable you select the one you will use for your research projects. In the next unit we shall look at the population of the study and how to select your samples. 19.8 SUMMARY In this unit, you learnt that experimental researches are designed to establish causal relationships. It involves the manipulation of independent variables and holding all other variables constant, and observing the effect of the independent variable. The characteristics are control, manipulation and observation. You studied the steps in experimental research and the different types of designs. You also studied the action research where you were told that it is a research intended to solve practical problems of an individual, group or institution through planned intervention in the day to day working. The stages are i. Diagnosis ii. Planning and intervention. iii. Intervention and impact assessment iv. Reflection 19.9 TUTOR MARKED ASSIGNMENT i. Explain the characteristics of Experimental Research? ii. What is Action Research? iii. What are the characteristics of Action Research? 19.10 REFERENCE / FURTHER READING Cohen, L. and Morrison, L. (1989) Research Methods in Education. London. Rutledge. IGNOU (2001) Research Methods for Distance Education. ES315 New Delhi STRIDE ANSWERS TO SELF ASSESSMENT EXERCISES i. An experimental research is a research study in which on or more independent variables are manipulated and in which all or nearly all possible influential variables not pertinent to the problem of investigation are kept to a minimum. ii. The three characteristics of experimental research are a. Control

b. Manipulation c. Observation
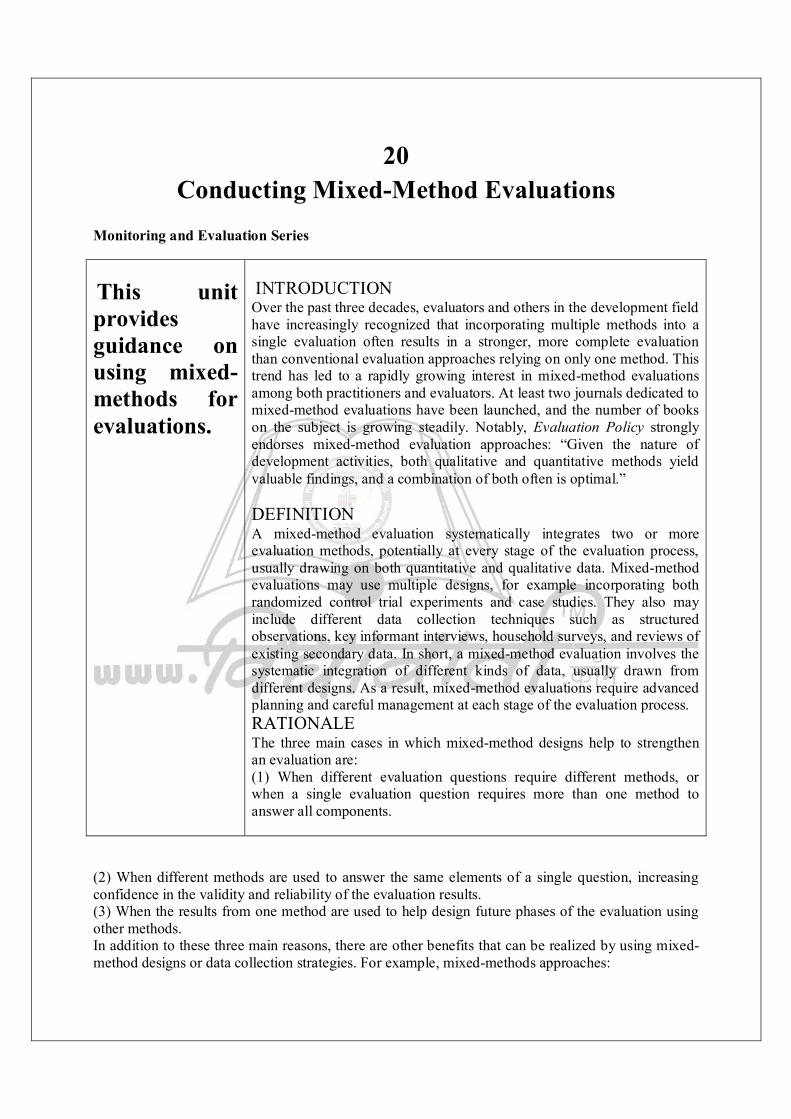
20 Conducting Mixed-Method Evaluations
Monitoring and Evaluation Series
This unit provides guidance on using mixed-methods for evaluations.
INTRODUCTION Over the past three decades, evaluators and others in the development field have increasingly recognized that incorporating multiple methods into a single evaluation often results in a stronger, more complete evaluation than conventional evaluation approaches relying on only one method. This trend has led to a rapidly growing interest in mixed-method evaluations among both practitioners and evaluators. At least two journals dedicated to mixed-method evaluations have been launched, and the number of books on the subject is growing steadily. Notably, Evaluation Policy strongly endorses mixed-method evaluation approaches: “Given the nature of development activities, both qualitative and quantitative methods yield valuable findings, and a combination of both often is optimal.” DEFINITION A mixed-method evaluation systematically integrates two or more evaluation methods, potentially at every stage of the evaluation process, usually drawing on both quantitative and qualitative data. Mixed-method evaluations may use multiple designs, for example incorporating both randomized control trial experiments and case studies. They also may include different data collection techniques such as structured observations, key informant interviews, household surveys, and reviews of existing secondary data. In short, a mixed-method evaluation involves the systematic integration of different kinds of data, usually drawn from different designs. As a result, mixed-method evaluations require advanced planning and careful management at each stage of the evaluation process. RATIONALE The three main cases in which mixed-method designs help to strengthen an evaluation are: (1) When different evaluation questions require different methods, or when a single evaluation question requires more than one method to answer all components.
(2) When different methods are used to answer the same elements of a single question, increasing confidence in the validity and reliability of the evaluation results. (3) When the results from one method are used to help design future phases of the evaluation using other methods. In addition to these three main reasons, there are other benefits that can be realized by using mixed-method designs or data collection strategies. For example, mixed-methods approaches:

Are more likely to reveal unanticipated results. Can provide a deeper understanding of why change is or is not occurring as planned. Often capture a wider range of perspectives than might be captured by a single method. (1) USING DIFFERENT METHODS TO ANSWER DIFFERENT QUESTIONS OR TO ANSWER DIFFERENT PARTS OF THE SAME QUESTION In many cases, one evaluation method will be insufficient to answer all of the questions included in an evaluation statement of work (SOW). For example, suppose an SOW involves an evaluation of a project that includes a new teaching technique, and includes two questions: #1. “Was there a statistically significant difference between female and male students’ academic achievement test scores?” and #2. “How did students’ parents perceive the effects of the project?” A single method will likely be insufficient to adequately answer both of these questions. To answer the first question, the evaluator might choose a quasi-experimental design that uses existing test scores from before project implementation and new test scores from after completion to compare the performance of male and female students. This approach would address the question of whether the program resulted in differences in test scores between females and males. But these methods would not help to answer question #2. To understand parent perceptions, the evaluator likely would use individual or focus group interviews of a sample of parents, and perhaps conduct an evaluative case study in order to more deeply understand how parents view the program. Sometimes, one evaluation question may contain multiple parts, and it may be necessary to use different methods to address each part. For example, question #1 could be changed slightly to ask, “Was there a statistically significant difference between female and male students’ scores? And, what explains possible gender differences in test scores?” In this case, simply relying on test scores in a quasi-experimental design would be insufficient. To understand the mechanism behind differences in female and male scores would require a different method, such as key informant interviews with teachers or focus group discussions with students. (2) USING DIFFERENT METHODS TO ANSWER THE SAME QUESTION: TRIANGULATION Even if an evaluation question can be answered using only one method, often it is preferable to combine multiple methods to answer the same question in order to gain a more complete understanding of the issue and more confidence in the findings. By approaching the same question from more than one perspective or by using more than one technique, evaluators can then compare and contrast the results from these different methods. This process is known as triangulation. If the findings from the different methods are similar, or reinforce one another, then users can have greater confidence in the findings than if they are based on only one method.
A NOTE ON TERMINOLOGY In the literature on evaluation, “method” is sometimes used to refer to a data collection technique (interviews, surveys, observations), and other times to an evaluation design or approach (experimental, quasi-experimental, non-experimental). Though the definition is not completely settled in the literature, this Technical Note treats evaluations that combine methods in either sense as mixed-method evaluations. If the findings from different methods vary significantly, the user and evaluator must carefully consider what might have happened to produce these divergent findings. One possible explanation could be bias in one set of data. Triangulation can help to minimize bias in cases like these, with data from one method acting as a check or balance against data from another method. For example, evaluators may use secondary data from the Ministry of Economy to measure changes in exports
related to a trade facilitation project. But they may also suspect that firms are underreporting their exports to the government in order to pay less in taxes. To help mitigate the risk of bias caused by this underreporting in the government data, the evaluation team may distribute a survey to supported firms and also conduct in-depth interviews with key informants from a sub-sample of firms in order to obtain a more accurate picture of how the project has influenced exports. Evaluators looking to answer one question with multiple methods often combine them using the parallel process described below. It is important for the evaluation manager to understand how this process of triangulation will work, because it has implications for the resources needed to carry out such an evaluation. (3) USING ONE METHOD TO INFORM THE DESIGN OF ANOTHER METHOD In some cases, one method can be used to help guide the use of another method, or to explain the findings from another method. In the first case, imagine an SOW for the evaluation of a youth vocational training project including the evaluation question: “Why do youth choose to participate in project activities?” The evaluator may wish to conduct a survey of participants, but be unsure how to word the questions, or what answer choices to include. By first conducting individual and focus group interviews with participants and non-participants, the evaluator may be able to identify some common reasons for participation among the target population, and then use these data to construct the survey. In this way, the qualitative methods (individual and focus group interviews), conducted first, can inform the quantitative method (survey), that comes afterward. Because this use of mixed-method evaluation requires each method to be sequenced, one after the other, these methods are often incorporated into mixed-method evaluations using sequential processes. Again, this design choice has time and resource implications, as discussed below. HOW TO MIX METHODS As mentioned above, evaluators must consider carefully how they will integrate the different methods used into a coherent, thoughtful evaluation design. This section outlines three of the most common ways in which
QUICK ADVICE FOR THE USAID EVALUATION MANAGER Mixed method evaluation involves the systematic integration of different kinds of data, usually drawn from different evaluation designs. As a result, mixed-method evaluations require advanced planning and affect the evaluation budget. Mixed method evaluations yield valuable findings, and a combination of both is often optimal given the nature of development activities. Mixed methods are more likely to reveal unanticipated results (a key advantage of evaluation over performance monitoring), which can provide a deeper understanding of why change is or isn’t taking place as planned. It often captures a wider range of perspectives than might be captured by a single method. At the planning stage, the evaluation manager must decide which methods to use and how to combine them. These decisions will be based primarily on the purpose of the evaluation and the key evaluation questions, but evaluation managers must also take into account factors such as time and cost. An evaluation manager should seek advice from a colleague with evaluation design expertise, as needed. Lastly, using mixed methods requires mixed skills on the evaluation team. It is important to consider during the planning stage what kind of skills will be needed in order to conduct each aspect of the evaluation successfully, and then to select team members accordingly. methods can be combined to accomplish the purposes described above: parallel combinations, sequential combinations, and multi-level combinations. (Table 2, at the end of this document, lists two additional techniques: conversion and data synthesis; for purposes of this note, however, the three techniques discussed in the text are sufficient to provide an overview of the issues.) A single
evaluation might use more than one, or even all, of these combination patterns at different points during the evaluation process. Each of these variations involves important management decisions on issues such as which data sources to rely on and how to gain access to them, what sites should be included in the evaluation (all project sites or a sample, and if just a sample, how the sample should be drawn), how much depth of explanation is needed, which stakeholders’ views are most relevant, and so on. These kinds of questions normally need to be addressed in the SOW so that the evaluators can develop designs that answer the questions of interest. And while the evaluators may help to clarify questions and provide guidance on practical implications of design choices, it is the responsibility of the USAID managers to have made the key decisions, such as what questions need to be answered and what kinds of evidence are needed, when developing the SOW. These choices have important implications for time and resources. Mixed-method evaluations must be carefully planned with a thorough understanding of why and how each method is to be used to answer the questions. One must carefully consider the integrity of the design of the evaluation. Adding more methods to a design with the idea that “more is better” can lead to unnecessary complications and cost. PARALLEL COMBINATIONS In parallel combinations, methods are used separately and the findings are integrated after the data are analyzed. The same evaluation team might be involved in implementing multiple evaluation methods, and the actual data collection and analysis can happen over the same period of time, or at different times. The key point is that in parallel combinations, each method is conducted in its entirety, separately from the other methods, as shown in Figure 1. For example, a team evaluating an alternative development project could collect data from government statistics on the number of acres of land converted from illegal to legal crops, and then analyze this quantitative data to estimate the impact of the project. At the same time, the same team also might conduct individual and focus group interviews with farmers to better understand their choice of what to grow. These two methods could take place simultaneously, and the data analyzed separately. Then, if the data from the two methods were intended to answer the same question, the findings could be triangulated. If they were intended to answer different questions, then the results would be combined, or synthesized, in the evaluation report. SEQUENTIAL COMBINATION Multiple methods also can be used at different times and in a specific order. With sequential combinations, methods are employed one after the other, with the findings from methods used earlier in the evaluation informing the design and implementation of methods used later in the evaluation.
The image part with relationship ID rId6 was not found in the file.
Round 1 data collection: Based on the evaluation design, the evaluator constructs data collection instruments, conducts a first round of data collection, and analyzes that data. For example, as illustrated in Figure 2, if the evaluation is intended to determine whether a water, sanitation and hygiene (WASH) project is leading to higher rates of hand-washing in a particular community, the evaluator may first collect and analyze quantitative data from the most recent census to gather information about the population of the community and any relevant demographic characteristics, such as age, socio-economic status, and ethnicity. Use of Round 1 findings to inform Round 2 data collection: The evaluator then can use the findings from the first round of data collection to inform the second round. In this example, the census data would help the evaluators identify the demographic characteristics that should be represented among the second-round interviewees. These interviews would help bring to light the common reasons why the affected population chooses to wash their hands, or not, and what obstacles may exist that prevent them from doing so. Use of Round 1 and 2 findings to inform Round 3 data collection: Based on qualitative information collected during the interviews, the evaluator would design the content of a household survey. This survey would help to answer the central question of what proportion of villagers has changed their hand-washing behavior, as well as why their behavior changed. The household survey would be conducted in the community, possibly following a sampling strategy based on Round 1 quantitative data. The data collected during the Round 3 household survey would directly address the original evaluation questions. While it might be possible to do only a survey, the mixed methods approach would have a number of advantages: thanks to the Round 1 analysis the sample would be more representative of the total population of the village, and the survey questions would be more appropriately tailored to the local context and to the diversity of the community thanks to the Round 2 analysis. MULTILEVEL COMBINATIONS Many projects involve systems with multiple levels, and the evaluators of these projects often must collect data and draw conclusions about each of these levels in order to have a clear understanding of the overall performance of the project. Not surprisingly, the evaluator may conclude that different kinds of methods are best suited to collecting and analyzing information from different levels. For an example of this type of evaluation, consider an education project which is intended to raise student literacy by introducing more effective teaching strategies in a set of project schools. The project is designed so that the head teacher from each project school is trained by project trainers at the district level, and these teachers then return to their own schools to train their fellow teachers.
To understand whether the project has been effective, the evaluator will need to collect data on student literacy, likely based on the scores on a standardized test. But to understand why the project
The image part with relationship ID rId7 was not found in the file.
has been effective or not will also require data from additional levels. As shown in Figure 3, the evaluator may also want to collect attendance data from the trainings that occurred at the district level and conduct in-depth and focus group interviews with the project trainers responsible for that training. At the school level, the same type of data could be collected from both the teachers who received the district training, and from those other teachers who received the trainings in their own schools. The evaluator may also conduct structured observations of classrooms in project schools in order to see firsthand whether teachers are using the literacy techniques promoted by the trainings. Incorporating different types of data at these different levels provides the evaluator with a more complete, holistic understanding of how the project operates and how it achieved, or did not achieve, its goals. Multi-level mixed-method evaluations can be combined with either parallel or sequential processes, or a combination of the two, depending on the levels of the project and the purpose of the evaluation. In the example above, there is a parallel process embedded in the multi-level design. However, integrating different types of data at different levels like this does make the overall evaluation design more complex, and requires additional planning, coordination, and management of the evaluation to make sure that all the data collected are analyzed and incorporated into the final report. While much of this responsibility necessarily falls to the evaluators, the implication for managers is that they must provide careful oversight of this complex evaluation process to ensure that the efforts are timely and well-coordinated, and carried out within time and budget constraints. Thus, from the manager’s point of view there is a trade-off between the quality of these mixed-method evaluations in terms of accuracy and completeness, and the time and resource costs necessary to carry them out. INTEGRATING MULTIPLE METHODS INTO THE EVALUATION In order to get the most out of a mixed-method evaluation, the evaluation manager and the evaluator must consider carefully what purpose each method is intended to fulfill, and how they will be combined, at each stage of the evaluation, to most efficiently and effectively accomplish these purposes. PLANNING THE EVALUATION In order to conduct a successful mixed-method evaluation, the evaluator must start at the planning stage. At this point, the evaluator or evaluation manager must decide which methods to use and how to combine them. These decisions will be based primarily on the purpose of the evaluation and the key evaluation questions, but evaluation managers must also take into account factors such as time and cost. When drafting the evaluation SOW (Scope of Work), the evaluation manager must first decide which questions need to be answered and how rigorous the evaluation needs to be. If the evaluation is intended to estimate impact that can be attributed to a specific intervention, then the evaluation will include some kind of experimental or quasi-experimental design which typically includes a control or comparison group. This
decision must be made at the planning stage of the project so the project design and management will allow for this kind of evaluation design. If the evaluation is intended to answers questions more oriented toward project management, then non-experimental designs likely will be sufficient. In cases in which an evaluation needs to answer both attribution-related and other types of questions, the evaluation manager may choose an evaluation that incorporates aspects of both experimental (or quasi-experimental) and non-experimental designs. If at the planning stage the managers decide that the evaluation requires mixed-methods, they need to be aware that it will require careful management throughout the evaluation to ensure they accomplish their dual purposes. To see how combining these kinds of methods, or evaluation designs, can strengthen an evaluation, imagine a project that aims to increase farmers’ income by training them in improved farming techniques. The project design stipulates treatment and control groups in order to allow an evaluation to measure the contribution of the project to increased farmer income. In this case, the evaluation manager might decide on a quasi-experimental design with a treatment group, who receive the training, and a control group, who do not. At the same time, the evaluation also may aim to determine whether the project was implemented according to its original design, and this part of the evaluation may rely on a non-experimental design, focusing on a description of project operations, to fulfill this aim. The quasi-experimental component of the evaluation may reveal no significant difference in income between farmers in the treatment group and those in the control group, which would indicate that the project had no impact. Some stakeholders may also conclude from this finding that training projects of this kind do not increase farmer’s incomes. At the same time, the results of the non-experimental component of the evaluation may reveal that only a small number of farmers in the treatment group actually received the intended training, or that they all did receive the training and then shared the improved farming techniques with the farmers in the control group. In either case, this additional information would help to explain the findings of the quasi-experimental part of the evaluation: it is possible that training of this type can lead to increases in farmers’ income, but because of faulty implementation, it is impossible to know for sure from this evaluation. Once the evaluation team has finalized the overall evaluation design, the next step is to plan for data collection. In some cases, the evaluator may choose to begin using multiple data collection methods even during the planning stage, to help design tools or methodologies that then will be used during the data collection or data analysis stages of the overall evaluation. This use of mixed methods follows the sequential pattern of combining methods described above. A review of relevant literature and secondary data is one method commonly employed at the planning stage. Stakeholder consultations, also a common part of the planning stage, can take the form of individual and focus group interviews. The evaluator also could decide to conduct a mini-survey of some of the
The image part with relationship ID rId8 was not found in the file.
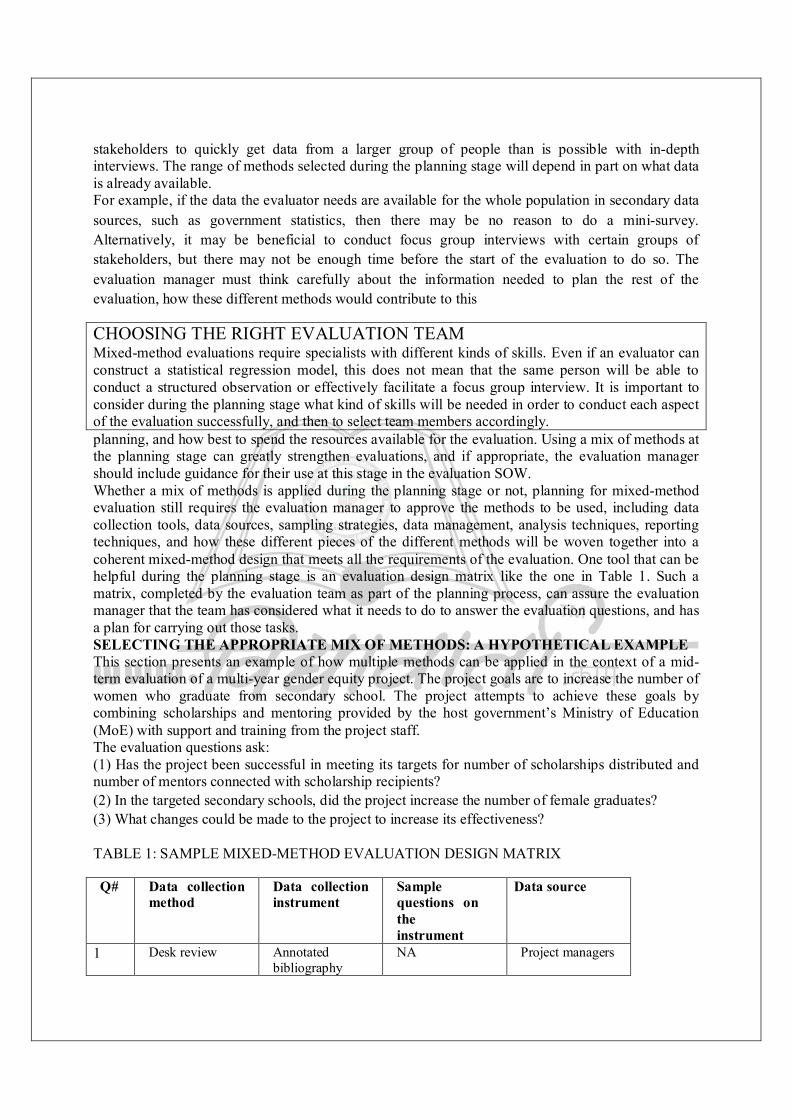
stakeholders to quickly get data from a larger group of people than is possible with in-depth interviews. The range of methods selected during the planning stage will depend in part on what data is already available. For example, if the data the evaluator needs are available for the whole population in secondary data sources, such as government statistics, then there may be no reason to do a mini-survey. Alternatively, it may be beneficial to conduct focus group interviews with certain groups of stakeholders, but there may not be enough time before the start of the evaluation to do so. The evaluation manager must think carefully about the information needed to plan the rest of the evaluation, how these different methods would contribute to this
CHOOSING THE RIGHT EVALUATION TEAM Mixed-method evaluations require specialists with different kinds of skills. Even if an evaluator can construct a statistical regression model, this does not mean that the same person will be able to conduct a structured observation or effectively facilitate a focus group interview. It is important to consider during the planning stage what kind of skills will be needed in order to conduct each aspect of the evaluation successfully, and then to select team members accordingly. planning, and how best to spend the resources available for the evaluation. Using a mix of methods at the planning stage can greatly strengthen evaluations, and if appropriate, the evaluation manager should include guidance for their use at this stage in the evaluation SOW. Whether a mix of methods is applied during the planning stage or not, planning for mixed-method evaluation still requires the evaluation manager to approve the methods to be used, including data collection tools, data sources, sampling strategies, data management, analysis techniques, reporting techniques, and how these different pieces of the different methods will be woven together into a coherent mixed-method design that meets all the requirements of the evaluation. One tool that can be helpful during the planning stage is an evaluation design matrix like the one in Table 1. Such a matrix, completed by the evaluation team as part of the planning process, can assure the evaluation manager that the team has considered what it needs to do to answer the evaluation questions, and has a plan for carrying out those tasks. SELECTING THE APPROPRIATE MIX OF METHODS: A HYPOTHETICAL EXAMPLE This section presents an example of how multiple methods can be applied in the context of a mid-term evaluation of a multi-year gender equity project. The project goals are to increase the number of women who graduate from secondary school. The project attempts to achieve these goals by combining scholarships and mentoring provided by the host government’s Ministry of Education (MoE) with support and training from the project staff. The evaluation questions ask: (1) Has the project been successful in meeting its targets for number of scholarships distributed and number of mentors connected with scholarship recipients? (2) In the targeted secondary schools, did the project increase the number of female graduates? (3) What changes could be made to the project to increase its effectiveness? TABLE 1: SAMPLE MIXED-METHOD EVALUATION DESIGN MATRIX
Q#
Data collection method
Data collection instrument
Sample questions on the instrument
Data source
1 Desk review
Annotated bibliography
NA
Project managers
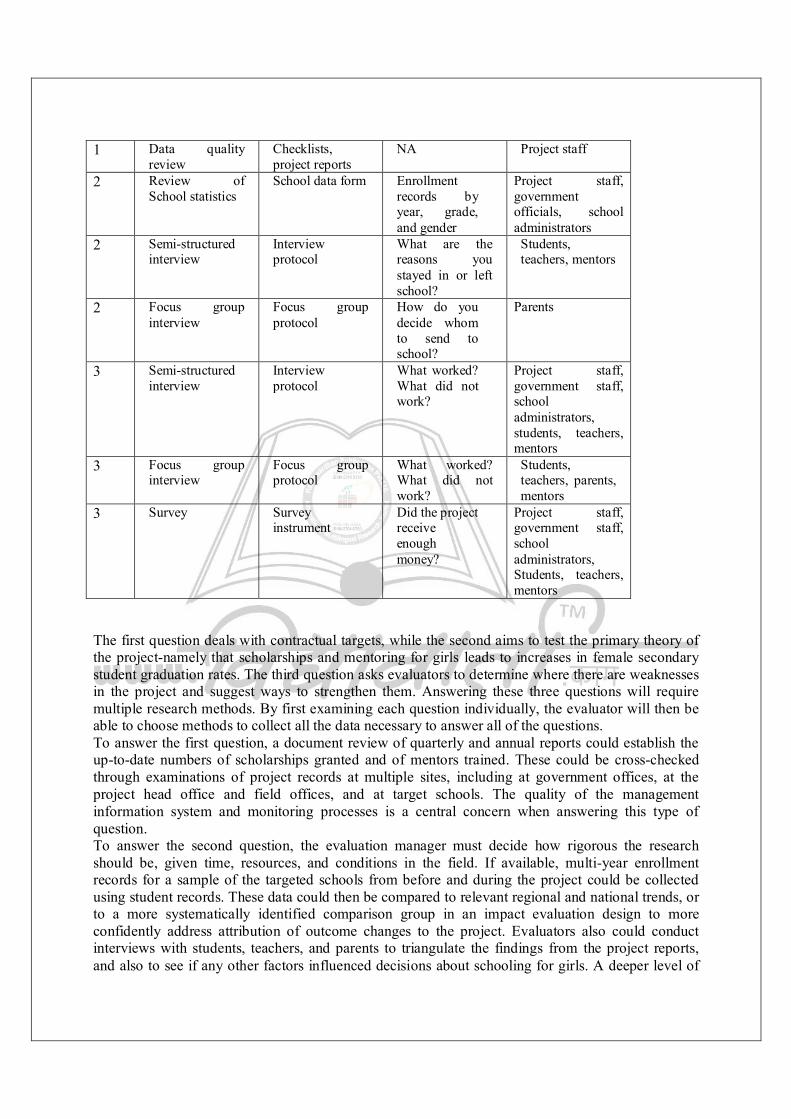
1 Data quality review
Checklists, project reports
NA
Project staff
2 Review of School statistics
School data form
Enrollment records by year, grade, and gender
Project staff, government officials, school administrators
2 Semi-structured interview
Interview protocol
What are the reasons you stayed in or left school?
Students, teachers, mentors
2 Focus group interview
Focus group protocol
How do you decide whom to send to school?
Parents
3 Semi-structured interview
Interview protocol
What worked? What did not work?
Project staff, government staff, school administrators, students, teachers, mentors
3 Focus group interview
Focus group protocol
What worked? What did not work?
Students, teachers, parents, mentors
3 Survey
Survey instrument
Did the project receive enough money?
Project staff, government staff, school administrators, Students, teachers, mentors
The first question deals with contractual targets, while the second aims to test the primary theory of the project-namely that scholarships and mentoring for girls leads to increases in female secondary student graduation rates. The third question asks evaluators to determine where there are weaknesses in the project and suggest ways to strengthen them. Answering these three questions will require multiple research methods. By first examining each question individually, the evaluator will then be able to choose methods to collect all the data necessary to answer all of the questions. To answer the first question, a document review of quarterly and annual reports could establish the up-to-date numbers of scholarships granted and of mentors trained. These could be cross-checked through examinations of project records at multiple sites, including at government offices, at the project head office and field offices, and at target schools. The quality of the management information system and monitoring processes is a central concern when answering this type of question. To answer the second question, the evaluation manager must decide how rigorous the research should be, given time, resources, and conditions in the field. If available, multi-year enrollment records for a sample of the targeted schools from before and during the project could be collected using student records. These data could then be compared to relevant regional and national trends, or to a more systematically identified comparison group in an impact evaluation design to more confidently address attribution of outcome changes to the project. Evaluators also could conduct interviews with students, teachers, and parents to triangulate the findings from the project reports, and also to see if any other factors influenced decisions about schooling for girls. A deeper level of
analysis would examine the retention and graduation data for the entire school population—scholarship and non-scholarship students—and compare them. Non-scholarship recipients and their families could also be interviewed. To answer the third question, evaluators must determine among all the stakeholders involved with the project who should be consulted. Evaluators likely would conduct semi-structured interviews with key project staff, teachers, mentors, students, and their parents. A survey tool could be developed as well and administered to select groups of beneficiaries to rate multiple aspects of the project. After examining the questions, it is apparent that either a parallel or multi-level approach can work. The questions could be investigated separately but simultaneously, and then the findings compared in the analysis stage. All three questions, however, share some common populations and sites, and so it is likely more efficient in this case to use a multi-level design. The mix of different tools that would be used in this evaluation model—project statistics, school data forms, semi-structured interviews for four different populations, focus group protocols, and a survey—would be influenced by the location and population of the different research sites, in this case sites at the federal and state government, schools, and households.
TAKING INTO ACCOUNT PRACTICAL CONSTRAINTS In many cases, the ideal mix of methods will not be possible, either due to constraints on the evaluation itself, such as limited time or funding, or due to contextual factors, such as a challenging geographic or political environment. All evaluations must deal with these types of constraints, but they are especially relevant in deciding among different methods and ways to integrate them into a mixed-method design. In some cases a mixed-method approach can help overcome some of these obstacles. For example, if the evaluation ideally would include a large-scale household survey, but this method is too costly or time-consuming, an analysis of existing census data could be used to select a small purposive sample of informants to interview that included members of all the relevant social groups. Or if a certain portion of the population of interest is inaccessible due to security concerns, statistical matching techniques based on secondary data can be used to identify a similar, alternative group to include in the evaluation sample. DATA COLLECTION Having designed the evaluation and identified data needs and sources, the next step is to carry out the data collection strategy. Mixed-method designs usually require multiple data collection methods to accommodate the different kinds of data needed to carry them out. This can be complex, time-consuming, and costly. However, with careful planning, it may be possible to design data collection instruments and sampling methodologies so that different kinds of data can be collected with a relatively small additional investment of time and other resources. For example, if an evaluation of an education project requires the evaluator to administer a short, standardized test to a sample of students in project schools, it might be possible to add a small number of closed-ended or open-ended survey questions to the end of the test, asking, for example, what the student had for breakfast that morning, so the evaluation also could examine how student nutrition affected educational outcomes. The evaluator could also coordinate with school officials to schedule a number of classroom observations, a focus group interview with teachers from the school, and an in-depth interview with the principal, all on the same day. In this way, several different types of data can be collected in only one visit, minimizing the disruption to the students and teachers, as well as travel time and transportation costs. Another example is a household survey which, in addition to asking questions of family members, also instructs enumerators to observe and note characteristics such as the building materials the house is made of, which often correlates with family
wealth. With some forethought and creativity, data collection instruments can be systematically integrated to help capture a broad range of data effectively and efficiently. DATA ANALYSIS It is important to design the data analysis strategy before the actual data collection begins because the way that the data will be analyzed and used can affect both the choice and the order of data collection methods. Analyzing data collected from a mixture of methods is often more complicated than analyzing the data derived from one method, as the evaluator must integrate multiple data analysis methods in order to determine and understand key findings. There are several different general techniques to analyze data from mixed-method approaches, including parallel analysis, sequential analysis, and multilevel analysis, corresponding to the patterns of combining methods described above, as well as conversion analysis and data synthesis. Table 2 briefly describes these different analysis techniques and the situations in which each method is best applied. More specific data analysis techniques, such as key word coding or theme analysis for qualitative data, and cross-tabulations or regression modeling for quantitative data, can also be used within the framework of any of these more general data analysis techniques. As with all evaluations, the choice of analytical techniques depends on the purpose of the evaluation and the type of data involved, as well as time and resources available.
When Findings Do Not Converge In cases where mixed-method evaluations employ triangulation, it is not unusual that findings from the separate analysis of each data set do not converge to support the same conclusions. If this occurs, the evaluator must try to resolve the conflict among divergent findings. This is not a disaster. Often this kind of situation can present an opportunity to generate more nuanced explanations and important additional findings that are of great value. One method to use when findings from different methods diverge is to carefully re-examine the raw qualitative data through a second and more in-depth content analysis. This step is taken to determine if there were any factors or issues that were missed when these data were first being organized for analysis. The results of this third layer of analysis can produce a deeper understanding of the data, and can then be used to generate new interpretations. In some cases, other factors external to the project might be discovered through contextual analysis of economic, social, or political conditions or an analysis of operations and interventions across project sites. Another approach is to reanalyze all of the disaggregated data in each data set separately, by characteristics of the respondents as appropriate to the study, such as age, gender, educational background, socio-economic status, or locale of respondents. The results of this analysis may yield other information that can help to resolve the divergence of findings. This further analysis will provide additional explanations for the variances in findings. While most evaluators build this type of disaggregation into the analysis of the data during the design phase of the evaluation, it is worth reexamining patterns from disaggregated data. Sometimes data quality issues, such as the validity of secondary data sources or possible errors in survey data from incomplete recording or incorrect coding of responses can cause dissonance in results. If the evaluators are still at the project site, it is possible to resolve data quality issues with limited follow-up data collection by, for example, conducting in-depth interviews with key informants. The data analysis approaches noted above underscore the need for USAID evaluation managers to plan adequate time and resources for data analysis in evaluation SOWs, as it is a critical component of any evaluation, and perhaps even more so in one using a mixed methods approach. Dealing with Divergent Findings: An Example of Triangulation
Imagine an evaluation to assess the impact of a school feeding project on school attendance rates. School records showed that daily enrolment had increased by ten to fifteen percent after the school feeding project began. A review of records from other local schools without the feeding project did not find any similar increase. A household survey before and after the project detected only a much smaller increase. Interviews with key informants provided different opinions. NGOs involved with the project, or who ran other school feeding projects, reported the project had been successful, whereas several other informants said that the school might deliberately over-report the increase to convince sponsors to continue the feeding project. How would triangulation be used to obtain the best estimate on the basis of this conflicting information? First, the evaluators responsible for managing each kind of data collection would meet to explore possible explanations for the differences and to understand any possible sources of bias in the data. How reliable are attendance records? Does someone check names each day while the students are there, or does the teacher try to recall at some later point in the day after the students have gone home? Is there any reason why schools would intentionally inflate the number of children attending? When is attendance recorded? If it is at the start of the day, might some children just come for the breakfast and then leave – but be reported as attending? Are there any reasons that parents might misreport the number of their children attending school? Might key informants have any reason to over- or under-estimate the effects of the school feeding project?
Second, if this discussion does not fully explain the differences, as it probably would not in this case, the evaluators might agree on the additional kinds of data that would help clarify the situation and which would be feasible to collect. The most obvious approach would be to examine in more detail the school attendance records to address the questions mentioned above. Third, a return to the field would be organized (where feasible). When revisiting the schools, the evaluators also would compare the attendance records with the number of children in the classroom after the breakfast had ended. They also might identify some of the children who were not in school but whose parents had reported in the survey that they attended regularly. Some of the families might then be revisited to check on the consistency between parents’ reports of attendance and actual school attendance. They would then conduct informal interviews to try to understand reasons for the discrepancies. These follow-up returns to the field are extremely valuable, but they can only take place if time and resources have been budgeted in advance. Consequently, it is recommended that, the evaluation budget should include time and money for this purpose as these kinds of inconsistencies are very commonly detected during data analysis. REPORTING Through the use of mixed-method evaluations, findings and conclusions can be enriched and strengthened. Yet there is a tendency to underuse, or even not to use, all the data collected for the evaluation. Evaluators can rely too heavily on one particular data source if it generates easily digestible and understandable information for a project manager. For example, in too many cases quantitative data that can be presented easily in graphs or tables are emphasized, whereas possibly more important but harder to present data generated from qualitative methods are insufficiently analyzed and reported. Evaluation reports should strive for interesting graphical presentations of findings from qualitative data as well. One way to prevent underutilization of findings is to write a statement of work that provides the evaluator sufficient time to analyze the data sets from each method employed, and hence to develop valid findings, explanations, and strong conclusions that a project manager can use with confidence. Additionally, statements of work for evaluation should require evidence of, and reporting on, the
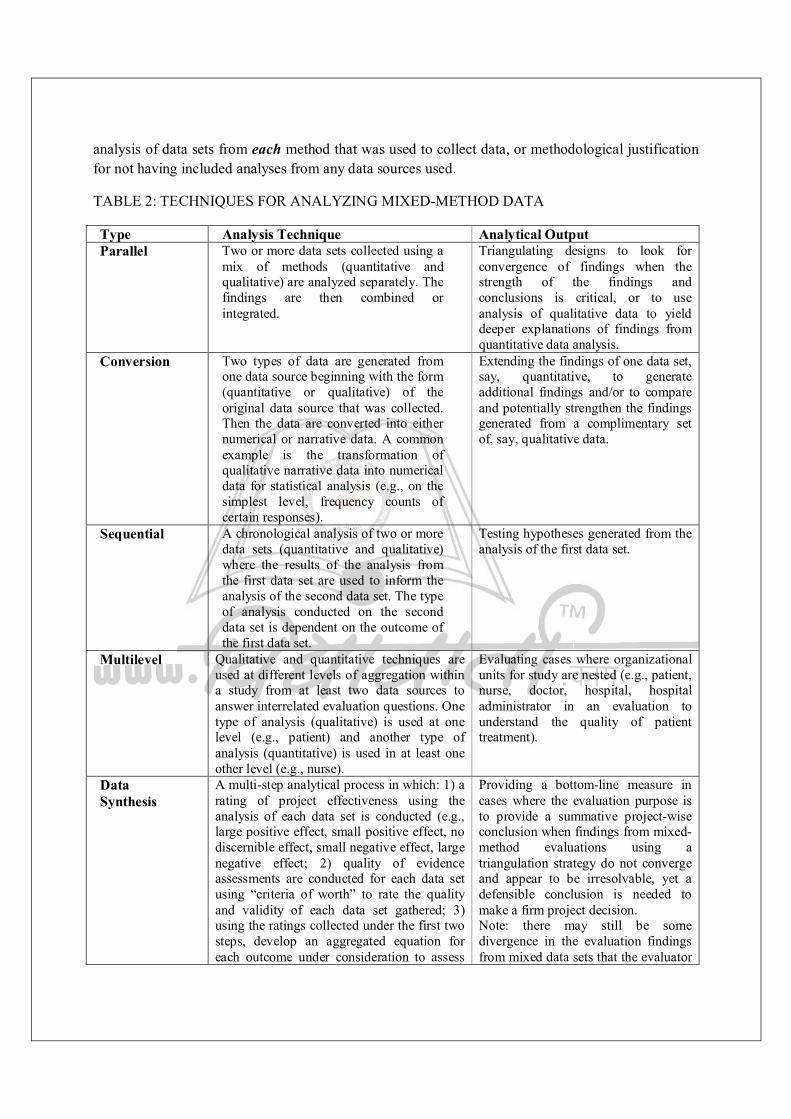
analysis of data sets from each method that was used to collect data, or methodological justification for not having included analyses from any data sources used.
TABLE 2: TECHNIQUES FOR ANALYZING MIXED-METHOD DATA
Type
Analysis Technique
Analytical Output Parallel
Two or more data sets collected using a mix of methods (quantitative and qualitative) are analyzed separately. The findings are then combined or integrated.
Triangulating designs to look for convergence of findings when the strength of the findings and conclusions is critical, or to use analysis of qualitative data to yield deeper explanations of findings from quantitative data analysis.
Conversion
Two types of data are generated from one data source beginning with the form (quantitative or qualitative) of the original data source that was collected. Then the data are converted into either numerical or narrative data. A common example is the transformation of qualitative narrative data into numerical data for statistical analysis (e.g., on the simplest level, frequency counts of certain responses).
Extending the findings of one data set, say, quantitative, to generate additional findings and/or to compare and potentially strengthen the findings generated from a complimentary set of, say, qualitative data.
Sequential
A chronological analysis of two or more data sets (quantitative and qualitative) where the results of the analysis from the first data set are used to inform the analysis of the second data set. The type of analysis conducted on the second data set is dependent on the outcome of the first data set.
Testing hypotheses generated from the analysis of the first data set.
Multilevel
Qualitative and quantitative techniques are used at different levels of aggregation within a study from at least two data sources to answer interrelated evaluation questions. One type of analysis (qualitative) is used at one level (e.g., patient) and another type of analysis (quantitative) is used in at least one other level (e.g., nurse).
Evaluating cases where organizational units for study are nested (e.g., patient, nurse, doctor, hospital, hospital administrator in an evaluation to understand the quality of patient treatment).
Data Synthesis
A multi-step analytical process in which: 1) a rating of project effectiveness using the analysis of each data set is conducted (e.g., large positive effect, small positive effect, no discernible effect, small negative effect, large negative effect; 2) quality of evidence assessments are conducted for each data set using “criteria of worth” to rate the quality and validity of each data set gathered; 3) using the ratings collected under the first two steps, develop an aggregated equation for each outcome under consideration to assess
Providing a bottom-line measure in cases where the evaluation purpose is to provide a summative project-wise conclusion when findings from mixed-method evaluations using a triangulation strategy do not converge and appear to be irresolvable, yet a defensible conclusion is needed to make a firm project decision. Note: there may still be some divergence in the evaluation findings from mixed data sets that the evaluator

the overall strength and validity of each finding; and 4) average outcome-wise effectiveness estimates to produce one overall project-wise effectiveness index.
can still attempt to resolve and/or explore to further enrich the analysis and findings.
21 RESEARCH PROPOSALS
Unit Structures: 21.0 Introduction 21.1 Objectives 21.2 Main Content
21.2.1 Meaning of Research Proposal 21.3 Types of Research Proposal
21.3.1 Thesis Proposal 21.3.2 Grant Proposal
21.4 Contents of a Research Proposal 21.4.1 Research Objectives and Scholarly Significance 21.4.2 Researcher’s Technical Qualifications 21.4.3 The Level of Funding Required 21.4.4 Work Plan
21.5 Key Criteria for Assessing a Research Proposal 21.5.1 Track Record 21.5.2 Originality 21.5.3 Feasibility 21.5.4 Clarity 21.5.5 Output
21.6 Conclusion 21.7 Summary 21.8 Tutor-Marked Assignment 21.9 References/Further Reading 21.0 INTRODUCTION Writing a proposal is a very important segment in research activity. Let us liken it to a roadmap which a researcher draws for himself to enable him navigate the rough and yet interesting field of research. You should do well to consider your research as an adventurous journey. In this journey, your supervisor or sponsors of your research need to be convinced that you know the road to your destination, and that you will not miss your way in the midst of uncertainties and difficulties that you may encounter on the way. The proposal does the job of convincing them that you understand what your topic is all about. It also guides you, just like the map guides a traveller, all the way to the end of your research. Thus, it pays you, in no small measure, to acquaint yourself with the rudiments of writing research proposal which we shall introduce to you in this unit. 21.1 OBJECTIVES At the end of this unit, you should be able to:
define research proposal state types of research proposal draft different types of research proposal list the likely questions to search for before writing a proposal for research grant
21.2 Main Content 21.2.1 Meaning of Research Proposal Research proposal is a comprehensive summary of what a researcher intends to achieve in his research work. According to Matt Henn et al (2006), A research proposal, then, is a written plan for a study. It spells out in detail what the researcher intends to do. It permits others to learn about the intended research, and to offer suggestions for improving the study. It helps the researcher to clarify what needs to be done, and aims to avoid unintentional pitfalls or unknown problems (257). A good proposal does not stop at what should be achieved. It also shows how and when the researcher hopes to achieve what he is proposing. Hence, we can say that a research proposal is fashioned to answer the ‘what’, the ‘how’ and the ‘when’ questions of research. The research proposal is so relevant that supervisors and sponsors rate very highly the “researchability” of a topic and the ability of the researcher to carry out a particular research from the proposal submitted for the research. Apart from providing the early ground of rating the researcher’s ability, the research proposal serves as an organized plan of action for the researcher to follow. From time to time, a good researcher returns to his or her proposal to check whether what he or she is doing is still in tandem with what he proposed in the beginning of his research. At this level of your academic career, you must have noticed that books and experiments can become very interesting that they lure a researcher away from his intended aim. Whenever this happens, seasoned researchers take recourse in the research proposal which they had prepared earlier in order to retrace their steps. What this tells you is that even when you are doing a private research, or when your supervisor or sponsor has not asked for a research proposal, you do yourself a world of good to prepare one for your own use. Besides the above, a good research proposal helps you, the researcher, to have a proper foresight on what is involved in executing a particular study. With proper research proposal, you can visualize, ahead of time, the major difficulties that may mar the research and find ways of curbing them. 21.3 Types of Research Proposal Research proposal can be categorized into two. They include: Thesis Proposal and Grant Proposal.
21.3.1 Thesis Proposal Thesis proposal is the type of research proposal written by students in the course of writing their long essays. It is part of today’s tradition that a student writes and submits a long essay to his or her department before he or she graduates from any institution of higher learning. In Nigeria, this long essay is called project if written for the purposes of N.C.E., Bachelor’s degree, and Diploma. If it is written for the purpose of master’s degree it is called thesis, and dissertation if written for a doctorate degree. However, especially in postgraduate studies, before a student is permitted to write his long essay, he is expected to submit his thesis proposal to his Department. In the thesis proposal, the student provides a detailed roadmap about the research he intends to carry out. At this level, the student’s supervisor is expected to judge the feasibility or otherwise of the student’s title solely on the strength of their proposal. Looking at a student’s thesis proposal, their supervisors will be able to determine: (a) the theoretical framework on which the student’s work is based (b) the contribution the student’s research will to make to scholarship (c) whether there is sufficient literature to support the student’s research efforts (d) whether the methods of data collection and analysis adopted by the student are suitable for the research
A well written thesis proposal should clearly address the above points. You have no reason carrying on with a particular research if you cannot prove, in your thesis proposal, that your research will address the points. This demands that a student should put in all their best in crafting their thesis proposal in order to convince their supervisors that they know what they aim at. Patience and diligence are too important virtues which expert researchers advice that you adopt in order to write a good thesis proposal. 21.3.2 Grant Proposal Grant proposal is a proposal written to statutory, voluntary or philanthropic agencies by a researcher requesting for funds to enable him or her carry out a specific research. Traditionally, the following are some of the reputed agencies that sponsor research by awarding grants to researchers: The Education Trust Fund (ETF), Rockefeller Foundation, Carnegie Corporation, Ford Foundation, Hewlett Packard Foundation, the Robert Wood Johnson Foundation, United Nations Research Institute for Social Development (UNRISD), etc. You must have proved yourself as expert proposal writer before you write grant proposal to any of these research agencies. The only way to become an expert proposal writer is to take the writing of your thesis proposal very seriously as a student. Indeed, grant proposal is a battlefield for expert researchers. Here, the competition is tough and the grant money at stake is often quite large. Since there are many scholars who compete for the grant money of the sponsoring agencies, the agencies make sure that they fund only the best proposal which shows the greatest potential for success. That you are sure, in your head, that your work carries great potential is quite irrelevant here. What is relevant is your ability to convince the grant agencies that your research has potential.
21.4 Contents of a Research Proposal A research proposal, whether thesis or grant proposal, must possess certain things to be considered a good proposal by assessors. Matt Henn et al (2006: 250) lists the traditional contents of research proposal to include: (1) research objectives and scholarly significance; (2) researcher’s technical qualifications; and (3) the level of funding required (4) work plan. 21.4.1 Research Objectives and Scholarly Significance Here, the proposal exposes the issue or issues which he wants to examine. The researcher discusses what he or she intends to achieve in his or her research. He or she also informs his or her assessors the methodology he will adopt in order to arrive at the conclusion of his research. It is not just enough to list these, that is issues and methodology, without justifying them. A good proposal should be able to tell his reviewers why the issue he is considering and the method he has adopted to pursue the issue are chosen despite the presence of other myriads of issues and methods. He needs to harp on the significance, purpose, relevance or importance of his research. Every research must address a problem. Thus, assessors will look at your proposal to identify the problems you seek to address in your research work. Other items which must be contained in a good proposal are hypotheses, definition of terms, and target group of your research. You should also state the research design, instrument, and methods of data analysis to be adopted. Also important in a research proposal is the review of literature relevant for the study. This gives you the opportunity to link your work with previous researches. It also helps you to identify a gap which you want to fill in your research. After writing the literature review, you have to list books and other reference materials that are useful to your research. A careful examination of what we have discussed above reveals that what are needed to show the objective and significance of your research are the traditional items that are contained in chapter one (background of study, purpose of study, scope of study, statement of problem, significance of study, methodology, definition of terms, sample design, hypothesis) as well as chapter two (literature
review), and bibliography of any long essay are needed to show the significance and objective of your research. 21.4.2 Researcher’s Technical Qualifications A research proposal must also state the qualification of the researcher. In thesis proposal, this is stated in the title page of the research where the researcher states that he is either pursuing a bachelor’s degree, a master’s degree or a doctorate degree. This is the much that is required from thesis proposal. However, technical qualifications become more serious when the researcher is involved with grant proposal. Here, the researcher is often expected to attach a full dossier of his curriculum vitae to the grant proposal. The grant agencies need to be convinced that the researcher has the requisite experience to undertake a research work in the field he is applying for.
21.4.3 The Level of Funding Required A research proposal, especially grant proposal, is expected to contain information concerning the resources needed to undertake a research. What this entails is that the researcher should carry out a market survey of items that are needed for his research, fees to be paid to research assistants and others. The researcher should be careful to state the exact amount so that his research will not be constrained by lack of resources. He should also be careful not to overstate the money he needs for the research. 21.4.4 Work Plan A research proposal should contain a work plan which contains the time table of what the researcher plans to do, and when they will do it. The work plan details aspects of the research that will be completed at every point in time. In thesis proposal, your supervisor may not request for your work plan, but you should have a work plan of your own to help you complete your research in a record time. On the other hand, the work plan is an indispensable part of a grant proposal. Research sponsors need to convince themselves that you have a plan to complete the research in record time. In most research proposals, the work plan is prepared in a table format where each activity is paired against a specified time. 21.5 Key Criteria for Assessing a Research Proposal When reviewers assess your research proposal, whether thesis proposal or grant proposal, they will award you marks based on the following: track record, originality, feasibility, clarity, and outputs. 21.5.1 Track Record The reviewers always consider the antecedents of researchers in assessing their research proposals. This is where your technical qualifications, which you submitted earlier, play a major role. There is no gain saying that researchers who have proved themselves in the past as capable of sustaining and ending a research work successfully are favoured more than new ones. For instance, if you are applying for a doctorate degree with your research proposal, the supervisors know that you already have a record of completing a successful research at your undergraduate and master’s degree levels. Consider their reaction to one who has not got any experience at these levels. Things are more serious when the proposal is for grant. Researchers who have completed research for other agencies are favoured more than those who have not. This should not discourage a first time grant proposal writer. In one way or the other, they have proved that they can carry and sustain a research if they already have a PhD. Besides, they should know that this is not the only criterion of assessment. They should concentrate on other criteria as if their life depends on them.
21.5.2 Originality Assessors of research proposal always look out for the contribution a particular research will make to knowledge. A researcher should be able to prove that his research does not re-invent knowledge.
They should convince their assessors that nobody, before them, had arrived at the same conclusion they propose to arrive at. This tells you that you do not just generate a topic for research. You should be able to prove that your topic has worth, and that so far, you alone hold (a private and mental) patent to the idea that your topic intends to address. When reviewers read the chapters one and two of your proposal, they will be able to decide whether your research is original to you or whether you are re-inventing the wheel (Re-inventing the wheel is euphemism for researching a topic already researched by others.). 21.5.3 Feasibility A research that proposes to bring down the sky for us to touch and feel is original in all its ramifications. However, the assessors are likely to conclude that what the research proposes is an impossible task, and therefore throw it out even if the researcher has impeccable track records. The reviewers will also look at your time table, fund demanded, and what you propose to do within the research period to take decision on the feasibility of your proposal. If they are convinced that what you are proposing can be achieved within your stipulated time and fund, they will consider your proposal as feasible. Finally, in planning for research, seek to address what can be achieved over a record time and with moderate budget. 21.5.4 Clarity What is under examination here is your skill as a researcher. The assessors want to convince themselves that you know your topic very well, and that you understand the question you have proposed to tackle. No researcher worth his salt is expected to fail in this area, so it is often allotted low marks, but its importance is that once you are able to prove that you lack a researcher’s skill the assessors feel that there is no need continuing your assessment. So to avoid such conclusion being reached about your research proposal you should be clear-headed on what you want to achieve with your research. Besides this, you should be very forceful in expressing your points. 21.5.5 Outputs The reviewers of research proposal are interested in the benefits your research is to give to society. You must be very explicit in stating this. 21.6 CONCLUSION A researcher who wants to make progress in his research should learn the art of writing proposal. The feasibility as well as the relevance of a research is judged by the research proposal which a researcher puts forward for consideration. A wise student considers the proposal as very essential for the success of his research. 21.7 SUMMARY This Unit has x-rayed research proposal in its entirety. It looks at thesis proposal which advanced students must submit to the university before embarking on the main research. It also explores research grant proposal which grant seekers must present to corporate bodies before their request could be considered. It exposes the contents of a good research proposal, telling the researcher what the assessors look out for in any research proposal. 21.8 TUTOR- MARKED ASSIGNMENT 1. What do you understand by the term Research Proposal? 2. Discuss the two types of research proposal. 3. Discuss the contents of a research proposal. 4. Show your understanding of the criteria for judging research proposal. 21.9 Reference/Further Reading

B. C. Iwuama, et al. (1992) Research Methods in Education. Benin: World of Books Publishers. B. G. Nworgu. (1991) Educational Research: Basic Issues & Methodology. Ibadan: Wisdom Publishers Limited. E. O. Akuezuilo, (1993) Research Methodology and Statistics.Awka: NUEL CENTI Publishers. Catherine Dawson. (2002) Practical Research Methods.Oxford: Howtobooks. Matt Hennetal (2006). A Short Introduction to Social Research.London: Sage Publications. P. E. Nmah, (2010) ‘Research Grant: A Necessary Tool for Dynamic National and Academic Development’ in Ekpunobi et al (Ed) Research Methodology: TheBasics. Onitsha: EFS Allied Publishers.
22 RESEARCH REPORT
Unit Structures: 22.0 Introduction 22.1 Objectives 22.2 Main Content
22.2.1 Meaning of Research Report 22.2.2 Types of Research report
22.2.2.1 Written Research Report 22.2.2.2 Oral Research Report
22.3 Importance of Research Report 22.4 Contents of Research Report
22.4.1 Preliminary Pages 22.4.2 Main Body 22.4.3 References
22.5 Causes of Failure in Research Report 22.5.1 Lack of Logical Structure 22.5.2 Undeveloped Ideas 22.5.3 Lack of Organization 22.5.4 Grammatical and Spelling Mistakes 22.5.5 Plagiarism 22.5.6 Repetition/ Irrelevant Information 22.5.7 Weak Conclusion
22.7 Conclusion 22.8 Summary 22.9 Tutor-Marked Assignment 22.10 Reference:/Further Reading
22.0 INTRODUCTION Every research is meant for the public. This means that researches are meant to be communicated to a third party. The researcher must bear this in mind as he begins his study. He is to remember that he should present his research to other people. If he remembers this, he must devise a plan to note down whatever he observes during the research in order to present same at the end of his research. A research report is what is presented at the end of the research process but it is a process, that runs throughout the intervals of the investigation. 22.1 OBJECTIVES At the end of this unit, you should be able to: i. state the import of report. ii. list the important parts of a research report. iii. explain each of the important parts of a research report. iv. write a report using a research topic.
22.2 MAIN CONTENT 22.2.1 Meaning of a Research Report A research report is a result of research findings. It is a very essential part of the research process. The import of the report is to communicate to others the experiences which you, the investigator, has passed through during the study. As a researcher, you should, at the end of the study make sure that the report is well-presented. A research report brings a research process to an end, and it is what a researcher will present to his supervisors or sponsors. Before he writes down the findings of his research, a researcher should first of all assemble together all the available information he had stored up as his research was unfolding. He takes time to sieve the relevant from the irrelevant, and takes time to put down the relevant information in the best language that is within his reach. A good report takes several trials and efforts to be produced. This requires that the researcher, while compiling his report, should be patient enough to read through his drafts, make as many changes or corrections to the drafts until he is finally satisfied that he can do no better. Self-Assessment Exercise 3.1 What is a research report? 22.2.2 Types of Research Report We distinguish between two types of research report. They include: written research report and oral research report. 22.2.2.1 Written Research Report A written research report is one that is presented in a written form. Here, the researcher compiles all he has done throughout the period of his research and produces it in form of a book which he passes over to relevant bodies. There are three bodies to whom a research report can be submitted. They include: the universities, journal editors, sponsoring agencies. Universities: Research reports that are submitted to universities are often in the form of student projects, theses or dissertations. Indeed, all universities in the world require their students to submit written research reports at the end of their undergraduate and postgraduate studies. These reports are stocked in the university libraries as reference materials for future researchers. Each university has specific instructions on how to write the research report. So a good student should discover what these instructions are in his university before writing his research report. He must adhere strictly to every instruction, as expected. One of the ways to discover this is to request, from your university library, copies of previously written reports and examine them thoroughly. Journal Editors: A research report written by more established or non-student researchers are presented in a journal. A research report which is presented in a journal often targets a wider audience. There are about hundreds of thousands of journals that are published annually which report major research findings. Getting published in a journal is quite competitive and a researcher must be at his best to be able to produce an article that is publishable in a journal. An undergraduate may not be required to publish in a journal, but a postgraduate student must know that he is expected to publish articles in reputable journals.
Research reports meant for a journal undergo what is called peer review where the quality of each research report is judged by external persons unknown to the author. The peer reviewers must certify that a report has substance, is original, and has a contribution to make to knowledge before it is published. A researcher who wants to increase the acceptability of his research report in a journal should ensure that his report meets the following criteria:
1. his topic must be both topical and original
2. his report is sent to the right journal which has interest in the type of topic he has researched on 3. ensure that his report conforms to set-down rules and regulations that govern submission in the target journal 4. make sure that the report is well written in clear and sharp language 5. receive a critique of the report from a friend or colleague, and try to respond to his comments before sending out the report (always bear in mind that research is more of a collaborative endeavour) 6. ensure that your sources are well cited. Sponsoring Agencies: Researchers are used to receiving uncountable requests from companies, governments, and other types of organisations to research a topic of interest for them. A researcher engaged in this type of research is often paid huge sum of money by the agencies that need his services. At the end of the research, the researcher puts up a written report which he submits to the agency that hired him. This type of research report is often called technical report, and most times its used, publication and circulation lie at the discretion of the agency that sponsored the report. 22.2.2.2 Oral Research Report Oral research report involves making a verbal presentation of one’s research findings. There are researches that demand that a researcher presents the report of his research orally to an audience: teachers, friends, classmates, conference attendees, etc. At other times, it is demanded that oral presentation accompanies a written research. Whichever is the case, a researcher should learn the rudiments of oral presentation of research reports. In the present age of Information and Communication Technology (ICT), most oral reports are often made with power points, a Microsoft programme that offers audio and visual alternatives to your presentation. To make the best out of your oral report presentation, you should do the following: 1. be early to the presentation venue. This affords you the opportunity to make sure that the whole place is as you would like it. 2. come with aide memoirs, either on cards, paper, OHP transparencies, etc., that will help you to recollect vital points. 3. make sure that your voice is at its best. Use gestures and eyes contacts to relate with your audience 4. address every question put to you as best as you can. Self-Assessment Exercise 3.2 Discuss the two types of research report in detail 22.3 Importance of Research Report The research report is very important because of the following reasons: 22.3.1 It Enhances Criticism and Verification The ultimate aim of reporting one’s research is to publicise one’s findings. Once findings are publicised, other researchers have access to them. This gives them the opportunity to ask their own questions about the claims made by the research reporter. Criticizing a research report will help to strengthen the research. Asking questions may also involve going through the same procedure as the research reporter to know whether one would arrive at the same conclusion like him. 22.3.2 Public Adoption Researches are meant to benefit the public. The only way the public will benefit from the report is when it comes to know about the report and adopts it for practical use. 22.3.3 Provides Avenue for Further Research Research findings excite the imagination and spur other researchers into considering other aspects of the same issue. Without knowing it, a researcher often leaves openings to other researchers to exploit in their research. These openings can only be pursued if findings are made public to interesting researchers.
22.3.4 Guide to Future Researchers Research report helps future researchers to know what has been done in a field and what remains to be done. If reports remain unpublished, researchers will always re-invent the wheel thinking they are engaged in original research work. Self-Assessment Exercise 3.3 List and explain four reasons why research report is important 22.4 Contents of a Research Report There are three parts to every research report. They include: (a) preliminaries, (2) main body, and (3) references.
22.4.1 The Preliminary Pages The preliminaries are the first part of a research report. Most universities have laid down rules and specifications for writing the preliminaries. A student researcher should do well to follow the instruction given by his university in preparing the preliminary pages of his research report. For the most part, the preliminary pages of research contain the following information: title page, dedication (if any), acknowledgements, table of contents, list of tables (if any), and list of figures (if any), abstract. As a rule, the titles of all the items that fall under the preliminaries are written in capital letters. The Title Page: The title page of a research report is usually the first page of a research report. It is usually made up of the following information: title of thesis, name of the candidate, purpose of the research report, university, and/or department which the researcher is affiliated to, name of the university or organization to which it is submitted, month and year of submission or acceptance. Every item in the title page is written in capital letters as they convey important information about the researcher as well as the research report. Dedication (if any): Dedication appears on a separate page of the research report. Here the researcher gives the name of the person to whom he dedicates his research. The dedication is optional. However, some universities demand that their students include it. Acknowledgements: This is the third or second item in a research report depending on whether the dedication is included or not. On this page, the researcher acknowledges all the help and assistance he received in the course of the research. A student research report is likely to acknowledge his supervisor, lecturers, mates, family members and friends. Table of Contents: The table of contents contains all the main headings and important sub-headings of a research report in the order in which they appear in the work. The page in which every item in the table of contents appears should be marked against that item or sub-item. List of Tables: Some researches do not have tables. In that case, the researcher should not have provision for list of table in his research. However, a report that contains table should have a separate page where names of the tables are listed against the page where they appear in the work. List of Figures: This is a page that details all the illustrations, graphs and drawings that may be found in a research report. The pages on which these items appear in the main work are marked against them in the list. Like list of tables, list of figures is not necessary if the report does not have any figure in it. Abstract: The abstract is the last part of the preliminary pages. It is a summary account outlining the major features of your study. An abstract serves as a microcosm of your project report. It is meant to provide, at a glance, a summary of the problem of study, including hypotheses, the research methodology and the results. By its very nature, the length of the abstract is usually one hundred and fifty to two hundred and fifty words, typewritten and double-spaced.
22.4.2 Main Body This is the section where the researcher makes his report per se. From this we can deduce that the main body pages contain the most important parts of the research work. Here, the researcher takes time to detail what he has done. Traditionally, the main chapter of a research report contains five or six chapters. . Chapter 1. Introduction: This chapter stipulates the background of the research, the statement of the research problem, significance of research, research scope, hypothesis, as well as definitions of terms. As expected, the introduction leads one into the research by making clearer the factors that influenced the researcher’s concern with the question under consideration. Gilbert (2001) captures the essence of chapter one. He holds that it indicates: The topic of the paper, demonstrates why this topic is interesting and important, and show how the approach taken in the paper is an advance on previous work. In brief, the purpose of the Introduction is to get the reader hooked. This means starting from the reader’s present knowledge and leading him or her on to seeing that the topic is worth spending some time investigating. Chapter 2. Review of Related Literature: The chapter on literature review is an essential step in any research project. The function of the literature review, according to Nworgu (1991), is to provide background information on the research question and to identify what others have said and/ or discovered about the question. Effective review of literature affords you the opportunity of realizing the areas that have been properly investigated and those that still need further investigation thereby guiding you towards restructuring the topic where necessary. It also familiarizes you with the necessary techniques which you may wish to employ for your own research work. Chapter 3. Design or Methodology of Research: This chapter shows the perspective from which the researcher approaches the research. Knowing the perspective from which a researcher approaches a research will help other researchers to toe the same path if they want to replicate the research in order to confirm or refute its findings. This chapter deals with the method, population and sample of the study as well as the tools and techniques of the research. In essence, it informs the reader about who and who were involved in the research as well as how they were selected in the midst of others, the manner in which data was collected, problems encountered during the collection of data, and ethical considerations that arose in the process of data collection. Chapter 4. Analysis and Interpretation of Data: In chapter four, the researcher analyses the data which he has gathered in the course of his research. He interprets the data here and tries to make inference from his interpretation. Chapter 5. Conclusions and Suggestions: This is the final chapter of a report. Here, the researcher summarizes his research findings and suggests ways of improving the research. It is in this chapter that the research questions raised in chapter one are answered. When this chapter is well-written, it points out the researcher’s special contribution to knowledge.
22.4. 3 References The references consist the last part of a research. The references are made up of the bibliography and the appendices. Bibliography: In carrying out your research project, you often make use of ideas borrowed from other sources. You are expected to provide proper citations to such sources which you have made reference to and from where you must have obtained useful ideas in executing your research. This is done at the end of your research paper under the title ‘Bibliography’ or ‘Works Cited’ and is considered very significant. The most authoritative guide for referencing adopted by the National Open University of Nigeria is that provided by the American Psychological Association (APA). It is advisable to categorize the bibliographical data into ‘Books’, ‘Articles’ and, perhaps, other materials under which you would include ‘unpublished works,’ if they are many.
Appendix: The Appendix is the last part of the research project report. It consists of all materials that are related to the report and which may be referred to for greater details but which are not suitable for inclusion in the main body of the report. Such materials include: (a) Questionnaire used for data collection, (b) Question papers of test examinations, (c) Examination scripts of pupils, (d) Letters written to and received from respondents and authorities, (e) Comprehensive mark sheets, (f) Collection of photographs, (g) Collections of tables and maps, Etc. 22.5 Causes of Failure in Research Report Presenting a successful research report demands diligence and hard work. However, we have witnessed numerous instances where some research reports fail. Some students have been awarded low marks, and others told to represent their report simply because the report was not properly done. There are also instances where reports submitted for publication in journals were turned down. In what follows, we consider some of the reasons why such reports fail 22.5.1 Lack of Logical Structure Research points should cohere. Research points are said to cohere when there is a connection between one point and another. When reviewers read research report, they look out for coherence. When they are unable to find it, they simply conclude that the research lacks logical structure and, therefore, should be rejected. 22.5.2 Undeveloped Ideas Most researchers are full of ideas. However, having ideas without developing them does not attract credit to a researcher. I have reviewed research reports in the past where the researchers lay down ideas after ideas and make no effort to develop them. We may liken this to a gardener spreading seeds in his garden without watering them, leaving them to the mercy of the sun, and wild animals. The sun represents the reviewer who immediately fails the report. The wild animals represent other researchers who may lay hold of the ideas in future, develop them and have credit for them. To develop his ideas, a researcher should think about every point that comes to his mind. He should consider all angles to the points, give reasons why what is accepted is accepted and why what is rejected is rejected. 22.5.3 Lack of Organization A work lacks organization when it is not well-arranged. An unarranged report may place the research problems in chapter three instead of chapter one. What this tells you is that there are set down procedures for writing every form of research report. A researcher that fails to conform to the procedure of his own form of report risks having reviewers reject his work. 22.5.4 Grammatical and Spelling Mistakes It is often assumed that anyone who makes careless grammatical and spelling mistakes has no business with research. A researcher should be thorough. He understands that no good writer submits the first draft of his write-up. Every good researcher should also be a good writer. He should carve out time to go through his research report as many times as possible. This affords him the opportunity to strengthen any grammatical or spelling errors that may want to sabotage his research efforts. 22.5.5 Plagiarism
Plagiarism is treated in details in the last unit. It involves taking over the work of others and presenting them as your own. Many student researchers have failed in their reporting because their assessors discovered that they copied other works. 22.5.6 Repetition/ Irrelevant Information A good research report should go straight to its point. There should not be any room for repetition of ideas or for ‘gossiping’ about irrelevant information. We know from experience that, in order to gain volume, a researcher is often tempted to repeat points he has made elsewhere in the report, and to recount facts that do not contribute to the well-being of the research. At this level, understand that nothing is neutral in a research report. Consequently, any point that does not strengthen a research report weakens it. So be sure to include only the information that will strengthen your report. Once a reviewer is convinced that your report is replete with repetitions and irrelevant information, he stops assessing the report there and then and concludes that the researcher has nothing new to say. 22.5.7 Weak Conclusion Remember that the conclusion of a research report is meant to bring out the researcher’s contribution to the research work. When they read the conclusion of a research report, assessors look for the specific contributions the researcher has made to knowledge. When they cannot find this, they conclude that the whole research report is of no value. Now think of all the sleepless nights. 22.7 CONCLUSION We can rightly say that a research does not yet exist if it is not communicated. Communication can only be achieved when findings are reported by researchers. Thus, research report publicises a research and makes it available for public consumption. A researcher does himself a lot of good if he learns how to report his research well. 22.8 SUMMARY From this unit: we can deduce the following
The report is a very essential part of the research process. A well-written report should be organized, properly documented, and carefully edited. The research work is incomplete without a well-written report.
22.9 TUTOR-MARKED ASSIGNMENT 1. Show your understanding of meaning research report. 2. Discuss the contents of main body of a research report. 3. Compare and contrast a research report meant for journal editor and one meant for sponsoring agents. 4. Discuss seven reasons why a research report may fail. 5. What is oral research report? 22.10 REFERENCE/FURTHER READING B. C. Iwuama et al. (1992) Research Methods in Education. Benin: World of Books Publishers. B.G. Nworgu (1991) Educational Research: Basic Issues & Methodology. Ibadan: Wisdom Publishers Limited.) Introduction to Educational Research. B. O. Oluikpe. (2004). Thesis Writing: Its Form and Style. Onitsha: Africana First Publishers Limited. C. Dawson (2002). Practical Reseach Methods.Oxford: How to Do Books.
C. S. Ilechukwu (1996) Essentials of Theses and Other Research Reports.Nsukka: Fulladu Publishing Company. E. Nwabueze (2009). Research Methods: An Intergrated Approach. Enugu: ABIC Books& Equip. Ltd. E. C. Osuala. (1982). Introduction to Research Methodology. Onitsha: Africana First Publishers Limited E. O. Akuezuilo. (1993). Research Methodology and Statistics.Awka: NUEL CENTI Publishers. O. C. Nwana (1981). Ibadan: HEBN Publishers Plc. M. Hennetal (2006). A Short Introduction to Social Research.London: Sage Publications. Y. S. Singh (2006). Fundamentals of Research Methodology and Statistics. New Delhi: New Age International Publishers.
23 LITERATURE REVIEW
Unit Structures: 23.0 Introduction 23.1 Objectives 23.2 Main Content 23.2.1 Definitions of Literature Review 23.3 Aims of Literature Review 23.4 Types of Literature Review
23.4.1 Integrated Research Review 23.4.2 Theoretical Review 23.4.3 Thematic Review
23.5 Qualities of a Good Literature Review 23.5.1 Accuracy 23.5.2 Relevance
23.6 The Importance of Literature Review 23.6.1 It provides Background Knowledge of the Research Topic 23.6.2 Helps the Researcher to Place His Work in Context of Previous Researches 23.6.3 Helps the Researcher to Identify Data Sources 23.6.4 Helps the Researcher to Identify Knowledge Gap 23.6.5 Helps the Researcher to Identify the Shortcomings of Previous Researches 23.6.6 Helps the Researcher to Identify Other Researchers for Possible Collaboration 23.6.7 Helps the Researcher to Learn How Others Structured Their Works 23.6.8 Helps the Researcher to Formulate Researchable Topics 23.6.9 Helps the Researcher Not to Repeat a Research
23.7 Sources of Literature 23.7.1 Books and Journals 23.7.2 Electronic Databases 23.7.3 Government 23.7.4 The Internet
23.8 Conclusion 23.9 Summary 23.10 Tutor-Marked Assignments 23.11Works Cited/Further Readings
23.0 INTRODUCTION Academic research work is never the work of one person. A researcher who desires to make the best of his research work must know that his research work is more of a collaboration effort than a solo effort. He must realize that he needs to consult previous researchers whose work will light the path of his research for him. The act of consulting the works of such other previous researchers is what we call literature review. This unit is devoted to examining the details of literature review. 23.1 OBJECTIVES At the end of this unit, you should be able to: i. define literature review, ii. know different methods of reviewing literature, iii. understand the rudiments of a good literature review,

iv. appreciate the importance of literature review, v. know the various sources of literature review. 23.2 MAIN CONTENT 23.2.1 Definitions of Literature Review We begin by analyzing the component words of our term: literature and review. Laws et al, cited by Blaxter et al (2006), hold that literature refers to researches already conducted in a particular subject. Review, on the other hand, is a critical assessment of information at your disposal and making sense of it in relation to your research. Literature review, therefore, is defined as the investigation, examination, analysis, discussion, and critique of studies that have been conducted in one’s area of interest in order to show their relevance to one’s study. Another definition of it is given by Fink (2005), who sees it as “a systematic, explicit, and reproducible method for identifying, evaluating and synthesizing the existing body of completed and recorded work produced by researchers, scholars and practitioners.” Scientific work is built upon previous scientific works. What this means is that what other scientists have done is quite relevant if a new scientist must make progress in his work. No matter your academic discipline, your academic research work is a scientific work. As a scientific work, your research must be built upon previous researches made in the area of your interest. In accordance with this, Tayie (2005),claims that the ultimate aim of literature review is “to show how your study evolved out of past efforts and how the prior research provides a justification for your study.” The implication is that, no matter what your topic is, there exists an extensive body of literature related to your topic, written in the past by researchers whose names you may never have heard before. Your job as a researcher is to locate these works and discuss some of them. Marczyk, et al (2005) recommend what should constitute the salient questions of your discussion if what you are doing is to be regarded as a good literature review. They include:
i. Have other researchers done any work in this topic area? ii. What do the results of their studies suggest? iii. Did previous researchers encounter any unforeseen methodological difficulties of which future researchers should be aware of when planning or conducting studies? iv. Does more research need to be conducted on this topic, and if so, in what specific areas? The literature to be reviewed may not be written directly about your topic, but it is your duty as a researcher to discover how it is related to your topic and discuss it. For instance, a student writing a project on “Code-switching among Nigerian Language Users” ought to know that other researches about code-switching anywhere in the world is relevant to his work. He also has to know that works about Nigerian languages which are not specific about code-switching are also important to him, and so on. When you are reading the literature for review, you must read with purpose. You must be able to differentiate between reading for the purpose of review and reading for entertainment and pleasure. A good literature review is selective. This means that if you want to make the best of your literature review, you must know which literature items to select out of the ones that are available to you. As a rule of the thumb, when you have two literature items vying for equal attention, when you must choose from one of them, you should favour recent materials on the topic, as they represent the highest development of the topic in question. Apart from recent materials, a good literature review should identify the seminal work that was done in the area of the researcher’s interest. We refer to seminal work as any work that experts in any field refer to as key work in a particular research interest in their field.

You must have noticed that the literature review often falls in chapter two of your research work. This means that it is written early in your research work. Indeed, most universities expect the literature review to form part of the students’ project proposal. Do not be deceived by the position of the literature review into thinking that literature review is a work you finish early. The best thing is to see what you wrote early as your first draft, since the reality of literature review is that you keep coming back to it as your research progresses and as you discover information that was not available to you when you first wrote your first draft. Self-Assessment Exercise 3.1 What is literature review? 23.3 Aims of Literature Review This refers to what a literature review intends to achieve. Torgesson (n.d).identifies nine of such aims of literature review. He lists them as follows: i. to address a specific (well focused, relevant) question; ii. to search for, locate and collate the results of the research in a systematic way; iii. to reduce bias at all stages of the review (publication, selection and other forms of bias); iv. to appraise the quality of the research in the light of the research question; v. to synthesize the results of the review in an explicit way; vi. to make the knowledge base more accessible; vii. to identify gaps; to place new proposals in the context of existing knowledge; viii. to propose a future research agenda; to make recommendations; ix. to present all stages of the review in the final report to enable critical appraisal and replication. Self-Assessment Exercise 3.2 List six aims of literature review. 23.4 Types of Literature Review A long list of types of literature review has been developed by scholars. However, a thorough examination shows that all of these can be coalesced into just three forms of literature review. They include: integrated research review, the theoretical review, and the thematic research review. 23.4.1 Integrated Research Review The integrated research review is the type that examines previous works in a particular area of interest and identifies the relationship among the works being examined. Through careful examination of these previous works, the researcher discovers areas that have not been worked on or areas that need attention. The discovered lacuna is what a good researcher must intend to fill. One who is using the integrated research review will do well if he arranges his literature review in order of time of publication from the earliest to the newest in order to show the historical development of his topic. 23.4.2 Theoretical Review According to Cooper (1989) the theoretical review attempts to examine the various theories which researchers have put forward concerning a particular topic. The researcher undertakes a critical examination of the theories in order to rate their importance. 23.4.3 Thematic Review Under the thematic type of literature review, the researcher structures his review in sections or themes in order to capture different approaches, interpretations, schools of thought, and so on, in the area of study. Odimegwu (2010) holds that the thematic method requires that the researcher goes through all the works to be reviewed in order to sieve out dominant themes and organize his research according to the dominant themes. With these themes, it will be easier for the researcher to highlight
achievements and deficiencies in the field of study. This demands a great deal of analysis and synthesis on the part of the researcher. Self-Assessment Exercise 3.3 Differentiate between the theoretical method of review and the thematic method.
23.5 Qualities of a Good Literature Review A good literature review makes some special demand on the researcher. Tayie (2005) warns that, in writing your literature review, you must make sure that what you have written is accurate and relevant. Thus, accuracy and relevance are two qualities of a good literature review. 23.5.1 Accuracy A good literature review should present the authors’ views as they presented them. This means that every point, position, finding, etc., of each research must be presented the way the author of the literature you are reviewing presented them. There may be a temptation to distort some facts in order to suit one’s position in an issue. This should be avoided completely. Perhaps, it is necessary to state here that your literature review should not contain only the works that support your position. As you must have already noticed, there are always works that hold positions that are in opposition to your own. When you find such works, you should review them too. Your ability to refute such positions shows your readiness for research work. On the other hand, your inability to refute them means that you have nothing to offer on the topic. 23.5.2 Relevance In 3.4.1, we said that a good literature review should be accurate, and should represent facts as presented by the authors of the literature. This is not the only thing you are required to do. Your literature review should constitute a work on its own, different from the work of the authors you have reviewed. If you are able to achieve this, then you have done a good job, and your work has relevance. Tayie (2005) holds that a relevant literature review should contain analysis and synthesis. This means that researcher must sieve out the salient points in the literature he encounters and make the necessary connection between it and other materials. What is your own view concerning others’ positions you have highlighted? Your ability to show these ensures that your writing will not be disjointed, and will not be seen as assemblage of unrelated writings. Self-Assessment Exercise 3.4 Discuss the two qualities of a good literature review. 23.6 The Importance of Literature Review A good literature review is of utmost importance to your work. Researchers who know how to write the literature review well know that their works are almost done once they are through with their literature review. The truth is that there are examiners who score students based on the contents of their literature review. This underscores the relevance of literature review to your research work. In what follows, we shall state some of the reasons why literature review is of importance to your academic research work.
23.6.1 It provides Background Knowledge of the Research Topic Very few things are known to us by intuition. This implies that we gain most of our knowledge through experience. Literature items are one of the major sources of experience from which we come to know the things that we know. Literature review gives you the opportunity to acquaint yourself thoroughly with your topic. The more literature you review, the more knowledge you gain about your topic. Your examiner wants to know the level of knowledge you possess about your topic. A good literature review affords you the opportunity to demonstrate your knowledge to your examiner. Haider(2004) holds that a good background knowledge of one’s topic gives one the opportunity to discover the subjects in which the topic has been studied, the main perspectives on the topic in previous research, the key concepts in an area of study, the main research questions in previous

research, the main conclusions in previous research. In addition to these, a good background knowledge of the literature in one’s area of interest will help one to sieve out which areas of a particular material are relevant for one’s research. One will also be able to know which of the relevant literatures are open to debate as this will help him to form his own view about the topic. 23.6.2 Helps the Researcher to Place His Work in the Context of Previous Researches A good literature review must be able to show a connection between the research and previous researches. It gives room for comparison to be made between the research and those that came before it. 23.6.3 Helps the Researcher to Identify Data Sources The researchers whose works you are reviewing consulted scholars who wrote before them. The works of such scholars are of relevance to your work too. So literature review will provide you the lead to other works that are important to your work. 23.6.4 Helps the Researcher to Identify Knowledge Gap A good literature review should first of all identify the progress that has been made in the area of study that is of interest to the researcher. This is necessary if the researcher will not make the mistake of researching topics others have concluded. Besides this, literature review shows areas of knowledge where much progress has not been made. This creates an opening for the researcher to show areas where he intends to contribute. 23.6.5 Helps the Researcher to Identify the Shortcomings of Previous Researches Reading and discussing the literature written in your area of interest open your eyes to what others have done. More specifically, it shows you the problems encountered by previous researchers on your topic. This immediately raises, in your mind, a question of how to surmount those problems which were shortcomings to previous researchers. For instance, a previous researcher in your area of interest may have encountered problem in his work because of the method he adopted while he was on the research. You may not know this if you do not read his work. As a result, there is a great tendency that you too will adopt the same method he used and fall into the same error. 23.6.6 Helps the Researcher to Identify Other Researchers for Possible Collaboration When you do literature review you encounter scholars who share the same interest with you. This will open your eyes to the fact that every researcher approaches the question from different perspective. On discovering, this, you may develop the interest to collaborate with some of the researchers in order to give your work the advantage of having two good heads on it. 23.6.7 Helps the Researcher to Learn How Others Structured Their Works The literature that you consult in the process of your research should serve as your teacher. It should open your eyes to what others have done in your field of interest and how they did it. This will help you to try to emulate them in the structuring of your work. 23.6.8 Helps the Researcher to Formulate Researchable Topics You may have heard from your supervisor that some topics are not researchable. Researching unresearchable topics has proved the bane of many a stubborn student. Paucity of literature or outright unavailability of previous literature in a particular area is one of the reasons that may make a topic unresearchable. A good student should run as fast as his legs can carry him from such topics that have no previous literature written on them. If other writers do not find the area appealing enough to devote their expertise to it, it means there is nothing there for you. Thus, if a topic has rich literature devoted to it, it means there is something there which others are digging. You can dig too. We do not deny the possibility of ground-breaking/unprecedented research or discovery that is unrelated to anything we already know. If your dreams is to make such discovery, keep your dream for the future as what is demanded of you as a student is just to learn the rudiments of searching, and researching into what others have searched. 23.6.9 Helps the Researcher Not to Repeat a Research
Literature review saves you the pain of repeating researches that have been done by others in the past. Redoing researches done by others and arriving at the same conclusion like them is regarded as mark of un-seriousness and dishonesty. Reviewing the literature done by others gives you the advantage of knowing who has done what, and saves you the disgrace of coming out with outdated research. Isaac Newton completed his research on Gravitation hundreds of years ago. What if a researcher comes out with the same discovery as Isaac Newton in 2002 and announces to the whole world that he arrived at his discovery through an original study? Such a person will be looked upon with pity for wasting his energy in a work that has since been completed. In sum, literature review affords researcher the opportunity of knowing what has been done in the areas of his research, what remains to be done, and the basis for his own research. Besides, the techniques to employ to employ in his investigation would be clear to a researcher once he has done a good literature review.
Self-Assessment Exercise 3.5 List five reasons why you consider literature review very important to your research. 23.7 Sources of Literature The literature to be reviewed can be obtained from the following sources: Books and Journals; Electronic Data Bases, Government and Industry, Internet. 23.7.1 Books and Journals Books and Journals are the easiest sources of the literature for review. Books and Journals detail what have been written in a particular topic over time. An undergraduate that engages in a research should see his textbooks as the natural place to begin. From there, he can proceed to more sophisticated books, and then journals. Journals are more technical and often give a particular author’s point of view to an issue. Having access to journals will help the student to learn how to form his own point of view on an issue and how to argue his case. Journals also have more advantage than books, as they always treats current issues. A research student knows that he can buy some of these books and journals on his own. However, the surest place to look for books and journals remains the library. Good libraries have stockpiles of current books and journals on a wide variety of topics. The beauty of books and journals is that a book or journal can always, in its reference section, direct you to other books that are relevant for your research. The library is a good place to come for such books. Many books and journals can also be located in the Internet. While some of these books and journals are free, others demand that you make some payment to have access to them. A research student can access some of the free journals in the Internet through this link: www.doaj.org Once you get hold of a book that you think is important for your research, quickly go through its table of contents and check whether it treats any issue that is relevant to your research. If you cannot find this in the table of contents, then you check through the index page toward the end of the book for important words or terms of your research. If the book contains what you need for your research the index page will direct you to the exact page to find it. 23.7.2 Electronic Databases A database refers to electronic warehouse of information. There are uncountable number of database management systems that operate databases, provide storage, access, security, and backup of educational materials. The databases arrange information orderly and one knows exactly where to get what one needs once one gets access to them. There are databases that allow students direct access once he has paid some fees. Most databases are open for institutional subscriptions only. In this case, a student that needs information from a particular database may only do so using his institution’s subscription. Do approach your university’s librarian for instruction/directives on how to access these

databases. Through the instrumentality of National Universities Commission, they are provided free of charge to students and researchers in institutions. 23.7.3 Government Government reports on various issues provide a ready source of literature review. Most government reports are free, and a research student can easily walk into the ministry where the information exists, identify himself and have the information he needs. Government can provide you information on population, education, birth rate, and so on. 23.7.4 The Internet The Internet provides an amazing number of pieces of information such that it is difficult for a good surfer of the web to exhaust the literatures that are available on the Internet in his research work. Thus, the Internet is one of the first places a student should begin his research from. Using one of the numerous search engines available on the Internet can be quite helpful to a student who is researching on any topic. Self-Assessment Exercise 3.6 List and explain three sources of literature. 23.8 CONCLUSION We have made you understand that literature review is of utmost importance to your research. Being able to trace the development of your research topic is an essential step in any research work. A research student should endeavour to do a thorough literature review of his work if he intends other scholars to take his research seriously. 23.9 SUMMARY We have led you through the rudiments of literature review. You have also understood why it is important that you do literature review. Moreover, you have learnt how to organize your literature review for effective performance as well as where to locate sources for your literature review. 23.10 TUTOR-MARKED ASSIGNMENTS 1. Distinguish between thematic research review method and integrated research review method. 2. Discuss how you can ensure the accuracy of your literature review. 3. List eight aims of literature review. 23.11 WORKS CITED/FURTHER READINGS A. Fink. (2005) Conducting Research Literature Reviews: From the Internet to Paper, 2nd edn. Thousand Oaks, CA: Sage. American Psychological Association (1994) Publication manual of the American Psychological Association, 4th ed. APA: Washington DC C. Hart. (1998). Doing a Literature Review: Releasing the Social Science Research Imagination. Thousand Oaks, CA: Sage. D. Silverman. (2001) Interpreting Qualitative Data: Methods for Analysing Talk, Text and Interaction, 2nd edition, London: Sage. G. Marczyk., D. DeMatteo., and D. Festinger. (2005). Essentials of Research Design and Methodology.New Jersey: John Wiley and Sons, Inc. H. M. Cooper. (1989).Integrating Research: A Guide for Literature Reviews, Sage Publications: Newbury Park CA, USA. I. Odimegwu. (2010). “On Literature Review.” www.ikeodimegwu.com Retrieved on 25 Oct. 2010
K. Fox. (2004) Watching the English: The Hidden Rules of English Behaviour. London: Hodder& Stoughton. L. Blaxter, C.Hughes, and M. Tight. (2006). How to Research. Berkshire: Open University Press. L. Locke., W. Spirduso., and S. Silverman. (2004).Reading and Understanding Research, 2nd edn. Thousand Oaks, CA: Sage. S. Tayie. (2005). Research Methods and Writing Research Proposal. Cairo: CAPSCU. T. B. Cornwell., and I. Maignan. (1998).An International Review of Sponsorship Research,” Journal of Advertising, 27(1): 1-21.
24 THE CITATION STYLES
Unit Structures: 24.0 Introduction 24.1 Objectives 24.2 Main Content 24.2.1 Definition of Citation 24.3 Types of Citation 24.4 The Relevance of Citation 24.5 What to Cite 24.6 Explanation About the MLA Citation Style 24.7 General Guidelines About Works Cited In MLA 24.8 Samples of Works Cited for Printed Materials 24.9 Samples of Works Cited for Web Materials 24.10 Citing Additional Common Sources 24.11 The APA Style 24.12 Conclusion 24.13 Summary 24.14 Tutor-Marked Assignments 24.15 Works Cited/Further Readings 24.0 INTRODUCTION Researchers are like members of a community. As a community, researchers live by rules that govern research activities. This unit is designed to aid your understanding of principles and practices of citation. Through practical examples, the unit leads you step-by-step to the various ways of citing various sources which you use in your research. 24.1 OBJECTIVES At the end of this unit, you should be able to: i. define citation ii. explain why citation is very important iii. distinguish between different types of citation iv. identify items to cite in your research v. assimilate the rules guiding the different citation styles vi. cite your sources very well. 24.2 MAIN CONTENT 24.2.1 Definition of Citation Citation simply means the act of acknowledging your sources. The need to acknowledge sources arises from the fact that a researcher’s work is often done with the help of other researchers whose works he has consulted. When a researcher cites his sources, he gives credit to those authors whose works he consulted in the course of his research. Self-Assessment Exercise 3.1 What is citation? 24.3 Types of Citation
Citations are done in three basic forms. They include footnotes, endnotes and parenthetical citation. Each of these forms gives a reader ample information about the materials (books, journals, web sources, cassettes, CDs, etc.) you used in your research. 24.3.1 Footnotes Footnotes locate sections that are quoted inside a work and provide a reader with the information as regards the source of a quotation. Footnote requires that a researcher inserts serialized numbers after the sentence or quote that requires a note. The Microsoft Word processing program has a function that allows you to insert and format footnotes automatically. This could be of great importance to you if you learn how to use it. Footnotes appear at the foot of every page that has a quotation or borrowed material in order to provide information about the quotation or borrowed material. Usually, footnotes contain all the information as the work cited except they provide added information on the page from where the quotation is taken. This is often the last information to be provided in the footnote. Another difference between footnote and work cited list is that footnote begins with authors’ first name, whereas the works cited list begins with his last name. Finally, while entries in works cited section are arranged alphabetically footnotes are numbered in the order of appearance. Most researchers no longer favour footnote as a form of citation. However, there are a number of institutes and universities which insist that their students use the footnote as their form of citation. A student researcher should, therefore, bear in mind that the decision of his supervisor or institution is final as regards the type of citation to use. Example of a Footnote: “Good English demands that the verb rely should be followed by the preposition on or upon and never in.”1
The relevant information about this quotation should be captured at the end of the page in which it appears. Below is how the information about the quotation will appear at the end of the page. 1. Joy Eyisi. Common Errors in the Use of English. Onitsha: Africana First Publishers Ltd., 2004. 258. 24.3.2 Endnotes More departments and professors advice their students to use the endnote type of citation. The endnote shares all the characteristics of the footnote but one. Thus, a student who has mastered the footnote shall find it easy to use the endnote. However, the endnote differs from the footnote in that, while the footnote appears at the foot of the page where the quotation is made, the endnote appears at the end of the entire chapter. Example of an Endnote: “Good English demands that the verb rely should be followed by the preposition on or upon and never in.”1
The relevant information about this quotation should be captured at the end of the chapter in which it appears. Below is how the information about the quotation will appear at the end of the chapter. 1 Joy Eyisi. Common Errors in the Use of English. Onitsha: Africana First Publishers Ltd., 2004. 258 Notice that, as already indicated above, the presentation is the same as that of the footnote, except that the endnote appears at the end of the chapter. 24.3.3 Parenthetical Citations This is the most current way of citing sources within the body of a research paper. Most scholars favour the parenthetical type of citation. The reason for the prominence which the parenthetical citation enjoys among researchers is as a result of its easy-to-use method, and its ability to inform readers immediately of the source of information. The parenthetical citation “lists the book the statement or information was taken from and the page number in parentheses immediately following the statement” (Stark 89).
Example of Parenthetical Citation: “Good English demands that the verb rely should be followed by the preposition on or upon and never in” (Eyisi 258) This simply informs the reader that the citation was taken from page 258 of a book authored by Eyisi. To know the name of the book the reader is expected to see the Works Cited lists at the end of the research. Self-Assessment Exercise 3.2 Demonstrate with two examples each, your knowledge of the use of endnote and parenthetical citation. 24.4 The Relevance of Citation Academic research is a scientific work. The aim of research is to propel progress in the body of knowledge that is available to us. Progress in research, and in knowledge, therefore, is cumulative. What this means is that, when researchers make their discovery they only build on the work of previous researchers. Thus, when one cites, one shows the previous researchers whose works one is building upon. By doing this, one is able to show the limit of progress made by other people, and the extent of one’s own progress.
When a researcher fails to cite his sources, it could be as a result of one or a combination of a number of these factors: 1. He has not contributed anything to knowledge. In this case, his research is worthless. 2. He has written a work of fiction. 3. He has made an entirely new discovery that is unconnected to anything anybody has done on earth. Why this could be possible thousands of years ago, scholars believe that it is no longer possible for anybody to make a discovery in our world that is totally unrelated to the works of others before him. 4. He is dishonest. In this case, he wants to appropriate the works of others to himself. A researcher who does this has committed a crime known in the academic world as plagiarism. Plagiarism is a serious crime. It may lead to the suspension or expulsion of a student once it is discovered. Apart from helping to demarcate your contribution from that of others, there are other reasons why it is important to cite your sources. Griffith (1982) lists these to include: 1. Allowing others to find and read the same material as you. This is very important as reading the same material as you did affords others the opportunity to have all the evidence that informed the conclusion that led to your discovery at hand. This will help them to confirm your discovery or reject them. A researcher is always seen as a seeker of the truth. He is not afraid of having others disagree with him. 2. Allowing others to check the reliability of your sources, and your ability to use them fairly and accurately. 3. When you cite experts in your field, it confers some level of authority on your work that such honoured experts corroborate your study. Self-Assessment Exercise 3.3 Explain four reasons why citation is very important. 24.5 What to Cite While it is very important that a researcher cites his sources, it must be noted that there are instances when this is not necessary. For instance, one should not cite oneself. Again one should not cite common knowledge. Knowledge is common when it is expected that all average learners have it. For example, it is a common knowledge that Chinua Achebe is the author of Things Fall Apart, and that
Wole Soyinka was the first African to win Nobel Laurel in literature. Even when you find such information written down in a book, you are not expected to cite it. An average educated Nigerian knows this. We are still stuck to our question: What do we cite? We may cite the following:
Primary Sources: These are considered the most important sources in any research work. Primary sources include “accounts of circumstances by individuals who are directly involved or have experienced what they are writing about first-hand”(Stark 2003). A person writing a research on The Joys of Motherhood by Buchi Emecheta must know that her primary source is The Joys of Motherhood. Writings of other people about The Joys of Motherhood only qualify as secondary sources. Other things that will qualify as primary source here includes Emecheta’s personal diaries from a particular time period, physical, geographical, or topographical maps of the setting of her work, etc. Whenever you take information directly from the primary source, you are expected to acknowledge it. Secondary Sources: These include “books, magazine articles, or pamphlets by authors who have already collected materials and written about events after they have occurred, or from a perspective that is not immediate or firsthand” (Stark 25). Example of secondary sources include: reference books, compendiums of various kinds, a collected history of ideas or world philosophies, a Reader’s Guide to current and past periodicals, etc. Any reference to this must also be acknowledged. Direct Quote: Direct quotes refer to those quotations which you take from a book or other sources and place in your work without modification. You should always cite this whether you take it from primary or secondary source. Paraphrase: When you paraphrase, you state other people’s ideas in your own words. When you do this, you are expected to cite it. Unassimilated Ideas: Some ideas may have stayed for a very long time with you that you think they are yours. When this happens it is said that you have assimilated the idea. But be careful about this. When one assimilates an idea, one must have infused it with one’s own words, and thoughts, such that the words of the originator of the idea are no longer there and one is no longer conscious of the idea originating from other persons. However, once one is conscious that an idea comes from another person, one must cite one’s source. Self-Assessment Exercise 3.4 Draw a list of instances where you must cite your source. 24.6 The MLA Citation Style The MLA Citation Style is one of the popular methods for providing information about sources used in a research paper. Other popular citation styles include the APA Style, developed by the American Psychological Association; the Chicago Style, developed by the University of Chicago Press. The MLA Style was developed by the Modern Language Association of America. The Modern Language Association of America was founded in 1883 in New York City as an organization of scholars and teachers of English and other modern languages. Apart from researchers in the field of languages, the MLA Style of Citation is particularly favoured by scholars in other field of Humanities. Since it published its “MLA Style Sheet” in 1951, the MLA has been updating its style to meet with the challenges of the times. This unit draws heavily from the seventh edition of the MLA Handbook for Writers of Research Papers published in 2009.
Self-Assessment Exercise 3.5 Scholars in which field favour the use of the MLA? 24.7 General Guidelines about Works Cited in MLA A student who has adopted the MLA Style of Citation is expected to draw a list of all the works he cited in the course of his research. Remember that you were told in 3.2 above that, apart from few
differences which have already been noted, the works cited section is similar to the footnote and endnote. The following rules guide the listing of works cited section. 1. The list of works cited appears at the end of the research. 2. It begins on a new page different from the page containing parts of a chapter of the research. 3. Centre the title, Works Cited, an inch from the top of the page. 4. Double-space between the title and the first entry. 5. Begin each entry flush with the left margin. When an entry runs more than a line, indent the subsequent line or lines one-half inch from the left margin. 6. Arrange entries in alphabetical order. 7. Alphabetize entries by the authors’ last names. 8. Double space within an entry and between entries. 9. When an author has more than one work, substitute three hyphens for the author’s name after the first citation. 10. Names of authors are written as they appear in his work: Do not write initials when the author has given his name in full. 11. Always italicize the title of books. 12. Entries are made in this order for books: Author’s last name, author’s first name, title of book, city of publication, publisher’s name and date of publication. Self-Assessment Exercise 3.6 Outline five rules guiding the use of the MLA Style. 24.8 Samples of Works Cited for Printed Materials A. BOOKS Example with Book by One Author Omazu, Eric. The Last Requiem. Pittsburg: RoseDog Books, 2011. Print. Example with Book by Two Authors Bernstein, Carl, and Woodward, Bob. All the President’s Men. New York: Warner Books, 1974. Print. Example with Two or More Books by the Same Author Eyisi, Joy. Common Errors in the Use of English. Onitsha: Africana First Publishers Ltd., 2004. Print. ---. The Mechanics of Reading Comprehension and Summary Writing. Nimo: Rex Charles and Patrick Ltd., 2005. Print. Example with an Edited Book McIntyre, Lisa, ed. The Practical Skeptic: Readings in Sociology. Boston: McGrawHill, 2002. Print Example with a Translated Book O’Brien, Justin, trans. The Myth of Sisyphus and Other Essays. New York: Vintage Books, 1955. Print. B. PERIODICALS Periodicals include such media like newspapers, magazines, and scholarly journals. Example with an Article in a Scholarly Journal Olanrewaju, Farinde. “Forensic Linguistics: Power and Asymmetries in the Nigerian Courtroom Discourse.”UJAH 11.2 (2010): 40-70. Print. Example with an Article in a Newspaper

As a rule, do not include article, definite or indefinite, before the name of a newspaper when you cite it. When articles of a newspaper are not printed on consecutive pages, write only the first page number and a plus sign. This rule is also applicable to magazine articles. We shall demonstrate this last point when giving example with article in a magazine. Ikeje, Ogochukwu. “INEC’s Seat of Fire.” Nation 30 Jan. 2011: 12. Print. Example with an Article in a Magazine Kolade-Otitoju, Babajide.“Jonathan’s Burden.”News 1 Mar. 2010: 18+. Print. Self-Assessment Exercise 3.7 Demonstrate with your own examples how to cite a magazine article, and two books by the same author using the MLA. 24.9 Samples of Works Cited for Web Materials The Internet has come to stay with us. At the same time, it has come to change the way things are done. Research is one of the human activities that are affected by the Internet. This is because uncountable research materials abound on the Internet, and the researcher only needs to move his mouse to have access to them. Giving the volume of sources which the Internet yields, all the major citation guides have adjusted their methods of citations in order to accommodate Internet sources. In this section, we shall study how the MLA web materials are cited.
As a general rule, it is required of the researcher to provide such information as: 1. Name of the author of the work 2. Title of the work 3. Title of host website 4. Publisher of the website, if not available use N.p. 5. Date of publication (day, month and year as available) 6. Medium of Publication (Web) 7. Date of access (day, month and year) Example with Non periodical Publication Lenburg, Jeff. Guide to Research. New York: Facts on File Inc., 2005. Web. 29 Dec. 2010 Example with Periodical Publication (Journal) Shah, Parilah Mohd, and Fauziah Ahmad. “A Comparative Account of the Bilingual Education Programs in Malaysia and the United States. GEMA Online Journal of Language Studies 7.2 (2007): 63-77. Web. 5 June 2008. Self- Assessment Exercise 3.8 Demonstrate your understanding of how to cite MLA periodical publication from the web using your own example. 24.10 Citing Additional Common Sources Television or Radio Broadcast: As a rule, television or radio broadcast are cited in this order: 1. Title of episode or segment (in quotation marks) 2. Title of programme or series (in italics) 3. Name of network 4. City of the station 5. Broadcast date 6. medium of Reception (Radio or Television) Example
“Fredrick Douglass.” Civil War Journal. Narr. Danny Glover. Dir. Craig. Haffner. Arts and Entertainment Network. 6 Apr. 1993. Television. Self-Assessment Exercise 3.9 Give an example of how to cite a television broadcast using the MLA
24.11 The APA Style APA Style is the citation style developed by the American Psychological Association. It is a model of citation that is favoured mainly by researchers in the Sciences. The APA style does not differ in terms of content from the MLA Style we treated before. The difference that exists between APA and MLA has to do with position of some of the contents of citation. We must note the following as some of the major rules that guide APA Style Citation. 1. Date follows immediately after the name of the author 2. Only the first letter of the title or sub-title (except proper nouns) are written in capital letters 3. Names of all authors are written down unless they are up to six and above A Book by One Author Omazu, E. (2001). The last requiem. Pittsburg: RoseDog Books. A Book by Six or More Authors Nwaolisa, et al. Banking in the twenty-first century. Awka Etiti: Gabriel Emeh A Book by a Group or Corporate Author American Psychological Association.(2001). Publication manual. Washington D.C.: APA A Translated Book Camus, A. (1955). The myth of sisyphus and other essays. (O’Brien. Trans)New York: Vintage Books An Article in an Encyclopaedia with One Author Bergman, P. G. (1998). Relativity. In The new Encyclopaedia Britannica (Vol. 26, pp. 501–508). Chicago: Encyclopaedia Britannica. An Article or Chapter in an Edited Book Tutuola, A. (1976). Akanke and the jealous pawn broker. In A. G. S. Momodu and U. Schild (Eds.), Nigerianwriting (pp. 80-95). Benin City: Bendel Book Depot An Article in a Journal Olanrewaju, F. (2010). Forensic linguistics: Power and asymmetries in the Nigerian courtroom discourse.UJAH 11 (2) 40-70.
Article in a Newspaper Ikeje, Ogochukwu. (2011, January 30). INEC’s seat of fire.”The Nation p. 12. An Article from Electronic Journal Taib, M. (2010). The Pathology of race and racism in postcolonial society: A reflection on Frantz Fanon’s black skin, white mask. The Reading Group. Jan 30, 2011. from http// www.thereadinggroup.sg.pdf. Self-Assessment Exercise 3.10 Cite a book by one author using the APA Style Citation Guide. 24.12 CONCLUSION We have made you to understand that research is a cumulative work. Research works are meant to build upon earlier researches. Thus, a research has the obligation to show the links which his work has with previously existing researches. The only way to do this is through citation. You have been
guided on the appropriate way to cite some of your sources through the use of the MLA an APA Citation Styles. 24.13 SUMMARY In this unit, we have tried to understand the meaning of citation, and why citation is very important. We have also exposed to you the use of the MLA and APA Citation Styles. 24.14 TUTOR-MARKED ASSIGNMENTS 1. What is citation? 2. Give four reasons why you consider it important to cite your sources. 3. List the four types of citation and demonstrate your understanding of their usage with examples. 4. List ten guidelines for the Works Cited Section in an MLA Style. 5. Using the APA Style, demonstrate how you should cite a newspaper article. 24.15 WORKS CITED/FURTHER READINGS Eyisi, Joy. (2004). Common Errors in the Use of English. Onitsha: Africana First Publishers Ltd. Griffith, Kelley. (1982). Writing Essays about Literature. San Diego: Harcourt Brace Jovanovich Publishers, 1982. Lenburg, Jeff. (2009). Guide to Research. New York: Facts on File Inc., 2005. MLAHandbook for Writers of Research Papers 7thed. New York: Modern Language Association of America. Stark, Racheal. Research and Writing Skills Success in 20 Minutes a Day.New York: Learning Express, 2003. Web. 25 Jan. 2011.
25 INTERNET RESEARCH
Unit Structures: 25.0 Introduction 25.1 Objectives 25.2 Main Content 25.2.1 Understanding the Internet 25.3 Problems of the Internet 25.4 Research information on the internet 25.5 Internet Search Engines
25.5.1 Advantages of the Search Engines 25.5.2 Disadvantages of the Search Engines
25.6 Metasearch Engines 25.6.1 Advantages of the Metasearch Engines 25.6.2 Disadvantages of the Metasearch Engines
25.7 Subject Gateways 25.7.1 Advantages of the Subject Gateways 25.7.2 Disadvantages of the Subject Gateways
25.8 Conclusion 25.9 Summary 25.10 Tutor-Marked Assignment 25.11 Works Cited/Further Readings 25. 0 INTRODUCTION The Internet is one of the scientific revolutions of the 20th and 21st centuries. It has affected the way things are done in our world. Today, anyone who does not make the use of the Internet is described as living in the past. Indeed, one of the areas that the Internet has offered us tremendous assistance is in the area of research. A researcher who makes good use of the internet has the whole world in his hand during the period of his research. This unit guides you on some of the tips to make a successful use of the Internet in your research. 25.1 OBJECTIVES At the end of this unit you should be able to: i. understand the meaning of internet ii. know the problems associated with researching on the internet iii. know the type of material available for your research on the internet iv. know the research options available on the internet and how to use them. 25.2 MAIN CONTENT 25.2.1 Understanding the Internet The internet (otherwise known as the World Wide Web, abbreviated as www) refers to a network of computers that are globally linked to one another through satellite and telephone. The internet collects information from a linked computer and makes same available to other computers that are scattered world-wide. The Internet provides an easy way to share information between people that are separated by space and time. Researching through the internet can be a hard and difficult process if the researcher lacks appropriate know-how about how to approach the internet. The internet is said to contain an estimated 3 billion documents not indexed in any standard vocabulary or by standard Library of Congress subject headings. So if you do not know what you want, you will not get very
far. On the other hand, one who knows the rudiments of the internet finds it as the most simplistic way to research. Self-Assessment Exercise 3.1 1. What is the Internet?
2. Why do you consider the knowledge of the internet significant to a researcher? 25.3 Problems Associated with Internet Research Despite the advantages that the internet offers, a researcher should be quite careful with the information he accesses on the internet. This is because there are a number of problems associated with researching with the internet. Such problems include the following: 1. Not all the information on the internet are “reputable, credible, accurate, or reliable in terms of content.” (Lenbourg 2005). Thus, it is advised that the researcher avoids personal web pages as they are more prone to inaccurate and misleading information. 2. Internet information is often overloaded and may provide the researcher with the problem of choice and selection. 3. There is also the problem of information move or site change. When this happens, the researcher finds it difficult to locate a previously marked information. Self-Assessment Exercise 3.2 What are the three problems associated with internet research? 25.4 Research Information on the Internet A researcher who has decided to make use of the internet for his research should realize that, even though the internet offers easy access to information that are shared by users, there are limits to what are available on the internet. A good knowledge of these will help the scholar not to pursue a wild goose chase in the process of his research. Thus, information that cannot be got from the internet should be looked for elsewhere. For a guide, Zainudin Johari of the Unity College International provides a list of items that a researcher can find from the internet for purposes of his research. They include the following: i. Company reports and financial information, ii. Conference proceedings, iii. Contact details for other researchers, iv. Laws, government announcements and parliamentary debates, v. News and current affairs, vi. Databases of reference materials, vii. Places where you can discuss topics and ask for help, viii. Reference sources like almanacs, dictionaries, encyclopaedias, etc. Self-Assessment Exercise 3.3 List five research information one can access on the internet. 25.5 Internet Search Engines The search engines enable the researcher to search for internet materials using key words which describe the information one is researching. They are best suited for providing information when one is searching for words that are less common, topics that are narrow, and when one wants to view a large number of pages. The search engines constantly update themselves through the activities of computer programmes (bots or spiders) which constantly search the internet for new information. Once new information is found, the programmes index them in a central database for references.
Some of the internet search engines include: Excite http://www.excite.com; Google http://www.google.com; AltaVista http://altavista.com. 25.5.1 Advantages of the Search Engines The following are the advantages of a search engine: 1. Provision of a wide coverage of the Web. 2. Orderly arrangement of materials according to their relevance to your research. 3. It is flexible, as it offers the researcher the opportunity to refine and enhance his research. 4. At times, they offer links to related materials. 5. Sometimes they offer a directory listing of popular sites. 25.5.2 Disadvantages of Search Engines The following are the disadvantages of search engines: 1. May return too much information that may be unmanageable to the researcher. 2. Have less capacity to sort out information. 3. Different engines have different information. This means that the researcher must search in more than one search engine. 4. The search engines do not have similar rules for refining search. 5. Some search engines, at times, include advertisements as search results. Self-Assessment Exercise 3.4 List five advantages of a search engine. 25.6 Metasearch Engines The Metasearch engines provide a researcher with information that is contained in many search engines at once. The Metasearch Engines do not search information directly on the web. Rather they send the search to many search engines at once which locate the information and return same to the meatasearch engines. As a rule, always begin your internet research with the metasearch engines as they provide you with overview of what are available. Some of the well-known metasearch engines include: Dogpilehttp://www.dogpile.com; Search.com http://www.search.com; and Metacrawlerhttp://metacrawler.com. 25.6.1 Advantages of Metasearch Engines 1. They provide search in many search engines. 2. They are able to eliminate duplicate records or pages. 3. They are able to sort pages into topics. 25.6.2 Disadvantages of Metasearch Engines 1. They often return too much information. 2. They are discriminatory in the results they show. Self-Assessment Exercise 3.5 Demonstrate your understanding of the way metasearch engines work. 25.7 Subject Gateways Another name for Subject Gateways is Directories. The Subject Gateways organize web pages according to subject areas. The subject gateways are used when a researcher is researching on a well-defined topic, needs less material, or access to databases. Some of the known subject gateways include yahoo http:// www.yahoo.com; BUBL http://bubl.ac.uk; Lii.org http://lii.org. 25.7.1 Advantages of Subject Gateways
1. They skip sites that are no longer available most of the times. 2. They locate substantial and relevant materials. 3. They make it easier to locate a topic. 25.7.2 Disadvantages of Subject Gateways 1. They cover smaller information on the web. 2. They are unlikely to list new sites 3. They depend on the amount of human input available for maintenance 4. They do not offer clear organization and categorization of subjects. Self-Assessment Exercise 3.6 List four disadvantages of subject gateways. 25.8 CONCLUSION The internet provides a wide range of information that it has become a goldmine for researchers. Understanding the nature of information on the internet, and how to adapt them for one’s use is of vital importance in making progress in one’s research work. 25.9 SUMMARY In this unit, you have been made to understand the meaning of the internet. You have also been exposed to the advantages and disadvantages associated with using the internet for your research. The unit has also exposed you to the various options available to you as you conduct your internet research. 25.10 TUTOR-MARKED ASSIGNMENTS 1. List the problems associated with researching on the internet. 2. Differentiate between the search engines and the metasearch engines. 3. List the advantages of the Subject Gateways. 25.11 WORKS CITED/FURTHER READINGS Jeff Lenburg. (2005). Guide to Research. New York: Facts on File Inc. L. Blaxter, C.Hughes, and M. Tight. (2006). How to Research. Berkshire: Open University Press. ZainudinJohari (2010). How to do Research on the Internet. Web Article. Accessed on 27/4/2011
26 THE USE OF LIBRARY IN RESEARCH
Unit Structures: 26.0 Introduction 26.1 Objectives 26.2 Main Content 26.2.1 The Meaning of Library 26.3 Types of Libraries 26.4 The Importance of Library in Research 26.5 Other Library Services 26.6 Conclusion 26.7 Tutor Marked Assignment 26.8 Reference/ Further Reading
26.0 INTRODUCTION The library is indispensable in any form of research especially as it concerns review of literature. Books and different sources are found in the library. The main reason for research is the quest for knowledge. Men and women, adult and children all desire to know one thing or the other. As they do so, they search for books which are found in abundance in the library. In the words of Nwogwugwu (2001), the purpose of research sometimes is to bring solutions to educational, social, political, and economic problems. Sometimes, the purpose is to add to man’s store of knowledge or to expose issues as they are. The main thrust of this unit, therefore, is to explore the various ways the library is used for research purposes. 26.1 OBJECTIVES At the end of this unit, you should be able to:
define library list and explain the types of library list and explain the usefulness of the library in research.
26.2 MAIN CONTENTS 26.2.1 The Meaning of Library A library is a place where resourcefully selected and acquired books and non-book materials are housed, meticulously and orderly arranged to make for easy location, retrieval and use. A library is also a collection of records of superior minds in different formats and languages, preserved, organized, and interpreted to address broad and different needs of individuals for facts, knowledge, and leisure. According to Wikipedia, the free Encyclopaedia (2006), a library is a collection of sources, resources, and services, and the structure in which it is housed. It is organized for use and maintained by a public body, an institution, or a private individual. In a more traditional sense, a library is a collection of books. In libraries, there are usually books on different disciplines stocked in shelves. These books include those from the arts/ humanities, natural sciences, social sciences, engineering, etc. There are also periodicals, dictionaries, reference materials, etc. Library, in this sense, refers to a collection of books. In yet another sense, a library can mean the building that houses such collections. It is usually common to hear one say “I want to go to the library’. Different universities in the world as well as secondary schools have their libraries. Nursery and primary schools are not left out. Most books in the libraries are consulted by researchers
who cannot afford to purchase expensive collections themselves or who require professional assistance for their research. It is pertinent to note from the above definitions that the library is indispensable in a quest for knowledge. Information put down on paper by superior minds who may be living or dead are stored in the library for generations yet unborn. The basic functions of the libraries are to collect, process, store, preserve, evaluate, and disseminate/ communicate the world’s recorded knowledge. As a researcher, you need past knowledge, which is available from the libraries in various forms of documents. The need for research is felt in this present time as the quest for knowledge increases. There is a continuous growth in the number of academic institutions and the research activities of these institutions in various disciplines have continued to grow. This according to Nwogwugwu (2001), is because of the multi-disciplinary researches and ‘seepage’ of literature into various other subject publications and the fluid nature of academic disciplines being pursued in universities today. Rao (1993) claims that, if there is no information provided from the library or the ones provided are inadequate, the researcher will be faced with the following problems:
The researcher does the research without information and works, perhaps, less productively for the same number of research hours; or
The researcher has to spend more of his research time in locating and obtaining information for himself with consequent reduction in output; and or
The researcher has to work for longer hours to collect information for himself. From the foregoing statements, it could be affirmed that the researcher will end up achieving little or nothing and thus become frustrated if there is no library. Self-Assessment Exercise 3.1 What is library? 26.3 Types of Libraries There are different types of libraries where you can go for your research. They include: academic libraries, public libraries, research libraries, and special libraries. Academic Libraries These libraries are located on the campuses of colleges and universities and serve primarily the students and faculty of such institution as well as other academic institutions. Some academic libraries, especially those public institutions, are accessible to members of the general public in whole or in part. Academic libraries support the teaching and research programmes of their institutions. In academic libraries, students are issued with library cards that enable them to gain access into the library. They are also issued with borrower’s cards, which enable them to borrow books for a period of two weeks, depending on the institution. Examples of such academic libraries are The National Open University of Nigeria Libraries found in different states of the country; Festus Aghagbo Nwako Digital Library of Nnamdi Azikiwe University, Awka; The University of Nigeria Nsukka Digital Library, to mention but a few. You should visit any of the libraries in your study centre for your research. Public Libraries or Public Lending Libraries These libraries provide services to the general public and make, at least, some of their books available for borrowing so that readers may use them over a period of days or weeks. These types of libraries issue library cards to community members wishing to borrow books. Public libraries attempt to meet a wide variety of readers’ needs. In addition to traditional reading materials, their collections contain social services information, reference works, phonograph records and CDs, and recreational books and films. Many public libraries sponsor lectures, group discussions, dramatic, musical or film presentations and exhibitions. Public libraries also provide reading machines and audiotapes for blind
people and large-print books for visually impaired people. You can look out for any public library around you for your research. Research Libraries These libraries are intended for supporting scholarly research. They maintain permanent collections and attempt to provide access to all necessary materials. Research libraries are most often academic libraries or national libraries. Research libraries are usually supported by private endowments and contributions and mainly serve the needs of scholars. Because such collections contain many rare and valuable materials, the use is almost confined within the library building. Such libraries often publish scholarly studies of materials in their collections, sponsor lectures, and arrange exhibitions of their most important holdings. Such libraries can be of immense help in your research. Special Libraries All other libraries fall into this category. Many private businesses and public organizations, including hospitals, museums, research laboratories, law firms, and many government departments and agencies maintain their own libraries for the use of their employees in doing specialized research related to their work. Special libraries may or may not be accessible to some identified parts of the general public. Branches of a large academic or research libraries dealing with particular subjects are also usually called ‘special libraries’. They are generally associated with one or more academic departments. You can find out and access the library in your work place. These libraries will be of immense benefit to you, no matter how small each may be. Visit as many libraries as possible for a worthwhile research. Self-Assessment Exercise 3.2 Distinguish between academic libraries and special libraries. 26.4 The Importance of Libraries in Research The library helps the researcher in the following ways: 1. The library serves as an eye-opener to the researcher. In carrying out your research, the library helps you, be aware of the following:
What is happening currently in the area of your research elsewhere. Who else is doing the research in the same field (the address and the stages of the research
and also the findings or result which might be useful to you). Contact with others who are doing research in similar subjects will help in broadening your
knowledge of the literature, in obtaining advice about the techniques and methods, and in gaining access to particular facility or a suitable skill which may be of great assistance.
2. The library helps the researcher in selecting and defining research topics. Before embarking on research, you must have a topic in mind for the purpose of the research. The library helps you to sharpen or narrow down the topic if it is too vague, broad, or general. The library, with the help of the librarian, provides you with either some core articles or encyclopaedic essays to comprehend the broad scope of the topic and helps to limit the focus. 3. The library helps the researcher in knowing the availability of literature in his research area. Since the library supplies you with enough books, magazines, and articles, you can seek the library’s help in knowing the availability and accessibility of required literature in your work. 4. The library helps in initiating research. In the libraries, there are subject lists either in the form of catalogues or bibliographies and reviews, articles, abstracts, and indexes. These help to initiate research and give the researcher direction for a successful and worthwhile research. 5. The library helps to avoid duplication of research. This role of the library is very important because there is no point delving into a research that has already been carried out by a particular researcher at a particular point in time. The library helps you
to confirm whether or not the same research has been investigated by others elsewhere. For instance, if a particular researcher carried out a research on ‘The Development of Christianity in the Tiv Society’ in 2008 and another researcher takes up the same topic the next year unmindful of or ignoring such completed research, it will ultimately lead to wastage of the resources and energy of both the researcher and society. The researcher can depend on the library in avoiding duplication of research. 6. Reference material in the library helps the researcher. The reference section is of immense help for the purpose of research work. The reference materials include encyclopaedias, dictionaries, journals, periodicals, handbook; yearbook, etc. Encyclopaedias contain general summary articles about subjects. Some articles also include a short bibliography of books and/or articles you may want to look at. There are general encyclopaedias like: Encyclopaedia Britannica and Encyclopaedia Americana. There are also specialized encyclopaedias, like: The Encyclopaedia of Language, The Encyclopaedia of Philosophy, The Encyclopaedia of Religion and Ethics, The Encyclopaedia of World Art, The International Encyclopaedia of Science and Technology, etc. During your research in the library, you may come across different words whose meanings you do not know. In this case, what do you do? You should pick a dictionary. There are general dictionaries like: Webster’s International Dictionary, Oxford English Dictionary, Longman Dictionary of Contemporary English, etc. There are also specialized dictionaries, like: The Dictionary of Phrasal Verbs, Dictionary of Idioms, A Dictionary of the Social Sciences, Encyclopaedic Dictionary of Mathematics, Dictionary of American History, Oxford Classical Dictionary, Theological Dictionary of the New Testament, Funk & Wagnall’s Standard Dictionary of Folklore, Mythology and Legend, Dictionary of Religion etc. Periodicals: The word periodical refers to a publication that is issued periodically or at regular recurring intervals, once a year, once a month, or once a week. Magazines, journals, and newspapers are all periodicals. In academic circles, there are popular periodicals and scholarly periodicals. Popular periodicals are written for the general public. They include the newspapers and magazines. Information useful in research can be found in newspapers and magazines. In reputable and functional libraries, newspapers and magazines are supplied on daily basis. This, however, helps the researchers to get whatever information they want for their research work. Scholarly periodicals are often called journals. They contain reviews, essays, and research reports written by experts and scholars in a field. There are so many journals in different fields. Examples of such journals are: The English Language Teaching Journal, The International Journal of the English Language, Journal of Marketing, American Journal of Christian Theology, Journal of Political Economy, Journal of Communication, American Political Science Review, British Journal of Sociology, to mention but a few. These journals are very essential in research. In the journals, the researchers rub mind with experts who have written extensively on various areas of interest in their discipline. As a researcher, do not relent in making use of various journals in our university library or in any other libraries. You will undoubtedly find them very useful. 7. The library helps the researcher in providing information regarding certain bodies/ organizations concerned with the subject field of the researcher. 8. The Library also keeps users abreast of the latest information in their areas of interest through current awareness services. 9. The library provides conducive space/reading environment: Academic libraries usually have good space and suitable building and surroundings for storing various kinds of documents suitable for research. They also provide proper lighting, ventilation, and conducive noiseless reading environment needed for research. Self-Assessment Exercise 3.3
Discuss five reasons why the library is important. 26.5 Other Library Services The academic library offers other various services required by its users. Nwogwugwu (2001) enumerates the following services that help researchers to carry out worthwhile and hitch-free research in libraries. They are as follows:
Bibliographical Services: This relates to compilation of bibliographies relevant to the topic of research.
Literature Search Services: The library searches data from various data bases depending on
the availability of facilities.
Current Awareness Services and SDI Services: This is to keep researchers up to date with the current advances in the subject field of the researchers by providing the list of articles or content pages of journals and newspapers recently received, new accession list, in-house indexing services, etc.
Document Delivery Services: This has to do with delivering physical document to the user
either from the library collection or from other sources.
Reference and Information Services: This has to do with providing both short range, that is, providing specific pieces of information, and long-range reference services by searching for current backlog of literature.
Translation Services: This is done by libraries on behalf of users either to obtain the
required translation copies of the foreign language documents from some international translation centres, such as the British Library Document Supply Centre (BLDSC), London National Translation Centre Chicago, etc.
Referral Services: A method of service to the scholars by directing them to the most likely
sources, like institutions, libraries or individuals who possess the expertise, information/documents when they are not in stock of the library of one’s institution and cannot be obtained by inter library loan.
Reference Services: The reference work for a librarian is the process of helping users find
information; it is one of the professional public services demanding skill in communication, familiarity with information sources, and a wide general knowledge. The reference librarian helps researchers whenever they have difficulties in consulting books in the library. As you go to libraries for your research, endeavour to visit the reference librarian because his services will be of immense help to you.
Self-Assessment Exercise 3.4 What five other functions do libraries perform? 26.6 CONCLUSION The library plays an indispensable role in research. Research work is very interesting for a resounding thesis or dissertation. If your library does not have a specific book, journal, or magazines you need for your research work, do not be discouraged. Visit other libraries in your town or city. Do

not relent in your bid to reach the zenith. Visit libraries and rub mind with great men and women who have put their thoughts and wits on the pages of books and you will see yourself making great marks in your field. In sum, as you grow academically, you should form the habit of buying books and gradually building your own library. 26.7 Tutor-Marked Assignment 1. What is a library? 2. List and explain the types of libraries known to you. 3. List and explain the usefulness of library in research. 26.8 Reference/ Further Reading B.A. Adeyemi, and P.A Fasina (2004). A Multifaceted Approach to Research Methods. Osogbo: Jevova Lovelinks Press and Publishers. Robert Allen (ed.). (1994). Chambers Encyclopedia ofEnglish Dictionary. Edinburgh: Chambers. Joy Eyisi (2007). The Secret of Academic Success. Awka: SCOA Heritage Systems Joy Eyisi (2008). Hints on How to Succeed in any Examination. Awka: Fab Anieh Nigeria Ltd. Susan Habbuch (1985). Writing Research Papers Across the Curriculum, USA: CBS College Publishing. Microsoft Encarta (2006). http://en.wikipedia.org/wiki/library B.G. Nworgu. (1991). Educational Research: Basic Issues & Methodology. Ibadan: Wisdom Publishers Limited.) Introduction to Educational Research. Cliff Nwogwugwu (2001). ‘Academic Libraries and Research’ in Azubuike et al (ed). Fundamentals of Library and Information Services. Awka: NEPAJ Publishers. E. C. Osuala. (1982). Introduction to Research Methodology. Onitsha: Africana First Publishers Limited. S. S. Rao. (1993). ‘University Libraries in India: Their Role in Academic Research’ in Dorothy Isaac et al (ed), Academic Libraries: Role in the National Development. Madras: T.R Publication
27 CASE STUDY
Unit Structures: 27.0 Introduction 27.1 Objectives 27.2 Main Content 27.2.1 Meaning of Case Study 27.3 Phases of Case Study 27.4 Types of Case Study 27.5 Sources of Data in Case Study 27.6 Advantages of Case Study 27.7 Disadvantages of Case Study 27.8 Conclusion 27.9 Summary 27.10 Tutor-Marked Assignment 27.11 Reference/ Further Reading 27.0 INTRODUCTION The case study method has proved to be a time-tested method of research. It entails an in-depth study of particular cases. A researcher who wants to study varying aspect of a subject matter will find the case study a suitable method. In this unit, we shall try to lead you through the fundamentals of case study. 27.1 OBJECTIVES At the end of this unit, you will be able to: i. learn the meaning of case study ii. know when a research is suited for the adoption of the case study method iii. know the limitations of case study iv. enumerate the advantages of case study. 27.2 Main Content 27.2.1 Meaning of Case Study Case study entails a thorough, detailed or in-depth study of all the manifestations, peculiarities or characteristics of a particular case or unit. It involves a systematic accumulation of information about a unit which may be a particular person, social setting, event, or group, to permit the researcher to effectively understand how it operates or functions (Berg 2001). In a case study, the researcher decides on the number of individuals he wants to study: one, two, five, hundred, etc., as there is actually no prescription on number. The aim could either be to analyse the life or function of such individuals. Since case study makes no special demand on number of units to be studied, Blaxter et al (2006), submit that case study is ideally suited to the needs and resources of the small-scale researcher. According to Singh (2006), case study gives subjective rather than objective information. It gives a detailed knowledge about the phenomena and one may not be able to generalize beyond the knowledge. Unlike population sampling, where an inference can be made from the study of a population sample for the whole population, in case study no such inference is made. Thus, case study does not assume that an individual, group, or unit is true representative of the whole population. Case study emphasises the existence of individual differences, as well as intra-individual differences. It is on account of this that prediction or conclusion that applies to the whole population cannot be drawn
following the study of a unit (Singh 2006). The difficulty or impossibility of generalizing or drawing inference from a case study is one of the criticisms against the case study. Case study is not a type of methods of data collection. Rather, a case study can incorporate a number of data collection methods. Gray (2004), claims that case study is adopted in research when a “why” and ”how” questions are being asked about a contemporary set of events over which the researcher has no control. Self-Assessment Exercise 3.1 1. Define case study. 2. Differentiate between population sampling and case study 27.3 Phases of Case Study Yogesh (2006) identifies three phases of case study. They include: retrospective phase, prospective phase, and conspective phase. 1. Retrospective phase: This refers to the past records of the case completely, which is used in diagnosing the case. 2. Prospective phase: This refers to the present status of the case, which is helpful in understanding the case. The suggestions and remediation can be offered to the case. 3. Conspective phase: This refers to the future development and improvement of the case, which is also employed to examine the effects of the remediation given to the case. Self-Assessment Exercise 3.2 List and explain the three phases of case study. 27.4 Types of Case Study Basically, we distinguish between six types of case study. They include the following: group or a community case study, causal comparative case study, activity analysis, content or document analysis, a follow-up study, and trend studies (Yogesh 2006). 1. Community Case Studies Bruce (2001) defines community as some geographically delineated unit within a larger society. A community case study entails an in-depth study, and a careful description and analysis of a group of people who occupy a particular geographical territory. This type of case study investigates the location, appearance, prevailing economic activity, climate, historical development, patterns of living, social structure, goals and life values, social institutions within the community that meet the human needs, etc. In this type of case study, the community is the case being studied. A researcher who undertakes to engage in a case study of a community intends to gain enough information about the way the community operates, mode of behaviour of members and sorts of social relations that members engage in. 2. Causal Comparative Studies This sort of case study seeks to provide solution by analysing causal relationship between factors. It seeks to discover the factors that bring about the existence of a particular state of affairs. 3. Activity Analysis This analyses the activities that an individual or individuals perform in society. Through this, it will be possible to establish whether the individuals perform the roles they are expected to perform, whether they perform more roles than they can perform or whether it is necessary to increase their roles. An activity analysis may require that you study how, for example, teachers of C.R.K. in Community Secondary School, Ndiukwuenu, teach their subject. 4. Content or Document Analysis This type of case study involves a systematic examination of current records or documents as sources of data. In documentary analysis, the following may be used as sources of data: official records and reports, printed forms, textbooks, reference books, letters, autobiographies, diaries, pictures, films
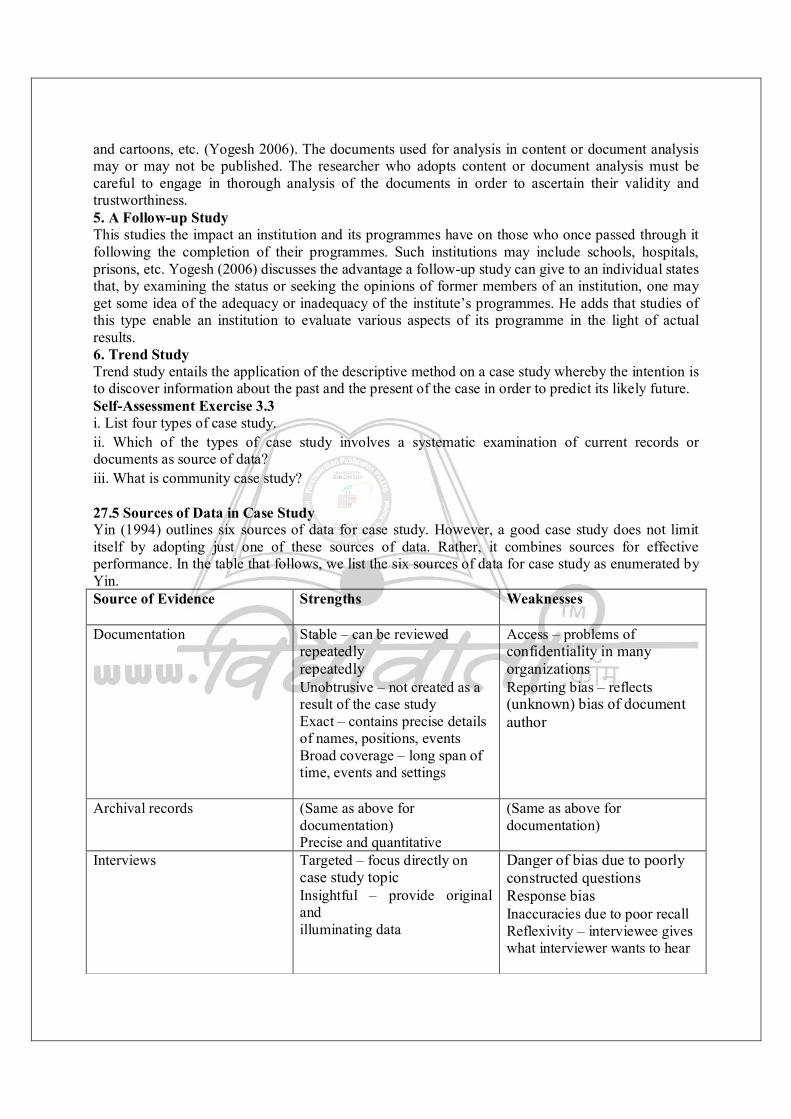
and cartoons, etc. (Yogesh 2006). The documents used for analysis in content or document analysis may or may not be published. The researcher who adopts content or document analysis must be careful to engage in thorough analysis of the documents in order to ascertain their validity and trustworthiness. 5. A Follow-up Study This studies the impact an institution and its programmes have on those who once passed through it following the completion of their programmes. Such institutions may include schools, hospitals, prisons, etc. Yogesh (2006) discusses the advantage a follow-up study can give to an individual states that, by examining the status or seeking the opinions of former members of an institution, one may get some idea of the adequacy or inadequacy of the institute’s programmes. He adds that studies of this type enable an institution to evaluate various aspects of its programme in the light of actual results. 6. Trend Study Trend study entails the application of the descriptive method on a case study whereby the intention is to discover information about the past and the present of the case in order to predict its likely future. Self-Assessment Exercise 3.3 i. List four types of case study. ii. Which of the types of case study involves a systematic examination of current records or documents as source of data? iii. What is community case study? 27.5 Sources of Data in Case Study Yin (1994) outlines six sources of data for case study. However, a good case study does not limit itself by adopting just one of these sources of data. Rather, it combines sources for effective performance. In the table that follows, we list the six sources of data for case study as enumerated by Yin. Source of Evidence
Strengths Weaknesses
Documentation
Stable – can be reviewed repeatedly repeatedly Unobtrusive – not created as a result of the case study Exact – contains precise details of names, positions, events Broad coverage – long span of time, events and settings
Access – problems of confidentiality in many organizations Reporting bias – reflects (unknown) bias of document author
Archival records
(Same as above for documentation) Precise and quantitative
(Same as above for documentation)
Interviews
Targeted – focus directly on case study topic Insightful – provide original and illuminating data
Danger of bias due to poorly constructed questions Response bias Inaccuracies due to poor recall Reflexivity – interviewee gives what interviewer wants to hear
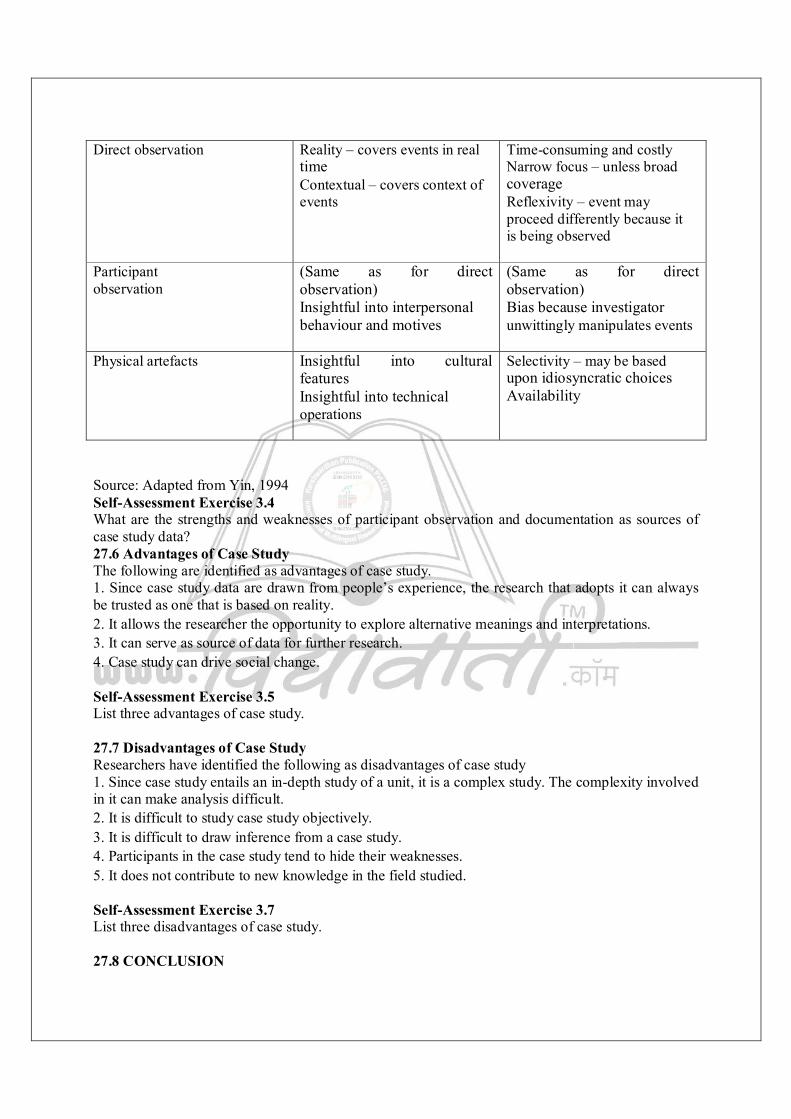
Direct observation
Reality – covers events in real time Contextual – covers context of events
Time-consuming and costly Narrow focus – unless broad coverage Reflexivity – event may proceed differently because it is being observed
Participant observation
(Same as for direct observation) Insightful into interpersonal behaviour and motives
(Same as for direct observation) Bias because investigator unwittingly manipulates events
Physical artefacts
Insightful into cultural features Insightful into technical operations
Selectivity – may be based upon idiosyncratic choices Availability
Source: Adapted from Yin, 1994 Self-Assessment Exercise 3.4 What are the strengths and weaknesses of participant observation and documentation as sources of case study data? 27.6 Advantages of Case Study The following are identified as advantages of case study. 1. Since case study data are drawn from people’s experience, the research that adopts it can always be trusted as one that is based on reality. 2. It allows the researcher the opportunity to explore alternative meanings and interpretations. 3. It can serve as source of data for further research. 4. Case study can drive social change. Self-Assessment Exercise 3.5 List three advantages of case study. 27.7 Disadvantages of Case Study Researchers have identified the following as disadvantages of case study 1. Since case study entails an in-depth study of a unit, it is a complex study. The complexity involved in it can make analysis difficult. 2. It is difficult to study case study objectively. 3. It is difficult to draw inference from a case study. 4. Participants in the case study tend to hide their weaknesses. 5. It does not contribute to new knowledge in the field studied. Self-Assessment Exercise 3.7 List three disadvantages of case study. 27.8 CONCLUSION
The case study method is a proven method of studying individual cases. Its ability to offer an all-round and in-depth study of its subject matter makes it an attractive method for undertaking research. However, despite the advantages that case study affords to research, researchers have often found it a difficult water to navigate. The unit we have studied is a tour guide to you in your research, if you have decided to make use of the case study method. 27.9 SUMMARY In this unit, you have learnt the meaning of case study. You have also learnt the different types of study that are suited for different types of cases. The unit has also pointed out to you the advantages as well as the disadvantages of case study. You were also shown where to access your data for case study. 27.10 TUTOR-MARKED ASSIGNMENT 1. List the six sources of data for case study. 2. Discuss the six types of case study. 3. Case study is suitable for answering which types of questions? 27.11 Works Cited/Further Readings Berg Bruce (2001).Qualitative Research Methods. U.S.A.: Pearson Educational Company. David Gray (2004). Doing Research in the Real World. London: Sage Publications. Loraine Blaxter, Christina Hughes, Malcolm Tight (2006). How to Research. New York: Open University Press. R. Gomm, M. Hammersley, and P. Foster (eds). (2000). Case Study Method: Key Issues, Key Texts. London: Sage. R. K. Yin (1993) . Applications of Case Study Research. Thousand Oaks, CA: Sage. R. K. Yin (1994). Case Study Research: Design and Methods, 2nd edn. Thousand Oaks, CA: Sage. Yogesh Singh (2006). Fundamentals of Research Methodology and Statistics. New Delhi: New Age International Publishing Ltd.

28 RESEARCH ETHICS
Unit Structures: 28.0 Introduction 28.1 Objectives 28.2 Main Content 28.2.1 Meaning of Ethics 28.3 Ethics and Research 28.4 History of Research Ethics 28.5 Some Ethical Issues in Research 28.6 Conclusion 28.7 Summary 28.8 Tutor-Marked Assignments 28.9 Works Cited/Further Reading 28.0 INTRODUCTION Since every research involves people, there is need to have a code of moral conduct that guides researchers in the course of doing their research. Thus, ethics in research captures such moral codes that guide researchers in the course of doing their researches. As you will discover, obedience to such codes is of immense benefit to the researcher, the participants in his research, the sponsors of his research, and the general public. In a way, it is also important to the profession of research, as it makes the continuation of business of research possible. 28.1 OBJECTIVES At the end of this unit, you should have learnt: i. The meaning of ethics. ii. The relationship between ethics and research. iii. The historical circumstance that gave rise to researchers’ concern with ethics. iv. The major ethical issues that are of concern to researchers. 28.2 MAIN CONTENTS 28.2.1 Meaning of Ethics Ethics in research borders on some of the philosophical issues involved in research. Indeed, philosophers consider ethics as one of the important branches of philosophy. Ethics relates to the rules of relations that guide human interactions. Its basic concern is to recommend how we can relate to other human beings in our world. Are there specific ways suitable for relating to others? Or is any manner of behaviour permitted? Thus, ethics deals with the correct way of behaving towards other human beings. Resnik(1998) defines ethics as “standards of conduct (or social norms) that prescribe behaviour”. Self-Assessment Exercise 3.1 What is the basic concern of ethics? 28.3 Ethics and Research Every form of research involves people, either as instruments, respondents, population, beneficiaries or sponsors of research. Thus, since every research involves people we can also say that every
research involves ethics. The researcher who engages in research work has some responsibilities in the manner he relates with the people who have anything to do with his research. Thus, to a great extent, in the course of his research the researcher is engaged with the question of moral choices: How does he relate to the people he is studying? How does he arrive at a conclusion in a difficult research terrain? He is always faced with the question of making correct choices throughout the course of his research. For instance, a researcher who is being frustrated in the process of assessing his data may be faced with making a choice between cutting corners or sticking to the right course, even if it entails not getting the data needed. If he cuts corners, he may make up data that do not exist anywhere and pass them off as results of intensive field work. Thus, ethics in research is concerned with the researcher’s responsibility to stick to certain ethical standards in the course of his research activities. Blaxteret al (2006), express the relationship between the researcher and ethics when they state that: “You owe a duty to yourself as a researcher, as well as to other researchers and to the subjects of and audience for your research, to exercise responsibility in the processes of data collection, analysis and dissemination”. Ethical issues in research arise mainly in research designs that use the qualitative methods of data collection. Thus, a researcher that adopts such methods as surveys, interviews, questionnaire is, in one way or the other, faced with taking decisions that involve ethical issues. Indeed, most sponsors of research request that researchers undertake a study of the ethical implications of their research before embarking on the research. Greener (2008) identifies steps to ensure that one’s research does not constitute an ethical harm to any person. They include: 1. Identifying stakeholders to the research (participants, students, competitors, sponsors, yourself as researcher, etc.) 2. Identifying the possible risk of your research to each of the stakeholders 3. Specifying the level of probability that these risks will be experienced by the stakeholders (unlikely, possible, probable). A researcher who has identified the ethical implications of his research, weighs these negative aspects of these implications against the expected benefits of the research to society. If the benefits do not far outweigh the negative implications, the researcher has the obligation not to embark on such a research. The underlying factor about ethics in research is that researchers should be ethical in their research. Again, Blaxter et al (2006) inform us about what ethical research entails: Ethical research involves getting the informed consent of those you are going to interview, question, observe or take materials from. It involves reaching agreements about the uses of this data, and how its analysis will be reported and disseminated. And it is about keeping to such agreements when they have been reached. The importance which ethics has assumed in research stems from a number of factors. Resnik (1998) lists the factors as follows: 1. Researchers’ interest in ethics arose because it was discovered that “ethical misconduct and ethically questionable conduct in many aspects of research, and a perceived lack of ethics in science have threatened the stability and integrity of research” (PSRCR 1992, Hilts 1996, Hedges 1997 cited in Resnik 1998). 2. Another reason why ethics has become a pressing concern is that science’s increasing interdependence with business and industry has generated ethical conflicts between scientific values and business values (PSRCR 1992, Reiser 1993). These conflicts have raised concerns about the funding of science, peer, scientific openness, the ownership of knowledge, and the sharing of resources. Universities have expressed concerns about scientists who use their facilities to conduct secret research for private industry or personal economic gain (Bowie 1994).
Self-Assessment Exercise 3.2 i. What is ethical research
ii. List the three steps to ensure that one’s research does not constitute an ethical harm to any person. 28.4 History of Research Ethics The researchers’ concern with ethics is a relatively new one. It is said to have arisen as a result of the treatment which the Nazi subjected people under the guise of biomedical research during the World War II. Nazi researchers (mainly physicians and scientists) were reported to have dismembered research participants, exposed others to virus, freezing temperatures, malaria, poison and untested drugs in the name of human experimentation (Berg 2001). These violations led to the famous Nuremberg Trials. The Trials resulted in a 10-point code, the Nuremberg Code of 1949, which insisted that researchers, henceforth, must be guided by some codes of conduct that will protect the human subjects. Henn et al (2006) aver that the core of Nuremberg Code still underlie many ethical codes of practice for researchers of today. They include such codes of practice as: i. Every research should ensure informed voluntary consent of the participant ii. The results should be ‘for the good of society, not random and unnecessary’. iii. Research should be ‘conducted as to avoid all unnecessary physical and mental suffering and injury’. iv. Participants should be allowed to terminate their involvement at any time. v. Researchers should terminate research if any ethical concern arises. It must be noted that, despite the existence of the Nuremberg Code, researchers continued to engage in unethical research behaviour. This has led to the Declaration of Helsinki adopted by the WHO in 1964 which seeks to regulate the ethical conduct of medical researchers. Other research associations have adapted or modified the Nuremberg Code to take care of ethical concerns arising from their research. Self-Assessment Exercise 3.3 i. List three ethical codes of practice for researchers. ii. What is the name of the 10-point code which insisted that researchers, henceforth, must be guided by some codes of conduct that will protect the human subjects? 28.5 Some Ethical Issues in Research Confidentiality/Participant Anonymity The two terms confidentiality and anonymity are related but they differ substantially. Henn et al (2006) distinguish between the two terms: “Confidentiality is an active attempt to remove from the research records any identifying features of the research participants, and anonymity means that those who participate in the research remain nameless.” A researcher is under obligation not to reveal information that is damaging to the participants in his research. It is not always the case that information that is damaging to participants is defined. The researcher has to use his sixth sense to decipher this. Indeed, a researcher should not reveal the names of participants in his research or give tips that will reveal the identity of the participant. (“The event happened in the university with its headquarters in Victoria Island” gives tips to a third person that the National Open University of Nigeria (NOUN) is being referred to.) The ideal thing is that the researcher should rather assign codes to every participant in such a way that he or she alone knows who they are. In occasions where
giving names is indispensable, the researcher must obtain the consent of the participant to be named before publishing his research. Informed Consent The principle of informed consent demands that participants in a research must agree freely to participate in the research. It also demands that they should possess all the information that relates to their participation in the research. Such information as the duration of the research, about their right to refuse to answer any question, to withdraw at any stage of the research, if they want, and full identity of the researcher must be clearly communicated to the participants. Some category of persons, like deranged people and children below the age of 12 are not fit to give informed consents. Any research involving their participation must be consented to by one who has their care or who is legally authorised to represent their interests. The SRA, cited by Henn et al (2006) suggests that the following points are those that ought to be communicated to potential research participants to gain their informed consent: i. The purpose of the study, its policy implications, and so on, ii. The identity of the funder(s), iii. The anticipated use of the data and the form of publication that may result, iv. The identity of the interviewer/experimenter and their organisational base, v. How the individual was chosen, for example the sampling method used, vi. What the individual’s role in the study will be, vii. Any possible harm or discomfort that may result from the research, viii. The degree of anonymity and confidentiality assured, ix. The proposed data storage arrangements, the degree of security, and so on, x. The procedures of the study, for example the time involved, the setting, and so on, and xi. Whether their participation is voluntary or compulsory: • If participation is compulsory, the potential consequences of non-compliance; • If participation is voluntary, their entitlement to withdraw consent. Some organizations insist that informed consent must be ensured in writing. Typically, informed consent slips contain a written statement of potential risk and benefit and some phrases to the effect that these risks and benefits have been explained. As a rule, these slips are dated and signed by both the potential subject and the researchers or their designated representatives (Bruce 2001). Voluntary Participation An important ethical concern is that participants freely volunteer to participate in a research. This implies that the researcher, or any of his collaborators, does not exploit his position to coerce or manipulate people into participating in his research. Thus, participants must actively and freely volunteer to participate in the research. Coercing people and manipulating them to participate in research are two conditions that impugn on their dignity as human persons. Once any of these conditions exists, the participants are said not to have participated voluntarily. Non-voluntary participation also affects the confidence in the data generated from such participation. An example of coerced or manipulated participation arises when a student participates in a research because he or she believes that not participating will attract some punishment from his or her teacher. Again, when people are offered incentives to participate in a research, such research is simply a manipulated research. Covert Research Some researchers are known to have hidden their identities as researchers in the course of their research. A researcher that does this hides his presence from the participants and sits as one of them. Ethicists argue that adopting such a measure (covert research) will violate the rights of participants. There is also the argument that the researcher himself will be harmed if he is discovered by the

participants. There is also the danger that the participants will commit crime, especially if they are investigating criminals, as it will entail that they will commit the crimes with them. Engaging in covert research violates other ethical codes like the informed consent and voluntary participation, since the participants’ consents are not sought. Thus, the less researchers are engaged in covert research the better. Despite the dangers associated with covert research, it is argued that some researches cannot be carried out without the researcher hiding his identity. For instance, one investigating drug peddlers, deviants, etc. cannot gain the confidence of the subjects if he announces himself as a researcher. This being the case, it will be very difficult for society to understand the life behavioural pattern of such people. It is argued that under such circumstances, the researcher is permitted to research covertly. But we must know that this raises another problem. What happens if the researcher is caught with the criminals in the process of his research? How would he convince the law enforcers that he is not one of them? Some experts have suggested that he reports his plans to research such people to the law enforcement agents before embarking on the research, and get their approval. However, a counter argument holds that doing so is tantamount to informing against one’s participants and violating the principle of confidentiality and anonymity, which every participant ought to enjoy. So the dilemma remains. What does the researcher do? Berg (2001) advises that what course of action the researcher should follow depends on what he is studying, when he plans to conduct the study and what he plans to do with the conduct. The advice is that the researcher should simply be cautious. Harm Research can be quite harmful to individuals in many ways. Henn et al (2006), lists the nature of harms that can result from research to include: psychological, physical, legal and professional harms. A researcher has the responsibility to examine the harm implication of his research before embarking on it. Some research can also harm others after their publication. So the researcher guides against publishing reports that will harm other persons. Honesty Another demand which ethics makes of researchers is that they should be honest with their findings. An honest researcher should guide against these three factors: fabrication, manipulation and misrepresentation. Fabrication occurs when a researcher makes up data; manipulation occurs when a researcher alters data or results (PSRCR 1992). According to Babbage (1970), misrepresentation occurs when a researcher fails to truthfully or objectively report data or results. Three forms of misrepresentation are prominent. They include: trimming, cooking, and fudging. Trimming occurs when scientists fail to report results that do not support their hypotheses. Fudging occurs when scientists try to make results appear to be better than they really are. Scientists “cook” the data when they design tests or experiments in order to obtain results they already have good reasons to suspect will be positive or when they avoid conducting tests that are likely to yield negative results. Thus, a good researcher should not fabricate facts and figures where they do not exist. Honesty in research demands that the researcher does not manipulate data in such a way that they suit his purposes. This requires that neither data nor result should be falsified or fabricated. The researcher must present data as he sees them. Honesty helps to engender the cooperation and trust necessary for scientific research. Researchers need to be able to trust each other, but this trust breaks down when researchers are not honest (Committee on the Conduct of Science 1994, Whitbeck 1995b cited in Resnik 1998). Openness A research is never meant for personal consumption. Therefore, every scientific research is meant to be shared by other members of research community. Therefore, to make one’s research open to others (especially when it is completed) is one of the ethical demands made of researchers. Resnik (1998) lists some of the reasons why openness is very important in research. They include: 1. It saves knowledge from becoming dogmatic, uncritical and biased.
2. It helps to build an atmosphere of trust and cooperation among researchers. 3. It helps to advance knowledge as more progress can be gained when researchers work together rather than in isolation, when they share data, research sites and resources, and build on previous research. Ethical Issue Box: How would you deal with these ethical issues if you encounter them in your research? 1 You are researching the parenting behaviour of the parents of hospitalized children. You believe that when they are left alone some parents harm their children. You have a video camera. Do you set it up and use it? 2 You have been granted access to an archive of rare documents of crucial importance to your research. It would save you a lot of time if you could take some of the documents home, and security is very lax. Do you ‘borrow’ some of the documents? 3 You are part of a team researching issues of sexuality and you are using email to conduct interviews. You realize that the male members of your team have greater access to men and that the female members have greater access to women. To help with validity your team decides that female researchers should interview male respondents and vice versa. You log on, but your new respondents decline to discuss issues with a member of the opposite sex. You are worried that this will endanger the research project. Do you try again, but this time change your name and pretend that you are the same sex as the respondents? 4 Your research has highlighted unethical practices in your organization concerning the abuse of expenses claims. Do you publish it? 5 You find a newsgroup on the Internet that is discussing issues central to your research. Do you ‘lurk’ (listen in without participating) and make use of the data? 6 You have been offered £1,000,000 to conduct research into GM foods. The funder is a multinational chemical company with interests in GM crops. Do you accept the funding? 7 You have been offered £100 to conduct research into GM foods. The funder is a local direct action group opposed to the development of GM crops. Do you accept the funding? 8 You find a document on the Internet that has done much of the background work for your topic. The deadline for the completion of your project has passed. Do you include the relevant detail in your dissertation but omit the reference? 9 Your research involves interviewing children under 5 years old. How do you ensure that they are able to give ‘informed consent’? Adapted from Box 6.3: Dealing with Ethical Issues in Blaxter et al (2006). 28.6 CONCLUSION A researcher, especially a field researcher, who takes cognizance of the ethical issues treated above is bound to excel in his research. He will gain the confidence of research sponsors, participants and, above all, help to prosper the business of research. A careful obedience to them also means that the researcher does not put himself in danger in the process of carrying out his research or reporting his research findings. 28.7 SUMMARY In this unit, we have guided you to understand the meaning of ethics, the relevance of ethics to research as well as the historical circumstances that gave rise to researchers’ concern to ethics. You have also learnt the various ethical issues that pose challenges to researchers in the course of their jobs. 28.8 TUTOR-MARKED ASSIGNMENTS

1. Distinguish between confidentiality and anonymity. 2. State five points a researcher ought to communicate to his or her participants to ensure that he has their informed consent. 3. Give two conditions under which people can be said not to have participated voluntarily in a research. 4. List the dangers involved in covert research. 5. Identify four types of harm that can result from a research. 6. Give four reasons why openness is essential in research. 28.9 Works Cited/Further Reading American Sociological Association. (1984). Code of Ethics. Washington, DC: American Sociological Association. Bruce Berg. (2001). Qualitative Research Methods for the Social Sciences. U.S.A. Pearson Education Company C. Babbage. (1970). Reflections on the Decline of Science in England, New York: Augustus Kelley. David B. Resnik (1998). The Ethics of Science: An Introduction. London: Routledge. J. Rest. (1986) Moral Development, New York: Praeger. Loraine Blaxter, Christina Hughes, Malcolm Tight, (2006). How to Research. New York: Open University Press. Matt Henn, Mark Weinstein, and Nick Foard. (2006). A Short Introduction to Social Research.London: Sage Publications Ltd. Panel on Scientific Responsibility and the Conduct of Research (PSRCR) (1992). Responsible Science, vol. 1, Washington, DC: National Academy Press R. F. Boruch, & J. Cecil. (1979). Assuring the Confidentiality of Social Research Data. Philadelphia: University of Pennsylvania Press. Sue Greener (2008). Business Research Methods. Ventus Publishing APS
29 PLAGIARISM
Unit Structures: 29.0 Introduction 29.1 Objectives 29.2 Main Content 29.2.1 Meaning of Plagiarism 29.3 Types of Plagiarism 29.4 Consequences of Plagiarism 29.5 Tips on How to Avoid Plagiarism 29.6 Conclusion 29.7 Summary 29.8 Tutor-Marked Assignment 29.9 Works Cited/Further Readings
29.0 INTRODUCTION Dishonesty in academic works has continued to pose serious problems to students and their teachers. Incidence of copying other people’s work is on the rise, as more and more people copy earlier researches without giving credit. Not giving credit for a work is an unethical practice that is frowned at in the academic world. A student researcher does himself a world of good if he knows what plagiarism is and tries to avoid it. 29.1 OBJECTIVES At the end of this unit, you should be able to: i. Know the meaning of plagiarism ii. Identify the various types of plagiarism iii. Understand the consequences of plagiarism iv. Learn how to avoid plagiarism. 29.2 MAIN CONTENT 29.2.1 Meaning of Plagiarism Etymologically, the word “plagiarism” comes from the Latin word plagiarius,which means ‘kidnapper’. If we want to approach the definition of plagiarism from the etymology of the word we say that it means kidnapping the words or ideas of others. But more conventionally, plagiarism means stealing the words or ideas of others and using them as your own. The Simon Frazer University of Canada gives the definition of plagiarism as “a form of academic dishonesty in which an individual submits or presents the work of another person as his or her own. . . Plagiarism also exists when there is inadequate recognition given to the author for phrases, sentences, or ideas of the author incorporated into an essay.” Sources which individuals plagiarize include: books, songs, interviews, correspondence, articles, and so on. In its guide to its students, University of Illinois lists practices that constitute plagiarism. They include: copying the words of others, whether from a source or another student; purchasing or downloading a paper from the internet and turning it in; paraphrasing (rewriting in your own words) a source and not documenting it; not using quotation marks properly when using material from another source. The research field is open for wide consultation and borrowing of ideas, but there is a rule that if you consult a person’s words or ideas, you must acknowledge that person. You acknowledge him by telling your reader that, even though some of the things you have written belong to you, a particular portion of the writing belongs to a named person. To fail to acknowledge your source, to fail to say
that an idea is not yours, is to plagiarize. It is a serious crime in the academic world. According to Granitz and Loewy (2007) the crime of “plagiarism tips the scales of fair competition, hampers learning, dilutes individual and class grades, and cheapens the value of honest work, hurting the perpetrator, other students, as well as their professors.” Copying from others’ works and failing to acknowledge them attracts severe punishment in the academic world. Indeed, the offender is looked at the same way that bankers might look at a staff who pilfered customer’s wealth kept in the bank. Depending on the nature of plagiarism, and the academic level of the plagiarist involved, plagiarism may be punished with instant expulsion or failure of the course involved. Some universities go as far as withdrawing certificates and degrees awarded their former students once they discover that such a former student plagiarized some or all of their research work. Self-Assessment Exercise 3.1 i. Define plagiarism.
ii. What is the meaning of the Latin word from which the English word, plagiarism, arose? 29.3 Types of Plagiarism Plagiarism can take several forms. Researchers classify the several forms plagiarism can take into four. They include: global plagiarism, patchwork plagiarism, incremental plagiarism, and self-plagiarism. 29.3.1 Global Plagiarism Lucas (2004) defines global plagiarism as stealing your whole work from another source, and passing them off as your own. The internet particularly has made this type of plagiarism tempting as there are numerous internet sources a plagiarist may decide to consult, lift and appropriate to himself. There are also numerous internet sites that promise to conduct researches for others. If the internet has helped plagiarists to engage in plagiarism, students should know that the same internet also makes detection of plagiarized work easier. There are arrays of computer software that makes detection of works plagiarized from the internet easy. A simple click of the mouse easily reveals source of internet articles if one appropriated them. Global plagiarism is the worst form of plagiarism. Lucas regards it as “the most blatant—and unforgivable—kind of plagiarism, it is grossly unethical.” It is impossible for the plagiarist to acknowledge the owners of the idea he has appropriated if he engages in global plagiarism. This is because the whole work will be shown to belong to another author different from him. The best way to avoid this form of plagiarism is for the researcher to bend down to his work. 29.3.2 Patchwork Plagiarism Lucas (2004) describes patchwork plagiarism as the type of plagiarism that occurs when a writer steals his entire work from two or more sources. Students who do patchwork plagiarism consult many sources and take time to appropriate relevant sections from them and join them together to form a coherent work done by them. Like as is the case with global plagiarism, it is also impossible for the plagiarist in patchwork plagiarism to acknowledge that he is not the owner of the ideas or words he appropriated. If he does this, his work will turn out to be product of two or more authors excluding himself. 29.3.3 Incremental Plagiarism According to Lucas (2004) this type of plagiarism occurs when a writer takes a portion of a person’s work and incorporates it into his work as if they form part of his original work. Here he fails to cite his author. Unlike the authors in the global and patchwork plagiarism who cannot be acknowledged, the authors who own works that are plagiarized in incremental plagiarism can still be acknowledged if the plagiarist wants to do so. This is because, despite passing off other people’s ideas as his own,
he still has his original input into the work. Most researchers who engage in incremental plagiarism often claim ignorance that they did not know that what they did was plagiarism. 29.3.4 Self-Plagiarism Another name of self-plagiarism is recycling fraud. This type of plagiarism involves one plagiarizing from one’s earlier work. It occurs when a researcher republishes a work he has published earlier, or portion of them in another place without indicating that he has published it earlier. Most researchers who engage in self-plagiarism rarely know that it is academic dishonesty to republish an earlier research. Roig(2002) lists four forms that self-plagiarism can take. We discuss three of such forms here. They include: duplicate publication, salami-slicing, and text recycling. In duplicate publication, a researcher republishes all or substantial parts of an earlier published work in another medium different from the first. Duplicate self plagiarism presents a whole article or a good portion of it as original and current when indeed it is not. Salami-slicing involves cutting up results of a study and publishing them in multiple articles. This type of self plagiarism gives the impression that the author has done multiple research work when indeed he has only done one research work. To avoid salami-slicing, a researcher should publish the outcome of a study in one piece. Text-recycling entails an author copying some portions of his earlier work and including them in another research different from the original. Self-assessment Exercise 3.2 i. List the four types of plagiarism, 29.4 Consequences of Plagiarism We have so far emphasized that plagiarism is an academic fraud. It is the greatest crime one can commit in the academic world. A student researcher should understand that research is not an easy work. It poses the same problem to his lecturer as it poses to him. However, this is no justification for plagiarism. Plagiarizing research work comes with serious consequences. Snapper (1999) lists what he considers as the harms or consequences of plagiarism 1. Plagiarism denies the author credit. The author of the idea or work a plagiarist has claimed as his own is the first victim of plagiarism. Snapper holds that when we fail to acknowledge an author we deny him reputation due to him as the original owner of the idea. 2. It denies the readers the chance of reading up additional sources related to the topic. 3. It dents the image of the plagiarist. In some instances, plagiarism has ended the career of many promising personalities. Self-assessment Exercise 3.3 What are the three harms of plagiarism? 29.5 Tips on How to Avoid Plagiarism Sue Hendrix lists the following tips on how to avoid plagiarism. 1. Use quotation marks around all works and phrases from any source and cite the source. 2. Cite the source for any idea that are not your original ideas. 3. Paraphrase by putting information in your own words but still remember to cite the source. 4. List every source that is used in the paper in the Works Cited. Self-Assessment Exercise 3.4 List four tips on how to avoid plagiarism 29.6 CONCLUSION

Plagiarism is a serious crime in the academic world. It can cut down the scholarly life of a burgeoning scholar long before he has attained his height. Worse still, it can bring down an intellectual giant from the big height he has attained. A research student should avoid plagiarism as one avoids leprosy. He should be very careful about citing his sources; making sure that he acknowledges works by others as works by others. This gives his work credibility. 29.7 SUMMARY In this unit, we explained the meaning of plagiarism to you. We also exposed the different types of plagiarism to you, as well as the consequences of plagiarism and how to avoid plagiarism. Avoiding plagiarism in your research work means that you have put forward a good foot in your work as a researcher. 29.8 TUTOR-MARKED ASSIGNMENTS 1. What is plagiarism 2. Distinguish between global plagiarism and patchwork plagiarism 3. Show your understanding of the three types of self-plagiarism 4. List four tips on how to avoid plagiarism 29.9 WORKS CITED/ FURTHER READINGS John Snapper (1999). “On the Web: Plagiarism Matters More than Copyright Piracy.” Ethics and Information Technology 1pp.127-136 M. Roig. (November, 2002). Recycling Portions of Text from the Same Author/s Previously Published Papers in Psychology: An Exploratory Study. Paper Presented at the Second Office of Research Integrity’s Conference on Research Integrity, Bethesda, MD. Neil Granitz and Dana Loewy (2007). “Applying Ethical Theories: Interpreting and Responding to Student Plagiarism.” Journal of Business Ethics 72. pp.293-206. P. McCarthy. (1993, October). The Paper Mill. The New Physician, 24-27. P. Scanlon. (2007). “Song from Myself: An Anatomy of Self Plagiarism.” Plagiary II. Stephen Lucas. (2004). The Art of Public Speaking. New York: McGrawHill Sue Hendrix.“Plagiarism”www1.gcs.k12.al.us/pdf/plagiarism.pdf.Accessed on 10/4/2011 W. Sutherland-Smith. (2008).Plagiarism, the Internet and Student Learning. New York: Routledge

30 Data Analysis
Data analysis embraces a whole range of activities of both the qualitative and quantitative type. It is usual tendency in behavioral research that much use of quantative analysis is made and statistical methods and techniques are employed. The statistical methods and techniques are employed. The statistical methods and techniques have got a special position in research because they provide answers to the problems. Kaul defines data analysis as, ”Studying the organized material in order to discover inherent facts. The data are studied from as many angles as possible to explore the new facts.” Purpose: The following are the main purposes of data analysis: (i) Description: It involves a set of activities that are as essential first step in the development of most fields. A researcher must be able to identify a topic about which much was not known; he must be able to convince others about its importance and must be able to collect data. (ii) Construction of Measurement Scale: The researcher should construct a measurement scale. All numbers generated by measuring instruments can be placed into one of four categories:
(a) Nominal: The number serves as nothing more than labels. For example no 1 was not less than no 2 .Similarly no 2 was neither more than no 1 and nor less than no 3. (b) Ordinal: Such numbers are used to designate an ordering along some dimensions such as from less to more, from small to large, from sooner to later.
(c) Interval: The interval provides more précised information than ordinal one. By this type of measurement the researcher can make exact and meaningful decisions. For example if A,B and C are of 150 cm, 145cm and 140 cm height, the researcher can say that A is 5 cm taller than B and B is 5 cm taller than C.
(d) Ratio Scale: It has two unique characteristics. The intervals between points can be demonstrated to be precisely the same and the scale has a conceptually meaningful zero point. (iii) Generating empirical relationships: Another purpose of analysis of data is identification of regularities and relationships among data. The researcher has no clear idea about the relationship which will be found from the collected data. If the data were available in details it will be easier to determine the relationship. The researcher can develop theories if he is able to recognize pattern and order of data. The pattern may be showing association among variables, which may be done by calculating correlation among variables or showing order, precedence or priority. The derivation of empirical laws may be made in the form of simple equations relating one interval or ratio scaled variable to a few others through graph methods. (iv) Explanation and prediction: Generally knowledge and research are equated with the identification of causal relationships and all research activities are directed to it. But in many fields the research has not been developed to the level where causal explanation is possible or valid predictions can be made. In such a situation explanation and prediction is construct as enabling the values of one set of variables to be derived given the values of another.
Functions: The following are the main functions of data analysis: (i) The researcher should analyze the available data for examining the statement of the problem.
(ii) The researcher should analyze the available data for examining each hypothesis of the problem.
(iii) The researcher should study the original records of the data before data analysis.
(iv) The researcher should analyze the data for thinking about the research problem in lay man’s term.
(v) The researcher should analyze the data by attacking it through statistical calculations.
(vi) The researcher should think in terms of significant tables that the available data permits for the analysis of data. Statistical Calculations: The researcher will have to use either descriptive statistics or inferential statistics for the purpose of the analysis. (i) The descriptive statistics may be on any of the following forms: (a) Measures of Central Tendency: These measures are mean, median, mode geometric mean and harmonic mean. In behavioral statistics the last two measures are not used. Which of the first three will be used in social statistics depends upon the nature of the problem. (b) Measures of Variability: These measures are range, mean deviation, quartile deviation and standard deviation. In social statistics the first two measures are rarely used. The use of standard deviation is very frequently made for the purpose of analysis. (c) Measures of Relative Position: These measures are standard scores (Z or T scores), percentiles and percentile ranks .All of them are used in educational statistics for data analysis. (d) Measures of Relationship: There measures are Co-efficient of Correlation, partial correlation and multiple correlations. All of them are used in educational statistics for the analysis of data. However the use of rank method is made more in comparison to Karl pearson method. (ii)The inferential statistics may be in any one of the following forms: (a) Significance of Difference between Means: It is used to determine whether a true difference exists between population means of two samples. (b) Analysis of Variance: The Z or t tests are used to determine whether there was any significant difference between the means of two random samples. The F test enables the researcher to determine whether the sample means differ from one another to a greater extent then the test scores differ from their own sample means using the F ratio. (c) Analysis of Co-Variance: It is an extension of analysis of variance to test the significance of difference between means of final experimental data by taking into account the Correlation between the dependent variable
and one or more Co-variates or control variables and by adjusting initial mean differences in the group. (d) Correlation Methods: Either of two methods of correlation can be used for the purpose of calculating the significance of the difference between Co-efficient of Correlation. (e) Chi Square Test: It is used to estimate the like hood that some factor other than chance accounts to the observed relationship. In this test the expected frequency and observed frequency are used for evaluating Chi Square. (f) Regression Analysis: For calculating the probability of occurrence of any phenomenon or for predicting the phenomenon or relationship between different variables regression analysis is cone.
31 Interpretation of Data
According to F.L. Whitney, interpretation means an adequate exposition of the true meaning of the material presented in terms of the purposes of the study being reported and of the chapter and section topic involved. Purposes: The following are the main purposes of interpretation of data or results; (i) To throw light on the real significance of the material in the context.
(ii) To understand implications of the data.
(iii) To provide hints of conclusions and recommendations of the researcher.
(iv) To show the values of greatest worth that has resulted from the research. (v) To refer important generalization. Factors: The researcher should keep the following factors in consideration in interpretation of data; (i) Not to ignore those factors which are unstudied: In social / behavioral researches there are many factors which have their impact upon the findings of the research but no researcher is in the position to study all the factors. Naturally he does not take into account in interpretation of the results those factors which have not been studied. It has its effect upon the search of truth. Thus the researcher should take into consideration such factors in his interpretation. For example if a comparison has been made between the traditional method of teaching and any modern method of teaching in respect of effectiveness of teaching, the interpretation that successful attainment is the result of method of teaching only is complete denial of the role of general mental ability, high achievement motivation and better study habits etc. (ii) Not to ignore those factors which have not been selected for study: In social / behavioral researches, the subjects are generally so large that the researcher collects the data from a selected group only. The researcher should remember that some factors which have not been included in selective group are equally important in their impact upon findings. For example if the researcher collects data from a particular school in a particular area and then he concludes about all the schools/colleges. (iii) Not to over –interpret the expected results: The researcher should remember that even if he finds the findings of the research as per his expectations he should not interpret more than what can be interpreted on the basis of data available. The researcher should be cautious that he reports all such factors which might be responsible for the findings. (iv) Not to exercise defense mechanism in interpreting the results: The researcher should remember that it is not necessary that the hypotheses should always be confirmed. It is possible that the researcher may exercise defense mechanism if the results of the study are not found as per expectations of the research. In such a situation he should not try to find faults in tools or samples for the results against his expectations. If any researcher tries to do so, his interpretation will not be considered fair. The hypotheses are made in the beginning of the

research when the knowledge of the researcher about the problem is very limited. Agreement between the tentative and the results is not necessary.
32 Time management skills
Unit Structures: 32.0 Time in research. 32.1 Definition of time management. 32.2 Benefits of time management. 32.3 Risks of improper time management. 32.4 Techniques for time management. 32.5 Setting goals. 32.6 Setting priorities. 32.7 Planning. 32.8 Scheduling. 32.9 Revising. 32.10 Procrastination. 32.11 Causes of procrastination. 32.12 Overcoming procrastination. 32.13 Eliminating the time wasting habits. 32.14 Surfing in internet, chatting on MSN, and exploring the software 32.15 Non-stop working for hours at a time. 31.0 Time in research. People think that "researchers' or academicians' time is very flexible. They can prepare their own schedules or weekly time tables, therefore time management skills is not critical for them." This is wrong. Just on contrary. It is because of this possibility of flexibility that researchers need to be good time managers. Researchers need long hours. They may need to enter dark tracks from time to time. The results might be unpredictable and unexpectable. Some procedures may take longer time than expected. Therefore, they need careful time management to reserve time for such cases. Researchers have several different responsibilities like, • taking and studying for courses • lab assistantship • tutoring • invigilation • departmental works • exam grading etc. A researcher will be lost among these works if he/she is not skillful in time management. Any failure in time management will result with the omission of some work, lower quality of research, depression etc. Another good reason for the necessity of time management skills is the presence of deadlines for most work undertaken by a researcher. The research schedule by itself should be carefully designed to fit into the time allowed. Requests for extension may not be helpful, and usually they result with a damage in your career either by elongating the time to reach your goals or making your skills and background questionable.
You especially need to improve your time management skills if you often say: "No need to worry. I can prepare it in the last week, or in the last night." Keep in mind that there there are no hard and fast rules on how to spend time while undertaking research. What matters is that you should be content with your won use of time. Note that time spent on leisure activities or talking to people is not necessarily time wasted. You need them, in a balanced fashion, to maintain your physical and mental health, and help your work. 32.1 Definition of time management. We should spend some effort to manage the time since: • time is not something that can be changed in any way, it can not be accelerated or slowed, or stopped. • time itself can not be controlled, • therefore time itself can not be managed. We can only control our "use" of our time. Time management is essentially the organization of your time in a manner that most effectively helps you meet important goals. 32.2 Benefits of time management.
you can gain control over your time. That does not mean that you become super-workaholic. It means you can finish earlier.
You will have improved self-confidence by being more organized and get greater satisfaction from your research experience.
You will have less stress due to easier coping with the deadlines. That will not help only in research activities but also help to improve your health and interpersonal relations.
You will have better productivity and performance. All of the above will prepare the most suitable medium and conditions for a quality
research. Your career will benefit much from the research under these conditions in which there is no time pressure.
32.3 Risks of improper time management. Poor time management can lead to opposite of these benefits. You may become a slave to deadlines. Poor time management is often the result of procrastination (delaying to a later time). The more you procrastinate, the more pressure will adversely affect your performance. Some people believe that they become more productive towards the deadlines. That is a misconception. The work done just before the deadlines had been proved to be of very low quality. Unexpected drawbacks like sicknesses, computer crashes etc can not be tolerated towrds the deadlines. Some people believe that they work well under pressure. But there is always a risk for failure. An early start will prevent such risks.

The most serious damaging effect of a poor time management is the potential negative effect on interpersonal relations. This may endup with poor student-supervisor relations, weakened group-interactions, anxiety in personal relations etc.
32.4 Techniques for time management.
A time management system can be summarized in five steps. 1. setting goals 2. setting priorities 3. planning 4. scheduling 5. revising A small warning. You should not become a superorganized or superbusy researcher, otherwise, your performance will suffer. Thus, do not spend too much time on planning and scheduling. Try to spend just enough time on your time management such that you believe you are meeting all of your goals in a timely manner. Setting goals.
Establishing goals and objectives is the first step.
Goals are outcome statements that define what you are trying to accomplish . Goals describe future expected outcomes or states. They provide programmatic direction. They focus on ends rather than means.
Example: "Finishing the experiments for thesis"
Objectives tell how to meet a goal. Objectives are clear, realistic, specific, measurable, and time-limited, statements of action which when completed will move towards goal achievement. They start with an action word.
Examples:
- "Revieving the literature for the latest free-amine protection methods within 15 days"
- "Designing the free-amine protection experiments until the end of January"
- "Sending the results to METU for analysis latest June 20"
- "Analysis of results and doing fine tuning experiments until September 1"
Make sure that the goals and objectives are clear and concise.
Also make sure that the objectives are also measurable; i.e., it can be removed from your list when completed without difficulty.
Your objectives should not be too simple or too complex such that they should be realistic enough: they should not look discouraging or extremely demanding.
There are usually more than one onjectives for each goal. (2 to 5 objectives per goal)
Begin by brainstorming. Write down as many goals and objectives as possible and do bubble sorting; i.e., sort them in order of importance (more relevant to your goals).
You can use a pyramid to picture your goals and objectives. Put your short range goals to the top wheres the long range ones are at the bottom. Your pyramide may have 4-5 levels.: daily (at the top), weekly, monthly, yearly... goals. Highest priority is placed on the daily goals.
Priority should not be confused with importance. The most important goals are the long-range goals, but the highest priority goals are the daily goals. One will fail in attaining a yearly goal if he/she can not manage with the daily goals.
Never avoid discussing your goals with your supervisor. His/her priority list may be different, and clash with yours.
Once you have a refined list of your goals, you may start labeling the relative importance of of each goal by labeling them as A, B, and C (or similar). A might mean "critical", B "important" and C "minimally important (that must still can not be overlooked)".
32.6 Setting priorities. Setting priorities will let you know what constitutes the best use of your time. It will also ensure that the most urgent tasks will be worked on first. Once again priority and importance are not the same. Importance implies the overall significance of the outcome. Priority is a measure of both "importance" and the "urgency". So the priority of a goal depends both on its importance and its urgency. You must give higher priority to an earlier task. You must assign priorities to all tasks. The priorities may change by time. Therefore, they may be revised from time to time. You may give priorities as "high", "medium" or "low"; or 1, 2, 3, 4 and 5. You can give a high priority to a long term important task to give an early start to it. Caution: Avoid “paralysis by analysis”: A perfectionist attitude will result with inabilities in assigning priority to the tasks since everything is equally important and urgent according to a perfectist. They can’t easily choose a task to start with. At the end, they may prefer to do nothing. This phenomenon is known as “paralysis by analysis”.
32.7 Planning. Planning is the listing of the tasks and establishing a time line that includes each task.
Planning involves other variables like budgeting, availability of resources, originality, data analysis methods, etc and puts them on a timely basis. Planning usually starts by thinking about the goals and priorities. It could actually be completed in the mind. However, most experts strongly recommend that you formalize the plan in writing to avoid forgetting something. You may have monthly, or weekly plans. Some experts strongly recommend to do "do-lists" or "To-do lists" You can start your day by preparing a do-list for the day and set priority to each task. This do-list will motivate you to remember your responsibilities that must be carried out during the day. Items that you could not complete one day can be the starting work of the next day. A good advantage of a do-list is that it will give a chance to evaluate/assess your progress. Crossing off completed items will provide a sense of satisfaction. Don't forget to include some flexibility in your plans since no research is completed as exactly as planned. There is always a possibility of deviation due to several reasons. Therefore, you never finish a task on the planned time. Therefore be realistic while you do your planning.
32.8 Scheduling.
Scheduling is deciding when to spend the times you estimated on the tasks. When are you going to do a one-week experiment? On Monday afternoon + Wednesday morning + whole Saturday? Research needs concentration and continuity. You are dealing with several different activities. Try to schedule your research activities ýnto days or time-slots you are most likely to have minimum concentration distorts or disturbance. Doing research in your office hours might not be fruitful. Leave enough flexibility in your scheduling as well for setbacks, time overruns, delays and other unforeseen reasons. 32.9 Revising. Periodic revising of your goals and tasks, plans and schedules is necessary. For example, when goal-A of highest priority is finished, your goal-B may become goal-A. Revising is needed to compare your goals and objectives with your performance, and to see if you are proceeding as scheduled. If you have fallen behind the schedule, revise it. If you are ahead of schedule, then you can revise your goals to include more goals and objectives, or finish earlier. 32.10 Procrastination. Procrastination is carrying out less urgent tasks first and continuously delaying the most urgent tasks. There are various symptoms (signs) of procrastination: • Watching TV instead of doing homework • Talking with friends instead of concentrating on the team project • Delaying the return of library books
Procrastination have consequences like prevention of success, delay of effects that can be very serious or even disastrous. 32.11 Causes of procrastination. There are three reasons: Facing an unpleasant task is the most common reason. Procrastinator hopes hat the task will go away before he or she starts on it!!!! Unfortunately it doesn't. It will end up with accumulating stress each day. Facing a complex or intimidating task can also lead to procrastination. The procrastinator doesn't know how to begin solving the problem, and believes that the effort could be wasteful, and the award for this may not worth doing it. Facing indecision is having difficulty in assigning priorities to competing demands on his or her time. Usually perfectionists fall into this class. People who are affraid of doing wrong decisions also fall into this class. 32.12 Overcoming procrastination. Recognize procrastination and admit to yourself that you are a procrastinator. It is is difficult to do it (like admitting that a person has a drinking problem), but it is a necessary beginning step. Learn to separate the main task into smaller tasks that are easier and less unpleasant. This a very effective method as it helps to increase the motivation after each successfuly completed subtask. Formulate a simple leading task to get started. For example you may develop an outline of a research paper before writing a manuscript. Set firm early deadlines. You can set your own deadlines so that they are earlier than the true deadlines and and adhere to your deadlines. You can tell teh others about your deadlines to increase the chance of success. This creates an external pressure to meet your deadlines. Schedule the unpleasant tasks first. You will feel that the rest of the tasks will be downhill once you manage the difficult one. Just work hard to complete the first task.
Promise an award to yourself upon completion of a tough task. This may have variations: • rewarding at set points on the project • using a variable-reward system in which their reward decreases in value as the completion date is extended etc. Learn to do planning and scheduling consistently. Weekly planning and scheduling will ensure that you remain in control of your time. Please note that procrastination is habit forming like all other bad habits. Just recognize that there is such a problem and do not allow to build such habits. Once you submit your homework late, and your instructor stayed silent, most probably you will be trapped by procrastination and submit the second homework late, even later than the first one. This however put you in stress, damage your impression on your instructor, and lower the quality of your work. 32.13 Eliminating the time wasting habits.
This is necessary to improve your time management skills. It requires the assessment of how you currently spend your time. This can be done by keeping a careful log-book for a short period of time, say 1 week. It includes writing everything you do and time spent for them. Common time wasting habits are:
Failure to balance the demands of an activity and your mood. Every activity requires different levels of concentration. Have a flexible schedule to adjust your mood.
Taking a perfectionist's attitude for an unimportant task. This is something like wasting your time for the preparation of publication quality graphs or demonstrations to be used for discussing the results with your supervisor. A quick draft graph may suffice, and save you a lot of time.
Not using the technology. Use of computers, phones, scanners, user friendly graphing software etc. may be helpful and save your time considerably. Carrying your laptop to everywhere may improve your efficiency as you are always ready to show your results anytime to anybody, get their opinion, to the necessary changes or improvements on your project etc.
Having no plan for unexpected free time or unscheduled delays. You should always have something to do (like reading an article, drawing a graph, reading a users manual etc) when you find an unexpected free time like while waiting for the end of a long telephone conversation of your supervisor during your visit.
Having frequent and inefficient meetings. Some meeting coordinators may fail to keep the discussions on track and convert the discussions to conversations or branch the discussion to unnecessary topics. If you think so, take over and ensure, diplomatically, that the discussion stays on track. If it is inappropriate to do it, then you can think about your research project and brainstorm yourself on a problem of immediate concern.
Having frequent and long phone conversations. When talking with a person, stay focused on the agenda. Gently request your friends and relatives not to disturb you during the work hours for unimportant and non urgent issues. Don't forget, you are doing a job which requires high level of concentration.
Chitchat. Some of chitchat may be desirable but it must be avoided since it can easily distort your attention.
32.14 Surfing in internet, chatting, and exploring the software This is the most common time wasting habit nowadays and worth a separate section. Surfing on the pages which has nothing to do with your goals and expectations can easily kill your time. Be firm with yourself. Decide in advance what precisely you are going to use the web for, and stick to it. Or allow yourself a specific small amount of surfing as a break from the work. If you can't stop yourself surfing or chatting through internet you can try one or more of the followings: • keep your door open as to allow others to see what you are doing. • align the monitor of your computer such that anybody entered the room would be able to see what you are doing with your computer. You definitely won't want anybody see you wasting your time. uninstall chat programs from your office- computer.
Trying to explore the most sophisticated features or capabilities of a software, trying to learn a software which is not of absolute necessity in your field. For example, learning a detailed use of AutoCad will have almost no help (hence a total time waste) for a chemist. Similarly trying to explore all features of PhotoShop is also a time waste if you are not going to deal with photography at professional level. Such software will also have other negative consequences like slowing your computer down. 32.15 Non-stop working for hours at a time. In some cases the students may find themselves studying for very long time periods, say 13 hours, without giving a true break. The common cause is usually the time pressure, or pure delight and fascination. In addition to diminishing level of concentration and efficiency, such work/study habits have other health drawbacks like eye strain (after prolonged use of computers), excessive tiredness, unknown effects to pregnant women, repetative strain injury etc. Although it may be necessary under certain conditions, one can, and indeed must avoid non-stop works. One must develop habits to give regular breaks. You can go ahead and get a cup of coffee, chat with your friends, or better do some physical exercise. Or you can at least do a totally different work like washing the clothes delayed to these break times. Nonstop work till late-night should especially be avoided. No creativity or healthy decision capability is expected from a sleepy person.
References 1. Anderson, J. A., (1987), Communication Research: Issues and Methods, (New York: McGraw-Hill). 2. Babbie, E. R., (1990), Survey Research Methods (2nd ed.), (Belmont, CA: Wadsworth). 3. Babbie, E. R., (1989), the Practice of Social Research (5th ed.),(Belmont, CA: Wadsworth). 4. Backstrom, C. & Hursh-Cesar, G., (1981), Survey Research,(New York: John Wiley). 5. Bogdan, R., & Taylor, S., (1984), Introduction to Qualitative Research Methods (2nd ed.), (New York: John Wiley). 6. Beeville, H., (1985), Audience Ratings, (Hillsdale, NY: Lawrence Erlbaum). 7. Blalock, H. M., (1972), Social Statistics, (New York: McGraw- Hill). 8. Brighton, M., (1981), Data Capture in the 1980s,Communicare, Journal of Communication Science, 2(1), pp. 12-19. 9. Dillman, D., (1978), Mail and Telephone Survey, (New York: John Wiley). 10.Elliot, S. C., (1980), Focus Group Research: A Workbook for Broadcasters, (Washington, DC: National Association of Broadcasters). 11.Endos. P. L., (1974), Data Collection Methods, Mail Survey. In R. Ferber (Ed.), Handbook of Marketing Research, (New York: McGraw-Hill). 12.Fletchedr, J. E., & Wimmer, R. D., (1981), Focus Group Interviews in Radio Research, (Washington, DC: National Association of Broadcasters). 13.Fowler, J. E., (1984), Survey Research Methods, (Beverly Hills, CA: Sage Publications). 14.Fox, R. J., Crask, M. R., & Kim, J., (1989), Mail Survey Response rate. Public Opinion Quarterly, 52(4), pp. 467-491. 15.Cochran, W. G., (1963), Sampling Techniques, (New York: John Wiley). 16.Glenn, N., (1972), Archival data on political Attitudes: Opportunities and Pitfalls, in D. Nimmos and C Bonjean (Eds.), Political Attitudes and Public Opinion, (New York: David McKay). 17.Gorsuch, R. L., (1974), Factor Analysis, (Philadelphia: W.B., Saunders). 18.Hyman, H. H., (1954), Interviewing in Social Research, (Chicago: University of Chicago Press). 19.Kerlinger, F. N., (1986), Foundations of Behavioral Research, (New York: Holt, Rinehart and Winston). 20.Kish, L., (1965), Survey Sampling, (New York: John Wiley). 21.Lavarakas, P. J., (1987), Telephone Survey Methods, Sampling, Selection and Supervision, (Beverly Hills, CA: Sage Publications). 22.Merriam, S. B., (1988), Case Study Research in Education, (San Francisco: Jossy-Bass). 23.Nunnally, J. C., (1978), Psychometric Theory, (New York: McGraw-Hill). 24.Raj, D., (1972), The Design of Sample Surveys, (New York: McGraw-Hill). 25.Rosenthal, R. & Rosnow, R. L., (1969), Artifact in Behavioral Research, (New York: Academic Press). 26.Skinner, B. F., (1953), Science and Human Behavior, (New York: Mamillan).
27.Singer, E., & Presser, S, (Eds.), (1989), Survey Research Methods: A Reader, (Chicago: University of Chicago Press). 28.Sewell, W., & Shaw, M., (1968), Increasing Returns in Mail Surveys, American Sociological Review, 33, 193. 29.Sharp, L., & Frankel, J., (1983), Respondent Burden: A Test of Some Common Assumptions, Public Opinion Quarterly, 47 (1),pp. 36-53. 30.Tayie, S., (2000), Mass Communication Research, (Cairo: Dar EL Nahda El Arabia). 31.Waltizer, M. H. & Wiener P.L., (1978), Research Methods and Analysis: Searching for Relationships, (New York: Harper & Row). 32.Wimmer. R. D. & J. R. Dominick, (1995), Mass Media: An Introduction, (3rd ed.), (Wadsworth, Belmont, CA). 33.Yin, R., (1989). Case Study Research (2nd ed.), (Newbury Park, CA: Sage Publication). 34.Yin, R., Bateman, P., & Moore, G., (1983), Case Studies and Organizational Innovation, (Washington, DC: Cosmos Corporation). Beauchamp, T, Faden, R., Wallace, R. J., & Walters, L. (Eds.). (1982). Ethical Issues in Social Science Research. Baltimore: Johns Hopkins University Press. 35.Bower, R., & de Gasparis, P. (1978). Ethics in Social Research. New York: Praeger. 36.Cook, S. (1976). Ethical Issues in The Conduct of Research in Social Relations. In C. Sellitz, L.Wrightsman, & S. Cook (Eds.), Research methods in social relations. New York: Holt, Rinehart & Wins ton. 37.Elms, A. (1982). Keeping Deception Honest. In T. Beauchamp, R. Faden, R.J. Wallace, & L. Walters (Eds.), Ethical Issues in Social Science Research. Baltimore: Johns Hopkins University Press. 38.Epstein, Y., Suedefeld, P., & Silverstein, S. (1973). The Experimental Contract. American Psychologist, 28,212-121. 39.Fillenbaum, S. (1966). Prior Deception and Subsequent Psychology, 4, pp. 532 - 537. 40.Greenberg, B. S., & Garramone, G. M. (1989). Ethical Issues in Mass Communication Research. In G. H. Stempel & B. H. Westley (Eds.), Research methods in Mass Communication (2nd ed.), Englewood Cliffs, NJ: Prentice-Hall. 41.Kelman, H. (1967). Human Use of Human Subjects: The Problem of Deception in Social Psychological Experiments. Psychological Bulletin, 67, 1—11. 42.Kelman, H. (1982). Ethical Issues in Different Social Science Methods. In T. Beauchamp, R. Faden, R. J. Wallace, & L. Walters (Eds.), Ethical Issues in Social Science Research.Baltimore: Johns Hopkins University Press. 43.www.google.com.


