Embed Size (px)
Citation preview
Report on the Police Department Staffing Study
SAN FRANCISCO, CALIFORNIA
March 4, 2020
Report on the Police Department Staffing Analysis San Francisco, CA
Matrix Consulting Group
Table of Contents
Introduction and Executive Summary 1
Overview of Staffing Analysis Methodologies 6
Field Operations Bureau 11
Introduction 11
Administration 14
Patrol Services 18
Foot Beats 41
District Plain Clothes and Homeless Units 56 ]]
District Housing Officers 64 ]]
School Resource Officers 67 ]]
Station Support and Captain’s Staff 70 ]]
Night Shift Captains 72 ]]
Healthy Streets Operations Center (HSOC) 74 ]]
Other Non-District Specialized Units 79
Report on the Police Department Staffing Analysis San Francisco, CA
Matrix Consulting Group
Investigations Bureau 91
Administration 91
Overview of Case Workload and Staffing Methodologies 91
Gang Task Force (GTF) 106
Crime Gun Investigations Center (CGIC) 111
Narcotics Unit 115
Station Investigative Teams (SIT) 119
Burglary Unit 124
Special Victims Unit 126
Night Investigations 129
Traffic Crash Investigations 132
Homicide Investigations 134
Robbery Unit 136
Common Themes and Findings Across Investigative Units 138
Forensic Services Division 141 ]]
Special Investigations Division 141
Special Operations Bureau 153
Overview of Key Considerations in Staffing Needs 153
Administration 154
Municipal Transportation Agency (SFMTA) 154
Report on the Police Department Staffing Analysis San Francisco, CA
Matrix Consulting Group
Traffic Company – Motors 160
SWAT 165
Explosive Ordinance Disposal (EOD Unit) 167 ]]
Canine – Citywide 168 ]]
Mounted, Honda, and Marine Units 170 ]]
Homeland Security, UASI, and DOC 172
Administration Bureau 174
Administration 174
Fleet and Facilities 174
Training Division 178
Staff Services 189
Crime Information Services Unit 201
Strategic Management Bureau 213
Administration 213
Fiscal Division 174
Technology Division 174
Staff Services 189
Report on the Police Department Staffing Analysis San Francisco, CA
Matrix Consulting Group
Chief of Staff 227
Administration 228
Policy and Public Affairs 228
Strategic Communications 229
Office of Risk Management 231
Office of the Chief 251
Summary of Staffing Analysis Results 254
Report on the Police Department Staffing Analysis San Francisco, CA
Matrix Consulting Group 1
1. Introduction and Executive Summary
(1) Background to the Study
In October 2016, the United States Department of Justice (DOJ) issued a report on the Collaborative Reform Initiative (CRI) of the San Francisco Police Department (SFPD) that included the recommendation of developing a Strategic Plan. In addition, as SFPD approached its charter-mandated staffing levels of 1,971 sworn personnel, the city sought a new methodology for determining its appropriate staffing levels. As a result of these two areas of interest, the city commissioned this study with the support of Board of Supervisors President Norman Yee.
The study has been conducted during a period for major growth and change in San Francisco that is anticipated to continue into the future. This evolution has brought a dynamic environment and new public safety challenges to the city, requiring the San Francisco Police Department to adapt in order to maintain its service commitments to the community. This study is designed to aid in that process by providing a review of the department and opportunities to enhance how it
The scope of the study encompasses every bureau and division of the department excluding the Airport Bureau, examining each unit and work group individually. The study is focused around four areas of analysis in particular in order to provide the Department with strategies to plan for and adapt to the city’s growth:
• Development of a comprehensive understanding of the San Francisco Police Department and its staffing, operations, organization, and workload.
• Analysis of operations management and organization, which examines current
management techniques, and identifies opportunities for improvement based on best practices. Examples of this include management of cases in criminal investigations and department civilianization opportunities.
• Evaluation of staffing needs for every SFPD unit and assignment category,
through a comprehensive analysis of staff availability, workload, service objectives, and staffing factors.
• Creation of an interactive staffing tool that enables the department to perform
the staffing analysis in the future as needs evolve over time, providing data-driven methodologies for allocating staffing resources.
Report on the Police Department Staffing Analysis San Francisco, CA
Matrix Consulting Group 2
In summary, the study is designed to ensure that the current organization is an effective base upon which to build as San Francisco changes in ways that cannot be foreseen now.
(2) Approaches Utilized in the Study
The project team utilized a number of approaches in order to fully understand the service environment and issues relevant to the study, including the following:
• On-site interviews with SFPD leadership, managers in each departmental functional area, many unit supervisors and line staff throughout the Department. There was also specific input from the San Francisco Police Officers’ Association at the initiation of the project.
• External meetings were also held with Supervisor Yee, the Controller’s Office,
the District Attorney’s Office and others. • Data collection and analysis across every service area in order to understand
workloads, staff availability, and staffing needs. • Iterative and interactive process in which the consultants reviewed findings at
several levels within the department and city, including the Police Commission, an internal steering committee within SFPD as well as the executive team, Supervisor Yee, representatives from the Mayor’s Office, and the Staffing Task Force, which is comprised of representatives from the Controller’s Office and community members.
The final report represents the culmination of this process, presenting the results of our analysis, including specific recommendations for the department on staffing, organization, and operations management.
(3) Summary of Key Findings and Recommendations
The following presents a summarized list of the most critical findings and recommendations made in the report:
• The department should adopt data-driven approaches for allocating staffing resources and identifying needs. This report identifies workload-based methodologies for determining staffing needs in approximately 48% of total department personnel – including the areas of patrol, foot beats, and investigative units.
• Patrol staffing is severely inadequate to handle incoming community-
generated workload, as evidence by uncommitted (proactive) time in patrol being
Report on the Police Department Staffing Analysis San Francisco, CA
Matrix Consulting Group 3
well below minimal levels. This has lead to extraordinarily long response times to lower-priority calls for service (84 minutes for Priority C). Significant additional staffing is needed to address service level issues, which largely fall into two categories:
– Significant resources in patrol are drawn from patrol to staff the district ‘station keeper’ roles, with the required coverage hours equivalent to about 65 full-time officer positions. To delineate this role separately from patrol, the same number of officers positions will need to be added.
– In addition to the previous recommendation, another 134 officer positions are needed to staff patrol at a level that is able to consistently be able to handle incoming workloads and maintain level of at least 30%. and improve response times to low-priority incidents.
• Significant disparities exist in patrol service levels from district to district:
– Median response times to lower-priority (Priority C) incidents range from 38 minutes to as high as 171 minutes in the Mission District.
– Patrol proactivity (uncommitted time) ranges from as low as -7% in the Tenderloin District to as high as 47% in the Richmond District.
– To address these severe disparities, a data-driven approach to patrol staffing should be adopted that proportionally allocates officers to the districts based on their workload levels.
• Create foot beat assignments through a data-driven methodology that identifies
concentrations of pedestrian activity. The initial zones are then refined as part of a process of commander review and discretion, input from local leaders, and community outreach.
• Combine certain types of non-patrol proactive resources organized at the district
station level, including plain clothes and homeless officers, into a problem-oriented policing team.
• Address deficiencies in investigative case management by acquiring and
implementing case management software. • Reorganize the Special Victims Unit by splitting creating new specialized
investigative units and reallocating certain case types to existing investigative units.
• Centralize K9 resources, which are currently organized under multiple areas of the
police department.
Report on the Police Department Staffing Analysis San Francisco, CA
Matrix Consulting Group 4
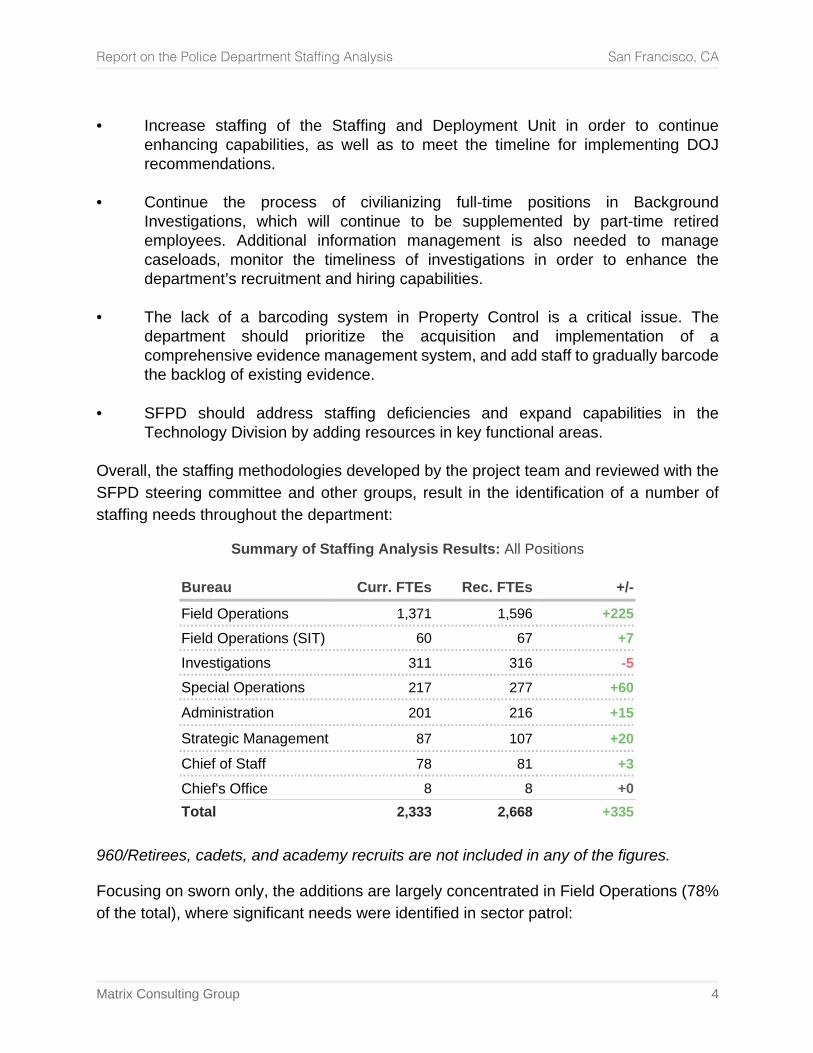
• Increase staffing of the Staffing and Deployment Unit in order to continue
enhancing capabilities, as well as to meet the timeline for implementing DOJ recommendations.
• Continue the process of civilianizing full-time positions in Background
Investigations, which will continue to be supplemented by part-time retired employees. Additional information management is also needed to manage caseloads, monitor the timeliness of investigations in order to enhance the department’s recruitment and hiring capabilities.
• The lack of a barcoding system in Property Control is a critical issue. The
department should prioritize the acquisition and implementation of a comprehensive evidence management system, and add staff to gradually barcode the backlog of existing evidence.
• SFPD should address staffing deficiencies and expand capabilities in the
Technology Division by adding resources in key functional areas. Overall, the staffing methodologies developed by the project team and reviewed with the SFPD steering committee and other groups, result in the identification of a number of staffing needs throughout the department:
Summary of Staffing Analysis Results: All Positions
Bureau Curr. FTEs Rec. FTEs +/-
Field Operations 1,371 1,596 +225 Field Operations (SIT) 60 67 +7 Investigations 311 316 -5 Special Operations 217 277 +60 Administration 201 216 +15
Strategic Management 87 107 +20 Chief of Staff 78 81 +3 Chief's Office 8 8 +0 Total 2,333 2,668 +335
960/Retirees, cadets, and academy recruits are not included in any of the figures.
Focusing on sworn only, the additions are largely concentrated in Field Operations (78% of the total), where significant needs were identified in sector patrol:
Report on the Police Department Staffing Analysis San Francisco, CA
Matrix Consulting Group 5
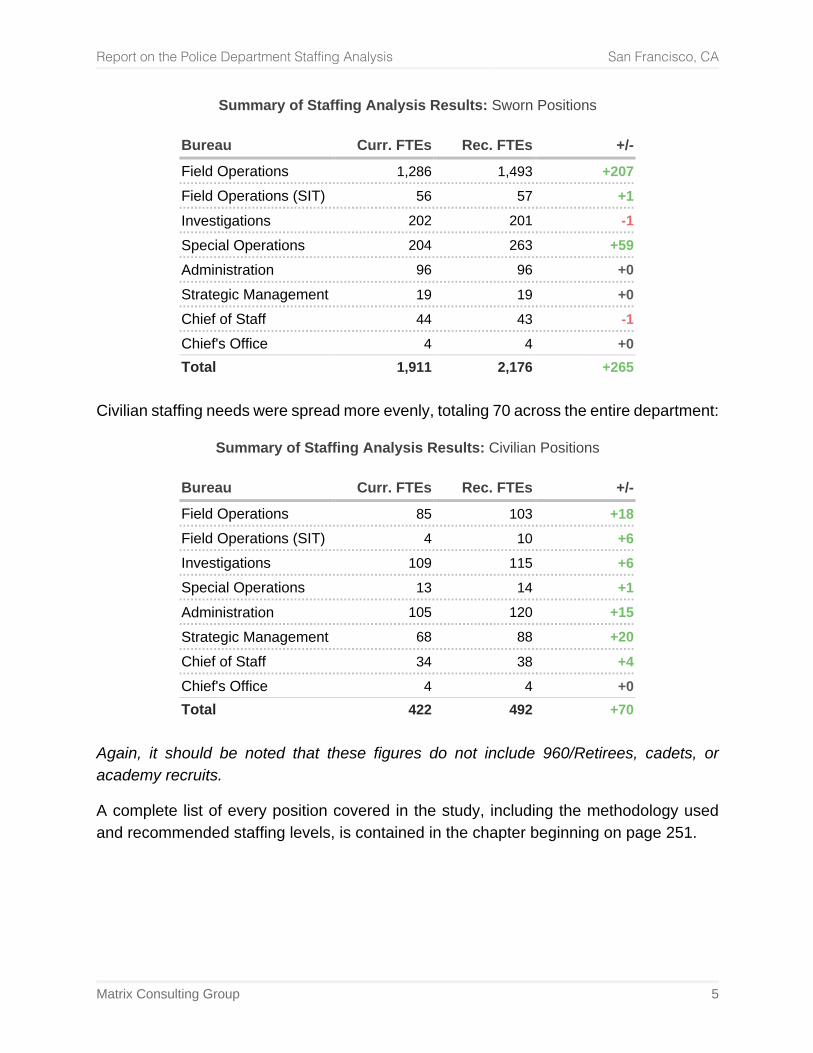
Summary of Staffing Analysis Results: Sworn Positions
Bureau Curr. FTEs Rec. FTEs +/- Field Operations 1,286 1,493 +207 Field Operations (SIT) 56 57 +1 Investigations 202 201 -1 Special Operations 204 263 +59 Administration 96 96 +0 Strategic Management 19 19 +0 Chief of Staff 44 43 -1 Chief's Office 4 4 +0 Total 1,911 2,176 +265
Civilian staffing needs were spread more evenly, totaling 70 across the entire department:
Summary of Staffing Analysis Results: Civilian Positions
Bureau Curr. FTEs Rec. FTEs +/- Field Operations 85 103 +18 Field Operations (SIT) 4 10 +6 Investigations 109 115 +6 Special Operations 13 14 +1 Administration 105 120 +15 Strategic Management 68 88 +20 Chief of Staff 34 38 +4 Chief's Office 4 4 +0 Total 422 492 +70
Again, it should be noted that these figures do not include 960/Retirees, cadets, or academy recruits.
A complete list of every position covered in the study, including the methodology used and recommended staffing levels, is contained in the chapter beginning on page 251.
Report on the Police Department Staffing Analysis San Francisco, CA
Matrix Consulting Group 6
2. Overview of Staffing Analysis Methodologies
At the core of the analysis is the identification of staffing needs for every position and unit within the department. Each assignment is assigned a methodology, from which staffing needs are calculated. In the interactive tool, as service needs change in the future, the staffing needs are updated using the same methodological framework that was used before.
(1) Primary Aims in Determining Staffing Methodologies
Given the challenges of creating a system that calculates staffing needs using valid approaches both today and into the future, the following objectives and attributes were prioritized:
• Prioritization Data-Driven Methods: For as high of a percentage of the positions in the department as possible, the analysis should quantitatively demonstrate the relationship between workloads and staffing needs. As a result, workload-based methodologies are prioritized and used where data is available to conduct it.
• Flexibility: Parameters should have the space to be adjusted and re-weighted as
factors change in the future. Additionally, there should be space for commander discretion, as well as community or city-driven priorities, to either determine or override staffing needs for positions. This is particularly true for proactive, discretionary resources.
• Replicability: The study is designed to provide the department with an interactive
tool to evaluate staffing needs in the future using the same methodologies shown in this report. As a result, all calculations and modes of analysis must be replicable. To make this feasible, data collection should not be too onerous, and calculation processes should follow similar steps or are largely automated. This includes: – Minimizing the number of workload variables. For positions with many
miscellaneous tasks, they can be grouped together into an estimated percentage of staff time.
– Standardizing availability figures for different types of position, such as sworn patrol, non-patrol sworn, civilian, etc.
• Uniform Structure: The report and interactive tool evaluate the staffing needs for
over 600 separate assignments in the department. If the structure of their staffing methodologies were completely unique, the model would be exponentially more difficult to work with and to communicate the results from. As a result,
Report on the Police Department Staffing Analysis San Francisco, CA
Matrix Consulting Group 7
methodologies are grouped into categories that follow the same calculation process, albeit with different variables and metrics.
(2) Overview of Staffing Methodology Categories
In order to facilitate the uniformity and replicability, the staffing methodologies for individual positions are grouped into one of five categories. These are referenced throughout the report, form the basis of how the interactive model is structure. The following subsections provide a brief summary of methodology type:
(2.1) Workload-Based Methodologies
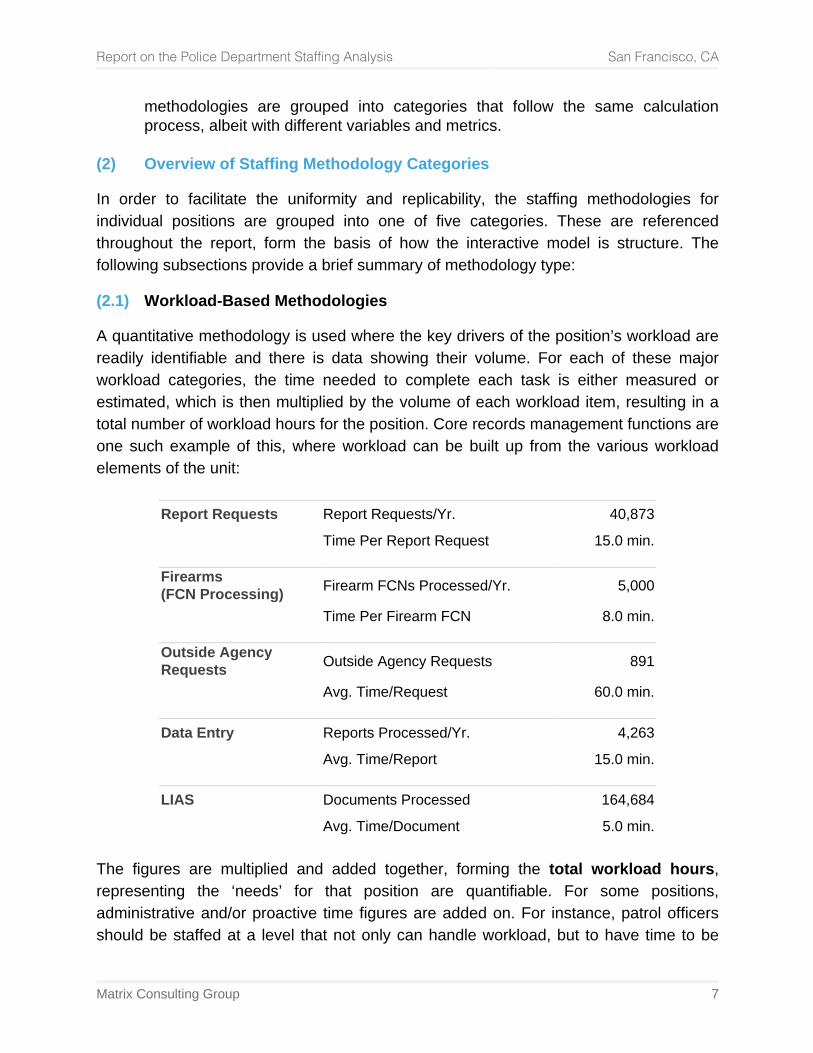
A quantitative methodology is used where the key drivers of the position’s workload are readily identifiable and there is data showing their volume. For each of these major workload categories, the time needed to complete each task is either measured or estimated, which is then multiplied by the volume of each workload item, resulting in a total number of workload hours for the position. Core records management functions are one such example of this, where workload can be built up from the various workload elements of the unit:
Report Requests Report Requests/Yr. 40,873 Time Per Report Request 15.0 min.
Firearms (FCN Processing) Firearm FCNs Processed/Yr. 5,000
Time Per Firearm FCN 8.0 min.
Outside Agency Requests Outside Agency Requests 891
Avg. Time/Request 60.0 min.
Data Entry Reports Processed/Yr. 4,263 Avg. Time/Report 15.0 min.
LIAS Documents Processed 164,684 Avg. Time/Document 5.0 min.
The figures are multiplied and added together, forming the total workload hours, representing the ‘needs’ for that position are quantifiable. For some positions, administrative and/or proactive time figures are added on. For instance, patrol officers should be staffed at a level that not only can handle workload, but to have time to be
Report on the Police Department Staffing Analysis San Francisco, CA
Matrix Consulting Group 8
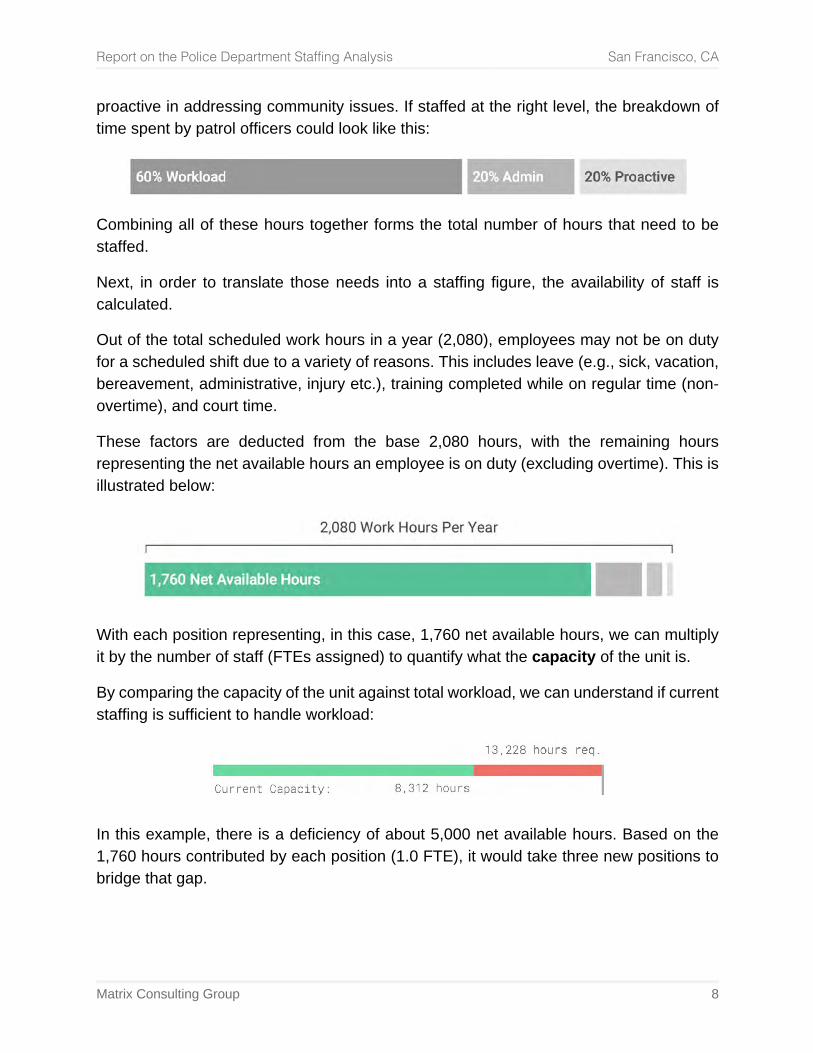
proactive in addressing community issues. If staffed at the right level, the breakdown of time spent by patrol officers could look like this:
Combining all of these hours together forms the total number of hours that need to be staffed.
Next, in order to translate those needs into a staffing figure, the availability of staff is calculated.
Out of the total scheduled work hours in a year (2,080), employees may not be on duty for a scheduled shift due to a variety of reasons. This includes leave (e.g., sick, vacation, bereavement, administrative, injury etc.), training completed while on regular time (non-overtime), and court time.
These factors are deducted from the base 2,080 hours, with the remaining hours representing the net available hours an employee is on duty (excluding overtime). This is illustrated below:
With each position representing, in this case, 1,760 net available hours, we can multiply it by the number of staff (FTEs assigned) to quantify what the capacity of the unit is.
By comparing the capacity of the unit against total workload, we can understand if current staffing is sufficient to handle workload:
In this example, there is a deficiency of about 5,000 net available hours. Based on the 1,760 hours contributed by each position (1.0 FTE), it would take three new positions to bridge that gap.
Report on the Police Department Staffing Analysis San Francisco, CA
Matrix Consulting Group 9
(2.2) Ratio-based Methodologies
The staffing needs of many units are tied in relation to something else – whether it is the number of staff in a unit, an external or environmental variable, or the number of staff they supervise. For instance, the number of officers assigned to the Basic Recruit Course (police academy) scales based on the number of recruits being trained at a time, which in turn is guided by POST mandates for instructor-to-student ratios. Other common examples of ratio-based positions include:
• Span of control: Supervisors scale based on the targeted number of direct reports for that function. Example: Patrol sergeant staffing has been calculated at a ratio of 1 sergeant for every 6 officers.
• Support to other staff: A position that supports others, and increasing the size of the unit increases workload and staffing needs. This also includes functions that support the entire department. Example: Human Resources is calculated as a group relative to total agency staffing, since they support the entire department.
• Ratio based on other variables: Any type of quantitative comparison to staffing needs, such as minimum instructor-to-student ratios, environmental factors like the number of Part I crimes, number of vacancies in the department, etc. Example: School resource officers scale in relation to the number of high schools, with additional assigned or shared with other schools based on student body population.
(2.3) Non-Scalable Methodologies
For many positions, it is not feasible to tie staffing needs to variables or quantitative methodologies. These can be grouped into a few sub-categories:
• Selective: The position, while not necessarily an essential or core function of the department, is established to produce a particular capability (e.g., a robust video production team) or to affect public safety environment (e.g., crime reduction units). Where appropriate, functions or positions within SFPD that exist in other agencies of like size are annotated. Example: Analysts in the Budget Unit, where expansion of the unit is recommended in order to broaden its functionality and capabilities.
• Unique: Position occupies a unique role that, within the general frame of the analysis, will not scale. Department executives are examples of unique/non-scalable positions. Example: The chief of police, as well as all and executives over a bureau or division.
Report on the Police Department Staffing Analysis San Francisco, CA
Matrix Consulting Group 10
An additional sub-category is listed in the report, “Needs-based assessment”, refers to a position where a one-time staffing analysis was conducted by the project team, and steps should be taken to make it possible to conduct a workload-based assessment in the future once additional metrics and are tracked.
(2.4) Fixed Hours Methodology
A position whose staffing needs are based on a fixed number of hours that need to be staffed for. For instance, while SWAT Team size is determined from the number needed to comprise a fully functional team, the number of teams – and consequently, the total number of staff needed – is based on the number of hours per day that SWAT teams should be on duty for. The same is true for K9 coverage.
(3) Distribution of Methodology Types Used
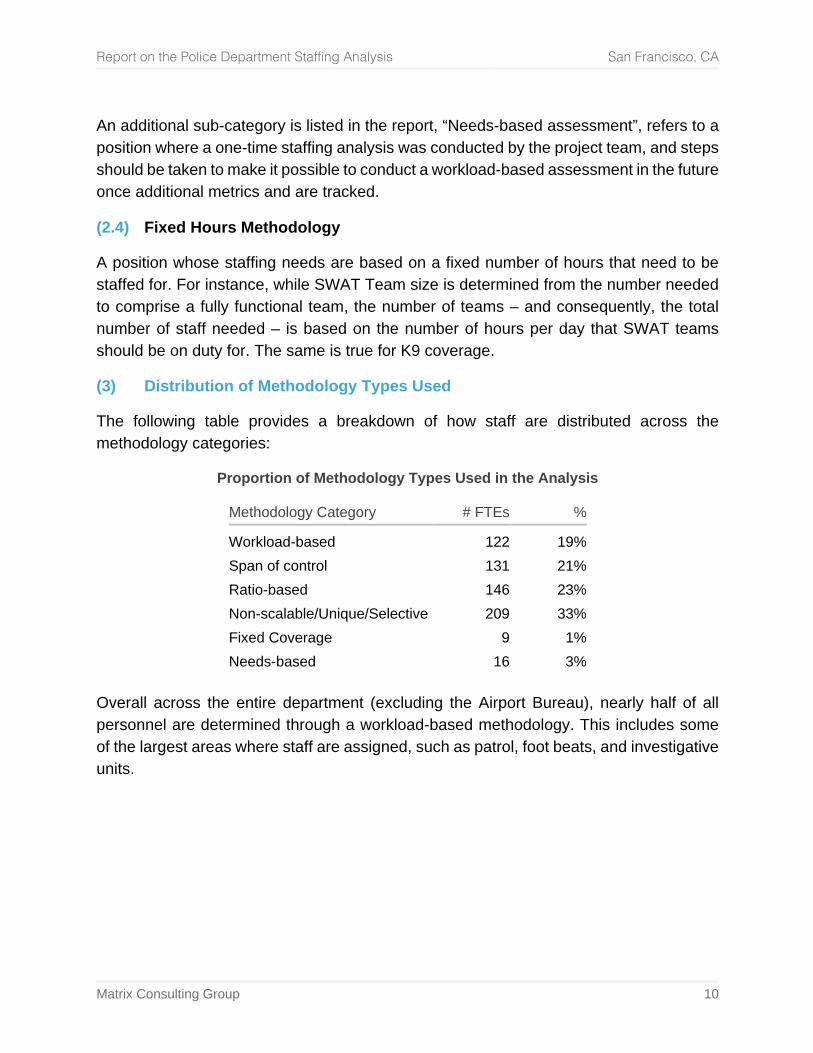
The following table provides a breakdown of how staff are distributed across the methodology categories:
Proportion of Methodology Types Used in the Analysis
Methodology Category # FTEs %
Workload-based 122 19% Span of control 131 21% Ratio-based 146 23% Non-scalable/Unique/Selective 209 33% Fixed Coverage 9 1% Needs-based 16 3%
Overall across the entire department (excluding the Airport Bureau), nearly half of all personnel are determined through a workload-based methodology. This includes some of the largest areas where staff are assigned, such as patrol, foot beats, and investigative units.
Report on the Police Department Staffing Analysis San Francisco, CA
Matrix Consulting Group 11
3. Field Operations Bureau
1. Introduction
The following chapter presents analysis of all functions within the Field Operations Bureau, including patrol, foot beats, and district station proactive teams. Each section outlines the methodological process used by the project team to determine staffing needs for each function, using workload-based approaches when feasible.
It is important to note that that the decentralized station investigation teams (SIT) are not included in this analysis, as they have been covered within the Investigations Bureau phase of the study.
For many positions, staffing needs directly relate to specific workloads that can be measured. For patrol, incoming calls for service and associated workloads are an important factor in determining staffing needs, using it as a basis to determine how much time there is available to be proactive.
(1.1) Net Availability
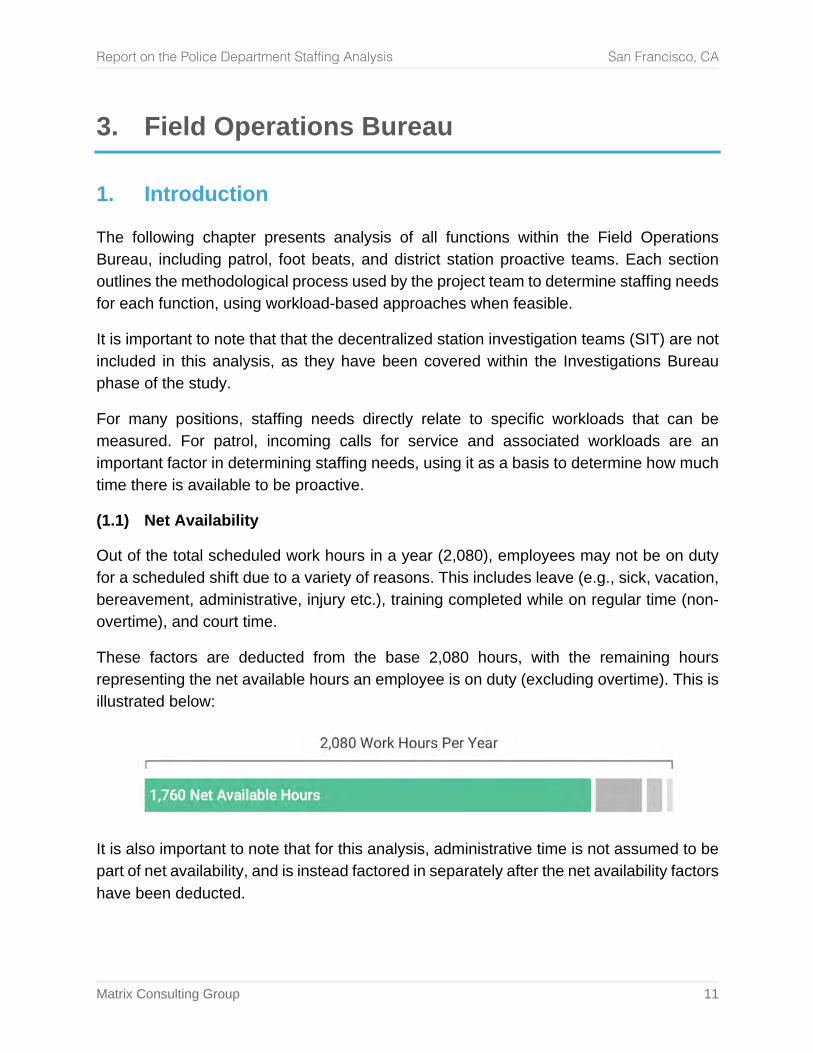
Out of the total scheduled work hours in a year (2,080), employees may not be on duty for a scheduled shift due to a variety of reasons. This includes leave (e.g., sick, vacation, bereavement, administrative, injury etc.), training completed while on regular time (non-overtime), and court time.
These factors are deducted from the base 2,080 hours, with the remaining hours representing the net available hours an employee is on duty (excluding overtime). This is illustrated below:
It is also important to note that for this analysis, administrative time is not assumed to be part of net availability, and is instead factored in separately after the net availability factors have been deducted.
Report on the Police Department Staffing Analysis San Francisco, CA
Matrix Consulting Group 12
(1.2) Administrative Time
Administrative time includes duties that are not tied to specific workloads, may be too individually minor to be used as a workload metric, or represent activities that form part of a regular workday that scale according to the number of employees, rather than specific service need. At a macro level, for instance, the time that is spent on a unit meeting scales primarily in accordance with the number of staff that attended.
The definition of administrative time for various units can be interpreted broadly, but generally reflects ancillary and supporting workload augmenting core business activities. Examples of administrative time include, but are not limited to the following activities:
• Time spent by staff performing training for other personnel (e.g., range officer).
• Formal meetings conducted as part of committees, special teams, in task forces, ad-hoc group sessions, etc.
• Informal discussions, or ‘desk time’ with colleagues.
• Supporting duties or special assignments designed to facilitate effective department operations (e.g., Explorer Representative).
• Downtime in between completing tasks
• Breaks, including meals, bathroom, and miscellaneous
• Interface with partnering agencies such as public works, health services, dispatch, etc., in order to provide services.
• Maintaining databases reflective of key performance indicators for unit operations.
This list reflects examples of administrative time and should be juxtaposed against the activities included under the proactive time category for each particular unit.
(1.3) Proactive Time
Proactive time includes all activities not counted under administrative time that are not directly tied to a reactive workload, such as assigned cases. it represents the leftover time after investigative and administrative workloads have been handled. Often, proactive time is oriented around achieving a certain outcome (e.g., crime reduction), service level objective, or completion of a larger project.
Activities that are included under the proactive time factor are different for each unit, although they generally share similar characteristics. Descriptions and examples of activities included under proactive time are listed for each unit individually.
Report on the Police Department Staffing Analysis San Francisco, CA
Matrix Consulting Group 13
In the staffing analysis, proactive time is assumed as a factors that comprises a certain percentage of net available time, alongside the administrative time factor.
(1.4) Core Workloads for Field Operations
Core Workloads for functional units within Field Operations varies dependent upon a number of variables. Key workload variables influencing Field Operations include, but are not limited to the following:
• Community-generated Calls for Service (CFS): Reflects telephone (or text) calls from the community via 911, 311, 7-digit telephone line, or another source.
• Volume of Events/Responses: The actual number of events. This can include
number of students, number of homeless, number of pedestrians, number of businesses, etc.
• Location of Events/Responses: The actual geographic area or facility where the
event/response occurs. This could be a high school, a certain route in which a foot beat is walked to interact with pedestrians and businesses, a patrol unit deployment location, a low income housing unit, etc.
• Workload Per Event and Service Level Expectations: The appropriate time
required to handle or resolve the event is also a strong workload consideration. This could range from reactive responses to 311 calls to the amount of effort required proactively to address special needs clientele upon contact (e.g. homeless service support initiative).
(1.5) Combining the Factors to Determine Staffing Needs
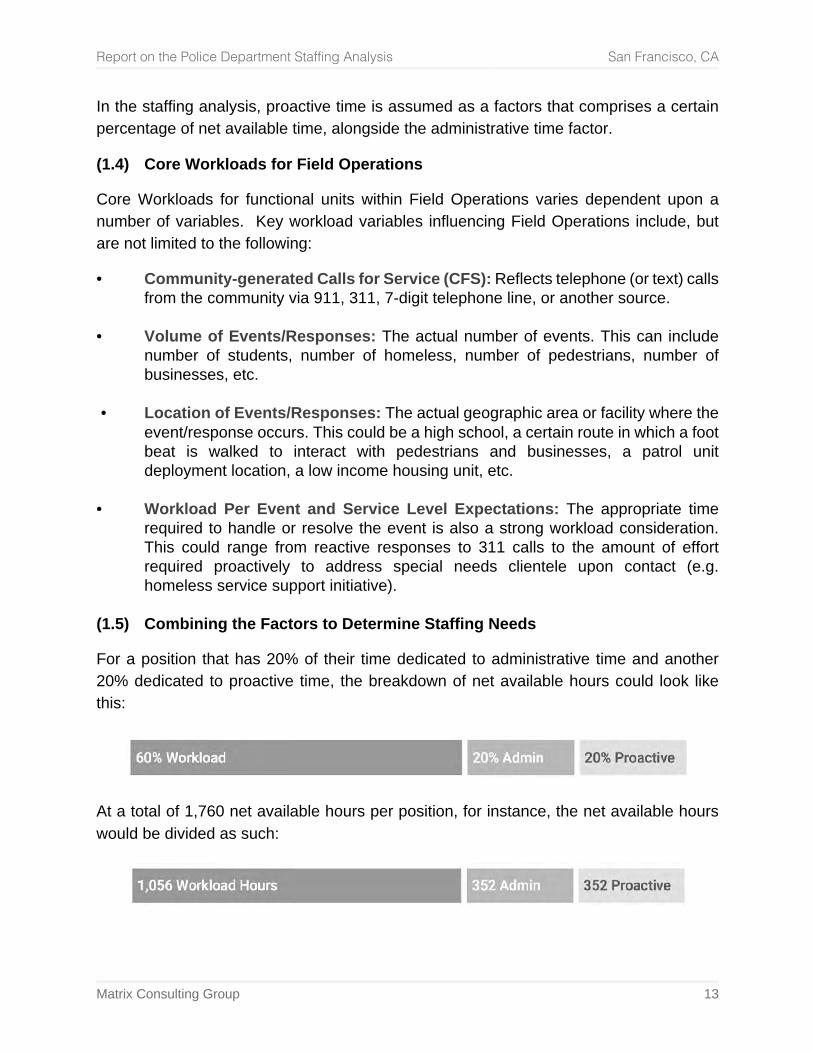
For a position that has 20% of their time dedicated to administrative time and another 20% dedicated to proactive time, the breakdown of net available hours could look like this:
At a total of 1,760 net available hours per position, for instance, the net available hours would be divided as such:
Report on the Police Department Staffing Analysis San Francisco, CA
Matrix Consulting Group 14
2. Administration
1. Assistant Chief of Operations
The Assistant Chief is not within the Field Operations Bureau, but instead reports directly to the Chief of Police. The Deputy Chief positions over the Field Operations Bureau, Special Operations Bureau, Investigative Bureau, and Airport Bureau are direct reports.
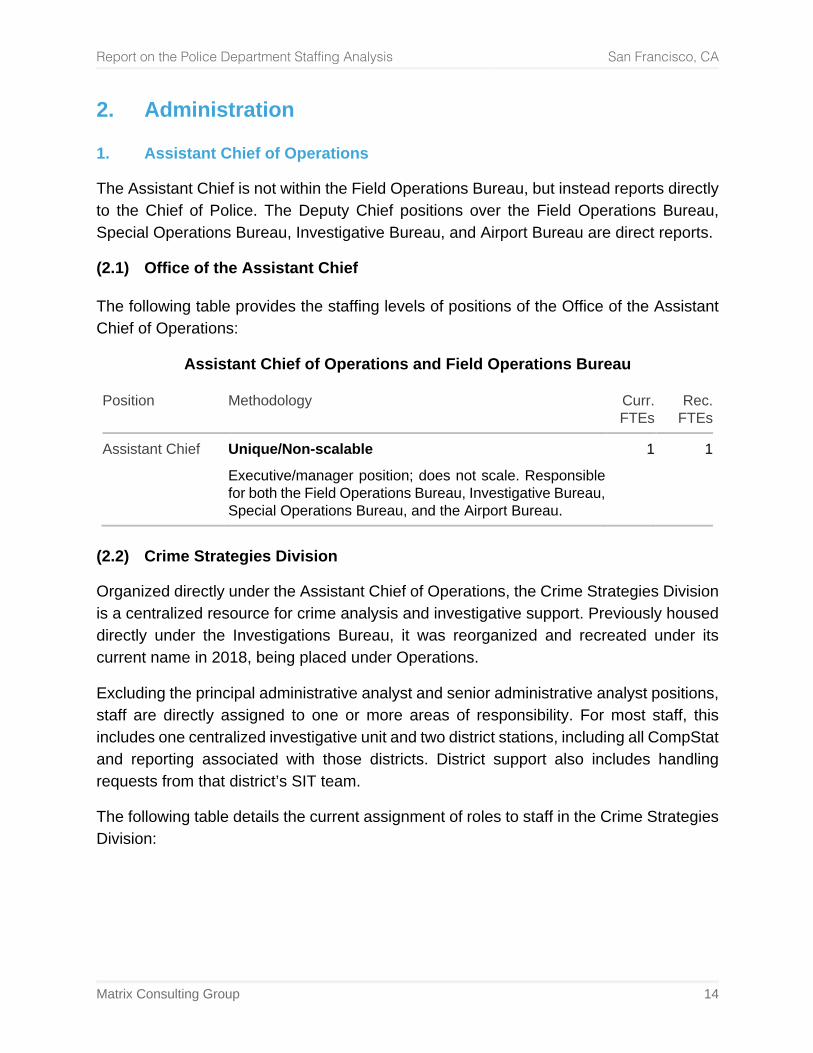
(2.1) Office of the Assistant Chief The following table provides the staffing levels of positions of the Office of the Assistant Chief of Operations:
Assistant Chief of Operations and Field Operations Bureau
Position Methodology Curr. FTEs
Rec. FTEs
Assistant Chief
Unique/Non-scalable
Executive/manager position; does not scale. Responsible for both the Field Operations Bureau, Investigative Bureau, Special Operations Bureau, and the Airport Bureau.
1 1
(2.2) Crime Strategies Division
Organized directly under the Assistant Chief of Operations, the Crime Strategies Division is a centralized resource for crime analysis and investigative support. Previously housed directly under the Investigations Bureau, it was reorganized and recreated under its current name in 2018, being placed under Operations.
Excluding the principal administrative analyst and senior administrative analyst positions, staff are directly assigned to one or more areas of responsibility. For most staff, this includes one centralized investigative unit and two district stations, including all CompStat and reporting associated with those districts. District support also includes handling requests from that district’s SIT team.
The following table details the current assignment of roles to staff in the Crime Strategies Division:
Report on the Police Department Staffing Analysis San Francisco, CA
Matrix Consulting Group 15
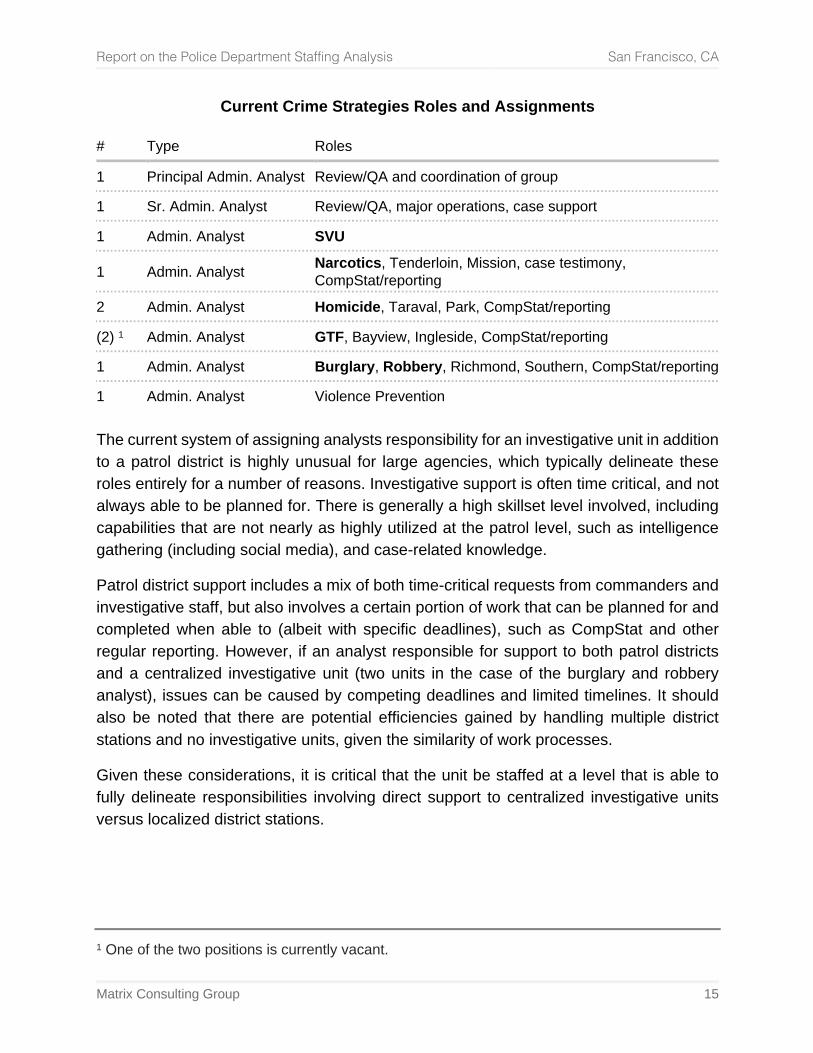
Current Crime Strategies Roles and Assignments
# Type Roles
1 Principal Admin. Analyst Review/QA and coordination of group
1 Sr. Admin. Analyst Review/QA, major operations, case support
1 Admin. Analyst SVU
1 Admin. Analyst Narcotics, Tenderloin, Mission, case testimony, CompStat/reporting
2 Admin. Analyst Homicide, Taraval, Park, CompStat/reporting
(2) 1 Admin. Analyst GTF, Bayview, Ingleside, CompStat/reporting
1 Admin. Analyst Burglary, Robbery, Richmond, Southern, CompStat/reporting
1 Admin. Analyst Violence Prevention The current system of assigning analysts responsibility for an investigative unit in addition to a patrol district is highly unusual for large agencies, which typically delineate these roles entirely for a number of reasons. Investigative support is often time critical, and not always able to be planned for. There is generally a high skillset level involved, including capabilities that are not nearly as highly utilized at the patrol level, such as intelligence gathering (including social media), and case-related knowledge.
Patrol district support includes a mix of both time-critical requests from commanders and investigative staff, but also involves a certain portion of work that can be planned for and completed when able to (albeit with specific deadlines), such as CompStat and other regular reporting. However, if an analyst responsible for support to both patrol districts and a centralized investigative unit (two units in the case of the burglary and robbery analyst), issues can be caused by competing deadlines and limited timelines. It should also be noted that there are potential efficiencies gained by handling multiple district stations and no investigative units, given the similarity of work processes.
Given these considerations, it is critical that the unit be staffed at a level that is able to fully delineate responsibilities involving direct support to centralized investigative units versus localized district stations.
1 One of the two positions is currently vacant.
Report on the Police Department Staffing Analysis San Francisco, CA
Matrix Consulting Group 16
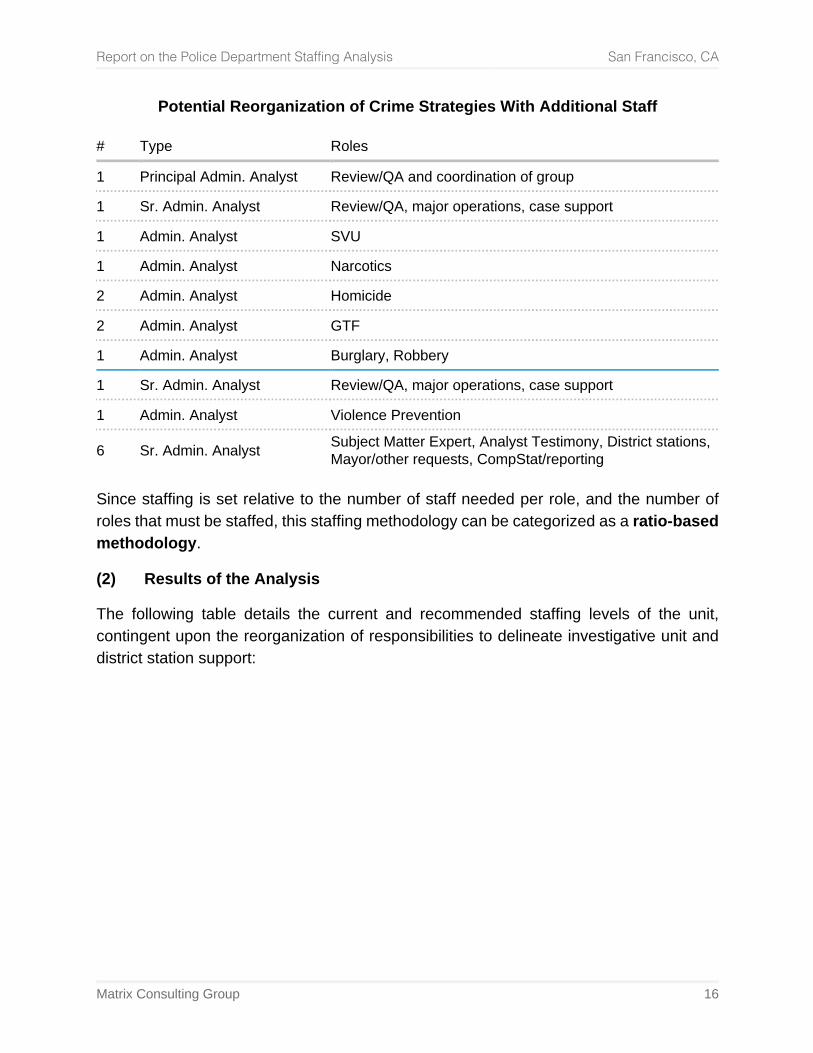
Potential Reorganization of Crime Strategies With Additional Staff
# Type Roles
1 Principal Admin. Analyst Review/QA and coordination of group
1 Sr. Admin. Analyst Review/QA, major operations, case support
1 Admin. Analyst SVU
1 Admin. Analyst Narcotics
2 Admin. Analyst Homicide
2 Admin. Analyst GTF
1 Admin. Analyst Burglary, Robbery
1 Sr. Admin. Analyst Review/QA, major operations, case support
1 Admin. Analyst Violence Prevention
6 Sr. Admin. Analyst Subject Matter Expert, Analyst Testimony, District stations, Mayor/other requests, CompStat/reporting
Since staffing is set relative to the number of staff needed per role, and the number of roles that must be staffed, this staffing methodology can be categorized as a ratio-based methodology.
(2) Results of the Analysis
The following table details the current and recommended staffing levels of the unit, contingent upon the reorganization of responsibilities to delineate investigative unit and district station support:
Report on the Police Department Staffing Analysis San Francisco, CA
Matrix Consulting Group 17
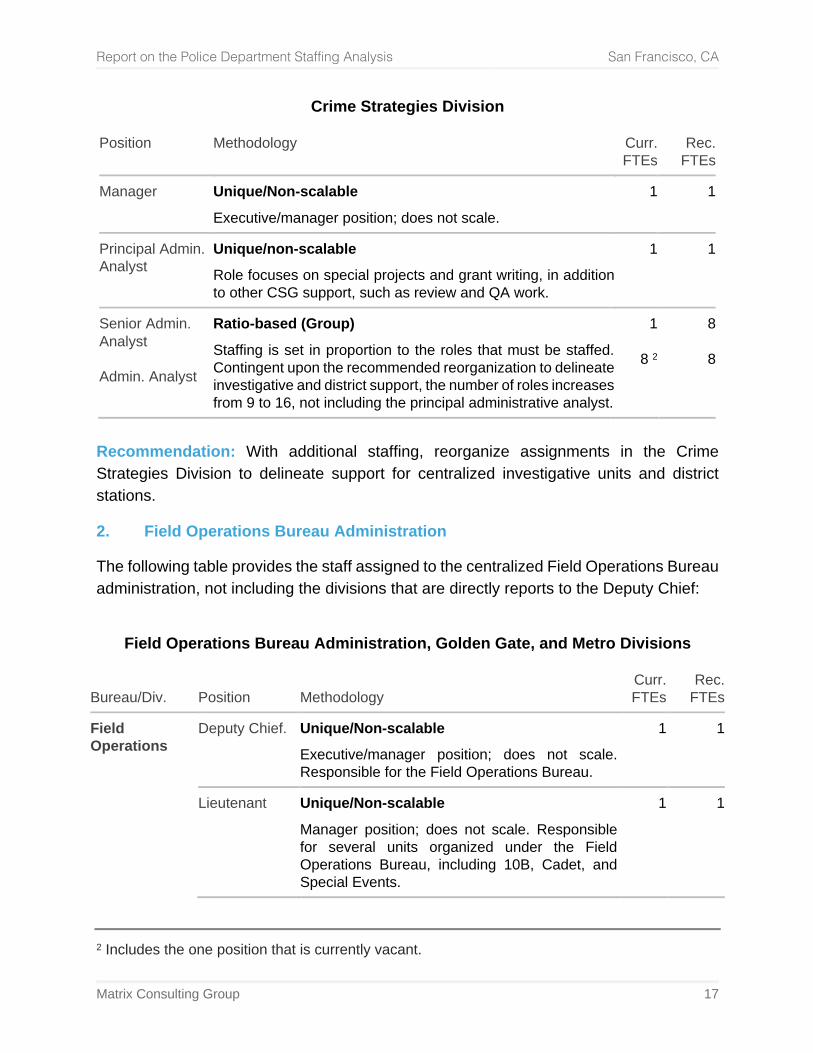
Crime Strategies Division
Position Methodology Curr. FTEs
Rec. FTEs
Manager Unique/Non-scalable
Executive/manager position; does not scale. 1 1
Principal Admin. Analyst
Unique/non-scalable
Role focuses on special projects and grant writing, in addition to other CSG support, such as review and QA work.
1 1
Senior Admin. Analyst Admin. Analyst
Ratio-based (Group)
Staffing is set in proportion to the roles that must be staffed. Contingent upon the recommended reorganization to delineate investigative and district support, the number of roles increases from 9 to 16, not including the principal administrative analyst.
1
8 2
8
8
Recommendation: With additional staffing, reorganize assignments in the Crime Strategies Division to delineate support for centralized investigative units and district stations.
2. Field Operations Bureau Administration
The following table provides the staff assigned to the centralized Field Operations Bureau administration, not including the divisions that are directly reports to the Deputy Chief:
Field Operations Bureau Administration, Golden Gate, and Metro Divisions
Bureau/Div. Position Methodology Curr. FTEs
Rec. FTEs
Field Operations
Deputy Chief.
Unique/Non-scalable
Executive/manager position; does not scale. Responsible for the Field Operations Bureau.
1 1
Lieutenant
Unique/Non-scalable
Manager position; does not scale. Responsible for several units organized under the Field Operations Bureau, including 10B, Cadet, and Special Events.
1 1
2 Includes the one position that is currently vacant.
Report on the Police Department Staffing Analysis San Francisco, CA
Matrix Consulting Group 18
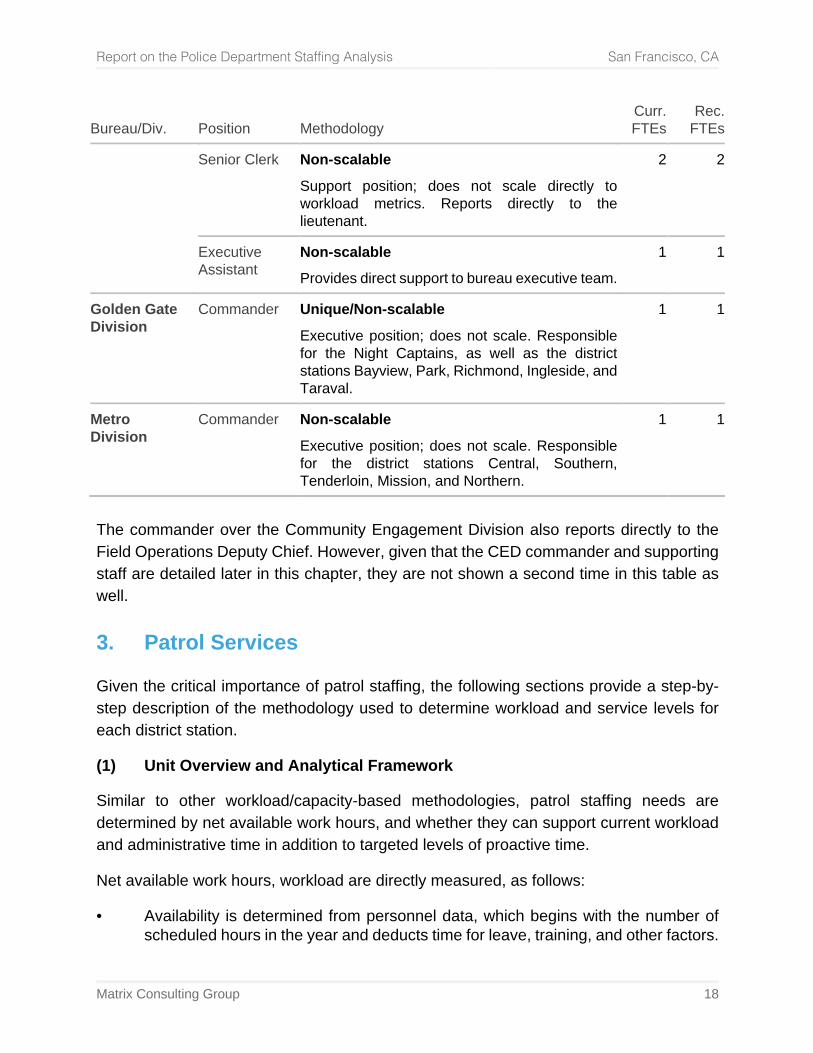
Bureau/Div. Position Methodology Curr. FTEs
Rec. FTEs
Senior Clerk Non-scalable
Support position; does not scale directly to workload metrics. Reports directly to the lieutenant.
2 2
Executive Assistant
Non-scalable
Provides direct support to bureau executive team. 1 1
Golden Gate Division
Commander Unique/Non-scalable
Executive position; does not scale. Responsible for the Night Captains, as well as the district stations Bayview, Park, Richmond, Ingleside, and Taraval.
1 1
Metro Division
Commander Non-scalable
Executive position; does not scale. Responsible for the district stations Central, Southern, Tenderloin, Mission, and Northern.
1 1
The commander over the Community Engagement Division also reports directly to the Field Operations Deputy Chief. However, given that the CED commander and supporting staff are detailed later in this chapter, they are not shown a second time in this table as well.
3. Patrol Services
Given the critical importance of patrol staffing, the following sections provide a step-by-step description of the methodology used to determine workload and service levels for each district station.
(1) Unit Overview and Analytical Framework
Similar to other workload/capacity-based methodologies, patrol staffing needs are determined by net available work hours, and whether they can support current workload and administrative time in addition to targeted levels of proactive time.
Net available work hours, workload are directly measured, as follows:
• Availability is determined from personnel data, which begins with the number of scheduled hours in the year and deducts time for leave, training, and other factors.
Report on the Police Department Staffing Analysis San Francisco, CA
Matrix Consulting Group 19
• Workload hours are calculated from the time spent handling community-generated
calls for service. The total is deducted from net available hours. • Administrative time is estimated through the number of and time spent by patrol
units writing reports, which is combined with the estimated time per shift spent on miscellaneous unit administrative tasks such as shift briefings, meal breaks, etc. The total is deducted from net available hours.
– SFPD does track a significant portion of time spent on administrative functions. However, it was determined through interviews that this likely does not capture the totality of administrative time, and that some inconsistencies may exist from team to team or from station to station that may make it less reliable to use the what is tracked as a measurement of administrative time.
• Proactive (unobligated) time is the result of deducting workload and administrative
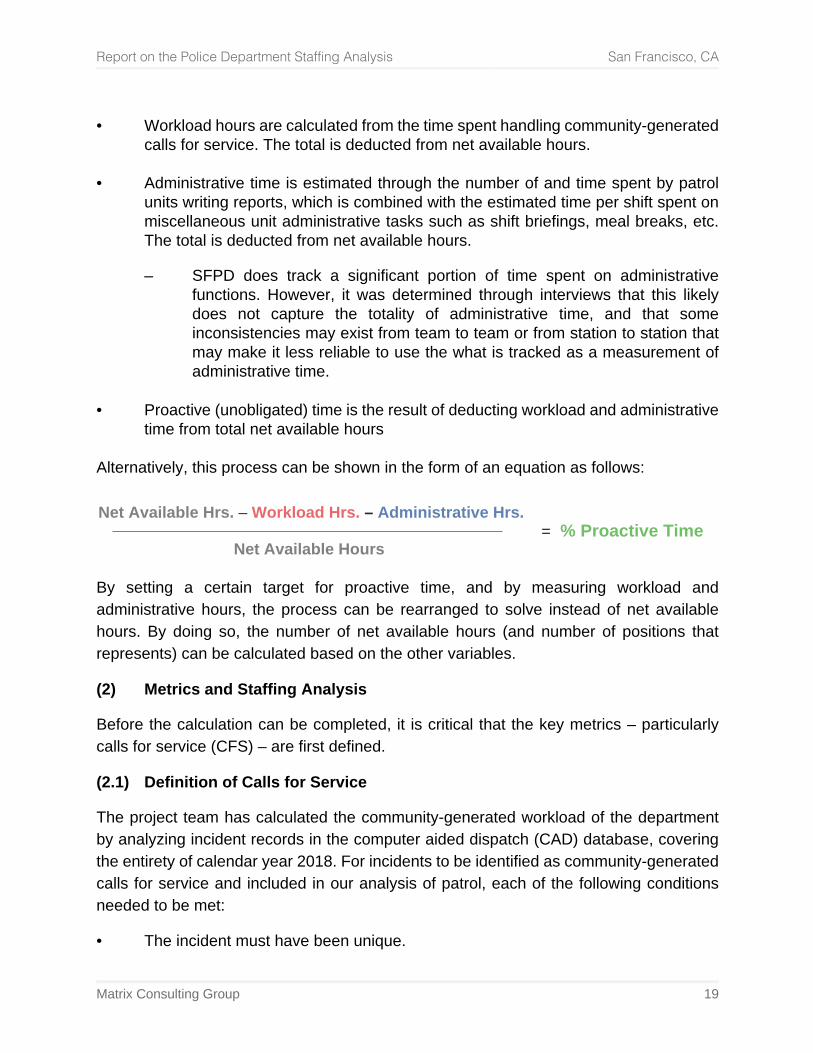
time from total net available hours Alternatively, this process can be shown in the form of an equation as follows:
Net Available Hrs. – Workload Hrs. – Administrative Hrs.
Net Available Hours = % Proactive Time
By setting a certain target for proactive time, and by measuring workload and administrative hours, the process can be rearranged to solve instead of net available hours. By doing so, the number of net available hours (and number of positions that represents) can be calculated based on the other variables.
(2) Metrics and Staffing Analysis
Before the calculation can be completed, it is critical that the key metrics – particularly calls for service (CFS) – are first defined.
(2.1) Definition of Calls for Service
The project team has calculated the community-generated workload of the department by analyzing incident records in the computer aided dispatch (CAD) database, covering the entirety of calendar year 2018. For incidents to be identified as community-generated calls for service and included in our analysis of patrol, each of the following conditions needed to be met:
• The incident must have been unique.
Report on the Police Department Staffing Analysis San Francisco, CA
Matrix Consulting Group 20
• The incident must have first been first created in calendar year 2018. • The incident must have involved at least one officer assigned to patrol, as identified
by the individual unit codes of each response to the call. • The incident type of the event must have sufficiently corresponded to a community-
generated event. Call types that could be identified with a high level of certainty as being either self-initiated (e.g., traffic stops) or other kinds of activity generated by the department (e.g., directed patrol) have not been counted as community-generated calls for service.
• There must have been no major irregularities or issues with the data recorded for
the incident that would prevent sufficient analysis, such as having no unit code or lack of any time stamps.
After filtering through the data using the methodology outlined above, the remaining incidents represent the community-generated calls for service handled by SFPD patrol units.
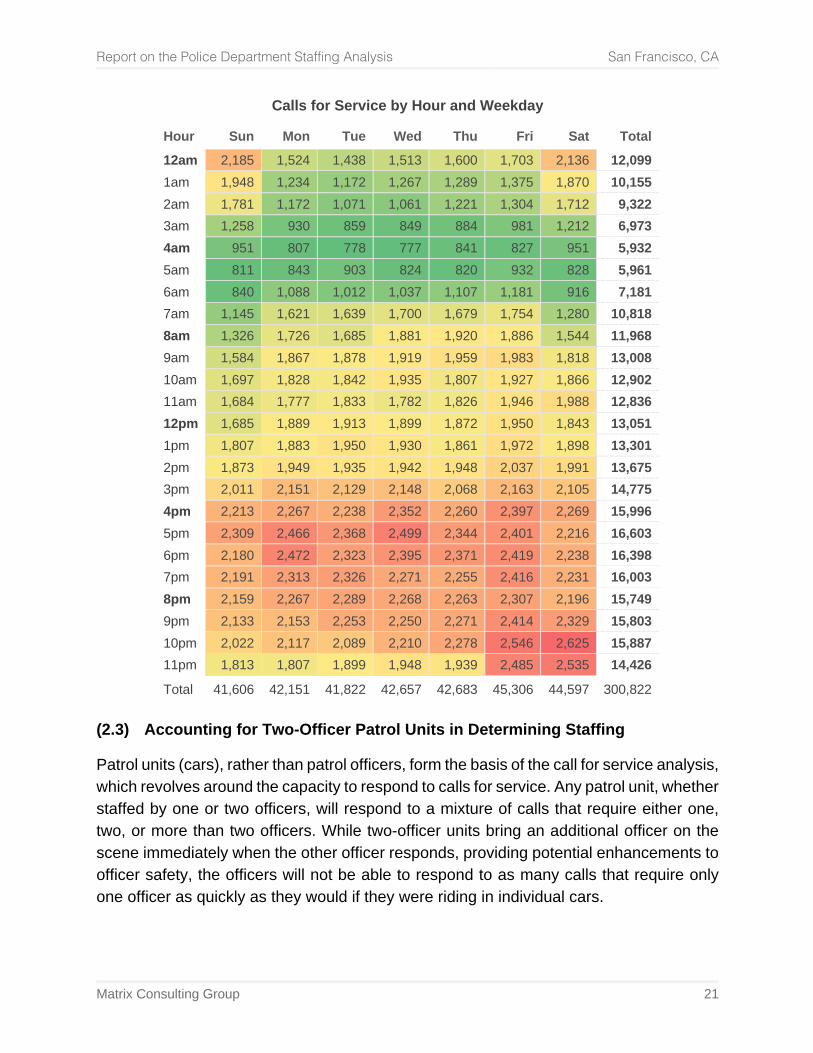
(2.2) Patrol Calls for Service
In total, SFPD patrol units responded to as many as 300,822 calls for service over the past year. The rates at which they occur follow fairly regular patterns throughout the week, as shown in the following table:
Report on the Police Department Staffing Analysis San Francisco, CA
Matrix Consulting Group 21
Calls for Service by Hour and Weekday
Hour Sun Mon Tue Wed Thu Fri Sat Total
12am 2,185 1,524 1,438 1,513 1,600 1,703 2,136 12,099 1am 1,948 1,234 1,172 1,267 1,289 1,375 1,870 10,155 2am 1,781 1,172 1,071 1,061 1,221 1,304 1,712 9,322 3am 1,258 930 859 849 884 981 1,212 6,973 4am 951 807 778 777 841 827 951 5,932 5am 811 843 903 824 820 932 828 5,961 6am 840 1,088 1,012 1,037 1,107 1,181 916 7,181 7am 1,145 1,621 1,639 1,700 1,679 1,754 1,280 10,818 8am 1,326 1,726 1,685 1,881 1,920 1,886 1,544 11,968 9am 1,584 1,867 1,878 1,919 1,959 1,983 1,818 13,008 10am 1,697 1,828 1,842 1,935 1,807 1,927 1,866 12,902 11am 1,684 1,777 1,833 1,782 1,826 1,946 1,988 12,836 12pm 1,685 1,889 1,913 1,899 1,872 1,950 1,843 13,051 1pm 1,807 1,883 1,950 1,930 1,861 1,972 1,898 13,301 2pm 1,873 1,949 1,935 1,942 1,948 2,037 1,991 13,675 3pm 2,011 2,151 2,129 2,148 2,068 2,163 2,105 14,775 4pm 2,213 2,267 2,238 2,352 2,260 2,397 2,269 15,996 5pm 2,309 2,466 2,368 2,499 2,344 2,401 2,216 16,603 6pm 2,180 2,472 2,323 2,395 2,371 2,419 2,238 16,398 7pm 2,191 2,313 2,326 2,271 2,255 2,416 2,231 16,003 8pm 2,159 2,267 2,289 2,268 2,263 2,307 2,196 15,749 9pm 2,133 2,153 2,253 2,250 2,271 2,414 2,329 15,803 10pm 2,022 2,117 2,089 2,210 2,278 2,546 2,625 15,887 11pm 1,813 1,807 1,899 1,948 1,939 2,485 2,535 14,426
Total 41,606 42,151 41,822 42,657 42,683 45,306 44,597 300,822 (2.3) Accounting for Two-Officer Patrol Units in Determining Staffing
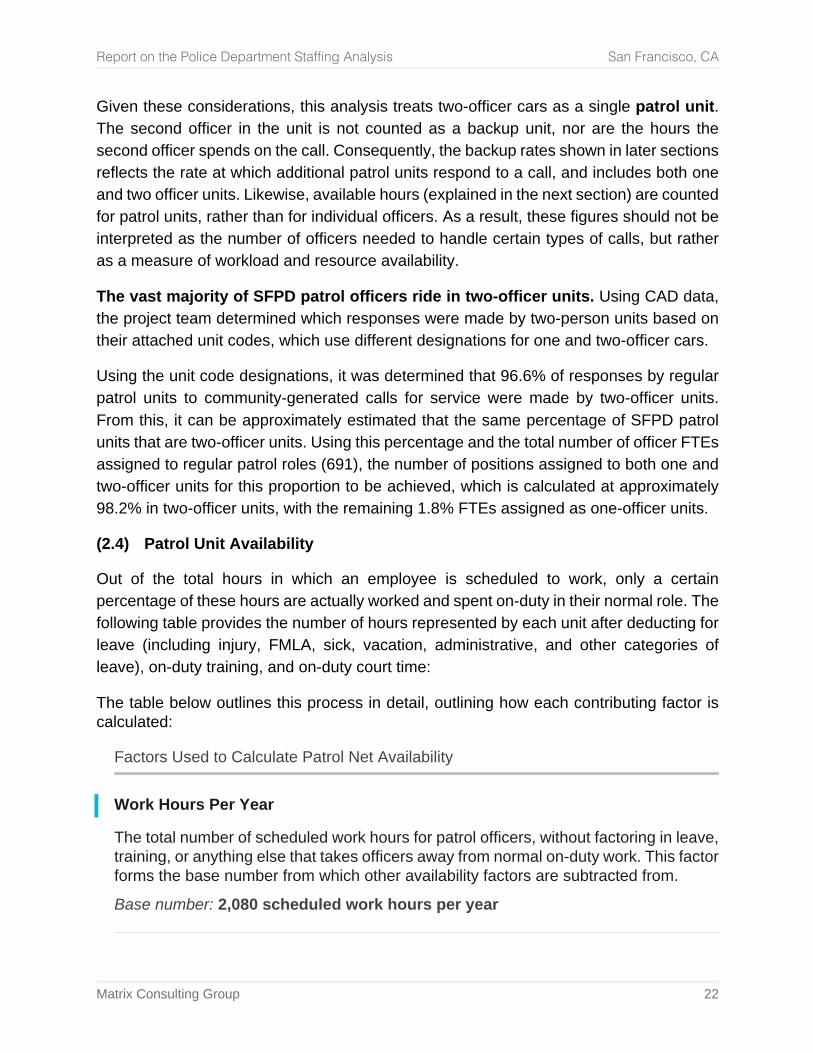
Patrol units (cars), rather than patrol officers, form the basis of the call for service analysis, which revolves around the capacity to respond to calls for service. Any patrol unit, whether staffed by one or two officers, will respond to a mixture of calls that require either one, two, or more than two officers. While two-officer units bring an additional officer on the scene immediately when the other officer responds, providing potential enhancements to officer safety, the officers will not be able to respond to as many calls that require only one officer as quickly as they would if they were riding in individual cars.
Report on the Police Department Staffing Analysis San Francisco, CA
Matrix Consulting Group 22
Given these considerations, this analysis treats two-officer cars as a single patrol unit. The second officer in the unit is not counted as a backup unit, nor are the hours the second officer spends on the call. Consequently, the backup rates shown in later sections reflects the rate at which additional patrol units respond to a call, and includes both one and two officer units. Likewise, available hours (explained in the next section) are counted for patrol units, rather than for individual officers. As a result, these figures should not be interpreted as the number of officers needed to handle certain types of calls, but rather as a measure of workload and resource availability.
The vast majority of SFPD patrol officers ride in two-officer units. Using CAD data, the project team determined which responses were made by two-person units based on their attached unit codes, which use different designations for one and two-officer cars.
Using the unit code designations, it was determined that 96.6% of responses by regular patrol units to community-generated calls for service were made by two-officer units. From this, it can be approximately estimated that the same percentage of SFPD patrol units that are two-officer units. Using this percentage and the total number of officer FTEs assigned to regular patrol roles (691), the number of positions assigned to both one and two-officer units for this proportion to be achieved, which is calculated at approximately 98.2% in two-officer units, with the remaining 1.8% FTEs assigned as one-officer units.
(2.4) Patrol Unit Availability
Out of the total hours in which an employee is scheduled to work, only a certain percentage of these hours are actually worked and spent on-duty in their normal role. The following table provides the number of hours represented by each unit after deducting for leave (including injury, FMLA, sick, vacation, administrative, and other categories of leave), on-duty training, and on-duty court time:
The table below outlines this process in detail, outlining how each contributing factor is calculated:
Factors Used to Calculate Patrol Net Availability
Work Hours Per Year
The total number of scheduled work hours for patrol officers, without factoring in leave, training, or anything else that takes officers away from normal on-duty work. This factor forms the base number from which other availability factors are subtracted from.
Base number: 2,080 scheduled work hours per year
Report on the Police Department Staffing Analysis San Francisco, CA
Matrix Consulting Group 23
Total Leave Hours (subtracted from total work hours per year)
Includes all types of leave, as well as injuries and military leave – anything that would cause officers that are normally scheduled to work on a specific day to instead not be on duty. As a result, this category excludes on-duty training, administrative time, and on-duty court time.
Calculated from SFPD HRMS data: 330 check hours of leave per year On-Duty Court Time (subtracted from total work hours per year)
The total number of hours that each officer spends per year attending court while on duty, including transit time. Court attendance while on overtime is not included in the figure. Without any data recording on-duty court time specifically for patrol officers, the number of hours is estimated based on the experience of the project team.
Estimated: 20 hours of on-duty court time per year
On-Duty Training Time (subtracted from total work hours per year)
The total number of hours spent per year in training that are completed while on-duty and not on overtime. Due to limitations in separating training by assignment and in distinguishing training completed on overtime versus regular time, the number of hours is estimated based on the experience of the project team.
Estimated: 50 hours of on-duty training time per year
Total Net Available Hours
After subtracting the previous factors from the total work hours per year, the remaining hours comprise the total net available hours for officers – the time in which they are available to work after accounting for all leave, on-duty training, court, and administrative time. Net availability can also be expressed as a percentage of the base number of work hours per year.
Calculated by subtracting the previously listed factors from the base number: 1,700 net available hours per patrol unit
Again, it is important to note that, while availability factors are represented individually for officers, the total net available hours per unit is considered on a per-unit basis, with the majority of patrol units being comprised of two officers.
Report on the Police Department Staffing Analysis San Francisco, CA
Matrix Consulting Group 24
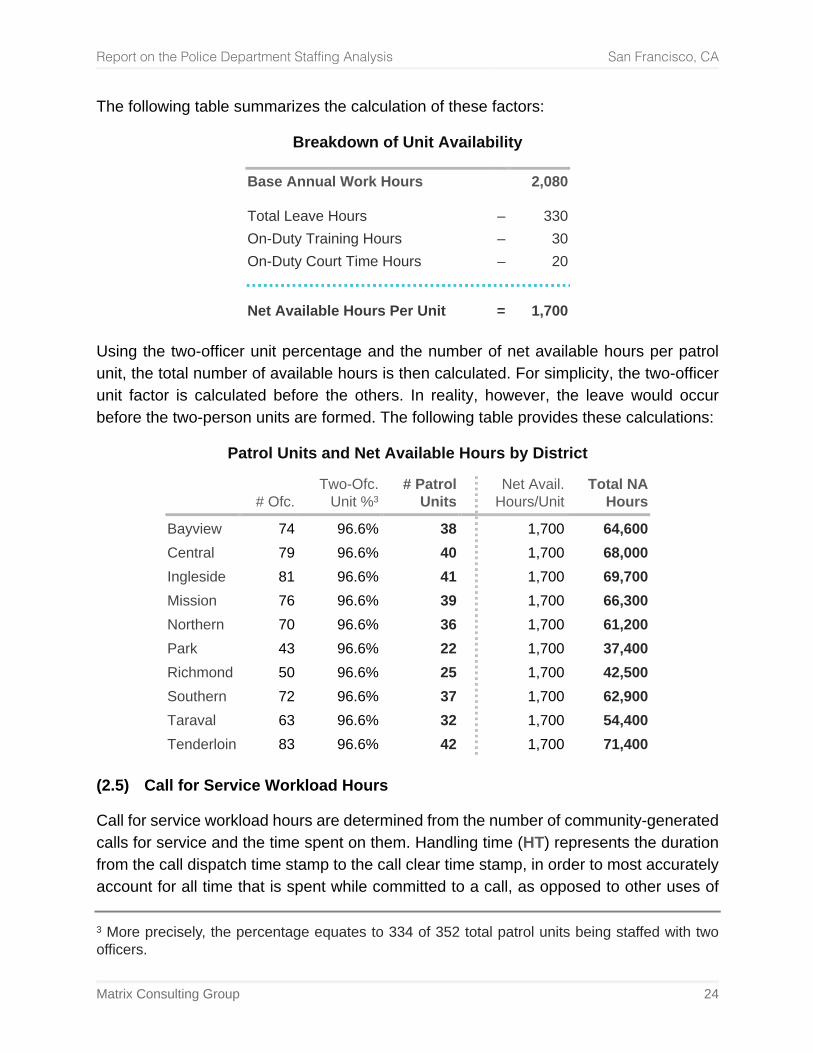
The following table summarizes the calculation of these factors:
Breakdown of Unit Availability
Base Annual Work Hours 2,080
Total Leave Hours – 330 On-Duty Training Hours – 30 On-Duty Court Time Hours – 20
Net Available Hours Per Unit = 1,700 Using the two-officer unit percentage and the number of net available hours per patrol unit, the total number of available hours is then calculated. For simplicity, the two-officer unit factor is calculated before the others. In reality, however, the leave would occur before the two-person units are formed. The following table provides these calculations:
Patrol Units and Net Available Hours by District
# Ofc.
Two-Ofc. Unit %3
# Patrol Units
Net Avail. Hours/Unit
Total NA Hours
Bayview 74 96.6% 38 1,700 64,600 Central 79 96.6% 40 1,700 68,000 Ingleside 81 96.6% 41 1,700 69,700 Mission 76 96.6% 39 1,700 66,300 Northern 70 96.6% 36 1,700 61,200 Park 43 96.6% 22 1,700 37,400 Richmond 50 96.6% 25 1,700 42,500 Southern 72 96.6% 37 1,700 62,900 Taraval 63 96.6% 32 1,700 54,400 Tenderloin 83 96.6% 42 1,700 71,400
(2.5) Call for Service Workload Hours
Call for service workload hours are determined from the number of community-generated calls for service and the time spent on them. Handling time (HT) represents the duration from the call dispatch time stamp to the call clear time stamp, in order to most accurately account for all time that is spent while committed to a call, as opposed to other uses of
3 More precisely, the percentage equates to 334 of 352 total patrol units being staffed with two officers.
Report on the Police Department Staffing Analysis San Francisco, CA
Matrix Consulting Group 25
time. The responding unit that has the highest handling time is labeled as the primary unit. Backup unit (BU) handling time is then also calculated for all units on the call.
In this case, the CAD data only displayed time stamps for the first unit, and as a result, handling time for backup units was estimated at a rate of 75% of the primary unit’s handling time on each individual call – a normative estimate based on the experience of the project team. However, because calls featuring backup unit responses tend to be more severe, and consequently often require higher workloads for personnel on-scene, the average backup unit handling time is actually higher than the overall average for primary units, resulting in an overall average of 55.4 minutes per backup unit response.
The following table presents these calculations, adding together the total workload hours resulting from community-generated calls for service:
Primary and Backup Unit CFS Handling Time Hours by District
# CFS
Avg. HT
Primary Unit Hours
Backup Responses
BU HT
BU Hours
Total CFS Hours
Bayview 22,898 49.7 18,958 14,508 65.2 15,774 34,732 Central 41,739 34.8 24,214 20,199 44.6 15,030 39,244 Ingleside 22,216 54.7 20,255 11,656 78.8 15,316 35,571 Mission 37,999 41.3 26,132 19,894 55.4 18,367 44,500 Northern 35,439 39.1 23,075 13,507 55.0 12,391 35,466 Park 13,684 41.9 9,557 4,107 57.1 3,905 13,462 Richmond 13,804 38.9 8,946 6,237 46.2 4,802 13,747 Southern 34,432 39.3 22,549 15,198 46.4 11,756 34,305 Taraval 21,578 41.3 14,857 12,368 51.6 10,638 25,495 Tenderloin 56,732 37.6 35,543 22,458 56.5 21,132 56,675
(2.6) Administrative Time
Several options for measuring and estimating time spent on administrative time were considered for the analysis. The CAD system includes a 10-7 code for unit activity, corresponding to report writing time or other tasks. Given that units putting themselves on this status includes time stamps for the beginning and end of the event, the 10-7 code is generally able to show the amount of time officers spend on these tasks. However, it was determined through interviews conducted by the project team that this is not universally done in all events of report writing and administrative tasks, and that there were some inconsistencies. For instance, not all meal breaks, other types of breaks, gas filling, and briefings are going to be recorded in CAD. There may also be differences by
Report on the Police Department Staffing Analysis San Francisco, CA
Matrix Consulting Group 26
district station in prevailing practices that affect the rates and types of activity which is generally logged under 10-7 or other unit status codes.
The extremely low amount of time available for SFPD patrol units outside of responding to community-generated calls for service, examined later in this chapter, also complicates this issue somewhat. If officers are going from call to call without break most of the time, their availability to take meal breaks and spend time on other administrative tasks is going to be both limited and fragmented, and can be broken up into many much smaller pieces that may not be logged as 10-7. Consequently, if the eventual goal is to determine staffing needs for patrol based on workload and proactive time targets, using current 10-7 codes for administrative time may not present a true and accurate picture.
While some of these issues are speculative, the combination of questions regarding factors that affect 10-7 time logging led the project team to instead estimate time spent on administrative tasks based on how long they typically take in similarly sized departments, using estimates. As a result, administrative hours have been estimated based on a combination of two time categories:
• Miscellaneous unit administrative time, including meal breaks, briefing, gas time, etc. This is estimated at 90 minutes per shift, with the number of shifts calculated after accounting for leave4.
• Report writing time, which includes time spent on any reports related to
community-generated calls for service. This is determined using the rate of reports per call for service, as well as an estimate of 45 minutes per report.
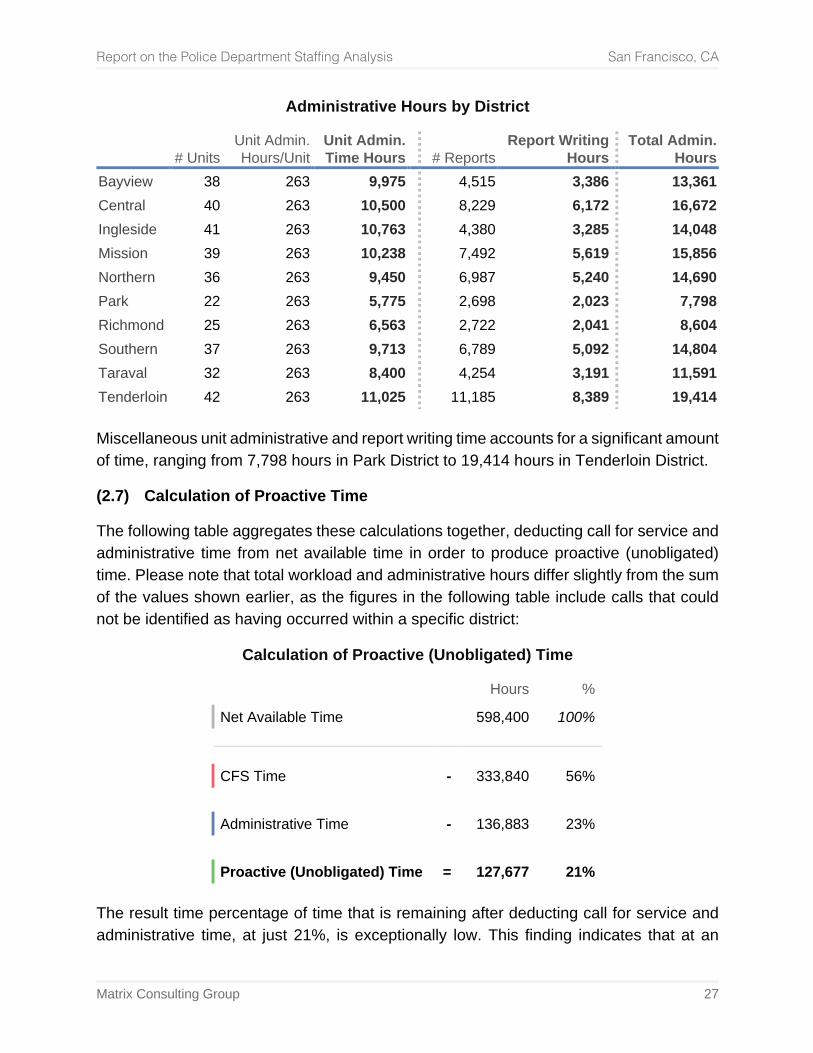
The following table provides these calculations, showing the breakdown of administrative hours estimated for each district station:
4 As stated earlier, SFPD does track a significant portion of time spent on administrative functions. However, it was determined through interviews that this likely does not capture the totality of administrative time, and that some inconsistencies may exist from team to team or from station to station that may make it less reliable to use the what is tracked as a measurement of administrative time.
Report on the Police Department Staffing Analysis San Francisco, CA
Matrix Consulting Group 27
Administrative Hours by District
# Units
Unit Admin. Hours/Unit
Unit Admin. Time Hours
# Reports
Report Writing Hours
Total Admin. Hours
Bayview 38 263 9,975 4,515 3,386 13,361 Central 40 263 10,500 8,229 6,172 16,672 Ingleside 41 263 10,763 4,380 3,285 14,048 Mission 39 263 10,238 7,492 5,619 15,856 Northern 36 263 9,450 6,987 5,240 14,690 Park 22 263 5,775 2,698 2,023 7,798 Richmond 25 263 6,563 2,722 2,041 8,604 Southern 37 263 9,713 6,789 5,092 14,804 Taraval 32 263 8,400 4,254 3,191 11,591 Tenderloin 42 263 11,025 11,185 8,389 19,414 Miscellaneous unit administrative and report writing time accounts for a significant amount of time, ranging from 7,798 hours in Park District to 19,414 hours in Tenderloin District.
(2.7) Calculation of Proactive Time
The following table aggregates these calculations together, deducting call for service and administrative time from net available time in order to produce proactive (unobligated) time. Please note that total workload and administrative hours differ slightly from the sum of the values shown earlier, as the figures in the following table include calls that could not be identified as having occurred within a specific district:
Calculation of Proactive (Unobligated) Time
Hours %
Net Available Time 598,400 100%
CFS Time - 333,840 56%
Administrative Time - 136,883 23%
Proactive (Unobligated) Time = 127,677 21% The result time percentage of time that is remaining after deducting call for service and administrative time, at just 21%, is exceptionally low. This finding indicates that at an
Report on the Police Department Staffing Analysis San Francisco, CA
Matrix Consulting Group 28
overall level, available patrol resources are not sufficient to handle incoming call workloads while retaining sufficient time to be proactive.
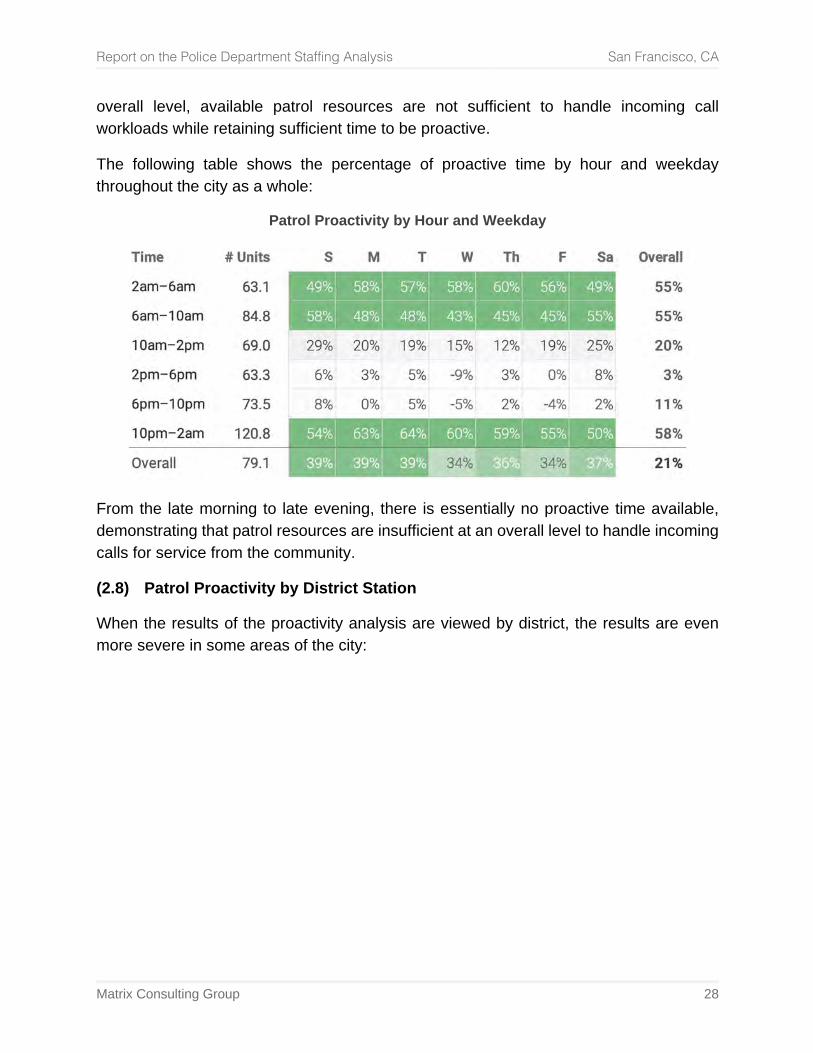
The following table shows the percentage of proactive time by hour and weekday throughout the city as a whole:
Patrol Proactivity by Hour and Weekday
From the late morning to late evening, there is essentially no proactive time available, demonstrating that patrol resources are insufficient at an overall level to handle incoming calls for service from the community.
(2.8) Patrol Proactivity by District Station
When the results of the proactivity analysis are viewed by district, the results are even more severe in some areas of the city:
Report on the Police Department Staffing Analysis San Francisco, CA
Matrix Consulting Group 29
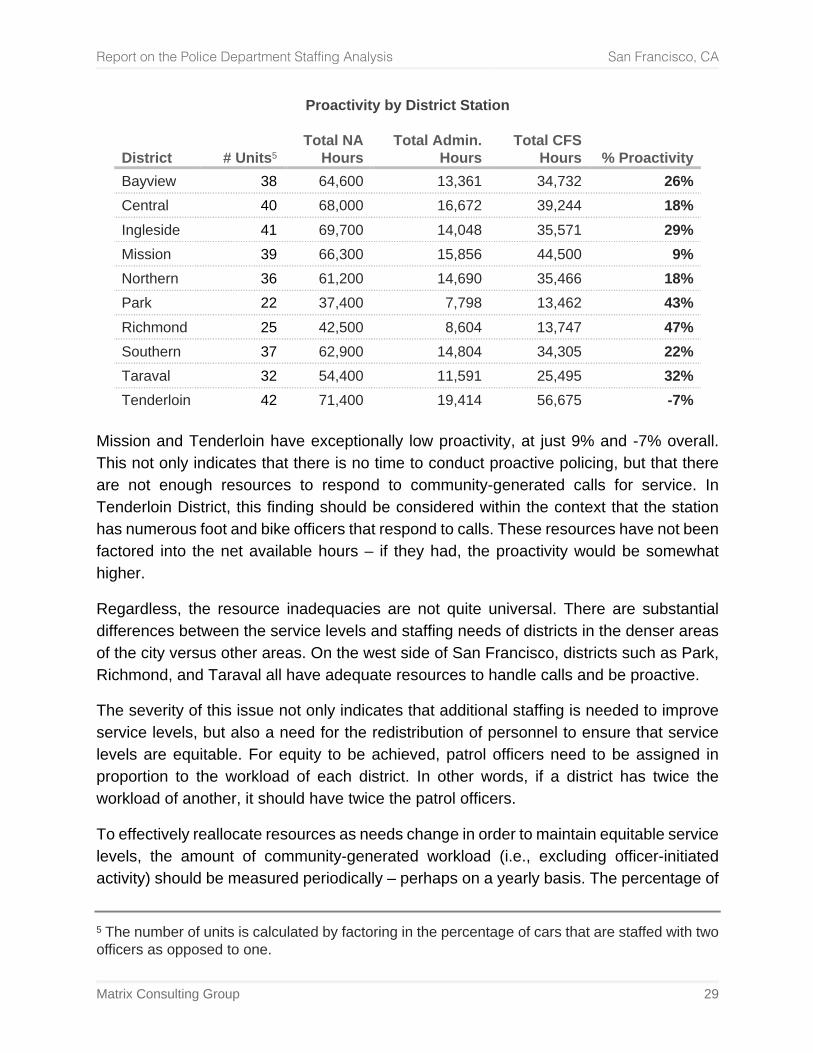
Proactivity by District Station
District # Units5 Total NA
Hours Total Admin.
Hours Total CFS
Hours % Proactivity Bayview 38 64,600 13,361 34,732 26% Central 40 68,000 16,672 39,244 18% Ingleside 41 69,700 14,048 35,571 29% Mission 39 66,300 15,856 44,500 9% Northern 36 61,200 14,690 35,466 18% Park 22 37,400 7,798 13,462 43% Richmond 25 42,500 8,604 13,747 47% Southern 37 62,900 14,804 34,305 22% Taraval 32 54,400 11,591 25,495 32% Tenderloin 42 71,400 19,414 56,675 -7%
Mission and Tenderloin have exceptionally low proactivity, at just 9% and -7% overall. This not only indicates that there is no time to conduct proactive policing, but that there are not enough resources to respond to community-generated calls for service. In Tenderloin District, this finding should be considered within the context that the station has numerous foot and bike officers that respond to calls. These resources have not been factored into the net available hours – if they had, the proactivity would be somewhat higher.
Regardless, the resource inadequacies are not quite universal. There are substantial differences between the service levels and staffing needs of districts in the denser areas of the city versus other areas. On the west side of San Francisco, districts such as Park, Richmond, and Taraval all have adequate resources to handle calls and be proactive.
The severity of this issue not only indicates that additional staffing is needed to improve service levels, but also a need for the redistribution of personnel to ensure that service levels are equitable. For equity to be achieved, patrol officers need to be assigned in proportion to the workload of each district. In other words, if a district has twice the workload of another, it should have twice the patrol officers.
To effectively reallocate resources as needs change in order to maintain equitable service levels, the amount of community-generated workload (i.e., excluding officer-initiated activity) should be measured periodically – perhaps on a yearly basis. The percentage of
5 The number of units is calculated by factoring in the percentage of cars that are staffed with two officers as opposed to one.
Report on the Police Department Staffing Analysis San Francisco, CA
Matrix Consulting Group 30
workload in each district a should then be used to determine the percentage of patrol officers that are allocated there. By allocating officers in proportion to workload, the patrol service levels are equitable as a result.
Recommendation: In order to provide equitable patrol service levels, periodically calculate the community-generated workload in each district, and use the results to proportionally allocate patrol officers to each district.
(3) Adding Context to the Patrol Findings Using Response Time Analytics
These findings are echoed by response time statistics, which are best analyzed according to the priority levels that calls for service are assigned. For the purposes of this analysis, response time is defined as the duration from the call created time stamp to the on scene time stamp of the earliest arriving patrol unit. Both time stamps are required, and calls must have response times over 0.01 minutes to be counted (in order to filter out on-view and self-initiated incidents).
It is critical to also note that this analysis involves patrol units only, in order to use the data from a standpoint of patrol resource availability. From the perspective of a community member, a response by any unit would be a better measure of how quickly the police can arrive at the scene of an emergency. If no patrol units responded to the call, or if it was a self-initiated incident, the statistics are not been included in the statistics shown in this section.
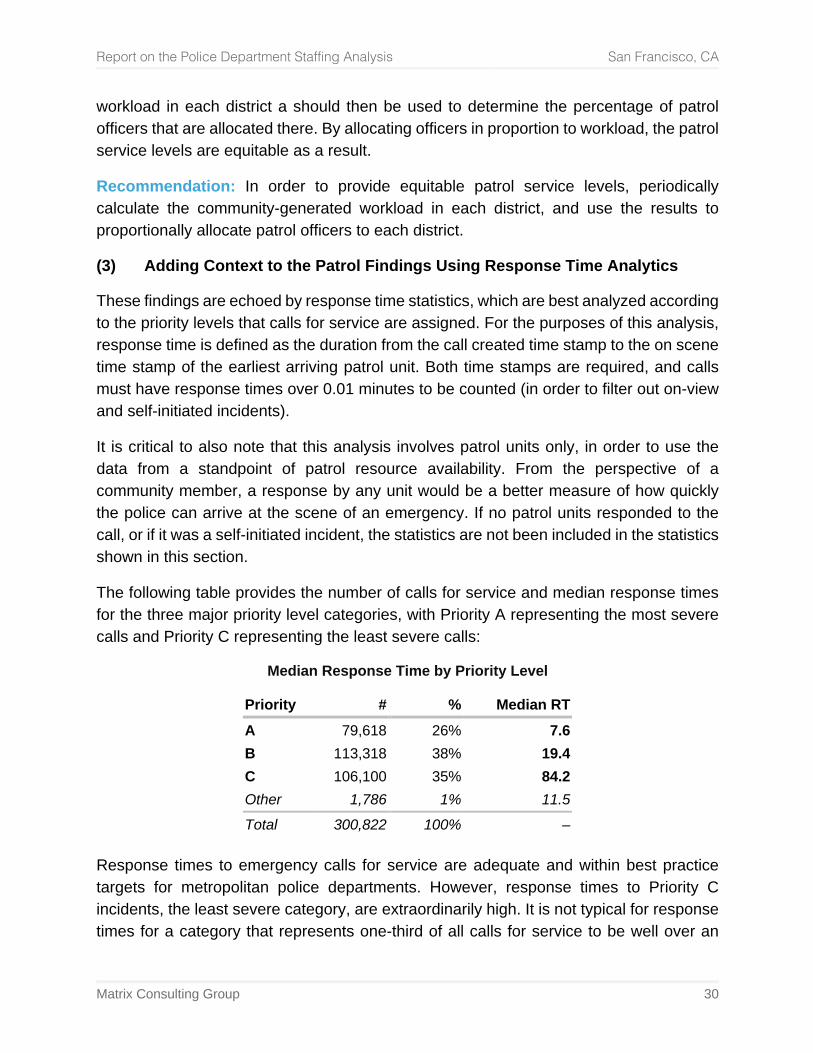
The following table provides the number of calls for service and median response times for the three major priority level categories, with Priority A representing the most severe calls and Priority C representing the least severe calls:
Median Response Time by Priority Level
Priority # % Median RT A 79,618 26% 7.6 B 113,318 38% 19.4 C 106,100 35% 84.2 Other 1,786 1% 11.5 Total 300,822 100% –
Response times to emergency calls for service are adequate and within best practice targets for metropolitan police departments. However, response times to Priority C incidents, the least severe category, are extraordinarily high. It is not typical for response times for a category that represents one-third of all calls for service to be well over an
Report on the Police Department Staffing Analysis San Francisco, CA
Matrix Consulting Group 31
hour, and such a high median response time is strongly indicative of severe resource issues.
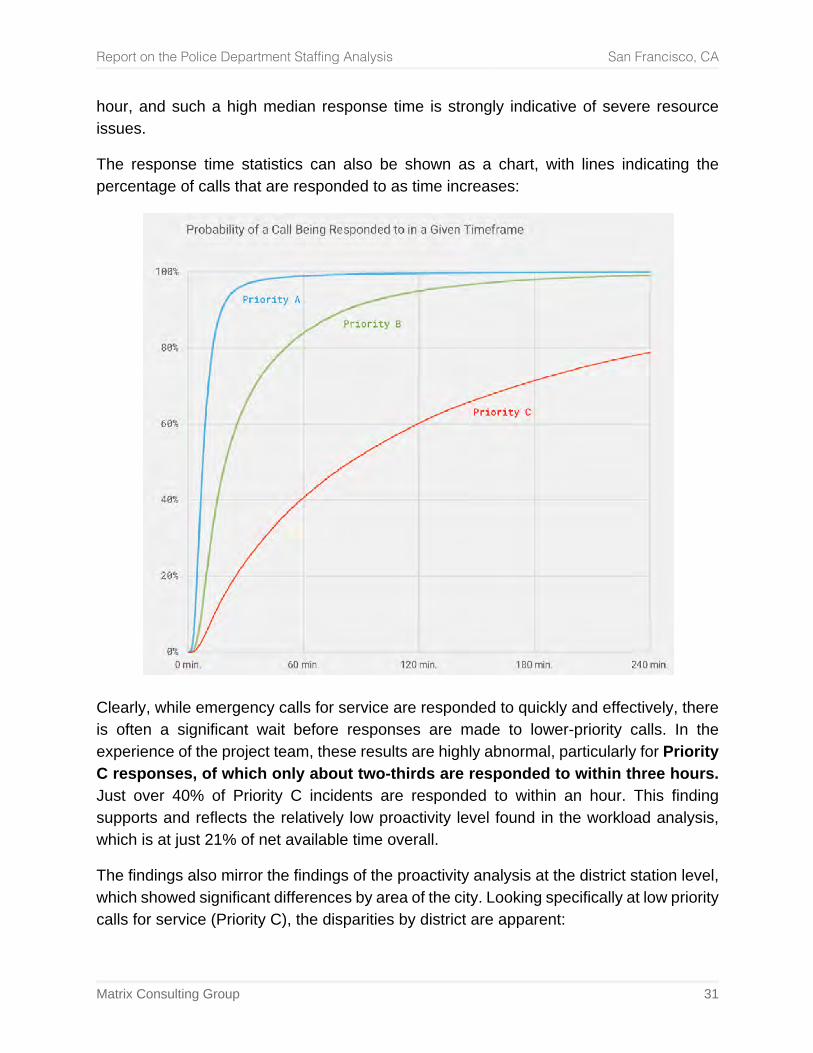
The response time statistics can also be shown as a chart, with lines indicating the percentage of calls that are responded to as time increases:
Clearly, while emergency calls for service are responded to quickly and effectively, there is often a significant wait before responses are made to lower-priority calls. In the experience of the project team, these results are highly abnormal, particularly for Priority C responses, of which only about two-thirds are responded to within three hours. Just over 40% of Priority C incidents are responded to within an hour. This finding supports and reflects the relatively low proactivity level found in the workload analysis, which is at just 21% of net available time overall.
The findings also mirror the findings of the proactivity analysis at the district station level, which showed significant differences by area of the city. Looking specifically at low priority calls for service (Priority C), the disparities by district are apparent:
Report on the Police Department Staffing Analysis San Francisco, CA
Matrix Consulting Group 32
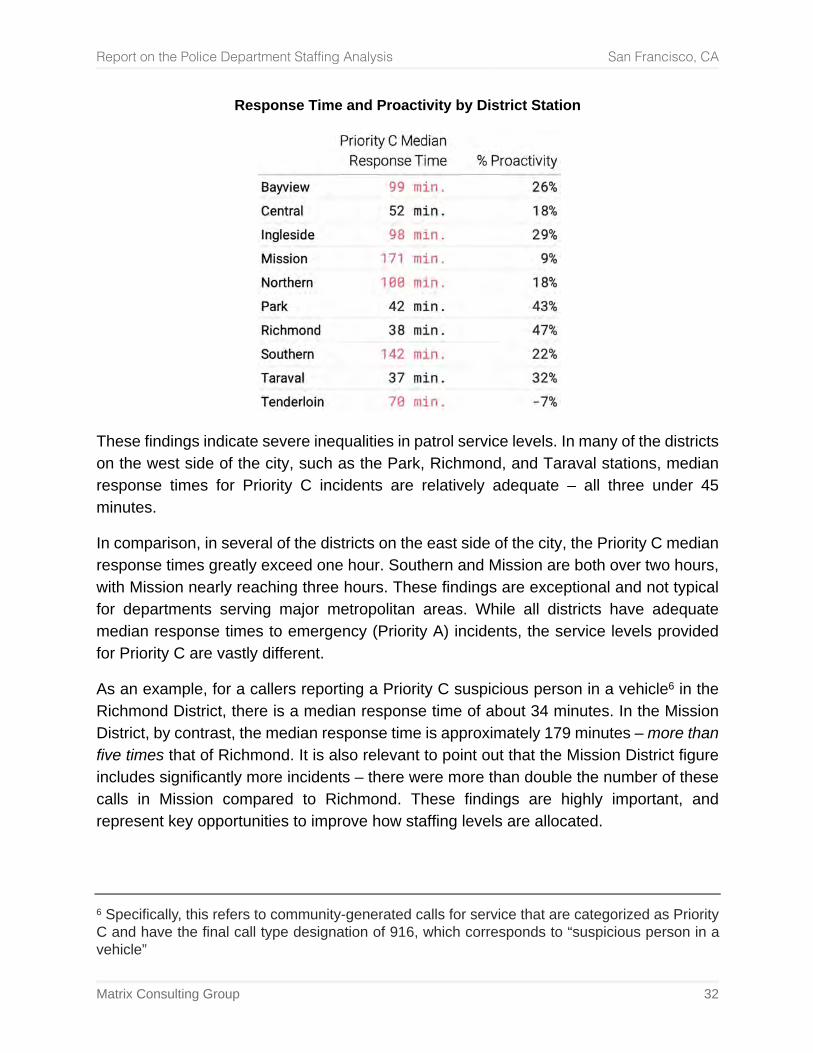
Response Time and Proactivity by District Station
These findings indicate severe inequalities in patrol service levels. In many of the districts on the west side of the city, such as the Park, Richmond, and Taraval stations, median response times for Priority C incidents are relatively adequate – all three under 45 minutes.
In comparison, in several of the districts on the east side of the city, the Priority C median response times greatly exceed one hour. Southern and Mission are both over two hours, with Mission nearly reaching three hours. These findings are exceptional and not typical for departments serving major metropolitan areas. While all districts have adequate median response times to emergency (Priority A) incidents, the service levels provided for Priority C are vastly different.
As an example, for a callers reporting a Priority C suspicious person in a vehicle6 in the Richmond District, there is a median response time of about 34 minutes. In the Mission District, by contrast, the median response time is approximately 179 minutes – more than five times that of Richmond. It is also relevant to point out that the Mission District figure includes significantly more incidents – there were more than double the number of these calls in Mission compared to Richmond. These findings are highly important, and represent key opportunities to improve how staffing levels are allocated.
6 Specifically, this refers to community-generated calls for service that are categorized as Priority C and have the final call type designation of 916, which corresponds to “suspicious person in a vehicle”
Report on the Police Department Staffing Analysis San Francisco, CA
Matrix Consulting Group 33
(4) Analysis of Patrol Staffing Needs
The analysis of proactivity and response times has developed substantial evidence that patrol resources are inadequate to handle incoming workload, nor to enable proactive and problem-oriented policing services to provided. The following subsections provide analysis of the additional resources that would be needed to reach targeted service levels, after accounting for turnover and supervisory staffing needs.
(4.1) Process for Calculating of Patrol Staffing Needs
In order to determine patrol unit staffing needs, a target for proactive time is first set. The proactive portion of time represents that which is left over after accounting for call for service and administrative workloads – two variables that are measurable and known. As a result, by setting a specific target for proactive time, the number of hours it represents can be calculated as a percentage of net available time. By extension, if the number of hours required to reach the proactive time target is known, and after measuring call for service and administrative workloads, the number of available hours that need to be staffed for is also known.
A targeted proactivity level of at least 30%7 is set for each station, based on the proactive units such as foot beats and bike units available to each station that may supplement coverage in the field as needed.
It is also important to note that units such as foot beats or bike officers do not contribute to the availability or workload statistics, and thus do not factor into the staffing analysis.
(4.2) Accounting for the Impact of Turnover
To determine staffing needs, it is also important to consider the number of vacancies that currently exist, as well as the rate of turnover. An agency will never be fully staffed, as there will always be vacancies occurring as a result of retirement, termination, and other factors. When these events occur, it takes a significant amount of time to recruit a new position, complete the hiring process, run an academy, and complete the FTO program before the individual becomes an on-duty officer. Given this consideration, agencies must always hire above the number needed to provide a targeted level of service.
7 It is common for proactive time calculations to follow a different order for calculating variables. If miscellaneous unit administrative time is considered as a net availability factor (deducted similarly to on-duty training hours) – rather than a workload factor – and report writing time is considered as part of call fort service workloads, then the proactivity level equivalent to this figure would be approximately 36%.
Report on the Police Department Staffing Analysis San Francisco, CA
Matrix Consulting Group 34
The amount of ‘buffer’ that an agency requires should be based on the historical rate of attrition. Attrition can take many forms – if it is assumed that the majority of vacancies are carried in patrol staffing, a vacancy at the officer level in any other area of the organization would consequently remove one officer from regular patrol duties. Likewise, promotions would have the same effect, in that they create an open position slot in patrol. Given these considerations, the turnover rate is defined in this report as the average percentage of sworn positions that separate from the department (whether from resignation, retirement, termination, or another reason).
All sworn in the department are included for the reason that patrol is generally the backbone of the organization, where all new officers are placed following completion of the FTO program, and the initial place from which officers are reassigned to other units or promote out of. As a result, any separation elsewhere in the organization has a cascading effect. A lieutenant retiring eventually requires the promotion of a sergeant, which in turn necessitates the promotion of an officer in time.
Not included, however, are individuals that separate from the department while in the academy or FTO program. Nor does the analysis count these positions as being part of current patrol staffing. The reason for this is the point in calculating the turnover rate is to determine how many positions need to be brought onboard as full, on-duty employees in order to replace those that are lost. While academy and FTO attrition rates influence recruitment goals and academy sizes, it does not help inform how many active employees will separate each year.
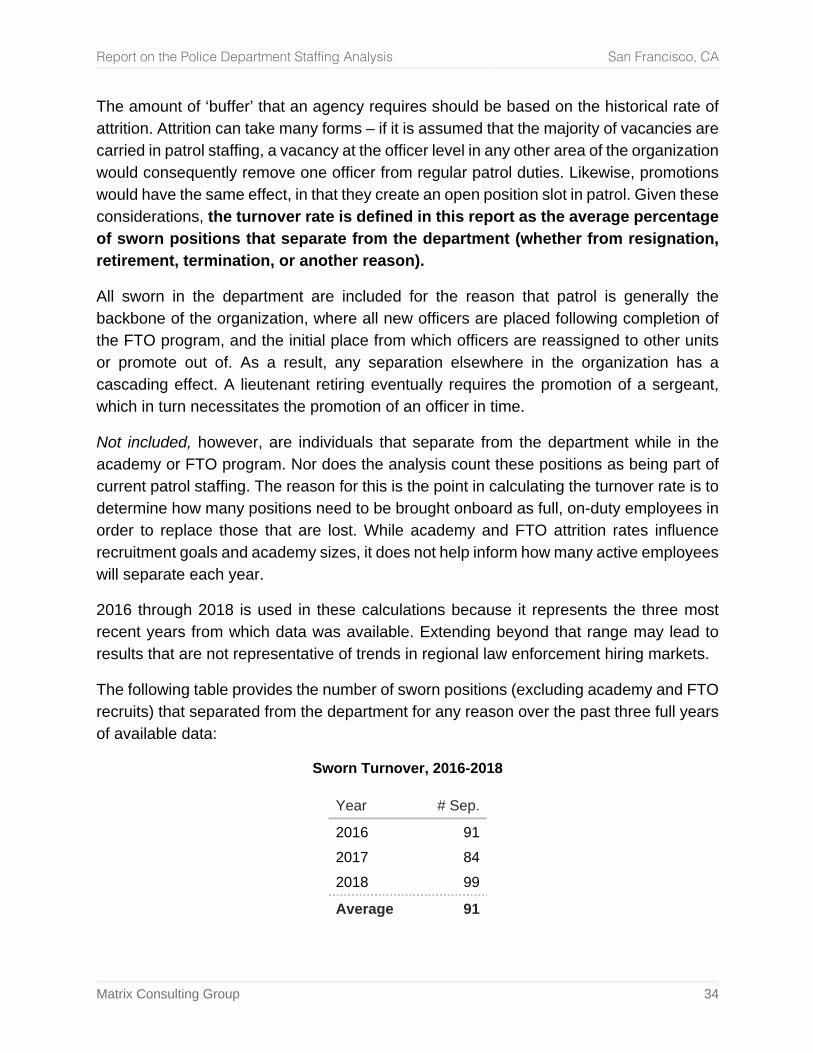
2016 through 2018 is used in these calculations because it represents the three most recent years from which data was available. Extending beyond that range may lead to results that are not representative of trends in regional law enforcement hiring markets.
The following table provides the number of sworn positions (excluding academy and FTO recruits) that separated from the department for any reason over the past three full years of available data:
Sworn Turnover, 2016-2018
Year # Sep.
2016 91 2017 84 2018 99
Average 91
Report on the Police Department Staffing Analysis San Francisco, CA
Matrix Consulting Group 35
As a percentage of total sworn (current positions, not budgeted), this represents an average rate of approximately 4.1%. This is relatively low, and may underrepresent upcoming waves in retirement. As a result, a normative estimate as been placed on the turnover rate, increasing the rate of turnover to be used in staffing calculations by an additional 20%, resulting in an effective turnover rate of 5.0% per year.
Given these calculations, an additional 5% authorized (budgeted) positions should be added on top of the actual number currently filled (actual) positions in order to account for turnover while maintaining the ability to meet the targeted proactivity level in patrol.
(4.3) Calculation of Patrol Officer Staffing Needs
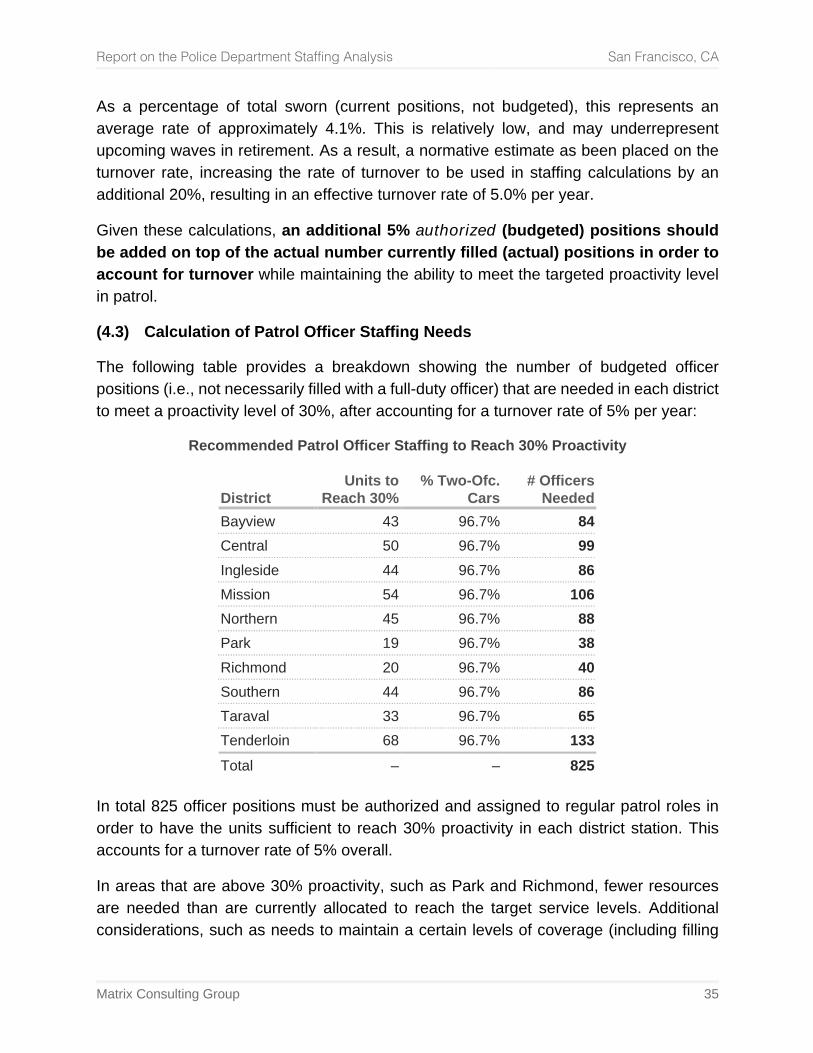
The following table provides a breakdown showing the number of budgeted officer positions (i.e., not necessarily filled with a full-duty officer) that are needed in each district to meet a proactivity level of 30%, after accounting for a turnover rate of 5% per year:
Recommended Patrol Officer Staffing to Reach 30% Proactivity
District Units to
Reach 30% % Two-Ofc.
Cars # Officers
Needed Bayview 43 96.7% 84 Central 50 96.7% 99 Ingleside 44 96.7% 86 Mission 54 96.7% 106 Northern 45 96.7% 88 Park 19 96.7% 38 Richmond 20 96.7% 40 Southern 44 96.7% 86 Taraval 33 96.7% 65 Tenderloin 68 96.7% 133 Total – – 825
In total 825 officer positions must be authorized and assigned to regular patrol roles in order to have the units sufficient to reach 30% proactivity in each district station. This accounts for a turnover rate of 5% overall.
In areas that are above 30% proactivity, such as Park and Richmond, fewer resources are needed than are currently allocated to reach the target service levels. Additional considerations, such as needs to maintain a certain levels of coverage (including filling
Report on the Police Department Staffing Analysis San Francisco, CA
Matrix Consulting Group 36
individual patrol areas in each shift) should also be considered, in addition to officer safety concerns. These considerations must also factor into patrol staffing.
Additionally, to this point, the analysis has not factored in the role of station keepers – officers that are required on each shift to staff the district stations. This is examined in a subsequent section.
Moreover, the finding presents a significant opportunity for the department to adopt a data-driven methodology for allocating patrol personnel based on need, where the number of officers is proportionally assigned according to the call for service workloads in each district. Doing so will address the currently severe disparities in service levels by district station, which are reflected in the vast differences in response times to lower-priority calls for service.
At an overall level, however, significant additional resources are required to increase service levels in patrol. To address these issues and bring overall proactivity to 30%, an additional 134 officer positions are needed across all ten district stations. Beyond these numbers, it should again be noted that factors such as achieving staffing levels necessary for the deployment of units to all patrol areas in each shift, as well as officer safety concerns, should also be considered.
Recommendation: Prioritize the addition of 134 officers to patrol to address significant service level issues.
Recommendation: Transition to a data-driven methodology for assigning patrol resources based on call for service workloads.
(4.4) Analysis of Patrol Sergeant Staffing Needs
Staffing needs for patrol sergeants can be measured by span of control ratios, or the average number of officers that are supervised by a sergeant. Many of the key drivers of sergeant workloads, such as reviewing reports, uses of force and pursuits, and performance evaluations, scale directly with the number of officers that are assigned to a sergeant. Consequently, the more officers that are assigned per sergeant, the less time that sergeants are able to be out in the field directly supervising them.
In order to meet span of control targets, the following table shows the number of authorized sergeant positions that are needed in each district, using a ratio of 1 sergeant for every 6 officer positions:
Report on the Police Department Staffing Analysis San Francisco, CA
Matrix Consulting Group 37
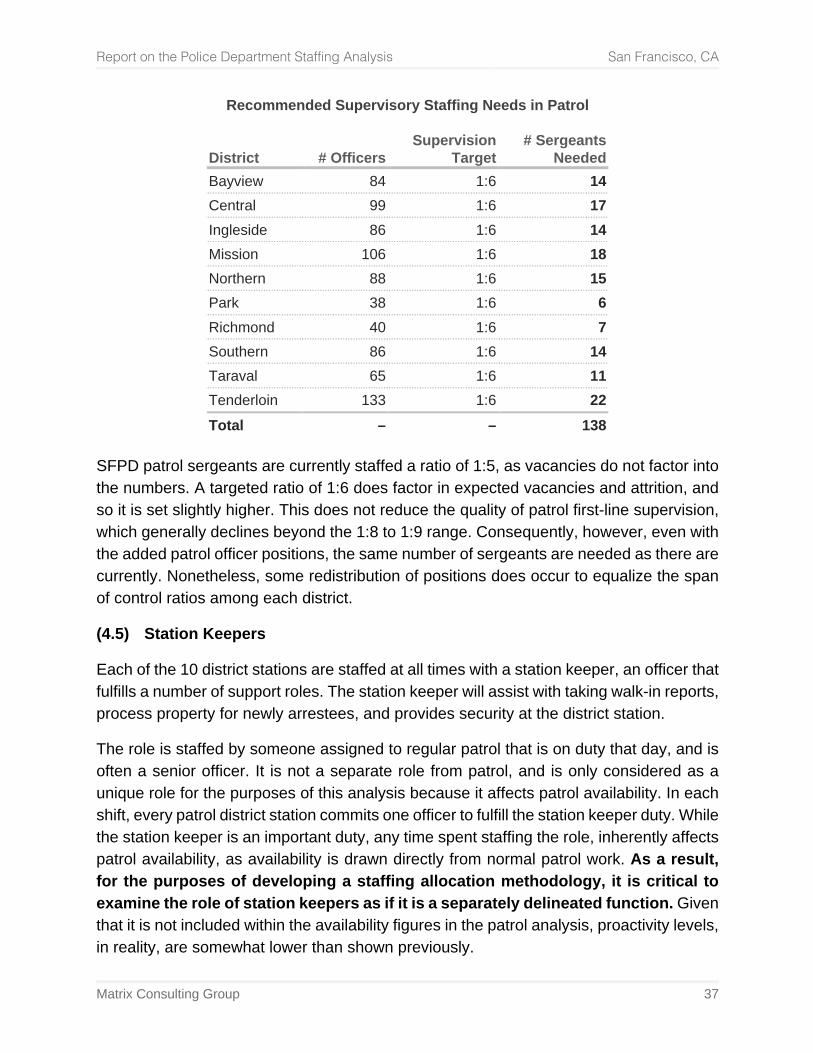
Recommended Supervisory Staffing Needs in Patrol
District # Officers Supervision
Target # Sergeants
Needed Bayview 84 1:6 14 Central 99 1:6 17 Ingleside 86 1:6 14 Mission 106 1:6 18 Northern 88 1:6 15 Park 38 1:6 6 Richmond 40 1:6 7 Southern 86 1:6 14 Taraval 65 1:6 11 Tenderloin 133 1:6 22 Total – – 138
SFPD patrol sergeants are currently staffed a ratio of 1:5, as vacancies do not factor into the numbers. A targeted ratio of 1:6 does factor in expected vacancies and attrition, and so it is set slightly higher. This does not reduce the quality of patrol first-line supervision, which generally declines beyond the 1:8 to 1:9 range. Consequently, however, even with the added patrol officer positions, the same number of sergeants are needed as there are currently. Nonetheless, some redistribution of positions does occur to equalize the span of control ratios among each district.
(4.5) Station Keepers
Each of the 10 district stations are staffed at all times with a station keeper, an officer that fulfills a number of support roles. The station keeper will assist with taking walk-in reports, process property for newly arrestees, and provides security at the district station.
The role is staffed by someone assigned to regular patrol that is on duty that day, and is often a senior officer. It is not a separate role from patrol, and is only considered as a unique role for the purposes of this analysis because it affects patrol availability. In each shift, every patrol district station commits one officer to fulfill the station keeper duty. While the station keeper is an important duty, any time spent staffing the role, inherently affects patrol availability, as availability is drawn directly from normal patrol work. As a result, for the purposes of developing a staffing allocation methodology, it is critical to examine the role of station keepers as if it is a separately delineated function. Given that it is not included within the availability figures in the patrol analysis, proactivity levels, in reality, are somewhat lower than shown previously.
Report on the Police Department Staffing Analysis San Francisco, CA
Matrix Consulting Group 38
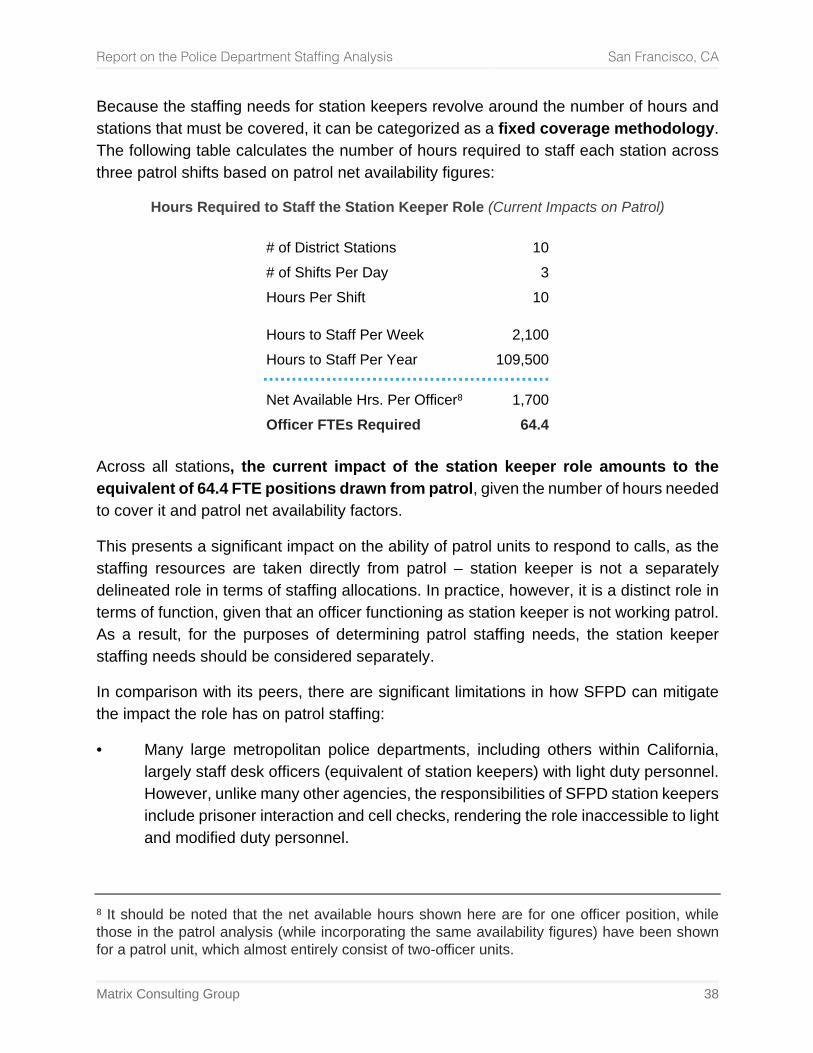
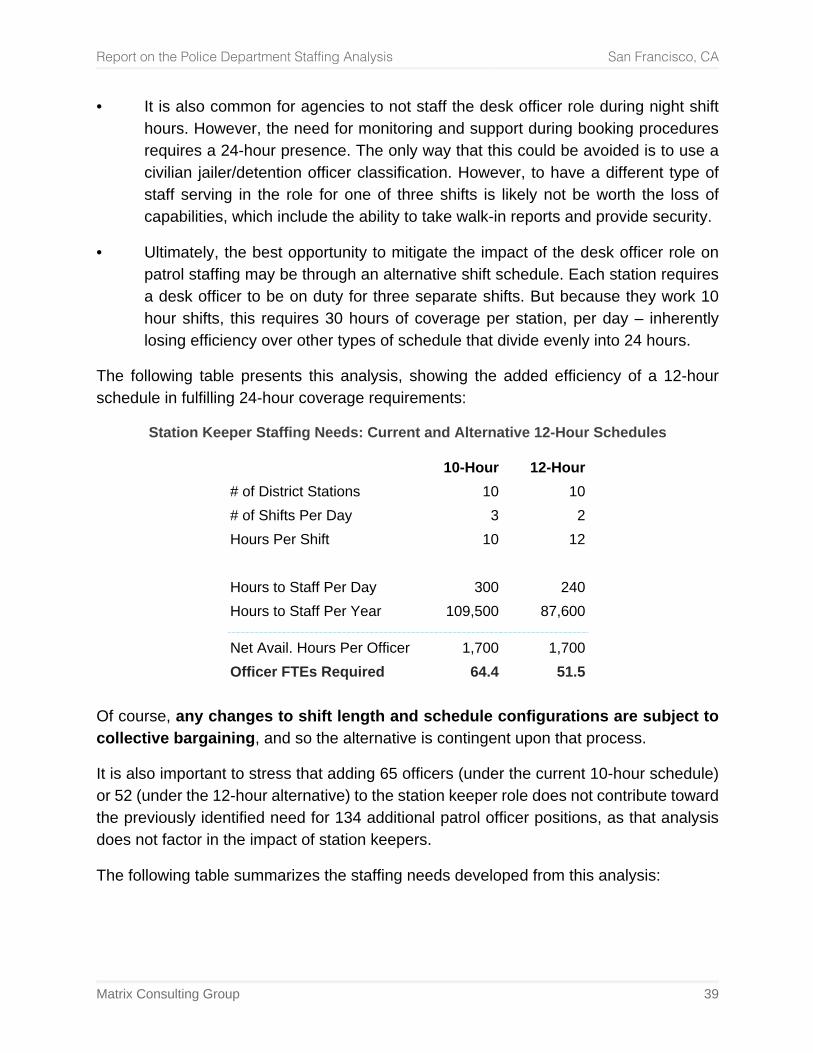
Because the staffing needs for station keepers revolve around the number of hours and stations that must be covered, it can be categorized as a fixed coverage methodology. The following table calculates the number of hours required to staff each station across three patrol shifts based on patrol net availability figures:
Hours Required to Staff the Station Keeper Role (Current Impacts on Patrol)
# of District Stations 10 # of Shifts Per Day 3 Hours Per Shift 10
Hours to Staff Per Week 2,100 Hours to Staff Per Year 109,500
Net Available Hrs. Per Officer8 1,700 Officer FTEs Required 64.4
Across all stations, the current impact of the station keeper role amounts to the equivalent of 64.4 FTE positions drawn from patrol, given the number of hours needed to cover it and patrol net availability factors.
This presents a significant impact on the ability of patrol units to respond to calls, as the staffing resources are taken directly from patrol – station keeper is not a separately delineated role in terms of staffing allocations. In practice, however, it is a distinct role in terms of function, given that an officer functioning as station keeper is not working patrol. As a result, for the purposes of determining patrol staffing needs, the station keeper staffing needs should be considered separately.
In comparison with its peers, there are significant limitations in how SFPD can mitigate the impact the role has on patrol staffing:
• Many large metropolitan police departments, including others within California, largely staff desk officers (equivalent of station keepers) with light duty personnel. However, unlike many other agencies, the responsibilities of SFPD station keepers include prisoner interaction and cell checks, rendering the role inaccessible to light and modified duty personnel.
8 It should be noted that the net available hours shown here are for one officer position, while those in the patrol analysis (while incorporating the same availability figures) have been shown for a patrol unit, which almost entirely consist of two-officer units.
Report on the Police Department Staffing Analysis San Francisco, CA
Matrix Consulting Group 39
• It is also common for agencies to not staff the desk officer role during night shift hours. However, the need for monitoring and support during booking procedures requires a 24-hour presence. The only way that this could be avoided is to use a civilian jailer/detention officer classification. However, to have a different type of staff serving in the role for one of three shifts is likely not be worth the loss of capabilities, which include the ability to take walk-in reports and provide security.
• Ultimately, the best opportunity to mitigate the impact of the desk officer role on patrol staffing may be through an alternative shift schedule. Each station requires a desk officer to be on duty for three separate shifts. But because they work 10 hour shifts, this requires 30 hours of coverage per station, per day – inherently losing efficiency over other types of schedule that divide evenly into 24 hours.
The following table presents this analysis, showing the added efficiency of a 12-hour schedule in fulfilling 24-hour coverage requirements:
Station Keeper Staffing Needs: Current and Alternative 12-Hour Schedules
10-Hour 12-Hour # of District Stations 10 10 # of Shifts Per Day 3 2 Hours Per Shift 10 12
Hours to Staff Per Day 300 240 Hours to Staff Per Year 109,500 87,600
Net Avail. Hours Per Officer 1,700 1,700 Officer FTEs Required 64.4 51.5
Of course, any changes to shift length and schedule configurations are subject to collective bargaining, and so the alternative is contingent upon that process.
It is also important to stress that adding 65 officers (under the current 10-hour schedule) or 52 (under the 12-hour alternative) to the station keeper role does not contribute toward the previously identified need for 134 additional patrol officer positions, as that analysis does not factor in the impact of station keepers.
The following table summarizes the staffing needs developed from this analysis:
Report on the Police Department Staffing Analysis San Francisco, CA
Matrix Consulting Group 40
District Station Keepers (Currently Drawn from Patrol Staffing)
Position Methodology Curr.
FTEs Rec.
FTEs
Officer Fixed coverage
Based on 24-7 coverage requirements for all 10 district stations.
• In a 10-hour shift configuration, 109,500 hours must be staffed by 65 FTEs.
• In a 12-hour shift alternative (subject to collective bargaining), 87,600 hours must be staffed by 52 FTEs.
– 52
It must be stressed that these officers are currently taken directly from patrol staffing. To that effect, these positions already exist as a portion of patrol officer time.
Recommendation: As a pilot program for the station keeper role only, and subject to collective bargaining, test a 12-hour shift configuration to reduce the assignment’s impact on patrol staffing.
Recommendation: Consider coverage needs for station keepers separately from patrol staffing.
Recommendation: In addition to the officer positions needed in regular patrol roles, additional officer positions should be added to staff the district station keeper roles, which are currently pulled from patrol staffing. Given 24-7 coverage mandates, this requires 65 officers under the current 10-hour schedule, or 52 positions under a 12-hour alternative, which is subject to collective bargaining.
(5) Patrol Dispatch SOPs and Protocol
During the course of the project several interviews were conducted with patrol and line level staff. An issue that was identified as limiting patrol efficiency is dispatch to non-priority or cold calls. Under current dispatch protocols all calls for service must be “voice” dispatched. In our interviews with line staff some indicated that this protocol was in place for officer safety as everyone would know where other units are because every call was voice dispatched, however this also means officers are not able self-dispatch to low priority calls that they may be near or to efficiently take calls that are near to each other in in travel sequence versus call sequence. This can account for the high median response time of 84.2 minutes to low priority calls for service.
Report on the Police Department Staffing Analysis San Francisco, CA
Matrix Consulting Group 41
Officer safety is a very important issue and should be considered in dispatch protocols, however SFPD deploys 2-person patrol units so there is cover on every call, including low priority or cold calls. Allowing patrol units to self-dispatch to low priority or cold calls frees up valuable “air time” and allows officers to be more efficient in call handling as they can respond to calls in geographic sequence which is very important when travel times can be increased due to normal congestion. Self-dispatching to low priority calls via in car computer will still allow other units and dispatch to know what call the patrol unit is on and what their location is should cover be needed. Many large cities allow self-dispatching of low priority or cold calls as way to more efficiently handle the call load and reduce unneeded radio communication.
Recommendation: Enable two person units to self-dispatch to low priority calls for service.
4. Foot Beats
Foot beat officers are an example of a position that does not scale directly with workload and availability calculation are foot beats, an electively staffed and largely proactive unit oriented around achieving a desired public safety outcome.
The following sections provide a detailed description on the methodology for determining foot beat staffing needs and assignments, given the critical importance of this issue.
(1) Identifying Foot Beat Locations and Staffing Needs
Foot beats have been demonstrated in numerous studies9 as being highly effective strategies for reducing crime and the fear of crime, combatting disorder, and building relationships with communities. Officers are able to directly interface with businesses, community groups, and resolve issues at the local level much more quickly than officers in black and white patrol cars, particularly in a dense, high-traffic location.
However, foot beats provide more value and efficacy in certain types of locations than in others. Areas that are walkable, dense, and have high levels of activity enable the officer on foot to make more community member contacts and other proactive work than would be possible in a patrol car.
Officers assigned to foot beats are utilized in this type of proactive capacity for the vast majority of their time. Consequently, their workload is not directly proportional to incoming 9 Ratcliffe, Jerry H., et al. “The Philadelphia Foot Patrol Experiment: A Randomized Controlled Trial Of Police Patrol Effectiveness In Violent Crime Hotspots*.” Criminology, vol. 49, no. 3, 2011, pp. 795–831., doi:10.1111/j.1745-9125.2011.00240.x.
Report on the Police Department Staffing Analysis San Francisco, CA
Matrix Consulting Group 42
service needs. As a result, it is an elective decision that the department makes to staff these positions. However, because their staffing needs cannot be traced back directly to a measurable workload, such as calls for service hours, different metrics must be created. Other service need metrics such as Part I crimes can perhaps provide a benchmark of a foot beat’s effectiveness, but there are limitations in using that data to allocate resources between district stations. Moreover, the primary goal in establishing a foot beat is often not to reduce crime necessarily, but rather to build police-community relations, establish a presence in an area of importance, and to serve as a liaison to the neighborhoods and business communities.
There are numerous potential directions to take in using metrics to identify foot beats locations. Demographics (e.g., population density, vulnerable communities), commercial activity (e.g., total square feet of commercial space, number of non-office business establishments, etc.), public spaces that serve as a focal point for activity, as well as service needs (e.g., crime and calls for service), are all valid approaches. But because each is relatively narrow within entire scope of the foot beat officer role, constructing a methodology would require multiple variables. In order to balance out locations and not over/underweight certain areas that lack in a metrics, foot beats would have to be determined by a composite score.
If a goal of the methodology is to reduce the subjectivity and discretionary process of allocating foot beat resources, then complex composite scores ultimately do not achieve this objective. Instead, a simpler methodology is needed that can tie together different place defining attributes.
(2) Pedestrian Traffic and Place-Based Policing
One such opportunity is to utilize pedestrian traffic for the central metric for place-based policing, as it effectively links together each of the other metrics. High concentrations of pedestrians correlate to commercial activity, public spaces, density of people, and calls for service alike. Furthermore, it fulfills the additional need for a foot beat to be walkable, because high pedestrian activity will often be in the most walkable areas.
The San Francisco Municipal Transportation Agency (SFMTA) produces a statistical model that estimates the volume of pedestrians that cross each intersection in the city, using the results to identify where pedestrians are at the greatest risk of being the victim of vehicle collisions. The is updated annually, and is publicly available in a GIS-based format that enables for additional analysis to be performed with the base data.
Beyond the stated objective of the dataset, the pedestrian volume data can be repurposed as a method of defining and identifying locations for place-based policing strategies.
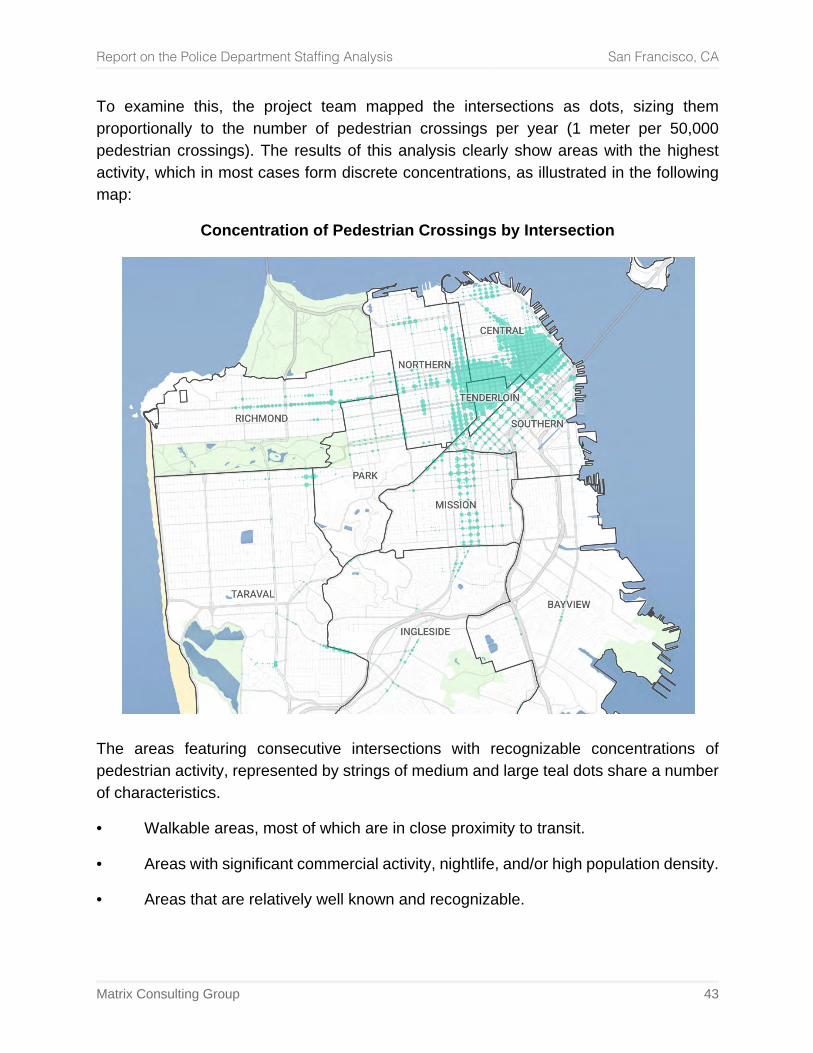
Report on the Police Department Staffing Analysis San Francisco, CA
Matrix Consulting Group 43
To examine this, the project team mapped the intersections as dots, sizing them proportionally to the number of pedestrian crossings per year (1 meter per 50,000 pedestrian crossings). The results of this analysis clearly show areas with the highest activity, which in most cases form discrete concentrations, as illustrated in the following map:
Concentration of Pedestrian Crossings by Intersection
The areas featuring consecutive intersections with recognizable concentrations of pedestrian activity, represented by strings of medium and large teal dots share a number of characteristics.
• Walkable areas, most of which are in close proximity to transit.
• Areas with significant commercial activity, nightlife, and/or high population density.
• Areas that are relatively well known and recognizable.
Report on the Police Department Staffing Analysis San Francisco, CA
Matrix Consulting Group 44
The stretch that includes Civic Center, the Tenderloin, and the Financial District have such high volumes of pedestrian traffic that the intersection dots overlap to form a contiguous area that is shaded teal. Additionally, it is worth noting that the GIS analysis actually renders a dot for every intersection in the city. The difference between the higher-activity intersections and the rest of the city is so great that the less busy intersections are not visible in the map.
Where there are consecutive intersections with concentrated pedestrian activity, most of which are major streets, it is possible to construct a hypothetical foot beat, representing an area that is roughly the size of a zone that could be patrolled on foot by one or more officers.
Many of the regions with high pedestrian activity correlate with recognizable neighborhoods and areas of interest. This is particularly true from the perspective of the public, as many of the concentrated areas are located on or intersect patrol district boundaries. The following map illustrates this by labeling a number of areas where pedestrian activity is concentrated:
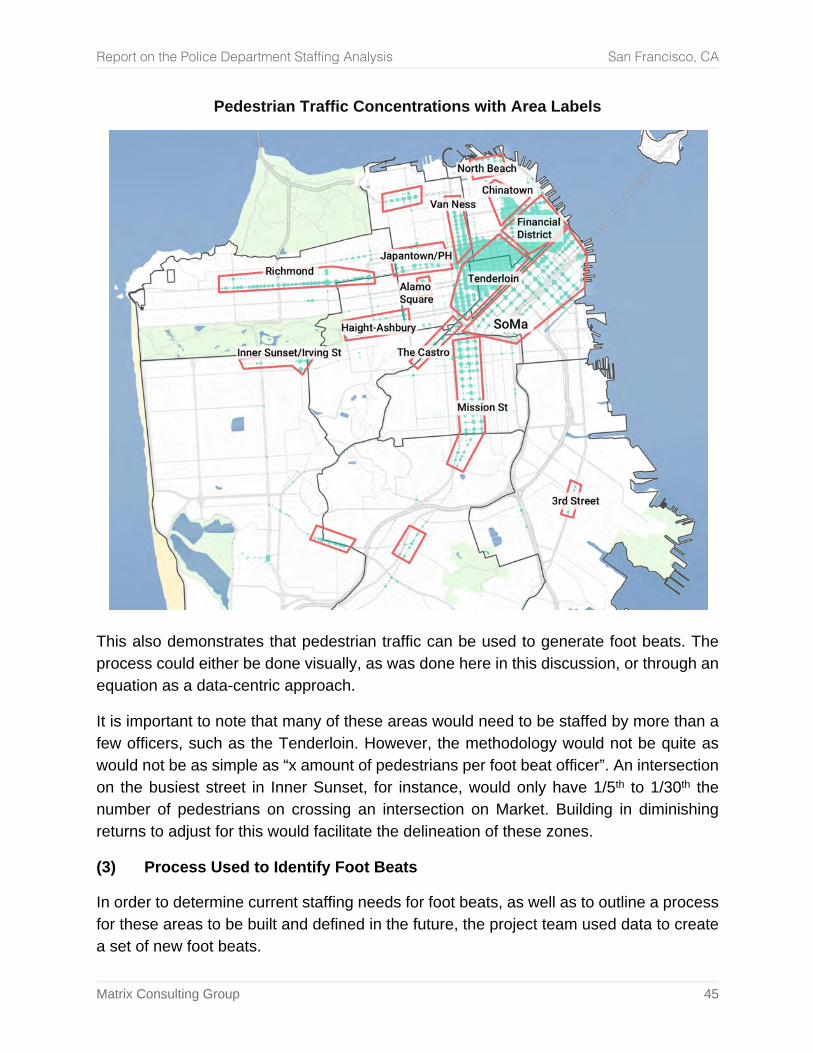
Report on the Police Department Staffing Analysis San Francisco, CA
Matrix Consulting Group 45
Pedestrian Traffic Concentrations with Area Labels
This also demonstrates that pedestrian traffic can be used to generate foot beats. The process could either be done visually, as was done here in this discussion, or through an equation as a data-centric approach.
It is important to note that many of these areas would need to be staffed by more than a few officers, such as the Tenderloin. However, the methodology would not be quite as would not be as simple as “x amount of pedestrians per foot beat officer”. An intersection on the busiest street in Inner Sunset, for instance, would only have 1/5th to 1/30th the number of pedestrians on crossing an intersection on Market. Building in diminishing returns to adjust for this would facilitate the delineation of these zones.
(3) Process Used to Identify Foot Beats
In order to determine current staffing needs for foot beats, as well as to outline a process for these areas to be built and defined in the future, the project team used data to create a set of new foot beats.
Report on the Police Department Staffing Analysis San Francisco, CA
Matrix Consulting Group 46
To begin the process, the intersections are loaded into the GIS program with pedestrian model estimates. The points are given a data-defined setting for displayed width using a rate of 1 meter (to scale) for every 50,000 pedestrians. Other recommended layers include streets, district boundaries, and parks. Foot beat areas are then identified and drawn through the following steps:
(1) 5 out of 10 consecutive intersections in a line must have over 2 million pedestrians/year pedestrian crossings. This is visually apparent, but is confirmed by selecting the points.
(2) Zones are then expanded until there is significant drop-off in pedestrian volume the next 2-3 intersections (typically where there is below 600,000 pedestrians/year).
(3) Zones are then simplified and adjusted to better conform to recognizable neighborhood areas.
(4) The zones are cut to district borders. Some areas have been cut into multiple districts, such as the Tenderloin neighborhood and Mission St. Exceptions were made in some areas where the zone was extended across district borders by up to one city block.
(5) Using the final borders, zones are cut from the final list if the total number of pedestrians among all included intersections is under 60 million/year.
An example of these factors is shown in the following map, where the borders of the foot beat have been simplified and cut off before the intersections where pedestrian activity diminishes to a fraction of the others in the area:
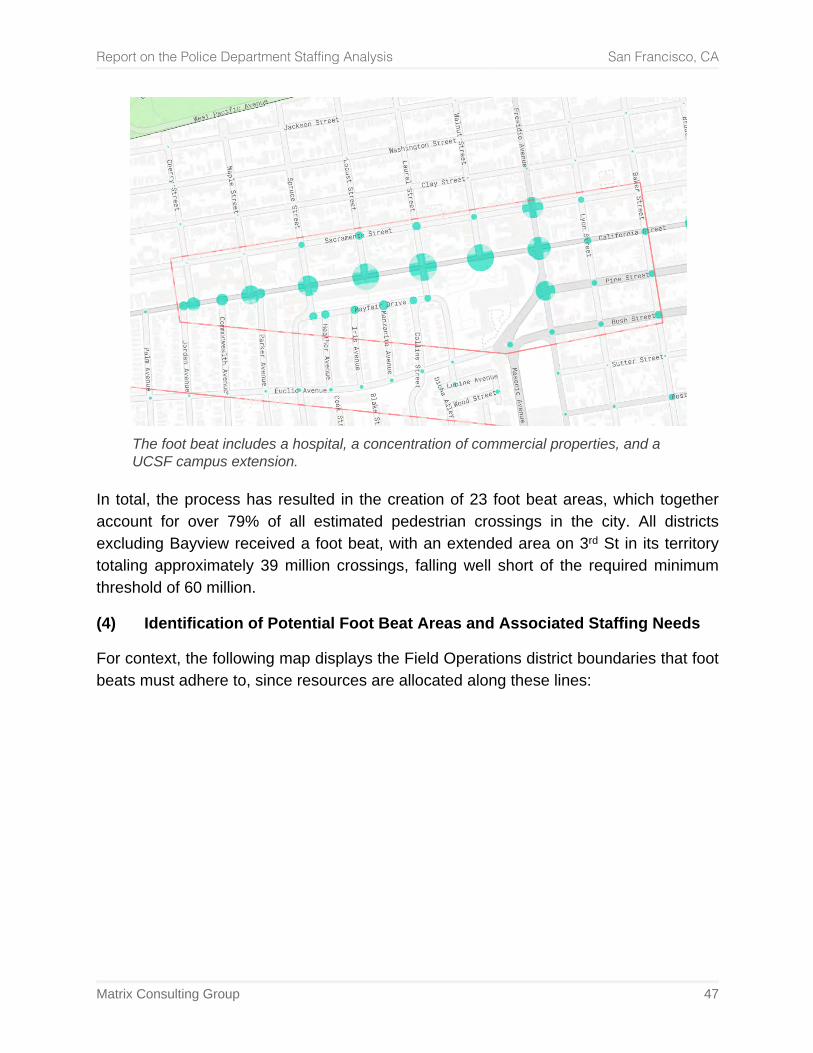
Report on the Police Department Staffing Analysis San Francisco, CA
Matrix Consulting Group 47
The foot beat includes a hospital, a concentration of commercial properties, and a UCSF campus extension.
In total, the process has resulted in the creation of 23 foot beat areas, which together account for over 79% of all estimated pedestrian crossings in the city. All districts excluding Bayview received a foot beat, with an extended area on 3rd St in its territory totaling approximately 39 million crossings, falling well short of the required minimum threshold of 60 million.
(4) Identification of Potential Foot Beat Areas and Associated Staffing Needs
For context, the following map displays the Field Operations district boundaries that foot beats must adhere to, since resources are allocated along these lines:
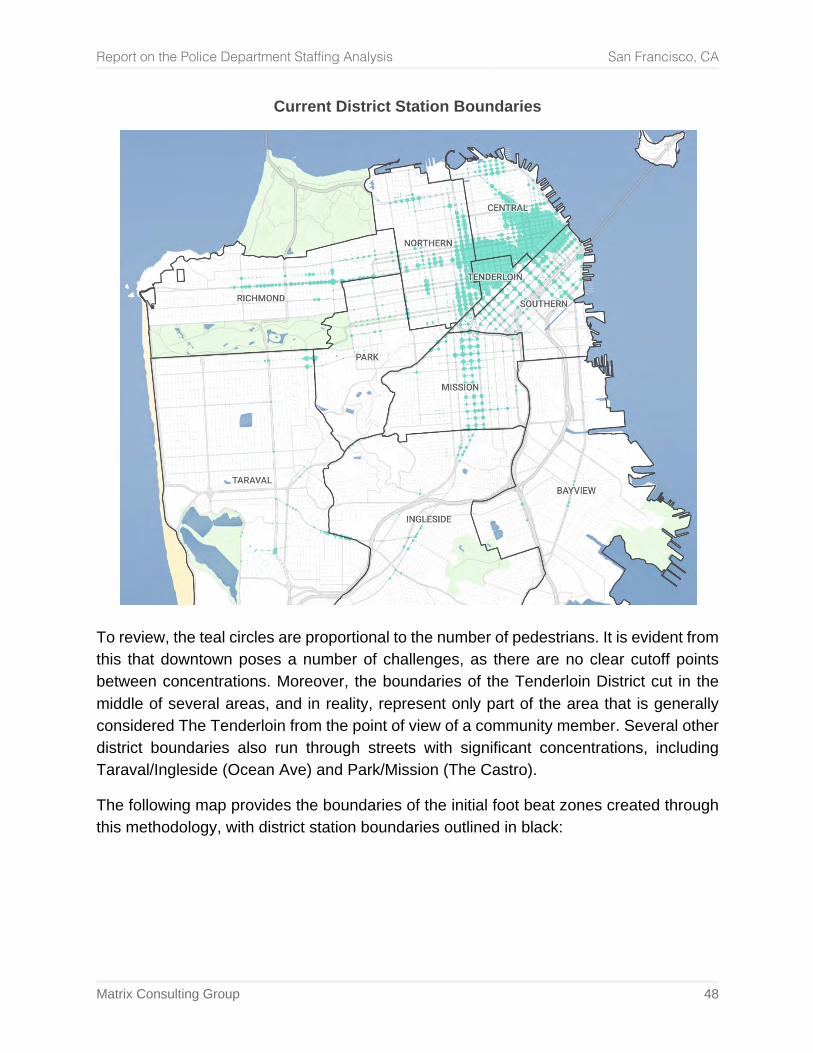
Report on the Police Department Staffing Analysis San Francisco, CA
Matrix Consulting Group 48
Current District Station Boundaries
To review, the teal circles are proportional to the number of pedestrians. It is evident from this that downtown poses a number of challenges, as there are no clear cutoff points between concentrations. Moreover, the boundaries of the Tenderloin District cut in the middle of several areas, and in reality, represent only part of the area that is generally considered The Tenderloin from the point of view of a community member. Several other district boundaries also run through streets with significant concentrations, including Taraval/Ingleside (Ocean Ave) and Park/Mission (The Castro).
The following map provides the boundaries of the initial foot beat zones created through this methodology, with district station boundaries outlined in black:
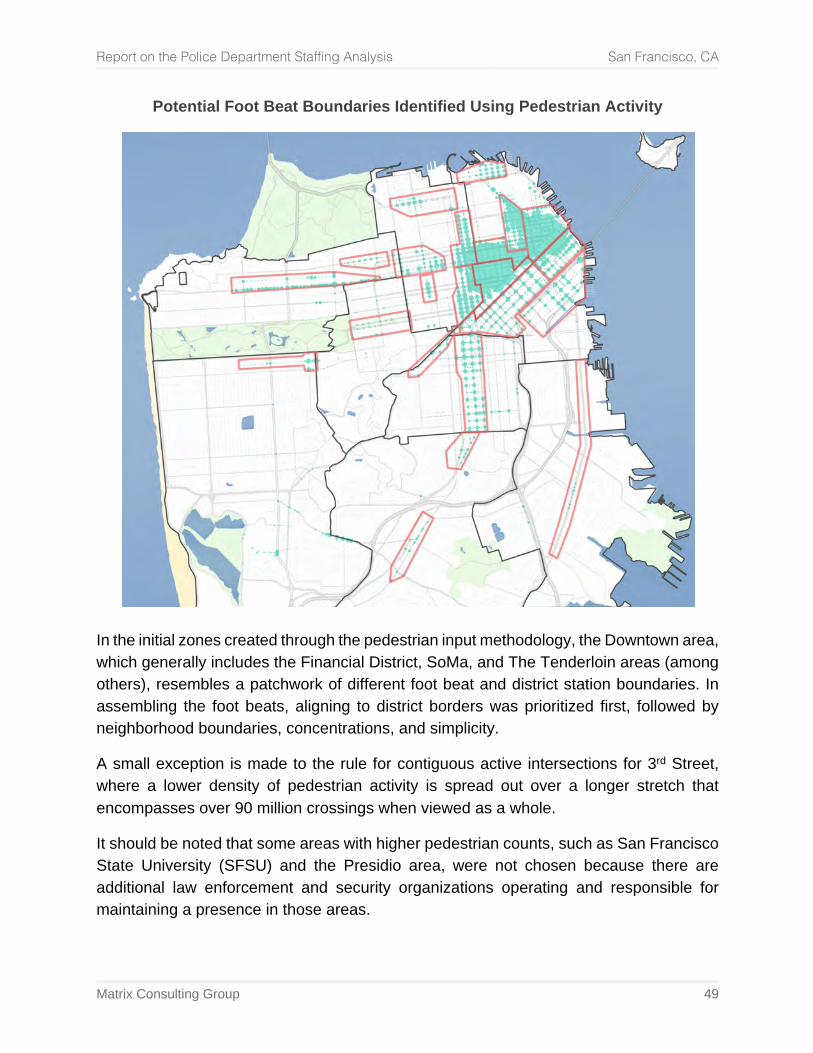
Report on the Police Department Staffing Analysis San Francisco, CA
Matrix Consulting Group 49
Potential Foot Beat Boundaries Identified Using Pedestrian Activity
In the initial zones created through the pedestrian input methodology, the Downtown area, which generally includes the Financial District, SoMa, and The Tenderloin areas (among others), resembles a patchwork of different foot beat and district station boundaries. In assembling the foot beats, aligning to district borders was prioritized first, followed by neighborhood boundaries, concentrations, and simplicity.
A small exception is made to the rule for contiguous active intersections for 3rd Street, where a lower density of pedestrian activity is spread out over a longer stretch that encompasses over 90 million crossings when viewed as a whole.
It should be noted that some areas with higher pedestrian counts, such as San Francisco State University (SFSU) and the Presidio area, were not chosen because there are additional law enforcement and security organizations operating and responsible for maintaining a presence in those areas.
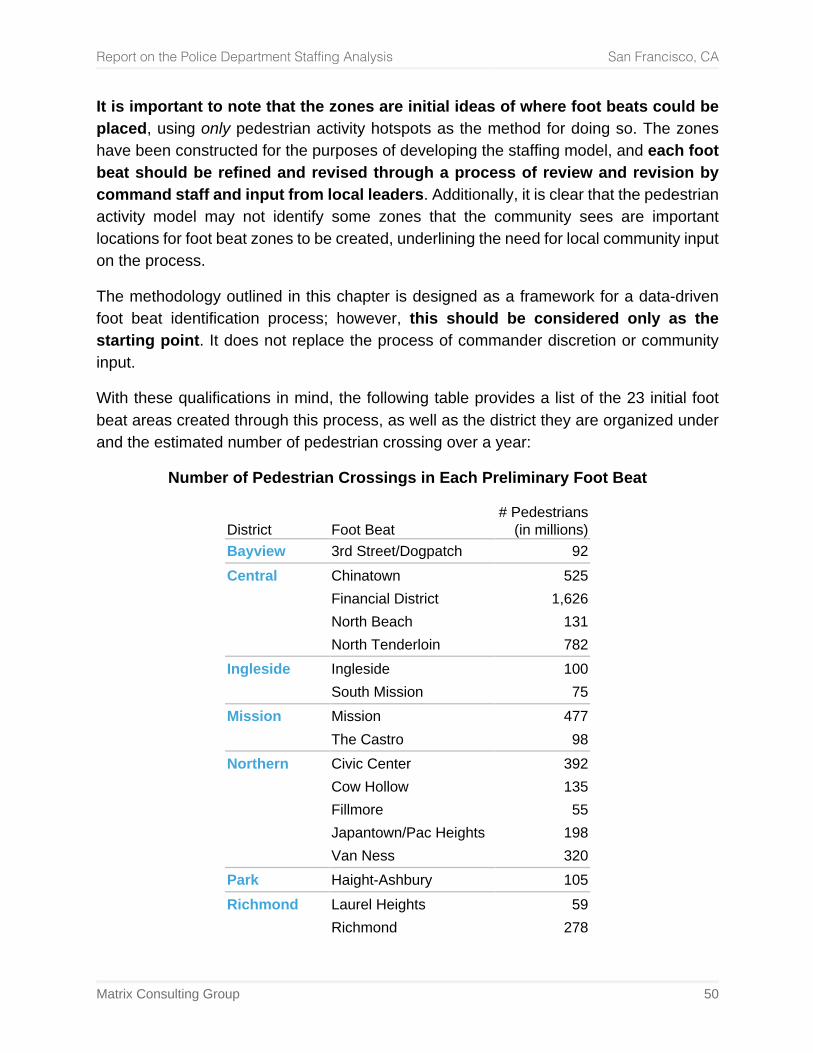
Report on the Police Department Staffing Analysis San Francisco, CA
Matrix Consulting Group 50
It is important to note that the zones are initial ideas of where foot beats could be placed, using only pedestrian activity hotspots as the method for doing so. The zones have been constructed for the purposes of developing the staffing model, and each foot beat should be refined and revised through a process of review and revision by command staff and input from local leaders. Additionally, it is clear that the pedestrian activity model may not identify some zones that the community sees are important locations for foot beat zones to be created, underlining the need for local community input on the process.
The methodology outlined in this chapter is designed as a framework for a data-driven foot beat identification process; however, this should be considered only as the starting point. It does not replace the process of commander discretion or community input.
With these qualifications in mind, the following table provides a list of the 23 initial foot beat areas created through this process, as well as the district they are organized under and the estimated number of pedestrian crossing over a year:
Number of Pedestrian Crossings in Each Preliminary Foot Beat
District Foot Beat
# Pedestrians (in millions)
Bayview 3rd Street/Dogpatch 92 Central Chinatown 525 Financial District 1,626 North Beach 131 North Tenderloin 782 Ingleside Ingleside 100 South Mission 75 Mission Mission 477 The Castro 98 Northern Civic Center 392 Cow Hollow 135 Fillmore 55 Japantown/Pac Heights 198 Van Ness 320 Park Haight-Ashbury 105 Richmond Laurel Heights 59 Richmond 278
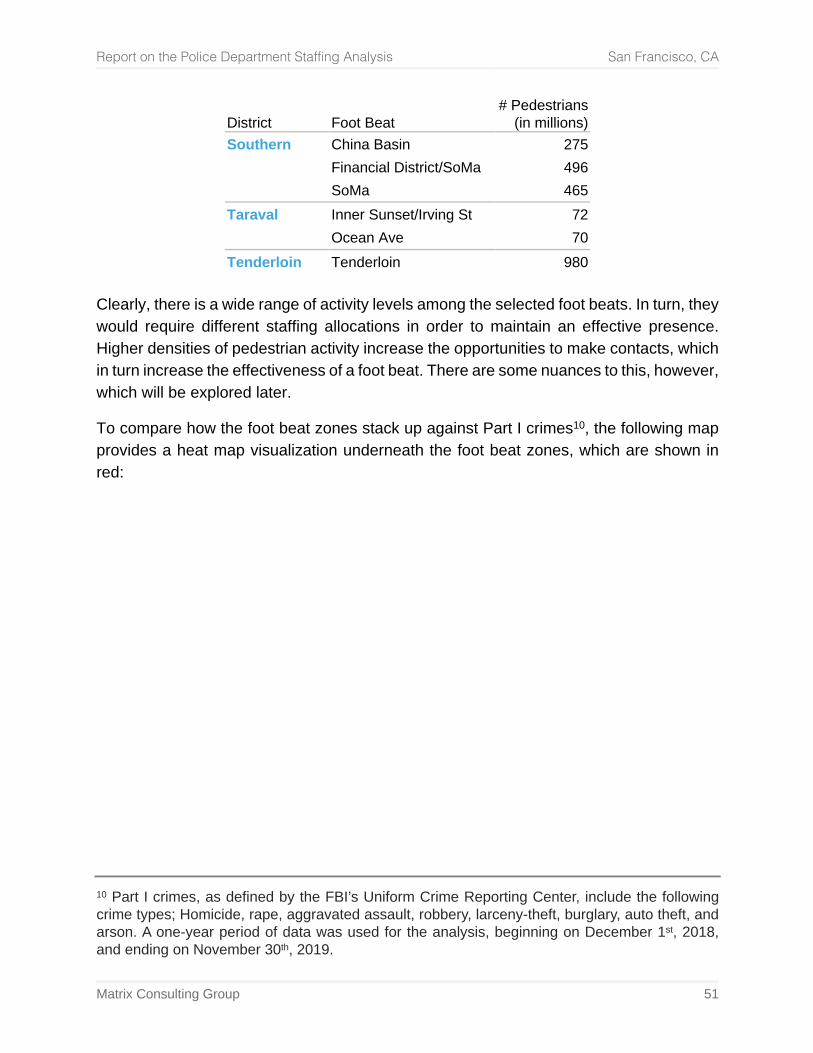
Report on the Police Department Staffing Analysis San Francisco, CA
Matrix Consulting Group 51
District Foot Beat
# Pedestrians (in millions)
Southern China Basin 275 Financial District/SoMa 496 SoMa 465 Taraval Inner Sunset/Irving St 72 Ocean Ave 70 Tenderloin Tenderloin 980
Clearly, there is a wide range of activity levels among the selected foot beats. In turn, they would require different staffing allocations in order to maintain an effective presence. Higher densities of pedestrian activity increase the opportunities to make contacts, which in turn increase the effectiveness of a foot beat. There are some nuances to this, however, which will be explored later.
To compare how the foot beat zones stack up against Part I crimes10, the following map provides a heat map visualization underneath the foot beat zones, which are shown in red:
10 Part I crimes, as defined by the FBI’s Uniform Crime Reporting Center, include the following crime types; Homicide, rape, aggravated assault, robbery, larceny-theft, burglary, auto theft, and arson. A one-year period of data was used for the analysis, beginning on December 1st, 2018, and ending on November 30th, 2019.
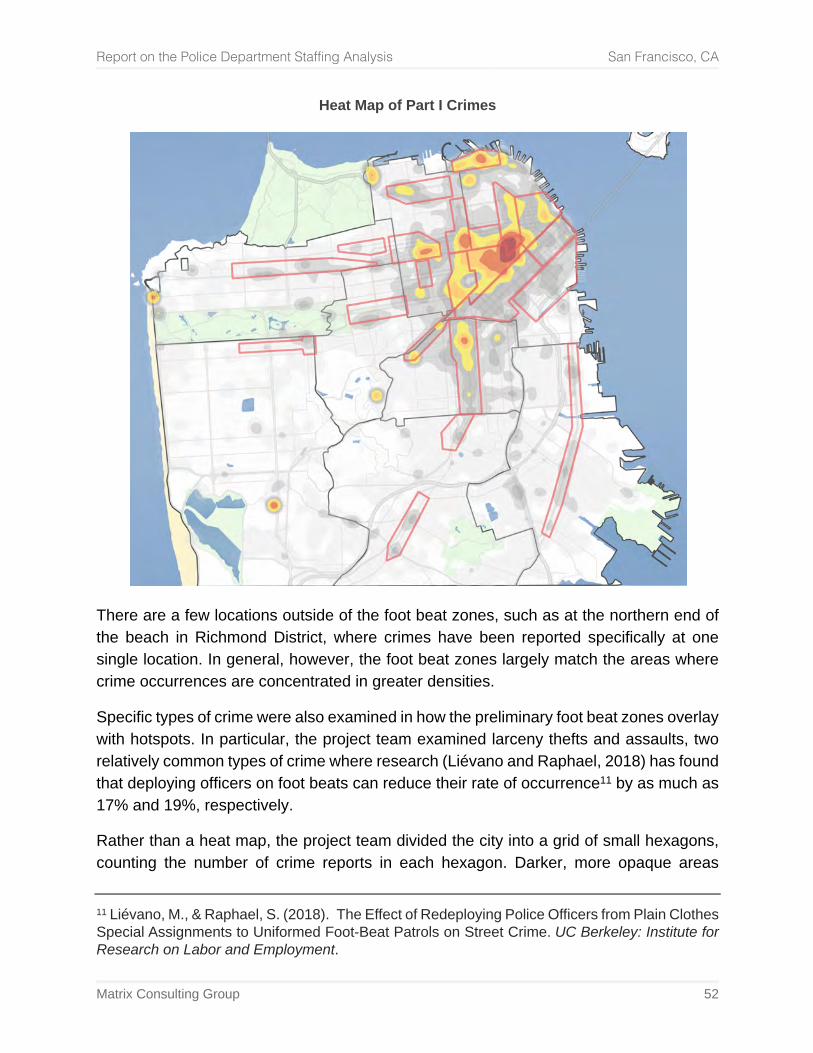
Report on the Police Department Staffing Analysis San Francisco, CA
Matrix Consulting Group 52
Heat Map of Part I Crimes
There are a few locations outside of the foot beat zones, such as at the northern end of the beach in Richmond District, where crimes have been reported specifically at one single location. In general, however, the foot beat zones largely match the areas where crime occurrences are concentrated in greater densities.
Specific types of crime were also examined in how the preliminary foot beat zones overlay with hotspots. In particular, the project team examined larceny thefts and assaults, two relatively common types of crime where research (Liévano and Raphael, 2018) has found that deploying officers on foot beats can reduce their rate of occurrence11 by as much as 17% and 19%, respectively.
Rather than a heat map, the project team divided the city into a grid of small hexagons, counting the number of crime reports in each hexagon. Darker, more opaque areas
11 Liévano, M., & Raphael, S. (2018). The Effect of Redeploying Police Officers from Plain Clothes Special Assignments to Uniformed Foot-Beat Patrols on Street Crime. UC Berkeley: Institute for Research on Labor and Employment.
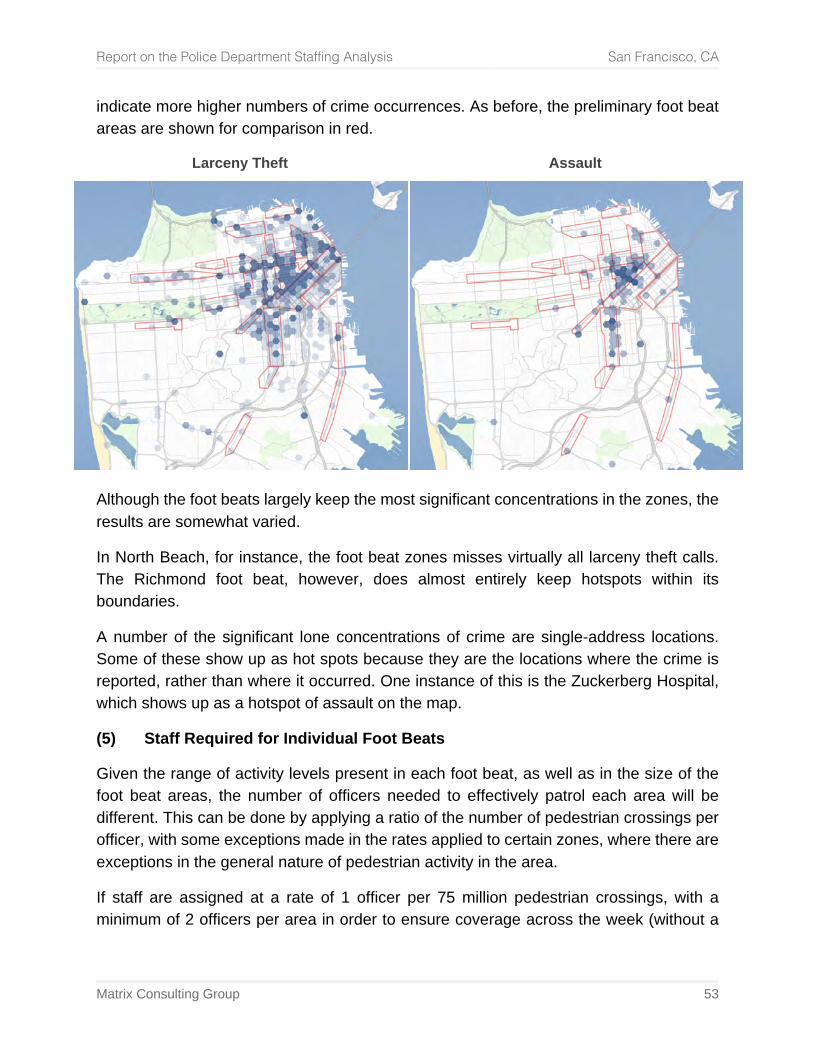
Report on the Police Department Staffing Analysis San Francisco, CA
Matrix Consulting Group 53
indicate more higher numbers of crime occurrences. As before, the preliminary foot beat areas are shown for comparison in red.
Larceny Theft
Assault
Although the foot beats largely keep the most significant concentrations in the zones, the results are somewhat varied.
In North Beach, for instance, the foot beat zones misses virtually all larceny theft calls. The Richmond foot beat, however, does almost entirely keep hotspots within its boundaries.
A number of the significant lone concentrations of crime are single-address locations. Some of these show up as hot spots because they are the locations where the crime is reported, rather than where it occurred. One instance of this is the Zuckerberg Hospital, which shows up as a hotspot of assault on the map.
(5) Staff Required for Individual Foot Beats
Given the range of activity levels present in each foot beat, as well as in the size of the foot beat areas, the number of officers needed to effectively patrol each area will be different. This can be done by applying a ratio of the number of pedestrian crossings per officer, with some exceptions made in the rates applied to certain zones, where there are exceptions in the general nature of pedestrian activity in the area.
If staff are assigned at a rate of 1 officer per 75 million pedestrian crossings, with a minimum of 2 officers per area in order to ensure coverage across the week (without a
Report on the Police Department Staffing Analysis San Francisco, CA
Matrix Consulting Group 54
complete relief factor), the necessary staffing allocations range from 2 to 22 officers per foot beat.
The rule should not be applied uniformly, however, as there are some areas where pedestrian activity is fundamentally different in nature. The Financial District has the highest pedestrian count, at over 1,600 million crossings per year. A much larger share of the pedestrians are in transit to and from work than in other areas, meaning that pedestrians are less likely to be interacting with the neighborhood as they travel from one point to another. Because of the density and diversity of transit options available to downtown commuters, a high number are also traveling by public transit, meaning that more walking may likely be required, thus further driving up the count of intersection crossings. As a result, a different increment of officers per crossings is applied, at 300 million per FTE, compared to the standard rate of 75 million.
The following table presents these statistics, showing the number of pedestrian crossings and officers needed to staff each area that meets the minimum threshold for establishing a foot beat:
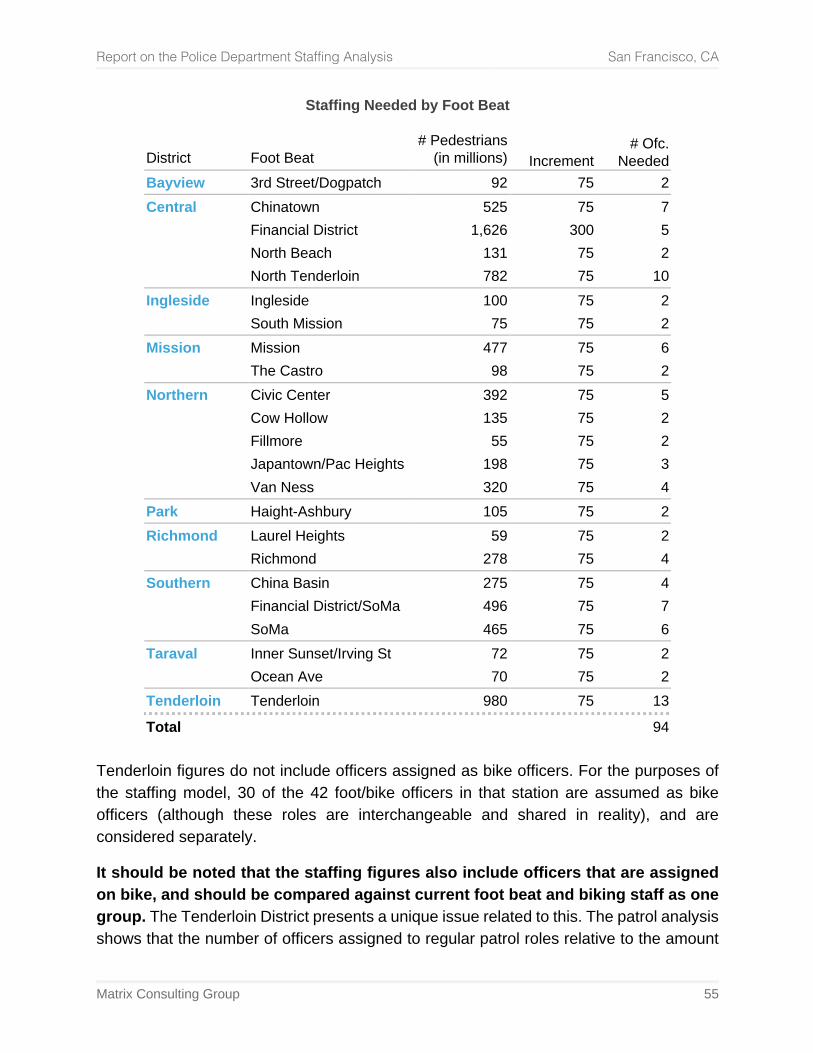
Report on the Police Department Staffing Analysis San Francisco, CA
Matrix Consulting Group 55
Staffing Needed by Foot Beat
District
Foot Beat
# Pedestrians (in millions)
Increment
# Ofc. Needed
Bayview 3rd Street/Dogpatch 92 75 2 Central Chinatown 525 75 7 Financial District 1,626 300 5 North Beach 131 75 2 North Tenderloin 782 75 10 Ingleside Ingleside 100 75 2 South Mission 75 75 2 Mission Mission 477 75 6 The Castro 98 75 2 Northern Civic Center 392 75 5 Cow Hollow 135 75 2 Fillmore 55 75 2 Japantown/Pac Heights 198 75 3 Van Ness 320 75 4 Park Haight-Ashbury 105 75 2 Richmond Laurel Heights 59 75 2 Richmond 278 75 4 Southern China Basin 275 75 4 Financial District/SoMa 496 75 7 SoMa 465 75 6 Taraval Inner Sunset/Irving St 72 75 2 Ocean Ave 70 75 2 Tenderloin Tenderloin 980 75 13 Total 94
Tenderloin figures do not include officers assigned as bike officers. For the purposes of the staffing model, 30 of the 42 foot/bike officers in that station are assumed as bike officers (although these roles are interchangeable and shared in reality), and are considered separately.
It should be noted that the staffing figures also include officers that are assigned on bike, and should be compared against current foot beat and biking staff as one group. The Tenderloin District presents a unique issue related to this. The patrol analysis shows that the number of officers assigned to regular patrol roles relative to the amount
Report on the Police Department Staffing Analysis San Francisco, CA
Matrix Consulting Group 56
of workload handled by the district is significantly less than other areas, and consequently shows a need for a significant staffing increase.
This finding, however, should be viewed with the context of the many bike officers assigned to the district, who may also handle calls in addition to proactive roles, but who have not been factored into the analysis of regular patrol units. Likewise, the foot beat and bike officer analysis is staffing them solely for their proactive capabilities. As a result, the recommended staffing numbers show both a need for greatly augmented patrol staffing, as well as fewer foot beat and bike officers – although more are recommended in the district than in most other districts.
Recommendation: Identify potential foot beat zones using SFMTA pedestrian count estimates as a basis. The 23 zones that have been initially identified should then be reviewed, modified, and revised through a process of commander review and community input, with additional zones created as needed where prioritized by the community.
Recommendation: Allocate foot beat officers to each district in proportion to pedestrian counts, with some adjustments and exceptions.
(6) Additional Considerations
The purpose of this analysis has been to establish a data-driven approach to allocating foot beat zones. It should be considered within those limited confines – as an analysis that does not account for qualitative factors, such as topical concerns of the public, SFPD experience, and other factors that may change from year to year. This is underscored by the reality that foot beats are inherently discretionary in nature, and intersect with politics to a degree. As a result, it is important to weigh the recommended foot beat zones and the number of staff allocated to them should be within the context of commander discretion. If SFPD executive team members and commanders identify priorities and needs that differ from the outputs shown from this methodology, then those needs are valid was well, and should be considered over what is recommended in this chapter.
5. District Plain Clothes and Homeless Units
The following subsections examine the staff assigned to Plain Clothes Teams and as Homeless Officers at the district level, examining opportunities to combine functionality while staffing both areas appropriately.
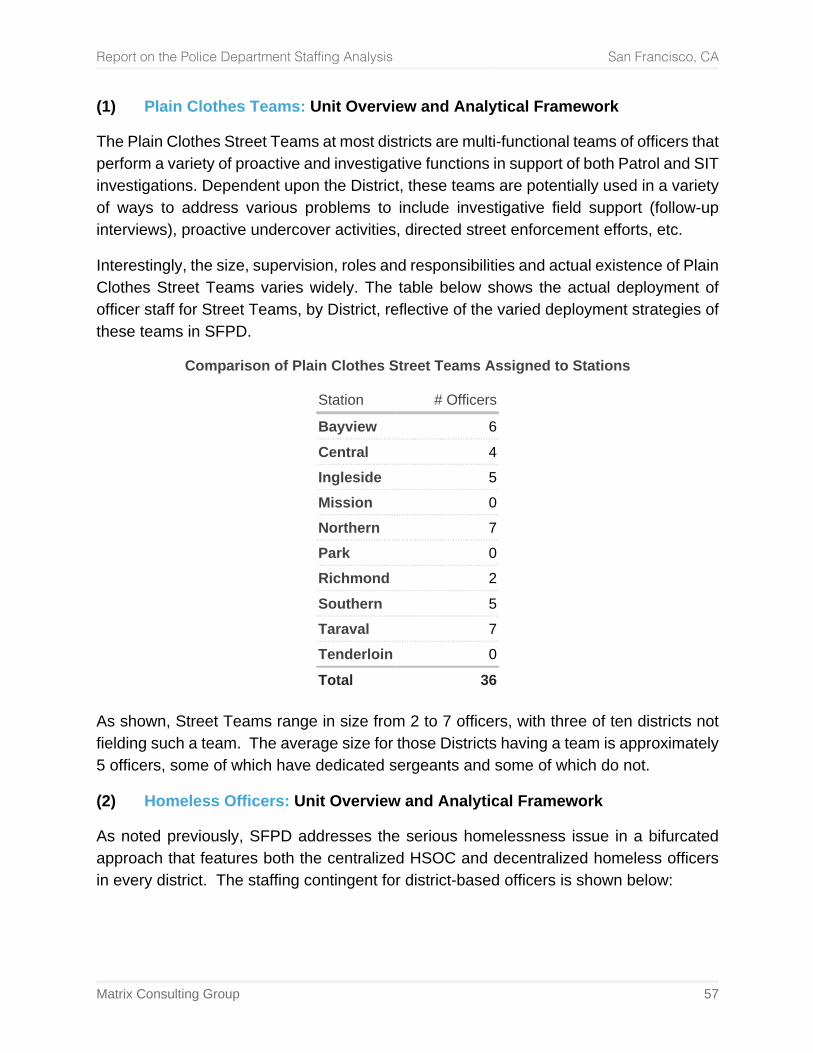
Report on the Police Department Staffing Analysis San Francisco, CA
Matrix Consulting Group 57
(1) Plain Clothes Teams: Unit Overview and Analytical Framework
The Plain Clothes Street Teams at most districts are multi-functional teams of officers that perform a variety of proactive and investigative functions in support of both Patrol and SIT investigations. Dependent upon the District, these teams are potentially used in a variety of ways to address various problems to include investigative field support (follow-up interviews), proactive undercover activities, directed street enforcement efforts, etc.
Interestingly, the size, supervision, roles and responsibilities and actual existence of Plain Clothes Street Teams varies widely. The table below shows the actual deployment of officer staff for Street Teams, by District, reflective of the varied deployment strategies of these teams in SFPD.
Comparison of Plain Clothes Street Teams Assigned to Stations
Station # Officers
Bayview 6 Central 4 Ingleside 5 Mission 0 Northern 7 Park 0 Richmond 2 Southern 5 Taraval 7 Tenderloin 0 Total 36
As shown, Street Teams range in size from 2 to 7 officers, with three of ten districts not fielding such a team. The average size for those Districts having a team is approximately 5 officers, some of which have dedicated sergeants and some of which do not.
(2) Homeless Officers: Unit Overview and Analytical Framework
As noted previously, SFPD addresses the serious homelessness issue in a bifurcated approach that features both the centralized HSOC and decentralized homeless officers in every district. The staffing contingent for district-based officers is shown below:
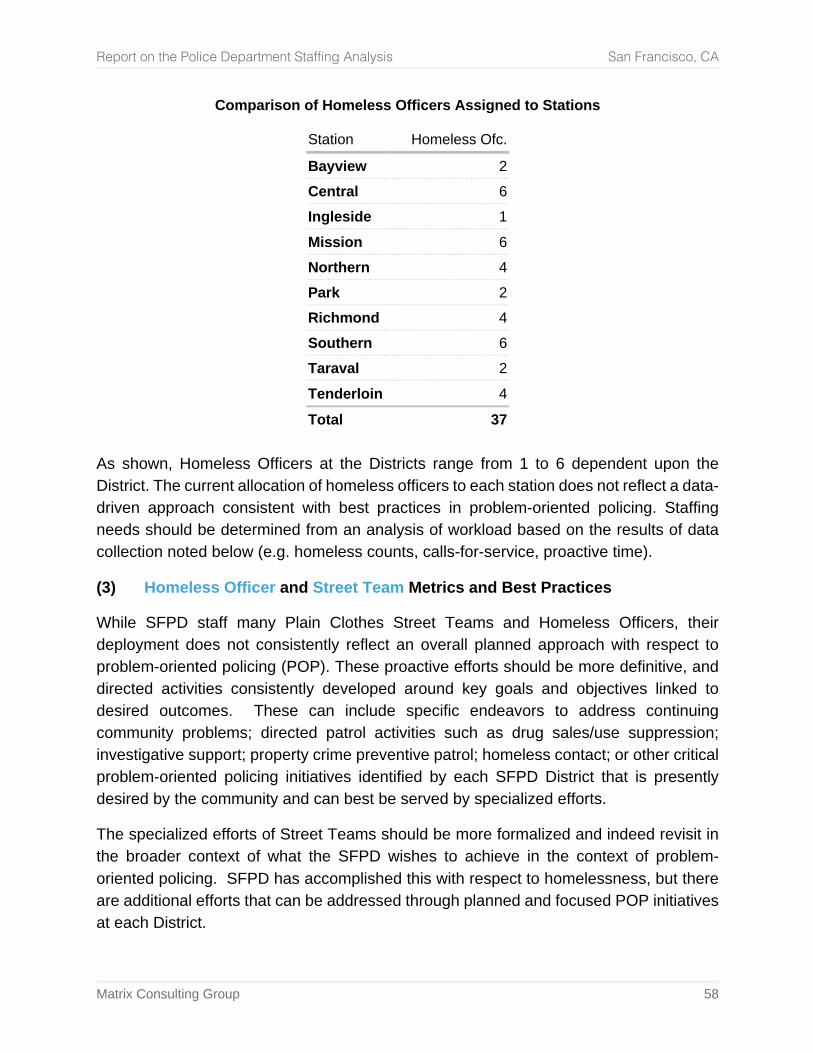
Report on the Police Department Staffing Analysis San Francisco, CA
Matrix Consulting Group 58
Comparison of Homeless Officers Assigned to Stations
Station Homeless Ofc.
Bayview 2 Central 6 Ingleside 1 Mission 6 Northern 4 Park 2 Richmond 4 Southern 6 Taraval 2 Tenderloin 4 Total 37
As shown, Homeless Officers at the Districts range from 1 to 6 dependent upon the District. The current allocation of homeless officers to each station does not reflect a data-driven approach consistent with best practices in problem-oriented policing. Staffing needs should be determined from an analysis of workload based on the results of data collection noted below (e.g. homeless counts, calls-for-service, proactive time).
(3) Homeless Officer and Street Team Metrics and Best Practices
While SFPD staff many Plain Clothes Street Teams and Homeless Officers, their deployment does not consistently reflect an overall planned approach with respect to problem-oriented policing (POP). These proactive efforts should be more definitive, and directed activities consistently developed around key goals and objectives linked to desired outcomes. These can include specific endeavors to address continuing community problems; directed patrol activities such as drug sales/use suppression; investigative support; property crime preventive patrol; homeless contact; or other critical problem-oriented policing initiatives identified by each SFPD District that is presently desired by the community and can best be served by specialized efforts.
The specialized efforts of Street Teams should be more formalized and indeed revisit in the broader context of what the SFPD wishes to achieve in the context of problem-oriented policing. SFPD has accomplished this with respect to homelessness, but there are additional efforts that can be addressed through planned and focused POP initiatives at each District.
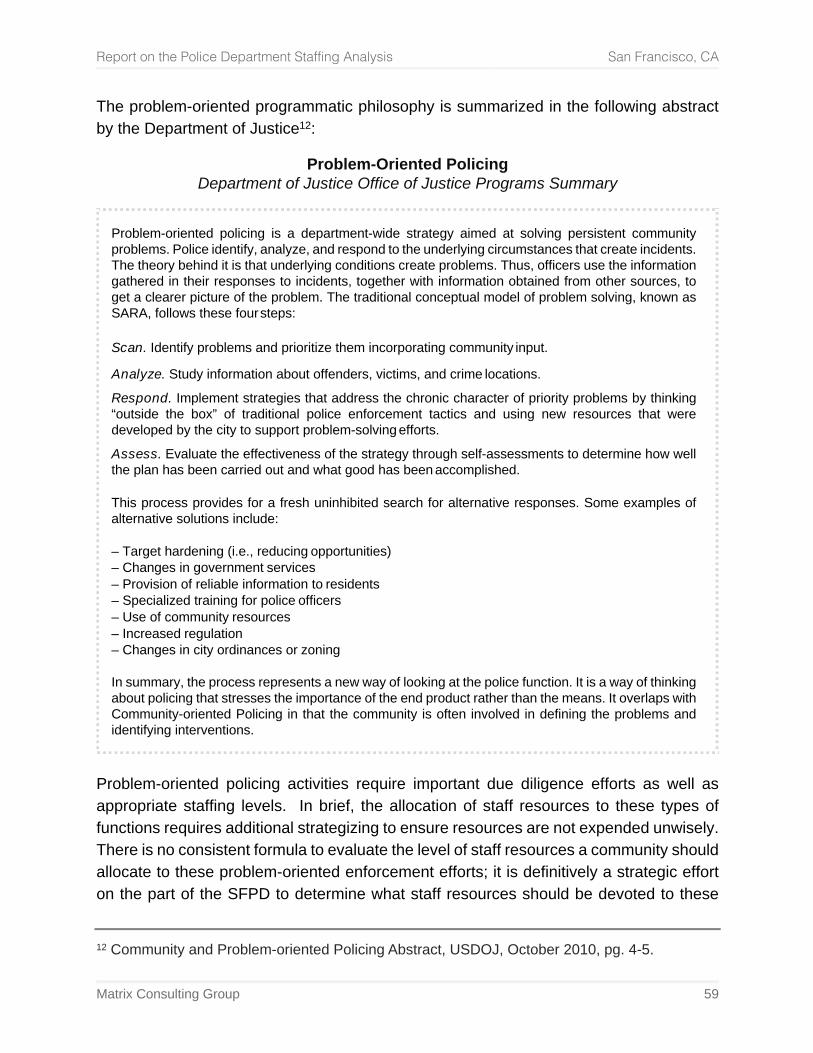
Report on the Police Department Staffing Analysis San Francisco, CA
Matrix Consulting Group 59
The problem-oriented programmatic philosophy is summarized in the following abstract by the Department of Justice12:
Problem-Oriented Policing Department of Justice Office of Justice Programs Summary
Problem-oriented policing is a department-wide strategy aimed at solving persistent community problems. Police identify, analyze, and respond to the underlying circumstances that create incidents. The theory behind it is that underlying conditions create problems. Thus, officers use the information gathered in their responses to incidents, together with information obtained from other sources, to get a clearer picture of the problem. The traditional conceptual model of problem solving, known as SARA, follows these four steps: Scan. Identify problems and prioritize them incorporating community input.
Analyze. Study information about offenders, victims, and crime locations.
Respond. Implement strategies that address the chronic character of priority problems by thinking “outside the box” of traditional police enforcement tactics and using new resources that were developed by the city to support problem-solving efforts.
Assess. Evaluate the effectiveness of the strategy through self-assessments to determine how well the plan has been carried out and what good has been accomplished. This process provides for a fresh uninhibited search for alternative responses. Some examples of alternative solutions include: – Target hardening (i.e., reducing opportunities) – Changes in government services – Provision of reliable information to residents – Specialized training for police officers – Use of community resources – Increased regulation – Changes in city ordinances or zoning In summary, the process represents a new way of looking at the police function. It is a way of thinking about policing that stresses the importance of the end product rather than the means. It overlaps with Community-oriented Policing in that the community is often involved in defining the problems and identifying interventions.
Problem-oriented policing activities require important due diligence efforts as well as appropriate staffing levels. In brief, the allocation of staff resources to these types of functions requires additional strategizing to ensure resources are not expended unwisely. There is no consistent formula to evaluate the level of staff resources a community should allocate to these problem-oriented enforcement efforts; it is definitively a strategic effort on the part of the SFPD to determine what staff resources should be devoted to these
12 Community and Problem-oriented Policing Abstract, USDOJ, October 2010, pg. 4-5.
Report on the Police Department Staffing Analysis San Francisco, CA
Matrix Consulting Group 60
efforts and how they should be applied. However, certain guidelines can be applied as a starting point.
The executive management of the SFPD, in cooperation with District Captains, should revisit the staff levels of problem-oriented teams that include primarily:
• Existing Plain Clothes Street Team personnel; and • Existing Homeless Officers. There are two options consistent with problem-oriented policing philosophies that SFPD should consider:
• These two teams should be combined and reformulated into a new Street Team in the broader context of formalized problem-oriented policing, using the SARA framework defined in the previously shown DOJ abstract, as well as other efforts, to strategically develop a specialized unit staffing plan that mitigates community harm, focuses more on the process of targeting problems in the community and making assigned staff accountable for results.
• The two teams can remain separated with unique missions; however, such a
deployment does not benefit from the economies of scale and the advantages of being able to strategically deploy personnel on overall larger teams to address POP efforts as they arise.
The data below provides staffing metrics to allow for a combination of these two units or to continue staffing individual units.
(3.1) Administrative and Proactive Time
Because fully “proactive units” are often designed to dedicate 100% of their time to specialized field efforts and the supporting administrative time required, development of staffing requirements can be based on other approaches noted below. As a result, the staffing needs of this unit are not analyzed using a workload-based approach.
(3.2) Workload Metrics
Because staffing levels in proactive units can flex tremendously, generally speaking they can be devised as a proportion of total core staff. In this instance, assuming each district reflects its only unique policing agency, a proportion of the total field officers at each District is recommended.
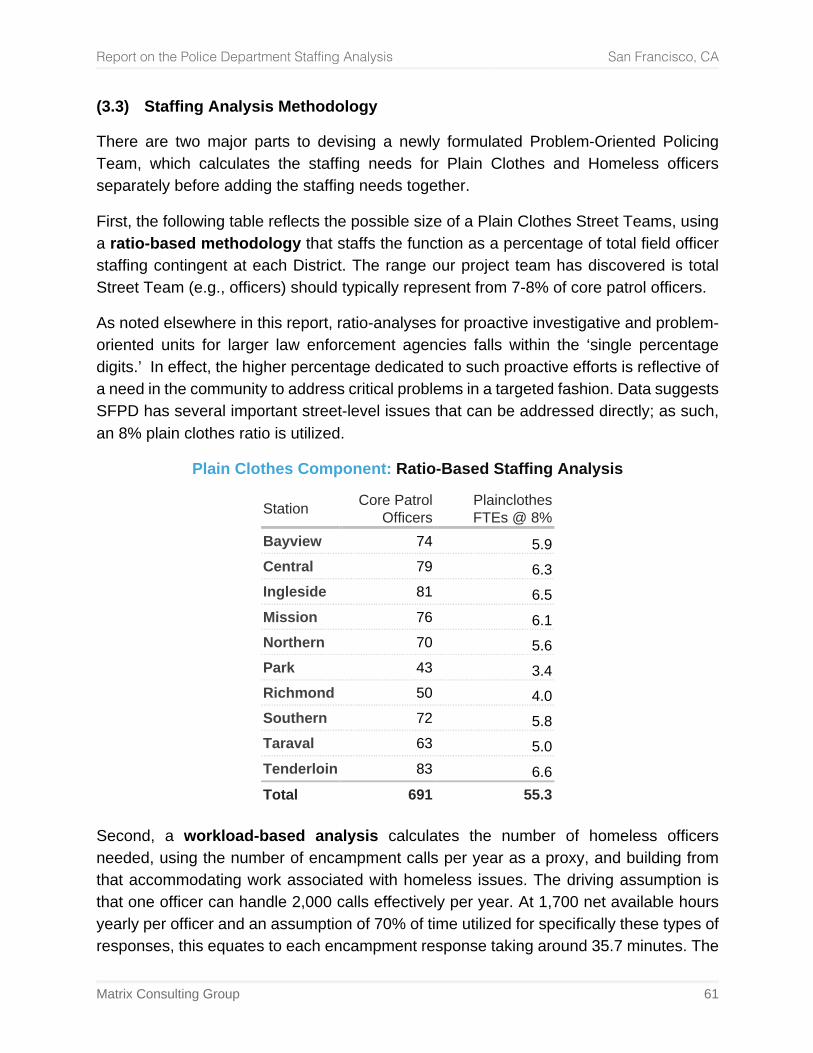
Report on the Police Department Staffing Analysis San Francisco, CA
Matrix Consulting Group 61
(3.3) Staffing Analysis Methodology
There are two major parts to devising a newly formulated Problem-Oriented Policing Team, which calculates the staffing needs for Plain Clothes and Homeless officers separately before adding the staffing needs together.
First, the following table reflects the possible size of a Plain Clothes Street Teams, using a ratio-based methodology that staffs the function as a percentage of total field officer staffing contingent at each District. The range our project team has discovered is total Street Team (e.g., officers) should typically represent from 7-8% of core patrol officers.
As noted elsewhere in this report, ratio-analyses for proactive investigative and problem-oriented units for larger law enforcement agencies falls within the ‘single percentage digits.’ In effect, the higher percentage dedicated to such proactive efforts is reflective of a need in the community to address critical problems in a targeted fashion. Data suggests SFPD has several important street-level issues that can be addressed directly; as such, an 8% plain clothes ratio is utilized.
Plain Clothes Component: Ratio-Based Staffing Analysis
Station Core Patrol Officers
Plainclothes FTEs @ 8%
Bayview 74 5.9 Central 79 6.3 Ingleside 81 6.5 Mission 76 6.1 Northern 70 5.6 Park 43 3.4 Richmond 50 4.0 Southern 72 5.8 Taraval 63 5.0 Tenderloin 83 6.6 Total 691 55.3
Second, a workload-based analysis calculates the number of homeless officers needed, using the number of encampment calls per year as a proxy, and building from that accommodating work associated with homeless issues. The driving assumption is that one officer can handle 2,000 calls effectively per year. At 1,700 net available hours yearly per officer and an assumption of 70% of time utilized for specifically these types of responses, this equates to each encampment response taking around 35.7 minutes. The
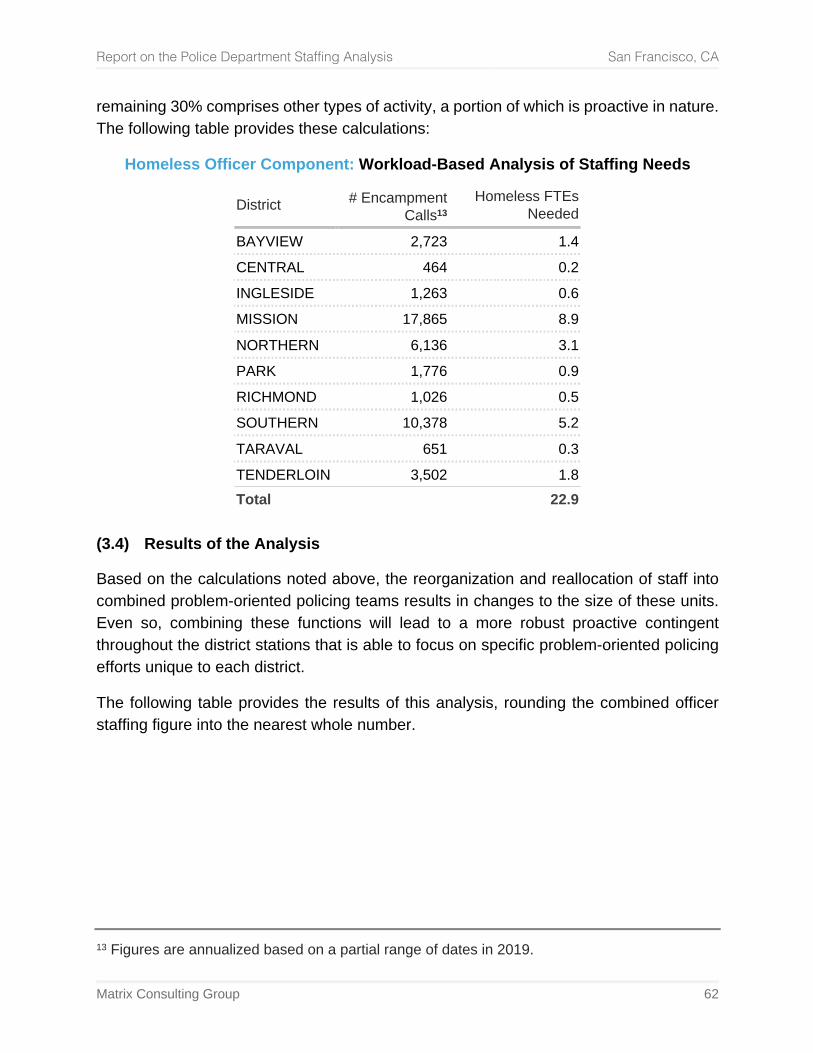
Report on the Police Department Staffing Analysis San Francisco, CA
Matrix Consulting Group 62
remaining 30% comprises other types of activity, a portion of which is proactive in nature. The following table provides these calculations:
Homeless Officer Component: Workload-Based Analysis of Staffing Needs
District
# Encampment Calls13
Homeless FTEs Needed
BAYVIEW 2,723 1.4 CENTRAL 464 0.2 INGLESIDE 1,263 0.6 MISSION 17,865 8.9 NORTHERN 6,136 3.1 PARK 1,776 0.9 RICHMOND 1,026 0.5 SOUTHERN 10,378 5.2 TARAVAL 651 0.3 TENDERLOIN 3,502 1.8 Total 22.9
(3.4) Results of the Analysis
Based on the calculations noted above, the reorganization and reallocation of staff into combined problem-oriented policing teams results in changes to the size of these units. Even so, combining these functions will lead to a more robust proactive contingent throughout the district stations that is able to focus on specific problem-oriented policing efforts unique to each district.
The following table provides the results of this analysis, rounding the combined officer staffing figure into the nearest whole number.
13 Figures are annualized based on a partial range of dates in 2019.
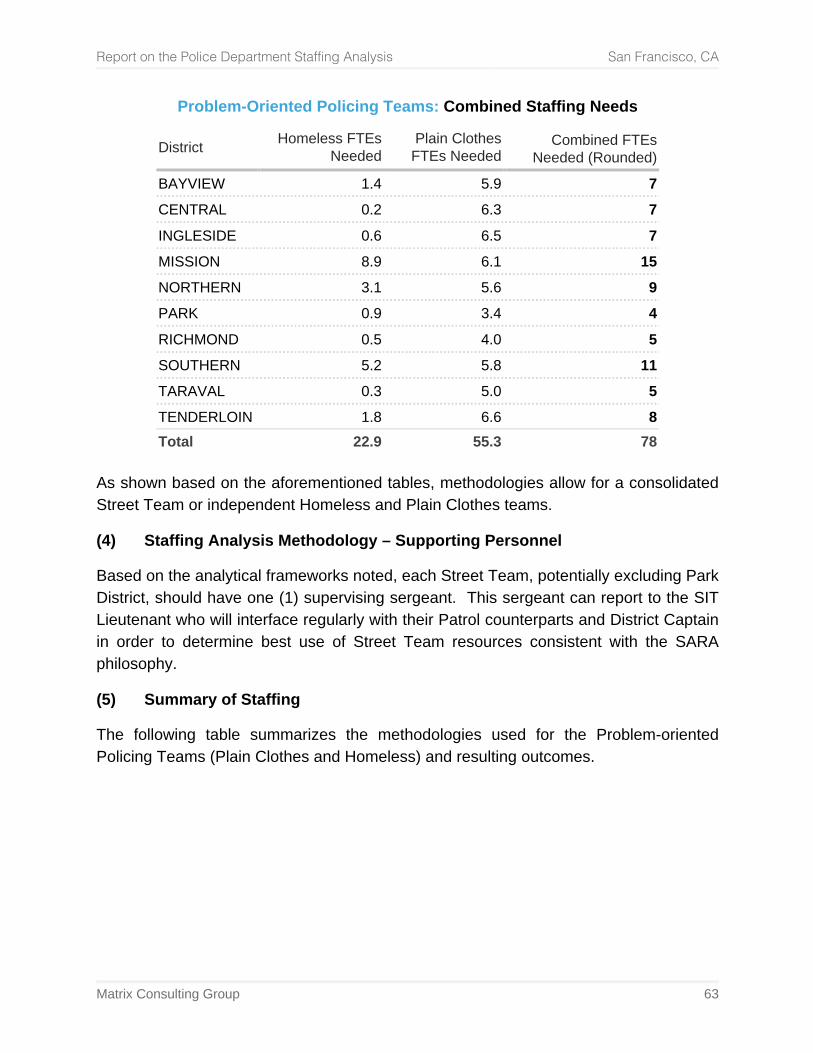
Report on the Police Department Staffing Analysis San Francisco, CA
Matrix Consulting Group 63
Problem-Oriented Policing Teams: Combined Staffing Needs
District
Homeless FTEs Needed
Plain Clothes FTEs Needed
Combined FTEs Needed (Rounded)
BAYVIEW 1.4 5.9 7 CENTRAL 0.2 6.3 7 INGLESIDE 0.6 6.5 7 MISSION 8.9 6.1 15 NORTHERN 3.1 5.6 9 PARK 0.9 3.4 4 RICHMOND 0.5 4.0 5 SOUTHERN 5.2 5.8 11 TARAVAL 0.3 5.0 5 TENDERLOIN 1.8 6.6 8 Total 22.9 55.3 78
As shown based on the aforementioned tables, methodologies allow for a consolidated Street Team or independent Homeless and Plain Clothes teams.
(4) Staffing Analysis Methodology – Supporting Personnel
Based on the analytical frameworks noted, each Street Team, potentially excluding Park District, should have one (1) supervising sergeant. This sergeant can report to the SIT Lieutenant who will interface regularly with their Patrol counterparts and District Captain in order to determine best use of Street Team resources consistent with the SARA philosophy.
(5) Summary of Staffing
The following table summarizes the methodologies used for the Problem-oriented Policing Teams (Plain Clothes and Homeless) and resulting outcomes.
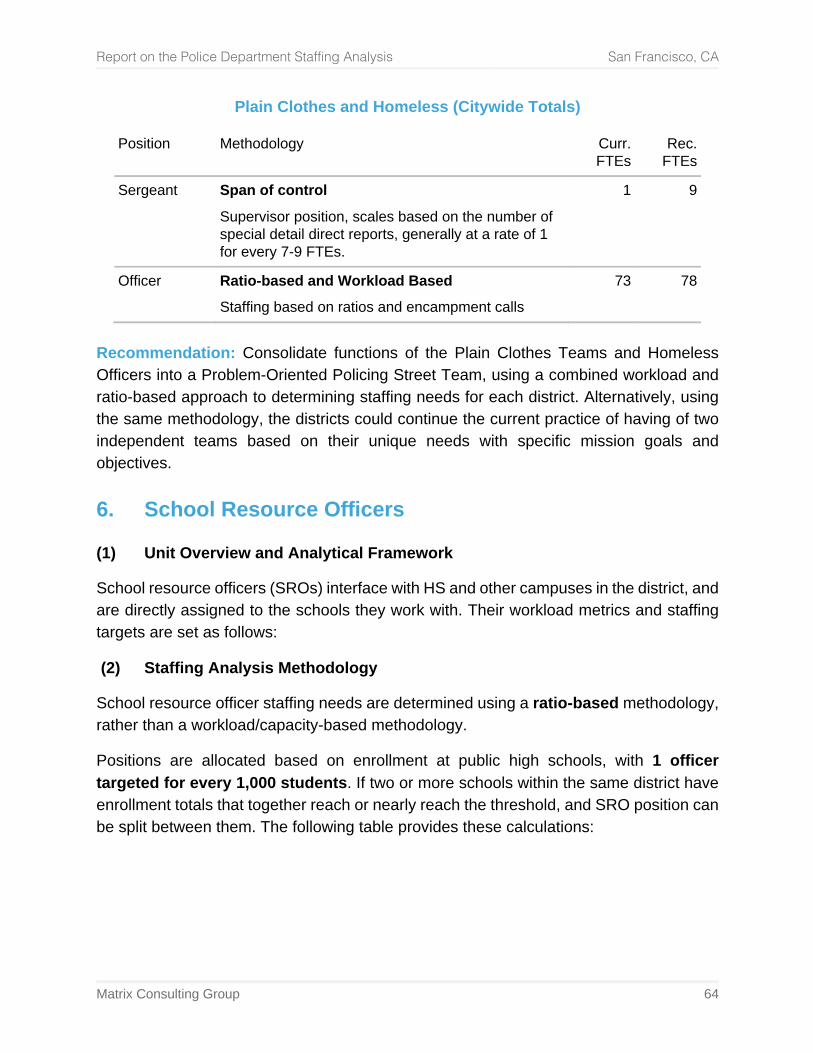
Report on the Police Department Staffing Analysis San Francisco, CA
Matrix Consulting Group 64
Plain Clothes and Homeless (Citywide Totals)
Position Methodology Curr. FTEs
Rec. FTEs
Sergeant Span of control
Supervisor position, scales based on the number of special detail direct reports, generally at a rate of 1 for every 7-9 FTEs.
1 9
Officer Ratio-based and Workload Based
Staffing based on ratios and encampment calls 73 78
Recommendation: Consolidate functions of the Plain Clothes Teams and Homeless Officers into a Problem-Oriented Policing Street Team, using a combined workload and ratio-based approach to determining staffing needs for each district. Alternatively, using the same methodology, the districts could continue the current practice of having of two independent teams based on their unique needs with specific mission goals and objectives.
6. School Resource Officers
(1) Unit Overview and Analytical Framework
School resource officers (SROs) interface with HS and other campuses in the district, and are directly assigned to the schools they work with. Their workload metrics and staffing targets are set as follows:
(2) Staffing Analysis Methodology
School resource officer staffing needs are determined using a ratio-based methodology, rather than a workload/capacity-based methodology.
Positions are allocated based on enrollment at public high schools, with 1 officer targeted for every 1,000 students. If two or more schools within the same district have enrollment totals that together reach or nearly reach the threshold, and SRO position can be split between them. The following table provides these calculations:
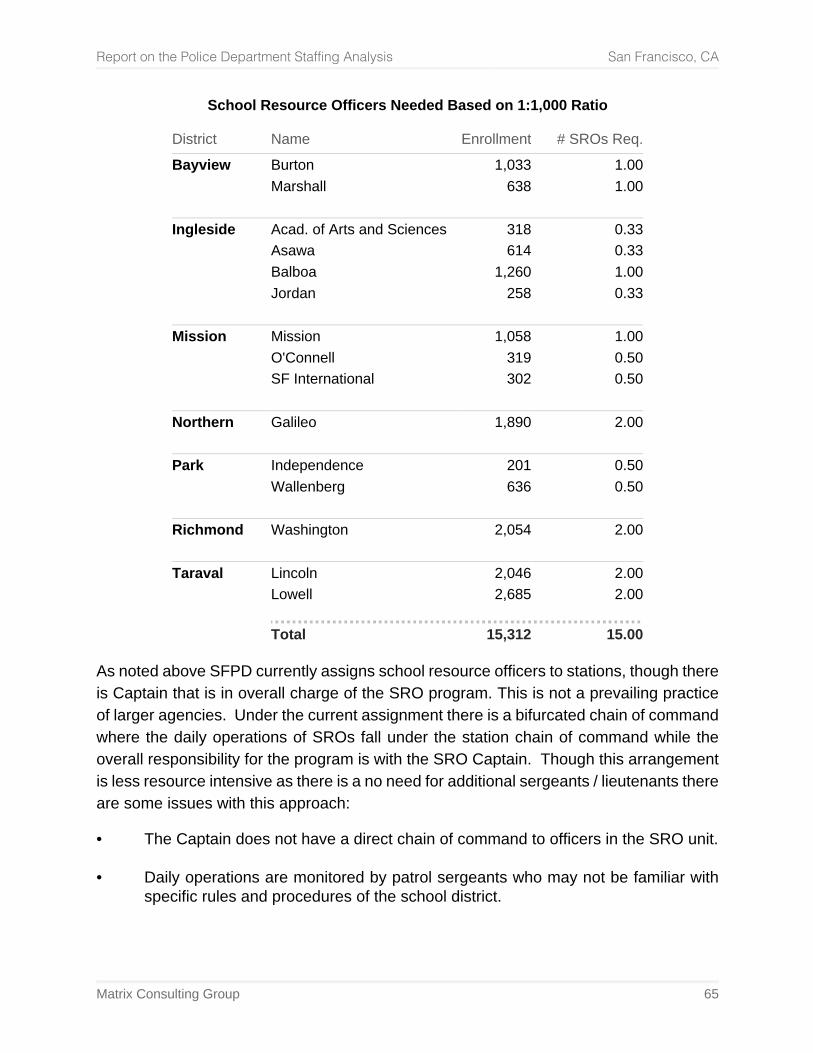
Report on the Police Department Staffing Analysis San Francisco, CA
Matrix Consulting Group 65
School Resource Officers Needed Based on 1:1,000 Ratio
District Name Enrollment # SROs Req.
Bayview Burton 1,033 1.00 Marshall 638 1.00
Ingleside Acad. of Arts and Sciences 318 0.33 Asawa 614 0.33 Balboa 1,260 1.00 Jordan 258 0.33
Mission Mission 1,058 1.00 O'Connell 319 0.50 SF International 302 0.50
Northern Galileo 1,890 2.00
Park Independence 201 0.50 Wallenberg 636 0.50
Richmond Washington 2,054 2.00
Taraval Lincoln 2,046 2.00 Lowell 2,685 2.00
Total 15,312 15.00
As noted above SFPD currently assigns school resource officers to stations, though there is Captain that is in overall charge of the SRO program. This is not a prevailing practice of larger agencies. Under the current assignment there is a bifurcated chain of command where the daily operations of SROs fall under the station chain of command while the overall responsibility for the program is with the SRO Captain. Though this arrangement is less resource intensive as there is a no need for additional sergeants / lieutenants there are some issues with this approach:
• The Captain does not have a direct chain of command to officers in the SRO unit. • Daily operations are monitored by patrol sergeants who may not be familiar with
specific rules and procedures of the school district.
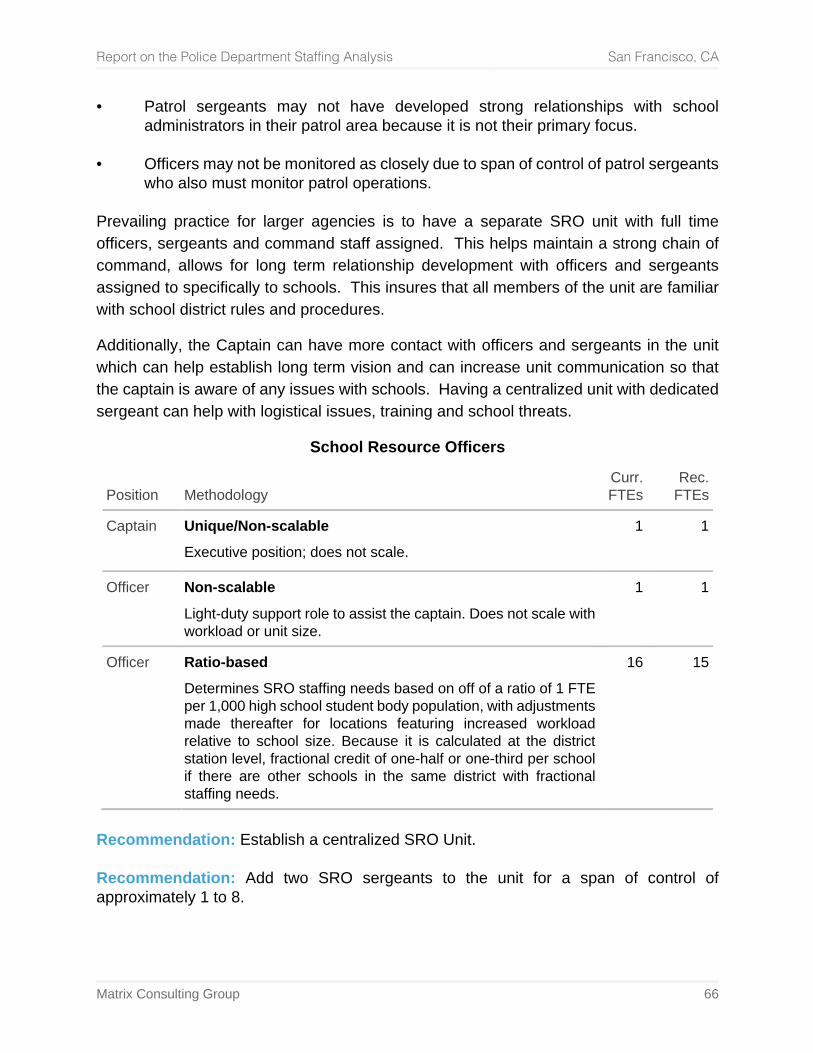
Report on the Police Department Staffing Analysis San Francisco, CA
Matrix Consulting Group 66
• Patrol sergeants may not have developed strong relationships with school administrators in their patrol area because it is not their primary focus.
• Officers may not be monitored as closely due to span of control of patrol sergeants
who also must monitor patrol operations. Prevailing practice for larger agencies is to have a separate SRO unit with full time officers, sergeants and command staff assigned. This helps maintain a strong chain of command, allows for long term relationship development with officers and sergeants assigned to specifically to schools. This insures that all members of the unit are familiar with school district rules and procedures.
Additionally, the Captain can have more contact with officers and sergeants in the unit which can help establish long term vision and can increase unit communication so that the captain is aware of any issues with schools. Having a centralized unit with dedicated sergeant can help with logistical issues, training and school threats.
School Resource Officers
Position Methodology Curr.
FTEs Rec.
FTEs
Captain Unique/Non-scalable
Executive position; does not scale. 1 1
Officer Non-scalable
Light-duty support role to assist the captain. Does not scale with workload or unit size.
1 1
Officer Ratio-based
Determines SRO staffing needs based on off of a ratio of 1 FTE per 1,000 high school student body population, with adjustments made thereafter for locations featuring increased workload relative to school size. Because it is calculated at the district station level, fractional credit of one-half or one-third per school if there are other schools in the same district with fractional staffing needs.
16 15
Recommendation: Establish a centralized SRO Unit. Recommendation: Add two SRO sergeants to the unit for a span of control of approximately 1 to 8.
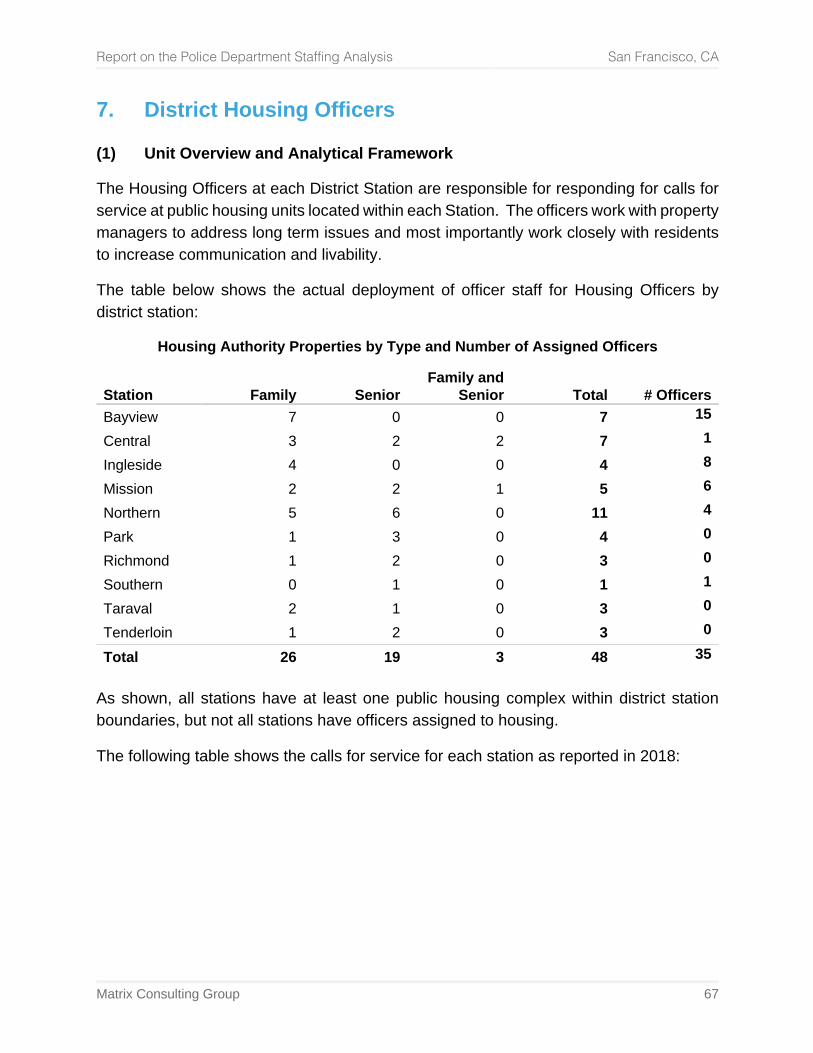
Report on the Police Department Staffing Analysis San Francisco, CA
Matrix Consulting Group 67
7. District Housing Officers
(1) Unit Overview and Analytical Framework
The Housing Officers at each District Station are responsible for responding for calls for service at public housing units located within each Station. The officers work with property managers to address long term issues and most importantly work closely with residents to increase communication and livability.
The table below shows the actual deployment of officer staff for Housing Officers by district station:
Housing Authority Properties by Type and Number of Assigned Officers
Station Family Senior Family and
Senior Total # Officers Bayview 7 0 0 7 15
Central 3 2 2 7 1
Ingleside 4 0 0 4 8
Mission 2 2 1 5 6
Northern 5 6 0 11 4
Park 1 3 0 4 0
Richmond 1 2 0 3 0
Southern 0 1 0 1 1
Taraval 2 1 0 3 0
Tenderloin 1 2 0 3 0
Total 26 19 3 48 35 As shown, all stations have at least one public housing complex within district station boundaries, but not all stations have officers assigned to housing.
The following table shows the calls for service for each station as reported in 2018:
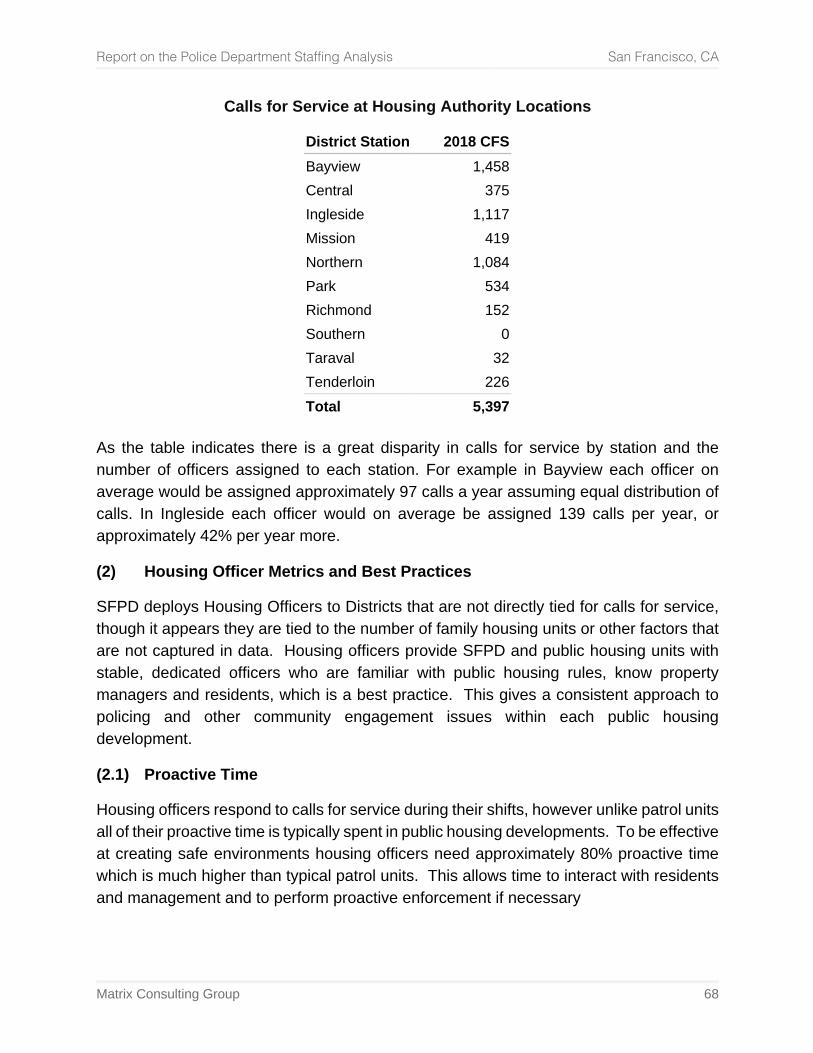
Report on the Police Department Staffing Analysis San Francisco, CA
Matrix Consulting Group 68
Calls for Service at Housing Authority Locations
District Station 2018 CFS Bayview 1,458 Central 375 Ingleside 1,117 Mission 419 Northern 1,084 Park 534 Richmond 152 Southern 0 Taraval 32 Tenderloin 226 Total 5,397
As the table indicates there is a great disparity in calls for service by station and the number of officers assigned to each station. For example in Bayview each officer on average would be assigned approximately 97 calls a year assuming equal distribution of calls. In Ingleside each officer would on average be assigned 139 calls per year, or approximately 42% per year more.
(2) Housing Officer Metrics and Best Practices
SFPD deploys Housing Officers to Districts that are not directly tied for calls for service, though it appears they are tied to the number of family housing units or other factors that are not captured in data. Housing officers provide SFPD and public housing units with stable, dedicated officers who are familiar with public housing rules, know property managers and residents, which is a best practice. This gives a consistent approach to policing and other community engagement issues within each public housing development.
(2.1) Proactive Time
Housing officers respond to calls for service during their shifts, however unlike patrol units all of their proactive time is typically spent in public housing developments. To be effective at creating safe environments housing officers need approximately 80% proactive time which is much higher than typical patrol units. This allows time to interact with residents and management and to perform proactive enforcement if necessary
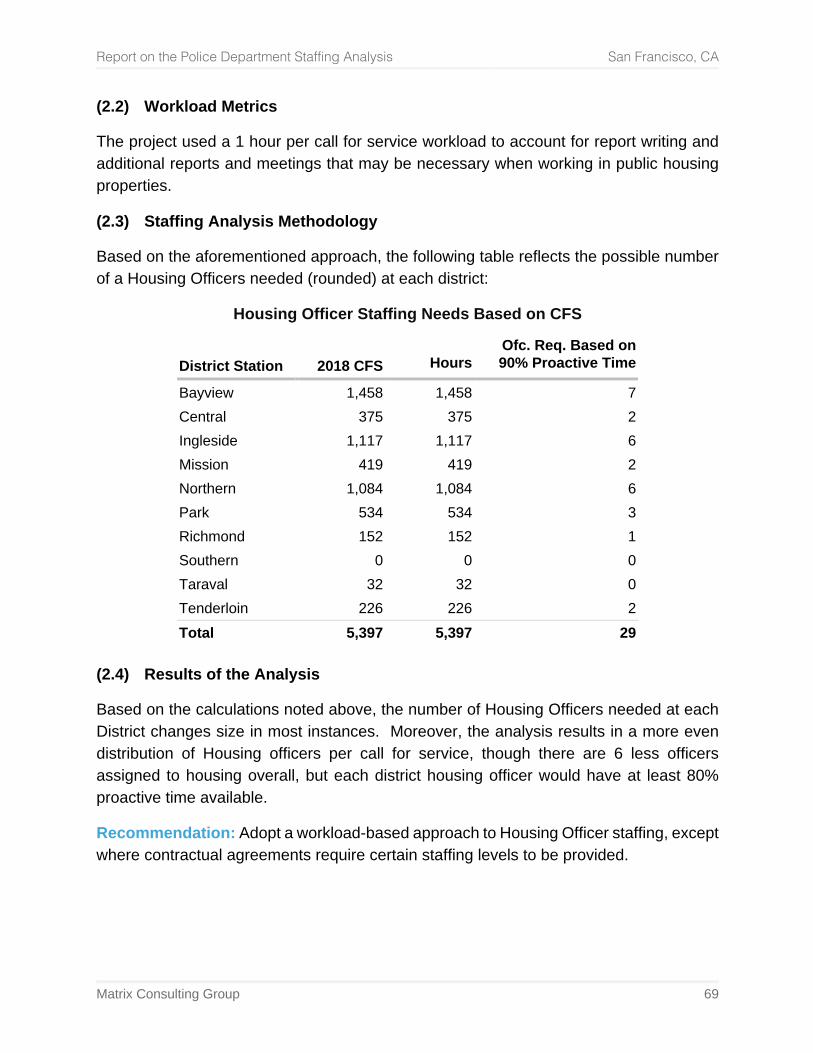
Report on the Police Department Staffing Analysis San Francisco, CA
Matrix Consulting Group 69
(2.2) Workload Metrics
The project used a 1 hour per call for service workload to account for report writing and additional reports and meetings that may be necessary when working in public housing properties.
(2.3) Staffing Analysis Methodology
Based on the aforementioned approach, the following table reflects the possible number of a Housing Officers needed (rounded) at each district:
Housing Officer Staffing Needs Based on CFS
District Station
2018 CFS
Hours
Ofc. Req. Based on 90% Proactive Time
Bayview 1,458 1,458 7 Central 375 375 2 Ingleside 1,117 1,117 6 Mission 419 419 2 Northern 1,084 1,084 6 Park 534 534 3 Richmond 152 152 1 Southern 0 0 0 Taraval 32 32 0 Tenderloin 226 226 2 Total 5,397 5,397 29
(2.4) Results of the Analysis
Based on the calculations noted above, the number of Housing Officers needed at each District changes size in most instances. Moreover, the analysis results in a more even distribution of Housing officers per call for service, though there are 6 less officers assigned to housing overall, but each district housing officer would have at least 80% proactive time available.
Recommendation: Adopt a workload-based approach to Housing Officer staffing, except where contractual agreements require certain staffing levels to be provided.
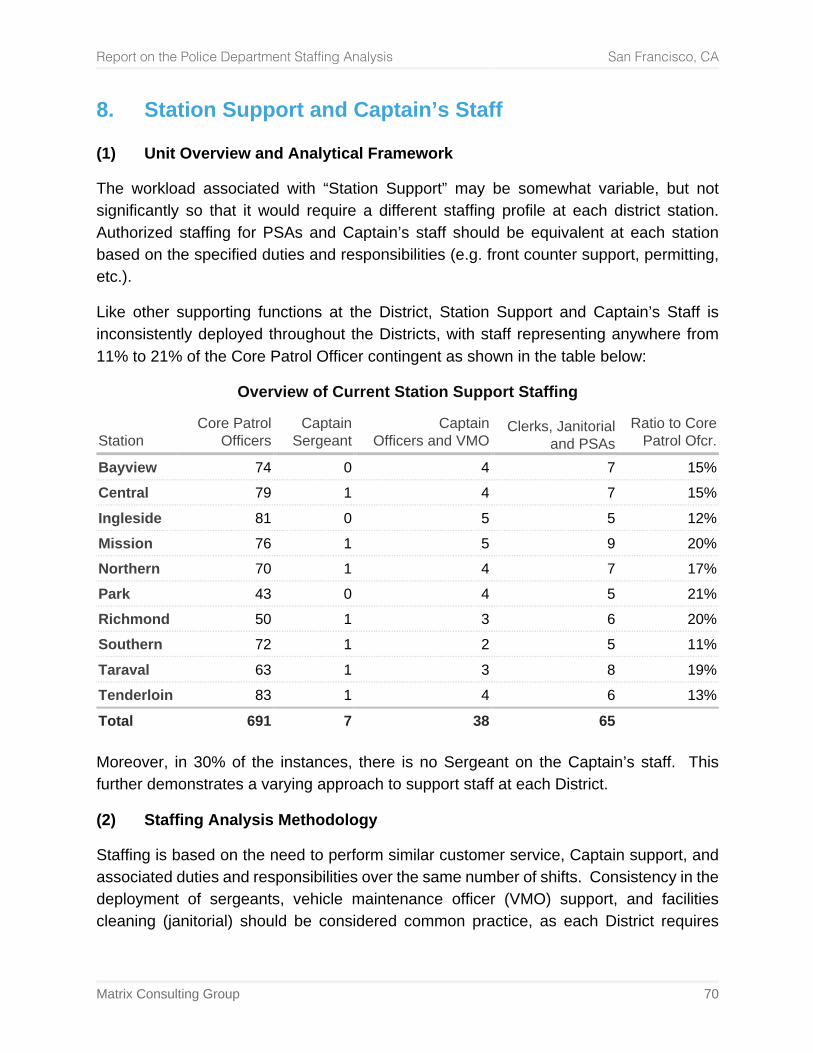
Report on the Police Department Staffing Analysis San Francisco, CA
Matrix Consulting Group 70
8. Station Support and Captain’s Staff
(1) Unit Overview and Analytical Framework
The workload associated with “Station Support” may be somewhat variable, but not significantly so that it would require a different staffing profile at each district station. Authorized staffing for PSAs and Captain’s staff should be equivalent at each station based on the specified duties and responsibilities (e.g. front counter support, permitting, etc.).
Like other supporting functions at the District, Station Support and Captain’s Staff is inconsistently deployed throughout the Districts, with staff representing anywhere from 11% to 21% of the Core Patrol Officer contingent as shown in the table below:
Overview of Current Station Support Staffing
Station
Core Patrol Officers
Captain Sergeant
Captain Officers and VMO
Clerks, Janitorial and PSAs
Ratio to Core Patrol Ofcr.
Bayview 74 0 4 7 15% Central 79 1 4 7 15% Ingleside 81 0 5 5 12% Mission 76 1 5 9 20% Northern 70 1 4 7 17% Park 43 0 4 5 21% Richmond 50 1 3 6 20% Southern 72 1 2 5 11% Taraval 63 1 3 8 19% Tenderloin 83 1 4 6 13% Total 691 7 38 65 Moreover, in 30% of the instances, there is no Sergeant on the Captain’s staff. This further demonstrates a varying approach to support staff at each District.
(2) Staffing Analysis Methodology
Staffing is based on the need to perform similar customer service, Captain support, and associated duties and responsibilities over the same number of shifts. Consistency in the deployment of sergeants, vehicle maintenance officer (VMO) support, and facilities cleaning (janitorial) should be considered common practice, as each District requires
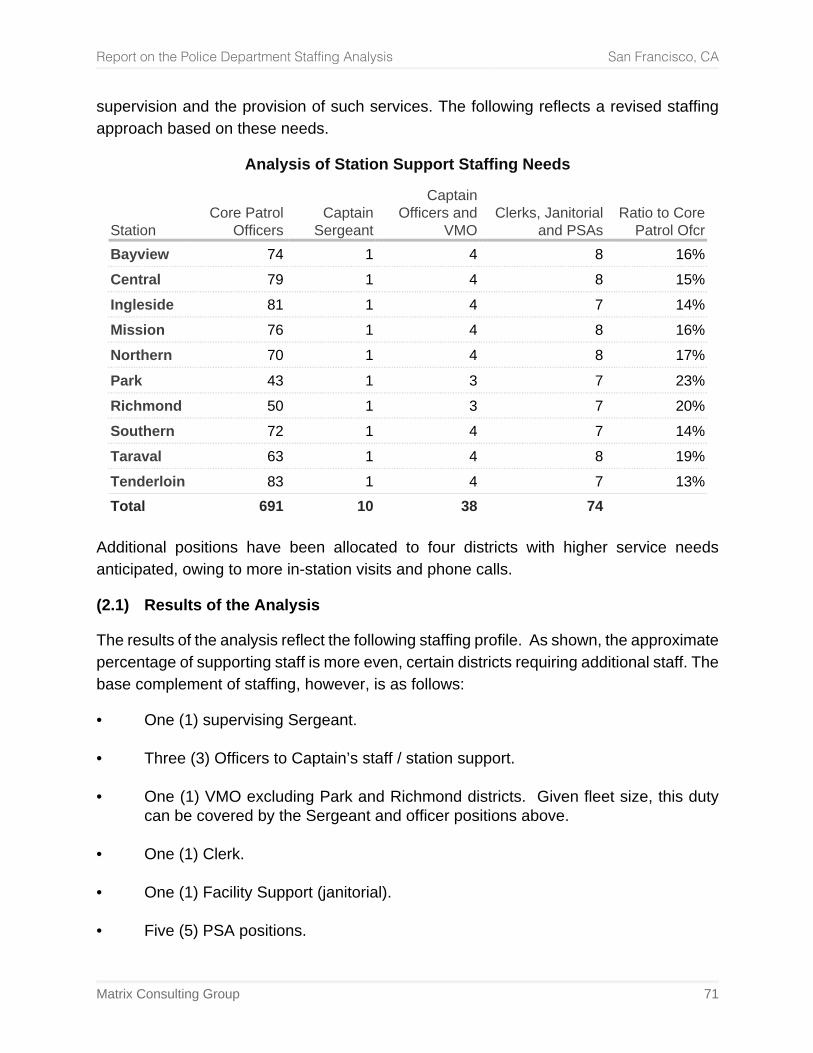
Report on the Police Department Staffing Analysis San Francisco, CA
Matrix Consulting Group 71
supervision and the provision of such services. The following reflects a revised staffing approach based on these needs.
Analysis of Station Support Staffing Needs
Station
Core Patrol Officers
Captain Sergeant
Captain Officers and
VMO Clerks, Janitorial
and PSAs Ratio to Core
Patrol Ofcr Bayview 74 1 4 8 16% Central 79 1 4 8 15% Ingleside 81 1 4 7 14% Mission 76 1 4 8 16% Northern 70 1 4 8 17% Park 43 1 3 7 23% Richmond 50 1 3 7 20% Southern 72 1 4 7 14% Taraval 63 1 4 8 19% Tenderloin 83 1 4 7 13% Total 691 10 38 74
Additional positions have been allocated to four districts with higher service needs anticipated, owing to more in-station visits and phone calls.
(2.1) Results of the Analysis
The results of the analysis reflect the following staffing profile. As shown, the approximate percentage of supporting staff is more even, certain districts requiring additional staff. The base complement of staffing, however, is as follows:
• One (1) supervising Sergeant. • Three (3) Officers to Captain’s staff / station support. • One (1) VMO excluding Park and Richmond districts. Given fleet size, this duty
can be covered by the Sergeant and officer positions above. • One (1) Clerk. • One (1) Facility Support (janitorial). • Five (5) PSA positions.
Report on the Police Department Staffing Analysis San Francisco, CA
Matrix Consulting Group 72
9. Night Shift Captains
(1) Unit Overview and Analytical Framework
The SFPD utilizes a Night Shift Captain position with two captains that work a 4-10 shift. The Captains are responsible for overseeing patrol operations during hours when senior management and station captains are normally off shift. Night Shift Captains can coordinate responses to major incidents, re-allocate resources among the 10 stations as the need arises and are able to handle critical incidents. The benefit of a night captain position is that there is a senior command person in charge during the most critical times of the day (afternoon / evening). This is especially important in a large city like San Francisco that is an international destination with thousands of daily international and national visitors. An incident in this city could draw international attention and having senior command staff available after normal work hours insures that there is a coordinated response to any incident.
(2) Staffing Analysis
Using only two captains to cover 365 days with leave, vacation and training means that there will be many days a year when there is no coverage unless a third captain is brought in or the other captain works more than 40 hours. Adding a third captain would present another challenge which is there would be many days when there are 2 or 3 captains working which is more than typically necessary.
A possible solution is to use an acting captain (senior lieutenant) to cover vacations or training. This would provide the SFPD with a person in charge during the preferred coverage hours and would help develop senior lieutenants for future promotions. This would also reduce the cost of a full time third captain when is not a need for additional full-time staff.
Recommendation: Create an SOP for acting Captain’s position to cover night shift captain vacancies when they occur.
10. Community Engagement Supporting Services
(1) Unit Overview and Analytical Framework
The Community Engagement Division (CED) provides an overall Department structure and framework to enhance community relationships in our City. Members assigned work collectively to support the effort of all stations, bureaus and assignments in the Department by promoting community policing and community engagement policies,
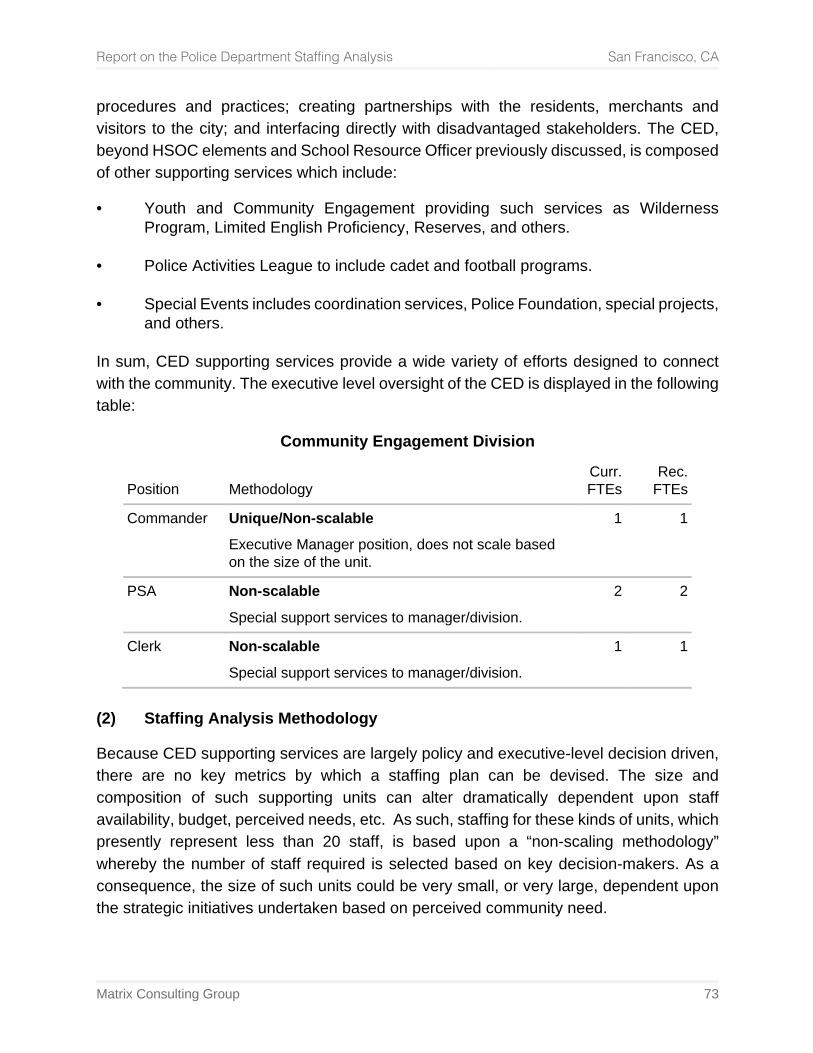
Report on the Police Department Staffing Analysis San Francisco, CA
Matrix Consulting Group 73
procedures and practices; creating partnerships with the residents, merchants and visitors to the city; and interfacing directly with disadvantaged stakeholders. The CED, beyond HSOC elements and School Resource Officer previously discussed, is composed of other supporting services which include:
• Youth and Community Engagement providing such services as Wilderness Program, Limited English Proficiency, Reserves, and others.
• Police Activities League to include cadet and football programs. • Special Events includes coordination services, Police Foundation, special projects,
and others. In sum, CED supporting services provide a wide variety of efforts designed to connect with the community. The executive level oversight of the CED is displayed in the following table:
Community Engagement Division
Position Methodology Curr.
FTEs Rec.
FTEs
Commander Unique/Non-scalable
Executive Manager position, does not scale based on the size of the unit.
1 1
PSA Non-scalable
Special support services to manager/division. 2 2
Clerk Non-scalable
Special support services to manager/division. 1 1
(2) Staffing Analysis Methodology
Because CED supporting services are largely policy and executive-level decision driven, there are no key metrics by which a staffing plan can be devised. The size and composition of such supporting units can alter dramatically dependent upon staff availability, budget, perceived needs, etc. As such, staffing for these kinds of units, which presently represent less than 20 staff, is based upon a “non-scaling methodology” whereby the number of staff required is selected based on key decision-makers. As a consequence, the size of such units could be very small, or very large, dependent upon the strategic initiatives undertaken based on perceived community need.
Report on the Police Department Staffing Analysis San Francisco, CA
Matrix Consulting Group 74
(3) Results of the Analysis
The results of the non-scaling analysis reflect the existing staffing level in CED of 19 total personnel in various job classifications is adequate unless perceived by decision-makers otherwise. With respect to the types of job classifications performing the work, supporting services often provide opportunities for civilianization. These include special event planning and youth and community engagement activities now performed by officers but that could potentially be performed by other non-sworn staff.
11. Healthy Streets Operations Center (HSOC)
(1) Unit Overview and Analytical Framework
The Healthy Streets Operations Center (HSOC) has been developed to better coordinate the many city agencies involved in addressing homelessness and unhealthy street behavior. HSOC is structured as a unified command with representatives of City departments all in one room which direct, plan, and coordinate responses to street behaviors and homelessness. It is an expansion of coordinated efforts that began in San Francisco’s Mission District.
HSOC’s mission is to provide unified and coordinated City service and responses to unsheltered persons experiencing homelessness. The role of the SFPD is initial engagement, and as a last resort, enforcement to respond to critical issues. One of the key service drivers and primary partners—the City’s 311—provides non-emergency intake of homeless related issues from the public14. The HSOC has three primary goals:
• San Francisco’s streets are safe and clean. • Meet the shelter and service needs of individuals on the streets. • Establish a unified City response to homelessness and street behavior. Key strategies include developing a zone-based plan to identify key issues impacting each zone and tactics to address them; use a proactive team-based approach; outreach and engage to offer treatment and housing; and coordinate dispatch functions to share information and coordinate resources. The HSOC is supported in the field by 32 officers and their attendant supervision and management, and eight (8) sworn and civilian staff assigned to the HSOC “Emergency Operations Center” (EOC). There is a broad line defining responsibilities between HSOC Officers and Homeless Officers, discussed later 14 Healthy Streets Operation Center Homeless Outreach; Police Commission Report; 9/5/18; pg. 1-3
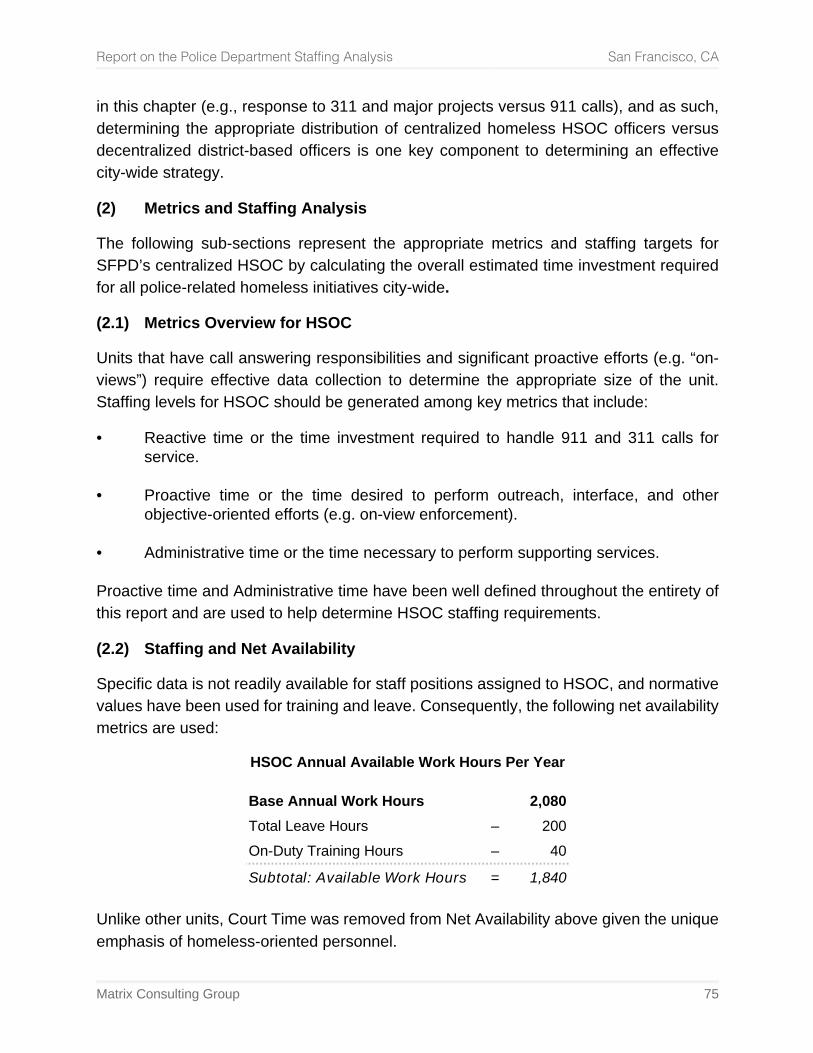
Report on the Police Department Staffing Analysis San Francisco, CA
Matrix Consulting Group 75
in this chapter (e.g., response to 311 and major projects versus 911 calls), and as such, determining the appropriate distribution of centralized homeless HSOC officers versus decentralized district-based officers is one key component to determining an effective city-wide strategy.
(2) Metrics and Staffing Analysis
The following sub-sections represent the appropriate metrics and staffing targets for SFPD’s centralized HSOC by calculating the overall estimated time investment required for all police-related homeless initiatives city-wide.
(2.1) Metrics Overview for HSOC
Units that have call answering responsibilities and significant proactive efforts (e.g. “on-views”) require effective data collection to determine the appropriate size of the unit. Staffing levels for HSOC should be generated among key metrics that include:
• Reactive time or the time investment required to handle 911 and 311 calls for service.
• Proactive time or the time desired to perform outreach, interface, and other
objective-oriented efforts (e.g. on-view enforcement). • Administrative time or the time necessary to perform supporting services. Proactive time and Administrative time have been well defined throughout the entirety of this report and are used to help determine HSOC staffing requirements.
(2.2) Staffing and Net Availability
Specific data is not readily available for staff positions assigned to HSOC, and normative values have been used for training and leave. Consequently, the following net availability metrics are used:
HSOC Annual Available Work Hours Per Year
Base Annual Work Hours 2,080 Total Leave Hours – 200 On-Duty Training Hours – 40
Subtotal: Available Work Hours = 1,840 Unlike other units, Court Time was removed from Net Availability above given the unique emphasis of homeless-oriented personnel.
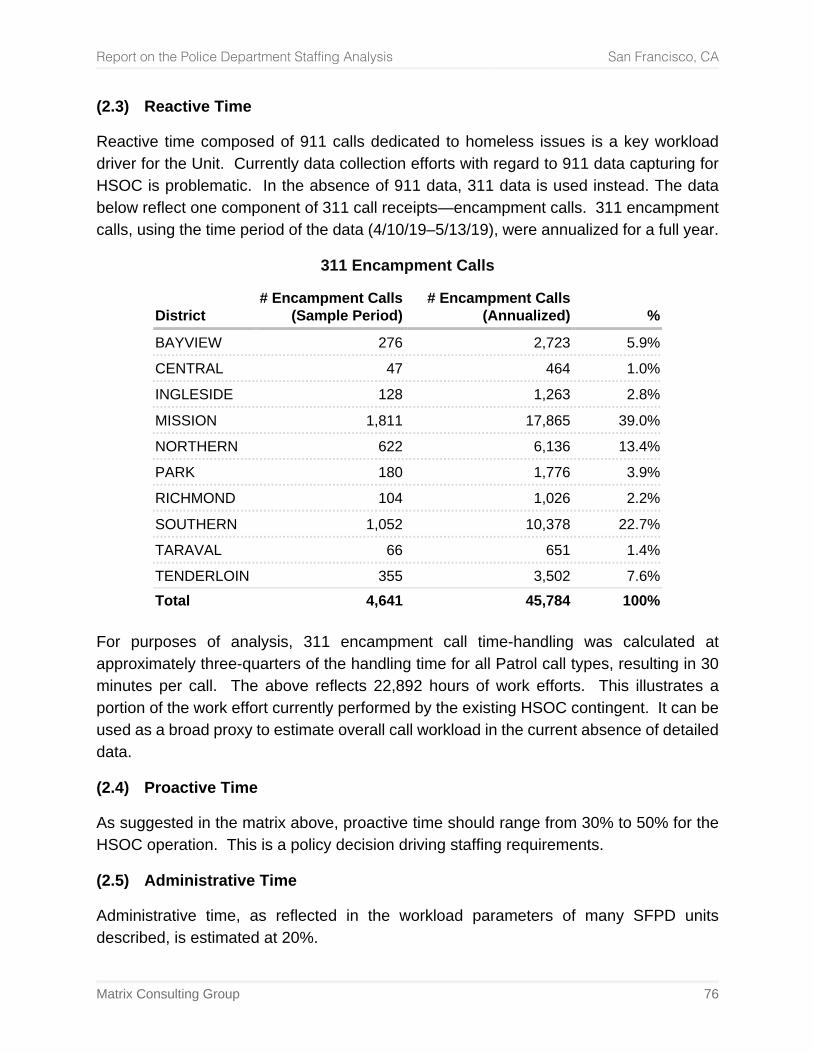
Report on the Police Department Staffing Analysis San Francisco, CA
Matrix Consulting Group 76
(2.3) Reactive Time
Reactive time composed of 911 calls dedicated to homeless issues is a key workload driver for the Unit. Currently data collection efforts with regard to 911 data capturing for HSOC is problematic. In the absence of 911 data, 311 data is used instead. The data below reflect one component of 311 call receipts—encampment calls. 311 encampment calls, using the time period of the data (4/10/19–5/13/19), were annualized for a full year.
311 Encampment Calls
District
# Encampment Calls (Sample Period)
# Encampment Calls (Annualized)
%
BAYVIEW 276 2,723 5.9% CENTRAL 47 464 1.0% INGLESIDE 128 1,263 2.8% MISSION 1,811 17,865 39.0% NORTHERN 622 6,136 13.4% PARK 180 1,776 3.9% RICHMOND 104 1,026 2.2% SOUTHERN 1,052 10,378 22.7% TARAVAL 66 651 1.4% TENDERLOIN 355 3,502 7.6% Total 4,641 45,784 100%
For purposes of analysis, 311 encampment call time-handling was calculated at approximately three-quarters of the handling time for all Patrol call types, resulting in 30 minutes per call. The above reflects 22,892 hours of work efforts. This illustrates a portion of the work effort currently performed by the existing HSOC contingent. It can be used as a broad proxy to estimate overall call workload in the current absence of detailed data.
(2.4) Proactive Time
As suggested in the matrix above, proactive time should range from 30% to 50% for the HSOC operation. This is a policy decision driving staffing requirements.
(2.5) Administrative Time
Administrative time, as reflected in the workload parameters of many SFPD units described, is estimated at 20%.
Report on the Police Department Staffing Analysis San Francisco, CA
Matrix Consulting Group 77
(2.6) Staffing Analysis Methodology
Based on the aforementioned data, the following components should be utilized to create an HSOC field officer staffing framework.
• Reactive time estimated for 311 and 911 calls at 45,784 hours (22,892 x 2). In the absence of sufficiently detailed 911 and 311 data in terms of identifying homelessness-related incidents, this is a broad estimate of time required for such homeless response using the 311 encampment calls as a proxy. Given that the HSOC officer contingent and overall District homeless officer contingent are approximately the same size, the assumption is that 311 and 911 workload is nearly equivalent. Clearly capturing these details will solidify staffing requirements.
• Proactive time desired, estimated at 45,784 hours (40% proactive). The
proactive time target is consistent with the deployment of many types of patrol-related initiatives. Targets below 40% typically do not provide sufficient blocks of time to conduct effective directed efforts, while targets above 60% proactive time are difficult for supervisors and leadership to effectively manage given a potential over-abundance of “free time.” Thus, targeted proactive time between 40% and 60% is suggested, with the former proportion recommended given other district-based resources are also directed to homeless initiatives (i.e. homeless officers).
• Administrative time, estimated at 22,892 hours (20 administrative). • Based on total hours, a policy determination of what proportion of those hours
should be handled by centralized HSOC officers versus de-centralized District Officers.
• Officers-per-homeless, as a framework only, should represent 1-to-75 to 1-to-125
when the ability to accurately capture such data is readily available. (2.7) Results of the Staffing Analysis
Based on the calculations for total homelessness-related workload, and given the targets for proactive work and administrative time (totaling 60%), the total number of available work hours that must be staffed for can then be calculated:
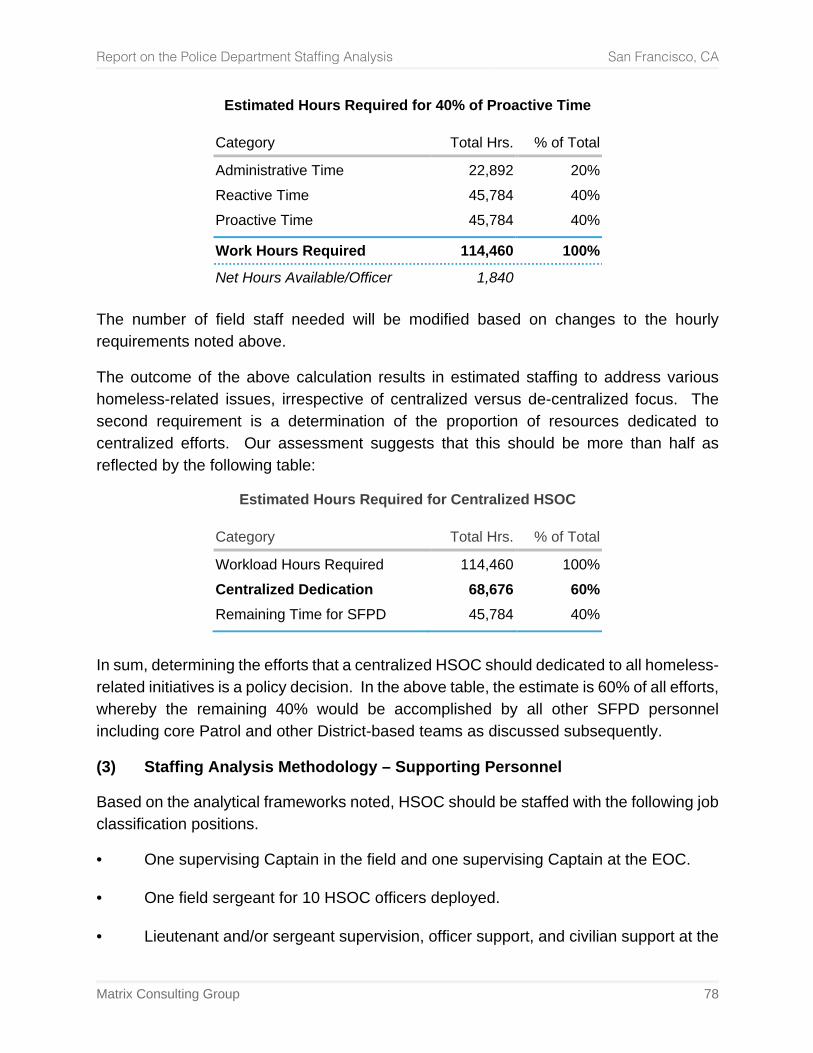
Report on the Police Department Staffing Analysis San Francisco, CA
Matrix Consulting Group 78
Estimated Hours Required for 40% of Proactive Time
Category Total Hrs. % of Total
Administrative Time 22,892 20% Reactive Time 45,784 40% Proactive Time 45,784 40%
Work Hours Required 114,460 100%
Net Hours Available/Officer 1,840 The number of field staff needed will be modified based on changes to the hourly requirements noted above.
The outcome of the above calculation results in estimated staffing to address various homeless-related issues, irrespective of centralized versus de-centralized focus. The second requirement is a determination of the proportion of resources dedicated to centralized efforts. Our assessment suggests that this should be more than half as reflected by the following table:
Estimated Hours Required for Centralized HSOC
Category Total Hrs. % of Total
Workload Hours Required 114,460 100% Centralized Dedication 68,676 60% Remaining Time for SFPD 45,784 40%
In sum, determining the efforts that a centralized HSOC should dedicated to all homeless-related initiatives is a policy decision. In the above table, the estimate is 60% of all efforts, whereby the remaining 40% would be accomplished by all other SFPD personnel including core Patrol and other District-based teams as discussed subsequently.
(3) Staffing Analysis Methodology – Supporting Personnel
Based on the analytical frameworks noted, HSOC should be staffed with the following job classification positions.
• One supervising Captain in the field and one supervising Captain at the EOC. • One field sergeant for 10 HSOC officers deployed. • Lieutenant and/or sergeant supervision, officer support, and civilian support at the
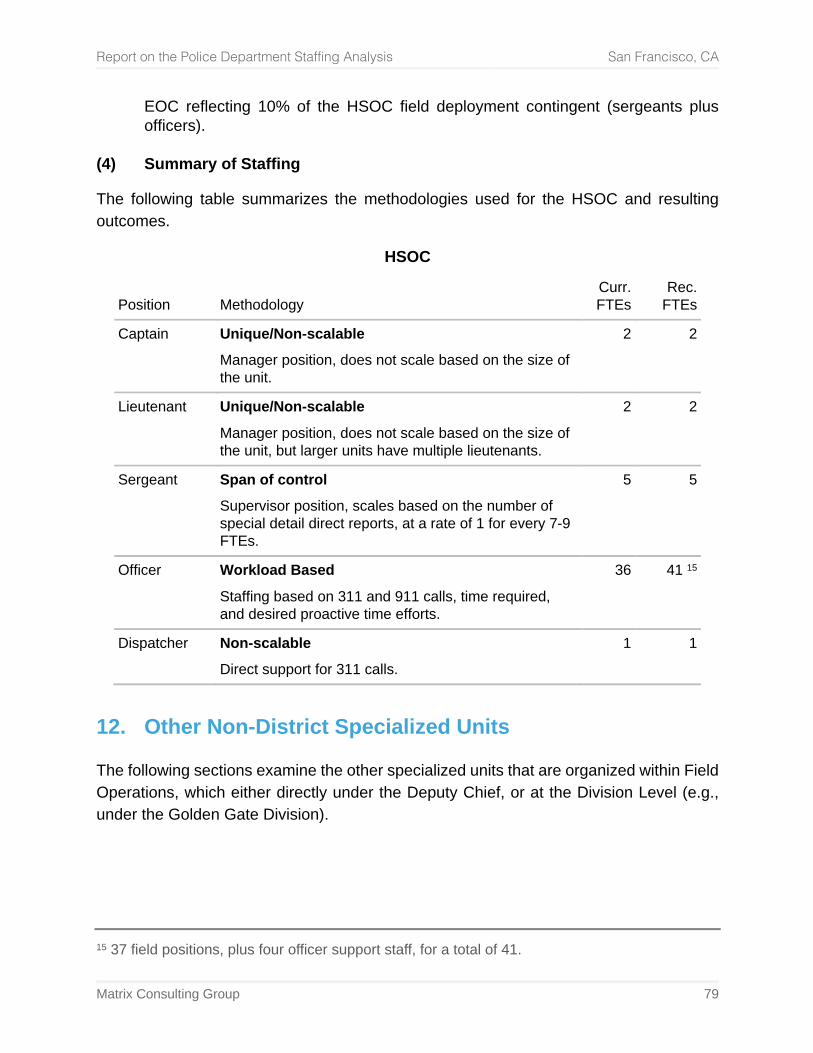
Report on the Police Department Staffing Analysis San Francisco, CA
Matrix Consulting Group 79
EOC reflecting 10% of the HSOC field deployment contingent (sergeants plus officers).
(4) Summary of Staffing
The following table summarizes the methodologies used for the HSOC and resulting outcomes.
HSOC
Position Methodology Curr.
FTEs Rec.
FTEs
Captain Unique/Non-scalable
Manager position, does not scale based on the size of the unit.
2 2
Lieutenant Unique/Non-scalable
Manager position, does not scale based on the size of the unit, but larger units have multiple lieutenants.
2 2
Sergeant Span of control
Supervisor position, scales based on the number of special detail direct reports, at a rate of 1 for every 7-9 FTEs.
5 5
Officer Workload Based
Staffing based on 311 and 911 calls, time required, and desired proactive time efforts.
36 41 15
Dispatcher Non-scalable
Direct support for 311 calls. 1 1
12. Other Non-District Specialized Units
The following sections examine the other specialized units that are organized within Field Operations, which either directly under the Deputy Chief, or at the Division Level (e.g., under the Golden Gate Division).
15 37 field positions, plus four officer support staff, for a total of 41.
Report on the Police Department Staffing Analysis San Francisco, CA
Matrix Consulting Group 80
1. Transbay Joint Powers Authority (TJPA)
(1) Unit Overview and Analytical Framework
The Transbay Joint Powers Authority (TJPA) has primary jurisdiction with respect to all matters concerning the financing, design, development, construction, and operation of the Transbay Program. The TJPA is a joint exercise of powers authority created by the City and County of San Francisco, the Alameda-Contra Costa Transit District, the Peninsula Corridor Joint Powers Board, the California High Speed Rail Authority, and Caltrans.
To enhance public safety at the new transit center and related facilities under the TJPA’s control including, but not limited to, all levels of the transit center, bus ramp, bus storage facility, Natoma Pedestrian Way, and the portion of Shaw Alley that transects the center, the TJPA is implemented a robust safety and security program. The TJPA’s safety and security program includes a multilayered security team consisting of roving ambassadors, private unarmed security guards, and law enforcement officers on contract with the SFPD. Ten (10) SFPD officers are deployed daily, most assignments accomplished on overtime given full-time staffing dedicated to the effort is one (1) sergeant and five (5) officers. These officer are periodically augmented by supporting patrol officers in a backup capacity originating from the Southern Station.
(2) Metrics and Staffing Analysis
The following sub-sections represent the appropriate metrics and staffing targets for SFPD’s TJPA as they are presently deployed.
(2.1) Metrics Overview for the TJPA
The contract with the TJPA is the driving “metric.” In January 2018 the TJPA Board of Directors approved a Memorandum of Understanding (MOU) between the TJPA and the San Francisco Police Department (SFPD) for on-site law enforcement services at the new transit center and related facilities under the TJPA’s control for $2.3 million annually (FY17-18), escalated by 3% each year. The key proviso for this agreement was the, “Deployment of a minimum of 10-shifts per day for each day of the year, filed by police officers who are sworn members of the SFPD. The police services described in the MOU are intended to enhance, rather than supersede, diminish, or replace the community policing services already provided throughout San Francisco by the SFPD. SFPD’s Southern Station will continue to provide this standard level of community policing and
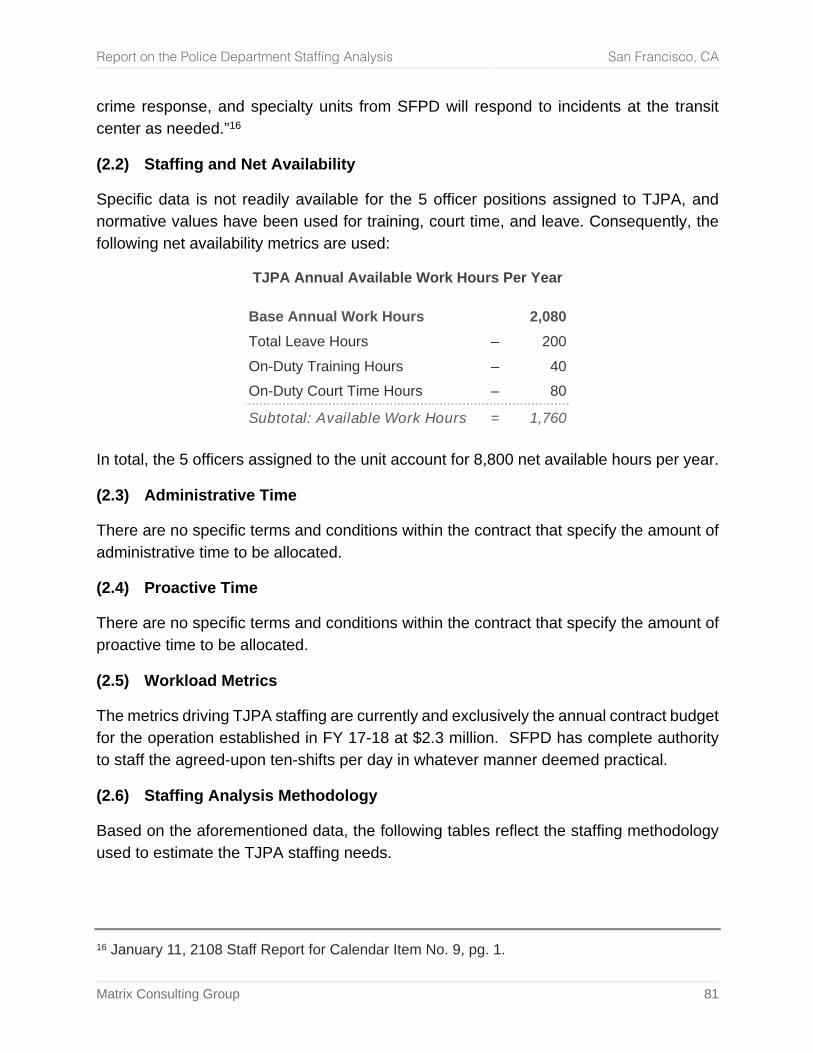
Report on the Police Department Staffing Analysis San Francisco, CA
Matrix Consulting Group 81
crime response, and specialty units from SFPD will respond to incidents at the transit center as needed.”16
(2.2) Staffing and Net Availability
Specific data is not readily available for the 5 officer positions assigned to TJPA, and normative values have been used for training, court time, and leave. Consequently, the following net availability metrics are used:
TJPA Annual Available Work Hours Per Year
Base Annual Work Hours 2,080 Total Leave Hours – 200 On-Duty Training Hours – 40 On-Duty Court Time Hours – 80
Subtotal: Available Work Hours = 1,760 In total, the 5 officers assigned to the unit account for 8,800 net available hours per year.
(2.3) Administrative Time
There are no specific terms and conditions within the contract that specify the amount of administrative time to be allocated.
(2.4) Proactive Time
There are no specific terms and conditions within the contract that specify the amount of proactive time to be allocated.
(2.5) Workload Metrics
The metrics driving TJPA staffing are currently and exclusively the annual contract budget for the operation established in FY 17-18 at $2.3 million. SFPD has complete authority to staff the agreed-upon ten-shifts per day in whatever manner deemed practical.
(2.6) Staffing Analysis Methodology
Based on the aforementioned data, the following tables reflect the staffing methodology used to estimate the TJPA staffing needs.
16 January 11, 2108 Staff Report for Calendar Item No. 9, pg. 1.
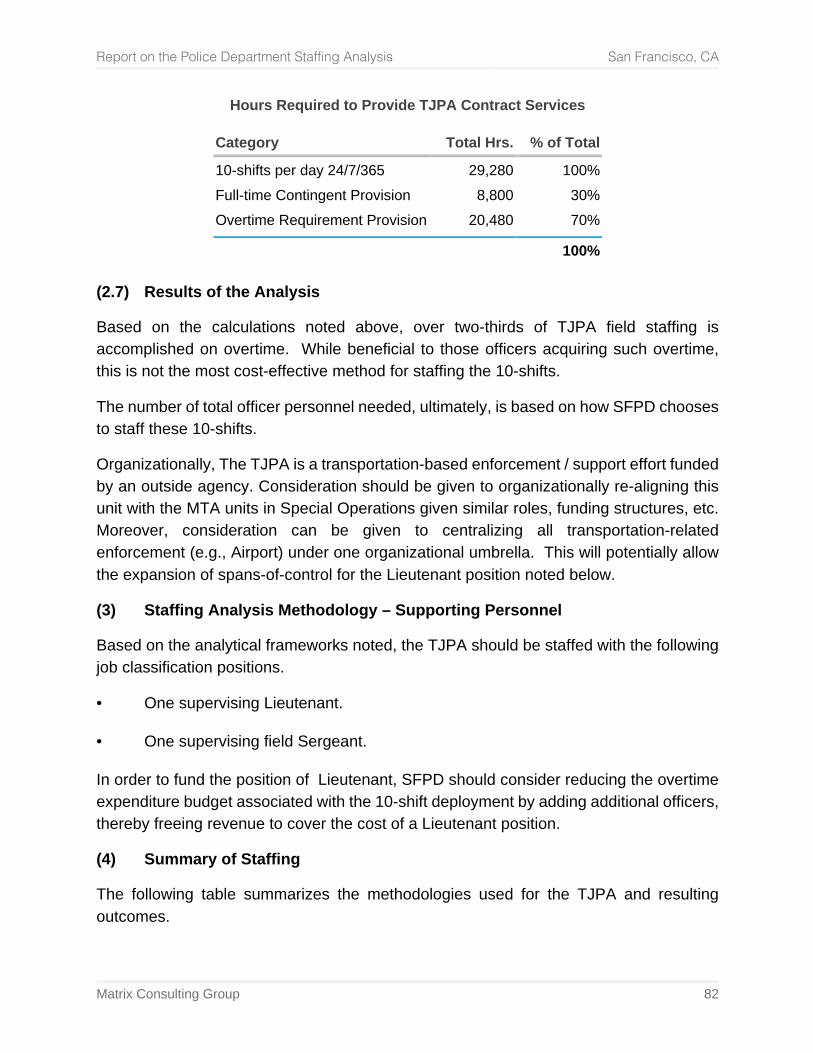
Report on the Police Department Staffing Analysis San Francisco, CA
Matrix Consulting Group 82
Hours Required to Provide TJPA Contract Services
Category Total Hrs. % of Total
10-shifts per day 24/7/365 29,280 100% Full-time Contingent Provision 8,800 30% Overtime Requirement Provision 20,480 70%
100%
(2.7) Results of the Analysis
Based on the calculations noted above, over two-thirds of TJPA field staffing is accomplished on overtime. While beneficial to those officers acquiring such overtime, this is not the most cost-effective method for staffing the 10-shifts.
The number of total officer personnel needed, ultimately, is based on how SFPD chooses to staff these 10-shifts.
Organizationally, The TJPA is a transportation-based enforcement / support effort funded by an outside agency. Consideration should be given to organizationally re-aligning this unit with the MTA units in Special Operations given similar roles, funding structures, etc. Moreover, consideration can be given to centralizing all transportation-related enforcement (e.g., Airport) under one organizational umbrella. This will potentially allow the expansion of spans-of-control for the Lieutenant position noted below.
(3) Staffing Analysis Methodology – Supporting Personnel
Based on the analytical frameworks noted, the TJPA should be staffed with the following job classification positions.
• One supervising Lieutenant. • One supervising field Sergeant. In order to fund the position of Lieutenant, SFPD should consider reducing the overtime expenditure budget associated with the 10-shift deployment by adding additional officers, thereby freeing revenue to cover the cost of a Lieutenant position.
(4) Summary of Staffing
The following table summarizes the methodologies used for the TJPA and resulting outcomes.
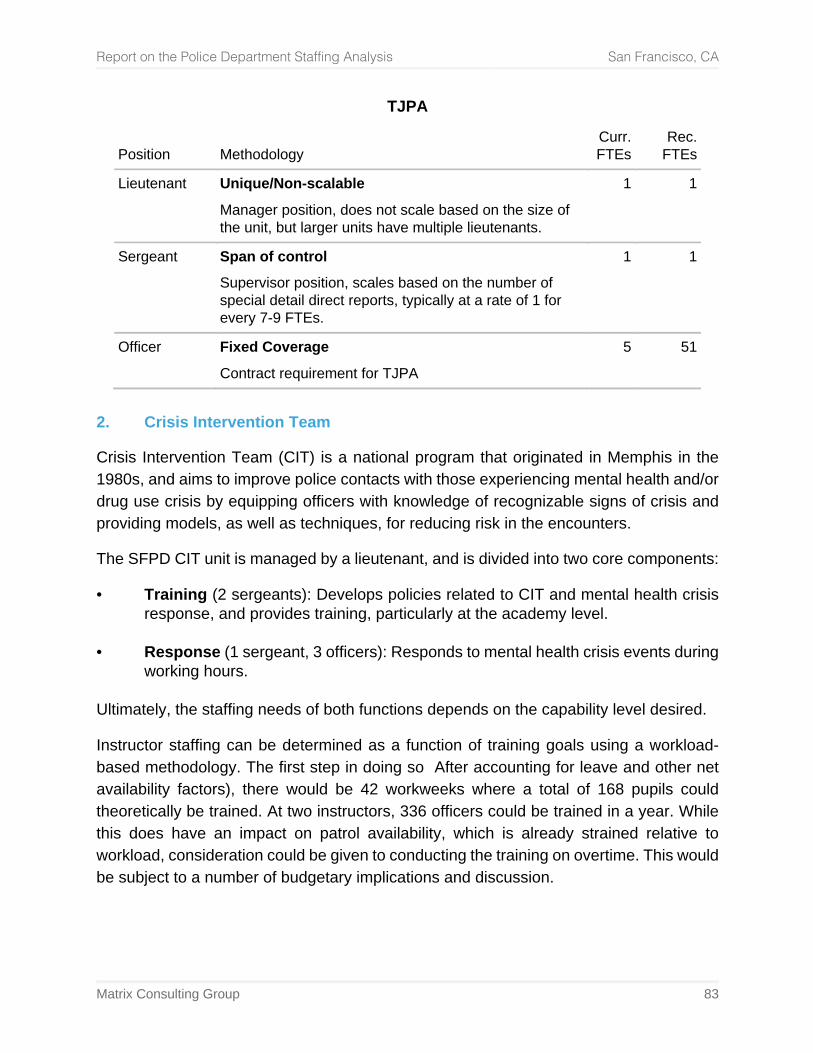
Report on the Police Department Staffing Analysis San Francisco, CA
Matrix Consulting Group 83
TJPA
Position Methodology Curr.
FTEs Rec.
FTEs
Lieutenant Unique/Non-scalable
Manager position, does not scale based on the size of the unit, but larger units have multiple lieutenants.
1 1
Sergeant Span of control
Supervisor position, scales based on the number of special detail direct reports, typically at a rate of 1 for every 7-9 FTEs.
1 1
Officer Fixed Coverage
Contract requirement for TJPA
5 51
2. Crisis Intervention Team
Crisis Intervention Team (CIT) is a national program that originated in Memphis in the 1980s, and aims to improve police contacts with those experiencing mental health and/or drug use crisis by equipping officers with knowledge of recognizable signs of crisis and providing models, as well as techniques, for reducing risk in the encounters.
The SFPD CIT unit is managed by a lieutenant, and is divided into two core components:
• Training (2 sergeants): Develops policies related to CIT and mental health crisis response, and provides training, particularly at the academy level.
• Response (1 sergeant, 3 officers): Responds to mental health crisis events during
working hours. Ultimately, the staffing needs of both functions depends on the capability level desired.
Instructor staffing can be determined as a function of training goals using a workload-based methodology. The first step in doing so After accounting for leave and other net availability factors), there would be 42 workweeks where a total of 168 pupils could theoretically be trained. At two instructors, 336 officers could be trained in a year. While this does have an impact on patrol availability, which is already strained relative to workload, consideration could be given to conducting the training on overtime. This would be subject to a number of budgetary implications and discussion.
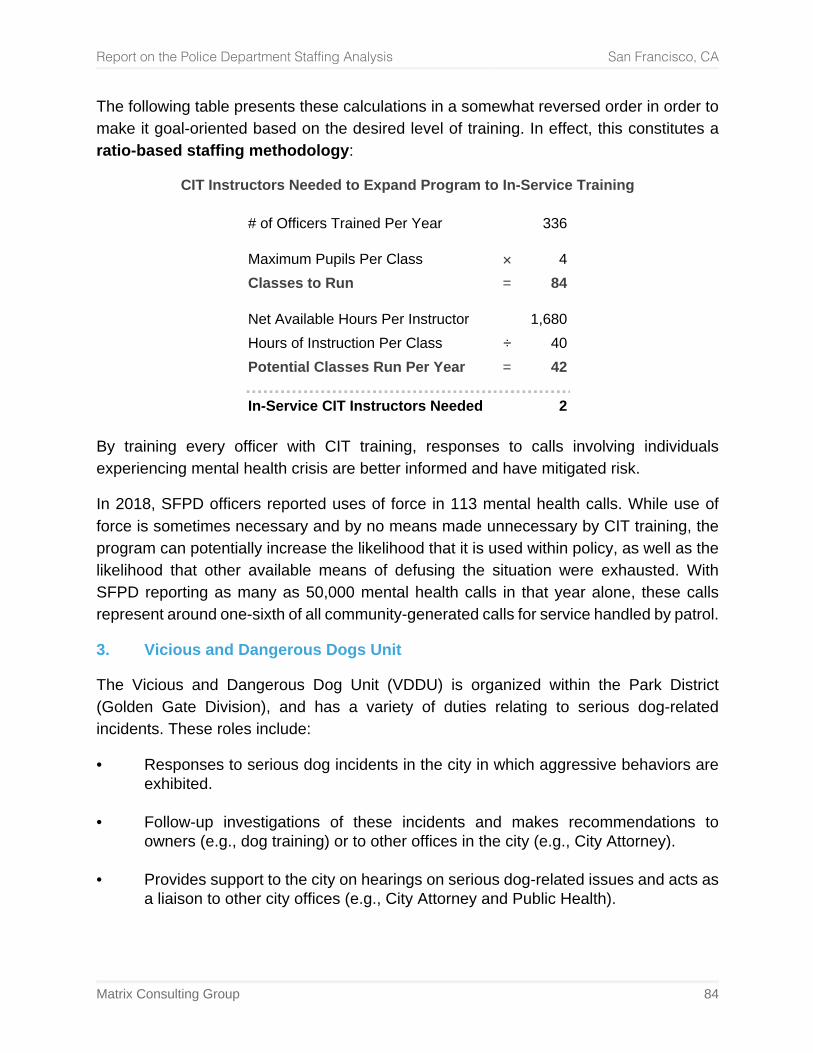
Report on the Police Department Staffing Analysis San Francisco, CA
Matrix Consulting Group 84
The following table presents these calculations in a somewhat reversed order in order to make it goal-oriented based on the desired level of training. In effect, this constitutes a ratio-based staffing methodology:
CIT Instructors Needed to Expand Program to In-Service Training
# of Officers Trained Per Year 336
Maximum Pupils Per Class × 4 Classes to Run = 84
Net Available Hours Per Instructor 1,680 Hours of Instruction Per Class ÷ 40 Potential Classes Run Per Year = 42
In-Service CIT Instructors Needed 2
By training every officer with CIT training, responses to calls involving individuals experiencing mental health crisis are better informed and have mitigated risk.
In 2018, SFPD officers reported uses of force in 113 mental health calls. While use of force is sometimes necessary and by no means made unnecessary by CIT training, the program can potentially increase the likelihood that it is used within policy, as well as the likelihood that other available means of defusing the situation were exhausted. With SFPD reporting as many as 50,000 mental health calls in that year alone, these calls represent around one-sixth of all community-generated calls for service handled by patrol.
3. Vicious and Dangerous Dogs Unit
The Vicious and Dangerous Dog Unit (VDDU) is organized within the Park District (Golden Gate Division), and has a variety of duties relating to serious dog-related incidents. These roles include:
• Responses to serious dog incidents in the city in which aggressive behaviors are exhibited.
• Follow-up investigations of these incidents and makes recommendations to
owners (e.g., dog training) or to other offices in the city (e.g., City Attorney). • Provides support to the city on hearings on serious dog-related issues and acts as
a liaison to other city offices (e.g., City Attorney and Public Health).
Report on the Police Department Staffing Analysis San Francisco, CA
Matrix Consulting Group 85
One police officer fulfills these roles. While housed at Park Station, the scope of these responsibilities is citywide.
There is potential for the unit’s staffing to be determined using a workload-based approach. However, for this to be feasible, additional tracking is needed on non-response workload metrics, such as the time involved in follow-up investigations and appearances at city hearings, as well as time spent working in a liaison capacity with other city agencies. Currently, however, the unit is set as a non-scalable methodology.
Vicious and Dangerous Dogs
Position Methodology Staffing
Officer Non-scalable
Provides a unique role. If workload were tracked, a workload-based methodology could be developed.
1
4. Alcohol Liaison Unit
The SFPD Alcohol Liaison Unit (ALU) processes permit applications and provides enforcement on related issues for establishments throughout San Francisco, working in coordination with the state Alcoholic Beverage Control (ABC) agency. There are over 800 businesses and other organizations in the city that are permitted to serve hard liquor. Key roles of the unit include:
• Processing applications and supporting applicants • Backgrounding applicants • Field inspections of permitted occupancies In addition, the unit is responsible for managing tow truck companies and parking lots. The unit is staffed with 1 lieutenant, 2 sergeants, and 2 officers, and works Monday through Friday on 8-hour shifts from 0900 to 1700.
In effect, the more alcohol permits that are granted, the more work there is to oversee the application process and enforce regulations. Aside from the tow truck and parking lot roles, the majority of the unit’s workload can be considered as scaling proportionally to the number of liquor permits. Changes within the last two years the process for obtaining liquor licensing may over the medium and long-term alter the workload of the unit.
Consequently, the unit’s staffing should be linked to the number of alcohol permits that exist as needs change over the coming years. As a result, the staffing for the unit is set
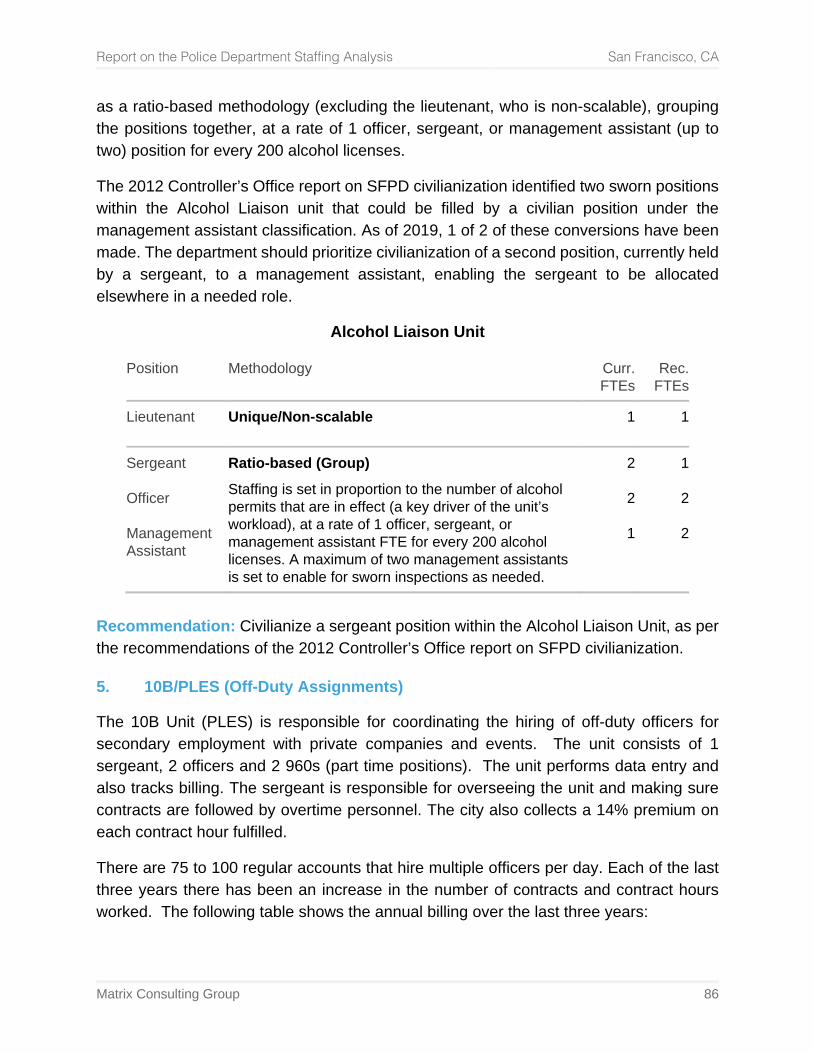
Report on the Police Department Staffing Analysis San Francisco, CA
Matrix Consulting Group 86
as a ratio-based methodology (excluding the lieutenant, who is non-scalable), grouping the positions together, at a rate of 1 officer, sergeant, or management assistant (up to two) position for every 200 alcohol licenses.
The 2012 Controller’s Office report on SFPD civilianization identified two sworn positions within the Alcohol Liaison unit that could be filled by a civilian position under the management assistant classification. As of 2019, 1 of 2 of these conversions have been made. The department should prioritize civilianization of a second position, currently held by a sergeant, to a management assistant, enabling the sergeant to be allocated elsewhere in a needed role.
Alcohol Liaison Unit
Position Methodology Curr. FTEs
Rec. FTEs
Lieutenant Unique/Non-scalable 1 1
Sergeant Officer Management Assistant
Ratio-based (Group)
Staffing is set in proportion to the number of alcohol permits that are in effect (a key driver of the unit’s workload), at a rate of 1 officer, sergeant, or management assistant FTE for every 200 alcohol licenses. A maximum of two management assistants is set to enable for sworn inspections as needed.
2
2
1
1
2
2
Recommendation: Civilianize a sergeant position within the Alcohol Liaison Unit, as per the recommendations of the 2012 Controller’s Office report on SFPD civilianization.
5. 10B/PLES (Off-Duty Assignments)
The 10B Unit (PLES) is responsible for coordinating the hiring of off-duty officers for secondary employment with private companies and events. The unit consists of 1 sergeant, 2 officers and 2 960s (part time positions). The unit performs data entry and also tracks billing. The sergeant is responsible for overseeing the unit and making sure contracts are followed by overtime personnel. The city also collects a 14% premium on each contract hour fulfilled.
There are 75 to 100 regular accounts that hire multiple officers per day. Each of the last three years there has been an increase in the number of contracts and contract hours worked. The following table shows the annual billing over the last three years:
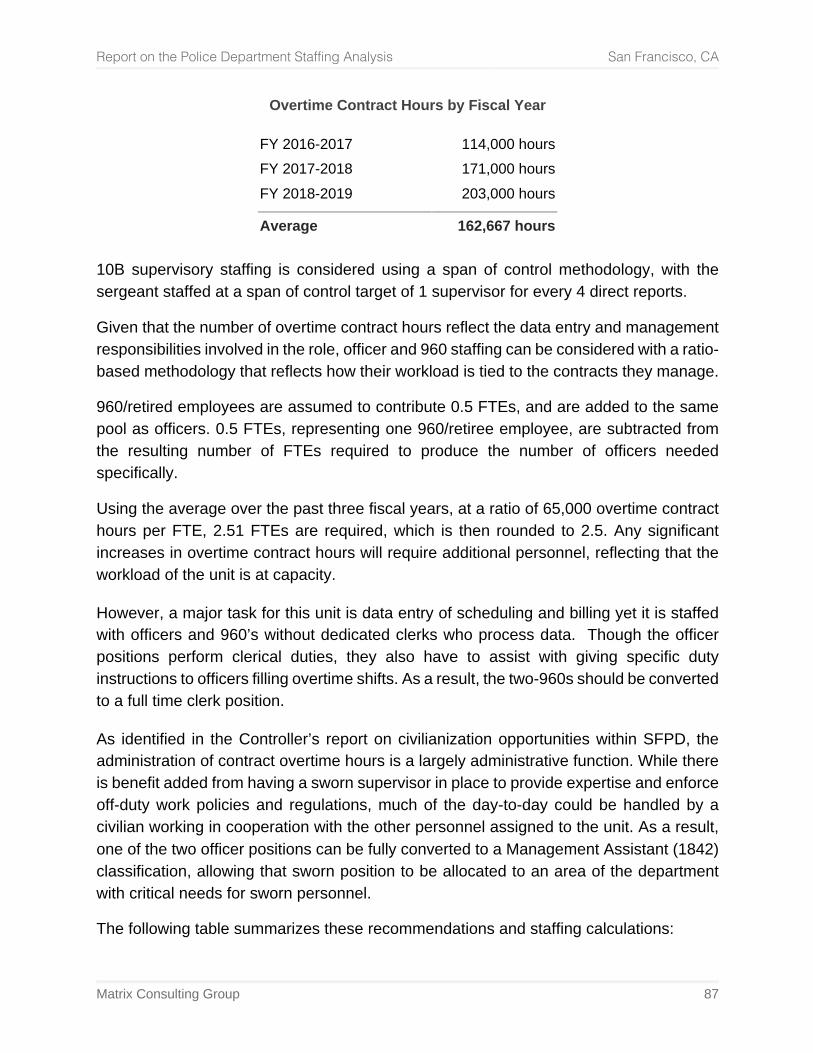
Report on the Police Department Staffing Analysis San Francisco, CA
Matrix Consulting Group 87
Overtime Contract Hours by Fiscal Year
FY 2016-2017 114,000 hours FY 2017-2018 171,000 hours FY 2018-2019 203,000 hours
Average 162,667 hours
10B supervisory staffing is considered using a span of control methodology, with the sergeant staffed at a span of control target of 1 supervisor for every 4 direct reports.
Given that the number of overtime contract hours reflect the data entry and management responsibilities involved in the role, officer and 960 staffing can be considered with a ratio-based methodology that reflects how their workload is tied to the contracts they manage.
960/retired employees are assumed to contribute 0.5 FTEs, and are added to the same pool as officers. 0.5 FTEs, representing one 960/retiree employee, are subtracted from the resulting number of FTEs required to produce the number of officers needed specifically.
Using the average over the past three fiscal years, at a ratio of 65,000 overtime contract hours per FTE, 2.51 FTEs are required, which is then rounded to 2.5. Any significant increases in overtime contract hours will require additional personnel, reflecting that the workload of the unit is at capacity.
However, a major task for this unit is data entry of scheduling and billing yet it is staffed with officers and 960’s without dedicated clerks who process data. Though the officer positions perform clerical duties, they also have to assist with giving specific duty instructions to officers filling overtime shifts. As a result, the two-960s should be converted to a full time clerk position.
As identified in the Controller’s report on civilianization opportunities within SFPD, the administration of contract overtime hours is a largely administrative function. While there is benefit added from having a sworn supervisor in place to provide expertise and enforce off-duty work policies and regulations, much of the day-to-day could be handled by a civilian working in cooperation with the other personnel assigned to the unit. As a result, one of the two officer positions can be fully converted to a Management Assistant (1842) classification, allowing that sworn position to be allocated to an area of the department with critical needs for sworn personnel.
The following table summarizes these recommendations and staffing calculations:
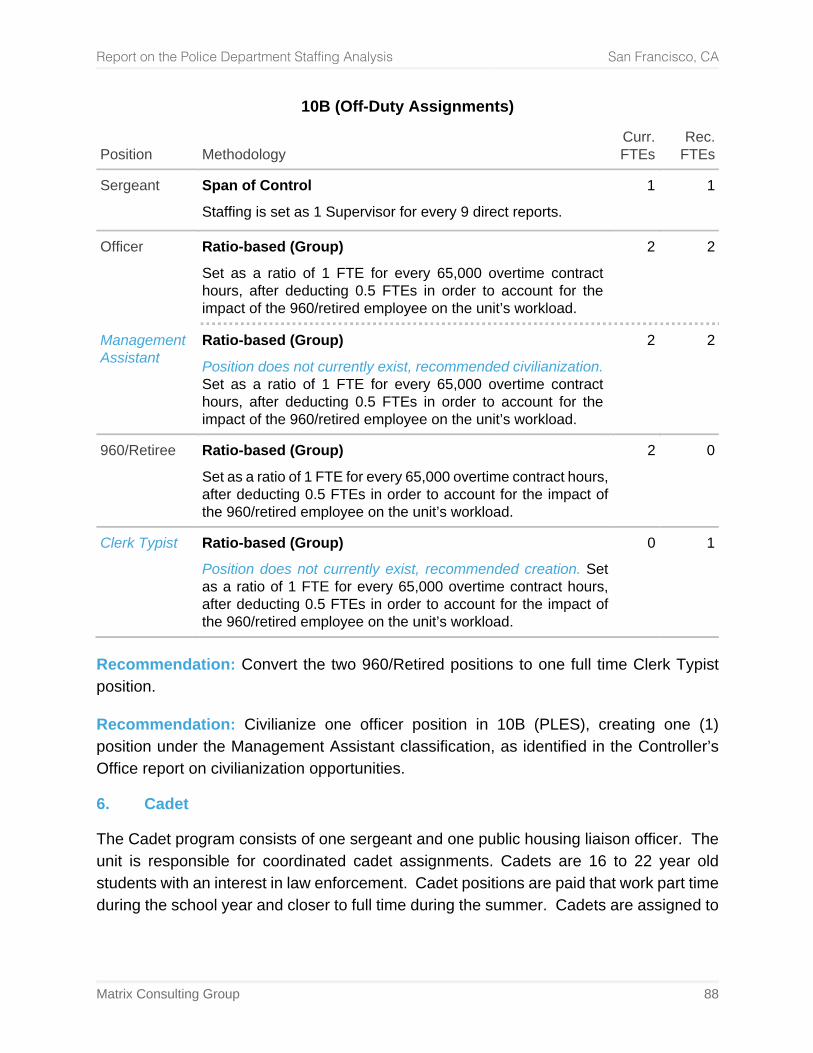
Report on the Police Department Staffing Analysis San Francisco, CA
Matrix Consulting Group 88
10B (Off-Duty Assignments)
Position Methodology Curr.
FTEs Rec.
FTEs
Sergeant Span of Control
Staffing is set as 1 Supervisor for every 9 direct reports. 1 1
Officer Ratio-based (Group)
Set as a ratio of 1 FTE for every 65,000 overtime contract hours, after deducting 0.5 FTEs in order to account for the impact of the 960/retired employee on the unit’s workload.
2 2
Management Assistant
Ratio-based (Group)
Position does not currently exist, recommended civilianization. Set as a ratio of 1 FTE for every 65,000 overtime contract hours, after deducting 0.5 FTEs in order to account for the impact of the 960/retired employee on the unit’s workload.
2 2
960/Retiree Ratio-based (Group)
Set as a ratio of 1 FTE for every 65,000 overtime contract hours, after deducting 0.5 FTEs in order to account for the impact of the 960/retired employee on the unit’s workload.
2 0
Clerk Typist Ratio-based (Group)
Position does not currently exist, recommended creation. Set as a ratio of 1 FTE for every 65,000 overtime contract hours, after deducting 0.5 FTEs in order to account for the impact of the 960/retired employee on the unit’s workload.
0 1
Recommendation: Convert the two 960/Retired positions to one full time Clerk Typist position.
Recommendation: Civilianize one officer position in 10B (PLES), creating one (1) position under the Management Assistant classification, as identified in the Controller’s Office report on civilianization opportunities.
6. Cadet
The Cadet program consists of one sergeant and one public housing liaison officer. The unit is responsible for coordinated cadet assignments. Cadets are 16 to 22 year old students with an interest in law enforcement. Cadet positions are paid that work part time during the school year and closer to full time during the summer. Cadets are assigned to
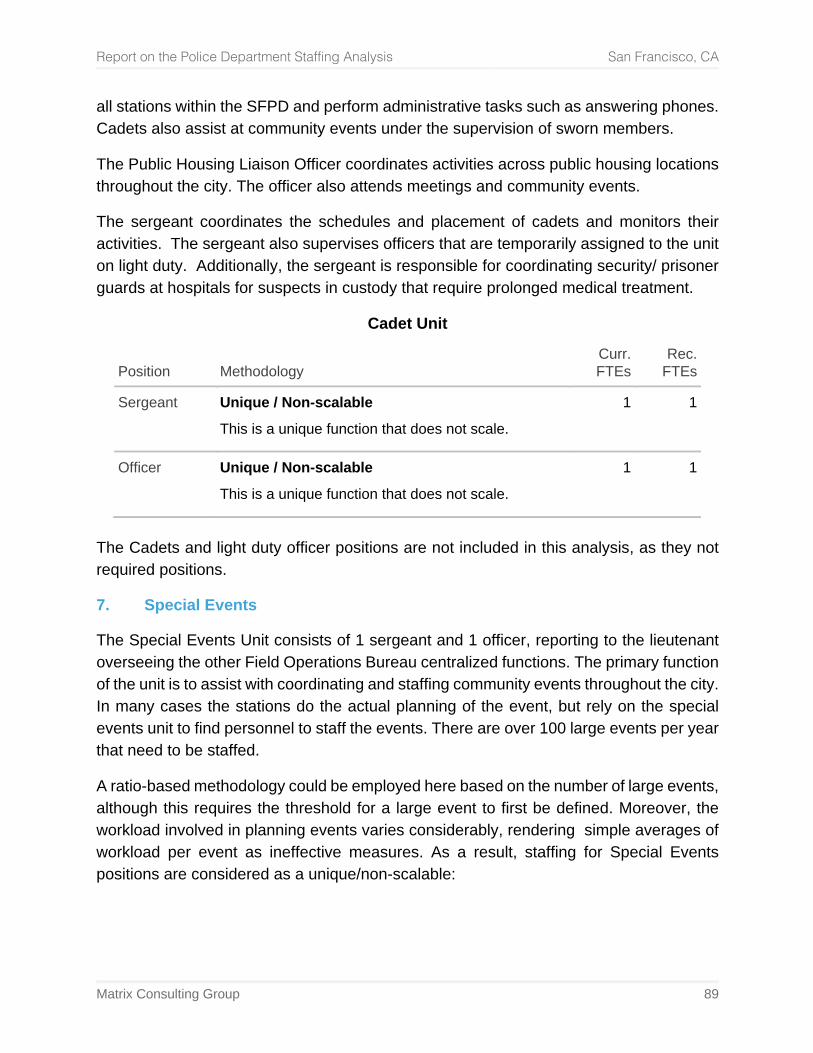
Report on the Police Department Staffing Analysis San Francisco, CA
Matrix Consulting Group 89
all stations within the SFPD and perform administrative tasks such as answering phones. Cadets also assist at community events under the supervision of sworn members.
The Public Housing Liaison Officer coordinates activities across public housing locations throughout the city. The officer also attends meetings and community events.
The sergeant coordinates the schedules and placement of cadets and monitors their activities. The sergeant also supervises officers that are temporarily assigned to the unit on light duty. Additionally, the sergeant is responsible for coordinating security/ prisoner guards at hospitals for suspects in custody that require prolonged medical treatment.
Cadet Unit
Position Methodology Curr.
FTEs Rec.
FTEs
Sergeant Unique / Non-scalable
This is a unique function that does not scale. 1 1
Officer Unique / Non-scalable
This is a unique function that does not scale. 1 1
The Cadets and light duty officer positions are not included in this analysis, as they not required positions.
7. Special Events
The Special Events Unit consists of 1 sergeant and 1 officer, reporting to the lieutenant overseeing the other Field Operations Bureau centralized functions. The primary function of the unit is to assist with coordinating and staffing community events throughout the city. In many cases the stations do the actual planning of the event, but rely on the special events unit to find personnel to staff the events. There are over 100 large events per year that need to be staffed.
A ratio-based methodology could be employed here based on the number of large events, although this requires the threshold for a large event to first be defined. Moreover, the workload involved in planning events varies considerably, rendering simple averages of workload per event as ineffective measures. As a result, staffing for Special Events positions are considered as a unique/non-scalable:
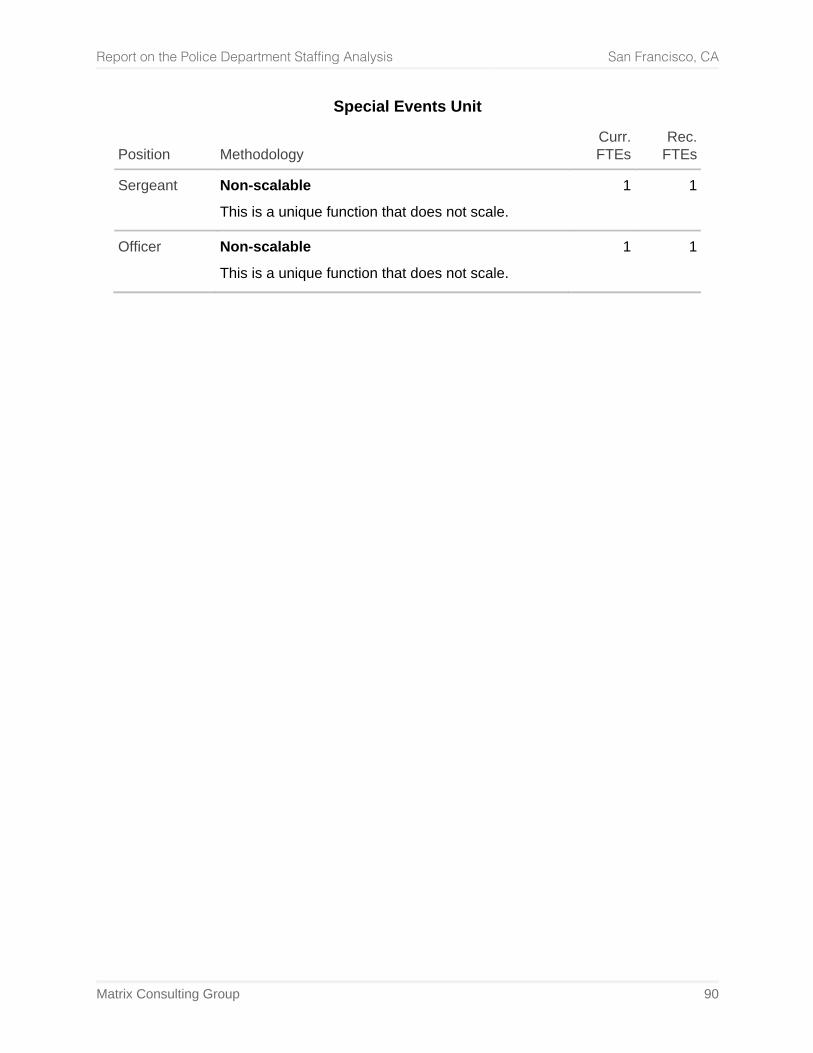
Report on the Police Department Staffing Analysis San Francisco, CA
Matrix Consulting Group 90
Special Events Unit
Position Methodology Curr.
FTEs Rec.
FTEs
Sergeant Non-scalable
This is a unique function that does not scale. 1 1
Officer Non-scalable
This is a unique function that does not scale. 1 1
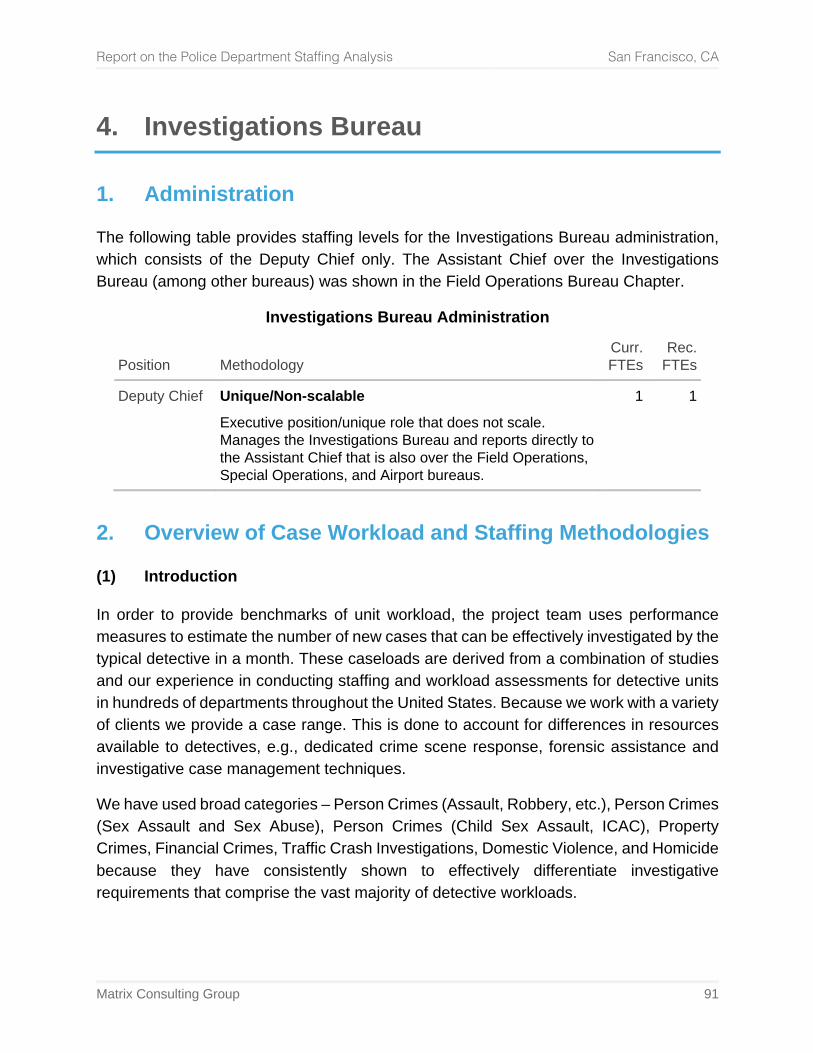
Report on the Police Department Staffing Analysis San Francisco, CA
Matrix Consulting Group 91
4. Investigations Bureau
1. Administration
The following table provides staffing levels for the Investigations Bureau administration, which consists of the Deputy Chief only. The Assistant Chief over the Investigations Bureau (among other bureaus) was shown in the Field Operations Bureau Chapter.
Investigations Bureau Administration
Position Methodology Curr.
FTEs Rec.
FTEs
Deputy Chief Unique/Non-scalable
Executive position/unique role that does not scale. Manages the Investigations Bureau and reports directly to the Assistant Chief that is also over the Field Operations, Special Operations, and Airport bureaus.
1 1
2. Overview of Case Workload and Staffing Methodologies
(1) Introduction In order to provide benchmarks of unit workload, the project team uses performance measures to estimate the number of new cases that can be effectively investigated by the typical detective in a month. These caseloads are derived from a combination of studies and our experience in conducting staffing and workload assessments for detective units in hundreds of departments throughout the United States. Because we work with a variety of clients we provide a case range. This is done to account for differences in resources available to detectives, e.g., dedicated crime scene response, forensic assistance and investigative case management techniques.
We have used broad categories – Person Crimes (Assault, Robbery, etc.), Person Crimes (Sex Assault and Sex Abuse), Person Crimes (Child Sex Assault, ICAC), Property Crimes, Financial Crimes, Traffic Crash Investigations, Domestic Violence, and Homicide because they have consistently shown to effectively differentiate investigative requirements that comprise the vast majority of detective workloads.
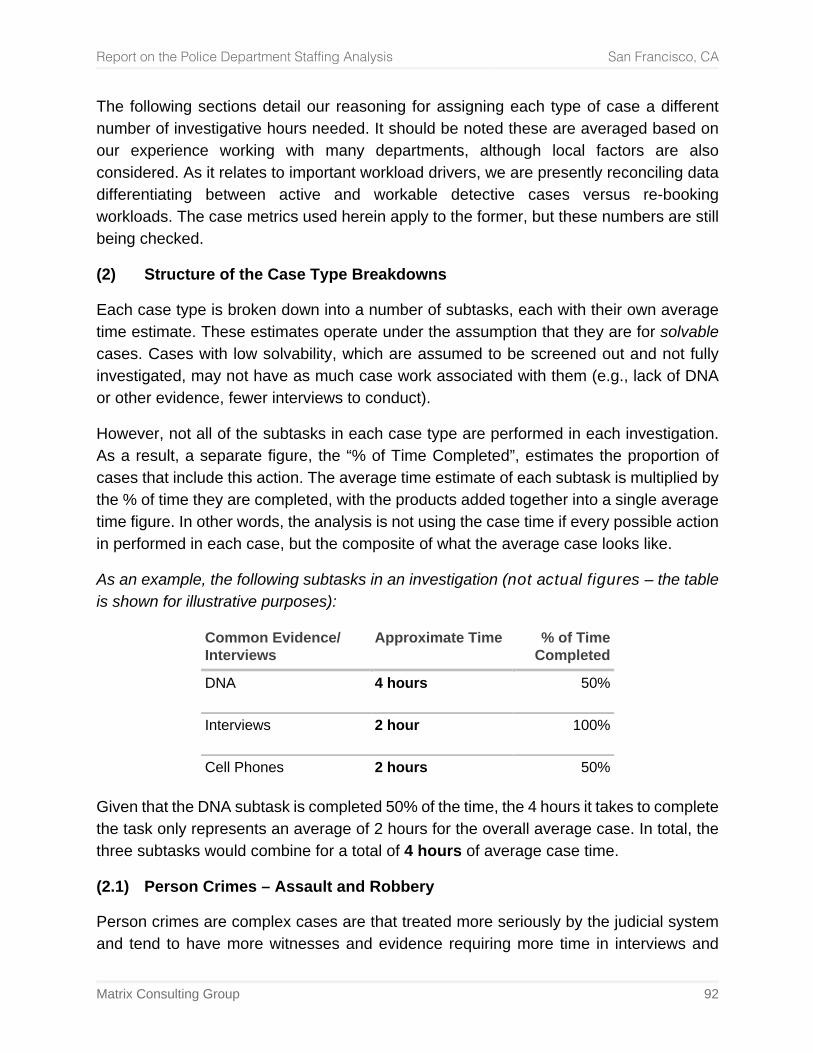
Report on the Police Department Staffing Analysis San Francisco, CA
Matrix Consulting Group 92
The following sections detail our reasoning for assigning each type of case a different number of investigative hours needed. It should be noted these are averaged based on our experience working with many departments, although local factors are also considered. As it relates to important workload drivers, we are presently reconciling data differentiating between active and workable detective cases versus re-booking workloads. The case metrics used herein apply to the former, but these numbers are still being checked.
(2) Structure of the Case Type Breakdowns
Each case type is broken down into a number of subtasks, each with their own average time estimate. These estimates operate under the assumption that they are for solvable cases. Cases with low solvability, which are assumed to be screened out and not fully investigated, may not have as much case work associated with them (e.g., lack of DNA or other evidence, fewer interviews to conduct).
However, not all of the subtasks in each case type are performed in each investigation. As a result, a separate figure, the “% of Time Completed”, estimates the proportion of cases that include this action. The average time estimate of each subtask is multiplied by the % of time they are completed, with the products added together into a single average time figure. In other words, the analysis is not using the case time if every possible action in performed in each case, but the composite of what the average case looks like.
As an example, the following subtasks in an investigation (not actual figures – the table is shown for illustrative purposes):
Common Evidence/ Interviews
Approximate Time % of Time Completed
DNA 4 hours 50%
Interviews 2 hour 100%
Cell Phones 2 hours 50%
Given that the DNA subtask is completed 50% of the time, the 4 hours it takes to complete the task only represents an average of 2 hours for the overall average case. In total, the three subtasks would combine for a total of 4 hours of average case time.
(2.1) Person Crimes – Assault and Robbery
Person crimes are complex cases are that treated more seriously by the judicial system and tend to have more witnesses and evidence requiring more time in interviews and
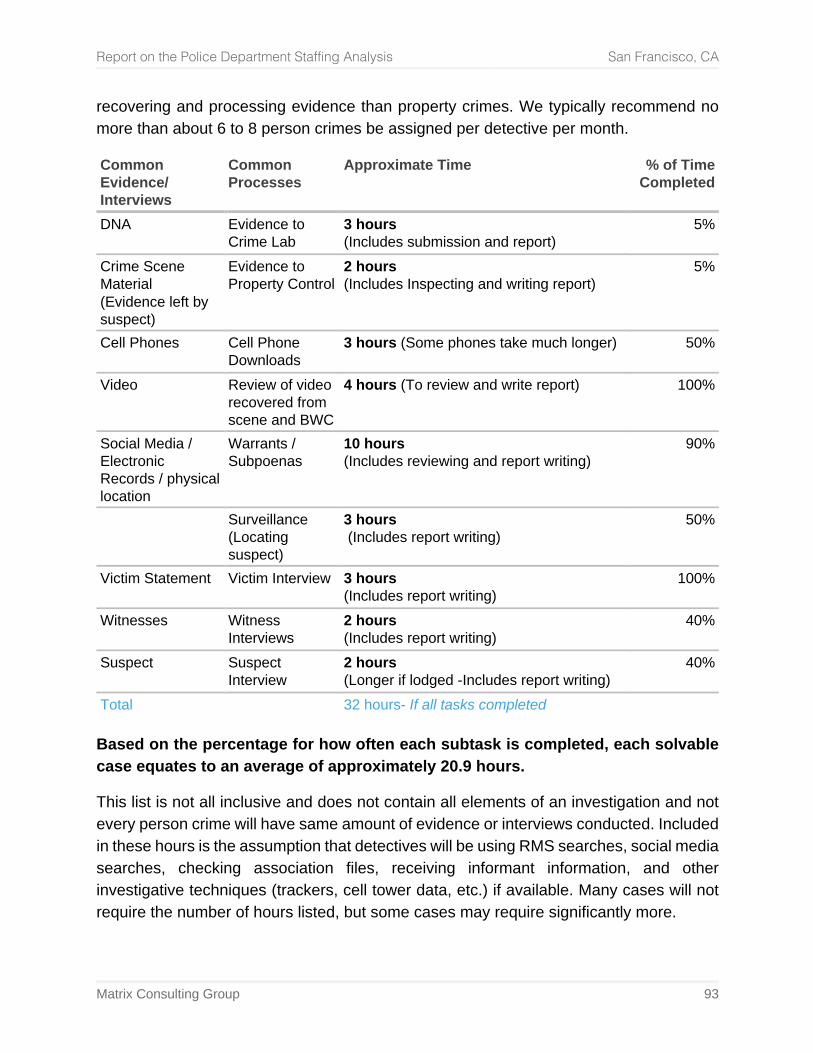
Report on the Police Department Staffing Analysis San Francisco, CA
Matrix Consulting Group 93
recovering and processing evidence than property crimes. We typically recommend no more than about 6 to 8 person crimes be assigned per detective per month.
Common Evidence/ Interviews
Common Processes
Approximate Time % of Time Completed
DNA Evidence to Crime Lab
3 hours (Includes submission and report)
5%
Crime Scene Material (Evidence left by suspect)
Evidence to Property Control
2 hours (Includes Inspecting and writing report)
5%
Cell Phones Cell Phone Downloads
3 hours (Some phones take much longer) 50%
Video Review of video recovered from scene and BWC
4 hours (To review and write report) 100%
Social Media / Electronic Records / physical location
Warrants / Subpoenas
10 hours (Includes reviewing and report writing)
90%
Surveillance (Locating suspect)
3 hours (Includes report writing)
50%
Victim Statement Victim Interview 3 hours (Includes report writing)
100%
Witnesses Witness Interviews
2 hours (Includes report writing)
40%
Suspect Suspect Interview
2 hours (Longer if lodged -Includes report writing)
40%
Total 32 hours- If all tasks completed
Based on the percentage for how often each subtask is completed, each solvable case equates to an average of approximately 20.9 hours.
This list is not all inclusive and does not contain all elements of an investigation and not every person crime will have same amount of evidence or interviews conducted. Included in these hours is the assumption that detectives will be using RMS searches, social media searches, checking association files, receiving informant information, and other investigative techniques (trackers, cell tower data, etc.) if available. Many cases will not require the number of hours listed, but some cases may require significantly more.
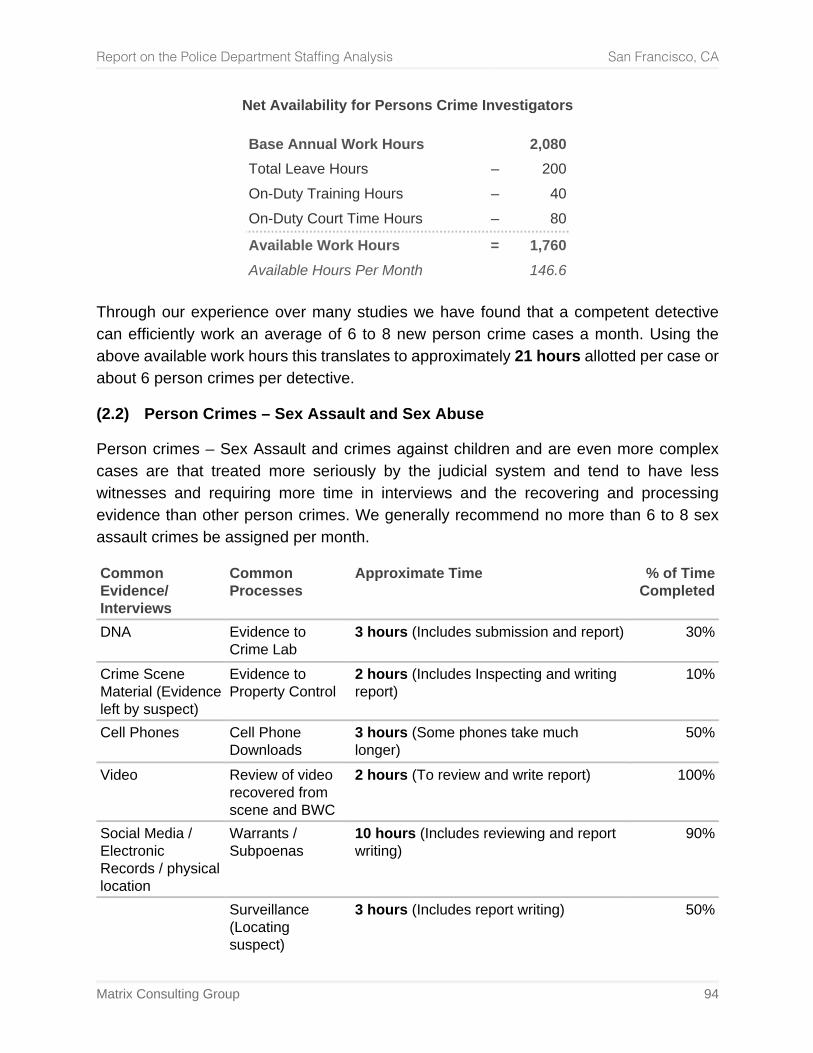
Report on the Police Department Staffing Analysis San Francisco, CA
Matrix Consulting Group 94
Net Availability for Persons Crime Investigators
Base Annual Work Hours 2,080 Total Leave Hours – 200 On-Duty Training Hours – 40 On-Duty Court Time Hours – 80
Available Work Hours = 1,760 Available Hours Per Month 146.6
Through our experience over many studies we have found that a competent detective can efficiently work an average of 6 to 8 new person crime cases a month. Using the above available work hours this translates to approximately 21 hours allotted per case or about 6 person crimes per detective.
(2.2) Person Crimes – Sex Assault and Sex Abuse
Person crimes – Sex Assault and crimes against children and are even more complex cases are that treated more seriously by the judicial system and tend to have less witnesses and requiring more time in interviews and the recovering and processing evidence than other person crimes. We generally recommend no more than 6 to 8 sex assault crimes be assigned per month.
Common Evidence/ Interviews
Common Processes
Approximate Time % of Time Completed
DNA Evidence to Crime Lab
3 hours (Includes submission and report) 30%
Crime Scene Material (Evidence left by suspect)
Evidence to Property Control
2 hours (Includes Inspecting and writing report)
10%
Cell Phones Cell Phone Downloads
3 hours (Some phones take much longer)
50%
Video Review of video recovered from scene and BWC
2 hours (To review and write report) 100%
Social Media / Electronic Records / physical location
Warrants / Subpoenas
10 hours (Includes reviewing and report writing)
90%
Surveillance (Locating suspect)
3 hours (Includes report writing) 50%
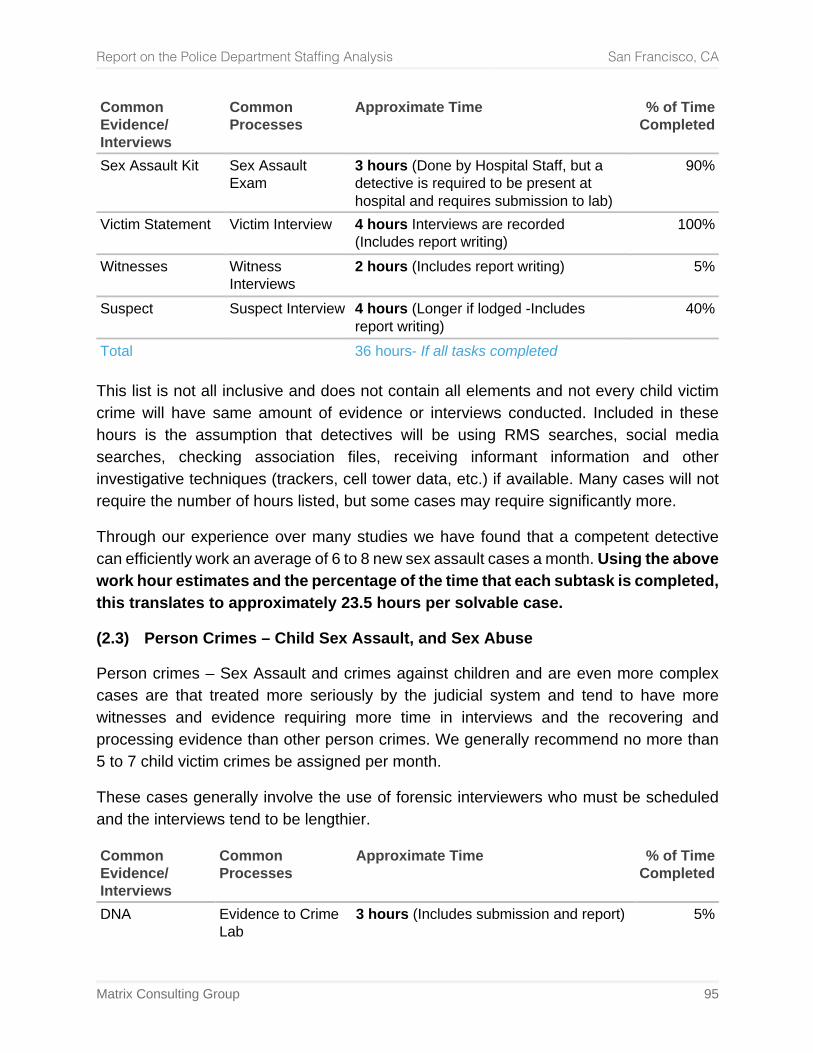
Report on the Police Department Staffing Analysis San Francisco, CA
Matrix Consulting Group 95
Common Evidence/ Interviews
Common Processes
Approximate Time % of Time Completed
Sex Assault Kit Sex Assault Exam
3 hours (Done by Hospital Staff, but a detective is required to be present at hospital and requires submission to lab)
90%
Victim Statement Victim Interview 4 hours Interviews are recorded (Includes report writing)
100%
Witnesses Witness Interviews
2 hours (Includes report writing) 5%
Suspect Suspect Interview 4 hours (Longer if lodged -Includes report writing)
40%
Total 36 hours- If all tasks completed This list is not all inclusive and does not contain all elements and not every child victim crime will have same amount of evidence or interviews conducted. Included in these hours is the assumption that detectives will be using RMS searches, social media searches, checking association files, receiving informant information and other investigative techniques (trackers, cell tower data, etc.) if available. Many cases will not require the number of hours listed, but some cases may require significantly more.
Through our experience over many studies we have found that a competent detective can efficiently work an average of 6 to 8 new sex assault cases a month. Using the above work hour estimates and the percentage of the time that each subtask is completed, this translates to approximately 23.5 hours per solvable case.
(2.3) Person Crimes – Child Sex Assault, and Sex Abuse
Person crimes – Sex Assault and crimes against children and are even more complex cases are that treated more seriously by the judicial system and tend to have more witnesses and evidence requiring more time in interviews and the recovering and processing evidence than other person crimes. We generally recommend no more than 5 to 7 child victim crimes be assigned per month.
These cases generally involve the use of forensic interviewers who must be scheduled and the interviews tend to be lengthier.
Common Evidence/ Interviews
Common Processes
Approximate Time % of Time Completed
DNA Evidence to Crime Lab
3 hours (Includes submission and report) 5%
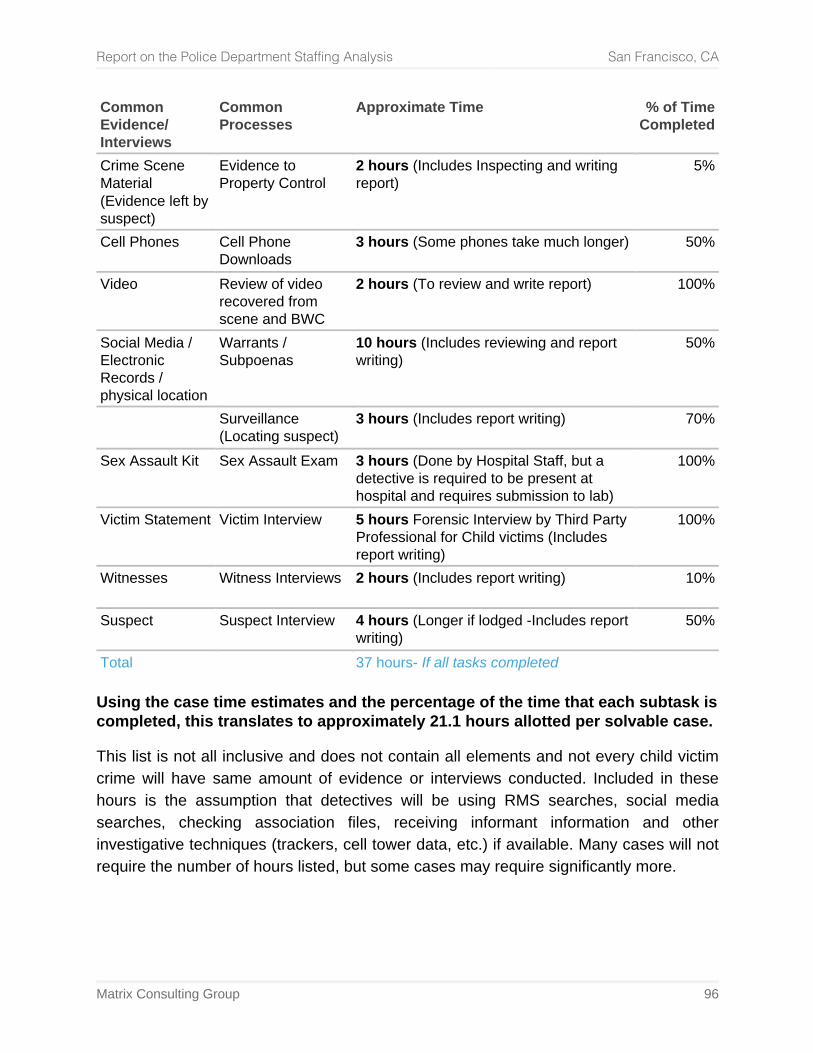
Report on the Police Department Staffing Analysis San Francisco, CA
Matrix Consulting Group 96
Common Evidence/ Interviews
Common Processes
Approximate Time % of Time Completed
Crime Scene Material (Evidence left by suspect)
Evidence to Property Control
2 hours (Includes Inspecting and writing report)
5%
Cell Phones Cell Phone Downloads
3 hours (Some phones take much longer) 50%
Video Review of video recovered from scene and BWC
2 hours (To review and write report) 100%
Social Media / Electronic Records / physical location
Warrants / Subpoenas
10 hours (Includes reviewing and report writing)
50%
Surveillance (Locating suspect)
3 hours (Includes report writing) 70%
Sex Assault Kit Sex Assault Exam 3 hours (Done by Hospital Staff, but a detective is required to be present at hospital and requires submission to lab)
100%
Victim Statement Victim Interview 5 hours Forensic Interview by Third Party Professional for Child victims (Includes report writing)
100%
Witnesses Witness Interviews 2 hours (Includes report writing) 10%
Suspect Suspect Interview 4 hours (Longer if lodged -Includes report writing)
50%
Total 37 hours- If all tasks completed
Using the case time estimates and the percentage of the time that each subtask is completed, this translates to approximately 21.1 hours allotted per solvable case.
This list is not all inclusive and does not contain all elements and not every child victim crime will have same amount of evidence or interviews conducted. Included in these hours is the assumption that detectives will be using RMS searches, social media searches, checking association files, receiving informant information and other investigative techniques (trackers, cell tower data, etc.) if available. Many cases will not require the number of hours listed, but some cases may require significantly more.
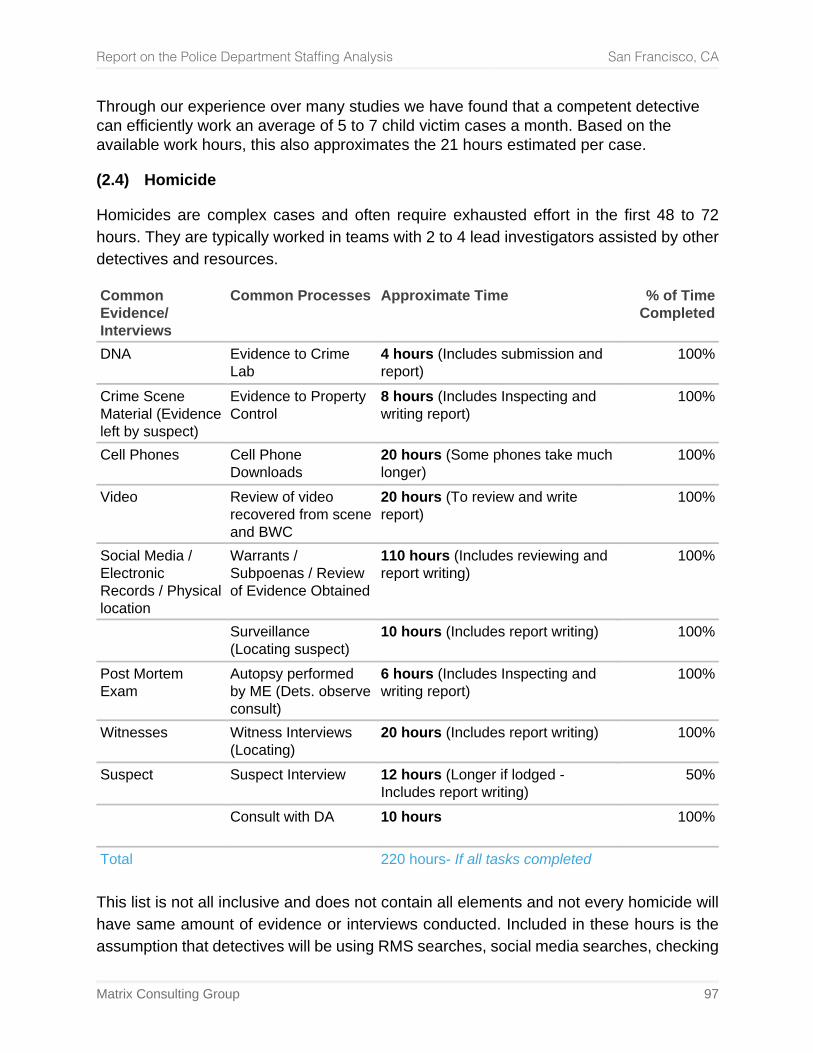
Report on the Police Department Staffing Analysis San Francisco, CA
Matrix Consulting Group 97
Through our experience over many studies we have found that a competent detective can efficiently work an average of 5 to 7 child victim cases a month. Based on the available work hours, this also approximates the 21 hours estimated per case.
(2.4) Homicide
Homicides are complex cases and often require exhausted effort in the first 48 to 72 hours. They are typically worked in teams with 2 to 4 lead investigators assisted by other detectives and resources.
Common Evidence/ Interviews
Common Processes Approximate Time % of Time Completed
DNA Evidence to Crime Lab
4 hours (Includes submission and report)
100%
Crime Scene Material (Evidence left by suspect)
Evidence to Property Control
8 hours (Includes Inspecting and writing report)
100%
Cell Phones Cell Phone Downloads
20 hours (Some phones take much longer)
100%
Video Review of video recovered from scene and BWC
20 hours (To review and write report)
100%
Social Media / Electronic Records / Physical location
Warrants / Subpoenas / Review of Evidence Obtained
110 hours (Includes reviewing and report writing)
100%
Surveillance (Locating suspect)
10 hours (Includes report writing) 100%
Post Mortem Exam
Autopsy performed by ME (Dets. observe consult)
6 hours (Includes Inspecting and writing report)
100%
Witnesses Witness Interviews (Locating)
20 hours (Includes report writing) 100%
Suspect Suspect Interview 12 hours (Longer if lodged -Includes report writing)
50%
Consult with DA 10 hours 100%
Total 220 hours- If all tasks completed This list is not all inclusive and does not contain all elements and not every homicide will have same amount of evidence or interviews conducted. Included in these hours is the assumption that detectives will be using RMS searches, social media searches, checking
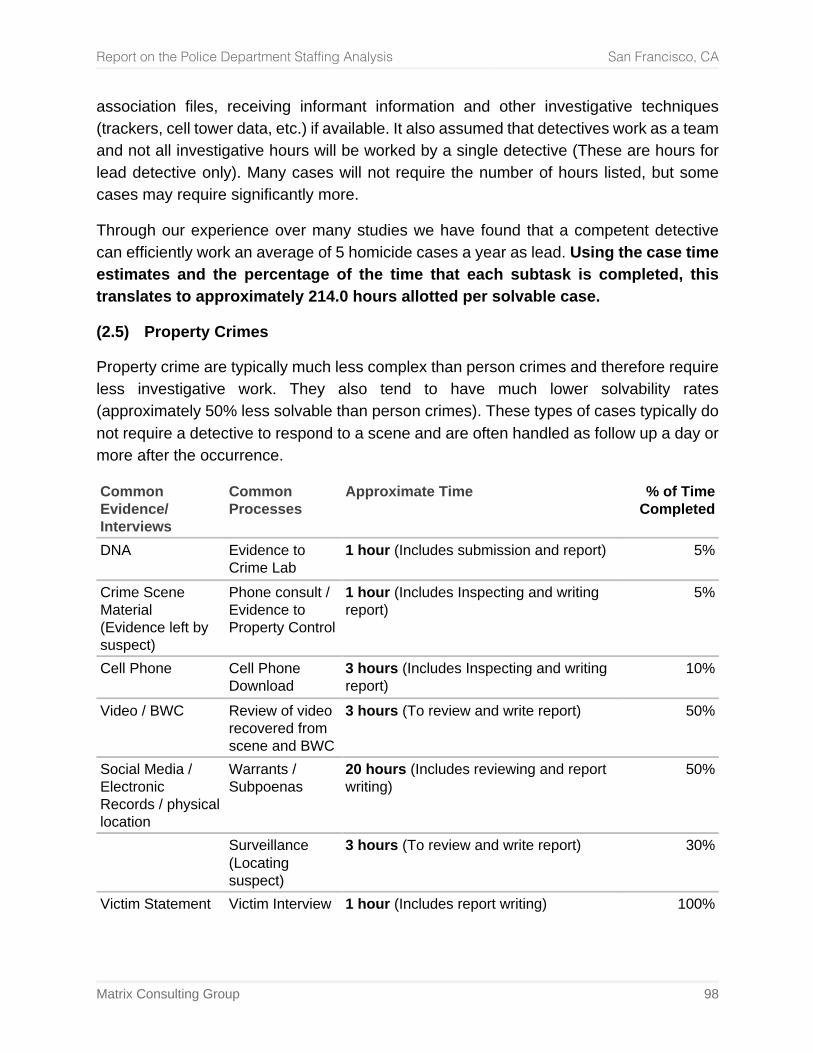
Report on the Police Department Staffing Analysis San Francisco, CA
Matrix Consulting Group 98
association files, receiving informant information and other investigative techniques (trackers, cell tower data, etc.) if available. It also assumed that detectives work as a team and not all investigative hours will be worked by a single detective (These are hours for lead detective only). Many cases will not require the number of hours listed, but some cases may require significantly more.
Through our experience over many studies we have found that a competent detective can efficiently work an average of 5 homicide cases a year as lead. Using the case time estimates and the percentage of the time that each subtask is completed, this translates to approximately 214.0 hours allotted per solvable case.
(2.5) Property Crimes
Property crime are typically much less complex than person crimes and therefore require less investigative work. They also tend to have much lower solvability rates (approximately 50% less solvable than person crimes). These types of cases typically do not require a detective to respond to a scene and are often handled as follow up a day or more after the occurrence.
Common Evidence/ Interviews
Common Processes
Approximate Time % of Time Completed
DNA Evidence to Crime Lab
1 hour (Includes submission and report) 5%
Crime Scene Material (Evidence left by suspect)
Phone consult / Evidence to Property Control
1 hour (Includes Inspecting and writing report)
5%
Cell Phone Cell Phone Download
3 hours (Includes Inspecting and writing report)
10%
Video / BWC Review of video recovered from scene and BWC
3 hours (To review and write report) 50%
Social Media / Electronic Records / physical location
Warrants / Subpoenas
20 hours (Includes reviewing and report writing)
50%
Surveillance (Locating suspect)
3 hours (To review and write report) 30%
Victim Statement Victim Interview 1 hour (Includes report writing) 100%
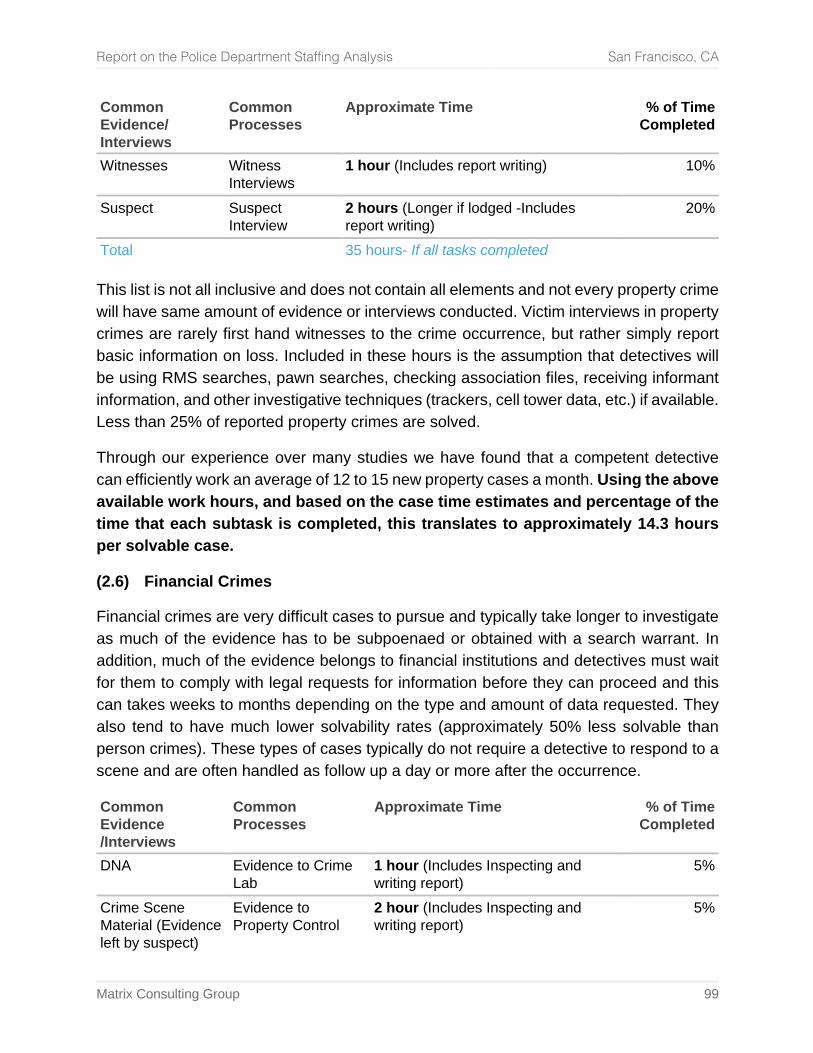
Report on the Police Department Staffing Analysis San Francisco, CA
Matrix Consulting Group 99
Common Evidence/ Interviews
Common Processes
Approximate Time % of Time Completed
Witnesses Witness Interviews
1 hour (Includes report writing) 10%
Suspect Suspect Interview
2 hours (Longer if lodged -Includes report writing)
20%
Total 35 hours- If all tasks completed
This list is not all inclusive and does not contain all elements and not every property crime will have same amount of evidence or interviews conducted. Victim interviews in property crimes are rarely first hand witnesses to the crime occurrence, but rather simply report basic information on loss. Included in these hours is the assumption that detectives will be using RMS searches, pawn searches, checking association files, receiving informant information, and other investigative techniques (trackers, cell tower data, etc.) if available. Less than 25% of reported property crimes are solved.
Through our experience over many studies we have found that a competent detective can efficiently work an average of 12 to 15 new property cases a month. Using the above available work hours, and based on the case time estimates and percentage of the time that each subtask is completed, this translates to approximately 14.3 hours per solvable case.
(2.6) Financial Crimes
Financial crimes are very difficult cases to pursue and typically take longer to investigate as much of the evidence has to be subpoenaed or obtained with a search warrant. In addition, much of the evidence belongs to financial institutions and detectives must wait for them to comply with legal requests for information before they can proceed and this can takes weeks to months depending on the type and amount of data requested. They also tend to have much lower solvability rates (approximately 50% less solvable than person crimes). These types of cases typically do not require a detective to respond to a scene and are often handled as follow up a day or more after the occurrence.
Common Evidence /Interviews
Common Processes
Approximate Time % of Time Completed
DNA Evidence to Crime Lab
1 hour (Includes Inspecting and writing report)
5%
Crime Scene Material (Evidence left by suspect)
Evidence to Property Control
2 hour (Includes Inspecting and writing report)
5%
Report on the Police Department Staffing Analysis San Francisco, CA
Matrix Consulting Group 100
Common Evidence /Interviews
Common Processes
Approximate Time % of Time Completed
Cell Phone Cell Phone Download
3 hours (To review and write report) 10%
Video / BWC Review of video recovered from scene and BWC
4 hours (To review and write report) 50%
Social Media / Electronic Records / physical location
Warrants / Subpoenas / Document review
20 hours (Includes reviewing and report writing)
100%
Surveillance (Locating suspect)
3 hour (Includes report writing) 30%
Victim Statement Victim Interview 1 hour (Includes report writing) 100%
Witnesses Witness Interviews 1 hours(Includes report writing) 10%
Suspect Suspect Interview 2 hours (Longer if lodged -Includes report writing)
20%
Total 37 hours- If all tasks completed
Based on the percentage for how often each subtask is completed, each solvable case equates to an average of approximately 24 hours.
This list is not all inclusive and does not contain all elements and not every property crime will have same amount of evidence or interviews conducted. Victim interviews in financial crimes are rarely first hand witnesses to the crime occurrence, but rather simply report basic information on loss. Included in these hours is the assumption that detectives will be using RMS searches, checking association files, receiving informant information, and other investigative techniques (trackers, cell tower data, etc.) if available. Less than 25% of reported financial crimes are solved.
Through our experience over many studies we have found that a competent detective can efficiently work an average of 6 to 8 new financial cases a month.
(2.7) Domestic Violence
Domestic Violence Crimes are unique in that victim and the suspect are known, however victims may not be fully cooperative with the investigation. The safety of the victim also can be affected unlike many other investigative cases. These types of cases typically do not require a detective to respond to a scene and are often handled as follow up after initial investigation by patrol officers.
Report on the Police Department Staffing Analysis San Francisco, CA
Matrix Consulting Group 101
Common Evidence/ Interviews
Common Processes
Approximate Time % of Time Completed
Video / Pictures of injuries
Review of video / pictures taken at the scene and BWC
3 hour (To review and write report 100%
Social Media / Electronic Records / physical location
Warrants / Subpoenas / Document review
4 hours (Includes reviewing and report writing)
50%
Surveillance (Locating suspect)
3 hour (To review and write report) 50%
Victim Statement Victim Interview 3 hours (Includes report writing) 50%
Witnesses Witness Interviews
1 hours (Includes report writing) 100%
Suspect Suspect Interview 2 hours (Longer if lodged -Includes report writing)
50%
Total 16 hours- If all tasks completed
This list is not all inclusive and does not contain all elements and not every property crime will have same amount of evidence or interviews conducted. Investigators may also be involved in working with DV advocates or arranging for services for the victim when need.
Through our experience over many studies we have found that a competent detective can efficiently work an average of 12 to 15 domestic violence cases a month. Using the above available work hours this translates to approximately 11 hours allotted per case.
(2.8) Traffic Crash Investigations
Traffic crash investigations are processes similar to person crimes in that these cases involve injury of a person or death. Fatal crashes involve reconstruction of the crash event which requires extensive investigation and crash scene processing.
Common Evidence/ Interviews
Common Processes Approximate Time % of Time Completed
Crash Scene Material (Evidence left by suspect)
Evidence to Property Control
2 hours (Includes Inspecting and writing report)
5%
Report on the Police Department Staffing Analysis San Francisco, CA
Matrix Consulting Group 102
Common Evidence/ Interviews
Common Processes Approximate Time % of Time Completed
Crash scene processing / reconstruction
Measuring crash scene-Diagrams
8 hours 100%
Video Review of video recovered from scene and BWC
2 hours (To review and write report
40%
Vehicles / Electronic Records / Physical location
Warrants / Subpoenas / Document review
10 hours (Includes reviewing and report writing)
100%
Victim Statement Victim Interview 1 hour (Includes report writing) 100%
Witnesses statement
Witness Interviews 1 hour (Includes report writing) 100%
Suspect Suspect Interview 2 hours (Longer if lodged -Includes report writing)
50%
Total 26 hours- If all tasks completed
This list is not all inclusive and does not contain all elements and not every crash scene investigation will have same amount of evidence or interviews conducted. Victim interviews may have to be conducted after medical treatment and recovery. Included in these hours is the assumption that detectives will be using RMS searches, checking association files, receiving informant information, and other investigative techniques (trackers, cell tower data, etc.) if available.
Through our experience over many studies we have found that a competent detective can efficiently work an average of 6 to 8 new crash cases a month. Using the above available work hours, case time estimates, and the percentage of the time that each subtask is completed, this translates to approximately 21 hours per solvable case.
(3) Overview of the Staffing Analysis Methodology
For many positions, staffing needs directly relate to specific workloads that can be measured. For patrol, incoming calls for service and associated workloads are an important factor in determining staffing needs. For many types of investigators, the workload from assigned cases are a key driver of staffing needs.
(3.1) Net Availability
Out of the total scheduled work hours in a year (2,080), employees may not be on duty for a scheduled shift due to a variety of reasons. This includes leave (e.g., sick, vacation,
Report on the Police Department Staffing Analysis San Francisco, CA
Matrix Consulting Group 103
bereavement, administrative, injury etc.), training completed while on regular time (non-overtime), and court time.
These factors are deducted from the base 2,080 hours, with the remaining hours representing the net available hours an employee is on duty (excluding overtime). This is illustrated below:
Normative values have been used for net availability factors where data was not available.
It is important to note that for this analysis, administrative time is not assumed to be part of net availability, and is instead factored in separately after the net availability factors have been deducted.
(3.2) Administrative Time
Administrative time includes duties that are not tied to specific workloads, may be too individually minor to be used as a workload metric, or represent activities that form part of a regular workday that scale according to the number of employees, rather than specific service need. At a macro level, for instance, the time that is spent on a unit meeting scales primarily in accordance with the number of staff that attended.
The definition of administrative time for various units can be interpreted broadly, but generally reflects ancillary and supporting workload augmenting core business activities. Examples of administrative time include, but are not limited to the following activities:
• Time spent by staff performing training for other personnel (e.g., range officer).
• Formal meetings conducted as part of committees, special teams, in task forces, ad-hoc group sessions, etc.
• Informal discussions, or ‘desk time’ with colleagues.
• Supporting duties or special assignments designed to facilitate effective department operations (e.g., Explorer Representative).
• Downtime in between completing tasks
• Breaks, including meals, bathroom, and miscellaneous
Report on the Police Department Staffing Analysis San Francisco, CA
Matrix Consulting Group 104
• Reviewing cases with supervisor
• Any workloads related to a case that are not covered by a subtask in the case time breakdown
– Reviewing cases upon assignment
– Miscellaneous contact with victims that is not covered by a subtask
– Unsuccessful contacts
– Emails and other communications
– Administrative preparation and assembly of materials related to a case
– Rebookings.
• Workload not related to a single case, but are part of broader investigative efforts such as development of a crime pattern or series bulletin, authoring of a “white paper,” development of an intelligence briefing, etc.
• Maintaining databases reflective of key performance indicators for unit operations.
• Broader generic support to other entities such as the DA’s or Prosecutor’s office. With respect to re-booking workload, this can be included in administrative time based on an estimated average time per case and total re-booking workload estimate per year.
This list reflects examples of administrative time and should be juxtaposed against the activities included under the proactive time category for each particular unit.
(3.3) Proactive Time
Proactive time includes all activities not counted under administrative time that are not directly tied to a reactive workload, such as assigned cases. it represents the leftover time after investigative and administrative workloads have been handled. Often, proactive time is oriented around achieving a certain outcome (e.g., crime reduction), service level objective, or completion of a larger project. Activities that are included under the proactive time factor are different for each unit, although they generally share similar characteristics. Descriptions and examples of activities included under proactive time are listed for each unit individually.
In the staffing analysis, proactive time is assumed as a factors that comprises a certain percentage of net available time, alongside the administrative time factor.
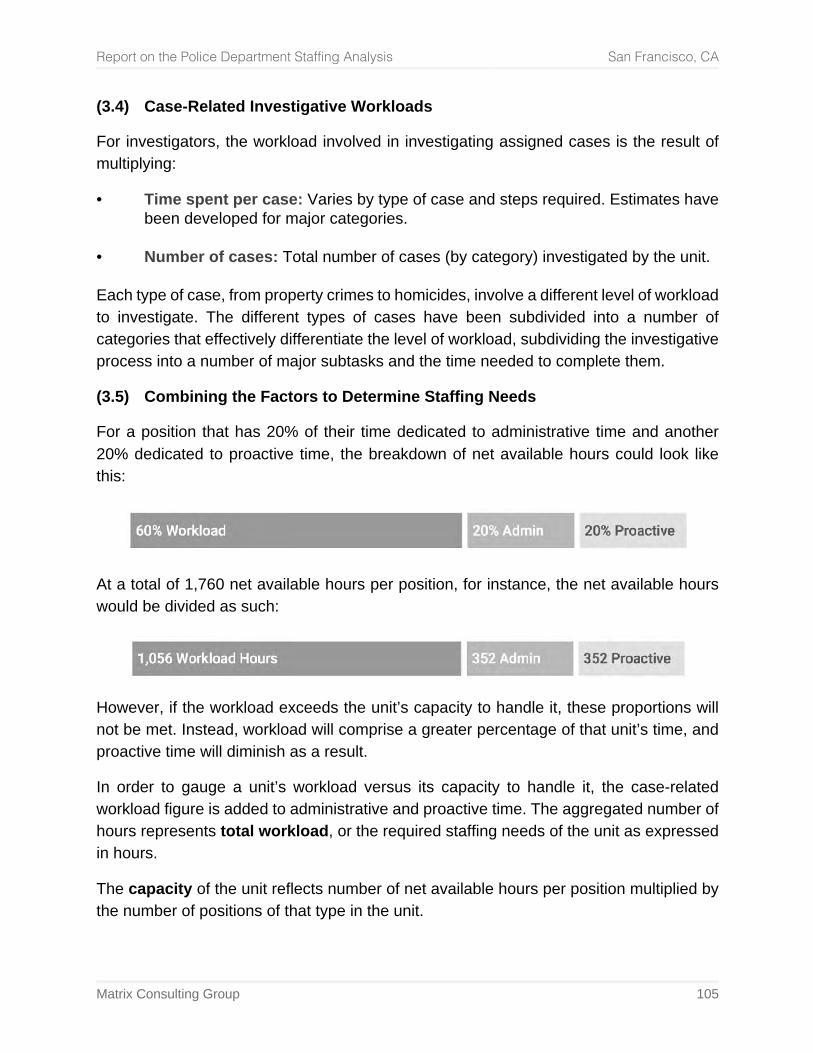
Report on the Police Department Staffing Analysis San Francisco, CA
Matrix Consulting Group 105
(3.4) Case-Related Investigative Workloads
For investigators, the workload involved in investigating assigned cases is the result of multiplying:
• Time spent per case: Varies by type of case and steps required. Estimates have been developed for major categories.
• Number of cases: Total number of cases (by category) investigated by the unit. Each type of case, from property crimes to homicides, involve a different level of workload to investigate. The different types of cases have been subdivided into a number of categories that effectively differentiate the level of workload, subdividing the investigative process into a number of major subtasks and the time needed to complete them.
(3.5) Combining the Factors to Determine Staffing Needs
For a position that has 20% of their time dedicated to administrative time and another 20% dedicated to proactive time, the breakdown of net available hours could look like this:
At a total of 1,760 net available hours per position, for instance, the net available hours would be divided as such:
However, if the workload exceeds the unit’s capacity to handle it, these proportions will not be met. Instead, workload will comprise a greater percentage of that unit’s time, and proactive time will diminish as a result.
In order to gauge a unit’s workload versus its capacity to handle it, the case-related workload figure is added to administrative and proactive time. The aggregated number of hours represents total workload, or the required staffing needs of the unit as expressed in hours.
The capacity of the unit reflects number of net available hours per position multiplied by the number of positions of that type in the unit.
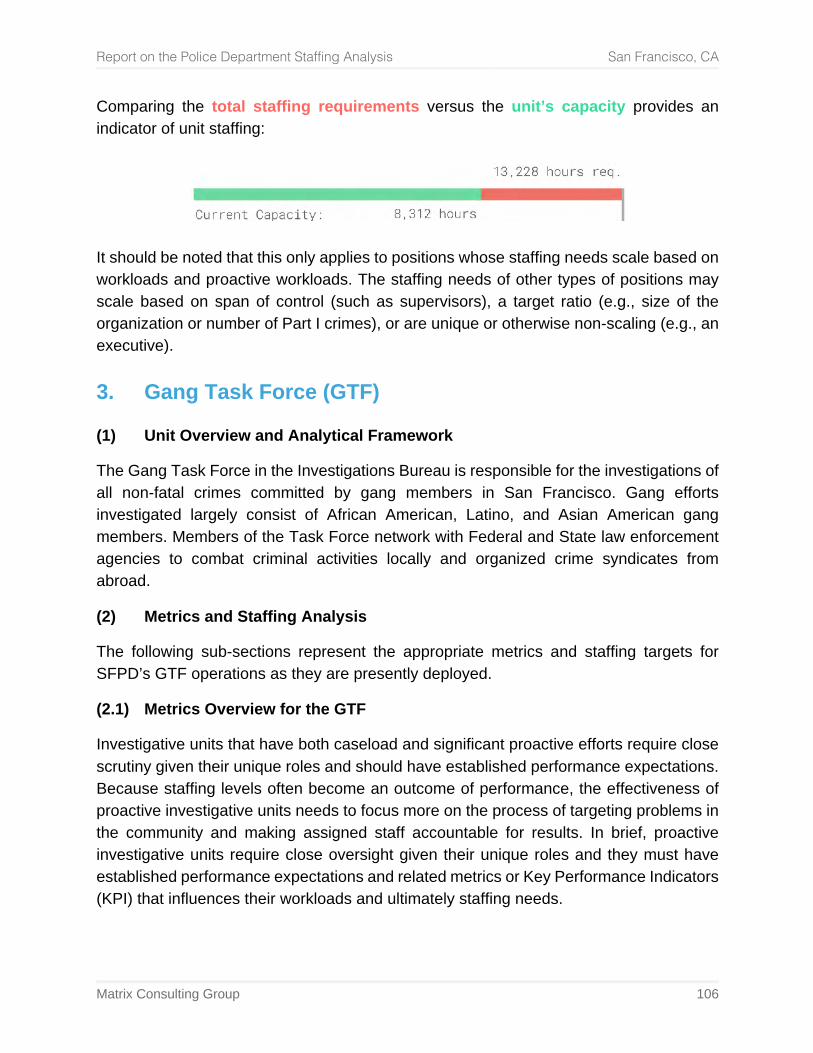
Report on the Police Department Staffing Analysis San Francisco, CA
Matrix Consulting Group 106
Comparing the total staffing requirements versus the unit’s capacity provides an indicator of unit staffing:
It should be noted that this only applies to positions whose staffing needs scale based on workloads and proactive workloads. The staffing needs of other types of positions may scale based on span of control (such as supervisors), a target ratio (e.g., size of the organization or number of Part I crimes), or are unique or otherwise non-scaling (e.g., an executive).
3. Gang Task Force (GTF)
(1) Unit Overview and Analytical Framework
The Gang Task Force in the Investigations Bureau is responsible for the investigations of all non-fatal crimes committed by gang members in San Francisco. Gang efforts investigated largely consist of African American, Latino, and Asian American gang members. Members of the Task Force network with Federal and State law enforcement agencies to combat criminal activities locally and organized crime syndicates from abroad.
(2) Metrics and Staffing Analysis
The following sub-sections represent the appropriate metrics and staffing targets for SFPD’s GTF operations as they are presently deployed.
(2.1) Metrics Overview for the GTF
Investigative units that have both caseload and significant proactive efforts require close scrutiny given their unique roles and should have established performance expectations. Because staffing levels often become an outcome of performance, the effectiveness of proactive investigative units needs to focus more on the process of targeting problems in the community and making assigned staff accountable for results. In brief, proactive investigative units require close oversight given their unique roles and they must have established performance expectations and related metrics or Key Performance Indicators (KPI) that influences their workloads and ultimately staffing needs.
Report on the Police Department Staffing Analysis San Francisco, CA
Matrix Consulting Group 107
(2.2) Staffing and Net Availability
Specific data is not readily available for staff positions assigned to GTF, and normative values have been used for training, court time, and leave. Consequently, the following net availability metrics are used:
GTF Annual Available Work Hours Per Year
Base Annual Work Hours 2,080 Total Leave Hours – 200 On-Duty Training Hours – 40 On-Duty Court Time Hours – 80
Subtotal: Available Work Hours = 1,760 In total, the 15 sergeants assigned to the unit account for 26,400 net available hours per year.
(2.3) Administrative Time
Interviews with GTF personnel suggest administrative time that reflects 20% of available work hours, after accounting for factors such as leave and training time. This equates to 352 hours of administrative work per year for each FTE.
The types of tasks that are involved in administrative time have been outlined in the methodological explanation section at the beginning of this chapter.
With 15 sergeants assigned to the unit, the administrative time for the unit would total 5,280 hours at a rate of 20% of available time per position.
(2.4) Proactive Time
Interview with GTF personnel suggest time dedicated to on-site work and proactive field work is an important portion of investigator workload. By example, the following key proactive efforts are undertaken:
• Conducts case investigations, surveillance, warrants and intelligence gathering for a variety of city gangs.
• One sergeant typically assigned to each of approximately 15 gangs for tracking purposes (10 African American, 4 Latino, 1 Asian American).
• Investigates each case for gang enhancement probability and interfaces with dedicated DAs.
Report on the Police Department Staffing Analysis San Francisco, CA
Matrix Consulting Group 108
• GTF works with the graffiti abatement program.
• Works with FBI “Safe Streets” gang enhancement agents.
Currently, investigators of the Gang Task Force are tasked with a multitude of different tasks. Each member has a specific expertise related to multiple gangs in a specific area. There is an expectation that each member maintain a working knowledge of all gangs throughout San Francisco outside of their own expertise.
As illustrated above, there are numerous duties and responsibilities relative proactive initiatives. Importantly however, these efforts are not yet framed in the context of the aforementioned performance metrics and KPI approach that can inform how to staff such a unit.
There are no gang-related performance metrics other than cases investigated which precludes an effective estimate of how much “intelligence/field” proactive efforts should be dedicated to SFPD’s GTF operation. In the absence of such data, providing a reasonable level of proactive time for such efforts, such as 40%, is much more practical than estimating significant levels of proactive time, particularly in light of interview results.
Interviews with GTF personnel suggest that proactive work reflects 20% of total net available staff time; this would be added to 20% administrative time for other ancillary duties. However, during the course of interviews it was discovered that duties such as Gang Intelligence Databases are behind in updating. Moreover, the aforementioned KPI efforts would require tracking and reporting. As such, our assessment is that as much as 60% of time should be dedicated to proactive/administrative efforts such as intelligence gathering, surveillance, and active gang monitoring. With 20% allotted to administrative time, this results in a target of 40% of time available for proactive work.
Consequently, this target leaves no more than 40% time remaining for investigative case work. Should the investigative work represent a greater share than that, this would come at the cost of proactive work. Given this consideration, the proportion of time represented by investigative work (and the amount left over proactive work) provide for benchmarks in determining whether staffing levels are adequate).
(2.5) Workload Metrics
Given the unique nature of GTF cases, it is estimated that 18 hours per case is a reasonable starting point for GTF caseload. Importantly, this workload also includes re-booking cases, as the special efforts required for gang enhancement on cases should be accomplished by gang staff as opposed to a centralized re-booking unit. Thus, this case metric is a combination of re-booking and case investigative efforts.
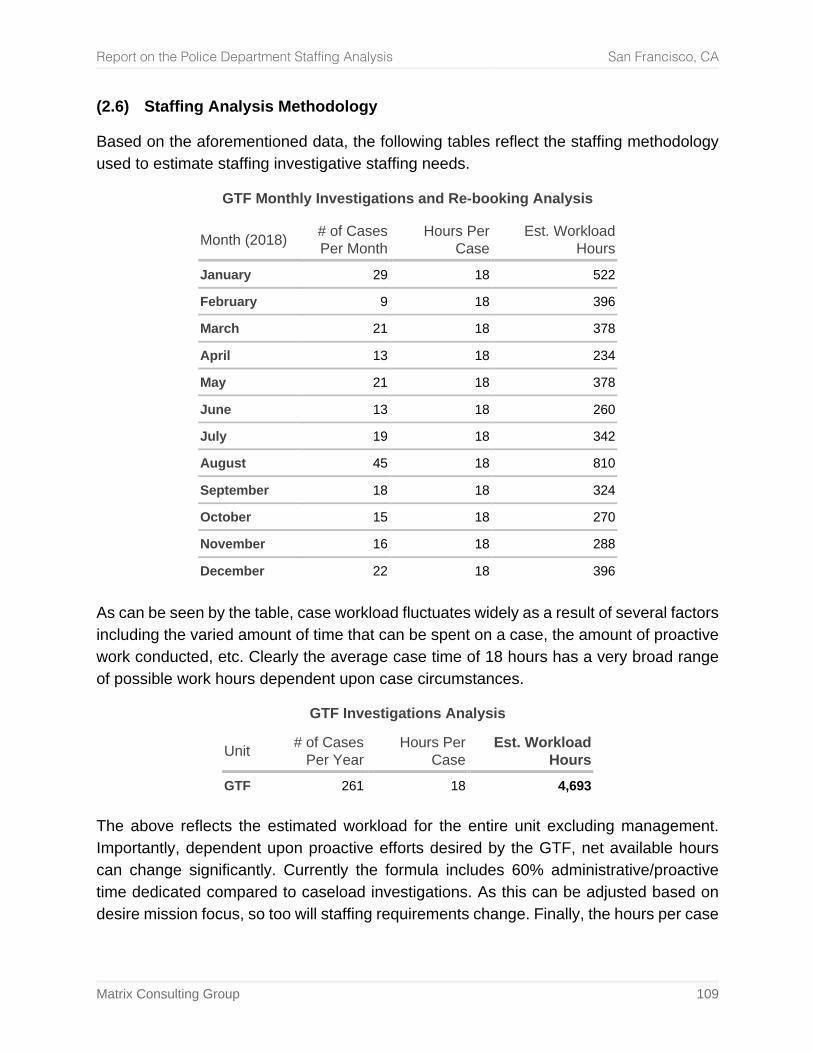
Report on the Police Department Staffing Analysis San Francisco, CA
Matrix Consulting Group 109
(2.6) Staffing Analysis Methodology
Based on the aforementioned data, the following tables reflect the staffing methodology used to estimate staffing investigative staffing needs.
GTF Monthly Investigations and Re-booking Analysis
Month (2018) # of Cases Per Month
Hours Per Case
Est. Workload Hours
January 29 18 522
February 9 18 396
March 21 18 378
April 13 18 234
May 21 18 378
June 13 18 260
July 19 18 342
August 45 18 810
September 18 18 324
October 15 18 270
November 16 18 288
December 22 18 396 As can be seen by the table, case workload fluctuates widely as a result of several factors including the varied amount of time that can be spent on a case, the amount of proactive work conducted, etc. Clearly the average case time of 18 hours has a very broad range of possible work hours dependent upon case circumstances.
GTF Investigations Analysis
Unit # of Cases Per Year
Hours Per Case
Est. Workload Hours
GTF 261 18 4,693 The above reflects the estimated workload for the entire unit excluding management. Importantly, dependent upon proactive efforts desired by the GTF, net available hours can change significantly. Currently the formula includes 60% administrative/proactive time dedicated compared to caseload investigations. As this can be adjusted based on desire mission focus, so too will staffing requirements change. Finally, the hours per case
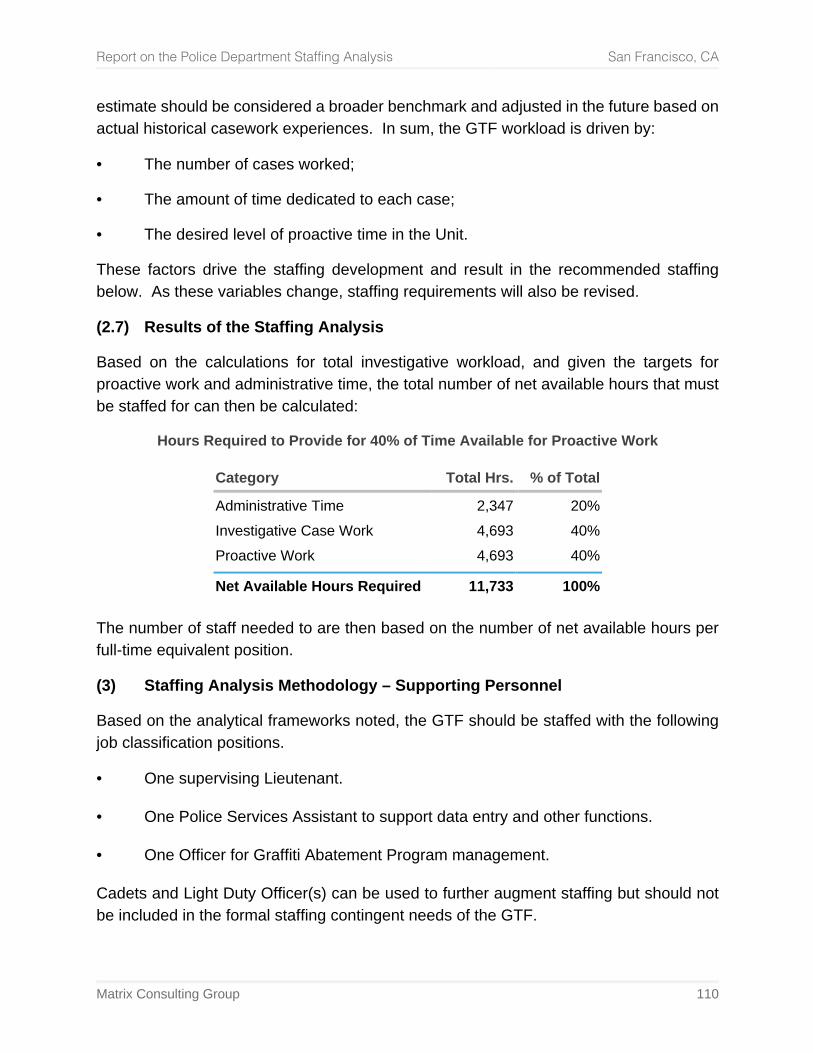
Report on the Police Department Staffing Analysis San Francisco, CA
Matrix Consulting Group 110
estimate should be considered a broader benchmark and adjusted in the future based on actual historical casework experiences. In sum, the GTF workload is driven by:
• The number of cases worked;
• The amount of time dedicated to each case;
• The desired level of proactive time in the Unit.
These factors drive the staffing development and result in the recommended staffing below. As these variables change, staffing requirements will also be revised.
(2.7) Results of the Staffing Analysis
Based on the calculations for total investigative workload, and given the targets for proactive work and administrative time, the total number of net available hours that must be staffed for can then be calculated:
Hours Required to Provide for 40% of Time Available for Proactive Work
Category Total Hrs. % of Total
Administrative Time 2,347 20% Investigative Case Work 4,693 40% Proactive Work 4,693 40%
Net Available Hours Required 11,733 100% The number of staff needed to are then based on the number of net available hours per full-time equivalent position.
(3) Staffing Analysis Methodology – Supporting Personnel
Based on the analytical frameworks noted, the GTF should be staffed with the following job classification positions.
• One supervising Lieutenant. • One Police Services Assistant to support data entry and other functions. • One Officer for Graffiti Abatement Program management. Cadets and Light Duty Officer(s) can be used to further augment staffing but should not be included in the formal staffing contingent needs of the GTF.
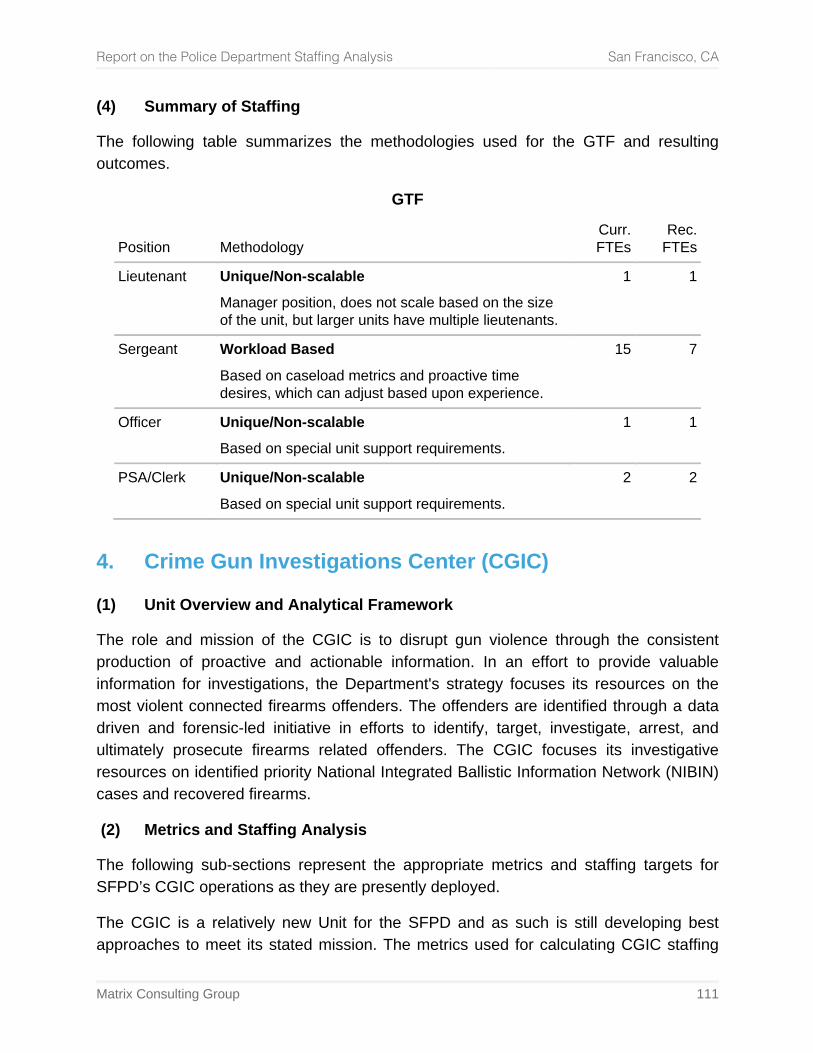
Report on the Police Department Staffing Analysis San Francisco, CA
Matrix Consulting Group 111
(4) Summary of Staffing
The following table summarizes the methodologies used for the GTF and resulting outcomes.
GTF
Position Methodology Curr.
FTEs Rec.
FTEs
Lieutenant Unique/Non-scalable
Manager position, does not scale based on the size of the unit, but larger units have multiple lieutenants.
1 1
Sergeant Workload Based
Based on caseload metrics and proactive time desires, which can adjust based upon experience.
15 7
Officer Unique/Non-scalable
Based on special unit support requirements. 1 1
PSA/Clerk Unique/Non-scalable
Based on special unit support requirements. 2 2
4. Crime Gun Investigations Center (CGIC)
(1) Unit Overview and Analytical Framework
The role and mission of the CGIC is to disrupt gun violence through the consistent production of proactive and actionable information. In an effort to provide valuable information for investigations, the Department's strategy focuses its resources on the most violent connected firearms offenders. The offenders are identified through a data driven and forensic-led initiative in efforts to identify, target, investigate, arrest, and ultimately prosecute firearms related offenders. The CGIC focuses its investigative resources on identified priority National Integrated Ballistic Information Network (NIBIN) cases and recovered firearms.
(2) Metrics and Staffing Analysis
The following sub-sections represent the appropriate metrics and staffing targets for SFPD’s CGIC operations as they are presently deployed.
The CGIC is a relatively new Unit for the SFPD and as such is still developing best approaches to meet its stated mission. The metrics used for calculating CGIC staffing
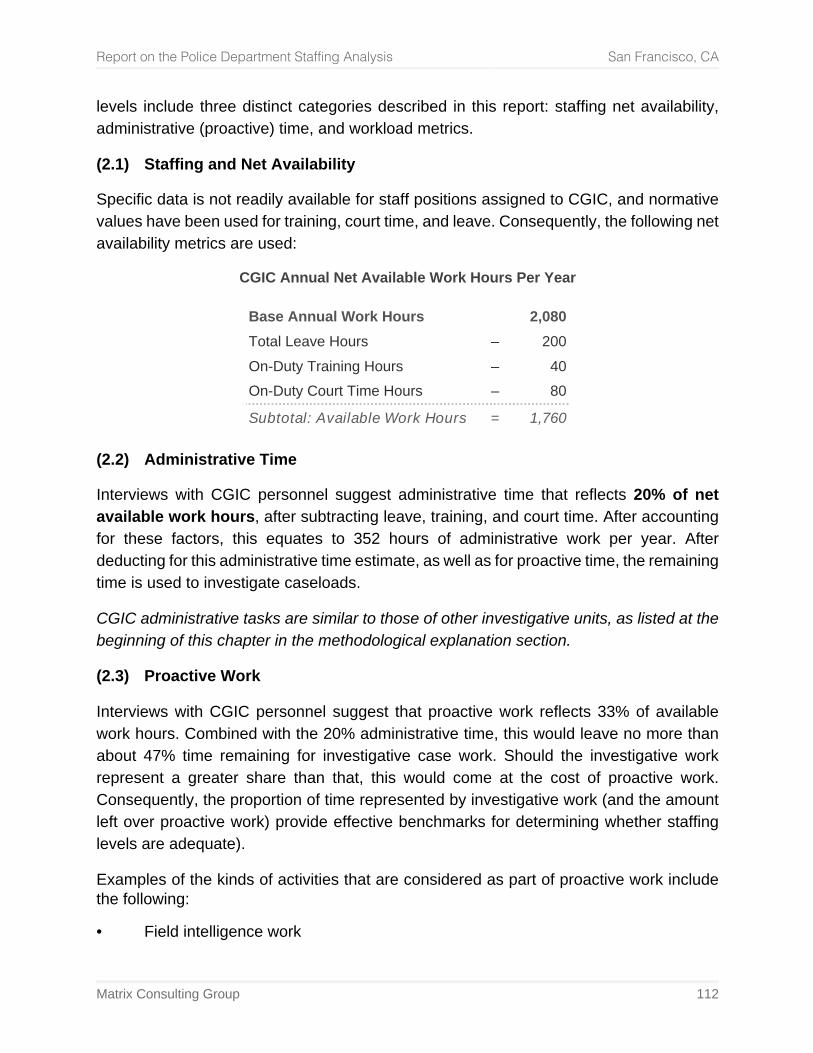
Report on the Police Department Staffing Analysis San Francisco, CA
Matrix Consulting Group 112
levels include three distinct categories described in this report: staffing net availability, administrative (proactive) time, and workload metrics.
(2.1) Staffing and Net Availability
Specific data is not readily available for staff positions assigned to CGIC, and normative values have been used for training, court time, and leave. Consequently, the following net availability metrics are used:
CGIC Annual Net Available Work Hours Per Year
Base Annual Work Hours 2,080 Total Leave Hours – 200 On-Duty Training Hours – 40 On-Duty Court Time Hours – 80
Subtotal: Available Work Hours = 1,760 (2.2) Administrative Time
Interviews with CGIC personnel suggest administrative time that reflects 20% of net available work hours, after subtracting leave, training, and court time. After accounting for these factors, this equates to 352 hours of administrative work per year. After deducting for this administrative time estimate, as well as for proactive time, the remaining time is used to investigate caseloads.
CGIC administrative tasks are similar to those of other investigative units, as listed at the beginning of this chapter in the methodological explanation section.
(2.3) Proactive Work
Interviews with CGIC personnel suggest that proactive work reflects 33% of available work hours. Combined with the 20% administrative time, this would leave no more than about 47% time remaining for investigative case work. Should the investigative work represent a greater share than that, this would come at the cost of proactive work. Consequently, the proportion of time represented by investigative work (and the amount left over proactive work) provide effective benchmarks for determining whether staffing levels are adequate).
Examples of the kinds of activities that are considered as part of proactive work include the following:
• Field intelligence work
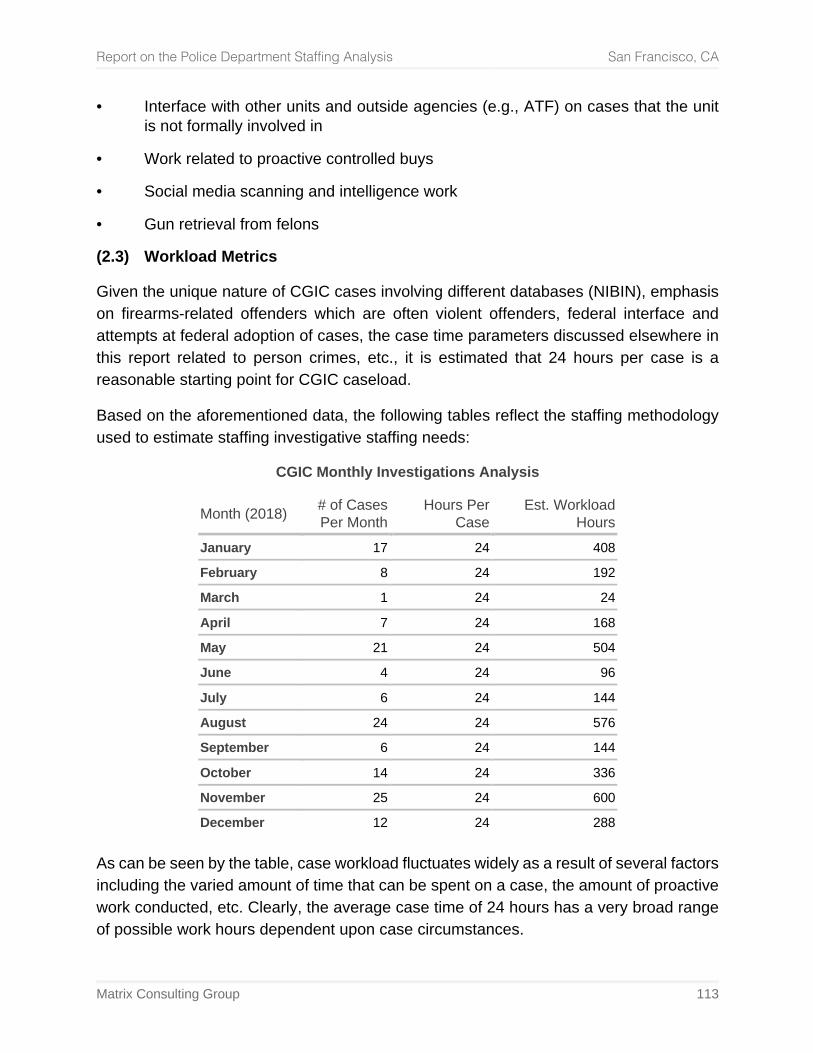
Report on the Police Department Staffing Analysis San Francisco, CA
Matrix Consulting Group 113
• Interface with other units and outside agencies (e.g., ATF) on cases that the unit is not formally involved in
• Work related to proactive controlled buys
• Social media scanning and intelligence work
• Gun retrieval from felons
(2.3) Workload Metrics
Given the unique nature of CGIC cases involving different databases (NIBIN), emphasis on firearms-related offenders which are often violent offenders, federal interface and attempts at federal adoption of cases, the case time parameters discussed elsewhere in this report related to person crimes, etc., it is estimated that 24 hours per case is a reasonable starting point for CGIC caseload.
Based on the aforementioned data, the following tables reflect the staffing methodology used to estimate staffing investigative staffing needs:
CGIC Monthly Investigations Analysis
Month (2018) # of Cases Per Month
Hours Per Case
Est. Workload Hours
January 17 24 408
February 8 24 192
March 1 24 24
April 7 24 168
May 21 24 504
June 4 24 96
July 6 24 144
August 24 24 576
September 6 24 144
October 14 24 336
November 25 24 600
December 12 24 288 As can be seen by the table, case workload fluctuates widely as a result of several factors including the varied amount of time that can be spent on a case, the amount of proactive work conducted, etc. Clearly, the average case time of 24 hours has a very broad range of possible work hours dependent upon case circumstances.
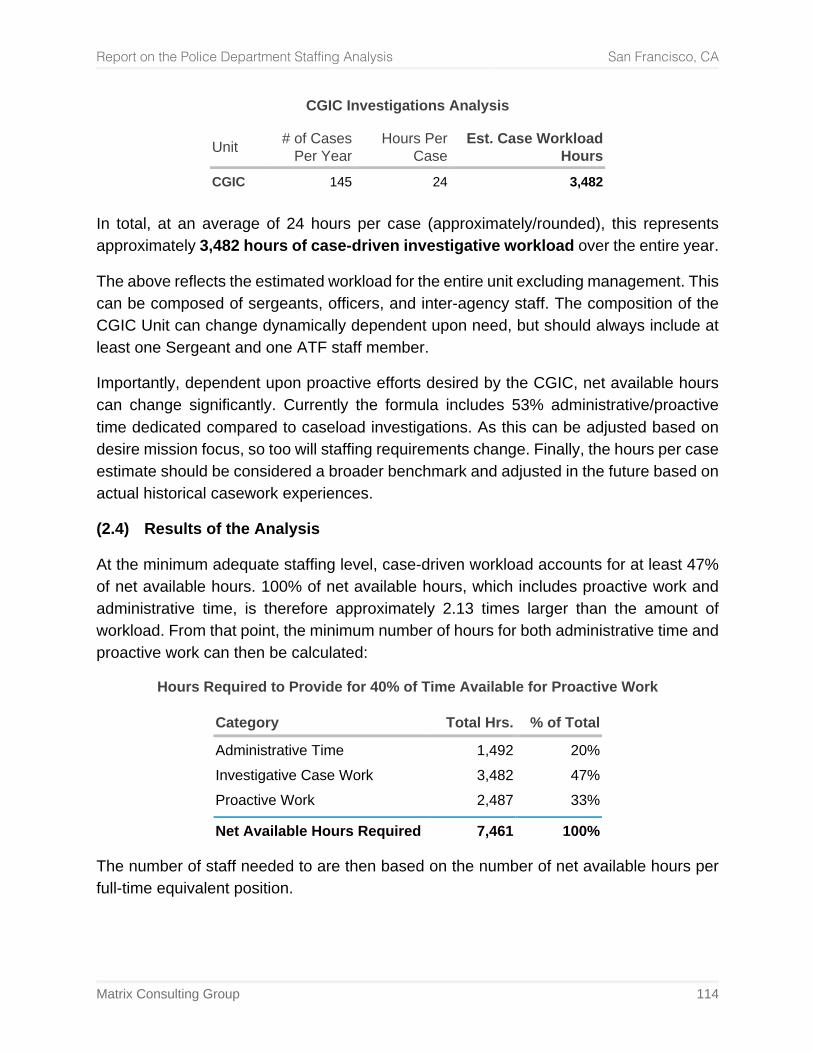
Report on the Police Department Staffing Analysis San Francisco, CA
Matrix Consulting Group 114
CGIC Investigations Analysis
Unit # of Cases Per Year
Hours Per Case
Est. Case Workload Hours
CGIC 145 24 3,482 In total, at an average of 24 hours per case (approximately/rounded), this represents approximately 3,482 hours of case-driven investigative workload over the entire year.
The above reflects the estimated workload for the entire unit excluding management. This can be composed of sergeants, officers, and inter-agency staff. The composition of the CGIC Unit can change dynamically dependent upon need, but should always include at least one Sergeant and one ATF staff member.
Importantly, dependent upon proactive efforts desired by the CGIC, net available hours can change significantly. Currently the formula includes 53% administrative/proactive time dedicated compared to caseload investigations. As this can be adjusted based on desire mission focus, so too will staffing requirements change. Finally, the hours per case estimate should be considered a broader benchmark and adjusted in the future based on actual historical casework experiences.
(2.4) Results of the Analysis
At the minimum adequate staffing level, case-driven workload accounts for at least 47% of net available hours. 100% of net available hours, which includes proactive work and administrative time, is therefore approximately 2.13 times larger than the amount of workload. From that point, the minimum number of hours for both administrative time and proactive work can then be calculated:
Hours Required to Provide for 40% of Time Available for Proactive Work
Category Total Hrs. % of Total
Administrative Time 1,492 20% Investigative Case Work 3,482 47% Proactive Work 2,487 33%
Net Available Hours Required 7,461 100% The number of staff needed to are then based on the number of net available hours per full-time equivalent position.
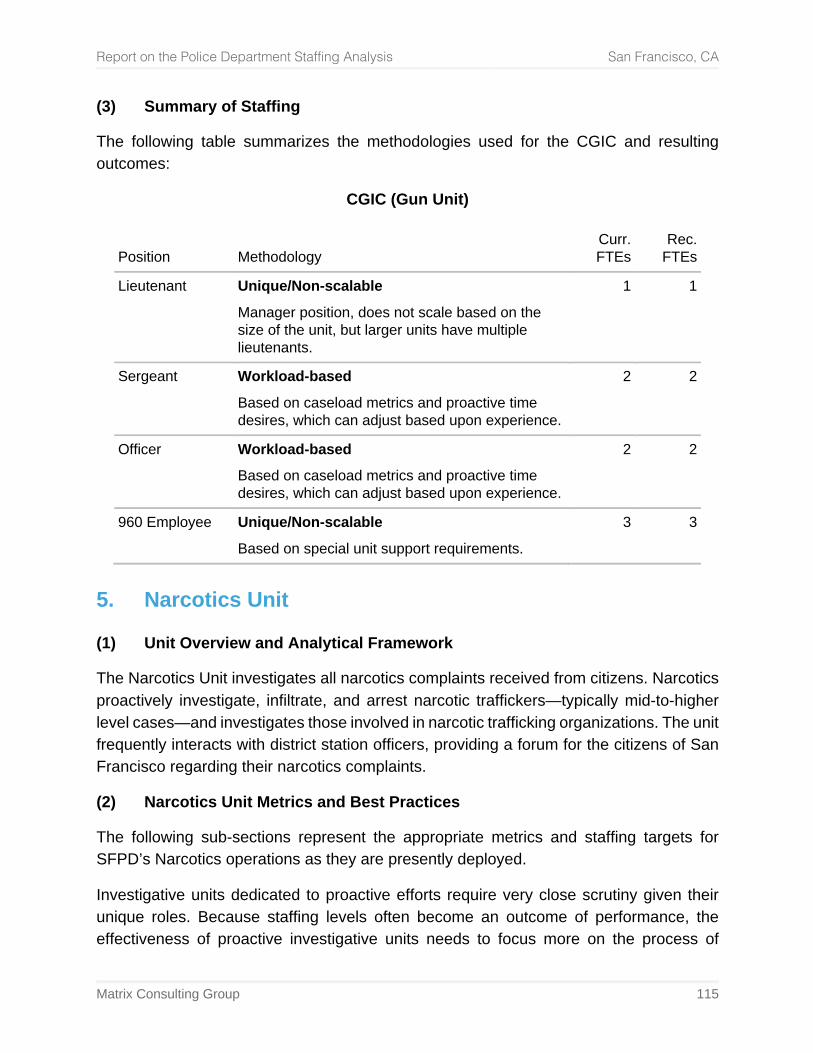
Report on the Police Department Staffing Analysis San Francisco, CA
Matrix Consulting Group 115
(3) Summary of Staffing
The following table summarizes the methodologies used for the CGIC and resulting outcomes:
CGIC (Gun Unit)
Position Methodology Curr.
FTEs Rec.
FTEs
Lieutenant Unique/Non-scalable
Manager position, does not scale based on the size of the unit, but larger units have multiple lieutenants.
1 1
Sergeant Workload-based
Based on caseload metrics and proactive time desires, which can adjust based upon experience.
2 2
Officer Workload-based
Based on caseload metrics and proactive time desires, which can adjust based upon experience.
2 2
960 Employee Unique/Non-scalable
Based on special unit support requirements. 3 3
5. Narcotics Unit
(1) Unit Overview and Analytical Framework
The Narcotics Unit investigates all narcotics complaints received from citizens. Narcotics proactively investigate, infiltrate, and arrest narcotic traffickers—typically mid-to-higher level cases—and investigates those involved in narcotic trafficking organizations. The unit frequently interacts with district station officers, providing a forum for the citizens of San Francisco regarding their narcotics complaints.
(2) Narcotics Unit Metrics and Best Practices
The following sub-sections represent the appropriate metrics and staffing targets for SFPD’s Narcotics operations as they are presently deployed.
Investigative units dedicated to proactive efforts require very close scrutiny given their unique roles. Because staffing levels often become an outcome of performance, the effectiveness of proactive investigative units needs to focus more on the process of
Report on the Police Department Staffing Analysis San Francisco, CA
Matrix Consulting Group 116
targeting problems in the community and making assigned staff accountable for results. In brief, proactive investigative units require close oversight given their unique roles and they must have established performance expectations and related metrics or Key Performance Indicators (KPI) that influences their workloads and ultimately staffing needs. Metrics, such as the following, are employed to determine the effectiveness of proactive operations in a Narcotics and other similar units.
Best Management Practices Performance Review for Narcotics Efforts
Performance Target
Reporting Criteria
Are decisions made at the appropriate level?
Major initiatives are documented and approved by the Lieutenants or Sergeants in a Tactical Action Plan format.
Clearly defined mission that focuses on both street level as well as large-scale interdiction.
Unit has been developed with specific missions; this information is noted in the respective Tactical Action Plans.
Internal systems and performance measures have been designed to provide for internal accountability.
The Unit provides quarterly performance reports relative to output metrics that foster accountability.
Internal systems provide for clear accountability and tracking of property/evidence.
In association with Property and Evidence, clear protocols are in place and reported upon.
Interaction with local, state, federal and international agencies is performed.
The Unit is involved in several cooperative efforts and task forces and output and outcome measures are reported upon.
The unit is located off-site from the main department. Secured and trackable/auditable storage on-site for narcotics, money, weapons, other contraband, is available for use in undercover work
Secured facilities are in place and periodically audited for security.
Asset seizure funds are regularly audited by an external entity.
Audit trails are in place to ensure the appropriate use of asset seizure funds.
(2.1) Administrative and Proactive Time
Proactive Units are generally dedicated 100% to administrative time, proactive time, and the proactive cases they develop. In the instance of the Narcotics Unit the following key efforts reflect proactive activities.
Report on the Police Department Staffing Analysis San Francisco, CA
Matrix Consulting Group 117
• Investigates mid-level narcotics operations, including asset forfeiture.
• Performs proactive, long-term investigative efforts conducted in teams.
• Some staff assigned on task forces to include homeland security, DEA at airport and DEA Main.
With most performance reporting in any law enforcement agency, proactive enforcement units often report on performance outputs that includes number of arrests, weapons and drugs confiscated, monies seized, warrants served, etc. It is difficult, however, to objectively link such outputs to performance outcomes—specifically the suppression of illegal narcotics activities within San Francisco. Special enforcement activities should be tied to mitigating “community harm” as a result of these enforcement efforts, and reporting tools utilized to attempt to measure this. The tracking, measuring and reporting of these KPIs should be part of the administrative efforts for this unit.
In instances where a proactive unit’s workload is significantly centered around reactive caseloads, staffing levels should be constructed as reflected by the analysis shown in the Gang Task Forces discussed previously.
However, because fully “proactive units” are often designed to dedicate 100% of their time to specialized field efforts and the supporting administrative time required, development of staffing requirements can be based on other approaches noted below. As a result, the staffing needs of this unit are not analyzed using a workload-based approach.
(2.2) Workload Metrics
Workload metrics noted above should be reported upon. These metrics however (e.g. amount of money seized) do not impact staffing needs in a numerical fashion. Rather, they represent the magnitude of success that should help inform staffing level requirements.
Because staffing levels in proactive units can flex tremendously, generally speaking they can be devised as a proportion of total investigative staff in a law enforcement agency.
(3) Staffing Analysis Methodology
Based on the aforementioned approach, the following table reflects the possible size of a Narcotics Unit based upon the total line investigative staffing in a law enforcement agency. The range our project team has discovered is typically between 3% and 7% of the investigative workforce is assigned to narcotics and/or a combined vice/narcotics unit.
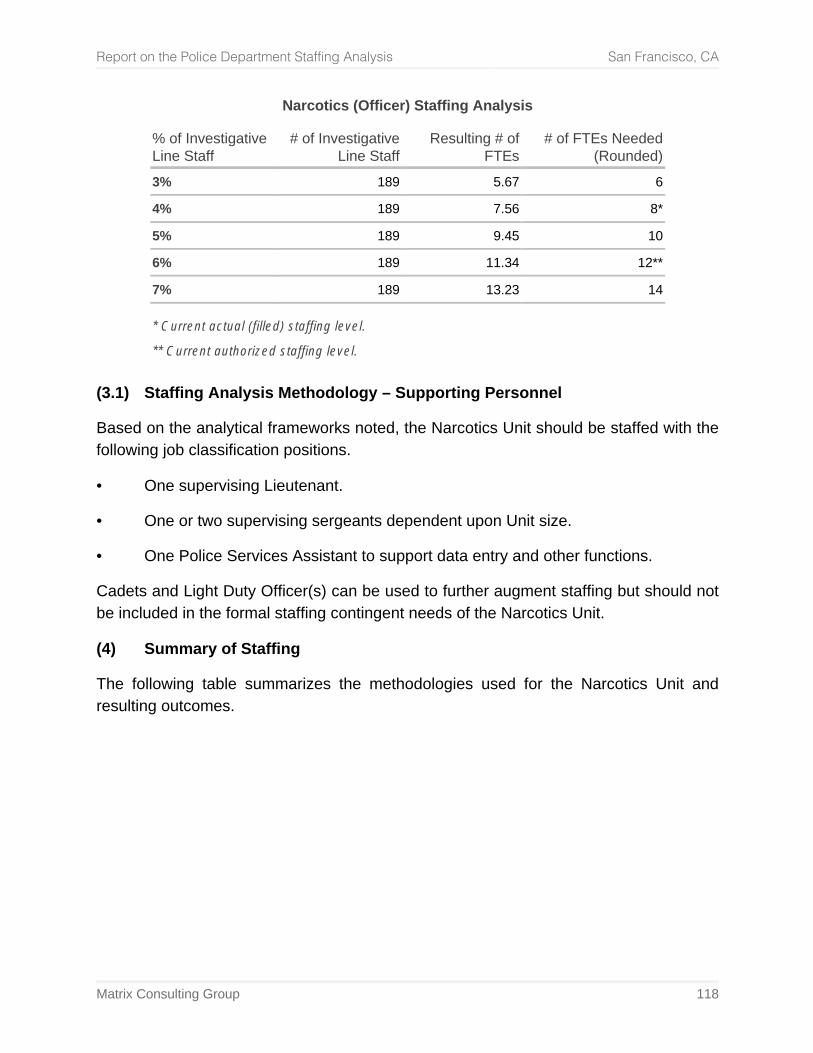
Report on the Police Department Staffing Analysis San Francisco, CA
Matrix Consulting Group 118
Narcotics (Officer) Staffing Analysis
% of Investigative Line Staff
# of Investigative Line Staff
Resulting # of FTEs
# of FTEs Needed (Rounded)
3% 189 5.67 6
4% 189 7.56 8*
5% 189 9.45 10
6% 189 11.34 12**
7% 189 13.23 14
* Current actual (filled) staffing level.
** Current authorized staffing level. (3.1) Staffing Analysis Methodology – Supporting Personnel
Based on the analytical frameworks noted, the Narcotics Unit should be staffed with the following job classification positions.
• One supervising Lieutenant.
• One or two supervising sergeants dependent upon Unit size.
• One Police Services Assistant to support data entry and other functions.
Cadets and Light Duty Officer(s) can be used to further augment staffing but should not be included in the formal staffing contingent needs of the Narcotics Unit.
(4) Summary of Staffing
The following table summarizes the methodologies used for the Narcotics Unit and resulting outcomes.
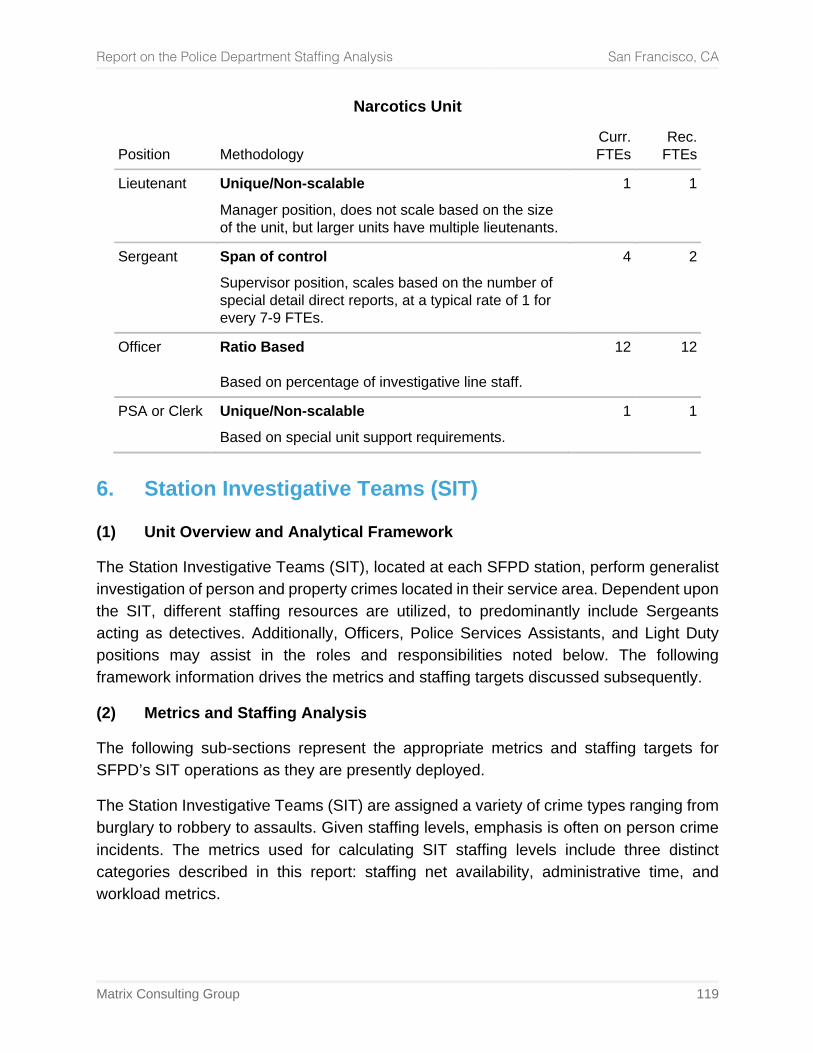
Report on the Police Department Staffing Analysis San Francisco, CA
Matrix Consulting Group 119
Narcotics Unit
Position Methodology Curr.
FTEs Rec.
FTEs
Lieutenant Unique/Non-scalable
Manager position, does not scale based on the size of the unit, but larger units have multiple lieutenants.
1 1
Sergeant Span of control
Supervisor position, scales based on the number of special detail direct reports, at a typical rate of 1 for every 7-9 FTEs.
4 2
Officer Ratio Based Based on percentage of investigative line staff.
12 12
PSA or Clerk Unique/Non-scalable
Based on special unit support requirements. 1 1
6. Station Investigative Teams (SIT)
(1) Unit Overview and Analytical Framework
The Station Investigative Teams (SIT), located at each SFPD station, perform generalist investigation of person and property crimes located in their service area. Dependent upon the SIT, different staffing resources are utilized, to predominantly include Sergeants acting as detectives. Additionally, Officers, Police Services Assistants, and Light Duty positions may assist in the roles and responsibilities noted below. The following framework information drives the metrics and staffing targets discussed subsequently.
(2) Metrics and Staffing Analysis
The following sub-sections represent the appropriate metrics and staffing targets for SFPD’s SIT operations as they are presently deployed.
The Station Investigative Teams (SIT) are assigned a variety of crime types ranging from burglary to robbery to assaults. Given staffing levels, emphasis is often on person crime incidents. The metrics used for calculating SIT staffing levels include three distinct categories described in this report: staffing net availability, administrative time, and workload metrics.
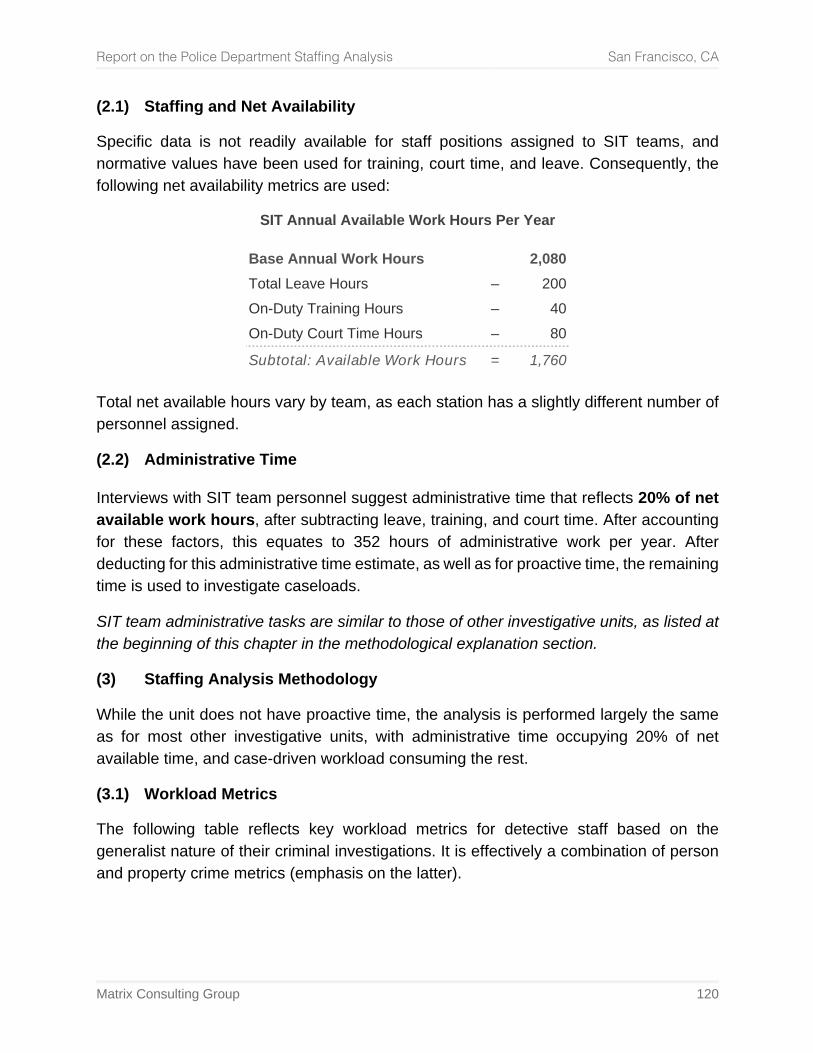
Report on the Police Department Staffing Analysis San Francisco, CA
Matrix Consulting Group 120
(2.1) Staffing and Net Availability
Specific data is not readily available for staff positions assigned to SIT teams, and normative values have been used for training, court time, and leave. Consequently, the following net availability metrics are used:
SIT Annual Available Work Hours Per Year
Base Annual Work Hours 2,080 Total Leave Hours – 200 On-Duty Training Hours – 40 On-Duty Court Time Hours – 80
Subtotal: Available Work Hours = 1,760 Total net available hours vary by team, as each station has a slightly different number of personnel assigned.
(2.2) Administrative Time Interviews with SIT team personnel suggest administrative time that reflects 20% of net available work hours, after subtracting leave, training, and court time. After accounting for these factors, this equates to 352 hours of administrative work per year. After deducting for this administrative time estimate, as well as for proactive time, the remaining time is used to investigate caseloads.
SIT team administrative tasks are similar to those of other investigative units, as listed at the beginning of this chapter in the methodological explanation section.
(3) Staffing Analysis Methodology
While the unit does not have proactive time, the analysis is performed largely the same as for most other investigative units, with administrative time occupying 20% of net available time, and case-driven workload consuming the rest.
(3.1) Workload Metrics
The following table reflects key workload metrics for detective staff based on the generalist nature of their criminal investigations. It is effectively a combination of person and property crime metrics (emphasis on the latter).
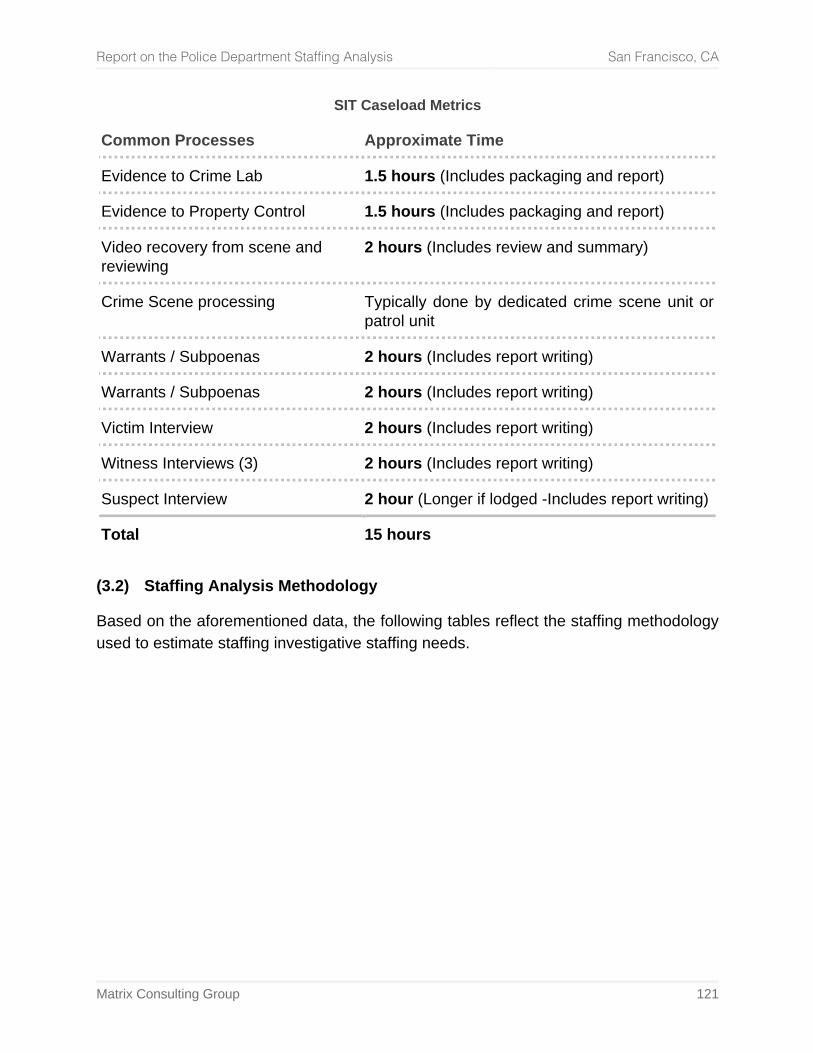
Report on the Police Department Staffing Analysis San Francisco, CA
Matrix Consulting Group 121
SIT Caseload Metrics
Common Processes Approximate Time
Evidence to Crime Lab 1.5 hours (Includes packaging and report)
Evidence to Property Control 1.5 hours (Includes packaging and report)
Video recovery from scene and reviewing
2 hours (Includes review and summary)
Crime Scene processing Typically done by dedicated crime scene unit or patrol unit
Warrants / Subpoenas 2 hours (Includes report writing)
Warrants / Subpoenas 2 hours (Includes report writing)
Victim Interview 2 hours (Includes report writing)
Witness Interviews (3) 2 hours (Includes report writing)
Suspect Interview 2 hour (Longer if lodged -Includes report writing)
Total
15 hours
(3.2) Staffing Analysis Methodology
Based on the aforementioned data, the following tables reflect the staffing methodology used to estimate staffing investigative staffing needs.
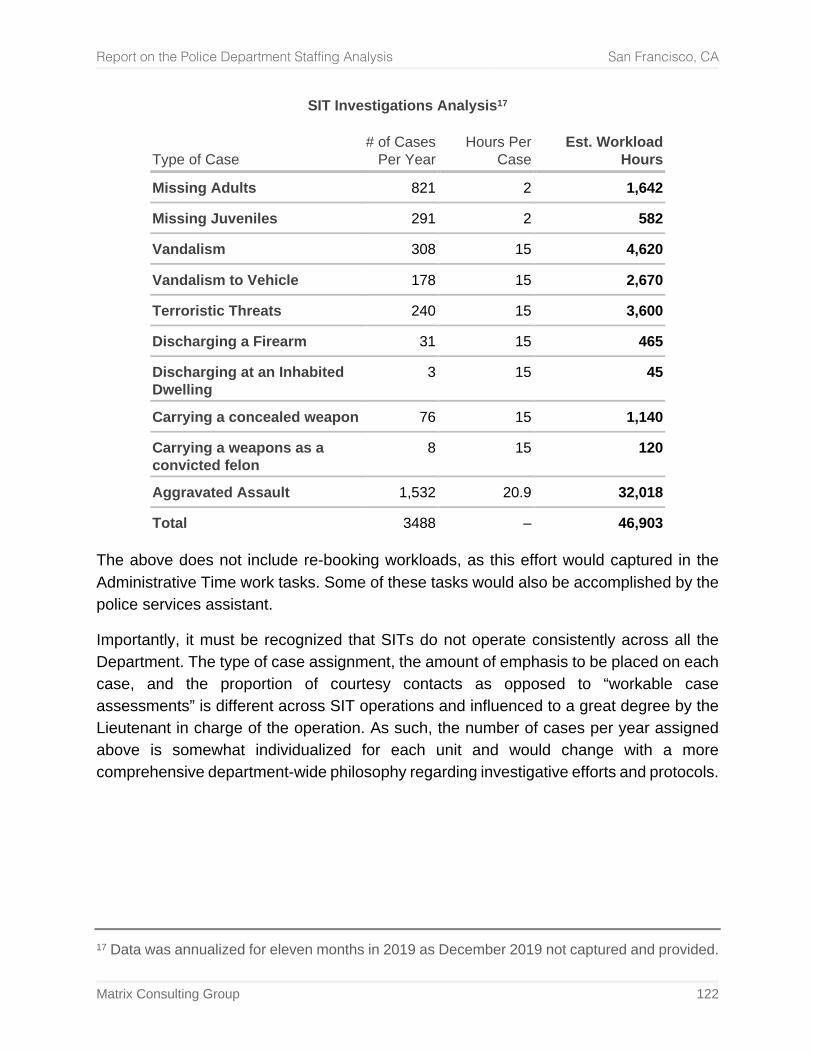
Report on the Police Department Staffing Analysis San Francisco, CA
Matrix Consulting Group 122
SIT Investigations Analysis17
Type of Case # of Cases
Per Year Hours Per
Case Est. Workload
Hours
Missing Adults 821 2 1,642
Missing Juveniles 291 2 582
Vandalism 308 15 4,620
Vandalism to Vehicle 178 15 2,670
Terroristic Threats 240 15 3,600
Discharging a Firearm 31 15 465
Discharging at an Inhabited Dwelling
3 15 45
Carrying a concealed weapon 76 15 1,140
Carrying a weapons as a convicted felon
8 15 120
Aggravated Assault 1,532 20.9 32,018
Total 3488 – 46,903 The above does not include re-booking workloads, as this effort would captured in the Administrative Time work tasks. Some of these tasks would also be accomplished by the police services assistant.
Importantly, it must be recognized that SITs do not operate consistently across all the Department. The type of case assignment, the amount of emphasis to be placed on each case, and the proportion of courtesy contacts as opposed to “workable case assessments” is different across SIT operations and influenced to a great degree by the Lieutenant in charge of the operation. As such, the number of cases per year assigned above is somewhat individualized for each unit and would change with a more comprehensive department-wide philosophy regarding investigative efforts and protocols.
17 Data was annualized for eleven months in 2019 as December 2019 not captured and provided.
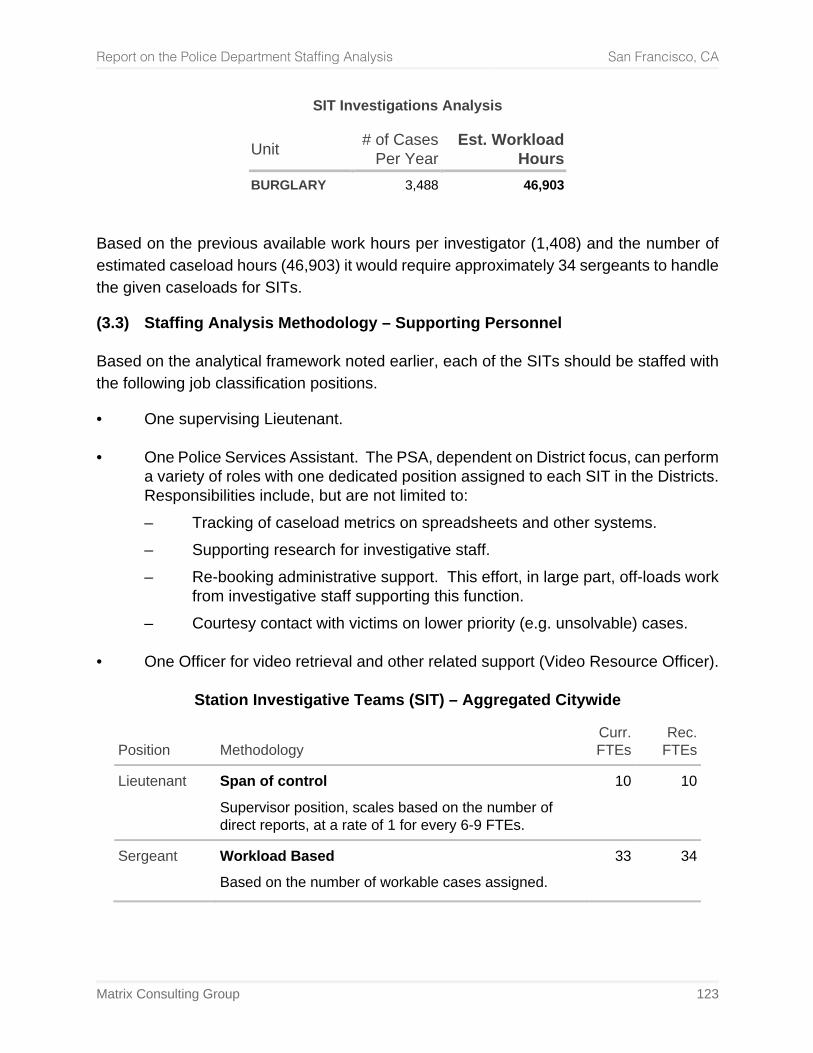
Report on the Police Department Staffing Analysis San Francisco, CA
Matrix Consulting Group 123
SIT Investigations Analysis
Unit # of Cases Per Year
Est. Workload Hours
BURGLARY 3,488 46,903
Based on the previous available work hours per investigator (1,408) and the number of estimated caseload hours (46,903) it would require approximately 34 sergeants to handle the given caseloads for SITs.
(3.3) Staffing Analysis Methodology – Supporting Personnel Based on the analytical framework noted earlier, each of the SITs should be staffed with the following job classification positions.
• One supervising Lieutenant. • One Police Services Assistant. The PSA, dependent on District focus, can perform
a variety of roles with one dedicated position assigned to each SIT in the Districts. Responsibilities include, but are not limited to: – Tracking of caseload metrics on spreadsheets and other systems. – Supporting research for investigative staff. – Re-booking administrative support. This effort, in large part, off-loads work
from investigative staff supporting this function. – Courtesy contact with victims on lower priority (e.g. unsolvable) cases.
• One Officer for video retrieval and other related support (Video Resource Officer).
Station Investigative Teams (SIT) – Aggregated Citywide
Position Methodology Curr.
FTEs Rec.
FTEs
Lieutenant Span of control
Supervisor position, scales based on the number of direct reports, at a rate of 1 for every 6-9 FTEs.
10 10
Sergeant Workload Based
Based on the number of workable cases assigned. 33 34
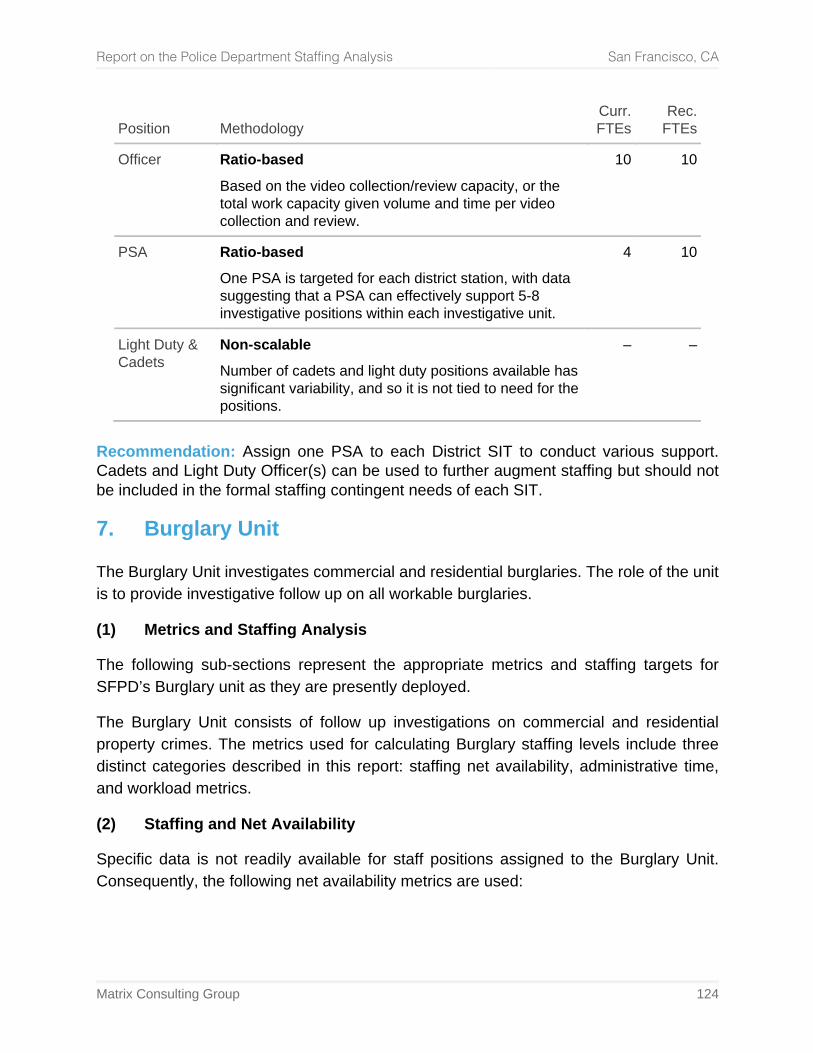
Report on the Police Department Staffing Analysis San Francisco, CA
Matrix Consulting Group 124
Position Methodology Curr.
FTEs Rec.
FTEs
Officer Ratio-based
Based on the video collection/review capacity, or the total work capacity given volume and time per video collection and review.
10 10
PSA Ratio-based
One PSA is targeted for each district station, with data suggesting that a PSA can effectively support 5-8 investigative positions within each investigative unit.
4 10
Light Duty & Cadets
Non-scalable
Number of cadets and light duty positions available has significant variability, and so it is not tied to need for the positions.
– –
Recommendation: Assign one PSA to each District SIT to conduct various support. Cadets and Light Duty Officer(s) can be used to further augment staffing but should not be included in the formal staffing contingent needs of each SIT.
7. Burglary Unit
The Burglary Unit investigates commercial and residential burglaries. The role of the unit is to provide investigative follow up on all workable burglaries.
(1) Metrics and Staffing Analysis
The following sub-sections represent the appropriate metrics and staffing targets for SFPD’s Burglary unit as they are presently deployed.
The Burglary Unit consists of follow up investigations on commercial and residential property crimes. The metrics used for calculating Burglary staffing levels include three distinct categories described in this report: staffing net availability, administrative time, and workload metrics.
(2) Staffing and Net Availability
Specific data is not readily available for staff positions assigned to the Burglary Unit. Consequently, the following net availability metrics are used:
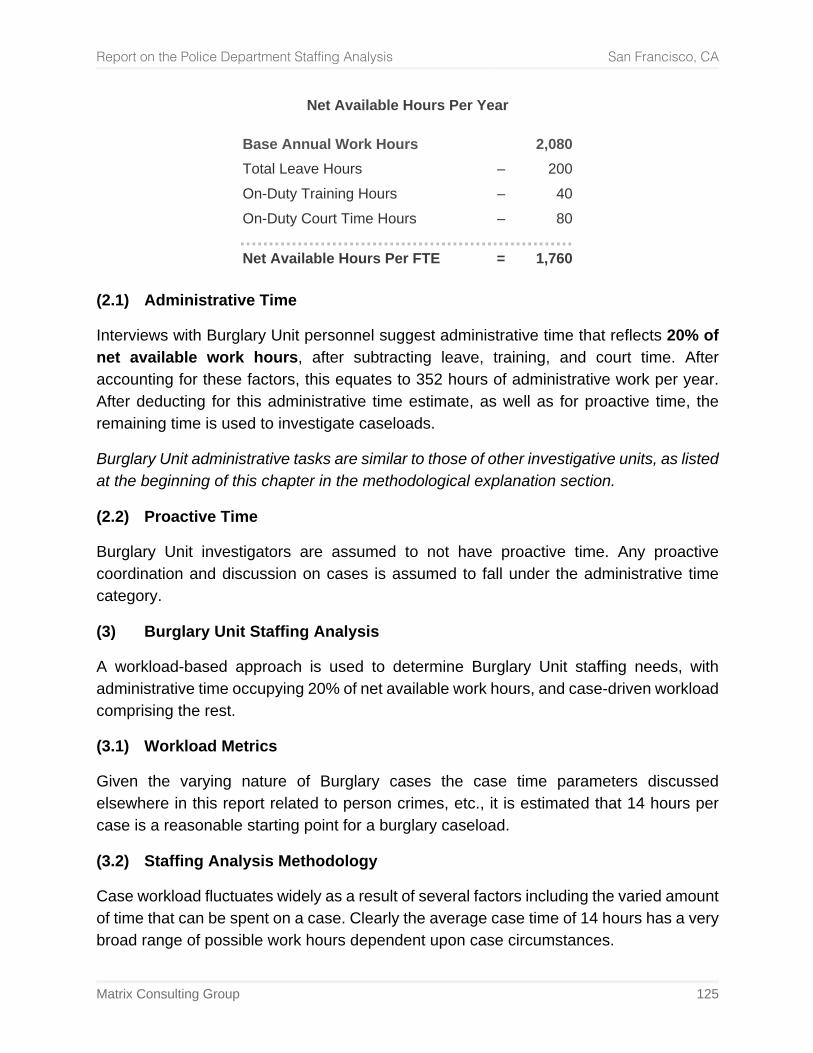
Report on the Police Department Staffing Analysis San Francisco, CA
Matrix Consulting Group 125
Net Available Hours Per Year
Base Annual Work Hours 2,080 Total Leave Hours – 200 On-Duty Training Hours – 40 On-Duty Court Time Hours – 80
Net Available Hours Per FTE = 1,760 (2.1) Administrative Time
Interviews with Burglary Unit personnel suggest administrative time that reflects 20% of net available work hours, after subtracting leave, training, and court time. After accounting for these factors, this equates to 352 hours of administrative work per year. After deducting for this administrative time estimate, as well as for proactive time, the remaining time is used to investigate caseloads.
Burglary Unit administrative tasks are similar to those of other investigative units, as listed at the beginning of this chapter in the methodological explanation section.
(2.2) Proactive Time
Burglary Unit investigators are assumed to not have proactive time. Any proactive coordination and discussion on cases is assumed to fall under the administrative time category.
(3) Burglary Unit Staffing Analysis
A workload-based approach is used to determine Burglary Unit staffing needs, with administrative time occupying 20% of net available work hours, and case-driven workload comprising the rest.
(3.1) Workload Metrics
Given the varying nature of Burglary cases the case time parameters discussed elsewhere in this report related to person crimes, etc., it is estimated that 14 hours per case is a reasonable starting point for a burglary caseload.
(3.2) Staffing Analysis Methodology
Case workload fluctuates widely as a result of several factors including the varied amount of time that can be spent on a case. Clearly the average case time of 14 hours has a very broad range of possible work hours dependent upon case circumstances.
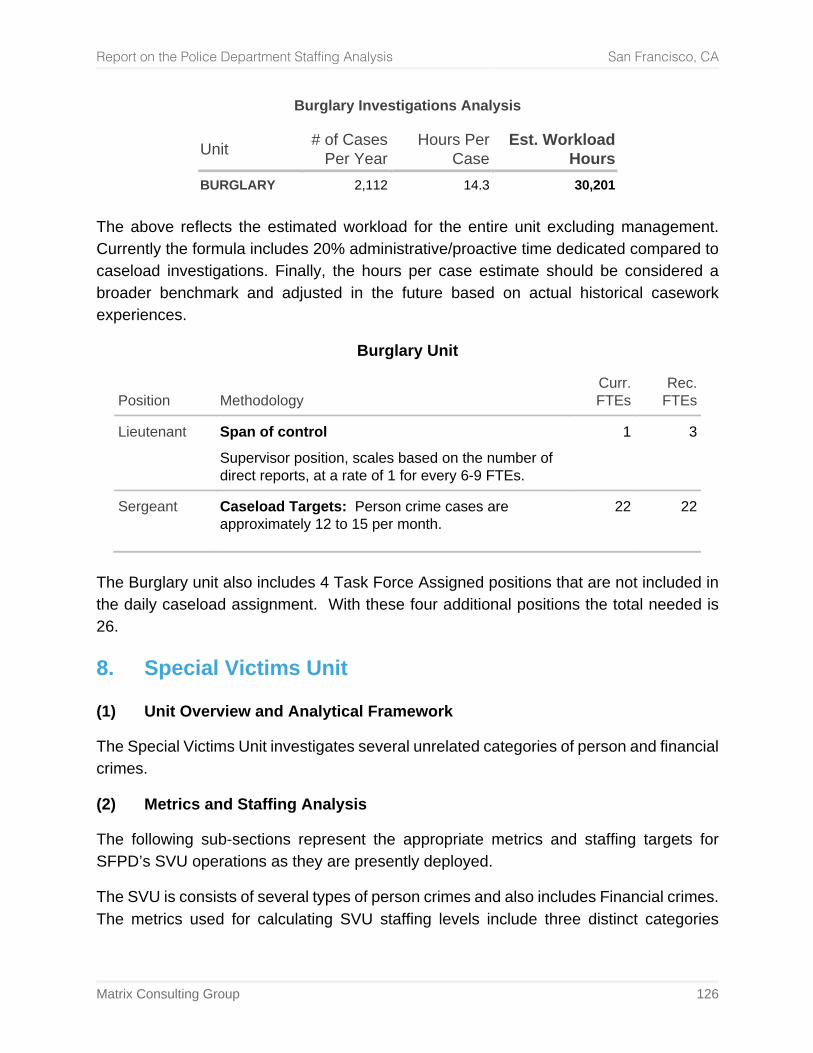
Report on the Police Department Staffing Analysis San Francisco, CA
Matrix Consulting Group 126
Burglary Investigations Analysis
Unit # of Cases Per Year
Hours Per Case
Est. Workload Hours
BURGLARY 2,112 14.3 30,201 The above reflects the estimated workload for the entire unit excluding management. Currently the formula includes 20% administrative/proactive time dedicated compared to caseload investigations. Finally, the hours per case estimate should be considered a broader benchmark and adjusted in the future based on actual historical casework experiences.
Burglary Unit
Position Methodology Curr.
FTEs Rec.
FTEs
Lieutenant Span of control
Supervisor position, scales based on the number of direct reports, at a rate of 1 for every 6-9 FTEs.
1 3
Sergeant Caseload Targets: Person crime cases are approximately 12 to 15 per month.
22 22
The Burglary unit also includes 4 Task Force Assigned positions that are not included in the daily caseload assignment. With these four additional positions the total needed is 26.
8. Special Victims Unit
(1) Unit Overview and Analytical Framework
The Special Victims Unit investigates several unrelated categories of person and financial crimes.
(2) Metrics and Staffing Analysis
The following sub-sections represent the appropriate metrics and staffing targets for SFPD’s SVU operations as they are presently deployed.
The SVU is consists of several types of person crimes and also includes Financial crimes. The metrics used for calculating SVU staffing levels include three distinct categories
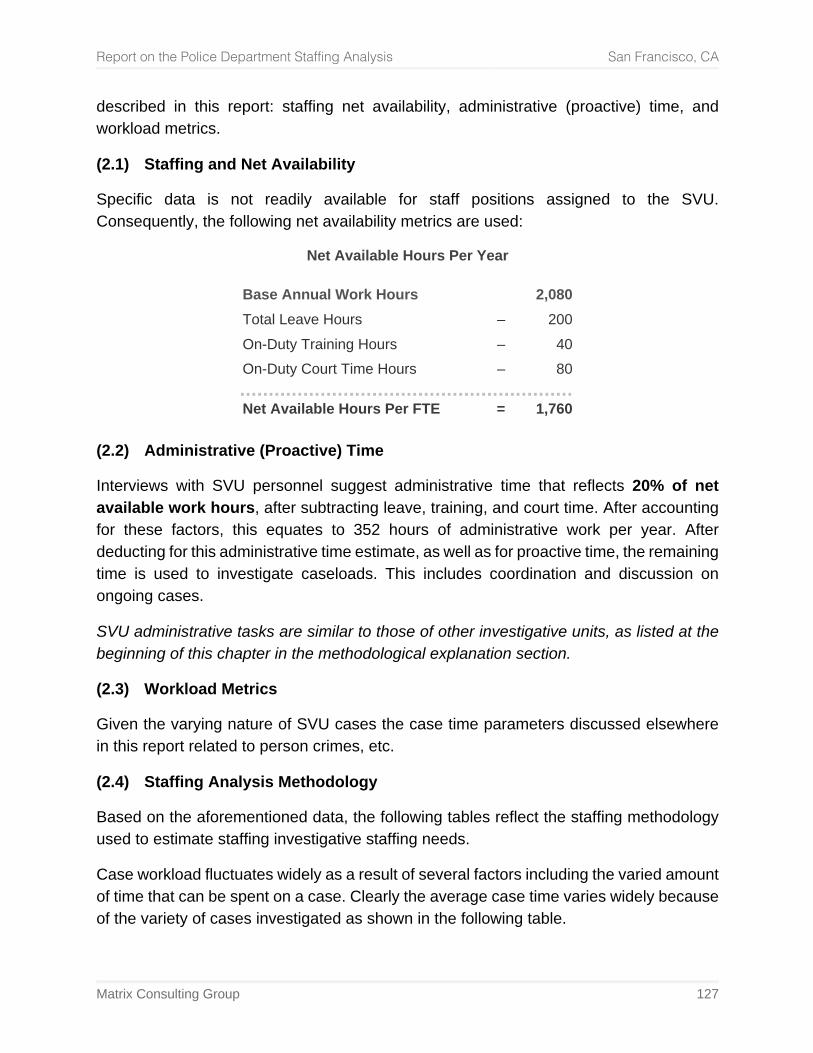
Report on the Police Department Staffing Analysis San Francisco, CA
Matrix Consulting Group 127
described in this report: staffing net availability, administrative (proactive) time, and workload metrics.
(2.1) Staffing and Net Availability
Specific data is not readily available for staff positions assigned to the SVU. Consequently, the following net availability metrics are used:
Net Available Hours Per Year
Base Annual Work Hours 2,080 Total Leave Hours – 200 On-Duty Training Hours – 40 On-Duty Court Time Hours – 80
Net Available Hours Per FTE = 1,760 (2.2) Administrative (Proactive) Time
Interviews with SVU personnel suggest administrative time that reflects 20% of net available work hours, after subtracting leave, training, and court time. After accounting for these factors, this equates to 352 hours of administrative work per year. After deducting for this administrative time estimate, as well as for proactive time, the remaining time is used to investigate caseloads. This includes coordination and discussion on ongoing cases.
SVU administrative tasks are similar to those of other investigative units, as listed at the beginning of this chapter in the methodological explanation section.
(2.3) Workload Metrics
Given the varying nature of SVU cases the case time parameters discussed elsewhere in this report related to person crimes, etc.
(2.4) Staffing Analysis Methodology
Based on the aforementioned data, the following tables reflect the staffing methodology used to estimate staffing investigative staffing needs.
Case workload fluctuates widely as a result of several factors including the varied amount of time that can be spent on a case. Clearly the average case time varies widely because of the variety of cases investigated as shown in the following table.
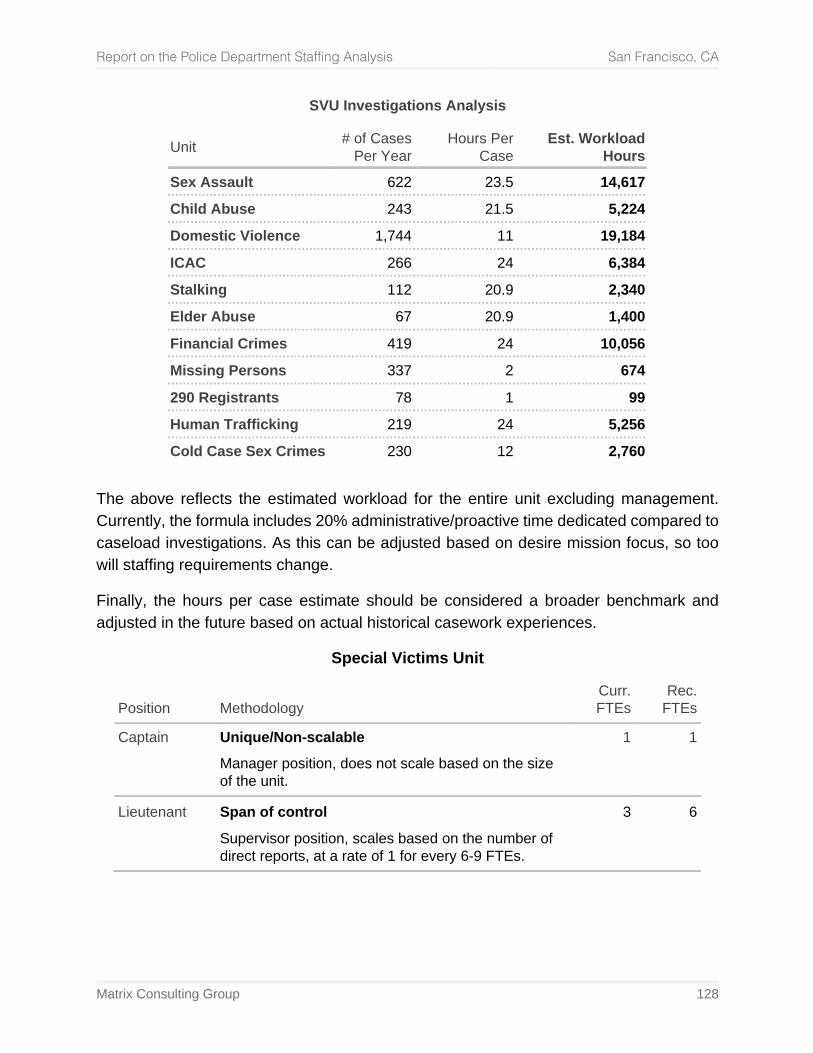
Report on the Police Department Staffing Analysis San Francisco, CA
Matrix Consulting Group 128
SVU Investigations Analysis
Unit # of Cases Per Year
Hours Per Case
Est. Workload Hours
Sex Assault 622 23.5 14,617
Child Abuse 243 21.5 5,224
Domestic Violence 1,744 11 19,184
ICAC 266 24 6,384
Stalking 112 20.9 2,340
Elder Abuse 67 20.9 1,400
Financial Crimes 419 24 10,056
Missing Persons 337 2 674
290 Registrants 78 1 99
Human Trafficking 219 24 5,256
Cold Case Sex Crimes 230 12 2,760
The above reflects the estimated workload for the entire unit excluding management. Currently, the formula includes 20% administrative/proactive time dedicated compared to caseload investigations. As this can be adjusted based on desire mission focus, so too will staffing requirements change.
Finally, the hours per case estimate should be considered a broader benchmark and adjusted in the future based on actual historical casework experiences.
Special Victims Unit
Position Methodology Curr.
FTEs Rec.
FTEs
Captain
Unique/Non-scalable
Manager position, does not scale based on the size of the unit.
1 1
Lieutenant Span of control
Supervisor position, scales based on the number of direct reports, at a rate of 1 for every 6-9 FTEs.
3 6
Report on the Police Department Staffing Analysis San Francisco, CA
Matrix Consulting Group 129
Position Methodology Curr.
FTEs Rec.
FTEs
Sergeant Workload-based
Staffing needs determined from caseloads. Person crime cases are approximately 6 to 8 per month. Includes increases to some units, and decreases to others as a result of the workload-based analysis. A full breakdown by unit and assignment is contained in the last chapter of this report.
46 41
Clerk Ratio-based
Data suggests that a Clerk can effectively support 5-9 investigative positions in each investigative unit.
4 4
The table above is based on the current assignments and does not include the recommended reassignment of Financial Crimes to general crimes.
9. Night Investigations
The role and mission of the Night Investigations Unit is to provide after-hours detective response to major crimes, typically person crimes. The unit can take a case completely or do the preliminary investigation required and then have a centralized detective unit complete the follow up. Night Investigations can also follow up on cases after hours or assist other units.
(2) Night Investigations Metrics and Staffing Analysis
The following sub-sections represent the appropriate metrics and staffing targets for SFPD’s Night Investigations Unit as they are presently deployed.
The metrics for Night Investigations apply to cases they retain. The metrics used for calculating CGIC staffing levels include three distinct categories described in this report: staffing net availability, administrative (proactive) time, and workload metrics.
(2.1) Staffing Net Availability
Specific data is not readily available for staff positions assigned to the Night Investigations. Consequently, the following net availability metrics are used:
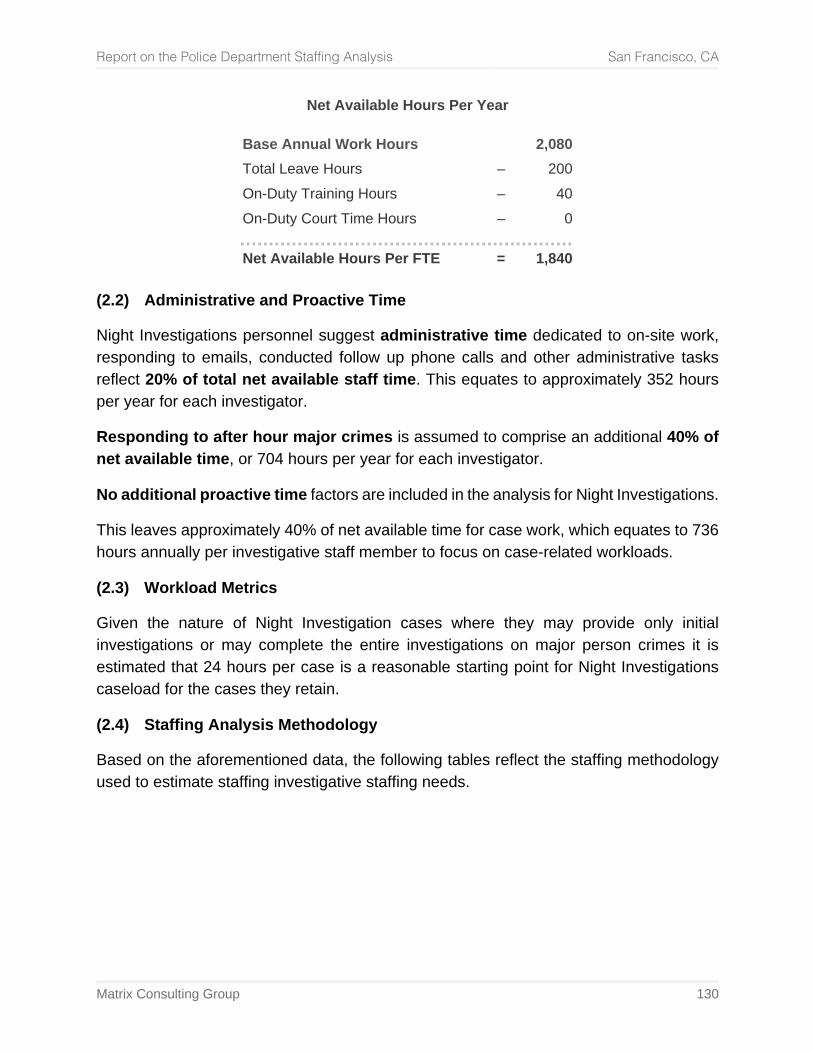
Report on the Police Department Staffing Analysis San Francisco, CA
Matrix Consulting Group 130
Net Available Hours Per Year
Base Annual Work Hours 2,080 Total Leave Hours – 200 On-Duty Training Hours – 40 On-Duty Court Time Hours – 0
Net Available Hours Per FTE = 1,840 (2.2) Administrative and Proactive Time
Night Investigations personnel suggest administrative time dedicated to on-site work, responding to emails, conducted follow up phone calls and other administrative tasks reflect 20% of total net available staff time. This equates to approximately 352 hours per year for each investigator.
Responding to after hour major crimes is assumed to comprise an additional 40% of net available time, or 704 hours per year for each investigator.
No additional proactive time factors are included in the analysis for Night Investigations.
This leaves approximately 40% of net available time for case work, which equates to 736 hours annually per investigative staff member to focus on case-related workloads.
(2.3) Workload Metrics
Given the nature of Night Investigation cases where they may provide only initial investigations or may complete the entire investigations on major person crimes it is estimated that 24 hours per case is a reasonable starting point for Night Investigations caseload for the cases they retain.
(2.4) Staffing Analysis Methodology
Based on the aforementioned data, the following tables reflect the staffing methodology used to estimate staffing investigative staffing needs.
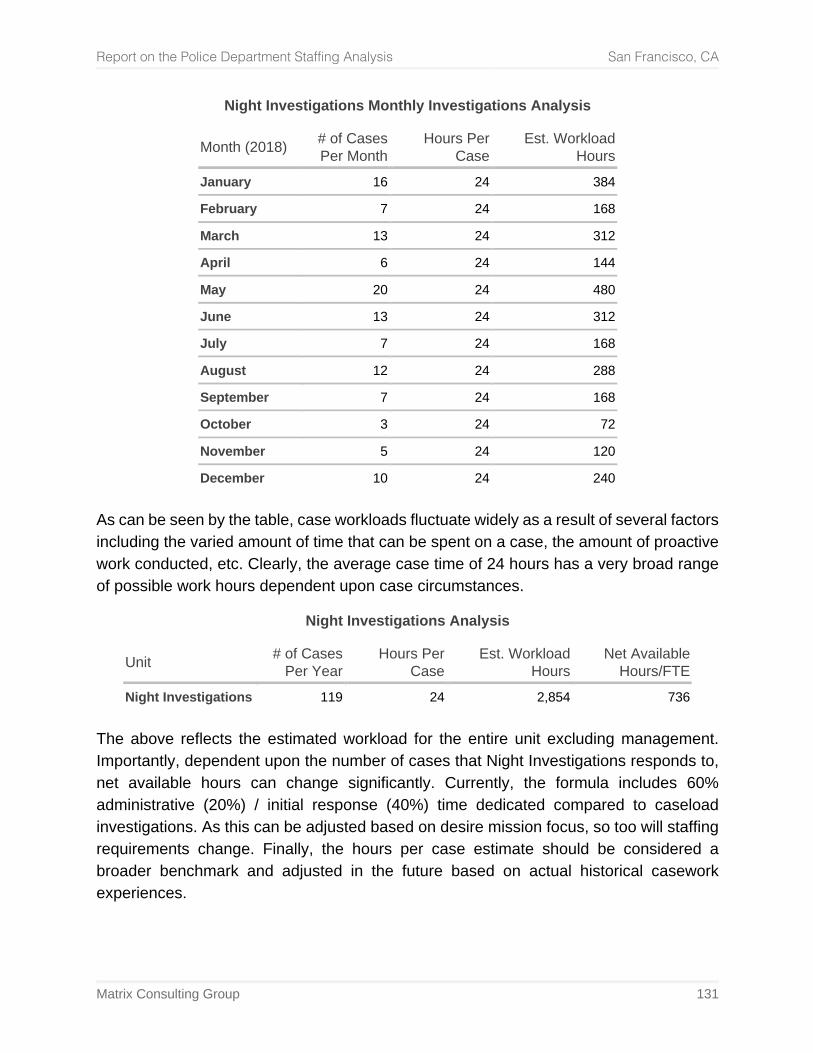
Report on the Police Department Staffing Analysis San Francisco, CA
Matrix Consulting Group 131
Night Investigations Monthly Investigations Analysis
Month (2018) # of Cases Per Month
Hours Per Case
Est. Workload Hours
January 16 24 384
February 7 24 168
March 13 24 312
April 6 24 144
May 20 24 480
June 13 24 312
July 7 24 168
August 12 24 288
September 7 24 168
October 3 24 72
November 5 24 120
December 10 24 240 As can be seen by the table, case workloads fluctuate widely as a result of several factors including the varied amount of time that can be spent on a case, the amount of proactive work conducted, etc. Clearly, the average case time of 24 hours has a very broad range of possible work hours dependent upon case circumstances.
Night Investigations Analysis
Unit # of Cases Per Year
Hours Per Case
Est. Workload Hours
Net Available Hours/FTE
Night Investigations 119 24 2,854 736 The above reflects the estimated workload for the entire unit excluding management. Importantly, dependent upon the number of cases that Night Investigations responds to, net available hours can change significantly. Currently, the formula includes 60% administrative (20%) / initial response (40%) time dedicated compared to caseload investigations. As this can be adjusted based on desire mission focus, so too will staffing requirements change. Finally, the hours per case estimate should be considered a broader benchmark and adjusted in the future based on actual historical casework experiences.
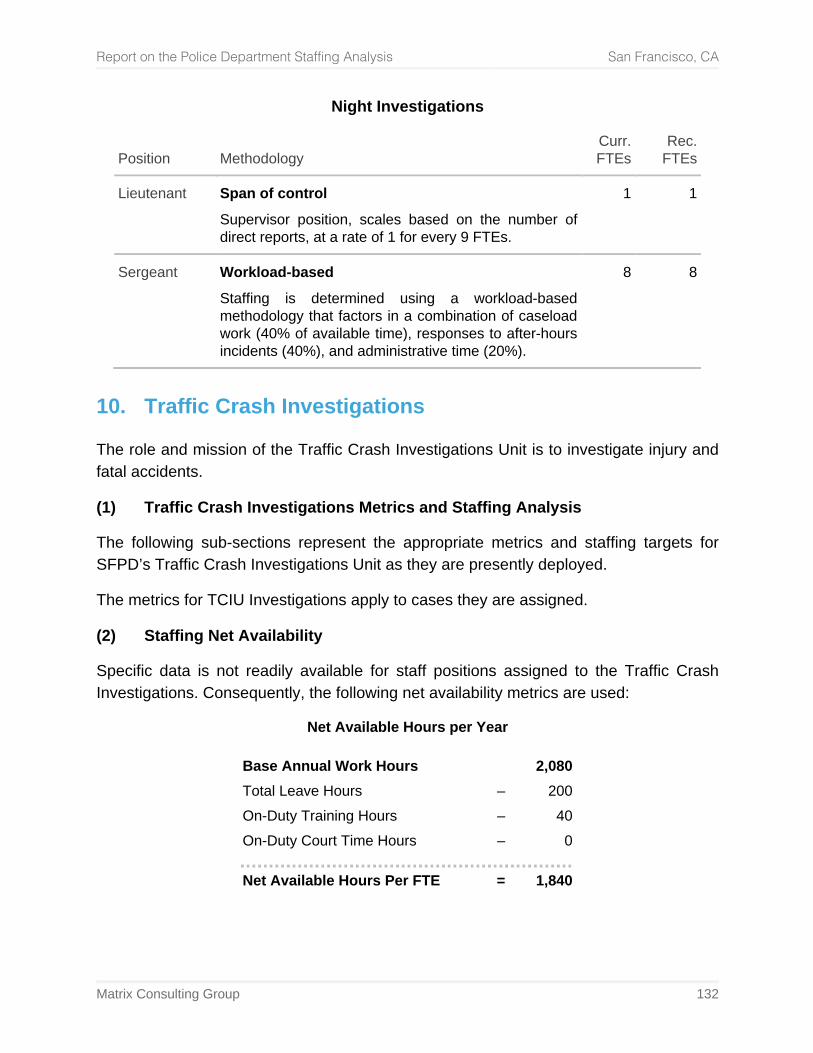
Report on the Police Department Staffing Analysis San Francisco, CA
Matrix Consulting Group 132
Night Investigations
Position Methodology Curr.
FTEs Rec.
FTEs
Lieutenant Span of control
Supervisor position, scales based on the number of direct reports, at a rate of 1 for every 9 FTEs.
1 1
Sergeant Workload-based
Staffing is determined using a workload-based methodology that factors in a combination of caseload work (40% of available time), responses to after-hours incidents (40%), and administrative time (20%).
8 8
10. Traffic Crash Investigations
The role and mission of the Traffic Crash Investigations Unit is to investigate injury and fatal accidents.
(1) Traffic Crash Investigations Metrics and Staffing Analysis
The following sub-sections represent the appropriate metrics and staffing targets for SFPD’s Traffic Crash Investigations Unit as they are presently deployed.
The metrics for TCIU Investigations apply to cases they are assigned.
(2) Staffing Net Availability
Specific data is not readily available for staff positions assigned to the Traffic Crash Investigations. Consequently, the following net availability metrics are used:
Net Available Hours per Year
Base Annual Work Hours 2,080 Total Leave Hours – 200 On-Duty Training Hours – 40 On-Duty Court Time Hours – 0
Net Available Hours Per FTE = 1,840
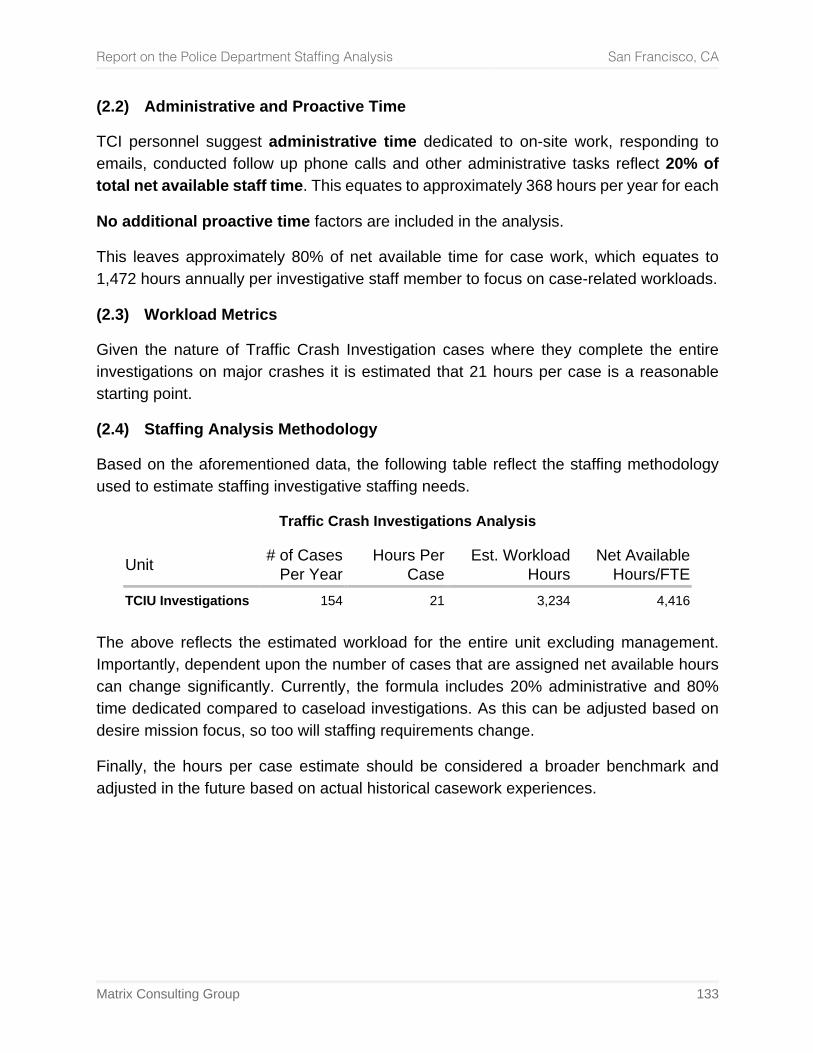
Report on the Police Department Staffing Analysis San Francisco, CA
Matrix Consulting Group 133
(2.2) Administrative and Proactive Time
TCI personnel suggest administrative time dedicated to on-site work, responding to emails, conducted follow up phone calls and other administrative tasks reflect 20% of total net available staff time. This equates to approximately 368 hours per year for each
No additional proactive time factors are included in the analysis.
This leaves approximately 80% of net available time for case work, which equates to 1,472 hours annually per investigative staff member to focus on case-related workloads.
(2.3) Workload Metrics
Given the nature of Traffic Crash Investigation cases where they complete the entire investigations on major crashes it is estimated that 21 hours per case is a reasonable starting point.
(2.4) Staffing Analysis Methodology
Based on the aforementioned data, the following table reflect the staffing methodology used to estimate staffing investigative staffing needs.
Traffic Crash Investigations Analysis
Unit # of Cases Per Year
Hours Per Case
Est. Workload Hours
Net Available Hours/FTE
TCIU Investigations 154 21 3,234 4,416 The above reflects the estimated workload for the entire unit excluding management. Importantly, dependent upon the number of cases that are assigned net available hours can change significantly. Currently, the formula includes 20% administrative and 80% time dedicated compared to caseload investigations. As this can be adjusted based on desire mission focus, so too will staffing requirements change.
Finally, the hours per case estimate should be considered a broader benchmark and adjusted in the future based on actual historical casework experiences.
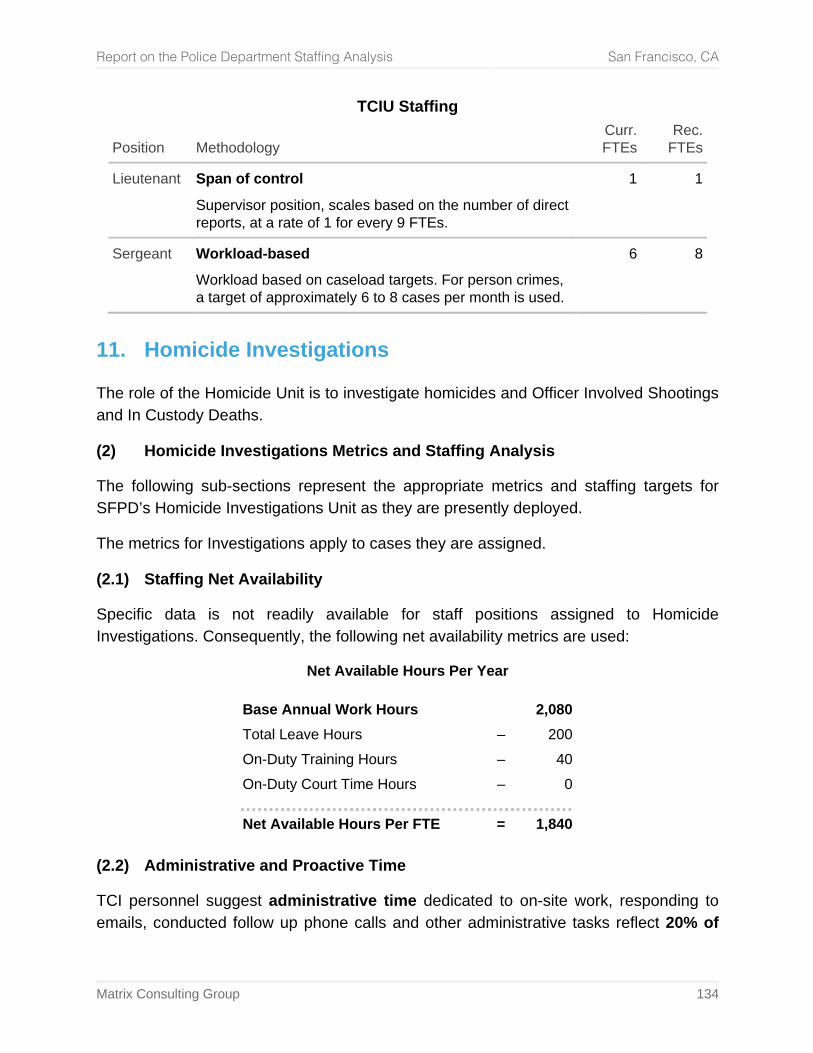
Report on the Police Department Staffing Analysis San Francisco, CA
Matrix Consulting Group 134
TCIU Staffing
Position Methodology Curr.
FTEs Rec.
FTEs
Lieutenant Span of control
Supervisor position, scales based on the number of direct reports, at a rate of 1 for every 9 FTEs.
1 1
Sergeant Workload-based
Workload based on caseload targets. For person crimes, a target of approximately 6 to 8 cases per month is used.
6 8
11. Homicide Investigations
The role of the Homicide Unit is to investigate homicides and Officer Involved Shootings and In Custody Deaths.
(2) Homicide Investigations Metrics and Staffing Analysis
The following sub-sections represent the appropriate metrics and staffing targets for SFPD’s Homicide Investigations Unit as they are presently deployed.
The metrics for Investigations apply to cases they are assigned.
(2.1) Staffing Net Availability
Specific data is not readily available for staff positions assigned to Homicide Investigations. Consequently, the following net availability metrics are used:
Net Available Hours Per Year
Base Annual Work Hours 2,080 Total Leave Hours – 200 On-Duty Training Hours – 40 On-Duty Court Time Hours – 0
Net Available Hours Per FTE = 1,840 (2.2) Administrative and Proactive Time
TCI personnel suggest administrative time dedicated to on-site work, responding to emails, conducted follow up phone calls and other administrative tasks reflect 20% of
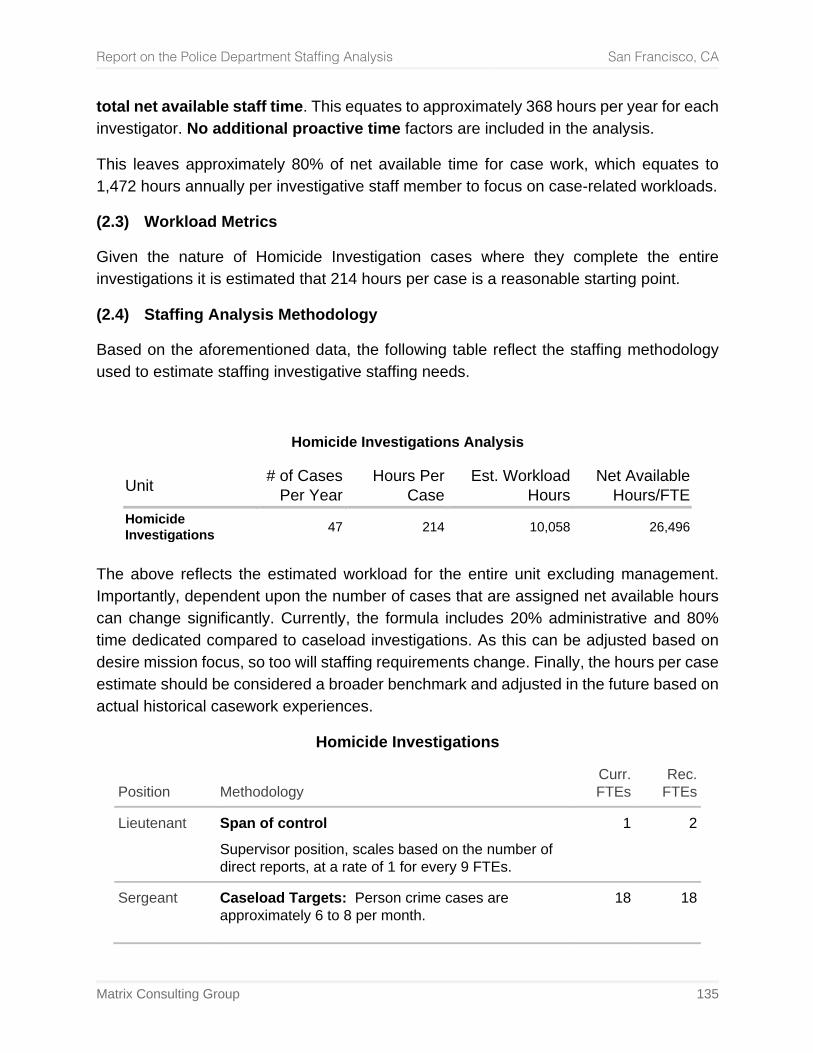
Report on the Police Department Staffing Analysis San Francisco, CA
Matrix Consulting Group 135
total net available staff time. This equates to approximately 368 hours per year for each investigator. No additional proactive time factors are included in the analysis.
This leaves approximately 80% of net available time for case work, which equates to 1,472 hours annually per investigative staff member to focus on case-related workloads.
(2.3) Workload Metrics
Given the nature of Homicide Investigation cases where they complete the entire investigations it is estimated that 214 hours per case is a reasonable starting point.
(2.4) Staffing Analysis Methodology
Based on the aforementioned data, the following table reflect the staffing methodology used to estimate staffing investigative staffing needs.
Homicide Investigations Analysis
Unit # of Cases Per Year
Hours Per Case
Est. Workload Hours
Net Available Hours/FTE
Homicide Investigations 47 214 10,058 26,496
The above reflects the estimated workload for the entire unit excluding management. Importantly, dependent upon the number of cases that are assigned net available hours can change significantly. Currently, the formula includes 20% administrative and 80% time dedicated compared to caseload investigations. As this can be adjusted based on desire mission focus, so too will staffing requirements change. Finally, the hours per case estimate should be considered a broader benchmark and adjusted in the future based on actual historical casework experiences.
Homicide Investigations
Position Methodology Curr.
FTEs Rec.
FTEs
Lieutenant Span of control
Supervisor position, scales based on the number of direct reports, at a rate of 1 for every 9 FTEs.
1 2
Sergeant Caseload Targets: Person crime cases are approximately 6 to 8 per month.
18 18
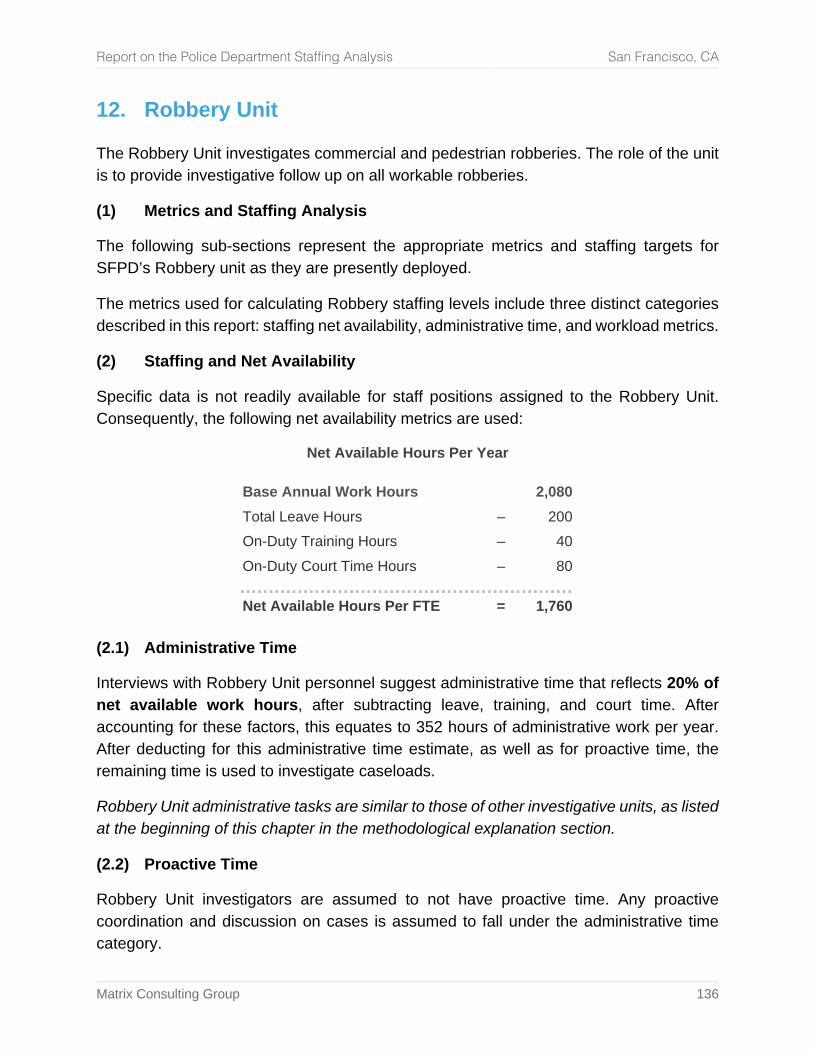
Report on the Police Department Staffing Analysis San Francisco, CA
Matrix Consulting Group 136
12. Robbery Unit
The Robbery Unit investigates commercial and pedestrian robberies. The role of the unit is to provide investigative follow up on all workable robberies.
(1) Metrics and Staffing Analysis
The following sub-sections represent the appropriate metrics and staffing targets for SFPD’s Robbery unit as they are presently deployed.
The metrics used for calculating Robbery staffing levels include three distinct categories described in this report: staffing net availability, administrative time, and workload metrics.
(2) Staffing and Net Availability
Specific data is not readily available for staff positions assigned to the Robbery Unit. Consequently, the following net availability metrics are used:
Net Available Hours Per Year
Base Annual Work Hours 2,080 Total Leave Hours – 200 On-Duty Training Hours – 40 On-Duty Court Time Hours – 80
Net Available Hours Per FTE = 1,760 (2.1) Administrative Time
Interviews with Robbery Unit personnel suggest administrative time that reflects 20% of net available work hours, after subtracting leave, training, and court time. After accounting for these factors, this equates to 352 hours of administrative work per year. After deducting for this administrative time estimate, as well as for proactive time, the remaining time is used to investigate caseloads.
Robbery Unit administrative tasks are similar to those of other investigative units, as listed at the beginning of this chapter in the methodological explanation section.
(2.2) Proactive Time
Robbery Unit investigators are assumed to not have proactive time. Any proactive coordination and discussion on cases is assumed to fall under the administrative time category.
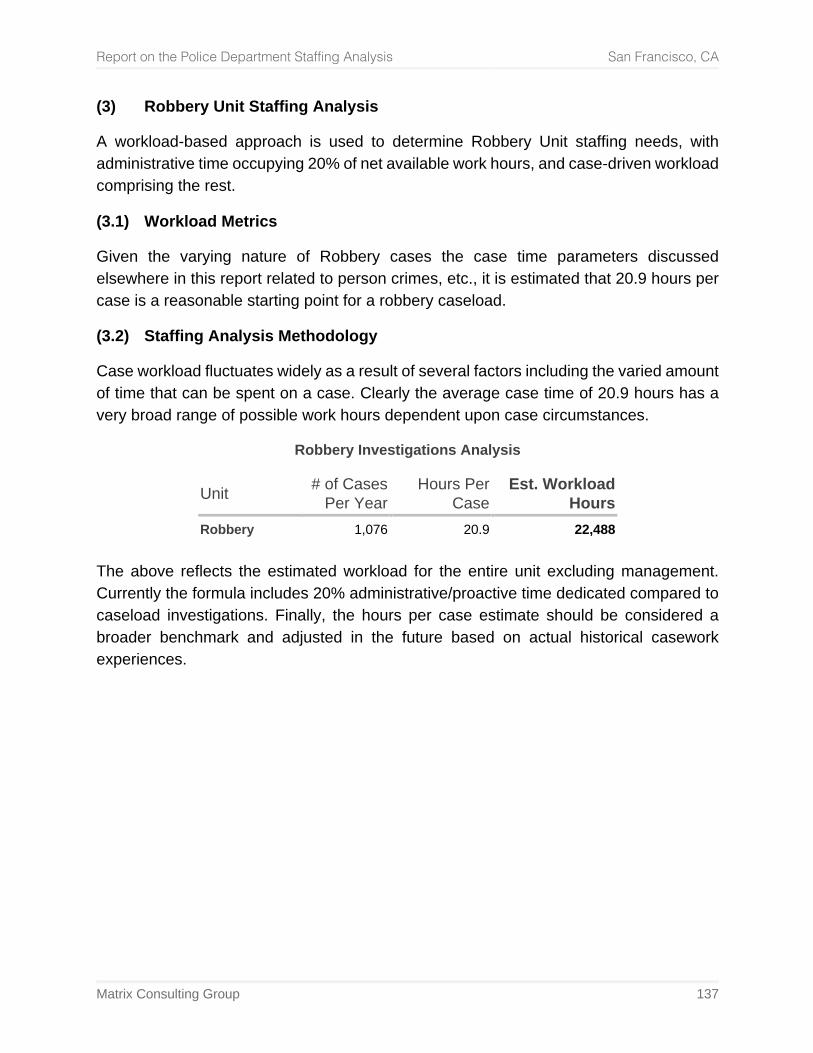
Report on the Police Department Staffing Analysis San Francisco, CA
Matrix Consulting Group 137
(3) Robbery Unit Staffing Analysis
A workload-based approach is used to determine Robbery Unit staffing needs, with administrative time occupying 20% of net available work hours, and case-driven workload comprising the rest.
(3.1) Workload Metrics
Given the varying nature of Robbery cases the case time parameters discussed elsewhere in this report related to person crimes, etc., it is estimated that 20.9 hours per case is a reasonable starting point for a robbery caseload.
(3.2) Staffing Analysis Methodology
Case workload fluctuates widely as a result of several factors including the varied amount of time that can be spent on a case. Clearly the average case time of 20.9 hours has a very broad range of possible work hours dependent upon case circumstances.
Robbery Investigations Analysis
Unit # of Cases Per Year
Hours Per Case
Est. Workload Hours
Robbery 1,076 20.9 22,488 The above reflects the estimated workload for the entire unit excluding management. Currently the formula includes 20% administrative/proactive time dedicated compared to caseload investigations. Finally, the hours per case estimate should be considered a broader benchmark and adjusted in the future based on actual historical casework experiences.
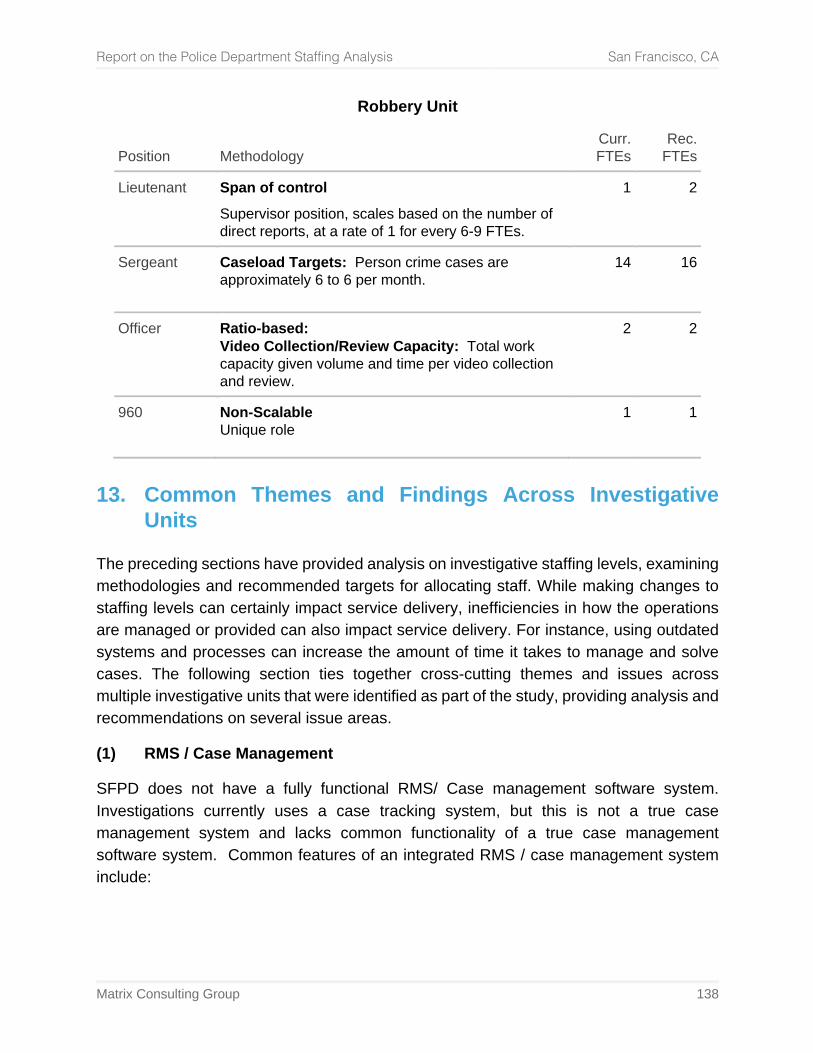
Report on the Police Department Staffing Analysis San Francisco, CA
Matrix Consulting Group 138
Robbery Unit
Position Methodology Curr.
FTEs Rec.
FTEs
Lieutenant Span of control
Supervisor position, scales based on the number of direct reports, at a rate of 1 for every 6-9 FTEs.
1 2
Sergeant Caseload Targets: Person crime cases are approximately 6 to 6 per month.
14 16
Officer Ratio-based: Video Collection/Review Capacity: Total work capacity given volume and time per video collection and review.
2 2
960 Non-Scalable Unique role
1 1
13. Common Themes and Findings Across Investigative Units
The preceding sections have provided analysis on investigative staffing levels, examining methodologies and recommended targets for allocating staff. While making changes to staffing levels can certainly impact service delivery, inefficiencies in how the operations are managed or provided can also impact service delivery. For instance, using outdated systems and processes can increase the amount of time it takes to manage and solve cases. The following section ties together cross-cutting themes and issues across multiple investigative units that were identified as part of the study, providing analysis and recommendations on several issue areas.
(1) RMS / Case Management
SFPD does not have a fully functional RMS/ Case management software system. Investigations currently uses a case tracking system, but this is not a true case management system and lacks common functionality of a true case management software system. Common features of an integrated RMS / case management system include:
Report on the Police Department Staffing Analysis San Francisco, CA
Matrix Consulting Group 139
• The ability of patrol officers / sergeants to flag reports for distribution to the correct investigative unit e.g. all robberies cases could be automatically sent to the robbery unit once approved by the patrol sergeant / records unit.
• Cases can be electronically assigned by the unit supervisor which creates an exact
chain of assignment with date and time and any notes the supervisor wishes to include.
• Cases could be electronically re-assigned if they went to the wrong unit or a
decision was made by an investigative supervisor that a different unit should investigate e.g. case is flagged assault, but is really a robbery. An assault unit supervisor could re-assign the case to the robbery que. SFPD currently uses a “green” sheet paper transfer process which can slow down the transfer and the investigation.
• Case assignment can be seen by others. Currently a patrol officer or supervisor
has to call or email investigative units to find out who is assigned a case. With an effective case management system officers can easily find out who has been assigned a case or whether a case has been assigned. This can be helpful if a victim or witness contacts the officer with additional information or wants to know who is assigned the case. This is also helpful if the officer developed additional information has writes a follow up report. With effective case tracking the assigned detective will be notified of the follow up report as well.
• The ability to monitor investigative caseloads, case time frames, case closure
rates, open cases and total assigned cases in real time. Under the current system all these have to be done by hand calculation.
There are many other features and benefits of an effective case management system.
Recommendation: Acquire an effective case management system that is integrated with RMS. (2) Investigative Unit Scope and Delineation of Responsibilities
There are some units that are overly broad in their scope of what they will investigate. In the Special Victims Unit there are some investigators assigned to “the PIT” and are assigned Domestic Violence, Sex Assault and Child Abuse cases like a small agency would, not as specialists. This is not the prevailing practice for larger agencies as each of these cases rely on different processes and many times even different prosecution standards. Child sex abuse requires a forensic interview/ exam and sometimes rape kit (forensic comb and swab, etc.). This is processed much different than a domestic assault. It should be noted that some of the crimes have advocacy groups (Domestic Violence, Sexual Assault, Hate Crimes, and Child Abuse).
Report on the Police Department Staffing Analysis San Francisco, CA
Matrix Consulting Group 140
There is also a perception that assignment to “the PIT” is somewhat unfavorable, and that personnel will try to rotate out of the unit when they can, leading to PIT comprising a higher proportion of newer investigators than other units at the same rank. This is particularly an issue given the types of crimes that “the PIT” investigates, many of which require advanced skillsets to be developed and benefit from having significant experience. Typically, in comparably sized departments, the investigators working on cases such as child abuse and sex crimes have some of the more experienced detectives assigned to the unit. This lends itself to career development through attending outside training programs in the investigative specialty.
It is preferred to have specialists investigate these case types for a number of reasons, most importantly because they become expert on a specific type of case. As specialists, they can develop a better knowledge of procedural aspects of the case, develop relationships with prosecutors if they are assigned by specialty. They also may become more efficient at investigating specific types of cases because of having more experience doing them. Last and perhaps most importantly, investigators may have a particular aptitudes for certain types of cases and therefore can be more invested in the case from an investigative standpoint. Given these considerations, the investigators in “the PIT” section of SVU should be assigned specific types of cases. SVU should be broken into sections that have common investigative processes and victims:
• Sex Crimes: – ICAC – Cold Case (Sex Assault) – Sex Assault – Child Sex Abuse – 290 unit – Human Trafficking
• Family Crimes:
– Domestic Violence – Elder Abuse (non-financial) – Child Abuse / Neglect (non-sexual) – Stalking (including non-domestic) – Missing persons
Other cases outside of these areas should be sent to existing or newly created units, including:
Report on the Police Department Staffing Analysis San Francisco, CA
Matrix Consulting Group 141
• Financial Crimes (new standalone unit):
– Fraud (from PIT) – Elder Financial Crimes – Identity Theft
• SITs:
– Assaults – Thefts. – Vandalism
Recommendation: Reorganize the Special Victims Unit by splitting creating new specialized investigative units and reallocating certain case types to existing investigative units. 3. Spans of Control
There are large spans on control in some units with one lieutenant supervising 18 detectives (sergeants). Large spans of control limit supervisory control and influence. This can impact operational efficiency and effective case management and oversight. Some units have delegated case management to a detective (sergeant) because of large units and the need to keep case assignments evenly dispersed.
Recommendation: Within investigative units, limit spans of control from 6 to 9 direct reports per supervisor.
14. Forensic Services Division
1. Workload Methodology The following sections provides a detailed breakdown of the calculated time needed to perform certain functions or to provide investigative assistance. After this analysis, staffing calculations are provided for each unit within the Forensic Services Division individually.
(1) Introduction In order to provide benchmarks of unit workload, the project team uses performance measures to estimate the number of possesses that can be effectively performed by the typical criminalist in a month. These workloads are derived from a combination of studies
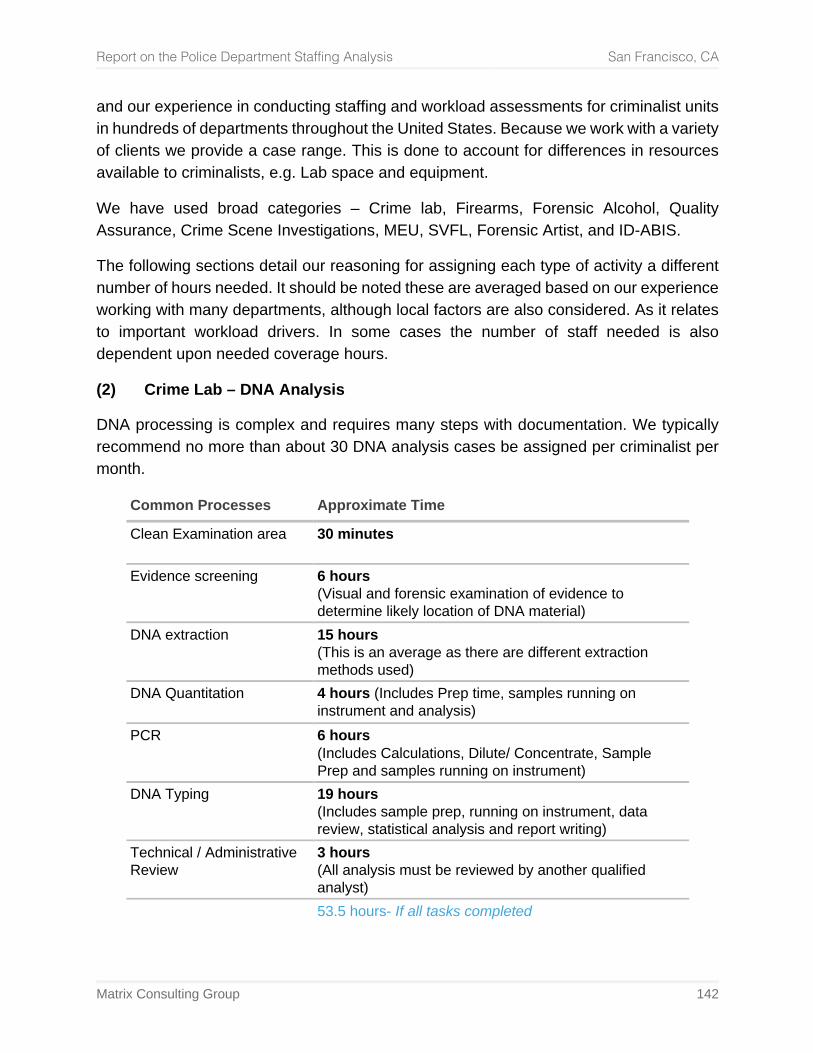
Report on the Police Department Staffing Analysis San Francisco, CA
Matrix Consulting Group 142
and our experience in conducting staffing and workload assessments for criminalist units in hundreds of departments throughout the United States. Because we work with a variety of clients we provide a case range. This is done to account for differences in resources available to criminalists, e.g. Lab space and equipment.
We have used broad categories – Crime lab, Firearms, Forensic Alcohol, Quality Assurance, Crime Scene Investigations, MEU, SVFL, Forensic Artist, and ID-ABIS.
The following sections detail our reasoning for assigning each type of activity a different number of hours needed. It should be noted these are averaged based on our experience working with many departments, although local factors are also considered. As it relates to important workload drivers. In some cases the number of staff needed is also dependent upon needed coverage hours.
(2) Crime Lab – DNA Analysis
DNA processing is complex and requires many steps with documentation. We typically recommend no more than about 30 DNA analysis cases be assigned per criminalist per month.
Common Processes Approximate Time
Clean Examination area 30 minutes
Evidence screening 6 hours (Visual and forensic examination of evidence to determine likely location of DNA material)
DNA extraction 15 hours (This is an average as there are different extraction methods used)
DNA Quantitation 4 hours (Includes Prep time, samples running on instrument and analysis)
PCR 6 hours (Includes Calculations, Dilute/ Concentrate, Sample Prep and samples running on instrument)
DNA Typing 19 hours (Includes sample prep, running on instrument, data review, statistical analysis and report writing)
Technical / Administrative Review
3 hours (All analysis must be reviewed by another qualified analyst)
53.5 hours- If all tasks completed
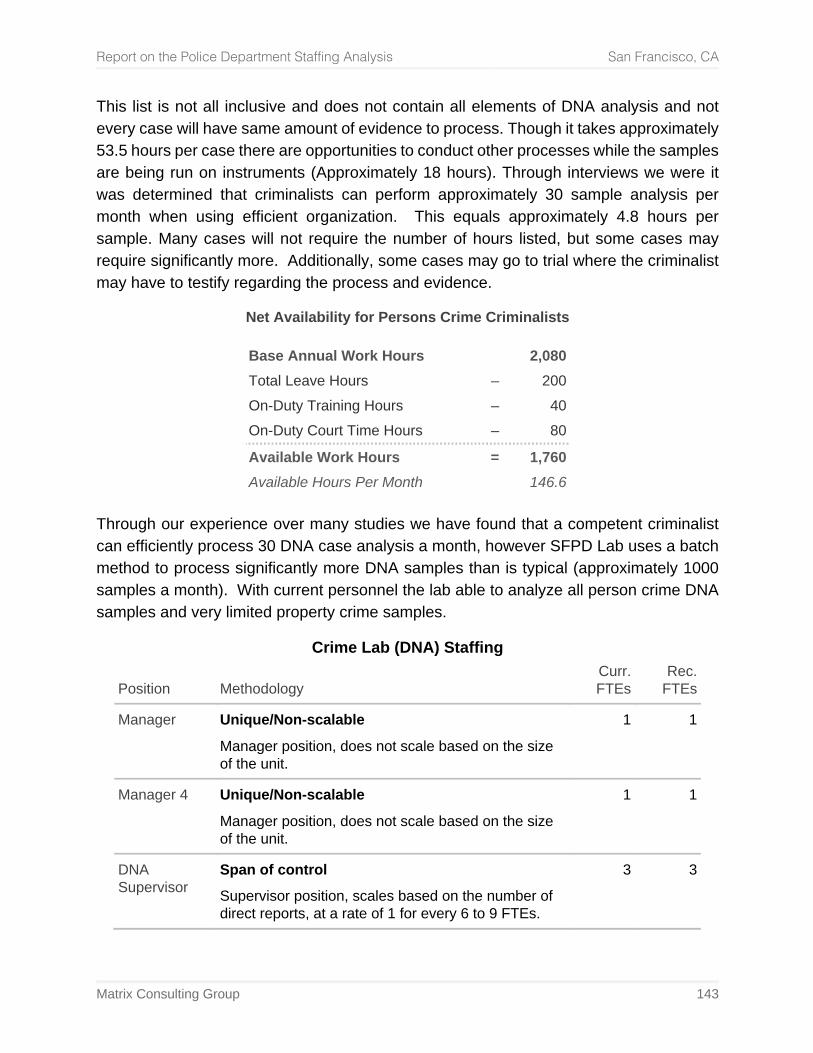
Report on the Police Department Staffing Analysis San Francisco, CA
Matrix Consulting Group 143
This list is not all inclusive and does not contain all elements of DNA analysis and not every case will have same amount of evidence to process. Though it takes approximately 53.5 hours per case there are opportunities to conduct other processes while the samples are being run on instruments (Approximately 18 hours). Through interviews we were it was determined that criminalists can perform approximately 30 sample analysis per month when using efficient organization. This equals approximately 4.8 hours per sample. Many cases will not require the number of hours listed, but some cases may require significantly more. Additionally, some cases may go to trial where the criminalist may have to testify regarding the process and evidence.
Net Availability for Persons Crime Criminalists
Base Annual Work Hours 2,080 Total Leave Hours – 200 On-Duty Training Hours – 40 On-Duty Court Time Hours – 80
Available Work Hours = 1,760 Available Hours Per Month 146.6
Through our experience over many studies we have found that a competent criminalist can efficiently process 30 DNA case analysis a month, however SFPD Lab uses a batch method to process significantly more DNA samples than is typical (approximately 1000 samples a month). With current personnel the lab able to analyze all person crime DNA samples and very limited property crime samples.
Crime Lab (DNA) Staffing
Position Methodology Curr.
FTEs Rec.
FTEs
Manager Unique/Non-scalable
Manager position, does not scale based on the size of the unit.
1 1
Manager 4 Unique/Non-scalable
Manager position, does not scale based on the size of the unit.
1 1
DNA Supervisor
Span of control
Supervisor position, scales based on the number of direct reports, at a rate of 1 for every 6 to 9 FTEs.
3 3
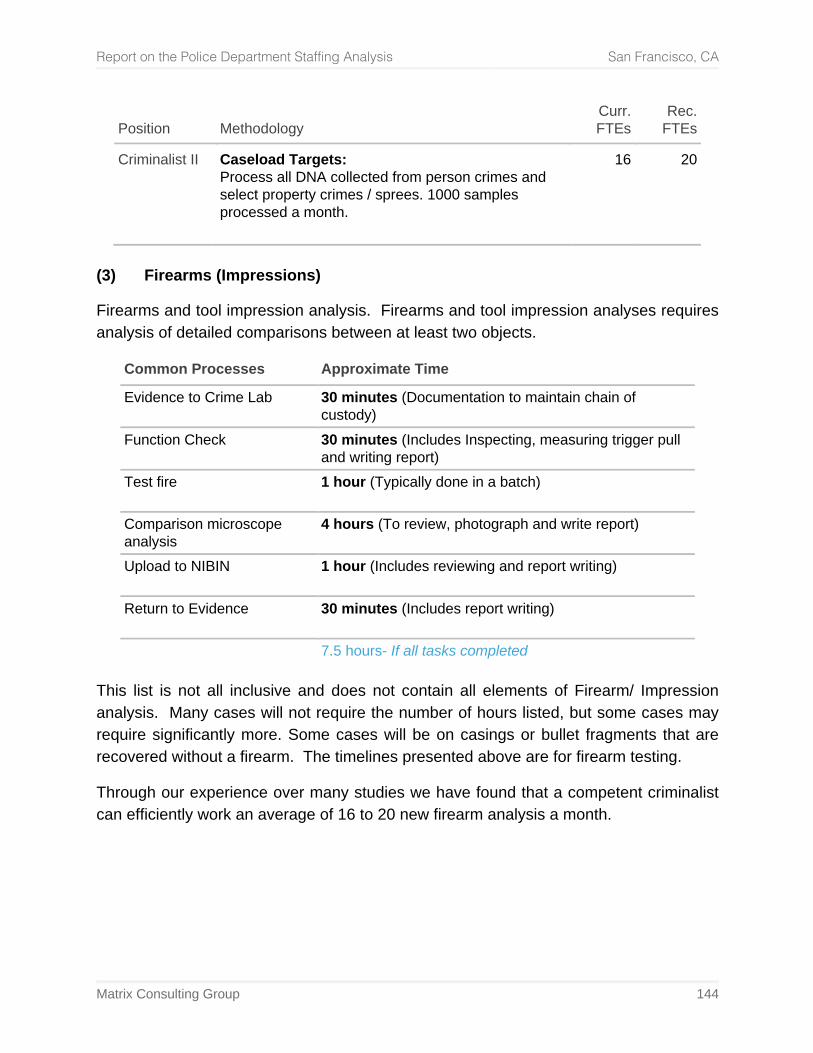
Report on the Police Department Staffing Analysis San Francisco, CA
Matrix Consulting Group 144
Position Methodology Curr.
FTEs Rec.
FTEs
Criminalist II Caseload Targets: Process all DNA collected from person crimes and select property crimes / sprees. 1000 samples processed a month.
16 20
(3) Firearms (Impressions)
Firearms and tool impression analysis. Firearms and tool impression analyses requires analysis of detailed comparisons between at least two objects.
Common Processes Approximate Time
Evidence to Crime Lab 30 minutes (Documentation to maintain chain of custody)
Function Check 30 minutes (Includes Inspecting, measuring trigger pull and writing report)
Test fire 1 hour (Typically done in a batch)
Comparison microscope analysis
4 hours (To review, photograph and write report)
Upload to NIBIN 1 hour (Includes reviewing and report writing)
Return to Evidence 30 minutes (Includes report writing)
7.5 hours- If all tasks completed This list is not all inclusive and does not contain all elements of Firearm/ Impression analysis. Many cases will not require the number of hours listed, but some cases may require significantly more. Some cases will be on casings or bullet fragments that are recovered without a firearm. The timelines presented above are for firearm testing.
Through our experience over many studies we have found that a competent criminalist can efficiently work an average of 16 to 20 new firearm analysis a month.
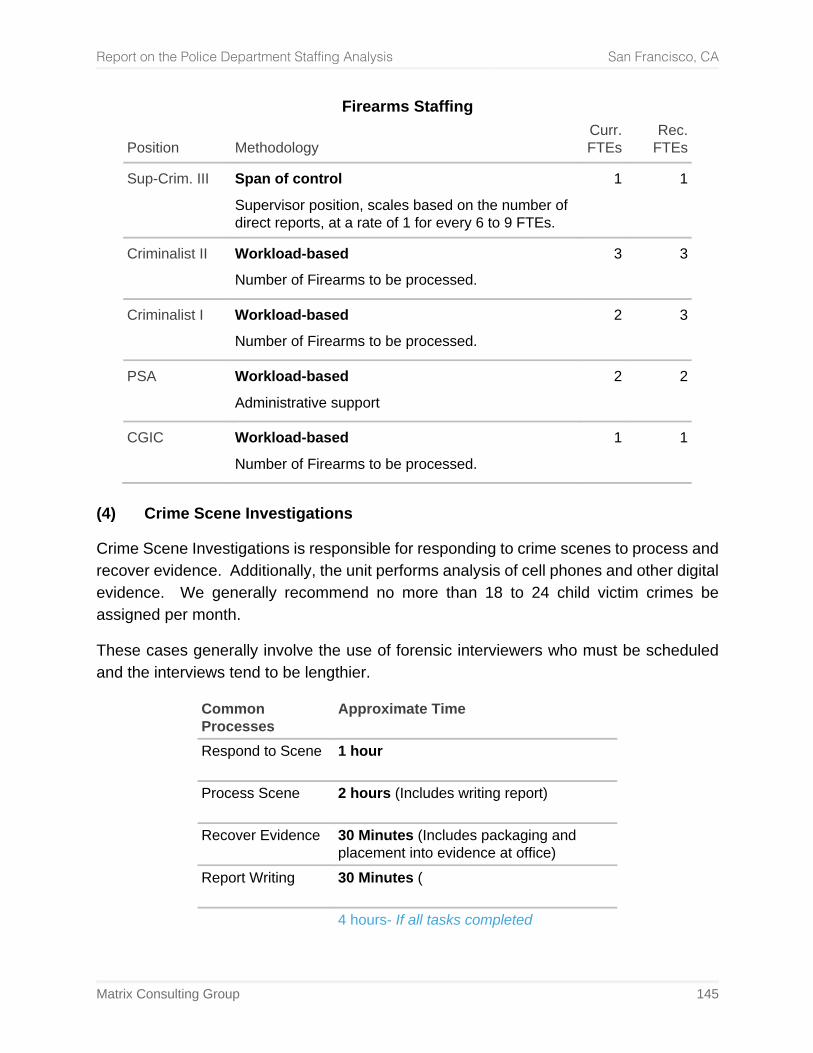
Report on the Police Department Staffing Analysis San Francisco, CA
Matrix Consulting Group 145
Firearms Staffing
Position Methodology Curr.
FTEs Rec.
FTEs
Sup-Crim. III Span of control
Supervisor position, scales based on the number of direct reports, at a rate of 1 for every 6 to 9 FTEs.
1 1
Criminalist II Workload-based
Number of Firearms to be processed. 3 3
Criminalist I Workload-based
Number of Firearms to be processed. 2 3
PSA Workload-based
Administrative support 2 2
CGIC Workload-based
Number of Firearms to be processed. 1 1
(4) Crime Scene Investigations
Crime Scene Investigations is responsible for responding to crime scenes to process and recover evidence. Additionally, the unit performs analysis of cell phones and other digital evidence. We generally recommend no more than 18 to 24 child victim crimes be assigned per month.
These cases generally involve the use of forensic interviewers who must be scheduled and the interviews tend to be lengthier.
Common Processes
Approximate Time
Respond to Scene 1 hour
Process Scene 2 hours (Includes writing report)
Recover Evidence 30 Minutes (Includes packaging and placement into evidence at office)
Report Writing 30 Minutes (
4 hours- If all tasks completed
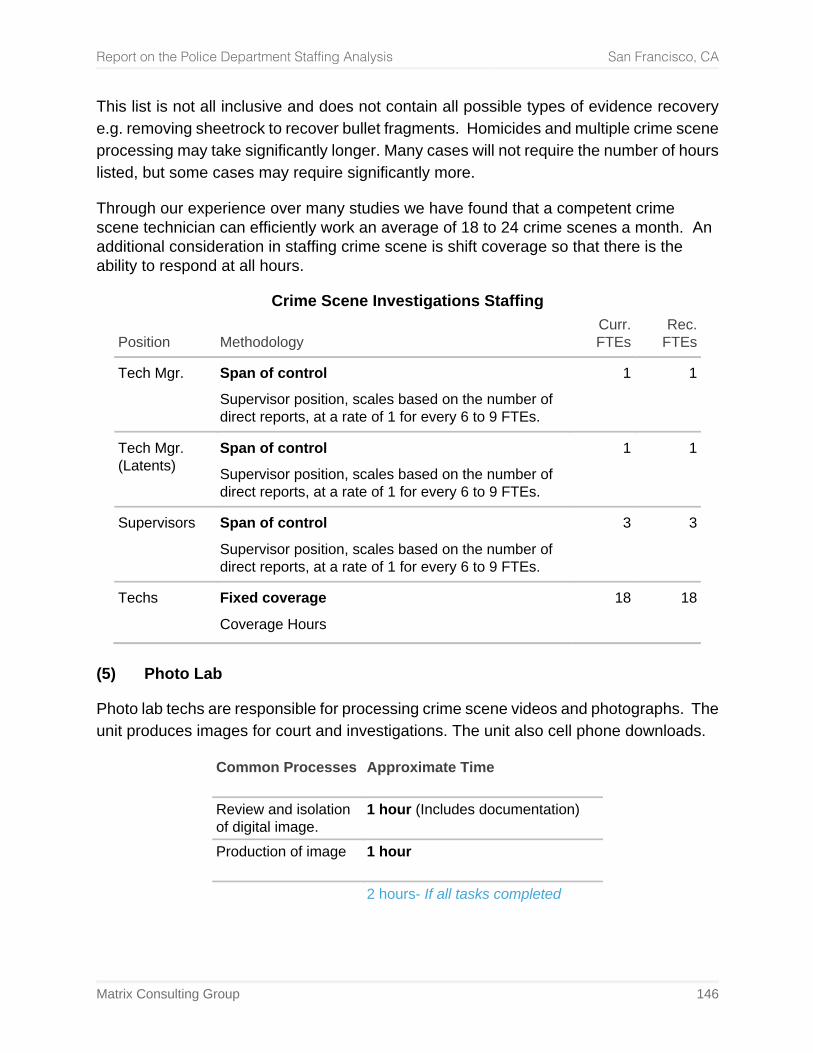
Report on the Police Department Staffing Analysis San Francisco, CA
Matrix Consulting Group 146
This list is not all inclusive and does not contain all possible types of evidence recovery e.g. removing sheetrock to recover bullet fragments. Homicides and multiple crime scene processing may take significantly longer. Many cases will not require the number of hours listed, but some cases may require significantly more.
Through our experience over many studies we have found that a competent crime scene technician can efficiently work an average of 18 to 24 crime scenes a month. An additional consideration in staffing crime scene is shift coverage so that there is the ability to respond at all hours.
Crime Scene Investigations Staffing
Position Methodology Curr.
FTEs Rec.
FTEs
Tech Mgr. Span of control
Supervisor position, scales based on the number of direct reports, at a rate of 1 for every 6 to 9 FTEs.
1 1
Tech Mgr. (Latents)
Span of control
Supervisor position, scales based on the number of direct reports, at a rate of 1 for every 6 to 9 FTEs.
1 1
Supervisors Span of control
Supervisor position, scales based on the number of direct reports, at a rate of 1 for every 6 to 9 FTEs.
3 3
Techs Fixed coverage
Coverage Hours 18 18
(5) Photo Lab
Photo lab techs are responsible for processing crime scene videos and photographs. The unit produces images for court and investigations. The unit also cell phone downloads.
Common Processes Approximate Time
Review and isolation of digital image.
1 hour (Includes documentation)
Production of image 1 hour
2 hours- If all tasks completed
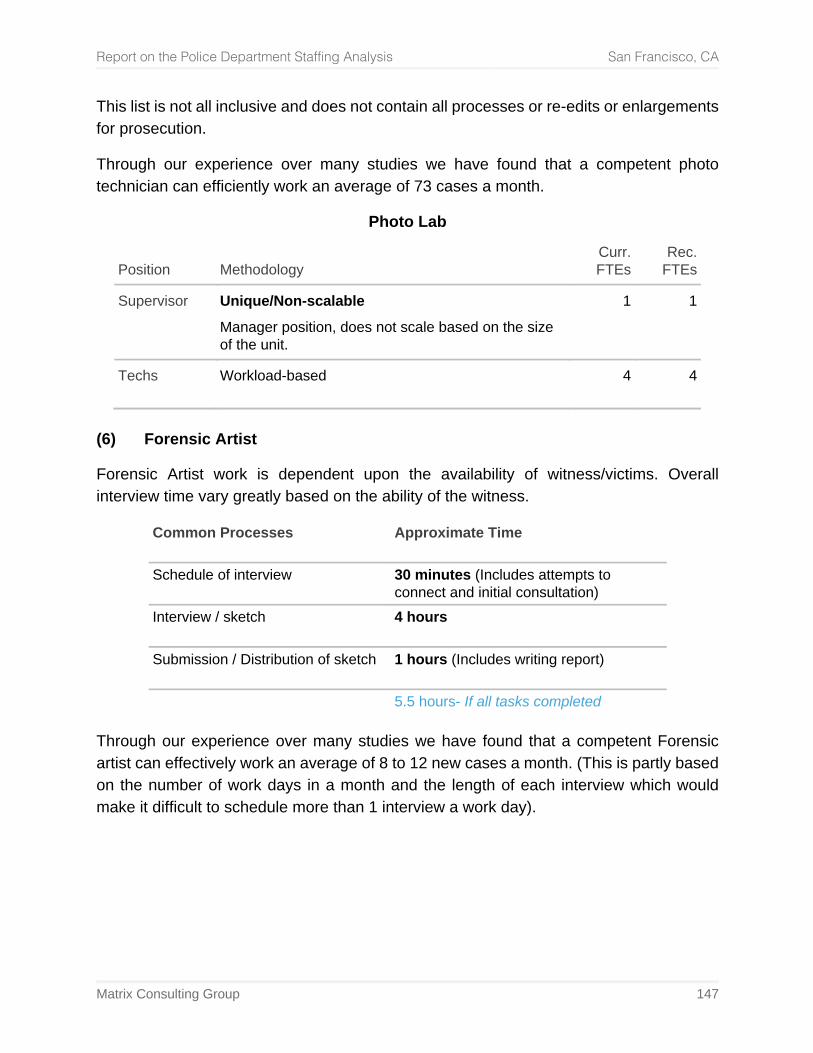
Report on the Police Department Staffing Analysis San Francisco, CA
Matrix Consulting Group 147
This list is not all inclusive and does not contain all processes or re-edits or enlargements for prosecution.
Through our experience over many studies we have found that a competent photo technician can efficiently work an average of 73 cases a month.
Photo Lab
Position Methodology Curr.
FTEs Rec.
FTEs
Supervisor Unique/Non-scalable
Manager position, does not scale based on the size of the unit.
1 1
Techs Workload-based 4 4
(6) Forensic Artist
Forensic Artist work is dependent upon the availability of witness/victims. Overall interview time vary greatly based on the ability of the witness.
Common Processes Approximate Time
Schedule of interview 30 minutes (Includes attempts to connect and initial consultation)
Interview / sketch 4 hours
Submission / Distribution of sketch 1 hours (Includes writing report)
5.5 hours- If all tasks completed
Through our experience over many studies we have found that a competent Forensic artist can effectively work an average of 8 to 12 new cases a month. (This is partly based on the number of work days in a month and the length of each interview which would make it difficult to schedule more than 1 interview a work day).
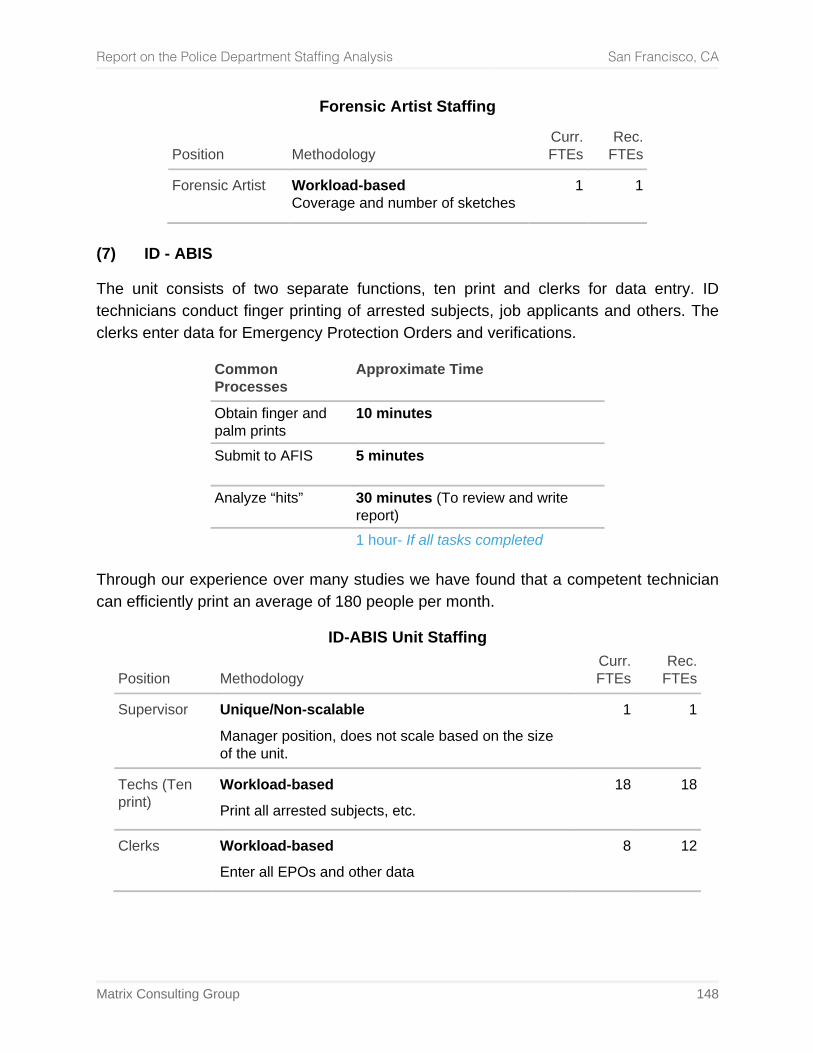
Report on the Police Department Staffing Analysis San Francisco, CA
Matrix Consulting Group 148
Forensic Artist Staffing
Position Methodology Curr.
FTEs Rec.
FTEs
Forensic Artist Workload-based Coverage and number of sketches
1 1
(7) ID - ABIS
The unit consists of two separate functions, ten print and clerks for data entry. ID technicians conduct finger printing of arrested subjects, job applicants and others. The clerks enter data for Emergency Protection Orders and verifications.
Common Processes
Approximate Time
Obtain finger and palm prints
10 minutes
Submit to AFIS 5 minutes
Analyze “hits” 30 minutes (To review and write report)
1 hour- If all tasks completed
Through our experience over many studies we have found that a competent technician can efficiently print an average of 180 people per month.
ID-ABIS Unit Staffing
Position Methodology Curr.
FTEs Rec.
FTEs
Supervisor Unique/Non-scalable
Manager position, does not scale based on the size of the unit.
1 1
Techs (Ten print)
Workload-based
Print all arrested subjects, etc. 18 18
Clerks Workload-based
Enter all EPOs and other data 8 12
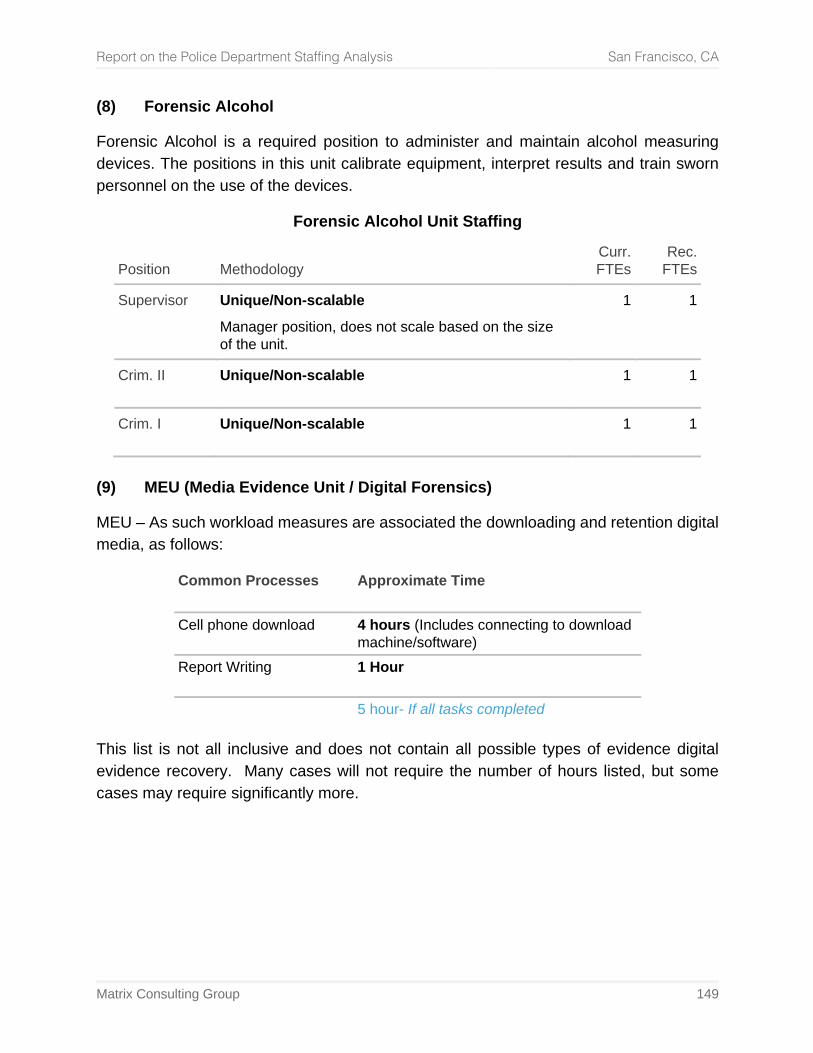
Report on the Police Department Staffing Analysis San Francisco, CA
Matrix Consulting Group 149
(8) Forensic Alcohol
Forensic Alcohol is a required position to administer and maintain alcohol measuring devices. The positions in this unit calibrate equipment, interpret results and train sworn personnel on the use of the devices.
Forensic Alcohol Unit Staffing
Position Methodology Curr.
FTEs Rec.
FTEs
Supervisor Unique/Non-scalable
Manager position, does not scale based on the size of the unit.
1 1
Crim. II Unique/Non-scalable
1 1
Crim. I Unique/Non-scalable
1 1
(9) MEU (Media Evidence Unit / Digital Forensics)
MEU – As such workload measures are associated the downloading and retention digital media, as follows:
Common Processes Approximate Time
Cell phone download 4 hours (Includes connecting to download machine/software)
Report Writing 1 Hour
5 hour- If all tasks completed
This list is not all inclusive and does not contain all possible types of evidence digital evidence recovery. Many cases will not require the number of hours listed, but some cases may require significantly more.
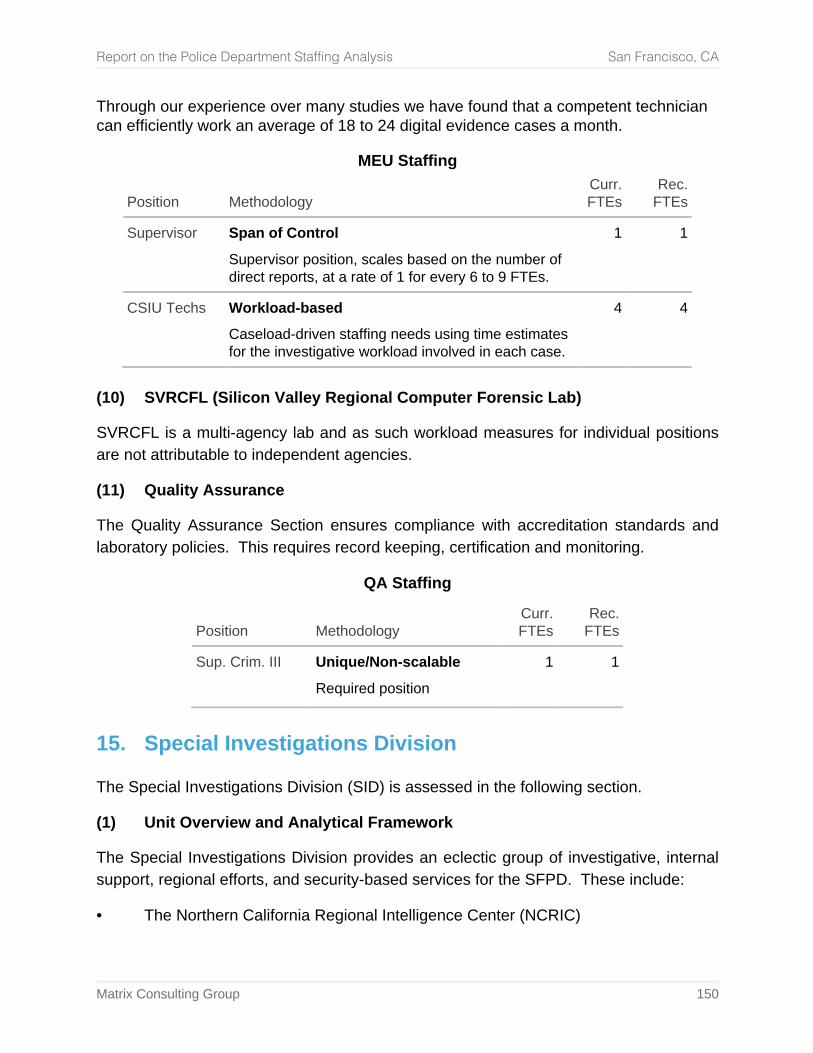
Report on the Police Department Staffing Analysis San Francisco, CA
Matrix Consulting Group 150
Through our experience over many studies we have found that a competent technician can efficiently work an average of 18 to 24 digital evidence cases a month.
MEU Staffing
Position Methodology Curr.
FTEs Rec.
FTEs
Supervisor Span of Control
Supervisor position, scales based on the number of direct reports, at a rate of 1 for every 6 to 9 FTEs.
1 1
CSIU Techs Workload-based
Caseload-driven staffing needs using time estimates for the investigative workload involved in each case.
4 4
(10) SVRCFL (Silicon Valley Regional Computer Forensic Lab)
SVRCFL is a multi-agency lab and as such workload measures for individual positions are not attributable to independent agencies.
(11) Quality Assurance
The Quality Assurance Section ensures compliance with accreditation standards and laboratory policies. This requires record keeping, certification and monitoring.
QA Staffing
Position Methodology Curr.
FTEs Rec.
FTEs
Sup. Crim. III Unique/Non-scalable
Required position 1 1
15. Special Investigations Division
The Special Investigations Division (SID) is assessed in the following section.
(1) Unit Overview and Analytical Framework
The Special Investigations Division provides an eclectic group of investigative, internal support, regional efforts, and security-based services for the SFPD. These include:
• The Northern California Regional Intelligence Center (NCRIC)
Report on the Police Department Staffing Analysis San Francisco, CA
Matrix Consulting Group 151
• The Arson Task Force • The US Marshall’s Task Force • The Mayor’s Security Unit • The Technical Services Unit • Administration and Main Office support In sum, SID provides a variety of supporting services designed to service internal customers, support regional initiatives, and provide security to the Mayor’s Office.
(2) Staffing Analysis Methodology
Because SID supporting services are largely policy and executive-level decision driven, there are no key metrics by which a staffing plan can be devised. The size and composition of these units is driven by various factors including Mayor’s requests, inter-agency requests for support, Chief’s Office directives, and other specialized requirements.
Because staffing for these kinds of units, which entails approximately 30 staff of which nearly half are dedicated to Mayor’s Security or specialized/confidential investigations promulgated by the Chief’s Office, the staffing contingent is considered as a non-scaling methodology, whereby the number of staff required is selected based on key decision-makers, not by some metric-driven analyses. As a consequence, the size of such units could be modest or very large, dependent upon the strategic initiatives undertaken based on perceived needs.
By example, the NCRIC is presently staffed with two people dedicated to supporting regional intelligence to the benefit of all Northern California law enforcement agencies. Given San Francisco is one of the largest municipalities in the region, such resource allocation might be perceived as underwhelming.
(3) Results of the Analysis
The results of the non-scaling analysis reflect that the existing staffing level in SID of 32 total personnel in various job classifications is adequate, excluding the possible inclusion of an overseeing Captain, unless perceived by decision-makers otherwise.
Report on the Police Department Staffing Analysis San Francisco, CA
Matrix Consulting Group 152
(4) Summary of Staffing
The following table summarizes the methodologies used for the Special Investigations Division and resulting outcomes.
Special Investigations Division
Position Methodology Curr.
FTEs Rec.
FTEs
Captain Unique/Non-scalable
Manager position, does not scale based on the size of the unit.
0 1
Lieutenant Unique/Non-scalable
Manager position, does not scale based on the size of the unit, but larger units have multiple lieutenants.
1 1
Sergeant Unique/Non-scalable
Specialized assignments often driven by external factors (e.g. Mayor’s Office)
15 15
Officer Unique/Non-scalable
Specialized assignments often driven by external factors (e.g. Mayor’s Office)
14 14
960 Employee Unique/Non-scalable
Based on special unit support requirements.
1
1
PSA/Clerk Ratio-based
1 position for every 2 Platoons 1 1
Report on the Police Department Staffing Analysis San Francisco, CA
Matrix Consulting Group 153
5. Special Operations Bureau
1. Overview of Key Considerations in Special Operations Staffing Needs
The following illustrate certain methodological approaches used in determining staffing needs for Special Operations.
(1) Core Workloads for Special Operations
Core workloads for functional units within Special Operations is different dependent upon a number of variables. Key workload variables influencing Special Operations include, but are not limited to the following:
• Community-generated Calls for Service (CFS): Reflects certain specific call types that would be responded to by specialized units. As an example, traffic collisions for Motors or Prowler for a K9 Unit.
• Volume of Clientele: The actual number of citizenry served falling within specific
pre-defined categories. This can include number of riders on the transit system, number of customers boarding and alighting at stops, etc.
• Location of Clientele: The actual geographic location in which service clientele
are located. This can be crime victims within a certain radius of a specific location, such as a bus stop, which would require an extrapolation that such victims were likely riders of the transit system.
• Service-level Expectations: This can be multi-faceted, ranging from community
expectations, City Council expectations, or expectations to provide high-risk services at the highest level of officer safety.
(2) Other Workload Considerations
The staffing needs of other types of positions may scale based on span of control (such as supervisors); are unique or otherwise non-scaling (e.g., an executive); or are driven by other factors such as contractual requirements.
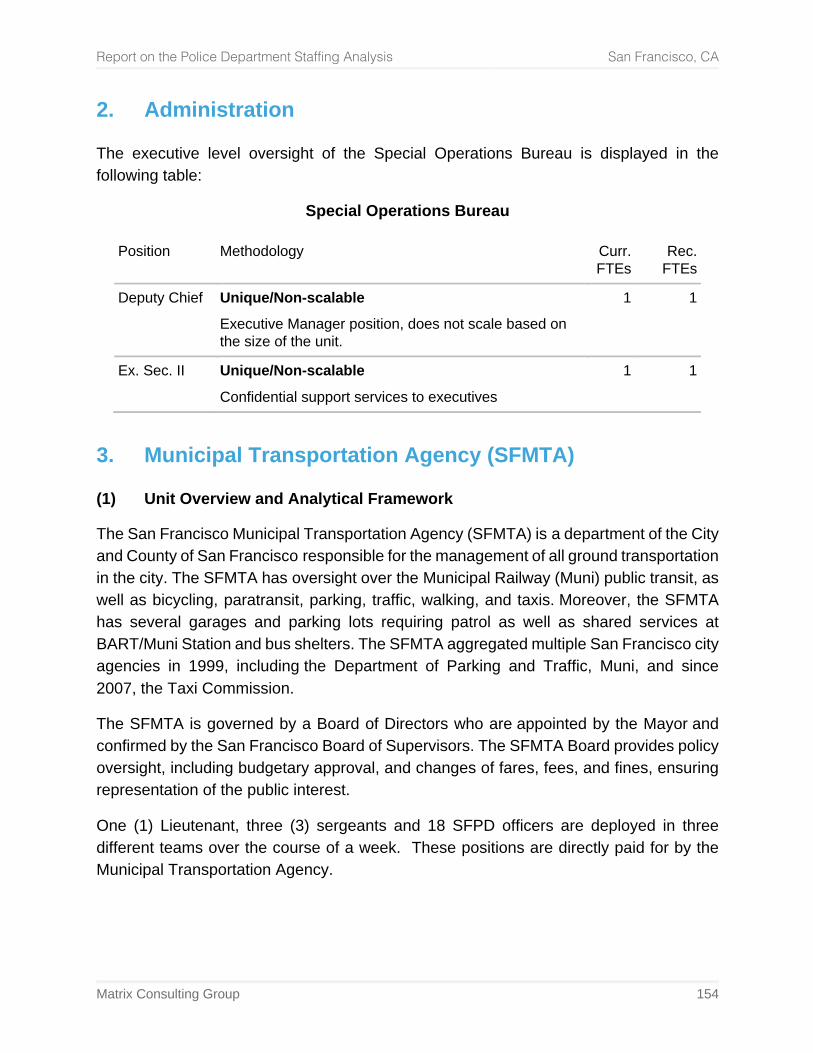
Report on the Police Department Staffing Analysis San Francisco, CA
Matrix Consulting Group 154
2. Administration
The executive level oversight of the Special Operations Bureau is displayed in the following table:
Special Operations Bureau
Position Methodology Curr. FTEs
Rec. FTEs
Deputy Chief Unique/Non-scalable
Executive Manager position, does not scale based on the size of the unit.
1 1
Ex. Sec. II Unique/Non-scalable
Confidential support services to executives 1 1
3. Municipal Transportation Agency (SFMTA)
(1) Unit Overview and Analytical Framework
The San Francisco Municipal Transportation Agency (SFMTA) is a department of the City and County of San Francisco responsible for the management of all ground transportation in the city. The SFMTA has oversight over the Municipal Railway (Muni) public transit, as well as bicycling, paratransit, parking, traffic, walking, and taxis. Moreover, the SFMTA has several garages and parking lots requiring patrol as well as shared services at BART/Muni Station and bus shelters. The SFMTA aggregated multiple San Francisco city agencies in 1999, including the Department of Parking and Traffic, Muni, and since 2007, the Taxi Commission.
The SFMTA is governed by a Board of Directors who are appointed by the Mayor and confirmed by the San Francisco Board of Supervisors. The SFMTA Board provides policy oversight, including budgetary approval, and changes of fares, fees, and fines, ensuring representation of the public interest.
One (1) Lieutenant, three (3) sergeants and 18 SFPD officers are deployed in three different teams over the course of a week. These positions are directly paid for by the Municipal Transportation Agency.
Report on the Police Department Staffing Analysis San Francisco, CA
Matrix Consulting Group 155
The following groups are under the command of the SFPD Traffic Company Commander, and operate in close coordination with SFMTA’s Security, Investigations & Enforcement Section.
• Muni Response Team (MRT): a uniformed presence in the transit system, assists with transit enforcement and special events.
• Muni Task Force (MTF): Plain clothes investigative services specific to criminal
activity in the transit system. This includes both proactive and reactive investigative efforts.
• MTA K-9 Unit: Explosive threat assessment and detection on the transit system. (2) Metrics and Staffing Analysis - SFMTA
The following sub-sections represent the appropriate metrics and staffing targets for SFPD’s MTA as they are presently deployed.
(2.1) Metrics Overview for the SFMTA
The SFMTA Work Order is the driving “metric” for SFPD deployment. In effect, the Municipal Transportation Agency is acting as customer and paying for service through inter-Department financing.
MTA has location-specific victims and offenders, primarily within transit transportation (e.g. buses) or at pick-up locales (e.g. bus stop). In effect, SFPD is providing service to unique areas similar to Foot beats, TJPA, etc., instead of exclusively using “beat officers” to respond to calls for service.
Whereas staffing could potentially be based on calls for service or incident-based, this is not practical (in part because such data is not readily tracked); SFMTA officers’ mission is largely preventive visibility as opposed to response-orientation unlike SFPD Patrol which largely provides a proactive and visible presence as well as reactive responses.
Other metrics, such as transit miles to determine law enforcement staffing needs are not reflective of the baseline community requiring services. The transit population served can flex dramatically irrespective of the size of the transportation network.
Transit organizations generally devise performance metrics around financial outcomes and ridership. As such, a ridership-based staffing plan is relevant. A derivative of the “officers-per-thousand” model widely discussed in law enforcement circles is the most practical methodological approach.
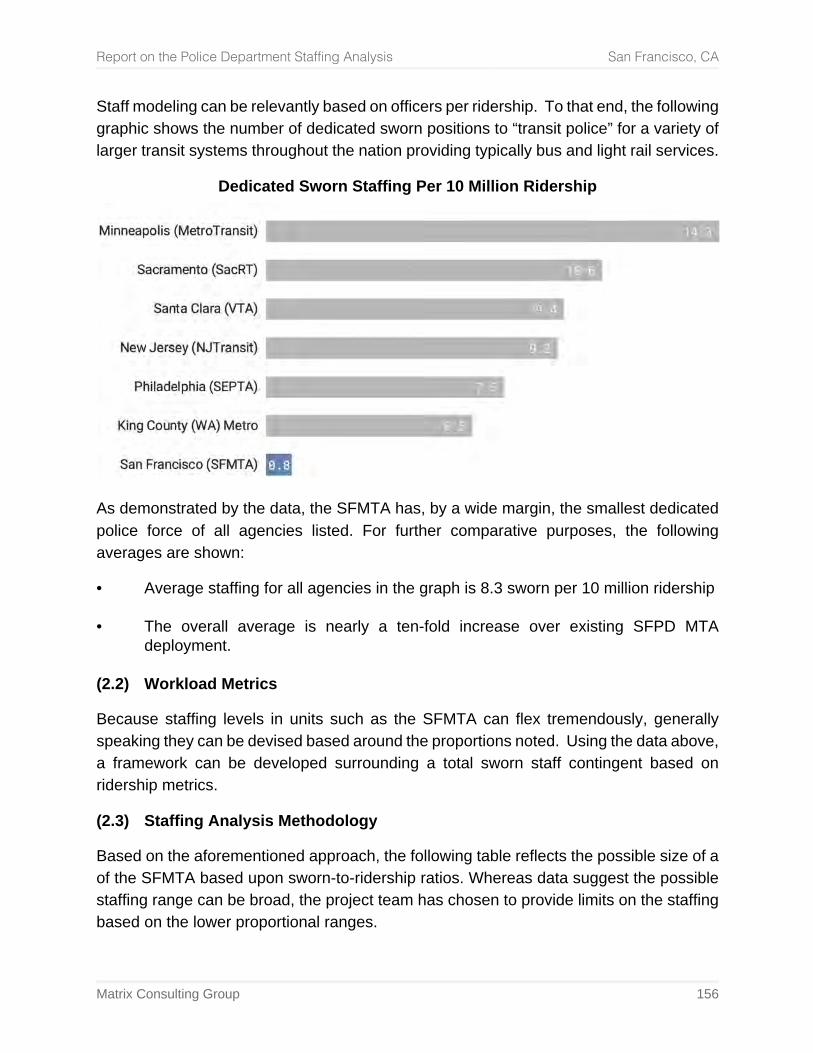
Report on the Police Department Staffing Analysis San Francisco, CA
Matrix Consulting Group 156
Staff modeling can be relevantly based on officers per ridership. To that end, the following graphic shows the number of dedicated sworn positions to “transit police” for a variety of larger transit systems throughout the nation providing typically bus and light rail services.
Dedicated Sworn Staffing Per 10 Million Ridership
As demonstrated by the data, the SFMTA has, by a wide margin, the smallest dedicated police force of all agencies listed. For further comparative purposes, the following averages are shown:
• Average staffing for all agencies in the graph is 8.3 sworn per 10 million ridership • The overall average is nearly a ten-fold increase over existing SFPD MTA
deployment. (2.2) Workload Metrics
Because staffing levels in units such as the SFMTA can flex tremendously, generally speaking they can be devised based around the proportions noted. Using the data above, a framework can be developed surrounding a total sworn staff contingent based on ridership metrics.
(2.3) Staffing Analysis Methodology
Based on the aforementioned approach, the following table reflects the possible size of a of the SFMTA based upon sworn-to-ridership ratios. Whereas data suggest the possible staffing range can be broad, the project team has chosen to provide limits on the staffing based on the lower proportional ranges.
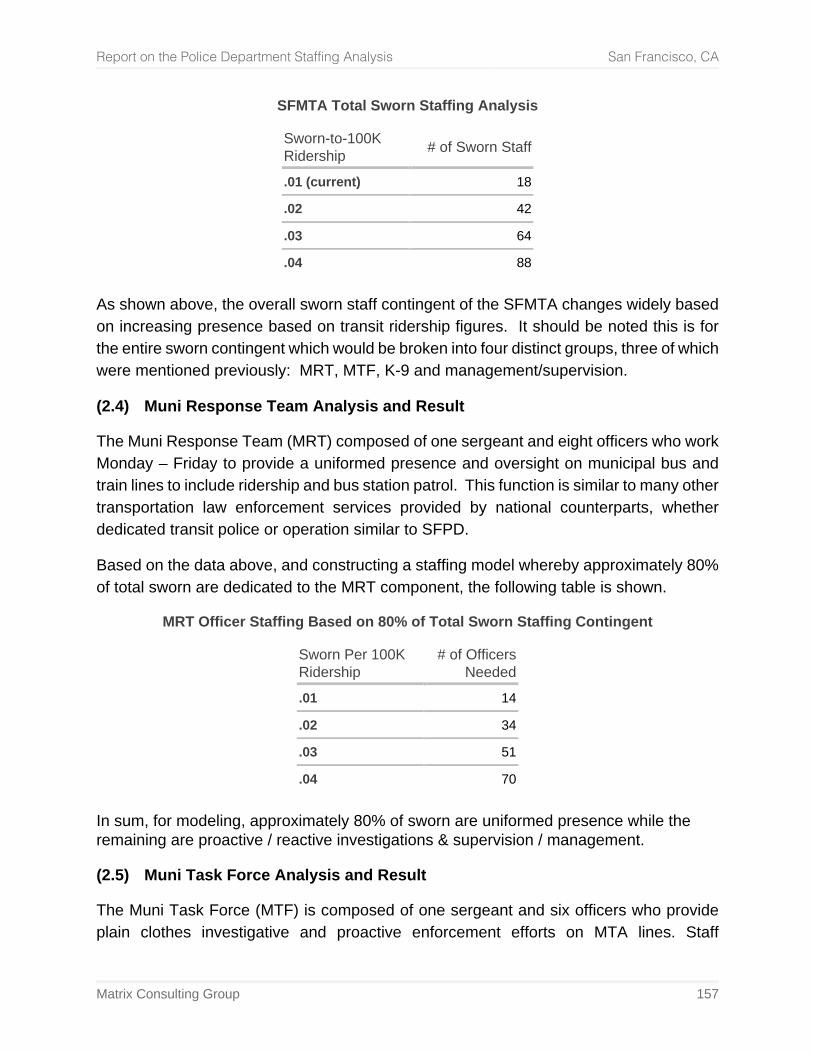
Report on the Police Department Staffing Analysis San Francisco, CA
Matrix Consulting Group 157
SFMTA Total Sworn Staffing Analysis
Sworn-to-100K Ridership # of Sworn Staff
.01 (current) 18
.02 42
.03 64
.04 88 As shown above, the overall sworn staff contingent of the SFMTA changes widely based on increasing presence based on transit ridership figures. It should be noted this is for the entire sworn contingent which would be broken into four distinct groups, three of which were mentioned previously: MRT, MTF, K-9 and management/supervision.
(2.4) Muni Response Team Analysis and Result
The Muni Response Team (MRT) composed of one sergeant and eight officers who work Monday – Friday to provide a uniformed presence and oversight on municipal bus and train lines to include ridership and bus station patrol. This function is similar to many other transportation law enforcement services provided by national counterparts, whether dedicated transit police or operation similar to SFPD.
Based on the data above, and constructing a staffing model whereby approximately 80% of total sworn are dedicated to the MRT component, the following table is shown.
MRT Officer Staffing Based on 80% of Total Sworn Staffing Contingent
Sworn Per 100K Ridership
# of Officers Needed
.01 14
.02 34
.03 51
.04 70 In sum, for modeling, approximately 80% of sworn are uniformed presence while the remaining are proactive / reactive investigations & supervision / management.
(2.5) Muni Task Force Analysis and Result
The Muni Task Force (MTF) is composed of one sergeant and six officers who provide plain clothes investigative and proactive enforcement efforts on MTA lines. Staff
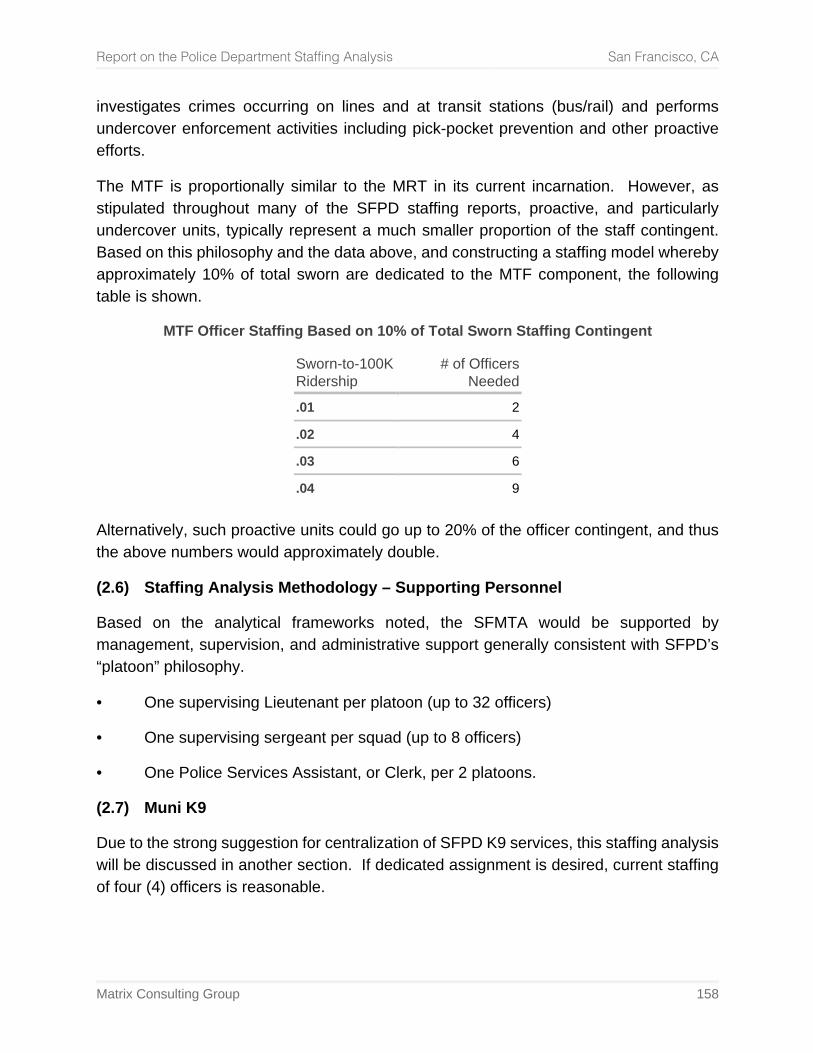
Report on the Police Department Staffing Analysis San Francisco, CA
Matrix Consulting Group 158
investigates crimes occurring on lines and at transit stations (bus/rail) and performs undercover enforcement activities including pick-pocket prevention and other proactive efforts.
The MTF is proportionally similar to the MRT in its current incarnation. However, as stipulated throughout many of the SFPD staffing reports, proactive, and particularly undercover units, typically represent a much smaller proportion of the staff contingent. Based on this philosophy and the data above, and constructing a staffing model whereby approximately 10% of total sworn are dedicated to the MTF component, the following table is shown.
MTF Officer Staffing Based on 10% of Total Sworn Staffing Contingent
Sworn-to-100K Ridership
# of Officers Needed
.01 2
.02 4
.03 6
.04 9 Alternatively, such proactive units could go up to 20% of the officer contingent, and thus the above numbers would approximately double.
(2.6) Staffing Analysis Methodology – Supporting Personnel
Based on the analytical frameworks noted, the SFMTA would be supported by management, supervision, and administrative support generally consistent with SFPD’s “platoon” philosophy.
• One supervising Lieutenant per platoon (up to 32 officers)
• One supervising sergeant per squad (up to 8 officers)
• One Police Services Assistant, or Clerk, per 2 platoons.
(2.7) Muni K9
Due to the strong suggestion for centralization of SFPD K9 services, this staffing analysis will be discussed in another section. If dedicated assignment is desired, current staffing of four (4) officers is reasonable.
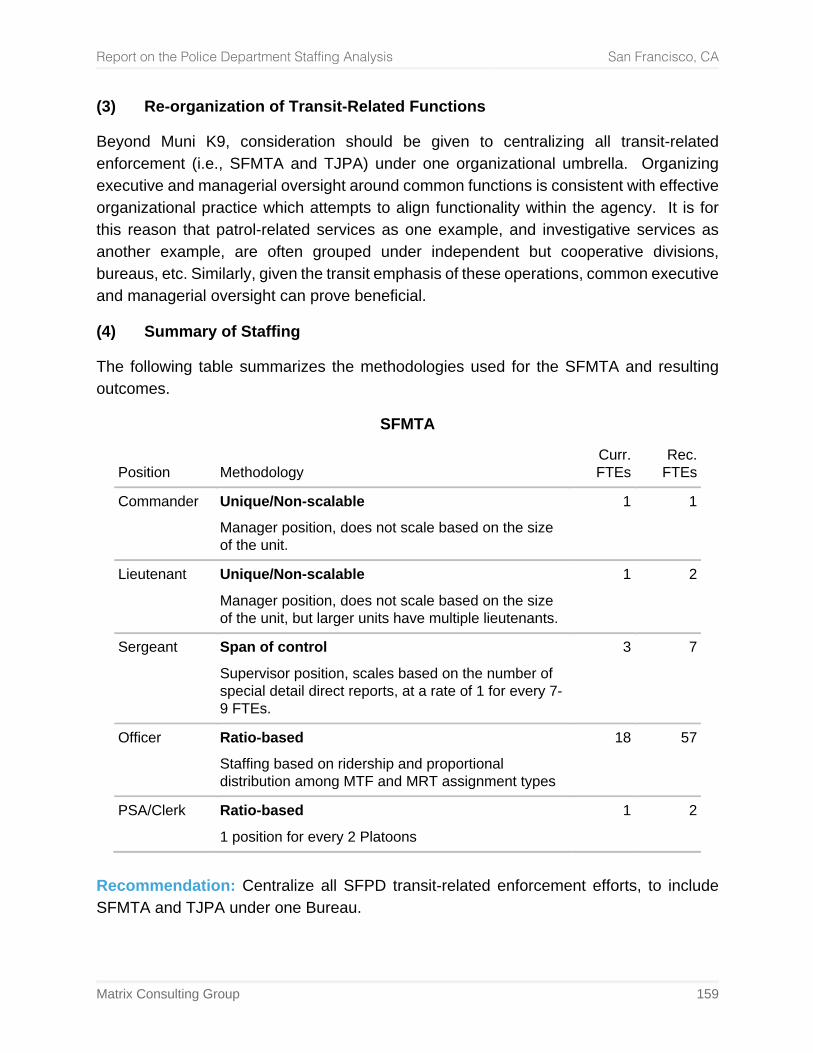
Report on the Police Department Staffing Analysis San Francisco, CA
Matrix Consulting Group 159
(3) Re-organization of Transit-Related Functions
Beyond Muni K9, consideration should be given to centralizing all transit-related enforcement (i.e., SFMTA and TJPA) under one organizational umbrella. Organizing executive and managerial oversight around common functions is consistent with effective organizational practice which attempts to align functionality within the agency. It is for this reason that patrol-related services as one example, and investigative services as another example, are often grouped under independent but cooperative divisions, bureaus, etc. Similarly, given the transit emphasis of these operations, common executive and managerial oversight can prove beneficial.
(4) Summary of Staffing
The following table summarizes the methodologies used for the SFMTA and resulting outcomes.
SFMTA
Position Methodology Curr.
FTEs Rec.
FTEs
Commander Unique/Non-scalable
Manager position, does not scale based on the size of the unit.
1 1
Lieutenant Unique/Non-scalable
Manager position, does not scale based on the size of the unit, but larger units have multiple lieutenants.
1 2
Sergeant Span of control
Supervisor position, scales based on the number of special detail direct reports, at a rate of 1 for every 7-9 FTEs.
3 7
Officer Ratio-based
Staffing based on ridership and proportional distribution among MTF and MRT assignment types
18 57
PSA/Clerk Ratio-based
1 position for every 2 Platoons 1 2
Recommendation: Centralize all SFPD transit-related enforcement efforts, to include SFMTA and TJPA under one Bureau.
Report on the Police Department Staffing Analysis San Francisco, CA
Matrix Consulting Group 160
4. Traffic Company – Motors
(1) Unit Overview and Analytical Framework
SFPD has a Captain overseeing the management and operation of a centralized traffic enforcement detail (Motors or SOLO). Enforcement efforts and traffic collision (TCIU) form the bulk of duties and responsibilities to moving violation enforcement, major traffic collision response, and numerous special event participation (motorcade, etc.).
The Traffic Company has fluctuated in size over many years to a great degree. Currently 44 officers, 5 sergeants, 2 lieutenants and a clerk typist provide operational support.
(2) Metrics and Staffing Analysis - Traffic
The determination of how Motors wish to spend proactive time (e.g. enforcement) versus reactive time (e.g. CFS collisions, motorcades, etc.), and the magnitude of such fluctuating work, in part drives staffing. Mostly, the size of a Traffic Unit is contingent upon policy direction based on community desired efforts.
(2.1) Metrics Overview for Traffic
The overarching and primary mission of traffic enforcement is reducing the occurrence of death and injury related to vehicular collisions. To that end, minimizing both fatal and injury accidents should be a core business responsibility of any law enforcement agency intent on preserving life and property. This type of mission requires the expenditure of enforcement time (e.g. ticket generation) on proactive efforts. Reactive efforts, such as after-the-fact collision investigation, motorcade support, calls-for-service back-up, etc., and other dedicated duties not linked to enforcement efforts impact the ability to control traffic and the related collisions.
(2.2) Reactive Time
While the various type of reactive efforts performed by Motors cannot be fully calculated, one key area of service is readily available. The following table shows the number of collision calls for service—both injury and non-injury—that a Traffic Unit could respond to. This reflects workload by hour of day and day of week.
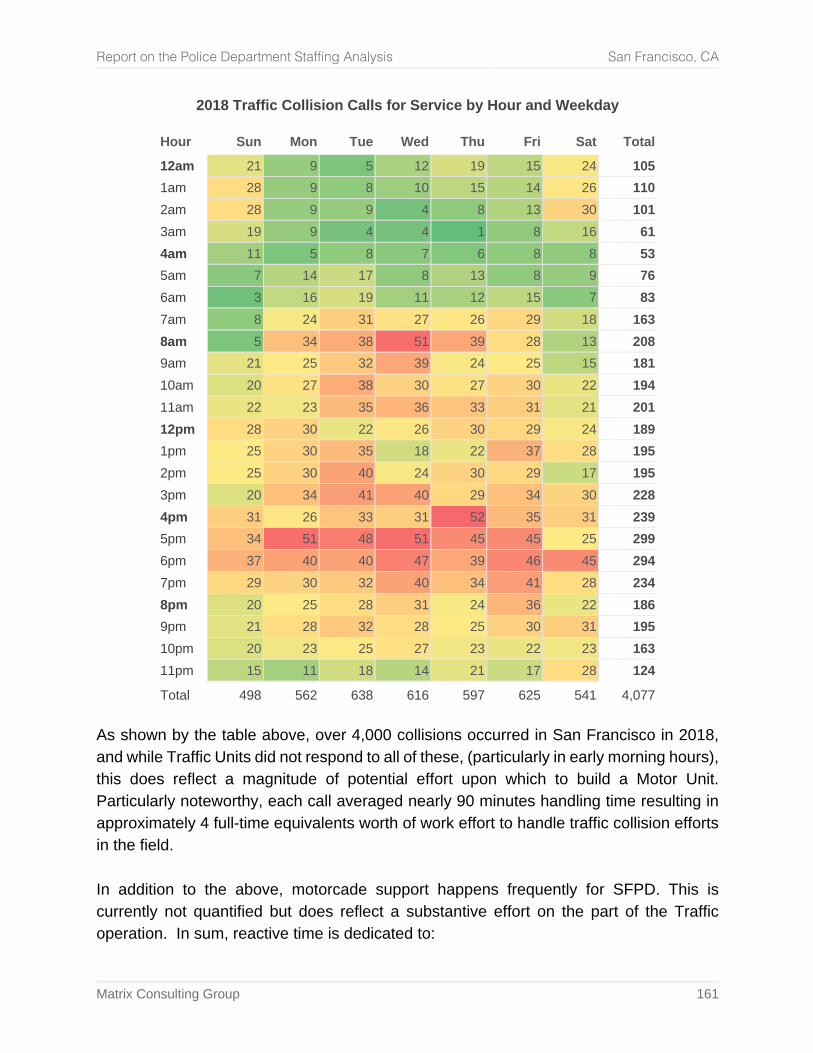
Report on the Police Department Staffing Analysis San Francisco, CA
Matrix Consulting Group 161
2018 Traffic Collision Calls for Service by Hour and Weekday
Hour Sun Mon Tue Wed Thu Fri Sat Total
12am 21 9 5 12 19 15 24 105 1am 28 9 8 10 15 14 26 110 2am 28 9 9 4 8 13 30 101 3am 19 9 4 4 1 8 16 61 4am 11 5 8 7 6 8 8 53 5am 7 14 17 8 13 8 9 76 6am 3 16 19 11 12 15 7 83 7am 8 24 31 27 26 29 18 163 8am 5 34 38 51 39 28 13 208 9am 21 25 32 39 24 25 15 181 10am 20 27 38 30 27 30 22 194 11am 22 23 35 36 33 31 21 201 12pm 28 30 22 26 30 29 24 189 1pm 25 30 35 18 22 37 28 195 2pm 25 30 40 24 30 29 17 195 3pm 20 34 41 40 29 34 30 228 4pm 31 26 33 31 52 35 31 239 5pm 34 51 48 51 45 45 25 299 6pm 37 40 40 47 39 46 45 294 7pm 29 30 32 40 34 41 28 234 8pm 20 25 28 31 24 36 22 186 9pm 21 28 32 28 25 30 31 195 10pm 20 23 25 27 23 22 23 163 11pm 15 11 18 14 21 17 28 124
Total 498 562 638 616 597 625 541 4,077 As shown by the table above, over 4,000 collisions occurred in San Francisco in 2018, and while Traffic Units did not respond to all of these, (particularly in early morning hours), this does reflect a magnitude of potential effort upon which to build a Motor Unit. Particularly noteworthy, each call averaged nearly 90 minutes handling time resulting in approximately 4 full-time equivalents worth of work effort to handle traffic collision efforts in the field. In addition to the above, motorcade support happens frequently for SFPD. This is currently not quantified but does reflect a substantive effort on the part of the Traffic operation. In sum, reactive time is dedicated to:
Report on the Police Department Staffing Analysis San Francisco, CA
Matrix Consulting Group 162
• Reactive time dedicated to motorcades
• Reactive time dedicated to calls for service response (collisions)
• Reactive time dedicated to officer calls for service back-up
• Reactive time dedicated to traffic fatality and other investigations
(2.3) Proactive Time
Proactive efforts are nearly exclusively dedicated to various traffic enforcement efforts resulting in citation or warnings. In order to facilitate San Francisco’s “Vision Zero,” the SFPD must be a key partner, through enforcement efforts, in this zero traffic deaths endeavor. This ultimately requires sufficient proactive enforcement efforts, as evidenced by ticketing, to reach this goal.
Traffic enforcement should become part of the problem-oriented policing philosophy framed by San Francisco’s expectations for these kinds of services. Ultimately the degree to which the City wishes to enforce traffic laws, thereby impacting collision frequency, will help dictate the level of Motor staffing which should be deployed. This is both a fiscal and service-level decision. In effect, it requires determining and quantifying the desired amount of time dedicated to:
• Proactive time dedicated to traffic enforcement efforts (citations, warnings)
• Proactive time dedicated to citizen outreach efforts (good driver “reward tickets”)
(2.4) Workload Metrics
There are two key workload considerations with respect to a Motors operation that will ultimately drive the desired staffing levels:
• How much time annually (total hours) does SFPD and the community wish Motors to spend on proactive initiatives?
• Once total hours of proactivity are selected, what percentage of the Motor Units’ annual time do these proactive hours represent?
As noted earlier in this report, Patrol Services has varied proactive time available, with a recommendation for a minimum of 30%. Given a Motor Unit is ultimately designed to be a proactive unit, this 30% proactive target should be considered a minimum, with up to a 60% proactive target to conduct effective proactive activities designed to execute the City’s Vision Zero plan.
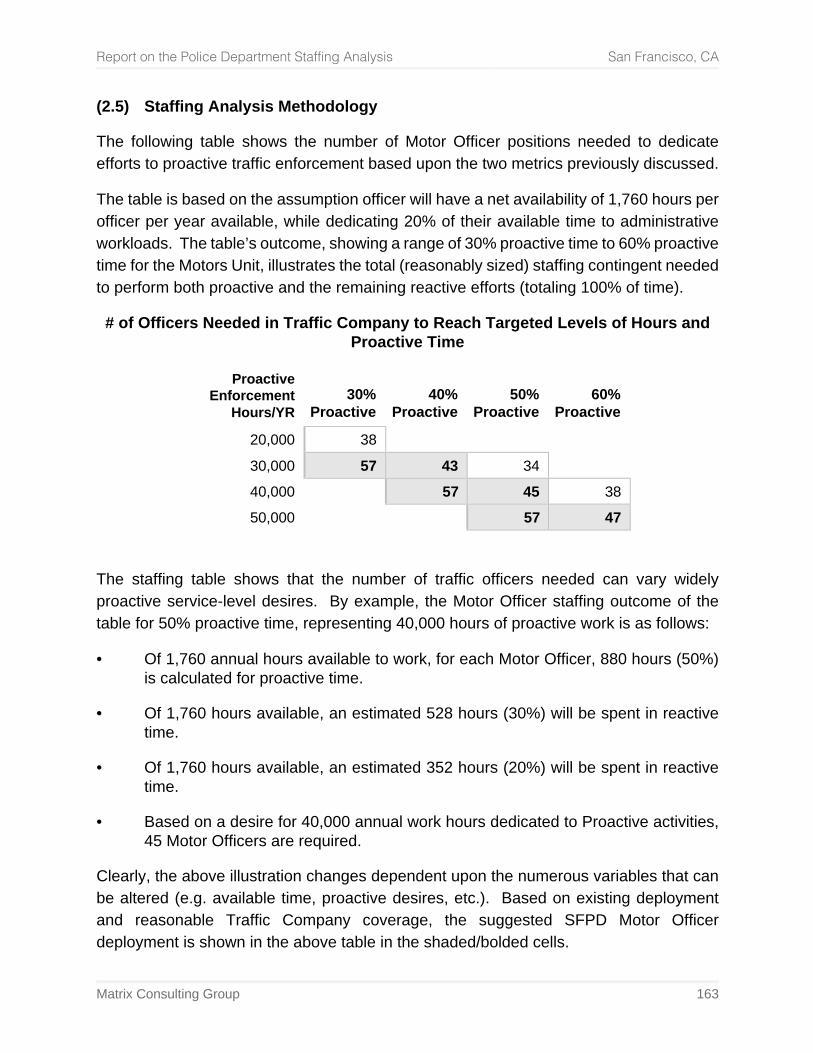
Report on the Police Department Staffing Analysis San Francisco, CA
Matrix Consulting Group 163
(2.5) Staffing Analysis Methodology
The following table shows the number of Motor Officer positions needed to dedicate efforts to proactive traffic enforcement based upon the two metrics previously discussed.
The table is based on the assumption officer will have a net availability of 1,760 hours per officer per year available, while dedicating 20% of their available time to administrative workloads. The table’s outcome, showing a range of 30% proactive time to 60% proactive time for the Motors Unit, illustrates the total (reasonably sized) staffing contingent needed to perform both proactive and the remaining reactive efforts (totaling 100% of time).
# of Officers Needed in Traffic Company to Reach Targeted Levels of Hours and Proactive Time
Proactive
Enforcement Hours/YR
30% Proactive
40% Proactive
50% Proactive
60% Proactive
20,000 38
30,000 57 43 34
40,000 57 45 38 50,000 57 47
The staffing table shows that the number of traffic officers needed can vary widely proactive service-level desires. By example, the Motor Officer staffing outcome of the table for 50% proactive time, representing 40,000 hours of proactive work is as follows:
• Of 1,760 annual hours available to work, for each Motor Officer, 880 hours (50%) is calculated for proactive time.
• Of 1,760 hours available, an estimated 528 hours (30%) will be spent in reactive time.
• Of 1,760 hours available, an estimated 352 hours (20%) will be spent in reactive time.
• Based on a desire for 40,000 annual work hours dedicated to Proactive activities, 45 Motor Officers are required.
Clearly, the above illustration changes dependent upon the numerous variables that can be altered (e.g. available time, proactive desires, etc.). Based on existing deployment and reasonable Traffic Company coverage, the suggested SFPD Motor Officer deployment is shown in the above table in the shaded/bolded cells.
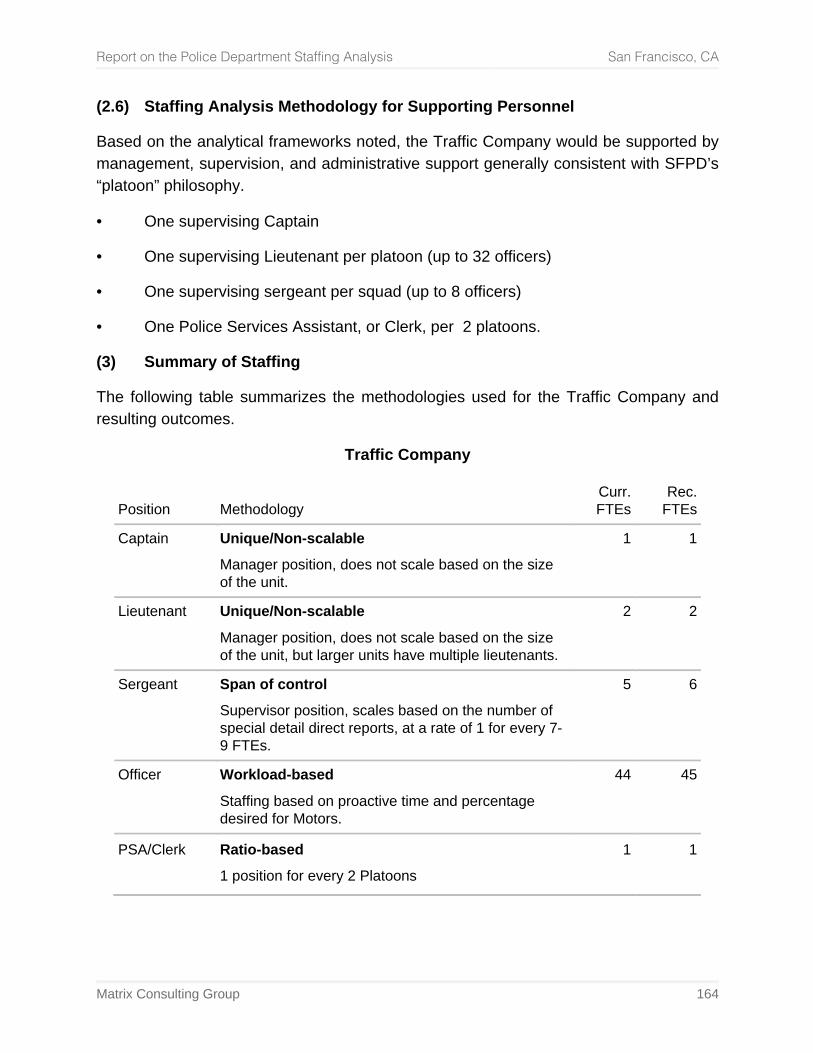
Report on the Police Department Staffing Analysis San Francisco, CA
Matrix Consulting Group 164
(2.6) Staffing Analysis Methodology for Supporting Personnel
Based on the analytical frameworks noted, the Traffic Company would be supported by management, supervision, and administrative support generally consistent with SFPD’s “platoon” philosophy.
• One supervising Captain
• One supervising Lieutenant per platoon (up to 32 officers)
• One supervising sergeant per squad (up to 8 officers)
• One Police Services Assistant, or Clerk, per 2 platoons.
(3) Summary of Staffing
The following table summarizes the methodologies used for the Traffic Company and resulting outcomes.
Traffic Company
Position Methodology Curr.
FTEs Rec.
FTEs
Captain Unique/Non-scalable
Manager position, does not scale based on the size of the unit.
1 1
Lieutenant Unique/Non-scalable
Manager position, does not scale based on the size of the unit, but larger units have multiple lieutenants.
2 2
Sergeant Span of control
Supervisor position, scales based on the number of special detail direct reports, at a rate of 1 for every 7-9 FTEs.
5 6
Officer Workload-based
Staffing based on proactive time and percentage desired for Motors.
44 45
PSA/Clerk Ratio-based
1 position for every 2 Platoons 1 1
Report on the Police Department Staffing Analysis San Francisco, CA
Matrix Consulting Group 165
5. Special Weapons and Tactics (SWAT)
The SWAT and EOD narratives begin a series of sections where staffing levels are based on metrics related to such things as officer safety, policy directive, executive direction, etc. In effect, many of these are qualitatively based staffing decisions as opposed to quantitatively based decisions, though there are exceptions.
(1) Unit Overview and Analytical Framework
SWAT provides a variety of tactical-related and other support services to Department with primary duty High Risk search and arrest warrants. SWAT deploys in four teams of approximately one sergeant and seven officers in size and operates 7-day per week 10am-8pm. SWAT performs high risk warrants and conducts specialized efforts to include tactical response (barricaded suspect); saturation in shooting / homicide incident; mass-arrest event support; under-cover incident support; and academy training. SWAT is supported by several dozen “Specialists” who are officers, etc. assigned in Patrol and Investigations to provide SWAT support, on call-in, RE: perimeter support, sniper, hostage.
(2) Metrics and Staffing Analysis
Beyond the size of a SWAT tactical team based on National Tactical Officer Association (NTOA) guidelines, the total number of personnel dedicated to SWAT is a policy decision. In effect, the number of teams deployed, as opposed to size, are a function of the number of simultaneous tactical call-outs the agency is prepared to respond to, the ability to rapidly gain assistance from other inter-agency SWAT operations (San Francisco does not have timely access to such mutual aid SWAT operations given the location, traffic patterns, etc.), the level of on-duty (as opposed to call-out) coverage, and the frequency in which activities such as high-risk warrant services are provided.
Tactical callouts should range from 14-16 personnel for an entry team composed of 2 supervisors and 12-14 officers. This is generally two teams which could be split (e.g. 1 sergeant and 7 officers) to accomplish various warrant services dependent upon facility, locale and risk assessment.
The staffing level of SWAT should be predicated on the number of teams the City wishes to deploy of each kind of functional unit. Team size, based on various guidelines, should be 1 sergeant and 7 officers. Currently there are four SWAT teams.
The following table show the number of staff needed dependent upon the number of teams deployed. Reiterating, the number of teams is predicated on the level of warrant
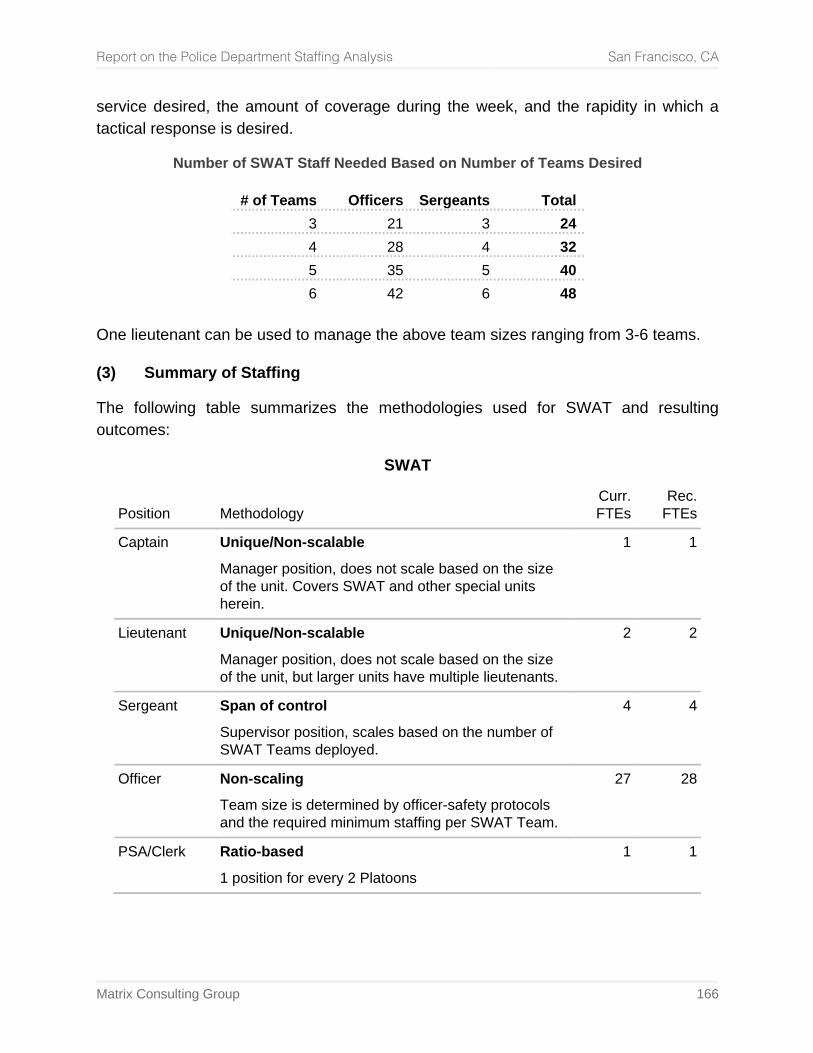
Report on the Police Department Staffing Analysis San Francisco, CA
Matrix Consulting Group 166
service desired, the amount of coverage during the week, and the rapidity in which a tactical response is desired.
Number of SWAT Staff Needed Based on Number of Teams Desired
# of Teams Officers Sergeants Total 3 21 3 24 4 28 4 32 5 35 5 40 6 42 6 48
One lieutenant can be used to manage the above team sizes ranging from 3-6 teams.
(3) Summary of Staffing
The following table summarizes the methodologies used for SWAT and resulting outcomes:
SWAT
Position Methodology Curr.
FTEs Rec.
FTEs
Captain Unique/Non-scalable
Manager position, does not scale based on the size of the unit. Covers SWAT and other special units herein.
1 1
Lieutenant Unique/Non-scalable
Manager position, does not scale based on the size of the unit, but larger units have multiple lieutenants.
2 2
Sergeant Span of control
Supervisor position, scales based on the number of SWAT Teams deployed.
4 4
Officer Non-scaling
Team size is determined by officer-safety protocols and the required minimum staffing per SWAT Team.
27 28
PSA/Clerk Ratio-based
1 position for every 2 Platoons 1 1
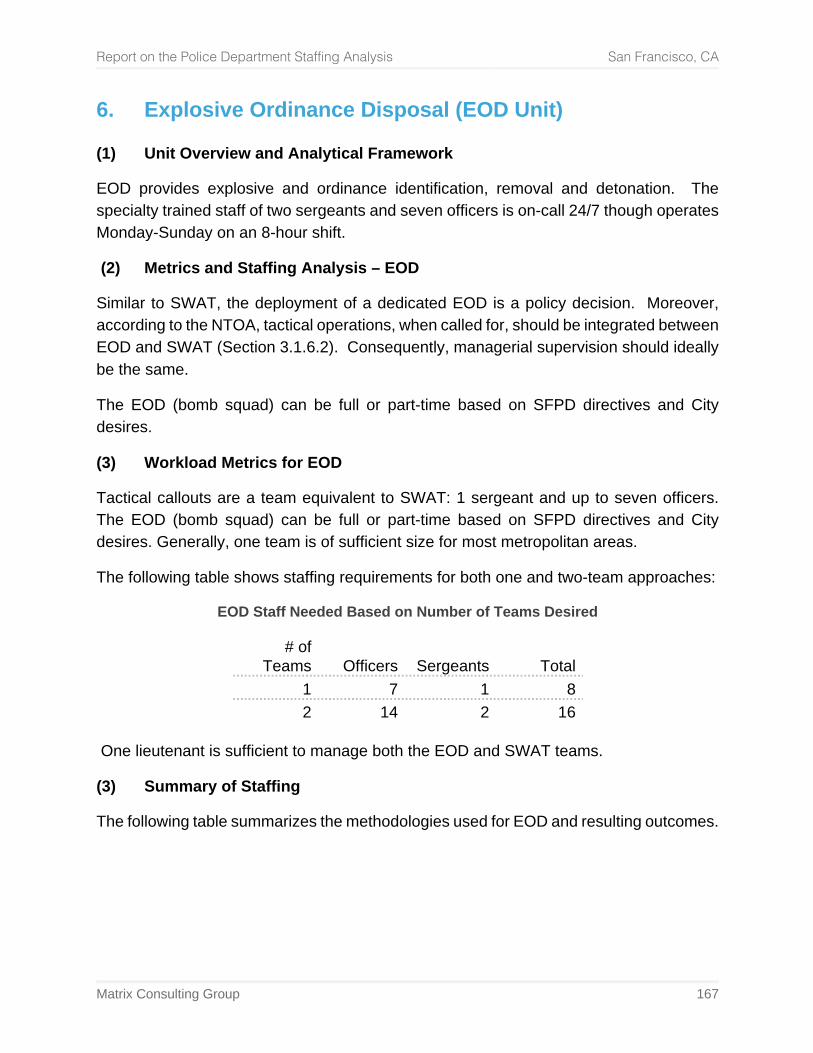
Report on the Police Department Staffing Analysis San Francisco, CA
Matrix Consulting Group 167
6. Explosive Ordinance Disposal (EOD Unit)
(1) Unit Overview and Analytical Framework
EOD provides explosive and ordinance identification, removal and detonation. The specialty trained staff of two sergeants and seven officers is on-call 24/7 though operates Monday-Sunday on an 8-hour shift.
(2) Metrics and Staffing Analysis – EOD
Similar to SWAT, the deployment of a dedicated EOD is a policy decision. Moreover, according to the NTOA, tactical operations, when called for, should be integrated between EOD and SWAT (Section 3.1.6.2). Consequently, managerial supervision should ideally be the same.
The EOD (bomb squad) can be full or part-time based on SFPD directives and City desires.
(3) Workload Metrics for EOD
Tactical callouts are a team equivalent to SWAT: 1 sergeant and up to seven officers. The EOD (bomb squad) can be full or part-time based on SFPD directives and City desires. Generally, one team is of sufficient size for most metropolitan areas.
The following table shows staffing requirements for both one and two-team approaches:
EOD Staff Needed Based on Number of Teams Desired
# of Teams Officers Sergeants Total
1 7 1 8 2 14 2 16
One lieutenant is sufficient to manage both the EOD and SWAT teams.
(3) Summary of Staffing
The following table summarizes the methodologies used for EOD and resulting outcomes.
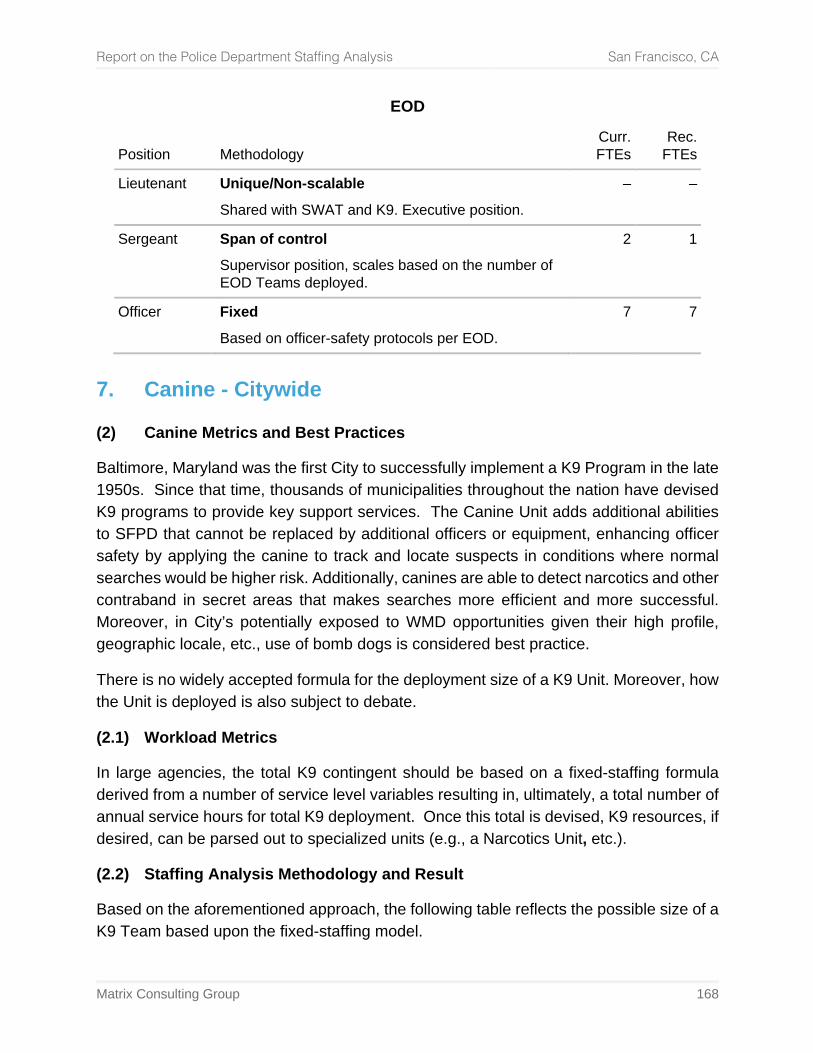
Report on the Police Department Staffing Analysis San Francisco, CA
Matrix Consulting Group 168
EOD
Position Methodology Curr.
FTEs Rec.
FTEs
Lieutenant Unique/Non-scalable
Shared with SWAT and K9. Executive position. – –
Sergeant Span of control
Supervisor position, scales based on the number of EOD Teams deployed.
2 1
Officer Fixed
Based on officer-safety protocols per EOD. 7 7
7. Canine - Citywide
(2) Canine Metrics and Best Practices
Baltimore, Maryland was the first City to successfully implement a K9 Program in the late 1950s. Since that time, thousands of municipalities throughout the nation have devised K9 programs to provide key support services. The Canine Unit adds additional abilities to SFPD that cannot be replaced by additional officers or equipment, enhancing officer safety by applying the canine to track and locate suspects in conditions where normal searches would be higher risk. Additionally, canines are able to detect narcotics and other contraband in secret areas that makes searches more efficient and more successful. Moreover, in City’s potentially exposed to WMD opportunities given their high profile, geographic locale, etc., use of bomb dogs is considered best practice.
There is no widely accepted formula for the deployment size of a K9 Unit. Moreover, how the Unit is deployed is also subject to debate.
(2.1) Workload Metrics
In large agencies, the total K9 contingent should be based on a fixed-staffing formula derived from a number of service level variables resulting in, ultimately, a total number of annual service hours for total K9 deployment. Once this total is devised, K9 resources, if desired, can be parsed out to specialized units (e.g., a Narcotics Unit, etc.).
(2.2) Staffing Analysis Methodology and Result
Based on the aforementioned approach, the following table reflects the possible size of a K9 Team based upon the fixed-staffing model.
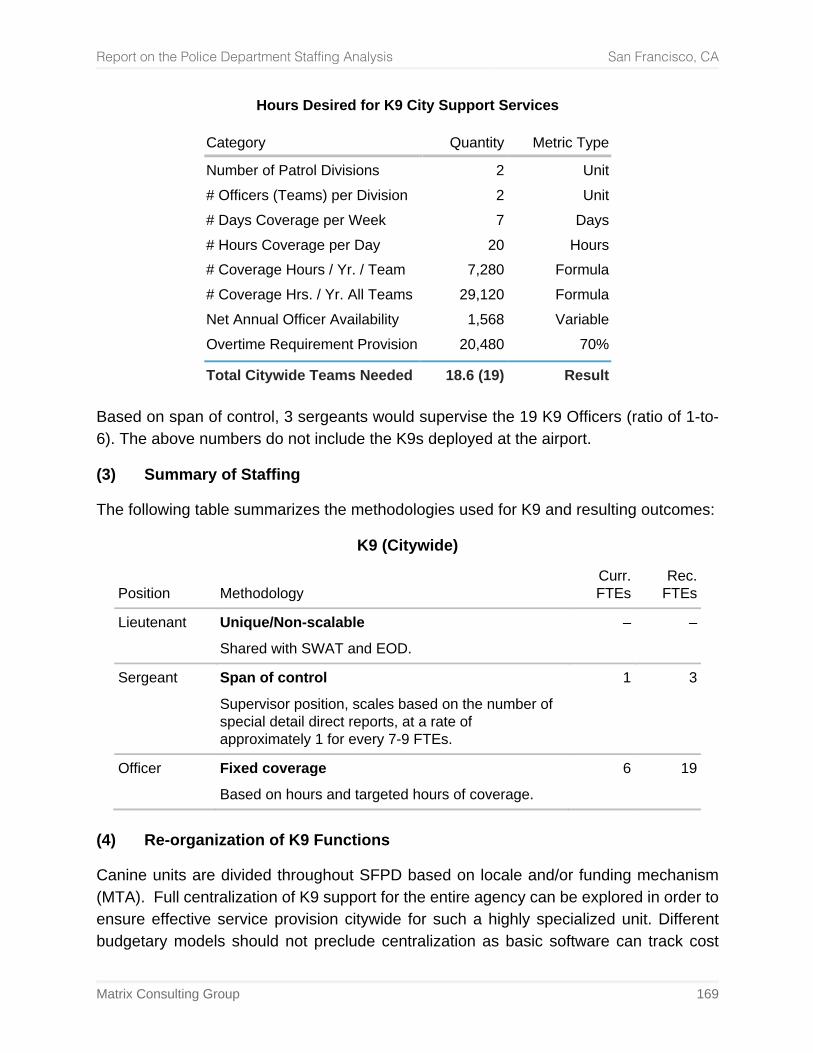
Report on the Police Department Staffing Analysis San Francisco, CA
Matrix Consulting Group 169
Hours Desired for K9 City Support Services
Category Quantity Metric Type
Number of Patrol Divisions 2 Unit # Officers (Teams) per Division 2 Unit # Days Coverage per Week 7 Days # Hours Coverage per Day 20 Hours # Coverage Hours / Yr. / Team 7,280 Formula # Coverage Hrs. / Yr. All Teams 29,120 Formula Net Annual Officer Availability 1,568 Variable Overtime Requirement Provision 20,480 70%
Total Citywide Teams Needed 18.6 (19) Result Based on span of control, 3 sergeants would supervise the 19 K9 Officers (ratio of 1-to-6). The above numbers do not include the K9s deployed at the airport.
(3) Summary of Staffing
The following table summarizes the methodologies used for K9 and resulting outcomes:
K9 (Citywide)
Position Methodology Curr.
FTEs Rec.
FTEs
Lieutenant Unique/Non-scalable
Shared with SWAT and EOD. – –
Sergeant Span of control
Supervisor position, scales based on the number of special detail direct reports, at a rate of approximately 1 for every 7-9 FTEs.
1 3
Officer Fixed coverage
Based on hours and targeted hours of coverage. 6 19
(4) Re-organization of K9 Functions
Canine units are divided throughout SFPD based on locale and/or funding mechanism (MTA). Full centralization of K9 support for the entire agency can be explored in order to ensure effective service provision citywide for such a highly specialized unit. Different budgetary models should not preclude centralization as basic software can track cost
Report on the Police Department Staffing Analysis San Francisco, CA
Matrix Consulting Group 170
allocation. The experience of our project team suggests that full centralization of a law enforcement’s K9 Unit leads to economies of scale and consistent management and utilization. Fundamentally, centralized command and control of a K9 unit would benefit from consistent training approaches, rapid coverage in the event of major event or disaster, etc.
Recommendation: Centralize all K9 functions under one operational company, excluding the Airport Bureau K9 unit. In the event SFPD does not wish centralization, the same staffing model can be used per specialized unit.
8. Mounted, Honda, and Marine Units
(1) Units Overview and Analytical Framework
The Mounted, Honda, and Marine Unit are all specialized units with unique deployment needs and specialized service approaches. The Mounted Unit (equine) is a legislative directive and was voter approved, thus is existence is mandated (though not its size). The Honda Unit is a specialized motorcycle unit on “dirt bikes” performing various proactive functions. It is quite unique in the nation with few counterparts in the United States. The Marine Unit patrol SF Bay waterways and has the ability to fluctuate in size widely.
(2) Staffing Analysis Methodology
Given all three units are fundamentally based on policy and/or executive directives, determining a staffing size for each function through quantitative means is not practical.
With regard to the Marine Unit, it too has unique functions that can be expanded or contracted based on policy directive. This can include the potential for extended boater safety contact, additional national security-related inspections, more or less interface with the Coast Guard and other Bay Area marine patrol services, and the like. The missions chosen by the Marine Unit, therefore, will have a direct nexus to the staffing levels required.
As stipulated, staffing is contingent upon policy direct, executive directive, and ultimately funding levels, with the appropriate management, supervision and administrative support functions identified throughout these staffing reports.
(2.1) Workload Metrics
While staffing levels is a policy decision, a fixed post methodology similar to K9 services can serve to inform staffing patterns for these 3 specialized units.
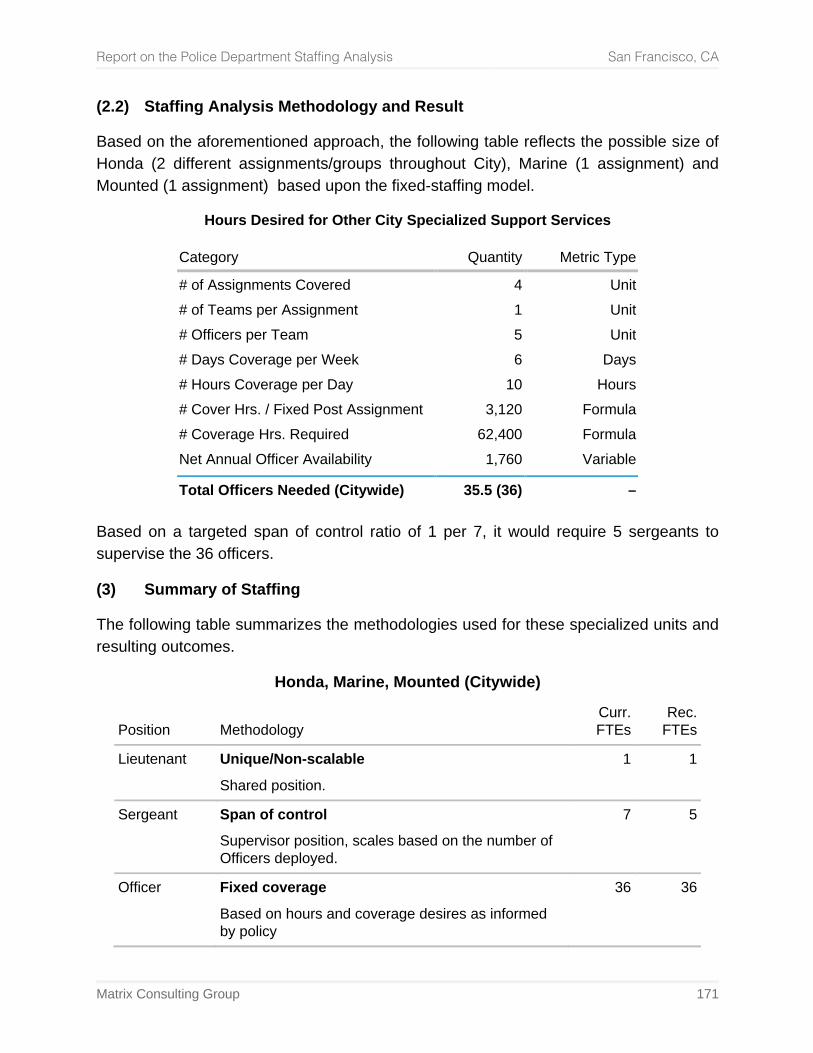
Report on the Police Department Staffing Analysis San Francisco, CA
Matrix Consulting Group 171
(2.2) Staffing Analysis Methodology and Result
Based on the aforementioned approach, the following table reflects the possible size of Honda (2 different assignments/groups throughout City), Marine (1 assignment) and Mounted (1 assignment) based upon the fixed-staffing model.
Hours Desired for Other City Specialized Support Services
Category Quantity Metric Type
# of Assignments Covered 4 Unit # of Teams per Assignment 1 Unit # Officers per Team 5 Unit # Days Coverage per Week 6 Days # Hours Coverage per Day 10 Hours # Cover Hrs. / Fixed Post Assignment 3,120 Formula # Coverage Hrs. Required 62,400 Formula Net Annual Officer Availability 1,760 Variable
Total Officers Needed (Citywide) 35.5 (36) – Based on a targeted span of control ratio of 1 per 7, it would require 5 sergeants to supervise the 36 officers.
(3) Summary of Staffing
The following table summarizes the methodologies used for these specialized units and resulting outcomes.
Honda, Marine, Mounted (Citywide)
Position Methodology Curr.
FTEs Rec.
FTEs
Lieutenant Unique/Non-scalable
Shared position. 1 1
Sergeant Span of control
Supervisor position, scales based on the number of Officers deployed.
7 5
Officer Fixed coverage
Based on hours and coverage desires as informed by policy
36 36
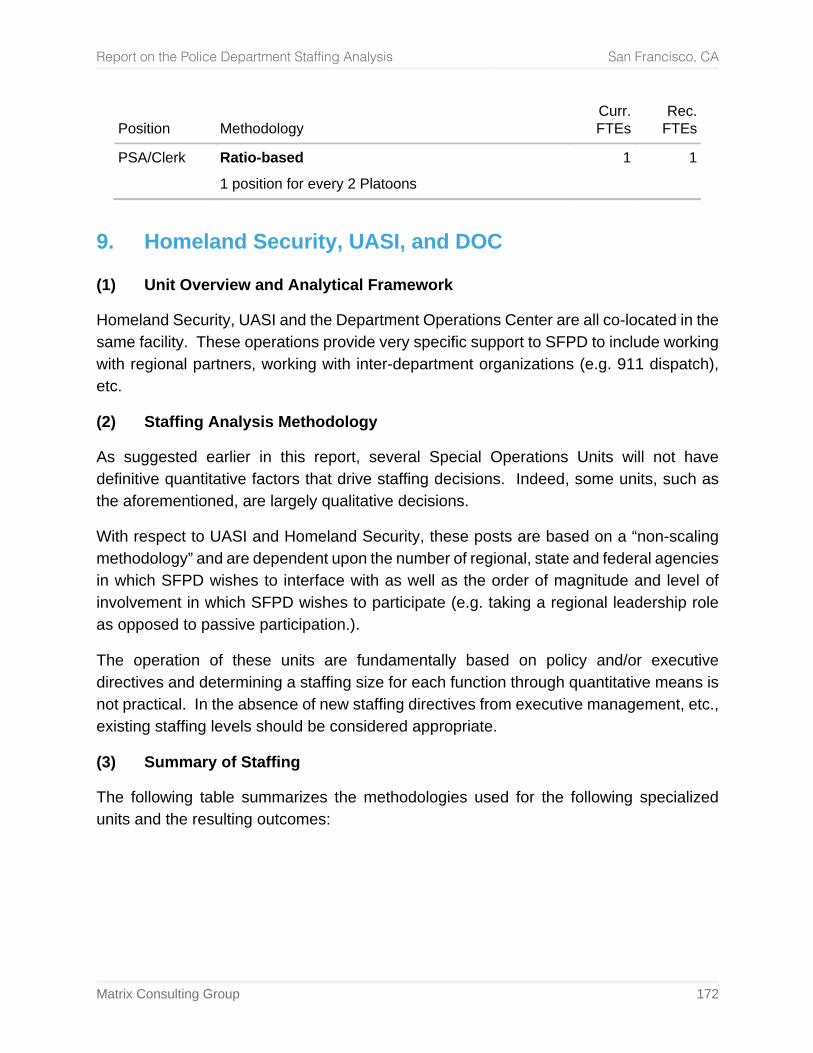
Report on the Police Department Staffing Analysis San Francisco, CA
Matrix Consulting Group 172
Position Methodology Curr.
FTEs Rec.
FTEs
PSA/Clerk Ratio-based
1 position for every 2 Platoons 1 1
9. Homeland Security, UASI, and DOC
(1) Unit Overview and Analytical Framework
Homeland Security, UASI and the Department Operations Center are all co-located in the same facility. These operations provide very specific support to SFPD to include working with regional partners, working with inter-department organizations (e.g. 911 dispatch), etc.
(2) Staffing Analysis Methodology
As suggested earlier in this report, several Special Operations Units will not have definitive quantitative factors that drive staffing decisions. Indeed, some units, such as the aforementioned, are largely qualitative decisions.
With respect to UASI and Homeland Security, these posts are based on a “non-scaling methodology” and are dependent upon the number of regional, state and federal agencies in which SFPD wishes to interface with as well as the order of magnitude and level of involvement in which SFPD wishes to participate (e.g. taking a regional leadership role as opposed to passive participation.).
The operation of these units are fundamentally based on policy and/or executive directives and determining a staffing size for each function through quantitative means is not practical. In the absence of new staffing directives from executive management, etc., existing staffing levels should be considered appropriate.
(3) Summary of Staffing
The following table summarizes the methodologies used for the following specialized units and the resulting outcomes:
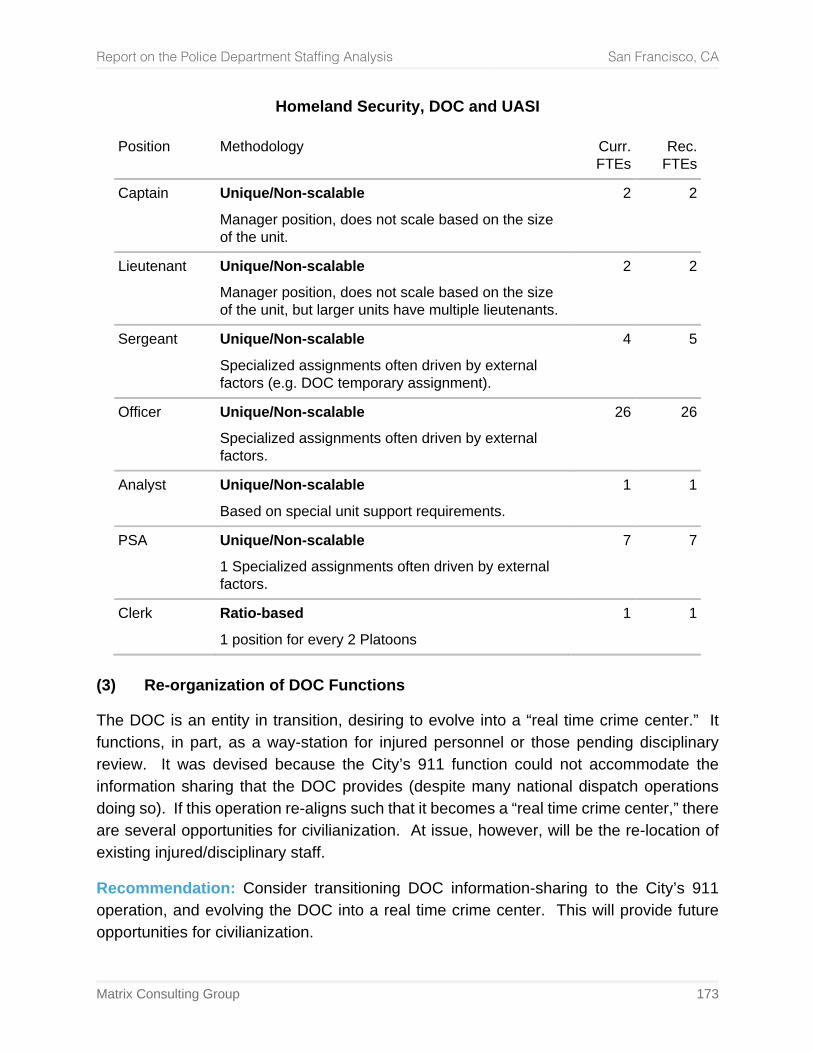
Report on the Police Department Staffing Analysis San Francisco, CA
Matrix Consulting Group 173
Homeland Security, DOC and UASI
Position Methodology Curr. FTEs
Rec. FTEs
Captain Unique/Non-scalable
Manager position, does not scale based on the size of the unit.
2 2
Lieutenant Unique/Non-scalable
Manager position, does not scale based on the size of the unit, but larger units have multiple lieutenants.
2 2
Sergeant Unique/Non-scalable
Specialized assignments often driven by external factors (e.g. DOC temporary assignment).
4 5
Officer Unique/Non-scalable
Specialized assignments often driven by external factors.
26 26
Analyst Unique/Non-scalable
Based on special unit support requirements. 1 1
PSA Unique/Non-scalable
1 Specialized assignments often driven by external factors.
7 7
Clerk Ratio-based
1 position for every 2 Platoons 1 1
(3) Re-organization of DOC Functions
The DOC is an entity in transition, desiring to evolve into a “real time crime center.” It functions, in part, as a way-station for injured personnel or those pending disciplinary review. It was devised because the City’s 911 function could not accommodate the information sharing that the DOC provides (despite many national dispatch operations doing so). If this operation re-aligns such that it becomes a “real time crime center,” there are several opportunities for civilianization. At issue, however, will be the re-location of existing injured/disciplinary staff.
Recommendation: Consider transitioning DOC information-sharing to the City’s 911 operation, and evolving the DOC into a real time crime center. This will provide future opportunities for civilianization.
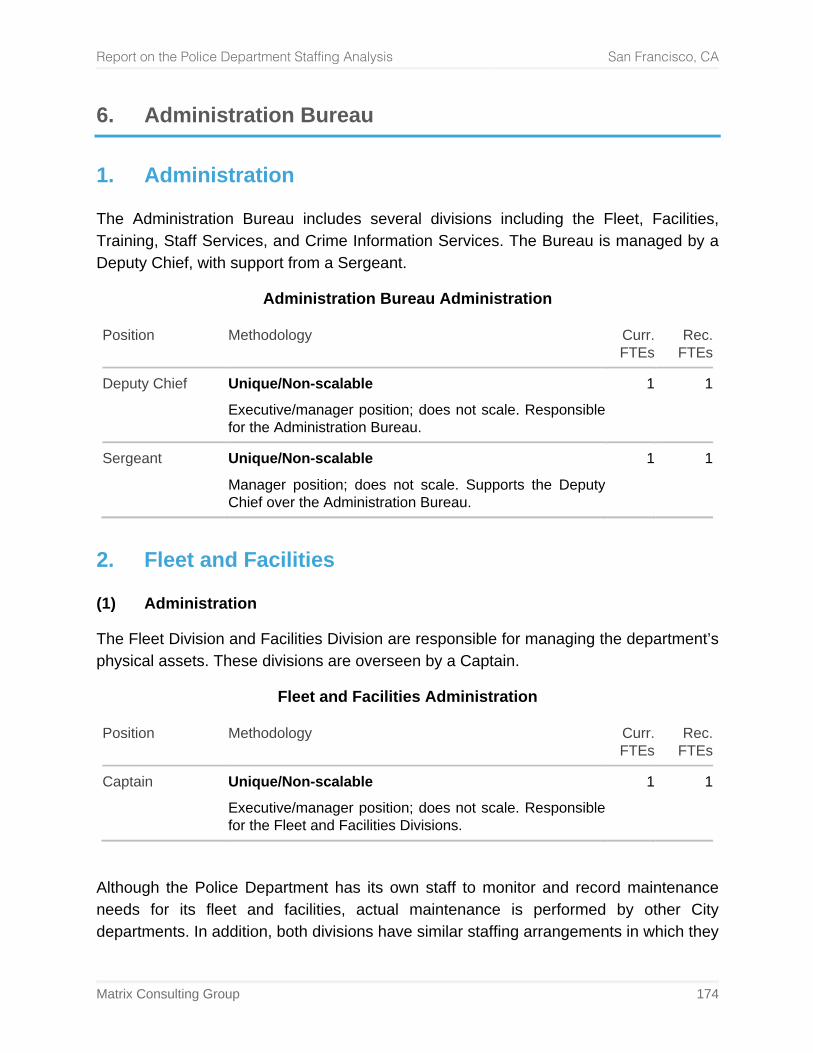
Report on the Police Department Staffing Analysis San Francisco, CA
Matrix Consulting Group 174
6. Administration Bureau
1. Administration
The Administration Bureau includes several divisions including the Fleet, Facilities, Training, Staff Services, and Crime Information Services. The Bureau is managed by a Deputy Chief, with support from a Sergeant.
Administration Bureau Administration
Position Methodology Curr. FTEs
Rec. FTEs
Deputy Chief
Unique/Non-scalable
Executive/manager position; does not scale. Responsible for the Administration Bureau.
1 1
Sergeant
Unique/Non-scalable
Manager position; does not scale. Supports the Deputy Chief over the Administration Bureau.
1 1
2. Fleet and Facilities
(1) Administration
The Fleet Division and Facilities Division are responsible for managing the department’s physical assets. These divisions are overseen by a Captain.
Fleet and Facilities Administration
Position Methodology Curr. FTEs
Rec. FTEs
Captain
Unique/Non-scalable
Executive/manager position; does not scale. Responsible for the Fleet and Facilities Divisions.
1 1
Although the Police Department has its own staff to monitor and record maintenance needs for its fleet and facilities, actual maintenance is performed by other City departments. In addition, both divisions have similar staffing arrangements in which they
Report on the Police Department Staffing Analysis San Francisco, CA
Matrix Consulting Group 175
coordinate with line level staff that do not report to the Fleet and Facilities Divisions, but to their respective station or post assignments.
(2) Facilities
For the Facilities Division, the Building & Grounds Maintenance Superintendent and Maintenance Planner coordinate with 11 budgeted Facility Coordinators; however, only one of the Facility Coordinators reports directly to the Facilities Division, as the other 10 positions report to their respective command staff of the stations in which they are assigned. Altogether, the Division is responsible for maintaining 33 buildings used by the Police Department.
Facility Coordinators inspect and monitor police facilities for preventative and corrective maintenance needs and work with San Francisco Public Works and Real Estate to coordinate all maintenance work, in addition to a range of other activities necessary to manage the department’s facilities and physical assets. Currently, there are 10 Facility Coordinators assigned to each of the 10 district stations, and the remaining 23 facilities have been supported primarily by the Building & Grounds Maintenance Superintendent and Maintenance Planner. An eleventh Facility Coordinator was added during the course of this study to assist the Building & Grounds Superintendent and Maintenance Planner in supporting the 23 other facilities not prior supported by a Facility Coordinator.
A ratio of one Facility Coordinator per district station is adequate to manage the asset management program for those facilities. Since the remaining 23 facilities are not as active as the 10 district stations, a Facility Coordinator has greater capacity to support multiple facilities.
We estimate that a ratio of one Facility Coordinator per four non-station facilities is adequate to manage the department’s asset management program so that the Building & Grounds Superintendent and Maintenance Planner may focus on high level project management and planning for the department, as opposed to regular preventative and corrective maintenance monitoring. This ratio infers that six Facility Coordinators are needed to adequately support the non-station facilities. Altogether, we estimate that 16 total budgeted Facility Coordinators are required to support the Facilities Division.
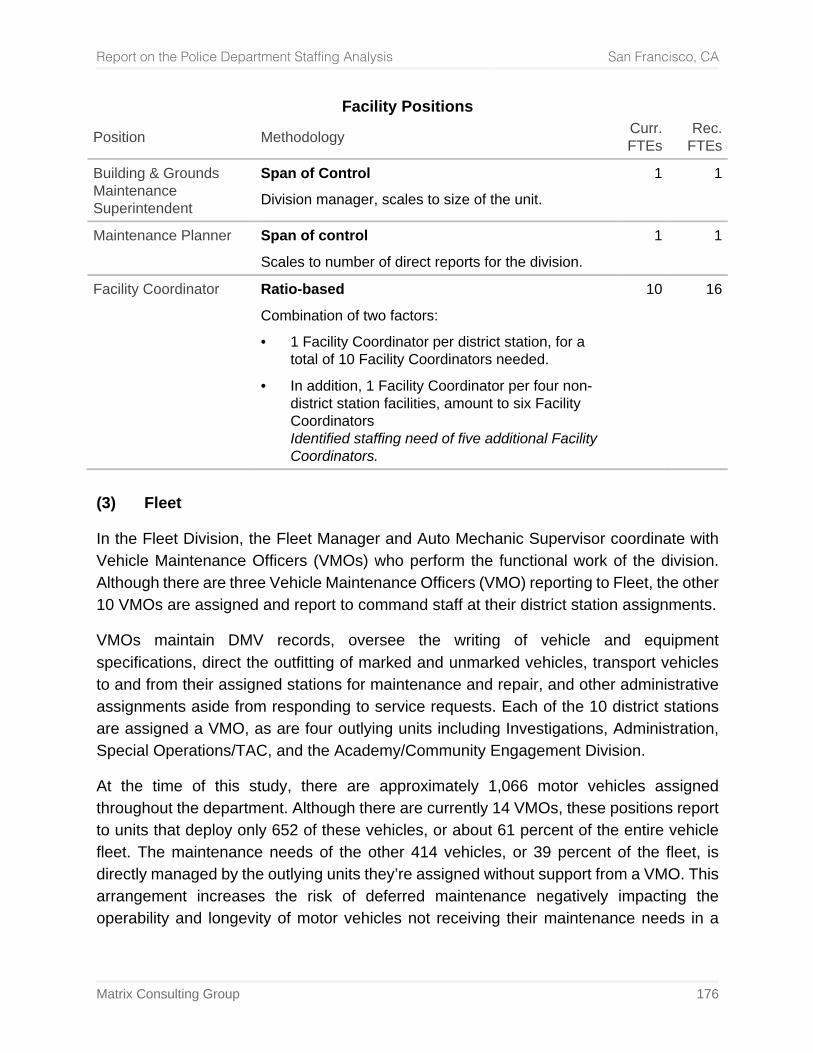
Report on the Police Department Staffing Analysis San Francisco, CA
Matrix Consulting Group 176
Facility Positions
Position Methodology Curr. FTEs
Rec. FTEs
Building & Grounds Maintenance Superintendent
Span of Control
Division manager, scales to size of the unit. 1 1
Maintenance Planner Span of control
Scales to number of direct reports for the division. 1 1
Facility Coordinator Ratio-based
Combination of two factors:
• 1 Facility Coordinator per district station, for a total of 10 Facility Coordinators needed.
• In addition, 1 Facility Coordinator per four non-district station facilities, amount to six Facility Coordinators Identified staffing need of five additional Facility Coordinators.
10 16
(3) Fleet
In the Fleet Division, the Fleet Manager and Auto Mechanic Supervisor coordinate with Vehicle Maintenance Officers (VMOs) who perform the functional work of the division. Although there are three Vehicle Maintenance Officers (VMO) reporting to Fleet, the other 10 VMOs are assigned and report to command staff at their district station assignments.
VMOs maintain DMV records, oversee the writing of vehicle and equipment specifications, direct the outfitting of marked and unmarked vehicles, transport vehicles to and from their assigned stations for maintenance and repair, and other administrative assignments aside from responding to service requests. Each of the 10 district stations are assigned a VMO, as are four outlying units including Investigations, Administration, Special Operations/TAC, and the Academy/Community Engagement Division.
At the time of this study, there are approximately 1,066 motor vehicles assigned throughout the department. Although there are currently 14 VMOs, these positions report to units that deploy only 652 of these vehicles, or about 61 percent of the entire vehicle fleet. The maintenance needs of the other 414 vehicles, or 39 percent of the fleet, is directly managed by the outlying units they’re assigned without support from a VMO. This arrangement increases the risk of deferred maintenance negatively impacting the operability and longevity of motor vehicles not receiving their maintenance needs in a
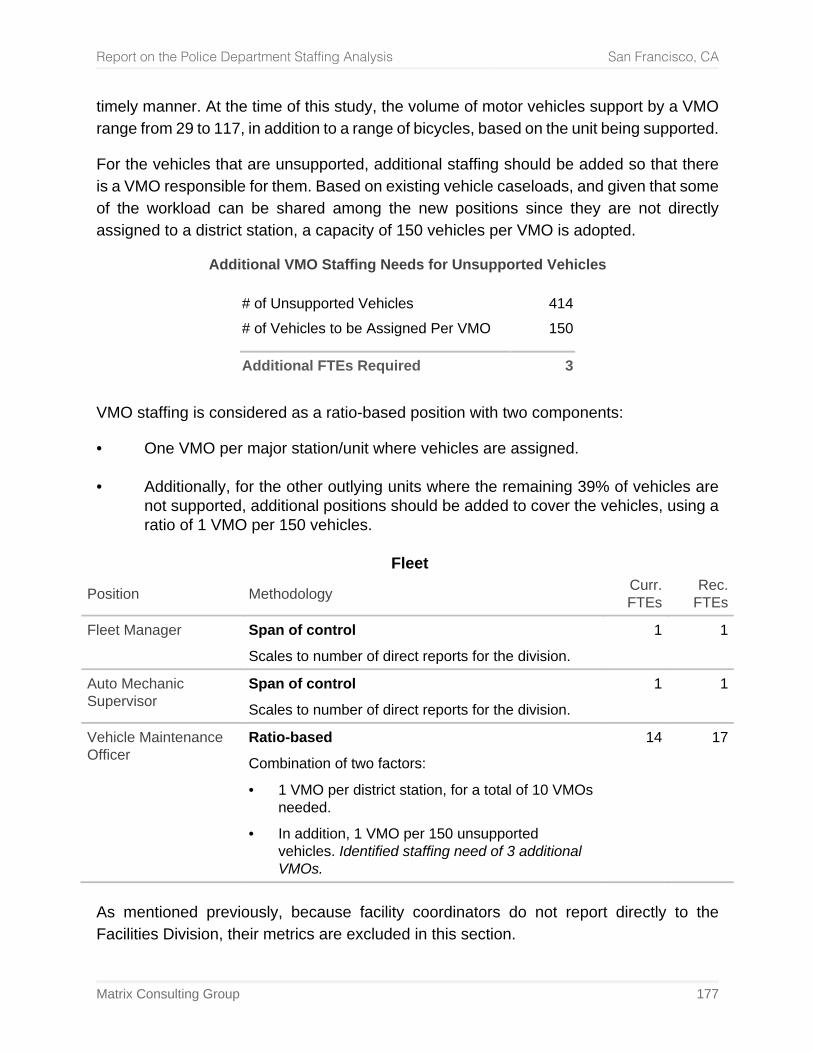
Report on the Police Department Staffing Analysis San Francisco, CA
Matrix Consulting Group 177
timely manner. At the time of this study, the volume of motor vehicles support by a VMO range from 29 to 117, in addition to a range of bicycles, based on the unit being supported.
For the vehicles that are unsupported, additional staffing should be added so that there is a VMO responsible for them. Based on existing vehicle caseloads, and given that some of the workload can be shared among the new positions since they are not directly assigned to a district station, a capacity of 150 vehicles per VMO is adopted.
Additional VMO Staffing Needs for Unsupported Vehicles
# of Unsupported Vehicles 414 # of Vehicles to be Assigned Per VMO 150
Additional FTEs Required 3
VMO staffing is considered as a ratio-based position with two components:
• One VMO per major station/unit where vehicles are assigned. • Additionally, for the other outlying units where the remaining 39% of vehicles are
not supported, additional positions should be added to cover the vehicles, using a ratio of 1 VMO per 150 vehicles.
Fleet
Position Methodology Curr. FTEs
Rec. FTEs
Fleet Manager Span of control
Scales to number of direct reports for the division. 1 1
Auto Mechanic Supervisor
Span of control
Scales to number of direct reports for the division. 1 1
Vehicle Maintenance Officer
Ratio-based
Combination of two factors:
• 1 VMO per district station, for a total of 10 VMOs needed.
• In addition, 1 VMO per 150 unsupported vehicles. Identified staffing need of 3 additional VMOs.
14 17
As mentioned previously, because facility coordinators do not report directly to the Facilities Division, their metrics are excluded in this section.
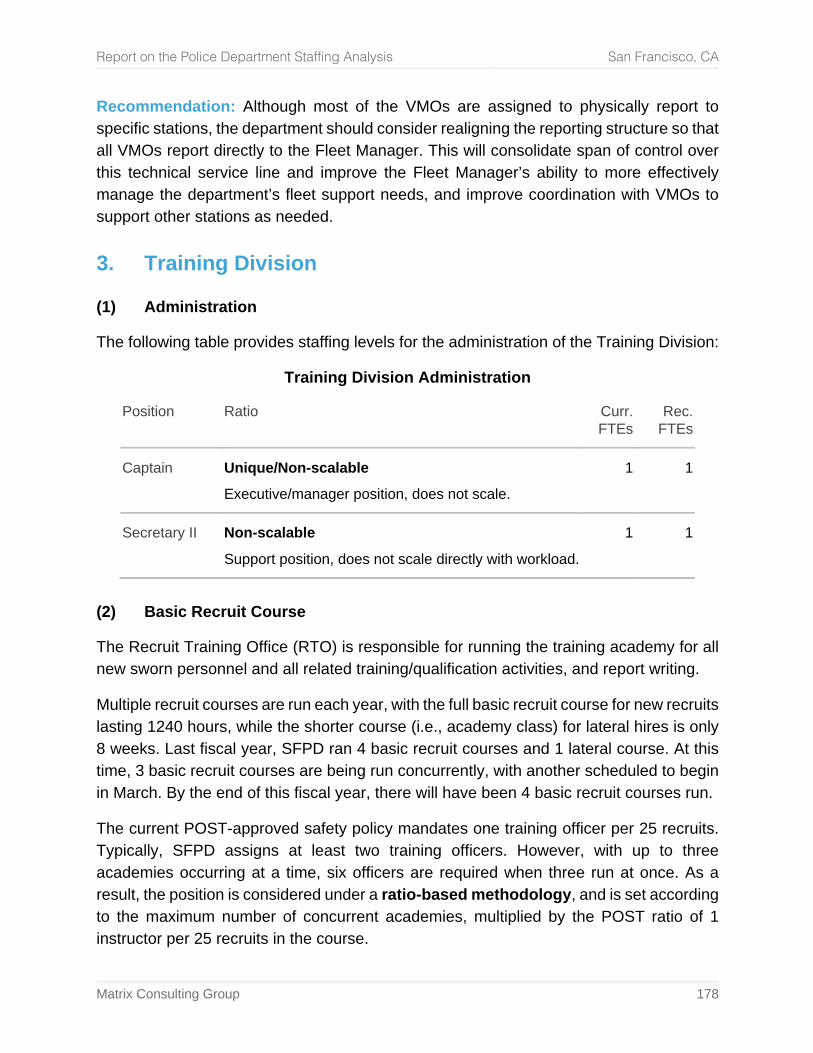
Report on the Police Department Staffing Analysis San Francisco, CA
Matrix Consulting Group 178
Recommendation: Although most of the VMOs are assigned to physically report to specific stations, the department should consider realigning the reporting structure so that all VMOs report directly to the Fleet Manager. This will consolidate span of control over this technical service line and improve the Fleet Manager’s ability to more effectively manage the department’s fleet support needs, and improve coordination with VMOs to support other stations as needed.
3. Training Division
(1) Administration
The following table provides staffing levels for the administration of the Training Division:
Training Division Administration
Position Ratio Curr. FTEs
Rec. FTEs
Captain Unique/Non-scalable
Executive/manager position, does not scale. 1 1
Secretary II Non-scalable
Support position, does not scale directly with workload. 1 1
(2) Basic Recruit Course
The Recruit Training Office (RTO) is responsible for running the training academy for all new sworn personnel and all related training/qualification activities, and report writing.
Multiple recruit courses are run each year, with the full basic recruit course for new recruits lasting 1240 hours, while the shorter course (i.e., academy class) for lateral hires is only 8 weeks. Last fiscal year, SFPD ran 4 basic recruit courses and 1 lateral course. At this time, 3 basic recruit courses are being run concurrently, with another scheduled to begin in March. By the end of this fiscal year, there will have been 4 basic recruit courses run.
The current POST-approved safety policy mandates one training officer per 25 recruits. Typically, SFPD assigns at least two training officers. However, with up to three academies occurring at a time, six officers are required when three run at once. As a result, the position is considered under a ratio-based methodology, and is set according to the maximum number of concurrent academies, multiplied by the POST ratio of 1 instructor per 25 recruits in the course.
Report on the Police Department Staffing Analysis San Francisco, CA
Matrix Consulting Group 179
Over the past five years, classes have been run with an average of 48.5 recruits, excluding lateral academies. Included within this number are typically around 5 additional recruits that are in the academy for the San Francisco Sheriff’s Department or other agencies.
The Recruit Training Office (RTO) is organized with 1 lieutenant, 1 sergeant, and 6 officers, and is responsible for providing training in a number of core areas. These roles are distinct from EVOC and PT/DT, which are handled by other staff. Staff provide basic recruit course (academy) training. POST requirements for course certification call for 1 officer for every 25 recruits. With five officers, a total of 125 recruits can be supported. It is important to note that these are the minimum requirements for POST certification, and do not necessarily represent best practices. Additionally, multiple basic recruit courses are run concurrently, requiring additional time to administer, manage, and provide training than if the same number of recruits were in a single course. As a result, the staffing analysis uses a lower ratio of 1 officer for every 10 recruits. This will require an additional officer position to meet, as 55 recruits are currently budgeted for.
(2.1) Physical Training and Defensive Tactics
PT/DT (Physical Training/Defensive Tactics) manages the physical fitness testing program that all SFPD sworn personnel are required to qualify for twice yearly. The role includes a staffing contingent of 1 sergeant and 4 officers. In addition, a newly created civilian PT instructor position, but is not currently filled. Additional trainers are brought in for defensive tactics training as needed.
Defensive tactics training for trainees in the basic recruit course is one of the primary responsibilities of the unit. Standards for instructor-to-pupil ratios for most defensive tactics techniques are mandated in POST guidelines. In general, a 1:20 ratio is needed for defensive tactics classes. Handcuffing requires a 1:8 ratio, while certain techniques have much lower mandated ratios, such as the carotid restraint (1:1). Multiple instructors are present in a course, and the class is broken down and rotated through in order to handle the subjects requiring lower ratios, while the rest of the class reviews other techniques.
The unit is also responsible for incorporating and educating on updates to case law, which can present changes to the defensive tactics techniques and protocols trained for use by officers.
For in-service personnel, the unit provides continual professional training (CPT). Every two weeks, sworn personnel spend a week in training, which include a mix of both
Report on the Police Department Staffing Analysis San Francisco, CA
Matrix Consulting Group 180
defensive tactics training and case law updates. The sergeant over the unit is responsible for updating and developing the curriculum, which is in part informed by use of force case studies and other priorities that are identified.
On the physical training component, the unit coordinates and administers the semiannual physical fitness exam for both recruits on in-service personnel. For recruits, the POST battery outlines five different tasks that must be completed successfully within a certain time fame. This includes a 1.5-mile run, 500-yard sprint, climbing over a six-foot wall and sprinting 50 yards, climbing over a six-foot fence and sprinting 50 yards, and completing an obstacle course. For in-service personnel, vacation time is awarded based on individual score. A certain score is not required to maintain certification, pay, or employment.
Staffing is set at a combined ratio for physical training and defensive tactics, relative to maximum recruit course size. Based on interviews conducted by the project team, as well as POST requirements for instructor-to-pupil ratios, the unit’s staffing is sufficient for basic recruit course instructor and other responsibilities, such as case law updates, for the current size of recruit classes. If the basic recruit course classes were to become significantly larger, maintaining the required ratios would require additional staff.
Consequently, the staffing analysis uses a ratio-based methodology based on these considerations, at 1 sergeant (non-scaling), plus 4 instructors per 40 recruits in a basic recruit course – or rather, 1 officer per 12.5 recruits. Concurrent courses are run, but because they are staggered, the largest class size is used. Once class sizes reach 63, an additional officer position would automatically be needed.
(2.2) EVOC
EVOC (Emergency Vehicle Operator Course) is staffed by 1 sergeant and 2 officers, and provides mostly (but not exclusively) basic recruit course training. Additional instructors are brought in through collateral assignments. The current POST certification specifies a 1:4 student-to-instructor ratio.
The EVOC course itself is mandated by CA POST, and includes a wide range of basic, intermediate, and advanced driving techniques related to law enforcement vehicle operation 40 hours are mandated by POST for new recruits. Due to deficiencies identified in recent years with new recruits, as well as declining rates of successful completion of EVOC standards, this has been expanded to 84 hours. Instructors observed that many techniques related to driving in dense urban environments, such as parallel parking, vehicle maneuvering at low speeds, and others were lacking among younger recruits.
Report on the Police Department Staffing Analysis San Francisco, CA
Matrix Consulting Group 181
One element of the course is the precision maneuvers course (PMC) which includes a variety of techniques that must be completed within time limits (added to simulate higher-pressure environments), such as completing safe U-turns, forward and backward slalom, reverse parking in stalls, and T-turns. This part of the course is taught at Pier 96. In addition to the full-time instructors, a total of 15 part time instructors are used in the EVOC course training.
The current model is somewhat dependent on overtime, with instructors having to conduct a portion of the training outside of regular hours, i.e., extra recruit practice, remediation, and re-testing. Some in service training is done outside of regular hours to accommodate early starting mid-night units. Given the limit of 520 overtime hours per year, and the close instructor-to-pupil ratios necessary for providing the course, the staffing needs of EVOC are inherently tied to the size of the largest basic recruit class (since concurrent courses are staggered). Consequently, staffing could potentially be set using a ratio-based methodology. However, staffing needs fluctuate significantly based on the availability of instructors teaching the class in an ancillary capacity to their regular duty. As a result, an element of this position should be considered as non-scaling or selective.
(2.3) Report Writing
Report writing is taught at the basic recruit course by one sergeant position, who is assigned directly to that role. Unlike the other training staff, this role is exclusively focused on basic recruit course-level training, with the exception of FTO trainees having difficulty and requiring remedial training support. The role is unique, and does not scale unless the scope of the unit changes to include review and coordination of training priorities for in-service personnel.
(2.4) Basic Recruit Course Staffing
The following table summarizes the methodologies used for basic recruit course functions, as well as the range:
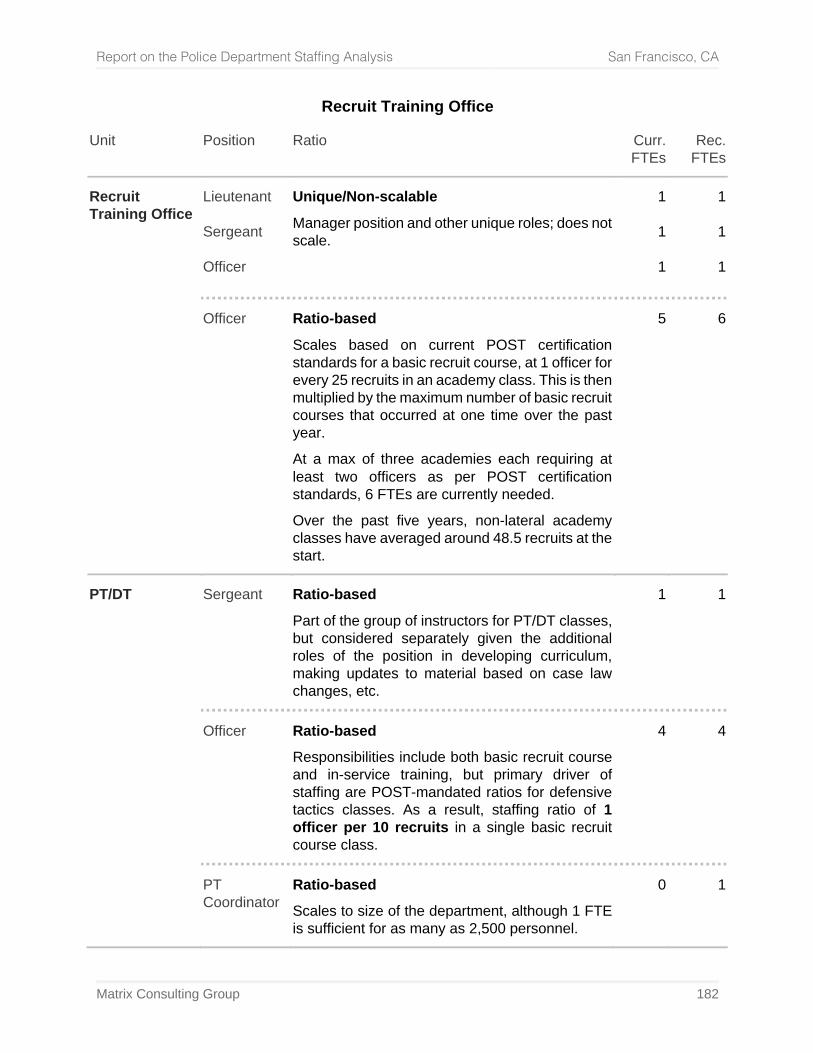
Report on the Police Department Staffing Analysis San Francisco, CA
Matrix Consulting Group 182
Recruit Training Office
Unit Position Ratio Curr. FTEs
Rec. FTEs
Recruit Training Office
Lieutenant Sergeant Officer
Unique/Non-scalable
Manager position and other unique roles; does not scale.
1
1
1
1
1
1
Officer Ratio-based
Scales based on current POST certification standards for a basic recruit course, at 1 officer for every 25 recruits in an academy class. This is then multiplied by the maximum number of basic recruit courses that occurred at one time over the past year.
At a max of three academies each requiring at least two officers as per POST certification standards, 6 FTEs are currently needed.
Over the past five years, non-lateral academy classes have averaged around 48.5 recruits at the start.
5 6
PT/DT
Sergeant Ratio-based
Part of the group of instructors for PT/DT classes, but considered separately given the additional roles of the position in developing curriculum, making updates to material based on case law changes, etc.
1 1
Officer Ratio-based
Responsibilities include both basic recruit course and in-service training, but primary driver of staffing are POST-mandated ratios for defensive tactics classes. As a result, staffing ratio of 1 officer per 10 recruits in a single basic recruit course class.
4 4
PT Coordinator
Ratio-based
Scales to size of the department, although 1 FTE is sufficient for as many as 2,500 personnel.
0 1
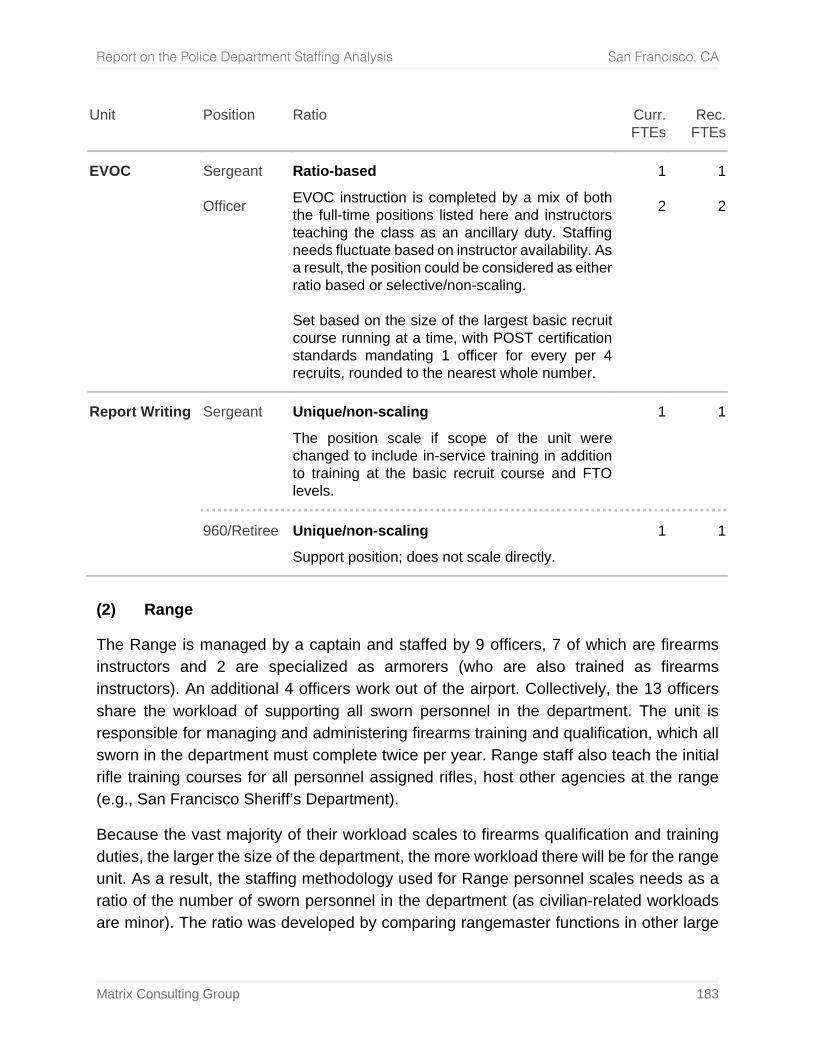
Report on the Police Department Staffing Analysis San Francisco, CA
Matrix Consulting Group 183
Unit Position Ratio Curr. FTEs
Rec. FTEs
EVOC
Sergeant Officer
Ratio-based
EVOC instruction is completed by a mix of both the full-time positions listed here and instructors teaching the class as an ancillary duty. Staffing needs fluctuate based on instructor availability. As a result, the position could be considered as either ratio based or selective/non-scaling. Set based on the size of the largest basic recruit course running at a time, with POST certification standards mandating 1 officer for every per 4 recruits, rounded to the nearest whole number.
1
2
1
2
Report Writing
Sergeant Unique/non-scaling
The position scale if scope of the unit were changed to include in-service training in addition to training at the basic recruit course and FTO levels.
1 1
960/Retiree Unique/non-scaling
Support position; does not scale directly. 1 1
(2) Range
The Range is managed by a captain and staffed by 9 officers, 7 of which are firearms instructors and 2 are specialized as armorers (who are also trained as firearms instructors). An additional 4 officers work out of the airport. Collectively, the 13 officers share the workload of supporting all sworn personnel in the department. The unit is responsible for managing and administering firearms training and qualification, which all sworn in the department must complete twice per year. Range staff also teach the initial rifle training courses for all personnel assigned rifles, host other agencies at the range (e.g., San Francisco Sheriff’s Department).
Because the vast majority of their workload scales to firearms qualification and training duties, the larger the size of the department, the more workload there will be for the range unit. As a result, the staffing methodology used for Range personnel scales needs as a ratio of the number of sworn personnel in the department (as civilian-related workloads are minor). The ratio was developed by comparing rangemaster functions in other large
Report on the Police Department Staffing Analysis San Francisco, CA
Matrix Consulting Group 184
metropolitan agencies. As a ratio to total sworn, the number of range personnel employed by SFPD is similar, although it is at the high end of the range.
The additional agencies that use the SFPD range, present an additional workload factor, however, and so staffing needs must be adjusted as a consequence of this. Staffing is set as a ratio of 1 FTE for every 200 sworn positions in the department, plus one additional FTE to account for support provided to outside agencies.
POST certification requirements mandate an instructor-to-recruit ratio of 1 to 3. For in-service firearms qualification and training, a ratio of 1 to 5 is required. Training is not conducted all at the same time for either group, and so staffing is based on the number needed to fulfill in-service training requirements. However, as academies are run, the workload of the unit fluctuates
Range
Position Ratio Curr. FTEs
Rec. FTEs
Sergeant Unique/non-scalable
Executive position, does not scale. 1 1
Officer Ratio-based
Scales based on the number of sworn personnel in the department, at 1 per 200 sworn FTEs. In addition to this, 1 FTE is added to account for support provided to outside agencies.
9 10
(3) Field Training Office
The Field Training Office manages and coordinates the department's FTO program. The unit's staffing is comprised of one lieutenant, one sergeant, one officer, and one civilian clerk typist position. The unit is responsible for the administrative coordination of the program, managing assignments, FTO trainer availability, evaluations, and teaching the following classes: 40 hours for certification, 24 hour re-certification classes for FTO/FTO sergeants, introduction to FTO for recruits, and the FTO preparation week. A key component of this is the review of DOR (daily observation report) evaluations, which comprise an average of approximately 30 per day with an additional 30 weekly supervisor reviews, each of which is estimated to take within the range of 16 to 34 minutes.
The unit also tracks FTO program graduates, who are classified as probationary officers for one year after FTO. Every month, the probationary officers have an appraisal
Report on the Police Department Staffing Analysis San Francisco, CA
Matrix Consulting Group 185
completed, consisting of 8 pages and 6 categories. The Field Training Office estimates that each monthly appraisal takes approximately 30 minutes to review and file for compliance. There are currently 108 officers on probationary status.
At this time, there are 146 certified FTO trainers; however, only 113 are assigned to stations that are eligible to receive trainees. Currently, there are 28 trainees undergoing the FTO program, which constitutes a ratio of approximately 4 eligible trainers18 for every trainee. This is expected to diminish somewhat with the next two academy classes graduating (estimated within the 20-30 range) as the current FTO class completed the program.
(3.1) FTO Staffing Methodology
Historically, there have often more trainees in the FTO program at one time than there are currently – sometimes as many as 90 or more. To accommodate the additional workload this involved, the unit was staffed with one additional officer than the unit is currently allocated. This creates a critical data point for use in developing staffing ratios, as the unit needed to grow to match the scale of the program.
• It is assumed that the unit’s lieutenant and sergeant are non-scalable as supervisors, although they do assist with a portion of the work handled by officers. Staffing for officers can then be set relative to the number of FTO trainees.
• For officers assigned to the unit, Based on the estimated time needed to review DORs (16 to 34 minutes, although some of that work is shared) and additional station visit/ride-along duties, 1 officer is required for every 20 trainees in the program. Beyond that threshold, the workload can be assumed to exceed capacity, and an additional officer would be required.
• The clerk typist position has been listed as non-scalable/elective in order to be more flexibly adjusted.
(3.2) Field Training Staffing Summary
The following table provides a summary of the current staffing levels of the unit, as well as the factors used to determine needs:
18 Refers to the 113 FTO trainers that are assigned to the stations permitted to have FTO trainees.
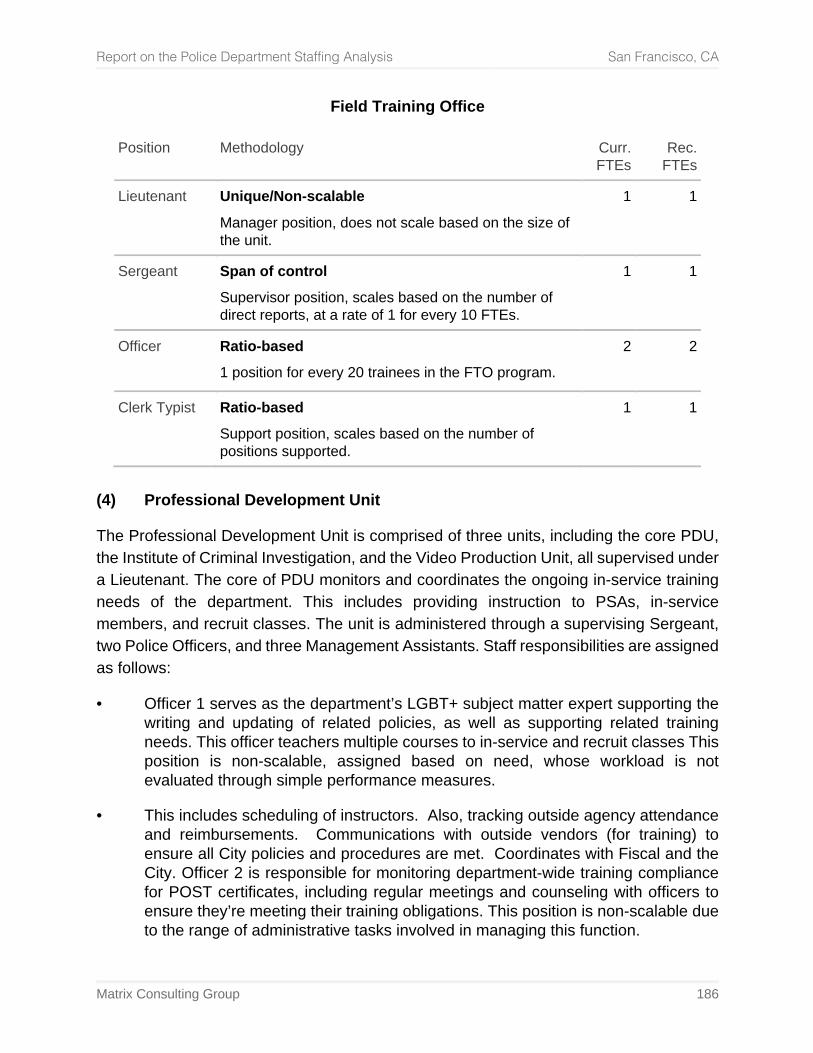
Report on the Police Department Staffing Analysis San Francisco, CA
Matrix Consulting Group 186
Field Training Office
Position Methodology Curr. FTEs
Rec. FTEs
Lieutenant Unique/Non-scalable
Manager position, does not scale based on the size of the unit.
1 1
Sergeant Span of control
Supervisor position, scales based on the number of direct reports, at a rate of 1 for every 10 FTEs.
1 1
Officer Ratio-based
1 position for every 20 trainees in the FTO program. 2 2
Clerk Typist
Ratio-based
Support position, scales based on the number of positions supported.
1 1
(4) Professional Development Unit
The Professional Development Unit is comprised of three units, including the core PDU, the Institute of Criminal Investigation, and the Video Production Unit, all supervised under a Lieutenant. The core of PDU monitors and coordinates the ongoing in-service training needs of the department. This includes providing instruction to PSAs, in-service members, and recruit classes. The unit is administered through a supervising Sergeant, two Police Officers, and three Management Assistants. Staff responsibilities are assigned as follows:
• Officer 1 serves as the department’s LGBT+ subject matter expert supporting the writing and updating of related policies, as well as supporting related training needs. This officer teachers multiple courses to in-service and recruit classes This position is non-scalable, assigned based on need, whose workload is not evaluated through simple performance measures.
• This includes scheduling of instructors. Also, tracking outside agency attendance and reimbursements. Communications with outside vendors (for training) to ensure all City policies and procedures are met. Coordinates with Fiscal and the City. Officer 2 is responsible for monitoring department-wide training compliance for POST certificates, including regular meetings and counseling with officers to ensure they’re meeting their training obligations. This position is non-scalable due to the range of administrative tasks involved in managing this function.
Report on the Police Department Staffing Analysis San Francisco, CA
Matrix Consulting Group 187
• Management Assistant 1 is referred to as the advanced officer training manager. The incumbent monitors Advanced Officer Continuing Professional Training (ACPT) records for the entire department to ensure ongoing compliance. This position is non-scalable due to the range of administrative tasks involved in managing this function.
• Management Assistant 2 is referred to as the outside training manager. The incumbent reviews, approves, and processes all outside training requests for the entire department. This position is non-scalable due to the range of administrative tasks involved in managing this function.
• Management Assistant 3 is referred to as the internal training manager. The incumbent is responsible for processing billing for the unit, such as invoices for training courses set up and attended by department staff at the City College of San Francisco. The incumbent also monitors city mandated training requirements. Due to the ranging administrative work of the incumbent, this position is non-scalable. Creates course announcements, and creates course rosters. Create, update, populate and close each course session in HRMS and on the POST website.
Media Production Technicians in the Video Production Unit are responsible for producing digital media used in a range of trainings for the department, from academy training to ongoing in-service training. The work of a Media Production Technician is complex as staff must script productions, coordinate with subject matter experts and other stakeholders to verify script content, cast and coordinate with staff for productions, record the production, and then edit productions for release. Although hours are not currently tracked by staff and project, there is potential to use a workload-methodology to project future staffing needs. Staff should record the number of hours expended by staff per production to establish a baseline average of hours required per production. This data can be used to extrapolate for future staffing needs assessments should management seek to modify the output and demands of the VPU.
The last unit of the PDU is the Institute of Criminal Investigation, a regional POST training program. Pursuant to a contract with the State to administer this POST program, the current deployment of a Sergeant to run the Institute satisfies minimum staffing requirements. The incumbent is primarily serving as the Institute’s administrator responsible for managing the logistics to host this regional training event periodically throughout each year. Due to the contract requirement, this position is selective and non-scalable.
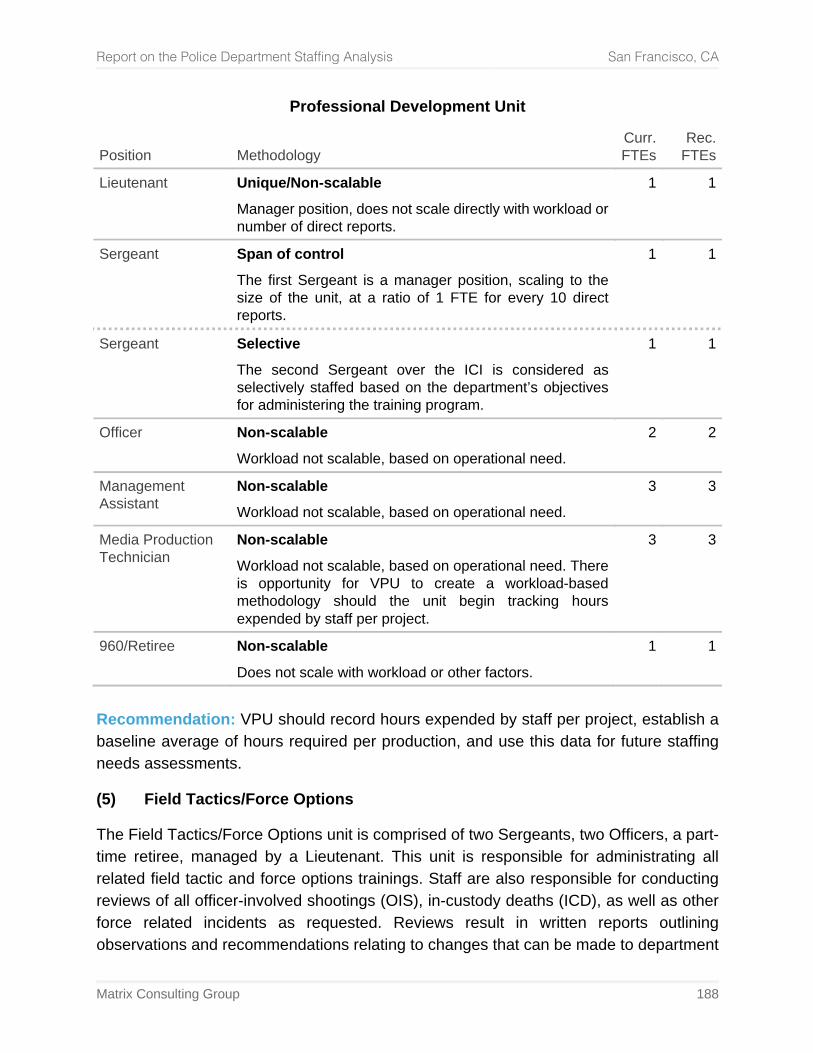
Report on the Police Department Staffing Analysis San Francisco, CA
Matrix Consulting Group 188
Professional Development Unit
Position Methodology Curr. FTEs
Rec. FTEs
Lieutenant Unique/Non-scalable
Manager position, does not scale directly with workload or number of direct reports.
1 1
Sergeant Span of control
The first Sergeant is a manager position, scaling to the size of the unit, at a ratio of 1 FTE for every 10 direct reports.
1 1
Sergeant Selective
The second Sergeant over the ICI is considered as selectively staffed based on the department’s objectives for administering the training program.
1 1
Officer Non-scalable
Workload not scalable, based on operational need. 2 2
Management Assistant
Non-scalable
Workload not scalable, based on operational need. 3 3
Media Production Technician
Non-scalable
Workload not scalable, based on operational need. There is opportunity for VPU to create a workload-based methodology should the unit begin tracking hours expended by staff per project.
3 3
960/Retiree Non-scalable
Does not scale with workload or other factors. 1 1
Recommendation: VPU should record hours expended by staff per project, establish a baseline average of hours required per production, and use this data for future staffing needs assessments.
(5) Field Tactics/Force Options
The Field Tactics/Force Options unit is comprised of two Sergeants, two Officers, a part-time retiree, managed by a Lieutenant. This unit is responsible for administrating all related field tactic and force options trainings. Staff are also responsible for conducting reviews of all officer-involved shootings (OIS), in-custody deaths (ICD), as well as other force related incidents as requested. Reviews result in written reports outlining observations and recommendations relating to changes that can be made to department
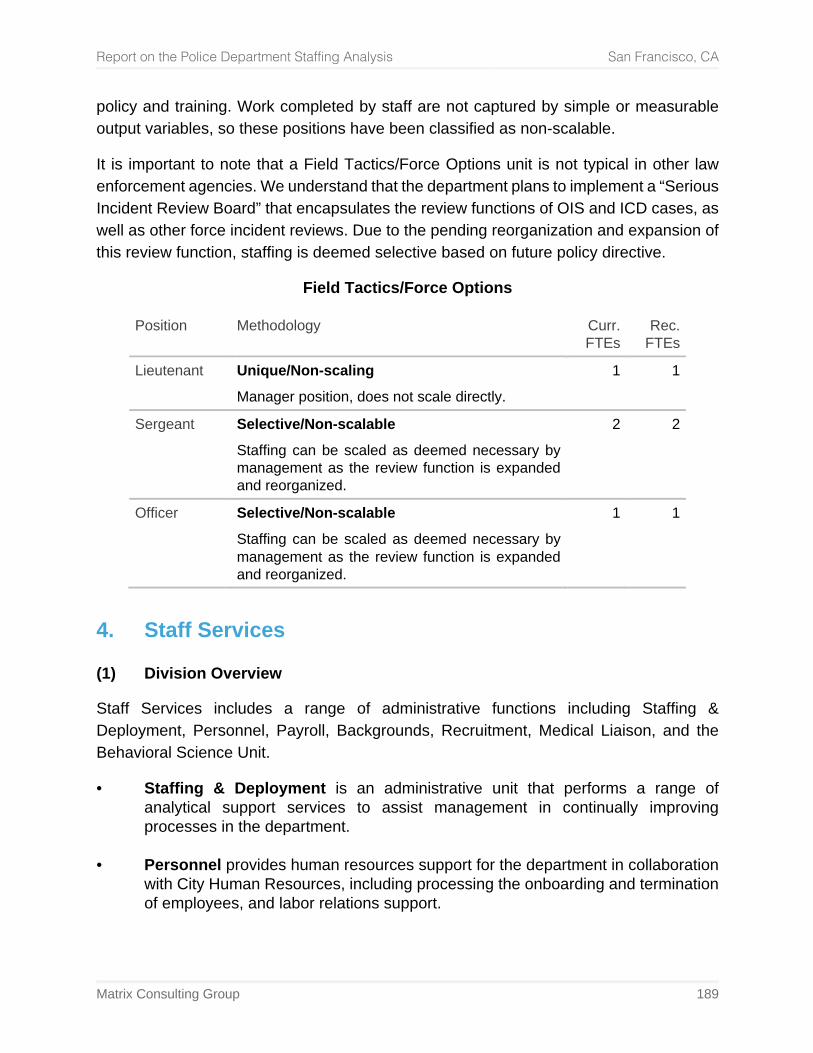
Report on the Police Department Staffing Analysis San Francisco, CA
Matrix Consulting Group 189
policy and training. Work completed by staff are not captured by simple or measurable output variables, so these positions have been classified as non-scalable.
It is important to note that a Field Tactics/Force Options unit is not typical in other law enforcement agencies. We understand that the department plans to implement a “Serious Incident Review Board” that encapsulates the review functions of OIS and ICD cases, as well as other force incident reviews. Due to the pending reorganization and expansion of this review function, staffing is deemed selective based on future policy directive.
Field Tactics/Force Options
Position Methodology Curr. FTEs
Rec. FTEs
Lieutenant Unique/Non-scaling
Manager position, does not scale directly. 1 1
Sergeant Selective/Non-scalable
Staffing can be scaled as deemed necessary by management as the review function is expanded and reorganized.
2 2
Officer Selective/Non-scalable
Staffing can be scaled as deemed necessary by management as the review function is expanded and reorganized.
1 1
4. Staff Services
(1) Division Overview
Staff Services includes a range of administrative functions including Staffing & Deployment, Personnel, Payroll, Backgrounds, Recruitment, Medical Liaison, and the Behavioral Science Unit.
• Staffing & Deployment is an administrative unit that performs a range of analytical support services to assist management in continually improving processes in the department.
• Personnel provides human resources support for the department in collaboration
with City Human Resources, including processing the onboarding and termination of employees, and labor relations support.
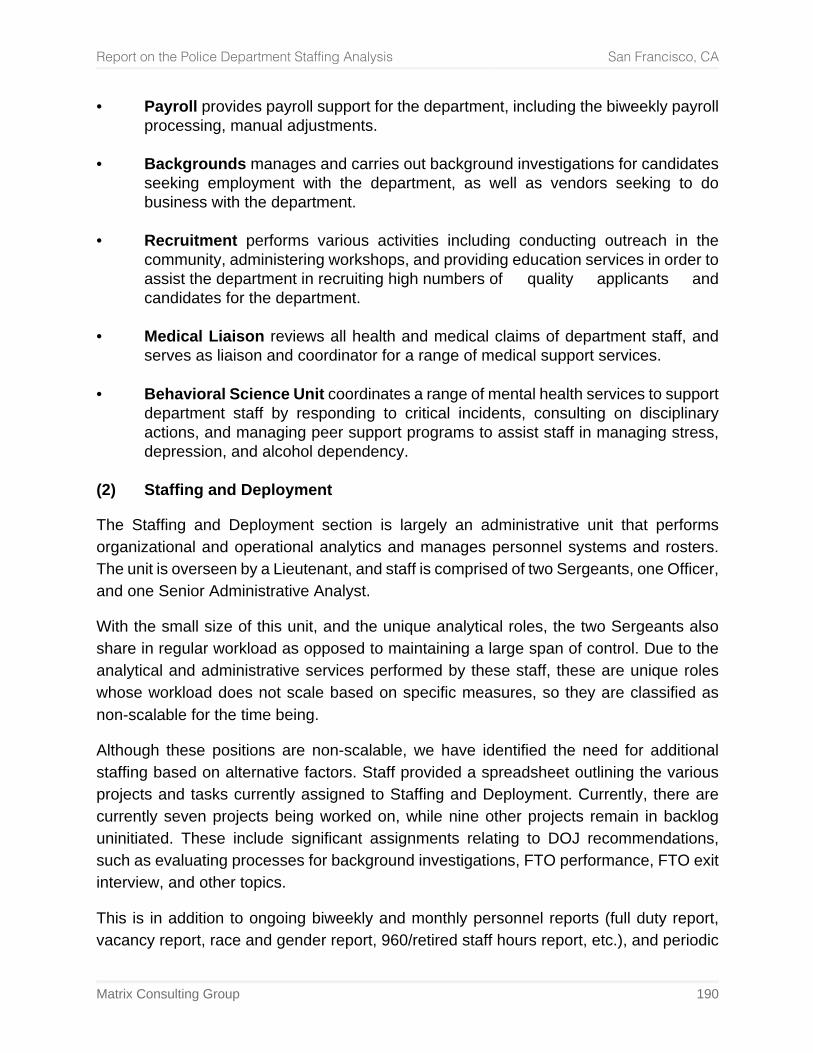
Report on the Police Department Staffing Analysis San Francisco, CA
Matrix Consulting Group 190
• Payroll provides payroll support for the department, including the biweekly payroll processing, manual adjustments.
• Backgrounds manages and carries out background investigations for candidates
seeking employment with the department, as well as vendors seeking to do business with the department.
• Recruitment performs various activities including conducting outreach in the
community, administering workshops, and providing education services in order to assist the department in recruiting high numbers of quality applicants and candidates for the department.
• Medical Liaison reviews all health and medical claims of department staff, and
serves as liaison and coordinator for a range of medical support services. • Behavioral Science Unit coordinates a range of mental health services to support
department staff by responding to critical incidents, consulting on disciplinary actions, and managing peer support programs to assist staff in managing stress, depression, and alcohol dependency.
(2) Staffing and Deployment
The Staffing and Deployment section is largely an administrative unit that performs organizational and operational analytics and manages personnel systems and rosters. The unit is overseen by a Lieutenant, and staff is comprised of two Sergeants, one Officer, and one Senior Administrative Analyst.
With the small size of this unit, and the unique analytical roles, the two Sergeants also share in regular workload as opposed to maintaining a large span of control. Due to the analytical and administrative services performed by these staff, these are unique roles whose workload does not scale based on specific measures, so they are classified as non-scalable for the time being.
Although these positions are non-scalable, we have identified the need for additional staffing based on alternative factors. Staff provided a spreadsheet outlining the various projects and tasks currently assigned to Staffing and Deployment. Currently, there are currently seven projects being worked on, while nine other projects remain in backlog uninitiated. These include significant assignments relating to DOJ recommendations, such as evaluating processes for background investigations, FTO performance, FTO exit interview, and other topics.
This is in addition to ongoing biweekly and monthly personnel reports (full duty report, vacancy report, race and gender report, 960/retired staff hours report, etc.), and periodic
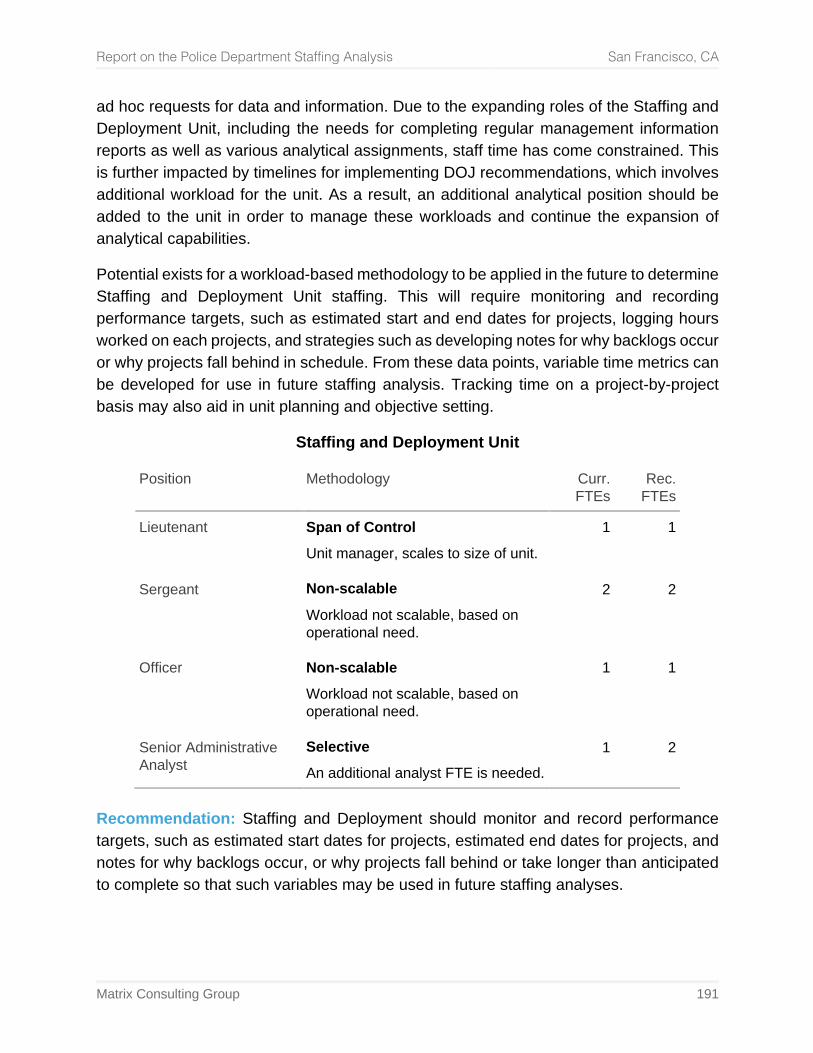
Report on the Police Department Staffing Analysis San Francisco, CA
Matrix Consulting Group 191
ad hoc requests for data and information. Due to the expanding roles of the Staffing and Deployment Unit, including the needs for completing regular management information reports as well as various analytical assignments, staff time has come constrained. This is further impacted by timelines for implementing DOJ recommendations, which involves additional workload for the unit. As a result, an additional analytical position should be added to the unit in order to manage these workloads and continue the expansion of analytical capabilities.
Potential exists for a workload-based methodology to be applied in the future to determine Staffing and Deployment Unit staffing. This will require monitoring and recording performance targets, such as estimated start and end dates for projects, logging hours worked on each projects, and strategies such as developing notes for why backlogs occur or why projects fall behind in schedule. From these data points, variable time metrics can be developed for use in future staffing analysis. Tracking time on a project-by-project basis may also aid in unit planning and objective setting.
Staffing and Deployment Unit
Position Methodology Curr. FTEs
Rec. FTEs
Lieutenant Sergeant Officer
Senior Administrative Analyst
Span of Control
Unit manager, scales to size of unit. Non-scalable
Workload not scalable, based on operational need. Non-scalable
Workload not scalable, based on operational need. Selective
An additional analyst FTE is needed.
1
2
1
1
1
2
1
2
Recommendation: Staffing and Deployment should monitor and record performance targets, such as estimated start dates for projects, estimated end dates for projects, and notes for why backlogs occur, or why projects fall behind or take longer than anticipated to complete so that such variables may be used in future staffing analyses.
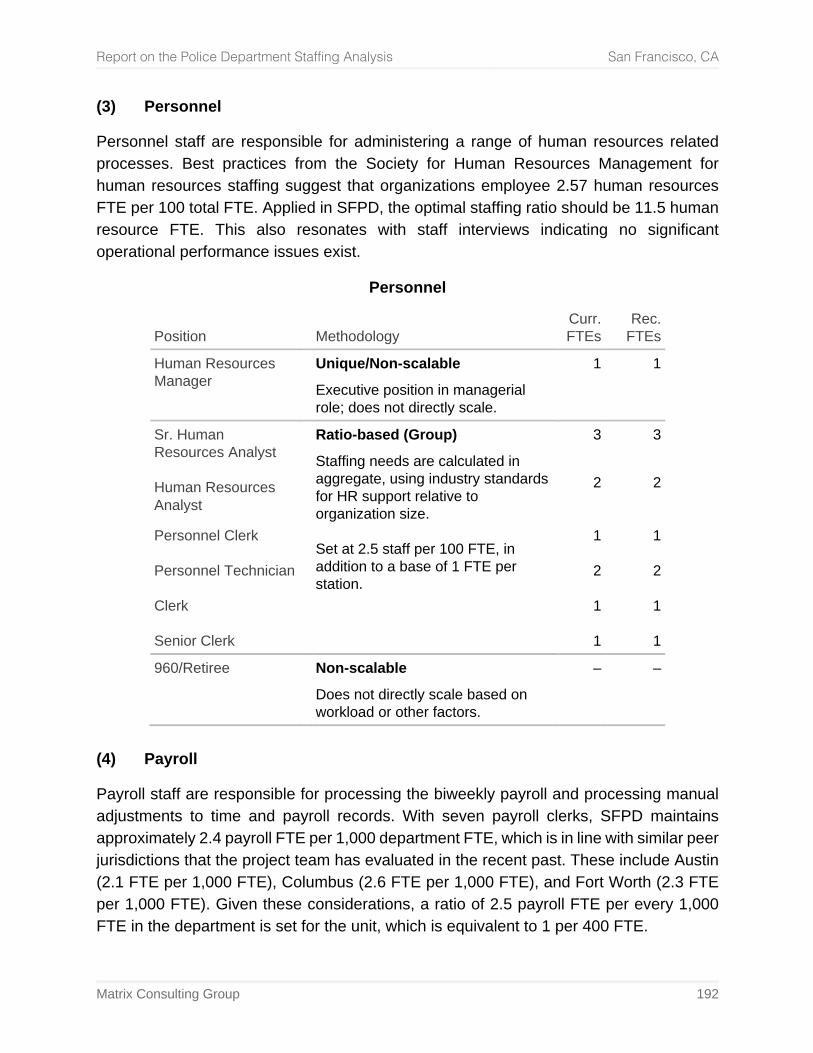
Report on the Police Department Staffing Analysis San Francisco, CA
Matrix Consulting Group 192
(3) Personnel
Personnel staff are responsible for administering a range of human resources related processes. Best practices from the Society for Human Resources Management for human resources staffing suggest that organizations employee 2.57 human resources FTE per 100 total FTE. Applied in SFPD, the optimal staffing ratio should be 11.5 human resource FTE. This also resonates with staff interviews indicating no significant operational performance issues exist.
Personnel
Position Methodology Curr. FTEs
Rec. FTEs
Human Resources Manager
Unique/Non-scalable
Executive position in managerial role; does not directly scale.
1 1
Sr. Human Resources Analyst Human Resources Analyst Personnel Clerk Personnel Technician Clerk Senior Clerk
Ratio-based (Group)
Staffing needs are calculated in aggregate, using industry standards for HR support relative to organization size. Set at 2.5 staff per 100 FTE, in addition to a base of 1 FTE per station.
3
2
1
2
1
1
3
2
1
2
1
1
960/Retiree Non-scalable
Does not directly scale based on workload or other factors.
– –
(4) Payroll
Payroll staff are responsible for processing the biweekly payroll and processing manual adjustments to time and payroll records. With seven payroll clerks, SFPD maintains approximately 2.4 payroll FTE per 1,000 department FTE, which is in line with similar peer jurisdictions that the project team has evaluated in the recent past. These include Austin (2.1 FTE per 1,000 FTE), Columbus (2.6 FTE per 1,000 FTE), and Fort Worth (2.3 FTE per 1,000 FTE). Given these considerations, a ratio of 2.5 payroll FTE per every 1,000 FTE in the department is set for the unit, which is equivalent to 1 per 400 FTE.
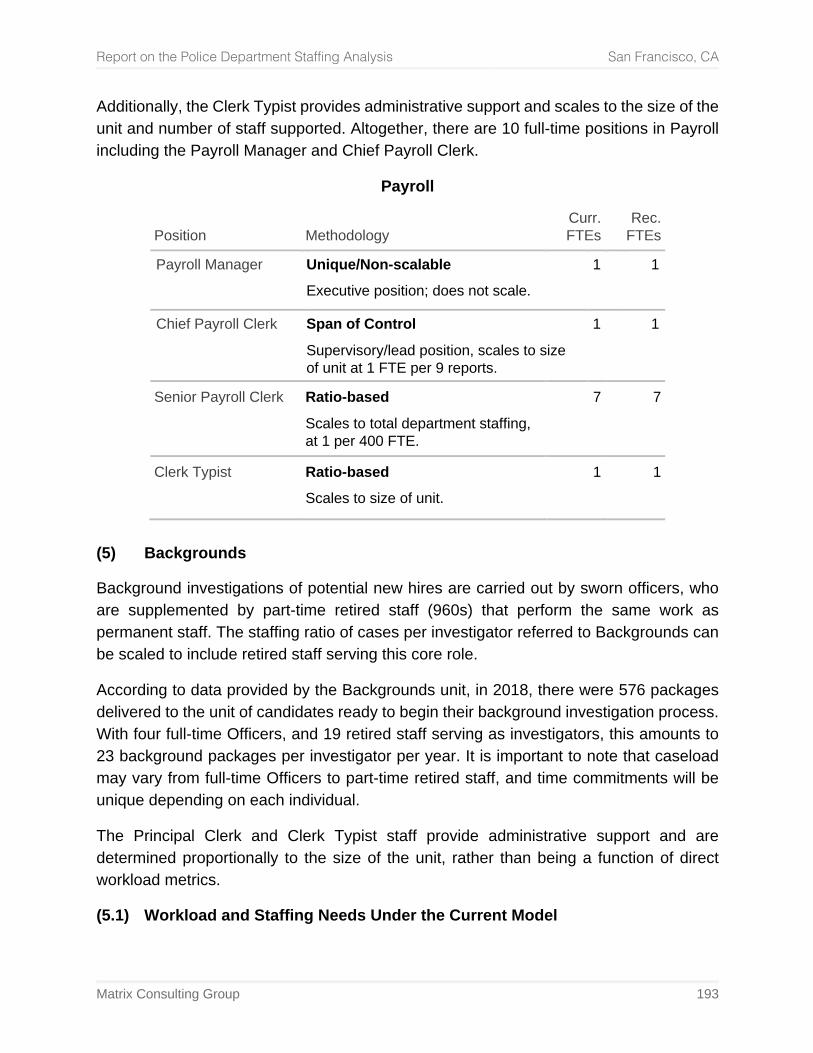
Report on the Police Department Staffing Analysis San Francisco, CA
Matrix Consulting Group 193
Additionally, the Clerk Typist provides administrative support and scales to the size of the unit and number of staff supported. Altogether, there are 10 full-time positions in Payroll including the Payroll Manager and Chief Payroll Clerk.
Payroll
Position Methodology Curr. FTEs
Rec. FTEs
Payroll Manager Unique/Non-scalable
Executive position; does not scale. 1 1
Chief Payroll Clerk Span of Control
Supervisory/lead position, scales to size of unit at 1 FTE per 9 reports.
1 1
Senior Payroll Clerk Ratio-based
Scales to total department staffing, at 1 per 400 FTE.
7 7
Clerk Typist Ratio-based
Scales to size of unit. 1 1
(5) Backgrounds
Background investigations of potential new hires are carried out by sworn officers, who are supplemented by part-time retired staff (960s) that perform the same work as permanent staff. The staffing ratio of cases per investigator referred to Backgrounds can be scaled to include retired staff serving this core role.
According to data provided by the Backgrounds unit, in 2018, there were 576 packages delivered to the unit of candidates ready to begin their background investigation process. With four full-time Officers, and 19 retired staff serving as investigators, this amounts to 23 background packages per investigator per year. It is important to note that caseload may vary from full-time Officers to part-time retired staff, and time commitments will be unique depending on each individual.
The Principal Clerk and Clerk Typist staff provide administrative support and are determined proportionally to the size of the unit, rather than being a function of direct workload metrics.
(5.1) Workload and Staffing Needs Under the Current Model
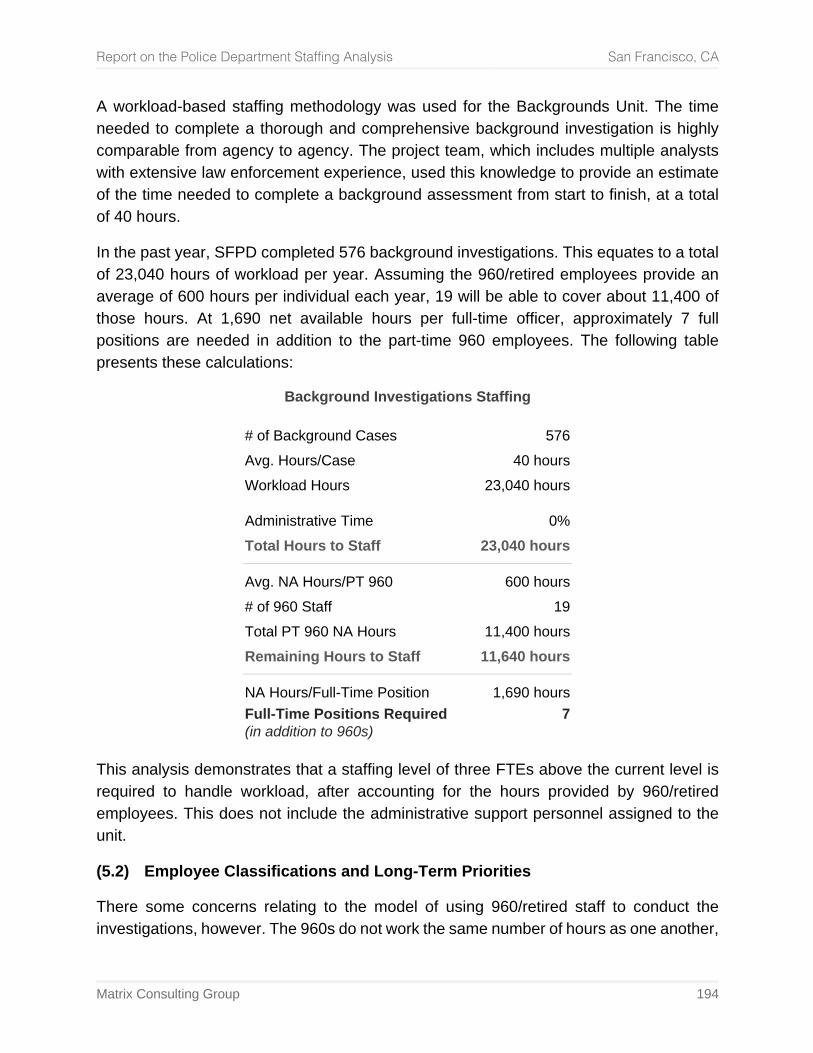
Report on the Police Department Staffing Analysis San Francisco, CA
Matrix Consulting Group 194
A workload-based staffing methodology was used for the Backgrounds Unit. The time needed to complete a thorough and comprehensive background investigation is highly comparable from agency to agency. The project team, which includes multiple analysts with extensive law enforcement experience, used this knowledge to provide an estimate of the time needed to complete a background assessment from start to finish, at a total of 40 hours.
In the past year, SFPD completed 576 background investigations. This equates to a total of 23,040 hours of workload per year. Assuming the 960/retired employees provide an average of 600 hours per individual each year, 19 will be able to cover about 11,400 of those hours. At 1,690 net available hours per full-time officer, approximately 7 full positions are needed in addition to the part-time 960 employees. The following table presents these calculations:
Background Investigations Staffing
# of Background Cases 576 Avg. Hours/Case 40 hours Workload Hours 23,040 hours
Administrative Time 0% Total Hours to Staff 23,040 hours
Avg. NA Hours/PT 960 600 hours # of 960 Staff 19 Total PT 960 NA Hours 11,400 hours Remaining Hours to Staff 11,640 hours
NA Hours/Full-Time Position 1,690 hours Full-Time Positions Required (in addition to 960s)
7
This analysis demonstrates that a staffing level of three FTEs above the current level is required to handle workload, after accounting for the hours provided by 960/retired employees. This does not include the administrative support personnel assigned to the unit.
(5.2) Employee Classifications and Long-Term Priorities
There some concerns relating to the model of using 960/retired staff to conduct the investigations, however. The 960s do not work the same number of hours as one another,
Report on the Police Department Staffing Analysis San Francisco, CA
Matrix Consulting Group 195
with some 960s working far more than others. Because no 960 works more than 0.5 FTE (40 hours over two weeks), they are not able to complete a typical background investigation in one week. As a result, they will generally either pick it up the next week, or pass it on to another 960, requiring some coordination.
However, there are also a number of advantages. With the unit historically occupied by sworn positions, the 960s have freed officer FTEs up to be assigned to areas where they are most needed. 960s are also a flexible resource, and their staffing levels can be more elastically scaled to actual needs as workload fluctuates over time.
Nonetheless, current information systems do not allow for a comprehensive examination of whether the part-time model leads to longer background investigations, rendering any such judgment speculative.
Outside of the considerations regarding the balance of full-time and part-time personnel, a transition to civilian background investigators in place of sworn investigators is underway, having been planned for multiple years. Over the long-term, the unit will replace a portion or all of the officers assigned to the unit with a new civilian classification (Background Investigator).This is a highly advantageous move, given that a civilian job market for specifically background investigators already exists, with many of the candidates already possessing experience conducting backgrounds for defense contractors, federal agencies, and other organizations that operate in high-security environments.
As a result, the time needed to develop a skilled background investigator upon hire/assignment to the unit can be reduced, in addition to the benefit of sworn personnel being freed up for other assignments that require their specific skillsets. This transition should be continued and maximized, and should work toward an eventual goal of fully civilianizing the unit at the line level. However, it is important to stress that the change does not replace either the sworn supervision component or the ability for 960/retired employees to assist with the workload.
(5.3) Information Systems
In order to measure the relative effectiveness of staffing decisions, the unit should prioritize the continued development of information management systems that allow caseloads, case progress, and time performance to be tracked. Given the intensely competitive market that exists currently for hiring new police recruits, the ability for the department to be able to conduct comprehensive backgrounds in a timely manner is a significant factor in the department’s ability to recruit sufficient numbers of qualified candidates. As a result, the turnaround time for background investigations is a highly
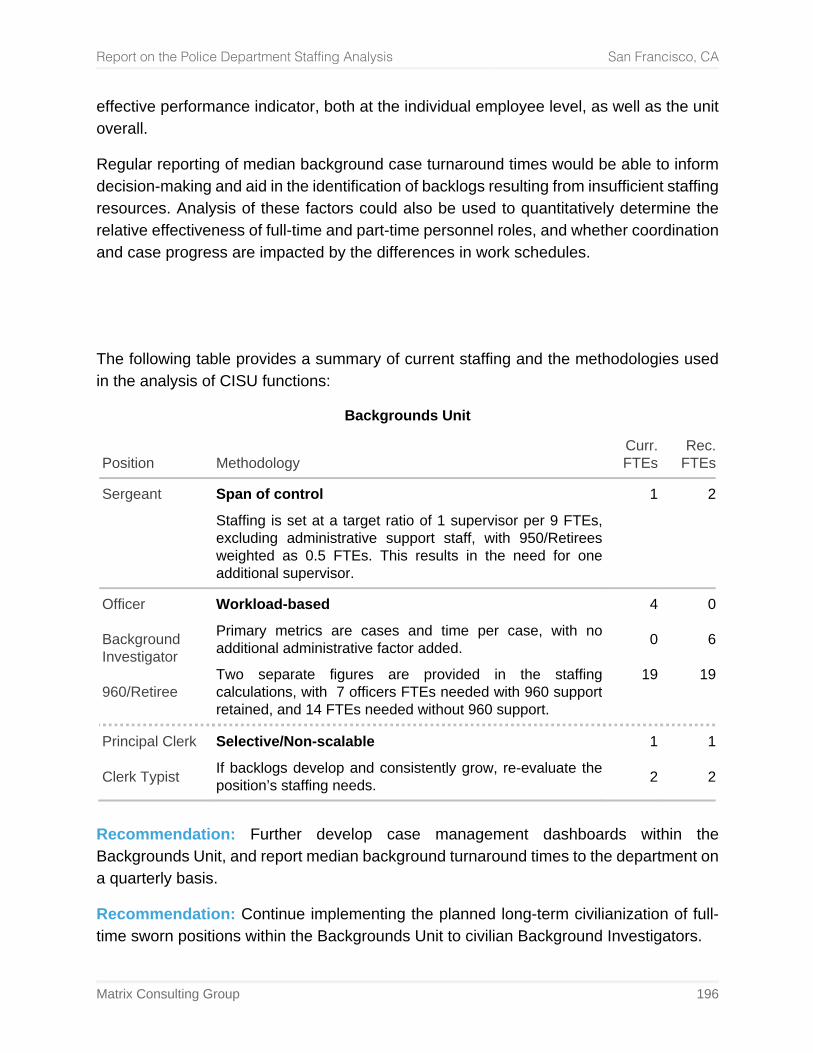
Report on the Police Department Staffing Analysis San Francisco, CA
Matrix Consulting Group 196
effective performance indicator, both at the individual employee level, as well as the unit overall.
Regular reporting of median background case turnaround times would be able to inform decision-making and aid in the identification of backlogs resulting from insufficient staffing resources. Analysis of these factors could also be used to quantitatively determine the relative effectiveness of full-time and part-time personnel roles, and whether coordination and case progress are impacted by the differences in work schedules.
The following table provides a summary of current staffing and the methodologies used in the analysis of CISU functions:
Backgrounds Unit
Position Methodology Curr. FTEs
Rec. FTEs
Sergeant Span of control
Staffing is set at a target ratio of 1 supervisor per 9 FTEs, excluding administrative support staff, with 950/Retirees weighted as 0.5 FTEs. This results in the need for one additional supervisor.
1 2
Officer Background Investigator 960/Retiree
Workload-based
Primary metrics are cases and time per case, with no additional administrative factor added.
Two separate figures are provided in the staffing calculations, with 7 officers FTEs needed with 960 support retained, and 14 FTEs needed without 960 support.
4
0
19
0
6
19
Principal Clerk Clerk Typist
Selective/Non-scalable
If backlogs develop and consistently grow, re-evaluate the position’s staffing needs.
1
2
1
2
Recommendation: Further develop case management dashboards within the Backgrounds Unit, and report median background turnaround times to the department on a quarterly basis.
Recommendation: Continue implementing the planned long-term civilianization of full-time sworn positions within the Backgrounds Unit to civilian Background Investigators.
Report on the Police Department Staffing Analysis San Francisco, CA
Matrix Consulting Group 197
(6) Recruitment
Recruitment is overseen by a Sergeant and comprised of three officers, a part-time civilian recruiter, and a senior clerk. The sworn personnel and recruiter perform largely the same functions in coordinating outreach efforts to improve recruitment outcomes. Additionally, the senior clerk provides administrative support to the unit where specific workload measures are not applied. This position scales to the size of the unit and the number of positions supported.
Ultimately, the objective of a recruitment unit is to increase the number of candidates able to fill positions in the department that are vacant or anticipated to become vacant. If a department had zero vacancies and an extremely low rate of attrition, few if any staff would likely be needed to keep those positions filled. Conversely, a department with significant number of vacancies has a much greater need to fill, which requires a more robust approach to attracting new candidates.
Given these considerations, staffing for officers in this unit are determined using a ratio of staff to the sum of two variables:
• The number of sworn vacancies in the department. • The three-year average total of sworn resignations, terminations, and retirements. For instance, if there were 100 vacancies and an average attrition of 100 officers each year, the sum of the two variables is 200.
In order adequately address these needs, the staffing target is set at a ratio of 1 FTE per 50, using the sum of vacancies and average attrition (resignations, terminations, and retirements). This results in an additional position being needed to bring the total to four.
As attrition increases and vacancies increase, staffing needs scale upwards as a result. The three-year average, in contrast to using a single year, grants some stability (i.e., less dramatic year-to-year shifts in the unit), while still presenting the department with flexibility.
It is also important to highlight that the effectiveness of recruitment extends beyond staffing. Recruiting for law enforcement positions, particularly in recent years, is an especially competitive hiring market. Police departments face additional challenges that are rare in the private sector, including long hiring processes. Best practice recruiting operations utilize digital marketing effectively, including the use of geofencing for ad targeting, social media, geofencing, and SEO (search engine optimization).
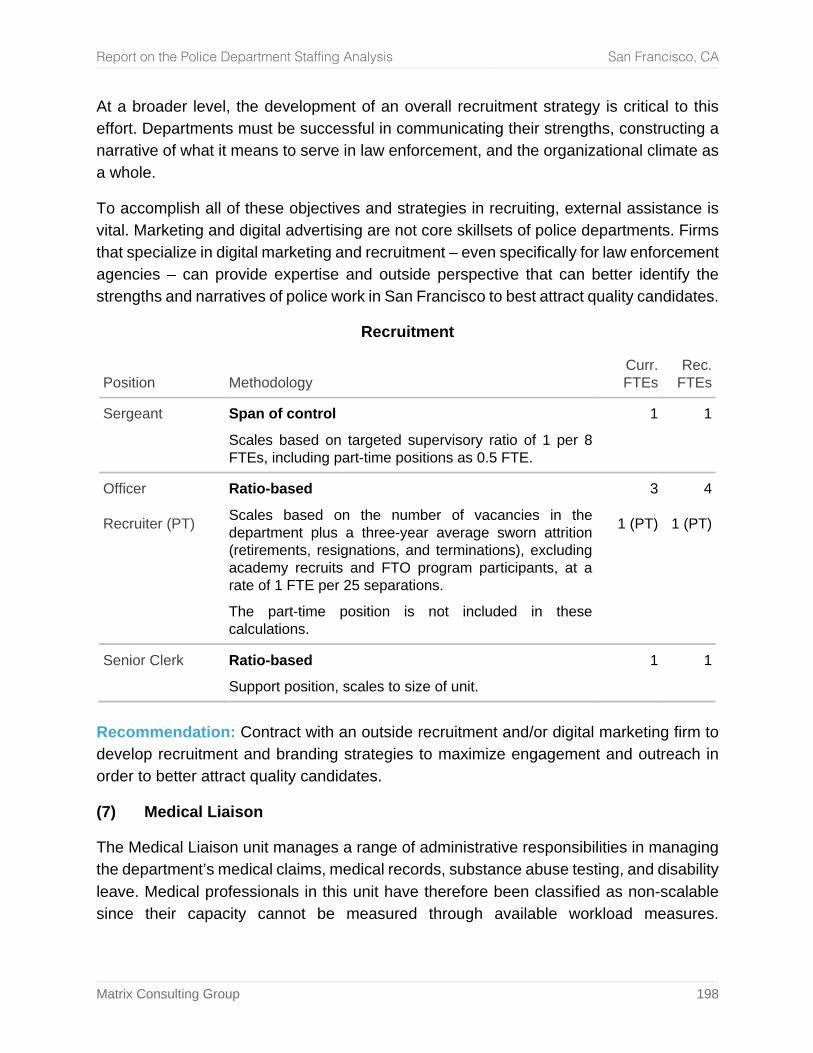
Report on the Police Department Staffing Analysis San Francisco, CA
Matrix Consulting Group 198
At a broader level, the development of an overall recruitment strategy is critical to this effort. Departments must be successful in communicating their strengths, constructing a narrative of what it means to serve in law enforcement, and the organizational climate as a whole.
To accomplish all of these objectives and strategies in recruiting, external assistance is vital. Marketing and digital advertising are not core skillsets of police departments. Firms that specialize in digital marketing and recruitment – even specifically for law enforcement agencies – can provide expertise and outside perspective that can better identify the strengths and narratives of police work in San Francisco to best attract quality candidates.
Recruitment
Position Methodology Curr. FTEs
Rec. FTEs
Sergeant Span of control
Scales based on targeted supervisory ratio of 1 per 8 FTEs, including part-time positions as 0.5 FTE.
1 1
Officer Recruiter (PT)
Ratio-based
Scales based on the number of vacancies in the department plus a three-year average sworn attrition (retirements, resignations, and terminations), excluding academy recruits and FTO program participants, at a rate of 1 FTE per 25 separations.
The part-time position is not included in these calculations.
3
1 (PT)
4
1 (PT)
Senior Clerk Ratio-based
Support position, scales to size of unit. 1 1
Recommendation: Contract with an outside recruitment and/or digital marketing firm to develop recruitment and branding strategies to maximize engagement and outreach in order to better attract quality candidates.
(7) Medical Liaison
The Medical Liaison unit manages a range of administrative responsibilities in managing the department’s medical claims, medical records, substance abuse testing, and disability leave. Medical professionals in this unit have therefore been classified as non-scalable since their capacity cannot be measured through available workload measures.
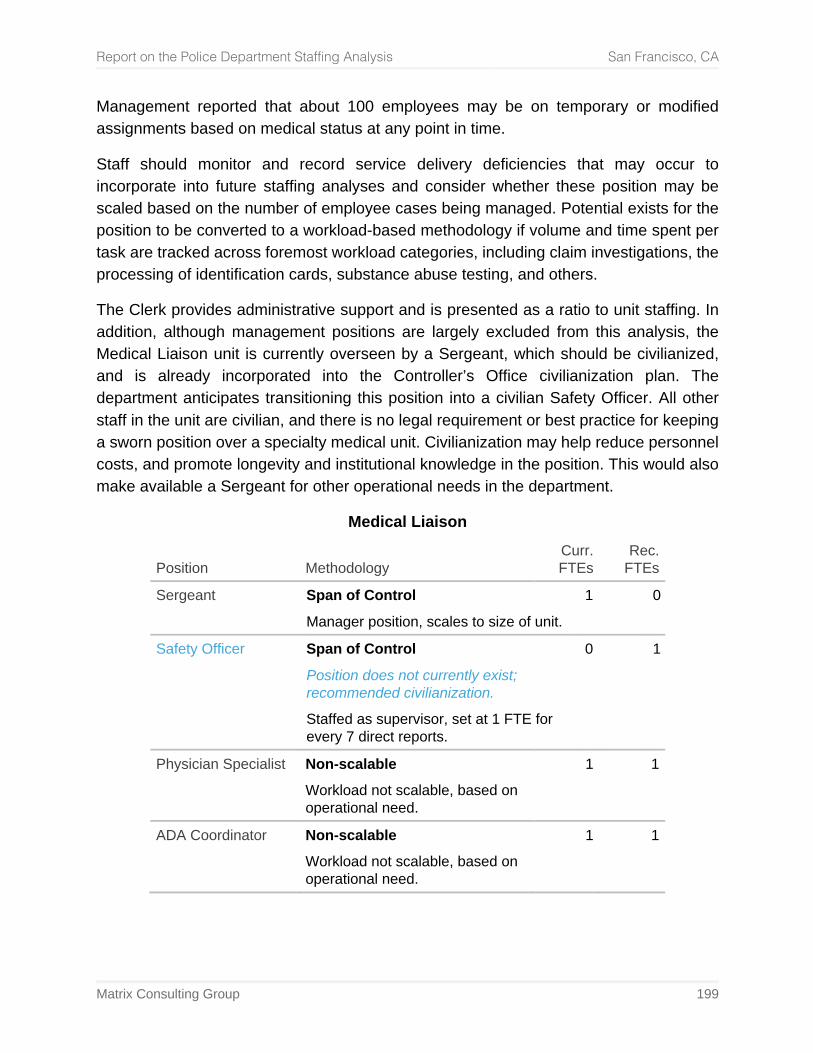
Report on the Police Department Staffing Analysis San Francisco, CA
Matrix Consulting Group 199
Management reported that about 100 employees may be on temporary or modified assignments based on medical status at any point in time.
Staff should monitor and record service delivery deficiencies that may occur to incorporate into future staffing analyses and consider whether these position may be scaled based on the number of employee cases being managed. Potential exists for the position to be converted to a workload-based methodology if volume and time spent per task are tracked across foremost workload categories, including claim investigations, the processing of identification cards, substance abuse testing, and others.
The Clerk provides administrative support and is presented as a ratio to unit staffing. In addition, although management positions are largely excluded from this analysis, the Medical Liaison unit is currently overseen by a Sergeant, which should be civilianized, and is already incorporated into the Controller’s Office civilianization plan. The department anticipates transitioning this position into a civilian Safety Officer. All other staff in the unit are civilian, and there is no legal requirement or best practice for keeping a sworn position over a specialty medical unit. Civilianization may help reduce personnel costs, and promote longevity and institutional knowledge in the position. This would also make available a Sergeant for other operational needs in the department.
Medical Liaison
Position Methodology Curr. FTEs
Rec. FTEs
Sergeant Span of Control
Manager position, scales to size of unit. 1 0
Safety Officer Span of Control
Position does not currently exist; recommended civilianization.
Staffed as supervisor, set at 1 FTE for every 7 direct reports.
0 1
Physician Specialist Non-scalable
Workload not scalable, based on operational need.
1 1
ADA Coordinator Non-scalable
Workload not scalable, based on operational need.
1 1
Report on the Police Department Staffing Analysis San Francisco, CA
Matrix Consulting Group 200
Position Methodology Curr. FTEs
Rec. FTEs
Benefits Technician Non-scalable
Workload not scalable, based on operational need.
1 1
Clerk Ratio-based
Scales to size of the unit 1 1
Recommendation: The Medical Liaison unit should monitor and record data and information relating to ongoing service delivery deficiencies that may occur to use as factors for future staffing needs assessments.
Recommendation: Civilianize the Sergeant over the Medical Liaison unit and replace with a position under the Safety Officer classification.
(8) Behavioral Science Unit
Behavioral Science staff manage mental health and peer support programs, including services to help staff manage stress, depression, or unhealthy habits, such as alcohol dependency. The workload capacity of the unit is not easily quantifiable, so these positions are classified as non-scalable for this assessment. Management reported that BSU may be managing around 15 cases at any given point in time, subject to seasonal fluctuation. Staff should monitor and record data and information relating to service delivery deficiencies to use as factors for future staffing analyses, including whether staffing may be scaled based on the number of cases being managed.
Potential exists for the position to be converted to a workload-based methodology centered around caseloads and average time spent per week on each case, as well as time spent providing proactive support (e.g., support groups), with an additional administrative time component added as well.
Report on the Police Department Staffing Analysis San Francisco, CA
Matrix Consulting Group 201
Behavioral Science Unit
Position Methodology Curr. FTEs
Rec. FTEs
Sergeant Non-scalable
Workload not scalable, based on operational need.
1 1
Officer Non-scalable
Workload not scalable, based on operational need.
1 1
Chaplain Non-scalable
Workload not scalable, based on operational need.
1 1
Recommendation: The Behavioral Science Unit should monitor and record data and information relating to ongoing service delivery deficiencies that may occur to use as factors for future staffing needs assessments.
5. Crime Information Services Unit
The Crime Information Services Unit (CISU) includes an array of different functions pertaining to records management, administrative support, and property and evidence management (Property Control).
1. Core Records Management Functions
Staff assigned to CISU are directly assigned to one of the sub-units, such as the Data Entry Team or Report Requests Team. In practice, staff are cross-trained in each area, and work is shared as needed between Records Management staff. The exceptions are Backgrounds and Mailroom functions, which are examined separately.
For the purposes of this analysis, these workloads are aggregated together into one pool. Staffing for the Crime Information Services Unit (excluding Backgrounds and Mailroom) is determined as a workload-based methodology, aggregating together the following assignments:
• Report Requests • Report • Outside Agency Requests
Report on the Police Department Staffing Analysis San Francisco, CA
Matrix Consulting Group 202
• Laserfiche Imaging Archive System (LIAS) • Data Entry • Firearm FCN Processing The calculations are for civilian staff only, and so the handling of external background requests (i.e., not for SFPD employment), which are handled by sworn officers, are excluded. Mailroom is also excluded, as it is a unique role that does not directly scale.
An administrative time figure is added as well to reflect telephone calls, miscellaneous workload that does not fit into any of the core metrics used, various requests throughout the day, any gaps or downtime between work items, and any other workload categories that are not directly listed. Given the number of telephone calls and miscellaneous workloads that CISU personnel handle, a much higher administrative time factor is used compared to many functions, at 50% of staffing. This also provides a buffer for periods of high activity versus lower-activity periods that needs to be staffed, such as when the workload diminished during swing shift hours.
The following table presents these calculations, building up total staffing needs from each workload element:
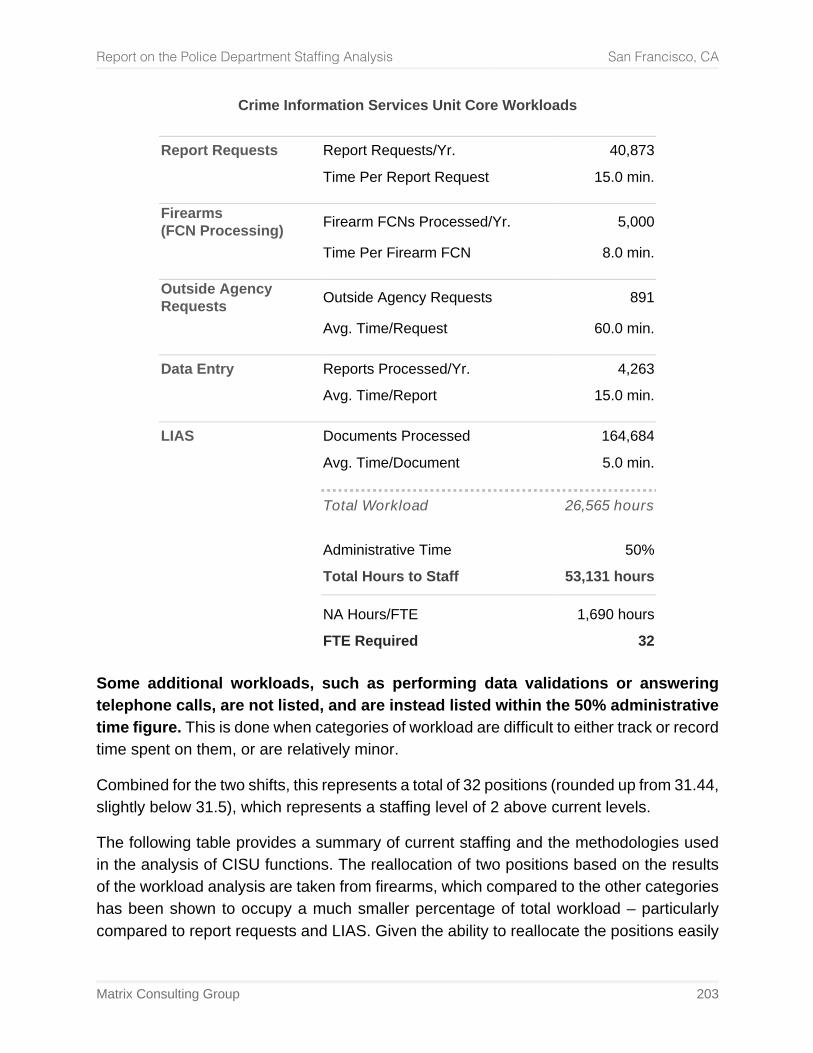
Report on the Police Department Staffing Analysis San Francisco, CA
Matrix Consulting Group 203
Crime Information Services Unit Core Workloads
Report Requests Report Requests/Yr. 40,873
Time Per Report Request 15.0 min.
Firearms (FCN Processing) Firearm FCNs Processed/Yr. 5,000
Time Per Firearm FCN 8.0 min.
Outside Agency Requests Outside Agency Requests 891
Avg. Time/Request 60.0 min.
Data Entry Reports Processed/Yr. 4,263 Avg. Time/Report 15.0 min.
LIAS Documents Processed 164,684
Avg. Time/Document 5.0 min.
Total Workload 26,565 hours Administrative Time 50% Total Hours to Staff 53,131 hours
NA Hours/FTE 1,690 hours FTE Required 32
Some additional workloads, such as performing data validations or answering telephone calls, are not listed, and are instead listed within the 50% administrative time figure. This is done when categories of workload are difficult to either track or record time spent on them, or are relatively minor.
Combined for the two shifts, this represents a total of 32 positions (rounded up from 31.44, slightly below 31.5), which represents a staffing level of 2 above current levels.
The following table provides a summary of current staffing and the methodologies used in the analysis of CISU functions. The reallocation of two positions based on the results of the workload analysis are taken from firearms, which compared to the other categories has been shown to occupy a much smaller percentage of total workload – particularly compared to report requests and LIAS. Given the ability to reallocate the positions easily
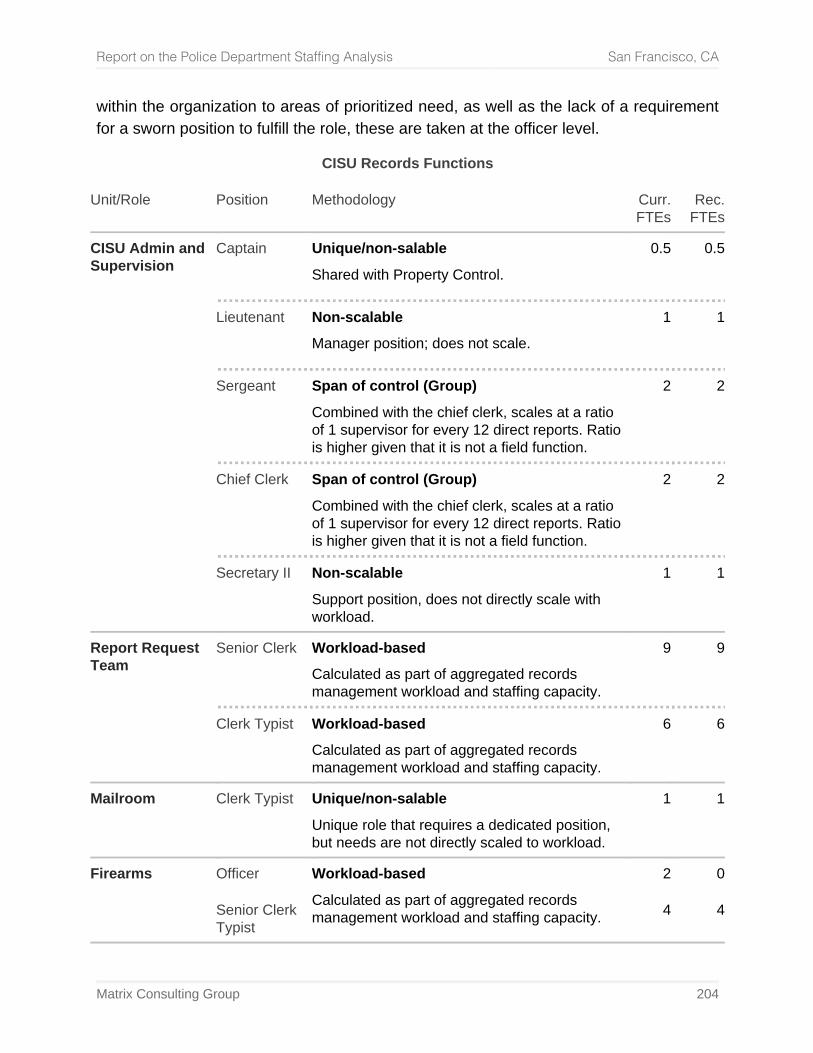
Report on the Police Department Staffing Analysis San Francisco, CA
Matrix Consulting Group 204
within the organization to areas of prioritized need, as well as the lack of a requirement for a sworn position to fulfill the role, these are taken at the officer level.
CISU Records Functions
Unit/Role Position Methodology Curr. FTEs
Rec. FTEs
CISU Admin and Supervision
Captain Unique/non-salable
Shared with Property Control. 0.5 0.5
Lieutenant Non-scalable
Manager position; does not scale. 1 1
Sergeant Span of control (Group)
Combined with the chief clerk, scales at a ratio of 1 supervisor for every 12 direct reports. Ratio is higher given that it is not a field function.
2 2
Chief Clerk Span of control (Group)
Combined with the chief clerk, scales at a ratio of 1 supervisor for every 12 direct reports. Ratio is higher given that it is not a field function.
2 2
Secretary II Non-scalable
Support position, does not directly scale with workload.
1 1
Report Request Team
Senior Clerk Workload-based
Calculated as part of aggregated records management workload and staffing capacity.
9 9
Clerk Typist Workload-based
Calculated as part of aggregated records management workload and staffing capacity.
6 6
Mailroom Clerk Typist Unique/non-salable
Unique role that requires a dedicated position, but needs are not directly scaled to workload.
1 1
Firearms Officer Workload-based
Calculated as part of aggregated records management workload and staffing capacity.
2 0
Senior Clerk Typist
4 4
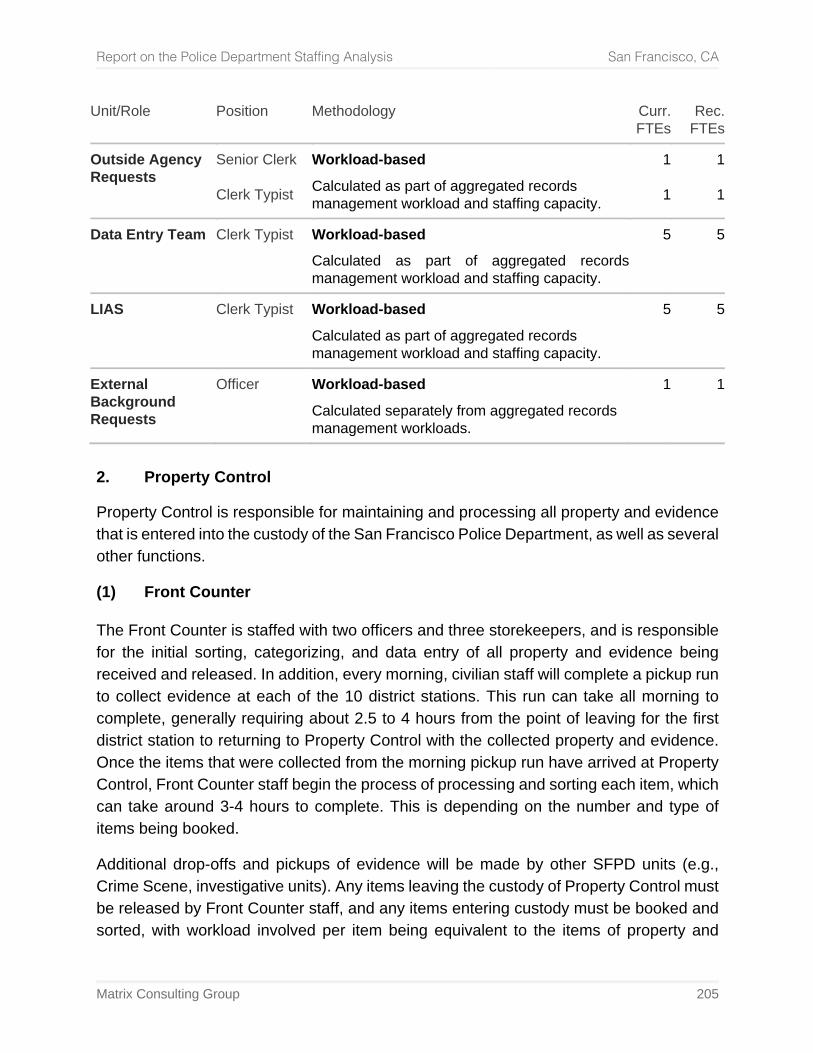
Report on the Police Department Staffing Analysis San Francisco, CA
Matrix Consulting Group 205
Unit/Role Position Methodology Curr. FTEs
Rec. FTEs
Outside Agency Requests
Senior Clerk Clerk Typist
Workload-based
Calculated as part of aggregated records management workload and staffing capacity.
1
1
1
1
Data Entry Team Clerk Typist Workload-based
Calculated as part of aggregated records management workload and staffing capacity.
5 5
LIAS Clerk Typist Workload-based
Calculated as part of aggregated records management workload and staffing capacity.
5 5
External Background Requests
Officer Workload-based
Calculated separately from aggregated records management workloads.
1 1
2. Property Control
Property Control is responsible for maintaining and processing all property and evidence that is entered into the custody of the San Francisco Police Department, as well as several other functions.
(1) Front Counter The Front Counter is staffed with two officers and three storekeepers, and is responsible for the initial sorting, categorizing, and data entry of all property and evidence being received and released. In addition, every morning, civilian staff will complete a pickup run to collect evidence at each of the 10 district stations. This run can take all morning to complete, generally requiring about 2.5 to 4 hours from the point of leaving for the first district station to returning to Property Control with the collected property and evidence. Once the items that were collected from the morning pickup run have arrived at Property Control, Front Counter staff begin the process of processing and sorting each item, which can take around 3-4 hours to complete. This is depending on the number and type of items being booked.
Additional drop-offs and pickups of evidence will be made by other SFPD units (e.g., Crime Scene, investigative units). Any items leaving the custody of Property Control must be released by Front Counter staff, and any items entering custody must be booked and sorted, with workload involved per item being equivalent to the items of property and
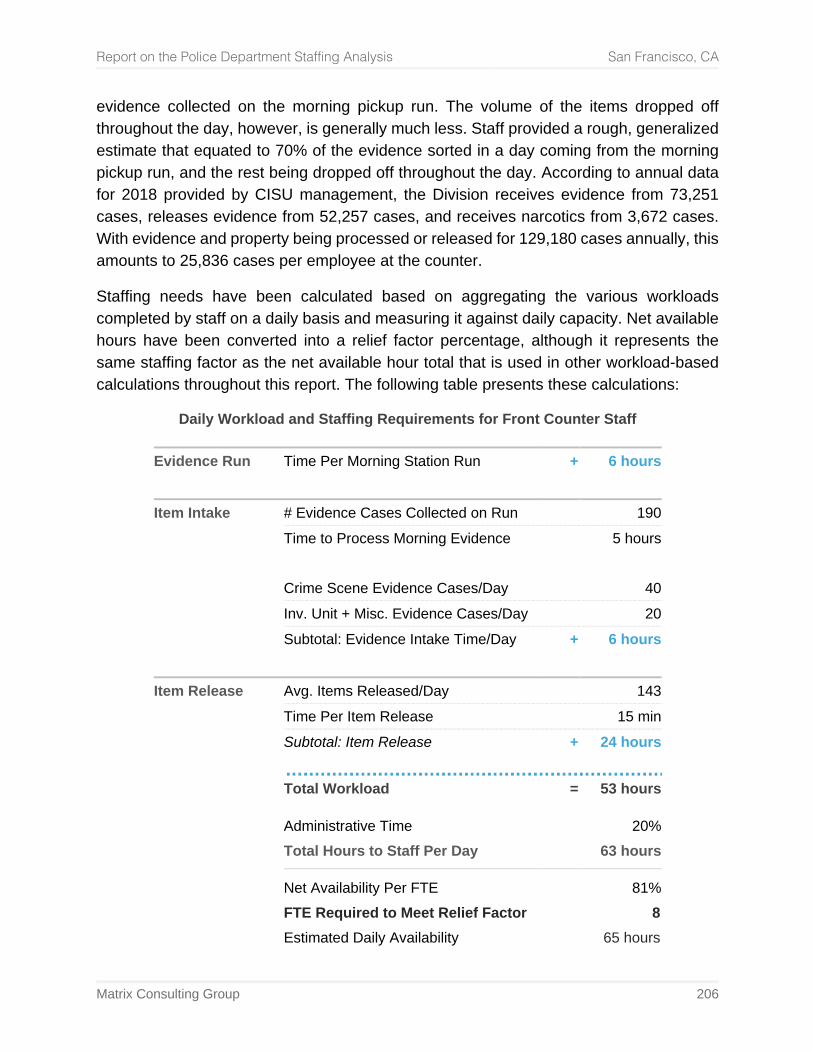
Report on the Police Department Staffing Analysis San Francisco, CA
Matrix Consulting Group 206
evidence collected on the morning pickup run. The volume of the items dropped off throughout the day, however, is generally much less. Staff provided a rough, generalized estimate that equated to 70% of the evidence sorted in a day coming from the morning pickup run, and the rest being dropped off throughout the day. According to annual data for 2018 provided by CISU management, the Division receives evidence from 73,251 cases, releases evidence from 52,257 cases, and receives narcotics from 3,672 cases. With evidence and property being processed or released for 129,180 cases annually, this amounts to 25,836 cases per employee at the counter.
Staffing needs have been calculated based on aggregating the various workloads completed by staff on a daily basis and measuring it against daily capacity. Net available hours have been converted into a relief factor percentage, although it represents the same staffing factor as the net available hour total that is used in other workload-based calculations throughout this report. The following table presents these calculations:
Daily Workload and Staffing Requirements for Front Counter Staff
Evidence Run Time Per Morning Station Run + 6 hours
Item Intake # Evidence Cases Collected on Run 190 Time to Process Morning Evidence 5 hours
Crime Scene Evidence Cases/Day 40 Inv. Unit + Misc. Evidence Cases/Day 20 Subtotal: Evidence Intake Time/Day + 6 hours
Item Release Avg. Items Released/Day 143 Time Per Item Release 15 min Subtotal: Item Release + 24 hours
Total Workload = 53 hours
Administrative Time 20% Total Hours to Staff Per Day 63 hours
Net Availability Per FTE 81% FTE Required to Meet Relief Factor 8 Estimated Daily Availability 65 hours
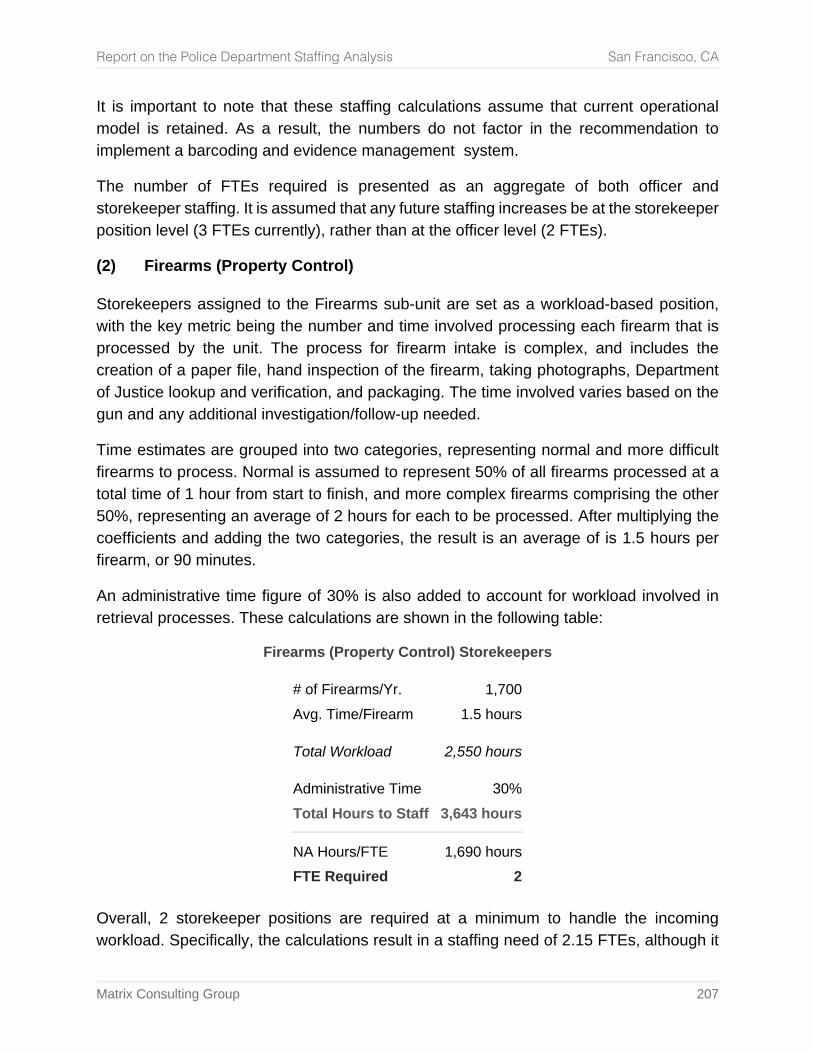
Report on the Police Department Staffing Analysis San Francisco, CA
Matrix Consulting Group 207
It is important to note that these staffing calculations assume that current operational model is retained. As a result, the numbers do not factor in the recommendation to implement a barcoding and evidence management system.
The number of FTEs required is presented as an aggregate of both officer and storekeeper staffing. It is assumed that any future staffing increases be at the storekeeper position level (3 FTEs currently), rather than at the officer level (2 FTEs).
(2) Firearms (Property Control) Storekeepers assigned to the Firearms sub-unit are set as a workload-based position, with the key metric being the number and time involved processing each firearm that is processed by the unit. The process for firearm intake is complex, and includes the creation of a paper file, hand inspection of the firearm, taking photographs, Department of Justice lookup and verification, and packaging. The time involved varies based on the gun and any additional investigation/follow-up needed.
Time estimates are grouped into two categories, representing normal and more difficult firearms to process. Normal is assumed to represent 50% of all firearms processed at a total time of 1 hour from start to finish, and more complex firearms comprising the other 50%, representing an average of 2 hours for each to be processed. After multiplying the coefficients and adding the two categories, the result is an average of is 1.5 hours per firearm, or 90 minutes.
An administrative time figure of 30% is also added to account for workload involved in retrieval processes. These calculations are shown in the following table:
Firearms (Property Control) Storekeepers
# of Firearms/Yr. 1,700 Avg. Time/Firearm 1.5 hours
Total Workload 2,550 hours
Administrative Time 30% Total Hours to Staff 3,643 hours
NA Hours/FTE 1,690 hours FTE Required 2
Overall, 2 storekeeper positions are required at a minimum to handle the incoming workload. Specifically, the calculations result in a staffing need of 2.15 FTEs, although it
Report on the Police Department Staffing Analysis San Francisco, CA
Matrix Consulting Group 208
is too low to be rounded to an additional FTE. Any officers that are assigned to the unit are supplemental to this, and should not fill the positions interchangeably.
(3) Narcotics (Property Control)
Storekeepers assigned to the Narcotics Unit are responsible for intake, processing, release, and transport of all narcotics that are entered into the custody of Property Control. Both personnel assigned to the unit are sworn officers.
Intake of items is generally done in groups, estimated at a total of 6 hours per day. This equates to approximately 7.5 minutes per envelope. Additional intake and release work requests are generated throughout the day, which is accounted for in the staffing methodology as an administrative time of 20%.
All narcotics testing is conducted by the Alameda County Sheriff's Office, with at least one transport across the bay occurring per week, depending on the number and time sensitivity of requests for testing made by the San Francisco District Attorney. Each transport may involve around 40 items (estimated average) and take around 2.5 hours round trip, depending on traffic conditions. Upon return, all envelopes that are picked up from Alameda must then be processed again as they reenter the custody of SFPD Property Control.
Narcotics Unit Officers
Hrs./Day on Envelopes 6.0 hours
# Trips to Alameda 1.5/week Time Per Round Trip 3 hours
Envelopes Returned/Trip 40 Time Per Envelop 7.5 min.
Total Workload 1,877 hours
Administrative Time 20% Total Hours to Staff 2,346 hours
NA Hours/FTE 1,690 hours FTE Required 2
The number of FTEs required has been rounded up, as any staffing needs over 1.0 would cause workload exceed capacity and cause processing delays.
Report on the Police Department Staffing Analysis San Francisco, CA
Matrix Consulting Group 209
(4) Lost and Found
One Storekeeper is assigned to lost and found evidence management. The position is a unique role, and cross-training allows for shared workload with other functions. As a result of handling a unique role that does not require the full net available hours of an FTE, this study as listed the position as unique/non-scalable, although a certain percentage of hours could be allocated to other Property Control functions.
(5) Parcel Returns
One Storekeeper is assigned to Parcel Returns, who manages the mailroom, sorting, receiving, and delivering of parcels containing property and evidence. While the role can be considered as administrative support, the position’s workload does not scale based on the number of staff being supported. Consequently, the position is assumed to be unique and non-scalable for the purposes of this analysis.
(6) Holds and Destructions
One Sergeant and eight part-time retired sworn staff manage the inventory for evidence and property holds and destruction. The retired staff serve a core function in running this unit and are given a ratio to the total number cases generated annual that involve the reception of evidence into Property Control, which amounts to 76,923 cases in 2018.
These positions have been set at a ratio to the entire department, given that it revolves around a specific process and schedule for retention. If the department implements an upgraded evidence management system, there will be significant opportunities to improve the management of retention data and transition to a more efficient method of purging items. Based on these factors, staffing needs is not directly scalable at this time, but should be re-examined if a new evidence management system is implemented.
(7) Uniforms/Disbursal of Equipment
Two Storekeepers run the Uniforms unit and management the inventory, disbursement, and replacement of uniforms and equipment, including as portable radios, batteries, and other items. The workload of this function scales directly with the size of the organization, as more full-time positions require more uniforms and equipment to be disbursed. As a result, the position’s staffing is set as a ratio-based methodology, at 1 position for every 1,000 sworn positions in the organization.
(8) Over Flow Warehouse
Four storekeepers are assigned to transport items to the overflow warehouse located in Building 606 within the Hunters Point Shipyard area. Items that are large, not ready for
Report on the Police Department Staffing Analysis San Francisco, CA
Matrix Consulting Group 210
destruction, and will be in storage long-term are eligible to be transferred to the offsite warehouse. This includes many large items that would otherwise quickly fill up space at the main Property Control facility.
The full-time storekeepers are assisted by three part-time retired staff. One 960 employee specializes in transporting bicycles, which are one of the items most frequently transported to Building 606.
Including round trip travel time, unloading, and loading items back, the trip in totality can often take around 5 hours to complete. With the 960 employees assigned to the unit, staffing does not need to be allocated so that the full-time storekeepers can handle all workload. Given the less time-critical nature of the work, as well as the relatively low risk involved in this aspect of Property Control compared to areas such as narcotics and firearms, assigning retired staff to the overflow transport role should be prioritized.
While workload-based staffing methodologies could be applied to the unit, there is a high degree of variability in the unit’s work. The spatial requirements for transporting various types of overflow items varies considerably, and one case may require numerous trips to be completed. As a result, while the time involved in completing a trip can be readily estimated, it is far more difficult to estimate the average number of items transported per trip.
Instead, staffing needs can be represented by the backlog of items that need to be transported. If more items are entering the queue to be transported than can be transported in a week on a consistent basis, and it impacts space availability in the main facility, then additional staff would be needed.
(9) Issues Regarding Property Control Management Systems A recurring theme throughout Property Control is the completion of manual processes and paper logging. This takes additional time and is significantly more prone to user error than a full electronic record keeping system, which is a best practice in police property and evidence management. The most critical issue, however, is that no barcoding system is used for processing items within Property Control, excluding for narcotics. Barcoding is an essential practice for property and evidence units, as is able to automatically maintain a chain of custody, recording the date and time an item was scanned, the action being taken (e.g., release, intake, transports, etc.). Integration with a full-featured evidence management system allows for data to feed from the barcode scanner to the database, and generally is able to automatically creating, filling, updating records as items are scanned.
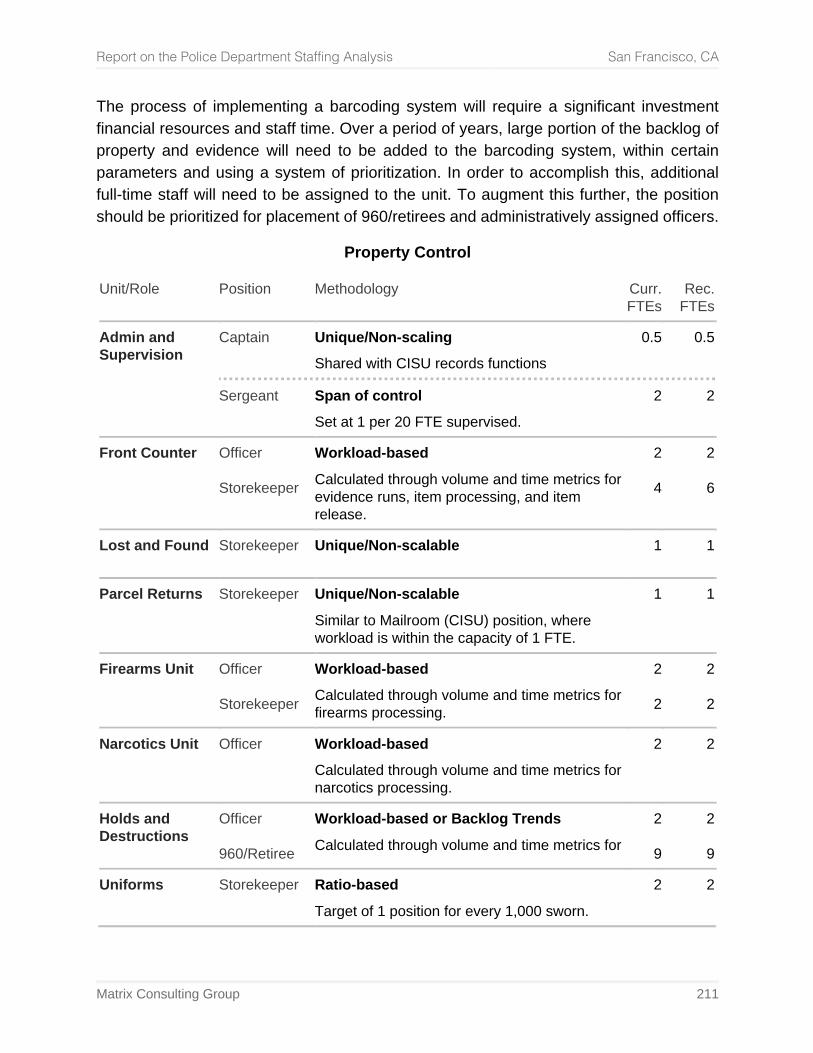
Report on the Police Department Staffing Analysis San Francisco, CA
Matrix Consulting Group 211
The process of implementing a barcoding system will require a significant investment financial resources and staff time. Over a period of years, large portion of the backlog of property and evidence will need to be added to the barcoding system, within certain parameters and using a system of prioritization. In order to accomplish this, additional full-time staff will need to be assigned to the unit. To augment this further, the position should be prioritized for placement of 960/retirees and administratively assigned officers.
Property Control
Unit/Role Position Methodology Curr. FTEs
Rec. FTEs
Admin and Supervision
Captain Unique/Non-scaling
Shared with CISU records functions 0.5 0.5
Sergeant Span of control
Set at 1 per 20 FTE supervised. 2 2
Front Counter Officer Storekeeper
Workload-based
Calculated through volume and time metrics for evidence runs, item processing, and item release.
2
4
2
6
Lost and Found Storekeeper
Unique/Non-scalable 1 1
Parcel Returns Storekeeper Unique/Non-scalable
Similar to Mailroom (CISU) position, where workload is within the capacity of 1 FTE.
1 1
Firearms Unit Officer Storekeeper
Workload-based
Calculated through volume and time metrics for firearms processing.
2
2
2
2
Narcotics Unit Officer
Workload-based
Calculated through volume and time metrics for narcotics processing.
2 2
Holds and Destructions
Officer 960/Retiree
Workload-based or Backlog Trends
Calculated through volume and time metrics for 2
9
2
9
Uniforms Storekeeper
Ratio-based
Target of 1 position for every 1,000 sworn. 2 2
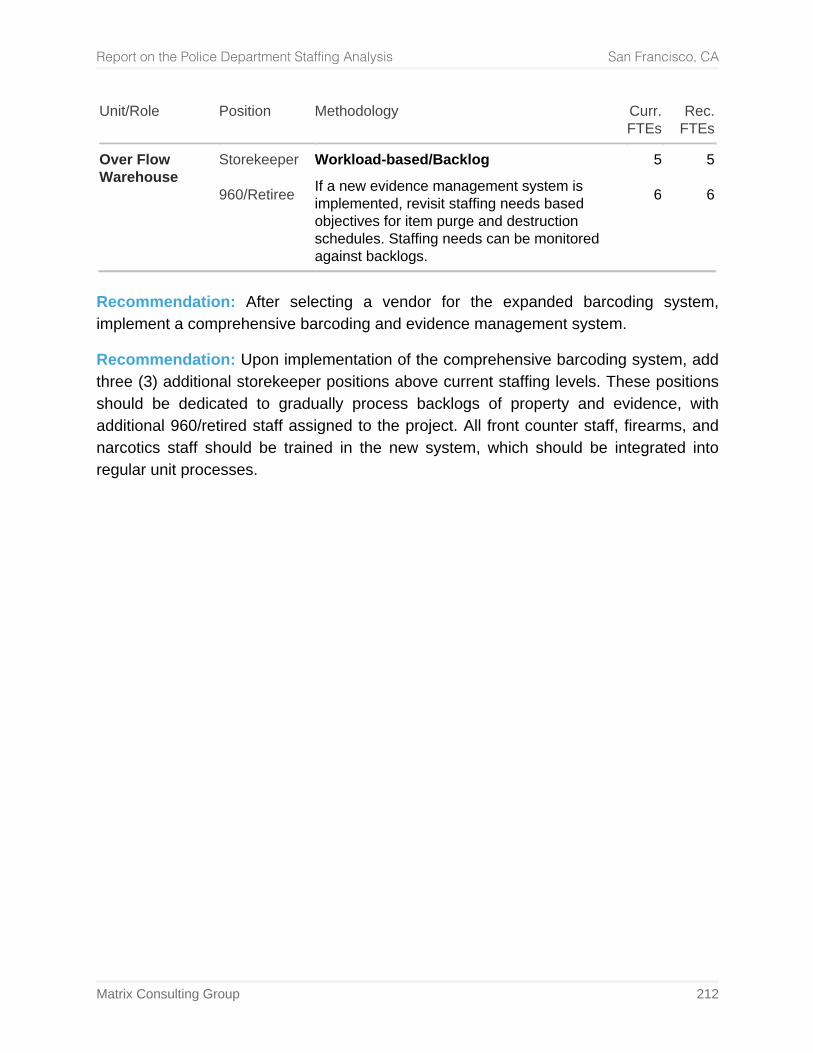
Report on the Police Department Staffing Analysis San Francisco, CA
Matrix Consulting Group 212
Unit/Role Position Methodology Curr. FTEs
Rec. FTEs
Over Flow Warehouse
Storekeeper 960/Retiree
Workload-based/Backlog
If a new evidence management system is implemented, revisit staffing needs based objectives for item purge and destruction schedules. Staffing needs can be monitored against backlogs.
5
6
5
6
Recommendation: After selecting a vendor for the expanded barcoding system, implement a comprehensive barcoding and evidence management system.
Recommendation: Upon implementation of the comprehensive barcoding system, add three (3) additional storekeeper positions above current staffing levels. These positions should be dedicated to gradually process backlogs of property and evidence, with additional 960/retired staff assigned to the project. All front counter staff, firearms, and narcotics staff should be trained in the new system, which should be integrated into regular unit processes.
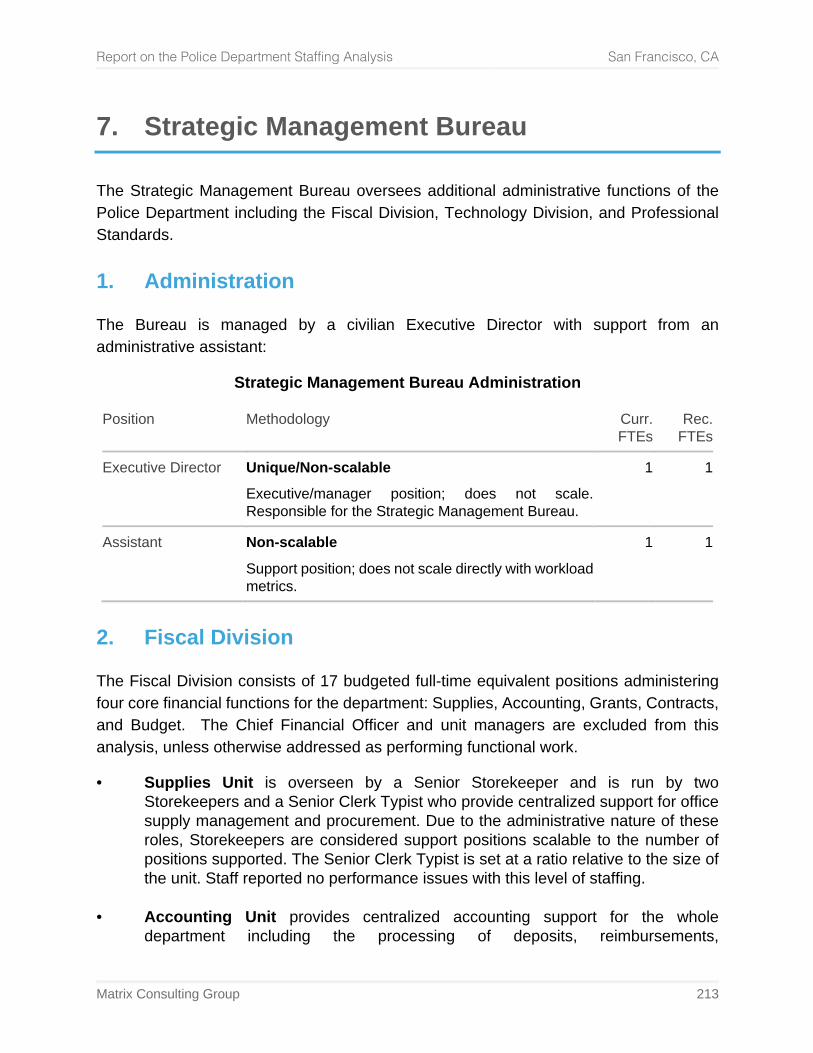
Report on the Police Department Staffing Analysis San Francisco, CA
Matrix Consulting Group 213
7. Strategic Management Bureau
The Strategic Management Bureau oversees additional administrative functions of the Police Department including the Fiscal Division, Technology Division, and Professional Standards.
1. Administration
The Bureau is managed by a civilian Executive Director with support from an administrative assistant:
Strategic Management Bureau Administration
Position Methodology Curr. FTEs
Rec. FTEs
Executive Director
Unique/Non-scalable
Executive/manager position; does not scale. Responsible for the Strategic Management Bureau.
1 1
Assistant
Non-scalable
Support position; does not scale directly with workload metrics.
1 1
2. Fiscal Division
The Fiscal Division consists of 17 budgeted full-time equivalent positions administering four core financial functions for the department: Supplies, Accounting, Grants, Contracts, and Budget. The Chief Financial Officer and unit managers are excluded from this analysis, unless otherwise addressed as performing functional work.
• Supplies Unit is overseen by a Senior Storekeeper and is run by two Storekeepers and a Senior Clerk Typist who provide centralized support for office supply management and procurement. Due to the administrative nature of these roles, Storekeepers are considered support positions scalable to the number of positions supported. The Senior Clerk Typist is set at a ratio relative to the size of the unit. Staff reported no performance issues with this level of staffing.
• Accounting Unit provides centralized accounting support for the whole
department including the processing of deposits, reimbursements,

Report on the Police Department Staffing Analysis San Francisco, CA
Matrix Consulting Group 214
interdepartmental charges, and review of invoice and purchase orders. The Unit is managed by an Accounting Manager and run by two Accountant III, one Accountant II, and three Senior Account Clerks. Due to the varying accounting activities that reduce the accuracy of specific workload measures, these positions are considered non-scalable. Staff reported no performance issues with current staff levels. Unit management should monitor and record service delivery and performance issues as they arise to incorporate as variables indicating future staffing needs.
• Grants Unit is managed by a Grants Manager with support from two Grants
Administrative Analysts. Calculating staffing based on the number of RFPs or contract managed was initially explored, but such a measure does not capture the complexity of administrative work required in completing these tasks, so these positions are considered non-scalable. Staff reported no performance issues with this staffing level.
• Contracts Unit consists of one Contracts Administrative Analyst, whose capacity
is not easily measured through simple workload variables. This position is therefore deemed to be non-scalable for this assessment. Staff reported no performance issues with this level of staffing.
• Budget Unit consists of one Budget Manager who leads the department’s budget
development each year. The incumbent also produces biweekly overtime reports for command staff and assists with special projects and requests requiring budget input. Workload capacity is not easily measured through simple workload variables, so this position is deemed to be non-scalable for this assessment. However, one of the Grants Administrative Analysts is reportedly supporting the Budget Manager by producing monthly budget monitoring reports for the Controller, as well as serving as the department’s position control manager. Management should allocate one additional budget analyst to relieve the Grants Administrative Analyst of budget responsibilities, as well as creating the capacity to proactively monitor and advise bureaus and divisions of their spending.
Selective/non-scaling methodology for the division. In the Budget Unit, analysis focuses on the unit’s capabilities in comparison with other large police agencies. In particular, opportunities to implement more proactive approaches to unit budget monitoring were examined, as well as the ability for the position to provide support to the Grants Unit.
Potential also exists in the budget unit to adapt a workload-based methodology, which will require monitoring of key workload drivers and the time needed to complete them, such as the quarterly report, the biweekly overtime report, which typically takes two days to complete, and all accounting duties.
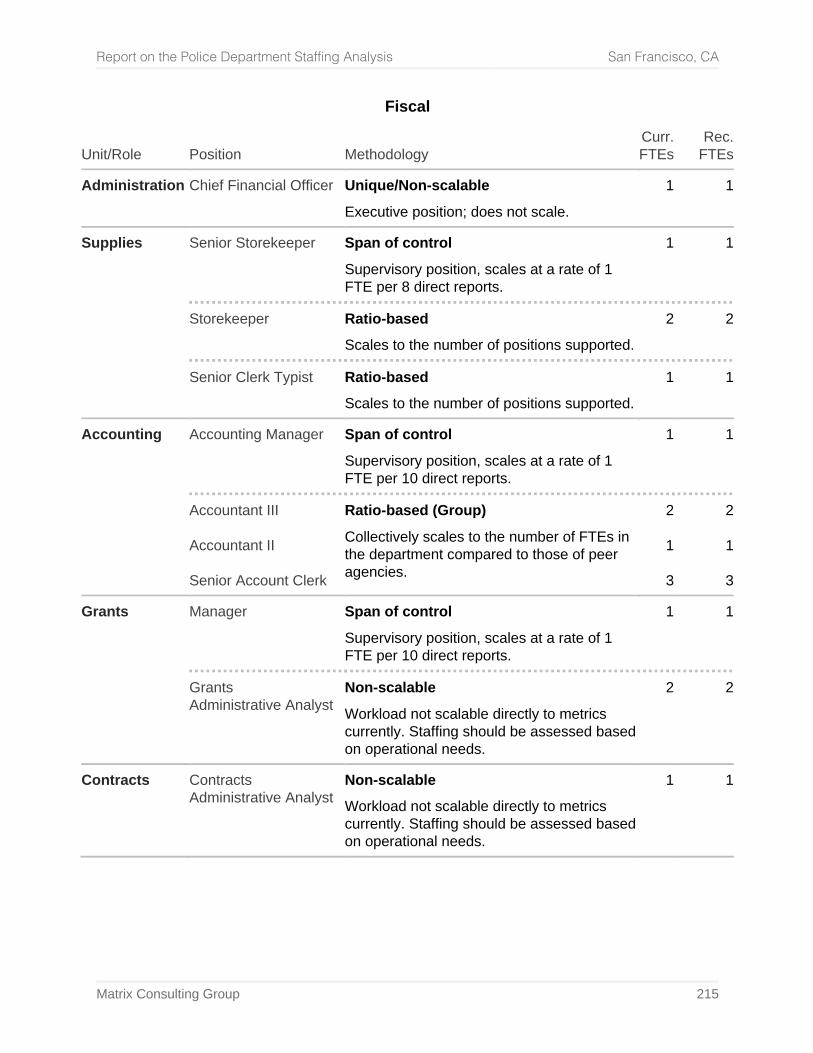
Report on the Police Department Staffing Analysis San Francisco, CA
Matrix Consulting Group 215
Fiscal
Unit/Role Position Methodology Curr. FTEs
Rec. FTEs
Administration Chief Financial Officer Unique/Non-scalable
Executive position; does not scale. 1 1
Supplies Senior Storekeeper Span of control
Supervisory position, scales at a rate of 1 FTE per 8 direct reports.
1 1
Storekeeper Ratio-based
Scales to the number of positions supported. 2 2
Senior Clerk Typist Ratio-based
Scales to the number of positions supported. 1 1
Accounting Accounting Manager Span of control
Supervisory position, scales at a rate of 1 FTE per 10 direct reports.
1 1
Accountant III Accountant II Senior Account Clerk
Ratio-based (Group)
Collectively scales to the number of FTEs in the department compared to those of peer agencies.
2
1
3
2
1
3
Grants Manager Span of control
Supervisory position, scales at a rate of 1 FTE per 10 direct reports.
1 1
Grants Administrative Analyst
Non-scalable
Workload not scalable directly to metrics currently. Staffing should be assessed based on operational needs.
2 2
Contracts Contracts Administrative Analyst
Non-scalable
Workload not scalable directly to metrics currently. Staffing should be assessed based on operational needs.
1 1

Report on the Police Department Staffing Analysis San Francisco, CA
Matrix Consulting Group 216
Unit/Role Position Methodology Curr. FTEs
Rec. FTEs
Budget Budget Manager Unique/Non-scalable
Workload not scalable directly to metrics currently. Staffing should be assessed based on operational needs.
1 1
Budget Analyst Selective
Position does not exist currently. Recommended creation of new role.
0 1
Recommendation: Fiscal Unit management should monitor and record service delivery and performance issues as they arise to incorporate as metrics for a workload-based methodology. Recommendation: A new Budget Analyst position should be created within the Budget Unit and staffed with one (1) FTE.
3. Technology Division
The Technology Division consists of four divisions, as detailed in the following sections.
(1) Technical Services & Support
Technical Services manages the 24-hour help desk and provides regular ongoing technical support for the entire department. The division is comprised of 12 full-time positions overseen by an IT Project Director and run by nine IT Operations Support Administrators (engineers), two Officers, and a part-time retiree. Six of the engineers and one of the Officers are assigned to manage a particular technical service, as well as respond to work orders from the help desk. Technical services include:
• Managing the build and refreshing of desktops and laptops • Testing applications coming out of build • Supporting departmentwide telecommunications (landlines) • Script writing • Mobile device management • Body worn camera deployment and refreshing • Training for applications
Report on the Police Department Staffing Analysis San Francisco, CA
Matrix Consulting Group 217
For the remaining three engineers, two of them are primarily dedicated as field representatives responding to work orders requiring physical support, while the third engineer manages the front desk responding to service requests and walk-ins. The second full-time Officer manages Internal Affairs requests requiring technical expertise, as well as provides telecommunications technical support. The remaining part-time retiree is a former Officer who serves as the lead for telecommunications contract management and procurement support, as well as managing escalation and liaising with other City departments.
Due to the breadth and complexity of work completed by each engineer, these positions are considered non-scalable since capacity cannot be measured through simple workload measures. However, additional staffing needs have been identified through alternative variables analyzed.
Management explained that every engineer or officer managing one of the technical services would be adequately staffed to manage their service line if they did not have to respond to work orders from the help desk. For the six engineers and one Officer who this applies to, each individual is estimated to spend between 20% up to 60% of their time responding to work orders. Four of the engineers and the Officer dedicate 20% of their time to work orders, while one engineer dedicates 30% of their time to work orders, and the remaining engineer who focuses on resolving the most complex technical troubleshooting spends about 60% of his time on work orders. Altogether, this amounts to 190% capacity, or almost two full-time positions.
In addition, Technical Services & Support relies on four contractors who operate on an equivalent full-time basis responding to field work, service requests, and assisting the front counter due to lack of staffing to handle the workload.
Based on these metrics, Management should allocate six additional full-time engineers (IT Operations Support Administrators) to consolidate work order and field support requests with a core group of engineers and allow current staff to focus on managing their respective technical service areas.
We also note that the two Officers in this unit have been identified by the department for potential civilianization into IT Operations Support Administrators. The incumbents are currently technically capable and skilled in their respective assignments, so management has indicated that civilianization is likely to occur through attrition and turnover.
(2) Architecture and Operations
Architecture and Operations provides technical support and maintenance for all networks, systems, security, and access controls used in department applications and systems. The
Report on the Police Department Staffing Analysis San Francisco, CA
Matrix Consulting Group 218
unit is led by an IS Project Director and administered by eight IS Engineers ranging from Journey to Senior to Principal steps. One engineer is dedicated to security, while a second engineer supports networking, and the remaining six engineers are dedicated to systems.
Due to the complexity of technical tasks managed by each engineer, productivity is not measured through simple workload measures. However, there are industry best practices for applying a ratio of engineers based on specific technical functions.
The Technology Division manages a large network including 184 network switches, 82 wireless access points, 76 routers, and 18 firewalls, 20 critical systems, and 224 servers. The entire police department currently has only one dedicated security manager to oversee this broad network. While industry ratios for security personnel vary, the police department needs to allocate at least one additional IS Engineer to create redundancy in security oversight. Additional staff will mitigate the loss of institutional knowledge and allow for continuous coverage through succession planning should the current incumbent vacate the position, as well as offer immediate relief for when the current incumbent is out of the office or unavailable.
As for network support, the unit also only employs one engineer to manage 184 network switches, as well as the wireless access points, routers, and firewalls. Industry best practices recommended a ratio of one engineer per 100 network switches. For the police department, this would amount to 1.84 full-time equivalent staffing. Management should therefore appropriate one additional full-time engineer to meet industry standards and better oversee the department’s broad network.
Finally, the unit has six systems engineers to support the department’s 20 critical systems and 224 servers. Industry staffing ratios for server support vary depending on the size of the organization, and whether servers are physical or virtual. Unit personnel recommend a ratio of one engineer per 30 servers based on their portfolio, amounting to 7.5 full-time equivalent employees. Based on this ratio, management should appropriate two additional full-time engineers to better support the department’s systems and servers.
(3) Applications and Business Intelligence
The Applications and Business Intelligence unit provides technical case management and programming support for all custom and package systems and databases, as well as compiling dashboards and other business intelligence for the department. The unit is managed by a Manager V and administered by 10 IS Programmer Analysts (Analyst to Senior), three IS Business Analysts (Senior to Principal), a Senior IS Engineer, and an IS Project Director.
Report on the Police Department Staffing Analysis San Francisco, CA
Matrix Consulting Group 219
Due to the complexity in technical work performed by the applications/programming and business intelligence teams, workload cannot be measured through easily quantifiable variables. These positions are therefore recognized as non-scalable for this assessment. However, we have identified staffing needs based on alternative factors.
In the applications team, programmers are responsible for a range of projects from website development, to applications programming, to database administration. Staff have expressed specific concerns for specialized functions where only one staff member is dedicated, and redundancy and succession planning are required. There is currently one programmer dedicated to working on projects through PeopleSoft/HRMS. Due to the increase in operational analytics and management information being produced for legislators, management, mandated reporting, and other external requests, this function has become increasingly important to the department. Although workload metrics were unavailable for this function, a vital support role such as this requires additional staffing to promote institutional knowledge, allow for succession planning, and increase coverage of this service area for when the incumbent is out of the office, or should the incumbent vacate the position. Management should allocate one additional programmer to support HRMS programming.
In the business intelligence team, there are similar concerns for providing redundancy in service coverage and preserving institutional knowledge for core support operations. Currently there is only one programmer for metadata modeling, and one programmer for ETL (extraction, transformation, loading) development. These roles are crucial in allowing dashboards and automated reports to accurately extract data and information. As the department becomes more technology advanced and relies on data dashboards for a range of operational needs, the need for supporting these programming roles increases. Management should appropriate two additional programmers to support metadata modeling and ETL development and mitigate the risk of loss of institutional knowledge and optimize coverage for this function when the incumbents are out of the office or unavailable.
(4) Project Management Office
The Project Management Office (PMO) manages the implementation of information systems projects, particularly enterprise software. The unit is run by a Manager V, supported by two budgeted Project Managers (one vacant during the time of this staffing study), a Senior Business Analyst, and a Business Analyst.
The Project Managers perform the conventional project management responsibilities of scoping out projects, defining business requirements, and monitoring the implementation and roll out of projects. The Senior Business Analyst monitors the Technology Division’s
Report on the Police Department Staffing Analysis San Francisco, CA
Matrix Consulting Group 220
budget and provides procurement support for technology purchases. The Business Analyst provides support in monitoring low priority or low impact projects. Due to the breadth and complexity of administrative and analytical work required, workload for positions cannot be measured through simple variables. These positions are therefore recognized as non-scalable for this assessment. However, we have identified staffing needs based on alternative factors.
With the current structure of the PMO, staff are barely able to focus on managing operational projects. As it is, for Fiscal Year 2019-20, there are 11 projects being administered, of which the PMO Manager is assigned the lead to seven of these projects and serves as a subject matter expert for an eighth project. The one staffed Project Manager is assigned as a subject matter expert for only one project. While the PMO Manager is absorbing regular project management work while the second Project Manager position is vacant, there is little to no capacity for the PMO to conduct strategic planning or administer a comprehensive technology training program. Management should appropriate one additional Project Manager to mitigate regular project management responsibilities from being absorbed by the PMO Manager even when a vacancy exists.
In addition, management should appropriate a Project Manager or Business Analyst to assist with technology planning. For example, there is currently no capacity for the PMO to analyze future technological needs based on useful lifecycle of assets or programs, or the impact of evolving technologies, such as the emergence of virtual or cloud-based systems and how they might integrate or replace current systems.
Finally, it is apparent that no formal, centralized training program with dedicated staff exists for technological tools and systems used throughout the police department. Management should appropriate one Project Manager and one Business Analyst to development a training program focused on technological tools and systems used throughout the department, including new implementations.
Staff in the new strategic planning and technology training programs should also monitor workload activity, establish measurable performance targets for each project, and monitor and record progress in achieving those goals as variables to be used in evaluating future staffing needs.
(5) Summary of Staffing Needs
Across all Technology Division sub-units, the identified staffing needs include the following:
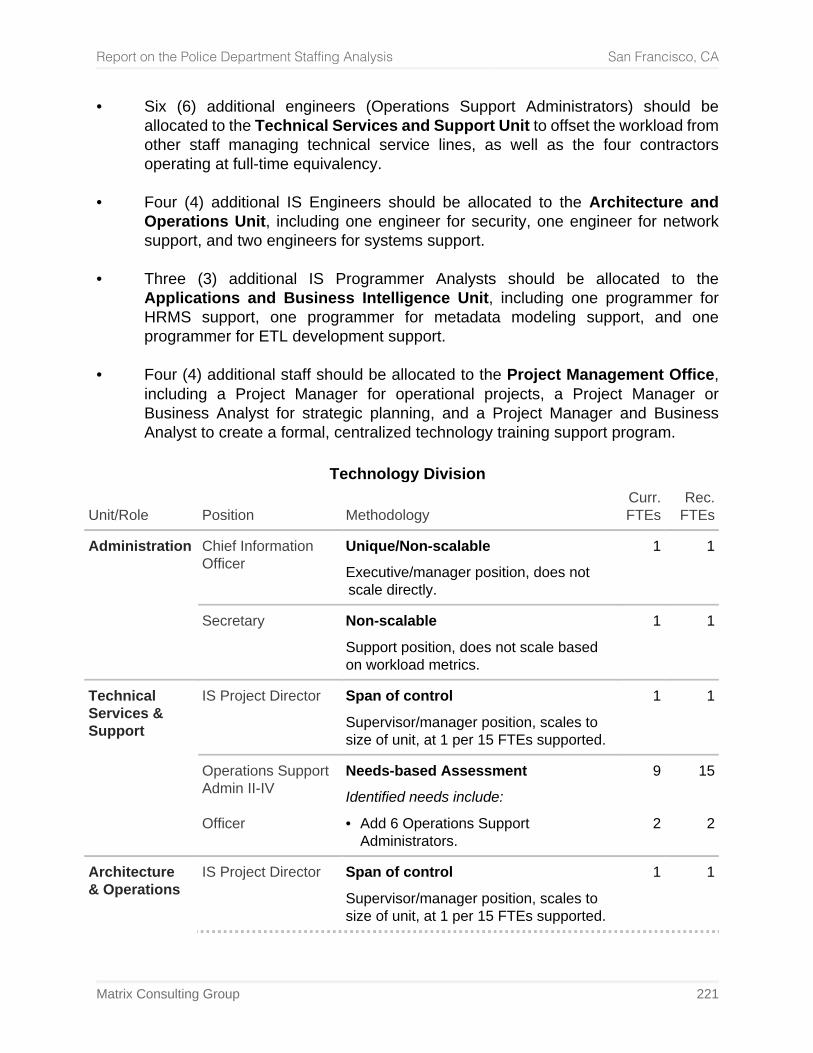
Report on the Police Department Staffing Analysis San Francisco, CA
Matrix Consulting Group 221
• Six (6) additional engineers (Operations Support Administrators) should be allocated to the Technical Services and Support Unit to offset the workload from other staff managing technical service lines, as well as the four contractors operating at full-time equivalency.
• Four (4) additional IS Engineers should be allocated to the Architecture and
Operations Unit, including one engineer for security, one engineer for network support, and two engineers for systems support.
• Three (3) additional IS Programmer Analysts should be allocated to the
Applications and Business Intelligence Unit, including one programmer for HRMS support, one programmer for metadata modeling support, and one programmer for ETL development support.
• Four (4) additional staff should be allocated to the Project Management Office,
including a Project Manager for operational projects, a Project Manager or Business Analyst for strategic planning, and a Project Manager and Business Analyst to create a formal, centralized technology training support program.
Technology Division
Unit/Role Position Methodology Curr. FTEs
Rec. FTEs
Administration Chief Information Officer
Unique/Non-scalable
Executive/manager position, does not scale directly.
1 1
Secretary Non-scalable
Support position, does not scale based on workload metrics.
1
1
Technical Services & Support
IS Project Director
Span of control
Supervisor/manager position, scales to size of unit, at 1 per 15 FTEs supported.
1 1
Operations Support Admin II-IV Officer
Needs-based Assessment
Identified needs include:
• Add 6 Operations Support Administrators.
9
2
15
2
Architecture & Operations
IS Project Director Span of control
Supervisor/manager position, scales to size of unit, at 1 per 15 FTEs supported.
1 1
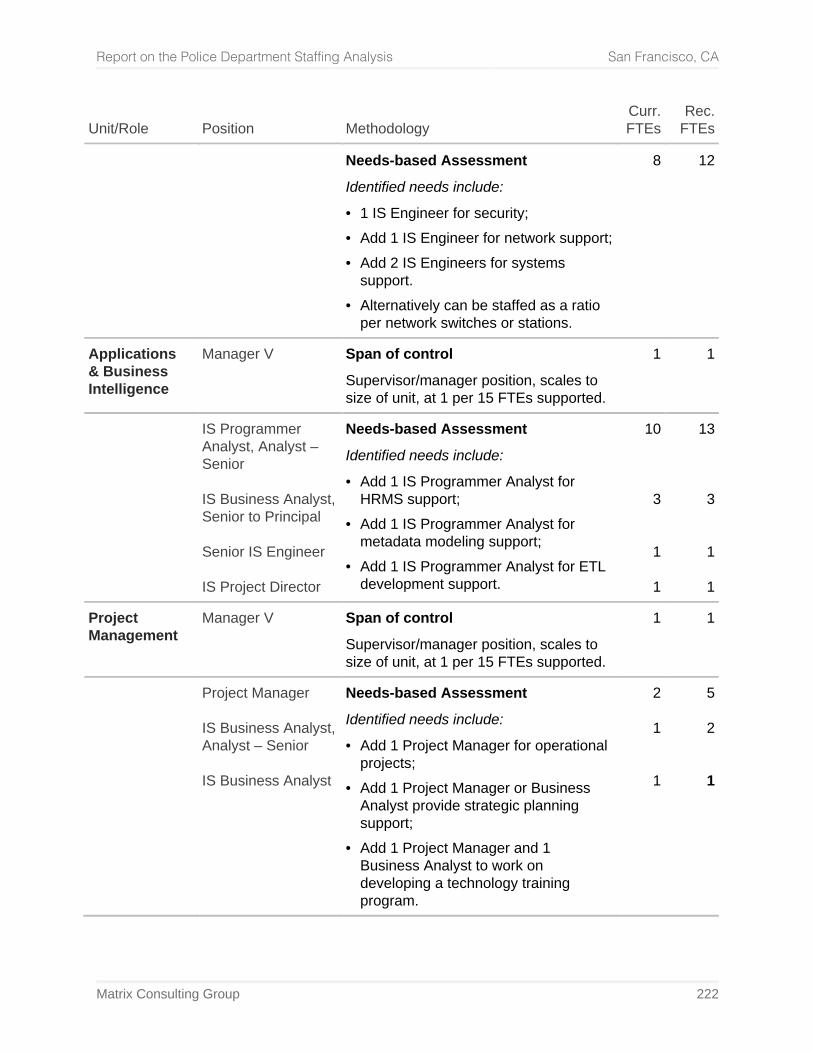
Report on the Police Department Staffing Analysis San Francisco, CA
Matrix Consulting Group 222
Unit/Role Position Methodology Curr. FTEs
Rec. FTEs
Needs-based Assessment
Identified needs include:
• 1 IS Engineer for security; • Add 1 IS Engineer for network support; • Add 2 IS Engineers for systems
support. • Alternatively can be staffed as a ratio
per network switches or stations.
8 12
Applications & Business Intelligence
Manager V
Span of control
Supervisor/manager position, scales to size of unit, at 1 per 15 FTEs supported.
1 1
IS Programmer Analyst, Analyst – Senior IS Business Analyst, Senior to Principal Senior IS Engineer IS Project Director
Needs-based Assessment
Identified needs include:
• Add 1 IS Programmer Analyst for HRMS support;
• Add 1 IS Programmer Analyst for metadata modeling support;
• Add 1 IS Programmer Analyst for ETL development support.
10
3
1
1
13
3
1
1
Project Management
Manager V
Span of control
Supervisor/manager position, scales to size of unit, at 1 per 15 FTEs supported.
1 1
Project Manager IS Business Analyst, Analyst – Senior IS Business Analyst
Needs-based Assessment
Identified needs include:
• Add 1 Project Manager for operational projects;
• Add 1 Project Manager or Business Analyst provide strategic planning support;
• Add 1 Project Manager and 1 Business Analyst to work on developing a technology training program.
2
1
1
5
2
1
Report on the Police Department Staffing Analysis San Francisco, CA
Matrix Consulting Group 223
4. Professional Standards
Professional Standard is divided into four units, as detailed in the following subsections.
(1) Staff Inspections Staff Inspections serves as an internal audit unit for the entire department. Their objective is to monitor ongoing compliance with the department’s wide range of policies and procedures. The unit is currently run by a Sergeant, supported with two Officers, one of which was vacant during the time of this study. The Business Analysis Team also hired additional Senior Administrative Analysts that were approved during the Fiscal Year 2019-20 budget cycle, two of which are being shared to provide audit and analytical support for Staff Inspections.
Audit shops conventionally measure productivity based on hours dedicated by staff per audit report produced. Average hours per report vary from organization, so there is no industry standard. In the Association of Local Government Auditor’s Performance Measures for Audit Organizations (last updated in 2017), industry best practices recommend that audit shops measure the total hours recorded by staff to complete each audit report to estimate an annual average. These averages can be used in an annual work plan that outline what audit projects are planned for the coming year, the total hours required to complete these projects, and the estimated staffing needs.
The number of hours dedicated to complete audits is not currently tracked or recorded, nor are annual work plans developed to outline the productive expectations of the unit for the year. In order to move toward a workload-based approach for the unit, the supervisor should begin compiling annual work plans that dictate the total number of audits that are expected to be completed each year. Staff should then track and report the number of hours they work on by audit project. This can then be used to determine the workload involved in each practice, and consequently enhance the project planning process by providing information on staff capacity, enabling for more realistic objective setting and project planning decisions.
In the interim before these practices can be implemented, these officers and analysts serving as auditors in this unit are recognized as non-scalable.
(2) Written Directives Written Directives is responsible for coordinating department wide policy reviews and leading efforts in creating and updating policies and procedures. The unit is run by a Sergeant with support from an Officer and Management Assistant. Staff do not typically
Report on the Police Department Staffing Analysis San Francisco, CA
Matrix Consulting Group 224
write the policies and procedures but serve as coordinators in working with subject matter experts throughout the police department who typically lead in revising and writing policies. Staff capacity is not easily tracked through simple workload measures, so these positions are recognized as non-scalable for this assessment.
(3) Business Analysis Team The Business Analysis Team serves as a data clearing house for various external and internal data requests for focus on operational performance. As of Fiscal Year 2019-20, the BAT is budgeted with six Senior Administrative Analysts, and one Administrative Analyst (vacant at the time of this study). Currently, BAT is sharing two of its Senior Administrative Analysts to support operational needs in Staff Inspections with audit work. Reform initiatives under Compliance Support are supported through this unit as well.
Reports vary greatly in scope and turnaround time, and although staff maintain rosters of reports and requests being processed, specific workload measures are not tracked to estimate staffing capacity, such as hours dedicated per report. Due to the complexity of effort required to respond to and process the breadth of requests and reports, BAT analytical positions are recognized as non-scalable for this assessment.
(4) Compliance Support The Compliance Support Unit is responsible for supporting department wide progress in implementing organizational reforms relating to the Collaborative Reform Initiative with the Department of Justice. There are currently four Officers assigned to support a portfolio of recommendations for each of the five Objectives or focus areas of the DOJ assessment. Although there are four active Officers in the unit, there are actually seven positions budgeted and filled (one being a recruit), but three of the positions have incumbents out on leave (including the recruit). The Officers will also be supported by two Senior Administrative Analyst positions created during the Fiscal Year 2019-20 budget cycle. Management has also identified the five officer positions as being eligible for civilianization as a part of the department wide civilianization plan, likely to be replaced by Senior Administrative Analysts.
Productivity for these positions is not measured through easily quantifiable workload variables due to the administrative and analytical nature of their work, so they are recognized as non-scalable for this study. In the absence of workload measures, staff did provide a spreadsheet outlining the various projects being managed with a summary of the DOJ Recommendations being implemented and stakeholders who are responsible for overseeing the implementation.
Report on the Police Department Staffing Analysis San Francisco, CA
Matrix Consulting Group 225
The unit should incorporate additional variables to track in this worklog. Since there are multiple stakeholders throughout the police department responsible for the monitoring and implementation of any given DOJ Recommendation, these notes and information should help clarify whether staffing levels in the Compliance Unit have any impact on the oversight and implementation of Recommendations, or whether issues are occurring in other units and divisions.
Potential exists for a workload-based methodology to be used in the future. The Staff Inspections Unit should adopt annual work plans that dictate annual productivity expectations (number of audit projects). In order to move toward a workload-based methodology, the unit should begin recording the number of hours that staff work on each audit project. This will enable the establishment of a baseline for determining the time needed to complete individual projects.
(5) Civilianization
In the Controller’s Office’s May 13, 2019, Memorandum titled San Francisco Police Department Civilianization Progress and Options, the department identified several sworn positions throughout the Professional Standards division as candidates for potential civilianization. We outline the following positions identified for potential civilianization:
• Professional Standards: The managing Lieutenant identified for potential reclassification to Manager IV.
• Written Directives: The Sergeant and Officer were identified for reclassification to Senior Management Assistant, and Management Assistant.
• Compliance Support: Five Police Officers were identified for reclassification to Senior Administrative Analysts.
Sworn positions are subject to institutional knowledge loss as they are subject to promotion and rotation. Civilianization of the aforementioned positions could improve employee retention in each unit, as well as promote managerial stability with the transition of the Lieutenant to a permanent civilian manager. A hiring process of Senior Administrative Analysts is underway to take over duties in the Staff Inspections Unit and Compliance Support Unit. The department should use attrition and turnover as opportunities to incrementally reclassify these positions. As positions are incrementally reclassified, the department should evaluate whether retaining any remaining sworn incumbents enhance operational performance justifying the retainment of minimal sworn presence in each unit.
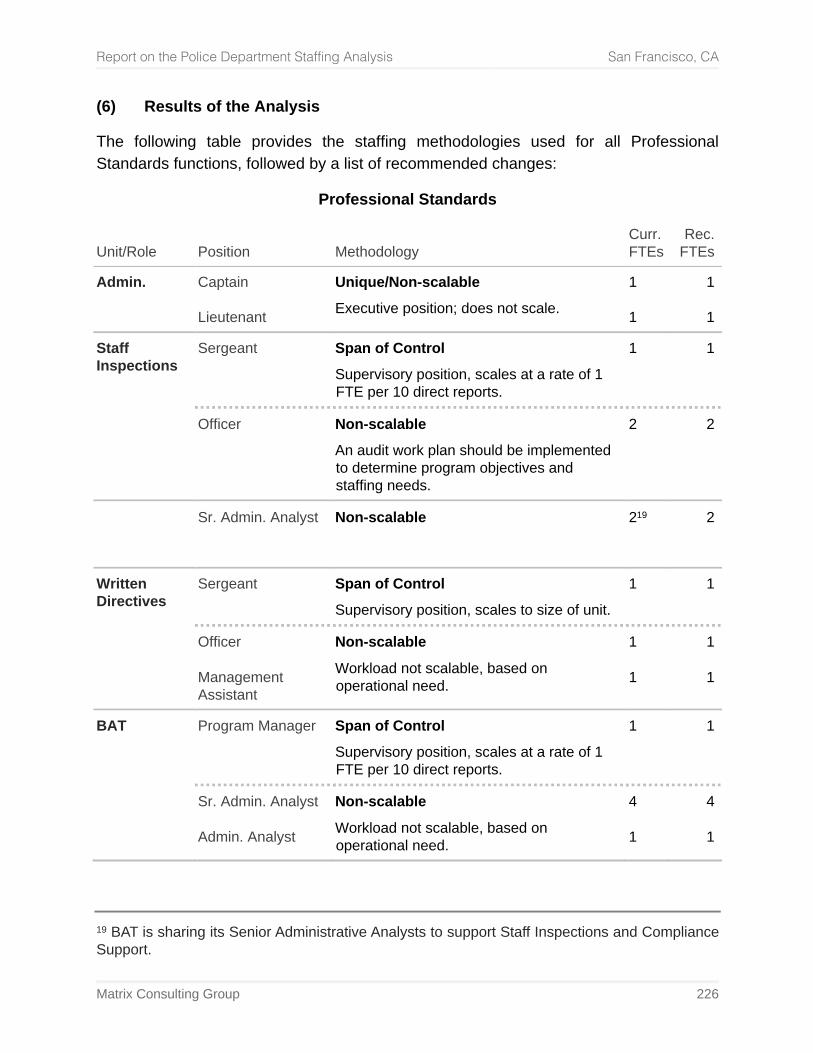
Report on the Police Department Staffing Analysis San Francisco, CA
Matrix Consulting Group 226
(6) Results of the Analysis
The following table provides the staffing methodologies used for all Professional Standards functions, followed by a list of recommended changes:
Professional Standards
Unit/Role Position Methodology Curr. FTEs
Rec. FTEs
Admin. Captain Lieutenant
Unique/Non-scalable
Executive position; does not scale. 1 1
1
1
Staff Inspections
Sergeant Span of Control
Supervisory position, scales at a rate of 1 FTE per 10 direct reports.
1 1
Officer
Non-scalable
An audit work plan should be implemented to determine program objectives and staffing needs.
2
2
Sr. Admin. Analyst
Non-scalable
219
2
Written Directives
Sergeant Span of Control
Supervisory position, scales to size of unit. 1 1
Officer Management Assistant
Non-scalable
Workload not scalable, based on operational need.
1 1
1
1
BAT Program Manager Span of Control
Supervisory position, scales at a rate of 1 FTE per 10 direct reports.
1 1
Sr. Admin. Analyst Admin. Analyst
Non-scalable
Workload not scalable, based on operational need.
4 1
4
1
19 BAT is sharing its Senior Administrative Analysts to support Staff Inspections and Compliance Support.
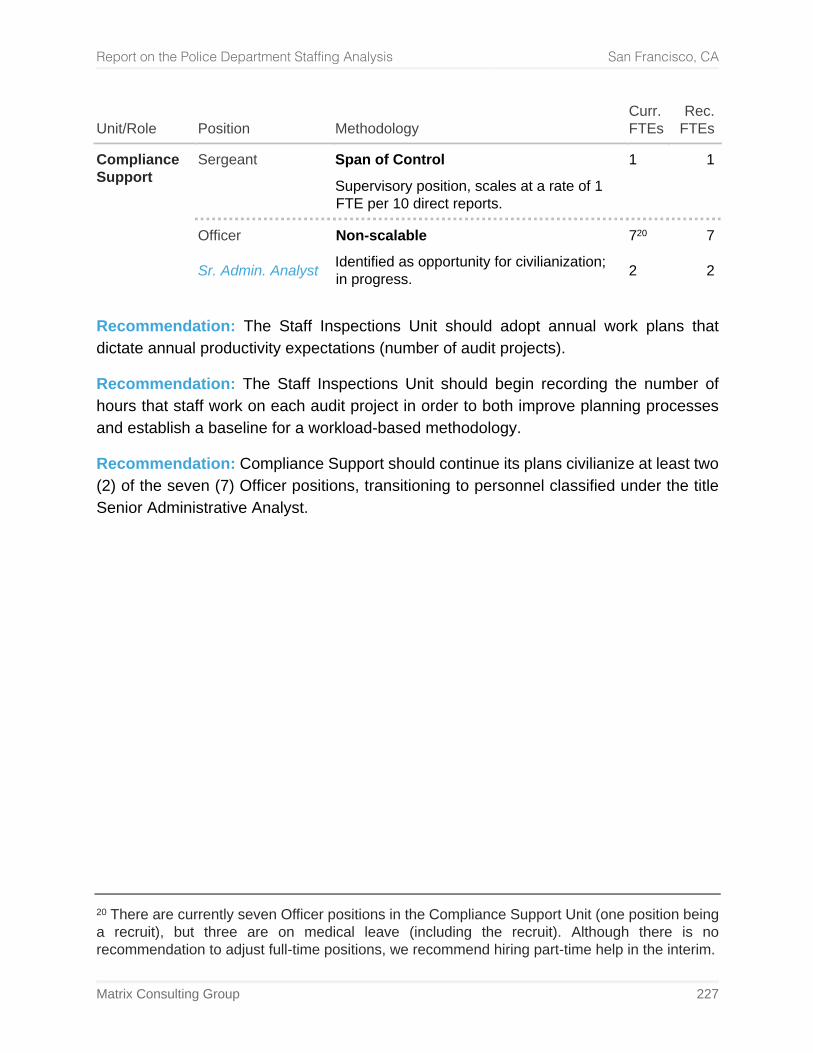
Report on the Police Department Staffing Analysis San Francisco, CA
Matrix Consulting Group 227
Unit/Role Position Methodology Curr. FTEs
Rec. FTEs
Compliance Support
Sergeant Span of Control
Supervisory position, scales at a rate of 1 FTE per 10 direct reports.
1 1
Officer Sr. Admin. Analyst
Non-scalable
Identified as opportunity for civilianization; in progress.
720 2
7
2
Recommendation: The Staff Inspections Unit should adopt annual work plans that dictate annual productivity expectations (number of audit projects).
Recommendation: The Staff Inspections Unit should begin recording the number of hours that staff work on each audit project in order to both improve planning processes and establish a baseline for a workload-based methodology.
Recommendation: Compliance Support should continue its plans civilianize at least two (2) of the seven (7) Officer positions, transitioning to personnel classified under the title Senior Administrative Analyst.
20 There are currently seven Officer positions in the Compliance Support Unit (one position being a recruit), but three are on medical leave (including the recruit). Although there is no recommendation to adjust full-time positions, we recommend hiring part-time help in the interim.
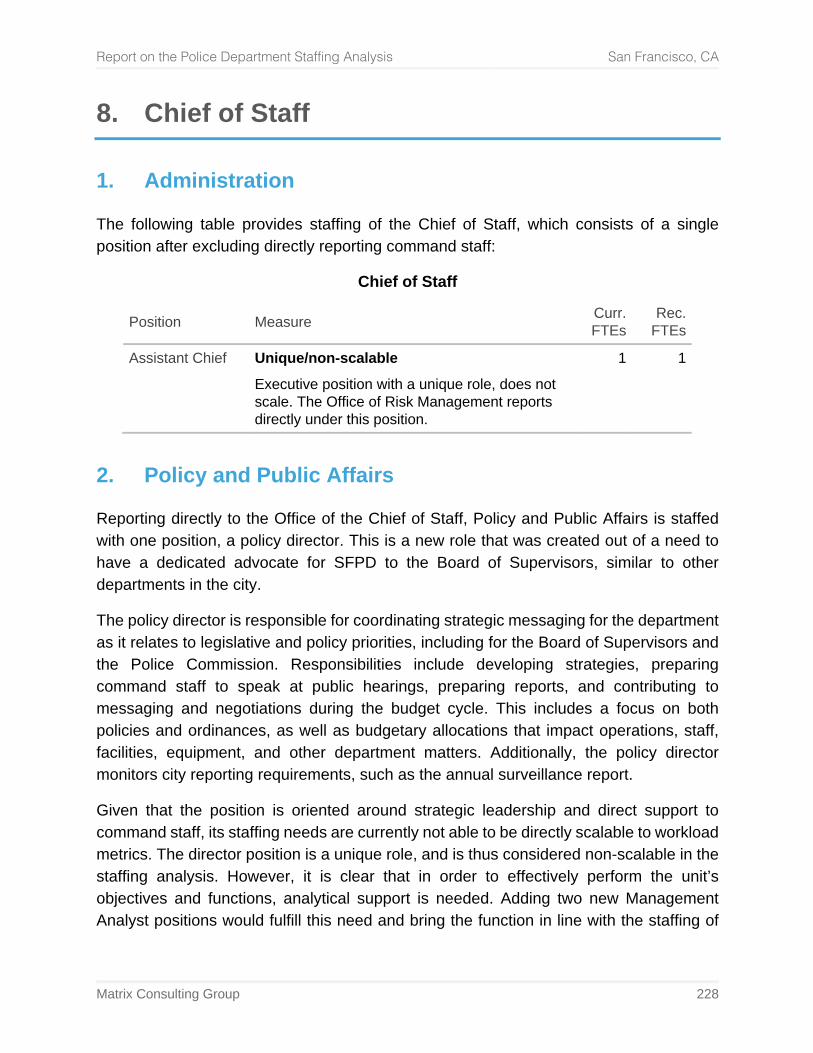
Report on the Police Department Staffing Analysis San Francisco, CA
Matrix Consulting Group 228
8. Chief of Staff
1. Administration
The following table provides staffing of the Chief of Staff, which consists of a single position after excluding directly reporting command staff:
Chief of Staff
Position Measure Curr. FTEs
Rec. FTEs
Assistant Chief Unique/non-scalable
Executive position with a unique role, does not scale. The Office of Risk Management reports directly under this position.
1 1
2. Policy and Public Affairs
Reporting directly to the Office of the Chief of Staff, Policy and Public Affairs is staffed with one position, a policy director. This is a new role that was created out of a need to have a dedicated advocate for SFPD to the Board of Supervisors, similar to other departments in the city.
The policy director is responsible for coordinating strategic messaging for the department as it relates to legislative and policy priorities, including for the Board of Supervisors and the Police Commission. Responsibilities include developing strategies, preparing command staff to speak at public hearings, preparing reports, and contributing to messaging and negotiations during the budget cycle. This includes a focus on both policies and ordinances, as well as budgetary allocations that impact operations, staff, facilities, equipment, and other department matters. Additionally, the policy director monitors city reporting requirements, such as the annual surveillance report.
Given that the position is oriented around strategic leadership and direct support to command staff, its staffing needs are currently not able to be directly scalable to workload metrics. The director position is a unique role, and is thus considered non-scalable in the staffing analysis. However, it is clear that in order to effectively perform the unit’s objectives and functions, analytical support is needed. Adding two new Management Analyst positions would fulfill this need and bring the function in line with the staffing of
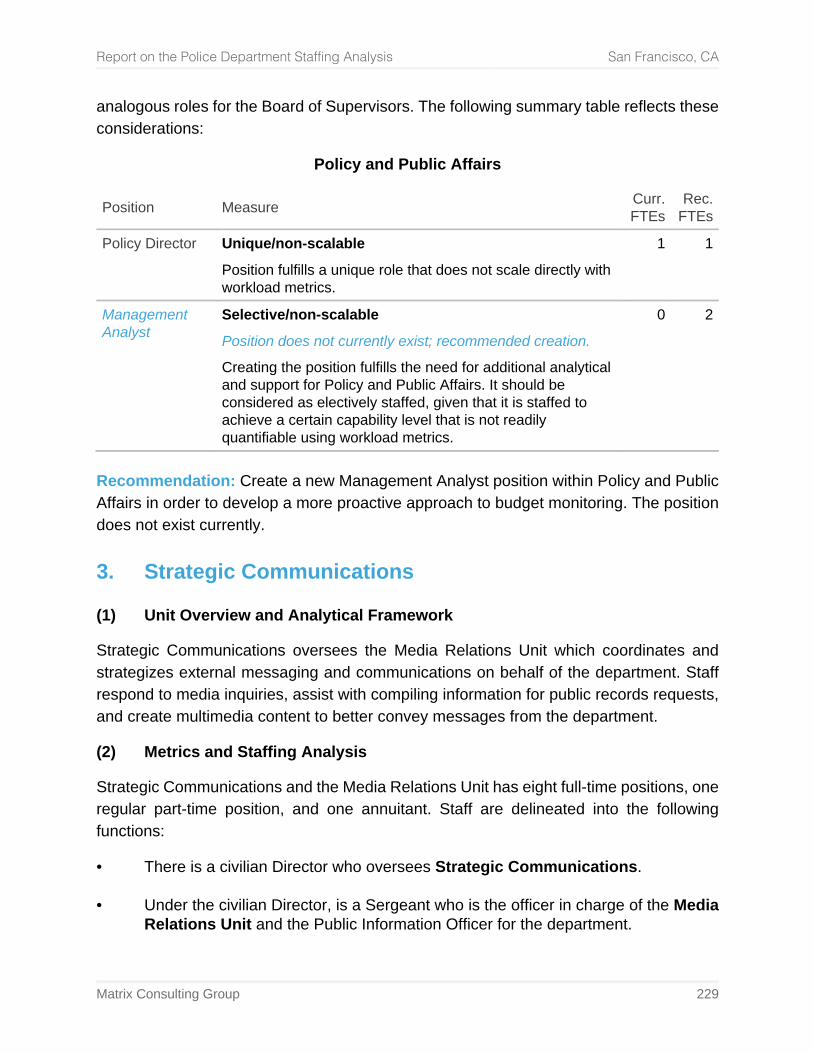
Report on the Police Department Staffing Analysis San Francisco, CA
Matrix Consulting Group 229
analogous roles for the Board of Supervisors. The following summary table reflects these considerations:
Policy and Public Affairs
Position Measure Curr. FTEs
Rec. FTEs
Policy Director Unique/non-scalable
Position fulfills a unique role that does not scale directly with workload metrics.
1 1
Management Analyst
Selective/non-scalable
Position does not currently exist; recommended creation.
Creating the position fulfills the need for additional analytical and support for Policy and Public Affairs. It should be considered as electively staffed, given that it is staffed to achieve a certain capability level that is not readily quantifiable using workload metrics.
0 2
Recommendation: Create a new Management Analyst position within Policy and Public Affairs in order to develop a more proactive approach to budget monitoring. The position does not exist currently.
3. Strategic Communications
(1) Unit Overview and Analytical Framework
Strategic Communications oversees the Media Relations Unit which coordinates and strategizes external messaging and communications on behalf of the department. Staff respond to media inquiries, assist with compiling information for public records requests, and create multimedia content to better convey messages from the department.
(2) Metrics and Staffing Analysis
Strategic Communications and the Media Relations Unit has eight full-time positions, one regular part-time position, and one annuitant. Staff are delineated into the following functions:
• There is a civilian Director who oversees Strategic Communications. • Under the civilian Director, is a Sergeant who is the officer in charge of the Media
Relations Unit and the Public Information Officer for the department.
Report on the Police Department Staffing Analysis San Francisco, CA
Matrix Consulting Group 230
• Three sworn Officers perform Public Information Officer (PIO) duties and respond to media and external inquiries on a regular basis and coordinate public messaging on behalf of the department. PIOs respond to approximately 168 media email inquiries and 179 phone inquiries, amounting to 347 inquiries each week. In 2018, PIOs also wrote 176 news releases. The amount of work required to respond to each request or prepare each press release varies, so workload metrics cannot be applied for these positions. These positions are therefore non-scalable for this assessment.
• One sworn Officer serves as a Website Manager who maintains and updates the
department’s website, including uploading documents for public dissemination. Since this is a technical support position whose workload varies, staffing is non-scalable.
• One civilian serves as a Social Media Manager. Since this position is unique and
serves in a technical support position, staffing is non-scalable. • A portion of the Public Records Act requests are triaged through a part-time
retiree who coordinates responses. According to data provided by the department, in 2017 (the most recently available data), the unit processed 184 records requests. Work required to respond to requests varies significantly, so this position is considered non-scalable.
• There is one regular fulltime civilian who serves as a videographer for the unit.
Workload measures were not available for this position, and due to its unique role, staffing has been classified as non-scalable.
• Lastly, there is a full-time Office Manager that provides administrative support and
scales to the size of the unit. Staffing is not based on workload measures. (3) Results of the Staffing Analysis
There are no recommended adjustments to staffing levels from this evaluation based on feedback from staff that staffing levels are adequate. However, during the course of this study, the Website Manager position became vacant and was identified for civilianization. We agree with this action, and also suggest that management consolidate the Website Manager duties with the Social Media Manager.
In the Controller’s Office’s May 2019 report “Civilianization Progress and Options”, the department identified the Media Relations Unit’s Officer positions as potential candidates for civilianization. After reviewing the unit’s staffing structure and duties, we recommend that the department maintain its current structure of utilizing sworn Officers as Public
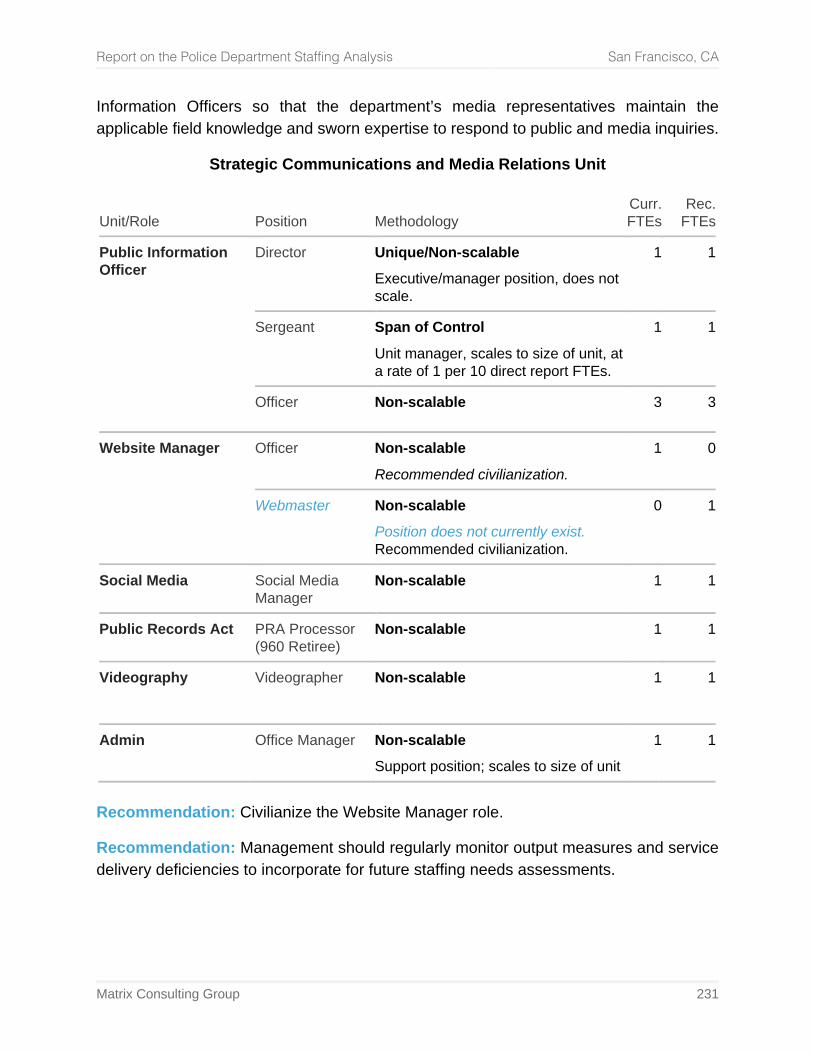
Report on the Police Department Staffing Analysis San Francisco, CA
Matrix Consulting Group 231
Information Officers so that the department’s media representatives maintain the applicable field knowledge and sworn expertise to respond to public and media inquiries.
Strategic Communications and Media Relations Unit
Unit/Role Position Methodology Curr. FTEs
Rec. FTEs
Public Information Officer
Director Unique/Non-scalable
Executive/manager position, does not scale.
1 1
Sergeant Span of Control
Unit manager, scales to size of unit, at a rate of 1 per 10 direct report FTEs.
1 1
Officer Non-scalable 3 3
Website Manager Officer Non-scalable
Recommended civilianization. 1 0
Webmaster Non-scalable
Position does not currently exist. Recommended civilianization.
0 1
Social Media Social Media Manager
Non-scalable 1 1
Public Records Act PRA Processor (960 Retiree)
Non-scalable 1 1
Videography Videographer Non-scalable 1 1
Admin Office Manager Non-scalable
Support position; scales to size of unit 1 1
Recommendation: Civilianize the Website Manager role.
Recommendation: Management should regularly monitor output measures and service delivery deficiencies to incorporate for future staffing needs assessments.
Report on the Police Department Staffing Analysis San Francisco, CA
Matrix Consulting Group 232
4. Office of Risk Management
The Office of Risk Management is organized within the Office of the Chief of Staff, and includes the Legal Division, Internal Affairs, and a number of other units.
The following table presents staffing for the administration of the office:
Office of Risk Management
Position Methodology Curr. FTEs
Rec. FTEs
Commander Unique/Non-scalable
Executive position; does not scale. 1 1
Captain Unique/Non-scalable
Executive position; does not scale. 1 1
1. Court Liaison
Court Liaison is organized within Risk Management is collection of several different functions, operating out of the Hall of Justice. The unit is organized under the Office of Risk Management following a recent change. It is supervised by a sergeant, and is divided into a number of different specialized roles that each have only 1 or 2 positions assigned.
(1.1) Traffic Subpoenas
The traffic subpoenas function is staffed with 1 officer and 1 senior clerk, and completes administrative processing of traffic subpoenas issued by the courts for SFPD officers.
A lack of integration and links between information systems exponentially increases the work needed to complete the role’s main responsibility – notifying officers of their court dates for traffic ticket cases. The process operates as follows:
• Beginning with a traffic ticket being protested by an accused individual, the court assigns a calendar date, which is populated in the court’s information management system.
• The SFPD traffic subpoenas staff have access to the calendar, and run a report in
advance of the court date. • Because the report does not include the officer’s name, and instead only their
identification number, staff enter the information into a manually updated MS Access database, which fills in the needed fields and exports into a PDF.
Report on the Police Department Staffing Analysis San Francisco, CA
Matrix Consulting Group 233
• Copies of the PDF are printed and attached to the citation, which is then sent to the officer.
• If the case is dismissed, additional paperwork needs to be completed. E-citations, which the department has transitioned to fairly recently, are designed to minimize processing time by auto-populating fields and submitting electronically. However, because the court requires a paper copy, they are printed, sorted, and mailed to the courts (whether juvenile or adult) and ID Bureau.
The function used to be staffed with 3 positions; however, following the consolidation to two court rooms, staffing was reduced to two given that court dates would not be scheduled concurrently. This suggests that it is feasible to set the staffing of the function based on a ratio to the number of traffic courts, or of court days per month.
It is estimated that there are 30 court dates scheduled per day, and with the court meeting four times per week, this equates to 120 over this timeframe. Taking into account time and utilization estimates conveyed to the project team, a staffing ratio for the function is set at 1 FTE for every 2,500 court dates per year. At that ratio, a 20% increase in workload would trigger an additional FTE. Alternatively, at 3,000 court dates per year, a 40% increase in workload would trigger an additional FTE. These numbers should be adjusted as work volume changes and any investments in process automation or database integration are made.
(1.2) Public Front Counter and Witness Subpoenas The Court Liaison Unit’s public front counter is staffed by 1 senior clerk position, who is also responsible for processing all witness subpoenas
Since moving locations, the public front counter has received additional traffic. Questions directed for any of the Legal Division functions are often asked at the public counter, including body camera and traffic discovery requests, as well as individuals seeking resolution of towed vehicle, due to the early closing time of the tow counter down the hall.
As officers sign into court at court, the clerk records it and stamps the officer’s physical overtime card, manually enters the time start and end times, verifies that the overtime is approved and valid, and provides a paper receipt to the officer. Additional copies are also printed,
Processing subpoenas, however, is the foremost workload of the position, given both the volume and steps involved. Last month, 382 subpoenas were processed in the unit, which
Report on the Police Department Staffing Analysis San Francisco, CA
Matrix Consulting Group 234
equates to about 22 per court day. All cover sheets are handwritten, scanned, and emailed.
Stacks of court cancellation notes are delivered by the DA twice per day. The clerk then looks up the identity and location within the organization of the officer reference and notifies the individual.
There is no backup for the position other than the sworn payroll/floater officer, and given the workload involved with the witness subpoenas, this can result in delays and the public counter being unavailable. Given these considerations, the position is considered as selective/non-scalable, with the primary issue being the need to add a relief factor by creating an additional a position, which would also allow for some delineation of responsibilities between the roles.
(1.3) Payroll/Floater
1 officer It is important to note that, unlike a number of officers performing clerical roles, this position is designated as permanently requiring an officer, and is not placed in the role due to modified/restricted duty. Given that the officer is co-located with and sometimes provides support to the public counter, it is necessary that the employee assigned to the role is able to make contact with the public.
The officer is responsible for payroll duties relating to court, whether on overtime or in lieu of the officer working their regular shift, and thus earning pay at their regular rate. The officer coordinates court appearances, overtime, and pay for shifts missed because of court, getting approval from supervisors to do so. If the officer is on the night shift, it must be verified as per the labor agreement that there are a minimum of 8 hours between the assumed end of the court appearance and the officer returning to duty.
The officer completes all requests on the physical overtime cards, completing as many as 1,000 per pay period (two weeks). Many are filled out incorrectly, requiring the officer to be contacted to make corrections.
(1.4) Legal Counsel The Legal Counsel Unit within Court Liaison provides legal advice, on subpoena and court issues primarily. It is staffed with 1 legal counsel (attorney) and 1 paralegal staff. The unit reviews subpoenas when they merit additional review, such when they are informal, from out-of-county DAs, or have some other type of issue that requires legal counsel to make a determination on whether or not to comply with the subpoena.
Report on the Police Department Staffing Analysis San Francisco, CA
Matrix Consulting Group 235
(1.5) Records Subpoenas The Records Subpoena function is staffed with 1 clerk positions, and is responsible for coordinating and processing subpoenas for records. As with the other subpoena functions, common issues emerge regarding the lack of automation and linkage between various information management systems. Moreover, process duplication and conversion between electronic and paper records add to the time needed to complete processing workloads, ensuring that consolidation of roles and/or cross-training is not feasible.
(1.6) Summary of Court Liaison Staffing Factors The following table provides a summary of the current staffing of each sub-unit within Court Liaison, as well as the type of methodology identified for the position’s staffing factors:
Court Liaison
Unit Position Methodology Curr. FTEs
Rec. FTEs
Supervisor/ Policies Audits
Sergeant Span of control
Scales to number if direct reports and miscellaneous workloads, such as auditing reports and work on policies.
1 1
Legal Counsel
Legal Counsel Paralegal
Unique/non-scalable
Support position for a unit with two FTEs, does not scale directly with workload
1
1
1
1
Public Front Counter & Witness Subpoenas
Senior Clerk Selective/non-scalable
If a relief factor is desired to increase service level to the public, an additional FTE is needed.
1 1
Traffic Subpoenas Senior Clerk Officer
Ratio-based
Staffing set at 1 FTE per 2,500 traffic subpoena dates issued, which requires a 20% increase in workload to require another FTE.
1
1
1
1
Records Subpoenas
Senior Clerk Workload-based/Unique
Staffing could be potentially scaled based on subpoena workloads; however, variations in workload make this more difficult.
1 1
Report on the Police Department Staffing Analysis San Francisco, CA
Matrix Consulting Group 236
Unit Position Methodology Curr. FTEs
Rec. FTEs
Payroll/ Floater
Officer Unique/non-scalable
Unique role that requires an FTE, but has the capacity to help out with witness subpoenas as well.
1 1
2. Legal Division
The Legal Division is organized under the Office of Risk Management, and is organized with several sub-units under it, including a unit of the same name, Court Liaison, and EEO.
(1) Legal Unit Public Record Act (PRA) requests are the primary workload driver of the Legal Unit, which is tasked with assisting the City Attorney’s Office in fulfilling them. This is a complex mission, having evolved significantly over the past few years with the emergence of body-worn cameras and the recent passing of CA SB-1421.
The new law amends the Police Bill of Rights and expands the Public Records Act to allow individuals to request documents that were previously able to be withheld by law enforcement agencies. This includes any records relating to incidents where an officer discharged a gun at an individual, committed sexual assault, and incidents where an officer was found to act “dishonestly” in the investigation, reporting, and enforcement of crime or other law enforcement roles. With some exceptions, agencies are mandated to fulfill the request within 18 months, and must respond within 10 days – although a 14-day extension may be filed by the agency. Clearly, PRA requests are not new, however, they have increased in both activity and, in many cases, complexity given the areas covered by the law.
The process of fulfilling a PRA request begins when it is received. A legal assistant is assigned the request, who then enters it within an information management system to monitor and track the department’s progress in completing the request. Through the same system, the Legal Unit responds to the requester and requests clarification if needed. A 14-day extension may also be sent.
The complexity and workload created by PRA requests vary extensively, ranging from narrow focuses that may only require a few hours to fulfill, to a vast and complicated request that requires significant media production and contributions from multiple units.
Report on the Police Department Staffing Analysis San Francisco, CA
Matrix Consulting Group 237
Given how recently the law was passed that allows for the new types of PRA requests, it is unclear how the unit’s workload will evolve over the medium and long-term future. It could be suspected that there was unfilled demand for the type of information and documents that were previously withheld that is now being requested within a short time frame, although it is unlikely to diminish significantly.
The project team was provided with examples demonstrating this range, and it evident that each PRA request can have wide-ranging legal implications if the proper delineation is made between what must be restricted, redacted, and provided.
Theoretically, the staffing of the unit could be constructed as a workload-based methodology that uses the number of PRA requests and adds a time estimate per request. The PRA requests could be striated into different levels of complexity or workload involved, given the extremely wide range of staff time that a requests can represent. Ultimately, however, it is not feasible to do so at this time for a few reasons:
• It is inherently difficult to measure PRA/SB 2421 workload involved, given the variation in the complexity and workload involved in the requests, as well as the number of units that they create workload for.
• Responses to SB 1421 are still evolving. The passing of SB 1421 required
SFPD to develop a number of new systems, processes, and decision checklists to better and more efficiently respond to these requests.
• Departments are proactively being more transparent in response to the law.
Shortly before or after the law was passed, major California departments such as SFPD and LAPD created a process by which body-worn camera footage is automatically released following an officer-involved shooting.
• Technological solutions could provide some limited relief in the long-term
as solutions to automate aspects of PRA workload, such as video production and records-gathering aspects of PRAs are developed. For instance, AI-based facial recognition in body camera video has been in the process of development for several years, and could speed up the process of video redaction when used retroactively.
As a result, the project team does not recommend conducting a workload-based staffing analysis of the Legal Unit at this time, However, as the unit evolves its processes and strategies for handling PRA requests further, these measures should be developed, both for the Legal Unit and other units impacted by the PRAs and SB 1421 requests, such as the Body Camera Unit.
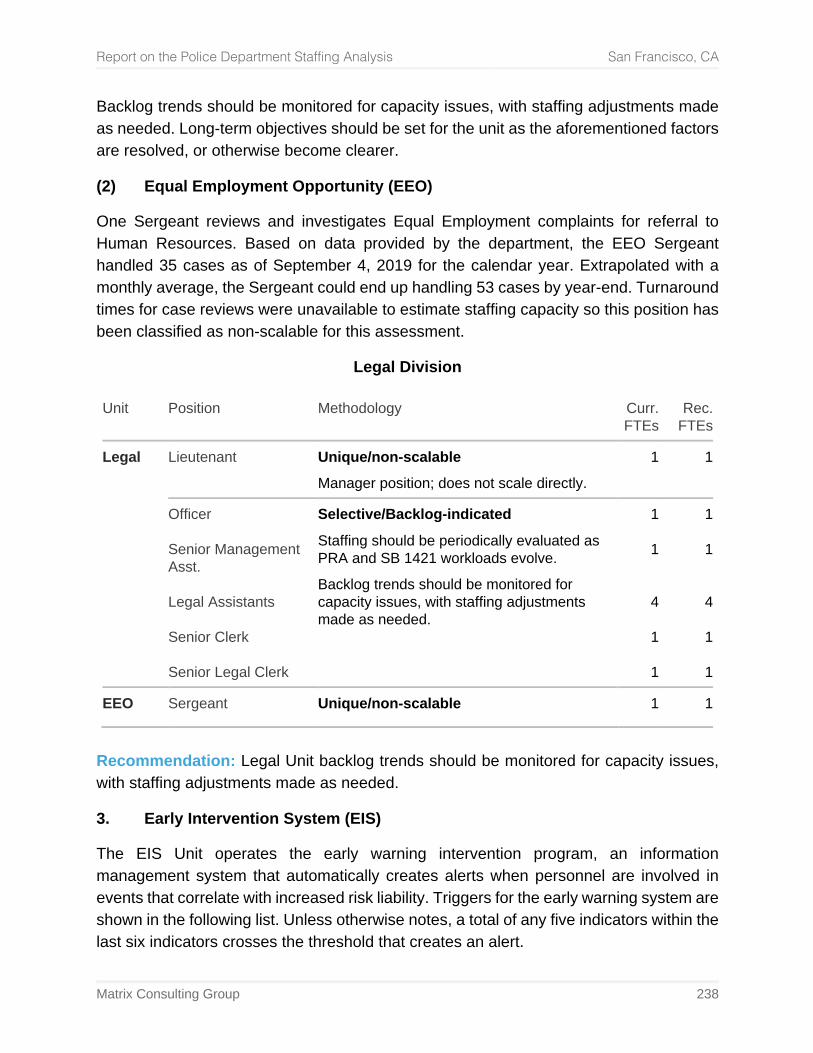
Report on the Police Department Staffing Analysis San Francisco, CA
Matrix Consulting Group 238
Backlog trends should be monitored for capacity issues, with staffing adjustments made as needed. Long-term objectives should be set for the unit as the aforementioned factors are resolved, or otherwise become clearer.
(2) Equal Employment Opportunity (EEO)
One Sergeant reviews and investigates Equal Employment complaints for referral to Human Resources. Based on data provided by the department, the EEO Sergeant handled 35 cases as of September 4, 2019 for the calendar year. Extrapolated with a monthly average, the Sergeant could end up handling 53 cases by year-end. Turnaround times for case reviews were unavailable to estimate staffing capacity so this position has been classified as non-scalable for this assessment.
Legal Division
Unit Position Methodology Curr. FTEs
Rec. FTEs
Legal Lieutenant Unique/non-scalable
Manager position; does not scale directly. 1 1
Officer Senior Management Asst. Legal Assistants Senior Clerk Senior Legal Clerk
Selective/Backlog-indicated
Staffing should be periodically evaluated as PRA and SB 1421 workloads evolve.
Backlog trends should be monitored for capacity issues, with staffing adjustments made as needed.
1
1
4
1
1
1
1
4
1
1
EEO Sergeant Unique/non-scalable 1 1
Recommendation: Legal Unit backlog trends should be monitored for capacity issues, with staffing adjustments made as needed.
3. Early Intervention System (EIS)
The EIS Unit operates the early warning intervention program, an information management system that automatically creates alerts when personnel are involved in events that correlate with increased risk liability. Triggers for the early warning system are shown in the following list. Unless otherwise notes, a total of any five indicators within the last six indicators crosses the threshold that creates an alert.
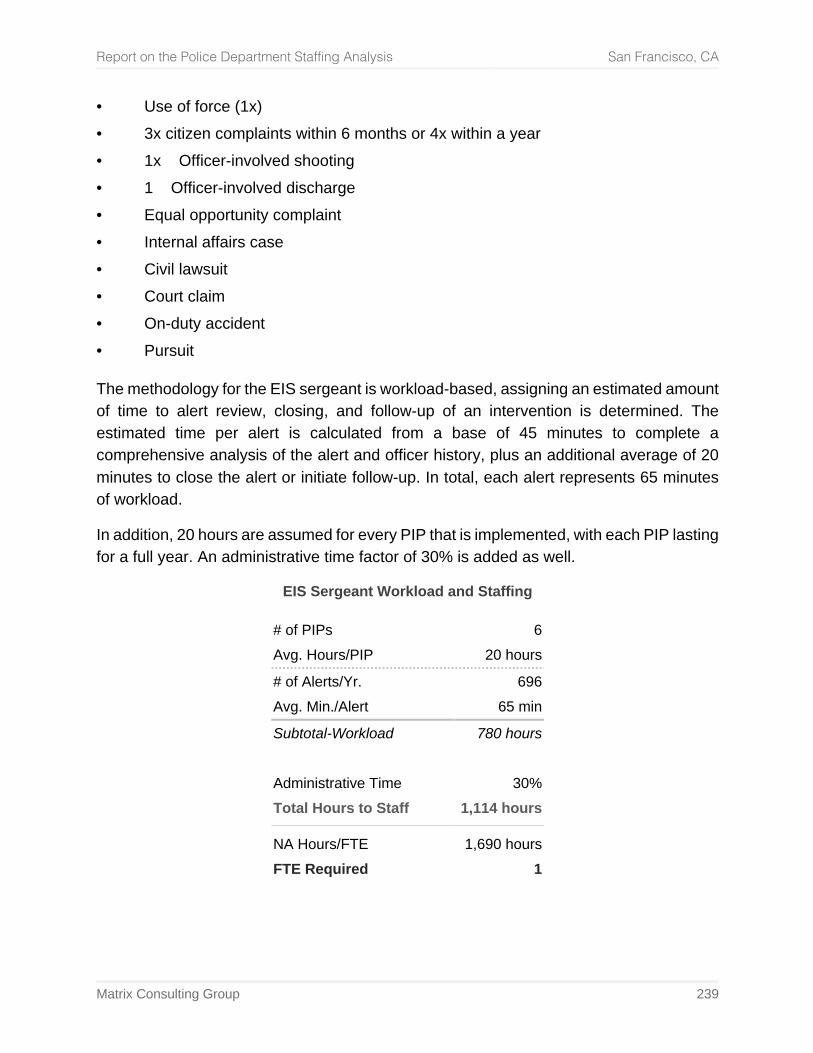
Report on the Police Department Staffing Analysis San Francisco, CA
Matrix Consulting Group 239
• Use of force (1x) • 3x citizen complaints within 6 months or 4x within a year • 1x Officer-involved shooting • 1 Officer-involved discharge • Equal opportunity complaint • Internal affairs case • Civil lawsuit • Court claim • On-duty accident • Pursuit The methodology for the EIS sergeant is workload-based, assigning an estimated amount of time to alert review, closing, and follow-up of an intervention is determined. The estimated time per alert is calculated from a base of 45 minutes to complete a comprehensive analysis of the alert and officer history, plus an additional average of 20 minutes to close the alert or initiate follow-up. In total, each alert represents 65 minutes of workload.
In addition, 20 hours are assumed for every PIP that is implemented, with each PIP lasting for a full year. An administrative time factor of 30% is added as well.
EIS Sergeant Workload and Staffing
# of PIPs 6 Avg. Hours/PIP 20 hours
# of Alerts/Yr. 696 Avg. Min./Alert 65 min
Subtotal-Workload 780 hours
Administrative Time 30% Total Hours to Staff 1,114 hours
NA Hours/FTE 1,690 hours FTE Required 1
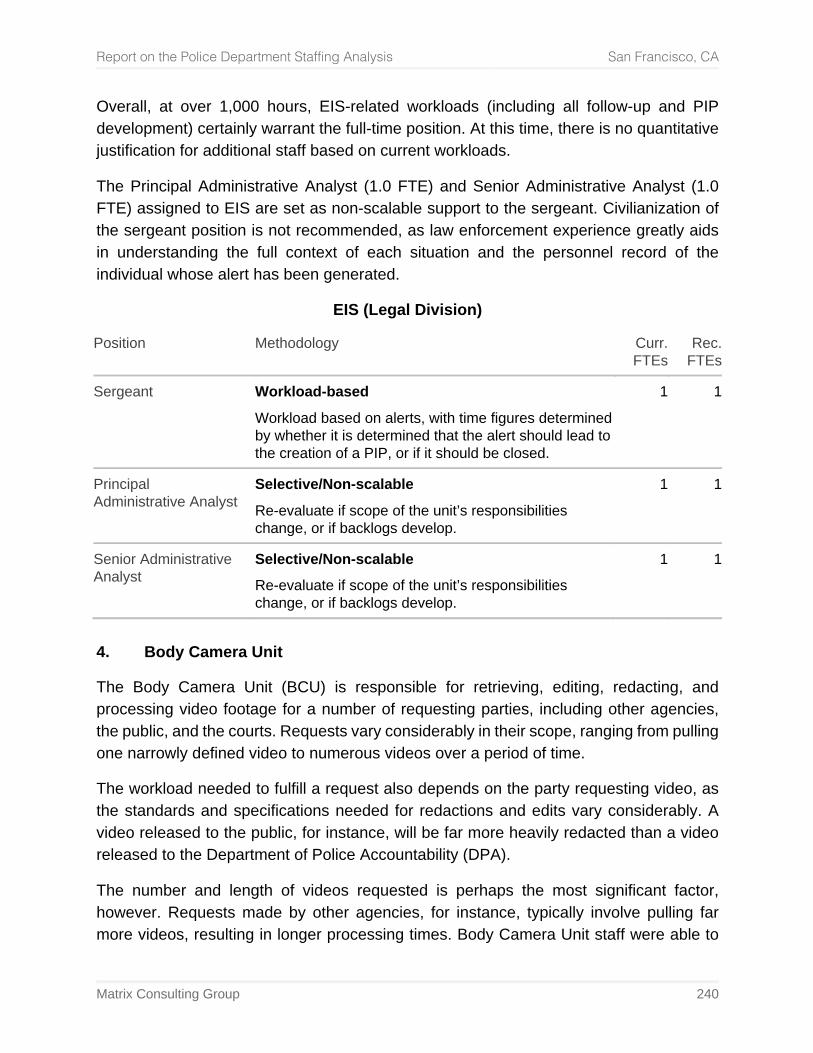
Report on the Police Department Staffing Analysis San Francisco, CA
Matrix Consulting Group 240
Overall, at over 1,000 hours, EIS-related workloads (including all follow-up and PIP development) certainly warrant the full-time position. At this time, there is no quantitative justification for additional staff based on current workloads.
The Principal Administrative Analyst (1.0 FTE) and Senior Administrative Analyst (1.0 FTE) assigned to EIS are set as non-scalable support to the sergeant. Civilianization of the sergeant position is not recommended, as law enforcement experience greatly aids in understanding the full context of each situation and the personnel record of the individual whose alert has been generated.
EIS (Legal Division)
Position Methodology Curr. FTEs
Rec. FTEs
Sergeant Workload-based
Workload based on alerts, with time figures determined by whether it is determined that the alert should lead to the creation of a PIP, or if it should be closed.
1 1
Principal Administrative Analyst
Selective/Non-scalable
Re-evaluate if scope of the unit’s responsibilities change, or if backlogs develop.
1 1
Senior Administrative Analyst
Selective/Non-scalable
Re-evaluate if scope of the unit’s responsibilities change, or if backlogs develop.
1 1
4. Body Camera Unit
The Body Camera Unit (BCU) is responsible for retrieving, editing, redacting, and processing video footage for a number of requesting parties, including other agencies, the public, and the courts. Requests vary considerably in their scope, ranging from pulling one narrowly defined video to numerous videos over a period of time.
The workload needed to fulfill a request also depends on the party requesting video, as the standards and specifications needed for redactions and edits vary considerably. A video released to the public, for instance, will be far more heavily redacted than a video released to the Department of Police Accountability (DPA).
The number and length of videos requested is perhaps the most significant factor, however. Requests made by other agencies, for instance, typically involve pulling far more videos, resulting in longer processing times. Body Camera Unit staff were able to
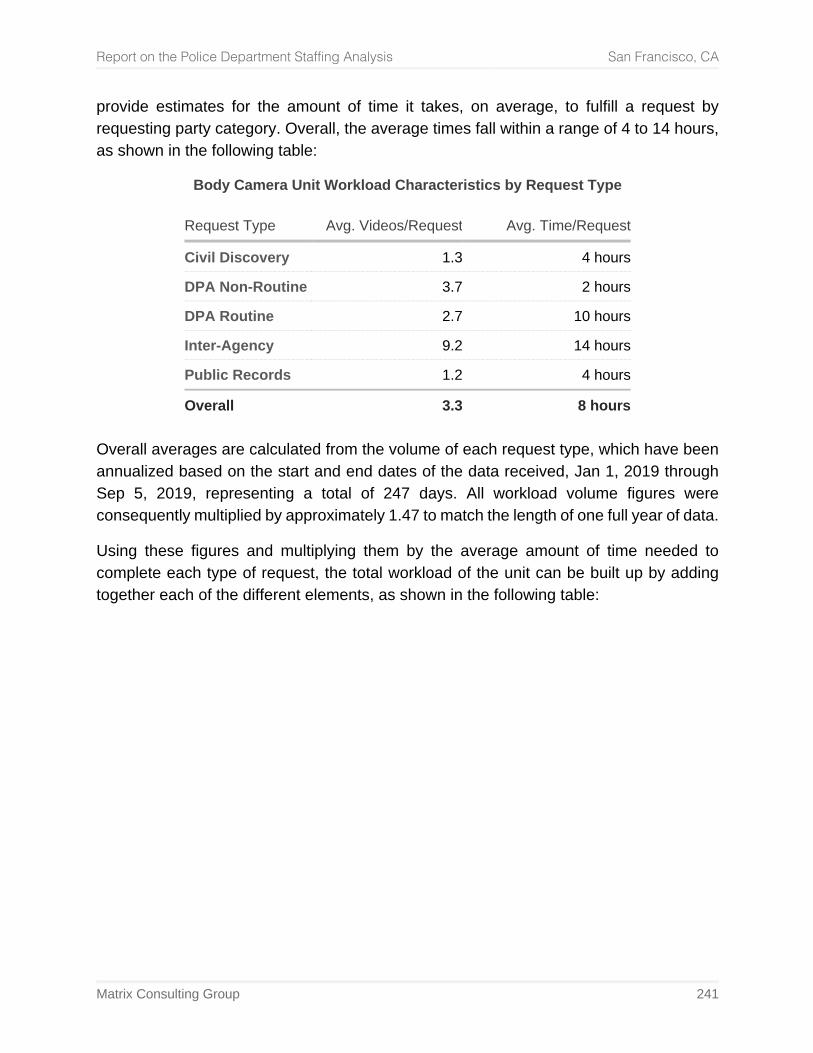
Report on the Police Department Staffing Analysis San Francisco, CA
Matrix Consulting Group 241
provide estimates for the amount of time it takes, on average, to fulfill a request by requesting party category. Overall, the average times fall within a range of 4 to 14 hours, as shown in the following table:
Body Camera Unit Workload Characteristics by Request Type
Request Type Avg. Videos/Request Avg. Time/Request
Civil Discovery 1.3 4 hours
DPA Non-Routine 3.7 2 hours
DPA Routine 2.7 10 hours
Inter-Agency 9.2 14 hours
Public Records 1.2 4 hours
Overall 3.3 8 hours Overall averages are calculated from the volume of each request type, which have been annualized based on the start and end dates of the data received, Jan 1, 2019 through Sep 5, 2019, representing a total of 247 days. All workload volume figures were consequently multiplied by approximately 1.47 to match the length of one full year of data.
Using these figures and multiplying them by the average amount of time needed to complete each type of request, the total workload of the unit can be built up by adding together each of the different elements, as shown in the following table:
Report on the Police Department Staffing Analysis San Francisco, CA
Matrix Consulting Group 242
Body Camera Unit: Legal Assistant Staffing Calculations
Civil Discovery # of Civil Discoveries/Yr. 275 Avg. Time/Civil Discovery 4.0 hours
DPA Non-Routine # of DPAs (non-routine)/Yr. 59
Avg. Time/DPA Non-Routine 2.0 hours
DPA Routine # of DPAs (routine)/Yr. 501 Avg. Time/DPA Routine 10.0 hours
Inter-Agency # of Inter-Agency Req./Yr. 250 Avg. Time/Inter-Agency 14.0 hours
Public Records # of Public Records Req./Yr. 301
Avg. Time/Public Records 4.0 hours
Total Workload 10,929 hours
Administrative Time 20% Total Hours to Staff 13,662 hours
NA Hours/FTE 1,690 hours
FTE Required 9 Administrative time figures represent any workload that isn’t represented by the five categories, as well as all time that isn’t utilized toward the videos, including breaks, meals, meetings, email correspondence in relation to BCU requests, or anything else.
The analysis demonstrates that current staffing is adequate, but it is expected that the unit’s workload will continue to evolve rapidly in the near and medium-term future, and these trends should be monitored.
The two officers assigned to the unit share workload with the legal assistants, and while the workload does not show the need for additional capacity at an overall level, BCU workload is often highly variable. As a result, workload on a particular week or period of weeks will require additional resources than the 9 demonstrated at an overall level.
The following table summarizes this information for the Body Camera Unit:
Report on the Police Department Staffing Analysis San Francisco, CA
Matrix Consulting Group 243
Body Camera Unit
Position Methodology Curr. FTEs
Rec. FTEs
Legal Assistant Workload-based (Group)
Workload calculated based on estimated average time needed to fulfill five different types of requests.
9 9
Officer Workload-based (Group)
Shares work with legal assistants, and is assumed to handle remainder of workload.
2 2
5. Internal Affairs Division
The Internal Affairs Division is comprised of three units, including Internal Affairs, Officer Involved Shooting Team, and the Brady Unit.
(1) Brady Unit
The Brady Unit is comprised of one attorney and one senior legal clerk. As of September 5, 2019, the staff had fielded 90 requests for Brady material for the year. Extrapolated on a monthly average, the unit could field around 135 cases by year-end. Due to extensive variation in the workload involved in handling a Brady request, it is not feasible to construct an overall average. Moreover, the number of miscellaneous tasks associated with the role would require a very high generalized administrative time figure. The combination of these factors would cause a workload-based overall capacity measure to not be particularly useful in examining capacity, particularly given week-to-week variation in workload.
As a result of these considerations, the attorney and senior legal clerk positions have been set as unique/non-scalable. Brady staff should monitor for backlogs and delays processing motions in the future, as these may indicate that staffing issues should be re-examined.
(2) Internal Affairs – Administrative
The unit is responsible for handling all internal affairs cases that rise to this level and are not criminal investigations. The unit’s scope includes administrative review of all officer-involved shootings.
Report on the Police Department Staffing Analysis San Francisco, CA
Matrix Consulting Group 244
(2.1) Administrative IA Cases (Non-OIC)
Staffing needs for sergeants assigned to Internal Affairs–Administrative are determined through a workload-based methodology, the structure of which mirrors the calculation process that is used for units investigating criminal cases. As with many units in the Investigations Bureau, staff assigned to Internal Affairs are case-driven, following a process that takes the case through assignment, information retrieval and witness identification, interviews, and concluding with written investigative findings.
Administrative Internal Affairs investigations are different than criminal cases, however, in that subject of the investigation is generally known, interviews are scheduled in advance and are conducted in accordance with POBRA and collective bargaining agreement protocols. There is typically a union representative present. Generally statements are compelled, meaning the subject of the investigation is required answer questions. Questions are limited to policy violation allegations. Once an investigation is complete, a determination of the finding is conducted internally as is proposed discipline if warranted.
There are major differences in workload between the majority of internal affairs cases and ones regarding an officer-involved shooting, not only in complexity and depth, but in the specific timelines required for completing the investigation.
The following table provides a breakdown of the major steps involved in a typical Internal Affairs administrative investigation, having been developed from the experience of the project team – particularly the staff with experience conducting these types of investigations. As a result, our methodology of estimating investigative case time has been split into two categories, with workload for officer-involved shooting cases being reviewed separately.
It is important to stress that not every case is the same. Some cases are more complex or involve additional elements that others do not. To help represent this, the table provides both the percentage of the time that each task is completed, and among only the cases where that task is completed, the average amount of time needed to do so. These numbers are then multiplied together, before being added with all other rows to produce the overall average time needed to fully investigate a case.
Report on the Police Department Staffing Analysis San Francisco, CA
Matrix Consulting Group 245
Case Time Estimates for Administrative IA Investigations (Non-OIS)
Common Tasks Processes Avg. Time % of Cases
Complaint Review
Determine if allegation is a policy violation. Time figure includes reviewing complaint.
1 hour 100%
Find relevant CAD entry, police report, video or other documentation relevant to the complaint
Determine subject(s) of allegation. Time figure includes CAD enquiry and report(s) review.
4 hours 100%
Interview Complainant N/A 1 hour 100%
Write Complaint and Allegation(s)
Determine which policy or policies could have been violated. Includes review and report writing time.
4 hours 100%
Schedule subject officer Interview
Includes sending written notice within proper timelines.
0.5 hours 100%
Write Interview Questions N/A 1 hour 100%
Conduct witness interviews N/A 1 hour 80%
Conduct subject interviews Interviews are recorded, and the time estimated includes report writing.
4 hours 100%
Write Investigative Finding Includes report writing. 8 hours 100%
Total 24.5 hours This list is not all inclusive and does not contain all steps that may be taken. Some cases may have several witnesses. The 80% average for witness interviews is estimated based on the SFPD current 2 officer deployment so most cases would involve at least two interviews. Many cases will not require the number of hours listed, but some cases may require significantly more.
Through our experience over many studies we have found that a competent internal affair s investigator can efficiently work an average of 4 to 6 new internal affairs cases a month. Using the above available work hours this translates to approximately 24.5 hours allotted per case. This case hour analysis excludes complaint enquiries that do not result in a full investigation, as well as cases that are never assigned.
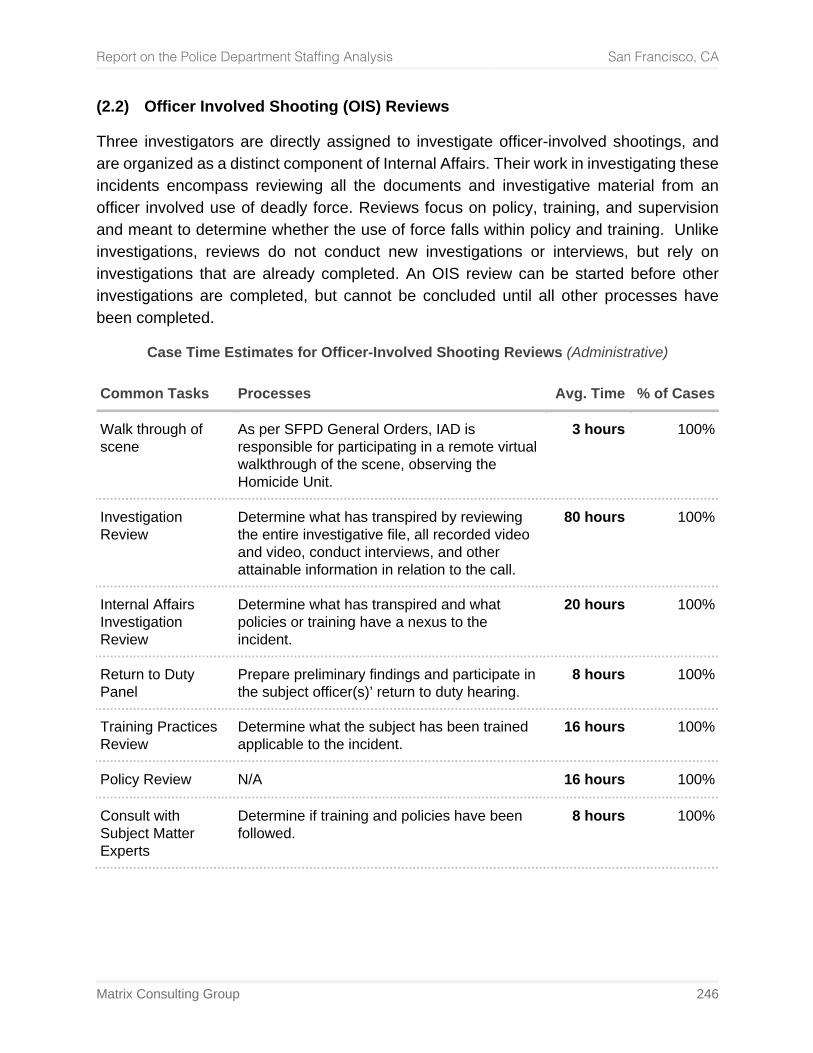
Report on the Police Department Staffing Analysis San Francisco, CA
Matrix Consulting Group 246
(2.2) Officer Involved Shooting (OIS) Reviews
Three investigators are directly assigned to investigate officer-involved shootings, and are organized as a distinct component of Internal Affairs. Their work in investigating these incidents encompass reviewing all the documents and investigative material from an officer involved use of deadly force. Reviews focus on policy, training, and supervision and meant to determine whether the use of force falls within policy and training. Unlike investigations, reviews do not conduct new investigations or interviews, but rely on investigations that are already completed. An OIS review can be started before other investigations are completed, but cannot be concluded until all other processes have been completed.
Case Time Estimates for Officer-Involved Shooting Reviews (Administrative)
Common Tasks Processes Avg. Time % of Cases
Walk through of scene
As per SFPD General Orders, IAD is responsible for participating in a remote virtual walkthrough of the scene, observing the Homicide Unit.
3 hours 100%
Investigation Review
Determine what has transpired by reviewing the entire investigative file, all recorded video and video, conduct interviews, and other attainable information in relation to the call.
80 hours 100%
Internal Affairs Investigation Review
Determine what has transpired and what policies or training have a nexus to the incident.
20 hours 100%
Return to Duty Panel
Prepare preliminary findings and participate in the subject officer(s)’ return to duty hearing.
8 hours 100%
Training Practices Review
Determine what the subject has been trained applicable to the incident.
16 hours 100%
Policy Review N/A 16 hours 100%
Consult with Subject Matter Experts
Determine if training and policies have been followed.
8 hours 100%
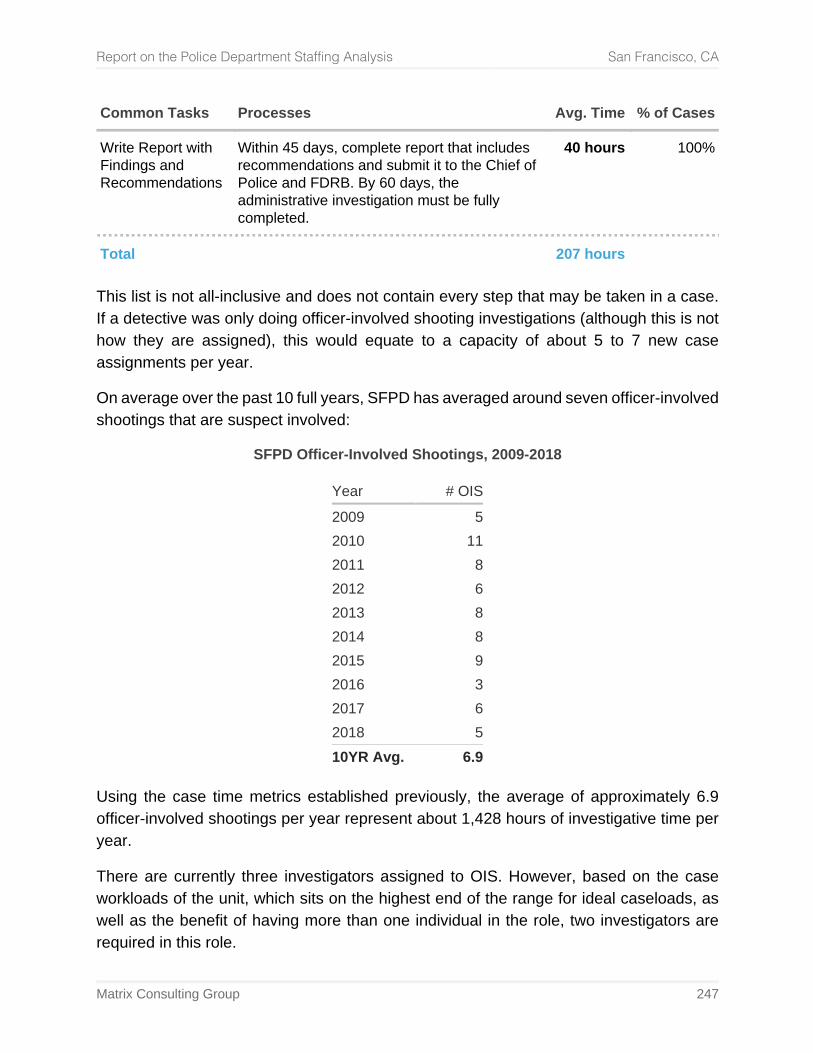
Report on the Police Department Staffing Analysis San Francisco, CA
Matrix Consulting Group 247
Common Tasks Processes Avg. Time % of Cases
Write Report with Findings and Recommendations
Within 45 days, complete report that includes recommendations and submit it to the Chief of Police and FDRB. By 60 days, the administrative investigation must be fully completed.
40 hours 100%
Total 207 hours This list is not all-inclusive and does not contain every step that may be taken in a case. If a detective was only doing officer-involved shooting investigations (although this is not how they are assigned), this would equate to a capacity of about 5 to 7 new case assignments per year.
On average over the past 10 full years, SFPD has averaged around seven officer-involved shootings that are suspect involved:
SFPD Officer-Involved Shootings, 2009-2018
Year # OIS 2009 5 2010 11 2011 8 2012 6 2013 8 2014 8 2015 9 2016 3 2017 6 2018 5 10YR Avg. 6.9
Using the case time metrics established previously, the average of approximately 6.9 officer-involved shootings per year represent about 1,428 hours of investigative time per year.
There are currently three investigators assigned to OIS. However, based on the case workloads of the unit, which sits on the highest end of the range for ideal caseloads, as well as the benefit of having more than one individual in the role, two investigators are required in this role.
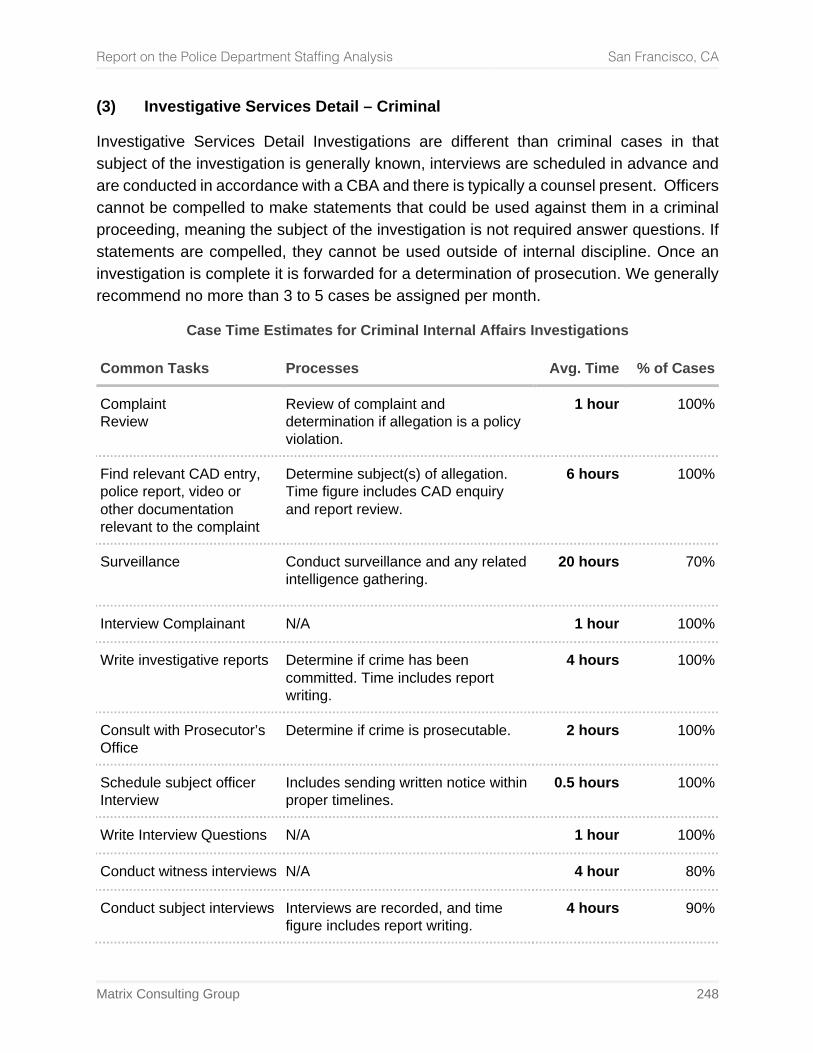
Report on the Police Department Staffing Analysis San Francisco, CA
Matrix Consulting Group 248
(3) Investigative Services Detail – Criminal
Investigative Services Detail Investigations are different than criminal cases in that subject of the investigation is generally known, interviews are scheduled in advance and are conducted in accordance with a CBA and there is typically a counsel present. Officers cannot be compelled to make statements that could be used against them in a criminal proceeding, meaning the subject of the investigation is not required answer questions. If statements are compelled, they cannot be used outside of internal discipline. Once an investigation is complete it is forwarded for a determination of prosecution. We generally recommend no more than 3 to 5 cases be assigned per month.
Case Time Estimates for Criminal Internal Affairs Investigations
Common Tasks Processes Avg. Time % of Cases
Complaint Review
Review of complaint and determination if allegation is a policy violation.
1 hour 100%
Find relevant CAD entry, police report, video or other documentation relevant to the complaint
Determine subject(s) of allegation. Time figure includes CAD enquiry and report review.
6 hours 100%
Surveillance Conduct surveillance and any related intelligence gathering.
20 hours 70%
Interview Complainant N/A 1 hour 100%
Write investigative reports Determine if crime has been committed. Time includes report writing.
4 hours 100%
Consult with Prosecutor’s Office
Determine if crime is prosecutable. 2 hours 100%
Schedule subject officer Interview
Includes sending written notice within proper timelines.
0.5 hours 100%
Write Interview Questions N/A 1 hour 100%
Conduct witness interviews N/A 4 hour 80%
Conduct subject interviews Interviews are recorded, and time figure includes report writing.
4 hours 90%
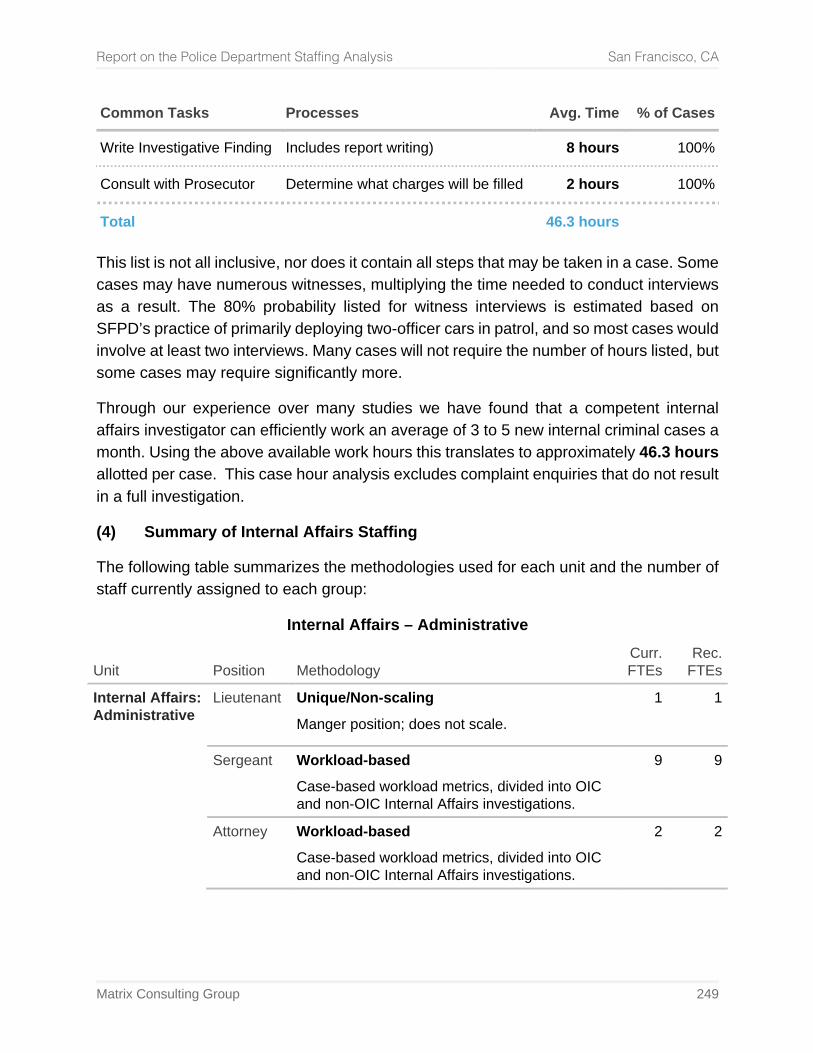
Report on the Police Department Staffing Analysis San Francisco, CA
Matrix Consulting Group 249
Common Tasks Processes Avg. Time % of Cases
Write Investigative Finding Includes report writing) 8 hours 100%
Consult with Prosecutor Determine what charges will be filled 2 hours 100%
Total 46.3 hours This list is not all inclusive, nor does it contain all steps that may be taken in a case. Some cases may have numerous witnesses, multiplying the time needed to conduct interviews as a result. The 80% probability listed for witness interviews is estimated based on SFPD’s practice of primarily deploying two-officer cars in patrol, and so most cases would involve at least two interviews. Many cases will not require the number of hours listed, but some cases may require significantly more.
Through our experience over many studies we have found that a competent internal affairs investigator can efficiently work an average of 3 to 5 new internal criminal cases a month. Using the above available work hours this translates to approximately 46.3 hours allotted per case. This case hour analysis excludes complaint enquiries that do not result in a full investigation.
(4) Summary of Internal Affairs Staffing
The following table summarizes the methodologies used for each unit and the number of staff currently assigned to each group:
Internal Affairs – Administrative
Unit Position Methodology Curr. FTEs
Rec. FTEs
Internal Affairs: Administrative
Lieutenant
Unique/Non-scaling
Manger position; does not scale. 1 1
Sergeant
Workload-based
Case-based workload metrics, divided into OIC and non-OIC Internal Affairs investigations.
9 9
Attorney
Workload-based
Case-based workload metrics, divided into OIC and non-OIC Internal Affairs investigations.
2 2
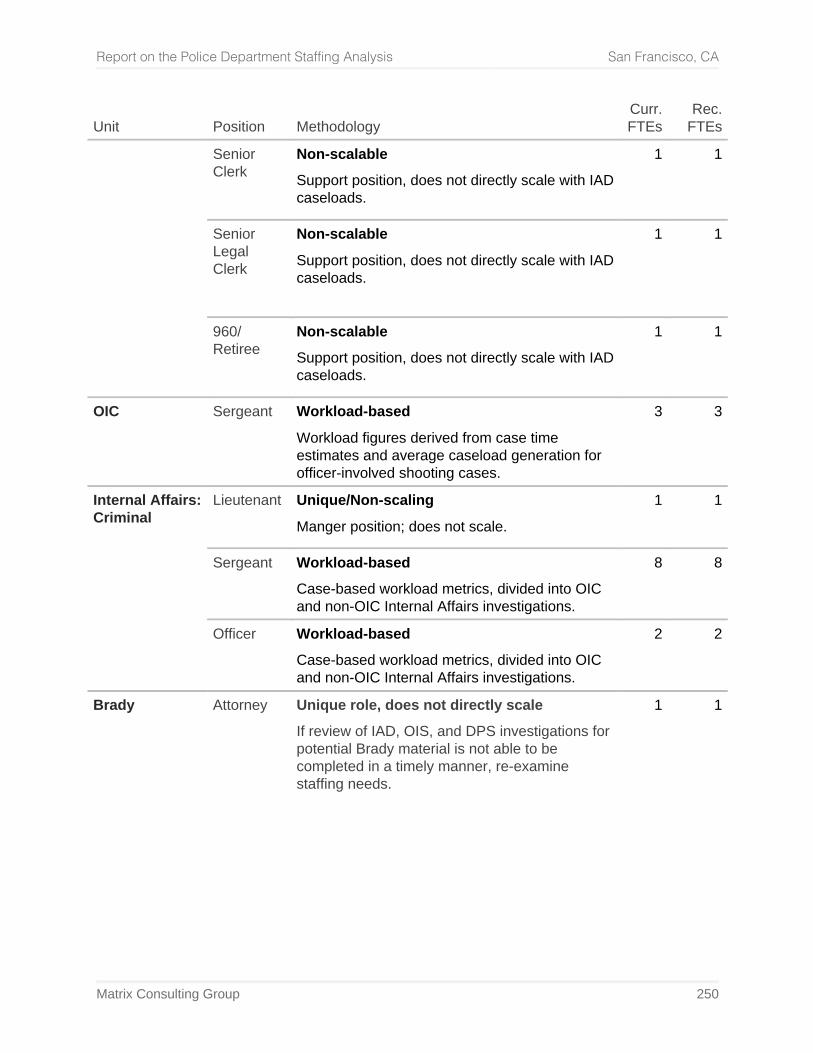
Report on the Police Department Staffing Analysis San Francisco, CA
Matrix Consulting Group 250
Unit Position Methodology Curr. FTEs
Rec. FTEs
Senior Clerk
Non-scalable
Support position, does not directly scale with IAD caseloads.
1 1
Senior Legal Clerk
Non-scalable
Support position, does not directly scale with IAD caseloads.
1 1
960/ Retiree
Non-scalable
Support position, does not directly scale with IAD caseloads.
1 1
OIC Sergeant Workload-based
Workload figures derived from case time estimates and average caseload generation for officer-involved shooting cases.
3 3
Internal Affairs: Criminal
Lieutenant
Unique/Non-scaling
Manger position; does not scale. 1 1
Sergeant
Workload-based
Case-based workload metrics, divided into OIC and non-OIC Internal Affairs investigations.
8 8
Officer
Workload-based
Case-based workload metrics, divided into OIC and non-OIC Internal Affairs investigations.
2 2
Brady Attorney Unique role, does not directly scale
If review of IAD, OIS, and DPS investigations for potential Brady material is not able to be completed in a timely manner, re-examine staffing needs.
1 1
Report on the Police Department Staffing Analysis San Francisco, CA
Matrix Consulting Group 251
9. Office of the Chief
(1) Unit Overview and Analytical Framework
The Office of the Chief provides administrative support to the Chief of Police and manages a variety of special projects, but is also a City department head responsible for maintaining a fiscally sound operation. Staff in the Chief’s Office provide high level support for the Chief of Police in managing his/her oversight of the department and its operations.
Management positions may be discussed in narrative of staffing arrangements below, but the staffing excludes supervisory and management positions to focus on staff administering core functions in the office.
(2) Metrics and Staffing Analysis
The Chief’s Office is comprised of seven full-time positions including:
• A Lieutenant who is responsible for direct oversight of the office. • Two sworn Police Officers who triage, refer, and elevate points of contact to the
Chief as appropriate. This includes fielding phone calls, emails, and in-person contact directed at the Chief in the office, as well as in public spaces. Officers also act as an escort detail for the Chief, which includes driving the Chief to events, and providing general security. Workload for these positions is not easily captured through simple workload measures, so these positions have been classified as non-scalable.
• Two Managers who manage and coordinate oversight for special projects
assigned by the Chief, including projects to support the Chief as department head in liaising with legislators and administrators in City Hall and other city agencies. This may include submitting ad hoc requests for operational data and information to Staffing & Deployment, BAT, or other divisions, as well as analyzing and repackaging internally prepared data, information, and reports for the Chief’s purposes. Work for these positions is complex and not captured through simple workload measures, therefore these positions have been classified as non-scalable.
• An Executive Secretary III who manages scheduling and calendaring, emails to
the Chief, and other conventional administrative support assignments. Staffing is not based on workload measures, but scales to the size of the unit and the number of positions supported.
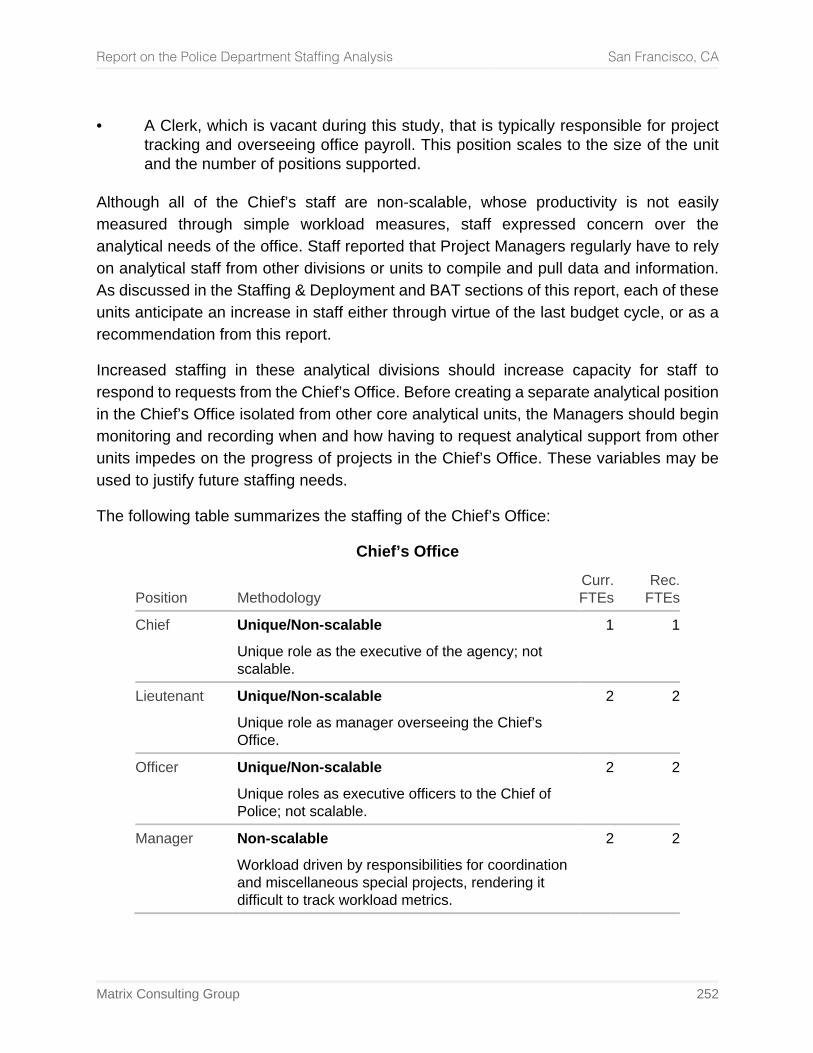
Report on the Police Department Staffing Analysis San Francisco, CA
Matrix Consulting Group 252
• A Clerk, which is vacant during this study, that is typically responsible for project
tracking and overseeing office payroll. This position scales to the size of the unit and the number of positions supported.
Although all of the Chief’s staff are non-scalable, whose productivity is not easily measured through simple workload measures, staff expressed concern over the analytical needs of the office. Staff reported that Project Managers regularly have to rely on analytical staff from other divisions or units to compile and pull data and information. As discussed in the Staffing & Deployment and BAT sections of this report, each of these units anticipate an increase in staff either through virtue of the last budget cycle, or as a recommendation from this report.
Increased staffing in these analytical divisions should increase capacity for staff to respond to requests from the Chief’s Office. Before creating a separate analytical position in the Chief’s Office isolated from other core analytical units, the Managers should begin monitoring and recording when and how having to request analytical support from other units impedes on the progress of projects in the Chief’s Office. These variables may be used to justify future staffing needs.
The following table summarizes the staffing of the Chief’s Office:
Chief’s Office
Position Methodology Curr. FTEs
Rec. FTEs
Chief Unique/Non-scalable
Unique role as the executive of the agency; not scalable.
1 1
Lieutenant Unique/Non-scalable
Unique role as manager overseeing the Chief’s Office.
2 2
Officer Unique/Non-scalable
Unique roles as executive officers to the Chief of Police; not scalable.
2 2
Manager Non-scalable
Workload driven by responsibilities for coordination and miscellaneous special projects, rendering it difficult to track workload metrics.
2 2
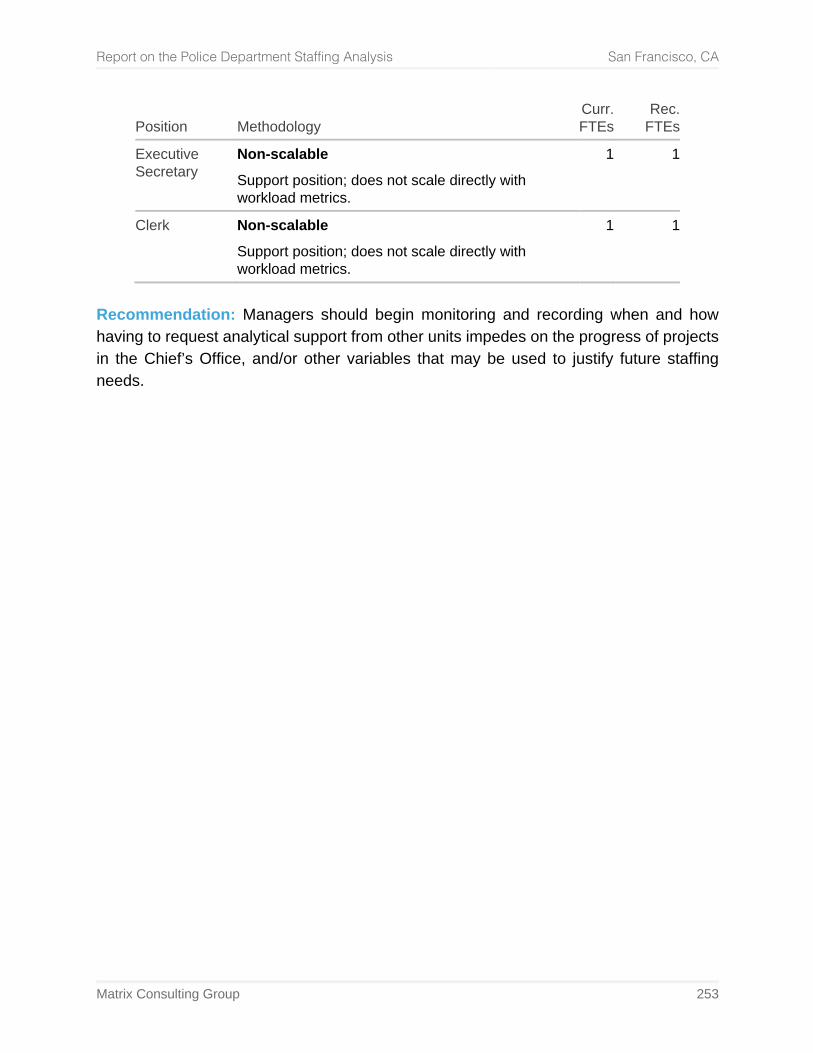
Report on the Police Department Staffing Analysis San Francisco, CA
Matrix Consulting Group 253
Position Methodology Curr. FTEs
Rec. FTEs
Executive Secretary
Non-scalable
Support position; does not scale directly with workload metrics.
1 1
Clerk Non-scalable
Support position; does not scale directly with workload metrics.
1 1
Recommendation: Managers should begin monitoring and recording when and how having to request analytical support from other units impedes on the progress of projects in the Chief’s Office, and/or other variables that may be used to justify future staffing needs.
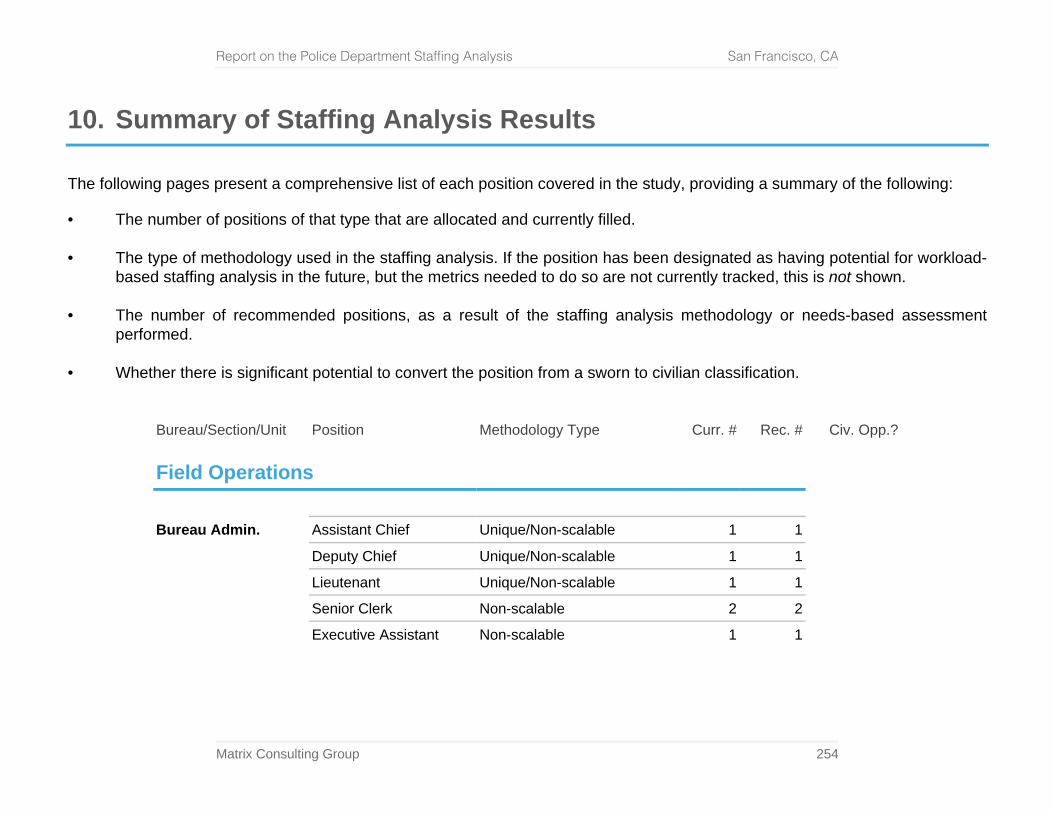
Report on the Police Department Staffing Analysis San Francisco, CA
Matrix Consulting Group 254
10. Summary of Staffing Analysis Results
The following pages present a comprehensive list of each position covered in the study, providing a summary of the following:
• The number of positions of that type that are allocated and currently filled. • The type of methodology used in the staffing analysis. If the position has been designated as having potential for workload-
based staffing analysis in the future, but the metrics needed to do so are not currently tracked, this is not shown. • The number of recommended positions, as a result of the staffing analysis methodology or needs-based assessment
performed. • Whether there is significant potential to convert the position from a sworn to civilian classification.
Bureau/Section/Unit Position Methodology Type Curr. # Rec. # Civ. Opp.?
Field Operations
Bureau Admin. Assistant Chief Unique/Non-scalable 1 1 Deputy Chief Unique/Non-scalable 1 1 Lieutenant Unique/Non-scalable 1 1 Senior Clerk Non-scalable 2 2 Executive Assistant Non-scalable 1 1
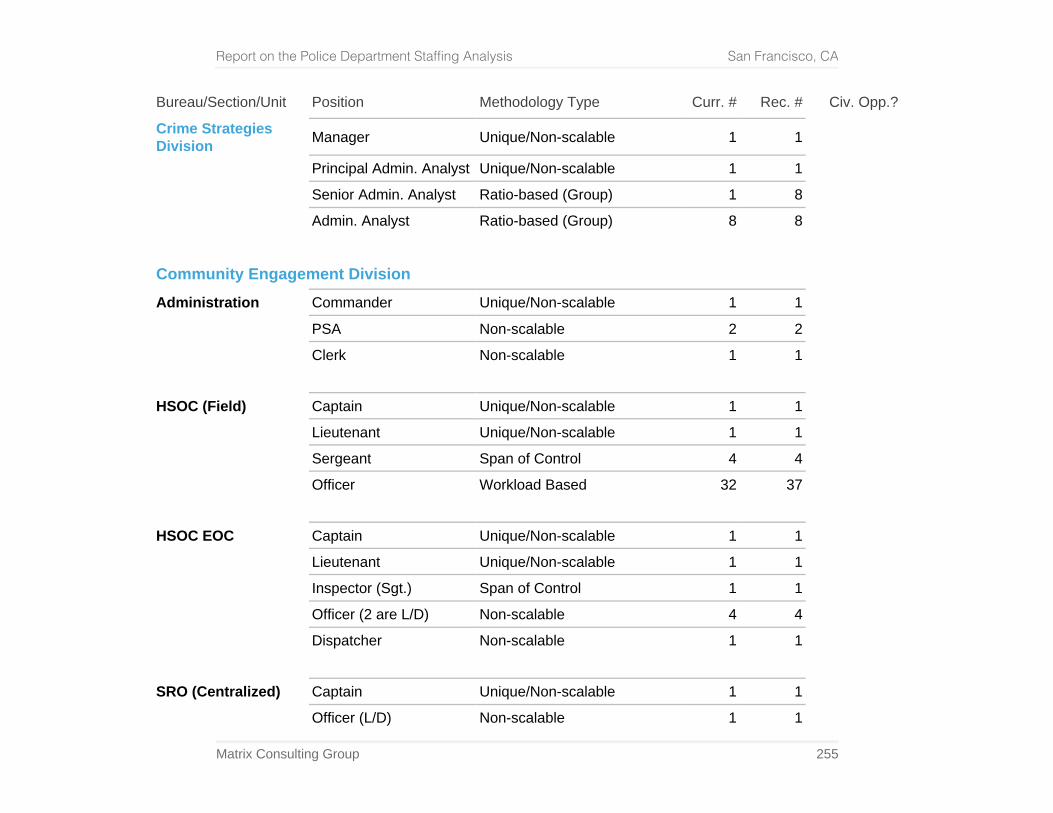
Report on the Police Department Staffing Analysis San Francisco, CA
Matrix Consulting Group 255
Bureau/Section/Unit Position Methodology Type Curr. # Rec. # Civ. Opp.?
Crime Strategies Division Manager Unique/Non-scalable 1 1
Principal Admin. Analyst Unique/Non-scalable 1 1 Senior Admin. Analyst Ratio-based (Group) 1 8 Admin. Analyst Ratio-based (Group) 8 8
Community Engagement Division
Administration Commander Unique/Non-scalable 1 1 PSA Non-scalable 2 2 Clerk Non-scalable 1 1
HSOC (Field) Captain Unique/Non-scalable 1 1 Lieutenant Unique/Non-scalable 1 1 Sergeant Span of Control 4 4 Officer Workload Based 32 37
HSOC EOC Captain Unique/Non-scalable 1 1
Lieutenant Unique/Non-scalable 1 1 Inspector (Sgt.) Span of Control 1 1 Officer (2 are L/D) Non-scalable 4 4 Dispatcher Non-scalable 1 1
SRO (Centralized) Captain Unique/Non-scalable 1 1 Officer (L/D) Non-scalable 1 1
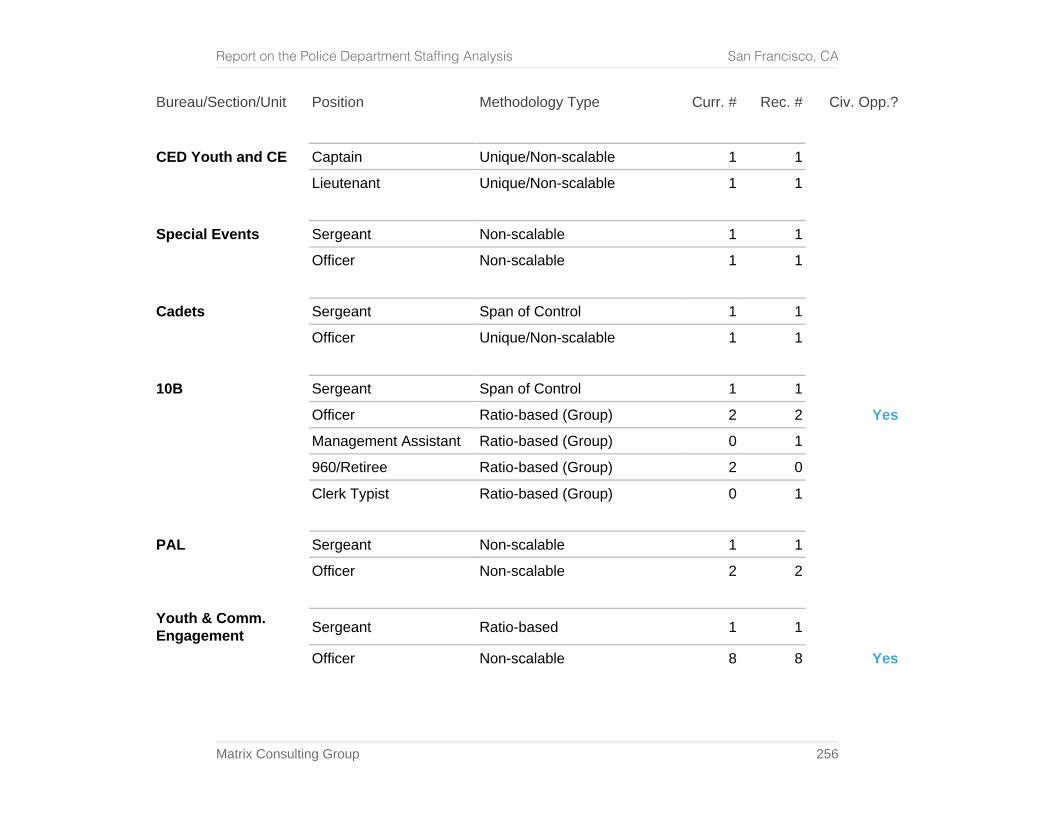
Report on the Police Department Staffing Analysis San Francisco, CA
Matrix Consulting Group 256
Bureau/Section/Unit Position Methodology Type Curr. # Rec. # Civ. Opp.?
CED Youth and CE Captain Unique/Non-scalable 1 1
Lieutenant Unique/Non-scalable 1 1
Special Events Sergeant Non-scalable 1 1 Officer Non-scalable 1 1
Cadets Sergeant Span of Control 1 1 Officer Unique/Non-scalable 1 1
10B Sergeant Span of Control 1 1 Officer Ratio-based (Group) 2 2 Yes Management Assistant Ratio-based (Group) 0 1 960/Retiree Ratio-based (Group) 2 0 Clerk Typist Ratio-based (Group) 0 1
PAL Sergeant Non-scalable 1 1 Officer Non-scalable 2 2
Youth & Comm. Engagement Sergeant Ratio-based 1 1
Officer Non-scalable 8 8 Yes
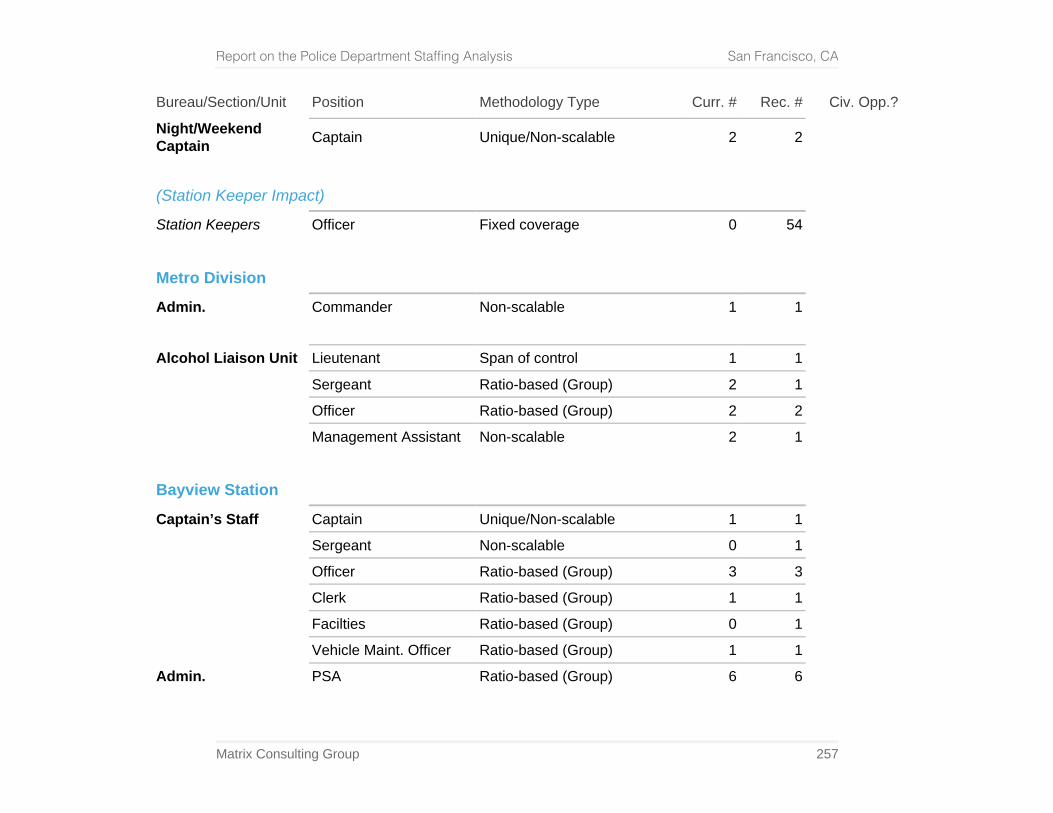
Report on the Police Department Staffing Analysis San Francisco, CA
Matrix Consulting Group 257
Bureau/Section/Unit Position Methodology Type Curr. # Rec. # Civ. Opp.?
Night/Weekend Captain Captain Unique/Non-scalable 2 2
(Station Keeper Impact)
Station Keepers Officer Fixed coverage 0 54
Metro Division
Admin. Commander Non-scalable 1 1
Alcohol Liaison Unit Lieutenant Span of control 1 1 Sergeant Ratio-based (Group) 2 1 Officer Ratio-based (Group) 2 2 Management Assistant Non-scalable 2 1
Bayview Station
Captain’s Staff Captain Unique/Non-scalable 1 1 Sergeant Non-scalable 0 1
Officer Ratio-based (Group) 3 3 Clerk Ratio-based (Group) 1 1 Facilties Ratio-based (Group) 0 1 Vehicle Maint. Officer Ratio-based (Group) 1 1
Admin. PSA Ratio-based (Group) 6 6
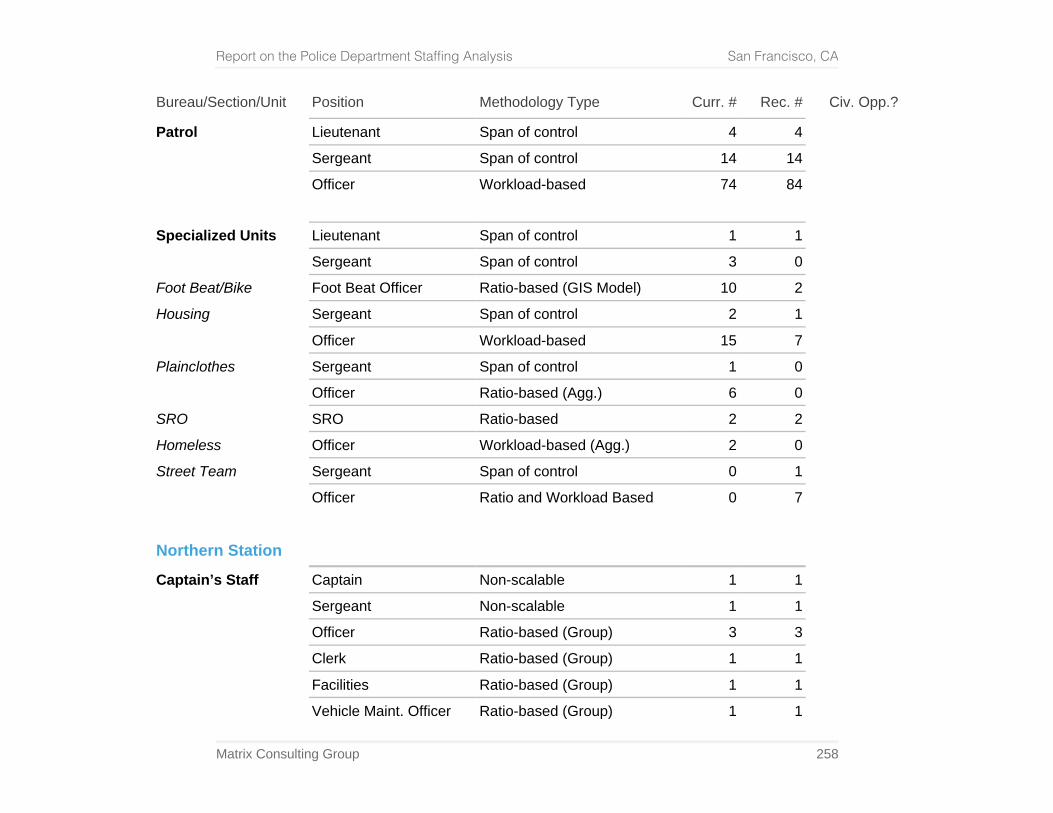
Report on the Police Department Staffing Analysis San Francisco, CA
Matrix Consulting Group 258
Bureau/Section/Unit Position Methodology Type Curr. # Rec. # Civ. Opp.?
Patrol Lieutenant Span of control 4 4 Sergeant Span of control 14 14 Officer Workload-based 74 84
Specialized Units Lieutenant Span of control 1 1 Sergeant Span of control 3 0
Foot Beat/Bike Foot Beat Officer Ratio-based (GIS Model) 10 2
Housing Sergeant Span of control 2 1 Officer Workload-based 15 7
Plainclothes Sergeant Span of control 1 0 Officer Ratio-based (Agg.) 6 0
SRO SRO Ratio-based 2 2
Homeless Officer Workload-based (Agg.) 2 0
Street Team Sergeant Span of control 0 1
Officer Ratio and Workload Based 0 7
Northern Station
Captain’s Staff Captain Non-scalable 1 1 Sergeant Non-scalable 1 1 Officer Ratio-based (Group) 3 3 Clerk Ratio-based (Group) 1 1 Facilities Ratio-based (Group) 1 1 Vehicle Maint. Officer Ratio-based (Group) 1 1
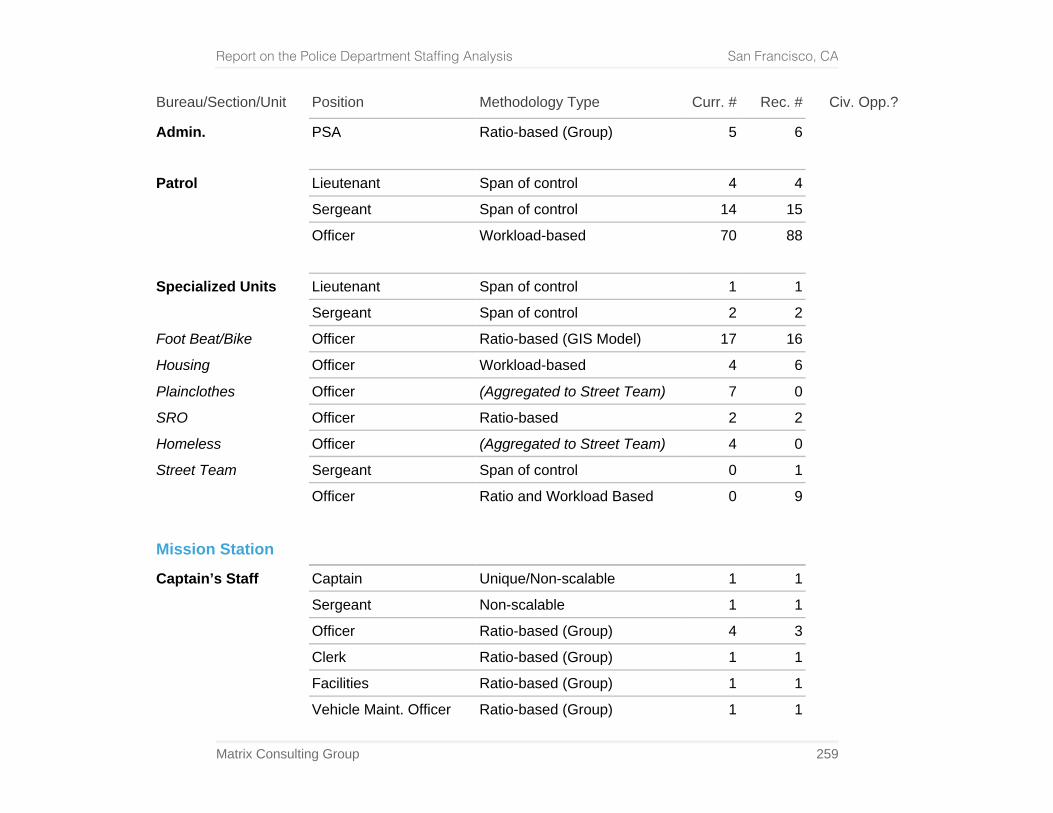
Report on the Police Department Staffing Analysis San Francisco, CA
Matrix Consulting Group 259
Bureau/Section/Unit Position Methodology Type Curr. # Rec. # Civ. Opp.?
Admin. PSA Ratio-based (Group) 5 6
Patrol Lieutenant Span of control 4 4 Sergeant Span of control 14 15 Officer Workload-based 70 88
Specialized Units Lieutenant Span of control 1 1 Sergeant Span of control 2 2
Foot Beat/Bike Officer Ratio-based (GIS Model) 17 16
Housing Officer Workload-based 4 6
Plainclothes Officer (Aggregated to Street Team) 7 0
SRO Officer Ratio-based 2 2
Homeless Officer (Aggregated to Street Team) 4 0
Street Team Sergeant Span of control 0 1 Officer Ratio and Workload Based 0 9
Mission Station
Captain’s Staff Captain Unique/Non-scalable 1 1 Sergeant Non-scalable 1 1 Officer Ratio-based (Group) 4 3 Clerk Ratio-based (Group) 1 1 Facilities Ratio-based (Group) 1 1 Vehicle Maint. Officer Ratio-based (Group) 1 1
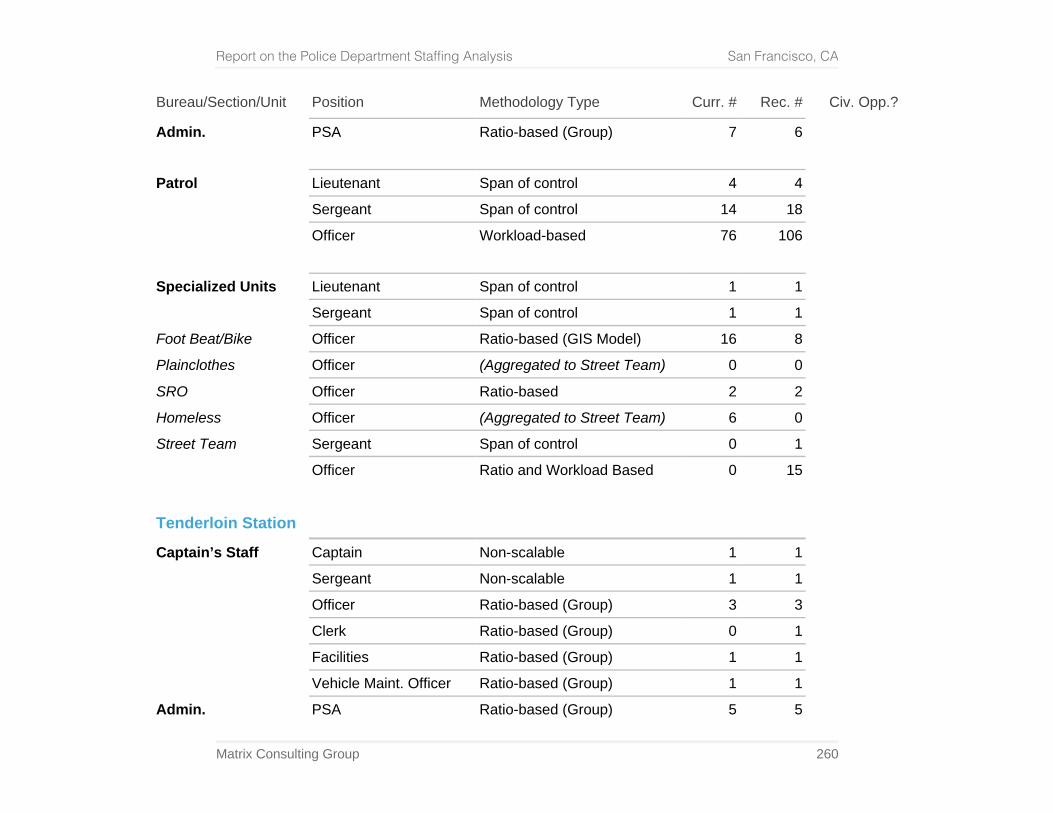
Report on the Police Department Staffing Analysis San Francisco, CA
Matrix Consulting Group 260
Bureau/Section/Unit Position Methodology Type Curr. # Rec. # Civ. Opp.?
Admin. PSA Ratio-based (Group) 7 6
Patrol Lieutenant Span of control 4 4 Sergeant Span of control 14 18 Officer Workload-based 76 106
Specialized Units Lieutenant Span of control 1 1 Sergeant Span of control 1 1
Foot Beat/Bike Officer Ratio-based (GIS Model) 16 8
Plainclothes Officer (Aggregated to Street Team) 0 0
SRO Officer Ratio-based 2 2
Homeless Officer (Aggregated to Street Team) 6 0
Street Team Sergeant Span of control 0 1 Officer Ratio and Workload Based 0 15
Tenderloin Station
Captain’s Staff Captain Non-scalable 1 1
Sergeant Non-scalable 1 1 Officer Ratio-based (Group) 3 3 Clerk Ratio-based (Group) 0 1 Facilities Ratio-based (Group) 1 1 Vehicle Maint. Officer Ratio-based (Group) 1 1
Admin. PSA Ratio-based (Group) 5 5
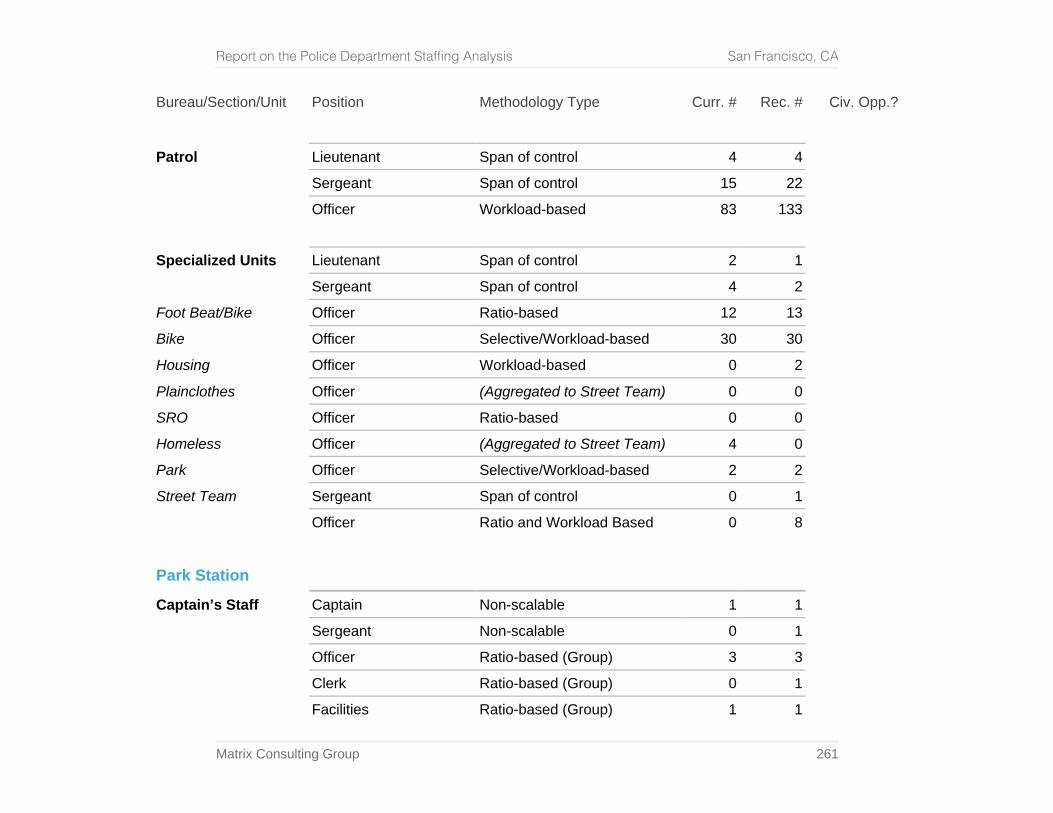
Report on the Police Department Staffing Analysis San Francisco, CA
Matrix Consulting Group 261
Bureau/Section/Unit Position Methodology Type Curr. # Rec. # Civ. Opp.?
Patrol Lieutenant Span of control 4 4
Sergeant Span of control 15 22 Officer Workload-based 83 133
Specialized Units Lieutenant Span of control 2 1 Sergeant Span of control 4 2
Foot Beat/Bike Officer Ratio-based 12 13
Bike Officer Selective/Workload-based 30 30
Housing Officer Workload-based 0 2
Plainclothes Officer (Aggregated to Street Team) 0 0
SRO Officer Ratio-based 0 0
Homeless Officer (Aggregated to Street Team) 4 0
Park Officer Selective/Workload-based 2 2
Street Team Sergeant Span of control 0 1 Officer Ratio and Workload Based 0 8
Park Station
Captain’s Staff Captain Non-scalable 1 1 Sergeant Non-scalable 0 1 Officer Ratio-based (Group) 3 3 Clerk Ratio-based (Group) 0 1 Facilities Ratio-based (Group) 1 1
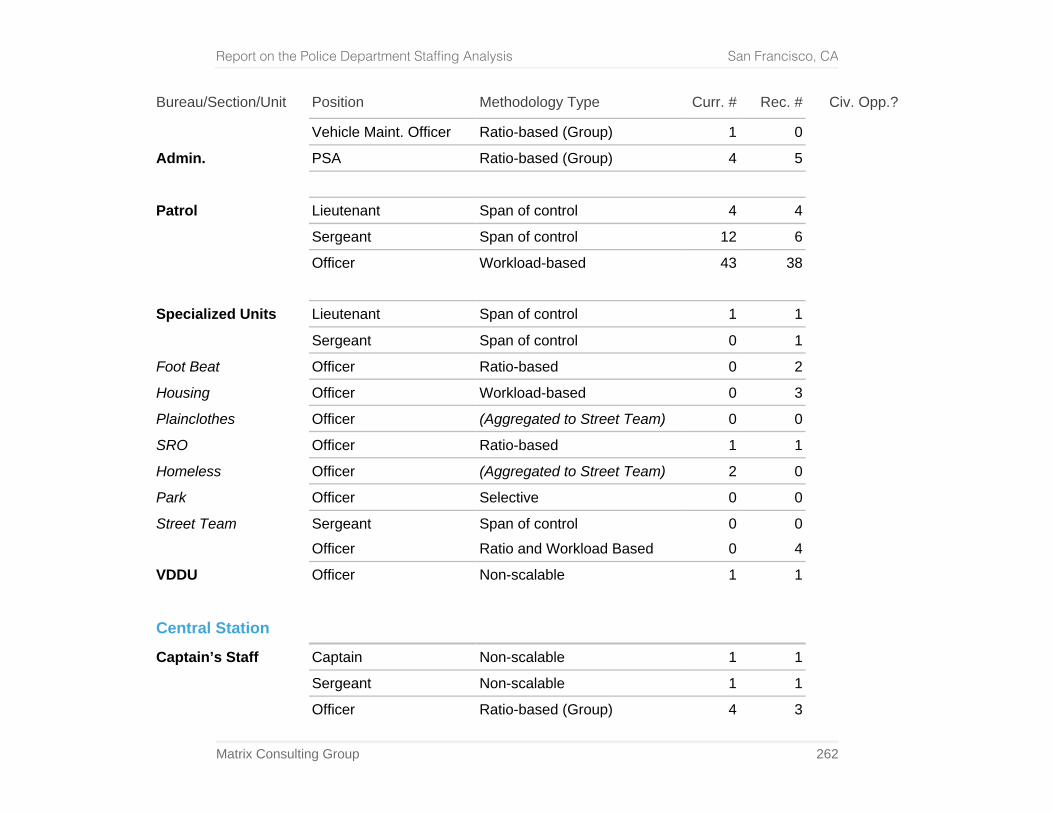
Report on the Police Department Staffing Analysis San Francisco, CA
Matrix Consulting Group 262
Bureau/Section/Unit Position Methodology Type Curr. # Rec. # Civ. Opp.?
Vehicle Maint. Officer Ratio-based (Group) 1 0
Admin. PSA Ratio-based (Group) 4 5
Patrol Lieutenant Span of control 4 4 Sergeant Span of control 12 6 Officer Workload-based 43 38
Specialized Units Lieutenant Span of control 1 1 Sergeant Span of control 0 1
Foot Beat Officer Ratio-based 0 2
Housing Officer Workload-based 0 3
Plainclothes Officer (Aggregated to Street Team) 0 0
SRO Officer Ratio-based 1 1
Homeless Officer (Aggregated to Street Team) 2 0
Park Officer Selective 0 0
Street Team Sergeant Span of control 0 0 Officer Ratio and Workload Based 0 4
VDDU Officer Non-scalable 1 1
Central Station
Captain’s Staff Captain Non-scalable 1 1 Sergeant Non-scalable 1 1 Officer Ratio-based (Group) 4 3
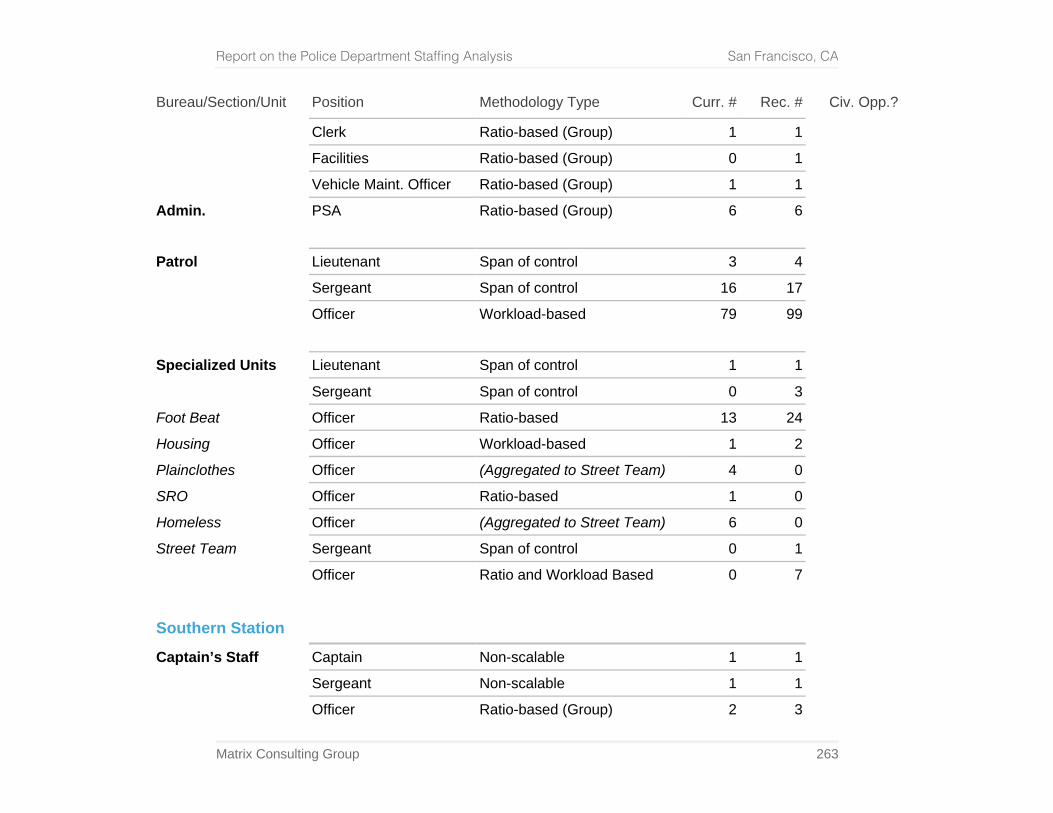
Report on the Police Department Staffing Analysis San Francisco, CA
Matrix Consulting Group 263
Bureau/Section/Unit Position Methodology Type Curr. # Rec. # Civ. Opp.?
Clerk Ratio-based (Group) 1 1 Facilities Ratio-based (Group) 0 1 Vehicle Maint. Officer Ratio-based (Group) 1 1
Admin. PSA Ratio-based (Group) 6 6
Patrol Lieutenant Span of control 3 4 Sergeant Span of control 16 17 Officer Workload-based 79 99
Specialized Units Lieutenant Span of control 1 1 Sergeant Span of control 0 3
Foot Beat Officer Ratio-based 13 24
Housing Officer Workload-based 1 2
Plainclothes Officer (Aggregated to Street Team) 4 0
SRO Officer Ratio-based 1 0
Homeless Officer (Aggregated to Street Team) 6 0
Street Team Sergeant Span of control 0 1 Officer Ratio and Workload Based 0 7
Southern Station
Captain’s Staff Captain Non-scalable 1 1 Sergeant Non-scalable 1 1 Officer Ratio-based (Group) 2 3
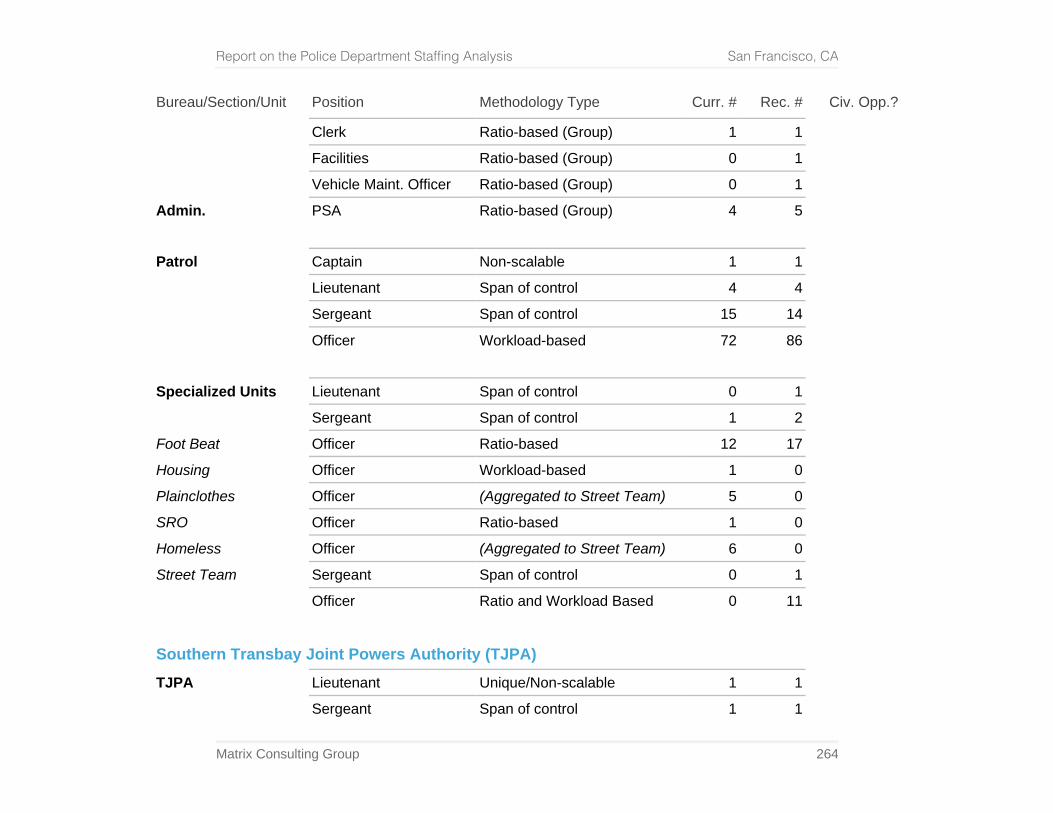
Report on the Police Department Staffing Analysis San Francisco, CA
Matrix Consulting Group 264
Bureau/Section/Unit Position Methodology Type Curr. # Rec. # Civ. Opp.?
Clerk Ratio-based (Group) 1 1 Facilities Ratio-based (Group) 0 1 Vehicle Maint. Officer Ratio-based (Group) 0 1
Admin. PSA Ratio-based (Group) 4 5
Patrol Captain Non-scalable 1 1 Lieutenant Span of control 4 4 Sergeant Span of control 15 14 Officer Workload-based 72 86
Specialized Units Lieutenant Span of control 0 1 Sergeant Span of control 1 2
Foot Beat Officer Ratio-based 12 17
Housing Officer Workload-based 1 0
Plainclothes Officer (Aggregated to Street Team) 5 0
SRO Officer Ratio-based 1 0
Homeless Officer (Aggregated to Street Team) 6 0
Street Team Sergeant Span of control 0 1 Officer Ratio and Workload Based 0 11
Southern Transbay Joint Powers Authority (TJPA)
TJPA Lieutenant Unique/Non-scalable 1 1 Sergeant Span of control 1 1
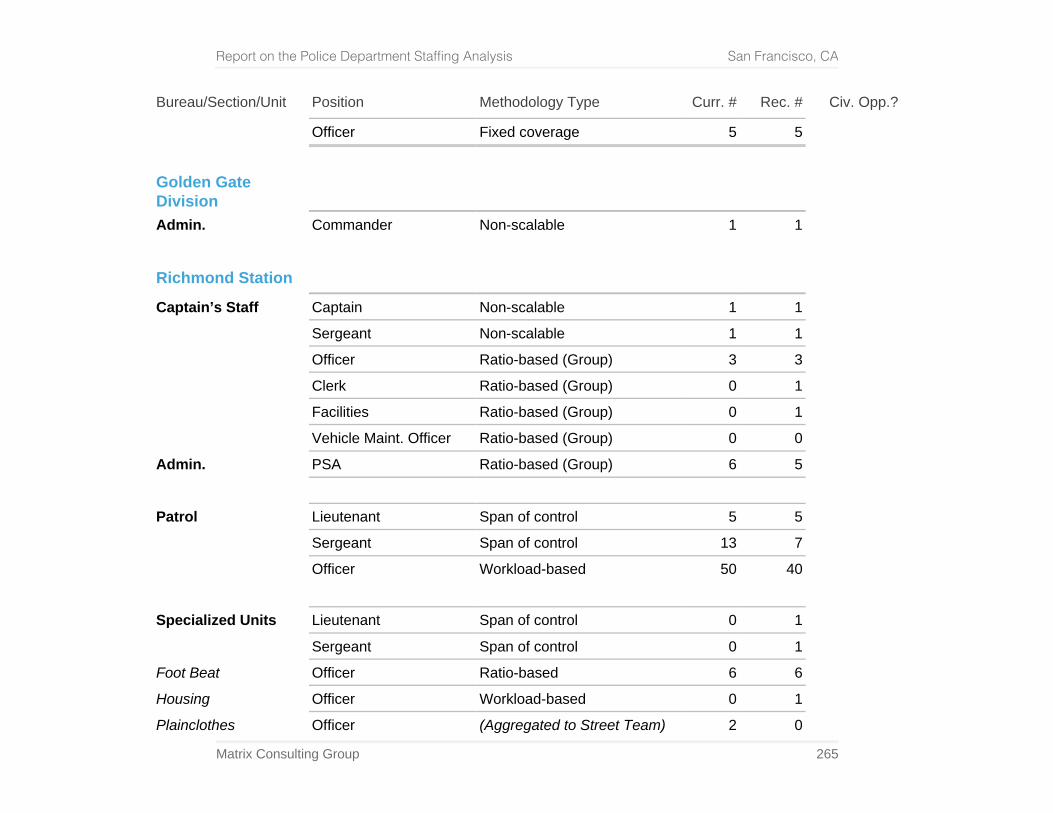
Report on the Police Department Staffing Analysis San Francisco, CA
Matrix Consulting Group 265
Bureau/Section/Unit Position Methodology Type Curr. # Rec. # Civ. Opp.?
Officer Fixed coverage 5 5
Golden Gate Division
Admin. Commander Non-scalable 1 1
Richmond Station
Captain’s Staff Captain Non-scalable 1 1 Sergeant Non-scalable 1 1 Officer Ratio-based (Group) 3 3 Clerk Ratio-based (Group) 0 1
Facilities Ratio-based (Group) 0 1 Vehicle Maint. Officer Ratio-based (Group) 0 0
Admin. PSA Ratio-based (Group) 6 5
Patrol Lieutenant Span of control 5 5 Sergeant Span of control 13 7 Officer Workload-based 50 40
Specialized Units Lieutenant Span of control 0 1 Sergeant Span of control 0 1
Foot Beat Officer Ratio-based 6 6
Housing Officer Workload-based 0 1
Plainclothes Officer (Aggregated to Street Team) 2 0
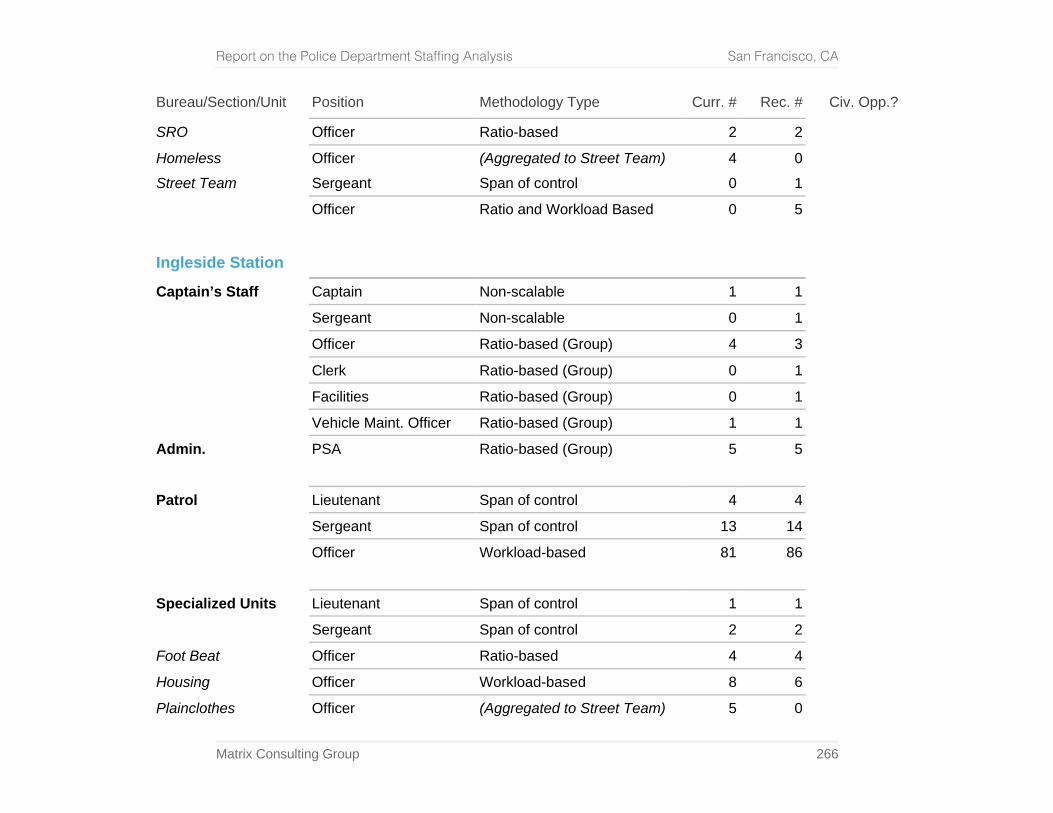
Report on the Police Department Staffing Analysis San Francisco, CA
Matrix Consulting Group 266
Bureau/Section/Unit Position Methodology Type Curr. # Rec. # Civ. Opp.?
SRO Officer Ratio-based 2 2
Homeless Officer (Aggregated to Street Team) 4 0
Street Team Sergeant Span of control 0 1 Officer Ratio and Workload Based 0 5
Ingleside Station
Captain’s Staff Captain Non-scalable 1 1 Sergeant Non-scalable 0 1 Officer Ratio-based (Group) 4 3 Clerk Ratio-based (Group) 0 1 Facilities Ratio-based (Group) 0 1 Vehicle Maint. Officer Ratio-based (Group) 1 1
Admin. PSA Ratio-based (Group) 5 5
Patrol Lieutenant Span of control 4 4 Sergeant Span of control 13 14 Officer Workload-based 81 86
Specialized Units Lieutenant Span of control 1 1
Sergeant Span of control 2 2
Foot Beat Officer Ratio-based 4 4
Housing Officer Workload-based 8 6
Plainclothes Officer (Aggregated to Street Team) 5 0
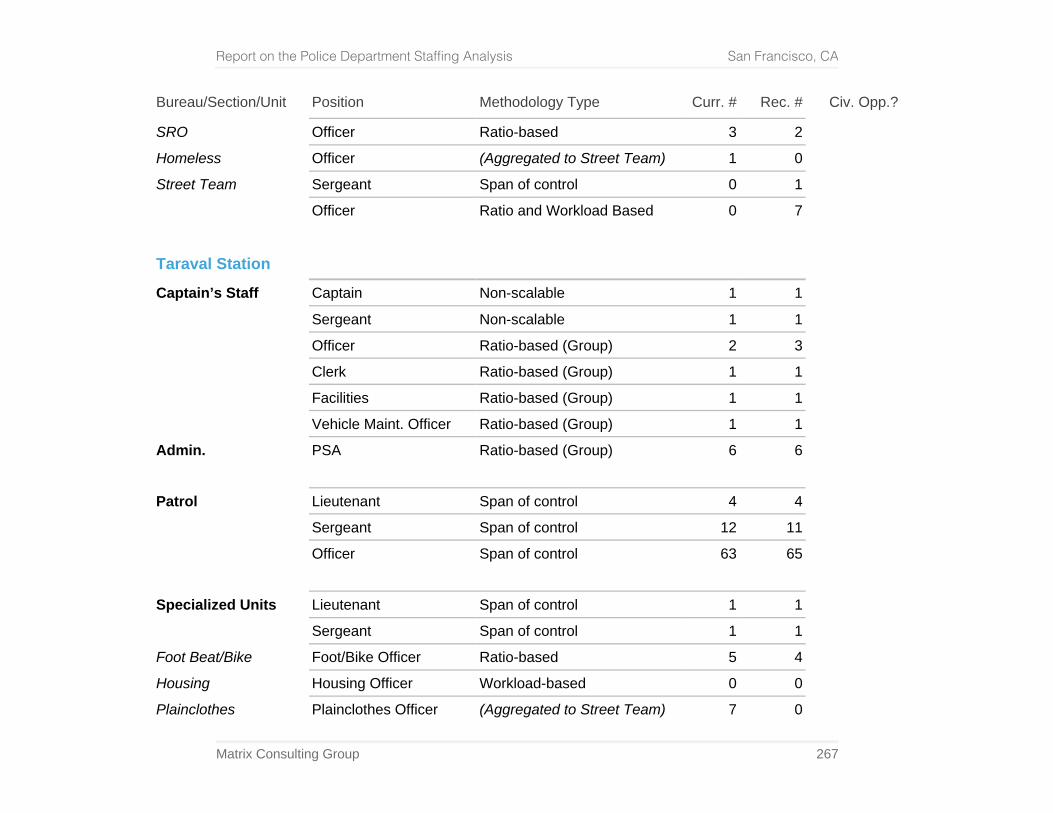
Report on the Police Department Staffing Analysis San Francisco, CA
Matrix Consulting Group 267
Bureau/Section/Unit Position Methodology Type Curr. # Rec. # Civ. Opp.?
SRO Officer Ratio-based 3 2
Homeless Officer (Aggregated to Street Team) 1 0
Street Team Sergeant Span of control 0 1 Officer Ratio and Workload Based 0 7
Taraval Station
Captain’s Staff Captain Non-scalable 1 1 Sergeant Non-scalable 1 1 Officer Ratio-based (Group) 2 3 Clerk Ratio-based (Group) 1 1 Facilities Ratio-based (Group) 1 1 Vehicle Maint. Officer Ratio-based (Group) 1 1
Admin. PSA Ratio-based (Group) 6 6
Patrol Lieutenant Span of control 4 4
Sergeant Span of control 12 11 Officer Span of control 63 65
Specialized Units Lieutenant Span of control 1 1 Sergeant Span of control 1 1
Foot Beat/Bike Foot/Bike Officer Ratio-based 5 4
Housing Housing Officer Workload-based 0 0
Plainclothes Plainclothes Officer (Aggregated to Street Team) 7 0
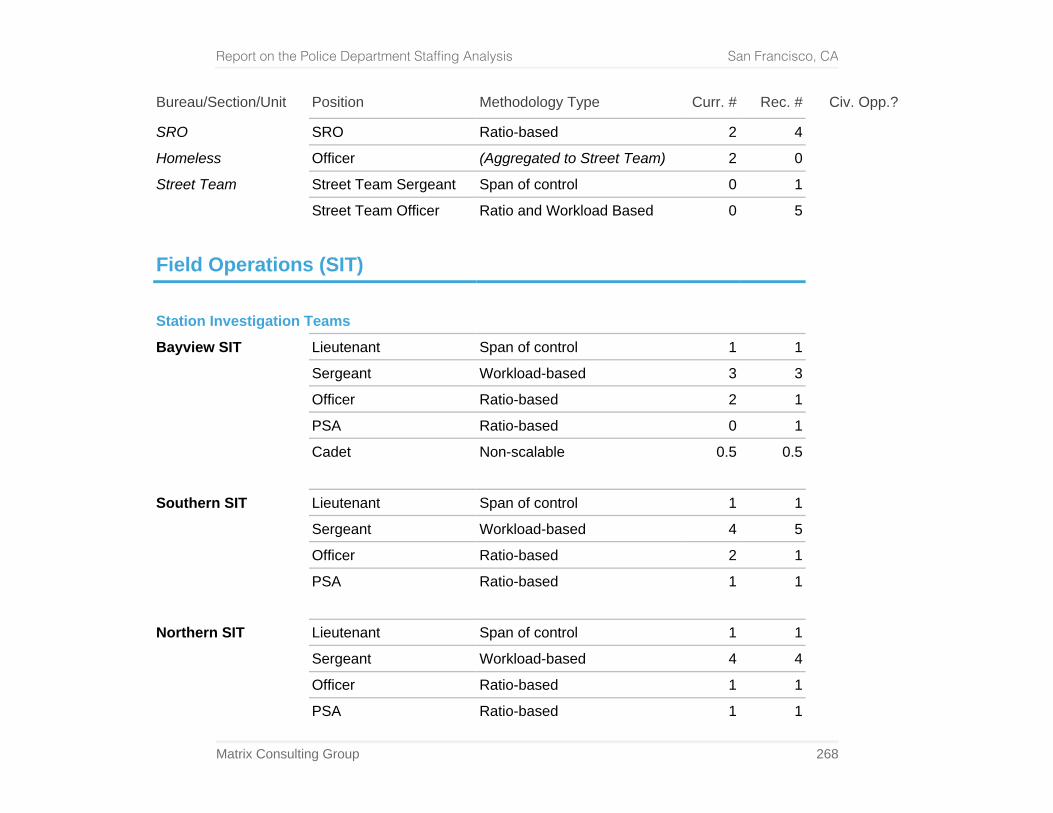
Report on the Police Department Staffing Analysis San Francisco, CA
Matrix Consulting Group 268
Bureau/Section/Unit Position Methodology Type Curr. # Rec. # Civ. Opp.?
SRO SRO Ratio-based 2 4
Homeless Officer (Aggregated to Street Team) 2 0
Street Team Street Team Sergeant Span of control 0 1 Street Team Officer Ratio and Workload Based 0 5
Field Operations (SIT)
Station Investigation Teams
Bayview SIT Lieutenant Span of control 1 1 Sergeant Workload-based 3 3 Officer Ratio-based 2 1 PSA Ratio-based 0 1 Cadet Non-scalable 0.5 0.5
Southern SIT Lieutenant Span of control 1 1
Sergeant Workload-based 4 5 Officer Ratio-based 2 1 PSA Ratio-based 1 1
Northern SIT Lieutenant Span of control 1 1 Sergeant Workload-based 4 4 Officer Ratio-based 1 1 PSA Ratio-based 1 1
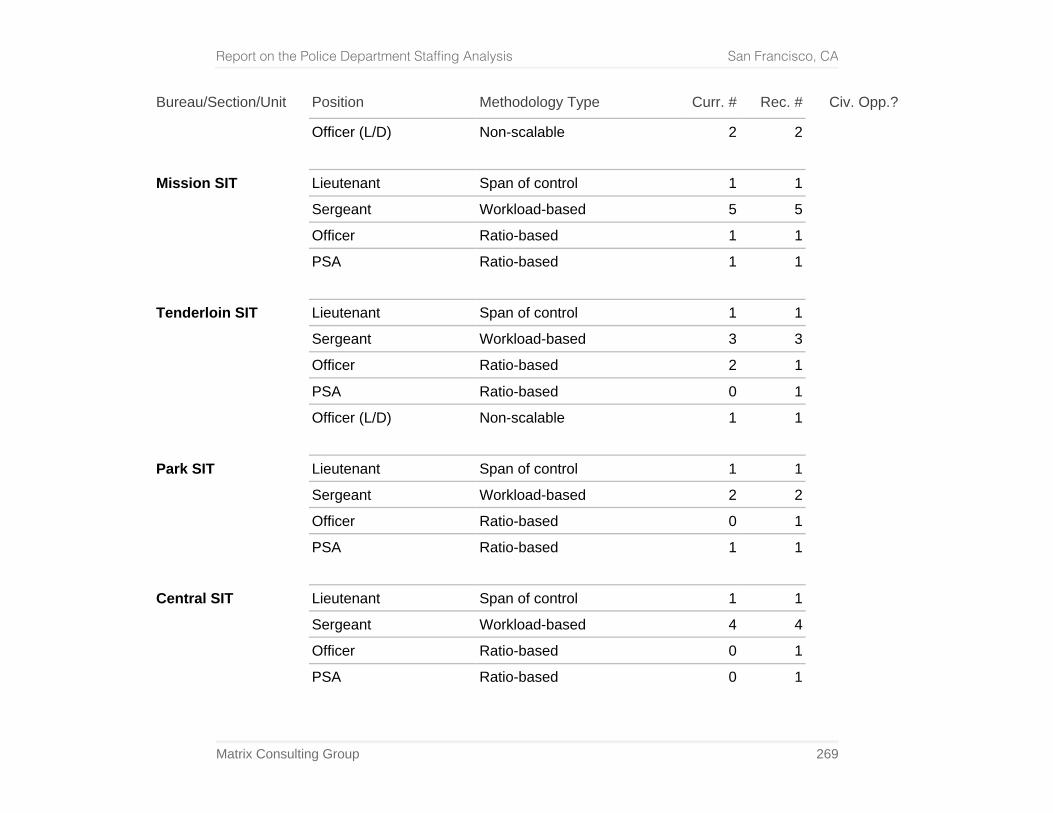
Report on the Police Department Staffing Analysis San Francisco, CA
Matrix Consulting Group 269
Bureau/Section/Unit Position Methodology Type Curr. # Rec. # Civ. Opp.?
Officer (L/D) Non-scalable 2 2
Mission SIT Lieutenant Span of control 1 1 Sergeant Workload-based 5 5 Officer Ratio-based 1 1 PSA Ratio-based 1 1
Tenderloin SIT Lieutenant Span of control 1 1 Sergeant Workload-based 3 3 Officer Ratio-based 2 1 PSA Ratio-based 0 1 Officer (L/D) Non-scalable 1 1
Park SIT Lieutenant Span of control 1 1 Sergeant Workload-based 2 2 Officer Ratio-based 0 1 PSA Ratio-based 1 1
Central SIT Lieutenant Span of control 1 1 Sergeant Workload-based 4 4
Officer Ratio-based 0 1 PSA Ratio-based 0 1
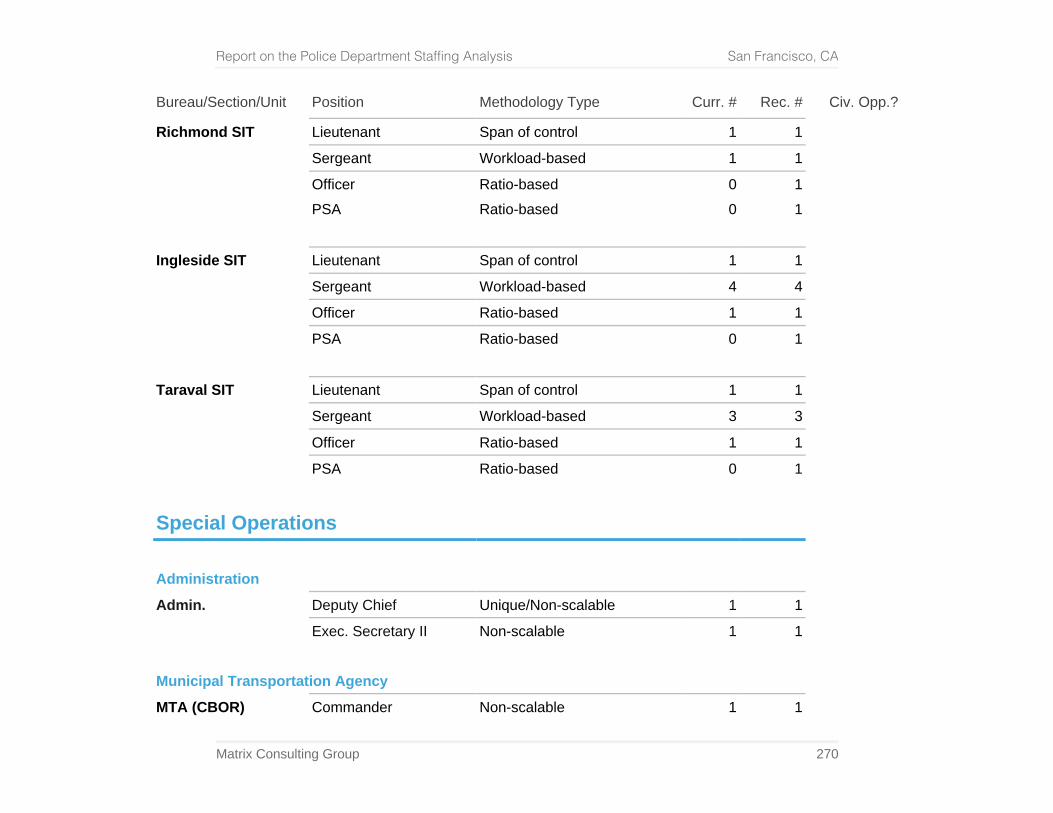
Report on the Police Department Staffing Analysis San Francisco, CA
Matrix Consulting Group 270
Bureau/Section/Unit Position Methodology Type Curr. # Rec. # Civ. Opp.?
Richmond SIT Lieutenant Span of control 1 1 Sergeant Workload-based 1 1 Officer Ratio-based 0 1 PSA Ratio-based 0 1
Ingleside SIT Lieutenant Span of control 1 1 Sergeant Workload-based 4 4 Officer Ratio-based 1 1 PSA Ratio-based 0 1
Taraval SIT Lieutenant Span of control 1 1 Sergeant Workload-based 3 3 Officer Ratio-based 1 1 PSA Ratio-based 0 1
Special Operations
Administration
Admin. Deputy Chief Unique/Non-scalable 1 1
Exec. Secretary II Non-scalable 1 1
Municipal Transportation Agency
MTA (CBOR) Commander Non-scalable 1 1
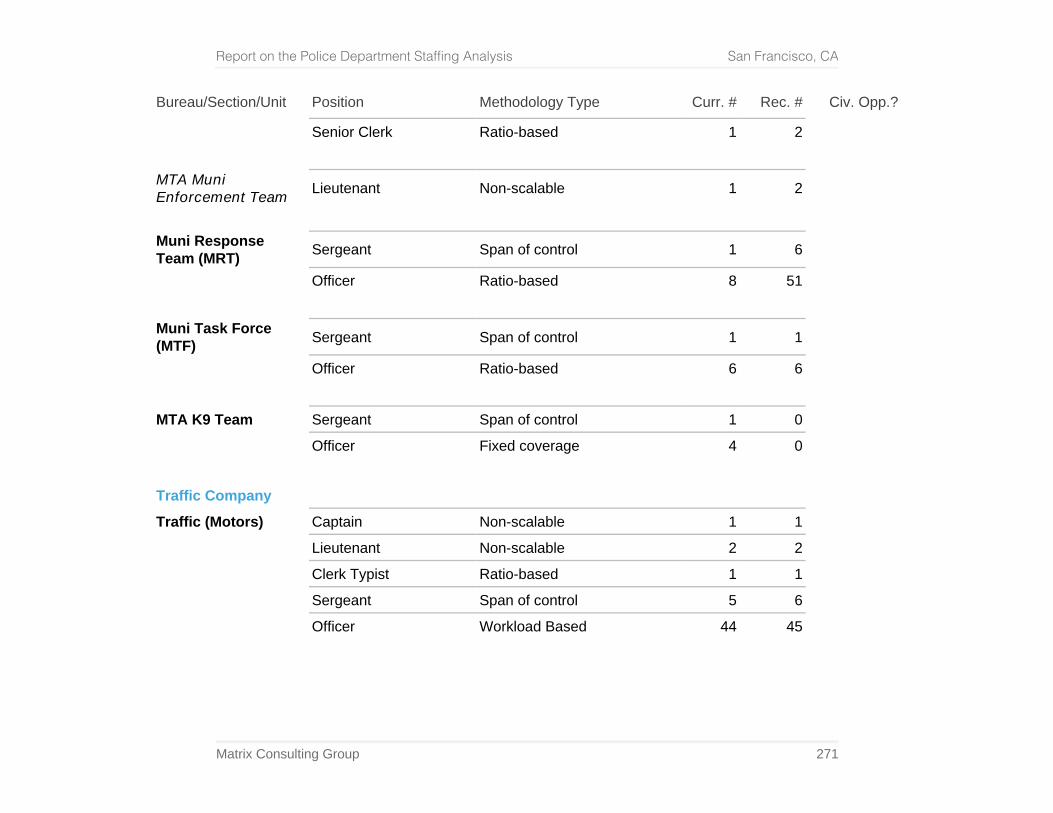
Report on the Police Department Staffing Analysis San Francisco, CA
Matrix Consulting Group 271
Bureau/Section/Unit Position Methodology Type Curr. # Rec. # Civ. Opp.?
Senior Clerk Ratio-based 1 2
MTA Muni Enforcement Team Lieutenant Non-scalable 1 2
Muni Response Team (MRT) Sergeant Span of control 1 6
Officer Ratio-based 8 51
Muni Task Force (MTF) Sergeant Span of control 1 1
Officer Ratio-based 6 6
MTA K9 Team Sergeant Span of control 1 0 Officer Fixed coverage 4 0
Traffic Company
Traffic (Motors) Captain Non-scalable 1 1 Lieutenant Non-scalable 2 2 Clerk Typist Ratio-based 1 1 Sergeant Span of control 5 6
Officer Workload Based 44 45
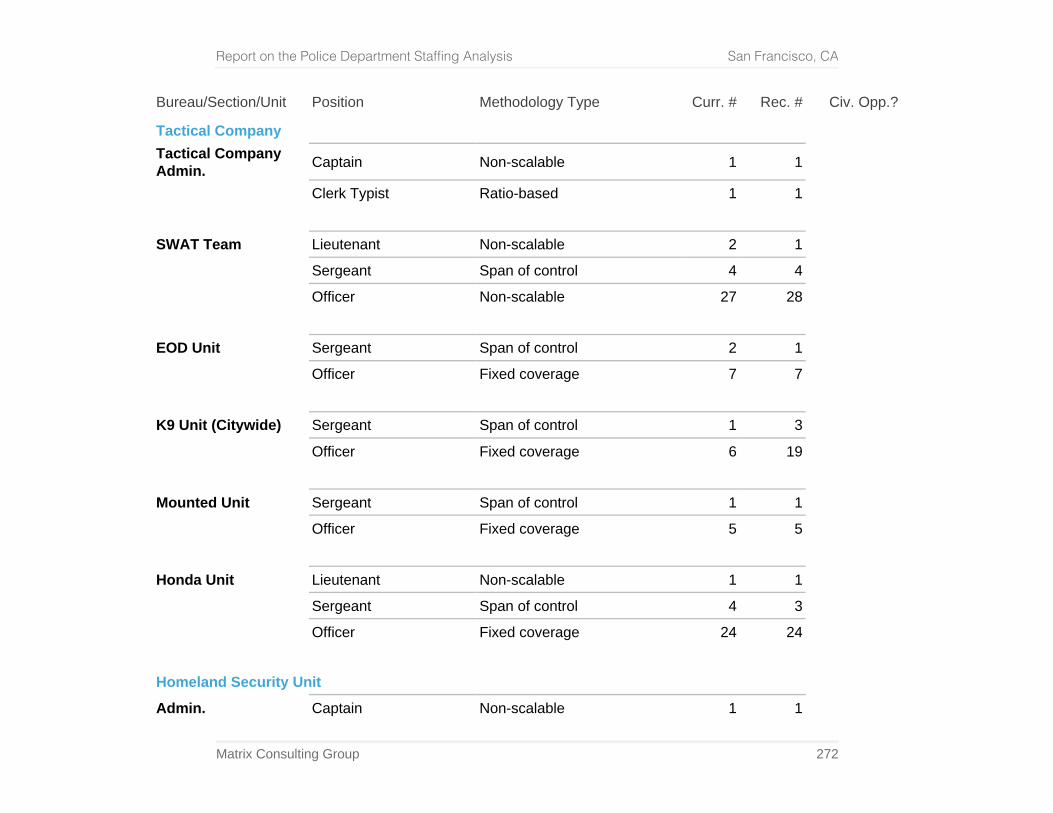
Report on the Police Department Staffing Analysis San Francisco, CA
Matrix Consulting Group 272
Bureau/Section/Unit Position Methodology Type Curr. # Rec. # Civ. Opp.?
Tactical Company
Tactical Company Admin. Captain Non-scalable 1 1
Clerk Typist Ratio-based 1 1
SWAT Team Lieutenant Non-scalable 2 1 Sergeant Span of control 4 4 Officer Non-scalable 27 28
EOD Unit Sergeant Span of control 2 1 Officer Fixed coverage 7 7
K9 Unit (Citywide) Sergeant Span of control 1 3 Officer Fixed coverage 6 19
Mounted Unit Sergeant Span of control 1 1 Officer Fixed coverage 5 5
Honda Unit Lieutenant Non-scalable 1 1 Sergeant Span of control 4 3 Officer Fixed coverage 24 24
Homeland Security Unit
Admin. Captain Non-scalable 1 1
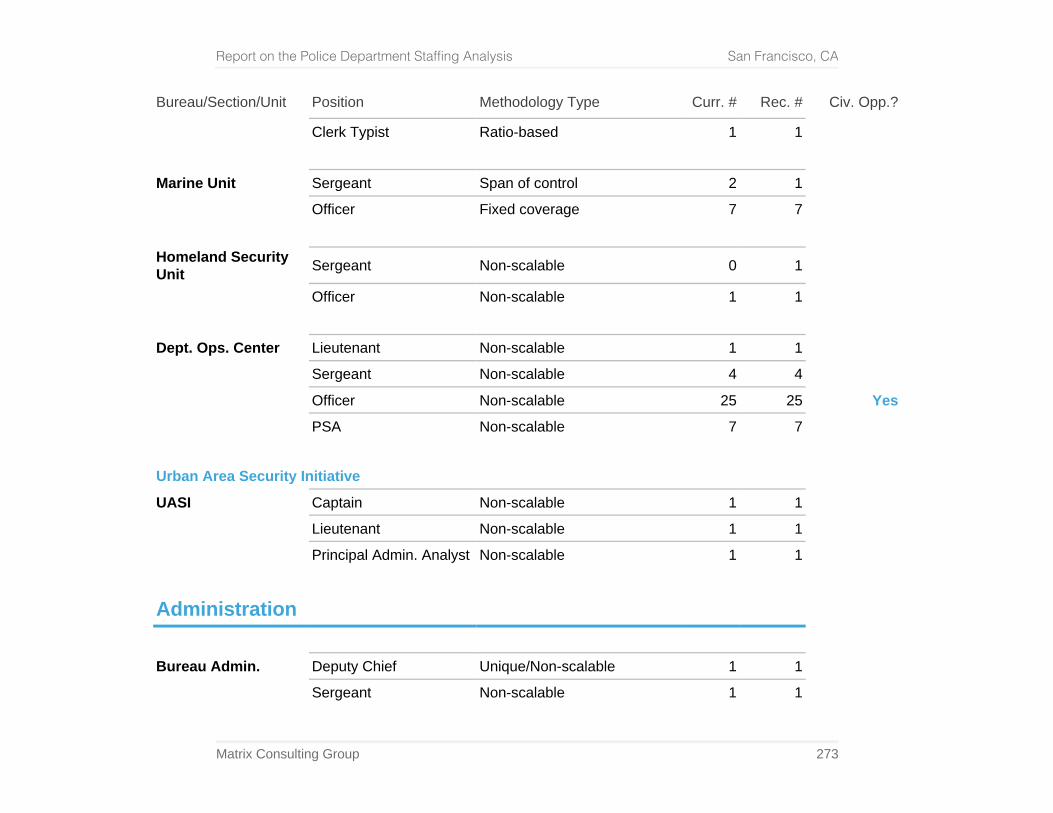
Report on the Police Department Staffing Analysis San Francisco, CA
Matrix Consulting Group 273
Bureau/Section/Unit Position Methodology Type Curr. # Rec. # Civ. Opp.?
Clerk Typist Ratio-based 1 1
Marine Unit Sergeant Span of control 2 1 Officer Fixed coverage 7 7
Homeland Security Unit Sergeant Non-scalable 0 1
Officer Non-scalable 1 1
Dept. Ops. Center Lieutenant Non-scalable 1 1 Sergeant Non-scalable 4 4 Officer Non-scalable 25 25 Yes PSA Non-scalable 7 7
Urban Area Security Initiative
UASI Captain Non-scalable 1 1 Lieutenant Non-scalable 1 1 Principal Admin. Analyst Non-scalable 1 1
Administration
Bureau Admin. Deputy Chief Unique/Non-scalable 1 1 Sergeant Non-scalable 1 1
Report on the Police Department Staffing Analysis San Francisco, CA
Matrix Consulting Group 274
Bureau/Section/Unit Position Methodology Type Curr. # Rec. # Civ. Opp.?
Fleet and Facilities
Administration Captain Unique/Non-scalable 1 1
Facilities Bldg. and Grounds Maint. Superintendent Span of Control 1 1
Maintenance Planner Span of control 1 1 Facility Coordinator Ratio-based 10 16
Fleet Fleet Manager Span of control 1 1
Auto Mechanic Supervisor Span of control 1 1
Vehicle Maint. Officer Ratio-based 14 17
Training Division
Administration Captain Unique/Non-scalable 1 1 Secretary II Non-scalable 1 1
Basic Recruit Course Lieutenant Unique/Non-scalable 1 1 Sergeant Ratio-based 1 1 Officer Ratio-based 1 1
RTO Officer Ratio-based 5 6
PT/DT Sergeant Ratio-based 1 1 Officer Ratio-based 4 4
Report on the Police Department Staffing Analysis San Francisco, CA
Matrix Consulting Group 275
Bureau/Section/Unit Position Methodology Type Curr. # Rec. # Civ. Opp.?
PT Coordinator Ratio-based 0 1
EVOC Sergeant Ratio-based 1 1 Officer Ratio-based 2 2
Report Writing Sergeant Unique/Non-scalable 1 1 960/Retiree Non-scalable 1 1
Range Sergeant Unique/Non-scalable 1 1 Officer Ratio-based 9 10
Field Training Office Lieutenant Ratio-based 1 1 Sergeant Ratio-based 1 1 Officer Ratio-based 2 2 Clerk Typist Non-scalable 1 1
Professional Dev. Lieutenant Unique/Non-scalable 1 1 Sergeant Span of control 1 1 Sergeant Selective 1 1 Officer Selective/Non-scalable 2 2 Management Assistant Non-scalable 3 3 Media Production Tech. Non-scalable 3 3
960/Retiree Non-scalable 1 1
Report on the Police Department Staffing Analysis San Francisco, CA
Matrix Consulting Group 276
Bureau/Section/Unit Position Methodology Type Curr. # Rec. # Civ. Opp.?
Field Tactics/Force Options Lieutenant Span of control 1 1
Sergeant Selective/Non-scalable 2 2 Officer Selective/Non-scalable 2 2 960/Retiree Selective/Non-scalable 1 1
Staff Services
Administration Captain Unique/Non-scalable 1 1 Lieutenant Span of control 1 1 Secretary Non-scalable 1 1
Staffing & Deployment Lieutenant Span of Control 1 1
Sergeant Non-scalable 2 2 Officer Non-scalable 1 1 Senior Admin. Analyst Selective 1 2
Personnel HR Manager Unique/Non-scalable 1 1
Senior HR Analyst Ratio-based (Group) 3 3 HR Analyst Ratio-based (Group) 2 2 Business Analyst Ratio-based (Group) 1 1 Personnel Technician Ratio-based (Group) 1 1 Personnel Clerk Ratio-based (Group) 2 2 Senior Clerk Ratio-based (Group) 1 1 Clerk Ratio-based (Group) 1 1
Report on the Police Department Staffing Analysis San Francisco, CA
Matrix Consulting Group 277
Bureau/Section/Unit Position Methodology Type Curr. # Rec. # Civ. Opp.?
960/Retiree Non-scalable – –
Payroll Payroll Manager Unique/Non-scalable 1 1 Chief Payroll Clerk Span of control 1 1 Senior Payroll Clerk Ratio-based 7 7 Clerk Typist Ratio-based 1 1
Backgrounds Sergeant Span of control 1 2 Officer Workload-based 4 0 Yes Background Investigator Workload-based 0 6 Principal Clerk Selective/Non-scalable 1 1 Clerk Typist Selective/Non-scalable 2 2 960/Retiree Workload-based 19 19
Recruitment Sergeant Span of control 1 1 Officer Ratio-based 3 4 Senior Clerk Ratio-based 1 1 Recruiter (PT) Ratio-based 1 1
Medical Liaison Sergeant Span of control 1 0 Yes Safety Officer Span of control 0 1 Physician Specialist Non-scalable 1 1 EEO Senior Specialist Non-scalable 1 1
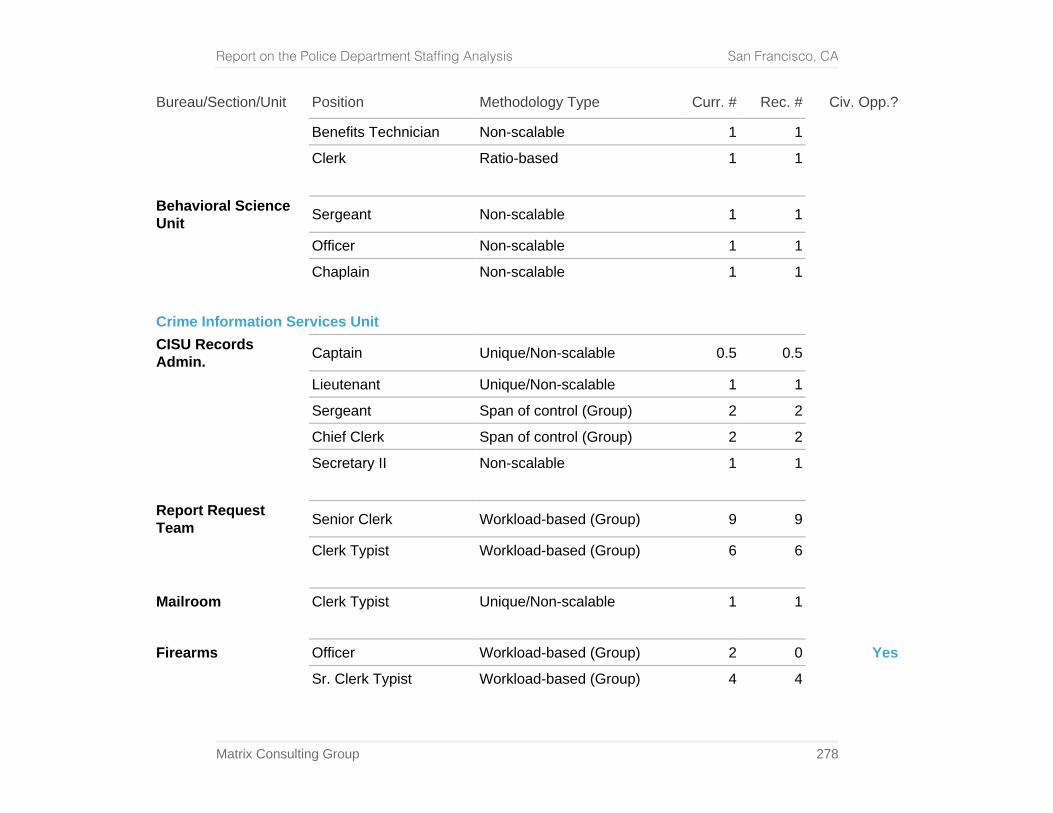
Report on the Police Department Staffing Analysis San Francisco, CA
Matrix Consulting Group 278
Bureau/Section/Unit Position Methodology Type Curr. # Rec. # Civ. Opp.?
Benefits Technician Non-scalable 1 1 Clerk Ratio-based 1 1
Behavioral Science Unit Sergeant Non-scalable 1 1
Officer Non-scalable 1 1 Chaplain Non-scalable 1 1
Crime Information Services Unit
CISU Records Admin. Captain Unique/Non-scalable 0.5 0.5
Lieutenant Unique/Non-scalable 1 1 Sergeant Span of control (Group) 2 2 Chief Clerk Span of control (Group) 2 2 Secretary II Non-scalable 1 1
Report Request Team Senior Clerk Workload-based (Group) 9 9
Clerk Typist Workload-based (Group) 6 6
Mailroom Clerk Typist Unique/Non-scalable 1 1
Firearms Officer Workload-based (Group) 2 0 Yes Sr. Clerk Typist Workload-based (Group) 4 4
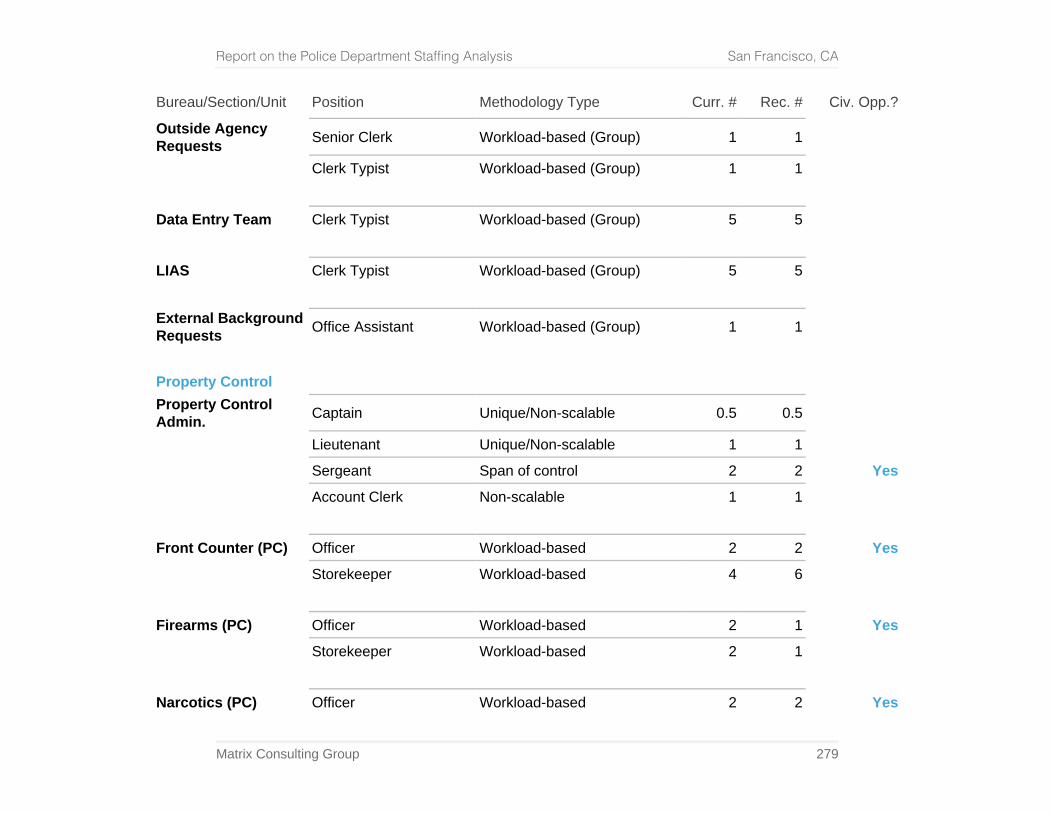
Report on the Police Department Staffing Analysis San Francisco, CA
Matrix Consulting Group 279
Bureau/Section/Unit Position Methodology Type Curr. # Rec. # Civ. Opp.?
Outside Agency Requests Senior Clerk Workload-based (Group) 1 1
Clerk Typist Workload-based (Group) 1 1
Data Entry Team Clerk Typist Workload-based (Group) 5 5
LIAS Clerk Typist Workload-based (Group) 5 5
External Background Requests Office Assistant Workload-based (Group) 1 1
Property Control
Property Control Admin. Captain Unique/Non-scalable 0.5 0.5
Lieutenant Unique/Non-scalable 1 1 Sergeant Span of control 2 2 Yes Account Clerk Non-scalable 1 1
Front Counter (PC) Officer Workload-based 2 2 Yes Storekeeper Workload-based 4 6
Firearms (PC) Officer Workload-based 2 1 Yes Storekeeper Workload-based 2 1
Narcotics (PC) Officer Workload-based 2 2 Yes
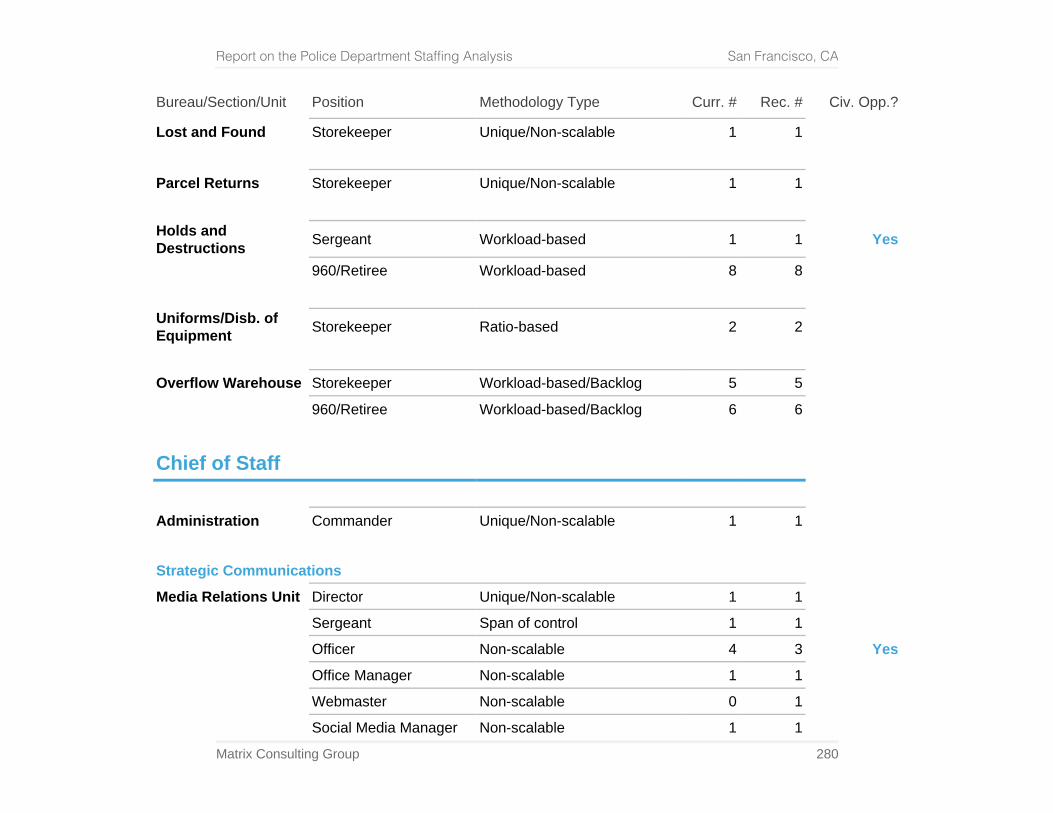
Report on the Police Department Staffing Analysis San Francisco, CA
Matrix Consulting Group 280
Bureau/Section/Unit Position Methodology Type Curr. # Rec. # Civ. Opp.?
Lost and Found Storekeeper Unique/Non-scalable 1 1
Parcel Returns Storekeeper Unique/Non-scalable 1 1
Holds and Destructions Sergeant Workload-based 1 1 Yes 960/Retiree Workload-based 8 8
Uniforms/Disb. of Equipment Storekeeper Ratio-based 2 2
Overflow Warehouse Storekeeper Workload-based/Backlog 5 5 960/Retiree Workload-based/Backlog 6 6
Chief of Staff
Administration Commander Unique/Non-scalable 1 1
Strategic Communications
Media Relations Unit Director Unique/Non-scalable 1 1 Sergeant Span of control 1 1 Officer Non-scalable 4 3 Yes Office Manager Non-scalable 1 1 Webmaster Non-scalable 0 1 Social Media Manager Non-scalable 1 1
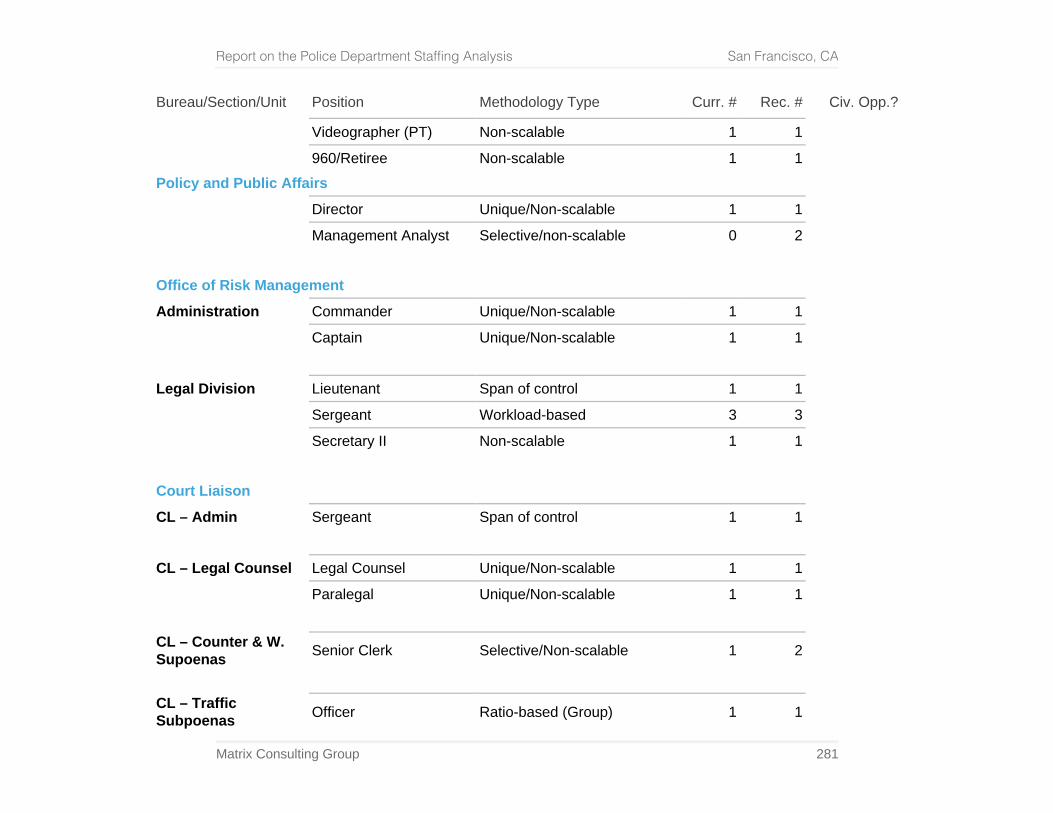
Report on the Police Department Staffing Analysis San Francisco, CA
Matrix Consulting Group 281
Bureau/Section/Unit Position Methodology Type Curr. # Rec. # Civ. Opp.?
Videographer (PT) Non-scalable 1 1 960/Retiree Non-scalable 1 1
Policy and Public Affairs
Director Unique/Non-scalable 1 1 Management Analyst Selective/non-scalable 0 2
Office of Risk Management
Administration Commander Unique/Non-scalable 1 1 Captain Unique/Non-scalable 1 1
Legal Division Lieutenant Span of control 1 1 Sergeant Workload-based 3 3 Secretary II Non-scalable 1 1
Court Liaison
CL – Admin Sergeant Span of control 1 1
CL – Legal Counsel Legal Counsel Unique/Non-scalable 1 1 Paralegal Unique/Non-scalable 1 1
CL – Counter & W. Supoenas Senior Clerk Selective/Non-scalable 1 2
CL – Traffic Subpoenas Officer Ratio-based (Group) 1 1
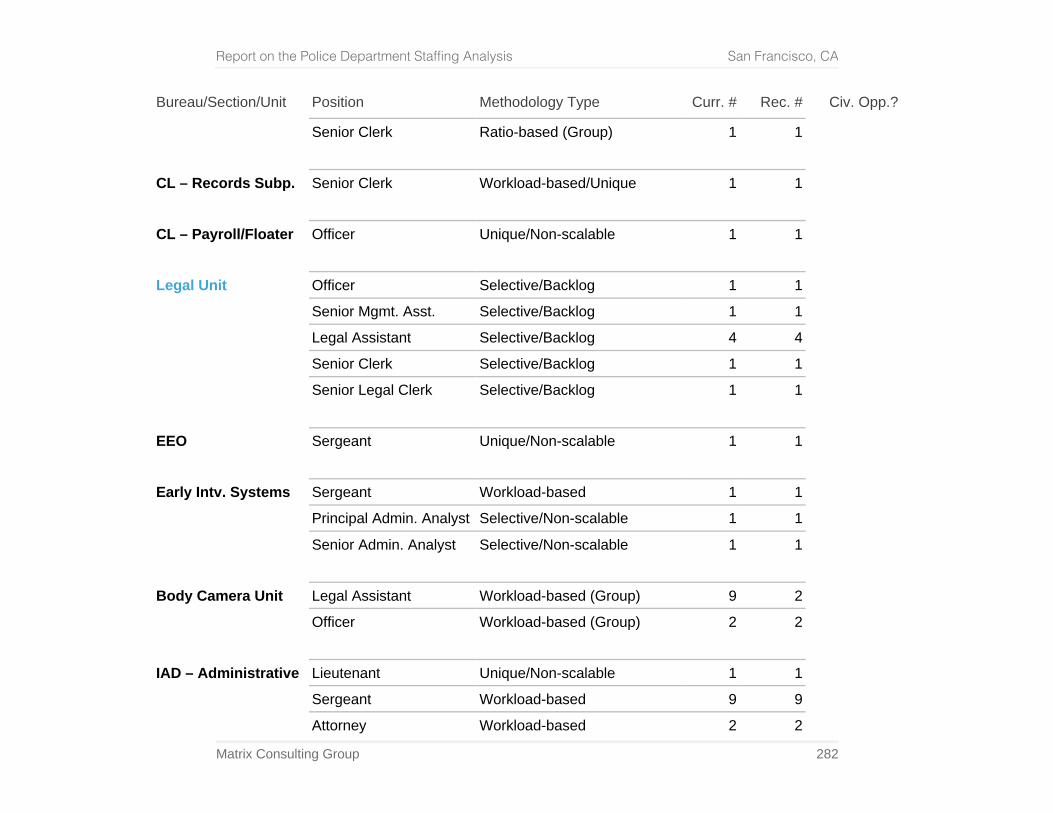
Report on the Police Department Staffing Analysis San Francisco, CA
Matrix Consulting Group 282
Bureau/Section/Unit Position Methodology Type Curr. # Rec. # Civ. Opp.?
Senior Clerk Ratio-based (Group) 1 1
CL – Records Subp. Senior Clerk Workload-based/Unique 1 1
CL – Payroll/Floater Officer Unique/Non-scalable 1 1
Legal Unit Officer Selective/Backlog 1 1 Senior Mgmt. Asst. Selective/Backlog 1 1 Legal Assistant Selective/Backlog 4 4 Senior Clerk Selective/Backlog 1 1 Senior Legal Clerk Selective/Backlog 1 1
EEO Sergeant Unique/Non-scalable 1 1
Early Intv. Systems Sergeant Workload-based 1 1 Principal Admin. Analyst Selective/Non-scalable 1 1 Senior Admin. Analyst Selective/Non-scalable 1 1
Body Camera Unit Legal Assistant Workload-based (Group) 9 2 Officer Workload-based (Group) 2 2
IAD – Administrative Lieutenant Unique/Non-scalable 1 1 Sergeant Workload-based 9 9 Attorney Workload-based 2 2
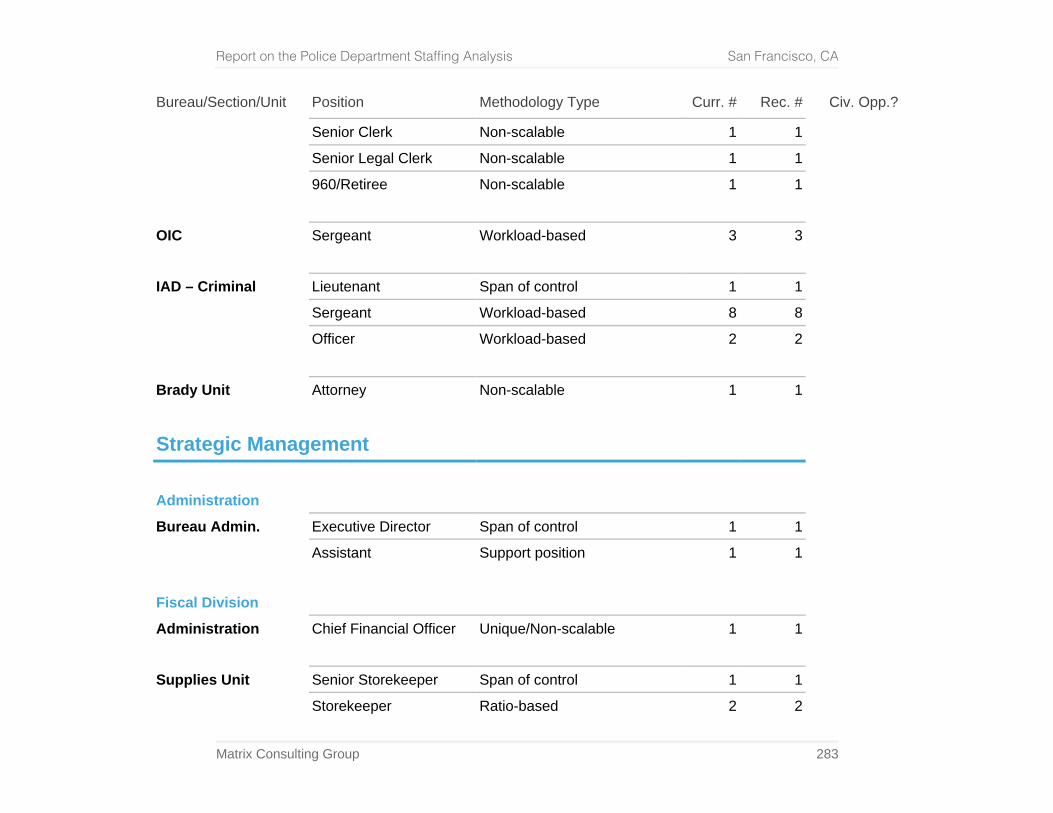
Report on the Police Department Staffing Analysis San Francisco, CA
Matrix Consulting Group 283
Bureau/Section/Unit Position Methodology Type Curr. # Rec. # Civ. Opp.?
Senior Clerk Non-scalable 1 1 Senior Legal Clerk Non-scalable 1 1 960/Retiree Non-scalable 1 1
OIC Sergeant Workload-based 3 3
IAD – Criminal Lieutenant Span of control 1 1 Sergeant Workload-based 8 8 Officer Workload-based 2 2
Brady Unit Attorney Non-scalable 1 1
Strategic Management
Administration
Bureau Admin. Executive Director Span of control 1 1 Assistant Support position 1 1
Fiscal Division
Administration Chief Financial Officer Unique/Non-scalable 1 1
Supplies Unit Senior Storekeeper Span of control 1 1 Storekeeper Ratio-based 2 2
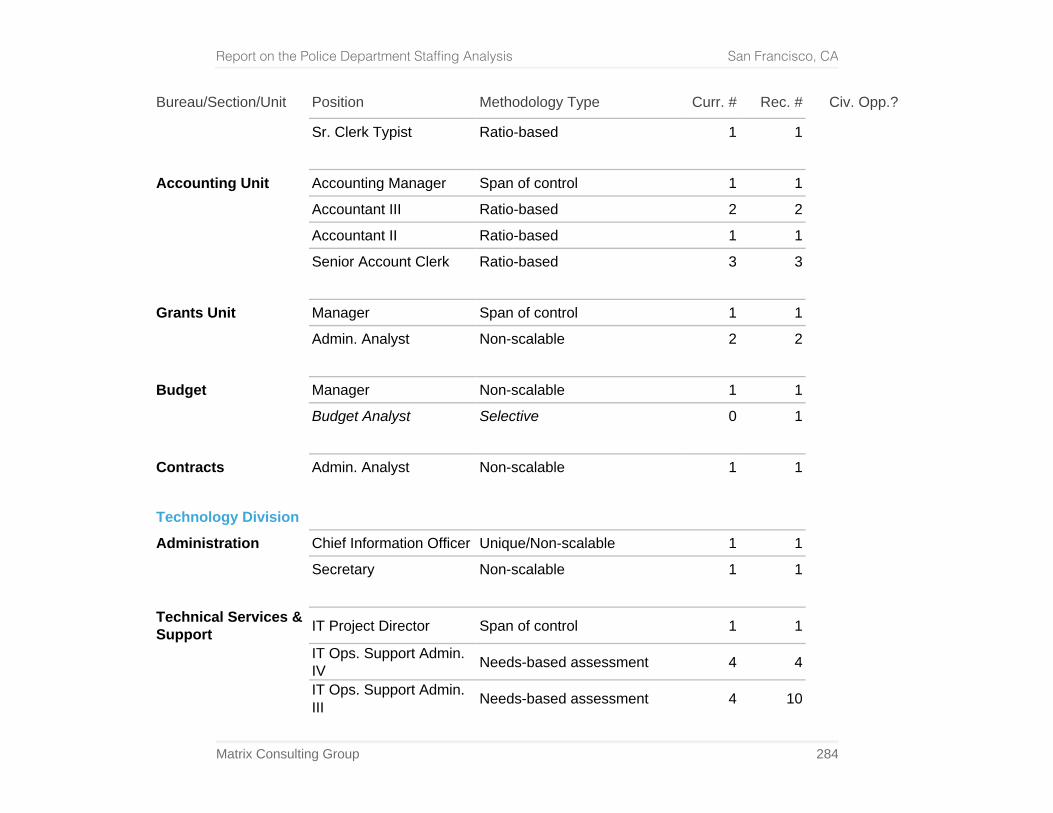
Report on the Police Department Staffing Analysis San Francisco, CA
Matrix Consulting Group 284
Bureau/Section/Unit Position Methodology Type Curr. # Rec. # Civ. Opp.?
Sr. Clerk Typist Ratio-based 1 1
Accounting Unit Accounting Manager Span of control 1 1 Accountant III Ratio-based 2 2 Accountant II Ratio-based 1 1 Senior Account Clerk Ratio-based 3 3
Grants Unit Manager Span of control 1 1 Admin. Analyst Non-scalable 2 2
Budget Manager Non-scalable 1 1 Budget Analyst Selective 0 1
Contracts Admin. Analyst Non-scalable 1 1
Technology Division
Administration Chief Information Officer Unique/Non-scalable 1 1 Secretary Non-scalable 1 1
Technical Services & Support IT Project Director Span of control 1 1
IT Ops. Support Admin. IV Needs-based assessment 4 4
IT Ops. Support Admin. III Needs-based assessment 4 10
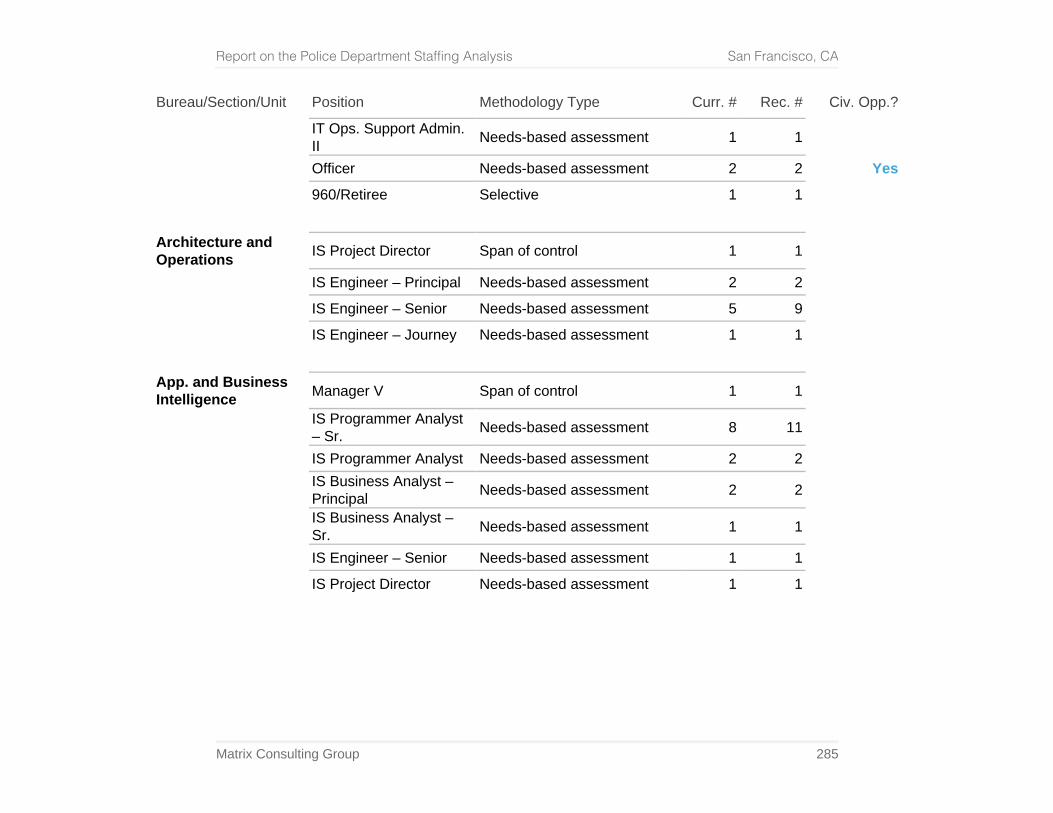
Report on the Police Department Staffing Analysis San Francisco, CA
Matrix Consulting Group 285
Bureau/Section/Unit Position Methodology Type Curr. # Rec. # Civ. Opp.?
IT Ops. Support Admin. II Needs-based assessment 1 1
Officer Needs-based assessment 2 2 Yes 960/Retiree Selective 1 1
Architecture and Operations IS Project Director Span of control 1 1
IS Engineer – Principal Needs-based assessment 2 2 IS Engineer – Senior Needs-based assessment 5 9 IS Engineer – Journey Needs-based assessment 1 1
App. and Business Intelligence Manager V Span of control 1 1
IS Programmer Analyst – Sr. Needs-based assessment 8 11
IS Programmer Analyst Needs-based assessment 2 2
IS Business Analyst – Principal Needs-based assessment 2 2
IS Business Analyst – Sr. Needs-based assessment 1 1
IS Engineer – Senior Needs-based assessment 1 1 IS Project Director Needs-based assessment 1 1
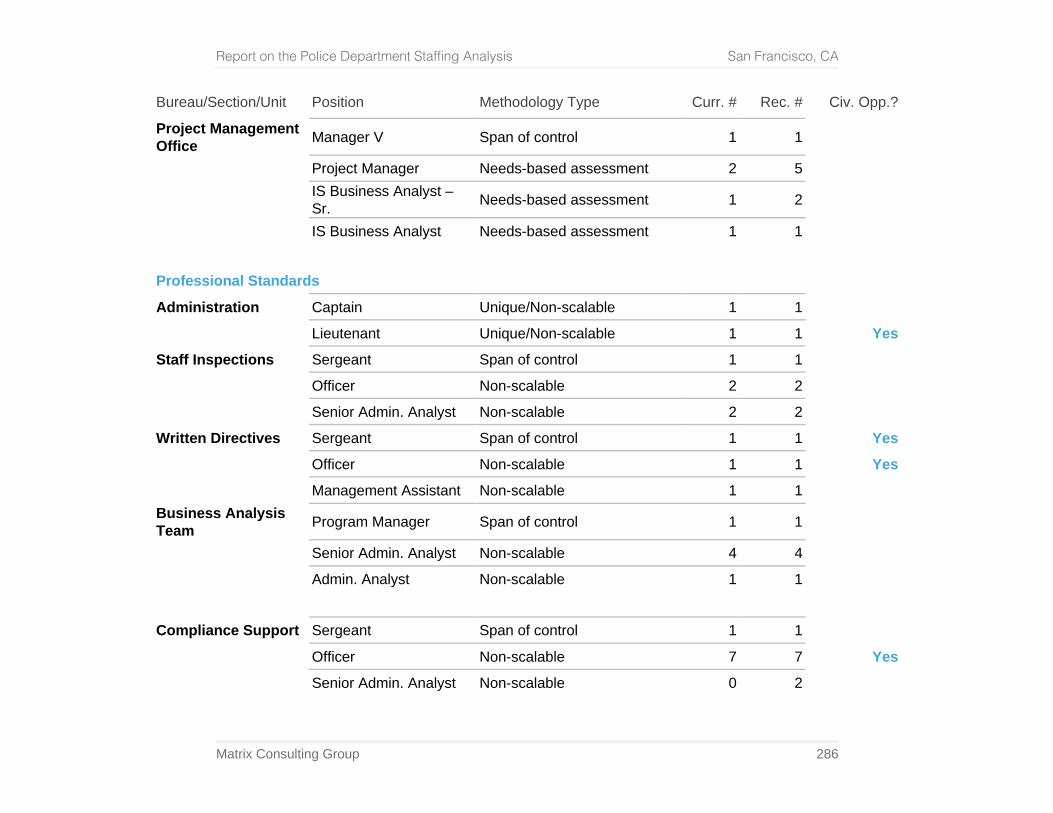
Report on the Police Department Staffing Analysis San Francisco, CA
Matrix Consulting Group 286
Bureau/Section/Unit Position Methodology Type Curr. # Rec. # Civ. Opp.?
Project Management Office Manager V Span of control 1 1
Project Manager Needs-based assessment 2 5
IS Business Analyst – Sr. Needs-based assessment 1 2
IS Business Analyst Needs-based assessment 1 1
Professional Standards
Administration Captain Unique/Non-scalable 1 1 Lieutenant Unique/Non-scalable 1 1 Yes Staff Inspections Sergeant Span of control 1 1 Officer Non-scalable 2 2
Senior Admin. Analyst Non-scalable 2 2 Written Directives Sergeant Span of control 1 1 Yes Officer Non-scalable 1 1 Yes Management Assistant Non-scalable 1 1
Business Analysis Team Program Manager Span of control 1 1
Senior Admin. Analyst Non-scalable 4 4 Admin. Analyst Non-scalable 1 1
Compliance Support Sergeant Span of control 1 1 Officer Non-scalable 7 7 Yes Senior Admin. Analyst Non-scalable 0 2
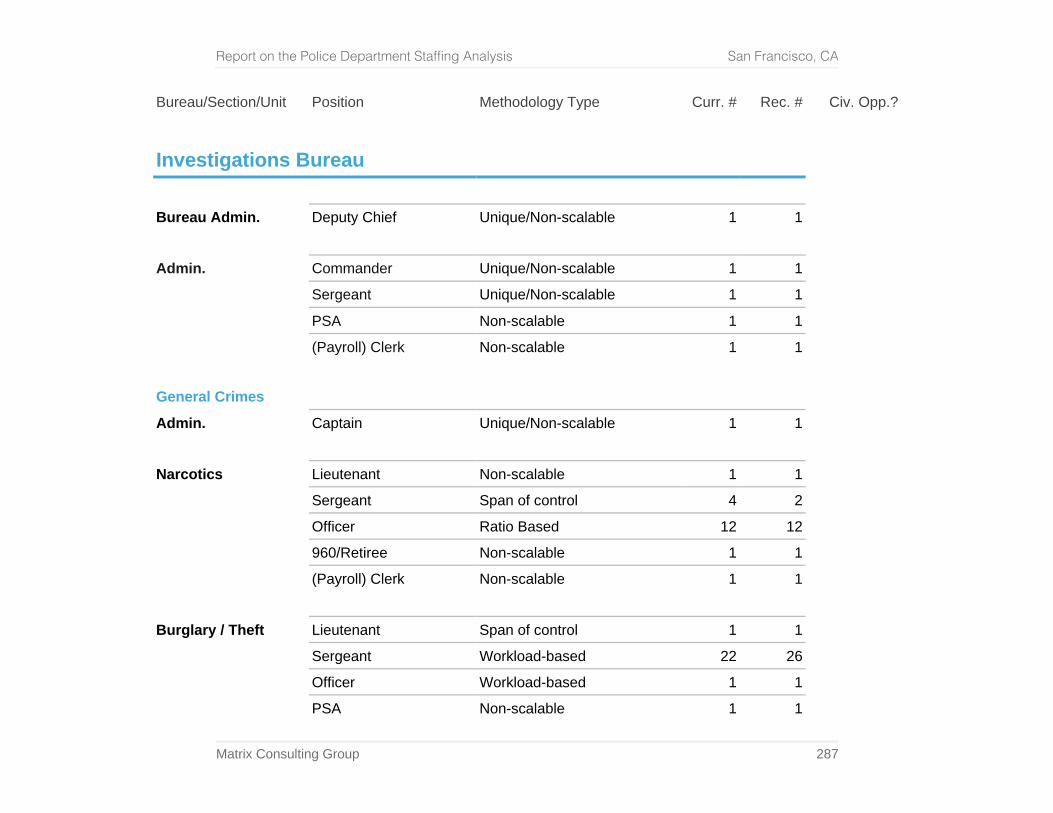
Report on the Police Department Staffing Analysis San Francisco, CA
Matrix Consulting Group 287
Bureau/Section/Unit Position Methodology Type Curr. # Rec. # Civ. Opp.?
Investigations Bureau
Bureau Admin. Deputy Chief Unique/Non-scalable 1 1
Admin. Commander Unique/Non-scalable 1 1 Sergeant Unique/Non-scalable 1 1 PSA Non-scalable 1 1 (Payroll) Clerk Non-scalable 1 1
General Crimes
Admin. Captain Unique/Non-scalable 1 1
Narcotics Lieutenant Non-scalable 1 1 Sergeant Span of control 4 2 Officer Ratio Based 12 12 960/Retiree Non-scalable 1 1 (Payroll) Clerk Non-scalable 1 1
Burglary / Theft Lieutenant Span of control 1 1 Sergeant Workload-based 22 26
Officer Workload-based 1 1 PSA Non-scalable 1 1
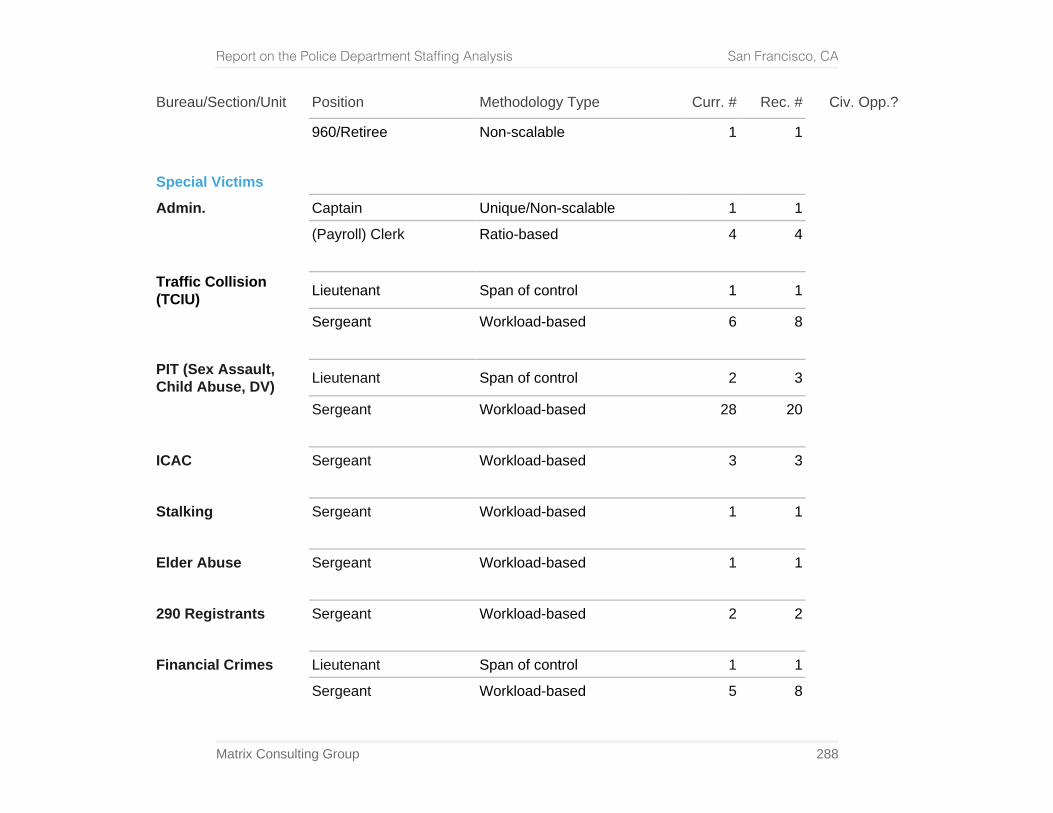
Report on the Police Department Staffing Analysis San Francisco, CA
Matrix Consulting Group 288
Bureau/Section/Unit Position Methodology Type Curr. # Rec. # Civ. Opp.?
960/Retiree Non-scalable 1 1
Special Victims
Admin. Captain Unique/Non-scalable 1 1
(Payroll) Clerk Ratio-based 4 4
Traffic Collision (TCIU) Lieutenant Span of control 1 1
Sergeant Workload-based 6 8
PIT (Sex Assault, Child Abuse, DV) Lieutenant Span of control 2 3
Sergeant Workload-based 28 20
ICAC Sergeant Workload-based 3 3
Stalking Sergeant Workload-based 1 1
Elder Abuse Sergeant Workload-based 1 1
290 Registrants Sergeant Workload-based 2 2
Financial Crimes Lieutenant Span of control 1 1 Sergeant Workload-based 5 8
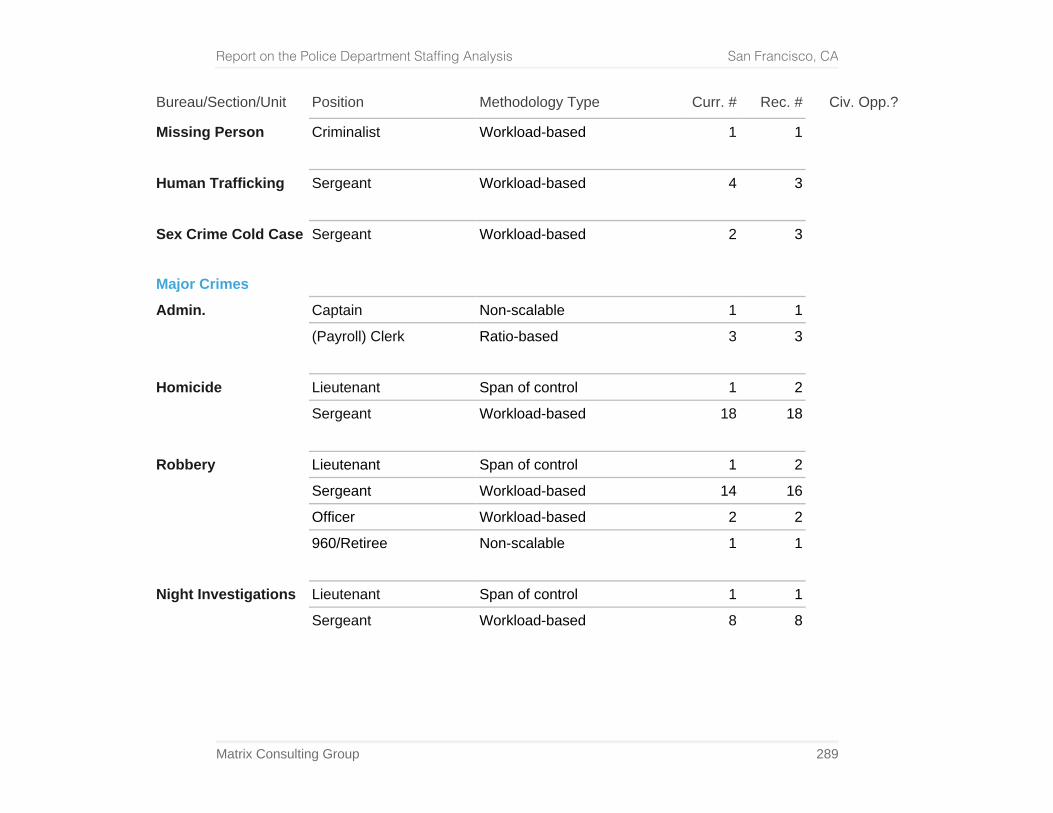
Report on the Police Department Staffing Analysis San Francisco, CA
Matrix Consulting Group 289
Bureau/Section/Unit Position Methodology Type Curr. # Rec. # Civ. Opp.?
Missing Person Criminalist Workload-based 1 1
Human Trafficking Sergeant Workload-based 4 3
Sex Crime Cold Case Sergeant Workload-based 2 3
Major Crimes
Admin. Captain Non-scalable 1 1
(Payroll) Clerk Ratio-based 3 3
Homicide Lieutenant Span of control 1 2 Sergeant Workload-based 18 18
Robbery Lieutenant Span of control 1 2 Sergeant Workload-based 14 16 Officer Workload-based 2 2 960/Retiree Non-scalable 1 1
Night Investigations Lieutenant Span of control 1 1 Sergeant Workload-based 8 8
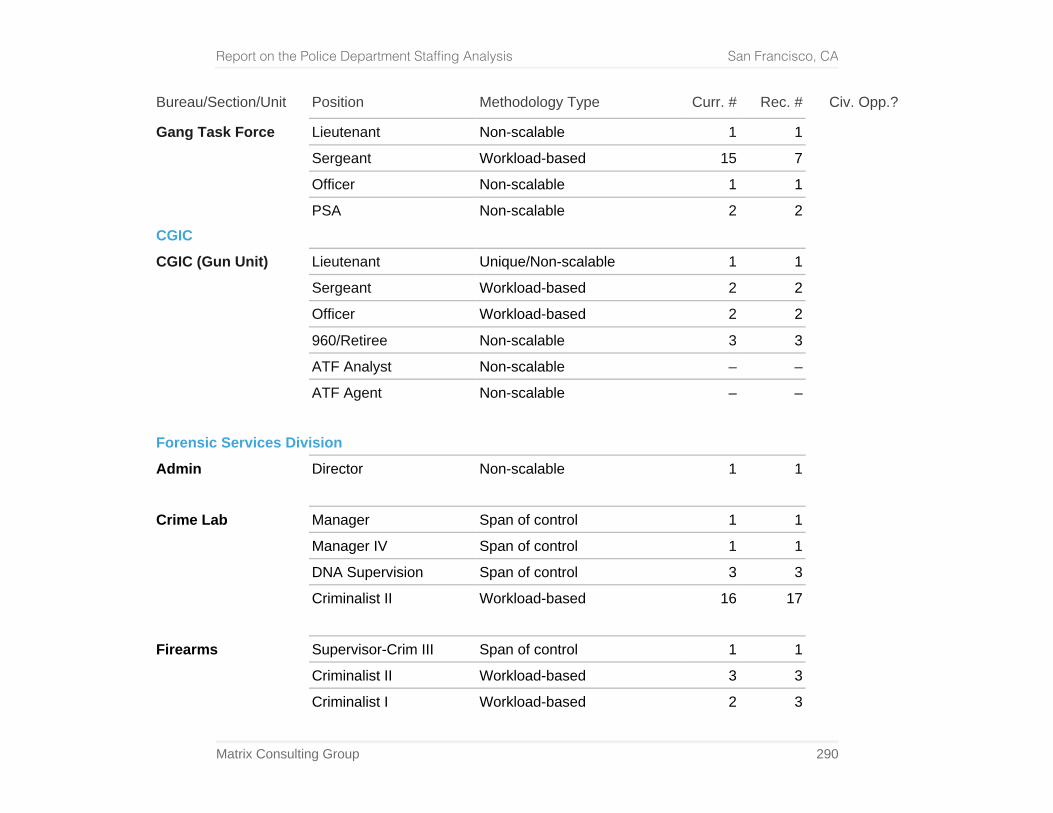
Report on the Police Department Staffing Analysis San Francisco, CA
Matrix Consulting Group 290
Bureau/Section/Unit Position Methodology Type Curr. # Rec. # Civ. Opp.?
Gang Task Force Lieutenant Non-scalable 1 1 Sergeant Workload-based 15 7 Officer Non-scalable 1 1 PSA Non-scalable 2 2
CGIC
CGIC (Gun Unit) Lieutenant Unique/Non-scalable 1 1 Sergeant Workload-based 2 2 Officer Workload-based 2 2 960/Retiree Non-scalable 3 3 ATF Analyst Non-scalable – – ATF Agent Non-scalable – –
Forensic Services Division
Admin Director Non-scalable 1 1
Crime Lab Manager Span of control 1 1 Manager IV Span of control 1 1 DNA Supervision Span of control 3 3 Criminalist II Workload-based 16 17
Firearms Supervisor-Crim III Span of control 1 1 Criminalist II Workload-based 3 3
Criminalist I Workload-based 2 3
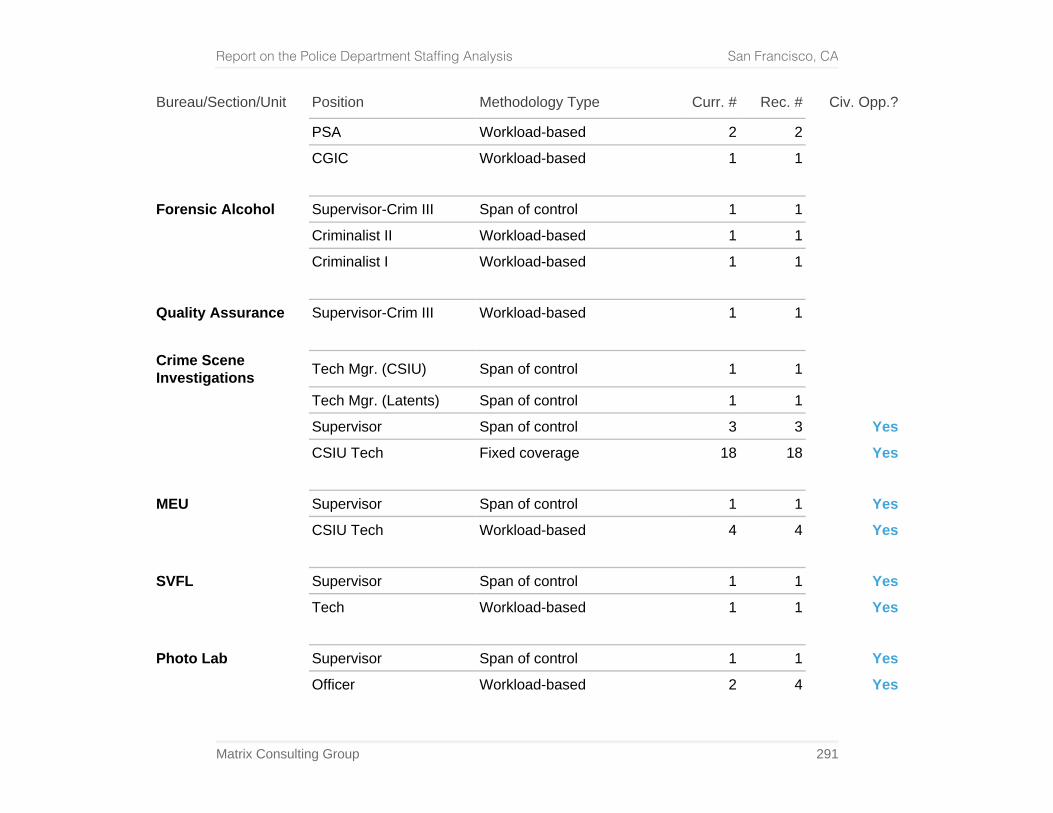
Report on the Police Department Staffing Analysis San Francisco, CA
Matrix Consulting Group 291
Bureau/Section/Unit Position Methodology Type Curr. # Rec. # Civ. Opp.?
PSA Workload-based 2 2 CGIC Workload-based 1 1
Forensic Alcohol Supervisor-Crim III Span of control 1 1 Criminalist II Workload-based 1 1 Criminalist I Workload-based 1 1
Quality Assurance Supervisor-Crim III Workload-based 1 1
Crime Scene Investigations Tech Mgr. (CSIU) Span of control 1 1
Tech Mgr. (Latents) Span of control 1 1 Supervisor Span of control 3 3 Yes CSIU Tech Fixed coverage 18 18 Yes
MEU Supervisor Span of control 1 1 Yes CSIU Tech Workload-based 4 4 Yes
SVFL Supervisor Span of control 1 1 Yes Tech Workload-based 1 1 Yes
Photo Lab Supervisor Span of control 1 1 Yes Officer Workload-based 2 4 Yes
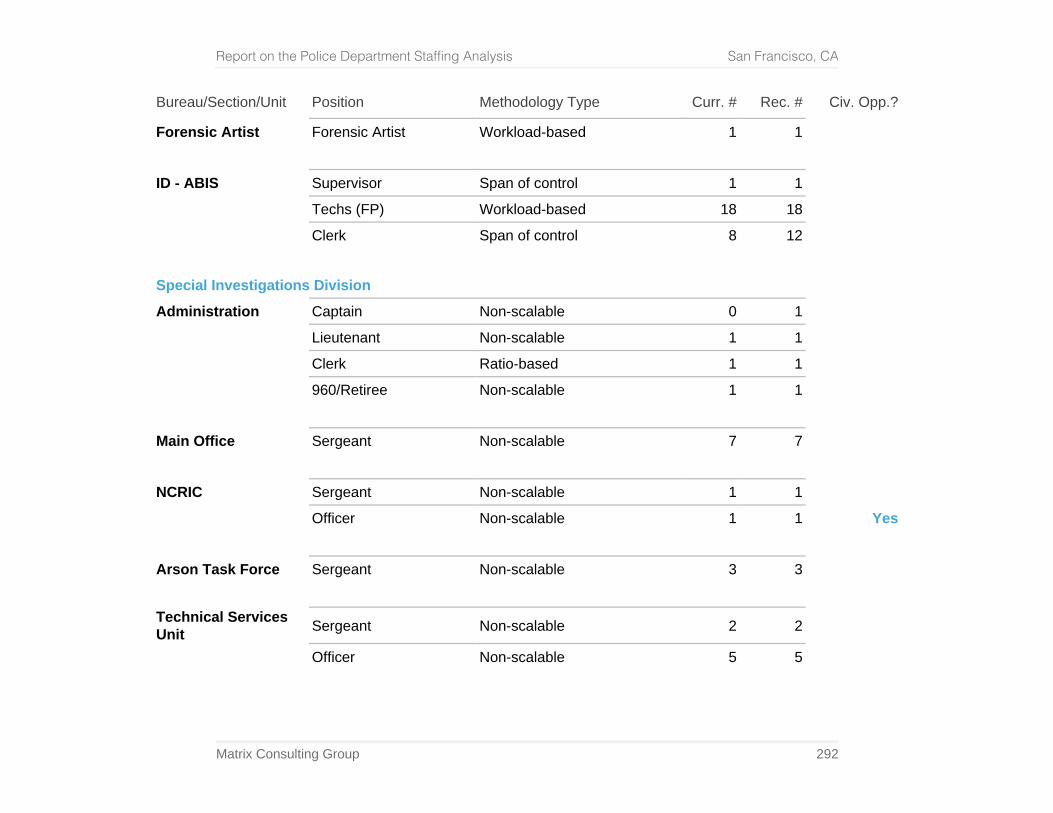
Report on the Police Department Staffing Analysis San Francisco, CA
Matrix Consulting Group 292
Bureau/Section/Unit Position Methodology Type Curr. # Rec. # Civ. Opp.?
Forensic Artist Forensic Artist Workload-based 1 1
ID - ABIS Supervisor Span of control 1 1 Techs (FP) Workload-based 18 18 Clerk Span of control 8 12
Special Investigations Division
Administration Captain Non-scalable 0 1 Lieutenant Non-scalable 1 1 Clerk Ratio-based 1 1 960/Retiree Non-scalable 1 1
Main Office Sergeant Non-scalable 7 7
NCRIC Sergeant Non-scalable 1 1 Officer Non-scalable 1 1 Yes
Arson Task Force Sergeant Non-scalable 3 3
Technical Services Unit Sergeant Non-scalable 2 2
Officer Non-scalable 5 5
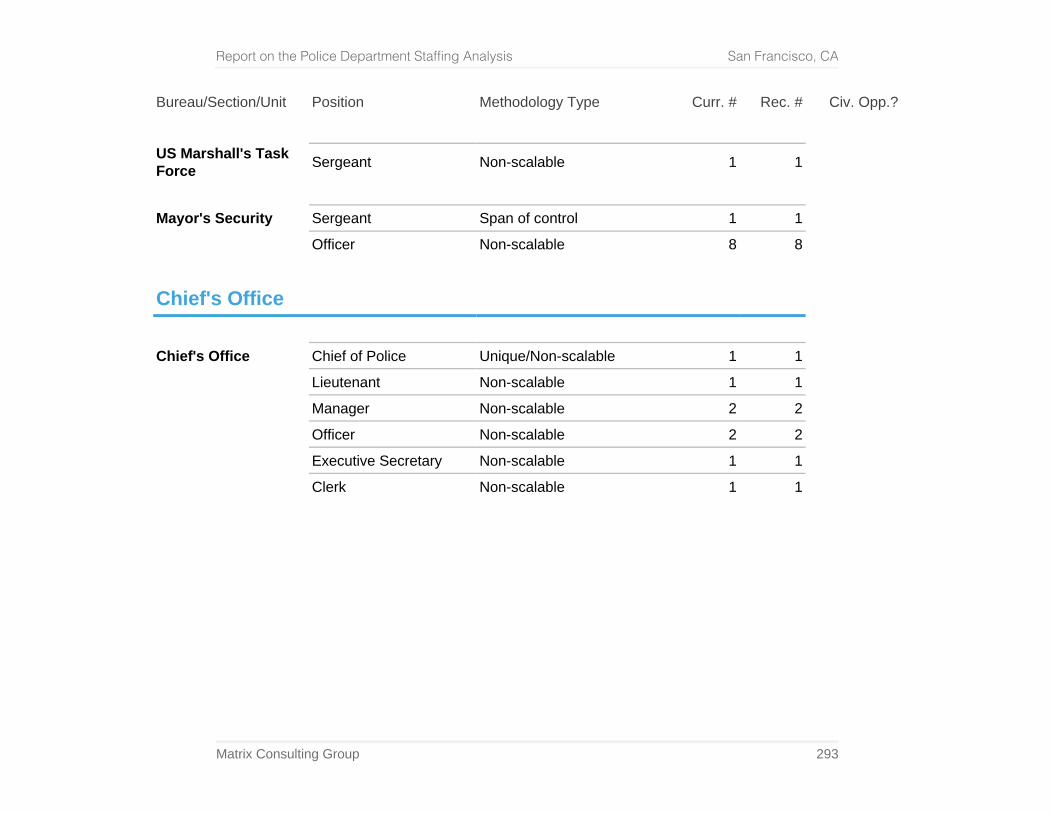
Report on the Police Department Staffing Analysis San Francisco, CA
Matrix Consulting Group 293
Bureau/Section/Unit Position Methodology Type Curr. # Rec. # Civ. Opp.?
US Marshall's Task Force Sergeant Non-scalable 1 1
Mayor's Security Sergeant Span of control 1 1 Officer Non-scalable 8 8
Chief's Office
Chief's Office Chief of Police Unique/Non-scalable 1 1 Lieutenant Non-scalable 1 1 Manager Non-scalable 2 2 Officer Non-scalable 2 2 Executive Secretary Non-scalable 1 1
Clerk Non-scalable 1 1


