Embed Size (px)
Citation preview

MIT Open Access Articles
Replacing chloride anions in dyeing enables cheaper effluent concentration and recycling
The MIT Faculty has made this article openly available. Please sharehow this access benefits you. Your story matters.
Citation: Gupta, Priyanshu Ranjan, Shanmukham, Saravana Perumal, Patel, Chirag G, Lienhard, John H and Swaminathan, Jaichander. 2022. "Replacing chloride anions in dyeing enables cheaper effluent concentration and recycling." Desalination, 533.
As Published: 10.1016/J.DESAL.2022.115761
Publisher: Elsevier BV
Persistent URL: https://hdl.handle.net/1721.1/144376
Version: Author's final manuscript: final author's manuscript post peer review, without publisher's formatting or copy editing
Terms of use: Creative Commons Attribution-Noncommercial-Share Alike

Replacing chloride anions in dyeing enables cheaper effluent concentration1
and recycling2
Priyanshu Ranjan Guptaa, Saravana Perumal Shanmukhamb, Chirag Patela, John H. Lienhardc,3
Jaichander Swaminathana,∗4
aMechanical Engineering Discipline, Dr. Kiran C. Patel Centre for Sustainable Development, IIT Gandhinagar, Gujarat5
382355, India6
bSP Textile Processors Pvt. Ltd., Chithode, Erode, Tamilnadu, India7
cRohsenow Kendall Heat Transfer Lab, Massachusetts Institute of Technology, Cambridge MA 02139, USA8
Abstract9
Reverse osmosis followed by distillation is commonly used to recycle fresh water and concentrated brine in10
the textile dyeing industry to achieve zero liquid discharge. Unlike natural water bodies, the chemistry of11
industrial effluents is governed by the choice of chemicals in various processing steps. This study experi-12
mentally demonstrates that replacing chloride with sulfate anions in the dyeing process baths can lead to13
significant energy and cost savings in effluent treatment by using NF membranes for brine concentration. The14
impact of electrolyte choice and concentration on fabric color is evaluated in a dyeing unit. While achieving15
similar fabric color, thermodynamic minimum energy consumption for sulfate brine concentration is around16
50% lower as a result of its lower osmotic pressure. Practically, we show that while an RO membrane can17
concentrate the sulfate brine upto 60g/kg at 60 bar pressure, nanofiltration membranes can concentrate the18
same to around 99g/kg at the same pressure as a result of its higher permeability. Commercially acceptable19
color reproducibility was achieved for 3-5 cycles for different shades of dyeing when reusing NF brine in the20
dyebath. Ultrafiltration treatment of the concentrated brine reduces color deviation by 50–80% and is a21
promising method for brine polishing.22
Keywords: energy, thermodynamics, nanofiltration, reverse osmosis, reactive dyeing, effluent recycling23
∗Corresponding authorEmail addresses: [email protected] (John H. Lienhard), [email protected] (Jaichander Swaminathan)P.R. Gupta, S.P. Shanmukham, S. Patel, J.H. Lienhard V, J. Swaminathan, “Replacing chloride anions in dyeing enables
cheaper effluent concentration and recycling,” Desalination, online 20 April 2022, 533:115761, 1 July 2022.
Preprint submitted to Elsevier August 18, 2022

Nomenclature24
Roman symbols25
a∗ CIELAB coordinate on the Red-Green Axis, -26
b∗ CIELAB coordinate on the Blue-Yellow Axis, -27
A Membrane permeability, L/m2-h-bar or m/s-Pa28
Am Area of membrane, m229
ai,x Activity of ith component in stream ‘x’30
C Chroma, -31
∆E Simple distance metric in CIELAB color space, -32
∆Ecmc,2:1 Modified distance metric to compare colors accounting for human visual perception. -33
f(s) Trendline fitted L∗, a∗ and b∗34
H Hue, degree35
j Flux, L/m2-h or m/s36
L Lightness37
L∗ CIELAB coordinate on the Lightness Axis, -38
LR Liquor Ratio, m3 of water/kg of fabric39
mfabric Mass of fabric dyed, kg40
Nbaths Number of baths in the dyeing process41
p1, p2, q2 Coefficients for fitting L∗, a∗ and b∗42
Rm Resistance offered by the membrane to water transport, s-Pa/m43
s Salinity, g/L44
Sgen Entropy generation rate, W/K45
sgen Specific entropy generation, J/m3-K46
S Weight factors for various axes when calculating color difference47
T0 Ambient temperature, K48
V Volume flow rate, m3/s49
w Specific energy consumption, kWh/m350
∆wexcess Excess specific energy, J/m351
W Least Work of Separation, J/s52
Subscripts53
b Concentrated brine reject stream54
2

DB Dyebath55
f Feed56
gen Generated57
i Solute species58
m Membrane59
p Permeate product stream60
w Water61
Greek symbols62
π Osmotic pressure, bar63
Acronyms64
BOD Biological oxygen demand65
COD Chemical oxygen demand66
ED Electrodialysis67
ETP Effluent treatment plant68
FRP Fiber reinforced plastic69
MED Multi-effect distillation70
MF Microfiltration71
MVC Mechanical vapor compression72
NF Nanofiltraiton73
PV Pressure vessel74
R.H.S Right hand side75
RO Reverse osmosis76
TDS Total dissolved solids77
TOC Total organic carbon78
TVC Thermal vapor compression79
UF Ultrafiltration80
ZLD Zero liquid discharge81
3

1. Introduction82
1.1. Zero liquid discharge in textile dyeing83
The presence of textile processing industries in water-scarce and agriculturally active regions has led84
to competition for water withdrawal and restrictions on treated effluent discharge. Effluent treatment and85
recycling plays a critical role in managing the textile industry’s water-footprint. This study focuses on the86
reactive dyeing of cotton fabric which uses around 12–15 tons of water per ton of fiber processed [1, 2].87
Reactive dyes have been gaining popularity ever since their introduction in the 1950s due to the wide range88
of bright colors available and their good wash fastness as a result of forming covalent bonds with the fabric [3].89
Wastewater from dyeing is characterized by high COD, BOD, color, and TDS [4, 5]. Primary and secondary90
treatment steps such as coagulation-flocculation, biological processes (aerobic and anaerobic), and sometimes91
even advanced oxidation processes, such as ozonation, are used to reduce the dye concentrations and organic92
content [6–10]. However, inorganic salts are not removed by these techniques and therefore the discharge of93
such effluents results in soil degradation and increased TDS [11, 12].94
As a result, environmental protection agencies have increasingly mandated zero liquid discharge (ZLD)95
regulations on the textile dyeing industry to manage their impact on the local water resources. In order96
to achieve ZLD, desalination technologies like reverse osmosis, thermal distillation, electrodialysis, and me-97
chanical vapor compression are necessary to recover freshwater and concentrated brine from the secondary98
treated effluent [13–17]. Fig. 1 shows the typical combination of technologies used for water and salt recovery99
in textile units. After desalination, the brine is highly concentrated in salts and also contains dye molecules100
and fragments that were not effectively removed in the initial treatment steps. Therefore, color reappears101
in this desalination brine. Nanofiltration is commonly used as a polishing step to remove color and other102
molecules while allowing NaCl to pass into the polished brine for recycling.103
Being a fragmented and heterogenous sector dominated by small and medium-scale enterprises, the textile104
dyeing industry faces significant hurdles regarding compliance with the zero liquid discharge norms mandated105
by environmental protection agencies. Implementing ZLD usually involves significant energy consumption.106
While RO is an energy-efficient process for desalination compared to thermal distillation processes [18, 19],107
it is limited by membrane fouling and by the higher feed pressures required to overcome the concentrated108
brine’s osmotic pressure [20]. The thermal concentration processes are highly energy intensive and inefficient109
technologies [21–24]. Around 50% of the energy consumed by the textile dyeing units today goes into110
the water treatment plants alone [25–27]. Consequently, identifying suitable process interventions that can111
reduce the cost of water treatment and recycling while maintaining, if not improving, the final dyed fabric112
quality is essential for the industry’s sustenance and growth.113
4

Figure 1: Typical layout and operation of various technologies in a textile dyeing effluent treatment plant for implementingZLD.
1.2. Recovery and reuse of salt and water in the dyeing process114
As shown in Fig. 1, in addition to the pure water, salt or saline brine is also recovered for reuse in the115
dyebath. Ranganathan et al. [28] and Vishnu et al. [15] have reported on multiple dyeing units in Tirupur,116
India, that employ a combination of RO and MED in their effluent treatment plant (ETP) for recovering117
water and salts.118
A simplified schematic representation of the various steps involved in reactive dyeing of cotton is shown119
in Fig. 2. The fabric is subjected to a sequence of baths, and, in each bath, the fabric is placed inside120
an aqueous solution containing specific additives at a particular temperature. In Fig. 2, e.g., a total of 8121
steps are considered, with the first three being preparatory steps prior to the actual dyeing. Bath 4 is the122
critical dyebath step, wherein reactive dyes are bound to the fabric. Baths 5 to 8 are used post-dyeing to123
remove unbounded dyes, chemical treatment to ensure colorfastness, and impart other favorable properties124
to the fabric. The amount of water used per bath is proportional to the mass of fabric being dyed, and the125
proportionality constant is referred to as the liquor ratio (mass of water per bath/mass of fabric). The liquor126
ratio (LR) is a function of the geometry of the dyeing apparatus and ranges from 7–12, with newer machines127
being designed at lower LR. Thus, the total amount of water used in dyeing is Nbaths × LR×mfabric, where128
Nbaths is the number of baths and mfabric is the mass of fabric dyed.129
In order for concentrated brine to be reused in the dyebath, the combined effluent has to be desalinated130
until the brine concentration exceeds the required concentration of the dyebath (sDB). Usually, in dyeing131
units, the combined effluent starts at around 7 g/L salinity and is thus concentrated to beyond 80 g/L or132
solid salt is recovered so that it can be used in the dyebath even for the darkest shades of fabric. For lighter133
shades of dyeing, the solution is diluted as required. The need and role of salt in dyeing and some recent134
5

Figure 2: Effluent streams from various baths in textile dyeing are mixed to form the combined effluent. Our focus is on thedissolved solutes which are handled in the tertiary desalination treatment steps.
studies evaluating elimination of salt from the dyeing process are discussed in Appendix A.135
1.3. Separate collection, treatment, and reuse of the high salinity dyebath effluent?136
The effluents from the dyebath and the wash bath that immediately follows it are salty, whereas the137
effluents from the other baths leave at relatively low salinity. Therefore, it would be advantageous to collect138
and treat these solutions separately. There has been significant research interest focused on decolorization of139
the dyebath effluent, and reuse of the saline solution. Li et al. [29] reported acceptable color reproducibility140
for up to 3 cycles by recycling the dyebath effluent after treatment using a novel heterogeneous Fenton system.141
However, the process requires the addition of new salt to increase the concentration of the treated solution142
upto the level of the dyebath requirements. Grimau et al. [1, 30] used electrochemical decolorization of the143
dyebath and post-dyebath wash solutions to reuse the decolorized solutions with dissolved salt in dyeing,144
saving up to 72% of the NaCl consumption. Bilinska et al. [31] used ozonation to remove the color from145
the effluent to produce a brine that may be reused in the dyebath. However, the build-up of transformation146
products from ozonation limited the reusability of the brine to a single reuse cycle.147
The recent academic literature has been very focused on the development and testing of novel membranes148
for efficient separation of dyes and inorganic salts. Various loose NF and tight UF membranes have been149
formulated [32–40] with a range of additives [41, 42] to achieve high rejection of dyes and low rejection of150
inorganic salts simultaneously. While commercial dyeing units using NF for brine polishing and are therefore151
restricted to recovery of chlorides in the brine recovery solution, these membranes are developed to allow152
6

passage of all inorganic salt species. Ye et al. [43] used a loose NF membrane as an anion exchange mem-153
brane in electrodialysis and demonstrated dye-salt fractionation using ED. Buscio et. al. [44] demonstrated154
electrochemical decolorization of the colored retentate obtained after nanofiltration-based separation of dyes155
and salt.156
Although it would be advantageous from an energy standpoint to separate and treat the effluent different157
steps of the dyeing process separately (to avoid the entropy generation associated with mixing streams at158
different salinities), it is a common practice that all the effluent streams are combined. One of the reasons159
for this is that the commonly used conventional biological processes for color removal are ineffective at high160
feed salinity. The other reason is that a set of small dyeing units would not have individual water treatment161
infrastructure, and therefore rely on subscription to a centralized common effluent treatment plant, to which162
they send all their effluents and from where they would get back clean water and saline brine for reuse.163
1.4. Objectives of the present study164
The focus of this study is on the tertiary treatment stage (desalination steps) of an ETP where the165
secondary treated effluent is separated into a concentrated brine and clean water for reuse in the dyebath and166
other processing steps respectively. For the first time, we explore how controlling the electrolyte used in the167
upstream processes (particulary the dyebath) can influence the energy consumption in the effluent treatment168
plant. Using a model textile dyeing plant layout, the impact of replacing chloride with sulphate anions on169
the energy consumption for desalinating the secondary treated brine is analyzed. Since reproducibility of170
the fabric colors is a major factor in making such an intervention acceptable to the industry at scale, we also171
look at the impact of reusing the concentrated brine as the liquor for the dyebath on the resulting color of172
the dyed fabric.173
Unlike natural water bodies such as seawater and brackish groundwater, whose composition is deter-174
mined by nature, the composition of industrial effluents can be tuned by changing the chemical used in each175
processing step. Historically, the choice of chemicals would likely have been governed by local cost opti-176
mization, i.e., among the choices available, the option that provides satisfactory performance at the lowest177
cost would be chosen to maximize profits. The impact of chemical selection on ZLD implementation would178
not have been considered prior to ZLD regulations. After ZLD was mandated, water treatment has often179
been considered an add-on to the core dyeing operations and hence a system level optimization has not been180
undertaken, though effluent treatment imposes a significant economic burden on the dyeing units.181
The influence of different electrolytes on the uptake of anionic dyes has been studied in the past. Madan et182
al. [45] observed that at an equal equivalent concentration of dyebath solutions, the sorption of hydrolyzed183
dyes (CI reactive red, brown, blue 4, and 9) to the fabric is usually higher for those electrolytes with a184
7

larger cation size. Sakata [46] and Sivaraja Iyer [47] observed similar trends in their respective studies with185
other dyes. However, since the primary and secondary treatment steps do little to deal with the inorganic186
electrolytes, the electrolyte chosen for the dyebath shows up in the brine that is concentrated through the187
tertiary treatment step.188
Mistry et al. [48] considered desalination of various saline streams and showed that the thermodynamic189
limit of the minimum energy required for desalination is a strong function of the ions present in water for190
solutions of the same overall salinity or ionic strength. Hence, the choice of electrolyte in the dyeing process191
can be expected to have an impact on the energy requirement as well as technologies necessary for effluent192
recycling. This study looks at the relation between these two factors for a model textile dyeing plant as193
summarized in Fig. 3.194
Figure 3: Schematic representation of the proposed interventions in comparison to a conventional system.
1.4.1. Manuscript layout195
Initially, we compare the energy required for brine recycling based on literature data for dye uptake196
as a function of salinity of various electrolytes in the dyebath (Section 3.1). In the industry, NaCl and197
Na2SO4 are recommended and commonly used in reactive dyeing. Therefore we focus on these two salts198
in subsequent sections. The potential advantages, both based on separation-process thermodynamics and199
kinetics, associated with replacing all the Cl− ions in solution with SO2−4 ions are discussed in Section 3.2.200
The impact of electrolyte concentration on the fabric color produced with both NaCl and Na2SO4 at various201
concentrations is discussed in Section 3.3. Based on these results, the thermodynamic energy requirements202
are compared in Section 3.4.203
8

Practically, further energy savings are possible if the effluent has SO2−4 as its primary anion since NF204
membranes can be used for salt-water separation rather than RO. This hypothesis is evaluated experimentally205
in Section 3.5, and the reusability of the NF brine for dyeing is also studied. Finally, the potential of206
using ultrafiltration for Na2SO4 brine polishing to improve color quality during brine reuse is demonstrated207
experimentally.208
2. Methods209
2.1. Thermodynamic minimum energy evaluation210
The secondary treated combined effluent needs to be split into a relatively clean product and a saline211
brine for complete recycling. As shown in Fig. 2, this involves concentrating the effluent from the combined212
effluent feed salinity of sf = sDB/Nbaths up to a brine salinity of sb = sDB. For each choice of electrolyte,213
once sDB is known, the thermodynamic minimum energy required per unit volume of the combined effluent214
can be calculated as w = W/Vf , where Vf is the volume of the combined effluent and W is the least work215
required for separation. W can be evaluated by combining the first and second laws of thermodynamics216
applied to the separation system and setting entropy generation (losses) to be zero [49]:217
W = RT[{
Nw,b ln(aw,b) + Nw,p ln(aw,p)− Nw,f ln(aw,f)}
+∑i
{Ni,b ln(ai,b) + Ni,p ln(ai,p)− Ni,f ln(ai,f)
}](1)
where N is the mole flow rate, a is activity, w denotes water, and i refers to various solute species. The218
subscripts b, p, and f denote the brine, product, and feed respectively. The activity of various species in219
Eq. 1 are obtained using the pyEQL package [50] or PHREEQC [51, 52].220
Note that the effluents from multiple dyeing operations are mixed in common practice. In each oper-221
ation, sDB is chosen based on the depth of fabric shade desired, so there are multiple values of sDB, for222
example at shighDB , smediumDB , and slowDB. Therefore the combined effluent salinity will be a weighted average of223 {
shighDB
/Nbaths, s
mediumDB
/Nbaths, s
lowDB
/Nbaths
}, with the weighting being based on the number of loads of dark,224
medium, and light shades dyed. However, the final brine concentration after separation should still be shighDB225
so that even for the darkest shades, the brine can be reused in the dyebath as-is, whereas for the lighter226
shades, it can be appropriately diluted down as necessary. For simplicity, only one dyebath salinity level227
is considered in these calculations. The trends for energy consumption will be similar even if a portfolio of228
dyeing shades and a corresponding weighted average is considered instead.229
9

2.2. Dyeing experiments230
The dyeing tests were carried out at SP Textile Processors, Pvt. Ltd., in Erode, Tamil Nadu, India.231
Dyeing was performed on an infrared lab dyeing machine from RB engineering. Previously bleached and232
washed cotton yarn samples (5 g) were used as the target material. Since the yarn is already prepared for233
dyeing, it is exposed to the dyebath directly. A liquor ratio of 8 is used in this device (40 ml of water per bath234
for 5 g of fabric). After the dyebath, 8 additional wash baths are performed. The temperature and duration235
of various baths were matched with the settings used in the production machines. Yarn samples were pre-236
treated by demineralizing, peroxide boiling, hot washing, and neutralizing. These pre-treated samples were237
then dyed in the lab dyeing machine. The dyebath was followed by washing, neutralizing, soaping, hot238
washing, and finishing baths. The dyebath pH was maintained at around 11 using Na2CO3 and NaOH.239
Following this, fixation of dyes was performed using 15 g/L solution of Na2CO3 for 28, 28, and 21 minutes240
for olive, light blue, and light purple recipes, respectively. In tests using Na2SO4 as the electrolyte in the241
dyebath, the combined effluent pH was adjusted using H2SO4 acid. Also, high-grade auxiliary chemicals242
such as soda ash were used to reduce Cl− addition in the form of impurities.243
To compare the impact of electrolyte choice (NaCl vs. Na2SO4) on the color produced, dyeing was244
performed at constant dyestuff concentration while changing the concentration of each electrolyte from 10245
to 80 g/L, in steps of 10 g/L. This way, we tried to isolate the electrolyte type and concentration impact246
when holding other parameters constant. Note that both the dye and salt concentration would be varied247
simultaneously to produce darker or lighter shades in practice.248
2.3. Color analysis and comparison249
The color of the dyed cloth was measured using a color meter under simulated D65 illumination conditions250
[53]. The color is measured along the L∗, a∗, and b∗ coordinates (in Cartesian space) or equivalently, in251
terms of lightness (L∗), chroma (C) and hue (H) coordinates (in cylindrical polar space). The interconversion252
between the L∗a∗b∗ and the L∗CH coordinates is done as shown in [54]. Fig. 4 gives a visualization of the253
3D color space using either of these systems. L∗ values in the CMC colorspace vary from 0 to 100, where254
0 indicates a dark shade and 100 indicates bright white. The a∗, and b∗ values range from −150 to +150.255
Negative values of a∗ indicate greener, whereas positive values indicate more redness. Similarly, a negative256
value of b∗ coordinate indicates a more yellow color while positive values corresponds to a more blue color.257
Comparisons between a measured color and a standard were performed by calculating the ∆Ecmc,2:1258
value, which is an appropriately weighted distance measure between the two points in LCH space:259
∆Ecmc,2:1 =
√(∆L∗
lSL
)2
+
(∆C
cSC
)2
+
(∆H
SH
)2
(2)
10

Figure 4: 3D Color space with showing the different axes (L, a∗, b∗ for the CIELAB system and L, C (chroma), H (hue) for theLCH system); the point indicates the position of a sample point with respect to each axis. (For representative purposes only)
The weighting factors (S) along each axis are functions of the point coordinates and are used to account260
for variations in human visual perception. Further, since the eye’s sensitivity to differences in lightness and261
chroma are not equal, l and c are numeric parametric factors that allow these individual differences to be262
independently weighted relative to the difference in hue. The choice of l and c values are usually based on263
industrial practices. For textile industries, l is set to 2 and c is set to 1. ∆Ecmc,2:1 is calculated according264
to UNE-EN ISO 105-J03: 2010 [55] following the steps outlined in [54]. A value of ∆Ecmc,2:1 below 1 is265
considered to be visually indistinguishable from the comparison color standard.266
2.4. Membrane brine concentration and effluent recycling267
The water flux, permeability, and salt rejection of various membranes were compared using a Sterlitech268
HP4750X stirred cell setup capable of withstanding up to 172 bar of applied pressure. The applied pressure269
was increased with time using a pressure regulator at the outlet of a pressurized N2 tank to maintain water270
flux at around 15–20 L/m2-hr, even as the feed salinity and osmotic pressure inside the system increased.271
Water flux was calculated by taking the derivative of the total permeate mass collected with respect to time.272
The permeate conductivity was measured after every 15 mL of permeate collected. Based on the cumulative273
water and salt lost in the permeate, the feed salinity inside the system was also inferred. Using the permeate274
and feed salinity, the salt rejection during that time-frame was calculated as 1− (sp/sf).275
In order to assess the reusability of the dyeing effluent, the combined effluent was first treated with ferrous276
sulfate and aeration for color removal. The decolorized solution was then concentrated using a Desal-5 DK277
nanofiltration membrane (GE/Suez) in the Sterlitech stirred cell HP4750 setup (for the multi-cycle trial in278
the dyeing unit) or CF042 cross-flow setup. The pressure was manually adjusted with time to ensure that279
the flux was maintained around 15–20 LMH. A PAN50 ultrafiltration membrane (Nanostone Water) was280
11

used for the polishing experiment. The color of fabric produced using these (suitably diluted) brines in the281
dyebath was compared with the color produced using a pure salt solution at the same conductivity.282
3. Results and Discussion283
3.1. Ranking electrolytes based on energy for effluent recycling284
To understand the energy implications of the choice of dyebath electrolyte, in the dyebath, we use data285
reported by Madan et al. [45] for dye uptake vs. solution concentration for CI Reactive Red at 40 °C (Fig. 5a).286
The dyebath concentration was varied over the range of 0.1–1 equivalents/L for chloride salts of ammonium,287
magnesium, sodium, and lithium chloride, as well as ammonium sulfate. Significant differences in dye uptake288
were observed amongst the different salts at the same normality. At low concentrations, the dye uptake of289
MgCl2, NH4Cl and (NH4)2SO4 are much higher than that of NaCl, which in turn is higher than LiCl.290
Uptake in the case of MgCl2 stabilizes beyond a particular solution concentration, whereas the trend among291
the other salts remains consistent up to higher concentrations.292
0.0
0.1
0.2
0.3
0.4
0 3 6 9 12Dye uptake [g/kg-fabric]
Spec
ific
ener
gy
[kW
h/m
3] LiCl
NaClMgCl2NH4Cl(NH4)2SO4
(a) Dye uptake vs. dyebath concentration (sDB) forvarious electrolytes reported in [45].
0
3
6
9
12
0 0.2 0.4 0.6 0.8 1
Dye
upta
ke [
g/k
g-f
abric]
Dyebath normality [eq/L]
NH4CL
MgCl2NaClLiCl
(NH4)2SO4
(b) Comparison of least work for desalination for dif-ferent salts to achieve the same dye uptake.
Figure 5: Impact of dyebath electrolyte on dye uptake and energy cost of effluent recycling
At each value of dye uptake, therefore, we have the sDB required for each salt choice. Therefore, for293
each dye uptake and salt combination, the minimum work for concentrating the combined effluent starting294
at sDB/Nbaths up to sDB by recovering pure water is calculated using Eq. 1, for Nbaths = 8. The activity295
of various species is evaluated using the phreeqc.dat database using the PHREEQC software. There is a296
large difference in the specific energy consumption among the salts to achieve the same level of dye uptake.297
At low dye uptakes (≲ 5 g-dye/kg-cotton), the order of least work requirement is: LiCl > NaCl > NH4Cl298
> MgCl2 > (NH4)2SO4. Although MgCl2 seems to provide energy savings, divalent cations causing water299
hardness are usually removed and avoided in dyeing plants. Beyond a dye uptake of 5 g-dye/kg-cotton, the300
least work requirement for MgCl2 appears to shoot up due to the dye uptake saturating after about 0.5 eq/L.301
12

The ammonium salts promise lower energy, but they are unstable and would convert into ammonia at low302
pH before being lost from the solution. Additionally, they are more expensive and are not used commonly303
in the industry. In the textile dyeing industry, NaCl and Na2SO4 are recommended as potential electrolytes304
for use in the dyebath by dyestuff manufacturers. Therefore, a comparison between NaCl and Na2SO4 is305
our focus going forward. Note that (NH4)2SO4 requires lower energy for recycling than NH4Cl, although a306
higher concentration of (NH4)2SO4 is required in the dyebath than NH4Cl to achieve the same dye uptake.307
Our hypothesis based on these trends is that replacing Cl− with SO2−4 as the anion of choice in textile308
dyeing can provide cost savings when considering the overall process, including brine concentration and309
recycling. The potential advantages are explored from both a theoretical and practical perspective in the310
following section.311
3.2. Potential advantages of replacing Cl− with SO2−4312
3.2.1. Thermodynamics: osmotic pressure, least energy.313
Recall that the energy required for brine concentration was lower in the case of (NH4)2SO4 compared314
to NH4Cl. The reason for the lower energy consumption in the case of the sulfate salt at nearly equal315
cation concentration can be understood as follows: at equal molality of the cation scat, assuming complete316
dissociation, the total concentration of solutes is 2 × scat in the case of NH4Cl whereas in the case of317
(NH4)2SO4 it is only32×scat (since there is only
12 the number of SO2−
4 ions for every NH+4 ion in (NH4)2SO4).318
At low solute concentrations, if the solution behavior is close to ideal, the osmotic pressure is directly319
proportional to the total concentration of solutes, and so correspondingly, the least work of separation is320
also lower.321
From discussions with the industry, we learn that sodium sulfate and chloride are used in approximately322
similar concentrations in terms of g/L to achieve light and dark shades of fabric, i.e., both in the case of323
NaCl and Na2SO4, a dark shade requires around 70–80 g/L concentration in the dyebath, and a light shade324
needs only about 15–20 g/L, with medium shades requiring concentration levels in between these limits. Due325
to the differences in molecular weight and charge between the two anions (SO2−4 and Cl−), a similar g/L326
concentration results in ionic strength values that are around 20% different in the two cases. For the same327
concentration, s, in g/L, the corresponding concentration of dissociated ions in mol/L is 2×(s/58.44) = 0.034s328
for NaCl and 3× (s/142) = 0.021s for Na2SO4 which is about 38% lower.329
Figure 6 compares the osmotic pressure of Na2SO4 and NaCl solutions at similar concentration in g/L.330
The osmotic pressure of the Na2SO4 brine is significantly lower than that of NaCl brines. Permeate flux is331
a function of the difference between the applied hydraulic pressure and the solution osmotic pressure. Using332
sodium sulfate brines would yield significant energy savings since the pump needs to pressurize the feed to333
13
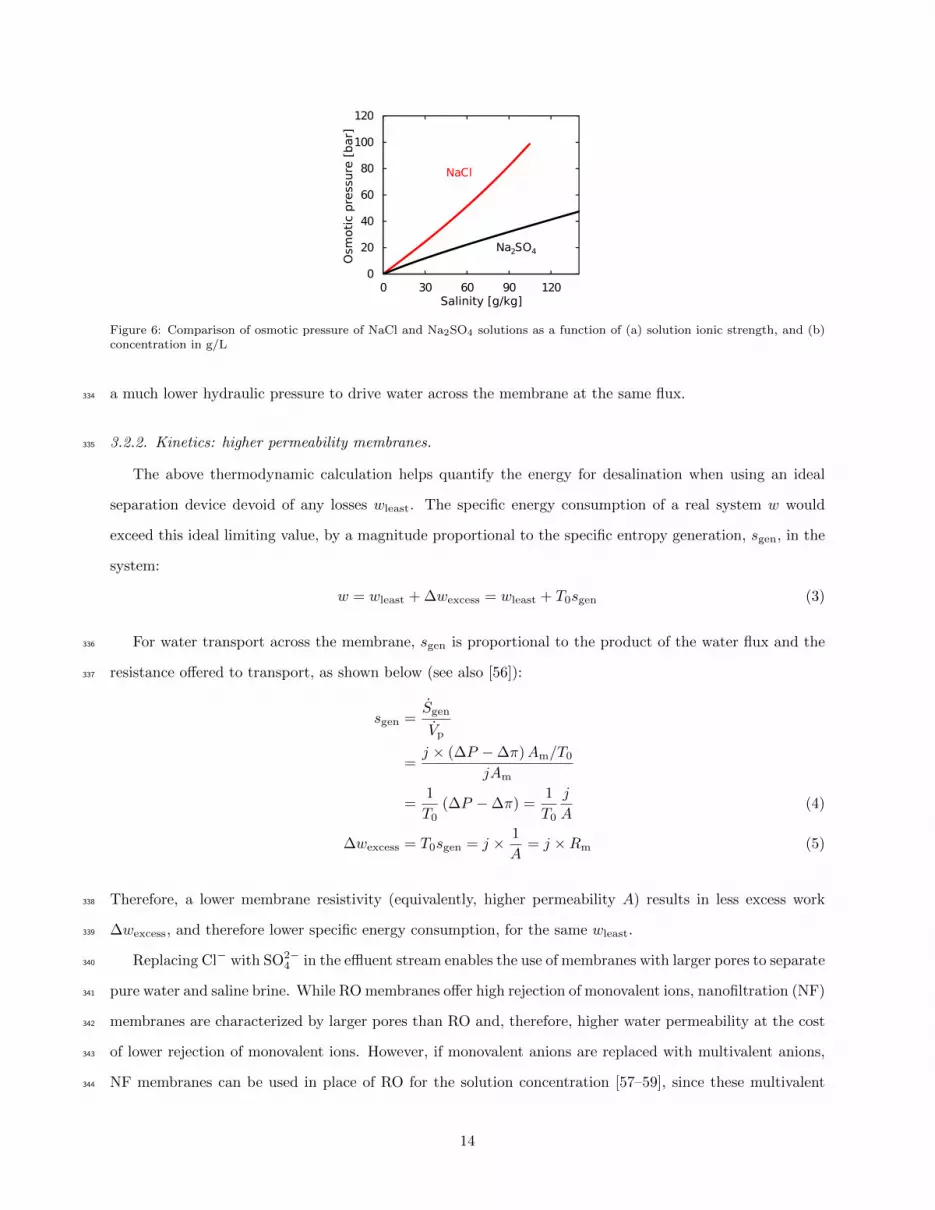
Figure 6: Comparison of osmotic pressure of NaCl and Na2SO4 solutions as a function of (a) solution ionic strength, and (b)concentration in g/L
a much lower hydraulic pressure to drive water across the membrane at the same flux.334
3.2.2. Kinetics: higher permeability membranes.335
The above thermodynamic calculation helps quantify the energy for desalination when using an ideal
separation device devoid of any losses wleast. The specific energy consumption of a real system w would
exceed this ideal limiting value, by a magnitude proportional to the specific entropy generation, sgen, in the
system:
w = wleast +∆wexcess = wleast + T0sgen (3)
For water transport across the membrane, sgen is proportional to the product of the water flux and the336
resistance offered to transport, as shown below (see also [56]):337
sgen =Sgen
Vp
=j × (∆P −∆π)Am/T0
jAm
=1
T0(∆P −∆π) =
1
T0
j
A(4)
∆wexcess = T0sgen = j × 1
A= j ×Rm (5)
Therefore, a lower membrane resistivity (equivalently, higher permeability A) results in less excess work338
∆wexcess, and therefore lower specific energy consumption, for the same wleast.339
Replacing Cl− with SO2−4 in the effluent stream enables the use of membranes with larger pores to separate340
pure water and saline brine. While ROmembranes offer high rejection of monovalent ions, nanofiltration (NF)341
membranes are characterized by larger pores than RO and, therefore, higher water permeability at the cost342
of lower rejection of monovalent ions. However, if monovalent anions are replaced with multivalent anions,343
NF membranes can be used in place of RO for the solution concentration [57–59], since these multivalent344
14

anions are rejected effectively due to charge-based exclusion by the membrane active layer. Hilal et al. [60–345
62] have investigated this idea in the form of Cl−-SO2−4 ion-exchange resins coupled with NF membranes for346
lower-energy desalination. If SO2−4 is rejected, so is Na+ to satisfy electroneutrality in the product stream.347
These NF membranes are usually 2-5× more permeable than RO due to their larger pores, which reduces348
the excess work required to operate the desalination process at the same overall flux.349
Pres
sure
[bar
]
Feed salinity [g/kg]
Osmotic pressure
SW30HR (RO)
NF90
NF270
(a) Applied pressure (dead-end setup). (b) Na2SO4 rejection (dead-end setup).
(c) Steady-state applied pressure in cross-flow mem-brane system with a Desal DK membrane.
(d) Na2SO4 rejection in cross-flow membrane systemwith a Desal DK membrane.
Figure 7: (a,b) Dead-end filtration experimental comparison of membranes for partial desalination of Na2SO4 solution up to 120g/kg. (c,d) Steady-state pressure and rejection data for Na2SO4 concentration using a Desal DK NF membrane in a cross-flowoperation mode. In all cases, the applied pressure is adjusted with changing feed concentration to maintain an average fluxbetween 15–20 L/m2-hr.
Commercially-available NF membranes, NF90 and NF270 (Dow), and an RO membrane, SW30HR, were350
tested for their ability to desalinate pure sodium sulfate solutions up to a salinity of 110 g/kg or 1.75 mol351
Na+/kg-w, which is higher than sDB required for the darkest shades. These tests were performed in a352
Sterlitech HP4750X stirred cell setup. The stirrer speed was set at 300 rpm and kept constant across the353
experiments. In order to test the membrane flux and rejection under realistic conditions over a wide range of354
salinities, the permeate flux was maintained within a range of 15–20 LMH by increasing the feed pressure as355
the feed salinity inside the dead-end apparatus rose with time. The measured flux with all three membranes356
is shown in the inset of Fig. 7b.357
While the SW30HR membrane achieves a better salt rejection, the NF90 also consistently achieves358
15

more than 98% rejection of Na2SO4 while requiring a much lower applied pressure as a result of its higher359
permeability (Fig. 7a). The NF270 membrane has a lower rejection than NF90, which gradually increases360
from 94% to 97% at higher salinity and correspondingly has slightly better permeability. Note that the lower361
rejection seen at 30 g/kg and 60 g/kg for NF270 (and similar deviations in the other cases) are aberrations362
due to refilling and restarting the experiment with fresh feed (this is necessary to ensure sufficient solution363
volume in the system so that the stirring action is effective). Another problem with the dead-end stirred364
cell setup is that since salinity is changing continuously with time, the results may not indicate steady-state365
values, which would be observed during long-term operation in the industry.366
Brine concentration was studied using a cross-flow membrane test to correct for these effects. At each feed367
salinity level considered, the steady-state membrane performance was evaluated by emptying the permeate368
back into the feed tank to maintain constant feed salinity until the flux and salt rejection values stabilized.369
The applied pressure and rejection data for these tests using a Desal DK NF membrane are shown in Figs. 7c370
and 7d respectively. The average rejection achieved by the DK membrane is around 96%, and it decreases371
slowly with an increase in salinity. This trend may result from a reduction in membrane water permeability372
due to compaction with time at high applied pressures, whereas the salt permeability may remain relatively373
constant. Up to a feed salinity of 80 g/kg, a feed pressure of 40 bar is sufficient, and we need to apply 50374
bar pressure to exceed 90 g/kg solution salinity.375
An important takeaway from these tests is that concentrating the brine beyond 90 g/kg is possible using376
the NF membranes with applied pressure lower than 60 bar while still maintaining water flux greater than377
15 L/m2-hr throughout. On the other hand, for the RO membrane, a pressure of about 80 bar is required.378
Standard FRP pressure vessels for spiral wound membrane elements are available up to a 69 bar (1000379
psi) pressure rating, which would suffice for the brine concentration beyond 90 g/kg using NF membranes.380
This pressure vessel limitation is one of the reasons why dyeing units are forced to use less efficient thermal381
processes to manage their RO brine. The alternative for dyeing units at present is to invest in specialized382
high-pressure RO modules to go up to 150 bar applied pressure to outperform distillation energetically.383
However, the capital cost of such specialized high-pressure vessels and membrane elements is higher than384
conventional PVs and spiral-wound elements.385
3.3. NaCl vs. Na2SO4: color differences386
In the above discussion, we have compared the energy for desalination of NaCl and Na2SO4 at similar387
salinity (in g/L) without explicitly accounting for the color differences when dyeing with these two salts.388
Producing a fabric with an acceptable color is a critical requirement for a dyeing unit, so differences in color389
production between the two salts must be evaluated.390
16

Table 1: Dyes tested
Color Dye, strengthRed Red SPD, 2%Blue Navy blue SPD, 2%Black Black WNN, 8%
We tested the use of Na2SO4 in the dyebath with different dye recipes (Table 1) and compared the391
resulting dyed fabric color with those produced using NaCl at different salinity levels for both salts. The392
salinity was changed from 10–80 g/L in steps of 10 g/L. The dyestuff concentration was kept constant in all393
the dyeing trials to isolate the salt’s impact alone.394
0 0.5 1 1.513
14
15
16
17
18
Ligh
tnes
s (L
*)
NaClNa2SO4
Electrolyte Normality [eq/L]
(a) Black L∗
0 0.5 1 1.5Electrolyte Normality [eq/L]
0
0.2
0.4
0.6
Gre
en-R
ed (a*
)
NaClNa2SO4
(b) Black a∗
0 0.5 1 1.5-4
-3.5
-3
-2.5
-2
Blu
e-Ye
llow
(b*
)
NaClNa2SO4
Electrolyte Normality [eq/L]
(c) Black b∗
0 0.5 1 1.529
30
31
32
33
34
35NaClNa2SO4
Ligh
tnes
s (L
*)
Electrolyte Normality [eq/L]
(d) Blue L∗
0 0.5 1 1.5 Electrolyte Normality [eq/L]
-6.5
-6
-5.5
-5
-4.5
-4
Gre
en-R
ed (a*
)
NaClNa2SO4
(e) Blue a∗
0 0.5 1 1.5-18.3
-18.2
-18.1
-18
-17.9
-17.8
NaClNa2SO4
Blu
e-Yel
low
(b*
)
Electrolyte Normality [eq/L]
(f) Blue b∗
0 0.5 1 1.543
44
45
46
47
48NaClNa2SO4
Ligh
tnes
s (L
*)
Electrolyte Normality [eq/L]
(g) Red L∗
0 0.5 1 1.558.5
59
59.5
60
60.5
61
61.5
NaClNa2SO4
Gre
en-R
ed (a*
)
Electrolyte Normality [eq/L]
(h) Red a∗
0 0.5 1 1.5-2
-1
0
1
2
NaClNa2SO4
Blu
e-Yel
low
(b*
)
Electrolyte Normality [eq/L]
(i) Red b∗
Figure 8: L∗, a∗, and b∗ values obtained with varying concentration of NaCl and Na2SO4.
Figure 8 shows the color produced (in terms of L∗, a∗, and b∗ values) at each sDB level for both the395
salts. For all the three dye recipes, the a∗ and b∗ coordinates follow similar increasing trends with higher396
17

concentrations of both electrolytes, while the decreasing L∗ values indicate that the shade becomes darker397
with increasing salt concentration. The change in the L∗ is the major contributor (> 50%) to the color398
difference observed with increasing dyebath salinity, as shown in Fig. 9 which shows the color difference399
(∆Ecmc,2:1) at various dyebath salinities, compared to the color produced with a 10 g/L solution. The400
relative normalized contribution of each axis is calculated as the ratio of each squared term on the R.H.S of401
Eq. 2 to (∆Ecmc,2:1).402
4
3.5
3
2.5
2
1.5
1
Ecm
c
20 30 40 50 60 70 80NaC l salinity [g/L]
Norm
alis
ed
Contr
ibutio
nof axe
s
1
0.8
0.6
0.4
0.2
0
Lightness (L*)Red-Green (a*)Blue-Yellow (b*)
Ecmc
(a) Black
20 30 40 50 60 70 80NaC l salinity [g/L]
Norm
alis
ed
Contr
ibutio
nof axe
s
Lightness (L*)Red-Green (a*)Blue-Yellow (b*)
Ecmc
4.5
4
3.5
3
2.5
2
1.5
1
Ecm
c
1
0.8
0.6
0.4
0.2
0
(b) Blue
3.2
3
2.8
2.6
2.4
2.2
2
1.8
1.6
Ecm
c
20 30 40 50 60 70 80NaC l salinity [g/L]
1
0.8
0.6
0.4
0.2
0Norm
alis
ed
Contr
ibutio
nof axe
s
Lightness (L*)Red-Green (a*)Blue-Yellow (b*)
Ecmc
(c) Red
Figure 9: Color difference (∆Ecmc,2:1) when using various concentrations of NaCl solution compared to 10 g/L dyebath, andthe relative contributions from the three axes.
The use of Na2SO4 gave shades close to that produced by a similar number of equivalents of NaCl. While403
NaCl is a 1:1 electrolyte, Na2SO4 is a 2:1 electrolyte. However, similar equivalents of NaCl and Na2SO4 will404
result in similar concentrations of the cation, Na+. Sakata [46], and Sivaraja Iyer [47] noted that the nature405
and concentration of the cation has a strong influence on the absorption of direct dyes on cellulosic fiber in406
comparison to the anions, which do not have a strong differential effect on the same.407
3.4. NaCl vs. Na2SO4: energy at similar color408
The color differences between using NaCl and Na2SO4 dyebaths at the same salinity are shown in Fig. 10.409
It may be noted that the ∆Ecmc,2:1 is less than 1 across all the dyes and salinity levels, indicating that410
relatively similar shades are achieved at the same salt concentration in g/L. The plot also shows the411
minimum energy required for brine concentration for both salts. Lower energy is needed in the case of the412
Na2SO4 solution due to its lower osmotic pressure, as shown in Fig. 6. When matching the color achieved413
with NaCl with Na2SO4 the least work is lower by around 30–50% (Appendix B).414
3.5. Na2SO4: use of NF for brine concentration415
3.5.1. Water reusability experiments.416
Textile dyeing is a complex process involving the use of not only the dye mixtures and salts, but also417
many other ‘auxiliary’ compounds. Even though some of these compounds may break down during the418
18

Figure 10: Energy Requirements and Color differences at the tested salinities
primary and secondary treatment, their byproducts can build up in the system over several cycles of reuse.419
Li et al. [29] noted that further treatment for total organic carbon (TOC) removal would be required for420
reuse of brine treated by their Fenton system beyond three cycles, whereas Bilinska et al. [31] were only421
able to reuse the brine for one cycle. Hence, it is crucial to study the reusability of the treated brine after422
NF-based concentration.423
Figure 11: Color reproduction over brine reusability cycles
Three different dye recipes (Table 2, Fig. 12) producing different shades (bright blue, brown, and olive)
were dyed with Na2SO4 in the dyebath, taking care to reduce Cl− ion addition through the other chemical
additives used. The color obtained initially when pure Na2SO4 is used in the dyebath is taken as the
baseline against which the data from further reusability trials are compared. After decolorization, the
combined effluent was concentrated using the Desal DK NF membrane in a dead-end filtration cell at the
dyeing unit, until the pressure requirement reached 60 bar. An average water recovery of 88% was achieved,
19

Table 2: Recipes and dye concentrations.
Color Dye recipe(% of fabric mass)
Na2SO4
conc.[ g/L ]
Olive Meactive Blue FBS (0.4%),Meactive Red F3B (0.1%),Meactive Yellow F3R (0.6%)
40
Bright blue Meactive Blue FBS (0.1%),Meactive Red F3B (0.1%),Moh. Bril Blue RN (0.6%)
40
Brown Chemifix ultra blue 3D (1.5%),Meactive Red F3B (1.3%),Meactive Yellow F3R (1%)
60
Figure 12: Structures of the reactive dyes used.
20

with an average instantaneous conductivity rejection of 85%. Since the flux is held constant during the
concentration process, the instantaneous rejection (Rinst) was calculated in terms of the overall observed
rejection (Roverall = 1− sp/sf) and recovery ratio (RR) as:
Rinst = 1− ln (1− RR(1−Roverall))
ln(1− RR)(6)
The brine thus produced was then reused in the dyebath after necessary dilution. The color produced424
after each round is compared with the baseline color in terms of ∆Ecmc,2:1, and the results are shown in425
Fig. 11. The number of cycles of acceptable reusability appears to be strongly influenced by the dye recipe.426
The olive dye seems best suited for brine reusability with acceptable dyeing (∆Ecmc,2:1 ≤ 1) for all 5 cycles.427
The blue dye could reuse the brine for up to 3 cycles, but in the 4th and 5th cycles, the color difference is428
quite close to 1. In the case of the brown dye, acceptable color reproduction is achieved only for 2 cycles429
before the color starts to deviate significantly. These color deviations could result from the buildup of the430
TOC and other molecules, which could interfere with the dyeing process.431
3.5.2. Polishing with UF and impact on reusability432
(a) Membrane flux in dead-end UF polishing of NFbrine. (b) Dyed yarn using lab-grade solution and brines.
Figure 13: UF polishing of NF brine.
In order to further eliminate the buildup of other contaminants that could affect the dyeing process, a433
polishing step would be necessary to produce a clean Na2SO4 solution for use in the dyebath. In this regard,434
the concentrated brine was filtered using a UF membrane. The pore size of such a membrane is such that435
it can eliminate other impurities such as color-causing compounds without rejecting the sodium and sulfate436
ions. The use of this polishing step was tested for two dye mixtures, blue and olive.437
The brine stream that was polished using UF showed significant improvement in terms of matching the438
color obtained using a pure salt solution for both the colors (Table 3). The much lower color deviations in439
21

Table 3: Impact of ultrafiltration (UF) on color reproduction.
∆L∗ ∆C ∆H ∆Ecmc,2:1
Bright Blue
UF retentate 0.31 −1.35 0.06 0.73UF permeate 0.41 −0.46 0.03 0.31
Olive
UF retentate 0.17 0.39 0.46 0.61UF permeate −0.09 0.04 0.05 0.08
the case of polished brine (0.31 vs. 0.73 and 0.08 vs. 0.61) show that UF polishing can be a promising method440
to increase the number of cycles for up to which the brine may be reused for dyeing effectively. Much lower441
suspended solids (3 mg/L) in the UF permeate compared to the retentate (50 mg/L) could be the reason442
for the improved color reproduction with the UF permeate.443
Figure 13a shows the flux decline observed in the UF process when operated in a dead-end setup with444
stirring at 300 RPM. A backwash step would be necessary to clean the UF membrane and maintain flux445
periodically. Just as existing dyeing units that use NaCl in their dyebath employ NF membranes for polish-446
ing, replacing Cl− ions with SO2−4 as suggested in this study may be coupled with changing the polishing447
technology from NF to UF to allow sulfate ions to pass through while preventing other larger impurities448
from passing.449
4. Conclusions450
Unlike natural water bodies, the composition of industrial effluents can be adjusted through the appro-451
priate choice of chemicals in the upstream processing steps. In the context of textile dyeing, this provides452
an opportunity to reduce the energy cost for effluent recycling towards implementing zero liquid discharge453
by choosing the appropriate electrolytes for the dyebaths.454
The effect of dyebath electrolyte on dye uptake was reviewed from the literature. The thermodynamic455
least energy for brine concentration was then calculated for a dyeing unit with a total of 8 baths (3 prepara-456
tory, 1 dye, and 4 wash baths) based on the electrolyte concentrations required for similar dye uptake. At457
low dye uptakes (≲ 5 g-dye/kg-cotton), the order of least work requirement is found to be: LiCl > NaCl >458
NH4Cl > MgCl2 > (NH4)2SO4.459
Further, the impact of replacing Cl− ions with SO2−4 ions in the dyebath on the energy consumption for460
brine concentration was calculated. We observe that solutions with SO2−4 ions require around 50% lower461
energy than solutions with Cl− ions. The practicality of this intervention was tested by measuring the462
difference in the color of the final fabrics dyed using NaCl and Na2SO4. This difference came out to be463
22

within industrially acceptable limits (∆Ecmc,2:1 < 1).464
In addition to the thermodynamic advantage, we also demonstrated that such an intervention could allow465
us to replace RO systems with more permeable NF membranes in the desalination step. Experimentally,466
we observed that while SW30(HR) can concentrate the sulfate brine up to 60g/kg at 60 bar pressure,467
nanofiltration membranes NF90 and NF270 can concentrate the brine to 87 g/kg and 99g/kg respectively468
at the same pressure. These high salinity brines are especially useful for achieving the darkest shades of469
fabric in the dyebath. Further, the higher water recovery reduces the dependence on less efficient thermal470
processes for brine concentration. Concentrating the brine up to a salinity of 90g/kg using the SW30(HR)471
membrane will require an applied pressure of ∼77bar. NF90 and NF270 membranes can achieve the same472
at pressures as low as ∼58 bar and ∼54 bar, respectively.473
The reusability of the brine concentrated using NF membranes is also tested over multiple cycles. Ac-474
ceptable color reproducibility (∆Ecmc,2:1 < 1) (compared to pure salt solution) are obtained for 3–5 cycles475
for various colors and dye recipes. Finally, ultrafiltration treatment is demonstrated to be a promising476
method for polishing the sulfate brine, with color differences improving by around 50–80%. This can further477
reduce the energy load compared to existing brine polishing methods that use NF membranes. However, the478
observation of different levels of reproducibility highlights that the possible energy savings and acceptability479
are sensitive to the dye recipe used.480
Overall, the ideas presented and developed in this study open up a novel method for textile dyeing units481
to reduce the cost associated with their effluent treatment and recycling through process interventions in482
the dyeing process. Going forward, the idea that the chemistry of the upstream processes and the effluents483
eventually released strongly impacts ZLD costs should be explored in other industries beyond textile dyeing.484
Acknowledgments485
This work was funded by the Department of Science & Technology, Govt. of India. Reference no. DST/486
TMD(EWO)/ OWUIS-2018/ RS-03 (G). JS thanks the Tata Center for Technology & Design at MIT for487
initial financial support. The authors would like to thank Mr. Stalin and Ms. Devika at SP Textile Processors488
Pvt. Ltd. for their help with running the dyeing and reusability experiments, Prof. Lalit Anand for allowing489
the use of the high-pressure dead-end test cell at MIT, and Tiffany Tao for assistance with the dead-end490
filtration tests.491
23

Appendix A. Is salt absolutely necessary for dyeing?492
The dyeing process involves three crucial steps that determine the final product color. The first is the493
exhaustion of the dye into the fiber. When the fiber is dipped into the dyebath, dye molecules from the bulk494
need to move towards the fabric to be available for reaction. The dye molecules then need to migrate within495
the interstitial water between the fibers in order to ensure a more level or uniform distribution of the color.496
The third step is the fixation of the dyes onto the fabric. Once the dye has been sufficiently exhausted and497
migrated, additives are added to the dyebath to start the reaction - the dye molecules in the bulk solution498
undergo hydrolysis and are rendered useless. In contrast, those in the vicinity of the fiber undergo fixation499
onto the fiber. Reactive dyes, being anionic molecules themselves, are repelled by the negative surface charge500
on the hydrolyzed cellulosic fiber and suffer from a low degree of exhaustion and fixation of around 60%501
[63]. Electrolytes in the form of salt are added to the dyebath to increase the dye-fiber substantivity. The502
amount of salt used in dyeing cellulosic fibers depends on not just the dye but also the desired shade of the503
final product. Dark shades use high electrolyte concentrations (60-80 g/L), whereas the lighter shades can504
do with lower salinity (10-30 g/L).505
Two theories have been propounded in the literature to describe the mechanism by which salts aid in506
the exhaustion and fixation of anionic dyes to cellulosic fibers. The first, more commonly cited reason is507
decreased repulsion between the negative surface charge on the fabric and dye molecules with increasing508
solution ionic strength. This enables the dyes to approach closer to the fiber so that hydrogen bonding509
and other short-range forces can start operating. A second less commonly discussed mechanism is that the510
electrolytes reduce the solubility of the dyes in the bulk dyebath solution and promote dye aggregation. This511
pushes the dye into the interstitial water in the fiber and makes more dye available for the fixation step512
[64–67].513
Xia et al. [68] have suggested and demonstrated the use of ethanol-water mixture instead of saline water514
in the dyebath. Burkinshaw and Salihu [65, 66] conducted extensive studies on the possibility of eliminating515
the need for salts in dyeing. The authors proposed that reducing the liquor ratio (LR, mass of water516
per unit mass of fabric) would reduce the amount of water in the dyebath available for dye dissolution,517
consequently pushing the dye towards the fiber. The study achieved a reasonably similar dye uptake at518
LR = 1.5 irrespective of electrolyte addition. Further, the depth of shade at an LR of 1.5 without NaCl519
addition was the same as for an LR of 10 with 50 g/L NaCl addition.520
However, operating at such low liquor ratios in large-scale dyeing is not yet feasible and could result in521
practical problems associated with obtaining a consistent color throughout the fabric. High liquor ratios favor522
dye migration and give a more level (or uniform) finish. Operating at such high liquor ratios necessitates the523
24

use of salt in the dyebath. However, since the salt itself does not have any affinity to the fiber, it is almost524
completely discharged with the exhausted dyebath effluent [69–71].525
Appendix B. Comparing energy based on best fit of color526
Although color differences at the same salinity levels (in g/L) are within acceptable limits, there is an527
opportunity to reproduce even closer colors by further tuning the salinity of Na2SO4. The trends obtained528
for the L∗, a∗, and b∗ coordinates for were fitted using a rational polynomial of the form f(s) = (p1s +529
p2)/(1+ q2s). Since the a∗ value saturated beyond solution normality of 0.5 eq/L in the case of the red dye,530
a good fit was not obtained in this case. Using the fits, the concentration of Na2SO4 required to get the531
closest match in the color based on ∆Ecmc,2:1 was calculated.532
(a) Black (b) Blue
(c) Black (d) Blue
Figure B.14: Comparing the salinity of Na2SO4 required to achieve the closest color to what is produced at a particular salinityof NaCl. The corresponding ∆Ecmc,2:1 value is also shown. Least energy comparison between the two salts when achievingsimilar color.
The concentration of Na2SO4 required to match the color obtained using NaCl has been plotted in533
25

Fig. B.14. In the range of salinity used in this study, the sodium sulfate requirement is lower than that for534
NaCl for the black dye. The color difference between the color coordinates achieved by using NaCl and by535
using Na2SO4is quantified in terms of ∆Ecmc,2:1. The ∆Ecmc,2:1 value decreases from 0.5 at low salinity536
before going through a minima of 0.07, obtained at a salinity of 24.9 g/L Na2SO4. This point corresponds537
to a NaCl-based dyebath of salinity 30 g/L. For blue dye, this trend is opposite in nature, increasing first538
from ∆Ecmc,2:1 of 0.1 at low salinity and reaching a maxima at a salinity of 30 g/L NaCl before decreasing539
again.540
Based on the above estimations, the minimum energy requirements for concentrating the combined541
effluent from sDB/8 up to sDB are calculated using Eq. 1. This desalination process corresponds to a542
recovery ratio of 87.5%. The energy savings on switching from NaCl to Na2SO4 are immediately evident543
for black and blue dyes. Using the above estimates for salt requirements for replacing the sodium chloride544
with appropriate concentration of sodium sulfate, the energy requirement for brine reconcentration can be545
reduced to 45–50%. Although the blue dye requires relatively higher concentrations of sodium sulfate than546
sodium chloride in g/L, an energy savings of about 35–50% is still predicted in this case as well.547
References548
[1] V. Buscio, V. Lopez-Grimau, M. D. Alvarez, C. Gutierrez-Bouzan, Reducing the environmental impact549
of textile industry by reusing residual salts and water: ECUVal system, Chemical Engineering Journal550
373 (2019) 161–170. doi:10.1016/J.CEJ.2019.04.146.551
[2] K. Xie, F. Cheng, W. Zhao, L. Xu, Micelle dyeing with low liquor ratio for reactive dyes using di-552
alkyl maleic acid ester surfactants, Journal of Cleaner Production 19 (2011) 332–336. doi:10.1016/j.553
jclepro.2010.10.006.554
[3] I. Holme, Technology-dyeing cellulosic fibres, Textiles Magazine 31 (2004) 8–13.555
[4] A. Khatri, M. H. Peerzada, M. Mohsin, M. White, A review on developments in dyeing cotton fabrics556
with reactive dyes for reducing effluent pollution, Journal of Cleaner Production 87 (2015) 50–57.557
doi:10.1016/j.jclepro.2014.09.017.558
[5] D. Xu, H. Liang, X. Zhu, L. Yang, X. Luo, Y. Guo, Y. Liu, L. Bai, G. Li, X. Tang, Metal-559
polyphenol dual crosslinked graphene oxide membrane for desalination of textile wastewater, Desalina-560
tion 487 (2020) 114503. URL: https://www.sciencedirect.com/science/article/pii/S0011916420304987.561
doi:https://doi.org/10.1016/j.desal.2020.114503.562
26

[6] L. Bilinska, M. Gmurek, S. Ledakowicz, Textile wastewater treatment by aops for brine reuse, Pro-563
cess Safety and Environmental Protection 109 (2017) 420–428. URL: https://www.sciencedirect.com/564
science/article/pii/S0957582017301362. doi:https://doi.org/10.1016/j.psep.2017.04.019.565
[7] S. Arslan, M. Eyvaz, E. Gurbulak, E. Yuksel, A Review of State-of-the-Art Technologies in Dye-566
Containing Wastewater Treatment – The Textile Industry Case, 2016. doi:10.5772/64140.567
[8] C. Suksaroj, M. Heran, C. Allegre, F. Persin, Treatment of textile plant effluent by nanofiltration and/or568
reverse osmosis for water reuse, Desalination 178 (2005) 333–341. doi:10.1016/j.desal.2004.11.043.569
[9] A. Bes-Pia, J. Mendoza-Roca, M. Alcaina-Miranda, A. Iborra-Clar, M. Iborra-Clar, Combination of570
physico-chemical treatment and nanofiltration to reuse wastewater of a printing, dyeing and finishing571
textile industry, Desalination 157 (2003) 73–80. doi:10.1016/S0011-9164(03)00385-0.572
[10] T.-H. Kim, C. Park, E.-B. Shin, S. Kim, Decolorization of disperse and reactive dye solutions using573
ferric chloride, Desalination 161 (2004) 49–58. doi:10.1016/S0011-9164(04)90039-2.574
[11] R. M. Christie, Environmental aspects of textile dyeing, Elsevier, 2007. URL: https://www.elsevier.575
com/books/environmental-aspects-of-textile-dyeing/christie/978-1-84569-115-8.576
[12] R. Kant, Textile dyeing industry an environmental hazard, Natural Science 4 (2011) 22–26. doi:10.577
4236/ns.2012.41004.578
[13] Y. Li, X. Zhang, Y. Wang, J. Wang, D. Wang, Feasibility study of multi-effect distillation deal-579
ing with high-salinity organic ro concentrates: Experiment and theoretical analysis, Desalina-580
tion 505 (2021) 115007. URL: https://www.sciencedirect.com/science/article/pii/S0011916421000783.581
doi:https://doi.org/10.1016/j.desal.2021.115007.582
[14] P. Goh, K. Wong, A. Ismail, Membrane technology: A versatile tool for saline wastewater treatment583
and resource recovery, Desalination 521 (2022) 115377. URL: https://www.sciencedirect.com/science/584
article/pii/S0011916421004483. doi:https://doi.org/10.1016/j.desal.2021.115377.585
[15] G. Vishnu, S. Palanisamy, K. Joseph, Assessment of fieldscale zero liquid discharge treatment systems586
for recovery of water and salt from textile effluents, Journal of Cleaner Production 16 (2008) 1081–1089.587
doi:10.1016/j.jclepro.2007.06.005.588
[16] D. S. Kharat, L. Kumar, P. Kumar, R. S. Mahwar, P. M. Ansari, B. Sengupta, Advance meth-589
ods for treatment of textile industry effluents, Resource Recycling Series RERES/7/2007, Cen-590
tral Pollution Control Board, Delhi, India, 2007. URL: https://cpcb.nic.in/openpdffile.php?id=591
UmVwb3J0RmlsZXMvTmV3SXRlbV84OV8yNy5wZGY=.592
27

[17] C. Balcik-Canbolat, C. Sengezer, H. Sakar, A. Karagunduz, B. Keskinler, A study on near zero liq-593
uid discharge approach for the treatment of reverse osmosis membrane concentrate by electrodialysis,594
Environmental technology 41 (2018) 440–449. doi:10.1080/09593330.2018.1501610.595
[18] T. Altmann, J. Robert, A. T. Bouma, J. Swaminathan, J. H. Lienhard, Primary energy and exergy of596
desalination technologies in a power-water cogeneration scheme, Applied Energy 252 (2019). doi:10.597
1016/j.apenergy.2019.113319.598
[19] A. T. Bouma, J. Swaminathan, J. H. Lienhard, Metrics matter: Accurately defining energy efficiency599
in desalination, Journal of Heat Transfer 142 (2020). doi:10.1115/1.4048250.600
[20] D. M. Davenport, A. Deshmukh, J. R. Werber, M. Elimelech, High-pressure reverse osmosis for energy-601
efficient hypersaline brine desalination: current status, design considerations, and research needs, En-602
vironmental Science & Technology Letters 5 (2018) 467–475. doi:10.1021/acs.estlett.8b00274.603
[21] K. H. Mistry, R. K. McGovern, G. P. Thiel, E. K. Summers, S. M. Zubair, J. H. Lienhard, Entropy604
generation analysis of desalination technologies, Entropy 13 (2011) 1829–1864. URL: https://www.605
mdpi.com/1099-4300/13/10/1829. doi:10.3390/e13101829.606
[22] Z. Wang, T. Horseman, A. P. Straub, N. Y. Yip, D. Li, M. Elimelech, S. Lin,607
Pathways and challenges for efficient solar-thermal desalination, Science Advances 5608
(2019) eaax0763. URL: https://www.science.org/doi/abs/10.1126/sciadv.aax0763. doi:10.1126/609
sciadv.aax0763. arXiv:https://www.science.org/doi/pdf/10.1126/sciadv.aax0763.610
[23] K. C. Ng, M. Burhan, Q. Chen, D. Ybyraiymkul, F. H. Akhtar, M. Kumja, R. W. Field, M. W.611
Shahzad, A thermodynamic platform for evaluating the energy efficiency of combined power generation612
and desalination plants, Npj Clean Water 4 (2021) 1–10.613
[24] D. Brogioli, F. La Mantia, N. Y. Yip, Thermodynamic analysis and energy efficiency of thermal614
desalination processes, Desalination 428 (2018) 29–39.615
[25] J. K. Vyas, Challenges against implementation of ZLD in textile processing Industries and clusters in616
India, Technical Report, Centre for Environment Education, Ahmedabad, Ahmedabad, Gujarat, India,617
2016. URL: https://www.ceeindia.org/file/ZLD-Concept-note.pdf.618
[26] J. Gronwall, A. Jonsson, Regulating effluents from India’s textile sector: New commands and compliance619
monitoring for zero liquid discharge, Law, Environment and Development Journal 13 (2017). URL:620
http://www.lead-journal.org/content/17013.pdf.621
28

[27] J. Gronwall, A. Jonsson, The impact of ‘zero’ coming into fashion: Zero liquid discharge uptake622
and socio-technical transitions in Tirupur, Water Alternatives 10 (2017) 602–24. URL: https://www.623
water-alternatives.org/index.php/alldoc/articles/vol10/v10issue2/372-a10-2-22/file.624
[28] K. Ranganathan, K. Karunagaran, D. C. Sharma, Recycling of wastewaters of textile dyeing industries625
using advanced treatment technology and cost analysis—case studies, Resources, Conservation and626
Recycling 50 (2007) 306–318. doi:10.1016/j.resconrec.2006.06.004.627
[29] B. Li, Y. Dong, Z. Ding, Y. Xu, C. Zou, Renovation and reuse of reactive dyeing effluent by a novel628
heterogeneous fenton system based on metal modified PTFE fibrous catalyst/H2O2, International629
Journal of Photoenergy 2013 (2013). doi:10.1155/2013/169493.630
[30] V. Lopez-Grimau, M. del Carmen Gutierrez-Bouzan, J. Valldeperas, M. Crespi, Reuse of the water and631
salt of reactive dyeing effluent after electrochemical decolorisation, Coloration Technology 128 (2012)632
36–43. doi:10.1111/j.1478-4408.2011.00343.x.633
[31] L. Bilinska, K. Blus, M. Gmurek, S. Ledakowicz, Brine recycling from industrial textile wastewater634
treated by ozone. by-products accumulation. Part 1: multi recycling loop, Water 11 (2019) 460. doi:10.635
3390/w11030460.636
[32] J. Ding, H. Wu, P. Wu, Preparation of highly permeable loose nanofiltration membranes using sulfonated637
polyethylenimine for effective dye/salt fractionation, Chemical Engineering Journal 396 (2020) 125199.638
doi:10.1016/J.CEJ.2020.125199.639
[33] W. Ye, K. Ye, F. Lin, H. Liu, M. Jiang, J. Wang, R. Liu, J. Lin, Enhanced fractionation of dye/salt640
mixtures by tight ultrafiltration membranes via fast bio-inspired co-deposition for sustainable textile641
wastewater management, Chemical Engineering Journal 379 (2020) 122321. doi:10.1016/J.CEJ.2019.642
122321.643
[34] J. Wang, R. He, X. Han, D. Jiao, J. Zhu, F. Lai, X. Liu, J. Liu, Y. Zhang, B. Van der Bruggen, High644
performance loose nanofiltration membranes obtained by a catechol-based route for efficient dye/salt645
separation, Chemical Engineering Journal 375 (2019) 121982. doi:10.1016/J.CEJ.2019.121982.646
[35] A. Metecan, A. Cihanoglu, S. Alsoy Altinkaya, A positively charged loose nanofiltration membrane647
fabricated through complexing of alginate and polyethyleneimine with metal ions on the polyamideimide648
support for dye desalination, Chemical Engineering Journal 416 (2021) 128946. doi:https://doi.org/649
10.1016/j.cej.2021.128946.650
29

[36] J. Lin, Q. Chen, X. Huang, Z. Yan, X. Lin, W. Ye, S. Arcadio, P. Luis, J. Bi, B. Van der Bruggen,651
S. Zhao, Integrated loose nanofiltration-electrodialysis process for sustainable resource extraction from652
high-salinity textile wastewater, Journal of Hazardous Materials 419 (2021) 126505. doi:10.1016/J.653
JHAZMAT.2021.126505.654
[37] M. Jiang, K. Ye, J. Deng, J. Lin, W. Ye, S. Zhao, B. Van Der Bruggen, Conventional Ultrafiltration As655
Effective Strategy for Dye/Salt Fractionation in Textile Wastewater Treatment, Environmental Science656
and Technology 52 (2018) 10698–10708. URL: https://pubs.acs.org/doi/abs/10.1021/acs.est.8b02984.657
doi:10.1021/ACS.EST.8B02984/SUPPL_FILE/ES8B02984_SI_001.PDF.658
[38] X. Ma, P. Chen, M. Zhou, Z. Zhong, F. Zhang, W. Xing, Tight Ultrafiltration Ceramic Membrane for659
Separation of Dyes and Mixed Salts (both NaCl/Na2SO4) in Textile Wastewater Treatment, Industrial660
and Engineering Chemistry Research 56 (2017) 7070–7079. URL: https://pubs.acs.org/doi/abs/10.1021/661
acs.iecr.7b01440. doi:10.1021/ACS.IECR.7B01440.662
[39] C.-C. Ye, F.-Y. Zhao, J.-K. Wu, X.-D. Weng, P.-Y. Zheng, Y.-F. Mi, Q.-F. An, C.-J. Gao, Sulfated poly-663
electrolyte complex nanoparticles structured nanoflitration membrane for dye desalination, Chemical664
Engineering Journal 307 (2017) 526–536. doi:https://doi.org/10.1016/j.cej.2016.08.122.665
[40] M. Mondal, S. De, Treatment of textile plant effluent by hollow fiber nanofiltration membrane and666
multi-component steady state modeling, Chemical Engineering Journal 285 (2016) 304–318. doi:https:667
//doi.org/10.1016/j.cej.2015.10.005.668
[41] T. Tavangar, M. Karimi, M. Rezakazemi, K. R. Reddy, T. M. Aminabhavi, Textile waste, dyes/inorganic669
salts separation of cerium oxide-loaded loose nanofiltration polyethersulfone membranes, Chemical670
Engineering Journal 385 (2020) 123787. doi:10.1016/J.CEJ.2019.123787.671
[42] X. Zhang, X. Du, Y. Ke, Y. G. Zhang, Z. K. Xu, Loose nanofiltration membranes with assembled672
antifouling surfaces of organophosphonic acid/Fe(III) for managing textile dyeing effluents, Journal of673
Membrane Science 640 (2021) 119821. doi:10.1016/J.MEMSCI.2021.119821.674
[43] W. Ye, R. Liu, X. Chen, Q. Chen, J. Lin, X. Lin, B. Van der Bruggen, S. Zhao, Loose nanofiltration-675
based electrodialysis for highly efficient textile wastewater treatment, Journal of Membrane Science 608676
(2020) 118182. doi:10.1016/J.MEMSCI.2020.118182.677
[44] V. Buscio, M. Garcıa-Jimenez, M. Vilaseca, V. Lopez-Grimau, M. Crespi, C. Gutierrez-Bouzan, Reuse678
of textile dyeing effluents treated with coupled nanofiltration and electrochemical processes, Materials679
9 (2016) 490. doi:10.3390/ma9060490.680
30

[45] G. L. Madan, S. K. Shrivastava, Physical chemistry of dyeing of cellulosic fibers with reactive dyes.681
Part I: the role of electrolytes in the sorption of hydrolyzed reactive dyes, Textile Research Journal 49682
(1979) 322–325. doi:10.1177/004051757904900604.683
[46] K. Sakata, A. Katayama, The influence of different electrolytes on the absorption of ionic surfactants in684
acetate fibers, Journal of Colloid and Interface Science 123 (1988) 129–135. doi:10.1016/0021-9797(88)685
90229-9.686
[47] S. R. Sivaraja Iyer, G. Srinivasan, N. Baddi, The influence of different electrolytes on the interaction687
of Chlorazol Sky Blue FF with the cotton fiber surface in aqueous solutions, Textile Research Journal688
38 (1968) 693–700. doi:10.1177/004051756803800703.689
[48] K. H. Mistry, H. A. Hunter, J. H. Lienhard, Effect of composition and nonideal solution behavior on690
desalination calculations for mixed electrolyte solutions with comparison to seawater, Desalination 318691
(2013) 34–47. doi:10.1016/j.desal.2013.03.015.692
[49] G. P. Thiel, E. W. Tow, L. D. Banchik, H. W. Chung, J. H. Lienhard, Energy consumption in693
desalinating produced water from shale oil and gas extraction, Desalination 366 (2015) 94–112.694
doi:10.1016/j.desal.2014.12.038.695
[50] R. S. Kingsbury, pyEQL package, Available from https://pyeql.readthedocs.io/en/latest/ (2021-06-11),696
2013.697
[51] D. L. Parkhurst, C. A. J. Appelo, Description of input and examples for PHREEQC version 3–A698
computer program for speciation, batch-reaction, one-dimensional transport, and inverse geochemical699
calculations, U.S. Geological Survey, Reston, VA, USA, 2013. URL: https://pubs.usgs.gov/tm/06/a43.700
[52] S. R. Charlton, D. L. Parkhurst, Modules based on the geochemical model phreeqc for use in scripting701
and programming languages, Computers & Geosciences 37 (2011) 1653–1663. doi:10.1016/j.cageo.702
2011.02.005.703
[53] T. Mouw, Tolerancing Part 3: Color Space vs. Color Tolerance, Available at https://www.xrite.com/704
blog/tolerancing-part-3 (2021-04-23), 2018.705
[54] B. J. Lindbloom, Delta E (CMC), Available at http://brucelindbloom.com/index.html?Eqn DeltaE706
CMC.html (2021-04-23), 2017.707
[55] Technical Committee ISO/TC 38/SC 1, Textiles — Tests for colour fastness — Part J03: Calculation708
of colour differences, ISO Standard ISO 105-J03:2009, International Organization for Standardization,709
2009. URL: https://www.iso.org/standard/51385.html, accessed 2021-06-30.710
31

[56] J. H. Lienhard, Energy savings in desalination technologies: Reducing entropy generation by transport711
processes, Journal of Heat Transfer 141 (2019) 072001. doi:10.1115/1.4043571.712
[57] S. Sarkar, A. K. SenGupta, A new hybrid ion exchange-nanofiltration (HIX-NF) separation process for713
energy-efficient desalination: Process concept and laboratory evaluation, Journal of Membrane Science714
324 (2008) 76–84. doi:10.1016/j.memsci.2008.06.058.715
[58] L. Meihong, Y. Sanchuan, Z. Yong, G. Congjie, Study on the thin-film composite nanofiltration mem-716
brane for the removal of sulfate from concentrated salt aqueous: Preparation and performance, Journal717
of Membrane Science 310 (2008) 289–295. doi:10.1016/j.memsci.2007.11.002.718
[59] E. Curcio, X. Ji, A. M. Quazi, S. Barghi, G. Di Profio, E. Fontananova, T. Macleod, E. Drioli, Hybrid719
nanofiltration-membrane crystallization system for the treatment of sulfate wastes, Journal of Membrane720
Science 360 (2010) 493–498. doi:10.1016/j.memsci.2010.05.053.721
[60] N. Hilal, V. Kochkodan, H. Al Abdulgader, D. Johnson, A combined ion exchange–nanofiltration process722
for water desalination: II. Membrane selection, Desalination 363 (2015) 51–57. doi:10.1016/J.DESAL.723
2014.11.017.724
[61] N. Hilal, V. Kochkodan, H. Al Abdulgader, S. Mandale, S. A. Al-Jlil, A combined ion ex-725
change–nanofiltration process for water desalination: III. Pilot scale studies, Desalination 363 (2015)726
58–63. doi:10.1016/J.DESAL.2014.11.030.727
[62] N. Hilal, V. Kochkodan, H. Al Abdulgader, S. Mandale, S. A. Al-Jlil, A combined ion ex-728
change–nanofiltration process for water desalination: I. sulphate–chloride ion-exchange in saline so-729
lutions, Desalination 363 (2015) 44–50. doi:10.1016/J.DESAL.2014.11.016.730
[63] S. E. Laursen, J. Hansen, J. Bagh, O. K. Jensen, I. Werther, Environmental Assessment of Textiles.731
Life Cycle Screening of Textiles Containing Cotton, Wool, Viscose, Polyester or Acrylic Fibres, volume732
369 of Miljoprojekt, Danish Environmental Protection Agency, 1997.733
[64] S. M. Burkinshaw, Physico-chemical aspects of textile coloration, John Wiley & Sons, 2016. URL:734
https://www.wiley.com/en-us/Physico+chemical+Aspects+of+Textile+Coloration-p-9781118725696.735
[65] S. M. Burkinshaw, G. Salihu, The role of auxiliaries in the immersion dyeing of textile fibres: Part736
6 analysis of conventional models that describe the manner by which inorganic electrolytes promote737
reactive dye uptake on cellulosic fibres, Dyes and Pigments 161 (2019) 595–604. doi:10.1016/j.dyepig.738
2017.09.028.739
32

[66] S. M. Burkinshaw, G. Salihu, The role of auxiliaries in the immersion dyeing of textile fibres: Part740
7 theoretical models to describe the mechanism by which inorganic electrolytes promote reactive dye741
uptake on cellulosic fibres, Dyes and Pigments 161 (2019) 605–613. doi:10.1016/j.dyepig.2017.09.742
024.743
[67] A. Khatri, M. White, R. Padhye, N. H. Momin, The use of reflectance measurements in the determi-744
nation of diffusion of reactive dyes into cellulosic fiber, Color Research & Application 39 (2014) 63–69.745
doi:10.1002/col.21764.746
[68] L. Xia, A. Wang, C. Zhang, Y. Liu, H. Guo, C. Ding, Y. Wang, W. Xu, Environmentally friendly747
dyeing of cotton in an ethanol-water mixture with excellent exhaustion, Green Chemistry 20 (2018)748
4473–4483. doi:10.1039/c8gc01814f.749
[69] V. Lopez-Grimau, C. Gutierrez, M. Sala, M. Crespi, Electrochemical decolourisation of cotton dye750
baths for reuse purposes: a way to reduce salinity of the textile wastewater, Desalination and Water751
Treatment 51 (2013) 1527–1532. doi:10.1080/19443994.2012.714585.752
[70] S. M. Burkinshaw, G. Salihu, The role of auxiliaries in the immersion dyeing of textile fibres: Part 1753
an overview, Dyes and Pigments 161 (2019) 519–530. doi:10.1016/j.dyepig.2017.08.016.754
[71] J. Cegarra, Determination of the migratory properties of direct dyes, Journal of the Society of Dyers755
and Colourists 73 (1957) 375–381. doi:10.1111/j.1478-4408.1957.tb02208.x.756
33


