Embed Size (px)
Citation preview
Remote Attack Detection Method in IDA: MLSI-BasedIntrusion Detection with Discriminant Analysis
Midori Asaka,1 Takefumi Onabuta,1 Tadashi Inoue,1 Shunji Okazawa,2 and Shigeki Goto3
1Information-Technology Promotion Agency, Japan, Tokyo, 113-6591 Japan
2The Japan Research Institute, Tokyo, 102-0082 Japan
3Waseda University, Tokyo, 169-8555 Japan
SUMMARY
In order to detect intrusions, IDA (Intrusion Detec-tion Agent system) initially monitors system logs in orderto discover an MLSI—which is a certain event which inmany cases occurs during an intrusion. If an MLSI is found,then IDA judges whether the MLSI is accompanied by anintrusion. We adopt discriminant analysis to analyze infor-mation after IDA detects an MLSI in a remote attack.Discriminant analysis provides a classification functionthat allows IDA to separate intrusive activities from nonin-trusive activities. Using discriminant analysis, we can de-tect intrusions by analyzing only a part of the system callsoccurring on a host machine, and we can determine whetheran unknown sample is an intrusion. In this paper, we explainin detail how we perform discriminant analysis to detectintrusions, and evaluate the classification function. We alsodescribe how to extract a sample from system logs, whichis necessary to implement the discriminant analysis func-tion in IDA. © 2002 Wiley Periodicals, Inc. Electron CommJpn Pt 1, 86(4): 50–62, 2003; Published online in WileyInterScience (www.interscience.wiley.com). DOI 10.1002/ecja.10053
Key words: computer security; remote attack de-tection; intrusion detection agent (IDA); marks left bysuspected intruders (MLSI); discriminant analysis.
1. Introduction
We have been developing an intrusion detection sys-tem which we call IDA (Intrusion Detection Agent system)[1, 2]. The main goal of IDA is detecting intrusions that doserious damage to computer systems without necessitatingheavy overhead analysis [3]. Therefore, IDA detects anintrusion in which a privileged mode is seized. In order todetect an intrusion, IDA monitors MLSIs (Marks Left bySuspected Intruders) in system logs on a host. If IDA findsan MLSI, IDA analyzes information only related to theMLSI and determines whether the MLSI accompanies anintrusion. An MLSI is an event that is often accompaniedby an intrusion that seizes a privileged mode. This does notmean that a set of MLSIs is identical to a set of intrusions.An MLSI may be accompanied by a normal activity. IDAmonitors only MLSIs, thus enabling IDA to lighten themonitoring load. Some recent research projects have ad-dressed a new type of intrusion detection method whichwould monitor not all user activities but only the privilegedprocesses [4–7].
IDA’s goal is to detect local attacks* and remoteattacks.† IDA can currently detect local attacks. We arepresently improving IDA in order to enable it to detect
© 2002 Wiley Periodicals, Inc.
Electronics and Communications in Japan, Part 1, Vol. 86, No. 4, 2003Translated from Denshi Joho Tsushin Gakkai Ronbunshi, Vol. J85-B, No. 1, January 2002, pp. 60–74
*Initiated against a machine which the attacker already has a right toaccess, when the attacker attempts to exceed his or her authority.†Initiated against a machine which the attacker does not have the right toaccess directly.
50
remote attacks. IDA cannot detect remote attacks using thesame method which it uses to detect local attacks, becausemany network applications exploited by attackers run in aprivileged mode from when they start up. Therefore, weinvestigated several methods for detecting remote attacks,and found that we could distinguish between intrusions andnormal activities by using discriminant analysis, a kind ofmultivariate analysis.
Using discriminant analysis, we can discriminate be-tween a group of normal behaviors and a group of intrusivebehaviors by analyzing only a part of the system callsoccurring on the target host machine, and we can classifyan unknown activity into either group without having toupdate the data for analysis. Further, the classification isdetermined by a simple quadratic equation. Thus, we canreduce the overhead required by analyzing and collectinginformation.
However, in order to implement an IDA through theuse of discriminant analysis, it is necessary to establish amethod for extracting a sample from system logs, which isoutputted continuously. This paper explains our newmethod of separating intrusions from normal behavior bymeans of discriminant analysis, and describes the methodof extracting a sample for discriminant analysis from sys-tem logs. Section 2 explains MLSIs, defines MLSIs in IDA,and describes how a sample is extracted from system logs.Section 3 describes mainly the classification of groups ofintrusions and normal activities by use of discriminantanalysis, and compares some results of the analysis. Section4 describes an evaluation of our method, and some relatedworks. Section 5 provides further discussion.
2. MLSI: Marks Left by SuspectedIntruders
2.1. Outline of MLSI
The history of research and development of intrusiondetection systems (IDSs) dates to the early 1980s primarilyin SRI [8–10]. With rapid diffusion of the Internet there isa healthy flow of commercial products [11]. However, thereare still many problems regarding precision improvementand cost reduction remaining. IDSs are classified into twotypes such as network-based IDSs and host-based IDSsaccording to where to obtain resources for analyzing intru-sions. There is another classification according to how todetect intrusions, such as misuse intrusion detection andanomaly intrusion detection. In misuse intrusion detection,known patterns of intrusion are used to try to identifyintrusions when they happen. In anomaly intrusion detec-tion, it is assumed that the nature of the intrusion is un-known, but that the intrusion will result in behavior
different from that normally seen in the system. Both meth-ods offer some advantages and disadvantages.
IDA is a host-based IDS. We have developed a newapproach that we call MLSI-based intrusion detection, andhave implemented IDA by use of it. The basic concept ofMLSI followed from collecting cracking tools, analyzingcracking methods, and examining incidents. The idea ofMLSIs is as follows. Although each intrusion activity isdifferent, as we view the information reported by CERT, wefind a limited number of types of MLSIs and recognize thatcertain types are common to many cases. For example, inmany cases attackers start up shell on superuser privilege,which constitutes one of the MLSIs. As mentioned pre-viously, if the goals of the intruders are limited and wedefine MLSIs to match the goals, we hypothesize that wecan detect many intrusions by monitoring MLSIs. This isnot the first time that researchers have had the idea ofdetecting intrusions based on marks left by suspected in-truders. We know of an integrity check tool called Tripwire[12, 13], which detects file modifications which we wouldcall MLSIs. However, although Tripwire can detect attack-ers’ marks (file modifications), it does not make the finaldecision as to whether the event is an intrusion or not. Thefinal decision is left entirely to administrators. Therefore,we developed an intrusion detection method that not onlyfinds the attackers’ marks but also makes the final decision;that is, this method finds the marks that are the intruders’specific goals or effects (MLSI), and then analyzes themand concludes whether the mark is derived from an intru-sion.
We can apply many methods of information analysisafter finding an MLSI. We may analyze information bypattern matching in light of known intrusive patterns. Themethod will fall into misuse intrusion detection. We canalso select anomaly intrusion detection method, which de-cides an intrusion based on how much an activity deviatesfrom normal. After all, in this system we adopt discriminantanalysis to analyze information after IDA finds an MLSI.The method falls into anomaly intrusion detection.
2.2. Some problems of remote attack detectionin IDA
There are many methods of classifying intrusions. Weclassify intrusions into three types for the purpose of clari-fying the intrusion detection-target of IDA.
Local attack: A local attack is one in which theattacker already has access to a machine; this is a case inwhich a user attempts to exceed his or her authority on thatmachine.
51

Remote attack: A remote attack is any attack that isinitiated against a machine to which the attacker does nothave direct access.
Miscellaneous: All intrusions except for the intru-sions described above. For example, DoS attack, port scan,sniffing, and so on.
We have so far built only local attack detectionmechanism into IDA. IDA does not detect intrusions clas-sified as “miscellaneous” above; it mainly detects intru-sions in which the goal of an attacker is to gain a privilegedaccess to a host. IDA can detect buffer overflow and modi-fication of critical system files as it detects local attacks.After an MLSI is detected, IDA concludes based on knowl-edge of known intrusion patterns that an activity that leftthe MLSI is an intrusion.
We have recently been researching and developing amethod to detect remote attacks such as buffer overflow andthose that execute arbitrary commands remotely. However,IDA cannot detect remote attacks using the same methodemployed in detecting local attacks. In local attack detec-tion, IDA detects buffer overflow by examining that anintruder has bypassed the regular procedure to gain a privi-leged access (such as root). In remote attack detection,many network daemons are running as privileged modesfrom when they started to run. Therefore, IDA cannot detectremote attacks by discovering that an intruder has bypassedthe regular procedure to gain privileged mode, because itstarts in privileged mode from the beginning.
With that situation, we can consider intrusion asdeviation not from one’s own authority but from permittedfunction of each application [14]. That is, an intruder ex-ploits an application for improper purposes. Therefore, anIDS can detect an intrusion if it can recognize that kind ofdeviation. This idea is common to specification-based in-trusion detection proposed by Ko [6, 7]. However, it isdifficult to recognize proper purposes of an application andto describe the purposes in IDSs whenever a new applica-tion is installed in the system. This type of IDS is classifiedas anomaly intrusion detection.
After all, we use discriminant analysis, a kind ofmultivariate analysis, to detect remote attacks. It can sepa-rate intrusions from normal activities by a calculated clas-sification function. Knowledge of neither remote attacksnor normal function of network application is necessary inour method of detecting remote attacks. Moreover, al-though it can detect some unknown intrusion patterns, it isa lightweight intrusion detection method. The details of ourmethod will be described in the next subsection.
2.3. Definition of MLSIs
Briefly, MLSIs are goals of intruders, and in manycases an MLSI accompanies an intrusion. However, an
MLSI may accompany normal activities as well. Therefore,it is desirable that we define MLSIs that indicate intrusionsas much as possible and that contain normal activities aslittle as possible. In the context of the local attack detectionmethod, we defined MLSIs as follows:
• Root shell is started up by a process whose audit-ID* is not root.
• Modification of critical files such as
In remote attack detection method, we define MLSIs asfollows. In all cases, those are activated by networkdaemons.
We monitor /bin/sh because it accompanies buff-er overflow. Besides /bin/sh, we monitor all shells thatare included in /etc/shells. For the purpose of detect-ing “executing arbitrary commands.” we monitor cat,make, etc. Strictly speaking, if we want to detect all arbi-trary executing commands, we must monitor all commands.But that is troublesome. Therefore, we extract some com-mands that are critical for computer systems to monitor. Inorder to detect MLSIs and to decide an intrusion, we mustcollect system calls. We have developed an audit tool thatcan record all system calls generated on Redhat Linux(kernel 2.2.14).
In this paper, we consider network daemon programsas normal activities and cracking tools available on theInternet as remote attacks. We selected 65 normal activitiesat random and recorded almost all system calls generatedby these activities. We also recorded system calls generatedby the cracking tools. The number of samples used indiscriminant analysis is 12 as intrusive activities and 11 asnormal activities that an MLSI has been left. All crackingtools we collected leave an MLSI. Eleven out of 65 normalactivities leave an MLSI. There are cracking tools andMLSIs left by the tools below (Table 1).
2.4. Strategy for extracting system logs
We found that discriminant analysis is effective tointrusion detection. To perform discriminant analysis, wemust determine how to obtain samples. We obtained intru-sion samples by running cracking tools and normal activi-ties by running network daemon programs on hosts on anetwork. However, it is difficult to extract one sampleautomatically from system logs because the records of all
*An audit-ID is properly assigned to a user when he or she logs into a host.If the user changes his or her ID by su, the audit-ID is not changed.
52

processes executed on a host at that moment are outputtedinto system logs. Although each process can be identifiedby its process ID, we cannot easily identify the relation(e.g., parent–child relationship, ancestor or descendant, orhaving no relation) of the processes. Furthermore, oneactivity is not always constructed by one process, and a startpoint and end point of an activity (not a session) in a logfile are not easily identified. For reasons, it is difficult toautomatically extract one sample (activity) from systemlogs in an IDS. If we implement a complicated procedurethat extracts a sample from a log file in IDA, we violate theintended design goal (light weight) of IDA. Therefore, wemust consider how to extract a sample from a log file easily.We consider the extraction method from the followingpoints of view.
• The number of system callsA certain number of system calls are extracted in a
certain number of processes that are in a parent-and-childrelation in system log. Extraction is performed by back-tracking from when an MLSI occurs and the number ofsystem calls and processes extracted are fixed beforehand.
• TimeSystem calls are extracted within a certain time which
is fixed beforehand. The system calls are contained in oneor more processes that are in a parent-and-child relation.Extraction is performed by backtracking from when anMLSI occurs.
• The number of processesAll system calls are extracted within a fixed number
of processes that are in a parent-and-child relation. Extrac-tion is performed by backtracking from when an MLSIoccurs.
• Characteristic system callSystem calls are extracted in one or more processes
that are in a parent-and-child relation. The extraction range
is based on certain characteristic system calls (e.g., fork,exit, etc.) to an MLSI.
We investigated the details of the obtained system logs andexamined how to extract system calls in terms of the above-mentioned viewpoints.
• The number of system callsThe numbers of system calls generated in each activ-
ity were a minimum of 6 and a maximum of 3410.• TimeAbout 80% of all data required an execution time of
less than 1 second, and about 20% required an executiontime of 2 seconds or more.
• The number of processesThe numbers of processes which occurs during one
activity among all data were minimum of 1 and a maximumof 12.
• Characteristic system callAlthough the number of system calls which appeared
among all data was about 70, there was no system call thatwas sure to appear in every activity; therefore, we cannotchoose any one system call (i.e., starting point of extrac-tion).
A comprehensive consideration of the above indi-cates that it is not realistic to extract one sample in terms oftime, the number of processes, or a characteristic systemcall. For example, when one sample is cut off in less than lsecond, some activities may not be ended within that time.That is, it will be cut in the middle of an act. According tothe system’s operating situation, the same sample is notnecessarily obtained from the same activity. For example,a large overhead requires too much execution time. There-fore, the number of system calls decreases. On the otherhand, the number of processes contained in one activity isfluid. After all, it is realistic to assume that all processes arechosen or are restricted to one. At any rate, the beginningof one activity (not a session) cannot be easily recognizedmechanically. On synthesizing all the available informa-tion, we decided to extract system calls in a single processthat revealed an MLSI. Furthermore, we changed the num-ber of system calls cut off in the process and examinedwhether this would result in a change in discriminant analy-sis. Section 3.3 describes the details.
Due to extract system calls which constitute a samplefrom one process, it is possible for a network service thatactivates a child process with respect to each request of auser to identify an individual sample based on process IDin the case that some users access the network servicesimultaneously or one user performs some activities simul-taneously in the service. Many services activated by inedtfall into this type. There are a few services such as cannaserver or jserver, which are input methods for Japanese, thatprocess more than one user’s request in one process. Our
Table 1. Cracking tools and MLSIs
53
method works in almost all cases except this type of service.However, neither canna server nor jserver has left MLSIs,and we remove both services from our investigation.
3. Intrusion Detection Based onDiscriminant Analysis
3.1. Outline of discriminant analysis
An MLSI may be left by a normal activity. Therefore,after detecting an MLSI, it is necessary to judge whetherthe activity that leaves the MLSI is normal or intrusive. Weemploy discriminant analysis to determine this.
The goal of multivariate analysis is to analyze therelationships among many variables. Multivariate analysisconsists not of one method but of several techniques. Thechoice of methods and the types of analyses employed aredetermined largely by the objectives of the investigation.Multivariate methods most naturally lend themselves to thefollowing objectives [15]:
1. Data reduction or structural simplification2. Sorting and grouping3. Investigation of dependence among variables4. Prediction5. Construction and testing of hypotheses
We employ discriminant analysis for the purpose of “sort-ing and grouping.” By “sorting and grouping,” a group ofsimilar samples can be established based on a measuredcharacteristic. Specifically, discriminant analysis providesa function that classifies samples.
The goal of discriminant analysis, which was estab-lished by Fisher [16], is to discriminate between two groups(populations) that overlap so that the rate of misclassifica-tion may be decreased as much as possible. The analysistries to find a classification function that minimizes theprobability of misclassification. It is possible to performdiscriminant analysis on arbitrary groups. However, thisdoes not mean that any groups are well separable (i.e.,provide a low misclassification rate) by discriminant analy-sis. If discriminant analysis can provide a low error rate, theclassification function is adequate.
Discriminant analysis provides a classification func-tion that does not only separate two groups of knownsamples but also classifies a new sample in either group.Using discriminant analysis, we can discriminate betweena group of normal behaviors and a group of intrusivebehaviors, and we can classify an unknown activity intoeither group without having to update the data for analysis.Further, the classification is determined using a simplequadratic equation (the Mahalanobis distance). Thus, we
can reduce the overhead of analyzing and collecting infor-mation (i.e., system calls). Generally, discriminant analysisis performed using the following procedure:
1. Selection of predictor variablesA predictor variable is an element which constitutes
a sample and is data that affects criterion variables (e.g.,whether a sample is an intrusion or not). Predictor variablesare chosen in terms of the following general viewpoints:
• High correlation with the criterion variable• Either will be deleted supposing that predictor
variables have mutually high correlation2. Test of multivariate normal distributionIn discriminant analysis, if we plan to separate only
groups of intrusions from normal activities, it is not neces-sary to assume the normality of the two groups [15]. How-ever, if we want to classify a new and unknown activity(sample) into either the group of intrusions or the group ofnormal activities, we should first test the normality of thetwo groups. In the case in which each group is not normallydistributed, it is necessary to transform the variables so thatthe variables in each group are more nearly normal.
3. Test of equality in covariance matrixNext, we investigate the equality of the covariance
matrices of the intrusion group and the normal group. If thecovariance matrices are equal, a linear discriminant func-tion is employed for analysis. If the covariance matrices arenot equal, the Mahalanobis distance is used. In this paper,the covariance matrices of the two groups are not equal. Asa result, we perform discriminant analysis using the Maha-lanobis distance.
4. Discrimination between groupsDiscrimination is achieved using the linear discrimi-
nant function and discriminant score or using the Maha-lanobis distance, the results of separation are estimated bycalculating the apparent error rate (APER) (describedlater).
5. Evaluation of classification functionThe classification function (i.e., linear discriminant
function or the Mahalanobis distance) is evaluated by cal-culating the actual error rate (AER) (described later). If weuse a large number of samples to determine a classificationfunction, it can be considered that the apparent error rate isthe same as the actual error rate. If we cannot obtain a largenumber of samples, we evaluate the samples by means ofjackknifing, and obtain an estimate of the expected actualerror rate. This is explained in detail in the followingsubsection.
3.2. Discriminating between intrusions andnormal activities
We tried to separate remote attacks from normalnetwork activities. In this subsection, the details of this
54

process are described using one example. We used for ouranalysis a set of multivariate analysis tools made by EsumiCorp. [17].
3.2.1. Making predictor variables
In performing discriminant analysis for intrusion de-tection, if we can select each kind of system call as apredictor variable, the process is simple. That is, we chosecertain kinds of system calls such as “execve” and“open,” and count how many times they appear in oneactivity in the log file. Then, discriminant analysis is per-formed for such data regarding one sample. We find, how-ever, that the population of system calls does not follow themultivariate normal distribution. We must make new pre-dictor variables that follow the multivariate normal distri-bution.
In order to establish new predictor variables, we firstchoose system calls that show comparatively strong corre-lations with intrusions. Next, we extract the system calls bythe length fixed beforehand, and count how many times theselected system calls have appeared in the extracted log.Extraction is performed by backtracking from when anMLSI occurs. For example, in a certain example, forkoccurs once, open occurs 11 times, and chdir occursonce. In this manner, we generate samples and performprincipal component analyses of the samples to make thenew variables. Finally, we transform the variable (compo-nents) for normalization. This is necessary because thesamples obtained by principal component analysis are notnormally distributed. Thereby, we can classify a new andunknown activity (sample) into either the group of intru-sions or the group of normal activities. The details of theprincipal analysis of system calls and the transformation ofvariables are described in the Appendix.
3.2.2. Test of equality of covariance matricesand separation of the two groups
We test the equality of covariance matrices of eachgroup using the predictor variables obtained previously (thedetails are described in the Appendix). In our case, thecovariance matrices are not equal. Therefore, we classify asample using the Mahalanobis distance. The Mahalanobisdistance D2 between point X and a group that has thedistribution N(µ, Σ) is defined as
where µ is the mean of the group and Σ–1 is the inversematrix of the covariance matrix Σ of the group. x′ is atransposed matrix of x. The Mahalanobis distance takesvariance–covariance into consideration. For the purpose of
classifying an activity into a group of intrusions or a groupof normal activities, we calculate the Mahalanobis distancefrom the activity to each group, and classify the activity intothe nearest group.
The results of an example whose sample contains 400system calls are now considered (Table 2). Each sampleindicates an activity. Samples from No. 1 to No. 11 arenormal activities, and those from No. 12 to No. 23 areintrusions. In addition, in regard to the intrusion data whichwe have, all have left an MLSI. We take up only what hasleft an MLSI as a sample of not only an intrusion but alsoof a normal activity because analysis for intrusion detectionis performed only on the activity that has left an MLSI. Thenumber in the “Gr.” column indicates the group to whichthe sample belongs. Group 1 represents the normal activi-ties and Group 2 represents the intrusions. For example,comparing the distances from sample No. 1 to Group 1(Distance 1) and Group 2 (Distance 2), respectively, theresult shows that the distance to Group 1 is smaller than thatto Group 2. Thus, sample No. 1 is classified into Group 1(normal activities) based on the Mahalanobis distance. No-tably, sample No. 1 belongs to the group of normal activi-ties; the result from the Mahalanobis distance and the actualvalue are identical (i.e., the result of the classification iscorrect). We evaluated the result of the Mahalanobis dis-
Table 2. Results of discrimination
55
tance for each sample. The results show that only sampleNo. 12 was misclassified as normal.
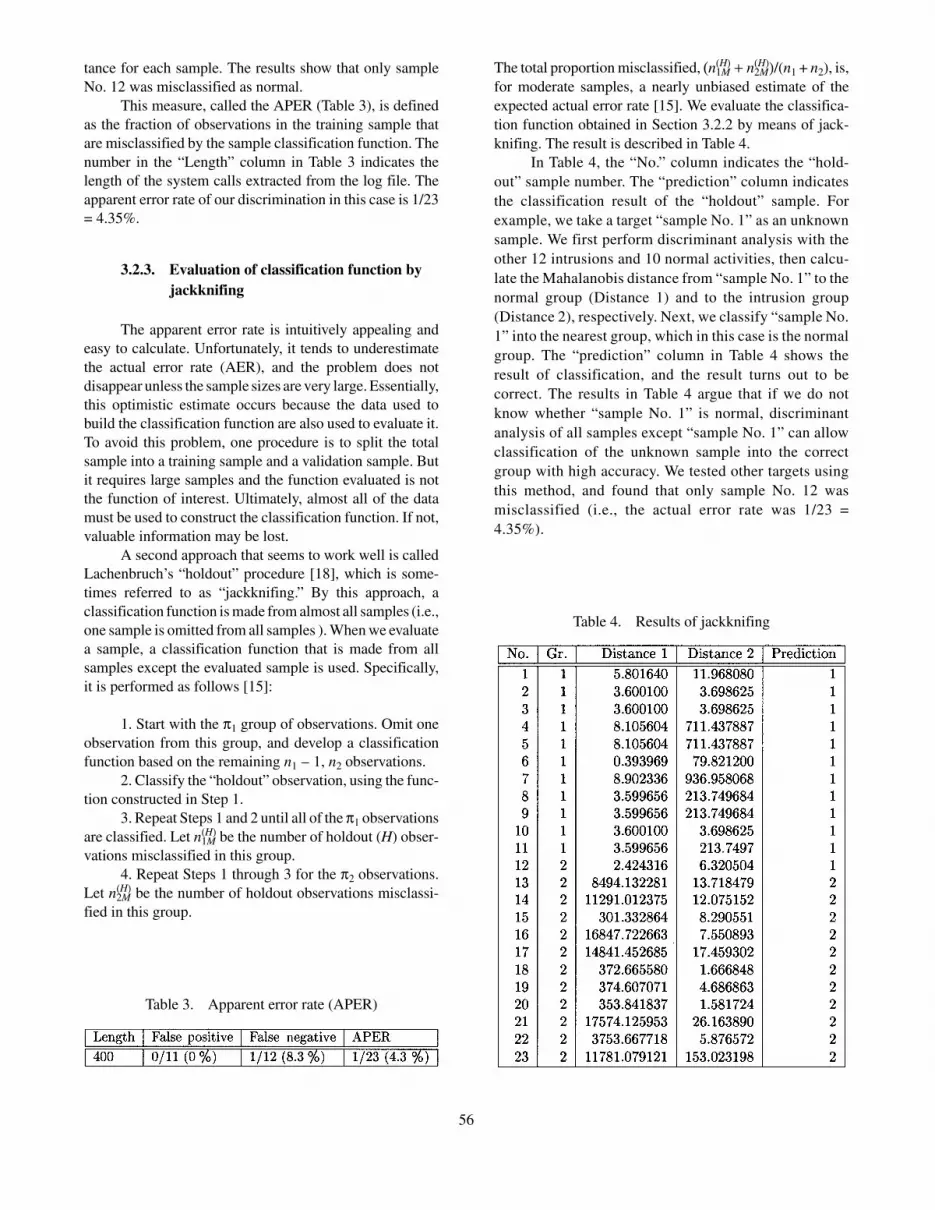
This measure, called the APER (Table 3), is definedas the fraction of observations in the training sample thatare misclassified by the sample classification function. Thenumber in the “Length” column in Table 3 indicates thelength of the system calls extracted from the log file. Theapparent error rate of our discrimination in this case is 1/23= 4.35%.
3.2.3. Evaluation of classification function byjackknifing
The apparent error rate is intuitively appealing andeasy to calculate. Unfortunately, it tends to underestimatethe actual error rate (AER), and the problem does notdisappear unless the sample sizes are very large. Essentially,this optimistic estimate occurs because the data used tobuild the classification function are also used to evaluate it.To avoid this problem, one procedure is to split the totalsample into a training sample and a validation sample. Butit requires large samples and the function evaluated is notthe function of interest. Ultimately, almost all of the datamust be used to construct the classification function. If not,valuable information may be lost.
A second approach that seems to work well is calledLachenbruch’s “holdout” procedure [18], which is some-times referred to as “jackknifing.” By this approach, aclassification function is made from almost all samples (i.e.,one sample is omitted from all samples ). When we evaluatea sample, a classification function that is made from allsamples except the evaluated sample is used. Specifically,it is performed as follows [15]:
1. Start with the π1 group of observations. Omit oneobservation from this group, and develop a classificationfunction based on the remaining n1 – 1, n2 observations.
2. Classify the “holdout” observation, using the func-tion constructed in Step 1.
3. Repeat Steps 1 and 2 until all of the π1 observationsare classified. Let n1M
(H) be the number of holdout (H) obser-vations misclassified in this group.
4. Repeat Steps 1 through 3 for the π2 observations.Let n2M
(H) be the number of holdout observations misclassi-fied in this group.
The total proportion misclassified, (n1M(H) + n2M
(H))/(n1 + n2), is,for moderate samples, a nearly unbiased estimate of theexpected actual error rate [15]. We evaluate the classifica-tion function obtained in Section 3.2.2 by means of jack-knifing. The result is described in Table 4.
In Table 4, the “No.” column indicates the “hold-out” sample number. The “prediction” column indicatesthe classification result of the “holdout” sample. Forexample, we take a target “sample No. 1” as an unknownsample. We first perform discriminant analysis with theother 12 intrusions and 10 normal activities, then calcu-late the Mahalanobis distance from “sample No. 1” to thenormal group (Distance 1) and to the intrusion group(Distance 2), respectively. Next, we classify “sample No.1” into the nearest group, which in this case is the normalgroup. The “prediction” column in Table 4 shows theresult of classification, and the result turns out to becorrect. The results in Table 4 argue that if we do notknow whether “sample No. 1” is normal, discriminantanalysis of all samples except “sample No. 1” can allowclassification of the unknown sample into the correctgroup with high accuracy. We tested other targets usingthis method, and found that only sample No. 12 wasmisclassified (i.e., the actual error rate was 1/23 =4.35%).
Table 3. Apparent error rate (APER)
Table 4. Results of jackknifing
56

3.3. Classification results of various lengths ofsystem calls
In this subsection, we perform discriminant analysisof various lengths of extracting system calls. Extraction isperformed by backtracking from when an MLSI occurs. Weinvestigate the influence of the extraction length of systemcalls on our classification of intrusions and normal activi-ties. The number of system calls contained in each processdiffers considerably. Analyzing samples that containroughly the same number of system calls leads to an im-provement in accuracy (i.e., a decrease in error rate). Theanalyzed patterns are as follows:
• All system calls which appeared in one processup to an occurrence of an MLSI are extracted.
• One hundred, 200, 300, 400, 500, 600, 700, 800,or 1000 system calls which appeared in one proc-ess up to an occurrence of an MLSI are extracted.
If the number of system calls contained in a processis shorter than the fixed number of system calls extracted,we extract system calls in terms of the shorter length. Forexample, in a case in which we extract 100 system callsfrom observations and 50 system calls appear in one obser-vation, we extract 50 system calls from the observation andgenerate a sample using the 50 system calls. We performdiscriminant analysis of each case, with the results shownin Table 5 which indicates the APER and AER. Althoughthere is some variation, the table shows that an error rate ofaround 400 system calls is low. Based on the results ofanalysis, the difference between normal activities and in-trusions is considered to be clustered around an MLSI.When the range increases, unnecessary information in-creases. Conversely, when the range is too small, theamount of information required for intrusion detection isconsidered to decrease.
4. Discussion
In this paper, we propose an MLSI-based intrusiondetection system which initially detects an MLSI, thenanalyzes and judges whether the MLSI accompanies anactual intrusion. We employ discriminant analysis for dis-tinguishing between normal activities and intrusions. Thissystem includes the following distinctive features.
4.1. Distinctive features of employingdiscriminant analysis
• No need to update the detection rulesEven if some new intrusion patterns are reported, our
method can detect intrusions without updating the decided-upon rules of intrusion detection (i.e., classification func-tion) after discriminating between these groups. This isbecause discriminant analysis is not performed at eachapplication; rather, all activities of network daemons areregarded as the population.
• No database or profilesIn our approach, whether or not an activity is an
intrusion is based on the Mahalanobis distance to the nor-mal group and to the intrusion group (i.e., classification isbased on proximity). Our approach does not require that adatabase be built or that a profile for intrusion detection beestablished; thus, it can reduce system overhead.
• Classification of new intrusions or activities In discriminant analysis, if the data appear to be
multivariate normal, each new sample can be classified intoeither group (i.e., the intrusive group or the normal group)by calculating the classification function. In other words,our method can detect new intrusion patterns. Furthermore,the result of Lachenbruch’s holdout method is a nearlyunbiased estimate of the expected actual error rate.
• No need to keep the order of system callsThe distinctive feature of this method is that we can
detect intrusions without examining all system calls; detec-tion can be performed on the basis of only certain kinds ofsystem calls appearing in privileged processes. Moreover,only the number of system calls is needed for our method.The order in which system calls occurred is not necessaryfor our intrusion detection method.
• Difficulty in evading our methodIt is difficult for attackers to evade our intrusion
detection method. Our method detects intrusions based onthe number of each kind of system call. If an attacker wantsto evade our method, the attacker must leave system callsregarding his or her activity on the target system such thatthe result (value) of substituting the number of system callsfor the classification function is contained in the range ofnormal activities and out of the range of intrusions. This isnot easy. If an attacker does not use any system calls we
Table 5. Error rate
57
select, he or she cannot evade our system. This is becauseour method does not perform intrusion detection based onwhether each system call we select appears or not.
Though we select some (10 to 20) kinds of systemcalls in our discriminant analysis, there are some variationsin the selection of system calls for intrusion detection. Thisdoes not mean that we can perform effective discriminantanalysis for intrusion detection based on random selectionof system calls. However, if selected system calls in eachintrusion detection system adopting our detection methodare different, it is more difficult for attackers to evade ourproposed method.
4.2. Distinctive features of MLSI-basedintrusion detection
• Extracting a sample with ease, and accuracy ofintrusion detection
As described in this paper, it is not generally easy toautomatically extract one activity (not a session) from a logfile. We define MLSIs and a sample for discriminant analy-sis as system calls extracted in terms of a fixed length froman MLSI. As a result of this method, it is easy to extract asample. Moreover, analyzing samples that contain approxi-mately 400 system calls leads to accurate intrusion detec-tion.
• Narrowing down intrusion detection targetthrough the use of an MLSI
In our approach, only a process that leaves an MLSIis a target for intrusion detection. This enables our methodto analyze not all network activities but only a part of them.It is considered that this approach creates a smaller errorrate than a method which separate intrusions from all nor-mal activities. Furthermore, it lessens the effect of falsepositives by narrowing the detection target. That is, if acertain intrusion detection method without MLSI analyzes1000 activities, and the rate of false positives of the methodis 10%, then 100 normal activities are mistaken for intru-sions. Using the same case, if an MLSI is left in 50 activi-ties, then the method using MLSI mistakes 5 normalactivities for intrusions.
• Occurrence rate of MLSIs
We investigated the rate of MLSIs in our developmentenvironment within a certain time and found that the MLSIstriggered at a rate of 0.018% of the system events(4/22,483). If we extracted 400 system calls from an MLSI,we should analyze only 7.1% of the data (1600/22,483).
Though this is dependent on the environment, it is oneexample demonstrating the validity of our method.
4.3. Problems accompanying our method
• Intrusion detection after finding an MLSI
In our approach, intrusion detection begins only afteran MLSI is discovered. This means that the method cannotdetect intrusions before the attack that left the MLSI hasbeen completed, which is a disadvantage of our system. Forexample, USTAT [19] can detect intrusion in the middle ofthe intrusion activity. However, our experiments showedthat our method can detect an intrusion within 1 secondafter an MLSI is discovered. Moreover, IDA, which em-ploys our method, has mechanisms in its operating systemthat prevent an intruder from modifying system logs evenif he or she gains the privileged mode [20].
• Criterion of selecting system calls for classifica-tion function
In this paper, we select system calls based on corre-lation with intrusion, and perform discriminant analysis ineach case. However, correlation with intrusion varies interms of the length of system calls extracted. Therefore, thekind of system calls required for discriminant analysis arenot fixed. Moreover, it may be more accurate to selectsystem calls a part of which have low correlation withintrusion. We cannot assert that the selection method basedon correlation with intrusion is the most efficient.
5. Conclusion
In this paper, we define MLSIs for use in remoteattack detection in IDA system and describe a new intrusiondetection method that uses discriminant analysis. Our re-sults demonstrated that extracting a certain number of sys-tem calls from system logs raises detection accuracy.Moreover, initiating intrusion detection after finding anMLSI reduces analysis overhead. We also describe how toextract system calls from log files. In addition, although wepropose a new intrusion detection method which integratesdiscriminant analysis into MLSI-based intrusion detection,discriminant analysis can also be used for intrusion detec-tion with methods other than MLSIs.
Our future research includes the following: • Collecting more samples in a live environment.• Extending our method to cover other types of
intrusions, such as local attacks.• Experimenting with IDA using this approach in a
live environment.
58
REFERENCES
1. http://www.ipa.go.jp/STC/ida2. Asaka M. Information-gathering with mobile agents
for an intrusion detection system. Systems and Com-puters in Japan 1999;30:31–37.
3. Asaka M, Tsuchiya M, Onabuta T, Okazawa S, GotoS. Local attack detection and intrusion route tracing.IEICE Trans Commun 1999;E82-B:1826–1833.
4. Forrest S, Hofmeyr SA, Somayaji A, Longstaff TA.A sense of self for Unix processes. Proc IEEE Sym-posium on Computer Security and Privacy, 1996.
5. Hofmeyr SA, Somayaji A, Forrest S. Intrusion detec-tion using sequences of system calls. Computer Se-curity 1998;6:151–180.
6. Ko C, Fink G, Levitt K. Automated detection ofvulnerabilities in privileged programs by executionmonitoring. Proc 10th Annual Computer SecurityApplications Conference, Orlando, FL, 1994, p 134–144.
7. Ko C, Ruschitzka M, Levitt K. Execution monitoringof security-critical programs in distributed systems:A specification-based approach. Proc IEEE Sympo-sium on Security and Privacy, p 134–144, 1997.
8. Lunt TF. Detecting intruders in computer systems.Conference on Auditing and Computer Technology,1993.
9. Lunt TF et al. A real time intrusion detection expertsystem (IDES). Technical Report, Computer ScienceLaboratory, SRI International, Menlo Park, CA,1992.
10. Denning DE. An intrusion-detection model. IEEETrans Eng 1987;13:222–232.
11. http://www-rnks.informatik.tu-cottbus.de/sobirey/ids.html
12. Kim GH, Spafford EH. Experience with Tripwire:Using integrity checkers for intrusion detection. Pur-due Technical Report CSD-TR-94-012, 1994.
13. http://www.tripwiresecurity.com/14. Harada S, Asaka M. Applying legitimate access da-
tabase for MLSI-based intrusion detection. IPSJ J2000;41:2208–2215. (in Japanese)
15. Johnson RA, Wichern DW. Applied multivariate sta-tistical analysis. 4th edition. Prentice–Hall; 1998.
16. Fisher RA. The statistical utilization of multiplemeasurements. Annals of Eugenics 1938;8:376–386.
17. http://www.esumi.co.jp18. Lachenbruch PA, Mickey MR. Estimation of error
rate in discriminant analysis. Technometrics1968;10:1–10.
19. Ilgun K, Kemmerer RA, Porras PA. State transitionanalysis: A rule-based intrusion detection approach.IEEE Trans Software Eng 1995;21:181–199.
20. Onabuta T, Inoue T, Asaka M. The study of securitymechanism for intrusion detection systems. Tech RepIEICE 2000;ISEC2000-48.
21. Box G, Cox D. An analysis of transformations. J RStat Soc B 1964;26:211–252.
APPENDIX
Generate Predictor Variables by Use ofPrincipal Component Analysis
1. Generate predictor variables
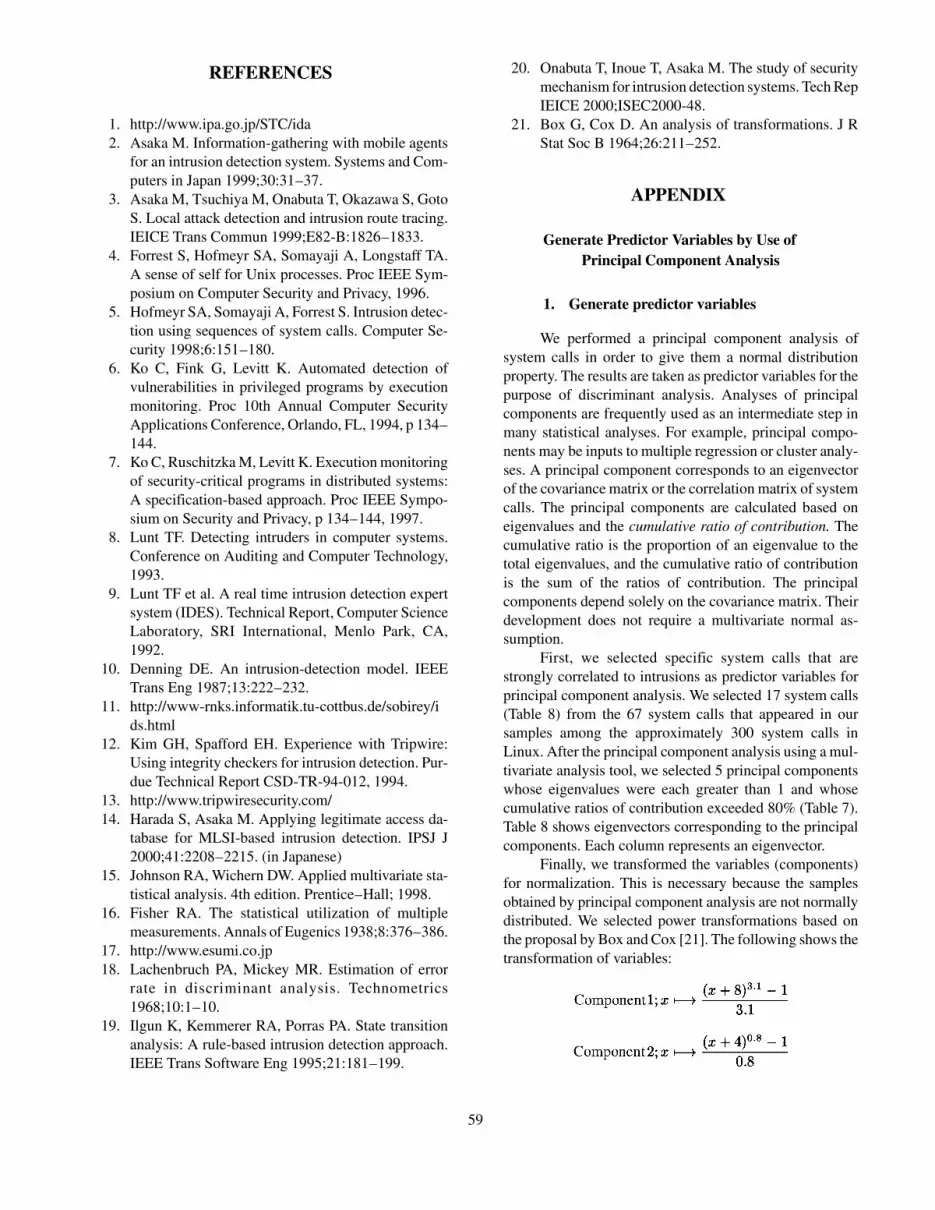
We performed a principal component analysis ofsystem calls in order to give them a normal distributionproperty. The results are taken as predictor variables for thepurpose of discriminant analysis. Analyses of principalcomponents are frequently used as an intermediate step inmany statistical analyses. For example, principal compo-nents may be inputs to multiple regression or cluster analy-ses. A principal component corresponds to an eigenvectorof the covariance matrix or the correlation matrix of systemcalls. The principal components are calculated based oneigenvalues and the cumulative ratio of contribution. Thecumulative ratio is the proportion of an eigenvalue to thetotal eigenvalues, and the cumulative ratio of contributionis the sum of the ratios of contribution. The principalcomponents depend solely on the covariance matrix. Theirdevelopment does not require a multivariate normal as-sumption.
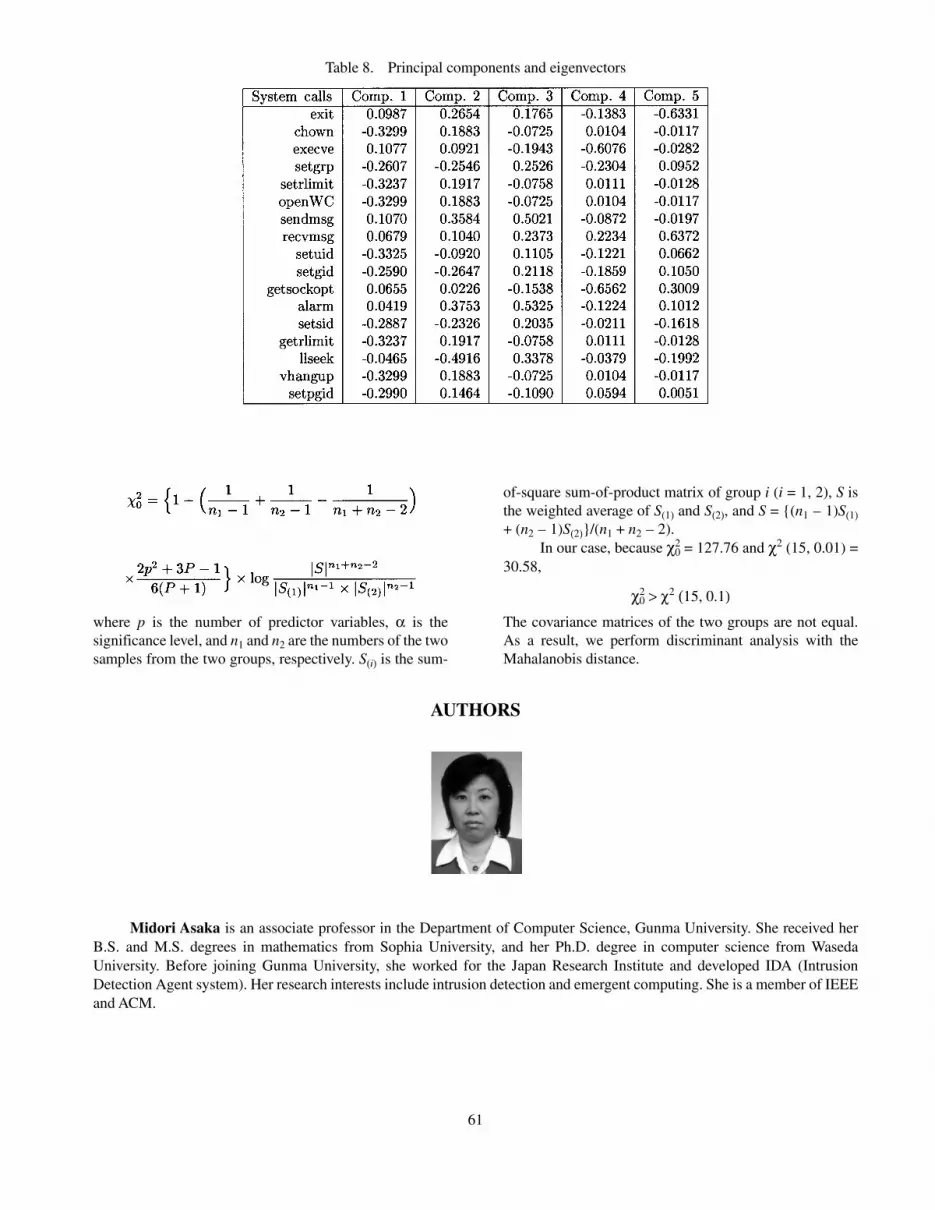
First, we selected specific system calls that arestrongly correlated to intrusions as predictor variables forprincipal component analysis. We selected 17 system calls(Table 8) from the 67 system calls that appeared in oursamples among the approximately 300 system calls inLinux. After the principal component analysis using a mul-tivariate analysis tool, we selected 5 principal componentswhose eigenvalues were each greater than 1 and whosecumulative ratios of contribution exceeded 80% (Table 7).Table 8 shows eigenvectors corresponding to the principalcomponents. Each column represents an eigenvector.
Finally, we transformed the variables (components)for normalization. This is necessary because the samplesobtained by principal component analysis are not normallydistributed. We selected power transformations based onthe proposal by Box and Cox [21]. The following shows thetransformation of variables:
59
2. Test of multivariate normal distribution
We tested whether or not the samples are normallydistributed by using a method called Q–Q plots [15] afterthe transformation of variables. The steps leading to a Q–Qplot are:
1. Order the original observation to get x(1), x(2), . . . ,x(n) and their corresponding probabil ity values(1 − 1
2)/n,(2 − 1
2)/n, . . . , (n − 1
2)/n;
2. Calculate the standard normal quantiles*
q(1), q(2), . . . , q(n); and3. Plot the pairs of observations (q(1),x(1)),
(q(2), x(2)), . . . , (q(n), x(n)), and examine the “straightness”of the outcome.
The straightness of the Q–Q plot can be measured bycalculating the correlation coefficient rQ of the points in theplot. In the case of the sample size n ≤ 11, we rejected thehypothesis of normality at the significance level of 1% ifrQ falls below 0.89. In the case of the sample size n ≤ 12,we rejected the hypothesis of normality at the significancelevel of 1% if rQ falls below 0.90. Each correlation coeffi-cient rQ of the principal components of the normal group is
above 0.89, and that of the intrusion group is above 0.90.Therefore, the hypothesis of normality was not rejected.
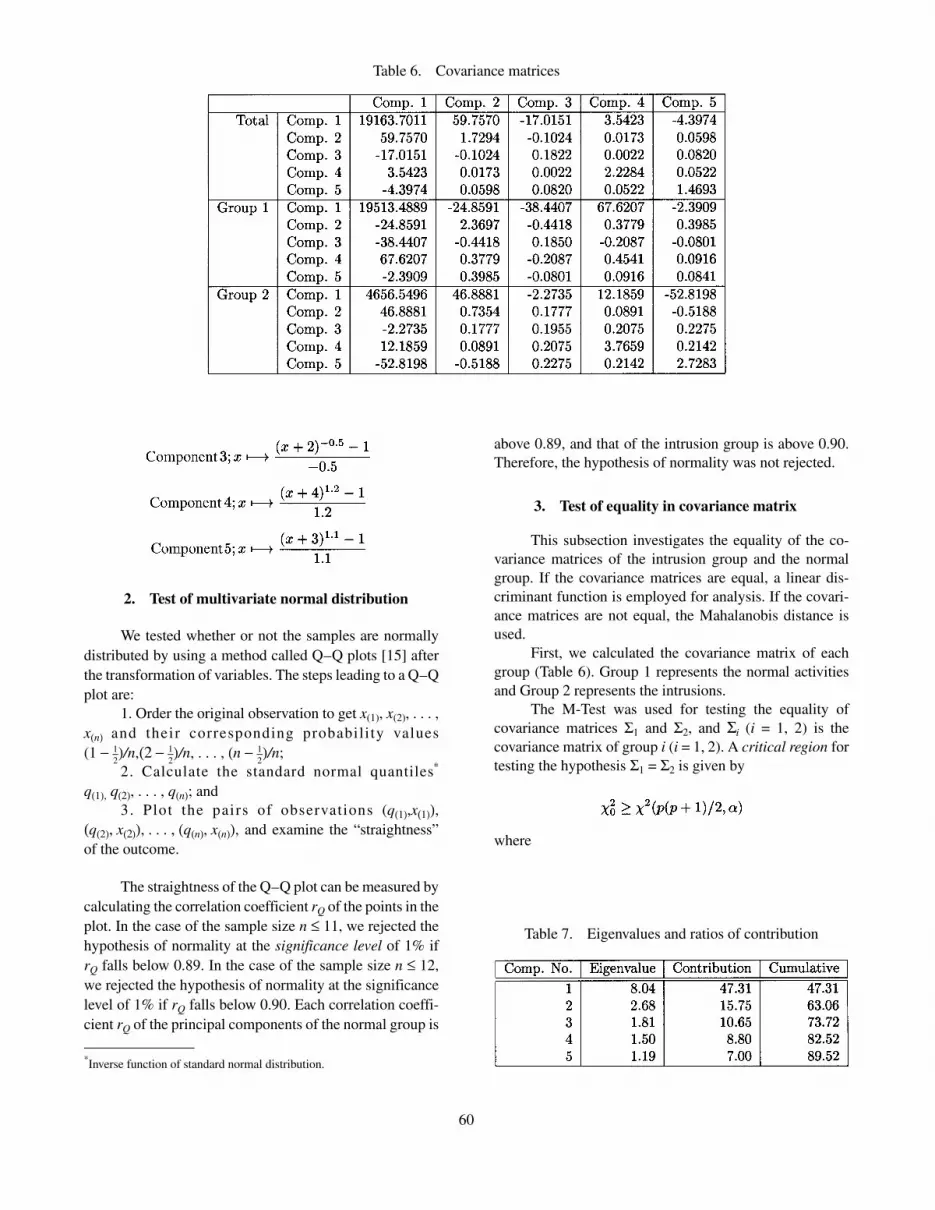
3. Test of equality in covariance matrix
This subsection investigates the equality of the co-variance matrices of the intrusion group and the normalgroup. If the covariance matrices are equal, a linear dis-criminant function is employed for analysis. If the covari-ance matrices are not equal, the Mahalanobis distance isused.
First, we calculated the covariance matrix of eachgroup (Table 6). Group 1 represents the normal activitiesand Group 2 represents the intrusions.
The M-Test was used for testing the equality ofcovariance matrices Σ1 and Σ2, and Σi (i = 1, 2) is thecovariance matrix of group i (i = 1, 2). A critical region fortesting the hypothesis Σ1 = Σ2 is given by
where
Table 7. Eigenvalues and ratios of contribution
Table 6. Covariance matrices
*Inverse function of standard normal distribution.
60
where p is the number of predictor variables, α is thesignificance level, and n1 and n2 are the numbers of the twosamples from the two groups, respectively. S(i) is the sum-
of-square sum-of-product matrix of group i (i = 1, 2), S isthe weighted average of S(1) and S(2), and S = {(n1 – 1)S(1)+ (n2 – 1)S(2)}/(n1 + n2 – 2).
In our case, because χ02 = 127.76 and χ2 (15, 0.01) =
30.58,
χ02 > χ2 (15, 0.1)
The covariance matrices of the two groups are not equal.As a result, we perform discriminant analysis with theMahalanobis distance.
AUTHORS
Midori Asaka is an associate professor in the Department of Computer Science, Gunma University. She received herB.S. and M.S. degrees in mathematics from Sophia University, and her Ph.D. degree in computer science from WasedaUniversity. Before joining Gunma University, she worked for the Japan Research Institute and developed IDA (IntrusionDetection Agent system). Her research interests include intrusion detection and emergent computing. She is a member of IEEEand ACM.
Table 8. Principal components and eigenvectors
61

AUTHORS (continued) (from left to right)
Takefumi Onabuta received his B.E. degree in economics from Musashi University in 1994 and M.S. degree ininformation science from the Japan Advanced Institute of Science and Technology in 1996. He has been with the Japan ResearchInstitute since 1996. His research interests include mobile agent and intrusion detection systems. He is a member of IPSJ.
Tadashi Inoue received his B.S. degree in science from Hirosaki University in 1994, and M.S. degree in informationscience from the Japan Advanced Institute of Science and Technology in 1996. He is currently with Software Research AssociatesInc. His research interests include formal method and intrusion detection systems. He is a member of IPSJ.
Shunji Okazawa received his B.E. degree in information and computer sciences from Osaka University in 1994 and M.E.degree in information science from Nara Institute of Science and Technology in 1996. He joined the Japan Research Institutein 1996. His research interests are in intrusion detection.
Shigeki Goto is a professor in the Department of Information and Computer Science, Waseda University. He receivedhis B.S. and M.S. degrees in mathematics from the University of Tokyo. Prior to becoming a professor at Waseda University,he worked for NTT for many years. He also earned a Ph.D. degree in information engineering from the University of Tokyo.He is a computer scientist and an editor of New Generation Computing (Ohm Press and Springer-Verlag). He is a member ofACM and IEEE, and was a trustee of the Internet Society from 1994 to 1997.
62