Embed Size (px)
Citation preview

Reimagining Everything CX
Concentrix Investor DayJanuary 25, 2022

2022 Concentrix Corp. All Rights Reserved.
Slides Not for Publication Without Express Written Consent
Safe Harbor StatementsThis presentation includes forward-looking statements within the meaning of Section 27A of the Securities Act of 1933 and Section 21E of the Securities
Exchange Act of 1934. Forward-looking statements include, but are not limited to, statements regarding the Company’s expected future financial
condition, results of operations, including revenue, revenue growth, operating income and EBITDA, margin expansion, effective tax rate, cash flows,
leverage, liquidity, business strategy, competitive position, acquisition opportunities and industry consolidation, capital allocation, capital expenditures,
growth opportunities, expansion of capabilities, operational efficiencies, automation, market opportunity and forecasts, long-term financial targets,
including revenue, revenue from mergers and acquisitions, annual organic revenue growth, non-GAAP operating income margin, technology-infused
revenue, and statements that include words such as believe, expect, may, will, provide, could and should and other similar expressions. These forward-
looking statements are inherently uncertain and involve substantial risks and uncertainties that could cause actual results to differ materially from those
expressed or implied by such statements. Risks and uncertainties include, among other things: risks related to general economic conditions, including
uncertainty related to the COVID-19 pandemic and its impact on the global economy, supply chains, inflation, the Company’s business and the business
of the Company’s clients; other communicable diseases, natural disasters, adverse weather conditions or public health crises; cyberattacks on the
Company’s or its clients’ networks and information technology systems; the inability to protect personal and proprietary information; the failure of the
Company’s staff and contractors to adhere to the Company’s and its clients’ controls and processes; the inability to execute on the Company’s digital CX
strategy; the inability to successfully identify, complete and integrate strategic acquisitions or investments, including the integration of PK; competitive
conditions in the Company’s industry and consolidation of its competitors; geopolitical, economic and climate or weather related risks in regions with a
significant concentration of the Company’s operations; higher than expected tax liabilities; the loss of key personnel; the demand for CX solutions and
technology; variability in demand by the clients or the early termination of the Company’s client contracts; the level of business activity of the Company’s
clients and the market acceptance and performance of their products and services; the operability of communication services and information technology
systems and networks; changes in law, regulations or regulatory guidance; currency exchange rate fluctuations; damage to the Company’s reputation
through the actions or inactions of third parties; increases in the cost of labor; investigative or legal actions; and other factors contained in the Company’s
Annual Report on Form 10-K for the fiscal year ended November 30, 2020 filed with the Securities and Exchange Commission and subsequent SEC
filings. The Company does not undertake a duty to update forward-looking statements, which speak only as of the date on which they are made.

2022 Concentrix Corp. All Rights Reserved. Slides Not for Publication Without Express Written Consent
Today’s Agenda

2022 Concentrix Corp. All Rights Reserved.
Slides Not for Publication Without Express Written Consent
Today’s Team
Monica EggerSenior Vice President
Financial Planning and Analysis
Cormac TwomeyExecutive Vice President
Global Operations and Delivery
Rick RossoExecutive Vice President
Sales and Account Management
Andre ValentineChief Financial Officer
Dinesh VenugopalPresident
Concentrix Catalyst
Bahar OzkanGlobal Senior Director
Wellbeing, Trust & Safety
Denise McCutchen-GraceGVP, Customer Interaction Technologies
Vijay IjjuHead of Strategy and Technology
Concentrix Catalyst
Kathy JuveExecutive Vice President
CX Technology, Analytics & Insights
Chris CaldwellPresident and CEO
Concentrix Corporation

2022 Concentrix Corp. All Rights Reserved.
Slides Not for Publication Without Express Written Consent
Today’s Key Messages
We are Reimagining Everything CX, to be the greatest
customer engagement company in the world
Market leader
driving revenue
growth and
margin expansion
Dynamic and
growing market
Exceptional client
base and strategic
partnerships
Industry-leading
capabilities, with
a view to the
future

2022 Concentrix Corp. All Rights Reserved.
Slides Not for Publication Without Express Written Consent
We’re Just Getting Started

2022 Concentrix Corp. All Rights Reserved.
Slides Not for Publication Without Express Written Consent
CX isn’t what it used to be
800#In
Person
Letter

2022 Concentrix Corp. All Rights Reserved.
Slides Not for Publication Without Express Written Consent
The CX ecosystem has expandedCreating new ways for customers and brands to connect
800#Mobile
Web
SocialIn
Person
The
Market
$90B
Source: Everest, IDC, Gartner, HFS,
Markets and Markets, Nelson Hall,
and other industry research.
LetterChat

2022 Concentrix Corp. All Rights Reserved.
Slides Not for Publication Without Express Written Consent
Experiences are now personalized and dynamicEnabled by data and analytics
VoiceMobile
Web
Personalization
Feedback
InsightsProactive
Notifications
AI
SocialIn
Person
Expanded
Market
$410B
Source: Everest, IDC, Gartner, HFS,
Markets and Markets, Nelson Hall,
and other industry research.
LetterChat

2022 Concentrix Corp. All Rights Reserved.
Slides Not for Publication Without Express Written Consent
CX is seamless across physical & virtualEnabled by platforms and technology
VoiceMobile
Web
Personalization
Feedback
InsightsProactive
Notifications
Interconnectivity
Cloud Experience
Platforms
Data
Lakes
APIs
SocialIn
Person
Web 3.0
Digital IT
Services Market
$270B17% growth
Our TAM
$550B+
Source: Everest, IDC, Gartner, HFS,
Markets and Markets, Nelson Hall,
and other industry research.
LetterChat
AI

2022 Concentrix Corp. All Rights Reserved.
Slides Not for Publication Without Express Written Consent
CX “Solution” Market is large and growingFew competitors can offer complete solution
Digital IT
Services Market
$270B17% growth
CX Adjacent
Markets
$320B8% growth
CX BPO
Market
$90B5% growth
Source: Everest, IDC, Gartner, HFS, Markets and Markets, Nelson Hall, and other industry research.

2022 Concentrix Corp. All Rights Reserved.
Slides Not for Publication Without Express Written Consent
CX Adjacent Markets
$320B8% growth
Voice of Customer
DigitalServices
Consulting& Design
Analytics
OtherBPO
AICX Technology
CX BPO
$90B5% growth
Market Size and Peers
Source: Everest, IDC, Gartner, HFS, Markets and Markets, Nelson Hall, and other industry research.
CX BPO and Adjacent Markets
⚫ ~$90B core CX BPO market
o Expected CAGR of ~5% in 2021-2025
o Only ~28% of the CX market is outsourced today
o Includes ~$8B Digital CX, growing considerably
faster at a CAGR of 30-35% in 2016-2020
⚫ Addressable market beyond core $320B+
o Growing 8%+ over the next 3 years
⚫ Overall “CX Solutions” market $410B+

2022 Concentrix Corp. All Rights Reserved.
Slides Not for Publication Without Express Written Consent
Digital IT Services Market
Digital IT
Services Market
$270B17% growth
Market Size and Peers
⚫ Total IT services market size at ~$1T in 2020
o ~9% CAGR in 2020-2022
⚫ Includes $270B digital IT spend
o 17% estimated growth
o Areas include:
• Consulting
• App Development
• Cloud access services
• Application managed services
Source: Gartner and management estimates.
2022 Concentrix Corp. All Rights Reserved.
Slides Not for Publication Without Express Written Consent
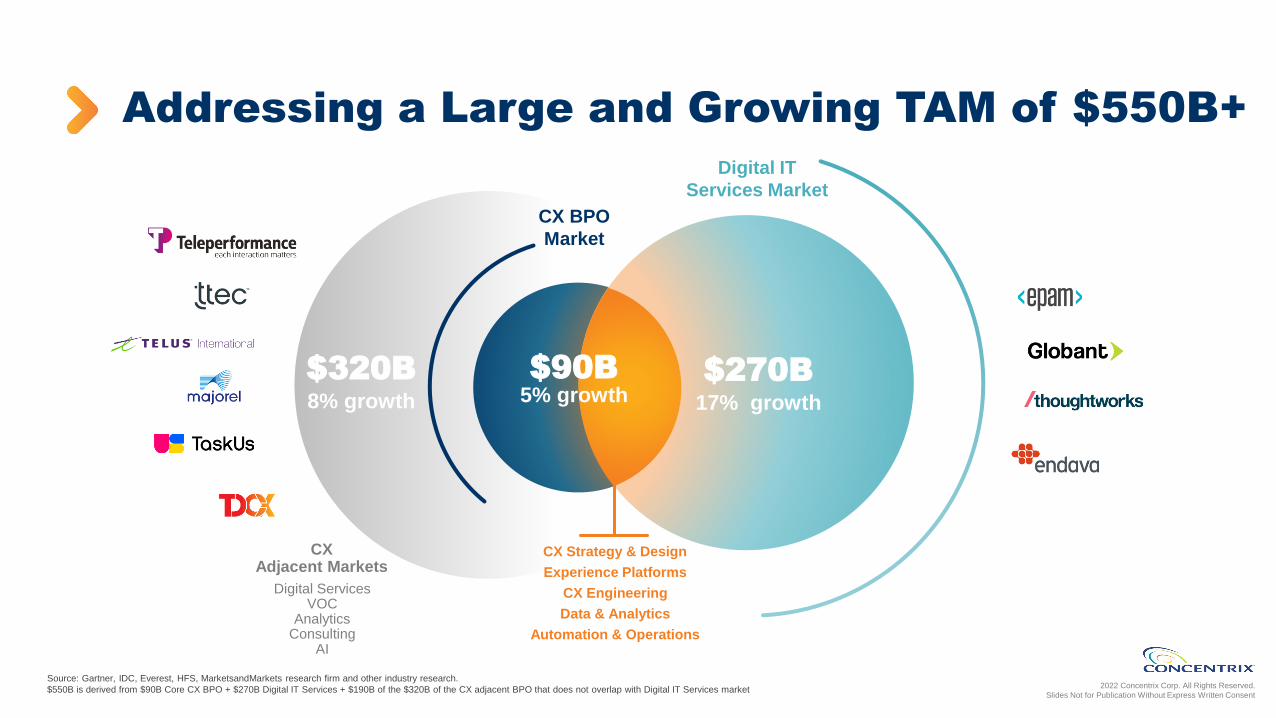
Addressing a Large and Growing TAM of $550B+
$270B17% growth
Digital IT
Services Market
$320B8% growth
CX BPO
Market
Source: Gartner, IDC, Everest, HFS, MarketsandMarkets research firm and other industry research.
$550B is derived from $90B Core CX BPO + $270B Digital IT Services + $190B of the $320B of the CX adjacent BPO that does not overlap with Digital IT Services market
CX Strategy & Design
Experience Platforms
CX Engineering
Data & Analytics
Automation & Operations
$90B5% growth
CXAdjacent Markets
Digital ServicesVOC
AnalyticsConsulting
AI
2022 Concentrix Corp. All Rights Reserved.
Slides Not for Publication Without Express Written Consent
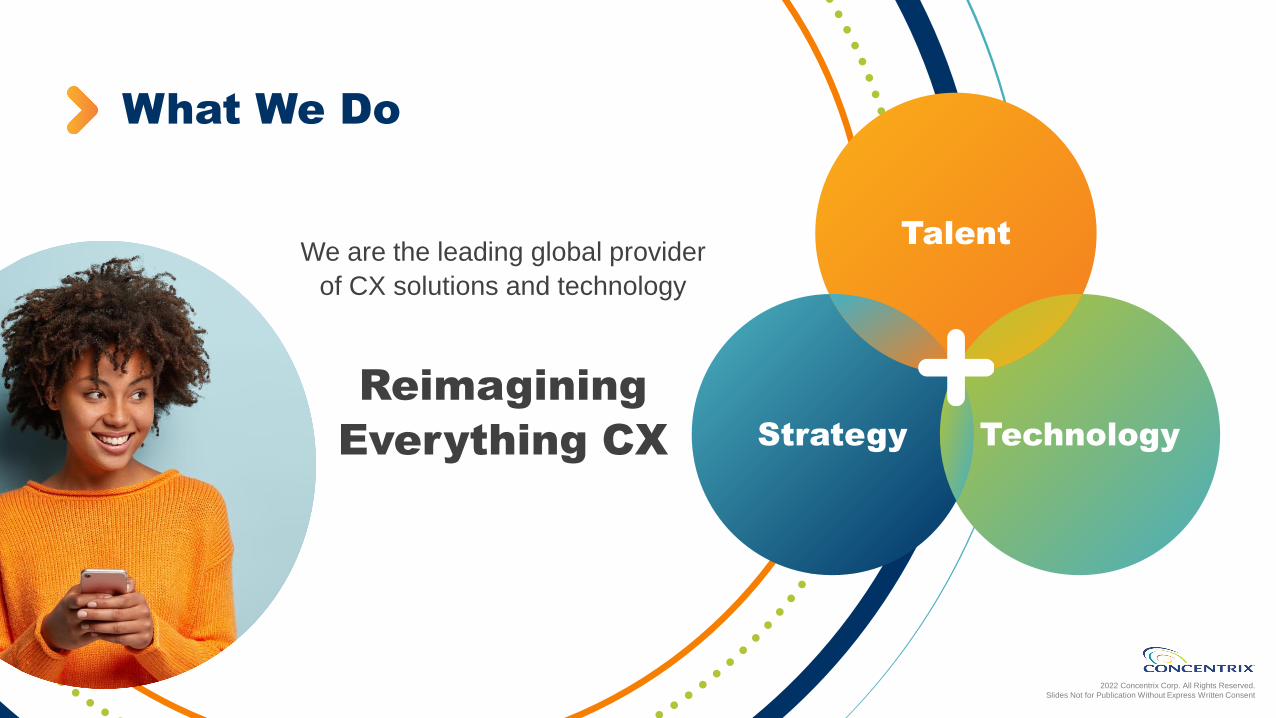
What We Do
We are the leading global provider
of CX solutions and technology
Reimagining
Everything CX TechnologyStrategy
Talent

2022 Concentrix Corp. All Rights Reserved.
Slides Not for Publication Without Express Written Consent
Accepted
personalized
offer from
travel
company
9:42 a.m.
Browsed
social
video
content
10:57 a.m.
Approved
for elective
medical
procedure
1:15 p.m.Applied for
a new
mortgage
3:28 p.m.
Ordered
dinner
delivery
5:14 pm
Configured
a new car and
confirmed
delivery
7:19pm
Virtually
designed and
‘tried on’
new shoes
8:49 pm
7:15 a.m.
Received
blood glucose
alert on
smart device
Updated
online music
subscription
10:01 p.m.
You count on us every single day
Shopped
for NFT on
Metaverse
6:10pm
3:01 a.m.
Received
proactive
fraud alert

2022 Concentrix Corp. All Rights Reserved.
Slides Not for Publication Without Express Written Consent
Our Path Forward
The Evolution of CX

2022 Concentrix Corp. All Rights Reserved.
Slides Not for Publication Without Express Written Consent
CX is a Key Strategic Initiative
Top 5 Executive Business Priorities
HBR: Making Customer Experience the Heart of the Enterprise, 2021
Top 3 Digital IT Business Priorities
57%Customer
Trust &
Loyalty
60%Customer
Experience
51%Customer
Retention
Source: Gartner, McKinsey, client feedback.
35%
37%
44%
47%
58%
Improve customer experience
Increase efficiency/lower costs
Increase revenue
Increase innovation
Improve organizational agility
2022 Concentrix Corp. All Rights Reserved.
Slides Not for Publication Without Express Written Consent
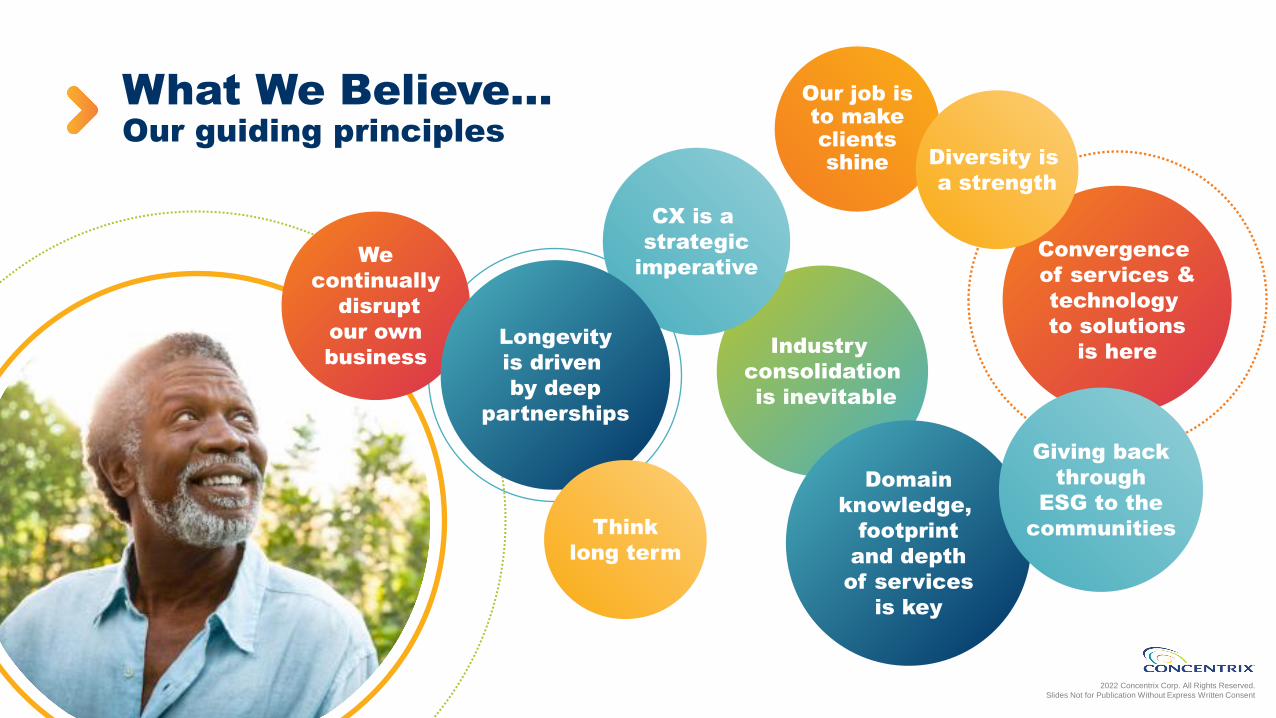
Convergence
of services &
technology
to solutions
is here
What We Believe… Our guiding principles
Industry
consolidation
is inevitable
CX is a
strategic
imperativeWe
continually
disrupt
our own
businessLongevity
is driven
by deep
partnerships
Our job is to make clients shine
Domain
knowledge,
footprint
and depth
of services
is key
Giving back
through
ESG to the
communitiesThink
long term
Diversity is
a strength

2022 Concentrix Corp. All Rights Reserved.
Slides Not for Publication Without Express Written Consent
Our Board of DirectorsEngaged, driven and diverse
Director
Director
DirectorChair of the Board
Director Director
Director
Director

2022 Concentrix Corp. All Rights Reserved.
Slides Not for Publication Without Express Written Consent
Our Executive LeadershipExperienced, diverse and global
Chris CaldwellPresident and CEO
Concentrix Corporation
Guy BrosseauExecutive Vice President
Information Systems and Security
Philip CassidyExecutive Vice President
Strategic Projects and Corporate Strategy
Monica EggerSenior Vice President
Financial Planning and Analysis
Jason MarasiganSenior Vice President
Corporate Development
Kim SullivanSenior Vice President
People Solutions
Cormac TwomeyExecutive Vice President
Global Operations and Delivery
Debbie GonzalezSenior Vice President
Global Marketing and Communications
Rick RossoExecutive Vice President
Sales and Account Management
Andre ValentineChief Financial Officer
Kathy JuveExecutive Vice President
CX Technology, Analytics and Insights
Jane FogartyExecutive Vice President
Legal and Corporate Secretary
Dinesh VenugopalPresident
Concentrix Catalyst

2022 Concentrix Corp. All Rights Reserved.
Slides Not for Publication Without Express Written Consent
2021 ESG Commitment in Action
MalaysiaHelping underprivileged children
IndiaFighting hunger
Ireland, France, Spain, PortugalKeeping beaches clean & healthy
El SalvadorHelping elderly in need
United StatesCommunity COVID relief efforts
New ZealandFighting impact of climate change
PhilippinesMeasles immunization drive
JapanHelping single mothers
70+Green
initiativesworldwide
72,000+Metric tonreduction
of CO2
87,000+pounds ofE-Wasteethicallyrecycled
100K+Volunteer hours in
2021

2022 Concentrix Corp. All Rights Reserved.
Slides Not for Publication Without Express Written Consent
How We See the Market Working Over TimeSupercycles
⚫ Emerging drivers of new revenue
⚫ Characterized by period of high,
robust growth
⚫ Many successful players in early
stages of cycles that might be smaller
⚫ Consolidation for scale over time with
partners that offer ”more”
⚫ Participants with scale and deep
expertise drive long-term growth and
participate in supercycles differently

2022 Concentrix Corp. All Rights Reserved.
Slides Not for Publication Without Express Written Consent
Offshore
Outsourcing
2000s
eCommerce
2000s
Digital
Transformation
Early 2010s
Content
Moderation
Late 2010s
SupercyclesSuccessfully executing to scale and drive long term growth
Concentrix
⚫ Focused on long-term
growth and real value
⚫ Deep expertise in
multiple disciplines
⚫ Execute through to
scale
24/7 Support
Cost savings
Flexibility
Scalability
Mobile-first
Social
Omnichannel
Ecosystem
Connectivity
5G
User
Experience
Design
Engagement
Acceleration
Cloud
IoT
Agile
AI / ML
Data labelling
Automation
Customization
Compliance

2022 Concentrix Corp. All Rights Reserved.
Slides Not for Publication Without Express Written Consent
Next Gen Supercycles
Metaverse
Web3
Ethical AI
VR / AR
Networking
Digital economy
Edge computing
Blockchain
Security
Interoperability
Semantic Web
Decentralization
Crypto
NFT
Privacy
Anti-bias
Non-discrimination
Transparency
Algorithm
…
…

2022 Concentrix Corp. All Rights Reserved.
Slides Not for Publication Without Express Written Consent
IBM CRM &
Industry Vertical
Business
is acquired
$1.1B
in revenue 2017
2004 20072009
20112013
20152014
2016
2018
2020
2021
2019
$4.7B
in revenue
$189M
in revenue
$2.0B
in revenue
Convergys
is acquired
Concentrix
completes
spin-off
PK is
acquired
2005-2013
Establishing the CX Platform2014-2019
Transformation through disruptive acquisitions
2020 +
Positioned for
growth
Initial
Investment
A Journey of Bold Transformation
2022 Concentrix Corp. All Rights Reserved.
Slides Not for Publication Without Express Written Consent
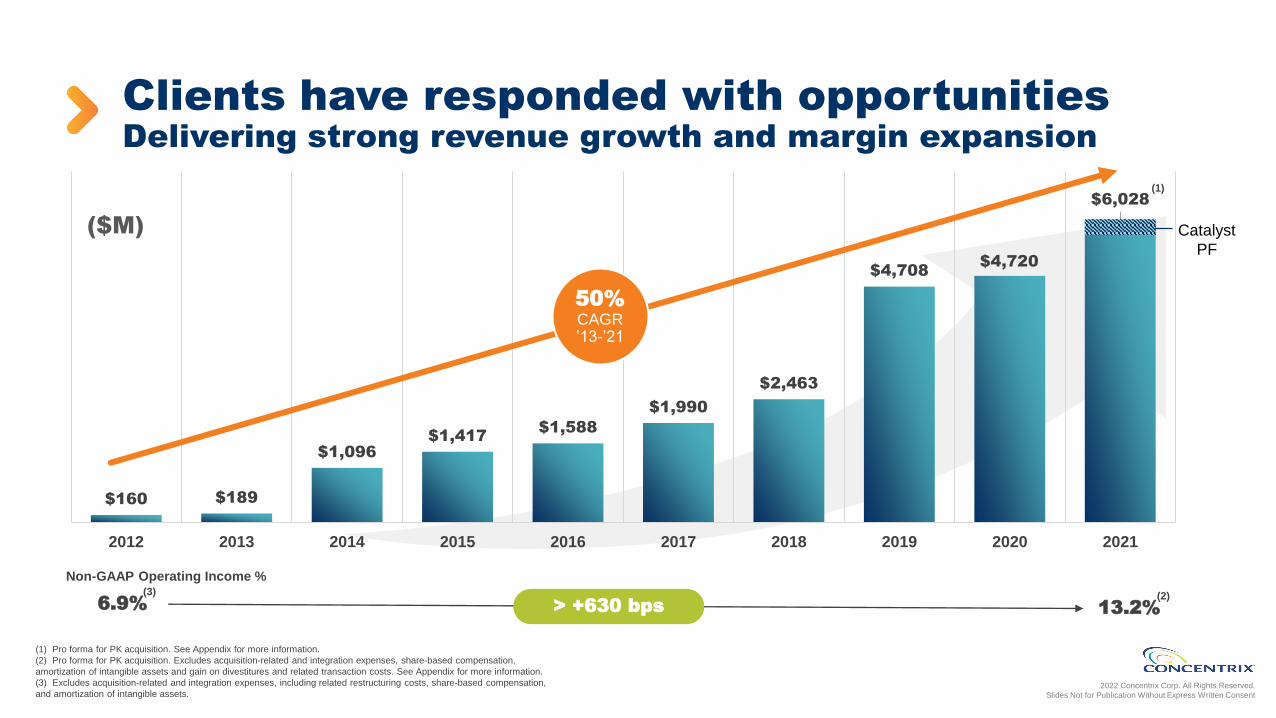
Clients have responded with opportunitiesDelivering strong revenue growth and margin expansion
Non-GAAP Operating Income %
6.9% 13.2%> +630 bps
($M)
$160 $189
$1,096$1,417
$1,588
$1,990
$2,463
$4,708$4,920
$6,028
2012 2013 2014 2015 2016 2017 2018 2019 2020 2021
50%CAGR’13-’21
$4,720
Catalyst
PF
(1) Pro forma for PK acquisition. See Appendix for more information.
(2) Pro forma for PK acquisition. Excludes acquisition-related and integration expenses, share-based compensation,
amortization of intangible assets and gain on divestitures and related transaction costs. See Appendix for more information.
(3) Excludes acquisition-related and integration expenses, including related restructuring costs, share-based compensation,
and amortization of intangible assets.
(1)
(2)(3)

2022 Concentrix Corp. All Rights Reserved.
Slides Not for Publication Without Express Written Consent
Concentrix Today
DEEPindustry and domain
knowledge
EXCEPTIONALtechnology, digital, and
analytics expertise
UNPARALLELEDability to deliver high-value
CX and technology globally
~$380M*Fiscal 2021
Free Cash Flow
~$6.0B*Fiscal 2021
Revenue
~$800M*Fiscal 2021
Non-GAAP OI
16 years
average tenure of
the top 25 clients
168industry awards
FY’20 and ‘21
70+languages
40+ countries
6 continents
750+clients
125+global new
economy clients
100+Fortune Global
500 clients
340+ IP Assets
* Pro forma for PK acquisition. Non-GAAP operating income excludes acquisition-related and integration expenses, share-based compensation, amortization of intangible assets and gain on divestitures and related
transaction costs. Free cash flow is a non-GAAP measure equal to cash flow from operations, less capital expenditures. See Appendix for more information.

2022 Concentrix Corp. All Rights Reserved.
Slides Not for Publication Without Express Written Consent(1) Rankings based on 2021 Global Fortune 500 list; 2021 Bankrate; 2022 ValuePenguin; 2021 Statista
Trusted Partner to Enterprise and New Economy Brands
Select Fortune Global 500 & New Economy Clients (1)
4 of the Top 5
techcompanies
5 of the Top 5
US banks
4 of the Top 5US healthinsurancecompanies
Across All Major Industries
Healthcare Services
Consumer Electronics
Banking & Financial Services
Automotive Insurance Media &
Communications
Retail & e-Commerce
Technology Travel,
Transportation
& Tourism
8 of theTop 10 consumer electronicscompanies
3 of theTop 5
2021 global
IPOs
4 of the Top 5
social
brands
7 of theTop 10
fintech
companies
3 of the
Top 5 e-comm
companies
Our Top 5 clients represented 25% of revenue in 2021
2022 Concentrix Corp. All Rights Reserved.
Slides Not for Publication Without Express Written Consent
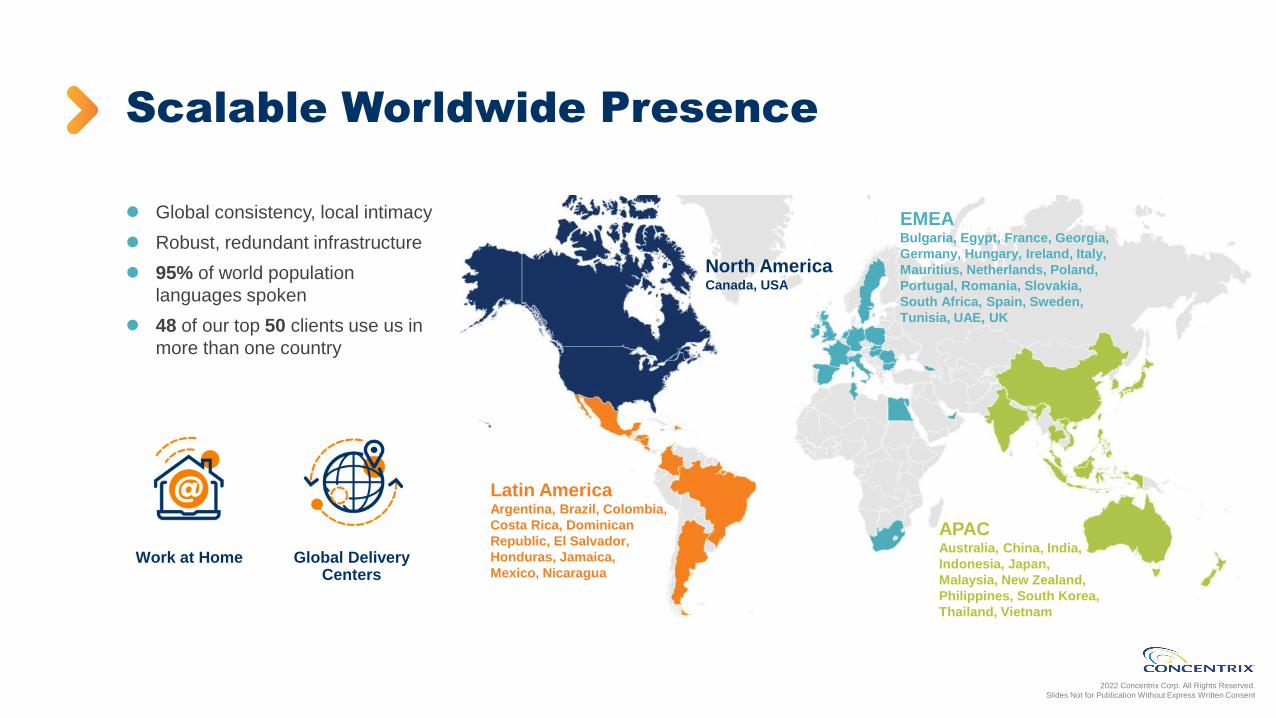
Scalable Worldwide Presence
⚫ Global consistency, local intimacy
⚫ Robust, redundant infrastructure
⚫ 95% of world population
languages spoken
⚫ 48 of our top 50 clients use us in
more than one country
Work at Home Global Delivery Centers
Latin AmericaArgentina, Brazil, Colombia,
Costa Rica, Dominican
Republic, El Salvador,
Honduras, Jamaica,
Mexico, Nicaragua
North AmericaCanada, USA
EMEABulgaria, Egypt, France, Georgia,
Germany, Hungary, Ireland, Italy,
Mauritius, Netherlands, Poland,
Portugal, Romania, Slovakia,
South Africa, Spain, Sweden,
Tunisia, UAE, UK
APACAustralia, China, India,
Indonesia, Japan,
Malaysia, New Zealand,
Philippines, South Korea,
Thailand, Vietnam
2022 Concentrix Corp. All Rights Reserved.
Slides Not for Publication Without Express Written Consent
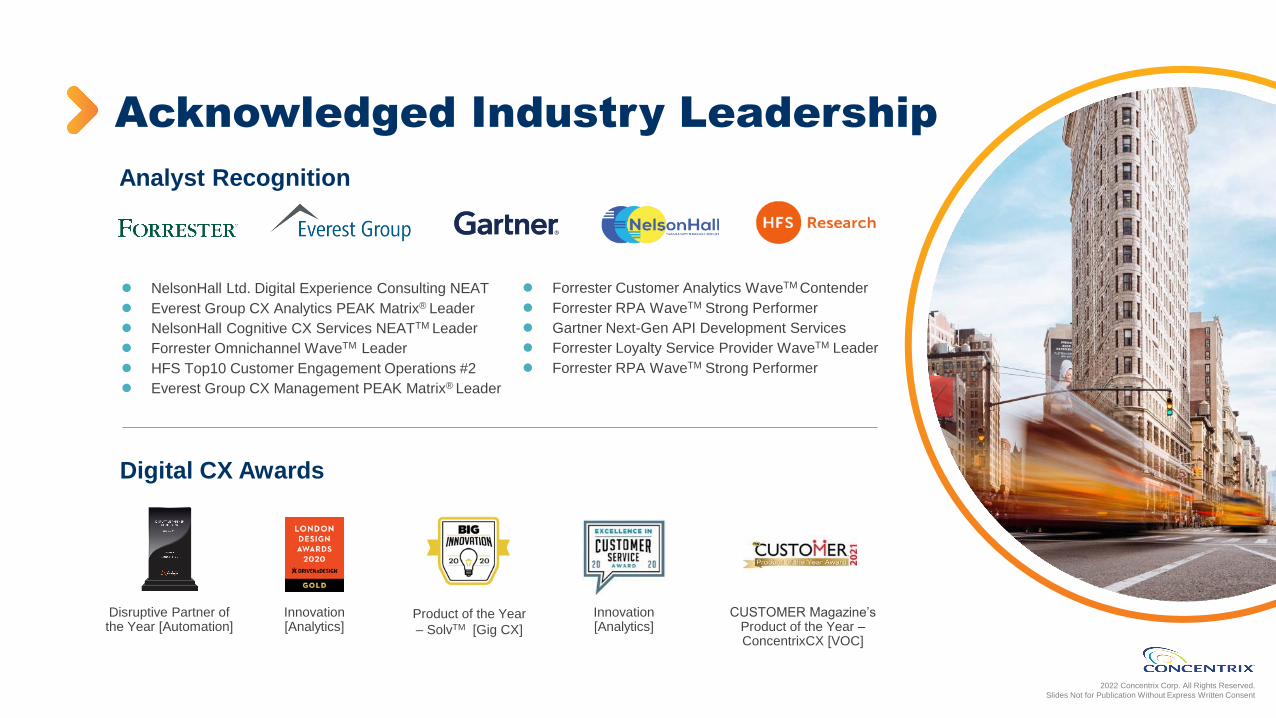
⚫ NelsonHall Ltd. Digital Experience Consulting NEAT
⚫ Everest Group CX Analytics PEAK Matrix® Leader
⚫ NelsonHall Cognitive CX Services NEATTM Leader
⚫ Forrester Omnichannel WaveTM Leader
⚫ HFS Top10 Customer Engagement Operations #2
⚫ Everest Group CX Management PEAK Matrix® Leader
Digital CX Awards
Disruptive Partner of the Year [Automation]
Innovation [Analytics]
Product of the Year
– SolvTM [Gig CX]
CUSTOMER Magazine’s Product of the Year –ConcentrixCX [VOC]
Innovation [Analytics]
Acknowledged Industry Leadership
Analyst Recognition
⚫ Forrester Customer Analytics WaveTM Contender
⚫ Forrester RPA WaveTM Strong Performer
⚫ Gartner Next-Gen API Development Services
⚫ Forrester Loyalty Service Provider WaveTM Leader
⚫ Forrester RPA WaveTM Strong Performer

2022 Concentrix Corp. All Rights Reserved.
Slides Not for Publication Without Express Written Consent
Recognized as a Leading EmployerPeople, Culture & Diversity
Our commitment to staff, diversity, culture and thought leadership makes us
one of the most awarded and globally recognized companies in the industry

2022 Concentrix Corp. All Rights Reserved.
Slides Not for Publication Without Express Written Consent
Our First Year as a Public Company
Growth Strategy
Further invest in emerging markets
Selectively pursue strategic acquisitions
Relentlessly innovate, develop new digital solutions
Expand wallet share through deeper client relationships
1
2
3
4
*
(1) Constant currency revenue growth, excluding revenue for businesses acquired or divested since the beginning of the prior year. See Appendix for more information.
(2) Excludes acquisition-related and integration expenses, share-based compensation, amortization of intangible assets and gain on divestitures and related transaction costs. See Appendix for more information.
$5.6Brevenue
17.3% revenue
growth (adj.
constant currency)
13.1%non-GAAP
operating
margin
(1)
(2)
2021 Progress
Growing in Emerging Markets 20%+
PK deeply complementary,
accretive CX digital acquisition
Further investments in digital CX
transformation, analytics, VOC
Growing 35% with Strategic Brand Partners
and 18% with Integrated Partners

2022 Concentrix Corp. All Rights Reserved.
Slides Not for Publication Without Express Written Consent
Our Recent Strategic Acquisition
Enhancing our end-to-end technology capabilities
Significantly enhances CX digital transformation capabilities at scale
Brings strong portfolio of intellectual assets and advanced CX technology
Strengthens presence in high growth, $270B digital IT services market
Enhances financial profile through accretion to EPS and growth rate

2022 Concentrix Corp. All Rights Reserved.
Slides Not for Publication Without Express Written Consent
Accelerating digital outcomes for clients by combining expertise and solutions to design and engineer pioneering CX
Capabilities Solutions Outcomes+ =$530M expected revenue*
$85M expected adjusted EBITDA*
20%+ expected revenue growth*
5,000+ staff
11 locations across 4 countries
65%+ NPS
200+ IP Assets
80% of revenue with F250 clients
Strategy
& Design
Cloud
Engineering
Data &
Analytics
Automation
& Ops
Digital
Engineering
Experience
Platforms
Loyalty & Membership
CX Acceleration
Integrated Human Experience
Enterprise Modernization
API Strategy
Intelligent Automation
Customer Acquisition
Customer Engagement
Customer Retention
Speed to Market
Business Optimization
Telecom &
Media
Technology &
Software
Healthcare &
Life Sciences
Transportation &
LogisticsEmerging
Retail &
CPG
*Based on expected financial results for the first full year following the acquisition. Adjusted EBITDA is a non-GAAP financial measure and excludes acquisition-related and integration expenses, share-based compensation, amortization of intangible assets and depreciation.
PK: A Leading CX Design Engineering Company
2022 Concentrix Corp. All Rights Reserved.
Slides Not for Publication Without Express Written Consent
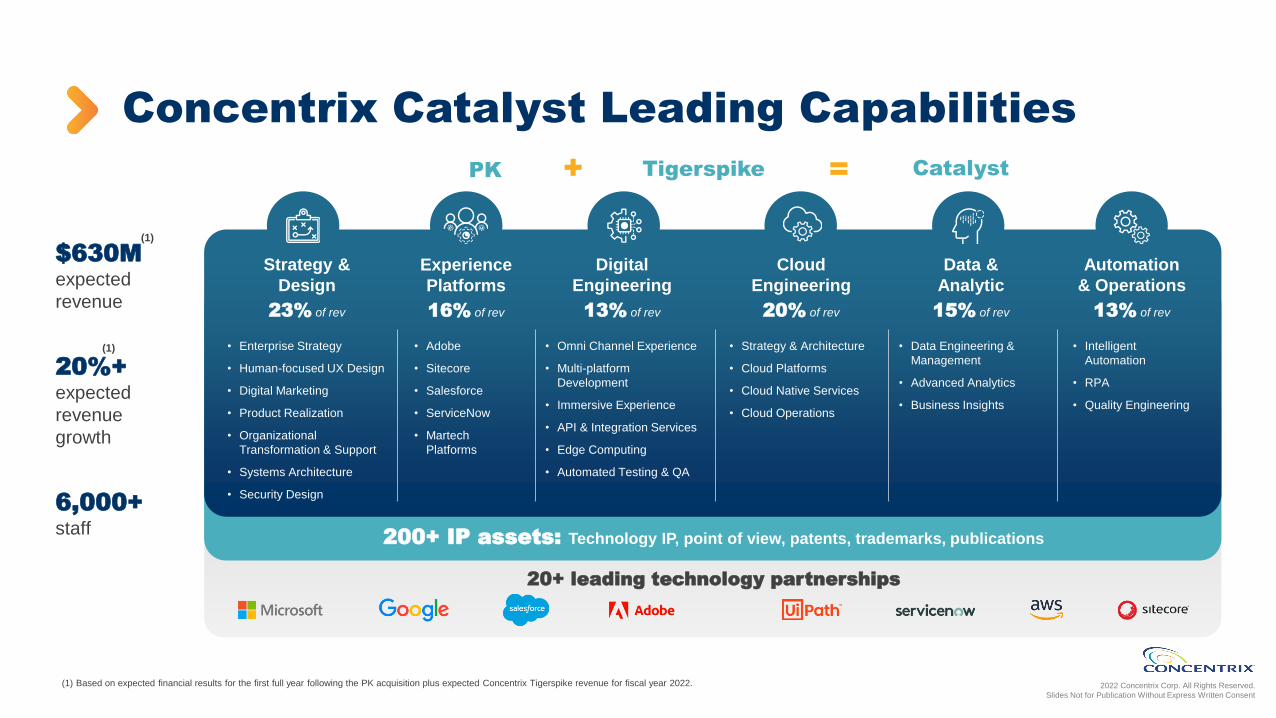
Concentrix Catalyst Leading Capabilities
• Enterprise Strategy
• Human-focused UX Design
• Digital Marketing
• Product Realization
• Organizational
Transformation & Support
• Systems Architecture
• Security Design
• Adobe
• Sitecore
• Salesforce
• ServiceNow
• Martech
Platforms
• Omni Channel Experience
• Multi-platform
Development
• Immersive Experience
• API & Integration Services
• Edge Computing
• Automated Testing & QA
• Strategy & Architecture
• Cloud Platforms
• Cloud Native Services
• Cloud Operations
• Data Engineering &
Management
• Advanced Analytics
• Business Insights
• Intelligent
Automation
• RPA
• Quality Engineering
200+ IP assets: Technology IP, point of view, patents, trademarks, publications
20+ leading technology partnerships
PK Tigerspike Catalyst+ =
$630Mexpected
revenue
20%+ expected
revenue
growth
6,000+ staff
Strategy &
Design
23% of rev
Experience
Platforms
16% of rev
Digital
Engineering
13% of rev
Cloud
Engineering
20% of rev
Data &
Analytic
15% of rev
Automation
& Operations
13% of rev
(1) Based on expected financial results for the first full year following the PK acquisition plus expected Concentrix Tigerspike revenue for fiscal year 2022.
(1)
(1)

2022 Concentrix Corp. All Rights Reserved.
Slides Not for Publication Without Express Written Consent
Case StudiesReimagining Everything CX
Driving growth + innovation
For our clients + our operations
The power of Concentrix +
Concentrix Catalyst

2022 Concentrix Corp. All Rights Reserved.
Slides Not for Publication Without Express Written Consent
CURRENT STATE
Client Relationship
• 15+ years trusted partnership
• Thought Leader in
Operational Delivery of CX
• Top 5 client account
• 2019 & 2021 Finalist, Supplier
of the Year
• Award winning Training
Gamification Project
• Partner in sales, support, and
retention programs on a
global basis for commercial
and consumer customers in
multiple languages
CX Strategy & Design
Revenue Growth Services
Omnichannel Post-sale Engagement
Insights & Analytics
CX Strategy & Design: Digital Blueprints
Digital Sales Enablement
Digital Build & Omnichannel Engineering
Insights & Analytics
CASE STUDY / LEADING GLOBAL TECHNOLOGY BRAND
Better Together

2022 Concentrix Corp. All Rights Reserved.
Slides Not for Publication Without Express Written Consent
Build a turn-key as-a-service solution for large SMB market. Outsource infrastructure and programmatic processes, including building out the strategy, offer details and operationalizing the product globally
POTENTIAL OUTCOMES
$1BSMB Sales
in 5 Years
$10MEstimated Efficiency
Savings
+10%Increase in
Renewal Rates
Awareness
ConsiderationPurchase Engagement
Loyalty &
Retention
⚫ E2E SMB GTM Strategy
& CX Design
⚫ Solution Roadmap
⚫ Digital Sales & Success
Content & Tools Build
⚫ Sales Insights &
Analytics
⚫ Partner Enablement
⚫ Pre-sales Engagement
⚫ Post- Sale Engagement
⚫ Deployment & Usage Content
Development
⚫ Engagement Automation Build
⚫ Engagement Insights & Analytics
⚫ Loyalty / Customer
Success Strategy & CX
Design
⚫ Customer Success
Engagement
⚫ Retention / Customer
Success Insights &
Analytics
⚫ Customer Lifetime Value
Optimization Roadmap
CHALLENGE
SOLUTION
CASE STUDY LEADING GLOBAL TECHNOLOGY BRAND
The Power of Concentrix + Catalyst

2022 Concentrix Corp. All Rights Reserved.
Slides Not for Publication Without Express Written Consent
CASE STUDY GLOBAL FOOTWEAR/ATHLETIC BRAND
The Power of Concentrix + Catalyst
POTENTIAL OUTCOMES
Delivering end-to-end CX solutions to create new high impact possibilities and drive value for fanatical consumers
⚫ Concentrix: Membership support &
enrollment in voice and digital channels
⚫ Concentrix Catalyst: Membership design &
build for the primary digital membership
⚫ Concentrix + Concentrix Catalyst:
o Design, build, operate, and optimize
consumer support more seamlessly
across all remote interactions
o Re-imagine and integrate MX
o Establish membership and meta-
commerce MX and CX journeys in
metaverse
⚫ Very highly engaged
customer segments
⚫ Opportunity to deepen
membership engagement
and grow spend
⚫ Membership design and
operations effective but not
integrated
⚫ Strategic priority to engage
in the metaverse
CHALLENGE SOLUTION
Best in class digital consumer engagement
Expand Member
EnrollmentSpend/Member Member Effort
Metaverse
Engagement

2022 Concentrix Corp. All Rights Reserved.
Slides Not for Publication Without Express Written Consent
CASE STUDY / TOP 5 FINTECH
Reimagining CX to enable innovation and hypergrowth
OUTCOMES
Partnering with high-flying FinTech as the catalyst to enable new product launches and growth, applying a re-imagined CX and operational framework to serve over 13 million consumers and growing
⚫ Mission to deliver customer-centric
financial products and better
mobile banking
⚫ Experiencing significant growth, of
~10M+ customers YOY
⚫ High CX expectations of Gen Z
and Millennial customers
⚫ Opportunity to optimize voice,
digital and social interactions
⚫ Need to better support complex
and disparate business functions
CHALLENGE SOLUTION
⚫ Design and optimize critical and non-
standardized customer processes
⚫ Act as launchpad for new product
introductions and pilot programs
⚫ Support non-traditional BPO functions
such as enterprise incident, project
and workforce management
⚫ Reinvent customer journeys through
process mapping and operational
analytics
⚫ Test and deploy social media and
digital interaction strategies
SOLUTION
Driving Compliance in
Record Time
Premier PartnerTo help design, build and deliver strategic
initiatives and new product launches
Automated
25-40%social media interaction categorization

2022 Concentrix Corp. All Rights Reserved.
Slides Not for Publication Without Express Written Consent
CASE STUDY / GLOBAL LEADING CRYPTO WALLET/EXCHANGE
Strategic brand partnership driving hypergrowth
OUTCOMES
Helping one of the world’s largest digital currency exchanges globally and rapidly scale their global business model to support users in 100+ countries
⚫ Increasing consumer and
regulatory pressure to offer
live support
⚫ Launching 24/7 live global
support across phone and
messaging
⚫ Customer utilization
volume of live support +
interaction types unknown
CHALLENGE SOLUTION
⚫ Consistent operational framework to
support most critical CX customer
touchpoints across multiple live channels
⚫ Designed, built and enabled a domestic
multi-site approach and introduce Work at
Home brand ambassadors
⚫ Designed and implemented operational
framework to support rapid domestic growth
and global expansions
⚫ Expert analysis captured areas to drive
improved OpEx, quality, cost containment
and re-imagining innovation targets
SOLUTION
Helping to re-imagine
omni-channel CXacross multiple-markets
Partnering to meet a dynamic set of
global regulatory
expectations
Delivered Improved
CX Journeys for
>56M customers in record time

2022 Concentrix Corp. All Rights Reserved.
Slides Not for Publication Without Express Written Consent
CASE STUDY / GOVERNMENT AGENCY
Making a difference with a human-centric design approach
OUTCOMES
Reimagining the user experience to help people that are deaf, hard of hearing and/or have a speech impairment to make and receive phone calls
⚫ Hearing and speech impaired
Australian citizens in need of
critical relay services had been
receiving a poor experience
⚫ Needed a fresh, new solution
that was cost effective and tech-
updated to deliver improved
consumer support and
satisfaction and drive usage
CHALLENGE
⚫ Partnered with Australian
government in a 3-month Agile
Design & Build project to deliver
new iOS and Android apps
⚫ Designed, Built and delivered a new
omni-channel infrastructure and
relay officer model leveraging our
human-centric design approach.
⚫ Provided new SMS, Messaging and
Video capabilities creating greater
access for relay users.
SOLUTION
46%YoY cost savings through a
robust and transparent operation
with new mobile app interface
30%of call volume now
running through the
Concentrix mobile apps
Re-Imagined E2E Experience
Significantly improved satisfaction rate, re-use rate,
and better empowered the extended base of
hearing-impaired users.

2022 Concentrix Corp. All Rights Reserved.
Slides Not for Publication Without Express Written Consent
Outcome-focused approach drives technology-enabled, digital-first transformation
CASE STUDY / ICONIC HOME GOODS RETAIL BRAND
Reinventing the retail experience through digital transformation
OUTCOMES
⚫ CX Analytics identified 80+ opportunities
to improve customer journey
⚫ Deployed XP Messaging to offer
channel-of-choice and deflect voice calls
⚫ Deployed Conversational AI to enable
self-service via SMS text, social, web
messaging or voice virtual assistant
⚫ Captured client journey information to
more quickly resolve customer issues
⚫ Support needed for high
growth e-comm traffic
⚫ Lack of modern digital
self-service channels
⚫ Need for agile and tech-
enabled CX platform
⚫ Desire to improve
response levels and CSAT
CHALLENGE SOLUTION
41%of messaging
interactions deflected
or resolved by bots
20%reduction in cost per
transaction through
digital shift
27%reduction in AHT for Voice with
8% improvement in CSAT
4 Millionconversations shifted to
messaging in 2021

2022 Concentrix Corp. All Rights Reserved.
Slides Not for Publication Without Express Written Consent

2022 Concentrix Corp. All Rights Reserved.
Slides Not for Publication Without Express Written Consent
CASE STUDY / HEALTHCARE PROVIDER
Bringing the focus back to patient care
OUTCOMES
⚫ Multiple legacy systems migrated to
one cloud-based Amazon Connect
environment
⚫ Brand ambassadors to support patient
assistance center
⚫ Conversational AI lets patients express
what they need, in their own words
⚫ Introduced digital self-service channels
including text and chatbots
⚫ Integrated data between channels so
patient calls are routed properly
without repeating information
⚫ Heavy technical debt from
maintaining multiple legacy
systems
⚫ Siloed systems, limited data
sharing
⚫ On-boarding new clinics was
complex – taxing time and
resources
⚫ Patients frustrated by long
hold times causing 40% of
calls to be abandoned
CHALLENGE SOLUTION
85%reduction in calls
abandoned
40%reduction in
overall costs
$500kannual savings to
on-board new clinics
Designed a transformation strategy for a regional healthcare system with 220 clinicians that streamlines infrastructure, allows greater access to information, and improves the patient experience

2022 Concentrix Corp. All Rights Reserved.
Slides Not for Publication Without Express Written Consent
CASE STUDY / U.S. BANK
Reimagining the banking experience through feedback
OUTCOME
20%increase in customer
loyalty in 12 months
⚫ ConcentrixCX was deployed across 16
moments of truth
⚫ Millions of customer signals are flowing
into the bank in real-time providing
feedback on digital interactions, advisor
interactions, branch experiences, etc.
⚫ Professional services deployed
alongside technology
⚫ Feedback is used to drive strategy
decisions, guide teller behavior and
customer recovery initiatives
⚫ Incumbent partner with dated
technology
⚫ Lack of customer feedback
across moments
⚫ Not enough insight into CX
breakpoints
⚫ The bank did not have an easy
way to analyze results and drive
action across the business
⚫ Lots of data, no insights
CHALLENGE SOLUTION
Our enterprise feedback management platform – ConcentrixCX– was deployed across 16 listening posts, capturing feedback and guiding improvement decisions in real-time
15K+bank staff have adopted
ConcentrixCX

2022 Concentrix Corp. All Rights Reserved.
Slides Not for Publication Without Express Written Consent
CASE STUDY / GLOBAL LEADING SOCIAL BRAND
Strategic brand partnership driving innovation + organic growth
OUTCOMES
Helping a leading global social business protect their brand and capture/support substantial growth in advertising and consumer products
⚫ Velocity to support industry pace
⚫ Agility to adjust to business changes
⚫ Growing capacity to support critical
programs in multiple markets
⚫ Very high service quality expectation
⚫ Cost effective and efficient support
⚫ Increasing consumer and
governmental expectations of
social interventions
CHALLENGE SOLUTION
⚫ Dedicated teams to address high impact
business lines and deliver top
operational scores
⚫ Demonstrated excellence and agility
across all business lines
⚫ Developed a custom rapid deployment
model for each business
⚫ Deployed analytics and process experts
to identify innovation opportunities
⚫ Invested in unique success assets
⚫ Selected to pilot new business changes
SOLUTION
85%2018-2021 CAGR in
client’s spend
with Concentrix
#1 PartnerIn most recent
Strategic Scorecard
26%2018-2021 CAGR in client’s revenue
“Concentrix continues to be one of our top partners not
only in operational excellence and performance, but in
innovation, transparency and in providing leadership to
our global network of partners.” Client Executive

2022 Concentrix Corp. All Rights Reserved.
Slides Not for Publication Without Express Written Consent
Wellnest Reach
Clinically-led 5-stage recurring
psychometric assessment suite to
monitor cognitive resiliency by work-type.
Wellnest Surround
Clinically-designed wellbeing foundation
training and certification for all staff.
Cognitive Innovation Research Hub
Behavioral studies that explore relationship between preventative Mental Health support and role of Content Moderation.
11.5kTrust and Safety
experts worldwide
>20Languages supported
in 14 countries
40+Clinical Wellness
professionals globally
2.2BnAnnual Content and Social
Moderation reviews
Personalized wellness plans and reporting to
measure utilization, feedback and effectiveness
Wellnest Inform
Leading with InnovationWellnest Care Program

2022 Concentrix Corp. All Rights Reserved.
Slides Not for Publication Without Express Written Consent
⚫ Wellnest Comprehend transforms how we understand human performance by focusing on psychological safety and engagement
⚫ Correlates VHR trends with AI intelligence on oxytocin to identify vulnerability in resiliency and allow for proactive intervention and change
⚫ Enables data backed insights to effect change in shift durations, task rotation, tenure, skills profiling.
Wellnest ComprehendInnovating with AI and Neuroscience

2022 Concentrix Corp. All Rights Reserved.
Slides Not for Publication Without Express Written Consent
Transformation is Happening EverywhereTech is accelerating transformation for clients and operations
Customer Transformation
Digital
Training
Operating Automation
Self-Service
Customer
Journey
Insights
Cloud
Contact Center
Technology
VOC AI
Website
Experience
Design
Biometrics & Data Security
CX Quality Insights
Virtual & Community
Hubs
Collaborative EnvironmentsProcess
Automation
Smart Ambassador
Assist
Candidate Experience

2022 Concentrix Corp. All Rights Reserved.
Slides Not for Publication Without Express Written Consent
Technology Embedded Across Operations
114K+Ambassadors with Smart Assist Tech
104K+Digitally Trained
89%Virtual Hires
2KInnovators
160M+Images auto-screened weekly
Proven Value from Technology at Scale
61%Clients (62% New
Economy) rated Innovation
100% or higher YoY
29%YoY growth for Clients
with 93%+ rating (37%
for New Economy)
65%more Clients buying
Talent +Tech YoY
(71% more New Economy)
45%YoY growth for New
Economy clients
buying Talent +Tech
1.1BInteractionsAutomated

2022 Concentrix Corp. All Rights Reserved.
Slides Not for Publication Without Express Written Consent
We’re Just Getting Started
The Future of CX

2022 Concentrix Corp. All Rights Reserved.
Slides Not for Publication Without Express Written Consent
Priorities for Future Growth
Growth Strategy 2022 Priorities
Continue to expand in
emerging markets
Expand capabilities in key
growth areas
Invest in technology solutions
to disrupt and differentiate
Continued execution on our
client strategy
Further invest in
emerging markets
Selectively pursue
strategic acquisitions
Relentlessly innovate,
develop new digital solutions
Expand wallet share through
deeper client relationships1
2
3
4

2022 Concentrix Corp. All Rights Reserved.
Slides Not for Publication Without Express Written Consent
Growth Strategy 2022 Priorities
Continued execution on our
client strategy
Further invest in
emerging markets
Selectively pursue
strategic acquisitions
Relentlessly innovate,
develop new digital solutions
Expand wallet share through
deeper client relationships1
2
3
4
Priorities for Future Growth
2022 Concentrix Corp. All Rights Reserved.
Slides Not for Publication Without Express Written Consent
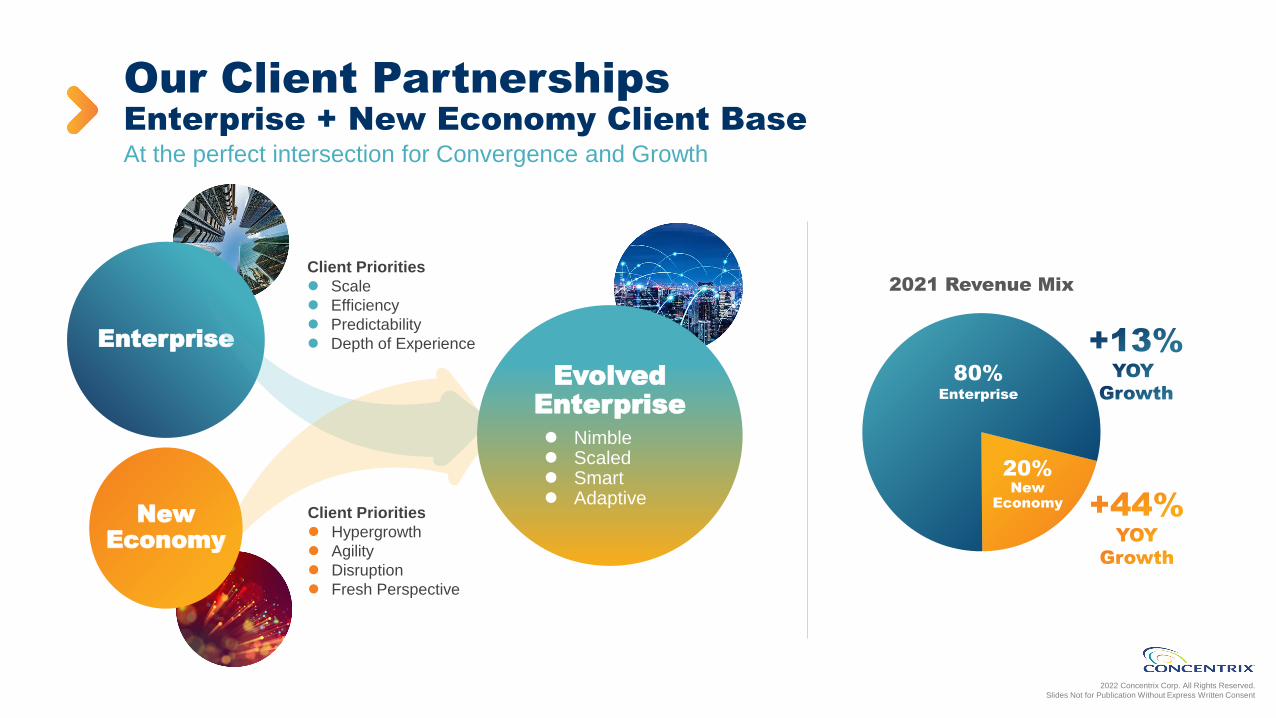
Our Client PartnershipsEnterprise + New Economy Client Base
Enterprise
NewEconomy
At the perfect intersection for Convergence and Growth
2021 Revenue Mix
80%Enterprise
20%New
Economy
Client Priorities
⚫ Scale
⚫ Efficiency
⚫ Predictability
⚫ Depth of Experience
Client Priorities
⚫ Hypergrowth
⚫ Agility
⚫ Disruption
⚫ Fresh Perspective
EvolvedEnterprise⚫ Nimble⚫ Scaled⚫ Smart⚫ Adaptive
2022 Concentrix Corp. All Rights Reserved.
Slides Not for Publication Without Express Written Consent
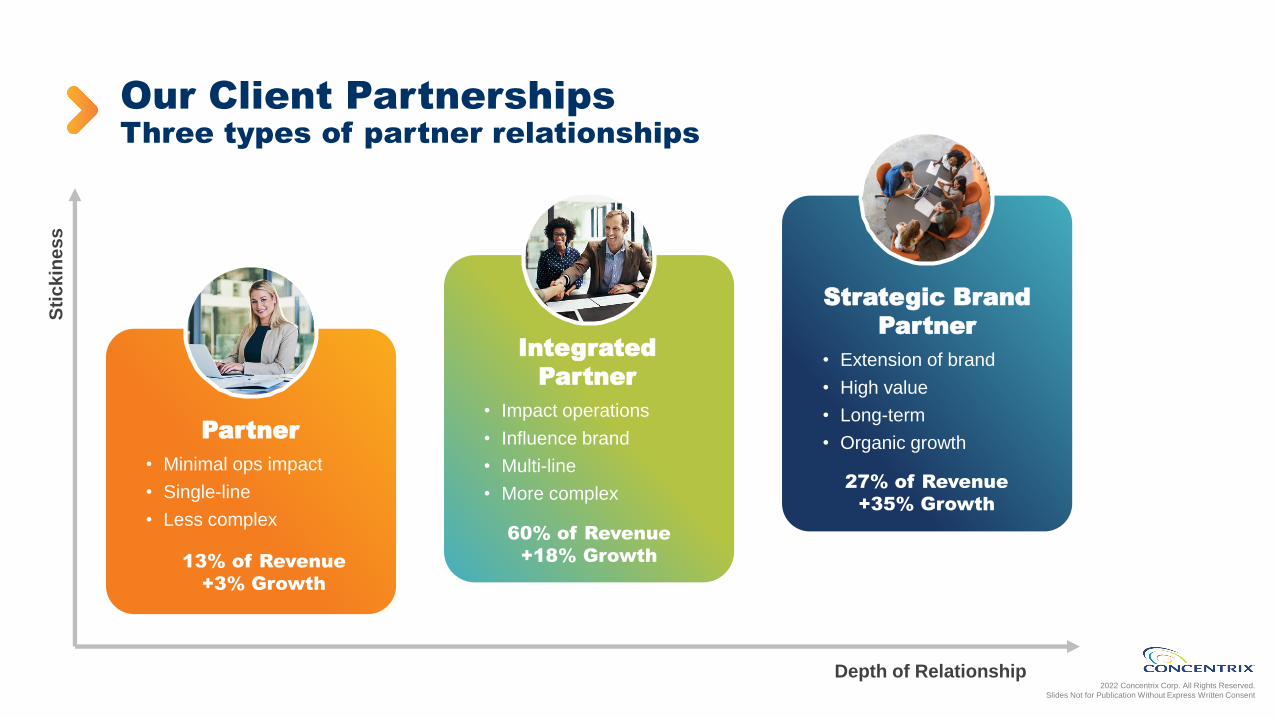
Our Client PartnershipsThree types of partner relationships
Strategic Brand
Partner
• Extension of brand
• High value
• Long-term
• Organic growthPartner
• Minimal ops impact
• Single-line
• Less complex
Integrated
Partner
• Impact operations
• Influence brand
• Multi-line
• More complex
Depth of Relationship
Sti
ck
ine
ss
13% of Revenue
+3% Growth
60% of Revenue
+18% Growth
27% of Revenue
+35% Growth

2022 Concentrix Corp. All Rights Reserved.
Slides Not for Publication Without Express Written Consent
Growth Strategy 2022 Priorities
Invest in technology solutions
to disrupt and differentiate
Continued execution on our
client strategy
Further invest in
emerging markets
Selectively pursue
strategic acquisitions
Relentlessly innovate,
develop new digital solutions
Expand wallet share through
deeper client relationships1
2
3
4
Priorities for Future Growth

2022 Concentrix Corp. All Rights Reserved.
Slides Not for Publication Without Express Written Consent
How Digital is Built into Our Business
Integrated into our
solutions offering
Independently procured
technology platforms
and solutions
Imbedded in our
operations

2022 Concentrix Corp. All Rights Reserved.
Slides Not for Publication Without Express Written Consent
Our Technology Capabilities & PartnershipsInnovating to enable new CX solutions
Leading Technology PartnersTechnology-infused Solutions
Platforms &
App Development
Technology &
Systems
Integration
Experience
Design
IVRInnovation,
Automation &
Optimization
Digital
Self-Service
Voice of the
CustomerAnalytics &
Consulting
Speech & Text
Insights

2022 Concentrix Corp. All Rights Reserved.
Slides Not for Publication Without Express Written Consent
Growth Strategy 2022 Priorities
Continue to expand in
emerging markets
Invest in technology solutions
to disrupt and differentiate
Continued execution on our
client strategy
Further invest in
emerging markets
Selectively pursue
strategic acquisitions
Relentlessly innovate,
develop new digital solutions
Expand wallet share through
deeper client relationships1
2
3
4
Priorities for Future Growth

2022 Concentrix Corp. All Rights Reserved.
Slides Not for Publication Without Express Written Consent
The Value of Our Emerging Markets
⚫ Innovative go to market execution
⚫ Incubation for new technology-
infused solutions
⚫ Supporting new emerging brands
o ~ 27% of our new economy
clients start in these markets, and
will be the next global brands
⚫ Leverage global reach to expand
with multinational brands
o Growing with clients in regions
they see growth opportunities
Growing at 20%+Serving domestic demand in emerging markets
Thailand Indonesia Vietnam
Brazil India China ROC

2022 Concentrix Corp. All Rights Reserved.
Slides Not for Publication Without Express Written Consent
Growth Strategy 2022 Priorities
Continue to expand in
emerging markets
Expand capabilities in key growth
areas
Invest in technology solutions
to disrupt and differentiate
Continued execution on our
client strategy
Further invest in
emerging markets
Selectively pursue
strategic acquisitions
Relentlessly innovate,
develop new digital solutions
Expand wallet share through
deeper client relationships1
2
3
4
Priorities for Future Growth

2022 Concentrix Corp. All Rights Reserved.
Slides Not for Publication Without Express Written Consent
Pursue Strategic Acquisitions
Focus
⚫ Deep domain expertise
digital engineering, sales gen, analytics,
banking, healthcare…
⚫ Attractive client portfolios
new economy clients…
⚫ New technology that enhances overall business
ethical AI, VOC, CX technology…
Disciplined approach
⚫ Financially accretive to overall business
⚫ Ability to pay higher multiples for higher value
capabilities that bring long term value
⚫ Cultural alignment
Strong Track Record
CRM BPO
CX design &
engineering at scale
CX client portfolio
& footprint
CX design &
engineering
CX clients &
capabilities
CX scale & vertical
expertise

2022 Concentrix Corp. All Rights Reserved.
Slides Not for Publication Without Express Written Consent
Our Financial Objectives
Our Path Forward

2022 Concentrix Corp. All Rights Reserved.
Slides Not for Publication Without Express Written Consent
1From CX → IX
Building Intelligent Experiences
2
From CX → MX
3
From CX → BX
4
From CX → ICX
Connecting the Front to the
Back is critical
Building immersive
experiences on the Edge
Building virtual experiences in
the Metaverse
Now 12-18 Months 18-24 Months 24+ Months
1
2
3
4
Shaping the Future of CXCX will evolve into an intelligent, immersive, and connected experience for consumers.
1- Bloomberg. (n.d.). Metaverse Market Size . Bloomberg.com. Retrieved January 20, 2022, from https://www.bloomberg.com/professional/blog/metaverse-may-be-800-billion-market-next-tech-platform/
2 - ReportLinker. https://www.globenewswire.com/news-release/2021/11/16/2335773/0/en/The-edge-computing-market-size-is-expected-to-grow-from-USD-36-5-billion-in-2021-to-USD-87-3-billion-by-2026-at-a-Compound-Annual-Growth-Rate-CAGR-of-19-0.html.
3 - MarketWatch. (2022, January 12). Hyper Automation market . MarketWatch. Retrieved January 21, 2022, from https://www.marketwatch.com/press-release/hyper-automation-market-size-growing-at-9-cagr-to-hit-usd-3199-billion-by-2027-2022-01-12
4 - “Artificial Intelligence Market: Global Industry Trends, Share, Size, Growth, Opportunity and Forecast 2022-2027.” Size, Share, Growth, Trends 2022-2027, https://www.imarcgroup.com/artifical-intelligence-market.
Market by
20241
$800B
Market by
20262
$87B
Market by
20273
$320B
Market by
20274
$308B
2022 Concentrix Corp. All Rights Reserved.
Slides Not for Publication Without Express Written Consent
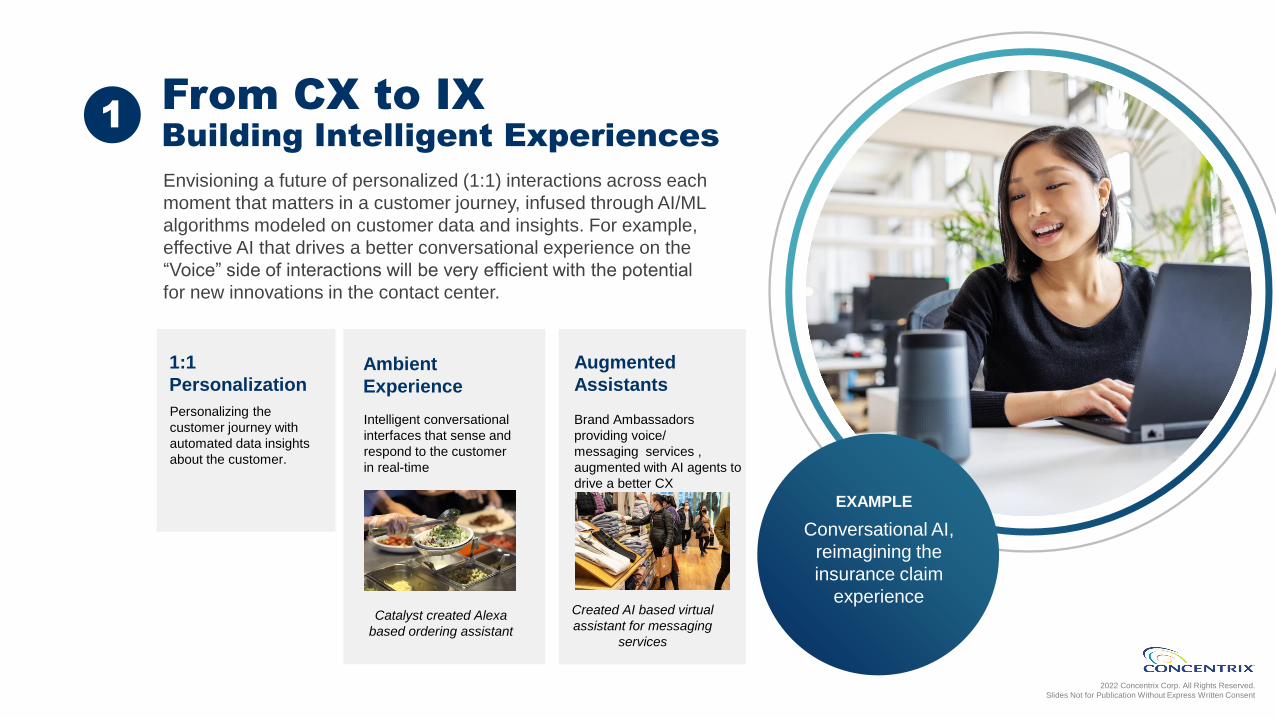
Envisioning a future of personalized (1:1) interactions across each
moment that matters in a customer journey, infused through AI/ML
algorithms modeled on customer data and insights. For example,
effective AI that drives a better conversational experience on the
“Voice” side of interactions will be very efficient with the potential
for new innovations in the contact center.
Conversational AI,
reimagining the
insurance claim
experience
1:1
Personalization
Personalizing the
customer journey with
automated data insights
about the customer.
Ambient
Experience
Intelligent conversational
interfaces that sense and
respond to the customer
in real-time
Augmented
Assistants
Brand Ambassadors
providing voice/
messaging services ,
augmented with AI agents to
drive a better CX
Catalyst created Alexa
based ordering assistant
Created AI based virtual
assistant for messaging
services
EXAMPLE
From CX to IXBuilding Intelligent Experiences
1

2022 Concentrix Corp. All Rights Reserved.
Slides Not for Publication Without Express Written Consent
BX will evolve with Hyper-Automation and the middle platform. The
middle platform is comprised of APIS, Event Driven architectures
that drive an exceptional customer experience. An exceptional CX is
only possible if enterprises build an effective and efficient middle
platform. The current landscape, with a war for talent, will drive
demand for automation, low-code/no-code as effective approaches
to address the digital demand problem.
Frictionless payments
and money lending
regardless of bank
affiliation
Hyper-
Automation
Going beyond RPA and
looking at automating
digital operations across
each touchpoint in a
customer journey from
front to back.
Middle Platform
A dynamic enterprise
that is built on APIs and
Event Driven will deliver
a better CX across all
touch points
Market by 2027
$22B
EXAMPLE
Data Fabric
A Data Fabric that pulls
together data across
multi-cloud as well as
on-prem to drive better
insights driving better CX
Market by 2026
$7B
From CX to BXConnecting the Front to the Back
2

2022 Concentrix Corp. All Rights Reserved.
Slides Not for Publication Without Express Written Consent
This is the final area that will drive significant investments especially
around connected experiences ( BOPIS/BOPAC/Smart Everything).
This is all about the intersection of 5G, Cloud , AI on the Edge.
Technological advancements, including 5G and IoT, create touchpoints
for digital engagement that bring new expectations and opportunities.
Adaptive and Predictive
Maintenance + Machine
Learning for Intuitive
Infotainment Systems
AR/VR and
Mixed Reality
Smart
Everything
Smart Cities , Smart
Factories, and the
connected edge. Data
and Intelligence
deployed on the edge to
drive a better CX
Connected
Vehicles
Evolving the experience
in the cars and machine
to machine interactions,
as the Car becomes the
new mobile phone.
Immersive experiences
blending the physical with
the digital world brought
to life through interactive,
motion design.
$36.1BBy 2024
$30BBy 2023
EXAMPLE
$312BBy 2024
From CX to ICXCreating Immersive Experiences
3

2022 Concentrix Corp. All Rights Reserved.
Slides Not for Publication Without Express Written Consent
The world's largest brands across industries can no longer ignore the
reality of the Metaverse and the value of emergent virtual economies
as virtual environments become more mainstream. The necessity to
build and equip teams to serve the metaverse is clear, just as it was
for the transformation from physical (in-store) to Digital.
Increasing brand
engagement through
Metaverse
Applications
Brand Virtual
EngagementEvolving brand experiences
in the metaverse. Virtual
Real Estate and Brand
Presence with immersive
content
Relevant Use Cases for the Metaverse
Virtual
Events
Community Driven virtual
events and possibly
virtual concerts, sporting
events can shift to the
metaverse.
Virtual Retail
Stores
Brand focused retail
stores showcasing
products and driving
engagement in the
metaverse
Virtual
Workplaces
The evolution of the
employee workplace will
be in the metaverse.
Simulation &
Training
Immersive real-time 3D
experiences with semantic
content, physics engine ,
delivering for the
enterprise
EXAMPLE
4From CX to MXBuilding For The Metaverse
Market by 20241
$800B
1- Bloomberg. (n.d.). Metaverse Market Size . Bloomberg.com. Retrieved January 20, 2022, from https://www.bloomberg.com/professional/blog/metaverse-may-be-800-billion-market-next-tech-platform/

2022 Concentrix Corp. All Rights Reserved.
Slides Not for Publication Without Express Written Consent
Inventing New Value StreamsBuilding For Web 3.0
Digital Assets /
Virtual Goods
NFTs and
Market
Places
Blockchain,
DAOs,
Decentralized
Experiences
Virtual
Platforms
Tokens/
Crypto
Currencies
Web 1.0
• Static Web Pages
• Portals providing
content
• e-Commerce
• Java /JavaScript
Web 2.0
Digital
Identities
/Avatars
• Semantic Web
• Realtime 3D
content
• dApps
• NFTs
• VR/AR and XR
• Blockchains
• Digital Avatars
• AI Driven
• Trustless and
Permissionless
Web 3.0
• Mobile Apps
• Social Media
• Walled
Gardens for
Content
• UGC
• High Speed
Data / Comms
Human
Interface
Web 3.0 is the next evolution of the internet. It is about a new technology
stack that is open, permissionless, trustless and completely decentralized.
This is the "internet in real-time 3D".
Moving from information exchange in Web 2.0 to value exchange in Web3
which is community driven and open.

2022 Concentrix Corp. All Rights Reserved.
Slides Not for Publication Without Express Written Consent
The Future of CX
Q&A

2022 Concentrix Corp. All Rights Reserved.
Slides Not for Publication Without Express Written Consent
2020A 2021A
Other
Healthcare
Banking, financialservices and ins
Retail, travel andecommerce
Communications andmedia
Technology andconsumer electronics
Strong Growth Across Verticals and Geographies
Revenue Growth Across
Vertical Segments ($M)
4,720
5,587
⚫ Differentiated brand experience
⚫ High compliance and barriers to entry
⚫ One-to-many
⚫ Engineered obsolescence
Revenue Growth Across
Geographies Served
2020A 2021A
Asia-Pacific
Europe
Americas
26%
17%
23%
(1) Constant currency revenue growth, excluding revenue for businesses acquired or divested since the beginning of the prior year.
(1)
17%

2022 Concentrix Corp. All Rights Reserved.
Slides Not for Publication Without Express Written Consent
Accelerating Post-Covid Revenue Growth, Margin Expansion, Cash Flow Generation
Note: USD in millions.
(1) Excludes acquisition-related and integration expenses, including related restructuring costs, share-based compensation, spin-off related
expenses, amortization of intangible assets and gain on divestitures and related transaction costs. See Appendix for more information.
(2) Free Cash Flow calculation: Net cash provided by operating activities, less capital expenditures. See Appendix for more information.
2020A financials include impact from COVID-19
Strong Free Cash Flow (2)
Strong Revenue Growth Operating Income Expansion (1)
EBITDA Margin Expansion (1)
$4,708 $4,720$5,587
2019A 2020A 2021A 2022P
$542 $509
$734
2019A 2020A 2021A 2022P
$677 $639
$874
2019A 2020A 2021A 2022P
$339 $336 $365
2019A 2020A 2021A 2022P
Non-GAAPOperating
Margin11.5% 10.8% 13.1%
Adjusted
EBITDA
Margin14.4% 13.5% 15.6%

2022 Concentrix Corp. All Rights Reserved.
Slides Not for Publication Without Express Written Consent
Current Business Outlook
FY 2022
Q1 2022
$6.45-6.60BRevenue
Revenue Growth(Adjusted Constant Currency)
Non-GAAP OI
Non-GAAP
Op Margin
$190-205M
$1.51-1.54BRevenue
Non-GAAP OI
(1) Constant currency revenue growth, adjusted for divested businesses and pro forma for PK acquisition.
(2) Non-GAAP operating income excludes acquisition-related and integration expenses, share-based compensation and amortization of intangible assets.
(3) Represents Non-GAAP operating income margin at the midpoint of the guidance ranges for non-GAAP operating income and revenue.
(2)
9-12%(1)
~ 13.9%(3)
$890-930M(2)

2022 Concentrix Corp. All Rights Reserved.
Slides Not for Publication Without Express Written Consent
Long-Term Financial Targets ≥ $10B By 2025
Future
M&AOrganic
Growth
2023-25 Targets
≥$10B by 2025
~9%
~14.5% by 2025
~$1.5B
Total Revenue
Annual Organic
Revenue Growth
Non-GAAP
Op Margin
Revenue
from M&A
Technology-infused
Revenue>95% by 2025
Sources of ≥ $10B Revenue By 2025
(1) Represents constant currency revenue growth rate.
(2) Non-GAAP operating income excludes acquisition-related and integration expenses, share-based compensation and amortization of intangible assets.
(2)
(1)

2022 Concentrix Corp. All Rights Reserved.
Slides Not for Publication Without Express Written Consent
Path to Above-Market Growth Potential Impacts
Revenue
Organic growth
New Economy client
growth
Enterprise client growth
Digital service growth
Acquisitions
Well-capitalized to continue
to pursue M&A
Focused on driving strong
financial returns
Margin
Growth in more complex services
Operational efficiencies
Internal technology automation
End-to-end process
Outcomes-based models

2022 Concentrix Corp. All Rights Reserved.
Slides Not for Publication Without Express Written Consent
Evolving Mutually-Beneficial Financial Model
Transaction-based Outcomes-based
Client outcomes-based model provides opportunity for margin expansion
Future
⚫ Revenue driven by successfully
completing a ”unit of Measure”
⚫ Revenue to labor growth linear
Today
⚫ Aligned goals with client
⚫ Ability for non-linear growth with labor
⚫ Gain share, fixed price, % of

2022 Concentrix Corp. All Rights Reserved.
Slides Not for Publication Without Express Written Consent
Revenue Growth Drivers
2021A 2022 Guidance New Economy ClientGrowth
Enterprise ClientGrowth
Inorganic Growth 2025 Revenue Target
$6.5B
$10B
CNXC
$6.0B
$1.5B
$8.5B
(1) Pro forma for PK acquisition.
(2) Represents the midpoint of 2022 guidance range.
(2)
(1)
≥
Catalyst PF
CNXC
Catalyst PF

2022 Concentrix Corp. All Rights Reserved.
Slides Not for Publication Without Express Written Consent
~14.5%
13.9%
13.2%
2021A 2022 Guidance Growth in MoreComplex Services
OperationalEfficiencies &Automation
End-to-end Process& Outcomes-based
Models
2025 Non-GAAPOperating Margin
Target
(2)
(1)
(3)
Catalyst PF
CNXC
Margin Expansion Drivers
(1) Pro forma for PK acquisition. Non-GAAP operating income excludes acquisition-related and integration expenses, share-based compensation, amortization of intangible assets and gain on divestitures and related transaction costs.
(2) Represents Non-GAAP operating income margin at the midpoint of the 2022 guidance range for non-GAAP operating income and revenue. Excludes acquisition-related and integration expenses, share-based compensation and
amortization of intangible assets.
(3) Target non-GAAP operating income margin excludes acquisition-related and integration expenses, share-based compensation and amortization of intangible assets.
Catalyst PF
CNXC

2022 Concentrix Corp. All Rights Reserved.
Slides Not for Publication Without Express Written Consent
Capital Structure Overview
Total Liquidity
Cash and Cash Equivalents (1) $182
Capacity on A/R Securitization (2) $45
New Undrawn Revolver $1,000
Total Liquidity $1,227
Total Debt (3)
New Revolver -
New Term Loan A $2,100
A/R Securitization $305
Total Debt / Adj. EBITDA (4) 2.6x
Net Debt / Adj. EBITDA (4) 2.4x
Strong liquidity position
Strong balance sheet
Strong cash flow generation for
Note: USD in millions.
(1) Reported Company cash balance as of 11/30/21 .
(2) Represents unused capacity on $350 million accounts receivable securitization facility pro forma for the PK acquisition.
(3) Total debt is shown pro forma for financing to complete PK acquisition.
(4) Assumes $943 million Adj. EBITDA Pro forma for PK acquisition. Excludes acquisition-related and integration expenses, share-based
compensation, amortization of intangible assets and gain on divestitures and related transaction costs.
⚫ Debt paydown
⚫ Returning capital to investors
⚫ Strategic M&A

2022 Concentrix Corp. All Rights Reserved.
Slides Not for Publication Without Express Written Consent
Concentrix Capital AllocationTop Priorities
Investments in
Technology
Strategic
M&A
Investments in
Key Verticals
Shareholder
Return
CapEx• Disciplined CapEx spend in line with ~3% of revenue annually
• Investment in expansion and enhancing capabilities to drive organic growth
M&A • Disciplined M&A approach focused on transactions that drive strong financial returns
Leverage• Maintain leverage under 3x to ensure financial flexibility
• Strong cash flow generation
Shareholder
Return• Dividend paid quarterly
• Share repurchase authorization
2022 Concentrix Corp. All Rights Reserved.
Slides Not for Publication Without Express Written Consent
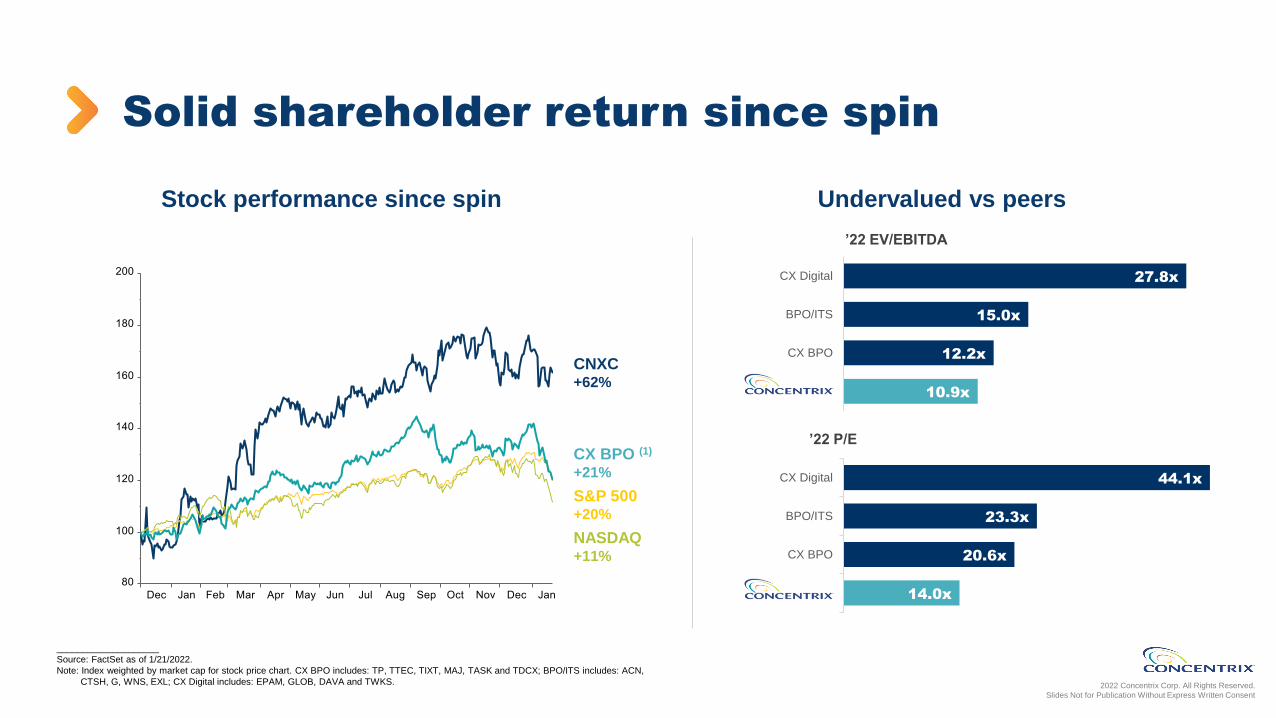
Solid shareholder return since spin
27.8x
15.0x
12.2x
10.9x
CX Digital
BPO/ITS
CX BPO
Concentrix
44.1x
23.3x
20.6x
14.0x
CX Digital
BPO/ITS
CX BPO
Concentrix
’22 EV/EBITDA
’22 P/E
Undervalued vs peers
____________________
Source: FactSet as of 1/21/2022.
Note: Index weighted by market cap for stock price chart. CX BPO includes: TP, TTEC, TIXT, MAJ, TASK and TDCX; BPO/ITS includes: ACN,
CTSH, G, WNS, EXL; CX Digital includes: EPAM, GLOB, DAVA and TWKS.
Stock performance since spin
CNXC+62%
S&P 500+20%
NASDAQ+11%
CX BPO (1)
+21%

2022 Concentrix Corp. All Rights Reserved.
Slides Not for Publication Without Express Written Consent
⚫ Market leader in digital CX
o Innovating to become greatest customer engagement company in the world
⚫ Executing successful strategy to stay differentiated
o Revenue growth
o Margin expansion
⚫ Unmatched CX capabilities
o Strategy, talent, technology
o Future-proofed roadmap
⚫ Building strategic client partnerships
o Enterprise brands
o New Economy brands
⚫ Compelling valuation relative to peers
In SummaryAttractive Investment Profile

2022 Concentrix Corp. All Rights Reserved.
Slides Not for Publication Without Express Written Consent
Our Financial Objectives

2022 Concentrix Corp. All Rights Reserved. Slides Not for Publication Without Express Written Consent
Appendix

Non-GAAP Financial MeasuresIn addition to disclosing financial results that are determined in accordance with GAAP, we also disclose certain non-GAAP financial information, including:
⚫ Constant currency revenue growth, which is revenue growth adjusted for the translation effect of foreign currencies so that certain financial results can be viewed without the impact of fluctuations in foreign currency exchange rates, thereby facilitating period-to-period comparisons of our business performance. Constant currency revenue growth is calculated by translating the revenue of each fiscal year in the billing currency to U.S. dollars using the comparable prior year’s currency conversion rate in comparison the prior year’s revenue. Generally, when the U.S. dollar either strengthens or weakens against other currencies, revenue growth at constant currency rates or adjusting for currency will be higher or lower than revenue growth reported at actual exchange rates.
⚫ Adjusted constant currency revenue growth, which is constant currency revenue growth excluding revenue for businesses acquired or divested since the beginning of the prior year period so that revenue growth can be viewed without the impact of acquisitions or divestitures, thereby facilitating period-to-period comparisons of our business performance.
⚫ Non-GAAP operating income, which is operating income, adjusted to exclude acquisition-related and integration expenses, including related restructuring costs, spin-off related expenses, amortization of intangible assets, share-based compensation and gain on divestitures and related transaction costs.
⚫ Non-GAAP operating margin, which is non-GAAP operating income, as defined above, divided by revenue.
⚫ Adjusted earnings before interest, taxes, depreciation, and amortization, or adjusted EBITDA, which is non-GAAP operating income, as defined above, plus depreciation.
⚫ Adjusted EBITDA margin, which is adjusted EBITDA, as defined above, divided by revenue.
⚫ Free cash flow, which is cash flows from operating activities less capital expenditures. We believe that free cash flow is a meaningful measure of cash flows since capital expenditures are a necessary component of ongoing operations. However, free cash flow has limitations because it does not represent the residual cash flow available for discretionary expenditures. For example, free cash flow does not incorporate payments for business acquisitions.
We believe that providing this additional information is useful to investors to better assess and understand our base operating performance, especially when comparing results with previous periods and for planning and forecasting in future periods, primarily because management typically monitors the business adjusted for these items in addition to GAAP results. Management also uses these non-GAAP measures to establish operational goals and, in some cases, for measuring performance for compensation purposes. These non-GAAP financial measures exclude amortization of intangible assets. Although intangible assets contribute to our revenue generation, the amortization of intangible assets does not directly relate to the services performed for our clients. Additionally, intangible asset amortization expense typically fluctuates based on the size and timing of our acquisition activity. Accordingly, we believe excluding the amortization of intangible assets, along with the other non-GAAP adjustments which neither relate to the ordinary course of our business nor reflect our underlying business performance, enhances our and our investors’ ability to compare our past financial performance with its current performance and to analyze underlying business performance and trends. These non-GAAP financial measures also exclude share-based compensation expense. Given the subjective assumptions and the variety of award types that companies can use when calculating share-based compensation expense, management believes this additional information allows investors to make additional comparisons between our operating results and those of our peers. As these non-GAAP financial measures are not calculated in accordance with GAAP, they may not necessarily be comparable to similarly titled measures employed by other companies. These non-GAAP financial measures should not be considered in isolation or as a substitute for the comparable GAAP measures and should be used as a complement to, and in conjunction with, data presented in accordance with GAAP.

Historical Performance
Note: USD in millions.
(1) Adjusted to exclude acquisition-related and integration expenses, including related restructuring costs, spin-off related expenses, share-based compensation, amortization of intangible assets and gain on divestiture and related
transaction costs.
(2) Free cash flow calculation: Net cash provided by operating activities less capital expenditures.
Fiscal Years Ended November 30,
2019A 2020A 2021A CAGR ‘19A-’21A
Revenue $4,707.9 $4,719.5 $5,587.0 8.9%
% Growth 91.1% 0.2% 18.4%
Non-GAAP operating income (1) 542.0 509.4 733.7 16.3%
% Margin 11.5% 10.8% 13.1% +160 bps
Adjusted EBITDA (1) 676.8 638.5 874.0 13.6%
% Margin 14.4% 13.5% 15.6% +120 bps
Net income 117.2 164.8 405.686.0%
% Growth 142.7% 40.6% 146.1%
Net cash provided by operating activities 449.7 507.6 514.2 6.9%
% Revenue 9.6% 10.8% 9.2% -40 bps
Capital expenditures 111.1 171.3 149.1 15.8%
% Revenue 2.4% 3.6% 2.7% +30 bps
Free cash flow (2) 338.6 336.3 365.1 3.8%

GAAP to Non-GAAP ReconciliationFiscal Years Ended November 30,
2019A 2020A 2021A
Operating income $294.3 $308.8 $572.4
Acquisition-related and integration expenses 70.5 27.9 0.8
Spin-off related expenses - 9.5 -
Amortization of intangibles 166.6 147.3 136.9
Share-based compensation 10.6 15.9 36.8
Gain on divestitures and related transaction costs - - (13.2)
Non-GAAP operating income $542.0 $509.4 $733.7
Net Income $117.2 $164.8 $405.6
Interest expense and finance charges, net 92.2 48.3 23.0
Provision for income taxes 87.3 103.1 150.1
Other expense (income), net (2.3) (7.4) (6.3)
Acquisition-related and integration expenses 70.5 27.9 0.8
Spin-off related expenses - 9.5 -
Gain on divestitures and related transaction costs - - (13.2)
Amortization of intangibles 166.6 147.3 136.9
Share-based compensation 10.6 15.9 36.8
Depreciation (excluding accelerated depreciation in acquisition-related and
integration expenses above)134.7 129.1 140.3
Adjusted EBITDA $676.8 $638.5 $874.0
Note: USD in millions.

GAAP to Non-GAAP Reconciliation
Note: USD in millions.
Fiscal Years Ended November 30,
2019A 2020A 2021A
Operating margin 6.3% 6.5% 10.2%
Non-GAAP operating margin 11.5% 10.8% 13.1%
Adjusted EBITDA margin 14.4% 13.5% 15.6%
Fiscal Year Ended
November 30,
2021A
Revenue $5,587.0
Revenue growth, as reported under U.S. GAAP 18.4%
Foreign exchange impact (2.0)%
Constant current revenue growth 16.4%
Effect of excluding revenue of acquired and divested businesses 0.9%
Adjusted constant currency revenue growth 17.3%

GAAP to Non-GAAP Reconciliation
Note: USD in millions.
(1) PK revenue, non-GAAP operating income, and free cash flow were derived from PK’s preacquisition accounting records
Fiscal Year Ended
November 30,
2021
Free cash flow $365.1
PK free cash flow (1) 12.0
Pro forma free cash flow $377.1
Fiscal Year Ended
November 30,
2021
Non-GAAP operating income $733.7
PK Non-GAAP operating income (1) 63.0
Pro forma Non-GAAP operating income $796.7
Pro forma Non-GAAP operating income margin 13.2%
Fiscal Year Ended
November 30,
2021
Revenue $5,587.0
PK revenue (1) 441.2
Pro forma revenue $6,028.2


