Embed Size (px)
Citation preview
RESEARCH PAPER
Regulation of flooding tolerance of SAG12:ipt Arabidopsisplants by cytokinin
Le Nguyen Huynh1, Tara VanToai2,*, John Streeter1 and Gary Banowetz3
1 Department of Horticulture and Crop Science, Ohio State University, Columbus, OH 43210, USA2 USDA-ARS-Soil Drainage Research Units, Columbus, OH 43210, USA3 USDA-ARS National Forage Seed Production Research Center, Corvallis, OR 97331, USA
Received 2 November 2004; Accepted 18 February 2005
Abstract
A SAG12:ipt gene construct, which increases cytokinin
biosynthesis in response to senescence, was intro-
duced into Arabidopsis plants to delay senescence
induced by flooding stress. Two forms of flooding
stress, including total submergence and root water-
logging, were applied to SAG12:ipt (IPT) and wild-type
(WT) plants for 1, 3, and 5 d. A separate experiment
compared the recovery of WT and IPT plants subjected
to flooding stress. Biomass accumulation, carbohy-
drate and chlorophyll contents, and cytokinin and
abscisic acid were quantified to compare genotypic
responses to flooding stress and post-flooding re-
covery. Real-time RT-PCR studies were performed to
quantify ipt and SAG12 gene expression. IPT plants
exposed to waterlogging accumulated greater quanti-
ties of cytokinins more rapidly than WT plants or those
exposed to total submergence. Cytokinin accumulation
was accompanied by phenotypic adaptations, includ-
ing chlorophyll retention and increased biomass and
carbohydrate content relative to WT plants. Abscisic
acid accumulated rapidly in WT and IPT plants under
waterlogging stress but remained low in all genotypes
exposed to total submergence. IPT plants showed
improved recovery after waterlogging stress was re-
moved. Expression of ipt in submerged plants did not
result in cytokinin accumulation until submergence
stress was removed. At that point, IPT plants accumu-
lated greater quantities of cytokinin and recovered to
a greater extent than WT plants. This study established
the relationship between flooding tolerance and cyto-
kinin accumulation in IPT plants and suggested that
translation of ipt transcripts and subsequent cytokinin
accumulation were delayed under submergence
stress.
Key words: Abiotic stress, abscisic acid, cytokinin, ipt gene,
real-time RT-PCR, SAG12 gene, submergence, waterlogging.
Introduction
Flooding is a severe constraint on crop growth and affectsabout 16% of production areas worldwide (Boyer, 1982).Soil can become flooded due to poor drainage or excessiverainfall or irrigation. The severity of the flooding stress isaffected by flooding duration, crop variety, growth stage,soil type, fertility levels, pathogens, and flooding conditions(Sullivan et al., 2001). Flooding stress is initiated by eitherwaterlogging, when only the roots are flooded, or completesubmergence when the entire plants are under water. Whilesome plants have adaptive mechanisms that permit survivalduring long-term waterlogging (Bacanamwo and Purcell,1999a), most plants die within 1 or 2 d of submergence(Sullivan et al., 2001).
Flooding induces or accelerates plant senescence intobacco (Nicotiana tabacum L.), tomato (Lycopersiconesculentum L.), sunflower (Helianthus annuus L.), barley(Hordeum vulgare L.), peas (Pisum sativum L.), wheat(Triticum aestivum L.), maize (Zea mays L.), and soybean(Glycine max L.) (Burrows and Carr, 1969; Drew andSisworo, 1977; Olymbios and Schwabe, 1977; Jackson,1979; Trought and Drew, 1980; VanToai et al., 1994). Themost obvious symptom of flooding injury is leaf chlorosis,which is followed by necrosis, defoliation, cessation ofgrowth, and premature plant death. Within 1 d of flooding,the concentration of the anti-senescence hormone, cytokinin,
* To whom correspondence should be addressed. Fax: +1 301 838 0208. E-mail: [email protected] of trade names is for the benefit of readers and does not imply endorsement of the product by the US Department of Agriculture.
Published by Oxford University Press [2005] on behalf of the Society for Experimental Biology.
Journal of Experimental Botany, Vol. 56, No. 415, pp. 1397–1407, May 2005
doi:10.1093/jxb/eri141 Advance Access publication 29 March, 2005
by guest on August 23, 2014
http://jxb.oxfordjournals.org/D
ownloaded from
in sunflower xylem sap declined sharply to a very lowlevel which may have resulted from the decreased cyto-kinin synthesis in roots and the inability of the anaerobicroots to export cytokinin to the aerial part of the plant(Burrows and Carr, 1969). Cytokinin is synthesized at theroot apical meristem (Short and Torrey, 1972) wheredepressed metabolic activity and cell death due to floodingoccur much earlier than in other tissues (VanToai et al.,1995).To determine whether enhanced endogenous cytokinin
production improved flooding tolerance, Zhang et al.(2000) generated transgenic plants containing the chimericSAG12:ipt gene. The ipt gene encodes the enzyme iso-pentenyl transferase which catalyses the initial, rate-limiting step in the cytokinin biosynthesis pathway. Theproduction of cytokinin in the SAG12:ipt transgenic plantsis autoregulated because the senescence-specific SAG12promoter was used to drive the expression of the ipt gene(Gan and Amasino, 1995). The prevention of senescence, inturn, attenuates promoter activity and prevents hormoneoverproduction. The SAG12:ipt (IPT) Arabidopsis plantsshowed normal growth but exhibited a 7–10 d delay inplant senescence. They remained greener and producedmore biomass and seeds than wild-type (WT) plants underwaterlogging and submergence stress (Zhang et al., 2000).Since cytokinin concentration was not determined in thisstudy, the relationship between cytokinin concentration andflooding tolerance of IPT plants remains to be confirmed.In many cases, plants that survive flooding die after the
stress is removed (Sullivan et al., 2001). The post-floodingperiod can be as injurious as flooding itself, in part becauseof senescence-associated processes initiated in response tothe original stress. Plants which are tolerant to floodingneed to survive or grow during the stress but also to recoverafter the stress is removed. Most literature on floodingtolerance has focused exclusively on the flooding periodand has neglected the post-flooding period.In the current study, the comprehensive role of cytokinin
in regulating flooding tolerance was characterized in IPTArabidopsis plants at different time points during the 5 d ofsubmergence and waterlogging stress and the 5 d post-flooding recovery period. The relationship of floodingtolerance responses to expression of the ipt and SAG12genes was also documented, together with the accumulationof abscisic acid (ABA) during these periods.
Materials and methods
Plant materials
Transformation of Arabidopsis thaliana ecotype Columbia plantswith the Agrobacterium tumefaciens strain (GV 3101) containing theSAG12:ipt chimeric gene in a binary vector was performed asdescribed by Zhang et al. (2000). Two independent transgenic lines(IPT3 and IPT5) were used in this study. Transgenic seedlingsresistant to kanamycin were transplanted to 6 cm plastic pots
containing Metro-Mix 350 (WR Grace & Co., Cambridge, MA,USA) medium at one plant per pot. Plants were grown in a growthchamber maintained at constant 24 8C and 16 h light (250 lmolphoton m�2 s�1) for 2 weeks before being subjected to floodingstress. At that time, plants had 11 or 12 rosette leaves.
Flooding and recovery treatments
Transgenic (IPT3 and IPT5) and WT plants were subjected tocomplete submergence or waterlogging treatment for 1, 3, and 5 d.The submergence treatment consisted of submerging the entire plantunder 6 cm of water, while in the waterlogging treatment the waterwas maintained at 1 cm above the soil surface. In the recoveryexperiment, the water was drained after 1, 3, and 5 d of submergenceor waterlogging stress and the plants allowed to recover for 5 d.Control plants were not flooded. At each time point, total biomass andchlorophyll contents of seven individual plants were quantified.Soluble sugar, cytokinin, and ABA content and gene expression wereanalysed on pooled samples of seven plants.
Phenotypic analysis of responses to flooding and
post-flooding recovery
Analysis of shoot biomass: Above-ground parts collected fromindividual plants at each time point were immediately frozen withliquid nitrogen and freeze-dried. Dry tissues were ground, weighed,and stored in tightly sealed plastic vials.
Analysis of chlorophyll: Leaf discs (3 mm diameter) were harvestedfrom each of the three fully expanded uppermost leaves, soaked in3 ml dimethylformamide (DMF) and incubated in the dark for 48 h at4 8C. Absorbance of the DMF extract was measured at 647, 665, and720 nm with a dual-beam spectrophotometer (Beckman DU-50Series, Fullerton, CA, USA) using 100% DMF as a blank. Chloro-phyll concentration was calculated in mg l�1 using the equation ofInskeep and Bloom (1985) modified from the formulation of Moran(1982).
Analysis of soluble sugars: Sucrose, glucose, and fructose ofharvested plant tissues were determined as described by Streeterand Strimbu (1998). Soluble sugar was extracted from dried, groundtissues (5 mg) with 125 ll pyridine and 125 ll STOX reagent (PierceChemical Co., Rockford, IL, USA). The mixtures were vortexed andincubated at 70 8C for 40 min with occasional mixing. The mixtureswere then cooled to room temperature and thoroughly mixed with200 ll hexamethyldisilazane and 20 ll trifluoroacetic acid. After anadditional 60 min incubation at room temperature, soluble sugarconcentrations were determined using a Hewlett-Packard 5890 SeriesII gas chromatograph (Hewlett-Packard Co., Avondale, PA, USA)equipped with a 3% OV-17 on Chromsorb WHP column. Peak areaswere quantified with a Hewlett-Packard 3396A integrator. Allsamples were analysed twice.
Analysis of cytokinin and ABA: Lyophilized leaf samples wereextracted with chilled 80% methanol, cytokinins present in theextracts were purified by reverse-phase high-performance liquidchromatography, and zeatin, dihydrozeatin, zeatin riboside (ZR),dihydrozeatin riboside, isopentenyl adenine, isopentenyl adenosine(iPA), and ABA content were quantified as previously described(Trione et al., 1985; Banowetz et al., 1994). Total cytokinin wascalculated as the sum of individual components.
Analysis of gene expression by the real-time RT-PCR: Total RNAwas extracted from lyophilized leaf samples by the lithium chloridemethod (Franz and Wolfgang, 1993). First-strand cDNA synthesis
1398 Huynh et al.
by guest on August 23, 2014
http://jxb.oxfordjournals.org/D
ownloaded from
was performed using the Ready-To-Go T-Primed First-Strand Kit(Amersham Pharmacia Biotech, Inc., Piscataway, NJ, USA). Real-Time PCR was performed with specific primers of the ipt gene(forward 59-ACCCATGGACCTGCATCTA; reverse 59-GGAGCT-CAGGGCGGCGTAACC) and of the native SAG12 genes (forward59-GTGTCTACGCGGATGTGAAG; reverse 59-CAGCAAACT-GATTTACCGCA) by the intercalating SYBR Green method usingthe ABI Prism 7900HT Sequence Detection System (Applied Bio-system, Foster City, CA, USA). Gene expression was quantified withthe standard curve of actin gene (forward 59-CTGGAGATGATG-CACCAAGA; reverse 59-CCTCATCACCAACGTAAGCA) ampli-fied from a serial dilution of control, non-flooded samples using themanufacturer’s protocol (Ambion, Inc., Austin, TX, USA). Relativeexpression values were normalized to the lowest expression valuetaken as 1. Samples were run in duplicate, and data presented are themean of the two replications 6standard deviation. The presence ofa single amplicon of the predicted size was confirmed by meltingcurve analyses of the data.
Results
Biomass analysis
Transgenic IPT plants generally accumulate 20–30% moreshoot biomass than WT plants under non-stress controlconditions (Zhang et al., 2000). To avoid the potentialeffects of individual differences in plant vigour on floodingtolerance, the plants in the current study were selected tohave the same size. Consequently, no difference in biomassaccumulation was detected betweenWT and IPT3 and IPT5transgenic plants at each of three sampling times in the non-flooded control treatment (Table 1). One day of submer-gence showed no damage on growth of both WT and IPTplants. Both genotypes, however, lost about 10% biomassat day 3. IPT plants quickly adapted to the stress andresumed growth. At day 5, IPT plants contained 15% morebiomass than plants at day 3, while WT plants showed nogrowth during submergence.
It is interesting that waterlogging was not damaging tothe growth of Arabidopsis plants. Both WT and IPT plantsof the 1 d waterlogging treatment accumulated morebiomass than control plants of the same age. After 3 d ofwaterlogging treatment, transgenic plants accumulatedmore biomass than control plants, while WT plants grewas well as control plants. The IPT plants subjected to the 5 dwaterlogging treatment continued to grow as well as controlplants, while WT plants accumulated 20% less biomass.
In the recovery experiment, plants were removed fromthe control, submergence, and waterlogging treatments atday 1, day 3, and day 5, and allowed to recover for 5 dbefore biomass accumulation was quantified. As expected,control, non-flooded WT, IPT3, and IPT5 plants accumu-lated 60–140% more biomass during the additional 5 d ofgrowth but no difference was detected between the geno-types (Table 2). The results confirmed that IPT plants grownormally under control, non-stressed conditions comparedwith WT plants. In the submergence treatment, no differ-ence was detected between WT and IPT plants recovering
from 1 d stress. IPT plants subjected to 3 d and 5 dsubmergence treatment recovered and grew significantlybetter than WT plants that received the same stresstreatment (Table 2). Similarly, no difference in biomasswas detected between WT and IPT plants recovered from1 d of waterlogging. As waterlogging became more severe,the differences between IPT and WT plants became moredistinct. In the 3 d and 5 d treatments, recovering IPT plantsaccumulated 11% and 25% more biomass than WT plantsreceiving the same stress duration, respectively (Table 2).
The results showed that IPT plants grew better than WTplants under submergence and waterlogging stress. Whenthe stress was removed, transgenic plants recovered fasterand accumulated more biomass than WT plants.
Chlorophyll analysis
No difference in the chlorophyll concentration was detectedbetween non-flooded WT and IPT plants. At day 1 of the
Table 1. Biomass (mg plant�1 DW) of WT, IPT3, and IPT5Arabidopsis plants at 1, 3, and 5 d under control non-flooded,submergence, and waterlogging treatment
Data represent means (n=7) 6standard deviation.
Treatment Genotype Flooding duration (d)
1 3 5
Biomass (mg plant�1 DW)
Control WT 76611 115622 171620IPT3 83613 115615 180611IPT5 77613 108610 189623
Submergence WT 7667 7265 7068IPT3 8168 7966 9263IPT5 8067 7665 8768
Waterlogging WT 9867 11366 15369IPT3 10266 149611 190613IPT5 9462 12968 183617
Table 2. Biomass (mg plant�1 DW) of WT, IPT3, and IPT5Arabidopsis plants after 5 d of recovery from 1, 3, and 5 d ofnon-flooded, submergence, and waterlogging treatment
Data represent means (n=7) 6standard deviation.
Treatment Genotype Flooding duration (d)
1 3 5
Biomass (mg plant�1 DW)
Control WT 168613 222626 309622IPT3 19366 215614 282620IPT5 188618 216619 303624
Submergence WT 14766 11965 9169IPT3 164612 15667 125614IPT5 16569 149611 116610
Waterlogging WT 16164 15363 157620IPT3 169611 170611 212613IPT5 16365 17469 212618
Regulation of flooding tolerance of SAG12:ipt Arabidopsis plants 1399
by guest on August 23, 2014
http://jxb.oxfordjournals.org/D
ownloaded from
non-flooded treatment, the average concentration was689648 lg g�1 FW. As the plants matured, the concen-tration increased to 73869 lg g�1 FW at day 3 and825623 lg g�1 FW at day 5. Waterlogging for 1 d did notchange the chlorophyll concentration of WT and IPT plants(718625 lg g�1 FW) as compared with non-floodedcontrol plants. After 3 and 5 d of waterlogging stress, theaverage chlorophyll concentration was 10% higher in IPT(745624 lg g�1 FW) than in WT plants (678638 lg g�1
FW). Submergence stress reduced chlorophyll concentra-tion of both WT and transgenic plants by 19% at day 3(59368 lg g�1 FW) and 35% (538610 lg g�1 FW) atday 5.In the post-flooding recovery phase, IPT plants contained
5–8% more chlorophyll content during recovery fromwaterlogging stress and 20% more chlorophyll duringrecovery from 5 d of submergence than WT plants thatreceived the same treatment.
Soluble sugar analysis
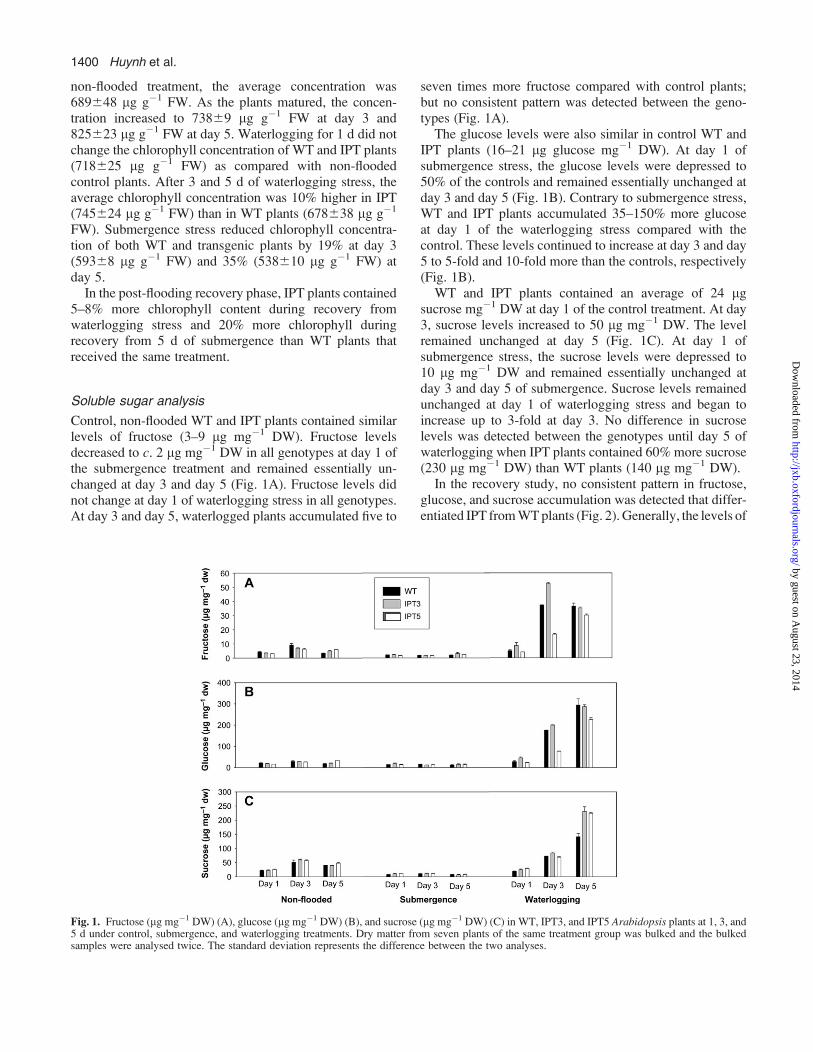
Control, non-flooded WT and IPT plants contained similarlevels of fructose (3–9 lg mg�1 DW). Fructose levelsdecreased to c. 2 lg mg�1 DW in all genotypes at day 1 ofthe submergence treatment and remained essentially un-changed at day 3 and day 5 (Fig. 1A). Fructose levels didnot change at day 1 of waterlogging stress in all genotypes.At day 3 and day 5, waterlogged plants accumulated five to
seven times more fructose compared with control plants;but no consistent pattern was detected between the geno-types (Fig. 1A).
The glucose levels were also similar in control WT andIPT plants (16–21 lg glucose mg�1 DW). At day 1 ofsubmergence stress, the glucose levels were depressed to50% of the controls and remained essentially unchanged atday 3 and day 5 (Fig. 1B). Contrary to submergence stress,WT and IPT plants accumulated 35–150% more glucoseat day 1 of the waterlogging stress compared with thecontrol. These levels continued to increase at day 3 and day5 to 5-fold and 10-fold more than the controls, respectively(Fig. 1B).
WT and IPT plants contained an average of 24 lgsucrose mg�1 DW at day 1 of the control treatment. At day3, sucrose levels increased to 50 lg mg�1 DW. The levelremained unchanged at day 5 (Fig. 1C). At day 1 ofsubmergence stress, the sucrose levels were depressed to10 lg mg�1 DW and remained essentially unchanged atday 3 and day 5 of submergence. Sucrose levels remainedunchanged at day 1 of waterlogging stress and began toincrease up to 3-fold at day 3. No difference in sucroselevels was detected between the genotypes until day 5 ofwaterlogging when IPT plants contained 60% more sucrose(230 lg mg�1 DW) than WT plants (140 lg mg�1 DW).
In the recovery study, no consistent pattern in fructose,glucose, and sucrose accumulation was detected that differ-entiated IPT fromWTplants (Fig. 2). Generally, the levels of
Fig. 1. Fructose (lg mg�1 DW) (A), glucose (lg mg�1 DW) (B), and sucrose (lg mg�1 DW) (C) in WT, IPT3, and IPT5 Arabidopsis plants at 1, 3, and5 d under control, submergence, and waterlogging treatments. Dry matter from seven plants of the same treatment group was bulked and the bulkedsamples were analysed twice. The standard deviation represents the difference between the two analyses.
1400 Huynh et al.
by guest on August 23, 2014
http://jxb.oxfordjournals.org/D
ownloaded from

all three sugars increased 4–5-fold in the recovery fromsubmergence stress; sugar levels did not change much in therecovery from 1 d of waterlogging stress, but declined in therecovery from 3 and 5 d of waterlogging stress.
Cytokinin analysis
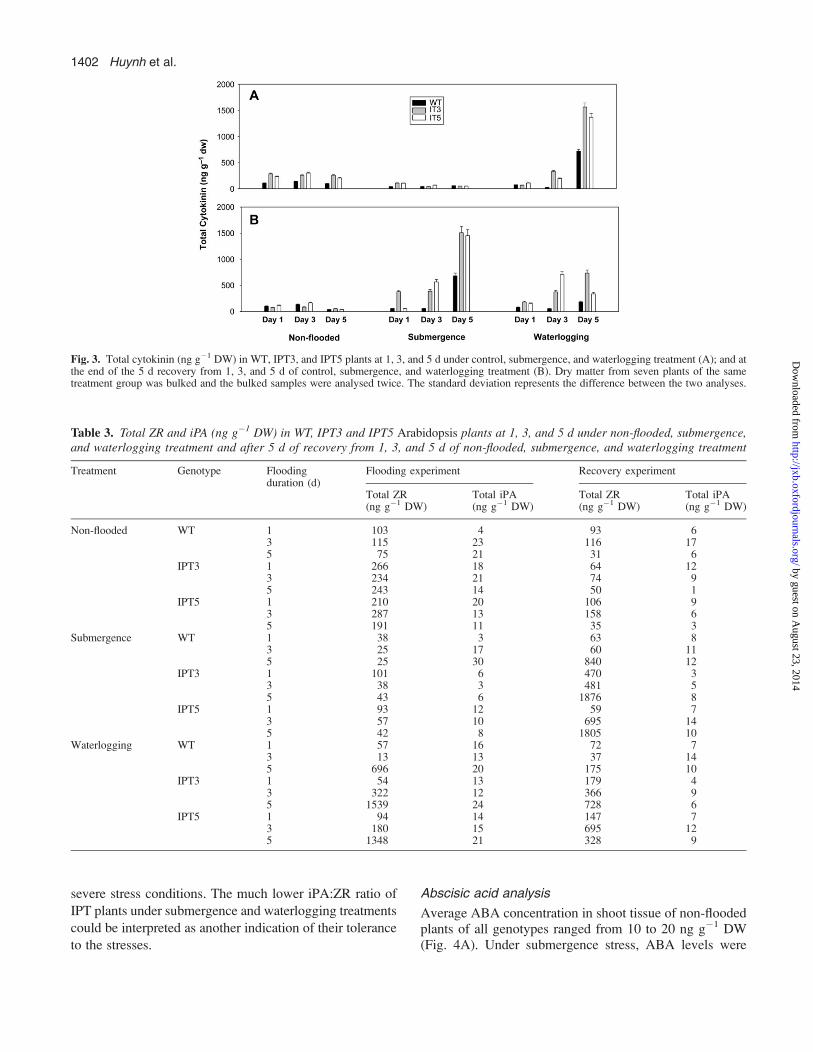
The average cytokinin concentration in shoot tissue ofcontrol, non-flooded WT plants was 100 ng g�1 DW, whilelevels measured in IPT3 and IPT5 plants ranged from 250to 300 ng g�1 DW (Fig. 3A). At day 1 of submergence,cytokinins decreased significantly in all genotypes, al-though the levels were still 2-fold higher in IPT3 andIPT5 plants (100 ng g�1 DW) compared with WT plants(40 ng g�1 DW) (Fig. 3A). At day 3 and day 5 ofsubmergence, cytokinin levels were similar in WT andtransgenic plants. At day 1 of waterlogging, cytokininlevels declined from 50% to 100% in all genotypes(68–108 ng g�1 DW) compared with non-flooded controlplants (Fig. 3A). At day 3 of waterlogging, cytokinin levelsfurther declined in WT plants (26 ng g�1 DW), but in-creased 2–4-fold in IPT5 and IPT3 plants (350–1500 ng g�1
DW). At day 5 of waterlogging, cytokinin levels in-creased substantially in WT plants (700 ng g�1 DW), butremained 50% lower than levels measured in IPT3 andIPT5 plants (1400–1500 ng g�1 DW) (Fig. 3A).
In the recovery experiment, cytokinin levels in IPTplants were consistently higher than in WT plants. IPTplants subjected to 3 d submergence stress accumulatedup to 10-fold more cytokinin (700 ng g�1 DW) than WT
plants (70 ng g�1 DW). A 2-fold higher cytokinin accu-mulation was also detected in IPT plants recovered from 5 dsubmergence stress (1800 ng g�1 DW) compared with WTplants stressed for the same duration (850 ng g�1 DW)(Fig. 3A).
Similarly, IPT plants that recovered from waterloggingstress consistently accumulated more cytokinin than WTplants that received the same stress treatment. IPT plantsrecovered from the 1 d waterlogging stress contained150–180 ng g�1 DW while WT plants only contained80 ng g�1 DW. After recovery from the 3 d waterloggingtreatment, cytokinin levels remained at 50 ng g�1 DW inWT, but increased to 375 and 700 ng g�1 DW in IPT3 andIPT5 plants, respectively. After recovery from the 5 dwaterlogging treatment, cytokinin levels were much lowerin WT plants (200 ng g�1 DW) compared with IPT3(350 ng g�1 DW) and IPT5 plants (750 ng g�1 DW).
Differences in cytokinin levels between WT and IPTplants were due largely to changes in ZR content (Table 3).Under control, non-flooded conditions, ZR-type cytokininswere the predominant form in WT plants (c. 95%), whilethe iPA-type cytokinin only contributed 4% of the total(Table 3). This iPA:ZR ratio of 0.04 was similar in controlIPT plants despite the fact that transgenics accumulatedtwice as much cytokinin. As WT plants in this study aged,the iPA:ZR ratio increased to 0.28 at day 5 of the controltreatment (Table 3). Under submergence stress, the iPA:ZRratio was as large as 1.20 suggesting that the enzyme(s)converting iPA to ZR were affected by senescence and
Fig. 2. Fructose (lg mg�1 DW) (A), glucose (lg mg�1 DW) (B), and sucrose (lg mg�1 DW) (C) inWT, IPT3, and IPT5 Arabidopsis plants at the end ofthe 5 d recovery from 1, 3, and 5 d of control, submergence, and waterlogging treatment. Dry matter from seven plants of the same treatment group wasbulked and the bulked samples were analysed twice. The standard deviation represents the difference between the two analyses.
Regulation of flooding tolerance of SAG12:ipt Arabidopsis plants 1401
by guest on August 23, 2014
http://jxb.oxfordjournals.org/D
ownloaded from
severe stress conditions. The much lower iPA:ZR ratio of
IPT plants under submergence and waterlogging treatments
could be interpreted as another indication of their tolerance
to the stresses.
Abscisic acid analysis
Average ABA concentration in shoot tissue of non-floodedplants of all genotypes ranged from 10 to 20 ng g�1 DW(Fig. 4A). Under submergence stress, ABA levels were
Fig. 3. Total cytokinin (ng g�1 DW) in WT, IPT3, and IPT5 plants at 1, 3, and 5 d under control, submergence, and waterlogging treatment (A); and atthe end of the 5 d recovery from 1, 3, and 5 d of control, submergence, and waterlogging treatment (B). Dry matter from seven plants of the sametreatment group was bulked and the bulked samples were analysed twice. The standard deviation represents the difference between the two analyses.
Table 3. Total ZR and iPA (ng g�1 DW) in WT, IPT3 and IPT5 Arabidopsis plants at 1, 3, and 5 d under non-flooded, submergence,and waterlogging treatment and after 5 d of recovery from 1, 3, and 5 d of non-flooded, submergence, and waterlogging treatment
Treatment Genotype Floodingduration (d)
Flooding experiment Recovery experiment
Total ZR(ng g�1 DW)
Total iPA(ng g�1 DW)
Total ZR(ng g�1 DW)
Total iPA(ng g�1 DW)
Non-flooded WT 1 103 4 93 63 115 23 116 175 75 21 31 6
IPT3 1 266 18 64 123 234 21 74 95 243 14 50 1
IPT5 1 210 20 106 93 287 13 158 65 191 11 35 3
Submergence WT 1 38 3 63 83 25 17 60 115 25 30 840 12
IPT3 1 101 6 470 33 38 3 481 55 43 6 1876 8
IPT5 1 93 12 59 73 57 10 695 145 42 8 1805 10
Waterlogging WT 1 57 16 72 73 13 13 37 145 696 20 175 10
IPT3 1 54 13 179 43 322 12 366 95 1539 24 728 6
IPT5 1 94 14 147 73 180 15 695 125 1348 21 328 9
1402 Huynh et al.
by guest on August 23, 2014
http://jxb.oxfordjournals.org/D
ownloaded from

reduced substantially in all genotypes. By contrast, ABAlevels increased 1.5–3-fold in all genotypes under water-logging stress and continued to increase at 3 d and 5 d to ashigh as 700 ng g�1 DW (Fig. 4A). There was no consistentpattern that suggested IPT plants accumulated more ABAthan WT plants.
In the recovery experiment, WT and IPT differed in ABAaccumulation only in plants exposed to 5 d of submergence(Fig. 4B). Similarly, significant genotypic differencesduring recovery from waterlogging were only apparent inplants exposed to 5 d of waterlogging.
Gene expression
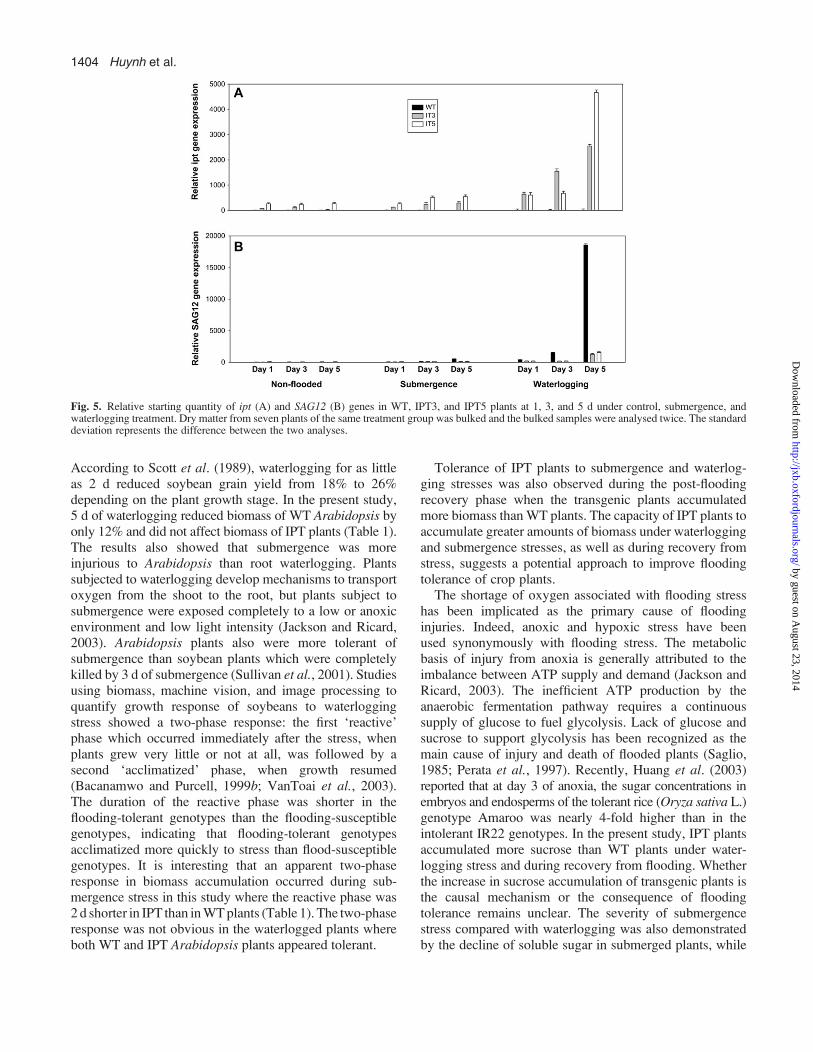
Relative expression of the ipt transgene, the native SAG12 geneand the positive control actin gene was quantified by real-timeRT-PCR. Expression of the actin gene remained essentiallyconstant in all treatments. Ipt transcripts were detected incontrol, non-flooded IPT3 and IPT5 plants at levels 50-foldand 250-fold higher than in control WT plants, respectively(Fig. 5A). After 1 d of submergence, ipt gene expressionincreased 100-fold in IPT3 plants and 25-fold in IPT5 plants.Ipt transcript levels increased at day 3 and day 5 of sub-mergence to c. 250-fold in IPT3 plants and c. 500-fold inIPT5 plants. The increase in ipt transcript accumulation inIPT plants under submergencewas highly significant, but evengreater increases occurred in plants subjected to waterloggingstress. At 1 d of waterlogging, ipt-gene expression increasedc. 400-fold in IPT3 and IPT5 plants. The accumulation wasfurther increased at day 3 and day 5 to 1500- and 2000-fold,respectively, in IPT3 plants. In IPT5 plants, the increase wasas high as 4000-fold at day 5 of waterlogging (Fig. 5A).
Expression of the senescence-specific, native SAG12gene was at base-line levels in non-flooded plants of both
genotypes. In response to flooding stress, SAG12 geneexpression followed an almost opposite pattern to that ofthe ipt gene. The expression remained at base line in IPTplants throughout the entire submergence duration, butincreased 5-fold in WT plants at the day 5 treatment. Underwaterlogging, SAG12 gene expression of IPT3 and IPT5plants remained at base-line levels at day 1 and day 3 ofwaterlogging stress. At day 5, the expression increased 10-fold in IPT plants. WT plants showed a 5-fold increase inSAG12 expression at day 1 of waterlogging. The expressionincreased to 10-fold at day 3 and 1800-fold at day 5.
Discussion
Phenotypic responses of IPT plants to waterloggingand submergence stresses
The fact that IPT plants are more tolerant of submergenceand waterlogging than WT plants can further be substan-tiated by the results of similar studies conducted underdifferent conditions at two other locations. In all thesestudies, the similar trend that transgenic plants grew biggerthan WT plants at 5 d of submergence and 3 d and 5 d ofwaterlogging was observed (data not shown). In addition,the differences between transgenic and WT plants would bemuch greater if random IPT plants were assigned to thetreatments. As mentioned, to avoid the confounded effectsdue to the generally 20–30% larger size of IPT plantscompared with WT plants, IPT plants of similar size to WTplants were selected for the treatments. Consequently, theselected IPT plants were smaller than average IPT plants.
Arabidopsis plants are more tolerant to waterloggingthan other dicots (Burrows and Carr, 1969; Jackson, 1979).
Fig. 4. Total ABA (ng g�1 DW) in WT, IPT3, and IPT5 plants at 1, 3, and 5 d under control, submergence, and waterlogging treatment (A); and at theend of the 5 d recovery from 1, 3, and 5 d of control, submergence, and waterlogging treatment (B). Dry matter from seven plants of the same treatmentgroup was bulked and the bulked samples were analysed twice. The standard deviation represents the difference between the two analyses.
Regulation of flooding tolerance of SAG12:ipt Arabidopsis plants 1403
by guest on August 23, 2014
http://jxb.oxfordjournals.org/D
ownloaded from
According to Scott et al. (1989), waterlogging for as littleas 2 d reduced soybean grain yield from 18% to 26%depending on the plant growth stage. In the present study,5 d of waterlogging reduced biomass of WT Arabidopsis byonly 12% and did not affect biomass of IPT plants (Table 1).The results also showed that submergence was moreinjurious to Arabidopsis than root waterlogging. Plantssubjected to waterlogging develop mechanisms to transportoxygen from the shoot to the root, but plants subject tosubmergence were exposed completely to a low or anoxicenvironment and low light intensity (Jackson and Ricard,2003). Arabidopsis plants also were more tolerant ofsubmergence than soybean plants which were completelykilled by 3 d of submergence (Sullivan et al., 2001). Studiesusing biomass, machine vision, and image processing toquantify growth response of soybeans to waterloggingstress showed a two-phase response: the first ‘reactive’phase which occurred immediately after the stress, whenplants grew very little or not at all, was followed by asecond ‘acclimatized’ phase, when growth resumed(Bacanamwo and Purcell, 1999b; VanToai et al., 2003).The duration of the reactive phase was shorter in theflooding-tolerant genotypes than the flooding-susceptiblegenotypes, indicating that flooding-tolerant genotypesacclimatized more quickly to stress than flood-susceptiblegenotypes. It is interesting that an apparent two-phaseresponse in biomass accumulation occurred during sub-mergence stress in this study where the reactive phase was2 d shorter in IPT than inWTplants (Table 1). The two-phaseresponse was not obvious in the waterlogged plants whereboth WT and IPT Arabidopsis plants appeared tolerant.
Tolerance of IPT plants to submergence and waterlog-ging stresses was also observed during the post-floodingrecovery phase when the transgenic plants accumulatedmore biomass thanWT plants. The capacity of IPT plants toaccumulate greater amounts of biomass under waterloggingand submergence stresses, as well as during recovery fromstress, suggests a potential approach to improve floodingtolerance of crop plants.
The shortage of oxygen associated with flooding stresshas been implicated as the primary cause of floodinginjuries. Indeed, anoxic and hypoxic stress have beenused synonymously with flooding stress. The metabolicbasis of injury from anoxia is generally attributed to theimbalance between ATP supply and demand (Jackson andRicard, 2003). The inefficient ATP production by theanaerobic fermentation pathway requires a continuoussupply of glucose to fuel glycolysis. Lack of glucose andsucrose to support glycolysis has been recognized as themain cause of injury and death of flooded plants (Saglio,1985; Perata et al., 1997). Recently, Huang et al. (2003)reported that at day 3 of anoxia, the sugar concentrations inembryos and endosperms of the tolerant rice (Oryza sativa L.)genotype Amaroo was nearly 4-fold higher than in theintolerant IR22 genotypes. In the present study, IPT plantsaccumulated more sucrose than WT plants under water-logging stress and during recovery from flooding. Whetherthe increase in sucrose accumulation of transgenic plants isthe causal mechanism or the consequence of floodingtolerance remains unclear. The severity of submergencestress compared with waterlogging was also demonstratedby the decline of soluble sugar in submerged plants, while
Fig. 5. Relative starting quantity of ipt (A) and SAG12 (B) genes in WT, IPT3, and IPT5 plants at 1, 3, and 5 d under control, submergence, andwaterlogging treatment. Dry matter from seven plants of the same treatment group was bulked and the bulked samples were analysed twice. The standarddeviation represents the difference between the two analyses.
1404 Huynh et al.
by guest on August 23, 2014
http://jxb.oxfordjournals.org/D
ownloaded from
sugars continued to increase in plants under waterloggingstress. However, unlike transgenic SAG12:ipt tobaccoplants, which accumulated 3–5-fold more glucose andfructose during senescence than WT plants (Wingleret al., 1998), no genotypic difference in the accumulationof these sugars was detected under submergence, water-logging, and post-flooding recovery periods.
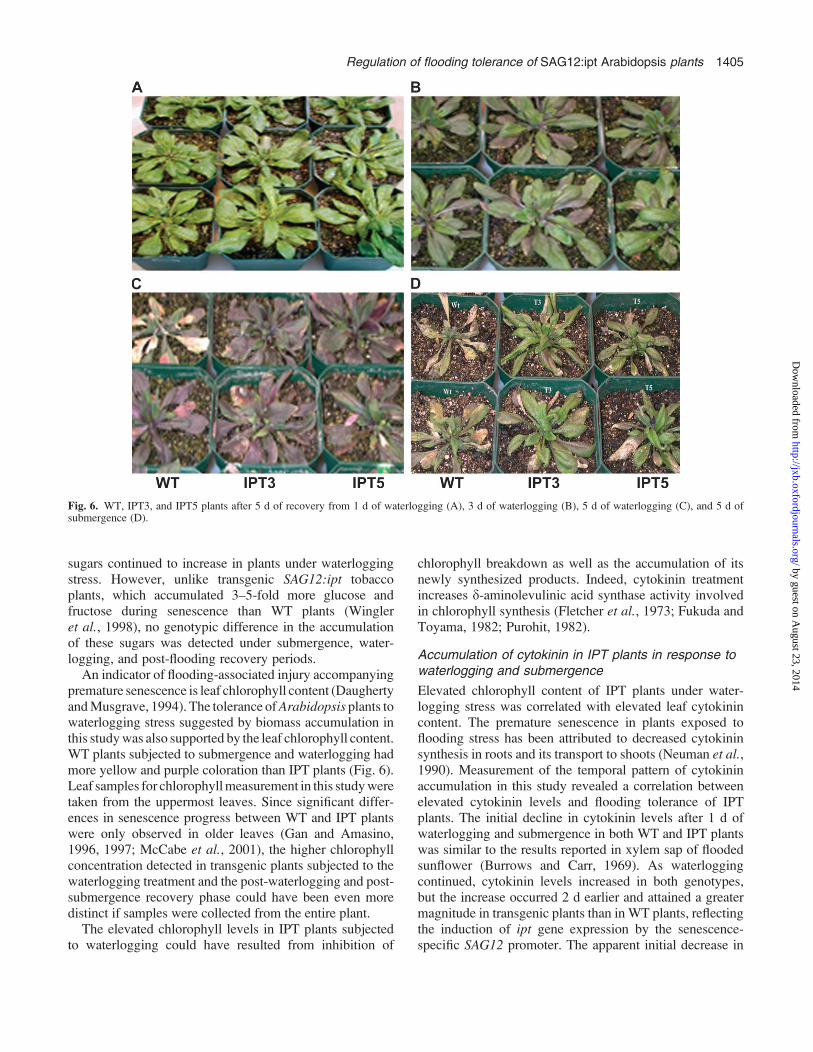
An indicator of flooding-associated injury accompanyingpremature senescence is leaf chlorophyll content (DaughertyandMusgrave, 1994). The tolerance ofArabidopsis plants towaterlogging stress suggested by biomass accumulation inthis studywas also supported by the leaf chlorophyll content.WT plants subjected to submergence and waterlogging hadmore yellow and purple coloration than IPT plants (Fig. 6).Leaf samples for chlorophyllmeasurement in this studyweretaken from the uppermost leaves. Since significant differ-ences in senescence progress between WT and IPT plantswere only observed in older leaves (Gan and Amasino,1996, 1997; McCabe et al., 2001), the higher chlorophyllconcentration detected in transgenic plants subjected to thewaterlogging treatment and the post-waterlogging and post-submergence recovery phase could have been even moredistinct if samples were collected from the entire plant.
The elevated chlorophyll levels in IPT plants subjectedto waterlogging could have resulted from inhibition of
chlorophyll breakdown as well as the accumulation of itsnewly synthesized products. Indeed, cytokinin treatmentincreases d-aminolevulinic acid synthase activity involvedin chlorophyll synthesis (Fletcher et al., 1973; Fukuda andToyama, 1982; Purohit, 1982).
Accumulation of cytokinin in IPT plants in response towaterlogging and submergence
Elevated chlorophyll content of IPT plants under water-logging stress was correlated with elevated leaf cytokinincontent. The premature senescence in plants exposed toflooding stress has been attributed to decreased cytokininsynthesis in roots and its transport to shoots (Neuman et al.,1990). Measurement of the temporal pattern of cytokininaccumulation in this study revealed a correlation betweenelevated cytokinin levels and flooding tolerance of IPTplants. The initial decline in cytokinin levels after 1 d ofwaterlogging and submergence in both WT and IPT plantswas similar to the results reported in xylem sap of floodedsunflower (Burrows and Carr, 1969). As waterloggingcontinued, cytokinin levels increased in both genotypes,but the increase occurred 2 d earlier and attained a greatermagnitude in transgenic plants than in WT plants, reflectingthe induction of ipt gene expression by the senescence-specific SAG12 promoter. The apparent initial decrease in
Fig. 6. WT, IPT3, and IPT5 plants after 5 d of recovery from 1 d of waterlogging (A), 3 d of waterlogging (B), 5 d of waterlogging (C), and 5 d ofsubmergence (D).
Regulation of flooding tolerance of SAG12:ipt Arabidopsis plants 1405
by guest on August 23, 2014
http://jxb.oxfordjournals.org/D
ownloaded from
cytokinin content followed by increased accumulation inresponse to waterlogging suggests a two-phase response. Itis intriguing that the accumulation of biomass under water-logging did not show that two-phase response.
Accumulation of ipt and SAG12 transcripts in IPTplants in response to waterlogging and submergence
While roots are the major site of cytokinin synthesis,expression of the GUS reporter gene driven by the SAG12promoter is not detected in roots (Zhang et al., 2000). Thehigh levels of cytokinin in IPT plants associated with theincreased ipt transcript accumulation indicated that leafexpression of the ipt gene produced a functional isopentenyltransferase enzyme. Of special note was the observation thatipt transcript accumulation under submergence stress did notresult in increased cytokinin accumulation. The lack ofrelationship between ipt transcript accumulation and cyto-kinin accumulation during submergence stress suggests thateither translation of the ipt transcript was impacted, or theactivity of the translated product was inhibited, possibly dueto limiting quantities of oxygen and adenylate energy.Alternately, cytokinins could be less stable or metabolizedmore rapidly under submergence stress.The SAG12 gene was first identified from leaves that
were in the late stage of senescence and were visibly yellow(Weaver et al., 1998). In the present study, the largeincrease in SAG12 transcript accumulation in WT plants atday 5 of submergence and waterlogging treatments in-dicated the association between senescence and stress inWT plants, whereas no accumulation was detected in IPTplants. As expected, the temporal pattern of SAG12 geneexpression was opposite to that of the ipt gene, showing theeffectiveness of cytokinin in delaying senescence.
Accumulation of ABA in IPT plants in response towaterlogging and submergence
Flooding can induce changes in hormones other thancytokinins, including ABA. According to Hwang andVanToai (1991), exogenous treatment with ABA improvedanoxic tolerance of corn seedlings. Chang et al. (2003)reported that ABA regulated floral senescence and itsaccumulation was significantly higher in corollas of WTthan of IPT petunia. In the present study, ABA andcytokinin accumulation increased simultaneously. The in-creased ABA accumulation during waterlogging was simi-lar to the results reported in pea plants (Zhang and Davies,1990). Since flooded plants suffer from water deficit due tothe decreased hydraulic conductance caused by the short-age of oxygen and energy charge (Else et al., 2001), theincrease in ABA can be taken as an adaptive measure thatregulates stomatal closure to avoid the leaf wilting whichcommonly occurred in flooded plants. Additionally, ABAmay increase the growth stimulatory effect of cytokinin asreported by Blumenfield and Gazit (1970).
This study identified and characterized impacts of cyto-kinin overproduction on the tolerance of Arabidopsis plantsto waterlogging and submergence stresses. The increasedtolerance of both transgenic IPT3 and IPT5 lines to water-logging coincided with the increase in cytokinin levelsduring the flooding and recovery periods. IPT plantsaccumulated more biomass and more cytokinin after 1 dsubmergence stress. However, the increases in ipt transcriptaccumulation at day 5 of this treatment were not accom-panied by cytokinin accumulation. IPT plants also accu-mulated more cytokinin and showed improved recoveryfrom the submergence stress than WT plants. These resultssuggest that cytokinin accumulation during waterloggingand recovery from waterlogging and submergence is animportant mechanism of flooding tolerance.
Acknowledgements
We are grateful to Mr Bert Bishop of the Ohio Agricultural Researchand Development Center, Ohio State University, Wooster, OH, USAfor his help with statistical analysis of the data. This paper(manuscript number HCS 03-29) is a joint contribution of theUSDA-ARS and Ohio State University. Partial salaries and researchsupport were provided by state and federal funds appropriated to theOhio Agricultural Research and Development Center, The OhioState University.
References
Bacanamwo M, Purcell LC. 1999a. Soybean root morphologicaland anatomical traits associated with acclimation to flooding. CropScience 39, 143–149.
Bacanamwo M, Purcell LC. 1999b. Soybean dry matter and Naccumulation responses to flooding stress, N sources, and hypoxia.Journal of Experimental Botany 50, 689–696.
Banowetz GM, Hess JR, Carman JG. 1994. A monoclonalantibody against the plant growth regulator, abscisic acid.Hybridoma 13, 537–541.
Blumenfeld A, Gazit S. 1970. Interaction of kinetin and abscisicacid in the growth of soybean callus. Plant Physiology 45,535–536.
Boyer JS. 1982. Plant productivity and environment. Science 218,443–448.
Burrows WJ, Carr DJ. 1969. Effects of flooding the root systemof sunflower plants on the cytokinin content of the xylem sap.Plant Physiology 22, 1105–1112.
Chang H, Jones ML, Banowetz GM, Clark DG. 2003. Over-production of cytokinins in petunia flowers transformed withPSAG12:IPT delays corolla senescence. Plant Physiology 132,2174–2183.
Daugherty CJ, Musgrave ME. 1994. Characterization of popula-tions of rapid-cycling Brassica rapa L. selected for differentialwaterlogging tolerance. Journal of Experimental Botany 45,385–392.
Drew MC, Sisworo EJ. 1977. Early effects of flooding on nitrogendeficiency and leaf chlorosis in barley. New Phytologist 79,567–571.
Else MC, Coupland D, Dutton L, Jackson MB. 2001. Decreasedroot hydraulic conductivity reduces leaf water potential, initiatesstomatal closure and slows leaf expansion in flooded plants of
1406 Huynh et al.
by guest on August 23, 2014
http://jxb.oxfordjournals.org/D
ownloaded from
castor oil (Ricinus communis) despite diminished delivery of ABAfrom the roots to shoots in xylem sap. Physiologia Plantarum 111,46–54.
Fletcher R, Teo C, Ali A. 1973. Stimulation of chlorophyll synthesisin cucumber cotyledons by benzyladenine. Canadian Journal ofBotany 51, 937–939.
Franz V, Wolfgang S. 1993. Simple method of RNA isolationfrom human leucocytic cell lines. Nucleic Acids Research 21,4852–4853.
Fukuda K, Toyama S. 1982. Electron microscope studies on themorphogenesis of plastids. XI. Ultrastructural changes of thechloroplasts in tomato leaves treated with ethylene and kinetin.Cytologia 47, 725–736.
Gan S, Amasino RM. 1995. Inhibition of leaf senescence byautoregulated production of cytokinin. Science 270, 1986–1988.
Gan S, Amasino RM. 1996. Cytokinins in plant senescence: fromspray and pray to clone and play. BioEssays 18, 557–565.
Gan S, Amasino RM. 1997. Molecular genetic regulation andmanipulation of leaf senescence. Plant Physiology 113, 313–319.
Huang S, Greenway H, Colmer TD. 2003. Anoxia tolerance inrice seedlings: exogenous glucose improves growth of an anoxia-‘intolerant’, but not of a -‘tolerant’ genotype. Journal of Experi-mental Botany 54, 2363–2373.
Hwang SY, VanToai TT. 1991. Activities of proteinases in maizeand soybean roots in response to anoxic stress. Plant and Soil 126,127–132.
Inskeep WP, Bloom PR. 1985. Extinction coefficients of chloro-phyll a and b in N-N-dimethylformamide and 80% acetone.Plant Physiology 77, 483–485.
Jackson MB. 1979. Rapid injury to peas by soil waterlogging.Journal of the Science of Food and Agriculture 30, 143–152.
Jackson MB, Ricard B. 2003. Physiology, biochemistry andmolecular biology of plant root systems subjected to floodingof the soil. In: de Kroon H, Visser EJW, eds. Ecological studies,Vol. 168. Root ecology. Springer-Verlag: Heidelberg/Berlin,193–213.
McCabe MS, Garratt LC, Schepers F, Jordi WJRM, StoopenGM, Davelaar E, van Rhijn HA, Power JB, Davey MR. 2001.Effect of pSAG12:ipt gene expression on development andsenescence in transgenic lettuce. Plant Physiology 127, 505–516.
Moran R. 1982. Formulae for determination of chlorophyllouspigments extracted with N-N-dimethylformamide. PlantPhysiology 69, 1376–1380.
Neuman DS, Rood SB, Smith BA. 1990. Does cytokinin transportfrom root-to-shoot in the xylem sap regulate leaf responses to roothypoxia? Journal of Experimental Botany 41, 1325–1333.
Olymbios CM, Schwabe WW. 1977. Effects of aeration and soilcompaction on growth of the carrot, Daucus carota L. The Journalof the American Society for Horticultural Science 52, 485–500.
Perata P, Guglielminetti L, Alpi A. 1997. Mobilization of endo-sperm reserves in cereal seeds under anoxia. Annals of Botany 79,49–56.
Purohit S. 1982. Prevention by kinetin of ethylene-inducedchlorophylase activity in senescing detached leaves of Helianthusannuus. Biochemie und Physiologie der Pflanzen 177, 625–627.
Saglio PH. 1985. Effect of path or sink anoxia on sugar translocationin roots of maize seedlings. Plant Physiology 77, 285–290.
Scott HD, DeAngulo J, Daniels MB, Wood LS. 1989. Floodduration effects on soybean growth and yield. Agronomy Journal81, 631–636.
Short KC, Torrey JG. 1972. Cytokinins in seedling roots of pea.Plant Physiology 49, 155–160.
Streeter JG, Strimbu CE. 1998. Simultaneous extraction and de-rivatization of carbohydrates from green plant tissues for analysis bygas-liquid chromatography. Analytical Biochemistry 259, 253–257.
Sullivan M, VanToai T, Fausey N, Beuerlein J, Parkinson R,Soboyejo A. 2001. Evaluating on-farm flooding impacts onsoybean. Crop Science 41, 1–8.
Trione EJ, Krygier BB, Banowetz GM, Kathrein JM. 1985. Thedevelopment of monoclonal antibodies against the cytokinin zeatinriboside. Journal of Plant Growth Regulation 4, 101–109.
Trought MCT, Drew MC. 1980. The development of waterloggingdamage in wheat seedlings (Triticum aestivum L.). I. Shoot androot growth in relation to changes in the concentrations ofdissolved gases and solutes in the soil solution. Plant and Soil54, 77–94.
VanToai TT, Beuerlein JE, Schmitthenner AF, St Martin KS.1994. Genetic variability for flooding tolerance in soybeans. CropScience 34, 1112–1115.
VanToai TT, Saglio P, Ricard B, Pradet A. 1995. Developmentalregulation of anoxic stress tolerance in maize. Plant, Cell andEnvironment 18, 937–942.
VanToai TT, Yang Y, Ling P, Boru G, Karica M, Roberts V,Hua D, Bishop B. 2003. Monitoring soybean tolerance to floodingstress by image processing technique. In: VanToai TT, et al., ed.Digital imaging and spectral techniques: applications to precisionagriculture and crop physiology. ASA Special Publication No. 66.Madison, WI: The American Society of Agronomy, 43–51.
Weaver LM, Gan S, Quirino B, Amasino RM. 1998. A compari-son of the expression patterns of several senescence-associatedgenes in response to stress and hormone treatment. Plant Molecu-lar Biology 37, 455–469.
Wingler A, von Schaewen A, Leegood RC, Lea PJ, Quick WP.1998. Regulation of leaf senescence by cytokinin, sugars, andlight: effects on NADH-dependent hydroxypyruvate reductase.Plant Physiology 116, 329–335.
Zhang J, Davies WJ. 1990. Changes in the concentration of ABA inxylem sap as a function of changing soil water status can accountfor changes in leaf conductance and growth. Plant, Cell andEnvironment 13, 277–285.
Zhang J, VanToai TT, Huynh LN, Preiszner J. 2000. Floodingtolerance of transgenic Arabidopsis plants containing the auto-regulated cytokinin biosynthesis system. Molecular Breeding 6,135–144.
Regulation of flooding tolerance of SAG12:ipt Arabidopsis plants 1407
by guest on August 23, 2014
http://jxb.oxfordjournals.org/D
ownloaded from