Embed Size (px)
Citation preview
Nuclear Engineering and Design 99 (1987) 213-222 213 North-Holland, Amsterdam
V A L I D A T I O N O F A B O T F O M F L O O D I N G M O D E L
Mario DE SALVE and Bruno P A N E L L A
Dipartirnento di Energetica, Politecnico di Torino, 10129 Torino, Italy
To validate a thermal-hydraulic model, which predicts the wall temperature history and the quench front propagation during the bottom reflooding of tubular channels, a comparison is made between the predicted results and the experimental data performed on a facility with a 2 m long, 0.01 m inner diameter and a 0.001 m thick AISI 304 vertical tubular test section. The initial wall temperature ranges from 600 to 700°C, the flooding mass velocity ranges from 127 to 254 kg/mZs, the inlet water temperature ranges from 20 to 80°C, the pressure is 0.1 MPa, New void fraction, vapour enthalpy, critical Weber number and heat flux correlations in the inverted annular flow region are presented. The actual quality and the heat transfer in the dispersed flow film boiling are evaluated on the basis of Mastanaiah and Ganic model. The strong effect of the inverted annular film boiling heat transfer on the quench mechanism is shown. The agreement between the predictions and the data is fairly good especially when the quench front propagation rate change is not strong, but also in the other cases the trend is correct and the results are encouraging.
1. Introduction
The physical mechanisms in the rewetting of a hot, dry surface during the emergency core cooling by bot- tom reflooding have been analysed by several authors in recent years in order to accurately predict the wall temperature distribution and the quench front propa- gation of LWR core channels during the reflooding phase following a loss of coolant accident.
The treatment of the thermal-hydraulics ahead of the quench front, which is very important to evaluate the wall temperature history, has not been adequate so far; the flow patterns which may occur in such a region are the inverted annular flow (at low void fraction) or the dispersed flow (at high void fraction).
The contribution of the present paper is to validate a thermal-hydraufic model (and the calculation code RIBFA), which predicts the temperature distribution and the rewetting velocity during the bottom reflooding of tubular channels, by a comparison of the predicted results with the experimental data performed on a facil- ity in which a 2 m long, 0.01 m inside diameter and 0.001 m thick AISI 304 vertical tube was electrically heated at high temperature and flooded from the bot- tom at constant inlet flow rate. The initial wall tempera- ture ranges from 600 to 700°C, the inlet water subcool- ing ranges from 20 to 80°C, the flooding rate ranges from 0.01 to 0.02 kg/s (the inlet velocities ranges from about 0.12 to 0.25 m/s); the pressure is 0.1 MPa. Data
are presented as wall temperature history and quench front propagation rate and as collapsed liquid level in the tube. The philosophy of the present model and the solution of the transient conduction equation are re- ported by De Salve and Panella in refs. [1] and [2]. The local heat transfer coefficients, based on a generalized boiling curve, provide the boundary conditions for the solution of the conduction equation.
In the channel during the re flooding three main control volumes (time dependent) are considered on the basis of the prevailing flow regime: the single phase (liquid) region, the two-phase region, and the dispersed flow region (with a possible super-heated region). Each control volume has moving boundaries and contains several flow patterns and heat transfer regimes; the continuity and energy equations for the coolant are coupled to a one- dimensional (only axial) conduction equation for the wall; the expficit finite differences approximation is used to resolve the differential equa- tions in a quasi-steady-state form.
The reflooding is analysed at constant inlet flow rate, because on one hand so far little is known about the transient two-phase flow and heat transfer; on the other hand the aim of the present work is essentially to develop a relatively simple code to be validated by data from a laboratory-scale single tube experimental facility with no variation of the boundary conditions applied at the inlet of the tube and of the pressure level in order to avoid bundles and housing effects and to have a be-
0029-5493/87 /$03 .50 © Elsevier Science Publishers B.V. (Nor th -Hol land Physics Publishing Division)
214 M. De Salve, B. Panella / Validation ~[ a bottom/loodmg mode/
haviour of the channel not far from being steady state. Special care is devoted to the analysis of the
wall-liquid interaction near the quench front and to the fluid dynamics and heat transfer in the precursory cooling region. New correlations of the void fraction, vapour enthalpy, critical Weber number and heat trans- fer coefficient in the inverted annular flow are pre- sented.
The code RIBFA is not applicable to LWR mainly because the conduction equations concern a tubular channel even if inner heat generation and non-uniform power shape can be handled. The thermal-hydraulics models are one-dimensional and they do not depend on the geometry; so minor improvements could extend the applicability to the reflood phase of LWR's.
2. Heat transfer regimes and flow patterns boundaries
Criteria for the following boundaries between the regions with different flow patterns and heat transfer regimes are established in this model: the onset of the incipient boiling, the net vapour generation front, the transition from bubble-churn flow to annular (or in- verted annular) flow, the onset of the dispersed flow and the possible transition to a super-heated vapour region. The adoption of steady-state criteria seems to be reasonable as low reflooding velocity and lower quench front propagation rate situations are investigated.
The onset of the incipient boiling is evaluated by the Bergles-Rohsenow criterion [3]; although the transient boiling curve presents an hysteresis with lower heat flux during the cool-down process according to Yao and Chung [4], there is no significant difference between the transient and the steady state curves.
The net vapour generation front, which is the boundary between the single phase and the two-phase regions is predicted by adopting the Saha-Zuber crite- rion [5] assuming the phenomenon to be controlled by the wall temperature TNV6 and the local liquid subcool- ing. The heat flux to the coolant between z m and Zyw; is evaluated by the Dittus-Boelter correlation for the convective term and the Forster-Zuber-Chen correla- tion [6] for the nucleate boiling term. Either in steady state or in transient conditions the maximum heat flux to the coolant corresponds to the transition from transi- tion film boiling to nucleate boiling (DNB). The DNB wall temperature is evaluated by adopting the Ponter- Haigh correlation [7] for the departure from nucleate boiling heat flux and the Forster-Zuber-Chen correla- tion for the heat transfer coefficient; the effect of the liquid subeooling is taken in account.
The transition from transition fihn boiling to stable film boiling usually occurs when the heat flux is mini- mum. Such heat flux and the corresponding wall tem- perature increase with the flow rate
A characteristic "apparent quench temperature" '1~ is usually derived from the time history wall tempera- ture curves in correspondence of the knee often oc- curing in the wall temperature-time trace at a certain height. Tq can be interpreted as the wall temperature at which the heat flux in a well defined time suddenly increases: it is affected by the local fluid dynamic parameter (flow rate and quality) and by the thermal properties of the wall and the coolant [8]. According to Groeneveld and Rousseau [9] Tq is higher than the minimum fihn boiling heat flux temperature which is the locus of the valley of the heat transfer surface; it must be noted that the heat transfer surface is changing with time because the thermal-hydraulic conditions dur.. ing reflooding are changing. The data to be compared with the present model show a relevant dependence of Tq on the channel height (and on the local subcooling) and a lesser dependence on the flooding rate. In order to estimate the maximum wall temperature Tq at which a permanent liquid-wall contact can occur, it is as-. sumed the interaction between a c~otant mass at 7) temperature and a wall at T temperature is char- acterized by the heat transfer coefficient "h" during the interaction phase and the delay time "'t'" necessary for the re-establishment of the conditions which allow the liquid to wet the surface. As the maximum liquid tem- perature under metastable conditions (according to Spiegler [10]) is T I .... = 273 ° C, the wall wettability con- ditions are reached when the wall temperature becomes less or equal to 273°C. On the basis of the Baumeis- ter-Simon [11] correlation, which gives the temperature of a semi-infinite wall in contact with a water drop of infinite mass as a function of time, the following corre- lation is deduced for Tq* by De Salve and Panelta [1]:
Tq* = Tt+ 1(273 - T~), 1)
where
a = e x p ( t * ) e r f c ( t ~ ) , 2)
where t* = h 2 t / ( # e k ) w is a dimensionless time in which t is the duration of the wall-liquid interaction phase till the re-establishment of a permanent contact and h is the average heat transfer coefficient during such a phase. For the relatively high flooding velocity tests performed by De Salve and Panella [12] t* < 0.5 and the correla- tion (2) gives " a " values between 0.5 and 1. The param-

M. De Salve, B. Panella / Validation of a bottom flooding model 215
eter t* depends on the local thermal-hydraulic condi- tions and on the wall temperature at the beginning of the interaction phase: it increases with the mass veloc- ity, the liquid temperature and the wall temperature. To take into account the dependence of Tq* on the flow rate eq. (1) has been rearranged including a term de- rived from the experiments of Iloeje et al. [13]:
Tq* = T/+ 0.355(1 + 0.279G°49)(273 - Tl). (3)
Values of the parameter " a " between 0.5 and 1 corre- spond in eq. (3) to mass velocity G between 50 and 300 kg/m2 s.
Fig. 1 presents the apparent quench temperature Tq as a function of the local liquid temperature TI, which is evaluated by a steady state heat balance, for the tests performed by De Salve and Panella [12]. It can be seen that Tq decreases as TI increases, except at very low subcooling when the liquid at the quench front is nearly saturated; there is also an effect of the initial wall temperature (Tq is higher at higher To) and a slight effect of the flow rate. The wall temperature Tq* values predicted by the eq. (1) at t* = 0., 0.1, 0.2 and 0.5 and predicted by eq. (3) at G = 127, 191 and 254 kg/m2s are also shown. Because of the relatively high flooding velocity of the present tests an inverted annular flow, with a relevant mass of liquid, is likely to occur just ahead of the quench front, so it seems reasonable that Tq values are close to Tq* values, predicted with t* between 0.1 and 0.5 as it is shown in fig. 1. With reference to the data the dimensionless time t* de- creases with the local subcooling and increase with the wall temperature and slightly with G. Eq. (3) overpre- dicts the flow rate effect and does not take in account the initial wall temperature effect.
The Wallis criterion [15] is used for the transition
o
600
400
200
100
.1 / \ T (°C
0 6OO
~eq.(1) _ e g . ( 3 )
127 1~1 2~4" 700 O~ a • O •
0 4O 80
T (°C) 1
Fig. 1. Apparent quench temperature vs. liquid temperature. Dark symbols T o = 700°C.
from bubble-chum to annular flow. If the criterion is satisfied an annular flow is assumed to occur up to the quench front downstream of which a dispersed flow develops; if it is not verified below the quench front, an inverted annular flow regime will exist downstream of the quench front. In such a case the onset of the liquid entrainment and carryover, that is the transition from the inverted annular flow to the dispersed flow, depends on the liquid core stability. The fragmentation of the inverted annular flow liquid column is believed to be related to the Kelvin-Helmholtz type instabilities at the liquid-vapour interface, which is affected by the rela- tive velocity between the phases, so the Weber number can be adopted as a key parameter of the liquid column stability. The critical Weber number has been derived by De Salve and Panella [2] by lineafizing the continu- ity and momentum equations about the steady state solution and by determining the conditions of the tran- sition from a hyperbolic equation system to a parabolic (We = Wec) or to an elliptic (We > W%) one. The criti- cal Weber number, based on the channel diameter, is given by the correlation:
( We c = 2 1 + P v 1 a 1 + 3 • (4) O/ a ~/1 a 2
Kawaji and Banerjee [17] analysis for the linear stability of the hydraulic equation system is similar but with a different pressure difference between the phases [2]; apart from such a difference condition (4) is the same as condition (43) of ref. [17] if the wave number k = 2/v/~D. Instead the point of transition to a dispersed flow regime is determined in ref. [17] by predicting the necking of the liquid column due to the growing am- plitude of the interfacial waves, that is to the void fraction profile. As limiting values between 0.3 and 0.5 for the void fraction in the inverted annular flow are suggested by Groeneveld and Rousseau [9] and by Plummer et al. [16], the corresponding critical Weber numbers predicted by eq. (4), are lower than 5, less than 8 which is the We~ value suggested by Analytis and Yadigaroglu [18] and much more lower than 20 as suggested by Denham [19]. It must be noted that the predicted Weber number as a function of the distance from the quench front has a different trend in refs. [18] and [19] owing to different thermal-hydraulic models; so the Wee, that is chosen empirically on the basis of an evaluation of the inverted annular flow region length, is different. However it has to be observed that the effect of the critical Weber number on the results of the present model is not strong in agreement with Analytis [18], because there is a rather gradual transition from
216 M. De Sah~e, B. Panella / Validation of a bottom floodmg mode/
IAF boiling to inverted slug or dispersed flow regimes with no abrupt change in the heat transfer coefficient. After a transition region with liquid slugs and large drops, a dispersed flow pattern with small liquid drop- lets flowing in a continuous vapour stream, occurs. The transition from the dispersed flow to the super-heated region occurs when the flow quality becomes equal to 1.
3. Flow rate and void fraction evolution
In the single phase liquid region (control volume 1) the flow rate is assumed constant. In the two-phase region with dispersed steam phase (control volume 2) the mass flux along the channel derives from the con- tinuity equation, by assuming constant liquid and vapour densities:
= ( o , - (5) ~)z
The void fraction time derivative is relevant between the net vapour generation front and the onset of the disper- sed flow region. In the control volume 3 the time change of the void fraction can be considered negligible and the mass flux is assumed constant with the height. In the region between the net vapour generation front and the transition point to the stable film boiling, the void fraction is predicted by the usual correlations based on the drift flux model with different values of the parameters C0 and V~ depending on the flow pat- tern. In the inverted annular flow region the cross sectional averaged void fraction has been derived by the present authors [2] from the mass conservation equa- tions for the liquid and the vapour under the hypothesis of steady state flow and negligible axial gradient of the average liquid velocity:
a = X + a o ( 1 x ) ( l a0x°(1-a°))(1-x0) ' (6)
where x o and a 0 are the flow quality and the void fraction at the onset of the inverted annular flow. The correlation (6) underpredicts the axial gradient of the data obtained by Fung and Groeneveld [20] but it is not certain if the flow pattern of such film boiling data is an inverted annular flow and to what extent.
In the dispersed flow region the flow pattern is characterized by small liquid droplets flowing in a con- tinuous vapour stream with a rather strong thermal non-equilibrium and a void fraction higher than 0.8; the liquid phase is assumed saturated. To predict the void fraction the droplets evolution is evaluated by a flag-
mentation criterion, depending ¢~n the droplet Webe~ number, and the evaporation rate, which has been de- rived by the present authors [2].
4. Thermal non-equilibrium
Downstream of the net vapour generation front up to the quench front the mixture enthalpy is evaluated by the steady state mixture energy equation where the liquid enthalpy is predicted by the Zuber et al. profile fit correlation [21], which takes into account the thermal non-equilibrium. A double thermal non-equilibrium is likely to be in the inverted annular flow region as the liquid core may be still subcooled and the vapour layer is superheated with the steam temperature increasing with the distance from the quench front. The same Zuber profile fit correlation is used to evaluate the liquid enthalpy of the core, while for the cross sectional averaged vapour enthalpy Hv the following profile fit correlation is suggested:
1t~ = g w + ( H ...... - tire, ) 1 - exp , HLS:-- tq '
(7)
where H ...... is the maximum attainable value of the vapour enthalpy (corresponding to the wail tempera- ture) and Hq is the mixture enthaipy at the onset of the inverted annular flow. The inverted annular flow actual quality is given by:
,. = ( t I H + ) / ( H v - HI) . (8)
As regards the thermal non-equilibrium in the dis- persed flow region, the vapour temperature is controlled both by wall to vapour and vapour to liquid droplets heat exchange. Some models have been analysed and compared with data by the present authors [2]. In accordance with those findings a method derived from Mastanaiah and Ganic model [22] is adopted in the present code. The actual quality axial gradient is given
by:
d z GHfg (qw d 4- qra) + q~id = - G - , (9)
where qw a and qrd are the heat fluxes from the wall to the droplets corresponding respectively to the direct contact and radiation heat transfer mechanisms, q~a is the heat flux from the vapour to the droplets per unit volume of the channel, Sv is the vapour generation rate per unit volume. The vapour temperature gradient is
M. De Salve, B. Panella / Validation of a bottom flooding model 217
given by:
dz xGcv D qvd -- Svcv(rv - Ts) , (10)
where qw-v is the heat flux from the wall to the vapour. The different heat flux terms will be given in the next section. Such a method can be applied also at negative equilibrium quality and in the transition region from the inverted annular flow to the dispersed flow.
5. Heat transfer correlations
Some of the heat transfer correlations have been already mentioned in section 2. In the two-phase re#on downstream of the net vapour generation front, the nucleate boiling and forced convection vaporization heat transfer is predicted by the Chen correlation [6] and downstream of the DNB front the transition film boil- ing heat transfer is evaluated by the Ramu-Weisman correlation [23].
The transition film boiling regime is characterized by a certain fraction f of the wall which is wetted while the fraction (1 - f ) is dry. The heat flux is often expressed as sum of two terms corresponding to the heat transfer from the wall to the liquid by nucleate boiling and from the wall to the vapour. From a conceptual point of view the transition to a stable film boiling occurs when the fraction f becomes zero and the rewetting temperature can be defined as the wall temperature at which a permanent contact between wall and liquid is reestab- fished, while the apparent quench temperature, as given by eq. (1), is a wall temperature upper limit above which no permanent direct contact between liquid and surface is possible.
The Ramu-Weisman correlation does not contains the parameter f but the convective as well as the boiling component are considered. According to Wang et al. [24] this correlation overestimates the data at low flow rate and high quality, while the experimental results obtained by Cheng [25] at G = 136 kg/m2s are un- derpredicted. The inverted annular film boiling (IAFB) is a relatively efficient heat transfer regime just above the quench front because of the thin film of vapour between the wall and the liquid column. In the IAFB it seems important to take into account either convection from the wall to the vapour or the vapour boundary layer-liquid column surface interaction or radiation from the wall to the liquid heat transfer mechanisms. So the IAFB heat flux can be given by the correlation:
qIAFB = h ¢ ( T - rv) + h,AF(T-- T~) + h r ( r - Ts). (11)
The convective heat transfer coefficient h e is evaluated by the Heineman correlation [26], to get con- tinuity at the boundary between IAFB and DFFB. The fluctuations of the liquid column, so that the liquid penetrates into the annular vapour film, can be taken in account by a peculiar IAFB heat flux term which de- creases quickly with the distance from the quench front. On the other hand the heat transfer by direct contact between the wall and the liquid cannot be neglected also at rather high temperature according to Chen [27]. The following correlation is chosen for h lAF:
qTBQF ( W e ) h IAF = 1 - ( 1 2 ) T~ n ( r - ,) W~c '
where We is the hquid core Weber number, We c is the We critical value and qTBQF is the heat flux at the onset of the stable film boiling (that is at quench front) where the wall wetted fraction f becomes zero. The h iA F
value tends to zero at We approaching Weo when the IAFB to DFFB transition occurs. Eq. (12) is a tentative approach for the l iquid-wall interaction term that the present authors suppose to be dependent also on the Weber number because such a number can be consid- ered related to the frequency and wavelength of the liquid column fluctuations, which in turn affect the direct contact heat transfer.
The thermal radiation term to the liquid is given by the Hottel correlation [28].
In the dispersed flow region the main heat transfer mechanisms from the wall to the fluid are the wall-to- vapour convective heat transfer (heat flux qw-v), the wall to droplets radiative heat transfer (heat flux qrd)
and the wall to droplets direct contact heat transfer (heat flux qw-d)" The wall to vapour heat transfer coefficient can be evaluated by the Heineman correla- tion; the radiative heat transfer between the wall and the liquid is accounted for by the method reported by Sun et al. [29] where a proper choice for the emissivity values of "the liquid, vapour and wall is given by Arrieta and Yadigaroglu [30]. The wall to droplet heat transfer mechanism is the more difficult to model; most models assume that direct wall contact by liquid drops is negli- gible because of the highly superheated wall, but, according to Chen [27], recent evidence is accumulating that wall-liquid contact could be possible and the heat transfer is significant in the region close to the CHF location. On the basis of the Mastanaiah and Ganic model [22] the heat flux from the wall to the droplets can be calculated by the correlation
qw-d = KdcfdHfg exp(1 -- T/T~), (i3)
218 M. De Salue, B. Panella / Validation o] a bottonl flooding modd
where K d is the droplet deposition velocity and fd is the deposition factor; the bulk droplets concentration c can be evaluated by the relation:
= - - - ( i 4 ) c + l _ x p v
In the present model a proper choice of the product K a f d is an input of the code. As it can be seen the term qw d, given by eq. (13), decreases sharply as the wall temperature increases; there may be some contribution of this term to the overall average heat transfer for those conditions in which the dispersed flow region starts near the quench front, where the wall temperature is not too high.
6. Prediction of bottom reflooding data
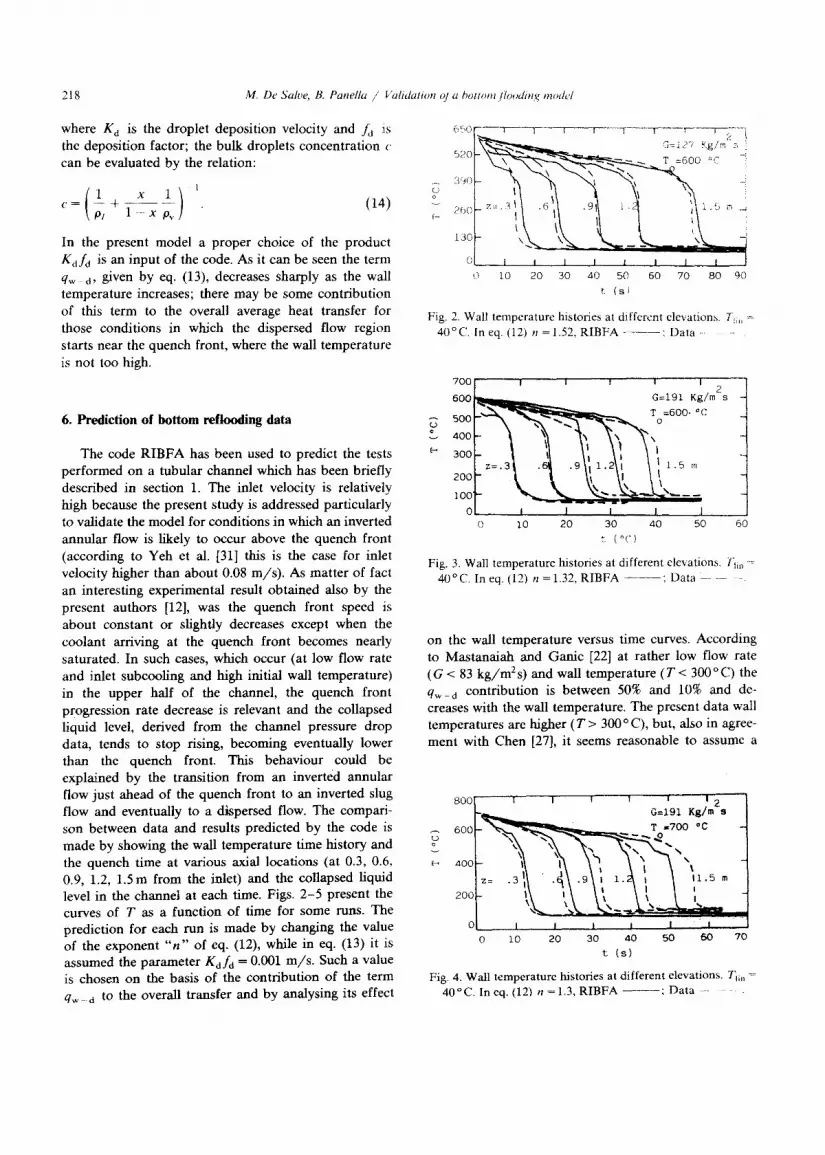
The code R I B F A has been used to predict the tests performed on a tubular channel which has been briefly described in section 1. The inlet velocity is relatively high because the present study is addressed particularly to validate the model for conditions in which an inverted annular flow is likely to occur above the quench front (according to Yeh et at. [31] this is the case for inlet velocity higher than about 0.08 m/s ) . As matter of fact an interesting experimental result obtained also by the present authors [12], was the quench front speed is about constant or slightly decreases except when the coolant arriving at the quench front becomes nearly saturated. In such cases, which occur (at low flow rate and inlet subcooling and high initial wall temperature) in the upper half of the channel, the quench front progression rate decrease is relevant and the collapsed liquid level, derived from the channel pressure drop data, tends to stop rising, becoming eventually lower than the quench front. This behaviour could be explained by the transition from an inverted annular flow just ahead of the quench front to an inverted slug flow and eventually to a dispersed flow. The compari- son between data and results predicted by the code is made by showing the wall temperature time history and the quench time at various axial locations (at 0.3, 0.6, 0.9, 1.2, 1.5 m from the inlet) and the collapsed liquid level in the channel at each time. Figs. 2 -5 present the curves of T as a function of time for some runs. The prediction for each run is made by changing the value of the exponent " n " of eq. (12), while in eq. (13) it is assumed the parameter K d f d = 0 . 0 0 1 m / s . Such a value is chosen on the basis of the contribution of the term qw- a to the overall transfer and by analysing its effect
o
(i 50 r r - - T ~ - T . . . . . . . .
5 2 ° F ~ k " ~
260
o [ i
,.) 10 20
r F ....... 3" ......... 7 . . . . T . . . . . . r-- . . . . 2 G:127 .~;g/'m 5; ' ~
600 °C ii
i ' i 1 .5 m
I I I I I I
30 ao 50 6o 7o 8o 90
t <s~
Fig. 2. Wall temperature histories at different elevations. ;rt~,, = 40°C. In eq. (12) n =1.52, RIBFA . . . . ; Data
700 ! 1 I i I 600 G=191 Kg/m2s
500 To=600" °C
o , o o \ Z . . . . 9 i . 1 .5 m
200
ioo ~ ~,~ ~ L ~ , ~----
o I I I I I 0 10 20 30 40 50 60
t. ( °C )
Fig. 3. Wall temperature histories at different elevations, l°lin =
40 o C. In eq. (12) n = 1.32, RIBFA - - - - - ; Data
on the wall temperature versus time curves. According to Mastanaiah and Ganic [22] at rather low flow rate (G < 83 kg/m2s) and wall temperature (T < 300°C) the qw-d contribution is between 50% and 10% and de- creases with the wall temperature. The present data wall temperatures are higher (T > 300 o C), but, also in agree- ment with Chen [27], it seems reasonable to assume a
o v
800
600
40C
20C
0
I I ! l
- I I
- ~
I I I
, i 2 G=191 Kg/m s
T =700 °C
",,%
11.5 m
[ ! 21 70 0 i o 20 30 40 5o 6 o
t ( s )
Fig. 4. W~ltemperaturel~stodes at differentelevations. Tim = 40°C. In eq.(12) n =1.3, R I B F A - - - - : Data ....
M. De Salve, B. Panella / Validation of a bottom flooding model 219
8O0
U 600
L
4 0 0
2OO
| I I I I I
G=I91 Kg/m2s k ~ T :700 °C
- II I', I i I t t
I I I I I I 4 0 8 0 1 2 0 1 6 0 2 0 0 2 4 0 2 8 0
t (s)
Fig. 5. Wall temperature histories at different elevations. Tli n = 80°C. In eq. (12) n =1.6, RIBFA ; Data - - - - - -
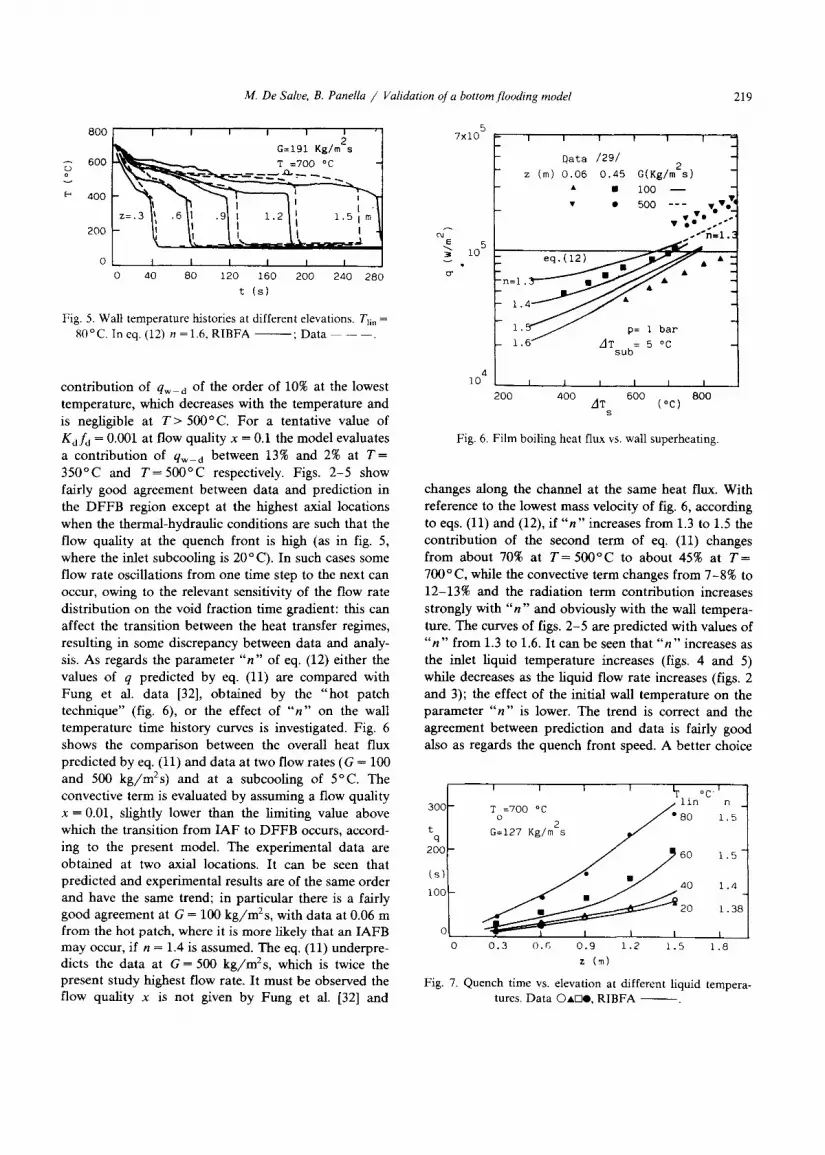
contribution of qw d of the order of 10% at the lowest temperature, which decreases with the temperature and is negligible at T > 500°C. For a tentative value of K d f d = 0.001 at flow quality x = 0.1 the model evaluates a contribution of qw d between 13% and 2% at T = 350°C and T = 5 0 0 ° C respectively. Figs. 2 -5 show fairly good agreement between data and prediction in the D F F B region except at the highest axial locations when the thermal-hydraulic conditions are such that the flow quality at the quench front is high (as in fig. 5, where the inlet subcooling is 20 ° C). In such cases some flow rate oscillations from one time step to the next can occur, owing to the relevant sensitivity of the flow rate distribution on the void fraction time gradient: this can affect the transition between the heat transfer regimes, resulting in some discrepancy between data and analy- sis. As regards the parameter " n " of eq. (12) either the values of q predicted by eq. (11) are compared with Fung et al. data [32], obtained by the " h o t patch technique" (fig. 6), or the effect of " n " on the wall temperature time history curves is investigated. Fig. 6 shows the comparison between the overall heat flux predicted by eq. (11) and data at two flow rates (G = 100 and 500 kg/m2s) and at a subcooling of 5°C. The convective term is evaluated by assuming a flow quality x = 0.01, slightly lower than the limiting value above which the transition from IAF to D F F B occurs, accord- ing to the present model. The experimental data are obtained at two axial locations. It can be seen that predicted and experimental results are of the same order and have the same trend; in particular there is a fairly good agreement at G = 100 kg/m2s, with data at 0.06 m from the hot patch, where it is more likely that an IAFB may occur, if n = 1.4 is assumed. The eq. (11) underpre- dicts the data at G = 500 kg/m2s, which is twice the present study highest flow rate. It must be observed the flow quality x is not given by Fung et al. [32] and
5 7xlO
3 105
4 i0
I I I ! ! [
D a t a / 2 9 /
z (m) 0.06 0.45 C(Kg/m2s) • • i00 -- • • 500 v Vo
.Vo v"
i .5"~/ p= i bar 1.61 ZJT = 5 °C
sub
2 0 0 I I I I I I
aoo 6oo 8 0 0 AT (°c)
s
Fig. 6. Film boiling heat flux vs. wall superheating.
changes along the channel at the same heat flux. With reference to the lowest mass velocity of fig. 6, according to eqs. (11) and (12), if " n " increases from 1.3 to 1.5 the contribution of the second term of eq. (11) changes from about 70% at T = 500°C to about 45% at T = 700 ° C, while the convective term changes from 7-8% to 12-13% and the radiation term contribution increases strongly with " n " and obviously with the wall tempera- ture. The curves of figs. 2 -5 are predicted with values of " n " from 1.3 to 1.6. It can be seen that " n " increases as the inlet liquid temperature increases (figs. 4 and 5) while decreases as the liquid flow rate increases (figs. 2 and 3); the effect of the initial wall temperature on the parameter " n " is lower. The trend is correct and the agreement between prediction and data is fairly good also as regards the quench front speed. A better choice
I I I I i T oC I 1in n 300 T =700 °C /o
o / "80 1.5 tq G=127 Kg/m2s ~
2 0 0 / p 60 i. 5
(s) ~ • •
I00 4 0 1.4.
2 0 1 . 3 8
0 0.3 0 . 6 0.9 1.2 1 . 5 I . 8
z (m)
Fig. 7. Qucnch time vs. elcvation at diffcrcnt liquid tempera-
tures. Data O4D@, RIBFA - -

220 M. De Salve, B. Panella / Validation of a bottom flooding model
2. - - i I , I . | | | pred. e x p . | ~I
~ ' • 600 °C
. / m 2 s
& ~ O ± 1 rl
O. ~, I I
0 30 60 90
t (s)
Fig. 8. Quench front position and collapsed liquid level vs. time.
of the parameter " n " would be possible but this was not the objective of the present investigation; however if " n " is increased by 15% for the same run the quench time increases on the average by about 50%. As regards the quench time, fig. 7 shows a fairly good agreement between analytical results and data also when the quench front speed decreases along the channel. In fig. 8 the collapsed liquid level, derived by De Salve and Panella [12] from the pressure difference record during the reflooding, and the quench front level are compared with the analytical results for a run. The agreement is fairly good, that means the average void fraction and the liquid mass in the channel at each time are fairly well estimated and the predicted height of the liquid column in the IAF region is in qualitative agreement with the experiment values.
7. Conduf ion
A model which predicts the thermal-hydraulics dur- ing the reflooding of a tubular channel has been analysed and the analytical results have been compared with bottom flooding data at relatively high inlet velocity at which it is likely the precursory cooling phase is char- acterized by an inverted annular flow ahead of the quench front. The correlations which evaluate the ap- parent quench temperature, the void fraction, the vapour enthalpy and the liquid column stability in the inverted annular flow, seem to work well. The trend of the new heat transfer correlation in the inverted annular flow
seems correct and in fairly good agreement with the few available data, in the investigated range of the parame- ters. The direct wall to droplet interaction heat transfer in the dispersed flow region seems to be not negligible near the quench front. The prediction of the wall tem- perature time history curves, of the quench front time and speed and of the collapsed liquid level are in fairly good agreement with data also when the quench front speed decrease along the channel is relevant. However the predicted results are conservative and with a correct trend for a proper choice of the parameter "n" of eq. (12). A best estimate model requires further appropriate and extensive experiments particularly as regards the transition film boiling heat transfer terms and wetted fraction, the thermal-hydraulics in the inverted annular flow and the heat transfer in the precurso~ cooling region where the parameters like "n" and "Kdfd" must be related to the local thermal-hydraulic conditions.
Acknowledgements
The work has been carried out within the framework of the ENEA's LWR Safety Research Program.
Nomenclature
c specific heat, D diameter of the channel, f wetted fraction, fd droplet deposition factor, G mass flux, h heat transfer coefficient, H enthalpy, Hfg latent heat of vaporization, K droplet deposition velocity, k thermal conductivity, p pressure, q heat flux, S vapour generation rate per unit volume, t time, T temperature, wall temperature, u phase velocity, W flow rate, We Weber number, x flow quality, z axial coordinate.
Greek
a void fraction, A T~u b subcooling,

M. De Salve, B. Panella / Validation of a bottom flooding model 221
A T, up
P ~3
superheated wall temperature, density, surface tension.
Subscripts
c col IB l LEV N V G
0 q r
s sub sup v v - d w - d w - v w
convective, collapsed, incipent boiling, liquid, swollen liquid level,
net vapour generation, initial, quench front, radiat ion, saturated, subcooled, superheated, vapour, vapour to droplets, wall to droplets, wall to vapour, wall.
A bbreuiations
D F F B I A F IAFB
dispersed flow film boiling, inverted annula r flow,
inverted annula r film boiling.
R e f e r e n c e s
[1] M. De Salve and B. Panella, Analytical model for bottom reflooding thermal-hydraulics in circular ducts and com- parison with experimental results, in: Heat Transfer in Nuclear Reactor Safety, ed. S.G. Bankoff and N.H. Afgan (Hemisphere-McGraw Hill, New York, 1982) pp. 747-762.
[2] M. De Salve and B. Panella, Thermal-hydraulics of the precursory cooling during bottom reflooding, in: Multi- Phase Flow and Heat Transfer, III Part B, ed. T.N. Veziroglu and A.E. Bergles, (Elsevier, Amsterdam, 1984) pp. 259-277.
[3] A.E. Bergles and W.M. Rohsenow, The determination of forced convection surface-boiling heat transfer, ASME J. Heat Transfer 86 (1970) 365-370.
[4] S.C. Yao and Y. Chung, Experimental studies of transient pool boiling heat transfer on a vertical tube, in: Multi- Phase Flow and Heat Transfer, III Part A, ed. T.N. Veziroglu and A.E. Bergles (Elsevier, Amsterdam, 1984) pp. 615-623.
[5] P. Saha and N. Zuber, Point of net vapor generation and vapor void fraction in subcooled boiling, Proc. 5th Inter- nat. Heat Transfer Conf. Tokio, Vol. IV (1974) pp. 175-179.
[6] J.C. Chen, A correlation for boiling heat transfer to saturated fluids in convection flow, ASME Paper, 63-HT- 34 (1963).
[7] A.B. Ponter and C.P. Haigh, The boiling crisis in saturated and subcooled pool boiling at reduced pressures, Int. J. Heat Mass Transfer 12 (1969) 429-437.
[8] O.C. Iloeje et al., Effects of mass flux, flow quality, thermal and surface properties of materials on rewet of dispersed flow film boiling, ASME J. Heat Transfer 104 (1982) 304-308.
[9] D.C. Groeneveld and J.C. Rousseau, CHF and post- CHF heat transfer, in: Advances in Two-Phase Flow and Heat Transfer, Vol. I, ed. S. Kakac and M. Ishii (Nijhoff, Groningen, 1983) pp. 203-277.
[10] P. Spiegler et al., Onset of stable film boiling and the foam limit, Int. J. Heat Mass Transfer 6 (1963) 987-994.
[11] K.J. Baumeister and F.F. Simon, Leidenfrost temperature. Its correlation for liquid metals, cryogens, hydrocarbons and water, ASME J. Heat Transfer 95 (1973) 166-173.
[12] M. De Salve and B. Panella, Void fraction and quench time in bottom reflooding experiments, Heat and Tech- nology 3 (1985) 64-102.
[13] O.C. Iloeje et al., An investigation of the collapse and surface rewet in film boiling in forced vertical flow, ASME J. Heat Transfer 97 (1975) 166-172.
[14] D. Hein et al., Maximum wetting temperatures up to critical pressure, Internat. Workshop on Fundamental Aspects of Post Dryout Heat Transfer, Salt Lake City (April 1984).
[15] G.B. Wallis, One Dimensional Two-Phase Flow (McGraw Hill, New York, 1968).
[16] D.B. Plummer et al., Post critical heat transfer to flowing liquid in a vertical tube, MIT Report, 72718-91 (1974).
[17] M. Kawaaji and S. Banerjee, A two-fluid model for re- flooding of a vertical tube: Structure and stability of the inverted annular flow model, Symposium Series 225, Vol. 79 (1983) pp. 236-249.
[18] G.Th. Analytis and G. Yadigaroglu, Analytical modeling of inverted annular film boiling, Proc. 3rd Internat. Topi- cal Meeting on Reactor Thermal Hydraulics, Newport, Vol. 1, Paper 2b (October 1985).
[19] M.K. Denham, Inverted annular film boiling and the Bromley model, Report AEEW-R 1590, Winfrith (January 1983).
[20] K.K. Fung and D.C. Groeneveld, Measurement of void fraction in steady state subcooled and low quality flow film boiling, Internat. J. Multiphase Flow 6 (1980) 357-361.
[21] N. Zuber et al., Vapor void fraction in subcooled boiling and saturated boiling systems, Proc. 3rd Interuat. Heat Transfer Conf., Chicago, Vol. 5 (1966) 24.
[22] K. Mastanaiah and E. Ganic, Heat transfer in two compo- nent dispersed flow, ASME J. Heat Transfer 103 (1981) 300-306.
[23] K. Ramu and J. Weisman, Transition flow boiling heat transfer to water in vertical annulus, Nucl. Engrg. Des. 40 (1977) 285-295.

222 M. De Salve, B. Panella / l/Ztfidation of a bottom flooding model
[24] S. Wang et at., Studies of transition boiling heat transfer with saturated water at 1-4 bar, Nucl. Engrg. Des. 70 (i982) 223-243.
[25] S.C. Cheng, et al., Transition boiling heat transfer m forced vertical flow, Final Report 1978-79, Argonne Con- tract N. 31-109-38-3564 (1979).
[26] J.B. Heineman, An experimental investigation of heat transfer to super-heated steam in round and rectangular channels, ANL Report 6213 (1960).
[27] J.C. Chen, Review of post-dryout heat transfer in disper- sed two-phase flow, Internat. Workshop on Fundamental Aspects of Post-Dryout Heat Transfer, Salt Lake City (April 1984).
[28] H.C. Hottel and A.F. Sarofim, Radiative Transfer (Mc- Graw Hill, New York, 1967).
[29] K.H. Sun et al., Calculations of combined radiation and convection heat transfer in rod bundles under emergency cooling conditions, ASME J. Heat Transfer 98 (1976) 414-420.
[30] g. Arrieta and G. Yadigaroglu. Analytical model for bottom reflooding heat transfer in light water reactors, EPRI Report, NP-756 (August 1978).
[31] H.C. Yeh et al., Reflood heat transfer correlation, Nud. Technol. 46 (1979) 473-481.
[32] K.K Fung et at., Subcooled and low quality flow film boiling of water at atmospheric pressure, Nucl. Engrg. Des. 35 (1979) 51-57.


